accounting - principles - Ebooks | PapaCambridge
1295
TWELFTH EDITION ACCOUNTING PRINCIPLES
-
Upload
khangminh22 -
Category
Documents
-
view
0 -
download
0
Transcript of accounting - principles - Ebooks | PapaCambridge

T W E L F T H E D I T I O N
ACCOUNTINGPRINCIPLES


ACCOUNT CLASSIFICATION AND PRESENTATION
Account Title Classification Financial StatementNormalBalance
AAccounts Payable Current Liability Balance Sheet Credit
Accounts Receivable Current Asset Balance Sheet Debit
Accumulated Depreciation—Buildings Plant Asset—Contra Balance Sheet Credit
Accumulated Depreciation—Equipment Plant Asset—Contra Balance Sheet Credit
Advertising Expense Operating Expense Income Statement Debit
Allowance for Doubtful Accounts Current Asset—Contra Balance Sheet Credit
Amortization Expense Operating Expense Income Statement Debit
BBad Debt Expense Operating Expense Income Statement Debit
Bonds Payable Long-Term Liability Balance Sheet Credit
Buildings Plant Asset Balance Sheet Debit
CCash Current Asset Balance Sheet Debit
Common Stock Stockholders’ Equity Balance Sheet Credit
Copyrights Intangible Asset Balance Sheet Debit
Cost of Goods Sold Cost of Goods Sold Income Statement Debit
DDebt Investments Current Asset/Long-Term
InvestmentBalance Sheet Debit
Depreciation Expense Operating Expense Income Statement Debit
Discount on Bonds Payable Long-Term Liability—Contra Balance Sheet DebitDividends Temporary account closed
to Retained EarningsRetained Earnings Statement
Debit
Dividends Payable Current Liability Balance Sheet Credit
EEquipment Plant Asset Balance Sheet Debit
FFreight-Out Operating Expense Income Statement Debit
GGain on Disposal of Plant Assets Other Income Income Statement Credit
Goodwill Intangible Asset Balance Sheet Debit
IIncome Summary Temporary account closed
to Retained EarningsNot Applicable (1)
Income Tax Expense Income Tax Expense Income Statement Debit
Income Taxes Payable Current Liability Balance Sheet Credit
Insurance Expense Operating Expense Income Statement Debit
Interest Expense Other Expense Income Statement Debit
Interest Payable Current Liability Balance Sheet Credit
Interest Receivable Current Asset Balance Sheet Debit
Interest Revenue Other Income Income Statement Credit
Inventory Current Asset Balance Sheet (2) Debit
Account Title Classification Financial StatementNormalBalance
LLand Plant Asset Balance Sheet Debit
Loss on Disposal of Plant Assets Other Expense Income Statement Debit
MMaintenance and Repairs Expense Operating Expense Income Statement Debit
Mortgage Payable Long-Term Liability Balance Sheet Credit
NNotes Payable Current Liability/
Long-Term LiabilityBalance Sheet Credit
OOwner’s Capital Owner’s Equity Owner’s Equity and
Balance SheetCredit
Owner’s Drawings Temporary account closed to Owner’s Capital
Owner’s Equity Debit
PPatents Intangible Asset Balance Sheet Debit
Paid-in Capital in Excess of Par—Common Stock
Stockholders’ Equity Balance Sheet Credit
Paid-in Capital in Excess of Par—Preferred Stock
Stockholders’ Equity Balance Sheet Credit
Preferred Stock Stockholders’ Equity Balance Sheet Credit
Premium on Bonds Payable Long-Term Liability Balance Sheet Credit
Prepaid Insurance Current Asset Balance Sheet Debit
Prepaid Rent Current Asset Balance Sheet Debit
RRent Expense Operating Expense Income Statement DebitRetained Earnings Stockholders’ Equity Balance Sheet and Retained
Earnings StatementCredit
SSalaries and Wages Expense Operating Expense Income Statement Debit
Salaries and Wages Payable Current Liability Balance Sheet Credit
Sales Discounts Revenue—Contra Income Statement Debit
Sales Returns and Allowances Revenue—Contra Income Statement Debit
Sales Revenue Revenue Income Statement Credit
Selling Expenses Operating Expense Income Statement Debit
Service Revenue Revenue Income Statement Credit
Stock Investments Current Asset/Long-Term Investment
Balance Sheet Debit
Supplies Current Asset Balance Sheet Debit
Supplies Expense Operating Expense Income Statement Debit
TTreasury Stock Stockholders’ Equity—Contra Balance Sheet Debit
UUnearned Service Revenue Current Liability Balance Sheet Credit
Utilities Expense Operating Expense Income Statement Debit
(1) The normal balance for Income Summary will be credit when there is a net income, debit when there is a net loss. The Income Summary account does not appear on any financial statement.
(2) If a periodic system is used, Inventory also appears on the income statement in the calculation of cost of goods sold.

CHART OF ACCOUNTS
The following is a sample chart of accounts. It does not represent a comprehensive chart of all the accounts used in this textbook but rather those accounts that are commonly used. This sample chart of accounts is for a company that generates both service revenue as well as sales revenue. It uses the perpetual approach to inventory. If a periodic system was used, the following temporary accounts would be needed to record inventory purchases: Purchases, Freight-In, Purchase Returns and Allowances, and Purchase Discounts.
AssetsCash
Accounts Receivable
Allowance for Doubtful Accounts
Interest Receivable
Inventory
Supplies
Prepaid Insurance
Prepaid Rent
Land
Equipment
Accumulated Depreciation— Equipment
Buildings
Accumulated Depreciation— Buildings
Copyrights
Goodwill
Patents
LiabilitiesNotes Payable
Accounts Payable
Unearned Service Revenue
Salaries and Wages Payable
Unearned Rent Revenue
Interest Payable
Dividends Payable
Income Taxes Payable
Bonds Payable
Discount on Bonds Payable
Premium on Bonds Payable
Mortgage Payable
Owner’s and Stockholders’EquityOwner’s Capital
Owner’s Drawings
Common Stock
Paid-in Capital in Excess of Par— Common Stock
Preferred Stock
Paid-in Capital in Excess of Par— Preferred Stock
Treasury Stock
Retained Earnings
Dividends
Income Summary
RevenuesService Revenue
Sales Revenue
Sales Discounts
Sales Returns and Allowances
Interest Revenue
Gain on Disposal of Plant Assets
ExpensesAdvertising Expense
Amortization Expense
Bad Debt Expense
Cost of Goods Sold
Depreciation Expense
Freight-Out
Income Tax Expense
Insurance Expense
Interest Expense
Loss on Disposal of Plant Assets
Maintenance and Repairs Expense
Rent Expense
Salaries and Wages Expense
Supplies Expense
Utilities Expense

T W E L F T H E D I T I O N
ACCOUNTINGPRINCIPLES
Jerry J. Weygandt PhD, CPAUniversity of Wisconsin—Madison
Madison, Wisconsin
Paul D. Kimmel PhD, CPAUniversity of Wisconsin—Milwaukee
Milwaukee, Wisconsin
Donald E. Kieso PhD, CPANorthern Illinois University
DeKalb, Illinois

D E D I C A T E D T O
the Wiley sales representativeswho sell our books and service our adopters in a professional and ethical manner, and toEnid, Merlynn, and Donna
Vice President and Director George HoffmanExecutive Editor Michael McDonaldCustomer and Market Development Manager Christopher DeJohnDevelopment Editor Ed BrislinAssistant Development Editor Rebecca CostantiniEditorial Supervisor Terry Ann TatroEditorial Associate Margaret ThompsonSenior Content Manager Dorothy SinclairSenior Production Editor Valerie A. VargasSenior Director, Marketing Amy ScholzSenior Marketing Manager Karolina Zarychta HonsaProduct Design Manager Allison MorrisProduct Design Associate Matt OrigoniMedia Specialist Elena Santa MariaDesign Director Harry NolanCover Design Maureen EideInterior Design Maureen Eide/Kristine CarneySenior Photo Editor Mary Ann PriceMarket Solutions Assistant Elizabeth KearnsMarketing Assistant Anna WilhelmCover and title page Marina Grau/Shutterstock
This book was set in New Aster LT Std by Aptara®, Inc. and printed and bound by Courier Kendallville.The cover was printed by Courier Kendallville.
Founded in 1807, John Wiley & Sons, Inc. has been a valued source of knowledge and understanding for more than 200 years, helping people around the world meet their needs and fulfill their aspirations. Our company is built on a foundation of principles that include responsibility to the communities we serve and where we live and work. In 2008, we launched a Corporate Citizenship Initiative, a global effort to address the environmental, social, economic, and ethical challenges we face in our business. Among the issues we are addressing are carbon impact, paper specifications and procurement, ethical conduct within our business and among our vendors, and community and charitable support. For more information, please visit our website: www.wiley.com/go/citizenship.
Copyright © 2015, 2012, 2010, 2008, 2005, 2002, 2000 John Wiley & Sons, Inc. All rights reserved. No part of this publication may be reproduced, stored in a retrieval system or transmitted in any form or by any means, electronic, mechanical, photocopying, recording, scanning or otherwise, except as permitted under Sections 107 or 108 of the 1976 United States Copyright Act, without either the prior written permission of the Publisher, or authorization through payment of the appropriate per-copy fee to the Copyright Clearance Center, Inc. 222 Rosewood Drive, Danvers, MA 01923, website www.copyright.com. Requests to the Publisher for permission should be addressed to the Permissions Department, John Wiley & Sons, Inc., 111 River Street, Hoboken, NJ 07030-5774, (201)748-6011, fax (201)748-6008, website http://www.wiley.com/go/permissions.
Evaluation copies are provided to qualified academics and professionals for review purposes only, for use in their courses during the next academic year. These copies are licensed and may not be sold or transferred to a third party. Upon completion of the review period, please return the evaluation copy to Wiley. Return instructions and a free of charge return shipping label are available at www.wiley.com/go/returnlabel. Outside of the United States, please contact your local representative.
ISBN-13 978-1-118-87505-6
Binder-Ready Version ISBN 978-1-118-96990-8
Printed in the United States of America
10 9 8 7 6 5 4 3 2 1

1 Accounting in Action 2 2 The Recording Process 48 3 Adjusting the Accounts 92 4 Completing the Accounting Cycle 148 5 Accounting for Merchandising Operations 206 6 Inventories 262 7 Accounting Information Systems 310 8 Fraud, Internal Control, and Cash 354 9 Accounting for Receivables 40410 Plant Assets, Natural Resources, and Intangible Assets 44211 Current Liabilities and Payroll Accounting 49012 Accounting for Partnerships 53213 Corporations: Organization and Capital Stock
Transactions 57014 Corporations: Dividends, Retained Earnings,
and Income Reporting 60815 Long-Term Liabilities 64416 Investments 69017 Statement of Cash Flows 72618 Financial Statement Analysis 78419 Managerial Accounting 83420 Job Order Costing 87621 Process Costing 91622 Cost-Volume-Profit 96023 Budgetary Planning 100424 Budgetary Control and Responsibility Accounting 105225 Standard Costs and Balanced Scorecard 110026 Incremental Analysis and Capital Budgeting 1146
APPENDICESA Specimen Financial Statements: Apple Inc.B Specimen Financial Statements: PepsiCo, Inc.C Specimen Financial Statements: The Coca-Cola Company D Specimen Financial Statements: Amazon.com, Inc.E Specimen Financial Statements: Wal-Mart Stores, Inc.F Specimen Financial Statements: Louis VuittonG Time Value of MoneyH Standards of Ethical Conduct for Managerial Accountants
Cases for Managerial Decision-Making*
*Available at the book’s companion website, www.wiley.com/college/weygandt.
iii
Brief Contents

Dear Student,
Why This Course? Remember your biology course in high school? Did you have one of those “invisible man” models (or maybe something more high-tech than that) that gave you the opportunity to look “inside” the human body? This accounting course offers something similar. To understand a business, you have to understand the finan-cial insides of a business organization. An accounting course will help you understand the essential financial components of businesses. Whether you are looking at a large multinational company like Apple or Starbucks or a single-owner software consulting business or coffee shop, knowing the fundamentals of accounting will help you understand what is happening. As an employee, a manager, an investor,a business owner, or a director of your own personal finances—any of which roles you will have at some point in your life—you will make better decisions for having taken this course.
Why This Book? Hundreds of thousands of stu-dents have used this textbook. Your instructor has chosen it for you because of its trusted reputation. The authors have worked hard to keep the book fresh, timely, and accurate.
How to Succeed? We’ve asked many students and many instructors whether there is a secret for success in this course. The nearly unanimous answer turns out to be not much of a secret: “Do the homework.” This is one course where doing is learning. The more time you spend on the homework assignments—using the various tools that this textbook provides—the more likely you are to learn the essential concepts, techniques, and methods of accounting. Besides the textbook itself, WileyPLUS and the book’s companion website also offers various support resources.
Good luck in this course. We hope you enjoy the experience and that you put to good use throughout a lifetime of success the knowledge you obtain in this course. We are sure you will not be disappointed.
Jerry J. WeygandtPaul D. KimmelDonald E. Kieso
“Whether you are looking at a large multinational company like Apple or Starbucks or a single-owner software consulting business or coffee shop, knowing the fundamentals of accounting will help you understand what is happening.”
From the Authors
iv

Jerry WeygandtJerry J. Weygandt, PhD, CPA, is Arthur Andersen Alumni Emeritus Professor of Accounting at the University of Wisconsin—Madison. He holds a Ph.D. in accounting from the University of Illinois. Articles by Professor Weygandt have appeared in the Accounting Review, Journal of Accounting Research, Accounting Horizons, Journal of Accountancy, and other academic and profes-sional journals. These articles have examined such financial reporting issues as accounting for price-level adjustments, pensions, convert-ible securities, stock option contracts, and interim reports. Professor Weygandt is author of other accounting and financial report-ing books and is a member of the American Accounting Association, the American Institute of Certified Public Accountants, and the Wisconsin Society of Certified Public Accountants. He has served on numerous committees of the American Accounting Association and as a member of the editorial board of the Accounting Review; he also has served as President and Secretary-Treasurer of the American Accounting Association. In addition, he has been actively involved with the American Institute of Certified Public Accountants and has been a member of the Accounting Standards Executive Committee (AcSEC) of that organization. He has served on the FASB task force that examined the report-ing issues related to accounting for income taxes and served as a trustee of the Financial Accounting Foundation. Professor Weygandt has received the Chancellor’s Award for Excellence in Teaching and the Beta Gamma Sigma Dean’s Teaching Award. He is on the board of directors of M & I Bank of Southern Wisconsin. He is the recipient of the Wisconsin Institute of CPA’s Outstanding Educator’s Award and the Lifetime Achievement Award. In 2001 he received the American Accounting Association’s Outstanding Educator Award.
Paul KimmelPaul D. Kimmel, PhD, CPA, received his bachelor’s degree from the University of Minnesota and his doctorate in account-ing from the University of Wisconsin. He is an Associate Professor at the University of Wisconsin—Milwaukee, and has public accounting experience with Deloitte & Touche (Minneapolis). He was the recipient of the UWM School of Business Advisory Council Teaching Award, the Reggie Taite Excellence in Teaching Award and a three-time winner of the Outstanding Teaching Assistant Award at the University of Wisconsin. He is also a recipient of the Elijah Watts Sells Award for Honorary Distinction for his results on the CPA exam. He is a member of the American Accounting Association and the Institute of Management Accountants and has published articles in Accounting Review, Accounting Horizons, Advances in Management Accounting, Managerial Finance, Issues in Accounting Education, Journal of Accounting Education, as well as other journals. His research interests include accounting for finan-cial instruments and innovation in accounting education. He has published papers and given numerous talks on incorporating critical thinking into accounting education, and helped prepare a catalog of critical thinking resources for the Federated Schools of Accountancy.
Don KiesoDonald E. Kieso, PhD, CPA, received his bachelor’s degree from Aurora University and his doctorate in accounting from the University of Illinois. He has served as chairman of the Department of Accountancy and is currently the KPMG Emeritus Professor of Accountancy at Northern Illinois University. He has public accounting experience with Price Waterhouse & Co. (San Francisco and Chicago) and Arthur Andersen & Co. (Chicago) and research experience with the Research Division of the American Institute of Certified Public Accountants (New York). He has done post doctorate work as a Visiting Scholar at the University of California at Berkeley and is a recipient of NIU’s Teaching Excellence Award and four Golden Apple Teaching Awards. Professor Kieso is the author of other accounting and business books and is a member of the American Accounting Association, the American Institute of Certified Public Accountants, and the Illinois CPA Society. He has served as a member of the Board of Directors of the Illinois CPA Society, then AACSB’s Accounting Accreditation Committees, the State of Illinois Comptroller’s Commission, as Secretary-Treasurer of the Federation of Schools of Accountancy, and as Secretary-Treasurer of the American Accounting Association. Professor Kieso is currently serving on the Board of Trustees and Executive Committee of Aurora University, as a member of the Board of Directors of Kishwaukee Community Hospital, and as Treasurer and Director of Valley West Community Hospital. From 1989 to 1993 he served as a charter member of the national Accounting Education Change Commission. He is the recipient of the Outstanding Accounting Educator Award from the Illinois CPA Society, the FSA’s Joseph A. Silvoso Award of Merit, the NIU Foundation’s Humanitarian Award for Service to Higher Education, a Distinguished Service Award from the Illinois CPA Society, and in 2003 an honorary doctorate from Aurora University.
Author Commitment

Practice Made Simple
Personalized PracticeBased on cognitive science, WileyPLUS with ORION is a personalized, adaptive learning experience that gives students the practice they need to build profi ciency on topics while using their study time most effectively. The adaptive engine is powered by hundreds of unique questions per chapter, giving students endless opportunities for practice throughout the course.
The Team for Success is focused on helping students get the most out of their accounting course by making practice simple. Both in the printed text and the online environment of WileyPLUS, new opportunities for self-guided practice allow students to check their knowledge of accounting concepts, skills, and problem-solving techniques as they receive individual feedback at the question, learning objective, and course level.

Streamlined Learning ObjectivesNewly streamlined learning objectives help students make the best use of their time outside of class. Each learning objective is addressed by reading content, answering a variety of practice and assessment questions, and watching educational videos, so that no matter where students begin their work, the relevant resources and practice are readily accessible.
In WileyPLUS, the new practice assignments include several Do ITs, Brief Exercises, Exercises, and Problems, giving students the opportunity to check their work or see the answer and solution after their fi nal attempt.
In the text, the new Review and Practice section includes:
• Learning Objectives Review • Glossary Review • Practice Multiple-Choice Questions and Solutions • Practice Exercises and Solutions • Practice Problem and Solution
ReadingContent
EducationalVideos
Assessment
LearningObjective
Review and Practice A new section in the text and in WileyPLUS offers students more opportunities for self-guided practice.

WileyPLUS with ORIONOver 5,500 new questions are available for practice and review. WileyPLUS with Orion is an adaptive study and practice tool that helps students build proficiency in course topics.
Updated Content and DesignWe scrutinized all chapter material to find new ways to engage students and help them learn accounting concepts. Homework problems were updated in all chapters. A new learning objective structure helps students practice their understanding of concepts with DO IT! exercises before they move on to different topics in other learning objectives. Coupled with a new interior design and revised infographics, the new outcomes-oriented approach motivates students and helps them make the best use of their time.
WileyPLUS VideosOver 300 videos are available in WileyPLUS. More than 150 of the videos are new to the 12th Edition. The videos walk students through relevant homework problems and solutions, review important concepts, provide overviews of Excel skills, and explore topics in a real-world context.
Student Practice and SolutionsNew practice opportunities with solutions are integrated throughout the textbook and WileyPLUS course. Each textbook chapter now provides students with a Review and Practice section that includes learning objective summaries, multiple-choice questions with feedback for each answer choice, and both practice exercises and problems with solutions. Also, each learning objective module in the textbook is now followed by a DO IT! exercise with an accompanying solution. In WileyPLUS, two brief exercises, two DO IT! exercises, two exercises, and a new problem are available for practice with each chapter. These practice questions are algorithmic, providing students with multiple opportunities for advanced practice.
Real World ContextWe expanded our practice of using numerous examples of real companies throughout the textbook. For example, new feature stories highlight operations of Clif Bar, Groupon, and REI. Also, in WileyPLUS, real-world Insight boxes now have questions that can be assigned as homework.
ExcelNew Excel skill videos help students understand Excel features they can apply in their accounting studies. A new continuing Excel tutorial is also available at the end of each managerial accounting chapter.
More information about the 12th Edition is available on the book’s website at www.wiley.com/college/weygandt.
viii
What’s New?

1 Accounting in Action 2Knowing the Numbers: Clif Bar 2LO 1: Identify the activities and users associated
with accounting. 4Three Activities 4Who Uses Accounting Data 5
LO 2: Explain the building blocks of accounting: ethics, principles, and assumptions. 7
Ethics in Financial Reporting 7Generally Accepted Accounting Principles 8Measurement Principles 9Assumptions 9
LO 3: State the accounting equation, and defineits components. 12
Assets 12Liabilities 12Owner’s Equity 13
LO 4: Analyze the effects of business transactions on the accounting equation. 14
Transaction Analysis 15Summary of Transactions 19
LO 5: Describe the four financial statements and how they are prepared. 21
Income Statement 21Owner’s Equity Statement 21Balance Sheet 23Statement of Cash Flows 23
LO *6: APPENDIX 1A: Explain the career opportunities in accounting. 25
Public Accounting 25Private Accounting 26Governmental Accounting 26Forensic Accounting 26“Show Me the Money” 26
A Look at IFRS 46
2 The Recording Process 48 Accidents Happen: MF Global Holdings 48LO 1: Describe how accounts, debits, and credits
are used to record business transactions. 50The Account 50Debits and Credits 50Summary of Debit/Credit Rules 53
LO 2: Indicate how a journal is used in the recording process. 54
Steps in the Recording Process 54The Journal 55
LO 3: Explain how a ledger and posting help in the recording process. 57
The Ledger 57Posting 59The Recording Process Illustrated 60Summary Illustration of Journalizing and
Posting 66LO 4: Prepare a trial balance. 68
Limitations of a Trial Balance 68Locating Errors 69Dollar Signs and Underlining 69
A Look at IFRS 90
3 Adjusting the Accounts 92Keeping Track of Groupons: Groupon 92LO 1: Explain the accrual basis of accounting
and the reasons for adjusting entries. 94Fiscal and Calendar Years 94Accrual-versus Cash-Basis Accounting 94Recognizing Revenues and Expenses 95The Need for Adjusting Entries 96Types of Adjusting Entries 96
LO 2: Prepare adjusting entries for deferrals. 97Prepaid Expenses 98Unearned Revenues 101
LO 3: Prepare adjusting entries for accruals. 104Accrued Revenues 104Accrued Expenses 106Summary of Basic Relationships 109
LO 4: Describe the nature and purpose of an adjusted trial balance. 111
Preparing the Adjusted Trial Balance 111Preparing Financial Statements 112
LO *5: APPENDIX 3A: Prepare adjusting entries for the alternative treatment of deferrals. 115
Prepaid Expenses 116Unearned Revenues 117Summary of Additional Adjustment
Relationships 118LO *6: APPENDIX 3B: Discuss financial reporting
concepts. 119Qualities of Useful Information 119Assumptions in Financial Reporting 119Principles in Financial Reporting 120Cost Constraint 121
A Look at IFRS 146
ix
Table of Contents

4Completing the Accounting Cycle 148
Everyone Likes to Win: Rhino Foods 148LO 1: Prepare a worksheet. 150
Steps in Preparing a Worksheet 150Preparing Financial Statements from a
Worksheet 157Preparing Adjusting Entries from a
Worksheet 158LO 2: Prepare closing entries and a post-closing
trial balance. 158Preparing Closing Entries 159Posting Closing Entries 161Preparing a Post-Closing Trial Balance 163
LO 3: Explain the steps in the accounting cycle and how to prepare correcting entries. 166
Summary of the Accounting Cycle 166Reversing Entries—An Optional Step 166Correcting Entries—An Avoidable Step 167
LO 4: Identify the sections of a classified balancesheet. 169
Current Assets 170Long-Term Investments 171Property, Plant, and Equipment 171Intangible Assets 171Current Liabilities 172Long-Term Liabilities 173Owner’s Equity 174
LO *5: APPENDIX 4A: Prepare reversing entries. 175
Reversing Entries Example 175A Look at IFRS 202
5Accounting for Merchandising Operations 206
Buy Now, Vote Later: REI 206 LO 1: Describe merchandising operations and
inventory systems. 208Operating Cycles 208Flow of Costs 209
LO 2: Record purchases under a perpetual inventory system. 211
Freight Costs 213Purchase Returns and Allowances 214Purchase Discounts 214Summary of Purchasing Transactions 215
LO 3: Record sales under a perpetual inventory system. 216
Sales Returns and Allowances 217Sales Discounts 218
LO 4: Apply the steps in the accounting cycle to a merchandising company. 220
Adjusting Entries 220Closing Entries 220Summary of Merchandising Entries 221
LO 5: Compare a multiple-step with a single-step income statement. 222
Multiple-Step Income Statement 222Single-Step Income Statement 226Classified Balance Sheet 226
LO *6: APPENDIX 5A: Prepare a worksheet for a merchandising company. 228
Using a Worksheet 228LO *7: APPENDIX 5B: Record purchases and sales
under a periodic inventory system. 229Determining Cost of Goods Sold Under a Periodic
System 230Recording Merchandise Transactions 230Recording Purchases of Merchandise 231Recording Sales of Merchandise 232Journalizing and Posting Closing Entries 233Using a Worksheet 234
A Look at IFRS 259
6 Inventories 262
“Where Is That Spare Bulldozer Blade?”: Caterpillar 262LO 1: Discuss how to classify and determine
inventory. 264Classifying Inventory 264Determining Inventory Quantities 265
LO 2: Apply inventory cost flow methods and discuss their financial effects. 268
Specific Identification 269Cost Flow Assumptions 269Financial Statement and Tax Effects of Cost Flow
Methods 274Using Inventory Cost Flow Methods
Consistently 275LO 3: Indicate the effects of inventory errors on
the financial statements. 277Income Statement Effects 277Balance Sheet Effects 278
LO 4: Explain the statement presentation and analysis of inventory. 279
Presentation 279Lower-of-Cost-or-Net Realizable Value 279Analysis 280
LO *5: APPENDIX 6A: Apply the inventory cost flow methods to perpetual inventory records. 282
First-In, First-Out (FIFO) 282Last-In, First-Out (LIFO) 283Average-Cost 283
x

LO *6: APPENDIX 6B: Describe the two methods of estimating inventories. 284
Gross Profit Method 284Retail Inventory Method 285
A Look at IFRS 308
7Accounting Information Systems 310
QuickBooks® Helps This Retailer Sell Guitars 310LO 1: Explain the basic concepts of an accounting
information system. 312Computerized Accounting Systems 312Manual Accounting Systems 314
LO 2: Describe the nature and purpose of a subsidiary ledger. 315
Subsidiary Ledger Example 315Advantages of Subsidiary Ledgers 316
LO 3: Record transactions in special journals. 317Sales Journal 318Cash Receipts Journal 320Purchases Journal 324Cash Payments Journal 326Effects of Special Journals on the General
Journal 329Cyber Security: A Final Comment 330
A Look at IFRS 353
8Fraud, Internal Control, and Cash 354
Minding the Money in Madison: Barriques 354LO 1: Discuss fraud and the principles of internal
control. 356Fraud 356The Sarbanes-Oxley Act 356Internal Control 357Principles of Internal Control Activities 358Limitations of Internal Control 365
LO 2: Apply internal control principles to cash. 366
Cash Receipts Controls 366Cash Disbursements Controls 369Petty Cash Fund 370
LO 3: Identify the control features of a bank account. 373
Making Bank Deposits 373Writing Checks 374Bank Statements 375Reconciling the Bank Account 376Electronic Funds Transfer (EFT) System 380
LO 4: Explain the reporting of cash. 381Cash Equivalents 381Restricted Cash 382
A Look at IFRS 402
9 Accounting for Receivables 404A Dose of Careful Management Keeps Receivables Healthy: Whitehall-Robins 404LO 1: Explain how companies recognize accounts
receivable. 406Types of Receivables 406Recognizing Accounts Receivable 406
LO 2: Describe how companies value accounts receivable and record their disposition. 408
Valuing Accounts Receivable 408Disposing of Accounts Receivable 414
LO 3: Explain how companies recognize notes receivable. 417
Determining the Maturity Date 417Computing Interest 418Recognizing Notes Receivable 419
LO 4: Describe how companies value notes receivable, record their disposition, and present and analyze receivables. 420
Valuing Notes Receivable 420Disposing of Notes Receivable 420Statement Presentation and Analysis 422
A Look at IFRS 440
10Plant Assets, Natural Resources, and Intangible Assets
442
How Much for a Ride to the Beach?: Rent-A-Wreck 442LO 1: Explain the accounting for plant asset
expenditures. 444Determining the Cost of Plant Assets 444Expenditures During Useful Life 446
LO 2: Apply depreciation methods to plant assets. 448
Factors in Computing Depreciation 449Depreciation Methods 449Depreciation and Income Taxes 454Revising Periodic Depreciation 454
LO 3: Explain how to account for the disposal of plant assets. 455
Retirement of Plant Assets 456Sale of Plant Assets 456
LO 4: Describe how to account for natural resources and intangible assets. 458
Natural Resources 458Depletion 458Intangible Assets 460Accounting for Intangible Assets 460Research and Development Costs 462
xi
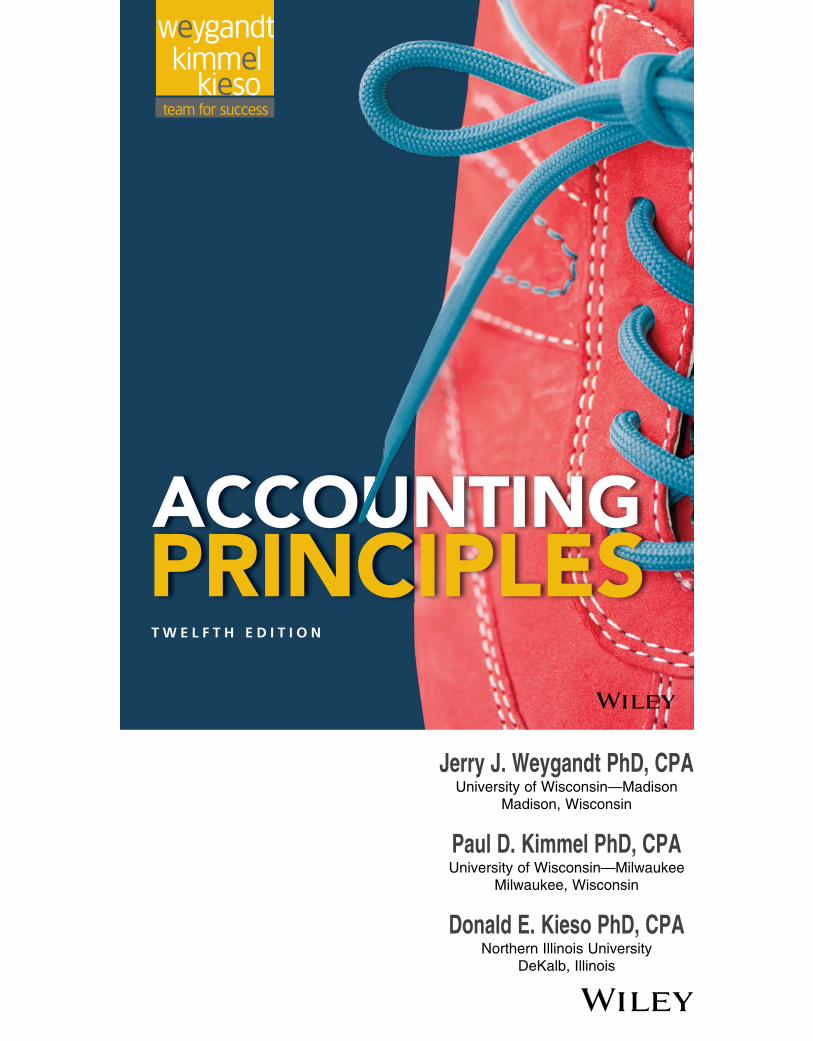
LO 5: Discuss how plant assets, natural resources, and intangible assets are reported and analyzed. 463
Presentation 463Analysis 464
LO *6: APPENDIX 10A: Explain how to account for the exchange of plant assets. 465
Loss Treatment 465Gain Treatment 466
A Look at IFRS 487
11Current Liabilities and Payroll Accounting 490
Financing His Dreams: Wilbert Murdock 490LO 1: Explain how to account for current
liabilities. 492What Is a Current Liability? 492Notes Payable 492Sales Taxes Payable 493Unearned Revenues 494Current Maturities of Long-Term Debt 494
LO 2: Discuss how current liabilities are reported and analyzed. 495
Reporting Uncertainty 495Reporting of Current Liabilities 497Analysis of Current Liabilities 497
LO 3: Explain how to account for payroll. 499Determining the Payroll 499Recording the Payroll 503Employer Payroll Taxes 506Filing and Remitting Payroll Taxes 508Internal Control for Payroll 508
LO *4: APPENDIX 11A: Discuss additional fringe benefits associated with employee compensation. 510
Paid Absences 510Postretirement Benefits 511
A Look at IFRS 530
12Accounting for Partnerships 532
From Trials to the Top Ten: Razor & Tie 532LO 1: Discuss and account for the formation of a
partnership. 534Characteristics of Partnerships 534Organizations with Partnership
Characteristics 535Advantages and Disadvantages of
Partnerships 537The Partnership Agreement 537Accounting for a Partnership Formation 538
LO 2: Explain how to account for net income or net loss of a partnership. 539
Dividing Net Income or Net Loss 539Partnership Financial Statements 542
LO 3: Explain how to account for the liquidation of a partnership. 543
No Capital Deficiency 544Capital Deficiency 546
LO *4: APPENDIX 12A: Prepare journal entries when a partner is either admitted or withdraws. 549
Admission of a Partner 549Withdrawal of a Partner 552
13Corporations: Organization and Capital Stock Transactions 570
What’s Cooking?: Nike 570LO 1: Discuss the major characteristics of
a corporation. 572Characteristics of a Corporation 572Forming a Corporation 574Stockholder Rights 576Stock Issue Considerations 576Corporate Capital 579
LO 2: Explain how to account for the issuance of common and preferred stock. 581
Issuing Par Value Common Stock for Cash 581Issuing No-Par Common Stock for Cash 582Issuing Common Stock for Services or Noncash
Assets 582Accounting for Preferred Stock 583
LO 3: Explain how to account for treasury stock. 584
Purchase of Treasury Stock 584Disposal of Treasury Stock 585
LO 4: Prepare a stockholders’ equity section. 587A Look at IFRS 605
14Corporations: Dividends, Retained Earnings, andIncome Reporting
608
Owning a Piece of the Action: Van Meter Inc. 608LO 1: Explain how to account for cash
dividends. 610Cash Dividends 610Dividend Preferences 612
LO 2: Explain how to account for stock dividends and splits. 615
Stock Dividends 615Stock Splits 617
xii

LO 3: Prepare and analyze a comprehensive stockholders’ equity section. 619
Retained Earnings 619Statement Presentation and Analysis 622
LO 4: Describe the form and content of corporation income statements. 623
Income Statement Presentation 623Income Statement Analysis 624
A Look at IFRS 642
15 Long-Term Liabilities 644And Then There Were Two 644LO 1: Describe the major characteristics of bonds. 646
Types of Bonds 646Issuing Procedures 646Determining the Market Price of a Bond 647
LO 2: Explain how to account for bond transactions. 649
Issuing Bonds at Face Value 649Discount or Premium on Bonds 650Issuing Bonds at a Discount 651Issuing Bonds at a Premium 652Redeeming and Converting Bonds 654
LO 3: Explain how to account for long-term notes payable. 656
Long-Term Notes Payable 656LO 4: Discuss how long-term liabilities are
reported and analyzed. 657Presentation 657Use of Ratios 658Debt and Equity Financing 658Lease Liabilities and Off-Balance-Sheet
Financing 659LO *5: APPENDIX 15A: Apply the straight-line
method of amortizing bond discount and bond premium. 662
Amortizing Bond Discount 662Amortizing Bond Premium 663
LO *6: APPENDIX 15B: Apply the effective-interest method of amortizing bond discount and bond premium. 664
Amortizing Bond Discount 665Amortizing Bond Premium 666
A Look at IFRS 686
16 Investments 690“Is There Anything Else We Can Buy?”: Time Warner 690LO 1: Explain how to account for debt
investments. 692Why Corporations Invest 692Accounting for Debt Investments 693
LO 2: Explain how to account for stock investments. 695
Holdings of Less than 20% 696Holdings Between 20% and 50% 696Holdings of More than 50% 698
LO 3: Discuss how debt and stock investments are reported in financial statements. 700
Categories of Securities 700Balance Sheet Presentation 703Presentation of Realized and Unrealized Gain or
Loss 704Classified Balance Sheet 705
A Look at IFRS 723
17 Statement of Cash Flows 726Got Cash?: Microsoft 726LO 1: Discuss the usefulness and format of the
statement of cash flows. 728Usefulness of the Statement of Cash Flows 728Classification of Cash Flows 728Significant Noncash Activities 729Format of the Statement of Cash Flows 730
LO 2: Prepare a statement of cash flows using the indirect method. 731
Indirect and Direct Methods 732Indirect Method—Computer Services
Company 732Step 1: Operating Activities 734Summary of Conversion to Net Cash Provided
by Operating Activities—Indirect Method 737Step 2: Investing and Financing Activities 738Step 3: Net Change in Cash 739
LO 3: Analyze the statement of cash flows. 742Free Cash Flow 742
LO *4: APPENDIX 17A: Prepare a statement of cash flows using the direct method. 743
Step 1: Operating Activities 745Step 2: Investing and Financing Activities 749Step 3: Net Change in Cash 751
LO *5: APPENDIX 17B: Use a worksheet to prepare the statement of cash flows using the indirect method. 751
Preparing the Worksheet 752LO *6: APPENDIX 17C: Use the T-account approach
to prepare a statement of cash flows. 755A Look at IFRS 782
18Financial Statement Analysis 784
It Pays to Be Patient: Warren Buffett 784LO 1: Apply horizontal and vertical analysis to
financial statements. 786Need for Comparative Analysis 786Tools of Analysis 786
xiii

Horizontal Analysis 787Vertical Analysis 790
LO 2: Analyze a company’s performance using ratio analysis. 792
Liquidity Ratios 793Profitability Ratios 796Solvency Ratios 800Summary of Ratios 802
LO 3: Apply the concept of sustainable income. 804Discontinued Operations 805Other Comprehensive Income 805
A Look at IFRS 832
19 Managerial Accounting 834Just Add Water . . . and Paddle: Current Designs 834 LO 1: Identify the features of managerial
accounting and the functions of management. 836
Comparing Managerial and Financial Accounting 836
Management Functions 836Organizational Structure 838
LO 2: Describe the classes of manufacturing costs and the differences between product and period costs. 840
Manufacturing Costs 840Product versus Period Costs 842Illustration of Cost Concepts 842
LO 3: Demonstrate how to compute cost of goods manufactured and prepare financial statements for a manufacturer. 844
Income Statement 844Cost of Goods Manufactured 845Cost of Goods Manufactured Schedule 846Balance Sheet 846
LO 4: Discuss trends in managerial accounting. 848Service Industries 848Focus on the Value Chain 849Balanced Scorecard 850Business Ethics 851Corporate Social Responsibility 852
20 Job Order Costing 876Profiting from the Silver Screen: Disney 876LO 1: Describe cost systems and the flow of costs
in a job order system. 878Process Cost System 878Job Order Cost System 878Job Order Cost Flow 879Accumulating Manufacturing Costs 880
LO 2: Use a job cost sheet to assign costs to work in process. 882
Raw Materials Costs 883Factory Labor Costs 885
LO 3: Demonstrate how to determine and use the predetermined overhead rate. 887
LO 4: Prepare entries for manufacturing and service jobs completed and sold. 890
Assigning Costs to Finished Goods 890Assigning Costs to Cost of Goods Sold 891Summary of Job Order Cost Flows 891Job Order Costing for Service Companies 893Advantages and Disadvantages of Job Order
Costing 894LO 5: Distinguish between under- and overapplied
manufacturing overhead. 895Under- or Overapplied Manufacturing
Overhead 896
21 Process Costing 916The Little Guy Who Could: Jones Soda Co. 916LO 1: Discuss the uses of a process cost
system and how it compares to a job order system. 918
Uses of Process Cost Systems 918Process Costing for Service Companies 919Similarities and Differences Between Job Order
Cost and Process Cost Systems 919LO 2: Explain the flow of costs in a process
cost system and the journal entries to assign manufacturing costs. 921
Process Cost Flow 921Assigning Manufacturing Costs—Journal
Entries 921LO 3: Compute equivalent units. 924
Weighted-Average Method 924Refinements on the Weighted-Average
Method 925LO 4: Complete the four steps to prepare a
production cost report. 927Compute the Physical Unit Flow (Step 1) 928Compute the Equivalent Units of Production
(Step 2) 928Compute Unit Production Costs (Step 3) 929Prepare a Cost Reconciliation Schedule
(Step 4) 930Preparing the Production Cost Report 930Costing Systems—Final Comments 931
LO 5: Explain just-in-time (JIT) processing and activity-based costing (ABC). 932
Just-in-Time Processing 932Activity-Based Costing 934
xiv

LO *6: APPENDIX 21A: Apply activity-based costing to a manufacturer. 936
Identify and Classify Activities and Assign Overhead to Cost Pools (Step 1) 936
Identify Cost Drivers (Step 2) 937Compute Activity-Based Overhead Rates
(Step 3) 937Allocate Overhead Costs to Products (Step 4) 938Comparing Unit Costs 939Benefits of ABC 939Limitations of ABC 939
22 Cost-Volume-Profit 960Don’t Worry—Just Get Big: Amazon.com 960LO 1: Explain variable, fixed, and mixed costs
and the relevant range. 962Variable Costs 962Fixed Costs 963Relevant Range 964Mixed Costs 965
LO 2: Apply the high-low method to determine the components of mixed costs. 966
High-Low Method 967Importance of Identifying Variable and Fixed
Costs 969LO 3: Prepare a CVP income statement to
determine contribution margin. 970Basic Components 970CVP Income Statement 970
LO 4: Compute the break-even point using three approaches. 974
Mathematical Equation 974Contribution Margin Technique 975Graphic Presentation 976
LO 5: Determine the sales required to earn target net income and determine margin of safety. 977
Target Net Income 977Margin of Safety 979
LO 6: Use CVP analysis to respond to changes in the business environment. 980
Case I: Offering a Discount 980Case II: Investing in New Equipment 981Case III: Determining Required Sales 981CVP Income Statement Revisited 982
LO *7: APPENDIX 22A: Explain the differences between absorption costing and variable costing. 983
Example Comparing Absorption Costing with Variable Costing 984
Rationale for Variable Costing 986
23 Budgetary Planning 1004What’s in Your Cupcake?: BabyCakes NYC 1004LO 1: State the essentials of effective budgeting
and the components of the master budget. 1006Budgeting and Accounting 1006The Benefits of Budgeting 1006Essentials of Effective Budgeting 1006The Master Budget 1009
LO 2: Prepare budgets for sales, production, and direct materials. 1011
Sales Budget 1011Production Budget 1012Direct Materials Budget 1013
LO 3: Prepare budgets for direct labor, manufacturing overhead, and selling and administrative expenses, and a budgeted income statement. 1016
Direct Labor Budget 1016Manufacturing Overhead Budget 1017Selling and Administrative Expense Budget 1018Budgeted Income Statement 1018
LO 4: Prepare a cash budget and a budgeted balance sheet. 1020
Cash Budget 1020Budgeted Balance Sheet 1023
LO 5: Apply budgeting principles to nonmanufacturing companies. 1025
Merchandisers 1025Service Companies 1026Not-for-Profit Organizations 1027
24Budgetary Control and Responsibility Accounting 1052
Pumpkin Madeleines and a Movie: Tribeca Grand Hotel 1052LO 1: Describe budgetary control and static budget
reports. 1054Budgetary Control 1054Static Budget Reports 1055
LO 2: Prepare flexible budget reports. 1057Why Flexible Budgets? 1057Developing the Flexible Budget 1060Flexible Budget—A Case Study 1060Flexible Budget Reports 1062
LO 3: Apply responsibility accounting to cost and profit centers. 1064
Controllable versus Noncontrollable Revenues and Costs 1066
Principles of Performance Evaluation 1066Responsibility Reporting System 1068Types of Responsibility Centers 1070
xv

LO 4: Evaluate performance in investment centers. 1073
Return on Investment (ROI) 1073Responsibility Report 1074Judgmental Factors in ROI 1075Improving ROI 1075
25Standard Costs and Balanced Scorecard 1100
80,000 Different Caffeinated Combinations: Starbucks 1100LO 1: Describe standard costs. 1102
Distinguishing Between Standards and Budgets 1103
Setting Standard Costs 1103LO 2: Determine direct materials variances. 1107
Analyzing and Reporting Variances 1107Direct Materials Variances 1108
LO 3: Determine direct labor and total manufacturing overhead variances. 1111
Direct Labor Variances 1111Manufacturing Overhead Variances 1113
LO 4: Prepare variance reports and balanced scorecards. 1115
Reporting Variances 1115Income Statement Presentation of
Variances 1116Balanced Scorecard 1117
LO *5: APPENDIX 25A: Identify the features of a standard cost accounting system. 1120
Journal Entries 1120Ledger Accounts 1122
LO *6: APPENDIX 25B: Compute overhead controllable and volume variances. 1123
Overhead Controllable Variance 1123Overhead Volume Variance 1124
26Incremental Analysis and Capital Budgeting 1146
Keeping It Clean: Method Products 1146LO 1: Describe management’s decision-making
process and incremental analysis. 1148Incremental Analysis Approach 1148How Incremental Analysis Works 1149Types of Incremental Analysis 1150
LO 2: Analyze the relevant costs in various decisions involving incremental analysis. 1151
Special Price Order 1151Make or Buy 1152Sell or Process Further 1155
Repair, Retain, or Replace Equipment 1156Eliminate an Unprofitable Segment or
Product 1157LO 3: Contrast annual rate of return and cash
payback in capital budgeting. 1159Capital Budgeting 1159Evaluation Process of Capital Budgeting 1159Annual Rate of Return 1160Cash Payback 1162
LO 4: Distinguish between the net present value and internal rate of return methods. 1164
Net Present Value Method 1164Internal Rate of Return Method 1166Comparing Discounted Cash Flow
Methods 1168
ASpecimen Financial Statements: Apple Inc. A-1
BSpecimen Financial Statements: PepsiCo, Inc. B-1
CSpecimen Financial Statements: The Coca-Cola Company
C-1
DSpecimen Financial Statements: Amazon.com, Inc.
D-1
ESpecimen Financial Statements: Wal-Mart Stores, Inc.
E-1
FSpecimen Financial Statements: Louis Vuitton F-1
G Time Value of Money G-1LO 1: Compute interest and future values. G-1
Nature of Interest G-1Future Value of a Single Amount G-3Future Value of an Annuity G-4
xvi
LO 2: Compute present values. G-7Present Value Variables G-7Present Value of a Single Amount G-7Present Value of an Annuity G-9Time Periods and Discounting G-11Present Value of a Long-Term Note or
Bond G-11LO 3: Compute the present value in capital
budgeting situations. G-14LO 4: Use a financial calculator to solve time value
of money problems. G-15Present Value of a Single Sum G-16Present Value of an Annuity G-17Useful Applications of the Financial
Calculator G-17
HStandards of Ethical Conduct for Management Accountants
H-1
IMA Statement of Ethical Professional Practice H-1
Principles H-1Standards H-1Resolution of Ethical Conflict H-2
Cases for Managerial Decision-Making*Company Index I-1Subject Index I-3
*Available online at www.wiley.com/college/weygandt.
xvii

Accounting Principles has benefited greatly from the input of focus group participants, manuscript reviewers, those who have sent comments by letter or e-mail, ancillary authors, and proofers. We greatly appreciate the constructive suggestions and innovative ideas of reviewers and the creativity and accuracy of the ancillary authors and checkers.
Twelfth EditionKaren AndrewsLewis-Clark State CollegeSandra BaileyOregon Institute of TechnologyShele BannonQueensborough Community CollegeRobert BartaSuffolk County Community CollegeQuent BelowRoane State Community CollegeLila BergmanHunter CollegeGlen BrauchleDowling CollegeDouglas BrownForsyth Technical Community CollegeRonald CampbellNorth Carolina A&T State UniversityElizabeth CapenerDominican University of CaliforniaBeth CarrawayHorry-Georgetown Technical CollegeJackie CaseuCape Fear Community CollegeKim CharlandKansas State UniversitySuzanne CorySt. Mary’s UniversityPaul CoxMedgar Evers CollegeJoseph CunninghamHarford Community CollegeKate DemarestCarroll Community CollegeRichard DuggerKilgore CollegeBill ElliottOral Roberts UniversityCole EngelFort Hays State UniversityGary FordTompkins Cortland Community CollegeAlan FosterJ.S. Reynolds Community CollegeDale FowlerOhio Christian UniversityGeorge GardnerBemidji State University
Willard GarmanUniversity of California, Los AngelesJospeh JurkowskiD’youville CollegeRandy KiddMetropolitan Community CollegeCindy KillianWilkes Community CollegeShirly KleinerJohnson County Community CollegeDavid KrugJohnson County Community CollegeChristy LandCatawba Valley Community CollegeAnita LeslieYork Technical CollegeLori MajorLuzerne County Community CollegeCharles MaloneNorth Carolina A&T State UniversityKen MarkKansas City Kansas Community CollegeBarbara MichalUniversity of Rio GrandeAllison MooreLos Angeles Southwest CollegeBrandis PhillipsNorth Carolina A&T State UniversityMary PhillipsNorth Carolina Central UniversityLa Vonda RameySchoolcraft CollegeJ. Ramos-AlexanderNew Jersey City UniversityMichelle RandallSchoolcraft CollegeRuthie ReynoldsTennessee State UniversityKathie RogersSuffolk Community CollegeKent SchneiderEast Tennessee State UniversityNadia SchwartzAugustana CollegeMehdi SheikholeslamiBemidji State UniversityBradley SmithDes Moines Area Community CollegeEmil SorianoContra Costa College
John StancilFlorida Southern CollegeLinda SummeyCentral Carolina Community CollegeJoan Van HiseFairfi eld UniversityPat WrightLong Island UniversityJudith ZanderGrossmont College
WileyPLUS Developers and Reviewers
Carole Brandt-FinkLaura McNallyMelanie Yon
Ancillary Authors, Contributors, Proofers, and Accuracy Checkers
Bridget AnakweDelaware State UniversityMichael BarnesLansing Community CollegeEllen BartleySt. Joseph’s CollegeLuAnn BeanFlorida Institute of TechnologyJack BorkeUniversity of Wisconsin—PlattevilleSandee CohenColumbia College ChicagoTerry ElliottMorehead State UniversityJames EmigVillanova UniversityLarry FalcettoEmporia State UniversityHeidi HanselKirkwood Community CollegeCoby HarmonUniversity of California—Santa BarbaraKaren HernGrossmont CollegeDerek JacksonSt. Mary’s University of MinnesotaLaurie LarsonValencia College
xviii
Acknowledgments

xix
Jeanette MiliusIowa Western Community College
Jill MisuracaUniversity of Tampa
Barbara MullerArizona State University
Yvonne PhangBorough of Manhattan Community College
Laura ProsserBlack Hills State University
Alice SineathUniversity of Maryland University College
Lakshmy SivaratnamKansas City Kansas Community College
Teresa SpeckSt. Mary’s University of Minnesota
Lynn StallworthAppalachian State UniversityCalvin TanKapiolani Community CollegeMike TrebeshLansing Community CollegeDick WassonSouthwestern CollegeLori Grady ZaherBucks County Community College
Advisory Board
Janice AkaoButler Community CollegeMichael BarnesLansing Community College
Jackie CaseyCape Fear Community CollegeLisa ColeJohnson County Community CollegeSusan CordesJohnson County Community CollegeKim GatzkeDelgado Community CollegeDrew GoodsonCentral Carolina Community CollegeThomas KamHawaii Pacifi c UniversityAlfonso MaldonadoLaredo Community CollegeLakshmy SivaratnamKansas City Kansas Community CollegePatricia WalczakLansing Community College
We appreciate the considerable support provided to us by the following people at Current Designs: Mike Cichanowski, Jim Brown, Diane Buswell, and Jake Greseth. We also ben-efited from the assistance and suggestions provided to us by Joan Van Hise in the preparation of materials related to sustainability. We appreciate the exemplary support and commitment given to us by executive editor Michael McDonald, senior mar-keting manager Karolina Zarychta Honsa, customer and prod-uct development manager Christopher DeJohn, development editor Ed Brislin, assistant development editor Rebecca Costantini, market solutions assistant Elizabeth Kearns, marketing assistant Anna Wilhelm, editorial supervisor Terry Ann Tatro, editorial associate Margaret Thompson, productdesign manager Allie Morris, product design associate Matt
Origoni, designers Maureen Eide and Kristine Carney, photo editor Mary Ann Price, indexer Steve Ingle, and Denise Showers at Aptara. All of these professionals provided innu-merable services that helped the textbook take shape. Finally, our thanks to Amy Scholz, Susan Elbe, George Hoffman, Tim Stookesberry, Douglas Reiner, Brent Gordon, Joe Heider, and Steve Smith for their support and leadership in Wiley’s Global Education. We will appreciate suggestions and comments from users—instructors and students alike. You can send your thoughts and ideas about the textbook to us via email at: [email protected].
Jerry J. Weygandt Paul D. Kimmel Donald E. Kieso Madison, Wisconsin Milwaukee, Wisconsin DeKalb, Illinois

Many students who take this course do not plan to be
accountants. If you are in that group, you might be thinking,
“If I’m not going to be an accountant, why do I need to know
accounting?” Well, consider this quote from Harold Geneen,
the former chairman of IT&T: “To be good at your business,
you have to know the numbers—cold.” In business,
accounting and fi nancial statements are the means for
communicating the numbers. If you don’t know how to read
fi nancial statements, you can’t really know your business.
Many businesses agree with this view. They see the value of
their employees being able to read fi nancial statements and
understand how their actions affect the company’s fi nancial
results. For example, consider Clif Bar & Company. The
original Clif Bar® energy bar was created in 1990 by Gary
Erickson and his mother in her kitchen. Today, the company
has almost 300 employees.
Clif Bar is guided by what it calls its Five Aspirations—
Sustaining Our Business, Our Brands, Our People, Our
Community, and the Planet. Its website documents its efforts
and accomplishments in these fi ve areas. Just a few examples
include the company’s use of organic products to protect soil,
water, and biodiversity; the “smart” solar array (the largest in
North America), which provides nearly all the electrical needs
for its 115,000-square foot building; and the incentives Clif
Bar provides to employees to reduce their personal
environmental impact, such as $6,500 toward the purchase
of an effi cient car or $1,000 per year for eco-friendly
improvements toward their homes.
One of the company’s proudest moments was the creation of
an employee stock ownership plan (ESOP) in 2010. This plan
gives its employees 20% ownership of the company (Gary and
his wife Kit own the other 80%). The ESOP also resulted in
Clif Bar enacting an open-book management program,
including the commitment to educate all employee-owners
about its fi nances. Armed with this basic fi nancial knowledge,
employees are more aware of the fi nancial impact of their
actions, which leads to better decisions.
Many other companies have adopted this open-book
management approach. Even in companies that do not practice
open-book management, employers generally assume that
managers in all areas of the company are “fi nancially literate.”
Taking this course will go a long way to making you fi nancially
literate. In this textbook, you will learn how to read and
prepare fi nancial statements, and how to use basic tools to
evaluate fi nancial results. Throughout this textbook, we
attempt to increase your familiarity with fi nancial reporting
by providing numerous references, questions, and exercises
that encourage you to explore the fi nancial statements of
well-known companies.
Knowing the Numbers
The Feature Story below about Clif Bar & Company highlights the importance of having good fi nancial information and knowing how to use it to make effective business decisions. Whatever your pursuits or occupation, the need for fi nancial information is inescapable. You cannot earn a living, spend money, buy on credit, make an investment, or pay taxes without receiving, using, or dispensing fi nancial information. Good decision-making depends on good information.
CHAPTER PREVIEW
1
FEATURE STORY
Accounting in Action
The Feature Story helps you picture how the chapter topic relates to the real world of accounting and business.
The Chapter Preview describes the purpose of the chapter and highlights major topics.
2

Analyze the effects of business transactions on the accounting equation.
Describe the four fi nancial statements and how they are prepared.
Explain the building blocks of accounting: ethics, principles, and assumptions.
State the accounting equation, and defi ne its components.
2
3
4
5
Identify the activities and users associated with accounting.1
CHAPTER OUTLINE
Basic ConceptsDO IT! 1• Three activities• Accounting data users
Building Blocks of Accounting
DO IT! 2
• Ethics• GAAP• Measurement principles• Assumptions
Learning Objectives
Owner’s Equity EffectsDO IT! 3• Assets• Liabilities• Owner’s equity
Tabular AnalysisDO IT! 4
Financial Statement ItemsDO IT! 5
• Transaction analysis• Summary of transactions
• Income statement• Owner’s equity statement• Balance sheet• Statement of cash fl ows
© Dan Moore/iStockphotoThe Chapter Outline presents the chapter’s topics and subtopics, as well as practice opportunities.
Go to the REVIEW AND PRACTICE section at the end of the chapter for a review of key concepts and practice applications with solutions.
Visit WileyPLUS with ORION for additional tutorials and practice opportunities.
Analyze the effects of business t ti th ti
Explain the building blocks of accounting: ethics, principles, and assumptions.
State the accounting equation, and defi ne its components.
2
3
4
Building Blocks of Accounting
DO IT! 2
• Ethics• GAAP• Measurement principles• Assumptions
Owner’s Equity Effects DO IT! 3• Assets• Liabilities• Owner’s equity
T b l A l iDO IT! 4• Transaction analysis
Identify the activities and usersassociated with accounting.1
CHAPTER OUTLINE
Basic Concepts DO IT! 1• Three activities• Accounting data users
Learning Objectives
© D© D© DDD© D© D© Dananananan MoMMooMMooMooMooMooMoooo /re/re//re/re/re/rre/re/re/iStSiStStiStiStiStiStiSt kkkkckocockocockoock hhphohhphoohophohophottttototototoThThe ChChapter Outline presents the chapter’s topics and subtopics, as well as practice opportunities.

4 1 Accounting in Action
1 Identify the activities and users associated with accounting.LEARNING OBJECTIVE
What consistently ranks as one of the top career opportunities in business? What frequently rates among the most popular majors on campus? What was the undergraduate degree chosen by Nike founder Phil Knight, Home Depot co-founder Arthur Blank, former acting director of the Federal Bureau of Inves-tigation (FBI) Thomas Pickard, and numerous members of Congress? Account-ing.1 Why did these people choose accounting? They wanted to understand what was happening fi nancially to their organizations. Accounting is the fi nancial information system that provides these insights. In short, to understand your organization, you have to know the numbers. Accounting consists of three basic activities—it identifi es, records, and communicates the economic events of an organization to interested users. Let’s take a closer look at these three activities.
Three Activities
As a starting point to the accounting process, a company identifi es the economic events relevant to its business. Examples of economic events are the sale of snack chips by PepsiCo, the provision of cell phone services by AT&T, and the payment of wages by Facebook. Once a company like PepsiCo identifi es economic events, it records those events in order to provide a history of its fi nancial activities. Recording consists of keeping a systematic, chronological diary of events, measured in dollars and cents. In recording, PepsiCo also classifi es and summarizes economic events. Finally, PepsiCo communicates the collected information to interested users by means of accounting reports. The most common of these reports are called fi nancial statements. To make the reported fi nancial information meaningful, PepsiCo reports the recorded data in a standardized way. It accumulates infor-mation resulting from similar transactions. For example, PepsiCo accumulates all sales transactions over a certain period of time and reports the data as one amount in the company’s fi nancial statements. Such data are said to be reported in the aggregate. By presenting the recorded data in the aggregate, the account-ing process simplifi es a multitude of transactions and makes a series of activities understandable and meaningful. A vital element in communicating economic events is the accountant’s ability to analyze and interpret the reported information. Analysis involves use of ratios, percentages, graphs, and charts to highlight signifi cant fi nancial trends and relationships. Interpretation involves explaining the uses, meaning, and limitations of reported data. Appendices A–E show the fi nancial statements of Apple Inc., PepsiCo Inc., The Coca-Cola Company, Amazon.com, Inc., and Wal-Mart Stores, Inc., respectively. (In addition, in the A Look at IFRS section at the end of each chapter, the French company Louis Vuitton Moët Hennessy is analyzed.) We refer to these statements at various places throughout the text-book. At this point, these fi nancial statements probably strike you as complex and confusing. By the end of this course, you’ll be surprised at your ability to under-stand, analyze, and interpret them. Illustration 1-1 summarizes the activities of the accounting process.
1The appendix to this chapter describes job opportunities for accounting majors and explains why accounting is such a popular major.
Essential terms are printed in blue when they fi rst appear, and are defi ned in the end-of-chapter Glossary Review.

Accounting Activities and Users 5
You should understand that the accounting process includes the bookkeeping function. Bookkeeping usually involves only the recording of economic events. It is therefore just one part of the accounting process. In total, accounting involves the entire process of identifying, recording, and communicating economic events.2
Who Uses Accounting Data
The fi nancial information that users need depends upon the kinds of decisions they make. There are two broad groups of users of fi nancial information: internal users and external users.
INTERNAL USERS
Internal users of accounting information are managers who plan, organize, and run the business. These include marketing managers, production supervisors, fi nance directors, and company offi cers. In running a business, internal users must answer many important questions, as shown in Illustration 1-2.
Illustration 1-1The activities of the accounting process
Identification Recording
Communication
Select economic events (transactions) Record, classify, and summarize
Prepare accounting reports
Analyze and interpret for users
CHIP CITY
DELL
. . . .
.........
2The origins of accounting are generally attributed to the work of Luca Pacioli, an Italian Renaissance mathematician. Pacioli was a close friend and tutor to Leonardo da Vinci and a contemporary of Christopher Columbus. In his 1494 text Summa de Arithmetica, Geometria, Proportione et Proportionalite, Pacioli described a system to ensure that fi nancial information was recorded effi ciently and accurately.
To answer these and other questions, internal users need detailed information on a timely basis. Managerial accounting provides internal reports to help users make decisions about their companies. Examples are fi nancial comparisons of operating alternatives, projections of income from new sales campaigns, and forecasts of cash needs for the next year.
Illustration 1-2Questions that internal users ask
STOCK
ONSTRIKEON
STRIKE
ONSTRIKE
Snack chips Beverages
CO
LA
Questions Asked by Internal Users
Is cash sufficient to paydividends to
Microsoft stockholders?
Finance
Can General Motors afford to give its employees pay
raises this year?
Human Resources
Which PepsiCo product line is the most profitable? Should any
product lines be eliminated?
Management
What price should Apple chargefor an iPod to maximize the
company's net income?
Marketing

6 1 Accounting in Action
EXTERNAL USERS
External users are individuals and organizations outside a company who want fi nancial information about the company. The two most common types of exter-nal users are investors and creditors. Investors (owners) use accounting infor-mation to decide whether to buy, hold, or sell ownership shares of a company. Creditors (such as suppliers and bankers) use accounting information to evalu-ate the risks of granting credit or lending money. Illustration 1-3 shows some questions that investors and creditors may ask.
The Scoop on Accounting
Accounting can serve as a useful recruiting tool even for the human resources department. Rhino Foods, located in Burlington, Ver-mont, is a manufacturer of specialty ice cream. Its cor-porate website includes the following:
“Wouldn’t it be great to work where you were part of a team? Where your input and hard work made a difference?
Where you weren’t kept in the dark about what management was thinking? . . . Well—it’s not a dream! It’s the way we do business . . . Rhino Foods believes in family, honesty and open communication—we really care about and appreciate our employees—and it shows. Operating results are posted and monthly group meetings inform all employees about what’s happening in the Company. Employees also share in the Company’s profi ts, in addition to having an excellent comprehensive benefi ts package.”
Source: www.rhinofoods.com/workforus/workforus.html.
What are the benefi ts to the company and its employees of making the fi nancial statements available to all employees? (Go to WileyPLUS for this answer and additional questions.)© Agnieszka Pastuszak-Maksim/
iStockphoto
Rhino FoodsAccounting Across the Organization
Accounting Across the Organization boxes demonstrate applications of accounting infor-mation in various business functions.
Illustration 1-3Questions that external users ask
What do we doif they catch us?
BILLCOLLECTOR
Yeah!
Questions Asked by External Users
Is General Electric earningsatisfactory income?
Investors
How does Disney compare in size and profitability with Time Warner?
Investors
Will United Airlines be ableto pay its debts as they come due?
Creditors
Financial accounting answers these questions. It provides economic and fi nancial information for investors, creditors, and other external users. The infor-mation needs of external users vary considerably. Taxing authorities, such as the Internal Revenue Service, want to know whether the company complies with tax laws. Regulatory agencies, such as the Securities and Exchange Commission or the Federal Trade Commission, want to know whether the company is operating within prescribed rules. Customers are interested in whether a company like Telsa will continue to honor product warranties and support its product lines. Labor unions such as the Major League Baseball Players Association want to know whether the owners have the ability to pay increased wages and benefi ts.

Building Blocks of Accounting 7
Indicate whether each of the fi ve statements presented below is true or false.
1. The three steps in the accounting process are identifi cation, recording, and communi-cation.
2. Bookkeeping encompasses all steps in the accounting process.
3. Accountants prepare, but do not interpret, fi nancial reports.
4. The two most common types of external users are investors and company offi cers.
5. Managerial accounting activities focus on reports for internal users.
DO IT! 1 Basic Concepts
1. True 2. False. Bookkeeping involves only the recording step. 3. False. Accoun-tants analyze and interpret information in reports as part of the communication step. 4. False. The two most common types of external users are investors and creditors. 5. True.
Related exercise material: E1-1, E1-2, and DO IT! 1-1.
Solution
2 Explain the building blocks of accounting: ethics, principles, and assumptions.
LEARNING OBJECTIVE
A doctor follows certain protocols in treating a patient’s illness. An architect follows certain structural guidelines in designing a building. Similarly, an accoun-tant follows certain standards in reporting fi nancial information. These standards are based on specifi c principles and assumptions. For these standards to work, however, a fundamental business concept must be present—ethical behavior.
Ethics in Financial Reporting
People won’t gamble in a casino if they think it is “rigged.” Similarly, people won’t play the stock market if they think stock prices are rigged. In recent years, the fi nancial press has been full of articles about fi nancial scandals at Enron, World-Com, HealthSouth, AIG, and other companies. As the scandals came to light, mistrust of fi nancial reporting in general grew. One article in the Wall Street Jour-nal noted that “repeated disclosures about questionable accounting practices have bruised investors’ faith in the reliability of earnings reports, which in turn has sent stock prices tumbling.” Imagine trying to carry on a business or invest money if you could not depend on the fi nancial statements to be honestly prepared. Infor-mation would have no credibility. There is no doubt that a sound, well-functioning economy depends on accurate and dependable fi nancial reporting. United States regulators and lawmakers were very concerned that the econ-omy would suffer if investors lost confi dence in corporate accounting because of unethical fi nancial reporting. In response, Congress passed the Sarbanes-Oxley Act (SOX). Its intent is to reduce unethical corporate behavior and decrease the likelihood of future corporate scandals. As a result of SOX, top management must now certify the accuracy of fi nancial information. In addition, penalties for fraudulent fi nancial activity are much more severe. Also, SOX increased the independence requirements of the outside auditors who review the accuracy of corporate fi nancial statements and increased the oversight role of boards of directors. The standards of conduct by which actions are judged as right or wrong, hon-est or dishonest, fair or not fair, are ethics. Effective fi nancial reporting depends on sound ethical behavior. To sensitize you to ethical situations in business and
ETHICS NOTE
Circus-founder P.T. Barnum is alleged to have said, “Trust everyone, but cut the deck.” What Sarbanes-Oxley does is to provide measures that (like cutting the deck of playing cards) help ensure that fraud will not occur.
Ethics Notes help sensitize you to some of the ethical issues in accounting.
The DO IT! exercises ask you to put newly acquired knowledge to work. They outline the Action Plan necessary to complete the exercise, and they show a Solution.
Action Plan✔ Review the basic
concepts discussed.✔ Develop an under-
standing of the key terms used.

8 1 Accounting in Action
to give you practice at solving ethical dilemmas, we address ethics in a number of ways in this textbook:
1. A number of the Feature Stories and other parts of the textbook discuss the central importance of ethical behavior to fi nancial reporting.
2. Ethics Insight boxes and marginal Ethics Notes highlight ethics situations and issues in actual business settings.
3. Many of the People, Planet, and Profi t Insight boxes focus on ethical issues that companies face in measuring and reporting social and environmental issues.
4. At the end of the chapter, an Ethics Case simulates a business situation and asks you to put yourself in the position of a decision-maker in that case.
When analyzing these various ethics cases, as well as experiences in your own life, it is useful to apply the three steps outlined in Illustration 1-4.
Illustration 1-4Steps in analyzing ethics cases and situations
#1ALT
#2ALT
2. Identify and analyzethe principal elementsin the situation.
Identify the stakeholders—persons or groups who maybe harmed or benefited. Askthe question: What are theresponsibilities and obligationsof the parties involved?
3. Identify the alternatives,and weigh the impact ofeach alternative on variousstakeholders.
Select the most ethicalalternative, considering all theconsequences. Sometimes therewill be one right answer. Othersituations involve more thanone right solution; thesesituations require an evaluationof each and a selection of thebest alternative.
1. Recognize an ethicalsituation and the ethicalissues involved.
Use your personal ethics toidentify ethical situations andissues. Some businesses andprofessional organizationsprovide written codes ofethics for guidance in somebusiness situations.
Insight boxes provide examples of business situations from various perspectives—ethics, investor, international, and corporate social responsibility. Guideline answers to the critical thinking questions are available in WileyPLUS and at www.wiley.com/college/weygandt. Additional questions are offered in WileyPLUS.
Generally Accepted Accounting Principles
The accounting profession has developed standards that are generally accepted and universally practiced. This common set of standards is called generally accepted accounting principles (GAAP). These standards indicate how to report economic events.
I Felt the Pressure —Would You?
“I felt the pressure.” That’s what some of the employees of the now-defunct law fi rm of Dewey & LeBoeuf LLP indicated when they helped to overstate revenue and use accounting tricks to hide losses and cover up cash shortages. These employees worked for the former fi nance director and former chief fi nancial offi cer (CFO) of the fi rm.
Here are some of their comments:
• “I was instructed by the CFO to create invoices, knowing they would not be sent to clients. When I created these invoices, I knew that it was inappropriate.”
• “I intentionally gave the auditors incorrect information in the course of the audit.”
What happened here is that a small group of lower-level employees over a period of years carried out the instructions of their bosses. Their bosses, however, seemed to have no concern as evidenced by various e-mails with one another in which they referred to their fi nancial manipulations as accounting tricks, cooking the books, and fake income.
Source: Ashby Jones, “Guilty Pleas of Dewey Staff Detail the Alleged Fraud,” Wall Street Journal (March 28, 2014).
Why did these employees lie, and what do you believe should be their penalty for these lies? (Go to WileyPLUS for this answer and additional questions.)
Dewey & LeBoeuf LLPEthics Insight
© Alliance/Shutterstock

Building Blocks of Accounting 9
The primary accounting standard-setting body in the United States is the Financial Accounting Standards Board (FASB). The Securities and Exchange Commission (SEC) is the agency of the U.S. government that oversees U.S. fi nancial markets and accounting standard-setting bodies. The SEC relies on the FASB to develop accounting standards, which public companies must follow. Many countries outside of the United States have adopted the accounting standards issued by the Inter-national Accounting Standards Board (IASB). These standards are called International Financial Reporting Standards (IFRS). As markets become more global, it is often desirable to compare the results of companies from different countries that report using different accounting standards. In order to increase comparability, in recent years the two standard-setting bodies have made efforts to reduce the differ-ences between U.S. GAAP and IFRS. This process is referred to as convergence. As a result of these convergence efforts, it is likely that someday there will be a single set of high-quality accounting standards that are used by companies around the world. Because convergence is such an important issue, we highlight any major differences between GAAP and IFRS in International Notes (as shown in the margin here) and provide a more in-depth discussion in the A Look at IRFS section at the end of each chapter.
Measurement Principles
GAAP generally uses one of two measurement principles, the historical cost prin-ciple or the fair value principle. Selection of which principle to follow generally relates to trade-offs between relevance and faithful representation. Relevance means that fi nancial information is capable of making a difference in a decision. Faithful representation means that the numbers and descriptions match what really existed or happened—they are factual.
HISTORICAL COST PRINCIPLE
The historical cost principle (or cost principle) dictates that companies record assets at their cost. This is true not only at the time the asset is purchased, but also over the time the asset is held. For example, if Best Buy purchases land for $300,000, the company initially reports it in its accounting records at $300,000. But what does Best Buy do if, by the end of the next year, the fair value of the land has increased to $400,000? Under the historical cost principle, it continues to report the land at $300,000.
FAIR VALUE PRINCIPLE
The fair value principle states that assets and liabilities should be reported at fair value (the price received to sell an asset or settle a liability). Fair value information may be more useful than historical cost for certain types of assets and liabilities. For example, certain investment securities are reported at fair value because mar-ket price information is usually readily available for these types of assets. In deter-mining which measurement principle to use, companies weigh the factual nature of cost fi gures versus the relevance of fair value. In general, most companies choose to use cost. Only in situations where assets are actively traded, such as investment securities, do companies apply the fair value principle extensively.
Assumptions
Assumptions provide a foundation for the accounting process. Two main assumptions are the monetary unit assumption and the economic entity assumption.
MONETARY UNIT ASSUMPTION
The monetary unit assumption requires that companies include in the account-ing records only transaction data that can be expressed in money terms. This
Over 100 countries use International Financial Reporting Standards (called IFRS). For example, all com-panies in the European Union follow international standards. The differences between U.S. and international standards are not generally signifi cant.
International Note
International Notes highlight differences between U.S. and international accounting standards.
Helpful HintRelevance and faithful representation are two primary qualities that make accounting information useful for decision-making.
Helpful Hints further clarify concepts being discussed.

10 1 Accounting in Action
assumption enables accounting to quantify (measure) economic events. The monetary unit assumption is vital to applying the historical cost principle. This assumption prevents the inclusion of some relevant information in the accounting records. For example, the health of a company’s owner, the quality of service, and the morale of employees are not included. The reason: Companies cannot quantify this information in money terms. Though this information is important, companies record only events that can be measured in money.
ECONOMIC ENTITY ASSUMPTION
An economic entity can be any organization or unit in society. It may be a company (such as Crocs, Inc.), a governmental unit (the state of Ohio), a munic-ipality (Seattle), a school district (St. Louis District 48), or a church (Southern Baptist). The economic entity assumption requires that the activities of the entity be kept separate and distinct from the activities of its owner and all other economic entities. To illustrate, Sally Rider, owner of Sally’s Boutique, must keep her personal living costs separate from the expenses of the business. Similarly, J. Crew and Gap Inc. are segregated into separate economic entities for accounting purposes.
PROPRIETORSHIP A business owned by one person is generally a proprietor-ship. The owner is often the manager/operator of the business. Small service-type businesses (plumbing companies, beauty salons, and auto repair shops), farms, and small retail stores (antique shops, clothing stores, and used-book stores) are often proprietorships. Usually, only a relatively small amount of money (capital) is necessary to start in business as a proprietorship. The owner (proprietor) receives any profi ts, suffers any losses, and is person-ally liable for all debts of the business. There is no legal distinction between the business as an economic unit and the owner, but the accounting records of the business activities are kept separate from the personal records and activi-ties of the owner.
PARTNERSHIP A business owned by two or more persons associated as partners is a partnership. In most respects a partnership is like a proprietorship except that more than one owner is involved. Typically, a partnership agreement (written or oral) sets forth such terms as initial investment, duties of each partner, division of net income (or net loss), and settlement to be made upon death or withdrawal of a partner. Each partner generally has unlimited personal liability for the debts of the partnership. Like a proprietorship, for accounting purposes the partner-ship transactions must be kept separate from the personal activities of the partners. Partnerships are often used to organize retail and service-type busi-nesses, including professional practices (lawyers, doctors, architects, and certi-fi ed public accountants).
CORPORATION A business organized as a separate legal entity under state corpo-ration law and having ownership divided into transferable shares of stock is a corporation. The holders of the shares (stockholders) enjoy limited liability; that is, they are not personally liable for the debts of the corporate entity. Stock-holders may transfer all or part of their ownership shares to other investors at any time (i.e., sell their shares). The ease with which ownership can change adds to the attractiveness of investing in a corporation. Because ownership can be transferred without dissolving the corporation, the corporation enjoys an unlimited life. Although the combined number of proprietorships and partnerships in the United States is more than fi ve times the number of corporations, the revenue produced by corporations is eight times greater. Most of the largest companies
ETHICS NOTE
The importance of the economic entity assumption is illustrated by scandals involving Adelphia. In this case, senior company employees entered into transactions that blurred the line between the employees’ fi nancial interests and those of the company. For example, Adelphia guaranteed over $2 billion of loans to the founding family.

Building Blocks of Accounting 11
Indicate whether each of the fi ve statements presented below is true or false.
1. Congress passed the Sarbanes-Oxley Act to reduce unethical behavior and decrease the likelihood of future corporate scandals.
2. The primary accounting standard-setting body in the United States is the Financial Accounting Standards Board (FASB).
3. The historical cost principle dictates that companies record assets at their cost. In later periods, however, the fair value of the asset must be used if fair value is higher than its cost.
4. Relevance means that fi nancial information matches what really happened; the infor-mation is factual.
5. A business owner’s personal expenses must be separated from expenses of the business to comply with accounting’s economic entity assumption.
DO IT! 2 Building Blocks of Accounting
1. True. 2. True. 3. False. The historical cost principle dictates that companies record assets at their cost. Under the historical cost principle, the company must also use cost in later periods. 4. False. Faithful representation, not relevance, means that fi nancial information matches what really happened; the information is factual. 5. True.
Related exercise material: E1-3, E1-4, and DO IT! 1-2.
Action Plan✔ Review the discussion
of ethics and fi nancial reporting standards.
✔ Develop an understanding of the key terms used.
Solution
Spinning the Career Wheel
How will the study of account-ing help you? A working knowledge of accounting is desirable for virtually every fi eld of business. Some exam-ples of how accounting is used in business careers include:
General management: Man-agers at Ford Motors, Massa-chusetts General Hospital, California State University—Fullerton, a McDonald’s fran-chise, and a Trek bike shop all need to understand account-ing data in order to make wise business decisions.
Marketing: Marketing spe-cialists at Procter & Gamble
must be sensitive to costs and benefi ts, which accounting helps them quantify and understand. Making a sale is meaningless unless it is a profi table sale.
Finance: Do you want to be a banker for Citicorp, an investment analyst for Goldman Sachs, or a stock broker for Merrill Lynch? These fi elds rely heavily on accounting knowledge to analyze fi nancial statements. In fact, it is dif-fi cult to get a good job in a fi nance function without two or three courses in accounting.
Real estate: Are you interested in being a real estate bro-ker for Prudential Real Estate? Because a third party—the bank—is almost always involved in fi nancing a real estate transaction, brokers must understand the numbers involved: Can the buyer afford to make the payments to the bank? Does the cash fl ow from an industrial property justify the purchase price? What are the tax benefi ts of the purchase?
How might accounting help you? (Go to WileyPLUS for this answer and additional questions.)Josef Volavka/iStockphoto
Accounting Across the Organization
in the United States—for example, ExxonMobil, Ford, Wal-Mart Stores, Inc., Citigroup, and Apple—are corporations.

12 1 Accounting in Action
3 State the accounting equation, and defi ne its components.LEARNING OBJECTIVE
The two basic elements of a business are what it owns and what it owes. Assets are the resources a business owns. For example, Google has total assets of approx-imately $93.8 billion. Liabilities and owner’s equity are the rights or claims against these resources. Thus, Google has $93.8 billion of claims against its $93.8 billion of assets. Claims of those to whom the company owes money (cred-itors) are called liabilities. Claims of owners are called owner’s equity. Google has liabilities of $22.1 billion and owners’ equity of $71.7 billion. We can express the relationship of assets, liabilities, and owner’s equity as an equation, as shown in Illustration 1-5.
Illustration 1-5The basic accounting equation
Assets 5 Liabilities 1 Owner’s Equity
This relationship is the basic accounting equation. Assets must equal the sum of liabilities and owner’s equity. Liabilities appear before owner’s equity in the basic accounting equation because they are paid fi rst if a business is liquidated. The accounting equation applies to all economic entities regardless of size, nature of business, or form of business organization. It applies to a small propri-etorship such as a corner grocery store as well as to a giant corporation such as PepsiCo. The equation provides the underlying framework for recording and summarizing economic events. Let’s look in more detail at the categories in the basic accounting equation.
Assets
As noted above, assets are resources a business owns. The business uses its assets in carrying out such activities as production and sales. The common characteris-tic possessed by all assets is the capacity to provide future services or benefi ts. In a business, that service potential or future economic benefi t eventually results in cash infl ows (receipts). For example, consider Campus Pizza, a local restau-rant. It owns a delivery truck that provides economic benefi ts from delivering pizzas. Other assets of Campus Pizza are tables, chairs, jukebox, cash register, oven, tableware, and, of course, cash.
Liabilities
Liabilities are claims against assets—that is, existing debts and obligations. Businesses of all sizes usually borrow money and purchase merchandise on credit. These economic activities result in payables of various sorts:
• Campus Pizza, for instance, purchases cheese, sausage, fl our, and beverages on credit from suppliers. These obligations are called accounts payable.
• Campus Pizza also has a note payable to First National Bank for the money borrowed to purchase the delivery truck.
• Campus Pizza may also have salaries and wages payable to employees and sales and real estate taxes payable to the local government.
All of these persons or entities to whom Campus Pizza owes money are its creditors. Creditors may legally force the liquidation of a business that does not pay its debts. In that case, the law requires that creditor claims be paid before owner-ship claims.

The Accounting Equation 13
Owner’s Equity
The ownership claim on total assets is owner’s equity. It is equal to total assets minus total liabilities. Here is why: The assets of a business are claimed by either creditors or owners. To fi nd out what belongs to owners, we subtract the creditors’ claims (the liabilities) from assets. The remainder is the owner’s claim on the assets—the owner’s equity. Since the claims of creditors must be paid before ownership claims, owner’s equity is often referred to as residual equity.
INCREASES IN OWNER’S EQUITY
In a proprietorship, owner’s investments and revenues increase owner’s equity.
INVESTMENTS BY OWNER Investments by owner are the assets the owner puts into the business. These investments increase owner’s equity. They are recorded in a category called owner’s capital.
REVENUES Revenues are the gross increase in owner’s equity resulting from business activities entered into for the purpose of earning income. Gener-ally, revenues result from selling merchandise, performing services, renting prop-erty, and lending money. Common sources of revenue are sales, fees, services, commissions, interest, dividends, royalties, and rent. Revenues usually result in an increase in an asset. They may arise from different sources and are called various names depending on the nature of the business. Campus Pizza, for instance, has two categories of sales revenues—pizza sales and beverage sales.
DECREASES IN OWNER’S EQUITY
In a proprietorship, owner’s drawings and expenses decrease owner’s equity.
DRAWINGS An owner may withdraw cash or other assets for personal use. We use a separate classifi cation called drawings to determine the total withdrawals for each accounting period. Drawings decrease owner’s equity. They are recorded in a category called owner’s drawings.
EXPENSES Expenses are the cost of assets consumed or services used in the pro-cess of earning revenue. They are decreases in owner’s equity that result from operating the business. For example, Campus Pizza recognizes the following expenses: cost of ingredients (meat, fl our, cheese, tomato paste, mushrooms, etc.); cost of beverages; salaries and wages expense; utilities expense (electric, gas, and water expense); delivery expense (gasoline, repairs, licenses, etc.); sup-plies expense (napkins, detergents, aprons, etc.); rent expense; interest expense; and property tax expense. In summary, owner’s equity is increased by an owner’s investments and by revenues from business operations. Owner’s equity is decreased by an owner’s withdrawals of assets and by expenses. Illustration 1-6 expands the basic account-ing equation by showing the items that comprise owner’s equity. This format is referred to as the expanded accounting equation.
Helpful HintIn some places, we use the term “owner’s equity” and in others we use “owners’ equity.” Owner’s (singular, possessive) refers to one owner (the case with a sole proprietorship). Owners’ (plural, possessive) refers to multiple owners (the case with partnerships or corporations).
Illustration 1-6Expanded accounting equation
Basic Equation Assets 5 Liabilities 1 Owner’s Equity
Expanded Equation Assets 5 Liabilities 1 Owner’s
2 Owner’s
1 Revenues
2 Expenses
Capital Drawings

14 1 Accounting in Action
Classify the following items as investment by owner (I), owner’s drawings (D), revenues (R), or expenses (E). Then indicate whether each item increases or decreases owner’s equity.
1. Rent Expense. 3. Drawings.
2. Service Revenue. 4. Salaries and Wages Expense.
Solution
DO IT! 3 Owner’s Equity Effects
1. Rent Expense is an expense (E); it decreases owner’s equity. 2. Service Revenue is revenue (R); it increases owner’s equity. 3. Drawings is owner’s drawings (D); it decreases owner’s equity. 4. Salaries and Wages Expense is an expense (E); it decreases owner’s equity.
Related exercise material: BE1-1, BE1-2, BE1-3, BE1-4, BE1-5, BE1-8, E1-5, and DO IT! 1-3.
Action Plan✔ Understand the
sources of revenue.✔ Understand what
causes expenses.✔ Review the rules for
changes in owner’s equity.
✔ Recognize that draw-ings are withdrawals of cash or other assets from the business for personal use.
4 Analyze the effects of business transactions on the accounting equation.
LEARNING OBJECTIVE
Transactions (business transactions) are a business’s economic events recorded by accountants. Transactions may be external or internal. External transactions involve economic events between the company and some outside enterprise. For example, Campus Pizza’s purchase of cooking equipment from a supplier, payment of monthly rent to the landlord, and sale of pizzas to customers are external transactions. Inter-nal transactions are economic events that occur entirely within one company. The use of cooking and cleaning supplies are internal transactions for Campus Pizza. Companies carry on many activities that do not represent business transac-tions. Examples are hiring employees, responding to e-mails, talking with custom-ers, and placing merchandise orders. Some of these activities may lead to business transactions. Employees will earn wages, and suppliers will deliver ordered mer-chandise. The company must analyze each event to fi nd out if it affects the com-ponents of the accounting equation. If it does, the company will record the transaction. Illustration 1-7 demonstrates the transaction identifi cation process.
Illustration 1-7Transaction identifi cation process
RENT
CHIP CITY
DELL
YesNoYes
Events
Criterion
Record/Don’t Record
Pay rentDiscuss product design withpotential customer
Purchase computer
Is the financial position (assets, liabilities, or owner’s equity) of the company changed?

Analyzing Business Transactions 15
Each transaction must have a dual effect on the accounting equation. For example, if an asset is increased, there must be a corresponding (1) decrease in another asset, (2) increase in a specifi c liability, or (3) increase in owner’s equity. Two or more items could be affected. For example, as one asset is increased $10,000, another asset could decrease $6,000 and a liability could increase $4,000. Any change in a liability or ownership claim is subject to similar analysis.
Transaction Analysis
To demonstrate how to analyze transactions in terms of the accounting equa-tion, we will review the business activities of Softbyte, a smartphone app devel-opment company. Softbyte is the creation of Ray Neal, an entrepreneur who wants to create focused apps that inspire and engage users of all ages. Ray was encouraged to start his own business after the success of “FoodAlert,” a cus-tomizable app he developed that tracks the daily location of local food trucks. The following business transactions occur during Softbyte’s fi rst month of operations.
TRANSACTION (1). INVESTMENT BY OWNER Ray Neal starts a smartphone app development company which he names Softbyte. On September 1, 2017, he invests $15,000 cash in the business. This transaction results in an equal increase in assets and owner’s equity.
Helpful HintStudy these transactions until you are sure you understand them. They are not diffi cult, but understanding them is important to your success in this course. The ability to analyze transactions in terms of the basic account-ing equation is essential in accounting.
The asset Cash increases $15,000, and owner’s equity (identifi ed as Owner’s Capital) increases $15,000.
Assets 5 Liabilities 1 Owner’s Equity
Owner’s Cash 5 Capital
(1) 1$15,000 5 1$15,000 Initial investment
Basic Analysis
Equation Analysis
Observe that the equality of the accounting equation has been maintained. Note that the investments by the owner do not represent revenues, and they are excluded in determining net income. Therefore, it is necessary to make clear that the increase is an investment (increasing Owner’s Capital) rather than revenue.
TRANSACTION (2). PURCHASE OF EQUIPMENT FOR CASH Softbyte purchases com-puter equipment for $7,000 cash. This transaction results in an equal increase and decrease in total assets, though the composition of assets changes.
The asset Cash decreases $7,000, and the asset Equipment increases $7,000.
Basic Analysis
Equation Analysis
Assets 5 Liabilities 1 Owner’s Equity
Cash 1 Equipment 5 Owner’s Capital
$15,000 $15,000
(2) 27,000 1$7,000
$ 8,000 1 $7,000 5 $15,000
$15,000
⎧ ⎪ ⎪ ⎪ ⎪ ⎨ ⎪ ⎪ ⎪ ⎪ ⎩

16 1 Accounting in Action
Observe that total assets are still $15,000. Owner’s equity also remains at $15,000, the amount of Ray Neal’s original investment.
TRANSACTION (3). PURCHASE OF SUPPLIES ON CREDIT Softbyte purchases for $1,600 from Mobile Solutions headsets and other computer accessories expected to last several months. Mobile Solutions agrees to allow Softbyte to pay this bill in October. This transaction is a purchase on account (a credit purchase). Assets increase because of the expected future benefi ts of using the headsets and computer accessories, and liabilities increase by the amount due to Mobile Solutions.
The asset Supplies increases $1,600, and the liability Accounts Payable increases $1,600.Basic
Analysis
Equation Analysis
Assets 5 Liabilities 1 Owner’s Equity
Accounts Owner’s Cash 1 Supplies 1 Equipment 5 Payable 1 Capital
$8,000 $7,000 $15,000
(3) 1$1,600 1$1,600
$8,000 1 $1,600 1 $7,000 5 $1,600 1 $15,000
$16,600 $16,600
⎧ ⎪ ⎪ ⎪ ⎪ ⎪ ⎪ ⎪ ⎪ ⎨ ⎪ ⎪ ⎪ ⎪ ⎪ ⎪ ⎪ ⎪ ⎩ ⎧ ⎪ ⎪ ⎪ ⎪ ⎪ ⎨ ⎪ ⎪ ⎪ ⎪ ⎪ ⎩
Total assets are now $16,600. This total is matched by a $1,600 creditor’s claim and a $15,000 ownership claim.
TRANSACTION (4). SERVICES PERFORMED FOR CASH Softbyte receives $1,200 cash from customers for app development services it has performed. This transaction represents Softbyte’s principal revenue-producing activity. Recall that revenue increases owner’s equity.
The asset Cash increases $1,200, and owner’s equity increases $1,200 due to Service Revenue.Basic
Analysis
Equation Analysis
Assets 5 Liabilities 1 Owner’s Equity
Accounts Owner’s Cash 1 Supplies 1 Equipment 5 Payable 1 Capital 1 Revenues
$8,000 $1,600 $7,000 $1,600 $15,000
(4) 11,200 1$1,200 Service Revenue
$9,200 1 $1,600 1 $7,000 5 $1,600 1 $15,000 1 $1,200
$17,800 $17,800
⎧ ⎪ ⎪ ⎪ ⎪ ⎪ ⎪ ⎪ ⎨ ⎪ ⎪ ⎪ ⎪ ⎪ ⎪ ⎪ ⎩ ⎧ ⎪ ⎪ ⎪ ⎪ ⎪ ⎪ ⎪ ⎨ ⎪ ⎪ ⎪ ⎪ ⎪ ⎪ ⎪ ⎩
The two sides of the equation balance at $17,800. Service Revenue is included in determining Softbyte’s net income. Note that we do not have room to give details for each individual revenue and expense account in this illustration. Thus, revenues (and expenses when we get to them) are summarized under one column heading for Revenues and one for Expenses. However, it is important to keep track of the category (account) titles affected (e.g., Service Revenue) as they will be needed when we prepare fi nancial statements later in the chapter.

Analyzing Business Transactions 17
TRANSACTION (5). PURCHASE OF ADVERTISING ON CREDIT Softbyte receives a bill for $250 from the Daily News for advertising on its online website but postpones payment until a later date. This transaction results in an increase in liabilities and a decrease in owner’s equity.
The two sides of the equation still balance at $17,800. Owner’s equity decreases when Softbyte incurs the expense. Expenses are not always paid in cash at the time they are incurred. When Softbyte pays at a later date, the liability Accounts Payable will decrease, and the asset Cash will decrease [see Transaction (8)]. The cost of advertising is an expense (rather than an asset) because the com-pany has used the benefi ts. Advertising Expense is included in determining net income.
TRANSACTION (6). SERVICES PERFORMED FOR CASH AND CREDIT Softbyte per-forms $3,500 of app development services for customers. The company receives cash of $1,500 from customers, and it bills the balance of $2,000 on account. This transaction results in an equal increase in assets and owner’s equity.
Softbyte recognizes $3,500 in revenue when it performs the service. In exchange for this service, it received $1,500 in Cash and Accounts Receivable of $2,000. This Accounts Receivable represents customers’ promises to pay $2,000 to Softbyte in the future. When it later receives collections on account, Softbyte will increase Cash and will decrease Accounts Receivable [see Trans-action (9)].
The liability Accounts Payable increases $250, and owner’s equity decreases $250 due to Advertising Expense.
Basic Analysis
Equation Analysis
Assets 5 Liabilities 1 Owner’s Equity
Accounts Owner’s Cash 1 Supplies 1 Equipment 5 Payable 1 Capital 1 Revenues 2 Expenses
$9,200 $1,600 $7,000 $1,600 $15,000 $1,200
(5) 1250 2$250
$9,200 1 $1,600 1 $7,000 5 $1,850 1 $15,000 1 $1,200 2 $ 250
$17,800 $17,800
⎧ ⎪ ⎪ ⎪ ⎪ ⎪ ⎪ ⎪ ⎪ ⎪ ⎪ ⎨ ⎪ ⎪ ⎪ ⎪ ⎪ ⎪ ⎪ ⎪ ⎪ ⎩
AdvertisingExpense
⎧ ⎪ ⎪ ⎪ ⎪ ⎪ ⎪ ⎨ ⎪ ⎪ ⎪ ⎪ ⎪ ⎪ ⎩
Three specifi c items are affected: The asset Cash increases $1,500, the asset Accounts Receivable increases $2,000, and owner’s equity increases $3,500 due to Service Revenue.
Basic Analysis
Equation Analysis
Assets 5 Liabilities 1 Owner’s Equity
Accounts Accounts Owner’s Cash 1 Receivable 1 Supplies 1 Equipment 5 Payable 1 Capital 1 Revenues 2 Expenses $9,200 $1,600 $7,000 $1,850 $15,000 $1,200 $250
(6) 11,500 1$2,000 13,500
$10,700 1 $ 2,000 1 $1,600 1 $7,000 5 $1,850 1 $15,000 1 $4,700 2 $250
$21,300 $21,300
⎧ ⎪ ⎪ ⎪ ⎪ ⎪ ⎪ ⎪ ⎪ ⎪ ⎨ ⎪ ⎪ ⎪ ⎪ ⎪ ⎪ ⎪ ⎪ ⎩ ⎧ ⎪ ⎪ ⎪ ⎪ ⎪ ⎪ ⎪ ⎪ ⎪ ⎨ ⎪ ⎪ ⎪ ⎪ ⎪ ⎪ ⎪ ⎪ ⎩
ServiceRevenue

18 1 Accounting in Action
The two sides of the equation now balance at $19,600. Three lines in the analysis indicate the different types of expenses that have been incurred.
TRANSACTION (8). PAYMENT OF ACCOUNTS PAYABLE Softbyte pays its $250 Daily News bill in cash. The company previously [in Transaction (5)] recorded the bill as an increase in Accounts Payable and a decrease in owner’s equity.
Observe that the payment of a liability related to an expense that has previously been recorded does not affect owner’s equity. The company recorded this expense in Transaction (5) and should not record it again.
TRANSACTION (9). RECEIPT OF CASH ON ACCOUNT Softbyte receives $600 in cash from customers who had been billed for services [in Transaction (6)]. Transac-tion (9) does not change total assets, but it changes the composition of those assets.
TRANSACTION (7). PAYMENT OF EXPENSES Softbyte pays the following expenses in cash for September: offi ce rent $600, salaries and wages of employees $900, and utilities $200. These payments result in an equal decrease in assets and owner’s equity.
The asset Cash decreases $1,700, and owner’s equity decreases $1,700 due to the specifi c expense categories (Rent Expense, Salaries and Wages Expense, and Utilities Expense).
Basic Analysis
Equation Analysis
⎧ ⎪ ⎪ ⎪ ⎪ ⎪ ⎪ ⎪ ⎪ ⎨ ⎪ ⎪ ⎪ ⎪ ⎪ ⎪ ⎪ ⎪ ⎩
Assets 5 Liabilities 1 Owner’s Equity
Accounts Accounts Owner’s Cash 1 Receivable 1 Supplies 1 Equipment 5 Payable 1 Capital 1 Revenues 2 Expenses
$10,700 $2,000 $1,600 $7,000 $1,850 $15,000 $4,700 $ 250
(7) 21,700 2600 2900 2200
$9,000 1 $2,000 1 $1,600 1 $7,000 5 $1,850 1 $15,000 1 $4,700 2 $1,950
$19,600 $19,600
Rent Expense Sal. and Wages Exp.Utilities Exp.
⎧ ⎪ ⎪ ⎪ ⎪ ⎪ ⎪ ⎪ ⎪ ⎨ ⎪ ⎪ ⎪ ⎪ ⎪ ⎪ ⎪ ⎩This cash payment “on account” decreases the asset Cash by $250 and also decreases the liability Accounts Payable by $250.
Basic Analysis
Equation Analysis
Assets 5 Liabilities 1 Owner’s Equity
Accounts Accounts Owner’s Cash 1 Receivable 1 Supplies 1 Equipment 5 Payable 1 Capital 1 Revenues 2 Expenses
$9,000 $2,000 $1,600 $7,000 $1,850 $15,000 $4,700 $1,950
2250 2250
$8,750 1 $2,000 1 $1,600 1 $7,000 5 $1,600 1 $15,000 1 $4,700 2 $1,950
$19,350 $19,350
⎧ ⎪ ⎪ ⎪ ⎪ ⎪ ⎪ ⎪ ⎪ ⎨ ⎪ ⎪ ⎪ ⎪ ⎪ ⎪ ⎪ ⎪ ⎩ ⎧ ⎪ ⎪ ⎪ ⎪ ⎪ ⎪ ⎪ ⎪ ⎪ ⎨ ⎪ ⎪ ⎪ ⎪ ⎪ ⎪ ⎪ ⎪ ⎪ ⎩
(8)

Analyzing Business Transactions 19
Note that the collection of an account receivable for services previously billed and recorded does not affect owner’s equity. Softbyte already recorded this revenue in Transaction (6) and should not record it again.
TRANSACTION (10). WITHDRAWAL OF CASH BY OWNER Ray Neal withdraws $1,300 in cash from the business for his personal use. This transaction results in an equal decrease in assets and owner’s equity.
Observe that the effect of a cash withdrawal by the owner is the opposite of the effect of an investment by the owner. Owner’s drawings are not expenses. Expenses are incurred for the purpose of earning revenue. Drawings do not generate revenue. They are a disinvestment. Like owner’s investment, the company excludes owner’s drawings in determining net income.
Summary of Transactions
Illustration 1-8 (page 20) summarizes the September transactions of Softbyte to show their cumulative effect on the basic accounting equation. It also indicates the transaction number and the specifi c effects of each transaction. Illustration 1-8 demonstrates some signifi cant facts:
1. Each transaction is analyzed in terms of its effect on: (a) The three components of the basic accounting equation. (b) Specifi c items within each component.
2. The two sides of the equation must always be equal.
The asset Cash increases $600, and the asset Accounts Receivable decreases $600.Basic
Analysis
Equation Analysis
Assets 5 Liabilities 1 Owner’s Equity
Accounts Accounts Owner’s Cash 1 Receivable 1 Supplies 1 Equipment 5 Payable 1 Capital 1 Revenues 2 Expenses
$8,750 $2,000 $1,600 $7,000 $1,600 $15,000 $4,700 $1,950
1600 2600
$9,350 1 $1,400 1 $1,600 1 $7,000 5 $1,600 1 $15,000 1 $4,700 2 $1,950
$19,350 $19,350
⎧ ⎪ ⎪ ⎪ ⎪ ⎪ ⎪ ⎪ ⎪ ⎨ ⎪ ⎪ ⎪ ⎪ ⎪ ⎪ ⎪ ⎪ ⎩ ⎧ ⎪ ⎪ ⎪ ⎪ ⎪ ⎪ ⎪ ⎪ ⎪ ⎨ ⎪ ⎪ ⎪ ⎪ ⎪ ⎪ ⎪ ⎪ ⎪ ⎩
(9)
The asset Cash decreases $1,300, and owner’s equity decreases $1,300 due to owner’s withdrawal (Owner’s Drawings).
Basic Analysis
Equation Analysis
Assets 5 Liabilities 1 Owner’s Equity
Accounts Accounts Owner’s Owner’s Cash 1 Receivable 1 Supplies 1 Equipment 5 Payable 1 Capital 2 Drawings 1 Revenues 2 Expenses
$9,350 $1,400 $1,600 $7,000 $1,600 $15,000 $4,700 $1,950
(10) 21,300 2 $1,300
$8,050 1 $1,400 1 $1,600 1 $7,000 5 $1,600 1 $15,000 2 $1,300 1 $4,700 2 $1,950
$18,050 $18,050
⎧ ⎪ ⎪ ⎪ ⎪ ⎪ ⎪ ⎪ ⎪ ⎨ ⎪ ⎪ ⎪ ⎪ ⎪ ⎪ ⎪ ⎪ ⎩ ⎧ ⎪ ⎪ ⎪ ⎪ ⎪ ⎪ ⎪ ⎪ ⎪ ⎪ ⎨ ⎪ ⎪ ⎪ ⎪ ⎪ ⎪ ⎪ ⎪ ⎪ ⎪ ⎩
Drawings

20 1 Accounting in Action
There! You made it through your fi rst transaction analysis. If you feel a bit shaky on any of the transactions, it might be a good idea at this point to get up, take a short break, and come back again for a 10- to 15-minute review of the transactions, to make sure you understand them before you go on to the next section.
Assets 5 Liabilities 1 Owner’s Equity
Trans- Accounts Accounts Owner’s Owner’saction Cash 1 Receivable 1 Supplies 1 Equipment 5 Payable 1 Capital 2 Drawings 1 Rev. 2 Exp.
(1) 1$15,000 1 $15,000 (2) 27,000 1$7,000 (3) 1$1,600 1$1,600 (4) 11,200 1$1,200 (5) 1250 2$250 (6) 11,500 1$2,000 13,500 (7) 2600 2600 2900 2900 2200 2200 (8) 2250 2250 (9) 1600 2600 (10) 21,300 2$1,300
$ 8,050 1 $1,400 1 $1,600 1 $7,000 5 $1,600 1 $15,000 2 $1,300 1 $4,700 2 $1,950
$18,050 $18,050
⎧ ⎪ ⎪ ⎪ ⎪ ⎪ ⎪ ⎪ ⎪ ⎪ ⎨ ⎪ ⎪ ⎪ ⎪ ⎪ ⎪ ⎪ ⎪ ⎪ ⎩ ⎧ ⎪ ⎪ ⎪ ⎪ ⎪ ⎪ ⎪ ⎪ ⎪ ⎪ ⎨ ⎪ ⎪ ⎪ ⎪ ⎪ ⎪ ⎪ ⎪ ⎪ ⎪ ⎪ ⎩
Rent ExpenseSal./Wages Exp.Utilities Expense
Service RevenueAdver. Expense Service Revenue
Drawings
Initial invest.
Illustration 1-8Tabular summary of Softbyte transactions
Transactions made by Virmari & Co., a public accounting fi rm, for the month of August are shown below. Prepare a tabular analysis which shows the effects of these transac-tions on the expanded accounting equation, similar to that shown in Illustration 1-8.
1. The owner invested $25,000 cash in the business.
2. The company purchased $7,000 of offi ce equipment on credit.
3. The company received $8,000 cash in exchange for services performed.
4. The company paid $850 for this month’s rent.
5. The owner withdrew $1,000 cash for personal use.
Solution
DO IT! 4 Tabular Analysis
Assets 5 Liabilities 1 Owner’s Equity
Trans- Accounts Owner’s Owner’saction Cash 1 Equipment 5 Payable 1 Capital 2 Drawings 1 Revenues 2 Expenses
(1) 1$25,000 1$25,000 (2) 1$7,000 1$7,000 (3) 18,000 1$8,000 (4) 2850 2$850 (5) 21,000 2$1,000
$31,150 1 $7,000 5 $7,000 1 $25,000 2 $1,000 1 $8,000 2 $850
$38,150 $38,150
Related exercise material: BE1-6, BE1-7, BE1-9, E1-6, E1-7, E1-8, and DO IT! 1-4.
Action Plan✔ Analyze the effects of
each transaction on the accounting equation.
✔ Use appropriate category names (not descriptions).
✔ Keep the accounting equation in balance.
Service RevenueRent Expense
⎧ ⎪ ⎪ ⎪ ⎪ ⎨ ⎪ ⎪ ⎪ ⎪ ⎩ ⎧ ⎪ ⎪ ⎪ ⎪ ⎪ ⎪ ⎪ ⎪ ⎪ ⎪ ⎪ ⎪ ⎪ ⎨ ⎪ ⎪ ⎪ ⎪ ⎪ ⎪ ⎪ ⎪ ⎪ ⎪ ⎪ ⎪ ⎪ ⎩
Drawings

The Four Financial Statements 21
5 Describe the four fi nancial statements and how they are prepared.LEARNING OBJECTIVE
Companies prepare four fi nancial statements from the summarized accounting data:
1. An income statement presents the revenues and expenses and resulting net income or net loss for a specifi c period of time.
2. An owner’s equity statement summarizes the changes in owner’s equity for a specifi c period of time.
3. A balance sheet reports the assets, liabilities, and owner’s equity at a specifi c date.
4. A statement of cash fl ows summarizes information about the cash infl ows (receipts) and outfl ows (payments) for a specifi c period of time.
These statements provide relevant fi nancial data for internal and exter-nal users. Illustration 1-9 (page 22) shows the fi nancial statements of Softbyte. Note that the statements shown in Illustration 1-9 are interrelated:
1. Net income of $2,750 on the income statement is added to the beginning balance of owner’s capital in the owner’s equity statement.
2. Owner’s capital of $16,450 at the end of the reporting period shown in the owner’s equity statement is reported on the balance sheet.
3. Cash of $8,050 on the balance sheet is reported on the statement of cash fl ows.
Also, explanatory notes and supporting schedules are an integral part of every set of fi nancial statements. We illustrate these notes and schedules in later chap-ters of this textbook. Be sure to carefully examine the format and content of each statement in Illustration 1-9. We describe the essential features of each in the following sections.
Income Statement
The income statement reports the revenues and expenses for a specifi c period of time. (In Softbyte’s case, this is “For the Month Ended September 30, 2017.”) Softbyte’s income statement is prepared from the data appearing in the owner’s equity columns of Illustration 1-8 (page 20). The income statement lists revenues fi rst, followed by expenses. Finally the statement shows net income (or net loss). Net income results when revenues exceed expenses. A net loss occurs when expenses exceed revenues. Although practice varies, we have chosen in our illustrations and homework solutions to list expenses in order of magnitude. (We will consider alternative formats for the income statement in later chapters.) Note that the income statement does not include investment and withdrawal transactions between the owner and the business in measuring net income. For example, as explained earlier, Ray Neal’s withdrawal of cash from Softbyte was not regarded as a business expense.
Owner’s Equity Statement
The owner’s equity statement reports the changes in owner’s equity for a specifi c period of time. The time period is the same as that covered by the income state-ment. Data for the preparation of the owner’s equity statement come from the owner’s equity columns of the tabular summary (Illustration 1-8) and from the income statement. The fi rst line of the statement shows the beginning owner’s equity amount (which was zero at the start of the business). Then come the own-er’s investments, net income (or loss), and the owner’s drawings. This statement indicates why owner’s equity has increased or decreased during the period.
Alternative TerminologyThe income statement is sometimes referred to as the statement of operations, earnings statement, or profi t and loss statement.
Alternative Terminology notes introduce other terms you might hear or read.
The primary types of fi nancial statements required by GAAP and IFRS are the same. In practice, some format differences do exist in presentations commonly employed by GAAP companies compared to IFRS companies.
International Note
Helpful HintThe income statement, owner’s equity statement, and statement of cash fl ows are all for a period of time, whereas the balance sheet is for a point in time.
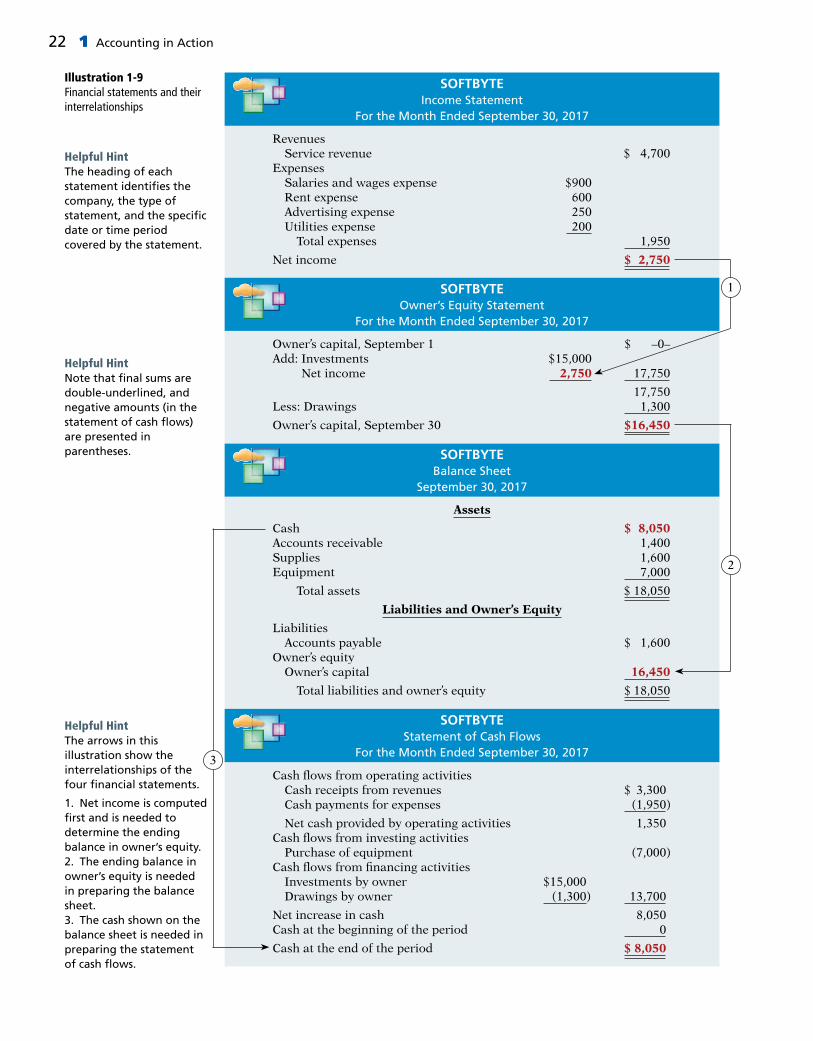
22 1 Accounting in Action
SOFTBYTEIncome Statement
For the Month Ended September 30, 2017
Revenues Service revenue $ 4,700Expenses Salaries and wages expense $900 Rent expense 600 Advertising expense 250 Utilities expense 200 Total expenses 1,950
Net income $ 2,750
SOFTBYTEBalance Sheet
September 30, 2017
Assets
Cash $ 8,050Accounts receivable 1,400Supplies 1,600Equipment 7,000
Total assets $ 18,050
Liabilities and Owner’s Equity
Liabilities Accounts payable $ 1,600Owner’s equity Owner’s capital 16,450
Total liabilities and owner’s equity $ 18,050
1SOFTBYTEOwner’s Equity Statement
For the Month Ended September 30, 2017
Owner’s capital, September 1 $ –0–Add: Investments $15,000 Net income 2,750 17,750
17,750Less: Drawings 1,300
Owner’s capital, September 30 $16,450
2
3
SOFTBYTEStatement of Cash Flows
For the Month Ended September 30, 2017
Cash fl ows from operating activities Cash receipts from revenues $ 3,300 Cash payments for expenses (1,950)
Net cash provided by operating activities 1,350Cash fl ows from investing activities Purchase of equipment (7,000)Cash fl ows from fi nancing activities Investments by owner $15,000 Drawings by owner (1,300) 13,700
Net increase in cash 8,050Cash at the beginning of the period 0
Cash at the end of the period $ 8,050
Illustration 1-9Financial statements and their interrelationships
Helpful HintThe heading of each statement identifi es the company, the type of statement, and the specifi c date or time period covered by the statement.
Helpful HintNote that fi nal sums are double-underlined, and negative amounts (in the statement of cash fl ows) are presented in parentheses.
Helpful HintThe arrows in this illustration show the interrelationships of the four fi nancial statements.
1. Net income is computed fi rst and is needed to determine the ending balance in owner’s equity.2. The ending balance in owner’s equity is needed in preparing the balance sheet.3. The cash shown on the balance sheet is needed in preparing the statement of cash fl ows.

The Four Financial Statements 23
What if Softbyte had reported a net loss in its fi rst month? Let’s assume that during the month of September 2017, Softbyte lost $10,000. Illustration 1-10 shows the presentation of a net loss in the owner’s equity statement.
SOFTBYTEOwner’s Equity Statement
For the Month Ended September 30, 2017
Owner’s capital, September 1 $ –0–Add: Investments 15,000
15,000Less: Drawings $ 1,300 Net loss 10,000 11,300
Owner’s capital, September 30 $ 3,700
Illustration 1-10Presentation of net loss
If the owner makes any additional investments, the company reports them in the owner’s equity statement as investments.
Balance Sheet
Softbyte’s balance sheet reports the assets, liabilities, and owner’s equity at a spe-cifi c date (in Softbyte’s case, September 30, 2017). The company prepares the bal-ance sheet from the column headings of the tabular summary (Illustration 1-8) and the month-end data shown in its last line. Observe that the balance sheet lists assets at the top, followed by liabilities and owner’s equity. Total assets must equal total liabilities and owner’s equity. Softbyte reports only one liability—accounts payable—in its balance sheet. In most cases, there will be more than one liability. When two or more liabilities are involved, a customary way of listing is as follows.
Illustration 1-11Presentation of liabilitiesLiabilities
Notes payable $ 10,000Accounts payable 63,000Salaries and wages payable 18,000
Total liabilities $91,000
The balance sheet is a snapshot of the company’s fi nancial condition at a specifi c moment in time (usually the month-end or year-end).
Statement of Cash Flows
The statement of cash fl ows provides information on the cash receipts and pay-ments for a specifi c period of time. The statement of cash fl ows reports (1) the cash effects of a company’s operations during a period, (2) its investing activities, (3) its fi nancing activities, (4) the net increase or decrease in cash during the period, and (5) the cash amount at the end of the period. Reporting the sources, uses, and change in cash is useful because investors, creditors, and others want to know what is happening to a company’s most liquid resource. The statement of cash fl ows provides answers to the following simple but important questions.
1. Where did cash come from during the period?
2. What was cash used for during the period?
3. What was the change in the cash balance during the period?

24 1 Accounting in Action
As shown in Softbyte’s statement of cash fl ows, cash increased $8,050 during the period. Net cash provided by operating activities increased cash $1,350. Cash fl ow from investing activities decreased cash $7,000. And cash fl ow from fi nancing activities increased cash $13,700. At this time, you need not be concerned with how these amounts are determined. Chapter 17 will examine the statement of cash fl ows in detail.
Beyond Financial Statements
Should we expand our fi nancial statements beyond the income statement, owner’s equity statement, balance sheet, and statement of cash fl ows? Some believe we should take into
account ecological and social performance, in addition to fi nancial results, in evaluating a company. The argument is that a company’s responsibility lies with anyone who is infl uenced by its actions. In other words, a company should be interested in benefi ting many different parties, instead of only maximizing stockholders’ interests.
A socially responsible business does not exploit or endan-ger any group of individuals. It follows fair trade practices, provides safe environments for workers, and bears responsi-bility for environmental damage. Granted, measurement of these factors is diffi cult. How to report this information is also controversial. But many interesting and useful efforts are underway. Throughout this textbook, we provide addi-tional insights into how companies are attempting to meet the challenge of measuring and reporting their contributions to society, as well as their fi nancial results, to stockholders.
Why might a company’s stockholders be interested in its environmental and social performance? (Go to WileyPLUS for this answer and additional questions.)
© Marek Uliasz/iStockphoto
People, Planet, and Profi t Insight
Presented below is selected information related to Flanagan Company at December 31, 2017. Flanagan reports fi nancial information monthly.
Equipment $10,000 Utilities Expense $ 4,000Cash 8,000 Accounts Receivable 9,000Service Revenue 36,000 Salaries and Wages Expense 7,000Rent Expense 11,000 Notes Payable 16,500Accounts Payable 2,000 Owner’s Drawings 5,000
(a) Determine the total assets of Flanagan Company at December 31, 2017.
(b) Determine the net income that Flanagan Company reported for December 2017.
(c) Determine the owner’s equity of Flanagan Company at December 31, 2017.
Solution
DO IT! 5 Financial Statement Items
(a) The total assets are $27,000, comprised of Cash $8,000, Accounts Receivable $9,000, and Equipment $10,000.
(b) Net income is $14,000, computed as follows.
Revenues Service revenue $36,000 Expenses Rent expense $11,000 Salaries and wages expense 7,000 Utilities expense 4,000
Total expenses 22,000
Net income $14,000
Action Plan✔ Remember the basic
accounting equation: assets must equal liabilities plus owner’s equity.
✔ Review previous fi nancial statements to determine how total assets, net income, and owner’s equity are computed.

Appendix 1A: Career Opportunities in Accounting 25
(c) The ending owner’s equity of Flanagan Company is $8,500. By rewriting the accounting equation, we can compute owner’s equity as assets minus liabilities, as follows.
Total assets [as computed in (a)] $27,000 Less: Liabilities Notes payable $16,500 Accounts payable 2,000 18,500
Owner’s equity $ 8,500
Note that it is not possible to determine the company’s owner’s equity in any other way because the beginning total for owner’s equity is not provided.
Related exercise material: BE1-10, BE1-11, E1-9, E1-10, E1-11, E1-12, E1-13, E1-14, E1-15, E1-16, and DO IT! 1-5.
6 APPENDIX 1A: Explain the career opportunities in accounting.
Why is accounting such a popular major and career choice? First, there are a lot of jobs. In many cities in recent years, the demand for accountants exceeded the supply. Not only are there a lot of jobs, but there are a wide array of opportuni-ties. As one accounting organization observed, “accounting is one degree with 360 degrees of opportunity.” Accounting is also hot because it is obvious that accounting matters. Interest in accounting has increased, ironically, because of the attention caused by the account-ing failures of companies such as Enron and WorldCom. These widely publicized scandals revealed the important role that accounting plays in society. Most people want to make a difference, and an accounting career provides many opportunities to contribute to society. Finally, the Sarbanes-Oxley Act (SOX) (see page 7) signifi -cantly increased the accounting and internal control requirements for corporations. This dramatically increased demand for professionals with accounting training. Accountants are in such demand that it is not uncommon for accounting students to have accepted a job offer a year before graduation. As the following discussion reveals, the job options of people with accounting degrees are virtually unlimited.
Public Accounting
Individuals in public accounting offer expert service to the general public, in much the same way that doctors serve patients and lawyers serve clients. A major portion of public accounting involves auditing. In auditing, a certifi ed public accountant (CPA) examines company fi nancial statements and provides an opin-ion as to how accurately the fi nancial statements present the company’s results and fi nancial position. Analysts, investors, and creditors rely heavily on these “audit opinions,” which CPAs have the exclusive authority to issue. Taxation is another major area of public accounting. The work that tax special-ists perform includes tax advice and planning, preparing tax returns, and represent-ing clients before governmental agencies such as the Internal Revenue Service. A third area in public accounting is management consulting. It ranges from installing basic accounting software or highly complex enterprise resource plan-ning systems, to performing support services for major marketing projects and merger and acquisition activities. Many CPAs are entrepreneurs. They form small- or medium-sized practices that frequently specialize in tax or consulting services.
LEARNING OBJECTIVE
*

26 1 Accounting in Action
Private Accounting
Instead of working in public accounting, you might choose to be an employee of a for-profi t company such as Starbucks, Google, or PepsiCo. In private (or man-agerial) accounting, you would be involved in activities such as cost accounting (fi nding the cost of producing specifi c products), budgeting, accounting informa-tion system design and support, and tax planning and preparation. You might also be a member of your company’s internal audit team. In response to SOX, the internal auditors’ job of reviewing the company’s operations to ensure compli-ance with company policies and to increase effi ciency has taken on increased importance. Alternatively, many accountants work for not-for-profi t organizations such as the Red Cross or the Bill and Melinda Gates Foundation, or for museums, libraries, or performing arts organizations.
Governmental Accounting
Another option is to pursue one of the many accounting opportunities in govern-mental agencies. For example, the Internal Revenue Service (IRS), Federal Bureau of Investigation (FBI), and the Securities and Exchange Commission (SEC) all employ accountants. The FBI has a stated goal that at least 15 percent of its new agents should be CPAs. There is also a very high demand for accounting educators at public colleges and universities and in state and local governments.
Forensic Accounting
Forensic accounting uses accounting, auditing, and investigative skills to conduct investigations into theft and fraud. It is listed among the top 20 career paths of the future. The job of forensic accountants is to catch the perpetrators of the estimated $600 billion per year of theft and fraud occurring at U.S. companies. This includes tracing money-laundering and identity-theft activities as well as tax evasion. Insur-ance companies hire forensic accountants to detect frauds such as arson, and law offi ces employ forensic accountants to identify marital assets in divorces. Forensic accountants often have FBI, IRS, or similar government experience.
“Show Me the Money”
How much can a new accountant make? Take a look at the average salaries for college graduates in public and private accounting. Keep in mind if you also have a CPA license, you’ll make 10–15% more when you start out.
Employer Jr. Level (0–3 yrs.) Sr. Level (4–6 yrs.)
Public accounting (large fi rm) $51,500–$74,250 $71,000–$92,250Public accounting (small fi rm) $42,500–$60,500 $57,000–$74,000Corporate accounting (large company) $41,750–$68,500 $67,000–$86,500Corporate accounting (small company) $37,000–$56,750 $52,750–$68,500
Illustration 1A-1Salary estimates for jobs in public and corporate accounting
Serious earning potential over time gives CPAs great job security. Here are some examples of upper-level salaries for managers in corporate accounting. Note that geographic region, experience, education, CPA certifi cation, and com-pany size each play a role in determining salary.
Illustration 1A-2Upper-level management salaries in corporate accounting
Position Large Company Small to Medium Company
Chief fi nancial offi cer $189,750–$411,000 $96,750–$190,500Corporate controller $128,000–$199,000 $82,750–$144,750Tax manager $100,250–$142,500 $79,500–$110,750
Helpful HintFor up-to-date salary estimates, check out www.startheregoplaces.com.

Review and Practice 27
1 Identify the activities and users associated with account-ing. Accounting is an information system that identifi es, records, and communicates the economic events of an organization to interested users. The major users and uses of accounting are as follows. (a) Management uses accounting information to plan, organize, and run the business. (b) Investors (owners) decide whether to buy, hold, or sell their fi nancial interests on the basis of accounting data. (c) Creditors (suppliers and bankers) evaluate the risks of granting credit or lending money on the basis of accounting information. Other groups that use accounting information are taxing authorities, regu-latory agencies, customers, and labor unions.
Explain the building blocks of accounting: ethics, prin-ciples, and assumptions. Ethics are the standards of conduct by which actions are judged as right or wrong. Effective fi nancial reporting depends on sound ethical behavior.
Generally accepted accounting principles are a common set of standards used by accountants. The primary accounting standard-setting body in the United States is the Financial Accounting Standards Board. The monetary unit assumption requires that companies include in the accounting records only trans-action data that can be expressed in terms of money. The economic entity assumption requires that the activ-ities of each economic entity be kept separate from the activities of its owner(s) and other economic entities.
State the accounting equation, and defi ne its compo-nents. The basic accounting equation is:
Assets 5 Liabilities 1 Owner’s Equity
Assets are resources a business owns. Liabilities are creditorship claims on total assets. Owner’s equity is the ownership claim on total assets.
2
3
The expanded accounting equation is:
Assets 5 Liabilities 1 Owner’s Capital 2 Owner’s Drawings 1 Revenues 2 Expenses
Owner’s capital is assets the owner puts into the busi-ness. Owner’s drawings are the assets the owner with-draws for personal use. Revenues are increases in assets resulting from income-earning activities. Expenses are the costs of assets consumed or services used in the process of earning revenue.
Analyze the effects of business transactions on the accounting equation. Each business transaction must have a dual effect on the accounting equation. For example, if an individual asset increases, there must be a corresponding (1) decrease in another asset, (2) increase in a specifi c liability, or (3) increase in owner’s equity.
Describe the four fi nancial statements and how they are prepared. An income statement presents the reve-nues and expenses, and resulting net income or net loss, for a specifi c period of time. An owner’s equity statement summarizes the changes in owner’s equity for a specifi c period of time. A balance sheet reports the assets, liabilities, and owner’s equity at a specifi c date. A statement of cash fl ows summarizes informa-tion about the cash infl ows (receipts) and outfl ows (payments) for a specifi c period of time.
Explain the career opportunities in accounting.Accounting offers many different jobs in fi elds such as public and private accounting, governmental, and forensic accounting. Accounting is a popular major because there are many different types of jobs, with unlimited potential for career advancement.
4
5
* 6
LEARNING OBJECTIVES REVIEW
1
REVIEW AND PRACTICE
Accounting The information system that identifi es, records, and communicates the economic events of an organization to interested users. (p. 4).
Assets Resources a business owns. (p. 12).Auditing The examination of fi nancial statements by a
certifi ed public accountant in order to express an opin-ion as to the fairness of presentation. (p. 25).
Balance sheet A fi nancial statement that reports the assets, liabilities, and owner’s equity at a specifi c date. (p. 2).
Basic accounting equation Assets 5 Liabilities 1 Owner’s equity. (p. 21).
*
Bookkeeping A part of the accounting process that involves only the recording of economic events. (p. 5).
Convergence The process of reducing the differences between U.S. GAAP and IFRS. (p. 9).
Corporation A business organized as a separate legal entity under state corporation law, having ownership divided into transferable shares of stock. (p. 10).
Drawings Withdrawal of cash or other assets from an unincorporated business for the personal use of the owner(s). (p. 13).
Economic entity assumption An assumption that requires that the activities of the entity be kept separate
GLOSSARY REVIEW
The Review and Practice section provides opportunities for students to review key concepts and terms as well as complete multiple-choice questions, exercises, and a comprehensive problem. Detailed solutions are also included.

28 1 Accounting in Action
and distinct from the activities of its owner and all other economic entities. (p. 10).
Ethics The standards of conduct by which actions are judged as right or wrong, honest or dishonest, fair or not fair. (p. 7).
Expanded accounting equation Assets 5 Liabilities 1 Owner’s capital 2 Owner’s drawings 1 Revenues 2 Expenses. (p. 13).
Expenses The cost of assets consumed or services used in the process of earning revenue. (p. 13).
Fair value principle An accounting principle stating that assets and liabilities should be reported at fair value (the price received to sell an asset or settle a liability). (p. 9).
Faithful representation Numbers and descriptions match what really existed or happened—they are factual. (p. 9).
Financial accounting The fi eld of accounting that pro-vides economic and fi nancial information for investors, creditors, and other external users. (p. 6).
Financial Accounting Standards Board (FASB) A pri-vate organization that establishes generally accepted accounting principles in the United States (GAAP). (p. 9).
Forensic accounting An area of accounting that uses accounting, auditing, and investigative skills to con-duct investigations into theft and fraud. (p. 26).
Generally accepted accounting principles (GAAP) Common standards that indicate how to report eco-nomic events. (p. 8).
Historical cost principle An accounting principle that states that companies should record assets at their cost. (p. 9).
Income statement A fi nancial statement that presents the revenues and expenses and resulting net income or net loss of a company for a specifi c period of time. (p. 21).
International Accounting Standards Board (IASB) An accounting standard-setting body that issues standards adopted by many countries outside of the United States. (p. 9).
International Financial Reporting Standards (IFRS) International accounting standards set by the Interna-tional Accounting Standards Board (IASB). (p. 9).
Investments by owner The assets an owner puts into the business. (p. 13).
Liabilities Creditor claims against total assets. (p. 12).Management consulting An area of public accounting
ranging from development of accounting and computer
*
*
systems to support services for marketing projects and merger and acquisition activities. (p. 25).
Managerial accounting The fi eld of accounting that provides internal reports to help users make decisions about their companies. (p. 5).
Monetary unit assumption An assumption stating that companies include in the accounting records only transaction data that can be expressed in terms of money. (p. 9).
Net income The amount by which revenues exceed expenses. (p. 21).
Net loss The amount by which expenses exceed reve-nues. (p. 21).
Owner’s equity The ownership claim on total assets. (p. 13).
Owner’s equity statement A fi nancial statement that summarizes the changes in owner’s equity for a specifi c period of time. (p. 21).
Partnership A business owned by two or more persons associated as partners. (p. 10).
Private (or managerial) accounting An area of accounting within a company that involves such activ-ities as cost accounting, budgeting, design and support of accounting information systems, and tax planning and preparation. (p. 26).
Proprietorship A business owned by one person. (p. 10).Public accounting An area of accounting in which the
accountant offers expert service to the general public. (p. 25).
Relevance Financial information that is capable of mak-ing a difference in a decision. (p. 9).
Revenues The gross increase in owner’s equity resulting from business activities entered into for the purpose of earning income. (p. 13).
Sarbanes-Oxley Act (SOX) Law passed by Congress intended to reduce unethical corporate behavior. (p. 7).
Securities and Exchange Commission (SEC) A gov-ernmental agency that oversees U.S. fi nancial markets and accounting standard-setting bodies. (p. 9).
Statement of cash fl ows A fi nancial statement that summarizes information about the cash infl ows (receipts) and cash outfl ows (payments) for a specifi c period of time. (p. 21).
Taxation An area of public accounting involving tax advice, tax planning, preparing tax returns, and repre-senting clients before governmental agencies. (p. 25).
Transactions The economic events of a business that are recorded by accountants. (p. 14).
*
*
*
1. Which of the following is not a step in the accounting process?(a) Identifi cation. (c) Recording.(b) Economic entity. (d) Communication.
(LO 1) 2. Which of the following statements about users of accounting information is incorrect?(a) Management is an internal user.(b) Taxing authorities are external users.
(LO 1)
PRACTICE MULTIPLE-CHOICE QUESTIONS

(c) Present creditors are external users.(d) Regulatory authorities are internal users.
3. The historical cost principle states that:(a) assets should be initially recorded at cost and
adjusted when the fair value changes.(b) activities of an entity are to be kept separate and
distinct from its owner.(c) assets should be recorded at their cost.(d) only transaction data capable of being expressed
in terms of money be included in the accounting records.
4. Which of the following statements about basic assump-tions is correct?(a) Basic assumptions are the same as accounting
principles.(b) The economic entity assumption states that there
should be a particular unit of accountability.(c) The monetary unit assumption enables account-
ing to measure employee morale.(d) Partnerships are not economic entities.
5. The three types of business entities are:(a) proprietorships, small businesses, and partner-
ships.(b) proprietorships, partnerships, and corporations.(c) proprietorships, partnerships, and large busi-
nesses.(d) fi nancial, manufacturing, and service companies.
6. Net income will result during a time period when:(a) assets exceed liabilities.(b) assets exceed revenues.(c) expenses exceed revenues.(d) revenues exceed expenses.
7. As of December 31, 2017, Kent Company has assets of $3,500 and owner’s equity of $2,000. What are the lia-bilities for Kent Company as of December 31, 2017?(a) $1,500. (c) $2,500.(b) $1,000. (d) $2,000.
8. Performing services on account will have the follow-ing effects on the components of the basic accounting equation:(a) increase assets and decrease owner’s equity.(b) increase assets and increase owner’s equity.(c) increase assets and increase liabilities.(d) increase liabilities and increase owner’s equity.
9. Which of the following events is not recorded in the accounting records?(a) Equipment is purchased on account.(b) An employee is terminated.
(LO 2)
(LO 2)
(LO 2)
(LO 3)
(LO 3)
(LO 4)
(LO 4)
(c) A cash investment is made into the business.(d) The owner withdraws cash for personal use.
10. During 2017, Bruske Company’s assets decreased $50,000 and its liabilities decreased $50,000. Its own-er’s equity therefore:(a) increased $50,000. (c) decreased $100,000.(b) decreased $50,000. (d) did not change.
11. Payment of an account payable affects the compo-nents of the accounting equation in the following way.(a) Decreases owner’s equity and decreases liabilities.(b) Increases assets and decreases liabilities.(c) Decreases assets and increases owner’s equity.(d) Decreases assets and decreases liabilities.
12. Which of the following statements is false?(a) A statement of cash fl ows summarizes informa-
tion about the cash infl ows (receipts) and out-fl ows (payments) for a specifi c period of time.
(b) A balance sheet reports the assets, liabilities, and owner’s equity at a specifi c date.
(c) An income statement presents the revenues, expenses, changes in owner’s equity, and resulting net income or net loss for a specifi c period of time.
(d) An owner’s equity statement summarizes the changes in owner’s equity for a specifi c period of time.
13. On the last day of the period, Alan Cesska Company buys a $900 machine on credit. This transaction will affect the:(a) income statement only.(b) balance sheet only.(c) income statement and owner’s equity statement
only.(d) income statement, owner’s equity statement, and
balance sheet. 14. The fi nancial statement that reports assets, liabilities,
and owner’s equity is the:(a) income statement.(b) owner’s equity statement.(c) balance sheet.(d) statement of cash fl ows.
15. Services performed by a public accountant include:(a) auditing, taxation, and management consulting.(b) auditing, budgeting, and management consulting.(c) auditing, budgeting, and cost accounting.(d) auditing, budgeting, and management consulting.
(LO 4)
(LO 4)
(LO 5)
(LO 5)
(LO 5)
* (LO 6)
Solutions
1. (b) Economic entity is not one of the steps in the accounting process. The other choices are true because (a) identifi cation is the fi rst step in the accounting process, (c) recording is the second step in the accounting process, and (d) communication is the third and fi nal step in the accounting process.
2. (d) Regulatory authorities are external, not internal, users of accounting information. The other choices are true state-ments.
3. (c) The historical cost principle states that assets should be recorded at their cost. The other choices are incorrect because (a) the historical cost principle does not say that assets should be adjusted for changes in fair value, (b) describes the economic entity assumption, and (d) describes the monetary unit assumption.
4. (b) The economic entity assumption states that there should be a particular unit of accountability. The other choices are incor-rect because (a) basic assumptions are not the same as accounting principles, (c) the monetary unit assumption allows accounting to measure economic events, and (d) partnerships are economic entities.
Practice Multiple-Choice Questions 29

5. (b) Proprietorships, partnerships, and corporations are the three types of business entities. Choices (a) and (c) are incorrect because small and large businesses only denote the sizes of businesses. Choice (d) is incorrect because fi nancial, manufacturing, and service companies are types of businesses, not business entities.
6. (d) Net income results when revenues exceed expenses. The other choices are incorrect because (a) assets and liabilities are not used in the computation of net income; (b) revenues, not assets, are included in the computation of net income; and (c) when expenses exceed revenues, a net loss results.
7. (a) Using a variation of the basic accounting equation, Assets 2 Owner’s equity 5 Liabilities, $3,500 2 $2,000 5 $1,500. There-fore, choices (b) $1,000, (c) $2,500, and (d) $2,000 are incorrect.
8. (b) When services are performed on account, assets are increased and owner’s equity is increased. The other choices are incor-rect because when services are performed on account (a) owner’s equity is increased, not decreased; (c) liabilities are not affected; and (d) owner’s equity is increased and liabilities are not affected.
9. (b) If an employee is terminated, this represents an activity of a company, not a business transaction. Assets, liabilities, and owner’s equity are not affected. Thus, there is no effect on the accounting equation. The other choices are incorrect because they are all recorded: (a) when equipment is purchased on account, both assets and liabilities increase; (c) when a cash investment is made into a business, both assets and owner’s equity increase; and (d) when an owner withdraws cash for personal use, both assets and owner’s equity decrease.
10. (d) In this situation, owner’s equity does not change because only assets and liabilities decreased $50,000. Therefore, the other choices are incorrect.
11. (d) Payment of an account payable results in an equal decrease of assets (cash) and liabilities (accounts payable). The other choices are incorrect because payment of an account payable (a) does not affect owner’s equity, (b) does not increase assets, and (c) does not affect owner’s equity.
12. (c) An income statement represents the revenues, expenses, and the resulting net income or net loss for a specifi c period of time but not the changes in owner’s equity. The other choices are true statements.
13. (b) This transaction will cause assets to increase by $900 and liabilities to increase by $900. The other choices are incorrect because this transaction (a) will have no effect on the income statement, (c) will have no effect on the income statement or the owner’s equity statement, and (d) will affect the balance sheet but not the income statement or the owner’s equity statement.
14. (c) The balance sheet is the statement that reports assets, liabilities and owner’s equity. The other choices are incorrect because (a) the income statement reports revenues and expenses, (b) the owner’s equity statement reports details about owner’s equity, and (d) the statement of cash fl ows reports infl ows and outfl ows of cash.
*15. (a) Auditing, taxation, and management consulting are all services performed by public accountants. The other choices are incorrect because public accountants do not perform budgeting or cost accounting.
30 1 Accounting in Action
1. Selected transactions for Fabulous Flora Company are listed below.
1. Made cash investment to start business.
2. Purchased equipment on account.
3. Paid salaries.
4. Billed customers for services performed.
5. Received cash from customers billed in (4).
6. Withdrew cash for owner’s personal use.
7. Incurred advertising expense on account.
8. Purchased additional equipment for cash.
9. Received cash from customers when service was performed.
InstructionsList the numbers of the above transactions and describe the effect of each transaction on assets, liabilities, and owner’s equity. For example, the fi rst answer is: (1) Increase in assets and increase in owner’s equity.
Analyze the effect of transactions.
(LO 3, 4)
PRACTICE EXERCISES
1. 1. Increase in assets and increase in owner’s equity.
2. Increase in assets and increase in liabilities.
3. Decrease in assets and decrease in owner’s equity.
4. Increase in assets and increase in owner’s equity.
Solution

Practice Problem 31
2. Alma’s Payroll Services Company entered into the following transactions during May 2017.
1. Purchased computers for $15,000 from Bytes of Data on account.
2. Paid $3,000 cash for May rent on storage space.
3. Received $12,000 cash from customers for contracts billed in April.
4. Performed payroll services for Magic Construction Company for $2,500 cash.
5. Paid Northern Ohio Power Co. $7,000 cash for energy usage in May.
6. Alma invested an additional $25,000 in the business.
7. Paid Bytes of Data for the computers purchased in (1) above.
8. Incurred advertising expense for May of $900 on account.
InstructionsIndicate with the appropriate letter whether each of the transactions above results in:
(a) an increase in assets and a decrease in assets.
(b) an increase in assets and an increase in owner’s equity.
(c) an increase in assets and an increase in liabilities.
(d) a decrease in assets and a decrease in owner’s equity.
(e) a decrease in assets and a decrease in liabilities.
(f) an increase in liabilities and a decrease in owner’s equity.
(g) an increase in owner’s equity and a decrease in liabilities.
Analyze the effect oftransactions on assets, liabilities, and owner’s equity.
(LO 3, 4)
5. Increase in assets and decrease in assets.
6. Decrease in assets and decrease in owner’s equity.
7. Increase in liabilities and decrease in owner’s equity.
8. Increase in assets and decrease in assets.
9. Increase in assets and increase in owner’s equity.
2. 1. (c) 3. (a) 5. (d) 7. (e)
2. (d) 4. (b) 6. (b) 8. (f)
Solution
Joan Robinson opens her own law offi ce on July 1, 2017. During the fi rst month of opera-tions, the following transactions occurred.
1. Joan invested $11,000 in cash in the law practice.
2. Paid $800 for July rent on offi ce space.
3. Purchased equipment on account $3,000.
4. Performed legal services to clients for cash $1,500.
5. Borrowed $700 cash from a bank on a note payable.
6. Performed legal services for client on account $2,000.
7. Paid monthly expenses: salaries and wages $500, utilities $300, and advertising $100.
8. Joan withdrew $1,000 cash for personal use.
Instructions(a) Prepare a tabular summary of the transactions.
(b) Prepare the income statement, owner’s equity statement, and balance sheet at July 31, 2017, for Joan Robinson, Attorney.
PRACTICE PROBLEM
Prepare a tabular presentation and fi nancial statements.
(LO 4, 5)

32 1 Accounting in Action
Solution
Assets 5 Liabilities 1 Owner’s Equity
Trans- Accounts Notes Accounts Owner’s Owner’saction Cash 1 Receivable 1 Equipment 5 Payable 1 Payable 1 Capital 2 Drawings 1 Revenues 2 Expenses
(1) 1$11,000 5 1$11,000(2) 2800 2$800(3) 1$3,000 5 1$3,000(4) 11,500 1$1,500(5) 1700 1$700(6) 1$2,000 12,000(7) 2500 2500
2300 2300 2100 2100
(8) 21,000 2$1,000
$10,500 1 $2,000 1 $3,000 5 $700 1 $3,000 1 $11,000 2 $1,000 1 $3,500 2 $1,700
$15,500 $15,500
⎧ ⎪ ⎪ ⎪ ⎪ ⎪ ⎪ ⎪ ⎨ ⎪ ⎪ ⎪ ⎪ ⎪ ⎪ ⎪ ⎩ ⎧ ⎪ ⎪ ⎪ ⎪ ⎪ ⎪ ⎪ ⎪ ⎪ ⎪ ⎪ ⎪ ⎪ ⎪ ⎪ ⎪ ⎨ ⎪ ⎪ ⎪ ⎪ ⎪ ⎪ ⎪ ⎪ ⎪ ⎪ ⎪ ⎪ ⎪ ⎪ ⎪ ⎪ ⎩
(a)
(b)
JOAN ROBINSON, ATTORNEYIncome Statement
For the Month Ended July 31, 2017
Revenues Service revenue $3,500Expenses Rent expense $800 Salaries and wages expense 500 Utilities expense 300 Advertising expense 100
Total expenses 1,700
Net income $1,800
JOAN ROBINSON, ATTORNEYOwner’s Equity Statement
For the Month Ended July 31, 2017
Owner’s capital, July 1 $ 0Add: Investments $11,000 Net income 1,800 12,800
12,800Less: Drawings 1,000
Owner’s capital, July 31 $11,800
JOAN ROBINSON, ATTORNEYBalance SheetJuly 31, 2017
Assets
Cash $10,500Accounts receivable 2,000Equipment 3,000
Total assets $15,500
Liabilities and Owner’s EquityLiabilities Notes payable $ 700 Accounts payable 3,000
Total liabilities 3,700Owner’s equity Owner’s capital 11,800
Total liabilities and owner’s equity $15,500

Questions 33
Brief Exercises, Exercises, DO IT! Exercises, and Problems and many additional resources are available for practice in WileyPLUS
QUESTIONS
1. “Accounting is ingrained in our society and it is vital to our economic system.” Do you agree? Explain.
2. Identify and describe the steps in the accounting process.
3. (a) Who are internal users of accounting data? (b) How does accounting provide relevant data to these users?
4. What uses of fi nancial accounting information are made by (a) investors and (b) creditors?
5. “Bookkeeping and accounting are the same.” Do you agree? Explain.
6. Trenton Travel Agency purchased land for $90,000 cash on December 10, 2017. At December 31, 2017, the land’s value has increased to $93,000. What amount should be reported for land on Trenton’s balance sheet at December 31, 2017? Explain.
7. What is the monetary unit assumption?8. What is the economic entity assumption?9. What are the three basic forms of business organiza-
tions for profi t-oriented enterprises? 10. Rachel Hipp is the owner of a successful printing
shop. Recently, her business has been increasing, and Rachel has been thinking about changing the organization of her business from a proprietorship to a corporation. Discuss some of the advantages Rachel would enjoy if she were to incorporate her business.
11. What is the basic accounting equation? 12. (a) Defi ne the terms assets, liabilities, and owner’s
equity.(b) What items affect owner’s equity?
13. Which of the following items are liabilities of Siebers Jewelry Stores?(a) Cash.(b) Accounts payable.(c) Owner’s drawings.(d) Accounts receivable.(e) Supplies.(f) Equipment.(g) Salaries and wages payable.(h) Service revenue.(i) Rent expense.
14. Can a business enter into a transaction in which only the left side of the basic accounting equation is affected? If so, give an example.
15. Are the following events recorded in the accounting records? Explain your answer in each case.(a) The owner of the company dies.(b) Supplies are purchased on account.(c) An employee is fi red.(d) The owner of the business withdraws cash from
the business for personal use.
16. Indicate how the following business transactions affect the basic accounting equation.(a) Paid cash for janitorial services.(b) Purchased equipment for cash.(c) Invested cash in the business.(d) Paid accounts payable in full.
17. Listed below are some items found in the fi nancial statements of Tony Gruber Co. Indicate in which fi nancial statement(s) the following items would appear.(a) Service revenue.(b) Equipment.(c) Advertising expense.(d) Accounts receivable.(e) Owner’s capital.(f) Salaries and wages payable.
18. In February 2017, Maria Osgood invested an addi-tional $10,000 in her business, Osgood’s Pharmacy, which is organized as a proprietorship. Osgood’s accountant, Carl Sota, recorded this receipt as an increase in cash and revenues. Is this treatment appropriate? Why or why not?
19. “A company’s net income appears directly on the income statement and the owner’s equity statement, and it is included indirectly in the company’s balance sheet.” Do you agree? Explain.
20. Saylor Enterprises had a capital balance of $168,000 at the beginning of the period. At the end of the accounting period, the capital balance was $198,000.(a) Assuming no additional investment or withdraw-
als during the period, what is the net income for the period?
(b) Assuming an additional investment of $13,000 but no withdrawals during the period, what is the net income for the period?
21. Summarized operations for Bayles Co. for the month of July are as follows.
Revenues recognized: for cash $20,000; on account $70,000.
Expenses incurred: for cash $26,000; on account $40,000.
Indicate for Bayles Co. (a) the total revenues, (b) the total expenses, and (c) net income for the month of July.
22. The basic accounting equation is Assets 5 Liabilities 1Owner’s equity. Replacing the words in that equation with dollar amounts, what is Apple’s accounting equa-tion at September 24, 2013? (Hint: Owner’s equity is equivalent to shareholders’ equity.)
NOTE: All asterisked Questions, Exercises, and Problems relate to material in the appendix to the chapter.

34 1 Accounting in Action
BRIEF EXERCISES
BE1-1 Presented below is the basic accounting equation. Determine the missing amounts.
Assets 5 Liabilities 1 Owner’s Equity
(a) $90,000 $50,000 ?(b) ? $44,000 $70,000(c) $94,000 ? $53,000
BE1-2 Given the accounting equation, answer each of the following questions.
(a) The liabilities of Weber Company are $120,000 and the owner’s equity is $232,000. What is the amount of Weber Company’s total assets?
(b) The total assets of Weber Company are $190,000 and its owner’s equity is $91,000. What is the amount of its total liabilities?
(c) The total assets of Weber Company are $800,000 and its liabilities are equal to one-half of its total assets. What is the amount of Weber Company’s owner’s equity?
BE1-3 At the beginning of the year, Gilles Company had total assets of $800,000 and total liabilities of $300,000. Answer the following questions.
(a) If total assets increased $150,000 during the year and total liabilities decreased $60,000, what is the amount of owner’s equity at the end of the year?
(b) During the year, total liabilities increased $100,000 and owner’s equity decreased $70,000. What is the amount of total assets at the end of the year?
(c) If total assets decreased $80,000 and owner’s equity increased $120,000 during the year, what is the amount of total liabilities at the end of the year?
BE1-4 Use the expanded accounting equation to answer each of the following questions.
(a) The liabilities of Kafka Company are $90,000. Owner’s capital is $150,000; drawings are $40,000; revenues, $450,000; and expenses, $320,000. What is the amount of Kafka Company’s total assets?
(b) The total assets of Rivera Company are $57,000. Owner’s capital is $25,000; drawings are $7,000; revenues, $52,000; and expenses, $35,000. What is the amount of the com-pany’s total liabilities?
(c) The total assets of Alcorn Co. are $600,000 and its liabilities are equal to two-thirds of its total assets. What is the amount of Alcorn Co.’s owner’s equity?
BE1-5 Indicate whether each of the following items is an asset (A), liability (L), or part of owner’s equity (OE).
________ (a) Accounts receivable ________ (d) Supplies________ (b) Salaries and wages payable ________ (e) Owner’s capital________ (c) Equipment ________ (f) Notes payable
BE1-6 Presented below are three business transactions. On a sheet of paper, list the letters (a), (b), and (c) with columns for assets, liabilities, and owner’s equity. For each column, indicate whether the transactions increased (1), decreased (2), or had no effect (NE) on assets, liabilities, and owner’s equity.
(a) Purchased supplies on account.(b) Received cash for performing a service.(c) Paid expenses in cash.
BE1-7 Follow the same format as in BE1-6. Determine the effect on assets, liabilities, and owner’s equity of the following three transactions.
(a) Invested cash in the business.(b) Withdrawal of cash by owner.(c) Received cash from a customer who had previously been billed for services
performed.
BE1-8 Classify each of the following items as owner’s drawings (D), revenue (R), or expense (E).
Use basic accounting equation.
(LO 3)
Use basic accounting equation.
(LO 3)
Use basic accounting equation.
(LO 3)
Solve expanded accounting equation.
(LO 3)
Identify assets, liabilities, and owner’s equity.
(LO 3)
Determine effect of transactions on basic accounting equation.
(LO 4)
Determine effect of transactions on basic accounting equation.
(LO 4)
Classify items affecting owner’s equity.
(LO 3)

DO IT! Exercises 35
________ (a) Advertising expense ________ (e) Owner’s drawings________ (b) Service revenue ________ (f) Rent revenue________ (c) Insurance expense ________ (g) Utilities expense________ (d) Salaries and wages expense
BE1-9 Presented below are three transactions. Mark each transaction as affecting owner’s investment (I), owner’s drawings (D), revenue (R), expense (E), or not affecting owner’s equity (NOE).
________ (a) Received cash for services performed________ (b) Paid cash to purchase equipment________ (c) Paid employee salaries
BE1-10 In alphabetical order below are balance sheet items for Mendoza Company at December 31, 2017. Kathy Mendoza is the owner of Mendoza Company. Prepare a balance sheet, following the format of Illustration 1-9.
Accounts payable $90,000Accounts receivable 72,500Cash 49,000Owner’s capital 31,500
BE1-11 Indicate whether the following items would appear on the income statement (IS), balance sheet (BS), or owner’s equity statement (OE).
________ (a) Notes payable ________ (d) Cash________ (b) Advertising expense ________ (e) Service revenue________ (c) Owner’s capital
Determine effect of transactions on basic owner’s equity.
(LO 4)
Prepare a balance sheet.
(LO 5)
Determine where items appear on fi nancial statements.
(LO 5)
Indicate whether each of the fi ve statements presented below is true or false.
1. The three steps in the accounting process are identifi cation, recording, and examination.2. The accounting process includes the bookkeeping function.3. Managerial accounting provides reports to help investors and creditors evaluate a
company.4. The two most common types of external users are investors and creditors.5. Internal users include human resources managers.
Indicate whether each of the fi ve statements presented below is true or false.
1. Congress passed the Sarbanes-Oxley Act to ensure that investors invest only in compa-nies that will be profi table.
2. The standards of conduct by which actions are judged as loyal or disloyal are ethics.3. The primary accounting standard-setting body in the United States is the Securities
and Exchange Commission (SEC).4. The historical cost principle dictates that companies record assets at their cost and
continue to report them at their cost over the time the assets are held.5. The monetary unit assumption requires that companies record only transactions that
can be measured in money.
Classify the following items as investment by owner (I), owner’s drawings (D), revenues (R), or expenses (E). Then indicate whether each item increases or decreases owner’s equity.
(1) Drawings. (3) Advertising expense.(2) Rent revenue. (4) Owner puts personal assets into the business.
Transactions made by M. Alberti and Co., a law fi rm, for the month of March are shown below and on the next page. Prepare a tabular analysis which shows the effects of these transactions on the expanded accounting equation, similar to that shown in Illustration 1-8.
1. The company performed $20,000 of services for customers, on credit.2. The company received $20,000 in cash from customers who had been billed for services
(in transaction 1).
Review basic concepts.
(LO 1)
Identify building blocks of accounting.
(LO 2)
Evaluate effects of transactions on owner’s equity.
(LO 3)
Prepare tabular analysis.
(LO 4)
DO IT! Exercises
DO IT! 1-1
DO IT! 1-2
DO IT! 1-3
DO IT! 1-4

36 1 Accounting in Action
3. The company received a bill for $2,300 of advertising but will not pay it until a later date.
4. M. Alberti withdrew $3,600 cash from the business for personal use.
Presented below is selected information related to Kirby Company at December 31, 2017. Kirby reports fi nancial information monthly.
Accounts Payable $ 3,000 Salaries and Wages Expense $16,500Cash 6,500 Notes Payable 25,000Advertising Expense 6,000 Rent Expense 10,500Service Revenue 53,500 Accounts Receivable 13,500Equipment 29,000 Owner’s Drawings 7,500
(a) Determine the total assets of Kirby Company at December 31, 2017.(b) Determine the net income that Kirby Company reported for December 2017.(c) Determine the owner’s equity of Kirby Company at December 31, 2017.
Determine specifi c amounts on the fi nancial statements.
(LO 5)
DO IT! 1-5
EXERCISES
E1-1 Genesis Company performs the following accounting tasks during the year.
________Analyzing and interpreting information.________Classifying economic events.________Explaining uses, meaning, and limitations of data.________Keeping a systematic chronological diary of events.________Measuring events in dollars and cents.________Preparing accounting reports.________Reporting information in a standard format.________Selecting economic activities relevant to the company.________Summarizing economic events.
Accounting is “an information system that identifi es, records, and communicates the economic events of an organization to interested users.”
InstructionsCategorize the accounting tasks performed by Genesis as relating to either the identifi ca-tion (I), recording (R), or communication (C) aspects of accounting.
E1-2 (a) The following are users of fi nancial statements.
________Customers ________Securities and Exchange Commission________Internal Revenue Service ________Store manager________Labor unions ________Suppliers________Marketing manager ________Vice president of fi nance________Production supervisor
InstructionsIdentify the users as being either external users or internal users.
(b) The following questions could be asked by an internal user or an external user.
________Can we afford to give our employees a pay raise?________Did the company earn a satisfactory income?________Do we need to borrow in the near future?________How does the company’s profi tability compare to other companies?________What does it cost us to manufacture each unit produced?________Which product should we emphasize?________Will the company be able to pay its short-term debts?
InstructionsIdentify each of the questions as being more likely asked by an internal user or an external user.
E1-3 Angela Duffy, president of Duffy Company, has instructed Jana Barth, the head of the accounting department for Duffy Company, to report the company’s land in the com-pany’s accounting reports at its fair value of $170,000 instead of its cost of $100,000. Duffy
Identify users of accounting information.
(LO 1)
Classify the three activities of accounting.
(LO 1)
Discuss ethics and the historical cost principle.
(LO 2)
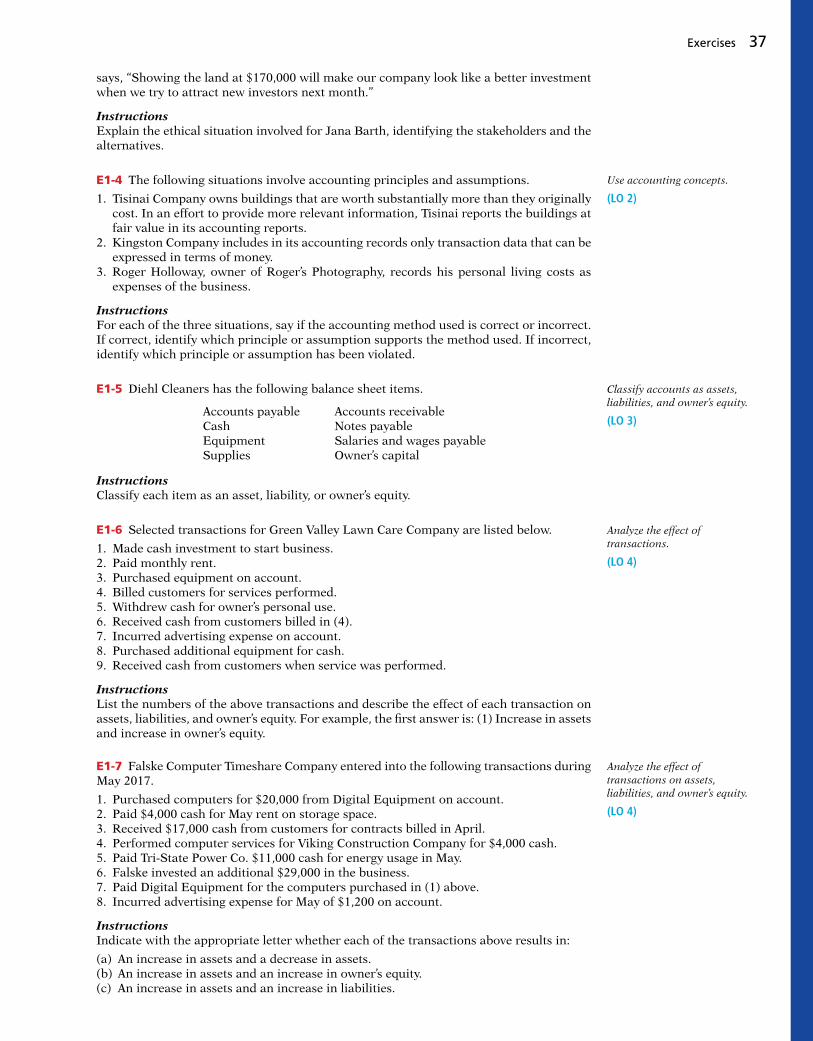
Exercises 37
says, “Showing the land at $170,000 will make our company look like a better investment when we try to attract new investors next month.”
InstructionsExplain the ethical situation involved for Jana Barth, identifying the stakeholders and the alternatives.
E1-4 The following situations involve accounting principles and assumptions.
1. Tisinai Company owns buildings that are worth substantially more than they originally cost. In an effort to provide more relevant information, Tisinai reports the buildings at fair value in its accounting reports.
2. Kingston Company includes in its accounting records only transaction data that can be expressed in terms of money.
3. Roger Holloway, owner of Roger’s Photography, records his personal living costs as expenses of the business.
InstructionsFor each of the three situations, say if the accounting method used is correct or incorrect. If correct, identify which principle or assumption supports the method used. If incorrect, identify which principle or assumption has been violated.
E1-5 Diehl Cleaners has the following balance sheet items.
Accounts payable Accounts receivable Cash Notes payable Equipment Salaries and wages payable Supplies Owner’s capital
InstructionsClassify each item as an asset, liability, or owner’s equity.
E1-6 Selected transactions for Green Valley Lawn Care Company are listed below.
1. Made cash investment to start business.2. Paid monthly rent.3. Purchased equipment on account.4. Billed customers for services performed.5. Withdrew cash for owner’s personal use.6. Received cash from customers billed in (4).7. Incurred advertising expense on account.8. Purchased additional equipment for cash.9. Received cash from customers when service was performed.
InstructionsList the numbers of the above transactions and describe the effect of each transaction on assets, liabilities, and owner’s equity. For example, the fi rst answer is: (1) Increase in assets and increase in owner’s equity.
E1-7 Falske Computer Timeshare Company entered into the following transactions during May 2017.
1. Purchased computers for $20,000 from Digital Equipment on account.2. Paid $4,000 cash for May rent on storage space.3. Received $17,000 cash from customers for contracts billed in April.4. Performed computer services for Viking Construction Company for $4,000 cash.5. Paid Tri-State Power Co. $11,000 cash for energy usage in May.6. Falske invested an additional $29,000 in the business.7. Paid Digital Equipment for the computers purchased in (1) above.8. Incurred advertising expense for May of $1,200 on account.
InstructionsIndicate with the appropriate letter whether each of the transactions above results in:
(a) An increase in assets and a decrease in assets.(b) An increase in assets and an increase in owner’s equity.(c) An increase in assets and an increase in liabilities.
Use accounting concepts.
(LO 2)
Classify accounts as assets, liabilities, and owner’s equity.
(LO 3)
Analyze the effect of transactions.
(LO 4)
Analyze the effect of transactions on assets, liabilities, and owner’s equity.
(LO 4)

38 1 Accounting in Action
(d) A decrease in assets and a decrease in owner’s equity.(e) A decrease in assets and a decrease in liabilities.(f) An increase in liabilities and a decrease in owner’s equity.(g) An increase in owner’s equity and a decrease in liabilities.
E1-8 An analysis of the transactions made by Arthur Cooper & Co., a certifi ed public accounting fi rm, for the month of August is shown below. The expenses were $650 for rent, $4,800 for salaries and wages, and $400 for utilities.
Analyze transactions and compute net income.
(LO 4)
Accounts Accounts Owner’s Owner’s Cash 1 Receivable 1 Supplies 1 Equipment 5 Payable 1 Capital 2 Drawings 1 Revenues 2 Expenses
1. 1$15,000 1$15,000 2. 22,000 1$5,000 1$3,000 3. 2750 1$750 4. 14,600 1$3,900 1$8,500 5. 21,500 21,500 6. 22,000 2$2,000 7. 2650 2$650 8. 1450 2450 9. 24,800 24,80010. 1400 2400
Instructions(a) Describe each transaction that occurred for the month.(b) Determine how much owner’s equity increased for the month.(c) Compute the amount of net income for the month.
E1-9 An analysis of transactions for Arthur Cooper & Co. was presented in E1–8.
InstructionsPrepare an income statement and an owner’s equity statement for August and a balance sheet at August 31, 2017. Assume that August is the company’s fi rst month of business.
E1-10 Finch Company had the following assets and liabilities on the dates indicated.
December 31 Total Assets Total Liabilities
2016 $400,000 $250,000 2017 $460,000 $300,000 2018 $590,000 $400,000
Finch began business on January 1, 2016, with an investment of $100,000.
InstructionsFrom an analysis of the change in owner’s equity during the year, compute the net income (or loss) for:
(a) 2016, assuming Finch’s drawings were $15,000 for the year.(b) 2017, assuming Finch made an additional investment of $45,000 and had no drawings
in 2017.(c) 2018, assuming Finch made an additional investment of $15,000 and had drawings of
$25,000 in 2018.
E1-11 Two items are omitted from each of the following summaries of balance sheet and income statement data for two proprietorships for the year 2017, Greene’s Goods and Solar Enterprises.
Greene’s Solar Goods Enterprises
Beginning of year: Total assets $110,000 $129,000 Total liabilities 85,000 (c) Total owner’s equity (a) 80,000
Prepare fi nancial statements.
(LO 5)
Determine net income (or loss).
(LO 5)
Analyze fi nancial statements items.
(LO 5)

Exercises 39
End of year: Total assets 160,000 180,000 Total liabilities 120,000 50,000 Total owner’s equity 40,000 130,000Changes during year in owner’s equity: Additional investment (b) 25,000 Drawings 37,000 (d) Total revenues 220,000 100,000 Total expenses 175,000 60,000
InstructionsDetermine the missing amounts.
E1-12 The following information relates to Armanda Co. for the year 2017.
Owner’s capital, January 1, 2017 $48,000 Advertising expense $ 1,800Owner’s drawings during 2017 6,000 Rent expense 10,400Service revenue 63,600 Utilities expense 3,100Salaries and wages expense 29,500
InstructionsAfter analyzing the data, prepare an income statement and an owner’s equity statement for the year ending December 31, 2017.
E1-13 Abby Roland is the bookkeeper for Cheng Company. Abby has been trying to deter-mine the correct balance sheet for Cheng Company. Cheng’s balance sheet is shown below.
Prepare income statement and owner’s equity statement.
(LO 5)
Correct an incorrectly prepared balance sheet.
(LO 5)
InstructionsPrepare a correct balance sheet.
E1-14 Loren Satina is the sole owner of Clear View Park, a public camping ground near the Lake Mead National Recreation Area. Loren has compiled the following fi nancial information as of December 31, 2017.
Revenues during 2017—camping fees $140,000 Fair value of equipment $140,000Revenues during 2017—general store 65,000 Notes payable 60,000Accounts payable 11,000 Expenses during 2017 150,000Cash on hand 23,000 Accounts receivable 17,500Original cost of equipment 105,500
Instructions(a) Determine Loren Satina’s net income from Clear View Park for 2017.(b) Prepare a balance sheet for Clear View Park as of December 31, 2017.
E1-15 Presented below is fi nancial information related to the 2017 operations of Sea Legs Cruise Company.
Maintenance and repairs expense $ 95,000Utilities expense 13,000Salaries and wages expense 142,000Advertising expense 24,500Ticket revenue 410,000
Compute net income and prepare a balance sheet.
(LO 5)
Prepare an income statement.
(LO 5)
CHENG COMPANYBalance Sheet
December 31, 2017
Assets Liabilities
Cash $15,000 Accounts payable $21,000Supplies 8,000 Accounts receivable (6,500)Equipment 46,000 Owner’s capital 67,500Owner’s drawings 13,000 Total liabilities and
Total assets $82,000 owner’s equity $82,000

40 1 Accounting in Action
InstructionsPrepare the 2017 income statement for Sea Legs Cruise Company.
E1-16 Presented below is information related to the sole proprietorship of Alice Henning, attorney.
Legal service revenue—2017 $335,000Total expenses—2017 211,000Assets, January 1, 2017 96,000Liabilities, January 1, 2017 62,000Assets, December 31, 2017 168,000Liabilities, December 31, 2017 100,000Drawings—2017 ?
InstructionsPrepare the 2017 owner’s equity statement for Alice Henning’s legal practice.
Prepare an owner’s equity statement.
(LO 5)
EXERCISES: SET B AND CHALLENGE EXERCISES
Visit the book’s companion website, at www.wiley.com/college/weygandt, and choose the Student Companion site to access Exercises: Set B and Challenge Exercises.
PROBLEMS: SET A
P1-1A On April 1, Julie Spengel established Spengel’s Travel Agency. The following trans-actions were completed during the month.
1. Invested $15,000 cash to start the agency. 2. Paid $600 cash for April offi ce rent. 3. Purchased equipment for $3,000 cash. 4. Incurred $700 of advertising costs in the Chicago Tribune, on account. 5. Paid $900 cash for offi ce supplies. 6. Performed services worth $10,000: $3,000 cash is received from customers, and the
balance of $7,000 is billed to customers on account. 7. Withdrew $600 cash for personal use. 8. Paid Chicago Tribune $500 of the amount due in transaction (4). 9. Paid employees’ salaries $2,500.10. Received $4,000 in cash from customers who have previously been billed in transac-
tion (6).
Instructions(a) Prepare a tabular analysis of the transactions using the following column headings:
Cash, Accounts Receivable, Supplies, Equipment, Accounts Payable, Owner’s Capital, Owner’s Drawings, Revenues, and Expenses.
(b) From an analysis of the owner’s equity columns, compute the net income or net loss for April.
P1-2A Judi Salem opened a law offi ce on July 1, 2017. On July 31, the balance sheet showed Cash $5,000, Accounts Receivable $1,500, Supplies $500, Equipment $6,000, Accounts Payable $4,200, and Owner’s Capital $8,800. During August, the following trans-actions occurred.
1. Collected $1,200 of accounts receivable.2. Paid $2,800 cash on accounts payable.3. Recognized revenue of $7,500 of which $3,000 is collected in cash and the balance is
due in September.4. Purchased additional equipment for $2,000, paying $400 in cash and the balance on
account.5. Paid salaries $2,500, rent for August $900, and advertising expenses $400.
(a) Total assets $20,800
(b) Net income $6,200
Analyze transactions and prepare income statement, owner’s equity statement, and balance sheet.
(LO 3, 4, 5)
Analyze transactions and compute net income.
(LO 3, 4)
Check fi gures provide a key number to let you know you are on the right track.

Problems: Set A 41
6. Withdrew $700 in cash for personal use.7. Received $2,000 from Standard Federal Bank—money borrowed on a note payable.8. Incurred utility expenses for month on account $270.
Instructions(a) Prepare a tabular analysis of the August transactions beginning with July 31 balances.
The column headings should be as follows: Cash 1 Accounts Receivable 1 Supplies 1 Equipment 5 Notes Payable 1 Accounts Payable 1 Owner’s Capital 2 Owner’s Draw-ings 1 Revenues 2 Expenses.
(b) Prepare an income statement for August, an owner’s equity statement for August, and a balance sheet at August 31.
P1-3A On June 1, Cindy Godfrey started Divine Designs Co., a company that provides craft opportunities, by investing $12,000 cash in the business. Following are the assets and liabilities of the company at June 30 and the revenues and expenses for the month of June.
Cash $10,150 Service Revenue $6,500Accounts Receivable 2,800 Advertising Expense 500Supplies 2,000 Rent Expense 1,600Equipment 10,000 Gasoline Expense 200Notes Payable 9,000 Utilities Expense 150Accounts Payable 1,200
Cindy made no additional investment in June but withdrew $1,300 in cash for personal use during the month.
Instructions(a) Prepare an income statement and owner’s equity statement for the month of June and
a balance sheet at June 30, 2017.(b) Prepare an income statement and owner’s equity statement for June assuming the
following data are not included above: (1) $900 of services were performed and billed but not collected at June 30, and (2) $150 of gasoline expense was incurred but not paid.
P1-4A Trixie Maye started her own consulting fi rm, Matrix Consulting, on May 1, 2017. The following transactions occurred during the month of May.
May 1 Trixie invested $7,000 cash in the business. 2 Paid $900 for offi ce rent for the month. 3 Purchased $600 of supplies on account. 5 Paid $125 to advertise in the County News. 9 Received $4,000 cash for services performed. 12 Withdrew $1,000 cash for personal use. 15 Performed $5,400 of services on account. 17 Paid $2,500 for employee salaries. 20 Paid for the supplies purchased on account on May 3. 23 Received a cash payment of $4,000 for services performed on account on
May 15. 26 Borrowed $5,000 from the bank on a note payable. 29 Purchased equipment for $4,200 on account. 30 Paid $275 for utilities.
Instructions(a) Show the effects of the previous transactions on the accounting equation using the
following format.
(a) Total assets $16,800
(b) Net income $3,430Ending capital $11,530
Prepare income statement, owner’s equity statement, and balance sheet.
(LO 5)
(a) Net income $4,050Owner’s equity $14,750Total assets $24,950
(b) Owner’s equity $15,500
Analyze transactions and prepare fi nancial statements.
(LO 3, 4, 5)
(a) Total assets $20,800
Assets Liabilities Owner’s Equity
Accounts Notes Accounts Owner’s Owner’sDate Cash 1 Receivable 1 Supplies 1 Equipment 5 Payable 1 Payable 1 Capital 2 Drawings 1 Revenues 2 Expenses
(b) Prepare an income statement for the month of May.(c) Prepare a balance sheet at May 31, 2017.
(b) Net income $5,600(c) Cash $14,600
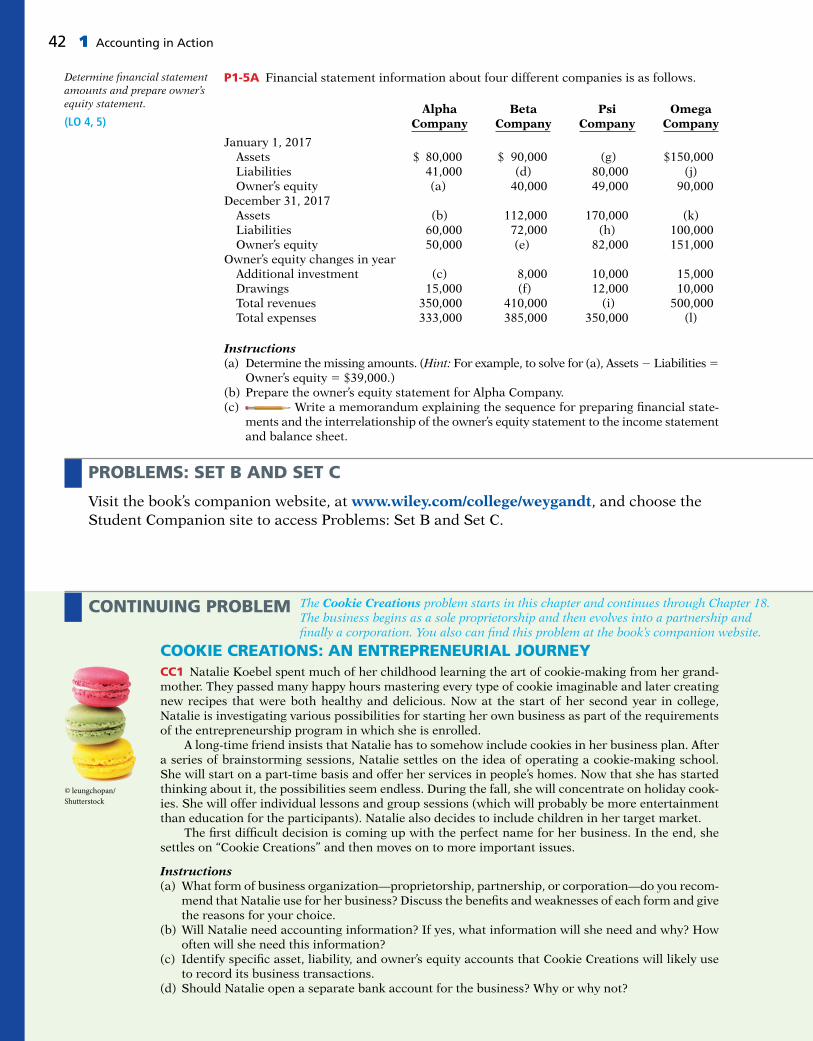
42 1 Accounting in Action
P1-5A Financial statement information about four different companies is as follows.Determine fi nancial statement amounts and prepare owner’s equity statement.
(LO 4, 5) Alpha Beta Psi Omega Company Company Company Company
January 1, 2017 Assets $ 80,000 $ 90,000 (g) $150,000 Liabilities 41,000 (d) 80,000 (j) Owner’s equity (a) 40,000 49,000 90,000December 31, 2017 Assets (b) 112,000 170,000 (k) Liabilities 60,000 72,000 (h) 100,000 Owner’s equity 50,000 (e) 82,000 151,000Owner’s equity changes in year Additional investment (c) 8,000 10,000 15,000 Drawings 15,000 (f) 12,000 10,000 Total revenues 350,000 410,000 (i) 500,000 Total expenses 333,000 385,000 350,000 (l)
Instructions(a) Determine the missing amounts. (Hint: For example, to solve for (a), Assets 2 Liabilities 5
Owner’s equity 5 $39,000.)(b) Prepare the owner’s equity statement for Alpha Company.(c) Write a memorandum explaining the sequence for preparing fi nancial state-
ments and the interrelationship of the owner’s equity statement to the income statement and balance sheet.
PROBLEMS: SET B AND SET C
Visit the book’s companion website, at www.wiley.com/college/weygandt, and choose the Student Companion site to access Problems: Set B and Set C.
CONTINUING PROBLEM
COOKIE CREATIONS: AN ENTREPRENEURIAL JOURNEYCC1 Natalie Koebel spent much of her childhood learning the art of cookie-making from her grand-mother. They passed many happy hours mastering every type of cookie imaginable and later creating new recipes that were both healthy and delicious. Now at the start of her second year in college, Natalie is investigating various possibilities for starting her own business as part of the requirements of the entrepreneurship program in which she is enrolled. A long-time friend insists that Natalie has to somehow include cookies in her business plan. After a series of brainstorming sessions, Natalie settles on the idea of operating a cookie-making school. She will start on a part-time basis and offer her services in people’s homes. Now that she has started thinking about it, the possibilities seem endless. During the fall, she will concentrate on holiday cook-ies. She will offer individual lessons and group sessions (which will probably be more entertainment than education for the participants). Natalie also decides to include children in her target market. The fi rst diffi cult decision is coming up with the perfect name for her business. In the end, she settles on “Cookie Creations” and then moves on to more important issues.
Instructions(a) What form of business organization—proprietorship, partnership, or corporation—do you recom-
mend that Natalie use for her business? Discuss the benefi ts and weaknesses of each form and give the reasons for your choice.
(b) Will Natalie need accounting information? If yes, what information will she need and why? How often will she need this information?
(c) Identify specifi c asset, liability, and owner’s equity accounts that Cookie Creations will likely use to record its business transactions.
(d) Should Natalie open a separate bank account for the business? Why or why not?
The Cookie Creations problem starts in this chapter and continues through Chapter 18. The business begins as a sole proprietorship and then evolves into a partnership and fi nally a corporation. You also can fi nd this problem at the book’s companion website.
© leungchopan/Shutterstock

Broadening Your Perspective 43
PERSPECTIVEFINANCIAL REPORTING AND ANALYSIS
Financial Reporting Problem: Apple Inc.BYP1-1 The fi nancial statements of Apple Inc. for 2013 are presented in Appendix A. Instructions for accessing and using the company’s complete annual report, including the notes to the fi nancial state-ments, are also provided in Appendix A.
InstructionsRefer to Apple’s fi nancial statements and answer the following questions.
(a) What were Apple’s total assets at September 28, 2013? At September 29, 2012?(b) How much cash (and cash equivalents) did Apple have on September 28, 2013?(c) What amount of accounts payable did Apple report on September 28, 2013? On September 29,
2012?(d) What were Apple’s net sales in 2011? In 2012? In 2013?(e) What is the amount of the change in Apple’s net income from 2012 to 2013?
Comparative Analysis Problem: PepsiCo, Inc. vs. The Coca-Cola CompanyBYP1-2 PepsiCo, Inc.’s fi nancial statements are presented in Appendix B. Financial statements of The Coca-Cola Company are presented in Appendix C. Instructions for accessing and using the com-plete annual reports of PepsiCo and Coca-Cola, including the notes to the fi nancial statements, are also provided in Appendices B and C, respectively.
Instructions(a) Based on the information contained in these fi nancial statements, determine the following for
each company. (1) Total assets at December 28, 2013, for PepsiCo and for Coca-Cola at December 31, 2013. (2) Accounts (notes) receivable, net at December 28, 2013, for PepsiCo and at December 31, 2013,
for Coca-Cola. (3) Net revenues for year ended in 2013. (4) Net income for year ended in 2013.(b) What conclusions concerning the two companies can be drawn from these data?
Comparative Analysis Problem: Amazon.com, Inc. vs. Wal-Mart Stores, Inc.BYP1-3 Amazon.com, Inc.’s fi nancial statements are presented in Appendix D. Financial statements of Wal-Mart Stores, Inc. are presented in Appendix E. Instructions for accessing and using the com-plete annual reports of Amazon and Wal-Mart, including the notes to the fi nancial statements, are also provided in Appendices D and E, respectively.
Instructions(a) Based on the information contained in these fi nancial statements, determine the following for
each company. (1) Total assets at December 31, 2013, for Amazon and for Wal-Mart at January 31, 2014. (2) Receivables (net) at December 31, 2013, for Amazon and for Wal-Mart at January 31, 2014. (3) Net sales (product only) for year ended in 2013 (2014 for Wal-Mart). (4) Net income for the year ended in 2013 (2014 for Wal-Mart).(b) What conclusions concerning these two companies can be drawn from these data?
Real-World FocusBYP1-4 This exercise will familiarize you with skill requirements, job descriptions, and salaries for accounting careers.
Address: www.careers-in-accounting.com, or go to www.wiley.com/college/weygandt
BROADENING YOUR

InstructionsGo to the site shown above. Answer the following questions.
(a) What are the three broad areas of accounting (from “Skills and Talents”)?(b) List eight skills required in accounting.(c) How do the three accounting areas differ in terms of these eight required skills?(d) Explain one of the key job options in accounting.(e) What is the overall salary range for a junior staff accountant?
CRITICAL THINKING
Decision-Making Across the OrganizationBYP1-5 Anya and Nick Ramon, local golf stars, opened the Chip-Shot Driving Range on March 1, 2017, by investing $25,000 of their cash savings in the business. A caddy shack was constructed for cash at a cost of $8,000, and $800 was spent on golf balls and golf clubs. The Ramons leased fi ve acres of land at a cost of $1,000 per month and paid the fi rst month’s rent. During the fi rst month, advertis-ing costs totaled $750, of which $100 was unpaid at March 31, and $500 was paid to members of the high-school golf team for retrieving golf balls. All revenues from customers were deposited in the company’s bank account. On March 15, Anya and Nick withdrew a total of $1,000 in cash for personal living expenses. A $120 utility bill was received on March 31 but was not paid. On March 31, the bal-ance in the company’s bank account was $18,900. Anya and Nick thought they had a pretty good fi rst month of operations. But, their estimates of profi tability ranged from a loss of $6,100 to net income of $2,480.
InstructionsWith the class divided into groups, answer the following.
(a) How could the Ramons have concluded that the business operated at a loss of $6,100? Was this a valid basis on which to determine net income?
(b) How could the Ramons have concluded that the business operated at a net income of $2,480? (Hint: Prepare a balance sheet at March 31.) Was this a valid basis on which to determine net income?
(c) Without preparing an income statement, determine the actual net income for March.(d) What was the revenue recognized in March?
Communication ActivityBYP1-6 Sandi Alcon, the bookkeeper for New York Company, has been trying to determine the cor-rect balance sheet for the company. The company’s balance sheet is shown below.
NEW YORK COMPANYBalance Sheet
For the Month Ended December 31, 2017
Assets Liabilities
Equipment $25,500 Owner’s capital $26,000Cash 9,000 Accounts receivable (6,000)Supplies 2,000 Owner’s drawings (2,000)Accounts payable (8,000) Notes payable 10,500
$28,500 $28,500
InstructionsExplain to Sandi Alcon in a memo why the original balance sheet is incorrect, and what should be done to correct it.
Ethics CaseBYP1-7 After numerous campus interviews, Travis Chase, a senior at Great Northern College, received two offi ce interview invitations from the Baltimore offi ces of two large fi rms. Both fi rms offered to cover his out-of-pocket expenses (travel, hotel, and meals). He scheduled the interviews for both fi rms on the same day, one in the morning and one in the afternoon. At the conclusion of each interview, he
44 1 Accounting in Action

Broadening Your Perspective 45
submitted to both fi rms his total out-of-pocket expenses for the trip to Baltimore: mileage $112 (280 miles at $0.40), hotel $130, meals $36, and parking and tolls $18, for a total of $296. He believes this approach is appropriate. If he had made two trips, his cost would have been two times $296. He is also certain that neither fi rm knew he had visited the other on that same trip. Within 10 days, Travis received two checks in the mail, each in the amount of $296.
Instructions(a) Who are the stakeholders (affected parties) in this situation?(b) What are the ethical issues in this case?(c) What would you do in this situation?
All About YouBYP1-8 Some people are tempted to make their fi nances look worse to get fi nancial aid. Companies sometimes also manage their fi nancial numbers in order to accomplish certain goals. Earnings man-agement is the planned timing of revenues, expenses, gains, and losses to smooth out bumps in net income. In managing earnings, companies’ actions vary from being within the range of ethical activity to being both unethical and illegal attempts to mislead investors and creditors.
InstructionsProvide responses for each of the following questions.
(a) Discuss whether you think each of the following actions (adapted from www.fi naid.org/fafsa/maximize.phtml) to increase the chances of receiving fi nancial aid is ethical.
(1) Spend the student’s assets and income fi rst, before spending parents’ assets and income. (2) Accelerate necessary expenses to reduce available cash. For example, if you need a new car,
buy it before applying for fi nancial aid. (3) State that a truly fi nancially dependent child is independent. (4) Have a parent take an unpaid leave of absence for long enough to get below the “threshold”
level of income.(b) What are some reasons why a company might want to overstate its earnings?(c) What are some reasons why a company might want to understate its earnings?(d) Under what circumstances might an otherwise ethical person decide to illegally overstate or
understate earnings?
FASB Codifi cation ActivityBYP1-9 The FASB has developed the Financial Accounting Standards Board Accounting Stan-dards Codifi cation (or more simply “the Codifi cation”). The FASB’s primary goal in developing the Codifi cation is to provide in one place all the authoritative literature related to a particular topic. To provide easy access to the Codifi cation, the FASB also developed the Financial Accounting Stan-dards Board Codifi cation Research System (CRS). CRS is an online, real-time database that pro-vides easy access to the Codifi cation. The Codifi cation and the related CRS provide a topically organized structure, subdivided into topic, subtopics, sections, and paragraphs, using a numerical index system. You may fi nd this system useful in your present and future studies, and so we have provided an opportunity to use this online system as part of the Broadening Your Perspective section.
InstructionsAcademic access to the FASB Codifi cation is available through university subscriptions, obtained from the American Accounting Association (at http://aaahq.org/FASB/Access.cfm), for an annual fee of $150. This subscription covers an unlimited number of students within a single institution. Once this access has been obtained by your school, you should log in (at http://aaahq.org/ascLogin.cfm) and familiarize yourself with the resources that are accessible at the FASB Codifi cation site.
Considering People, Planet, and Profi tBYP1-10 This chapter’s Feature Story discusses the fact that although Clif Bar & Company is not a public company, it does share its fi nancial information with its employees as part of its open-book management approach. Further, although it does not publicly share its fi nancial information, it does provide a different form of an annual report to external users. In this report, the company provides information regarding its sustainability efforts.
Address: www.issuu.com/clifbar/docs/clif_all_aspirations_2012

InstructionsAccess the 2010 annual report of Clif Bar & Company at the site shown above and then answer the following questions.
(a) What are the Five Aspirations?(b) What was the company 10-year compounded annual growth rate? What is the amount of 10-year
organic purchases made by the company?
46 1 Accounting in Action
A Look at IFRS
7 Describe the impact of international accounting standards on U.S. fi nancial reporting.
LEARNING OBJECTIVE
Most agree that there is a need for one set of international accounting standards. Here is why:
Multinational corporations. Today’s companies view the entire world as their market. For example, Coca-Cola, Intel, and McDonald’s generate more than 50% of their sales outside the United States. Many foreign companies, such as Toyota, Nestlé, and Sony, fi nd their largest market to be the United States.
Mergers and acquisitions. The mergers between Fiat/Chrysler and Vodafone/Mannesmann suggest that we will see even more such business combinations of companies from different countries in the future.
Information technology. As communication barriers continue to topple through advances in tech-nology, companies and individuals in different countries and markets are becoming more comfortable buying and selling goods and services from one another.
Financial markets. Financial markets are of international signifi cance today. Whether it is currency, equity securities (stocks), bonds, or derivatives, there are active markets throughout the world trading these types of instruments.
Key PointsFollowing are the key similarities and differences between GAAP and IFRS as related to accounting fundamentals.
Similarities• The basic techniques for recording business transactions are the same for U.S. and international
companies.
• Both international and U. S. accounting standards emphasize transparency in fi nancial reporting. Both sets of standards are primarily driven by meeting the needs of investors and creditors.
• The three most common forms of business organizations, proprietorships, partnerships, and corpo-rations, are also found in countries that use international accounting standards
Differences• International standards are referred to as International Financial Reporting Standards (IFRS),
developed by the International Accounting Standards Board. Accounting standards in the United States are referred to as generally accepted accounting principles (GAAP) and are developed by the Financial Accounting Standards Board.
• IFRS tends to be simpler in its accounting and disclosure requirements; some people say it is more “principles-based.” GAAP is more detailed; some people say it is more “rules-based.”
• The internal control standards applicable to Sarbanes-Oxley (SOX) apply only to large public com-panies listed on U.S. exchanges. There is continuing debate as to whether non-U.S. companies should have to comply with this extra layer of regulation.

A Look at IFRS 47
Looking to the FutureBoth the IASB and the FASB are hard at work developing standards that will lead to the elimination of major differences in the way certain transactions are accounted for and reported.
IFRS Practice
IFRS Self-Test Questions
1. Which of the following is not a reason why a single set of high-quality international accounting standards would be benefi cial?(a) Mergers and acquisition activity.(b) Financial markets.(c) Multinational corporations.(d) GAAP is widely considered to be a superior reporting system.
2. The Sarbanes-Oxley Act determines:(a) international tax regulations.(b) internal control standards as enforced by the IASB.(c) internal control standards of U.S. publicly traded companies.(d) U.S. tax regulations.
3. IFRS is considered to be more:(a) principles-based and less rules-based than GAAP.(b) rules-based and less principles-based than GAAP.(c) detailed than GAAP.(d) None of the above.
IFRS ExercisesIFRS1-1 Who are the two key international players in the development of international accounting standards? Explain their role.
IFRS1-2 What is the benefi t of a single set of high-quality accounting standards?
International Financial Reporting Problem: Louis Vuitton
IFRS1-3 The fi nancial statements of Louis Vuitton are presented in Appendix F. Instructions for access-ing and using the company’s complete annual report, including the notes to its fi nancial statements, are also provided in Appendix F.
InstructionsVisit Louis Vuitton’s corporate website and answer the following questions from the company’s 2013 annual report.
(a) What accounting fi rm performed the audit of Louis Vuitton’s fi nancial statements?(b) What is the address of the company’s corporate headquarters?(c) What is the company’s reporting currency?
Answers to IFRS Self-Test Questions
1. d 2. c 3. a

How organized are you fi nancially? Take a short quiz. Answer
yes or no to each question:
• Does your wallet contain so many cash machine receipts
that you’ve been declared a walking fi re hazard?
• Do you wait until your debit card is denied before checking
the status of your funds?
• Was Aaron Rodgers (the quarterback for the Green Bay
Packers) playing high school football the last time you
verifi ed the accuracy of your bank account?
If you think it is hard to keep track of the many transactions
that make up your life, imagine how diffi cult it is for a big
corporation to do so. Not only that, but now consider how
important it is for a large company to have good accounting
records, especially if it has control of your life savings.
MF Global Holdings Ltd is such a company. As a big
investment broker, it held billions of dollars of investments for
clients. If you had your life savings invested at MF Global, you
might be slightly displeased if you heard this from one of its
representatives: “You know, I kind of remember an account
for someone with a name like yours—now what did we do
with that?”
Unfortunately, that is almost exactly what happened to MF
Global’s clients shortly before it fi led for bankruptcy. During
the days immediately following the bankruptcy fi ling,
regulators and auditors struggled to piece things together. In
the words of one regulator, “Their books are a disaster . . .
we’re trying to fi gure out what numbers are real numbers.”
One company that considered buying an interest in MF Global
walked away from the deal because it “couldn’t get a sense
of what was on the balance sheet.” That company said the
information that should have been instantly available instead
took days to produce.
It now appears that MF Global did not properly segregate
customer accounts from company accounts. And, because of
its sloppy recordkeeping, customers were not protected when
the company had fi nancial troubles. Total customer losses
were approximately $1 billion. As you can see, accounting
matters!
Source: S. Patterson and A. Lucchetti, “Inside the Hunt for MF Global Cash,”
Wall Street Journal Online (November 11, 2011).
Accidents Happen
In Chapter 1, we analyzed business transactions in terms of the accounting equation, and we presented the cumulative effects of these transactions in tabular form. Imagine a company like MF Global (as in the Feature Story below) using the same tabular format as Softbyte to keep track of its transactions. In a single day, MF Global engaged in thousands of business transactions. To record each transaction this way would be impractical, expensive, and unnecessary. Instead, companies use a set of procedures and records to keep track of transaction data more easily. This chapter introduces and illustrates these basic procedures and records.
CHAPTER PREVIEW
2
FEATURE STORY
The Recording Process
48

Prepare a trial balance.
Indicate how a journal is used in the recording process.
Explain how a ledger and posting help in the recording process.
2
3
4
Describe how accounts, debits, and credits are used to record business transactions.
1 Normal Account Balances
DO IT! 1• The account • Debits and credits• Summary of debit/credit rules
• Steps in the recording process• The journal
Learning Objectives
Recording Business ActivitiesPostingDO IT! 3
• The ledger• Posting• The recording process
illustrated• Summary illustration of
journalizing and posting
Trial BalanceDO IT! 4• Limitations of a trial balance• Locating errors• Dollar signs and underlining
DO IT! 2 Recording Business Activities
Go to the REVIEW AND PRACTICE section at the end of the chapter for a review of key concepts and practice applications with solutions.
Visit WileyPLUS with ORION for additional tutorials and practice opportunities.
Prepare a trial balance.
Indicate how a journal is used in therecording process.
Explain how a ledger and posting help in the recording process.
2
3
4
Describe how accounts, debits, and credits are used to record businesstransactions.
1 Normal Account Balances
DO IT! 1• The account • Debits and credits• Summary of debit/credit rules
• Steps in the recording process• The journal
Posting DO IT! 3
• The ledger• Posting• The recording process
illustrated• Summary illustration of
journalizing and posting
Trial Balance DO IT! 4• Limitations of a trial balance• Locating errors• Dollar signs and underlining
DO IT! 2 Recording Business Activities
Learning Objectives
Nick Laham/Getty Images, Inc.
CHAPTER OUTLINE

50 2 The Recording Process
1 Describe how accounts, debits, and credits are used to record business transactions.
LEARNING OBJECTIVE
The Account
An account is an individual accounting record of increases and decreases in a spe-cifi c asset, liability, or owner’s equity item. For example, Softbyte (the company discussed in Chapter 1) would have separate accounts for Cash, Accounts Receiv-able, Accounts Payable, Service Revenue, Salaries and Wages Expense, and so on. (Note that whenever we are referring to a specifi c account, we capitalize the name.) In its simplest form, an account consists of three parts: (1) a title, (2) a left or debit side, and (3) a right or credit side. Because the format of an account resem-bles the letter T, we refer to it as a T-account. Illustration 2-1 shows the basic form of an account.
Illustration 2-1Basic form of account Title of Account
Left or debit side Right or credit side
We use this form often throughout this book to explain basic accounting relationships.
Debits and Credits
The term debit indicates the left side of an account, and credit indicates the right side. They are commonly abbreviated as Dr. for debit and Cr. for credit. They do not mean increase or decrease, as is commonly thought. We use the terms debit and credit repeatedly in the recording process to describe where entries are made in accounts. For example, the act of entering an amount on the left side of an account is called debiting the account. Making an entry on the right side is crediting the account. When comparing the totals of the two sides, an account shows a debit balance if the total of the debit amounts exceeds the credits. An account shows a credit balance if the credit amounts exceed the debits. Note the position of the debit side and credit side in Illustration 2-1. The procedure of recording debits and credits in an account is shown in Illustration 2-2 for the transactions affecting the Cash account of Softbyte. The data are taken from the Cash column of the tabular summary in Illustration 1-8 (page 20).
Illustration 2-2Tabular summary and account form for Softbyte’s Cash account
Account FormTabular Summary
$15,000–7,0001,2001,500
–1,700–250600
–1,300$ 8,050
Cash Cash
15,0001,2001,500
600
7,0001,700
2501,300
Balance
(Debits) (Credits)
(Debit)
8,050

Accounts, Debits, and Credits 51
Every positive item in the tabular summary represents a receipt of cash. Every negative amount represents a payment of cash. Notice that in the account form, we record the increases in cash as debits and the decreases in cash as credits. For example, the $15,000 receipt of cash (in red) is debited to Cash, and the 2$7,000 payment of cash (in blue) is credited to Cash. Having increases on one side and decreases on the other reduces recording errors and helps in determining the totals of each side of the account as well as the account balance. The balance is determined by netting the two sides (subtracting one amount from the other). The account balance, a debit of $8,050, indicates that Softbyte had $8,050 more increases than decreases in cash. In other words, Soft-byte started with a balance of zero and now has $8,050 in its Cash account.
DEBIT AND CREDIT PROCEDURE
In Chapter 1, you learned the effect of a transaction on the basic accounting equation. Remember that each transaction must affect two or more accounts to keep the basic accounting equation in balance. In other words, for each transaction, debits must equal credits. The equal-ity of debits and credits provides the basis for the double-entry system of recording transactions. Under the double-entry system, the dual (two-sided) effect of each transaction is recorded in appropriate accounts. This system provides a logical method for recording transactions and also helps ensure the accuracy of the recorded amounts as well as the detection of errors. If every transaction is recorded with equal debits and credits, the sum of all the debits to the accounts must equal the sum of all the credits. The double-entry system for determining the equality of the accounting equa-tion is much more effi cient than the plus/minus procedure used in Chapter 1. The following discussion illustrates debit and credit procedures in the double-entry system.
DR./CR. PROCEDURES FOR ASSETS AND LIABILITIES
In Illustration 2-2 for Softbyte, increases in Cash—an asset—were entered on the left side, and decreases in Cash were entered on the right side. We know that both sides of the basic equation (Assets 5 Liabilities 1 Owner’s Equity) must be equal. It therefore follows that increases and decreases in liabilities will have to be recorded opposite from increases and decreases in assets. Thus, increases in liabilities must be entered on the right or credit side, and decreases in liabilities must be entered on the left or debit side. The effects that debits and credits have on assets and liabilities are summarized in Illustration 2-3.
Rules for accounting for specifi c events sometimes differ across countries. Despite the differences, the double-entry accounting system is the basis of accounting systems worldwide.
International Note
Illustration 2-3Debit and credit effects—assets and liabilities
Debits Credits
Increase assets Decrease assets Decrease liabilities Increase liabilities
Asset accounts normally show debit balances. That is, debits to a specifi c asset account should exceed credits to that account. Likewise, liability accounts normally show credit balances. That is, credits to a liability account should exceed debits to that account. The normal balance of an account is on the side where an increase in the account is recorded. Illustration 2-4 shows the normal balances for assets and liabilities.
Assets Liabilities
Debit for Credit for Debit for Credit for increase decrease decrease increase
Normal Normal balance balance
Illustration 2-4Normal balances—assets and liabilities

52 2 The Recording Process
Knowing the normal balance in an account may help you trace errors. For example, a credit balance in an asset account such as Land or a debit balance in a liability account such as Salaries and Wages Payable usually indicates an error. Occasionally, though, an abnormal balance may be correct. The Cash account, for example, will have a credit balance when a company has overdrawn its bank balance (i.e., written a check that “bounced”).
DR./CR. PROCEDURES FOR OWNER’S EQUITY
As Chapter 1 indicated, owner’s investments and revenues increase owner’s equity. Owner’s drawings and expenses decrease owner’s equity. Companies keep accounts for each of these types of transactions.
OWNER’S CAPITAL Investments by owners are credited to the Owner’s Capital account. Credits increase this account, and debits decrease it. When an owner invests cash in the business, the company debits (increases) Cash and credits (increases) Owner’s Capital. When the owner’s investment in the business is reduced, Owner’s Capital is debited (decreased). Illustration 2-5 shows the rules of debit and credit for the Owner’s Capital account.
We can diagram the normal balance in Owner’s Capital as follows.
OWNER’S DRAWINGS An owner may withdraw cash or other assets for personal use. Withdrawals could be debited directly to Owner’s Capital to indicate a decrease in owner’s equity. However, it is preferable to use a separate account, called Own-er’s Drawings. This separate account makes it easier to determine total withdraw-als for each accounting period. Owner’s Drawings is increased by debits and decreased by credits. Normally, the drawings account will have a debit balance. Illustration 2-7 shows the rules of debit and credit for the Owner’s Drawings account.
Illustration 2-5Debit and credit effects—Owner’s Capital
Debits Credits
Decrease Owner’s Capital Increase Owner’s Capital
Illustration 2-6Normal balance—Owner’s Capital
Owner’s Capital
Debit for Credit for decrease increase
Normal balance
Illustration 2-7Debit and credit effects—Owner’s Drawings
Debits Credits
Increase Owner’s Drawings Decrease Owner’s Drawings
We can diagram the normal balance as follows.
Illustration 2-8Normal balance—Owner’s Drawings
Owner’s Drawings
Debit for Credit for increase decrease
Normal balance
The Owner’s Drawings account decreases owner’s equity. It is not an income statement account like revenues and expenses.

Accounts, Debits, and Credits 53
REVENUES AND EXPENSES The purpose of earning revenues is to benefi t the owner(s) of the business. When a company recognizes revenues, owner’s equity increases. Therefore, the effect of debits and credits on revenue accounts is the same as their effect on Owner’s Capital. That is, revenue accounts are increased by credits and decreased by debits. Expenses have the opposite effect. Expenses decrease owner’s equity. Since expenses decrease net income and revenues increase it, it is logical that the increase and decrease sides of expense accounts should be the opposite of revenue accounts. Thus, expense accounts are increased by debits and decreased by credits. Illustration 2-9 shows the rules of debits and credits for revenues and expenses.
Keeping Score
The Chicago Cubs baseball team probably has these major revenue and expense accounts:
Revenues Expenses
Admissions (ticket sales) Players’ salariesConcessions Administrative salariesTelevision and radio TravelAdvertising Ballpark maintenance
Do you think that the Chicago Bears football team would be likely to have the same major revenue and expense accounts as the Cubs? (Go to WileyPLUS for this answer and additional questions.)Jonathan Daniel/Getty Images, Inc.
Chicago CubsInvestor Insight
Helpful HintBecause revenues increase owner’s equity, a revenue account has the same debit/credit rules as the Owner’s Capital account. Expenses have the opposite effect.
Illustration 2-9Debit and credit effects—revenues and expenses
Debits Credits
Decrease revenues Increase revenuesIncrease expenses Decrease expenses
Credits to revenue accounts should exceed debits. Debits to expense accounts should exceed credits. Thus, revenue accounts normally show credit balances, and expense accounts normally show debit balances. Illustration 2-10 shows the normal balances for revenues and expenses.
Summary of Debit/Credit Rules
Illustration 2-11 shows a summary of the debit/credit rules and effects on each type of account. Study this diagram carefully. It will help you understand the fundamentals of the double-entry system.
Illustration 2-10Normal balances—revenues and expenses
Revenues Expenses
Debit for Credit for Debit for Credit for decrease increase increase decrease
Normal Normal balance balance Helpful Hint
You may want to book-mark Illustration 2-11. You probably will refer to it often.
Assets Owner’s Equity+Basic
Equation
Expanded
Equation = + – + –
Debit / Credit
Effects
Liabilities=
Dr.+
Assets
Cr.–
Dr.–
Liabilities
Cr.+
Dr.–
Owner’sCapital
Cr.+
Dr.+
Owner’sDrawings
Cr.–
Dr.–
Revenues
Cr.+
Dr.+
Expenses
Cr.–
Illustration 2-11Summary of debit/credit rules

54 2 The Recording Process
Kate Browne has just rented space in a shopping mall. In this space, she will open a hair salon to be called “Hair It Is.” A friend has advised Kate to set up a double-entry set of accounting records in which to record all of her business transactions. Identify the balance sheet accounts that Kate will likely need to record the transac-tions needed to open her business. Indicate whether the normal balance of each account is a debit or a credit.
Solution
DO IT! 1 Normal Account Balances
Kate would likely need the following accounts in which to record the transactions necessary to ready her hair salon for opening day:
Cash (debit balance) If she borrows money: Notes Payable
Equipment (debit balance) (credit balance)
Supplies (debit balance) Owner’s Capital (credit balance)
Accounts Payable (credit balance)
Related exercise material: BE2-1, BE2-2, E2-1, E2-2, E2-4, and DO IT! 2-1.
Action Plan✔ Determine the types
of accounts needed. Kate will need asset accounts for each different type of asset she invests in the business and liability accounts for any debts she incurs.
✔ Understand the types of owner’s equity accounts. Only Owner’s Capital will be needed when Kate begins the business. Other owner’s equity accounts will be needed later.
2 Indicate how a journal is used in the recording process.LEARNING OBJECTIVE
Steps in the Recording Process
Although it is possible to enter transaction information directly into the accounts without using a journal, few businesses do so. Practically every business uses three basic steps in the recording process:
1. Analyze each transaction for its effects on the accounts.
2. Enter the transaction information in a journal.
3. Transfer the journal information to the appropriate accounts in the ledger.1
The recording process begins with the transaction. Business documents, such as a sales receipt, a check, or a bill, provide evidence of the transaction. The company analyzes this evidence to determine the transaction’s effects on specifi c accounts. The company then enters the transaction in the journal. Finally, it trans-fers the journal entry to the designated accounts in the ledger. Illustration 2-12 shows the recording process.
1We discuss here the manual recording process as we believe students should understand it fi rst before learning and using a computerized system.
ETHICS NOTE
International Outsourcing Services, LLC was accused of submitting fraudulent store coupons to companies for reimbursement of as much as $250 million. Use of proper business documents reduces the likelihood of fraudulent activity.
Journal Ledger
JournalJournal
Journal
LedgerAssets Liabilities
Owner’s Equity
Invoice
Enter transaction in a journal Transfer journal informationto ledger accounts
The Recording Process
Analyze each transaction
Illustration 2-12The recording process

The Journal 55
The steps in the recording process occur repeatedly. In Chapter 1, we illus-trated the fi rst step, the analysis of transactions, and will give further examples in this and later chapters. The other two steps in the recording process are explained in the next sections.
The Journal
Companies initially record transactions in chronological order (the order in which they occur). Thus, the journal is referred to as the book of original entry. For each transaction, the journal shows the debit and credit effects on specifi c accounts. Companies may use various kinds of journals, but every company has the most basic form of journal, a general journal. Typically, a general journal has spaces for dates, account titles and explanations, references, and two amount columns. See the format of the journal in Illustration 2-13 (below). Whenever we use the term “journal” in this textbook, we mean the general journal unless we specify otherwise. The journal makes several signifi cant contributions to the recording process:
1. It discloses in one place the complete effects of a transaction.
2. It provides a chronological record of transactions.
3. It helps to prevent or locate errors because the debit and credit amounts for each entry can be easily compared.
JOURNALIZING
Entering transaction data in the journal is known as journalizing. Companies make separate journal entries for each transaction. A complete entry consists of (1) the date of the transaction, (2) the accounts and amounts to be debited and credited, and (3) a brief explanation of the transaction. Illustration 2-13 shows the technique of journalizing, using the fi rst two transac-tions of Softbyte. Recall that on September 1, Ray Neal invested $15,000 cash in the business, and Softbyte purchased computer equipment for $7,000 cash. The number J1 indicates that these two entries are recorded on the fi rst page of the journal. Illus-tration 2-13 shows the standard form of journal entries for these two transactions. (The boxed numbers correspond to explanations in the list below the illustration.)
Illustration 2-13Technique of journalizing
Date Account Titles and Explanation Ref. Debit Credit
2017 Sept. 1 Cash 15,000 Owner’s Capital 15,000 (Owner’s investment of cash in business)
1 Equipment 7,000 Cash 7,000 (Purchase of equipment for cash)
GENERAL JOURNAL J1
234
1
5
1 The date of the transaction is entered in the Date column.2 The debit account title (that is, the account to be debited) is entered fi rst at the
extreme left margin of the column headed “Account Titles and Explanation,” and the amount of the debit is recorded in the Debit column.
3 The credit account title (that is, the account to be credited) is indented and entered on the next line in the column headed “Account Titles and Explanation,” and the amount of the credit is recorded in the Credit column.
4 A brief explanation of the transaction appears on the line below the credit account title. A space is left between journal entries. The blank space sepa-rates individual journal entries and makes the entire journal easier to read.
5 The column titled Ref. (which stands for Reference) is left blank when the journal entry is made. This column is used later when the journal entries are transferred to the ledger accounts.

56 2 The Recording Process
It is important to use correct and specifi c account titles in journalizing. Erroneous account titles lead to incorrect fi nancial statements. However, some fl exibility exists initially in selecting account titles. The main criterion is that each title must appropriately describe the content of the account. Once a com-pany chooses the specifi c title to use, it should record under that account title all later transactions involving the account.2
SIMPLE AND COMPOUND ENTRIES
Some entries involve only two accounts, one debit and one credit. (See, for exam-ple, the entries in Illustration 2-13.) This type of entry is called a simple entry. Some transactions, however, require more than two accounts in journalizing. An entry that requires three or more accounts is a compound entry. To illustrate, assume that on July 1, Butler Company purchases a delivery truck costing $14,000. It pays $8,000 cash now and agrees to pay the remaining $6,000 on account (to be paid later). The compound entry is as follows.
2In homework problems, you should use specifi c account titles when they are given. When account titles are not given, you may select account titles that identify the nature and content of each account. The account titles used in journalizing should not contain explanations such as Cash Paid or Cash Received.
Illustration 2-14Compound journal entry
Date Account Titles and Explanation Ref. Debit Credit
2017July 1 Equipment 14,000 Cash 8,000 Accounts Payable 6,000 (Purchased truck for cash with balance
on account)
GENERAL JOURNAL J1
In a compound entry, the standard format requires that all debits be listed before the credits.
Boosting Microsoft’s Profi ts
Microsoft originally designed the Xbox 360 to have 256 megabytes of memory. But the design department said that amount of memory wouldn’t support the best special effects. The purchasing department said that adding more memory would cost $30—which was 10% of the estimated selling
price of $300. The marketing department, however, “determined that adding the memory would let Microsoft reduce marketing costs and attract more game developers, boosting royalty revenue. It would also extend the life of the console, generating more sales.”
As a result of these changes, Xbox enjoyed great success. But, it does have competitors. Its newest video game console,
Xbox One, is now in a battle with Sony’s Playstation4 for market share. How to compete? First, Microsoft bundled the critically acclaimed Titanfall with its Xbox One. By including the game most Xbox One buyers were going to purchase anyway, Microsoft was making its console more attractive. In addition, retailers are also discounting the Xbox, which should get the momentum going for increased sales. What Microsoft is doing is making sure that Xbox One is the center of the home entertainment system in the long run, even if it suffers a bit of a hard-ware loss today.
Sources: Robert A. Guth, “New Xbox Aim for Microsoft: Profi tability,” Wall Street Journal (May 24, 2005), p. C1; and David Thier, “Will Microsoft Give the Xbox One a $50 Price Cut?,” www.Forbes.com (March 26, 2014).
In what ways is this Microsoft division using accounting to assist in its effort to become more profi table? (Go to WileyPLUS for this answer and additional questions.)
© fl yfl oor/iStockphoto
MicrosoftAccounting Across the Organization

The Ledger and Posting 57
Kate Browne engaged in the following activities in establishing her salon, Hair It Is:
1. Opened a bank account in the name of Hair It Is and deposited $20,000 of her own money in this account as her initial investment.
2. Purchased equipment on account (to be paid in 30 days) for a total cost of $4,800.
3. Interviewed three people for the position of hair stylist.
Prepare the entries to record the transactions.
Solution
DO IT! 2 Recording Business Activities
The three activities would be recorded as follows.
1. Cash 20,000 Owner’s Capital 20,000 (Owner’s investment of cash in business)
2. Equipment 4,800 Accounts Payable 4,800 (Purchase of equipment on account)
3. No entry because no transaction has occurred.
Related exercise material: BE2-3, BE2-4, BE2-5, BE2-6, E2-3, E2-5, E2-6, E2-7, and DO IT! 2-2.
Action Plan✔ Understand which
activities need to be recorded and which do not. Any that affect assets, liabilities, or owner’s equity should be recorded in a journal.
✔ Analyze the effects of transactions on asset, liability, and owner’s equity accounts.
3 Explain how a ledger and posting help in the recording process.LEARNING OBJECTIVE
The Ledger
The entire group of accounts maintained by a company is the ledger. The ledger provides the balance in each of the accounts as well as keeps track of changes in these balances. Companies may use various kinds of ledgers, but every company has a gen-eral ledger. A general ledger contains all the asset, liability, and owner’s equity accounts, as shown in Illustration 2-15 for J. Lind Company. Whenever we use the term “ledger” in this textbook, we are referring to the general ledger unless we specify otherwise.
IndividualAsset
Accounts
IndividualLiability
Accounts
IndividualOwner's Equity
Accounts
Equipment
Land
Supplies
Cash
Interest Payable
Salaries and Wages Payable
Accounts Payable
Notes Payable
Salaries and Wages Expense
Service Revenue
Owner's Drawings
Owner's Capital
Illustration 2-15The general ledger, which contains all of a company’s accounts

58 2 The Recording Process
STANDARD FORM OF ACCOUNT
The simple T-account form used in accounting textbooks is often very useful for illustration purposes. However, in practice, the account forms used in ledgers are much more structured. Illustration 2-16 shows a typical form, using assumed data from a cash account.
A Convenient Overstatement
Sometimes a company’s invest-ment securities suffer a perma-nent decline in value below their original cost. When this occurs, the company is sup-posed to reduce the recorded value of the securities on its balance sheet (“write-them down” in common fi nancial lingo) and record a loss. It appears, however, that during the fi nancial crisis of 2008, employees at some fi nancial
institutions chose to look the other way as the value of their investments skidded.
A number of Wall Street traders that worked for the investment bank Credit Suisse Group were charged with
intentionally overstating the value of securities that had suffered declines of approximately $2.85 billion. One rea-son that they may have been reluctant to record the losses is out of fear that the company’s shareholders and clients would panic if they saw the magnitude of the losses. How-ever, personal self-interest might have been equally to blame—the bonuses of the traders were tied to the value of the investment securities.
Source: S. Pulliam, J. Eaglesham, and M. Siconolfi , “U.S. Plans Changes on Bond Fraud,” Wall Street Journal Online (February 1, 2012).
What incentives might employees have had to overstate the value of these investment securities on the company’s fi nancial statements? (Go to WileyPLUS for this answer and additional questions.)
© Nuno Silva/iStockphoto
Credit Suisse GroupEthics Insight
Illustration 2-16Three-column form of account CASH NO. 101
Date Explanation Ref. Debit Credit Balance
2017June 1 25,000 25,000 2 8,000 17,000 3 4,200 21,200 9 7,500 28,700 17 11,700 17,000 20 250 16,750 30 7,300 9,450
This format is called the three-column form of account. It has three money columns—debit, credit, and balance. The balance in the account is determined after each transaction. Companies use the explanation space and reference col-umns to provide special information about the transaction.
Companies arrange the ledger in the sequence in which they present the accounts in the fi nancial statements, beginning with the balance sheet accounts. First in order are the asset accounts, followed by liability accounts, owner’s capital, owner’s drawings, revenues, and expenses. Each account is numbered for easier identifi cation. The ledger provides the balance in each of the accounts. For example, the Cash account shows the amount of cash available to meet current obligations. The Accounts Receivable account shows amounts due from customers. Accounts Payable shows amounts owed to creditors.

The Ledger and Posting 59
Posting
Transferring journal entries to the ledger accounts is called posting. This phase of the recording process accumulates the effects of journalized transactions into the individual accounts. Posting involves the following steps.
1. In the ledger, in the appropriate columns of the account(s) debited, enter the date, journal page, and debit amount shown in the journal.
2. In the reference column of the journal, write the account number to which the debit amount was posted.
3. In the ledger, in the appropriate columns of the account(s) credited, enter the date, journal page, and credit amount shown in the journal.
4. In the reference column of the journal, write the account number to which the credit amount was posted.
Illustration 2-17 shows these four steps using Softbyte’s fi rst journal entry. The boxed numbers indicate the sequence of the steps.
Illustration 2-17Posting a journal entry
2017Sept.1 Cash
Owner's Capital (Owner’s investment of cash in business)
Date Account Titles and Explanation
GENERAL JOURNAL
Ref. Debit Credit
J1
2017Sept.1
Date Explanation Ref. Debit Credit Balance
No.101Cash
GENERAL LEDGER
Key: Post to debit account–date, journal page number, and amount.Enter debit account number in journal reference column.Post to credit account–date, journal page number, and amount.Enter credit account number in journal reference column.
No.301
2017Sept.1
Date Explanation Ref. Debit Credit Balance
Owner's Capital
2
2
4
4
1
1
3
3
15,00015,000
J1 15,000 15,000
J1 15,000 15,000
101301
Posting should be performed in chronological order. That is, the company should post all the debits and credits of one journal entry before proceeding to the next journal entry. Postings should be made on a timely basis to ensure that the ledger is up-to-date.3
The reference column of a ledger account indicates the journal page from which the transaction was posted.4 The explanation space of the ledger account is used infrequently because an explanation already appears in the journal.
3In homework problems, you can journalize all transactions before posting any of the journal entries.4After the last entry has been posted, the accountant should scan the reference column in the journal, to confi rm that all postings have been made.

60 2 The Recording Process
CHART OF ACCOUNTS
The number and type of accounts differ for each company. The number of accounts depends on the amount of detail management desires. For example, the management of one company may want a single account for all types of utility expense. Another may keep separate expense accounts for each type of utility, such as gas, electricity, and water. Similarly, a small company like Softbyte will have fewer accounts than a corporate giant like Dell. Softbyte may be able to manage and report its activities in 20 to 30 accounts, while Dell may require thousands of accounts to keep track of its worldwide activities. Most companies have a chart of accounts. This chart lists the accounts and the account numbers that identify their location in the ledger. The numbering system that identifi es the accounts usually starts with the balance sheet accounts and follows with the income statement accounts. In this and the next two chapters, we will be explaining the accounting for Pioneer Advertising (a service company). Accounts 101–199 indicate asset accounts; 200–299 indicate liabilities; 301–350 indicate owner’s equity accounts; 400–499, revenues; 601–799, expenses; 800–899, other revenues; and 900–999, other expenses. Illustration 2-18 shows Pioneer’s chart of accounts. Accounts listed in red are used in this chapter; accounts shown in black are explained in later chapters.
Helpful HintOn the textbook’s front endpapers, you also will fi nd an expanded chart of accounts.
You will notice that there are gaps in the numbering system of the chart of accounts for Pioneer. Companies leave gaps to permit the insertion of new accounts as needed during the life of the business.
The Recording Process Illustrated
Illustrations 2-19 through 2-28 (pages 61–65) show the basic steps in the record-ing process, using the October transactions of Pioneer Advertising. Pioneer’s accounting period is a month. In these illustrations, a basic analysis, an equation analysis, and a debit-credit analysis precede the journal entry and posting of each transaction. For simplicity, we use the T-account form to show the posting instead of the standard account form. Study these transaction analyses carefully. The purpose of transaction analysis is fi rst to identify the type of account involved, and then to deter-mine whether to make a debit or a credit to the account. You should always
Helpful HintThe Accounting Cycle Tutorial in WileyPLUS provides an interactive presentation of the ac-counting cycle using these transaction analyses.
Illustration 2-18Chart of accounts PIONEER ADVERTISING
Chart of Accounts
Assets Owner’s Equity
101 Cash 301 Owner’s Capital112 Accounts Receivable 306 Owner’s Drawings126 Supplies 350 Income Summary130 Prepaid Insurance157 Equipment Revenues
158 Accumulated Depreciation—Equipment 400 Service Revenue
Liabilities Expenses
200 Notes Payable 631 Supplies Expense201 Accounts Payable 711 Depreciation Expense209 Unearned Service Revenue 722 Insurance Expense212 Salaries and Wages Payable 726 Salaries and Wages 230 Interest Payable Expense 729 Rent Expense 732 Utilities Expense 905 Interest Expense

The Ledger and Posting 61
Illustration 2-19Investment of cash by owner
TransactionOn October 1, C. R. Byrd invests $10,000 cash in an advertisingcompany called Pioneer Advertising.
BasicAnalysis
The asset Cash increases $10,000; owner’s equity(specifically, Owner's Capital) increases $10,000.
Debit–CreditAnalysis
Debits increase assets: debit Cash $10,000.Credits increase owner's equity: credit Owner's Capital $10,000.
JournalEntry
Posting Oct. 1 10,000
Cash 101
Oct. 1 10,000
Owner's Capital 301
Oct. 1 Cash Owner's Capital (Owner’s investment of cash in business)
101301
10,00010,000
EquationAnalysis
+10,000
Liabilities Owner's Equity
Owner'sCapital
+10,000
Assets =
Cash =
+
Illustration 2-20Purchase of offi ce equipment
TransactionOn October 1, Pioneer purchases office equipment costing$5,000 by signing a 3-month, 12%, $5,000 note payable.
BasicAnalysis
The asset Equipment increases $5,000;the liability Notes Payable increases $5,000.
Debit–CreditAnalysis
Debits increase assets: debit Equipment $5,000.Credits increase liabilities: credit Notes Payable $5,000.
JournalEntry
Oct. 1 5,000
Equipment 157
Oct. 1 5,000
Notes Payable 200Posting
Oct. 1 Equipment Notes Payable (Issued 3-month, 12% note for office equipment)
157200
5,0005,000
EquationAnalysis
Owner's Equity
Equipment
+5,000
NotesPayable
+5,000
Assets = Liabilities
=
+
perform this type of analysis before preparing a journal entry. Doing so will help you understand the journal entries discussed in this chapter as well as more com-plex journal entries in later chapters.
Helpful HintFollow these steps:1. Determine what type of
account is involved.2. Determine what items
increased or decreased and by how much.
3. Translate the increases and decreases into debits and credits.
Cash Flowsno effect
Cash Flows110,000

62 2 The Recording Process
Illustration 2-21Receipt of cash for future service Transaction
On October 2, Pioneer receives a $1,200 cash advance fromR. Knox, a client, for advertising services that are expectedto be completed by December 31.
BasicAnalysis
Debit–CreditAnalysis
Debits increase assets: debit Cash $1,200.Credits increase liabilities: credit Unearned Service Revenue $1,200.
The asset Cash increases $1,200; the liability Unearned ServiceRevenue increases $1,200 because the service has not beenperformed yet. That is, when Pioneer receives an advancepayment, it should record an unearned revenue (a liability) inorder to recognize the obligation that exists. Note also thatalthough most liabilities have the word “payable” in their title,unearned revenue is considered a liability because the liabilityis satisfied by providing a product or performing a service.
JournalEntry
PostingCash 101
Oct. 2 1,200Unearned Service Revenue 209
Oct. 2 Cash Unearned Service Revenue (Received cash from R. Knox for future service)
101209
1,2001,200
EquationAnalysis
+1,200
Unearned ServiceRevenue
+1,200
Assets Liabilities Owner's Equity=
=Cash
+
Oct. 1 10,000 2 1,200
Illustration 2-22Payment of monthly rent
Transaction
BasicAnalysis
Debit–CreditAnalysis
Debits increase expenses: debit Rent Expense $900.Credits decrease assets: credit Cash $900.
The expense account Rent Expense increases $900 becausethe payment pertains only to the current month; the assetCash decreases $900.
JournalEntry
Posting Oct. 1 10,000 2 1,200
Cash 101 Rent Expense 729
Oct. 3 Rent Expense Cash (Paid October rent)
729101
900900
Oct. 3 900 Oct. 3 900
On October 3, Pioneer pays office rent for October incash, $900.
EquationAnalysis Cash
-900
RentExpense
-900
Owner's EquityAssets = +Liabilities
=Cash Flows2900
Cash Flows11,200

The Ledger and Posting 63
Illustration 2-23Payment for insurance
TransactionOn October 4, Pioneer pays $600 for a one-year insurancepolicy that will expire next year on September 30.
BasicAnalysis
Debit–CreditAnalysis
Debits increase assets: debit Prepaid Insurance $600.Credits decrease assets: credit Cash $600.
The asset Prepaid Insurance increases $600 because thepayment extends to more than the current month; the assetCash decreases $600. Payments of expenses that will benefitmore than one accounting period are prepaid expenses orprepayments. When a company makes a payment, it debitsan asset account in order to show the service or benefit thatwill be received in the future.
JournalEntry
Posting Oct. 4 600Oct. 1 10,000 2 1,200
Oct. 3 900 4 600
130101
Cash 101 Prepaid Insurance 130
Oct. 4 Prepaid Insurance Cash (Paid one-year policy; effective date October 1)
600600
EquationAnalysis +
Owner's Equity
CashPrepaid
Insurance
+600-600
Assets = Liabilities +
Illustration 2-24Purchase of supplies on credit
TransactionOn October 5, Pioneer purchases an estimated 3-month supplyof advertising materials on account from Aero Supply for $2,500.
BasicAnalysis
Debit–CreditAnalysis
Debits increase assets: debit Supplies $2,500.Credits increase liabilities: credit Accounts Payable $2,500.
The asset Supplies increases $2,500; the liabilityAccounts Payable increases $2,500.
JournalEntry
Posting Oct. 5 2,500
Supplies 126
Oct. 5 2,500
Accounts Payable 201
Oct. 5 Supplies Accounts Payable (Purchased supplies on account from Aero Supply)
126201
2,5002,500
EquationAnalysis
+2,500 +2,500
Owner's Equity
AccountsPayableSupplies
Assets = Liabilities
=
+
Cash Flowsno effect
Cash Flows2600

64 2 The Recording Process
Illustration 2-25Hiring of employees
Event
On October 9, Pioneer hires four employees to begin work onOctober 15. Each employee is to receive a weekly salary of $500for a 5-day work week, payable every 2 weeks—first paymentmade on October 26.
BasicAnalysis
A business transaction has not occurred. There is only anagreement between the employer and the employees to enterinto a business transaction beginning on October 15. Thus, adebit–credit analysis is not needed because there is no accountingentry (see October 26 transaction for first entry).
Illustration 2-26Withdrawal of cash by owner
TransactionOn October 20, C. R. Byrd withdraws $500 cash forpersonal use.
BasicAnalysis
Debit–CreditAnalysis
Debits increase drawings: debit Owner's Drawings $500.Credits decrease assets: credit Cash $500.
The owner’s equity account Owner’s Drawings increases$500; the asset Cash decreases $500.
JournalEntry
Posting Oct. 1 10,000 2 1,200
Cash 101
Oct. 3 9004 600
20 500
Oct. 20 Owner's Drawings Cash (Withdrew cash for personal use)
306101
500500
Oct. 20 500
Owner's Drawings 306
EquationAnalysis Cash
-500
Owner's Equity
Owner'sDrawings
-500
Assets = Liabilities +
=
Cash Flowsno effect
Cash Flows2500

The Ledger and Posting 65
Illustration 2-27Payment of salaries
TransactionOn October 26, Pioneer owes employee salaries of $4,000and pays them in cash (see October 9 event).
BasicAnalysis
Debit–CreditAnalysis
Debits increase expenses: debit Salaries andWages Expense $4,000.Credits decrease assets: credit Cash $4,000.
The expense account Salaries and Wages Expense increases $4,000; the asset Cash decreases $4,000.
JournalEntry
Posting
Oct. 26 Salaries and Wages Expense Cash (Paid salaries to date)
726101
4,0004,000
Oct. 1 10,000 2 1,200
Cash 101Oct. 26 4,000
Salaries andWages Expense 726
EquationAnalysis
Assets = +Liabilities Owner's Equity
Cash
-4,000
=Salaries and Wages
Expense
-4,000
34
2026
900600500
4,000
Oct.
Illustration 2-28Receipt of cash for services performedTransaction
On October 31, Pioneer receives $10,000 in cash from CopaCompany for advertising services performed in October.
BasicAnalysis
Debit–CreditAnalysis
Debits increase assets: debit Cash $10,000.Credits increase revenues: credit Service Revenue $10,000.
The asset Cash increases $10,000; the revenue accountService Revenue increases $10,000.
JournalEntry
PostingOct. 31 10,000
Service Revenue 400
Oct. 1 10,000 2 1,200
31 10,000
Cash 101
Oct. 3 900 4 600 20 500 26 4,000
Oct. 31 Cash Service Revenue (Received cash for services performed)
101400
10,00010,000
EquationAnalysis Cash
+10,000
Owner's Equity
ServiceRevenue
+10,000
Assets = Liabilities +
=
Cash Flows24,000
Cash Flows110,000

66 2 The Recording Process
Summary Illustration of Journalizing and Posting
Illustration 2-29 shows the journal for Pioneer Advertising for October.
Illustration 2-29General journal entries
Date Account Titles and Explanation Ref. Debit Credit
2017Oct. 1 Cash 101 10,000 Owner’s Capital 301 10,000 (Owner’s investment of cash in business)
1 Equipment 157 5,000 Notes Payable 200 5,000 (Issued 3-month, 12% note for offi ce
equipment)
2 Cash 101 1,200 Unearned Service Revenue 209 1,200 (Received cash from R. Knox for
future service)
3 Rent Expense 729 900 Cash 101 900 (Paid October rent)
4 Prepaid Insurance 130 600 Cash 101 600 (Paid one-year policy; effective date
October 1)
5 Supplies 126 2,500 Accounts Payable 201 2,500 (Purchased supplies on account from
Aero Supply)
20 Owner’s Drawings 306 500 Cash 101 500 (Withdrew cash for personal use)
26 Salaries and Wages Expense 726 4,000 Cash 101 4,000 (Paid salaries to date)
31 Cash 101 10,000 Service Revenue 400 10,000 (Received cash for services performed)
GENERAL JOURNAL PAGE J1

The Ledger and Posting 67
Illustration 2-30General ledger
GENERAL LEDGER
Cash No. 101
Date Explanation Ref. Debit Credit Balance
2017 Oct. 1 J1 10,000 10,000 2 J1 1,200 11,200 3 J1 900 10,300 4 J1 600 9,700 20 J1 500 9,200 26 J1 4,000 5,200 31 J1 10,000 15,200
Supplies No. 126
Date Explanation Ref. Debit Credit Balance
2017 Oct. 5 J1 2,500 2,500
Prepaid Insurance No. 130
Date Explanation Ref. Debit Credit Balance
2017 Oct. 4 J1 600 600
Equipment No. 157
Date Explanation Ref. Debit Credit Balance
2017 Oct. 1 J1 5,000 5,000
Notes Payable No. 200
Date Explanation Ref. Debit Credit Balance
2017 Oct. 1 J1 5,000 5,000
Accounts Payable No. 201
Date Explanation Ref. Debit Credit Balance
2017 Oct. 5 J1 2,500 2,500
Unearned Service Revenue No. 209
Date Explanation Ref. Debit Credit Balance
2017 Oct. 2 J1 1,200 1,200
Owner’s Capital No. 301
Date Explanation Ref. Debit Credit Balance
2017 Oct. 1 J1 10,000 10,000
Owner’s Drawings No. 306
Date Explanation Ref. Debit Credit Balance
2017 Oct. 20 J1 500 500
Service Revenue No. 400
Date Explanation Ref. Debit Credit Balance
2017 Oct. 31 J1 10,000 10,000
Salaries and Wages Expense No. 726
Date Explanation Ref. Debit Credit Balance
2017 Oct. 26 J1 4,000 4,000
Rent Expense No. 729
Date Explanation Ref. Debit Credit Balance
2017 Oct. 3 J1 900 900
Illustration 2-30 shows the ledger, with all balances in red.
Kate Browne recorded the following transactions in a general journal during the month of March.
Mar. 4 Cash 2,280 Service Revenue 2,280
15 Salaries and Wages Expense 400 Cash 400
19 Utilities Expense 92 Cash 92
Post these entries to the Cash account of the general ledger to determine its ending balance. The beginning balance of Cash on March 1 was $600.
Solution
DO IT! 3 Posting
Cash
3/1 Bal. 600 3/15 4003/4 2,280 3/19 92
3/31 Bal. 2,388
Related exercise material: BE2-7, BE2-8, E2-8, E2-12, and DO IT! 2-3.
Action Plan✔ Recall that posting
involves transferring the journalized debits and credits to specifi c accounts in the ledger.
✔ Determine the ending balance by netting the total debits and credits.

68 2 The Recording Process
4 Prepare a trial balance.LEARNING OBJECTIVE
A trial balance is a list of accounts and their balances at a given time. Customar-ily, companies prepare a trial balance at the end of an accounting period. They list accounts in the order in which they appear in the ledger. Debit balances appear in the left column and credit balances in the right column. The trial balance proves the mathematical equality of debits and credits after posting. Under the double-entry system, this equality occurs when the sum of the debit account balances equals the sum of the credit account balances. A trial balance may also uncover errors in journalizing and posting. For example, a trial balance may well have detected the error at MF Global discussed in the Feature Story. In addition, a trial balance is useful in the preparation of fi nancial statements, as we will explain in the next two chapters. The steps for preparing a trial balance are:
1. List the account titles and their balances in the appropriate debit or credit column.
2. Total the debit and credit columns.
3. Prove the equality of the two columns.
Illustration 2-31 shows the trial balance prepared from Pioneer Advertising’s ledger. Note that the total debits equal the total credits.
Illustration 2-31A trial balance
A trial balance is a necessary checkpoint for uncovering certain types of errors. For example, if only the debit portion of a journal entry has been posted, the trial balance would bring this error to light.
Limitations of a Trial Balance
A trial balance does not guarantee freedom from recording errors, however. Numerous errors may exist even though the totals of the trial balance columns agree. For example, the trial balance may balance even when:
1. A transaction is not journalized.
2. A correct journal entry is not posted.
3. A journal entry is posted twice.
Helpful HintNote that the order of presentation in the trial balance is:
AssetsLiabilitiesOwner’s equityRevenuesExpenses
ETHICS NOTE
An error is the result of an unintentional mistake; it is neither ethical nor unethical. An irregularity is an intentional misstatement, which is viewed as unethical.
PIONEER ADVERTISINGTrial Balance
October 31, 2017
Debit Credit
Cash $ 15,200Supplies 2,500Prepaid Insurance 600Equipment 5,000Notes Payable $ 5,000Accounts Payable 2,500Unearned Service Revenue 1,200Owner’s Capital 10,000Owner’s Drawings 500Service Revenue 10,000Salaries and Wages Expense 4,000Rent Expense 900
$28,700 $28,700

The Trial Balance 69
4. Incorrect accounts are used in journalizing or posting.
5. Offsetting errors are made in recording the amount of a transaction.
As long as equal debits and credits are posted, even to the wrong account or in the wrong amount, the total debits will equal the total credits. The trial balance does not prove that the company has recorded all transactions or that the ledger is correct.
Locating Errors
Errors in a trial balance generally result from mathematical mistakes, incorrect postings, or simply transcribing data incorrectly. What do you do if you are faced with a trial balance that does not balance? First, determine the amount of the difference between the two columns of the trial balance. After this amount is known, the following steps are often helpful:
1. If the error is $1, $10, $100, or $1,000, re-add the trial balance columns and recompute the account balances.
2. If the error is divisible by 2, scan the trial balance to see whether a balance equal to half the error has been entered in the wrong column.
3. If the error is divisible by 9, retrace the account balances on the trial balance to see whether they are incorrectly copied from the ledger. For example, if a balance was $12 and it was listed as $21, a $9 error has been made. Reversing the order of numbers is called a transposition error.
4. If the error is not divisible by 2 or 9, scan the ledger to see whether an account balance in the amount of the error has been omitted from the trial balance, and scan the journal to see whether a posting of that amount has been omitted.
Dollar Signs and Underlining
Note that dollar signs do not appear in journals or ledgers. Dollar signs are typi-cally used only in the trial balance and the fi nancial statements. Generally, a dollar sign is shown only for the fi rst item in the column and for the total of that column. A single line (a totaling rule) is placed under the column of fi gures to be added or subtracted. Total amounts are double-underlined to indicate they are fi nal sums.
Why Accuracy Matters
While most companies record transactions very carefully, the reality is that mistakes still hap-pen. For example, bank regula-tors fi ned Bank One Corporation (now Chase) $1.8 million because they felt that the unre-liability of the bank’s account-ing system caused it to violate regulatory requirements.
Also, in recent years Fannie Mae, the government-chartered mortgage association, announced a series of large accounting errors. These announcements caused alarm among investors, regulators, and politicians because they fear that the errors may suggest larger, undetected problems. This is important because the home-mortgage
market depends on Fannie Mae to buy hundreds of billions of dollars of mortgages each year from banks, thus enabling the banks to issue new mortgages.
Finally, before a major overhaul of its accounting system, the fi nancial records of Waste Management Inc. were in such disarray that of the company’s 57,000 employees, 10,000 were receiving pay slips that were in error.
The Sarbanes-Oxley Act was created to minimize the occurrence of errors like these by increasing every employee’s responsibility for accurate fi nancial reporting.
In order for these companies to prepare and issue fi nan-cial statements, their accounting equations (debits and credits) must have been in balance at year-end. How could these errors or misstatements have occurred? (Go to WileyPLUS for this answer and additional questions.)
Enviromatic/iStockphoto
Fannie MaeInvestor Insight

70 2 The Recording Process
The following accounts come from the ledger of SnowGo Company at December 31, 2017.
157 Equipment $88,000 301 Owner’s Capital $20,000306 Owner’s Drawings 8,000 212 Salaries and Wages201 Accounts Payable 22,000 Payable 2,000726 Salaries and Wages 200 Notes Payable (due in 3 months) 19,000 Expense 42,000 732 Utilities Expense 3,000112 Accounts Receivable 4,000 130 Prepaid Insurance 6,000400 Service Revenue 95,000 101 Cash 7,000
Prepare a trial balance in good form.
Solution
DO IT! 4 Trial Balance
Related exercise material: BE2-9, BE2-10, E2-9, E2-10, E2-11, E2-13, E2-14, and DO IT! 2-4.
Action Plan✔ Determine normal
balances and list ac-counts in the order they appear in the ledger.
✔ Accounts with debit balances appear in the left column, and those with credit balances in the right column.
✔ Total the debit and credit columns to prove equality.
SNOWGO COMPANYTrial Balance
December 31, 2017
Debit Credit
Cash $ 7,000Accounts Receivable 4,000Prepaid Insurance 6,000Equipment 88,000Notes Payable $ 19,000Accounts Payable 22,000Salaries and Wages Payable 2,000Owner’s Capital 20,000Owner’s Drawings 8,000Service Revenue 95,000Utilities Expense 3,000Salaries and Wages Expense 42,000
$158,000 $158,000
Describe how accounts, debits, and credits are used to record business transactions. An account is a record of increases and decreases in specifi c asset, liability, and owner’s equity items. The terms debit and credit are synonymous with left and right. Assets, drawings, and expenses are increased by debits and decreased by credits. Liabilities, owner’s capital, and revenues are increased by credits and decreased by debits.
Indicate how a journal is used in the recording process. The basic steps in the recording process are (a) analyze each transaction for its effects on the accounts, (b) enter the transaction information in a
1
2
journal, and (c) transfer the journal information to the appropriate accounts in the ledger.
The initial accounting record of a transaction is entered in a journal before the data are entered in the accounts. A journal (a) discloses in one place the complete effects of a transaction, (b) provides a chronological record of transactions, and (c) prevents or locates errors because the debit and credit amounts for each entry can be easily compared.
Explain how a ledger and posting help in the record-ing process. The ledger is the entire group of accounts maintained by a company. The ledger provides the
3
LEARNING OBJECTIVES REVIEW
1
REVIEW AND PRACTICE

Practice Multiple-Choice Questions 71
balance in each of the accounts as well as keeps track of changes in these balances. Posting is the transfer of journal entries to the ledger accounts. This phase of the recording process accumulates the effects of journalized transactions in the individual accounts.
Prepare a trial balance. A trial balance is a list of accounts and their balances at a given time. Its pri-mary purpose is to prove the equality of debits and credits after posting. A trial balance also uncovers errors in journalizing and posting and is useful in preparing fi nancial statements.
4
Account A record of increases and decreases in specifi c asset, liability, or owner’s equity items. (p. 50).
Chart of accounts A list of accounts and the account numbers that identify their location in the ledger. (p. 60).
Compound entry A journal entry that involves three or more accounts. (p. 56).
Credit The right side of an account. (p. 50).Debit The left side of an account. (p. 50).Double-entry system A system that records in appro-
priate accounts the dual effect of each transaction. (p. 51).
General journal The most basic form of journal. (p. 55).General ledger A ledger that contains all asset, liability,
and owner’s equity accounts. (p. 57).Journal An accounting record in which transactions are
initially recorded in chronological order. (p. 55).
Journalizing The entering of transaction data in the journal. (p. 55).
Ledger The entire group of accounts maintained by a company. (p. 57).
Normal balance An account balance on the side where an increase in the account is recorded. (p. 51).
Posting The procedure of transferring journal entries to the ledger accounts. (p. 59).
Simple entry A journal entry that involves only two accounts. (p. 56).
T-account The basic form of an account. (p. 50).Three-column form of account A form with columns
for debit, credit, and balance amounts in an account. (p. 58).
Trial balance A list of accounts and their balances at a given time. (p. 68).
GLOSSARY REVIEW
1. Which of the following statements about an account is true?(a) The right side of an account is the debit or
increase side.(b) An account is an individual accounting record of
increases and decreases in specifi c asset, liability, and owner’s equity items.
(c) There are separate accounts for specifi c assets and liabilities but only one account for owner’s equity items.
(d) The left side of an account is the credit or decrease side.
2. Debits:(a) increase both assets and liabilities.(b) decrease both assets and liabilities.(c) increase assets and decrease liabilities.(d) decrease assets and increase liabilities.
3. A revenue account:(a) is increased by debits.(b) is decreased by credits.(c) has a normal balance of a debit.(d) is increased by credits.
4. Accounts that normally have debit balances are:(a) assets, expenses, and revenues.(b) assets, expenses, and owner’s capital.(c) assets, liabilities, and owner’s drawings.(d) assets, owner’s drawings, and expenses.
(LO 1)
(LO 1)
(LO 1)
(LO 1)
5. The expanded accounting equation is:(a) Assets 1 Liabilities 5 Owner’s Capital 1 Owner’s
Drawings 1 Revenues 1 Expenses.(b) Assets 5 Liabilities 1 Owner’s Capital 1 Owner’s
Drawings 1 Revenues 2 Expenses.(c) Assets 5 Liabilities 2 Owner’s Capital 2 Owner’s
Drawings 2 Revenues 2 Expenses.(d) Assets 5 Liabilities 1 Owner’s Capital 2 Owner’s
Drawings 1 Revenues 2 Expenses. 6. Which of the following is not part of the recording
process?(a) Analyzing transactions.(b) Preparing a trial balance.(c) Entering transactions in a journal.(d) Posting transactions.
7. Which of the following statements about a journal is false?(a) It is not a book of original entry.(b) It provides a chronological record of transactions.(c) It helps to locate errors because the debit and credit
amounts for each entry can be readily compared.(d) It discloses in one place the complete effect of a
transaction. 8. The purchase of supplies on account should result in:
(a) a debit to Supplies Expense and a credit to Cash.(b) a debit to Supplies Expense and a credit to Accounts
Payable.
(LO 1)
(LO 2)
(LO 2)
(LO 2)
PRACTICE MULTIPLE-CHOICE QUESTIONS

72 2 The Recording Process
(c) a debit to Supplies and a credit to Accounts Payable.(d) a debit to Supplies and a credit to Accounts
Receivable. 9. The order of the accounts in the ledger is:
(a) assets, revenues, expenses, liabilities, owner’s cap-ital, owner’s drawings.
(b) assets, liabilities, owner’s capital, owner’s draw-ings, revenues, expenses.
(c) owner’s capital, assets, revenues, expenses, liabili-ties, owner’s drawings.
(d) revenues, assets, expenses, liabilities, owner’s capital, owner’s drawings.
10. A ledger:(a) contains only asset and liability accounts.(b) should show accounts in alphabetical order.(c) is a collection of the entire group of accounts
maintained by a company.(d) is a book of original entry.
11. Posting:(a) normally occurs before journalizing.(b) transfers ledger transaction data to the journal.(c) is an optional step in the recording process.(d) transfers journal entries to ledger accounts.
12. Before posting a payment of $5,000, the Accounts Pay-able of Senator Company had a normal balance of $16,000. The balance after posting this transaction was:(a) $21,000. (c) $11,000.(b) $5,000. (d) Cannot be determined.
(LO 3)
(LO 3)
(LO 3)
(LO 3)
13. A trial balance:(a) is a list of accounts with their balances at a given
time.(b) proves the journalized transactions are correct.(c) will not balance if a correct journal entry is posted
twice.(d) proves that all transactions have been recorded.
14. A trial balance will not balance if:(a) a correct journal entry is posted twice.(b) the purchase of supplies on account is debited to
Supplies and credited to Cash.(c) a $100 cash drawing by the owner is debited to
Owner’s Drawings for $1,000 and credited to Cash for $100.
(d) a $450 payment on account is debited to Accounts Payable for $45 and credited to Cash for $45.
15. The trial balance of Jeong Company had accounts with the following normal balances: Cash $5,000, Service Revenue $85,000, Salaries and Wages Pay-able $4,000, Salaries and Wages Expense $40,000, Rent Expense $10,000, Owner’s Capital $42,000, Owner’s Drawings $15,000, and Equipment $61,000. In preparing a trial balance, the total in the debit col-umn is:(a) $131,000. (c) $91,000.(b) $216,000. (d) $116,000.
(LO 4)
(LO 4)
(LO 4)
Solutions
1. (b) An account is an individual accounting record of increases and decreases in specifi c asset, liability, and owner’s equity items. The other choices are incorrect because (a) the right side of the account is the credit side, not the debit side, and can be the increase or the decrease side, depending on the specifi c classifi cation account; (c) there are also separate accounts for different owner’s equity items; and (d) the left side of the account is the debit side, not the credit side, and can be either the decrease or the increase side, depending on the specifi c classifi cation account.
2. (c) Debits increase assets but they decrease liabilities. The other choices are incorrect because debits (a) decrease, not increase, liabilities; (b) increase, not decrease, assets; and (d) increase, not decrease, assets and decrease, not increase, liabilities.
3. (d) A revenue account is increased by credits. The other choices are incorrect because a revenue account (a) is increased by credits, not debits; (b) is decreased by debits, not credits; and (c) has a normal balance of a credit, not a debit.
4. (d) Assets, owner’s drawings, and expenses all have normal debit balances. The other choices are incorrect because (a) revenues have normal credit balances, (b) owner’s capital has a normal credit balance, and (c) liabilities have normal credit balances.
5. (d) The expanded accounting equation is Assets 5 Liabilities 1 Owner’s Capital 2 Owner’s Drawings 1 Revenue 2 Expenses. The other choices are incorrect because (a) both Owner’s Drawings and Expenses must be subtracted, not added, and Liabilities should be added to the right side of equation, not to the left side; (b) Owner’s Drawings must be subtracted, not added; and (c) Owner’s Capital and Revenues must be added, not subtracted.
6. (b) Preparing the trial balance is not part of the recording process. Choices (a) analyzing transactions, (b) preparing a trial balance, and (c) entering transactions in a journal are all part of the recording process.
7. (a) The journal is a book of original entry. The other choices are all true statements.
8. (c) The purchase of supplies on account results in a debit to Supplies and a credit to Accounts Payable. The other choices are incor-rect because the purchase of supplies on account results in (a) a debit to Supplies, not Supplies Expense, and a credit to Accounts Payable, not Cash; (b) a debit to Supplies, not Supplies Expense; and (d) a credit to Accounts Payable, not Accounts Receivable.
9. (b) The correct order of the accounts in the ledger is assets, liabilities, owner’s capital, owner’s drawing, revenues, expenses. The other choices are incorrect because they do not refl ect this order. The order of the accounts in the ledger is (1) balance sheet accounts: assets, liabilities, and owner’s equity accounts (owner’s capital and owner’s drawings); and then (2) income statement accounts: revenues and expenses.
10. (c) A ledger is a collection of all the accounts maintained by a company. The other choices are incorrect because a ledger (a) contains all account types—assets, liabilities, owner’s equity, revenue, and expense accounts—not just assets and liability accounts; (b) usually shows accounts in account number order, not alphabetical order; and (d) is not a book of original entry because entries made in the ledger come from the journals (the books of original entry).
11. (d) Posting transfers journal entries to ledger accounts. The other choices are incorrect because posting (a) occurs after jour-nalizing, (b) transfers journal transaction data to the ledger; and (c) is not an optional step in the recording process.

12. (c) The balance is $11,000 ($16,000 normal balance 2 $5,000 payment), not (a) $21,000 or (b) $5,000. Choice (d) is incorrect because the balance can be determined.
13. (a) A trial balance is a list of accounts with their balances at a given time. The other choices are incorrect because (b) the trial balance does not prove that journalized transactions are correct; (c) if a journal entry is posted twice, the trial balance will still balance; and (d) the trial balance does not prove that all transactions have been recorded.
14. (c) The trial balance will not balance in this case because the debit of $1,000 to Owner’s Drawings is not equal to the credit of $100 to Cash. The other choices are incorrect because (a) if a correct journal entry is posted twice, the trial balance will still balance; (b) if the purchase of supplies on account is debited to Supplies and credited to Cash, Cash and Accounts Payable will be understated but the trial balance will still balance; and (d) since the debit and credit amounts are the same, the trial balance will still balance but both Accounts Payable and Cash will be overstated.
15. (a) The total debit column 5 $5,000 (Cash) 1 $40,000 (Salaries and Wages Expense) 1 $10,000 (Rent Expense) 1 $15,000 (Owner’s Drawings) 1 $61,000 (Equipment) 5 $131,000. The normal balance for Assets, Expenses, and Owner’s Drawings is a debit. The other choices are incorrect because (b) revenue of $85,000 should not be included in the total of $216,000 and its nor-mal balance is a credit; (c) the total of $91,000 is missing the Salaries and Wages Expense of $40,000, which has a normal balance of a debit; and (d) the total of $116,000 is missing the Owner’s Drawings of $15,000, which has a normal balance of a debit.
1. Presented below is information related to Hammond Real Estate Agency.
Oct. 1 Lia Berge begins business as a real estate agent with a cash investment of $30,000 2 Paid rent, $700, on offi ce space. 3 Purchases offi ce equipment for $2,800, on account. 6 Sells a house and lot for Hal Smith; bills Hal Smith $4,400 for realty services
performed. 27 Pays $1,100 on the balance related to the transaction of October 3. 30 Receives bill for October utilities, $130 (not paid at this time).
InstructionsJournalize the transactions. (You may omit explanations)
Analyze transactions and determine their effect on accounts.
(LO 1)
PRACTICE EXERCISES
Practice Exercises 73
1. GENERAL JOURNAL
Date Account Titles and Explanation Ref. Debit Credit
Oct. 1 Cash 30,000 Owner’s Capital 30,000
2 Rent Expense 700 Cash 700
3 Equipment 2,800 Accounts Payable 2,800
6 Accounts Receivable 4,400 Service Revenue 4,400
27 Accounts Payable 1,100 Cash 1,100
30 Utilities Expense 130 Accounts Payable 130
Solution
2. The T-accounts below summarize the ledger of Depot Company at the end of the fi rst month of operations.
Cash No. 101 Unearned Service Revenue No. 209
4/1 16,000 4/15 700 4/30 1,6004/12 1,200 4/25 1,6004/29 9004/30 1,600
Journalize transactions from account data and prepare a trial balance.
(LO 2, 4)

74 2 The Recording Process
2. (a) GENERAL JOURNAL
Date Account Titles and Explanation Ref. Debit Credit
Apr. 1 Cash 16,000 Owner’s Capital 16,000 (Owner’s investment of cash in business)
12 Cash 1,200 Service Revenue 1,200 (Received cash for services performed)
15 Salaries and Wages Expense 700 Cash 700 (Paid salaries to date)
25 Accounts payable 1,600 Cash 1,600 (Paid creditors on account)
29 Cash 900 Accounts Receivable 900 (Received cash in payment of account)
30 Cash 1,600 Unearned Service Revenue 1,600 (Received cash for future services)
Solution
DEPOT COMPANYTrial Balance
April 30, 2017
Debit Credit
Cash $17,400Accounts Receivable 2,000Supplies 1,900Accounts Payable $ 300Unearned Service Revenue 1,600Owner’s Capital 16,000Service Revenue 4,100Salaries and Wages Expense 700
$22,000 $22,000
(b)
Instructions(a) Prepare the complete general journal (including explanations) from which the post-
ings to Cash were made.
(b) Prepare a trial balance at April 30, 2017.
Accounts Receivable No. 112 Owner’s Capital No. 301
4/7 2,900 4/29 900 4/1 16,000
Supplies No. 126 Service Revenue No. 400
4/4 1,900 4/7 2,900 4/12 1,200
Accounts Payable No. 201 Salaries and Wages Expense No. 726
4/25 1,600 4/4 1,900 4/15 700

Practice Problem 75
Bob Sample opened the Campus Laundromat on September 1, 2017. During the fi rst month of operations, the following transactions occurred.
Sept. 1 Bob invested $20,000 cash in the business. 2 The company paid $1,000 cash for store rent for September. 3 Purchased washers and dryers for $25,000, paying $10,000 in cash and signing
a $15,000, 6-month, 12% note payable. 4 Paid $1,200 for a one-year accident insurance policy. 10 Received a bill from the Daily News for online advertising of the opening of
the laundromat $200. 20 Bob withdrew $700 cash for personal use. 30 The company determined that cash receipts for laundry services for the
month were $6,200.
The chart of accounts for the company is the same as that for Pioneer Advertising plus No. 610 Advertising Expense.
Instructions(a) Journalize the September transactions. (Use J1 for the journal page number.)
(b) Open ledger accounts and post the September transactions.
(c) Prepare a trial balance at September 30, 2017.
Solution
PRACTICE PROBLEM
GENERAL JOURNAL J1
Date Account Titles and Explanation Ref. Debit Credit
2017Sept. 1 Cash 101 20,000 Owner’s Capital 301 20,000 (Owner’s investment of cash in business)
2 Rent Expense 729 1,000 Cash 101 1,000 (Paid September rent)
3 Equipment 157 25,000 Cash 101 10,000 Notes Payable 200 15,000 (Purchased laundry equipment for cash and 6-month, 12% note payable)
4 Prepaid Insurance 130 1,200 Cash 101 1,200 (Paid one-year insurance policy)
10 Advertising Expense 610 200 Accounts Payable 201 200 (Received bill from Daily News for
advertising)
20 Owner’s Drawings 306 700 Cash 101 700 (Withdrew cash for personal use)
30 Cash 101 6,200 Service Revenue 400 6,200 (Received cash for services performed)
(a)
Journalize transactions, post, and prepare a trial balance.
(LO 1, 2, 3, 4)

(b) GENERAL LEDGER
Cash No. 101
Date Explanation Ref. Debit Credit Balance
2017Sept. 1 J1 20,000 20,000
2 J1 1,000 19,000 3 J1 10,000 9,000 4 J1 1,200 7,800 20 J1 700 7,100 30 J1 6,200 13,300
Prepaid Insurance No. 130
Date Explanation Ref. Debit Credit Balance
2017Sept. 4 J1 1,200 1,200
Equipment No. 157
Date Explanation Ref. Debit Credit Balance
2017Sept. 3 J1 25,000 25,000
76 2 The Recording Process
Service Revenue No. 400
Date Explanation Ref. Debit Credit Balance
2017Sept. 30 J1 6,200 6,200
Advertising Expense No. 610
Date Explanation Ref. Debit Credit Balance
2017Sept. 10 J1 200 200
Rent Expense No. 729
Date Explanation Ref. Debit Credit Balance
2017Sept. 2 J1 1,000 1,000
(c)CAMPUS LAUNDROMAT
Trial BalanceSeptember 30, 2017
Debit Credit
Cash $13,300Prepaid Insurance 1,200Equipment 25,000Notes Payable $15,000Accounts Payable 200Owner’s Capital 20,000Owner’s Drawings 700Service Revenue 6,200Advertising Expense 200Rent Expense 1,000
$41,400 $41,400
Brief Exercises, Exercises, DO IT! Exercises, and Problems and many additional resources are available for practice in WileyPLUS
QUESTIONS
1. Describe the parts of a T-account. 2. “The terms debit and credit mean increase and
decrease, respectively.” Do you agree? Explain.
3. Heath Precourt, a fellow student, contends that the double-entry system means each transaction must be recorded twice. Is Heath correct? Explain.
Notes Payable No. 200
Date Explanation Ref. Debit Credit Balance
2017Sept. 3 J1 15,000 15,000
Accounts Payable No. 201
Date Explanation Ref. Debit Credit Balance
2017Sept. 10 J1 200 200
Owner’s Capital No. 301
Date Explanation Ref. Debit Credit Balance
2017Sept. 1 J1 20,000 20,000
Owner’s Drawings No. 306
Date Explanation Ref. Debit Credit Balance
2017Sept. 20 J1 700 700

Brief Exercises 77
4. Erica Mendez, a beginning accounting student, believes debit balances are favorable and credit bal-ances are unfavorable. Is Erica correct? Discuss.
5. State the rules of debit and credit as applied to (a) asset accounts, (b) liability accounts, and (c) the owner’s equity accounts (revenue, expenses, owner’s drawings, and owner’s capital).
6. What is the normal balance for each of the following accounts? (a) Accounts Receivable. (b) Cash. (c) Owner’s Drawings. (d) Accounts Payable. (e) Service Revenue. (f) Salaries and Wages Expense. (g) Owner’s Capital.
7. Indicate whether each of the following accounts is an asset, a liability, or an owner’s equity account and whether it has a normal debit or credit balance: (a) Accounts Receivable, (b) Accounts Payable, (c) Equipment, (d) Owner’s Drawings, and (e) Supplies.
8. For the following transactions, indicate the account debited and the account credited.(a) Supplies are purchased on account.(b) Cash is received on signing a note payable.(c) Employees are paid salaries in cash.
9. Indicate whether the following accounts generally will have (a) debit entries only, (b) credit entries only, or (c) both debit and credit entries.(1) Cash. (5) Salaries and Wages(2) Accounts Receivable. Expense.(3) Owner’s Drawings. (6) Service Revenue.(4) Accounts Payable.
10. What are the basic steps in the recording process? 11. What are the advantages of using a journal in the
recording process?12. (a) When entering a transaction in the journal,
should the debit or credit be written fi rst?(b) Which should be indented, the debit or credit?
13. Describe a compound entry, and provide an example.14. (a) Should business transaction debits and credits be
recorded directly in the ledger accounts?
(b) What are the advantages of fi rst recording trans-actions in the journal and then posting to the ledger?
15. The account number is entered as the last step in posting the amounts from the journal to the ledger. What is the advantage of this step?
16. Journalize the following business transactions.(a) Qing Wei invests $9,000 cash in the business.(b) Insurance of $800 is paid for the year.(c) Supplies of $2,000 are purchased on account.(d) Cash of $7,500 is received for services performed.
17. (a) What is a ledger?(b) What is a chart of accounts and why is it
important?18. What is a trial balance and what are its purposes?19. Victor Grimm is confused about how accounting
information fl ows through the accounting system. He believes the fl ow of information is as follows.(a) Debits and credits posted to the ledger.(b) Business transaction occurs.(c) Information entered in the journal.(d) Financial statements are prepared.(e) Trial balance is prepared.
Is Victor correct? If not, indicate to Victor the proper fl ow of the information.
20. Two students are discussing the use of a trial balance. They wonder whether the following errors, each con-sidered separately, would prevent the trial balance from balancing.(a) The bookkeeper debited Cash for $600 and cred-
ited Salaries and Wages Expense for $600 for payment of wages.
(b) Cash collected on account was debited to Cash for $900 and Service Revenue was credited for $90.
What would you tell them?21. What are the normal balances for Apple’s Cash,
Accounts Payable, and Interest Expense accounts?
BRIEF EXERCISES
BE2-1 For each of the following accounts, indicate the effects of (a) a debit and (b) a credit on the accounts and (c) the normal balance of the account.
1. Accounts Payable. 4. Accounts Receivable.2. Advertising Expense. 5. Owner’s Capital.3. Service Revenue. 6. Owner’s Drawings.
BE2-2 Transactions for the Tage Oslo Company for the month of June are presented below. Identify the accounts to be debited and credited for each transaction.
June 1 Tage Oslo invests $5,000 cash in a small welding business of which he is the sole proprietor.
2 Purchases equipment on account for $2,400. 3 $800 cash is paid to landlord for June rent. 12 Sends a bill to J. Kronsnoble for $300 for welding work performed on account.
BE2-3 Using the data in BE2-2, journalize the transactions. (You may omit explanations.)
BE2-4 Jen Shumway, a fellow student, is unclear about the basic steps in the recording process. Identify and briefl y explain the steps in the order in which they occur.
Indicate debit and credit effects and normal balance.
(LO 1)
Identify accounts to be debited and credited.
(LO 1)
Journalize transactions.
(LO 2)
Identify and explain steps in recording process.
(LO 2)

78 2 The Recording Process
BE2-5 M. Gonzales has the following transactions during August of the current year. Indi-cate (a) the effect on the accounting equation and (b) the debit-credit analysis illustrated on pages 61–65 of the textbook.
Aug. 1 Opens an offi ce as a fi nancial advisor, investing $8,000 in cash. 4 Pays insurance in advance for 6 months, $1,800 cash. 16 Receives $3,600 from clients for services performed. 27 Pays secretary $1,000 salary.
BE2-6 Using the data in BE2-5, journalize the transactions. (You may omit explanations.)
BE2-7 Selected transactions for the Brook Wang Company are presented in journal form below. Post the transactions to T-accounts. Make one T-account for each item and deter-mine each account’s ending balance.
Indicate basic and debit-credit analysis.
(LO 2)
Journalize transactions.
(LO 2)Post journal entries to T-accounts.
(LO 3)
J1
Date Account Titles and Explanation Ref. Debit Credit
May 5 Accounts Receivable 4,400 Service Revenue 4,400 (Billed for services performed)
12 Cash 2,400 Accounts Receivable 2,400 (Received cash in payment of account)
15 Cash 3,000 Service Revenue 3,000 (Received cash for services performed)
BE2-8 Selected journal entries for the Brook Wang Company are presented in BE2-7. Post the transactions using the standard form of account.
BE2-9 From the ledger balances given below, prepare a trial balance for the Amaro Com-pany at June 30, 2017. List the accounts in the order shown on page 58 of the textbook. All account balances are normal. Accounts Payable $8,100, Cash $5,800, Owner’s Capital $15,000, Owner’s Drawings $1,200, Equipment $17,000, Service Revenue $10,000, Accounts Receivable $3,000, Sala-ries and Wages Expense $5,100, and Rent Expense $1,000.
BE2-10 An inexperienced bookkeeper prepared the following trial balance. Prepare a cor-rect trial balance, assuming all account balances are normal.
Post journal entries to standard form of account.
(LO 3)
Prepare a trial balance.
(LO 4)
Prepare a correct trial balance.
(LO 4)
CAPPSHAW COMPANYTrial Balance
December 31, 2017
Debit Credit
Cash $10,800Prepaid Insurance $ 3,500Accounts Payable 3,000Unearned Service Revenue 2,200Owner’s Capital 9,000Owner’s Drawings 4,500Service Revenue 25,600Salaries and Wages Expense 18,600Rent Expense 2,400
$31,600 $48,000

Exercises 79
Tom Rast has just rented space in a strip mall. In this space, he will open a photography studio, to be called “Picture This!” A friend has advised Tom to set up a double-entry set of accounting records in which to record all of his business transactions. Identify the balance sheet accounts that Tom will likely need to record the transac-tions needed to open his business. Indicate whether the normal balance of each account is a debit or credit.
Tom Rast engaged in the following activities in establishing his photography studio, Picture This!:
1. Opened a bank account in the name of Picture This! and deposited $6,300 of his own money into this account as his initial investment.
2. Purchased photography supplies at a total cost of $1,100. The business paid $400 in cash and the balance is on account.
3. Obtained estimates on the cost of photography equipment from three different manu-facturers.
In what form (type of record) should Tom record these three activities? Prepare the entries to record the transactions.
Tom Rast recorded the following transactions during the month of April.
April 3 Cash 3,400 Service Revenue 3,400April 16 Rent Expense 700 Cash 700April 20 Salaries and Wages Expense 250 Cash 250
Post these entries to the Cash T-account of the general ledger to determine the ending balance in cash. The beginning balance in cash on April 1 was $1,600.
The following accounts are taken from the ledger of Carland Company at December 31, 2017.
200 Notes Payable $20,000 101 Cash $ 6,000301 Owner’s Capital 28,000 126 Supplies 6,000157 Equipment 80,000 729 Rent Expense 4,000306 Owner’s Drawings 8,000 212 Salaries and Wages Payable 3,000726 Salaries and Wages Expense 38,000 201 Accounts Payable 11,000400 Service Revenue 88,000 112 Accounts Receivable 8,000
Prepare a trial balance in good form.
Identify normal balances.
(LO 1)
Record business activities.
(LO 2)
Post transactions.
(LO 3)
Prepare a trial balance.
(LO 4)
DO IT! Exercises
DO IT! 2-1
DO IT! 2-2
DO IT! 2-3
DO IT! 2-4
EXERCISES
E2-1 Kim Yi has prepared the following list of statements about accounts.
1. An account is an accounting record of either a specifi c asset or a specifi c liability.2. An account shows only increases, not decreases, in the item it relates to.3. Some items, such as Cash and Accounts Receivable, are combined into one account.4. An account has a left, or credit side, and a right, or debit side.5. A simple form of an account consisting of just the account title, the left side, and the
right side, is called a T-account.
InstructionsIdentify each statement as true or false. If false, indicate how to correct the statement.
E2-2 Selected transactions for A. Mane, an interior decorator, in her fi rst month of business, are as follows.
Jan. 2 Invested $10,000 cash in business. 3 Purchased used car for $3,000 cash for use in business.
Analyze statements about accounting and the recording process.
(LO 1)
Identify debits, credits, and normal balances.
(LO 1)

80 2 The Recording Process
9 Purchased supplies on account for $500. 11 Billed customers $2,400 for services performed. 16 Paid $350 cash for advertising. 20 Received $700 cash from customers billed on January 11. 23 Paid creditor $300 cash on balance owed. 28 Withdrew $1,000 cash for personal use by owner.
InstructionsFor each transaction, indicate the following.
(a) The basic type of account debited and credited (asset, liability, owner’s equity).(b) The specifi c account debited and credited (Cash, Rent Expense, Service Revenue, etc.).(c) Whether the specifi c account is increased or decreased.(d) The normal balance of the specifi c account.
Use the following format, in which the January 2 transaction is given as an example.
E2-3 Data for A. Mane, interior decorator, are presented in E2-2.
InstructionsJournalize the transactions using journal page J1. (You may omit explanations.)
E2-4 The following information relates to Sanculi Real Estate Agency.
Oct. 1 Alan Sanculi begins business as a real estate agent with a cash investment of $15,000.
2 Hires an administrative assistant. 3 Purchases offi ce furniture for $1,900, on account. 6 Sells a house and lot for R. Craig; bills R. Craig $3,800 for realty services
performed. 27 Pays $1,100 on the balance related to the transaction of October 3. 30 Pays the administrative assistant $2,500 in salary for October.
InstructionsPrepare the debit-credit analysis for each transaction as illustrated on pages 61–65.
E2-5 Transaction data for Sanculi Real Estate Agency are presented in E2-4.
InstructionsJournalize the transactions. (You may omit explanations.)
E2-6 Marx Industries had the following transactions.
1. Borrowed $5,000 from the bank by signing a note.2. Paid $3,100 cash for a computer.3. Purchased $850 of supplies on account.
Instructions(a) Indicate what accounts are increased and decreased by each transaction.(b) Journalize each transaction. (Omit explanations.)
E2-7 Halladay Enterprises had the following selected transactions.
1. Bo Halladay invested $4,000 cash in the business.2. Paid offi ce rent of $840.3. Performed consulting services and billed a client $5,200.4. Bo Halladay withdrew $750 cash for personal use.
Instructions(a) Indicate the effect each transaction has on the accounting equation (Assets 5 Liabilities 1 Owner’s Equity), using plus and minus signs.(b) Journalize each transaction. (Omit explanations.)
Journalize transactions.
(LO 2)
Analyze transactions and determine their effect on accounts.
(LO 1)
Journalize transactions.
(LO 2)
Analyze transactions and journalize.
(LO 1, 2)
Analyze transactions and journalize.
(LO 1, 2)
Account Debited Account Credited
(a) (b) (c) (d) (a) (b) (c) (d) Basic Specifi c Normal Basic Specifi c Normal Date Type Account Effect Balance Type Account Effect Balance
Jan. 2 Asset Cash Increase Debit Owner’s Owner’s Increase Credit Equity Capital

Exercises 81
E2-8 Teresa Alvarez has prepared the following list of statements about the general ledger.
1. The general ledger contains all the asset and liability accounts but no owner’s equity accounts.
2. The general ledger is sometimes referred to as simply the ledger.3. The accounts in the general ledger are arranged in alphabetical order.4. Each account in the general ledger is numbered for easier identifi cation.5. The general ledger is a book of original entry.
InstructionsIdentify each statement as true or false. If false, indicate how to correct the statement.
E2-9 Selected transactions from the journal of June Feldman, investment broker, are presented below.
Analyze statements about the ledger.
(LO 3)
Post journal entries and prepare a trial balance.
(LO 3, 4)
Date Account Titles and Explanation Ref. Debit Credit
Aug. 1 Cash 5,000 Owner’s Capital 5,000 (Owner’s investment of cash in business)
10 Cash 2,600 Service Revenue 2,600 (Received cash for services performed)
12 Equipment 5,000 Cash 2,300 Notes Payable 2,700 (Purchased equipment for cash
and notes payable)
25 Accounts Receivable 1,700 Service Revenue 1,700 (Billed clients for services performed)
31 Cash 900 Accounts Receivable 900 (Receipt of cash on account)
Instructions(a) Post the transactions to T-accounts.(b) Prepare a trial balance at August 31, 2017.
E2-10 The T-accounts below summarize the ledger of Daggett Landscaping Company at the end of the fi rst month of operations.
Journalize transactions from account data and prepare a trial balance.
(LO 2, 4) Cash No. 101 Unearned Service Revenue No. 209
4/1 12,000 4/15 1,300 4/30 1,0004/12 900 4/25 1,5004/29 4004/30 1,000
Accounts Receivable No. 112 Owner’s Capital No. 301
4/7 3,200 4/29 400 4/1 12,000
Supplies No. 126 Service Revenue No. 400
4/4 1,800 4/7 3,200 4/12 900
Accounts Payable No. 201 Salaries and Wages Expense No. 726
4/25 1,500 4/4 1,800 4/15 1,300

82 2 The Recording Process
Instructions(a) Prepare the complete general journal (including explanations) from which the post-
ings to Cash were made.(b) Prepare a trial balance at April 30, 2017.
E2-11 Presented below is the ledger for Shumway Co.Journalize transactions from account data and prepare a trial balance.
(LO 2, 4)
Instructions(a) Reproduce the journal entries for the transactions that occurred on October 1, 10, and
20, and provide explanations for each.(b) Determine the October 31 balance for each of the accounts above, and prepare a trial
balance at October 31, 2017.
E2-12 Selected transactions for Dianne Burke Company during its fi rst month in business are presented below.
Sept. 1 Invested $10,000 cash in the business. 5 Purchased equipment for $12,000 paying $4,000 in cash and the balance on
account. 25 Paid $3,000 cash on balance owed for equipment. 30 Withdrew $700 cash for personal use.
Burke’s chart of accounts shows: No. 101 Cash, No. 157 Equipment, No. 201 Accounts Payable, No. 301 Owner’s Capital, and No. 306 Owner’s Drawings.
Instructions(a) Journalize the transactions on page J1 of the journal. (Omit explanations.)(b) Post the transactions using the standard account form.
E2-13 The bookkeeper for J.L. Kang Equipment Repair made a number of errors in jour-nalizing and posting, as described below.
1. A credit posting of $525 to Accounts Receivable was omitted.2. A debit posting of $750 for Prepaid Insurance was debited to Insurance Expense.3. A collection from a customer of $100 in payment of its account owed was journalized
and posted as a debit to Cash $100 and a credit to Service Revenue $100.4. A credit posting of $415 to Property Taxes Payable was made twice.
Prepare journal entries and post using standard account form.
(LO 2, 3)
Analyze errors and their effects on trial balance.
(LO 4)
Cash No. 101
10/1 3,000 10/4 40010/10 750 10/12 1,50010/10 4,000 10/15 35010/20 500 10/30 30010/25 2,000 10/31 500
Owner’s Capital No. 301
10/1 3,000 10/25 2,000
Owner’s Drawings No. 306
10/30 300
Accounts Receivable No. 112
10/6 800 10/20 50010/20 940
Service Revenue No. 400
10/6 800 10/10 750 10/20 940
Supplies No. 126
10/4 400
Salaries and Wages Expense No. 726
10/31 500
Equipment No. 157
10/3 2,000
Rent Expense No. 729
10/15 350
Notes Payable No. 200
10/10 4,000
Accounts Payable No. 201
10/12 1,500 10/3 2,000

Problems: Set A 83
5. A cash purchase of supplies for $250 was journalized and posted as a debit to Supplies $25 and a credit to Cash $25.
6. A debit of $625 to Advertising Expense was posted as $652.
InstructionsFor each error:
(a) Indicate whether the trial balance will balance.(b) If the trial balance will not balance, indicate the amount of the difference.(c) Indicate the trial balance column that will have the larger total.
Consider each error separately. Use the following form, in which error (1) is given as an example.
E2-14 The accounts in the ledger of Overnite Delivery Service contain the following balances on July 31, 2017.
Accounts Receivable $ 7,642 Prepaid Insurance $ 1,968Accounts Payable 8,396 Maintenance and Repairs Expense 961Cash ? Service Revenue 10,610Equipment 49,360 Owner’s Drawings 700Gasoline Expense 758 Owner’s Capital 42,000Utilities Expense 523 Salaries and Wages Expense 4,428Notes Payable 17,000 Salaries and Wages Payable 815
InstructionsPrepare a trial balance with the accounts arranged as illustrated in the chapter and fi ll in the missing amount for Cash.
Prepare a trial balance.
(LO 4)
(a) (b) (c) Error In Balance Difference Larger Column
(1) No $525 debit
EXERCISES: SET B AND CHALLENGE EXERCISES
Visit the book’s companion website, at www.wiley.com/college/weygandt, and choose the Student Companion site to access Exercises: Set B and Challenge Exercises.
PROBLEMS: SET A
P2-1A Holz Disc Golf Course was opened on March 1 by Ian Holz. The following selected events and transactions occurred during March.
Mar. 1 Invested $20,000 cash in the business. 3 Purchased Rainbow Golf Land for $15,000 cash. The price consists of land
$12,000, shed $2,000, and equipment $1,000. (Make one compound entry.) 5 Paid advertising expenses of $900. 6 Paid cash $600 for a one-year insurance policy. 10 Purchased golf discs and other equipment for $1,050 from Stevenson
Company payable in 30 days. 18 Received $1,100 in cash for golf fees (Holz records golf fees as service revenue). 19 Sold 150 coupon books for $10 each. Each book contains 4 coupons that
enable the holder to play one round of disc golf. 25 Withdrew $800 cash for personal use. 30 Paid salaries of $250. 30 Paid Stevenson Company in full. 31 Received $2,700 cash for golf fees.
Holz Disc Golf uses the following accounts: Cash, Prepaid Insurance, Land, Buildings, Equipment, Accounts Payable, Unearned Service Revenue, Owner’s Capital, Owner’s Drawings, Service Revenue, Advertising Expense, and Salaries and Wages Expense.
InstructionsJournalize the March transactions.
Journalize a series of transactions.
(LO 1, 2)

84 2 The Recording Process
P2-2A Emily Valley is a licensed dentist. During the fi rst month of the operation of her business, the following events and transactions occurred.April 1 Invested $20,000 cash in her business. 1 Hired a secretary-receptionist at a salary of $700 per week payable monthly. 2 Paid offi ce rent for the month $1,100. 3 Purchased dental supplies on account from Dazzle Company $4,000. 10 Performed dental services and billed insurance companies $5,100. 11 Received $1,000 cash advance from Leah Mataruka for an implant. 20 Received $2,100 cash for services performed from Michael Santos. 30 Paid secretary-receptionist for the month $2,800. 30 Paid $2,400 to Dazzle for accounts payable due.Emily uses the following chart of accounts: No. 101 Cash, No. 112 Accounts Receivable, No. 126 Supplies, No. 201 Accounts Payable, No. 209 Unearned Service Revenue, No. 301 Owner’s Capital, No. 400 Service Revenue, No. 726 Salaries and Wages Expense, and No. 729 Rent Expense.Instructions(a) Journalize the transactions.(b) Post to the ledger accounts.(c) Prepare a trial balance on April 30, 2017.
P2-3A Maquoketa Services was formed on May 1, 2017. The following transactions took place during the fi rst month.Transactions on May 1: 1. Jay Bradford invested $40,000 cash in the company, as its sole owner. 2. Hired two employees to work in the warehouse. They will each be paid a salary of
$3,050 per month. 3. Signed a 2-year rental agreement on a warehouse; paid $24,000 cash in advance for
the fi rst year. 4. Purchased furniture and equipment costing $30,000. A cash payment of $10,000 was
made immediately; the remainder will be paid in 6 months. 5. Paid $1,800 cash for a one-year insurance policy on the furniture and equipment.Transactions during the remainder of the month:
6. Purchased basic offi ce supplies for $420 cash. 7. Purchased more offi ce supplies for $1,500 on account. 8. Total revenues earned were $20,000—$8,000 cash and $12,000 on account. 9. Paid $400 to suppliers for accounts payable due. 10. Received $3,000 from customers in payment of accounts receivable. 11. Received utility bills in the amount of $380, to be paid next month. 12. Paid the monthly salaries of the two employees, totaling $6,100.
Instructions(a) Prepare journal entries to record each of the events listed. (Omit explanations.)(b) Post the journal entries to T-accounts.(c) Prepare a trial balance as of May 31, 2017.
P2-4A The trial balance of Avtar Sandhu Co. shown below does not balance.
Journalize transactions, post, and prepare a trial balance.
(LO 1, 2, 3, 4)
(c) Trial balance totals $29,800
Journalize transactions, post, and prepare a trial balance.
(LO 1, 2, 3, 4)
(c) Trial balance totals $81,480
Prepare a correct trial balance.
(LO 4)AVTAR SANDHU CO.
Trial BalanceJune 30, 2017
Debit Credit
Cash $ 3,340Accounts Receivable $ 2,812Supplies 1,200Equipment 2,600Accounts Payable 3,666Unearned Service Revenue 1,100Owner’s Capital 8,000Owner’s Drawings 800Service Revenue 2,480Salaries and Wages Expense 3,200Utilities Expense 810
$12,522 $17,486

Problems: Set B and Set C 85
Each of the listed accounts has a normal balance per the general ledger. An examination of the ledger and journal reveals the following errors.
1. Cash received from a customer in payment of its account was debited for $580, and Accounts Receivable was credited for the same amount. The actual collection was for $850.
2. The purchase of a computer on account for $710 was recorded as a debit to Supplies for $710 and a credit to Accounts Payable for $710.
3. Services were performed on account for a client for $980. Accounts Receivable was debited for $980, and Service Revenue was credited for $98.
4. A debit posting to Salaries and Wages Expense of $700 was omitted.5. A payment of a balance due for $306 was credited to Cash for $306 and credited to
Accounts Payable for $360.6. The withdrawal of $600 cash for Sandhu’s personal use was debited to Salaries and
Wages Expense for $600 and credited to Cash for $600.
InstructionsPrepare a correct trial balance. (Hint: It helps to prepare the correct journal entry for the transaction described and compare it to the mistake made.)
P2-5A The Starr Theater, owned by Meg Vargo, will begin operations in March. The Starr will be unique in that it will show only triple features of sequential theme movies. As of March 1, the ledger of Starr showed: No. 101 Cash $3,000, No. 140 Land $24,000, No. 145 Buildings (concession stand, projection room, ticket booth, and screen) $10,000, No. 157 Equipment $10,000, No. 201 Accounts Payable $7,000, and No. 301 Owner’s Capital $40,000. During the month of March, the following events and transactions occurred.
Mar. 2 Rented the three Indiana Jones movies to be shown for the fi rst 3 weeks of March. The fi lm rental was $3,500; $1,500 was paid in cash and $2,000 will be paid on March 10.
3 Ordered the Lord of the Rings movies to be shown the last 10 days of March. It will cost $200 per night.
9 Received $4,300 cash from admissions. 10 Paid balance due on Indiana Jones movies rental and $2,100 on March 1
accounts payable. 11 Starr Theater contracted with Adam Ladd to operate the concession stand.
Ladd is to pay 15% of gross concession receipts, payable monthly, for the rental of the concession stand.
12 Paid advertising expenses $900. 20 Received $5,000 cash from customers for admissions. 20 Received the Lord of the Rings movies and paid the rental fee of $2,000. 31 Paid salaries of $3,100. 31 Received statement from Adam Ladd showing gross receipts from concessions of
$6,000 and the balance due to Starr Theater of $900 ($6,000 3 15%) for March. Ladd paid one-half the balance due and will remit the remainder on April 5.
31 Received $9,000 cash from customers for admissions.
In addition to the accounts identifi ed above, the chart of accounts includes: No. 112 Accounts Receivable, No. 400 Service Revenue, No. 429 Rent Revenue, No. 610 Advertis-ing Expense, No. 726 Salaries and Wages Expense, and No. 729 Rent Expense.
Instructions(a) Enter the beginning balances in the ledger. Insert a check mark (✓) in the reference
column of the ledger for the beginning balance.(b) Journalize the March transactions. Starr records admission revenue as service revenue,
rental of the concession stand as rent revenue, and fi lm rental expense as rent expense.(c) Post the March journal entries to the ledger. Assume that all entries are posted from
page 1 of the journal.(d) Prepare a trial balance on March 31, 2017.
Trial balance totals $15,462
Journalize transactions, post, and prepare a trial balance.
(LO 1, 2, 3, 4)
(d) Trial balance totals $64,100
PROBLEMS: SET B AND SET C
Visit the book’s companion website, at www.wiley.com/college/weygandt, and choose the Student Companion site to access Problems: Set B and Set C.

86 2 The Recording Process
CONTINUING PROBLEM
COOKIE CREATIONS: AN ENTREPRENEURIAL JOURNEY(Note: This is a continuation of the Cookie Creations problem from Chapter 1.)
CC2 After researching the different forms of business organization. Natalie Koebel decides to operate “Cookie Creations” as a proprietorship. She then starts the process of getting the business running. In November 2016, the following activities take place.
Nov. 8 Natalie cashes her U.S. Savings Bonds and receives $520, which she deposits in her personal bank account.
8 She opens a bank account under the name “Cookie Creations” and transfers $500 from her personal account to the new account.
11 Natalie pays $65 for advertising. 13 She buys baking supplies, such as fl our, sugar, butter, and chocolate chips, for $125 cash.
(Hint: Use Supplies account.) 14 Natalie starts to gather some baking equipment to take with her when teaching the
cookie classes. She has an excellent top-of-the-line food processor and mixer that originally cost her $750. Natalie decides to start using it only in her new business. She estimates that the equipment is currently worth $300. She invests the equipment in the business.
16 Natalie realizes that her initial cash investment is not enough. Her grandmother lends her $2,000 cash, for which Natalie signs a note payable in the name of the business. Natalie deposits the money in the business bank account. (Hint: The note does not have to be repaid for 24 months. As a result, the note payable should be reported in the accounts as the last liability and also on the balance sheet as the last liability.)
17 She buys more baking equipment for $900 cash. 20 She teaches her fi rst class and collects $125 cash. 25 Natalie books a second class for December 4 for $150. She receives $30 cash in advance as
a down payment. 30 Natalie pays $1,320 for a one-year insurance policy that will expire on December 1, 2017.
Instructions(a) Prepare journal entries to record the November transactions.(b) Post the journal entries to general ledger accounts.(c) Prepare a trial balance at November 30.
PERSPECTIVEFINANCIAL REPORTING AND ANALYSIS
Financial Reporting Problem: Apple Inc.BYP2-1 The fi nancial statements of Apple Inc. are presented in Appendix A. Instructions for access-ing and using the company’s complete annual report, including the notes to the fi nancial statements, are also provided in Appendix A. Apple’s fi nancial statements contain the following selected accounts, stated in millions of dollars.
Accounts Payable Cash and Cash EquivalentsAccounts Receivable Research and Development ExpenseProperty, Plant, and Equipment Inventories
Instructions(a) Answer the following questions. (1) What is the increase and decrease side for each account? (2) What is the normal balance for each account?
BROADENING YOUR
© leungchopan/Shutterstock

Broadening Your Perspective 87
(b) Identify the probable other account in the transaction and the effect on that account when: (1) Accounts Receivable is decreased. (2) Accounts Payable is decreased. (3) Inventories are increased.(c) Identify the other account(s) that ordinarily would be involved when: (1) Research and Development Expense is increased. (2) Property, Plant, and Equipment is increased.
Comparative Analysis Problem: PepsiCo, Inc. vs. The Coca-Cola CompanyBYP2-2 PepsiCo, Inc.’s fi nancial statements are presented in Appendix B. Financial statement of The Coca-Cola Company are presented in Appendix C. Instructions for accessing and using the complete annual reports of PepsiCo and Coca-Cola, including the notes to the fi nancial statements, are also provided in Appendices B and C, respectively.
Instructions(a) Based on the information contained in the fi nancial statements, determine the normal balance of
the listed accounts for each company.
PepsiCo Coca-Cola1. Inventory 1. Accounts Receivable2. Property, Plant, and Equipment 2. Cash and Cash Equivalents3. Accounts Payable 3. Cost of Goods Sold (expense)4. Interest Expense 4. Sales (revenue)
(b) Identify the other account ordinarily involved when: (1) Accounts Receivable is increased. (2) Salaries and Wages Payable is decreased. (3) Property, Plant, and Equipment is increased. (4) Interest Expense is increased.
Comparative Analysis Problem: Amazon.com, Inc. vs. Wal-Mart Stores, Inc.BYP2-3 Amazon.com, Inc.’s fi nancial statements are presented in Appendix D. Financial statements of Wal-Mart Stores, Inc. are presented in Appendix E. Instructions for accessing and using the com-plete annual reports of Amazon and Wal-Mart, including the notes to the fi nancial statements, are also provided in Appendices D and E, respectively.
Instructions(a) Based on the information contained in the fi nancial statements, determine the normal balance of
the listed accounts for each company.
Amazon Wal-Mart1. Interest Expense 1. Net Product Revenues2. Cash and Cash Equivalents 2. Inventories3. Accounts Payable 3. Cost of Sales
(b) Identify the other account ordinarily involved when: (1) Accounts Receivable is increased. (2) Interest Expense is increased. (3) Salaries and Wages Payable is decreased. (4) Service Revenue is increased.
Real-World FocusBYP2-4 Much information about specifi c companies is available on the Internet. Such information includes basic descriptions of the company’s location, activities, industry, fi nancial health, and fi nan-cial performance.
Address: biz.yahoo.com/i, or go to www.wiley.com/college/weygandt

Steps1. Type in a company name, or use index to fi nd company name.2. Choose Profi le. Perform instructions (a)–(c) below.3. Click on the company’s specifi c industry to identify competitors. Perform instructions (d)–(g) below.
InstructionsAnswer the following questions.
(a) What is the company’s industry?(b) What is the company’s total sales?(c) What is the company’s net income?(d) What are the names of four of the company’s competitors?(e) Choose one of these competitors.(f) What is this competitor’s name? What are its sales? What is its net income?(g) Which of these two companies is larger by size of sales? Which one reported higher net income?
BYP2-5 The January 27, 2011, edition of the New York Times contains an article by Richard Sandomir entitled “N.F.L. Finances, as Seen Through Packers’ Records.” The article discusses the fact that the Green Bay Packers are the only NFL team that publicly publishes its annual report.
InstructionsRead the article and answer the following questions.
(a) Why are the Green Bay Packers the only professional football team to publish and distribute an annual report?
(b) Why is the football players’ labor union particularly interested in the Packers’ annual report?(c) In addition to the players’ labor union, what other outside party might be interested in the annual
report?(d) Even though the Packers’ revenue increased in recent years, the company’s operating profi t fell
signifi cantly. How does the article explain this decline?
CRITICAL THINKING
Communication ActivityBYP2-6 Amelia’s Maid Company offers home-cleaning service. Two recurring transactions for the company are billing customers for services performed and paying employee salaries. For example, on March 15, bills totaling $6,000 were sent to customers and $2,000 was paid in salaries to employees.
InstructionsWrite a memo to your instructor that explains and illustrates the steps in the recording process for each of the March 15 transactions. Use the format illustrated in the text under the heading, “The Recording Process Illustrated” (p. 61).
Ethics CasesBYP2-7 Ellynn Kole is the assistant chief accountant at Doman Company, a manufacturer of com-puter chips and cellular phones. The company presently has total sales of $20 million. It is the end of the fi rst quarter. Ellynn is hurriedly trying to prepare a trial balance so that quarterly fi nancial state-ments can be prepared and released to management and the regulatory agencies. The total credits on the trial balance exceed the debits by $1,000. In order to meet the 4 p.m. deadline, Ellynn decides to force the debits and credits into balance by adding the amount of the difference to the Equipment account. She chooses Equipment because it is one of the larger account balances; percentage-wise, it will be the least misstated. Ellynn “plugs” the difference! She believes that the difference will not affect anyone’s decisions. She wishes that she had another few days to fi nd the error but realizes that the fi nancial statements are already late.
Instructions(a) Who are the stakeholders in this situation?(b) What are the ethical issues involved in this case?(c) What are Ellynn’s alternatives?
BYP2-8 If you haven’t already done so, in the not-too-distant future you will prepare a résumé. In some ways, your résumé is like a company’s annual report. Its purpose is to enable others to evaluate your past, in an effort to predict your future.
88 2 The Recording Process

Broadening Your Perspective 89
A résumé is your opportunity to create a positive fi rst impression. It is important that it be impressive—but it should also be accurate. In order to increase their job prospects, some people are tempted to “infl ate” their résumés by overstating the importance of some past accomplishments or positions. In fact, you might even think that “everybody does it” and that if you don’t do it, you will be at a disadvantage. David Edmondson, the president and CEO of well-known electronics retailer Radio Shack, over-stated his accomplishments by claiming that he had earned a bachelor’s of science degree, when in fact he had not. Apparently, his employer had not done a background check to ensure the accuracy of his résumé. Should Radio Shack have fi red him?
YES: Radio Shack is a publicly traded company. Investors, creditors, employees, and others doing business with the company will not trust it if its leader is known to have poor integrity. The “tone at the top” is vital to creating an ethical organization.NO: Mr. Edmondson had been a Radio Shack employee for 11 years. He had served the company in a wide variety of positions, and had earned the position of CEO through exceptional perfor-mance. While the fact that he lied 11 years earlier on his résumé was unfortunate, his service since then made this past transgression irrelevant. In addition, the company was in the midst of a massive restructuring, which included closing 700 of its 7,000 stores. It could not afford addi-tional upheaval at this time.
InstructionsWrite a response indicating your position regarding this situation. Provide support for your view.
All About YouBYP2-9 Every company needs to plan in order to move forward. Its top management must consider where it wants the company to be in three to fi ve years. Like a company, you need to think about where you want to be three to fi ve years from now, and you need to start taking steps now in order to get there.
InstructionsProvide responses to each of the following items.
(a) Where would you like to be working in three to fi ve years? Describe your plan for getting there by identifying between fi ve and 10 specifi c steps that you need to take.
(b) In order to get the job you want, you will need a résumé. Your résumé is the equivalent of a com-pany’s annual report. It needs to provide relevant and reliable information about your past accom-plishments so that employers can decide whether to “invest” in you. Do a search on the Internet to fi nd a good résumé format. What are the basic elements of a résumé?
(c) A company’s annual report provides information about a company’s accomplishments. In order for investors to use the annual report, the information must be reliable; that is, users must have faith that the information is accurate and believable. How can you provide assurance that the information on your résumé is reliable?
(d) Prepare a résumé assuming that you have accomplished the fi ve to 10 specifi c steps you identifi ed in part (a). Also, provide evidence that would give assurance that the information is reliable.
Considering People, Planet, and Profi tBYP2-10 Auditors provide a type of certifi cation of corporate fi nancial statements. Certifi cation is used in many other aspects of business as well. For example, it plays a critical role in the sustainability movement. The February 7, 2012, issue of the New York Times contained an article by S. Amanda Caudill entitled “Better Lives in Better Coffee,” which discusses the role of certifi cation in the coffee business.
Address: http://scientistatwork.blogs.nytimes.com/2012/02/07/better-lives-in-better-coffee
InstructionsRead the article and answer the following questions.
(a) The article mentions three different certifi cation types that coffee growers can obtain from three different certifi cation bodies. Using fi nancial reporting as an example, what potential problems might the existence of multiple certifi cation types present to coffee purchasers?
(b) According to the author, which certifi cation is most common among coffee growers? What are the possible reasons for this?
(c) What social and environmental benefi ts are coffee certifi cations trying to achieve? Are there also potential fi nancial benefi ts to the parties involved?
90 2 The Recording Process
5 Compare the procedures for the accounting process under GAAP and IFRS.
LEARNING OBJECTIVE
International companies use the same set of procedures and records to keep track of transaction data. Thus, the material in Chapter 2 dealing with the account, general rules of debit and credit, and steps in the recording process—the journal, ledger, and chart of accounts—is the same under both GAAP and IFRS.
Key PointsFollowing are the key similarities and differences between GAAP and IFRS as related to the recording process.
Similarities• Transaction analysis is the same under IFRS and GAAP.
• Both the IASB and the FASB go beyond the basic defi nitions provided in the textbook for the key elements of fi nancial statements, that is assets, liabilities, equity, revenue, and expenses. The impli-cations of the expanded defi nitions are discussed in more advanced accounting courses.
• As shown in the textbook, dollar signs are typically used only in the trial balance and the fi nancial statements. The same practice is followed under IFRS, using the currency of the country where the reporting company is headquartered.
• A trial balance under IFRS follows the same format as shown in the textbook.
Differences• IFRS relies less on historical cost and more on fair value than do FASB standards.
• Internal controls are a system of checks and balances designed to prevent and detect fraud and errors. While most public U.S. companies have these systems in place, many non-U.S. companies have never completely documented the controls nor had an independent auditors attest to their effectiveness.
Looking to the FutureThe basic recording process shown in this textbook is followed by companies across the globe. It is unlikely to change in the future. The defi nitional structure of assets, liabilities, equity, revenues, and expenses may change over time as the IASB and FASB evaluate their overall conceptual framework for establishing accounting standards.
IFRS Practice
IFRS Self-Test Questions
1. Which statement is correct regarding IFRS?(a) IFRS reverses the rules of debits and credits, that is, debits are on the right and credits are on
the left.(b) IFRS uses the same process for recording transactions as GAAP.(c) The chart of accounts under IFRS is different because revenues follow assets.(d) None of the above statements are correct.
2. The expanded accounting equation under IFRS is as follows:(a) Assets 5 Liabilities 1 Owner’s Capital 1 Owner’s Drawings 1 Revenues 2 Expenses.(b) Assets 1 Liabilities 5 Owner’s Capital 1 Owner’s Drawings 1 Revenues 2 Expenses.(c) Assets 5 Liabilities 1 Owner’s Capital 2 Owner’s Drawings 1 Revenues 2 Expenses.(d) Assets 5 Liabilities 1 Owner’s Capital 1 Owner’s Drawings 2 Revenues 2 Expenses.
3. A trial balance:(a) is the same under IFRS and GAAP.(b) proves that transactions are recorded correctly.
A Look at IFRS

A Look at IFRS 91
(c) proves that all transactions have been recorded.(d) will not balance if a correct journal entry is posted twice.
4. One difference between IFRS and GAAP is that:(a) GAAP uses accrual-accounting concepts and IFRS uses primarily the cash basis of accounting.(b) IFRS uses a different posting process than GAAP.(c) IFRS uses more fair value measurements than GAAP.(d) the limitations of a trial balance are different between IFRS and GAAP.
5. The general policy for using proper currency signs (dollar, yen, pound, etc.) is the same for both IFRS and this textbook. This policy is as follows:(a) Currency signs only appear in ledgers and journal entries.(b) Currency signs are only shown in the trial balance.(c) Currency signs are shown for all compound journal entries.(d) Currency signs are shown in trial balances and fi nancial statements.
International Financial Reporting Problem: Louis Vuitton
IFRS2-1 The fi nancial statements of Louis Vuitton are presented in Appendix F. Instructions for accessing and using the company’s complete annual report, including the notes to its fi nancial state-ments, are also provided in Appendix F.
InstructionsDescribe in which statement each of the following items is reported, and the position in the statement (e.g., current asset).
(a) Other operating income and expense.(b) Cash and cash equivalents.(c) Trade accounts payable.(d) Cost of net fi nancial debt.
Answers to IFRS Self-Test Questions
1. b 2. c 3. a 4. c 5. d

Who doesn’t like buying things at a discount? That’s why it’s
not surprising that three years after it started as a company,
Groupon was estimated to be worth $16 billion. This translates
into an average increase in value of almost $15 million per day.
Now consider that Groupon had previously been estimated
to be worth even more than that. What happened? Well,
accounting regulators and investors began to question the
way that Groupon had accounted for some of its transactions.
But if Groupon sells only coupons (“groupons”), how hard
can it be to accurately account for that? It turns out that
accounting for coupons is not as easy as you might think.
First, consider what happens when Groupon makes a sale.
Suppose it sells a groupon for $30 for Highrise Hamburgers.
When it receives the $30 from the customer, it must turn over
half of that amount ($15) to Highrise Hamburgers. So should
Groupon record revenue for the full $30 or just $15? Until
recently, Groupon recorded the full $30. But, in response to
an SEC ruling on the issue, Groupon now records revenue
of $15 instead.
A second issue is a matter of timing. When should Groupon
record this $15 revenue? Should it record the revenue when it
sells the groupon, or must it wait until the customer uses the
groupon at Highrise Hamburgers? You can fi nd the answer to
this question in the notes to Groupon’s fi nancial statements. It
recognizes the revenue once “the number of customers who
purchase the daily deal exceeds the predetermined threshold,
the Groupon has been electronically delivered to the purchaser
and a listing of Groupons sold has been made available to the
merchant.”
The accounting becomes even more complicated when you
consider the company’s loyalty programs. Groupon offers free
or discounted groupons to its subscribers for doing things
such as referring new customers or participating in
promotions. These groupons are to be used for future
purchases, yet the company must record the expense at the
time the customer receives the groupon. The cost of these
programs is huge for Groupon, so the timing of this expense
can defi nitely affect its reported income.
The fi nal kicker is that Groupon, like all other companies,
must rely on many estimates in its fi nancial reporting. For
example, Groupon reports that “estimates are utilized for, but
not limited to, stock-based compensation, income taxes,
valuation of acquired goodwill and intangible assets, customer
refunds, contingent liabilities and the depreciable lives of fi xed
assets.” It concludes by saying that “actual results could differ
materially from those estimates.” So, next time you use a
coupon, think about what that means for the company’s
accountants!.
Keeping Track of Groupons
In Chapter 1, you learned a neat little formula: Net income 5 Revenues 2 Expenses. In Chapter 2, you learned some rules for recording revenue and expense transactions. Guess what? Things are not really that nice and neat. In fact, it is often diffi cult for companies to determine in what time period they should report some revenues and expenses. In other words, in measuring net income, timing is everything.
CHAPTER PREVIEW
3
FEATURE STORY
Adjusting the Accounts
92

Describe the nature and purpose of an adjusted trial balance.
Prepare adjusting entries for deferrals.
Prepare adjusting entries for accruals.
2
3
4
Explain the accrual basis of accounting and the reasons for adjusting entries.1 Timing ConceptsDO IT! 1
• Fiscal and calendar years• Accrual- vs. cash-basis
accounting• Recognizing revenues and
expenses• Need for adjusting entries• Types of adjusting entries
Adjusting Entries for Deferrals
DO IT! 2• Prepaid expenses• Unearned revenues
Learning Objectives
Adjusting Entries for AccrualsDO IT! 3
• Accrued revenues• Accrued expenses• Summary of basic relationships
Trial BalanceDO IT! 4• Preparing the adjusted trial
balance• Preparing fi nancial statements
Go to the REVIEW AND PRACTICE section at the end of the chapter for a review of key concepts and practice applications with solutions.
Visit WileyPLUS with ORION for additional tutorials and practice opportunities.
CHAPTER OUTLINE
Rudy Archuleta/Redux Pictures

94 3 Adjusting the Accounts
1 Explain the accrual basis of accounting and the reasons for adjusting entries.
LEARNING OBJECTIVE
If we could wait to prepare fi nancial statements until a company ended its oper-ations, no adjustments would be needed. At that point, we could easily determine its fi nal balance sheet and the amount of lifetime income it earned. However, most companies need immediate feedback about how well they are doing. For example, management usually wants monthly fi nancial statements. The Internal Revenue Service requires all businesses to fi le annual tax returns. Therefore, accountants divide the economic life of a business into artifi cial time periods. This convenient assumption is referred to as the time period assumption. Many business transactions affect more than one of these arbitrary time periods. For example, the airplanes purchased by Southwest Airlines fi ve years ago are still in use today. We must determine the relevance of each business transaction to specifi c accounting periods. (How much of the cost of an airplane contributed to operations this year?)
Fiscal and Calendar Years
Both small and large companies prepare fi nancial statements periodically in order to assess their fi nancial condition and results of operations. Accounting time periods are generally a month, a quarter, or a year. Monthly and quar-terly time periods are called interim periods. Most large companies must pre-pare both quarterly and annual fi nancial statements. An accounting time period that is one year in length is a fi scal year. A fi scal year usually begins with the fi rst day of a month and ends 12 months later on the last day of a month. Many businesses use the calendar year (January 1 to December 31) as their accounting period. Some do not. Companies whose fi scal year differs from the calendar year include Delta Air Lines, June 30, and The Walt Disney Company, September 30. Sometimes a company’s year-end will vary from year to year. For example, PepsiCo’s fi scal year ends on the Friday closest to December 31, which was December 29 in 2012 and December 28 in 2013.
Accrual- versus Cash-Basis Accounting
What you will learn in this chapter is accrual-basis accounting. Under the accrual basis, companies record transactions that change a company’s fi nancial statements in the periods in which the events occur. For example, using the accrual basis to determine net income means companies recognize revenues when they perform services (rather than when they receive cash). It also means recognizing expenses when incurred (rather than when paid). An alternative to the accrual basis is the cash basis. Under cash-basis accounting, companies record revenue when they receive cash. They record an expense when they pay out cash. The cash basis seems appealing due to its sim-plicity, but it often produces misleading fi nancial statements. It fails to record revenue for a company that has performed services but for which the company has not received the cash. As a result, the cash basis does not match expenses with revenues. Accrual-basis accounting is therefore in accordance with generally accepted accounting principles (GAAP). Individuals and some small compa-nies, however, do use cash-basis accounting. The cash basis is justifi ed for small businesses because they often have few receivables and payables. Medium and large companies use accrual-basis accounting.
Alternative TerminologyThe time period assumption is also called the periodicity assumption.
Time PeriodAssumption
Year 1 Year 10
Year 6

Accrual-Basis Accounting and Adjusting Entries 95
Recognizing Revenues and Expenses
It can be diffi cult to determine when to report revenues and expenses. The reve-nue recognition principle and the expense recognition principle help in this task.
REVENUE RECOGNITION PRINCIPLE
When a company agrees to perform a service or sell a product to a customer, it has a performance obligation. When the company meets this performance obligation, it recognizes revenue. The revenue recognition principle there-fore requires that companies recognize revenue in the accounting period in which the performance obligation is satisfi ed. To illustrate, assume that Dave’s Dry Cleaning cleans clothing on June 30 but customers do not claim and pay for their clothes until the fi rst week of July. Dave’s should record revenue in June when it performed the service (satisfi ed the performance obligation) rather than in July when it received the cash. At June 30, Dave’s would report a receiv-able on its balance sheet and revenue in its income statement for the service performed.
EXPENSE RECOGNITION PRINCIPLE
Accountants follow a simple rule in recognizing expenses: “Let the expenses fol-low the revenues.” Thus, expense recognition is tied to revenue recognition. In the dry cleaning example, this means that Dave’s should report the salary expense incurred in performing the June 30 cleaning service in the same period in which it recognizes the service revenue. The critical issue in expense recognition is when the expense makes its contribution to revenue. This may or may not be the same period in which the expense is paid. If Dave’s does not pay the salary incurred on June 30 until July, it would report salaries payable on its June 30 balance sheet. This practice of expense recognition is referred to as the expense recognition principle (often referred to as the matching principle). It dictates that efforts (expenses) be matched with results (revenues). Illustration 3-1 summarizes the revenue and expense recognition principles.
Revenue is recog-nized when performance
obligation is satisfied.
Revenue Recognition
Customerrequests service
Satisfied performance
obligation
Cashreceived
MatchingRevenues
Expenses
Advertising
Delivery
Utilities
Expense Recognition
Illustration 3-1GAAP relationships in revenue and expense recognition
Revenue and ExpenseRecognition
In accordance with generallyaccepted accounting principles
(GAAP).
Expense Recognition Principle
Match expenses with revenues in theperiod when the company makes
efforts to generate those revenues.
Time Period Assumption
Economic life of businesscan be divided into
artificial time periods.
Revenue RecognitionPrinciple
Recognize revenue in theaccounting period in which the
performance obligation is satisfied.
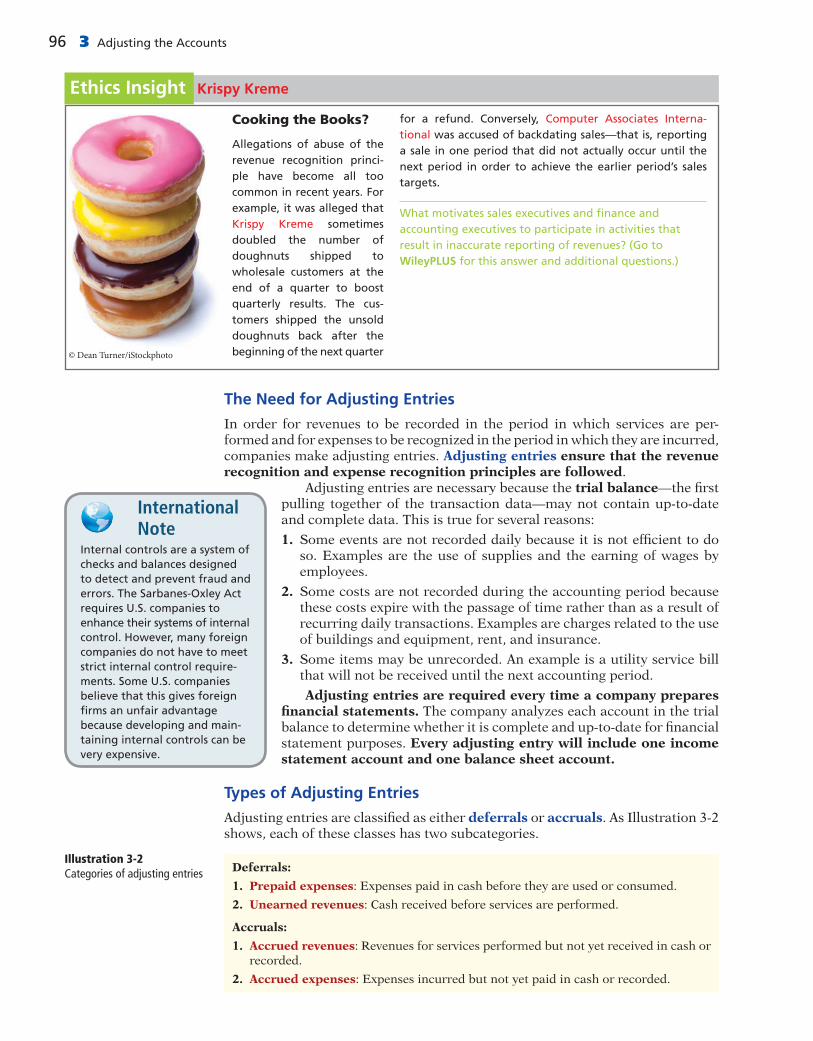
96 3 Adjusting the Accounts
The Need for Adjusting Entries
In order for revenues to be recorded in the period in which services are per-formed and for expenses to be recognized in the period in which they are incurred, companies make adjusting entries. Adjusting entries ensure that the revenue recognition and expense recognition principles are followed.
Adjusting entries are necessary because the trial balance—the fi rst pulling together of the transaction data—may not contain up-to-date and complete data. This is true for several reasons:
1. Some events are not recorded daily because it is not effi cient to do so. Examples are the use of supplies and the earning of wages by employees.
2. Some costs are not recorded during the accounting period because these costs expire with the passage of time rather than as a result of recurring daily transactions. Examples are charges related to the use of buildings and equipment, rent, and insurance.
3. Some items may be unrecorded. An example is a utility service bill that will not be received until the next accounting period.
Adjusting entries are required every time a company prepares fi nancial statements. The company analyzes each account in the trial balance to determine whether it is complete and up-to-date for fi nancial statement purposes. Every adjusting entry will include one income statement account and one balance sheet account.
Types of Adjusting Entries
Adjusting entries are classifi ed as either deferrals or accruals. As Illustration 3-2 shows, each of these classes has two subcategories.
Cooking the Books?
Allegations of abuse of the revenue recognition princi-ple have become all too common in recent years. For example, it was alleged that Krispy Kreme sometimes doubled the number of doughnuts shipped to wholesale customers at the end of a quarter to boost quarterly results. The cus-tomers shipped the unsold doughnuts back after the beginning of the next quarter
for a refund. Conversely, Computer Associates Interna-tional was accused of backdating sales—that is, reporting a sale in one period that did not actually occur until the next period in order to achieve the earlier period’s sales targets.
What motivates sales executives and fi nance and accounting executives to participate in activities that result in inaccurate reporting of revenues? (Go to WileyPLUS for this answer and additional questions.)
Krispy KremeEthics Insight
© Dean Turner/iStockphoto
Internal controls are a system of checks and balances designed to detect and prevent fraud and errors. The Sarbanes-Oxley Act requires U.S. companies to enhance their systems of internal control. However, many foreign companies do not have to meet strict internal control require-ments. Some U.S. companies believe that this gives foreign fi rms an unfair advantage because developing and main-taining internal controls can be very expensive.
International Note
Illustration 3-2Categories of adjusting entries Deferrals:
1. Prepaid expenses: Expenses paid in cash before they are used or consumed.
2. Unearned revenues: Cash received before services are performed.
Accruals:
1. Accrued revenues: Revenues for services performed but not yet received in cash or recorded.
2. Accrued expenses: Expenses incurred but not yet paid in cash or recorded.

Adjusting Entries for Deferrals 97
Subsequent sections give examples of each type of adjustment. Each example is based on the October 31 trial balance of Pioneer Advertising from Chapter 2, reproduced in Illustration 3-3.
Illustration 3-3Trial balance
PIONEER ADVERTISINGTrial Balance
October 31, 2017
Debit Credit
Cash $ 15,200Supplies 2,500Prepaid Insurance 600Equipment 5,000Notes Payable $ 5,000Accounts Payable 2,500Unearned Service Revenue 1,200Owner’s Capital 10,000Owner’s Drawings 500Service Revenue 10,000Salaries and Wages Expense 4,000Rent Expense 900
$28,700 $28,700
We assume that Pioneer uses an accounting period of one month. Thus, monthly adjusting entries are made. The entries are dated October 31.
Several timing concepts are discussed on pages 94–95. A list of concepts is provided in the left column below, with a description of the concept in the right column below. There are more descriptions provided than concepts. Match the description of the concept to the concept.
1. ____Accrual-basis accounting.
2. ____Calendar year.
3. ____Time period assumption.
4. ____Expense recognition principle.
DO IT! 1 Timing Concepts
1. f 2. e 3. c 4. b
Related exercise material: BE3-1, BE3-2, E3-1, E3-2, E3-3, and DO IT! 3-1.
Action Plan✔ Review the glossary
terms identifi ed on pages 122–123.
✔ Study carefully the revenue recognition principle, the expense recognition principle, and the time period assumption.
(a) Monthly and quarterly time periods.(b) Efforts (expenses) should be matched
with results (revenues).(c) Accountants divide the economic life of
a business into artifi cial time periods.(d) Companies record revenues when they
receive cash and record expenses when they pay out cash.
(e) An accounting time period that starts on January 1 and ends on December 31.
(f) Companies record transactions in the period in which the events occur.
Solution
2 Prepare adjusting entries for deferrals.LEARNING OBJECTIVE
To defer means to postpone or delay. Deferrals are expenses or revenues that are recognized at a date later than the point when cash was originally exchanged. The two types of deferrals are prepaid expenses and unearned revenues.

98 3 Adjusting the Accounts
Prepaid Expenses
When companies record payments of expenses that will benefi t more than one accounting period, they record an asset called prepaid expenses or prepay-ments. When expenses are prepaid, an asset account is increased (debited) to show the service or benefi t that the company will receive in the future. Exam-ples of common prepayments are insurance, supplies, advertising, and rent. In addition, companies make prepayments when they purchase buildings and equipment. Prepaid expenses are costs that expire either with the passage of time (e.g., rent and insurance) or through use (e.g., supplies). The expiration of these costs does not require daily entries, which would be impractical and unnecessary. Accordingly, companies postpone the recognition of such cost expirations until they prepare fi nancial statements. At each statement date, they make adjusting entries to record the expenses applicable to the current accounting period and to show the remaining amounts in the asset accounts. Prior to adjustment, assets are overstated and expenses are understated. Therefore, as shown in Illustration 3-4, an adjusting entry for prepaid expenses results in an increase (a debit) to an expense account and a decrease (a credit) to an asset account.
Illustration 3-4Adjusting entries for prepaid expenses
Prepaid Expenses
Asset
CreditAdjustingEntry (–)
UnadjustedBalance
Expense
DebitAdjustingEntry (+)
Supplies used;record supplies expense
Supplies purchased;record asset
Oct. 31
Oct. 5
Supplies
Let’s look in more detail at some specifi c types of prepaid expenses, beginning with supplies.
SUPPLIES
The purchase of supplies, such as paper and envelopes, results in an increase (a debit) to an asset account. During the accounting period, the company uses sup-plies. Rather than record supplies expense as the supplies are used, companies recognize supplies expense at the end of the accounting period. At the end of the accounting period, the company counts the remaining supplies. As shown in Illustration 3-5, the difference between the unadjusted balance in the Supplies (asset) account and the actual cost of supplies on hand represents the supplies used (an expense) for that period. Recall from Chapter 2 that Pioneer Advertising purchased supplies costing $2,500 on October 5. Pioneer recorded the purchase by increasing (debiting) the asset Supplies. This account shows a balance of $2,500 in the October 31 trial balance. An inventory count at the close of business on October 31 reveals that $1,000 of supplies are still on hand. Thus, the cost of supplies used is $1,500 ($2,500 2 $1,000). This use of supplies decreases an asset, Supplies. It also decreases owner’s equity by increasing an expense account, Supplies Expense. This is shown in Illustration 3-5. After adjustment, the asset account Supplies shows a balance of $1,000, which is equal to the cost of supplies on hand at the statement date. In addition, Supplies Expense shows a balance of $1,500, which equals the cost of supplies used in October. If Pioneer does not make the adjusting entry, October expenses are understated and net income is overstated by $1,500. More-over, both assets and owner’s equity will be overstated by $1,500 on the October 31 balance sheet.

Adjusting Entries for Deferrals 99
INSURANCE
Companies purchase insurance to protect themselves from losses due to fi re, theft, and unforeseen events. Insurance must be paid in advance, often for more than one year. The cost of insurance (premiums) paid in advance is recorded as an increase (debit) in the asset account Prepaid Insurance. At the fi nancial state-ment date, companies increase (debit) Insurance Expense and decrease (credit) Prepaid Insurance for the cost of insurance that has expired during the period. On October 4, Pioneer Advertising paid $600 for a one-year fi re insurance policy. Coverage began on October 1. Pioneer recorded the payment by increas-ing (debiting) Prepaid Insurance. This account shows a balance of $600 in the October 31 trial balance. Insurance of $50 ($600 4 12) expires each month. The expiration of prepaid insurance decreases an asset, Prepaid Insurance. It also decreases owner’s equity by increasing an expense account, Insurance Expense. As shown in Illustration 3-6, the asset Prepaid Insurance shows a balance of $550, which represents the unexpired cost for the remaining 11 months of
Illustration 3-5Adjustment for supplies
Debit–CreditAnalysis
JournalEntry
Posting
BasicAnalysis
EquationAnalysis
Oct. 5 2,500
Oct. 31 Bal. 1,000
Oct. 31 Adj. 1,500
Supplies 126 631
Oct. 31 Adj. 1,500
Oct. 31 Bal. 1,500
Supplies Expense
Debits increase expenses: debit Supplies Expense $1,500. Credits decrease assets: credit Supplies $1,500.
Oct. 31 Supplies Expense Supplies (To record supplies used)
1,5001,500
The expense Supplies Expense is increased $1,500; the assetSupplies is decreased $1,500.
Assets
Supplies
–$1,500
=
=
+Liabilities Owner’s Equity
Supplies Expense
–$1,500
(1)
Debit–CreditAnalysis
JournalEntry
BasicAnalysis
Debits increase expenses: debit Insurance Expense $50. Credits decrease assets: credit Prepaid Insurance $50.
Oct. 31 Insurance Expense Prepaid Insurance (To record insurance expired)
5050
The expense Insurance Expense is increased $50; the assetPrepaid Insurance is decreased $50.
Assets
Prepaid Insurance
�$50
(2)=
=
+Liabilities Owner’s Equity
Insurance Expense
�$50
EquationAnalysis
PostingPrepaid Insurance 130 722Insurance Expense
Oct. 4 600
Oct. 31 Bal. 550
Oct. 31 Adj. 50 Oct. 31 Adj. 50
Oct. 31 Bal. 50
Illustration 3-6Adjustment for insurance
Insurance Policy
Nov$50
Dec$50
Jan$50
Feb$50
March$50
April$50
May$50
June$50
July$50
Aug$50
Sept$50
1 YEAR $600
Oct$50
FIRE INSURANCE1 year
insurance policy$600
Insurance expired;record insurance expense
Insurance purchased;record asset
Oct. 4
Oct. 31
Insurance

100 3 Adjusting the Accounts
coverage. At the same time, the balance in Insurance Expense equals the insur-ance cost that expired in October. If Pioneer does not make this adjustment, October expenses are understated by $50 and net income is overstated by $50. Moreover, both assets and owner’s equity will be overstated by $50 on the October 31 balance sheet.
DEPRECIATION
A company typically owns a variety of assets that have long lives, such as build-ings, equipment, and motor vehicles. The period of service is referred to as the useful life of the asset. Because a building is expected to be of service for many years, it is recorded as an asset, rather than an expense, on the date it is acquired. As explained in Chapter 1, companies record such assets at cost, as required by the historical cost principle. To follow the expense recognition principle, compa-nies allocate a portion of this cost as an expense during each period of the asset’s useful life. Depreciation is the process of allocating the cost of an asset to expense over its useful life.
NEED FOR ADJUSTMENT The acquisition of long-lived assets is essentially a long-term prepayment for the use of an asset. An adjusting entry for depreciation is needed to recognize the cost that has been used (an expense) during the period and to report the unused cost (an asset) at the end of the period. One very important point to understand: Depreciation is an allocation concept, not a valuation concept. That is, depreciation allocates an asset’s cost to the periods in which it is used. Depreciation does not attempt to report the actual change in the value of the asset. For Pioneer Advertising, assume that depreciation on the equipment is $480 a year, or $40 per month. As shown in Illustration 3-7, rather than decrease (credit) the asset account directly, Pioneer instead credits Accumulated Depreciation—Equipment. Accumulated Depreciation is called a contra asset account. Such
Depreciation recognized;record depreciation expense
Equipment purchased;record asset
Oct. 2
Oct. 31
Depreciation
Equipment
Nov$40
Dec$40
Jan$40
Feb$40
March$40
April$40
May$40
June$40
July$40
Aug$40
Sept$40
Oct$40
Depreciation = $480/year
Debit–CreditAnalysis
JournalEntry
Posting
BasicAnalysis
Oct. 31 Adj. 40
Oct. 31 Bal. 40
Accumulated Depreciation—Equipment 711158
Oct. 31 Adj. 40
Oct. 31 Bal. 40
DepreciationExpense
Oct. 2 5,000
Oct. 31 Bal. 5,000
Equipment 157
Debits increase expenses: debit Depreciation Expense $40. Credits increase contra assets: credit Accumulated Depreciation—Equipment $40.
Oct. 31 Depreciation Expense Accumulated Depreciation—Equipment (To record monthly depreciation)
4040
The expense Depreciation Expense is increased $40; the contra assetAccumulated Depreciation—Equipment is increased $40.
Assets
AccumulatedDepreciation—Equipment
–$40
=
=
+Liabilities Owner’s Equity
Depreciation Expense
–$40
EquationAnalysis
Illustration 3-7Adjustment for depreciation

Adjusting Entries for Deferrals 101
an account is offset against an asset account on the balance sheet. Thus, the Accumulated Depreciation—Equipment account offsets the asset Equipment. This account keeps track of the total amount of depreciation expense taken over the life of the asset. To keep the accounting equation in balance, Pioneer decreases owner’s equity by increasing an expense account, Depreciation Expense. The balance in the Accumulated Depreciation—Equipment account will increase $40 each month, and the balance in Equipment remains $5,000.
STATEMENT PRESENTATION As indicated, Accumulated Depreciation—Equipment is a contra asset account. It is offset against Equipment on the balance sheet. The normal balance of a contra asset account is a credit. A theoretical alternative to using a contra asset account would be to decrease (credit) the asset account by the amount of depreciation each period. But using the contra account is prefera-ble for a simple reason: It discloses both the original cost of the equipment and the total cost that has been expensed to date. Thus, in the balance sheet, Pioneer deducts Accumulated Depreciation—Equipment from the related asset account, as shown in Illustration 3-8.
Helpful HintAll contra accounts have increases, decreases, and normal balances opposite to the account to which they relate.
Book value is the difference between the cost of any depreciable asset and its related accumulated depreciation. In Illustration 3-8, the book value of the equip-ment at the balance sheet date is $4,960. The book value and the fair value of the asset are generally two different values. As noted earlier, the purpose of depre-ciation is not valuation but a means of cost allocation. Depreciation expense identifi es the portion of an asset’s cost that expired during the period (in this case, in October). The accounting equation shows that without this adjusting entry, total assets, total owner’s equity, and net income are overstated by $40 and depreciation expense is understated by $40. Illustration 3-9 summarizes the accounting for prepaid expenses.
Illustration 3-8Balance sheet presentation of accumulated depreciation
Equipment $ 5,000Less: Accumulated depreciation—equipment 40
$4,960
Alternative TerminologyBook value is also referred to as carrying value.
Illustration 3-9Accounting for prepaid expenses Reason for Accounts Before Adjusting
Examples Adjustment Adjustment Entry
Insurance, supplies, Prepaid expenses Assets overstated. Dr. Expensesadvertising, rent, recorded in asset Expenses Cr. Assetsdepreciation accounts have understated. or Contra been used. Assets
ACCOUNTING FOR PREPAID EXPENSES
Unearned Revenues
When companies receive cash before services are performed, they record a liabil-ity by increasing (crediting) a liability account called unearned revenues. In other words, a company now has a performance obligation (liability) to transfer a service to one of its customers. Items like rent, magazine subscriptions, and customer deposits for future service may result in unearned revenues. Airlines such as United, Southwest, and Delta, for instance, treat receipts from the sale of tickets as unearned revenue until the fl ight service is provided. Unearned revenues are the opposite of prepaid expenses. Indeed, unearned revenue on the books of one company is likely to be a prepaid expense on the books of the company that has made the advance payment. For example, if iden-tical accounting periods are assumed, a landlord will have unearned rent revenue when a tenant has prepaid rent.

102 3 Adjusting the Accounts
When a company receives payment for services to be performed in a future accounting period, it increases (credits) an unearned revenue (a liability) account to recognize the liability that exists. The company subsequently recognizes reve-nues when it performs the service. During the accounting period, it is not practi-cal to make daily entries as the company performs services. Instead, the company delays recognition of revenue until the adjustment process. Then, the company makes an adjusting entry to record the revenue for services performed during the period and to show the liability that remains at the end of the accounting period. Typically, prior to adjustment, liabilities are overstated and revenues are under-stated. Therefore, as shown in Illustration 3-10, the adjusting entry for unearned revenues results in a decrease (a debit) to a liability account and an increase (a credit) to a revenue account.
Illustration 3-10Adjusting entries for unearned revenues
Unearned Revenues
Liability Revenue
CreditAdjustingEntry (+)
DebitAdjustingEntry (–)
UnadjustedBalance
Pioneer Advertising received $1,200 on October 2 from R. Knox for advertis-ing services expected to be completed by December 31. Pioneer credited the pay-ment to Unearned Service Revenue. This liability account shows a balance of $1,200 in the October 31 trial balance. From an evaluation of the services Pioneer performed for Knox during October, the company determines that it should rec-ognize $400 of revenue in October. The liability (Unearned Service Revenue) is therefore decreased, and owner’s equity (Service Revenue) is increased. As shown in Illustration 3-11, the liability Unearned Service Revenue now shows a balance of $800. That amount represents the remaining advertising services expected to be performed in the future. At the same time, Service Revenue shows
$1,200
Thank youin advance for
your work
I will finishby Dec. 31
Some service has beenperformed; some revenue
is recorded
Cash is received in advance;liability is recorded
Oct. 2
Oct. 31
Unearned Revenues
Debit–CreditAnalysis
JournalEntry
Posting
BasicAnalysis
Oct. 31 Adj. 400 Oct. 2 1,200
Oct. 31 Bal. 800
Oct. 3 10,000 31 Adj. 400
Oct. 31 Bal. 10,400
Unearned Service Revenue 209 Service Revenue 400
Debits decrease liabilities: debit Unearned Service Revenue $400. Credits increase revenues: credit Service Revenue $400.
Oct. 31 Unearned Service Revenue Service Revenue (To record revenue for services performed)
400400
The liability Unearned Service Revenue is decreased $400; the revenueService Revenue is increased $400.
Assets
UnearnedService Revenue
= +Liabilities Owner’s Equity
Service RevenueEquationAnalysis
�$400 �$400
Illustration 3-11Service revenue accounts after adjustment

Adjusting Entries for Deferrals 103
total revenue recognized in October of $10,400. Without this adjustment, revenues and net income are understated by $400 in the income state-ment. Moreover, liabilities will be overstated and owner’s equity will be understated by $400 on the October 31 balance sheet. Illustration 3-12 summarizes the accounting for unearned revenues.
Illustration 3-12Accounting for unearned revenues Reason for Accounts Before Adjusting
Examples Adjustment Adjustment Entry
Rent, magazine Unearned revenues Liabilities Dr. Liabilitiessubscriptions, recorded in liability overstated. Cr. Revenuescustomer deposits accounts are now Revenuesfor future service recognized as understated. revenue for services performed.
ACCOUNTING FOR UNEARNED REVENUES
Turning Gift Cards into Revenue
Those of you who are market-ing majors (and even most of you who are not) know that gift cards are among the hot-test marketing tools in mer-chandising today. Customers purchase gift cards and give them to someone for later use. In a recent year, gift-card sales topped $95 billion.
Although these programs are popular with marketing executives, they create account-
ing questions. Should revenue be recorded at the time the gift card is sold, or when it is exercised? How should expired gift cards be accounted for? In a recent balance sheet, Best Buy reported unearned revenue related to gift cards of $428 million.
Source: Robert Berner, “Gift Cards: No Gift to Investors,” Business-Week (March 14, 2005), p. 86.
Suppose that Robert Jones purchases a $100 gift card at Best Buy on December 24, 2016, and gives it to his wife, Mary Jones, on December 25, 2016. On January 3, 2017, Mary uses the card to purchase $100 worth of CDs. When do you think Best Buy should recognize revenue and why? (Go to WileyPLUS for this answer and additional questions.)
© Skip ODonnell/iStockphoto
Best BuyAccounting Across the Organization
The ledger of Hammond Company, on March 31, 2017, includes these selected accounts before adjusting entries are prepared.
Debit Credit
Prepaid Insurance $ 3,600Supplies 2,800Equipment 25,000Accumulated Depreciation—Equipment $5,000Unearned Service Revenue 9,200
An analysis of the accounts shows the following.
1. Insurance expires at the rate of $100 per month.
2. Supplies on hand total $800.
3. The equipment depreciates $200 a month.
4. During March, services were performed for one-half of the unearned service revenue.
Prepare the adjusting entries for the month of March.
DO IT! 2 Adjusting Entries for Deferrals

104 3 Adjusting the Accounts
1. Insurance Expense 100 Prepaid Insurance 100 (To record insurance expired)
2. Supplies Expense 2,000 Supplies 2,000 (To record supplies used)
3. Depreciation Expense 200 Accumulated Depreciation—Equipment 200 (To record monthly depreciation)
4. Unearned Service Revenue 4,600 Service Revenue 4,600 (To record revenue for services performed)
Solution
Related exercise material: BE3-2, BE3-3, BE3-4, BE3-5, BE3-6, and DO IT! 3-2.
Action Plan✔ Make adjusting entries
at the end of the period for revenues recognized and expenses incurred in the period.
✔ Don’t forget to make adjusting entries for deferrals. Failure to adjust for deferrals leads to overstatement of the asset or liability and understatement of the related expense or revenue.
3 Prepare adjusting entries for accruals.LEARNING OBJECTIVE
The second category of adjusting entries is accruals. Prior to an accrual adjust-ment, the revenue account (and the related asset account) or the expense account (and the related liability account) are understated. Thus, the adjusting entry for accruals will increase both a balance sheet and an income statement account.
Accrued Revenues
Revenues for services performed but not yet recorded at the statement date are accrued revenues. Accrued revenues may accumulate (accrue) with the passing of time, as in the case of interest revenue. These are unrecorded because the earn-ing of interest does not involve daily transactions. Companies do not record inter-est revenue on a daily basis because it is often impractical to do so. Accrued revenues also may result from services that have been performed but not yet billed nor collected, as in the case of commissions and fees. These may be unre-corded because only a portion of the total service has been performed and the clients will not be billed until the service has been completed. An adjusting entry records the receivable that exists at the balance sheet date and the revenue for the services performed during the period. Prior to adjust-ment, both assets and revenues are understated. As shown in Illustration 3-13, an adjusting entry for accrued revenues results in an increase (a debit) to an asset account and an increase (a credit) to a revenue account.
Illustration 3-13Adjusting entries for accrued revenues Accrued Revenues
Asset Revenue
DebitAdjustingEntry (+)
CreditAdjustingEntry (+)
My feeis $200
Revenue and receivableare recorded forunbilled services
Accrued Revenues

Adjusting Entries for Accruals 105
In October, Pioneer Advertising performed services worth $200 that were not billed to clients on or before October 31. Because these services are not billed, they are not recorded. The accrual of unrecorded service revenue increases an asset account, Accounts Receivable. It also increases owner’s equity by increasing a revenue account, Service Revenue, as shown in Illustration 3-14. Illustration 3-14
Adjustment for accrued revenue
The asset Accounts Receivable shows that clients owe Pioneer $200 at the balance sheet date. The balance of $10,600 in Service Revenue represents the total revenue for services performed by Pioneer during the month ($10,000 1 $400 1 $200). Without the adjusting entry, assets and owner’s equity on the balance sheet and revenues and net income on the income statement are understated. On November 10, Pioneer receives cash of $200 for the services performed in October and makes the following entry.
Debit–CreditAnalysis
JournalEntry
Posting
BasicAnalysis
Oct. 31 Adj. 200
Oct. 31 Bal. 200
Accounts Receivable 112
Debits increase assets: debit Accounts Receivable $200. Credits increase revenues: credit Service Revenue $200.
Oct. 31 Accounts Receivable Service Revenue (To record revenue for services performed)
200200
The asset Accounts Receivable is increased $200; the revenue ServiceRevenue is increased $200.
Assets = +Liabilities Owner’s Equity
Service Revenue
�$200
AccountsReceivable
�$200
EquationAnalysis
Oct. 3 10,000 31 400 31 Adj. 200
Oct. 31 Bal. 10,600
Service Revenue 400
Equation analyses summarize the effects of transactions on the three elements of the accounting equation, as well as the effect on cash fl ows.
The company records the collection of the receivables by a debit (increase) to Cash and a credit (decrease) to Accounts Receivable. Illustration 3-15 summarizes the accounting for accrued revenues.
Illustration 3-15Accounting for accrued revenues
Reason for Accounts Before AdjustingExamples Adjustment Adjustment Entry
Interest, rent, Services performed Assets Dr. Assetsservices but not yet received understated. Cr. Revenues in cash or recorded. Revenues understated.
ACCOUNTING FOR ACCRUED REVENUES
Nov. 10 Cash 200 Accounts Receivable 200 (To record cash collected on account)
12002200
Cash Flows1200
A OEL5 1
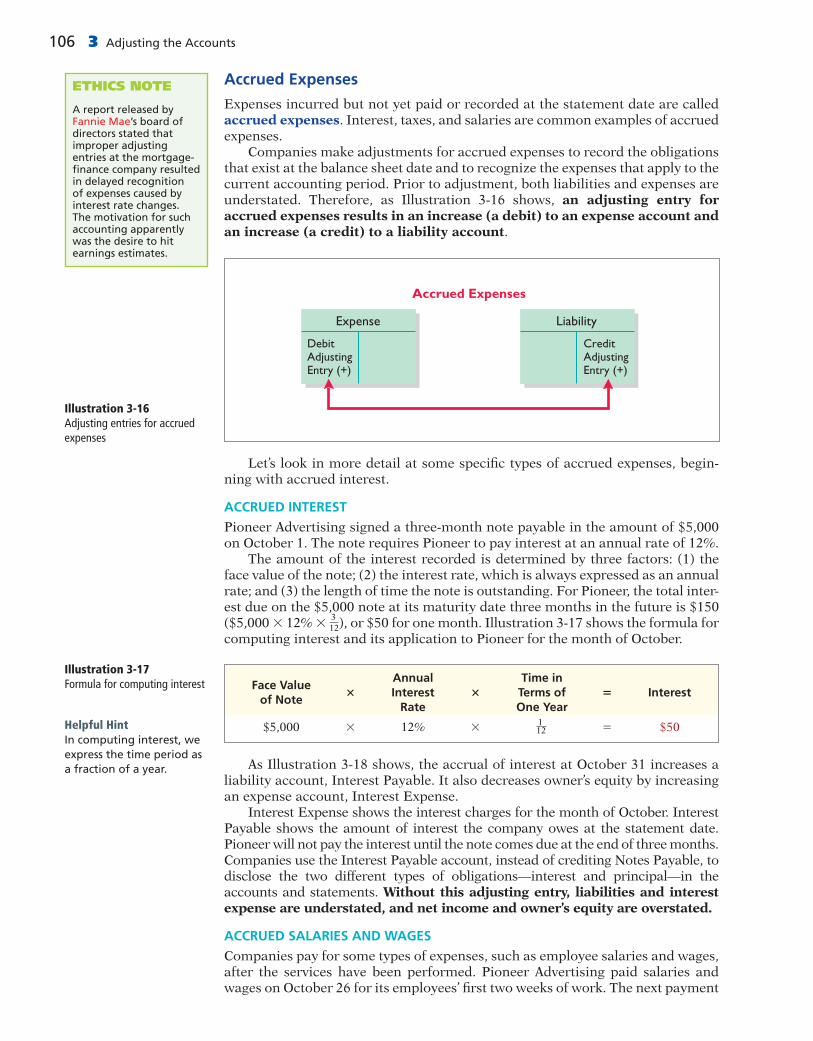
106 3 Adjusting the Accounts
Accrued Expenses
Expenses incurred but not yet paid or recorded at the statement date are called accrued expenses. Interest, taxes, and salaries are common examples of accrued expenses. Companies make adjustments for accrued expenses to record the obligations that exist at the balance sheet date and to recognize the expenses that apply to the current accounting period. Prior to adjustment, both liabilities and expenses are understated. Therefore, as Illustration 3-16 shows, an adjusting entry for accrued expenses results in an increase (a debit) to an expense account and an increase (a credit) to a liability account.
ETHICS NOTE
A report released by Fannie Mae’s board of directors stated that improper adjusting entries at the mortgage-fi nance company resulted in delayed recognition of expenses caused by interest rate changes. The motivation for such accounting apparently was the desire to hit earnings estimates.
Illustration 3-16Adjusting entries for accrued expenses
Accrued Expenses
Expense Liability
CreditAdjustingEntry (+)
DebitAdjustingEntry (+)
Let’s look in more detail at some specifi c types of accrued expenses, begin-ning with accrued interest.
ACCRUED INTEREST
Pioneer Advertising signed a three-month note payable in the amount of $5,000 on October 1. The note requires Pioneer to pay interest at an annual rate of 12%. The amount of the interest recorded is determined by three factors: (1) the face value of the note; (2) the interest rate, which is always expressed as an annual rate; and (3) the length of time the note is outstanding. For Pioneer, the total inter-est due on the $5,000 note at its maturity date three months in the future is $150 ($5,000 3 12% 3
312), or $50 for one month. Illustration 3-17 shows the formula for
computing interest and its application to Pioneer for the month of October.
Illustration 3-17Formula for computing interest
Face Value Annual Time in
of Note
3 Interest 3 Terms of 5 Interest Rate One Year
$5,000 3 12% 3 112 5 $50
As Illustration 3-18 shows, the accrual of interest at October 31 increases a liability account, Interest Payable. It also decreases owner’s equity by increasing an expense account, Interest Expense. Interest Expense shows the interest charges for the month of October. Interest Payable shows the amount of interest the company owes at the statement date. Pioneer will not pay the interest until the note comes due at the end of three months. Companies use the Interest Payable account, instead of crediting Notes Payable, to disclose the two different types of obligations—interest and principal—in the accounts and statements. Without this adjusting entry, liabilities and interest expense are understated, and net income and owner’s equity are overstated.
ACCRUED SALARIES AND WAGES
Companies pay for some types of expenses, such as employee salaries and wages, after the services have been performed. Pioneer Advertising paid salaries and wages on October 26 for its employees’ fi rst two weeks of work. The next payment
Helpful HintIn computing interest, we express the time period as a fraction of a year.

Adjusting Entries for Accruals 107
of salaries will not occur until November 9. As Illustration 3-19 shows, three working days remain in October (October 29–31).
Illustration 3-18Adjustment for accrued interest
Debit–CreditAnalysis
JournalEntry
Posting
BasicAnalysis
EquationAnalysis
Oct. 31 Adj. 50
Oct. 31 Bal. 50
Oct. 31 Adj. 50
Oct. 31 Bal. 50
Interest Expense 905 Interest Payable 230
Debits increase expenses: debit Interest Expense $50. Credits increase liabilities: credit Interest Payable $50.
Oct. 31 Interest Expense Interest Payable (To record interest on notes payable)
5050
The expense Interest Expense is increased $50; the liability InterestPayable is increased $50.
Assets =
Interest Payable
�$50
+Liabilities Owner’s Equity
Interest Expense
�$50
Illustration 3-19Calendar showing Pioneer’s pay periodsOctober
Adjustment period
Start ofpay period
Payday Payday
S M Tu W Th F S1 2 3 4 5 6
7 8 9 10 11 12 1314 16 17 18 19 2021 22 23 24 25 2728 29 30 31
2615
November
S M Tu W Th F S1 2 3
4 5 6 7 8 1011 13 14 15 16 1718 19 20 21 22 2425 26 27 28
2329 30
129
At October 31, the salaries and wages for these three days represent an accrued expense and a related liability to Pioneer. The employees receive total salaries and wages of $2,000 for a fi ve-day work week, or $400 per day. Thus, accrued salaries and wages at October 31 are $1,200 ($400 3 3). This accrual increases a liability, Salaries and Wages Payable. It also decreases owner’s equity by increasing an expense account, Salaries and Wages Expense, as shown in Illustration 3-20 (page 108). After this adjustment, the balance in Salaries and Wages Expense of $5,200 (13 days 3 $400) is the actual salary and wages expense for October. The balance in Salaries and Wages Payable of $1,200 is the amount of the liability for salaries and wages Pioneer owes as of October 31. Without the $1,200 adjustment for salaries and wages, Pioneer’s expenses are understated $1,200 and its liabil-ities are understated $1,200. Pioneer pays salaries and wages every two weeks. Consequently, the next payday is November 9, when the company will again pay total salaries and wages of $4,000. The payment consists of $1,200 of salaries and wages payable at October 31 plus $2,800 of salaries and wages expense for November (7 working days, as shown in the November calendar 3 $400). Therefore, Pioneer makes the following entry on November 9.

108 3 Adjusting the Accounts
Illustration 3-20Adjustment for accrued salaries and wages
Debit–CreditAnalysis
JournalEntry
Posting
BasicAnalysis
EquationAnalysis
Oct. 26 4,000 31 Adj. 1,200
Oct. 31 Bal. 5,200
Oct. 31 Adj. 1,200
Oct. 31 Bal. 1,200
Salaries and Wages Expense 726 Salaries and Wages Payable 212
Debits increase expenses: debit Salaries and Wages Expense $1,200. Credits increase liabilities: credit Salaries and Wages Payable $1,200.
Oct. 31 Salaries and Wages Expense Salaries and Wages Payable (To record accrued salaries and wages)
1,2001,200
The expense Salaries and Wages Expense is increased $1,200; the liabilityaccount Salaries and Wages Payable is increased $1,200.
Assets
Salaries and Wages Payable
�$1,200
= +Liabilities Owner’s Equity
Salaries and Wages Expense
�$1,200
Nov. 9 Salaries and Wages Payable 1,200 Salaries and Wages Expense 2,800 Cash 4,000 (To record November 9 payroll)
This entry eliminates the liability for Salaries and Wages Payable that Pioneer recorded in the October 31 adjusting entry, and it records the proper amount of Salaries and Wages Expense for the period between November 1 and November 9. Illustration 3-21 summarizes the accounting for accrued expenses.
Illustration 3-21Accounting for accrued expenses Reason for Accounts Before Adjusting
Examples Adjustment Adjustment Entry
Interest, rent, Expenses have Expenses understated. Dr. Expensessalaries been incurred but Liabilities understated. Cr. Liabilities not yet paid in cash or recorded.
ACCOUNTING FOR ACCRUED EXPENSES
Got Junk?
Do you have an old computer or two that you no longer use? How about an old TV that needs replacing? Many people do. Approximately 163,000 comput-ers and televisions become obsolete each day. Yet, in a recent year, only 11% of com-puters were recycled. It is esti-mated that 75% of all computers
ever sold are sitting in storage somewhere, waiting to be disposed of. Each of these old TVs and computers is loaded with lead, cadmium, mercury, and other toxic chemicals. If you have one of these electronic gadgets, you have a respon-sibility, and a probable cost, for disposing of it. Companies have the same problem, but their discarded materials may include lead paint, asbestos, and other toxic chemicals.
What accounting issue might this cause for companies? (Go to WileyPLUS for this answer and additional questions.)© Nathan Gleave/iStockphoto
People, Planet, and Profi t Insight
21,200 22,80024,000
Cash Flows24,000
A OEL5 1

Adjusting Entries for Accruals 109
Summary of Basic Relationships
Illustration 3-22 summarizes the four basic types of adjusting entries. Take some time to study and analyze the adjusting entries. Be sure to note that each adjust-ing entry affects one balance sheet account and one income statement account.
Illustration 3-22Summary of adjusting entriesType of Adjustment
Prepaid expenses
Unearned revenues
Accrued revenues
Accrued expenses
Accounts Before Adjustment
Assets overstated.Expenses understated.
Liabilities overstated.Revenues understated.
Assets understated.Revenues understated.
Expenses understated.Liabilities understated.
Adjusting Entry
Dr. Expenses Cr. Assets or
Contra Assets
Dr. Liabilities Cr. Revenues
Dr. Assets Cr. Revenues
Dr. Expenses Cr. Liabilities
Illustrations 3-23 (below) and 3-24 (on page 110) show the journalizing and posting of adjusting entries for Pioneer Advertising on October 31. The ledger identifi es all adjustments by the reference J2 because they have been recorded on page 2 of the general journal. The company may insert a center caption “Adjust-ing Entries” between the last transaction entry and the fi rst adjusting entry in the journal. When you review the general ledger in Illustration 3-24, note that the entries highlighted in color are the adjustments.
Date Account Titles and Explanation Ref. Debit Credit
2017 Adjusting EntriesOct. 31 Supplies Expense 631 1,500 Supplies 126 1,500 (To record supplies used)
31 Insurance Expense 722 50 Prepaid Insurance 130 50 (To record insurance expired)
31 Depreciation Expense 711 40 Accumulated Depreciation—Equipment 158 40 (To record monthly depreciation)
31 Unearned Service Revenue 209 400 Service Revenue 400 400 (To record revenue for services
performed)
31 Accounts Receivable 112 200 Service Revenue 400 200 (To record revenue for services
performed)
31 Interest Expense 905 50 Interest Payable 230 50 (To record interest on notes payable)
31 Salaries and Wages Expense 726 1,200 Salaries and Wages Payable 212 1,200 (To record accrued salaries
and wages)
GENERAL JOURNAL J2Illustration 3-23General journal showing adjusting entries
Helpful Hint(1) Adjusting entries should not involve debits or credits to Cash.(2) Evaluate whether the adjustment makes sense. For example, an adjustment to recognize supplies used should increase Supplies Expense.(3) Double-check all computations.(4) Each adjusting entry affects one balance sheet account and one income statement account.

110
Illustration 3-24General ledger after adjustment
GENERAL LEDGER
Cash No. 101
Date Explanation Ref. Debit Credit Balance
2017Oct. 1 J1 10,000 10,000 2 J1 1,200 11,200 3 J1 900 10,300 4 J1 600 9,700 20 J1 500 9,200 26 J1 4,000 5,200 31 J1 10,000 15,200
Supplies No. 126
Date Explanation Ref. Debit Credit Balance
2017Oct. 5 J1 2,500 2,500 31 Adj. entry J2 1,500 1,000
Prepaid Insurance No. 130
Date Explanation Ref. Debit Credit Balance
2017Oct. 4 J1 600 600 31 Adj. entry J2 50 550
Unearned Service Revenue No. 209
Date Explanation Ref. Debit Credit Balance
2017Oct. 2 J1 1,200 1,200 31 Adj. entry J2 400 800
Equipment No. 157
Date Explanation Ref. Debit Credit Balance
2017Oct. 1 J1 5,000 5,000
Notes Payable No. 200
Date Explanation Ref. Debit Credit Balance
2017Oct. 1 J1 5,000 5,000
Accounts Payable No. 201
Date Explanation Ref. Debit Credit Balance
2017Oct. 5 J1 2,500 2,500
Accounts Receivable No. 112
Date Explanation Ref. Debit Credit Balance
2017Oct. 31 Adj. entry J2 200 200
Salaries and Wages Payable No. 212
Date Explanation Ref. Debit Credit Balance
2017Oct. 31 Adj. entry J2 1,200 1,200
Accumulated Depreciation—Equipment No. 158
Date Explanation Ref. Debit Credit Balance
2017Oct. 31 Adj. entry J2 40 40
Interest Payable No. 230
Date Explanation Ref. Debit Credit Balance
2017Oct. 31 Adj. entry J2 50 50
Owner’s Capital No. 301
Date Explanation Ref. Debit Credit Balance
2017Oct. 1 J1 10,000 10,000
Owner’s Drawings No. 306
Date Explanation Ref. Debit Credit Balance
2017Oct. 20 J1 500 500
Supplies Expense No. 631
Date Explanation Ref. Debit Credit Balance
2017Oct. 31 Adj. entry J2 1,500 1,500
Service Revenue No. 400
Date Explanation Ref. Debit Credit Balance
2017Oct. 31 J1 10,000 10,000 31 Adj. entry J2 400 10,400 31 Adj. entry J2 200 10,600
Depreciation Expense No. 711
Date Explanation Ref. Debit Credit Balance
2017Oct. 31 Adj. entry J2 40 40
Insurance Expense No. 722
Date Explanation Ref. Debit Credit Balance
2017Oct. 31 Adj. entry J2 50 50
Salaries and Wages Expense No. 726
Date Explanation Ref. Debit Credit Balance
2017Oct. 26 J1 4,000 4,000 31 Adj. entry J2 1,200 5,200
Rent Expense No. 729
Date Explanation Ref. Debit Credit Balance
2017Oct. 3 J1 900 900
Interest Expense No. 905
Date Explanation Ref. Debit Credit Balance
2017Oct. 31 Adj. entry J2 50 50

Adjusted Trial Balance and Financial Statements 111
Micro Computer Services began operations on August 1, 2017. At the end of August 2017, management prepares monthly fi nancial statements. The following information relates to August.
1. At August 31, the company owed its employees $800 in salaries and wages that will be paid on September 1.
2. On August 1, the company borrowed $30,000 from a local bank on a 15-year mortgage. The annual interest rate is 10%.
3. Revenue for services performed but unrecorded for August totaled $1,100.
Prepare the adjusting entries needed at August 31, 2017.
Solution
DO IT! 3 Adjusting Entries for Accruals
1. Salaries and Wages Expense 800 Salaries and Wages Payable 800 (To record accrued salaries)
2. Interest Expense 250 Interest Payable 250 (To record accrued interest:
$30,000 3 10% 3 112 5 $250)
3. Accounts Receivable 1,100 Service Revenue 1,100 (To record revenue for services performed)
Related exercise material: BE3-7, E3-5, E3-6, E3-7, E3-8, E3-9, and DO IT! 3-3.
Action Plan✔ Make adjusting entries
at the end of the period to recognize revenues for services performed and for expenses incurred.
✔ Don’t forget to make adjusting entries for accruals. Adjusting entries for accruals will increase both a balance sheet and an income statement account.
4 Describe the nature and purpose of an adjusted trial balance.LEARNING OBJECTIVE
After a company has journalized and posted all adjusting entries, it prepares another trial balance from the ledger accounts. This trial balance is called an adjusted trial balance. It shows the balances of all accounts, including those adjusted, at the end of the accounting period. The purpose of an adjusted trial balance is to prove the equality of the total debit balances and the total credit balances in the ledger after all adjustments. Because the accounts contain all data needed for fi nancial statements, the adjusted trial balance is the primary basis for the preparation of fi nancial statements.
Preparing the Adjusted Trial Balance
Illustration 3-25 (page 112) presents the adjusted trial balance for Pioneer Adver-tising prepared from the ledger accounts in Illustration 3-24. The amounts affected by the adjusting entries are highlighted in color. Compare these amounts to those in the unadjusted trial balance in Illustration 3-3 (page 97). In this com-parison, you will see that there are more accounts in the adjusted trial balance as a result of the adjusting entries made at the end of the month.

Illustration 3-25Adjusted trial balance
PIONEER ADVERTISINGAdjusted Trial Balance
October 31, 2017
Debit Credit
Cash $ 15,200Accounts Receivable 200Supplies 1,000Prepaid Insurance 550Equipment 5,000Accumulated Depreciation—Equipment $ 40Notes Payable 5,000Accounts Payable 2,500Interest Payable 50Unearned Service Revenue 800Salaries and Wages Payable 1,200Owner’s Capital 10,000Owner’s Drawings 500Service Revenue 10,600Salaries and Wages Expense 5,200Supplies Expense 1,500Rent Expense 900Insurance Expense 50Interest Expense 50Depreciation Expense 40
$30,190 $30,190
Preparing Financial Statements
Companies can prepare fi nancial statements directly from the adjusted trial balance. Illustrations 3-26 (page 113) and 3-27 (page 114) present the inter-relationships of data in the adjusted trial balance and the fi nancial statements. As Illustration 3-26 shows, companies prepare the income statement from the revenue and expense accounts. Next, they use the owner’s capital and draw-ings accounts and the net income (or net loss) from the income statement to prepare the owner’s equity statement.
112 3 Adjusting the Accounts

Adjusted Trial Balance and Financial Statements 113
As Illustration 3-27 (page 114) shows, companies then prepare the balance sheet from the asset and liability accounts and the ending owner’s capital balance as reported in the owner’s equity statement.
Illustration 3-26Preparation of the income statement and owner’s equity statement from the adjusted trial balance
PIONEER ADVERTISINGAdjusted Trial Balance
October 31, 2017
CashAccounts ReceivableSuppliesPrepaid InsuranceEquipmentAccumulated Depreciation— EquipmentNotes PayableAccounts PayableUnearned Service RevenueSalaries and Wages PayableInterest Payable
$15,200200
1,000550
5,000
500
5,2001,500
900505040
$ 405,0002,500
8001,200
5010,000
10,600
$30,190 $30,190
Debit Credit
PIONEER ADVERTISINGIncome Statement
For the Month Ended October 31, 2017
Revenues Service revenue
Expenses Salaries and wages expense Supplies expense Rent expense Insurance expense Interest expense Depreciation expense
Total expenses
Net income
$5,2001,500
900505040
$10,600
7,740
$ 2,860
PIONEER ADVERTISINGOwner’s Equity Statement
For the Month Ended October 31, 2017
Owner’s capital, October 1Add: Investments
Net income
$ –0–10,00010,0002,860
12,860
Service RevenueSalaries and Wages ExpenseSupplies ExpenseRent ExpenseInsurance ExpenseInterest ExpenseDepreciation Expense
Owner’s CapitalOwner’s Drawings
Account
500$12,360
Owner’s drawingsOwner’s capital, October 31
To balance sheet

114 3 Adjusting the Accounts
CashAccounts ReceivableSuppliesPrepaid InsuranceEquipmentAccumulated Depreciation— EquipmentNotes PayableAccounts PayableUnearned Service RevenueSalaries and Wages PayableInterest PayableOwner’s CapitalOwner’s DrawingsService RevenueSalaries and Wages ExpenseSupplies ExpenseRent ExpenseInsurance ExpenseInterest ExpenseDepreciation Expense
$15,200200
1,000550
5,000
500
5,2001,500
900505040
$ 405,0002,500
8001,200
5010,000
10,600
$30,190 $30,190
Account Debit Credit
PIONEER ADVERTISINGBalance Sheet
October 31, 2017
CashAccounts receivableSuppliesPrepaid insuranceEquipmentLess: Accumulated depreciation—equip. Total assets
$5,000
40
Assets
Liabilities Notes payable Accounts payable Unearned service revenue Salaries and wages payable Interest payable Total liabilitiesOwner’s equity Owner’s capital Total liabilities and owner’s equity
$15,200200
1,000550
4,960$21,910
Liabilities and Owner’s Equity
$ 5,000
2,500 800 1,200
50 9,550
12,360
$21,910
Capital balance at Oct. 31 from owner’s equitystatement in Illustration 3-26
PIONEER ADVERTISINGAdjusted Trial Balance
October 31, 2017
Illustration 3-27Preparation of the balance sheet from the adjusted trial balance
Skolnick Co. was organized on April 1, 2017. The company prepares quarterly fi nancial statements. The adjusted trial balance amounts at June 30 are shown below.
Debit Credit
Cash $ 6,700 Accumulated Depreciation—Accounts Receivable 600 Equipment $ 850Prepaid Rent 900 Notes Payable 5,000Supplies 1,000 Accounts Payable 1,510Equipment 15,000 Salaries and Wages Payable 400Owner’s Drawings 600 Interest Payable 50Salaries and Wages Expense 9,400 Unearned Rent Revenue 500Rent Expense 1,500 Owner’s Capital 14,000Depreciation Expense 850 Service Revenue 14,200Supplies Expense 200 Rent Revenue 800Utilities Expense 510Interest Expense 50
$37,310 $37,310
DO IT! 4 Trial Balance
(a) Determine the net income for the quarter April 1 to June 30.
(b) Determine the total assets and total liabilities at June 30, 2017, for Skolnick Co.
(c) Determine the amount of owner’s capital at June 30, 2017.

Appendix 3A: Adjusting Entries for the Alternative Treatment of Deferrals 115
(a) The net income is determined by adding revenues and subtracting expenses. The net income is computed as follows.
Revenues Service revenue $14,200 Rent revenue 800 Total revenues $15,000
Expenses Salaries and wages expense 9,400 Rent expense 1,500 Depreciation expense 850 Utilities expense 510 Supplies expense 200 Interest expense 50 Total expenses 12,510
Net income $ 2,490
(b) Total assets and liabilities are computed as follows.
Assets Liabilities
Cash $ 6,700 Notes payable $5,000Accounts receivable 600 Accounts payable 1,510Supplies 1,000 Unearned rentPrepaid rent 900 revenue 500Equipment $15,000 Salaries and wagesLess: Accumulated payable 400 depreciation— Interest payable 50 equipment 850 14,150
Total assets $23,350 Total liabilities $7,460
(c) Owner’s capital, April 1 $ 0 Add: Investments 14,000 Net income 2,490 Less: Owner’s drawings 600
Owner’s capital, June 30 $15,890
Solution
Related exercise material: BE3-9, BE3-10, E3-11, E3-12, E3-13, and DO IT! 3-4.
Action Plan✔ In an adjusted trial
balance, all asset, liability, revenue, and expense accounts are properly stated.
✔ To determine the ending balance in Owner’s Capital, add net income and subtract dividends.
5 APPENDIX 3A: Prepare adjusting entries for the alternative treatment of deferrals.
In discussing adjusting entries for prepaid expenses and unearned revenues, we illustrated transactions for which companies made the initial entries to balance sheet accounts. In the case of prepaid expenses, the company debited the prepay-ment to an asset account. In the case of unearned revenue, the company credited a liability account to record the cash received. Some companies use an alternative treatment. (1) When a company prepays an expense, it debits that amount to an expense account. (2) When it receives payment for future services, it credits the amount to a revenue account. In this appendix, we describe the circumstances that justify such entries and the differ-ent adjusting entries that may be required. This alternative treatment of prepaid expenses and unearned revenues has the same effect on the fi nancial statements as the procedures described in the chapter.
LEARNING OBJECTIVE
*

116 3 Adjusting the Accounts
Prepaid Expenses
Prepaid expenses become expired costs either through the passage of time (e.g., insurance) or through consumption (e.g., advertising supplies). If at the time of purchase the company expects to consume the supplies before the next fi nan-cial statement date, it may choose to debit (increase) an expense account rather than an asset account. This alternative treatment is simply more convenient. Assume that Pioneer Advertising expects that it will use before the end of the month all of the supplies purchased on October 5. A debit of $2,500 to Supplies Expense (rather than to the asset account Supplies) on October 5 will eliminate the need for an adjusting entry on October 31. At October 31, the Supplies Expense account will show a balance of $2,500, which is the cost of supplies used between October 5 and October 31. But what if the company does not use all the supplies? For example, what if an inventory of $1,000 of advertising supplies remains on October 31? Obviously, the company would need to make an adjusting entry. Prior to adjustment, the expense account Supplies Expense is overstated $1,000, and the asset account Supplies is understated $1,000. Thus, Pioneer makes the following adjusting entry.
After the company posts the adjusting entry, the accounts show the following.
Oct. 31 Supplies 1,000 Supplies Expense 1,000 (To record supplies inventory)
After adjustment, the asset account Supplies shows a balance of $1,000, which is equal to the cost of supplies on hand at October 31. In addition, Sup-plies Expense shows a balance of $1,500. This is equal to the cost of supplies used between October 5 and October 31. Without the adjusting entry, expenses are overstated and net income is understated by $1,000 in the October income statement. Also, both assets and owner’s equity are understated by $1,000 on the October 31 balance sheet. Illustration 3A-2 compares the entries and accounts for advertising supplies in the two adjustment approaches.
Illustration 3A-1Prepaid expenses accounts after adjustment
Supplies Supplies Expense
10/31 Adj. 1,000 10/5 2,500 10/31 Adj. 1,000
10/31 Bal. 1,500
Illustration 3A-2Adjustment approaches—a comparison
Prepayment Initially Prepayment Initially Debited to Asset Account Debited to Expense Account (per chapter) (per appendix)
Oct. 5 Supplies 2,500 Oct. 5 Supplies Expense 2,500 Accounts Payable 2,500 Accounts Payable 2,500
Oct. 31 Supplies Expense 1,500 Oct. 31 Supplies 1,000 Supplies 1,500 Supplies Expense 1,000
11,00011,000 Exp
Cash Flowsno effect
A OEL5 1

Appendix 3A: Adjusting Entries for the Alternative Treatment of Deferrals 117
After Pioneer posts the entries, the accounts appear as follows.
Illustration 3A-3Comparison of accounts (per chapter) (per appendix)
Supplies Supplies
10/5 2,500 10/31 Adj. 1,500 10/31 Adj. 1,000
10/31 Bal. 1,000
Supplies Expense Supplies Expense
10/31 Adj. 1,500 10/5 2,500 10/31 Adj. 1,000
10/31 Bal. 1,500
Note that the account balances under each alternative are the same at October 31: Supplies $1,000 and Supplies Expense $1,500.
Unearned Revenues
Unearned revenues are recognized as revenue at the time services are performed. Similar to the case for prepaid expenses, companies may credit (increase) a rev-enue account when they receive cash for future services. To illustrate, assume that Pioneer Advertising received $1,200 for future ser-vices on October 2. Pioneer expects to perform the services before October 31.1 In such a case, the company credits Service Revenue. If Pioneer in fact performs the service before October 31, no adjustment is needed. However, if at the statement date Pioneer has not performed $800 of the services, it would make an adjusting entry. Without the entry, the revenue account Service Revenue is overstated $800, and the liability account Unearned Service Revenue is understated $800. Thus, Pioneer makes the following adjusting entry.
Helpful HintThe required adjusted balances here are Service Revenue $400 and Unearned Service Revenue $800.
Oct. 31 Service Revenue 800 Unearned Service Revenue 800 (To record unearned service revenue)
After Pioneer posts the adjusting entry, the accounts show the following.
Illustration 3A-4Unearned service revenue accounts after adjustment
Unearned Service Revenue Service Revenue
10/31 Adj. 800 10/31 Adj. 800 10/2 1,200 10/31 Bal. 400
The liability account Unearned Service Revenue shows a balance of $800. This equals the services that will be performed in the future. In addition, the balance in Service Revenue equals the services performed in October. Without the adjust-ing entry, both revenues and net income are overstated by $800 in the October income statement. Also, liabilities are understated by $800 and owner’s equity is overstated by $800 on the October 31 balance sheet.
1This example focuses only on the alternative treatment of unearned revenues. For simplicity, we have ignored the entries to Service Revenue pertaining to the immediate recognition of revenue ($10,000) and the adjusting entry for accrued revenue ($200).
2800 Rev1800
Cash Flowsno effect
A OEL5 1

118 3 Adjusting the Accounts
After Pioneer posts the entries, the accounts appear as follows.
Illustration 3A-5Adjustment approaches—a comparison
Unearned Service Revenue Unearned Service Revenue Initially Credited Initially Credited to Liability Account to Revenue Account (per chapter) (per appendix)
Oct. 2 Cash 1,200 Oct. 2 Cash 1,200 Unearned Service Service Revenue 1,200 Revenue 1,200
Oct. 31 Unearned Service Oct. 31 Service Revenue 800 Revenue 400 Unearned Service Service Revenue 400 Revenue 800
Illustration 3A-6Comparison of accounts (per chapter) (per appendix)
Unearned Service Revenue Unearned Service Revenue
10/31 Adj. 400 10/2 1,200 10/31 Adj. 800
10/31 Bal. 800
Service Revenue Service Revenue
10/31 Adj. 400 10/31 Adj. 800 10/2 1,200
10/31 Bal. 400
Note that the balances in the accounts are the same under the two alternatives: Unearned Service Revenue $800 and Service Revenue $400.
Summary of Additional Adjustment Relationships
Illustration 3A-7 provides a summary of basic relationships for deferrals.Illustration 3A-7Summary of basic relationships for deferrals
Type of Reason for Account Balances Adjusting Adjustment Adjustment before Adjustment Entry
1. Prepaid expenses (a) Prepaid expenses initially recorded Assets overstated. Dr. Expenses in asset accounts have been used. Expenses understated. Cr. Assets (b) Prepaid expenses initially recorded Assets understated. Dr. Assets in expense accounts have not Expenses overstated. Cr. Expenses been used.
2. Unearned revenues (a) Unearned revenues initially recorded in liability accounts are now Liabilities overstated. Dr. Liabilities recognized as revenue. Revenues understated. Cr. Revenues (b) Unearned revenues initially recorded Liabilities understated. Dr. Revenues in revenue accounts are still Revenues overstated. Cr. Liabilities unearned.
Alternative adjusting entries do not apply to accrued revenues and accrued expenses because no entries occur before companies make these types of adjusting entries.
Illustration 3A-5 compares the entries and accounts for initially recording unearned service revenue in (1) a liability account or (2) a revenue account.

Appendix 3B: Financial Reporting Concepts 119
6 APPENDIX 3B: Discuss fi nancial reporting concepts.
This appendix provides a summary of the concepts in action used in this text-book. In addition, it provides other useful concepts which accountants use as a basis for recording and reporting fi nancial information.
Qualities of Useful Information
Recently, the FASB completed the fi rst phase of a project in which it developed a conceptual framework to serve as the basis for future accounting standards. The framework begins by stating that the primary objective of fi nancial report-ing is to provide fi nancial information that is useful to investors and creditors for making decisions about providing capital. Useful information should possess two fundamental qualities, relevance and faithful representation, as shown in Illustration 3B-1.
ENHANCING QUALITIES
In addition to the two fundamental qualities, the FASB also describes a number of enhancing qualities of useful information. These include comparability, consistency, verifi ability, timeliness, and understandability. In accounting, comparability results when different companies use the same accounting prin-ciples. Another characteristic that enhances comparability is consistency. Con-sistency means that a company uses the same accounting principles and methods from year to year. Information is verifi able if independent observers, using the same methods, obtain similar results. For accounting information to have rele-vance, it must be timely. That is, it must be available to decision-makers before it loses its capacity to infl uence decisions. For example, public companies like Google or Best Buy provide their annual reports to investors within 60 days of their year-end. Information has the quality of understandability if it is presented in a clear and concise fashion, so that reasonably informed users of that informa-tion can interpret it and comprehend its meaning.
Assumptions in Financial Reporting
To develop accounting standards, the FASB relies on some key assumptions, as shown in Illustration 3B-2 (page 120). These include assumptions about the monetary unit, economic entity, time period, and going concern.
Illustration 3B-1Fundamental qualities of useful information
BIG SHOT
Tell mewhat I need
to know
Relevance Accounting information has relevance if it would make a difference in a business decision. Information is considered relevant if it provides information that has predictive value, that is, helps provide accurate expectations about the future, and has confi rmatory value, that is, confi rms or corrects prior expectations. Materiality is a company-specifi c aspect of relevance. An item is material when its size makes it likely to infl uence the decision of an investor or creditor.
Faithful Representation Faithful representation means that information accurately depicts what really happened. To provide a faithful representation, information must be complete (nothing important has been omitted), neutral (is not biased toward one position or another), and free from error.
LEARNING OBJECTIVE
*

120 3 Adjusting the Accounts
Illustration 3B-2Key assumptions in fi nancial reporting
Now Future
Ford
Chrysler
GM
Ford
Chrysler
GM
Start ofbusiness
End ofbusiness
2013
2015 2017 2019 2021
2023
J F
QTR1
QTR2
QTR3
QTR4
M A M J J A S O N D
Accounting
Records
– Salaries
paid
$ $ $ $ $
Measure of
employee
satisfaction
Total number
of employees
Salaries paid
Percent of
international
employees
$Monetary Unit Assumption The monetary unit assumption requires that only those things that can be expressed in money are included in the accounting records. This means that certain important information needed by investors, creditors, and managers, such as customer satisfaction, is not reported in the fi nancial statements.
Economic Entity Assumption The economic entity assumption states that every economic entity can be separately identifi ed and accounted for. In order to assess a company’s performance and fi nancial position accurately, it is important to not blur company transactions with personal transactions (especially those of its managers) or transactions of other companies.
Time Period Assumption Notice that the income statement, retained earnings statement, and statement of cash fl ows all cover periods of one year, and the balance sheet is prepared at the end of each year. The time period assumption states that the life of a business can be divided into artifi cial time periods and that useful reports covering those periods can be prepared for the business.
Going Concern Assumption The going concern assumption states that the business will remain in operation for the foreseeable future. Of course, many businesses do fail, but in general it is reasonable to assume that the business will continue operating.
Principles in Financial Reporting
MEASUREMENT PRINCIPLES
GAAP generally uses one of two measurement principles, the historical cost prin-ciple or the fair value principle. Selection of which principle to follow generally relates to trade-offs between relevance and faithful representation.
HISTORICAL COST PRINCIPLE The historical cost principle (or cost principle, dis-cussed in Chapter 1) dictates that companies record assets at their cost. This is true not only at the time the asset is purchased but also over the time the asset is held. For example, if land that was purchased for $30,000 increases in value to $40,000, it continues to be reported at $30,000.
FAIR VALUE PRINCIPLE The fair value principle (discussed in Chapter 1) indi-cates that assets and liabilities should be reported at fair value (the price received to sell an asset or settle a liability). Fair value information may be more useful than historical cost for certain types of assets and liabilities. For example, certain investment securities are reported at fair value because market price information is often readily available for these types of assets. In choosing between cost and fair value, two qualities that make accounting information useful for decision-making are used—relevance and faithful representation. In determining which measurement principle to use, the factual nature of cost fi gures are weighed ver-sus the relevance of fair value. In general, most assets follow the historical cost principle because fair values may not be representationally faithful. Only in situ-ations where assets are actively traded, such as investment securities, is the fair value principle applied.

Review and Practice 121
REVENUE RECOGNITION PRINCIPLE
The revenue recognition principle requires that companies recognize revenue in the accounting period in which the performance obligation is satisfi ed. As dis-cussed earlier in the chapter, in a service company, revenue is recognized at the time the service is performed. In a merchandising company, the performance obligation is generally satisfi ed when the goods transfer from the seller to the buyer (discussed in Chapter 5). At this point, the sales transaction is complete and the sales price established.
EXPENSE RECOGNITION PRINCIPLE
The expense recognition principle (often referred to as the matching principle, discussed earlier in the chapter) dictates that efforts (expenses) be matched with results (revenues). Thus, expenses follow revenues.
FULL DISCLOSURE PRINCIPLE
The full disclosure principle (discussed in Chapter 11) requires that companies disclose all circumstances and events that would make a difference to fi nancial statement users. If an important item cannot reasonably be reported directly in one of the four types of fi nancial statements, then it should be discussed in notes that accompany the statements.
Cost Constraint
Providing information is costly. In deciding whether companies should be required to provide a certain type of information, accounting standard-setters consider the cost constraint. It weighs the cost that companies will incur to pro-vide the information against the benefi t that fi nancial statement users will gain from having the information available.
Cost
Benefits
Explain the accrual basis of accounting and the rea-sons for adjusting entries. The time period assumption assumes that the economic life of a business is divided into artifi cial time periods. Accrual-basis accounting means that companies record events that change a company’s fi nancial statements in the periods in which those events occur, rather than in the periods in which the company receives or pays cash.
Companies make adjusting entries at the end of an accounting period. Such entries ensure that compa-nies recognize revenues in the period in which the performance obligation is satisfi ed and recognize expenses in the period in which they are incurred. The major types of adjusting entries are deferrals (prepaid expenses and unearned revenues) and accruals (accrued revenues and accrued expenses).
Prepare adjusting entries for deferrals. Deferrals are either prepaid expenses or unearned revenues. Com-panies make adjusting entries for deferrals to record the portion of the prepayment that represents the
1
2
expense incurred or the revenue for services per-formed in the current accounting period.
Prepare adjusting entries for accruals. Accruals are either accrued revenues or accrued expenses. Compa-nies make adjusting entries for accruals to record rev-enues for services performed and expenses incurred in the current accounting period that have not been recognized through daily entries.
Describe the nature and purpose of an adjusted trial balance. An adjusted trial balance shows the balances of all accounts, including those that have been adjusted, at the end of an accounting period. Its purpose is to prove the equality of the total debit balances and total credit balances in the ledger after all adjustments.
Prepare adjusting entries for the alternative treat-ment of deferrals. Companies may initially debit prepayments to an expense account. Likewise, they may credit unearned revenues to a revenue account. At the end of the period, these accounts may be
3
4
* 5
LEARNING OBJECTIVES REVIEW
1
REVIEW AND PRACTICE

overstated. The adjusting entries for prepaid expenses are a debit to an asset account and a credit to an expense account. Adjusting entries for unearned rev-enues are a debit to a revenue account and a credit to a liability account.
Discuss fi nancial reporting concepts. To be judged useful, information should have the primary charac-teristics of relevance and faithful representation. In addition, it should be comparable, consistent, verifi -able, timely, and understandable.
The monetary unit assumption requires that companies include in the accounting records only transaction data that can be expressed in terms of money. The economic entity assumption states that economic events can be identifi ed with a particular unit of accountability. The time period assumption states that the economic life of a business can be divided into artifi cial time periods and that meaningful
6*
accounting reports can be prepared for each period. The going concern assumption states that the com-pany will continue in operation long enough to carry out its existing objectives and commitments.
The historical cost principle states that compa-nies should record assets at their cost. The fair value principle indicates that assets and liabilities should be reported at fair value. The revenue recognition principle requires that companies recognize revenue in the accounting period in which the performance obligation is satisfi ed. The expense recognition principle dictates that efforts (expenses) be matched with results (revenues). The full disclosure princi-ple requires that companies disclose circumstances and events that matter to fi nancial statement users.
The cost constraint weighs the cost that compa-nies incur to provide a type of information against its benefi ts to fi nancial statement users.
Accrual-basis accounting Accounting basis in which companies record transactions that change a compa-ny’s fi nancial statements in the periods in which the events occur. (p. 94).
Accruals Adjusting entries for either accrued revenues or accrued expenses. (p. 96).
Accrued expenses Expenses incurred but not yet paid in cash or recorded. (p. 106).
Accrued revenues Revenues for services performed but not yet received in cash or recorded. (p. 104).
Adjusted trial balance A list of accounts and their balances after the company has made all adjustments. (p. 111).
Adjusting entries Entries made at the end of an accounting period to ensure that companies follow the revenue recognition and expense recognition princi-ples. (p. 96).
Book value The difference between the cost of a depre-ciable asset and its related accumulated depreciation. (p. 101).
Calendar year An accounting period that extends from January 1 to December 31. (p. 94).
Cash-basis accounting Accounting basis in which com-panies record revenue when they receive cash and an expense when they pay out cash. (p. 94).
*Comparability Ability to compare the accounting infor-mation of different companies because they use the same accounting principles. (p. 119).
*Consistency Use of the same accounting principles and methods from year to year within a company. (p. 119).
Contra asset account An account offset against an asset account on the balance sheet. (p. 100).
*Cost constraint Constraint that weighs the cost that companies will incur to provide the information against the benefi t that fi nancial statement users will gain from having the information available. (p. 121).
Deferrals Adjusting entries for either prepaid expenses or unearned revenues. (p. 96).
Depreciation The process of allocating the cost of an asset to expense over its useful life. (p. 100).
Economic entity assumption An assumption that every economic entity can be separately identifi ed and accounted for. (p. 120).
Expense recognition principle (matching principle) The principle that companies match efforts (expenses) with accomplishments (revenues). (pp. 95, 121).
Fair value principle Assets and liabilities should be reported at fair value (the price received to sell an asset or settle a liability). (p. 120).
Faithful representation Information that accurately depicts what really happened. (p. 119).
Fiscal year An accounting period that is one year in length. (p. 94).
Full disclosure principle Accounting principle that dictates that companies disclose circumstances and events that make a difference to fi nancial statement users. (p. 121).
Going concern assumption The assumption that the company will continue in operation for the foreseeable future. (p. 120).
Historical cost principle An accounting principle that states that companies should record assets at their cost. (p. 120).
Interim periods Monthly or quarterly accounting time periods. (p. 94).
Materiality A company-specifi c aspect of relevance. An item is material when its size makes it likely to infl u-ence the decision of an investor or creditor. (p. 119).
Monetary unit assumption An assumption that requires that only those things that can be expressed in money are included in the accounting records. (p. 120).
*
*
*
*
*
*
*
*
GLOSSARY REVIEW
122 3 Adjusting the Accounts

Practice Multiple-Choice Questions 123
Prepaid expenses (prepayments) Expenses paid in cash before they are used or consumed. (p. 98).
Relevance The quality of information that indicates the information makes a difference in a decision. (p. 119).
Revenue recognition principle The principle that compa-nies recognize revenue in the accounting period in which the performance obligation is satisfi ed. (pp. 95, 121).
Timely Information that is available to decision-makers before it loses its capacity to infl uence decisions. (p. 119).
Time period assumption An assumption that accoun-tants can divide the economic life of a business into artifi cial time periods. (pp. 94, 120).
*
*
Understandability Information presented in a clear and concise fashion so that users can interpret it and com-prehend its meaning. (p. 119).
Unearned revenues A liability recorded for cash received before services are performed. (p. 101).
Useful life The length of service of a long-lived asset. (p. 100).
Verifi able The quality of information that occurs when independent observers, using the same methods, obtain similar results. (p. 119).
*
*
1. The revenue recognition principle states that:(a) revenue should be recognized in the accounting
period in which a performance obligation is satisfi ed.
(b) expenses should be matched with revenues.(c) the economic life of a business can be divided into
artifi cial time periods.(d) the fi scal year should correspond with the calen-
dar year. 2. The time period assumption states that:
(a) companies must wait until the calendar year is completed to prepare fi nancial statements.
(b) companies use the fi scal year to report fi nancial information.
(c) the economic life of a business can be divided into artifi cial time periods.
(d) companies record information in the time period in which the events occur.
3. Which of the following statements about the accrual basis of accounting is false?(a) Events that change a company’s fi nancial state-
ments are recorded in the periods in which the events occur.
(b) Revenue is recognized in the period in which ser-vices are performed.
(c) This basis is in accord with generally accepted accounting principles.
(d) Revenue is recorded only when cash is received, and expense is recorded only when cash is paid.
4. The principle or assumption dictating that efforts (expenses) be matched with accomplishments (reve-nues) is the:(a) expense recognition principle.(b) cost assumption.(c) time period assumption.(d) revenue recognition principle.
5. Adjusting entries are made to ensure that:(a) expenses are recognized in the period in which
they are incurred.(b) revenues are recorded in the period in which ser-
vices are performed.(c) balance sheet and income statement accounts
have correct balances at the end of an accounting period.
(d) All the responses above are correct.
(LO 1)
(LO 1)
(LO 1)
(LO 1)
(LO 1)
6. Each of the following is a major type (or category) of adjusting entries except:(a) prepaid expenses.(b) accrued revenues.(c) accrued expenses.(d) recognized revenues.
7. The trial balance shows Supplies $1,350 and Supplies Expense $0. If $600 of supplies are on hand at the end of the period, the adjusting entry is:(a) Supplies 600 Supplies Expense 600(b) Supplies 750 Supplies Expense 750(c) Supplies Expense 750 Supplies 750(d) Supplies Expense 600 Supplies 600
8. Adjustments for prepaid expenses:(a) decrease assets and increase revenues.(b) decrease expenses and increase assets.(c) decrease assets and increase expenses.(d) decrease revenues and increase assets.
9. Accumulated Depreciation is:(a) a contra asset account.(b) an expense account.(c) an owner’s equity account.(d) a liability account.
10. Rivera Company computes depreciation on delivery equipment at $1,000 for the month of June. The adjusting entry to record this depreciation is as follows.(a) Depreciation Expense 1,000 Accumulated Depreciation—
Rivera Company 1,000(b) Depreciation Expense 1,000 Equipment 1,000(c) Depreciation Expense 1,000 Accumulated Depreciation—
Equipment 1,000(d) Equipment Expense 1,000 Accumulated Depreciation—
Equipment 1,000 11. Adjustments for unearned revenues:
(a) decrease liabilities and increase revenues.(b) have an assets-and-revenues-account relationship.
(LO 1)
(LO 2)
(LO 2)
(LO 2)
(LO 2)
(LO 2)
PRACTICE MULTIPLE-CHOICE QUESTIONS

124 3 Adjusting the Accounts
(c) increase assets and increase revenues.(d) decrease revenues and decrease assets.
12. Adjustments for accrued revenues:(a) have a liabilities-and-revenues-account relation-
ship.(b) have an assets-and-revenues-account relationship.(c) decrease assets and revenues.(d) decrease liabilities and increase revenues.
13. Anika Wilson earned a salary of $400 for the last week of September. She will be paid on October 1. The adjusting entry for Anika’s employer at September 30 is:(a) No entry is required.(b) Salaries and Wages Expense 400 Salaries and Wages Payable 400(c) Salaries and Wages Expense 400 Cash 400(d) Salaries and Wages Payable 400 Cash 400
14. Which of the following statements is incorrect con-cerning the adjusted trial balance?(a) An adjusted trial balance proves the equality of
the total debit balances and the total credit bal-ances in the ledger after all adjustments are made.
(b) The adjusted trial balance provides the primary basis for the preparation of fi nancial statements.
(LO 3)
(LO 3)
(LO 4)
(c) The adjusted trial balance lists the account bal-ances segregated by assets and liabilities.
(d) The adjusted trial balance is prepared after the adjusting entries have been journalized and posted.
15. The trial balance shows Supplies $0 and Supplies Expense $1,500. If $800 of supplies are on hand at the end of the period, the adjusting entry is:(a) debit Supplies $800 and credit Supplies Expense
$800.(b) debit Supplies Expense $800 and credit Supplies
$800.(c) debit Supplies $700 and credit Supplies Expense
$700.(d) debit Supplies Expense $700 and credit Supplies
$700. 16. Neutrality is an ingredient of:
Faithful Representation Relevance
(a) Yes Yes(b) No No(c) Yes No(d) No Yes
17. Which item is a constraint in fi nancial accounting?(a) Comparability. (c) Cost.(b) Materiality. (d) Consistency.
(LO 5)*
(LO 6)*
(LO 6)*
Solutions
1. (a) Revenue should be recognized in the accounting period in which a performance obligation is satisfi ed. The other choices are incorrect because (b) defi nes the expense recognition principle, (c) describes the time period assumption, and (d) a company’s fi scal year does not need to correspond with the calendar year.
2. (c) The economic life of a business can be divided into artifi cial time periods. The other choices are incorrect because (a) com-panies report their activities on a more frequent basis and not necessarily based on a calendar year; (b) companies report fi nancial information more frequently than annually, such as monthly or quarterly, in order to evaluate results of operations; and (d) describes accrual-basis accounting.
3. (d) Under the accrual basis of accounting, revenue is recognized when the performance obligation is satisfi ed, not when cash is received, and expense is recognized when incurred, not when cash is paid. The other choices are all true statements.
4. (a) The expense recognition principle dictates that expenses be matched with revenues. The other choices are incorrect because (b) there is no cost assumption, but the historical cost principle states that assets should be recorded at their cost; (c) the time period assumption states that the economic life of a business can be divided into artifi cial time periods; and (d) the revenue recognition principle indicates that revenue should be recognized in the accounting period in which a performance obligation is satisfi ed.
5. (d) Adjusting entries are made for the reasons noted in choices (a), (b), and (c). The other choices are true statements, but (d) is the better answer.
6. (d) Unearned revenues, not recognized revenues, are one of the major categories of adjusting entries. The other choices all list one of the major categories of adjusting entries.
7. (c) Debiting Supplies Expense for $750 and crediting Supplies for $750 will decrease Supplies and increase Supplies Expense. The other choices are incorrect because (a) will increase Supplies and decrease Supplies Expense and also for the wrong amounts, (b) will increase Supplies and decrease Supplies Expense, and (d) will cause Supplies to have an incorrect balance of $750 ($1,350 2 $600) and Supplies Expense to have an incorrect balance of $600 ($0 1 $600).
8. (c) Adjustments for prepaid expenses decrease assets and increase expenses. The other choices are incorrect because an adjust-ing entry for prepaid expenses (a) increases expenses, not revenues; (b) increases, not decreases, expenses and decreases, not increases, assets; and (d) increases expenses, not decreases, revenues and decreases, not increases, assets.
9. (a) Accumulated Depreciation is a contra asset account; it is offset against an asset account on the balance sheet. The other choices are incorrect because Accumulated Depreciation is not (b) an expense account nor located on the income statement, (c) an owner’s equity account, or (d) a liability account.
10. (c) The adjusting entry is to debit Depreciation Expense and credit Accumulated Depreciation—Equipment. The other choices are incorrect because (a) the contra asset account title includes the asset being depreciated, not the company name; (b) the credit should be to the contra asset account, not directly to the asset; and (d) the debit for this entry should be Depreciation Expense, not Equipment Expense.
11. (a) Adjustments for unearned revenues will consist of a debit (decrease) to unearned revenues (a liability) and a credit (increase) to a revenue account. Choices (b), (c), and (d) are incorrect because adjustments for unearned revenues will increase revenues but will have no effect on assets.

12. (b) Adjustments for accrued revenues will have an assets-and-revenues-account relationship. Choices (a) and (d) are incorrect because adjustments for accrued revenues have no effect on liabilities. Choice (c) is incorrect because these adjustments will increase, not decrease, both assets and revenues.
13. (b) The adjusting entry should be to debit Salaries and Wages Expense for $400 and credit Salaries and Wages Payable for $400. The other choices are incorrect because (a) if an adjusting entry is not made, the amount of money owed (liability) that is shown on the balance sheet will be understated and the amount of salaries and wages expense will also be understated; (c) the credit account is incorrect as adjusting entries never affect cash; and (d) the debit account should be Salaries and Wages Expense and the credit account should be Salaries and Wages Payable. Adjusting entries never affect cash.
14. (c) The accounts on the trial balance can be segregated by the balance in the account—either debit or credit—not whether they are assets or liabilities. All accounts in the ledger are included in the adjusted trial balance, not just assets and liabilities. The other choices are all true statements.
*15. (a) This adjusting entry correctly states the Supplies account at $800 ($0 1 $800) and the Supplies Expense account at $700 ($1,500 2 $800). The other choices are incorrect because (b) will cause the Supplies account to have a credit balance (assets have a normal debit balance) and the Supplies Expense account to be stated at $2,300, which is too high; (c) will result in a $700 balance in the Supplies account ($100 too low) and an $800 balance in the Supplies Expense account ($100 too high); and (d) will cause the Supplies account to have a credit balance (assets have a normal debit balance) and the Supplies Expense account to be stated at $2,200, which is too high.
*16. (c) Neutrality is one of the enhancing qualities that makes information more representationally faithful, not relevant. There-fore, choices (a), (b), and (d) are incorrect.
*17. (c) Cost is a constraint in fi nancial accounting. The other choices are all enhancing qualities of useful information.
1. Evan Watts, D.D.S., opened a dental practice on January 1, 2017. During the fi rst month of operations, the following transactions occurred.
1. Watts performed services for patients totaling $2,400. These services have not yet been recorded.
2. Utility expenses incurred but not paid prior to January 31 totaled $400.
3. Purchased dental equipment on January 1 for $80,000, paying $20,000 in cash and signing a $60,000, 3-year note payable. The equipment depreciates $500 per month. Interest is $600 per month.
4. Purchased a one-year malpractice insurance policy on January 1 for $12,000.
5. Purchased $2,600 of dental supplies. On January 31, determined that $900 of supplies were on hand.
InstructionsPrepare the adjusting entries on January 31. Account titles are Accumulated Depreciation—Equipment, Depreciation Expense, Service Revenue, Accounts Receivable, Insurance Expense, Interest Expense, Interest Payable, Prepaid Insurance, Supplies, Supplies Expense, Utilities Expense, and Utilities Payable.
Prepare adjusting entries.
(LO 2, 3)
PRACTICE EXERCISES
1. JANUARY 31
Jan. 31 Accounts Receivable 2,400 Service Revenue 2,400
Utilities Expense 400 Utilities Payable 400
Depreciation Expense 500 Accumulated Depreciation—Equipment 500
Interest Expense 600 Interest Payable 600
Insurance Expense ($12,000 4 12) 1,000 Prepaid Insurance 1,000
Supplies Expense ($2,600 2 $900) 1,700 Supplies 1,700
Solution
Practice Exercises 125

2. The income statement of Venden Co. for the month of July shows net income of $4,000 based on Service Revenue $8,700, Salaries and Wages Expense $2,500, Supplies Expense $1,700, and Utilities Expense $500. In reviewing the statement, you discover the following.
1. Insurance expired during July of $700 was omitted.
2. Supplies expense includes $250 of supplies that are still on hand at July 31.
3. Depreciation on equipment of $300 was omitted.
4. Accrued but unpaid wages at July 31 of $400 were not included.
5. Services performed but unrecorded totaled $650.
InstructionsPrepare a correct income statement for July 2017.
126 3 Adjusting the Accounts
Prepare correct income statement.
(LO 2, 3, 4)
Solution
VENDEN CO.Income Statement
For the Month Ended July 31, 2017
Revenues Service revenue ($8,700 1 $650) $9,350Expenses Salaries and wages expense ($2,500 1 $400) $2,900 Supplies expense ($1,700 2 $250) 1,450 Utilities expense 500 Insurance expense 700 Depreciation expense 300
Total expenses 5,850
Net income $3,500
2.
The Green Thumb Lawn Care Company began operations on April 1. At April 30, the trial balance shows the following balances for selected accounts.
Prepaid Insurance $ 3,600Equipment 28,000Notes Payable 20,000Unearned Service Revenue 4,200Service Revenue 1,800
Analysis reveals the following additional data.
1. Prepaid insurance is the cost of a 2-year insurance policy, effective April 1.
2. Depreciation on the equipment is $500 per month.
3. The note payable is dated April 1. It is a 6-month, 12% note.
4. Seven customers paid for the company’s 6-month lawn service package of $600 begin-ning in April. The company performed services for these customers in April.
5. Lawn services performed for other customers but not recorded at April 30 totaled $1,500.
InstructionsPrepare the adjusting entries for the month of April. Show computations.
PRACTICE PROBLEM
Prepare adjusting entries from selected data.
(LO 2, 3)

Questions 127
GENERAL JOURNAL J1
Date Account Titles and Explanation Ref. Debit Credit
Adjusting Entries
Apr. 30 Insurance Expense 150 Prepaid Insurance 150 (To record insurance expired: $3,600 4 24 5 $150 per month)
30 Depreciation Expense 500 Accumulated Depreciation—Equipment 500 (To record monthly depreciation)
30 Interest Expense 200 Interest Payable 200 (To record interest on notes payable: $20,000 3 12% 3 1/12 5 $200)
30 Unearned Service Revenue 700 Service Revenue 700 (To record revenue for services performed: $600 4 6 5 $100; $100 per month 3 7 5 $700)
30 Accounts Receivable 1,500 Service Revenue 1,500 (To record revenue for services performed)
Solution
Brief Exercises, Exercises, DO IT! Exercises, and Problems and many additional resources are available for practice in WileyPLUS
QUESTIONS
1. (a) How does the time period assumption affect an accountant’s analysis of business transactions?
(b) Explain the terms fi scal year, calendar year, and interim periods.
2. Defi ne two generally accepted accounting principles that relate to adjusting the accounts.
3. Susan Hardy, a lawyer, accepts a legal engagement in March, performs the work in April, and is paid in May. If Hardy’s law fi rm prepares monthly fi nancial statements, when should it recognize revenue from this engagement? Why?
4. Why do accrual-basis fi nancial statements provide more useful information than cash-basis statements?
5. In completing the engagement in Question 3, Hardy pays no costs in March, $2,000 in April, and $2,500 in May (incurred in April). How much expense should the fi rm deduct from revenues in the month when it recognizes the revenue? Why?
6. “Adjusting entries are required by the historical cost principle of accounting.” Do you agree? Explain.
7. Why may a trial balance not contain up-to-date and complete fi nancial information?
8. Distinguish between the two categories of adjusting entries, and identify the types of adjustments applica-ble to each category.
9. What is the debit/credit effect of a prepaid expense adjusting entry?
10. “Depreciation is a valuation process that results in the reporting of the fair value of the asset.” Do you agree? Explain.
11. Explain the differences between depreciation expense and accumulated depreciation.
12. G. Phillips Company purchased equipment for $18,000. By the current balance sheet date, $6,000 had been depreciated. Indicate the balance sheet pre-sentation of the data.
13. What is the debit/credit effect of an unearned revenue adjusting entry?
14. A company fails to recognize revenue for services per-formed but not yet received in cash or recorded. Which of the following accounts are involved in the adjusting entry: (a) asset, (b) liability, (c) revenue, or (d) expense? For the accounts selected, indicate whether they would be debited or credited in the entry.
15. A company fails to recognize an expense incurred but not paid. Indicate which of the following accounts is debited and which is credited in the adjusting entry: (a) asset, (b) liability, (c) revenue, or (d) expense.
16. A company makes an accrued revenue adjusting entry for $900 and an accrued expense adjusting entry for
NOTE: All asterisked Questions, Exercises, and Problems relate to material in the appendices to the chapter.

128 3 Adjusting the Accounts
$700. How much was net income understated prior to these entries? Explain.
17. On January 9, a company pays $5,000 for salaries and wages of which $2,000 was reported as Salaries and Wages Payable on December 31. Give the entry to record the payment.
18. For each of the following items before adjustment, indicate the type of adjusting entry (prepaid expense, unearned revenue, accrued revenue, or accrued expense) that is needed to correct the misstatement. If an item could result in more than one type of adjusting entry, indicate each of the types.(a) Assets are understated.(b) Liabilities are overstated.(c) Liabilities are understated.(d) Expenses are understated.(e) Assets are overstated.(f) Revenue is understated.
19. One-half of the adjusting entry is given below. Indi-cate the account title for the other half of the entry.(a) Salaries and Wages Expense is debited.(b) Depreciation Expense is debited.(c) Interest Payable is credited.(d) Supplies is credited.(e) Accounts Receivable is debited.(f) Unearned Service Revenue is debited.
20. “An adjusting entry may affect more than one balance sheet or income statement account.” Do you agree? Why or why not?
21. Why is it possible to prepare fi nancial statements directly from an adjusted trial balance?
22. Dashan Company debits Supplies Expense for all pur-chases of supplies and credits Rent Revenue for all advanced rentals. For each type of adjustment, give the adjusting entry.
23. (a) What is the primary objective of fi nancial reporting?
(b) Identify the characteristics of useful accounting information.
*24. Dan Fineman, the president of King Company, is pleased. King substantially increased its net income in 2017 while keeping its unit inventory relatively the same. Howard Gross, chief accountant, cautions Dan, however. Gross says that since King changed its method of inventory valuation, there is a consistency problem and it is diffi cult to determine whether King is better off. Is Gross correct? Why or why not?
*25. What is the distinction between comparability and consistency?
*26. Describe the constraint inherent in the presentation of accounting information.
*27. Quinn Becker is president of Better Books. She has no accounting background. Becker cannot under-stand why fair value is not used as the basis for all accounting measurement and reporting. Discuss.
*28. What is the economic entity assumption? Give an example of its violation.
*
*
BRIEF EXERCISES
BE3-1 The ledger of Althukair Company includes the following accounts. Explain why each account may require adjustment.
(a) Prepaid Insurance.(b) Depreciation Expense.(c) Unearned Service Revenue.(d) Interest Payable.
BE3-2 Kee Company accumulates the following adjustment data at December 31. Indi-cate (a) the type of adjustment (prepaid expense, accrued revenue, and so on), and (b) the status of accounts before adjustment (overstated or understated).
1. Supplies of $100 are on hand.2. Services performed but not recorded total $900.3. Interest of $200 has accumulated on a note payable.4. Rent collected in advance totaling $650 has been earned.
BE3-3 Schramel Advertising Company’s trial balance at December 31 shows Supplies $6,700 and Supplies Expense $0. On December 31, there are $2,100 of supplies on hand. Prepare the adjusting entry at December 31, and using T-accounts, enter the balances in the accounts, post the adjusting entry, and indicate the adjusted balance in each account.
BE3-4 At the end of its fi rst year, the trial balance of Bronowski Company shows Equip-ment $30,000 and zero balances in Accumulated Depreciation—Equipment and Depreci-ation Expense. Depreciation for the year is estimated to be $4,000. Prepare the adjusting entry for depreciation at December 31, post the adjustments to T-accounts, and indicate the balance sheet presentation of the equipment at December 31.
BE3-5 On July 1, 2017, Major Co. pays $15,120 to Cruz Insurance Co. for a 3-year insur-ance contract. Both companies have fi scal years ending December 31. For Major Co., jour-nalize and post the entry on July 1 and the adjusting entry on December 31.
Indicate why adjusting entries are needed.
(LO 1)
Identify the major types of adjusting entries.
(LO 1, 2)
Prepare adjusting entry for supplies.
(LO 2)
Prepare adjusting entry for depreciation.
(LO 2)
Prepare adjusting entry for prepaid expense.
(LO 2)

Brief Exercises 129
BE3-6 Using the data in BE3-5, journalize and post the entry on July 1 and the adjusting entry on December 31 for Cruz Insurance Co. Cruz uses the accounts Unearned Service Revenue and Service Revenue.
BE3-7 The bookkeeper for Abduli Company asks you to prepare the following accrued adjusting entries at December 31.
1. Interest on notes payable of $400 is accrued.2. Services performed but not recorded total $2,300.3. Salaries earned by employees of $900 have not been recorded.
Use the following account titles: Service Revenue, Accounts Receivable, Interest Expense, Interest Payable, Salaries and Wages Expense, and Salaries and Wages Payable.
BE3-8 The trial balance of Obenauf Company includes the following balance sheet accounts, which may require adjustment. For each account that requires adjustment, indi-cate (a) the type of adjusting entry (prepaid expense, unearned revenue, accrued revenue, or accrued expense) and (b) the related account in the adjusting entry.
Accounts Receivable Interest PayablePrepaid Insurance Unearned Service RevenueAccumulated Depreciation—Equipment
BE3-9 The adjusted trial balance of Wilder Company at December 31, 2017, includes the following accounts: Owner’s Capital $15,600, Owner’s Drawings $7,000, Service Revenue $39,000, Salaries and Wages Expense $16,000, Insurance Expense $2,000, Rent Expense $4,000, Supplies Expense $1,500, and Depreciation Expense $1,300. Prepare an income statement for the year.
BE3-10 Partial adjusted trial balance data for Wilder Company is presented in BE3-9. The balance in Owner’s Capital is the balance as of January 1. Prepare an owner’s equity state-ment for the year assuming net income is $14,200 for the year.
*BE3-11 Eckholm Company records all prepayments in income statement accounts. At April 30, the trial balance shows Supplies Expense $2,800, Service Revenue $9,200, and zero bal-ances in related balance sheet accounts. Prepare the adjusting entries at April 30 assuming (a) $400 of supplies on hand and (b) $3,000 of service revenue should be reported as unearned.
*BE3-12 The accompanying chart shows the qualitative characteristics of useful accounting information. Fill in the blanks.
UsefulnessEnhancingQualities
Relevance
(a)
(b)
(c)
Consistency
(f)
(g)
(h)
Understandability
FundamentalQualities
FaithfulRepresentation
(d)
Neutral
(e)
Prepare adjusting entry for unearned revenue.
(LO 2)
Prepare adjusting entries for accruals.
(LO 3)
Prepare an income statement from an adjusted trial balance.
(LO 4)
Prepare an owner’s equity statement from an adjusted trial balance.
(LO 4)Prepare adjusting entries under alternative treatment of deferrals.
(LO 5)
Identify characteristics of useful information.
(LO 6)
Analyze accounts in an unadjusted trial balance.
(LO 1, 2, 3)

130 3 Adjusting the Accounts
*BE3-13 Given the characteristics of useful accounting information, complete each of the following statements.
(a) For information to be _____, it should have predictive value, confi rmatory value, and be material.
(b) _____ is the quality of information that gives assurance that the information accu-rately depicts what really happened.
(c) _____ means using the same accounting principles and methods from year to year within a company.
*BE3-14 Here are some qualitative characteristics of useful accounting information:
1. Predictive value. 3. Verifi able.2. Neutral. 4. Timely.
Match each qualitative characteristic to one of the following statements.
________ (a) Accounting information should help provide accurate expectations about future events.
________ (b) Accounting information cannot be selected, prepared, or presented to favor one set of interested users over another.
________ (c) The quality of information that occurs when independent observers, using the same methods, obtain similar results.
________ (d) Accounting information must be available to decision-makers before it loses its capacity to infl uence their decisions.
*BE3-15 Select the response that completes the following statement correctly. The full dis-closure principle dictates that:
(a) fi nancial statements should disclose all assets at their cost.(b) fi nancial statements should disclose only those events that can be measured in currency.(c) fi nancial statements should disclose all events and circumstances that would matter to
users of fi nancial statements.(d) fi nancial statements should not be relied on unless an auditor has expressed an unqual-
ifi ed opinion on them.
Several timing concepts are discussed on pages 94–95. A list of concepts is provided below in the left column, with a description of the concept in the right column. There are more descriptions provided than concepts. Match the description of the concept to the concept.
1. ____ Cash-basis accounting.
2. ____ Fiscal year.
3. ____ Revenue recognition principle.
4. ____ Expense recognition principle.
DO IT! Exercises
DO IT! 3-1
DO IT! 3-2
(a) Monthly and quarterly time periods.(b) Accountants divide the economic life of a
business into artifi cial time periods.(c) Efforts (expenses) should be matched with
accomplishments (revenues).(d) Companies record revenues when they
receive cash and record expenses when they pay out cash.
(e) An accounting time period that is one year in length.
(f) An accounting time period that starts on January 1 and ends on December 31.
(g) Companies record transactions in the period in which the events occur.
(h) Recognize revenue in the accounting period in which a performance obligation is satisfi ed.
The ledger of Jahnke, Inc. on March 31, 2017, includes the following selected accounts before adjusting entries.
Identify characteristics of useful information.
(LO 6)
Identify characteristics of useful information.
(LO 6)
Defi ne full disclosure principle.
(LO 6)
Identify timing concepts.
(LO 1)
Prepare adjusting entries for deferrals.
(LO 2)

Exercises 131
Debit Credit
Prepaid Insurance 2,400Supplies 2,500Equipment 30,000Unearned Service Revenue 9,000
An analysis of the accounts shows the following.
1. Insurance expires at the rate of $300 per month.2. Supplies on hand total $1,100.3. The equipment depreciates $480 per month.4. During March, services were performed for two-fi fths of the unearned service revenue.
Prepare the adjusting entries for the month of March.
Fiske Computer Services began operations in July 2017. At the end of the month, the company prepares monthly fi nancial statements. It has the following informa-tion for the month.
1. At July 31, the company owed employees $1,300 in salaries that the company will pay in August.
2. On July 1, the company borrowed $20,000 from a local bank on a 10-year note. The annual interest rate is 6%.
3. Service revenue unrecorded in July totaled $2,400.
Prepare the adjusting entries needed at July 31, 2017.
Yang Co. was organized on April 1, 2017. The company prepares quarterly fi nancial statements. The adjusted trial balance amounts at June 30 are shown below.
DO IT! 3-3
DO IT! 3-4
Debit
Cash $ 5,360Accounts Receivable 480Prepaid Rent 720Supplies 920Equipment 12,000Owner’s Drawings 500Salaries and Wages Expense 7,400Rent Expense 1,200Depreciation Expense 700Supplies Expense 160Utilities Expense 410Interest Expense 40
$29,890
Credit
Accumulated Depreciation— Equipment $ 700Notes Payable 4,000Accounts Payable 790Salaries and Wages Payable 300Interest Payable 40Unearned Rent Revenue 400Owner’s Capital 11,200Service Revenue 11,360Rent Revenue 1,100
$29,890
(a) Determine the net income for the quarter April 1 to June 30.(b) Determine the total assets and total liabilities at June 30, 2017, for Yang Company.(c) Determine the amount that appears for Owner’s Capital at June 30, 2017.
EXERCISES
E3-1 Chloe Davis has prepared the following list of statements about the time period assumption.
1. Adjusting entries would not be necessary if a company’s life were not divided into arti-fi cial time periods.
2. The IRS requires companies to fi le annual tax returns.3. Accountants divide the economic life of a business into artifi cial time periods, but each
transaction affects only one of these periods.4. Accounting time periods are generally a month, a quarter, or a year.5. A time period lasting one year is called an interim period.6. All fi scal years are calendar years, but not all calendar years are fi scal years.
Calculate amounts from trial balance.
(LO 4)
Prepare adjusting entries for accruals.
(LO 3)
Explain the time period assumption.
(LO 1)

InstructionsIdentify each statement as true or false. If false, indicate how to correct the statement.
E3-2 On numerous occasions, proposals have surfaced to put the federal government on the accrual basis of accounting. This is no small issue. If this basis were used, it would mean that billions in unrecorded liabilities would have to be booked, and the federal defi cit would increase substantially.
Instructions (a) What is the difference between accrual-basis accounting and cash-basis accounting?(b) Why would politicians prefer the cash basis over the accrual basis?(c) Write a letter to your senator explaining why the federal government should adopt the
accrual basis of accounting.
E3-3 Carillo Industries collected $108,000 from customers in 2017. Of the amount col-lected, $25,000 was for services performed in 2016. In addition, Carillo performed services worth $36,000 in 2017, which will not be collected until 2018. Carillo Industries also paid $72,000 for expenses in 2017. Of the amount paid, $30,000 was for expenses incurred on account in 2016. In addition, Carillo incurred $42,000 of expenses in 2017, which will not be paid until 2018.
Instructions(a) Compute 2017 cash-basis net income.(b) Compute 2017 accrual-basis net income.
E3-4 Hong Corporation encounters the following situations:
1. Hong collects $1,300 from a customer in 2017 for services to be performed in 2018. 2. Hong incurs utility expense which is not yet paid in cash or recorded. 3. Hong’s employees worked 3 days in 2017 but will not be paid until 2018. 4. Hong performs services for customers but has not yet received cash or recorded the
transaction. 5. Hong paid $2,400 rent on December 1 for the 4 months starting December 1. 6. Hong received cash for future services and recorded a liability until the service was
performed. 7. Hong performed consulting services for a client in December 2017. On December 31,
it had not billed the client for services provided of $1,200. 8. Hong paid cash for an expense and recorded an asset until the item was used up. 9. Hong purchased $900 of supplies in 2017; at year-end, $400 of supplies remain unused. 10. Hong purchased equipment on January 1, 2017; the equipment will be used for
5 years. 11. Hong borrowed $10,000 on October 1, 2017, signing an 8% one-year note payable.
InstructionsIdentify what type of adjusting entry (prepaid expense, unearned revenue, accrued expense, or accrued revenue) is needed in each situation at December 31, 2017.
E3-5 Devin Wolf Company has the following balances in selected accounts on December 31, 2017.
Accounts Receivable $ –0–Accumulated Depreciation—Equipment –0–Equipment 7,000Interest Payable –0–Notes Payable 10,000Prepaid Insurance 2,100Salaries and Wages Payable –0–Supplies 2,450Unearned Service Revenue 30,000
All the accounts have normal balances. The information below has been gathered at December 31, 2017.
1. Devin Wolf Company borrowed $10,000 by signing a 9%, one-year note on September 1, 2017.
132 3 Adjusting the Accounts
Distinguish between cash and accrual basis of accounting.
(LO 1)
Compute cash and accrual accounting income.
(LO 1)
Identify the type of adjusting entry needed.
(LO 1, 2, 3)
Prepare adjusting entries from selected data.
(LO 2, 3)

Exercises 133
2. A count of supplies on December 31, 2017, indicates that supplies of $900 are on hand.3. Depreciation on the equipment for 2017 is $1,000.4. Devin Wolf Company paid $2,100 for 12 months of insurance coverage on June 1, 2017.5. On December 1, 2017, Devin Wolf collected $32,000 for consulting services to be per-
formed from December 1, 2017, through March 31, 2018.6. Devin Wolf performed consulting services for a client in December 2017. The client will
be billed $4,200.7. Devin Wolf Company pays its employees total salaries of $9,000 every Monday for the
preceding 5-day week (Monday through Friday). On Monday, December 29, employees were paid for the week ending December 26. All employees worked the last 3 days of 2017.
InstructionsPrepare adjusting entries for the seven items described above.
E3-6 Zaragoza Company accumulates the following adjustment data at December 31.
1. Services performed but not recorded total $1,000.2. Supplies of $300 have been used.3. Utility expenses of $225 are unpaid.4. Services related to unearned service revenue of $260 were performed.5. Salaries of $800 are unpaid.6. Prepaid insurance totaling $350 has expired.
InstructionsFor each of the above items indicate the following.
(a) The type of adjustment (prepaid expense, unearned revenue, accrued revenue, or accrued expense).
(b) The status of accounts before adjustment (overstatement or understatement).
E3-7 The ledger of Passehl Rental Agency on March 31 of the current year includes the selected accounts, shown below, before adjusting entries have been prepared.
An analysis of the accounts shows the following.
1. The equipment depreciates $400 per month.2. One-third of the unearned rent revenue was earned during the quarter.3. Interest of $500 is accrued on the notes payable.4. Supplies on hand total $750.5. Insurance expires at the rate of $300 per month.
InstructionsPrepare the adjusting entries at March 31, assuming that adjusting entries are made quarterly. Additional accounts are Depreciation Expense, Insurance Expense, Interest Payable, and Supplies Expense.
E3-8 Meghan Lindh, D.D.S., opened a dental practice on January 1, 2017. During the fi rst month of operations, the following transactions occurred.
1. Performed services for patients who had dental plan insurance. At January 31, $875 of such services were performed but not yet recorded.
2. Utility expenses incurred but not paid prior to January 31 totaled $650.
Debit Credit
Prepaid Insurance $ 3,600Supplies 2,800Equipment 25,000Accumulated Depreciation—Equipment $ 8,400Notes Payable 20,000Unearned Rent Revenue 10,200Rent Revenue 60,000Interest Expense –0–Salaries and Wages Expense 14,000
Identify types of adjustments and account relationships.
(LO 2, 3, 4)
Prepare adjusting entries from selected account data.
(LO 2, 3)
Prepare adjusting entries.
(LO 2, 3)

134 3 Adjusting the Accounts
3. Purchased dental equipment on January 1 for $80,000, paying $20,000 in cash and signing a $60,000, 3-year note payable. The equipment depreciates $400 per month. Interest is $500 per month.
4. Purchased a one-year malpractice insurance policy on January 1 for $24,000.5. Purchased $1,600 of dental supplies. On January 31, determined that $400 of supplies
were on hand.
InstructionsPrepare the adjusting entries on January 31. Account titles are Accumulated Depreciation—Equipment, Depreciation Expense, Service Revenue, Accounts Receivable, Insurance Expense, Interest Expense, Interest Payable, Prepaid Insurance, Supplies, Supplies Expense, Utilities Expense, and Utilities Payable.
E3-9 The trial balance for Pioneer Advertising is shown in Illustration 3-3 (page 97). Instead of the adjusting entries shown in the textbook at October 31, assume the following adjustment data.
1. Supplies on hand at October 31 total $500.2. Expired insurance for the month is $120.3. Depreciation for the month is $50.4. Services related to unearned service revenue in October worth $600 were performed.5. Services performed but not recorded at October 31 are $360.6. Interest accrued at October 31 is $95.7. Accrued salaries at October 31 are $1,625.
InstructionsPrepare the adjusting entries for the items above.
E3-10 The income statement of Montee Co. for the month of July shows net income of $1,400 based on Service Revenue $5,500, Salaries and Wages Expense $2,300, Supplies Expense $1,200, and Utilities Expense $600. In reviewing the statement, you discover the following.
1. Insurance expired during July of $400 was omitted.2. Supplies expense includes $250 of supplies that are still on hand at July 31.3. Depreciation on equipment of $150 was omitted.4. Accrued but unpaid salaries and wages at July 31 of $300 were not included.5. Services performed but unrecorded totaled $650.
InstructionsPrepare a correct income statement for July 2017.
E3-11 A partial adjusted trial balance of Frangesch Company at January 31, 2017, shows the following.
FRANGESCH COMPANYAdjusted Trial Balance
January 31, 2017
Debit Credit
Supplies $ 850Prepaid Insurance 2,400Salaries and Wages Payable $ 920Unearned Service Revenue 750Supplies Expense 950Insurance Expense 400Salaries and Wages Expense 2,900Service Revenue 2,000
InstructionsAnswer the following questions, assuming the year begins January 1.
(a) If the amount in Supplies Expense is the January 31 adjusting entry, and $1,000 of supplies was purchased in January, what was the balance in Supplies on January 1?
Prepare adjusting entries.
(LO 2, 3)
Prepare correct income statement.
(LO 1, 2, 3)
Analyze adjusted data.
(LO 1, 2, 3, 4)

Exercises 135
(b) If the amount in Insurance Expense is the January 31 adjusting entry, and the original insurance premium was for one year, what was the total premium and when was the policy purchased?
(c) If $3,800 of salaries was paid in January, what was the balance in Salaries and Wages Payable at December 31, 2016?
E3-12 Selected accounts of Holly Company are shown as follows.
Supplies Expense
7/31 800
Supplies Salaries and Wages Payable
7/1 Bal. 1,100 7/31 800 7/31 1,2007/10 650
Accounts Receivable Unearned Service Revenue
7/31 500 7/31 1,150 7/1 Bal. 1,500 7/20 1,000
Salaries and Wages Expense Service Revenue
7/15 1,200 7/14 2,0007/31 1,200 7/31 1,150 7/31 500
InstructionsAfter analyzing the accounts, journalize (a) the July transactions and (b) the adjusting entries that were made on July 31. (Hint: July transactions were for cash.)
E3-13 The trial balances before and after adjustment for Turnquist Company at the end of its fi scal year are presented below.
TURNQUIST COMPANYTrial Balance
August 31, 2017
Before After Adjustment Adjustment
Dr. Cr. Dr. Cr.
Cash $10,400 $10,400Accounts Receivable 8,800 11,400Supplies 2,300 900Prepaid Insurance 4,000 2,500Equipment 14,000 14,000Accumulated Depreciation—Equipment $ 3,600 $ 4,500Accounts Payable 5,800 5,800Salaries and Wages Payable –0– 1,100Unearned Rent Revenue 1,500 400Owner’s Capital 15,600 15,600Service Revenue 34,000 36,600Rent Revenue 11,000 12,100Salaries and Wages Expense 17,000 18,100Supplies Expense –0– 1,400Rent Expense 15,000 15,000Insurance Expense –0– 1,500Depreciation Expense –0– 900
$71,500 $71,500 $76,100 $76,100
InstructionsPrepare the adjusting entries that were made.
Journalize basic transactions and adjusting entries.
(LO 2, 3)
Prepare adjusting entries from analysis of trial balances.
(LO 2, 3, 4)

136 3 Adjusting the Accounts
E3-14 The adjusted trial balance for Turnquist Company is given in E3-13.
InstructionsPrepare the income and owner’s equity statements for the year and the balance sheet at August 31.
E3-15 The following data are taken from the comparative balance sheets of Bundies Billiards Club, which prepares its fi nancial statements using the accrual basis of accounting.
December 31 2017 2016
Accounts receivable from members $16,000 $ 8,000Unearned service revenue 17,000 25,000
Members are billed based upon their use of the club’s facilities. Unearned service revenues arise from the sale of gift certifi cates, which members can apply to their future use of club facilities. The 2017 income statement for the club showed that service revenue of $161,000 was earned during the year.
Instructions(Hint: You will probably fi nd it helpful to use T-accounts to analyze these data.)
(a) Prepare journal entries for each of the following events that took place during 2017. (1) Accounts receivable from 2016 were all collected. (2) Gift certifi cates outstanding at the end of 2016 were all redeemed. (3) An additional $38,000 worth of gift certifi cates were sold during 2017. A portion of
these was used by the recipients during the year; the remainder was still outstand-ing at the end of 2017.
(4) Services performed for members for 2017 were billed to members. (5) Accounts receivable for 2017 (i.e., those billed in item [4] above) were partially
collected.(b) Determine the amount of cash received by the club, with respect to member services,
during 2017.
*E3-16 Zac Brown Company has the following balances in selected accounts on December 31, 2017.
Service Revenue $40,000Insurance Expense 2,700Supplies Expense 2,450
All the accounts have normal balances. Zac Brown Company debits prepayments to expense accounts when paid, and credits unearned revenues to revenue accounts when received. The following information below has been gathered at December 31, 2017.
1. Zac Brown Company paid $2,700 for 12 months of insurance coverage on June 1, 2017.2. On December 1, 2017, Zac Brown Company collected $40,000 for consulting services to
be performed from December 1, 2017, through March 31, 2018.3. A count of supplies on December 31, 2017, indicates that supplies of $900 are on hand.
InstructionsPrepare the adjusting entries needed at December 31, 2017.
*E3-17 At Sekon Company, prepayments are debited to expense when paid, and unearned revenues are credited to revenue when cash is received. During January of the current year, the following transactions occurred.
Jan. 2 Paid $1,920 for fi re insurance protection for the year. 10 Paid $1,700 for supplies. 15 Received $6,100 for services to be performed in the future.
On January 31, it is determined that $2,100 of the services were performed and that there are $650 of supplies on hand.
Instructions(a) Journalize and post the January transactions. (Use T-accounts.)(b) Journalize and post the adjusting entries at January 31.(c) Determine the ending balance in each of the accounts.
Prepare fi nancial statements from adjusted trial balance.
(LO 4)
Record transactions on accrual basis; convert revenue to cash receipts.
(LO 2, 3)
Journalize adjusting entries.
(LO 5)
Journalize transactions and adjusting entries.
(LO 5)

Exercises 137
*E3-18 Presented below are the assumptions and principles discussed in this chapter.
1. Full disclosure principle. 4. Time period assumption.2. Going concern assumption. 5. Historical cost principle.3. Monetary unit assumption. 6. Economic entity assumption.
InstructionsIdentify by number the accounting assumption or principle that is described below. Do not use a number more than once.
_______ (a) Is the rationale for why plant assets are not reported at liquidation value. (Note: Do not use the historical cost principle.)
_______ (b) Indicates that personal and business recordkeeping should be separately maintained.
_______ (c) Assumes that the monetary unit is the “measuring stick” used to report on fi nancial performance.
_______ (d) Separates fi nancial information into time periods for reporting purposes._______ (e) Measurement basis used when a reliable estimate of fair value is not available._______ (f) Dictates that companies should disclose all circumstances and events that
make a difference to fi nancial statement users.
*E3-19 Weber Co. had three major business transactions during 2017.
(a) Reported at its fair value of $260,000 merchandise inventory with a cost of $208,000.(b) The president of Weber Co., Austin Weber, purchased a truck for personal use and
charged it to his expense account.(c) Weber Co. wanted to make its 2017 income look better, so it added 2 more weeks to the
year (a 54-week year). Previous years were 52 weeks.
InstructionsIn each situation, identify the assumption or principle that has been violated, if any, and discuss what the company should have done.
*E3-20 The following characteristics, assumptions, principles, or constraint guide the FASB when it creates accounting standards.
Relevance Expense recognition principleFaithful representation Time period assumptionComparability Going concern assumptionConsistency Historical cost principleMonetary unit assumption Full disclosure principleEconomic entity assumption Materiality
Match each item above with a description below.
1. ________ Ability to easily evaluate one company’s results relative to another’s. 2. ________ Belief that a company will continue to operate for the foreseeable future. 3. ________ The judgment concerning whether an item’s size is large enough to matter to
decision-makers. 4. ________ The reporting of all information that would make a difference to fi nancial
statement users. 5. ________ The practice of preparing fi nancial statements at regular intervals. 6. ________ The quality of information that indicates the information makes a difference
in a decision. 7. ________ A belief that items should be reported on the balance sheet at the price that
was paid to acquire them. 8. ________ A company’s use of the same accounting principles and methods from year
to year. 9. ________ Tracing accounting events to particular companies. 10. ________ The desire to minimize bias in fi nancial statements. 11. ________ Reporting only those things that can be measured in monetary units. 12. ________ Dictates that efforts (expenses) be matched with results (revenues).
*E3-21 Speyeware International Inc., headquartered in Vancouver, Canada, specializes in Internet safety and computer security products for both the home and commercial mar-kets. In a recent balance sheet, it reported a defi cit of US$5,678,288. It has reported only net losses since its inception. In spite of these losses, Speyeware’s shares of stock have traded anywhere from a high of $3.70 to a low of $0.32 on the Canadian Venture Exchange.
Identify accounting assumptions and principles.
(LO 6)
Identify the assumption or principle that has been violated.
(LO 6)
Identity fi nancial accounting concepts and principles.
(LO 6)
Comment on the objective and qualitative characteristics of accounting information.
(LO 6)

138 3 Adjusting the Accounts
Speyeware’s fi nancial statements have historically been prepared in Canadian dollars. Recently, the company adopted the U.S. dollar as its reporting currency.
Instructions (a) What is the objective of fi nancial reporting? How does this objective meet or not meet
Speyeware’s investors’ needs?(b) Why would investors want to buy Speyeware’s shares if the company has consistently
reported losses over the last few years? Include in your answer an assessment of the relevance of the information reported on Speyeware’s fi nancial statements.
(c) Comment on how the change in reporting information from Canadian dollars to U.S. dollars likely affected the readers of Speyeware’s fi nancial statements. Include in your answer an assessment of the comparability of the information.
*E3-22 A friend of yours, Gina Moore, recently completed an undergraduate degree in science and has just started working with a biotechnology company. Gina tells you that the owners of the business are trying to secure new sources of fi nancing which are needed in order for the company to proceed with development of a new healthcare product. Gina said that her boss told her that the company must put together a report to present to potential investors. Gina thought that the company should include in this package the detailed scientifi c fi ndings related to the Phase I clinical trials for this product. She said, “I know that the bio-tech industry sometimes has only a 10% success rate with new products, but if we report all the scientifi c fi ndings, everyone will see what a sure success this is going to be! The president was talking about the importance of following some set of accounting principles. Why do we need to look at some accounting rules? What they need to realize is that we have scientifi c results that are quite encouraging, some of the most talented employees around, and the start of some really great customer relationships. We haven’t made any sales yet, but we will. We just need the funds to get through all the clinical testing and get government approval for our product. Then these investors will be quite happy that they bought in to our company early!”
Instructions (a) What is accounting information?(b) Comment on how Gina’s suggestions for what should be reported to prospective inves-
tors conforms to the qualitative characteristics of accounting information. Do you think that the things that Gina wants to include in the information for investors will conform to fi nancial reporting guidelines?
EXERCISES: SET B AND CHALLENGE EXERCISES
Visit the book’s companion website, at www.wiley.com/college/weygandt, and choose the Student Companion site to access Exercises: Set B and Challenge Exercises.
PROBLEMS: SET A
P3-1A Logan Krause started her own consulting fi rm, Krause Consulting, on May 1, 2017. The trial balance at May 31 is as follows.
KRAUSE CONSULTINGTrial BalanceMay 31, 2017
Account Number Debit Credit
101 Cash $ 4,500 112 Accounts Receivable 6,000 126 Supplies 1,900 130 Prepaid Insurance 3,600 149 Equipment 11,400 201 Accounts Payable $ 4,500 209 Unearned Service Revenue 2,000 301 Owner’s Capital 18,700 400 Service Revenue 9,500 726 Salaries and Wages Expense 6,400 729 Rent Expense 900
$34,700 $34,700
Comment on the objective and qualitative characteristics of fi nancial reporting.
(LO 6)
Prepare adjusting entries, post to ledger accounts, and prepare an adjusted trial balance.
(LO 2, 3, 4)

Problems: Set A 139
In addition to those accounts listed on the trial balance, the chart of accounts for Krause Consulting also contains the following accounts and account numbers: No. 150 Accumu-lated Depreciation—Equipment, No. 212 Salaries and Wages Payable, No. 631 Supplies Expense, No. 717 Depreciation Expense, No. 722 Insurance Expense, and No. 732 Utilities Expense.
Other data:
1. $900 of supplies have been used during the month.2. Utilities expense incurred but not paid on May 31, 2017, $250.3. The insurance policy is for 2 years.4. $400 of the balance in the unearned service revenue account remains unearned at the
end of the month.5. May 31 is a Wednesday, and employees are paid on Fridays. Krause Consulting has two
employees, who are paid $920 each for a 5-day work week.6. The offi ce furniture has a 5-year life with no salvage value. It is being depreciated at
$190 per month for 60 months.7. Invoices representing $1,700 of services performed during the month have not been
recorded as of May 31.
Instructions(a) Prepare the adjusting entries for the month of May. Use J4 as the page number for
your journal.(b) Post the adjusting entries to the ledger accounts. Enter the totals from the trial balance
as beginning account balances and place a check mark in the posting reference column.(c) Prepare an adjusted trial balance at May 31, 2017.
P3-2A Mac’s Motel opened for business on May 1, 2017. Its trial balance before adjust-ment on May 31 is as follows.
MAC’S MOTELTrial BalanceMay 31, 2017
Account Number Debit Credit
101 Cash $ 3,500 126 Supplies 2,080 130 Prepaid Insurance 2,400 140 Land 12,000 141 Buildings 60,000 149 Equipment 15,000 201 Accounts Payable $ 4,800 208 Unearned Rent Revenue 3,300 275 Mortgage Payable 40,000 301 Owner’s Capital 41,380 429 Rent Revenue 10,300 610 Advertising Expense 600 726 Salaries and Wages Expense 3,300 732 Utilities Expense 900
$99,780 $99,780
In addition to those accounts listed on the trial balance, the chart of accounts for Mac’s Motel also contains the following accounts and account numbers: No. 142 Accumulated Depreciation—Buildings, No. 150 Accumulated Depreciation—Equipment, No. 212 Sala-ries and Wages Payable, No. 230 Interest Payable, No. 619 Depreciation Expense, No. 631 Supplies Expense, No. 718 Interest Expense, and No. 722 Insurance Expense.
Other data:
1. Prepaid insurance is a 1-year policy starting May 1, 2017.2. A count of supplies shows $750 of unused supplies on May 31.3. Annual depreciation is $3,000 on the buildings and $1,500 on equipment.4. The mortgage interest rate is 12%. (The mortgage was taken out on May 1.)5. Two-thirds of the unearned rent revenue has been earned.6. Salaries of $750 are accrued and unpaid at May 31.
(c) Adj. trial balance $37,944
Prepare adjusting entries, post, and prepare adjusted trial balance and fi nancial statements.
(LO 2, 3, 4)

140 3 Adjusting the Accounts
Instructions(a) Journalize the adjusting entries on May 31.(b) Prepare a ledger using the three-column form of account. Enter the trial balance
amounts and post the adjusting entries. (Use J1 as the posting reference.)(c) Prepare an adjusted trial balance on May 31.(d) Prepare an income statement and an owner’s equity statement for the month of May
and a balance sheet at May 31.
P3-3A Alena Co. was organized on July 1, 2017. Quarterly fi nancial statements are pre-pared. The unadjusted and adjusted trial balances as of September 30 are shown below.
ALENA CO.Trial Balance
September 30, 2017
Unadjusted Adjusted
Dr. Cr. Dr. Cr.
Cash $ 8,700 $ 8,700Accounts Receivable 10,400 11,500Supplies 1,500 650Prepaid Rent 2,200 500Equipment 18,000 18,000Accumulated Depreciation—Equipment $ –0– $ 700Notes Payable 10,000 10,000Accounts Payable 2,500 2,500Salaries and Wages Payable –0– 725Interest Payable –0– 100Unearned Rent Revenue 1,900 450Owner’s Capital 22,000 22,000Owner’s Drawings 1,600 1,600Service Revenue 16,000 17,100Rent Revenue 1,410 2,860Salaries and Wages Expense 8,000 8,725Rent Expense 1,900 3,600Depreciation Expense 700Supplies Expense 850Utilities Expense 1,510 1,510Interest Expense 100
$53,810 $53,810 $56,435 $56,435
Instructions(a) Journalize the adjusting entries that were made.(b) Prepare an income statement and an owner’s equity statement for the 3 months ending
September 30 and a balance sheet at September 30.(c) If the note bears interest at 12%, how many months has it been outstanding?
P3-4A A review of the ledger of Remina Company at December 31, 2017, produces the following data pertaining to the preparation of annual adjusting entries.
1. Prepaid Insurance $10,440. The company has separate insurance policies on its build-ings and its motor vehicles. Policy B4564 on the building was purchased on April 1, 2016, for $7,920. The policy has a term of 3 years. Policy A2958 on the vehicles was purchased on January 1, 2017, for $4,500. This policy has a term of 2 years.
2. Unearned Rent Revenue $429,000. The company began subleasing offi ce space in its new building on November 1. At December 31, the company had the following rental contracts that are paid in full for the entire term of the lease.
Term Number of Date (in months) Monthly Rent Leases
Nov. 1 9 $5,000 5Dec. 1 6 $8,500 4
(c) Adj. trial balance $101,305
(d) Net income $4,645Ending capital $46,025Total assets $93,075
Prepare adjusting entries and fi nancial statements.
(LO 2, 3, 4)
(b) Net income $4,475Ending capital $24,875Total assets $38,650
Prepare adjusting entries.
(LO 2, 3)
1. Insurance expense $4,890
2. Rent revenue $84,000

Problems: Set A 141
3. Notes Payable $120,000. This balance consists of a note for 9 months at an annual interest rate of 9%, dated November 1.
4. Salaries and Wages Payable $0. There are eight salaried employees. Salaries are paid every Friday for the current week. Five employees receive a salary of $700 each per week, and three employees earn $500 each per week. Assume December 31 is a Tues-day. Employees do not work weekends. All employees worked the last 2 days of December.
InstructionsPrepare the adjusting entries at December 31, 2017.
P3-5A On November 1, 2017, the account balances of Hamm Equipment Repair were as follows.
During November, the following summary transactions were completed.
Nov. 8 Paid $1,700 for salaries due employees, of which $700 is for October salaries. 10 Received $3,620 cash from customers on account. 12 Received $3,100 cash for services performed in November. 15 Purchased equipment on account $2,000. 17 Purchased supplies on account $700. 20 Paid creditors on account $2,700. 22 Paid November rent $400. 25 Paid salaries $1,700. 27 Performed services on account and billed customers for these services $2,200. 29 Received $600 from customers for future service.
Adjustment data consist of:
1. Supplies on hand $1,400.2. Accrued salaries payable $350.3. Depreciation for the month is $200.4. Services related to unearned service revenue of $1,220 were performed.
Instructions(a) Enter the November 1 balances in the ledger accounts.(b) Journalize the November transactions.(c) Post to the ledger accounts. Use J1 for the posting reference. Use the following addi-
tional accounts: No. 407 Service Revenue, No. 615 Depreciation Expense, No. 631 Supplies Expense, No. 726 Salaries and Wages Expense, and No. 729 Rent Expense.
(d) Prepare a trial balance at November 30.(e) Journalize and post adjusting entries.(f) Prepare an adjusted trial balance.(g) Prepare an income statement and an owner’s equity statement for November and a
balance sheet at November 30.
*P3-6A Johnson Graphics Company was organized on January 1, 2017, by Cameron Johnson. At the end of the fi rst 6 months of operations, the trial balance contained the accounts shown on page 142.
No. Debit No. Credit
101 Cash $ 2,400 154 Accumulated Depreciation—Equipment $ 2,000112 Accounts Receivable 4,250 201 Accounts Payable 2,600126 Supplies 1,800 209 Unearned Service Revenue 1,200153 Equipment 12,000 212 Salaries and Wages Payable 700 301 Owner’s Capital 13,950
$20,450 $20,450
3. Interest expense $1,800
4. Salaries and wages expense $2,000
(f) Adj. trial balance $26,200(g) Net income $1,770;
Ending capital $15,720Total assets $19,250
(d) Trial balance $25,650
Journalize transactions and follow through accounting cycle to preparation of fi nancial statements.
(LO 2, 3, 4)
Prepare adjusting entries, adjusted trial balance, and fi nancial statements using appendix.
(LO 2, 3, 4, 5)

142 3 Adjusting the Accounts
Debit Credit
Cash $ 8,600 Notes Payable $ 20,000Accounts Receivable 14,000 Accounts Payable 9,000Equipment 45,000 Owner’s Capital 22,000Insurance Expense 2,700 Sales Revenue 52,100Salaries and Wages Expense 30,000 Service Revenue 6,000Supplies Expense 3,700Advertising Expense 1,900Rent Expense 1,500Utilities Expense 1,700
$109,100 $109,100
Analysis reveals the following additional data.
1. The $3,700 balance in Supplies Expense represents supplies purchased in January. At June 30, $1,500 of supplies are on hand.
2. The note payable was issued on February 1. It is a 9%, 6-month note.3. The balance in Insurance Expense is the premium on a one-year policy, dated March 1,
2017.4. Service revenues are credited to revenue when received. At June 30, services revenue of
$1,300 are unearned.5. Revenue for services performed but unrecorded at June 30 totals $2,000.6. Depreciation is $2,250 per year.
Instructions(a) Journalize the adjusting entries at June 30. (Assume adjustments are recorded every
6 months.)(b) Prepare an adjusted trial balance.(c) Prepare an income statement and owner’s equity statement for the 6 months ended
June 30 and a balance sheet at June 30.
PROBLEMS: SET B AND SET C
Visit the book’s companion website, at www.wiley.com/college/weygandt, and choose the Student Companion site to access Problems: Set B and Set C.
CONTINUING PROBLEM
(b) Adj. trial balance$112,975
(c) Net income $18,725Ending capital $40,725Total assets $71,775
COOKIE CREATIONS: AN ENTREPRENEURIAL JOURNEY(Note: This is a continuation of the Cookie Creations problem from Chapters 1 and 2. Use the infor-mation from the previous chapters and follow the instructions below using the general ledger accounts you have already prepared.)
CC3 It is the end of November and Natalie has been in touch with her grandmother. Her grandmother asked Natalie how well things went in her fi rst month of business. Natalie, too, would like to know if she has been profi table or not during November. Natalie realizes that in order to determine Cookie Creations’ income, she must fi rst make adjustments. Natalie puts together the following additional information.
1. A count reveals that $35 of baking supplies were used during November.2. Natalie estimates that all of her baking equipment will have a useful life of 5 years or 60 months.
(Assume Natalie decides to record a full month’s worth of depreciation, regardless of when the equipment was obtained by the business.)
3. Natalie’s grandmother has decided to charge interest of 6% on the note payable extended on November 16. The loan plus interest is to be repaid in 24 months. (Assume that half a month of interest accrued during November.)
4. On November 30, a friend of Natalie’s asks her to teach a class at the neighborhood school. Natalie agrees and teaches a group of 35 fi rst-grade students how to make gingerbread cookies. The next day, Natalie prepares an invoice for $300 and leaves it with the school principal. The principal says that he will pass the invoice along to the head offi ce, and it will be paid sometime in December.
© leungchopan/Shutterstock

Broadening Your Perspective 143
PERSPECTIVEFINANCIAL REPORTING AND ANALYSIS
Financial Reporting Problem: Apple Inc.BYP3-1 The fi nancial statements of Apple Inc. are presented in Appendix A at the end of this text-book. Instructions for accessing and using the company’s complete annual report, including the notes to the fi nancial statements, are also provided in Appendix A.
Instructions(a) Using the consolidated fi nancial statements and related information, identify items that may
result in adjusting entries for prepayments.(b) Using the consolidated fi nancial statements and related information, identify items that may
result in adjusting entries for accruals.(c) What has been the trend since 2011 for net income?
Comparative Analysis Problem: PepsiCo, Inc. vs. The Coca-Cola CompanyBYP3-2 PepsiCo, Inc.’s fi nancial statements are presented in Appendix B. Financial statements of The Coca-Cola Company are presented in Appendix C. Instructions for accessing and using the complete annual reports of PepsiCo and Coca-Cola, including the notes to the fi nancial statements, are also provided in Appendices B and C, respectively.
InstructionsBased on information contained in these fi nancial statements, determine the following for each company.
(a) Net increase (decrease) in property, plant, and equipment (net) from 2012 to 2013.(b) Increase (decrease) in selling, general, and administrative expenses from 2012 to 2013.(c) Increase (decrease) in long-term debt (obligations) from 2012 to 2013.(d) Increase (decrease) in net income from 2012 to 2013.(e) Increase (decrease) in cash and cash equivalents from 2012 to 2013.
Comparative Analysis Problem: Amazon.com, Inc. vs. Wal-Mart Stores, Inc.BYP3-3 Amazon.com, Inc.’s fi nancial statements are presented in Appendix D. Financial statements of Wal-Mart Stores, Inc. are presented in Appendix E. Instructions for accessing and using the com-plete annual reports of Amazon and Wal-Mart, including the notes to the fi nancial statements, are also provided in Appendices D and E, respectively.
InstructionsBased on information contained in these fi nancial statements, determine the following for each company.
1. (a) Increase (decrease) in interest expense from 2012 to 2013. (b) Increase (decrease) in net income from 2012 to 2013. (c) Increase (decrease) in cash fl ow from operations from 2012 to 2013.2. Cash fl ow from operations and net income for each company is different. What are some possible
reasons for these differences?
BROADENING YOUR
5. Natalie receives a utilities bill for $45. The bill is for utilities consumed by Natalie’s business during November and is due December 15.
InstructionsUsing the information that you have gathered through Chapter 2, and based on the new information above, do the following.
(a) Prepare and post the adjusting journal entries.(b) Prepare an adjusted trial balance.(c) Using the adjusted trial balance, calculate Cookie Creations’ net income or net loss for the month
of November. Do not prepare an income statement.

144 3 Adjusting the Accounts
Real-World FocusBYP3-4 No fi nancial decision-maker should ever rely solely on the fi nancial information reported in the annual report to make decisions. It is important to keep abreast of fi nancial news. This activity demonstrates how to search for fi nancial news on the Internet.
Address: http://biz.yahoo.com/i, or go to www.wiley.com/college/weygandt
Steps:1. Type in either Wal-Mart, Target Corp., or Kmart.2. Choose News.3. Select an article that sounds interesting to you and that would be relevant to an investor in these
companies.
Instructions(a) What was the source of the article (e.g., Reuters, Businesswire, Prnewswire)?(b) Assume that you are a personal fi nancial planner and that one of your clients owns stock in the
company. Write a brief memo to your client summarizing the article and explaining the implica-tions of the article for his or her investment.
CRITICAL THINKING
Decision-Making Across the OrganizationBYP3-5 Happy Camper Park was organized on April 1, 2016, by Erica Hatt. Erica is a good manager but a poor accountant. From the trial balance prepared by a part-time bookkeeper, Erica prepared the following income statement for the quarter that ended March 31, 2017.
HAPPY CAMPER PARKIncome Statement
For the Quarter Ended March 31, 2017
Revenues Rent revenue $90,000Operating expenses Advertising $ 5,200 Salaries and wages 29,800 Utilities 900 Depreciation 800 Maintenance and repairs 4,000
Total operating expenses 40,700
Net income $49,300
Erica thought that something was wrong with the statement because net income had never exceeded $20,000 in any one quarter. Knowing that you are an experienced accountant, she asks you to review the income statement and other data. You fi rst look at the trial balance. In addition to the account balances reported above in the income statement, the ledger contains the following additional selected balances at March 31, 2017.
Supplies $ 6,200Prepaid Insurance 7,200Notes Payable 12,000
You then make inquiries and discover the following.
1. Rent revenues include advanced rentals for summer occupancy $15,000.2. There were $1,700 of supplies on hand at March 31.3. Prepaid insurance resulted from the payment of a one-year policy on January 1, 2017.4. The mail on April 1, 2017, brought the following bills: advertising for week of March 24, $110;
repairs made March 10, $260; and utilities, $180.5. There are four employees who receive wages totaling $300 per day. At March 31, 2 days’ salaries
and wages have been incurred but not paid.6. The note payable is a 3-month, 10% note dated January 1, 2017.
InstructionsWith the class divided into groups, answer the following.
(a) Prepare a correct income statement for the quarter ended March 31, 2017.(b) Explain to Erica the generally accepted accounting principles that she did not recognize in prepar-
ing her income statement and their effect on her results.
Broadening Your Perspective 145
Communication ActivityBYP3-6 In reviewing the accounts of Kelli Taylor Co. at the end of the year, you discover that adjust-ing entries have not been made.
InstructionsWrite a memo to Kelli Taylor, the owner of Kelli Taylor Co., that explains the following: the nature and purpose of adjusting entries, why adjusting entries are needed, and the types of adjusting entries that may be made.
Ethics CaseBYP3-7 Russell Company is a pesticide manufacturer. Its sales declined greatly this year due to the passage of legislation outlawing the sale of several of Russell’s chemical pesticides. In the coming year, Russell will have environmentally safe and competitive chemicals to replace these discontinued prod-ucts. Sales in the next year are expected to greatly exceed any prior year’s. The decline in sales and profi ts appears to be a one-year aberration. But even so, the company president fears a large dip in the current year’s profi ts. He believes that such a dip could cause a signifi cant drop in the market price of Russell’s stock and make the company a takeover target. To avoid this possibility, the company president calls in Zoe Baas, controller, to discuss this period’s year-end adjusting entries. He urges her to accrue every possible revenue and to defer as many expenses as possible. He says to Zoe, “We need the revenues this year, and next year can easily absorb expenses deferred from this year. We can’t let our stock price be hammered down!” Zoe didn’t get around to recording the adjusting entries until January 17, but she dated the entries December 31 as if they were recorded then. Zoe also made every effort to comply with the president’s request.
Instructions(a) Who are the stakeholders in this situation?(b) What are the ethical considerations of (1) the president’s request and (2) Zoe dating the adjusting
entries December 31?(c) Can Zoe accrue revenues and defer expenses and still be ethical?
All About YouBYP3-8 Companies must report or disclose in their fi nancial statement information about all liabilities, including potential liabilities related to environmental cleanup. There are many situations in which you will be asked to provide personal fi nancial information about your assets, liabilities, revenue, and expenses. Sometimes you will face diffi cult decisions regarding what to disclose and how to disclose it.
InstructionsSuppose that you are putting together a loan application to purchase a home. Based on your income and assets, you qualify for the mortgage loan, but just barely. How would you address each of the following situations in reporting your fi nancial position for the loan application? Provide responses for each of the following situations.
(a) You signed a guarantee for a bank loan that a friend took out for $20,000. If your friend doesn’t pay, you will have to pay. Your friend has made all of the payments so far, and it appears he will be able to pay in the future.
(b) You were involved in an auto accident in which you were at fault. There is the possibility that you may have to pay as much as $50,000 as part of a settlement. The issue will not be resolved before the bank processes your mortgage request.
(c) The company for which you work isn’t doing very well, and it has recently laid off employees. You are still employed, but it is quite possible that you will lose your job in the next few months.
Considering People, Planet, and Profi tBYP3-9 Many companies have potential pollution or environmental-disposal problems—not only for electronic gadgets, but also for the lead paint or asbestos they sold. How do we fi t these issues into the accounting equation? Are these costs and related liabilities that companies should report?
YES: As more states impose laws holding companies responsible, and as more courts levy pollution-related fi nes, it becomes increasingly likely that companies will have to pay large amounts in the future.NO: The amounts still are too diffi cult to estimate. Putting inaccurate estimates on the fi nancial statements reduces their usefulness. Instead, why not charge the costs later, when the actual envi-ronmental cleanup or disposal occurs, at which time the company knows the actual cost?

146 3 Adjusting the Accounts
InstructionsWrite a response indicating your position regarding this situation. Provide support for your view.
FASB Codifi cation ActivityBYP3-10 If your school has a subscription to the FASB Codifi cation, go to http://aaahq.org/asclogin.cfm to log in and prepare responses to the following.
InstructionsAccess the glossary (“Master Glossary”) to answer the following.
(a) What is the defi nition of revenue?(b) What is the defi nition of compensation?
7 Compare the procedures for adjusting entries under GAAP and IFRS.
LEARNING OBJECTIVE
It is often diffi cult for companies to determine in what time period they should report particular rev-enues and expenses. Both the IASB and FASB are working on a joint project to develop a common conceptual framework that will enable companies to better use the same principles to record transac-tions consistently over time.
Key PointsFollowing are the key similarities and differences between GAAP and IFRS as related to accrual accounting.
Similarities• In this chapter, you learned accrual-basis accounting applied under GAAP. Companies applying
IFRS also use accrual-basis accounting to ensure that they record transactions that change a com-pany’s fi nancial statements in the period in which events occur.
• Similar to GAAP, cash-basis accounting is not in accordance with IFRS.
• IFRS also divides the economic life of companies into artifi cial time periods. Under both GAAP and IFRS, this is referred to as the time period assumption.
• The general revenue recognition principle required by GAAP that is used in this textbook is similar to that used under IFRS.
• Revenue recognition fraud is a major issue in U.S. fi nancial reporting. The same situation occurs in other countries, as evidenced by revenue recognition breakdowns at Dutch software company Baan NV, Japanese electronics giant NEC, and Dutch grocer Ahold NV.
Differences• Under IFRS, revaluation (using fair value) of items such as land and buildings is permitted. IFRS
allows depreciation based on revaluation of assets, which is not permitted under GAAP.
• The terminology used for revenues and gains, and expenses and losses, differs somewhat between IFRS and GAAP. For example, income under IFRS includes both revenues, which arise during the normal course of operating activities, and gains, which arise from activities outside of the normal sales of goods and services. The term income is not used this way under GAAP. Instead, under GAAP income refers to the net difference between revenues and expenses.
• Under IFRS, expenses include both those costs incurred in the normal course of operations as well as losses that are not part of normal operations. This is in contrast to GAAP, which defi nes each separately.
A Look at IFRS

A Look at IFRS 147
Looking to the FutureThe IASB and FASB are completing a joint project on revenue recognition. The purpose of this project is to develop comprehensive guidance on when to recognize revenue. It is hoped that this approach will lead to more consistent accounting in this area. For more on this topic, see www.fasb.org/project/ revenue_recognition.shtml.
IFRS Practice
IFRS Self-Test Questions
1. IFRS:(a) uses accrual accounting.(b) uses cash-basis accounting.(c) allows revenue to be recognized when a customer makes an order.(d) requires that revenue not be recognized until cash is received.
2. Which of the following statements is false?(a) IFRS employs the time period assumption.(b) IFRS employs accrual accounting.(c) IFRS requires that revenues and costs must be capable of being measured reliably.(d) IFRS uses the cash basis of accounting.
3. As a result of the revenue recognition project by the FASB and IASB:(a) revenue recognition places more emphasis on when the performance obligation is satisfi ed.(b) revenue recognition places more emphasis on when revenue is realized.(c) revenue recognition places more emphasis on when expenses are incurred.(d) revenue is no longer recorded unless cash has been received.
4. Which of the following is false?(a) Under IFRS, the term income describes both revenues and gains.(b) Under IFRS, the term expenses includes losses.(c) Under IFRS, companies do not engage in the adjusting process.(d) Under IFRS, revenue recognition fraud is a major issue.
5. Accrual-basis accounting:(a) is optional under IFRS.(b) results in companies recording transactions that change a company’s fi nancial statements in
the period in which events occur.(c) has been eliminated as a result of the IASB/FASB joint project on revenue recognition.(d) is not consistent with the IASB conceptual framework.
International Financial Reporting Problem: Louis Vuitton
IFRS3-1 The fi nancial statements of Louis Vuitton are presented in Appendix F. Instructions for accessing and using the company’s complete annual report, including the notes to its fi nancial state-ments, are also provided in Appendix F.
InstructionsVisit Louis Vuitton’s corporate website and answer the following questions from Louis Vuitton’s 2013 annual report.
(a) From the notes to the fi nancial statements, how does the company determine the amount of revenue to record at the time of a sale?
(b) From the notes to the fi nancial statements, how does the company determine the provision for product returns?
(c) Using the consolidated income statement and consolidated statement of fi nancial position, iden-tify items that may result in adjusting entries for deferrals.
(d) Using the consolidated income statement, identify two items that may result in adjusting entries for accruals.
Answers to IFRS Self-Test Questions
1. a 2. d 3. a 4. c 5. b

When Ted Castle was a hockey coach at the University of
Vermont, his players were self-motivated by their desire to
win. Hockey was a game you usually either won or lost. But
at Rhino Foods, Inc., a bakery-foods company he founded in
Burlington, Vermont, he discovered that manufacturing-line
workers were not so self-motivated. Ted thought, what if he
turned the food-making business into a game, with rules,
strategies, and trophies?
In a game, knowing the score is all-important. Ted felt that
only if the employees know the score—know exactly how
the business is doing daily, weekly, monthly—could he turn
food-making into a game. But Rhino is a closely held,
family-owned business, and its fi nancial statements and
profi ts were confi dential. Ted wondered, should he open
Rhino’s books to the employees?
A consultant put Ted’s concerns in perspective when he
said, “Imagine you’re playing touch football. You play for
an hour or two, and the whole time I’m sitting there with a
book, keeping score. All of a sudden I blow the whistle,
and I say, ‘OK, that’s it. Everybody go home.’ I close my
book and walk away. How would you feel?” Ted opened
his books and revealed the fi nancial statements to his
employees.
The next step was to teach employees the rules and strategies
of how to “win” at making food. The fi rst lesson: “Your
opponent at Rhino is expenses. You must cut and control
expenses.” Ted and his staff distilled those lessons into daily
scorecards—production reports and income statements—that
keep Rhino’s employees up-to-date on the game. At noon
each day, Ted posts the previous day’s results at the entrance
to the production room. Everyone checks whether they made
or lost money on what they produced the day before. And it’s
not just an academic exercise: There’s a bonus check for each
employee at the end of every four-week “game” that meets
profi tability guidelines.
Rhino has fl ourished since the fi rst game. Employment has
increased from 20 to 130 people, while both revenues and
profi ts have grown dramatically.
Everyone Likes to Win
As the Feature Story below highlights, at Rhino Foods, Inc., fi nancial statements help employees understand what is happening in the business. In Chapter 3, we prepared fi nancial statements directly from the adjusted trial balance. However, with so many details involved in the end-of-period accounting procedures, it is easy to make errors. One way to minimize errors in the records and to simplify the end-of-period procedures is to use a worksheet.
In this chapter, we will explain the role of the worksheet in accounting. We also will study the remaining steps in the accounting cycle, especially the closing process, again using Pioneer Advertising as an example. Then, we will consider correcting entries and classifi ed balance sheets.
CHAPTER PREVIEW
4
FEATURE STORY
Completing the Accounting Cycle
148

CHAPTER OUTLINE
Comstock/Getty Images, Inc.
CHAPTER OUTLINE
CCComComComComComstotstostosto k/ck/ck//ck/ck/ck/GGGetGetGetGettytytyty ImaImaImaImagesgesgesges IIII, Incnccncncnc..
Go to the REVIEW AND PRACTICE section at the end of the chapter for a review of key concepts and practice applications with solutions.
Visit WileyPLUS with ORION for additional tutorials and practice opportunities.
Identify the sections of a classifi ed balance sheet.
Prepare closing entries and a post-closing trial balance.
Explain the steps in the accounting cycle and how to prepare correcting entries.
2
3
4
WorksheetDO IT! 1
• Steps in preparing a worksheet• Preparing fi nancial statements
from a worksheet• Preparing adjusting entries from
a worksheet
Closing EntriesDO IT! 2• Preparing closing entries• Posting closing entries• Preparing a post-closing trial
balance
Learning Objectives
Correcting EntriesDO IT! 3
• Summary of the accounting cycle
• Reversing entries• Correcting entries
Balance Sheet Classifi cations
DO IT! 4
• Current assets• Long-term investments• Property, plant, and equipment• Intangible assets• Current liabilities• Long-term liabilities• Owner’s equity
Prepare a worksheet.1

150 4 Completing the Accounting Cycle
1 Prepare a worksheet.LEARNING OBJECTIVE
A worksheet is a multiple-column form used in the adjustment process and in preparing fi nancial statements. As its name suggests, the worksheet is a working tool. It is not a permanent accounting record. It is neither a journal nor a part of the general ledger. The worksheet is merely a device used in preparing adjust-ing entries and the fi nancial statements. Companies generally computerize work-sheets using an electronic spreadsheet program such as Excel. Illustration 4-1 shows the basic form of a worksheet and the fi ve steps for preparing it. Each step is performed in sequence. The use of a worksheet is optional. When a company chooses to use one, it prepares fi nancial statements directly from the worksheet. It enters the adjustments in the worksheet columns and then journalizes and posts the adjustments after it has prepared the fi nancial statements. Thus, worksheets make it possible to provide the fi nancial statements to management and other interested parties at an earlier date.
Steps in Preparing a Worksheet
We will use the October 31 trial balance and adjustment data of Pioneer Advertis-ing from Chapter 3 to illustrate how to prepare a worksheet. In the following pages, we describe and then demonstrate each step of the process.
Formulas Data Review ViewPage LayoutInsert
AP18 fx
E F GB C D H J KI
Worksheet.xlsWorksheet.xlsHome
123
4
5
6
7
8
9
10
11
12
13
14
15
16
17
18
19
20
21
22
23
24
25
Dr. Cr. Dr. Cr. Dr. Cr. Dr. Cr. Dr. Cr.Account Titles
Trial Balance Adjustments AdjustedTrial Balance
IncomeStatement
Balance Sheet
Worksheet
Extend adjustedbalances to appropriate
statement columns.
Total the statement columns,compute net income
(or net loss), andcomplete worksheet.
Enteradjustment
data.
2 4
5
Prepare atrial balance
on theworksheet.
1
Enteradjustedbalances.
3
Illustration 4-1Form and procedure fora worksheet

The Worksheet 151
The fi rst step in preparing a worksheet is to enter all ledger accounts with balances in the account titles column and then enter debit and credit amounts from the ledger in the trial balance columns. Illustra-tion 4-2 shows the worksheet trial balance for Pioneer Advertising. This trial balance is the same one that appears in Illustration 2-31 (page 68) and Illustration 3-3 (page 97).
Include all accounts withbalances from ledger.
Trial balance amounts comedirectly from ledgeraccounts.
Formulas Data Review ViewPage LayoutInsert
AP18 fx
E F GB C D H I J K
Pioneer Advertising.xlsPioneer Advertising.xlsHome
123
4
5
6
7
8
9
10
11
12
13
14
15
16
17
18
19
20
21
22
23
24
25
26
27
28
29
30
31
32
33
34
35
36
Trial Balance AdjustmentsAdjusted
Trial BalanceIncome
StatementBalance
SheetDr. Cr. Dr. Cr. Dr. Cr. Dr. Cr. Dr. Cr.Account Titles
CashSuppliesPrepaid InsuranceEquipmentNotes PayableAccounts PayableUnearned Service RevenueOwner’s CapitalOwner’s DrawingsService RevenueSalaries and Wages ExpenseRent Expense Totals
15,2002,500
6005,000
500
4,000900
28,700
5,0002,5001,200
10,000
10,000
28,700
PIONEER ADVERTISINGWorksheet
For the Month Ended October 31, 2017
Illustration 4-2Preparing a trial balance
STEP 1: PREPARE A TRIAL BALANCE ON THE WORKSHEET

152 4 Completing the Accounting Cycle
As shown in Illustration 4-3, the second step when using a worksheet is to enter all adjustments in the adjustments columns. In entering the adjustments, use applicable trial balance accounts. If additional accounts are needed, insert them on the lines immediately below the trial balance totals. A different letter identifi es the debit and credit for each adjusting entry. The term used to describe this process is keying. Companies do not journalize the adjust-ments until after they complete the worksheet and prepare the fi nancial statements. The adjustments for Pioneer Advertising are the same as the adjustments in Illustration 3-23 (page 109). They are keyed in the adjustments columns of the worksheet as follows.
(a) Pioneer debits an additional account, Supplies Expense, $1,500 for the cost of supplies used, and credits Supplies $1,500.
(b) Pioneer debits an additional account, Insurance Expense, $50 for the insur-ance that has expired, and credits Prepaid Insurance $50.
(c) The company needs two additional depreciation accounts. It debits Depreci-ation Expense $40 for the month’s depreciation, and credits Accumulated Depreciation—Equipment $40.
(d) Pioneer debits Unearned Service Revenue $400 for services performed, and credits Service Revenue $400.
(e) Pioneer debits an additional account, Accounts Receivable, $200 for services performed but not billed, and credits Service Revenue $200.
(f) The company needs two additional accounts relating to interest. It debits Interest Expense $50 for accrued interest, and credits Interest Payable $50.
(g) Pioneer debits Salaries and Wages Expense $1,200 for accrued salaries, and credits an additional account, Salaries and Wages Payable, $1,200.
After Pioneer has entered all the adjustments, the adjustments columns are totaled to prove their equality.
STEP 2: ENTER THE ADJUSTMENTS IN THE ADJUSTMENTS COLUMNS

The Worksheet 153
Illustration 4-3AEntering the adjustments in the adjustments columns
Formulas Data Review ViewPage LayoutInsert
AP18 fx
E F GB C D H I J K
Pioneer Advertising.xlsPioneer Advertising.xlsHome
123
4
5
6
7
8
9
10
11
12
13
14
15
16
17
18
19
20
21
22
23
24
25
26
27
28
29
30
31
32
33
34
35
36
Trial Balance AdjustmentsAdjusted
Trial BalanceIncome
StatementBalance
SheetDr. Cr. Dr. Cr. Dr. Cr. Dr. Cr. Dr. Cr.Account Titles
CashSuppliesPrepaid InsuranceEquipmentNotes PayableAccounts PayableUnearned Service RevenueOwner’s CapitalOwner’s DrawingsService Revenue
Salaries and Wages ExpenseRent Expense Totals
15,2002,500
6005,000
500
4,000900
28,700
5,0002,5001,200
10,000
10,000
28,700
PIONEER ADVERTISINGWorksheet
For the Month Ended October 31, 2017
Supplies ExpenseInsurance ExpenseAccum. Depreciation— EquipmentDepreciation ExpenseAccounts ReceivableInterest ExpenseInterest PayableSalaries and Wages Payable Totals 3,440 3,440
Add additional accountsas needed to completethe adjustments:(a) Supplies Used.(b) Insurance Expired.(c) Depreciation Expensed.(d) Service Revenue Recognized.(e) Service Revenue Accrued.(f) Interest Accrued.(g) Salaries Accrued.
Enter adjustment amountsin appropriate columns,and use letters to cross-reference the debit andcredit adjustments.
Total adjustments columnsand check for equality.
400
1,200
1,50050
40200
50
(d)
(g)
(a)(b)
(c)(e)(f)
1,50050
400200
40
501,200
(a)(b)
(d)(e)
(c)
(f )(g)

154 4 Completing the Accounting Cycle
STEP 3: ENTER ADJUSTED BALANCES IN THE ADJUSTED TRIAL BALANCE COLUMNS
Illustration 4-4Entering adjusted balances in the adjusted trial balance columns
Formulas Data Review ViewPage LayoutInsert
AP18 fx
E F GB C D H I J K
Pioneer Advertising.xlsPioneer Advertising.xlsHome
123
4
5
6
7
8
9
10
11
12
13
14
15
16
17
18
19
20
21
22
23
24
25
26
27
28
29
30
31
32
33
34
35
36
Trial Balance AdjustmentsAdjusted
Trial BalanceIncome
StatementBalance
SheetDr. Cr. Dr. Cr. Dr. Cr. Dr. Cr. Dr. Cr.Account Titles
CashSuppliesPrepaid InsuranceEquipmentNotes PayableAccounts PayableUnearned Service RevenueOwner’s CapitalOwner’s DrawingsService Revenue
Salaries and Wages ExpenseRent Expense Totals
15,2002,500
6005,000
500
4,000900
28,700
5,0002,5001,200
10,000
10,000
28,700
PIONEER ADVERTISINGWorksheet
For the Month Ended October 31, 2017
Supplies ExpenseInsurance ExpenseAccum. Depreciation— EquipmentDepreciation ExpenseAccounts ReceivableInterest ExpenseInterest PayableSalaries and Wages Payable Totals 3,440 3,440
400
1,200
1,50050
40200
50
(d)
(g)
(a)(b)
(c)(e)(f)
1,50050
400200
40
501,200
(a)(b)
(d)(e)
(c)
(f )(g)
15,2001,000
5505,000
500
5,200900
1,50050
40200
50
5,0002,500
80010,000
10,600
40
501,200
30,190 30,190
Combine trial balance amounts with adjustment amounts to obtain the adjusted trial balance.
Total adjusted trial balance columns and check for equality.
As shown in Illustration 4-4, Pioneer Advertising next determines the adjusted balance of an account by combining the amounts entered in the fi rst four columns of the worksheet for each account. For example, the Prepaid Insurance account in the trial balance columns has a $600 debit balance and a $50 credit in the adjustments columns. The result is a $550 debit balance recorded in the adjusted trial balance columns. For each account, the amount in the adjusted trial balance columns is the balance that will appear in the ledger after journalizing and posting the adjusting entries. The balances in these columns are the same as those in the adjusted trial balance in Illustration 3-25 (page 112). After Pioneer has entered all account balances in the adjusted trial balance columns, the columns are totaled to prove their equality. If the column totals do not agree, the fi nancial statement columns will not balance and the fi nancial statements will be incorrect.

STEP 4: EXTEND ADJUSTED TRIAL BALANCE AMOUNTS TO APPROPRIATE FINANCIAL STATEMENT COLUMNS
As shown in Illustration 4-5, the fourth step is to extend adjusted trial balance amounts to the income state-ment and balance sheet columns of the worksheet. Pioneer Advertising enters balance sheet accounts in the appropriate balance sheet debit and credit columns. For instance, it enters Cash in the balance sheet debit column, and Notes Payable in the balance sheet credit column. Pioneer extends Accumulated Depreciation—Equipment to the balance sheet credit column. The reason is that accumulated depreciation is a contra asset account with a credit balance. Because the worksheet does not have columns for the owner’s equity statement, Pioneer extends the balance in owner’s capital to the balance sheet credit column. In addition, it extends the balance in owner’s drawings to the balance sheet debit column because it is an owner’s equity account with a debit balance. The company enters the expense and revenue accounts such as Salaries and Wages Expense and Service Revenue in the appropriate income statement columns.
Illustration 4-5Extending the adjusted trial balance amounts to appropriate fi nancial statement columns
Formulas Data Review ViewPage LayoutInsert
AP18 fx
E F GB C D H I J K
Pioneer Advertising.xlsPioneer Advertising.xlsHome
123
4
5
6
7
8
9
10
11
12
13
14
15
16
17
18
19
20
21
22
23
24
25
26
27
28
29
30
31
32
33
34
35
36
Trial Balance AdjustmentsAdjusted
Trial BalanceIncome
StatementBalance
SheetDr. Cr. Dr. Cr. Dr. Cr. Dr. Cr. Dr. Cr.Account Titles
CashSuppliesPrepaid InsuranceEquipmentNotes PayableAccounts PayableUnearned Service RevenueOwner’s CapitalOwner’s DrawingsService Revenue
Salaries and Wages ExpenseRent Expense Totals
15,2002,500
6005,000
500
4,000900
28,700
5,0002,5001,200
10,000
10,000
28,700
PIONEER ADVERTISINGWorksheet
For the Month Ended October 31, 2017
Supplies ExpenseInsurance ExpenseAccum. Depreciation— EquipmentDepreciation ExpenseAccounts ReceivableInterest ExpenseInterest PayableSalaries and Wages Payable Totals 3,440 3,440
400
1,200
1,50050
40200
50
(d)
(g)
(a)(b)
(c)(e)(f)
1,50050
400200
40
501,200
(a)(b)
(d)(e)
(c)
(f )(g)
15,2001,000
5505,000
500
5,200900
1,50050
40200
50
5,0002,500
80010,000
10,600
40
501,200
30,190 30,190
5,200900
1,50050
40
50
10,600
Extend all revenue and expense account balances to the income statement columns.
Extend all asset and liability account balances, as well as owner’s capital and drawings accountbalances, to the balance sheet columns.
15,2001,000
5505,000
500
200
5,0002,500
80010,000
40
501,200
Helpful HintEvery adjusted trial balance amount must be extended to one of the four statement columns.

As shown in Illustration 4-6, Pioneer Advertising must now total each of the fi nancial statement columns. The net income or loss for the period is the difference between the totals of the two income statement columns. If total credits exceed total debits, the result is net income. In such a case, the company inserts the words “Net Income” in the account titles space. It then enters the amount in the income statement debit column and the balance sheet credit column. The debit amount balances the income statement columns; the credit amount balances the balance sheet columns. In addition, the credit in the balance sheet column indicates the increase in owner’s equity resulting from net income. What if total debits in the income statement columns exceed total credits? In that case, Pioneer has a net loss. It enters the amount of the net loss in the income statement credit column and the balance sheet debit column. After entering the net income or net loss, Pioneer determines new column totals. The totals shown in the debit and credit income statement columns will match. So will the totals shown in the debit and credit balance sheet columns. If either the income statement columns or the balance sheet columns are not equal after the net income or net loss has been entered, there is an error in the worksheet.
Illustration 4-6 Computing net income or net loss and completing the worksheet
Formulas Data Review ViewPage LayoutInsert
A E F GB C D H I J K
Home
123
4
5
6
7
8
9
10
11
12
13
14
15
16
17
18
19
20
21
22
23
24
25
26
27
28
29
30
31
32
33
34
35
36
Trial Balance AdjustmentsAdjusted
Trial BalanceIncome
StatementBalance
SheetDr. Cr. Dr. Cr. Dr. Cr. Dr. Cr. Dr. Cr.Account Titles
CashSuppliesPrepaid InsuranceEquipmentNotes PayableAccounts PayableUnearned Service RevenueOwner’s CapitalOwner’s DrawingsService Revenue
Salaries and Wages ExpenseRent Expense Totals
15,2002,500
6005,000
500
4,000900
28,700
5,0002,5001,200
10,000
10,000
28,700
PIONEER ADVERTISINGWorksheet
For the Month Ended October 31, 2017
Supplies ExpenseInsurance ExpenseAccum. Depreciation— EquipmentDepreciation ExpenseAccounts ReceivableInterest ExpenseInterest PayableSalaries and Wages Payable Totals 3,440 3,440
400
1,200
1,50050
40200
50
(d)
(g)
(a)(b)
(c)(e)(f)
1,50050
400200
40
501,200
(a)(b)
(d)(e)
(c)
(f )(g)
15,2001,000
5505,000
500
5,200900
1,50050
40200
50
5,0002,500
80010,000
10,600
40
501,200
30,190 30,190
5,200900
1,50050
40
50
10,600
15,2001,000
5505,000
500
200
5,0002,500
80010,000
40
501,200
7,740
2,86010,600
10,600
10,600
22,450
22,450
19,590
2,86022,450
The difference between the totals of the two income statement columns determines net incomeor net loss.
Net income is extended to the credit column of the balance sheet columns. (Net loss would beextended to the debit column.)
Net Income Totals
STEP 5: TOTAL THE STATEMENT COLUMNS, COMPUTE THE NET INCOME (OR NET LOSS), AND COMPLETE THE WORKSHEET

The Worksheet 157
Illustration 4-7Financial statements from a worksheet
PIONEER ADVERTISINGIncome Statement
For the Month Ended October 31, 2017
Revenues Service revenue $10,600 Expenses Salaries and wages expense $5,200 Supplies expense 1,500 Rent expense 900 Insurance expense 50 Interest expense 50 Depreciation expense 40 Total expenses 7,740
Net income $ 2,860
PIONEER ADVERTISINGOwner’s Equity Statement
For the Month Ended October 31, 2017
Owner’s capital, October 1 $ –0– Add: Investments $10,000
Net income 2,860 12,860
12,860 Less: Drawings 500
Owner’s capital, October 31 $12,360
PIONEER ADVERTISINGBalance Sheet
October 31, 2017
Assets
Cash $15,200 Accounts receivable 200 Supplies 1,000 Prepaid insurance 550 Equipment $5,000 Less: Accumulated depreciation—equipment 40 4,960
Total assets $21,910
Liabilities and Owner’s Equity
Liabilities Notes payable $5,000 Accounts payable 2,500 Interest payable 50 Unearned service revenue 800 Salaries and wages payable 1,200 Total liabilities $ 9,550 Owner’s equity Owner’s capital 12,360
Total liabilities and owner’s equity $21,910
Preparing Financial Statements from a Worksheet
After a company has completed a worksheet, it has at hand all the data required for preparation of fi nancial statements. The income statement is prepared from the income statement columns. The balance sheet and owner’s equity statement are prepared from the balance sheet columns. Illustration 4-7 shows the fi nancial

158 4 Completing the Accounting Cycle
statements prepared from Pioneer Advertising’s worksheet. At this point, the com-pany has not journalized or posted adjusting entries. Therefore, ledger balances for some accounts are not the same as the fi nancial statement amounts. The amount shown for owner’s capital on the worksheet is the account bal-ance before considering drawings and net income (or loss). When the owner has made no additional investments of capital during the period, this worksheet amount for owner’s capital is the balance at the beginning of the period. Using a worksheet, companies can prepare fi nancial statements before they journalize and post adjusting entries. However, the completed worksheet is not a substitute for formal fi nancial statements. The format of the data in the fi nancial statement columns of the worksheet is not the same as the format of the fi nancial statements. A worksheet is essentially a working tool of the accoun-tant; companies do not distribute it to management and other parties.
Preparing Adjusting Entries from a Worksheet
A worksheet is not a journal, and it cannot be used as a basis for posting to ledger accounts. To adjust the accounts, the company must journalize the adjustments and post them to the ledger. The adjusting entries are prepared from the adjustments columns of the worksheet. The reference letters in the adjustments columns and the explanations of the adjustments at the bottom of the worksheet help identify the adjusting entries. The journalizing and posting of adjusting entries follows the preparation of fi nancial statements when a work-sheet is used. The adjusting entries on October 31 for Pioneer Advertising are the same as those shown in Illustration 3-23 (page 109).
Helpful HintNote that writing the explanation to the adjust-ment at the bottom of the worksheet is not required.
Susan Elbe is preparing a worksheet. Explain to Susan how she should extend the follow-ing adjusted trial balance accounts to the fi nancial statement columns of the worksheet.
Cash Owner’s DrawingsAccumulated Depreciation—Equipment Service RevenueAccounts Payable Salaries and Wages Expense
DO IT! 1 Worksheet
Income statement debit column—Salaries and Wages ExpenseIncome statement credit column—Service RevenueBalance sheet debit column—Cash; Owner’s DrawingsBalance sheet credit column—Accumulated Depreciation—Equipment; Accounts
Payable
Related exercise material: BE4-1, BE4-2, BE4-3, E4-1, E4-2, E4-5, E4-6, and DO IT! 4-1.
Action Plan✔ Balance sheet: Extend
assets to debit col-umn. Extend liabilities to credit column. Extend contra assets to credit column. Extend drawings ac-count to debit column.
✔ Income statement: Extend expenses to debit column. Extend revenues to credit column.
Solution
2 Prepare closing entries and a post-closing trial balance.LEARNING OBJECTIVE
At the end of the accounting period, the company makes the accounts ready for the next period. This is called closing the books. In closing the books, the com-pany distinguishes between temporary and permanent accounts. Temporary accounts relate only to a given accounting period. They include all income statement accounts and the owner’s drawings account. The company closes all temporary accounts at the end of the period.

Closing the Books 159
In contrast, permanent accounts relate to one or more future accounting periods. They consist of all balance sheet accounts, including the owner’s capital account. Permanent accounts are not closed from period to period. Instead, the company carries forward the balances of permanent accounts into the next accounting period. Illustration 4-8 identifi es the accounts in each category.
Alternative TerminologyTemporary accounts are sometimes called nominal accounts, and permanent accounts are sometimes called real accounts.
1We explain closing entries for a partnership and for a corporation in Chapters 12 and 13, respectively.
Preparing Closing Entries
At the end of the accounting period, the company transfers temporary account balances to the permanent owner’s equity account, Owner’s Capital, by means of closing entries.1
Closing entries formally recognize in the ledger the transfer of net income (or net loss) and owner’s drawings to owner’s capital. The owner’s equity state-ment shows the results of these entries. Closing entries also produce a zero balance in each temporary account. The temporary accounts are then ready to accumulate data in the next accounting period separate from the data of prior periods. Permanent accounts are not closed. Journalizing and posting closing entries is a required step in the account-ing cycle. (See Illustration 4-15 on page 166.) The company performs this step after it has prepared fi nancial statements. In contrast to the steps in the cycle that you have already studied, companies generally journalize and post closing entries only at the end of the annual accounting period. Thus, all temporary accounts will contain data for the entire year. In preparing closing entries, companies could close each income statement account directly to owner’s capital. However, to do so would result in excessive detail in the permanent Owner’s Capital account. Instead, companies close the revenue and expense accounts to another temporary account, Income Sum-mary, and they transfer the resulting net income or net loss from this account to owner’s capital. Companies record closing entries in the general journal. A center caption, Closing Entries, inserted in the journal between the last adjusting entry and the fi rst closing entry, identifi es these entries. Then the company posts the closing entries to the ledger accounts. Companies generally prepare closing entries directly from the adjusted bal-ances in the ledger. They could prepare separate closing entries for each nomi-nal account, but the following four entries accomplish the desired result more effi ciently:
1. Debit each revenue account for its balance, and credit Income Summary for total revenues.
2. Debit Income Summary for total expenses, and credit each expense account for its balance.
Illustration 4-8Temporary versus permanent accounts
PERMANENTThese accounts are not closed
TEMPORARYThese accounts are closed
Owner’s drawings account
All expense accounts
All revenue accounts
Owner’s capital account
All liability accounts
All asset accounts
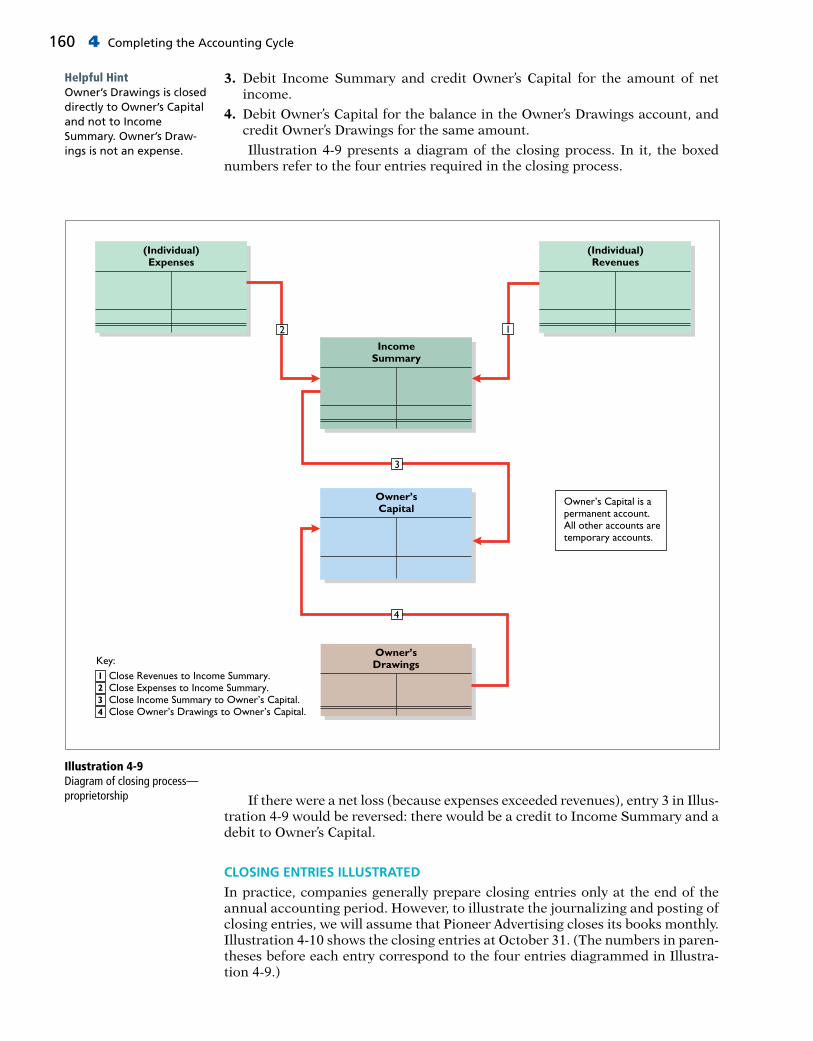
160 4 Completing the Accounting Cycle
3. Debit Income Summary and credit Owner’s Capital for the amount of net income.
4. Debit Owner’s Capital for the balance in the Owner’s Drawings account, and credit Owner’s Drawings for the same amount.
Illustration 4-9 presents a diagram of the closing process. In it, the boxed numbers refer to the four entries required in the closing process.
Helpful HintOwner’s Drawings is closed directly to Owner’s Capital and not to Income Summary. Owner’s Draw-ings is not an expense.
Illustration 4-9Diagram of closing process—proprietorship
Owner’s Capital is apermanent account.All other accounts aretemporary accounts.
(Individual)Revenues
IncomeSummary
2 1
(Individual)Expenses
Owner’sCapital
3
Owner’sDrawings
4
Key:Close Revenues to Income Summary.Close Expenses to Income Summary.Close Income Summary to Owner’s Capital.Close Owner’s Drawings to Owner’s Capital.
2
4
1
3
If there were a net loss (because expenses exceeded revenues), entry 3 in Illus-tration 4-9 would be reversed: there would be a credit to Income Summary and a debit to Owner’s Capital.
CLOSING ENTRIES ILLUSTRATED
In practice, companies generally prepare closing entries only at the end of the annual accounting period. However, to illustrate the journalizing and posting of closing entries, we will assume that Pioneer Advertising closes its books monthly. Illustration 4-10 shows the closing entries at October 31. (The numbers in paren-theses before each entry correspond to the four entries diagrammed in Illustra-tion 4-9.)

Closing the Books 161
Note that the amounts for Income Summary in entries (1) and (2) are the totals of the income statement credit and debit columns, respectively, in the work-sheet. A couple of cautions in preparing closing entries. (1) Avoid unintentionally doubling the revenue and expense balances rather than zeroing them. (2) Do not close Owner’s Drawings through the Income Summary account. Owner’s Drawings is not an expense, and it is not a factor in determining net income.
Posting Closing Entries
Illustration 4-11 shows the posting of the closing entries and the underlining (ruling) of the accounts. Note that all temporary accounts have zero balances after posting the closing entries. In addition, notice that the balance in owner’s capital (Owner’s Capital) represents the total equity of the owner at the end of the accounting period. This balance is shown on the balance sheet and is the ending capital reported on the owner’s equity statement, as shown in Illustra-tion 4-7 (page 157). Pioneer Advertising uses the Income Summary account only in closing. It does not journalize and post entries to this account during the year. As part of the closing process, Pioneer totals, balances, and double-underlines its temporary accounts—revenues, expenses, and Owner’s Drawings, as shown in T-account form in Illustration 4-11 (page 162). It does not close its permanent accounts—assets, liabilities, and Owner’s Capital. Instead, Pioneer draws a single underline beneath the current-period entries for the permanent accounts. The account balance is then entered below the single underline and is carried forward to the next period (for example, see Owner’s Capital).
Illustration 4-10Closing entries journalized GENERAL JOURNAL J3
Date Account Titles and Explanation Ref. Debit Credit
Closing Entries
2017 (1) Oct. 31 Service Revenue 400 10,600 Income Summary 350 10,600 (To close revenue account)
(2) 31 Income Summary 350 7,740 Supplies Expense 631 1,500 Depreciation Expense 711 40 Insurance Expense 722 50 Salaries and Wages Expense 726 5,200 Rent Expense 729 900 Interest Expense 905 50 (To close expense accounts)
(3) 31 Income Summary 350 2,860 Owner’s Capital 301 2,860 (To close net income to capital)
(4) 31 Owner’s Capital 301 500 Owner’s Drawings 306 500 (To close drawings to capital)
Helpful HintThe balance in Income Summary before it is closed must equal the net income or net loss for the period.

162 4 Completing the Accounting Cycle
Illustration 4-11Posting of closing entries
4,0001,200
Salaries and WagesExpense
5,200
5,200
5,200
(2)
726
900
RentExpense
900(2)
729
50
InsuranceExpense
50(2)
722
40
DepreciationExpense
40(2)
711
50
InterestExpense
50(2)
905
1,500
SuppliesExpense
1,500(2)
631
500
Owner’sCapital
10,0002,860
Bal. 12,360
(3)
301
(4)
10,600
ServiceRevenue
10,600
10,000400200
10,600
400
(1)
500
Owner’sDrawings
500(4)
306
7,7402,860
IncomeSummary
10,600
10,600
10,600
(1)
350
(2)(3)
2
2
3
4
1
Key:Close Revenues to Income Summary.Close Expenses to Income Summary.Close Income Summary to Owner’s Capital.Close Owner’s Drawings to Owner’s Capital.
2
4
1
3
Cisco Performs the Virtual Close
Technology has dramatically shortened the closing process. Recent surveys have reported that the average company now takes only six to seven days to close, rather than the previous 20 days. But a few companies do much better. Cisco Systems can perform a “virtual close”—closing within 24 hours on any day in the quarter. The same is true at Lockheed Martin Corp.,
which improved its closing time by 85% in just the last few
years. Not very long ago, it took 14 to 16 days. Managers at these companies emphasize that this increased speed has not reduced the accuracy and completeness of the data.
This is not just showing off. Knowing exactly where you are fi nancially all of the time allows the company to respond faster than its competitors. It also means that the hundreds of people who used to spend 10 to 20 days a quarter tracking transactions can now be more usefully employed on things such as mining data for business intel-ligence to fi nd new business opportunities.
Source: “Reporting Practices: Few Do It All,” Financial Executive (November 2003), p. 11.
Who else benefi ts from a shorter closing process? (Go to WileyPLUS for this answer and additional questions.)
© Steve Cole/iStockphoto
Cisco SystemsAccounting Across the Organization

Closing the Books 163
Preparing a Post-Closing Trial Balance
After Pioneer Advertising has journalized and posted all closing entries, it pre-pares another trial balance, called a post-closing trial balance, from the ledger. The post-closing trial balance lists permanent accounts and their balances after the journalizing and posting of closing entries. The purpose of the post-closing trial balance is to prove the equality of the permanent account balances car-ried forward into the next accounting period. Since all temporary accounts will have zero balances, the post-closing trial balance will contain only permanent—balance sheet—accounts. Illustration 4-12 shows the post-closing trial balance for Pioneer Advertising.
Illustration 4-12Post-closing trial balancePIONEER ADVERTISING
Post-Closing Trial BalanceOctober 31, 2017
Debit Credit
Cash $ 15,200Accounts Receivable 200Supplies 1,000Prepaid Insurance 550Equipment 5,000Accumulated Depreciation—Equipment $ 40Notes Payable 5,000Accounts Payable 2,500Unearned Service Revenue 800Salaries and Wages Payable 1,200Interest Payable 50Owner’s Capital 12,360
$21,950 $21,950
Pioneer prepares the post-closing trial balance from the permanent accounts in the ledger. Illustration 4-13 (page 164) shows the permanent accounts in Pioneer’s general ledger.

164 4 Completing the Accounting Cycle
Illustration 4-13General ledger, permanent accounts
GENERAL LEDGER
Cash No. 101
Date Explanation Ref. Debit Credit Balance
2017Oct. 1 J1 10,000 10,000 2 J1 1,200 11,200 3 J1 900 10,300 4 J1 600 9,700 20 J1 500 9,200 26 J1 4,000 5,200 31 J1 10,000 15,200
Accounts Receivable No. 112
Date Explanation Ref. Debit Credit Balance
2017Oct. 31 Adj. entry J2 200 200
Supplies No. 126
Date Explanation Ref. Debit Credit Balance
2017Oct. 5 J1 2,500 2,500 31 Adj. entry J2 1,500 1,000
Prepaid Insurance No. 130
Date Explanation Ref. Debit Credit Balance
2017Oct. 4 J1 600 600 31 Adj. entry J2 50 550
Equipment No. 157
Date Explanation Ref. Debit Credit Balance
2017Oct. 1 J1 5,000 5,000
Accumulated Depreciation—Equipment No. 158
Date Explanation Ref. Debit Credit Balance
2017Oct. 31 Adj. entry J2 40 40
Notes Payable No. 200
Date Explanation Ref. Debit Credit Balance
2017Oct. 1 J1 5,000 5,000
Accounts Payable No. 201
Date Explanation Ref. Debit Credit Balance
2017Oct. 5 J1 2,500 2,500
Unearned Service Revenue No. 209
Date Explanation Ref. Debit Credit Balance
2017Oct. 2 J1 1,200 1,200 31 Adj. entry J2 400 800
Salaries and Wages Payable No. 212
Date Explanation Ref. Debit Credit Balance
2017Oct. 31 Adj. entry J2 1,200 1,200
Interest Payable No. 230
Date Explanation Ref. Debit Credit Balance
2017Oct. 31 Adj. entry J2 50 50
Owner’s Capital No. 301
Date Explanation Ref. Debit Credit Balance
2017Oct. 1 J1 10,000 10,000 31 Closing entry J3 2,860 12,860 31 Closing entry J3 500 12,360
Note: The permanent accounts for Pioneer Advertising are shown here. Illustration 4-14 (page 165) shows the temporary accounts. Both permanent and temporary accounts are part of the general ledger. They are segregated here to aid in learning.
(Permanent Accounts Only)
A post-closing trial balance provides evidence that the company has properly journalized and posted the closing entries. It also shows that the accounting equation is in balance at the end of the accounting period. However, like the trial balance, it does not prove that Pioneer has recorded all transactions or that the ledger is correct. For example, the post-closing trial balance still will balance even if a transaction is not journalized and posted or if a transaction is journal-ized and posted twice. The remaining accounts in the general ledger are temporary accounts, shown in Illustration 4-14. After Pioneer correctly posts the closing entries, each tempo-rary account has a zero balance. These accounts are double-underlined to fi nalize the closing process.

Closing the Books 165
Illustration 4-14General ledger, temporary accounts
GENERAL LEDGER
(Temporary Accounts Only)
Owner’s Drawings No. 306
Date Explanation Ref. Debit Credit Balance
2017Oct. 20 J1 500 500 31 Closing entry J3 500 –0–
Income Summary No. 350
Date Explanation Ref. Debit Credit Balance
2017Oct. 31 Closing entry J3 10,600 10,600 31 Closing entry J3 7,740 2,860 31 Closing entry J3 2,860 –0–
Service Revenue No. 400
Date Explanation Ref. Debit Credit Balance
2017Oct. 31 J1 10,000 10,000 31 Adj. entry J2 400 10,400 31 Adj. entry J2 200 10,600 31 Closing entry J3 10,600 –0–
Supplies Expense No. 631
Date Explanation Ref. Debit Credit Balance
2017Oct. 31 Adj. entry J2 1,500 1,500 31 Closing entry J3 1,500 –0–
Depreciation Expense No. 711
Date Explanation Ref. Debit Credit Balance
2017Oct. 31 Adj. entry J2 40 40 31 Closing entry J3 40 –0–
Insurance Expense No. 722
Date Explanation Ref. Debit Credit Balance
2017Oct. 31 Adj. entry J2 50 50 31 Closing entry J3 50 –0–
Salaries and Wages Expense No. 726
Date Explanation Ref. Debit Credit Balance
2017Oct. 26 J1 4,000 4,000 31 Adj. entry J2 1,200 5,200 31 Closing entry J3 5,200 –0–
Rent Expense No. 729
Date Explanation Ref. Debit Credit Balance
2017Oct. 3 J1 900 900 31 Closing entry J3 900 –0–
Interest Expense No. 905
Date Explanation Ref. Debit Credit Balance
2017Oct. 31 Adj. entry J2 50 50 31 Closing entry J3 50 –0–
Note: The temporary accounts for Pioneer Advertising are shown here. Illustration 4-13 (page 164) shows the permanent accounts. Both permanent and temporary accounts are part of the general ledger. They are segregated here to aid in learning.
The worksheet for Hancock Company shows the following in the fi nancial statement columns:
Owner’s drawings $15,000Owner’s capital $42,000Net income $18,000
Prepare the closing entries at December 31 that affect owner’s capital.
Solution
DO IT! 2 Closing Entries
Related exercise material: BE4-4, BE4-5, BE4-6, E4-4, E4-7, E4-8, E4-11, and DO IT! 4-2.
Action Plan✔ Close Income
Summary to Owner’s Capital.
✔ Close Owner’s Drawings to Owner’s Capital.
Dec. 31 Income Summary 18,000 Owner’s Capital 18,000 (To close net income to capital)
31 Owner’s Capital 15,000 Owner’s Drawings 15,000 (To close drawings to capital)

166 4 Completing the Accounting Cycle
3 Explain the steps in the accounting cycle and how to prepare correcting entries.
LEARNING OBJECTIVE
Summary of the Accounting Cycle
Illustration 4-15 summarizes the steps in the accounting cycle. You can see that the cycle begins with the analysis of business transactions and ends with the preparation of a post-closing trial balance.
Illustration 4-15Steps in the accounting cycle
7
Prepare financialstatements:
Income statementOwner’s equity statement
Balance sheet
5
Journalize and postadjusting entries:deferrals/accruals
6
Prepare an adjustedtrial balance
Optional steps: If a worksheet is prepared, Steps 4, 5, and 6 are incorporated in the worksheet.If reversing entries are prepared, they occur between Steps 9 and 1 as discussed below.
4
Prepare atrial balance
3
Post toledger accounts
2
Journalize thetransactions
1
Analyze businesstransactions
9
Prepare a post-closingtrial balance
8
Journalize andpost closing entries
Steps 1–3 may occur daily during the accounting period. Companies perform Steps 4–7 on a periodic basis, such as monthly, quarterly, or annually. Steps 8 and 9—closing entries and a post-closing trial balance—usually take place only at the end of a company’s annual accounting period. There are also two optional steps in the accounting cycle. As you have seen, companies may use a worksheet in preparing adjusting entries and fi nancial statements. In addition, they may use reversing entries, as explained below.
Reversing Entries—An Optional Step
Some accountants prefer to reverse certain adjusting entries by making a revers-ing entry at the beginning of the next accounting period. A reversing entry is the exact opposite of the adjusting entry made in the previous period. Use of reversing

Accounting Cycle and Correcting Entries 167
entries is an optional bookkeeping procedure; it is not a required step in the accounting cycle. Accordingly, we have chosen to cover this topic in an appendix at the end of the chapter.
Correcting Entries—An Avoidable Step
Unfortunately, errors may occur in the recording process. Companies should cor-rect errors, as soon as they discover them, by journalizing and posting correcting entries. If the accounting records are free of errors, no correcting entries are needed. You should recognize several differences between correcting entries and adjusting entries. First, adjusting entries are an integral part of the accounting cycle. Correcting entries, on the other hand, are unnecessary if the records are error-free. Second, companies journalize and post adjustments only at the end of an accounting period. In contrast, companies make correcting entries when-ever they discover an error. Finally, adjusting entries always affect at least one balance sheet account and one income statement account. In contrast, correcting entries may involve any combination of accounts in need of correction. Correct-ing entries must be posted before closing entries. To determine the correcting entry, it is useful to compare the incorrect entry with the correct entry. Doing so helps identify the accounts and amounts that should—and should not—be corrected. After comparison, the accountant makes an entry to correct the accounts. The following two cases for Mercato Co. illustrate this approach.
CASE 1
On May 10, Mercato Co. journalized and posted a $50 cash collection on account from a customer as a debit to Cash $50 and a credit to Service Revenue $50. The company discovered the error on May 20, when the customer paid the remaining balance in full.
Comparison of the incorrect entry with the correct entry reveals that the debit to Cash $50 is correct. However, the $50 credit to Service Revenue should have been credited to Accounts Receivable. As a result, both Service Revenue and Accounts Receivable are overstated in the ledger. Mercato makes the following correcting entry.
Incorrect Entry (May 10) Correct Entry (May 10)
Cash 50 Cash 50 Service Revenue 50 Accounts Receivable 50
Illustration 4-16Comparison of entries
Illustration 4-17Correcting entry
Correcting Entry
May 20 Service Revenue 50 Accounts Receivable 50 (To correct entry of May 10)
250 Rev250
Cash Flowsno effect
A OEL5 1
CASE 2
On May 18, Mercato purchased on account equipment costing $450. The transac-tion was journalized and posted as a debit to Equipment $45 and a credit to Accounts Payable $45. The error was discovered on June 3, when Mercato received the monthly statement for May from the creditor.
Incorrect Entry (May 18) Correct Entry (May 18)
Equipment 45 Equipment 450 Accounts Payable 45 Accounts Payable 450
Illustration 4-18Comparison of entries
Comparison of the two entries shows that two accounts are incorrect. Equip-ment is understated $405, and Accounts Payable is understated $405. Mercato makes the correcting entry shown in Illustration 4-19 (page 168).
ETHICS NOTE
When companies fi nd errors in previously released income statements, they restate those numbers. Perhaps because of the increased scrutiny caused by Sarbanes-Oxley, in a recent year companies fi led a record 1,195 restatements.
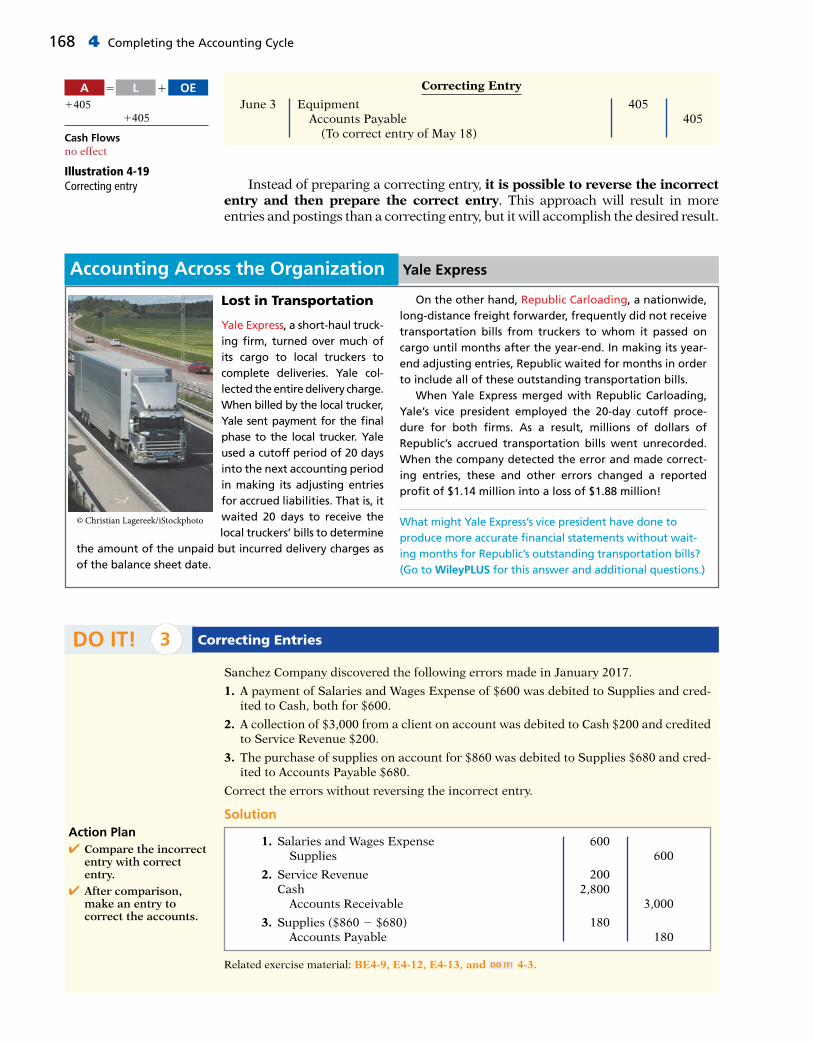
168 4 Completing the Accounting Cycle
Instead of preparing a correcting entry, it is possible to reverse the incorrect entry and then prepare the correct entry. This approach will result in more entries and postings than a correcting entry, but it will accomplish the desired result.
14051405
Cash Flowsno effect
A OEL5 1 Correcting Entry
June 3 Equipment 405 Accounts Payable 405 (To correct entry of May 18)
Lost in Transportation
Yale Express, a short-haul truck-ing fi rm, turned over much of its cargo to local truckers to complete deliveries. Yale col-lected the entire delivery charge. When billed by the local trucker, Yale sent payment for the fi nal phase to the local trucker. Yale used a cutoff period of 20 days into the next accounting period in making its adjusting entries for accrued liabilities. That is, it waited 20 days to receive the local truckers’ bills to determine
the amount of the unpaid but incurred delivery charges as of the balance sheet date.
On the other hand, Republic Carloading, a nationwide, long-distance freight forwarder, frequently did not receive transportation bills from truckers to whom it passed on cargo until months after the year-end. In making its year-end adjusting entries, Republic waited for months in order to include all of these outstanding transportation bills.
When Yale Express merged with Republic Carloading, Yale’s vice president employed the 20-day cutoff proce-dure for both fi rms. As a result, millions of dollars of Republic’s accrued transportation bills went unrecorded. When the company detected the error and made correct-ing entries, these and other errors changed a reported profi t of $1.14 million into a loss of $1.88 million!
What might Yale Express’s vice president have done to produce more accurate fi nancial statements without wait-ing months for Republic’s outstanding transportation bills? (Go to WileyPLUS for this answer and additional questions.)
© Christian Lagereek/iStockphoto
Yale ExpressAccounting Across the Organization
Sanchez Company discovered the following errors made in January 2017.
1. A payment of Salaries and Wages Expense of $600 was debited to Supplies and cred-ited to Cash, both for $600.
2. A collection of $3,000 from a client on account was debited to Cash $200 and credited to Service Revenue $200.
3. The purchase of supplies on account for $860 was debited to Supplies $680 and cred-ited to Accounts Payable $680.
Correct the errors without reversing the incorrect entry.
Solution
DO IT! 3 Correcting Entries
Related exercise material: BE4-9, E4-12, E4-13, and DO IT! 4-3.
Action Plan✔ Compare the incorrect
entry with correct entry.
✔ After comparison, make an entry to correct the accounts.
1. Salaries and Wages Expense 600 Supplies 600
2. Service Revenue 200 Cash 2,800 Accounts Receivable 3,000
3. Supplies ($860 2 $680) 180 Accounts Payable 180
Illustration 4-19Correcting entry

Classifi ed Balance Sheet 169
These groupings help fi nancial statement readers determine such things as (1) whether the company has enough assets to pay its debts as they come due, and (2) the claims of short- and long-term creditors on the company’s total assets. Many of these groupings can be seen in the balance sheet of Franklin Company shown in Illustration 4-21 below and on the next page. In the sections that follow, we explain each of these groupings.
4 Identify the sections of a classifi ed balance sheet.LEARNING OBJECTIVE
The balance sheet presents a snapshot of a company’s fi nancial position at a point in time. To improve users’ understanding of a company’s fi nancial position, com-panies often use a classifi ed balance sheet. A classifi ed balance sheet groups together similar assets and similar liabilities, using a number of standard classi-fi cations and sections. This is useful because items within a group have similar economic characteristics. A classifi ed balance sheet generally contains the stan-dard classifi cations listed in Illustration 4-20.
Illustration 4-20Standard balance sheet classifi cations
Assets Liabilities and Owner’s Equity
Current assets Current liabilities Long-term investments Long-term liabilities Property, plant, and equipment Owner’s (Stockholders’) equity Intangible assets
Illustration 4-21Classifi ed balance sheet
FRANKLIN COMPANYBalance Sheet
October 31, 2017
AssetsCurrent assets Cash $ 6,600 Debt investments 2,000 Accounts receivable 7,000 Notes receivable 1,000 Inventory 3,000 Supplies 2,100 Prepaid insurance 400
Total current assets $22,100
Long-term investments Stock investments 5,200 Investment in real estate 2,000 7,200
Property, plant, and equipment Land 10,000 Equipment $24,000 Less: Accumulated depreciation—
equipment 5,000 19,000 29,000
Intangible assets Patents 3,100
Total assets $61,400

170 4 Completing the Accounting Cycle
Current Assets
Current assets are assets that a company expects to convert to cash or use up within one year or its operating cycle, whichever is longer. In Illustration 4-21, Franklin Company had current assets of $22,100. For most businesses, the cutoff for classifi cation as current assets is one year from the balance sheet date. For example, accounts receivable are current assets because the company will collect them and convert them to cash within one year. Supplies is a current asset because the company expects to use them up in operations within one year. Some companies use a period longer than one year to classify assets and liabilities as current because they have an operating cycle longer than one year. The operating cycle of a company is the average time that it takes to purchase inventory, sell it on account, and then collect cash from customers. For most businesses, this cycle takes less than a year so they use a one-year cutoff. But for some businesses, such as vineyards or airplane manufacturers, this period may be longer than a year. Except where noted, we will assume that companies use one year to determine whether an asset or liability is current or long-term. Common types of current assets are (1) cash, (2) investments (such as short-term U.S. government securities), (3) receivables (notes receivable, accounts receivable, and interest receivable), (4) inventories, and (5) prepaid expenses (supplies and insurance). On the balance sheet, companies usually list these items in the order in which they expect to convert them into cash. Illustration 4-22 presents the current assets of Southwest Airlines Co.
Liabilities and Owner’s EquityCurrent liabilities Notes payable $11,000 Accounts payable 2,100 Unearned service revenue 900 Salaries and wages payable 1,600 Interest payable 450
Total current liabilities $16,050
Long-term liabilities Mortgage payable 10,000 Notes payable 1,300
Total long-term liabilities 11,300
Total liabilities 27,350
Owner’s equity Owner’s capital 34,050
Total liabilities and owner’s equity $61,400
Helpful HintRecall that the basic accounting equation is Assets 5 Liabilities 1 Owner’s Equity.
Illustration 4-21(continued )
Illustration 4-22Current assets section
SOUTHWEST AIRLINES CO.Balance Sheet (partial)
(in millions)
Current assets Cash and cash equivalents $1,390 Short-term investments 369 Accounts receivable 241 Inventories 181 Prepaid expenses and other current assets 420
Total current assets $2,601
Real World

Classifi ed Balance Sheet 171
As we explain later in the chapter, a company’s current assets are important in assessing its short-term debt-paying ability.
Long-Term Investments
Long-term investments are generally (1) investments in stocks and bonds of other companies that are normally held for many years, (2) long-term assets such as land or buildings that a company is not currently using in its operating activi-ties, and (3) long-term notes receivable. In Illustration 4-21, Franklin Company reported total long-term investments of $7,200 on its balance sheet. Yahoo! Inc. reported long-term investments in its balance sheet, as shown in Illustration 4-23.
Alternative TerminologyLong-term investments are often referred to simply as investments.
Illustration 4-23Long-term investments section
YAHOO! INC.Balance Sheet (partial)
(in thousands)
Long-term investments Investments in securities $90,266
Property, Plant, and Equipment
Property, plant, and equipment are assets with relatively long useful lives that a company is currently using in operating the business. This category includes land, buildings, machinery and equipment, delivery equipment, and furniture. In Illustration 4-21, Franklin Company reported property, plant, and equipment of $29,000.
Depreciation is the practice of allocating the cost of assets to a number of years. Companies do this by systematically assigning a por-tion of an asset’s cost as an expense each year (rather than expensing the full purchase price in the year of purchase). The assets that the com-pany depreciates are reported on the balance sheet at cost less accumu-lated depreciation. The accumulated depreciation account shows the total amount of depreciation that the company has expensed thus far in the asset’s life. In Illustration 4-21, Franklin Company reported accu-mulated depreciation of $5,000.
Illustration 4-24 presents the property, plant, and equipment of Cooper Tire & Rubber Company.
Alternative TerminologyProperty, plant, and equipment is sometimes called fi xed assets or plant assets.
Intangible Assets
Many companies have long-lived assets that do not have physical substance yet often are very valuable. We call these assets intangible assets. One signifi cant intangible asset is goodwill. Others include patents, copyrights, and trademarks
Helpful HintSometimes intangible assets are reported under a broader heading called “Other assets.”
COOPER TIRE & RUBBER COMPANYBalance Sheet (partial)
(in thousands)
Property, plant, and equipment Land and land improvements $ 41,553 Buildings 298,706 Machinery and equipment 1,636,091 Molds, cores, and rings 268,158 $2,244,508
Less: Accumulated depreciation 1,252,692
$ 991,816
Illustration 4-24Property, plant, and equipment section
Recently, China adopted Inter-national Financial Reporting Standards (IFRS). This was done in an effort to reduce fraud and increase investor confi dence in fi nancial reports. Under these standards, many items, such as property, plant, and equipment, may be reported at current fair values rather than historical cost.
International Note
Real World
Real World

172 4 Completing the Accounting Cycle
Current Liabilities
In the liabilities and owner’s equity section of the balance sheet, the fi rst grouping is current liabilities. Current liabilities are obligations that the company is to pay within the coming year or its operating cycle, whichever is longer. Common examples are accounts payable, salaries and wages payable, notes payable, inter-est payable, and income taxes payable. Also included as current liabilities are current maturities of long-term obligations—payments to be made within the next year on long-term obligations. In Illustration 4-21, Franklin Company reported fi ve different types of current liabilities, for a total of $16,050.
Regaining Goodwill
After falling to unforeseen lows amidst scandals, recalls, and economic crises, the Amer-ican public’s positive percep-tion of the reputation of corporate America is on the rise. Overall corporate reputa-tion is experiencing rehabilita-tion as the American public gives high marks overall to cor-porate America, specifi c indus-tries, and the largest number of individual companies in a
dozen years. This is according to the fi ndings of the 2011 Harris Interactive RQ Study, which measures the reputa-tions of the 60 most visible companies in the United States.
The survey focuses on six reputational dimensions that infl uence reputation and consumer behavior. Four of these
dimensions, along with the fi ve corporations that ranked highest within each, are as follows.
• Social Responsibility: (1) Whole Foods Market, (2) Johnson & Johnson, (3) Google, (4) The Walt Disney Company, (5) Procter & Gamble Co.
• Emotional Appeal: (1) Johnson & Johnson, (2) Amazon.com, (3) UPS, (4) General Mills, (5) Kraft Foods
• Financial Performance: (1) Google, (2) Berkshire Hathaway, (3) Apple, (4) Intel, (5) The Walt Disney Company
• Products and Services: (1) Intel Corporation, (2) 3M Com-pany, (3) Johnson & Johnson, (4) Google, (5) Procter & Gamble Co.
Source: www.harrisinteractive.com.
Name two industries today which are probably rated low on the reputational characteristics of “being trusted” and “having high ethical standards.” (Go to WileyPLUS for this answer and additional questions.)
© Gehringi/iStockphoto
People, Planet, and Profi t Insight
TIME WARNER, INC.Balance Sheet (partial)
(in millions)
Intangible assets Goodwill $40,953 Film library 2,690 Customer lists 2,540 Cable television franchises 38,048 Sports franchises 262 Brands, trademarks, and other intangible assets 8,313
$92,806
Illustration 4-25Intangible assets section
or trade names that give the company exclusive right of use for a specifi ed period of time. In Illustration 4-21, Franklin Company reported intangible assets of $3,100. Illustration 4-25 shows the intangible assets of media giant Time Warner, Inc.
ETHICS NOTE
A company that has more current assets than current liabilities can increase the ratio of current assets to current liabilities by using cash to pay off some current liabilities. This gives the appearance of being more liquid. Do you think this move is ethical?
Real World

Classifi ed Balance Sheet 173
Users of fi nancial statements look closely at the relationship between current assets and current liabilities. This relationship is important in evaluating a com-pany’s liquidity—its ability to pay obligations expected to be due within the next year. When current assets exceed current liabilities, the likelihood for paying the liabilities is favorable. When the reverse is true, short-term creditors may not be paid, and the company may ultimately be forced into bankruptcy.
Can a Company Be Too Liquid?
There actually is a point where a company can be too liquid—that is, it can have too much working capital (current assets less current liabilities). While it is important to be liquid enough to be able to pay short-term bills as they come due, a com-pany does not want to tie up its cash in extra inventory or receivables that are not earning the company money.
By one estimate from the REL Consultancy Group, the thousand largest U.S. companies
have on their books cumulative excess working capital of $764 billion. Based on this fi gure, companies could have reduced debt by 36% or increased net income by 9%. Given that managers throughout a company are interested in improving profi tability, it is clear that they should have an eye toward managing working capital. They need to aim for a “Goldilocks solution”—not too much, not too little, but just right.
Source: K. Richardson, “Companies Fall Behind in Cash Management,” Wall Street Journal (June 19, 2007).
What can various company managers do to ensure that working capital is managed effi ciently to maximize net income? (Go to WileyPLUS for this answer and additional questions.)
© Jorge Salcedo/iStockphoto
REL Consultancy GroupAccounting Across the Organization
S.S. Ongoing
Liquidity
S.S. Bankruptcy
Illiquidity
Long-Term Liabilities
Long-term liabilities are obligations that a company expects to pay after one year. Liabilities in this category include bonds payable, mortgages payable, long-term notes payable, lease liabilities, and pension liabilities. Many companies report long-term debt maturing after one year as a single amount in the balance sheet and show the details of the debt in notes that accompany the fi nancial state-ments. Others list the various types of long-term liabilities. In Illustration 4-21, Franklin Company reported long-term liabilities of $11,300. Illustration 4-27 (page 174) shows the long-term liabilities that The Procter & Gamble Company reported in its balance sheet.
Illustration 4-26Current liabilities section
MARCUS CORPORATIONBalance Sheet (partial)
(in thousands)
Current liabilities Notes payable $ 239 Accounts payable 24,242 Current maturities of long-term debt 57,250 Other current liabilities 27,477 Income taxes payable 11,215 Salaries and wages payable 6,720
Total current liabilities $127,143
Real World
Illustration 4-26 shows the current liabilities section adapted from the balance sheet of Marcus Corporation.

174 4 Completing the Accounting Cycle
Owner’s Equity
The content of the owner’s equity section varies with the form of business organiza-tion. In a proprietorship, there is one capital account. In a partnership, there is a capital account for each partner. Corporations divide owners’ equity into two accounts—Common Stock (sometimes referred to as Capital Stock) and Retained Earnings. Corporations record stockholders’ investments in the company by debit-ing an asset account and crediting the Common Stock account. They record in the Retained Earnings account income retained for use in the business. Corporations combine the Common Stock and Retained Earnings accounts and report them on the balance sheet as stockholders’ equity. (We discuss these corporation accounts in later chapters.) Nordstrom, Inc. recently reported its stockholders’ equity section as follows.
Alternative TerminologyCommon stock is sometimes called capital stock.
Illustration 4-27Long-term liabilities section
THE PROCTER & GAMBLE COMPANYBalance Sheet (partial)
(in millions)
Long-term liabilities Long-term debt $23,375 Deferred income taxes 12,015 Other noncurrent liabilities 5,147
Total long-term liabilities $40,537
The following accounts were taken from the fi nancial statements of Callahan Company.
________ Salaries and wages payable ________ Stock investments (long-term)________ Service revenue ________ Equipment________ Interest payable ________ Accumulated depreciation—________ Goodwill equipment________ Debt investments (short-term) ________ Depreciation expense________ Mortgage payable (due in 3 years) ________ Owner’s capital ________ Unearned service revenue
Match each of the following to its proper balance sheet classifi cation, shown below. If the item would not appear on a balance sheet, use “NA.”
Current assets (CA) Current liabilities (CL)Long-term investments (LTI) Long-term liabilities (LTL)Property, plant, and equipment (PPE) Owner’s equity (OE)Intangible assets (IA)
Solution
DO IT! 4 Balance Sheet Classifi cations
__CL__ Salaries and wages payable __LTI__ Stock investments (long-term)__NA__ Service revenue __PPE__ Equipment__CL__ Interest payable __PPE__ Accumulated depreciation—__IA__ Goodwill equipment__CA__ Debt investments (short-term) __NA__ Depreciation expense__LTL__ Mortgage payable (due __OE__ Owner’s capital in 3 years) __CL__ Unearned service revenue
Related exercise material: BE4-11, E4-14, E4-15, E4-16, E4-17, and DO IT! 4-4.
Action Plan✔ Analyze whether each
fi nancial statement item is an asset, liability, or owner’s equity.
✔ Determine if asset and liability items are short-term or long-term.
Real World
NORDSTROM, INC.Balance Sheet (partial)
(in thousands)
Stockholders’ equity Common stock, 271,331 shares $ 685,934 Retained earnings 1,406,747
Total stockholders’ equity $2,092,681
Illustration 4-28Stockholders’ equity section Real
World

Appendix 4A: Reversing Entries 175
5 APPENDIX 4A: Prepare reversing entries.
After preparing the fi nancial statements and closing the books, it is often helpful to reverse some of the adjusting entries before recording the regular transactions of the next period. Such entries are reversing entries. Companies make a revers-ing entry at the beginning of the next accounting period. Each reversing entry is the exact opposite of the adjusting entry made in the previous period. The recording of reversing entries is an optional step in the accounting cycle. The purpose of reversing entries is to simplify the recording of a subsequent transaction related to an adjusting entry. For example, in Chapter 3 (page 108), the payment of salaries after an adjusting entry resulted in two debits: one to Salaries and Wages Payable and the other to Salaries and Wages Expense. With reversing entries, the company can debit the entire subsequent payment to Sala-ries and Wages Expense. The use of reversing entries does not change the amounts reported in the fi nancial statements. What it does is simplify the recording of subsequent transactions.
Reversing Entries Example
Companies most often use reversing entries to reverse two types of adjusting entries: accrued revenues and accrued expenses. To illustrate the optional use of reversing entries for accrued expenses, we will use the salaries expense transac-tions for Pioneer Advertising as illustrated in Chapters 2, 3, and 4. The transaction and adjustment data are as follows.
1. October 26 (initial salary entry): Pioneer pays $4,000 of salaries and wages earned between October 15 and October 26.
2. October 31 (adjusting entry): Salaries and wages earned between October 29 and October 31 are $1,200. The company will pay these in the November 9 payroll.
3. November 9 (subsequent salary entry): Salaries and wages paid are $4,000. Of this amount, $1,200 applied to accrued salaries and wages payable and $2,800 was earned between November 1 and November 9.
Illustration 4A-1 shows the entries with and without reversing entries.
LEARNING OBJECTIVE
*
Without Reversing Entries(per chapter)
Initial Salary Entry
Oct. 26 Salaries and Wages Expense 4,000 Cash 4,000
Adjusting Entry
Oct. 31 Salaries and Wages Expense 1,200 Salaries and Wages Payable 1,200
Closing Entry
Oct. 31 Income Summary 5,200 Salaries and Wages Expense 5,200
Reversing Entry
Nov. 1 No reversing entry is made.
Subsequent Salary Entry
Nov. 9 Salaries and Wages Payable 1,200 Salaries and Wages Expense 2,800 Cash 4,000
With Reversing Entries(per appendix)
Initial Salary Entry
Oct. 26 (Same entry)
Adjusting Entry
Oct. 31 (Same entry)
Closing Entry
Oct. 31 (Same entry)
Reversing Entry
Nov. 1 Salaries and Wages Payable 1,200 Salaries and Wages Expense 1,200
Subsequent Salary Entry
Nov. 9 Salaries and Wages Expense 4,000 Cash 4,000
Illustration 4A-1Comparative entries—not reversing vs. reversing

176 4 Completing the Accounting Cycle
The fi rst three entries are the same whether or not Pioneer uses reversing entries. The last two entries are different. The November 1 reversing entry elim-inates the $1,200 balance in Salaries and Wages Payable created by the October 31 adjusting entry. The reversing entry also creates a $1,200 credit balance in the Salaries and Wages Expense account. As you know, it is unusual for an expense account to have a credit balance. The balance is correct in this instance, though, because it anticipates that the entire amount of the fi rst salaries and wages pay-ment in the new accounting period will be debited to Salaries and Wages Expense. This debit will eliminate the credit balance. The resulting debit balance in the expense account will equal the salaries and wages expense incurred in the new accounting period ($2,800 in this example). If Pioneer makes reversing entries, it can debit all cash payments of expenses to the expense account. This means that on November 9 (and every payday) Pioneer can debit Salaries and Wages Expense for the amount paid, without regard to any accrued salaries and wages payable. Being able to make the same entry each time simplifi es the recording process. The company can record subsequent transactions as if the related adjusting entry had never been made. Illustration 4A-2 shows the posting of the entries with reversing entries.
Illustration 4A-2Postings with reversing entries
Salaries and Wages Expense
10/26 Paid 4,000 10/31 Closing 5,200 31 Adjusting 1,200
5,200 5,200
11/9 Paid 4,000 11/1 Reversing 1,200
Salaries and Wages Payable
11/1 Reversing 1,200 10/31 Adjusting 1,200
A company can also use reversing entries for accrued revenue adjusting entries. For Pioneer, the adjusting entry was Accounts Receivable (Dr.) $200 and Service Revenue (Cr.) $200. Thus, the reversing entry on November 1 is:
Nov. 1 Service Revenue 200 Accounts Receivable 200 (To reverse October 31 adjusting entry)
2200 Rev1200
Cash Flowsno effect
A OEL5 1
When Pioneer collects the accrued service revenue, it debits Cash and credits Service Revenue.
Prepare a worksheet. The steps in preparing a work-sheet are as follows. (a) Prepare a trial balance on the worksheet. (b) Enter the adjustments in the adjustments columns. (c) Enter adjusted balances in the adjusted
trial balance columns. (d) Extend adjusted trial balance amounts to appropriate fi nancial statement columns. (e) Total the statement columns, compute net income (or net loss), and complete the worksheet.
LEARNING OBJECTIVES REVIEW
1
REVIEW AND PRACTICE

Prepare closing entries and a post-closing trial balance. Closing the books occurs at the end of an accounting period. The process is to journalize and post closing entries and then underline and balance all accounts. In closing the books, companies make separate entries to close revenues and expenses to Income Summary, Income Summary to Owner’s Cap-ital, and Owner’s Drawings to Owner’s Capital. Only temporary accounts are closed. A post-closing trial balance contains the balances in permanent accounts that are carried forward to the next accounting period. The purpose of this trial balance is to prove the equality of these balances.
Explain the steps in the accounting cycle and how to prepare correcting entries. The required steps in the accounting cycle are (1) analyze business transac-tions, (2) journalize the transactions, (3) post to ledger accounts, (4) prepare a trial balance, (5) jour-nalize and post adjusting entries, (6) prepare an adjusted trial balance, (7) prepare fi nancial state-ments, (8) journalize and post closing entries, and (9) prepare a post-closing trial balance.
3
One way to determine the correcting entry is to compare the incorrect entry with the correct entry. After comparison, the company makes a correcting entry to correct the accounts. An alternative to a cor-recting entry is to reverse the incorrect entry and then prepare the correct entry.
Identify the sections of a classifi ed balance sheet. A classifi ed balance sheet categorizes assets as current assets; long-term investments; property, plant, and equipment; and intangibles. Liabilities are classifi ed as either current or long-term. There is also an owner’s (owners’) equity section, which varies with the form of business organization.
Prepare reversing entries. Reversing entries are the opposite of the adjusting entries made in the preced-ing period. Some companies choose to make revers-ing entries at the beginning of a new accounting period to simplify the recording of later transactions related to the adjusting entries. In most cases, only accrued adjusting entries are reversed.
4
5*
2
Classifi ed balance sheet A balance sheet that contains standard classifi cations or sections. (p. 169).
Closing entries Entries made at the end of an account-ing period to transfer the balances of temporary accounts to a permanent owner’s equity account, Owner’s Capital. (p. 159).
Correcting entries Entries to correct errors made in recording transactions. (p. 167).
Current assets Assets that a company expects to convert to cash or use up within one year. (p. 170).
Current liabilities Obligations that a company expects to pay within the coming year or its operating cycle, whichever is longer. (p. 172).
Income Summary A temporary account used in closing revenue and expense accounts. (p. 159).
Intangible assets Noncurrent assets that do not have physical substance. (p. 171).
Liquidity The ability of a company to pay obligations expected to be due within the next year. (p. 173).
Long-term investments Generally, (1) investments in stocks and bonds of other companies that companies normally hold for many years, and (2) long-term assets, such as land and buildings, not currently being used in operations. (p. 171).
Long-term liabilities Obligations that a company expects to pay after one year. (p. 173).
Operating cycle The average time that it takes to pur-chase inventory, sell it on account, and then collect cash from customers. (p. 170).
Permanent (real) accounts Accounts that relate to one or more future accounting periods. Consist of all bal-ance sheet accounts. Balances are carried forward to the next accounting period. (p. 159).
Post-closing trial balance A list of permanent accounts and their balances after a company has journalized and posted closing entries. (p. 163).
Property, plant, and equipment Assets with relatively long useful lives and currently being used in opera-tions. (p. 171).
Reversing entry An entry, made at the beginning of the next accounting period that is the exact opposite of the adjusting entry made in the previous period. (p. 166).
Stockholders’ equity The ownership claim of share-holders on total assets. It is to a corporation what owner’s equity is to a proprietorship. (p. 174).
Temporary (nominal) accounts Accounts that relate only to a given accounting period. Consist of all income statement accounts and owner’s drawings account. All temporary accounts are closed at end of the accounting period. (p. 158).
Worksheet A multiple-column form that may be used in making adjusting entries and in preparing fi nancial statements. (p. 150).
GLOSSARY REVIEW
Review and Practice 177

1. Which of the following statements is incorrect con-cerning the worksheet?(a) The worksheet is essentially a working tool of the
accountant.(b) The worksheet is distributed to management and
other interested parties.(c) The worksheet cannot be used as a basis for post-
ing to ledger accounts.(d) Financial statements can be prepared directly
from the worksheet before journalizing and post-ing the adjusting entries.
2. In a worksheet, net income is entered in the following columns:(a) income statement (Dr) and balance sheet (Dr).(b) income statement (Cr) and balance sheet (Dr).(c) income statement (Dr) and balance sheet (Cr).(d) income statement (Cr) and balance sheet (Cr).
3. In the unadjusted trial balance of its worksheet for the year ended December 31, 2017, Knox Company reported Equipment of $120,000. The year-end adjust-ing entries require an adjustment of $15,000 for depre-ciation expense for the equipment. After the adjusted trial balance is completed, what amount should be shown in the fi nancial statement columns?(a) A debit of $105,000 for Equipment in the balance
sheet column.(b) A credit of $15,000 for Depreciation Expense—
Equipment in the income statement column.(c) A debit of $120,000 for Equipment in the balance
sheet column.(d) A debit of $15,000 for Accumulated Depreciation—
Equipment in the balance sheet column. 4. An account that will have a zero balance after closing
entries have been journalized and posted is:(a) Service Revenue.(b) Supplies.(c) Prepaid Insurance.(d) Accumulated Depreciation—Equipment.
5. When a net loss has occurred, Income Summary is:(a) debited and Owner’s Capital is credited.(b) credited and Owner’s Capital is debited.(c) debited and Owner’s Drawings is credited.(d) credited and Owner’s Drawings is debited.
6. The closing process involves separate entries to close (1) expenses, (2) drawings, (3) revenues, and (4) income summary. The correct sequencing of the entries is:(a) (4), (3), (2), (1). (c) (3), (1), (4), (2).(b) (1), (2), (3), (4). (d) (3), (2), (1), (4).
7. Which types of accounts will appear in the post-closing trial balance?(a) Permanent (real) accounts.(b) Temporary (nominal) accounts.(c) Accounts shown in the income statement columns
of a worksheet.(d) None of these answer choices is correct.
8. All of the following are required steps in the account-ing cycle except:(a) journalizing and posting closing entries.(b) preparing fi nancial statements.
(LLOOO 11))
(LO 1)
(LO 1)
(LO 2)
(LO 2)
(LO 2)
(LO 2)
(LO 3)
(c) journalizing the transactions.(d) preparing a worksheet.
9. The proper order of the following steps in the account-ing cycle is:(a) prepare unadjusted trial balance, journalize
transactions, post to ledger accounts, journalize and post adjusting entries.
(b) journalize transactions, prepare unadjusted trial balance, post to ledger accounts, journalize and post adjusting entries.
(c) journalize transactions, post to ledger accounts, prepare unadjusted trial balance, journalize and post adjusting entries.
(d) prepare unadjusted trial balance, journalize and post adjusting entries, journalize transactions, post to ledger accounts.
10. When Ramirez Company purchased supplies worth $500, it incorrectly recorded a credit to Supplies for $5,000 and a debit to Cash for $5,000. Before correct-ing this error:(a) Cash is overstated and Supplies is overstated.(b) Cash is understated and Supplies is understated.(c) Cash is understated and Supplies is overstated.(d) Cash is overstated and Supplies is understated.
11. Cash of $100 received at the time the service was per-formed was journalized and posted as a debit to Cash $100 and a credit to Accounts Receivable $100. Assuming the incorrect entry is not reversed, the correcting entry is:(a) debit Service Revenue $100 and credit Accounts
Receivable $100.(b) debit Accounts Receivable $100 and credit Service
Revenue $100.(c) debit Cash $100 and credit Service Revenue $100.(d) debit Accounts Receivable $100 and credit Cash
$100.12. The correct order of presentation in a classifi ed bal-
ance sheet for the following current assets is:(a) accounts receivable, cash, prepaid insurance,
inventory.(b) cash, inventory, accounts receivable, prepaid
insurance.(c) cash, accounts receivable, inventory, prepaid
insurance.(d) inventory, cash, accounts receivable, prepaid
insurance.13. A company has purchased a tract of land. It expects to
build a production plant on the land in approximately 5 years. During the 5 years before construction, the land will be idle. The land should be reported as:(a) property, plant, and equipment.(b) land expense.(c) a long-term investment.(d) an intangible asset.
14. In a classifi ed balance sheet, assets are usually classi-fi ed using the following categories:(a) current assets; long-term assets; property, plant,
and equipment; and intangible assets.(b) current assets; long-term investments; property,
plant, and equipment; and tangible assets.
(LO 3)
(LO 3)
(LO 3)
(LO 4)
(LO 4)
(LO 4)
PRACTICE MULTIPLE-CHOICE QUESTIONS
178 4 Completing the Accounting Cycle

Solutions
1. (b) The worksheet is a working tool of the accountant; it is not distributed to management and other interested parties. The other choices are all true statements.
2. (c) Net income is entered in the Dr column of the income statement and the Cr column of the balance sheet. The other choices are incorrect because net income is entered in the (a) Cr (not Dr) column of the balance sheet, (b) Dr (not Cr) column of the income statement and in the Cr (not Dr) column of the balance sheet, and (d) Dr (not Cr) column of the income statement.
3. (c) A debit of $120,000 for Equipment would appear in the balance sheet column. The other choices are incorrect because (a) Equipment, less accumulated depreciation of $15,000, would total $105,000 under assets on the balance sheet, not on the work-sheet; (b) a debit, not credit, for Depreciation Expense would appear in the income statement column; and (d) a credit, not debit, of $15,000 for Accumulated Depreciation—Equipment would appear in the balance sheet column.
4. (a) The Service Revenue account will have a zero balance after closing entries have been journalized and posted because it is a temporary account. The other choices are incorrect because (b) Supplies, (c) Prepaid Insurance, and (d) Accumulation Depreciation—Equipment are all permanent accounts and therefore not closed in the closing process.
5. (b) The effect of a net loss is a credit to Income Summary and a debit to Owner’s Capital. The other choices are incorrect because (a) Income Summary is credited, not debited, and Owner’s Capital is debited, not credited; (c) Income Summary is credited, not debited, and Owner’s Drawings is not affected; and (d) Owner’s Capital, not Owner’s Drawings, is debited.
6. (c) The correct order is (3) revenues, (1) expenses, (4) income summary, and (2) drawings. Therefore, choices (a), (b), and (d) are incorrect.
7. (a) Permanent accounts appear in the post-closing trial balance. The other choices are incorrect because (b) temporary accounts and (c) income statement accounts are closed to a zero balance and are therefore not included in the post-closing trial balance. Choice (d) is wrong as there is only one correct answer for this question.
8. (d) Preparing a worksheet is not a required step in the accounting cycle. The other choices are all required steps in the account-ing cycle.
9. (c) The proper order of the steps in the accounting cycle is (1) journalize transactions, (2) post to ledger accounts, (3) prepare unadjusted trial balance, and (4) journalize and post adjusting entries. Therefore, choices (a), (b), and (d) are incorrect.
10. (d) This entry causes Cash to be overstated and Supplies to be understated. Supplies should have been debited (increasing supplies) and Cash should have been credited (decreasing cash). The other choices are incorrect because (a) Supplies is under-stated, not overstated; (b) Cash is overstated, not understated; and (c) Cash is overstated, not understated, and Supplies is under-stated, not overstated.
11. (b) The correcting entry is to debit Accounts Receivable $100 and credit Service Revenue $100. The other choices are incorrect because (a) Service Revenue should be credited, not debited, and Accounts Receivable should be debited, not credited; (c) Service Revenue should be credited for $100, and Cash should not be included in the correcting entry as it was recorded properly; and (d) Accounts Receivable should be debited for $100 and Cash should not be included in the correcting entry as it was recorded properly.
12. (c) Companies list current assets on balance sheet in the order of liquidity: cash, accounts receivable, inventory, and prepaid insurance. Therefore, choices (a), (b), and (d) are incorrect.
13. (c) Long-term investments include long-term assets such as land that a company is not currently using in its operating activi-ties. The other choices are incorrect because (a) land would be reported as property, plant, and equipment only if it is being cur-rently used in the business; (b) land is an asset, not an expense; and (d) land has physical substance and thus is a tangible property.
14. (d) These are the categories usually used in a classifi ed balance sheet. The other choices are incorrect because the categories (a) “long-term assets” and (b) and (c) “tangible assets” are generally not used.
15. (a) Current assets are listed in order of their liquidity, not (b) by importance, (c) by longevity, or (d) alphabetically.
*16. (c) The use of reversing entries simplifi es the recording of the fi rst payroll following the end of the year by eliminating the need to make an entry to the Salaries and Wages Payable account. The other choices are incorrect because (a) Salaries and Wages Pay-able is not part of the payroll entry on January 8, and the debit to Salaries and Wages Expense should be for $3,400, not $2,000; and (b) and (d) the Salaries and Wages Expense account, not the Salaries and Wages Payable account, should be debited.
(c) current assets; long-term investments; tangible assets; and intangible assets.
(d) current assets; long-term investments; property, plant, and equipment; and intangible assets.
15. Current assets are listed:(a) by expected conversion to cash.(b) by importance.(c) by longevity.(d) alphabetically.
16. On December 31, Kevin Hartman Company correctly made an adjusting entry to recognize $2,000 of
(LO 4)
*(LO 5)
accrued salaries payable. On January 8 of the next year, total salaries of $3,400 were paid. Assuming the correct reversing entry was made on January 1, the entry on January 8 will result in a credit to Cash $3,400 and the following debit(s):(a) Salaries and Wages Payable $1,400 and Salaries
and Wages Expense $2,000.(b) Salaries and Wages Payable $2,000 and Salaries
and Wages Expense $1,400.(c) Salaries and Wages Expense $3,400.(d) Salaries and Wages Payable $3,400.
Practice Multiple-Choice Questions 179

180 4 Completing the Accounting Cycle
1. Hercules Company ended its fi scal year on August 31, 2017. The company’s adjusted trial balance as of the end of its fi scal year is as shown below.
PRACTICE EXERCISES
Journalize and post closing entries, and prepare a post-closing trial balance.
(LO 2)
Instructions(a) Prepare the closing entries using page J15 in a general journal.
(b) Post to Owner’s Capital and No. 350 Income Summary accounts. (Use the three-column form.)
(c) Prepare a post-closing trial balance at August 31, 2017.
HERCULES COMPANYAdjusted Trial Balance
August 31, 2017
No. Account Titles Debit Credit
101 Cash $10,900112 Accounts Receivable 6,200157 Equipment 10,600167 Accumulated Depr.—Equip. $ 5,400201 Accounts Payable 2,800208 Unearned Rent Revenue 1,200301 Owner’s Capital 31,700306 Owner’s Drawings 12,000404 Service Revenue 42,400429 Rent Revenue 6,100711 Depreciation Expense 2,700720 Salaries and Wages Expense 37,100732 Utilities Expense 10,100
$89,600 $89,600
Solution
(b) Owner’s Capital No. 301
Date Explanation Ref. Debit Credit Balance
Aug. 31 Balance 31,700 31 Close net loss J15 1,400 30,300 31 Close drawings J15 12,000 18,300
Income Summary No. 350
Date Explanation Ref. Debit Credit Balance
Aug. 31 Close revenue J15 48,500 48,500 31 Close expenses J15 49,000 (1,400) 31 Close net loss J15 1,400 0
GENERAL JOURNAL J15
Date Account Titles Ref. Debit Credit
Aug. 31 Service Revenue 404 42,400 Rent Revenue 429 6,100 Income Summary 350 48,500 (To close revenue accounts)
31 Income Summary 350 49,900 Salaries and Wages Expense 720 37,100 Utilities Expense 732 10,100 Depreciation Expense 711 2,700 (To close expense accounts)
31 Owner’s Capital 301 1,400 Income Summary 350 1,400 (To close net loss to capital)
31 Owner’s Capital 301 12,000 Owner’s Drawings 306 12,000 (To close drawings to capital)
1. (a)

2. The adjusted trial balance for Hercules Company is presented in Practice Exercise 1.
Instructions(a) Prepare an income statement and an owner’s equity statement for the year ended
August 31, 2017. Hercules did not make any capital investments during the year.
(b) Prepare a classifi ed balance sheet at August 31, 2017.
HERCULES COMPANYPost-Closing Trial Balance
August 31, 2017
Debit Credit
Cash $10,900Accounts Receivable 6,200Equipment 10,600Accumulated Depreciation—Equipment $ 5,400Accounts Payable 2,800Unearned Rent Revenue 1,200Owner’s Capital 18,300
$27,700 $27,700
(c)
Prepare fi nancial statements.
(LO 4)
Solution
HERCULES COMPANYIncome Statement
For the Year Ended August 31, 2017
HERCULES COMPANYOwner’s Equity Statement
For the Year Ended August 31, 2017
Revenues Service revenue $42,400 Rent revenue 6,100 Total revenues $48,500Expenses Salaries and wages expense 37,100 Utilities expense 10,100 Depreciation expense 2,700
Total expenses 49,900
Net loss $ (1,400)
Owner’s capital, September 1, 2016 $31,700Less: Net loss $ 1,400 Owner’s drawings 12,000 13,400
Owner’s capital, August 31, 2017 $18,300
2. (a)
Practice Exercises 181

182 4 Completing the Accounting Cycle
HERCULES COMPANYBalance Sheet
August 31, 2017
Assets
Current assets Cash $10,900 Accounts receivable 6,200 Total current assets $17,100Property, plant, and equipment Equipment 10,600 Less: Accumulated depreciation—equip. 5,400 5,200
Total assets $22,300
Liabilities and Owner’s Equity
Current liabilities Accounts payable $2,800 Unearned rent revenue 1,200 Total current liabilities $ 4,000Owner’s equity Owner’s capital 18,300
Total liabilities and owner’s equity $22,300
(b)
At the end of its fi rst month of operations, Pampered Pet Service has the following unad-justed trial balance.
PRACTICE PROBLEM
PAMPERED PET SERVICEAugust 31, 2017
Trial Balance
Debit Credit
Cash $ 5,400Accounts Receivable 2,800Supplies 1,300Prepaid Insurance 2,400Equipment 60,000Notes Payable $40,000Accounts Payable 2,400Owner’s Capital 30,000Owner’s Drawings 1,000Service Revenue 4,900Salaries and Wages Expense 3,200Utilities Expense 800Advertising Expense 400
$77,300 $77,300
Other data:
1. Insurance expires at the rate of $200 per month.
2. $1,000 of supplies are on hand at August 31.
3. Monthly depreciation on the equipment is $900.
4. Interest of $500 on the notes payable has accrued during August.
Prepare worksheet and classifi ed balance sheet, and journalize closing entries.
(LO 1, 2, 4)

Instructions(a) Prepare a worksheet.
(b) Prepare a classifi ed balance sheet assuming $35,000 of the notes payable are long-term.
(c) Journalize the closing entries.
(a) PAMPERED PET SERVICEWorksheet for the Month Ended August 31, 2017
Trial Adjusted Trial Income Balance Balance Adjustments Balance Statement Sheet
Account Titles Dr. Cr. Dr. Cr. Dr. Cr. Dr. Cr. Dr. Cr.
Cash 5,400 5,400 5,400Accounts Receivable 2,800 2,800 2,800Supplies 1,300 (b) 300 1,000 1,000Prepaid Insurance 2,400 (a) 200 2,200 2,200Equipment 60,000 60,000 60,000Notes Payable 40,000 40,000 40,000Accounts Payable 2,400 2,400 2,400Owner’s Capital 30,000 30,000 30,000Owner’s Drawings 1,000 1,000 1,000Service Revenue 4,900 4,900 4,900Salaries and Wages Expense 3,200 3,200 3,200Utilities Expense 800 800 800Advertising Expense 400 400 400
Totals 77,300 77,300
Insurance Expense (a) 200 200 200Supplies Expense (b) 300 300 300Depreciation Expense (c) 900 900 900Accumulated Depreciation— Equipment (c) 900 900 900Interest Expense (d) 500 500 500Interest Payable (d) 500 500 500
Totals 1,900 1,900 78,700 78,700 6,300 4,900 72,400 73,800
Net Loss 1,400 1,400
Totals 6,300 6,300 73,800 73,800
Explanation: (a) insurance expired, (b) supplies used, (c) depreciation expensed, and (d) interest accrued.
(a)
Solution
Practice Problem 183

(c)Aug. 31 Service Revenue 4,900 Income Summary 4,900 (To close revenue account)
31 Income Summary 6,300 Salaries and Wages Expense 3,200 Depreciation Expense 900 Utilities Expense 800 Interest Expense 500 Advertising Expense 400 Supplies Expense 300 Insurance Expense 200 (To close expense accounts)
31 Owner’s Capital 1,400 Income Summary 1,400 (To close net loss to capital)
31 Owner’s Capital 1,000 Owner’s Drawings 1,000 (To close drawings to capital)
(b)
PAMPERED PET SERVICEBalance Sheet
August 31, 2017
Assets
Current assets Cash $ 5,400 Accounts receivable 2,800 Supplies 1,000 Prepaid insurance 2,200
Total current assets $11,400Property, plant, and equipment Equipment 60,000 Less: Accumulated depreciation—equipment 900 59,100
Total assets $70,500
Liabilities and Owner’s Equity
Current liabilities Notes payable $ 5,000 Accounts payable 2,400 Interest payable 500
Total current liabilities $ 7,900Long-term liabilities Notes payable 35,000
Total liabilities 42,900Owner’s equity Owner’s capital 27,600*
Total liabilities and owner’s equity $70,500
*Owner’s capital $30,000 less drawings $1,000 and net loss $1,400.
184 4 Completing the Accounting Cycle

Brief Exercises 185
Brief Exercises, Exercises, DO IT! Exercises, and Problems and many additional resources are available for practice in WileyPLUS
QUESTIONS
1. “A worksheet is a permanent accounting record and its use is required in the accounting cycle.” Do you agree? Explain.
2. Explain the purpose of the worksheet. 3. What is the relationship, if any, between the amount
shown in the adjusted trial balance column for an account and that account’s ledger balance?
4. If a company’s revenues are $125,000 and its expenses are $113,000, in which fi nancial statement columns of the worksheet will the net income of $12,000 appear? When expenses exceed revenues, in which columns will the difference appear?
5. Why is it necessary to prepare formal fi nancial state-ments if all of the data are in the statement columns of the worksheet?
6. Identify the account(s) debited and credited in each of the four closing entries, assuming the company has net income for the year.
7. Describe the nature of the Income Summary account and identify the types of summary data that may be posted to this account.
8. What are the content and purpose of a post-closing trial balance?
9. Which of the following accounts would not appear in the post-closing trial balance? Interest Payable, Equipment, Depreciation Expense, Owner’s Draw-ings, Unearned Service Revenue, Accumulated Depreciation—Equipment, and Service Revenue.
10. Distinguish between a reversing entry and an adjust-ing entry. Are reversing entries required?
11. Indicate, in the sequence in which they are made, the three required steps in the accounting cycle that involve journalizing.
12. Identify, in the sequence in which they are prepared, the three trial balances that are often used to report fi nancial information about a company.
13. How do correcting entries differ from adjusting entries?
14. What standard classifi cations are used in preparing a classifi ed balance sheet?
15. What is meant by the term “operating cycle?” 16. Defi ne current assets. What basis is used for arrang-
ing individual items within the current assets section? 17. Distinguish between long-term investments and prop-
erty, plant, and equipment. 18. (a) What is the term used to describe the owner’s
equity section of a corporation? (b) Identify the two owners’ equity accounts in a corporation and indicate the purpose of each.
19. Using Apple’s annual report, determine its current liabilities at September 29, 2012, and September 28, 2013. Were current liabilities higher or lower than current assets in these two years?
20. Cigale Company prepares reversing entries. If the adjusting entry for interest payable is reversed, what type of an account balance, if any, will there be in Interest Payable and Interest Expense after the revers-ing entry is posted?
21. At December 31, accrued salaries payable totaled $3,500. On January 10, total salaries of $8,000 are paid. (a) Assume that reversing entries are made at January 1. Give the January 10 entry, and indicate the Salaries and Wages Expense account balance after the entry is posted. (b) Repeat part (a) assuming reversing entries are not made.
*
*
NOTE: All asterisked Questions, Exercises, and Problems relate to material in the appendix to the chapter.
BRIEF EXERCISES
BE4-1 The steps in using a worksheet are presented in random order below. List the steps in the proper order by placing numbers 1–5 in the blank spaces.
(a) _____ Prepare a trial balance on the worksheet.(b) _____ Enter adjusted balances.(c) _____ Extend adjusted balances to appropriate statement columns.(d) _____ Total the statement columns, compute net income (loss), and complete the
worksheet.(e) _____ Enter adjustment data.
BE4-2 The ledger of Lentz Company includes the following unadjusted balances: Prepaid Insurance $3,000, Service Revenue $58,000, and Salaries and Wages Expense $25,000. Adjusting entries are required for (a) expired insurance $1,800; (b) services performed $1,100, but unbilled and uncollected; and (c) accrued salaries payable $800. Enter the unadjusted balances and adjustments into a worksheet and complete the worksheet for all accounts. (Note: You will need to add the following accounts: Accounts Receivable, Sala-ries and Wages Payable, and Insurance Expense.)
List the steps in preparing a worksheet.
(LO 1)
Prepare partial worksheet.
(LO 1)

186 4 Completing the Accounting Cycle
BE4-3 The following selected accounts appear in the adjusted trial balance columns of the worksheet for Ashram Company: Accumulated Depreciation, Depreciation Expense, Owner’s Capital, Owner’s Drawings, Service Revenue, Supplies, and Accounts Payable. Indicate the fi nancial statement column (income statement Dr., balance sheet Cr., etc.) to which each balance should be extended.
BE4-4 The ledger of Duston Company contains the following balances: Owner’s Capital $30,000, Owner’s Drawings $2,000, Service Revenue $50,000, Salaries and Wages Expense $29,000, and Supplies Expense $7,000. Prepare the closing entries at December 31.
BE4-5 Using the data in BE4-4, enter the balances in T-accounts, post the closing entries, and underline and balance the accounts.
BE4-6 The income statement for Arbor Vitae Golf Club for the month ending July 31 shows Service Revenue $16,400, Salaries and Wages Expense $8,400, Maintenance and Repairs Expense $2,500, and Net Income $5,700. Prepare the entries to close the revenue and expense accounts. Post the entries to the revenue and expense accounts, and complete the closing process for these accounts using the three-column form of account.
BE4-7 Using the data in BE4-3, identify the accounts that would be included in a post-closing trial balance.
BE4-8 The steps in the accounting cycle are listed in random order below. List the steps in proper sequence, assuming no worksheet is prepared, by placing numbers 1–9 in the blank spaces.
(a) ________ Prepare a trial balance.(b) ________ Journalize the transactions.(c) ________ Journalize and post closing entries.(d) ________ Prepare fi nancial statements.(e) ________ Journalize and post adjusting entries.(f) ________ Post to ledger accounts.(g) ________ Prepare a post-closing trial balance.(h) ________ Prepare an adjusted trial balance.(i) ________ Analyze business transactions.
BE4-9 At Raymond Company, the following errors were discovered after the transactions had been journalized and posted. Prepare the correcting entries.
1. A collection on account from a customer for $870 was recorded as a debit to Cash $870 and a credit to Service Revenue $870.
2. The purchase of store supplies on account for $1,510 was recorded as a debit to Sup-plies $1,150 and a credit to Accounts Payable $1,150.
BE4-10 The balance sheet debit column of the worksheet for Mrotet Company includes the following accounts: Accounts Receivable $12,500, Prepaid Insurance $3,600, Cash $4,100, Supplies $5,200, and Debt Investments (short-term) $6,700. Prepare the current assets section of the balance sheet, listing the accounts in proper sequence.
BE4-11 The following are the major balance sheet classifi cations:
Current assets (CA) Current liabilities (CL)Long-term investments (LTI) Long-term liabilities (LTL)Property, plant, and equipment (PPE) Owner’s equity (OE)Intangible assets (IA)
Match each of the following accounts to its proper balance sheet classifi cation.
________ Accounts payable ________ Income taxes payable________ Accounts receivable ________ Debt investments (long-term)________ Accumulated depreciation—buildings ________ Land________ Buildings ________ Inventory________ Cash ________ Patents________ Copyrights ________ Supplies
Identify worksheet columns for selected accounts.
(LO 1)
Prepare closing entries from ledger balances.
(LO 2)
Post closing entries; underline and balance T-accounts.
(LO 2)Journalize and post closing entries using the three-column form of account.
(LO 2)
Identify post-closing trial balance accounts.
(LO 2)List the required steps in the accounting cycle in sequence.
(LO 3)
Prepare correcting entries.
(LO 3)
Prepare the current assets section of a balance sheet.
(LO 4)
Classify accounts on balance sheet.
(LO 4)

Exercises 187
BE4-12 At October 31, Zanskas Company made an accrued expense adjusting entry of $2,100 for salaries. Prepare the reversing entry on November 1, and indicate the balances in Salaries and Wages Payable and Salaries and Wages Expense after posting the reversing entry.
* Prepare reversing entries.
(LO 5)
Jordan Carr is preparing a worksheet. Explain to Jordan how he should extend the following adjusted trial balance accounts to the fi nancial statement columns of the worksheet.
Service Revenue Accounts ReceivableNotes Payable Accumulated DepreciationOwner’s Capital Utilities Expense
The worksheet for Ajeeb Company shows the following in the fi nancial state-ment columns.
Owner’s drawings $22,000Owner’s capital 70,000Net income 41,000
Prepare the closing entries at December 31 that affect owner’s capital.
Hanson Company has an inexperienced accountant. During the fi rst month on the job, the accountant made the following errors in journalizing transactions. All entries were posted as made.
1. The purchase of supplies for $650 cash was debited to Equipment $210 and credited to Cash $210.
2. A $500 withdrawal of cash for B. Hanson’s personal use was debited to Salaries and Wages Expense $900 and credited to Cash $900.
3. A payment on account of $820 to a creditor was debited to Accounts Payable $280 and credited to Cash $280.
Prepare the correcting entries.
The following accounts were taken from the fi nancial statements of Giles Company.________ Interest revenue ________ Owner’s capital________ Utilities payable ________ Accumulated depreciation—equipment________ Accounts payable ________ Equipment________ Supplies ________ Salaries and wages expense________ Bonds payable ________ Debt investments (long-term)________ Goodwill ________ Unearned rent revenue
Match each of the accounts to its proper balance sheet classifi cation, as shown below. If the item would not appear on a balance sheet, use “NA.”
Current assets (CA) Current liabilities (CL)Long-term investments (LTI) Long-term liabilities (LTL)Property, plant, and equipment (PPE) Owner’s equity (OE)Intangible assets (IA)
Prepare closing entries.
(LO 2)
Prepare correcting entries.
(LO 3)
DO IT! Exercises
DO IT! 4-1
DO IT! 4-2
DO IT! 4-3
DO IT! 4-4
Prepare a worksheet.
(LO 1)
Match accounts to balance sheet classifi cations.
(LO 4)
EXERCISES
E4-1 The trial balance columns of the worksheet for Dixon Company at June 30, 2017, are as follows.
Complete the worksheet.
(LO 1)

188 4 Completing the Accounting Cycle
Other data:
1. A physical count reveals $500 of supplies on hand.2. $100 of the unearned revenue is still unearned at month-end.3. Accrued salaries are $210.
InstructionsEnter the trial balance on a worksheet and complete the worksheet.
E4-2 The adjusted trial balance columns of the worksheet for Savaglia Company are as follows.
Complete the worksheet.
(LO 1)
DIXON COMPANYWorksheet
For the Month Ended June 30, 2017
Trial Balance
Account Titles Dr. Cr.
Cash 2,320Accounts Receivable 2,440Supplies 1,880Accounts Payable 1,120Unearned Service Revenue 240Owner’s Capital 3,600Service Revenue 2,400Salaries and Wages Expense 560Miscellaneous Expense 160
7,360 7,360
SAVAGLIA COMPANYWorksheet (partial)
For the Month Ended April 30, 2017
Adjusted Income Trial Balance Statement Balance Sheet
Account Titles Dr. Cr. Dr. Cr. Dr. Cr.
Cash 10,000Accounts Receivable 7,840Prepaid Rent 2,280Equipment 23,050Accumulated Depreciation—Equip. 4,900Notes Payable 5,700Accounts Payable 4,920Owner’s Capital 27,960Owner’s Drawings 3,650Service Revenue 15,590Salaries and Wages Expense 10,840Rent Expense 760Depreciation Expense 650Interest Expense 57Interest Payable 57
Totals 59,127 59,127
InstructionsComplete the worksheet.
E4-3 Worksheet data for Savaglia Company are presented in E4-2. The owner did not make any additional investments in the business in April.
Prepare fi nancial statements from worksheet.
(LO 1, 4)

Exercises 189
InstructionsPrepare an income statement, an owner’s equity statement, and a classifi ed balance sheet.
E4-4 Worksheet data for Savaglia Company are presented in E4-2.
Instructions(a) Journalize the closing entries at April 30.(b) Post the closing entries to Income Summary and Owner’s Capital. Use T-accounts.(c) Prepare a post-closing trial balance at April 30.
E4-5 The adjustments columns of the worksheet for Becker Company are shown below.
Journalize and post closing entries and prepare a post-closing trial balance.
(LO 2)
Prepare adjusting entries from a worksheet, and extend balances to worksheet columns.
(LO 1)
Instructions(a) Prepare the adjusting entries.(b) Assuming the adjusted trial balance amount for each account is normal, indicate the
fi nancial statement column to which each balance should be extended.
E4-6 Selected worksheet data for Rosa Company are presented below. Derive adjusting entries from worksheet data.
(LO 1)
Adjustments
Account Titles Debit Credit
Accounts Receivable 1,100Prepaid Insurance 300Accumulated Depreciation—Equipment 900Salaries and Wages Payable 500Service Revenue 1,100Salaries and Wages Expense 500 Insurance Expense 300Depreciation Expense 900
2,800 2,800
Instructions(a) Fill in the missing amounts.(b) Prepare the adjusting entries that were made.
E4-7 Victoria Lee Company had the following adjusted trial balance. Prepare closing entries, and prepare a post-closing trial balance.
(LO 2)
Adjusted Account Titles Trial Balance Trial Balance
Dr. Cr. Dr. Cr.
Accounts Receivable ? 34,000Prepaid Insurance 26,000 20,000Supplies 7,000 ?Accumulated Depreciation—Equipment 12,000 ?Salaries and Wages Payable ? 5,600Service Revenue 88,000 97,000Insurance Expense ?Depreciation Expense 10,000Supplies Expense 4,500Salaries and Wages Expense ? 49,000

190 4 Completing the Accounting Cycle
Instructions(a) Prepare closing entries at June 30, 2017.(b) Prepare a post-closing trial balance.
E4-8 Okabe Company ended its fi scal year on July 31, 2017. The company’s adjusted trial balance as of the end of its fi scal year is shown below.
Journalize and post closing entries, and prepare a post-closing trial balance.
(LO 2)
VICTORIA LEE COMPANYAdjusted Trial Balance
For the Month Ended June 30, 2017
Adjusted Trial Balance
Account Titles Debit Credit
Cash $ 3,712Accounts Receivable 3,904Supplies 480Accounts Payable $ 1,382Unearned Service Revenue 160Owner’s Capital 5,760Owner’s Drawings 550Service Revenue 4,300Salaries and Wages Expense 1,260Miscellaneous Expense 256Supplies Expense 1,900Salaries and Wages Payable 460
$12,062 $12,062
OKABE COMPANYAdjusted Trial Balance
July 31, 2017
No. Account Titles Debit Credit
101 Cash $ 9,840112 Accounts Receivable 8,780157 Equipment 15,900158 Accumulated Depreciation—Equip. $ 7,400201 Accounts Payable 4,220208 Unearned Rent Revenue 1,800301 Owner’s Capital 45,200306 Owner’s Drawings 16,000400 Service Revenue 64,000429 Rent Revenue 6,500711 Depreciation Expense 8,000726 Salaries and Wages Expense 55,700732 Utilities Expense 14,900
$129,120 $129,120
Instructions(a) Prepare the closing entries using page J15.(b) Post to Owner’s Capital and No. 350 Income Summary accounts. (Use the three-column
form.)(c) Prepare a post-closing trial balance at July 31.
E4-9 The adjusted trial balance for Okabe Company is presented in E4-8.
Instructions(a) Prepare an income statement and an owner’s equity statement for the year. Okabe did
not make any capital investments during the year.(b) Prepare a classifi ed balance sheet at July 31.
Prepare fi nancial statements.
(LO 4)

Exercises 191
E4-10 Renee Davis has prepared the following list of statements about the accounting cycle.
1. “Journalize the transactions” is the fi rst step in the accounting cycle.2. Reversing entries are a required step in the accounting cycle.3. Correcting entries do not have to be part of the accounting cycle.4. If a worksheet is prepared, some steps of the accounting cycle are incorporated into the
worksheet.5. The accounting cycle begins with the analysis of business transactions and ends with
the preparation of a post-closing trial balance.6. All steps of the accounting cycle occur daily during the accounting period.7. The step of “post to the ledger accounts” occurs before the step of “journalize the trans-
actions.”8. Closing entries must be prepared before fi nancial statements can be prepared.
InstructionsIdentify each statement as true or false. If false, indicate how to correct the statement.
E4-11 Selected accounts for Tamora’s Salon are presented below. All June 30 postings are from closing entries.
Prepare closing entries.
(LO 2)
Answer questions related to the accounting cycle.
(LO 3)
Instructions(a) Prepare the closing entries that were made.(b) Post the closing entries to Income Summary.
E4-12 Noah Bahr Company discovered the following errors made in January 2017.
1. A payment of Salaries and Wages Expense of $700 was debited to Equipment and cred-ited to Cash, both for $700.
2. A collection of $1,000 from a client on account was debited to Cash $100 and credited to Service Revenue $100.
3. The purchase of equipment on account for $760 was debited to Equipment $670 and credited to Accounts Payable $670.
Instructions(a) Correct the errors by reversing the incorrect entry and preparing the correct entry.(b) Correct the errors without reversing the incorrect entry.
E4-13 Patel Company has an inexperienced accountant. During the fi rst 2 weeks on the job, the accountant made the following errors in journalizing transactions. All entries were posted as made.
1. A payment on account of $750 to a creditor was debited to Accounts Payable $570 and credited to Cash $570.
2. The purchase of supplies on account for $560 was debited to Equipment $56 and cred-ited to Accounts Payable $56.
3. A $500 withdrawal of cash for N. Patel’s personal use was debited to Salaries and Wages Expense $500 and credited to Cash $500.
InstructionsPrepare the correcting entries.
E4-14 The adjusted trial balance for McCoy Bowling Alley at December 31, 2017, contains the following accounts.
Prepare correcting entries.
(LO 3)
Prepare correcting entries.
(LO 3)
Prepare a classifi ed balance sheet.
(LO 4)
Salaries and Wages Expense
6/10 3,200 6/30 8,8006/28 5,600
Supplies Expense
6/12 600 6/30 1,3006/24 700
Service Revenue
6/30 18,100 6/15 9,700 6/24 8,400
Rent Expense
6/1 3,000 6/30 3,000
Owner’s Capital
6/30 2,100 6/1 12,000 6/30 5,000
Bal. 14,900
Owner’s Drawings
6/13 1,000 6/30 2,1006/25 1,100

192 4 Completing the Accounting Cycle
Instructions(a) Prepare a classifi ed balance sheet; assume that $20,000 of the note payable will be paid
in 2018.(b) Comment on the liquidity of the company.
E4-15 The following are the major balance sheet classifi cations.
Current assets (CA) Current liabilities (CL)Long-term investments (LTI) Long-term liabilities (LTL)Property, plant, and equipment (PPE) Owner’s equity (OE)Intangible assets (IA)
InstructionsClassify each of the following accounts taken from Faust Company’s balance sheet.
________ Accounts payable ________ Accumulated depreciation—equipment________ Accounts receivable ________ Buildings________ Cash ________ Land (in use)________ Owner’s capital ________ Notes payable (due in 2 years)________ Patents ________ Supplies________ Salaries and wages payable ________ Equipment________ Inventory ________ Prepaid expenses________ Stock investments
(to be sold in 7 months)
E4-16 The following items were taken from the fi nancial statements of J. Pineda Company. (All amounts are in thousands.)
Long-term debt $ 1,000 Accumulated depreciation—equipment $ 5,655Prepaid insurance 880 Accounts payable 1,444Equipment 11,500 Notes payable (due after 2018) 400Stock investments (long-term) 264 Owner’s capital 12,955Debt investments (short-term) 3,690 Accounts receivable 1,696Notes payable (due in 2018) 500 Inventory 1,256Cash 2,668
InstructionsPrepare a classifi ed balance sheet in good form as of December 31, 2017.
E4-17 These fi nancial statement items are for Basten Company at year-end, July 31, 2017.
Salaries and wages payable $ 2,080 Notes payable (long-term) $ 1,800Salaries and wages expense 48,700 Cash 14,200Utilities expense 22,600 Accounts receivable 9,780Equipment 34,400 Accumulated depreciation—equipment 6,000Accounts payable 4,100 Owner’s drawings 3,000Service revenue 63,000 Depreciation expense 4,000Rent revenue 8,500 Owner’s capital (beginning of the year) 51,200
Instructions(a) Prepare an income statement and an owner’s equity statement for the year. The owner
did not make any new investments during the year.(b) Prepare a classifi ed balance sheet at July 31.
Classify accounts on balance sheet.
(LO 4)
Prepare a classifi ed balance sheet.
(LO 4)
Prepare fi nancial statements.
(LO 4)
Debit Credit
Buildings $128,800 Owner’s Capital $115,000Accounts Receivable 14,520 Accumulated Depreciation—Buildings 42,600Prepaid Insurance 4,680 Accounts Payable 12,300Cash 18,040 Notes Payable 97,780Equipment 62,400 Accumulated Depreciation—Equipment 18,720Land 67,000 Interest Payable 3,800Insurance Expense 780 Service Revenue 17,180Depreciation Expense 7,360 $307,380Interest Expense 3,800
$307,380

Problems: Set A 193
E4-18 Lovrek Company pays salaries of $12,000 every Monday for the preceding 5-day week (Monday through Friday). Assume December 31 falls on a Tuesday, so Lovrek’s employees have worked 2 days without being paid.
Instructions(a) Assume the company does not use reversing entries. Prepare the December 31 adjust-
ing entry and the entry on Monday, January 6, when Lovrek pays the payroll.(b) Assume the company does use reversing entries. Prepare the December 31 adjusting
entry, the January 1 reversing entry, and the entry on Monday, January 6, when Lovrek pays the payroll.
E4-19 On December 31, the adjusted trial balance of Shihata Employment Agency shows the following selected data.
Accounts Receivable $24,500 Service Revenue $92,500Interest Expense 7,700 Interest Payable 2,200
Analysis shows that adjusting entries were made to (1) accrue $5,000 of service revenue and (2) accrue $2,200 interest expense.
Instructions(a) Prepare the closing entries for the temporary accounts shown above at December 31.(b) Prepare the reversing entries on January 1.(c) Post the entries in (a) and (b). Underline and balance the accounts. (Use T-accounts.)(d) Prepare the entries to record (1) the collection of the accrued revenue on January 10
and (2) the payment of all interest due ($3,000) on January 15.(e) Post the entries in (d) to the temporary accounts.
*
* Prepare closing and reversing entries.
(LO 2, 5)
Use reversing entries.
(LO 5)
EXERCISES: SET B AND CHALLENGE EXERCISES
Visit the book’s companion website, at www.wiley.com/college/weygandt, and choose the Student Companion site to access Exercises: Set B and Challenge Exercises.
PROBLEMS: SET A
P4-1A The trial balance columns of the worksheet for Warren Roofi ng at March 31, 2017, are as follows.
Prepare a worksheet, fi nancial statements, and adjusting and closing entries.
(LO 1, 2, 4)WARREN ROOFING
WorksheetFor the Month Ended March 31, 2017
Trial Balance
Account Titles Dr. Cr.
Cash 4,500Accounts Receivable 3,200Supplies 2,000Equipment 11,000Accumulated Depreciation—Equipment 1,250Accounts Payable 2,500Unearned Service Revenue 550Owner’s Capital 12,900Owner’s Drawings 1,100Service Revenue 6,300Salaries and Wages Expense 1,300Miscellaneous Expense 400
23,500 23,500

194 4 Completing the Accounting Cycle
Other data:
1. A physical count reveals only $480 of roofi ng supplies on hand.2. Depreciation for March is $250.3. Unearned revenue amounted to $260 at March 31.4. Accrued salaries are $700.
Instructions(a) Enter the trial balance on a worksheet and complete the worksheet.(b) Prepare an income statement and owner’s equity statement for the month of March
and a classifi ed balance sheet at March 31. T. Warren made an additional investment in the business of $10,000 in March.
(c) Journalize the adjusting entries from the adjustments columns of the worksheet.(d) Journalize the closing entries from the fi nancial statement columns of the worksheet.
P4-2A The adjusted trial balance columns of the worksheet for Thao Company, owned by D. Thao, are as follows.
(a) Adjusted trial balance $24,450
(b) Net income $2,420Total assets $17,680
Complete worksheet; prepare fi nancial statements, closing entries, and post-closing trial balance.
(LO 1, 2, 4)THAO COMPANY
WorksheetFor the Year Ended December 31, 2017
Adjusted
Account Trial Balance
No. Account Titles Dr. Cr.
101 Cash 5,300 112 Accounts Receivable 10,800 126 Supplies 1,500 130 Prepaid Insurance 2,000 157 Equipment 27,000 158 Accumulated Depreciation—Equipment 5,600 200 Notes Payable 15,000 201 Accounts Payable 6,100 212 Salaries and Wages Payable 2,400 230 Interest Payable 600 301 Owner’s Capital 13,000 306 Owner’s Drawings 7,000 400 Service Revenue 61,000 610 Advertising Expense 8,400 631 Supplies Expense 4,000 711 Depreciation Expense 5,600 722 Insurance Expense 3,500 726 Salaries and Wages Expense 28,000 905 Interest Expense 600
Totals 103,700 103,700
Instructions(a) Complete the worksheet by extending the balances to the fi nancial statement
columns.(b) Prepare an income statement, owner’s equity statement, and a classifi ed balance sheet.
(Note: $5,000 of the notes payable become due in 2018.) D. Thao did not make any additional investments in the business during the year.
(c) Prepare the closing entries. Use J14 for the journal page.(d) Post the closing entries. Use the three-column form of account. Income Summary is
No. 350.(e) Prepare a post-closing trial balance.
P4-3A The completed fi nancial statement columns of the worksheet for Bray Company are shown as follows.
(a) Net income $10,900
(b) Current assets $19,600Current liabilities $14,100
(e) Post-closing trial balance $46,600
Prepare fi nancial statements, closing entries, and post-closing trial balance.
(LO 1, 2, 4)

Problems: Set A 195
Instructions(a) Prepare an income statement, an owner’s equity statement, and a classifi ed balance sheet.(b) Prepare the closing entries. L. Bray did not make any additional investments during
the year.(c) Post the closing entries and underline and balance the accounts. (Use T-accounts.)
Income Summary is account No. 350.(d) Prepare a post-closing trial balance.
P4-4A Vang Management Services began business on January 1, 2017, with a capital investment of $120,000. The company manages condominiums for owners (Service Reve-nue) and rents space in its own offi ce building (Rent Revenue). The trial balance and adjusted trial balance columns of the worksheet at the end of the fi rst year are as follows.
(a) Ending capital $30,800Total current assets $22,400
(d) Post-closing trial balance $46,400
Complete worksheet; prepare classifi ed balance sheet, entries, and post-closing trial balance.
(LO 1, 2, 4)
BRAY COMPANYWorksheet
For the Year Ended December 31, 2017
Account Income Statement Balance Sheet
No. Account Titles Dr. Cr. Dr. Cr.
101 Cash 8,800 112 Accounts Receivable 10,800 130 Prepaid Insurance 2,800 157 Equipment 24,000 158 Accumulated Depreciation—Equip. 4,200 201 Accounts Payable 9,000 212 Salaries and Wages Payable 2,400 301 Owner’s Capital 19,500 306 Owner’s Drawings 11,000 400 Service Revenue 60,000 622 Maintenance and Repairs Expense 1,700 711 Depreciation Expense 2,800 722 Insurance Expense 1,800 726 Salaries and Wages Expense 30,000 732 Utilities Expense 1,400
Totals 37,700 60,000 57,400 35,100 Net Income 22,300 22,300
60,000 60,000 57,400 57,400
VANG MANAGEMENT SERVICESWorksheet
For the Year Ended December 31, 2017 Adjusted Trial Balance Trial Balance
Account Titles Dr. Cr. Dr. Cr.
Cash 13,800 13,800Accounts Receivable 28,300 28,300Prepaid Insurance 3,600 2,400Land 67,000 67,000Buildings 127,000 127,000Equipment 59,000 59,000Accounts Payable 12,500 12,500Unearned Rent Revenue 6,000 1,500Mortgage Payable 120,000 120,000Owner’s Capital 144,000 144,000Owner’s Drawings 22,000 22,000Service Revenue 90,700 90,700Rent Revenue 29,000 33,500Salaries and Wages Expense 42,000 42,000Advertising Expense 20,500 20,500Utilities Expense 19,000 19,000
Totals 402,200 402,200

196 4 Completing the Accounting Cycle
Instructions(a) Prepare a complete worksheet.(b) Prepare a classifi ed balance sheet. (Note: $30,000 of the mortgage note payable is due
for payment next year.)(c) Journalize the adjusting entries.(d) Journalize the closing entries.(e) Prepare a post-closing trial balance.
P4-5A Anya Clark opened Anya’s Cleaning Service on July 1, 2017. During July, the following transactions were completed.
July 1 Anya invested $20,000 cash in the business. 1 Purchased used truck for $12,000, paying $4,000 cash and the balance on
account. 3 Purchased cleaning supplies for $2,100 on account. 5 Paid $1,800 cash on a 1-year insurance policy effective July 1. 12 Billed customers $4,500 for cleaning services. 18 Paid $1,500 cash on amount owed on truck and $1,400 on amount owed on
cleaning supplies. 20 Paid $2,800 cash for employee salaries. 21 Collected $3,400 cash from customers billed on July 12. 25 Billed customers $6,000 for cleaning services. 31 Paid $350 for the monthly gasoline bill for the truck. 31 Withdraw $5,600 cash for personal use.
The chart of accounts for Anya’s Cleaning Service contains the following accounts: No. 101 Cash, No. 112 Accounts Receivable, No. 126 Supplies, No. 130 Prepaid Insurance, No. 157 Equipment, No. 158 Accumulated Depreciation—Equipment, No. 201 Accounts Pay-able, No. 212 Salaries and Wages Payable, No. 301 Owner’s Capital, No. 306 Owner’s Drawings, No. 350 Income Summary, No. 400 Service Revenue, No. 631 Supplies Expense, No. 633 Gasoline Expense, No. 711 Depreciation Expense, No. 722 Insurance Expense, and No. 726 Salaries and Wages Expense.
Instructions(a) Journalize and post the July transactions. Use page J1 for the journal and the three-
column form of account.(b) Prepare a trial balance at July 31 on a worksheet.(c) Enter the following adjustments on the worksheet and complete the worksheet. (1) Unbilled and uncollected revenue for services performed at July 31 were $2,700. (2) Depreciation on equipment for the month was $500. (3) One-twelfth of the insurance expired. (4) An inventory count shows $600 of cleaning supplies on hand at July 31. (5) Accrued but unpaid employee salaries were $1,000.(d) Prepare the income statement and owner’s equity statement for July and a classifi ed
balance sheet at July 31.(e) Journalize and post adjusting entries. Use page J2 for the journal.(f) Journalize and post closing entries and complete the closing process. Use page J3 for
the journal.(g) Prepare a post-closing trial balance at July 31.
(a) Net income $24,900(b) Total current assets
$44,500
(e) Post-closing trial balance $297,500
Complete all steps in accounting cycle.
(LO 1, 2, 4)
(b) Trial balance $37,700(c) Adjusted trial balance
$41,900
(d) Net income $6,900Total assets $29,500
(g) Post-closing trial balance $30,000
Adjusted Trial Balance Trial Balance
Account Titles Dr. Cr. Dr. Cr.
Insurance Expense 1,200Depreciation Expense 6,600Accumulated Depreciation—Buildings 3,000Accumulated Depreciation—Equipment 3,600Interest Expense 10,000Interest Payable 10,000
Totals 418,800 418,800

Comprehensive Problem: Chapters 2 to 4 197
P4-6A Casey Hartwig, CPA, was retained by Global Cable to prepare fi nancial statements for April 2017. Hartwig accumulated all the ledger balances per Global’s records and found the following.
Analyze errors and prepare correcting entries and trial balance.
(LO 3)
Casey Hartwig reviewed the records and found the following errors.
1. Cash received from a customer on account was recorded as $950 instead of $590.2. A payment of $75 for advertising expense was entered as a debit to Miscellaneous
Expense $75 and a credit to Cash $75.3. The fi rst salary payment this month was for $1,900, which included $700 of salaries pay-
able on March 31. The payment was recorded as a debit to Salaries and Wages Expense $1,900 and a credit to Cash $1,900. (No reversing entries were made on April 1.)
4. The purchase on account of a printer costing $310 was recorded as a debit to Supplies and a credit to Accounts Payable for $310.
5. A cash payment of repair expense on equipment for $96 was recorded as a debit to Equipment $69 and a credit to Cash $69.
Instructions(a) Prepare an analysis of each error showing (1) the incorrect entry, (2) the correct entry,
and (3) the correcting entry. Items 4 and 5 occurred on April 30, 2017.(b) Prepare a correct trial balance. (b) Trial balance $22,690
GLOBAL CABLETrial BalanceApril 30, 2017
Debit Credit
Cash $ 4,100Accounts Receivable 3,200Supplies 800Equipment 10,600Accumulated Depreciation—Equip. $ 1,350Accounts Payable 2,100Salaries and Wages Payable 700Unearned Service Revenue 890Owner’s Capital 12,900Service Revenue 5,450Salaries and Wages Expense 3,300Advertising Expense 600Miscellaneous Expense 290Depreciation Expense 500
$23,390 $23,390
PROBLEMS: SET B AND SET C
Visit the book’s companion website, at www.wiley.com/college/weygandt, and choose the Student Companion site to access Problems: Set B and Set C.
COMPREHENSIVE PROBLEM: CHAPTERS 2 TO 4
CP4 Ashley Williams opened Ashley’s Maids Cleaning Service on July 1, 2017. During July, the com-pany completed the following transactions.
July 1 Invested $14,000 cash in the business. 1 Purchased a used truck for $10,000, paying $3,000 cash and the balance on account. 3 Purchased cleaning supplies for $800 on account. 5 Paid $2,160 on a 1-year insurance policy, effective July 1. 12 Billed customers $3,800 for cleaning services. 18 Paid $1,000 of amount owed on truck, and $400 of amount owed on cleaning supplies. 20 Paid $1,600 for employee salaries. 21 Collected $1,400 from customers billed on July 12. 25 Billed customers $1,900 for cleaning services.
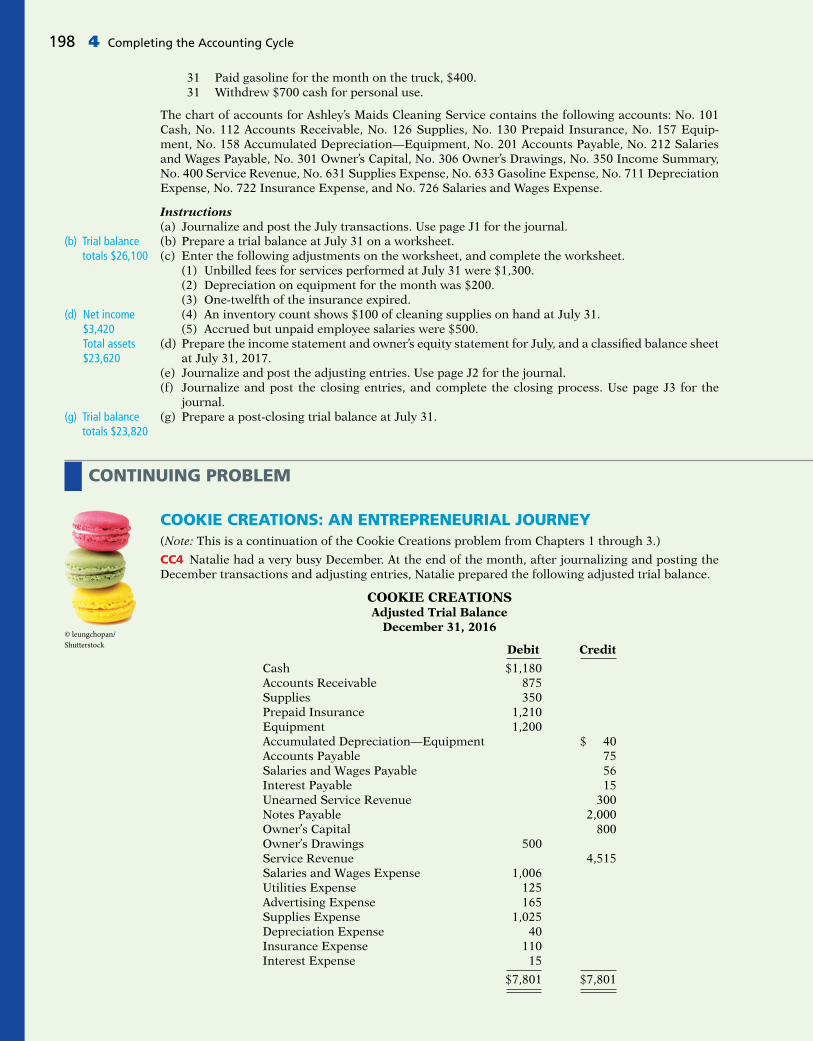
31 Paid gasoline for the month on the truck, $400. 31 Withdrew $700 cash for personal use.
The chart of accounts for Ashley’s Maids Cleaning Service contains the following accounts: No. 101 Cash, No. 112 Accounts Receivable, No. 126 Supplies, No. 130 Prepaid Insurance, No. 157 Equip-ment, No. 158 Accumulated Depreciation—Equipment, No. 201 Accounts Payable, No. 212 Salaries and Wages Payable, No. 301 Owner’s Capital, No. 306 Owner’s Drawings, No. 350 Income Summary, No. 400 Service Revenue, No. 631 Supplies Expense, No. 633 Gasoline Expense, No. 711 Depreciation Expense, No. 722 Insurance Expense, and No. 726 Salaries and Wages Expense.
Instructions(a) Journalize and post the July transactions. Use page J1 for the journal.(b) Prepare a trial balance at July 31 on a worksheet.(c) Enter the following adjustments on the worksheet, and complete the worksheet. (1) Unbilled fees for services performed at July 31 were $1,300. (2) Depreciation on equipment for the month was $200. (3) One-twelfth of the insurance expired. (4) An inventory count shows $100 of cleaning supplies on hand at July 31. (5) Accrued but unpaid employee salaries were $500.(d) Prepare the income statement and owner’s equity statement for July, and a classifi ed balance sheet
at July 31, 2017.(e) Journalize and post the adjusting entries. Use page J2 for the journal.(f) Journalize and post the closing entries, and complete the closing process. Use page J3 for the
journal.(g) Prepare a post-closing trial balance at July 31.
(b) Trial balance totals $26,100
(d) Net income $3,420Total assets $23,620
(g) Trial balance totals $23,820
CONTINUING PROBLEM
COOKIE CREATIONS: AN ENTREPRENEURIAL JOURNEY(Note: This is a continuation of the Cookie Creations problem from Chapters 1 through 3.)
CC4 Natalie had a very busy December. At the end of the month, after journalizing and posting the December transactions and adjusting entries, Natalie prepared the following adjusted trial balance.
COOKIE CREATIONSAdjusted Trial Balance
December 31, 2016
Debit Credit
Cash $1,180Accounts Receivable 875Supplies 350Prepaid Insurance 1,210Equipment 1,200Accumulated Depreciation—Equipment $ 40Accounts Payable 75Salaries and Wages Payable 56Interest Payable 15Unearned Service Revenue 300Notes Payable 2,000Owner’s Capital 800Owner’s Drawings 500Service Revenue 4,515Salaries and Wages Expense 1,006Utilities Expense 125Advertising Expense 165Supplies Expense 1,025Depreciation Expense 40 Insurance Expense 110Interest Expense 15
$7,801 $7,801
198 4 Completing the Accounting Cycle
© leungchopan/Shutterstock

Broadening Your Perspective 199
InstructionsUsing the information in the adjusted trial balance, do the following.
(a) Prepare an income statement and an owner’s equity statement for the 2 months ended December 31, 2016, and a classifi ed balance sheet at December 31, 2016. The note payable has a stated inter-est rate of 6%, and the principal and interest are due on November 16, 2018.
(b) Natalie has decided that her year-end will be December 31, 2016. Prepare and post closing entries as of December 31, 2016.
(c) Prepare a post-closing trial balance.
PERSPECTIVEFINANCIAL REPORTING AND ANALYSIS
Financial Reporting Problem: Apple Inc.BYP4-1 The fi nancial statements of Apple Inc. are presented in Appendix A at the end of this text-book. Instructions for accessing and using the company’s complete annual report, including the notes to the fi nancial statements, are also provided in Appendix A.
InstructionsAnswer the questions below using Apple’s Consolidated Balance Sheets.
(a) What were Apple’s total current assets at September 28, 2013, and September 29, 2012?(b) Are assets that Apple included under current assets listed in proper order? Explain.(c) How are Apple’s assets classifi ed?(d) What was Apple’s “Cash and cash equivalents” at September 28, 2013?(e) What were Apple’s total current liabilities at September 28, 2013, and September 29, 2012?
Comparative Analysis Problem: PepsiCo, Inc. vs. The Coca-Cola CompanyBYP4-2 PepsiCo, Inc.’s fi nancial statements are presented in Appendix B. Financial statements of The Coca-Cola Company are presented in Appendix C. Instructions for accessing and using the com-plete annual reports of PepsiCo and Coca-Cola, including the notes to the fi nancial statements, are also provided in Appendices B and C, respectively.
Instructions(a) Based on the information contained in these fi nancial statements, determine each of the following
for PepsiCo at December 31, 2013, and for Coca-Cola at December 31, 2013. (1) Total current assets. (2) Net amount of property, plant, and equipment (land, buildings, and equipment). (3) Total current liabilities. (4) Total equity.(b) What conclusions concerning the companies’ respective fi nancial positions can be drawn?
Comparative Analysis Problem: Amazon.com, Inc. vs. Wal-Mart Stores, Inc.BYP4-3 Amazon.com, Inc.’s fi nancial statements are presented in Appendix D. Financial statements of Wal-Mart Stores, Inc. are presented in Appendix E. Instructions for accessing and using the com-plete annual reports of Amazon and Wal-Mart, including the notes to the fi nancial statements, are also provided in Appendices D and E, respectively.
Instructions(a) Based on the information contained in these fi nancial statements, determine the following for
Amazon at December 31, 2013, and Wal-Mart at January 31, 2014. (1) Total current assets. (2) Net amount of property and equipment (fi xed assets), net. (3) Total current liabilities. (4) Total equity.(b) What conclusions concerning these two companies can be drawn from these data?
BROADENING YOUR

200 4 Completing the Accounting Cycle
Real-World FocusBYP4-4 Numerous companies have established home pages on the Internet, e.g., the soda companies Capt’n Eli Root Beer Company (www.captneli.com/rootbeer.php) and Cheerwine (www.cheerwine.com).
InstructionsExamine the home pages of any two companies and answer the following questions.
(a) What type of information is available?(b) Is any accounting-related information presented?(c) Would you describe the home page as informative, promotional, or both? Why?
CRITICAL THINKING
Decision-Making Across the OrganizationBYP4-5 Whitegloves Janitorial Service was started 2 years ago by Jenna Olson. Because business has been exceptionally good, Jenna decided on July 1, 2017, to expand operations by acquiring an additional truck and hiring two more assistants. To fi nance the expansion, Jenna obtained on July 1, 2017, a $25,000, 10% bank loan, payable $10,000 on July 1, 2018, and the balance on July 1, 2019. The terms of the loan require the borrower to have $10,000 more current assets than current liabilities at December 31, 2017. If these terms are not met, the bank loan will be refi nanced at 15% interest. At December 31, 2017, the accountant for Whitegloves Janitorial Service Inc. prepared the balance sheet shown below.
WHITEGLOVES JANITORIAL SERVICEBalance Sheet
December 31, 2017
Assets
Current assets Cash $ 6,500 Accounts receivable 9,000 Supplies 5,200 Prepaid insurance 4,800
Total current assets 25,500
Property, plant, and equipment Equipment (net) 22,000 Delivery trucks (net) 34,000
Total property, plant, and equipment 56,000
Total assets $81,500
Liabilities and Owner’s Equity
Current liabilities Notes payable $10,000 Accounts payable 2,500
Total current liabilities 12,500Long-term liability Notes payable 15,000
Total liabilities 27,500Owner’s equity Owner’s capital 54,000
Total liabilities and owner’s equity $81,500
Jenna presented the balance sheet to the bank’s loan offi cer on January 2, 2018, confi dent that the company had met the terms of the loan. The loan offi cer was not impressed. She said, “We need fi nancial statements audited by a CPA.” A CPA was hired and immediately realized that the balance sheet had been prepared from a trial balance and not from an adjusted trial balance. The adjustment data at the balance sheet date consisted of the following.
1. Unbilled janitorial services performed were $3,700.2. Janitorial supplies on hand were $2,500.3. Prepaid insurance was a 3-year policy dated January 1, 2017.4. December expenses incurred but unpaid at December 31, $500.5. Interest on the bank loan was not recorded.6. The amounts for property, plant, and equipment presented in the balance sheet were reported net
of accumulated depreciation (cost less accumulated depreciation). These amounts were $4,000 for cleaning equipment and $5,000 for delivery trucks as of January 1, 2017. Depreciation for 2017 was $2,000 for cleaning equipment and $5,000 for delivery trucks.
InstructionsWith the class divided into groups, answer the following.
(a) Prepare a correct balance sheet.(b) Were the terms of the bank loan met? Explain.

Broadening Your Perspective 201
Communication ActivityBYP4-6 The accounting cycle is important in understanding the accounting process.
InstructionsWrite a memo to your instructor that lists the steps of the accounting cycle in the order they should be completed. End with a paragraph that explains the optional steps in the cycle.
Ethics CaseBYP4-7 As the controller of Take No Prisoners Perfume Company, you discover a misstatement that overstated net income in the prior year’s fi nancial statements. The misleading fi nancial statements appear in the company’s annual report which was issued to banks and other creditors less than a month ago. After much thought about the consequences of telling the president, Mike Flanary, about this misstatement, you gather your courage to inform him. Mike says, “Hey! What they don’t know won’t hurt them. But, just so we set the record straight, we’ll adjust this year’s fi nancial statements for last year’s misstatement. We can absorb that misstatement better in this year than in last year anyway! Just don’t make such a mistake again.”
Instructions(a) Who are the stakeholders in this situation?(b) What are the ethical issues in this situation?(c) What would you do as a controller in this situation?
All About YouBYP4-8 Companies prepare balance sheets in order to know their fi nancial position at a specifi c point in time. This enables them to make a comparison to their position at previous points in time, and gives them a basis for planning for the future. In order to evaluate your fi nancial position, you need to pre-pare a personal balance sheet. Assume that you have compiled the following information regarding your fi nances. (Note: Some of the items might not be used in your personal balance sheet.)
Amount owed on student loan balance (long-term) $ 5,000Balance in checking account 1,200Certifi cate of deposit (6-month) 3,000Annual earnings from part-time job 11,300Automobile 7,000Balance on automobile loan (current portion) 1,500Balance on automobile loan (long-term portion) 4,000Home computer 800Amount owed to you by younger brother 300Balance in money market account 1,800Annual tuition 6,400Video and stereo equipment 1,250Balance owed on credit card (current portion) 150Balance owed on credit card (long-term portion) 1,650
InstructionsPrepare a personal balance sheet using the format you have learned for a classifi ed balance sheet for a company. For the capital account, use Owner’s Capital.
FASB Codifi cation ActivityBYP4-9 If your school has a subscription to the FASB Codifi cation, go to http://aaahq.org/ascLogin.cfm to log in and prepare responses to the following.
Instructions(a) Access the glossary (“Master Glossary”) at the FASB Codifi cation website to answer the following. (1) What is the defi nition of current assets? (2) What is the defi nition of current liabilities?(b) A company wants to offset its accounts payable against its cash account and show a cash amount
net of accounts payable on its balance sheet. Identify the criteria (found in the FASB Codifi cation) under which a company has the right of set off. Does the company have the right to offset accounts payable against the cash account?
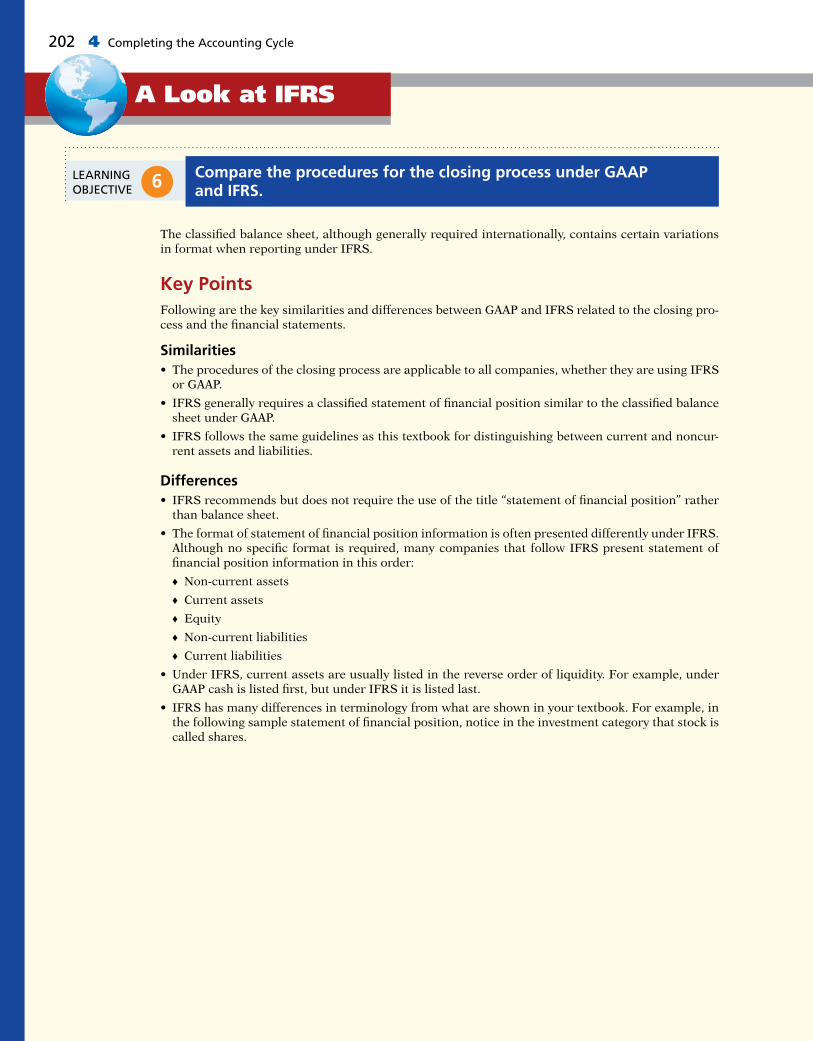
202 4 Completing the Accounting Cycle
6 Compare the procedures for the closing process under GAAP and IFRS.
LEARNING OBJECTIVE
The classifi ed balance sheet, although generally required internationally, contains certain variations in format when reporting under IFRS.
Key PointsFollowing are the key similarities and differences between GAAP and IFRS related to the closing pro-cess and the fi nancial statements.
Similarities• The procedures of the closing process are applicable to all companies, whether they are using IFRS
or GAAP.
• IFRS generally requires a classifi ed statement of fi nancial position similar to the classifi ed balance sheet under GAAP.
• IFRS follows the same guidelines as this textbook for distinguishing between current and noncur-rent assets and liabilities.
Differences• IFRS recommends but does not require the use of the title “statement of fi nancial position” rather
than balance sheet.
• The format of statement of fi nancial position information is often presented differently under IFRS. Although no specifi c format is required, many companies that follow IFRS present statement of fi nancial position information in this order:
♦ Non-current assets
♦ Current assets
♦ Equity
♦ Non-current liabilities
♦ Current liabilities
• Under IFRS, current assets are usually listed in the reverse order of liquidity. For example, under GAAP cash is listed fi rst, but under IFRS it is listed last.
• IFRS has many differences in terminology from what are shown in your textbook. For example, in the following sample statement of fi nancial position, notice in the investment category that stock is called shares.
A Look at IFRS

A Look at IFRS 203
FRANKLIN COMPANYStatement of Financial Position
October 31, 2017
AssetsIntangible assets Patents $ 3,100
Property, plant, and equipment Land $10,000 Equipment $24,000 Less: Accumulated depreciation 5,000 19,000 29,000
Long-term investments Share investments 5,200 Investment in real estate 2,000 7,200
Current assets Prepaid insurance 400 Supplies 2,100 Inventory 3,000 Notes receivable 1,000 Accounts receivable 7,000 Debt investments 2,000 Cash 6,600 22,100
Total assets $61,400
Equity and LiabilitiesEquity Owner’s capital $34,050
Non-current liabilities Mortgage payable $10,000 Notes payable 1,300 11,300
Current liabilities Notes payable 11,000 Accounts payable 2,100 Salaries and wages payable 1,600 Unearned service revenue 900 Interest payable 450 16,050
Total equity and liabilities $61,400
• Both GAAP and IFRS are increasing the use of fair value to report assets. However, at this point IFRS has adopted it more broadly. As examples, under IFRS, companies can apply fair value to property, plant, and equipment, and in some cases intangible assets.
Looking to the FutureThe IASB and the FASB are working on a project to converge their standards related to fi nancial state-ment presentation. A key feature of the proposed framework is that each of the statements will be organized in the same format, to separate an entity’s fi nancing activities from its operating and invest-ing activities and, further, to separate fi nancing activities into transactions with owners and creditors. Thus, the same classifi cations used in the statement of fi nancial position would also be used in the income statement and the statement of cash fl ows. The project has three phases. You can follow the joint fi nancial presentation project at the following link: http://www.fasb.org/project/fi nancial_statement_presentation.shtml.

204 4 Completing the Accounting Cycle
IFRS Practice
IFRS Self-Test Questions
1. A company has purchased a tract of land and expects to build a production plant on the land in approximately 5 years. During the 5 years before construction, the land will be idle. Under IFRS, the land should be reported as:(a) land expense.(b) property, plant, and equipment.(c) an intangible asset.(d) a long-term investment.
2. Current assets under IFRS are listed generally:(a) by importance.(b) in the reverse order of their expected conversion to cash.(c) by longevity.(d) alphabetically.
3. Companies that use IFRS:(a) may report all their assets on the statement of fi nancial position at fair value.(b) may offset assets against liabilities and show net assets and net liabilities on their statements
of fi nancial position, rather than the underlying detailed line items.(c) may report noncurrent assets before current assets on the statement of fi nancial position.(d) do not have any guidelines as to what should be reported on the statement of fi nancial position.
4. Companies that follow IFRS to prepare a statement of fi nancial position generally use the follow-ing order of classifi cation:(a) current assets, current liabilities, noncurrent assets, noncurrent liabilities, equity.(b) noncurrent assets, noncurrent liabilities, current assets, current liabilities, equity.(c) noncurrent assets, current assets, equity, noncurrent liabilities, current liabilities.(d) equity, noncurrent assets, current assets, noncurrent liabilities, current liabilities.
IFRS ExercisesIFRS4-1 In what ways does the format of a statement of fi nancial of position under IFRS often differ from a balance sheet presented under GAAP?
IFRS4-2 What term is commonly used under IFRS in reference to the balance sheet?
IFRS4-3 The statement of fi nancial position for Wallby Company includes the following accounts (in British pounds): Accounts Receivable £12,500, Prepaid Insurance £3,600, Cash £15,400, Supplies £5,200, and Debt Investments (short-term) £6,700. Prepare the current assets section of the statement of fi nancial position, listing the accounts in proper sequence.
IFRS4-4 The following information is available for Sutter Bowling Alley at December 31, 2017.
Buildings $128,800 Owner’s Capital $115,000Accounts Receivable 14,520 Accumulated Depreciation—Buildings 42,600Prepaid Insurance 4,680 Accounts Payable 12,300Cash 18,040 Notes Payable 97,780Equipment 62,400 Accumulated Depreciation—Equipment 18,720Land 64,000 Interest Payable 2,600Insurance Expense 780 Bowling Revenues 14,180Depreciation Expense 7,360Interest Expense 2,600
Prepare a classifi ed statement of fi nancial position. Assume that $13,900 of the notes payable will be paid in 2018.

A Look at IFRS 205
International Comparative Analysis Problem: Apple vs. Louis Vuitton
IFRS4-5 The fi nancial statements of Louis Vuitton are presented in Appendix F. Instructions for accessing and using the company’s complete annual report, including the notes to its fi nancial state-ments, are also provided in Appendix F.
InstructionsIdentify fi ve differences in the format of the statement of fi nancial position used by Louis Vuitton compared to a company, such as Apple, that follows GAAP. (Apple’s fi nancial statements are available in Appendix A.)
Answers to IFRS Self-Test Questions
1. d 2. b 3. c 4. c

Have you ever shopped for outdoor gear at an REI (Recreational
Equipment Incorporated) store? If so, you might have been
surprised if a salesclerk asked if you were a member. A
member? What do you mean a member? You soon realize
that REI might not be your typical store. In fact, there’s a lot
about REI that makes it different.
REI is a consumer cooperative, or “co-op” for short. To fi gure
out what that means, consider this quote from the company’s
annual stewardship report:
As a cooperative, the Company is owned by its members. Each
member is entitled to one vote in the election of the Company’s
Board of Directors. Since January 1, 2008, the nonrefundable,
nontransferable, one-time membership fee has been 20 dollars.
As of December 31, 2010, there were approximately 10.8 million
members.
Voting rights? Now that’s something you don’t get from
shopping at Wal-Mart. REI members get other benefi ts as
well, including sharing in the company’s profi ts through a
dividend at the end of the year, which can be used for
purchases at REI stores during the next two years. The more
you spend, the bigger your dividend.
Since REI is a co-op, you might also wonder whether
management’s incentives might be a little different than at
other stores. For example, is management still concerned
about making a profi t? The answer is yes, as it ensures the
long-term viability of the company. At the same time, REI’s
members want the company to be run effi ciently, so that
prices remain low. In order for its members to evaluate just
how well management is doing, REI publishes an audited
annual report, just like publicly traded companies do. So,
while profi t maximization might not be the ultimate goal for
REI, the accounting and reporting issues are similar to those of
a typical corporation.
How well is this business model working for REI? Well, it has
consistently been rated as one of the best places to work in
the United States by Fortune magazine. It is one of only fi ve
companies named each year since the list was created in 1998.
Also, REI had sustainable business practices long before social
responsibility became popular at other companies. The CEO’s
stewardship report states “we reduced the absolute amount
of energy we use despite opening four new stores and
growing our business; we grew the amount of FSC-certifi ed
paper we use to 58.4 percent of our total paper footprint—
including our cash register receipt paper; we facilitated
2.2 million volunteer hours and we provided $3.7 million to
more than 330 conservation and recreation nonprofi ts.”
So, while REI, like other retailers, closely monitors its fi nancial
results, it also strives to succeed in other areas. And, with over
10 million votes at stake, REI’s management knows that it has
to deliver.
Buy Now, Vote Later
Merchandising is one of the largest and most infl uential industries in the United States. It is likely that a number of you will work for a merchandiser. Therefore, understanding the fi nancial statements of merchandising companies is important. In this chapter, you will learn the basics about reporting merchandising transactions. In addition, you will learn how to prepare and analyze a commonly used form of the income statement—the multiple-step income statement.
CHAPTER PREVIEW
5
FEATURE STORY
Accounting for Merchandising Operations
206

Describe merchandising operations and inventory systems.1
Learning Objectives
Compare a multiple-step with a single-step income statement.5 Financial Statement
Classifi cationsDO IT! 5
• Multiple-step income statement• Single-step income statement• Classifi ed balance sheet
Describe merchandising operations and inventory systems.1
Learning ObjectivesLearning Objectives
© omgimages/iStockphoto
CHAPTER OUTLINE
Merchandising Operations and Inventory Systems
DO IT! 1• Operating cycles• Flow of costs
Record purchases under a perpetual inventory system.2 Purchase TransactionsDO IT! 2
• Freight costs• Purchase returns and
allowances• Purchase discounts• Summary of purchasing
transactions
Record sales under a perpetual inventory system.3 Sales TransactionsDO IT! 3• Sales returns and allowances
• Sales discounts
Apply the steps in the accounting cycle to a merchandising company.4 Closing EntriesDO IT! 4
• Adjusting entries• Closing entries• Summary of merchandising
entries
Go to the REVIEW AND PRACTICE section at the end of the chapter for a review of key concepts and practice applications with solutions.
Visit WileyPLUS with ORION for additional tutorials and practice opportunities.

208 5 Accounting for Merchandising Operations
1 Describe merchandising operations and inventory systems.LEARNING OBJECTIVE
REI, Wal-Mart, and Amazon.com are called merchandising companies because they buy and sell merchandise rather than perform services as their primary source of revenue. Merchandising companies that purchase and sell directly to consumers are called retailers. Merchandising companies that sell to retailers are known as wholesalers. For example, retailer Walgreens might buy goods from wholesaler McKesson. Retailer Offi ce Depot might buy offi ce supplies from wholesaler United Stationers. The primary source of revenues for merchandis-ing companies is the sale of merchandise, often referred to simply as sales revenue or sales. A merchandising company has two categories of expenses: cost of goods sold and operating expenses. Cost of goods sold is the total cost of merchandise sold during the period. This expense is directly related to the revenue recognized from the sale of goods. Illustration 5-1 shows the income measurement process for a merchandising company. The items in the two blue boxes are unique to a merchandising com-pany; they are not used by a service company.
Illustration 5-1Income measurement process for a merchandising company Sales
Revenue
Cost ofGoods Sold
GrossProfit
OperatingExpenses
NetIncome(Loss)
Less
Equals Less
Equals
Illustration 5-2Operating cycle for a service company
Service Company
Cash
AccountsReceivable
Receive Cash Perform Services
Operating Cycles
The operating cycle of a merchandising company ordinarily is longer than that of a service company. The purchase of merchandise inventory and its eventual sale lengthen the cycle. Illustration 5-2 shows the operating cycle of a service company.

Merchandising Operations and Inventory Systems 209
Illustration 5-3 shows the operating cycle of a merchandising company.
Illustration 5-3Operating cycle for a merchandising company
Sell Inventory
Merchandising Company
Cash
InventoryAccountsReceivable
Receive Cash Buy InventoryTV
TVTV
TV
Note that the added asset account for a merchandising company is the Inventory account. Companies report inventory as a current asset on the balance sheet.
Flow of Costs
The fl ow of costs for a merchandising company is as follows. Beginning inven-tory plus the cost of goods purchased is the cost of goods available for sale. As goods are sold, they are assigned to cost of goods sold. Those goods that are not sold by the end of the accounting period represent ending inventory. Illustration 5-4 describes these relationships. Companies use one of two systems to account for inventory: a perpetual inventory system or a periodic inventory system.
BeginningInventory
Cost of GoodsPurchased
Cost of GoodsAvailable for Sale
Cost ofGoods Sold
EndingInventory
Illustration 5-4Flow of costs
PERPETUAL SYSTEM
In a perpetual inventory system, companies keep detailed records of the cost of each inventory purchase and sale. These records continuously—perpetually—show the inventory that should be on hand for every item. For example, a Ford dealership has separate inventory records for each automobile, truck, and van on its lot and showroom fl oor. Similarly, a Kroger grocery store uses bar codes and optical scanners to keep a daily running record of every box of cereal and every jar of jelly that it buys and sells. Under a perpetual inventory system, a company determines the cost of goods sold each time a sale occurs.
Helpful HintFor control purposes, companies take a physical inventory count under the perpetual system, even though it is not needed to determine cost of goods sold.

210 5 Accounting for Merchandising Operations
PERIODIC SYSTEM
In a periodic inventory system, companies do not keep detailed inventory records of the goods on hand throughout the period. Instead, they determine the cost of goods sold only at the end of the accounting period—that is, periodi-cally. At that point, the company takes a physical inventory count to determine the cost of goods on hand. To determine the cost of goods sold under a periodic inventory system, the following steps are necessary:
1. Determine the cost of goods on hand at the beginning of the accounting period.
2. Add to it the cost of goods purchased.
3. Subtract the cost of goods on hand at the end of the accounting period.
Illustration 5-5 graphically compares the sequence of activities and the tim-ing of the cost of goods sold computation under the two inventory systems.
ADVANTAGES OF THE PERPETUAL SYSTEM
Companies that sell merchandise with high unit values, such as automobiles, furniture, and major home appliances, have traditionally used perpetual systems. The growing use of computers and electronic scanners has enabled many more companies to install perpetual inventory systems. The perpetual inventory system is so named because the accounting records continuously—perpetually—show the quantity and cost of the inventory that should be on hand at any time. A perpetual inventory system provides better control over inventories than a periodic system. Since the inventory records show the quantities that should be on hand, the company can count the goods at any time to see whether the amount of goods actually on hand agrees with the inventory records. If shortages are uncovered, the company can investigate immediately. Although a perpetual inventory system requires both additional clerical work and expense to maintain the subsidiary records, a computerized system can minimize this cost. Much of Amazon.com’s success is attributed to its sophisticated inventory system. Some businesses fi nd it either unnecessary or uneconomical to invest in a sophisticated, computerized perpetual inventory system such as Amazon’s. Many small merchandising businesses fi nd that basic accounting software
Illustration 5-5Comparing perpetual and periodic inventory systems
Perpetual
System
End of PeriodInventory Purchased
Record revenueand
compute and recordcost of goods sold
Record purchaseof inventory
Item Sold
End of PeriodInventory Purchased Item Sold
No entry
Periodic
System
Record revenueonly
Compute andrecord cost
of goods sold
SOLD
SOLD
Record purchaseof inventory

Recording Purchases under a Perpetual System 211
provides some of the essential benefi ts of a perpetual inventory system. Also, managers of some small businesses still find that they can control their merchandise and manage day-to-day operations using a periodic inventory system. Because of the widespread use of the perpetual inventory system, we illustrate it in this chapter. We discuss and illustrate the periodic system in Appendix 5B.
© Ben Blankenburg/iStockphoto
Morrow Snowboards, Inc.Investor Insight
Morrow Snowboards Improves Its Stock Appeal
Investors are often eager to invest in a company that has a hot new product. However, when snowboard-maker Morrow Snowboards, Inc. issued shares of stock to the public for the fi rst time, some investors expressed reluc-tance to invest in Morrow because of a number of accounting control problems.
To reduce investor concerns, Morrow implemented a per-petual inventory system to improve its control over inven-tory. In addition, the company stated that it would perform a physical inventory count every quarter until it felt that its perpetual inventory system was reliable.
If a perpetual system keeps track of inventory on a daily basis, why do companies ever need to do a physical count? (Go to WileyPLUS for this answer and additional questions.)
Indicate whether the following statements are true or false.
1. The primary source of revenue for a merchandising company results from performing services for customers.
2. The operating cycle of a service company is usually shorter than that of a merchandis-ing company.
3. Sales revenue less cost of goods sold equals gross profi t.
4. Ending inventory plus the cost of goods purchased equals cost of goods available for sale.
DO IT! 1 Merchandising Operations and Inventory Systems
1. False. The primary source of revenue for a service company results from performing services for customers. 2. True. 3. True. 4. False. Beginning inven-tory plus the cost of goods purchased equals cost of goods available for sale.
Related exercise material: BE5-1, BE5-2, E5-1, and DO IT! 5-1.
Action Plan✔ Review merchandising
concepts.✔ Understand the
fl ow of costs in a merchandising company.
Solution
2 Record purchases under a perpetual inventory system.LEARNING OBJECTIVE
Companies purchase inventory using cash or credit (on account). They normally record purchases when they receive the goods from the seller. Every purchase should be supported by business documents that provide written evidence of the

212 5 Accounting for Merchandising Operations
transaction. Each cash purchase should be supported by a canceled check or a cash register receipt indicating the items purchased and amounts paid. Compa-nies record cash purchases by an increase in Inventory and a decrease in Cash. A purchase invoice should support each credit purchase. This invoice indicates the total purchase price and other relevant information. However, the purchaser does not prepare a separate purchase invoice. Instead, the pur-chaser uses as a purchase invoice a copy of the sales invoice sent by the seller. In Illustration 5-6, for example, Sauk Stereo (the buyer) uses as a purchase invoice the sales invoice prepared by PW Audio Supply (the seller).
May 4 Inventory 3,800 Accounts Payable 3,800 (To record goods purchased on account from PW Audio Supply)
13,80013,800
Cash Flowsno effect
A OEL5 1
Under the perpetual inventory system, companies record purchases of merchan-dise for sale in the Inventory account. Thus, REI would increase (debit) Inventory for clothing, sporting goods, and anything else purchased for resale to customers. Not all purchases are debited to Inventory, however. Companies record pur-chases of assets acquired for use and not for resale, such as supplies, equipment, and similar items, as increases to specifi c asset accounts rather than to Inventory.
Helpful HintTo better understand the contents of this invoice, identify these items:1. Seller2. Invoice date3. Purchaser4. Salesperson5. Credit terms6. Freight terms7. Goods sold: catalog
number, description, quantity, price per unit
8. Total invoice amount
Illustration 5-6Sales invoice used as purchase invoice by Sauk Stereo
27 Circle DriveHarding, Michigan 48281
PW Audio Supply
INVOICE NO. 731
Firm Name
Attention of
Address
SOLD
TO
City State Zip
IMPORTANT: ALL RETURNS MUST BE MADE WITHIN 10 DAYS TOTAL
Date 5/4/17 Salesperson Malone Terms 2/10, n/30 FOB Shipping Point
Catalog No. Description Quantity Price Amount
X572Y9820 Printed CircuitBoard-prototype 1 2,300 $2,300
A2547Z45 Production ModelCircuits 5 300 1,500
$3,800
Sauk Stereo
James Hoover, Purchasing Agent
125 Main Street
Chelsea Illinois 60915
Sauk Stereo makes the following journal entry to record its purchase from PW Audio Supply. The entry increases (debits) Inventory and increases (credits) Accounts Payable.

Recording Purchases under a Perpetual System 213
For example, to record the purchase of materials used to make shelf signs or for cash register receipt paper, REI would increase (debit) Supplies.
Freight Costs
The sales agreement should indicate who—the seller or the buyer—is to pay for transporting the goods to the buyer’s place of business. When a common carrier such as a railroad, trucking company, or airline transports the goods, the carrier prepares a freight bill in accord with the sales agreement. Freight terms are expressed as either FOB shipping point or FOB destination. The letters FOB mean free on board. Thus, FOB shipping point means that the seller places the goods free on board the carrier, and the buyer pays the freight costs. Conversely, FOB destination means that the seller places the goods free on board to the buyer’s place of business, and the seller pays the freight. For example, the sales invoice in Illustration 5-6 indicates FOB shipping point. Thus, the buyer (Sauk Stereo) pays the freight charges. Illustration 5-7 illustrates these shipping terms.
Illustration 5-7Shipping terms
Ownershippasses to
buyer here
Seller Seller
Ownershippasses to
buyer here
FOB Shipping PointBuyer pays freight costs
FOB DestinationSeller pays freight costs
Buyer Buyer
PublicCarrierCo.
PublicCarrierCo.
FREIGHT COSTS INCURRED BY THE BUYER
When the buyer incurs the transportation costs, these costs are considered part of the cost of purchasing inventory. Therefore, the buyer debits (increases) the Inventory account. For example, if Sauk Stereo (the buyer) pays Public Carrier Co. $150 for freight charges on May 6, the entry on Sauk Stereo’s books is:
Thus, any freight costs incurred by the buyer are part of the cost of merchandise purchased. The reason: Inventory cost should include all costs to acquire the inventory, including freight necessary to deliver the goods to the buyer. Compa-nies recognize these costs as cost of goods sold when inventory is sold.
FREIGHT COSTS INCURRED BY THE SELLER
In contrast, freight costs incurred by the seller on outgoing merchandise are an operating expense to the seller. These costs increase an expense account titled Freight-Out (sometimes called Delivery Expense). For example, if the freight terms on the invoice in Illustration 5-6 had required PW Audio Supply (the seller) to pay the freight charges, the entry by PW Audio Supply would be:
May 6 Inventory 150 Cash 150 (To record payment of freight on goods purchased)
11502150
Cash Flows2150
A OEL5 1
May 4 Freight-Out (or Delivery Expense) 150 Cash 150 (To record payment of freight on goods sold)
2150 Exp2150
Cash Flows2150
A OEL5 1
When the seller pays the freight charges, the seller will usually establish a higher invoice price for the goods to cover the shipping expense.

214 5 Accounting for Merchandising Operations
Purchase Returns and Allowances
A purchaser may be dissatisfi ed with the merchandise received because the goods are damaged or defective, of inferior quality, or do not meet the purchaser’s spec-ifi cations. In such cases, the purchaser may return the goods to the seller for credit if the sale was made on credit, or for a cash refund if the purchase was for cash. This transaction is known as a purchase return. Alternatively, the pur-chaser may choose to keep the merchandise if the seller is willing to grant an allowance (deduction) from the purchase price. This transaction is known as a purchase allowance. Assume that Sauk Stereo returned goods costing $300 to PW Audio Supply on May 8. The following entry by Sauk Stereo for the returned merchandise decreases (debits) Accounts Payable and decreases (credits) Inventory.
May 8 Accounts Payable 300 Inventory 300 (To record return of goods purchased from PW Audio Supply)
23002300
Cash Flowsno effect
A OEL5 1
Because Sauk Stereo increased Inventory when the goods were received, Inven-tory is decreased when Sauk Stereo returns the goods. Suppose instead that Sauk Stereo chose to keep the goods after being granted a $50 allowance (reduction in price). It would reduce (debit) Accounts Payable and reduce (credit) Inventory for $50.
Purchase Discounts
The credit terms of a purchase on account may permit the buyer to claim a cash discount for prompt payment. The buyer calls this cash discount a purchase discount. This incentive offers advantages to both parties. The purchaser saves money, and the seller is able to shorten the operating cycle by converting the accounts receivable into cash. Credit terms specify the amount of the cash discount and time period in which it is offered. They also indicate the time period in which the purchaser is expected to pay the full invoice price. In the sales invoice in Illustration 5-6(page 212), credit terms are 2/10, n/30, which is read “two-ten, net thirty.” This means that the buyer may take a 2% cash discount on the invoice price, less (“net of”) any returns or allowances, if payment is made within 10 days of the invoice date (the discount period). Otherwise, the invoice price, less any returns or allowances, is due 30 days from the invoice date. Alternatively, the discount period may extend to a specifi ed number of days following the month in which the sale occurs. For example, 1/10 EOM (end of month) means that a 1% discount is available if the invoice is paid within the fi rst 10 days of the next month. When the seller elects not to offer a cash discount for prompt payment, credit terms will specify only the maximum time period for paying the balance due. For example, the invoice may state the time period as n/30, n/60, or n/10 EOM. This means, respectively, that the buyer must pay the net amount in 30 days, 60 days, or within the fi rst 10 days of the next month. When the buyer pays an invoice within the discount period, the amount of the discount decreases Inventory. Why? Because companies record inventory at cost and, by paying within the discount period, the buyer has reduced its cost. To illustrate, assume Sauk Stereo pays the balance due of $3,500 (gross invoice price of $3,800 less purchase returns and allowances of $300) on May 14, the last day of the discount period. The cash discount is $70 ($3,500 3 2%), and Sauk Stereo pays $3,430 ($3,500 2 $70). The entry Sauk Stereo makes to record its May 14 payment decreases (debits) Accounts Payable by the amount of the gross invoice
Helpful HintThe term net in “net 30” means the remaining amount due after subtracting any sales returns and allowances and partial payments.

Recording Purchases under a Perpetual System 215
price, reduces (credits) Inventory by the $70 discount, and reduces (credits) Cash by the net amount owed.
May 14 Accounts Payable 3,500 Cash 3,430 Inventory 70 (To record payment within discount period)
23,50023,430 270
Cash Flows23,430
A OEL5 1
If Sauk Stereo failed to take the discount and instead made full payment of $3,500 on June 3, it would debit Accounts Payable and credit Cash for $3,500 each.
June 3 Accounts Payable 3,500 Cash 3,500 (To record payment with no discount taken)
2350023,500
Cash Flows23,500
A OEL5 1
A merchandising company usually should take all available discounts. Pass-ing up the discount may be viewed as paying interest for use of the money. For example, passing up the discount offered by PW Audio Supply would be compa-rable to Sauk Stereo paying an interest rate of 2% for the use of $3,500 for 20 days. This is the equivalent of an annual interest rate of approximately 36.5% (2% 3 365/20). Obviously, it would be better for Sauk Stereo to borrow at pre-vailing bank interest rates of 6% to 10% than to lose the discount.
Summary of Purchasing Transactions
The following T-account (with transaction descriptions in red) provides a sum-mary of the effect of the previous transactions on Inventory. Sauk Stereo origi-nally purchased $3,800 worth of inventory for resale. It then returned $300 of goods. It paid $150 in freight charges, and fi nally, it received a $70 discount off the balance owed because it paid within the discount period. This results in a balance in Inventory of $3,580.
Inventory
Purchase May 4 3,800 May 8 300 Purchase return
Freight-in 6 150 14 70 Purchase discount
Balance 3,580
On September 5, De La Hoya Company buys merchandise on account from Junot Diaz Company. The selling price of the goods is $1,500, and the cost to Diaz Company was $800. On September 8, De La Hoya returns defective goods with a selling price of $200. Record the transactions on the books of De La Hoya Company.
DO IT! 2 Purchase Transactions
Sept. 5 Inventory 1,500 Accounts Payable 1,500 (To record goods purchased on account)
8 Accounts Payable 200 Inventory 200 (To record return of defective goods)
Related exercise material: BE5-3, BE5-5, E5-2, E5-3, E5-4, and DO IT! 5-2.
Action Plan✔ Purchaser records
goods at cost.✔ When goods are
returned, purchaser reduces Inventory.
Solution

216 5 Accounting for Merchandising Operations
3 Record sales under a perpetual inventory system.LEARNING OBJECTIVE
In accordance with the revenue recognition principle, companies record sales revenue when the performance obligation is satisfi ed. Typically, the performance obligation is satisfi ed when the goods transfer from the seller to the buyer. At this point, the sales transaction is complete and the sales price established. Sales may be made on credit or for cash. A business document should sup-port every sales transaction, to provide written evidence of the sale. Cash regis-ter documents provide evidence of cash sales. A sales invoice, like the one shown in Illustration 5-6 (page 212), provides support for a credit sale. The orig-inal copy of the invoice goes to the customer, and the seller keeps a copy for use in recording the sale. The invoice shows the date of sale, customer name, total sales price, and other relevant information. The seller makes two entries for each sale. The fi rst entry records the sale: The seller increases (debits) Cash (or Accounts Receivable if a credit sale) and also increases (credits) Sales Revenue. The second entry records the cost of the merchandise sold: The seller increases (debits) Cost of Goods Sold and also decreases (credits) Inventory for the cost of those goods. As a result, the Inventory account will show at all times the amount of inventory that should be on hand. To illustrate a credit sales transaction, PW Audio Supply records its May 4 sale of $3,800 to Sauk Stereo (see Illustration 5-6) as follows (assume the mer-chandise cost PW Audio Supply $2,400).
May 4 Accounts Receivable 3,800 Sales Revenue 3,800 (To record credit sale to Sauk Stereo per invoice #731)
13,80013,800 Rev
Cash Flowsno effect
A OEL5 1
4 Cost of Goods Sold 2,400 Inventory 2,400 (To record cost of merchandise sold on invoice #731 to Sauk Stereo)
22,400 Exp22,400
Cash Flowsno effect
A OEL5 1
For internal decision-making purposes, merchandising companies may use more than one sales account. For example, PW Audio Supply may decide to keep separate sales accounts for its sales of TVs, Blu-ray players, and headsets. REI might use separate accounts for camping gear, children’s clothing, and ski equipment—or it might have even more narrowly defi ned accounts. By using separate sales accounts for major product lines, rather than a single combined sales account, company management can more closely monitor sales trends and respond more strategically to changes in sales patterns. For example, if TV sales are increasing while Blu-ray player sales are decreasing, PW Audio Supply might reevaluate both its advertising and pricing policies on these items to ensure they are optimal. On its income statement presented to outside investors, a merchandising company normally would provide only a single sales fi gure—the sum of all of its individual sales accounts. This is done for two reasons. First, providing detail on all of its individual sales accounts would add considerable length to its income statement. Second, companies do not want their competitors to know the details of their operating results. However, Microsoft recently expanded its disclosure of revenue from three to fi ve types. The reason: The additional categories enabled fi nancial statement users to better evaluate the growth of the company’s consumer and Internet businesses.
ETHICS NOTE
Many companies are trying to improve the quality of their fi nancial reporting. For example, General Electric now provides more detail on its revenues and operating profi ts.

Recording Sales under a Perpetual System 217
Sales Returns and Allowances
We now look at the “fl ip side” of purchase returns and allowances, which the seller records as sales returns and allowances. These are transactions where the seller either accepts goods back from the buyer (a return) or grants a reduc-tion in the purchase price (an allowance) so the buyer will keep the goods. PW Audio Supply’s entries to record credit for returned goods involve (1) an increase (debit) in Sales Returns and Allowances (a contra account to Sales Revenue) and a decrease (credit) in Accounts Receivable at the $300 selling price, and (2) an increase (debit) in Inventory (assume a $140 cost) and a decrease (credit) in Cost of Goods Sold, as shown below (assuming that the goods were not defective).
Holly Harmon was a cashier at a national superstore for only a short while when she began stealing merchandise using three methods. Under the fi rst method, her hus-band or friends took UPC labels from cheaper items and put them on more expensive items. Holly then scanned the goods at the register. Using the second method, Holly scanned an item at the register but then voided the sale and left the merchandise in the shopping cart. A third approach was to put goods into large plastic containers. She scanned the plastic containers but not the goods within them. One day, Holly did not call in sick or show up for work. In such instances, the company reviews past surveillance tapes to look for suspicious activity by employees. This enabled the store to observe the thefts and to identify the participants.
Total take: $12,000
THE MISSING CONTROLSHuman resource controls. A background check would have revealed Holly’s previous criminal record. She would not have been hired as a cashier.Physical controls. Software can fl ag high numbers of voided transactions or a high number of sales of low-priced goods. Random comparisons of video records with cash register records can ensure that the goods reported as sold on the register are the same goods that are shown being purchased on the video recording. Finally, employees should be aware that they are being monitored.
Source: Adapted from Wells, Fraud Casebook (2007), pp. 251–259.
ANATOMY OF A FRAUD1 At the end of “Anatomy of a Fraud” stories, which describe some recent real-world frauds, we discuss the missing control activi-ties that would likely have prevented or uncovered the fraud.
May 8 Sales Returns and Allowances 300 Accounts Receivable 300 (To record credit granted to Sauk Stereo for returned goods)
2300 Rev2300
Cash Flowsno effect
A OEL5 1
If Sauk Stereo returns goods because they are damaged or defective, then PW Audio Supply’s entry to Inventory and Cost of Goods Sold should be for the fair value of the returned goods, rather than their cost. For example, if the returned
8 Inventory 140 Cost of Goods Sold 140 (To record cost of goods returned)
11401140 Exp
Cash Flowsno effect
A OEL5 1
1The “Anatomy of a Fraud” stories in this textbook are adapted from Fraud Casebook: Lessons from the Bad Side of Business, edited by Joseph T. Wells (Hoboken, NJ: John Wiley & Sons, Inc., 2007). Used by permission. The names of some of the people and organizations in the stories are fi ctitious, but the facts in the stories are true.

218 5 Accounting for Merchandising Operations
goods were defective and had a fair value of $50, PW Audio Supply would debit Inventory for $50 and credit Cost of Goods Sold for $50. What happens if the goods are not returned but the seller grants the buyer an allowance by reducing the purchase price? In this case, the seller debits Sales Returns and Allowances and credits Accounts Receivable for the amount of the allowance. An allowance has no impact on Inventory or Cost of Goods Sold. Sales Returns and Allowances is a contra revenue account to Sales Revenue. This means that it is offset against a revenue account on the income statement. The normal balance of Sales Returns and Allowances is a debit. Companies use a contra account, instead of debiting Sales Revenue, to disclose in the accounts and in the income statement the amount of sales returns and allowances. Disclosure of this information is important to management. Excessive returns and allowances may suggest problems—inferior merchandise, ineffi ciencies in fi lling orders, errors in billing customers, or delivery or shipment mistakes. Moreover, a decrease (debit) recorded directly to Sales Revenue would obscure the relative importance of sales returns and allowances as a percentage of sales. It also could distort comparisons between total sales in different accounting periods.
Should Costco Change Its Return Policy?
In most industries, sales returns are relatively minor. But returns of consumer electronics can really take a bite out of profi ts. Recently, the marketing execu-tives at Costco Wholesale Corp. faced a diffi cult decision. Costco has always prided itself on its generous return policy. Most goods have had an unlim-ited grace period for returns. However, a new policy requires that certain electronics must be
returned within 90 days of their purchase. The reason? The cost of returned products such as high-defi nition TVs, com-puters, and iPods cut an estimated 8¢ per share off Costco’s earnings per share, which was $2.30.
Source: Kris Hudson, “Costco Tightens Policy on Returning Electronics,” Wall Street Journal (February 27, 2007), p. B4.
If a company expects signifi cant returns, what are the implications for revenue recognition? (Go to WileyPLUS for this answer and additional questions.)
© Jacob Wackerhausen/iStockphoto
Costco Wholesale Corp.Accounting Across the Organization
Sales Discounts
As mentioned in our discussion of purchase transactions, the seller may offer the customer a cash discount—called by the seller a sales discount—for the prompt payment of the balance due. Like a purchase discount, a sales discount is based on the invoice price less returns and allowances, if any. The seller increases (debits) the Sales Discounts account for discounts that are taken. For example, PW Audio Supply makes the following entry to record the cash receipt on May 14 from Sauk Stereo within the discount period.
May 14 Cash 3,430 Sales Discounts 70 Accounts Receivable 3,500 (To record collection within 2/10, n/30 discount period from Sauk Stereo)
Like Sales Returns and Allowances, Sales Discounts is a contra revenue account to Sales Revenue. Its normal balance is a debit. PW Audio Supply uses this account, instead of debiting Sales Revenue, to disclose the amount of cash
13,430 270 Rev23,500
Cash Flows13,430
A OEL5 1

Recording Sales under a Perpetual System 219
discounts taken by customers. If Sauk Stereo does not take the discount, PW Audio Supply increases (debits) Cash for $3,500 and decreases (credits) Accounts Receivable for the same amount at the date of collection. The following T-accounts summarize the three sales-related transactions and show their combined effect on net sales.
Sales Revenue Sales Returns and Allowances Sales Discounts
3,800 300 70
Net Sales $3,430
Selling Green
Here is a question an executive of PepsiCo was asked: Should PepsiCo market green? The executive indicated that the company should, as he believes it’s the No. 1 thing consumers all over the world care about. Here are some of his thoughts on this issue:
“Sun Chips are part of the food business I run. It’s a ‘healthy snack.’ We decided that Sun Chips, if it’s a healthy snack, should be made in
facilities that have a net-zero footprint. In other words, I want off the electric grid everywhere we make Sun Chips. We did that. Sun Chips should be made in a facility that puts back more water than it uses. It does that. And we
partnered with our suppliers and came out with the world’s fi rst compostable chip package.
Now, there was an issue with this package: It was louder than the New York subway, louder than jet engines taking off. What would a company that’s committed to green do: walk away or stay committed? If your people are passion-ate, they’re going to fi x it for you as long as you stay com-mitted. Six months later, the compostable bag has half the noise of our current package.
So the view today is: we should market green, we should be proud to do it . . . it has to be a 360-degree process, both internal and external. And if you do that, you can monetize environmental sustainability for the shareholders.”
Source: “Four Problems—and Solutions,” Wall Street Journal (March 7, 2011), p. R2.
What is meant by “monetize environmental sustainability” for shareholders? (Go to WileyPLUS for this answer and additional questions.)
Helen Sessions/Alamy
PepsiCoPeople, Planet, and Profi t Insight
On September 5, De La Hoya Company buys merchandise on account from Junot Diaz Company. The selling price of the goods is $1,500, and the cost to Diaz Company was $800. On September 8, De La Hoya returns defective goods with a selling price of $200 and a fair value of $30. Record the transactions on the books of Junot Diaz Company.
DO IT! 3 Sales Transactions
Sept. 5 Accounts Receivable 1,500 Sales Revenue 1,500 (To record credit sale)
5 Cost of Goods Sold 800 Inventory 800 (To record cost of goods sold on account)
Action Plan✔ Seller records both the
sale and the cost of goods sold at the time of the sale.
✔ When goods are returned, the seller records the return in a contra account, Sales Returns and Allow-ances, and reduces Accounts Receivable.
Solution

8 Sales Returns and Allowances 200 Accounts Receivable 200 (To record credit granted for receipt of returned goods)
8 Inventory 30 Cost of Goods Sold 30 (To record fair value of goods returned)
Related exercise material: BE5-3, BE5-4, E5-3, E5-4, E5-5, and DO IT! 5-3.
Action Plan (cont’d)✔ Any goods returned
increase Inventory and reduce Cost of Goods Sold. Defective or damaged inventory is recorded at fair value (scrap value).
4 Apply the steps in the accounting cycle to a merchandising company.
LEARNING OBJECTIVE
Up to this point, we have illustrated the basic entries for transactions relating to purchases and sales in a perpetual inventory system. Now we consider the remaining steps in the accounting cycle for a merchandising company. Each of the required steps described in Chapter 4 for service companies apply to mer-chandising companies. Appendix 5A to this chapter shows use of a worksheet by a merchandiser (an optional step).
Adjusting Entries
A merchandising company generally has the same types of adjusting entries as a service company. However, a merchandiser using a perpetual system will require one additional adjustment to make the records agree with the actual inventory on hand. Here’s why. At the end of each period, for control purposes, a merchandising company that uses a perpetual system will take a physical count of its goods on hand. The company’s unadjusted balance in Inventory usually does not agree with the actual amount of inventory on hand. The perpetual inventory records may be incorrect due to recording errors, theft, or waste. Thus, the company needs to adjust the perpetual records to make the recorded inventory amount agree with the inventory on hand. This involves adjusting Inventory and Cost of Goods Sold. For example, suppose that PW Audio Supply has an unadjusted balance of $40,500 in Inventory. Through a physical count, PW Audio Supply determines that its actual merchandise inventory at December 31 is $40,000. The company would make an adjusting entry as follows.
Closing Entries
A merchandising company, like a service company, closes to Income Summary all accounts that affect net income. In journalizing, the company credits all tempo-rary accounts with debit balances, and debits all temporary accounts with credit balances, as shown below for PW Audio Supply. Note that PW Audio Supply closes Cost of Goods Sold to Income Summary.
Dec. 31 Sales Revenue 480,000 Income Summary 480,000 (To close income statement accounts with credit balances)
Helpful HintThe easiest way to prepare the fi rst two closing entries is to identify the temporary accounts by their balances and then prepare one entry for the credits and one for the debits.
Dec. 31 Cost of Goods Sold 500 Inventory 500 (To adjust inventory to physical count)
25002500 Exp
Cash Flowsno effect
A OEL5 1
220 5 Accounting for Merchandising Operations

Merchandising Company Accounting Cycle 221
31 Income Summary 450,000 Sales Returns and Allowances 12,000 Sales Discounts 8,000 Cost of Goods Sold 316,000 Salaries and Wages Expense 64,000 Freight-Out 7,000 Advertising Expense 16,000 Utilities Expense 17,000 Depreciation Expense 8,000 Insurance Expense 2,000 (To close income statement accounts with debit balances)
31 Income Summary 30,000 Owner’s Capital 30,000 (To close net income to capital)
31 Owner’s Capital 15,000 Owner’s Drawings 15,000 (To close drawings to capital)
Illustration 5-8Daily recurring and adjusting and closing entries
Transactions Daily Recurring Entries Dr. Cr.
Selling merchandise to customers. Cash or Accounts Receivable XX Sales Revenue XX Cost of Goods Sold XX Inventory XX
Granting sales returns or allowances Sales Returns and Allowances XX to customers. Cash or Accounts Receivable XX Inventory XX Cost of Goods Sold XX
Paying freight costs on sales; FOB Freight-Out XX destination. Cash XX
Receiving payment from customers Cash XX within discount period. Sales Discounts XX Accounts Receivable XX
Purchasing merchandise for resale. Inventory XX Cash or Accounts Payable XX
Paying freight costs on merchandise Inventory XX purchased; FOB shipping point. Cash XX
Receiving purchase returns or Cash or Accounts Payable XX allowances from suppliers. Inventory XX
Paying suppliers within discount period. Accounts Payable XX Inventory XX Cash XX
Purchase Transactions
Sales Transactions
After PW Audio Supply has posted the closing entries, all temporary accounts have zero balances. Also, Owner’s Capital has a balance that is carried over to the next period.
Summary of Merchandising Entries
Illustration 5-8 summarizes the entries for the merchandising accounts using a perpetual inventory system.
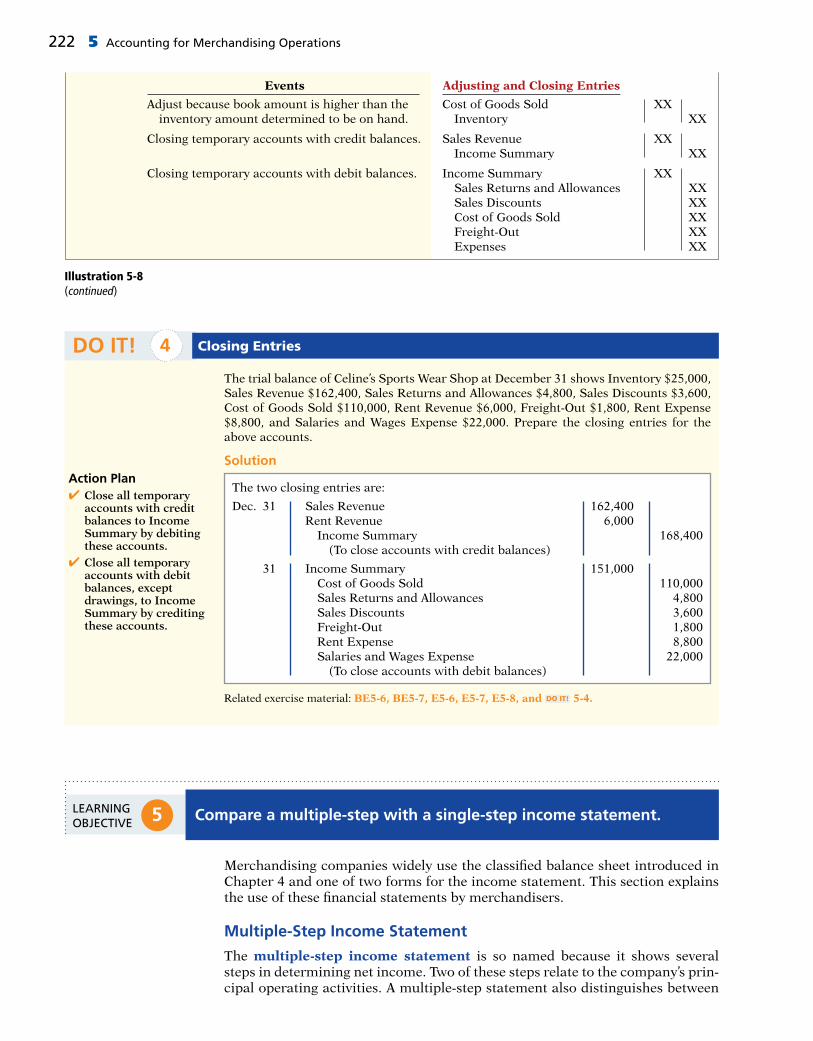
222 5 Accounting for Merchandising Operations
Events Adjusting and Closing Entries
Adjust because book amount is higher than the Cost of Goods Sold XX inventory amount determined to be on hand. Inventory XX
Closing temporary accounts with credit balances. Sales Revenue XX Income Summary XX
Closing temporary accounts with debit balances. Income Summary XX Sales Returns and Allowances XX Sales Discounts XX Cost of Goods Sold XX Freight-Out XX Expenses XX
Illustration 5-8(continued)
The trial balance of Celine’s Sports Wear Shop at December 31 shows Inventory $25,000, Sales Revenue $162,400, Sales Returns and Allowances $4,800, Sales Discounts $3,600, Cost of Goods Sold $110,000, Rent Revenue $6,000, Freight-Out $1,800, Rent Expense $8,800, and Salaries and Wages Expense $22,000. Prepare the closing entries for the above accounts.
Solution
DO IT! 4 Closing Entries
Related exercise material: BE5-6, BE5-7, E5-6, E5-7, E5-8, and DO IT! 5-4.
Action Plan✔ Close all temporary
accounts with credit balances to Income Summary by debiting these accounts.
✔ Close all temporary accounts with debit balances, except drawings, to Income Summary by crediting these accounts.
The two closing entries are:
Dec. 31 Sales Revenue 162,400 Rent Revenue 6,000 Income Summary 168,400 (To close accounts with credit balances)
31 Income Summary 151,000 Cost of Goods Sold 110,000 Sales Returns and Allowances 4,800 Sales Discounts 3,600 Freight-Out 1,800 Rent Expense 8,800 Salaries and Wages Expense 22,000 (To close accounts with debit balances)
5 Compare a multiple-step with a single-step income statement.LEARNING OBJECTIVE
Merchandising companies widely use the classifi ed balance sheet introduced in Chapter 4 and one of two forms for the income statement. This section explains the use of these fi nancial statements by merchandisers.
Multiple-Step Income Statement
The multiple-step income statement is so named because it shows several steps in determining net income. Two of these steps relate to the company’s prin-cipal operating activities. A multiple-step statement also distinguishes between

Multiple-Step vs. Single-Step Income Statement 223
operating and nonoperating activities. Finally, the statement highlights inter-mediate components of income and shows subgroupings of expenses.
INCOME STATEMENT PRESENTATION OF SALES
The multiple-step income statement begins by presenting sales revenue. It then deducts contra revenue accounts—sales returns and allowances, and sales discounts—from sales revenue to arrive at net sales. Illustration 5-9 presents the sales section for PW Audio Supply, using assumed data.
Illustration 5-9Computation of net salesPW AUDIO SUPPLY
Income Statement (partial)
Sales Sales revenue $ 480,000 Less: Sales returns and allowances $12,000 Sales discounts 8,000 20,000
Net sales $460,000
GROSS PROFIT
From Illustration 5-1, you learned that companies deduct cost of goods sold from sales revenue to determine gross profi t. For this computation, companies use net sales (which takes into consideration Sales Returns and Allowances and Sales Discounts) as the amount of sales revenue. On the basis of the sales data in Illustration 5-9 (net sales of $460,000) and cost of goods sold under the perpetual inventory system (assume $316,000), PW Audio Supply’s gross profi t is $144,000, computed as follows.
Alternative TerminologyGross profi t is sometimes referred to as gross margin.
Illustration 5-10Computation of gross profi tNet sales $ 460,000
Cost of goods sold 316,000
Gross profi t $144,000
We also can express a company’s gross profi t as a percentage, called the gross profi t rate. To do so, we divide the amount of gross profi t by net sales. For PW Audio Supply, the gross profi t rate is 31.3%, computed as follows.
Illustration 5-11Gross profi t rate formula and computation
Gross Profi t 4 Net Sales 5 Gross Profi t Rate
$144,000 4 $460,000 5 31.3%
Analysts generally consider the gross profi t rate to be more useful than the gross profi t amount. The rate expresses a more meaningful (qualitative) relation-ship between net sales and gross profi t. For example, a gross profi t of $1,000,000 may sound impressive. But if it is the result of a gross profi t rate of only 7%, it is not so impressive. The gross profi t rate tells how many cents of each sales dollar go to gross profi t. Gross profi t represents the merchandising profi t of a company. It is not a measure of the overall profi tability because operating expenses are not yet deducted. But managers and other interested parties closely watch the amount and trend of gross profi t. They compare current gross profi t with amounts reported in past periods. They also compare the company’s gross profi t rate with

224 5 Accounting for Merchandising Operations
rates of competitors and with industry averages. Such comparisons provide information about the effectiveness of a company’s purchasing function and the soundness of its pricing policies.
OPERATING EXPENSES AND NET INCOME
Operating expenses are the next component in measuring net income for a mer-chandising company. They are the expenses incurred in the process of earning sales revenue. These expenses are similar in merchandising and service compa-nies. At PW Audio Supply, operating expenses were $114,000. The company determines its net income by subtracting operating expenses from gross profi t. Thus, net income is $30,000, as shown below.
Illustration 5-12Operating expenses in computing net income
Gross profi t $144,000Operating expenses 114,000
Net income $ 30,000
The net income amount is the so-called “bottom line” of a company’s income statement.
NONOPERATING ACTIVITIES
Nonoperating activities consist of various revenues and expenses and gains and losses that are unrelated to the company’s main line of operations. When nonop-erating items are included, the label “Income from operations” (or “Operating income”) precedes them. This label clearly identifi es the results of the company’s normal operations, an amount determined by subtracting cost of goods sold and operating expenses from net sales. The results of nonoperating activities are shown in the categories “Other revenues and gains” and “Other expenses and losses.” Illustration 5-13 lists examples of each.
Illustration 5-13Other items of nonoperating activities
Other Revenues and Gains
Interest revenue from notes receivable and marketable securities.
Dividend revenue from investments in common stock.
Rent revenue from subleasing a portion of the store.
Gain from the sale of property, plant, and equipment.
Other Expenses and Losses
Interest expense on notes and loans payable.
Casualty losses from recurring causes, such as vandalism and accidents.
Loss from the sale or abandonment of property, plant, and equipment.
Loss from strikes by employees and suppliers.
Merchandising companies report the nonoperating activities in the income statement immediately after the company’s operating activities. Illustration 5-14 shows these sections for PW Audio Supply, using assumed data. The distinction between operating and nonoperating activities is crucial to many external users of fi nancial data. These users view operating income as sus-tainable and many nonoperating activities as non-recurring. Therefore, when forecasting next year’s income, analysts put the most weight on this year’s oper-ating income and less weight on this year’s nonoperating activities.
ETHICS NOTE
Companies manage earnings in various ways. ConAgra Foods recorded a non-recurring gain for $186 million from the sale of Pilgrim’s Pride stock to help meet an earnings projection for the quarter.
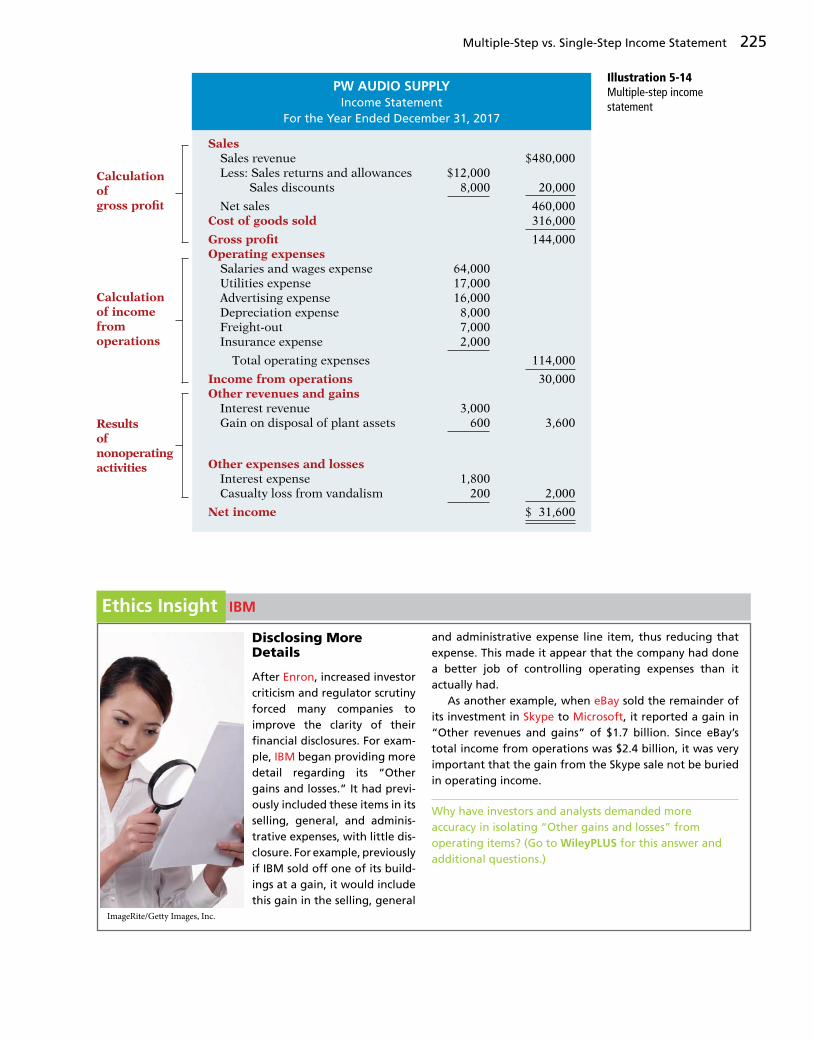
Multiple-Step vs. Single-Step Income Statement 225
Illustration 5-14Multiple-step income statement
PW AUDIO SUPPLYIncome Statement
For the Year Ended December 31, 2017
Sales Sales revenue $480,000 Less: Sales returns and allowances $12,000 Sales discounts 8,000 20,000
Net sales 460,000Cost of goods sold 316,000
Gross profi t 144,000Operating expenses Salaries and wages expense 64,000 Utilities expense 17,000 Advertising expense 16,000 Depreciation expense 8,000 Freight-out 7,000 Insurance expense 2,000
Total operating expenses 114,000
Income from operations 30,000Other revenues and gains Interest revenue 3,000 Gain on disposal of plant assets 600 3,600
Other expenses and losses Interest expense 1,800 Casualty loss from vandalism 200 2,000
Net income $ 31,600
Results of nonoperating activities
Calculation of gross profi t
Calculation of income from operations
Disclosing More Details
After Enron, increased investor criticism and regulator scrutiny forced many companies to improve the clarity of their fi nancial disclosures. For exam-ple, IBM began providing more detail regarding its “Other gains and losses.” It had previ-ously included these items in its selling, general, and adminis-trative expenses, with little dis-closure. For example, previously if IBM sold off one of its build-ings at a gain, it would include this gain in the selling, general
and administrative expense line item, thus reducing that expense. This made it appear that the company had done a better job of controlling operating expenses than it actually had.
As another example, when eBay sold the remainder of its investment in Skype to Microsoft, it reported a gain in “Other revenues and gains” of $1.7 billion. Since eBay’s total income from operations was $2.4 billion, it was very important that the gain from the Skype sale not be buried in operating income.
Why have investors and analysts demanded more accuracy in isolating “Other gains and losses” from operating items? (Go to WileyPLUS for this answer and additional questions.)
IBMEthics Insight
ImageRite/Getty Images, Inc.

226 5 Accounting for Merchandising Operations
Single-Step Income Statement
Another income statement format is the single-step income statement. The statement is so named because only one step—subtracting total expenses from total revenues—is required in determining net income. In a single-step statement, all data are classifi ed into two categories: (1) revenues, which include both operating revenues and other revenues and gains; and (2) expenses, which include cost of goods sold, operating expenses, and other expenses and losses. Illustration 5-15 shows a single-step statement for PW Audio Supply.
Illustration 5-15Single-step income statement PW AUDIO SUPPLY
Income StatementFor the Year Ended December 31, 2017
Revenues Net sales $460,000 Interest revenue 3,000 Gain on disposal of plant assets 600
Total revenues 463,600
Expenses Cost of goods sold $316,000 Operating expenses 114,000 Interest expense 1,800 Casualty loss from vandalism 200
Total expenses 432,000
Net income $ 31,600
There are two primary reasons for using the single-step format. (1) A company does not realize any type of profi t or income until total revenues exceed total expenses, so it makes sense to divide the statement into these two categories. (2) The format is simpler and easier to read. For homework problems, however, you should use the single-step format only when specifi cally instructed to do so.
Classifi ed Balance Sheet
In the balance sheet, merchandising companies report inventory as a current asset immediately below accounts receivable. Recall from Chapter 4 that companies generally list current asset items in the order of their closeness to cash (liquidity). Inventory is less close to cash than accounts receivable because the goods must fi rst be sold and then collection made from the customer. Illustration 5-16 presents the assets section of a classifi ed balance sheet for PW Audio Supply.
Helpful HintThe $40,000 is the cost of the inventory on hand, not its expected selling price.
Illustration 5-16Assets section of a classifi ed balance sheet
PW AUDIO SUPPLYBalance Sheet (Partial)
December 31, 2017
AssetsCurrent assets Cash $ 9,500 Accounts receivable 16,100 Inventory 40,000 Prepaid insurance 1,800
Total current assets 67,400Property, plant, and equipment Equipment $80,000 Less: Accumulated depreciation—equipment 24,000 56,000
Total assets $123,400

Multiple-Step vs. Single-Step Income Statement 227
You are presented with the following list of accounts from the adjusted trial balance for merchandiser Gorman Company. Indicate in which fi nancial statement and under what classifi cation each of the following would be reported.
Accounts Payable Interest PayableAccounts Receivable InventoryAccumulated Depreciation—Buildings LandAccumulated Depreciation—Equipment Notes Payable (due in 3 years)Advertising Expense Owner’s Capital (beginning balance)Buildings Owner’s DrawingsCash Property Taxes PayableDepreciation Expense Salaries and Wages ExpenseEquipment Salaries and Wages PayableFreight-Out Sales Returns and AllowancesGain on Disposal of Plant Assets Sales RevenueInsurance Expense Utilities ExpenseInterest Expense
DO IT! 5 Financial Statement Classifi cations
Related exercise material: BE5-8, BE5-9, E5-9, E5-10, E5-12, E5-13, E5-14, and DO IT! 5-5.
Action Plan✔ Review the major
sections of the income statement: sales, cost of goods sold, operating expenses, other revenues and gains, and other expenses and losses.
✔ Add net income and investments to beginning capital and deduct drawings to arrive at ending capital in the owner’s equity statement.
✔ Review the major sections of the balance sheet, income statement, and owner’s equity statement.
Solution
FinancialAccount Statement Classifi cation
Accounts Payable Balance sheet Current liabilitiesAccounts Receivable Balance sheet Current assetsAccumulated Depreciation— Balance sheet Property, plant, and Buildings equipmentAccumulated Depreciation— Balance sheet Property, plant, and Equipment equipmentAdvertising Expense Income statement Operating expensesBuildings Balance sheet Property, plant, and equipmentCash Balance sheet Current assetsDepreciation Expense Income statement Operating expensesEquipment Balance sheet Property, plant, and equipmentFreight-Out Income statement Operating expensesGain on Disposal of Plant Income statement Other revenues and Assets gainsInsurance Expense Income statement Operating expensesInterest Expense Income statement Other expenses and lossesInterest Payable Balance sheet Current liabilitiesInventory Balance sheet Current assetsLand Balance sheet Property, plant, and equipmentNotes Payable (due in 3 years) Balance sheet Long-term liabilitiesOwner’s Capital Owner’s equity Beginning balance statementOwner’s Drawings Owner’s equity Deduction section statementProperty Taxes Payable Balance sheet Current liabilitiesSalaries and Wages Expense Income statement Operating expensesSalaries and Wages Payable Balance sheet Current liabilitiesSales Returns and Allowances Income statement SalesSales Revenue Income statement SalesUtilities Expense Income statement Operating expenses

228 5 Accounting for Merchandising Operations
6 APPENDIX 5A: Prepare a worksheet for a merchandising company.
Using a Worksheet
As indicated in Chapter 4, a worksheet enables companies to prepare fi nancial statements before they journalize and post adjusting entries. The steps in prepar-ing a worksheet for a merchandising company are the same as for a service com-pany (see pages 150–156). Illustration 5A-1 shows the worksheet for PW Audio Supply (excluding nonoperating items). The unique accounts for a merchandiser using a perpetual inventory system are in red.
LEARNING OBJECTIVE
*
Formulas Data Review ViewPage LayoutInsert
AP18 fx
E F GB C D H I J K
PW Audio Supply.xlsPW Audio Supply.xlsHome
123
4
5
6
7
8
9
10
11
12
13
14
15
16
17
18
19
20
21
22
23
24
25
26
27
28
29
30
31
32
33
Trial Balance AdjustmentsAdjusted
Trial BalanceIncome
StatementBalance
SheetDr. Cr. Dr. Cr. Dr. Cr. Dr. Cr. Dr. Cr.Accounts
PW AUDIO SUPPLYWorksheet
For the Year Ended December 31, 2017
9,50016,10040,5003,800
80,000
15,000
12,0008,000
315,5007,000
16,00059,00017,000
599,400
16,00020,40083,000
480,000
599,400
480,000
480,000
480,000
(a) 500(b) 2,000
(c) 8,000
(d) 5,00015,500
24,00020,40083,000
5,000132,400
30,000162,400
CashAccounts ReceivableInventoryPrepaid InsuranceEquipmentAccumulated Depreciation— EquipmentAccounts PayableOwner's CapitalOwner's DrawingsSales RevenueSales Returns and AllowancesSales DiscountsCost of Goods SoldFreight-OutAdvertising ExpenseSalaries and Wages ExpenseUtilities Expense TotalsInsurance ExpenseDepreciation ExpenseSalaries and Wages Payable TotalsNet Income Totals
(a) 500
(d) 5,000
(b) 2,000(c) 8,000
15,500
9,50016,10040,000
1,80080,000
15,000
12,0008,000
316,0007,000
16,00064,00017,000
2,0008,000
612,400
24,00020,40083,000
480,000
5,000612,400
12,0008,000
316,0007,000
16,00064,00017,000
2,0008,000
450,00030,000
480,000
9,50016,10040,000
1,80080,000
15,000
162,400
162,400
Key: (a) Adjustment to inventory on hand. (b) Insurance expired. (c) Depreciation expense.(d) Salaries and wages accrued.
Illustration 5A-1Worksheet for merchandising company—perpetual inventory system
Appendix 5B: Periodic Inventory System 229
TRIAL BALANCE COLUMNS
Data for the trial balance come from the ledger balances of PW Audio Supply at December 31. The amount shown for Inventory, $40,500, is the year-end inven-tory amount from the perpetual inventory system.
ADJUSTMENTS COLUMNS
A merchandising company generally has the same types of adjustments as a ser-vice company. As you see in the worksheet, adjustments (b), (c), and (d) are for insurance, depreciation, and salaries. Pioneer Advertising, as illustrated in Chap-ters 3 and 4, also had these adjustments. Adjustment (a) was required to adjust the perpetual inventory carrying amount to the actual count. After PW Audio Supply enters all adjustments data on the worksheet, it estab-lishes the equality of the adjustments column totals. It then extends the balances in all accounts to the adjusted trial balance columns.
ADJUSTED TRIAL BALANCE
The adjusted trial balance shows the balance of all accounts after adjustment at the end of the accounting period.
INCOME STATEMENT COLUMNS
Next, the merchandising company transfers the accounts and balances that affect the income statement from the adjusted trial balance columns to the income state-ment columns. PW Audio Supply shows Sales Revenue of $480,000 in the credit column. It shows the contra revenue accounts Sales Returns and Allowances $12,000 and Sales Discounts $8,000 in the debit column. The difference of $460,000 is the net sales shown on the income statement (Illustration 5-14, page 225). Finally, the company totals all the credits in the income statement column and compares those totals to the total of the debits in the income statement col-umn. If the credits exceed the debits, the company has net income. PW Audio Supply has net income of $30,000. If the debits exceed the credits, the company would report a net loss.
BALANCE SHEET COLUMNS
The major difference between the balance sheets of a service company and a merchandiser is inventory. PW Audio Supply shows the ending inventory amount of $40,000 in the balance sheet debit column. The information to prepare the owner’s equity statement is also found in these columns. That is, the Owner’s Capital account is $83,000. Owner’s Drawings are $15,000. Net income results when the total of the debit column exceeds the total of the credit column in the balance sheet columns. A net loss results when the total of the credits exceeds the total of the debit balances.
7 APPENDIX 5B: Record purchases and sales under a periodic inventory system.
As described in this chapter, companies may use one of two basic systems of accounting for inventories: (1) the perpetual inventory system or (2) the periodic inventory system. In the chapter, we focused on the characteristics of the perpet-ual inventory system. In this appendix, we discuss and illustrate the periodic inventory system. One key difference between the two systems is the point at which the company computes cost of goods sold. For a visual reminder of this difference, refer back to Illustration 5-5 (on page 210).
LEARNING OBJECTIVE
*

230 5 Accounting for Merchandising Operations
Determining Cost of Goods Sold Under a Periodic System
Determining cost of goods sold is different when a periodic inventory system is used rather than a perpetual system. As you have seen, a company using a per-petual system makes an entry to record cost of goods sold and to reduce inven-tory each time a sale is made. A company using a periodic system does not determine cost of goods sold until the end of the period. At the end of the period, the company performs a count to determine the ending balance of inventory. It then calculates cost of goods sold by subtracting ending inventory from the cost of goods available for sale. Goods available for sale is the sum of begin-ning inventory plus purchases, as shown in Illustration 5B-1.
Illustration 5B-1Basic formula for cost of goods sold using the periodic system
Beginning Inventory 1 Cost of Goods Purchased
Cost of Goods Available for Sale 2 Ending Inventory
Cost of Goods Sold
Another difference between the two approaches is that the perpetual system directly adjusts the Inventory account for any transaction that affects inventory (such as freight costs, returns, and discounts). The periodic system does not do this. Instead, it creates different accounts for purchases, freight costs, returns, and discounts. These various accounts are shown in Illustration 5B-2, which presents the calculation of cost of goods sold for PW Audio Supply using the periodic approach.
Note that the basic elements from Illustration 5B-1 are highlighted in Illus-tration 5B-2. You will learn more in Chapter 6 about how to determine cost of goods sold using the periodic system. The use of the periodic inventory system does not affect the form of presen-tation in the balance sheet. As under the perpetual system, a company reports inventory in the current assets section.
Recording Merchandise Transactions
In a periodic inventory system, companies record revenues from the sale of merchandise when sales are made, just as in a perpetual system. Unlike the per-petual system, however, companies do not attempt on the date of sale to
Illustration 5B-2Cost of goods sold for a merchandiser using a periodic inventory system
PW AUDIO SUPPLYCost of Goods Sold
For the Year Ended December 31, 2017
Cost of goods sold Inventory, January 1 $ 36,000 Purchases $325,000 Less: Purchase returns and allowances $10,400 Purchase discounts 6,800 17,200
Net purchases 307,800Add: Freight-in 12,200
Cost of goods purchased 320,000
Cost of goods available for sale 356,000Less: Inventory, December 31 40,000
Cost of goods sold $316,000
Helpful HintThe far right column identifi es the primary items that make up cost of goods sold of $316,000. The middle column explains cost of goods purchased of $320,000. The left column reports contra purchase items of $17,200.

Appendix 5B: Periodic Inventory System 231
record the cost of the merchandise sold. Instead, they take a physical inven-tory count at the end of the period to determine (1) the cost of the merchandise then on hand and (2) the cost of the goods sold during the period. And, under a periodic system, companies record purchases of merchandise in the Pur-chases account rather than in the Inventory account. Also, in a periodic system, purchase returns and allowances, purchase discounts, and freight costs on purchases are recorded in separate accounts. To illustrate the recording of merchandise transactions under a periodic inventory system, we will use purchase/sales transactions between PW Audio Supply and Sauk Stereo, as illustrated for the perpetual inventory system in this chapter.
Recording Purchases of Merchandise
On the basis of the sales invoice (Illustration 5-6, shown on page 212) and receipt of the merchandise ordered from PW Audio Supply, Sauk Stereo records the $3,800 purchase as follows.
Helpful HintBe careful not to debit purchases of equipment or supplies to a Purchases account.
May 4 Purchases 3,800 Accounts Payable 3,800 (To record goods purchased on account from PW Audio Supply)
May 6 Freight-In (Transportation-In) 150 Cash 150 (To record payment of freight on goods purchased)
May 8 Accounts Payable 300 Purchase Returns and Allowances 300 (To record return of goods purchased from PW Audio Supply)
Purchases is a temporary account whose normal balance is a debit.
FREIGHT COSTS
When the purchaser directly incurs the freight costs, it debits the account Freight-In (or Transportation-In). For example, if Sauk Stereo pays Public Carrier Co. $150 for freight charges on its purchase from PW Audio Supply on May 6, the entry on Sauk Stereo’s books is:
Alternative TerminologyFreight-In is also called Transportation-In.
Like Purchases, Freight-In is a temporary account whose normal balance is a debit. Freight-In is part of cost of goods purchased. The reason is that cost of goods purchased should include any freight charges necessary to bring the goods to the purchaser. Freight costs are not subject to a purchase discount. Purchase discounts apply only to the invoice cost of the merchandise.
PURCHASE RETURNS AND ALLOWANCES
Sauk Stereo returns $300 of goods to PW Audio Supply and prepares the following entry to recognize the return.
Purchase Returns and Allowances is a temporary account whose normal balance is a credit.

232 5 Accounting for Merchandising Operations
PURCHASE DISCOUNTS
On May 14, Sauk Stereo pays the balance due on account to PW Audio Supply, taking the 2% cash discount allowed by PW Audio Supply for payment within 10 days. Sauk Stereo records the payment and discount as follows.
May 14 Accounts Payable ($3,800 2 $300) 3,500 Purchase Discounts ($3,500 3 .02) 70 Cash 3,430 (To record payment within the discount period)
May 14 Cash 3,430 Sales Discounts ($3,500 3 .02) 70 Accounts Receivable ($3,800 2 $300) 3,500 (To record collection within 2/10, n/30 discount period from Sauk Stereo)
May 4 Accounts Receivable 3,800 Sales Revenue 3,800 (To record credit sales per invoice #731 to Sauk Stereo)
May 8 Sales Returns and Allowances 300 Accounts Receivable 300 (To record credit granted to Sauk Stereo for returned goods)
Purchase Discounts is a temporary account whose normal balance is a credit.
Recording Sales of Merchandise
The seller, PW Audio Supply, records the sale of $3,800 of merchandise to Sauk Stereo on May 4 (sales invoice No. 731, Illustration 5-6, page 212) as follows.
SALES RETURNS AND ALLOWANCES
To record the returned goods received from Sauk Stereo on May 8, PW Audio Supply records the $300 sales return as follows.
SALES DISCOUNTS
On May 14, PW Audio Supply receives payment of $3,430 on account from Sauk Stereo. PW Audio Supply honors the 2% cash discount and records the payment of Sauk Stereo’s account receivable in full as follows.
COMPARISON OF ENTRIES—PERPETUAL VS. PERIODIC
Illustration 5B-3 summarizes the periodic inventory entries shown in this appen-dix and compares them to the perpetual system entries from the chapter. Entries that differ in the two systems are shown in color.

Appendix 5B: Periodic Inventory System 233
Journalizing and Posting Closing Entries
For a merchandising company, like a service company, all accounts that affect the determination of net income are closed to Income Summary. Data for the prepa-ration of closing entries may be obtained from the income statement columns of the worksheet. In journalizing, all debit column amounts are credited, and all credit columns amounts are debited. To close the merchandise inventory in a periodic inventory system:
1. The beginning inventory balance is debited to Income Summary and credited to Inventory.
2. The ending inventory balance is debited to Inventory and credited to Income Summary.
The two entries for PW Audio Supply are as follows.
Illustration 5B-3Comparison of entries for perpetual and periodic inventory systems
ENTRIES ON SAUK STEREO’S BOOKS
Transaction Perpetual Inventory System Periodic Inventory System
May 4 Purchase of Inventory 3,800 Purchases 3,800 merchandise on credit. Accounts Payable 3,800 Accounts Payable 3,800
6 Freight costs on Inventory 150 Freight-In 150 purchases. Cash 150 Cash 150
8 Purchase returns and Accounts Payable 300 Accounts Payable 300 allowances. Inventory 300 Purchase Returns and Allowances 300
14 Payment on account Accounts Payable 3,500 Accounts Payable 3,500 with a discount. Cash 3,430 Cash 3,430 Inventory 70 Purchase Discounts 70
ENTRIES ON PW AUDIO SUPPLY’S BOOKS
Transaction Perpetual Inventory System Periodic Inventory System
May 4 Sale of merchandise Accounts Receivable 3,800 Accounts Receivable 3,800 on credit. Sales Revenue 3,800 Sales Revenue 3,800
Cost of Goods Sold 2,400 No entry for cost of Inventory 2,400 goods sold
8 Return of Sales Returns and Sales Returns and merchandise sold. Allowances 300 Allowances 300 Accounts Receivable 300 Accounts Receivable 300
Inventory 140 No entry Cost of Goods Sold 140
14 Cash received on Cash 3,430 Cash 3,430 account with a Sales Discounts 70 Sales Discounts 70 discount. Accounts Receivable 3,500 Accounts Receivable 3,500
(1)Dec. 31 Income Summary 36,000 Inventory 36,000 (To close beginning inventory)
(2) 31 Inventory 40,000 Income Summary 40,000 (To record ending inventory)

234 5 Accounting for Merchandising Operations
After posting, the Inventory and Income Summary accounts will show the following.
Illustration 5B-4Posting closing entries for merchandise inventory
Inventory Income Summary
1/1 Bal. 36,000 12/31 Close 36,000 12/31 Close 36,000 12/31 Close 40,00012/31 Close 40,000
12/31 Bal. 40,000
Often, the closing of inventory is included with other closing entries, as shown below for PW Audio Supply. (Close inventory with other accounts in home-work problems unless stated otherwise.)
Helpful HintExcept for merchandise inventory, the easiest way to prepare the fi rst two closing entries is to identify the temporary accounts by their balances and then prepare one entry for the credits and one for the debits.
Dec. 31 Inventory (Dec. 31) 40,000 Sales Revenue 480,000 Purchase Returns and Allowances 10,400 Purchase Discounts 6,800 Income Summary 537,200 (To record ending inventory and close accounts with credit balances)
31 Income Summary 507,200 Inventory (Jan. 1) 36,000 Sales Returns and Allowances 12,000 Sales Discounts 8,000 Purchases 325,000 Freight-In 12,200 Salaries and Wages Expense 64,000 Freight-Out 7,000 Advertising Expense 16,000 Utilities Expense 17,000 Depreciation Expense 8,000 Insurance Expense 2,000 (To close beginning inventory and other income statement accounts with debit balances)
31 Income Summary 30,000 Owner’s Capital 30,000 (To transfer net income to capital)
31 Owner’s Capital 15,000 Owner’s Drawings 15,000 (To close drawings to capital)
After the closing entries are posted, all temporary accounts have zero bal-ances. In addition, Owner’s Capital has a credit balance of $98,000: beginning balance 1 net income 2 drawings ($83,000 1 $30,000 2 $15,000).
Using a Worksheet
As indicated in Chapter 4, a worksheet enables companies to prepare fi nancial statements before journalizing and posting adjusting entries. The steps in prepar-ing a worksheet for a merchandising company are the same as they are for a service company (see pages 150–156).
TRIAL BALANCE COLUMNS
Data for the trial balance come from the ledger balances of PW Audio Supply at December 31. The amount shown for Inventory, $36,000, is the beginning inventory amount from the periodic inventory system.

Appendix 5B: Periodic Inventory System 235
ADJUSTMENTS COLUMNS
A merchandising company generally has the same types of adjustments as a service company. As you see in the worksheet in Illustration 5B-5, adjustments (a), (b), and (c) are for insurance, depreciation, and salaries and wages. These adjustments were also required for Pioneer Advertising, as illustrated in Chapters 3 and 4. The unique accounts for a merchandiser using a periodic inventory sys-tem are shown in capital red letters. Note, however, that the worksheet excludes nonoperating items. After all adjustment data are entered on the worksheet, the equality of the adjustment column totals is established. The balances in all accounts are then extended to the adjusted trial balance columns.
Illustration 5B-5Worksheet for merchandising company—periodic inventory system
Formulas Data Review ViewPage LayoutInsert
AP18 fx
E F GB C D H I J K
PW Audio Supply.xlsPW Audio Supply.xlsHome
123
4
5
6
7
8
9
10
11
12
13
14
15
16
17
18
19
20
21
22
23
24
25
26
27
28
29
30
31
32
33
34
35
36
Trial Balance AdjustmentsAdjusted
Trial BalanceIncome
StatementBalance
SheetDr. Cr. Dr. Cr. Dr. Cr. Dr. Cr. Dr. Cr.Accounts
PW AUDIO SUPPLYWorksheet
For the Year Ended December 31, 2017
CashAccounts ReceivableINVENTORYPrepaid InsuranceEquipmentAccumulated Depreciation— EquipmentAccounts PayableOwner's CapitalOwner's DrawingsSALES REVENUESALES RETURNS AND ALLOWANCESSALES DISCOUNTSPURCHASESPURCHASE RETURNS AND ALLOWANCESPURCHASE DISCOUNTSFREIGHT-INFreight-OutAdvertising ExpenseSalaries and Wages ExpenseUtilities Expense TotalsInsurance ExpenseDepreciation ExpenseSalaries and Wages Payable TotalsNet Income Totals
9,50016,10036,0003,800
80,000
15,000
12,0008,000
325,000
12,2007,000
16,00059,00017,000
616,600
16,00020,40083,000
480,000
10,4006,800
616,600
(c) 5,000
(a) 2,000(b) 8,000
15,000
(a) 2,000
(b) 8,000
(c) 5,00015,000
9,50016,10036,000
1,80080,000
15,000
12,0008,000
325,000
12,2007,000
16,00064,00017,000
2,0008,000
629,600
9,50016,10040,000
1,80080,000
15,000
162,400
162,400
36,000
12,0008,000
325,000
12,2007,000
16,00064,00017,000
2,0008,000
507,20030,000
537,200
24,00020,40083,000
480,000
10,4006,800
5,000629,600
24,00020,40083,000
5,000132,400
30,000162,400
40,000
480,000
10,4006,800
537,200
537,200
Key: (a) Insurance expired. (b) Depreciation expense. (c) Salaries and wages accrued.

236 5 Accounting for Merchandising Operations
INCOME STATEMENT COLUMNS
Next, PW Audio Supply transfers the accounts and balances that affect the income statement from the adjusted trial balance columns to the income statement col-umns. The company shows Sales Revenue of $480,000 in the credit column. It shows the contra revenue accounts, Sales Returns and Allowances of $12,000 and Sales Discounts of $8,000 in the debit column. The difference of $460,000 is the net sales shown on the income statement (Illustration 5-9, page 223). Similarly, Purchases of $325,000 and Freight-In of $12,200 are extended to the debit col-umn. The contra purchase accounts, Purchase Returns and Allowances of $10,400 and Purchase Discounts of $6,800, are extended to the credit columns. The worksheet procedures for the Inventory account merit specifi c comment. The procedures are:
1. The beginning balance, $36,000, is extended from the adjusted trial balance column to the income statement debit column. From there, it can be added in reporting cost of goods available for sale in the income statement.
2. The ending inventory, $40,000, is added to the worksheet by an income state-ment credit and a balance sheet debit. The credit makes it possible to deduct ending inventory from the cost of goods available for sale in the income statement to determine cost of goods sold. The debit means the ending inven-tory can be reported as an asset on the balance sheet.
These two procedures are specifi cally illustrated below:
Illustration 5B-6Worksheet procedures for inventories
Income Statement Balance Sheet
Dr. Cr. Dr. Cr.
Inventory (1) 36,000 40,000 (2) 40,000
The computation for cost of goods sold, taken from the income statement column in Illustration 5B-5, is as follows.
Illustration 5B-7Computation of cost of goods sold from worksheet columns
Debit Column Credit Column
Beginning inventory $ 36,000 Ending inventory $40,000Purchases 325,000 Purchase returns and allowances 10,400Freight-in 12,200 Purchase discounts 6,800
Total debits 373,200 Total credits $57,200Less: Total credits 57,200
Cost of goods sold $316,000
Finally, PW Audio Supply totals all the credits in the income statement column and compares these totals to the total of the debits in the income statement col-umn. If the credits exceed the debits, the company has net income. PW Audio Supply has net income of $30,000. If the debits exceed the credits, the company would report a net loss.
BALANCE SHEET COLUMNS
The major difference between the balance sheets of a service company and a merchandising company is inventory. PW Audio Supply shows ending inventory of $40,000 in the balance sheet debit column. The information to prepare the owner’s equity statement is also found in these columns. That is, the Owner’s Capital account is $83,000. Owner’s Drawings are $15,000. Net income results when the total of the debit column exceeds the total of the credit column in the balance sheet columns. A net loss results when the total of the credits exceeds the total of the debit balances.
Helpful HintIn a periodic system, cost of goods sold is a computation—it is not a separate account with a balance.
Review and Practice 237
Describe merchandising operations and inventory systems. Because of inventory, a merchandising com-pany has sales revenue, cost of goods sold, and gross profi t. To account for inventory, a merchandising company must choose between a perpetual and a periodic inventory system.
Record purchases under a perpetual inventory system.The company debits the Inventory account for all purchases of merchandise and freight-in, and credits it for purchase discounts and purchase returns and allowances.
Record sales under a perpetual inventory system.When a merchandising company sells inventory, it debits Accounts Receivable (or Cash) and credits Sales Revenue for the selling price of the merchan-dise. At the same time, it debits Cost of Goods Sold and credits Inventory for the cost of the inventory items sold. Sales Returns and Allowances and Sales Discounts are debited and are contra revenue accounts.
Apply the steps in the accounting cycle to a merchan-dising company. Each of the required steps in the accounting cycle for a service company applies to a merchandising company. A worksheet is again an
2
3
4
optional step. Under a perpetual inventory system, the company must adjust the Inventory account to agree with the physical count.
Compare a multiple-step with a single-step income statement. A multiple-step income statement shows numerous steps in determining net income, including nonoperating activities sections. A single-step income statement classifi es all data under two categories, rev-enues or expenses, and determines net income in one step.
Prepare a worksheet for a merchandising company.The steps in preparing a worksheet for a merchandis-ing company are the same as for a service company. The unique accounts for a merchandiser are Inven-tory, Sales Revenue, Sales Returns and Allowances, Sales Discounts, and Cost of Goods Sold.
Record purchases and sales under a periodic inven-tory system. In recording purchases under a periodic system, companies must make entries for (a) cash and credit purchases, (b) purchase returns and allow-ances, (c) purchase discounts, and (d) freight costs. In recording sales, companies must make entries for (a) cash and credit sales, (b) sales returns and allow-ances, and (c) sales discounts.
5
* 6
* 7
LEARNING OBJECTIVES REVIEW
1
REVIEW AND PRACTICE
Contra revenue account An account that is offset against a revenue account on the income statement. (p. 218).
Cost of goods sold The total cost of merchandise sold during the period. (p. 208).
FOB destination Freight terms indicating that the seller places the goods free on board to the buyer’s place of business, and the seller pays the freight. (p. 213).
FOB shipping point Freight terms indicating that the seller places goods free on board the carrier, and the buyer pays the freight costs. (p. 213).
Gross profi t The excess of net sales over the cost of goods sold. (p. 223).
Gross profi t rate Gross profi t expressed as a percentage, by dividing the amount of gross profi t by net sales. (p. 223).
Income from operations Income from a company’s principal operating activity; determined by subtracting cost of goods sold and operating expenses from net sales. (p. 224).
Multiple-step income statement An income state-ment that shows several steps in determining net income. (p. 222).
Net sales Sales revenue less sales returns and allowances and less sales discounts. (p. 223).
Nonoperating activities Various revenues, expenses, gains, and losses that are unrelated to a company’s main line of operations. (p. 224).
Operating expenses Expenses incurred in the process of earning sales revenue. (p. 224).
Other expenses and losses A nonoperating-activities section of the income statement that shows expenses and losses unrelated to the company’s main line of operations. (p. 224).
Other revenues and gains A nonoperating-activities section of the income statement that shows revenues and gains unrelated to the company’s main line of oper-ations. (p. 224).
Periodic inventory system An inventory system under which the company does not keep detailed inventory records throughout the accounting period but deter-mines the cost of goods sold only at the end of an accounting period. (p. 210).
Perpetual inventory system An inventory system under which the company keeps detailed records of the cost of each inventory purchase and sale, and the
GLOSSARY REVIEW

238 5 Accounting for Merchandising Operations
records continuously show the inventory that should be on hand. (p. 209).
Purchase allowance A deduction made to the selling price of merchandise, granted by the seller so that the buyer will keep the merchandise. (p. 214).
Purchase discount A cash discount claimed by a buyer for prompt payment of a balance due. (p. 214).
Purchase invoice A document that supports each credit purchase. (p. 212).
Purchase return A return of goods from the buyer to the seller for a cash or credit refund. (p. 214).
Sales discount A reduction given by a seller for prompt payment of a credit sale. (p. 218).
Sales invoice A document that supports each credit sale. (p. 216).
Sales returns and allowances Purchase returns and allowances from the seller’s perspective. See Purchase return and Purchase allowance, above. (p. 217).
Sales revenue (Sales) The primary source of revenue in a merchandising company. (p. 208).
Single-step income statement An income statement that shows only one step in determining net income. (p. 226).
1. Gross profi t will result if:(a) operating expenses are less than net income.(b) sales revenues are greater than operating
expenses.(c) sales revenues are greater than cost of goods sold.(d) operating expenses are greater than cost of goods
sold. 2. Under a perpetual inventory system, when goods are
purchased for resale by a company:(a) purchases on account are debited to Inventory.(b) purchases on account are debited to Purchases.(c) purchase returns are debited to Purchase Returns
and Allowances.(d) freight costs are debited to Freight-Out.
3. The sales accounts that normally have a debit balance are:(a) Sales Discounts.(b) Sales Returns and Allowances.(c) Both (a) and (b).(d) Neither (a) nor (b).
4. A credit sale of $750 is made on June 13, terms 2/10, net/30. A return of $50 is granted on June 16. The amount received as payment in full on June 23 is:(a) $700. (c) $685.(b) $686. (d) $650.
5. Which of the following accounts will normally appear in the ledger of a merchandising company that uses a perpetual inventory system?(a) Purchases. (c) Cost of Goods Sold.(b) Freight-In. (d) Purchase Discounts.
6. To record the sale of goods for cash in a perpetual inventory system:(a) only one journal entry is necessary to record cost
of goods sold and reduction of inventory.(b) only one journal entry is necessary to record the
receipt of cash and the sales revenue.(c) two journal entries are necessary: one to record
the receipt of cash and sales revenue, and one to record the cost of goods sold and reduction of inventory.
(d) two journal entries are necessary: one to record the receipt of cash and reduction of inventory, and one to record the cost of goods sold and sales revenue.
(LO 1)
(LO 2)
(LO 3)
(LO 3)
(LO 2)
(LO 3)
7. The steps in the accounting cycle for a merchandising company are the same as those in a service company except:(a) an additional adjusting journal entry for inven-
tory may be needed in a merchandising company.(b) closing journal entries are not required for a mer-
chandising company.(c) a post-closing trial balance is not required for a
merchandising company.(d) a multiple-step income statement is required for a
merchandising company. 8. The multiple-step income statement for a merchan-
dising company shows each of the following features except:(a) gross profi t.(b) cost of goods sold.(c) a sales section.(d) an investing activities section.
9. If sales revenues are $400,000, cost of goods sold is $310,000, and operating expenses are $60,000, the gross profi t is:(a) $30,000. (c) $340,000.(b) $90,000. (d) $400,000.
10. A single-step income statement:(a) reports gross profi t.(b) does not report cost of goods sold.(c) reports sales revenue and “Other revenues and
gains” in the revenues section of the income statement.
(d) reports operating income separately. 11. Which of the following appears on both a single-step
and a multiple-step income statement?(a) Inventory.(b) Gross profi t.(c) Income from operations.(d) Cost of goods sold.
12. In a worksheet using a perpetual inventory system, Inventory is shown in the following columns:(a) adjusted trial balance debit and balance sheet
debit.(b) income statement debit and balance sheet debit.(c) income statement credit and balance sheet debit.(d) income statement credit and adjusted trial bal-
ance debit.
(LO 4)
(LO 5)
(LO 5)
(LO 5)
(LO 5)
* (LO 6)
PRACTICE MULTIPLE-CHOICE QUESTIONS

Practice Multiple-Choice Questions 239
13. In determining cost of goods sold in a periodic system:(a) purchase discounts are deducted from net
purchases.(b) freight-out is added to net purchases.(c) purchase returns and allowances are deducted
from net purchases.(d) freight-in is added to net purchases.
14. If beginning inventory is $60,000, cost of goods pur-chased is $380,000, and ending inventory is $50,000, cost of goods sold is:
*(LO 7)
*(LO 7)
(a) $390,000. (c) $330,000.(b) $370,000. (d) $420,000.
15. When goods are purchased for resale by a company using a periodic inventory system:(a) purchases on account are debited to Inventory.(b) purchases on account are debited to Purchases.(c) purchase returns are debited to Purchase Returns
and Allowances.(d) freight costs are debited to Purchases.
* (LO 7)
Solutions
1. (c) Gross profi t will result if sales revenues are greater than cost of goods sold. The other choices are incorrect because (a) oper-ating expenses and net income are not used in the computation of gross profi t; (b) gross profi t results when sales revenues are greater than cost of goods sold, not operating expenses; and (d) gross profi t results when sales revenues, not operating expenses, are greater than cost of goods sold.
2. (a) Under a perpetual inventory system, when a company purchases goods for resale, purchases on account are debited to the Inventory account, not (b) Purchases or (c) Purchase Returns and Allowances. Choice (d) is incorrect because freight costs are also debited to the Inventory account, not the Freight-Out account.
3. (c) Both Sales Discounts and Sales Returns and Allowances normally have a debit balance. Choices (a) and (b) are both correct, but (c) is the better answer. Choice (d) is incorrect as both (a) and (b) are correct.
4. (b) The full amount of $686 is paid within 10 days of the purchase ($750 2 $50) 2 [($750 2 $50) 3 2%]. The other choices are incorrect because (a) does not consider the discount of $14; (c) the amount of the discount is based upon the amount after the return is granted ($700 3 2%), not the amount before the return of merchandise ($750 3 2%); and (d) does not constitute payment in full on June 23.
5. (c) The Cost of Goods Sold account normally appears in the ledger of a merchandising company using a perpetual inventory system. The other choices are incorrect because (a) the Purchases account, (b) the Freight-In account, and (d) the Purchase Dis-counts account all appear in the ledger of a merchandising company that uses a periodic inventory system.
6. (c) Two journal entries are necessary: one to record the receipt of cash and sales revenue, and one to record the cost of goods sold and reduction of inventory. The other choices are incorrect because (a) only considers the recognition of the expense and ignores the revenue, (b) only considers the recognition of revenue and leaves out the expense or cost of merchandise sold, and (d) the receipt of cash and sales revenue, not reduction of inventory, are paired together, and the cost of goods sold and reduction of inventory, not sales revenue, are paired together.
7. (a) An additional adjusting journal entry for inventory may be needed in a merchandising company to adjust for a physical inventory count, but it is not needed for a service company. The other choices are incorrect because (b) closing journal entries and (c) a post-closing trial balance are required for both types of companies, Choice (d) is incorrect because while a multiple-step income statement is not required for a merchandising company, it is useful to distinguish income generated from operating the business versus income or loss from nonrecurring, nonoperating items.
8. (d) An investing activities section appears on the statement of cash fl ows, not on a multiple-step income statement. Choices (a) gross profi t, (b) cost of goods sold, and (c) a sales section are all features of a multiple-step income statement.
9. (b) Gross profi t 5 Sales revenue ($400,000) 2 Cost of goods sold ($310,000) 5 $90,000, not (a) $30,000, (c) $340,000, or (d) $400,000.
10. (c) Both sales revenue and “Other revenues and gains” are reported in the revenues section of a single-step income statement. The other choices are incorrect because (a) gross profi t is not reported on a single-step income statement, (b) cost of goods sold is included in the expenses section of a single-step income statement, and (d) income from operations is not shown separately on a single-step income statement.
11. (d) Cost of goods sold appears on both a single-step and a multiple-step income statement. The other choices are incorrect because (a) inventory does not appear on either a single-step or a multiple-step income statement and (b) gross profi t and (c) income from operations appear on a multiple-step income statement but not on a single-step income statement.
12. (a) In a worksheet using a perpetual inventory system, inventory is shown in the adjusted trial balance debit column and in the balance sheet debit column. The other choices are incorrect because the Inventory account is not shown in the income statement columns.
*13. (d) In determining cost of goods sold in a periodic system, freight-in is added to net purchases. The other choices are incorrect because (a) purchase discounts are deducted from purchases, not net purchases; (b) freight-out is a cost of sales, not a cost of pur-chases; and (c) purchase returns and allowances are deducted from purchases, not net purchases.
*14. (a) Beginning inventory ($60,000) 1 Cost of goods purchased ($380,000) 2 Ending inventory ($50,000) 5 Cost of goods sold ($390,000), not (b) $370,000, (c) $330,000, or (d) $420,000.
*15. (b) Purchases for resale are debited to the Purchases account. The other choices are incorrect because (a) purchases on account are debited to Purchases, not Inventory; (c) Purchase Returns and Allowances are always credited; and (d) freight costs are debited to Freight-In, not Purchases.

240 5 Accounting for Merchandising Operations
1. On June 10, Spinner Company purchased $10,000 of merchandise from Lawrence Company, FOB shipping point, terms 2/10, n/30. Spinner pays the freight costs of $600 on June 11. Damaged goods totaling $700 are returned to Lawrence for credit on June 12. The fair value of these goods is $300. On June 19, Spinner pays Lawrence in full, less the pur-chase discount. Both companies use a perpetual inventory system.
Instructions(a) Prepare separate entries for each transaction on the books of Spinner Company.
(b) Prepare separate entries for each transaction for Lawrence Company. The merchan-dise purchased by Spinner on June 10 had cost Lawrence $6,400.
Prepare purchase and sales entries.
(LO 2, 3)
2. In its income statement for the year ended December 31, 2017, Sale Company reported the following condensed data.
Interest expense $ 50,000 Net sales $1,650,000Operating expenses 590,000 Interest revenue 20,000Cost of goods sold 902,000 Loss on disposal of equipment 7,000
Instructions(a) Prepare a multiple-step income statement.
(b) Prepare a single-step income statement.
Prepare multiple-step and single-step income statements.
(LO 5)
PRACTICE EXERCISES
1. (a)June 10 Inventory 10,000 Accounts Payable 10,000
11 Inventory 600 Cash 600
12 Accounts Payable 700 Inventory 700
19 Accounts Payable ($10,000 2 $700) 9,300 Inventory ($9,300 3 2%) 186 Cash ($9,300 2 $186) 9,114
(b) June 10 Accounts Receivable 10,000 Sales Revenue 10,000 Cost of Goods Sold 6,400 Inventory 6,400
12 Sales Returns and Allowances 700 Accounts Receivable 700 Inventory 300 Cost of Goods Sold 300
19 Cash ($9,300 2 $186) 9,114 Sales Discounts ($9,300 3 2%) 186 Accounts Receivable ($10,000 2 $700) 9,300
Solution

Practice Problem 241
Solution
2. (a)
The adjusted trial balance columns of Falcetto Company’s worksheet for the year ended December 31, 2017, are as follows. Debit Credit
Cash 14,500 Accumulated Depreciation—Accounts Receivable 11,100 Equipment 18,000Inventory 29,000 Notes Payable 25,000Prepaid Insurance 2,500 Accounts Payable 10,600Equipment 95,000 Owner’s Capital 81,000Owner’s Drawings 12,000 Sales Revenue 536,800Sales Returns and Allowances 6,700 Interest Revenue 2,500Sales Discounts 5,000 673,900Cost of Goods Sold 363,400Freight-Out 7,600Advertising Expense 12,000Salaries and Wages Expense 56,000Utilities Expense 18,000Rent Expense 24,000Depreciation Expense 9,000Insurance Expense 4,500Interest Expense 3,600
673,900
Prepare a multiple-step income statement.
(LO 5)
PRACTICE PROBLEM
(b)
SALE COMPANYIncome Statement
For the Year Ended December 31, 2017
Revenues Net sales $1,650,000 Interest revenue 20,000
Total revenues $1,670,000Expenses Cost of goods sold 902,000 Operating expenses 590,000 Interest expenses 50,000 Loss on sale of equipment 7,000
Total expenses 1,549,000
Net income $ 121,000
SALE COMPANYIncome Statement
For the Year Ended December 31, 2017
Net sales $1,650,000Cost of goods sold 902,000
Gross profi t 748,000Operating expenses 590,000
Income from operations 158,000Other revenues and gains Interest revenue $20,000Other expenses and losses Interest expense $50,000 Loss on disposal of equipment 7,000 57,000 (37,000)
Net income $ 121,000

242 5 Accounting for Merchandising Operations
InstructionsPrepare a multiple-step income statement for Falcetto Company.
Solution
FALCETTO COMPANYIncome Statement
For the Year Ended December 31, 2017
Sales Sales revenue $536,800 Less: Sales returns and allowances $ 6,700 Sales discounts 5,000 11,700
Net sales 525,100Cost of goods sold 363,400
Gross profi t 161,700Operating expenses Salaries and wages expense 56,000 Rent expense 24,000 Utilities expense 18,000 Advertising expense 12,000 Depreciation expense 9,000 Freight-out 7,600 Insurance expense 4,500
Total operating expenses 131,100
Income from operations 30,600Other revenues and gains Interest revenue 2,500Other expenses and losses Interest expense 3,600 1,100
Net income $ 29,500
Brief Exercises, Exercises, DO IT! Exercises, and Problems and many additional resources are available for practice in WileyPLUS
QUESTIONS
1. (a) “The steps in the accounting cycle for a merchan-dising company are different from the accounting cycle for a service company.” Do you agree or dis-agree? (b) Is the measurement of net income for a merchandising company conceptually the same as for a service company? Explain.
2. Why is the normal operating cycle for a merchandis-ing company likely to be longer than for a service company?
3. What components of revenues and expenses are differ-ent between merchandising and service companies?
4. How does income measurement differ between a merchandising and a service company?
5. When is cost of goods sold determined in a perpetual inventory system?
6. Distinguish between FOB shipping point and FOB destination. Identify the freight terms that will result in a debit to Inventory by the buyer and a debit to Freight-Out by the seller.
7. Explain the meaning of the credit terms 2/10, n/30. 8. Goods costing $2,000 are purchased on account on
July 15 with credit terms of 2/10, n/30. On July 18, a $200 credit memo is received from the supplier for damaged goods. Give the journal entry on July 24 to record payment of the balance due within the dis-count period using a perpetual inventory system.
9. Celina Harris believes revenues from credit sales may be recorded before they are collected in cash. Do you agree? Explain.
10. (a) What is the primary source document for record-ing (1) cash sales and (2) credit sales? (b) Using XXs for amounts, give the journal entry for each of the transactions in part (a).
11. A credit sale is made on July 10 for $900, terms 2/10, n/30. On July 12, $100 of goods are returned for credit. Give the journal entry on July 19 to record the receipt of the balance due within the discount period.
NOTE: All asterisked Questions, Exercises, and Problems relate to material in the appendices to the chapter.

Brief Exercises 243
12. Explain why the Inventory account will usually require adjustment at year-end.
13. Prepare the closing entries for the Sales Revenue account, assuming a balance of $200,000 and the Cost of Goods Sold account with a $145,000 balance.
14. What merchandising account(s) will appear in the post-closing trial balance?
15. Cupery Co. has sales revenue of $105,000, cost of goods sold of $70,000, and operating expenses of $20,000. What is its gross profi t and its gross profi t rate?
16. Stefan Page Company reports net sales of $800,000, gross profi t of $370,000, and net income of $240,000. What are its operating expenses?
17. Identify the distinguishing features of an income statement for a merchandising company.
18. Identify the sections of a multiple-step income state-ment that relate to (a) operating activities, and (b) nonoperating activities.
19. How does the single-step form of income statement differ from the multiple-step form?
20. Determine Apple’s gross profi t rate for 2013 and 2012. Indicate whether it increased or decreased from 2012 to 2013.
*21. Indicate the columns of the worksheet in a perpetual system in which (a) inventory and (b) cost of goods sold will be shown.
*22. Identify the accounts that are added to or deducted from Purchases in a periodic system to determine the cost of goods purchased. For each account, indicate whether it is added or deducted.
*23. Goods costing $3,000 are purchased on account on July 15 with credit terms of 2/10, n/30. On July 18, a $200 credit was received from the supplier for dam-aged goods. Give the journal entry on July 24 to record payment of the balance due within the dis-count period, assuming a periodic inventory system.
BRIEF EXERCISES
BE5-1 Presented below are the components in determining cost of goods sold. Determine the missing amounts.
Beginning Cost of Goods Ending Cost of Inventory Purchases Available for Sale Inventory Goods Sold
(a) $80,000 $100,000 ? ? $120,000(b) $50,000 ? $115,000 $35,000 ?(c) ? $110,000 $160,000 $29,000 ?
BE5-2 Presented below are the components in Veasy Company’s income statement. Deter-mine the missing amounts.
Sales Cost of Gross Operating Net Revenue Goods Sold Profi t Expenses Income
(a) $ 75,000 ? $28,000 ? $ 9,800 (b) $108,000 $70,000 ? ? $29,500 (c) ? $83,900 $79,600 $39,500 ?
BE5-3 Cha Company buys merchandise on account from Wirtz Company. The selling price of the goods is $780, and the cost of the goods is $470. Both companies use perpetual inventory systems. Journalize the transaction on the books of both companies.
BE5-4 Prepare the journal entries to record the following transactions on Novy Company’s books using a perpetual inventory system.
(a) On March 2, Novy Company sold $900,000 of merchandise to Opps Company, terms 2/10, n/30. The cost of the merchandise sold was $590,000.
(b) On March 6, Opps Company returned $90,000 of the merchandise purchased on March 2. The cost of the returned merchandise was $62,000.
(c) On March 12, Novy Company received the balance due from Opps Company.
BE5-5 From the information in BE5-4, prepare the journal entries to record these trans-actions on Opps Company’s books under a perpetual inventory system.
BE5-6 At year-end, the perpetual inventory records of Gutierrez Company showed mer-chandise inventory of $98,000. The company determined, however, that its actual inven-tory on hand was $96,100. Record the necessary adjusting entry.
BE5-7 Brueser Company has the following account balances: Sales Revenue $195,000, Sales Discounts $2,000, Cost of Goods Sold $117,000, and Inventory $40,000. Prepare the entries to record the closing of these items to Income Summary.
Compute missing amounts in determining cost of goods sold.
(LO 1)
Compute missing amounts in determining net income.
(LO 1)
Journalize perpetual inventory entries.
(LO 2, 3)
Journalize sales transactions.
(LO 3)
Journalize purchase transactions.
(LO 2)Prepare adjusting entry for inventory.
(LO 4)
Prepare closing entries for accounts.
(LO 4)
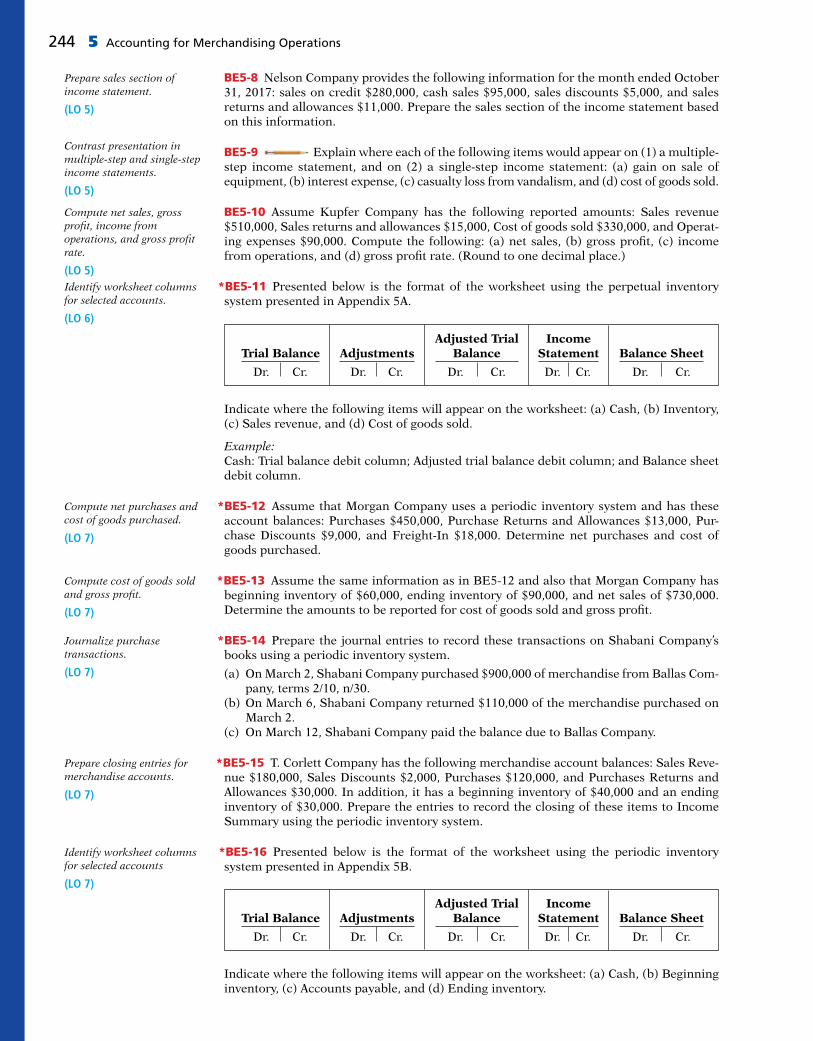
244 5 Accounting for Merchandising Operations
BE5-8 Nelson Company provides the following information for the month ended October 31, 2017: sales on credit $280,000, cash sales $95,000, sales discounts $5,000, and sales returns and allowances $11,000. Prepare the sales section of the income statement based on this information.
BE5-9 Explain where each of the following items would appear on (1) a multiple-step income statement, and on (2) a single-step income statement: (a) gain on sale of equipment, (b) interest expense, (c) casualty loss from vandalism, and (d) cost of goods sold.
BE5-10 Assume Kupfer Company has the following reported amounts: Sales revenue $510,000, Sales returns and allowances $15,000, Cost of goods sold $330,000, and Operat-ing expenses $90,000. Compute the following: (a) net sales, (b) gross profi t, (c) income from operations, and (d) gross profi t rate. (Round to one decimal place.)
*BE5-11 Presented below is the format of the worksheet using the perpetual inventory system presented in Appendix 5A.
Prepare sales section of income statement.
(LO 5)
Contrast presentation in multiple-step and single-step income statements.
(LO 5)
Compute net sales, gross profi t, income from operations, and gross profi t rate.
(LO 5)Identify worksheet columns for selected accounts.
(LO 6)
Adjusted Trial Income Trial Balance Adjustments Balance Statement Balance Sheet
Dr. Cr. Dr. Cr. Dr. Cr. Dr. Cr. Dr. Cr.
Indicate where the following items will appear on the worksheet: (a) Cash, (b) Inventory, (c) Sales revenue, and (d) Cost of goods sold.
Example:Cash: Trial balance debit column; Adjusted trial balance debit column; and Balance sheet debit column.
*BE5-12 Assume that Morgan Company uses a periodic inventory system and has these account balances: Purchases $450,000, Purchase Returns and Allowances $13,000, Pur-chase Discounts $9,000, and Freight-In $18,000. Determine net purchases and cost of goods purchased.
*BE5-13 Assume the same information as in BE5-12 and also that Morgan Company has beginning inventory of $60,000, ending inventory of $90,000, and net sales of $730,000. Determine the amounts to be reported for cost of goods sold and gross profi t.
*BE5-14 Prepare the journal entries to record these transactions on Shabani Company’s books using a periodic inventory system.
(a) On March 2, Shabani Company purchased $900,000 of merchandise from Ballas Com-pany, terms 2/10, n/30.
(b) On March 6, Shabani Company returned $110,000 of the merchandise purchased on March 2.
(c) On March 12, Shabani Company paid the balance due to Ballas Company.
*BE5-15 T. Corlett Company has the following merchandise account balances: Sales Reve-nue $180,000, Sales Discounts $2,000, Purchases $120,000, and Purchases Returns and Allowances $30,000. In addition, it has a beginning inventory of $40,000 and an ending inventory of $30,000. Prepare the entries to record the closing of these items to Income Summary using the periodic inventory system.
*BE5-16 Presented below is the format of the worksheet using the periodic inventory system presented in Appendix 5B.
Compute net purchases and cost of goods purchased.
(LO 7)
Compute cost of goods sold and gross profi t.
(LO 7)
Journalize purchase transactions.
(LO 7)
Prepare closing entries for merchandise accounts.
(LO 7)
Identify worksheet columns for selected accounts
(LO 7)
Adjusted Trial Income Trial Balance Adjustments Balance Statement Balance Sheet
Dr. Cr. Dr. Cr. Dr. Cr. Dr. Cr. Dr. Cr.
Indicate where the following items will appear on the worksheet: (a) Cash, (b) Beginning inventory, (c) Accounts payable, and (d) Ending inventory.

DO IT! Exercises 245
ExampleCash: Trial balance debit column; Adjustment trial balance debit column; and Balance sheet debit column.
Indicate whether the following statements are true or false.
1. A merchandising company reports gross profi t but a service company does not.2. Under a periodic inventory system, a company determines the cost of goods sold each
time a sale occurs.3. A service company is likely to use accounts receivable but a merchandising company is
not likely to do so.4. Under a periodic inventory system, the cost of goods on hand at the beginning of the
accounting period plus the cost of goods purchased less the cost of goods on hand at the end of the accounting period equals cost of goods sold.
On October 5, Wang Company buys merchandise on account from Davis Company. The selling price of the goods is $4,800, and the cost to Davis Company is $3,100. On October 8, Wang returns defective goods with a selling price of $650 and a fair value of $100. Record the transactions on the books of Wang Company.
Assume information similar to that in DO IT! 5-2: On October 5, Wang Com-pany buys merchandise on account from Davis Company. The selling price of the goods is $4,800, and the cost to Davis Company is $3,100. On October 8, Wang returns defective goods with a selling price of $650 and a fair value of $100. Record the transactions on the books of Davis Company.
The trial balance of Beads and Bangles at December 31 shows Inventory $21,000, Sales Revenue $156,000, Sales Returns and Allowances $4,000, Sales Discounts $3,000, Cost of Goods Sold $92,400, Interest Revenue $5,000, Freight-Out $1,800, Utilities Expense $7,700, and Salaries and Wages Expense $19,500. Prepare the closing entries for Beads and Bangles for these accounts.
Pfannes Company is preparing its multiple-step income statement, owner’s equity statement, and classifi ed balance sheet. Using the column headings Account, Financial Statement, and Classifi cation, indicate in which fi nancial statement and under what classifi cation each of the following would be reported.
Account Financial Statement Classifi cation
Accounts PayableAccounts ReceivableAccumulated Depreciation—BuildingsCashCasualty Loss from VandalismCost of Goods SoldDepreciation ExpenseEquipmentFreight-OutInsurance ExpenseInterest PayableInventoryLandNotes Payable (due in 5 years)Owner’s Capital (beginning balance)Owner’s DrawingsProperty Taxes PayableSalaries and Wages ExpenseSalaries and Wages PayableSales Returns and AllowancesSales RevenueUnearned Rent RevenueUtilities Expense
Answer general questions about merchandisers.
(LO 1)
Record transactions of purchasing company.
(LO 2)
Record transactions of selling company.
(LO 3)
Prepare closing entries for a merchandising company.
(LO 4)
Classify fi nancial statement accounts.
(LO 5)
DO IT! Exercises
DO IT! 5-1
DO IT! 5-2
DO IT! 5-3
DO IT! 5-4
DO IT! 5-5

246 5 Accounting for Merchandising Operations
EXERCISES
E5-1 Mr. McKenzie has prepared the following list of statements about service companies and merchandisers.
1. Measuring net income for a merchandiser is conceptually the same as for a service company.
2. For a merchandiser, sales less operating expenses is called gross profi t.3. For a merchandiser, the primary source of revenues is the sale of inventory.4. Sales salaries and wages is an example of an operating expense.5. The operating cycle of a merchandiser is the same as that of a service company.6. In a perpetual inventory system, no detailed inventory records of goods on hand are
maintained.7. In a periodic inventory system, the cost of goods sold is determined only at the end of
the accounting period.8. A periodic inventory system provides better control over inventories than a perpetual
system.
InstructionsIdentify each statement as true or false. If false, indicate how to correct the statement.
E5-2 Information related to Kerber Co. is presented below.
1. On April 5, purchased merchandise from Wilkes Company for $23,000, terms 2/10, net/30, FOB shipping point.
2. On April 6, paid freight costs of $900 on merchandise purchased from Wilkes.3. On April 7, purchased equipment on account for $26,000.4. On April 8, returned damaged merchandise to Wilkes Company and was granted a
$3,000 credit for returned merchandise.5. On April 15, paid the amount due to Wilkes Company in full.
Instructions(a) Prepare the journal entries to record these transactions on the books of Kerber Co.
under a perpetual inventory system.(b) Assume that Kerber Co. paid the balance due to Wilkes Company on May 4 instead of
April 15. Prepare the journal entry to record this payment.
E5-3 On September 1, Nixa Offi ce Supply had an inventory of 30 calculators at a cost of $18 each. The company uses a perpetual inventory system. During September, the follow-ing transactions occurred.
Sept. 6 Purchased 90 calculators at $22 each from York, terms net/30. 9 Paid freight of $90 on calculators purchased from York Co. 10 Returned 3 calculators to York Co. for $69 credit (including freight) because
they did not meet specifi cations. 12 Sold 26 calculators costing $23 (including freight) for $31 each to Sura Book
Store, terms n/30. 14 Granted credit of $31 to Sura Book Store for the return of one calculator that
was not ordered. 20 Sold 30 calculators costing $23 for $32 each to Davis Card Shop, terms n/30.
InstructionsJournalize the September transactions.
E5-4 On June 10, Diaz Company purchased $8,000 of merchandise from Taylor Company, FOB shipping point, terms 2/10, n/30. Diaz pays the freight costs of $400 on June 11. Dam-aged goods totaling $300 are returned to Taylor for credit on June 12. The fair value of these goods is $70. On June 19, Diaz pays Taylor Company in full, less the purchase dis-count. Both companies use a perpetual inventory system.
Instructions(a) Prepare separate entries for each transaction on the books of Diaz Company.(b) Prepare separate entries for each transaction for Taylor Company. The merchandise
purchased by Diaz on June 10 had cost Taylor $4,800.
Answer general questions about merchandisers.
(LO 1)
Journalize purchase transactions.
(LO 2)
Journalize perpetual inventory entries.
(LO 2, 3)
Prepare purchase and sales entries.
(LO 2, 3)

Exercises 247
E5-5 Presented below are transactions related to R. Humphrey Company.
1. On December 3, R. Humphrey Company sold $570,000 of merchandise to Frazier Co., terms 1/10, n/30, FOB destination. R. Humphrey paid $400 for freight charges. The cost of the merchandise sold was $350,000.
2. On December 8, Frazier Co. was granted an allowance of $20,000 for merchandise pur-chased on December 3.
3. On December 13, R. Humphrey Company received the balance due from Frazier Co.
Instructions(a) Prepare the journal entries to record these transactions on the books of R. Humphrey
Company using a perpetual inventory system.(b) Assume that R. Humphrey Company received the balance due from Frazier Co. on
January 2 of the following year instead of December 13. Prepare the journal entry to record the receipt of payment on January 2.
E5-6 The adjusted trial balance of Sang Company shows the following data pertaining to sales at the end of its fi scal year October 31, 2017: Sales Revenue $820,000, Freight-Out $16,000, Sales Returns and Allowances $25,000, and Sales Discounts $13,000.
Instructions(a) Prepare the sales section of the income statement.(b) Prepare separate closing entries for (1) sales revenue, and (2) the contra accounts to
sales revenue.
E5-7 Tim Jarosz Company had the following account balances at year-end: Cost of Goods Sold $60,000, Inventory $15,000, Operating Expenses $29,000, Sales Revenue $115,000, Sales Discounts $1,200, and Sales Returns and Allowances $1,700. A physical count of inventory determines that merchandise inventory on hand is $13,600.
Instructions(a) Prepare the adjusting entry necessary as a result of the physical count.(b) Prepare closing entries.
E5-8 Presented below is information related to Hoerl Co. for the month of January 2017.
Ending inventory per Insurance expense $ 12,000 perpetual records $ 21,600 Rent expense 20,000Ending inventory actually Salaries and wages expense 55,000 on hand 21,000 Sales discounts 10,000Cost of goods sold 218,000 Sales returns and allowances 13,000Freight-out 7,000 Sales revenue 380,000
Instructions(a) Prepare the necessary adjusting entry for inventory.(b) Prepare the necessary closing entries.
E5-9 Presented below is information for Kaila Company for the month of March 2017.
Cost of goods sold $215,000 Rent expense $ 30,000Freight-out 7,000 Sales discounts 8,000Insurance expense 6,000 Sales returns and allowances 13,000Salaries and wages expense 58,000 Sales revenue 380,000
Instructions(a) Prepare a multiple-step income statement.(b) Compute the gross profi t rate.
E5-10 In its income statement for the year ended December 31, 2017, Anhad Company reported the following condensed data.
Operating expenses $ 725,000 Interest revenue $ 28,000Cost of goods sold 1,289,000 Loss on disposal of plant assets 17,000Interest expense 70,000 Net sales 2,200,000
Instructions(a) Prepare a multiple-step income statement.(b) Prepare a single-step income statement.
Journalize sales transactions.
(LO 3)
Prepare sales section and closing entries.
(LO 4, 5)
Prepare adjusting and closing entries.
(LO 4)
Prepare adjusting and closing entries.
(LO 4)
Prepare multiple-step income statement.
(LO 5)
Prepare multiple-step and single-step income statements.
(LO 5)

248 5 Accounting for Merchandising Operations
E5-11 An inexperienced accountant for Stahr Company made the following errors in recording merchandising transactions.
1. A $210 refund to a customer for faulty merchandise was debited to Sales Revenue $210 and credited to Cash $210.
2. A $180 credit purchase of supplies was debited to Inventory $180 and credited to Cash $180.
3. A $215 sales discount was debited to Sales Revenue.4. A cash payment of $20 for freight on merchandise purchases was debited to Freight-
Out $200 and credited to Cash $200.
InstructionsPrepare separate correcting entries for each error, assuming that the incorrect entry is not reversed. (Omit explanations.)
E5-12 In 2017, Laquen Company had net sales of $900,000 and cost of goods sold of $522,000. Operating expenses were $225,000, and interest expense was $11,000. Laquen prepares a multiple-step income statement.
Instructions(a) Compute Laquen’s gross profi t.(b) Compute the gross profi t rate. Why is this rate computed by fi nancial statement users?(c) What is Laquen’s income from operations and net income?(d) If Laquen prepared a single-step income statement, what amount would it report for
net income?(e) In what section of its classifi ed balance sheet should Laquen report inventory?
E5-13 Presented below is fi nancial information for two different companies.
Summer Company Winter Company
Sales revenue $92,000 (d)Sales returns (a) $ 5,000Net sales 87,000 102,000Cost of goods sold 56,000 (e)Gross profi t (b) 41,500Operating expenses 15,000 (f)Net income (c) 18,000
Instructions(a) Determine the missing amounts.(b) Determine the gross profi t rates. (Round to one decimal place.)
E5-14 Financial information is presented below for three different companies.
Hardy Yee Wang Cosmetics Grocery Wholesalers
Sales revenue $90,000 $ (e) $122,000Sales returns and allowances (a) 5,000 12,000Net sales 86,000 95,000 (i)Cost of goods sold 56,000 (f) (j)Gross profi t (b) 38,000 24,000Operating expenses 15,000 (g) 18,000Income from operations (c) (h) (k)Other expenses and losses 4,000 7,000 (l)Net income (d) 11,000 5,000
InstructionsDetermine the missing amounts.
*E5-15 Presented on the next page are selected accounts for McPhan Company as reported in the worksheet using a perpetual inventory system at the end of May 2017.
Prepare correcting entries for sales and purchases.
(LO 2, 3)
Compute various income measures.
(LO 5)
Compute missing amounts and compute gross profi t rate.
(LO 5)
Compute missing amounts.
(LO 5)
Complete worksheet using a perpetual inventory system.
(LO 6)

Exercises 249
InstructionsComplete the worksheet by extending amounts reported in the adjusted trial balance to the appropriate columns in the worksheet. Do not total individual columns.
E5-16 The trial balance columns of the worksheet using a perpetual inventory system for Balistreri Company at June 30, 2017, are as follows.
BALISTRERI COMPANYWorksheet
For the Month Ended June 30, 2017
Trial Balance
Account Titles Debit Credit
Cash 1,920Accounts Receivable 2,440Inventory 11,640Accounts Payable 1,120Owner’s Capital 3,500Sales Revenue 42,500Cost of Goods Sold 20,560Operating Expenses 10,560
47,120 47,120
Other data:Operating expenses incurred on account, but not yet recorded, total $1,500.
InstructionsEnter the trial balance on a worksheet and complete the worksheet.
E5-17 The trial balance of A. Wiencek Company at the end of its fi scal year, August 31, 2017, includes these accounts: Inventory $19,500; Purchases $149,000; Sales Revenue $190,000; Freight-In $5,000; Sales Returns and Allowances $3,000; Freight-Out $1,000; and Purchase Returns and Allowances $2,000. The ending inventory is $23,000.
InstructionsPrepare a cost of goods sold section for the year ending August 31 (periodic inventory).
E5-18 On January 1, 2017, Brooke Hanson Corporation had inventory of $50,000. At December 31, 2017, Brooke Hanson had the following account balances.
Freight-in $ 4,000Purchases 509,000Purchase discounts 6,000Purchase returns and allowances 2,000Sales revenue 840,000Sales discounts 5,000Sales returns and allowances 10,000
At December 31, 2017, Brooke Hanson determines that its ending inventory is $60,000.
Instructions(a) Compute Brooke Hanson’s 2017 gross profi t.(b) Compute Brooke Hanson’s 2017 operating expenses if net income is $130,000 and
there are no nonoperating activities.
* Prepare a worksheet using a perpetual inventory system.
(LO 6)
* Prepare cost of goods sold section.
(LO 7)
* Compute various income statement items.
(LO 7)
Adjusted Income Accounts Trial Balance Statement Balance Sheet
Dr. Cr. Dr. Cr. Dr. Cr.
Cash 11,000Inventory 76,000Sales Revenue 480,000Sales Returns and Allowances 10,000Sales Discounts 9,000Cost of Goods Sold 300,000

250 5 Accounting for Merchandising Operations
*E5-19 Below is a series of cost of goods sold sections for companies B, F, L, and R.
B F L R
Beginning inventory $ 180 $ 70 $1,000 $ (j)Purchases 1,620 1,060 (g) 43,590Purchase returns and allowances 40 (d) 290 (k)Net purchases (a) 1,030 6,210 41,090Freight-in 110 (e) (h) 2,240Cost of goods purchased (b) 1,280 7,940 (l)Cost of goods available for sale 1,870 1,350 (i) 49,530Ending inventory 250 (f) 1,450 6,230Cost of goods sold (c) 1,230 7,490 43,300
InstructionFill in the lettered blanks to complete the cost of goods sold sections.
*E5-20 This information relates to Nandi Co.
1. On April 5, purchased merchandise from Dion Company for $25,000, terms 2/10, net/30, FOB shipping point.
2. On April 6, paid freight costs of $900 on merchandise purchased from Dion Company.3. On April 7, purchased equipment on account for $30,000.4. On April 8, returned some of April 5 merchandise, which cost $2,800, to Dion Company.5. On April 15, paid the amount due to Dion Company in full.
Instructions(a) Prepare the journal entries to record these transactions on the books of Nandi Co.
using a periodic inventory system.(b) Assume that Nandi Co. paid the balance due to Dion Company on May 4 instead of
April 15. Prepare the journal entry to record this payment.
*E5-21 Presented below is information related to Chung Co.
1. On April 5, purchased merchandise from Jose Company for $21,000, terms 2/10, net/30, FOB shipping point.
2. On April 6, paid freight costs of $800 on merchandise purchased from Jose.3. On April 7, purchased equipment on account from Winker Mfg. Co. for $26,000.4. On April 8, returned merchandise, which cost $4,000, to Jose Company.5. On April 15, paid the amount due to Jose Company in full.
Instructions(a) Prepare the journal entries to record these transactions on the books of Chung Co.
using a periodic inventory system.(b) Assume that Chung Co. paid the balance due to Jose Company on May 4 instead of
April 15. Prepare the journal entry to record this payment.
*E5-22 Presented below are selected accounts for T. Swift Company as reported in the worksheet at the end of May 2017. Ending inventory is $75,000.
Journalize purchase transactions.
(LO 7)
Journalize purchase transactions.
(LO 7)
Complete worksheet.
(LO 7)
Prepare cost of goods sold section.
(LO 7)
Adjusted Income Accounts Trial Balance Statement Balance Sheet
Dr. Cr. Dr. Cr. Dr. Cr.
Cash 9,000Inventory 80,000Purchases 240,000Purchase Returns and Allowances 30,000Sales Revenue 450,000Sales Returns and Allowances 10,000Sales Discounts 5,000Rent Expense 42,000
InstructionsComplete the worksheet by extending amounts reported in the adjustment trial balance to the appropriate columns in the worksheet. The company uses the periodic inventory system.

Problems: Set A 251
EXERCISES: SET B AND CHALLENGE EXERCISES
Visit the book’s companion website, at www.wiley.com/college/weygandt, and choose the Student Companion site to access Exercises: Set B and Challenge Exercises.
PROBLEMS: SET A
P5-1A Kern’s Book Warehouse distributes hardcover books to retail stores and extends credit terms of 2/10, n/30 to all of its customers. At the end of May, Kern’s inventory con-sisted of books purchased for $1,800. During June, the following merchandising transac-tions occurred.
June 1 Purchased books on account for $1,600 from Binsfeld Publishers, FOB destination, terms 2/10, n/30. The appropriate party also made a cash payment of $50 for the freight on this date.
3 Sold books on account to Reading Rainbow for $2,500. The cost of the books sold was $1,440.
6 Received $100 credit for books returned to Binsfeld Publishers. 9 Paid Binsfeld Publishers in full, less discount. 15 Received payment in full from Reading Rainbow. 17 Sold books on account to Rapp Books for $1,800. The cost of the books sold
was $1,080. 20 Purchased books on account for $1,800 from McGinn Publishers, FOB
destination, terms 2/15, n/30. The appropriate party also made a cash payment of $60 for the freight on this date.
24 Received payment in full from Rapp Books. 26 Paid McGinn Publishers in full, less discount. 28 Sold books on account to Baeten Bookstore for $1,600. The cost of the books
sold was $970. 30 Granted Baeten Bookstore $120 credit for books returned costing $72.
Kern’s Book Warehouse’s chart of accounts includes the following: No. 101 Cash, No. 112 Accounts Receivable, No. 120 Inventory, No. 201 Accounts Payable, No. 401 Sales Reve-nue, No. 412 Sales Returns and Allowances, No. 414 Sales Discounts, and No. 505 Cost of Goods Sold.
InstructionsJournalize the transactions for the month of June for Kern’s Book Warehouse using a per-petual inventory system.
P5-2A Renner Hardware Store completed the following merchandising transactions in the month of May. At the beginning of May, the ledger of Renner showed Cash of $5,000 and Owner’s Capital of $5,000.
May 1 Purchased merchandise on account from Braun’s Wholesale Supply $4,200, terms 2/10, n/30.
2 Sold merchandise on account $2,100, terms 1/10, n/30. The cost of the merchandise sold was $1,300.
5 Received credit from Braun’s Wholesale Supply for merchandise returned $300.
9 Received collections in full, less discounts, from customers billed on sales of $2,100 on May 2.
10 Paid Braun’s Wholesale Supply in full, less discount. 11 Purchased supplies for cash $400. 12 Purchased merchandise for cash $1,400. 15 Received refund for poor quality merchandise from supplier on cash purchase
$150. 17 Purchased merchandise from Valley Distributors $1,300, FOB shipping point,
terms 2/10, n/30. 19 Paid freight on May 17 purchase $130. 24 Sold merchandise for cash $3,200. The merchandise sold had a cost of $2,000. 25 Purchased merchandise from Lumley, Inc. $620, FOB destination, terms
2/10, n/30.
Journalize, post, and prepare a partial income statement.
(LO 2, 3, 5)
Journalize purchase and sales transactions under a perpetual inventory system.
(LO 2, 3)

252 5 Accounting for Merchandising Operations
27 Paid Valley Distributors in full, less discount. 29 Made refunds to cash customers for defective merchandise $70. The returned
merchandise had a fair value of $30. 31 Sold merchandise on account $1,000 terms n/30. The cost of the merchandise
sold was $560.
Renner Hardware’s chart of accounts includes the following: No. 101 Cash, No. 112 Accounts Receivable, No. 120 Inventory, No. 126 Supplies, No. 201 Accounts Payable, No. 301 Owner’s Capital, No. 401 Sales Revenue, No. 412 Sales Returns and Allowances, No. 414 Sales Discounts, and No. 505 Cost of Goods Sold.
Instructions(a) Journalize the transactions using a perpetual inventory system.(b) Enter the beginning cash and capital balances and post the transactions. (Use J1 for
the journal reference.)(c) Prepare an income statement through gross profi t for the month of May 2017.
P5-3A Big Box Store is located in midtown Madison. During the past several years, net income has been declining because of suburban shopping centers. At the end of the com-pany’s fi scal year on November 30, 2017, the following accounts appeared in two of its trial balances.
(c) Gross profi t $2,379
Prepare fi nancial statements and adjusting and closing entries.
(LO 4, 5)
Unadjusted Adjusted Unadjusted Adjusted
Accounts Payable $ 25,200 $ 25,200 Notes Payable $ 37,000 $ 37,000Accounts Receivable 30,500 30,500 Owner’s Capital 101,700 101,700Accumulated Depr.—Equip. 34,000 45,000 Owner’s Drawings 10,000 10,000Cash 26,000 26,000 Prepaid Insurance 10,500 3,500Cost of Goods Sold 518,000 518,000 Property Tax Expense 2,500Freight-Out 6,500 6,500 Property Taxes Payable 2,500Equipment 146,000 146,000 Rent Expense 15,000 15,000Depreciation Expense 11,000 Salaries and Wages Expense 96,000 96,000Insurance Expense 7,000 Sales Revenue 720,000 720,000Interest Expense 6,400 6,400 Sales Commissions Expense 6,500 11,000Interest Revenue 2,000 2,000 Sales Commissions Payable 4,500Inventory 32,000 32,000 Sales Returns and Allowances 8,000 8,000 Utilities Expense 8,500 8,500
Instructions(a) Prepare a multiple-step income statement, an owner’s equity statement, and a classi-
fi ed balance sheet. Notes payable are due in 2020.(b) Journalize the adjusting entries that were made.(c) Journalize the closing entries that are necessary.
P5-4A Yolanda Hagen, a former disc golf star, operates Yolanda’s Discorama. At the begin-ning of the current season on April 1, the ledger of Yolanda’s Discorama showed Cash $1,800, Inventory $2,500, and Owner’s Capital $4,300. The following transactions were completed during April.
Apr. 5 Purchased golf discs, bags, and other inventory on account from Mumford Co. $1,200, FOB shipping point, terms 2/10, n/60.
7 Paid freight on the Mumford purchase $50. 9 Received credit from Mumford Co. for merchandise returned $100. 10 Sold merchandise on account for $900, terms n/30. The merchandise sold had
a cost of $540. 12 Purchased disc golf shirts and other accessories on account from Saucer
Sportswear $670, terms 1/10, n/30. 14 Paid Mumford Co. in full, less discount. 17 Received credit from Saucer Sportswear for merchandise returned $70. 20 Made sales on account for $610, terms n/30. The cost of the merchandise sold
was $370. 21 Paid Saucer Sportswear in full, less discount. 27 Granted an allowance to customers for clothing that was fl awed $20. 30 Received payments on account from customers $900.
(a) Net income $32,100 Owner’s capital $123,800 Total assets $193,000
Journalize, post, and prepare a trial balance.
(LO 2, 3, 4)

Problems: Set A 253
The chart of accounts for the store includes the following: No. 101 Cash, No. 112 Accounts Receivable, No. 120 Inventory, No. 201 Accounts Payable, No. 301 Owner’s Capital, No. 401 Sales Revenue, No. 412 Sales Returns and Allowances, and No. 505 Cost of Goods Sold.
Instructions(a) Journalize the April transactions using a perpetual inventory system.(b) Enter the beginning balances in the ledger accounts and post the April transactions.
(Use J1 for the journal reference.)(c) Prepare a trial balance on April 30, 2017.
*P5-5A The trial balance of Gaolee Fashion Center contained the following accounts at November 30, the end of the company’s fi scal year.
(c) Total debits $5,810
Complete accounting cycle beginning with a worksheet.
(LO 4, 5, 6)
GAOLEE FASHION CENTERTrial Balance
November 30, 2017
Debit Credit
Cash $ 20,700Accounts Receivable 30,700Inventory 44,700Supplies 6,200Equipment 133,000Accumulated Depreciation—Equipment $ 28,000Notes Payable 60,000Accounts Payable 48,500Owner’s Capital 93,000Owner’s Drawings 12,000Sales Revenue 755,200Sales Returns and Allowances 8,800Cost of Goods Sold 497,400Salaries and Wages Expense 140,000Advertising Expense 24,400Utilities Expense 14,000Maintenance and Repairs Expense 12,100Freight-Out 16,700Rent Expense 24,000
Totals $984,700 $984,700
Adjustment data:
1. Supplies on hand totaled $2,600.2. Depreciation is $11,500 on the equipment.3. Interest of $3,800 is accrued on notes payable at November 30.4. Inventory actually on hand is $44,400.
Instructions(a) Enter the trial balance on a worksheet, and complete the worksheet.(b) Prepare a multiple-step income statement and an owner’s equity statement for the
year, and a classifi ed balance sheet as of November 30, 2017. Notes payable of $20,000 are due in January 2018.
(c) Journalize the adjusting entries.(d) Journalize the closing entries.(e) Prepare a post-closing trial balance.
*P5-6A At the end of Donaldson Department Store’s fi scal year on November 30, 2017, these accounts appeared in its adjusted trial balance.
Freight-In $ 7,500Inventory 40,000Purchases 585,000Purchase Discounts 6,300
(a) Adj. trial balance $1,000,000 Net loss $1,400
(b) Gross profi t $248,700 Total assets $191,900
Determine cost of goods sold and gross profi t under periodic approach.
(LO 5, 7)

254 5 Accounting for Merchandising Operations
Purchase Returns and Allowances 2,700Sales Revenue 1,000,000Sales Returns and Allowances 20,000
Additional facts:
1. Merchandise inventory on November 30, 2017, is $52,600.2. Donaldson Department Store uses a periodic system.
InstructionsPrepare an income statement through gross profi t for the year ended November 30, 2017.
*P5-7A Kayla Inc. operates a retail operation that purchases and sells home entertainment products. The company purchases all merchandise inventory on credit and uses a periodic inventory system. The Accounts Payable account is used for recording inventory pur-chases only; all other current liabilities are accrued in separate accounts. You are provided with the following selected information for the fi scal years 2014 through 2017, inclusive.
Gross profi t $409,100
Calculate missing amounts and assess profi tability.
(LO 5, 7)
Instructions(a) Calculate the missing amounts.(b) Sales declined over the 3-year fi scal period, 2015–2017. Does that mean that profi tabil-
ity necessarily also declined? Explain, computing the gross profi t rate and the profi t margin (Net income 4 Sales revenue) for each fi scal year to help support your answer. (Round to one decimal place.)
*P5-8A At the beginning of the current season on April 1, the ledger of Gage Pro Shop showed Cash $3,000, Inventory $4,000, and Owner’s Capital $7,000. These transactions occurred during April 2017.
Apr. 5 Purchased golf bags, clubs, and balls on account from Tiger Co. $1,200, FOB shipping point, terms 2/10, n/60.
7 Paid freight on Tiger Co. purchases $50. 9 Received credit from Tiger Co. for merchandise returned $100. 10 Sold merchandise on account to customers $600, terms n/30. 12 Purchased golf shoes, sweaters, and other accessories on account from Classic
Sportswear $450, terms 1/10, n/30. 14 Paid Tiger Co. in full. 17 Received credit from Classic Sportswear for merchandise returned $50. 20 Made sales on account to customers $600, terms n/30. 21 Paid Classic Sportswear in full. 27 Granted credit to customers for clothing that had fl aws $35. 30 Received payments on account from customers $600.
The chart of accounts for the pro shop includes Cash, Accounts Receivable, Inventory, Accounts Payable, Owner’s Capital, Sales Revenue, Sales Returns and Allowances, Purchases, Purchase Returns and Allowances, Purchase Discounts, and Freight-In.
Journalize, post, and prepare trial balance and partial income statement using periodic approach.
(LO 7)
2014 2015 2016 2017
Income Statement Data
Sales revenue $55,000 $ (e) $47,000Cost of goods sold (a) 14,800 14,300
Gross profi t 38,300 35,200 (i)Operating expenses 34,900 (f) 28,800
Net income $ (b) $ 2,500 $ (j)
Balance Sheet Data
Inventory $7,200 $ (c) $ 8,100 $ (k)Accounts payable 3,200 3,600 2,500 (l)
Additional Information
Purchases of merchandise inventory on account $14,200 $ (g) $13,200Cash payments to suppliers (d) (h) 13,600
(c) $4,700(g) $18,200(i) $32,700

Comprehensive Problem 255
Instructions(a) Journalize the April transactions using a periodic inventory system.(b) Using T-accounts, enter the beginning balances in the ledger accounts and post the
April transactions.(c) Prepare a trial balance on April 30, 2017.(d) Prepare an income statement through gross profi t, assuming merchandise inventory
on hand at April 30 is $4,824.
(c) Tot. trial balance $8,376 Gross profi t $465
PROBLEMS: SET B AND SET C
Visit the book’s companion website, at www.wiley.com/college/weygandt, and choose the Student Companion site to access Problems: Set B and Set C.
COMPREHENSIVE PROBLEM
CP5 On December 1, 2017, Rodriguez Distributing Company had the following account balances.
During December, the company completed the following summary transactions.
Dec. 6 Paid $1,600 for salaries and wages due employees, of which $600 is for December and $1,000 is for November salaries and wages payable.
8 Received $2,200 cash from customers in payment of account (no discount allowed). 10 Sold merchandise for cash $6,300. The cost of the merchandise sold was $4,100. 13 Purchased merchandise on account from Boehm Co. $9,000, terms 2/10, n/30. 15 Purchased supplies for cash $2,000. 18 Sold merchandise on account $15,000, terms 3/10, n/30. The cost of the merchandise sold
was $10,000. 20 Paid salaries and wages $1,800. 23 Paid Boehm Co. in full, less discount. 27 Received collections in full, less discounts, from customers billed on December 18.
Adjustment data:
1. Accrued salaries and wages payable $840.2. Depreciation $200 per month.3. Supplies on hand $1,500.
Instructions(a) Journalize the December transactions using a perpetual inventory system.(b) Enter the December 1 balances in the ledger T-accounts and post the December transactions. Use
Cost of Goods Sold, Depreciation Expense, Salaries and Wages Expense, Sales Revenue, Sales Discounts, and Supplies Expense.
(c) Journalize and post adjusting entries.(d) Prepare an adjusted trial balance.(e) Prepare an income statement and an owner’s equity statement for December and a classifi ed bal-
ance sheet at December 31.
(d) Totals $68,340(e) Net income $1,610
Debit Credit
Cash $ 7,200 Accumulated Depreciation—Accounts Receivable 4,600 Equipment $ 2,200Inventory 12,000 Accounts Payable 4,500Supplies 1,200 Salaries and Wages Payable 1,000Equipment 22,000 Owner’s Capital 39,300
$47,000 $47,000

256 5 Accounting for Merchandising Operations
CONTINUING PROBLEM
COOKIE CREATIONS: AN ENTREPRENEURIAL JOURNEY(Note: This is a continuation of the Cookie Creations problem from Chapters 1 through 4.)
CC5 Because Natalie has had such a successful fi rst few months, she is considering other opportu-nities to develop her business. One opportunity is the sale of fi ne European mixers. The owner of Kzinski Supply Company has approached Natalie to become the exclusive U.S. distributor of these fi ne mixers. The current cost of a mixer is approximately $525 (U.S.), and Natalie would sell each one for $1,050. Natalie comes to you for advice on how to account for these mixers.
Go to the book’s companion website, www.wiley.com/college/weygandt, to see the completion of this problem.
PERSPECTIVEFINANCIAL REPORTING AND ANALYSIS
Financial Reporting Problem: Apple Inc.BYP5-1 The fi nancial statements of Apple Inc. are presented in Appendix A at the end of this text-book. Instructions for accessing and using the company’s complete annual report, including the notes to the fi nancial statements, are also provided in Appendix A.
InstructionsAnswer the following questions using Apple’s Consolidated Statement of Income.
(a) What was the percentage change in (1) sales and in (2) net income from 2011 to 2012 and from 2012 to 2013?
(b) What was the company’s gross profi t rate in 2011, 2012, and 2013?(c) What was the company’s percentage of net income to net sales in 2011, 2012, and 2013? Comment
on any trend in this percentage.
Comparative Analysis Problem: PepsiCo, Inc. vs. The Coca-Cola CompanyBYP5-2 PepsiCo’s fi nancial statements are presented in Appendix B. Financial statements of The Coca-Cola Company are presented in Appendix C. Instructions for accessing and using the complete annual reports of PepsiCo and Coca-Cola, including the notes to the fi nancial statements, are also provided in Appendices B and C, respectively.
Instructions(a) Based on the information contained in these fi nancial statements, determine each of the following
for each company. (1) Gross profi t for 2013. (2) Gross profi t rate for 2013. (3) Operating income for 2013. (4) Percentage change in operating income from 2012 to 2013.(b) What conclusions concerning the relative profi tability of the two companies can you draw from
these data?
Comparative Analysis Problem: Amazon.com, Inc. vs. Wal-Mart Stores, Inc.BYP5-3 Amazon.com, Inc.’s fi nancial statements are presented in Appendix D. Financial statements of Wal-Mart Stores, Inc. are presented in Appendix E. (Use Wal-Mart’s January 31, 2014, fi nancial statements for comparative purposes.) Instructions for accessing and using the complete annual reports of Amazon and Wal-Mart, including the notes to the fi nancial statements, are also provided in Appendices D and E, respectively.
BROADENING YOUR
© leungchopan/Shutterstock
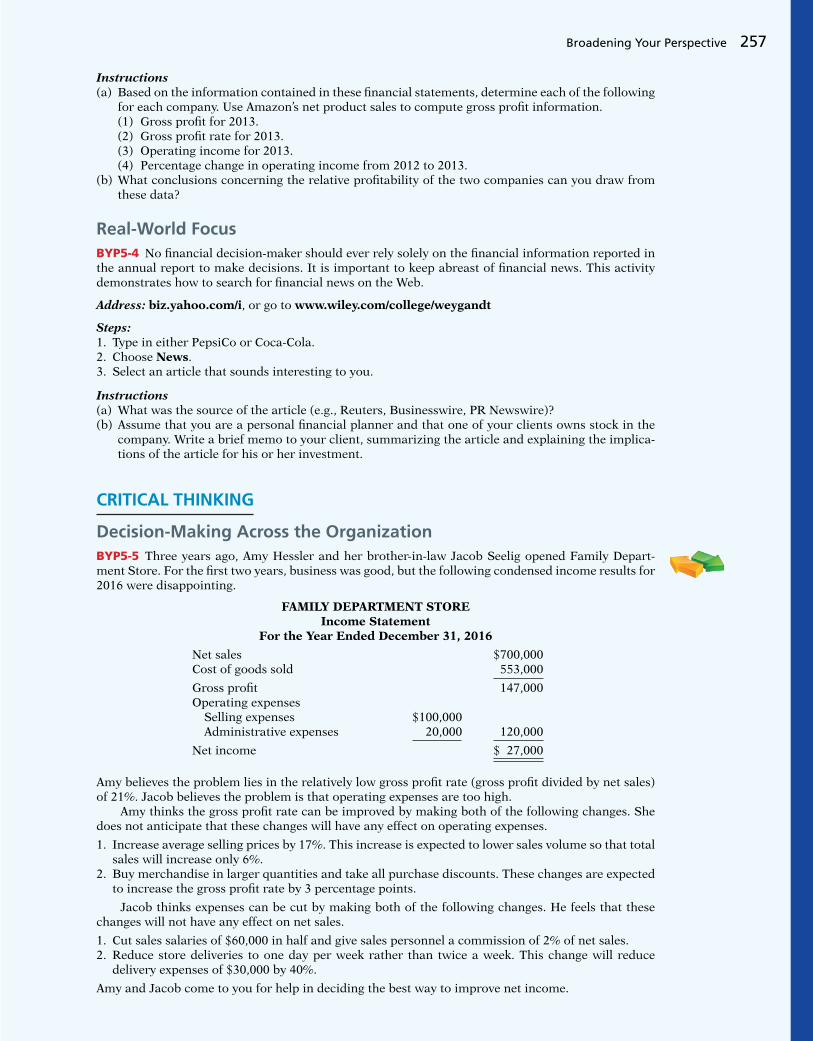
Broadening Your Perspective 257
Instructions(a) Based on the information contained in these fi nancial statements, determine each of the following
for each company. Use Amazon’s net product sales to compute gross profi t information. (1) Gross profi t for 2013. (2) Gross profi t rate for 2013. (3) Operating income for 2013. (4) Percentage change in operating income from 2012 to 2013.(b) What conclusions concerning the relative profi tability of the two companies can you draw from
these data?
Real-World FocusBYP5-4 No fi nancial decision-maker should ever rely solely on the fi nancial information reported in the annual report to make decisions. It is important to keep abreast of fi nancial news. This activity demonstrates how to search for fi nancial news on the Web.
Address: biz.yahoo.com/i, or go to www.wiley.com/college/weygandt
Steps:1. Type in either PepsiCo or Coca-Cola.2. Choose News.3. Select an article that sounds interesting to you.
Instructions(a) What was the source of the article (e.g., Reuters, Businesswire, PR Newswire)?(b) Assume that you are a personal fi nancial planner and that one of your clients owns stock in the
company. Write a brief memo to your client, summarizing the article and explaining the implica-tions of the article for his or her investment.
CRITICAL THINKING
Decision-Making Across the OrganizationBYP5-5 Three years ago, Amy Hessler and her brother-in-law Jacob Seelig opened Family Depart-ment Store. For the fi rst two years, business was good, but the following condensed income results for 2016 were disappointing.
Amy believes the problem lies in the relatively low gross profi t rate (gross profi t divided by net sales) of 21%. Jacob believes the problem is that operating expenses are too high. Amy thinks the gross profi t rate can be improved by making both of the following changes. She does not anticipate that these changes will have any effect on operating expenses.
1. Increase average selling prices by 17%. This increase is expected to lower sales volume so that total sales will increase only 6%.
2. Buy merchandise in larger quantities and take all purchase discounts. These changes are expected to increase the gross profi t rate by 3 percentage points.
Jacob thinks expenses can be cut by making both of the following changes. He feels that these changes will not have any effect on net sales.
1. Cut sales salaries of $60,000 in half and give sales personnel a commission of 2% of net sales.2. Reduce store deliveries to one day per week rather than twice a week. This change will reduce
delivery expenses of $30,000 by 40%.
Amy and Jacob come to you for help in deciding the best way to improve net income.
FAMILY DEPARTMENT STOREIncome Statement
For the Year Ended December 31, 2016
Net sales $700,000Cost of goods sold 553,000
Gross profi t 147,000Operating expenses Selling expenses $100,000 Administrative expenses 20,000 120,000
Net income $ 27,000

258 5 Accounting for Merchandising Operations
InstructionsWith the class divided into groups, answer the following.
(a) Prepare a condensed income statement for 2017, assuming (1) Amy’s changes are implemented and (2) Jacob’s ideas are adopted.
(b) What is your recommendation to Amy and Jacob?(c) Prepare a condensed income statement for 2017, assuming both sets of proposed changes are
made.
Communication ActivityBYP5-6 The following situation is in chronological order.
1. Parker decides to buy a surfboard. 2. He calls Surfi ng USA Co. to inquire about its surfboards. 3. Two days later, he requests Surfi ng USA Co. to make a surfboard. 4. Three days later, Surfi ng USA Co. sends him a purchase order to fi ll out. 5. He sends back the purchase order. 6. Surfi ng USA Co. receives the completed purchase order. 7. Surfi ng USA Co. completes the surfboard. 8. Parker picks up the surfboard. 9. Surfi ng USA Co. bills Parker.10. Surfi ng USA Co. receives payment from Parker.
InstructionsIn a memo to the president of Surfi ng USA Co., answer the following.
(a) When should Surfi ng USA Co. record the sale?(b) Suppose that with his purchase order, Parker is required to make a down payment. Would that
change your answer?
Ethics CaseBYP5-7 Tiffany Lyons was just hired as the assistant treasurer of Key West Stores. The company is a specialty chain store with nine retail stores concentrated in one metropolitan area. Among other things, the payment of all invoices is centralized in one of the departments Tiffany will manage. Her primary responsibility is to maintain the company’s high credit rating by paying all bills when due and to take advantage of all cash discounts. Jay Barnes, the former assistant treasurer who has been promoted to treasurer, is training Tiffany in her new duties. He instructs Tiffany that she is to continue the practice of preparing all checks “net of discount” and dating the checks the last day of the discount period. “But,” Jay continues, “we always hold the checks at least 4 days beyond the discount period before mailing them. That way, we get another 4 days of interest on our money. Most of our creditors need our business and don’t com-plain. And, if they scream about our missing the discount period, we blame it on the mail room or the post offi ce. We’ve only lost one discount out of every hundred we take that way. I think everybody does it. By the way, welcome to our team!”
Instructions(a) What are the ethical considerations in this case?(b) Who are the stakeholders that are harmed or benefi tted in this situation?(c) Should Tiffany continue the practice started by Jay? Does she have any choice?
All About YouBYP5-8 There are many situations in business where it is diffi cult to determine the proper period in which to record revenue. Suppose that after graduation with a degree in fi nance, you take a job as a manager at a consumer electronics store called Impact Electronics. The company has expanded rap-idly in order to compete with Best Buy. Impact has also begun selling gift cards for its electronic products. The cards are available in any dollar amount and allow the holder of the card to purchase an item for up to 2 years from the time the card is purchased. If the card is not used during that 2 years, it expires.
InstructionsAnswer the following questions.

A Look at IFRS 259
At what point should the revenue from the gift cards be recognized? Should the revenue be recognized at the time the card is sold, or should it be recorded when the card is redeemed? Explain the reasoning to support your answers.
FASB Codifi cation ActivityBYP5-9 If your school has a subscription to the FASB Codifi cation, go to http://aaahq.org/ascLogin.cfm to log in and prepare responses to the following.
Instructions(a) Access the glossary (“Master Glossary”) to answer the following: (1) What is the defi nition provided for inventory? (2) What is a customer?(b) What guidance does the Codifi cation provide concerning reporting inventories above cost?
A Look at IFRS
8 Compare the accounting for merchandising under GAAP and IFRS.LEARNING OBJECTIVE
The basic accounting entries for merchandising are the same under both GAAP and IFRS. The income statement is a required statement under both sets of standards. The basic format is similar although some differences do exist.
Key PointsFollowing are the key similarities and differences between GAAP and IFRS related to inventories.
Similarities• Under both GAAP and IFRS, a company can choose to use either a perpetual or periodic inventory
systems.
• The defi nition of inventories is basically the same under GAAP and IFRS.
• As indicated above, the basic accounting entries for merchandising are the same under both GAAP and IFRS.
• Both GAAP and IFRS require that income statement information be presented for multiple years. For example, IFRS requires that 2 years of income statement information be presented, whereas GAAP requires 3 years.
Differences• Under GAAP companies generally classify income statement items by function. Classifi cation by
function leads to descriptions like administration, distribution, and manufacturing. Under IFRS, companies must classify expenses either by nature or by function. Classifi cation by nature leads to descriptions such as the following: salaries, depreciation expense, and utilities expense. If a com-pany uses the functional-expense method on the income statement, disclosure by nature is required in the notes to the fi nancial statements.
• Presentation of the income statement under GAAP follows either a single-step or multiple-step format. IFRS does not mention a single-step or multiple-step approach.
• Under IFRS revaluation of land, buildings, and intangible assets is permitted. The initial gains and losses resulting from this revaluation are reported as adjustments to equity, often referred to as other comprehensive income. The effect of this difference is that the use of IFRS results in more transactions affecting equity (other comprehensive income) but not net income.

260 5 Accounting for Merchandising Operations
Looking to the FutureThe IASB and FASB are working on a project that would rework the structure of fi nancial statements. Specifi cally, this project will address the issue of how to classify various items in the income state-ment. A main goal of this new approach is to provide information that better represents how busi-nesses are run. In addition, this approach draws attention away from just one number—net income. It will adopt major groupings similar to those currently used by the statement of cash fl ows (operat-ing, investing, and fi nancing), so that numbers can be more readily traced across statements. For example, the amount of income that is generated by operations would be traceable to the assets and liabilities used to generate the income. Finally, this approach would also provide detail, beyond that currently seen in most statements (either GAAP or IFRS), by requiring that line items be presented both by function and by nature. The new fi nancial statement format was heavily infl uenced by sugges-tions from fi nancial statement analysts.
IFRS Practice
IFRS Self-Test Questions
1. Which of the following would not be included in the defi nition of inventory under IFRS?(a) Photocopy paper held for sale by an offi ce-supply store.(b) Stereo equipment held for sale by an electronics store.(c) Used offi ce equipment held for sale by the human relations department of a plastics company.(d) All of the above would meet the defi nition.
2. Which of the following would not be a line item of a company reporting costs by nature?(a) Depreciation expense. (c) Interest expense.(b) Salaries expense. (d) Manufacturing expense.
3. Which of the following would not be a line item of a company reporting costs by function?(a) Administration. (c) Utilities expense.(b) Manufacturing. (d) Distribution.
4. Which of the following statements is false?(a) IFRS specifi cally requires use of a multiple-step income statement.(b) Under IFRS, companies can use either a perpetual or periodic system.(c) The proposed new format for fi nancial statements was heavily infl uenced by the suggestions of
fi nancial statement analysts.(d) The new income statement format will try to de-emphasize the focus on the “net income” line
item.
IFRS ExercisesIFRS5-1 Explain the difference between the “nature-of-expense” and “function-of-expense” classifi cations.
IFRS5-2 For each of the following income statement line items, state whether the item is a “by nature” expense item or a “by function” expense item.
________ Cost of goods sold ________ Utilities expense________ Depreciation expense ________ Delivery expense________ Salaries and wages expense ________ General and administrative expenses________ Selling expenses
IFRS5-3 Matilda Company reported the following amounts (in euros) in 2017: Net income, €150,000; Unrealized gain related to revaluation of buildings, €10,000; and Unrealized loss on non-trading secu-rities, €(35,000). Determine Matilda’s total comprehensive income for 2017.

A Look at IFRS 261
International Financial Reporting Problem: Louis Vuitton
IFRS5-4 The fi nancial statements of Louis Vuitton are presented in Appendix F. Instructions for accessing and using the company’s complete annual report, including the notes to its fi nancial state-ments, are also provided in Appendix F.
InstructionsUse Louis Vuitton’s annual report to answer the following questions.
(a) Does Louis Vuitton use a multiple-step or a single-step income statement format? Explain how you made your determination.
(b) Instead of “interest expense,” what label does Louis Vuitton use for interest costs that it incurs?(c) Using the notes to the company’s fi nancial statements, determine the following: (1) Composition of the inventory. (2) Amount of inventory (gross) before impairment.
Answers to IFRS Self-Test Questions
1. c 2. d 3. c 4. a

Let’s talk inventory—big, bulldozer-size inventory. Caterpillar
Inc. is the world’s largest manufacturer of construction and
mining equipment, diesel and natural gas engines, and
industrial gas turbines. It sells its products in over 200 countries,
making it one of the most successful U.S. exporters. More than
70% of its productive assets are located domestically, and
nearly 50% of its sales are foreign.
In the past, Caterpillar’s profi tability suffered, but today
it is very successful. A big part of this turnaround can be
attributed to effective management of its inventory. Imagine
what it costs Caterpillar to have too many bulldozers sitting
around in inventory—a situation the company defi nitely wants
to avoid. Yet Caterpillar must also make sure it has enough
inventory to meet demand.
At one time during a 7-year period, Caterpillar’s sales
increased by 100% while its inventory increased by only 50%.
To achieve this dramatic reduction in the amount of resources
tied up in inventory while continuing to meet customers’
needs, Caterpillar used a two-pronged approach. First, it
completed a factory modernization program, which greatly
increased its production effi ciency. The program reduced by
60% the amount of inventory the company processes at any
one time. It also reduced by an incredible 75% the time it
takes to manufacture a part.
Second, Caterpillar dramatically improved its parts distribution
system. It ships more than 100,000 items daily from its 23
distribution centers strategically located around the world
(10 million square feet of warehouse space—remember, we’re
talking bulldozers). The company can virtually guarantee that
it can get any part to anywhere in the world within 24 hours.
These changes led to record exports, profi ts, and revenues for
Caterpillar. It would seem that things couldn’t be better. But
industry analysts, as well as the company’s managers,
thought otherwise. In order to maintain Caterpillar’s position
as the industry leader, management began another major
overhaul of inventory production and inventory management
processes. The goal: to cut the number of repairs in half,
increase productivity by 20%, and increase inventory turnover
by 40%.
In short, Caterpillar’s ability to manage its inventory has been
a key reason for its past success and will very likely play a
huge part in its future profi tability as well.
“Where Is That Spare Bulldozer Blade?”
In the previous chapter, we discussed the accounting for merchandise inventory using a perpetual inventory system. In this chapter, we explain the methods used to calculate the cost of inventory on hand at the balance sheet date and the cost of goods sold.
CHAPTER PREVIEW
6FEATURE STORY
Inventories
262

Go to the REVIEW AND PRACTICE section at the end of the chapter for a review of key concepts and practice applications with solutions.
Visit WileyPLUS with ORION for additional tutorials and practice opportunities.
Discuss how to classify and determine inventory.1
CHAPTER OUTLINE
Rules of OwnershipDO IT! 1• Classifying inventory• Determining inventory
quantities
Learning Objectives
Apply inventory cost fl ow methods and discuss their fi nancial effects.2 Cost Flow MethodsDO IT! 2
• Specifi c identifi cation• Cost fl ow assumptions• Financial statement and
tax effects• Using cost fl ow methods
consistently
Indicate the effects of inventory errors on the fi nancial statements.3 Inventory ErrorsDO IT! 3• Income statement effects
• Balance sheet effects
Explain the statement presentation and analysis of inventory.4 LCM and Inventory
TurnoverDO IT! 4
• Presentation• Lower-of-cost-or-market• Analysis
James Porter/Workbook/Getty Images, Inc.

264 6 Inventories
By observing the levels and changes in the levels of these three inven-tory types, fi nancial statement users can gain insight into management’s production plans. For example, low levels of raw materials and high levels of fi nished goods suggest that management believes it has enough inventory on hand and production will be slowing down—perhaps in anticipation of a reces-sion. Conversely, high levels of raw materials and low levels of fi nished goods probably signal that management is planning to step up production. Many companies have signifi cantly lowered inventory levels and costs using just-in-time (JIT) inventory methods. Under a just-in-time method, companies manufacture or purchase goods only when needed for use. Dell is famous for having developed a system for making computers in response to individual cus-tomer requests. Even though it makes each computer to meet each customer’s
1 Discuss how to classify and determine inventory.LEARNING OBJECTIVE
Two important steps in the reporting of inventory at the end of the accounting period are the classifi cation of inventory based on its degree of completeness and the determination of inventory amounts.
Classifying Inventory
How a company classifi es its inventory depends on whether the fi rm is a mer-chandiser or a manufacturer. In a merchandising company, such as those described in Chapter 5, inventory consists of many different items. For example, in a grocery store, canned goods, dairy products, meats, and produce are just a few of the inventory items on hand. These items have two common characteris-tics: (1) they are owned by the company, and (2) they are in a form ready for sale to customers in the ordinary course of business. Thus, merchandisers need only one inventory classifi cation, merchandise inventory, to describe the many dif-ferent items that make up the total inventory. In a manufacturing company, some inventory may not yet be ready for sale. As a result, manufacturers usually classify inventory into three categories: fi n-ished goods, work in process, and raw materials. Finished goods inventory is manufactured items that are completed and ready for sale. Work in process is that portion of manufactured inventory that has been placed into the production process but is not yet complete. Raw materials are the basic goods that will be used in production but have not yet been placed into production. For example, Caterpillar classifi es earth-moving tractors completed and ready for sale as fi nished goods. It classifi es the tractors on the assembly line in various stages of production as work in process. The steel, glass, tires, and other components that are on hand waiting to be used in the production of tractors are identifi ed as raw materials. Illustration 6-1 shows an adapted excerpt from Note 7 of Caterpillar’s annual report.
Helpful HintRegardless of the classifi ca-tion, companies report all inventories under Current Assets on the balance sheet.
December 31
(millions of dollars) 2013 2012 2011
Raw materials $ 2,966 $ 3,573 $ 3,766Work-in-process 2,589 2,920 2,959Finished goods 6,785 8,767 7,562Other 285 287 257
Total inventories $12,625 $15,547 $14,544
Illustration 6-1Composition of Caterpillar’s inventory

Classifying and Determining Inventory 265
particular specifi cations, Dell is able to assemble the computer and put it on a truck in less than 48 hours. The success of the JIT system depends on reliable suppliers. By integrating its information systems with those of its suppliers, Dell reduced its inventories to nearly zero. This is a huge advantage in an industry where products become obsolete nearly overnight. The accounting concepts discussed in this chapter apply to the inventory classifi cations of both merchandising and manufacturing companies. Our focus here is on merchandise inventory. Additional issues specifi c to manufac-turing companies are discussed later in the managerial section of this textbook (Chapters 19–26).
A Big Hiccup
JIT can save a company a lot of money, but it isn’t without risk. An unexpected disruption in the supply chain can cost a company a lot of money. Japa-nese automakers experienced just such a disruption when a 6.8-magnitude earthquake caused major damage to the company that produces 50% of their piston rings. The rings themselves cost only $1.50, but you can’t make a car without them. As a result, the auto-
makers were forced to shut down production for a few days—a loss of tens of thousands of cars.
Similarly, a major snowstorm halted production at the Canadian plants of Ford. A Ford spokesperson said, “Because the plants run with just-in-time inventory, we don’t have large stockpiles of parts sitting around. When you have a somewhat signifi cant disruption, you can pretty quickly run out of parts.”
Sources: Amy Chozick, “A Key Strategy of Japan’s Car Makers Backfi res,” Wall Street Journal (July 20, 2007); and Kate Linebaugh, “Canada Military Evacuates Motorists Stranded by Snow,” Wall Street Journal (December 15, 2010).
What steps might the companies take to avoid such a serious disruption in the future? (Go to WileyPLUS for this answer and additional questions.)© PeskyMonkey/iStockphoto
FordAccounting Across the Organization
Determining Inventory Quantities
No matter whether they are using a periodic or perpetual inventory system, all companies need to determine inventory quantities at the end of the accounting period. If using a perpetual system, companies take a physical inventory for the following reasons:
1. To check the accuracy of their perpetual inventory records.
2. To determine the amount of inventory lost due to wasted raw materials, shop-lifting, or employee theft.
Companies using a periodic inventory system take a physical inventory for two different purposes: to determine the inventory on hand at the balance sheet date, and to determine the cost of goods sold for the period. Determining inventory quantities involves two steps: (1) taking a physical inventory of goods on hand and (2) determining the ownership of goods.
TAKING A PHYSICAL INVENTORY
Companies take a physical inventory at the end of the accounting period. Taking a physical inventory involves actually counting, weighing, or measuring each kind of inventory on hand. In many companies, taking an inventory is a formida-ble task. Retailers such as Target, True Value Hardware, or Home Depot have thousands of different inventory items. An inventory count is generally more
ETHICS NOTE
In a famous fraud, a salad oil company fi lled its storage tanks mostly with water. The oil rose to the top, so auditors thought the tanks were full of oil. The company also said it had more tanks than it really did: It repainted numbers on the tanks to confuse auditors.

266 6 Inventories
accurate when goods are not being sold or received during the counting. Conse-quently, companies often “take inventory” when the business is closed or when business is slow. Many retailers close early on a chosen day in January—after the holiday sales and returns, when inventories are at their lowest level—to count inventory. Wal-Mart Stores, Inc., for example, has a year-end of January 31.
Falsifying Inventory to Boost Income
Managers at women’s apparel maker Leslie Fay were con-victed of falsifying inventory records to boost net income—and consequently to boost management bonuses. In another case, executives at Craig Consumer Electronics were accused of defrauding
lenders by manipulating inventory records. The indictment said the company classifi ed “defective goods as new or refurbished” and claimed that it owned certain shipments “from overseas suppliers” when, in fact, Craig either did not own the shipments or the shipments did not exist.
What effect does an overstatement of inventory have on a company’s fi nancial statements? (Go to WileyPLUS for this answer and additional questions.)
Leslie FayEthics Insight
© Greg Brookes/iStockphoto
DETERMINING OWNERSHIP OF GOODS
One challenge in computing inventory quantities is determining what inventory a company owns. To determine ownership of goods, two questions must be answered: Do all of the goods included in the count belong to the company? Does the company own any goods that were not included in the count?
GOODS IN TRANSIT A complication in determining ownership is goods in transit (on board a truck, train, ship, or plane) at the end of the period. The company may have purchased goods that have not yet been received, or it may have sold goods that have not yet been delivered. To arrive at an accurate count, the com-pany must determine ownership of these goods. Goods in transit should be included in the inventory of the company that has legal title to the goods. Legal title is determined by the terms of the sale, as shown in Illustration 6-2 and described below.
1. When the terms are FOB (free on board) shipping point, ownership of the goods passes to the buyer when the public carrier accepts the goods from the seller.
Ownershippasses to
buyer here
Seller Seller
Ownershippasses to
buyer here
FOB Shipping PointBuyer pays freight costs
FOB DestinationSeller pays freight costs
Buyer Buyer
PublicCarrierCo.
PublicCarrierCo.
Illustration 6-2Terms of sale

Classifying and Determining Inventory 267
2. When the terms are FOB destination, ownership of the goods remains with the seller until the goods reach the buyer.
If goods in transit at the statement date are ignored, inventory quantities may be seriously miscounted. Assume, for example, that Hargrove Company has 20,000 units of inventory on hand on December 31. It also has the following goods in transit:
1. Sales of 1,500 units shipped December 31 FOB destination.
2. Purchases of 2,500 units shipped FOB shipping point by the seller on December 31.
Hargrove has legal title to both the 1,500 units sold and the 2,500 units pur-chased. If the company ignores the units in transit, it would understate inventory quantities by 4,000 units (1,500 1 2,500). As we will see later in the chapter, inaccurate inventory counts affect not only the inventory amount shown on the balance sheet but also the cost of goods sold calculation on the income statement.
CONSIGNED GOODS In some lines of business, it is common to hold the goods of other parties and try to sell the goods for them for a fee, but without taking own-ership of the goods. These are called consigned goods. For example, you might have a used car that you would like to sell. If you take the item to a dealer, the dealer might be willing to put the car on its lot and charge you a commission if it is sold. Under this agreement, the dealer would not take ownership of the car, which would still belong to you. Therefore, if an inventory count were taken, the car would not be included in the dealer’s inventory because the dealer does not own it. Many car, boat, and antique dealers sell goods on consignment to keep their inventory costs down and to avoid the risk of purchasing an item that they will not be able to sell. Today, even some manufacturers are making con-signment agreements with their suppliers in order to keep their inventory levels low.
ANATOMY OF A FRAUD
Ted Nickerson, CEO of clock manufacturer Dally Industries, was feared by all of his employees. Ted also had expensive tastes. To support this habit, Ted took out large loans, which he collateralized with his shares of Dally Industries stock. If the price of Dally’s stock fell, he was required to provide the bank with more shares of stock. To achieve target net income fi gures and thus maintain the stock price, Ted coerced employees in the company to alter inventory fi gures. Inventory quantities were manipulated by changing the amounts on inventory control tags after the year-end physical inventory count. For example, if a tag said there were 20 units of a particular item, the tag was changed to 220. Similarly, the unit costs that were used to determine the value of ending inventory were increased from, for example, $125 per unit to $1,250. Both of these fraudulent changes had the effect of increasing the amount of reported ending inventory. This reduced cost of goods sold and increased net income.
Total take: $245,000
THE MISSING CONTROLIndependent internal verifi cation. The company should have spot-checked its inven-tory records periodically, verifying that the number of units in the records agreed with the amount on hand and that the unit costs agreed with vendor price sheets.
Source: Adapted from Wells, Fraud Casebook (2007), pp. 502–509.

268 6 Inventories
Cost of goods sold will differ depending on which two TVs the company sold. For example, it might be $1,470 ($720 1 $750), or $1,520 ($720 1 $800), or $1,550 ($750 1 $800). In this section, we discuss alternative costing methods available to Crivitz.
Hasbeen Company completed its inventory count. It arrived at a total inventory value of $200,000. As a new member of Hasbeen’s accounting department, you have been given the information listed below. Discuss how this information affects the reported cost of inventory.
1. Hasbeen included in the inventory goods held on consignment for Falls Co., costing $15,000.
2. The company did not include in the count purchased goods of $10,000 which were in transit (terms: FOB shipping point).
3. The company did not include in the count sold inventory with a cost of $12,000 which was in transit (terms: FOB shipping point).
Solution
DO IT! 1 Rules of Ownership
The goods of $15,000 held on consignment should be deducted from the inventory count. The goods of $10,000 purchased FOB shipping point should be added to the inventory count. Sold goods of $12,000 which were in transit FOB shipping point should not be included in the ending inventory. Thus, inventory should be carried at $195,000 ($200,000 2 $15,000 1 $10,000).
Related exercise material: BE6-1, BE6-2, E6-1, E6-2, and DO IT! 6-1.
Action Plan✔ Apply the rules of
ownership to goods held on consignment.
✔ Apply the rules of ownership to goods in transit.
2 Apply inventory cost fl ow methods and discuss their fi nancial effects.
LEARNING OBJECTIVE
Inventory is accounted for at cost. Cost includes all expenditures necessary to acquire goods and place them in a condition ready for sale. For example, freight costs incurred to acquire inventory are added to the cost of inventory, but the cost of shipping goods to a customer are a selling expense. After a company has determined the quantity of units of inventory, it applies unit costs to the quantities to compute the total cost of the inventory and the cost of goods sold. This process can be complicated if a company has purchased inventory items at different times and at different prices. For example, assume that Crivitz TV Company purchases three identical 50-inch TVs on different dates at costs of $720, $750, and $800. During the year, Crivitz sold two sets at $1,200 each. These facts are summarized in Illustration 6-3.
Illustration 6-3Data for inventory costing example
Purchases February 3 1 TV at $720 March 5 1 TV at $750 May 22 1 TV at $800
Sales June 1 2 TVs for $2,400 ($1,200 3 2)

Inventory Methods and Financial Effects 269
Specifi c Identifi cation
If Crivitz can positively identify which particular units it sold and which are still in ending inventory, it can use the specifi c identifi cation method of inventory costing. For example, if Crivitz sold the TVs it purchased on February 3 and May 22, then its cost of goods sold is $1,520 ($720 1 $800), and its ending inventory is $750 (see Illustration 6-4). Using this method, companies can accurately deter-mine ending inventory and cost of goods sold.
ETHICS NOTE
A major disadvantage of the specifi c identifi cation method is that management may be able to manipulate net income. For example, it can boost net income by selling units purchased at a low cost, or reduce net income by selling units purchased at a high cost.
Illustration 6-4Specifi c identifi cation method
Cost of goods sold = $720 + $800 = $1,520
Ending inventory = $750
SOLD
$800
SOLD
$720
$750
Ending inventory
Specifi c identifi cation requires that companies keep records of the original cost of each individual inventory item. Historically, specifi c identifi cation was possible only when a company sold a limited variety of high-unit-cost items that could be identifi ed clearly from the time of purchase through the time of sale. Examples of such products are cars, pianos, or expensive antiques. Today, bar coding, electronic product codes, and radio frequency identifi ca-tion make it theoretically possible to do specifi c identifi cation with nearly any type of product. The reality is, however, that this practice is still relatively rare. Instead, rather than keep track of the cost of each particular item sold, most com-panies make assumptions, called cost fl ow assumptions, about which units were sold.
Cost Flow Assumptions
Because specifi c identifi cation is often impractical, other cost fl ow methods are permitted. These differ from specifi c identifi cation in that they assume fl ows of costs that may be unrelated to the physical fl ow of goods. There are three assumed cost fl ow methods:
1. First-in, fi rst-out (FIFO)
2. Last-in, fi rst-out (LIFO)
3. Average-cost
There is no accounting requirement that the cost fl ow assumption be consistent with the physical movement of the goods. Company management selects the appropriate cost fl ow method. To demonstrate the three cost fl ow methods, we will use a periodic inventory system. We assume a periodic system because very few companies use perpet-ual LIFO, FIFO, or average-cost to cost their inventory and related cost of goods sold. Instead, companies that use perpetual systems often use an assumed cost (called a standard cost) to record cost of goods sold at the time of sale. Then, at the end of the period when they count their inventory, they recalculate cost

270 6 Inventories
of goods sold using periodic FIFO, LIFO, or average-cost as shown in this chapter and adjust cost of goods sold to this recalculated number.1
To illustrate the three inventory cost fl ow methods, we will use the data for Houston Electronics’ Astro condensers, shown in Illustration 6-5.
Illustration 6-5Data for Houston Electronics HOUSTON ELECTRONICS
Astro Condensers
Date Explanation Units Unit Cost Total Cost
Jan. 1 Beginning inventory 100 $10 $ 1,000Apr. 15 Purchase 200 11 2,200Aug. 24 Purchase 300 12 3,600Nov. 27 Purchase 400 13 5,200
Total units available for sale 1,000 $12,000 Units in ending inventory 450
Units sold 550
The cost of goods sold formula in a periodic system is:
1Also, some companies use a perpetual system to keep track of units, but they do not make an entry for perpetual cost of goods sold. In addition, fi rms that employ LIFO tend to use dollar-value LIFO, a method discussed in upper-level courses. FIFO periodic and FIFO perpetual give the same result. Therefore, companies should not incur the additional cost to use FIFO perpetual. Few companies use perpetual average-cost because of the added cost of recordkeeping. Finally, for instructional purposes, we believe it is easier to demonstrate the cost fl ow assumptions under the periodic system, which makes it more pedagogically appropriate.
(Beginning Inventory 1 Purchases) 2 Ending Inventory 5 Cost of Goods Sold
Houston Electronics had a total of 1,000 units available to sell during the period (beginning inventory plus purchases). The total cost of these 1,000 units is $12,000, referred to as cost of goods available for sale. A physical inventory taken at December 31 determined that there were 450 units in ending inventory. Therefore, Houston sold 550 units (1,000 2 450) during the period. To determine the cost of the 550 units that were sold (the cost of goods sold), we assign a cost to the ending inventory and subtract that value from the cost of goods available for sale. The value assigned to the ending inventory will depend on which cost fl ow method we use. No matter which cost fl ow assumption we use, though, the sum of cost of goods sold plus the cost of the ending inventory must equal the cost of goods available for sale—in this case, $12,000.
FIRST-IN, FIRST-OUT (FIFO)
The fi rst-in, fi rst-out (FIFO) method assumes that the earliest goods pur-chased are the fi rst to be sold. FIFO often parallels the actual physical fl ow of merchandise. That is, it generally is good business practice to sell the oldest units fi rst. Under the FIFO method, therefore, the costs of the earliest goods purchased are the fi rst to be recognized in determining cost of goods sold. (This does not necessarily mean that the oldest units are sold fi rst, but that the costs of the old-est units are recognized fi rst. In a bin of picture hangers at the hardware store, for example, no one really knows, nor would it matter, which hangers are sold fi rst.) Illustration 6-6 shows the allocation of the cost of goods available for sale at Houston Electronics under FIFO.

Inventory Methods and Financial Effects 271
Under FIFO, since it is assumed that the fi rst goods purchased were the fi rst goods sold, ending inventory is based on the prices of the most recent units pur-chased. That is, under FIFO, companies obtain the cost of the ending inven-tory by taking the unit cost of the most recent purchase and working backward until all units of inventory have been costed. In this example, Houston Electronics prices the 450 units of ending inventory using the most recent prices. The last purchase was 400 units at $13 on November 27. The remaining 50 units are priced using the unit cost of the second most recent pur-chase, $12, on August 24. Next, Houston Electronics calculates cost of goods sold by subtracting the cost of the units not sold (ending inventory) from the cost of all goods available for sale. Illustration 6-7 demonstrates that companies also can calculate cost of goods sold by pricing the 550 units sold using the prices of the fi rst 550 units acquired. Note that of the 300 units purchased on August 24, only 250 units are assumed sold. This agrees with our calculation of the cost of ending inventory, where 50 of these units were assumed unsold and thus included in ending inventory.
Illustration 6-6Allocation of costs—FIFO method
Helpful HintNote the sequencing of the allocation: (1) compute ending inventory, and (2) determine cost of goods sold.
Helpful HintAnother way of thinking about the calculation of FIFO ending inventory is the LISH assumption—last in still here.
COST OF GOODS AVAILABLE FOR SALE
Date Explanation Units Unit Cost Total Cost
Jan. 1 Beginning inventory 100 $10 $ 1,000Apr. 15 Purchase 200 11 2,200Aug. 24 Purchase 300 12 3,600Nov. 27 Purchase 400 13 5,200
Total 1,000 $12,000
STEP 1: ENDING INVENTORY STEP 2: COST OF GOODS SOLD
Unit Total Date Units Cost Cost
Nov. 27 400 $13 $ 5,200 Cost of goods available for sale $12,000 Aug. 24 50 12 600 Less: Ending inventory 5,800
Total 450 $5,800 Cost of goods sold $ 6,200
Cost ofgoods sold$1,000
$2,200
$5,200
$600
$3,000
$6,200
Ending inventory
$5,800Warehouse
Illustration 6-7Proof of cost of goods sold Date Units Unit Cost Total Cost
Jan. 1 100 $10 $ 1,000Apr. 15 200 11 2,200Aug. 24 250 12 3,000
Total 550 $6,200
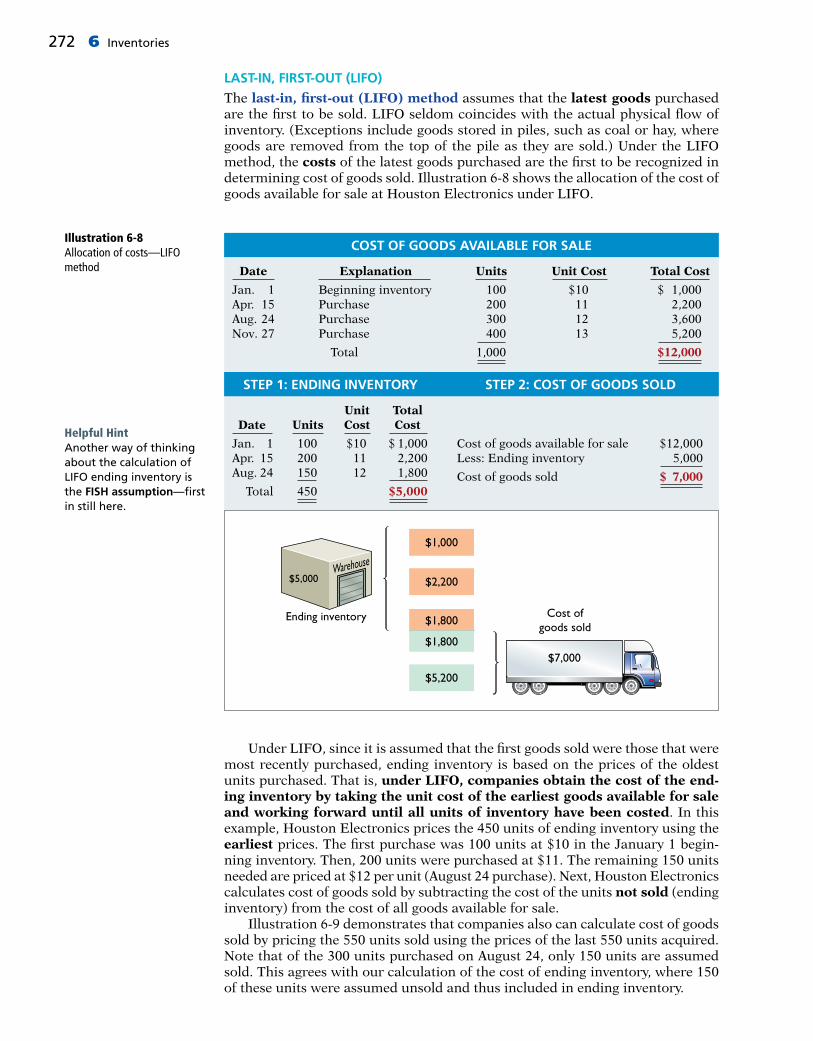
272 6 Inventories
LAST-IN, FIRST-OUT (LIFO)
The last-in, fi rst-out (LIFO) method assumes that the latest goods purchased are the fi rst to be sold. LIFO seldom coincides with the actual physical fl ow of inventory. (Exceptions include goods stored in piles, such as coal or hay, where goods are removed from the top of the pile as they are sold.) Under the LIFO method, the costs of the latest goods purchased are the fi rst to be recognized in determining cost of goods sold. Illustration 6-8 shows the allocation of the cost of goods available for sale at Houston Electronics under LIFO.
Illustration 6-8Allocation of costs—LIFO method
COST OF GOODS AVAILABLE FOR SALE
Date Explanation Units Unit Cost Total Cost
Jan. 1 Beginning inventory 100 $10 $ 1,000Apr. 15 Purchase 200 11 2,200Aug. 24 Purchase 300 12 3,600Nov. 27 Purchase 400 13 5,200
Total 1,000 $12,000
STEP 1: ENDING INVENTORY STEP 2: COST OF GOODS SOLD
Unit Total Date Units Cost Cost
Jan. 1 100 $10 $ 1,000 Cost of goods available for sale $12,000Apr. 15 200 11 2,200 Less: Ending inventory 5,000Aug. 24 150 12 1,800 Cost of goods sold $ 7,000
Total 450 $5,000
Cost ofgoods sold
$1,000
$2,200
$5,200
$1,800
$1,800$7,000
Ending inventory
$5,000Warehouse
Helpful HintAnother way of thinking about the calculation of LIFO ending inventory is the FISH assumption—fi rst in still here.
Under LIFO, since it is assumed that the fi rst goods sold were those that were most recently purchased, ending inventory is based on the prices of the oldest units purchased. That is, under LIFO, companies obtain the cost of the end-ing inventory by taking the unit cost of the earliest goods available for sale and working forward until all units of inventory have been costed. In this example, Houston Electronics prices the 450 units of ending inventory using the earliest prices. The fi rst purchase was 100 units at $10 in the January 1 begin-ning inventory. Then, 200 units were purchased at $11. The remaining 150 units needed are priced at $12 per unit (August 24 purchase). Next, Houston Electronics calculates cost of goods sold by subtracting the cost of the units not sold (ending inventory) from the cost of all goods available for sale. Illustration 6-9 demonstrates that companies also can calculate cost of goods sold by pricing the 550 units sold using the prices of the last 550 units acquired. Note that of the 300 units purchased on August 24, only 150 units are assumed sold. This agrees with our calculation of the cost of ending inventory, where 150 of these units were assumed unsold and thus included in ending inventory.

Inventory Methods and Financial Effects 273
Under a periodic inventory system, which we are using here, all goods pur-chased during the period are assumed to be available for the fi rst sale, regardless of the date of purchase.
AVERAGE-COST
The average-cost method allocates the cost of goods available for sale on the basis of the weighted-average unit cost incurred. The average-cost method assumes that goods are similar in nature. Illustration 6-10 presents the formula and a sample computation of the weighted-average unit cost.
Illustration 6-9Proof of cost of goods sold Date Units Unit Cost Total Cost
Nov. 27 400 $13 $5,200Aug. 24 150 12 1,800
Total 550 $7,000
The company then applies the weighted-average unit cost to the units on hand to determine the cost of the ending inventory. Illustration 6-11 shows the allocation of the cost of goods available for sale at Houston Electronics using average-cost.
Illustration 6-10Formula for weighted-average unit cost
Cost of Goods 4
Total Units 5
Weighted- Available for Sale Available for Sale Average Unit Cost
$12,000 4 1,000 5 $12
Illustration 6-11Allocation of costs—average-cost method
COST OF GOODS AVAILABLE FOR SALE
Date Explanation Units Unit Cost Total Cost
Jan. 1 Beginning inventory 100 $10 $ 1,000Apr. 15 Purchase 200 11 2,200Aug. 24 Purchase 300 12 3,600Nov. 27 Purchase 400 13 5,200
Total 1,000 $12,000
STEP 1: ENDING INVENTORY STEP 2: COST OF GOODS SOLD
$12,000 4 1,000 5 $12 Cost of goods available for sale $12,000
Unit Total Less: Ending inventory 5,400
Units Cost Cost Cost of goods sold $ 6,600
450 $12 $5,400
Cost ofgoods sold
$12,000 – $5,400= $6,600
Cost per unit
$12,000–––––––––1,000 units
= $12 per unit
Warehouse450 units × $12= $5,400
Ending inventory

274 6 Inventories
We can verify the cost of goods sold under this method by multiplying the units sold times the weighted-average unit cost (550 3 $12 5 $6,600). Note that this method does not use the average of the unit costs. That average is $11.50 ($10 1 $11 1 $12 1 $13 5 $46; $46 4 4). The average-cost method instead uses the average weighted by the quantities purchased at each unit cost.
Financial Statement and Tax Effects of Cost Flow Methods
Each of the three assumed cost fl ow methods is acceptable for use. For example, Reebok International Ltd. and Wendy’s International currently use the FIFO method of inventory costing. Campbell Soup Company, Kroger, and Walgreen Drugs use LIFO for part or all of their inventory. Bristol-Myers Squibb, Star-bucks, and Motorola use the average-cost method. In fact, a company may also use more than one cost fl ow method at the same time. Stanley Black & Decker Manufacturing Company, for example, uses LIFO for domestic inventories and FIFO for foreign inventories. Illustration 6-12 (in the margin) shows the use of the three cost fl ow methods in 500 large U.S. companies. The reasons companies adopt different inventory cost fl ow methods are varied, but they usually involve one of three factors: (1) income statement effects, (2) balance sheet effects, or (3) tax effects.
INCOME STATEMENT EFFECTS
To understand why companies might choose a particular cost fl ow method, let’s examine the effects of the different cost fl ow assumptions on the fi nancial state-ments of Houston Electronics. The condensed income statements in Illustration 6-13 assume that Houston sold its 550 units for $18,500, had operating expenses of $9,000, and is subject to an income tax rate of 30%.
Illustration 6-12Use of cost fl ow methods in major U.S. companies
24%LIFO
45%FIFO
16%Average-
Cost
15%Other
Illustration 6-13Comparative effects of cost fl ow methods
HOUSTON ELECTRONICSCondensed Income Statements
FIFO LIFO Average-Cost
Sales revenue $18,500 $18,500 $18,500
Beginning inventory 1,000 1,000 1,000Purchases 11,000 11,000 11,000
Cost of goods available for sale 12,000 12,000 12,000Ending inventory 5,800 5,000 5,400
Cost of goods sold 6,200 7,000 6,600
Gross profi t 12,300 11,500 11,900Operating expenses 9,000 9,000 9,000
Income before income taxes* 3,300 2,500 2,900Income tax expense (30%) 990 750 870
Net income $ 2,310 $ 1,750 $ 2,030
*We are assuming that Houston Electronics is a corporation, and corporations are required to pay income taxes.
Note the cost of goods available for sale ($12,000) is the same under each of the three inventory cost fl ow methods. However, the ending inventories and the costs of goods sold are different. This difference is due to the unit costs that the company allocated to cost of goods sold and to ending inventory. Each dollar of difference in ending inventory results in a corresponding dollar difference in income before income taxes. For Houston, an $800 difference exists between FIFO and LIFO cost of goods sold. In periods of changing prices, the cost fl ow assumption can have signifi cant impacts both on income and on evaluations of income, such as the following.

Inventory Methods and Financial Effects 275
1. In a period of infl ation, FIFO produces a higher net income because lower unit costs of the fi rst units purchased are matched against revenue.
2. In a period of infl ation, LIFO produces a lower net income because higher unit costs of the last goods purchased are matched against revenue.
3. If prices are falling, the results from the use of FIFO and LIFO are reversed. FIFO will report the lowest net income and LIFO the highest.
4. Regardless of whether prices are rising or falling, average-cost produces net income between FIFO and LIFO.
As shown in the Houston example (Illustration 6-13), in a period of rising prices FIFO reports the highest net income ($2,310) and LIFO the lowest ($1,750); aver-age-cost falls between these two amounts ($2,030). To management, higher net income is an advantage. It causes external users to view the company more favorably. In addition, management bonuses, if based on net income, will be higher. Therefore, when prices are rising (which is usually the case), companies tend to prefer FIFO because it results in higher net income. Others believe that LIFO presents a more realistic net income number. That is, LIFO matches the more recent costs against current revenues to provide a better measure of net income. During periods of infl ation, many challenge the quality of non-LIFO earnings, noting that failing to match current costs against current rev-enues leads to an understatement of cost of goods sold and an overstatement of net income. As some indicate, net income computed using FIFO creates “paper or phantom profi ts”—that is, earnings that do not really exist.
BALANCE SHEET EFFECTS
A major advantage of the FIFO method is that in a period of infl ation, the costs allocated to ending inventory will approximate their current cost. For example, for Houston Electronics, 400 of the 450 units in the ending inventory are costed under FIFO at the higher November 27 unit cost of $13. Conversely, a major shortcoming of the LIFO method is that in a period of inflation, the costs allocated to ending inventory may be significantly understated in terms of current cost. The understatement becomes greater over prolonged periods of inflation if the inventory includes goods purchased in one or more prior accounting periods. For example, Caterpillar has used LIFO for more than 50 years. Its balance sheet shows ending inventory of $12,625 million. But the inventory’s actual current cost if FIFO had been used is $15,129 million.
TAX EFFECTS
We have seen that both inventory on the balance sheet and net income on the income statement are higher when companies use FIFO in a period of infl ation. Yet, many companies have selected LIFO. Why? The reason is that LIFO results in the lowest income taxes (because of lower net income) during times of rising prices. For example, at Houston Electronics, income taxes are $750 under LIFO, compared to $990 under FIFO. The tax savings of $240 makes more cash avail-able for use in the business.
Using Inventory Cost Flow Methods Consistently
Whatever cost fl ow method a company chooses, it should use that method con-sistently from one accounting period to another. This approach is often referred to as the consistency concept, which means that a company uses the same accounting principles and methods from year to year. Consistent application enhances the comparability of fi nancial statements over successive time periods. In contrast, using the FIFO method one year and the LIFO method the next year would make it diffi cult to compare the net incomes of the two years. Although consistent application is preferred, it does not mean that a com-pany may never change its inventory costing method. When a company adopts a
Helpful HintA tax rule, often referred to as the LIFO conformity rule, requires that if companies use LIFO for tax purposes they must also use it for fi nancial report-ing purposes. This means that if a company chooses the LIFO method to reduce its tax bills, it will also have to report lower net income in its fi nancial statements.

276 6 Inventories
different method, it should disclose in the fi nancial statements the change and its effects on net income. Illustration 6-14 shows a typical disclosure, using informa-tion from recent fi nancial statements of Quaker Oats (now a unit of PepsiCo).
Illustration 6-14Disclosure of change in cost fl ow method
QUAKER OATSNotes to the Financial Statements
Note 1: Effective July 1, the Company adopted the LIFO cost fl ow assumption for valuing the majority of U.S. Grocery Products inventories. The Company believes that the use of the LIFO method better matches current costs with current revenues. The effect of this change on the current year was to decrease net income by $16.0 million.
Real World
The accounting records of Shumway Ag Implements show the following data.
Beginning inventory 4,000 units at $ 3Purchases 6,000 units at $ 4Sales 7,000 units at $12
Determine the cost of goods sold during the period under a periodic inventory system using (a) the FIFO method, (b) the LIFO method, and (c) the average-cost method.
Solution
DO IT! 2 Cost Flow Methods
Action Plan✔ Understand the
periodic inventory system.
✔ Allocate costs between goods sold and goods on hand (ending inventory) for each cost fl ow method.
✔ Compute cost of goods sold for each method.
Cost of goods available for sale 5 (4,000 3 $3) 1 (6,000 3 $4) 5 $36,000Ending inventory 5 10,000 2 7,000 5 3,000 units
(a) FIFO: $36,000 2 (3,000 3 $4) 5 $24,000
(b) LIFO: $36,000 2 (3,000 3 $3) 5 $27,000
(c) Average cost per unit: [(4,000 @ $3) 1 (6,000 @ $4)] 4 10,000 5 $3.60 Average-cost: $36,000 2 (3,000 3 $3.60) 5 $25,200
Related exercise material: BE6-3, BE6-4, BE6-5, E6-3, E6-4, E6-5, E6-6, E6-7, E6-8, and DO IT! 6-2.
Is LIFO Fair?
ExxonMobil Corporation, like many U.S. companies, uses LIFO to value its inventory for fi nancial reporting and tax purposes. In one recent year, this resulted in a cost of goods sold fi gure that was $5.6 bil-lion higher than under FIFO. By increasing cost of goods sold, ExxonMobil reduces net income, which reduces taxes. Critics say that LIFO provides an unfair “tax dodge.” As Con-gress looks for more sources of
tax revenue, some lawmakers favor the elimination of LIFO. Supporters of LIFO argue that the method is concep-tually sound because it matches current costs with current revenues. In addition, they point out that this matching provides protection against infl ation.
International accounting standards do not allow the use of LIFO. Because of this, the net income of foreign oil companies such as BP and Royal Dutch Shell are not directly comparable to U.S. companies, which makes analysis diffi cult.
Source: David Reilly, “Big Oil’s Accounting Methods Fuel Criticism,” Wall Street Journal (August 8, 2006), p. C1.
What are the arguments for and against the use of LIFO? (Go to WileyPLUS for this answer and additional questions.)
ExxonMobil CorporationInternational Insight
Bloomberg/Getty Images

Effects of Inventory Errors 277
If the error understates beginning inventory, cost of goods sold will be under-stated. If the error understates ending inventory, cost of goods sold will be over-stated. Illustration 6-16 shows the effects of inventory errors on the current year’s income statement.
3 Indicate the effects of inventory errors on the fi nancial statements.
LEARNING OBJECTIVE
Unfortunately, errors occasionally occur in accounting for inventory. In some cases, errors are caused by failure to count or price the inventory correctly. In other cases, errors occur because companies do not properly recognize the trans-fer of legal title to goods that are in transit. When errors occur, they affect both the income statement and the balance sheet.
Income Statement Effects
Under a periodic inventory system, both the beginning and ending inventories appear in the income statement. The ending inventory of one period automati-cally becomes the beginning inventory of the next period. Thus, inventory errors affect the computation of cost of goods sold and net income in two periods. The effects on cost of goods sold can be computed by fi rst entering incorrect data in the formula in Illustration 6-15 and then substituting the correct data.
Illustration 6-15Formula for cost of goods sold Beginning
Cost of Ending
Cost of 1 Goods 2 5 Goods Inventory
Purchased Inventory
Sold
Illustration 6-16Effects of inventory errors on current year’s income statement
Cost of When Inventory Error: Goods Sold Is: Net Income Is:
Understates beginning inventory Understated OverstatedOverstates beginning inventory Overstated UnderstatedUnderstates ending inventory Overstated UnderstatedOverstates ending inventory Understated Overstated
So far, the effects of inventory errors are fairly straightforward. Now, though, comes the (at fi rst) surprising part: An error in the ending inventory of the cur-rent period will have a reverse effect on net income of the next accounting period. Illustration 6-17 (page 278) shows this effect. As you study the illustra-tion, you will see that the reverse effect comes from the fact that understating ending inventory in 2016 results in understating beginning inventory in 2017 and overstating net income in 2017. Over the two years, though, total net income is correct because the errors offset each other. Notice that total income using incorrect data is $35,000 ($22,000 1 $13,000), which is the same as the total income of $35,000 ($25,000 1 $10,000) using correct data. Also note in this example that an error in the begin-ning inventory does not result in a corresponding error in the ending inventory for that period. The correctness of the ending inventory depends entirely on the accuracy of taking and costing the inventory at the balance sheet date under the periodic inventory system.
ETHICS NOTE
Inventory fraud increases during recessions. Such fraud includes pricing inventory at amounts in excess of its actual value, or claiming to have inventory when no inventory exists. Inventory fraud usually overstates ending inventory, thereby understating cost of goods sold and creating higher income.

278 6 Inventories
Balance Sheet Effects
Companies can determine the effect of ending inventory errors on the balance sheet by using the basic accounting equation: Assets 5 Liabilities 1 Owner’s Equity. Errors in the ending inventory have the effects shown in Illustration 6-18.
Illustration 6-17Effects of inventory errors on two years’ income statements
SAMPLE COMPANYCondensed Income Statements
2016 2017
Incorrect Correct Incorrect Correct
Sales revenue $80,000 $80,000 $90,000 $90,000Beginning inventory $20,000 $20,000 $12,000 $15,000Cost of goods purchased 40,000 40,000 68,000 68,000
Cost of goods available for sale 60,000 60,000 80,000 83,000Ending inventory 12,000 15,000 23,000 23,000
Cost of goods sold 48,000 45,000 57,000 60,000
Gross profi t 32,000 35,000 33,000 30,000Operating expenses 10,000 10,000 20,000 20,000
Net income $22,000 $25,000 $13,000 $10,000
$(3,000) $3,000 Net income Net income understated overstated
The errors cancel. Thus, the combined total income for the 2-year period is correct.
Illustration 6-18Effects of ending inventory errors on balance sheet
Ending Inventory Error Assets Liabilities Owner’s Equity
Overstated Overstated No effect Overstated Understated Understated No effect Understated
The effect of an error in ending inventory on the subsequent period was shown in Illustration 6-17. Recall that if the error is not corrected, the combined total net income for the two periods would be correct. Thus, total owner’s equity reported on the balance sheet at the end of 2017 will also be correct.
Visual Company overstated its 2016 ending inventory by $22,000. Determine the impact this error has on ending inventory, cost of goods sold, and owner’s equity in 2016 and 2017.
Solution
DO IT! 3 Inventory Errors
Action Plan✔ An ending inventory
error in one period will have an equal and opposite effect on cost of goods sold and net income in the next period.
✔ After two years, the errors have offset each other.
2016 2017
Ending inventory $22,000 overstated No effectCost of goods sold $22,000 understated $22,000 overstatedOwner’s equity $22,000 overstated No effect
Related exercise material: BE6-6, E6-9, E6-10, and DO IT! 6-3.

Inventory Statement Presentation and Analysis 279
4 Explain the statement presentation and analysis of inventory.LEARNING OBJECTIVE
Presentation
As indicated in Chapter 5, inventory is classifi ed in the balance sheet as a current asset immediately below receivables. In a multiple-step income statement, cost of goods sold is subtracted from net sales. There also should be disclosure of (1) the major inventory classifi cations, (2) the basis of accounting (cost, or lower-of-cost-or-market), and (3) the cost method (FIFO, LIFO, or average-cost). Wal-Mart Stores, Inc., for example, in its January 31, 2014, balance sheet reported inventories of $44,858 million under current assets. The accompanying notes to the fi nancial statements, as shown in Illustration 6-19, disclosed the following information.
As indicated in this note, Wal-Mart values its inventories at the lower-of-cost-or-market using LIFO and FIFO.
Lower-of-Cost-or-Market
The value of inventory for companies selling high-technology or fashion goods can drop very quickly due to continual changes in technology or fashions. These circumstances sometimes call for inventory valuation methods other than those presented so far. For example, at one time purchasing managers at Ford decided to make a large purchase of palladium, a precious metal used in vehicle emission devices. They made this purchase because they feared a future shortage. The shortage did not materialize, and by the end of the year the price of palladium had plummeted. Ford’s inventory was then worth $1 billion less than its original cost. Do you think Ford’s inventory should have been stated at cost, in accor-dance with the historical cost principle, or at its lower replacement cost? As you probably reasoned, this situation requires a departure from the cost basis of accounting. This is done by valuing the inventory at the lower-of-cost-or-market (LCM) in the period in which the price decline occurs. LCM is a basis whereby inventory is stated at the lower of either its cost or market value as determined by current replacement cost. LCM is an example of the accounting convention of conservatism. Conservatism means that the approach adopted among accounting alternatives is the method that is least likely to overstate assets and net income.
Illustration 6-19Inventory disclosures by Wal-Mart
WAL-MART STORES, INC.Notes to the Financial Statements
Note 1. Summary of Signifi cant Accounting Policies
Inventories
The Company values inventories at the lower of cost or market as determined primar-ily by the retail method of accounting, using the last-in, fi rst-out (“LIFO”) method for substantially all of the WalMart U.S. segment’s inventories. The WalMart Interna-tional segment’s inventories are primarily valued by the retail method of accounting, using the fi rst-in, fi rst-out (“FIFO”) method. The retail method of accounting results in inventory being valued at the lower of cost or market since permanent mark-downs are currently taken as a reduction of the retail value of inventory. The Sam’s Club segment’s inventories are valued based on the weighted-average cost using the LIFO method. At January 31, 2014 and 2013, the Company’s inventories valued at LIFO approximate those inventories as if they were valued at FIFO.
Real World
Under U.S. GAAP, companies cannot reverse inventory write-downs if inventory increases in value in subsequent periods. IFRS permits companies to reverse write-downs in some circumstances.
International Note

280 6 Inventories
Companies apply LCM to the items in inventory after they have used one of the cost fl ow methods (specifi c identifi cation, FIFO, LIFO, or average-cost) to determine cost. Under the LCM basis, market is defi ned as current replacement cost, not selling price. For a merchandising company, current replacement cost is the cost of purchasing the same goods at the present time from the usual sup-pliers in the usual quantities. Current replacement cost is used because a decline in the replacement cost of an item usually leads to a decline in the selling price of the item. To illustrate the application of LCM, assume that Ken Tuckie TV has the fol-lowing lines of merchandise with costs and market values as indicated. LCM produces the results shown in Illustration 6-20. Note that the amounts shown in the fi nal column are the lower-of-cost-or-market amounts for each item.
Analysis
The amount of inventory carried by a company has signifi cant economic conse-quences. And inventory management is a double-edged sword that requires con-stant attention. On the one hand, management wants to have a great variety and quantity available so that customers have a wide selection and items are always in stock. But, such a policy may incur high carrying costs (e.g., investment, stor-age, insurance, obsolescence, and damage). On the other hand, low inventory levels lead to stock-outs and lost sales. Common ratios used to manage and eval-uate inventory levels are inventory turnover and a related measure, days in inventory. Inventory turnover measures the number of times on average the inventory is sold during the period. Its purpose is to measure the liquidity of the inventory. The inventory turnover is computed by dividing cost of goods sold by the average inventory during the period. Unless seasonal factors are signifi cant, average inventory can be computed from the beginning and ending inventory balances. For example, Wal-Mart reported in its 2014 annual report a beginning inventory of $43,803 million, an ending inventory of $44,858 million, and cost of goods sold for the year ended January 31, 2014, of $358,069 million. The inventory turnover formula and computation for Wal-Mart are shown below.
Illustration 6-20Computation of lower-of-cost-or-market
Cost Market Lower-of-Cost- Units per Unit per Unit or-Market
Flat-screen TVs 100 $600 $550 $ 55,000 ($550 3 100)Satellite radios 500 90 104 45,000 ($90 3 500)Blu-ray players 850 50 48 40,800 ($48 3 850)CDs 3,000 5 6 15,000 ($5 3 3,000)
Total inventory $155,800
Illustration 6-21Inventory turnover formula and computation for Wal-Mart
Cost of Goods Sold
4 Average Inventory 5 Inventory Turnover
$358,069 4 $44,858 1 $43,803
5 8.1 times 2
A variant of the inventory turnover is days in inventory. This measures the average number of days inventory is held. It is calculated as 365 divided by the inventory turnover. For example, Wal-Mart’s inventory turnover of 8.1 times divided into 365 is approximately 45.1 days. This is the approximate time that it takes a company to sell the inventory once it arrives at the store. There are typical levels of inventory in every industry. Companies that are able to keep their inventory at lower levels and higher turnovers and still satisfy customer needs are the most successful.

Inventory Statement Presentation and Analysis 281
Too Many TVs or Too Few?
Financial analysts closely moni-tored the inventory manage-ment practices of companies during the recent recession. For example, some analysts fol-lowing Sony expressed concern because the company built up its inventory of televisions in an attempt to sell 25 million liquid crystal display (LCD) TVs—a 60% increase over the
prior year. A year earlier, Sony had cut its inventory levels so that its quarterly days in inventory was down to 38 days,
compared to 61 days for the same quarter a year before that. But now, as a result of its inventory build-up, days in inventory rose to 59 days. While management was saying that it didn’t think that Sony’s inventory levels were now too high, analysts were concerned that the company would have to engage in very heavy discounting in order to sell off its inventory. Analysts noted that the losses from dis-counting can be “punishing.”
Source: Daisuke Wakabayashi, “Sony Pledges to Corral Inventory,” Wall Street Journal Online (November 2, 2010).
For Sony, what are the advantages and disadvantages of having a low days in inventory measure? (Go to WileyPLUS for this answer and additional questions.)
© Dmitry Kutlayev/iStockphoto
SonyAccounting Across the Organization
(a) Tracy Company sells three different types of home heating stoves (gas, wood, and pellet). The cost and market value of its inventory of stoves are as follows.
Cost Market
Gas $ 84,000 $ 79,000Wood 250,000 280,000Pellet 112,000 101,000
Determine the value of the company’s inventory under the lower-of-cost-or-market approach.
(b) Early in 2017, Westmoreland Company switched to a just-in-time inventory system. Its sales revenue, cost of goods sold, and inventory amounts for 2016 and 2017 are shown below.
2016 2017
Sales revenue $2,000,000 $1,800,000Cost of goods sold 1,000,000 910,000Beginning inventory 290,000 210,000Ending inventory 210,000 50,000
Determine the inventory turnover and days in inventory for 2016 and 2017. Discuss the changes in the amount of inventory, the inventory turnover and days in inventory, and the amount of sales across the two years.
DO IT! 4 LCM and Inventory Turnover
The lowest value for each inventory type is gas $79,000, wood $250,000, and pellet $101,000. The total inventory value is the sum of these amounts, $430,000.
2016 2017
Inventory turnover $1,000,000 5 4
$910,000 5 7
($290,000 1 $210,000)/2 ($210,000 1 $50,000)/2
Days in 365 4 4 5 91.3 days 365 4 7 5 52.1 days inventory
Action Plan✔ Determine whether
cost or market value is lower for each inventory type.
✔ Sum the lowest value of each inventory type to determine the total value of inventory.
Action Plan✔ To fi nd the inventory
turnover, divide cost of goods sold by average inventory.
✔ To determine days in inventory, divide 365 days by the inventory turnover.
Solution
Solution

282 6 Inventories
Related exercise material: BE6-7, BE6-8, E6-11, E6-12, E6-13, E6-14, and DO IT! 6-4.
Action Plan (cont’d)✔ Just-in-time inventory
reduces the amount of inventory on hand, which reduces carry-ing costs. Reducing inventory levels by too much has potential negative implications for sales.
5 APPENDIX 6A: Apply the inventory cost fl ow methods to perpetual inventory records.
What inventory cost fl ow methods can companies employ if they use a perpetual inventory system? Simple—they can use any of the inventory cost fl ow methods described in the chapter. To illustrate the application of the three assumed cost fl ow methods (FIFO, LIFO, and average-cost), we will use the data shown in Illus-tration 6A-1 and in this chapter for Houston Electronics’ Astro condensers.
LEARNING OBJECTIVE
*
Illustration 6A-1Inventoriable units and costs HOUSTON ELECTRONICS
Astro Condensers
Unit Total Balance Date Explanation Units Cost Cost in Units
1/1 Beginning inventory 100 $10 $ 1,000 100 4/15 Purchases 200 11 2,200 300 8/24 Purchases 300 12 3,600 600 9/10 Sale 550 50 11/27 Purchases 400 13 5,200 450
$12,000
First-In, First-Out (FIFO)
Under perpetual FIFO, the company charges to cost of goods sold the cost of the earliest goods on hand prior to each sale. Therefore, the cost of goods sold on September 10 consists of the units on hand January 1 and the units purchased April 15 and August 24. Illustration 6A-2 shows the inventory under a FIFO method perpetual system.
Illustration 6A-2Perpetual system—FIFO Balance
Date Purchases Cost of Goods Sold (in units and cost)
January 1 (100 @ $10) $ 1,000 April 15 (200 @ $11) $2,200 (100 @ $10) (200 @ $11) $ 3,200
August 24 (300 @ $12) $3,600 (100 @ $10) (200 @ $11) $ 6,800 (300 @ $12) September 10 (100 @ $10) (200 @ $11) (250 @ $12) ( 50 @ $12) $ 600
$6,200
November 27 (400 @ $13) $5,200 ( 50 @ $12) $5,800 (400 @ $13)Ending inventory
Cost of goods sold
⎧ ⎪ ⎪ ⎨ ⎪ ⎪ ⎩
⎧⎨⎩
⎧⎨⎩
⎧⎪⎨⎪⎩
The company experienced a very signifi cant decline in its ending inventory as a result of the just-in-time inventory. This decline improved its inventory turnover and its days in inventory. However, its sales declined by 10%. It is possible that this decline was caused by the dramatic reduction in the amount of inventory that was on hand, which increased the likelihood of “stock-outs.” To determine the optimal inventory level, management must weigh the benefi ts of reduced inventory against the potential lost sales caused by stock-outs.

Appendix 6A: Inventory Cost Flow Methods in Perpetual Inventory Systems 283
The ending inventory in this situation is $5,800, and the cost of goods sold is $6,200 [(100 @ $10) 1 (200 @ $11) 1 (250 @ $12)]. Compare Illustrations 6-6 (page 271) and 6A-2. You can see that the results under FIFO in a perpetual system are the same as in a periodic system. In both cases, the ending inventory is $5,800 and cost of goods sold is $6,200. Regardless of the system, the fi rst costs in are the costs assigned to cost of goods sold.
Last-In, First-Out (LIFO)
Under the LIFO method using a perpetual system, the company charges to cost of goods sold the cost of the most recent purchase prior to sale. Therefore, the cost of the goods sold on September 10 consists of all the units from the August 24 and April 15 purchases plus 50 of the units in beginning inventory. Illustration 6A-3 shows the computation of the ending inventory under the LIFO method.
Illustration 6A-3Perpetual system—LIFO Balance
Date Purchases Cost of Goods Sold (in units and cost)
January 1 (100 @ $10) $ 1,000April 15 (200 @ $11) $2,200 (100 @ $10)
$ 3,200
(200 @ $11)August 24 (300 @ $12) $3,600 (100 @ $10) (200 @ $11) $ 6,800 (300 @ $12) September 10 (300 @ $12) (200 @ $11) ( 50 @ $10) (50 @ $10) $ 500
$6,300
November 27 (400 @ $13) $5,200 (50 @ $10) $5,700
(400 @ $13) Ending inventory
Cost of goods sold
⎧ ⎪ ⎨ ⎪ ⎩
⎧⎨⎩
⎧⎪⎨⎪⎩
⎧⎨⎩
The use of LIFO in a perpetual system will usually produce cost allocations that differ from those using LIFO in a periodic system. In a perpetual system, the company allocates the latest units purchased prior to each sale to cost of goods sold. In contrast, in a periodic system, the latest units purchased during the period are allocated to cost of goods sold. Thus, when a purchase is made after the last sale, the LIFO periodic system will apply this purchase to the pre-vious sale. Compare Illustrations 6-8 (page 272) and 6A-3. Illustration 6-8 shows that the 400 units at $13 purchased on November 27 applied to the sale of 550 units on September 10. Under the LIFO perpetual system in Illustration 6A-3, the 400 units at $13 purchased on November 27 are all applied to the ending inventory. The ending inventory in this LIFO perpetual illustration is $5,700, and cost of goods sold is $6,300, as compared to the LIFO periodic Illustration 6-8 (page 272) where the ending inventory is $5,000 and cost of goods sold is $7,000.
Average-Cost
The average-cost method in a perpetual inventory system is called the moving-average method. Under this method, the company computes a new average after each purchase, by dividing the cost of goods available for sale by the units on hand. The average cost is then applied to (1) the units sold, to determine the cost of goods sold, and (2) the remaining units on hand, to determine the ending inventory amount. Illustration 6A-4 (page 284) shows the application of the moving-average cost method by Houston Electronics (computations of the moving-average unit cost are shown after Illustration 6A-4).

284 6 Inventories
As indicated, Houston Electronics computes a new average each time it makes a purchase.
1. On April 15, after Houston buys 200 units for $2,200, a total of 300 units cost-ing $3,200 ($1,000 1 $2,200) are on hand. The average unit cost is $10.667 ($3,200 4 300).
2. On August 24, after Houston buys 300 units for $3,600, a total of 600 units costing $6,800 ($1,000 1 $2,200 1 $3,600) are on hand. The average cost per unit is $11.333 ($6,800 4 600).
3. On September 10, to compute cost of goods sold, Houston uses this unit cost of $11.333 until it makes another purchase, when the company computes a new unit cost. Accordingly, the unit cost of the 550 units sold on September 10 is $11.333, and the total cost of goods sold is $6,233.
4. On November 27, following the purchase of 400 units for $5,200, there are 450 units on hand costing $5,767 ($567 1 $5,200) with a new average cost of $12.816 ($5,767 4 450).
Compare this moving-average cost under the perpetual inventory system to Illus-tration 6-11 (page 273) showing the average-cost method under a periodic inven-tory system.
Illustration 6A-4Perpetual system— moving-average method
Balance Date Purchases Cost of Goods Sold (in units and cost)
January 1 (100 @ $10) $ 1,000April 15 (200 @ $11) $2,200 (300 @ $10.667) $ 3,200August 24 (300 @ $12) $3,600 (600 @ $11.333) $ 6,800September 10 (550 @ $11.333) (50 @ $11.333) $ 567
$6,233November 27 (400 @ $13) $5,200 (450 @ $12.816) $5,767
Ending inventory
Cost of goods sold
6 APPENDIX 6B: Describe the two methods of estimating inventories.
In the chapter, we assumed that a company would be able to physically count its inventory. What if it cannot? What if the inventory were destroyed by fi re or fl ood, for example? In that case, the company would use an estimate. Two circumstances explain why companies sometimes estimate inventories. First, a casualty such as fi re, fl ood, or earthquake may make it impossible to take a physical inventory. Second, managers may want monthly or quarterly fi nancial statements, but a physical inventory is taken only annually. The need for estimat-ing inventories occurs primarily with a periodic inventory system because of the absence of perpetual inventory records. There are two widely used methods of estimating inventories: (1) the gross profi t method, and (2) the retail inventory method.
Gross Profi t Method
The gross profi t method estimates the cost of ending inventory by applying a gross profi t rate to net sales. This method is relatively simple but effective. Accountants, auditors, and managers frequently use the gross profi t method to test the reasonableness of the ending inventory amount. It will detect large errors. To use this method, a company needs to know its net sales, cost of goods available for sale, and gross profi t rate. The company then can estimate its gross profi t for the period. Illustration 6B-1 shows the formulas for using the gross profi t method.
LEARNING OBJECTIVE
*

Appendix 6B: Estimating Inventories 285
To illustrate, assume that Kishwaukee Company wishes to prepare an income statement for the month of January. Its records show net sales of $200,000, begin-ning inventory $40,000, and cost of goods purchased $120,000. In the preceding year, the company realized a 30% gross profi t rate. It expects to earn the same rate this year. Given these facts and assumptions, Kishwaukee can compute the estimated cost of the ending inventory at January 31 under the gross profi t method as follows.
Illustration 6B-1Gross profi t method formulas Estimated Estimated
Step 1: Net Sales 2 Gross 5 Cost of Profi t Goods Sold
Cost of Goods Estimated Estimated Step 2: Available for 2 Cost of 5 Cost of Sale Goods Sold Ending Inventory
Illustration 6B-2Example of gross profi t methodStep 1:
Net sales $ 200,000Less: Estimated gross profi t (30% 3 $200,000) 60,000
Estimated cost of goods sold $140,000
Step 2:Beginning inventory $ 40,000Cost of goods purchased 120,000
Cost of goods available for sale 160,000Less: Estimated cost of goods sold 140,000
Estimated cost of ending inventory $ 20,000
The gross profi t method is based on the assumption that the gross profi t rate will remain constant. But, it may not remain constant, due to a change in mer-chandising policies or in market conditions. In such cases, the company should adjust the rate to refl ect current operating conditions. In some cases, companies can obtain a more accurate estimate by applying this method on a department or product-line basis. Note that companies should not use the gross profi t method to prepare fi nan-cial statements at the end of the year. These statements should be based on a physical inventory count.
Retail Inventory Method
A retail store such as Home Depot, Ace Hardware, or Walmart has thousands of different types of merchandise at low unit costs. In such cases, it is diffi cult and time-consuming to apply unit costs to inventory quantities. An alternative is to use the retail inventory method to estimate the cost of inventory. Most retail companies can establish a relationship between cost and sales price. The com-pany then applies the cost-to-retail percentage to the ending inventory at retail prices to determine inventory at cost. Under the retail inventory method, a company’s records must show both the cost and retail value of the goods available for sale. Illustration 6B-3 (page 286) presents the formulas for using the retail inventory method. We can demonstrate the logic of the retail method by using unit-cost data. Assume that Ortiz Inc. has marked 10 units purchased at $7 to sell for $10 per unit. Thus, the cost-to-retail ratio is 70% ($70 4 $100). If four units remain unsold, their retail value is $40 (4 3 $10), and their cost is $28 ($40 3 70%). This amount agrees with the total cost of goods on hand on a per unit basis (4 3 $7).

286 6 Inventories
Illustration 6B-4 shows application of the retail method for Valley West. Note that it is not necessary to take a physical inventory to determine the estimated cost of goods on hand at any given time.
Illustration 6B-3Retail inventory method formulas
Goods Ending Step 1: Available for 2 Net Sales 5 Inventory Sale at Retail at Retail
Goods Goods Cost-to- Step 2: Available for 4 Available for 5 Retail Sale at Cost Sale at Retail Ratio
Ending Cost-to- Estimated Step 3: Inventory 3 Retail 5 Cost of at Retail Ratio Ending Inventory
Illustration 6B-4Application of retail inventory method
At Cost At Retail
Beginning inventory $14,000 $ 21,500 Goods purchased 61,000 78,500
Goods available for sale $75,000 100,000 Less: Net sales 70,000
Step (1) Ending inventory at retail 5 $ 30,000Step (2) Cost-to-retail ratio 5 $75,000 4 $100,000 5 75%Step (3) Estimated cost of ending inventory 5 $30,000 3 75% 5 $22,500
The retail inventory method also facilitates taking a physical inventory at the end of the year. Valley West can value the goods on hand at the prices marked on the merchandise, and then apply the cost-to-retail ratio to the goods on hand at retail to determine the ending inventory at cost. The major disadvantage of the retail method is that it is an averaging tech-nique. Thus, it may produce an incorrect inventory valuation if the mix of the ending inventory is not representative of the mix in the goods available for sale. Assume, for example, that the cost-to-retail ratio of 75% for Valley West consists of equal proportions of inventory items that have cost-to-retail ratios of 70%, 75%, and 80%. If the ending inventory contains only items with a 70% ratio, an incorrect inventory cost will result. Companies can minimize this problem by applying the retail method on a department or product-line basis.
Helpful HintIn determining inventory at retail, companies use selling prices of the units.
1 Discuss how to classify and determine inventory. Merchandisers need only one inventory classifi cation, merchandise inventory, to describe the different items that make up total inventory. Manufacturers, on the other hand, usually classify inventory into three cate-gories: fi nished goods, work in process, and raw materials. To determine inventory quantities, manu-facturers (1) take a physical inventory of goods on hand and (2) determine the ownership of goods in transit or on consignment.
Apply inventory cost fl ow methods and discuss their fi nancial effects. The primary basis of accounting for inventories is cost. Cost of goods available for sale includes (a) cost of beginning inventory and (b) cost of goods purchased. The inventory cost fl ow methods are specifi c identifi cation and three assumed cost fl ow methods—FIFO, LIFO, and average-cost.
When prices are rising, the fi rst-in, fi rst-out (FIFO) method results in lower cost of goods sold and higher net income than the other methods. The last-in, fi rst-out
LEARNING OBJECTIVES REVIEW
1 2
REVIEW AND PRACTICE

Review and Practice 287
(LIFO) method results in the lowest income taxes. The reverse is true when prices are falling. In the balance sheet, FIFO results in an ending inventory that is closest to current value. Inventory under LIFO is the farthest from current value.
Indicate the effects of inventory errors on the fi nancial statements. In the income statement of the current year: (a) If beginning inventory is understated, net income is overstated. The reverse occurs if beginning inventory is overstated. (b) If ending inventory is overstated, net income is overstated. If ending inven-tory is understated, net income is understated. In the following period, its effect on net income for that period is reversed, and total net income for the two years will be correct.
In the balance sheet: Ending inventory errors will have the same effect on total assets and total owner’s equity and no effect on liabilities.
Explain the statement presentation and analysis of inventory. Inventory is classifi ed in the balance sheet as a current asset immediately below receivables. There also should be disclosure of (1) the major inventory classifi cations, (2) the basis of accounting, and (3) the cost method.
Companies use the lower-of-cost-or-market (LCM) basis when the current replacement cost (market) is less than cost. Under LCM, companies recognize the loss in the period in which the price decline occurs.
3
4
The inventory turnover is cost of goods sold divided by average inventory. To convert it to average days in inventory, divide 365 days by the inventory turnover.
Apply the inventory cost fl ow methods to perpetual inventory records. Under FIFO and a perpetual inven-tory system, companies charge to cost of goods sold the cost of the earliest goods on hand prior to each sale. Under LIFO and a perpetual system, companies charge to cost of goods sold the cost of the most recent purchase prior to sale. Under the moving-average (average-cost) method and a perpetual system, companies compute a new average cost after each purchase.
Describe the two methods of estimating inventories. The two methods of estimating inventories are the gross profi t method and the retail inventory method. Under the gross profi t method, companies apply a gross profi t rate to net sales to determine estimated gross profi t and cost of goods sold. They then subtract estimated cost of goods sold from cost of goods avail-able for sale to determine the estimated cost of the ending inventory.
Under the retail inventory method, companies compute a cost-to-retail ratio by dividing the cost of goods available for sale by the retail value of the goods available for sale. They then apply this ratio to the ending inventory at retail to determine the esti-mated cost of the ending inventory.
* 5
* 6
Average-cost method Inventory costing method that uses the weighted-average unit cost to allocate to end-ing inventory and cost of goods sold the cost of goods available for sale. (p. 273).
Consigned goods Goods held for sale by one party although ownership of the goods is retained by another party. (p. 267).
Consistency concept Dictates that a company use the same accounting principles and methods from year to year. (p. 275).
Current replacement cost The current cost to replace an inventory item. (p. 280).
Days in inventory Measure of the average number of days inventory is held; calculated as 365 divided by inventory turnover. (p. 280).
Finished goods inventory Manufactured items that are completed and ready for sale. (p. 264).
First-in, fi rst-out (FIFO) method Inventory costing method that assumes that the costs of the earliest goods purchased are the fi rst to be recognized as cost of goods sold. (p. 270).
FOB (free on board) destination Freight terms indi-cating that ownership of the goods remains with the seller until the goods reach the buyer. (p. 267).
FOB (free on board) shipping point Freight terms indicating that ownership of the goods passes to the buyer when the public carrier accepts the goods from the seller. (p. 266).
Gross profi t method A method for estimating the cost of the ending inventory by applying a gross profi t rate to net sales and subtracting estimated cost of goods sold from cost of goods available for sale. (p. 284).
Inventory turnover A ratio that measures the number of times on average the inventory sold during the period; computed by dividing cost of goods sold by the average inventory during the period. (p. 280).
Just-in-time (JIT) inventory Inventory system in which companies manufacture or purchase goods only when needed for use. (p. 264).
Last-in, fi rst-out (LIFO) method Inventory costing method that assumes the costs of the latest units pur-chased are the fi rst to be allocated to cost of goods sold. (p. 272).
Lower-of-cost-or-market (LCM) A basis whereby inven-tory is stated at the lower of either its cost or its market value as determined by current replacement cost. (p. 279).
Moving-average method A new average is computed after each purchase, by dividing the cost of goods avail-able for sale by the units on hand. (p. 283).
Raw materials Basic goods that will be used in production but have not yet been placed into production. (p. 264).
Retail inventory method A method for estimating the cost of the ending inventory by applying a cost-to-retail ratio to the ending inventory at retail. (p. 285).
Specifi c identifi cation method An actual physical fl ow costing method in which items still in inventory are
*
*
*
GLOSSARY REVIEW

288 6 Inventories
specifi cally costed to arrive at the total cost of the end-ing inventory. (p. 269).
Weighted-average unit cost Average cost that is weighted by the number of units purchased at each unit cost. (p. 273).
Work in process That portion of manufactured inven-tory that has been placed into the production process but is not yet complete. (p. 264).
1. Which of the following should not be included in the physical inventory of a company?(a) Goods held on consignment from another
company.(b) Goods shipped on consignment to another
company.(c) Goods in transit from another company shipped
FOB shipping point.(d) None of the above.
2. As a result of a thorough physical inventory, Railway Company determined that it had inventory worth $180,000 at December 31, 2017. This count did not take into consideration the following facts: Rogers Consignment store currently has goods worth $35,000 on its sales fl oor that belong to Railway but are being sold on consignment by Rogers. The selling price of these goods is $50,000. Railway purchased $13,000 of goods that were shipped on December 27, FOB desti-nation, that will be received by Railway on January 3. Determine the correct amount of inventory that Rail-way should report.(a) $230,000. (c) $228,000.(b) $215,000. (d) $193,000.
3. Cost of goods available for sale consists of two ele-ments: beginning inventory and(a) ending inventory.(b) cost of goods purchased.(c) cost of goods sold.(d) All of the answer choices are correct.
4. Poppins Company has the following:
Units Unit Cost
Inventory, Jan. 1 8,000 $11Purchase, June 19 13,000 12Purchase, Nov. 8 5,000 13
If Poppins has 9,000 units on hand at December 31, the cost of the ending inventory under FIFO is:(a) $99,000. (c) $113,000.(b) $108,000. (d) $117,000.
5. Using the data in Question 4 above, the cost of the ending inventory under LIFO is:(a) $113,000. (c) $99,000.(b) $108,000. (d) $100,000.
6. Hansel Electronics has the following:
Units Unit Cost
Inventory, Jan. 1 5,000 $ 8Purchase, April 2 15,000 $10Purchase, Aug. 28 20,000 $12
If Hansel has 7,000 units on hand at December 31, the cost of ending inventory under the average-cost method is:(a) $84,000. (c) $56,000.(b) $70,000. (d) $75,250.
(LO 1)
(LO 1)
(LO 2)
(LO 2)
(LO 2)
(LO 2)
7. In periods of rising prices, LIFO will produce:(a) higher net income than FIFO.(b) the same net income as FIFO.(c) lower net income than FIFO.(d) higher net income than average-cost.
8. Factors that affect the selection of an inventory cost-ing method do not include:(a) tax effects.(b) balance sheet effects.(c) income statement effects.(d) perpetual vs. periodic inventory system.
9. Falk Company’s ending inventory is understated $4,000. The effects of this error on the current year’s cost of goods sold and net income, respectively, are:(a) understated, overstated.(b) overstated, understated.(c) overstated, overstated.(d) understated, understated.
10. Pauline Company overstated its inventory by $15,000 at December 31, 2016. It did not correct the error in 2016 or 2017. As a result, Pauline’s owner’s equity was:(a) overstated at December 31, 2016, and understated
at December 31, 2017.(b) overstated at December 31, 2016, and properly
stated at December 31, 2017.(c) understated at December 31, 2016, and under-
stated at December 31, 2017.(d) overstated at December 31, 2016, and overstated
at December 31, 2017. 11. Norton Company purchased 1,000 widgets and has
200 widgets in its ending inventory at a cost of $91 each and a current replacement cost of $80 each. The ending inventory under lower-of-cost-or-market is:(a) $91,000. (c) $18,200.(b) $80,000. (d) $16,000.
12. Santana Company had beginning inventory of $80,000, ending inventory of $110,000, cost of goods sold of $285,000, and sales of $475,000. Santana’s days in inventory is:(a) 73 days. (c) 102.5 days.(b) 121.7 days. (d) 84.5 days.
13. Which of these would cause the inventory turnover to increase the most?(a) Increasing the amount of inventory on hand.(b) Keeping the amount of inventory on hand con-
stant but increasing sales.(c) Keeping the amount of inventory on hand con-
stant but decreasing sales.(d) Decreasing the amount of inventory on hand and
increasing sales. 14. In a perpetual inventory system:
(a) LIFO cost of goods sold will be the same as in a periodic inventory system.
(LO 2)
(LO 2)
(LO 3)
(LO 3)
(LO 4)
(LO 4)
(LO 4)
* (LO 5)
PRACTICE MULTIPLE-CHOICE QUESTIONS

Practice Multiple-Choice Questions 289
(b) average costs are a simple average of unit costs incurred.
(c) a new average is computed under the average-cost method after each sale.
(d) FIFO cost of goods sold will be the same as in a periodic inventory system.
15. King Company has sales of $150,000 and cost of goods available for sale of $135,000. If the gross profi t rate is 30%, the estimated cost of the ending inven-tory under the gross profi t method is:(a) $15,000. (c) $45,000.(b) $30,000. (d) $75,000.
*
Solutions
1. (a) Goods held on consignment should not be included because another company has title (ownership) to the goods. The other choices are incorrect because (b) goods shipped on consignment to another company and (c) goods in transit from another com-pany shipped FOB shipping point should be included in a company’s ending inventory. Choice (d) is incorrect as there is a correct answer for this question.
2. (b) The inventory held on consignment by Rogers should be included in Railway’s inventory balance at cost ($35,000). The purchased goods of $13,000 should not be included in inventory until January 3 because the goods are shipped FOB destina-tion. Therefore, the correct amount of inventory is $215,000 ($180,000 1 $35,000), not (a) $230,000, (c) $228,000, or (d) $193,000.
3. (b) Cost of goods available for sale consists of beginning inventory and cost of goods purchased, not (a) ending inventory or (c) cost of goods sold. Therefore, choice (d) All of the above is also incorrect.
4. (c) Under FIFO, ending inventory will consist of 5,000 units from the Nov. 8 purchase and 4,000 units from the June 19 purchase. Therefore, ending inventory is (5,000 3 $13) 1 (4,000 3 $12) 5 $113,000, not (a) $99,000, (b) $108,000, or (d) $117,000.
5. (d) Under LIFO, ending inventory will consist of 8,000 units from the inventory at Jan. 1 and 1,000 units from the June 19 pur-chase. Therefore, ending inventory is (8,000 3 $11) 1 (1,000 3 $12) 5 $100,000, not (a) $113,000, (b) $108,000, or (c) $99,000.
6. (d) Under the average-cost method, total cost of goods available for sale needs to be calculated in order to determine average cost per unit. The total cost of goods available is $430,000 5 (5,000 3 $8) 1 (15,000 3 $10) 1 (20,000 3 $12). The average cost per unit 5 ($430,000/40,000 total units available for sale) 5 $10.75. Therefore, ending inventory is ($10.75 3 7,000) 5 $75,250, not (a) $84,000, (b) $70,000, or (c) $56,000.
7. (c) In periods of rising prices, LIFO will produce lower net income than FIFO, not (a) higher than FIFO or (b) the same as FIFO. Choice (d) is incorrect because in periods of rising prices, LIFO will produce lower net income than average-cost. LIFO therefore charges the highest inventory cost against revenues in a period of rising prices.
8. (d) Perpetual vs. periodic inventory system is not one of the factors that affect the selection of an inventory costing method. The other choices are incorrect because (a) tax effects, (b) balance sheet effects, and (c) income statement effects all affect the selection of an inventory costing method.
9. (b) Because ending inventory is too low, cost of goods sold will be too high (overstated) and since cost of goods sold (an expense) is too high, net income will be too low (understated). Therefore, the other choices are incorrect.
10. (b) Owner’s equity is overstated by $15,000 at December 31, 2016, and is properly stated at December 31, 2017. An ending inventory error in one period will have an equal and opposite effect on cost of goods sold and net income in the next period; after two years, the errors have offset each other. The other choices are incorrect because owner’s equity (a) is properly stated, not under-stated, at December 31,2017; (c) is overstated, not understated, by $15,000 at December 31, 2016, and is properly stated, not under-stated, at December 31, 2017; and (d) is properly stated at December 31, 2017, not overstated.
11. (d) Under the LCM basis, “market” is defi ned as the current replacement cost. Therefore, ending inventory would be valued at 200 widgets 3 $80 each 5 $16,000, not (a) $91,000, (b) $80,000, or (c) $18,200.
12. (b) Santana’s days in inventory 5 365/Inventory turnover 5 365/[$285,000/ ($80,000 1 $110,000)/2)] 5 121.7 days, not (a) 73 days, (c) 102.5 days, or (d) 84.5 days.
13. (d) Decreasing the amount of inventory on hand will cause the denominator to decrease, causing inventory turnover to increase. Increasing sales will cause the numerator of the ratio to increase (higher sales means higher COGS), thus causing inventory turn-over to increase even more. The other choices are incorrect because (a) increasing the amount of inventory on hand causes the denominator of the ratio to increase while the numerator stays the same, causing inventory turnover to decrease; (b) keeping the amount of inventory on hand constant but increasing sales will cause inventory turnover to increase because the numerator of the ratio will increase (higher sales means higher COGS) while the denominator stays the same, which will result in a lesser inventory increase than decreasing amount of inventory on hand and increasing sales; and (c) keeping the amount of inventory on hand constant but decreasing sales will cause inventory turnover to decrease because the numerator of the ratio will decrease (lower sales means lower COGS) while the denominator stays the same.
*14. (d) FIFO cost of goods sold is the same under both a periodic and a perpetual inventory system. The other choices are incor-rect because (a) LIFO cost of goods sold is not the same under a periodic and a perpetual inventory system; (b) average costs are based on a moving average of unit costs, not an average of unit costs; and (c) a new average is computed under the average-cost method after each purchase, not sale.
*15. (b) COGS 5 Sales ($150,000) 2 Gross profi t ($150,000 3 30%) 5 $105,000. Ending inventory 5 Cost of goods available for sale ($135,000) 2 COGS ($105,000) 5 $30,000, not (a) $15,000, (c) $45,000, or (d) $75,000.
(LO 6)

290 6 Inventories
1. Matt Clark, an auditor with Grant CPAs, is performing a review of Parson Company’s inventory account. Parson did not have a good year and top management is under pres-sure to boost reported income. According to its records. the inventory balance at year-end was $600,000. However, the following information was not considered when determining that amount.
1. The physical count did not include goods purchased by Parson with a cost of $30,000 that were shipped FOB destination on December 28 and did not arrive at Parson’s ware-house until January 3.
2. Included in the company’s count were goods with a cost of $150,000 that the company is holding on consignment. The goods belong to Alvarez Corporation.
3. Included in the inventory account was $21,000 of offi ce supplies that were stored in the warehouse and were to be used by the company’s supervisors and managers during the coming year.
4. The company received an order on December 28 that was boxed and was sitting on the loading dock awaiting pick-up on December 31. The shipper picked up the goods on January 1 and delivered them on January 6. The shipping terms were FOB shipping point. The goods had a selling price of $29,000 and a cost of $19,000. The goods were not included in the count because they were sitting on the dock.
5. On December 29, Parson shipped goods with a selling price of $56,000 and a cost of $40,000 to Decco Corporation FOB shipping point. The goods arrived on January 3. Decco had only ordered goods with a selling price of $10,000 and a cost of $6,000. How-ever, a Parson’s sales manager had authorized the shipment and said that if Decco wanted to ship the goods back next week, it could.
6. Included in the count was $27,000 of goods that were parts for a machine that the com-pany no longer made. Given the high-tech nature of Parson’s products, it was unlikely that these obsolete parts had any other use. However, management would prefer to keep them on the books at cost, “since that is what we paid for them, after all.”
InstructionsPrepare a schedule to determine the correct inventory amount. Provide explanations for each item above, saying why you did or did not make an adjustment for each item.
PRACTICE EXERCISES
Determine the correct inventory amount.
(LO 1)
Solution
1. Ending inventory—as reported $600,000
1. No effect—title does not pass to Parson until goods are received(Jan. 3). 0
2. Subtract from inventory: The goods belong to Alvarez Corporation. Parson is merely holding them as a consignee. (150,000)
3. Subtract from inventory: Offi ce supplies should be carried in a separate account. They are not considered inventory held for resale. (21,000)
4. Add to inventory: The goods belong to Parson until they are shipped (Jan. 1). 19,000
5. Add to inventory: Decco ordered goods with a cost of $6,000. Parson should record the corresponding sales revenue of $10,000. Parson’s decision to ship extra “unordered” goods does not constitute a sale. The manager’s statement that Decco could ship the goods back indicates that Parson knows this over-shipment is not a legitimate sale. The manager acted unethically in an attempt to improve Parson’s reported income by overshipping. 34,000
6. Subtract from inventory: GAAP require that inventory be valued at the lower-of-cost-or-market. Obsolete parts should be adjusted from cost tozero if they have no other use. (27,000)
Correct inventory $455,000

Practice Problems 291
2. Rhode Software reported cost of goods sold as follows.
2016 2017
Beginning inventory $ 27,000 $ 40,000Cost of goods purchased 200,000 235,000
Cost of goods available for sale 227,000 275,000Ending inventory 40,000 45,000
Cost of goods sold $187,000 $230,000
Rhode made two errors: (1) 2016 ending inventory was overstated $4,000, and (2) 2017 ending inventory was understated $9,000.
InstructionsCompute the correct cost of goods sold for each year.
Determine effects of inventory errors.
(LO 3)
Solution
2. 2016 2017
Beginning inventory $ 27,000 $ 36,000Cost of goods purchased 200,000 235,000
Cost of goods available for sale 227,000 271,000Corrected ending inventory (36,000)a (54,000)b
Cost of goods sold $191,000 $217,000
a$40,000 2 $4,000 5 $36,000; b$45,000 1 $9,000 5 $54,000
1. Gerald D. Englehart Company has the following inventory, purchases, and sales data for the month of March.
Inventory: March 1 200 units @ $4.00 $ 800Purchases: March 10 500 units @ $4.50 2,250 March 20 400 units @ $4.75 1,900 March 30 300 units @ $5.00 1,500Sales: March 15 500 units March 25 400 units
The physical inventory count on March 31 shows 500 units on hand.
InstructionsUnder a periodic inventory system, determine the cost of inventory on hand at March 31 and the cost of goods sold for March under (a) FIFO, (b) LIFO, and (c) average-cost.
Compute inventory and cost of goods sold using three cost fl ow methods in a periodic inventory system.
(LO 2)
PRACTICE PROBLEMS
Solution
1. The cost of goods available for sale is $6,450, as follows.
Inventory: 200 units @ $4.00 $ 800Purchases: March 10 500 units @ $4.50 2,250 March 20 400 units @ $4.75 1,900 March 30 300 units @ $5.00 1,500
Total: 1,400 $6,450
Under a periodic inventory system, the cost of goods sold under each cost fl ow method is as follows.
(a) FIFO Method Ending inventory:
Unit Total Date Units Cost Cost
March 30 300 $5.00 $1,500March 20 200 4.75 950 $2,450
Cost of goods sold: $6,450 2 $2,450 5 $4,000

292 6 Inventories
*2. Practice Problem 1 on page 291 showed cost of goods sold computations under a peri-odic inventory system. Now let’s assume that Gerald D. Englehart Company uses a perpet-ual inventory system. The company has the same inventory, purchases, and sales data for the month of March as shown earlier:
Inventory: March 1 200 units @ $4.00 $ 800Purchases: March 10 500 units @ $4.50 2,250 March 20 400 units @ $4.75 1,900 March 30 300 units @ $5.00 1,500Sales: March 15 500 units March 25 400 units
The physical inventory count on March 31 shows 500 units on hand.
InstructionsUnder a perpetual inventory system, determine the cost of inventory on hand at March 31 and the cost of goods sold for March under (a) FIFO, (b) LIFO, and (c) moving-average cost.
(b) LIFO Method Ending inventory:
Unit Total Date Units Cost Cost
March 1 200 $4.00 $ 800March 10 300 4.50 1,350 $2,150
Cost of goods sold: $6,450 2 $2,150 5 $4,300
(c) Average-Cost Method Average unit cost: $6,450 4 1,400 5 $4.607 Ending inventory: 500 3 $4.607 5 $2,303.50
Cost of goods sold: $6,450 2 $2,303.50 5 $4,146.50
Solution
2. The cost of goods available for sale is $6,450, as follows.
Inventory: 200 units @ $4.00 $ 800Purchases: March 10 500 units @ $4.50 2,250 March 20 400 units @ $4.75 1,900 March 30 300 units @ $5.00 1,500
Total: 1,400 $6,450
Under a perpetual inventory system, the cost of goods sold under each cost fl ow method is as follows.
FIFO Method
Date Purchases Cost of Goods Sold Balance
March 1 (200 @ $4.00) $ 800March 10 (500 @ $4.50) $2,250 (200 @ $4.00) (500 @ $4.50)
$3,050
March 15 (200 @ $4.00) (300 @ $4.50) (200 @ $4.50) $ 900
$2,150March 20 (400 @ $4.75) $1,900 (200 @ $4.50) (400 @ $4.75)
$2,800
March 25 (200 @ $4.50) (200 @ $4.75) (200 @ $4.75) $ 950
$1,850March 30 (300 @ $5.00) $1,500 (200 @ $4.75)
(300 @ $5.00) $2,450
Ending inventory $2,450 Cost of goods sold: $2,150 1 $1,850 5 $4,000
(a)
⎧⎨⎩
⎧⎨⎩
⎧⎨⎩
⎧ ⎪ ⎪ ⎨ ⎪ ⎪ ⎩
⎧ ⎪ ⎪ ⎨ ⎪ ⎪ ⎩
Compute inventory and cost of goods sold using three cost fl ow methods in a perpetual inventory system.
(LO 5)

Questions 293
LIFO Method
Date Purchases Cost of Goods Sold Balance
March 1 (200 @ $4.00) $ 800March 10 (500 @ $4.50) $2,250 (200 @ $4.00) (500 @ $4.50)
$3,050
March 15 (500 @ $4.50) $2,250 (200 @ $4.00) $ 800March 20 (400 @ $4.75) $1,900 (200 @ $4.00) (400 @ $4.75)
$2,700
March 25 (400 @ $4.75) $1,900 (200 @ $4.00) $ 800March 30 (300 @ $5.00) $1,500 (200 @ $4.00)
(300 @ $5.00) $2,300
Ending inventory $2,300 Cost of goods sold: $2,250 1 $1,900 5 $4,150
Moving-Average Cost Method
Date Purchases Cost of Goods Sold Balance
March 1 (200 @ $ 4.00) $ 800March 10 (500 @ $4.50) $2,250 (700 @ $4.357) $3,050March 15 (500 @ $4.357) $2,179 (200 @ $4.357) $ 871March 20 (400 @ $4.75) $1,900 (600 @ $4.618) $2,771March 25 (400 @ $4.618) $1,847 (200 @ $4.618) $ 924March 30 (300 @ $5.00) $1,500 (500 @ $4.848) $2,424
Ending inventory $2,424 Cost of goods sold: $2,179 1 $1,847 5 $4,026
(b)
(c)
⎧⎨⎩
⎧⎨⎩
⎧⎨⎩
Brief Exercises, Exercises, DO IT! Exercises, and Problems and many additional resources are available for practice in WileyPLUS
QUESTIONS
1. “The key to successful business operations is effective inventory management.” Do you agree? Explain.
2. An item must possess two characteristics to be classi-fi ed as inventory by a merchandiser. What are these two characteristics?
3. Your friend Ben Johnson has been hired to help take the physical inventory in Pearson Hardware Store. Explain to Ben what this job will entail.
4. (a) Jovad Company ships merchandise to Martin Company on December 30. The merchandise reaches the buyer on January 6. Indicate the terms of sale that will result in the goods being included in (1) Jovad’s December 31 inventory, and (2) Martin’s December 31 inventory.
(b) Under what circumstances should Jovad Com-pany include consigned goods in its inventory?
5. Topp Hat Shop received a shipment of hats for which it paid the wholesaler $2,970. The price of the hats was $3,000 but Topp was given a $30 cash discount and required to pay freight charges of $50. In addi-tion, Topp paid $130 to cover the travel expenses of an employee who negotiated the purchase of the hats. What amount will Topp record for inventory? Why?
6. Explain the difference between the terms FOB shipping point and FOB destination.
7. Leah Clement believes that the allocation of invento-riable costs should be based on the actual physical fl ow of the goods. Explain to Leah why this may be both impractical and inappropriate.
8. What is a major advantage and a major disadvantage of the specifi c identifi cation method of inventory costing?
9. “The selection of an inventory cost fl ow method is a decision made by accountants.” Do you agree? Explain. Once a method has been selected, what accounting requirement applies?
10. Which assumed inventory cost fl ow method:(a) usually parallels the actual physical fl ow of
merchandise?(b) assumes that goods available for sale during an
accounting period are identical?(c) assumes that the latest units purchased are the
fi rst to be sold?11. In a period of rising prices, the inventory reported in
Bert Company’s balance sheet is close to the current cost of the inventory. Ernie Company’s inventory is considerably below its current cost. Identify the inventory cost fl ow method being used by each com-pany. Which company has probably been reporting the higher gross profi t?
12. Oscar Company has been using the FIFO cost fl ow method during a prolonged period of rising prices. During the same time period, Oscar has been paying out all of its net income as dividends. What adverse effects may result from this policy?
13. Kyle Adams is studying for the next accounting mid-term examination. What should Kyle know about (a) departing from the cost basis of accounting for
NOTE: All asterisked Questions, Exercises, and Problems relate to material in the appendices to the chapter.

294 6 Inventories
inventories and (b) the meaning of “market” in the lower-of-cost-or-market method?
14. Hendrix Entertainment Center has 5 televisions on hand at the balance sheet date. Each cost $400. The current replacement cost is $380 per unit. Under the lower-of-cost-or-market basis of accounting for inven-tories, what value should be reported for the televi-sions on the balance sheet? Why?
15. Warnke Stores has 20 toasters on hand at the balance sheet date. Each costs $27. The current replacement cost is $30 per unit. Under the lower-of-cost-or-market basis of accounting for inventories, what value should Warnke report for the toasters on the balance sheet? Why?
16. Sayaovang Company discovers in 2017 that its ending inventory at December 31, 2016, was $7,000 under-stated. What effect will this error have on (a) 2016 net income, (b) 2017 net income, and (c) the combined net income for the 2 years?
17. Dreher Company’s balance sheet shows Inventory $162,800. What additional disclosures should be made?
18. Under what circumstances might inventory turnover be too high? That is, what possible negative conse-quences might occur?
19. What inventory cost fl ow does Apple use for its inven-tories? (Hint: You will need to examine the notes for Apple’s fi nancial statements.)
*20. “When perpetual inventory records are kept, the results under the FIFO and LIFO methods are the same as they would be in a periodic inventory sys-tem.” Do you agree? Explain.
*21. How does the average-cost method of inventory cost-ing differ between a perpetual inventory system and a periodic inventory system?
*22. When is it necessary to estimate inventories? *23. Both the gross profi t method and the retail inventory
method are based on averages. For each method, indicate the average used, how it is determined, and how it is applied.
*24. Pawlowski Company has net sales of $400,000 and cost of goods available for sale of $300,000. If the gross profi t rate is 35%, what is the estimated cost of the ending inventory? Show computations.
*25. Cinderella Shoe Shop had goods available for sale in 2017 with a retail price of $120,000. The cost of these goods was $84,000. If sales during the period were $80,000, what is the ending inventory at cost using the retail inventory method?
BRIEF EXERCISES
BE6-1 Peosta Company identifi es the following items for possible inclusion in the taking of a physical inventory. Indicate whether each item should be included or excluded from the inventory taking.
(a) Goods shipped on consignment by Peosta to another company.(b) Goods in transit from a supplier shipped FOB destination.(c) Goods sold but being held for customer pickup.(d) Goods held on consignment from another company.
BE6-2 Stallman Company took a physical inventory on December 31 and determined that goods costing $200,000 were on hand. Not included in the physical count were $25,000 of goods purchased from Pelzer Corporation, FOB shipping point, and $22,000 of goods sold to Alvarez Company for $30,000, FOB destination. Both the Pelzer purchase and the Alvarez sale were in transit at year-end. What amount should Stallman report as its December 31 inventory?
BE6-3 In its fi rst month of operations, Weatherall Company made three purchases of merchandise in the following sequence: (1) 300 units at $6, (2) 400 units at $7, and (3) 200 units at $8. Assuming there are 380 units on hand, compute the cost of the ending inventory under the (a) FIFO method and (b) LIFO method. Weatherall uses a periodic inventory system.
BE6-4 Data for Weatherall Company are presented in BE6-3. Compute the cost of the ending inventory under the average-cost method, assuming there are 380 units on hand.
BE6-5 The management of Mastronardo Corp. is considering the effects of inventory-costing methods on its fi nancial statements and its income tax expense. Assuming that the price the company pays for inventory is increasing, which method will:
(a) Provide the highest net income?(b) Provide the highest ending inventory?(c) Result in the lowest income tax expense?(d) Result in the most stable earnings over a number of years?
BE6-6 Larkin Company reports net income of $90,000 in 2017. However, ending inven-tory was understated $7,000. What is the correct net income for 2017? What effect, if any, will this error have on total assets as reported in the balance sheet at December 31, 2017?
Identify items to be included in taking a physical inventory.
(LO 1)
Determine ending inventory amount.
(LO 1)
Compute ending inventory using FIFO and LIFO.
(LO 2)
Compute the ending inventory using average-cost.
(LO 2)Explain the fi nancial statement effect of inventory cost fl ow assumptions.
(LO 2)
Determine correct income statement amounts.
(LO 3)

Gresa Company just took its physical inventory. The count of inventory items on hand at the company’s business locations resulted in a total inventory cost of $300,000. In reviewing the details of the count and related inventory transactions, you have discovered the following.
1. Gresa has sent inventory costing $26,000 on consignment to Alissa Company. All of this inventory was at Alissa’s showrooms on December 31.
2. The company did not include in the count inventory (cost, $20,000) that was sold on December 28, terms FOB shipping point. The goods were in transit on December 31.
3. The company did not include in the count inventory (cost, $14,000) that was purchased with terms of FOB shipping point. The goods were in transit on December 31.
Compute the correct December 31 inventory.
The accounting records of Americo Electronics show the following data.
Beginning inventory 3,000 units at $5Purchases 8,000 units at $7Sales 9,400 units at $10
Determine cost of goods sold during the period under a periodic inventory system using (a) the FIFO method, (b) the LIFO method, and (c) the average-cost method. (Round unit cost to nearest tenth of a cent.)
Apply rules of ownership to determine inventory cost.
(LO 1)
Compute cost of goods sold under different cost fl ow methods.
(LO 2)
DO IT! Exercises
DO IT! 6-1
DO IT! 6-2
DO IT! Exercises 295
BE6-7 Cruz Video Center accumulates the following cost and market data at December 31.
Inventory Cost Market Categories Data Data
Cameras $12,000 $12,300 Camcorders 9,500 9,700 Blu-ray players 14,000 12,900
Compute the lower-of-cost-or-market valuation for the company’s total inventory.
BE6-8 At December 31, 2017, the following information was available for E. Hetzel Company: ending inventory $40,000, beginning inventory $56,000, cost of goods sold $270,000, and sales revenue $380,000. Calculate inventory turnover and days in inventory for E. Hetzel Company.
BE6-9 Rosario Department Store uses a perpetual inventory system. Data for product E2-D2 include the following purchases.
Number of Date Units Unit Price
May 7 50 $10 July 28 30 13
On June 1, Rosario sold 26 units, and on August 27, 40 more units. Prepare the perpetual inventory schedule for the above transactions using (a) FIFO, (b) LIFO, and (c) moving-average cost.
BE6-10 At May 31, Brunet Company has net sales of $340,000 and cost of goods available for sale of $230,000. Compute the estimated cost of the ending inventory, assuming the gross profi t rate is 35%.
BE6-11 On June 30, Joanna Fabrics has the following data pertaining to the retail inven-tory method. Goods available for sale: at cost $38,000; at retail $50,000; net sales $40,000; and ending inventory at retail $10,000. Compute the estimated cost of the ending inven-tory using the retail inventory method.
Determine the LCM valuation using inventory categories.
(LO 4)
Compute inventory turnover and days in inventory.
(LO 4)
* Apply cost fl ow methods to perpetual inventory records.
(LO 5)
* Apply the gross profi t method.
(LO 6)
* Apply the retail inventory method.
(LO 6)

296 6 Inventories
Vanida Company understated its 2016 ending inventory by $27,000. Deter-mine the impact this error has on ending inventory, cost of goods sold, and owner’s equity in 2016 and 2017.
(a) Cody Company sells three different categories of tools (small, medium, and large). The cost and market value of its inventory of tools are as follows.
Cost Market
Small $ 64,000 $ 73,000Medium 290,000 260,000Large 152,000 171,000
Determine the value of the company’s inventory under the lower-of-cost-or-market approach.(b) Early in 2017, Yeng Company switched to a just-in-time inventory system. Its sales, cost of goods sold, and inventory amounts for 2016 and 2017 are shown below.
2016 2017
Sales $3,120,000 $3,713,000Cost of goods sold 1,200,000 1,425,000Beginning inventory 180,000 220,000Ending inventory 220,000 100,000
Determine the inventory turnover and days in inventory for 2016 and 2017. Discuss the changes in the amount of inventory, the inventory turnover and days in inventory, and the amount of sales across the two years.
Determine effect of inventory error.
(LO 3)
Compute inventory value under LCM and assess inventory level.
(LO 4)
DO IT! 6-3
DO IT! 6-4
EXERCISES
E6-1 Tri-State Bank and Trust is considering giving Wilfred Company a loan. Before doing so, management decides that further discussions with Wilfred’s accountant may be desir-able. One area of particular concern is the inventory account, which has a year-end balance of $297,000. Discussions with the accountant reveal the following.
1. Wilfred sold goods costing $38,000 to Lilja Company, FOB shipping point, on Decem-ber 28. The goods are not expected to arrive at Lilja until January 12. The goods were not included in the physical inventory because they were not in the warehouse.
2. The physical count of the inventory did not include goods costing $95,000 that were shipped to Wilfred FOB destination on December 27 and were still in transit at year-end.
3. Wilfred received goods costing $22,000 on January 2. The goods were shipped FOB shipping point on December 26 by Brent Co. The goods were not included in the phys-ical count.
4. Wilfred sold goods costing $35,000 to Jesse Co., FOB destination, on December 30. The goods were received at Jesse on January 8. They were not included in Wilfred’s physical inventory.
5. Wilfred received goods costing $44,000 on January 2 that were shipped FOB destina-tion on December 29. The shipment was a rush order that was supposed to arrive December 31. This purchase was included in the ending inventory of $297,000.
InstructionsDetermine the correct inventory amount on December 31.
E6-2 Kari Downs, an auditor with Wheeler CPAs, is performing a review of Depue Com-pany’s inventory account. Depue did not have a good year, and top management is under pressure to boost reported income. According to its records, the inventory balance at year-end was $740,000. However, the following information was not considered when deter-mining that amount.
1. Included in the company’s count were goods with a cost of $250,000 that the company is holding on consignment. The goods belong to Kroeger Corporation.
2. The physical count did not include goods purchased by Depue with a cost of $40,000 that were shipped FOB destination on December 28 and did not arrive at Depue ware-house until January 3.
Determine the correct inventory amount.
(LO 1)
Determine the correct inventory amount.
(LO 1)

Exercises 297
3. Included in the inventory account was $14,000 of offi ce supplies that were stored in the warehouse and were to be used by the company’s supervisors and managers during the coming year.
4. The company received an order on December 29 that was boxed and sitting on the loading dock awaiting pick-up on December 31. The shipper picked up the goods on January 1 and delivered them on January 6. The shipping terms were FOB shipping point. The goods had a selling price of $40,000 and a cost of $28,000. The goods were not included in the count because they were sitting on the dock.
5. On December 29, Depue shipped goods with a selling price of $80,000 and a cost of $60,000 to Macchia Sales Corporation FOB shipping point. The goods arrived on January 3. Macchia had only ordered goods with a selling price of $10,000 and a cost of $8,000. However, a sales manager at Depue had authorized the shipment and said that if Machia wanted to ship the goods back next week, it could.
6. Included in the count was $40,000 of goods that were parts for a machine that the com-pany no longer made. Given the high-tech nature of Depue’s products, it was unlikely that these obsolete parts had any other use. However, management would prefer to keep them on the books at cost, “since that is what we paid for them, after all.”
InstructionsPrepare a schedule to determine the correct inventory amount. Provide explanations for each item above, saying why you did or did not make an adjustment for each item.
E6-3 On December 1, Kiyak Electronics Ltd. has three DVD players left in stock. All are identical, all are priced to sell at $150. One of the three DVD players left in stock, with serial #1012, was purchased on June 1 at a cost of $100. Another, with serial #1045, was purchased on November 1 for $88. The last player, serial #1056, was purchased on Novem-ber 30 for $80.
Instructions(a) Calculate the cost of goods sold using the FIFO periodic inventory method assuming
that two of the three players were sold by the end of December, Kiyak Electronics’ year-end.
(b) If Kiyak Electronics used the specifi c identifi cation method instead of the FIFO method, how might it alter its earnings by “selectively choosing” which particular players to sell to the two customers? What would Kiyak’s cost of goods sold be if the company wished to minimize earnings? Maximize earnings?
(c) Which of the two inventory methods do you recommend that Kiyak use? Explain why.
E6-4 Elsa’s Boards sells a snowboard, Xpert, that is popular with snowboard enthusiasts. Information relating to Elsa’s purchases of Xpert snowboards during September is shown below. During the same month, 121 Xpert snowboards were sold. Elsa’s uses a periodic inventory system.
Date Explanation Units Unit Cost Total Cost
Sept. 1 Inventory 26 $ 97 $ 2,522 Sept. 12 Purchases 45 102 4,590 Sept. 19 Purchases 20 104 2,080 Sept. 26 Purchases 50 105 5,250
Totals 141 $14,442
Instructions(a) Compute the ending inventory at September 30 and cost of goods sold using the FIFO
and LIFO methods. Prove the amount allocated to cost of goods sold under each method.(b) For both FIFO and LIFO, calculate the sum of ending inventory and cost of goods sold.
What do you notice about the answers you found for each method?
E6-5 Ballas Co. uses a periodic inventory system. Its records show the following for the month of May, in which 68 units were sold.
Units Unit Cost Total Cost
May 1 Inventory 30 $ 8 $240 15 Purchases 25 11 275 24 Purchases 35 12 420
Totals 90 $935
Calculate cost of goods sold using specifi c identifi cation and FIFO.
(LO 2)
Compute inventory and cost of goods sold using FIFO and LIFO.
(LO 2)
Compute inventory and cost of goods sold using FIFO and LIFO.
(LO 2)

298 6 Inventories
InstructionsCompute the ending inventory at May 31 and cost of goods sold using the FIFO and LIFO methods. Prove the amount allocated to cost of goods sold under each method.
E6-6 Moath Company reports the following for the month of June.
Units Unit Cost Total Cost
June 1 Inventory 200 $5 $1,000 12 Purchase 400 6 2,400 23 Purchase 300 7 2,100 30 Inventory 100
Instructions(a) Compute the cost of the ending inventory and the cost of goods sold under (1) FIFO
and (2) LIFO.(b) Which costing method gives the higher ending inventory? Why?(c) Which method results in the higher cost of goods sold? Why?
E6-7 Shawn Company had 100 units in beginning inventory at a total cost of $10,000. The company purchased 200 units at a total cost of $26,000. At the end of the year, Shawn had 75 units in ending inventory.
Instructions(a) Compute the cost of the ending inventory and the cost of goods sold under (1) FIFO,
(2) LIFO, and (3) average-cost.(b) Which cost fl ow method would result in the highest net income?(c) Which cost fl ow method would result in inventories approximating current cost in the
balance sheet?(d) Which cost fl ow method would result in Shawn paying the least taxes in the fi rst year?
E6-8 Inventory data for Moath Company are presented in E6-6.
Instructions(a) Compute the cost of the ending inventory and the cost of goods sold using the
average-cost method.(b) Will the results in (a) be higher or lower than the results under (1) FIFO and (2) LIFO?(c) Why is the average unit cost not $6?
E6-9 Elliott’s Hardware reported cost of goods sold as follows.
2016 2017
Beginning inventory $ 20,000 $ 30,000 Cost of goods purchased 150,000 175,000
Cost of goods available for sale 170,000 205,000 Ending inventory 30,000 35,000
Cost of goods sold $140,000 $170,000
Elliott’s made two errors: (1) 2016 ending inventory was overstated $3,000, and (2) 2017 ending inventory was understated $5,000.
InstructionsCompute the correct cost of goods sold for each year.
E6-10 Smart Watch Company reported the following income statement data for a 2-year period. 2016 2017
Sales revenue $220,000 $250,000
Cost of goods sold Beginning inventory 32,000 44,000 Cost of goods purchased 173,000 202,000
Cost of goods available for sale 205,000 246,000 Ending inventory 44,000 52,000
Cost of goods sold 161,000 194,000
Gross profi t $ 59,000 $ 56,000
Compute inventory and cost of goods sold using FIFO and LIFO.
(LO 2)
Compute inventory under FIFO, LIFO, and average-cost.
(LO 2)
Compute inventory and cost of goods sold using average-cost.
(LO 2)
Determine effects of inventory errors.
(LO 3)
Prepare correct income statements.
(LO 3)

Exercises 299
Smart uses a periodic inventory system. The inventories at January 1, 2016, and December 31, 2017, are correct. However, the ending inventory at December 31, 2016, was overstated $6,000.
Instructions(a) Prepare correct income statement data for the 2 years.(b) What is the cumulative effect of the inventory error on total gross profi t for the 2
years?(c) Explain in a letter to the president of Smart Watch Company what has hap-
pened, i.e., the nature of the error and its effect on the fi nancial statements.
E6-11 Freeze Frame Camera Shop uses the lower-of-cost-or-market basis for its inventory. The following data are available at December 31.
Item Units Unit Cost Market
Cameras: Minolta 5 $170 $156 Canon 6 150 152 Light meters: Vivitar 10 125 115 Kodak 14 120 135
InstructionsDetermine the amount of the ending inventory by applying the lower-of-cost-or-market basis.
E6-12 Charapata Company applied FIFO to its inventory and got the following results for its ending inventory.
Cameras 100 units at a cost per unit of $65 Blu-ray players 150 units at a cost per unit of $75 iPods 125 units at a cost per unit of $80
The cost of purchasing units at year-end was cameras $71, Blu-ray players $67, and iPods $78.
InstructionsDetermine the amount of ending inventory at lower-of-cost-or-market.
E6-13 This information is available for Abdullah’s Photo Corporation for 2015, 2016, and 2017.
2015 2016 2017
Beginning inventory $ 100,000 $ 300,000 $ 400,000 Ending inventory 300,000 400,000 480,000 Cost of goods sold 900,000 1,152,000 1,300,000 Sales revenue 1,200,000 1,600,000 1,900,000
InstructionsCalculate inventory turnover, days in inventory, and gross profi t rate (from Chapter 5) for Abdullah’s Photo Corporation for 2015, 2016, and 2017. Comment on any trends.
E6-14 The cost of goods sold computations for Sooner Company and Later Company are shown below. Sooner Company Later Company
Beginning inventory $ 45,000 $ 71,000 Cost of goods purchased 200,000 290,000
Cost of goods available for sale 245,000 361,000 Ending inventory 55,000 69,000
Cost of goods sold $190,000 $292,000
Instructions(a) Compute inventory turnover and days in inventory for each company.(b) Which company moves its inventory more quickly?
Determine ending inventory under LCM.
(LO 4)
Compute lower-of-cost-or-market
(LO 4)
Compute inventory turnover, days in inventory, and gross profi t rate.
(LO 4)
Compute inventory turnover and days in inventory.
(LO 4)

300 6 Inventories
E6-15 Ehrhart Appliance uses a perpetual inventory system. For its fl at-screen television sets, the January 1 inventory was 3 sets at $600 each. On January 10, Ehrhart purchased 6 units at $660 each. The company sold 2 units on January 8 and 5 units on January 15.
InstructionsCompute the ending inventory under (a) FIFO, (b) LIFO, and (c) moving-average cost.
E6-16 Moath Company reports the following for the month of June.
Date Explanation Units Unit Cost Total Cost
June 1 Inventory 200 $5 $1,000 12 Purchase 400 6 2,400 23 Purchase 300 7 2,100 30 Inventory 100
Instructions(a) Calculate the cost of the ending inventory and the cost of goods sold for each cost fl ow
assumption, using a perpetual inventory system. Assume a sale of 440 units occurred on June 15 for a selling price of $8 and a sale of 360 units on June 27 for $9.
(b) How do the results differ from E6-6 and E6-8?(c) Why is the average unit cost not $6 [($5 1 $6 1 $7) 4 3 5 $6]?
E6-17 Information about Elsa’s Boards is presented in E6-4. Additional data regarding Elsa’s sales of Xpert snowboards are provided below. Assume that Elsa’s uses a perpetual inventory system.
Date Units Unit Price Total Revenue
Sept. 5 Sale 12 $199 $ 2,388 Sept. 16 Sale 50 199 9,950 Sept. 29 Sale 59 209 12,331
Totals 121 $24,669
Instructions(a) Compute ending inventory at September 30 using FIFO, LIFO, and moving-average cost.(b) Compare ending inventory using a perpetual inventory system to ending inventory
using a periodic inventory system (from E6-4).(c) Which inventory cost fl ow method (FIFO, LIFO) gives the same ending inventory
value under both periodic and perpetual? Which method gives different ending inven-tory values?
E6-18 Shereen Company reported the following information for November and December 2017. November December
Cost of goods purchased $536,000 $ 610,000 Inventory, beginning-of-month 130,000 120,000 Inventory, end-of-month 120,000 ? Sales revenue 840,000 1,000,000
Shereen’s ending inventory at December 31 was destroyed in a fi re.
Instructions(a) Compute the gross profi t rate for November.(b) Using the gross profi t rate for November, determine the estimated cost of inventory
lost in the fi re.
E6-19 The inventory of Hang Company was destroyed by fi re on March 1. From an exam-ination of the accounting records, the following data for the fi rst 2 months of the year are obtained: Sales Revenue $51,000, Sales Returns and Allowances $1,000, Purchases $31,200, Freight-In $1,200, and Purchase Returns and Allowances $1,400.
InstructionsDetermine the merchandise lost by fi re, assuming:
(a) A beginning inventory of $20,000 and a gross profi t rate of 30% on net sales.(b) A beginning inventory of $30,000 and a gross profi t rate of 40% on net sales.
*Apply cost fl ow methods to perpetual records.
(LO 5)
*Calculate inventory and cost of goods sold using three cost fl ow methods in a perpetual inventory system.
(LO 5)
*Apply cost fl ow methods to perpetual records.
(LO 5)
*Use the gross profi t method to estimate inventory.
(LO 6)
*Determine merchandise lost using the gross profi t method of estimating inventory.
(LO 6)

Problems: Set A 301
E6-20 Kicks Shoe Store uses the retail inventory method for its two departments, Women’s Shoes and Men’s Shoes. The following information for each department is obtained.
Women’s Men’s Item Shoes Shoes
Beginning inventory at cost $ 25,000 $ 45,000 Cost of goods purchased at cost 110,000 136,300 Net sales 178,000 185,000 Beginning inventory at retail 46,000 60,000 Cost of goods purchased at retail 179,000 185,000
InstructionsCompute the estimated cost of the ending inventory for each department under the retail inventory method.
* Determine ending inventory at cost using retail method.
(LO 6)
PROBLEMS: SET A
Visit the book’s companion website, at www.wiley.com/college/weygandt, and choose the Student Companion site to access Exercises: Set B and Challenge Exercises.
P6-1A Houghton Limited is trying to determine the value of its ending inventory as of February 28, 2017, the company’s year-end. The following transactions occurred, and the accountant asked your help in determining whether they should be recorded or not.
(a) On February 26, Houghton shipped goods costing $800 to a customer and charged the customer $1,000. The goods were shipped with terms FOB shipping point and the receiving report indicates that the customer received the goods on March 2.
(b) On February 26, Crain Inc. shipped goods to Houghton under terms FOB shipping point. The invoice price was $450 plus $30 for freight. The receiving report indicates that the goods were received by Houghton on March 2.
(c) Houghton had $720 of inventory isolated in the warehouse. The inventory is desig-nated for a customer who has requested that the goods be shipped on March 10.
(d) Also included in Houghton’s warehouse is $700 of inventory that Korenic Producers shipped to Houghton on consignment.
(e) On February 26, Houghton issued a purchase order to acquire goods costing $900. The goods were shipped with terms FOB destination on February 27. Houghton received the goods on March 2.
(f) On February 26, Houghton shipped goods to a customer under terms FOB destina-tion. The invoice price was $390; the cost of the items was $240. The receiving report indicates that the goods were received by the customer on March 2.
InstructionsFor each of the above transactions, specify whether the item in question should be included in ending inventory, and if so, at what amount.
P6-2A Glee Distribution markets CDs of the performing artist Unique. At the beginning of October, Glee had in beginning inventory 2,000 of Unique’s CDs with a unit cost of $7. During October, Glee made the following purchases of Unique’s CDs.
Oct. 3 2,500 @ $8 Oct. 19 3,000 @ $10Oct. 9 3,500 @ $9 Oct. 25 4,000 @ $11
During October, 10,900 units were sold. Glee uses a periodic inventory system.
Instructions(a) Determine the cost of goods available for sale.(b) Determine (1) the ending inventory and (2) the cost of goods sold under each of the
assumed cost fl ow methods (FIFO, LIFO, and average-cost). Prove the accuracy of the cost of goods sold under the FIFO and LIFO methods.
(c) Which cost fl ow method results in (1) the highest inventory amount for the balance sheet and (2) the highest cost of goods sold for the income statement?
Determine items and amounts to be recorded in inventory.
(LO 1)
Determine cost of goods sold and ending inventory using FIFO, LIFO, and average-cost with analysis.
(LO 2)
(b)(2) Cost of goods sold: FIFO $ 94,500 LIFO $108,700 Average $101,370
EXERCISES: SET B AND CHALLENGE EXERCISES

302 6 Inventories
P6-3A Sekhon Company had a beginning inventory on January 1 of 160 units of Product 4-18-15 at a cost of $20 per unit. During the year, the following purchases were made.
Mar. 15 400 units at $23 Sept. 4 330 units at $26 July 20 250 units at $24 Dec. 2 100 units at $29
1,000 units were sold. Sekhon Company uses a periodic inventory system.
Instructions(a) Determine the cost of goods available for sale.(b) Determine (1) the ending inventory, and (2) the cost of goods sold under each of the
assumed cost fl ow methods (FIFO, LIFO, and average-cost). Prove the accuracy of the cost of goods sold under the FIFO and LIFO methods.
(c) Which cost fl ow method results in (1) the highest inventory amount for the balance sheet, and (2) the highest cost of goods sold for the income statement?
P6-4A The management of Gresa Inc. is reevaluating the appropriateness of using its present inventory cost fl ow method, which is average-cost. The company requests your help in determining the results of operations for 2017 if either the FIFO or the LIFO method had been used. For 2017, the accounting records show these data:
Inventories Purchases and Sales
Beginning (7,000 units) $14,000 Total net sales (180,000 units) $747,000 Ending (17,000 units) Total cost of goods purchased (190,000 units) 466,000
Purchases were made quarterly as follows.
Quarter Units Unit Cost Total Cost
1 50,000 $2.20 $110,000 2 40,000 2.35 94,000 3 40,000 2.50 100,000 4 60,000 2.70 162,000
190,000 $466,000
Operating expenses were $130,000, and the company’s income tax rate is 40%.
Instructions(a) Prepare comparative condensed income statements for 2017 under FIFO and LIFO.
(Show computations of ending inventory.)(b) Answer the following questions for management. (1) Which cost fl ow method (FIFO or LIFO) produces the more meaningful inventory
amount for the balance sheet? Why? (2) Which cost fl ow method (FIFO or LIFO) produces the more meaningful net
income? Why? (3) Which cost fl ow method (FIFO or LIFO) is more likely to approximate the actual
physical fl ow of goods? Why? (4) How much more cash will be available for management under LIFO than under
FIFO? Why? (5) Will gross profi t under the average-cost method be higher or lower than FIFO?
Than LIFO? (Note: It is not necessary to quantify your answer.)
P6-5A You are provided with the following information for Koetteritz Inc. for the month ended June 30, 2017. Koetteritz uses the periodic method for inventory.
Unit Cost or Date Description Quantity Selling Price
June 1 Beginning inventory 40 $40 June 4 Purchase 135 43 June 10 Sale 110 70 June 11 Sale return 15 70 June 18 Purchase 55 46 June 18 Purchase return 10 46 June 25 Sale 65 76 June 28 Purchase 35 50
Determine cost of goods sold and ending inventory, using FIFO, LIFO, and average-cost with analysis.
(LO 2)
(b)(2) Cost of goods sold: FIFO $23,340 LIFO $24,840 Average $24,097
Compute ending inventory, prepare income statements, and answer questions using FIFO and LIFO.
(LO 2)
(a) Gross profi t: FIFO $312,900 LIFO $303,000
Calculate ending inventory, cost of goods sold, gross profi t, and gross profi t rate under periodic method; compare results.
(LO 2)

Problems: Set A 303
Instructions(a) Calculate (i) ending inventory, (ii) cost of goods sold, (iii) gross profi t, and (iv) gross
profi t rate under each of the following methods. (1) LIFO. (2) FIFO. (3) Average-cost.(b) Compare results for the three cost fl ow assumptions.
P6-6A You are provided with the following information for Gobler Inc. Gobler Inc. uses the periodic method of accounting for its inventory transactions.
March 1 Beginning inventory 2,000 liters at a cost of 60¢ per liter.March 3 Purchased 2,500 liters at a cost of 65¢ per liter.March 5 Sold 2,300 liters for $1.05 per liter.March 10 Purchased 4,000 liters at a cost of 72¢ per liter.March 20 Purchased 2,500 liters at a cost of 80¢ per liter.March 30 Sold 5,200 liters for $1.25 per liter.
Instructions(a) Prepare partial income statements through gross profi t, and calculate the value of
ending inventory that would be reported on the balance sheet, under each of the fol-lowing cost fl ow assumptions. (Round ending inventory and cost of goods sold to the nearest dollar.)
(1) Specifi c identifi cation method assuming: (i) The March 5 sale consisted of 1,000 liters from the March 1 beginning inven-
tory and 1,300 liters from the March 3 purchase; and (ii) The March 30 sale consisted of the following number of units sold from begin-
ning inventory and each purchase: 450 liters from March 1; 550 liters from March 3; 2,900 liters from March 10; 1,300 liters from March 20.
(2) FIFO. (3) LIFO.(b) How can companies use a cost fl ow method to justify price increases? Which cost fl ow
method would best support an argument to increase prices?
P6-7A The management of Danica Co. asks your help in determining the comparative effects of the FIFO and LIFO inventory cost fl ow methods. For 2017, the accounting records provide the following data.
Inventory, January 1 (10,000 units) $ 47,000Cost of 100,000 units purchased 532,000Selling price of 84,000 units sold 735,000Operating expenses 140,000
Units purchased consisted of 35,000 units at $5.10 on May 10; 35,000 units at $5.30 on August 15; and 30,000 units at $5.60 on November 20. Income taxes are 30%.
Instructions(a) Prepare comparative condensed income statements for 2017 under FIFO and LIFO.
(Show computations of ending inventory.)(b) Answer the following questions for management. (1) Which inventory cost fl ow method produces the most meaningful inventory
amount for the balance sheet? Why? (2) Which inventory cost fl ow method produces the most meaningful net income?
Why? (3) Which inventory cost fl ow method is most likely to approximate actual physical
fl ow of the goods? Why? (4) How much additional cash will be available for management under LIFO than
under FIFO? Why? (5) How much of the gross profi t under FIFO is illusory in comparison with the gross
profi t under LIFO?
P6-8A Dempsey Inc. is a retailer operating in British Columbia. Dempsey uses the perpet-ual inventory method. All sales returns from customers result in the goods being returned to inventory; the inventory is not damaged. Assume that there are no credit transactions;
(a)(iii) Gross profi t: LIFO $4,330 FIFO $4,830 Average $4,546.90
Compare specifi c identifi cation, FIFO, and LIFO under periodic method; use cost fl ow assumption to justify price increase.
(LO 2)
(a) Gross profi t: (1) Specifi c identifi cation $3,715
(2) FIFO $3,930 (3) LIFO $3,385
Compute ending inventory, prepare income statements, and answer questions using FIFO and LIFO.
(LO 2)
*
Calculate cost of goods sold and ending inventory under LIFO, FIFO, and moving-average cost under the perpetual system; compare gross profi t under each assumption.
(LO 5)
(a) Net income FIFO $113,120 LIFO $101,220

304 6 Inventories
all amounts are settled in cash. You are provided with the following information for Dempsey Inc. for the month of January 2017.
Unit Cost or Date Description Quantity Selling Price
January 1 Beginning inventory 100 $15 January 5 Purchase 140 18 January 8 Sale 110 28 January 10 Sale return 10 28 January 15 Purchase 55 20 January 16 Purchase return 5 20 January 20 Sale 90 32 January 25 Purchase 20 22
Instructions(a) For each of the following cost fl ow assumptions, calculate (i) cost of goods sold,
(ii) ending inventory, and (iii) gross profi t. (1) LIFO. (2) FIFO. (3) Moving-average cost. (Round cost per unit to three decimal places.)(b) Compare results for the three cost fl ow assumptions.
P6-9A Wittmann Co. began operations on July 1. It uses a perpetual inventory system. During July, the company had the following purchases and sales.
Purchases
Date Units Unit Cost Sales Units
July 1 5 $122July 6 3July 11 7 $136July 14 5July 21 8 $147July 27 5
Instructions(a) Determine the ending inventory under a perpetual inventory system using (1) FIFO,
(2) moving-average cost, and (3) LIFO.(b) Which costing method produces the highest ending inventory valuation?
P6-10A Bao Company lost all of its inventory in a fi re on December 26, 2017. The account-ing records showed the following gross profi t data for November and December.
December November (to 12/26)
Net sales $600,000 $700,000Beginning inventory 32,000 36,000Purchases 389,000 420,000Purchase returns and allowances 13,300 14,900Purchase discounts 8,500 9,500Freight-in 8,800 9,900Ending inventory 36,000 ?
Bao is fully insured for fi re losses but must prepare a report for the insurance company.
Instructions(a) Compute the gross profi t rate for November.(b) Using the gross profi t rate for November, determine the estimated cost of the inventory
lost in the fi re.
P6-11A Rayre Books uses the retail inventory method to estimate its monthly ending inven-tories. The following information is available for two of its departments at October 31, 2017.
(a)(iii) Gross profi t: LIFO $2,160 FIFO $2,560 Average $2,421
*Determine ending inventory under a perpetual inventory system.
(LO 5)
(a) Ending inventory FIFO $1,029 Avg. $996 LIFO $957
*Compute gross profi t rate and inventory loss using gross profi t method.
(LO 6)
(a) Gross profi t rate 38%
*Compute ending inventory using retail method.
(LO 6)

Comprehensive Problem 305
Hardcovers Paperbacks
Cost Retail Cost Retail
Beginning inventory $ 420,000 $ 640,000 $ 280,000 $ 360,000Purchases 2,135,000 3,200,000 1,155,000 1,540,000Freight-in 24,000 12,000Purchase discounts 44,000 22,000Net sales 3,100,000 1,570,000
At December 31, Rayre Books takes a physical inventory at retail. The actual retail values of the inventories in each department are Hardcovers $744,000 and Paperbacks $335,000.
Instructions(a) Determine the estimated cost of the ending inventory for each department at October 31,
2017, using the retail inventory method.(b) Compute the ending inventory at cost for each department at December 31, assuming
the cost-to-retail ratios for the year are 65% for Hardcovers and 75% for Paperbacks.
(a) Hardcovers: End. Inv. $488,400
PROBLEMS: SET B AND SET C
Visit the book’s companion website, at www.wiley.com/college/weygandt, and choose the Student Companion site to access Problems: Set B and Set C.
COMPREHENSIVE PROBLEM
CP6 On December 1, 2017, Annalise Company had the account balances shown below.
Debit Credit
Cash $ 4,800 Accumulated Depreciation—Equipment $ 1,500Accounts Receivable 3,900 Accounts Payable 3,000Inventory 1,800* Owner’s Capital 27,000Equipment 21,000 $31,500 $31,500
*(3,000 3 $0.60)
The following transactions occurred during December.
Dec. 3 Purchased 4,000 units of inventory on account at a cost of $0.74 per unit. 5 Sold 4,400 units of inventory on account for $0.90 per unit. (It sold 3,000 of the $0.60
units and 1,400 of the $0.74.) 7 Granted the December 5 customer $180 credit for 200 units of inventory returned costing
$120. These units were returned to inventory. 17 Purchased 2,200 units of inventory for cash at $0.80 each. 22 Sold 2,100 units of inventory on account for $0.95 per unit. (It sold 2,100 of the $0.74 units.)
Adjustment data:
1. Accrued salaries payable $400.2. Depreciation $200 per month.
Instructions(a) Journalize the December transactions and adjusting entries, assuming Annalise uses the perpetual
inventory method.(b) Enter the December 1 balances in the ledger T-accounts and post the December transactions. In
addition to the accounts mentioned above, use the following additional accounts: Cost of Goods Sold, Depreciation Expense, Salaries and Wages Expense, Salaries and Wages Payable, Sales Rev-enue, and Sales Returns and Allowances.
(c) Prepare an adjusted trial balance as of December 31, 2017.(d) Prepare an income statement for December 2017 and a classifi ed balance sheet at December 31,
2017.(e) Compute ending inventory and cost of goods sold under FIFO, assuming Annalise Company uses
the periodic inventory system.(f) Compute ending inventory and cost of goods sold under LIFO, assuming Annalise Company uses
the periodic inventory system.

CONTINUING PROBLEM
COOKIE CREATIONS: AN ENTREPRENEURIAL JOURNEY(Note: This is a continuation of the Cookie Creations problem from Chapters 1 through 5.)
CC6 Natalie is busy establishing both divisions of her business (cookie classes and mixer sales) and completing her business degree. Her goals for the next 11 months are to sell one mixer per month and to give two to three classes per week. The cost of the fi ne European mixers is expected to increase. Natalie has just negotiated new terms with Kzinski that include shipping costs in the negotiated purchase price (mixers will be shipped FOB destination). Natalie must choose a cost fl ow assumption for her mixer inventory.
Go to the book’s companion website, www.wiley.com/college/weygandt, to see the completion of this problem.
PERSPECTIVEFINANCIAL REPORTING AND ANALYSIS
Financial Reporting Problem: Apple Inc.BYP6-1 The notes that accompany a company’s fi nancial statements provide informative details that would clutter the amounts and descriptions presented in the statements. Refer to the fi nancial state-ments of Apple Inc. in Appendix A as well as its annual report. Instructions for accessing and using the company’s complete annual report, including the notes to the fi nancial statements, are also pro-vided in Appendix A.
InstructionsAnswer the following questions. Complete the requirements in millions of dollars, as shown in Apple’s annual report.
(a) What did Apple report for the amount of inventories in its consolidated balance sheet at September 29, 2012? At September 28, 2013?
(b) Compute the dollar amount of change and the percentage change in inventories between 2012 and 2013. Compute inventory as a percentage of current assets at September 28, 2013.
(c) How does Apple value its inventories? Which inventory cost fl ow method does Apple use? (See Notes to the Financial Statements.)
(d) What is the cost of sales (cost of goods sold) reported by Apple for 2013, 2012, and 2011? Compute the percentage of cost of sales to net sales in 2013.
Comparative Analysis Problem:PepsiCo, Inc. vs. The Coca-Cola CompanyBYP6-2 PepsiCo’s fi nancial statements are presented in Appendix B. Financial statements of The Coca-Cola Company are presented in Appendix C. Instructions for accessing and using the complete annual reports of PepsiCo and Coca-Cola, including the notes to the fi nancial statements, are also provided in Appendices B and C, respectively.
Instructions(a) Based on the information contained in these fi nancial statements, compute the following 2013
ratios for each company. (1) Inventory turnover. (2) Days in inventory.(b) What conclusions concerning the management of the inventory can you draw from these data?
Comparative Analysis Problem:Amazon.com, Inc. vs. Wal-Mart Stores, Inc.BYP6-3 Amazon.com, Inc.’s fi nancial statements are presented in Appendix D. Financial statements of Wal-Mart Stores, Inc. are presented in Appendix E. Instructions for accessing and using the complete
BROADENING YOUR
306 6 Inventories
© leungchopan/Shutterstock

Broadening Your Perspective 307
annual reports of Amazon and Wal-Mart, including the notes to the fi nancial statements, are also provided in Appendices D and E, respectively.
Instructions(a) Based on the information contained in these fi nancial statements, compute the following 2013
ratios for each company. (1) Inventory turnover. (2) Days in inventory.(b) What conclusions concerning the management of the inventory can you draw from these data?
Real-World FocusBYP6-4 A company’s annual report usually will identify the inventory method used. Knowing that, you can analyze the effects of the inventory method on the income statement and balance sheet.
Address: www.cisco.com, or go to www.wiley.com/college/weygandt
InstructionsAnswer the following questions based on the current year’s annual report on Cisco’s website.
(a) At Cisco’s fi scal year-end, what was the inventory on the balance sheet?(b) How has this changed from the previous fi scal year-end?(c) How much of the inventory was fi nished goods?(d) What inventory method does Cisco use?
CRITICAL THINKING
Decision-Making Across the OrganizationBYP6-5 On April 10, 2017, fi re damaged the offi ce and warehouse of Corvet Company. Most of the accounting records were destroyed, but the following account balances were determined as of March 31, 2017: Inventory (January 1, 2017), $80,000; Sales Revenue (January 1–March 31, 2017), $180,000; Purchases (January 1–March 31, 2017), $94,000. The company’s fi scal year ends on December 31. It uses a periodic inventory system. From an analysis of the April bank statement, you discover cancelled checks of $4,200 for cash purchases during the period April 1–10. Deposits during the same period totaled $18,500. Of that amount, 60% were collections on accounts receivable, and the balance was cash sales. Correspondence with the company’s principal suppliers revealed $12,400 of purchases on ac-count from April 1 to April 10. Of that amount, $1,600 was for merchandise in transit on April 10 that was shipped FOB destination. Correspondence with the company’s principal customers produced acknowledgments of credit sales totaling $37,000 from April 1 to April 10. It was estimated that $5,600 of credit sales will never be acknowledged or recovered from customers. Corvet Company reached an agreement with the insurance company that its fi re-loss claim should be based on the average of the gross profi t rates for the preceding 2 years. The fi nancial statements for 2015 and 2016 showed the following data.
2016 2015
Net sales $600,000 $480,000Cost of goods purchased 404,000 356,000Beginning inventory 60,000 40,000Ending inventory 80,000 60,000
Inventory with a cost of $17,000 was salvaged from the fi re.
InstructionsWith the class divided into groups, answer the following.
(a) Determine the balances in (1) Sales Revenue and (2) Purchases at April 10. *(b) Determine the average gross profi t rate for the years 2015 and 2016. (Hint: Find the gross profi t
rate for each year and divide the sum by 2.) *(c) Determine the inventory loss as a result of the fi re, using the gross profi t method.
Communication ActivityBYP6-6 You are the controller of Small Toys Inc. Pamela Bames, the president, recently mentioned to you that she found an error in the 2016 fi nancial statements which she believes has corrected itself.

308 6 Inventories
7 Compare the accounting for inventories under GAAP and IFRS.LEARNING OBJECTIVE
The major IFRS requirements related to accounting and reporting for inventories are the same as GAAP. The major differences are that IFRS prohibits the use of the LIFO cost fl ow assumption and determines market in the lower-of-cost-or-market inventory valuation differently.
Relevant FactsFollowing are the key similarities and differences between GAAP and IFRS related to inventories.
She determined, in discussions with the Purchasing Department, that 2016 ending inventory was overstated by $1 million. Pamela says that the 2017 ending inventory is correct. Thus, she assumes that 2017 income is correct. Pamela says to you, “What happened has happened—there’s no point in worrying about it anymore.”
InstructionsYou conclude that Pamela is incorrect. Write a brief, tactful memo to Pamela, clarifying the situation.
Ethics CaseBYP6-7 R. J. Graziano Wholesale Corp. uses the LIFO method of inventory costing. In the current year, profi t at R. J. Graziano is running unusually high. The corporate tax rate is also high this year, but it is scheduled to decline signifi cantly next year. In an effort to lower the current year’s net income and to take advantage of the changing income tax rate, the president of R. J. Graziano Wholesale instructs the plant accountant to recommend to the purchasing department a large purchase of inven-tory for delivery 3 days before the end of the year. The price of the inventory to be purchased has doubled during the year, and the purchase will represent a major portion of the ending inventory value.
Instructions(a) What is the effect of this transaction on this year’s and next year’s income statement and income
tax expense? Why?(b) If R. J. Graziano Wholesale had been using the FIFO method of inventory costing, would the pres-
ident give the same directive?(c) Should the plant accountant order the inventory purchase to lower income? What are the ethical
implications of this order?
All About YouBYP6-8 Some of the largest business frauds ever perpetrated have involved the misstatement of inventory. Two classics were at Leslie Fay and McKesson Corporation.
InstructionsThere is considerable information regarding inventory frauds available on the Internet. Search for information about one of the two cases mentioned above, or inventory fraud at any other company, and prepare a short explanation of the nature of the inventory fraud.
FASB Codifi cation ActivityBYP6-9 If your school has a subscription to the FASB Codifi cation, go to http://aaahq.org/ascLogin.cfm to log in and prepare responses to the following.
Instructions(a) The primary basis for accounting for inventories is cost. How is cost defi ned in the Codifi cation?(b) What does the Codifi cation state regarding the use of consistency in the selection or employment
of a basis for inventory?
A Look at IFRS

Similarities• IFRS and GAAP account for inventory acquisitions at historical cost and value inventory at the
lower-of-cost-or-market subsequent to acquisition.
• Who owns the goods—goods in transit or consigned goods—as well as the costs to include in inven-tory are essentially accounted for the same under IFRS and GAAP.
Differences• The requirements for accounting for and reporting inventories are more principles-based under
IFRS. That is, GAAP provides more detailed guidelines in inventory accounting.
• A major difference between IFRS and GAAP relates to the LIFO cost fl ow assumption. GAAP per-mits the use of LIFO for inventory valuation. IFRS prohibits its use. FIFO and average-cost are the only two acceptable cost fl ow assumptions permitted under IFRS. Both sets of standards permit specifi c identifi cation where appropriate.
• In the lower-of-cost-or-market test for inventory valuation, IFRS defi nes market as net realizable value. GAAP, on the other hand, defi nes market as replacement cost.
Looking to the FutureOne convergence issue that will be diffi cult to resolve relates to the use of the LIFO cost fl ow assump-tion. As indicated, IFRS specifi cally prohibits its use. Conversely, the LIFO cost fl ow assumption is widely used in the United States because of its favorable tax advantages. In addition, many argue that LIFO from a fi nancial reporting point of view provides a better matching of current costs against rev-enue and, therefore, enables companies to compute a more realistic income.
IFRS Practice
IFRS Self-Test Questions
1. Which of the following should not be included in the inventory of a company using IFRS?(a) Goods held on consignment from another company.(b) Goods shipped on consignment to another company.(c) Goods in transit from another company shipped FOB shipping point.(d) None of the above.
2. Which method of inventory costing is prohibited under IFRS?(a) Specifi c identifi cation. (c) FIFO.(b) LIFO. (d) Average-cost.
IFRS ExercisesIFRS6-1 Briefl y describe some of the similarities and differences between GAAP and IFRS with respect to the accounting for inventories.
IFRS6-2 LaTour Inc. is based in France and prepares its fi nancial statements (in euros) in accordance with IFRS. In 2017, it reported cost of goods sold of €578 million and average inventory of €154 million. Briefl y discuss how analysis of LaTour’s inventory turnover (and comparisons to a company using GAAP) might be affected by differences in inventory accounting between IFRS and GAAP.
International Financial Reporting Problem: Louis Vuitton
IFRS6-3 The fi nancial statements of Louis Vuitton are presented in Appendix F. Instructions for accessing and using the company’s complete annual report, including the notes to its fi nancial state-ments, are also provided in Appendix F.
InstructionsUsing the notes to the company’s fi nancial statements, answer the following questions.
(a) What cost fl ow assumption does the company use to value inventory?(b) What amount of goods purchased for retail and fi nished products did the company report at
December 31, 2013?
Answers to IFRS Self-Test Questions
1. a 2. b
A Look at IFRS 309

Starting a small business requires many decisions. For
example, you have to decide where to locate, how much
space you need, how much inventory to have, how many
employees to hire, and where to advertise. Small business
owners are typically so concerned about the product and sales
side of their business that they often do not give enough
thought to something that is also critical to their success—
how to keep track of fi nancial results.
Small business owners today can choose either manual or
computerized accounting systems. For example, Paul and Laura
West were the owners of the fi rst independent dealership of
Carvin guitars and professional audio equipment. When they
founded their company in Sacramento, California, they
decided to purchase a computerized accounting system that
would integrate many aspects of their retail operations. They
wanted to use their accounting software to manage their
inventory of guitars and amplifi ers, enter sales, record and
report fi nancial data, and process credit card and debit card
transactions. They evaluated a number of options and chose
QuickBooks® by Intuit Inc.
QuickBooks®, like most other popular software packages,
has programs designed for the needs of a specifi c type of
business, which in this case is retailing. This QuickBooks®
retailing package automatically collects sales information
from its point-of-sale scanning devices. It also keeps track of
inventory levels and automatically generates purchase orders
for popular items when re-order points are reached. It even
supports specialized advertising campaigns.
For example, QuickBooks® compiled a customer database
from which the Wests sent out targeted direct mailings to
potential customers. The computerized system also enabled
data fi les to be emailed to the company’s accountant. This
kept down costs and made it easier and more effi cient for the
Wests to generate fi nancial reports as needed. The Wests
believed that the investment in the computerized system
saved them time and money, and allowed them to spend
more time on other aspects of their business.
Source: Intuit Inc., “QuickBooks® and ProAdvisor® Help Make Guitar Store a
Hit,” Journal of Accountancy (May 2006), p. 101.
QuickBooks® Helps This Retailer Sell Guitars
As the Feature Story below demonstrates, a reliable information system is a necessity for any company. Whether companies use pen, pencil, or computers in maintaining accounting records, certain principles and procedures apply. The purpose of this chapter is to explain and illustrate these features.
CHAPTER PREVIEW
7
FEATURE STORY
Accounting Information Systems
310

Explain the basic concepts of an accounting information system.1
CHAPTER OUTLINE
Basic AIS ConceptsDO IT! 1• Computerized accounting
systems• Manual accounting systems
Learning Objectives
Describe the nature and purpose of a subsidiary ledger.2 Subsidiary LedgersDO IT! 2
• Subsidiary ledger example • Advantages of subsidiary
ledgers
Record transactions in special journals.3 Special JournalsDO IT! 3
• Sales journal• Cash receipts journal• Purchases journal• Cash payments journal• Effects of special journals• Cyber security
Terra Images/Age Fotostock America, Inc.
Go to the REVIEW AND PRACTICE section at the end of the chapter for a review of key concepts and practice applications with solutions.
Visit WileyPLUS with ORION for additional tutorials and practice opportunities.

312 7 Accounting Information Systems
1 Explain the basic concepts of an accounting information system.LEARNING OBJECTIVE
The accounting information system collects and processes transaction data and communicates fi nancial information to decision-makers. It includes each of the steps in the accounting cycle that you studied in earlier chapters. It also includes the documents that provide evidence of the transactions, and the records, trial balances, worksheets, and fi nancial statements that result. An accounting system may be either manual or computerized. Most businesses use some sort of computerized accounting system, whether it is an off-the-shelf system for small businesses, like QuickBooks® or Sage 50, or a more complex custom-made system. Effi cient and effective accounting information systems are based on certain basic principles. These principles, as described in Illustration 7-1, are (1) cost-effectiveness, (2) usefulness, and (3) fl exibility. If the accounting system is cost-effective, provides useful output, and has the fl exibility to meet future needs, it can contribute to both individual and organizational goals.
Illustration 7-1Principles of an effi cient and effective accounting information system
Cost-Effectiveness
Useful Output
Flexibility
The accounting system must be cost-effective. Benefits of information mustoutweigh the costs of providing it.
To be useful, information must beunderstandable, relevant, reliable,timely, and accurate. Designers ofaccounting systems must considerthe needs and knowledge ofvarious users.
The accounting system shouldaccommodate a variety of usersand changing information needs.The system should be sufficientlyflexible to meet the resulting changesin the demands made upon it.
Technologicaladvances
Increased
competition
Changingaccountingprinciples
Organizationalgrowth
Government
regulation and
deregulation
CostsBenefits
“I want it tobe accurate.”
“I want it tobe reliable!” “It must be
relevant.”
Computerized Accounting Systems
Many small businesses use a computerized general ledger accounting system. General ledger accounting systems are software programs that integrate the various accounting functions related to sales, purchases, receivables, payables, cash receipts and disbursements, and payroll. They also generate fi nancial state-ments. Computerized systems have a number of advantages over manual sys-tems. First, the company typically enters data only once in a computerized system. Second, because the computer does most steps automatically, it elimi-nates many errors resulting from human intervention in a manual system, such

Basic Concepts of Accounting Information Systems 313
as errors in posting or preparation of fi nancial statements. Computerized sys-tems also provide up-to-the-minute information. More timely information often results in better business decisions. Many different general ledger software pack-ages are available.
CHOOSING A SOFTWARE PACKAGE
To identify the right software for your business, you must understand your com-pany’s operations. For example, consider its needs with regard to inventory, bill-ing, payroll, and cash management. In addition, the company might have specifi c needs that are not supported by all software systems. For example, you might want to track employees’ hours on individual jobs or to extract information for determining sales commissions. Choosing the right system is critical because installation of even a basic system is time-consuming, and learning a new system will require many hours of employee time.
ENTRY-LEVEL SOFTWARE
Software publishers tend to classify businesses into groups based on revenue and the number of employees. Companies with revenues of less than $5 million and up to 20 employees generally use entry-level programs. The two leading entry-level programs are Intuit’s QuickBooks® and The Sage Group’s Sage 50. These programs control more than 90% of the market. Each of these entry-level pro-grams comes in many different industry-specifi c versions. For example, some are designed for very specifi c industry applications such as restaurants, retailing, construction, manufacturing, or nonprofi t. Quality entry-level packages typically involve more than recording transac-tions and preparing fi nancial statements. Here are some common features and benefi ts:
• Easy data access and report preparation. Users can easily access infor-mation related to specifi c customers or suppliers. For example, you can view all transactions, invoices, payments, as well as contact information for a specifi c client.
• Audit trail. As a result of the Sarbanes-Oxley Act, companies are now far more concerned that their accounting system minimizes opportunities for fraud. Many programs provide an “audit trail” that enables the tracking of all transactions.
• Internal controls. Some systems have an internal accounting review that identifi es suspicious transactions or likely mistakes such as wrong account numbers or duplicate transactions.
• Customization. This feature enables the company to create data fi elds specifi c to the needs of its business.
• Network-compatibility. Multiple users in the company can access the system at the same time.
ENTERPRISE RESOURCE PLANNING SYSTEMS
Enterprise resource planning (ERP) systems are typically used by manufac-turing companies with more than 500 employees and $500 million in sales. The best-known of these systems are SAP AG’s SAP ERP (the most widely used) and Oracle’s ERP. ERP systems go far beyond the functions of an entry-level general ledger package. They integrate all aspects of the organization, including accounting, sales, human resource management, and manufacturing. Because of the complexity of an ERP system, implementation can take three years and cost fi ve times as much as the purchase price of the system. Purchase and implementation of ERP systems can cost from $250,000 to as much as $50 million for the largest multi-national corporations.
ETHICS NOTE
Entire books and movies have used cyber attacks as a major theme. Most programmers would agree that ensuring cyber security is the most diffi cult and time-consuming phase of their jobs.

314 7 Accounting Information Systems
Manual Accounting Systems
In manual accounting systems, someone performs each of the steps in the account-ing cycle by hand. For example, someone manually enters each accounting transaction in the journal and manually posts each to the ledger. Other manual computations must be made to obtain ledger account balances and to prepare a trial balance and fi nancial statements. In the remainder of this chapter, we illustrate the use of a manual system. You might be wondering, “Why cover manual accounting systems if the real world uses computerized systems?” First, small businesses still abound. Most of them begin operations with manual accounting systems and convert to comput-erized systems as the business grows. You may work in a small business or start your own someday, so it is useful to know how a manual system works. Second, to understand what computerized accounting systems do, you also need to under-stand manual accounting systems. The manual accounting system represented in the fi rst six chapters of this textbook is satisfactory in a company with a low volume of transactions. How-ever, in most companies, it is necessary to add additional ledgers and journals to the accounting system to record transaction data effi ciently.
Curbing Fraudulent Activity with Software
The Sarbanes-Oxley Act (SOX) requires that companies demonstrate that they have adequate controls in place to detect signifi cant fraudulent behavior by employees. The SOX requirements have created a huge market for software that can monitor and trace every recorded transaction and adjusting entry. This enables companies to pinpoint who used the accounting system
and when they used it. These systems also require “elec-tronic signatures” by employees for all signifi cant transac-tions. Such signatures verify that employees have followed
all required procedures, and that all actions are properly authorized. One fi rm that specializes in compliance soft-ware had 10 clients prior to SOX and 250 after SOX.
Note that small businesses have no standards like SOX and often do not have the resources to implement a fraud–prevention system. As a result, small businesses lose nearly $630 billion to fraud each year. To address this problem, more sophisticated software is being designed for small business fraud prevention.
Sources: W. M. Bulkeley and C. Forelle, “Anti-Crime Program: How Corporate Scandals Gave Tech Firms a New Business Line,” Wall Street Journal (December 9, 2005), p. A1; and “New Software Fights Small Business Fraud,” FOX Business (August 9, 2013).
Why might this software help reduce fraudulent activity by employees? (Go to WileyPLUS for this answer and additional questions.)
Ethics Insight
© Sean Locke/iStockphoto
Indicate whether the following statements are true or false.
1. An accounting information system collects and processes transaction data and com-municates fi nancial information to decision-makers.
2. A company typically enters data only once in a manual accounting system.
3. Enterprise resource planning (ERP) systems are typically used by companies with revenues of less than $5 million and up to 20 employees.
Solution
DO IT! 1 Basic AIS Concepts
1. True. 2. False. A company typically enters data only once in a computerized accounting system. 3. False. Enterprise resource planning (ERP) systems are typi-cally used by manufacturing companies with more than 500 employees and $500 million in sales.
Related exercise material: BE7-1, BE7-2, BE7-3, and DO IT! 7-1.
Action Plan✔ Understand the
principles of an effective accounting information system.
✔ Recognize the types of available general ledger software packages.

Subsidiary Ledgers 315
2 Describe the nature and purpose of a subsidiary ledger.LEARNING OBJECTIVE
Imagine a business that has several thousand charge (credit) customers and shows the transactions with these customers in only one general ledger account—Accounts Receivable. It would be nearly impossible to determine the balance owed by an individual customer at any specifi c time. Similarly, the amount pay-able to one creditor would be diffi cult to locate quickly from a single Accounts Payable account in the general ledger. Instead, companies use subsidiary ledgers to keep track of individual balances. A subsidiary ledger is a group of accounts with a common characteristic (for example, all accounts receivable). It is an addition to and an expansion of the general ledger. The subsidiary ledger frees the general ledger from the details of individual balances. Two common subsidiary ledgers are as follows.
1. The accounts receivable (or customers’) subsidiary ledger, which collects transaction data of individual customers.
2. The accounts payable (or creditors’) subsidiary ledger, which collects transaction data of individual creditors.
In each of these subsidiary ledgers, companies usually arrange individual accounts in alphabetical order. A general ledger account summarizes the detailed data from a subsidiary ledger. For example, the detailed data from the accounts receivable subsidiary ledger are summarized in Accounts Receivable in the general ledger. The general ledger account that summarizes subsidiary ledger data is called a control account. Illustration 7-2 presents an overview of the relationship of subsidiary ledgers to the general ledger. There, the general ledger control accounts and sub-sidiary ledger accounts are in green. Note that Cash and Owner’s Capital in this illustration are not control accounts because there are no subsidiary ledger accounts related to these accounts.
Illustration 7-2Relationship of general ledger and subsidiary ledgers
CashGeneralLedger
Controlaccounts
SubsidiaryLedgers
AccountsReceivable
CustomerB
CustomerC
CustomerA
AccountsPayable
Owner's Capital
CreditorY
CreditorZ
CreditorX
At the end of an accounting period, each general ledger control account balance must equal the composite balance of the individual accounts in the related subsidiary ledger. For example, the balance in Accounts Payable in Illustration 7-2 must equal the total of the subsidiary balances of Creditors X 1 Y 1 Z.
Subsidiary Ledger Example
Illustration 7-3 (page 316) lists credit sales and collections on account for Pujols Company.

316 7 Accounting Information Systems
Illustration 7-4 provides an example of a control account and subsidiary ledger for Pujols Company. (Due to space considerations, the explanation column in these accounts is not shown in this and subsequent illustrations.) Illustration 7-4 is based on the transactions listed in Illustration 7-3.
Illustration 7-3Sales and collection transactions
Credit Sales Collections on Account
Jan. 10 Aaron Co. $ 6,000 Jan. 19 Aaron Co. $4,000 12 Branden Inc. 3,000 21 Branden Inc. 3,000 20 Caron Co. 3,000 29 Caron Co. 1,000
$12,000 $8,000
Pujols can reconcile the total debits ($12,000) and credits ($8,000) in Accounts Receivable in the general ledger to the detailed debits and credits in the subsidi-ary accounts. Also, the balance of $4,000 in the control account agrees with the total of the balances in the individual accounts (Aaron Co. $2,000 1 Branden Inc. $0 1 Caron Co. $2,000) in the subsidiary ledger. As Illustration 7-4 shows, companies make monthly postings to the control accounts in the general ledger. This practice allows them to prepare monthly fi nancial statements. Companies post to the individual accounts in the subsidiary ledger daily. Daily posting ensures that account information is current. This enables the company to monitor credit limits, bill customers, and answer inquiries from customers about their account balances.
Advantages of Subsidiary Ledgers
Subsidiary ledgers have several advantages:
1. They show in a single account transactions affecting one customer or one creditor, thus providing up-to-date information on specifi c account balances.
Illustration 7-4Relationship between general and subsidiary ledgers
General Ledger Software for Accounting
File Edit View Go Bookmarks Tools Help
? Problem PostEntries Closing Reports Tools Help
General Ledger General Jrnl Sales Jrnl Cash Receipts Jrnl Purchases Jrnl
Date Ref. Debit Credit Balance
2017Jan 12
21
Branden Inc.
3,000 3,000
3,000------
Date Ref. Debit Credit Balance
2017Jan 31
31
Accounts Receivable No. 112
12,000 8,000
12,0004,000
The subsidiary ledgeris separate from thegeneral ledger.
Accounts Receivableis a control account.
Date Ref. Debit Credit Balance
2017Jan 20
29
Caron Co.
3,000 1,000
3,0002,000
Date Ref. Debit Credit Balance
2017Jan 10
19
Aaron Co.
6,000 4,000
6,0002,000
ACCOUNTS RECEIVABLE SUBSIDIARY LEDGER GENERAL LEDGER

Using Special Journals 317
2. They free the general ledger of excessive details. As a result, a trial balance of the general ledger does not contain vast numbers of individual account balances.
3. They help locate errors in individual accounts by reducing the number of accounts in one ledger and by using control accounts.
4. They make possible a division of labor in posting. One employee can post to the general ledger while someone else posts to the subsidiary ledgers.
”I’m John Smith, a.k.a. 13695071642”
Rather than relying on cus-tomer or creditor names in a subsidiary ledger, a computer-ized system expands the account number of the control
account in a prespecifi ed manner. For example, if the control account Accounts Receivable was numbered 10010, the fi rst account in the accounts receivable subsidiary
ledger might be numbered 10010–0001. Most systems allow inquiries about specifi c accounts in the subsidiary ledger (by account number) or about the control account. With the latter, the system would automatically total all the subsidiary accounts whenever an inquiry to the control account was made.
Why use numbers to identify names in a computerized system? (Go to WileyPLUS for this answer and additional questions.)
© Niels Laan/iStockphoto
Accounting Across the Organization
Presented below is information related to Sims Company for its fi rst month of opera-tions. Determine the balances that appear in the accounts payable subsidiary ledger. What Accounts Payable balance appears in the general ledger at the end of January?
Credit Purchases Cash Paid
Jan. 5 Devon Co. $11,000 Jan. 9 Devon Co. $7,000 11 Shelby Co. 7,000 14 Shelby Co. 2,000 22 Taylor Co. 14,000 27 Taylor Co. 9,000
Solution
DO IT! 2 Subsidiary Ledgers
Subsidiary ledger balances:
Devon Co.: $4,000 ($11,000 2 $7,000)
Shelby Co.: $5,000 ($7,000 2 $2,000)
Taylor Co.: $5,000 ($14,000 2 $9,000)
General ledger Accounts Payable balance: $14,000 ($4,000 1 $5,000 1 $5,000)
Related exercise material: BE7-4, BE7-5, E7-1, E7-2, E7-3, E7-4, E7-5, and DO IT! 7-2.
Action Plan✔ Subtract cash paid
from credit purchases to determine the bal-ances in the accounts payable subsidiary ledger.
✔ Sum the individual balances to determine the Accounts Payable balance.
3 Record transactions in special journals.LEARNING OBJECTIVE
So far, you have learned to journalize transactions in a two-column general jour-nal and post each entry to the general ledger. This procedure is satisfactory in only very small companies. To expedite journalizing and posting, most compa-nies use special journals in addition to the general journal.

318 7 Accounting Information Systems
Companies use special journals to record similar types of transactions. Examples are all sales of merchandise on account or all cash receipts. The types of transactions that occur frequently in a company determine what special journals the company uses. Most merchandising companies record daily transac-tions using the journals shown in Illustration 7-5.Illustration 7-5
Use of special journals and the general journal
SalesJournal
All sales ofmerchandiseon account
Used for:
Cash ReceiptsJournal
All cash received(including cashsales)
Used for:
PurchasesJournal
All purchasesof merchandiseon account
Used for:
Cash PaymentsJournal
All cash paid(including cashpurchases)
Used for:
GeneralJournal
Transactions thatcannot be enteredin a special journal,including correcting,adjusting, andclosing entries
Used for:
If a transaction cannot be recorded in a special journal, the company records it in the general journal. For example, if a company had special journals for only the four types of transactions listed above, it would record purchase returns and allowances that do not affect cash in the general journal. Similarly, correcting, adjusting, and closing entries are recorded in the general journal. In some situations, companies might use special journals other than those listed above. For example, when sales returns and allowances that do not affect cash are frequent, a company might use a special journal to record these transactions. Special journals permit greater division of labor because several people can record entries in different journals at the same time. For example, one employee may journalize all cash receipts, and another may journalize all credit sales. Also, the use of special journals reduces the time needed to complete the posting process. With special journals, companies may post some accounts monthly instead of daily, as we will illustrate later in the chapter. On the following pages, we discuss the four special journals shown in Illustration 7-5.
Sales Journal
In the sales journal, companies record sales of merchandise on account. Cash sales of merchandise go in the cash receipts journal. Credit sales of assets other than merchandise go in the general journal.
JOURNALIZING CREDIT SALES
To demonstrate use of a sales journal, we will use data for Karns Wholesale Sup-ply, which uses a perpetual inventory system. Under this system, each entry in the sales journal results in one entry at selling price and another entry at cost. The entry at selling price is a debit to Accounts Receivable (a control account) and a credit of equal amount to Sales Revenue. The entry at cost is a debit to Cost of Goods Sold and a credit of equal amount to Inventory (a control account). Using a sales journal with two amount columns, the company can show on only one line a sales transaction at both selling price and cost. Illustration 7-6 shows this two-column sales journal of Karns Wholesale Supply, using assumed credit sales transactions (for sales invoices 101–107). Note that, unlike the general journal, an explanation is not required for each entry in a special journal. Also, the use of prenumbered invoices ensures that all invoices are journalized and no invoices are duplicated. Finally, the reference
Helpful HintPostings are also made daily to individual ledger accounts in the inventory subsidiary ledger to main-tain a perpetual inventory.

Using Special Journals 319
(Ref.) column is not used in journalizing. It is used in posting the sales journal, as explained in the next section.
POSTING THE SALES JOURNAL
Companies make daily postings from the sales journal to the individual accounts receivable in the subsidiary ledger. Posting to the general ledger is done monthly. Illustration 7-7 (page 320) shows both the daily and monthly postings. A check mark (✓) is inserted in the reference column to indicate that the daily posting to the customer’s account has been made. If the subsidiary ledger accounts were numbered, the account number would be entered in place of the check mark. At the end of the month, Karns posts the column totals of the sales journal to the general ledger. Here, the column totals are as follows. From the selling-price column, a debit of $90,230 to Accounts Receivable (account No. 112), and a credit of $90,230 to Sales Revenue (account No. 401). From the cost column, a debit of $62,190 to Cost of Goods Sold (account No. 505), and a credit of $62,190 to Inventory (account No. 120). Karns inserts the account numbers below the col-umn totals to indicate that the postings have been made. In both the general ledger and subsidiary ledger accounts, the reference S1 indicates that the posting came from page 1 of the sales journal.
PROVING THE LEDGERS
The next step is to “prove” the ledgers. To do so, Karns must determine two things: (1) The total of the general ledger debit balances must equal the total of the gen-eral ledger credit balances. (2) The sum of the subsidiary ledger balances must equal the balance in the control account. Illustration 7-8 (page 321) shows the proof of the postings from the sales journal to the general and subsidiary ledgers.
ADVANTAGES OF THE SALES JOURNAL
The use of a special journal to record sales on account has a number of advan-tages. First, the one-line entry for each sales transaction saves time. In the sales journal, it is not necessary to write out the four account titles for each transac-tion. Second, only totals, rather than individual entries, are posted to the general ledger. This saves posting time and reduces the possibilities of errors in posting. Finally, a division of labor results because one individual can take responsibility for the sales journal.
Illustration 7-6Journalizing the sales journal—perpetual inventory system
General Ledger Software for Accounting
File Edit View Go Bookmarks Tools Help
? Problem PostEntries Closing Reports Tools Help
General Ledger General Jrnl Sales Jrnl Cash Receipts Jrnl Purchases Jrnl
SALES JOURNAL S1
Date Account DebitedInvoice
No.Accts. Receivable Dr.
Sales Revenue Cr.Cost of Goods Sold Dr.
Inventory Cr.Ref.
Abbot SistersBabson Co.Carson Bros.Deli Co.Abbot SistersDeli Co.Babson Co.
2017May 3
71419212427
101102103104105106107
10,60011,3507,8009,300
15,40021,21014,57090,230
6,3607,3705,0706,510
10,78015,90010,20062,190

320 7 Accounting Information Systems
Cash Receipts Journal
In the cash receipts journal, companies record all receipts of cash. The most common types of cash receipts are cash sales of merchandise and collections of accounts receivable. Many other possibilities exist, such as receipt of money from bank loans and cash proceeds from disposal of equipment. A one- or two-column cash receipts journal would not have space enough for all possible cash receipt transactions. Therefore, companies use a multiple-column cash receipts journal.
General Ledger Software for Accounting
File Edit View Go Bookmarks Tools Help
? Problem PostEntries Closing Reports Tools Help
General Ledger General Jrnl Sales Jrnl Cash Receipts Jrnl Purchases Jrnl
SALES JOURNAL S1
Date Account DebitedInvoice
No.Accts. Receivable Dr.
Sales Revenue Cr.Cost of Goods Sold Dr.
Inventory Cr.Ref.
Abbot SistersBabson Co.Carson Bros.Deli Co.Abbot SistersDeli Co.Babson Co.
2017May 3
71419212427
101102103104105106107
10,60011,3507,8009,300
15,40021,21014,57090,230
6,3607,3705,0706,510
10,78015,90010,20062,190
(112) / (401) (505) / (120)
Date Ref. Debit Credit Balance2017May 3
21
Abbot Sisters
10,60015,400
10,60026,000
Date Ref. Debit Credit Balance2017May 7
27
Babson Co.
11,35014,570
11,35025,920
Date Ref. Debit Credit Balance2017May 14
Carson Bros.
7,800 7,800
Date Ref. Debit Credit Balance2017May 31
Accounts Receivable
90,230 90,230
Date Ref. Debit Credit Balance2017May 19
24
Deli Co.
9,30021,210
9,30030,510
Date Ref. Debit Credit Balance2017May 31
Sales Revenue
90,230 90,230
The company posts individualamounts to the subsidiary ledger daily.
At the end of the accounting period,the company poststotals to the generalledger.
S1S1
S1S1
S1
S1S1
S1
S1
No. 112
Date Ref. Debit Credit Balance2017May 31
Inventory
62,190162,190S1
No. 120
No. 401
Date Ref. Debit Credit Balance2017May 31
Cost of Goods Sold
62,190 62,190S1
No. 505
The subsidiary ledger is separatefrom the general ledger.
Accounts Receivable is a controlaccount.
1The normal balance for Inventory is a debit. But because of the sequence in which we have posted the special journals,with the sales journal first, the credits to Inventory are posted before the debits. This posting sequence explains the creditbalance in Inventory, which exists only until the other journals are posted.
ACCOUNTS RECEIVABLE SUBSIDIARY LEDGER
GENERAL LEDGER
Illustration 7-7Posting the sales journal

Using Special Journals 321
Generally, a cash receipts journal includes the following columns: debit col-umns for Cash and Sales Discounts, and credit columns for Accounts Receivable, Sales Revenue, and “Other Accounts.” Companies use the Other Accounts cate-gory when the cash receipt does not involve a cash sale or a collection of accounts receivable. Under a perpetual inventory system, each sales entry also is accompa-nied by an entry that debits Cost of Goods Sold and credits Inventory for the cost of the merchandise sold. Illustration 7-9 (page 322) shows a six-column cash receipts journal. Companies may use additional credit columns if these columns signifi cantly reduce postings to a specifi c account. For example, a loan company such as Household International receives thousands of cash collections from customers. Using separate credit columns for Loans Receivable and Interest Revenue, rather than the Other Accounts credit column, would reduce postings.
JOURNALIZING CASH RECEIPTS TRANSACTIONS
To illustrate the journalizing of cash receipts transactions, we will continue with the May transactions of Karns Wholesale Supply. Collections from customers relate to the entries recorded in the sales journal in Illustration 7-6. The entries in the cash receipts journal are based on the following cash receipts.
May 1 D. A. Karns makes an investment of $5,000 in the business. 7 Cash sales of merchandise total $1,900 (cost, $1,240). 10 Received a check for $10,388 from Abbot Sisters in payment of invoice No. 101
for $10,600 less a 2% discount. 12 Cash sales of merchandise total $2,600 (cost, $1,690). 17 Received a check for $11,123 from Babson Co. in payment of invoice No. 102
for $11,350 less a 2% discount. 22 Received cash by signing a note for $6,000. 23 Received a check for $7,644 from Carson Bros. in full for invoice No. 103 for
$7,800 less a 2% discount. 28 Received a check for $9,114 from Deli Co. in full for invoice No. 104 for
$9,300 less a 2% discount.
Further information about the columns in the cash receipts journal is listed below and on page 323.
Debit Columns:
1. Cash. Karns enters in this column the amount of cash actually received in each transaction. The column total indicates the total cash receipts for the month.
2. Sales Discounts. Karns includes a Sales Discounts column in its cash receipts journal. By doing so, it does not need to enter sales discount items in the general journal. As a result, the cash receipts journal shows on one line the collection of an account receivable within the discount period.
Illustration 7-8Proving the equality of the postings from the sales journalPostings to
General Ledger
General Ledger
Credits
Debits
Debit Postings to the AccountsReceivable Subsidiary Ledger
Subsidiary Ledger
$26,00025,9207,800
30,510$90,230
Abbot SistersBabson Co.Carson Bros.Deli Co.
$62,19090,230
$152,420
$90,23062,190
$152,420
InventorySales Revenue
Accounts ReceivableCost of Goods Sold

322 7 Accounting Information Systems
Illustration 7-9Journalizing and posting the cash receipts journal
General Ledger Software for Accounting
File Edit View Go Bookmarks Tools Help
? Problem PostEntries Closing Reports Tools Help
General Ledger General Jrnl Sales Jrnl Cash Receipts Jrnl Purchases Jrnl
Date Ref. Debit Credit Balance2017May 3
1021
Abbot Sisters
10,600
15,400
10,600--------15,400
Date Ref. Debit Credit Balance2017May 7
1727
Babson Co.
11,350
14,570
11,350--------14,570
Date Ref. Debit Credit Balance2017May 14
23
Carson Bros.
7,800 7,800-------
The subsidiary ledgeris separate from thegeneral ledger.
Date Ref. Debit Credit Balance2017May 19
2428
Deli Co.
9,30021,210
9,30030,51021,210
S1CR1
S1
S1CR1
S1
S1CR1
S1S1
CR1
AccountsReceivable
Cr.
SalesDiscounts
Dr.CashDr.
SalesRevenue
Cr.
OtherAccounts
Cr.
Cost of GoodsSold Dr.
Inventory Cr.Ref.AccountCreditedDate
Owner's Capital2017May 1
7101217222328
5,0001,900
10,3882,600
11,1236,0007,6449,114
200
301
53,769
1,900
2,600
4,500
5,000
6,000
11,000(101) (414) (112) (401)
1,240
1,690
2,930(505)/(120)(x)
10,600
11,350
7,800
9,300
Date Ref. Debit Credit Balance2017May 31
Cash
53,769
Date Ref. Debit Credit Balance2017May 31
31
Accounts Receivable
90,230 90,23051,180
Date Ref. Debit Credit Balance2017May 22
Notes Payable
6,000
Date Ref. Debit Credit Balance2017May 1
Owner's Capital
5,000
CR1
S1CR1
CR1
CR1
39,050
6,000
5,000
53,769
Date Ref. Debit Credit Balance2017May 31
31
Sales Revenue
90,23094,730
S1CR1
90,2304,500
Date Ref. Debit Credit Balance2017May 31
31 62,190
65,120S1
CR162,1902,930
Sales Discounts
No. 101
No. 112
No. 200
No. 301
No. 401
No. 414
Date Ref. Debit Credit Balance2017May 31
31
Inventory
(62,190)(65,120)
S1CR1
62,1902,930
No. 120
Date Ref. Debit Credit Balance2017May 31 781 781CR1
Cost of Goods Sold No. 505
Accounts Receivableis a control account.
Abbot Sisters
Babson Co.Notes PayableCarson Bros.Deli Co.
212
227
156186781
10,600
11,350
7,8009,300
39,050
The company posts individualamounts to the subsidiary ledger daily.
At the end of the accounting period, thecompany posts totals to the general ledger.
GENERAL LEDGERACCOUNTS RECEIVABLE SUBSIDIARY LEDGER
CASH RECEIPTS JOURNAL CR1

Using Special Journals 323
Credit Columns:
3. Accounts Receivable. Karns uses the Accounts Receivable column to record cash collections on account. The amount entered here is the amount to be credited to the individual customer’s account.
4. Sales Revenue. The Sales Revenue column records all cash sales of merchan-dise. Cash sales of other assets (plant assets, for example) are not reported in this column.
5. Other Accounts. Karns uses the Other Accounts column whenever the credit is other than to Accounts Receivable or Sales Revenue. For example, in the fi rst entry, Karns enters $5,000 as a credit to Owner’s Capital. This column is often referred to as the sundry accounts column.
Debit and Credit Column:
6. Cost of Goods Sold and Inventory. This column records debits to Cost of Goods Sold and credits to Inventory.
In a multi-column journal, generally only one line is needed for each entry. Debit and credit amounts for each line must be equal. When Karns journalizes the collection from Abbot Sisters on May 10, for example, three amounts are indicated. Note also that the Account Credited column identifi es both general ledger and subsidiary ledger account titles. General ledger accounts are illus-trated in the May 1 and May 22 entries. A subsidiary account is illustrated in the May 10 entry for the collection from Abbot Sisters. When Karns has fi nished journalizing a multi-column journal, it totals the amount columns and compares the totals to prove the equality of debits and credits. Illustration 7-10 shows the proof of the equality of Karns’s cash receipts journal.
Helpful HintA subsidiary ledger account is credited when the entry involves a collection of accounts receivable. A general ledger account is credited when the account is not shown in a special column (and an amount must be entered in the Other Accounts column). Otherwise, no account is shown in the “Account Credited” column.
Illustration 7-10Proving the equality of the cash receipts journalDebits Credits
$39,0504,500
11,0002,930
$57,480
Accounts ReceivableSales RevenueOther AccountsInventory
$53,769781
2,930$57,480
CashSales DiscountsCost of Goods Sold
Totaling the columns of a journal and proving the equality of the totals is called footing and cross-footing a journal.
POSTING THE CASH RECEIPTS JOURNAL
Posting a multi-column journal (Illustration 7-9, page 322) involves the following steps.
1. At the end of the month, the company posts all column totals, except for the Other Accounts total, to the account title(s) specifi ed in the column heading (such as Cash or Accounts Receivable). The company then enters account numbers below the column totals to show that they have been posted. For example, Karns has posted Cash to account No. 101, Accounts Receivable to account No. 112, Inventory to account No. 120, Sales Revenue to account No. 401, Sales Discounts to account No. 414, and Cost of Goods Sold to account No. 505.
2. The company separately posts the individual amounts comprising the Other Accounts total to the general ledger accounts specifi ed in the Account Credited column. See, for example, the credit posting to Owner’s Capital. The total amount of this column has not been posted. The symbol (X) is inserted below the total to this column to indicate that the amount has not been posted.

324 7 Accounting Information Systems
3. The individual amounts in a column, posted in total to a control account (Accounts Receivable, in this case), are posted daily to the subsidiary ledger account specifi ed in the Account Credited column. See, for example, the credit posting of $10,600 to Abbot Sisters.
The symbol CR, used in both the subsidiary and general ledgers, identifi es post-ings from the cash receipts journal.
PROVING THE LEDGERS
After posting of the cash receipts journal is completed, Karns proves the ledgers. As shown in Illustration 7-11, the general ledger totals agree. Also, the sum of the subsidiary ledger balances equals the control account balance.
Illustration 7-11Proving the ledgers after posting the sales and the cash receipts journals
$ 53,76951,180
78165,120
$170,850
CashAccounts ReceivableSales DiscountsCost of Goods Sold
$15,40014,57021,210
$51,180
Abbot SistersBabson Co.Deli Co.
Schedule of Accounts Receivable(from accounts receivable subsidiary ledger)
$ 6,0005,000
94,73065,120
$170,850
Notes PayableOwner's CapitalSales RevenueInventory
Credits
General Ledger
Debits
Purchases Journal
In the purchases journal, companies record all purchases of merchandise on account. Each entry in this journal results in a debit to Inventory and a credit to Accounts Payable. For example, consider the following credit purchase transac-tions for Karns Wholesale Supply in Illustration 7-12.
Illustration 7-12Credit purchase transactions Date Supplier Amount
5/6 Jasper Manufacturing Inc. $11,000 5/10 Eaton and Howe Inc. 7,200 5/14 Fabor and Son 6,900 5/19 Jasper Manufacturing Inc. 17,500 5/26 Fabor and Son 8,700 5/29 Eaton and Howe Inc. 12,600
Illustration 7-13 shows the purchases journal for Karns Wholesale Supply. When using a one-column purchases journal (as in Illustration 7-13), a company cannot journalize other types of purchases on account or cash purchases in it. For example, if the company used the purchases journal in Illustration 7-13, Karns would have to record credit purchases of equipment or supplies in the general journal. Likewise, all cash purchases would be entered in the cash pay-ments journal.
JOURNALIZING CREDIT PURCHASES OF MERCHANDISE
The journalizing procedure is similar to that for a sales journal. Companies make entries in the purchases journal from purchase invoices. In contrast to the sales journal, the purchases journal may not have an invoice number column because

Using Special Journals 325
invoices received from different suppliers will not be in numerical sequence. To ensure that they record all purchase invoices, some companies consecutively number each invoice upon receipt and then use an internal document number column in the purchases journal. The entries for Karns Wholesale Supply are based on the assumed credit purchases listed in Illustration 7-12.
POSTING THE PURCHASES JOURNAL
The procedures for posting the purchases journal are similar to those for the sales journal. In this case, Karns makes daily postings to the accounts payable ledger. It makes monthly postings to Inventory and Accounts Payable in the general ledger. In both ledgers, Karns uses P1 in the reference column to show that the postings are from page 1 of the purchases journal.
Illustration 7-13Journalizing and posting the purchases journal
ACCOUNTS PAYABLE SUBSIDIARY LEDGER
The company posts individual amounts to the subsidiary ledger daily.
Date Ref. Debit Credit Balance
2017May 10
29
Eaton and Howe Inc.
7,20012,600
7,20019,800
Date Ref. Debit Credit Balance
2017May 14
26
Fabor and Son
6,9008,700
6,90015,600
Date Ref. Debit Credit Balance
2017May 6
19
Jasper Manufacturing Inc.
11,00028,500
P1P1
P1P1
P1P1
11,00017,500
PURCHASES JOURNAL P1
GENERAL LEDGER
At the end of the accounting period, the company posts totals to the general ledger.
Accounts Payable
Inventory
Date Account CreditedInventory Dr.
Accounts Payable Cr.Ref.
20176
1014192629
2/10, n/303/10, n/301/10, n/302/10, n/301/10, n/303/10, n/30
11,0007,2006,900
17,5008,700
12,60063,900
No. 201
No. 120
Terms
(120)/(201)
The subsidiary ledgeris separate from thegeneral ledger.
Accounts Payableis a control account.
Jasper Manufacturing Inc.Eaton and Howe Inc.Fabor and SonJasper Manufacturing Inc.Fabor and SonEaton and Howe Inc.
May
Date Ref. Debit Credit Balance
2017May 31
3131 63,900
(62,190)(65,120)(1,220)
62,1902,930
S1CR1
P1
Date Ref. Debit Credit Balance
201763,900 63,900P1May 31
General Ledger Software for Accounting
File Edit View Go Bookmarks Tools Help
? Problem PostEntries Closing Reports Tools Help
General Ledger General Jrnl Sales Jrnl Cash Receipts Jrnl Purchases Jrnl
Helpful HintPostings to subsidiary ledger accounts are done daily because it is often necessary to know a current balance for the subsidiary accounts.

326 7 Accounting Information Systems
Proof of the equality of the postings from the purchases journal to both ledgers is shown in Illustration 7-14.
Helpful HintA single-column purchases journal needs only to be footed to prove the equality of debits and credits.
EXPANDING THE PURCHASES JOURNAL
Some companies expand the purchases journal to include all types of purchases on account, not just merchandise. Instead of one column for inventory and accounts payable, they use a multiple-column format. This format usually includes a credit column for Accounts Payable and debit columns for purchases of Inven-tory, Supplies, and Other Accounts. Illustration 7-15 shows a multi-column pur-chases journal for Hanover Co. The posting procedures are similar to those shown earlier for posting the cash receipts journal. For homework problems, assume the use of a single-column purchases journal unless instructed otherwise.
Illustration 7-14Proving the equality of the purchases journal
Postings toGeneral Ledger
Credit Postings toAccounts Payable Ledger
$19,80015,60028,500
$63,900
Eaton and Howe Inc.Fabor and SonJasper Manufacturing Inc.
$63,900
$63,900
Inventory (debit)
Accounts Payable (credit)
Illustration 7-15Multi-column purchases journal
General Ledger Software for Accounting
File Edit View Go Bookmarks Tools Help
? Problem PostEntries Closing Reports Tools Help
General Ledger General Jrnl Sales Jrnl Cash Receipts Jrnl Purchases Jrnl
PURCHASES JOURNAL P1
Date Account Credited
AccountsPayable
Cr.
2017June 1
35
30
2,0001,5002,600
80056,600 4,900
2,000
Inventory Dr.
Other AccountsDr.
Account Ref. Amount
Equipment 157 2,6001,500
Ref.
Signe AudioWight Co.Orange Tree Co.
Sue's Business Forms8,700
80043,000
Supplies Dr.
Cash Payments Journal
In a cash payments (cash disbursements) journal, companies record all dis-bursements of cash. Entries are made from prenumbered checks. Because com-panies make cash payments for various purposes, the cash payments journal has multiple columns. Illustration 7-16 shows a four-column journal.
JOURNALIZING CASH PAYMENTS TRANSACTIONS
The procedures for journalizing transactions in this journal are similar to those for the cash receipts journal. Karns records each transaction on one line, and for each line there must be equal debit and credit amounts. The entries in the cash

Using Special Journals 327
General Ledger Software for Accounting
File Edit View Go Bookmarks Tools Help
? Problem PostEntries Closing Reports Tools Help
General Ledger General Jrnl Sales Jrnl Cash Receipts Jrnl Purchases Jrnl
ACCOUNTS PAYABLE SUBSIDIARY LEDGER GENERAL LEDGER
At the end of the accounting period, the company posts totals to the general ledger.
CASH PAYMENTS JOURNAL CP1
The subsidiary ledgeris separate from thegeneral ledger.
Accounts Payableis a control account.
The company posts individual amounts to the subsidiary ledger daily.
Date Ref. Debit Credit Balance
2017May 10
1929
Eaton and Howe Inc.
7,200
12,600
7,200-------
12,600
Date Ref. Debit Credit Balance
2017May 14
2326
Fabor and Son
6,900
8,700
6,900-------8,700
Date Ref. Debit Credit Balance
2017May 6
101928
Jasper Manufacturing Inc.
11,000--------17,500--------
Date Ref. Debit Credit Balance
2017May 31
31
Accounts Payable
42,60063,90021,300
101102103104105106107108
2017May 1
38
1019232830
130120120
306
1,200100
4,40010,7806,9846,831
17,150500
47,945
P1CP1
P1
P1CP1
P1
P1CP1
P1CP1
P1CP1
Date Ref. Debit Credit Balance
2017May 31
31
Cash
47,94553,7695,824
CR1CP1
No. 101
No. 201
11,000
17,500
(x)
DateCk.No. Account Debited Ref.
Other Accounts Dr.
AccountsPayable Dr. Inventory Cr.
CashCr.
1,200100
4,400
5006,200
11,0007,2006,900
17,500
42,600
22021669
350
855
(201) (120) (101)
7,200
6,900
11,000
17,500
Date Ref. Debit Credit Balance
2017May 3
831313131
Inventory
62,1902,930
855
1004,500
57,69060,6203,2802,425
CPICPI
SICRI
PlCPI
1004,400
63,900
No. 120
Date Ref. Debit Credit Balance
2017May 1
Prepaid Insurance
1,200 1,200CP1
No. 130
Date Ref. Debit Credit Balance
2017May 30
Owner's Drawings
500 500CP1
No. 306
53,769
63,900
Prepaid InsuranceInventoryInventoryJasper Manuf. Inc.Eaton & Howe Inc.Fabor and SonJasper Manuf. Inc.Owner's Drawings
Illustration 7-16Journalizing and posting the cash payments journal

328 7 Accounting Information Systems
payments journal in Illustration 7-16 are based on the following transactions for Karns Wholesale Supply.
May 1 Issued check No. 101 for $1,200 for the annual premium on a fi re insurance policy.
3 Issued check No. 102 for $100 in payment of freight when terms were FOB shipping point.
8 Issued check No. 103 for $4,400 for the purchase of merchandise. 10 Sent check No. 104 for $10,780 to Jasper Manufacturing Inc. in payment of
May 6 invoice for $11,000 less a 2% discount. 19 Mailed check No. 105 for $6,984 to Eaton and Howe Inc. in payment of May 10
invoice for $7,200 less a 3% discount. 23 Sent check No. 106 for $6,831 to Fabor and Son in payment of May 14 invoice
for $6,900 less a 1% discount. 28 Sent check No. 107 for $17,150 to Jasper Manufacturing Inc. in payment of
May 19 invoice for $17,500 less a 2% discount. 30 Issued check No. 108 for $500 to D. A. Karns as a cash withdrawal for personal
use.
Note that whenever Karns enters an amount in the Other Accounts column, it must identify a specifi c general ledger account in the Account Debited column. The entries for checks No. 101, 102, 103, and 108 illustrate this situation. Simi-larly, Karns must identify a subsidiary account in the Account Debited column whenever it enters an amount in the Accounts Payable column. See, for example, the entry for check No. 104. After Karns journalizes the cash payments journal, it totals the columns. The totals are then balanced to prove the equality of debits and credits.
POSTING THE CASH PAYMENTS JOURNAL
The procedures for posting the cash payments journal are similar to those for the cash receipts journal. Karns posts the amounts recorded in the Accounts Payable column individually to the subsidiary ledger and in total to the control account. It posts Inventory and Cash only in total at the end of the month. Trans-actions in the Other Accounts column are posted individually to the appropriate account(s) affected. The company does not post totals for the Other Accounts column. Illustration 7-16 shows the posting of the cash payments journal. Note that Karns uses the symbol CP as the posting reference. After postings are completed, the company proves the equality of the debit and credit balances in the general ledger. In addition, the control account balances should agree with the subsidiary ledger total balance. Illustration 7-17 shows the agreement of these balances.
Illustration 7-17Proving the ledgers after postings from the sales, cash receipts, purchases, and cash payments journals
5,82451,1802,4251,200
500781
65,120$127,030
CashAccounts ReceivableInventoryPrepaid InsuranceOwner's DrawingsSales DiscountsCost of Goods Sold
$12,6008,700
$21,300
Eaton and Howe Inc.Fabor and Son
Schedule of Accounts Payable(from accounts payable subsidiary ledger)
General Ledger
Debits
6,00021,3005,000
94,730$127,030
Notes PayableAccounts PayableOwner's CapitalSales Revenue
Credits
$
$

Using Special Journals 329
Effects of Special Journals on the General Journal
Special journals for sales, purchases, and cash substantially reduce the number of entries that companies make in the general journal. Only transactions that cannot be entered in a special journal are recorded in the general journal. For example, a company may use the general journal to record such transac-tions as granting of credit to a customer for a sales return or allowance, granting of credit from a supplier for purchases returned, acceptance of a note receivable from a customer, and purchase of equipment by issuing a note payable. Also, cor-recting, adjusting, and closing entries are made in the general journal. The general journal has columns for date, account title and explanation, ref-erence, and debit and credit amounts. When control and subsidiary accounts are not involved, the procedures for journalizing and posting of transactions are the same as those described in earlier chapters. When control and subsidiary accounts are involved, companies make two changes from the earlier procedures:
1. In journalizing, they identify both the control and the subsidiary accounts.
2. In posting, there must be a dual posting: once to the control account and once to the subsidiary account.
To illustrate, assume that on May 31, Karns Wholesale Supply returns $500 of merchandise for credit to Fabor and Son. Illustration 7-18 shows the entry in the gen-eral journal and the posting of the entry.
General Ledger Software for Accounting
File Edit View Go Bookmarks Tools Help
? Problem PostEntries Closing Reports Tools Help
General Ledger General Jrnl Sales Jrnl Cash Receipts Jrnl Purchases Jrnl
GENERAL JOURNAL
ACCOUNTS PAYABLE SUBSIDIARY LEDGER GENERAL LEDGER
Date Ref. Debit Credit Balance
2017May 14
232631
Fabor and Son
6,900
8,700
6,900-------8,7008,200
Date Ref. Debit Credit Balance
2017May 31
3131
Accounts Payable
63,900 63,90021,300
20,800
Date Ref. Debit Credit Balance
2017May 31
Inventory
500 500
Date Account Title and Explanation Ref.
Accounts Payable–Fabor and Son Inventory (Received credit for returned goods)
2017May 31 500
P1CP1
P1G1
P1CP1G1
G1
No. 201
No. 120
G1
CreditDebit
500
201/ 120
6,900
500
42,600500
Illustration 7-18Journalizing and posting the general journal
Note that the general journal indicates two accounts (Accounts Payable, and Fabor and Son) for the debit, and two postings (“201/✓”) in the reference column. One debit is posted to the control account and another debit is posted to the creditor’s account in the subsidiary ledger. If Karns receives cash instead of credit on this return, then it would record the transaction in the cash receipts journal.

330 7 Accounting Information Systems
Cyber Security: A Final Comment
Have you ever been hacked? With the increasing use of cell phones, tablets, and other social media outlets, a real risk exists that your confi dential information may be stolen and used illegally. Companies, individuals, and even nations have all been victims of cybercrime—a crime that involves the Internet, a computer system, or computer technology. For companies, cybercrime is clearly a major threat as the hacking of employees’ or customers’ records related to cybercrime can cost millions of dol-lars. Unfortunately, the numbers of security breaches are increasing. A security breach at Target, for example, cost the company a minimum of $20 million, the CEO lost his job, and sales plummeted. Here are three reasons for the rise in the successful hacks of corporate com-puter records.
1. Companies and their employees continue to increase their activity on the Internet, primarily due to the use of mobile devices and cloud computing.
2. Companies today collect and store unprecedented amounts of personal data on customers and employees.
3. Companies often take measures to protect themselves from cyber security attacks but then fail to check if employees are carrying out the proper security guidelines.
Note that cyber security risks extend far beyond company operations and compli-ance. Many hackers target highly sensitive intellectual information or other stra-tegic assets. Illustration 7-19 highlights the type of hackers and their motives, targets and impacts.Illustration 7-19
Profi les of hackers
Malicious Actors Motives Targets Impacts
Nation-state
Organized crime
Hacktivists
Insiders
• Economic, political, and/ or military advantage
• Immediate fi nancial gain
• Collect information for future fi nancial gains
• Infl uence political and/or social change
• Pressure businesses to change their practices
• Personal advantage, monetary gain
• Professional revenge• Patriotism
• Trade secrets• Sensitive business
information• Emerging technologies• Critical infrastructure
• Financial/payment systems
• Personally identifi able information
• Payment card information
• Protected health information
• Corporate secrets• Sensitive business
information• Information related
to key executives, employees, customers, and business partners
• Sales, deals, market strategies
• Corporate secrets, intellectual property
• Business operations• Personnel information
• Loss of competitive advantage
• Disruption to critical infrastructure
• Costly regulatory inquiries and penalties
• Consumer and shareholder lawsuits
• Loss of consumer confi dence
• Disruption of business activities
• Harm to brand and reputation
• Loss of consumer confi dence
• Trade secret disclosure• Operational disruption• Harm to brand and
reputation• National security
impact
Source: PriceWaterhouseCoopers, “Answering Your Cybersecurity Questions” (January 2014).

Review and Practice 331
Companies now recognize that cyber security systems that protect confi den-tial data must be implemented. It follows that companies (and nations and indi-viduals) must continually verify that their cyber security defenses are sound and uncompromised.
Swisher Company had the following transactions during March.
1. Collected cash on account from Oakland Company.
2. Purchased equipment by signing a note payable.
3. Sold merchandise on account.
4. Purchased merchandise on account.
5. Paid $2,400 for a 2-year insurance policy.
Identify the journal in which each of the transactions above is recorded. The company uses the special journals described in the chapter plus a general journal.
Solution
DO IT! 3 Special Journals
1. Collected cash on account from Oakland Company. Cash receipts journal
2. Purchased equipment by signing a note payable. General journal
3. Sold merchandise on account. Sales journal
4. Purchased merchandise on account. Purchases journal
5. Paid $2,400 for a 2-year insurance policy. Cash payments journal
Related exercise material: BE7-6, BE7-7, BE7-8, BE7-9, BE7-10, E7-6, E7-7, E7-8, E7-10, and DO IT! 7-3.
Action Plan✔ Determine if the
transaction involves the receipt of cash (cash receipts journal) or the payment of cash (cash payments journal).
✔ Determine if the transaction is a sale of merchandise on account (sales journal) or a purchase of merchandise on account (purchases journal).
✔ All other transactions are recorded in the general journal.
1 Explain the basic concepts of an accounting informa-tion system. The basic principles in developing an accounting information system are cost-effectiveness, useful output, and fl exibility. Most companies use a computerized accounting system. Smaller companies use entry-level software such as QuickBooks® or Sage 50. Larger companies use custom-made software packages, which often integrate all aspects of the organization.
Describe the nature and purpose of a subsidiary ledger. A subsidiary ledger is a group of accounts with a common characteristic. It facilitates the recording process by freeing the general ledger from details of individual balances.
Record transactions in special journals. Companies use special journals to group similar types of transac-tions. In a special journal, generally only one line is used to record a complete transaction.
2
3
LEARNING OBJECTIVES REVIEW
1
REVIEW AND PRACTICE
Accounting information system A system that collects and processes transaction data and communicates fi nancial information to decision-makers. (p. 312).
Accounts payable (creditors’) subsidiary ledger A subsidiary ledger that collects transaction data of indi-vidual creditors. (p. 315).
Accounts receivable (customers’) subsidiary ledgerA subsidiary ledger that collects transaction data of individual customers. (p. 315).
Cash payments (cash disbursements) journal A spe-cial journal that records all disbursements of cash. (p. 326).
GLOSSARY REVIEW

332 7 Accounting Information Systems
Cash receipts journal A special journal that records all cash received. (p. 320).
Control account An account in the general ledger that summarizes subsidiary ledger data. (p. 315).
Cybercrime A crime that involves the Internet, a com-puter system, or computer technology. (p. 330).
Manual accounting system A system in which some-one performs each of the steps in the accounting cycle by hand. (p. 314).
Purchases journal A special journal that records all purchases of merchandise on account. (p. 324).
Sales journal A special journal that records all sales of merchandise on account. (p. 318).
Special journals Journals that record similar types of transactions, such as all credit sales. (p. 318).
Subsidiary ledger A group of accounts with a common characteristic. (p. 315).
1. The basic principles of an accounting information system include all of the following except:(a) cost-effectiveness. (c) useful output.(b) fl exibility. (d) periodicity.
2. Which of the following is not an advantage of com-puterized accounting systems?(a) Data is entered only once in computerized account-
ing systems.(b) Computerized accounting systems provide up-to-
date information.(c) Computerized accounting systems eliminate enter-
ing of transaction information.(d) Computerized accounting systems eliminate many
errors resulting from human intervention. 3. Which of the following is incorrect concerning sub-
sidiary ledgers?(a) The purchases ledger is a common subsidiary
ledger for creditor accounts.(b) The accounts receivable ledger is a subsidiary
ledger.(c) A subsidiary ledger is a group of accounts with a
common characteristic.(d) An advantage of the subsidiary ledger is that it
permits a division of labor in posting. 4. Two common subsidiary ledgers are:
(a) accounts receivable and cash receipts.(b) accounts payable and cash payments.(c) accounts receivable and accounts payable.(d) sales and cost of goods sold.
5. At the beginning of the month, the accounts receiv-able subsidiary ledger showed balances for Apple Company $5,000 and Berry Company $7,000. During the month, credit sales were made to Apple $6,000, Berry $4,500, and Cantaloupe $8,500. Cash was col-lected on account from Berry $11,500 and Cantaloupe $3,000. At the end of the month, the control account Accounts Receivable in the general ledger should have a balance of:(a) $11,000. (c) $16,500.(b) $12,000. (d) $31,000.
6. A sales journal will be used for:
Credit Cash Sales Sales Sales Discounts
(a) no yes yes(b) yes no yes(c) yes no no(d) yes yes no
(LO 1)
(LO 1)
(LO 2)
(LO 2)
(LO 2)
(LO 3)
7. A purchase of equipment on account is recorded in the:(a) cash receipts journal. (c) cash payments journal.(b) purchases journal. (d) general journal.
8. A purchase of equipment using cash is recorded in the:(a) cash receipts journal. (c) cash payments journal.(b) purchases journal. (d) general journal.
9. Which of the following statements is correct?(a) The sales discount column is included in the cash
receipts journal.(b) The purchases journal records all purchases of
merchandise whether for cash or on account.(c) The cash receipts journal records sales on account.(d) Merchandise returned by the buyer is recorded by
the seller in the purchases journal. 10. Dotel Company’s cash receipts journal includes an
Accounts Receivable column and an Other Accounts column. At the end of the month, these columns are posted to the general ledger as:
Accounts Receivable Other Accounts
(a) a column total a column total(b) individual amounts a column total(c) individual amounts individual amounts(d) a column total individual amounts
11. Which of the following is incorrect concerning the posting of the cash receipts journal?(a) The total of the Other Accounts column is not
posted.(b) All column totals except the total for the Other
Accounts column are posted once at the end of the month to the account title(s) specifi ed in the column heading.
(c) The totals of all columns are posted daily to the accounts specifi ed in the column heading.
(d) The individual amounts in a column posted in total to a control account are posted daily to the subsidiary ledger account specifi ed in the Account Credited column.
12. Postings from the purchases journal to the subsidiary ledger are generally made:(a) yearly. (c) weekly.(b) monthly. (d) daily.
13. Which statement is incorrect regarding the general journal?(a) Only transactions that cannot be entered in a spe-
cial journal are recorded in the general journal.
(LO 3)
(LO 3)
(LO 3)
(LO 3)
(LO 3)
(LO 3)
(LO 3)
PRACTICE MULTIPLE-CHOICE QUESTIONS

(b) Dual postings are always required in the general journal.
(c) The general journal may be used to record accep-tance of a note receivable in payment of an account receivable.
(d) Correcting, adjusting, and closing entries are made in the general journal.
14. When companies use special journals:(a) they record all purchase transactions in the pur-
chases journal.
(LO 3)
(b) they record all cash received, except from cash sales, in the cash receipts journal.
(c) they record all cash disbursements in the cash payments journal.
(d) a general journal is not necessary.15. If a customer returns goods for credit, the selling
company normally makes an entry in the:(a) cash payments journal. (c) general journal.(b) sales journal. (d) cash receipts journal.
(LO 3)
Practice Exercises 333
Solutions
1. (d) Periodicity is not one of the basic principles of accounting information systems. The other choices are true statements.
2. (c) Computerized accounting systems do not eliminate the entering of transaction information. The other choices are advan-tages of computerized accounting systems.
3. (a) The accounts payable ledger, not the purchases ledger, is a common subsidiary ledger for creditor accounts. The other choices are true statements.
4. (c) Accounts receivable and accounts payable are two common subsidiary ledgers. The other choices are incorrect because (a) cash receipts, (b) cash payments, and (d) sales revenue and cost of goods sold are not subsidiary ledgers.
5. (c) The accounts receivable subsidiary ledger balances are the following: Apple Company $11,000 (beginning balance $5,000 1 credit sales $6,000), Berry Company $0 (beginning balance $7,000 1 credit sales $4,500 2 cash collected on account $11,500), and Cantaloupe $5,500 (credit sales $8,500 2 cash collected on account $3,000). The Accounts Receivable control account in the gen-eral ledger therefore has a balance of $16,500 ($11,000 1 $0 1 $5,500), not (a) $11,000, (b) $12,000, or (d) $31,000.
6. (c) The sales journal is used for credit sales. The cash receipts journal is used for cash sales and sales discounts. Therefore, choices (a), (b), and (d) are incorrect.
7. (d) Unless the company uses a multi-column purchases journal, the general journal is used to record the purchase of equipment on account. The other choices are incorrect because (a) the cash receipts journal would be used only if cash is received, (b) a one-column purchases journal cannot be used to record a purchase of equipment on account, and (c) the cash payments journal would be used only if this is a cash purchase.
8. (c) The cash payments journal includes all cash paid, including all cash purchases. The other choices are incorrect because (a) the cash receipts journal includes all cash received, including cash sales, not cash purchases; (b) the purchases journal includes only purchases of inventory on account, not cash purchases; and (d) the general journal is only used if a transaction cannot be entered in a special journal. In this case, this transaction can be entered into the cash payments journal.
9. (a) The sales discount column is included in the cash receipts journal. The other choices are incorrect because (b) the pur-chases journal only records purchases of inventory on account, not for cash; (c) the sales journal, not the cash receipts journal, records sales on account; and (d) when merchandise is returned by a buyer, the seller records this sales return in the general journal.
10. (d) The Accounts Receivable column would be posted to the general ledger as a column total, and the Other Accounts column would be posted as individual amounts. Therefore, the other choices are incorrect.
11. (c) The totals of all columns are not posted daily to the accounts specifi ed in the column heading. Instead, all column totals except the total for the Other Accounts column (which is never posted) are posted once at the end of the month to the account title(s) specifi ed in the column heading. The other choices are true statements.
12. (d) Postings from the purchases journal to the subsidiary ledger are usually made daily, not (a) yearly, (b) monthly, or (c) weekly.
13. (b) Dual postings are not always required in the general journal. Only when control and subsidiary accounts are involved are com-panies required to dual post: once to the control account and once to the subsidiary account. The other choices are true statements.
14. (c) When special journals are used, companies record all cash disbursements in the cash payments journal. The other choices are incorrect because when special journals are used, (a) companies record only purchases of inventory on account in the pur-chases journal; (b) companies record all cash receipts, including cash sales, in the cash receipts journal; and (d) a general journal is still needed.
15. (c) When a customer returns goods for credit (i.e., no cash is involved), the selling company records the transaction in the general journal, not the (a) cash payments journal, (b) sales journal, or (d) cash receipts journal.
1. On June 1, the balance of the Accounts Receivable control account in the general ledger of Rath Company was $13,620. The customers’ subsidiary ledger contained account bal-ances as follows: Wilson $2,000, Sanchez $3,140, Roberts $2,560, and Marks $5,920. At the end of June, the various journals contained the following information.
Post various journals to control and subsidiary accounts.
(LO 2, 3)
PRACTICE EXERCISES

Sales journal: Sales to Roberts $900, to Wilson $1,400, to Hardy $1,500, and to Marks $1,200.Cash receipts journal: Cash received from Roberts $1,610, from Marks $2,600, from Hardy $580, from Sanchez $2,100, and from Wilson $1,540.General journal: An allowance is granted to Marks $325.
Instructions(a) Set up control and subsidiary accounts and enter the beginning balances. Do not con-
struct the journals.(b) Post the various journals. Post the items as individual items or as totals, whichever
would be the appropriate procedure. (No sales discounts given.)(c) Prepare a schedule of accounts receivable and prove the agreement of the control
account with the subsidiary ledger at June 30, 2017.
334 7 Accounting Information Systems
GENERAL LEDGER
Accounts Receivable
Date Explanation Ref. Debit Credit Balance
June 1 Balance ✓ 13,620 S 5,000 18,620 CR 8,430 10,190 G 325 9,865
(c)RATH COMPANY
Schedule of Accounts ReceivableAs of June 30, 2017
Hardy $ 920Marks 4,195Roberts 1,850Sanchez 1,040Wilson 1,860
Total $9,865
Accounts Receivable $9,865
1. (a) and (b)
Sanchez
Date Explanation Ref. Debit Credit Balance
June 1 Balance ✓ 3,140 CR 2,100 1,040
Wilson
Date Explanation Ref. Debit Credit Balance
June 1 Balance ✓ 2,000 S 1,400 3,400 CR 1,540 1,860
Hardy
Date Explanation Ref. Debit Credit Balance
June 1 0 S 1,500 1,500 CR 580 920
Marks
Date Explanation Ref. Debit Credit Balance
June 1 Balance ✓ 5,920 S 1,200 7,120 CR 2,600 4,520 G 325 4,195
Roberts
Date Explanation Ref. Debit Credit Balance
June 1 Balance ✓ 2,560 S 900 3,460 CR 1,610 1,850
ACCOUNTS RECEIVABLE SUBSIDIARY LEDGER
Solution

Practice Problem 335
2. Below are some typical transactions incurred by Brimmer Company.
1. Received credit for merchandise purchased on credit.
2. Payment of employee wages.
3. Sales discount taken on goods sold.
4. Income summary closed to owner’s capital.
5. Purchase of offi ce supplies for cash.
6. Depreciation on building.
7. Purchase of merchandise on account.
8. Return of merchandise sold for credit.
9. Payment of creditors on account.
10. Collection on account from customers.
11. Sale of merchandise on account.
12. Sale of land for cash.
13. Sale of merchandise for cash.
InstructionsFor each transaction, indicate whether it would normally be recorded in a cash receipts journal, cash payments journal, sales journal, single-column purchases journal, or general journal.
Indicate use of special journals.
(LO 3)
2. 1. General journal 2. Cash payments journal 3. Cash receipts journal 4. General journal 5. Cash payments journal 6. General journal 7. Purchases journal
8. General journal 9. Cash payments journal10. Cash receipts journal11. Sales journal12. Cash receipts journal13. Cash receipts journal
Solution
Cassandra Wilson Company uses a six-column cash receipts journal with the following columns.
Cash (Dr.) Other Accounts (Cr.)Sales Discounts (Dr.) Cost of Goods Sold (Dr.) andAccounts Receivable (Cr.) Inventory (Cr.)Sales Revenue (Cr.)
Cash receipts transactions for the month of July 2017 are as follows.
July 3 Cash sales total $5,800 (cost, $3,480). 5 Received a check for $6,370 from Jeltz Company in payment of an invoice
dated June 26 for $6,500, terms 2/10, n/30. 9 Cassandra Wilson, the proprietor, made an additional investment of $5,000
in cash in the business. 10 Cash sales total $12,519 (cost, $7,511). 12 Received a check for $7,275 from R. Eliot & Co. in payment of a $7,500
invoice dated July 3, terms 3/10, n/30. 15 Received an advance of $700 cash for future services. 20 Cash sales total $15,472 (cost, $9,283). 22 Received a check for $5,880 from Beck Company in payment of $6,000
invoice dated July 13, terms 2/10, n/30. 29 Cash sales total $17,660 (cost, $10,596). 31 Received cash of $200 for interest earned for July.
Journalize transactions in cash receipts journal and explain posting procedure.
(LO 3)
PRACTICE PROBLEM
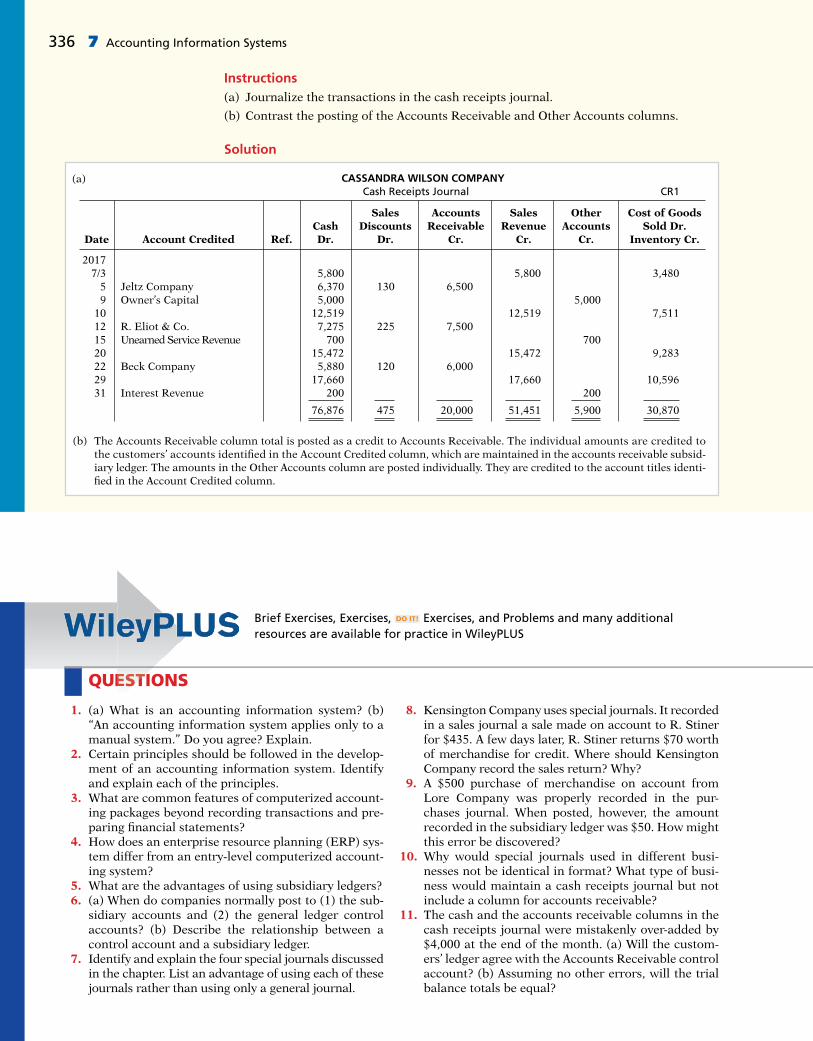
Instructions(a) Journalize the transactions in the cash receipts journal.
(b) Contrast the posting of the Accounts Receivable and Other Accounts columns.
336 7 Accounting Information Systems
Solution
(a) CASSANDRA WILSON COMPANY Cash Receipts Journal CR1
Sales Accounts Sales Other Cost of Goods Cash Discounts Receivable Revenue Accounts Sold Dr. Date Account Credited Ref. Dr. Dr. Cr. Cr. Cr. Inventory Cr.
2017 7/3 5,800 5,800 3,480 5 Jeltz Company 6,370 130 6,500 9 Owner’s Capital 5,000 5,000 10 12,519 12,519 7,511 12 R. Eliot & Co. 7,275 225 7,500 15 Unearned Service Revenue 700 700 20 15,472 15,472 9,283 22 Beck Company 5,880 120 6,000 29 17,660 17,660 10,596 31 Interest Revenue 200 200
76,876 475 20,000 51,451 5,900 30,870
(b) The Accounts Receivable column total is posted as a credit to Accounts Receivable. The individual amounts are credited to the customers’ accounts identifi ed in the Account Credited column, which are maintained in the accounts receivable subsid-iary ledger. The amounts in the Other Accounts column are posted individually. They are credited to the account titles identi-fi ed in the Account Credited column.
QUESTIONS
1. (a) What is an accounting information system? (b) “An accounting information system applies only to a manual system.” Do you agree? Explain.
2. Certain principles should be followed in the develop-ment of an accounting information system. Identify and explain each of the principles.
3. What are common features of computerized account-ing packages beyond recording transactions and pre-paring fi nancial statements?
4. How does an enterprise resource planning (ERP) sys-tem differ from an entry-level computerized account-ing system?
5. What are the advantages of using subsidiary ledgers? 6. (a) When do companies normally post to (1) the sub-
sidiary accounts and (2) the general ledger control accounts? (b) Describe the relationship between a control account and a subsidiary ledger.
7. Identify and explain the four special journals discussed in the chapter. List an advantage of using each of these journals rather than using only a general journal.
8. Kensington Company uses special journals. It recorded in a sales journal a sale made on account to R. Stiner for $435. A few days later, R. Stiner returns $70 worth of merchandise for credit. Where should Kensington Company record the sales return? Why?
9. A $500 purchase of merchandise on account from Lore Company was properly recorded in the pur-chases journal. When posted, however, the amount recorded in the subsidiary ledger was $50. How might this error be discovered?
10. Why would special journals used in different busi-nesses not be identical in format? What type of busi-ness would maintain a cash receipts journal but not include a column for accounts receivable?
11. The cash and the accounts receivable columns in the cash receipts journal were mistakenly over-added by $4,000 at the end of the month. (a) Will the custom-ers’ ledger agree with the Accounts Receivable control account? (b) Assuming no other errors, will the trial balance totals be equal?
EEEESSSSSTTTT
Brief Exercises, Exercises, DO IT! Exercises, and Problems and many additional resources are available for practice in WileyPLUS
Brief Exercises 337
12. One column total of a special journal is posted at month-end to only two general ledger accounts. One of these two accounts is Accounts Receivable. What is the name of this special journal? What is the other general ledger account to which that same month-end total is posted?
13. In what journal would the following transactions be recorded? (Assume that a two-column sales journal and a single-column purchases journal are used.)(a) Recording of depreciation expense for the year.(b) Credit given to a customer for merchandise pur-
chased on credit and returned.(c) Sales of merchandise for cash.(d) Sales of merchandise on account.(e) Collection of cash on account from a customer.(f) Purchase of offi ce supplies on account.
14. In what journal would the following transactions be recorded? (Assume that a two-column sales journal and a single-column purchases journal are used.)
(a) Cash received from signing a note payable.(b) Investment of cash by the owner of the business.(c) Closing of the expense accounts at the end of the
year.(d) Purchase of merchandise on account.(e) Credit received for merchandise purchased and
returned to supplier.(f) Payment of cash on account due a supplier.
15. What transactions might be included in a multiple-column purchases journal that would not be included in a single-column purchases journal?
16. Give an example of a transaction in the general jour-nal that causes an entry to be posted twice (i.e., to two accounts), one in the general ledger, the other in the subsidiary ledger. Does this affect the debit/credit equality of the general ledger?
17. Give some examples of appropriate general journal transactions for an organization using special journals.
BRIEF EXERCISES
BE7-1 Indicate whether each of the following statements is true or false.
1. When designing an accounting system, we need to think about the needs and knowl-edge of both the top managers and various other users.
2. When the environment changes as a result of technological advances, increased compe-tition, or government regulation, an accounting system does not have to be suffi ciently fl exible to meet the changes in order to save money.
3. In developing an accounting system, cost is relevant. The benefi ts obtained from the information disseminated must outweigh the cost of providing it.
BE7-2 Here is a list of words or phrases related to computerized accounting systems.
1. Entry-level software. 4. Audit trail.2. Enterprise resource planning systems. 5. Internal control.3. Network-compatible.
InstructionsMatch each word or phrase with the best description of it.
________ (a) Allows multiple users to access the system at the same time.________ (b) Enables the tracking of all transactions.________ (c) Identifi es suspicious transactions or likely mistakes such as wrong account
numbers or duplicate transactions.________ (d) Large-scale computer systems that integrate all aspects of the organization
including accounting, sales, human resource management, and manufacturing.________ (e) System for companies with revenues of less than $5 million and up to 20
employees.
BE7-3 Benji Borke has prepared the following list of statements about accounting infor-mation systems.
1. The accounting information system includes each of the steps of the accounting cycle, the documents that provide evidence of transactions that have occurred, and the accounting records.
2. The benefi ts obtained from information provided by the accounting information system need not outweigh the cost of providing that information.
3. Designers of accounting systems must consider the needs and knowledge of various users.
4. If an accounting information system is cost-effective and provides useful output, it does not need to be fl exible.
InstructionsIdentify each statement as true or false. If false, indicate how to correct the statement.
Explain basic concepts of an accounting information system.
(LO 1)
Explain basic concepts of an accounting information system.
(LO 1)
Explain basic concepts of an accounting information system.
(LO 1)

338 7 Accounting Information Systems
BE7-4 Presented below is information related to Gantner Company for its fi rst month of operations. Identify the balances that appear in the accounts receivable subsidiary ledger and the accounts receivable balance that appears in the general ledger at the end of January.
Credit Sales Cash Collections
Jan. 7 Austin Co. $10,000 Jan. 17 Austin Co. $7,000 15 Diaz Co. 8,000 24 Diaz Co. 4,000 23 Noble Co. 9,000 29 Noble Co. 9,000
BE7-5 Identify in what ledger (general or subsidiary) each of the following accounts is shown.(a) Rent Expense. (c) Notes Payable.(b) Accounts Receivable—Cabrera. (d) Accounts Payable—Pacheco.
BE7-6 Identify the journal in which each of the following transactions is recorded.(a) Cash sales. (d) Credit sales.(b) Owner withdrawal of cash. (e) Purchase of merchandise on account.(c) Cash purchase of land. (f) Receipt of cash for services performed.
BE7-7 Indicate whether each of the following debits and credits is included in the cash receipts journal. (Use “Yes” or “No” to answer this question.)(a) Debit to Sales Revenue. (c) Credit to Accounts Receivable.(b) Credit to Inventory. (d) Debit to Accounts Payable.
BE7-8 Villar Co. uses special journals and a general journal. Identify the journal in which each of the following transactions is recorded.(a) Purchased equipment on account.(b) Purchased merchandise on account.(c) Paid utility expense in cash.(d) Sold merchandise on account.
BE7-9 Identify the special journal(s) in which the following column headings appear.(a) Sales Discounts Dr. (d) Sales Revenue Cr.(b) Accounts Receivable Cr. (e) Inventory Dr.(c) Cash Dr.
BE7-10 Rauch Computer Components Inc. uses a multi-column cash receipts journal. Indicate which column(s) is/are posted only in total, only daily, or both in total and daily.(a) Accounts Receivable. (c) Cash.(b) Sales Discounts. (d) Other Accounts.
Identify subsidiary ledger accounts.
(LO 2)
Identify special journals.
(LO 3)
Identify entries to cash receipts journal.
(LO 3)
Identify transactions for special journals.
(LO 3)
Identify transactions for special journals.
(LO 3)
Indicate postings for cash receipts journal.
(LO 3)
Identify subsidiary ledger balances.
(LO 2)
Indicate whether the following statements are true or false.
1. A computerized accounting system must be customized to meet a company’s needs.2. Companies with revenues of less than $5 million and up to 20 employees generally use
entry-level programs rather than ERP systems.3. A manual accounting system provides more timely fi nancial information than a com-
puterized system.
Presented below is information related to Rizzo Company for its fi rst month of operations. Determine the balances that appear in the accounts payable subsidiary ledger. What Accounts Payable balance appears in the general ledger at the end of January?
Credit Purchases Cash Paid
Jan. 6 Gorst Company $11,000 Jan. 11 Gorst Company $ 6,500Jan. 10 Tian Company 12,000 Jan. 16 Tian Company 12,000Jan. 23 Maddox Company 10,000 Jan. 29 Maddox Company 7,700
DO IT! Exercises
DO IT! 7-1Explain basic concepts of an accounting information system.
(LO 1)
Determine subsidiary and general ledger balances.
(LO 2)
DO IT! 7-2

Hinske Company had the following transactions during April.
1. Sold merchandise on account.2. Purchased merchandise on account.3. Collected cash from a sale to Renfro Company.4. Recorded accrued interest on a note payable.5. Paid $2,000 for supplies.
Identify the journal in which each of the transactions above is recorded.
Identify special journals.
(LO 3)DO IT! 7-3
Exercises 339
EXERCISES
E7-1 Nex Company uses both special journals and a general journal as described in this chapter. On June 30, after all monthly postings had been completed, the Accounts Receiv-able control account in the general ledger had a debit balance of $340,000; the Accounts Payable control account had a credit balance of $77,000. The July transactions recorded in the special journals are summarized below. No entries affecting accounts receivable and accounts payable were recorded in the general journal for July.
Sales journal Total sales $161,400Purchases journal Total purchases $66,400Cash receipts journal Accounts receivable column total $131,000Cash payments journal Accounts payable column total $47,500
Instructions(a) What is the balance of the Accounts Receivable control account after the monthly
postings on July 31?(b) What is the balance of the Accounts Payable control account after the monthly post-
ings on July 31?(c) To what account(s) is the column total of $161,400 in the sales journal posted?(d) To what account(s) is the accounts receivable column total of $131,000 in the cash
receipts journal posted?
E7-2 Presented below is the subsidiary accounts receivable account of Jill Longley.
Determine control account balances, and explain posting of special journals.
(LO 2, 3)
Explain postings to subsidiary ledger.
(LO 2) Date Ref. Debit Credit Balance
2017Sept. 2 S31 61,000 61,000 9 G4 14,000 47,000 27 CR8 47,000 —
Instructions Write a memo to Sara Fogelman, chief fi nancial offi cer, that explains each
transaction.
E7-3 On September 1, the balance of the Accounts Receivable control account in the general ledger of Montgomery Company was $10,960. The customers’ subsidiary ledger contained account balances as follows: Hurley $1,440, Andino $2,640, Fowler $2,060, and Sogard $4,820. At the end of September, the various journals contained the following information.
Sales journal: Sales to Sogard $800, to Hurley $1,260, to Giambi $1,330, and to Fowler $1,600.Cash receipts journal: Cash received from Fowler $1,310, from Sogard $3,300, from Giambi $380, from Andino $1,800, and from Hurley $1,240.General journal: An allowance is granted to Sogard $220.
Instructions(a) Set up control and subsidiary accounts and enter the beginning balances. Do not con-
struct the journals.(b) Post the various journals. Post the items as individual items or as totals, whichever
would be the appropriate procedure. (No sales discounts given.)(c) Prepare a schedule of accounts receivable and prove the agreement of the controlling
account with the subsidiary ledger at September 30, 2017.
Post various journals to control and subsidiary accounts.
(LO 2, 3)

340 7 Accounting Information Systems
E7-4 Kieschnick Company has a balance in its Accounts Receivable control account of $10,000 on January 1, 2017. The subsidiary ledger contains three accounts: Bixler Com-pany, balance $4,000; Cuddyer Company, balance $2,500; and Freeze Company. During January, the following receivable-related transactions occurred.
Determine control and subsidiary ledger balances for accounts receivable.
(LO 2)
Instructions(a) What is the January 1 balance in the Freeze Company subsidiary account?(b) What is the January 31 balance in the control account?(c) Compute the balances in the subsidiary accounts at the end of the month.(d) Which January transaction would not be recorded in a special journal?
E7-5 Pennington Company has a balance in its Accounts Payable control account of $9,250 on January 1, 2017. The subsidiary ledger contains three accounts: Hale Company, balance $3,000; Janish Company, balance $1,875; and Valdez Company. During January, the following payable-related transactions occurred.
Determine control and subsidiary ledger balances for accounts payable.
(LO 2)
Credit Sales Collections Returns
Bixler Company $9,000 $8,000 $ -0-Cuddyer Company 7,000 2,500 3,000Freeze Company 8,500 9,000 -0-
Instructions(a) What is the January 1 balance in the Valdez Company subsidiary account?(b) What is the January 31 balance in the control account?(c) Compute the balances in the subsidiary accounts at the end of the month.(d) Which January transaction would not be recorded in a special journal?
E7-6 Gomes Company uses special journals and a general journal. The following transac-tions occurred during September 2017.
Sept. 2 Sold merchandise on account to H. Drew, invoice no. 101, $620, terms n/30. The cost of the merchandise sold was $420.
10 Purchased merchandise on account from A. Pagan $650, terms 2/10, n/30. 12 Purchased offi ce equipment on account from R. Cairo $6,500. 21 Sold merchandise on account to G. Holliday, invoice no. 102 for $800, terms
2/10, n/30. The cost of the merchandise sold was $480. 25 Purchased merchandise on account from D. Downs $860, terms n/30. 27 Sold merchandise to S. Miller for $700 cash. The cost of the merchandise sold
was $400.
Instructions(a) Prepare a sales journal (see Illustration 7-7) and a single-column purchases journal
(see Illustration 7-13). (Use page 1 for each journal.)(b) Record the transaction(s) for September that should be journalized in the sales journal
and the purchases journal.
E7-7 R. Santiago Co. uses special journals and a general journal. The following transac-tions occurred during May 2017.
May 1 R. Santiago invested $40,000 cash in the business. 2 Sold merchandise to Lawrie Co. for $6,300 cash. The cost of the merchandise
sold was $4,200. 3 Purchased merchandise for $7,700 from J. Moskos using check no. 101. 14 Paid salary to H. Rivera $700 by issuing check no. 102. 16 Sold merchandise on account to K. Stanton for $900, terms n/30. The cost of
the merchandise sold was $630. 22 A check of $9,000 is received from M. Mangini in full for invoice 101; no
discount given.
Record transactions in sales and purchases journal.
(LO 3)
Record transactions in cash receipts and cash payments journal.
(LO 3)
Purchases Payments Returns
Hale Company $6,750 $6,000 $ -0-Janish Company 5,250 1,875 2,250Valdez Company 6,375 6,750 -0-

Exercises 341
Instructions(a) Prepare a multiple-column cash receipts journal (see Illustration 7-9) and a multiple-
column cash payments journal (see Illustration 7-16). (Use page 1 for each journal.)(b) Record the transaction(s) for May that should be journalized in the cash receipts
journal and cash payments journal.
E7-8 Francisco Company uses the columnar cash journals illustrated in the textbook. In April, the following selected cash transactions occurred.
1. Made a refund to a customer as an allowance for damaged goods. 2. Received collection from customer within the 3% discount period. 3. Purchased merchandise for cash. 4. Paid a creditor within the 3% discount period. 5. Received collection from customer after the 3% discount period had expired. 6. Paid freight on merchandise purchased. 7. Paid cash for offi ce equipment. 8. Received cash refund from supplier for merchandise returned. 9. Withdrew cash for personal use of owner. 10. Made cash sales.
InstructionsIndicate (a) the journal, and (b) the columns in the journal that should be used in recording each transaction.
E7-9 Hasselback Company has the following selected transactions during March.
Mar. 2 Purchased equipment costing $7,400 from Bole Company on account. 5 Received credit of $410 from Carwell Company for merchandise damaged in
shipment to Hasselback. 7 Issued credit of $400 to Dempsey Company for merchandise the customer
returned. The returned merchandise had a cost of $260.
Hasselback Company uses a one-column purchases journal, a sales journal, the columnar cash journals used in the text, and a general journal.
Instructions(a) Journalize the transactions in the general journal.(b) In a brief memo to the president of Hasselback Company, explain the postings
to the control and subsidiary accounts from each type of journal.
E7-10 Below are some typical transactions incurred by Ricketts Company.
1. Payment of creditors on account. 2. Return of merchandise sold for credit. 3. Collection on account from customers. 4. Sale of land for cash. 5. Sale of merchandise on account. 6. Sale of merchandise for cash. 7. Received credit for merchandise purchased on credit. 8. Sales discount taken on goods sold. 9. Payment of employee wages. 10. Income summary closed to owner’s capital. 11. Depreciation on building. 12. Purchase of offi ce supplies for cash. 13. Purchase of merchandise on account.
InstructionsFor each transaction, indicate whether it would normally be recorded in a cash receipts journal, cash payments journal, sales journal, single-column purchases journal, or general journal.
E7-11 The general ledger of Hensley Company contained the following Accounts Payable control account (in T-account form). Also shown is the related subsidiary ledger.
Explain journalizing in cash journals.
(LO 3)
Journalize transactions in general journal and explain postings.
(LO 3)
Indicate journalizing in special journals.
(LO 3)
Explain posting to control account and subsidiary ledger.
(LO 2, 3)

342 7 Accounting Information Systems
Instructions(a) Indicate the missing posting reference and amount in the control account, and the
missing ending balance in the subsidiary ledger.(b) Indicate the amounts in the control account that were dual-posted (i.e., posted to the
control account and the subsidiary accounts).
E7-12 Selected accounts from the ledgers of Youngblood Company at July 31 showed the following.
Prepare purchases and general journals.
(LO 2, 3)
ACCOUNTS PAYABLE LEDGER
Benton Parks
Feb. 28 Bal. 4,600 Feb. 28 Bal. ?
Dooley
Feb. 28 Bal. 2,300
GENERAL LEDGER
Accounts Payable
Feb. 15 General journal 1,400 Feb. 1 Balance 26,025 28 ? ? 5 General journal 265 11 General journal 550 28 Purchases 13,400
Feb. 28 Balance 10,500
Equipment No. 157
Date Explanation Ref. Debit Credit Balance
July 1 G1 3,900 3,900
Accounts Payable No. 201
Date Explanation Ref. Debit Credit Balance
July 1 G1 3,900 3,900 15 G1 400 4,300 18 G1 100 4,200 25 G1 200 4,000 31 P1 9,300 13,300
Inventory No. 120
Date Explanation Ref. Debit Credit Balance
July 15 G1 400 400 18 G1 100 300 25 G1 200 100 31 P1 9,300 9,400
GENERAL LEDGER
ACCOUNTS PAYABLE LEDGER
Flaherty Equipment Co.
Date Explanation Ref. Debit Credit Balance
July 1 G1 3,900 3,900
Marsh Co.
Date Explanation Ref. Debit Credit Balance
July 3 P1 2,400 2,400 20 P1 1,700 4,100
Lange Corp
Date Explanation Ref. Debit Credit Balance
July 17 P1 1,400 1,400 18 G1 100 1,300 29 P1 1,600 2,900
Weller Co.
Date Explanation Ref. Debit Credit Balance
July 14 P1 1,100 1,100 25 G1 200 900
Yates Co.
Date Explanation Ref. Debit Credit Balance
July 12 P1 500 500 21 P1 600 1,100
Bernardo Inc.
Date Explanation Ref. Debit Credit Balance
July 15 G1 400 400

Problems: Set A 343
InstructionsFrom the data prepare:
(a) The single-column purchases journal for July.(b) The general journal entries for July.
E7-13 Tresh Products uses both special journals and a general journal as described in this chapter. Tresh also posts customers’ accounts in the accounts receivable subsidiary ledger. The postings for the most recent month are included in the subsidiary T-accounts below.
Determine correct posting amount to control account.
(LO 2, 3)
InstructionsDetermine the correct amount of the end-of-month posting from the sales journal to the Accounts Receivable control account.
E7-14 Selected account balances for Hulse Company at January 1, 2017, are presented below.
Accounts Payable $14,000Accounts Receivable 22,000Cash 17,000Inventory 13,500
Hulse’s sales journal for January shows a total of $110,000 in the selling price column, and its one-column purchases journal for January shows a total of $77,000. The column totals in Hulse’s cash receipts journal are Cash Dr. $61,000, Sales Dis-counts Dr. $1,100, Accounts Receivable Cr. $45,000, Sales Revenue Cr. $6,000, and Other Accounts Cr. $11,100. The column totals in Hulse’s cash payments journal for January are Cash Cr. $55,000, Inventory Cr. $1,000, Accounts Payable Dr. $46,000, and Other Accounts Dr. $10,000. Hulse’s total cost of goods sold for January is $63,600. Accounts Payable, Accounts Receivable, Cash, Inventory, and Sales Revenue are not involved in the Other Accounts column in either the cash receipts or cash payments journal, and are not involved in any general journal entries.
InstructionsCompute the January 31 balance for Hulse in the following accounts.
(a) Accounts Payable. (d) Inventory.(b) Accounts Receivable. (e) Sales Revenue.(c) Cash.
Compute balances in various accounts.
(LO 3)
Estes Gehrke
Bal. 340 250 Bal. 150 150 200 290
Truong Weiser
Bal. –0– 145 Bal. 120 120 145 190
150
EXERCISES: SET B AND CHALLENGE EXERCISES
Visit the book’s companion website, at www.wiley.com/college/weygandt, and choose the Student Companion site to access Exercises: Set B and Challenge Exercises.
PROBLEMS: SET A
P7-1A Kozma Company’s chart of accounts includes the following selected accounts.
101 Cash 401 Sales Revenue112 Accounts Receivable 414 Sales Discounts120 Inventory 505 Cost of Goods Sold301 Owner’s Capital
Journalize transactions in cash receipts journal; post to control account and subsidiary ledger.
(LO 2, 3)

344 7 Accounting Information Systems
On April 1, the accounts receivable ledger of Kozma Company showed the following bal-ances: Morrow $1,550, Rose $1,200, Jennings Co. $2,900, and Dent $2,200. The April transactions involving the receipt of cash were as follows.
Apr. 1 The owner, T. Kozma, invested additional cash in the business $7,200. 4 Received check for payment of account from Dent less 2% cash discount. 5 Received check for $920 in payment of invoice no. 307 from Jennings Co. 8 Made cash sales of merchandise totaling $7,245. The cost of the merchandise
sold was $4,347. 10 Received check for $600 in payment of invoice no. 309 from Morrow. 11 Received cash refund from a supplier for damaged merchandise $740. 23 Received check for $1,000 in payment of invoice no. 310 from Jennings Co. 29 Received check for payment of account from Rose (no cash discount allowed).
Instructions(a) Journalize the transactions above in a six-column cash receipts journal with columns
for Cash Dr., Sales Discounts Dr., Accounts Receivable Cr., Sales Revenue Cr., Other Accounts Cr., and Cost of Goods Sold Dr./Inventory Cr. Foot and cross-foot the journal.
(b) Insert the beginning balances in the Accounts Receivable control and subsidiary accounts, and post the April transactions to these accounts.
(c) Prove the agreement of the control account and subsidiary account balances.
P7-2A Reineke Company’s chart of accounts includes the following selected accounts.
101 Cash 201 Accounts Payable120 Inventory 306 Owner’s Drawings130 Prepaid Insurance 505 Cost of Goods Sold157 Equipment
On October 1, the accounts payable ledger of Reineke Company showed the following balances: Uggla Company $2,700, Orr Co. $2,500, Rosenthal Co. $1,800, and Clevenger Company $3,700. The October transactions involving the payment of cash were as follows.
Oct. 1 Purchased merchandise, check no. 63, $300. 3 Purchased equipment, check no. 64, $800. 5 Paid Uggla Company balance due of $2,700, less 2% discount, check no. 65,
$2,646. 10 Purchased merchandise, check no. 66, $2,550. 15 Paid Rosenthal Co. balance due of $1,800, check no. 67. 16 C. Reineke, the owner, pays his personal insurance premium of $400, check no. 68. 19 Paid Orr Co. in full for invoice no. 610, $2,000 less 2% cash discount, check
no. 69, $1,960. 29 Paid Clevenger Company in full for invoice no. 264, $2,500, check no. 70.
Instructions(a) Journalize the transactions above in a four-column cash payments journal with col-
umns for Other Accounts Dr., Accounts Payable Dr., Inventory Cr., and Cash Cr. Foot and cross-foot the journal.
(b) Insert the beginning balances in the Accounts Payable control and subsidiary accounts, and post the October transactions to these accounts.
(c) Prove the agreement of the control account and the subsidiary account balances.
P7-3A The chart of accounts of LR Company includes the following selected accounts.
112 Accounts Receivable 401 Sales Revenue120 Inventory 412 Sales Returns and Allowances126 Supplies 505 Cost of Goods Sold157 Equipment 610 Advertising Expense201 Accounts Payable
In July, the following transactions were completed. All purchases and sales were on account. The cost of all merchandise sold was 70% of the sales price.
July 1 Purchased merchandise from Eby Company $8,000. 2 Received freight bill from Shaw Shipping on Eby purchase $400. 3 Made sales to Fort Company $1,300 and to Hefner Bros. $1,500.
(a) Balancing totals $25,452
(c) Accounts Receivable $1,930
Journalize transactions in cash payments journal; post to control account and subsidiary ledgers.
(LO 2, 3)
(a) Balancing totals $13,050
(c) Accounts Payable $1,700
Journalize transactions in multi-column purchases journal and sales journal; post to the general and subsidiary ledgers.
(LO 2, 3)

Problems: Set A 345
5 Purchased merchandise from Getz Company $3,200. 8 Received credit on merchandise returned to Getz Company $300. 13 Purchased store supplies from Dayne Supply $720. 15 Purchased merchandise from Eby Company $3,600 and from Bosco Company
$4,300. 16 Made sales to Aybar Company $3,450 and to Hefner Bros. $1,870. 18 Received bill for advertising from Welton Advertisements $600. 21 Sales were made to Fort Company $310 and to Duncan Company $2,800. 22 Granted allowance to Fort Company for merchandise damaged in shipment $40. 24 Purchased merchandise from Getz Company $3,000. 26 Purchased equipment from Dayne Supply $900. 28 Received freight bill from Shaw Shipping on Getz purchase of July 24, $380. 30 Sales were made to Aybar Company $5,600.
Instructions(a) Journalize the transactions above in a purchases journal, a sales journal, and a general
journal. The purchases journal should have the following column headings: Date, Account Credited (Debited), Ref., Accounts Payable Cr., Inventory Dr., and Other Accounts Dr.
(b) Post to both the general and subsidiary ledger accounts. (Assume that all accounts have zero beginning balances.)
(c) Prove the agreement of the control and subsidiary accounts.
P7-4A Selected accounts from the chart of accounts of Mercer Company are shown below.
101 Cash 401 Sales Revenue112 Accounts Receivable 412 Sales Returns and Allowances120 Inventory 414 Sales Discounts126 Supplies 505 Cost of Goods Sold157 Equipment 726 Salaries and Wages Expense201 Accounts Payable
The cost of all merchandise sold was 60% of the sales price. During January, Mercer com-pleted the following transactions.
Jan. 3 Purchased merchandise on account from Gallagher Co. $9,000. 4 Purchased supplies for cash $80. 4 Sold merchandise on account to Wheeler $5,250, invoice no. 371, terms 1/10, n/30. 5 Returned $300 worth of damaged goods purchased on account from Gallagher Co.
on January 3. 6 Made cash sales for the week totaling $3,150. 8 Purchased merchandise on account from Phegley Co. $4,500. 9 Sold merchandise on account to Linton Corp. $5,400, invoice no. 372, terms 1/10,
n/30. 11 Purchased merchandise on account from Cora Co. $3,700. 13 Paid in full Gallagher Co. on account less a 2% discount. 13 Made cash sales for the week totaling $6,260. 15 Received payment from Linton Corp. for invoice no. 372. 15 Paid semi-monthly salaries of $14,300 to employees. 17 Received payment from Wheeler for invoice no. 371. 17 Sold merchandise on account to Delaney Co. $1,200, invoice no. 373, terms 1/10,
n/30. 19 Purchased equipment on account from Dozier Corp. $5,500. 20 Cash sales for the week totaled $3,200. 20 Paid in full Phegley Co. on account less a 2% discount. 23 Purchased merchandise on account from Gallagher Co. $7,800. 24 Purchased merchandise on account from Atchison Corp. $5,100. 27 Made cash sales for the week totaling $4,230. 30 Received payment from Delaney Co. for invoice no. 373. 31 Paid semi-monthly salaries of $13,200 to employees. 31 Sold merchandise on account to Wheeler $9,330, invoice no. 374, terms 1/10,
n/30.
(a) Purchases journal—Accounts Payable $25,100 Sales journal—Sales Revenue $16,830
(c) Accounts Receivable $16,790Accounts Payable $24,800
Journalize transactions in special journals.
(LO 2, 3)

346 7 Accounting Information Systems
Mercer Company uses the following journals.
1. Sales journal.2. Single-column purchases journal.3. Cash receipts journal with columns for Cash Dr., Sales Discounts Dr., Accounts
Receivable Cr., Sales Revenue Cr., Other Accounts Cr., and Cost of Goods Sold Dr./Inventory Cr.
4. Cash payments journal with columns for Other Accounts Dr., Accounts Payable Dr., Inventory Cr., and Cash Cr.
5. General journal.
InstructionsUsing the selected accounts provided:
(a) Record the January transactions in the appropriate journal noted.(b) Foot and cross-foot all special journals.(c) Show how postings would be made by placing ledger account numbers and check-
marks as needed in the journals. (Actual posting to ledger accounts is not required.)
P7-5A Presented below are the purchases and cash payments journals for Fornelli Co. for its fi rst month of operations.
(a) Sales journal $21,180Purchases journal $30,100Cash receipts journal balancing total $38,794Cash payments journal balancing total $40,780
Journalize in sales and cash receipts journals; post; prepare a trial balance; prove control to subsidiary; prepare adjusting entries; prepare an adjusted trial balance.
(LO 2, 3)
PURCHASES JOURNAL P1
Inventory Dr. Date Account Credited Ref. Accounts Payable Cr.
July 4 N. Alvarado 6,800 5 F. Rees 8,100 11 J. Gallup 5,920 13 C. Werly 15,300 20 M. Mangus 7,900
44,020
In addition, the following transactions have not been journalized for July. The cost of all merchandise sold was 65% of the sales price.
July 1 The founder, N. Fornelli, invests $80,000 in cash. 6 Sell merchandise on account to Dow Co. $6,200 terms 1/10, n/30. 7 Make cash sales totaling $8,000. 8 Sell merchandise on account to S. Goebel $4,600, terms 1/10, n/30. 10 Sell merchandise on account to W. Leiss $4,900, terms 1/10, n/30. 13 Receive payment in full from S. Goebel. 16 Receive payment in full from W. Leiss. 20 Receive payment in full from Dow Co. 21 Sell merchandise on account to H. Kenney $5,000, terms 1/10, n/30. 29 Returned damaged goods to N. Alvarado and received cash refund of $420.
CASH PAYMENTS JOURNAL CP1
Other Accounts Account Accounts Payable Inventory Cash Date Debited Ref. Dr. Dr. Cr. Cr.
July 4 Supplies 600 600 10 F. Rees 8,100 81 8,019 11 Prepaid Rent 6,000 6,000 15 N. Alvarado 6,800 6,800 19 Owner’s Drawings 2,500 2,500 21 C. Werly 15,300 153 15,147
9,100 30,200 234 39,066

Problems: Set A 347
Instructions(a) Open the following accounts in the general ledger.
101 Cash 306 Owner’s Drawings 112 Accounts Receivable 401 Sales Revenue 120 Inventory 414 Sales Discounts 126 Supplies 505 Cost of Goods Sold 131 Prepaid Rent 631 Supplies Expense 201 Accounts Payable 729 Rent Expense 301 Owner’s Capital
(b) Journalize the transactions that have not been journalized in the sales journal and the cash receipts journal (see Illustration 7-9).
(c) Post to the accounts receivable and accounts payable subsidiary ledgers. Follow the sequence of transactions as shown in the problem.
(d) Post the individual entries and totals to the general ledger.(e) Prepare a trial balance at July 31, 2017.(f) Determine whether the subsidiary ledgers agree with the control accounts in the general
ledger.(g) The following adjustments at the end of July are necessary. (1) A count of supplies indicates that $140 is still on hand. (2) Recognize rent expense for July, $500. Prepare the necessary entries in the general journal. Post the entries to the general
ledger.(h) Prepare an adjusted trial balance at July 31, 2017.
P7-6A The post-closing trial balance for Horner Co. is shown below.
(h) Totals $122,520
Journalize in special journals; post; prepare a trial balance.
(LO 2, 3)
(b) Sales journal total $20,700Cash receipts journal balancing totals $104,120
(e) Totals $122,520(f) Accounts Receivable
$5,000Accounts Payable $13,820
The subsidiary ledgers contain the following information: (1) accounts receivable—B. Hannigan $2,500, I. Kirk $7,500, and T. Hodges $5,000; (2) accounts payable—T. Igawa $12,000, D. Danford $18,000, and K. Thayer $13,000. The cost of all merchandise sold was 60% of the sales price.
The transactions for January 2018 are as follows.
Jan. 3 Sell merchandise to M. Ziesmer $8,000, terms 2/10, n/30. 5 Purchase merchandise from E. Pheatt $2,000, terms 2/10, n/30. 7 Receive a check from T. Hodges $3,500. 11 Pay freight on merchandise purchased $300. 12 Pay rent of $1,000 for January. 13 Receive payment in full from M. Ziesmer. 14 Post all entries to the subsidiary ledgers. Issued credit of $300 to B. Hannigan for
returned merchandise. 15 Send K. Thayer a check for $12,870 in full payment of account, discount $130. 17 Purchase merchandise from G. Roland $1,600, terms 2/10, n/30. 18 Pay sales salaries of $2,800 and offi ce salaries $2,000. 20 Give D. Danford a 60-day note for $18,000 in full payment of account payable. 23 Total cash sales amount to $9,100.
HORNER CO.Post-Closing Trial Balance
December 31, 2017
Debit Credit
Cash $ 41,500Accounts Receivable 15,000Notes Receivable 45,000Inventory 23,000Equipment 6,450Accumulated Depreciation—Equipment $ 1,500Accounts Payable 43,000Owner’s Capital 86,450
$130,950 $130,950
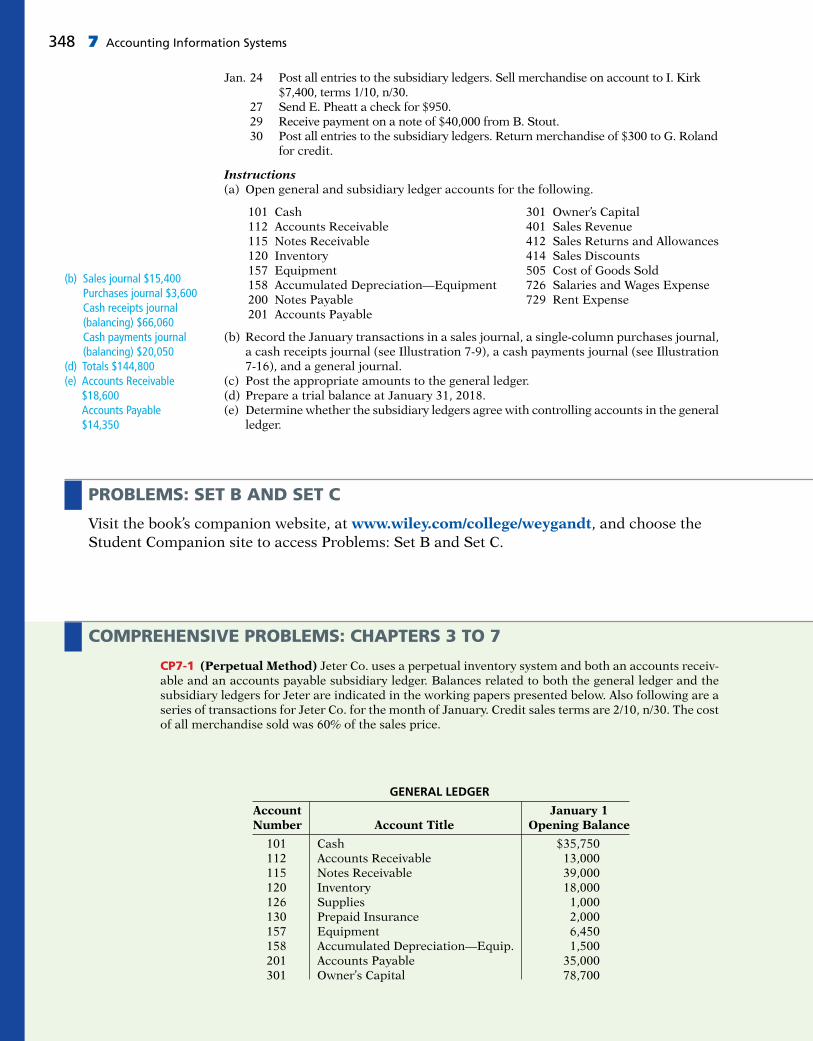
348 7 Accounting Information Systems
Jan. 24 Post all entries to the subsidiary ledgers. Sell merchandise on account to I. Kirk $7,400, terms 1/10, n/30.
27 Send E. Pheatt a check for $950. 29 Receive payment on a note of $40,000 from B. Stout. 30 Post all entries to the subsidiary ledgers. Return merchandise of $300 to G. Roland
for credit.
Instructions(a) Open general and subsidiary ledger accounts for the following.
101 Cash 301 Owner’s Capital 112 Accounts Receivable 401 Sales Revenue 115 Notes Receivable 412 Sales Returns and Allowances 120 Inventory 414 Sales Discounts 157 Equipment 505 Cost of Goods Sold 158 Accumulated Depreciation—Equipment 726 Salaries and Wages Expense 200 Notes Payable 729 Rent Expense 201 Accounts Payable
(b) Record the January transactions in a sales journal, a single-column purchases journal, a cash receipts journal (see Illustration 7-9), a cash payments journal (see Illustration 7-16), and a general journal.
(c) Post the appropriate amounts to the general ledger.(d) Prepare a trial balance at January 31, 2018.(e) Determine whether the subsidiary ledgers agree with controlling accounts in the general
ledger.
(b) Sales journal $15,400 Purchases journal $3,600 Cash receipts journal (balancing) $66,060 Cash payments journal (balancing) $20,050
(d) Totals $144,800(e) Accounts Receivable
$18,600Accounts Payable $14,350
PROBLEMS: SET B AND SET C
Visit the book’s companion website, at www.wiley.com/college/weygandt, and choose the Student Companion site to access Problems: Set B and Set C.
COMPREHENSIVE PROBLEMS: CHAPTERS 3 TO 7
CP7-1 (Perpetual Method) Jeter Co. uses a perpetual inventory system and both an accounts receiv-able and an accounts payable subsidiary ledger. Balances related to both the general ledger and the subsidiary ledgers for Jeter are indicated in the working papers presented below. Also following are a series of transactions for Jeter Co. for the month of January. Credit sales terms are 2/10, n/30. The cost of all merchandise sold was 60% of the sales price.
GENERAL LEDGER
Account January 1 Number Account Title Opening Balance
101 Cash $35,750 112 Accounts Receivable 13,000 115 Notes Receivable 39,000 120 Inventory 18,000 126 Supplies 1,000 130 Prepaid Insurance 2,000 157 Equipment 6,450 158 Accumulated Depreciation—Equip. 1,500 201 Accounts Payable 35,000 301 Owner’s Capital 78,700

Comprehensive Problems: Chapters 3 to 7 349
Jan. 3 Sell merchandise on account to B. Corpas $3,600, invoice no. 510, and to J. Revere $1,800, invoice no. 511.
5 Purchase merchandise from S. Gamel $5,000 and D. Posey $2,200, terms n/30. 7 Receive checks from S. Mahay $4,000 and B. Santos $2,000 after discount period has lapsed. 8 Pay freight on merchandise purchased $235. 9 Send checks to S. Meek for $9,000 less 2% cash discount, and to D. Saito for $11,000 less
1% cash discount. 9 Issue credit of $300 to J. Revere for merchandise returned. 10 Daily cash sales from January 1 to January 10 total $15,500. Make one journal entry for these sales. 11 Sell merchandise on account to R. Beltre $1,600, invoice no. 512, and to S. Mahay $900,
invoice no. 513. 12 Pay rent of $1,000 for January. 13 Receive payment in full from B. Corpas and J. Revere less cash discounts. 15 Withdraw $800 cash by M. Jeter for personal use. 15 Post all entries to the subsidiary ledgers. 16 Purchase merchandise from D. Saito $15,000, terms 1/10, n/30; S. Meek $14,200, terms
2/10, n/30; and S. Gamel $1,500, terms n/30. 17 Pay $400 cash for offi ce supplies. 18 Return $200 of merchandise to S. Meek and receive credit. 20 Daily cash sales from January 11 to January 20 total $20,100. Make one journal entry for
these sales. 21 Issue $15,000 note, maturing in 90 days, to R. Moses in payment of balance due. 21 Receive payment in full from S. Mahay less cash discount. 22 Sell merchandise on account to B. Corpas $2,700, invoice no. 514, and to R. Beltre $2,300,
invoice no. 515. 22 Post all entries to the subsidiary ledgers. 23 Send checks to D. Saito and S. Meek for full payment less cash discounts. 25 Sell merchandise on account to B. Santos $3,500, invoice no. 516, and to J. Revere $6,100,
invoice no. 517. 27 Purchase merchandise from D. Saito $14,500, terms 1/10, n/30; D. Posey $3,200, terms
n/30; and S. Gamel $5,400, terms n/30. 27 Post all entries to the subsidiary ledgers. 28 Pay $200 cash for offi ce supplies. 31 Daily cash sales from January 21 to January 31 total $21,300. Make one journal entry for
these sales. 31 Pay sales salaries $4,300 and offi ce salaries $3,800.
Instructions(a) Record the January transactions in a sales journal, a single-column purchases journal, a cash
receipts journal as shown in Illustration 7-9, a cash payments journal as shown in Illustration 7-16, and a two-column general journal.
(b) Post the journals to the general ledger.(c) Prepare a trial balance at January 31, 2017, in the trial balance columns of the worksheet. Com-
plete the worksheet using the following additional information. (1) Offi ce supplies at January 31 total $900. (2) Insurance coverage expires on October 31, 2017. (3) Annual depreciation on the equipment is $1,500. (4) Interest of $50 has accrued on the note payable.(d) Prepare a multiple-step income statement and an owner’s equity statement for January and a
classifi ed balance sheet at the end of January.(e) Prepare and post adjusting and closing entries.(f) Prepare a post-closing trial balance, and determine whether the subsidiary ledgers agree with the
control accounts in the general ledger.
Schedule of Accounts Receivable Schedule of Accounts Payable (from accounts receivable subsidiary ledger) (from accounts payable subsidiary ledger)
January 1 January 1 Opening Opening Customer Balance Creditor Balance
R. Beltre $1,500 S. Meek $ 9,000B. Santos 7,500 R. Moses 15,000S. Mahay 4,000 D. Saito 11,000

350 7 Accounting Information Systems
CP7-2 (Periodic Inventory) McBride Company has the following opening account balances in its general and subsidiary ledgers on January 1 and uses the periodic inventory system. All accounts have normal debit and credit balances.
In addition, the following transactions have not been journalized for January 2017.
Jan. 3 Sell merchandise on account to B. Berg $3,600, invoice no. 510, and J. Lutz $1,800, invoice no. 511.
5 Purchase merchandise on account from S. Colt $5,000 and D. Kahn $2,700. 7 Receive checks for $4,000 from S. Andrus and $2,000 from B. Boxberger. 8 Pay freight on merchandise purchased $180. 9 Send checks to S. Otero for $9,000 and D. Baroni for $11,000. 9 Issue credit of $300 to J. Lutz for merchandise returned. 10 Cash sales from January 1 to January 10 total $15,500. Make one journal entry for these sales. 11 Sell merchandise on account to R. Kotsay for $2,900, invoice no. 512, and to S. Andrus
$900, invoice no. 513. Post all entries to the subsidiary ledgers. 12 Pay rent of $1,000 for January. 13 Receive payment in full from B. Berg and J. Lutz. 15 Withdraw $800 cash by I. McBride for personal use. 16 Purchase merchandise on account from D. Baroni for $12,000, from S. Otero for $13,900,
and from S. Colt for $1,500. 17 Pay $400 cash for supplies. 18 Return $200 of merchandise to S. Otero and receive credit. 20 Cash sales from January 11 to January 20 total $17,500. Make one journal entry for these sales. 21 Issue $15,000 note to R. Rasmus in payment of balance due. 21 Receive payment in full from S. Andrus. Post all entries to the subsidiary ledgers. 22 Sell merchandise on account to B. Berg for $3,700, invoice no. 514, and to R. Kotsay for
$800, invoice no. 515. 23 Send checks to D. Baroni and S. Otero in full payment. 25 Sell merchandise on account to B. Boxberger for $3,500, invoice no. 516, and to J. Lutz for
$6,100, invoice no. 517.
Schedule of Accounts Receivable Schedule of Accounts Payable (from accounts receivable subsidiary ledger) (from accounts payable subsidiary ledger)
January 1 January 1 Opening Opening Customer Balance Creditor Balance
R. Kotsay $1,500 S. Otero $ 9,000B. Boxberger 7,500 R. Rasmus 15,000S. Andrus 4,000 D. Baroni 11,000
GENERAL LEDGER
Account January 1 Number Account Title Opening Balance
101 Cash $33,750 112 Accounts Receivable 13,000 115 Notes Receivable 39,000 120 Inventory 20,000 126 Supplies 1,000 130 Prepaid Insurance 2,000 157 Equipment 6,450 158 Accumulated Depreciation—Equip. 1,500 201 Accounts Payable 35,000 301 Owner’s Capital 78,700

27 Purchase merchandise on account from D. Baroni for $12,500, from D. Kahn for $1,200, and from S. Colt for $2,800.
28 Pay $200 cash for offi ce supplies. 31 Cash sales from January 21 to January 31 total $22,920. Make one journal entry for these
sales. 31 Pay sales salaries of $4,300 and offi ce salaries of $3,600.
Instructions(a) Record the January transactions in the appropriate journal—sales, purchases, cash receipts, cash
payments, and general.(b) Post the journals to the general and subsidiary ledgers. Add and number new accounts in an
orderly fashion as needed.(c) Prepare a trial balance at January 31, 2017, using a worksheet. Complete the worksheet using the
following additional information. (1) Supplies at January 31 total $700. (2) Insurance coverage expires on October 31, 2017. (3) Annual depreciation on the equipment is $1,500. (4) Interest of $30 has accrued on the note payable. (5) Inventory at January 31 is $15,000.(d) Prepare a multiple-step income statement and an owner’s equity statement for January and a clas-
sifi ed balance sheet at the end of January.(e) Prepare and post the adjusting and closing entries.(f) Prepare a post-closing trial balance, and determine whether the subsidiary ledgers agree with the
control accounts in the general ledger.
Broadening Your Perspective 351
PERSPECTIVEFINANCIAL REPORTING AND ANALYSIS
Real-World FocusBYP7-1 Intuit provides some of the leading accounting software packages. Information related to its products is found at its website.
Address: http://quickbooks.intuit.com or go to www.wiley.com/college/weygandt
InstructionsLook under product and services for the product QuickBooks for Accountants. Be ready to discuss its new features with the class.
CRITICAL THINKING
Decision-Making Across the OrganizationBYP7-2 Ermler & Trump is a wholesaler of small appliances and parts. Ermler & Trump is operated by two owners, Jack Ermler and Andrea Trump. In addition, the company has one employee, a repair specialist, who is on a fi xed salary. Revenues are earned through the sale of appliances to retailers (approximately 75% of total revenues), appliance parts to do-it-yourselfers (10%), and the repair of appliances brought to the store (15%). Appliance sales are made on both a credit and cash basis. Cus-tomers are billed on prenumbered sales invoices. Credit terms are always net/30 days. All parts sales and repair work are cash only. Merchandise is purchased on account from the manufacturers of both the appliances and the parts. Practically all suppliers offer cash discounts for prompt payments, and it is company policy to take all discounts. Most cash payments are made by check. Checks are most frequently issued to suppliers, to trucking companies for freight on merchandise purchases, and to newspapers, radio, and TV stations for advertising. All advertising bills are paid as received. Jack and Andrea each make a monthly drawing in cash for personal living expenses. The salaried repairman is paid twice monthly. Ermler & Trump currently has a manual accounting system.
BROADENING YOUR

352 7 Accounting Information Systems
InstructionsWith the class divided into groups, answer the following.
(a) Identify the special journals that Ermler & Trump should have in its manual accounting system. List the column headings appropriate for each of the special journals.
(b) What control and subsidiary accounts should be included in Ermler & Trump’s manual account-ing system? Why?
Communication ActivityBYP7-3 Jill Locey, a classmate, has a part-time bookkeeping job. She is concerned about the ineffi -ciencies in journalizing and posting transactions. Ben Newell is the owner of the company where Jill works. In response to numerous complaints from Jill and others, Ben hired two additional bookkeep-ers a month ago. However, the ineffi ciencies have continued at an even higher rate. The accounting information system for the company has only a general journal and a general ledger. Ben refuses to install a computerized accounting system.
InstructionsNow that Jill is an expert in manual accounting information systems, she decides to send a letter to Ben Newell explaining (1) why the additional personnel did not help and (2) what changes should be made to improve the effi ciency of the accounting department. Write the letter that you think Jill should send.
Ethics CaseBYP7-4 Wiemers Products Company operates three divisions, each with its own manufacturing plant and marketing/sales force. The corporate headquarters and central accounting offi ce are in Wiemers, and the plants are in Freeport, Rockport, and Bayport, all within 50 miles of Wiemers. Corporate management treats each division as an independent profi t center and encourages competition among them. They each have similar but different product lines. As a competitive incentive, bonuses are awarded each year to the employees of the fastest-growing and most-profi table division. Indy Grover is the manager of Wiemers’s centralized computerized accounting operation that enters the sales transactions and maintains the accounts receivable for all three divisions. Indy came up in the accounting ranks from the Bayport division where his wife, several relatives, and many friends still work. As sales documents are entered into the computer, the originating division is identifi ed by code. Most sales documents (95%) are coded, but some (5%) are not coded or are coded incor-rectly. As the manager, Indy has instructed the data-entry personnel to assign the Bayport code to all uncoded and incorrectly coded sales documents. This is done, he says, “in order to expedite processing and to keep the computer fi les current since they are updated daily.” All receivables and cash collections for all three divisions are handled by Wiemers as one subsidiary accounts receivable ledger.
Instructions(a) Who are the stakeholders in this situation?(b) What are the ethical issues in this case?(c) How might the system be improved to prevent this situation?
All About YouBYP7-5 In this chapter, you learned about a basic manual accounting information system. Comput-erized accounting systems range from the very basic and inexpensive to the very elaborate and expen-sive. However, even the most sophisticated systems are based on the fundamental structures and relationships that you learned in this chapter.
InstructionsGo to the book’s companion site, www.wiley.com/college/weygandt, and review the demonstration that is provided for the general ledger software package that is used with this textbook. Prepare a brief explanation of how the general ledger system works—that is, how it is used and what information it provides.

A Look at IFRS
4 Compare accounting information systems under GAAP and IFRS.LEARNING OBJECTIVE
As discussed in Chapter 1, IFRS is growing in acceptance around the world. For example, recent sta-tistics indicate a substantial number of the Global Fortune 500 companies use IFRS. And the chair-man of the IASB predicts that IFRS adoption will grow from its current level of 115 countries to nearly 150 countries in the near future. When countries accept IFRS for use as accepted accounting policies, companies need guidance to ensure that their fi rst IFRS fi nancial statements contain high-quality information. Specifi cally, IFRS 1 requires that information in a company’s fi rst IFRS statements (1) be transparent, (2) provide a suitable starting point, and (3) have a cost that does not exceed the benefi ts.
Relevant FactsFollowing are the key similarities and differences between GAAP and IFRS related to accounting information systems.
Similarities• The basic concepts related to an accounting information system are the same under GAAP and
IFRS.
• The use of subsidiary ledgers and control accounts, as well as the system used for recording trans-actions, are the same under GAAP and IFRS.
Differences• Many companies will be going through a substantial conversion process to switch from their cur-
rent reporting standards to IFRS.
• Upon fi rst-time adoption of IFRS, a company must present at least one year of comparative infor-mation under IFRS.
Looking to the FutureThe basic recording process shown in this textbook is followed by companies around the globe. It is unlikely to change in the future. The defi nitional structure of assets, liabilities, equity, revenues, and expenses may change over time as the IASB and FASB evaluate their overall conceptual framework for establishing accounting standards. In addition, high-quality international accounting requires both high-quality accounting standards and high-quality auditing. Similar to the convergence of GAAP and IFRS, there is a movement to improve international auditing standards.
A Look at IFRS 353

For many years, Barriques in Madison, Wisconsin, has been
named the city’s favorite coffeehouse. Barriques not only does
a booming business in coffee but also has wonderful baked
goods, delicious sandwiches, and a fi ne selection of wines.
“Our customer base ranges from college students to
neighborhood residents as well as visitors to our capital city,”
says bookkeeper Kerry Stoppleworth, who joined the
company shortly after it was founded in 1998. “We are
unique because we have customers who come in early on
their way to work for a cup of coffee and then will stop back
after work to pick up a bottle of wine for dinner. We stay very
busy throughout all three parts of the day.”
Like most businesses where purchases are low-cost and
high-volume, cash control has to be simple. “We use a
computerized point-of-sale (POS) system to keep track of our
inventory and allow us to effi ciently ring through an order for
a customer,” explains Stoppleworth. “You can either scan a
barcode for an item or enter in a code for items that don’t
have a barcode such as cups of coffee or bakery items.” The
POS system also automatically tracks sales by department and
maintains an electronic journal of all the sales transactions
that occur during the day.
“There are two POS stations at each store, and throughout the
day any of the staff may operate them,” says Stoppleworth. At
the end of the day, each POS station is reconciled separately.
The staff counts the cash in the drawer and enters this amount
into the closing totals in the POS system. The POS system then
compares the cash and credit amounts, less the cash being
carried forward to the next day (the fl oat), to the shift total in
the electronic journal. If there are discrepancies, a recount is
done and the journal is reviewed transaction by transaction to
identify the problem. The staff then creates a deposit ticket for
the cash less the fl oat and puts this in a drop safe with the
electronic journal summary report for the manager to review
and take to the bank the next day. Ultimately, the bookkeeper
reviews all of these documents as well as the deposit receipt
that the bank produces to make sure they are all in agreement.
As Stoppleworth concludes, “We keep the closing process and
accounting simple so that our staff can concentrate on taking
care of our customers and making great coffee and food.”
Minding the Money in Madison
As the Feature Story about recording cash sales at Barriques indicates below, control of cash is important to ensure that fraud does not occur. Companies also need controls to safeguard other types of assets. For example, Barriques undoubtedly has controls to prevent the theft of food and supplies, and controls to prevent the theft of tableware and dishes from its kitchen.
In this chapter, we explain the essential features of an internal control system and how it prevents fraud. We also describe how those controls apply to a specifi c asset—cash. The applications include some controls with which you may be already familiar, such as the use of a bank.
CHAPTER PREVIEW
8
FEATURE STORY
Fraud, Internal Control, and Cash
354

Explain the reporting of cash.
Apply internal control principles to cash.
Identify the control features of a bank account.
2
3
4
Discuss fraud and the principles of internal control.1
CHAPTER OUTLINE
Control ActivitiesDO IT! 1
• Fraud• The Sarbanes-Oxley Act• Internal control• Principles of internal control
activities• Limitations of internal control
Control over Cash Receipts2a
Petty Cash FundDO IT!
• Cash receipts controls• Cash disbursements controls• Petty cash fund
Learning Objectives
Bank ReconciliationDO IT! 3
• Making bank deposits • Writing checks• Bank statements• Reconciling the bank account• EFT system
Reporting CashDO IT! 4• Cash equivalents • Restricted cash
© James Pauls/iStockphoto
2b
Go to the REVIEW AND PRACTICE section at the end of the chapter for a review of key concepts and practice applications with solutions.
Visit WileyPLUS with ORION for additional tutorials and practice opportunities.

356 8 Fraud, Internal Control, and Cash
Opportunity
Financial Pressure Rationalization
Illustration 8-1Fraud triangle
1 Discuss fraud and the principles of internal control.LEARNING OBJECTIVE
The Feature Story describes many of the internal control procedures used by Barriques. These procedures are necessary to discourage employees from fraudulent activities.
Fraud
A fraud is a dishonest act by an employee that results in personal benefi t to the employee at a cost to the employer. Examples of fraud reported in the fi nancial press include the following.
• A bookkeeper in a small company diverted $750,000 of bill payments to a personal bank account over a three-year period.
• A shipping clerk with 28 years of service shipped $125,000 of merchandise to himself.
• A computer operator embezzled $21 million from Wells Fargo Bank over a two-year period.
• A church treasurer “borrowed” $150,000 of church funds to fi nance a friend’s business dealings.
Why does fraud occur? The three main factors that contribute to fraudulent activity are depicted by the fraud triangle in Illustration 8-1 (in the margin).
The most important element of the fraud triangle is opportunity. For an employee to commit fraud, the workplace environment must provide opportunities that an employee can take advantage of. Opportunities occur when the workplace lacks suffi cient controls to deter and detect fraud. For example, inadequate monitoring of employee actions can create opportunities for theft and can embolden employees because they believe they will not be caught.
A second factor that contributes to fraud is fi nancial pressure. Employees sometimes commit fraud because of personal fi nancial problems caused by too much debt. Or, they might commit fraud
because they want to lead a lifestyle that they cannot afford on their current salary.
The third factor that contributes to fraud is rationalization. In order to jus-tify their fraud, employees rationalize their dishonest actions. For example, employees sometimes justify fraud because they believe they are underpaid while the employer is making lots of money. Employees feel justifi ed in stealing because they believe they deserve to be paid more.
The Sarbanes-Oxley Act
What can be done to prevent or to detect fraud? After numerous corporate scan-dals came to light in the early 2000s, Congress addressed this issue by passing the Sarbanes-Oxley Act (SOX). Under SOX, all publicly traded U.S. corporations are required to maintain an adequate system of internal control. Corporate exec-utives and boards of directors must ensure that these controls are reliable and effective. In addition, independent outside auditors must attest to the adequacy of the internal control system. Companies that fail to comply are subject to fi nes, and company offi cers can be imprisoned. SOX also created the Public Company Accounting Oversight Board (PCAOB) to establish auditing standards and regu-late auditor activity. One poll found that 60% of investors believe that SOX helps safeguard their stock investments. Many say they would be unlikely to invest in a company that fails to follow SOX requirements. Although some corporate executives have criticized

Fraud and Internal Control 357
the time and expense involved in following the SOX requirements, SOX appears to be working well. For example, the chief accounting offi cer of Eli Lily noted that SOX triggered a comprehensive review of how the company documents its controls. This review uncovered redundancies and pointed out controls that needed to be added. In short, it added up to time and money well spent.
Internal Control
Internal control is a process designed to provide reasonable assurance regard-ing the achievement of objectives related to operations, reporting, and compli-ance. In more detail, it consists of all the related methods and measures adopted within an organization to safeguard assets, enhance the reliability of account-ing records, increase effi ciency of operations, and ensure compliance with laws and regulations. Internal control systems have fi ve primary components as listed below.1
• A control environment. It is the responsibility of top management to make it clear that the organization values integrity and that unethical activity will not be tolerated. This component is often referred to as the “tone at the top.”
• Risk assessment. Companies must identify and analyze the various fac-tors that create risk for the business and must determine how to manage these risks.
• Control activities. To reduce the occurrence of fraud, management must design policies and procedures to address the specifi c risks faced by the company.
• Information and communication. The internal control system must cap-ture and communicate all pertinent information both down and up the organization, as well as communicate information to appropriate external parties.
• Monitoring. Internal control systems must be monitored periodically for their adequacy. Signifi cant defi ciencies need to be reported to top manage-ment and/or the board of directors.
1The Committee of Sponsoring Organizations of the Treadway Commission, “Internal Control—Integrated Framework,” www.coso.org/documents/990025P_executive_summary_fi nal_May20_e.pdf.
And the Controls Are . . .
Internal controls are import-ant for an effective fi nancial reporting system. The same is true for sustainability report-ing. An effective system of internal controls for sustain-ability reporting will help in the following ways: (1) pre-vent the unauthorized use of data; (2) provide reasonable assurance that the informa-
tion is accurate, valid, and complete; and (3) report infor-mation that is consistent with overall sustainability
accounting policies. With these types of controls, users will have the confi dence that they can use the sustainability information effectively.
Some regulators are calling for even more assurance through audits of this information. Companies that potentially can cause environmental damage through greenhouse gases, as well as companies in the mining and extractive industries, are subject to reporting requirements. And, as demand for more information in the sustainability area expands, the need for audits of this information will grow.
Why is sustainability information important to investors? (Go to WileyPLUS for this answer and additional questions.)
© Karl Dolenc/iStockphoto
People, Planet, and Profi t Insight

358 8 Fraud, Internal Control, and Cash
Principles of Internal Control Activities
Each of the fi ve components of an internal control system is important. Here, we will focus on one component, the control activities. The reason? These activities are the backbone of the company’s efforts to address the risks it faces, such as fraud. The specifi c control activities used by a company will vary, depending on management’s assessment of the risks faced. This assessment is heavily infl u-enced by the size and nature of the company. The six principles of control activities are as follows.
• Establishment of responsibility
• Segregation of duties
• Documentation procedures
• Physical controls
• Independent internal verifi cation
• Human resource controls
We explain these principles in the following sections. You should recognize that they apply to most companies and are relevant to both manual and computerized accounting systems.
ESTABLISHMENT OF RESPONSIBILITY
An essential principle of internal control is to assign responsibility to specifi c employees. Control is most effective when only one person is responsible for a given task. To illustrate, assume that the cash on hand at the end of the day in a Safeway supermarket is $10 short of the cash entered in the cash register. If only one per-son has operated the register, the shift manager can quickly determine responsi-bility for the shortage. If two or more individuals have worked the register, it may be impossible to determine who is responsible for the error. Many retailers solve this problem by having registers with multiple drawers. This makes it possible for more than one person to operate a register but still allows identifi cation of a particular employee with a specifi c drawer. Only the signed-in cashier has access to his or her drawer. Establishing responsibility often requires limiting access only to authorized personnel, and then identifying those personnel. For example, the automated systems used by many companies have mechanisms such as identifying pass-codes that keep track of who made a journal entry, who entered a sale, or who went into an inventory storeroom at a particular time. Use of identifying pass-codes enables the company to establish responsibility by identifying the particu-lar employee who carried out the activity.
It’s your shift now. I’mturning in my cash drawer
and heading home.
Transfer of cash drawers
Maureen Frugali was a training supervisor for claims processing at Colossal Health-care. As a standard part of the claims-processing training program, Maureen created fi ctitious claims for use by trainees. These fi ctitious claims were then sent to the accounts payable department. After the training claims had been processed, she was to notify Accounts Payable of all fi ctitious claims, so that they would not be paid. However, she did not inform Accounts Payable about every fi ctitious claim. She cre-ated some fi ctitious claims for entities that she controlled (that is, she would receive the payment), and she let Accounts Payable pay her.
ANATOMY OF A FRAUD

Fraud and Internal Control 359
SEGREGATION OF DUTIES
Segregation of duties is indispensable in an internal control system. There are two common applications of this principle:
1. Different individuals should be responsible for related activities.
2. The responsibility for recordkeeping for an asset should be separate from the physical custody of that asset.
The rationale for segregation of duties is this: The work of one employee should, without a duplication of effort, provide a reliable basis for evaluat-ing the work of another employee. For example, the personnel that design and program computerized systems should not be assigned duties related to day-to-day use of the system. Otherwise, they could design the system to benefi t them personally and conceal the fraud through day-to-day use.
SEGREGATION OF RELATED ACTIVITIES Making one individual responsible for related activities increases the potential for errors and irregularities. Instead, companies should, for example, assign related purchasing activities to different individuals. Related purchasing activities include ordering merchan-dise, order approval, receiving goods, authorizing payment, and paying for goods or services. Various frauds are possible when one person handles related purchas-ing activities:
• If a purchasing agent is allowed to order goods without obtaining supervi-sory approval, the likelihood of the purchasing agent receiving kickbacks from suppliers increases.
• If an employee who orders goods also handles the invoice and receipt of the goods, as well as payment authorization, he or she might authorize pay-ment for a fi ctitious invoice.
These abuses are less likely to occur when companies divide the purchasing tasks. Similarly, companies should assign related sales activities to different indi-viduals. Related selling activities include making a sale, shipping (or delivering) the goods to the customer, billing the customer, and receiving payment. Various frauds are possible when one person handles related sales activities:
• If a salesperson can make a sale without obtaining supervisory approval, he or she might make sales at unauthorized prices to increase sales com-missions.
• A shipping clerk who also has access to accounting records could ship goods to himself.
• A billing clerk who handles billing and receipt could understate the amount billed for sales made to friends and relatives.
These abuses are less likely to occur when companies divide the sales tasks. The salespeople make the sale, the shipping department ships the goods on the basis of the sales order, and the billing department prepares the sales invoice after comparing the sales order with the report of goods shipped.
Total take: $11 million
THE MISSING CONTROLEstablishment of responsibility. The healthcare company did not adequately restrict the responsibility for authorizing and approving claims transactions. The training supervisor should not have been authorized to create claims in the company’s “live” system.
Source: Adapted from Wells, Fraud Casebook (2007), pp. 61–70.
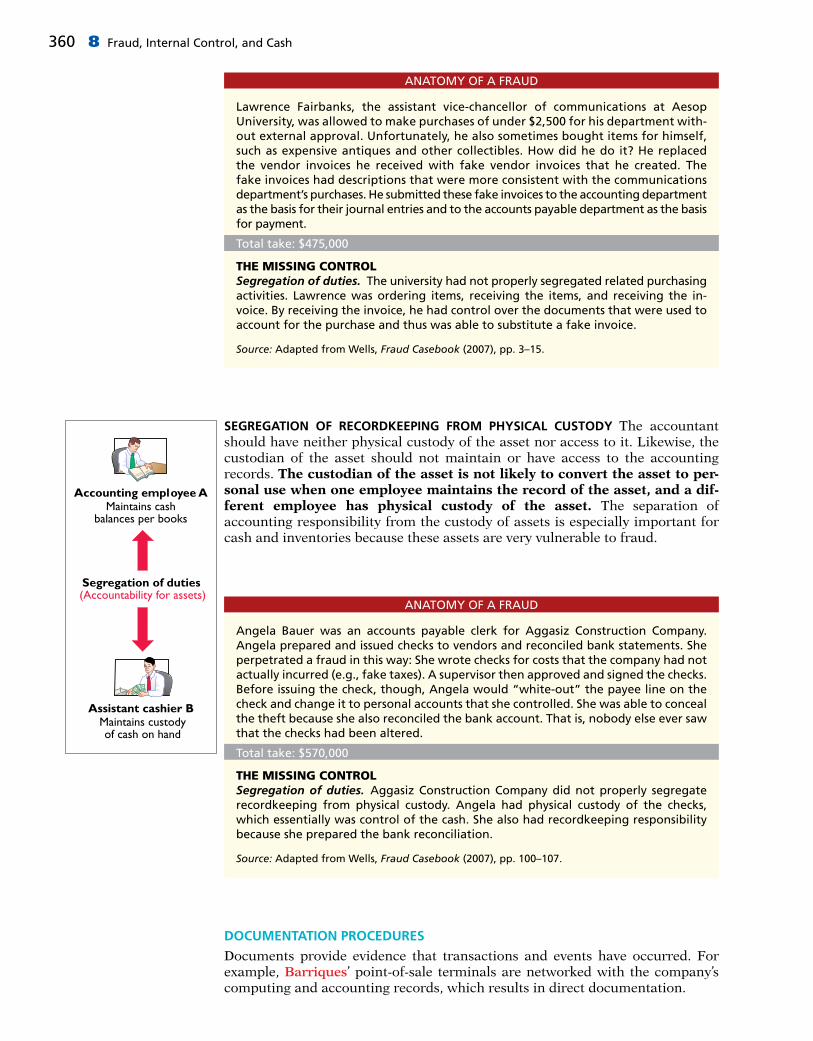
360 8 Fraud, Internal Control, and Cash
SEGREGATION OF RECORDKEEPING FROM PHYSICAL CUSTODY The accountant should have neither physical custody of the asset nor access to it. Likewise, the custodian of the asset should not maintain or have access to the accounting records. The custodian of the asset is not likely to convert the asset to per-sonal use when one employee maintains the record of the asset, and a dif-ferent employee has physical custody of the asset. The separation of accounting responsibility from the custody of assets is especially important for cash and inventories because these assets are very vulnerable to fraud.
Lawrence Fairbanks, the assistant vice-chancellor of communications at AesopUniversity, was allowed to make purchases of under $2,500 for his department with-out external approval. Unfortunately, he also sometimes bought items for himself, such as expensive antiques and other collectibles. How did he do it? He replaced the vendor invoices he received with fake vendor invoices that he created. The fake invoices had descriptions that were more consistent with the communications department’s purchases. He submitted these fake invoices to the accounting department as the basis for their journal entries and to the accounts payable department as the basis for payment.
Total take: $475,000
THE MISSING CONTROLSegregation of duties. The university had not properly segregated related purchasing activities. Lawrence was ordering items, receiving the items, and receiving the in-voice. By receiving the invoice, he had control over the documents that were used to account for the purchase and thus was able to substitute a fake invoice.
Source: Adapted from Wells, Fraud Casebook (2007), pp. 3–15.
ANATOMY OF A FRAUD
Angela Bauer was an accounts payable clerk for Aggasiz Construction Company. Angela prepared and issued checks to vendors and reconciled bank statements. She perpetrated a fraud in this way: She wrote checks for costs that the company had not actually incurred (e.g., fake taxes). A supervisor then approved and signed the checks. Before issuing the check, though, Angela would “white-out” the payee line on the check and change it to personal accounts that she controlled. She was able to conceal the theft because she also reconciled the bank account. That is, nobody else ever saw that the checks had been altered.
Total take: $570,000
THE MISSING CONTROLSegregation of duties. Aggasiz Construction Company did not properly segregate recordkeeping from physical custody. Angela had physical custody of the checks, which essentially was control of the cash. She also had recordkeeping responsibility because she prepared the bank reconciliation.
Source: Adapted from Wells, Fraud Casebook (2007), pp. 100–107.
ANATOMY OF A FRAUD
Segregation of duties(Accountability for assets)
Assistant cashier BMaintains custodyof cash on hand
Accounting employee AMaintains cash
balances per books
DOCUMENTATION PROCEDURES
Documents provide evidence that transactions and events have occurred. For example, Barriques’ point-of-sale terminals are networked with the company’s computing and accounting records, which results in direct documentation.
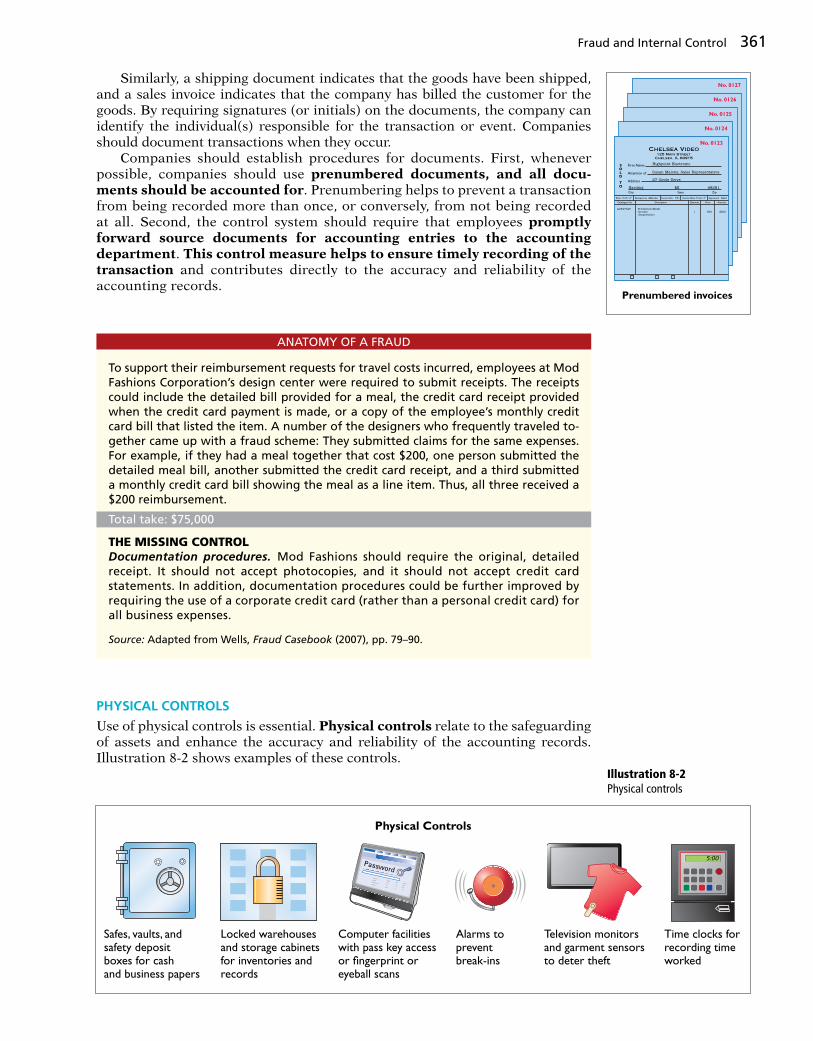
Fraud and Internal Control 361
Similarly, a shipping document indicates that the goods have been shipped, and a sales invoice indicates that the company has billed the customer for the goods. By requiring signatures (or initials) on the documents, the company can identify the individual(s) responsible for the transaction or event. Companies should document transactions when they occur. Companies should establish procedures for documents. First, whenever possible, companies should use prenumbered documents, and all docu-ments should be accounted for. Prenumbering helps to prevent a transaction from being recorded more than once, or conversely, from not being recorded at all. Second, the control system should require that employees promptly forward source documents for accounting entries to the accounting department. This control measure helps to ensure timely recording of the transaction and contributes directly to the accuracy and reliability of the accounting records.
PHYSICAL CONTROLS
Use of physical controls is essential. Physical controls relate to the safeguarding of assets and enhance the accuracy and reliability of the accounting records. Illustration 8-2 shows examples of these controls.
125 Main StreetChelsea, IL 60915
Chelsea VideoNo. 0123
No. 0124
No. 0125
No. 0126
No. 0127
Firm Name
Attention of
Address
SOLD
TO
City State Zip
Date 5/8/17 Salesperson Malone Invoice No. 731 Invoice Date 5/4/17
Catalogue No. Description Quantity Price Amount
A2547Z45 Production ModelCircuits(Inoperative)
1 300 $300
Approved Reid
Highpoint Electronic
Susan Malone, Sales Representative
27 Circle Drive
Harding MI 48281
Prenumbered invoices
To support their reimbursement requests for travel costs incurred, employees at Mod Fashions Corporation’s design center were required to submit receipts. The receipts could include the detailed bill provided for a meal, the credit card receipt provided when the credit card payment is made, or a copy of the employee’s monthly credit card bill that listed the item. A number of the designers who frequently traveled to-gether came up with a fraud scheme: They submitted claims for the same expenses. For example, if they had a meal together that cost $200, one person submitted the detailed meal bill, another submitted the credit card receipt, and a third submitted a monthly credit card bill showing the meal as a line item. Thus, all three received a $200 reimbursement.
Total take: $75,000
THE MISSING CONTROLDocumentation procedures. Mod Fashions should require the original, detailed receipt. It should not accept photocopies, and it should not accept credit card statements. In addition, documentation procedures could be further improved by requiring the use of a corporate credit card (rather than a personal credit card) for all business expenses.
Source: Adapted from Wells, Fraud Casebook (2007), pp. 79–90.
ANATOMY OF A FRAUD
Physical Controls
Alarms topreventbreak-ins
Locked warehousesand storage cabinetsfor inventories andrecords
Safes, vaults, andsafety depositboxes for cashand business papers
Television monitorsand garment sensorsto deter theft
Computer facilitieswith pass key accessor fingerprint oreyeball scans
Time clocks forrecording timeworked
Illustration 8-2Physical controls

362 8 Fraud, Internal Control, and Cash
INDEPENDENT INTERNAL VERIFICATION
Most internal control systems provide for independent internal verifi cation. This principle involves the review of data prepared by employees. To obtain max-imum benefi t from independent internal verifi cation:
1. Companies should verify records periodically or on a surprise basis.
2. An employee who is independent of the personnel responsible for the informa-tion should make the verifi cation.
3. Discrepancies and exceptions should be reported to a management level that can take appropriate corrective action.
Independent internal verifi cation is especially useful in comparing recorded accountability with existing assets. The reconciliation of the electronic journal with the cash in the point-of-sale terminal at Barriques is an example of this internal control principle. Other common examples are the reconciliation of a company’s cash balance per books with the cash balance per bank, and the veri-fi cation of the perpetual inventory records through a count of physical inventory. Illustration 8-3 shows the relationship between this principle and the segregation of duties principle.
At Centerstone Health, a large insurance company, the mailroom each day received insurance applications from prospective customers. Mailroom employees scanned the applications into electronic documents before the applications were processed. Once the applications were scanned, they could be accessed online by authorized employees.
Insurance agents at Centerstone Health earn commissions based upon successful applications. The sales agent’s name is listed on the application. However, roughly 15% of the applications are from customers who did not work with a sales agent. Two friends—Alex, an employee in recordkeeping, and Parviz, a sales agent—thought up a way to perpetrate a fraud. Alex identifi ed scanned applications that did not list a sales agent. After business hours, he entered the mailroom and found the hard-copy applications that did not show a sales agent. He wrote in Parviz’s name as the sales agent and then rescanned the application for processing. Parviz received the commis-sion, which the friends then split.
Total take: $240,000
THE MISSING CONTROLPhysical controls. Centerstone Health lacked two basic physical controls that could have prevented this fraud. First, the mailroom should have been locked during non-business hours, and access during business hours should have been tightly controlled. Second, the scanned applications supposedly could be accessed only by authorized employees using their passwords. However, the password for each employee was the same as the employee’s user ID. Since employee user-ID numbers were available to all other employees, all employees knew all other employees’ passwords. Unauthorized employees could access the scanned applications. Thus, Alex could enter the system using another employee’s password and access the scanned applications.
Source: Adapted from Wells, Fraud Casebook (2007), pp. 316–326.
ANATOMY OF A FRAUD
Bobbi Jean Donnelly, the offi ce manager for Mod Fashions Corporation’s design cen-ter, was responsible for preparing the design center budget and reviewing expense re-ports submitted by design center employees. Her desire to upgrade her wardrobe got the better of her, and she enacted a fraud that involved fi ling expense-reimbursement requests for her own personal clothing purchases. Bobbi Jean was able to conceal the fraud because she was responsible for reviewing all expense reports, including her
ANATOMY OF A FRAUD

Fraud and Internal Control 363
Large companies often assign independent internal verifi cation to internal auditors. Internal auditors are company employees who continuously evaluate the effectiveness of the company’s internal control systems. They review the activ-ities of departments and individuals to determine whether prescribed internal controls are being followed. They also recommend improvements when needed. For example, WorldCom was at one time the second largest U.S. telecommunica-tions company. The fraud that caused its bankruptcy (the largest ever when it occurred) involved billions of dollars. It was uncovered by an internal auditor.
HUMAN RESOURCE CONTROLS
Human resource control activities include the following.
1. Bond employees who handle cash. Bonding involves obtaining insurance protection against theft by employees. It contributes to the safeguarding of cash in two ways. First, the insurance company carefully screens all individ-uals before adding them to the policy and may reject risky applicants. Second, bonded employees know that the insurance company will vigorously prose-cute all offenders.
2. Rotate employees’ duties and require employees to take vacations. These measures deter employees from attempting thefts since they will not be able to permanently conceal their improper actions. Many banks, for example,
own. In addition, she sometimes was given ultimate responsibility for signing off on the expense reports when her boss was “too busy.” Also, because she controlled the budget, when she submitted her expenses, she coded them to budget items that she knew were running under budget, so that they would not catch anyone’s attention.
Total take: $275,000
THE MISSING CONTROLIndependent internal verifi cation. Bobbi Jean’s boss should have verifi ed her expense reports. When asked what he thought her expenses for a year were, the boss said about $10,000. At $115,000 per year, her actual expenses were more than 10 times what would have been expected. However, because he was “too busy” to verify her expense reports or to review the budget, he never noticed.
Source: Adapted from Wells, Fraud Casebook (2007), pp. 79–90.
Accounting Employee
Maintains cashbalances per books
Assistant Treasurer Makes monthly comparisons; reports
any unreconcilable differences to treasurer
Assistant Cashier
Maintains custodyof cash on hand
Segregationof Duties
Independent InternalVerification
Illustration 8-3Comparison of segregation of duties principle with independent internal verifi cation principle
If I take a vacationthey will know thatI’ve been stealing.
364 8 Fraud, Internal Control, and Cash
have discovered employee thefts when the employee was on vacation or assigned to a new position.
3. Conduct thorough background checks. Many believe that the most important and inexpensive measure any business can take to reduce employee theft and fraud is for the human resources department to conduct thorough background checks. Two tips: (1) Check to see whether job appli-cants actually graduated from the schools they list. (2) Never use telephone numbers for previous employers provided by the applicant. Always look them up yourself.
Ellen Lowry was the desk manager and Josephine Rodriguez was the head of house-keeping at the Excelsior Inn, a luxury hotel. The two best friends were so dedicated to their jobs that they never took vacations, and they frequently fi lled in for other employees. In fact, Ms. Rodriguez, whose job as head of housekeeping did not in-clude cleaning rooms, often cleaned rooms herself, “just to help the staff keep up.” These two “dedicated” employees, working as a team, found a way to earn a little more cash. Ellen, the desk manager, provided signifi cant discounts to guests who paid with cash. She kept the cash and did not register the guest in the hotel’s comput-erized system. Instead, she took the room out of circulation “due to routine mainte-nance.” Because the room did not show up as being used, it did not receive a normal housekeeping assignment. Instead, Josephine, the head of housekeeping, cleaned the rooms during the guests’ stay.
Total take: $95,000
THE MISSING CONTROLHuman resource controls. Ellen, the desk manager, had been fi red by a previous employer after being accused of fraud. If the Excelsior Inn had conducted a thorough background check, it would not have hired her. The hotel fraud was detected when Ellen missed work for a few days due to illness. A system of mandatory vacations and rotating days off would have increased the chances of detecting the fraud before it became so large.
Source: Adapted from Wells, Fraud Casebook (2007), pp. 145–155.
ANATOMY OF A FRAUD
SOX Boosts the Role of Human Resources
Under SOX, a company needs to keep track of employees’ degrees and certifi cations to ensure that employees continue to meet the specifi ed requirements of a job. Also, to ensure proper employee supervi-sion and proper separation of duties, companies must develop and moni-tor an organizational chart. When one corporation went through this exercise, it found that out of 17,000 employees, there were 400 people who did not report to anyone. The
corporation also had 35 people who reported to each other. In addition, if an employee complains of an unfair fi ring and mentions fi nancial issues at the company, HR should refer the case to the company audit committee and possibly to its legal counsel.
Why would unsupervised employees or employees who report to each other represent potential internal control threats? (Go to WileyPLUS for this answer and additional questions.)
Stockbyte/Getty Images, Inc.
Accounting Across the Organization
Fraud and Internal Control 365
Limitations of Internal Control
Companies generally design their systems of internal control to provide rea-sonable assurance of proper safeguarding of assets and reliability of the accounting records. The concept of reasonable assurance rests on the premise that the costs of establishing control procedures should not exceed their expected benefi t. To illustrate, consider shoplifting losses in retail stores. Stores could elimi-nate such losses by having a security guard stop and search customers as they leave the store. But store managers have concluded that the negative effects of such a procedure cannot be justifi ed. Instead, they have attempted to control shoplifting losses by less costly procedures. They post signs saying, “We reserve the right to inspect all packages” and “All shoplifters will be prosecuted.” They use hidden cameras and store detectives to monitor customer activity, and they install sensor equipment at exits. The human element is an important factor in every system of internal con-trol. A good system can become ineffective as a result of employee fatigue, care-lessness, or indifference. For example, a receiving clerk may not bother to count goods received and may just “fudge” the counts. Occasionally, two or more indi-viduals may work together to get around prescribed controls. Such collusion can signifi cantly reduce the effectiveness of a system, eliminating the protection offered by segregation of duties. No system of internal control is perfect. The size of the business also may impose limitations on internal control. Small companies often fi nd it diffi cult to segregate duties or to provide for inde-pendent internal verifi cation. A study by the Association of Certifi ed Fraud Exam-iners (Report to the Nation on Occupational Fraud and Abuse) indicates that businesses with fewer than 100 employees are most at risk for employee theft. In fact, 29% of frauds occurred at companies with fewer than 100 employees. The median loss at small companies was $154,000, which was close to the median fraud at companies with more than 10,000 employees ($160,000). A $154,000 loss can threaten the very existence of a small company.
Helpful HintControls may vary with the risk level of the activity. For example, management may consider cash to be high risk and maintaining inventories in the stock-room as low risk. Thus, management would have stricter controls for cash.
Identify which control activity is violated in each of the following situations, and explain how the situation creates an opportunity for a fraud.
1. The person with primary responsibility for reconciling the bank account and making all bank deposits is also the company’s accountant.
2. Wellstone Company’s treasurer received an award for distinguished service because he had not taken a vacation in 30 years.
3. In order to save money spent on order slips and to reduce time spent keeping track of order slips, a local bar/restaurant does not buy prenumbered order slips.
Solution
DO IT! 1 Control Activities
Related exercise material: BE8-1, BE8-2, BE8-3, BE8-4, E8-1, and DO IT! 8-1.
Action Plan✔ Familiarize yourself
with each of the control activities summarized on page 358.
✔ Understand the nature of the frauds that each control activity is intended to address.
1. Violates the control activity of segregation of duties. Recordkeeping should be sep-arate from physical custody. As a consequence, the employee could embezzle cash and make journal entries to hide the theft.
2. Violates the control activity of human resource controls. Key employees must take vacations. Otherwise, the treasurer, who manages the company’s cash, might embezzle cash and use his position to conceal the theft.
3. Violates the control activity of documentation procedures. If prenumbered docu-ments are not used, then it is virtually impossible to account for the documents. As a consequence, an employee could write up a dinner sale, receive the cash from the customer, and then throw away the order slip and keep the cash.
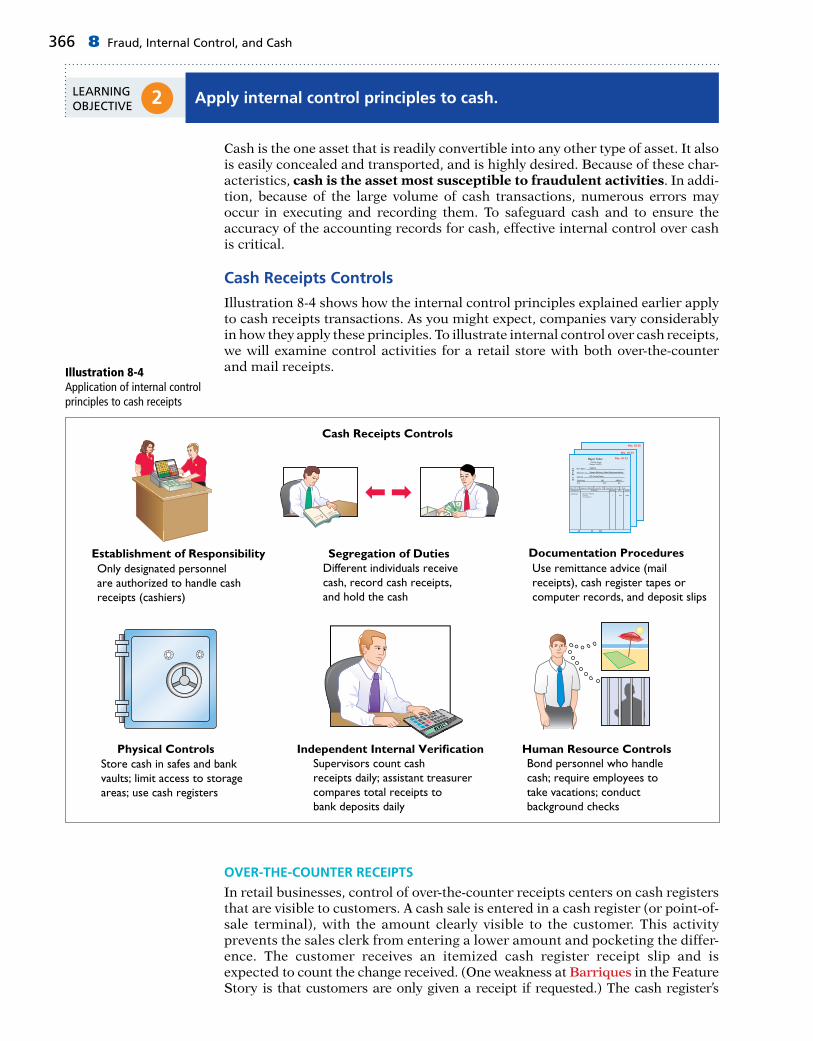
366 8 Fraud, Internal Control, and Cash
2 Apply internal control principles to cash.LEARNING OBJECTIVE
Cash is the one asset that is readily convertible into any other type of asset. It also is easily concealed and transported, and is highly desired. Because of these char-acteristics, cash is the asset most susceptible to fraudulent activities. In addi-tion, because of the large volume of cash transactions, numerous errors may occur in executing and recording them. To safeguard cash and to ensure the accuracy of the accounting records for cash, effective internal control over cash is critical.
Cash Receipts Controls
Illustration 8-4 shows how the internal control principles explained earlier apply to cash receipts transactions. As you might expect, companies vary considerably in how they apply these principles. To illustrate internal control over cash receipts, we will examine control activities for a retail store with both over-the-counter and mail receipts.
OVER-THE-COUNTER RECEIPTS
In retail businesses, control of over-the-counter receipts centers on cash registers that are visible to customers. A cash sale is entered in a cash register (or point-of- sale terminal), with the amount clearly visible to the customer. This activity prevents the sales clerk from entering a lower amount and pocketing the differ-ence. The customer receives an itemized cash register receipt slip and is expected to count the change received. (One weakness at Barriques in the Feature Story is that customers are only given a receipt if requested.) The cash register’s
Cash Receipts Controls
Different individuals receive cash, record cash receipts, and hold the cash
Documentation Procedures
Use remittance advice (mail receipts), cash register tapes or computer records, and deposit slips
Physical Controls Independent Internal Verification Human Resource Controls
Establishment of Responsibility Segregation of Duties
Store cash in safes and bankvaults; limit access to storageareas; use cash registers
Supervisors count cashreceipts daily; assistant treasurercompares total receipts tobank deposits daily
Bond personnel who handlecash; require employees totake vacations; conductbackground checks
Only designated personnel are authorized to handle cash receipts (cashiers)
125 Main StreetChelsea, IL 60915
Beyer Video No. 0123
No. 0124
No. 0125
Firm Name
Attention of
Address
SOLD
TO
City State Zip
Date 5/8/17 Salesperson Malone Invoice No. 731 Invoice Date 5/4/17
Catalogue No. Description Quantity Price Amount
z Reid
Illustration 8-4Application of internal control principles to cash receipts

Cash Controls 367
tape is locked in the register until a supervisor removes it. This tape accumulates the daily transactions and totals. At the end of the clerk’s shift, the clerk counts the cash and sends the cash and the count to the cashier. The cashier counts the cash, prepares a deposit slip, and deposits the cash at the bank. The cashier also sends a duplicate of the deposit slip to the accounting department to indicate cash received. The supervisor removes the cash register tape and sends it to the accounting department as the basis for a journal entry to record the cash received. (For point-of-sale systems, the accounting department receives information on daily transactions and totals through the computer network.) Illustration 8-5 summarizes this process.
This system for handling cash receipts uses an important internal control principle—segregation of recordkeeping from physical custody. The supervisor has access to the cash register tape but not to the cash. The clerk and the cashier have access to the cash but not to the register tape. In addition, the cash register tape provides documentation and enables independent internal verifi cation. Use of these three principles of internal control (segregation of recordkeeping from physical custody, documentation, and independent internal verifi cation) provides an effective system of internal control. Any attempt at fraudulent activity should be detected unless there is collusion among the employees. In some instances, the amount deposited at the bank will not agree with the cash recorded in the accounting records based on the cash register tape. These differences often result because the clerk hands incorrect change back to the retail customer. In this case, the difference between the actual cash and the amount reported on the cash register tape is reported in a Cash Over and Short
Helpful HintFlowcharts such as this one enhance the under-standing of the fl ow of documents, the processing steps, and the internal control procedures.
Clerk
Enters sales, counts cash
Sends cash and count to cashier
Counts cash, preparesdeposit slips
Sends cash and deposit slip to bank
Cashier
Supervisor
Removes locked cash register tape
Sends cash register tape to accounting dept.
Accounting DepartmentAgrees register tape to deposit slip
and records journal entry
Sends deposit slip copy to accounting dept.
BANK
Illustration 8-5Control of over-the-counter receipts

368 8 Fraud, Internal Control, and Cash
account. For example, suppose that the cash register tape indicated sales of $6,956.20 but the amount of cash was only $6,946.10. A cash shortfall of $10.10 exists. To account for this cash shortfall and related cash, the company makes the following entry.
Cash 6,946.10Cash Over and Short 10.10 Sales Revenue 6,956.20 (To record cash shortfall)
Cash Over and Short is an income statement item. It is reported as miscella-neous expense when there is a cash shortfall, and as miscellaneous revenue when there is an overage. Clearly, the amount should be small. Any material amounts in this account should be investigated.
MAIL RECEIPTS
All mail receipts should be opened in the presence of at least two mail clerks. These receipts are generally in the form of checks. A mail clerk should endorse each check “For Deposit Only.” This restrictive endorsement reduces the like-lihood that someone could divert the check to personal use. Banks will not give an individual cash when presented with a check that has this type of endorsement. The mail clerks prepare, in triplicate, a list of the checks received each day. This list shows the name of the check issuer, the purpose of the payment, and the amount of the check. Each mail clerk signs the list to establish responsibil-ity for the data. The original copy of the list, along with the checks, is then sent to the cashier’s department. A copy of the list is sent to the accounting depart-ment for recording in the accounting records. The clerks also keep a copy. This process provides excellent internal control for the company. By employing two clerks, the chance of fraud is reduced. Each clerk knows he or she is being observed by the other clerk(s). To engage in fraud, they would have to collude. The customers who submit payments also provide control because they will contact the company with a complaint if they are not properly credited for payment. Because the cashier has access to cash but not the records, and the accounting department has access to records but not cash, neither can engage in undetected fraud.
16,946.10210.10
16,956.20
Cash Flows16,946.10
A OEL5 1
L. R. Cortez is concerned about the control over cash receipts in his fast-food restaurant, Big Cheese. The restaurant has two cash registers. At no time do more than two employ-ees take customer orders and enter sales. Work shifts for employees range from 4 to 8 hours. Cortez asks your help in installing a good system of internal control over cash receipts.
DO IT! 2a Control over Cash Receipts
Cortez should assign a separate cash register drawer to each employee at the start of each work shift, with register totals set at zero. Each employee should have access to only the assigned register drawer to enter all sales. Each customer should be given a receipt. At the end of the shift, the employee should do a cash count. A separate employee should compare the cash count with the register tape to be sure they agree. In addition, Cortez should install an automated system that would enable the com-pany to compare orders entered in the register to orders processed by the kitchen.
Solution
Related exercise material: BE8-5, BE8-6, BE8-7, E8-2, and DO IT! 8-2a.
Action Plan✔ Differentiate among
the internal control principles of (1) establishing responsibility, (2) using physical controls, and (3) independent internal verifi cation.
✔ Design an effective system of internal control over cash receipts.

Cash Controls 369
Cash Disbursements Controls
Companies disburse cash for a variety of reasons, such as to pay expenses and liabilities or to purchase assets. Generally, internal control over cash disburse-ments is more effective when companies pay by check or electronic funds transfer (EFT) rather than by cash. One exception is payments for incidental amounts that are paid out of petty cash.2
Companies generally issue checks only after following specifi ed control pro-cedures. Illustration 8-6 shows how principles of internal control apply to cash disbursements.
2We explain the operation of a petty cash fund on pages 370–372.
Segregation of Duties Documentation Procedures
Use prenumbered checks and account for them in sequence; each check must have an approved invoice; require employees to use corporate credit cards for reimbursable expenses; stamp invoices “paid”
Different individuals approve and make payments; check- signers do not record disbursements
Cash Disbursements Controls
Physical Controls Independent Internal Verification Human Resource Controls
Establishment of Responsibility
Store blank checks in safes,with limited access; printcheck amounts by machinein indelible ink
Compare checks to invoices;reconcile bank statementmonthly
Bond personnel who handlecash; require employees totake vacations; conductbackground checks
Only designated personnel are authorized to sign checks (treasurer) and approve vendors
Payments Due
TREASURER
Illustration 8-6Application of internal control principles to cash disbursements
VOUCHER SYSTEM CONTROLS
Most medium and large companies use vouchers as part of their internal control over cash disbursements. A voucher system is a network of approvals by autho-rized individuals, acting independently, to ensure that all disbursements by check are proper. The system begins with the authorization to incur a cost or expense. It ends with the issuance of a check for the liability incurred. A voucher is an authorization form prepared for each expenditure. Companies require vouchers for all types of cash disbursements except those from petty cash.

370 8 Fraud, Internal Control, and Cash
The starting point in preparing a voucher is to fi ll in the appropriate informa-tion about the liability on the face of the voucher. The vendor’s invoice provides most of the needed information. Then, an employee in accounts payable records the voucher (in a journal called a voucher register) and fi les it according to the date on which it is to be paid. The company issues and sends a check on that date, and stamps the voucher “paid.” The paid voucher is sent to the accounting depart-ment for recording (in a journal called the check register). A voucher system involves two journal entries, one to record the liability when the voucher is issued and a second to pay the liability that relates to the voucher. The use of a voucher system, whether done manually or electronically, improves internal control over cash disbursements. First, the authorization pro-cess inherent in a voucher system establishes responsibility. Each individual has responsibility to review the underlying documentation to ensure that it is correct. In addition, the voucher system keeps track of the documents that back up each transaction. By keeping these documents in one place, a supervisor can inde-pendently verify the authenticity of each transaction. Consider, for example, the case of Aesop University presented on page 360. Aesop did not use a voucher system for transactions under $2,500. As a consequence, there was no indepen-dent verifi cation of the documents, which enabled the employee to submit fake invoices to hide his unauthorized purchases.
Petty Cash Fund
As you just learned, better internal control over cash disbursements is possible when companies make payments by check. However, using checks to pay small amounts is both impractical and a nuisance. For instance, a company would not want to write checks to pay for postage due, working lunches, or taxi fares. A common way of handling such payments, while maintaining satisfactory con-trol, is to use a petty cash fund to pay relatively small amounts. The operation of a petty cash fund, often called an imprest system, involves (1) establishing the fund, (2) making payments from the fund, and (3) replenishing the fund.3
ESTABLISHING THE PETTY CASH FUND
Two essential steps in establishing a petty cash fund are (1) appointing a petty cash custodian who will be responsible for the fund, and (2) determining the size of the fund. Ordinarily, a company expects the amount in the fund to cover antic-ipated disbursements for a three- to four-week period. To establish the fund, a company issues a check payable to the petty cash custodian for the stipulated amount. For example, if Laird Company decides to establish a $100 fund on March 1, the general journal entry is:
Mar. 1 Petty Cash 100 Cash 100 (To establish a petty cash fund)
The fund custodian cashes the check and places the proceeds in a locked petty cash box or drawer. Most petty cash funds are established on a fi xed-amount basis. The company will make no additional entries to the Petty Cash account unless management changes the stipulated amount of the fund. For example, if Laird Company decides on July 1 to increase the size of the fund to $250, it would debit Petty Cash $150 and credit Cash $150.
MAKING PAYMENTS FROM THE PETTY CASH FUND
The petty cash custodian has the authority to make payments from the fund that conform to prescribed management policies. Usually, management limits the size of
3The term “imprest” means an advance of money for a designated purpose.
A OEL5 1
11002100
Cash Flowsno effect
ETHICS NOTE
Petty cash funds are authorized and legitimate. In contrast, “slush” funds are unauthorized and hidden (under the table).

Cash Controls 371
expenditures that come from petty cash. Likewise, it may not permit use of the fund for certain types of transactions (such as making short-term loans to employees). Each payment from the fund must be documented on a prenumbered petty cash receipt (or petty cash voucher), as shown in Illustration 8-7. The signatures of both the fund custodian and the person receiving payment are required on the receipt. If other supporting documents such as a freight bill or invoice are avail-able, they should be attached to the petty cash receipt.
Helpful HintThe petty cash receipt satisfi es two internal control procedures: (1) establishing responsibility (signature of custodian), and (2) documentation procedures.
The petty cash custodian keeps the receipts in the petty cash box until the fund is replenished. The sum of the petty cash receipts and the money in the fund should equal the established total at all times. Management can (and should) make surprise counts at any time to determine whether the fund is being main-tained correctly. The company does not make an accounting entry to record a payment when it is made from petty cash. It is considered both inexpedient and unnecessary to do so. Instead, the company recognizes the accounting effects of each payment when it replenishes the fund.
REPLENISHING THE PETTY CASH FUND
When the money in the petty cash fund reaches a minimum level, the company replenishes the fund. The petty cash custodian initiates a request for reimburse-ment. The individual prepares a schedule (or summary) of the payments that have been made and sends the schedule, supported by petty cash receipts and other documentation, to the treasurer’s offi ce. The treasurer’s offi ce examines the receipts and supporting documents to verify that proper payments from the fund were made. The treasurer then approves the request and issues a check to restore the fund to its established amount. At the same time, all supporting documenta-tion is stamped “paid” so that it cannot be submitted again for payment. To illustrate, assume that on March 15 Laird’s petty cash custodian requests a check for $87. The fund contains $13 cash and petty cash receipts for postage $44, freight-out $38, and miscellaneous expenses $5. The general journal entry to record the check is as follows.
Mar. 15 Postage Expense 44 Freight-Out 38 Miscellaneous Expense 5 Cash 87 (To replenish petty cash fund)
Note that the reimbursement entry does not affect the Petty Cash account. Replenishment changes the composition of the fund by replacing the petty cash receipts with cash. It does not change the balance in the fund.
Paid to_________________________
For____________________________
CHARGE TO____________________
LAIRD COMPANYPetty Cash Receipt
Approved
Custodian
Date__________
Amount________
Received Payment
Acme Express Agency
Collect Express Charges
Freight-in
3/6/17
$18.00
No. 7
Illustration 8-7Petty cash receipt
244 Exp 238 Exp 25 Exp287
Cash Flows287
A OEL5 1
ETHICS NOTE
Internal control over a petty cash fund is strengthened by (1) having a supervisor make surprise counts of the fund to confi rm whether the paid petty cash receipts and fund cash equal the imprest amount, and (2) canceling or mutilating the paid petty cash receipts so they cannot be resubmitted for reimbursement.

372 8 Fraud, Internal Control, and Cash
Occasionally, in replenishing a petty cash fund, the company may need to recognize a cash shortage or overage. This results when the total of the cash plus receipts in the petty cash box does not equal the established amount of the petty cash fund. To illustrate, assume that Laird’s petty cash custodian has only $12 in cash in the fund plus the receipts as listed. The request for reimburse-ment would therefore be for $88, and Laird would make the following entry.
Mar. 15 Postage Expense 44 Freight-Out 38 Miscellaneous Expense 5 Cash Over and Short 1 Cash 88 (To replenish petty cash fund)
Conversely, if the custodian has $14 in cash, the reimbursement request would be for $86. The company would credit Cash Over and Short for $1 (overage). A company reports a debit balance in Cash Over and Short in the income statement as miscella-neous expense. It reports a credit balance in the account as miscellaneous revenue. The company closes Cash Over and Short to Income Summary at the end of the year. Companies should replenish a petty cash fund at the end of the accounting period, regardless of the cash in the fund. Replenishment at this time is neces-sary in order to recognize the effects of the petty cash payments on the fi nancial statements.
Helpful HintCash over and short situations result from mathematical errors or from failure to keep accurate records.
244 Exp 238 Exp 25 Exp 21 Exp288
Cash Flows288
A OEL5 1
How Employees Steal
Occupational fraud is using your own occupation for personal gain through the misuse or misapplication of the company’s resources or assets. This type of fraud is one of three types:
1. Asset misappropriation, such as theft of cash on hand, fraudulent disbursements, false refunds, ghost employees, personal purchases, and fi ctitious employees. This fraud is the most common but the least costly.
2. Corruption, such as bribery, illegal gratuities, and economic extortion. This fraud gener-ally falls in the middle between asset misappropriation and fi nancial statement fraud as regards frequency and cost.
3. Financial statement fraud, such as fi ctitious revenues, concealed liabilities and expenses, improper disclosures, and improper asset values. This fraud occurs less frequently than other types of fraud but it is the most costly.
The graph below shows the frequency and the median loss for each type of occupational fraud.
Source: 2014 Report to the Nations on Occupational Fraud and Abuse, Association of Certifi ed Fraud Examiners, pp. 10–12.
How can companies reduce the likelihood of occupational fraud? (Go to WileyPLUS for this answer and additional questions.)
Ethics Insight
© Chris Fernig/iStockphoto
100 20 30 40 50 60 8070 90 100%
Occupational Frauds by Frequency and Loss
Typ
e o
f F
rau
d (
Med
ian
Lo
ss)
Percent of Cases
Financial Statement Fraud
($1,000,000)
Corruption
($200,000)
Asset Misappropriation
($130,000)
9.0%
36.8%
85.4%

Control Features of a Bank Account 373
Bateer Company established a $50 petty cash fund on July 1. On July 30, the fund had $12 cash remaining and petty cash receipts for postage $14, offi ce supplies $10, and delivery expense $15. Prepare journal entries to establish the fund on July 1 and to replenish the fund on July 30.
Solution
DO IT! 2b Petty Cash Fund
July 1 Petty Cash 50 Cash 50 (To establish petty cash fund)
30 Postage Expense 14 Supplies 10 Delivery Expense 15 Cash Over and Short 1 Cash ($50 2 $12) 38 (To replenish petty cash)
Related exercise material: BE8-9, E8-7, E8-8, and DO IT! 8-2b.
Action Plan✔ To establish the fund,
set up a separate general ledger account.
✔ Determine how much cash is needed to replenish the fund: subtract the cash remaining from the petty cash fund balance.
✔ Total the petty cash receipts. Determine any cash over or short—the difference between the cash needed to replenish the fund and the total of the petty cash receipts.
✔ Record the expenses incurred according to the petty cash receipts when replenishing the fund.
3 Identify the control features of a bank account.LEARNING OBJECTIVE
The use of a bank contributes signifi cantly to good internal control over cash. A company can safeguard its cash by using a bank as a depository and as a clearinghouse for checks received and written. Use of a bank minimizes the amount of currency that a company must keep on hand. Also, use of a bank facilitates the control of cash because it creates a double record of all bank transactions—one by the company and the other by the bank. The asset account Cash maintained by the company should have the same balance as the bank’s liability account for that company. A bank reconciliation compares the bank’s balance with the company’s balance and explains any differences to make them agree. Many companies have more than one bank account. For effi ciency of opera-tions and better control, national retailers like Wal-Mart Stores, Inc. and Target may have regional bank accounts. Large companies, with tens of thousands of employees, may have a payroll bank account, as well as one or more general bank accounts. Also, a company may maintain several bank accounts in order to have more than one source for short-term loans when needed.
Making Bank Deposits
An authorized employee, such as the head cashier, should make a company’s bank deposits. Each deposit must be documented by a deposit slip (ticket), as shown in Illustration 8-8 (page 374). Deposit slips are prepared in duplicate. The bank retains the original; the depositor keeps the duplicate, machine-stamped by the bank to establish its authenticity.

374 8 Fraud, Internal Control, and Cash
Writing Checks
A check is a written order signed by the depositor directing the bank to pay a specifi ed sum of money to a designated recipient. There are three parties to a check: (1) the maker (or drawer) who issues the check, (2) the bank (or payer) on which the check is drawn, and (3) the payee to whom the check is payable. A check is a negotiable instrument that one party can transfer to another party by endorsement. Each check should be accompanied by an explanation of its purpose. In many companies, a remittance advice attached to the check, as shown in Illustration 8-9, explains the check’s purpose.
Illustration 8-8Deposit slip
1
2
3
4
5
6
7
8
9
10
11
12
13
14
15
16
17
18
19
CHECKS LIST SINGLY DOLLARS CENTS
ENTER TOTAL ON THE FRONT OF THIS TICKET
DEPOSIT TICKET
LAIRD COMPANY77 West Central Avenue,Midland, Michigan 48654
DATE
National Bank & TrustMidland, Michigan 48654
CURRENCY
COINCASH
LIST CHECKS SINGLY
TOTAL FROM OTHER SIDE
TOTAL
TOTAL FROM OTHER SIDE
NET DEPOSIT
USE OTHER SIDE FORADDITIONAL LISTINGS
BE SURE EACH ITEM ISPROPERLY ENDORSED
74—102/724
CHECKS AND OTHER ITEMS ARE RECEIVED FOR DEPOSIT SUBJECT TO THE PROVISIONS OF THE UNIFORM COMMERCIAL CODE OR ANY APPLICABLE COLLECTION AGREEMENT
TOTALReverse sideFront side
Bank code numbers
LAIRD COMPANY77 West Central Avenue,Midland, Michigan 48654
Memo
National Bank & TrustMidland, Michigan 48654
Pay to theorder of
No. 448
$
Dollars
Check
RemittanceAdvice
Maker
Payer
Payee
Detach this portion before cashing.
Date Description Gross Amount Discount Net Amount
4-16-17 Invoice No. 27662 1525.00 ---- 1525.00
W. A. Laird Company, Midland, MI
74—102/724
Illustration 8-9Check with remittance advice

Control Features of a Bank Account 375
It is important to know the balance in the checking account at all times. To keep the balance current, the depositor should enter each deposit and check on running-balance memo forms (or online statements) provided by the bank or on the check stubs in the checkbook.
Bank Statements
If you have a personal checking account, you are probably familiar with bank statements. A bank statement shows the depositor’s bank transactions and balances.4 Each month, a depositor receives a statement from the bank. Illustra-tion 8-10 presents a typical bank statement for Laird Company. It shows (1) checks paid and other debits (such as debit card transactions or direct with-drawals for bill payments) that reduce the balance in the depositor’s account, (2) deposits and other credits that increase the balance in the depositor’s account, and (3) the account balance after each day’s transactions.
4Our presentation assumes that the depositor makes all adjustments at the end of the month. In practice, a company may also make journal entries during the month as it reviews information from the bank regarding its account.
Helpful Hint Essentially, the bank statement is a copy of the bank’s records sent to the customer (or available online) for review.
Helpful Hint The bank credits to the customer’s account every deposit it receives. The reverse occurs when the bank “pays” a check issued by a company on its checking account balance. Payment reduces the bank’s liability. Thus, the bank debits check payments to the customer’s account with the bank.
Illustration 8-10Bank statement
National Bank & TrustMidland, Michigan 48654 Member FDIC
ACCOUNTSTATEMENT
LAIRD COMPANY77 WEST CENTRAL AVENUEMIDLAND, MICHIGAN 48654
Statement Date/CreditLine Closing Date
April 30, 2017
457923
ACCOUNT NUMBER
BalanceLast Statement
Deposits and Credits Checks and Debits BalanceThis StatementNo. Total Amount No. Total Amount
13,256.90 20 34,805.10 26 32,154.55 15,907.45
CHECKS AND DEBITS DEPOSITS AND CREDITS DAILY BALANCE
Date No. Amount
4–24–54–44–34–84–74–84–114–12
4–294–294–304–30
435436437438439440441442443
NSF459DM461
644.953,260.001,185.79
776.651,781.701,487.902,420.001,585.601,226.00
425.601,080.30
30.00620.15
Date Amount
4–24–34–54–74–84–9 CM4–114–124–13
4–274–294–30
4,276.852,137.501,350.47
982.461,320.281,035.002,720.00
757.411,218.56
1,545.572,929.452,128.60
Date Amount
4–24–34–44–54–74–84–94–114–12
4–274–294–30
16,888.8018,249.6517,063.8615,154.3314,648.8911,767.4712,802.4713,936.8713,468.28
13,005.4514,429.0015,907.45
Symbols: CM
DM
Credit MemoDebit Memo
EC
INT
Error CorrectionInterest Earned
NSF
SC
Not Sufficient FundsService Charge
Reconcile YourAccount Promptly
The bank statement lists in numerical sequence all “paid” checks, along with the date the check was paid and its amount. Upon paying a check, the bank stamps the check “paid”; a paid check is sometimes referred to as a canceled check. On the statement, the bank also includes memoranda explaining other debits and credits it made to the depositor’s account.

376 8 Fraud, Internal Control, and Cash
DEBIT MEMORANDUM
Some banks charge a monthly fee for their services. Often, they charge this fee only when the average monthly balance in a checking account falls below a spec-ifi ed amount. They identify the fee, called a bank service charge, on the bank statement by a symbol such as SC. The bank also sends with the statement a debit memorandum explaining the charge noted on the statement. Other debit memo-randa may also be issued for other bank services such as the cost of printing checks, issuing traveler’s checks, and wiring funds to other locations. The symbol DM is often used for such charges. Banks also use a debit memorandum when a deposited check from a customer “bounces” because of insuffi cient funds. For example, assume that J. R. Baron, a customer of Laird Company, sends a check for $425.60 to Laird Company for services performed. Unfortunately, Baron does not have suffi cient funds at its bank to pay for these services. In such a case, Baron’s bank marks the check NSF (not suffi cient funds) and returns it to Laird’s (the depositor’s) bank. Laird’s bank then debits Laird’s account, as shown by the symbol NSF on the bank statement in Illustration 8-10. The bank sends the NSF check and debit memorandum to Laird as notifi cation of the charge. Laird then records an Account Receivable from J. R. Baron (the writer of the bad check) and reduces cash for the NSF check.
CREDIT MEMORANDUM
Sometimes a depositor asks the bank to collect its notes receivable. In such a case, the bank will credit the depositor’s account for the cash proceeds of the note. This is illustrated by the symbol CM on the Laird Company bank statement. The bank issues and sends with the statement a credit memorandum to explain the entry. Many banks also offer interest on checking accounts. The interest earned may be indicated on the bank statement by the symbol CM or INT.
Reconciling the Bank Account
The bank and the depositor maintain independent records of the depositor’s checking account. People tend to assume that the respective balances will always agree. In fact, the two balances are seldom the same at any given time, and both balances differ from the “correct” or “true” balance. Therefore, it is necessary to make the balance per books and the balance per bank agree with the correct or true amount—a process called reconciling the bank account. The need for agreement has two causes:
1. Time lags that prevent one of the parties from recording the transaction in the same period as the other party.
2. Errors by either party in recording transactions.
Time lags occur frequently. For example, several days may elapse between the time a company mails a check to a payee and the date the bank pays the check. Similarly, when the depositor uses the bank’s night depository to make its depos-its, there will be a difference of at least one day between the time the depositor records the deposit and the time the bank does so. A time lag also occurs when-ever the bank mails a debit or credit memorandum to the depositor. The incidence of errors depends on the effectiveness of the internal controls maintained by the company and the bank. Bank errors are infrequent. However, either party could accidentally record a $450 check as $45 or $540. In addition, the bank might mistakenly charge a check drawn by C. D. Berg to the account of C. D. Burg.
RECONCILIATION PROCEDURE
The bank reconciliation should be prepared by an employee who has no other responsibilities pertaining to cash. If a company fails to follow this internal con-trol principle of independent internal verifi cation, cash embezzlements may go unnoticed. For example, a cashier who prepares the reconciliation can embezzle

Control Features of a Bank Account 377
cash and conceal the embezzlement by misstating the reconciliation. Thus, the bank accounts would reconcile, and the embezzlement would not be detected. In reconciling the bank account, it is customary to reconcile the balance per books and balance per bank to their adjusted (correct or true) cash bal-ances. The starting point in preparing the reconciliation is to enter the balance per bank statement and balance per books on the reconciliation schedule. The company then makes various adjustments, as shown in Illustration 8-11.
Adjustments tothe bank balance
Correct Cash Balance
Cash Balances
Adjustments tothe book balance
Per Bank Statement Per Books
Deposits in transit
$$$$$
Outstanding checks
Pay to the order of
Bank errors
“Oops”BANK
Notes collected by banks
$$$
NSF (bounced) checks
Pay to the order of
Check printing or
other service charges
Company errors
“Oops”
Illustration 8-11Bank reconciliation adjustments
The following steps should reveal all the reconciling items that cause the dif-ference between the two balances.
Step 1. Deposits in transit. Compare the individual deposits listed on the bank statement with deposits in transit from the preceding bank reconciliation and with the deposits per company records or duplicate deposit slips. De-posits recorded by the depositor that have not been recorded by the bank are the deposits in transit. Add these deposits to the balance per bank.
Step 2. Outstanding checks. Compare the paid checks shown on the bank statement with (a) checks outstanding from the previous bank recon-ciliation, and (b) checks issued by the company as recorded in the cash payments journal (or in the check register in your personal checkbook). Issued checks recorded by the company but that have not yet been paid by the bank are outstanding checks. Deduct outstanding checks from the balance per bank.
Helpful Hint Deposits in transit and outstanding checks are reconciling items because of time lags.

378 8 Fraud, Internal Control, and Cash
Step 3. Errors. Note any errors discovered in the foregoing steps and list them in the appropriate section of the reconciliation schedule. For example, if the company mistakenly recorded as $169 a paid check correctly written for $196, it would deduct the error of $27 from the balance per books. All errors made by the depositor are reconciling items in determining the ad-justed cash balance per books. In contrast, all errors made by the bank are reconciling items in determining the adjusted cash balance per bank.
Step 4. Bank memoranda. Trace bank memoranda to the depositor’s records. List in the appropriate section of the reconciliation schedule any unre-corded memoranda. For example, the company would deduct from the balance per books a $5 debit memorandum for bank service charges. Similarly, it would add to the balance per books $32 of interest earned.
BANK RECONCILIATION ILLUSTRATED
The bank statement for Laird Company (Illustration 8-10) shows a balance per bank of $15,907.45 on April 30, 2017. On this date the balance of cash per books is $11,589.45. Using the four reconciliation steps, Laird determines the following reconciling items.
Step 1. Deposits in transit: April 30 deposit (received bybank on May 1). $2,201.40
Step 2. Outstanding checks: No. 453, $3,000.00; no. 457,$1,401.30; no. 460, $1,502.70. 5,904.00
Step 3. Errors: Laird wrote check no. 443 for $1,226.00 and thebank correctly paid that amount. However, Laird recordedthe check as $1,262.00. 36.00
Step 4. Bank memoranda: a. Debit—NSF check from J. R. Baron for $425.60. 425.60 b. Debit—Charge for printing company checks $30.00. 30.00 c. Credit—Collection of note receivable for $1,000
plus interest earned $50, less bank collection fee $15.00. 1,035.00
Illustration 8-12 shows Laird’s bank reconciliation.
Alternative TerminologyThe terms adjusted cash balance, true cash balance, and correct cash balance are used interchangeably.
Illustration 8-12Bank reconciliation LAIRD COMPANY
Bank ReconciliationApril 30, 2017
Cash balance per bank statement $ 15,907.45Add: Deposits in transit 2,201.40
18,108.85Less: Outstanding checks No. 453 $3,000.00 No. 457 1,401.30 No. 460 1,502.70 5,904.00
Adjusted cash balance per bank $12,204.85
Cash balance per books $ 11,589.45Add: Collection of note receivable $1,000, plus
interest earned $50, less collection fee $15 $1,035.00 Error in recording check no. 443 36.00 1,071.00
12,660.45Less: NSF check 425.60 Bank service charge 30.00 455.60
Adjusted cash balance per books $12,204.85
Helpful Hint Note in the bank statement in Illustration 8-10 that checks no. 459 and 461 have been paid but check no. 460 is not listed. Thus, this check is outstanding. If a complete bank statement were provided, checks no. 453 and 457 would also not be listed. The amounts for these three checks are obtained from the company’s cash payments records.

Control Features of a Bank Account 379
ENTRIES FROM BANK RECONCILIATION
The company records each reconciling item used to determine the adjusted cash balance per books. If the company does not journalize and post these items, the Cash account will not show the correct balance. Laird Company would make the following entries on April 30.
COLLECTION OF NOTE RECEIVABLE This entry involves four accounts. Assuming that the interest of $50 has not been accrued and the collection fee is charged to Miscellaneous Expense, the entry is:
Apr. 30 Cash 1,035.00 Miscellaneous Expense 15.00 Notes Receivable 1,000.00 Interest Revenue 50.00 (To record collection of note receivable by bank)
BOOK ERROR The cash disbursements journal shows that check no. 443 was a payment on account to Andrea Company, a supplier. The correcting entry is:
Apr. 30 Cash 36.00 Accounts Payable—Andrea Company 36.00 (To correct error in recording check no. 443)
NSF CHECK As indicated earlier, an NSF check becomes an account receivable to the depositor. The entry is:
Apr. 30 Accounts Receivable—J. R. Baron 425.60 Cash 425.60 (To record NSF check)
BANK SERVICE CHARGES Depositors debit check printing charges (DM) and other bank service charges (SC) to Miscellaneous Expense because they are usually nominal in amount. The entry is:
Apr. 30 Miscellaneous Expense 30.00 Cash 30.00 (To record charge for printing company checks)
Instead of making four separate entries, Laird could combine them into one com-pound entry. After Laird has posted the entries, the Cash account will show the following.
Helpful Hint The entries that follow are adjusting entries. In prior chapters, Cash was an account that did not require adjustment. That was a simplifying assumption for learning purposes because we had not yet explained a bank reconciliation.
The adjusted cash balance in the ledger should agree with the adjusted cash bal-ance per books in the bank reconciliation in Illustration 8-12 (page 378). What entries does the bank make? If the company discovers any bank errors in preparing the reconciliation, it should notify the bank. The bank then can
Cash
Apr. 30 Bal. 11,589.45 Apr. 30 425.60 30 1,035.00 30 30.00 30 36.00
Apr. 30 Bal. 12,204.85
Illustration 8-13Adjusted balance in Cash account
1425.602425.60
Cash Flows2425.60
A OEL5 1
230 Exp230
Cash Flows230
A OEL5 1
11,035215 Exp
21,000150 Rev
Cash Flows11,035
A OEL5 1
136 136
Cash Flows136
A OEL5 1

380 8 Fraud, Internal Control, and Cash
make the necessary corrections in its records. The bank does not make any entries for deposits in transit or outstanding checks. Only when these items reach the bank will the bank record these items.
Electronic Funds Transfer (EFT) System
It is not surprising that companies and banks have developed approaches to transfer funds among parties without the use of paper (deposit tickets, checks, etc.). Such procedures, called electronic funds transfers (EFT), are disburse-ment systems that use wire, telephone, or computers to transfer cash balances from one location to another. Use of EFT is quite common. For example, many employees receive no formal payroll checks from their employers. Instead, employers send electronic payroll data to the appropriate banks. Also, individu-als and companies now frequently make regular payments such as those for house, car, and utilities by EFT. EFT transactions normally result in better internal control since no cash or checks are handled by company employees. This does not mean that opportuni-ties for fraud are eliminated. In fact, the same basic principles related to internal control apply to EFT transfers. For example, without proper segregation of duties and authorizations, an employee might be able to redirect electronic payments into a personal bank account and conceal the theft with fraudulent accounting entries.
Madoff’s Ponzi Scheme
No recent fraud has generated more interest and rage than the one perpetrated by Bernard Madoff. Madoff was an elite New York investment fund manager who was highly regarded by securities regula-tors. Investors fl ocked to him because he delivered very steady returns of between 10% and 15%, no matter whether the market was going up or going down. However, for many years, Madoff did not actually invest the cash that
people gave to him. Instead, he was running a Ponzi scheme: He paid returns to existing investors using cash received from new investors. As long as the size of his
investment fund continued to grow from new investments at a rate that exceeded the amounts that he needed to pay out in returns, Madoff was able to operate his fraud smoothly. To conceal his misdeeds, Madoff fabricated false invest-ment statements that were provided to investors. In addi-tion, Madoff hired an auditor that never verifi ed the accuracy of the investment records but automatically issued unqualifi ed opinions each year. Although a compet-ing fund manager warned the SEC a number of times over a nearly 10-year period that he thought Madoff was engaged in fraud, the SEC never aggressively investigated the allegations. Investors, many of which were charitable organizations, lost more than $18 billion. Madoff was sen-tenced to a jail term of 150 years.
How was Madoff able to conceal such a giant fraud? (Go to WileyPLUS for this answer and additional questions.)
Mary Altaff er/©AP/Wide World Photos
Investor Insight
Sally Kist owns Linen Kist Fabrics. Sally asks you to explain how she should treat the following reconciling items when reconciling the company’s bank account: (1) a debit memorandum for an NSF check, (2) a credit memorandum for a note collected by the bank, (3) outstanding checks, and (4) a deposit in transit.
DO IT! 3 Bank Reconciliation

Reporting Cash 381
Sally should treat the reconciling items as follows.
(1) NSF check: Deduct from balance per books.
(2) Collection of note: Add to balance per books.
(3) Outstanding checks: Deduct from balance per bank.
(4) Deposit in transit: Add to balance per bank.
Solution
Related exercise material: BE8-11, BE8-12, BE8-13, BE8-14, E8-9, E8-10, E8-11, E8-12, E8-13, and DO IT! 8-3.
Action Plan✔ Understand the
purpose of a bank reconciliation.
✔ Identify time lags and explain how they cause reconciling items.
4 Explain the reporting of cash.LEARNING OBJECTIVE
Cash consists of coins, currency (paper money), checks, money orders, and money on hand or on deposit in a bank or similar depository. Companies report cash in two different statements: the balance sheet and the statement of cash fl ows. The balance sheet reports the amount of cash available at a given point in time. The statement of cash fl ows shows the sources and uses of cash during a period of time. The statement of cash fl ows was introduced in Chapter 1 and will be discussed in much detail in Chapter 17. In this sec-tion, we discuss some important points regarding the presentation of cash in the balance sheet. When presented in a balance sheet, cash on hand, cash in banks, and petty cash are often combined and reported simply as Cash. Because it is the most liquid asset owned by the company, cash is listed fi rst in the current assets section of the balance sheet.
Cash Equivalents
Many companies use the designation “Cash and cash equivalents” in reporting cash. (See Illustration 8-14 for an example.) Cash equivalents are short-term, highly liquid investments that are both:
1. Readily convertible to known amounts of cash, and
2. So near their maturity that their market value is relatively insensitive to changes in interest rates. Generally, only investments with original maturities of three months or less qualify under this defi nition.
Illustration 8-14Balance sheet presentation of cash
DELTA AIR LINES, INC.Balance Sheet (partial)
December 31, 2013 (in millions)
Assets
Current assets Cash and cash equivalents $2,844 Short-term investments 959 Restricted cash 122
Real World
Examples of cash equivalents are Treasury bills, commercial paper (short-term corporate notes), and money market funds. All typically are purchased with cash that is in excess of immediate needs.

382 8 Fraud, Internal Control, and Cash
Occasionally, a company will have a net negative balance in its bank account. In this case, the company should report the negative balance among current liabilities. For example, farm equipment manufacturer Ag-Chem recently reported “Checks outstanding in excess of cash balances” of $2,145,000 among its current liabilities.
Restricted Cash
A company may have restricted cash, cash that is not available for general use but rather is restricted for a special purpose. For example, landfi ll companies are often required to maintain a fund of restricted cash to ensure they will have ade-quate resources to cover closing and clean-up costs at the end of a landfi ll site’s useful life. McKesson Corp. recently reported restricted cash of $962 million to be paid out as the result of investor lawsuits. Cash restricted in use should be reported separately on the balance sheet as restricted cash. If the company expects to use the restricted cash within the next year, it reports the amount as a current asset. When this is not the case, it reports the restricted funds as a noncurrent asset. Illustration 8-14 shows restricted cash reported in the fi nancial statements of Delta Air Lines. The company is required to maintain restricted cash as collateral to support insurance obligations related to workers’ compensation claims. Delta does not have access to these funds for general use, and so it must report them separately, rather than as part of cash and cash equivalents.
ETHICS NOTE
Recently, some companies were forced to restate their fi nancial statements because they had too broadly interpreted which types of investments could be treated as cash equivalents. By reporting these items as cash equivalents, the companies made themselves look more liquid.
Indicate whether each of the following statements is true or false.
1. Cash and cash equivalents are comprised of coins, currency (paper money), money orders, and NSF checks.
2. Restricted cash is classifi ed as either a current asset or noncurrent asset, depending on the circumstances.
3. A company may have a negative balance in its bank account. In this case, it should offset this negative balance against cash and cash equivalents on the balance sheet.
4. Because cash and cash equivalents often includes short-term investments, accounts receivable should be reported as the fi rst item on the balance sheet.
Solution
DO IT! 4 Reporting Cash
Related exercise material: E8-14, E8-15, and DO IT! 8-4.
Action Plan✔ Understand how
companies present cash and restricted cash on the balance sheet.
✔ Review the designations of cash equivalents and restricted cash, and how companies typically handle them.
1. False. NSF checks should be reported as receivables, not cash and cash equiva-lents. 2. True. 3. False. Companies that have a negative balance in their bank accounts should report the negative balance as a current liability. 4. False. Cash equivalents are readily convertible to known amounts of cash, and so near maturity (less than 3 months) that they are considered more liquid than accounts receivable and therefore are reported before accounts receivable on the balance sheet.
1 Discuss fraud and the principles of internal control. A fraud is a dishonest act by an employee that results in personal benefi t to the employee at a cost to the employer. The fraud triangle refers to the three factors
that contribute to fraudulent activity by employees: opportunity, fi nancial pressure, and rationalization. Internal control consists of all the related methods and measures adopted within an organization to
LEARNING OBJECTIVES REVIEW
1
REVIEW AND PRACTICE

Review and Practice 383
safeguard its assets, enhance the reliability of its accounting records, increase effi ciency of operations, and ensure compliance with laws and regulations.
The principles of internal control are establish-ment of responsibility, segregation of duties, docu-mentation procedures, physical controls, independent internal verifi cation, and human resource controls such as bonding and requiring employees to take vacations.
Apply internal control principles to cash. Internal controls over cash receipts include (a) designating specifi c personnel to handle cash; (b) assigning differ-ent individuals to receive cash, record cash, and maintain custody of cash; (c) using remittance advices for mail receipts, cash register tapes for over-the-counter receipts, and deposit slips for bank deposits; (d) using company safes and bank vaults to store cash with access limited to authorized personnel, and using cash registers in executing over-the-counter receipts; (e) making independent daily counts of reg-ister receipts and daily comparison of total receipts with total deposits; and (f) bonding personnel that handle cash and requiring them to take vacations.
Internal controls over cash disbursements include (a) having specifi c individuals such as the treasurer authorized to sign checks and approve vendors; (b) assigning different individuals to approve items for payment, make the payment, and record the payment; (c) using prenumbered checks and accounting for all checks, with each check supported by an approved invoice; (d) storing blank checks in a safe or vault with access restricted to authorized personnel, and
2
using a check-writing machine to imprint amounts on checks; (e) comparing each check with the approved invoice before issuing the check, and making monthly reconciliations of bank and book balances; and (f) bonding personnel who handle cash, requiring employees to take vacations, and conducting back-ground checks.
Companies operate a petty cash fund to pay rela-tively small amounts of cash. They must establish the fund, make payments from the fund, and replenish the fund when the cash in the fund reaches a mini-mum level.
Identify the control features of a bank account. A bank account contributes to good internal control by providing physical controls for the storage of cash. It minimizes the amount of currency that a company must keep on hand, and it creates a double record of a depositor’s bank transactions. It is customary to rec-oncile the balance per books and balance per bank to their adjusted balances. The steps in the reconciling process are to determine deposits in transit, outstand-ing checks, errors by the depositor or the bank, and unrecorded bank memoranda.
Explain the reporting of cash. Companies list cash fi rst in the current assets section of the balance sheet. In some cases, they report cash together with cash equivalents. Cash restricted for a special purpose is reported separately as a current asset or as a noncur-rent asset, depending on when the cash is expected to be used.
3
4
Bank reconciliation The process of comparing the bank’s balance of an account with the company’s bal-ance and explaining any differences to make them agree. (p. 373).
Bank service charge A fee charged by a bank for the use of its services. (p. 376).
Bank statement A monthly statement from the bank that shows the depositor’s bank transactions and bal-ances. (p. 375).
Bonding Obtaining insurance protection against theft by employees. (p. 363).
Cash Resources that consist of coins, currency, checks, money orders, and money on hand or on deposit in a bank or similar depository. (p. 381).
Cash equivalents Short-term, highly liquid invest-ments that can be converted to a specifi c amount of cash. (p. 381).
Check A written order signed by a bank depositor, direct-ing the bank to pay a specifi ed sum of money to a des-ignated recipient. (p. 374).
Deposits in transit Deposits recorded by the depositor but not yet recorded by the bank. (p. 377).
Electronic funds transfer (EFT) A disbursement system that uses wire, telephone, or computers to transfer funds from one location to another. (p. 380).
Fraud A dishonest act by an employee that results in per-sonal benefi t to the employee at a cost to the employer. (p. 356).
Fraud triangle The three factors that contribute to fraudulent activity by employees: opportunity, fi nancial pressure, and rationalization. (p. 356).
Internal auditors Company employees who continu-ously evaluate the effectiveness of the company’s inter-nal control system. (p. 363).
Internal control A process designed to provide reason-able assurance regarding the achievement of objectives related to operations, reporting, and compliance. (p. 357).
NSF check A check that is not paid by a bank because of insuffi cient funds in a customer’s bank account. (p. 376).
Outstanding checks Checks issued and recorded by a company but not yet paid by the bank. (p. 377).
Petty cash fund A cash fund used to pay relatively small amounts. (p. 370).
GLOSSARY REVIEW

384 8 Fraud, Internal Control, and Cash
Restricted cash Cash that must be used for a special purpose. (p. 382).
Sarbanes-Oxley Act (SOX) Regulations passed by Con-gress to try to reduce unethical corporate behavior. (p. 356).
1. Which of the following is not an element of the fraud triangle?(a) Rationalization. (b) Financial pressure. (c) Segregation of duties.(d) Opportunity.
2. An organization uses internal control to enhance the accuracy and reliability of accounting records and to:(a) safeguard assets.(b) prevent fraud.(c) produce correct fi nancial statements.(d) deter employee dishonesty.
3. Which of the following was not a result of the Sarbanes-Oxley Act?(a) Companies must fi le fi nancial statements with the
Internal Revenue Service.(b) All publicly traded companies must maintain ade-
quate internal controls.(c) The Public Company Accounting Oversight Board
was created to establish auditing standards and regulate auditor activity.
(d) Corporate executives and board of directors must ensure that controls are reliable and effective, and they can be fi ned or imprisoned for failure to do so.
4. The principles of internal control do not include:(a) establishment of responsibility.(b) documentation procedures.(c) management responsibility.(d) independent internal verifi cation.
5. Physical controls do not include:(a) safes and vaults to store cash.(b) independent bank reconciliations.(c) locked warehouses for inventories.(d) bank safety deposit boxes for important papers.
6. Which of the following control activities is not rele-vant when a company uses a computerized (rather than manual) accounting system?(a) Establishment of responsibility.(b) Segregation of duties.(c) Independent internal verifi cation.(d) All of these control activities are relevant to a
computerized system. 7. Permitting only designated personnel to handle cash
receipts is an application of the principle of:(a) segregation of duties.(b) establishment of responsibility.
(LO 1)
(LO 1)
(LO 1)
(LO 1)
(LO 1)
(LO 1)
(LO 2)
(c) independent internal verifi cation.(d) human resource controls.
8. The use of prenumbered checks in disbursing cash is an application of the principle of:(a) establishment of responsibility.(b) segregation of duties.(c) physical controls.(d) documentation procedures.
9. A company writes a check to replenish a $100 petty cash fund when the fund contains receipts of $94 and $4 in cash. In recording the check, the company should:(a) debit Cash Over and Short for $2.(b) debit Petty Cash for $94.(c) credit Cash for $94.(d) credit Petty Cash for $2.
10. The control features of a bank account do not include:(a) having bank auditors verify the correctness of the
bank balance per books.(b) minimizing the amount of cash that must be kept
on hand.(c) providing a double record of all bank transac-
tions.(d) safeguarding cash by using a bank as a deposi-
tory. 11. In a bank reconciliation, deposits in transit are:
(a) deducted from the book balance.(b) added to the book balance.(c) added to the bank balance.(d) deducted from the bank balance.
12. The reconciling item in a bank reconciliation that will result in an adjusting entry by the depositor is:(a) outstanding checks. (c) a bank error.(b) deposit in transit. (d) bank service charges.
13. Which of the following items in a cash drawer at November 30 is not cash?(a) Money orders.(b) Coins and currency.(c) An NSF check.(d) A customer check dated November 28.
14. Which of the following statements correctly describes the reporting of cash?(a) Cash cannot be combined with cash equivalents.(b) Restricted cash funds may be combined with
cash.(c) Cash is listed fi rst in the current assets section.(d) Restricted cash funds cannot be reported as a cur-
rent asset.
(LO 2)
(LO 2)
(LO 3)
(LO 3)
(LO 3)
(LO 4)
(LO 4)
Voucher An authorization form prepared for each pay-ment in a voucher system. (p. 369).
Voucher system A network of approvals by authorized individuals acting independently to ensure that all disbursements by check are proper. (p. 369).
PRACTICE MULTIPLE-CHOICE QUESTIONS

Practice Exercises 385
Solutions
1. (c) Segregation of duties is not an element of the fraud triangle. The other choices are fraud triangle elements.
2. (a) Safeguarding assets is one of the purposes of using internal control. The other choices are incorrect because while internal control can help to (b) prevent fraud, (c) produce correct fi nancial statements, and (d) deter employee dishonesty, it is not one of the main purposes of using it.
3. (a) Filing fi nancial statements with the IRS is not a result of the Sarbanes-Oxley Act (SOX); SOX focuses on the prevention or detection of fraud. The other choices are results of SOX.
4. (c) Management responsibility is not one of the principles of internal control. The other choices are true statements.
5. (b) Independent bank reconciliations are not a physical control. The other choices are true statements.
6. (d) Establishment of responsibility, segregation of duties and independent internal verifi cation are all relevant to a computerized system.
7. (b) Permitting only designated personnel to handle cash receipts is an application of the principle of establishment of responsi-bility, not (a) segregation of duties, (c) independent internal verifi cation, or (d) human resource controls.
8. (d) The use of prenumbered checks in disbursing cash is an application of the principle of documentation procedures, not (a) establishment of responsibility, (b) segregation of duties, or (c) physical controls.
9. (a) When this check is recorded, the company should debit Cash Over and Short for the shortage of $2 (total of the receipts plus cash in the drawer ($98) versus $100), not (b) debit Petty Cash for $94, (c) credit Cash for $94, or (d) credit Petty Cash for $2.
10. (a) Having bank auditors verify the correctness of the bank balance per books is not one of the control features of a bank account. The other choices are true statements.
11. (c) Deposits in transit are added to the bank balance on a bank reconciliation, not (a) deducted from the book balance, (b) added to the book balance, or (d) deducted from the bank balance.
12. (d) Because the depositor does not know the amount of the bank service charges until the bank statements is received, an adjusting entry must be made when the statement is received. The other choices are incorrect because (a) outstanding checks do not require an adjusting entry by the depositor because the checks have already been recorded in the depositor’s books, (b) depos-its in transit do not require an adjusting entry by the depositor because the deposits have already been recorded in the depositor’s books, and (c) bank errors do not require an adjusting entry by the depositor, but the depositor does need to inform the bank of the error so it can be corrected.
13. (c) An NSF check should not be considered cash. The other choices are true statements.
14. (c) Cash is listed fi rst in the current assets section. The other choices are incorrect because (a) cash and cash equivalents can be appropriately combined when reporting cash on the balance sheet, (b) restricted cash is not to be combined with cash when reporting cash on the balance sheet, and (d) restricted funds can be reported as current assets if they will be used within one year.
1. Listed below are fi ve procedures followed by Viel Company.
1. Total cash receipts are compared to bank deposits daily by Vonda Marshall, who receives cash over the counter.
2. Employees write down hours worked and turn in the sheet to the cashier’s offi ce.
3. As a cost-saving measure, employees do not take vacations.
4. Only the sales manager can approve credit sales.
5. Three different employees are assigned one task each related to inventory: ship goods to customers, bill customers, and receive payment from customers.
InstructionsIndicate whether each procedure is an example of good internal control or of weak inter-nal control. If it is an example of good internal control, indicate which internal control principle is being followed. If it is an example of weak internal control, indicate which internal control principles is violated. Use the table below.
Procedure IC Good or Weak? Related Internal Control Principle
1. 2. 3. 4. 5.
Indicate good or weak internal control procedures.
(LO 1, 2)
PRACTICE EXERCISES

386 8 Fraud, Internal Control, and Cash
Solution
1. Procedure IC Good or Weak? Related Internal Control Principle
1. Weak Independent internal verifi cation 2. Weak Physical controls 3. Weak Human resource controls 4. Good Establishment of responsibility 5. Good Segregation of duties
2. The information below relates to the Cash account in the ledger of Hillfarms Company.
Balance June 1—$9,947; Cash deposited—$37,120.Balance June 30—$10,094; Checks written—$36,973.
The June bank statement shows a balance of $9,525 on June 30 and the following mem-oranda.
Credits Debits
Collection of $850 note plus interest $34 $884 NSF check: R. Doll $245Interest earned on checking accounts $26 Safety deposit box rent $35
At June 30, deposits in transit were $2,581, and outstanding checks totaled $1,382.
Instructions(a) Prepare the bank reconciliation at June 30.
(b) Prepare the adjusting entries at June 30, assuming (1) the NFS check was from a cus-tomer on account, and (2) no interest had been accrued on the note.
Prepare bank reconciliation and adjusting entries.
(LO 3)
2. (a)
(b)
Solution
HILLFARMS COMPANYBank Reconciliation
June 30Cash balance per bank statement $ 9,525Add: Deposits in transit 2,581
12,106Less: Outstanding checks 1,382
Adjusted cash balance per bank $10,724
Cash balance per books $10,094Add: Collection of note receivable ($850 1 $34) $884 Interest earned 26 910
11,004Less: NSF check 245 Safety deposit box rent 35 280
Adjusted cash balance per books $10,724
June 30 Cash 884 Notes Receivable 850 Interest Revenue 34
30 Cash 26 Interest Revenue 26
30 Miscellaneous Expense 35 Cash 35
30 Accounts Receivable (R. Doll) 245 Cash 245

Practice Problem 387
Poorten Company’s bank statement for May 2017 shows the following data.
Balance 5/1 $12,650 Balance 5/31 $14,280Debit memorandum: Credit memorandum: NSF check $175 Collection of note receivable $505
The cash balance per books at May 31 is $13,319. Your review of the data reveals the following.
1. The NSF check was from Copple Co., a customer.
2. The note collected by the bank was a $500, 3-month, 12% note. The bank charged a $10 collection fee. No interest has been accrued.
3. Outstanding checks at May 31 total $2,410.
4. Deposits in transit at May 31 total $1,752.
5. A Poorten Company check for $352, dated May 10, cleared the bank on May 25. The company recorded this check, which was a payment on account, for $325.
Instructions(a) Prepare a bank reconciliation at May 31.
(b) Journalize the entries required by the reconciliation.
PRACTICE PROBLEM
Solution
(a) POORTEN COMPANY Bank Reconciliation May 31, 2017
Cash balance per bank statement $14,280Add: Deposits in transit 1,752
16,032Less: Outstanding checks 2,410
Adjusted cash balance per bank $13,622
Cash balance per books $13,319Add: Collection of note receivable $500, plus $15 interest, less collection fee $10 505
13,824
Less: NSF check $175 Error in recording check 27 202
Adjusted cash balance per books $13,622
(b)May 31 Cash 505 Miscellaneous Expense 10 Notes Receivable 500 Interest Revenue 15 (To record collection of note by bank)
31 Accounts Receivable—Copple Co. 175 Cash 175 (To record NSF check from Copple Co.)
31 Accounts Payable 27 Cash 27 (To correct error in recording check)
Prepare bank reconciliation and journalize entries.
(LO 3)

BRIEF EXERCISES
BE8-1 Match each situation with the fraud triangle factor—opportunity, fi nancial pres-sure, or rationalization—that best describes it.
1. An employee’s monthly credit card payments are nearly 75% of his or her monthly earnings.
2. An employee earns minimum wage at a fi rm that has reported record earnings for each of the last fi ve years.
Identify fraud triangle concepts.
(LO 1)
Brief Exercises, Exercises, DO IT! Exercises, and Problems and many additional resources are available for practice in WileyPLUS
QUESTIONS
1. A local bank reported that it lost $150,000 as the result of an employee fraud. Edward Jasso is not clear on what is meant by an “employee fraud.” Explain the meaning of fraud to Edward and give an example of frauds that might occur at a bank.
2. Fraud experts often say that there are three primary factors that contribute to employee fraud. Identify the three factors and explain what is meant by each.
3. Identify and describe the fi ve components of a good internal control system.
4. “Internal control is concerned only with enhancing the accuracy of the accounting records.” Do you agree? Explain.
5. What principles of internal control apply to most organizations?
6. At the corner grocery store, all sales clerks make change out of one cash register drawer. Is this a viola-tion of internal control? Why?
7. Liz Kelso is reviewing the principle of segregation of duties. What are the two common applications of this principle?
8. How do documentation procedures contribute to good internal control?
9. What internal control objectives are met by physical controls?
10. (a) Explain the control principle of independent inter-nal verifi cation. (b) What practices are important in applying this principle?
11. The management of Nickle Company asks you, as the company accountant, to explain (a) the concept of reasonable assurance in internal control and (b) the importance of the human factor in internal control.
12. Riverside Fertilizer Co. owns the following assets at the balance sheet date.
Cash in bank savings account $ 8,000Cash on hand 850Cash refund due from the IRS 1,000Checking account balance 14,000Postdated checks 500
What amount should Riverside report as cash in the balance sheet?
13. What principle(s) of internal control is (are) involved in making daily cash counts of over-the-counter receipts?
14. Seaton Department Stores has just installed new electronic cash registers in its stores. How do cash registers improve internal control over cash receipts?
15. At Kellum Wholesale Company, two mail clerks open all mail receipts. How does this strengthen internal control?
16. “To have maximum effective internal control over cash disbursements, all payments should be made by check.” Is this true? Explain.
17. Ken Deangelo Company’s internal controls over cash disbursements provide for the treasurer to sign checks imprinted by a check-writing machine in indelible ink after comparing the check with the approved invoice. Identify the internal control principles that are pres-ent in these controls.
18. How do the principles of (a) physical controls and (b) documentation controls apply to cash disbursements?
19. (a) What is a voucher system? (b) What principles of internal control apply to a voucher system?
20. What is the essential feature of an electronic funds transfer (EFT) procedure?
21. (a) Identify the three activities that pertain to a petty cash fund, and indicate an internal control principle that is applicable to each activity. (b) When are jour-nal entries required in the operation of a petty cash fund?
22. “The use of a bank contributes signifi cantly to good internal control over cash.” Is this true? Why or why not?
23. Anna Korte is confused about the lack of agreement between the cash balance per books and the balance per bank. Explain the causes for the lack of agree-ment to Anna, and give an example of each cause.
24. What are the four steps involved in fi nding differences between the balance per books and balance per bank?
25. Heather Kemp asks your help concerning an NSF check. Explain to Heather (a) what an NSF check is, (b) how it is treated in a bank reconciliation, and (c) whether it will require an adjusting entry.
26. (a) “Cash equivalents are the same as cash.” Do you agree? Explain. (b) How should restricted cash funds be reported on the balance sheet?
27. At what amount does Apple report cash and cash equivalents in its 2013 consolidated balance sheet?
388 8 Fraud, Internal Control, and Cash

Brief Exercises 389
3. An employee has an expensive gambling habit.4. An employee has check-writing and signing responsibilities for a small company, as
well as reconciling the bank account.
BE8-2 Shelly Eckert has prepared the following list of statements about internal control.
1. One of the objectives of internal control is to safeguard assets from employee theft, robbery, and unauthorized use.
2. One of the objectives of internal control is to enhance the accuracy and reliability of the accounting records.
3. No laws require U.S. corporations to maintain an adequate system of internal control.
Identify each statement as true or false. If false, indicate how to correct the statement.
BE8-3 Jessica Mahan is the new owner of Penny Parking. She has heard about internal control but is not clear about its importance for her business. Explain to Jessica the four purposes of internal control and give her one application of each purpose for Penny Parking.
BE8-4 The internal control procedures in Valentine Company provide that:
1. Employees who have physical custody of assets do not have access to the accounting records.
2. Each month, the assets on hand are compared to the accounting records by an internal auditor.
3. A prenumbered shipping document is prepared for each shipment of goods to customers.
Identify the principles of internal control that are being followed.
BE8-5 Rosenquist Company has the following internal control procedures over cash receipts. Identify the internal control principle that is applicable to each procedure.
1. All over-the-counter receipts are entered in cash registers.2. All cashiers are bonded.3. Daily cash counts are made by cashier department supervisors.4. The duties of receiving cash, recording cash, and custody of cash are assigned to differ-
ent individuals.5. Only cashiers may operate cash registers.
BE8-6 The cash register tape for Bluestem Industries reported sales of $6,871.50. Record the journal entry that would be necessary for each of the following situations. (a) Cash to be accounted for exceeds cash on hand by $50.75. (b) Cash on hand exceeds cash to be accounted for by $28.32.
BE8-7 While examining cash receipts information, the accounting department deter-mined the following information: opening cash balance $160, cash on hand $1,125.74, and cash sales per register tape $980.83. Prepare the required journal entry based upon the cash count sheet.
BE8-8 Pennington Company has the following internal control procedures over cash dis-bursements. Identify the internal control principle that is applicable to each procedure.
1. Company checks are prenumbered.2. The bank statement is reconciled monthly by an internal auditor.3. Blank checks are stored in a safe in the treasurer’s offi ce.4. Only the treasurer or assistant treasurer may sign checks.5. Check-signers are not allowed to record cash disbursement transactions.
BE8-9 On March 20, Dody’s petty cash fund of $100 is replenished when the fund contains $9 in cash and receipts for postage $52, freight-out $26, and travel expense $10. Prepare the journal entry to record the replenishment of the petty cash fund.
BE8-10 Lance Bachman is uncertain about the control features of a bank account. Explain the control benefi ts of (a) a check and (b) a bank statement.
Indicate internal control concepts.
(LO 1)
Explain the importance of internal control.
(LO 1)
Identify internal control principles.
(LO 1)
Identify the internal control principles applicable to cash receipts.
(LO 2)
Make journal entries for cash overage and shortfall.
(LO 2)
Make journal entry using cash count sheet.
(LO 2)
Identify the internal control principles applicable to cash disbursements.
(LO 2)
Prepare entry to replenish a petty cash fund.
(LO 2)
Identify the control features of a bank account.
(LO 3)

390 8 Fraud, Internal Control, and Cash
BE8-11 The following reconciling items are applicable to the bank reconciliation for Ellington Company: (1) outstanding checks, (2) bank debit memorandum for service charge, (3) bank credit memorandum for collecting a note for the depositor, and (4) depos-its in transit. Indicate how each item should be shown on a bank reconciliation.
BE8-12 Using the data in BE8-11, indicate (a) the items that will result in an adjustment to the depositor’s records and (b) why the other items do not require adjustment.
BE8-13 At July 31, Ramirez Company has the following bank information: cash balance per bank $7,420, outstanding checks $762, deposits in transit $1,620, and a bank service charge $20. Determine the adjusted cash balance per bank at July 31.
BE8-14 At August 31, Pratt Company has a cash balance per books of $9,500 and the fol-lowing additional data from the bank statement: charge for printing Pratt Company checks $35, interest earned on checking account balance $40, and outstanding checks $800. Determine the adjusted cash balance per books at August 31.
BE8-15 Zhang Company has the following cash balances: Cash in Bank $15,742, Payroll Bank Account $6,000, and Plant Expansion Fund Cash $25,000 to be used two years from now. Explain how each balance should be reported on the balance sheet.
Indicate location of reconciling items in a bank reconciliation.
(LO 3)
Identify reconciling items that require adjusting entries.
(LO 3)Prepare partial bank reconciliation.
(LO 3)
Prepare partial bank reconciliation.
(LO 3)
Explain the statement presentation of cash balances.
(LO 4)
Identify which control activity is violated in each of the following situations, and explain how the situation creates an opportunity for fraud or inappropriate account-ing practices.
1. Once a month, the sales department sends sales invoices to the accounting department to be recorded.
2. Leah Hutcherson orders merchandise for Rice Lake Company; she also receives mer-chandise and authorizes payment for merchandise.
3. Several clerks at Great Foods use the same cash register drawer.
Gary Stanten is concerned with control over mail receipts at Gary’s Sporting Goods. All mail receipts are opened by Al Krane. Al sends the checks to the accounting department, where they are stamped “For Deposit Only.” The accounting department re-cords and deposits the mail receipts weekly. Gary asks for your help in installing a good system of internal control over mail receipts.
Wilkinson Company established a $100 petty cash fund on August 1. On August 31, the fund had $7 cash remaining and petty cash receipts for postage $31, offi ce supplies $42, and miscellaneous expense $16. Prepare journal entries to establish the fund on August 1 and replenish the fund on August 31.
Roger Richman owns Richman Blankets. He asks you to explain how he should treat the following reconciling items when reconciling the company’s bank account.
1. Outstanding checks.2. A deposit in transit.3. The bank charged to the company account a check written by another company.4. A debit memorandum for a bank service charge.
Indicate whether each of the following statements is true or false.
1. A company has the following assets at the end of the year: cash on hand $40,000, cash refund due from customer $30,000, and checking account balance $22,000. Cash and cash equivalents is therefore $62,000.
2. A company that has received NSF checks should report these checks as a current liabil-ity on the balance sheet.
3. Restricted cash that is a current asset is reported as part of cash and cash equivalents.4. A company has cash in the bank of $50,000, petty cash of $400, and stock investments
of $100,000. Total cash and cash equivalents is therefore $50,400.
Identify violations of control activities.
(LO 1)
DO IT! 8-1
Design system of internal control over cash receipts.
(LO 2)
DO IT! 8-2a
Make journal entries for petty cash fund.
(LO 2)
DO IT! 8-2b
Explain treatment of items in bank reconciliation.
(LO 3)
DO IT! 8-3
Analyze statements about the reporting of cash.
(LO 4)
DO IT! 8-4
DO IT! Exercises

Exercises 391
EXERCISES
E8-1 Eve Herschel is the owner of Herschel’s Pizza. Herschel’s is operated strictly on a carryout basis. Customers pick up their orders at a counter where a clerk exchanges the pizza for cash. While at the counter, the customer can see other employees making the pizzas and the large ovens in which the pizzas are baked.
InstructionsIdentify the six principles of internal control and give an example of each principle that you might observe when picking up your pizza. (Note: It may not be possible to observe all the principles.)
E8-2 The following control procedures are used at Torres Company for over-the-counter cash receipts.
1. To minimize the risk of robbery, cash in excess of $100 is stored in an unlocked attaché case in the stock room until it is deposited in the bank.
2. All over-the-counter receipts are processed by three clerks who use a cash register with a single cash drawer.
3. The company accountant makes the bank deposit and then records the day’s receipts.4. At the end of each day, the total receipts are counted by the cashier on duty and recon-
ciled to the cash register total.5. Cashiers are experienced; they are not bonded.
Instructions(a) For each procedure, explain the weakness in internal control, and identify the control
principle that is violated.(b) For each weakness, suggest a change in procedure that will result in good internal
control.
E8-3 The following control procedures are used in Mendy Lang’s Boutique Shoppe for cash disbursements.
1. The company accountant prepares the bank reconciliation and reports any discrepan-cies to the owner.
2. The store manager personally approves all payments before signing and issuing checks.3. Each week, 100 company checks are left in an unmarked envelope on a shelf behind the
cash register.4. After payment, bills are fi led in a paid invoice folder.5. The company checks are unnumbered.
Instructions(a) For each procedure, explain the weakness in internal control, and identify the internal
control principle that is violated. (b) For each weakness, suggest a change in the procedure that will result in good internal
control.
E8-4 At Danner Company, checks are not prenumbered because both the purchasing agent and the treasurer are authorized to issue checks. Each signer has access to unis-sued checks kept in an unlocked fi le cabinet. The purchasing agent pays all bills pertain-ing to goods purchased for resale. Prior to payment, the purchasing agent determines that the goods have been received and verifi es the mathematical accuracy of the vendor’s invoice. After payment, the invoice is fi led by the vendor name, and the purchasing agent records the payment in the cash disbursements journal. The treasurer pays all other bills following approval by authorized employees. After payment, the treasurer stamps all bills PAID, fi les them by payment date, and records the checks in the cash disbursements journal. Danner Company maintains one checking account that is reconciled by the treasurer.
Instructions(a) List the weaknesses in internal control over cash disbursements. (b) Write a memo to the company treasurer indicating your recommendations
for improvement.
Identify the principles of internal control.
(LO 1)
Identify internal control weaknesses over cash receipts and suggest improvements.
(LO 1, 2)
Identify internal control weaknesses over cash disbursements and suggest improvements.
(LO 1, 2)
Identify internal control weaknesses for cash disbursements and suggest improvements.
(LO 2)

392 8 Fraud, Internal Control, and Cash
E8-5 Listed below are fi ve procedures followed by Eikenberry Company.
1. Several individuals operate the cash register using the same register drawer.2. A monthly bank reconciliation is prepared by someone who has no other cash respon-
sibilities.3. Joe Cockrell writes checks and also records cash payment journal entries.4. One individual orders inventory, while a different individual authorizes payments.5. Unnumbered sales invoices from credit sales are forwarded to the accounting department
every four weeks for recording.
InstructionsIndicate whether each procedure is an example of good internal control or of weak inter-nal control. If it is an example of good internal control, indicate which internal control principle is being followed. If it is an example of weak internal control, indicate which internal control principle is violated. Use the table below.
Procedure IC Good or Weak? Related Internal Control Principle
1. 2. 3. 4. 5.
E8-6 Listed below are fi ve procedures followed by Gilmore Company.
1. Employees are required to take vacations.2. Any member of the sales department can approve credit sales.3. Paul Jaggard ships goods to customers, bills customers, and receives payment from
customers.4. Total cash receipts are compared to bank deposits daily by someone who has no other
cash responsibilities.5. Time clocks are used for recording time worked by employees.
InstructionsIndicate whether each procedure is an example of good internal control or of weak inter-nal control. If it is an example of good internal control, indicate which internal control principle is being followed. If it is an example of weak internal control, indicate which internal control principle is violated. Use the table below.
Procedure IC Good or Weak? Related Internal Control Principle
1. 2. 3. 4. 5.
E8-7 Setterstrom Company established a petty cash fund on May 1, cashing a check for $100. The company reimbursed the fund on June 1 and July 1 with the following results.
June 1: Cash in fund $1.75. Receipts: delivery expense $31.25, postage expense $39.00, and miscellaneous expense $25.00.
July 1: Cash in fund $3.25. Receipts: delivery expense $21.00, entertainment expense $51.00, and miscellaneous expense $24.75.
On July 10, Setterstrom increased the fund from $100 to $130.
InstructionsPrepare journal entries for Setterstrom Company for May 1, June 1, July 1, and July 10.
E8-8 Horvath Company uses an imprest petty cash system. The fund was established on March 1 with a balance of $100. During March, the following petty cash receipts were found in the petty cash box.
Indicate whether procedure is good or weak internal control.
(LO 1, 2)
Indicate whether procedure is good or weak internal control.
(LO 1, 2)
Prepare journal entries for a petty cash fund.
(LO 2)
Prepare journal entries for a petty cash fund.
(LO 2)

Exercises 393
Receipt Date No. For Amount
3/5 1 Stamp Inventory $39 7 2 Freight-Out 21 9 3 Miscellaneous Expense 6 11 4 Travel Expense 24 14 5 Miscellaneous Expense 5
The fund was replenished on March 15 when the fund contained $2 in cash. On March 20, the amount in the fund was increased to $175.
InstructionsJournalize the entries in March that pertain to the operation of the petty cash fund.
E8-9 Don Wyatt is unable to reconcile the bank balance at January 31. Don’s reconcilia-tion is as follows.
Cash balance per bank $3,560.20Add: NSF check 490.00Less: Bank service charge 25.00
Adjusted balance per bank $4,025.20
Cash balance per books $3,875.20Less: Deposits in transit 530.00Add: Outstanding checks 730.00
Adjusted balance per books $4,075.20
Instructions(a) Prepare a correct bank reconciliation.(b) Journalize the entries required by the reconciliation.
E8-10 On April 30, the bank reconciliation of Westbrook Company shows three outstand-ing checks: no. 254, $650; no. 255, $620; and no. 257, $410. The May bank statement and the May cash payments journal show the following.
Prepare bank reconciliation and adjusting entries.
(LO 3)
Determine outstanding checks.
(LO 3)
Bank Statement
Checks Paid
Date Check No. Amount
5/4 254 $6505/2 257 4105/17 258 1595/12 259 2755/20 261 5005/29 263 4805/30 262 750
Cash Payments Journal
Checks Issued
Date Check No. Amount
5/2 258 $1595/5 259 2755/10 260 8905/15 261 5005/22 262 7505/24 263 4805/29 264 560
InstructionsUsing Step 2 in the reconciliation procedure, list the outstanding checks at May 31.
E8-11 The following information pertains to Crane Video Company.
1. Cash balance per bank, July 31, $7,263.2. July bank service charge not recorded by the depositor $28.3. Cash balance per books, July 31, $7,284.4. Deposits in transit, July 31, $1,300.5. Bank collected $700 note for Crane in July, plus interest $36, less fee $20. The collection
has not been recorded by Crane, and no interest has been accrued.6. Outstanding checks, July 31, $591.
Prepare bank reconciliation and adjusting entries.
(LO 3)

394 8 Fraud, Internal Control, and Cash
Instructions(a) Prepare a bank reconciliation at July 31.(b) Journalize the adjusting entries at July 31 on the books of Crane Video Company.
E8-12 The information below relates to the Cash account in the ledger of Minton Company.
Balance September 1—$17,150; Cash deposited—$64,000.Balance September 30—$17,404; Checks written—$63,746.
The September bank statement shows a balance of $16,422 on September 30 and the fol-lowing memoranda.
Credits Debits
Collection of $2,500 note plus interest $30 $2,530 NSF check: Richard Nance $425Interest earned on checking account $45 Safety deposit box rent $65
At September 30, deposits in transit were $5,450, and outstanding checks totaled $2,383.
Instructions(a) Prepare the bank reconciliation at September 30.(b) Prepare the adjusting entries at September 30, assuming (1) the NSF check was from
a customer on account, and (2) no interest had been accrued on the note.
E8-13 The cash records of Dawes Company show the following four situations.
1. The June 30 bank reconciliation indicated that deposits in transit total $920. During July, the general ledger account Cash shows deposits of $15,750, but the bank state-ment indicates that only $15,600 in deposits were received during the month.
2. The June 30 bank reconciliation also reported outstanding checks of $680. During the month of July, Dawes Company’s books show that $17,200 of checks were issued. The bank statement showed that $16,400 of checks cleared the bank in July.
3. In September, deposits per the bank statement totaled $26,700, deposits per books were $26,400, and deposits in transit at September 30 were $2,100.
4. In September, cash disbursements per books were $23,700, checks clearing the bank were $25,000, and outstanding checks at September 30 were $2,100.
There were no bank debit or credit memoranda. No errors were made by either the bank or Dawes Company.
InstructionsAnswer the following questions.
(a) In situation (1), what were the deposits in transit at July 31?(b) In situation (2), what were the outstanding checks at July 31?(c) In situation (3), what were the deposits in transit at August 31?(d) In situation (4), what were the outstanding checks at August 31?
E8-14 Wynn Company has recorded the following items in its fi nancial records.
Cash in bank $ 42,000Cash in plant expansion fund 100,000Cash on hand 12,000Highly liquid investments 34,000Petty cash 500Receivables from customers 89,000Stock investments 61,000
The highly liquid investments had maturities of 3 months or less when they were pur-chased. The stock investments will be sold in the next 6 to 12 months. The plant expansion project will begin in 3 years.
Instructions(a) What amount should Wynn report as “Cash and cash equivalents” on its balance
sheet?(b) Where should the items not included in part (a) be reported on the balance sheet?
Prepare bank reconciliation and adjusting entries.
(LO 3)
Compute deposits in transit and outstanding checks for two bank reconciliations.
(LO 3)
Show presentation of cash in fi nancial statements.
(LO 4)

Problems: Set A 395
PROBLEMS: SET A
P8-1A Bolz Offi ce Supply Company recently changed its system of internal control over cash disbursements. The system includes the following features. Instead of being unnumbered and manually prepared, all checks must now be pre-numbered and prepared by using the new accounts payable software purchased by the company. Before a check can be issued, each invoice must have the approval of Kathy Moon, the purchasing agent, and Robin Self, the receiving department supervisor. Checks must be signed by either Jennifer Edwards, the treasurer, or Rich Woodruff, the assistant treasurer. Before signing a check, the signer is expected to compare the amount of the check with the amount on the invoice. After signing a check, the signer stamps the invoice PAID and inserts within the stamp, the date, check number, and amount of the check. The “paid” invoice is then sent to the accounting department for recording. Blank checks are stored in a safe in the treasurer’s offi ce. The combination to the safe is known only by the treasurer and assistant treasurer. Each month, the bank statement is reconciled with the bank balance per books by the assistant chief accountant. All employees who handle or account for cash are bonded.
InstructionsIdentify the internal control principles and their application to cash disbursements of Bolz Offi ce Supply Company.
P8-2A Forney Company maintains a petty cash fund for small expenditures. The follow-ing transactions occurred over a 2-month period.
July 1 Established petty cash fund by writing a check on Scranton Bank for $200. 15 Replenished the petty cash fund by writing a check for $196.00. On this date
the fund consisted of $4.00 in cash and the following petty cash receipts: freight-out $92.00, postage expense $42.40, entertainment expense $46.60, and miscellaneous expense $11.20.
31 Replenished the petty cash fund by writing a check for $192.00. At this date, the fund consisted of $8.00 in cash and the following petty cash receipts: freight-out $82.10, charitable contributions expense $45.00, postage expense $25.50, and miscellaneous expense $39.40.
Aug. 15 Replenished the petty cash fund by writing a check for $187.00. On this date, the fund consisted of $13.00 in cash and the following petty cash receipts: freight-out $77.60, entertainment expense $43.00, postage expense $33.00, and miscellaneous expense $37.00.
16 Increased the amount of the petty cash fund to $300 by writing a check for $100.
31 Replenished the petty cash fund by writing a check for $284.00. On this date, the fund consisted of $16 in cash and the following petty cash receipts: postage expense $140.00, travel expense $95.60, and freight-out $47.10.
Instructions(a) Journalize the petty cash transactions.(b) Post to the Petty Cash account.(c) What internal control features exist in a petty cash fund?
P8-3A On May 31, 2017, Reber Company had a cash balance per books of $6,781.50. The bank statement from New York State Bank on that date showed a balance of $6,404.60. A comparison of the statement with the Cash account revealed the following facts.
1. The statement included a debit memo of $40 for the printing of additional company checks.
Journalize and post petty cash fund transactions.
(LO 2)
(a) July 15, Cash short $3.80(b) Aug. 31 balance $300
Prepare a bank reconciliation and adjusting entries.
(LO 3)
Identify internal control principles over cash disbursements.
(LO 1, 2)
EXERCISES: SET B AND CHALLENGE EXERCISES
Visit the book’s companion website, at www.wiley.com/college/weygandt, and choose the Student Companion site to access Exercises: Set B and Challenge Exercises.

396 8 Fraud, Internal Control, and Cash
2. Cash sales of $836.15 on May 12 were deposited in the bank. The cash receipts journal entry and the deposit slip were incorrectly made for $886.15. The bank credited Reber Company for the correct amount.
3. Outstanding checks at May 31 totaled $576.25. Deposits in transit were $2,416.15.4. On May 18, the company issued check No. 1181 for $685 to Lynda Carsen on account.
The check, which cleared the bank in May, was incorrectly journalized and posted by Reber Company for $658.
5. A $3,000 note receivable was collected by the bank for Reber Company on May 31 plus $80 interest. The bank charged a collection fee of $20. No interest has been accrued on the note.
6. Included with the cancelled checks was a check issued by Stiner Company to Ted Cress for $800 that was incorrectly charged to Reber Company by the bank.
7. On May 31, the bank statement showed an NSF charge of $680 for a check issued by Sue Allison, a customer, to Reber Company on account.
Instructions(a) Prepare the bank reconciliation at May 31, 2017.(b) Prepare the necessary adjusting entries for Reber Company at May 31, 2017.
P8-4A The bank portion of the bank reconciliation for Langer Company at November 30, 2017, was as follows.
LANGER COMPANYBank ReconciliationNovember 30, 2017
Cash balance per bank $14,367.90Add: Deposits in transit 2,530.20
16,898.10
Less: Outstanding checks Check Number Check Amount
3451 $2,260.40 3470 720.10 3471 844.50 3472 1,426.80 3474 1,050.00 6,301.80
Adjusted cash balance per bank $10,596.30
The adjusted cash balance per bank agreed with the cash balance per books at November 30. The December bank statement showed the following checks and deposits.
(a) Adjusted cash balance per bank $9,044.50
Prepare a bank reconciliation and adjusting entries from detailed data.
(LO 3)
Bank Statement
Checks Deposits
Date Number Amount Date Amount
12-1 3451 $ 2,260.40 12-1 $ 2,530.2012-2 3471 844.50 12-4 1,211.6012-7 3472 1,426.80 12-8 2,365.1012-4 3475 1,640.70 12-16 2,672.7012-8 3476 1,300.00 12-21 2,945.0012-10 3477 2,130.00 12-26 2,567.3012-15 3479 3,080.00 12-29 2,836.0012-27 3480 600.00 12-30 1,025.0012-30 3482 475.50 Total $18,152.9012-29 3483 1,140.0012-31 3485 540.80
Total $15,438.70

Problems: Set A 397
The cash records per books for December showed the following.
Cash Payments Journal
Date Number Amount Date Number Amount
12-1 3475 $1,640.70 12-20 3482 $ 475.5012-2 3476 1,300.00 12-22 3483 1,140.0012-2 3477 2,130.00 12-23 3484 798.0012-4 3478 621.30 12-24 3485 450.8012-8 3479 3,080.00 12-30 3486 889.5012-10 3480 600.00 Total $13,933.2012-17 3481 807.40
Cash Receipts Journal
Date Amount
12-3 $ 1,211.6012-7 2,365.1012-15 2,672.7012-20 2,954.0012-25 2,567.3012-28 2,836.0012-30 1,025.0012-31 1,690.40
Total $17,322.10
The bank statement contained two memoranda:
1. A credit of $5,145 for the collection of a $5,000 note for Langer Company plus interest of $160 and less a collection fee of $15. Langer Company has not accrued any interest on the note.
2. A debit of $572.80 for an NSF check written by L. Rees, a customer. At December 31, the check had not been redeposited in the bank.
At December 31, the cash balance per books was $12,485.20, and the cash balance per the bank statement was $20,154.30. The bank did not make any errors, but two errors were made by Langer Company.
Instructions(a) Using the four steps in the reconciliation procedure, prepare a bank reconciliation at
December 31.(b) Prepare the adjusting entries based on the reconciliation. (Hint: The correction of any
errors pertaining to recording checks should be made to Accounts Payable. The cor-rection of any errors relating to recording cash receipts should be made to Accounts Receivable.)
P8-5A Rodriguez Company maintains a checking account at the Imura Bank. At July 31, selected data from the ledger balance and the bank statement are shown below.
Cash in Bank
Per Books Per Bank
Balance, July 1 $17,600 $15,800July receipts 81,400July credits 83,470July disbursements 77,150July debits 74,756
Balance, July 31 $21,850 $24,514
Analysis of the bank data reveals that the credits consist of $79,000 of July deposits and a credit memorandum of $4,470 for the collection of a $4,400 note plus interest revenue of $70. The July debits per bank consist of checks cleared $74,700 and a debit memorandum of $56 for printing additional company checks. You also discover the following errors involving July checks. (1) A check for $230 to a creditor on account that cleared the bank in July was journalized and posted as $320. (2) A salary check to an employee for $255 was recorded by the bank for $155. The June 30 bank reconciliation contained only two reconciling items: deposits in transit $8,000 and outstanding checks of $6,200.
Instructions(a) Prepare a bank reconciliation at July 31, 2017.(b) Journalize the adjusting entries to be made by Rodriguez Company. Assume that inter-
est on the note has not been accrued.
(a) Adjusted balance per books $16,958.40
Prepare a bank reconciliation and adjusting entries.
(LO 3)
(a) Adjusted balance per books $26,354

398 8 Fraud, Internal Control, and Cash
P8-6A Rondelli Middle School wants to raise money for a new sound system for its audi-torium. The primary fund-raising event is a dance at which the famous disc jockey D.J. Sound will play classic and not-so-classic dance tunes. Matt Ballester, the music and the-ater instructor, has been given the responsibility for coordinating the fund-raising efforts. This is Matt’s fi rst experience with fund-raising. He decides to put the eighth-grade choir in charge of the event; he will be a relatively passive observer. Matt had 500 unnumbered tickets printed for the dance. He left the tickets in a box on his desk and told the choir students to take as many tickets as they thought they could sell for $5 each. In order to ensure that no extra tickets would be fl oating around, he told them to dispose of any unsold tickets. When the students received payment for the tickets, they were to bring the cash back to Matt and he would put it in a locked box in his desk drawer. Some of the students were responsible for decorating the gymnasium for the dance. Matt gave each of them a key to the money box and told them that if they took money out to purchase materials, they should put a note in the box saying how much they took and what it was used for. After 2 weeks the money box appeared to be getting full, so Matt asked Jeff Kenney to count the money, prepare a deposit slip, and deposit the money in a bank account Matt had opened. The day of the dance, Matt wrote a check from the account to pay the DJ. D.J. Sound, however, said that he accepted only cash and did not give receipts. So Matt took $200 out of the cash box and gave it to D.J. At the dance, Matt had Sam Copper working at the entrance to the gymnasium, collecting tickets from students, and selling tickets to those who had not prepurchased them. Matt estimated that 400 students attended the dance. The following day, Matt closed out the bank account, which had $250 in it, and gave that amount plus the $180 in the cash box to Principal Finke. Principal Finke seemed sur-prised that, after generating roughly $2,000 in sales, the dance netted only $430 in cash. Matt did not know how to respond.
InstructionsIdentify as many internal control weaknesses as you can in this scenario, and suggest how each could be addressed.
Identify internal control weaknesses in cash receipts and cash disbursements.
(LO 1, 2)
COMPREHENSIVE PROBLEM
CP8 On December 1, 2017, Fullerton Company had the following account balances.
Debit Credit
Cash $18,200 Accumulated Depreciation—Notes Receivable 2,200 Equipment $ 3,000Accounts Receivable 7,500 Accounts Payable 6,100Inventory 16,000 Owner’s Capital 64,400Prepaid Insurance 1,600 $73,500Equipment 28,000
$73,500
During December, the company completed the following transactions.
Dec. 7 Received $3,600 cash from customers in payment of account (no discount allowed). 12 Purchased merchandise on account from Vance Co. $12,000, terms 1/10, n/30. 17 Sold merchandise on account $16,000, terms 2/10, n/30. The cost of the merchandise sold
was $10,000. 19 Paid salaries $2,200. 22 Paid Vance Co. in full, less discount. 26 Received collections in full, less discounts, from customers billed on December 17. 31 Received $2,700 cash from customers in payment of account (no discount allowed).
PROBLEMS: SET B AND SET C
Visit the book’s companion website, at www.wiley.com/college/weygandt, and choose the Student Companion site to access Problems: Set B and Set C.

Broadening Your Perspective 399
CONTINUING PROBLEM
COOKIE CREATIONS: AN ENTREPRENEURIAL JOURNEY(Note: This is a continuation of the Cookie Creations problem from Chapters 1 through 7.)
CC8 Part 1 Natalie is struggling to keep up with the recording of her accounting transactions. She is spending a lot of time marketing and selling mixers and giving her cookie classes. Her friend John is an accounting student who runs his own accounting service. He has asked Natalie if she would like to have him do her accounting. John and Natalie meet and discuss her business.Part 2 Natalie decides that she cannot afford to hire John to do her accounting. One way that she can ensure that her cash account does not have any errors and is accurate and up-to-date is to prepare a bank reconciliation at the end of each month. Natalie would like you to help her.
Go to the book’s companion website, www.wiley.com/college/weygandt, to see the completion of this problem.
Adjustment data:
1. Depreciation $200 per month.2. Insurance expired $400.
Instructions(a) Journalize the December transactions. (Assume a perpetual inventory system.)(b) Enter the December 1 balances in the ledger T-accounts and post the December transactions. Use
Cost of Goods Sold, Depreciation Expense, Insurance Expense, Salaries and Wages Expense, Sales Revenue, and Sales Discounts.
(c) The statement from Jackson County Bank on December 31 showed a balance of $26,130. A com-parison of the bank statement with the Cash account revealed the following facts.
1. The bank collected a note receivable of $2,200 for Fullerton Company on December 15. 2. The December 31 receipts were deposited in a night deposit vault on December 31. These
deposits were recorded by the bank in January. 3. Checks outstanding on December 31 totaled $1,210. 4. On December 31, the bank statement showed an NSF charge of $680 for a check received by
the company from L. Bryan, a customer, on account.
Prepare a bank reconciliation as of December 31 based on the available information. (Hint: The cash balance per books is $26,100. This can be proven by fi nding the balance in the Cash account from parts (a) and (b).)
(d) Journalize the adjusting entries resulting from the bank reconciliation and adjustment data.(e) Post the adjusting entries to the ledger T-accounts.(f) Prepare an adjusted trial balance.(g) Prepare an income statement for December and a classifi ed balance sheet at December 31.
PERSPECTIVEFINANCIAL REPORTING AND ANALYSIS
Financial Reporting Problem: Apple Inc.BYP8-1 The fi nancial statements of Apple Inc. are presented in Appendix A at the end of this textbook. Instructions for accessing and using the company’s complete annual report, including the notes to the fi nancial statements, are also provided in Appendix A.
Instructions(a) What comments, if any, are made about cash in the report of the independent registered public
accounting fi rm?(b) What data about cash and cash equivalents are shown in the consolidated balance sheet?(c) In its notes to Consolidated Financial Statements, how does Apple defi ne cash equivalents?(d) In management’s Annual Report on Internal Control over Financial Reporting (Item 9A), what does
Apple’s management say about internal control?
BROADENING YOUR
© leungchopan/Shutterstock

Comparative Analysis Problem: PepsiCo, Inc. vs. The Coca-Cola CompanyBYP8-2 PepsiCo’s fi nancial statements are presented in Appendix B. Financial statements of The Coca-Cola Company are presented in Appendix C. Instructions for accessing and using the complete annual reports of PepsiCo and Coca-Cola, including the notes to the fi nancial statements, are also provided in Appendices B and C, respectively.
Instructions(a) Based on the information contained in these fi nancial statements, determine each of the following
for each company: (1) Cash and cash equivalents balance at December 28, 2013, for PepsiCo and at December 31,
2013, for Coca-Cola. (2) Increase (decrease) in cash and cash equivalents from 2012 to 2013. (3) Cash provided by operating activities during the year ended December 2013 (from statement
of cash fl ows).(b) What conclusions concerning the management of cash can be drawn from these data?
Comparative Analysis Problem: Amazon.com, Inc. vs. Wal-Mart Stores, Inc.BYP8-3 Amazon.com, Inc.’s fi nancial statements are presented in Appendix D. Financial statements of Wal-Mart Stores, Inc. are presented in Appendix E. Instructions for accessing and using the com-plete annual reports of Amazon and Wal-Mart, including the notes to the fi nancial statements, are also provided in Appendices D and E, respectively.
Instructions(a) Based on the information contained in these fi nancial statements, determine each of the following
for each company: (1) Cash and cash equivalents balance at December 31, 2013, for Amazon and at January 31,
2014, for Wal-Mart. (2) Increase (decrease) in cash and cash equivalents from 2012 to 2013. (3) Net cash provided by operating activities during the year ended December 31, 2013, for
Amazon and January 31, 2014, for Wal-Mart from statement of cash fl ows.(b) What conclusions concerning the management of cash can be drawn from these data?
Real-World FocusBYP8-4 All organizations should have systems of internal control. Universities are no exception. This site discusses the basics of internal control in a university setting.
Address: www.bc.edu/offi ces/audit/controls, or go to www.wiley.com/college/weygandt
Steps: Go to the site shown above.
InstructionsThe home page of this site provides links to pages that answer critical questions. Use these links to answer the following questions.
(a) In a university setting, who has responsibility for evaluating the adequacy of the system of internal control?
(b) What do reconciliations ensure in the university setting? Who should review the reconciliation?(c) What are some examples of physical controls?(d) What are two ways to accomplish inventory counts?
CRITICAL THINKING
Decision-Making Across the OrganizationBYP8-5 The board of trustees of a local church is concerned about the internal accounting controls for the offering collections made at weekly services. The trustees ask you to serve on a three-person audit team with the internal auditor of a local college and a CPA who has just joined the church.
400 8 Fraud, Internal Control, and Cash

Broadening Your Perspective 401
At a meeting of the audit team and the board of trustees you learn the following.
1. The church’s board of trustees has delegated responsibility for the fi nancial management and audit of the fi nancial records to the fi nance committee. This group prepares the annual budget and approves major disbursements. It is not involved in collections or recordkeeping. No audit has been made in recent years because the same trusted employee has kept church records and served as fi nancial secretary for 15 years. The church does not carry any fi delity insurance.
2. The collection at the weekly service is taken by a team of ushers who volunteer to serve one month. The ushers take the collection plates to a basement offi ce at the rear of the church. They hand their plates to the head usher and return to the church service. After all plates have been turned in, the head usher counts the cash received. The head usher then places the cash in the church safe along with a notation of the amount counted. The head usher volunteers to serve for 3 months.
3. The next morning the fi nancial secretary opens the safe and recounts the collection. The secretary withholds $150–$200 in cash, depending on the cash expenditures expected for the week, and deposits the remainder of the collections in the bank. To facilitate the deposit, church members who contribute by check are asked to make their checks payable to “Cash.”
4. Each month, the fi nancial secretary reconciles the bank statement and submits a copy of the rec-onciliation to the board of trustees. The reconciliations have rarely contained any bank errors and have never shown any errors per books.
InstructionsWith the class divided into groups, answer the following.
(a) Indicate the weaknesses in internal accounting control over the handling of collections.(b) List the improvements in internal control procedures that you plan to make at the next meeting of
the audit team for (1) the ushers, (2) the head usher, (3) the fi nancial secretary, and (4) the fi nance committee.
(c) What church policies should be changed to improve internal control?
Communication ActivityBYP8-6 As a new auditor for the CPA fi rm of Eaton, Quayle, and Hale, you have been assigned to review the internal controls over mail cash receipts of Pritchard Company. Your review reveals the following. Checks are promptly endorsed “For Deposit Only,” but no list of the checks is prepared by the person opening the mail. The mail is opened either by the cashier or by the employee who main-tains the accounts receivable records. Mail receipts are deposited in the bank weekly by the cashier.
InstructionsWrite a letter to Danny Peak, owner of Pritchard Company, explaining the weaknesses in internal control and your recommendations for improving the system.
Ethics CaseBYP8-7 You are the assistant controller in charge of general ledger accounting at Linbarger Bottling Company. Your company has a large loan from an insurance company. The loan agree-ment requires that the company’s cash account balance be maintained at $200,000 or more, as reported monthly. At June 30, the cash balance is $80,000, which you report to Lisa Infante, the fi nancial vice president. Lisa excitedly instructs you to keep the cash receipts book open for one additional day for purposes of the June 30 report to the insurance company. Lisa says, “If we don’t get that cash balance over $200,000, we’ll default on our loan agreement. They could close us down, put us all out of our jobs!” Lisa continues, “I talked to Oconto Distributors (one of Linbarger’s largest customers) this morning. They said they sent us a check for $150,000 yesterday. We should receive it tomorrow. If we include just that one check in our cash balance, we’ll be in the clear. It’s in the mail!”
Instructions(a) Who will suffer negative effects if you do not comply with Lisa Infante’s instructions? Who will
suffer if you do comply?(b) What are the ethical considerations in this case?(c) What alternatives do you have?
All About YouBYP8-8 The print and electronic media are full of stories about potential security risks that may arise from your computer or smartphone. It is important to keep in mind, however, that there are

also many other ways that your identity can be stolen. The federal government provides many resources to help protect you from identity thieves.
InstructionsGo to http://onguardonline.gov/idtheft.html, click Video and Media, and then click on ID Theft Faceoff. Complete the quiz provided there.
FASB Codifi cation ActivityBYP8-9 If your school has a subscription to the FASB Codifi cation, go to http://aaahq.org/ascLogin.cfm to log in and prepare responses to the following.
(a) How is cash defi ned in the Codifi cation?(b) How are cash equivalents defi ned in the Codifi cation?(c) What are the disclosure requirements related to cash and cash equivalents?
402 8 Fraud, Internal Control, and Cash
5 Compare the accounting for fraud, internal control, and cash under GAAP and IFRS.
LEARNING OBJECTIVE
Fraud can occur anywhere. Because the three main factors that contribute to fraud are universal in nature, the principles of internal control activities are used globally by companies. While Sarbanes-Oxley (SOX) does not apply to international companies, most large international companies have internal controls similar to those indicated in the chapter. IFRS and GAAP are also very similar in accounting for cash. IAS No. 1 (revised), “Presentation of Financial Statements,” is the only standard that discusses issues specifi cally related to cash.
Relevant FactsFollowing are the key similarities and differences between GAAP and IFRS related to fraud, internal control, and cash.
Similarities• The fraud triangle discussed in this chapter is applicable to all international companies. Some of
the major frauds on an international basis are Parmalat (Italy), Royal Ahold (the Netherlands), and Satyam Computer Services (India).
• Rising economic crime poses a growing threat to companies, with nearly one-third of all organiza-tions worldwide being victims of fraud in a recent 12-month period.
• Accounting scandals both in the United States and internationally have re-ignited the debate over the relative merits of GAAP, which takes a “rules-based” approach to accounting, versus IFRS, which takes a “principles-based” approach. The FASB announced that it intends to introduce more principles-based standards.
• On a lighter note, at one time the Ig Nobel Prize in Economics went to the CEOs of those compa-nies involved in the corporate accounting scandals of that year for “adapting the mathematical concept of imaginary numbers for use in the business world.” A parody of the Nobel Prizes, the Ig Nobel Prizes (read Ignoble, as not noble) are given each year in early October for 10 achievements that “fi rst make people laugh, and then make them think.” Organized by the scientifi c humor mag-azine Annals of Improbable Research (AIR), they are presented by a group that includes genuine Nobel laureates at a ceremony at Harvard University’s Sanders Theater. (See en.wikipedia.org/wiki/Ig_Nobel_Prize.)
• The accounting and internal control procedures related to cash are essentially the same under both IFRS and this textbook. In addition, the defi nition used for cash equivalents is the same.
• Most companies report cash and cash equivalents together under IFRS, as shown in this textbook. In addition, IFRS follows the same accounting policies related to the reporting of restricted cash.
A Look at IFRS

A Look at IFRS 403
Differences• The SOX internal control standards apply only to companies listed on U.S. exchanges. There is
continuing debate over whether foreign issuers should have to comply with this extra layer of regulation.
Looking to the FutureEthics has become a very important aspect of reporting. Different cultures have different perspectives on bribery and other questionable activities, and consequently penalties for engaging in such activi-ties vary considerably across countries. High-quality international accounting requires both high-quality accounting standards and high-quality auditing. Similar to the convergence of GAAP and IFRS, there is movement to improve international auditing standards. The International Auditing and Assurance Standards Board (IAASB) functions as an independent standard-setting body. It works to establish high-quality auditing and assurance and quality-control standards throughout the world. Whether the IAASB adopts internal control provisions similar to those in SOX remains to be seen. You can follow developments in the international audit arena at http://www.ifac.org/iaasb/.
IFRS Practice
IFRS Self-Test Questions
1. Non-U.S companies that follow IFRS:(a) do not normally use the principles of internal control activities described in this textbook.(b) often offset cash with accounts payable on the balance sheet.(c) are not required to follow SOX.(d) None of the above.
2. The Sarbanes-Oxley Act applies to:(a) all U.S. companies listed on U.S. exchanges.(b) all companies that list stock on any stock exchange in any country.(c) all European companies listed on European exchanges.(d) Both (a) and (c).
3. High-quality international accounting requires both high-quality accounting standards and:(a) a reconsideration of SOX to make it less onerous.(b) high-quality auditing standards.(c) government intervention to ensure that the public interest is protected.(d) the development of new principles of internal control activities.
IFRS ExerciseIFRS8-1 Some people argue that the internal control requirements of the Sarbanes-Oxley Act (SOX) put U.S. companies at a competitive disadvantage to companies outside the United States. Discuss the competitive implications (both pros and cons) of SOX.
International Financial Reporting Problem: Louis Vuitton
IFRS8–2 The fi nancial statements of Louis Vuitton are presented in Appendix F. Instructions for accessing and using the company’s complete annual report, including the notes to its fi nancial state-ments, are also provided in Appendix F.
InstructionsUsing the notes to the company’s fi nancial statements, what are Louis Vuitton’s accounting policies related to cash and cash equivalents?
Answers to IFRS Self-Test Questions
1. c 2. a 3. b

“Sometimes you have to know when to be very tough, and
sometimes you can give them a bit of a break,” said Vivi Su.
She wasn’t talking about her children but about the customers
of a subsidiary of former pharmaceutical company Whitehall-
Robins, where she worked as supervisor of credit and
collections.
For example, while the company’s regular terms were 1/15,
n/30 (1% discount if paid within 15 days), a customer might
have asked for and received a few days of grace and still got
the discount. Or a customer might have placed orders above
its credit limit, in which case, depending on its payment
history and the circumstances, Ms. Su might have authorized
shipment of the goods anyway.
“It’s not about drawing a line in the sand, and that’s all,”
she explained. “You want a good relationship with your
customers—but you also need to bring in the money.”
“The money,” in Whitehall-Robins’ case, amounted to some
$170 million in sales a year. Nearly all of it came in through the
credit accounts Ms. Su managed. The process started with
the decision to grant a customer an account in the fi rst place.
The sales rep gave the customer a credit application. “My
department reviews this application very carefully; a customer
needs to supply three good references, and we also run a
check with a credit fi rm like Equifax. If we accept them, then
based on their size and history, we assign a credit limit,”
Ms. Su explained.
Once accounts were established, “I get an aging report every
single day,” said Ms. Su. “The rule of thumb is that we should
always have at least 85% of receivables current—meaning
they were billed less than 30 days ago,” she continued. “But
we try to do even better than that—I like to see 90%.”
At 15 days overdue, Whitehall-Robins phoned the client. After
45 days, Ms. Su noted, “I send a letter. Then a second notice
is sent in writing. After the third and fi nal notice, the client
has 10 days to pay, and then I hand it over to a collection
agency, and it’s out of my hands.”
Ms. Su’s boss, Terry Norton, recorded an estimate for bad
debts every year, based on a percentage of receivables. The
percentage depended on the current aging history. He also
calculated and monitored the company’s accounts receivable
turnover, which the company reported in its fi nancial
statements.
Ms. Su knew that she and Mr. Norton were crucial to the
profi tability of Whitehall-Robins. “Receivables are generally
the second-largest asset of any company (after its capital
assets),” she pointed out. “So it’s no wonder we keep a very
close eye on them.”
A Dose of Careful Management Keeps Receivables Healthy
As indicated in the Feature Story below, receivables are a signifi cant asset for many pharmaceutical companies. Because a large portion of sales in the United States are credit sales, receivables are important to companies in other industries as well. As a consequence, companies must pay close attention to their receivables and manage them carefully. In this chapter, you will learn what journal entries companies make when they sell products, when they collect cash from those sales, and when they write off accounts they cannot collect.
CHAPTER PREVIEW
9
FEATURE STORY
Accounting for Receivables
404

Describe how companies value notes receivable, record their disposition, and present and analyze receivables.
Describe how companies value accounts receivable and record their disposition.
Explain how companies recognize notes receivable.
2
3
4
Explain how companies recognize accounts receivable.1 Recognizing Accounts
ReceivableDO IT! 1
• Types of receivables• Recognizing accounts
receivable
• Valuing accounts receivable• Disposing of accounts
receivable
Learning Objectives
Recording Business ActivitiesRecognizing Notes
ReceivableDO IT! 3• Determining the maturity date• Computing interest• Recognizing notes receivable
Analysis of ReceivablesDO IT! 4• Valuing notes receivable• Disposing of notes receivable• Statement presentation and
analysis
DO IT! 2 Uncollectible Accounts Receivable
CHAPTER OUTLINE
© Cogal/iStockphoto
Describe how companies value notes receivable, record their disposition,and present and analyze receivables.
Describe how companies value accounts receivable and record their disposition.
Explain how companies recognizenotes receivable.
2
3
4
Explain how companies recognizeaccounts receivable.1 Recognizing Accounts
Receivable DO IT! 1
• Types of receivables• Recognizing accounts
receivable
• Valuing accounts receivable• Disposing of accounts
receivable
Recognizing Notes Receivable DO IT! 3
• Determining the maturity date• Computing interest• Recognizing notes receivable
Analysis of Receivables DO IT! 4• Valuing notes receivable• Disposing of notes receivable• Statement presentation and
analysis
DO IT! 2 Uncollectible Accounts Receivable
Learning Objectives
CHAPTER OUTLINE
© Cogal/iStockphoto
Go to the REVIEW AND PRACTICE section at the end of the chapter for a review of key concepts and practice applications with solutions.
Visit WileyPLUS with ORION for additional tutorials and practice opportunities.

406 9 Accounting for Receivables
1 Explain how companies recognize accounts receivable.LEARNING OBJECTIVE
Types of Receivables
The term receivables refers to amounts due from individuals and companies. Receivables are claims that are expected to be collected in cash. The management of receivables is a very important activity for any company that sells goods or services on credit. Receivables are important because they represent one of a company’s most liquid assets. For many companies, receivables are also one of the largest assets. For example, receivables represent 13.7% of the current assets of pharmaceutical giant Rite Aid. Illustration 9-1 lists receivables as a percentage of total assets for fi ve other well-known companies in a recent year.
Illustration 9-1Receivables as a percentage of assets
Receivables as a Company Percentage of Total Assets
Ford Motor Company 43.2%General Electric 41.5Minnesota Mining and Manufacturing Company (3M) 12.7DuPont Co. 11.7Intel Corporation 3.9
The relative signifi cance of a company’s receivables as a percentage of its assets depends on various factors: its industry, the time of year, whether it extends long-term fi nancing, and its credit policies. To refl ect important differences among receivables, they are frequently classifi ed as (1) accounts receivable, (2) notes receivable, and (3) other receivables. Accounts receivable are amounts customers owe on account. They result from the sale of goods and services. Companies generally expect to collect accounts receivable within 30 to 60 days. They are usually the most signifi cant type of claim held by a company. Notes receivable are a written promise (as evidenced by a formal instru-ment) for amounts to be received. The note normally requires the collection of interest and extends for time periods of 60–90 days or longer. Notes and accounts receivable that result from sales transactions are often called trade receivables. Other receivables include nontrade receivables such as interest receivable, loans to company offi cers, advances to employees, and income taxes refundable. These do not generally result from the operations of the business. Therefore, they are generally classifi ed and reported as separate items in the balance sheet.
Recognizing Accounts Receivable
Recognizing accounts receivable is relatively straightforward. A service organiza-tion records a receivable when it performs service on account. A merchandiser records accounts receivable at the point of sale of merchandise on account. When a merchandiser sells goods, it increases (debits) Accounts Receivable and increases (credits) Sales Revenue. The seller may offer terms that encourage early payment by providing a dis-count. Sales returns also reduce receivables. The buyer might fi nd some of the goods unacceptable and choose to return the unwanted goods.
ETHICS NOTE
Companies report receivables from employees separately in the fi nancial statements. The reason: Sometimes these receivables are not the result of an “arm’s- length” transaction.
Recognition of Accounts Receivable 407
To review, assume that Jordache Co. on July 1, 2017, sells merchandise on account to Polo Company for $1,000, terms 2/10, n/30. On July 5, Polo returns merchandise with a sales price of $100 to Jordache Co. On July 11, Jordache receives payment from Polo Company for the balance due. The journal entries to record these transactions on the books of Jordache Co. are as follows. (Cost of goods sold entries are omitted.)
ETHICS NOTE
In exchange for lower interest rates, some companies have eliminated the 25-day grace period before fi nance charges kick in. Be sure you read the fi ne print in any credit agreement you sign.
July 1 Accounts Receivable—Polo Company 1,000 Sales Revenue 1,000 (To record sales on account)
July 5 Sales Returns and Allowances 100 Accounts Receivable—Polo Company 100 (To record merchandise returned)
July 11 Cash ($900 2 $18) 882 Sales Discounts ($900 3 .02) 18 Accounts Receivable—Polo Company 900 (To record collection of accounts receivable)
Helpful HintThese entries are the same as those described in Chapter 5. For simplicity, we have omitted inventory and cost of goods sold from this set of journal entries and from end-of-chapter material.
Some retailers issue their own credit cards. When you use a retailer’s credit card (JCPenney, for example), the retailer charges interest on the balance due if not paid within a specifi ed period (usually 25–30 days). To illustrate, assume that you use your JCPenney Company credit card to purchase clothing with a sales price of $300 on June 1, 2017. JCPenney will increase (debit) Accounts Receivable for $300 and increase (credit) Sales Revenue for $300 (cost of goods sold entry omitted) as follows.
June 1 Accounts Receivable 300 Sales Revenue 300 (To record sale of merchandise)
June 30 Accounts Receivable 4.50 Interest Revenue 4.50 (To record interest on amount due)
Assuming that you owe $300 at the end of the month and JCPenney charges 1.5% per month on the balance due, the adjusting entry that JCPenney makes to record interest revenue of $4.50 ($300 3 1.5%) on June 30 is as follows.
Interest revenue is often substantial for many retailers.
13001300 Rev
Cash Flowsno effect
A OEL5 1
14.5014.50 Rev
Cash Flowsno effect
A OEL5 1
Tasanee was the accounts receivable clerk for a large nonprofi t foundation that provided performance and exhibition space for the performing and visual arts. Her responsi-bilities included activities normally assigned to an accounts receivable clerk, such as recording revenues from various sources (donations, facility rental fees, ticket revenue, and bar receipts). However, she was also responsible for handling all cash and checks from the time they were received until the time she deposited them, as well as pre-paring the bank reconciliation. Tasanee took advantage of her situation by falsifying bank deposits and bank reconciliations so that she could steal cash from the bar receipts. Since nobody else logged the donations or matched the donation receipts to pledges prior to Tasanee receiving them, she was able to offset the cash that was stolen against donations that she received but didn’t record. Her crime was made easier by the fact that her boss, the company’s controller, only did a very superfi cial review of the bank reconciliation and thus didn’t notice that some numbers had been cut out from other documents and taped onto the bank reconciliation.
ANATOMY OF A FRAUD

408 9 Accounting for Receivables
Total take: $1.5 million
THE MISSING CONTROLSSegregation of duties. The foundation should not have allowed an accounts receiv-able clerk, whose job was to record receivables, to also handle cash, record cash, make deposits, and especially prepare the bank reconciliation.
Independent internal verifi cation. The controller was supposed to perform a thor-ough review of the bank reconciliation. Because he did not, he was terminated from his position.
Source: Adapted from Wells, Fraud Casebook (2007), pp. 183–194.
2 Describe how companies value accounts receivable and record their disposition.
LEARNING OBJECTIVE
Valuing Accounts Receivable
Once companies record receivables in the accounts, the next question is: How should they report receivables in the fi nancial statements? Companies report accounts receivable on the balance sheet as an asset. But determining the amount to report is sometimes diffi cult because some receivables will become uncollectible. Each customer must satisfy the credit requirements of the seller before the credit sale is approved. Inevitably, though, some accounts receivable become uncollectible. For example, a customer may not be able to pay because of a decline in its sales revenue due to a downturn in the economy. Similarly, individ-uals may be laid off from their jobs or faced with unexpected hospital bills. Companies record credit losses as Bad Debt Expense (or Uncollectible Accounts Expense). Such losses are a normal and necessary risk of doing business on a credit basis. When U.S. home prices fell, home foreclosures rose, and the economy slowed as a result of the fi nancial crises of 2008, lenders experienced huge increases in their bad debt expense. For example, during one quarter Wachovia (a large U.S. bank now owned by Wells Fargo) increased bad debt expense from $108 million to $408 million. Similarly, American Express increased its bad debt expense by 70%.
Alternative TerminologyYou will sometimes see Bad Debt Expense called Uncollectible Accounts Expense.
On May 1, Wilton sold merchandise on account to Bates for $50,000, terms 3/15, net 45. On May 4, Bates returns merchandise with a sales price of $2,000. On May 16, Wilton receives payment from Bates for the balance due. Prepare journal entries to record the May transactions on Wilton’s books. (You may ignore cost of goods sold entries and explanations.)
Solution
DO IT! 1 Recognizing Accounts Receivable
May 1 Accounts Receivable—Bates 50,000 Sales Revenue 50,000
May 4 Sales Returns and Allowances 2,000 Accounts Receivable—Bates 2,000
May 16 Cash ($48,000 2 $1,440) 46,560 Sales Discounts ($48,000 3 .03) 1,440 Accounts Receivable—Bates 48,000
Related exercise material: BE9-1, BE9-2, E9-1, E9-2, and DO IT! 9-1.
Action Plan✔ Prepare entry to
record the receivable and related return.
✔ Compute the sales discount and related entry.

Valuation and Disposition of Accounts Receivable 409
Two methods are used in accounting for uncollectible accounts: (1) the direct write-off method and (2) the allowance method. The following sections explain these methods.
DIRECT WRITE-OFF METHOD FOR UNCOLLECTIBLE ACCOUNTS
Under the direct write-off method, when a company determines a particular account to be uncollectible, it charges the loss to Bad Debt Expense. Assume, for example, that Warden Co. writes off as uncollectible M. E. Doran’s $200 balance on December 12. Warden’s entry is as follows.
Dec. 12 Bad Debt Expense 200 Accounts Receivable—M. E. Doran 200 (To record write-off of M. E. Doran account)
2200 Exp2200
Cash Flowsno effect
A OEL5 1
Under this method, Bad Debt Expense will show only actual losses from uncollectibles. The company will report accounts receivable at its gross amount. Although this method is simple, its use can reduce the usefulness of both the income statement and balance sheet. Consider the following example. Assume that in 2017, Quick Buck Computer Company decided it could increase its revenues by offering computers to college students without requiring any money down and with no credit-approval process. On campuses across the country, it distributed one million computers with a selling price of $800 each. This increased Quick Buck’s revenues and receivables by $800 million. The promotion was a huge success! The 2017 balance sheet and income statement looked great. Unfortunately, during 2018, nearly 40% of the customers defaulted on their loans. This made the 2018 income statement and balance sheet look terrible. Illustration 9-2 shows the effect of these events on the fi nancial statements if the direct write-off method is used.
Illustration 9-2Effects of direct write-off method
Year 2017 Year 2018
Huge sales promotion.Sales increase dramatically.
Accounts receivable increases dramatically.
Customers default on loans.Bad debt expense increases dramatically.
Accounts receivable plummets.
Netincome
Netincome
Under the direct write-off method, companies often record bad debt expense in a period different from the period in which they record the revenue. The method does not attempt to match bad debt expense to sales revenue in the income statement. Nor does the direct write-off method show accounts receiv-able in the balance sheet at the amount the company actually expects to receive. Consequently, unless bad debt losses are insignifi cant, the direct write-off method is not acceptable for fi nancial reporting purposes.
ALLOWANCE METHOD FOR UNCOLLECTIBLE ACCOUNTS
The allowance method of accounting for bad debts involves estimating uncol-lectible accounts at the end of each period. This provides better matching on the income statement. It also ensures that companies state receivables on the balance sheet at their cash (net) realizable value. Cash (net) realizable value is the net amount the company expects to receive in cash. It excludes amounts that the company estimates it will not collect. Thus, this method reduces receivables in the balance sheet by the amount of estimated uncollectible receivables.

410 9 Accounting for Receivables
GAAP requires the allowance method for fi nancial reporting purposes when bad debts are material in amount. This method has three essential features:
1. Companies estimate uncollectible accounts receivable. They match this esti-mated expense against revenues in the same accounting period in which they record the revenues.
2. Companies debit estimated uncollectibles to Bad Debt Expense and credit them to Allowance for Doubtful Accounts through an adjusting entry at the end of each period. Allowance for Doubtful Accounts is a contra account to Accounts Receivable.
3. When companies write off a specifi c account, they debit actual uncollectibles to Allowance for Doubtful Accounts and credit that amount to Accounts Receivable.
RECORDING ESTIMATED UNCOLLECTIBLES To illustrate the allowance method, assume that Hampson Furniture has credit sales of $1,200,000 in 2017. Of this amount, $200,000 remains uncollected at December 31. The credit manager estimates that $12,000 of these sales will be uncollectible. The adjusting entry to record the estimated uncollectibles increases (debits) Bad Debt Expense and increases (credits) Allowance for Doubtful Accounts, as follows.
Helpful HintIn this context, material means signifi cant or important to fi nancial statement users.
Dec. 31 Bad Debt Expense 12,000 Allowance for Doubtful Accounts 12,000 (To record estimate of uncollectible accounts)
212,000 Exp212,000
Cash Flowsno effect
A OEL5 1
Hampson reports Bad Debt Expense in the income statement as an operating expense (usually as a selling expense). Thus, the estimated uncollectibles are matched with sales in 2017. Hampson records the expense in the same year it made the sales. Allowance for Doubtful Accounts shows the estimated amount of claims on customers that the company expects will become uncollectible in the future. Companies use a contra account instead of a direct credit to Accounts Receivable because they do not know which customers will not pay. The credit balance in the allowance account will absorb the specifi c write-offs when they occur. As Illustration 9-3 shows, the company deducts the allowance account from accounts receivable in the current assets section of the balance sheet.
Current assets Cash $ 14,800 Accounts receivable $200,000 Less: Allowance for doubtful accounts 12,000 188,000 Inventory 310,000 Supplies 25,000
Total current assets $537,800
HAMPSON FURNITUREBalance Sheet (partial)
Illustration 9-3Presentation of allowance for doubtful accounts
The amount of $188,000 in Illustration 9-3 represents the expected cash real-izable value of the accounts receivable at the statement date. Companies do not close Allowance for Doubtful Accounts at the end of the fi scal year.
RECORDING THE WRITE-OFF OF AN UNCOLLECTIBLE ACCOUNT As described in the Feature Story, companies use various methods of collecting past-due accounts, such as letters, calls, and legal action. When they have exhausted all means of col-lecting a past-due account and collection appears impossible, the company writes
Helpful HintCash realizable value is sometimes referred to as accounts receivable (net).

Valuation and Disposition of Accounts Receivable 411
off the account. In the credit card industry, for example, it is standard practice to write off accounts that are 210 days past due. To prevent premature or unautho-rized write-offs, authorized management personnel should formally approve each write-off. To maintain segregation of duties, the employee authorized to write off accounts should not have daily responsibilities related to cash or receivables. To illustrate a receivables write-off, assume that the fi nancial vice president of Hampson Furniture authorizes a write-off of the $500 balance owed by R. A. Ware on March 1, 2018. The entry to record the write-off is as follows.
Mar. 1 Allowance for Doubtful Accounts 500 Accounts Receivable—R. A. Ware 500 (Write-off of R. A. Ware account)
15002500
Cash Flowsno effect
A OEL5 1
15002500
Cash Flowsno effect
A OEL5 1
Bad Debt Expense does not increase when the write-off occurs. Under the allow-ance method, companies debit every bad debt write-off to the allowance account rather than to Bad Debt Expense. A debit to Bad Debt Expense would be incorrect because the company has already recognized the expense when it made the adjusting entry for estimated bad debts. Instead, the entry to record the write-off of an uncollectible account reduces both Accounts Receivable and Allowance for Doubtful Accounts. After posting, the general ledger accounts appear as shown in Illustration 9-4.
A write-off affects only balance sheet accounts—not income statement accounts. The write-off of the account reduces both Accounts Receivable and Allowance for Doubtful Accounts. Cash realizable value in the balance sheet, therefore, remains the same, as Illustration 9-5 shows.
Accounts Receivable Allowance for Doubtful Accounts
Jan. 1 Bal. 200,000 Mar. 1 500 Mar. 1 500 Jan. 1 Bal. 12,000
Mar. 1 Bal. 199,500 Mar. 1 Bal. 11,500
Illustration 9-4General ledger balances after write-off
RECOVERY OF AN UNCOLLECTIBLE ACCOUNT Occasionally, a company collects from a customer after it has written off the account as uncollectible. The company makes two entries to record the recovery of a bad debt. (1) It reverses the entry made in writing off the account. This reinstates the customer’s account. (2) It journalizes the collection in the usual manner. To illustrate, assume that on July 1, R. A. Ware pays the $500 amount that Hampson had written off on March 1. Hampson makes the following entries.
Before Write-Off After Write-Off
Accounts receivable $ 200,000 $ 199,500Allowance for doubtful accounts 12,000 11,500
Cash realizable value $188,000 $188,000
Illustration 9-5Cash realizable value comparison
15002500
Cash Flows1500
A OEL5 1
(1)
July 1 Accounts Receivable—R. A. Ware 500 Allowance for Doubtful Accounts 500 (To reverse write-off of R. A. Ware account)
(2)
July 1 Cash 500 Accounts Receivable—R. A. Ware 500 (To record collection from R. A. Ware)
Note that the recovery of a bad debt, like the write-off of a bad debt, affects only balance sheet accounts. The net effect of the two entries above is a debit
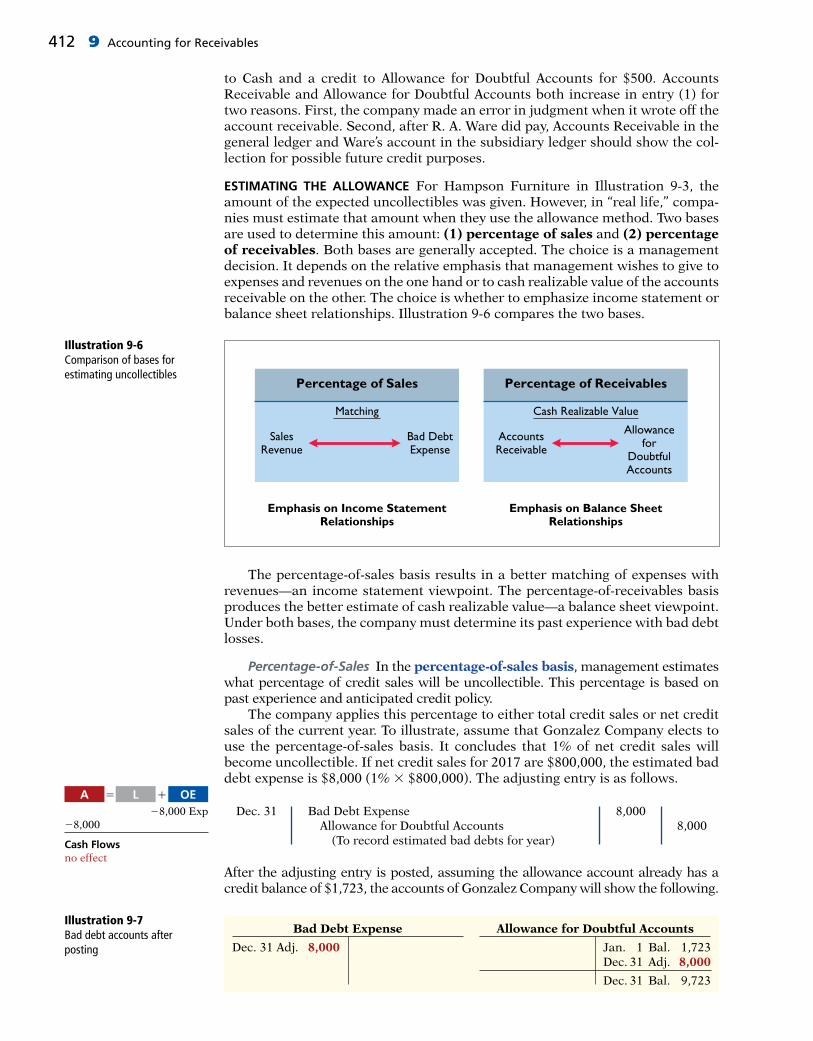
412 9 Accounting for Receivables
to Cash and a credit to Allowance for Doubtful Accounts for $500. Accounts Receivable and Allowance for Doubtful Accounts both increase in entry (1) for two reasons. First, the company made an error in judgment when it wrote off the account receivable. Second, after R. A. Ware did pay, Accounts Receivable in the general ledger and Ware’s account in the subsidiary ledger should show the col-lection for possible future credit purposes.
ESTIMATING THE ALLOWANCE For Hampson Furniture in Illustration 9-3, the amount of the expected uncollectibles was given. However, in “real life,” compa-nies must estimate that amount when they use the allowance method. Two bases are used to determine this amount: (1) percentage of sales and (2) percentage of receivables. Both bases are generally accepted. The choice is a management decision. It depends on the relative emphasis that management wishes to give to expenses and revenues on the one hand or to cash realizable value of the accounts receivable on the other. The choice is whether to emphasize income statement or balance sheet relationships. Illustration 9-6 compares the two bases.
Percentage of Sales
Matching
SalesRevenue
Bad DebtExpense
Percentage of Receivables
Cash Realizable Value
AccountsReceivable
Allowancefor
DoubtfulAccounts
Emphasis on Income StatementRelationships
Emphasis on Balance SheetRelationships
Illustration 9-6Comparison of bases for estimating uncollectibles
The percentage-of-sales basis results in a better matching of expenses with revenues—an income statement viewpoint. The percentage-of-receivables basis produces the better estimate of cash realizable value—a balance sheet viewpoint. Under both bases, the company must determine its past experience with bad debt losses.
Percentage-of-Sales In the percentage-of-sales basis, management estimates what percentage of credit sales will be uncollectible. This percentage is based on past experience and anticipated credit policy. The company applies this percentage to either total credit sales or net credit sales of the current year. To illustrate, assume that Gonzalez Company elects to use the percentage-of-sales basis. It concludes that 1% of net credit sales will become uncollectible. If net credit sales for 2017 are $800,000, the estimated bad debt expense is $8,000 (1% 3 $800,000). The adjusting entry is as follows.
Dec. 31 Bad Debt Expense 8,000 Allowance for Doubtful Accounts 8,000 (To record estimated bad debts for year)
28,000 Exp28,000
Cash Flowsno effect
A OEL5 1
After the adjusting entry is posted, assuming the allowance account already has a credit balance of $1,723, the accounts of Gonzalez Company will show the following.
Bad Debt Expense Allowance for Doubtful Accounts
Dec. 31 Adj. 8,000 Jan. 1 Bal. 1,723 Dec. 31 Adj. 8,000
Dec. 31 Bal. 9,723
Illustration 9-7Bad debt accounts after posting

Valuation and Disposition of Accounts Receivable 413
This basis of estimating uncollectibles emphasizes the matching of expenses with revenues. As a result, Bad Debt Expense will show a direct percent-age relationship to the sales base on which it is computed. When the company makes the adjusting entry, it disregards the existing balance in Allowance for Doubtful Accounts. The adjusted balance in this account should be a rea-sonable approximation of the realizable value of the receivables. If actual write-offs differ signifi cantly from the amount estimated, the company should modify the percentage for future years.
Percentage-of-Receivables Under the percentage-of-receivables basis, man-agement estimates what percentage of receivables will result in losses from uncol-lectible accounts. The company prepares an aging schedule, in which it classifi es customer balances by the length of time they have been unpaid. Because of its emphasis on time, the analysis is often called aging the accounts receivable. In the Feature Story, Whitehall-Robins prepared an aging report daily. After the company arranges the accounts by age, it determines the expected bad debt losses. It applies percentages based on past experience to the totals in each category. The longer a receivable is past due, the less likely it is to be collected. Thus, the estimated percentage of uncollectible debts increases as the number of days past due increases. Illustration 9-8 shows an aging schedule for Dart Company. Note that the estimated percentage uncollectible increases from 2% to 40% as the number of days past due increases.
Helpful HintWhere appropriate, companies may use only a single percentage rate.
Total estimated bad debts for Dart Company ($2,228) represent the amount of existing customer claims the company expects will become uncollectible in the future. This amount represents the required balance in Allowance for Doubtful Accounts at the balance sheet date. The amount of the bad debt adjusting entry is the difference between the required balance and the existing balance in the allowance account. If the trial balance shows Allowance for Doubtful Accounts with a credit balance of $528, the company will make an adjusting entry for $1,700 ($2,228 2 $528), as shown here.
Number of Days Past DueNot
Yet Due 1–30 31–60 61–90 Over 90Total
$ 540
CustomerT. E. AdertR. C. BortzB. A. CarlO. L. DikerT. O. Ebbet
Total Estimated Bad Debts
Others
Estimated Percentage Uncollectible 2%
$ 300
500
26,200
$ 2,228
$ 600
450300
700600
36,950$39,600
$ 100
3001,500
$1,900
$ 200
200
1,600$2,000
$ 250
3002,450
$3,000
$ 300
200
5,200$5,700$27,000
$ 228
4%
$ 300
10%
$ 400
20%
$ 760
40%
Formulas Data Review ViewPage LayoutInsert
AP18 fx
CB D E F G
Worksheet.xlsWorksheet.xlsHome
1
4
5
6
7
8
9
10
11
12
13
23
Illustration 9-8Aging schedule
Helpful HintThe older categories have higher percentages because the longer an account is past due, the less likely it is to be collected.
21,700 Exp21,700
Cash Flowsno effect
A OEL5 1
Dec. 31 Bad Debt Expense 1,700 Allowance for Doubtful Accounts 1,700 (To adjust allowance account to total estimated uncollectibles)

414 9 Accounting for Receivables
After Dart posts its adjusting entry, its accounts will appear as follows.
Occasionally, the allowance account will have a debit balance prior to adjust-ment. This occurs when write-offs during the year have exceeded previous provi-sions for bad debts. In such a case, the company adds the debit balance to the required balance when it makes the adjusting entry. Thus, if there had been a $500 debit balance in the allowance account before adjustment, the adjusting entry would have been for $2,728 ($2,228 1 $500) to arrive at a credit balance of $2,228 (see T-account in margin). The percentage-of-receivables basis will normally result in the better approximation of cash realizable value.
Bad Debt Expense Allowance for Doubtful Accounts
Dec. 31 Adj. 1,700 Bal. 528 Dec. 31 Adj. 1,700
Bal. 2,228
Illustration 9-9Bad debt accounts after posting
Allowancefor Doubtful Accounts
Dec. 31 Unadj. Dec. 31 Adj. 2,728 Bal. 500
Dec. 31 Bal. 2,228
Cookie Jar Allowances
There are many pressures on companies to achieve earnings targets. For managers, poor earnings can lead to dismissal or lack of promotion. It is not surprising then that manage-ment may be tempted to look for ways to boost their earnings number.
One way a company can achieve greater earnings is to lower its estimate of what is
needed in its Allowance for Doubtful Accounts (sometimes referred to as “tapping the cooking jar”). For example, suppose a company has an Allowance for Doubtful Accounts of $10 million and decides to reduce this balance
to $9 million. As a result of this change, Bad Debt Expense decreases by $1 million and earnings increase by $1 million.
Large banks such as JP Morgan Chase, Wells Fargo, and Bank of America recently decreased their Allowance for Doubtful Accounts by over $4 billion. These reductions came at a time when these big banks were still suffering from lower mortgage lending and trading activity, both of which lead to lower earnings. They justifi ed these reduc-tions in the allowance balances by noting that credit quality and economic conditions had improved. This may be so, but it sure is great to have a cookie jar that might be tapped when a boost in earnings is needed.
How might investors determine that a company is managing its earnings? (See WileyPLUS for this answer and additional questions.)
© Christy Th ompson/Shutterstock
Ethics Insight
Disposing of Accounts Receivable
In the normal course of events, companies collect accounts receivable in cash and remove the receivables from the books. However, as credit sales and receiv-ables have grown in signifi cance, the “normal course of events” has changed. Companies now frequently sell their receivables to another company for cash, thereby shortening the cash-to-cash operating cycle. Companies sell receivables for two major reasons. First, they may be the only reasonable source of cash. When money is tight, companies may not be able to borrow money in the usual credit markets. Or if money is available, the cost of borrowing may be prohibitive. A second reason for selling receivables is that billing and collection are often time-consuming and costly. It is often easier for a retailer to sell the receivables to another party with expertise in billing and collection matters. Credit card companies such as MasterCard, Visa, and Discover specialize in billing and col-lecting accounts receivable.

Valuation and Disposition of Accounts Receivable 415
SALE OF RECEIVABLES
A common sale of receivables is a sale to a factor. A factor is a fi nance company or bank that buys receivables from businesses and then collects the payments directly from the customers. Factoring is a multibillion dollar business. Factoring arrangements vary widely. Typically, the factor charges a commis-sion to the company that is selling the receivables. This fee ranges from 1–3% of the amount of receivables purchased. To illustrate, assume that Hendredon Furniture factors $600,000 of receivables to Federal Factors. Federal Factors assesses a service charge of 2% of the amount of receivables sold. The journal entry to record the sale by Hendredon Furniture on April 2, 2017, is as follows.
Apr. 2 Cash 588,000 Service Charge Expense (2% 3 $600,000) 12,000 Accounts Receivable 600,000 (To record the sale of accounts receivable)
1588,000 212,000 Exp2600,000
Cash Flows1588,000
A OEL5 1
If Hendredon often sells its receivables, it records the service charge expense as a selling expense. If the company infrequently sells receivables, it may report this amount in the “Other expenses and losses” section of the income statement.
CREDIT CARD SALES
Over one billion credit cards are in use in the United States—more than three credit cards for every man, woman, and child in this country. Visa, MasterCard, and American Express are the national credit cards that most individuals use. Three parties are involved when national credit cards are used in retail sales: (1) the credit card issuer, who is independent of the retailer; (2) the retailer; and (3) the customer. A retailer’s acceptance of a national credit card is another form of selling (factoring) the receivable. Illustration 9-10 shows the major advantages of national credit cards to the retailer. In exchange for these advantages, the retailer pays the credit card issuer a fee of 2–6% of the invoice price for its services.
Issuer maintains customeraccounts
Issuer investigates creditof customer
Issuer undertakes collectionprocess and absorbs any losses
Retailer receives cash morequickly from credit card issuer
Credit cardissuer
RetailerCustomer
Illustration 9-10Advantages of credit cards to the retailer

416 9 Accounting for Receivables
ACCOUNTING FOR CREDIT CARD SALES The retailer generally considers sales from the use of national credit card sales as cash sales. The retailer must pay to the bank that issues the card a fee for processing the transactions. The retailer records the credit card slips in a similar manner as checks deposited from a cash sale. To illustrate, Anita Ferreri purchases $1,000 of compact discs for her restau-rant from Karen Kerr Music Co., using her Visa First Bank Card. First Bank charges a service fee of 3%. The entry to record this transaction by Karen Kerr Music on March 22, 2017, is as follows.
Mar. 22 Cash 970 Service Charge Expense 30 Sales Revenue 1,000 (To record Visa credit card sales)
1970 230 Exp 11,000 Rev
Cash Flows1970
A OEL5 1
How Does a Credit Card Work?
Most of you know how to use a credit card, but do you know what happens in the trans-action and how the transaction is pro-cessed? Suppose that
you use a Visa card to purchase some new ties at Nord-strom. The salesperson swipes your card, which allows the information on the magnetic strip on the back of the card to be read. The salesperson then enters in the amount of the purchase. The machine contacts the Visa computer, which routes the call back to the bank that issued your Visa card. The issuing bank verifi es that the account exists, that the card is not stolen, and that you have not exceeded your credit limit. At this point, the slip is printed, which you sign.
Visa acts as the clearing agent for the transaction. It transfers funds from the issuing bank to Nordstrom’s bank account. Generally this transfer of funds, from sale to the receipt of funds in the merchant’s account, takes two to three days.
In the meantime, Visa puts a pending charge on your account for the amount of the tie purchase; that amount counts immediately against your available credit limit. At the end of the billing period, Visa sends you an invoice (your credit card bill) which shows the various charges you made, and the amounts that Visa expended on your behalf, for the month. You then must “pay the piper” for your stylish new ties.
Assume that Nordstrom prepares a bank reconciliation at the end of each month. If some credit card sales have not been processed by the bank, how should Nordstrom treat these transactions on its bank reconciliation? (Go to WileyPLUS for this answer and additional questions.)
© Michael Braun/iStockphoto
NordstromAccounting Across the Organization
Brule Co. has been in business fi ve years. The unadjusted trial balance at the end of the current year shows:
Accounts Receivable $30,000 Dr.Sales Revenue $180,000 Cr.Allowance for Doubtful Accounts $2,000 Dr.
Brule estimates bad debts to be 10% of receivables. Prepare the entry necessary to adjust Allowance for Doubtful Accounts.
Solution
DO IT! 2 Uncollectible Accounts Receivable
The following entry should be made to bring the balance in Allowance for Doubtful Accounts up to a normal credit balance of $3,000 (10% 3 $30,000):
Bad Debt Expense [(10% 3 $30,000) 1 $2,000] 5,000 Allowance for Doubtful Accounts 5,000 (To record estimate of uncollectible accounts)
Related exercise material: BE9-3, BE9-4, BE9-5, BE9-6, BE9-7, E9-3, E9-4, E9-5, E9-6, and DO IT! 9-2.
Action Plan✔ Estimate the amount
the company does not expect to collect.
✔ Consider the existing balance in the allowance account when using the percentage-of-receivables basis.
✔ Report receivables at their cash (net) realizable value.

Recognition of Notes Receivable 417
3 Explain how companies recognize notes receivable.LEARNING OBJECTIVE
Companies may also grant credit in exchange for a formal credit instrument known as a promissory note. A promissory note is a written promise to pay a specifi ed amount of money on demand or at a defi nite time. Promissory notes may be used (1) when individuals and companies lend or borrow money, (2) when the amount of the transaction and the credit period exceed normal limits, or (3) in settlement of accounts receivable. In a promissory note, the party making the promise to pay is called the maker. The party to whom payment is to be made is called the payee. The note may specifi cally identify the payee by name or may designate the payee simply as the bearer of the note. In the note shown in Illustration 9-11, Calhoun Company is the maker and Wilma Company is the payee. To Wilma Company, the promissory note is a note receivable. To Calhoun Company, it is a note payable.
Notes receivable give the holder a stronger legal claim to assets than do accounts receivable. Like accounts receivable, notes receivable can be readily sold to another party. Promissory notes are negotiable instruments (as are checks), which means that they can be transferred to another party by endorsement. Companies frequently accept notes receivable from customers who need to extend the payment of an outstanding account receivable. They often require such notes from high-risk customers. In some industries (such as the pleasure and sport boat industry), all credit sales are supported by notes. The majority of notes, however, originate from loans. The basic issues in accounting for notes receivable are the same as those for accounts receivable. On the following pages, we look at these issues. Before we do, however, we need to consider two issues that do not apply to accounts receiv-able: determining the maturity date and computing interest.
Determining the Maturity Date
When the life of a note is expressed in terms of months, you fi nd the date when it matures by counting the months from the date of issue. For example, the maturity
We promise to pay
to the order of
dollars
for value received with annual interest at
$1,000
2 months after date
Wilma Company
One Thousand and no/100 – – – – – – – – – – –
12%
Chicago, Illinois May 1, 2017
Interest Rate
Amount
Payee
Amount
Date of NoteDate Due
Calhoun Company
Treasurer
Maker
Illustration 9-11Promissory note
Helpful HintFor this note, the maker, Calhoun Company, debits Cash and credits Notes Payable. The payee, Wilma Company, debits Notes Receivable and credits Cash.

418 9 Accounting for Receivables
date of a three-month note dated May 1 is August 1. A note drawn on the last day of a month matures on the last day of a subsequent month. That is, a July 31 note due in two months matures on September 30. When the due date is stated in terms of days, you need to count the exact number of days to determine the maturity date. In counting, omit the date the note is issued but include the due date. For example, the maturity date of a 60-day note dated July 17 is September 15, computed as follows.
Term of note 60 daysJuly (31217) 14August 31 45
Maturity date: September 15
Illustration 9-12Computation of maturity date
Illustration 9-13 shows three ways of stating the maturity date of a promissory note.
On demand On a stated date
At the end of a stated period of time
WilmaCo.
WilmaCo.
WilmaCo.
“On demand,I promiseto pay...”
“On July 23,2017, I promise
to pay...”
“One year fromnow, I promise
to pay...”
Next Year
Illustration 9-13Maturity date of different notes
Computing Interest
Illustration 9-14 gives the basic formula for computing interest on an interest-bearing note.
Annual Time in
Face Value 3 Interest 3 Terms of 5 Interest
of Note
Rate One Year
Illustration 9-14Formula for computing interest
The interest rate specifi ed in a note is an annual rate of interest. The time factor in the formula in Illustration 9-14 expresses the fraction of a year that the note is outstanding. When the maturity date is stated in days, the time factor is often the number of days divided by 360. When counting days, omit the date that the note is issued but include the due date. When the due date is stated in months, the time factor is the number of months divided by 12. Illustration 9-15 shows computation of interest for various time periods.
Helpful HintThe interest rate specifi ed is the annual rate.
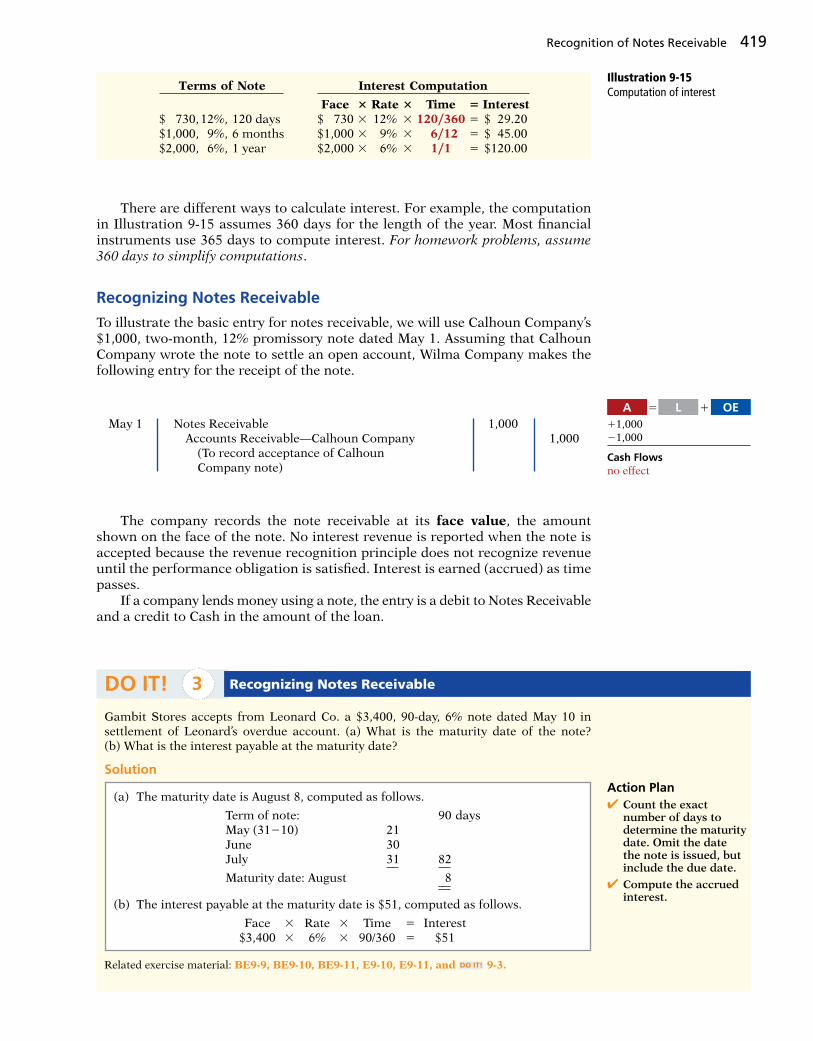
Recognition of Notes Receivable 419
There are different ways to calculate interest. For example, the computation in Illustration 9-15 assumes 360 days for the length of the year. Most fi nancial instruments use 365 days to compute interest. For homework problems, assume 360 days to simplify computations.
Recognizing Notes Receivable
To illustrate the basic entry for notes receivable, we will use Calhoun Company’s $1,000, two-month, 12% promissory note dated May 1. Assuming that Calhoun Company wrote the note to settle an open account, Wilma Company makes the following entry for the receipt of the note.
Terms of Note Interest Computation
Face 3 Rate 3 Time 5 Interest$ 730, 12%, 120 days $ 730 3 12% 3 120y360 5 $ 29.20$1,000, 9%, 6 months $1,000 3 9% 3 6y12 5 $ 45.00$2,000, 6%, 1 year $2,000 3 6% 3 1y1 5 $120.00
Illustration 9-15Computation of interest
11,00021,000
Cash Flowsno effect
A OEL5 1
May 1 Notes Receivable 1,000 Accounts Receivable—Calhoun Company 1,000 (To record acceptance of Calhoun Company note)
The company records the note receivable at its face value, the amount shown on the face of the note. No interest revenue is reported when the note is accepted because the revenue recognition principle does not recognize revenue until the performance obligation is satisfi ed. Interest is earned (accrued) as time passes. If a company lends money using a note, the entry is a debit to Notes Receivable and a credit to Cash in the amount of the loan.
Gambit Stores accepts from Leonard Co. a $3,400, 90-day, 6% note dated May 10 in settlement of Leonard’s overdue account. (a) What is the maturity date of the note? (b) What is the interest payable at the maturity date?
Solution
DO IT! 3 Recognizing Notes Receivable
(a) The maturity date is August 8, computed as follows.
Term of note: 90 daysMay (31210) 21June 30July 31 82
Maturity date: August 8
(b) The interest payable at the maturity date is $51, computed as follows.
Face 3 Rate 3 Time 5 Interest $3,400 3 6% 3 90/360 5 $51
Related exercise material: BE9-9, BE9-10, BE9-11, E9-10, E9-11, and DO IT! 9-3.
Action Plan✔ Count the exact
number of days to determine the maturity date. Omit the date the note is issued, but include the due date.
✔ Compute the accrued interest.

420 9 Accounting for Receivables
4 Describe how companies value notes receivable, record their disposition, and present and analyze receivables.
LEARNING OBJECTIVE
Valuing Notes Receivable
Valuing short-term notes receivable is the same as valuing accounts receivable. Like accounts receivable, companies report short-term notes receivable at their cash (net) realizable value. The notes receivable allowance account is Allow-ance for Doubtful Accounts. The estimations involved in determining cash realiz-able value and in recording bad debt expense and the related allowance are done similarly to accounts receivable.
Disposing of Notes Receivable
Notes may be held to their maturity date, at which time the face value plus accrued interest is due. In some situations, the maker of the note defaults, and the payee must make an appropriate adjustment. In other situations, similar to accounts receivable, the holder of the note speeds up the conversion to cash by selling the receivables (as described later in this chapter).
HONOR OF NOTES RECEIVABLE
A note is honored when its maker pays in full at its maturity date. For each interest-bearing note, the amount due at maturity is the face value of the note plus interest for the length of time specifi ed on the note. To illustrate, assume that Wolder Co. lends Higley Co. $10,000 on June 1, accepting a fi ve-month, 9% interest note. In this situation, interest is $375 ($10,000 3 9% 3 512). The amount due, the maturity value, is $10,375 ($10,000 1 $375). To obtain payment, Wolder (the payee) must present the note either to Higley Co. (the maker) or to the maker’s agent, such as a bank. If Wolder presents the note to Higley Co. on November 1, the maturity date, Wolder’s entry to record the collection is as follows.
Nov. 1 Cash 10,375 Notes Receivable 10,000 Interest Revenue ($10,000 3 9% 3 512) 375 (To record collection of Higley note and interest)
110,375210,000 1375 Rev
Cash Flows110,375
A OEL5 1
ACCRUAL OF INTEREST RECEIVABLE
Suppose instead that Wolder Co. prepares fi nancial statements as of September 30. The timeline in Illustration 9-16 presents this situation.
4 months 1 monthJune 1 Sept. 30 Nov. 1
Receives$375
Earns $300 Earns $75
Illustration 9-16Timeline of interest earned

Valuation and Disposition of Notes Receivable 421
To refl ect interest earned but not yet received, Wolder must accrue interest on September 30. In this case, the adjusting entry by Wolder is for four months of interest, or $300, as shown below.
13001300 Rev
Cash Flowsno effect
A OEL5 1
At the note’s maturity on November 1, Wolder receives $10,375. This amount represents repayment of the $10,000 note as well as fi ve months of interest, or $375, as shown below. The $375 is comprised of the $300 Interest Receivable accrued on September 30 plus $75 earned during October. Wolder’s entry to record the honoring of the Higley note on November 1 is as follows.
In this case, Wolder credits Interest Receivable because the receivable was estab-lished in the adjusting entry on September 30.
DISHONOR OF NOTES RECEIVABLE
A dishonored (defaulted) note is a note that is not paid in full at maturity. A dishonored note receivable is no longer negotiable. However, the payee still has a claim against the maker of the note for both the note and the interest. Therefore, the note holder usually transfers the Notes Receivable account to an Accounts Receivable account. To illustrate, assume that Higley Co. on November 1 indicates that it cannot pay at the present time. The entry to record the dishonor of the note depends on whether Wolder Co. expects eventual collection. If it does expect eventual collec-tion, Wolder Co. debits the amount due (face value and interest) on the note to Accounts Receivable. It would make the following entry at the time the note is dishonored (assuming no previous accrual of interest).
110,375210,000 2300 175 Rev
Cash Flows110,375
A OEL5 1
Sept. 30 Interest Receivable ($10,000 3 9% 3 412) 300
Interest Revenue 300 (To accrue 4 months’ interest on Higley note)
Nov. 1 Accounts Receivable—Higley 10,375 Notes Receivable 10,000 Interest Revenue 375 (To record the dishonor of Higley note)
If instead on November 1 there is no hope of collection, the note holder would write off the face value of the note by debiting Allowance for Doubtful Accounts. No interest revenue would be recorded because collection will not occur.
SALE OF NOTES RECEIVABLE
The accounting for the sale of notes receivable is recorded similarly to the sale of accounts receivable. The accounting entries for the sale of notes receivable are left for a more advanced course.
110,375210,000
1375 Rev
Cash Flowsno effect
A OEL5 1
Nov. 1 Cash [$10,000 1 (10,000 3 9% 3 512)] 10,375 Notes Receivable 10,000 Interest Receivable 300 Interest Revenue (10,000 3 9% 3 112)] 75 (To record collection of Higley note and interest)

422 9 Accounting for Receivables
Statement Presentation and Analysis
PRESENTATION
Companies should identify in the balance sheet or in the notes to the fi nancial statements each of the major types of receivables. Short-term receivables appear in the current assets section of the balance sheet. Short-term investments appear before short-term receivables because these investments are more liquid (nearer to cash). Companies report both the gross amount of receivables and the allow-ance for doubtful accounts. In a multiple-step income statement, companies report bad debt expense and service charge expense as selling expenses in the operating expenses section. Interest revenue appears under “Other revenues and gains” in the nonoperating activities section of the income statement.
ANALYSIS
Investors and corporate managers compute fi nancial ratios to evaluate the liquid-ity of a company’s accounts receivable. They use the accounts receivable turn-over to assess the liquidity of the receivables. This ratio measures the number of times, on average, the company collects accounts receivable during the period. It is computed by dividing net credit sales (net sales less cash sales) by the average net accounts receivable during the year. Unless seasonal factors are signifi cant, average net accounts receivable outstanding can be computed from the begin-ning and ending balances of net accounts receivable. For example, in 2013 Cisco Systems had net sales of $38,029 million for the year. It had a beginning accounts receivable (net) balance of $4,369 million and an ending accounts receivable (net) balance of $5,470 million. Assuming that Cisco’s sales were all on credit, its accounts receivable turnover is computed as follows.
Bad Information Can Lead to Bad Loans
Many factors have contributed to the recent credit crisis. One signifi cant factor that resulted in many bad loans was a failure by lenders to investigate loan customers suffi ciently. For example, Countrywide Finan-cial Corporation wrote many loans under its “Fast and Easy” loan program. That program allowed borrowers to provide little or no documentation for
their income or their assets. Other lenders had similar pro-grams, which earned the nickname “liars’ loans.” One study found that in these situations, 60% of applicants
overstated their incomes by more than 50% in order to qualify for a loan. Critics of the banking industry say that because loan offi cers were compensated for loan volume and because banks were selling the loans to investors rather than holding them, the lenders had little incentive to investigate the borrowers’ creditworthiness.
Sources: Glenn R. Simpson and James R. Hagerty, “Countrywide Loss Focuses Attention on Underwriting,” Wall Street Journal (April 30, 2008), p. B1; and Michael Corkery, “Fraud Seen as Driver in Wave of Foreclosures,” Wall Street Journal (December 21, 2007), p. A1.
What steps should the banks have taken to ensure the accuracy of fi nancial information provided on loan applications? (Go to WileyPLUS for this answer and additional questions.)
© Andy Dean/iStockphoto
Countrywide Financial CorporationAccounting Across the Organization
Illustration 9-17Accounts receivable turnover and computation
Net Credit Sales 4 Average Net
5 Accounts Receivable
Accounts Receivable Turnover
$38,029 4 $4,369 1 $5,470
5 7.7 times 2

Review and Practice 423
The result indicates an accounts receivable turnover of 7.7 times per year. The higher the turnover, the more liquid the company’s receivables. A variant of the accounts receivable turnover that makes the liquidity even more evident is its conversion into an average collection period in terms of days. This is done by dividing the accounts receivable turnover into 365 days. For example, Cisco’s turnover of 7.7 times is divided into 365 days, as shown in Illustration 9-18, to obtain approximately 47 days. This means that it takes Cisco 47 days to collect its accounts receivable.
Days in Year 4 Accounts Receivable
5 Average Collection
Turnover Period in Days
365 days 4 7.7 times 5 47 days
Illustration 9-18Average collection period for receivables formula and computation
Companies frequently use the average collection period to assess the effec-tiveness of a company’s credit and collection policies. The general rule is that the collection period should not greatly exceed the credit term period (that is, the time allowed for payment).
Explain how companies recognize accounts receivable.Receivables are frequently classifi ed as (1) accounts, (2) notes, and (3) other. Accounts receivable are amounts customers owe on account. Notes receivable are claims for which lenders issue formal instruments of credit as proof of the debt. Other receivables include nontrade receivables such as interest receivable, loans to company offi cers, advances to employees, and income taxes refundable.
Companies record accounts receivable when they perform a service on account or at the point of sale of merchandise on account. Accounts receivable are reduced by sales returns and allowances. Cash dis-counts reduce the amount received on accounts receivable. When interest is charged on a past due receivable, the company adds this interest to the accounts receivable balance and recognizes it as interest revenue.
LEARNING OBJECTIVES REVIEW
1
REVIEW AND PRACTICE
In 2017, Phil Mickelson Company has net credit sales of $923,795 for the year. It had a beginning accounts receivable (net) balance of $38,275 and an ending accounts receivable (net) balance of $35,988. Compute Phil Mickelson Company’s (a) accounts receivable turnover and (b) average collection period in days.
Solution
DO IT! 4 Analysis of Receivables
Net credit sales 4 Average net
5 Accounts receivable
accounts receivable turnover
$923,795 4 $38,275 1 $35,988
5
24.9 times 2
Days in year 4 Accounts receivable
5 Average collection
turnover period in days
365 4 24.9 times 5 14.7 days
Related exercise material: BE9-12, E9-14, and DO IT! 9-4.
Action Plan✔ Review the formula to
compute the accounts receivable turnover.
✔ Make sure that both the beginning and ending accounts receivable balances are considered in the computation.
✔ Review the formula to compute the average collection period in days.
(a)
(b)

424 9 Accounting for Receivables
Describe how companies value accounts receivable and record their disposition. There are two methods of accounting for uncollectible accounts: the allowance method and the direct write-off method. Companies may use either the percentage-of-sales or the percentage-of-receivables basis to estimate uncollectible accounts using the allowance method. The percentage-of-sales basis emphasizes the expense recognition (match-ing) principle. The percentage-of-receivables basis emphasizes the cash realizable value of the accounts receivable. An aging schedule is often used with this basis.
When a company collects an account receivable, it credits Accounts Receivable. When a company sells (factors) an account receivable, a service charge expense reduces the amount received.
Explain how companies recognize notes receivable. For a note stated in months, the maturity date is found by counting the months from the date of issue. For a note stated in days, the number of days is counted, omitting the issue date and counting the due date. The formula for computing interest is Face value 3 Interest rate 3 Time.
Companies record notes receivable at face value. In some cases, it is necessary to accrue interest prior to maturity. In this case, companies debit Interest Receivable and credit Interest Revenue.
Describe how companies value notes receivable, record their disposition, and present and analyze
receivables. As with accounts receivable, companies report notes receivable at their cash (net) realizable value. The notes receivable allowance account is Allowance for Doubtful Accounts. The computation and estimations involved in valuing notes receivable at cash realizable value, and in recording the proper amount of bad debt expense and the related allow-ance, are similar to those for accounts receivable.
Notes can be held to maturity. At that time the face value plus accrued interest is due, and the note is removed from the accounts. In many cases, the holder of the note speeds up the conversion by selling the receivable to another party (a factor). In some situa-tions, the maker of the note dishonors the note (defaults), in which case the company transfers the note and accrued interest to an account receivable or writes off the note.
Companies should identify in the balance sheet or in the notes to the fi nancial statements each major type of receivable. Short-term receivables are consid-ered current assets. Companies report the gross amount of receivables and the allowance for doubtful accounts. They report bad debt and service charge expenses in the multiple-step income statement as operating (selling) expenses. Interest revenue appears under other revenues and gains in the nonoperating activities section of the statement. Managers and investors evaluate accounts receivable for liquidity by computing a turnover ratio and an average collection period.
2
3
4
Accounts receivable Amounts owed by customers on account. (p. 406).
Accounts receivable turnover A measure of the liquidity of accounts receivable; computed by divid-ing net credit sales by average net accounts receiv-able. (p. 422).
Aging the accounts receivable The analysis of customer balances by the length of time they have been unpaid. (p. 413).
Allowance method A method of accounting for bad debts that involves estimating uncollectible accounts at the end of each period. (p. 409).
Average collection period The average amount of time that a receivable is outstanding; calculated by dividing 365 days by the accounts receivable turnover. (p. 423).
Bad Debt Expense An expense account to record uncol-lectible receivables. (p. 408).
Cash (net) realizable value The net amount a company expects to receive in cash. (p. 409).
Direct write-off method A method of accounting for bad debts that involves expensing accounts at the time they are determined to be uncollectible. (p. 409).
Dishonored (defaulted) note A note that is not paid in full at maturity. (p. 421).
Factor A fi nance company or bank that buys receivables from businesses and then collects the payments directly from the customers. (p. 415).
Maker The party in a promissory note who is making the promise to pay. (p. 417).
Notes receivable Written promise (as evidenced by a formal instrument) for amounts to be received. (p. 406).
Other receivables Various forms of nontrade receiv-ables, such as interest receivable and income taxes refundable. (p. 406).
Payee The party to whom payment of a promissory note is to be made. (p. 417).
Percentage-of-receivables basis Management estimates what percentage of receivables will result in losses from uncollectible accounts. (p. 413).
Percentage-of-sales basis Management estimates what percentage of credit sales will be uncollectible. (p. 412).
Promissory note A written promise to pay a specifi ed amount of money on demand or at a defi nite time. (p. 417).
Receivables Amounts due from individuals and other companies. (p. 406).
Trade receivables Notes and accounts receivable that result from sales transactions. (p. 406).
GLOSSARY REVIEW

Practice Multiple-Choice Questions 425
1. Receivables are frequently classifi ed as:(a) accounts receivable, company receivables, and
other receivables.(b) accounts receivable, notes receivable, and employee
receivables.(c) accounts receivable and general receivables.(d) accounts receivable, notes receivable, and other
receivables. 2. Buehler Company on June 15 sells merchandise on
account to Chaz Co. for $1,000, terms 2/10, n/30. On June 20, Chaz Co. returns merchandise worth $300 to Buehler Company. On June 24, payment is received from Chaz Co. for the balance due. What is the amount of cash received?(a) $700. (c) $686.(b) $680. (d) None of the above.
3. Which of the following approaches for bad debts is best described as a balance sheet method?(a) Percentage-of-receivables basis.(b) Direct write-off method.(c) Percentage-of-sales basis.(d) Both percentage-of-receivables basis and direct
write-off method. 4. Hughes Company has a credit balance of $5,000 in its
Allowance for Doubtful Accounts before any adjust-ments are made at the end of the year. Based on review and aging of its accounts receivable at the end of the year, Hughes estimates that $60,000 of its receivables are uncollectible. The amount of bad debt expense which should be reported for the year is:(a) $5,000. (c) $60,000.(b) $55,000. (d) $65,000.
5. Use the same information as in Question 4, except that Hughes has a debit balance of $5,000 in its Allow-ance for Doubtful Accounts before any adjustments are made at the end of the year. In this situation, the amount of bad debt expense that should be reported for the year is:(a) $5,000. (c) $60,000.(b) $55,000. (d) $65,000.
6. Net sales for the month are $800,000, and bad debts are expected to be 1.5% of net sales. The company uses the percentage-of-sales basis. If Allowance for Doubtful Accounts has a credit balance of $15,000 before adjustment, what is the balance after adjust-ment?(a) $15,000. (c) $23,000.(b) $27,000. (d) $31,000.
7. In 2017, Roso Carlson Company had net credit sales of $750,000. On January 1, 2017, Allowance for Doubtful Accounts had a credit balance of $18,000. During 2017, $30,000 of uncollectible accounts receiv-able were written off. Past experience indicates that 3% of net credit sales become uncollectible. What should be the adjusted balance of Allowance for Doubtful Accounts at December 31, 2017?(a) $10,050. (c) $22,500.(b) $10,500. (d) $40,500.
(LO 1)
(LO 1)
(LO 2)
(LO 2)
(LO 2)
(LO 2)
(LO 2)
8. An analysis and aging of the accounts receivable of Prince Company at December 31 reveals the following data.
Accounts receivable $800,000 Allowance for doubtful
accounts per books before adjustment 50,000
Amounts expected to become uncollectible 65,000
The cash realizable value of the accounts receivable at December 31, after adjustment, is:(a) $685,000. (c) $800,000.(b) $750,000. (d) $735,000.
9. Which of the following statements about Visa credit card sales is incorrect?(a) The credit card issuer makes the credit investiga-
tion of the customer.(b) The retailer is not involved in the collection process.(c) Two parties are involved.(d) The retailer receives cash more quickly than it
would from individual customers on account. 10. Blinka Retailers accepted $50,000 of Citibank Visa
credit card charges for merchandise sold on July 1. Citibank charges 4% for its credit card use. The entry to record this transaction by Blinka Retailers will include a credit to Sales Revenue of $50,000 and a debit(s) to:(a) Cash $48,000
and Service Charge Expense $2,000(b) Accounts Receivable $48,000
and Service Charge Expense $2,000(c) Cash $50,000(d) Accounts Receivable $50,000
11. One of the following statements about promissory notes is incorrect. The incorrect statement is:(a) The party making the promise to pay is called the
maker.(b) The party to whom payment is to be made is
called the payee.(c) A promissory note is not a negotiable instrument.(d) A promissory note is often required from high-
risk customers. 12. Foti Co. accepts a $1,000, 3-month, 6% promissory
note in settlement of an account with Bartelt Co. The entry to record this transaction is as follows.(a) Notes Receivable 1,015 Accounts Receivable 1,015(b) Notes Receivable 1,000 Accounts Receivable 1,000(c) Notes Receivable 1,000 Sales Revenue 1,000(d) Notes Receivable 1,030 Accounts Receivable 1,030
13. Ginter Co. holds Kolar Inc.’s $10,000, 120-day, 9% note. The entry made by Ginter Co. when the note is collected, assuming no interest has been previously accrued, is:(a) Cash 10,300 Notes Receivable 10,300
(LO 2)
(LO 2)
(LO 2)
(LO 3)
(LO 3)
(LO 4)
PRACTICE MULTIPLE-CHOICE QUESTIONS

426 9 Accounting for Receivables
(b) Cash 10,000 Notes Receivable 10,000(c) Accounts Receivable 10,300 Notes Receivable 10,000 Interest Revenue 300(d) Cash 10,300 Notes Receivable 10,000 Interest Revenue 300
14. Accounts and notes receivable are reported in the cur-rent assets section of the balance sheet at:(a) cash (net) realizable value.(b) net book value.
(LO 4)
(c) lower-of-cost-or-net realizable value.(d) invoice cost.
15. Oliveras Company had net credit sales during the year of $800,000 and cost of goods sold of $500,000. The balance in accounts receivable at the beginning of the year was $100,000, and the end of the year it was $150,000. What were the accounts receivable turnover and the average collection period in days?(a) 4.0 and 91.3 days.(b) 5.3 and 68.9 days.(c) 6.4 and 57 days.(d) 8.0 and 45.6 days.
(LO 4)
Solutions
1. (d) Receivables are frequently classifi ed as accounts receivable, notes receivable, and other receivables. The other choices are incorrect because receivables are not frequently classifi ed as (a) company receivables, (b), employee receivables, or (c) general receivables.
2. (c) Because payment is received within 10 days of the purchase, the cash received is $686 {[$1,000 2 $300] 2 [($1,000 2 $300) 3 2%)]}. The other choices are incorrect because (a) $700 does not consider the 2% discount; (b) the amount of the discount is based upon the amount after the return is granted ($700 3 2%), not the amount before the return of merchandise ($1,000 3 2%); and (d) there is a correct answer.
3. (a) The percentage-of-receivables basis is a balance sheet method because it emphasizes the cash (net) realizable value of accounts receivable. The other choices are incorrect because (b) the direct write-off method is neither a balance sheet nor an income statement method for accounting for bad debts, (c) the percentage-of-sales basis is an income statement method because it results in a better matching of expenses with revenues, and (d) only the percentage-of-receivables basis is a balance sheet method, not the direct write-off method.
4. (b) By crediting Allowance for Doubtful Accounts for $55,000, the new balance will be the required balance of $60,000. This adjusting entry debits Bad Debt Expense for $55,000 and credits Allowance for Doubtful Accounts for $55,000, not (a) $5,000, (c) $60,000, or (d) $65,000.
5. (d) By crediting Allowance for Doubtful Accounts for $65,000, the new balance will be the required balance of $60,000. This adjusting entry debits Bad Debt Expense for $65,000 and credits Allowance for Doubtful Accounts for $65,000, not (a) $5,000, (b) $55,000, or (c) $60,000.
6. (b) Net sales times the percentage expected to default equals the amount of bad debt expense for the year ($800,000 3 1.5% 5 $12,000). Because this adjusting entry credits Allowance for Doubtful Accounts, the balance after adjustment is $27,000 ($15,000 1 $12,000), not (a) $15,000, (c) $23,000, or (d) $31,000.
7. (b) The accounts written off during the year will result in a $30,000 debit to Allowance for Doubtful Accounts. The adjusting entry for bad debts will include a $22,500 credit ($750,000 3 3%) to Allowance for Doubtful Accounts. Combining the beginning balance of $ 18,000 credit, the $30,000 debit, and the $22,500 credit leaves a credit balance of $10,500 in the allowance account, not (a) $10,050, (c) $22,500, or (d) $40,500.
8. (d) Accounts Receivable less the expected uncollectible amount equals the cash realizable value of $735,000 ($800,000 2 $65,000), not (a) $685,000, (b) $750,000, or (c) $800,000.
9. (c) There are three parties, not two, involved in Visa credit card sales: the credit card company, the retailer, and the customer. The other choices are true statements.
10. (a) Credit card sales are considered cash sales. Cash is debited $48,000 for the net amount received ($50,000 2 $2,000 for credit card use fee), and Service Charge Expense is debited $2,000 for the 4% credit card use fee ($50,000 3 4%). The other choices are therefore incorrect.
11. (c) A promissory note is a negotiable instrument. The other choices are true statements.
12. (b) Notes Receivable is recorded at face value ($1,000). No interest on the note is recorded until it is earned. Accounts Receiv-able is credited because no new sales have been made. The other choices are therefore incorrect.
13. (d) Cash is debited for its maturity value [$10,000 1 interest earned ($10,000 3 1/3 3 9%)], Notes Receivable credited for its face value, and Interest Revenue credited for the amount of interest earned. The other choices are therefore incorrect.
l4. (a) Accounts Receivable is reported in the current assets section of the balance sheet at the gross amount less the allowance for doubtful accounts, not at (b) net book value, (c) lower-of-cost-or-net realizable value, or (d) invoice cost.
15. (c) The accounts receivable turnover is 6.4 [$800,000/($100,000 1 $150,000)/2)]. The average collection period in days is 57 days (365/6.4). The other choices are therefore incorrect.

Practice Exercises 427
1. The ledger of Nuro Company at the end of the current year shows Accounts Receivable $180,000, Sales Revenue $1,800,000, and Sales Returns and Allowances $60,000.
Instructions(a) If Nuro uses the direct write-off method to account for uncollectible accounts, journal-
ize the adjusting entry at December 31, assuming Nuro determines that Willie’s $2,900 balance is uncollectible.
(b) If Allowance for Doubtful Accounts has a credit balance of $4,300 in the trial balance, journalize the adjusting entry at December 31, assuming bad debts are expected to be (1) 1 % of net sales, and (2) 10% of accounts receivable.
(c) If Allowance for Doubtful Accounts has a debit balance of $410 in the trial balance, journalize the adjusting entry at December 31, assuming bad debts are expected to be (1) 0.75% of net sales and (2) 6% of accounts receivable.
Solution
PRACTICE EXERCISES
Journalize entries to record allowance for doubtful accounts using two different bases.
(LO 2)
1. (a) Dec. 31 Bad Debt Expense 2,900 Accounts Receivable—Willie’s 2,900
(b) (1) Dec. 31 Bad Debt Expense [($1,800,000 2 $60,000) 3 1%] 17,400 Allowance for Doubtful Accounts 17,400
(2) Dec. 31 Bad Debt Expense 13,700 Allowance for Doubtful Accounts [($180,000 3 10%) 2 $4,300] 13,700
(c) (1) Dec. 31 Bad Debt Expense [($1,800,000 2 $60,000) 3 0.75%] 13,050 Allowance for Doubtful Accounts 13,050
(2) Dec. 31 Bad Debt Expense 11,210 Allowance for Doubtful Accounts [($180,000 3 6%) 1 $410] 11,210
2. Sargeant Supply Co. has the following transactions related to notes receivable during the last 2 months of 2017.
Nov. 1 Loaned $20,000 cash to Mary Hawkins on a 1-year, 12% note.Dec. 11 Sold goods to Eminem, Inc., receiving a $9,000. 90-day, 8% note. 16 Received a $8,000, 6-month, 9% note in exchange for Rick DeLong’s outstanding
accounts receivable. 31 Accrued interest revenue on all notes receivable.
Instructions(a) Journalize the transactions for Sargeant Supply Co.
(b) Record the collection of the Hawkins note at its maturity in 2018.
Solution
Journalize entries for notes receivable transactions.
(LO 3, 4)
2. (a) 2017
Nov. 1 Notes Receivable 20,000 Cash 20,000
Dec. 11 Notes Receivable 9,000 Sales Revenue 9,000
16 Notes Receivable 8,000 Accounts Receivable—DeLong 8,000
31 Interest Receivable 470 Interest Revenue* 470
*Calculation of interest revenue:Hawkins’ note: $20,000 3 12% 3 2/12 5 $400Eminem’s note: 9,000 3 8% 3 20/360 5 40DeLong’s note: 8,000 3 9% 3 15/360 5 30 Total accrued interest $470

428 9 Accounting for Receivables
(b) 2018Nov. 1 Cash 22,400 Interest Receivable 400 Interest Revenue** 2,000 Notes Receivable 20,000
**($20,000 3 12% 3 10/12)
The following selected transactions relate to Dylan Company.
Mar. 1 Sold $20,000 of merchandise to Potter Company, terms 2/10, n/30. 11 Received payment in full from Potter Company for balance due on existing
accounts receivable. 12 Accepted Juno Company’s $20,000, 6-month, 12% note for balance due. 13 Made Dylan Company credit card sales for $13,200. 15 Made Visa credit card sales totaling $6,700. A 3% service fee is charged by Visa.Apr. 11 Sold accounts receivable of $8,000 to Harcot Factor. Harcot Factor assesses a
service charge of 2% of the amount of receivables sold. 13 Received collections of $8,200 on Dylan Company credit card sales and added
fi nance charges of 1.5% to the remaining balances.May 10 Wrote off as uncollectible $16,000 of accounts receivable. Dylan uses the
percentage-of-sales basis to estimate bad debts.June 30 Credit sales recorded during the fi rst 6 months total $2,000,000. The bad debt
percentage is 1% of credit sales. At June 30, the balance in the allowance ac-count is $3,500 before adjustment.
July 16 One of the accounts receivable written off in May was from J. Simon, who pays the amount due, $4,000, in full.
InstructionsPrepare the journal entries for the transactions. (Ignore entries for cost of goods sold.)
Solution
PRACTICE PROBLEM
Prepare entries for various receivables transactions.
(LO 1, 2, 3, 4)
Mar. 1 Accounts Receivable—Potter 20,000 Sales Revenue 20,000
(To record sales on account)
11 Cash 19,600 Sales Discounts (2% 3 $20,000) 400 Accounts Receivable—Potter 20,000 (To record collection of accounts receivable)
12 Notes Receivable 20,000 Accounts Receivable—Juno 20,000 (To record acceptance of Juno Company note)
13 Accounts Receivable 13,200 Sales Revenue 13,200 (To record company credit card sales)
15 Cash 6,499 Service Charge Expense (3% 3 $6,700) 201 Sales Revenue 6,700 (To record credit card sales)
Apr. 11 Cash 7,840 Service Charge Expense (2% 3 $8,000) 160 Accounts Receivable 8,000 (To record sale of receivables to factor)
13 Cash 8,200 Accounts Receivable 8,200 (To record collection of accounts receivable) Accounts Receivable [($13,200 2 $8,200) 3 1.5%] 75 Interest Revenue 75 (To record interest on amount due)

Questions 429
May 10 Allowance for Doubtful Accounts 16,000 Accounts Receivable 16,000 (To record write-off of accounts receivable)
June 30 Bad Debt Expense ($2,000,000 3 1%) 20,000 Allowance for Doubtful Accounts 20,000 (To record estimate of uncollectible accounts)
July 16 Accounts Receivable—J. Simon 4,000 Allowance for Doubtful Accounts 4,000 (To reverse write-off of accounts receivable)
Cash 4,000 Accounts Receivable—J. Simon 4,000 (To record collection of accounts receivable)
Brief Exercises, Exercises, DO IT! Exercises, and Problems and many additional resources are available for practice in WileyPLUS
QUESTIONS
1. What is the difference between an account receivable and a note receivable?
2. What are some common types of receivables other than accounts receivable and notes receivable?
3. Texaco Oil Company issues its own credit cards. Assume that Texaco charges you $40 interest on an unpaid balance. Prepare the journal entry that Texaco makes to record this revenue.
4. What are the essential features of the allowance method of accounting for bad debts?
5. Roger Holloway cannot understand why cash realiz-able value does not decrease when an uncollectible account is written off under the allowance method. Clarify this point for Roger.
6. Distinguish between the two bases that may be used in estimating uncollectible accounts.
7. Borke Company has a credit balance of $3,000 in Allowance for Doubtful Accounts. The estimated bad debt expense under the percentage-of-sales basis is $4,100. The total estimated uncollectibles under the percentage-of-receivables basis is $5,800. Prepare the adjusting entry under each basis.
8. How are bad debts accounted for under the direct write-off method? What are the disadvantages of this method?
9. Freida Company accepts both its own credit cards and national credit cards. What are the advantages of accepting both types of cards?
10. An article recently appeared in the Wall Street Journal indicating that companies are selling their receivables at a record rate. Why are companies selling their receivables?
11. Westside Textiles decides to sell $800,000 of its accounts receivable to First Factors Inc. First Factors assesses a service charge of 3% of the amount of receivables sold. Prepare the journal entry that West-side Textiles makes to record this sale.
12. Your roommate is uncertain about the advantages of a promissory note. Compare the advantages of a note receivable with those of an account receivable.
13. How may the maturity date of a promissory note be stated?
14. Indicate the maturity date of each of the following promissory notes:
Date of Note Terms
(a) March 13 one year after date of note(b) May 4 3 months after date(c) June 20 30 days after date(d) July 1 60 days after date
15. Compute the missing amounts for each of the follow-ing notes.
Annual Total Principal Interest Rate Time Interest
(a) ? 9% 120 days $ 450 (b) $30,000 10% 3 years ? (c) $60,000 ? 5 months $1,500 (d) $45,000 8% ? $1,200
16. In determining interest revenue, some fi nancial insti-tutions use 365 days per year and others use 360 days. Why might a fi nancial institution use 360 days?
17. Jana Company dishonors a note at maturity. What are the options available to the lender?
18. General Motors Corporation has accounts receivable and notes receivable. How should the receivables be reported on the balance sheet?
19. The accounts receivable turnover is 8.14, and average net receivables during the period are $400,000. What is the amount of net credit sales for the period?
20. What percentage does Apple’s allowance for doubt-ful accounts represent as a percentage of its gross receivables?

430 9 Accounting for Receivables
BRIEF EXERCISES
BE9-1 Presented below are three receivables transactions. Indicate whether these receiv-ables are reported as accounts receivable, notes receivable, or other receivables on a balance sheet.
(a) Sold merchandise on account for $64,000 to a customer.(b) Received a promissory note of $57,000 for services performed.(c) Advanced $10,000 to an employee.
BE9-2 Record the following transactions on the books of RAS Co.
(a) On July 1, RAS Co. sold merchandise on account to Waegelein Inc. for $17,200, terms 2/10, n/30.
(b) On July 8, Waegelein Inc. returned merchandise worth $3,800 to RAS Co.(c) On July 11, Waegelein Inc. paid for the merchandise.
BE9-3 During its fi rst year of operations, Gavin Company had credit sales of $3,000,000; $600,000 remained uncollected at year-end. The credit manager estimates that $31,000 of these receivables will become uncollectible.
(a) Prepare the journal entry to record the estimated uncollectibles.(b) Prepare the current assets section of the balance sheet for Gavin Company. Assume
that in addition to the receivables it has cash of $90,000, inventory of $130,000, and prepaid insurance of $7,500.
BE9-4 At the end of 2017, Carpenter Co. has accounts receivable of $700,000 and an allowance for doubtful accounts of $54,000. On January 24, 2018, the company learns that its receivable from Megan Gray is not collectible, and management authorizes a write-off of $6,200.
(a) Prepare the journal entry to record the write-off.(b) What is the cash realizable value of the accounts receivable (1) before the write-off and
(2) after the write-off?
BE9-5 Assume the same information as BE9-4. On March 4, 2018, Carpenter Co. receives payment of $6,200 in full from Megan Gray. Prepare the journal entries to record this transaction.
BE9-6 Farr Co. elects to use the percentage-of-sales basis in 2017 to record bad debt expense. It estimates that 2% of net credit sales will become uncollectible. Sales revenues are $800,000 for 2017, sales returns and allowances are $40,000, and the allowance for doubtful accounts has a credit balance of $9,000. Prepare the adjusting entry to record bad debt expense in 2017.
BE9-7 Kingston Co. uses the percentage-of-receivables basis to record bad debt expense. It estimates that 1% of accounts receivable will become uncollectible. Accounts receivable are $420,000 at the end of the year, and the allowance for doubtful accounts has a credit balance of $1,500.
(a) Prepare the adjusting journal entry to record bad debt expense for the year.(b) If the allowance for doubtful accounts had a debit balance of $800 instead of a credit
balance of $1,500, determine the amount to be reported for bad debt expense.
BE9-8 Presented below are two independent transactions.
(a) Tony’s Restaurant accepted a Visa card in payment of a $175 lunch bill. The bank charges a 4% fee. What entry should Tony’s make?
(b) Larkin Company sold its accounts receivable of $60,000. What entry should Larkin make, given a service charge of 3% on the amount of receivables sold?
BE9-9 Compute interest and fi nd the maturity date for the following notes.
Date of Note Principal Interest Rate (%) Terms
(a) June 10 $80,000 6% 60 days(b) July 14 $64,000 7% 90 days(c) April 27 $12,000 8% 75 days
Identify different types of receivables.
(LO 1)
Record basic accounts receivable transactions.
(LO 1)
Prepare entry for allowance method and partial balance sheet.
(LO 2, 4)
Prepare entry for write-off; determine cash realizable value.
(LO 2)
Prepare entries for collection of bad debt write-off.
(LO 2)
Prepare entry using percentage-of-sales method.
(LO 2)
Prepare entry using percentage-of-receivables method.
(LO 2)
Prepare entries to dispose of accounts receivable.
(LO 2)
Compute interest and determine maturity dates on notes.
(LO 3)

Exercises 431
BE9-10 Presented below are data on three promissory notes. Determine the missing amounts.
Date of Maturity Annual Total Note Terms Date Principal Interest Rate Interest
(a) April 1 60 days ? $600,000 6% ?(b) July 2 30 days ? 90,000 ? $600(c) March 7 6 months ? 120,000 10% ?
BE9-11 On January 10, 2017, Perez Co. sold merchandise on account to Robertsen Co. for $15,600, n/30. On February 9, Robertsen Co. gave Perez Co. a 10% promissory note in settlement of this account. Prepare the journal entry to record the sale and the settlement of the account receivable.
BE9-12 The fi nancial statements of Minnesota Mining and Manufacturing Company (3M) report net sales of $20.0 billion. Accounts receivable (net) are $2.7 billion at the beginning of the year and $2.8 billion at the end of the year. Compute 3M’s accounts receivable turn-over. Compute 3M’s average collection period for accounts receivable in days.
Determine maturity dates and compute interest and rates on notes.
(LO 3)
Prepare entry for notes receivable exchanged for account receivable.
(LO 3)
Compute ratios to analyze receivables.
(LO 4)
On March 1, Lincoln sold merchandise on account to Amelia Company for $28,000, terms 1/10, net 45. On March 6, Amelia returns merchandise with a sales price of $1,000. On March 11, Lincoln receives payment from Amelia for the balance due. Prepare journal entries to record the March transactions on Lincoln’s books. (You may ignore cost of goods sold entries and explanations.)
Gonzalez Company has been in business several years. At the end of the cur-rent year, the ledger shows the following:
Accounts Receivable $ 310,000 Dr.Sales Revenue 2,200,000 Cr.Allowance for Doubtful Accounts 6,100 Cr.
Bad debts are estimated to be 5% of accounts receivable. Prepare the entry to adjust Allow-ance for Doubtful Accounts.
Gentry Wholesalers accepts from Benton Stores a $6,200, 4-month, 9% note dated May 31 in settlement of Benton’s overdue account. (a) What is the maturity date of the note? (b) What is the interest payable at the maturity date?
In 2017, Wainwright Company has net credit sales of $1,300,000 for the year. It had a beginning accounts receivable (net) balance of $101,000 and an ending accounts receivable (net) balance of $107,000. Compute Wainwright Company’s (a) accounts receiv-able turnover and (b) average collection period in days.
Prepare entries to recognize accounts receivable.
(LO 1)
Prepare entry for uncollectible accounts.
(LO 2)
Compute maturity date and interest on note.
(LO 3)
Compute ratios for receivables.
(LO 4)
DO IT! Exercises
DO IT! 9-1
DO IT! 9-4
DO IT! 9-3
DO IT! 9-2
EXERCISES
E9-1 Presented below are selected transactions of Molina Company. Molina sells in large quantities to other companies and also sells its product in a small retail outlet.
March 1 Sold merchandise on account to Dodson Company for $5,000, terms 2/10, n/30.
3 Dodson Company returned merchandise worth $500 to Molina. 9 Molina collected the amount due from Dodson Company from the March 1
sale. 15 Molina sold merchandise for $400 in its retail outlet. The customer used his
Molina credit card. 31 Molina added 1.5% monthly interest to the customer’s credit card balance.
InstructionsPrepare journal entries for the transactions above.
Journalize entries related to accounts receivable.
(LO 1)

432 9 Accounting for Receivables
E9-2 Presented below are two independent situations.
(a) On January 6, Brumbaugh Co. sells merchandise on account to Pryor Inc. for $7,000, terms 2/10, n/30. On January 16, Pryor Inc. pays the amount due. Prepare the entries on Brumbaugh’s books to record the sale and related collection.
(b) On January 10, Andrew Farley uses his Paltrow Co. credit card to purchase merchan-dise from Paltrow Co. for $9,000. On February 10, Farley is billed for the amount due of $9,000. On February 12, Farley pays $5,000 on the balance due. On March 10, Farley is billed for the amount due, including interest at 1% per month on the unpaid balance as of February 12. Prepare the entries on Paltrow Co.’s books related to the transactions that occurred on January 10, February 12, and March 10.
E9-3 The ledger of Costello Company at the end of the current year shows Accounts Receivable $110,000, Sales Revenue $840,000, and Sales Returns and Allowances $20,000.
Instructions(a) If Costello uses the direct write-off method to account for uncollectible accounts, jour-
nalize the adjusting entry at December 31, assuming Costello determines that L. Dole’s $1,400 balance is uncollectible.
(b) If Allowance for Doubtful Accounts has a credit balance of $2,100 in the trial balance, journalize the adjusting entry at December 31, assuming bad debts are expected to be (1) 1% of net sales, and (2) 10% of accounts receivable.
(c) If Allowance for Doubtful Accounts has a debit balance of $200 in the trial balance, journalize the adjusting entry at December 31, assuming bad debts are expected to be (1) 0.75% of net sales and (2) 6% of accounts receivable.
E9-4 Menge Company has accounts receivable of $93,100 at March 31. Credit terms are 2/10, n/30. At March 31, Allowance for Doubtful Accounts has a credit balance of $1,200 prior to adjustment. The company uses the percentage-of-receivables basis for estimating uncollectible accounts. The company’s estimate of bad debts is shown below.
Journalize entries for recognizing accounts receivable.
(LO 1)
Journalize entries to record allowance for doubtful accounts using two different bases.
(LO 2)
Determine bad debt expense; prepare the adjusting entry for bad debt expense.
(LO 2)
Estimated Percentage Age of Accounts Balance, March 31 Uncollectible
1–30 days $60,000 2.0% 31–60 days 17,600 5.0% 61–90 days 8,500 20.0% Over 90 days 7,000 50.0%
$93,100
Instructions(a) Determine the total estimated uncollectibles.(b) Prepare the adjusting entry at March 31 to record bad debt expense.
E9-5 At December 31, 2016, Finzelberg Company had a credit balance of $15,000 in Allowance for Doubtful Accounts. During 2017, Finzelberg wrote off accounts totaling $11,000. One of those accounts ($1,800) was later collected. At December 31, 2017, an aging schedule indicated that the balance in Allowance for Doubtful Accounts should be $19,000.
InstructionsPrepare journal entries to record the 2017 transactions of Finzelberg Company.
E9-6 On December 31, 2017, Ling Co. estimated that 2% of its net sales of $450,000 will become uncollectible. The company recorded this amount as an addition to Allowance for Doubtful Accounts. On May 11, 2018, Ling Co. determined that the Jeff Shoemaker account was uncollectible and wrote off $1,100. On June 12, 2018, Shoemaker paid the amount previously written off.
InstructionsPrepare the journal entries on December 31, 2017, May 11, 2018, and June 12, 2018.
Journalize write-off and recovery.
(LO 2)
Journalize percentage of sales basis, write-off, recovery.
(LO 2)

Exercises 433
E9-7 Presented below are two independent situations.
(a) On March 3, Kitselman Appliances sells $650,000 of its receivables to Ervay Factors Inc. Ervay Factors assesses a fi nance charge of 3% of the amount of receivables sold. Prepare the entry on Kitselman Appliances’ books to record the sale of the receivables.
(b) On May 10, Fillmore Company sold merchandise for $3,000 and accepted the customer’s America Bank MasterCard. America Bank charges a 4% service charge for credit card sales. Prepare the entry on Fillmore Company’s books to record the sale of merchandise.
E9-8 Presented below are two independent situations.
(a) On April 2, Jennifer Elston uses her JCPenney Company credit card to purchase mer-chandise from a JCPenney store for $1,500. On May 1, Elston is billed for the $1,500 amount due. Elston pays $500 on the balance due on May 3. Elston receives a bill dated June 1 for the amount due, including interest at 1.0% per month on the unpaid balance as of May 3. Prepare the entries on JCPenney Co.’s books related to the trans-actions that occurred on April 2, May 3, and June 1.
(b) On July 4, Spangler’s Restaurant accepts a Visa card for a $200 dinner bill. Visa charges a 2% service fee. Prepare the entry on Spangler’s books related to this transaction.
E9-9 Colaw Stores accepts both its own and national credit cards. During the year, the following selected summary transactions occurred.
Jan. 15 Made Colaw credit card sales totaling $18,000. (There were no balances prior to January 15.)
20 Made Visa credit card sales (service charge fee 2%) totaling $4,500.Feb. 10 Collected $10,000 on Colaw credit card sales. 15 Added fi nance charges of 1.5% to Colaw credit card account balances.
InstructionsJournalize the transactions for Colaw Stores.
E9-10 Elburn Supply Co. has the following transactions related to notes receivable during the last 2 months of 2017. The company does not make entries to accrue interest except at December 31.
Nov. 1 Loaned $30,000 cash to Manny Lopez on a 12 month, 10% note.Dec. 11 Sold goods to Ralph Kremer, Inc., receiving a $6,750, 90-day, 8% note. 16 Received a $4,000, 180 day, 9% note in exchange for Joe Fernetti’s outstanding
accounts receivable. 31 Accrued interest revenue on all notes receivable.
Instructions(a) Journalize the transactions for Elburn Supply Co.(b) Record the collection of the Lopez note at its maturity in 2018.
E9-11 Record the following transactions for Redeker Co. in the general journal.
2017
May 1 Received a $9,000, 12-month, 10% note in exchange for Mark Chamber’s outstanding accounts receivable.
Dec. 31 Accrued interest on the Chamber note.Dec. 31 Closed the interest revenue account.
2018
May 1 Received principal plus interest on the Chamber note. (No interest has been accrued in 2018.)
E9-12 Vandiver Company had the following select transactions.
Apr. 1, 2017 Accepted Goodwin Company’s 12-month, 12% note in settlement of a $30,000 account receivable.
July 1, 2017 Loaned $25,000 cash to Thomas Slocombe on a 9-month, 10% note.Dec. 31, 2017 Accrued interest on all notes receivable.Apr. 1, 2018 Received principal plus interest on the Goodwin note.Apr. 1, 2018 Thomas Slocombe dishonored its note; Vandiver expects it will eventually
collect.
InstructionsPrepare journal entries to record the transactions. Vandiver prepares adjusting entries once a year on December 31.
Journalize entries for the sale of accounts receivable.
(LO 2)
Journalize entries for credit card sales.
(LO 2)
Journalize credit card sales, and indicate the statement presentation of fi nancing charges and service charge expense.
(LO 2)
Journalize entries for notes receivable transactions.
(LO 3)
Journalize entries for notes receivable.
(LO 3)
Prepare entries for note receivable transactions.
(LO 3, 4)

434 9 Accounting for Receivables
E9-13 On May 2, McLain Company lends $9,000 to Chang, Inc., issuing a 6-month, 9% note. At the maturity date, November 2, Chang indicates that it cannot pay.
Instructions(a) Prepare the entry to record the issuance of the note.(b) Prepare the entry to record the dishonor of the note, assuming that McLain Company
expects collection will occur.(c) Prepare the entry to record the dishonor of the note, assuming that McLain Company
does not expect collection in the future.
E9-14 Kerwick Company had accounts receivable of $100,000 on January 1, 2017. The only transactions that affected accounts receivable during 2017 were net credit sales of $1,000,000, cash collections of $920,000, and accounts written off of $30,000.
Instructions(a) Compute the ending balance of accounts receivable.(b) Compute the accounts receivable turnover for 2017.(c) Compute the average collection period in days.
Journalize entries for dishonor of notes receivable.
(LO 3, 4)
Compute accounts receivable turnover and average collection period.
(LO 4)
EXERCISES: SET B AND CHALLENGE EXERCISES
Visit the book’s companion website, at www.wiley.com/college/weygandt, and choose the Student Companion site to access Exercises: Set B and Challenge Exercises.
PROBLEMS: SET A
P9-1A At December 31, 2016, House Co. reported the following information on its balance sheet.
Accounts receivable $960,000Less: Allowance for doubtful accounts 80,000
During 2017, the company had the following transactions related to receivables.
1. Sales on account $3,700,0002. Sales returns and allowances 50,0003. Collections of accounts receivable 2,810,0004. Write-offs of accounts receivable deemed uncollectible 90,0005. Recovery of bad debts previously written off as uncollectible 29,000
Instructions(a) Prepare the journal entries to record each of these fi ve transactions. Assume that no
cash discounts were taken on the collections of accounts receivable.(b) Enter the January 1, 2017, balances in Accounts Receivable and Allowance for Doubtful
Accounts, post the entries to the two accounts (use T-accounts), and determine the balances.
(c) Prepare the journal entry to record bad debt expense for 2017, assuming that an aging of accounts receivable indicates that expected bad debts are $115,000.
(d) Compute the accounts receivable turnover for 2017 assuming the expected bad debt information provided in (c).
P9-2A Information related to Mingenback Company for 2017 is summarized below.
Total credit sales $2,500,000Accounts receivable at December 31 875,000Bad debts written off 33,000
Instructions(a) What amount of bad debt expense will Mingenback Company report if it uses the
direct write-off method of accounting for bad debts?(b) Assume that Mingenback Company estimates its bad debt expense to be 2% of credit
sales. What amount of bad debt expense will Mingenback record if it has an Allowance for Doubtful Accounts credit balance of $4,000?
(b) Accounts receivable $1,710,000ADA $19,000
(c) Bad debt expense $96,000
Prepare journal entries related to bad debt expense.
(LO 1, 2, 4)
Compute bad debt amounts.
(LO 2)

Problems: Set A 435
(c) Assume that Mingenback Company estimates its bad debt expense based on 6% of accounts receivable. What amount of bad debt expense will Mingenback record if it has an Allowance for Doubtful Accounts credit balance of $3,000?
(d) Assume the same facts as in (c), except that there is a $3,000 debit balance in Allowance for Doubtful Accounts. What amount of bad debt expense will Mingenback record?
(e) What is the weakness of the direct write-off method of reporting bad debt expense?
P9-3A Presented below is an aging schedule for Halleran Company. Journalize entries to record transactions related to bad debts.
(LO 2)Formulas Data Review ViewPage LayoutInsert
P18
Worksheet.xlsHome
A B C D E F G
Number of Days Past Due123456789
10
11
12
Customer TotalNot
Yet Due 1–30 31–60 61–90 Over 90AndersBlakeCoulsonDeleonOthers
Total Estimated Bad Debts
Estimated Percentage Uncollectible
$ 4,560
3%
$ 40,000
96,000
16,000
$ 38,610
$ 22,000
57,00040,000
34,000132,000
$285,000
$34,0006,000
$40,000
$35,000
$35,000
$12,000
14,00016,000$26,000
$10,000
6,000
$32,000$152,000
$ 1,920
6%
$ 3,380
13%
$ 8,750
25%
$20,000
50%
fx
At December 31, 2017, the unadjusted balance in Allowance for Doubtful Accounts is a credit of $12,000.
Instructions(a) Journalize and post the adjusting entry for bad debts at December 31, 2017.(b) Journalize and post to the allowance account the following events and transactions in
the year 2018. (1) On March 31, a $1,000 customer balance originating in 2017 is judged uncollectible. (2) On May 31, a check for $1,000 is received from the customer whose account was
written off as uncollectible on March 31.(c) Journalize the adjusting entry for bad debts on December 31, 2018, assuming that the
unadjusted balance in Allowance for Doubtful Accounts is a debit of $800 and the aging schedule indicates that total estimated bad debts will be $31,600.
P9-4A Rigney Inc. uses the allowance method to estimate uncollectible accounts receiv-able. The company produced the following aging of the accounts receivable at year-end.
(a) Bad debt expense $26,610
(c) Bad debt expense $32,400
Journalize transactions related to bad debts.
(LO 2)
Formulas Data Review ViewPage LayoutInsert
P18
Worksheet.xlsHome
A B C D E F G
Total
Number of Days Outstanding
0–30 31–60 91–120 Over 120Accounts receivable% uncollectibleEstimated bad debts
200,000 46,00077,000
1234567
23,000 15,00020%8%
61–9039,000
5%4%1%
fx
Instructions(a) Calculate the total estimated bad debts based on the above information.(b) Prepare the year-end adjusting journal entry to record the bad debts using the aged
uncollectible accounts receivable determined in (a). Assume the current balance in Allowance for Doubtful Accounts is a $8,000 debit.
(c) Of the above accounts, $5,000 is determined to be specifi cally uncollectible. Prepare the journal entry to write off the uncollectible account.
(d) The company collects $5,000 subsequently on a specifi c account that had previously been determined to be uncollectible in (c). Prepare the journal entry(ies) necessary to restore the account and record the cash collection.
(a) Tot. est. bad debts $9,400

436 9 Accounting for Receivables
(e) Comment on how your answers to (a)–(d) would change if Rigney Inc. used 4% of total accounts receivable rather than aging the accounts receivable. What are the advantages to the company of aging the accounts receivable rather than applying a percentage to total accounts receivable?
P9-5A At December 31, 2017, the trial balance of Darby Company contained the following amounts before adjustment.
Journalize entries to record transactions related to bad debts.
(LO 2)
Instructions(a) Based on the information given, which method of accounting for bad debts is Darby Com-
pany using—the direct write-off method or the allowance method? How can you tell?(b) Prepare the adjusting entry at December 31, 2017, for bad debt expense under each of
the following independent assumptions. (1) An aging schedule indicates that $11,750 of accounts receivable will be uncollectible. (2) The company estimates that 1% of sales will be uncollectible.(c) Repeat part (b) assuming that instead of a credit balance there is a $1,000 debit bal-
ance in Allowance for Doubtful Accounts.(d) During the next month, January 2018, a $3,000 account receivable is written off as
uncollectible. Prepare the journal entry to record the write-off.(e) Repeat part (d) assuming that Darby uses the direct write-off method instead of the
allowance method in accounting for uncollectible accounts receivable.(f) What type of account is Allowance for Doubtful Accounts? How does it affect
how accounts receivable is reported on the balance sheet at the end of the accounting period?
P9-6A Farwell Company closes its books monthly. On September 30, selected ledger account balances are:
(b) (2) $9,700
Prepare entries for various notes receivable transactions.
(LO 1, 2, 3, 4)
Debit Credit
Accounts Receivable $385,000Allowance for Doubtful Accounts $ 1,000Sales Revenue 970,000
Interest is computed using a 360-day year. During October, the following transactions were completed.
Oct. 7 Made sales of $6,900 on Farwell credit cards. 12 Made sales of $900 on MasterCard credit cards. The credit card service charge
is 3%. 15 Added $460 to Farwell customer balances for fi nance charges on unpaid balances. 15 Received payment in full from K. Goza Inc. on the amount due. 24 Received notice that the Holt note has been dishonored. (Assume that Holt is
expected to pay in the future.)
Instructions(a) Journalize the October transactions and the October 31 adjusting entry for accrued
interest receivable.(b) Enter the balances at October 1 in the receivable accounts. Post the entries to all of the
receivable accounts. There was no opening balance in accounts receivable.(c) Show the balance sheet presentation of the receivable accounts at October 31.
P9-7A On January 1, 2017, Harter Company had Accounts Receivable $139,000, Notes Receivable $25,000, and Allowance for Doubtful Accounts $13,200. The note receivable is from Willingham Company. It is a 4-month, 9% note dated December 31, 2016. Harter Company prepares fi nancial statements annually at December 31. During the year, the following selected transactions occurred.
(b) Accounts receivable $16,465
(c) Total receivables $32,585
Prepare entries for various receivable transactions.
(LO 1, 2, 3, 4)
Notes Receivable $37,000Interest Receivable 183
Notes Receivable include the following.
Date Maker Face Term Interest
Aug. 16 K. Goza Inc. $12,000 60 days 8%Aug. 25 Holt Co. 9,000 60 days 7%Sept. 30 Noblitt Corp. 16,000 6 months 9%

Comprehensive Problem 437
Jan. 5 Sold $20,000 of merchandise to Sheldon Company, terms n/15. 20 Accepted Sheldon Company’s $20,000, 3-month, 8% note for balance due.Feb. 18 Sold $8,000 of merchandise to Patwary Company and accepted Patwary’s
$8,000, 6-month, 9% note for the amount due.Apr. 20 Collected Sheldon Company note in full. 30 Received payment in full from Willingham Company on the amount due.May 25 Accepted Potter Inc.’s $6,000, 3-month, 7% note in settlement of a past-due
balance on account.Aug. 18 Received payment in full from Patwary Company on note due. 25 The Potter Inc. note was dishonored. Potter Inc. is not bankrupt; future
payment is anticipated.Sept. 1 Sold $12,000 of merchandise to Stanbrough Company and accepted a $12,000,
6-month, 10% note for the amount due.
InstructionsJournalize the transactions.
PROBLEMS: SET B AND SET C
Visit the book’s companion website, at www.wiley.com/college/weygandt, and choose the Student Companion site to access Problems: Set B and Set C.
COMPREHENSIVE PROBLEM
CP9 Winter Company’s balance sheet at December 31, 2016, is presented below.
During January 2017, the following transactions occurred. Winter uses the perpetual inventory method.
Jan. 1 Winter accepted a 4-month, 8% note from Merando Company in payment of Merando’s $1,200 account.
3 Winter wrote off as uncollectible the accounts of Inwood Corporation ($450) and Goza Company ($280).
8 Winter purchased $17,200 of inventory on account. 11 Winter sold for $28,000 on account inventory that cost $19,600. 15 Winter sold inventory that cost $700 to Mark Lauber for $1,000. Lauber charged this
amount on his Visa First Bank card. The service fee charged Winter by First Bank is 3%. 17 Winter collected $22,900 from customers on account. 21 Winter paid $14,300 on accounts payable. 24 Winter received payment in full ($280) from Goza Company on the account written off on
January 3. 27 Winter purchased supplies for $1,400 cash. 31 Winter paid other operating expenses, $3,718.
Adjustment data:
1. Interest is recorded for the month on the note from January 1.2. Bad debts are expected to be 6% of the January 31, 2017, accounts receivable.3. A count of supplies on January 31, 2017, reveals that $560 remains unused.
Instructions(You may want to set up T-accounts to determine ending balances.)
(a) Prepare journal entries for the transactions listed above and adjusting entries. (Include entries for cost of goods sold using the perpetual system.)
(b) Prepare an adjusted trial balance at January 31, 2017.(c) Prepare an income statement and an owner’s equity statement for the month ending January 31,
2017, and a classifi ed balance sheet as of January 31, 2017.
(b) Totals $74,765(c) Tot. assets
$47,473
WINTER COMPANYBalance Sheet
December 31, 2016
Cash $13,100 Accounts payable $ 8,750Accounts receivable 19,780 Owner’s capital 32,730Allowance for doubtful accounts (800) $41,480Inventory 9,400
$41,480

438 9 Accounting for Receivables
COOKIE CREATIONS: AN ENTREPRENEURIAL JOURNEY(Note: This is a continuation of the Cookie Creations problem from Chapters 1 through 8.)
CC9 One of Natalie’s friends, Curtis Lesperance, runs a coffee shop where he sells specialty coffees and prepares and sells muffi ns and cookies. He is eager to buy one of Natalie’s fi ne European mixers, which would enable him to make larger batches of muffi ns and cookies. However, Curtis cannot afford to pay for the mixer for at least 30 days. He asks Natalie if she would be willing to sell him the mixer on credit. Natalie comes to you for advice.
Go to the book’s companion website, www.wiley.com/college/weygandt, to see the completion of this problem.
PERSPECTIVEFINANCIAL REPORTING AND ANALYSIS
Financial Reporting Problem: RLF CompanyBYP9-1 RLF Company sells offi ce equipment and supplies to many organizations in the city and sur-rounding area on contract terms of 2/10, n/30. In the past, over 75% of the credit customers have taken advantage of the discount by paying within 10 days of the invoice date. The number of customers taking the full 30 days to pay has increased within the last year. Current in-dications are that less than 60% of the customers are now taking the discount. Bad debts as a percentage of gross credit sales have risen from the 2.5% provided in past years to about 4.5% in the current year. The company’s Finance Committee has requested more information on the collections of accounts receivable. The controller responded to this request with the report reproduced below.
RLF COMPANYAccounts Receivable Collections
May 31, 2017
The fact that some credit accounts will prove uncollectible is normal. Annual bad debt write-offs have been 2.5% of gross credit sales over the past 5 years. During the last fi scal year, this percentage increased to slightly less than 4.5%. The current Accounts Receivable balance is $1,400,000. The con-dition of this balance in terms of age and probability of collection is as follows.
Proportion of Total Age Categories Probability of Collection
60% not yet due 98% 22% less than 30 days past due 96% 9% 30 to 60 days past due 94% 5% 61 to 120 days past due 91% 21/2% 121 to 180 days past due 75% 11/2% over 180 days past due 30%
Allowance for Doubtful Accounts had a credit balance of $29,500 on June 1, 2016. RLF has provided for a monthly bad debt expense accrual during the current fi scal year based on the assumption that 4.5% of gross credit sales will be uncollectible. Total gross credit sales for the 2016–2017 fi scal year amounted to $2,900,000. Write-offs of bad accounts during the year totaled $102,000.
Instructions(a) Prepare an accounts receivable aging schedule for RLF Company using the age categories identi-
fi ed in the controller’s report to the Finance Committee showing the following. (1) The amount of accounts receivable outstanding for each age category and in total. (2) The estimated amount that is uncollectible for each category and in total.(b) Compute the amount of the year-end adjustment necessary to bring Allowance for Doubtful
Accounts to the balance indicated by the age analysis. Then prepare the necessary journal entry to adjust the accounting records.
(c) In a recessionary environment with tight credit and high interest rates: (1) Identify steps RLF Company might consider to improve the accounts receivable situation. (2) Then evaluate each step identifi ed in terms of the risks and costs involved.
BROADENING YOUR
CONTINUING PROBLEM
© leungchopan/Shutterstock

Broadening Your Perspective 439
Comparative Analysis Problem: PepsiCo, Inc. vs. The Coca-Cola CompanyBYP9-2 PepsiCo, Inc.’s fi nancial statements are presented in Appendix B. Financial statements of The Coca-Cola Company are presented in Appendix C. Instructions for accessing and using the com-plete annual reports of PepsiCo and Coca-Cola, including the notes to the fi nancial statements, are also provided in Appendices B and C, respectively.
Instructions(a) Based on the information in these fi nancial statements, compute the following 2013 ratios for
each company. (Assume all sales are credit sales and that PepsiCo’s receivables on its balance sheet are all trade receivables.)
(1) Accounts receivable turnover. (2) Average collection period for receivables.(b) What conclusions about managing accounts receivable can you draw from these data?
Comparative Analysis Problem: Amazon.com, Inc. vs. Wal-Mart Stores, Inc.BYP9-3 Amazon.com, Inc.’s fi nancial statements are presented in Appendix D. Financial statements of Wal-Mart Stores, Inc. are presented in Appendix E. Instructions for accessing and using the com-plete annual reports of Amazon and Wal-Mart, including the notes to the fi nancial statements, are also provided in Appendices D and E, respectively.
Instructions(a) Based on the information in these fi nancial statements, compute the following ratios for each
company (for the most recent year shown). (Assume all sales are credit sales.) (1) Accounts receivable turnover. (2) Average collection period for receivables.(b) What conclusions about managing accounts receivable can you draw from these data?
Real-World FocusBYP9-4 Purpose: To learn more about factoring.
Address: www.comcapfactoring.com, or go to www.wiley.com/college/weygandt
Steps: Go to the website, click on Invoice Factoring, and answer the following questions.(a) What are some of the benefi ts of factoring?(b) What is the range of the percentages of the typical discount rate?(c) If a company factors its receivables, what percentage of the value of the receivables can it expect
to receive from the factor in the form of cash, and how quickly will it receive the cash?
CRITICAL THINKING
Decision-Making Across the OrganizationBYP9-5 Carol and Sam Foyle own Campus Fashions. From its inception Campus Fashions has sold merchandise on either a cash or credit basis, but no credit cards have been accepted. During the past several months, the Foyles have begun to question their sales policies. First, they have lost some sales because of refusing to accept credit cards. Second, representatives of two metropolitan banks have been persuasive in almost convincing them to accept their national credit cards. One bank, City National Bank, has stated that its credit card fee is 4%. The Foyles decide that they should determine the cost of carrying their own credit sales. From the accounting records of the past 3 years, they accumulate the following data.
2018 2017 2016
Net credit sales $500,000 $550,000 $400,000Collection agency fees for slow-paying customers 2,450 2,500 2,300Salary of part-time accounts receivable clerk 4,100 4,100 4,100
Uncollectible account expense is 1.6% of net credit sales, billing and mailing costs 0.5%, and credit investigation fee on new customers is 0.15%.

5 Compare the accounting for receivables under GAAP and IFRS.LEARNING OBJECTIVE
The basic accounting and reporting issues related to the recognition, measurement, and disposition of receivables are essentially the same between IFRS and GAAP.
Key PointsFollowing are the key similarities and differences between GAAP and IFRS as related to the account-ing for receivables.
A Look at IFRS
440 9 Accounting for Receivables
Carol and Sam also determine that the average accounts receivable balance outstanding during the year is 5% of net credit sales. The Foyles estimate that they could earn an average of 8% annually on cash invested in other business opportunities.
InstructionsWith the class divided into groups, answer the following.
(a) Prepare a table showing, for each year, total credit and collection expenses in dollars and as a percentage of net credit sales.
(b) Determine the net credit and collection expense in dollars and as a percentage of sales after con-sidering the revenue not earned from other investment opportunities.
(c) Discuss both the fi nancial and nonfi nancial factors that are relevant to the decision.
Communication ActivityBYP9-6 Jill Epp, a friend of yours, overheard a discussion at work about changes her employer wants to make in accounting for uncollectible accounts. Jill knows little about accounting, and she asks you to help make sense of what she heard. Specifi cally, she asks you to explain the differences between the percentage-of-sales, percentage-of-receivables, and the direct write-off methods for uncollectible accounts.
InstructionsIn a letter of one page (or less), explain to Jill the three methods of accounting for uncollectibles. Be sure to discuss differences among these methods.
Ethics CaseBYP9-7 The controller of Diaz Co. believes that the yearly allowance for doubtful accounts for Diaz Co. should be 2% of net credit sales. The president of Diaz Co., nervous that the owners might expect the company to sustain its 10% growth rate, suggests that the controller increase the allowance for doubtful accounts to 4%. The president thinks that the lower net income, which refl ects a 6% growth rate, will be a more sustainable rate for Diaz Co.
Instructions(a) Who are the stakeholders in this case?(b) Does the president’s request pose an ethical dilemma for the controller?(c) Should the controller be concerned with Diaz Co.’s growth rate? Explain your answer.
FASB Codifi cation ActivityBYP9-8 If your school has a subscription to the FASB Codifi cation, go to http://aaahq.org/ascLogin.cfm to log in and prepare responses to the following.
(a) How are receivables defi ned in the Codifi cation?(b) What are the conditions under which losses from uncollectible receivables (Bad Debt Expense)
should be reported?

A Look at IFRS 441
Similarities• The recording of receivables, recognition of sales returns and allowances and sales discounts, and
the allowance method to record bad debts are the same between IFRS and GAAP.
• Both IFRS and GAAP often use the term impairment to indicate that a receivable may not be collected.
• The FASB and IASB have worked to implement fair value measurement (the amount they currently could be sold for) for fi nancial instruments, such as receivables. Both Boards have faced bitter opposition from various factions.
Differences• Although IFRS implies that receivables with different characteristics should be reported separately,
there is no standard that mandates this segregation.
• IFRS and GAAP differ in the criteria used to determine how to record a factoring transaction. IFRS uses a combination approach focused on risks and rewards and loss of control. GAAP uses loss of control as the primary criterion. In addition, IFRS permits partial derecognition of receivables; GAAP does not.
Looking to the FutureThe question of recording fair values for fi nancial instruments will continue to be an important issue to resolve as the Boards work toward convergence. Both the IASB and the FASB have indicated that they believe that fi nancial statements would be more transparent and understandable if companies recorded and reported all fi nancial instruments at fair value.
IFRS Practice
IFRS Self-Test Questions
1. Which of the following statements is false?(a) Receivables include equity securities purchased by the company.(b) Receivables include credit card receivables.(c) Receivables include amounts owed by employees as a result of company loans to employees.(d) Receivables include amounts resulting from transactions with customers.
2. Under IFRS:(a) the entry to record estimated uncollected accounts is the same as GAAP.(b) it is always acceptable to use the direct write-off method.(c) all fi nancial instruments are recorded at fair value.(d) None of the above.
International Financial Reporting Problem: Louis Vuitton
IFRS9-1 The fi nancial statements of Louis Vuitton are presented in Appendix F. Instructions for accessing and using the company’s complete annual report, including the notes to its fi nancial state-ments, are also provided in Appendix F.
InstructionsUse the company’s annual report to answer the following questions.
(a) What is the accounting policy related to accounting for trade accounts receivable?(b) According to the notes to the fi nancial statements, what accounted for the difference between
gross trade accounts receivable and net accounts receivable?(c) According to the notes to the fi nancial statements, what was the major reason why the balance in
receivables increased relative to the previous year?(d) Using information in the notes to the fi nancial statements, determine what percentage the provision
for impairment of receivables was as a percentage of total trade receivables for 2013 and 2012. How did the ratio change from 2012 to 2013, and what does this suggest about the company’s receivables?
Answers to IFRS Self-Test Questions
1. a 2. a

It’s spring break. Your plane has landed, you’ve fi nally found
your bags, and you’re dying to hit the beach—but fi rst you
need a “vehicular unit” to get you there. As you turn away
from baggage claim, you see a long row of rental agency
booths. Many are names that you know—Hertz, Avis,
and Budget. But a booth at the far end catches your eye—
Rent-A-Wreck. Now there’s a company making a clear
statement!
Any company that relies on equipment to generate revenues
must make decisions about what kind of equipment to buy,
how long to keep it, and how vigorously to maintain it.
Rent-A-Wreck has decided to rent used rather than new cars
and trucks. It rents these vehicles across the United States,
Europe, and Asia. While the big-name agencies push vehicles
with that “new car smell,” Rent-A-Wreck competes on price.
Rent-A-Wreck’s message is simple: Rent a used car and save
some cash. It’s not a message that appeals to everyone. If
you’re a marketing executive wanting to impress a big client,
you probably don’t want to pull up in a Rent-A-Wreck car. But
if you want to get from point A to point B for the minimum
cash per mile, then Rent-A-Wreck is playing your tune. The
company’s message seems to be getting across to the right
clientele. Revenues have increased signifi cantly.
When you rent a car from Rent-A-Wreck, you are renting from
an independent businessperson. This owner has paid a
“franchise fee” for the right to use the Rent-A-Wreck name.
In order to gain a franchise, he or she must meet fi nancial and
other criteria, and must agree to run the rental agency
according to rules prescribed by Rent-A-Wreck. Some of these
rules require that each franchise maintain its cars in a
reasonable fashion. This ensures that, though you won’t be
cruising down Daytona Beach’s Atlantic Avenue in a Mercedes
convertible, you can be reasonably assured that you won’t be
calling a towtruck.
How Much for a Ride to the Beach?
The accounting for long-term assets has important implications for a company’s reported results. In this chapter, we explain the application of the historical cost principle of accounting to property, plant, and equipment, such as Rent-A-Wreck vehicles, as well as to natural resources and intangible assets, such as the “Rent-A-Wreck” trademark. We also describe the methods that companies may use to allocate an asset’s cost over its useful life. In addition, we discuss the accounting for expenditures incurred during the useful life of assets, such as the cost of replacing tires and brake pads on rental cars.
CHAPTER PREVIEW
10
FEATURE STORY
Plant Assets, Natural Resources, and Intangible Assets
442

Describe how to account for natural resources and intangible assets.
Apply depreciation methods to plant assets.
Explain how to account for the disposal of plant assets.
2
3
4
Explain the accounting for plant asset expenditures.1 Cost of Plant AssetsDO IT! 1
• Determining the cost of plant assets
• Expenditures during useful life
• Factors in computing depreciation
• Depreciation methods• Depreciation and income taxes• Revising periodic depreciation
Learning Objectives
Recording Business ActivitiesPlant Asset DisposalDO IT! 3• Retirement of plant assets
• Sale of plant assets
Classifi cation ConceptsDO IT! 4
• Natural resources• Depletion• Intangible assets• Accounting for intangible assets• Research and development costs
Uncollectible Accounts Receivable
Go to the REVIEW AND PRACTICE section at the end of the chapter for a review of key concepts and practice applications with solutions.
Visit WileyPLUS with ORION for additional tutorials and practice opportunities.
CHAPTER OUTLINE
David Trood/Getty Images, Inc.
Straight-Line Depreciation2a
Revised DepreciationDO IT!
2b
Discuss how plant assets, natural resources, and intangible assets are reported and analyzed.
5 Asset TurnoverDO IT! 5• Presentation• Analysis
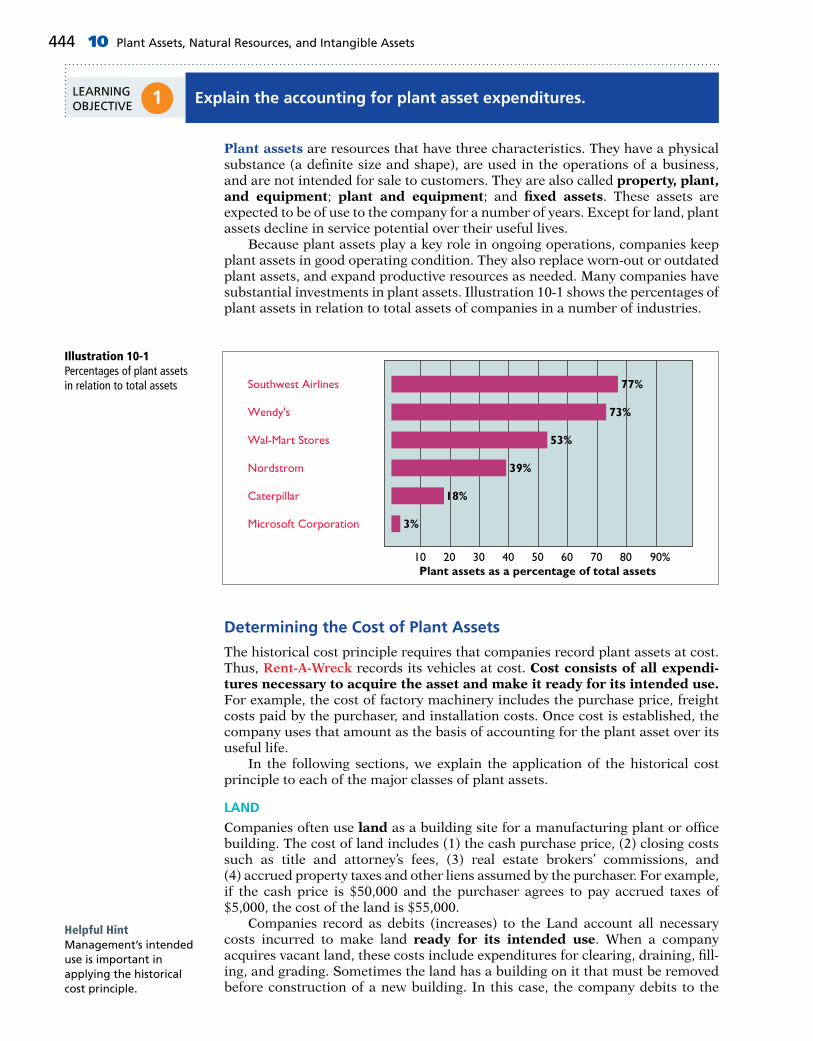
444 10 Plant Assets, Natural Resources, and Intangible Assets
1 Explain the accounting for plant asset expenditures.LEARNING OBJECTIVE
Plant assets are resources that have three characteristics. They have a physical substance (a defi nite size and shape), are used in the operations of a business, and are not intended for sale to customers. They are also called property, plant, and equipment; plant and equipment; and fi xed assets. These assets are expected to be of use to the company for a number of years. Except for land, plant assets decline in service potential over their useful lives. Because plant assets play a key role in ongoing operations, companies keep plant assets in good operating condition. They also replace worn-out or outdated plant assets, and expand productive resources as needed. Many companies have substantial investments in plant assets. Illustration 10-1 shows the percentages of plant assets in relation to total assets of companies in a number of industries.
Determining the Cost of Plant Assets
The historical cost principle requires that companies record plant assets at cost. Thus, Rent-A-Wreck records its vehicles at cost. Cost consists of all expendi-tures necessary to acquire the asset and make it ready for its intended use. For example, the cost of factory machinery includes the purchase price, freight costs paid by the purchaser, and installation costs. Once cost is established, the company uses that amount as the basis of accounting for the plant asset over its useful life. In the following sections, we explain the application of the historical cost principle to each of the major classes of plant assets.
LAND
Companies often use land as a building site for a manufacturing plant or offi ce building. The cost of land includes (1) the cash purchase price, (2) closing costs such as title and attorney’s fees, (3) real estate brokers’ commissions, and (4) accrued property taxes and other liens assumed by the purchaser. For example, if the cash price is $50,000 and the purchaser agrees to pay accrued taxes of $5,000, the cost of the land is $55,000. Companies record as debits (increases) to the Land account all necessary costs incurred to make land ready for its intended use. When a company acquires vacant land, these costs include expenditures for clearing, draining, fi ll-ing, and grading. Sometimes the land has a building on it that must be removed before construction of a new building. In this case, the company debits to the
Helpful HintManagement’s intended use is important in applying the historical cost principle.
Illustration 10-1Percentages of plant assets in relation to total assets
Wendy's 73%
10 20 30 40 50Plant assets as a percentage of total assets
60 70 80 90%
39%
18%
3%
53%
Nordstrom
Wal-Mart Stores
Caterpillar
77%Southwest Airlines
Microsoft Corporation

Plant Asset Expenditures 445
Land account all demolition and removal costs, less any proceeds from salvaged materials. To illustrate, assume that Hayes Company acquires real estate at a cash cost of $100,000. The property contains an old warehouse that is razed at a net cost of $6,000 ($7,500 in costs less $1,500 proceeds from salvaged materials). Additional expenditures are the attorney’s fee, $1,000, and the real estate broker’s commission, $8,000. The cost of the land is $115,000, computed as shown in Illustration 10-2.
LAND IMPROVEMENTS
Land improvements are structural additions made to land. Examples are drive-ways, parking lots, fences, landscaping, and underground sprinklers. The cost of land improvements includes all expenditures necessary to make the improve-ments ready for their intended use. For example, the cost of a new parking lot for Home Depot includes the amount paid for paving, fencing, and lighting. Thus, Home Depot debits to Land Improvements the total of all of these costs. Land improvements have limited useful lives, and their maintenance and replacement are the responsibility of the company. As a result, companies expense (depreciate) the cost of land improvements over their useful lives.
BUILDINGS
Buildings are facilities used in operations, such as stores, offi ces, factories, ware-houses, and airplane hangars. Companies debit to the Buildings account all nec-essary expenditures related to the purchase or construction of a building. When a building is purchased, such costs include the purchase price, closing costs (attorney’s fees, title insurance, etc.), and real estate broker’s commission. Costs to make the building ready for its intended use include expenditures for remod-eling and replacing or repairing the roof, fl oors, electrical wiring, and plumbing. When a new building is constructed, cost consists of the contract price plus payments for architects’ fees, building permits, and excavation costs. In addition, companies charge certain interest costs to the Buildings account. Interest costs incurred to fi nance the project are included in the cost of the build-ing when a signifi cant period of time is required to get the building ready for use. In these circumstances, interest costs are considered as necessary as materials and labor. However, the inclusion of interest costs in the cost of a constructed building is limited to the construction period. When construction has been completed, the company records subsequent interest payments on funds borrowed to fi nance the construction as debits (increases) to Interest Expense.
EQUIPMENT
Equipment includes assets used in operations, such as store check-out counters, offi ce furniture, factory machinery, delivery trucks, and airplanes. The cost of equipment, such as Rent-A-Wreck vehicles, consists of the cash purchase price, sales taxes, freight charges, and insurance during transit paid by the purchaser. It also includes expenditures required in assembling, installing, and testing the unit. However, Rent-A-Wreck does not include motor vehicle licenses and accident
Illustration 10-2Computation of cost of landLand
Cash price of property $ 100,000Net removal cost of warehouse ($7,500 2 $1,500) 6,000Attorney’s fee 1,000Real estate broker’s commission 8,000
Cost of land $115,000
Land 115,000 Cash 115,000 (To record purchase of land)
1115,0002115,000
Cash Flows2115,000
A OEL5 1Hayes makes the following entry to record the acquisition of the land.

446 10 Plant Assets, Natural Resources, and Intangible Assets
insurance on company vehicles in the cost of equipment. These costs represent annual recurring expenditures and do not benefi t future periods. Thus, they are treated as expenses as they are incurred. To illustrate, assume Merten Company purchases factory machinery at a cash price of $50,000. Related expenditures are for sales taxes $3,000, insurance during shipping $500, and installation and testing $1,000. The cost of the factory machinery is $54,500, as computed in Illustration 10-3.
Illustration 10-3Computation of cost of factory machinery
Factory Machinery
Cash price $ 50,000Sales taxes 3,000Insurance during shipping 500Installation and testing 1,000
Cost of factory machinery $54,500
Illustration 10-4Computation of cost of delivery truck
Delivery Truck
Cash price $ 22,000Sales taxes 1,320Painting and lettering 500
Cost of delivery truck $23,820
Merten makes the following summary entry to record the purchase and related expenditures.
Equipment 54,500 Cash 54,500 (To record purchase of factory machinery)
For another example, assume that Lenard Company purchases a delivery truck at a cash price of $22,000. Related expenditures consist of sales taxes $1,320, painting and lettering $500, motor vehicle license $80, and a three-year accident insurance policy $1,600. The cost of the delivery truck is $23,820, com-puted as follows.
154,500254,500
Cash Flows254,500
A OEL5 1
123,820 280 Exp1 1,600225,500
Cash Flows225,500
A OEL5 1
Lenard treats the cost of the motor vehicle license as an expense and the cost of the insurance policy as a prepaid asset. Thus, Lenard makes the following entry to record the purchase of the truck and related expenditures:
Equipment 23,820License Expense 80Prepaid Insurance 1,600 Cash 25,500 (To record purchase of delivery truck and related
expenditures)
Expenditures During Useful Life
During the useful life of a plant asset, a company may incur costs for ordinary repairs, additions, or improvements. Ordinary repairs are expenditures to main-tain the operating effi ciency and productive life of the unit. They usually are small amounts that occur frequently. Examples are motor tune-ups and oil changes, the painting of buildings, and the replacing of worn-out gears on machinery. Compa-nies record such repairs as debits to Maintenance and Repairs Expense as they are incurred. Because they are immediately charged as an expense against revenues, these costs are often referred to as revenue expenditures.

Plant Asset Expenditures 447
In contrast, additions and improvements are costs incurred to increase the operating effi ciency, productive capacity, or useful life of a plant asset. They are usually material in amount and occur infrequently. Additions and improvements increase the company’s investment in productive facilities. Companies generally debit these amounts to the plant asset affected. They are often referred to as capital expenditures. Companies must use good judgment in deciding between a revenue expendi-ture and capital expenditure. For example, assume that Rodriguez Co. purchases a number of wastepaper baskets. The proper accounting would appear to be to capitalize and then depreciate these wastepaper baskets over their useful life. However, Rodriguez will generally expense these wastepaper baskets immediately. This practice is justifi ed on the basis of materiality. Materiality refers to the impact of an item’s size on a company’s fi nancial operations. The materiality concept states that if an item would not make a difference in decision-making, the company does not have to follow GAAP in reporting that item.
ANATOMY OF A FRAUD
Bernie Ebbers was the founder and CEO of the phone company WorldCom. The company engaged in a series of increasingly large, debt-fi nanced acquisitions of other companies. These acquisitions made the company grow quickly, which made the stock price increase dramatically. However, because the acquired companies all had different accounting systems, WorldCom’s fi nancial records were a mess. When WorldCom’s performance started to fl atten out, Bernie coerced WorldCom’s accoun-tants to engage in a number of fraudulent activities to make net income look better than it really was and thus prop up the stock price. One of these frauds involved treating $7 billion of line costs as capital expenditures. The line costs, which were rental fees paid to other phone companies to use their phone lines, had always been properly expensed in previous years. Capitalization delayed expense recognition to future periods and thus boosted current-period profi ts.
Total take: $7 billion
THE MISSING CONTROLSDocumentation procedures. The company’s accounting system was a disorganized collection of non-integrated systems, which resulted from a series of corporate ac-quisitions. Top management took advantage of this disorganization to conceal its fraudulent activities.
Independent internal verifi cation. A fraud of this size should have been detected by a routine comparison of the actual physical assets with the list of physical assets shown in the accounting records.
Many U.S. Firms Use Leases
Leasing is big business for U.S. companies. For example, busi-ness investment in equipment in a recent year totaled $800 billion. Leasing accounted for about 33% of all business investments ($264 billion).
Who does the most leasing? Interestingly, major banks such as Continental Bank, J.P. Morgan Leasing, and US Bancorp Equip-
ment Finance are the major lessors. Also, many companies have established separate leasing companies, such as Boeing Capital Corporation, Dell Financial Services, and John Deere Capital Corporation. And, as an excellent exam-ple of the magnitude of leasing, leased planes account for nearly 40% of the U.S. fl eet of commercial airlines. Leasing is also becoming more common in the hotel industry. Marriott, Hilton, and InterContinental are increasingly choosing to lease hotels that are owned by someone else.
Why might airline managers choose to lease rather than purchase their planes? (Go to WileyPLUS for this answer and additional questions.)© Brian Raisbeck/iStockphoto
Accounting Across the Organization

448 10 Plant Assets, Natural Resources, and Intangible Assets
It is important to understand that depreciation is a process of cost alloca-tion. It is not a process of asset valuation. No attempt is made to measure the change in an asset’s fair value during ownership. So, the book value (cost less accumulated depreciation) of a plant asset may be quite different from its fair value. In fact, if an asset is fully depreciated, it can have a zero book value but still have a fair value. Depreciation applies to three classes of plant assets: land improvements, buildings, and equipment. Each asset in these classes is considered to be a depre-ciable asset. Why? Because the usefulness to the company and revenue-producing ability of each asset will decline over the asset’s useful life. Depreciation does not apply to land because its usefulness and revenue-producing ability generally remain intact over time. In fact, in many cases, the usefulness of land is greater over time because of the scarcity of good land sites. Thus, land is not a depre-ciable asset. During a depreciable asset’s useful life, its revenue-producing ability declines because of wear and tear. A delivery truck that has been driven 100,000 miles will be less useful to a company than one driven only 800 miles.
Assume that Drummond Heating and Cooling Co. purchases a delivery truck for $15,000 cash, plus sales taxes of $900 and delivery costs of $500. The buyer also pays $200 for painting and lettering, $600 for an annual insurance policy, and $80 for a motor vehicle license. Explain how each of these costs would be accounted for.
Solution
DO IT! 1 Cost of Plant Assets
The fi rst four payments ($15,000, $900, $500, and $200) are expenditures necessary to make the truck ready for its intended use. Thus, the cost of the truck is $16,600. The payments for insurance and the license are operating costs and therefore are expensed.
Related exercise material: BE10-1, BE10-2, BE10-3, E10-1, E10-2, E10-3, and DO IT! 10-1.
Action Plan✔ Identify expenditures
made in order to get delivery equipment ready for its intended use.
✔ Treat operating costs as expenses.
2 Apply depreciation methods to plant assets.LEARNING OBJECTIVE
As explained in Chapter 3, depreciation is the process of allocating to expense the cost of a plant asset over its useful (service) life in a rational and system-atic manner. Cost allocation enables companies to properly match expenses with revenues in accordance with the expense recognition principle, as shown in Illustration 10-5.
Illustration 10-5Depreciation as a cost allocation concept
Depreciationallocation
Year 1 Year 2 Year 3
Year 4 Year 5 Year 6
ETHICS NOTE
When a business is acquired, proper allocation of the purchase price to various asset classes is important since different depreciation treatments can materially affect income. For example, buildings are depreciated, but land is not.

Depreciation Methods 449
Revenue-producing ability may also decline because of obsolescence. Obsoles-cence is the process of becoming out of date before the asset physically wears out. For example, major airlines moved from Chicago’s Midway Airport to Chicago-O’Hare International Airport because Midway’s runways were too short for jumbo jets. Similarly, many companies replace their computers long before they origi-nally planned to do so because improvements in new computing technology make the old computers obsolete. Recognizing depreciation on an asset does not result in an accumula-tion of cash for replacement of the asset. The balance in Accumulated Depre-ciation represents the total amount of the asset’s cost that the company has charged to expense. It is not a cash fund. Note that the concept of depreciation is consistent with the going concern assumption. The going concern assumption states that the company will continue in operation for the foreseeable future. If a company does not use a going concern assumption, then plant assets should be stated at their fair value. In that case, depreciation of these assets is not needed.
Factors in Computing Depreciation
Three factors affect the computation of depreciation, as shown in Illustration 10-6.
Helpful HintDepreciation expense is reported on the income statement. Accumulated depreciation is reported on the balance sheet as a deduction from plant assets.
Illustration 10-6Three factors in computing depreciation
Cost: all expenditures necessary to acquire the asset and make it ready for intended use Useful life: estimate of the
expected life based on need for repair, service life, and vulnerability to obsolescence
Salvage value: estimate of the asset’s value at the end of its useful life
1. Cost. Earlier, we explained the issues affecting the cost of a depreciable asset. Recall that companies record plant assets at cost, in accordance with the his-torical cost principle.
2. Useful life. Useful life is an estimate of the expected productive life, also called service life, of the asset for its owner. Useful life may be expressed in terms of time, units of activity (such as machine hours), or units of output. Useful life is an estimate. In making the estimate, management considers such factors as the intended use of the asset, its expected repair and maintenance, and its vulnerability to obsolescence. Past experience with similar assets is often helpful in deciding on expected useful life. We might reasonably expect Rent-A-Wreck and Avis to use different estimated useful lives for their vehicles.
3. Salvage value. Salvage value is an estimate of the asset’s value at the end of its useful life. This value may be based on the asset’s worth as scrap or on its expected trade-in value. Like useful life, salvage value is an estimate. In mak-ing the estimate, management considers how it plans to dispose of the asset and its experience with similar assets.
Depreciation Methods
Depreciation is generally computed using one of the following methods:
1. Straight-line
2. Units-of-activity
3. Declining-balance
Alternative TerminologyAnother term sometimes used for salvage value is residual value.

450 10 Plant Assets, Natural Resources, and Intangible Assets
Each method is acceptable under generally accepted accounting principles. Management selects the method(s) it believes to be appropriate. The objective is to select the method that best measures an asset’s contribution to revenue over its useful life. Once a company chooses a method, it should apply it consistently over the useful life of the asset. Consistency enhances the comparability of fi nancial statements. Depreciation affects the balance sheet through accumulated depreci-ation and the income statement through depreciation expense. We will compare the three depreciation methods using the following data for a small delivery truck purchased by Barb’s Florists on January 1, 2017.
Illustration 10-8 (in the margin) shows the use of the primary depreciation methods in a sample of the largest companies in the United States.
STRAIGHT-LINE METHOD
Under the straight-line method, companies expense the same amount of depre-ciation for each year of the asset’s useful life. It is measured solely by the passage of time. To compute depreciation expense under the straight-line method, companies need to determine depreciable cost. Depreciable cost is the cost of the asset less its salvage value. It represents the total amount subject to depreciation. Under the straight-line method, to determine annual depreciation expense, we divide depreciable cost by the asset’s useful life. Illustration 10-9 shows the computation of the fi rst year’s depreciation expense for Barb’s Florists.
Illustration 10-7Delivery truck data Cost $13,000
Expected salvage value $ 1,000Estimated useful life in years 5Estimated useful life in miles 100,000
8% Other5% Units-of-activity
4% Declining-balance
83%Straight-line
Illustration 10-8Use of depreciation methods in large U.S. companies
Illustration 10-9Formula for straight-line method
Salvage Depreciable Cost 2 Value 5 Cost
$13,000 2 $1,000 5 $12,000
Annual Depreciable 4 Useful Life 5 Depreciation Cost (in years) Expense
$12,000 4 5 5 $2,400
Alternatively, we also can compute an annual rate of depreciation. In this case, the rate is 20% (100% 4 5 years). When a company uses an annual straight-line rate, it applies the percentage rate to the depreciable cost of the asset. Illustration 10-10 shows a depreciation schedule using an annual rate.
Illustration 10-10Straight-line depreciation schedule
$2,400
2017
2018
2019
2020
2021
Year
Dep
reci
atio
n Ex
pens
e
BARB’S FLORISTS
Computation End of Year Annual Depreciable Depreciation Depreciation Accumulated BookYear Cost 3 Rate 5 Expense Depreciation Value
2017 $12,000 20% $2,400 $ 2,400 $10,600*2018 12,000 20 2,400 4,800 8,2002019 12,000 20 2,400 7,200 5,8002020 12,000 20 2,400 9,600 3,4002021 12,000 20 2,400 12,000 1,000*Book value 5 Cost 2 Accumulated depreciation 5 ($13,000 2 $2,400).

Depreciation Methods 451
Note that the depreciation expense of $2,400 is the same each year. The book value (computed as cost minus accumulated depreciation) at the end of the use-ful life is equal to the expected $1,000 salvage value. What happens to these computations for an asset purchased during the year, rather than on January 1? In that case, it is necessary to prorate the annual depreciation on a time basis. If Barb’s Florists had purchased the delivery truck on April 1, 2017, the company would own the truck for nine months of the fi rst year (April–December). Thus, depreciation for 2017 would be $1,800 ($12,000 3 20% 3 9/12 of a year). The straight-line method predominates in practice. Such large companies as Campbell Soup, Marriott, and General Mills use the straight-line method. It is simple to apply, and it matches expenses with revenues when the use of the asset is reasonably uniform throughout the service life.
On January 1, 2017, Iron Mountain Ski Corporation purchased a new snow-grooming machine for $50,000. The machine is estimated to have a 10-year life with a $2,000 salvage value. What journal entry would Iron Mountain Ski Corporation make at December 31, 2017, if it uses the straight-line method of depreciation?
Solution
DO IT! 2a Straight-Line Depreciation
Related exercise material: BE10-4, BE10-5, E10-4, and DO IT! 10-2a.
Action Plan✔ Calculate depreciable
cost (Cost 2 Salvage value).
✔ Divide the depreciable cost by the asset’s estimated useful life.
Depreciation expense 5 Cost 2 Salvage value
5 $50,000 2 $2,000
5 $4,800 Useful life 10
The entry to record the fi rst year’s depreciation would be:
Dec. 31 Depreciation Expense 4,800 Accumulated Depreciation—Equipment 4,800 (To record annual depreciation on snow-grooming machine)
UNITS-OF-ACTIVITY METHOD
Under the units-of-activity method, useful life is expressed in terms of the total units of production or use expected from the asset, rather than as a time period. The units-of-activity method is ideally suited to factory machinery. Manufactur-ing companies can measure production in units of output or in machine hours. This method can also be used for such assets as delivery equipment (miles driven) and airplanes (hours in use). The units-of-activity method is generally not suit-able for buildings or furniture because depreciation for these assets is more a function of time than of use. To use this method, companies estimate the total units of activity for the entire useful life, and then divide these units into depreciable cost. The resulting number represents the depreciable cost per unit. The depreciable cost per unit is then applied to the units of activity during the year to determine the annual depreciation expense. To illustrate, assume that Barb’s Florists drives its delivery truck 15,000 miles in the fi rst year. Illustration 10-11 (page 452) shows the units-of-activity formula and the computation of the fi rst year’s depreciation expense.
Alternative TerminologyAnother term often used is the units-of-production method.
Helpful HintUnder any method, depreciation stops when the asset’s book value equals expected salvage value.

452 10 Plant Assets, Natural Resources, and Intangible Assets
The units-of-activity depreciation schedule, using assumed mileage, is as follows.
Illustration 10-11Formula for units-of-activity method
Depreciable Depreciable Total Units 5 Cost per Cost
4 of Activity Unit
$12,000 4 100,000 miles 5 $0.12
Depreciable Units of Annual Cost per 3 Activity during 5 Depreciation Unit the Year Expense
$0.12 3 15,000 miles 5 $1,800
Illustration 10-12Units-of-activity depreciation schedule
BARB’S FLORISTS
Computation End of Year Annual Units of Depreciable Depreciation Accumulated BookYear Activity 3 Cost/Unit 5 Expense Depreciation Value
2017 15,000 $0.12 $1,800 $ 1,800 $11,200*2018 30,000 0.12 3,600 5,400 7,6002019 20,000 0.12 2,400 7,800 5,2002020 25,000 0.12 3,000 10,800 2,2002021 10,000 0.12 1,200 12,000 1,000
*($13,000 2 $1,800).
$5,000$4,000$3,000$2,000$1,000
0
Year
Dep
reci
atio
n Ex
pens
e
2017
2018
2019
2020
2021
This method is easy to apply for assets purchased mid-year. In such a case, the company computes the depreciation using the productivity of the asset for the partial year. The units-of-activity method is not nearly as popular as the straight-line method (see Illustration 10-8, page 450) primarily because it is often diffi cult for companies to reasonably estimate total activity. However, some very large com-panies, such as Chevron and Boise Cascade (a forestry company), do use this method. When the productivity of an asset varies signifi cantly from one period to another, the units-of-activity method results in the best matching of expenses with revenues.
DECLINING-BALANCE METHOD
The declining-balance method produces a decreasing annual depreciation expense over the asset’s useful life. The method is so named because the periodic deprecia-tion is based on a declining book value (cost less accumulated depreciation) of the asset. With this method, companies compute annual depreciation expense by mul-tiplying the book value at the beginning of the year by the declining-balance depre-ciation rate. The depreciation rate remains constant from year to year, but the book value to which the rate is applied declines each year. At the beginning of the fi rst year, book value is the cost of the asset. This is because the balance in accumulated depreciation at the beginning of the asset’s useful life is zero. In subsequent years, book value is the difference between cost and accumulated depreciation to date. Unlike the other depreciation methods, the declining-balance method does not use depreciable cost in computing annual depreciation expense. That is, it ignores salvage value in determining the amount to which the declining-balance rate is applied. Salvage value, how-ever, does limit the total depreciation that can be taken. Depreciation stops when the asset’s book value equals expected salvage value.

Depreciation Methods 453
A common declining-balance rate is double the straight-line rate. The method is often called the double-declining-balance method. If Barb’s Florists uses the double-declining-balance method, it uses a depreciation rate of 40% (2 3 the straight-line rate of 20%). Illustration 10-13 shows the declining-balance formula and the computation of the fi rst year’s depreciation on the delivery truck.
Illustration 10-13Formula for declining-balance method
Book Value Declining- Annual at Beginning 3 Balance 5 Depreciation of Year Rate Expense
$13,000 3 40% 5 $5,200
The depreciation schedule under this method is as follows.
Illustration 10-14Double-declining-balance depreciation schedule
BARB’S FLORISTS
Computation End of Year Annual Book Value Depreciation Depreciation Accumulated BookYear Beginning of Year 3 Rate 5 Expense Depreciation Value
2017 $13,000 40% $5,200 $ 5,200 $7,8002018 7,800 40 3,120 8,320 4,6802019 4,680 40 1,872 10,192 2,8082020 2,808 40 1,123 11,315 1,6852021 1,685 40 685* 12,000 1,000*Computation of $674 ($1,685 3 40%) is adjusted to $685 in order for book value to equal salvage value.
$5,000$4,000$3,000$2,000$1,000
0
Year
Dep
reci
atio
n Ex
pens
e
2017
2018
2019
2020
2021
The delivery equipment is 69% depreciated ($8,320 4 $12,000) at the end of the second year. Under the straight-line method, the truck would be depreciated 40% ($4,800 4 $12,000) at that time. Because the declining-balance method pro-duces higher depreciation expense in the early years than in the later years, it is considered an accelerated-depreciation method. The declining-balance method is compatible with the expense recognition principle. It matches the higher depreciation expense in early years with the higher benefi ts received in these years. It also recognizes lower depreciation expense in later years, when the asset’s contribution to revenue is less. Some assets lose usefulness rapidly because of obsolescence. In these cases, the declining-balance method provides the most appropriate depreciation amount. When a company purchases an asset during the year, it must prorate the fi rst year’s declining-balance depreciation on a time basis. For example, if Barb’s Florists had purchased the truck on April 1, 2017, depreciation for 2017 would become $3,900 ($13,000 3 40% 3 9/12). The book value at the beginning of 2018 is then $9,100 ($13,000 2 $3,900), and the 2018 depreciation is $3,640 ($9,100 3 40%). Subsequent computations would follow from those amounts.
COMPARISON OF METHODS
Illustration 10-15 compares annual and total depreciation expense under each of the three methods for Barb’s Florists.
Helpful HintThe method recommended for an asset that is expected to be signifi cantly more productive in the fi rst half of its useful life is the declining-balance method.
Illustration 10-15Comparison of depreciation methods
Straight- Units-of- Declining- Year Line Activity Balance
2017 $ 2,400 $ 1,800 $ 5,2002018 2,400 3,600 3,1202019 2,400 2,400 1,8722020 2,400 3,000 1,1232021 2,400 1,200 685
$12,000 $12,000 $12,000

454 10 Plant Assets, Natural Resources, and Intangible Assets
Annual depreciation varies considerably among the methods, but total depreciation expense is the same ($12,000) for the fi ve-year period under all three methods. Each method is acceptable in accounting because each recog-nizes in a rational and systematic manner the decline in service potential of the asset. Illustration 10-16 graphs the depreciation expense pattern under each method.
Illustration 10-16Patterns of depreciation
Year
Straight-lineDeclining-balanceUnits-of-activity
Key:$5,000
$4,000
$3,000
$2,000
$1,000
02017 2018 2019 2020 2021
Dep
reci
atio
n Ex
pens
e
Depreciation and Income Taxes
The Internal Revenue Service (IRS) allows taxpayers to deduct depreciation expense when they compute taxable income. However, the IRS does not require taxpayers to use the same depreciation method on the tax return that is used in preparing fi nancial statements. Many corporations use straight-line in their fi nancial statements to maxi-mize net income. At the same time, they use a special accelerated-depreciation method on their tax returns to minimize their income taxes. Taxpayers must use on their tax returns either the straight-line method or a special accelerated-depreciation method called the Modifi ed Accelerated Cost Recovery System (MACRS).
Revising Periodic Depreciation
Depreciation is one example of the use of estimation in the accounting process. Management should periodically review annual depreciation expense. If wear and tear or obsolescence indicate that annual depreciation estimates are inade-quate or excessive, the company should change the amount of depreciation expense. When a change in an estimate is required, the company makes the change in current and future years. It does not change depreciation in prior periods. The rationale is that continual restatement of prior periods would adversely affect confi dence in fi nancial statements. To determine the new annual depreciation expense, the company fi rst com-putes the asset’s depreciable cost at the time of the revision. It then allocates the revised depreciable cost to the remaining useful life. To illustrate, assume that Barb’s Florists decides on January 1, 2020, to extend the useful life of the truck one year (a total life of six years) and increase its sal-vage value to $2,200. The company has used the straight-line method to depreci-ate the asset to date. Depreciation per year was $2,400 [($13,000 2 $1,000) 4 5]. Accumulated depreciation after three years (2017–2019) is $7,200 ($2,400 3 3), and book value is $5,800 ($13,000 2 $7,200). The new annual depreciation is $1,200, computed as shown in Illustration 10-17.
Helpful HintUse a step-by-step approach: (1) determine new depreciable cost; (2) divide by remaining useful life.

Plant Asset Disposals 455
Barb’s Florists makes no entry for the change in estimate. On December 31, 2020, during the preparation of adjusting entries, it records depreciation expense of $1,200. Companies must describe in the fi nancial statements signifi cant changes in estimates.
Illustration 10-17Revised depreciation computation
Book value, 1/1/20 $ 5,800Less: Salvage value 2,200
Depreciable cost $ 3,600
Remaining useful life 3 years (2020–2022)
Revised annual depreciation ($3,600 4 3) $ 1,200
Chambers Corporation purchased a piece of equipment for $36,000. It estimated a 6-year life and $6,000 salvage value. Thus, straight-line depreciation was $5,000 per year [($36,000 2 $6,000) 4 6]. At the end of year three (before the depreciation adjustment), it estimated the new total life to be 10 years and the new salvage value to be $2,000. Compute the revised depreciation.
Solution
DO IT! 2b Revised Depreciation
Related exercise material: BE10-8, E10-8, and DO IT! 10-2b.
Action Plan✔ Calculate depreciable
cost.✔ Divide depreciable
cost by new remaining life.
Original depreciation expense 5 [($36,000 2 $6,000) 4 6] 5 $5,000Accumulated depreciation after 2 years 5 2 3 $5,000 5 $10,000Book value 5 $36,000 2 $10,000 5 $26,000
Book value after 2 years of depreciation $26,000Less: New salvage value 2,000
Depreciable cost $24,000
Remaining useful life 8 years
Revised annual depreciation ($24,000 4 8) $ 3,000
3 Explain how to account for the disposal of plant assets.LEARNING OBJECTIVE
Companies dispose of plant assets that are no longer useful to them. Illustra-tion 10-18 shows the three ways in which companies make plant asset disposals.
Illustration 10-18Methods of plant asset disposal
Equipment is scrappedor discarded.
RetirementEquipment is soldto another party.
SaleExisting equipment is tradedfor new equipment.
Exchange
Lowy Co. Lowy Co.Piper Co. Piper Co.

456 10 Plant Assets, Natural Resources, and Intangible Assets
Whatever the disposal method, the company must determine the book value of the plant asset at the disposal date to determine the gain or loss. Recall that the book value is the difference between the cost of the plant asset and the accumu-lated depreciation to date. If the disposal does not occur on the fi rst day of the year, the company must record depreciation for the fraction of the year to the date of disposal. The company then eliminates the book value by reducing (deb-iting) Accumulated Depreciation for the total depreciation associated with that asset to the date of disposal and reducing (crediting) the asset account for the cost of the asset. In this chapter, we examine the accounting for the retirement and sale of plant assets. In the appendix to the chapter, we discuss and illustrate the account-ing for exchanges of plant assets.
Retirement of Plant Assets
To illustrate the retirement of plant assets, assume that Hobart Company retires its computer printers, which cost $32,000. The accumulated depreciation on these printers is $32,000. The equipment, therefore, is fully depreciated (zero book value). The entry to record this retirement is as follows.
What happens if a fully depreciated plant asset is still useful to the company? In this case, the asset and its accumulated depreciation continue to be reported on the balance sheet, without further depreciation adjustment, until the com-pany retires the asset. Reporting the asset and related accumulated depreciation on the balance sheet informs the fi nancial statement reader that the asset is still in use. Once fully depreciated, no additional depreciation should be taken, even if an asset is still being used. In no situation can the accumulated depreciation on a plant asset exceed its cost. If a company retires a plant asset before it is fully depreciated and no cash is received for scrap or salvage value, a loss on disposal occurs. For example, assume that Sunset Company discards delivery equipment that cost $18,000 and has accumulated depreciation of $14,000. The entry is as follows.
132,000232,000
Cash Flowsno effect
A OEL5 1
Accumulated Depreciation—Equipment 32,000 Equipment 32,000 (To record retirement of fully depreciated equipment)
114,00024,000 Exp
218,000
Cash Flowsno effect
A OEL5 1
Accumulated Depreciation—Equipment 14,000Loss on Disposal of Plant Assets 4,000 Equipment 18,000 (To record retirement of delivery equipment at a loss)
Helpful HintWhen disposing of a plant asset, a company removes from the accounts all amounts related to the asset. This includes the original cost and the total depreciation to date in the accumulated depreciation account.
Companies report a loss on disposal of plant assets in the “Other expenses and losses” section of the income statement.
Sale of Plant Assets
In a disposal by sale, the company compares the book value of the asset with the proceeds received from the sale. If the proceeds of the sale exceed the book value of the plant asset, a gain on disposal occurs. If the proceeds of the sale are less than the book value of the plant asset sold, a loss on disposal occurs. Only by coincidence will the book value and the fair value of the asset be the same when the asset is sold. Gains and losses on sales of plant assets are there-fore quite common. For example, Delta Airlines reported a $94,343,000 gain on the sale of fi ve Boeing B727-200 aircraft and fi ve Lockheed L-1011-1 aircraft.

Plant Asset Disposals 457
GAIN ON SALE
To illustrate a gain on sale of plant assets, assume that on July 1, 2017, Wright Company sells offi ce furniture for $16,000 cash. The offi ce furniture originally cost $60,000. As of January 1, 2017, it had accumulated depreciation of $41,000. Depre-ciation for the fi rst six months of 2017 is $8,000. Wright records depreciation expense and updates accumulated depreciation to July 1 with the following entry.
July 1 Depreciation Expense 8,000 Accumulated Depreciation—Equipment 8,000 (To record depreciation expense for the fi rst 6 months of 2017)
28,000 Exp28,000
Cash Flowsno effect
A OEL5 1
After the accumulated depreciation balance is updated, the company com-putes the gain or loss. The gain or loss is the difference between the proceeds from the sale and the book value at the date of disposal. Illustration 10-19 shows this computation for Wright Company, which has a gain on disposal of $5,000.
Illustration 10-19Computation of gain on disposal
Cost of offi ce furniture $60,000Less: Accumulated depreciation ($41,000 1 $8,000) 49,000
Book value at date of disposal 11,000Proceeds from sale 16,000
Gain on disposal of plant asset $ 5,000
Wright records the sale and the gain on disposal of the plant asset as follows.
July 1 Cash 9,000 Accumulated Depreciation—Equipment 49,000 Loss on Disposal of Plant Assets 2,000 Equipment 60,000 (To record sale of offi ce furniture at a loss)
1 9,000149,000
22,000 Exp260,000
Cash Flows19,000
A OEL5 1
July 1 Cash 16,000 Accumulated Depreciation—Equipment 49,000 Equipment 60,000 Gain on Disposal of Plant Assets 5,000 (To record sale of offi ce furniture at a gain)
116,000149,000260,000
15,000 Rev
Cash Flows116,000
A OEL5 1
Companies report a gain on disposal of plant assets in the “Other revenues and gains” section of the income statement.
LOSS ON SALE
Assume that instead of selling the offi ce furniture for $16,000, Wright sells it for $9,000. In this case, Wright computes a loss of $2,000 as follows.
Illustration 10-20Computation of loss on disposal
Cost of offi ce furniture $60,000Less: Accumulated depreciation 49,000
Book value at date of disposal 11,000Proceeds from sale 9,000
Loss on disposal of plant asset $ 2,000
Wright records the sale and the loss on disposal of the plant asset as follows.

458 10 Plant Assets, Natural Resources, and Intangible Assets
Companies report a loss on disposal of plant assets in the “Other expenses and losses” section of the income statement.
Overland Trucking has an old truck that cost $30,000, and it has accumulated deprecia-tion of $16,000 on this truck. Overland has decided to sell the truck. (a) What entry would Overland Trucking make to record the sale of the truck for $17,000 cash? (b) What entry would Overland Trucking make to record the sale of the truck for $10,000 cash?
DO IT! 3 Plant Asset Disposal
(a) Sale of truck for cash at a gain:
Cash 17,000 Accumulated Depreciation—Equipment 16,000 Equipment 30,000 Gain on Disposal of Plant Assets [$17,000 2 ($30,000 2 $16,000)] 3,000 (To record sale of truck at a gain)
(b) Sale of truck for cash at a loss:
Cash 10,000 Accumulated Depreciation—Equipment 16,000 Loss on Disposal of Plant Assets [$10,000 2 ($30,000 2 $16,000)] 4,000 Equipment 30,000 (To record sale of truck at a loss)
Related exercise material: BE10-9, BE10-10, E10-9, E10-10, and DO IT! 10-3.
Action Plan✔ At the time of disposal,
determine the book value of the asset.
✔ Compare the asset’s book value with the proceeds received to determine whether a gain or loss has occurred.
Solution
4 Describe how to account for natural resources and intangible assets.LEARNING OBJECTIVE
Natural Resources
Natural resources consist of standing timber and underground deposits of oil, gas, and minerals. These long-lived productive assets have two distinguishing characteristics: (1) they are physically extracted in operations (such as mining, cutting, or pumping), and (2) they are replaceable only by an act of nature. The acquisition cost of a natural resource is the price needed to acquire the resource and prepare it for its intended use. For an already-discovered resource, such as an existing coal mine, cost is the price paid for the property.
Depletion
The allocation of the cost of natural resources in a rational and systematic man-ner over the resource’s useful life is called depletion. (That is, depletion is to natural resources as depreciation is to plant assets.) Companies generally use the units-of-activity method (learned earlier in the chapter) to compute deple-tion. The reason is that depletion generally is a function of the units extracted during the year. Under the units-of-activity method, companies divide the total cost of the natural resource minus salvage value by the number of units estimated to be in the resource. The result is a depletion cost per unit. To compute depletion, the cost per unit is then multiplied by the number of units extracted.
Helpful HintOn a balance sheet, natural resources may be described more specifi cally as timberlands, mineral deposits, oil reserves, and so on.

Natural Resources and Intangible Assets 459
To illustrate, assume that Lane Coal Company invests $5 million in a mine estimated to have 1 million tons of coal and no salvage value. Illustration 10-21 shows the computation of the depletion cost per unit.
Illustration 10-21Computation of depletion cost per unit
Total Cost 2 Salvage Value
Total Estimated Units Available 5 Depletion Cost per Unit
$5,000,000 5 $5.00 per ton
$1,000,000
If Lane extracts 250,000 tons in the fi rst year, then the depletion for the year is $1,250,000 (250,000 tons 3 $5). It records the depletion as follows.
Inventory (coal) 1,250,000 Accumulated Depletion 1,250,000
11,250,00021,250,000
Cash Flowsno effect
A OEL5 1
Lane debits Inventory for the total depletion for the year and credits Accumu-lated Depletion to reduce the carrying value of the natural resource. Accumulated Depletion is a contra asset similar to Accumulated Depreciation. Lane credits Inventory when it sells the inventory and debits Cost of Goods Sold. The amount not sold remains in inventory and is reported in the current assets section of the balance sheet. Some companies do not use an Accumulated Depletion account. In such cases, the company credits the amount of depletion directly to the natural resources account.
ETHICS NOTE
Investors were stunned at news that Royal Dutch/Shell Group had signifi cantly overstated its reported oil reserves—and perhaps had done so intentionally.
Sustainability Report Please
Sustainability reports identify how the company is meeting its corporate social responsibil-ities. Many companies, both large and small, are now issu-
ing these reports. For example, companies such as Disney, Best Buy, Microsoft, Ford, and ConocoPhilips issue these
In addition to the environment, BHP Billiton has sections in its sustainability report which discuss people, safety, health, and community.
reports. Presented below is an adapted section of a recent BHP Billiton (a global mining, oil, and gas company) sus-tainability report on its environmental policies. These poli-cies are to (1) take action to address the challenges of climate change, (2) set and achieve targets that reduce pol-lution, and (3) enhance biodiversity by assessing and con-sidering ecological values and land-use aspects. Here is how BHP Billiton measures the success or failure of some of these policies:
Why do you believe companies issue sustainability reports? (Go to WileyPLUS for this answer and additional questions.)
© Christian Uhrig/iStockphoto
BHP BillitonPeople, Planet, and Profi t Insight
Environment Commentary Target Date
We will maintain total greenhouse gas emissions below FY2006 levels.
FY2013 greenhouse gas emissions were lower than the FY2006 baseline.
30 June 2017
All operations to offset impacts to biodiversity and the related benefi ts derived from ecosystems.
Land and Biodiversity Management Plans were developed at all our operations.
Annual
We will fi nance the conservation and continuing management of areas of high biodiversity and ecosystem value.
Two projects of international conservation signifi cance were established—the Five Rivers Conservation Project, in Australia, and the Valdivian Coastal Reserve Conservation Project, in Chile.
30 June 2017

460 10 Plant Assets, Natural Resources, and Intangible Assets
Intangible Assets
Intangible assets are rights, privileges, and competitive advantages that result from the ownership of long-lived assets that do not possess physical substance. Evidence of intangibles may exist in the form of contracts or licenses. Intangibles may arise from the following sources:
1. Government grants, such as patents, copyrights, licenses, trademarks, and trade names.
2. Acquisition of another business, in which the purchase price includes a pay-ment for goodwill.
3. Private monopolistic arrangements arising from contractual agreements, such as franchises and leases.
Some widely known intangibles are Microsoft’s patents, McDonald’s franchises, Apple’s trade name iPod, J.K. Rowling’s copyrights on the Harry Potter books, and the trademark Rent-A-Wreck in the Feature Story.
Accounting for Intangible Assets
Companies record intangible assets at cost. Intangibles are categorized as having either a limited life or an indefi nite life. If an intangible has a limited life, the company allocates its cost over the asset’s useful life using a process similar to depreciation. The process of allocating the cost of intangibles is referred to as amortization. The cost of intangible assets with indefi nite lives should not be amortized. To record amortization of an intangible asset, a company increases (debits) Amortization Expense, and decreases (credits) the specifi c intangible asset. (Unlike depreciation, no contra account, such as Accumulated Amortization, is usually used.) Intangible assets are typically amortized on a straight-line basis. For example, the legal life of a patent is 20 years. Companies amortize the cost of a patent over its 20-year life or its useful life, whichever is shorter. To illustrate the computation of patent amortization, assume that National Labs purchases a pat-ent at a cost of $60,000. If National estimates the useful life of the patent to be eight years, the annual amortization expense is $7,500 ($60,000 4 8). National records the annual amortization as follows.
Dec. 31 Amortization Expense 7,500 Patents 7,500 (To record patent amortization)
Companies classify Amortization Expense as an operating expense in the income statement. There is a difference between intangible assets and plant assets in determin-ing cost. For plant assets, cost includes both the purchase price of the asset and the costs incurred in designing and constructing the asset. In contrast, the initial cost for an intangible asset includes only the purchase price. Companies expense any costs incurred in developing an intangible asset.
PATENTS
A patent is an exclusive right issued by the U.S. Patent Offi ce that enables the recipient to manufacture, sell, or otherwise control an invention for a period of 20 years from the date of the grant. A patent is nonrenewable. But, companies can extend the legal life of a patent by obtaining new patents for improvements or other changes in the basic design. The initial cost of a patent is the cash or cash equivalent price paid to acquire the patent.
Helpful HintAmortization is to intangibles what depreciation is to plant assets and depletion is to natural resources.
27,500 Exp27,500
Cash Flowsno effect
A OEL5 1

Natural Resources and Intangible Assets 461
The saying, “A patent is only as good as the money you’re prepared to spend defending it,” is very true. Many patents are subject to litigation by competitors. Any legal costs an owner incurs in successfully defending a patent in an infringe-ment suit are considered necessary to establish the patent’s validity. The owner adds those costs to the Patents account and amortizes them over the remain-ing life of the patent. The patent holder amortizes the cost of a patent over its 20-year legal life or its useful life, whichever is shorter. Companies consider obsolescence and inadequacy in determining useful life. These factors may cause a patent to become economically ineffective before the end of its legal life.
COPYRIGHTS
The federal government grants copyrights, which give the owner the exclusive right to reproduce and sell an artistic or published work. Copyrights extend for the life of the creator plus 70 years. The cost of a copyright is the cost of acquiring and defending it. The cost may be only the small fee paid to the U.S. Copyright Offi ce. Or, it may amount to much more if an infringement suit is involved. The useful life of a copyright generally is signifi cantly shorter than its legal life. Therefore, copyrights usually are amortized over a relatively short period of time.
TRADEMARKS AND TRADE NAMES
A trademark or trade name is a word, phrase, jingle, or symbol that identifi es a particular enterprise or product. Trade names like Wheaties, Monopoly, Big Mac, Kleenex, Coca-Cola, and Jeep create immediate product identifi cation. They also generally enhance the sale of the product. The creator or original user may obtain exclusive legal right to the trademark or trade name by registering it with the U.S. Patent Offi ce. Such registration provides 20 years of protection. The registration may be renewed indefi nitely as long as the trademark or trade name is in use. If a company purchases the trademark or trade name, its cost is the purchase price. If a company develops and maintains the trademark or trade name, any costs related to these activities are expensed as incurred. Because trademarks and trade names have indefi nite lives, they are not amortized.
FRANCHISES
When you fi ll up your tank at the corner Shell station, eat lunch at Subway, or rent a car from Rent-A-Wreck, you are dealing with franchises. A franchise is a contractual arrangement between a franchisor and a franchisee. The franchisor grants the franchisee the right to sell certain products, perform specifi c services, or use certain trademarks or trade names, usually within a designated geographic area. Another type of franchise is a license. A license granted by a governmental body permits a company to use public property in performing its services. Exam-ples are the use of city streets for a bus line or taxi service, the use of public land for telephone and electric lines, and the use of airwaves for radio or TV broad-casting. In a recent license agreement, FOX, CBS, and NBC agreed to pay $27.9 billion for the right to broadcast NFL football games over an eight-year period. Franchises and licenses may by granted for a defi nite period of time, an indefi nite period, or perpetually. When a company can identify costs with the purchase of a franchise or license, it should recognize an intangible asset. Companies should amortize the cost of a limited-life franchise (or license) over its useful life. If the life is indefi nite, the cost is not amortized. Annual payments made under a franchise agreement are recorded as operating expenses in the period in which they are incurred.

462 10 Plant Assets, Natural Resources, and Intangible Assets
GOODWILL
Usually, the largest intangible asset that appears on a company’s balance sheet is goodwill. Goodwill represents the value of all favorable attributes that relate to a company that are not attributable to any other specifi c asset. These include exceptional management, desirable location, good customer relations, skilled employees, high-quality products, and harmonious relations with labor unions. Goodwill is unique. Unlike assets such as investments and plant assets, which can be sold individually in the marketplace, goodwill can be identifi ed only with the business as a whole. If goodwill can be identifi ed only with the business as a whole, how can its amount be determined? One could try to put a dollar value on the factors listed above (exceptional management, desirable location, and so on). But, the results would be very subjective, and such subjective valuations would not contribute to the reliability of fi nancial statements. Therefore, companies record goodwill only when an entire business is purchased. In that case, goodwill is the excess of cost over the fair value of the net assets (assets less liabilities) acquired. In recording the purchase of a business, the company debits (increases) the identifi able acquired assets, credits liabilities at their fair values, credits cash for the purchase price, and records the difference as goodwill. Goodwill is not amortized because it is considered to have an indefi nite life. Companies report goodwill in the balance sheet under intangible assets.
We Want to Own Glass
Google, which has trademarked the term “Google Glass,” now wants to trademark the term “Glass.” Why? Because the sim-ple word Glass has marketing advantages over the term Goo-gle Glass. It is easy to remember and is more universal. Regula-
tors, however, are balking at Google’s request. They say that the possible trademark is too similar to other existing or pending software trademarks that contain the word “glass.” Also, regulators suggest that the term Glass is merely descriptive and therefore lacks trademark protection.
For example, regulators note that a company that makes salsa could not trademark the term “Spicy Salsa.”
BorderStylo LLC, which developed a Web-browser extension called Write on Glass, has fi led a notice of oppo-sition to Google’s request. Google is fi ghting back and has sent the trademark examiner a 1,928-page application defense.
Source: Jacob Gershman, “Google Wants to Own ‘Glass’,” Wall Street Journal (April 4, 2014), p. B5.
If Google is successful in registering the term Glass, where will this trademark be reported on its fi nancial statements? (Go to WileyPLUS for this answer and additional questions.)
© Hattanas Kumchai/Shutterstock
GoogleAccounting Across the Organization
Research and Development Costs
Research and development costs are expenditures that may lead to patents, copyrights, new processes, and new products. Many companies spend consider-able sums of money on research and development (R&D). For example, in a recent year, IBM spent over $5.1 billion on R&D. Research and development costs present accounting problems. For one thing, it is sometimes diffi cult to assign the costs to specifi c projects. Also, there are uncertainties in identifying the extent and timing of future benefi ts. As a result, companies usually record R&D costs as an expense when incurred, whether the research and development is successful or not. To illustrate, assume that Laser Scanner Company spent $3 million on R&D that resulted in two highly successful patents. It spent $20,000 on legal fees for
Helpful HintResearch and development (R&D) costs are not intan-gible assets. But because they may lead to patents and copyrights, we discuss them in this section.

Statement Presentation and Analysis 463
the patents. The company would add the lawyers’ fees to the Patents account. The R&D costs, however, cannot be included in the cost of the patents. Instead, the company would record the R&D costs as an expense when incurred. Many disagree with this accounting approach. They argue that expensing R&D costs leads to understated assets and net income. Others, however, argue that capitalizing these costs will lead to highly speculative assets on the balance sheet. Who is right is diffi cult to determine.
Match the statement with the term most directly associated with it.
Copyrights Depletion Intangible assets Franchises Research and development costs
1. _______ The allocation of the cost of a natural resource to expense in a rational and systematic manner.
2. _______ Rights, privileges, and competitive advantages that result from the ownership of long-lived assets that do not possess physical substance.
3. _______ An exclusive right granted by the federal government to reproduce and sell an artistic or published work.
4. ________ A right to sell certain products or services or to use certain trademarks or trade names within a designated geographic area.
5. ________ Costs incurred by a company that often lead to patents or new products. These costs must be expensed as incurred.
DO IT! 4 Classifi cation Concepts
1. Depletion 4. Franchises
2. Intangible assets 5. Research and development costs
3. Copyrights
Related exercise material: BE10-11, BE10-12, E10-11, E10-12, E10-13, and DO IT! 10-4.
Action Plan✔ Know that the
accounting for intangibles often depends on whether the item has a fi nite or indefi nite life.
✔ Recognize the many similarities and differences between the accounting for natural resources, plant assets, and intangible assets.
Solution
5 Discuss how plant assets, natural resources, and intangible assets are reported and analyzed.
LEARNING OBJECTIVE
Presentation
Usually, companies combine plant assets and natural resources under “Property, plant, and equipment” in the balance sheet. They show intangibles separately. Companies disclose either in the balance sheet or the notes the balances of the major classes of assets, such as land, buildings, and equipment, and accumulated depreciation by major classes or in total. In addition, they should describe the depreciation and amortization methods that were used, as well as disclose the amount of depreciation and amortization expense for the period. Illustration 10-22 (page 464) shows a typical fi nancial statement presentation of property, plant, and equipment and intangibles for The Procter & Gamble Company (P&G) in its 2013 balance sheet. The notes to P&G’s fi nancial state-ments present greater details about the accounting for its long-term tangible and intangible assets.

464 10 Plant Assets, Natural Resources, and Intangible Assets
Illustration 10-23 shows another comprehensive presentation of property, plant, and equipment from the balance sheet of Owens-Illinois. The notes to the fi nancial statements of Owens-Illinois identify the major classes of property, plant, and equipment. They also indicate that depreciation and amortization are by the straight-line method, and depletion is by the units-of-activity method.
THE PROCTER & GAMBLE COMPANYBalance Sheet (partial)
(in millions)
June 30
2013 2012
Property, plant, and equipment Buildings $ 7,829 $ 7,324 Machinery and equipment 34,305 32,029 Land 878 880
43,012 40,233 Accumulated depreciation (21,346) (19,856)
Net property, plant, and equipment 21,666 20,377Goodwill and other intangible assets Goodwill 55,188 53,773 Trademarks and other intangible assets, net 31,572 30,988
Net goodwill and other intangible assets $86,760 $84,761
Real World
Illustration 10-22P&G’s presentation of property, plant, and equipment, and intangible assets
Analysis
Using ratios, we can analyze how effi ciently a company uses its assets to generate sales. The asset turnover analyzes the productivity of a company’s assets. It tells us how many dollars of sales a company generates for each dollar invested in assets. This ratio is computed by dividing net sales by average total assets for the period. Illustration 10-24 shows the computation of the asset turnover for The Procter & Gamble Company. P&G’s net sales for 2013 were $84,167 million. Its total ending assets were $139,263 million, and beginning assets were $132,244 million.
OWENS-ILLINOIS, INC.Balance Sheet (partial)
(in millions)
Real World
Property, plant, and equipment Timberlands, at cost, less accumulated depletion $ 95.4 Buildings and equipment, at cost $2,207.1 Less: Accumulated depreciation 1,229.0 978.1
Total property, plant, and equipment $1,073.5Intangibles Patents 410.0
Total $1,483.5
Illustration 10-23Owens-Illinois’ presentation of property, plant, and equipment, and intangible assets
Illustration 10-24Asset turnover formula and computation
Net Sales
4
Average Total 5
Asset Turnover
Assets
$84,167 4
$132,244 1 $139,263 5 .62 times
2

Appendix 10A: Exchange of Plant Assets 465
Thus, each dollar invested in assets produced $0.62 in sales for P&G. If a company is using its assets effi ciently, each dollar of assets will create a high amount of sales. This ratio varies greatly among different industries—from those that are asset-intensive (utilities) to those that are not (services).
6 APPENDIX 10A: Explain how to account for the exchange of plant assets.
LEARNING OBJECTIVE
*
Ordinarily, companies record a gain or loss on the exchange of plant assets. The rationale for recognizing a gain or loss is that most exchanges have commercial substance. An exchange has commercial substance if the future cash fl ows change as a result of the exchange. To illustrate, Ramos Co. exchanges some of its equipment for land held by Brodhead Inc. It is likely that the timing and amount of the cash fl ows arising from the land will differ signifi cantly from the cash fl ows arising from the equip-ment. As a result, both Ramos and Brodhead are in different economic positions. Therefore, the exchange has commercial substance, and the companies recog-nize a gain or loss in the exchange. Because most exchanges have commercial substance (even when similar assets are exchanged), we illustrate only this type of situation for both a loss and a gain.
Loss Treatment
To illustrate an exchange that results in a loss, assume that Roland Company exchanged a set of used trucks plus cash for a new semi-truck. The used trucks have a combined book value of $42,000 (cost $64,000 less $22,000 accumulated depreciation). Roland’s purchasing agent, experienced in the secondhand mar-ket, indicates that the used trucks have a fair value of $26,000. In addition to the trucks, Roland must pay $17,000 for the semi-truck. Roland computes the cost of the semi-truck as follows.
Paramour Company reported net income of $180,000, net sales of $420,000, and had total assets of $460,000 on January 1, 2017, and total assets on December 31, 2017, of $540,000 billion. Determine Paramour’s asset turnover for 2017.
DO IT! 5 Asset Turnover
Action Plan✔ Recognize that the
asset turnover analyzes the productivity of a company’s assets.
✔ Know the formula Net sales 4 Average total assets equals Asset turnover.
The asset turnover for Paramour Company is computed as follows.
Net Sales 4 Average Total Assets 5 Asset Turnover
$420,000 4 $460,000 1 $540,000 5 .84
2
Related Exercise material: BE10-14, E10-14, and DO IT! 10-5.
Solution
Illustration 10A-1Cost of semi-truckFair value of used trucks $26,000
Cash paid 17,000
Cost of semi-truck $43,000

466 10 Plant Assets, Natural Resources, and Intangible Assets
Roland incurs a loss on disposal of plant assets of $16,000 on this exchange. The reason is that the book value of the used trucks is greater than the fair value of these trucks. The computation is as follows.
Illustration 10A-2Computation of loss on disposal
Book value of used trucks ($64,000 2 $22,000) $ 42,000Fair value of used trucks 26,000
Loss on disposal of plant assets $16,000
In recording an exchange at a loss, three steps are required: (1) eliminate the book value of the asset given up, (2) record the cost of the asset acquired, and (3) recognize the loss on disposal of plant assets. Roland Company thus records the exchange on the loss as follows.
Equipment (new) 43,000Accumulated Depreciation—Equipment 22,000Loss on Disposal of Plant Assets 16,000 Equipment (old) 64,000 Cash 17,000 (To record exchange of used trucks for semi-truck)
Gain Treatment
To illustrate a gain situation, assume that Mark Express Delivery decides to exchange its old delivery equipment plus cash of $3,000 for new delivery equip-ment. The book value of the old delivery equipment is $12,000 (cost $40,000 less accumulated depreciation $28,000). The fair value of the old delivery equipment is $19,000. The cost of the new asset is the fair value of the old asset exchanged plus any cash paid (or other consideration given up). The cost of the new delivery equip-ment is $22,000, computed as follows.
143,000122,000
216,000 Exp264,000217,000
Cash Flows217,000
A OEL5 1
122,000128,000240,000
17,000 Rev2 3,000
Cash Flows2 3,000
A OEL5 1
A gain results when the fair value of the old delivery equipment is greater than its book value. For Mark Express, there is a gain of $7,000 on disposal of plant assets, computed as follows.
Mark Express Delivery records the exchange as follows.
Equipment (new) 22,000Accumulated Depreciation—Equipment (old) 28,000 Equipment (old) 40,000 Gain on Disposal of Plant Assets 7,000 Cash 3,000 (To record exchange of old delivery equipment for new delivery equipment)
Illustration 10A-3Cost of new delivery equipment Fair value of old delivery equipment $ 19,000
Cash paid 3,000
Cost of new delivery equipment $22,000
Illustration 10A-4Computation of gain on disposal
Fair value of old delivery equipment $19,000Book value of old delivery equipment ($40,000 2 $28,000) 12,000
Gain on disposal of plant assets $ 7,000

Review and Practice 467
In recording an exchange at a gain, the following three steps are involved: (1) elim-inate the book value of the asset given up, (2) record the cost of the asset acquired, and (3) recognize the gain on disposal of plant assets. Accounting for exchanges of plant assets becomes more complex if the transaction does not have commercial substance. This issue is discussed in more advanced accounting classes.
Explain the accounting for plant asset expenditures.The cost of plant assets includes all expenditures nec-essary to acquire the asset and make it ready for its intended use. Once cost is established, the company uses that amount as the basis of accounting for the plant assets over its useful life.
Companies incur revenue expenditures to main-tain the operating effi ciency and productive life of an asset. They debit these expenditures to Maintenance and Repairs Expense as incurred. Capital expendi-tures increase the operating effi ciency, productive capacity, or expected useful life of the asset. Compa-nies generally debit these expenditures to the plant asset affected.
Apply depreciation methods to plant assets. Deprecia-tion is the allocation of the cost of a plant asset to expense over its useful (service) life in a rational and systematic manner. Depreciation is not a process of valuation, nor is it a process that results in an accu-mulation of cash.
Three depreciation methods are:
Effect on Annual Method Depreciation Formula
Straight-line Constant Depreciable cost 4 amount Useful life (in years)Units-of- Varying Depreciable cost per activity amount unit 3 Units of activity during the yearDeclining- Decreasing Book value at beginning balance amount of year 3 Declining- balance rate
Companies make revisions of periodic deprecia-tion in present and future periods, not retroactively. They determine the new annual depreciation by dividing the depreciable cost at the time of the revi-sion by the remaining useful life.
1
2
Explain how to account for the disposal of plant assets.The accounting for disposal of a plant asset through retirement or sale is as follows. (a) Eliminate the book value of the plant asset at the date of disposal. (b) Record cash proceeds, if any. (c) Account for the difference between the book value and the cash pro-ceeds as a gain or loss on disposal.
Describe how to account for natural resources and intangible assets. Companies compute depletion cost per unit by dividing the total cost of the natural resource minus salvage value by the number of units estimated to be in the resource. They then multiply the depletion cost per unit by the number of units extracted.
The process of allocating the cost of an intangible asset is referred to as amortization. The cost of intan-gible assets with indefi nite lives is not amortized. Companies normally use the straight-line method for amortizing intangible assets.
Discuss how plant assets, natural resources, and intangible assets are reported and analyzed. Compa-nies usually combine plant assets and natural resources under property, plant, and equipment. They show intangibles separately under intangible assets. Either within the balance sheet or in the notes, companies should disclose the balances of the major classes of assets, such as land, buildings, and equipment, and accumulated depreciation by major classes or in total. They also should describe the depreciation and amor-tization methods used, and should disclose the amount of depreciation and amortization expense for the period. The asset turnover measures the productivity of a company’s assets in generating sales.
Explain how to account for the exchange of plant assets. Ordinarily, companies record a gain or loss on the exchange of plant assets. The rationale for recog-nizing a gain or loss is that most exchanges have com-mercial substance. An exchange has commercial substance if the future cash fl ows change as a result of the exchange.
3
4
5
* 6
LEARNING OBJECTIVES REVIEW
1
REVIEW AND PRACTICE
Accelerated-depreciation method Depreciation method that produces higher depreciation expense in the early years than in the later years. (p. 453).
Additions and improvements Costs incurred to increase the operating effi ciency, productive capacity, or useful life of a plant asset. (p. 447).
GLOSSARY REVIEW
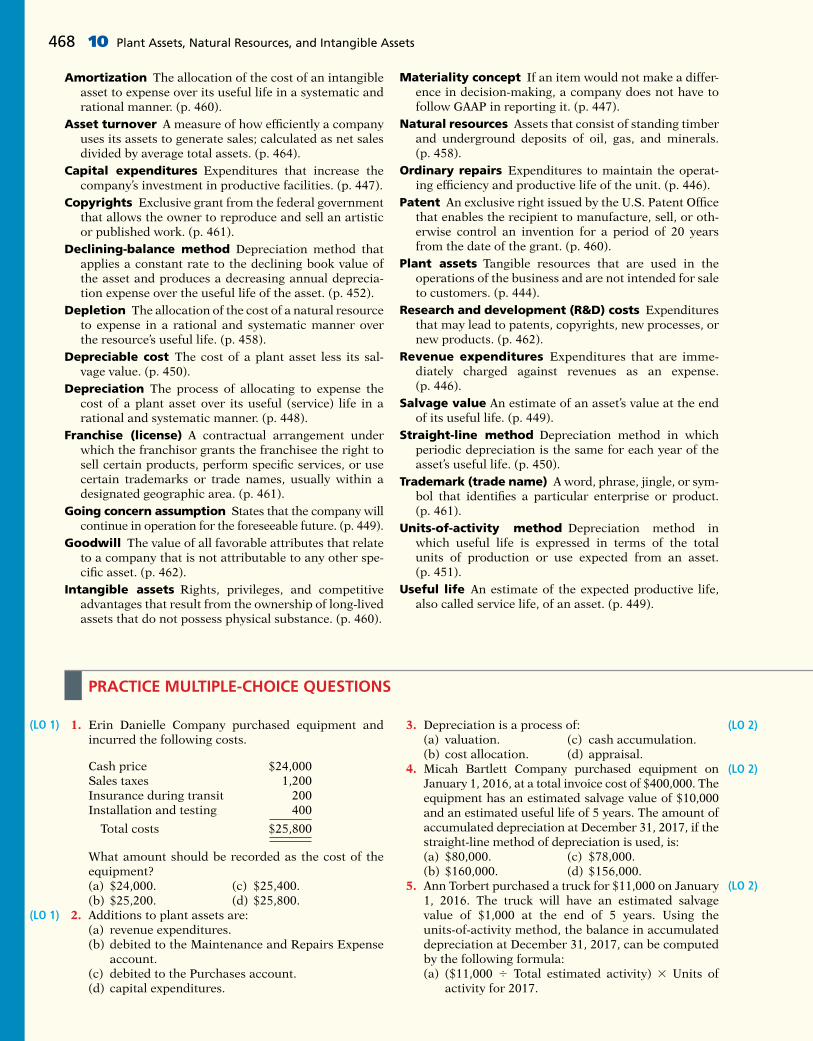
468 10 Plant Assets, Natural Resources, and Intangible Assets
1. Erin Danielle Company purchased equipment and incurred the following costs.
Cash price $24,000Sales taxes 1,200Insurance during transit 200Installation and testing 400
Total costs $25,800
What amount should be recorded as the cost of the equipment?(a) $24,000. (c) $25,400.(b) $25,200. (d) $25,800.
2. Additions to plant assets are:(a) revenue expenditures.(b) debited to the Maintenance and Repairs Expense
account.(c) debited to the Purchases account.(d) capital expenditures.
(LO 1)
(LO 1)
3. Depreciation is a process of:(a) valuation. (c) cash accumulation.(b) cost allocation. (d) appraisal.
4. Micah Bartlett Company purchased equipment on January 1, 2016, at a total invoice cost of $400,000. The equipment has an estimated salvage value of $10,000 and an estimated useful life of 5 years. The amount of accumulated depreciation at December 31, 2017, if the straight-line method of depreciation is used, is:(a) $80,000. (c) $78,000.(b) $160,000. (d) $156,000.
5. Ann Torbert purchased a truck for $11,000 on January 1, 2016. The truck will have an estimated salvage value of $1,000 at the end of 5 years. Using the units-of-activity method, the balance in accumulated depreciation at December 31, 2017, can be computed by the following formula:(a) ($11,000 4 Total estimated activity) 3 Units of
activity for 2017.
(LO 2)
(LO 2)
(LO 2)
PRACTICE MULTIPLE-CHOICE QUESTIONS
Amortization The allocation of the cost of an intangible asset to expense over its useful life in a systematic and rational manner. (p. 460).
Asset turnover A measure of how effi ciently a company uses its assets to generate sales; calculated as net sales divided by average total assets. (p. 464).
Capital expenditures Expenditures that increase the company’s investment in productive facilities. (p. 447).
Copyrights Exclusive grant from the federal government that allows the owner to reproduce and sell an artistic or published work. (p. 461).
Declining-balance method Depreciation method that applies a constant rate to the declining book value of the asset and produces a decreasing annual deprecia-tion expense over the useful life of the asset. (p. 452).
Depletion The allocation of the cost of a natural resource to expense in a rational and systematic manner over the resource’s useful life. (p. 458).
Depreciable cost The cost of a plant asset less its sal-vage value. (p. 450).
Depreciation The process of allocating to expense the cost of a plant asset over its useful (service) life in a rational and systematic manner. (p. 448).
Franchise (license) A contractual arrangement under which the franchisor grants the franchisee the right to sell certain products, perform specifi c services, or use certain trademarks or trade names, usually within a designated geographic area. (p. 461).
Going concern assumption States that the company will continue in operation for the foreseeable future. (p. 449).
Goodwill The value of all favorable attributes that relate to a company that is not attributable to any other spe-cifi c asset. (p. 462).
Intangible assets Rights, privileges, and competitive advantages that result from the ownership of long-lived assets that do not possess physical substance. (p. 460).
Materiality concept If an item would not make a differ-ence in decision-making, a company does not have to follow GAAP in reporting it. (p. 447).
Natural resources Assets that consist of standing timber and underground deposits of oil, gas, and minerals. (p. 458).
Ordinary repairs Expenditures to maintain the operat-ing effi ciency and productive life of the unit. (p. 446).
Patent An exclusive right issued by the U.S. Patent Offi ce that enables the recipient to manufacture, sell, or oth-erwise control an invention for a period of 20 years from the date of the grant. (p. 460).
Plant assets Tangible resources that are used in the operations of the business and are not intended for sale to customers. (p. 444).
Research and development (R&D) costs Expenditures that may lead to patents, copyrights, new processes, or new products. (p. 462).
Revenue expenditures Expenditures that are imme-diately charged against revenues as an expense. (p. 446).
Salvage value An estimate of an asset’s value at the end of its useful life. (p. 449).
Straight-line method Depreciation method in which periodic depreciation is the same for each year of the asset’s useful life. (p. 450).
Trademark (trade name) A word, phrase, jingle, or sym-bol that identifi es a particular enterprise or product. (p. 461).
Units-of-activity method Depreciation method in which useful life is expressed in terms of the total units of production or use expected from an asset. (p. 451).
Useful life An estimate of the expected productive life, also called service life, of an asset. (p. 449).

Practice Multiple-Choice Questions 469
(b) ($10,000 4 Total estimated activity) 3 Units of activity for 2017.
(c) ($11,000 4 Total estimated activity) 3 Units of activity for 2016 and 2017.
(d) ($10,000 4 Total estimated activity) 3 Units of activity for 2016 and 2017.
6. Jefferson Company purchased a piece of equipment on January 1, 2017. The equipment cost $60,000 and has an estimated life of 8 years and a salvage value of $8,000. What was the depreciation expense for the asset for 2018 under the double-declining-balance method?(a) $6,500. (c) $15,000.(b) $11,250. (d) $6,562.
7. When there is a change in estimated depreciation:(a) previous depreciation should be corrected.(b) current and future years’ depreciation should be
revised.(c) only future years’ depreciation should be revised.(d) None of the above.
8. Able Towing Company purchased a tow truck for $60,000 on January 1, 2015. It was originally depreci-ated on a straight-line basis over 10 years with an assumed salvage value of $12,000. On December 31, 2017, before adjusting entries had been made, the company decided to change the remaining estimated life to 4 years (including 2017) and the salvage value to $2,000. What was the depreciation expense for 2017?(a) $6,000. (c) $15,000.(b) $4,800. (d) $12,100.
9. Bennie Razor Company has decided to sell one of its old manufacturing machines on June 30, 2017. The machine was purchased for $80,000 on January 1, 2013, and was depreciated on a straight-line basis for 10 years assuming no salvage value. If the machine was sold for $26,000, what was the amount of the gain or loss recorded at the time of the sale?(a) $18,000. (c) $22,000.(b) $54,000. (d) $46,000.
10. Maggie Sharrer Company expects to extract 20 mil-lion tons of coal from a mine that cost $12 million. If no salvage value is expected and 2 million tons are mined in the fi rst year, the entry to record depletion will include a:(a) debit to Accumulated Depletion of $2,000,000.(b) credit to Depletion Expense of $1,200,000.(c) debit to Inventory of $1,200,000.(d) credit to Accumulated Depletion of $2,000,000.
11. Which of the following statements is false?(a) If an intangible asset has a fi nite life, it should be
amortized.
(LO 2)
(LO 2)
(LO 2)
(LO 3)
(LO 4)
(LO 4)
(b) The amortization period of an intangible asset can exceed 20 years.
(c) Goodwill is recorded only when a business is pur-chased.
(d) Research and development costs are expensed when incurred, except when the research and development expenditures result in a successful patent.
12. Martha Beyerlein Company incurred $150,000 of research and development costs in its laboratory to develop a patent granted on January 2, 2017. On July 31, 2017, Beyerlein paid $35,000 for legal fees in a successful defense of the patent. The total amount debited to Patents through July 31, 2017, should be:(a) $150,000. (c) $185,000.(b) $35,000. (d) $170,000.
13. Indicate which of the following statements is true.(a) Since intangible assets lack physical substance,
they need be disclosed only in the notes to the fi nancial statements.
(b) Goodwill should be reported as a contra account in the owner’s equity section.
(c) Totals of major classes of assets can be shown in the balance sheet, with asset details disclosed in the notes to the fi nancial statements.
(d) Intangible assets are typically combined with plant assets and natural resources and shown in the property, plant, and equipment section.
14. Lake Coffee Company reported net sales of $180,000, net income of $54,000, beginning total assets of $200,000, and ending total assets of $300,000. What was the company’s asset turnover?(a) 0.90. (c) 0.72.(b) 0.20. (d) 1.39.
15. Schopenhauer Company exchanged an old machine, with a book value of $39,000 and a fair value of $35,000, and paid $10,000 cash for a similar new machine. The transaction has commercial sub-stance. At what amount should the machine acquired in the exchange be recorded on Schopenhauer’s books?(a) $45,000.(b) $46,000.(c) $49,000.(d) $50,000.
16. In exchanges of assets in which the exchange has commercial substance:(a) neither gains nor losses are recognized immedi-
ately.(b) gains, but not losses, are recognized immediately.(c) losses, but not gains, are recognized immediately.(d) both gains and losses are recognized immediately.
(LO 4)
(LO 5)
(LO 5)
* (LO 6)
* (LO 6)
Solutions
1. (d) All of the costs ($1,200 1 $200 1 $400) in addition to the cash price ($24,000) should be included in the cost of the equipment because they were necessary expenditures to acquire the asset and make it ready for its intended use. The other choices are there-fore incorrect.
2. (d) When an addition is made to plant assets, it is intended to increase productive capacity, increase the assets’ useful life, or increase the effi ciency of the assets. This is called a capital expenditure. The other choices are incorrect because (a) additions to

470 10 Plant Assets, Natural Resources, and Intangible Assets
plant assets are not revenue expenditures because the additions will have a long-term useful life whereas revenue expenditures are minor repairs and maintenance that do not prolong the life of the assets; (b) additions to plant assets are debited to Plant Assets, not Maintenance and Repairs Expense, because the Maintenance and Repairs Expense account is used to record expenditures not intended to increase the life of the assets; and (c) additions to plant assets are debited to Plant Assets, not Purchases, because the Purchases account is used to record assets intended for resale (inventory).
3. (b) Depreciation is a process of allocating the cost of an asset over its useful life, not a process of (a) valuation, (c) cash accumu-lation, or (d) appraisal.
4. (d) Accumulated depreciation will be the sum of 2 years of depreciation expense. Annual depreciation for this asset is ($400,000 2 $10,000)/5 5 $78,000. The sum of 2 years’ depreciation is therefore $156,000 ($78,000 1 $78,000), not (a) $80,000, (b) $160,000, or (c) $78,000.
5. (d) The units-of-activity method takes salvage value into consideration; therefore, the depreciable cost is $10,000. This amount is divided by total estimated activity. The resulting number is multiplied by the units of activity used in 2016 and 2017 to compute the accumulated depreciation at the end of 2017, the second year of the asset’s use. The other choices are there-fore incorrect.
6. (b) For the double-declining method, the depreciation rate would be 25% or (1/8 3 2). For 2017, annual depreciation expense is $15,000 ($60,000 book value 3 25%); for 2018, annual depreciation expense is $11,250 [($60,000 2 $15,000) 3 25%], not (a) $6,500, (c) $15,000, or (d) $6,562.
7. (b) When there is a change in estimated depreciation, the current and future years’ depreciation computation should refl ect the new estimates. The other choices are incorrect because (a) previous years’ depreciation should not be adjusted when new estimates are made for depreciation, and (c) when there is a change in estimated depreciation, the current and future years’ depreciation computation should refl ect the new estimates. Choice (d) is wrong because there is a correct answer.
8. (d) First, calculate accumulated depreciation from January 1, 2015, through December 31, 2016, which is $9,600 {[($60,000 2 $12,000)/10 years] 3 2 years}. Next, calculate the revised depreciable cost, which is $48,400 ($60,000 2 $9,600 2 $2,000). Thus, the depreciation expense for 2017 is $12,100 ($48,400/4), not (a) $6,000, (b) $4,800, or (c) $15,000.
9. (a) First, the book value needs to be determined. The accumulated depreciation as of June 30, 2017, is $36,000 [($80,000/10) 3 4.5 years]. Thus, the cost of the machine less accumulated depreciation equals $44,000 ($80,000 2 $36,000). The loss recorded at the time of sale is $18,000 ($26,000 2 $44,000), not (b) $54,000, (c) $22,000, or (d) $46,000.
10. (c) The amount of depletion is determined by computing the depletion per unit ($12 million/20 million tons 5 $0.60 per ton) and then multiplying that amount times the number of units extracted during the year (2 million tons 3 $0.60 5 $1,200,000). This amount is debited to Inventory and credited to Accumulated Depletion. The other choices are therefore incorrect.
11. (d) Research and development (R&D) costs are expensed when incurred, regardless of whether the research and development expenditures result in a successful patent or not. The other choices are true statements.
12. (b) Because the $150,000 was spent developing the patent rather than buying it from another fi rm, it is debited to Research and Development Expense. Only the $35,000 spent on the successful defense can be debited to Patents, not (a) $150,000, (c) $185,000, or (d) $170,000.
13. (c) Reporting only totals of major classes of assets in the balance sheet is appropriate. Additional details can be shown in the notes to the fi nancial statements. The other choices are false statements.
14. (c) Asset turnover 5 Net sales ($180,000)/Average total assets [($200,000 1 $300,000)/2] 5 0.72 times, not (a) 0.90, (b) 0.20, or (d) 1.39 times.
*15. (a) When an exchange has commercial substance, the debit to the new asset is equal to the fair value of the old asset plus the cash paid ($35,000 1 $10,000 5 $45,000), not (b) $46,000, (c) $49,000, or (d) $50,000.
*16. (d) Both gains and losses are recognized immediately when an exchange of assets has commercial substance. The other choices are therefore incorrect.
1. Numo Company purchased a new machine on October 1, 2017, at a cost of $145,000. The company estimated that the machine will have a salvage value of $25,000.The machine is expected to be used for 20,000 working hours during its 5-year life.
InstructionsCompute the depreciation expense under the following methods for the year indicated.
(a) Straight-line for 2017.
(b) Units-of-activity for 2017, assuming machine usage was 3,400 hours.
(c) Declining-balance using double the straight-line rate for 2017 and 2018.
Determine depreciation for partial periods
(LO 2)
PRACTICE EXERCISES

Practice Problems 471
1. (a) Straight-line method:
1$145,000 2 $25,0005 2 5 $24,000 per year
2017 depreciation 5 $24,000 3 3/12 5 $6,000
(b) Units-of-activity method:
1$145,000 2 $25,00020,000 2 5 $6.00 per hour
2017 depreciation 5 3,400 hours 3 $6.00 5 $20,400
(c) Declining-balance method: 2017 depreciation 5 $145,000 3 40% 3 3/12 5 $14,500
Book value January 1, 2018 5 $145,000 2 $14,500 5 $130,500
2018 depreciation 5 $130,500 3 40% 5 $52,200
Solution
2. 1/2/17 Patents 840,000 Cash 840,000
4/1/17 Goodwill 450,000 Cash 450,000 (Part of the entry to record purchase of another company)
7/1/17 Franchises 330,000 Cash 330,000
9/1/17 Research and Development Expense 210,000 Cash 210,000
12/31/17 Amortization Expense ($840,000 4 7) 1 [($330,000 4 10) 3 1/2] 136,500 Patents 120,000 Franchises 16,500
Ending balances, 12/31/17: Patents 5 $720,000 ($840,000 2 $120,000) Goodwill 5 $450,000 Franchises 5 $313,500 ($330,000 2 $16,500) R&D expense 5 $210,000
Solution
2. Henning Company, organized in 2017, has the following transactions related to intan-gible assets.
1/2/17 Purchased patent (7-year life) $840,0004/1/17 Goodwill purchased (indefi nite life) 450,0007/1/17 10-year franchise: expiration date 7/1/2027 330,0009/1/17 Research and development costs 210,000
InstructionsPrepare the necessary entries to record these intangibles. All costs incurred were for cash. Make the adjusting entries as of December 31, 2017, recording any necessary amortization and refl ecting all balances accurately as of that date.
Prepare entries to set up appropriate accounts for different intangibles; amortize intangible assets.
(LO 4)
1. DuPage Company purchases a factory machine at a cost of $18,000 on January 1, 2017. DuPage expects the machine to have a salvage value of $2,000 at the end of its 4-year use-ful life. During its useful life, the machine is expected to be used 160,000 hours. Actual annual hourly use was 2017, 40,000; 2018, 60,000; 2019, 35,000; and 2020, 25,000.
Compute depreciation under different methods.
(LO 2)
PRACTICE PROBLEMS

InstructionsPrepare depreciation schedules for the following methods: (a) straight-line, (b) units-of-activity, and (c) declining-balance using double the straight-line rate.
472 10 Plant Assets, Natural Resources, and Intangible Assets
1. (a)Straight-Line Method
Computation Annual End of Year
Depreciable Depreciation Depreciation Accumulated BookYear Cost* 3 Rate 5 Expense Depreciation Value
2017 $16,000 25% $4,000 $ 4,000 $14,000**2018 16,000 25% 4,000 8,000 10,0002019 16,000 25% 4,000 12,000 6,0002020 16,000 25% 4,000 16,000 2,000
*$18,000 2 $2,000.**$18,000 2 $4,000.
(b)Units-of-Activity Method
Computation Annual End of Year
Units of Depreciable Depreciation Accumulated BookYear Activity 3 Cost/Unit 5 Expense Depreciation Value
2017 40,000 $0.10* $4,000 $ 4,000 $14,0002018 60,000 0.10 6,000 10,000 8,0002019 35,000 0.10 3,500 13,500 4,5002020 25,000 0.10 2,500 16,000 2,000
*($18,000 2 $2,000) 4 160,000.
(c)Declining-Balance Method
Computation End of Year
Book Value Annual Beginning of Depreciation Depreciation Accumulated BookYear Year 3 Rate* 5 Expense Depreciation Value
2017 $18,000 50% $9,000 $ 9,000 $9,0002018 9,000 50% 4,500 13,500 4,5002019 4,500 50% 2,250 15,750 2,2502020 2,250 50% 250** 16,000 2,000
*¼ 3 2.**Adjusted to $250 because ending book value should not be less than expected salvage value.
Solution
2. On January 1, 2017, Skyline Limousine Co. purchased a limo at an acquisition cost of $28,000. The vehicle has been depreciated by the straight-line method using a 4-year service life and a $4,000 salvage value. The company’s fi scal year ends on December 31.
InstructionsPrepare the journal entry or entries to record the disposal of the limousine assuming that it was:
(a) Retired and scrapped with no salvage value on January 1, 2021.
(b) Sold for $5,000 on July 1, 2020.
Record disposal of plant asset.
(LO 3)
2. (a) 1/1/21 Accumulated Depreciation—Equipment 24,000 Loss on Disposal of Plant Assets 4,000 Equipment 28,000 (To record retirement of limousine)
Solution
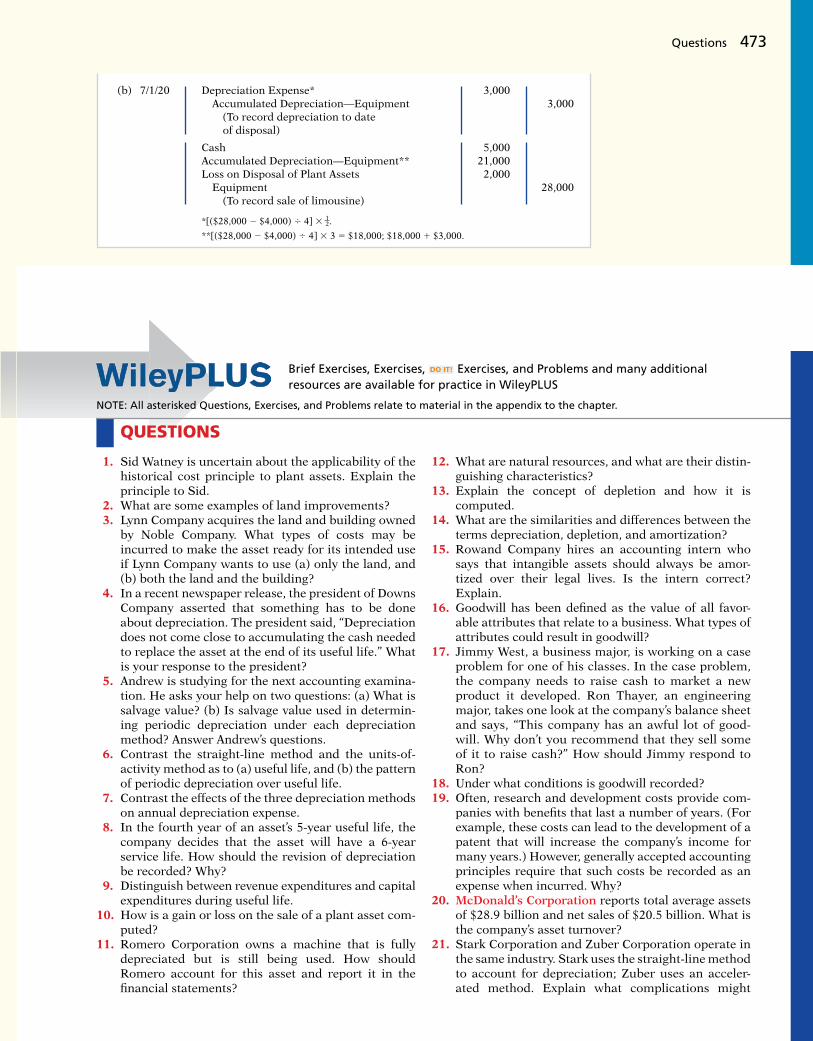
Questions 473
(b) 7/1/20 Depreciation Expense* 3,000 Accumulated Depreciation—Equipment 3,000 (To record depreciation to date
of disposal)
Cash 5,000 Accumulated Depreciation—Equipment** 21,000 Loss on Disposal of Plant Assets 2,000 Equipment 28,000 (To record sale of limousine)
*[($28,000 2 $4,000) 4 4] 3 12.
**[($28,000 2 $4,000) 4 4] 3 3 5 $18,000; $18,000 1 $3,000.
Brief Exercises, Exercises, DO IT! Exercises, and Problems and many additional resources are available for practice in WileyPLUS
QUESTIONS
1. Sid Watney is uncertain about the applicability of the historical cost principle to plant assets. Explain the principle to Sid.
2. What are some examples of land improvements? 3. Lynn Company acquires the land and building owned
by Noble Company. What types of costs may be incurred to make the asset ready for its intended use if Lynn Company wants to use (a) only the land, and (b) both the land and the building?
4. In a recent newspaper release, the president of Downs Company asserted that something has to be done about depreciation. The president said, “Depreciation does not come close to accumulating the cash needed to replace the asset at the end of its useful life.” What is your response to the president?
5. Andrew is studying for the next accounting examina-tion. He asks your help on two questions: (a) What is salvage value? (b) Is salvage value used in determin-ing periodic depreciation under each depreciation method? Answer Andrew’s questions.
6. Contrast the straight-line method and the units-of-activity method as to (a) useful life, and (b) the pattern of periodic depreciation over useful life.
7. Contrast the effects of the three depreciation methods on annual depreciation expense.
8. In the fourth year of an asset’s 5-year useful life, the company decides that the asset will have a 6-year service life. How should the revision of depreciation be recorded? Why?
9. Distinguish between revenue expenditures and capital expenditures during useful life.
10. How is a gain or loss on the sale of a plant asset com-puted?
11. Romero Corporation owns a machine that is fully depreciated but is still being used. How should Romero account for this asset and report it in the fi nancial statements?
12. What are natural resources, and what are their distin-guishing characteristics?
13. Explain the concept of depletion and how it is computed.
14. What are the similarities and differences between the terms depreciation, depletion, and amortization?
15. Rowand Company hires an accounting intern who says that intangible assets should always be amor-tized over their legal lives. Is the intern correct? Explain.
16. Goodwill has been defi ned as the value of all favor-able attributes that relate to a business. What types of attributes could result in goodwill?
17. Jimmy West, a business major, is working on a case problem for one of his classes. In the case problem, the company needs to raise cash to market a new product it developed. Ron Thayer, an engineering major, takes one look at the company’s balance sheet and says, “This company has an awful lot of good-will. Why don’t you recommend that they sell some of it to raise cash?” How should Jimmy respond to Ron?
18. Under what conditions is goodwill recorded?19. Often, research and development costs provide com-
panies with benefi ts that last a number of years. (For example, these costs can lead to the development of a patent that will increase the company’s income for many years.) However, generally accepted accounting principles require that such costs be recorded as an expense when incurred. Why?
20. McDonald’s Corporation reports total average assets of $28.9 billion and net sales of $20.5 billion. What is the company’s asset turnover?
21. Stark Corporation and Zuber Corporation operate in the same industry. Stark uses the straight-line method to account for depreciation; Zuber uses an acceler-ated method. Explain what complications might
NOTE: All asterisked Questions, Exercises, and Problems relate to material in the appendix to the chapter.

474 10 Plant Assets, Natural Resources, and Intangible Assets
arise in trying to compare the results of these two companies.
22. Gomez Corporation uses straight-line depreciation for fi nancial reporting purposes but an accelerated method for tax purposes. Is it acceptable to use differ-ent methods for the two purposes? What is Gomez’s motivation for doing this?
23. You are comparing two companies in the same indus-try. You have determined that Ace Corp. depreciates its plant assets over a 40-year life, whereas Liu Corp. depreciates its plant assets over a 20-year life. Discuss the implications this has for comparing the results of the two companies.
24. Sosa Company is doing signifi cant work to revitalize its warehouses. It is not sure whether it should
capitalize these costs or expense them. What are the implications for current-year net income and future net income of expensing versus capitalizing these costs?
*25. When assets are exchanged in a transaction involving commercial substance, how is the gain or loss on dis-posal of plant assets computed?
*26. Unruh Refrigeration Company trades in an old machine on a new model when the fair value of the old machine is greater than its book value. The trans-action has commercial substance. Should Unruh rec-ognize a gain on disposal of plant assets? If the fair value of the old machine is less than its book value, should Unruh recognize a loss on disposal of plant assets?
BRIEF EXERCISES
BE10-1 The following expenditures were incurred by McCoy Company in purchasing land: cash price $50,000, accrued taxes $3,000, attorneys’ fees $2,500, real estate broker’s commission $2,000, and clearing and grading $3,500. What is the cost of the land?
BE10-2 Rich Castillo Company incurs the following expenditures in purchasing a truck: cash price $30,000, accident insurance $2,000, sales taxes $2,100, motor vehicle license $100, and painting and lettering $400. What is the cost of the truck?
BE10-3 Flaherty Company had the following two transactions related to its delivery truck.
1. Paid $45 for an oil change.2. Paid $400 to install special gear unit, which increases the operating effi ciency of the
truck.
Prepare Flaherty’s journal entries to record these two transactions.
BE10-4 Corales Company acquires a delivery truck at a cost of $38,000. The truck is expected to have a salvage value of $6,000 at the end of its 4-year useful life. Compute annual depreciation expense for the fi rst and second years using the straight-line method.
BE10-5 Chisenhall Company purchased land and a building on January 1, 2017. Manage-ment’s best estimate of the value of the land was $100,000 and of the building $200,000. However, management told the accounting department to record the land at $220,000 and the building at $80,000. The building is being depreciated on a straight-line basis over 15 years with no salvage value. Why do you suppose management requested this account-ing treatment? Is it ethical?
BE10-6 Depreciation information for Corales Company is given in BE10-4. Assuming the declining-balance depreciation rate is double the straight-line rate, compute annual depre-ciation for the fi rst and second years under the declining-balance method.
BE10-7 Rosco Taxi Service uses the units-of-activity method in computing depreciation on its taxicabs. Each cab is expected to be driven 150,000 miles. Taxi no. 10 cost $39,500 and is expected to have a salvage value of $500. Taxi no. 10 is driven 30,000 miles in year 1 and 20,000 miles in year 2. Compute the depreciation for each year.
BE10-8 On January 1, 2017, the Morgantown Company ledger shows Equipment $32,000 and Accumulated Depreciation—Equipment $9,000. The depreciation resulted from using the straight-line method with a useful life of 10 years and salvage value of $2,000. On this date, the company concludes that the equipment has a remaining useful life of only 4 years with the same salvage value. Compute the revised annual depreciation.
Determine the cost of a truck.
(LO 1)
Prepare entries for delivery truck costs.
(LO 1)
Compute straight-line depreciation.
(LO 2)
Compute depreciation and evaluate treatment.
(LO 2)
Compute declining-balance depreciation.
(LO 2)
Compute depreciation using the units-of-activity method.
(LO 2)
Compute revised depreciation.
(LO 2)
Determine the cost of land.
(LO 1)

DO IT! Exercises 475
BE10-9 Prepare journal entries to record the following.
(a) Sound Tracker Company retires its delivery equipment, which cost $41,000. Accumu-lated depreciation is also $41,000 on this delivery equipment. No salvage value is received.
(b) Assume the same information as (a), except that accumulated depreciation is $37,000, instead of $41,000, on the delivery equipment.
BE10-10 Gunkelson Company sells equipment on September 30, 2017, for $18,000 cash. The equipment originally cost $72,000 and as of January 1, 2017, had accumulated depre-ciation of $42,000. Depreciation for the fi rst 9 months of 2017 is $5,250. Prepare the journal entries to (a) update depreciation to September 30, 2017, and (b) record the sale of the equipment.
BE10-11 Franceour Mining Co. purchased for $7 million a mine that is estimated to have 35 million tons of ore and no salvage value. In the fi rst year, 5 million tons of ore are extracted.
(a) Prepare the journal entry to record depletion for the fi rst year.(b) Show how this mine is reported on the balance sheet at the end of the fi rst year.
BE10-12 Campanez Company purchases a patent for $140,000 on January 2, 2017. Its estimated useful life is 10 years.
(a) Prepare the journal entry to record amortization expense for the fi rst year.(b) Show how this patent is reported on the balance sheet at the end of the fi rst year.
BE10-13 Information related to plant assets, natural resources, and intangibles at the end of 2017 for Dent Company is as follows: buildings $1,100,000, accumulated depreciation—buildings $600,000, goodwill $410,000, coal mine $500,000, and accumulated depletion—coal mine $108,000. Prepare a partial balance sheet of Dent Company for these items.
BE10-14 In a recent annual report, Target reported beginning total assets of $44.1 billion, ending total assets of $44.5 billion, and net sales of $63.4 billion. Compute Target’s asset turnover.
*BE10-15 Olathe Company exchanges old delivery equipment for new delivery equipment. The book value of the old delivery equipment is $31,000 (cost $61,000 less accumulated depreciation $30,000). Its fair value is $24,000, and cash of $5,000 is paid. Prepare the entry to record the exchange, assuming the transaction has commercial substance.
*BE10-16 Assume the same information as BE10-15, except that the fair value of the old delivery equipment is $33,000. Prepare the entry to record the exchange.
Prepare entries for disposal by retirement.
(LO 3)
Prepare entries for disposal by sale.
(LO 3)
Prepare depletion entry and balance sheet presentation for natural resources.
(LO 4)
Prepare amortization expense entry and balance sheet presentation for intangibles.
(LO 4)
Classify long-lived assets on balance sheet.
(LO 5)
Calculate asset turnover.
(LO 5)
Prepare entry for disposal by exchange.
(LO 6)
Prepare entry for disposal by exchange.
(LO 6)
Lofton Company purchased a delivery truck. The total cash payment was $27,900, including the following items.
Negotiated purchase price $24,000Installation of special shelving 1,100Painting and lettering 900Motor vehicle license 100Annual insurance policy 500Sales tax 1,300
Total paid $27,900
Explain how each of these costs would be accounted for.
On January 1, 2017, Emporia Country Club purchased a new riding mower for $15,000. The mower is expected to have an 8-year life with a $3,000 salvage value. What jour-nal entry would Emporia make at December 31, 2017, if it uses straight-line depreciation?
DO IT! Exercises
DO IT! 10-1
DO IT! 10-2a
Explain accounting for cost of plant assets.
(LO 1)
Calculate depreciation expense and make journal entry.
(LO 2)

476 10 Plant Assets, Natural Resources, and Intangible Assets
Pinewood Corporation purchased a piece of equipment for $70,000. It esti-mated an 8-year life and $2,000 salvage value. At the end of year four (before the depreci-ation adjustment), it estimated the new total life to be 10 years and the new salvage value to be $6,000. Compute the revised depreciation.
Napoli Manufacturing has old equipment that cost $52,000. The equipment has accumulated depreciation of $28,000. Napoli has decided to sell the equipment.
(a) What entry would Napoli make to record the sale of the equipment for $26,000 cash?(b) What entry would Napoli make to record the sale of the equipment for $15,000 cash?
Match the statement with the term most directly associated with it.
Goodwill AmortizationIntangible assets FranchisesResearch and development costs
1. ________ Rights, privileges, and competitive advantages that result from the ownership of long-lived assets that do not possess physical substance.
2. ________ The allocation of the cost of an intangible asset to expense in a rational and systematic manner.
3. ________ A right to sell certain products or services, or use certain trademarks or trade names, within a designated geographic area.
4. ________ Costs incurred by a company that often lead to patents or new products. These costs must be expensed as incurred.
5. ________ The excess of the cost of a company over the fair value of the net assets acquired.
For 2017, Sale Company reported beginning total assets of $300,000 and ending total assets of $340,000. Its net income for this period was $50,000, and its net sales were $400,000. Compute the company’s asset turnover for 2017.
Calculate revised depreciation
(LO 2)
Make journal entries to record plant asset disposal.
(LO 3)
DO IT! 10-4
DO IT! 10-5
DO IT! 10-3
Match intangibles classifi cations concepts.
(LO 4, 5)
Calculate asset turnover.
(LO 5)
EXERCISES
E10-1 The following expenditures relating to plant assets were made by Prather Company during the fi rst 2 months of 2017.
1. Paid $5,000 of accrued taxes at time plant site was acquired.2. Paid $200 insurance to cover possible accident loss on new factory machinery while the
machinery was in transit.3. Paid $850 sales taxes on new delivery truck.4. Paid $17,500 for parking lots and driveways on new plant site.5. Paid $250 to have company name and advertising slogan painted on new delivery truck.6. Paid $8,000 for installation of new factory machinery.7. Paid $900 for one-year accident insurance policy on new delivery truck.8. Paid $75 motor vehicle license fee on the new truck.
Instructions(a) Explain the application of the historical cost principle in determining the
acquisition cost of plant assets.(b) List the numbers of the foregoing transactions, and opposite each indicate the account
title to which each expenditure should be debited.
E10-2 Benedict Company incurred the following costs.
1. Sales tax on factory machinery purchased $ 5,0002. Painting of and lettering on truck immediately upon purchase 7003. Installation and testing of factory machinery 2,0004. Real estate broker’s commission on land purchased 3,5005. Insurance premium paid for fi rst year’s insurance on new truck 8806. Cost of landscaping on property purchased 7,2007. Cost of paving parking lot for new building constructed 17,9008. Cost of clearing, draining, and fi lling land 13,3009. Architect’s fees on self-constructed building 10,000
Determine property, plant, and equipment costs.
(LO 1)
Determine cost of plant acquisitions.
(LO 1)
DO IT! 10-2b

Exercises 477
InstructionsIndicate to which account Benedict would debit each of the costs.
E10-3 On March 1, 2017, Westmorlan Company acquired real estate on which it planned to construct a small offi ce building. The company paid $75,000 in cash. An old warehouse on the property was razed at a cost of $8,600; the salvaged materials were sold for $1,700. Additional expenditures before construction began included $1,100 attorney’s fee for work concerning the land purchase, $5,000 real estate broker’s fee, $7,800 architect’s fee, and $14,000 to put in driveways and a parking lot.
Instructions(a) Determine the amount to be reported as the cost of the land.(b) For each cost not used in part (a), indicate the account to be debited.
E10-4 Tom Parkey has prepared the following list of statements about depreciation.
1. Depreciation is a process of asset valuation, not cost allocation. 2. Depreciation provides for the proper matching of expenses with revenues. 3. The book value of a plant asset should approximate its fair value. 4. Depreciation applies to three classes of plant assets: land, buildings, and equipment. 5. Depreciation does not apply to a building because its usefulness and revenue-producing
ability generally remain intact over time. 6. The revenue-producing ability of a depreciable asset will decline due to wear and tear
and to obsolescence. 7. Recognizing depreciation on an asset results in an accumulation of cash for replace-
ment of the asset. 8. The balance in accumulated depreciation represents the total cost that has been
charged to expense. 9. Depreciation expense and accumulated depreciation are reported on the income
statement. 10. Four factors affect the computation of depreciation: cost, useful life, salvage value,
and residual value.
InstructionsIdentify each statement as true or false. If false, indicate how to correct the statement.
E10-5 Yello Bus Lines uses the units-of-activity method in depreciating its buses. One bus was purchased on January 1, 2017, at a cost of $148,000. Over its 4-year useful life, the bus is expected to be driven 100,000 miles. Salvage value is expected to be $8,000.
Instructions(a) Compute the depreciable cost per unit.(b) Prepare a depreciation schedule assuming actual mileage was: 2017, 26,000; 2018,
32,000; 2019, 25,000; and 2020, 17,000.
E10-6 Rottino Company purchased a new machine on October 1, 2017, at a cost of $150,000. The company estimated that the machine will have a salvage value of $12,000. The machine is expected to be used for 10,000 working hours during its 5-year life.
InstructionsCompute the depreciation expense under the following methods for the year indicated.
(a) Straight-line for 2017.(b) Units-of-activity for 2017, assuming machine usage was 1,700 hours.(c) Declining-balance using double the straight-line rate for 2017 and 2018.
E10-7 Linton Company purchased a delivery truck for $34,000 on January 1, 2017. The truck has an expected salvage value of $2,000, and is expected to be driven 100,000 miles over its estimated useful life of 8 years. Actual miles driven were 15,000 in 2017 and 12,000 in 2018.
Determine acquisition costs of land.
(LO 1)
Understand depreciation concepts.
(LO 2)
Compute depreciation under units-of-activity method.
(LO 2)
Determine depreciation for partial periods.
(LO 2)
Compute depreciation using different methods.
(LO 2)
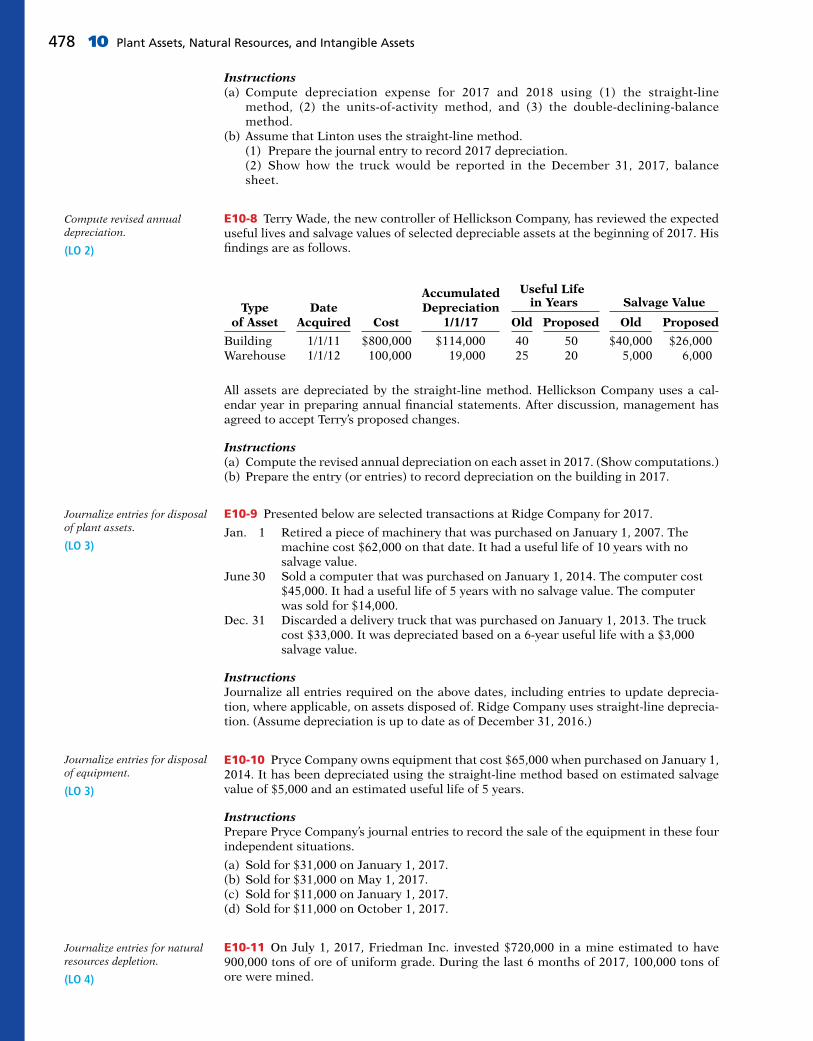
478 10 Plant Assets, Natural Resources, and Intangible Assets
Instructions(a) Compute depreciation expense for 2017 and 2018 using (1) the straight-line
method, (2) the units-of-activity method, and (3) the double-declining-balance method.
(b) Assume that Linton uses the straight-line method. (1) Prepare the journal entry to record 2017 depreciation. (2) Show how the truck would be reported in the December 31, 2017, balance
sheet.
E10-8 Terry Wade, the new controller of Hellickson Company, has reviewed the expected useful lives and salvage values of selected depreciable assets at the beginning of 2017. His fi ndings are as follows.
in Years Salvage Value Accumulated Useful Life
Type Date Depreciation of Asset Acquired Cost 1/1/17 Old Proposed Old Proposed
Building 1/1/11 $800,000 $114,000 40 50 $40,000 $26,000Warehouse 1/1/12 100,000 19,000 25 20 5,000 6,000
All assets are depreciated by the straight-line method. Hellickson Company uses a cal-endar year in preparing annual fi nancial statements. After discussion, management has agreed to accept Terry’s proposed changes.
Instructions(a) Compute the revised annual depreciation on each asset in 2017. (Show computations.)(b) Prepare the entry (or entries) to record depreciation on the building in 2017.
E10-9 Presented below are selected transactions at Ridge Company for 2017.
Jan. 1 Retired a piece of machinery that was purchased on January 1, 2007. The machine cost $62,000 on that date. It had a useful life of 10 years with no salvage value.
June 30 Sold a computer that was purchased on January 1, 2014. The computer cost $45,000. It had a useful life of 5 years with no salvage value. The computer was sold for $14,000.
Dec. 31 Discarded a delivery truck that was purchased on January 1, 2013. The truck cost $33,000. It was depreciated based on a 6-year useful life with a $3,000 salvage value.
InstructionsJournalize all entries required on the above dates, including entries to update deprecia-tion, where applicable, on assets disposed of. Ridge Company uses straight-line deprecia-tion. (Assume depreciation is up to date as of December 31, 2016.)
E10-10 Pryce Company owns equipment that cost $65,000 when purchased on January 1, 2014. It has been depreciated using the straight-line method based on estimated salvage value of $5,000 and an estimated useful life of 5 years.
InstructionsPrepare Pryce Company’s journal entries to record the sale of the equipment in these four independent situations.
(a) Sold for $31,000 on January 1, 2017.(b) Sold for $31,000 on May 1, 2017.(c) Sold for $11,000 on January 1, 2017.(d) Sold for $11,000 on October 1, 2017.
E10-11 On July 1, 2017, Friedman Inc. invested $720,000 in a mine estimated to have 900,000 tons of ore of uniform grade. During the last 6 months of 2017, 100,000 tons of ore were mined.
Journalize entries for disposal of plant assets.
(LO 3)
Journalize entries for disposal of equipment.
(LO 3)
Journalize entries for natural resources depletion.
(LO 4)
Compute revised annual depreciation.
(LO 2)

Exercises: Set B and Challenge Exercises 479
Instructions(a) Prepare the journal entry to record depletion.(b) Assume that the 100,000 tons of ore were mined, but only 80,000 units were sold. How
are the costs applicable to the 20,000 unsold units reported?
E10-12 The following are selected 2017 transactions of Pedigo Corporation.
Jan. 1 Purchased a small company and recorded goodwill of $150,000. Its useful life is indefi nite.
May 1 Purchased for $75,000 a patent with an estimated useful life of 5 years and a legal life of 20 years.
InstructionsPrepare necessary adjusting entries at December 31 to record amortization required by the events above.
E10-13 Gill Company, organized in 2017, has the following transactions related to intan-gible assets.
1/2/17 Purchased patent (7-year life) $595,0004/1/17 Goodwill purchased (indefi nite life) 360,0007/1/17 10-year franchise; expiration date 7/1/2027 480,0009/1/17 Research and development costs 185,000
InstructionsPrepare the necessary entries to record these intangibles. All costs incurred were for cash. Make the adjusting entries as of December 31, 2017, recording any necessary amortization and refl ecting all balances accurately as of that date.
E10-14 During 2017, Paola Corporation reported net sales of $3,500,000 and net income of $1,500,000. Its balance sheet reported average total assets of $1,400,000.
InstructionsCalculate the asset turnover.
*E10-15 Presented below are two independent transactions. Both transactions have com-mercial substance.
1. Mercy Co. exchanged old trucks (cost $64,000 less $22,000 accumulated deprecia-tion) plus cash of $17,000 for new trucks. The old trucks had a fair value of $38,000.
2. Pence Inc. trades its used machine (cost $12,000 less $4,000 accumulated depreciation) for a new machine. In addition to exchanging the old machine (which had a fair value of $11,000), Pence also paid cash of $3,000.
Instructions(a) Prepare the entry to record the exchange of assets by Mercy Co.(b) Prepare the entry to record the exchange of assets by Pence Inc.
*E10-16 Rizzo’s Delivery Company and Overland’s Express Delivery exchanged delivery trucks on January 1, 2017. Rizzo’s truck cost $22,000. It has accumulated depreciation of $15,000 and a fair value of $3,000. Overland’s truck cost $10,000. It has accumulated depre-ciation of $8,000 and a fair value of $3,000. The transaction has commercial substance.
Instructions(a) Journalize the exchange for Rizzo’s Delivery Company.(b) Journalize the exchange for Overland’s Express Delivery.
Prepare adjusting entries for amortization.
(LO 4)
Prepare entries to set up appropriate accounts for different intangibles; amortize intangible assets.
(LO 4)
Calculate asset turnover.
(LO 5)
Journalize entries for exchanges.
(LO 6)
Journalize entries for the exchange of plant assets.
(LO 6)
EXERCISES: SET B AND CHALLENGE EXERCISES
Visit the book’s companion website, at www.wiley.com/college/weygandt, and choose the Student Companion site to access Exercises: Set B and Challenge Exercises.

480 10 Plant Assets, Natural Resources, and Intangible Assets
PROBLEMS: SET A
P10-1A Venable Company was organized on January 1. During the fi rst year of opera-tions, the following plant asset expenditures and receipts were recorded in random order.
Debit
1. Cost of fi lling and grading the land $ 4,000 2. Full payment to building contractor 690,000 3. Real estate taxes on land paid for the current year 5,000 4. Cost of real estate purchased as a plant site (land $100,000 and
building $45,000) 145,000 5. Excavation costs for new building 35,000 6. Architect’s fees on building plans 10,000 7. Accrued real estate taxes paid at time of purchase of real estate 2,000 8. Cost of parking lots and driveways 14,000 9. Cost of demolishing building to make land suitable for construction
of new building 25,000
$930,000
Credit
10. Proceeds from salvage of demolished building $ 3,500
InstructionsAnalyze the foregoing transactions using the following column headings. Insert the number of each transaction in the Item space, and insert the amounts in the appropriate columns. For amounts entered in the Other Accounts column, also indicate the account titles.
Item Land Buildings Other Accounts
P10-2A In recent years, Avery Transportation purchased three used buses. Because of frequent turnover in the accounting department, a different accountant selected the depre-ciation method for each bus, and various methods were selected. Information concerning the buses is summarized as follows.
Salvage Useful Life Bus Acquired Cost Value in Years Depreciation Method
1 1/1/15 $ 96,000 $ 6,000 5 Straight-line 2 1/1/15 110,000 10,000 4 Declining-balance 3 1/1/16 92,000 8,000 5 Units-of-activity
For the declining-balance method, the company uses the double-declining rate. For the units-of-activity method, total miles are expected to be 120,000. Actual miles of use in the fi rst 3 years were 2016, 24,000; 2017, 34,000; and 2018, 30,000.
Instructions(a) Compute the amount of accumulated depreciation on each bus at December 31, 2017.(b) If Bus 2 was purchased on April 1 instead of January 1, what is the depreciation
expense for this bus in (1) 2015 and (2) 2016?
P10-3A On January 1, 2017, Evers Company purchased the following two machines for use in its production process.
Machine A: The cash price of this machine was $48,000. Related expenditures included: sales tax $1,700, shipping costs $150, insurance during ship-ping $80, installation and testing costs $70, and $100 of oil and lubri-cants to be used with the machinery during its fi rst year of operations. Evers estimates that the useful life of the machine is 5 years with a $5,000 salvage value remaining at the end of that time period. Assume that the straight-line method of depreciation is used.
Machine B: The recorded cost of this machine was $180,000. Evers estimates that the useful life of the machine is 4 years with a $10,000 salvage value remaining at the end of that time period.
Totals
Land $172,500Buildings $735,000
Compute depreciation under different methods.
(LO 2)
(a) Bus 2, 2016, $82,500
Compute depreciation under different methods.
(LO 2)
Determine acquisition costs of land and building.
(LO 1)

Problems: Set A 481
Instructions(a) Prepare the following for Machine A. (1) The journal entry to record its purchase on January 1, 2017. (2) The journal entry to record annual depreciation at December 31, 2017.(b) Calculate the amount of depreciation expense that Evers should record for Machine B
each year of its useful life under the following assumptions. (1) Evers uses the straight-line method of depreciation. (2) Evers uses the declining-balance method. The rate used is twice the straight-line rate. (3) Evers uses the units-of-activity method and estimates that the useful life of the
machine is 125,000 units. Actual usage is as follows: 2017, 45,000 units; 2018, 35,000 units; 2019, 25,000 units; 2020, 20,000 units.
(c) Which method used to calculate depreciation on Machine B reports the highest amount of depreciation expense in year 1 (2017)? The highest amount in year 4 (2020)? The highest total amount over the 4-year period?
P10-4A At the beginning of 2015, Mazzaro Company acquired equipment costing $120,000. It was estimated that this equipment would have a useful life of 6 years and a salvage value of $12,000 at that time. The straight-line method of depreciation was consid-ered the most appropriate to use with this type of equipment. Depreciation is to be recorded at the end of each year. During 2017 (the third year of the equipment’s life), the company’s engineers recon-sidered their expectations, and estimated that the equipment’s useful life would probably be 7 years (in total) instead of 6 years. The estimated salvage value was not changed at that time. However, during 2020 the estimated salvage value was reduced to $5,000.
InstructionsIndicate how much depreciation expense should be recorded each year for this equip-ment, by completing the following table.
Year Depreciation Expense Accumulated Depreciation
2015201620172018201920202021
P10-5A At December 31, 2017, Grand Company reported the following as plant assets.
Land $ 4,000,000Buildings $28,500,000Less: Accumulated depreciation—buildings 12,100,000 16,400,000
Equipment 48,000,000Less: Accumulated depreciation—equipment 5,000,000 43,000,000
Total plant assets $63,400,000
During 2018, the following selected cash transactions occurred.
April 1 Purchased land for $2,130,000.May 1 Sold equipment that cost $750,000 when purchased on January 1, 2014. The
equipment was sold for $450,000.June 1 Sold land purchased on June 1, 2008 for $1,500,000. The land cost $400,000.July 1 Purchased equipment for $2,500,000.Dec. 31 Retired equipment that cost $500,000 when purchased on December 31, 2008.
The company received no proceeds related to salvage.
Instructions(a) Journalize the above transactions. The company uses straight-line depreciation for
buildings and equipment. The buildings are estimated to have a 50-year life and no salvage value. The equipment is estimated to have a 10-year useful life and no salvage value. Update depreciation on assets disposed of at the time of sale or retirement.
(b) Record adjusting entries for depreciation for 2018.(c) Prepare the plant assets section of Grand’s balance sheet at December 31, 2018.
(b) (2) 2017 DDB depreciation $90,000
2021 depreciation expense $17,900
Journalize a series of equipment transactions related to purchase, sale, retirement, and depreciation.
(LO 2, 3, 5)
(b) Depreciation Expense—Buildings $570,000; Equipment $4,800,000
(c) Total plant assets $61,760,000
Calculate revisions to depreciation expense.
(LO 2)

482 10 Plant Assets, Natural Resources, and Intangible Assets
P10-6A Ceda Co. has equipment that cost $80,000 and that has been depreciated $50,000.
InstructionsRecord the disposal under the following assumptions.
(a) It was scrapped as having no value.(b) It was sold for $21,000.(c) It was sold for $31,000.
P10-7A The intangible assets section of Sappelt Company at December 31, 2017, is pre-sented below.
Patents ($70,000 cost less $7,000 amortization) $63,000Franchises ($48,000 cost less $19,200 amortization) 28,800
Total $91,800
The patent was acquired in January 2017 and has a useful life of 10 years. The franchise was acquired in January 2014 and also has a useful life of 10 years. The following cash transactions may have affected intangible assets during 2018.
Jan. 2 Paid $27,000 legal costs to successfully defend the patent against infringement by another company.
Jan.–June Developed a new product, incurring $140,000 in research and development costs. A patent was granted for the product on July 1. Its useful life is equal to its legal life.
Sept. 1 Paid $50,000 to an extremely large defensive lineman to appear in commercials advertising the company’s products. The commercials will air in September and October.
Oct. 1 Acquired a franchise for $140,000. The franchise has a useful life of 50 years.
Instructions(a) Prepare journal entries to record the transactions above.(b) Prepare journal entries to record the 2018 amortization expense.(c) Prepare the intangible assets section of the balance sheet at December 31, 2018.
P10-8A Due to rapid turnover in the accounting department, a number of transactions involving intangible assets were improperly recorded by Goins Company in 2017.
1. Goins developed a new manufacturing process, incurring research and development costs of $136,000. The company also purchased a patent for $60,000. In early January, Goins capitalized $196,000 as the cost of the patents. Patent amortization expense of $19,600 was recorded based on a 10-year useful life.
2. On July 1, 2017, Goins purchased a small company and as a result acquired goodwill of $92,000. Goins recorded a half-year’s amortization in 2017, based on a 50-year life ($920 amortization). The goodwill has an indefi nite life.
InstructionsPrepare all journal entries necessary to correct any errors made during 2017. Assume the books have not yet been closed for 2017.
P10-9A LaPorta Company and Lott Corporation, two corporations of roughly the same size, are both involved in the manufacture of in-line skates. Each company depreciates its plant assets using the straight-line approach. An investigation of their fi nancial statements reveals the following information.
LaPorta Co. Lott Corp.
Net income $ 800,000 $1,000,000Sales revenue 1,300,000 1,180,000Average total assets 2,500,000 2,000,000Average plant assets 1,800,000 1,000,000
Instructions(a) For each company, calculate the asset turnover.(b) Based on your calculations in part (a), comment on the relative effectiveness
of the two companies in using their assets to generate sales and produce net income.
Record disposals.
(LO 3)
(b) $9,000 loss
Prepare entries to record transactions related to acquisition and amortization of intangibles; prepare the intangible assets section.
(LO 4, 5)
(b) Amortization Expense (patents) $10,000 Amortization Expense (franchises) $5,500
(c) Total intangible assets $243,300
Prepare entries to correct errors made in recording and amortizing intangible assets.
(LO 4)
1. R&D Exp. $136,000
Calculate and comment on asset turnover.
(LO 5)

Comprehensive Problem: Chapters 3 to 10 483
PROBLEMS: SET B AND SET C
Visit the book’s companion website, at www.wiley.com/college/weygandt, and choose the Student Companion site to access Problems: Set B and Set C.
COMPREHENSIVE PROBLEM: CHAPTERS 3 TO 10
CP10 Hassellhouf Company’s trial balance at December 31, 2017, is presented below. All 2017 trans-actions have been recorded except for the items described as unrecorded transactions.
Unrecorded transactions:
1. On May 1, 2017, Hassellhouf purchased equipment for $21,200 plus sales taxes of $1,600 (all paid in cash).
2. On July 1, 2017, Hassellhouf sold for $3,500 equipment which originally cost $5,000. Accumulated depreciation on this equipment at January 1, 2017, was $1,800; 2017 depreciation prior to the sale of the equipment was $450.
3. On December 31, 2017, Hassellhouf sold on account $9,000 of inventory that cost $6,300. 4. Hassellhouf estimates that uncollectible accounts receivable at year-end is $3,500. 5. The note receivable is a one-year, 8% note dated April 1, 2017. No interest has been recorded. 6. The balance in prepaid insurance represents payment of a $3,600 6-month premium on Septem-
ber 1, 2017. 7. The building is being depreciated using the straight-line method over 30 years. The salvage value
is $30,000.
Debit Credit
Cash $ 28,000Accounts Receivable 36,800Notes Receivable 10,000Interest Receivable –0–Inventory 36,200Prepaid Insurance 3,600Land 20,000Buildings 150,000Equipment 60,000Patents 9,000Allowance for Doubtful Accounts $ 500Accumulated Depreciation—Buildings 50,000Accumulated Depreciation—Equipment 24,000Accounts Payable 27,300Salaries and Wages Payable –0–Unearned Rent Revenue 6,000Notes Payable (due in 2018) 11,000Interest Payable –0–Notes Payable (due after 2018) 30,000Owner’s Capital 113,600Owner’s Drawings 12,000Sales Revenue 905,000Interest Revenue –0–Rent Revenue –0–Gain on Disposal of Plant Assets –0–Bad Debt Expense –0–Cost of Goods Sold 630,000Depreciation Expense –0–Insurance Expense –0–Interest Expense –0–Other Operating Expenses 61,800Amortization Expense –0–Salaries and Wages Expense 110,000
Total $1,167,400 $1,167,400

484 10 Plant Assets, Natural Resources, and Intangible Assets
COOKIE CREATIONS: AN ENTREPRENEURIAL JOURNEY(Note: This is a continuation of the Cookie Creations problem from Chapters 1 through 9.)
CC10 Natalie is also thinking of buying a van that will be used only for business. Natalie is concerned about the impact of the van’s cost on her income statement and balance sheet. She has come to you for advice on calculating the van’s depreciation.
Go to the book’s companion website, www.wiley.com/college/weygandt, to see the completion of this problem.
PERSPECTIVEFINANCIAL REPORTING AND ANALYSIS
Financial Reporting Problem: Apple Inc.BYP10-1 The fi nancial statements of Apple Inc. are presented in Appendix A. Instructions for access-ing and using the company’s complete annual report, including the notes to the fi nancial statements, are also provided in Appendix A.
InstructionsRefer to Apple’s fi nancial statements and answer the following questions.
(a) What was the total cost and book value of property, plant, and equipment at September 28, 2013?(b) What was the amount of depreciation and amortization expense for each of the three years 2011–
2013?(c) Using the statement of cash fl ows, what is the amount of capital spending in 2013 and 2012?(d) Where does the company disclose its intangible assets, and what types of intangibles did it have at
September 28, 2013?
Comparative Analysis Problem: PepsiCo, Inc. vs. The Coca-Cola CompanyBYP10-2 PepsiCo, Inc.’s fi nancial statements are presented in Appendix B. Financial statements of The Coca-Cola Company are presented in Appendix C. Instructions for accessing and using the com-plete annual reports of PepsiCo and Coca-Cola, including the notes to the fi nancial statements, are also provided in Appendices B and C, respectively.
BROADENING YOUR
CONTINUING PROBLEM
8. The equipment owned prior to this year is being depreciated using the straight-line method over 5 years. The salvage value is 10% of cost.
9. The equipment purchased on May 1, 2017, is being depreciated using the straight-line method over 5 years, with a salvage value of $1,800.
10. The patent was acquired on January 1, 2017, and has a useful life of 10 years from that date. 11. Unpaid salaries and wages at December 31, 2017, total $5,200. 12. The unearned rent revenue of $6,000 was received on December 1, 2017, for 3 months’ rent. 13. Both the short-term and long-term notes payable are dated January 1, 2017, and carry a 9% inter-
est rate. All interest is payable in the next 12 months.
Instructions(a) Prepare journal entries for the transactions listed above.(b) Prepare an updated December 31, 2017, trial balance.(c) Prepare a 2017 income statement and an owner’s equity statement.(d) Prepare a December 31, 2017, classifi ed balance sheet.
(b) Totals $1,205,040
(d) Total assets $259,200
© leungchopan/Shutterstock

Broadening Your Perspective 485
Instructions(a) Compute the asset turnover for each company for 2013.(b) What conclusions concerning the effi ciency of assets can be drawn from these data?
Comparative Analysis Problem: Amazon.com, Inc. vs. Wal-Mart Stores, Inc.BYP10-3 Amazon.com, Inc.’s fi nancial statements are presented in Appendix D. Financial statements of Wal-Mart Stores, Inc. are presented in Appendix E. Instructions for accessing and using the com-plete annual reports of Amazon and Wal-Mart, including the notes to the fi nancial statements, are also provided in Appendices D and E, respectively.
Instructions(a) Compute the asset turnover for each company for 2013.(b) What conclusions concerning the effi ciency of assets can be drawn from these data?
Real-World FocusBYP10-4 A company’s annual report identifi es the amount of its plant assets and the depreciation method used.
Address: www.annualreports.com, or go to www.wiley.com/college/weygandt
Steps1. Select a particular company.2. Search by company name.3. Follow instructions below.
InstructionsAnswer the following questions.
(a) What is the name of the company?(b) What is the Internet address of the annual report?(c) At fi scal year-end, what is the net amount of its plant assets?(d) What is the accumulated depreciation?(e) Which method of depreciation does the company use?
CRITICAL THINKING
Decision-Making Across the OrganizationBYP10-5 Pinson Company and Estes Company are two proprietorships that are similar in many respects. One difference is that Pinson Company uses the straight-line method and Estes Company uses the declining-balance method at double the straight-line rate. On January 2, 2015, both compa-nies acquired the depreciable assets shown below.
Asset Cost Salvage Value Useful Life
Buildings $360,000 $20,000 40 yearsEquipment 130,000 10,000 10 years
Including the appropriate depreciation charges, annual net income for the companies in the years 2015, 2016, and 2017 and total income for the 3 years were as follows.
2015 2016 2017 Total
Pinson Company $84,000 $88,400 $90,000 $262,400Estes Company 68,000 76,000 85,000 229,000
At December 31, 2017, the balance sheets of the two companies are similar except that Estes Company has more cash than Pinson Company. Lynda Peace is interested in buying one of the companies. She comes to you for advice.

486 10 Plant Assets, Natural Resources, and Intangible Assets
InstructionsWith the class divided into groups, answer the following.
(a) Determine the annual and total depreciation recorded by each company during the 3 years.(b) Assuming that Estes Company also uses the straight-line method of depreciation instead of the
declining-balance method as in (a), prepare comparative income data for the 3 years.(c) Which company should Lynda Peace buy? Why?
Communication ActivityBYP10-6 The following was published with the fi nancial statements to American Exploration Company.
InstructionsWrite a brief memo to your instructor discussing American Exploration Company’s note regarding property, plant, and equipment. Your memo should address what is meant by the “successful efforts method” and “units-of-activity method.”
Ethics CaseBYP10-7 Turner Container Company is suffering declining sales of its principal product, nonbio-degradeable plastic cartons. The president, Robert Griffi n, instructs his controller, Alexis Landrum, to lengthen asset lives to reduce depreciation expense. A processing line of automated plastic extruding equipment, purchased for $3.5 million in January 2017, was originally estimated to have a useful life of 8 years and a salvage value of $300,000. Depreciation has been recorded for 2 years on that basis. Robert wants the estimated life changed to 12 years total, and the straight-line method continued. Alexis is hesitant to make the change, believing it is unethical to increase net income in this manner. Robert says, “Hey, the life is only an estimate, and I’ve heard that our competition uses a 12-year life on their production equipment.”
Instructions(a) Who are the stakeholders in this situation?(b) Is the change in asset life unethical, or is it simply a good business practice by an astute president?(c) What is the effect of Robert Griffi n’s proposed change on income before taxes in the year of
change?
All About YouBYP10-8 The Feature Story at the beginning of the chapter discussed the company Rent-A-Wreck. Note that the trade name Rent-A-Wreck is a very important asset to the company, as it creates imme-diate product identifi cation. As indicated in the chapter, companies invest substantial sums to ensure that their product is well-known to the consumer. Test your knowledge of who owns some famous brands and their impact on the fi nancial statements.
Instructions(a) Provide an answer to the four multiple-choice questions below. (1) Which company owns both Taco Bell and Pizza Hut? (a) McDonald’s. (c) Yum Brands. (b) CKE. (d) Wendy’s.
AMERICAN EXPLORATION COMPANYNotes to the Financial Statements
Property, Plant, and Equipment—The Company accounts for its oil and gas exploration and production activities using the successful efforts method of accounting. Under this method, acquisition costs for proved and unproved properties are capitalized when incurred.... The costs of drilling exploratory wells are capitalized pending determination of whether each well has discovered proved reserves. If proved reserves are not discovered, such drilling costs are charged to expense.... Depletion of the cost of producing oil and gas properties is computed on the units-of-activity method.

(2) Dairy Queen belongs to: (a) Breyer. (c) GE. (b) Berkshire Hathaway. (d) The Coca-Cola Company. (3) Philip Morris, the cigarette maker, is owned by: (a) Altria. (c) Boeing. (b) GE. (d) ExxonMobil. (4) AOL, a major Internet provider, belongs to: (a) Microsoft. (c) NBC. (b) Cisco. (d) Time Warner.(b) How do you think the value of these brands is reported on the appropriate company’s balance
sheet?
FASB Codifi cation ActivityBYP10-9 If your school has a subscription to the FASB Codifi cation, go to http://aaahq.org/ascLogin.cfm to log in and prepare responses to the following.
(a) What does it mean to capitalize an item?(b) What is the defi nition provided for an intangible asset?(c) Your great-uncle, who is a CPA, is impressed that you are taking an accounting class. Based on his
experience, he believes that depreciation is something that companies do based on past practice, not on the basis of authoritative guidance. Provide the authoritative literature to support the prac-tice of fi xed-asset depreciation.
A Look at IFRS 487
A Look at IFRS
7 Compare the accounting for long-lived assets under GAAP and IFRS.
LEARNING OBJECTIVE
IFRS follows most of the same principles as GAAP in the accounting for property, plant, and equip-ment. There are, however, some signifi cant differences in the implementation. IFRS allows the use of revaluation of property, plant, and equipment, and it also requires the use of component depreciation. In addition, there are some signifi cant differences in the accounting for both intangible assets and impairments.
Key PointsThe following are the key similarities and differences between GAAP and IFRS as related to the recording process for long-lived assets.
Similarities• The defi nition for plant assets for both IFRS and GAAP is essentially the same.
• Both IFRS and GAAP follow the historical cost principle when accounting for property, plant, and equipment at date of acquisition. Cost consists of all expenditures necessary to acquire the asset and make it ready for its intended use.
• Under both IFRS and GAAP, interest costs incurred during construction are capitalized. Recently, IFRS converged to GAAP requirements in this area.
• IFRS also views depreciation as an allocation of cost over an asset’s useful life. IFRS permits the same depreciation methods (e.g., straight-line, accelerated, and units-of-activity) as GAAP.
• Under both GAAP and IFRS, changes in the depreciation method used and changes in useful life are handled in current and future periods. Prior periods are not affected. GAAP recently conformed to international standards in the accounting for changes in depreciation methods.

488 10 Plant Assets, Natural Resources, and Intangible Assets
• The accounting for subsequent expenditures (such as ordinary repairs and additions) are essentially the same under IFRS and GAAP.
• The accounting for plant asset disposals is essentially the same under IFRS and GAAP.
• Initial costs to acquire natural resources are essentially the same under IFRS and GAAP.
• The defi nition of intangible assets is essentially the same under IFRS and GAAP.
• The accounting for exchanges of nonmonetary assets has recently converged between IFRS and GAAP. GAAP now requires that gains on exchanges of nonmonetary assets be recognized if the exchange has commercial substance. This is the same framework used in IFRS.
Differences• IFRS uses the term residual value rather than salvage value to refer to an owner’s estimate of an
asset’s value at the end of its useful life for that owner.
• IFRS allows companies to revalue plant assets to fair value at the reporting date. Companies that choose to use the revaluation framework must follow revaluation procedures. If revalua-tion is used, it must be applied to all assets in a class of assets. Assets that are experiencing rapid price changes must be revalued on an annual basis, otherwise less frequent revaluation is acceptable.
• IFRS requires component depreciation. Component depreciation specifi es that any signifi cant parts of a depreciable asset that have different estimated useful lives should be separately depreci-ated. Component depreciation is allowed under GAAP but is seldom used.
• As in GAAP, under IFRS the costs associated with research and development are segregated into the two components. Costs in the research phase are always expensed under both IFRS and GAAP. Under IFRS, however, costs in the development phase are capitalized as Development Costs once technological feasibility is achieved.
• IFRS permits revaluation of intangible assets (except for goodwill). GAAP prohibits revaluation of intangible assets.
Looking to the FutureThe IASB and FASB have identifi ed a project that would consider expanded recognition of inter-nally generated intangible assets. IFRS permits more recognition of intangibles compared to GAAP.
IFRS Practice
IFRS Self-Test Questions
1. Which of the following statements is correct?(a) Both IFRS and GAAP permit revaluation of property, plant, and equipment and intangible
assets (except for goodwill).(b) IFRS permits revaluation of property, plant, and equipment and intangible assets (except for
goodwill).(c) Both IFRS and GAAP permit revaluation of property, plant, and equipment but not intangible
assets.(d) GAAP permits revaluation of property, plant, and equipment but not intangible assets.
2. Research and development costs are:(a) expensed under GAAP.(b) expensed under IFRS.(c) expensed under both GAAP and IFRS.(d) None of the above.
IFRS ExercisesIFRS10-1 What is component depreciation, and when must it be used?
IFRS10-2 What is revaluation of plant assets? When should revaluation be applied?

IFRS10-3 Some product development expenditures are recorded as development expenses and others as development costs. Explain the difference between these accounts and how a company decides which classifi cation is appropriate.
International Financial Statement Analysis: Louis Vuitton
IFRS10-4 The fi nancial statements of Louis Vuitton are presented in Appendix F. Instructions for accessing and using the company’s complete annual report, including the notes to its fi nancial state-ments, are also provided in Appendix F.
InstructionsUse the company’s annual report to answer the following questions.
(a) According to the notes to the fi nancial statements, what method or methods does the company use to depreciate “property, plant, and equipment?” What rate(s) does it use to depreciate prop-erty, plant, and equipment?
(b) Using the notes to the fi nancial statements, identify the brands and trade names that are most signifi cant to the company.
(c) Using the notes to the fi nancial statements, determine (1) the balance in Accumulated Amortiza-tion and Impairment for intangible assets (other the goodwill), and (2) the balance in Accumu-lated Depreciation for property, plant, and equipment. (Round your amounts to the nearest thousand.)
Answers to IFRS Self-Test Questions
1. b 2. a
A Look at IFRS 489

What would you do if you had a great idea for a new product
but couldn’t come up with the cash to get the business off
the ground? Small businesses often cannot attract investors.
Nor can they obtain traditional debt fi nancing through bank
loans or bond issuances. Instead, they often resort to unusual,
and costly, forms of nontraditional fi nancing.
Such was the case for Wilbert Murdock. Murdock grew up in
a New York housing project and always had great ambitions.
His entrepreneurial spirit led him into some business ventures
that failed: a medical diagnostic tool, a device to eliminate
carpal tunnel syndrome, custom-designed sneakers, and a
device to keep people from falling asleep while driving.
Another idea was computerized golf clubs that analyze a
golfer’s swing and provide immediate feedback. Murdock
saw great potential in the idea. Many golfers are willing to
shell out considerable sums of money for devices that
might improve their game. But Murdock had no cash to
develop his product, and banks and other lenders had shied
away. Rather than give up, Murdock resorted to credit
cards—in a big way. He quickly owed $25,000 to credit
card companies.
While funding a business with credit cards might sound unusual,
it isn’t. A recent study found that one-third of businesses with
fewer than 20 employees fi nanced at least part of their
operations with credit cards. As Murdock explained, credit cards
are an appealing way to fi nance a start-up because “credit-
card companies don’t care how the money is spent.” However,
they do care how they are paid. And so Murdock faced high
interest charges and a barrage of credit card collection letters.
Murdock’s debt forced him to sacrifi ce nearly everything in
order to keep his business afl oat. His car stopped running, he
barely had enough money to buy food, and he lived and
worked out of a dimly lit apartment in his mother’s basement.
Through it all he tried to maintain a positive spirit, joking that,
if he becomes successful, he might some day get to appear in
an American Express commercial.
Source: Rodney Ho, “Banking on Plastic: To Finance a Dream, Many Entrepreneurs
Binge on Credit Cards,” Wall Street Journal (March 9, 1998), p. A1.
Financing His Dreams
CHAPTER PREVIEW Inventor-entrepreneur Wilbert Murdock, as the Feature Story below notes, had to use multiple credit cards to fi nance his business ventures. Murdock’s credit card debts would be classifi ed as current liabilities because they are due every month. Yet, by making minimal payments and paying high interest each month, Murdock used this credit source long-term. Some credit card balances remain outstanding for years as they accumulate interest.
CHAPTER PREVIEW
11
FEATURE STORY
Current Liabilities and Payroll Accounting
490

Discuss how current liabilities are reported and analyzed.
Explain how to account for payroll.
2
3
Explain how to account for current liabilities.1 Current LiabilitiesDO IT! 1
• What is a current liability?• Notes payable• Sales taxes payable• Unearned revenues• Current maturities of long-term
debt
• Reporting uncertainty• Reporting of current liabilities• Analysis of current liabilities
Learning Objectives
• Determining the payroll• Recording the payroll• Employer payroll taxes• Filing and remitting payroll taxes• Internal control for payroll
Uncollectible Accounts Receivable
Go to the REVIEW AND PRACTICE section at the end of the chapter for a review of key concepts and practice applications with solutions.
Visit WileyPLUS with ORION for additional tutorials and practice opportunities.
CHAPTER OUTLINE
Cary Westfall/iStockphoto
Reporting and Analyzing2DO IT!
Payroll3a
Employer’s Payroll TaxesDO IT!
3b

492 11 Current Liabilities and Payroll Accounting
1 Explain how to account for current liabilities.LEARNING OBJECTIVE
What Is a Current Liability?
You have learned that liabilities are defi ned as “creditors’ claims on total assets” and as “existing debts and obligations.” Companies must settle or pay these claims, debts, and obligations at some time in the future by transferring assets or services. The future date on which they are due or payable (the maturity date) is a signifi cant feature of liabilities. As explained in Chapter 4, a current liability is a debt that a company expects to pay within one year or the operating cycle, whichever is longer. Debts that do not meet this criterion are long-term liabilities. Financial statement users want to know whether a company’s obligations are current or long-term. A company that has more current liabilities than current assets often lacks liquidity, or short-term debt-paying ability. In addition, users want to know the types of liabilities a company has. If a company declares bank-ruptcy, a specifi c, predetermined order of payment to creditors exists. Thus, the amount and type of liabilities are of critical importance. The different types of current liabilities include notes payable, accounts payable, unearned revenues, and accrued liabilities such as taxes, salaries and wages, and interest payable. In the sections that follow, we discuss common types of current liabilities.
Notes Payable
Companies record obligations in the form of written notes as notes payable. Notes payable are often used instead of accounts payable because they give the lender formal proof of the obligation in case legal remedies are needed to collect the debt. Companies frequently issue notes payable to meet short-term fi nancing needs. Notes payable usually require the borrower to pay interest. Notes are issued for varying periods of time. Those due for payment within one year of the balance sheet date are usually classifi ed as current liabilities. To illustrate the accounting for notes payable, assume that First National Bank agrees to lend $100,000 on September 1, 2017, if Cole Williams Co. signs a $100,000, 12%, four-month note maturing on January 1. When a company issues an interest-bearing note, the amount of assets it receives upon issuance of the note generally equals the note’s face value. Cole Williams therefore will receive $100,000 cash and will make the following journal entry.
Helpful HintIn previous chapters, we explained the entries for accounts payable and the adjusting entries for some current liabilities.
Sept. 1 Cash 100,000 Notes Payable 100,000 (To record issuance of 12%, 4-month note to First National Bank)
1100,000 1100,000
Cash Flows1100,000
A OEL5 1
Interest accrues over the life of the note, and the company must periodically record that accrual. If Cole Williams prepares fi nancial statements annually, it makes an adjusting entry at December 31 to recognize interest expense and interest payable of $4,000 ($100,000 3 12% 3 4/12). Illustration 11-1 shows the formula for computing interest and its application to Cole Williams’ note.
Face Value Annual Time in of Note 3 Interest 3 Terms of 5 Interest Rate One Year
$100,000 3 12% 3 4/12 5 $4,000
Illustration 11-1Formula for computing interest

Mar. 25 Cash 10,600 Sales Revenue 10,000 Sales Taxes Payable 600 (To record daily sales and sales taxes)
Accounting for Current Liabilities 493
Cole Williams makes an adjusting entry as follows.
In the December 31 fi nancial statements, the current liabilities section of the balance sheet will show notes payable $100,000 and interest payable $4,000. In addition, the company will report interest expense of $4,000 under “Other expenses and losses” in the income statement. If Cole Williams prepared fi nancial statements monthly, the adjusting entry at the end of each month would be $1,000 ($100,000 3 12% 3 1/12). At maturity (January 1, 2018), Cole Williams must pay the face value of the note ($100,000) plus $4,000 interest ($100,000 3 12% 3 4/12). It records payment of the note and accrued interest as follows.
Dec. 31 Interest Expense 4,000 Interest Payable 4,000 (To accrue interest for 4 months on First National Bank note)
24,000 Exp 14,000
Cash Flowsno effect
A OEL5 1
2100,000 24,0002104,000
Cash Flows2104,000
A OEL5 1
Sales Taxes Payable
Many of the products we purchase at retail stores are subject to sales taxes. Many states also are now collecting sales taxes on purchases made on the Internet as well. Sales taxes are expressed as a percentage of the sales price. The selling com-pany collects the tax from the customer when the sale occurs. Periodically (usu-ally monthly), the retailer remits the collections to the state’s department of revenue. Collecting sales taxes is important. For example, the State of New York recently sued Sprint Corporation for $300 million for its alleged failure to collect sales taxes on phone calls. Under most state sales tax laws, the selling company must enter separately in the cash register the amount of the sale and the amount of the sales tax collected. (Gasoline sales are a major exception.) The company then uses the cash register readings to credit Sales Revenue and Sales Taxes Payable. For example, if the March 25 cash register reading for Cooley Grocery shows sales of $10,000 and sales taxes of $600 (sales tax rate of 6%), the journal entry is as follows.
Jan. 1 Notes Payable 100,000 Interest Payable 4,000 Cash 104,000 (To record payment of First National Bank interest-bearing note and accrued interest at maturity)
110,600 110,000 Rev 1600
Cash Flows110,600
A OEL5 1
When the company remits the taxes to the taxing agency, it debits Sales Taxes Payable and credits Cash. The company does not report sales taxes as an expense. It simply forwards to the government the amount paid by the customers. Thus, Cooley Grocery serves only as a collection agent for the taxing authority. Sometimes companies do not enter sales taxes separately in the cash register. To determine the amount of sales in such cases, divide total receipts by 100% plus the sales tax percentage. For example, assume that Cooley Grocery enters total receipts of $10,600. The receipts from the sales are equal to the sales price (100%) plus the tax percentage (6% of sales), or 1.06 times the sales total. We can com-pute the sales amount as follows.
$10,600 4 1.06 5 $10,000
Thus, we can fi nd the sales tax amount of $600 by either (1) subtracting sales from total receipts ($10,600 2 $10,000) or (2) multiplying sales by the sales tax rate ($10,000 3 6%).

494 11 Current Liabilities and Payroll Accounting
Unearned Revenues
A magazine publisher, such as Sports Illustrated, receives customers’ checks when they order magazines. An airline company, such as American Airlines, often receives cash when it sells tickets for future fl ights. Season tickets for con-certs, sporting events, and theater programs are also paid for in advance. How do companies account for unearned revenues that are received before goods are delivered or services are performed?
1. When a company receives the advance payment, it debits Cash and credits a current liability account identifying the source of the unearned revenue.
2. When the company recognizes revenue, it debits an unearned revenue account and credits a revenue account.
To illustrate, assume that Superior University sells 10,000 season football tickets at $50 each for its fi ve-game home schedule. The university makes the following entry for the sale of season tickets.
Aug. 6 Cash 500,000 Unearned Ticket Revenue 500,000 (To record sale of 10,000 season tickets)
Sept. 7 Unearned Ticket Revenue 100,000 Ticket Revenue 100,000 (To record football ticket revenue)
1500,000 1500,000
Cash Flows1500,000
A OEL5 1
2100,000 1100,000 Rev
Cash Flowsno effect
A OEL5 1
As each game is completed, Superior records the recognition of revenue with the following entry.
The account Unearned Ticket Revenue represents unearned revenue, and Superior reports it as a current liability. As the school recognizes revenue, it reclassifi es the amount from unearned revenue to Ticket Revenue. Unearned rev-enue is material for some companies. In the airline industry, for example, tickets sold for future fl ights represent almost 50% of total current liabilities. At United Air Lines, unearned ticket revenue is its largest current liability, recently amount-ing to over $1 billion. Illustration 11-2 shows specifi c unearned revenue and revenue accounts used in selected types of businesses.
Account Title
Type of Business Unearned Revenue Revenue
Airline Unearned Ticket Revenue Ticket RevenueMagazine publisher Unearned Subscription Revenue Subscription RevenueHotel Unearned Rent Revenue Rent Revenue
Illustration 11-2Unearned revenue and revenue accounts
Current Maturities of Long-Term Debt
Companies often have a portion of long-term debt that comes due in the current year. That amount is considered a current liability. As an example, assume that Wendy Construction issues a fi ve-year, interest-bearing $25,000 note on January 1, 2016. This note specifi es that each January 1, starting January 1, 2017, Wendy should pay $5,000 of the note. When the company prepares fi nancial statements on December 31, 2016, it should report $5,000 as a current liability and $20,000 as a long-term liability. (The $5,000 amount is the portion of the note that is due to be paid within the next 12 months.) Companies often identify current maturities

Reporting and Analyzing Current Liabilities 495
of long-term debt on the balance sheet as long-term debt due within one year. In a recent year, General Motors had $724 million of such debt. It is not necessary to prepare an adjusting entry to recognize the current maturity of long-term debt. At the balance sheet date, all obligations due within one year are classifi ed as current, and all other obligations as long-term.
You and several classmates are studying for the next accounting exam. They ask you to answer the following questions.
1. If cash is borrowed on a $50,000, 6-month, 12% note on September 1, how much interest expense would be incurred by December 31?
2. How is the sales tax amount determined when the cash register total includes sales taxes?
3. If $15,000 is collected in advance on November 1 for 3 months’ rent, what amount of rent revenue should be recognized by December 31?
Solution
DO IT! 1 Current Liabilities
1. $50,000 3 12% 3 4/12 5 $2,000
2. First, divide the total cash register receipts by 100% plus the sales tax percentage to fi nd the sales revenue amount. Second, subtract the sales revenue amount from the total cash register receipts to determine the sales taxes.
3. $15,000 3 2/3 5 $10,000
Related exercise material: BE11-1, BE11-2, BE11-3, BE11-4, E11-1, E11-2, E11-3, E11-4, and DO IT! 11-1.
Action Plan✔ Use the interest
formula: Face value of note 3 Annual interest rate 3 Time in terms of one year.
✔ Divide total receipts by 100% plus the tax rate to determine sales revenue, then subtract sales revenue from the total receipts.
✔ Determine what fraction of the total unearned rent should be recognized this year.
2 Discuss how current liabilities are reported and analyzed.LEARNING OBJECTIVE
Reporting Uncertainty
With notes payable, interest payable, accounts payable, and sales taxes payable, we know that an obligation to make a payment exists. But, suppose that your company is involved in a dispute with the Internal Revenue Service (IRS) over the amount of its income tax liability. Should you report the disputed amount as a liability on the balance sheet? Or, suppose your company is involved in a lawsuit which, if you lose, might result in bankruptcy. How should you report this major contingency? The answers to these questions are diffi cult because these liabilities are dependent—contingent—upon some future event. In other words, a contingent liability is a potential liability that may become an actual liability in the future. How should companies report contingent liabilities? They use the following guidelines:
1. If the contingency is probable (if it is likely to occur) and the amount can be reasonably estimated, the liability should be recorded in the accounts.
2. If the contingency is only reasonably possible (if it could happen), then it needs to be disclosed only in the notes that accompany the financial statements.
3. If the contingency is remote (if it is unlikely to occur), it need not be recorded or disclosed.

496 11 Current Liabilities and Payroll Accounting
REPORTING A CONTINGENT LIABILITY
Product warranties are an example of a contingent liability that companies should record in the accounts. Warranty contracts result in future costs that companies may incur in replacing defective units or repairing malfunctioning units. Generally, a manufacturer, such as Stanley Black & Decker, knows that it will incur some warranty costs. From prior experience with the product, the company usually can reasonably estimate the anticipated cost of servicing (honoring) the warranty. The accounting for warranty costs is based on the expense recognition principle. The estimated cost of honoring product warranty contracts should be rec-ognized as an expense in the period in which the sale occurs. To illustrate, assume that in 2017 Denson Manufacturing Company sells 10,000 washers and dryers at an average price of $600 each. The selling price includes a one-year warranty on parts. Denson expects that 500 units (5%) will be defective and that warranty repair costs will average $80 per unit. In 2017, the company honors war-ranty contracts on 300 units, at a total cost of $24,000. At December 31, it is necessary to accrue the estimated warranty costs on the 2017 sales. Denson computes the estimated warranty liability as follows.
Contingencies: How Big Are They?
Contingent liabilities abound in the real world. Consider Manville Corp., which fi led for bankruptcy when it was hit by billions of dollars in asbestos product-liability claims. Com-panies having multiple toxic waste sites are faced with cleanup costs that average $10 to $30 million and can reach as high as $500 million depend-ing on the type of waste. For
life and health insurance companies and their stockhold-ers, the cost of diseases such as diabetes, Alzheimer’s, and AIDS is like an iceberg: Everyone wonders how big such costs really are and what damage they might do in the future. And frequent-fl yer programs are so popular that airlines at one time owed participants more than 3 million round-trip domestic tickets. That’s enough to fl y at least 5.4 billion miles—free for the passengers, but at what future cost to the airlines?
Why do you think most companies disclose, but do not record, contingent liabilities? (Go to WileyPLUS for this answer and additional questions.)
Jeff rey Layton/iStockphoto
Manville Corp.Accounting Across the Organization
Number of units sold 10,000Estimated rate of defective units 3 5%
Total estimated defective units 500 Average warranty repair cost 3 $80
Estimated warranty liability $40,000
Illustration 11-3Computation of estimated warranty liability
The company makes the following adjusting entry.
Dec. 31 Warranty Expense 40,000 Warranty Liability 40,000 (To accrue estimated warranty costs)
Jan. 1– Warranty Liability 24,000Dec. 31 Repair Parts 24,000 (To record honoring of 300 warranty contracts on 2017 sales)
240,000 Exp 140,000
Cash Flowsno effect
A OEL5 1
224,000224,000
Cash Flowsno effect
A OEL5 1
Denson records those repair costs incurred in 2017 to honor warranty contracts on 2017 sales as shown below.

Reporting and Analyzing Current Liabilities 497
The company reports warranty expense of $40,000 under selling expenses in the income statement. It classifi es warranty liability of $16,000 ($40,000 2 $24,000) as a current liability on the balance sheet, assuming the warranty is estimated to be honored in the next year. In the following year, Denson should debit to Warranty Liability all expenses incurred in honoring warranty contracts on 2017 sales. To illustrate, assume that the company replaces 20 defective units in January 2018, at an average cost of $80 in parts and labor. The summary entry for the month of January 2018 is as follows.
Jan. 31 Warranty Liability 1,600 Repair Parts 1,600 (To record honoring of 20 warranty contracts on 2017 sales)
21,60021,600
Cash Flowsno effect
A OEL5 1
Reporting of Current Liabilities
Current liabilities are the fi rst category under liabilities on the balance sheet. Each of the principal types of current liabilities is listed separately. In addition, companies disclose the terms of notes payable and other key information about the individual items in the notes to the fi nancial statements. Companies seldom list current liabilities in the order of liquidity. The reason is that varying maturity dates may exist for specifi c obligations such as notes payable. As a matter of custom, many companies show notes payable fi rst and then accounts payable, regardless of amount. The current maturity of long-term debt is often shown last in the current liabilities section. Illustration 11-4 pro-vides an excerpt from Evan Company’s balance sheet, which is a common order of presentation among companies.
Helpful HintFor examples of real-world current liabilities sections, refer to the PepsiCo and Coca-Cola balance sheets in Appendices B and C.
EVAN COMPANYBalance Sheet
December 31, 2017
Assets
Current assets $ 500,000Property, plant and equipment (net) 150,000Other long-term assets 520,000
Total assets $1,170,000
Liabilities and Owner’s Equity
Current liabilities Notes payable $ 40,000 Accounts payable 110,000 Unearned revenue 30,000 Salaries and wages payable 90,000 Warranty liability 25,000 Current maturities of long-term debt 65,000
Total current liabilities 360,000
Noncurrent liabilities 620,000
Total liabilities 980,000
Owner’s equity 190,000
Total liabilities and owner’s equity $1,170,000
Illustration 11-4Balance sheet reporting of current liabilities
Analysis of Current Liabilities
Use of current and noncurrent classifi cations makes it possible to analyze a com-pany’s liquidity. Liquidity refers to the ability to pay maturing obligations and

498 11 Current Liabilities and Payroll Accounting
meet unexpected needs for cash. The relationship of current assets to current liabilities is critical in analyzing liquidity. We can express this relationship as a dollar amount (working capital) and as a ratio (the current ratio). The excess of current assets over current liabilities is working capital. Illustration 11-5 shows the formula for the computation of Evan Company’s working capital.
Current Current Working Assets 2 Liabilities 5 Capital
$500,000 2 $360,000 5 $140,000
Illustration 11-5Working capital formula and computation
As an absolute dollar amount, working capital offers limited informational value. For example, $1 million of working capital may be more than needed for a small company but inadequate for a large corporation. Also, $1 million of working capital may be adequate for a company at one time but inadequate at another time. The current ratio permits us to compare the liquidity of different-sized com-panies and of a single company at different times. The current ratio is calculated as current assets divided by current liabilities. Illustration 11-6 shows the for-mula for this ratio, along with its computation using Evan’s current asset and current liability data.
Current Current Current Assets 4 Liabilities 5 Ratio
$500,000 4 $360,000 5 1.39:1
Illustration 11-6Current ratio formula and computation
Historically, companies and analysts considered a current ratio of 2:1 to be the standard for a good credit rating. In recent years, however, many healthy compa-nies have maintained ratios well below 2:1 by improving management of their current assets and liabilities. Evan’s ratio of 1.39:1 is adequate but certainly below the standard of 2:1.
Lepid Company has the following account balances at December 31, 2017.
Notes payable ($80,000 due after 12/31/18) $200,000Unearned service revenue 75,000Other long-term debt ($30,000 due in 2018) 150,000Salaries and wages payable 22,000Other accrued expenses 15,000Accounts payable 100,000
In addition, Lepid is involved in a lawsuit. Legal counsel feels it is probable Lepid will pay damages of $38,000 in 2018.
(a) Prepare the current liabilities section of Lepid’s December 31, 2017, balance sheet.
(b) Lepid’s current assets are $504,000. Compute Lepid’s working capital and current ratio.
DO IT! 2 Reporting and Analyzing
Action Plan✔ Determine which
liabilities will be paid within one year or the operating cycle and include those as current liabilities.

Accounting for Payroll 499
(a) Current liabilities Notes payable $120,000 Accounts payable 100,000 Unearned service revenue 75,000 Lawsuit liability 38,000 Salaries and wages payable 22,000 Other accrued expenses 15,000 Long-term debt due within one year 30,000
Total current liabilities $400,000
(b) Working capital 5 Current assets 2 Current liabilities 5 $504,000 2 $400,000 5 $104,000Current ratio 5 Current assets 4 Current liabilities 5 $504,000 4 $400,000 5 1.26:1
Solution
Related exercise material: BE11-5, E11-7, E11-8, and DO IT! 11-2.
Action Plan (cont’d)✔ If the contingent
liability is probable and reasonably estimable, include it as a current liability.
✔ Use the formula for working capital: Current assets 2 Current liabilities.
✔ Use the formula for the current ratio: Current assets 4 Current liabilities.
3 Explain how to account for payroll.LEARNING OBJECTIVE
Payroll and related fringe benefi ts often make up a large percentage of current liabilities. Employee compensation is often the most signifi cant expense that a company incurs. For example, Costco recently reported total employees of 103,000 and labor and fringe benefi ts costs which approximated 70% of the com-pany’s total cost of operations. Payroll accounting involves more than paying employees’ wages. Companies are required by law to maintain payroll records for each employee, to fi le and pay payroll taxes, and to comply with state and federal tax laws related to employee compensation. The term “payroll” pertains to both salaries and wages of employees. Managerial, administrative, and sales personnel are generally paid salaries. Salaries are often expressed in terms of a specifi ed amount per month or per year rather than an hourly rate. Store clerks, factory employees, and manual laborers are normally paid wages. Wages are based on a rate per hour or on a piecework basis (such as per unit of product). Frequently, people use the terms “salaries” and “wages” interchangeably. The term “payroll” does not apply to payments made for services of pro-fessionals such as certifi ed public accountants, attorneys, and architects. Such professionals are independent contractors rather than salaried employees. Pay-ments to them are called fees. This distinction is important because government regulations relating to the payment and reporting of payroll taxes apply only to employees.
Determining the Payroll
Determining the payroll involves computing three amounts: (1) gross earnings, (2) payroll deductions, and (3) net pay.
GROSS EARNINGS
Gross earnings is the total compensation earned by an employee. It consists of wages or salaries, plus any bonuses and commissions. Companies determine total wages for an employee by multiplying the hours worked by the hourly rate of pay. In addition to the hourly pay rate, most compa-nies are required by law to pay hourly workers a minimum of 1½ times the regular hourly rate for overtime work in excess of eight hours per day or 40 hours per

500 11 Current Liabilities and Payroll Accounting
week. In addition, many employers pay overtime rates for work done at night, on weekends, and on holidays. For example, assume that Michael Jordan, an employee of Academy Company, worked 44 hours for the weekly pay period ending January 14. His regular wage is $12 per hour. For any hours in excess of 40, the company pays at one-and-a-half times the regular rate. Academy computes Jordan’s gross earnings (total wages) as follows.
Type of Pay Hours 3 Rate 5 Gross Earnings
Regular 40 3 $12 5 $ 480 Overtime 4 3 18 5 72
Total wages $552
Illustration 11-7Computation of total wages
This computation assumes that Jordan receives 1½ times his regular hourly rate ($12 3 1.5) for his overtime hours. Union contracts often require that overtime rates be as much as twice the regular rates. An employee’s salary is generally based on a monthly or yearly rate. The com-pany then prorates these rates to its payroll periods (e.g., biweekly or monthly). Most executive and administrative positions are salaried. Federal law does not require overtime pay for employees in such positions. Many companies have bonus agreements for employees. One survey found that over 94% of the largest U.S. manufacturing companies offer annual bonuses to key executives. Bonus arrangements may be based on such factors as increased sales or net income. Companies may pay bonuses in cash and/or by granting employees the opportunity to acquire shares of company stock at favorable prices (called stock option plans).
PAYROLL DEDUCTIONS
As anyone who has received a paycheck knows, gross earnings are usually very different from the amount actually received. The difference is due to payroll deductions. Payroll deductions may be mandatory or voluntary. Mandatory deductions are required by law and consist of FICA taxes and income taxes. Voluntary deductions are at the option of the employee. Illustration 11-8 summarizes common types of payroll deductions. Such deductions do not result in payroll tax expense to the employer. The employer is merely a collection agent, and subsequently transfers the deducted amounts to the government and designated recipients.
ETHICS NOTE
Bonuses often reward outstanding individual performance, but successful corporations also need considerable teamwork. A challenge is to motivate individuals while preventing an unethical employee from taking another’s idea for his or her own advantage.
Gross Pay Net PayPayroll Deductions
State and City Income Taxes
CharityFederal Income Tax
FICA Taxes
Insurance, Pensions, and/or Union dues
Insurance
Policy XYZ UnionMember
Illustration 11-8Payroll deductions

Accounting for Payroll 501
FICA TAXES In 1937, Congress enacted the Federal Insurance Contribution Act (FICA). FICA taxes are designed to provide workers with supplemental retirement, employment disability, and medical benefi ts. In 1965, Congress extended benefi ts to include Medicare for individuals over 65 years of age. The benefi ts are fi nanced by a tax levied on employees’ earnings. FICA taxes consist of a Social Security tax and a Medicare tax. They are paid by both employee and employer. The FICA tax rate is 7.65% (6.2% Social Security tax up to $117,000 plus 1.45% Medicare tax) of salary and wages for each employee.1 In addi-tion, the Medicare tax of 1.45% continues for an employee’s salary and wages in excess of $117,000. These tax rate and tax base requirements are shown in Illustration 11-9.
To illustrate the computation of FICA taxes, assume that Mario Ruez has total wages for the year of $100,000. In this case, Mario pays FICA taxes of $7,650 ($100,000 3 7.65%). If Mario has total wages of $124,000, Mario pays FICA taxes of $9,052, as shown in Illustration 11-10.
Social Security taxes
Employee and employer 6.2% on salary and wages up to $117,000
Medicare taxes
Employee and employer 1.45% on all salary and wages without limitation
Illustration 11-9FICA tax rate and tax base
Mario’s employer is also required to pay $9,052.
INCOME TAXES Under the U.S. pay-as-you-go system of federal income taxes, employers are required to withhold income taxes from employees each pay period. Four variables determine the amount to be withheld: (1) the employee’s gross earnings, (2) marital status, (3) the number of allowances claimed by the employee, and (4) the length of the pay period. The number of allowances claimed typically includes the employee, his or her spouse, and other dependents. Withholding tables furnished by the Internal Revenue Service indicate the amount of income tax to be withheld. Withholding amounts are based on gross wages and the number of allowances claimed. Separate tables are provided for weekly, biweekly, semimonthly, and monthly pay periods. Illustration 11-11 (page 502) shows the withholding tax table for Michael Jordan (assuming he earns $552 per week, is married, and claims two allowances). For a weekly salary of $552 with two allowances, the income tax to be withheld is $24 (highlighted in red). In addition, most states (and some cities) require employers to withhold income taxes from employees’ earnings. As a rule, the amounts withheld are a percentage (specifi ed in the state revenue code) of the amount withheld for the federal income tax. Or they may be a specifi ed percentage of the employee’s earn-ings. For the sake of simplicity, we have assumed that Jordan’s wages are subject to state income taxes of 2%, or $11.04 (2% 3 $552) per week. There is no limit on the amount of gross earnings subject to income tax with-holdings. In fact, under our progressive system of taxation, the higher the earn-ings, the higher the percentage of income withheld for taxes.
OTHER DEDUCTIONS Employees may voluntarily authorize withholdings for charitable organizations, retirement, and other purposes. All voluntary deductions
Social Security tax ($117,000 3 6.2%) $ 7,254Medicare tax ($124,000 3 1.45%) 1,798
Total FICA taxes $9,052
Illustration 11-10FICA tax computation
1The $117,000 limit is based upon 2014 guidelines set by the Social Security Administration.000 limit is based upon 2014 guidelines set by the Social Security Administration.

502 11 Current Liabilities and Payroll Accounting
from gross earnings should be authorized in writing by the employee. The autho-rization(s) may be made individually or as part of a group plan. Deductions for charitable organizations, such as the United Fund, or for fi nancial arrangements, such as U.S. savings bonds and repayment of loans from company credit unions, are made individually. Deductions for union dues, health and life insurance, and pension plans are often made on a group basis. We assume that Jordan has weekly voluntary deductions of $10 for the United Fund and $5 for union dues.
NET PAY
Academy Company determines net pay by subtracting payroll deductions from gross earnings. Illustration 11-12 shows the computation of Jordan’s net pay for the pay period.
Alternative TerminologyNet pay is also called take-home pay.
MARRIED Persons –– WEEKLY Payroll Period(For Wages Paid through December 2017)
If the wages are —
At least But lessthan
And the number of withholding allowances claimed is —
The amount of income tax to be withheld is —
0 1 2 3 4 5 6 7 8 9 10
00000
00000
00000
00000
00000
00000
00000
00000
00000
00000
00000
00000
00000
00000
00000
00000
00000
00000
00123
45678
00000
12345
6789
10
1112131415
45678
910111213
1415161718
1920212223
1112131415
1617181920
2122232425
2627282930
1920212223
2425262728
2930313233
3435373840
2728293031
3233343536
3839414244
4547485051
3435373840
4143444647
4950525355
5658596162
510520530540550
560570580590600
610620630640650
660670680690700
500510520530540
550560570580590
600610620630640
650660670680690
Illustration 11-11Withholding tax table
Gross earnings $ 552.00Payroll deductions: FICA taxes $42.23 Federal income taxes 24.00 State income taxes 11.04 United Fund 10.00 Union dues 5.00 92.27
Net pay $459.73
Illustration 11-12Computation of net pay
Assuming that Michael Jordan’s wages for each week during the year are $552, total wages for the year are $28,704 (52 3 $552). Thus, all of Jordan’s wages are subject to FICA tax during the year. In comparison, let’s assume that Jordan’s department head earns $3,000 per week, or $156,000 for the year. Since only the fi rst $117,000 is subject to Social Security taxes, the maximum FICA withholdings on the department head’s earnings would be $9,516 [($117,000 3 6.20%) 1 ($156,000 3 1.45%)].

Accounting for Payroll 503
Recording the Payroll
Recording the payroll involves maintaining payroll department records, recog-nizing payroll expenses and liabilities, and recording payment of the payroll.
MAINTAINING PAYROLL DEPARTMENT RECORDS
To comply with state and federal laws, an employer must keep a cumulative record of each employee’s gross earnings, deductions, and net pay during the year. The record that provides this information is the employee earnings record. Illustration 11-13 shows Michael Jordan’s employee earnings record.
Companies keep a separate earnings record for each employee and update these records after each pay period. The employer uses the cumulative payroll data on the earnings record to (1) determine when an employee has earned the maximum earn-ings subject to FICA taxes, (2) fi le state and federal payroll tax returns (as explained later), and (3) provide each employee with a statement of gross earnings and tax withholdings for the year. Illustration 11-17 (page 509) shows this statement. In addition to employee earnings records, many companies fi nd it useful to prepare a payroll register. This record accumulates the gross earnings, deduc-tions, and net pay by employee for each pay period. Illustration 11-14 (page 504) presents Academy Company’s payroll register. It provides the documentation for preparing a paycheck for each employee. For example, it shows the data for Michael Jordan in the wages section. In this example, Academy’s total weekly payroll is $17,210, as shown in the salaries and wages expense column (column N, row 31). Note that this record is a listing of each employee’s payroll data for the pay period. In some companies, a payroll register is a journal or book of original entry. Postings are made from it directly to ledger accounts. In other companies, the payroll register is a memorandum record that provides the data for a general journal entry and subsequent posting to the ledger accounts. Academy follows the latter procedure.
Formulas Data Review ViewPage LayoutInsert
AP18 fx
E F G
Academy Company.xls
B C D H I J NMLK
Home
123
4
5
6
7
8
9
10
11
12
13
14
15
16
17
19
20
18
ACADEMY COMPANYEmployee Earnings Record
For the Year 2017
Social Security Number
Michael Jordan
329-35-9547
December 24, 1994
September 1, 2015
Male
x
Address 2345 Mifflin Ave.
Hampton, Michigan 48292
555-238-9051
2
Married
198.00
36.00
54.0036.00
72.00
162.02
39.47
40.8539.47
42.23
86.00
20.00
22.0020.00
24.00
42.36
10.32
10.6810.32
11.04
40.00
10.00
10.0010.00
10.00
20.00
5.00
5.005.00
5.00
350.38
84.79
88.5384.79
92.27
1,767.62
431.21
445.47431.21
459.73974
10771133
1028
2,118.00
516.00
534.00516.00
552.00516.00
1,602.002,118.00
1,068.001/71/141/211/28Jan. Total
2017PeriodEnding
Gross Earnings Deductions
NetAmount
42444342
TotalHours
1,920.00
480.00
480.00480.00
480.00
Regular Overtime Total Cumulative FICAFed.
Inc. TaxState
Inc. TaxUnitedFund
UnionDues Total
CheckNo.
Payment
Single
Telephone
ExemptionsSex
Date Employed
Date of Birth
Name
Date Employment Ended
Illustration 11-13Employee earnings record

504 11 Current Liabilities and Payroll Accounting
RECOGNIZING PAYROLL EXPENSES AND LIABILITIES
From the payroll register in Illustration 11-14, Academy Company makes a journal entry to record the payroll. For the week ending January 14, the entry is as follows.
Illustration 11-14Payroll register
Formulas Data Review ViewPage LayoutInsert
AP18 fx
E
Academy Company.xls
F GB C D H I J NMLK
Home
7
8
9
10
11
21
22
23
29
30
31
32
321
4
5
6
ACADEMY COMPANYPayroll Register
For the Week Ending January 14, 2017
40
40
40
42
44
43
580.00
590.00
530.00
480.00
480.00
480.00
16,200.00
580.00
590.00
530.00
516.00
552.00
534.00
17,210.00
580.00
590.00
530.00
516.00
552.00
534.00
17,210.00
44.37
45.14
40.55
39.47
42.23
40.85
1,316.57
61.00
63.00
54.00
35.00
24.00
46.00
3,490.00
11.60
11.80
10.60
10.32
11.04
10.68
344.20
15.00
20.00
11.00
18.00
10.00
10.00
421.50
131.97
139.94
116.15
107.79
92.27
112.53
5,687.27
448.03
450.06
413.85
408.21
459.73
421.47
11,522.73
998
999
1000
1025
1028
1029
5.00
5.00
5.00
115.00
36.00
72.00
54.00
1,010.00
Arnold, Patricia
Canton, Matthew
Mueller, William
Bennett, Robin
Jordan, Michael
Milroy, Lee
Total
Employee
Earnings Deductions
Net PayTotalHours Regular
Over-time Gross FICA
FederalIncome
Tax
StateIncome
TaxUnitedFund
UnionDues Total
CheckNo.
Paid
Salaries andWages
Expense
Account Debited
Jan. 14 Salaries and Wages Expense 17,210.00 FICA Taxes Payable 1,316.57 Federal Income Taxes Payable 3,490.00 State Income Taxes Payable 344.20 United Fund Payable 421.50 Union Dues Payable 115.00 Salaries and Wages Payable 11,522.73 (To record payroll for the week ending January 14)
The company credits specifi c liability accounts for the mandatory and volun-tary deductions made during the pay period. In the example, Academy debits Salaries and Wages Expense for the gross earnings of its employees. The amount credited to Salaries and Wages Payable is the sum of the individual checks the employees will receive.
RECORDING PAYMENT OF THE PAYROLL
A company makes payments by check (or electronic funds transfer) either from its regular bank account or a payroll bank account. Each paycheck is usually accompanied by a detachable statement of earnings document. This shows the employee’s gross earnings, payroll deductions, and net pay, both for the period and for the year-to-date. Academy Company uses its regular bank account for payroll checks. Illustration 11-15 shows the paycheck and statement of earnings for Michael Jordan.
217,210.00 Exp 11,316.57 13,490.00 1344.20 1421.50 1115.00 111,522.73
Cash Flowsno effect
A OEL5 1

Accounting for Payroll 505
Following payment of the payroll, the company enters the check numbers in the payroll register. Academy records payment of the payroll as follows.
Illustration 11-15Paycheck and statement of earningsAC ACADEMY COMPANY
19 Center St.Hampton, MI 48291
Pay to theorder of
No. 1028
20
$
Dollars
City Bank & TrustP.O. Box 3000Hampton, MI 48291
For
62—1113
610
DETACH AND RETAIN THIS PORTION FOR YOUR RECORDS
NAME SOC. SEC. NO. EMPL. NUMBER NO. EXEMP PAY PERIOD ENDING
OTH. EARNINGS (2) GROSS
NET PAY
OTH. EARNINGS (1)REG. EARNINGSOTH. HRS. (2)OTH. HRS. (1)O.T. HRS.REG. HRS. O.T. EARNINGS
LOCAL TAXSTATE TAXFICAFED. W/H TAX OTHER DEDUCTIONS(1) (2) (3) (4)
Michael Jordan 329-35-9547 2 1/14/17
480.00 72.00440
42.2324.00 11.04 10.00 5.00
$552.00
459.73
NET PAYLOCAL TAXSTATE TAXFICAFED. W/H TAX OTHER DEDUCTIONS(1) (2) (3) (4)
81.7044.00 21.36 20.00 10.00 $890.94
YEAR TO DATE
Helpful HintNone of the income tax liabilities result in payroll tax expense for the employer because the employer is acting only as a collection agent for the government.
Many medium- and large-size companies use a payroll processing center that performs payroll recordkeeping services. Companies send the center payroll infor-mation about employee pay rates and hours worked. The center maintains the pay-roll records and prepares the payroll checks. In most cases, it costs less to process the payroll through the center (outsource) than if the company did so internally.
Jan. 14 Salaries and Wages Payable 11,522.73 Cash 11,522.73 (To record payment of payroll)
211,522.73211,522.73
Cash Flows211,522.73
A OEL5 1
In January, gross earnings in Ramirez Company were $40,000. All earnings are subject to 7.65% FICA taxes. Federal income tax withheld was $9,000, and state income tax with-held was $1,000. (a) Calculate net pay for January, and (b) record the payroll.
DO IT! 3a Payroll
(a) Net pay: $40,000 2 (7.65% 3 $40,000) 2 $9,000 2 $1,000 5 $26,940
(b) Salaries and Wages Expense 40,000 FICA Taxes Payable 3,060 Federal Income Taxes Payable 9,000 State Income Taxes Payable 1,000 Salaries and Wages Payable 26,940 (To record payroll)
Related exercise material: BE11-7, BE11-8, E11-9, E11-10, E11-11, E11-12, and DO IT! 11-3a.
Action Plan✔ Determine net pay by
subtracting payroll deductions from gross earnings.
✔ Record gross earnings as Salaries and Wages Expense, record payroll deductions as liabilities, and record net pay as Salaries and Wages Payable.
Solution

506 11 Current Liabilities and Payroll Accounting
Employer Payroll Taxes
Payroll tax expense for businesses results from three taxes that governmental agencies levy on employers. These taxes are (1) FICA, (2) federal unemployment tax, and (3) state unemployment tax. These taxes plus such items as paid vaca-tions and pensions (discussed in the appendix to this chapter) are collectively referred to as fringe benefi ts. As indicated earlier, the cost of fringe benefi ts in many companies is substantial.
FICA TAXES
Each employee must pay FICA taxes. In addition, employers must match each employee’s FICA contribution. This means the employer must remit to the federal government 12.4% of each employee’s fi rst $117,000 of taxable earnings, plus 2.9% of each employee’s earnings, regardless of amount. The matching contribu-tion results in payroll tax expense to the employer. The employer’s tax is subject to the same rate and maximum earnings as the employee’s. The company uses the same account, FICA Taxes Payable, to record both the employee’s and the em-ployer’s FICA contributions. For the January 14 payroll, Academy Company’s FICA tax contribution is $1,316.57 ($17,210.00 3 7.65%).
FEDERAL UNEMPLOYMENT TAXES
The Federal Unemployment Tax Act (FUTA) is another feature of the federal Social Security program. Federal unemployment taxes provide benefi ts for a limited period of time to employees who lose their jobs through no fault of their own. The FUTA tax rate is currently 6.2% of taxable wages. The taxable wage base is the fi rst $7,000 of wages paid to each employee in a calendar year. Employers who pay the state unemployment tax on a timely basis will receive an offset credit of up to 5.4%. Therefore, the net federal tax rate is generally 0.8% (6.2% 2 5.4%). This rate would equate to a maximum of $56 of federal tax per employee per year (0.8% 3 $7,000). State tax rates are based on state law. The employer bears the entire federal unemployment tax. There is no deduc-tion or withholding from employees. Companies use the account Federal Unem-ployment Taxes Payable to recognize this liability. The federal unemployment tax for Academy Company for the January 14 payroll is $137.68 ($17,210.00 3 0.8%).
STATE UNEMPLOYMENT TAXES
All states have unemployment compensation programs under state unemploy-ment tax acts (SUTA). Like federal unemployment taxes, state unemployment taxes provide benefi ts to employees who lose their jobs. These taxes are levied on employers.2 The basic rate is usually 5.4% on the fi rst $7,000 of wages paid to an employee during the year. The state adjusts the basic rate according to the employer’s experience rating. Companies with a history of stable employment may pay less than 5.4%. Companies with a history of unstable employment may pay more than the basic rate. Regardless of the rate paid, the company’s credit on the federal unemployment tax is still 5.4%. Companies use the account State Unemployment Taxes Payable for this lia-bility. The state unemployment tax for Academy Company for the January 14 payroll is $929.34 ($17,210.00 3 5.4%). Illustration 11-16 summarizes the types of employer payroll taxes.
RECORDING EMPLOYER PAYROLL TAXES
Companies usually record employer payroll taxes at the same time they record the payroll. The entire amount of gross pay ($17,210.00) shown in the payroll register in Illustration 11-14 is subject to each of the three taxes mentioned above.
Helpful HintBoth the employer and employee pay FICA taxes. Federal unemployment taxes and (in most states) the state unemployment taxes are borne entirely by the employer.
2In a few states, the employee is also required to make a contribution. In this textbook, including the homework, we will assume that the tax is only on the employer.

Accounting for Payroll 507
Accordingly, Academy records the payroll tax expense associated with the January 14 payroll with the following entry.
Illustration 11-16Employer payroll taxes
Federal Unemployment Taxes
FICA Taxes
State Unemployment Taxes
ComputationBased
on Wages
Note that Academy uses separate liability accounts instead of a single credit to Payroll Taxes Payable. Why? Because these liabilities are payable to different tax-ing authorities at different dates. Companies classify the liability accounts in the balance sheet as current liabilities since they will be paid within the next year. They classify Payroll Tax Expense on the income statement as an operating expense.
Jan. 14 Payroll Tax Expense 2,383.59 FICA Taxes Payable 1,316.57 Federal Unemployment Taxes Payable 137.68 State Unemployment Taxes Payable 929.34 (To record employer’s payroll taxes on
January 14 payroll)
22,383.59 Exp 11,316.57 1137.68 1929.34
Cash Flowsno effect
A OEL5 1
It Costs $74,000 to Put $44,000 in Sally’s Pocket
Sally works for Bogan Commu-nications, a small company in New Jersey that provides audio systems. She makes $59,000 a year but only nets $44,000. What happened to the other $15,000? Well, $2,376 goes for Sally’s share of the medical and dental insurance that Bogan
provides, $126 for state unemployment insurance, $149 for disability insurance, and $856 for Medicare. New Jersey takes $1,893 in income taxes, and the federal government gets $3,658 for Social Security and another $6,250 for income tax withholding. All of this adds up to some 22% of Sally’s gross pay going to Washington or Trenton.
Employing Sally costs Bogan plenty too. Bogan has to write checks for $74,000 so Sally can receive her $59,000 in base pay. Health insurance is the biggest cost. While Sally pays nearly $2,400 for coverage, Bogan pays the rest—$9,561. Then, the federal and state governments take $56 for federal unemployment coverage, $149 for disability insurance, $300 for workers’ comp, and $505 for state unemployment insurance. Finally, the government requires Bogan to pay $856 for Sally’s Medicare and $3,658 for her Social Security.
When you add it all up, it costs $74,000 to put $44,000 in Sally’s pocket and to give her $12,000 in benefi ts.
Source: Michael P. Fleischer, “Why I’m Not Hiring,” Wall Street Journal (August 9, 2010), p. A17.
How are the Social Security and Medicare taxes computed for Sally’s salary? (Go to WileyPLUS for this answer and additional questions.)
© svetikd/iStockphoto
Bogan CommunicationsAccounting Across the Organization

508 11 Current Liabilities and Payroll Accounting
Filing and Remitting Payroll Taxes
Preparation of payroll tax returns is the responsibility of the payroll department. The treasurer’s department makes the tax payment. Much of the information for the returns is obtained from employee earnings records. For purposes of reporting and remitting to the IRS, the company combines the FICA taxes and federal income taxes that it withheld. Companies must report the taxes quarterly, no later than one month following the close of each quarter. The remitting requirements depend on the amount of taxes withheld and the length of the pay period. Companies remit funds through deposits in either a Federal Reserve bank or an authorized commercial bank. Companies generally fi le and remit federal unemployment taxes annually on or before January 31 of the subsequent year. Earlier payments are required when the tax exceeds a specifi ed amount. Companies usually must fi le and pay state unemployment taxes by the end of the month following each quarter. When payroll taxes are paid, companies debit payroll liability accounts, and credit Cash.
ANATOMY OF A FRAUD
Art was a custodial supervisor for a large school district. The district was supposed to employ between 35 and 40 regular custodians, as well as 3 or 4 substitute custodians to fi ll in when regular custodians were absent. Instead, in addition to the regular cus-todians, Art “hired” 77 substitutes. In fact, almost none of these people worked for the district. Instead, Art submitted time cards for these people, collected their checks at the district offi ce, and personally distributed the checks to the “employees.” If a substitute’s check was for $1,200, that person would cash the check, keep $200, and pay Art $1,000.
Total take: $150,000
THE MISSING CONTROLSHuman resource controls. Thorough background checks should be performed. No employees should begin work until they have been approved by the Board of Educa-tion and entered into the payroll system. No employees should be entered into the payroll system until they have been approved by a supervisor. All paychecks should be distributed directly to employees at the offi cial school locations by designated employees.
Independent internal verifi cation. Budgets should be reviewed monthly to identify situations where actual costs signifi cantly exceed budgeted amounts.
Source: Adapted from Wells, Fraud Casebook (2007), pp. 164–171.
Employers also must provide each employee with a Wage and Tax Statement (Form W-2) by January 31 following the end of a calendar year. This statement shows gross earnings, FICA taxes withheld, and income taxes withheld for the year. The required W-2 form for Michael Jordan, using assumed annual data, is shown in Illustration 11-17. The employer must send a copy of each employee’s Wage and Tax Statement (Form W-2) to the Social Security Administration. This agency subsequently furnishes the Internal Revenue Service with the income data required.
Internal Control for Payroll
Chapter 8 introduced internal control. As applied to payrolls, the objectives of internal control are (1) to safeguard company assets against unauthorized pay-ments of payrolls, and (2) to ensure the accuracy and reliability of the accounting records pertaining to payrolls. Irregularities often result if internal control is lax. Frauds involving pay-roll include overstating hours, using unauthorized pay rates, adding fi ctitious employees to the payroll, continuing terminated employees on the payroll, and

Accounting for Payroll 509
distributing duplicate payroll checks. Moreover, inaccurate records will result in incorrect paychecks, fi nancial statements, and payroll tax returns. Payroll activities involve four functions: hiring employees, timekeeping, pre-paring the payroll, and paying the payroll. For effective internal control, compa-nies should assign these four functions to different departments or individuals. Illustration 11-18 highlights these functions and illustrates their internal control features.
Illustration 11-17W-2 form
For Privacy Act and Paperwork Reduction
Act Notice, see back of Copy D.
1
Employee’s social security number
Retirementplan
Third-partysick pay
Statutoryemployee
6
2
Employer’s name, address, and ZIP code
Allocated tips7
Advance EIC payment
8
109
Wages, tips, other compensation Federal income tax withheld
Social security tax withheldSocial security wages
12a11
Employer’s state ID number
43
Employer identification number (EIN)
Medicare wages and tips
Social security tips
13
5
Control number
snalp deifilauqnoNlaitini dna eman tsrif s’eeyolpmE
Medicare tax withheld
15
14
1716
Other
18
Employee’s address and ZIP code
State income taxState State wages, tips, etc. Locality name
Copy A For Social Security Administration — Send this entire page withForm W-3 to the Social Security Administration; photocopies are not acceptable.
Department of the Treasury—Internal Revenue Service
Form
Dependent care benefits
See instructions for box 12
Cat. No. 10134D
a
b
c
d
e
f
Void329-35-9547
36-2167852
Michael
423-1466-3 26,300.00
26,300.00
26,300.00
2,248.00
1,630.60
381.3526,300.00
526.00MI
2345 Mifflin Ave.Hampton, MI 48292
Jordan
Academy Company19 Center St.Hampton, MI 48291
W-2 Wage and TaxStatement 2
22222
10 7
OMB No. 1545-0008
For Official Use Only
Last nameCode
12bCode
12cCode
19Local wages, tips, etc. 20Local income tax
12dCode
Suff.
Payroll Function
Paying the Payroll
Preparing the Payroll
Timekeeping
Hiring Employees
Human Resources
Fraud prevented:Fictitious employeesare not added topayroll.
Internal control feature:Supervisors monitor hoursworked through time cardsand time reports.
Fraud prevented:Employee not paidfor hours not worked.
Internal control feature:Human Resources department documents and authorizes employment.
Internal control feature:Two (or more) employeesverify payroll amounts;supervisor approves.
Fraud prevented:Payroll calculationsare accurate andrelevant.
Internal control feature:Treasurer signs anddistributes prenumberedchecks.
Fraud prevented:Checks are not lost,misappropriated, orunavailable for proof ofpayment; endorsed checkprovides proof of payment.
Payroll Function
Illustration 11-18Internal control for payroll

510 11 Current Liabilities and Payroll Accounting
In January, the payroll supervisor determines that gross earnings for Halo Company are $70,000. All earnings are subject to 7.65% FICA taxes, 5.4% state unemployment taxes, and 0.8% federal unemployment taxes. Halo asks you to record the employer’s payroll taxes.
Solution
DO IT! 3b Employer’s Payroll Taxes
The entry to record the employer’s payroll taxes is:
Payroll Tax Expense 9,695 FICA Taxes Payable ($70,000 3 7.65%) 5,355 Federal Unemployment Taxes Payable ($70,000 3 0.8%) 560 State Unemployment Taxes Payable ($70,000 3 5.4%) 3,780 (To record employer’s payroll taxes on January payroll)
Related exercise material: BE11-9, E11-11, E11-13, and DO IT! 11-3b.
Action Plan✔ Compute the
employer’s payroll taxes on the period’s gross earnings.
✔ Identify the expense account(s) to be debited.
✔ Identify the liability account(s) to be credited.
4 APPENDIX 11A: Discuss additional fringe benefi ts associated with employee compensation.
In addition to the traditional payroll-tax fringe benefi ts (Social Security taxes, Medicare taxes, and state and federal unemployment taxes), employers incur other substantial fringe benefi t costs. Two of the most important are paid absences and postretirement benefi ts.
Paid Absences
Employees often are given rights to receive compensation for absences when they meet certain conditions of employment. The compensation may be for paid vacations, sick pay benefi ts, and paid holidays. When the payment for such absences is probable and the amount can be reasonably estimated, the com-pany should accrue a liability for paid future absences. When the amount cannot be reasonably estimated, the company should instead disclose the potential lia-bility. Ordinarily, vacation pay is the only paid absence that is accrued. The other types of paid absences are only disclosed. To illustrate, assume that Academy Company employees are entitled to one day’s vacation for each month worked. If 30 employees earn an average of $110 per day in a given month, the accrual for vacation benefi ts in one month is $3,300. Academy records the liability at the end of the month by the following adjusting entry.
LEARNING OBJECTIVE
*
Jan. 31 Vacation Benefi ts Expense 3,300 Vacation Benefi ts Payable 3,300 (To accrue vacation benefi ts expense)
This accrual is required by the expense recognition principle. Academy would report Vacation Benefi ts Expense as an operating expense in the income state-ment, and Vacation Benefi ts Payable as a current liability in the balance sheet. Later, when Academy pays vacation benefi ts, it debits Vacation Benefi ts Pay-able and credits Cash. For example, if employees take 10 days of vacation in July, the entry is as follows.
23,300 Exp13,300
Cash Flowsno effect
A OEL5 1

Appendix 11A: Additional Fringe Benefi ts 511
July 31 Vacation Benefi ts Payable 1,100 Cash 1,100 (To record payment of vacation benefi ts)
The magnitude of unpaid absences has gained employers’ attention. Consider the case of an assistant superintendent of schools who worked for 20 years and rarely took a vacation or sick day. A month or so before she retired, the school district discovered that she was due nearly $30,000 in accrued benefi ts. Yet the school district had never accrued the liability.
Postretirement Benefi ts
Postretirement benefi ts are benefi ts that employers provide to retired employees for (1) pensions and (2) healthcare and life insurance. Companies account for both types of postretirement benefi ts on the accrual basis. The cost of postretirement benefi ts is getting steep. For example, states and local-ities must deal with a $1 trillion defi cit in public employees’ retirement benefi t funds. This shortfall amounts to more than $8,800 for every household in the nation. Average Americans have debt of approximately $10,000 (not counting the mortgage on their home) and little in the way of savings. What will happen at retirement for these people? The picture is not pretty—people are living longer, the future of Social Security is unclear, and companies are cutting back on post-retirement benefi ts. This situation may lead to one of the great social and moral dilemmas this country faces in the next 40 years. The more you know about post-retirement benefi ts, the better you will understand the issues involved in this dilemma.
POSTRETIREMENT HEALTHCARE AND LIFE INSURANCE BENEFITS
Providing medical and related healthcare benefi ts for retirees was at one time an inexpensive and highly effective way of generating employee goodwill. This prac-tice has now turned into one of corporate America’s most worrisome fi nancial problems. Runaway medical costs, early retirement, and increased longevity are sending the liability for retiree health plans through the roof. Companies estimate and expense postretirement costs during the working years of the employee because the company benefi ts from the employee’s services during this period. However, the company rarely sets up funds to meet the cost of the future benefi ts. It follows a pay-as-you-go basis for these costs. The major reason is that the company does not receive a tax deduction until it actually pays the medical bill.
PENSION PLANS
A pension plan is an agreement whereby an employer provides benefi ts (pay-ments) to employees after they retire. The need for good accounting for pension plans becomes apparent when we consider the size of existing pension funds. Over 50 million workers currently participate in pension plans in the United States. Most pension plans are subject to the provisions of ERISA (Employee Retirement Income Security Act), a law enacted to curb abuses in the administra-tion and funding of such plans. Three parties are generally involved in a pension plan. The employer (com-pany) sponsors the pension plan. The plan administrator receives the contri-butions from the employer, invests the pension assets, and makes the benefi t payments to the pension recipients (retired employees). Illustration 11A-1 (page 512) indicates the fl ow of cash among the three parties involved in a pen-sion plan.
21,10021,100
Cash Flows21,100
A OEL5 1

512 11 Current Liabilities and Payroll Accounting
An employer-fi nanced pension is part of the employees’ compensation. ERISA establishes the minimum contribution that a company must make each year toward employee pensions. The most popular type of pension plan used is the 401(k) plan. A 401(k) plan works as follows. As an employee, you can contribute up to a certain percentage of your pay into a 401(k) plan, and your employer will match a percentage of your contribution. These contributions are then generally invested in stocks and bonds through mutual funds. These funds will grow without being taxed and can be withdrawn beginning at age 59-1/2. If you must access the funds earlier, you may be able to do so, but a penalty usually occurs along with a payment of tax on the proceeds. Any time you have the opportunity to be involved in a 401(k) plan, you should avail yourself of this benefi t! Companies record pension costs as an expense while the employees are working because that is when the company receives benefi ts from the employ-ees’ services. Generally, the pension expense is reported as an operating expense in the company’s income statement. Frequently, the amount contributed by the company to the pension plan is different from the amount of the pension expense. A liability is recognized when the pension expense to date is more than the company’s contributions to date. An asset is recognized when the pen-sion expense to date is less than the company’s contributions to date. Further consideration of the accounting for pension plans is left for more advanced courses. The two most common types of pension arrangements for providing benefi ts to employees after they retire are defi ned-contribution plans and defi ned-benefi t plans.
DEFINED-CONTRIBUTION PLAN In a defi ned-contribution plan, the plan defi nes the employer’s contribution but not the benefi t that the employee will receive at retirement. That is, the employer agrees to contribute a certain sum each period based on a formula. A 401(k) plan is typically a defi ned-contribution plan. The accounting for a defi ned-contribution plan is straightforward. The employer simply makes a contribution each year based on the formula established in the plan. As a result, the employer’s obligation is easily determined. It follows that the company reports the amount of the contribution required each period as pension expense. The employer reports a liability only if it has not made the contribution in full. To illustrate, assume that Alba Offi ce Interiors has a defi ned-contribution plan in which it contributes $200,000 each year to the pension fund for its employees. The entry to record this transaction is:
Illustration 11A-1Parties in a pension plan
Contributions Benefits
Fund Assets:Investments and Earnings
Employer Plan Administrator Pension Recipients
WKK Corp.Kear Trust
$ $ $ $
Founded in 1892
TRUE GRIT Co.
Pension Expense 200,000 Cash 200,000 (To record pension expense and contribution
to pension fund)
2200,0002200,000
Cash Flows2200,000
A OEL5 1

Review and Practice 513
Explain how to account for current liabilities. A cur-rent liability is a debt that a company expects to pay within one year or the operating cycle, whichever is longer. The major types of current liabilities are notes payable, accounts payable, sales taxes payable, unearned revenues, and accrued liabilities such as taxes, salaries and wages, and interest payable.
When a promissory note is interest-bearing, the amount of assets received upon the issuance of the note is generally equal to the face value of the note. Interest expense accrues over the life of the note. At maturity, the amount paid equals the face value of the note plus accrued interest.
Companies record sales taxes payable at the time the related sales occur. The company serves as a col-lection agent for the taxing authority. Sales taxes are not an expense to the company. Companies ini-tially record unearned revenues in an Unearned Revenue account. As a company recognizes reve-nue, a transfer from unearned revenue to revenue occurs. Companies report the current maturities of long-term debt as a current liability in the bal-ance sheet.
Discuss how current liabilities are reported and ana-lyzed. With notes payable, interest payable, accounts
2
payable, and sales taxes payable, an obligation to make a payment exists. In some cases, it is diffi cult to determine whether a liability exists. These situations are called contingent liabilities. If the contingency is probable (likely to occur) and the amount is rea-sonably estimable, the company should record the liability in the accounts. If the contingency is only reasonably possible (it could happen), then it should be disclosed only in the notes to the fi nancial state-ments. If the possibility that the contingency will hap-pen is remote (unlikely to occur), it need not be recorded or disclosed.
Companies should report the nature and amount of each current liability in the balance sheet or in schedules in the notes accompanying the statements. The liquidity of a company may be analyzed by com-puting working capital and the current ratio.
Explain how to account for payroll. The computation of the payroll involves gross earnings, payroll deductions, and net pay. In recording the payroll, companies debit Salaries and Wages Expense for gross earnings, credit individual tax and other liability accounts for payroll deductions, and credit Salaries and Wages Payable for net pay. When the payroll is paid, companies debit Salaries and Wages Payable and credit Cash.
3
LEARNING OBJECTIVES REVIEW
1
REVIEW AND PRACTICE
To the extent that Alba did not contribute the $200,000 defi ned contribution, it would record a liability. Pension payments to retired employees are made from the pension fund by the plan administrator.
DEFINED-BENEFIT PLAN In a defi ned-benefi t plan, the benefi ts that the employee will receive at the time of retirement are defi ned by the terms of the plan. Benefi ts are typically calculated using a formula that considers an employee’s compensa-tion level when he or she nears retirement and the employee’s years of service. Because the benefi ts in this plan are defi ned in terms of uncertain future vari-ables, an appropriate funding pattern is established to ensure that enough funds are available at retirement to meet the benefi ts promised. This funding level depends on a number of factors such as employee turnover, length of service, mor-tality, compensation levels, and investment earnings. The proper accounting for these plans is complex and is considered in more advanced accounting courses.
POSTRETIREMENT BENEFITS AS LONG-TERM LIABILITIES
While part of the liability associated with (1) postretirement healthcare and life insurance benefi ts and (2) pension plans is generally a current liability, the greater portion of these liabilities extends many years into the future. Therefore, many companies are required to report signifi cant amounts as long-term liabilities for postretirement benefi ts.

Employer payroll taxes consist of FICA, federal unemployment taxes, and state unemployment taxes. The taxes are usually accrued at the time the com-pany records the payroll, by debiting Payroll Tax Expense and crediting separate liability accounts for each type of tax.
The objectives of internal control for payroll are (1) to safeguard company assets against unauthorized
payments of payrolls, and (2) to ensure the accuracy of the accounting records pertaining to payrolls.
Discuss additional fringe benefi ts associated with employee compensation. Additional fringe benefi ts associated with wages are paid absences (paid vaca-tions, sick pay benefi ts, and paid holidays), and post-retirement benefi ts (pensions, healthcare, and life insurance).
* 4
Bonus Compensation to management and other person-nel, based on factors such as increased sales or the amount of net income. (p. 500).
Contingent liability A potential liability that may become an actual liability in the future. (p. 495).
Current ratio A measure of a company’s liquidity; com-puted as current assets divided by current liabilities. (p. 498).
*Defi ned-benefi t plan A pension plan in which the ben-efi ts that the employee will receive at retirement are defi ned by the terms of the plan. (p. 513).
*Defi ned-contribution plan A pension plan in which the employer’s contribution to the plan is defi ned by the terms of the plan. (p. 512).
Employee earnings record A cumulative record of each employee’s gross earnings, deductions, and net pay during the year. (p. 503).
Federal unemployment taxes Taxes imposed on the employer by the federal government that provide bene-fi ts for a limited time period to employees who lose their jobs through no fault of their own. (p. 506).
Fees Payments made for the services of professionals. (p. 499).
FICA taxes Taxes designed to provide workers with supplemental retirement, employment disability, and medical benefi ts. (p. 501).
Gross earnings Total compensation earned by an employee. (p. 499).
Net pay Gross earnings less payroll deductions. (p. 502).
Notes payable Obligations in the form of written notes. (p. 492).
Payroll deductions Deductions from gross earnings to determine the amount of a paycheck. (p. 500).
Payroll register A payroll record that accumulates the gross earnings, deductions, and net pay by employee for each pay period. (p. 503).
Pension plan An agreement whereby an employer pro-vides benefi ts to employees after they retire. (p. 511).
Postretirement benefi ts Payments by employers to retired employees for healthcare, life insurance, and pensions. (p. 511).
Salaries Employee pay based on a specifi ed amount rather than an hourly rate. (p. 499).
Statement of earnings A document attached to a pay-check that indicates the employee’s gross earnings, payroll deductions, and net pay. (p. 504).
State unemployment taxes Taxes imposed on the employer by states that provide benefi ts to employees who lose their jobs. (p. 506).
Wage and Tax Statement (Form W-2) A form showing gross earnings, FICA taxes withheld, and income taxes withheld, prepared annually by an employer for each employee. (p. 508).
Wages Amounts paid to employees based on a rate per hour or on a piecework basis. (p. 499).
Working capital A measure of a company’s liquidity; computed as current assets minus current liabilities. (p. 498).
*
*
GLOSSARY REVIEW
1. The time period for classifying a liability as current is one year or the operating cycle, whichever is:(a) longer. (c) probable.(b) shorter. (d) possible.
2. To be classifi ed as a current liability, a debt must be expected to be paid within:(a) one year.(b) the operating cycle.(c) 2 years.(d) (a) or (b), whichever is longer.
(LO 1)
(LO 1)
3. Maggie Sharrer Company borrows $88,500 on Sep-tember 1, 2017, from Sandwich State Bank by signing an $88,500, 12%, one-year note. What is the accrued interest at December 31, 2017?(a) $2,655. (c) $4,425.(b) $3,540. (d) $10,620.
4. RS Company borrowed $70,000 on December 1 on a 6-month, 6% note. At December 31:(a) neither the note payable nor the interest payable
is a current liability.
(LO 1)
(LO 1)
PRACTICE MULTIPLE-CHOICE QUESTIONS
514 11 Current Liabilities and Payroll Accounting

(b) the note payable is a current liability, but the interest payable is not.
(c) the interest payable is a current liability but the note payable is not.
(d) both the note payable and the interest payable are current liabilities.
5. Becky Sherrick Company has total proceeds from sales of $4,515. If the proceeds include sales taxes of 5%, the amount to be credited to Sales Revenue is:(a) $4,000. (c) $4,289.25.(b) $4,300. (d) No correct answer given.
6. Sensible Insurance Company collected a premium of $18,000 for a 1-year insurance policy on April 1. What amount should Sensible report as a current liability for Unearned Service Revenue at December 31?(a) $0. (c) $13,500.(b) $4,500. (d) $18,000.
7. Working capital is calculated as:(a) current assets minus current liabilities.(b) total assets minus total liabilities.(c) long-term liabilities minus current liabilities.(d) Both (b) and (c).
8. The current ratio is computed as:(a) total assets divided by total liabilities.(b) total assets divided by current liabilities.(c) current assets divided by total liabilities.(d) current assets divided by current liabilities.
9. A contingent liability should be recorded in the accounts when:(a) it is probable the contingency will happen, but the
amount cannot be reasonably estimated.(b) it is reasonably possible the contingency will hap-
pen, and the amount can be reasonably estimated.(c) it is probable the contingency will happen, and
the amount can be reasonably estimated.(d) it is reasonably possible the contingency will
happen, but the amount cannot be reasonably estimated.
(LO 1)
(LO 1)
(LO 2)
(LO 2)
(LO 2)
10. At December 31, Hanes Company prepares an adjusting entry for a product warranty contract. Which of the following accounts is/are included in the entry?(a) Miscellaneous Expense. (c) Repair Parts.(b) Warranty Liability. (d) Both (a) and (b).
11. Andy Manion earns $14 per hour for a 40-hour week and $21 per hour for any overtime work. If Manion works 45 hours in a week, gross earnings are:(a) $560. (c) $650.(b) $630. (d) $665.
12. When recording payroll:(a) gross earnings are recorded as salaries and wages
payable.(b) net pay is recorded as salaries and wages expense.(c) payroll deductions are recorded as liabilities.(d) More than one of the above.
13. Employer payroll taxes do not include:(a) federal unemployment taxes.(b) state unemployment taxes.(c) federal income taxes.(d) FICA taxes.
14. FICA Taxes Payable was credited for $7,500 in the entry when Antonio Company recorded payroll. When Antonio Company records employer’s payroll taxes, FICA Taxes Payable should be credited for:(a) $0. (c) $15,000.(b) $7,500. (d) Some other amount.
15. The department that should pay the payroll is the:(a) timekeeping department.(b) human resources department.(c) payroll department.(d) treasurer’s department.
16. Which of the following is not an additional fringe benefi t?(a) Postretirement pensions. (c) Paid vacations.(b) Paid absences. (d) Salaries.
(LO 2)
(LO 3)
(LO 3)
(LO 3)
(LO 3)
(LO 3)
* (LO 4)
Solutions
1. (a) The time period for classifying a liability as current is one year or the operating cycle, whichever is longer, not (b) shorter, (c) probable, or (d) possible.
2. (d) To be classifi ed as a current liability, a debt must be expected to be paid within one year or the operating cycle. Choices (a) and (b) are both correct, but (d) is the better answer. Choice (c) is incorrect.
3. (b) Accrued interest at December 31, 2017, is computed as the face value ($88,500) times the interest rate (12%) times the portion of the year the debt was outstanding (4 months out of 12), or $3,540 ($88,500 3 12% 3 4/12), not (a) $2,655, (c) $4,425, or (d) $10,620.
4. (d) Both the note payable and interest payable are current liabilities. Notes due for payment within one year of the balance sheet date are usually classifi ed as current liabilities. The other choices are therefore incorrect.
5. (b) Dividing the total proceeds ($4,515) by one plus the sales tax rate (1.05) will result in the amount of sales to be credited to the Sales Revenue account of $4,300 ($4,515 4 1.05). The other choices are therefore incorrect.
6. (b) The monthly premium is $1,500 or $18,000 divided by 12. Because Sensible has recognized 9 months of insurance revenue (April 1–December 31), 3 months’ insurance premium is still unearned. The amount that Sensible should report as Unearned Ser-vice Revenue is therefore $4,500 (3 months 3 $1,500), not (a) $0, (c) $13,500, or (d) $18,000.
7. (a) Working capital is defi ned as current assets minus current liabilities. The other choices are therefore incorrect.
8. (d) The current ratio is defi ned as current assets divided by current liabilities. The other choices are therefore incorrect.
9. (c) A contingent liability is recorded when the amount can be reasonably estimated and the likelihood of the contingency is probable. The other choices are therefore incorrect.
10. (b) The adjusting entry for product warranties includes a debit to Warranty Liability, not (a) Miscellaneous Expense, (c) Repair Parts, or (d) both Miscellaneous Expense and Warranty Liability.
Practice Multiple-Choice Questions 515

11. (d) Gross earnings are computed as (40 hours 3 $14 per hour) 1 (5 hours 3 $21 per hour) 5 $665, not (a) $560, (b) $630, or (c) $650.
12. (c) When recording payroll, payroll deductions are recorded as liabilities. The other choices are incorrect because (a) gross earnings are recorded as salaries and wages expense, (b) net pay is recorded as salaries and wages payable, and (d) only one of the answer choices is true concerning payroll.
13. (c) Federal income taxes are a payroll deduction, not an employer payroll tax. The employer is merely a collection agent. The other choices are all included in employer payroll taxes.
14. (b) Each employee pays FICA taxes, but the employer must match each employee’s FICA contribution. Because the employer’s tax is subject to the same rate and maximum earnings as the employee’s, FICA Taxes Payable would also be $7,500. The other choices are therefore incorrect.
15. (d) The treasurer’s department pays or distributes the payroll checks. The other choices are incorrect because (a) the timekeep-ing department monitors hours worked by employees, (b) the human resources department documents and authorizes employ-ment, and (c) the payroll department prepares the payroll checks.
*16. (d) Salaries are not an additional fringe benefi t. The other choices are true statements.
1. On June 1, Streamsong Company borrows $150,000 from First Bank on a 6-month, $150,000, 8% note.
Instructions(a) Prepare the entry on June 1.
(b) Prepare the adjusting entry on June 30.
(c) Prepare the entry at maturity (December 1), assuming monthly adjusting entries have been made through November 30.
(d) What was the total fi nancing cost (interest expense)?
Prepare entries for interest- bearing notes.
(LO 1)
2. Fun App Company has the following liability accounts after posting adjusting entries: Accounts Payable $77,000, Unearned Ticket Revenue $36,000, Warranty Liability $25,000, Interest Payable $10,000, Mortgage Payable $150,000, Notes Payable $100,000, and Sales Taxes Payable $14,000. Assume the company’s operating cycle is less than 1 year, ticket revenue will be recognized within 1 year, warranty costs are expected to be incurred within 1 year, and the notes mature in 3 years.
Instructions(a) Prepare the current liabilities section of the balance sheet, assuming $40,000 of the
mortgage is payable next year.
(b) Comment on Fun App Company’s liquidity, assuming total current assets are $350,000.
Prepare current liabilities section of the balance sheet and evaluate liquidity.
(LO 2)
PRACTICE EXERCISES
1. (a) June 1 Cash 150,000 Notes Payable 150,000
(b) June 30 Interest Expense 1,000 Interest Payable ($150,000 3 8% 3 1/12) 1,000
(c) Dec. 1 Notes Payable 150,000 Interest Payable ($150,000 3 8% 3 6/12) 6,000 Cash 156,000
(d) $6,000
Solution
516 11 Current Liabilities and Payroll Accounting

Solution
FUN APP COMPANYPartial Balance Sheet
Current liabilities Long-term debt due within one year $ 40,000 Accounts payable 77,000 Unearned ticket revenue 36,000 Warranty liability 25,000 Sales taxes payable 14,000 Interest payable 10,000
Total current liabilities $202,000
2. (a)
(b) Fun App Company’s working capital is $148,000 ($350,000 2 $202,000), and its current ratio is 1.73:1 ($350,000 4 $202,000). Although a current ratio of 2:1 has been considered the standard for a good credit rating, many companies operate successfully with a current ratio well below 2:1.
3. Erin Berge’s regular hourly wage rate is $18, and she receives a wage of 1½ times the regular hourly rate for work in excess of 40 hours. During a March weekly pay period, Erin worked 42 hours. Her gross earnings prior to the current week were $6,000. Erin is mar-ried and claims three withholding allowances. Her only voluntary deduction is for group hospitalization insurance at $20 per week. Assume federal income tax withheld is $76.
Instructions(a) Compute the following amounts for Erin’s wages for the current week. (1) Gross earnings. (2) FICA taxes (based on a 7.65% rate). (3) State income taxes withheld (based on a 3% rate). (4) Net pay.
(b) Record Erin’s pay.
Compute net pay and record pay for one employee.
(LO 3)
3. (a) (1) Regular 40 hours 3 $18 5 $720 Overtime 2 hours 3 $27 5 54
Gross earnings $774
(2) FICA taxes: ($774 3 7.65%) 5 $59.21 (3) State income taxes: ($774 3 3%) 5 $23.22 (4) Net Pay: ($774.00 2 $59.21 2 $76.00 2 $23.22 2$20.00) 5 $595.57
(b) Salaries and Wages Expense 774.00 FICA Taxes Payable 59.21 Federal Income Taxes Payable 76.00 State Income Taxes Payable 23.22 Health Insurance Payable 20.00 Salaries and Wages Payable 595.57
Solution
Indiana Jones Company had the following selected transactions.
Feb. 1 Signs a $50,000, 6-month, 9%-interest-bearing note payable to CitiBank and receives $50,000 in cash.
10 Cash register sales total $43,200, which includes an 8% sales tax.
PRACTICE PROBLEM
Practice Problem 517

28 The payroll for the month consists of salaries and wages of $50,000. All wages are subject to 7.65% FICA taxes. A total of $8,900 federal income taxes are withheld. The salaries are paid on March 1.
28 The company develops the following adjustment data. 1. Interest expense of $375 has been incurred on the note. 2. Employer payroll taxes include 7.65% FICA taxes, a 5.4% state unemployment
tax, and a 0.8% federal unemployment tax. 3. Some sales were made under warranty. Of the units sold under warranty, 350
are expected to become defective. Repair costs are estimated to be $40 per unit.
Instructions(a) Journalize the February transactions.
(b) Journalize the adjusting entries at February 28.
(a) Feb. 1 Cash 50,000 Notes Payable 50,000 (Issued 6-month, 9%-interest-bearing
note to CitiBank)
10 Cash 43,200 Sales Revenue ($43,200 4 1.08) 40,000 Sales Taxes Payable ($40,000 3 8%) 3,200 (To record sales revenue and sales
taxes payable)
28 Salaries and Wages Expense 50,000 FICA Taxes Payable (7.65% 3 $50,000) 3,825 Federal Income Taxes Payable 8,900 Salaries and Wages Payable 37,275 (To record February salaries)
(b) Feb. 28 Interest Expense 375 Interest Payable 375 (To record accrued interest for
February)
28 Payroll Tax Expense 6,925 FICA Taxes Payable 3,825 Federal Unemployment Taxes Payable 400 (0.8% 3 $50,000) State Unemployment Taxes Payable 2,700 (5.4% 3 $50,000) (To record employer’s payroll taxes on
February payroll)
28 Warranty Expense (350 3 $40) 14,000 Warranty Liability 14,000 (To record estimated warranty
liability)
Solution
1. Lori Randle believes a current liability is a debt that can be expected to be paid in one year. Is Lori correct? Explain.
2. Petrocelli Company obtains $40,000 in cash by signing a 7%, 6-month, $40,000 note payable to First Bank on July 1. Petrocelli’s fi scal year ends on September 30.
518 11 Current Liabilities and Payroll Accounting
Brief Exercises, Exercises, DO IT! Exercises, and Problems and many additional resources are available for practice in WileyPLUS
NOTE: All asterisked Questions, Exercises, and Problems relate to material in the appendix to the chapter.
QUESTIONS

Brief Exercises 519
What information should be reported for the note payable in the annual fi nancial statements?
3. (a) Your roommate says, “Sales taxes are reported as an expense in the income statement.” Do you agree? Explain.
(b) Jensen Company has cash proceeds from sales of $8,400. This amount includes $400 of sales taxes. Give the entry to record the proceeds.
4. Ottawa University sold 15,000 season football tickets at $80 each for its six-game home schedule. What entries should be made (a) when the tickets were sold, and (b) after each game?
5. What is liquidity? What are two measures of liquidity? 6. What is a contingent liability? Give an example of a con-
tingent liability that is usually recorded in the accounts. 7. Under what circumstances is a contingent liability
disclosed only in the notes to the fi nancial statements? Under what circumstances is a contingent liability not recorded in the accounts nor disclosed in the notes to the fi nancial statements?
8. What is the difference between gross pay and net pay? Which amount should a company record as wages and salaries expense?
9. Which payroll tax is levied on both employers and employees?
10. Are the federal and state income taxes withheld from employee paychecks a payroll tax expense for the employer? Explain your answer.
11. What do the following acronyms stand for: FICA, FUTA, and SUTA?
12. What information is shown in a W-2 statement?13. Distinguish between the two types of payroll deduc-
tions and give examples of each.14. What are the primary uses of the employee earnings
record?15. (a) Identify the three types of employer payroll taxes. (b) How are tax liability accounts and payroll tax
expense accounts classifi ed in the fi nancial state-ments?
16. You are a newly hired accountant with Nolasco Com-pany. On your fi rst day, the controller asks you to identify the main internal control objectives related to payroll accounting. How would you respond?
17. What are the four functions associated with payroll activities?
18. Identify two additional types of fringe benefi ts associ-ated with employees’ compensation.
19. Often during job interviews, the candidate asks the potential employer about the fi rm’s paid absences pol-icy. What are paid absences? How are they accounted for?
20. What are two types of postretirement benefi ts?21. Explain how a 401(k) plan works.22. What is the principal difference between a defi ned-
contribution pension plan and a defi ned-benefi t pen-sion plan?
*
*
***
BRIEF EXERCISES
BE11-1 Jamison Company has the following obligations at December 31: (a) a note pay-able for $100,000 due in 2 years, (b) a 10-year mortgage payable of $300,000 payable in ten $30,000 annual payments, (c) interest payable of $15,000 on the mortgage, and (d) accounts payable of $60,000. For each obligation, indicate whether it should be classifi ed as a current liability. (Assume an operating cycle of less than one year.)
BE11-2 Peralta Company borrows $60,000 on July 1 from the bank by signing a $60,000, 10%, one-year note payable.
(a) Prepare the journal entry to record the proceeds of the note.(b) Prepare the journal entry to record accrued interest at December 31, assuming adjust-
ing entries are made only at the end of the year.
BE11-3 Coghlan Auto Supply does not segregate sales and sales taxes at the time of sale. The register total for March 16 is $16,380. All sales are subject to a 5% sales tax. Compute sales taxes payable, and make the entry to record sales taxes payable and sales revenue.
BE11-4 Derby University sells 4,000 season basketball tickets at $210 each for its 12-game home schedule. Give the entry to record (a) the sale of the season tickets and (b) the reve-nue recognized by playing the fi rst home game.
BE11-5 Yahoo! Inc.’s recent fi nancial statements contain the following selected data (in thousands).
Current assets $ 4,594,772 Current liabilities $1,717,728Total assets 14,936,030 Total liabilities 2,417,394
Compute (a) working capital and (b) current ratio.
BE11-6 On December 1, Bruney Company introduces a new product that includes a one-year warranty on parts. In December, 1,000 units are sold. Management believes that 5% of the units will be defective and that the average warranty costs will be $90 per unit. Prepare the adjusting entry at December 31 to accrue the estimated warranty cost.
Identify whether obligations are current liabilities.
(LO 1)
Prepare entries for an interest-bearing note payable.
(LO 1)
Compute and record sales taxes payable.
(LO 1)
Prepare entries for unearned revenues.
(LO 1)
Analyze liquidity.
(LO 2)
Prepare adjusting entry for warranty costs.
(LO 2)

520 11 Current Liabilities and Payroll Accounting
BE11-7 Beth Corbin’s regular hourly wage rate is $16, and she receives an hourly rate of $24 for work in excess of 40 hours. During a January pay period, Beth works 45 hours. Beth’s federal income tax withholding is $95, she has no voluntary deductions, and the FICA tax rate is 7.65%. Compute Beth Corbin’s gross earnings and net pay for the pay period.
BE11-8 Data for Beth Corbin are presented in BE11-7. Prepare the journal entries to record (a) Beth’s pay for the period and (b) the payment of Beth’s wages. Use January 15 for the end of the pay period and the payment date.
BE11-9 In January, gross earnings in Lugo Company totaled $80,000. All earnings are subject to 7.65% FICA taxes, 5.4% state unemployment taxes, and 0.8% federal unemploy-ment taxes. Prepare the entry to record January payroll tax expense.
BE11-10 Swenson Company has the following payroll procedures.
(a) Supervisor approves overtime work.(b) The human resources department prepares hiring authorization forms for new hires.(c) A second payroll department employee verifi es payroll calculations.(d) The treasurer’s department pays employees.
Identify the payroll function to which each procedure pertains.
*BE11-11 At Ward Company, employees are entitled to one day’s vacation for each month worked. In January, 70 employees worked the full month. Record the vacation pay liability for January, assuming the average daily pay for each employee is $120.
Compute gross earnings and net pay.
(LO 3)
Record a payroll and the payment of wages.
(LO 3)
Record employer payroll taxes.
(LO 3)
Identify payroll functions.
(LO 3)
Record estimated vacation benefi ts.
(LO 4)
You and several classmates are studying for the next accounting exam. They ask you to answer the following questions:
1. If cash is borrowed on a $70,000, 9-month, 6% note on August 1, how much interest expense would be incurred by December 31?
2. The cash register total including sales taxes is $42,000, and the sales tax rate is 5%. What is the sales taxes payable?
3. If $45,000 is collected in advance on November 1 for 6-month magazine subscriptions, what amount of subscription revenue should be recognized by December 31?
Medlen Company, has the following account balances at December 31, 2017.
Notes payable ($60,000 due after 12/31/18) $100,000Unearned service revenue 70,000Other long-term debt ($90,000 due in 2018) 250,000Salaries and wages payable 32,000Accounts payable 63,000
In addition, Medlen is involved in a lawsuit. Legal counsel feels it is probable Medlen will pay damages of $25,000 in 2018.
(a) Prepare the current liabilities section of Medlen’s December 31, 2017, balance sheet.
(b) Medlen’s current assets are $570,000. Compute Medlen’s working capital and current ratio.
In January, gross earnings in Burrell Company were $80,000. All earnings are subject to 7.65% FICA taxes. Federal income tax withheld was $14,000, and state in-come tax withheld was $1,600. (a) Calculate net pay for January, and (b) record the payroll.
In January, the payroll supervisor determines that gross earnings for Carlyle Company are $120,000. All earnings are subject to 7.65% FICA taxes, 5.4% state unemployment taxes, and 0.8% federal unemployment taxes. Record the employer’s pay-roll taxes.
Answer questions about current liabilities.
(LO 1)
Prepare current liabilities section and compute liquidity measures.
(LO 2)
Calculate net pay and record payroll.
(LO 3)
Record employer’s payroll taxes.
(LO 3)
DO IT! Exercises
DO IT! 11-1
DO IT! 11-2
DO IT! 11-3a
DO IT! 11-3b

Exercises 521
EXERCISES
E11-1 C.S. Lewis Company had the following transactions involving notes payable.
July 1, 2017 Borrows $50,000 from First National Bank by signing a 9-month, 8% note.Nov. 1, 2017 Borrows $60,000 from Lyon County State Bank by signing a 3-month,
6% note.Dec. 31, 2017 Prepares adjusting entries.Feb. 1, 2018 Pays principal and interest to Lyon County State Bank.Apr. 1, 2018 Pays principal and interest to First National Bank.
InstructionsPrepare journal entries for each of the transactions.
E11-2 On June 1, Merando Company borrows $90,000 from First Bank on a 6-month, $90,000, 8% note.
Instructions(a) Prepare the entry on June 1.(b) Prepare the adjusting entry on June 30.(c) Prepare the entry at maturity (December 1), assuming monthly adjusting entries have
been made through November 30.(d) What was the total fi nancing cost (interest expense)?
E11-3 In performing accounting services for small businesses, you encounter the follow-ing situations pertaining to cash sales.
1. Poole Company enters sales and sales taxes separately on its cash register. On April 10, the register totals are sales $30,000 and sales taxes $1,500.
2. Waterman Company does not segregate sales and sales taxes. Its register total for April 15 is $25,680, which includes a 7% sales tax.
InstructionsPrepare the entry to record the sales transactions and related taxes for each client.
E11-4 Moreno Company publishes a monthly sports magazine, Fishing Preview. Sub-scriptions to the magazine cost $20 per year. During November 2017, Moreno sells 15,000 subscriptions beginning with the December issue. Moreno prepares fi nancial statements quarterly and recognizes subscription revenue at the end of the quarter. The company uses the accounts Unearned Subscription Revenue and Subscription Revenue.
Instructions(a) Prepare the entry in November for the receipt of the subscriptions.(b) Prepare the adjusting entry at December 31, 2017, to record sales revenue recognized
in December 2017.(c) Prepare the adjusting entry at March 31, 2018, to record sales revenue recognized in
the fi rst quarter of 2018.
E11-5 Betancourt Company sells automatic can openers under a 75-day warranty for defective merchandise. Based on past experience, Betancourt estimates that 3% of the units sold will become defective during the warranty period. Management estimates that the average cost of replacing or repairing a defective unit is $15. The units sold and units defective that occurred during the last 2 months of 2017 are as follows.
Units Units Defective Month Sold Prior to December 31
November 30,000 600 December 32,000 400
Instructions(a) Prepare the journal entries to record the estimated liability for warranties and the
costs incurred in honoring 1,000 warranty claims. (Assume actual costs of $15,000.)(b) Determine the estimated warranty liability at December 31 for the units sold in
November and December.(c) Give the entry to record the honoring of 500 warranty contracts in January at an aver-
age cost of $15.
Prepare entries for interest-bearing notes.
(LO 1)
Prepare entries for interest-bearing notes.
(LO 1)
Journalize sales and related taxes.
(LO 1)
Journalize unearned subscription revenue.
(LO 1)
Record estimated liability and expense for warranties.
(LO 2)

522 11 Current Liabilities and Payroll Accounting
E11-6 Gallardo Co. is involved in a lawsuit as a result of an accident that took place September 5, 2017. The lawsuit was fi led on November 1, 2017, and claims damages of $1,000,000.
Instructions(a) At December 31, 2017, Gallardo’s attorneys feel it is remote that Gallardo will lose the
lawsuit. How should the company account for the effects of the lawsuit?(b) Assume instead that at December 31, 2017, Gallardo’s attorneys feel it is probable that
Gallardo will lose the lawsuit and be required to pay $1,000,000. How should the com-pany account for this lawsuit?
(c) Assume instead that at December 31, 2017, Gallardo’s attorneys feel it is reasonably possible that Gallardo could lose the lawsuit and be required to pay $1,000,000. How should the company account for this lawsuit?
E11-7 Younger Online Company has the following liability accounts after posting adjust-ing entries: Accounts Payable $73,000, Unearned Ticket Revenue $24,000, Warranty Liability $18,000, Interest Payable $8,000, Mortgage Payable $120,000, Notes Payable $80,000, and Sales Taxes Payable $10,000. Assume the company’s operating cycle is less than 1 year, ticket revenue will be recognized within 1 year, warranty costs are expected to be incurred within 1 year, and the notes mature in 3 years.
Instructions(a) Prepare the current liabilities section of the balance sheet, assuming $30,000 of the
mortgage is payable next year.(b) Comment on Younger Online Company’s liquidity, assuming total current assets are
$300,000.
E11-8 Suppose the following fi nancial data were reported by 3M Company for 2016 and 2017 (dollars in millions).
3M COMPANYBalance Sheets (partial)
2017 2016
Current assets Cash and cash equivalents $ 3,040 $1,849 Accounts receivable, net 3,250 3,195 Inventories 2,639 3,013 Other current assets 1,866 1,541
Total current assets $10,795 $9,598Current liabilities $ 4,897 $5,839
Instructions(a) Calculate the current ratio and working capital for 3M for 2016 and 2017.(b) Suppose that at the end of 2017, 3M management used $200 million cash to pay off
$200 million of accounts payable. How would its current ratio and working capital have changed?
E11-9 Maria Garza’s regular hourly wage rate is $16, and she receives a wage of 1½ times the regular hourly rate for work in excess of 40 hours. During a March weekly pay period, Maria worked 42 hours. Her gross earnings prior to the current week were $6,000. Maria is married and claims three withholding allowances. Her only voluntary deduction is for group hospitalization insurance at $25 per week.
Instructions(a) Compute the following amounts for Maria’s wages for the current week. (1) Gross earnings. (2) FICA taxes. (Assume a 7.65% rate on maximum of $117,000.) (3) Federal income taxes withheld. (Use the withholding table in the text, page 502.) (4) State income taxes withheld. (Assume a 2.0% rate.) (5) Net pay.(b) Record Maria’s pay.
Record and disclose contingent liabilities.
(LO 2)
Prepare the current liabilities section of the balance sheet.
(LO 2)
Calculate current ratio and working capital before and after paying accounts payable.
(LO 2)
Compute net pay and record pay for one employee.
(LO 3)

Exercises 523
E11-10 Employee earnings records for Slaymaker Company reveal the following gross earnings for four employees through the pay period of December 15.
J. Seligman $93,500 L. Marshall $115,100R. Eby $113,600 T. Olson $120,000
For the pay period ending December 31, each employee’s gross earnings is $4,500. The FICA tax rate is 7.65% on gross earnings of $117,000.
InstructionsCompute the FICA withholdings that should be made for each employee for the December 31 pay period. (Show computations.)
E11-11 Ramirez Company has the following data for the weekly payroll ending January 31.
Federal Hours Hourly Income Tax HealthEmployee M T W T F S Rate Withholding Insurance
L. Helton 8 8 9 8 10 3 $12 $34 $10R. Kenseth 8 8 8 8 8 2 14 37 25D. Tavaras 9 10 8 8 9 0 15 58 25
Employees are paid 1½ times the regular hourly rate for all hours worked in excess of 40 hours per week. FICA taxes are 7.65% on the fi rst $117,000 of gross earnings. Ramirez Company is subject to 5.4% state unemployment taxes and 0.8% federal unemployment taxes on the fi rst $7,000 of gross earnings.
Instructions(a) Prepare the payroll register for the weekly payroll.(b) Prepare the journal entries to record the payroll and Ramirez’s payroll tax expense.
E11-12 Selected data from a February payroll register for Sutton Company are presented below. Some amounts are intentionally omitted.
Gross earnings: State income taxes $ (3) Regular $9,100 Union dues 100 Overtime (1) Total deductions (4)
Total (2) Net pay $7,595Deductions: Account debited: FICA taxes $ 765 Salaries and wages expense (5) Federal income taxes 1,140
FICA taxes are 7.65%. State income taxes are 4% of gross earnings.
Instructions(a) Fill in the missing amounts.(b) Journalize the February payroll and the payment of the payroll.
E11-13 According to a payroll register summary of Frederickson Company, the amount of employees’ gross pay in December was $850,000, of which $80,000 was not subject to Social Security taxes of 6.2% and $750,000 was not subject to state and federal unemploy-ment taxes.
Instructions(a) Determine the employer’s payroll tax expense for the month, using the following rates:
FICA 7.65%, state unemployment 5.4%, and federal unemployment 0.8%.(b) Prepare the journal entry to record December payroll tax expense.
*E11-14 Mayberry Company has two fringe benefi t plans for its employees:
1. It grants employees 2 days’ vacation for each month worked. Ten employees worked the entire month of March at an average daily wage of $140 per employee.
2. In its pension plan, the company recognizes 10% of gross earnings as a pension expense. Gross earnings in March were $40,000. No contribution has been made to the pension fund.
InstructionsPrepare the adjusting entries at March 31.
Compute maximum FICA deductions.
(LO 3)
Prepare payroll register and record payroll and payroll tax expense.
(LO 3)
Compute missing payroll amounts and record payroll.
(LO 3)
Determine employer’s payroll taxes; record payroll tax expense.
(LO 3)
Prepare adjusting entries for fringe benefi ts.
(LO 4)
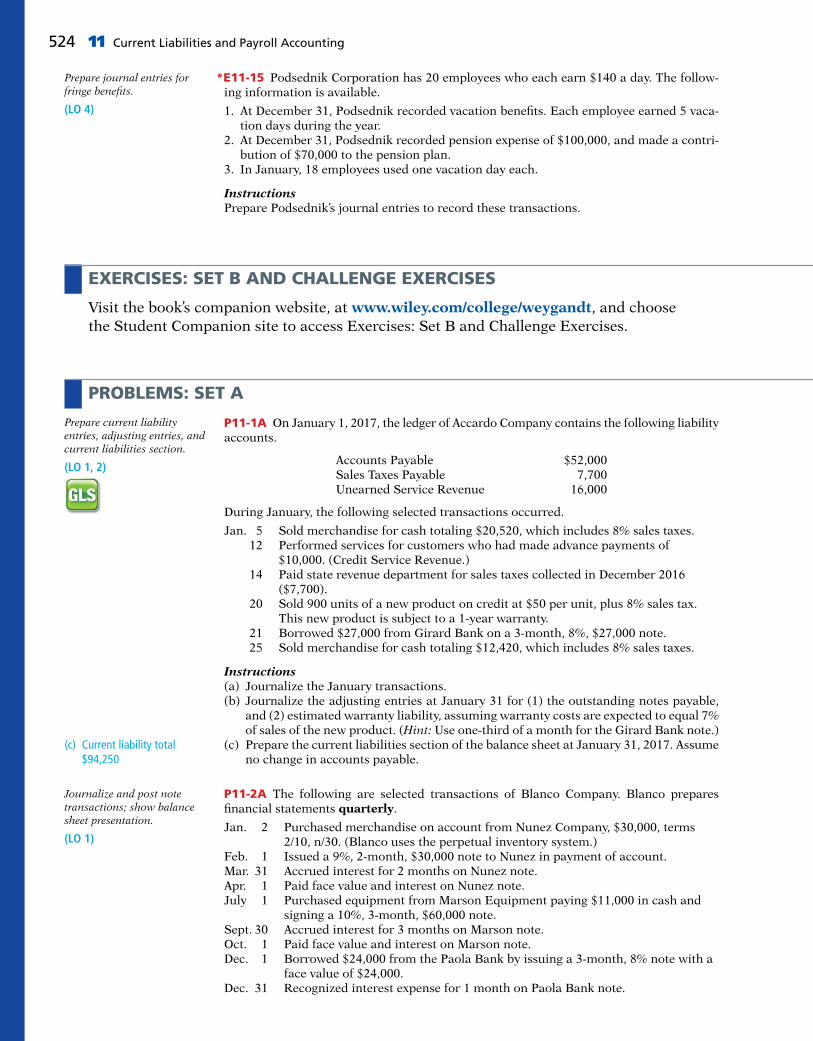
524 11 Current Liabilities and Payroll Accounting
*E11-15 Podsednik Corporation has 20 employees who each earn $140 a day. The follow-ing information is available.
1. At December 31, Podsednik recorded vacation benefi ts. Each employee earned 5 vaca-tion days during the year.
2. At December 31, Podsednik recorded pension expense of $100,000, and made a contri-bution of $70,000 to the pension plan.
3. In January, 18 employees used one vacation day each.
InstructionsPrepare Podsednik’s journal entries to record these transactions.
Prepare journal entries for fringe benefi ts.
(LO 4)
EXERCISES: SET B AND CHALLENGE EXERCISES
Visit the book’s companion website, at www.wiley.com/college/weygandt, and choose the Student Companion site to access Exercises: Set B and Challenge Exercises.
PROBLEMS: SET A
P11-1A On January 1, 2017, the ledger of Accardo Company contains the following liability accounts.
Accounts Payable $52,000Sales Taxes Payable 7,700Unearned Service Revenue 16,000
During January, the following selected transactions occurred.
Jan. 5 Sold merchandise for cash totaling $20,520, which includes 8% sales taxes. 12 Performed services for customers who had made advance payments of
$10,000. (Credit Service Revenue.) 14 Paid state revenue department for sales taxes collected in December 2016
($7,700). 20 Sold 900 units of a new product on credit at $50 per unit, plus 8% sales tax.
This new product is subject to a 1-year warranty. 21 Borrowed $27,000 from Girard Bank on a 3-month, 8%, $27,000 note. 25 Sold merchandise for cash totaling $12,420, which includes 8% sales taxes.
Instructions(a) Journalize the January transactions.(b) Journalize the adjusting entries at January 31 for (1) the outstanding notes payable,
and (2) estimated warranty liability, assuming warranty costs are expected to equal 7% of sales of the new product. (Hint: Use one-third of a month for the Girard Bank note.)
(c) Prepare the current liabilities section of the balance sheet at January 31, 2017. Assume no change in accounts payable.
P11-2A The following are selected transactions of Blanco Company. Blanco prepares fi nancial statements quarterly.
Jan. 2 Purchased merchandise on account from Nunez Company, $30,000, terms 2/10, n/30. (Blanco uses the perpetual inventory system.)
Feb. 1 Issued a 9%, 2-month, $30,000 note to Nunez in payment of account.Mar. 31 Accrued interest for 2 months on Nunez note.Apr. 1 Paid face value and interest on Nunez note.July 1 Purchased equipment from Marson Equipment paying $11,000 in cash and
signing a 10%, 3-month, $60,000 note.Sept. 30 Accrued interest for 3 months on Marson note.Oct. 1 Paid face value and interest on Marson note.Dec. 1 Borrowed $24,000 from the Paola Bank by issuing a 3-month, 8% note with a
face value of $24,000.Dec. 31 Recognized interest expense for 1 month on Paola Bank note.
Prepare current liability entries, adjusting entries, and current liabilities section.
(LO 1, 2)
(c) Current liability total $94,250
Journalize and post note transactions; show balance sheet presentation.
(LO 1)

Problems: Set A 525
Instructions(a) Prepare journal entries for the listed transactions and events.(b) Post to the accounts Notes Payable, Interest Payable, and Interest Expense.(c) Show the balance sheet presentation of notes and interest payable at December 31.(d) What is total interest expense for the year?
P11-3A Mann Hardware has four employees who are paid on an hourly basis plus time-and-a-half for all hours worked in excess of 40 a week. Payroll data for the week ended March 15, 2017, are presented below.
Federal Hours Hourly Income Tax United Employee Worked Rate Withholdings Fund
Ben Abel 40 $15.00 $ ? $5.00Rita Hager 42 16.00 ? 5.00Jack Never 44 13.00 60.00 8.00Sue Perez 46 13.00 61.00 5.00
Abel and Hager are married. They claim 0 and 4 withholding allowances, respectively. The following tax rates are applicable: FICA 7.65%, state income taxes 3%, state unemploy-ment taxes 5.4%, and federal unemployment 0.8%.
Instructions(a) Prepare a payroll register for the weekly payroll. (Use the wage-bracket withholding
table in the text for federal income tax withholdings.)(b) Journalize the payroll on March 15, 2017, and the accrual of employer payroll taxes.(c) Journalize the payment of the payroll on March 16, 2017.(d) Journalize the deposit in a Federal Reserve bank on March 31, 2017, of the FICA and
federal income taxes payable to the government.
P11-4A The following payroll liability accounts are included in the ledger of Harmon Company on January 1, 2017.
FICA Taxes Payable $ 760.00Federal Income Taxes Payable 1,204.60State Income Taxes Payable 108.95Federal Unemployment Taxes Payable 288.95State Unemployment Taxes Payable 1,954.40Union Dues Payable 870.00U.S. Savings Bonds Payable 360.00
In January, the following transactions occurred.
Jan. 10 Sent check for $870.00 to union treasurer for union dues. 12 Remitted check for $1,964.60 to the Federal Reserve bank for FICA taxes and
federal income taxes withheld. 15 Purchased U.S. Savings Bonds for employees by writing check for $360.00. 17 Paid state income taxes withheld from employees. 20 Paid federal and state unemployment taxes. 31 Completed monthly payroll register, which shows salaries and wages $58,000,
FICA taxes withheld $4,437, federal income taxes payable $2,158, state income taxes payable $454, union dues payable $400, United Fund contributions payable $1,888, and net pay $48,663.
31 Prepared payroll checks for the net pay and distributed checks to employees.
At January 31, the company also makes the following accrued adjustments pertaining to employee compensation.
1. Employer payroll taxes: FICA taxes 7.65%, federal unemployment taxes 0.8%, and state unemployment taxes 5.4%.
*2. Vacation pay: 6% of gross earnings.
Instructions(a) Journalize the January transactions.(b) Journalize the adjustments pertaining to employee compensation at January 31.
(d) $2,110
Prepare payroll register and payroll entries.
(LO 3)
(a) Net pay $2,039.30
(b) Payroll tax expense $349.43
(d) Cash paid $578.02
Journalize payroll transactions and adjusting entries.
(LO 3, 4)
(b) Payroll tax expense $8,033; Vacation benefi ts expense $3,480

526 11 Current Liabilities and Payroll Accounting
P11-5A For the year ended December 31, 2017, Denkinger Electrical Repair Company reports the following summary payroll data.
Gross earnings: Administrative salaries $200,000 Electricians’ wages 370,000
Total $570,000
Deductions: FICA taxes $ 38,645 Federal income taxes withheld 174,400 State income taxes withheld (3%) 17,100 United Fund contributions payable 27,500 Health insurance premiums 17,200
Total $274,845
Denkinger Company’s payroll taxes are Social Security tax 6.2%, Medicare tax 1.45%, state unemployment 2.5% (due to a stable employment record), and 0.8% federal unemploy-ment. Gross earnings subject to Social Security taxes of 6.2% total $490,000, and gross earnings subject to unemployment taxes total $135,000.
Instructions(a) Prepare a summary journal entry at December 31 for the full year’s payroll.(b) Journalize the adjusting entry at December 31 to record the employer’s payroll taxes.(c) The W-2 Wage and Tax Statement requires the following dollar data.
Wages, Tips, Federal Income State Income FICA FICA Tax Other Compensation Tax Withheld Tax Withheld Wages Withheld
Complete the required data for the following employees.
Employee Gross Earnings Federal Income Tax Withheld
Maria Sandoval $59,000 $28,500Jennifer Mingenback 26,000 10,200
Prepare entries for payroll and payroll taxes; prepare W-2 data.
(LO 3)
(a) Salaries and wages payable $295,155
(b) Payroll tax expense $43,100
PROBLEMS: SET B AND SET C
Visit the book’s companion website, at www.wiley.com/college/weygandt, and choose the Student Companion site to access Problems: Set B and Set C.
COMPREHENSIVE PROBLEM
CP11 Morgan Company’s balance sheet at December 31, 2016, is presented below.
MORGAN COMPANYBalance Sheet
December 31, 2016
Cash $ 30,000 Accounts Payable $ 13,750Inventory 30,750 Interest Payable 250Prepaid Insurance 6,000 Notes Payable 50,000Equipment 38,000 Owner’s Capital 40,750
$104,750 $104,750
During January 2017, the following transactions occurred. (Morgan Company uses the perpetual inventory system.)
1. Morgan paid $250 interest on the note payable on January 1, 2017. The note is due December 31, 2018.
2. Morgan purchased $261,100 of inventory on account. 3. Morgan sold for $440,000 cash, inventory which cost $265,000. Morgan also collected $28,600 in
sales taxes. 4. Morgan paid $230,000 in accounts payable. 5. Morgan paid $17,000 in sales taxes to the state.

CONTINUING PROBLEM
COOKIE CREATIONS: AN ENTREPRENEURIAL JOURNEY(Note: This is a continuation of the Cookie Creations problem from Chapters 1 through 10.)
CC11 Recall that Cookie Creations sells fi ne European mixers that it purchases from Kzinski Supply Co. Kzinski warrants the mixers to be free of defects in material and workmanship for a period of one year from the date of original purchase. If the mixer has such a defect, Kzinski will repair or replace the mixer free of charge for parts and labor.
Go to the book’s companion website, www.wiley.com/college/weygandt, to see the completion of this problem.
© leungchopan/Shutterstock
6. Paid other operating expenses of $30,000. 7. On January 31, 2017, the payroll for the month consists of salaries and wages of $60,000. All
salaries and wages are subject to 7.65% FICA taxes. A total of $8,900 federal income taxes are withheld. The salaries and wages are paid on February 1.
Adjustment data:
8. Interest expense of $250 has been incurred on the notes payable. 9. The insurance for the year 2017 was prepaid on December 31, 2016.10. The equipment was acquired on December 31, 2016, and will be depreciated on a straight-line
basis over 5 years with a $2,000 salvage value.11. Employer’s payroll taxes include 7.65% FICA taxes, a 5.4% state unemployment tax, and an 0.8%
federal unemployment tax.
Instructions(You may need to set up T-accounts to determine ending balances.)
(a) Prepare journal entries for the transactions listed above and the adjusting entries.(b) Prepare an adjusted trial balance at January 31, 2017.(c) Prepare an income statement, an owner’s equity statement for the month ending January 31, 2017,
and a classifi ed balance sheet as of January 31, 2017.
PERSPECTIVEFINANCIAL REPORTING AND ANALYSIS
Financial Reporting Problem: Apple Inc.BYP11-1 The fi nancial statements of Apple Inc. are presented in Appendix A. Instructions for access-ing and using the company’s complete annual report, including the notes to the fi nancial statements, are also provided in Appendix A.
InstructionsRefer to Apple’s fi nancial statements and answer the following questions about current and contin-gent liabilities and payroll costs.
(a) What were Apple’s total current liabilities at September 28, 2013? What was the increase/decrease in Apple’s total current liabilities from the prior year?
(b) In Apple’s Note 10, the company explains the nature of its contingencies. Under what conditions does Apple recognize (record and report) liabilities for contingencies?
(c) What were the components of total current liabilities on September 28, 2013?
Comparative Analysis Problem: PepsiCo, Inc. vs. The Coca-Cola CompanyBYP11-2 PepsiCo, Inc.’s fi nancial statements are presented in Appendix B. Financial statements of The Coca-Cola Company are presented in Appendix C. Instructions for accessing and using the com-plete annual reports of PepsiCo and Coca-Cola, including the notes to the fi nancial statements, are also provided in Appendices B and C, respectively.
BROADENING YOUR
Broadening Your Perspective 527
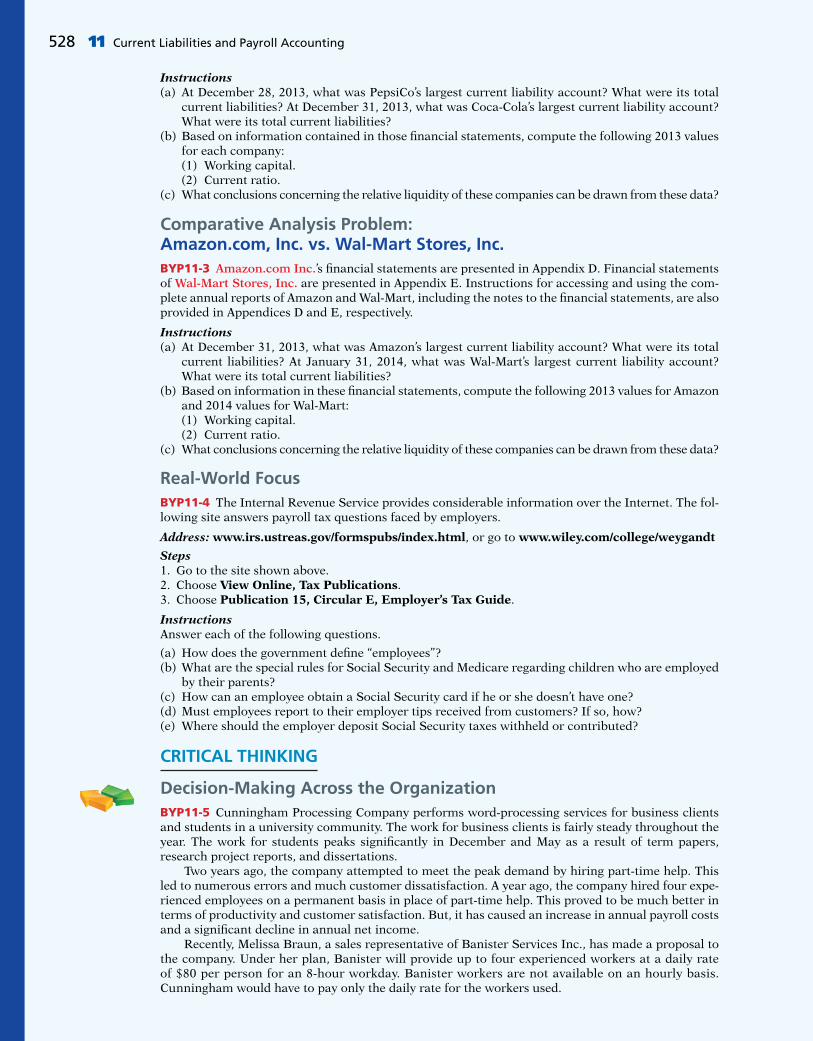
Instructions(a) At December 28, 2013, what was PepsiCo’s largest current liability account? What were its total
current liabilities? At December 31, 2013, what was Coca-Cola’s largest current liability account? What were its total current liabilities?
(b) Based on information contained in those fi nancial statements, compute the following 2013 values for each company:
(1) Working capital. (2) Current ratio.(c) What conclusions concerning the relative liquidity of these companies can be drawn from these data?
Comparative Analysis Problem: Amazon.com, Inc. vs. Wal-Mart Stores, Inc.BYP11-3 Amazon.com Inc.’s fi nancial statements are presented in Appendix D. Financial statements of Wal-Mart Stores, Inc. are presented in Appendix E. Instructions for accessing and using the com-plete annual reports of Amazon and Wal-Mart, including the notes to the fi nancial statements, are also provided in Appendices D and E, respectively.
Instructions(a) At December 31, 2013, what was Amazon’s largest current liability account? What were its total
current liabilities? At January 31, 2014, what was Wal-Mart’s largest current liability account? What were its total current liabilities?
(b) Based on information in these fi nancial statements, compute the following 2013 values for Amazon and 2014 values for Wal-Mart:
(1) Working capital. (2) Current ratio.(c) What conclusions concerning the relative liquidity of these companies can be drawn from these data?
Real-World FocusBYP11-4 The Internal Revenue Service provides considerable information over the Internet. The fol-lowing site answers payroll tax questions faced by employers.
Address: www.irs.ustreas.gov/formspubs/index.html, or go to www.wiley.com/college/weygandt
Steps1. Go to the site shown above.2. Choose View Online, Tax Publications.3. Choose Publication 15, Circular E, Employer’s Tax Guide.
InstructionsAnswer each of the following questions.
(a) How does the government defi ne “employees”?(b) What are the special rules for Social Security and Medicare regarding children who are employed
by their parents?(c) How can an employee obtain a Social Security card if he or she doesn’t have one?(d) Must employees report to their employer tips received from customers? If so, how?(e) Where should the employer deposit Social Security taxes withheld or contributed?
CRITICAL THINKING
Decision-Making Across the OrganizationBYP11-5 Cunningham Processing Company performs word-processing services for business clients and students in a university community. The work for business clients is fairly steady throughout the year. The work for students peaks signifi cantly in December and May as a result of term papers, research project reports, and dissertations. Two years ago, the company attempted to meet the peak demand by hiring part-time help. This led to numerous errors and much customer dissatisfaction. A year ago, the company hired four expe-rienced employees on a permanent basis in place of part-time help. This proved to be much better in terms of productivity and customer satisfaction. But, it has caused an increase in annual payroll costs and a signifi cant decline in annual net income. Recently, Melissa Braun, a sales representative of Banister Services Inc., has made a proposal to the company. Under her plan, Banister will provide up to four experienced workers at a daily rate of $80 per person for an 8-hour workday. Banister workers are not available on an hourly basis. Cunningham would have to pay only the daily rate for the workers used.
528 11 Current Liabilities and Payroll Accounting

The owner of Cunningham Processing, Carol Holt, asks you, as the company’s accountant, to pre-pare a report on the expenses that are pertinent to the decision. If the Banister plan is adopted, Carol will terminate the employment of two permanent employees and will keep two permanent employees. At the moment, each employee earns an annual income of $22,000. Cunningham pays 7.65% FICA taxes, 0.8% federal unemployment taxes, and 5.4% state unemployment taxes. The unemployment taxes apply to only the fi rst $7,000 of gross earnings. In addition, Cunningham pays $40 per month for each employee for medical and dental insurance. Carol indicates that if the Banister Services plan is accepted, her needs for temporary workers will be as follows.
Number Working Months of Employees Days per Month
January–March 2 20April–May 3 25June–October 2 18November–December 3 23
InstructionsWith the class divided into groups, answer the following.
(a) Prepare a report showing the comparative payroll expense of continuing to employ permanent workers compared to adopting the Banister Services Inc. plan.
(b) What other factors should Carol consider before fi nalizing her decision?
Communication ActivityBYP11-6 Mike Falcon, president of the Brownlee Company, has recently hired a number of additional employees. He recognizes that additional payroll taxes will be due as a result of this hiring, and that the company will serve as the collection agent for other taxes.
InstructionsIn a memorandum to Mike Falcon, explain each of the taxes, and identify the taxes that result in pay-roll tax expense to Brownlee Company.
Ethics CaseBYP11-7 Robert Eberle owns and manages Robert’s Restaurant, a 24-hour restaurant near the city’s medical complex. Robert employs 9 full-time employees and 16 part-time employees. He pays all of the full-time employees by check, the amounts of which are determined by Robert’s public accoun-tant, Anne Farr. Robert pays all of his part-time employees in currency. He computes their wages and withdraws the cash directly from his cash register. Anne has repeatedly urged Robert to pay all employees by check. But as Robert has told his competitor and friend, Danny Gall, who owns the Greasy Diner, “My part-time employees prefer the currency over a check. Also, I don’t withhold or pay any taxes or worker’s compensation insurance on those cash wages because they go totally unrecorded and unnoticed.”
Instructions(a) Who are the stakeholders in this situation?(b) What are the legal and ethical considerations regarding Robert’s handling of his payroll?(c) Anne Farr is aware of Robert’s payment of the part-time payroll in currency. What are her ethical
responsibilities in this case?(d) What internal control principle is violated in this payroll process?
All About YouBYP11-8 Medical costs are substantial and rising. But will they be the most substantial expense over your lifetime? Not likely. Will it be housing or food? Again, not likely. The answer is taxes. On average, Americans work 107 days to afford their taxes. Companies, too, have large tax burdens. They look very hard at tax issues in deciding where to build their plants and where to locate their administrative headquarters.
Instructions(a) Determine what your state income taxes are if your taxable income is $60,000 and you fi le as a
single taxpayer in the state in which you live.(b) Assume that you own a home worth $200,000 in your community and the tax rate is 2.1%. Compute
the property taxes you would pay.
Broadening Your Perspective 529

(c) Assume that the total gasoline bill for your automobile is $1,200 a year (300 gallons at $4 per gal-lon). What are the amounts of state and federal taxes that you pay on the $1,200?
(d) Assume that your purchases for the year total $9,000. Of this amount, $5,000 was for food and prescription drugs. What is the amount of sales tax you would pay on these purchases? (Many states do not levy a sales tax on food or prescription drugs. Does yours?)
(e) Determine what your Social Security taxes are if your income is $60,000.(f) Determine what your federal income taxes are if your taxable income is $60,000 and you fi le as a
single taxpayer.(g) Determine your total taxes paid based on the above calculations, and determine the percentage of
income that you would pay in taxes based on the following formula: Total taxes paid 4 Total income.
FASB Codifi cation ActivityBYP11-9 If your school has a subscription to the FASB Codifi cation, go to http://aaahq.org/ascLogin.cfm to log in and prepare responses to the following.
(a) What is the defi nition of current liabilities?(b) What is the defi nition of a contingent liability?(c) What guidance does the Codifi cation provide for the disclosure of contingent liabilities?
530 11 Current Liabilities and Payroll Accounting
5 Compare the accounting for payroll under GAAP and IFRS.LEARNING OBJECTIVE
IFRS and GAAP have similar defi nitions of liabilities. The general recording procedures for payroll are similar, although differences occur depending on the types of benefi ts that are provided in different countries. For example, companies in other countries often have different forms of pensions, unem-ployment benefi ts, welfare payments, and so on.
Key PointsFollowing are the key similarities and differences between GAAP and IFRS related to current liabili-ties and payroll.
Similarities• The basic defi nition of a liability under GAAP and IFRS is very similar. In a more technical way,
liabilities are defi ned by the IASB as a present obligation of the entity arising from past events, the settlement of which is expected to result in an outfl ow from the entity of resources embodying eco-nomic benefi ts.
• The accounting for current liabilities such as notes payable, unearned revenue, and payroll taxes payable are similar between IFRS and GAAP.
• Under IFRS, liabilities are classifi ed as current if they are expected to be paid within 12 months.
Differences• Companies using IFRS sometimes show liabilities before assets. Also, they will sometimes show
long-term liabilities before current liabilities.
• Under IFRS, companies sometimes will net current liabilities against current assets to show work-ing capital on the face of the statement of fi nancial position.
• Under GAAP, some contingent liabilities are recorded in the fi nancial statements, others are dis-closed, and in some cases no disclosure is required. Unlike GAAP, IFRS reserves the use of the term contingent liability to refer only to possible obligations that are not recognized in the fi nancial statements but may be disclosed if certain criteria are met.
A Look at IFRS

• For those items that GAAP would treat as recordable contingent liabilities, IFRS instead uses the term provisions. Provisions are defi ned as liabilities of uncertain timing or amount. Examples of provisions would be provisions for warranties, employee vacation pay, or anticipated losses. Under IFRS, the measurement of a provision related to an uncertain obligation is based on the best esti-mate of the expenditure required to settle the obligation.
Looking to the FutureThe FASB and IASB are currently involved in two projects, each of which has implications for the accounting for liabilities. One project is investigating approaches to differentiate between debt and equity instruments. The other project, the elements phase of the conceptual framework project, will evaluate the defi nitions of the fundamental building blocks of accounting. The results of these proj-ects could change the classifi cation of many debt and equity securities.
A Look at IFRS 531
IFRS Practice
IFRS Self-Test Questions
1. Which of the following is false?(a) Under IFRS, current liabilities must always be presented before noncurrent liabilities.(b) Under IFRS, an item is a current liability if it will be paid within the next 12 months.(c) Under IFRS, current liabilities are sometimes netted against current assets on the statement of
fi nancial position.(d) Under IFRS, a liability is only recognized if it is a present obligation.
2. Under IFRS, a contingent liability is:(a) disclosed in the notes if certain criteria are met.(b) reported on the face of the fi nancial statements if certain criteria are met.(c) the same as a provision.(d) not covered by IFRS.
3. Under IFRS, obligations related to warranties are considered:(a) contingent liabilities. (c) possible obligations.(b) provisions. (d) None of these.
4. The joint projects of the FASB and IASB could potentially:(a) change the defi nition of liabilities. (c) change the defi nition of assets.(b) change the defi nition of equity. (d) All of the above.
IFRS ExercisesIFRS11-1 Defi ne a provision and give an example.
IFRS11-2 Briefl y describe some of the similarities and differences between GAAP and IFRS with respect to the accounting for liabilities.
International Financial Statement Analysis: Louis Vuitton
IFRS11-3 The fi nancial statements of Louis Vuitton are presented in Appendix F. Instructions for accessing and using the company’s complete annual report, including the notes to the fi nancial state-ments, are also provided in Appendix F.
Instructions(a) What were the total current liabilities for the company as of December 31, 2013? What portion of
these current liabilities related to provisions?(b) What is the company’s accounting policies related to provisions?
Answers to IFRS Self-Test Questions
1. a 2. a 3. b 4. d

In 1990, Cliff Chenfeld and Craig Balsam gave up the razors,
ties, and six-fi gure salaries they had become accustomed to as
New York lawyers. Instead, they set up a partnership, Razor &
Tie Music, in Cliff’s living room. Ten years later, it became the
only record company in the country that had achieved success
in selling music both on television and in stores. Razor & Tie’s
entertaining and effective TV commercials have yielded
unprecedented sales for multi-artist music compilations. At
the same time, its hot retail label has been behind some of the
most recent original, progressive releases from artists such as
Norma Jean, For Today, Chelsea Grin, and Starset.
Razor & Tie got its start with its fi rst TV release, Those
Fabulous ’70s (100,000 copies sold), followed by Disco Fever
(over 300,000 sold). After restoring the respectability of the
oft-maligned music of the 1970s, the partners forged into the
musical ’80s with the same zeal that elicited success with their
fi rst releases. In 1993, Razor & Tie released Totally ’80s, a
collection of Top-10 singles from the 1980s that has sold over
450,000 units.
In 1995, Razor & Tie broke into the contemporary music world
with Living in the ’90s, the most successful record in the
history of the company. Featuring a number of songs that
were still hits on the radio at the time the package initially
aired, Living in the ’90s was a blockbuster. It received Gold
certifi cation in less than nine months and rewrote the rules on
direct-response albums. For the fi rst time, contemporary music
was available through an album offered only through
direct-response spots.
In fact, Razor & Tie is now a vertically integrated business that
includes a music company with major label distribution, a
music publishing business, a media buying company, a home
video company, a direct marketing operation, and a growing
database of entertainment consumers.
Razor & Tie has carved out a sizable piece of the market through
the complementary talents of the two partners. Their imagination
and savvy, along with exciting new releases planned for the
coming years, ensure Razor & Tie’s continued growth.
From Trials to the Top Ten
12
FEATURE STORY
Accounting for Partnerships
532
It is not surprising that when Cliff Chenfeld and Craig Balsam began Razor & Tie (see the Feature Story below), they decided to use the partnership form of organization. Both saw the need for hands-on control of their product and its promotion. In this chapter, we discuss reasons why businesses select the partnership form of organization. We also explain the major issues in accounting for partnerships.
CHAPTER PREVIEW

Ollyy/ShutterstocOllOllOllOlllOllOllOOO yy/yy/yy/yy/yy/yy/yy/yy/yy/yyyy/y/yyy ShuSShShuShuShuSS ttettettttt erstrstrsrsrstsrssrstococooooo
Explain how to account for net income or net loss of a partnership.
Explain how to account for the liquidation of a partnership.
2
3
Discuss and account for the formation of a partnership.1 Partnership
OrganizationDO IT! 1
• Characteristics of partnerships• Organizations with partnership
characteristics• Advantages and disadvantages
of partnerships• The partnership agreement• Accounting for a partnership
formation
• Dividing net income or net loss• Partnership fi nancial statements
Learning Objectives
• No capital defi ciency• Capital defi ciency
DO IT! 2 Division of Net Income
Go to the REVIEW AND PRACTICE section at the end of the chapter for a review of key concepts and practice applications with solutions.
Visit WileyPLUS with ORION for additional tutorials and practice opportunities.
CHAPTER OUTLINE
Partnership Liquidation—No Capital Defi ciency
3aPartnership Liquidation—Capital Defi ciency
DO IT!3b

534 12 Accounting for Partnerships
1 Discuss and account for the formation of a partnership.LEARNING OBJECTIVE
A partnership is an association of two or more persons to carry on as co-owners of a business for profi t. Partnerships are sometimes used in small retail, service, or manufacturing companies. Accountants, lawyers, and doctors also fi nd it desirable to form partnerships with other professionals in the fi eld.
Characteristics of Partnerships
Partnerships are fairly easy to form. People form partnerships simply by a verbal agreement or more formally by written agreement. We explain the principal char-acteristics of partnerships in the following sections.
ASSOCIATION OF INDIVIDUALS
A partnership is a legal entity. A partnership can own property (land, buildings, equipment) and can sue or be sued. A partnership also is an accounting entity. Thus, the personal assets, liabilities, and transactions of the partners are excluded from the accounting records of the partnership, just as they are in a proprietorship. The net income of a partnership is not taxed as a separate entity. But, a part-nership must fi le an information tax return showing partnership net income and each partner’s share of that net income. Each partner’s share is taxable at per-sonal tax rates, regardless of the amount of net income each withdraws from the business during the year.
MUTUAL AGENCY
Mutual agency means that each partner acts on behalf of the partnership when engaging in partnership business. The act of any partner is binding on all other partners. This is true even when partners act beyond the scope of their authority, so long as the act appears to be appropriate for the partnership. For example, a partner of a grocery store who purchases a delivery truck creates a binding con-tract in the name of the partnership, even if the partnership agreement denies this authority. On the other hand, if a partner in a law fi rm purchased a snowmo-bile for the partnership, such an act would not be binding on the partnership. The purchase is clearly outside the scope of partnership business.
LIMITED LIFE
Corporations have unlimited life. Partnerships do not. A partnership may be ended voluntarily at any time through the acceptance of a new partner or the withdrawal of a partner. It may be ended involuntarily by the death or incapacity of a partner. Partnership dissolution occurs whenever a partner withdraws or a new partner is admitted. Dissolution does not necessarily mean that the business ends. If the continuing partners agree, operations can continue without interrup-tion by forming a new partnership.
UNLIMITED LIABILITY
Each partner is personally and individually liable for all partnership liabilities. Creditors’ claims attach fi rst to partnership assets. If these are insuffi cient, the claims then attach to the personal resources of any partner, irrespective of that partner’s equity in the partnership. Because each partner is responsible for all the debts of the partnership, each partner is said to have unlimited liability.
CO-OWNERSHIP OF PROPERTY
Partners jointly own partnership assets. If the partnership is dissolved, each part-ner has a claim on total assets equal to the balance in his or her respective capital account. This claim does not attach to specifi c assets that an individual partner
Association of Individuals
Mutual Agency
Limited Life
Unlimited Liability

Forming a Partnership 535
contributed to the fi rm. Similarly, if a partner invests a building in the partner-ship valued at $100,000 and the building is later sold at a gain of $20,000, the partners all share in the gain. Partnership net income (or net loss) is also co-owned. If the partnership contract does not specify to the contrary, all net income or net loss is shared equally by the partners. As you will see later, though, partners may agree to unequal sharing of net income or net loss.
Organizations with Partnership Characteristics
If you are starting a business with a friend and each of you has little capital and your business is not risky, you probably want to use a partnership. As indicated above, the partnership is easy to establish and its cost is minimal. These types of partnerships are often called regular partnerships. However if your business is risky—say, roof repair or performing some type of professional service—you will want to limit your liability and not use a regular partnership. As a result, special forms of business organizations with partnership characteristics are now often used to provide protection from unlimited liability for people who wish to work together in some activity. The special partnership forms are limited partnerships, limited liability part-nerships, and limited liability companies. These special forms use the same accounting procedures as those described for a regular partnership. In addition, for taxation purposes, all the profi ts and losses pass through these organizations (similar to the regular partnership) to the owners, who report their share of part-nership net income or losses on their personal tax returns.
LIMITED PARTNERSHIPS
In a limited partnership, one or more partners have unlimited liability and one or more partners have limited liability for the debts of the fi rm. Those with unlimited liability are general partners. Those with limited liability are limited partners. Limited partners are responsible for the debts of the partnership up to the limit of their investment in the fi rm. The words “Limited Partnership,” “Ltd.,” or “LP” identify this type of organization. For the privilege of limited liability, the limited partner usually accepts less compensation than a general partner and exercises less infl uence in the affairs of the fi rm. If the limited partners get involved in management, they risk their liability protection.
LIMITED LIABILITY PARTNERSHIP
Most states allow professionals such as lawyers, doctors, and accoun-tants to form a limited liability partnership or “LLP.” The LLP is designed to protect innocent partners from malpractice or negligence claims resulting from the acts of another partner. LLPs generally carry large insurance policies as protection against malpractice suits. These professional partnerships vary in size from a medical partnership of three to fi ve doctors, to 150 to 200 partners in a large law fi rm, to more than 2,000 partners in an international accounting fi rm.
LIMITED LIABILITY COMPANIES
A hybrid form of business organization with certain features like a corporation and others like a limited partnership is the limited liability company or “LLC.” An LLC usually has a limited life. The owners, called members, have limited liability like owners of a corporation. Whereas limited partners do not actively participate in the management of a limited partnership (LP), the members of a limited liability company (LLC) can assume an active manage-ment role. For income tax purposes, the IRS usually classifi es an LLC as a partnership.
Helpful HintIn an LLP, all partners have limited liability. There are no general partners.
Much of the funding for successful new U.S. businesses comes from “venture capital” fi rms, which are organized as limited partnerships. To develop its own venture capital industry, China has taken steps to model its partnership laws to allow for limited partnerships like those in the United States.
International Note
Co-Ownership of Property
TOR Ltd.

536 12 Accounting for Partnerships
Illustration 12-1 summarizes different forms of organizations that have part-nership characteristics.
Limited Liability Companies Gain in Popularity
The proprietorship form of business organization is still the most popular, followed by the corporate form. But when-ever a group of individuals wants to form a partnership, the limited liability company is usually the popular choice.
One other form of business organization is a subchap-ter S corporation. A subchapter S corporation has many of the characteristics of a partnership—especially taxation as a partnership—but it is losing its popularity. The reason: It involves more paperwork and expense than a limited lia-bility company, which in most cases offers similar advan-tages.
Why do you think that the use of the limited liability company is gaining in popularity? (Go to WileyPLUS for this answer and additional questions.)
© Daniel Lafl or/iStockphoto
Accounting Across the Organization
Major Advantages
Simple and inexpensive tocreate and operate.
Limited partners have limitedpersonal liability for businessdebts as long as they do notparticipate in management.
General partners can raise cashwithout involving outsideinvestors in management ofbusiness.
Mostly of interest to partners inold-line professions such as law,medicine, and accounting.
Owners (partners) are notpersonally liable for themalpractice of other partners.
Owners have limited personalliability for business debts evenif they participate inmanagement.
Major Disadvantages
Owners (partners)personally liable forbusiness debts.
General partners personallyliable for business debts.
More expensive to create than regular partnership.
Suitable mainly for companiesthat invest in real estate.
Unlike a limited liabilitycompany, owners (partners)remain personally liable formany types of obligationsowed to business creditors,lenders, and landlords.
Often limited to a short listof professions.
More expensive to createthan regular partnership.
Limited LiabilityCompany
Limited LiabilityPartnership
Limited Partnership
LimitedPartners
GeneralPartner
Regular Partnership
General Partners
Illustration 12-1Different forms of organizations with partnership characteristics
Source: www.nolo.com.

Forming a Partnership 537
Advantages and Disadvantages of Partnerships
Why do people choose partnerships? One major advantage of a partnership is to combine the skills and resources of two or more individuals. In addition, partner-ships are easily formed and are relatively free from government regulations and restrictions. A partnership does not have to contend with the “red tape” that a corporation must face. Also, partners generally can make decisions quickly on substantive business matters without having to consult a board of directors. On the other hand, partnerships also have some major disadvantages. Unlim-ited liability is particularly troublesome. Many individuals fear they may lose not only their initial investment but also their personal assets if those assets are needed to pay partnership creditors. Illustration 12-2 summarizes the advantages and disadvantages of the regu-lar partnership form of business organization. As indicated previously, different types of partnership forms have evolved to reduce some of the disadvantages.
The Partnership Agreement
Ideally, the agreement of two or more individuals to form a partnership should be expressed in a written contract, called the partnership agreement or articles of co-partnership. The partnership agreement contains such basic information as the name and principal location of the fi rm, the purpose of the business, and date of inception. In addition, it should specify relationships among the partners, such as:
1. Names and capital contributions of partners.
2. Rights and duties of partners.
3. Basis for sharing net income or net loss.
4. Provision for withdrawals of assets.
5. Procedures for submitting disputes to arbitration.
6. Procedures for the withdrawal or addition of a partner.
7. Rights and duties of surviving partners in the event of a partner’s death.
We cannot overemphasize the importance of a written contract. The agree-ment should attempt to anticipate all possible situations, contingencies, and dis-agreements. The help of a lawyer is highly desirable in preparing the agreement.
Advantages Disadvantages
Combining skills and resources of two or more individuals Mutual agencyEase of formation Limited lifeFreedom from governmental regulations and restrictions Unlimited liabilityEase of decision-making
Illustration 12-2Advantages and disadvantages of a partnership
Dividing Up the Pie
What should you do when you and your business partner dis-agree to the point where you are no longer on speaking terms? Given how heated busi-ness situations can get, this is not an unusual occurrence.
Unfortunately, in many instances the partners do everything they can to undermine each other, eventually destroying the business. In some cases, people even steal from the part-nership because they either feel that they “deserve it” or they assume that the other partners are stealing from them.
It would be much better to follow the example of Jennifer Appel and her partner. They found that after opening a successful bakery and writing a cookbook, they couldn’t agree on how the business should be run. The other partner bought out Ms. Appel’s share of the busi-ness. Ms. Appel went on to start her own style of bakery, which she ultimately franchised.
Source: Paulette Thomas, “As Partnership Sours, Parting Is Sweet,” Wall Street Journal, (July 6, 2004), p. A20.
How can partnership confl icts be minimized and more easily resolved? (Go to WileyPLUS for this answer and additional questions.)
PhotoDisc/Getty Images, Inc.
Accounting Across the Organization
ETHICS NOTE
A well-developed partnership agreement specifi es in clear and concise language the process by which the partners will resolve ethical and legal problems. This issue is especially signifi cant when the partnership experiences fi nancial distress.

538 12 Accounting for Partnerships
Accounting for a Partnership Formation
We now turn to the basic accounting for partnerships. The major accounting issues relate to forming the partnership, dividing income or loss, and preparing fi nancial statements. When forming a partnership, each partner’s initial investment in a partner-ship is entered in the partnership records. The partnership should record these investments at the fair value of the assets at the date of their transfer to the partnership. All partners must agree to the values assigned. To illustrate, assume that A. Rolfe and T. Shea combine their proprietorships to start a partnership named U.S. Software. The fi rm will specialize in developing fi nancial modeling software. Rolfe and Shea have the following assets prior to the formation of the partnership.
The partnership records the investments as follows.
Investment of A. Rolfe
Cash 8,000Equipment 4,000 A. Rolfe, Capital 12,000 (To record investment of Rolfe)
Investment of T. Shea
Cash 9,000Accounts Receivable 4,000 Allowance for Doubtful Accounts 1,000 T. Shea, Capital 12,000 (To record investment of Shea)
Note that the partnership records neither the original cost of the equipment ($5,000) nor its book value ($5,000 2 $2,000). It records the equipment at its fair value, $4,000. The partnership does not carry forward any accumulated depreciation from the books of previous entities (in this case, the two propri-etorships). In contrast, the gross claims on customers ($4,000) are carried forward to the partnership. The partnership adjusts the allowance for doubtful accounts to $1,000, to arrive at a cash (net) realizable value of $3,000. A partnership may start with an allowance for doubtful accounts because it will continue to collect exist-ing accounts receivable, some of which are expected to be uncollectible. In addi-tion, this procedure maintains the control and subsidiary relationship between Accounts Receivable and the accounts receivable subsidiary ledger. After formation of the partnership, the accounting for transactions is similar to any other type of business organization. For example, the partners record all transactions with outside parties, such as the purchase or sale of inventory and the payment or receipt of cash, the same as would a sole proprietor. The steps in the accounting cycle described in Chapter 4 for a proprietorship also apply to a partnership. For example, the partnership prepares a trial balance
Book Value Fair Value
A. Rolfe T. Shea A. Rolfe T. Shea
Cash $ 8,000 $ 9,000 $ 8,000 $ 9,000Equipment 5,000 4,000Accumulated depreciation—equipment (2,000)Accounts receivable 4,000 4,000Allowance for doubtful accounts (700) (1,000)
$11,000 $12,300 $12,000 $12,000
Illustration 12-3Book and fair values of assets invested
Items under owners’ equity (OE) in the accounting equation analyses are not labeled in this partnership chapter. Nearly all affect partners’ capital accounts.
18,00014,000 112,000
Cash Flows18,000
A OEL5 1
19,00014,00021,000 112,000
Cash Flows19,000
A OEL5 1

Accounting for Net Income or Net Loss 539
and journalizes and posts adjusting entries. A worksheet may be used. There are minor differences in journalizing and posting closing entries and in preparing fi nancial statements, as we explain in the following sections. The differences occur because there is more than one owner.
Indicate whether each of the following statements is true or false.
________ 1. Partnerships have unlimited life. Corporations do not.
________ 2. Partners jointly own partnership assets. A partner’s claim on partnership assets does not attach to specifi c assets.
________ 3. In a limited partnership, the general partners have unlimited liability.
________ 4. The members of a limited liability company have limited liability, like share-holders of a corporation, and they are taxed like corporate shareholders.
________ 5. Because of mutual agency, the act of any partner is binding on all other partners.
Solution
DO IT! 1 Partnership Organization
Related exercise material: E12-1 and DO IT! 12-1.
Action Plan✔ When forming a
business, carefully consider what type of organization would best suit the needs of the business.
✔ Keep in mind the new, “hybrid” organizational forms that have many of the best characteristics of partnerships and corporations.
1. False. Corporations have unlimited life. Partnerships do not. 2. True. 3. True. 4. False. The members of a limited liability company are taxed like partners in a partnership. 5. True.
2 Explain how to account for net income or net loss of a partnership.LEARNING OBJECTIVE
Dividing Net Income or Net Loss
Partners equally share partnership net income or net loss unless the part-nership contract indicates otherwise. The same basis of division usually applies to both net income and net loss. It is customary to refer to this basis as the income ratio, the income and loss ratio, or the profi t and loss (P&L) ratio. Because of its wide acceptance, we use the term income ratio to identify the basis for dividing net income and net loss. The partnership recognizes a partner’s share of net income or net loss in the accounts through closing entries.
CLOSING ENTRIES
As in the case of a proprietorship, a partnership must make four entries in preparing closing entries. The entries are:
1. Debit each revenue account for its balance, and credit Income Summary for total revenues.
2. Debit Income Summary for total expenses, and credit each expense account for its balance.
3. Debit Income Summary for its balance, and credit each partner’s capital account for his or her share of net income. Or, credit Income Summary, and debit each partner’s capital account for his or her share of net loss.
4. Debit each partner’s capital account for the balance in that partner’s drawings account, and credit each partner’s drawings account for the same amount.
The fi rst two entries are the same as in a proprietorship. The last two entries are different because (1) there are two or more owners’ capital and drawings accounts, and (2) it is necessary to divide net income (or net loss) among the partners.

540 12 Accounting for Partnerships
To illustrate the last two closing entries, assume that AB Company has net income of $32,000 for 2017. The partners, L. Arbor and D. Barnett, share net income and net loss equally. Drawings for the year were Arbor $8,000 and Barnett $6,000. The last two closing entries are as follows.
Dec. 31 Income Summary 32,000 L. Arbor, Capital ($32,000 3 50%) 16,000 D. Barnett, Capital ($32,000 3 50%) 16,000 (To transfer net income to partners’ capital
accounts)
Dec. 31 L. Arbor, Capital 8,000 D. Barnett, Capital 6,000 L. Arbor, Drawings 8,000 D. Barnett, Drawings 6,000 (To close drawings accounts to capital
accounts)
Assume that the beginning capital balance is $47,000 for Arbor and $36,000 for Barnett. After posting the closing entries, the capital and drawings accounts will appear as shown in Illustration 12-4.
232,000 116,000 116,000
Cash Flowsno effect
A OEL5 1
28,000 26,000 18,000 16,000
Cash Flowsno effect
A OEL5 1
L. Arbor, Capital
12/31 Clos. 8,000 1/1 Bal. 47,000 12/31 Clos. 16,000
12/31 Bal. 55,000
L. Arbor, Drawings
12/31 Bal. 8,000 12/31 Clos. 8,000
D. Barnett, Capital
12/31 Clos. 6,000 1/1 Bal. 36,000 12/31 Clos. 16,000
12/31 Bal. 46,000
D. Barnett, Drawings
12/31 Bal. 6,000 12/31 Clos. 6,000
Illustration 12-4Partners’ capital and drawings accounts after closing
As in a proprietorship, the partners’ capital accounts are permanent accounts. Their drawings accounts are temporary accounts. Normally, the capital accounts will have credit balances, and the drawings accounts will have debit balances. Drawings accounts are debited when partners withdraw cash or other assets from the partnership for personal use.
INCOME RATIOS
As noted earlier, the partnership agreement should specify the basis for sharing net income or net loss. The following are typical income ratios.
1. A fi xed ratio, expressed as a proportion (6:4), a percentage (70% and 30%), or a fraction (2/3 and 1/3).
2. A ratio based either on capital balances at the beginning of the year or on average capital balances during the year.
3. Salaries to partners and the remainder on a fi xed ratio.
4. Interest on partners’ capital balances and the remainder on a fi xed ratio.
5. Salaries to partners, interest on partners’ capital, and the remainder on a fi xed ratio.
The objective is to settle on a basis that will equitably refl ect the partners’ capital investment and service to the partnership. A fi xed ratio is easy to apply, and it may be an equitable basis in some circumstances. Assume, for example, that Hughes and Lane are partners. Each contributes the same amount of capital, but Hughes expects to work full-time in the partnership and Lane expects to work only half-time. Accordingly, the partners agree to a fi xed ratio of 2/3 to Hughes and 1/3 to Lane. A ratio based on capital balances may be appropriate when the funds invested in the partnership are considered the critical factor. Capital ratios may also be equitable when the partners hire a manager to run the business and do not plan to take an active role in daily operations.
Helpful HintA proportion such as 4:4:2 has a denominator of 10 (4 1 4 1 2). Thus, the basis for sharing net income or loss is 4/10, 4/10, and 2/10.
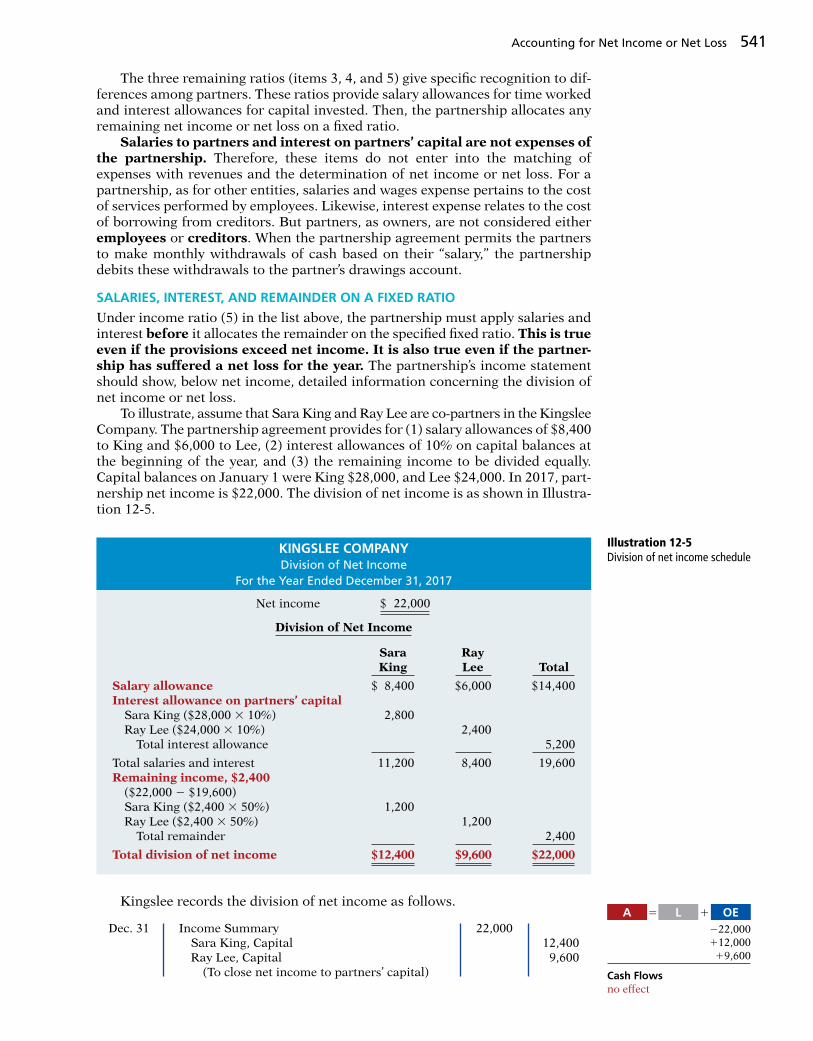
Accounting for Net Income or Net Loss 541
The three remaining ratios (items 3, 4, and 5) give specifi c recognition to dif-ferences among partners. These ratios provide salary allowances for time worked and interest allowances for capital invested. Then, the partnership allocates any remaining net income or net loss on a fi xed ratio. Salaries to partners and interest on partners’ capital are not expenses of the partnership. Therefore, these items do not enter into the matching of expenses with revenues and the determination of net income or net loss. For a partnership, as for other entities, salaries and wages expense pertains to the cost of services performed by employees. Likewise, interest expense relates to the cost of borrowing from creditors. But partners, as owners, are not considered either employees or creditors. When the partnership agreement permits the partners to make monthly withdrawals of cash based on their “salary,” the partnership debits these withdrawals to the partner’s drawings account.
SALARIES, INTEREST, AND REMAINDER ON A FIXED RATIO
Under income ratio (5) in the list above, the partnership must apply salaries and interest before it allocates the remainder on the specifi ed fi xed ratio. This is true even if the provisions exceed net income. It is also true even if the partner-ship has suffered a net loss for the year. The partnership’s income statement should show, below net income, detailed information concerning the division of net income or net loss. To illustrate, assume that Sara King and Ray Lee are co-partners in the Kingslee Company. The partnership agreement provides for (1) salary allowances of $8,400 to King and $6,000 to Lee, (2) interest allowances of 10% on capital balances at the beginning of the year, and (3) the remaining income to be divided equally. Capital balances on January 1 were King $28,000, and Lee $24,000. In 2017, part-nership net income is $22,000. The division of net income is as shown in Illustra-tion 12-5.
Net income $ 22,000
Division of Net Income
Sara Ray King Lee Total
Salary allowance $ 8,400 $6,000 $14,400Interest allowance on partners’ capital Sara King ($28,000 3 10%) 2,800 Ray Lee ($24,000 3 10%) 2,400 Total interest allowance 5,200
Total salaries and interest 11,200 8,400 19,600Remaining income, $2,400 ($22,000 2 $19,600) Sara King ($2,400 3 50%) 1,200 Ray Lee ($2,400 3 50%) 1,200 Total remainder 2,400
Total division of net income $12,400 $9,600 $22,000
KINGSLEE COMPANYDivision of Net Income
For the Year Ended December 31, 2017
Illustration 12-5Division of net income schedule
Kingslee records the division of net income as follows.
Dec. 31 Income Summary 22,000 Sara King, Capital 12,400 Ray Lee, Capital 9,600 (To close net income to partners’ capital)
222,000 112,000 19,600
Cash Flowsno effect
A OEL5 1

542 12 Accounting for Partnerships
Now let’s look at a situation in which the salary and interest allowances exceed net income. Assume that Kingslee Company’s net income is only $18,000. In this case, the salary and interest allowances will create a defi ciency of $1,600 ($18,000 2 $19,600). The computations of the allowances are the same as those in the preceding example. Beginning with total salaries and interest, we complete the division of net income as shown in Illustration 12-6.
Partnership Financial Statements
The fi nancial statements of a partnership are similar to those of a proprietorship. The differences are due to the number of owners involved. The income statement for a partnership is identical to the income statement for a proprietorship except for the division of net income, as shown earlier. The owners’ equity statement for a partnership is called the partners’ capital statement. It explains the changes in each partner’s capital account and in total partnership capital during the year. Illustration 12-7 shows the partners’ capital statement for Kingslee Company. It is based on the division of $22,000 of net income in Illustration 12-5 (page 541). The statement includes assumed data for the additional investment and drawings. The partnership prepares the partners’ capital statement from the income statement and the partners’ capital and draw-ings accounts.
Sara Ray King Lee Total
Total salaries and interest $11,200 $8,400 $19,600Remaining defi ciency ($1,600) ($18,000 2 $19,600) Sara King ($1,600 3 50%) (800) Ray Lee ($1,600 3 50%) (800) Total remainder (1,600)
Total division $10,400 $7,600 $18,000
Illustration 12-6Division of net income—income defi ciency
The balance sheet for a partnership is the same as for a proprietorship except for the owners’ equity section. For a partnership, the balance sheet shows the capital balances of each partner. Illustration 12-8 shows the owners’ equity section for Kingslee Company.
KINGSLEE COMPANYPartners’ Capital Statement
For the Year Ended December 31, 2017
Sara Ray King Lee Total
Capital, January 1 $28,000 $24,000 $52,000Add: Additional investment 2,000 2,000 Net income 12,400 9,600 22,000
42,400 33,600 76,000Less: Drawings 7,000 5,000 12,000
Capital, December 31 $35,400 $28,600 $64,000
Illustration 12-7Partners’ capital statement
Helpful HintAs in a proprietorship, partners’ capital may change due to (1) addi-tional investment, (2) drawings, and (3) net income or net loss.

Accounting for Liquidation 543
KINGSLEE COMPANYBalance Sheet (partial)
December 31, 2017
Total liabilities (assumed amount) $115,000Owners’ equity Sara King, capital $35,400 Ray Lee, capital 28,600
Total owners’ equity 64,000
Total liabilities and owners’ equity $179,000
Illustration 12-8Owners’ equity section of a partnership balance sheet
LeeMay Company reports net income of $57,000. The partnership agreement provides for salaries of $15,000 to L. Lee and $12,000 to R. May. They will share the remainder on a 60:40 basis (60% to Lee). L. Lee asks your help to divide the net income between the partners and to prepare the closing entry.
Solution
DO IT! 2 Division of Net Income
Related exercise material: BE12-3, BE12-4, BE12-5, E12-4, E12-5, and DO IT! 12-2.
Action Plan✔ Compute net income
exclusive of any sala-ries to partners and interest on partners’ capital.
✔ Deduct salaries to partners from net income.
✔ Apply the partners’ income ratios to the remaining net income.
✔ Prepare the closing entry distributing net income or net loss among the partners’ capital accounts.
The division of net income is as follows.
L. Lee R. May Total
Salary allowance $15,000 $12,000 $27,000Remaining income $30,000 ($57,000 2 $27,000) L. Lee (60% 3 $30,000) 18,000 R. May (40% 3 $30,000) 12,000 Total remaining income 30,000
Total division of net income $33,000 $24,000 $57,000
The closing entry for net income therefore is:
Income Summary 57,000 L. Lee, Capital 33,000 R. May, Capital 24,000 (To close net income to partners’
capital accounts)
3 Explain how to account for the liquidation of a partnership.LEARNING OBJECTIVE
Liquidation of a business involves selling the assets of the fi rm, paying liabilities, and distributing any remaining assets. Liquidation may result from the sale of the business by mutual agreement of the partners, from the death of a partner, or from bankruptcy. Partnership liquidation ends both the legal and economic life of the entity. From an accounting standpoint, the partnership should complete the accounting cycle for the fi nal operating period prior to liquidation. This includes preparing adjusting entries and fi nancial statements. It also involves preparing closing entries and a post-closing trial balance. Thus, only balance sheet accounts should be open as the liquidation process begins.

544 12 Accounting for Partnerships
In liquidation, the sale of noncash assets for cash is called realization. Any difference between book value and the cash proceeds is called the gain or loss on realization. To liquidate a partnership, it is necessary to:
1. Sell noncash assets for cash and recognize a gain or loss on realization.
2. Allocate gain/loss on realization to the partners based on their income ratios.
3. Pay partnership liabilities in cash.
4. Distribute remaining cash to partners on the basis of their capital balances.
Each of the steps must be performed in sequence. The partnership must pay creditors before partners receive any cash distributions. Also, an accounting entry must record each step. When a partnership is liquidated, all partners may have credit balances in their capital accounts. This situation is called no capital defi ciency. Or, one or more partners may have a debit balance in the capital account. This situation is termed a capital defi ciency. To illustrate each of these conditions, assume that Ace Company is liquidated when its ledger shows the following assets, liabilities, and owners’ equity accounts.
ETHICS NOTE
The process of selling noncash assets and then distributing the cash reduces the likelihood of partner disputes. If instead the partnership distributes noncash assets to partners to liquidate the fi rm, the partners would need to agree on the value of the noncash assets, which can be very diffi cult to determine.
No Capital Defi ciency
The partners of Ace Company agree to liquidate the partnership on the following terms. (1) The partnership will sell its noncash assets to Jackson Enterprises for $75,000 cash. (2) The partnership will pay its partnership liabilities. The income ratios of the partners are 3:2:1, respectively. The steps in the liquidation process are as follows.
1. Ace sells the noncash assets (accounts receivable, inventory, and equipment) for $75,000. The book value of these assets is $60,000 ($15,000 1 $18,000 1 $35,000 2 $8,000). Thus, Ace realizes a gain of $15,000 on the sale. The entry is:
Illustration 12-9Account balances prior to liquidation
Assets Liabilities and Owners’ Equity
Cash $ 5,000 Notes Payable $15,000Accounts Receivable 15,000 Accounts Payable 16,000Inventory 18,000 R. Arnet, Capital 15,000Equipment 35,000 P. Carey, Capital 17,800Accum. Depr.—Equipment (8,000) W. Eaton, Capital 1,200
$65,000 $65,000
Helpful HintThe income ratios’ denomi-nator for Ace Company is 6 (3 1 2 1 1).
(1)
Cash 75,000Accumulated Depreciation–Equipment 8,000 Accounts Receivable 15,000 Inventory 18,000 Equipment 35,000 Gain on Realization 15,000 (To record realization of noncash assets)
2. Ace allocates the $15,000 gain on realization to the partners based on their income ratios, which are 3:2:1. The entry is:
(2)
Gain on Realization 15,000 R. Arnet, Capital ($15,000 3 3/6) 7,500 P. Carey, Capital ($15,000 3 2/6) 5,000 W. Eaton, Capital ($15,000 3 1/6) 2,500 (To allocate gain to partners’ capital accounts)
A OEL5 1
175,000 18,000215,000218,000235,000
115,000
Cash Flows175,000
A OEL5 1
215,000 17,500 15,000 12,500
Cash Flowsno effect

Accounting for Liquidation 545
3. Partnership liabilities consist of Notes Payable $15,000 and Accounts Payable $16,000. Ace pays creditors in full by a cash payment of $31,000. The entry is:
(3)
Notes Payable 15,000Accounts Payable 16,000 Cash 31,000 (To record payment of partnership liabilities)
4. Ace distributes the remaining cash to the partners on the basis of their capital balances. After posting the entries in the fi rst three steps, all partnership accounts, including Gain on Realization, will have zero balances except for four accounts: Cash $49,000; R. Arnet, Capital $22,500; P. Carey, Capital $22,800; and W. Eaton, Capital $3,700, as shown below.
A OEL5 1
215,000 216,000231,000
Cash Flows231,000
Illustration 12-10Ledger balances before distribution of cash
Cash
Bal. 5,000 (3) 31,000(1) 75,000
Bal. 49,000
R. Arnet, Capital
Bal. 15,000 (2) 7,500
Bal. 22,500
P. Carey, Capital
Bal. 17,800 (2) 5,000
Bal. 22,800
W. Eaton, Capital
Bal. 1,200 (2) 2,500
Bal. 3,700
Ace records the distribution of cash as follows.
(4)
R. Arnet, Capital 22,500P. Carey, Capital 22,800W. Eaton, Capital 3,700 Cash 49,000 (To record distribution of cash to partners)
A OEL5 1
222,500 222,800 23,700249,000
Cash Flows249,000
After posting this entry, all partnership accounts will have zero balances. A word of caution: Partnerships should not distribute remaining cash to partners on the basis of their income-sharing ratios. On this basis, Arnet would receive three-sixths, or $24,500, which would produce an erroneous debit balance of $2,000. The income ratio is the proper basis for allocating net income or loss. It is not a proper basis for making the fi nal distribution of cash to the partners.
SCHEDULE OF CASH PAYMENTS
The schedule of cash payments shows the distribution of cash to the partners in a partnership liquidation. The schedule of cash payments is organized around the basic accounting equation. Illustration 12-11 shows the schedule for Ace
Formulas Data Review ViewPage LayoutInsert
P18 fx
ACE Company.xlsHome
A B C D FE G H I J K L M
4
3
2
1
56
8
7
91011
(1)&(2)
(3)(4)
Cash LiabilitiesNoncashAssets
R. Arnet,Capital
P. Carey,Capital
W. Eaton,Capital
ACE COMPANYSchedule of Cash Payments
5,000
75,00080,000
(31,000)49,000
(49,000)
60,000 31,000
31,000(31,000)
15,000 17,800 1,200
2,5003,700
3,700(3,700)
5,00022,800
22,800(22,800)
22,5007,500
22,500(22,500)
(60,000)
� ��
����
�
�
��
�
�
�
�
�
�
�
��
��
�
�
��
�
�
0 0 0 0 0 0
0
0
0
Balances before liquidationSale of noncash assets and allocation of gainNew balancesPay liabilitiesNew balancesCash distribution to partnersFinal balances
Item
Illustration 12-11Schedule of cash payments, no capital defi ciency
Alternative TerminologyThe schedule of cash payments is sometimes called a safe cash payments schedule.

546 12 Accounting for Partnerships
Company. The numbers in parentheses in column B refer to the four required steps in the liquidation of a partnership. They also identify the accounting entries that Ace must make. The cash payments schedule is especially useful when the liquidation process extends over a period of time.
The partners of Grafton Company have decided to liquidate their business. Noncash assets were sold for $115,000. The income ratios of the partners Kale D., Croix D., and Marais K. are 2:3:3, respectively. Complete the following schedule of cash payments for Grafton Company.
Solution
DO IT! 3a Partnership Liquidation—No Capital Defi ciency
Related exercise material: BE12-6, E12-8, E12-9, and DO IT! 12-3a.
Action Plan✔ First, sell the
noncash assets and determine the gain.
✔ Allocate the gain to the partners based on their income ratios.
✔ Use cash to pay off liabilities.
✔ Distribute remaining cash on the basis of their capital balances.
Formulas Data Review ViewPage LayoutInsert
P18
GRAFTON Company.xlsHome
fx
A B C ED F G H I J K L
3
2
1
45
7
6
8910
Balances before liquidationSale of noncash assets and allocation of gain
Cash distribution to partners
New balances
New balancesPay liabilities
Final balances
Cash LiabilitiesItemNoncashAssets
Kale D.,Capital
Croix D.,Capital
Marais K.,Capital
10,000 85,000 40,000 15,000 35,000 5,000
� � � � �
Formulas Data Review ViewPage LayoutInsert
P18
GRAFTON Company.xlsHome
fx
A B C ED F G H I J K L
3
2
1
45
7
6
89
11
10
Balances before liquidationSale of noncash assets and allocation of gain
Cash distribution to partners
New balances
New balancesPay liabilities
Final balances
Cash LiabilitiesItemNoncashAssets
Kale D.,Capital
Croix D.,Capital
Marais K.,Capital
10,000
115,000125,000
85,000
(85,000)–0–
(40,000)–0–
–0–
–0–
85,000
(85,000)
(40,000)–0–
–0–
40,000
40,0007,500a
22,500
22,500
(22,500)–0–
15,000
11,250b
a30,000 x 2/8b30,000 x 3/8
46,250
46,250
(46,250)–0–
35,000
11,250b
16,250
16,250
(16,250)–0–
5,000� � � � �
Capital Defi ciency
A capital defi ciency may result from recurring net losses, excessive drawings, or losses from realization suffered during liquidation. To illustrate, assume that Ace Company is on the brink of bankruptcy. The partners decide to liquidate by hav-ing a “going-out-of-business” sale. They sell merchandise at substantial discounts, and sell the equipment at auction. Cash proceeds from these sales and collections from customers total only $42,000. Thus, the loss from liquidation is $18,000 ($60,000 2 $42,000). The steps in the liquidation process are as follows.

Accounting for Liquidation 547
1. The entry for the realization of noncash assets is:
(1)
Cash 42,000Accumulated Depreciation—Equipment 8,000Loss on Realization 18,000 Accounts Receivable 15,000 Inventory 18,000 Equipment 35,000 (To record realization of noncash assets)
2. Ace allocates the loss on realization to the partners on the basis of their income ratios. The entry is:
A OEL5 1
142,000 18,000 218,000215,000218,000235,000
Cash Flows142,000
(2)
R. Arnet, Capital ($18,000 3 3/6) 9,000P. Carey, Capital ($18,000 3 2/6) 6,000W. Eaton, Capital ($18,000 3 1/6) 3,000 Loss on Realization 18,000 (To allocate loss on realization to partners)
3. Ace pays the partnership liabilities. This entry is the same as the previous one.
A OEL5 1
29,000 26,000 23,000 118,000
Cash Flowsno effect
(3)
Notes Payable 15,000Accounts Payable 16,000 Cash 31,000 (To record payment of partnership liabilities)
4. After posting the three entries, two accounts will have debit balances—Cash $16,000 and W. Eaton, Capital $1,800. Two accounts will have credit balances—R. Arnet, Capital $6,000 and P. Carey, Capital $11,800. All four accounts are shown below.
A OEL5 1
215,000 216,000231,000
Cash Flows231,000
Cash
Bal. 5,000 (3) 31,000(1) 42,000
Bal. 16,000
R. Arnet, Capital
(2) 9,000 Bal. 15,000
Bal. 6,000
P. Carey, Capital
(2) 6,000 Bal. 17,800
Bal. 11,800
W. Eaton, Capital
(2) 3,000 Bal. 1,200
Bal. 1,800
Eaton has a capital defi ciency of $1,800 and so owes the partnership $1,800. Arnet and Carey have a legally enforceable claim for that amount against Eaton’s personal assets. Note that the distribution of cash is still made on the basis of capital balances. But, the amount will vary depending on how Eaton settles the defi ciency. Two alternatives are presented in the following sections.
PAYMENT OF DEFICIENCY
If the partner with the capital defi ciency pays the amount owed the partnership, the defi ciency is eliminated. To illustrate, assume that Eaton pays $1,800 to the partnership. The entry is:
Illustration 12-12Ledger balances before distribution of cash
(a)
Cash 1,800 W. Eaton, Capital 1,800 (To record payment of capital defi ciency by Eaton)
A OEL5 1
11,800 11,800
Cash Flows11,800

548 12 Accounting for Partnerships
After posting this entry, account balances are as follows.
Illustration 12-13Ledger balances after paying capital defi ciency
Cash
Bal. 5,000 (3) 31,000(1) 42,000(a) 1,800
Bal. 17,800
R. Arnet, Capital
(2) 9,000 Bal. 15,000
Bal. 6,000
P. Carey, Capital
(2) 6,000 Bal. 17,800
Bal. 11,800
W. Eaton, Capital
(2) 3,000 Bal. 1,200 (a) 1,800
Bal. –0–
The cash balance of $17,800 is now equal to the credit balances in the capital accounts (Arnet $6,000 1 Carey $11,800). Ace now distributes cash on the basis of these balances. The entry is:
R. Arnet, Capital 6,000P. Carey, Capital 11,800 Cash 17,800 (To record distribution of cash to the partners)
After posting this entry, all accounts will have zero balances.
NONPAYMENT OF DEFICIENCY
If a partner with a capital defi ciency is unable to pay the amount owed to the partnership, the partners with credit balances must absorb the loss. The partner-ship allocates the loss on the basis of the income ratios that exist between the partners with credit balances. The income ratios of Arnet and Carey are 3:2, or 3/5 and 2/5, respectively. Thus, Ace would make the following entry to remove Eaton’s capital defi ciency.
Helpful HintThe ratios with all three partners were 3:2:1 and the denominator was therefore 6. Leaving out Eaton, the denominator changes to 5 (3 1 2).
(a)
R. Arnet, Capital ($1,800 3 3/5) 1,080P. Carey, Capital ($1,800 3 2/5) 720 W. Eaton, Capital 1,800 (To record write-off of capital defi ciency)
After posting this entry, the cash and capital accounts will have the following balances.
Cash
Bal. 5,000 (3) 31,000(1) 42,000
Bal. 16,000
R. Arnet, Capital
(2) 9,000 Bal. 15,000(a) 1,080
Bal. 4,920
P. Carey, Capital
(2) 6,000 Bal. 17,800(a) 720
Bal. 11,080
W. Eaton, Capital
(2) 3,000 Bal. 1,200 (a) 1,800
Bal. –0–
The cash balance ($16,000) now equals the sum of the credit balances in the capital accounts (Arnet $4,920 1 Carey $11,080). Ace records the distribution of cash as:
Illustration 12-14Ledger balances after nonpayment of capital defi ciency
R. Arnet, Capital 4,920P. Carey, Capital 11,080 Cash 16,000 (To record distribution of cash to the partners)
After posting this entry, all accounts will have zero balances.
A OEL5 1
26,000 211,800217,800
Cash Flows217,800
A OEL5 1
21,080 2720 11,800
Cash Flowsno effect
A OEL5 1
24,920 211,080216,000
Cash Flows216,000

Appendix 12A: Admission and Withdrawal of Partners 549
Kessington Company wishes to liquidate the fi rm by distributing the company’s cash to the three partners. Prior to the distribution of cash, the company’s balances are Cash $45,000; Rollings, Capital (Cr.) $28,000; Havens, Capital (Dr.) $12,000; and Ostergard, Capital (Cr.) $29,000. The income ratios of the three partners are 4:4:2, respectively. Pre-pare the entry to record the absorption of Havens’ capital defi ciency by the other part-ners and the distribution of cash to the partners with credit balances.
Solution
DO IT! 3b Partnership Liquidation—Capital Defi ciency
Rollings, Capital ($12,000 3 4/6) 8,000Ostergard, Capital ($12,000 3 2/6) 4,000 Havens, Capital 12,000 (To record write-off of capital defi ciency)
Rollings, Capital ($28,000 2 $8,000) 20,000Ostergard, Capital ($29,000 2 $4,000) 25,000 Cash 45,000 (To record distribution of cash to partners)
Related exercise material: E12-10 and DO IT! 12-3b.
Action Plan✔ Allocate any unpaid
capital defi ciency to the partners with credit balances, based on their income ratios.
✔ After distribution of the defi ciency, distribute cash to the remaining partners, based on their capital balances.
4 APPENDIX 12A: Prepare journal entries when a partner is either admitted or withdraws.
LEARNING OBJECTIVE
*
The chapter explained how the basic accounting for a partnership works. We now look at how to account for a common occurrence in partnerships—the addition or withdrawal of a partner.
Admission of a Partner
The admission of a new partner results in the legal dissolution of the existing partnership and the beginning of a new one. From an economic standpoint, how-ever, the admission of a new partner (or partners) may be of minor signifi cance in the continuity of the business. For example, in large public accounting or law fi rms, partners are admitted annually without any change in operating policies. To recognize the economic effects, it is necessary only to open a capital account for each new partner. In the entries illustrated in this appendix, we assume that the accounting records of the predecessor fi rm will continue to be used by the new partnership. A new partner may be admitted either by (1) purchasing the interest of one or more existing partners or (2) investing assets in the partnership. The former affects only the capital accounts of the partners who are parties to the transac-tion. The latter increases both net assets and total capital of the partnership.
PURCHASE OF A PARTNER’S INTEREST
The admission of a partner by purchase of an interest is a personal transaction between one or more existing partners and the new partner. Each party acts as an individual separate from the partnership entity. The individuals involved negoti-ate the price paid. It may be equal to or different from the capital equity acquired. The purchase price passes directly from the new partner to the partners who are giving up part or all of their ownership claims. Any money or other consideration exchanged is the personal property of the participants and not the property of the partnership. Upon purchase of an interest, the new partner acquires each selling partner’s capital interest and income ratio.
Helpful HintIn a purchase of an interest, the partnership is not a participant in the transaction. In this trans-action, the new partner contributes no cash to the partnership.
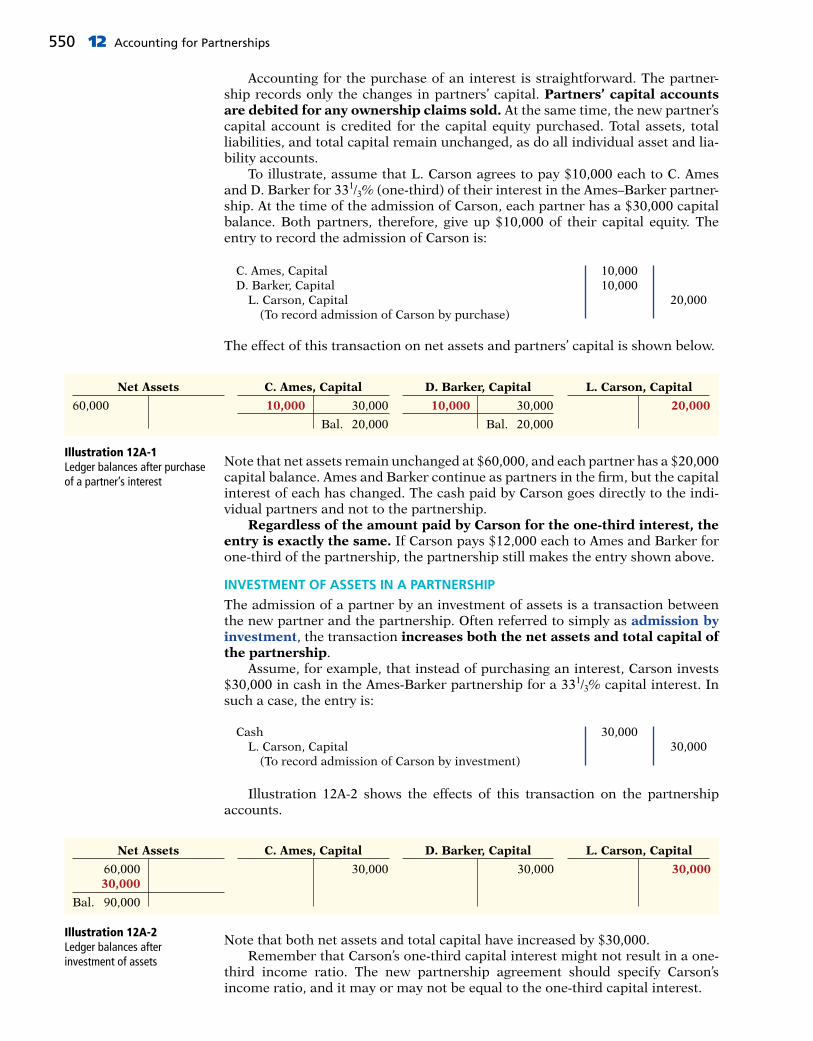
550 12 Accounting for Partnerships
Accounting for the purchase of an interest is straightforward. The partner-ship records only the changes in partners’ capital. Partners’ capital accounts are debited for any ownership claims sold. At the same time, the new partner’s capital account is credited for the capital equity purchased. Total assets, total liabilities, and total capital remain unchanged, as do all individual asset and lia-bility accounts. To illustrate, assume that L. Carson agrees to pay $10,000 each to C. Ames and D. Barker for 331/3% (one-third) of their interest in the Ames–Barker partner-ship. At the time of the admission of Carson, each partner has a $30,000 capital balance. Both partners, therefore, give up $10,000 of their capital equity. The entry to record the admission of Carson is:
C. Ames, Capital 10,000D. Barker, Capital 10,000 L. Carson, Capital 20,000 (To record admission of Carson by purchase)
The effect of this transaction on net assets and partners’ capital is shown below.
Illustration 12A-1Ledger balances after purchase of a partner’s interest
Net Assets
60,000
C. Ames, Capital
10,000 30,000
Bal. 20,000
D. Barker, Capital
10,000 30,000
Bal. 20,000
L. Carson, Capital
20,000
Note that net assets remain unchanged at $60,000, and each partner has a $20,000 capital balance. Ames and Barker continue as partners in the fi rm, but the capital interest of each has changed. The cash paid by Carson goes directly to the indi-vidual partners and not to the partnership. Regardless of the amount paid by Carson for the one-third interest, the entry is exactly the same. If Carson pays $12,000 each to Ames and Barker for one-third of the partnership, the partnership still makes the entry shown above.
INVESTMENT OF ASSETS IN A PARTNERSHIP
The admission of a partner by an investment of assets is a transaction between the new partner and the partnership. Often referred to simply as admission by investment, the transaction increases both the net assets and total capital of the partnership. Assume, for example, that instead of purchasing an interest, Carson invests $30,000 in cash in the Ames-Barker partnership for a 331/3% capital interest. In such a case, the entry is:
Cash 30,000 L. Carson, Capital 30,000 (To record admission of Carson by investment)
Illustration 12A-2 shows the effects of this transaction on the partnership accounts.
Net Assets
60,000 30,000
Bal. 90,000
C. Ames, Capital
30,000
D. Barker, Capital
30,000
L. Carson, Capital
30,000
Note that both net assets and total capital have increased by $30,000. Remember that Carson’s one-third capital interest might not result in a one-third income ratio. The new partnership agreement should specify Carson’s income ratio, and it may or may not be equal to the one-third capital interest.
Illustration 12A-2Ledger balances after investment of assets

Appendix 12A: Admission and Withdrawal of Partners 551
The comparison of the net assets and capital balances in Illustration 12A-3 shows the different effects of the purchase of an interest and admission by investment.
Illustration 12A-3Comparison of purchase of an interest and admission by investment
Purchase of an Interest Admission by Investment
Net assets $60,000 Net assets $90,000
Capital Capital C. Ames $20,000 C. Ames $30,000 D. Barker 20,000 D. Barker 30,000 L. Carson 20,000 L. Carson 30,000
Total capital $60,000 Total capital $90,000
When a new partner purchases an interest, the total net assets and total capital of the partnership do not change. When a partner is admitted by investment, both the total net assets and the total capital change by the amount of the new investment. In the case of admission by investment, further complications occur when the new partner’s investment differs from the capital equity acquired. When those amounts are not the same, the difference is considered a bonus either to (1) the existing (old) partners or (2) the new partner.
BONUS TO OLD PARTNERS For both personal and business reasons, the existing partners may be unwilling to admit a new partner without receiving a bonus. In an established fi rm, existing partners may insist on a bonus as compensation for the work they have put into the company over the years. Two accounting factors underlie the business reason. First, total partners’ capital equals the book value of the recorded net assets of the partnership. When the new partner is admitted, the fair values of assets such as land and buildings may be higher than their book values. The bonus will help make up the difference between fair value and book value. Second, when the partnership has been profi table, goodwill may exist. But, the partnership balance sheet does not report goodwill. The new partner is usually willing to pay the bonus to become a partner. A bonus to old partners results when the new partner’s investment in the fi rm is greater than the capital credit on the date of admittance. The bonus results in an increase in the capital balances of the old partners. The partnership allo-cates the bonus to them on the basis of their income ratios before the admis-sion of the new partner. To illustrate, assume that the Bart-Cohen partnership, owned by Sam Bart and Tom Cohen, has total capital of $120,000. Lea Eden acquires a 25% ownership (capital) interest in the partnership by making a cash investment of $80,000. The procedure for determining Eden’s capital credit and the bonus to the old partners is as follows.
1. Determine the total capital of the new partnership. Add the new partner’s investment to the total capital of the old partnership. In this case, the total capital of the new fi rm is $200,000, computed as follows.
Total capital of existing partnership $120,000Investment by new partner, Eden 80,000
Total capital of new partnership $200,000
2. Determine the new partner’s capital credit. Multiply the total capital of the new partnership by the new partner’s ownership interest. Eden’s capital credit is $50,000 ($200,000 3 25%).
3. Determine the amount of bonus. Subtract the new partner’s capital credit from the new partner’s investment. The bonus in this case is $30,000 ($80,000 2 $50,000).

552 12 Accounting for Partnerships
4. Allocate the bonus to the old partners on the basis of their income ratios. Assuming the ratios are Bart 60%, and Cohen 40%, the allocation is Bart $18,000 ($30,000 3 60%) and Cohen $12,000 ($30,000 3 40%).
The entry to record the admission of Eden is:
Cash 80,000 Sam Bart, Capital 18,000 Tom Cohen, Capital 12,000 Lea Eden, Capital 50,000 (To record admission of Eden and bonus to old partners)
BONUS TO NEW PARTNER A bonus to a new partner results when the new partner’s investment in the fi rm is less than his or her capital credit. This may occur when the new partner possesses special attributes that the partnership wants. For example, the new partner may be able to supply cash that the fi rm needs for expansion or to meet maturing debts. Or the new partner may be a recognized expert in a relevant fi eld. Thus, an engineering fi rm may be willing to give a renowned engineer a bonus to join the fi rm. The partners of a restaurant may offer a bonus to a sports celebrity in order to add the athlete’s name to the part-nership. A bonus to a new partner may also result when recorded book values on the partnership books are higher than their fair values. A bonus to a new partner results in a decrease in the capital balances of the old partners. The amount of the decrease for each partner is based on the income ratios before the admission of the new partner. To illustrate, assume that Lea Eden invests $20,000 in cash for a 25% ownership interest in the Bart–Cohen partnership. The computations for Eden’s capital credit and the bonus are as follows, using the four procedures described in the preceding section.
A OEL5 1
180,000 118,000 112,000 150,000
Cash Flows180,000
Illustration 12A-4Computation of capital credit and bonus to new partner
1. Total capital of Bart–Cohen partnership $120,000 Investment by new partner, Eden 20,000
Total capital of new partnership $140,000
2. Eden’s capital credit (25% 3 $140,000) $ 35,000
3. Bonus to Eden ($35,000 2 $20,000) $ 15,0004. Allocation of bonus to old partners: Bart ($15,000 3 60%) $9,000 Cohen ($15,000 3 40%) 6,000 $ 15,000
The partnership records the admission of Eden as follows.
Cash 20,000Sam Bart, Capital 9,000Tom Cohen, Capital 6,000 Lea Eden, Capital 35,000 (To record Eden’s admission and bonus)
Withdrawal of a Partner
Now let’s look at the opposite situation–the withdrawal of a partner. A partner may withdraw from a partnership voluntarily, by selling his or her equity in the fi rm. Or, he or she may withdraw involuntarily, by reaching mandatory retire-ment age or by dying. The withdrawal of a partner, like the admission of a partner, legally dissolves the partnership. The legal effects may be recognized by dissolv-ing the fi rm. However, it is customary to record only the economic effects of the partner’s withdrawal, while the fi rm continues to operate and reorganizes itself legally.
A OEL5 1
120,000 29,000 26,000 135,000
Cash Flows120,000

Appendix 12A: Admission and Withdrawal of Partners 553
As indicated earlier, the partnership agreement should specify the terms of withdrawal. The withdrawal of a partner may be accomplished by (1) payment from partners’ personal assets or (2) payment from partnership assets. The for-mer affects only the partners’ capital accounts. The latter decreases total net assets and total capital of the partnership.
PAYMENT FROM PARTNERS’ PERSONAL ASSETS
Withdrawal by payment from partners’ personal assets is a personal transac-tion between the partners. It is the direct opposite of admitting a new partner who purchases a partner’s interest. The remaining partners pay the retiring partner directly from their personal assets. Partnership assets are not involved in any way, and total capital does not change. The effect on the partnership is limited to changes in the partners’ capital balances. To illustrate, assume that partners Morz, Nead, and Odom have capital bal-ances of $25,000, $15,000, and $10,000, respectively. Morz and Nead agree to buy out Odom’s interest. Each of them agrees to pay Odom $8,000 in exchange for one-half of Odom’s total interest of $10,000. The entry to record the withdrawal is:
J. Odom, Capital 10,000 A. Morz, Capital 5,000 M. Nead, Capital 5,000 (To record purchase of Odom’s interest)
The effect of this entry on the partnership accounts is shown below.
A OEL5 1
210,000 15,000 15,000
Cash Flowsno effect
Net Assets
50,000
A. Morz, Capital
25,000 5,000
Bal. 30,000
M. Nead, Capital
15,000 5,000
Bal. 20,000
J. Odom, Capital
10,000 10,000
Bal. –0–
Note that net assets and total capital remain the same at $50,000. What about the $16,000 paid to Odom? You’ve probably noted that it is not recorded. The entry debited Odom’s capital only for $10,000, not for the $16,000 that she received. Similarly, both Morz and Nead credit their capital accounts for only $5,000, not for the $8,000 they each paid. After Odom’s withdrawal, Morz and Nead will share net income or net loss equally unless they indicate another income ratio in the partnership agreement.
PAYMENT FROM PARTNERSHIP ASSETS
Withdrawal by payment from partnership assets is a transaction that involves the partnership. Both partnership net assets and total capital decrease as a result. Using partnership assets to pay for a withdrawing partner’s interest is the reverse of admitting a partner through the investment of assets in the partnership. Many partnership agreements provide that the amount paid should be based on the fair value of the assets at the time of the partner’s withdrawal. When this basis is required, some maintain that any differences between recorded asset balances and their fair values should be (1) recorded by an adjusting entry, and (2) allocated to all partners on the basis of their income ratios. This position has serious fl aws. Recording the revaluations violates the historical cost principle, which requires that assets be stated at original cost. It also violates the going-concern assumption, which assumes the entity will continue indefi nitely. The terms of the partnership contract should not dictate the accounting for this event. In accounting for a withdrawal by payment from partnership assets, the part-nership should not record asset revaluations. Instead, it should consider any difference between the amount paid and the withdrawing partner’s capital balance as a bonus to the retiring partner or to the remaining partners.
Illustration 12A-5Ledger balances after payment from partners’ personal assets

554 12 Accounting for Partnerships
BONUS TO RETIRING PARTNER A partnership may pay a bonus to a retiring part-ner when:
1. The fair value of partnership assets is more than their book value,
2. There is unrecorded goodwill resulting from the partnership’s superior earn-ings record, or
3. The remaining partners are eager to remove the partner from the fi rm.
The partnership deducts the bonus from the remaining partners’ capital balances on the basis of their income ratios at the time of the withdrawal. To illustrate, assume that the following capital balances exist in the RST part-nership: Roman $50,000, Sand $30,000, and Terk $20,000. The partners share income in the ratio of 3:2:1, respectively. Terk retires from the partnership and receives a cash payment of $25,000 from the fi rm. The procedure for determining the bonus to the retiring partner and the allocation of the bonus to the remaining partners is as follows.
1. Determine the amount of the bonus. Subtract the retiring partner’s capital balance from the cash paid by the partnership. The bonus in this case is $5,000 ($25,000 2 $20,000).
2. Allocate the bonus to the remaining partners on the basis of their incomeratios. The ratios of Roman and Sand are 3:2. Thus, the allocation of the $5,000 bonus is: Roman $3,000 ($5,000 3 3/5) and Sand $2,000 ($5,000 3 2/5).
The partnership records the withdrawal of Terk as follows.
B. Terk, Capital 20,000F. Roman, Capital 3,000D. Sand, Capital 2,000 Cash 25,000 (To record withdrawal of and bonus to Terk)
Helpful HintCompare this entry to the one at the bottom of the page.
Helpful HintCompare this entry to the one above.
The remaining partners, Roman and Sand, will recover the bonus given to Terk as the partnership sells or uses the undervalued assets.
BONUS TO REMAINING PARTNERS The retiring partner may give a bonus to the remaining partners when:
1. Recorded assets are overvalued.
2. The partnership has a poor earnings record.
3. The partner is eager to leave the partnership.
In such cases, the cash paid to the retiring partner will be less than the retiring partner’s capital balance. The partnership allocates (credits) the bonus to the capital accounts of the remaining partners on the basis of their income ratios. To illustrate, assume instead that the partnership pays Terk only $16,000 for her $20,000 equity when she withdraws from the partnership. In that case:
1. The bonus to remaining partners is $4,000 ($20,000 2 $16,000).
2. The allocation of the $4,000 bonus is Roman $2,400 ($4,000 3 3/5) and Sand $1,600 ($4,000 3 2/5).
Under these circumstances, the entry to record the withdrawal is as follows.
A OEL5 1
220,00023,00022,000
225,000
Cash Flows225,000
B. Terk, Capital 20,000 F. Roman, Capital 2,400 D. Sand, Capital 1,600 Cash 16,000 (To record withdrawal of Terk and bonus to remaining partners)
A OEL5 1
220,00012,40011,600
216,000
Cash Flows216,000

Review and Practice 555
Note that if Sand had withdrawn from the partnership, Roman and Terk would divide any bonus on the basis of their income ratio, which is 3:1 or 75% and 25%.
DEATH OF A PARTNER
The death of a partner dissolves the partnership. However, partnership agreements usually contain a provision for the surviving partners to continue operations. When a partner dies, it usually is necessary to determine the partner’s equity at the date of death. This is done by (1) determining the net income or loss for the year to date, (2) closing the books, and (3) preparing fi nancial statements. The partnership agreement may also require an independent audit and a revaluation of assets. The surviving partners may agree to purchase the deceased partner’s equity from their personal assets. Or they may use partnership assets to settle with the deceased partner’s estate. In both instances, the entries to record the withdrawal of the partner are similar to those presented earlier. To facilitate payment from partnership assets, some partnerships obtain life insurance policies on each partner, with the partnership named as the benefi -ciary. The partnership then uses the proceeds from the insurance policy on the deceased partner to settle with the estate.
Discuss and account for the formation of a partner-ship. The principal characteristics of a partnership are (a) association of individuals, (b) mutual agency, (c) limited life, (d) unlimited liability, and (e) co-ownership of property. When formed, a partnership records each partner’s initial investment at the fair value of the assets at the date of their transfer to the partnership.
Explain how to account for net income or net loss of a partnership. Partnerships divide net income or net loss on the basis of the income ratio, which may be (a) a fi xed ratio, (b) a ratio based on beginning or average capital balances, (c) salaries to partners and the remainder on a fi xed ratio, (d) interest on part-ners’ capital and the remainder on a fi xed ratio, and (e) salaries to partners, interest on partners’ capital, and the remainder on a fi xed ratio.
The fi nancial statements of a partnership are simi-lar to those of a proprietorship. The principal differ-ences are as follows. (a) The partnership shows the division of net income on the income statement. (b) The owners’ equity statement is called a partners’ capital statement. (c) The partnership reports each partner’s capital on the balance sheet.
Explain how to account for the liquidation of a part-nership. When a partnership is liquidated, it is nec-essary to record the (a) sale of noncash assets, (b) allocation of the gain or loss on realization, (c) pay-ment of partnership liabilities, and (d) distribution of cash to the partners on the basis of their capital balances.
Prepare journal entries when a partner is either admitted or withdraws. The entry to record the admittance of a new partner by purchase of a part-ner’s interest affects only partners’ capital accounts. The entries to record the admittance by investment of assets in the partnership (a) increase both net assets and total capital and (b) may result in recogni-tion of a bonus to either the old partners or the new partner.
The entry to record a withdrawal from the firm when the partners pay from their personal assets affects only partners’ capital accounts. The entry to record a withdrawal when payment is made from partnership assets (a) decreases net assets and total capital and (b) may result in recognizing a bonus either to the retiring partner or the remaining partners.
4*
LEARNING OBJECTIVES REVIEW
1 3
2
REVIEW AND PRACTICE
Admission by investment Admission of a partner by investing assets in the partnership, causing both partnership net assets and total capital to increase. (p. 550).
Admission by purchase of an interest Admission of a partner in a personal transaction between one or more existing partners and the new partner; does not change total partnership assets or total capital. (p. 549).
GLOSSARY REVIEW
* *

556 12 Accounting for Partnerships
Capital defi ciency A debit balance in a partner’s capital account after allocation of gain or loss. (p. 544).
General partners Partners who have unlimited liability for the debts of the fi rm. (p. 535).
Income ratio The basis for dividing net income and net loss in a partnership. (p. 539).
Limited liability company A form of business organi-zation, usually classifi ed as a partnership for tax pur-poses and usually with limited life, in which partners, who are called members, have limited liability. (p. 535).
Limited liability partnership A partnership of profes-sionals in which partners are given limited liability and the public is protected from malpractice by insurance carried by the partnership. (p. 535).
Limited partners Partners whose liability for the debts of the fi rm is limited to their investment in the fi rm. (p. 535).
Limited partnership A partnership in which one or more general partners have unlimited liability and one or more partners have limited liability for the obliga-tions of the fi rm. (p. 535).
No capital defi ciency All partners have credit balances after allocation of gain or loss. (p. 544).
Partners’ capital statement The owners’ equity state-ment for a partnership which shows the changes in
each partner’s capital account and in total partnership capital during the year. (p. 542).
Partnership An association of two or more persons to carry on as co-owners of a business for profi t. (p. 534).
Partnership agreement A written contract expressing the voluntary agreement of two or more individuals in a partnership. (p. 537).
Partnership dissolution A change in partners due to withdrawal or admission, which does not necessarily terminate the business. (p. 534).
Partnership liquidation An event that ends both the legal and economic life of a partnership. (p. 543).
Schedule of cash payments A schedule showing the distribution of cash to the partners in a partnership liquidation. (p. 545).
Withdrawal by payment from partners’ personal assets Withdrawal of a partner in a personal transac-tion between partners; does not change total partner-ship assets or total capital. (p. 553).
Withdrawal by payment from partnership assets Withdrawal of a partner in a transaction involving the partnership, causing both partnership net assets and total capital to decrease. (p. 553).
*
*
1. Which of the following is not a characteristic of a partnership?(a) Taxable entity. (c) Mutual agency.(b) Co-ownership of property. (d) Limited life.
2. A partnership agreement should include each of the following except:(a) names and capital contributions of partners.(b) rights and duties of partners as well as basis for
sharing net income or loss.(c) basis for splitting partnership income taxes.(d) provision for withdrawal of assets.
3. The advantages of a partnership do not include:(a) ease of formation.(b) unlimited liability.(c) freedom from government regulation.(d) ease of decision-making.
4. Upon formation of a partnership, each partner’s initial investment of assets should be recorded at their:(a) book values. (c) fair values.(b) cost. (d) appraised values.
5. Ben and Sam Jenkins formed a partnership. Ben con-tributed $8,000 cash and a used truck that originally cost $35,000 and had accumulated depreciation of $15,000. The truck’s fair value was $16,000. Sam, a builder, contributed a new storage garage. His cost of construction was $40,000. The garage has a fair value of $55,000. What is the combined total capital that would be recorded on the partnership books for the two partners?(a) $79,000. (c) $75,000.(b) $60,000. (d) $90,000.
(LO 1)
(LO 1)
(LO 1)
(LO 1)
(LO 1)
6. The NBC Company reports net income of $60,000. If partners N, B, and C have an income ratio of 50%, 30%, and 20%, respectively, C’s share of the net income is:(a) $30,000. (c) $18,000.(b) $12,000. (d) No correct answer is given.
7. Using the data in Practice Multiple-Choice Question 6, what is B’s share of net income if the percentages are applicable after each partner receives a $10,000 salary allowance?(a) $12,000. (c) $19,000.(b) $20,000. (d) $21,000.
8. To close a partner’s drawings account, an entry must be made that:(a) debits that partner’s drawings account and credits
Income Summary.(b) debits that partner’s drawings account and credits
that partner’s capital account.(c) credits that partner’s drawings account and debits
that partner’s capital account.(d) credits that partner’s drawings account and debits
the fi rm’s dividend account. 9. Which of the following statements about partnership
fi nancial statements is true?(a) Details of the distribution of net income are
shown in the owners’ equity statement.(b) The distribution of net income is shown on the
balance sheet.(c) Only the total of all partner capital balances is
shown in the balance sheet.(d) The owners’ equity statement is called the part-
ners’ capital statement.
(LO 2)
(LO 2)
(LO 2)
(LO 2)
PRACTICE MULTIPLE-CHOICE QUESTIONS

Practice Multiple-Choice Questions 557
10. In the liquidation of a partnership, it is necessary to (1) distribute cash to the partners, (2) sell noncash assets, (3) allocate any gain or loss on realization to the partners, and (4) pay liabilities. These steps should be performed in the following order:(a) (2), (3), (4), (1).(b) (2), (3), (1), (4).(c) (3), (2), (1), (4).(d) (3), (2), (4), (1).
Use the following account balance information for Creekville Partnership to answer Practice Multiple-Choice Questions 11 and 12. Income ratios are 2:4:4 for Harriet, Mike, and Elly, respectively.
(LO 3) result, one of the partners has a capital defi ciency which that partner decides not to repay. The amount of cash that would ultimately be distributed to Elly would be:(a) $52,000. (c) $24,000.(b) $38,000. (d) $34,000.
13. Louisa Santiago purchases 50% of Leo Lemon’s capi-tal interest in the K & L partnership for $22,000. If the capital balance of Kate Kildare and Leo Lemon are $40,000 and $30,000, respectively, Santiago’s capital balance following the purchase is:(a) $22,000. (c) $20,000.(b) $35,000. (d) $15,000.
14. Capital balances in the MEM partnership are Mary, Capital $60,000; Ellen, Capital $50,000; and Mills, Capital $40,000, and income ratios are 5:3:2, respec-tively. The MEMO partnership is formed by admitting Oleg to the fi rm with a cash investment of $60,000 for a 25% capital interest. The bonus to be credited to Mills, Capital in admitting Oleg is:(a) $10,000. (c) $3,750.(b) $7,500. (d) $1,500.
15. Capital balances in the MURF partnership are Molly, Capital $50,000; Ursula, Capital $40,000; Ray, Capital $30,000; and Fred, Capital $20,000, and income ratios are 4:3:2:1, respectively. Fred withdraws from the fi rm following payment of $29,000 in cash from the partnership. Ursula’s capital balance after recording the withdrawal of Fred is:(a) $36,000. (c) $38,000.(b) $37,000. (d) $40,000.
* (LO 4)
* (LO 4)
* (LO 4)
Assets Liabilities and Owners’ Equity
Cash $ 9,000 Accounts payable $ 21,000Accounts Harriet, capital 23,000 receivable 22,000 Mike, capital 8,000Inventory 73,000 Elly, capital 52,000
$104,000 $104,000
11. Assume that as part of liquidation proceedings, Creekville sells its noncash assets for $85,000. The amount of cash that would ultimately be distributed to Elly would be:(a) $52,000. (c) $34,000.(b) $48,000. (d) $86,000.
12. Assume that as part of liquidation proceedings, Creekville sells its noncash assets for $60,000. As a
(LO 3)
(LO 3)
Solutions
1. (a) A partnership is not a taxable entity. Rather, the partnership income is taxed on the individual tax returns of the partners. The other choices are characteristics of a partnership.
2. (c) A partnership is not a taxable entity; therefore, the partnership agreement should not include the basis for splitting partner-ship income taxes. The other choices should be included in a partnership agreement.
3. (b) Unlimited liability is a disadvantage of a partnership. The other choices are advantages of a partnership.
4. (c) Upon formation of a partnership, each partner’s initial investment of assets should be recorded at their fair values, not (a) book values, (b) cost, or (d) appraised values.
5. (a) When a partnership is formed, assets invested by the partners are recorded at their fair values. Thus, the combined total capital is $8,000 (cash) 1 $16,000 (fair value of truck) 1 $55,000 (fair value of the new storage garage) 5 $79,000, not (b) $60,000, (c) $75,000, or (d) $90,000.
6. (b) C’s income is computed by multiplying the partnership income ($60,000) by partner C’s income ratio (20%) 5 $12,000. The other choices are incorrect because (a) is the amount of income that would be allocated to partner N ($60,000 3 50% 5 $30,000), (c) is the amount of income that would be allocated to partner B ($60,000 3 30% 5 $18,000), and (d) there is a correct answer.
7. (c) After allocating the salary allowance to each partner, $30,000 will be available to divide according to the income ratio [$60,000 2 ($10,000 3 3)]. Partner B’s share of the remainder is $9,000 ($30,000 3 30%). Partner B’s total share of income is equal to $19,000 (salary allowance of $10,000 1 B’s share of the remainder $9,000), not (a) $12,000, (b) $20,000, or (d) $21,000.
8. (c) To close a partner’s drawings account, an entry must be made that credits the partner’s drawings account and debits that partner’s capital account. The other choices are therefore incorrect because a partner’s drawings account or a dividend account is not debited.
9. (d) The owners’ equity statement for a partnership is called the partners’ capital statement. The other choices are incorrect because (a) the total amount, not the details, of the distribution of net income is shown in the partners’ capital statement; (b) the distribution of net income is not shown on the balance sheet but on the partners’ capital statement; and (c) each individual part-ner’s capital balance is shown in the balance sheet.
10. (a) The order of events in the liquidation of a partnership is (2) sell noncash assets, (3) allocate gain/loss, (4) pay partnership liabilities, and (1) distribute remaining cash. The other choices are therefore incorrect.
11. (b) The book value of the noncash assets is $95,000 ($22,000 1 $73,000). When Creekville sells its noncash assets for $85,000, Creekville realizes a loss of $10,000 on the sale. The income ratio for Elly is 40% (4/10). When allocating the $10,000 loss on

558 12 Accounting for Partnerships
realization to the partners, Elly’s capital account will be debited for $4,000 ($10,000 3 4/10). The amount of cash that would ultimately be distributed to Elly would be $48,000 ($52,000 2 $4,000), not (a) $52,000, (c) $34,000, or (d) $86,000.
12. (d) The loss on realization is $35,000 ($22,000 1 $73,000 2 $60,000). When allocating the $35,000 loss on realization to the partners, Harriet’s, Mike’s, and Elly’s capital accounts will be debited $7,000, $14,000, and $14,000, respectively, as per their income ratios. Mike will now have a capital defi ciency of $6,000 ($8,000 2 $14,000). Elly’s share of this defi ciency is $4,000 ($6,000 3 4/6). The amount of cash that would ultimately be distributed to Elly would be $34,000 ($52,000 2 $14,000 2 $4,000), not (a) $52,000, (b) $38,000, or (c) $24,000.
*13. (d) Because this is a purchase of a partner’s interest, Santiago’s capital account will be equal to half of the interest she is pur-chasing, or $15,000 ($30,000/2). The $22,000 paid by Santiago to Lemon is irrelevant in this question. The other choices are there-fore incorrect.
*14. (d) Total partnership capital after the investment by Oleg is $210,000 ($60,000 1 $50,000 1 $40,000 1 $60,000). Oleg’s share of partnership capital is $52,500 ($210,000 3 25%). The total bonus to the old partners related to Oleg’s admission is $7,500 [$60,000 (Oleg’s investment) 2 $52,500 (Oleg’s share of partnership capital)]. Mills’ share of the total bonus is equal to the total bonus ($7,500) times Mills’ income ratio (20%) or $1,500 ($7,500 3 20%), not (a) $10,000, (b) $7,500, or (c) $3,750.
*15. (b) The total bonus to Fred from the partnership is $9,000 ($29,000 2 $20,000). Because Fred has withdrawn, the income ratio must be restated as 4:3:2. Ursula’s share of the bonus paid to Fred is $3,000 {$9,000 3 [3/(4 1 3 1 2)]}. Because the bonus is being paid to Fred, Ursula’s capital account must be reduced by her share of the bonus. After Fred’s withdrawal, Ursula’s capital account will have a balance of $37,000 ($40,000 2 $3,000), not (a) $36,000, (c) $38,000, or (d) $40,000.
1. M. Gomez (beginning capital $50,000) and I. Inez (beginning capital $80,000) are part-ners. During 2017 the partnership earned net income of $60,000, and Gomez made draw-ings of $15,000 while Inez made drawings of $20,000.
Instructions(a) Assume the partnership income-sharing agreement calls for income to be divided 55%
to Gomez and 45% to Inez. Prepare the journal entry to record the allocation of net income.
(b) Assume the partnership income-sharing agreement calls for income to be divided with a salary of $30,000 to Gomez and $20,000 to Inez with the remainder divided 55% to Gomez and 45% to Inez. Prepare the journal entry to record the allocation of net income.
(c) Assume the partnership income-sharing agreement calls for income to be divided with a salary of $40,000 to Gomez and $30,000 to Inez, interest of 10% on beginning capital, and the remainder divided 50%–50%. Prepare the journal entry to record the allocation of net income.
(d) Compute the partners’ ending capital balances under the assumption in part (c).
Prepare journal entries to record allocation of net income.
(LO 2)
PRACTICE EXERCISES
1. (a) Income Summary 60,000 M. Gomez, Capital ($60,000 3 55%) 33,000 I. Inez, Capital ($60,000 3 45%) 27,000
(b) Income Summary 60,000 M. Gomez, Capital [$30,000 1 ($10,000 3 55%)] 35,500 I. Inez, Capital [$20,000 1 ($10,000 3 45%)] 24,500
(c) Income Summary 60,000 M. Gomez, Capital [$40,000 1 $5,000 2 ($23,000 3 50%)] 33,500 I. Inez, Capital [$30,000 1 $8,000 2 ($23,000 3 50%)] 26,500
(d) Gomez: $50,000 1 $33,500 2 $15,000 5 $68,500
Inez: $80,000 1 $26,500 2 $20,000 5 $86,500
Solution

Practice Problem 559
2. The Braun Company at December 31 has cash $15,000, noncash assets $110,000, liabilities $60,000, and the following capital balances: Ho $40,000 and Li $25,000. The fi rm is liquidated, and $90,000 in cash is received for the noncash assets. Ho’s and Li’s income ratios are 60% and 40%, respectively.
Instructions(a) Prepare a cash distribution schedule.
(b) Prepare the entries to record the following, assuming that The Braun Company decides to liquidate the company.
(1) The sale of noncash assets. (2) The allocation of the gain or loss on liquidation to the partners. (3) Payment of creditors. (4) Distribution of cash to the partners.
Prepare cash distribution schedule and journalize transactions in a liquidation.
(LO 2, 3)
2. (a) THE BRAUN COMPANYSchedule of Cash Payments
Noncash Ho, Li, Item Cash 1
Assets 5 Liabilities 1 Capital 1 Capital
Balances before liquidation $ 15,000 $110,000 $60,000 $40,000 $25,000Sale of noncash assets and allocation of gain 90,000 (110,000) (12,000) (8,000)
New balances 105,000 0 60,000 28,000 17,000Pay liabilities (60,000) (60,000)
New balances 45,000 0 0 28,000 17,000Cash distribution to partners (45,000) (28,000) (17,000)
Final balances $ 0 $ 0 $ 0 $ 0 $ 0
(b) (1) Loss of Realization 20,000 Cash 90,000 Noncash Assets 110,000
(2) Ho, Capital 12,000 Li, Capital 8,000 Loss on Realization 20,000
(3) Accounts Payable 60,000 Cash 60,000
(4) Ho, Capital 28,000 Li, Capital 17,000 Cash 45,000
Solution
On January 1, 2017, the capital balances in Hollingsworth Company are Lois Holly $26,000 and Jim Worth $24,000. In 2017 the partnership reports net income of $30,000. The income ratio provides for salary allowances of $12,000 for Holly and $10,000 to Worth and the remainder to be shared equally. Neither partner had any drawings in 2017.
Instructions(a) Prepare a schedule showing the distribution of net income in 2017.
(b) Journalize the division of 2017 net income to the partners.
Journalize and prepare a schedule showing distribution of net income.
(LO 2)
PRACTICE PROBLEM

(a) Net income $30,000
Division of Net Income
Lois Jim Holly Worth Total
Salary allowance $12,000 $10,000 $22,000 Remaining income $8,000
($30,000 2 $22,000) Lois Holly ($8,000 3 50%) 4,000 Jim Worth ($8,000 3 50%) 4,000 Total remainder 8,000 Total division of net income $16,000 $14,000 $30,000
(b) 12/31/17 Income Summary 30,000 Lois Holly, Capital 16,000 Jim Worth, Capital 14,000 (To close net income to partners’ capital)
560 12 Accounting for Partnerships
Solution
Brief Exercises, Exercises, DO IT! Exercises, and Problems and many additional resources are available for practice in WileyPLUS
QUESTIONS
1. The characteristics of a partnership include the fol-lowing: (a) association of individuals, (b) limited life, and (c) co-ownership of property. Explain each of these terms.
2. Kevin Mathis is confused about the partnership char-acteristics of (a) mutual agency and (b) unlimited liability. Explain these two characteristics for Kevin.
3. Lance Kosinski and Matt Morrisen are considering a business venture. They ask you to explain the advan-tages and disadvantages of the partnership form of organization.
4. Why might a company choose to use a limited partnership?
5. Newland and Palermo form a partnership. Newland contributes land with a book value of $50,000 and a fair value of $60,000. Newland also contributes equip-ment with a book value of $52,000 and a fair value of $57,000. The partnership assumes a $20,000 mortgage on the land. What should be the balance in Newland’s capital account upon formation of the partnership?
6. W. Jenson, N. Emch, and W. Gilligan have a partner-ship called Outlaws. A dispute has arisen among the partners. Jenson has invested twice as much in assets as the other two partners, and he believes net income and net losses should be shared in accordance with the capital ratios. The partnership agreement does not specify the division of profi ts and losses. How will net income and net loss be divided?
7. Mutt and Jeff are discussing how income and losses should be divided in a partnership they plan to form. What factors should be considered in determining the division of net income or net loss?
8. M. Elston and R. Ogle have partnership capital bal-ances of $40,000 and $80,000, respectively. The part-nership agreement indicates that net income or net loss should be shared equally. If net income for the partnership is $42,000, how should the net income be divided?
9. S. Pletcher and F. Holt share net income and net loss equally. (a) Which account(s) is (are) debited and credited to record the division of net income between the partners? (b) If S. Pletcher withdraws $30,000 in cash for personal use instead of salary, which account is debited and which is credited?
10. Partners T. Greer and R. Parks are provided salary allowances of $30,000 and $25,000, respectively. They divide the remainder of the partnership income in a ratio of 3:2. If partnership net income is $40,000, how much is allocated to Greer and Parks?
11. Are the fi nancial statements of a partnership similar to those of a proprietorship? Discuss.
12. How does the liquidation of a partnership differ from the dissolution of a partnership?
13. Roger Fuller and Mike Rangel are discussing the liq-uidation of a partnership. Roger maintains that all cash should be distributed to partners on the basis of their income ratios. Is he correct? Explain.
14. In continuing their discussion from Question 13, Mike says that even in the case of a capital defi ciency, all cash should still be distributed on the basis of capital balances. Is Mike correct? Explain.
15. Norris, Madson, and Howell have income ratios of 5:3:2 and capital balances of $34,000, $31,000, and $28,000, respectively. Noncash assets are sold at a
NOTE: All asterisked Questions, Exercises, and Problems relate to material in the appendix to the chapter.

Brief Exercises 561
gain and allocated to the partners. After creditors are paid, $103,000 of cash is available for distribution to the partners. How much cash should be paid to Madson?
16. Before the fi nal distribution of cash, account balances are Cash $27,000; S. Shea, Capital $19,000 (Cr.); L. Seastrom, Capital $12,000 (Cr.); and M. Luthi, Capital $4,000 (Dr.). Luthi is unable to pay any of the capital defi ciency. If the income-sharing ratios are 5:3:2, respec-tively, how much cash should be paid to L. Seastrom?
17. Why is Apple not a partnership? *18. Susan Turnbull decides to purchase from an existing
partner for $50,000 a one-third interest in a partner-ship. What effect does this transaction have on part-nership net assets?
*19. Jerry Park decides to invest $25,000 in a partnership for a one-sixth capital interest. How much do the partnership’s net assets increase? Does Park also acquire a one-sixth income ratio through this investment?
*20. Jill Parsons purchases for $72,000 Jamar’s interest in the Tholen-Jamar partnership. Assuming that Jamar has a $68,000 capital balance in the partnership, what journal entry is made by the partnership to record this transaction?
*21. Jaime Keller has a $41,000 capital balance in a part-nership. She sells her interest to Sam Parmenter for $45,000 cash. What entry is made by the partnership for this transaction?
*22. Andrea Riley retires from the partnership of Jaggard, Pester, and Riley. She receives $85,000 of partnership assets in settlement of her capital balance of $81,000. Assuming that the income-sharing ratios are 5:3:2, respectively, how much of Riley’s bonus is debited to Pester’s capital account?
*23. Your roommate argues that partnership assets should be revalued in situations like those in Question 21. Why is this generally not done?
*24. How is a deceased partner’s equity determined?
BRIEF EXERCISES
BE12-1 Barbara Ripley and Fred Nichols decide to organize the ALL-Star partnership. Ripley invests $15,000 cash, and Nichols contributes $10,000 cash and equipment having a book value of $3,500. Prepare the entry to record Nichols’s investment in the partner-ship, assuming the equipment has a fair value of $4,000.
BE12-2 Penner and Torres decide to merge their proprietorships into a partnership called Pentor Company. The balance sheet of Torres Co. shows:
Accounts receivable $16,000Less: Allowance for doubtful accounts 1,200 $14,800
Equipment 20,000Less: Accumulated depreciation—equip. 7,000 13,000
The partners agree that the net realizable value of the receivables is $14,500 and that the fair value of the equipment is $11,000. Indicate how the accounts should appear in the opening balance sheet of the partnership.
BE12-3 Rod Dall Co. reports net income of $75,000. The income ratios are Rod 60% and Dall 40%. Indicate the division of net income to each partner, and prepare the entry to distribute the net income.
BE12-4 PFW Co. reports net income of $45,000. Partner salary allowances are Pitts $15,000, Filbert $5,000, and Witten $5,000. Indicate the division of net income to each partner, assuming the income ratio is 50:30:20, respectively.
BE12-5 Nabb & Fry Co. reports net income of $31,000. Interest allowances are Nabb $7,000 and Fry $5,000, salary allowances are Nabb $15,000 and Fry $10,000, and the remainder is shared equally. Show the distribution of income.
BE12-6 After liquidating noncash assets and paying creditors, account balances in the Mann Co. are Cash $21,000; A, Capital (Cr.) $8,000; B, Capital (Cr.) $9,000; and C, Capital (Cr.) $4,000. The partners share income equally. Journalize the fi nal distribution of cash to the partners.
*BE12-7 Gamma Co. capital balances are Barr $30,000, Croy $25,000, and Eubank $22,000. The partners share income equally. Tovar is admitted to the fi rm by purchasing one-half of Eubank’s interest for $13,000. Journalize the admission of Tovar to the partnership.
Journalize entries in forming a partnership.
(LO 1)
Prepare portion of opening balance sheet for partnership.
(LO 1)
Journalize the division of net income using fi xed income ratios.
(LO 2)
Compute division of net income with a salary allowance and fi xed ratios.
(LO 2)
Show division of net income when allowances exceed net income.
(LO 2)
Journalize fi nal cash distribution in liquidation.
(LO 3)
Journalize admission by purchase of an interest.
(LO 4)

562 12 Accounting for Partnerships
*BE12-8 In Eastwood Co., capital balances are Irey $40,000 and Pedigo $50,000. The part-ners share income equally. Vernon is admitted to the fi rm with a 45% interest by an invest-ment of cash of $58,000. Journalize the admission of Vernon.
*BE12-9 Capital balances in Pelmar Co. are Lango $40,000, Oslo $30,000, and Fernetti $20,000. Lango and Oslo each agree to pay Fernetti $12,000 from their personal assets. Lango and Oslo each receive 50% of Fernetti’s equity. The partners share income equally. Journalize the withdrawal of Fernetti.
*BE12-10 Data pertaining to Pelmar Co. are presented in BE12-9. Instead of payment from personal assets, assume that Fernetti receives $24,000 from partnership assets in withdrawing from the fi rm. Journalize the withdrawal of Fernetti.
Journalize admission by investment.
(LO 4)
Journalize withdrawal paid by personal assets.
(LO 4)
Journalize withdrawal paid by partnership assets.
(LO 4)
Indicate whether each of the following statements is true or false.
________ 1. Each partner is personally and individually liable for all partnership liabilities.
________ 2. If a partnership dissolves, each partner has a claim to the specifi c assets he/she contributed to the fi rm.
________ 3. In a limited partnership, all partners have limited liability.
________ 4. A major advantage of regular partnership is that it is simple and inexpensive to create and operate.
________ 5. Members of a limited liability company can take an active management role.
Frontenac Company reported net income of $75,000. The partnership agree-ment provides for salaries of $25,000 to Miley and $18,000 to Guthrie. They divide the remainder 40% to Miley and 60% to Guthrie. Miley asks your help to divide the net income between the partners and to prepare the closing entry.
The partners of LR Company have decided to liquidate their business. Non-cash assets were sold for $125,000. The income ratios of the partners Cisneros, Gunselman, and Forren are 3:2:3, respectively. Complete the following schedule of cash payments for LR Company.
DO IT! Exercises
Analyze statements about partnership organization.
(LO 1)
DO IT! 12-1
Divide net income and prepare closing entry.
(LO 2)
DO IT! 12-2
DO IT! 12-3a
DO IT! 12-3b
Complete schedule of partnership liquidation payments.
(LO 3)
Prepare entries to record absorption of capital defi ciency and distribution of cash.
(LO 3)
Formulas Data Review ViewPage LayoutInsert
P18
LR Company.xlsHome
fx
A B C ED F G H I J K L
3
2
1
45
7
6
8910
Balances before liquidationSale of noncash assets and allocation of gain
Cash distribution to partners
New balances
New balancesPay liabilities
Final balances
Cash LiabilitiesItemNoncashAssets
Cisneros,Capital
Gunselman,Capital
Forren,Capital
15,000 90,000 40,000 20,000 32,000 13,000� � � � �
Parsons Company wishes to liquidate the fi rm by distributing the company’s cash to the three partners. Prior to the distribution of cash, the company’s balances are Cash $73,000; Oakley, Capital (Cr.) $47,000; Quaney, Capital (Dr.) $14,000; and Ellis, Cap-ital (Cr.) $40,000. The income ratios of the three partners are 3:3:4, respectively. Prepare the entry to record the absorption of Quaney’s capital defi ciency by the other partners and the distribution of cash to the partners with credit balances.

Exercises 563
EXERCISES
E12-1 Mark Rensing has prepared the following list of statements about partnerships.
1. A partnership is an association of three or more persons to carry on as co-owners of a business for profi t.
2. The legal requirements for forming a partnership can be quite burdensome.3. A partnership is not an entity for fi nancial reporting purposes.4. The net income of a partnership is taxed as a separate entity.5. The act of any partner is binding on all other partners, even when partners perform
business acts beyond the scope of their authority.6. Each partner is personally and individually liable for all partnership liabilities.7. When a partnership is dissolved, the assets legally revert to the original contributor.8. In a limited partnership, one or more partners have unlimited liability and one or more
partners have limited liability for the debts of the fi rm.9. Mutual agency is a major advantage of the partnership form of business.
InstructionsIdentify each statement as true or false. If false, indicate how to correct the statement.
E12-2 K. Decker, S. Rosen, and E. Toso are forming a partnership. Decker is transferring $50,000 of personal cash to the partnership. Rosen owns land worth $15,000 and a small building worth $80,000, which she transfers to the partnership. Toso transfers to the part-nership cash of $9,000, accounts receivable of $32,000, and equipment worth $39,000. The partnership expects to collect $29,000 of the accounts receivable.
Instructions(a) Prepare the journal entries to record each of the partners’ investments.(b) What amount would be reported as total owners’ equity immediately after the investments?
E12-3 Suzy Vopat has owned and operated a proprietorship for several years. On January 1, she decides to terminate this business and become a partner in the fi rm of Vopat and Sigma. Vopat’s investment in the partnership consists of $12,000 in cash, and the follow-ing assets of the proprietorship: accounts receivable $14,000 less allowance for doubtful accounts of $2,000, and equipment $30,000 less accumulated depreciation of $4,000. It is agreed that the allowance for doubtful accounts should be $3,000 for the partnership. The fair value of the equipment is $23,500.
InstructionsJournalize Vopat’s admission to the fi rm of Vopat and Sigma.
E12-4 McGill and Smyth have capital balances on January 1 of $50,000 and $40,000, respectively. The partnership income-sharing agreement provides for (1) annual salaries of $22,000 for McGill and $13,000 for Smyth, (2) interest at 10% on beginning capital balances, and (3) remaining income or loss to be shared 60% by McGill and 40% by Smyth.
Instructions(a) Prepare a schedule showing the distribution of net income, assuming net income is
(1) $50,000 and (2) $36,000.(b) Journalize the allocation of net income in each of the situations above.
E12-5 Coburn (beginning capital, $60,000) and Webb (beginning capital $90,000) are partners. During 2017, the partnership earned net income of $80,000, and Coburn made drawings of $18,000 while Webb made drawings of $24,000.
Instructions(a) Assume the partnership income-sharing agreement calls for income to be divided 45%
to Coburn and 55% to Webb. Prepare the journal entry to record the allocation of net income.
(b) Assume the partnership income-sharing agreement calls for income to be divided with a salary of $30,000 to Coburn and $25,000 to Webb, with the remainder divided 45% to Coburn and 55% to Webb. Prepare the journal entry to record the allocation of net income.
Identify characteristics of partnership.
(LO 1)
Journalize entry for formation of a partnership.
(LO 1)
Journalize entry for formation of a partnership.
(LO 1)
Prepare schedule showing distribution of net income and closing entry.
(LO 2)
Prepare journal entries to record allocation of net income.
(LO 2)

564 12 Accounting for Partnerships
(c) Assume the partnership income-sharing agreement calls for income to be divided with a salary of $40,000 to Coburn and $35,000 to Webb, interest of 10% on beginning cap-ital, and the remainder divided 50%–50%. Prepare the journal entry to record the allocation of net income.
(d) Compute the partners’ ending capital balances under the assumption in part (c).
E12-6 For National Co., beginning capital balances on January 1, 2017, are Nancy Payne $20,000 and Ann Dody $18,000. During the year, drawings were Payne $8,000 and Dody $5,000. Net income was $40,000, and the partners share income equally.
Instructions(a) Prepare the partners’ capital statement for the year.(b) Prepare the owners’ equity section of the balance sheet at December 31, 2017.
E12-7 Terry, Nick, and Frank are forming The Doctor Partnership. Terry is transferring $30,000 of personal cash and equipment worth $25,000 to the partnership. Nick owns land worth $28,000 and a small building worth $75,000, which he transfers to the partnership. There is a long-term mortgage of $20,000 on the land and building, which the partnership assumes. Frank transfers cash of $7,000, accounts receivable of $36,000, supplies worth $3,000, and equipment worth $27,000 to the partnership. The partnership expects to col-lect $32,000 of the accounts receivable.
InstructionsPrepare a classifi ed balance sheet for the partnership after the partners’ investments on December 31, 2017.
E12-8 Sedgwick Company at December 31 has cash $20,000, noncash assets $100,000, liabilities $55,000, and the following capital balances: Floyd $45,000 and DeWitt $20,000. The fi rm is liquidated, and $105,000 in cash is received for the noncash assets. Floyd and DeWitt income ratios are 60% and 40%, respectively.
InstructionsPrepare a schedule of cash payments.
E12-9 Data for Sedgwick Company are presented in E12-8. Sedgwick Company now decides to liquidate the partnership.
InstructionsPrepare the entries to record:
(a) The sale of noncash assets.(b) The allocation of the gain or loss on realization to the partners.(c) Payment of creditors.(d) Distribution of cash to the partners.
E12-10 Prior to the distribution of cash to the partners, the accounts in the VUP Com-pany are Cash $24,000; Vogel, Capital (Cr.) $17,000; Utech, Capital (Cr.) $15,000; and Pena, Capital (Dr.) $8,000. The income ratios are 5:3:2, respectively. VUP Company decides to liquidate the company.
Instructions(a) Prepare the entry to record (1) Pena’s payment of $8,000 in cash to the partnership and
(2) the distribution of cash to the partners with credit balances.(b) Prepare the entry to record (1) the absorption of Pena’s capital defi ciency by the other
partners and (2) the distribution of cash to the partners with credit balances.
*E12-11 K. Kolmer, C. Eidman, and C. Ryno share income on a 5:3:2 basis. They have cap-ital balances of $34,000, $26,000, and $21,000, respectively, when Don Jernigan is admit-ted to the partnership.
InstructionsPrepare the journal entry to record the admission of Don Jernigan under each of the fol-lowing assumptions.
Prepare partners’ capital statement and partial balance sheet.
(LO 2)
Prepare a classifi ed balance sheet of a partnership.
(LO 2)
Prepare cash payments schedule.
(LO 3)
Journalize transactions in a liquidation.
(LO 3)
Journalize transactions with a capital defi ciency.
(LO 3)
Journalize admission of a new partner by purchase of an interest.
(LO 4)

Exercises: Set B and Challenge Exercises 565
(a) Purchase of 50% of Kolmer’s equity for $19,000.(b) Purchase of 50% of Eidman’s equity for $12,000.(c) Purchase of 331/3% of Ryno’s equity for $9,000.
*E12-12 S. Pagan and T. Tabor share income on a 6:4 basis. They have capital balances of $100,000 and $60,000, respectively, when W. Wolford is admitted to the partnership.
InstructionsPrepare the journal entry to record the admission of W. Wolford under each of the following assumptions.
(a) Investment of $90,000 cash for a 30% ownership interest with bonuses to the existing partners.
(b) Investment of $50,000 cash for a 30% ownership interest with a bonus to the new partner.
*E12-13 N. Essex, C. Gilmore, and C. Heganbart have capital balances of $50,000, $40,000, and $30,000, respectively. Their income ratios are 4:4:2. Heganbart withdraws from the partnership under each of the following independent conditions.
1. Essex and Gilmore agree to purchase Heganbart’s equity by paying $17,000 each from their personal assets. Each purchaser receives 50% of Heganbart’s equity.
2. Gilmore agrees to purchase all of Heganbart’s equity by paying $22,000 cash from her personal assets.
3. Essex agrees to purchase all of Heganbart’s equity by paying $26,000 cash from his personal assets.
InstructionsJournalize the withdrawal of Heganbart under each of the assumptions above.
*E12-14 B. Higgins, J. Mayo, and N. Rice have capital balances of $95,000, $75,000, and $60,000, respectively. They share income or loss on a 5:3:2 basis. Rice withdraws from the partnership under each of the following conditions.
1. Rice is paid $64,000 in cash from partnership assets, and a bonus is granted to the retiring partner.
2. Rice is paid $52,000 in cash from partnership assets, and bonuses are granted to the remaining partners.
InstructionsJournalize the withdrawal of Rice under each of the assumptions above.
*E12-15 Foss, Albertson, and Espinosa are partners who share profi ts and losses 50%, 30%, and 20%, respectively. Their capital balances are $100,000, $60,000, and $40,000, respectively.
Instructions(a) Assume Garrett joins the partnership by investing $88,000 for a 25% interest
with bonuses to the existing partners. Prepare the journal entry to record his investment.
(b) Assume instead that Foss leaves the partnership. Foss is paid $110,000 with a bonus to the retiring partner. Prepare the journal entry to record Foss’s withdrawal.
Journalize admission of a new partner by investment.
(LO 4)
Journalize withdrawal of a partner with payment from partners’ personal assets.
(LO 4)
Journalize withdrawal of a partner with payment from partnership assets.
(LO 4)
Journalize entry for admission and withdrawal of partners.
(LO 4)
EXERCISES: SET B AND CHALLENGE EXERCISES
Visit the book’s companion website, at www.wiley.com/college/weygandt, and choose the Student Companion site to access Exercises: Set B and Challenge Exercises.
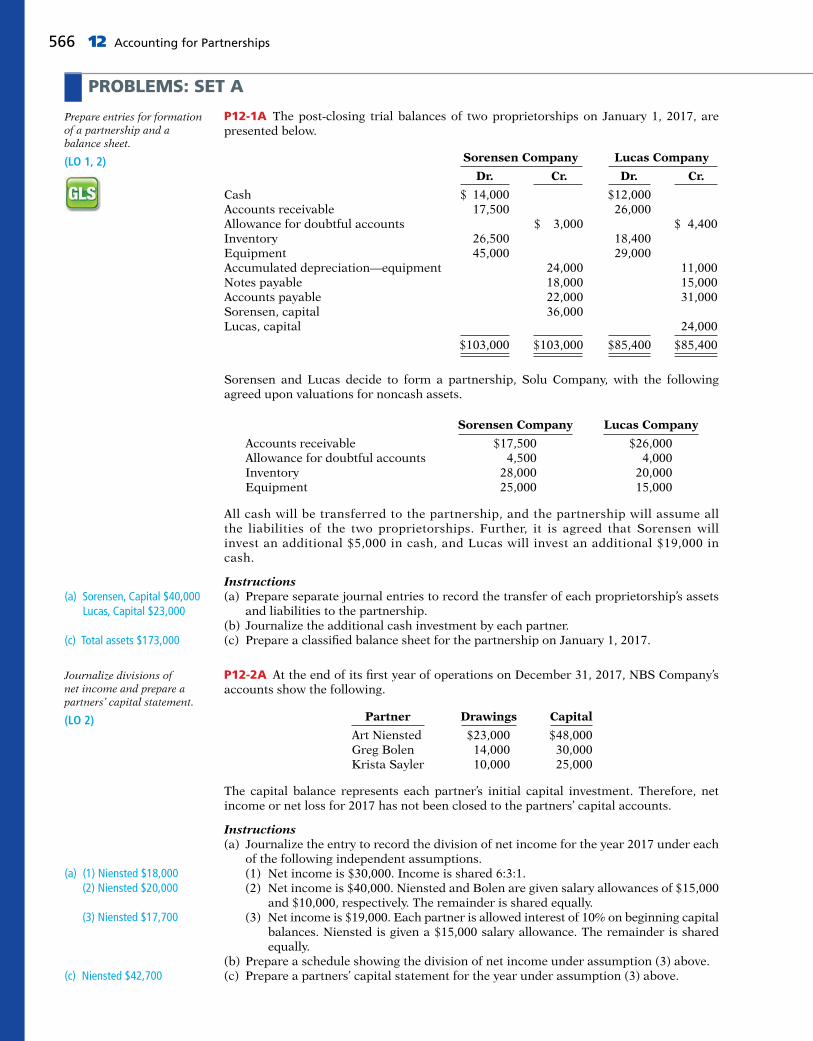
566 12 Accounting for Partnerships
PROBLEMS: SET A
P12-1A The post-closing trial balances of two proprietorships on January 1, 2017, are presented below.
Sorensen Company Lucas Company
Dr. Cr. Dr. Cr.
Cash $ 14,000 $12,000Accounts receivable 17,500 26,000Allowance for doubtful accounts $ 3,000 $ 4,400Inventory 26,500 18,400Equipment 45,000 29,000Accumulated depreciation—equipment 24,000 11,000Notes payable 18,000 15,000Accounts payable 22,000 31,000Sorensen, capital 36,000Lucas, capital 24,000
$103,000 $103,000 $85,400 $85,400
Sorensen and Lucas decide to form a partnership, Solu Company, with the following agreed upon valuations for noncash assets.
Sorensen Company Lucas Company
Accounts receivable $17,500 $26,000 Allowance for doubtful accounts 4,500 4,000 Inventory 28,000 20,000 Equipment 25,000 15,000
All cash will be transferred to the partnership, and the partnership will assume all the liabilities of the two proprietorships. Further, it is agreed that Sorensen will invest an additional $5,000 in cash, and Lucas will invest an additional $19,000 in cash.
Instructions(a) Prepare separate journal entries to record the transfer of each proprietorship’s assets
and liabilities to the partnership.(b) Journalize the additional cash investment by each partner.(c) Prepare a classifi ed balance sheet for the partnership on January 1, 2017.
P12-2A At the end of its fi rst year of operations on December 31, 2017, NBS Company’s accounts show the following.
Partner Drawings Capital
Art Niensted $23,000 $48,000Greg Bolen 14,000 30,000Krista Sayler 10,000 25,000
The capital balance represents each partner’s initial capital investment. Therefore, net income or net loss for 2017 has not been closed to the partners’ capital accounts.
Instructions(a) Journalize the entry to record the division of net income for the year 2017 under each
of the following independent assumptions. (1) Net income is $30,000. Income is shared 6:3:1. (2) Net income is $40,000. Niensted and Bolen are given salary allowances of $15,000
and $10,000, respectively. The remainder is shared equally. (3) Net income is $19,000. Each partner is allowed interest of 10% on beginning capital
balances. Niensted is given a $15,000 salary allowance. The remainder is shared equally.
(b) Prepare a schedule showing the division of net income under assumption (3) above.(c) Prepare a partners’ capital statement for the year under assumption (3) above.
Prepare entries for formation of a partnership and a balance sheet.
(LO 1, 2)
(a) Sorensen, Capital $40,000 Lucas, Capital $23,000
(c) Total assets $173,000
Journalize divisions of net income and prepare a partners’ capital statement.
(LO 2)
(a) (1) Niensted $18,000 (2) Niensted $20,000
(3) Niensted $17,700
(c) Niensted $42,700

Problems: Set A 567
P12-3A The partners in Crawford Company decide to liquidate the fi rm when the balance sheet shows the following.
CRAWFORD COMPANYBalance SheetMay 31, 2017
Assets Liabilities and Owners’ Equity
Cash $ 27,500 Notes payable $ 13,500Accounts receivable 25,000 Accounts payable 27,000Allowance for doubtful accounts (1,000) Salaries and wages payable 4,000Inventory 34,500 A. Jamison, capital 33,000Equipment 21,000 S. Moyer, capital 21,000Accumulated depreciation—equipment (5,500) P. Roper, capital 3,000
$101,500 $101,500
The partners share income and loss 5:3:2. During the process of liquidation, the following transactions were completed in the following sequence.
1. A total of $51,000 was received from converting noncash assets into cash.2. Gain or loss on realization was allocated to partners.3. Liabilities were paid in full.4. P. Roper paid his capital defi ciency.5. Cash was paid to the partners with credit balances.
Instructions(a) Prepare the entries to record the transactions.(b) Post to the cash and capital accounts.(c) Assume that Roper is unable to pay the capital defi ciency. (1) Prepare the entry to allocate Roper’s debit balance to Jamison and Moyer. (2) Prepare the entry to record the fi nal distribution of cash.
*P12-4A At April 30, partners’ capital balances in PDL Company are G. Donley $52,000, C. Lamar $48,000, and J. Pinkston $18,000. The income sharing ratios are 5:4:1, respec-tively. On May 1, the PDLT Company is formed by admitting J. Terrell to the fi rm as a partner.
Instructions(a) Journalize the admission of Terrell under each of the following independent assumptions. (1) Terrell purchases 50% of Pinkston’s ownership interest by paying Pinkston $16,000
in cash. (2) Terrell purchases 331/3% of Lamar’s ownership interest by paying Lamar $15,000
in cash. (3) Terrell invests $62,000 for a 30% ownership interest, and bonuses are given to the
old partners. (4) Terrell invests $42,000 for a 30% ownership interest, which includes a bonus to
the new partner.(b) Lamar’s capital balance is $32,000 after admitting Terrell to the partnership by invest-
ment. If Lamar’s ownership interest is 20% of total partnership capital, what were (1) Terrell’s cash investment and (2) the bonus to the new partner?
*P12-5A On December 31, the capital balances and income ratios in TEP Company are as follows.
Partner Capital Balance Income Ratio
Trayer $60,000 50%Emig 40,000 30%Posada 30,000 20%
Instructions(a) Journalize the withdrawal of Posada under each of the following assumptions. (1) Each of the continuing partners agrees to pay $18,000 in cash from personal funds
to purchase Posada’s ownership equity. Each receives 50% of Posada’s equity. (2) Emig agrees to purchase Posada’s ownership interest for $25,000 cash.
Prepare entries with a capital defi ciency in liquidation of a partnership.
(LO 3)
(a) Loss on realization $23,000 Cash paid: to Jamison $21,500; to Moyer $14,100
Journalize admission of a partner under different assumptions.
(LO 4)
(a) (1) Terrell $9,000
(2) Terrell $16,000
(3) Terrell $54,000
(4) Terrell $48,000
Journalize withdrawal of a partner under different assumptions.
(LO 4)
(a) (1) Emig, Capital $15,000
(2) Emig, Capital $30,000

568 12 Accounting for Partnerships
CONTINUING PROBLEM
COOKIE CREATIONS: AN ENTREPRENEURIAL JOURNEY(Note: This is a continuation of the Cookie Creations problem from Chapters 1 through 11.)
CC12 Natalie’s high school friend, Katy Peterson, has been operating a bakery for approximately 18 months. Because Natalie has been so successful operating Cookie Creations, Katy would like to have Natalie become her partner. Katy believes that together they will create a thriving cookie-making business. Natalie is quite happy with her current business set-up. Up until now, she had not consid-ered joining forces with anyone. However, Natalie thinks that it may be a good idea to establish a partnership with Katy, and decides to look into it.
Go to the book’s companion website, www.wiley.com/college/weygandt, to see the completion of this problem.
© leungchopan/Shutterstock
(3) Posada is paid $34,000 from partnership assets, which includes a bonus to the retiring partner.
(4) Posada is paid $22,000 from partnership assets, and bonuses to the remaining partners are recognized.
(b) If Emig’s capital balance after Posada’s withdrawal is $43,600, what were (1) the total bonus to the remaining partners and (2) the cash paid by the partnership to Posada?
PROBLEMS: SET B AND SET C
Visit the book’s companion website, at www.wiley.com/college/weygandt, and choose the Student Companion site to access Problems: Set B and Set C.
PERSPECTIVEFINANCIAL REPORTING AND ANALYSIS
Real-World FocusBYP12-1 This exercise is an introduction to the Big Four accounting fi rms, all of which are partnerships.
Addresses
Deloitte & Touche www.deloitte.com/Ernst & Young www.ey.com/KPMG www.us.kpmg.com/PricewaterhouseCoopers www.pwc.com/
or go to www.wiley.com/college/weygandt
Steps1. Select a fi rm that is of interest to you.2. Go to the fi rm’s homepage.
Instructions(a) Name two services performed by the fi rm.(b) What is the fi rm’s total annual revenue?(c) How many clients does it service?(d) How many people are employed by the fi rm?(e) How many partners are there in the fi rm?
Decision-Making Across the OrganizationBYP12-2 Stephen Wadson and Mary Shively, two professionals in the fi nance area, have worked for Morrisen Leasing for a number of years. Morrisen Leasing is a company that leases high-tech medical equipment to hospitals. Stephen and Mary have decided that, with their fi nancial expertise, they
BROADENING YOUR
(3) Bonus $4,000
(4) Bonus $8,000

Broadening Your Perspective 569
might start their own company to perform consulting services for individuals interested in leasing equipment. One form of organization they are considering is a partnership. If they start a partnership, each individual plans to contribute $50,000 in cash. In addition, Stephen has a used IBM computer that originally cost $3,700, which he intends to invest in the part-nership. The computer has a present fair value of $1,500. Although both Stephen and Mary are fi nancial wizards, they do not know a great deal about how a partnership operates. As a result, they have come to you for advice.
InstructionsWith the class divided into groups, answer the following.
(a) What are the major disadvantages of starting a partnership?(b) What type of document is needed for a partnership, and what should this document contain?(c) Both Stephen and Mary plan to work full-time in the new partnership. They believe that net
income or net loss should be shared equally. However, they are wondering how to provide com-pensation to Stephen Wadson for his investment of the computer. What would you tell them?
(d) Stephen is not sure how the computer equipment should be reported on his tax return. What would you tell him?
(e) As indicated above, Stephen and Mary have worked together for a number of years. Stephen’s skills complement Mary’s and vice versa. If one of them dies, it will be very diffi cult for the other to maintain the business, not to mention the diffi culty of paying the deceased partner’s estate for his or her partnership interest. What would you advise them to do?
Communication ActivityBYP12-3 You are an expert in the fi eld of forming partnerships. Ronald Hrabik and Meg Percival want to establish a partnership to start “Pasta Shop,’’ and they are going to meet with you to discuss their plans. Prior to the meeting, you will send them a memo discussing the issues they need to consider.
InstructionsWrite a memo in good form to be sent to Hrabik and Percival.
Ethics CaseBYP12-4 Alexandra and Kellie operate a beauty salon as partners who share profi ts and losses equally. The success of their business has exceeded their expectations; the salon is operating quite profi tably. Kellie is anxious to maximize profi ts and schedules appointments from 8 a.m. to 6 p.m. daily, even sacrifi cing some lunch hours to accommodate regular customers. Alexandra schedules her appoint-ments from 9 a.m. to 5 p.m. and takes long lunch hours. Alexandra regularly makes signifi cantly larger withdrawals of cash than Kellie does, but, she says, “Kellie, you needn’t worry, I never make a withdrawal without you knowing about it, so it is properly recorded in my drawings account and charged against my capital at the end of the year.” Alexandra’s withdrawals to date are double Kellie’s.
Instructions(a) Who are the stakeholders in this situation?(b) Identify the problems with Alexandra’s actions and discuss the ethical considerations involved.(c) How might the partnership agreement be revised to accommodate the differences in Alexandra’s
and Kellie’s work and withdrawal habits?
All About YouBYP12-5 As this chapter indicates, the partnership form of organization has advantages and disad-vantages. The chapter noted that different types of partnerships have been developed to minimize some of these disadvantages. Alternatively, an individual or company can choose the proprietorship or corporate form of organization.
InstructionsGo to two local businesses that are different, such as a restaurant, a retailer, a construction company, or a professional offi ce (dentist, doctor, etc.), and fi nd the answers to the following questions.
(a) What form of organization do you use in your business?(b) What do you believe are the two major advantages of this form of organization for your business?(c) What do you believe are the two major disadvantages of this form of organization for your business?(d) Do you believe that eventually you may choose another form of organization?(e) Did you have someone help you form this organization (attorney, accountant, relative, etc.)?
As partnership accounting is essentially the same under GAAP and IFRS, there is no A Look at IFRS section in this chapter.

What major U.S. corporation got its start 41 years ago with a
waffl e iron? Hint: It doesn’t sell food. Second hint: Swoosh.
Third hint: “Just do it.” That’s right, Nike. In 1971, Nike
co-founder Bill Bowerman put a piece of rubber into a
kitchen waffl e iron, and its trademark sole was born. It
seems fair to say that at Nike, “They don’t make ’em like
they used to.”
Nike was co-founded by Bowerman and Phil Knight, a
member of Bowerman’s University of Oregon track team.
Each began in the shoe business independently during the
early 1960s. Bowerman got his start by making hand-crafted
running shoes for his University of Oregon track team. Knight,
after completing graduate school, started a small business
importing low-cost, high-quality shoes from Japan. In 1964,
the two joined forces, each contributing $500, and formed
Blue Ribbon Sports, a partnership that marketed Japanese
shoes.
It wasn’t until 1971 that the company began manufacturing
its own line of shoes. With the new shoes came a new
corporate name–Nike–the Greek goddess of victory. It is hard
to imagine that the company that now boasts a stable full of
world-class athletes as promoters at one time had part-time
employees selling shoes out of car trunks at track meets.
Nike has achieved its success through relentless innovation
combined with unbridled promotion.
By 1980, Nike was suffi ciently established and issued its fi rst
stock to the public. That same year, it created a stock
ownership program for its employees, allowing them to share
in the company’s success. Since then, Nike has enjoyed
phenomenal growth, with 2014 sales reaching $27.8 billion
and total dividends paid of $799 million.
Nike is not alone in its quest for the top of the sport shoe
world. Reebok used to be Nike’s arch rival (get it? “arch”), but
then Reebok was acquired by the German company adidas.
Now adidas pushes Nike every step of the way.
The shoe market is fi ckle, with new styles becoming popular
almost daily and vast international markets still lying
untapped. Whether one of these two giants does eventually
take control of the pedi-planet remains to be seen.
Meanwhile, the shareholders sit anxiously in the stands as this
Olympic-size drama unfolds.
What’s Cooking?
Corporations like Nike and adidas have substantial resources at their disposal. In fact, the corporation is the dominant form of business organization in the United States in terms of sales, earnings, and number of employees. All of the 500 largest companies in the United States are corporations. In this chapter, we will explain the essential features of a corporation and the accounting for a corporation’s capital stock transactions. In Chapter 14, we will look at other issues related to accounting for corporations.
CHAPTER PREVIEW
13
FEATURE STORY
Corporations: Organization and Capital Stock Transactions
570

Prepare a stockholders’ equity section.
Explain how to account for the issuance of common and preferred stock.
Explain how to account for treasury stock.
2
3
4
Discuss the major characteristics of a corporation.1
• Characteristics of a corporation• Forming a corporation• Stockholder rights• Stock issue considerations• Corporate capital
• Issuing par value common stock for cash
• Issuing no-par common stock for cash
• Issuing common stock for services or noncash assets
• Accounting for preferred stock
Learning Objectives
Recording Business ActivitiesTreasury StockDO IT! 3• Purchase of treasury stock
• Disposal of treasury stock
Stockholders’ Equity SectionDO IT! 4• Capital stock• Additional paid-in capital
Go to the REVIEW AND PRACTICE section at the end of the chapter for a review of key concepts and practice applications with solutions.
Visit WileyPLUS with ORION for additional tutorials and practice opportunities.
CHAPTER OUTLINE
Franck Fife/AFP/Getty Images, Inc.
Corporate Organization1a
Corporate CapitalDO IT!
1b
Issuance of StockDO IT! 2
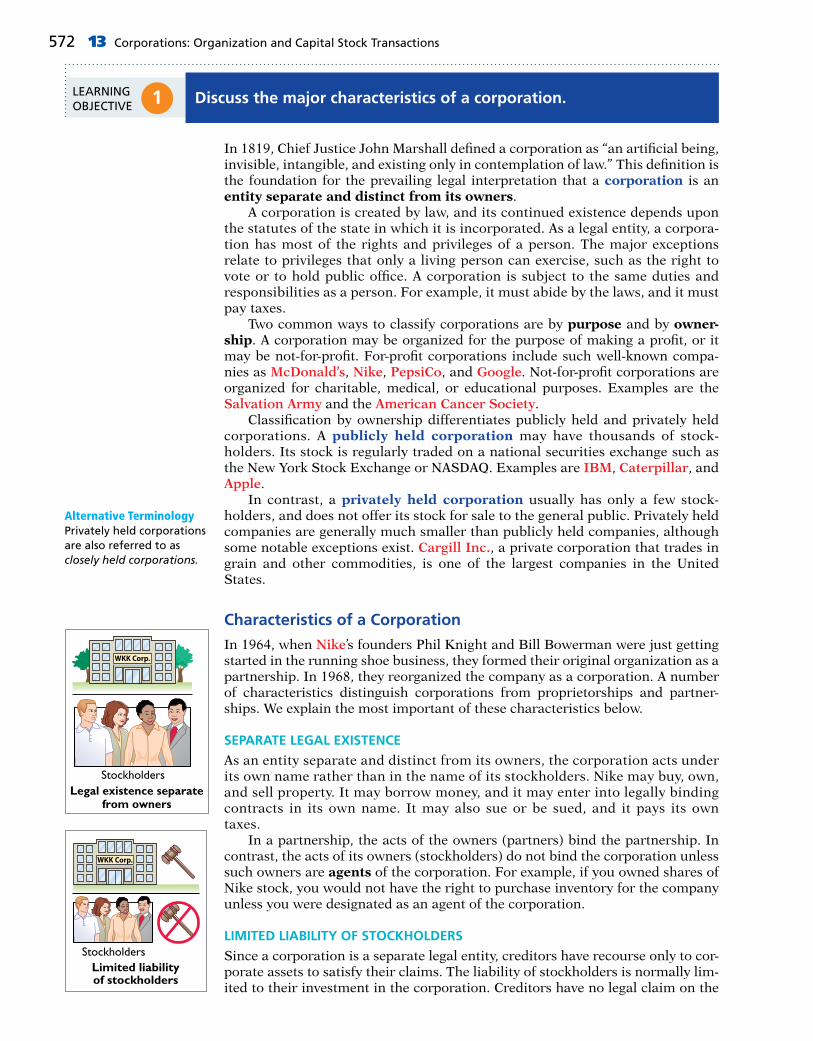
572 13 Corporations: Organization and Capital Stock Transactions
1 Discuss the major characteristics of a corporation.LEARNING OBJECTIVE
In 1819, Chief Justice John Marshall defi ned a corporation as “an artifi cial being, invisible, intangible, and existing only in contemplation of law.” This defi nition is the foundation for the prevailing legal interpretation that a corporation is an entity separate and distinct from its owners. A corporation is created by law, and its continued existence depends upon the statutes of the state in which it is incorporated. As a legal entity, a corpora-tion has most of the rights and privileges of a person. The major exceptions relate to privileges that only a living person can exercise, such as the right to vote or to hold public offi ce. A corporation is subject to the same duties and responsibilities as a person. For example, it must abide by the laws, and it must pay taxes. Two common ways to classify corporations are by purpose and by owner-ship. A corporation may be organized for the purpose of making a profi t, or it may be not-for-profi t. For-profi t corporations include such well-known compa-nies as McDonald’s, Nike, PepsiCo, and Google. Not-for-profi t corporations are organized for charitable, medical, or educational purposes. Examples are the Salvation Army and the American Cancer Society. Classifi cation by ownership differentiates publicly held and privately held corporations. A publicly held corporation may have thousands of stock-holders. Its stock is regularly traded on a national securities exchange such as the New York Stock Exchange or NASDAQ. Examples are IBM, Caterpillar, and Apple. In contrast, a privately held corporation usually has only a few stock-holders, and does not offer its stock for sale to the general public. Privately held companies are generally much smaller than publicly held companies, although some notable exceptions exist. Cargill Inc., a private corporation that trades in grain and other commodities, is one of the largest companies in the United States.
Characteristics of a Corporation
In 1964, when Nike’s founders Phil Knight and Bill Bowerman were just getting started in the running shoe business, they formed their original organization as a partnership. In 1968, they reorganized the company as a corporation. A number of characteristics distinguish corporations from proprietorships and partner-ships. We explain the most important of these characteristics below.
SEPARATE LEGAL EXISTENCE
As an entity separate and distinct from its owners, the corporation acts under its own name rather than in the name of its stockholders. Nike may buy, own, and sell property. It may borrow money, and it may enter into legally binding contracts in its own name. It may also sue or be sued, and it pays its own taxes. In a partnership, the acts of the owners (partners) bind the partnership. In contrast, the acts of its owners (stockholders) do not bind the corporation unless such owners are agents of the corporation. For example, if you owned shares of Nike stock, you would not have the right to purchase inventory for the company unless you were designated as an agent of the corporation.
LIMITED LIABILITY OF STOCKHOLDERS
Since a corporation is a separate legal entity, creditors have recourse only to cor-porate assets to satisfy their claims. The liability of stockholders is normally lim-ited to their investment in the corporation. Creditors have no legal claim on the
Alternative TerminologyPrivately held corporations are also referred to as closely held corporations.
WKK Corp.
Stockholders
WKK Corp.
Legal existence separatefrom owners
Stockholders
WKK Corp.
Limited liabilityof stockholders

Corporate Form of Organization 573
personal assets of the owners unless fraud has occurred. Even in the event of bankruptcy, stockholders’ losses are generally limited to their capital investment in the corporation.
TRANSFERABLE OWNERSHIP RIGHTS
Shares of capital stock give ownership in a corporation. These shares are trans-ferable units. Stockholders may dispose of part or all of their interest in a corpo-ration simply by selling their stock. The transfer of an ownership interest in a partnership requires the consent of each owner. In contrast, the transfer of stock is entirely at the discretion of the stockholder. It does not require the approval of either the corporation or other stockholders. The transfer of ownership rights between stockholders normally has no effect on the daily operating activities of the corporation. Nor does it affect the corpo-ration’s assets, liabilities, and total ownership equity. The transfer of these own-ership rights is a transaction between individual owners. The company does not participate in the transfer of these ownership rights after the original sale of the capital stock.
ABILITY TO ACQUIRE CAPITAL
It is relatively easy for a corporation to obtain capital through the issuance of stock. Buying stock in a corporation is often attractive to an investor because a stockholder has limited liability and shares of stock are readily transferable. Also, numerous individuals can become stockholders by investing relatively small amounts of money.
CONTINUOUS LIFE
The life of a corporation is stated in its charter. The life may be perpetual, or it may be limited to a specifi c number of years. If it is limited, the company can extend the life through renewal of the charter. Since a corporation is a separate legal entity, its continuance as a going concern is not affected by the withdrawal, death, or incapacity of a stockholder, employee, or offi cer. As a result, a successful company can have a continuous and perpetual life.
CORPORATION MANAGEMENT
Stockholders legally own the corporation. However, they manage the corpora-tion indirectly through a board of directors they elect. Philip Knight is the chairman of Nike. The board, in turn, formulates the operating policies for the company. The board also selects offi cers, such as a president and one or more vice presidents, to execute policy and to perform daily management functions. As a result of the Sarbanes-Oxley Act, the board is now required to monitor management’s actions more closely. Many feel that the failures of Enron, WorldCom, and more recently MF Global could have been avoided by more diligent boards. Illustration 13-1 (page 574) presents a typical organization chart showing the delegation of responsibility. The chief executive offi cer (CEO) has overall respon-sibility for managing the business. As the organization chart shows, the CEO delegates responsibility to other offi cers. The chief accounting offi cer is the con-troller. The controller’s responsibilities include (1) maintaining the accounting records, (2) ensuring an adequate system of internal control, and (3) preparing fi nancial statements, tax returns, and internal reports. The treasurer has custody of the corporation’s funds and is responsible for maintaining the company’s cash position. The organizational structure of a corporation enables a company to hire pro-fessional managers to run the business. On the other hand, the separation of ownership and management often reduces an owner’s ability to actively manage the company.
STOCK
Transferableownership rights
STOCK
STOCK= $ $
Ability to acquire capital
Founded in 1892
TRUE GRIT Co.
Continuous life
ETHICS NOTE
Managers who are not owners are often compensated based on the performance of the fi rm. They thus may be tempted to exaggerate fi rm performance by infl ating income fi gures.

574 13 Corporations: Organization and Capital Stock Transactions
GOVERNMENT REGULATIONS
A corporation is subject to numerous state and federal regulations. For example, state laws usually prescribe the requirements for issuing stock, the distributions of earnings permitted to stockholders, and the acceptable methods for buying back and retiring stock. Federal securities laws govern the sale of capital stock to the general public. Also, most publicly held corporations are required to make extensive disclosure of their fi nancial affairs to the Securities and Exchange Commission (SEC) through quarterly and annual reports (Forms 10Q and 10K). In addition, when a corporation lists its stock on organized securities exchanges, it must comply with the reporting requirements of these exchanges. Government regulations are designed to protect the owners of the corporation.
ADDITIONAL TAXES
Owners of proprietorships and partnerships report their share of earnings on their personal income tax returns. The individual owner then pays taxes on this amount. Corporations, on the other hand, must pay federal and state income taxes as a separate legal entity. These taxes can be substantial. They can amount to as much as 40% of taxable income. In addition, stockholders must pay taxes on cash dividends (pro rata distribu-tions of net income). Thus, many argue that the government taxes corporate income twice (double taxation)—once at the corporate level and again at the individual level. In summary, Illustration 13-2 shows the advantages and disadvantages of a corporation compared to a proprietorship and a partnership.
Forming a Corporation
A corporation is formed by grant of a state charter. The charter is a document that describes the name and purpose of the corporation, the types and number of shares of stock that are authorized to be issued, the names of the individuals that
Illustration 13-1Corporation organization chart
Vice PresidentHuman
Resources
Vice PresidentOperations
Vice PresidentFinance/Chief
Financial Officer
Vice PresidentMarketing
GeneralCounsel/Secretary
Treasurer Controller
Chairman andBoard ofDirectors
Stockholders
President andChief Executive
Officer
WKK Corp.WKK Corp.
State laws SEC laws
Stockexchangerequirements
Federalregulations
Government regulations
Additional taxes

Corporate Form of Organization 575
formed the company, and the number of shares that these individuals agreed to purchase. Regardless of the number of states in which a corporation has operat-ing divisions, it is incorporated in only one state. It is to the company’s advantage to incorporate in a state whose laws are favorable to the corporate form of business organization. For example, although General Motors has its headquarters in Michigan, it is incorporated in New Jersey. In fact, more and more corporations have been incorporating in states with rules that favor existing management. For example, Gulf Oil changed its state of incor-poration to Delaware to thwart possible unfriendly takeovers. There, certain defensive tactics against takeovers can be approved by the board of directors alone, without a vote by shareholders. Upon receipt of its charter from the state of incorporation, the corporation establishes by-laws. The by-laws establish the internal rules and procedures for conducting the affairs of the corporation. Corporations engaged in interstate commerce must also obtain a license from each state in which they do business. The license subjects the corporation’s operating activities to the general corpora-tion laws of the state. Costs incurred in the formation of a corporation are called organization costs. These costs include legal and state fees, and promotional expenditures involved in the organization of the business. Corporations expense organiza-tion costs as incurred. Determining the amount and timing of future benefi ts is so diffi cult that it is standard procedure to take a conservative approach of expensing these costs immediately.
Alternative TerminologyThe charter is often referred to as the articles of incorporation.
Advantages Disadvantages
Separate legal existence Corporation management—separation of Limited liability of stockholders ownership and managementTransferable ownership rights Government regulationsAbility to acquire capital Additional taxesContinuous lifeCorporation management—professional managers
Illustration 13-2Advantages and disadvantages of a corporation
A Thousand Millionaires!
Traveling to space or embark-ing on an expedition to exca-vate lost Mayan ruins are normally the stuff of adven-ture novels. But for employees of Facebook, these and other lavish dreams moved closer to reality when the world’s No. 1 online social network went public through an initial public offering (IPO) that may have created at least a thousand mil-
lionaires. The IPO was the largest in Internet history, valu-ing Facebook at over $104 billion.
With all these riches to be had, why did Mark Zuckerberg, the founder of Facebook, delay taking his company public?
Consider that the main motivation for issuing shares to the public is to raise money so you can grow your business. However, unlike a manufacturer or even an online retailer, Facebook doesn’t need major physical resources, it doesn’t have inventory, and it doesn’t really need much money for marketing. So in the past, the company hasn’t had much need for additional cash beyond what it was already gen-erating on its own. Finally, as head of a closely held, non-public company, Zuckerberg was subject to far fewer regulations than a public company.
Source: “Status Update: I’m Rich! Facebook Flotation to Create 1,000 Millionaires Among Company’s Rank and File,” Daily Mail Reporter (February 1, 2012).
Why did Mark Zuckerberg, the CEO and founder of Facebook, delay taking his company’s shares public through an initial public offering (IPO)? (Go to WileyPLUS for this answer and additional questions.)
Jeff Chiu/AP/Wide World Photos
FacebookAccounting Across the Organization

576 13 Corporations: Organization and Capital Stock Transactions
Stockholder Rights
When chartered, the corporation may begin selling shares of stock. When a corporation has only one class of stock, it is common stock. Each share of common stock gives the stockholder the ownership rights pictured in Illustra-tion 13-3. The articles of incorporation or the by-laws state the ownership rights of a share of stock.
1A number of companies have eliminated the preemptive right because they believe it makes an unnecessary and cumbersome demand on management. For example, by stockholder approval, IBM has dropped its preemptive right for stockholders.
Illustration 13-3Ownership rights of stockholders
Dividends
New shares issued
Before After
14% 14%
Lenders
Creditors
StockholdersGON Corp.
Going out of
business
Vote in election of board of directors at annual meeting and vote on actions that require stockholder approval.
1.
Share the corporateearnings through receiptof dividends.
2.
Share in assets upon liquidation in proportion to their holdings. This is called a residual claim because owners are paid with assets that remain after all other claims have been paid.
4.
Keep the same percentage ownership when new shares of stock are issued(preemptive right1).
3.
Stockholders have the right to:
Proof of stock ownership is evidenced by a form known as a stock certifi -cate. As Illustration 13-4 shows, the face of the certifi cate shows the name of the corporation, the stockholder’s name, the class and special features of the stock, the number of shares owned, and the signatures of authorized corporate offi cials. Prenumbered certifi cates facilitate accountability. They may be issued for any quantity of shares.
Stock Issue Considerations
Although Nike incorporated in 1968, it did not sell stock to the public until 1980. At that time, Nike evidently decided it would benefi t from the infusion of cash that a public sale would bring. When a corporation decides to issue stock, it must resolve a number of basic questions: How many shares should it authorize for sale? How should it issue the stock? What value should the corporation assign to the stock? We address these questions in the following sections.

Corporate Form of Organization 577
AUTHORIZED STOCK
The charter indicates the amount of stock that a corporation is authorized to sell. The total amount of authorized stock at the time of incorporation normally anticipates both initial and subsequent capital needs. As a result, the number of shares authorized generally exceeds the number initially sold. If it sells all autho-rized stock, a corporation must obtain consent of the state to amend its charter before it can issue additional shares. The authorization of capital stock does not result in a formal account-ing entry. The reason is that the event has no immediate effect on either corporate assets or stockholders’ equity. However, the number of autho-rized shares is often reported in the stockholders’ equity section. It is then simple to determine the number of unissued shares that the corporation can issue without amending the charter: subtract the total shares issued from the total authorized. For example, if Advanced Micro was authorized to sell 100,000 shares of common stock and issued 80,000 shares, 20,000 shares would remain unissued.
ISSUANCE OF STOCK
A corporation can issue common stock directly to investors. Alternatively, it can issue the stock indirectly through an investment banking fi rm that specializes in bringing securities to the attention of prospective investors. Direct issue is typical in closely held companies. Indirect issue is customary for a publicly held corporation. In an indirect issue, the investment banking fi rm may agree to underwrite the entire stock issue. In this arrangement, the investment banker buys the stock from the corporation at a stipulated price and resells the shares to investors. The corpo-ration thus avoids any risk of being unable to sell the shares. Also, it obtains imme-diate use of the cash received from the underwriter. The investment banking fi rm, in turn, assumes the risk of reselling the shares, in return for an underwriting fee.2
2Alternatively, the investment banking fi rm may agree only to enter into a best-efforts contract with the corporation. In such cases, the banker agrees to sell as many shares as possible at a specifi ed price. The corporation bears the risk of unsold stock. Under a best-efforts arrangement, the banking fi rm is paid a fee or commission for its services.
Illustration 13-4A stock certifi cate
Indirect issuance
STOCK
WKK Corp.XYZ Corp.
Really BigInvestment Bank, Inc.

578 13 Corporations: Organization and Capital Stock Transactions
For example, Google (the world’s number-one Internet search engine) used under-writers when it issued a highly successful initial public offering, raising $1.67 bil-lion. The underwriters charged a 3% underwriting fee (approximately $50 million) on Google’s stock offering. How does a corporation set the price for a new issue of stock? Among the factors to be considered are (1) the company’s anticipated future earnings, (2) its expected dividend rate per share, (3) its current fi nancial position, (4) the current state of the economy, and (5) the current state of the securities market. The cal-culation can be complex and is properly the subject of a fi nance course.
MARKET PRICE OF STOCK
The stock of publicly held companies is traded on organized exchanges. The interaction between buyers and sellers determines the prices per share. In gen-eral, the prices set by the marketplace tend to follow the trend of a company’s earnings and dividends. But, factors beyond a company’s control, such as an oil embargo, changes in interest rates, or the outcome of a presidential election, may cause day-to-day fl uctuations in market prices. The trading of capital stock on securities exchanges involves the transfer of already issued shares from an existing stockholder to another investor. These transactions have no impact on a corporation’s stockholders’ equity.
PAR AND NO-PAR VALUE STOCKS
Par value stock is capital stock to which the charter has assigned a value per share. Years ago, par value determined the legal capital per share that a com-pany must retain in the business for the protection of corporate creditors. That amount was not available for withdrawal by stockholders. Thus, in the past, most states required the corporation to sell its shares at par or above. However, par value was often immaterial relative to the value of the company’s stock—even at the time of issue. Thus, its usefulness as a protective device to cred-itors was questionable. For example, Loews Corporation’s par value is $0.01 per share, yet a new issue in 2014 would have sold at a market price in the $44 per share range. Thus, par has no relationship with market price. In the vast majority of cases, it is an immaterial amount. As a consequence, today many states do not require a par value. Instead, they use other means to protect creditors.
How to Read Stock Quotes
Organized exchanges trade the stock of publicly held companies at dollar prices per share estab-lished by the interaction between buyers and sellers. For each listed security, the fi nancial press reports the high and low prices of the stock during the year, the total volume of stock traded on a given day, the high and low prices for the day, and the closing market price, with the net change for the day. Nike is listed on the New York Stock Exchange. Here is a listing for Nike:
These numbers indicate the following. The high and low market prices for the last 52 weeks have been $79.64 and $62.81. The trading volume for the day was 2,912,866 shares. The high, low, and closing prices for that date were $77.25, $76.39, and $76.78, respectively. The net change for the day was a decrease of $0.35 per share.
For stocks traded on organized exchanges, how are the dollar prices per share established? What factors might infl uence the price of shares in the marketplace? (Go to WileyPLUS for this answer and additional questions.)
NikeInvestor Insight
Joe Robbins/Getty Images, Inc.
52 Weeks
Stock High Low Volume High Low Close Net Change
Nike 79.64 62.81 2,912,866 77.25 76.39 76.78 20.35

Corporate Form of Organization 579
No-par value stock is capital stock to which the charter has not assigned a value. No-par value stock is fairly common today. For example, Nike and Procter & Gamble both have no-par stock. In many states, the board of directors assigns a stated value to no-par shares.
Indicate whether each of the following statements is true or false.
______ 1. Similar to partners in a partnership, stockholders of a corporation have unlim-ited liability.
______ 2. It is relatively easy for a corporation to obtain capital through the issuance of stock.
______ 3. The separation of ownership and management is an advantage of the corpo-rate form of business.
______ 4. The journal entry to record the authorization of capital stock includes a credit to the appropriate capital stock account.
______ 5. All states require a par value per share for capital stock.
Solution
DO IT! 1a Corporate Organization
1. False. The liability of stockholders is normally limited to their investment in the corporation. 2. True. 3. False. The separation of ownership and management is a disadvantage of the corporate form of business. 4. False. The authorization of capital stock does not result in a formal accounting entry. 5. False. Many states do not require a par value.
Related exercise material: BE13-1, E13-1, E13-2, and DO IT! 13-1a.
Action Plan✔ Review the character-
istics of a corporation and understand which are advantages and which are disadvantages.
✔ Understand that corporations raise capital through the issuance of stock, which can be par or no-par.
Corporate Capital
Owners’ equity is identifi ed by various names: stockholders’ equity, shareholders’ equity, or corporate capital. The stockholders’ equity section of a corporation’s balance sheet consists of two parts: (1) paid-in (contributed) capital and (2) retained earnings (earned capital). The distinction between paid-in capital and retained earnings is important from both a legal and a fi nancial point of view. Legally, corporations can make distributions of earnings (declare dividends) out of retained earnings in all states. However, in many states they cannot declare dividends out of paid-in capital. Management, stockholders, and others often look to retained earnings for the continued existence and growth of the corporation.
PAID-IN CAPITAL
Paid-in capital is the total amount of cash and other assets paid in to the corpo-ration by stockholders in exchange for capital stock. As noted earlier, when a corporation has only one class of stock, it is common stock.
RETAINED EARNINGS
Retained earnings is net income that a corporation retains for future use. Net income is recorded in Retained Earnings by a closing entry that debits Income Summary and credits Retained Earnings. For example, assuming that net income for Delta Robotics in its fi rst year of operations is $130,000, the closing entry is:
Income Summary 130,000 Retained Earnings 130,000 (To close Income Summary and transfer net income to Retained Earnings)
A SEL5 1
2130,000 Inc 1130,000 RE
Cash Flowsno effect

580 13 Corporations: Organization and Capital Stock Transactions
If Delta Robotics has a balance of $800,000 in common stock at the end of its fi rst year, its stockholders’ equity section is as follows.
Illustration 13-5Stockholders’ equity section DELTA ROBOTICS
Balance Sheet (partial)
Stockholders’ equity Paid-in capital Common stock $800,000 Retained earnings 130,000
Total stockholders’ equity $930,000
Illustration 13-6 compares the owners’ equity (stockholders’ equity) accounts reported on a balance sheet for a proprietorship, a partnership, and a corporation.
Illustration 13-6Comparison of owners’ equity accounts
Proprietorship Partnership Corporation
Owner's Capital
Normal bal.
Common Stock
Normal bal.
Retained Earnings
Normal bal.
Able, Capital
Normal bal.
Baker, Capital
Normal bal.
WKKCorporation
xxxxxxxxxx
xxxxxxxxxx
xxxxxxxxx
At the end of its fi rst year of operation, Doral Corporation has $750,000 of common stock and net income of $122,000. Prepare (a) the closing entry for net income and (b) the stockholders’ equity section at year-end.
Solution
DO IT! 1b Corporate Capital
(a) Income Summary 122,000 Retained Earnings 122,000 (To close Income Summary and transfer net income to Retained Earnings)
(b) Stockholders’ equity Paid-in capital Common stock $750,000 Retained earnings 122,000
Total stockholders’ equity $872,000
Related exercise material: BE13-2 and DO IT! 13-1b.
Action Plan✔ Record net income in
Retained Earnings by a closing entry in which Income Summary is debited and Retained Earningsis credited.
✔ In the stockholders’ equity section, show(1) paid-in capital and(2) retained earnings.

Accounting for Common and Preferred Stock 581
2 Explain how to account for the issuance of common and preferred stock.
LEARNING OBJECTIVE
Let’s now look at how to account for issues of common stock. The primary objec-tives in accounting for the issuance of common stock are (1) to identify the spe-cifi c sources of paid-in capital, and (2) to maintain the distinction between paid-in capital and retained earnings. The issuance of common stock affects only paid-in capital accounts.
Issuing Par Value Common Stock for Cash
As discussed earlier, par value does not indicate a stock’s market price. Therefore, the cash proceeds from issuing par value stock may be equal to, greater than, or less than par value. When the company records issuance of common stock for cash, it credits the par value of the shares to Common Stock. It also records in a separate paid-in capital account the portion of the proceeds that is above or below par value. To illustrate, assume that Hydro-Slide, Inc. issues 1,000 shares of $1 par value common stock at par for cash. The entry to record this transaction is:
Cash 1,000 Common Stock 1,000 (To record issuance of 1,000 shares of $1 par
common stock at par)
Now assume that Hydro-Slide issues an additional 1,000 shares of the $1 par value common stock for cash at $5 per share. The amount received above the par value, in this case $4 ($5 2 $1), is credited to Paid-in Capital in Excess of Par—Common Stock. The entry is:
Cash 5,000 Common Stock 1,000 Paid-in Capital in Excess of Par—Common Stock 4,000 (To record issuance of 1,000 shares of $1 par
common stock)
The total paid-in capital from these two transactions is $6,000, and the legal capital is $2,000. Assuming Hydro-Slide, Inc. has retained earnings of $27,000, Illustration 13-7 shows the company’s stockholders’ equity section.
A SEL5 1
11,000 11,000 CS
Cash Flows11,000
A SEL5 1
15,000 11,000 CS 14,000 CS
Cash Flows15,000
When a corporation issues stock for less than par value, it debits the account Paid-in Capital in Excess of Par—Common Stock if a credit balance exists in this account. If a credit balance does not exist, then the corporation debits to Retained
Illustration 13-7Stockholders’ equity—paid-in capital in excess of par
HYDRO-SLIDE, INC.Balance Sheet (partial)
Stockholders’ equity Paid-in capital Common stock $ 2,000 Paid-in capital in excess of par—
common stock 4,000
Total paid-in capital 6,000 Retained earnings 27,000
Total stockholders’ equity $33,000
Alternative TerminologyPaid-in Capital in Excess of Par is also called Premium on Stock.

582 13 Corporations: Organization and Capital Stock Transactions
Earnings the amount less than par. This situation occurs only rarely. Most states do not permit the sale of common stock below par value because stockholders may be held personally liable for the difference between the price paid upon orig-inal sale and par value.
Issuing No-Par Common Stock for Cash
When no-par common stock has a stated value, the entries are similar to those illustrated for par value stock. The corporation credits the stated value to Com-mon Stock. Also, when the selling price of no-par stock exceeds stated value, the corporation credits the excess to Paid-in Capital in Excess of Stated Value—Common Stock. For example, assume that instead of $1 par value stock, Hydro-Slide, Inc. has $5 stated value no-par stock and the company issues 5,000 shares at $8 per share for cash. The entry is as follows.
Cash 40,000 Common Stock 25,000 Paid-in Capital in Excess of Stated Value—Common Stock 15,000 (To record issue of 5,000 shares of $5 stated
value no-par stock)
Hydro-Slide, Inc. reports Paid-in Capital in Excess of Stated Value—Common Stock as part of paid-in capital in the stockholders’ equity section. What happens when no-par stock does not have a stated value? In that case, the corporation credits the entire proceeds to Common Stock. Thus, if Hydro-Slide does not assign a stated value to its no-par stock, it records the issuance of the 5,000 shares at $8 per share for cash as follows.
Cash 40,000 Common Stock 40,000 (To record issue of 5,000 shares of no-par stock)
Organization Expense 5,000 Common Stock 4,000 Paid-in Capital in Excess of Par—Common Stock 1,000 (To record issuance of 4,000 shares of $1 par value
stock to attorneys)
Issuing Common Stock for Services or Noncash Assets
Corporations also may issue stock for services (compensation to attorneys or con-sultants) or for noncash assets (land, buildings, and equipment). In such cases, what cost should be recognized in the exchange transaction? To comply with the historical cost principle, in a noncash transaction cost is the cash equivalent price. Thus, cost is either the fair value of the consideration given up or the fair value of the consideration received, whichever is more clearly determinable. To illustrate, assume that attorneys have helped Jordan Company incorpo-rate. They have billed the company $5,000 for their services. They agree to accept 4,000 shares of $1 par value common stock in payment of their bill. At the time of the exchange, there is no established market price for the stock. In this case, the fair value of the consideration received, $5,000, is more clearly evident. Accordingly, Jordan Company makes the following entry.
A SEL5 1
140,000 125,000 CS 115,000 CS
Cash Flows140,000
A SEL5 1
140,000 140,000 CS
Cash Flows140,000
As explained on page 575, organization costs are expensed as incurred. In contrast, assume that Athletic Research Inc. is an existing publicly held corporation. Its $5 par value stock is actively traded at $8 per share. The company issues 10,000 shares of stock to acquire land recently advertised for sale at $90,000.
A SEL5 1
25,000 Exp 14,000 CS 11,000 CS
Cash Flowsno effect

Accounting for Common and Preferred Stock 583
The most clearly evident value in this noncash transaction is the market price of the consideration given, $80,000. The company records the transaction as follows.
Land 80,000 Common Stock 50,000 Paid-in Capital in Excess of Par—Common Stock 30,000 (To record issuance of 10,000 shares of $5 par value
stock for land)
Cash 120,000 Preferred Stock 100,000 Paid-in Capital in Excess of Par—Preferred Stock 20,000 (To record the issuance of 10,000 shares of $10 par
value preferred stock)
As illustrated in these examples, the par value of the stock is never a factor in determining the cost of the assets or services received in noncash transac-tions. This is also true of the stated value of no-par stock.
Accounting for Preferred Stock
To appeal to a larger segment of potential investors, a corporation may issue an additional class of stock, called preferred stock. Preferred stock has contractual provisions that give it some preference or priority over common stock. Typically, preferred stockholders have a priority as to (1) distributions of earnings (divi-dends) and (2) assets in the event of liquidation. However, they generally do not have voting rights. Like common stock, corporations may issue preferred stock for cash or for noncash assets. The entries for these transactions are similar to the entries for common stock. When a corporation has more than one class of stock, each paid-in capital account title should identify the stock to which it relates. A com-pany might have the following accounts: Preferred Stock, Common Stock, Paid-in Capital in Excess of Par—Preferred Stock, and Paid-in Capital in Excess of Par—Common Stock. For example, if Stine Corporation issues 10,000 shares of $10 par value pre-ferred stock for $12 cash per share, the entry to record the issuance is as follows.
A SEL5 1
180,000 150,000 CS 130,000 CS
Cash Flowsno effect
Preferred stock may have either a par value or no-par value. In the stockholders’ equity section of the balance sheet, companies list preferred stock fi rst because of its dividend and liquidation preferences over common stock.
A SEL5 1
1120,000 1100,000 PS 120,000 PS
Cash Flows1120,000
Cayman Corporation begins operations on March 1 by issuing 100,000 shares of $1 par value common stock for cash at $12 per share. On March 15, it issues 5,000 shares of common stock to attorneys in settlement of their bill of $50,000 for organization costs. On March 28, Cayman Corporation issues 1,500 shares of $10 par value preferred stock for cash at $30 per share. Journalize the issuance of the common and preferred shares, assuming the shares are not publicly traded.
Solution
DO IT! 2 Issuance of Stock
Mar. 1 Cash 1,200,000 Common Stock (100,000 3 $1) 100,000 Paid-in Capital in Excess of Par— Common Stock 1,100,000 (To record issuance of 100,000
shares at $12 per share)
Action Plan✔ In issuing shares for
cash, credit Common Stock for par value per share.
✔ Credit any additional proceeds in excess of par to a separate paid-in capital account.
✔ When stock is issued for services, use the cash equivalent price.

584 13 Corporations: Organization and Capital Stock Transactions
Mar. 15 Organization Expense 50,000 Common Stock (5,000 3 $1) 5,000 Paid-in Capital in Excess of Par—Common Stock 45,000 (To record issuance of 5,000 shares
for attorneys’ fees)
Mar. 28 Cash 45,000 Preferred Stock (1,500 3 $10) 15,000 Paid-in Capital in Excess of Par—Preferred Stock 30,000 (To record issuance of 1,500 shares at $30 per share)
Related exercise material: BE13-3, BE13-4, BE13-5, BE13-6, E13-3, E13-4, E13-6, and DO IT! 13-2.
Action Plan (cont’d)✔ For the cash equivalent
price, use either the fair value of what is given up or the fair value of what is received, whichever is more clearly determinable.
3 Explain how to account for treasury stock.LEARNING OBJECTIVE
Treasury stock is a corporation’s own stock that it has issued and subsequently reacquired from shareholders but not retired. A corporation may acquire treasury stock for various reasons:
1. To reissue the shares to offi cers and employees under bonus and stock com-pensation plans.
2. To increase trading of the company’s stock in the securities market. Compa-nies expect that buying their own stock will signal that management believes the stock is underpriced, which they hope will enhance its market price.
3. To have additional shares available for use in the acquisition of other companies.
4. To reduce the number of shares outstanding and thereby increase earnings per share.
Another infrequent reason for purchasing shares is that management may want to eliminate hostile shareholders by buying them out. Many corporations have treasury stock. For example, approximately 65% of U.S. companies have treasury stock. In a recent year, Nike purchased more than 6 million treasury shares.
Purchase of Treasury Stock
Companies generally account for treasury stock by the cost method. This method uses the cost of the shares purchased to value the treasury stock. Under the cost method, the company debits Treasury Stock for the price paid to reacquire the shares. When the company disposes of the shares, it credits to Treasury Stock the same amount it paid to reacquire the shares. To illustrate, assume that on January 1, 2017, the stockholders’ equity section of Mead, Inc. has 400,000 shares authorized and 100,000 shares of $5 par value com-mon stock outstanding (all issued at par value) and Retained Earnings of $200,000. The stockholders’ equity section before purchase of treasury stock is as follows.
Helpful HintTreasury shares do not have dividend rights or voting rights.
Illustration 13-8Stockholders’ equity with no treasury stock
MEAD, INC.Balance Sheet (partial)
Stockholders’ equity Paid-in capital Common stock, $5 par value, 400,000 shares
authorized, 100,000 shares issued and outstanding $500,000 Retained earnings 200,000
Total stockholders’ equity $700,000

Accounting for Treasury Stock 585
Feb. 1 Treasury Stock 32,000 Cash 32,000 (To record purchase of 4,000 shares of
treasury stock at $8 per share)
July 1 Cash 10,000 Treasury Stock 8,000 Paid-in Capital from Treasury Stock 2,000 (To record sale of 1,000 shares of treasury
stock above cost)
Mead debits Treasury Stock for the cost of the shares purchased ($32,000). Is the original paid-in capital account, Common Stock, affected? No, because the number of issued shares does not change. In the stockholders’ equity section of the balance sheet, Mead deducts trea-sury stock from total paid-in capital and retained earnings. Treasury Stock is a contra stockholders’ equity account. Thus, the acquisition of treasury stock reduces stockholders’ equity. The stockholders’ equity section of Mead, Inc. after purchase of treasury stock is as follows.
A SEL5 1
232,000 TS232,000
Cash Flows232,000
Illustration 13-9Stockholders’ equity with treasury stock
MEAD, INC.Balance Sheet (partial)
Stockholders’ equity Paid-in capital Common stock, $5 par value, 400,000 shares authorized,
100,000 shares issued, and 96,000 shares outstanding $500,000 Retained earnings 200,000
Total paid-in capital and retained earnings 700,000 Less: Treasury stock (4,000 shares) 32,000
Total stockholders’ equity $668,000
Mead discloses in the balance sheet both the number of shares issued (100,000) and the number in the treasury (4,000). The difference is the number of shares of stock outstanding (96,000). The term outstanding stock means the number of shares of issued stock that are being held by stockholders. Some maintain that companies should report treasury stock as an asset because it can be sold for cash. But under this reasoning, companies would also show unissued stock as an asset, which is clearly incorrect. Rather than being an asset, treasury stock reduces stockholder claims on corporate assets. This effect is correctly shown by reporting treasury stock as a deduction from total paid-in capital and retained earnings.
Disposal of Treasury Stock
Treasury stock is usually sold or retired. The accounting for its sale differs when treasury stock is sold above cost than when it is sold below cost.
SALE OF TREASURY STOCK ABOVE COST
If the selling price of the treasury shares is equal to their cost, the company records the sale of the shares by a debit to Cash and a credit to Treasury Stock. When the selling price of the shares is greater than their cost, the company cred-its the difference to Paid-in Capital from Treasury Stock. To illustrate, assume that on July 1, Mead, Inc. sells for $10 per share 1,000 of the 4,000 shares of its treasury stock previously acquired at $8 per share. The entry is as follows.
ETHICS NOTE
The purchase of treasury stock reduces the cushion (cash available) for creditors and preferred stockholders. A restriction for the cost of treasury stock purchased is often required. The restriction is usually applied to retained earnings.
A SEL5 1
110,000 18,000 TS 12,000 TS
Cash Flows110,000
Helpful HintTreasury stock transactions are classifi ed as capital stock transactions. As in the case when stock is issued, the income state-ment is not involved.
On February 1, 2017, Mead acquires 4,000 shares of its stock at $8 per share. The entry is as follows.

586 13 Corporations: Organization and Capital Stock Transactions
Mead does not record a $2,000 gain on sale of treasury stock for two reasons. (1) Gains on sales occur when assets are sold, and treasury stock is not an asset. (2) A corporation does not realize a gain or suffer a loss from stock transactions with its own stockholders. Thus, companies should not include in net income any paid-in capital arising from the sale of treasury stock. Instead, they report Paid-in Capital from Treasury Stock separately on the balance sheet, as a part of paid-in capital.
SALE OF TREASURY STOCK BELOW COST
When a company sells treasury stock below its cost, it usually debits to Paid-in Capital from Treasury Stock the excess of cost over selling price. Thus, if Mead, Inc. sells an additional 800 shares of treasury stock on October 1 at $7 per share, it makes the following entry.
Oct. 1 Cash 5,600 Paid-in Capital from Treasury Stock 800 Treasury Stock 6,400 (To record sale of 800 shares of treasury
stock below cost)
Dec. 1 Cash 15,400 Paid-in Capital from Treasury Stock 1,200 Retained Earnings 1,000 Treasury Stock 17,600 (To record sale of 2,200 shares of treasury
stock at $7 per share)
Observe the following from the two sales entries. (1) Mead credits Trea-sury Stock at cost in each entry. (2) Mead uses Paid-in Capital from Treasury Stock for the difference between cost and the resale price of the shares. (3) The original paid-in capital account, Common Stock, is not affected. The sale of treasury stock increases both total assets and total stockholders’ equity. After posting the foregoing entries, the treasury stock accounts will show the following balances on October 1.
A SEL5 1
15,600 2800 TS 16,400 TS
Cash Flows15,600
Illustration 13-10Treasury stock accounts Treasury Stock
Feb. 1 32,000 July 1 8,000 Oct. 1 6,400
Oct. 1 Bal. 17,600
Paid-in Capital from Treasury Stock
Oct. 1 800 July 1 2,000
Oct. 1 Bal. 1,200
When a company fully depletes the credit balance in Paid-in Capital from Treasury Stock, it debits to Retained Earnings any additional excess of cost over selling price. To illustrate, assume that Mead, Inc. sells its remaining 2,200 shares at $7 per share on December 1. The excess of cost over selling price is $2,200 [2,200 3 ($8 2 $7)]. In this case, Mead debits $1,200 of the excess to Paid-in Capital from Treasury Stock. It debits the remainder to Retained Earnings. The entry is as follows.
A SEL5 1
115,400 21,200 TS 21,000 RE 117,600 TS
Cash Flows115,400
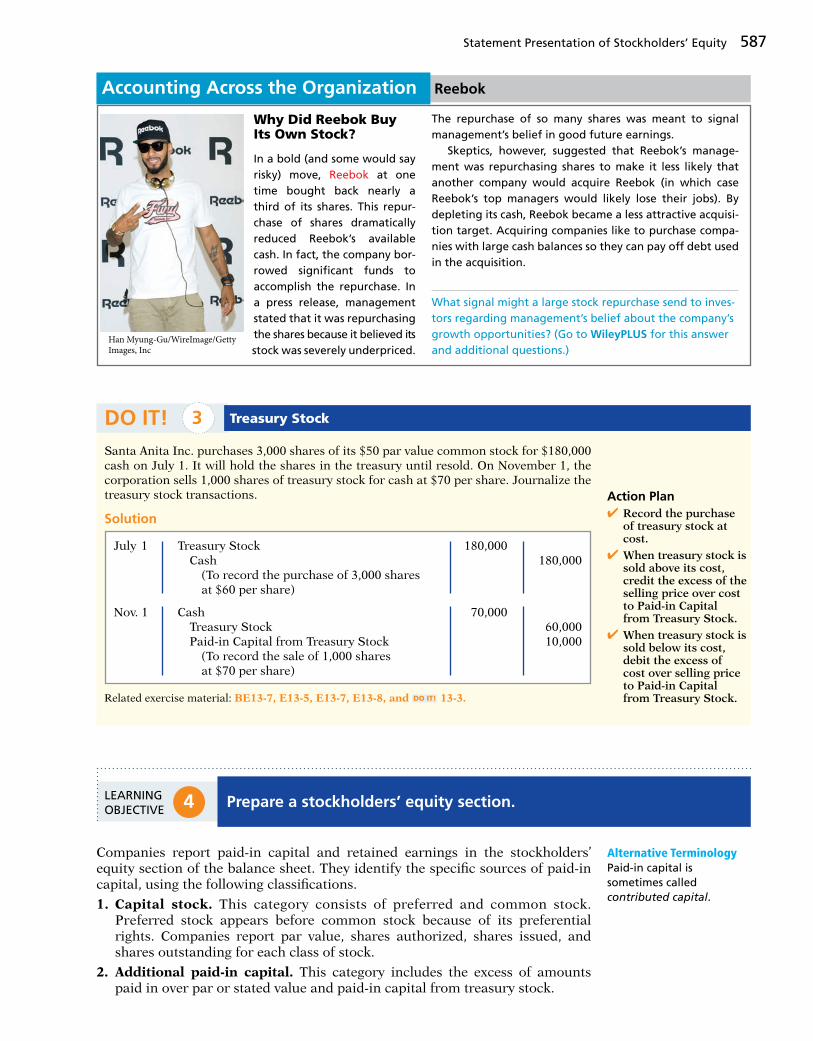
Statement Presentation of Stockholders’ Equity 587
Why Did Reebok Buy Its Own Stock?
In a bold (and some would say risky) move, Reebok at one time bought back nearly a third of its shares. This repur-chase of shares dramatically reduced Reebok’s available cash. In fact, the company bor-rowed signifi cant funds to accomplish the repurchase. In a press release, management stated that it was repurchasing the shares because it believed its stock was severely underpriced.
The repurchase of so many shares was meant to signal management’s belief in good future earnings.
Skeptics, however, suggested that Reebok’s manage-ment was repurchasing shares to make it less likely that another company would acquire Reebok (in which case Reebok’s top managers would likely lose their jobs). By depleting its cash, Reebok became a less attractive acquisi-tion target. Acquiring companies like to purchase compa-nies with large cash balances so they can pay off debt used in the acquisition.
What signal might a large stock repurchase send to inves-tors regarding management’s belief about the company’s growth opportunities? (Go to WileyPLUS for this answer and additional questions.)
Han Myung-Gu/WireImage/GettyImages, Inc
ReebokAccounting Across the Organization
Santa Anita Inc. purchases 3,000 shares of its $50 par value common stock for $180,000 cash on July 1. It will hold the shares in the treasury until resold. On November 1, the corporation sells 1,000 shares of treasury stock for cash at $70 per share. Journalize the treasury stock transactions.
DO IT! 3 Treasury Stock
July 1 Treasury Stock 180,000 Cash 180,000 (To record the purchase of 3,000 shares
at $60 per share)
Nov. 1 Cash 70,000 Treasury Stock 60,000 Paid-in Capital from Treasury Stock 10,000 (To record the sale of 1,000 shares
at $70 per share)
Related exercise material: BE13-7, E13-5, E13-7, E13-8, and DO IT! 13-3.
Action Plan✔ Record the purchase
of treasury stock at cost.
✔ When treasury stock is sold above its cost, credit the excess of the selling price over cost to Paid-in Capital from Treasury Stock.
✔ When treasury stock is sold below its cost, debit the excess of cost over selling price to Paid-in Capital from Treasury Stock.
Solution
4 Prepare a stockholders’ equity section.LEARNING OBJECTIVE
Companies report paid-in capital and retained earnings in the stockholders’ equity section of the balance sheet. They identify the specifi c sources of paid-in capital, using the following classifi cations.
1. Capital stock. This category consists of preferred and common stock. Preferred stock appears before common stock because of its preferential rights. Companies report par value, shares authorized, shares issued, and shares outstanding for each class of stock.
2. Additional paid-in capital. This category includes the excess of amounts paid in over par or stated value and paid-in capital from treasury stock.
Alternative TerminologyPaid-in capital is sometimes called contributed capital.

588 13 Corporations: Organization and Capital Stock Transactions
The stockholders’ equity section of Connally Inc. in Illustration 13-11 includes most of the accounts discussed in this chapter. The disclosures pertaining to Connally’s common stock indicate that the company issued 400,000 shares; 100,000 shares are unissued (500,000 authorized less 400,000 issued); and 390,000 shares are outstanding (400,000 issued less 10,000 shares in treasury).
CONNALLY INC.Balance Sheet (partial)
Stockholders’ equity Paid-in capital Capital stock 9% preferred stock, $100 par value,
10,000 shares authorized, 6,000 shares issued and outstanding $ 600,000 Common stock, no par, $5 stated value, 500,000
shares authorized, 400,000 shares issued, and 390,000 shares outstanding 2,000,000
Total capital stock 2,600,000 Additional paid-in capital In excess of par—preferred stock $ 30,000 In excess of stated value—common stock 860,000 From treasury stock 140,000
Total additional paid-in capital 1,030,000
Total paid-in capital 3,630,000 Retained earnings 1,058,000
Total paid-in capital and retained earnings 4,688,000 Less: Treasury stock (10,000 common shares) (at cost) 80,000
Total stockholders’ equity $4,608,000
Illustration 13-11Stockholders’ equity section
ANATOMY OF A FRAUD
The president, chief operating offi cer, and chief fi nancial offi cer of SafeNet, a software encryption company, were each awarded employee stock options by the company’s board of directors as part of their compensation package. Stock options enable an employee to buy a company’s stock sometime in the future at the price that existed when the stock option was awarded. For example, suppose that you received stock options today, when the stock price of your company was $30. Three years later, if the stock price rose to $100, you could “exercise” your options and buy the stockfor $30 per share, thereby making $70 per share. After being awarded their stock options, the three employees changed the award dates in the company’s records to dates in the past, when the company’s stock was trading at historical lows. For example, using the previous example, they would choose a past date when the stock was selling for $10 per share, rather than the $30 price on the actual award date. In our example, this would increase the profi t from exercising the options to $90 per share.
Total take: $1.7 million
THE MISSING CONTROLIndependent internal verifi cation. The company’s board of directors should have ensured that the awards were properly administered. For example, the date on the minutes from the board meeting could be compared to the dates that were recorded for the awards. In addition, the dates should again be confi rmed upon exercise.

Review and Practice 589
Jennifer Corporation has issued 300,000 shares of $3 par value common stock. It autho-rized 600,000 shares. The paid-in capital in excess of par on the common stock is $380,000. The corporation has reacquired 15,000 shares at a cost of $50,000 and is currently holding those shares. Treasury stock was reissued in prior years for $72,000 more than its cost. The corporation also has 4,000 shares issued and outstanding of 8%, $100 par value preferred stock. It authorized 10,000 shares. The paid-in capital in excess of par on the preferred stock is $25,000. Retained earnings is $610,000. Prepare the stockholders’ equity section of the balance sheet.
Solution
DO IT! 4 Stockholders’ Equity Section
Action Plan✔ Present capital stock
fi rst; list preferred stock before common stock.
✔ Present additional paid-in capital after capital stock.
✔ Report retained earnings after capital stock and additional paid-in capital.
✔ Deduct treasury stock from total paid-in capital and retained earnings.
JENNIFER CORPORATIONBalance Sheet (partial)
Stockholders’ equity Paid-in capital Capital stock 8% preferred stock, $100 par value, 10,000 shares authorized, 4,000 shares issued and outstanding $ 400,000 Common stock, $3 par value, 600,000 shares authorized, 300,000 shares issued, and 285,000 shares outstanding 900,000
Total capital stock 1,300,000Additional paid-in capital In excess of par—preferred stock $ 25,000 In excess of par—common stock 380,000 From treasury stock 72,000
Total additional paid-in capital 477,000
Total paid-in capital 1,777,000Retained earnings 610,000
Total paid-in capital and retained earnings 2,387,000Less: Treasury stock (15,000 common shares) (at cost) 50,000
Total stockholders’ equity $2,337,000
Related exercise material: BE13-8, E13-9, E13-11, E13-12, E13-13, E13-14, and DO IT! 13-4.
Discuss the major characteristics of a corporation. The major characteristics of a corporation are separate legal existence, limited liability of stockholders, trans-ferable ownership rights, ability to acquire capital, continuous life, corporation management, govern-ment regulations, and additional taxes.
Paid-in capital is the total amount paid in on capital stock. It is often called contributed capital. Retained earnings is net income retained in a corporation. It is often called earned capital.
1 Explain how to account for the issuance of common and preferred stock. When companies record the issuance of common stock for cash, they credit the par value of the shares to Common Stock. They record in a sepa-rate paid-in capital account the portion of the pro-ceeds that is above or below par value. When no-par common stock has a stated value, the entries are similar to those for par value stock. When no-par stock does not have a stated value, companies credit the entire proceeds to Common Stock.
2
LEARNING OBJECTIVES REVIEW
REVIEW AND PRACTICE

Preferred stock has contractual provisions that give it priority over common stock in certain areas. Typically, preferred stockholders have preferences (1) to dividends and (2) to assets in liquidation. They usually do not have voting rights.
Explain how to account for treasury stock. The cost method is generally used in accounting for treasury stock. Under this approach, companies debit Trea-sury Stock at the price paid to reacquire the shares. They credit the same amount to Treasury Stock when they sell the shares. The difference between the sales
3
price and cost is recorded in stockholders’ equity accounts, not in income statement accounts.
Prepare a stockholders’ equity section. In the stock-holders’ equity section, companies report paid-in cap-ital and retained earnings and identify specifi c sources of paid-in capital. Within paid-in capital, two classifi -cations are shown: capital stock and additional paid-in capital. If a corporation has treasury stock, it deducts the cost of treasury stock from total paid-in capital and retained earnings to obtain total stock-holders’ equity.
4
Authorized stock The amount of stock that a corporation is authorized to sell as indicated in its charter. (p. 577).
Charter A document that is issued by the state to set forth important terms and features regarding the creation of a corporation. (p. 574).
Corporation A business organized as a legal entity sepa-rate and distinct from its owners under state corpora-tion law. (p. 572).
No-par value stock Capital stock that has not been assigned a value in the corporate charter. (p. 579).
Organization costs Costs incurred in the formation of a corporation. (p. 575).
Outstanding stock Capital stock that has been issued and is being held by stockholders. (p. 585).
Paid-in capital Total amount of cash and other assets paid in to the corporation by stockholders in exchange for capital stock. (p. 579).
Par value stock Capital stock that has been assigned a value per share in the corporate charter. (p. 578).
Preferred stock Capital stock that has some preferences over common stock. (p. 583).
Privately held corporation A corporation that has only a few stockholders and whose stock is not available for sale to the general public. (p. 572).
Publicly held corporation A corporation that may have thousands of stockholders and whose stock is regularly traded on a national securities exchange. (p. 572).
Retained earnings Net income that the corporation retains for future use. (p. 579).
Stated value The amount per share assigned by the board of directors to no-par value stock. (p. 579).
Treasury stock A corporation’s own stock that has been issued and subsequently reacquired from shareholders by the corporation but not retired. (p. 584).
GLOSSARY REVIEW
590 13 Corporations: Organization and Capital Stock Transactions
1. Which of the following is not a major advantage of a corporate form of organization?(a) Separate legal existence.(b) Continuous life.(c) Government regulations.(d) Transferable ownership rights.
2. A major disadvantage of a corporation is:(a) limited liability of stockholders.(b) additional taxes.(c) transferable ownership rights.(d) separate legal existence.
3. Costs incurred in the formation of a corporation:(a) do not include legal fees.(b) are expensed as incurred.(c) are recorded as an asset.(d) provide future benefi ts whose amounts and timing
are easily determined. 4. Which of the following statements is false?
(a) Ownership of common stock gives the owner a voting right.
(b) The stockholders’ equity section begins with paid-in capital.
(LO 1)
(LO 1)
(LO 1)
(LO 1)
(c) The authorization of capital stock does not result in a formal accounting entry.
(d) Legal capital per share applies to par value stock but not to no-par value stock.
5. Total stockholders’ equity (in the absence of treasury stock) equals:(a) Total paid-in capital 1 Retained earnings.(b) Paid-in capital 1 Capital stock 1 Retained earnings.(c) Capital stock 1 Additional paid-in capital 2
Retained earnings.(d) Common stock 1 Retained earnings.
6. The account Retained Earnings is:(a) a subdivision of paid-in capital.(b) net income retained in the corporation.(c) reported as an expense in the income statement.(d) closed to capital stock.
7. A-Team Corporation issued 1,000 shares of $5 par value stock for land. The stock is actively traded at $9 per share. The land was advertised for sale at $10,500. The land should be recorded at:(a) $4,000. (c) $9,000.(b) $5,000. (d) $10,500.
(LO 1)
(LO 1)
(LO 2)
PRACTICE MULTIPLE-CHOICE QUESTIONS

8. ABC Corporation issues 1,000 shares of $10 par value common stock at $13 per share. In recording the transaction, credits are made to:(a) Common Stock $10,000 and Paid-in Capital in
Excess of Stated Value $3,000.(b) Common Stock $13,000.(c) Common Stock $10,000 and Paid-in Capital in
Excess of Par $3,000.(d) Common Stock $10,000 and Retained Earnings
$3,000. 9. Lucroy Corporation issues 100 shares of $10 par value
preferred stock at $12 per share. In recording the transaction, credits are made to:(a) Preferred Stock $1,200.(b) Preferred Stock $1,000 and Retained Earnings
$200.(c) Preferred Stock $1,000 and Paid-in Capital in
Excess of Preferred Value $200.(d) Preferred Stock $1,000 and Paid-in Capital in
Excess of Par—Preferred Stock $200. 10. Treasury stock may be repurchased:
(a) to reissue the shares to offi cers and employees under bonus and stock compensation plans.
(b) to signal to the stock market that management believes the stock is underpriced.
(c) to have additional shares available for use in the acquisition of other companies.
(d) More than one of the above.
(LO 2)
(LO 2)
(LO 3)
11. XYZ, Inc. sells 100 shares of $5 par value treasury stock at $13 per share. If the cost of acquiring the shares was $10 per share, the entry for the sale should include credits to:(a) Treasury Stock $1,000 and Paid-in Capital from
Treasury Stock $300.(b) Treasury Stock $500 and Paid-in Capital from
Treasury Stock $800.(c) Treasury Stock $1,000 and Retained Earnings $300.(d) Treasury Stock $500 and Paid-in Capital in Excess
of Par $800. 12. In the stockholders’ equity section, the cost of trea-
sury stock is deducted from:(a) total paid-in capital and retained earnings.(b) retained earnings.(c) total stockholders’ equity.(d) common stock in paid-in capital.
13. Which of the following is not reported under addi-tional paid-in capital?(a) Paid-in capital in excess of par.(b) Common stock.(c) Paid-in capital in excess of stated value.(d) Paid-in capital from treasury stock.
14. In the stockholders’ equity section of the balance sheet, common stock:(a) is listed before preferred stock.(b) is added to total capital stock.(c) is part of paid-in capital.(d) is part of additional paid-in capital.
(LO 3)
(LO 3)
(LO 4)
(LO 4)
Practice Multiple-Choice Questions 591
Solutions
1. (c) Government regulations are a disadvantage of a corporation. The other choices are advantages of a corporation.
2. (b) Additional taxes are a disadvantage of a corporation. The other choices are advantages of a corporation.
3. (b) Costs incurred in the formation of a corporation are expensed as incurred. The other choices are incorrect because costs incurred in the formation of a corporation (a) do include legal fees; (c) are recorded as an expense, not an asset; and (d) provide future benefi ts whose amounts and timing are diffi cult to determine. As a result, these costs are immediately expensed.
4. (d) Legal capital per share applies to both par value stock and no-par value stock. Many states no longer require a par value and therefore use other means to determine legal capital. The other choices are true statements.
5. (a) Total stockholders’ equity 5 Total paid-in capital 1 Retained earnings. The other choices are incorrect because (b) capital stock and (d) common stock are included under paid-in capital. Choice (c) is incorrect because retained earnings is generally not subtracted in arriving at total stockholders’ equity.
6. (b) Retained Earnings is net income retained in the corporation. The other choices are incorrect because the Retained Earnings account (a) is earned capital, not paid-in capital; (c) is reported in the statement of retained earnings and on the balance sheet, but not on the income statement; and (d) is a permanent or real account and is never closed.
7. (c) Cost is either the fair value of the consideration given up or the fair value of the consideration received, whichever is more clearly determinable. The most clearly determinable value in this noncash transaction is the fair value of the consideration given up of $9,000 ($9 per share 3 1,000). The other choices are therefore incorrect.
8. (c) Common Stock should be credited for $10,000 and Paid-in Capital in Excess of Par should be credited for $3,000. The stock is par value stock, not stated value stock, and this excess is contributed, not earned, capital. The other choices are therefore incorrect.
9. (d) Preferred Stock should be credited for $1,000 and Paid-In Capital in Excess of Par—Preferred Stock should be credited for $200. The other choices are incorrect because (a) a total credit for the entire proceeds to Preferred Stock is incorrect because Pre-ferred Stock has a total par value that is different than total proceeds; (b) this is contributed capital, not earned capital, so a credit to Retained Earnings is not correct; and (c) the account Paid-in Capital in Excess of Preferred Value is not an appropriate account title.
10. (d) Corporations repurchase treasury stock to have additional shares available for use in acquisition, to reissue shares under bonus and stock compensation plans, and to signal to the stock market that management believes the stock is underpriced. Although the other choices are true statements, choice (d) is the better answer.
11. (a) Treasury Stock should be credited for $1,000 (100 shares 3 $10, the acquisition price). Paid-in Capital from Treasury Stock should be credited for the difference between the $1,000 and the cash received of $1,300 (100 shares 3 $13), or $300. The other choices are therefore incorrect.
12. (a) The cost of treasury stock is deducted from total paid-in capital and retained earnings. The other choices are therefore incorrect.

13. (b) Common stock is reported in the capital stock section of paid-in capital, not in the additional paid-in capital section. The other choices are true statements.
14. (c) Common stock is part of paid-in capital. The other choices are incorrect because common stock (a) is listed after preferred stock, (b) is not added to total capital stock but is part of capital stock, and (d) is part of capital stock, not additional paid-in capital.
592 13 Corporations: Organization and Capital Stock Transactions
1. Bostick Co. had the following transactions during the current period.
Mar. 2 Issued 4,000 shares of $1 par value common stock to attorneys in payment of a bill for $35,000 for services performed in helping the company to incorporate.
June 12 Issued 50,000 shares of $1 par value common stock for cash of $360,000.July 11 Issued 2,000 shares of $100 par value preferred stock for cash at $120 per share.Nov. 28 Purchased 2,000 shares of treasury stock for $70,000.
InstructionsJournalize the transactions.
Journalize issuance of common and preferred stock and purchase of treasury stock.
(LO 2, 3)
PRACTICE EXERCISES
1. Mar. 2 Organization Expense 35,000 Common Stock (4,000 3 $1) 4,000 Paid-in Capital in Excess of Par— Common Stock 31,000
June 12 Cash 360,000 Common Stock (50,000 3 $1) 50,000 Paid-in Capital in Excess of Par— Common Stock 310,000
July 11 Cash (2,000 3 $120) 240,000 Preferred Stock (2,000 3 $100) 200,000 Paid-in Capital in Excess of Par— Preferred Stock (2,000 3 $20) 40,000
Nov. 28 Treasury Stock 70,000 Cash 70,000
Solution
2. Star Corporation purchased from its stockholders 5,000 shares of its own previously issued stock for $250,000. It later resold 2,000 shares for $53 per share, then 2,000 more shares for $48 per share, and fi nally 1,000 shares for $43 per share.
InstructionsPrepare journal entries for the purchase of the treasury stock and the three sales of treasury stock.
Journalize treasury stock transactions.
(LO 3)
2. Treasury Stock 250,000 Cash 250,000
Cash (2,000 3 $53) 106,000 Treasury Stock (2,000 3 $50) 100,000 Paid-in Capital from Treasury Stock 6,000
Cash (2,000 3 $48) 96,000 Paid-in Capital from Treasury Stock 4,000 Treasury Stock (2,000 3 $50) 100,000
Cash (1,000 3 $43) 43,000 Paid-in Capital from Treasury Stock ($6,000 2 $4,000) 2,000 Retained Earnings 5,000 Treasury Stock (1,000 3 $50) 50,000
Solution

Practice Problem 593
Rolman Corporation is authorized to issue 1,000,000 shares of $5 par value common stock. In its fi rst year, the company has the following stock transactions.
Jan. 10 Issued 400,000 shares of stock at $8 per share.July 1 Issued 100,000 shares of stock for land. The land had an asking price of $900,000.
The stock is currently selling on a national exchange at $8.25 per share.Sept. 1 Purchased 10,000 shares of common stock for the treasury at $9 per share.Dec. 1 Sold 4,000 shares of the treasury stock at $10 per share.
Instructions(a) Journalize the transactions.(b) Prepare the stockholders’ equity section assuming the company had retained earnings
of $200,000 at December 31.
Journalize transactions and prepare stockholders’ equity section.
(LO 2, 3, 4)
PRACTICE PROBLEM
(a) Jan. 10 Cash 3,200,000 Common Stock 2,000,000 Paid-in Capital in Excess of
Par—Common Stock 1,200,000 (To record issuance of 400,000
shares of $5 par value stock)
July 1 Land 825,000 Common Stock 500,000 Paid-in Capital in Excess
of Par—Common Stock 325,000 (To record issuance of
100,000 shares of $5 parvalue stock for land)
Sept. 1 Treasury Stock 90,000 Cash 90,000 (To record purchase of
10,000 shares of treasury stock at cost)
Dec. 1 Cash 40,000 Treasury Stock 36,000 Paid-in Capital from Treasury
Stock 4,000 (To record sale of 4,000 shares
of treasury stock above cost)
Solution
ROLMAN CORPORATIONBalance Sheet (partial)
Stockholders’ equity Paid-in capital Capital stock Common stock, $5 par value, 1,000,000 shares authorized, 500,000 shares issued, 494,000 shares outstanding $2,500,000 Additional paid-in capital In excess of par—common stock $1,525,000 From treasury stock 4,000
Total additional paid-in capital 1,529,000
Total paid-in capital 4,029,000 Retained earnings 200,000
Total paid-in capital and retained earnings 4,229,000 Less: Treasury stock (6,000 shares) 54,000
Total stockholders’ equity $4,175,000
(b)

Brief Exercises, Exercises, DO IT! Exercises, and Problems and many additional resources are available for practice in WileyPLUS
QUESTIONS
1. Mark Kemp, a student, asks your help in understand-ing the following characteristics of a corporation: (a) separate legal existence, (b) limited liability of stockholders, and (c) transferable ownership rights. Explain these characteristics to Mark.
2. (a) Your friend Katie Fehr cannot understand how the characteristic of corporation management is both an advantage and a disadvantage. Clarify this problem for Katie.
(b) Identify and explain two other disadvantages of a corporation.
3. (a) The following terms pertain to the forming of a corporation: (1) charter, (2) by-laws, and (3) organization costs. Explain the terms.
(b) Donna Fleming believes a corporation must be incorporated in the state in which its headquar-ters’ offi ce is located. Is Donna correct? Explain.
4. What are the basic ownership rights of common stockholders in the absence of restrictive provisions?
5. (a) What are the two principal components of stock-holders’ equity?
(b) What is paid-in capital? Give three examples. 6. How does the balance sheet for a corporation differ
from the balance sheet for a proprietorship? 7. The corporate charter of Luney Corporation allows
the issuance of a maximum of 100,000 shares of com-mon stock. During its fi rst two years of operations, Luney sold 70,000 shares to shareholders and reacquired 7,000 of these shares. After these transactions, how many shares are authorized, issued, and outstanding?
8. Which is the better investment—common stock with a par value of $5 per share, or common stock with a par value of $20 per share? Why?
9. What factors help determine the market price of stock? 10. What effect does the issuance of stock at a price above
par value have on the issuer’s net income? Explain.
11. Why is common stock usually not issued at a price that is less than par value?
12. Land appraised at $80,000 is purchased by issuing 1,000 shares of $20 par value common stock. The market price of the shares at the time of the exchange, based on active trading in the securities market, is $95 per share. Should the land be recorded at $20,000, $80,000, or $95,000? Explain.
13. For what reasons might a company like IBM repur-chase some of its stock (treasury stock)?
14. Meng, Inc. purchases 1,000 shares of its own previ-ously issued $5 par common stock for $12,000. Assuming the shares are held in the treasury, what effect does this transaction have on (a) net income, (b) total assets, (c) total paid-in capital, and (d) total stockholders’ equity?
15. The treasury stock purchased in Question 14 is resold by Meng, Inc. for $16,000. What effect does this trans-action have on (a) net income, (b) total assets, (c) total paid-in capital, and (d) total stockholders’ equity?
16. Diaz Inc.’s common stock has a par value of $1 and a current market price of $15. Explain why these amounts are different.
17. Indicate how each of the following accounts should be classifi ed in the stockholders’ equity section.(a) Common stock.(b) Paid-in capital in excess of par—common stock.(c) Retained earnings.(d) Treasury stock.(e) Paid-in capital from treasury stock.(f) Paid-in capital in excess of stated value—common
stock.(g) Preferred stock.
18. How many shares of common stock did Apple have outstanding at September 28, 2013, and at Septem-ber 29, 2012?
594 13 Corporations: Organization and Capital Stock Transactions
BRIEF EXERCISES
BE13-1 Angie Baden is studying for her accounting midterm examination. Identify for Angie the advantages and disadvantages of the corporate form of business organization.
BE13-2 At December 31, Ortiz Corporation reports net income of $480,000. Prepare the entry to close net income.
BE13-3 On May 10, Jack Corporation issues 2,000 shares of $10 par value common stock for cash at $18 per share. Journalize the issuance of the stock.
BE13-4 On June 1, Noonan Inc. issues 4,000 shares of no-par common stock at a cash price of $6 per share. Journalize the issuance of the shares assuming the stock has a stated value of $1 per share.
BE13-5 Lei Inc.’s $10 par value common stock is actively traded at a market price of $15 per share. Lei issues 5,000 shares to purchase land advertised for sale at $85,000. Journalize the issuance of the stock in acquiring the land.
List the advantages and disadvantages of a corporation.
(LO 1)Prepare closing entries.
(LO 1)
Prepare entries for issuance of par value common stock.
(LO 2)Prepare entries for issuance of no-par value common stock.
(LO 2)
Prepare entries for issuance of stock in a noncash transaction.
(LO 2)

Exercises 595
EXERCISES
E13-1 Andrea has prepared the following list of statements about corporations.
1. A corporation is an entity separate and distinct from its owners. 2. As a legal entity, a corporation has most of the rights and privileges of a person. 3. Most of the largest U.S. corporations are privately held corporations. 4. Corporations may buy, own, and sell property; borrow money; enter into legally binding
contracts; and sue and be sued. 5. The net income of a corporation is not taxed as a separate entity.
Identify characteristics of a corporation.
(LO 1)
BE13-6 Garb Inc. issues 5,000 shares of $100 par value preferred stock for cash at $130 per share. Journalize the issuance of the preferred stock.
BE13-7 On July 1, Raney Corporation purchases 500 shares of its $5 par value common stock for the treasury at a cash price of $9 per share. On September 1, it sells 300 shares of the treasury stock for cash at $11 per share. Journalize the two treasury stock transactions.
BE13-8 Pine Corporation has the following accounts at December 31: Common Stock, $10 par, 5,000 shares issued, $50,000; Paid-in Capital in Excess of Par—Common Stock $30,000; Retained Earnings $45,000; and Treasury Stock, 500 shares, $11,000. Prepare the stockholders’ equity section of the balance sheet.
Prepare entries for issuance of preferred stock.
(LO 2)Prepare entries for treasury stock transactions.
(LO 3)
Prepare stockholders’ equity section.
(LO 4)
Indicate whether each of the following statements is true or false.
_____ 1. The corporation is an entity separate and distinct from its owners.
_____ 2. The liability of stockholders is normally limited to their investment in the corporation.
_____ 3. The relative lack of government regulation is an advantage of the corporate form of business.
_____ 4. There is no journal entry to record the authorization of capital stock.
_____ 5. No-par value stock is quite rare today.
At the end of its fi rst year of operation, Goss Corporation has $1,000,000 of common stock and net income of $236,000. Prepare (a) the closing entry for net income and (b) the stockholders’ equity section at year-end.
Beauty Island Corporation began operations on April 1 by issuing 60,000 shares of $5 par value common stock for cash at $13 per share. On April 19, it issued 2,000 shares of common stock to attorneys in settlement of their bill of $27,500 for organization costs. In addition, Beauty Island issued 1,000 shares of $1 par value preferred stock for $6 cash per share. Journalize the issuance of the common and preferred shares, assuming the shares are not publicly traded.
Fouts Corporation purchased 2,000 shares of its $10 par value common stock for $130,000 on August 1. It will hold these shares in the treasury until resold. On December 1, the corporation sold 1,200 shares of treasury stock for cash at $72 per share. Journalize the treasury stock transactions.
Anders Corporation has issued 100,000 shares of $5 par value common stock. It authorized 500,000 shares. The paid-in capital in excess of par on the common stock is $240,000. The corporation has reacquired 7,000 shares at a cost of $46,000 and is currently holding those shares. Treasury stock was reissued in prior years for $47,000 more than its cost. The corporation also has 2,000 shares issued and outstanding of 7%, $100 par value preferred stock. It authorized 10,000 shares. The paid-in capital in excess of par on the preferred stock is $23,000. Retained earnings is $372,000. Prepare the stockholders’ equity section of the balance sheet.
DO IT! Exercises
DO IT! 13-1b
Analyze statements about corporate organization.
(LO 1)
DO IT! 13-1a
Close net income and prepare stockholders’ equity section.
(LO 1)
Journalize issuance of stock.
(LO 2)
DO IT! 13-2
DO IT! 13-3
DO IT! 13-4
Journalize treasury stock transactions.
(LO 3)
Prepare stockholders’ equity section.
(LO 4)

596 13 Corporations: Organization and Capital Stock Transactions
6. Creditors have a legal claim on the personal assets of the owners of a corporation if the corporation does not pay its debts.
7. The transfer of stock from one owner to another requires the approval of either the corporation or other stockholders.
8. The board of directors of a corporation legally owns the corporation. 9. The chief accounting offi cer of a corporation is the controller. 10. Corporations are subject to fewer state and federal regulations than partnerships or
proprietorships.
InstructionsIdentify each statement as true or false. If false, indicate how to correct the statement.
E13-2 Andrea (see E13-1) has studied the information you gave her in that exercise and has come to you with more statements about corporations.
1. Corporation management is both an advantage and a disadvantage of a corporation compared to a proprietorship or a partnership.
2. Limited liability of stockholders, government regulations, and additional taxes are the major disadvantages of a corporation.
3. When a corporation is formed, organization costs are recorded as an asset. 4. Each share of common stock gives the stockholder the ownership rights to vote at
stockholder meetings, share in corporate earnings, keep the same percentage ownership when new shares of stock are issued, and share in assets upon liquidation.
5. The number of issued shares is always greater than or equal to the number of authorized shares.
6. A journal entry is required for the authorization of capital stock. 7. Publicly held corporations usually issue stock directly to investors. 8. The trading of capital stock on a securities exchange involves the transfer of already
issued shares from an existing stockholder to another investor. 9. The market price of common stock is usually the same as its par value.10. Retained earnings is the total amount of cash and other assets paid in to the corporation
by stockholders in exchange for capital stock.
InstructionsIdentify each statement as true or false. If false, indicate how to correct the statement.
E13-3 During its fi rst year of operations, Foyle Corporation had the following transac-tions pertaining to its common stock.
Jan. 10 Issued 70,000 shares for cash at $5 per share.July 1 Issued 40,000 shares for cash at $7 per share.
Instructions(a) Journalize the transactions, assuming that the common stock has a par value of $5 per
share.(b) Journalize the transactions, assuming that the common stock is no-par with a stated
value of $1 per share.
E13-4 Osage Corporation issued 2,000 shares of stock.
InstructionsPrepare the entry for the issuance under the following assumptions.
(a) The stock had a par value of $5 per share and was issued for a total of $52,000.(b) The stock had a stated value of $5 per share and was issued for a total of $52,000.(c) The stock had no par or stated value and was issued for a total of $52,000.(d) The stock had a par value of $5 per share and was issued to attorneys for services
during incorporation valued at $52,000.(e) The stock had a par value of $5 per share and was issued for land worth $52,000.
E13-5 Quay Co. had the following transactions during the current period.
Mar. 2 Issued 5,000 shares of $5 par value common stock to attorneys in payment of a bill for $30,000 for services performed in helping the company to incorporate.
June 12 Issued 60,000 shares of $5 par value common stock for cash of $375,000.July 11 Issued 1,000 shares of $100 par value preferred stock for cash at $110 per share.Nov. 28 Purchased 2,000 shares of treasury stock for $80,000.
Identify characteristics of a corporation.
(LO 1)
Journalize issuance of common stock.
(LO 2)
Journalize issuance of common stock.
(LO 2)
Journalize issuance of common and preferred stock and purchase of treasury stock.
(LO 2, 3)

Exercises 597
InstructionsJournalize the transactions.
E13-6 As an auditor for the CPA fi rm of Hinkson and Calvert, you encounter the following situations in auditing different clients.
1. LR Corporation is a closely held corporation whose stock is not publicly traded. On December 5, the corporation acquired land by issuing 5,000 shares of its $20 par value common stock. The owners’ asking price for the land was $120,000, and the fair value of the land was $110,000.
2. Vera Corporation is a publicly held corporation whose common stock is traded on the securities markets. On June 1, it acquired land by issuing 20,000 shares of its $10 par value stock. At the time of the exchange, the land was advertised for sale at $250,000. The stock was selling at $11 per share.
InstructionsPrepare the journal entries for each of the situations above.
E13-7 On January 1, 2017, the stockholders’ equity section of Newlin Corporation shows common stock ($5 par value) $1,500,000; paid-in capital in excess of par $1,000,000; and retained earnings $1,200,000. During the year, the following treasury stock transactions occurred.
Mar. 1 Purchased 50,000 shares for cash at $15 per share.July 1 Sold 10,000 treasury shares for cash at $17 per share.Sept. 1 Sold 8,000 treasury shares for cash at $14 per share.
Instructions(a) Journalize the treasury stock transactions.(b) Restate the entry for September 1, assuming the treasury shares were sold at $12 per share.
E13-8 Rinehart Corporation purchased from its stockholders 5,000 shares of its own pre-viously issued stock for $255,000. It later resold 2,000 shares for $54 per share, then 2,000 more shares for $49 per share, and fi nally 1,000 shares for $43 per share.
InstructionsPrepare journal entries for the purchase of the treasury stock and the three sales of treasury stock.
E13-9 Tran Corporation is authorized to issue both preferred and common stock. The par value of the preferred is $50. During the fi rst year of operations, the company had the following events and transactions pertaining to its preferred stock.
Feb. 1 Issued 20,000 shares for cash at $53 per share.July 1 Issued 12,000 shares for cash at $57 per share.
Instructions(a) Journalize the transactions.(b) Post to the stockholders’ equity accounts.(c) Indicate the fi nancial statement presentation of the related accounts.
E13-10 Gilliam Corporation recently hired a new accountant with extensive experience in accounting for partnerships. Because of the pressure of the new job, the accountant was unable to review his textbooks on the topic of corporation accounting. During the fi rst month, the accountant made the following entries for the corporation’s capital stock.
May 2 Cash 130,000 Capital Stock 130,000 (Issued 10,000 shares of $10 par value common stock at $13 per share)
10 Cash 600,000 Capital Stock 600,000 (Issued 10,000 shares of $50 par value preferred stock at $60 per share)
Journalize noncash common stock transactions.
(LO 2)
Journalize treasury stock transactions.
(LO 3)
Journalize treasury stock transactions.
(LO 3)
Journalize preferred stock transactions and indicate statement presentation.
(LO 2, 4)
Prepare correct entries for capital stock transactions.
(LO 2, 3)

598 13 Corporations: Organization and Capital Stock Transactions
15 Capital Stock 15,000 Cash 15,000 (Purchased 1,000 shares of common stock for the treasury at $15 per share)
31 Cash 8,000 Capital Stock 5,000 Gain on Sale of Stock 3,000 (Sold 500 shares of treasury stock at $16 per share)
InstructionsOn the basis of the explanation for each entry, prepare the entry that should have been made for the capital stock transactions.
E13-11 The following stockholders’ equity accounts, arranged alphabetically, are in the ledger of Eudaley Corporation at December 31, 2017.
Common Stock ($5 stated value) $1,500,000Paid-in Capital in Excess of Par—Preferred Stock 280,000Paid-in Capital in Excess of Stated Value—Common Stock 900,000Preferred Stock (8%, $100 par) 500,000Retained Earnings 1,234,000Treasury Stock (10,000 common shares) 120,000
InstructionsPrepare the stockholders’ equity section of the balance sheet at December 31, 2017.
E13-12 The stockholders’ equity section of Haley Corporation at December 31 is as follows.
HALEY CORPORATIONBalance Sheet (partial)
Paid-in capital Preferred stock, 10,000 shares authorized, 6,000 shares issued and outstanding $ 300,000 Common stock, no par, 750,000 shares authorized, 600,000 shares issued 1,200,000
Total paid-in capital 1,500,000Retained earnings 1,858,000
Total paid-in capital and retained earnings 3,358,000Less: Treasury stock (10,000 common shares) 64,000
Total stockholders’ equity $3,294,000
Instructions From a review of the stockholders’ equity section, as chief accountant, write a
memo to the president of the company answering the following questions.
(a) How many shares of common stock are outstanding?(b) Assuming there is a stated value, what is the stated value of the common stock?(c) What is the par value of the preferred stock?
E13-13 The stockholders’ equity section of Aluminum Company of America (Alcoa) showed the following (in alphabetical order): additional paid-in capital $6,101, common stock $925, preferred stock $56, retained earnings $7,428, and treasury stock 2,828. All dollar data are in millions. The preferred stock has 557,740 shares authorized, with a par value of $100. At December 31 of the current year, 557,649 shares of preferred are issued and 546,024 shares are outstanding. There are 1.8 billion shares of $1 par value common stock autho-rized, of which 924.6 million are issued and 844.8 million are outstanding at December 31.
Prepare a stockholders’ equity section.
(LO 4)
Answer questions about stockholders’ equity section.
(LO 2, 3, 4)
Prepare a stockholders’ equity section.
(LO 4)

Problems: Set A 599
InstructionsPrepare the stockholders’ equity section of the current year, including disclosure of all relevant data.
E13-14 The ledger of Rolling Hills Corporation contains the following accounts: Common Stock, Preferred Stock, Treasury Stock, Paid-in Capital in Excess of Par—Preferred Stock, Paid-in Capital in Excess of Stated Value—Common Stock, Paid-in Capital from Treasury Stock, and Retained Earnings.
InstructionsClassify each account using the following table headings.
Paid-in Capital
Capital RetainedAccount Stock Additional Earnings Other
Classify stockholders’ equity accounts.
(LO 4)
EXERCISES: SET B AND CHALLENGE EXERCISES
Visit the book’s companion website, at www.wiley.com/college/weygandt, and choose the Student Companion site to access Exercises: Set B and Challenge Exercises.
PROBLEMS: SET A
P13-1A DeLong Corporation was organized on January 1, 2017. It is authorized to issue 10,000 shares of 8%, $100 par value preferred stock, and 500,000 shares of no-par common stock with a stated value of $2 per share. The following stock transactions were completed during the fi rst year.
Jan. 10 Issued 80,000 shares of common stock for cash at $4 per share.Mar. 1 Issued 5,000 shares of preferred stock for cash at $105 per share.Apr. 1 Issued 24,000 shares of common stock for land. The asking price of the land
was $90,000. The fair value of the land was $85,000.May 1 Issued 80,000 shares of common stock for cash at $4.50 per share.Aug. 1 Issued 10,000 shares of common stock to attorneys in payment of their bill of
$30,000 for services performed in helping the company organize.Sept. 1 Issued 10,000 shares of common stock for cash at $5 per share.Nov. 1 Issued 1,000 shares of preferred stock for cash at $109 per share.
Instructions(a) Journalize the transactions.(b) Post to the stockholders’ equity accounts. (Use J5 as the posting reference.)(c) Prepare the paid-in capital section of stockholders’ equity at December 31, 2017.
P13-2A Fechter Corporation had the following stockholders’ equity accounts on January 1, 2017: Common Stock ($5 par) $500,000, Paid-in Capital in Excess of Par—Common Stock $200,000, and Retained Earnings $100,000. In 2017, the company had the following trea-sury stock transactions.
Mar. 1 Purchased 5,000 shares at $8 per share.June 1 Sold 1,000 shares at $12 per share.Sept. 1 Sold 2,000 shares at $10 per share.Dec. 1 Sold 1,000 shares at $7 per share.
Fechter Corporation uses the cost method of accounting for treasury stock. In 2017, the company reported net income of $30,000.
Instructions(a) Journalize the treasury stock transactions, and prepare the closing entry at December 31,
2017, for net income.
Journalize stock transactions, post, and prepare paid-in capital section.
(LO 2, 4)
(c) Total paid-in capital $1,479,000
Journalize and post treasury stock transactions, and prepare stockholders’ equity section.
(LO 3, 4)

600 13 Corporations: Organization and Capital Stock Transactions
(b) Open accounts for (1) Paid-in Capital from Treasury Stock, (2) Treasury Stock, and (3) Retained Earnings. Post to these accounts using J10 as the posting reference.
(c) Prepare the stockholders’ equity section for Fechter Corporation at December 31, 2017.
P13-3A The stockholders’ equity accounts of Castle Corporation on January 1, 2017, were as follows.
Preferred Stock (8%, $50 par, 10,000 shares authorized) $ 400,000Common Stock ($1 stated value, 2,000,000 shares authorized) 1,000,000Paid-in Capital in Excess of Par—Preferred Stock 100,000Paid-in Capital in Excess of Stated Value—Common Stock 1,450,000Retained Earnings 1,816,000Treasury Stock (10,000 common shares) 50,000
During 2017, the corporation had the following transactions and events pertaining to its stockholders’ equity.
Feb. 1 Issued 25,000 shares of common stock for $120,000.Apr. 14 Sold 6,000 shares of treasury stock—common for $33,000.Sept. 3 Issued 5,000 shares of common stock for a patent valued at $35,000.Nov. 10 Purchased 1,000 shares of common stock for the treasury at a cost of $6,000.Dec. 31 Determined that net income for the year was $452,000.
No dividends were declared during the year.
Instructions(a) Journalize the transactions and the closing entry for net income.(b) Enter the beginning balances in the accounts, and post the journal entries to the stock-
holders’ equity accounts. (Use J5 for the posting reference.)(c) Prepare a stockholders’ equity section at December 31, 2017.
P13-4A Peck Corporation is authorized to issue 20,000 shares of $50 par value, 10% pre-ferred stock and 125,000 shares of $5 par value common stock. On January 1, 2017, the ledger contained the following stockholders’ equity balances.
Preferred Stock (10,000 shares) $500,000Paid-in Capital in Excess of Par—Preferred Stock 75,000Common Stock (70,000 shares) 350,000Paid-in Capital in Excess of Par—Common Stock 700,000Retained Earnings 300,000
During 2017, the following transactions occurred.
Feb. 1 Issued 2,000 shares of preferred stock for land having a fair value of $120,000.
Mar. 1 Issued 1,000 shares of preferred stock for cash at $65 per share.July 1 Issued 16,000 shares of common stock for cash at $7 per share.Sept. 1 Issued 400 shares of preferred stock for a patent. The asking price of the
patent was $30,000. Market price for the preferred stock was $70 and the fair value for the patent was indeterminable.
Dec. 1 Issued 8,000 shares of common stock for cash at $7.50 per share.Dec. 31 Net income for the year was $260,000. No dividends were declared.
Instructions(a) Journalize the transactions and the closing entry for net income.(b) Enter the beginning balances in the accounts, and post the journal entries to the stock-
holders’ equity accounts. (Use J2 for the posting reference.)(c) Prepare a stockholders’ equity section at December 31, 2017.
P13-5A The following stockholders’ equity accounts arranged alphabetically are in the ledger of Galindo Corporation at December 31, 2017.
(b) Treasury Stock $8,000
(c) Total stockholders’ equity $829,000
Journalize and post transactions, and prepare stockholders’ equity section.
(LO 1, 2, 3, 4)
(c) Total stockholders’ equity $5,350,000
Journalize and post stock transactions, and prepare stockholders’ equity section.
(LO 1, 2, 4)
(c) Total stockholders’ equity $2,570,000
Prepare stockholders’ equity section.
(LO 4)

Continuing Problem 601
Common Stock ($5 stated value) $2,000,000Paid-in Capital from Treasury Stock 10,000Paid-in Capital in Excess of Par—Preferred Stock 679,000Paid-in Capital in Excess of Stated Value—Common Stock 1,600,000Preferred Stock (8%, $50 par) 800,000Retained Earnings 1,748,000Treasury Stock (10,000 common shares) 130,000
InstructionsPrepare a stockholders’ equity section at December 31, 2017.
P13-6A Irwin Corporation has been authorized to issue 20,000 shares of $100 par value, 10%, preferred stock and 1,000,000 shares of no-par common stock. The corporation assigned a $2.50 stated value to the common stock. At December 31, 2017, the ledger con-tained the following balances pertaining to stockholders’ equity.
Preferred Stock $ 120,000Paid-in Capital in Excess of Par—Preferred Stock 20,000Common Stock 1,000,000Paid-in Capital in Excess of Stated Value—Common Stock 1,800,000Treasury Stock (1,000 common shares) 11,000Paid-in Capital from Treasury Stock 1,500Retained Earnings 82,000
The preferred stock was issued for land having a fair value of $140,000. All common stock issued was for cash. In November, 1,500 shares of common stock were purchased for the treasury at a per share cost of $11. In December, 500 shares of treasury stock were sold for $14 per share. No dividends were declared in 2017.
Instructions(a) Prepare the journal entries for the: (1) Issuance of preferred stock for land. (2) Issuance of common stock for cash. (3) Purchase of common treasury stock for cash. (4) Sale of treasury stock for cash.(b) Prepare the stockholders’ equity section at December 31, 2017.
Total stockholders’ equity $6,707,000
Prepare entries for stock transactions and prepare stockholders’ equity section.
(LO 2, 3, 4)
(b) Total stockholders’ equity $3,012,500
PROBLEMS: SET B AND SET C
Visit the book’s companion website, at www.wiley.com/college/weygandt, and choose the Student Companion site to access Problems: Set B and Set C.
CONTINUING PROBLEM
COOKIE CREATIONS: AN ENTREPRENEURIAL JOURNEY(Note: This is a continuation of the Cookie Creations problem from Chapters 1 through 12.)
CC13 Natalie’s friend, Curtis Lesperance, decides to meet with Natalie after hearing that her discus-sions about a possible business partnership with her friend Katy Peterson have failed. Because Natalie has been so successful with Cookie Creations and Curtis has been just as successful with his coffee shop, they both conclude that they could benefi t from each other’s business expertise. Curtis and Natalie next evaluate the different types of business organization. Because of the advantage of limited personal liability, they decide to form a corporation. Natalie and Curtis are very excited about this new business venture. They come to you with information about their businesses and with a number of questions.
Go to the book’s companion website, www.wiley.com/college/weygandt, to see the completion of this problem.
© leungchopan/Shutterstock

PERSPECTIVEFINANCIAL REPORTING AND ANALYSIS
Financial Reporting Problem: Apple Inc.BYP13-1 The stockholders’ equity section for Apple Inc. is shown in Appendix A. Instructions for accessing and using the company’s complete annual report, including the notes to the fi nancial state-ments, are also provided in Appendix A.
Instructions(a) What is the par or stated value per share of Apple’s common stock?(b) What percentage of Apple’s authorized common stock was issued at September 28, 2013?
Comparative Analysis Problem:PepsiCo, Inc. vs. The Coca-Cola CompanyBYP13-2 PepsiCo, Inc.’s fi nancial statements are presented in Appendix B. Financial statements of The Coca-Cola Company are presented in Appendix C. Instructions for accessing and using the com-plete annual reports of PepsiCo and Coca-Cola, including the notes to the fi nancial statements, are also provided in Appendices B and C, respectively.
Instructions(a) What is the par or stated value of Coca-Cola’s and PepsiCo’s common stock?(b) What percentage of authorized shares was issued by Coca-Cola at December 31, 2013, and by
PepsiCo at December 28, 2013?(c) How many shares are held as treasury stock by Coca-Cola at December 31, 2013, and by PepsiCo
at December 28, 2013?(d) How many Coca-Cola common shares are outstanding at December 31, 2013? How many PepsiCo
shares of common stock are outstanding at December 28, 2013?
Comparative Analysis Problem:Amazon.com, Inc. vs. Wal-Mart Stores, Inc.BYP13-3 Amazon.com, Inc.’s fi nancial statements are presented in Appendix D. Financial state-ments of Wal-Mart Stores, Inc. are presented in Appendix E. Instructions for accessing and using the complete annual reports of Amazon and Wal-Mart, including the notes to the fi nancial state-ments, are also provided in Appendices D and E, respectively. Wal-Mart has 11,000 million shares authorized.
Instructions(a) What is the par or stated value of Amazon’s and Wal-Mart’s common stock?(b) What percentage of authorized shares was issued by Amazon at December 31, 2013, and by
Wal-Mart at January 31, 2014?(c) How many shares are held as treasury stock by Amazon at December 31, 2013, and by Wal-Mart
at January 31, 2014?(d) How many Amazon common shares are outstanding at December 31, 2013? How many Wal-Mart
shares of common stock are outstanding at January 31, 2014?
Real-World FocusBYP13-4 SEC fi lings of publicly traded companies are available to view online.
Address: http://biz.yahoo.com/i, or go to www.wiley.com/college/weygandt
Steps1. Pick a company and type in the company’s name.2. Choose Quote.
BROADENING YOUR
602 13 Corporations: Organization and Capital Stock Transactions

Broadening Your Perspective 603
InstructionsAnswer the following questions.
(a) What company did you select?(b) What is its stock symbol?(c) What was the stock’s trading range today?(d) What was the stock’s trading range for the year?
CRITICAL THINKING
Decision-Making Across the OrganizationBYP13-5 The stockholders’ meeting for Percival Corporation has been in progress for some time. The chief fi nancial offi cer for Percival is presently reviewing the company’s fi nancial statements and is explaining the items that comprise the stockholders’ equity section of the balance sheet for the current year. The stockholders’ equity section of Percival Corporation at December 31, 2017, is as follows.
PERCIVAL CORPORATIONBalance Sheet (partial)
December 31, 2017
Paid-in capital Capital stock Preferred stock, authorized 1,000,000 shares, $100 par value, 6,000 shares issued and outstanding $ 600,000 Common stock, authorized 5,000,000 shares, $1 par value, 3,000,000 shares issued, and 2,700,000 outstanding 3,000,000
Total capital stock 3,600,000 Additional paid-in capital In excess of par—preferred stock $ 50,000 In excess of par—common stock 25,000,000 Total additional paid-in capital 25,050,000
Total paid-in capital 28,650,000Retained earnings 900,000
Total paid-in capital and retained earnings 29,550,000Less: Treasury stock (300,000 common shares) 9,300,000
Total stockholders’ equity $20,250,000
At the meeting, stockholders have raised a number of questions regarding the stockholders’ equity section.
InstructionsWith the class divided into groups, answer the following questions as if you were the chief fi nancial offi cer for Percival Corporation.
(a) “I thought the common stock was presently selling at $29.75, but the company has the stock stated at $1 per share. How can that be?”
(b) “Why is the company buying back its common stock? Furthermore, the treasury stock has a debit balance because it is subtracted from stockholders’ equity. Why is treasury stock not reported as an asset if it has a debit balance?”
Communication ActivityBYP13-6 Joe Moyer, your uncle, is an inventor who has decided to incorporate. Uncle Joe knows that you are an accounting major at U.N.O. In a recent letter to you, he ends with the question, “I’m fi lling

out a state incorporation application. Can you tell me the difference in the following terms: (1) autho-rized stock, (2) issued stock, (3) outstanding stock, and (4) preferred stock?”
InstructionsIn a brief note, differentiate for Uncle Joe among the four different stock terms. Write the letter to be friendly, yet professional.
Ethics CaseBYP13-7 The R&D division of Piqua Chemical Corp. has just developed a chemical for sterilizing the vicious Brazilian “killer bees” which are invading Mexico and the southern United States. The presi-dent of the company is anxious to get the chemical on the market to boost the company’s profi ts. He believes his job is in jeopardy because of decreasing sales and profi ts. The company has an opportu-nity to sell this chemical in Central American countries, where the laws are much more relaxed than in the United States. The director of Piqua’s R&D division strongly recommends further testing in the laboratory for side-effects of this chemical on other insects, birds, animals, plants, and even humans. He cautions the president, “We could be sued from all sides if the chemical has tragic side-effects that we didn’t even test for in the labs.” The president answers, “We can’t wait an additional year for your lab tests. We can avoid losses from such lawsuits by establishing a separate wholly owned corporation to shield Piqua Corp. from such lawsuits. We can’t lose any more than our investment in the new corporation, and we’ll invest in just the patent covering this chemical. We’ll reap the benefi ts if the chemical works and is safe, and avoid the losses from lawsuits if it’s a disaster.” The following week, Piqua creates a new wholly owned corporation called Finlay Inc., sells the chemical patent to it for $10, and watches the spraying begin.
Instructions(a) Who are the stakeholders in this situation?(b) Are the president’s motives and actions ethical?(c) Can Piqua shield itself against losses of Finlay Inc.?
All About YouBYP13-8 A high percentage of Americans own stock in corporations. As a shareholder in a corpora-tion, you will receive an annual report. One of the goals of this course is for you to learn how to navi-gate your way around an annual report.
InstructionsUse Apple’s 2013 annual report provided in Appendix A to answer the following questions.
(a) What CPA fi rm performed the audit of Apple’s fi nancial statements?(b) What was the amount of Apple’s earnings per share in 2013?(c) What were net sales in 2013?(d) How much cash did Apple spend on capital expenditures in 2013?(e) Over what life does the company depreciate its buildings?(f) What were the proceeds from issuance of common stock in 2013?
FASB Codifi cation ActivityBYP13-9 If your school has a subscription to the FASB Codifi cation, go to http://aaahq.org/ascLogin.cfm to log in and prepare responses to the following.
(a) How is common stock defi ned?(b) How is preferred stock defi ned?(c) What is the meaning of the term shares?
604 13 Corporations: Organization and Capital Stock Transactions

A Look at IFRS
5 Compare the accounting for stockholders’ equity under GAAP and IFRS.
LEARNING OBJECTIVE
The accounting for transactions related to stockholders’ equity, such as issuance of shares and purchase of treasury stock, are similar under both IFRS and GAAP. Major differences relate to terminology used, introduction of items such as revaluation surplus, and presentation of stockhold-ers’ equity information.
Key PointsFollowing are the key similarities and differences between GAAP and IFRS as related to stockholders’ equity.
Similarities• Aside from terminology used, the accounting transactions for the issuance of shares and the pur-
chase of treasury stocks are similar.
• Like GAAP, IFRS does not allow a company to record gains or losses on purchases of its own shares.
Differences• Under IFRS, the term reserves is used to describe all equity accounts other than those arising from
contributed (paid-in) capital. This would include, for example, reserves related to retained earnings, asset revaluations, and fair value differences.
• Many countries have a different mix of investor groups than in the United States. For example, in Germany, fi nancial institutions like banks are not only major creditors of corporations but often are the largest corporate stockholders as well. In the United States, Asia, and the United Kingdom, many companies rely on substantial investment from private investors.
• There are often terminology differences for equity accounts. The following summarizes some of the common differences in terminology.
GAAP IFRS
Common stock Share capital—ordinaryStockholders ShareholdersPar value Nominal or face valueAuthorized stock Authorized share capitalPreferred stock Share capital—preferencePaid-in capital Issued/allocated share capitalPaid-in capital in excess of par—common stock Share premium—ordinaryPaid-in capital in excess of par—preferred stock Share premium—preferenceRetained earnings Retained earnings or Retained profi tsRetained earnings defi cit Accumulated lossesAccumulated other comprehensive income General reserve and other reserve accounts
As an example of how similar transactions use different terminology under IFRS, consider the accounting for the issuance of 1,000 shares of $1 par value common stock for $5 per share. Under IFRS, the entry is as follows.
Cash 5,000 Share Capital—Ordinary 1,000 Share Premium—Ordinary 4,000
• A major difference between IFRS and GAAP relates to the account Revaluation Surplus. Revalua-tion surplus arises under IFRS because companies are permitted to revalue their property, plant,
A Look at IFRS 605

606 13 Corporations: Organization and Capital Stock Transactions
and equipment to fair value under certain circumstances. This account is part of general reserves under IFRS and is not considered contributed capital.
• IFRS often uses terms such as retained profi ts or accumulated profi t or loss to describe retained earnings. The term retained earnings is also often used.
• Equity is given various descriptions under IFRS, such as shareholders’ equity, owners’ equity, capital and reserves, and shareholders’ funds.
Looking to the FutureAs indicated in earlier discussions, the IASB and the FASB are currently working on a project related to fi nancial statement presentation. An important part of this study is to determine whether certain line items, subtotals, and totals should be clearly defi ned and required to be displayed in the fi nancial statements.
IFRS Practice
IFRS Self-Test Questions
1. Which of the following is true?(a) In the United States, the primary corporate stockholders are fi nancial institutions.(b) Share capital means total assets under IFRS.(c) The IASB and FASB are presently studying how fi nancial statement information should be
presented.(d) The accounting for treasury stock differs extensively between GAAP and IFRS.
2. Under IFRS, the amount of capital received in excess of par value would be credited to:(a) Retained Earnings.(b) Contributed Capital.(c) Share Premium.(d) Par value is not used under IFRS.
3. Which of the following is false?(a) Under GAAP, companies cannot record gains on transactions involving their own shares.(b) Under IFRS, companies cannot record gains on transactions involving their own shares.(c) Under IFRS, the statement of stockholders’ equity is a required statement.(d) Under IFRS, a company records a revaluation surplus when it experiences an increase in the
price of its common stock.
4. Which of the following does not represent a pair of GAAP/IFRS-comparable terms?(a) Additional paid-in capital/Share premium.(b) Treasury stock/Repurchase reserve.(c) Common stock/Share capital.(d) Preferred stock/Preference shares.
IFRS ExercisesIFRS13-1 On May 10, Jaurez Corporation issues 1,000 shares of $10 par value ordinary shares for cash at $18 per share. Journalize the issuance of the shares.
IFRS13-2 Meenen Corporation has the following accounts at December 31 (in euros): Share Capital—Ordinary, €10 par, 5,000 shares issued, €50,000; Share Premium—Ordinary €10,000; Retained Earnings €45,000; and Treasury Shares—Ordinary, 500 shares, €11,000. Prepare the equity section of the statement of fi nancial position.
IFRS13-3 Overton Co. had the following transactions during the current period.
Mar. 2 Issued 5,000 shares of $1 par value ordinary shares to attorneys in payment of a bill for $30,000 for services performed in helping the company to incorporate.
June 12 Issued 60,000 shares of $1 par value ordinary shares for cash of $375,000.July 11 Issued 1,000 shares of $100 par value preference shares for cash at $110 per share.Nov. 28 Purchased 2,000 treasury shares for $80,000.
InstructionsJournalize the above transactions.

A Look at IFRS 607
International Financial Reporting Problem: Louis Vuitton
IFRS13-4 The fi nancial statements of Louis Vuitton are presented in Appendix F. Instructions for accessing and using the company’s complete annual report, including the notes to its fi nancial state-ments, are also provided in Appendix F.
InstructionsUse the company’s annual report to answer the following questions.
(a) Determine the following amounts at December 31, 2013: (1) total equity, (2) total revaluation reserve, and (3) number of treasury shares.
(b) Examine the equity section of the company’s balance sheet. For each of the following, provide the comparable label that would be used under GAAP: (1) share capital, (2) share premium, and (3) net profi t, group share.
Answers to IFRS Self-Test Questions
1. c 2. c 3. d 4. b

Van Meter Inc., an electrical-parts distributor in Cedar Rapids,
Iowa, is 100% employee-owned. For many years, the
company has issued bonuses in the form of shares of
company stock to all of its employees. These bonus
distributions typically have a value equal to several weeks of
pay. Top management always thought that this was a great
program. Therefore, it came as quite a surprise a few years
ago when an employee stood up at a company-wide meeting
and said that he did not see any real value in receiving the
company’s shares. Instead, he wanted “a few hundred extra
bucks for beer and cigarettes.”
As it turned out, many of the company’s 340 employees felt
this way. Rather than end the stock bonus program, however,
the company decided to educate its employees on the value
of share ownership. The employees are now taught how to
determine the worth of their shares, the rights that come with
share ownership, and what they can do to help increase the
value of those shares.
As part of the education program, management developed a
slogan, “Work ten, get fi ve free.” The idea is that after
working 10 years, an employee’s shares would be worth the
equivalent of about fi ve years’ worth of salary. For example, a
person earning a $30,000 salary would earn $300,000 in
wages over a 10-year period. During that same 10-year
period, it was likely that the value of the employee’s shares
would accumulate to about $150,000 (fi ve years’ worth of
salary). This demonstrates in more concrete terms why
employees should be excited about share ownership.
A 12-member employee committee has the responsibility of
educating new employees about the program. The committee
also runs training programs so that employees understand
how their cost-saving actions improve the company’s results—
and its stock price. It appears that the company’s education
program to encourage employees to act like owners is
working. Profi tability has increased rapidly, and employee
turnover has fallen from 18% to 8%. Given Van Meter’s
success, many of the 10,000 other employee-owned
companies in the United States might want to investigate
whether their employees understand the benefi ts of share
ownership.
Source: Adapted from Simona Covel, “How to Get Workers to Think and Act
Like Owners,” Wall Street Journal Online (February 15, 2008).
Owning a Piece of the Action
As indicated in the Feature Story below, a profi table corporation like Van Meter Inc. can provide real benefi ts to employees through its stock bonus plan. And as employees learn more about the role of dividends, retained earnings, and earnings per share, they develop an understanding and appreciation for what the company is providing to them.
CHAPTER PREVIEW
14
FEATURE STORY
Corporations: Dividends, Retained Earnings, and Income Reporting
608

Describe the form and content of corporation income statements.
Prepare and analyze a comprehensive stockholders’ equity section.3
4
Explain how to account for cash dividends.1 Dividends on Preferred and
Common StockDO IT! 1
Stock Dividends and Stock Splits
DO IT! 2
• Cash dividends• Dividend preferences
Learning Objectives
Recording Business ActivitiesRetained Earnings
StatementDO IT! 3• Retained earnings• Statement presentation and
analysis
Stockholders’ Equity and EPSDO IT! 4• Income statement presentation
• Income statement analysis
CHAPTER OUTLINE
Daisy Daisy/Photographer’s Choice/Getty Images, Inc.
Explain how to account for stock dividends and splits.2 • Stock dividends
• Stock splits
Go to the REVIEW AND PRACTICE section at the end of the chapter for a review of key concepts and practice applications with solutions.
Visit WileyPLUS with ORION for additional tutorials and practice opportunities.

610 14 Corporations: Dividends, Retained Earnings, and Income Reporting
1 Explain how to account for cash dividends.LEARNING OBJECTIVE
A dividend is a corporation’s distribution of cash or stock to its stockholders on a pro rata (proportional to ownership) basis. Pro rata means that if you own 10% of the common shares, you will receive 10% of the dividend. Dividends can take four forms: cash, property, scrip (a promissory note to pay cash), or stock. Cash dividends predominate in practice although companies also declare stock dividends with some frequency. These two forms of dividends are therefore the focus of discussion in this chapter. Investors are very interested in a company’s dividend practices. In the fi nan-cial press, dividends are generally reported quarterly as a dollar amount per share. (Sometimes they are reported on an annual basis.) For example, Nike’s quarterly dividend rate in the fourth quarter of 2013 was 24 cents per share. The dividend rate for the fourth quarter of 2013 for GE was 22 cents, and for ConAgra Foods it was 25 cents.
Cash Dividends
A cash dividend is a pro rata distribution of cash to stockholders. Cash divi-dends are not paid on treasury shares. For a corporation to pay a cash dividend, it must have the following.
1. Retained earnings. The legality of a cash dividend depends on the laws of the state in which the company is incorporated. Payment of cash dividends from retained earnings is legal in all states. In general, cash dividend distributions from only the balance in common stock (legal capital) are illegal.
A dividend declared out of paid-in capital is termed a liquidating divi-dend. Such a dividend reduces or “liquidates” the amount originally paid in by stockholders. Statutes vary considerably with respect to cash dividends based on paid-in capital in excess of par or stated value. Many states permit such dividends.
2. Adequate cash. The legality of a dividend and the ability to pay a dividend are two different things. For example, Nike, with retained earnings of over $5.6 billion, could legally declare a dividend of at least $5.6 billion. But Nike’s cash balance is only $3.3 billion.
Before declaring a cash dividend, a company’s board of directors must carefully consider both current and future demands on the company’s cash resources. In some cases, current liabilities may make a cash dividend inap-propriate. In other cases, a major plant expansion program may warrant only a relatively small dividend.
3. Declared dividends. A company does not pay dividends unless its board of directors decides to do so, at which point the board “declares” the dividend. The board of directors has full authority to determine the amount of income to distribute in the form of a dividend and the amount to retain in the busi-ness. Dividends do not accrue like interest on a note payable, and they are not a liability until declared.
The amount and timing of a dividend are important issues for management to consider. The payment of a large cash dividend could lead to liquidity prob-lems for the company. On the other hand, a small dividend or a missed dividend may cause unhappiness among stockholders. Many stockholders expect to receive a reasonable cash payment from the company on a periodic basis. Many compa-nies declare and pay cash dividends quarterly. On the other hand, a number of high-growth companies pay no dividends, preferring to conserve cash to fi nance future capital expenditures.

Accounting for Cash Dividends 611
ENTRIES FOR CASH DIVIDENDS
Three dates are important in connection with dividends: (1) the declaration date, (2) the record date, and (3) the payment date. Normally, there are two to four weeks between each date. Companies make accounting entries on the declaration date and the payment date. On the declaration date, the board of directors formally declares (autho-rizes) the cash dividend and announces it to stockholders. The declaration of a cash dividend commits the corporation to a legal obligation. The company must make an entry to recognize the increase in Cash Dividends and the increase in the liability Dividends Payable. To illustrate, assume that on December 1, 2017, the directors of Media Gen-eral declare a 50 cents per share cash dividend on 100,000 shares of $10 par value common stock. The dividend is $50,000 (100,000 3 $0.50). The entry to record the declaration is as follows.
Declaration Date
Dec. 1 Cash Dividends 50,000 Dividends Payable 50,000 (To record declaration of cash dividend)
Media General debits the account Cash Dividends. Cash dividends decrease retained earnings. We use the specifi c title Cash Dividends to differentiate it from other types of dividends, such as stock dividends. Dividends Payable is a current liability. It will normally be paid within the next several months. For homework problems, you should use the Cash Dividends account for recording dividend declarations. At the record date, the company determines ownership of the outstanding shares for dividend purposes. The stockholders’ records maintained by the cor-poration supply this information. In the interval between the declaration date and the record date, the corporation updates its stock ownership records. For Media General, the record date is December 22. No entry is required on this date because the corporation’s liability recognized on the declaration date is unchanged.
Record Date
Dec. 22 No entry
On the payment date, the company makes cash dividend payments to the stockholders of record (as of December 22) and records the payment of the divi-dend. If January 20 is the payment date for Media General, the entry on that date is as follows.
Payment Date
Jan. 20 Dividends Payable 50,000 Cash 50,000 (To record payment of cash dividend)
Note that payment of the dividend reduces both current assets and current liabil-ities. It has no effect on stockholders’ equity. The cumulative effect of the decla-ration and payment of a cash dividend is to decrease both stockholders’ equity and total assets. Illustration 14-1 (page 612) summarizes the three important dates associated with dividends for Media General.
Helpful HintThe purpose of the record date is to identify the per-sons or entities that will receive the dividend, not to determine the amount of the dividend liability.
250,000 Div 150,000
Cash Flowsno effect
A SEL5 1
250,000250,000
Cash Flows250,000
A SEL5 1
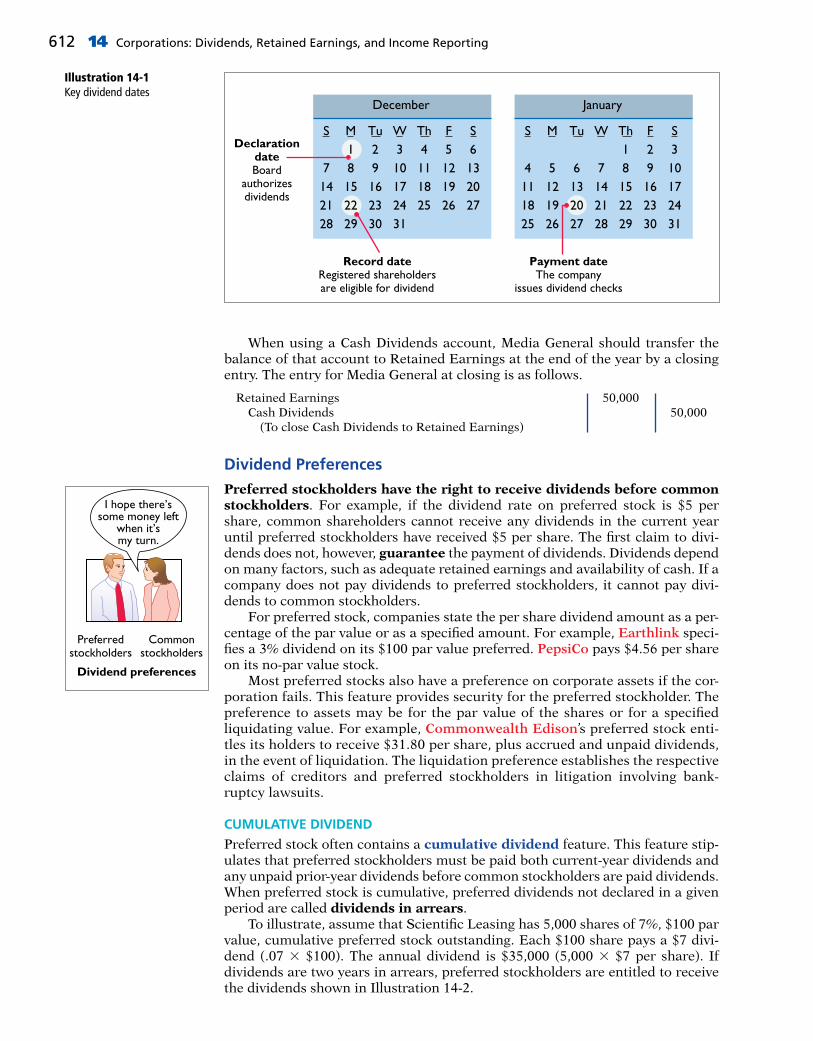
612 14 Corporations: Dividends, Retained Earnings, and Income Reporting
When using a Cash Dividends account, Media General should transfer the balance of that account to Retained Earnings at the end of the year by a closing entry. The entry for Media General at closing is as follows.
Retained Earnings 50,000 Cash Dividends 50,000 (To close Cash Dividends to Retained Earnings)
Dividend Preferences
Preferred stockholders have the right to receive dividends before common stockholders. For example, if the dividend rate on preferred stock is $5 per share, common shareholders cannot receive any dividends in the current year until preferred stockholders have received $5 per share. The fi rst claim to divi-dends does not, however, guarantee the payment of dividends. Dividends depend on many factors, such as adequate retained earnings and availability of cash. If a company does not pay dividends to preferred stockholders, it cannot pay divi-dends to common stockholders. For preferred stock, companies state the per share dividend amount as a per-centage of the par value or as a specifi ed amount. For example, Earthlink speci-fi es a 3% dividend on its $100 par value preferred. PepsiCo pays $4.56 per share on its no-par value stock. Most preferred stocks also have a preference on corporate assets if the cor-poration fails. This feature provides security for the preferred stockholder. The preference to assets may be for the par value of the shares or for a specifi ed liquidating value. For example, Commonwealth Edison’s preferred stock enti-tles its holders to receive $31.80 per share, plus accrued and unpaid dividends, in the event of liquidation. The liquidation preference establishes the respective claims of creditors and preferred stockholders in litigation involving bank-ruptcy lawsuits.
CUMULATIVE DIVIDEND
Preferred stock often contains a cumulative dividend feature. This feature stip-ulates that preferred stockholders must be paid both current-year dividends and any unpaid prior-year dividends before common stockholders are paid dividends. When preferred stock is cumulative, preferred dividends not declared in a given period are called dividends in arrears. To illustrate, assume that Scientifi c Leasing has 5,000 shares of 7%, $100 par value, cumulative preferred stock outstanding. Each $100 share pays a $7 divi-dend (.07 3 $100). The annual dividend is $35,000 (5,000 3 $7 per share). If dividends are two years in arrears, preferred stockholders are entitled to receive the dividends shown in Illustration 14-2.
Illustration 14-1Key dividend dates
20
December
DeclarationdateBoard
authorizesdividends
Record dateRegistered shareholdersare eligible for dividend
Payment dateThe company
issues dividend checks
S M Tu W Th F S2 3 4 5 6
7 8 9 10 11 12 1314 16 17 18 19 2021 23 24 25 2728 29 31
2615
January
S M Tu W Th F S1 2 3
4 5 6 7 8 1011 13 14 15 16 1718 19 22 2425 26 27 28
2329 30 31
129
1
3022 21
I hope there’ssome money left
when it’smy turn.
Dividend preferences
Preferredstockholders
Commonstockholders

Accounting for Cash Dividends 613
The company cannot pay dividends to common stockholders until it pays the entire preferred dividend. In other words, companies cannot pay dividends to common stockholders while any preferred dividends are in arrears. Dividends in arrears are not considered a liability. No obligation exists until the board of directors formally declares that the corporation will pay a divi-dend. However, companies should disclose in the notes to the fi nancial statements the amount of dividends in arrears. Doing so enables investors to assess the poten-tial impact of this commitment on the corporation’s fi nancial position. The investment community does not look favorably on companies that are unable to meet their dividend obligations. As a fi nancial offi cer noted in discuss-ing one company’s failure to pay its cumulative preferred dividend for a period of time, “Not meeting your obligations on something like that is a major black mark on your record.”
ALLOCATING CASH DIVIDENDS BETWEEN PREFERRED AND COMMON STOCK
As indicated, preferred stock has priority over common stock in regard to dividends. Holders of cumulative preferred stock must be paid any unpaid prior-year dividends and their current year’s dividend before common stockholders receive dividends. To illustrate, assume that at December 31, 2017, IBR Inc. has 1,000 shares of 8%, $100 par value cumulative preferred stock. It also has 50,000 shares of $10 par value common stock outstanding. The dividend per share for preferred stock is $8 ($100 par value 3 8%). The required annual dividend for preferred stock is therefore $8,000 (1,000 shares 3 $8). At December 31, 2017, the directors declare a $6,000 cash dividend. In this case, the entire dividend amount goes to preferred stockholders because of their dividend preference. The entry to record the decla-ration of the dividend is as follows.
Illustration 14-2Computation of total dividends to preferred stock
Dividends in arrears ($35,000 3 2) $ 70,000Current-year dividends 35,000
Total preferred dividends $105,000
Preferredstockholders
Dividendin
arrears
Currentdividend
Payment of acumulative dividend
Because of the cumulative feature, dividends of $2 ($8 2 $6) per share are in arrears on preferred stock for 2017. IBR must pay these dividends to preferred stockholders before it can pay any future dividends to common stockholders. IBR should disclose dividends in arrears in the fi nancial statements. At December 31, 2018, IBR declares a $50,000 cash dividend. The allocation of the dividend to the two classes of stock is as follows.
Dec. 31 Cash Dividends 6,000 Dividends Payable 6,000 (To record $6 per share cash dividend to preferred stockholders)
Dec. 31 Cash Dividends 50,000 Dividends Payable 50,000 (To record declaration of cash dividends of $10,000 to preferred stock and $40,000 to common stock)
A SEL5 1
26,000 Div 16,000
Cash Flowsno effect
Illustration 14-3Allocating dividends to preferred and common stock
Total dividend $50,000Allocated to preferred stock Dividends in arrears, 2017 (1,000 3 $2) $2,000 2018 dividend (1,000 3 $8) 8,000 10,000
Remainder allocated to common stock $40,000
The entry to record the declaration of the dividend is as follows.A SEL5 1
250,000 Div 150,000
Cash Flowsno effect

614 14 Corporations: Dividends, Retained Earnings, and Income Reporting
If IBR’s preferred stock is not cumulative, preferred stockholders receive only $8,000 in dividends in 2018. Common stockholders receive $42,000.
Investor Insight
Dividends in Demand
Investors seeking dividend income enjoyed a great year in 2013. A total of 418 companies in the Standard & Poor’s 500 index paid a dividend, matching the highest total since 1998. As shown in the following chart, dividend growth since 2008 more than doubled.
And for holders of dividend-paying stocks, corporate America may continue to sweeten the pot. One reason for optimism is that the average dividend payout—the percentage of corporate profi ts paid out as dividends—remains low at 36%. The historical average is 52%.
Source: Trevor Delaney and Jenni Sohn, “Dividends in Demand” Naples Daily News (January 8, 2014), p. 5B.
What factors must management consider in deciding how large a dividend to pay? (Go to WileyPLUS for this answer and additional questions.)
2008
50
100
150
200
250
300
350
400
02009 2010 2011 2012 2013
Increases and initiations
Decreases and suspensions
S&P 500 Dividend Actions
Palto/iStockphoto
MasterMind Corporation has 2,000 shares of 6%, $100 par value preferred stock out-standing at December 31, 2017. At December 31, 2017, the company declared a $60,000 cash dividend. Determine the dividend paid to preferred stockholders and common stockholders under each of the following scenarios.
1. The preferred stock is noncumulative, and the company has not missed any dividends in previous years.
2. The preferred stock is noncumulative, and the company did not pay a dividend in each of the two previous years.
3. The preferred stock is cumulative, and the company did not pay a dividend in each of the two previous years.
Solution
DO IT! 1 Dividends on Preferred and Common Stock
1. The company has not missed past dividends and the preferred stock is noncumu-lative. Thus, the preferred stockholders are paid only this year’s dividend. The dividend paid to preferred stockholders would be $12,000 (2,000 3 .06 3 $100). The dividend paid to common stockholders would be $48,000 ($60,000 2 $12,000).
Action Plan✔ Determine dividends
on preferred shares by multiplying the dividend rate times the par value of the stock times the number of preferred shares.

Accounting for Stock Dividends and Splits 615
2 Explain how to account for stock dividends and splits.LEARNING OBJECTIVE
Stock Dividends
A stock dividend is a pro rata (proportional to ownership) distribution of the corporation’s own stock to stockholders. Whereas a company pays cash in a cash dividend, a company issues shares of stock in a stock dividend. A stock dividend results in a decrease in retained earnings and an increase in paid-in capital. Unlike a cash dividend, a stock dividend does not decrease total stockholders’ equity or total assets. To illustrate, assume that you have a 2% ownership interest in Cetus Inc. That is, you own 20 of its 1,000 shares of common stock. If Cetus declares a 10% stock dividend, it would issue 100 shares (1,000 3 10%) of stock. You would receive two shares (2% 3 100). Would your ownership interest change? No, it would remain at 2% (22 4 1,100). You now own more shares of stock, but your own-ership interest has not changed. Cetus has disbursed no cash and has assumed no liabilities. What, then, are the purposes and benefi ts of a stock dividend? Corporations issue stock dividends generally for one or more of the following reasons.
1. To satisfy stockholders’ dividend expectations without spending cash.
2. To increase the marketability of the corporation’s stock. When the number of shares outstanding increases, the market price per share decreases. Decreas-ing the market price of the stock makes it easier for smaller investors to pur-chase the shares.
3. To emphasize that a company has permanently reinvested in the business a portion of stockholders’ equity, which therefore is unavailable for cash dividends.
When the dividend is declared, the board of directors determines the size of the stock dividend and the value assigned to each dividend. Generally, if the company issues a small stock dividend (less than 20–25% of the corporation’s issued stock), the value assigned to the dividend is the fair value (market price) per share. This treatment is based on the assumption that a small stock dividend will have little effect on the market price of the shares previously outstanding. Thus, many stockholders consider small stock divi-dends to be distributions of earnings equal to the market price of the shares distributed. If a company issues a large stock dividend (greater than 20–25%), the price assigned to the dividend is the par or stated value. Small stock divi-dends predominate in practice. Thus, we will illustrate only entries for small stock dividends.
2. The preferred stock is noncumulative. Thus, past unpaid dividends do not have to be paid. The dividend paid to preferred stockholders would be $12,000 (2,000 3 .06 3 $100). The dividend paid to common stockholders would be $48,000 ($60,000 2 $12,000).
3. The preferred stock is cumulative. Thus, dividends that have been missed (divi-dends in arrears) must be paid. The dividend paid to preferred stockholders would be $36,000 (3 3 2,000 3 .06 3 $100). Of the $36,000, $24,000 relates to dividends in arrears and $12,000 relates to the current dividend on preferred stock. The div-idend paid to common stockholders would be $24,000 ($60,000 2 $36,000).
Action Plan (cont’d)✔ Understand the
cumulative feature. If preferred stock is cumulative, then any missed dividends (dividends in arrears) and the current year’s dividend must be paid to preferred stockholders before dividends are paid to common stockholders.Related exercise material: BE14-2, E14-2 and DO IT! 14-1.

616 14 Corporations: Dividends, Retained Earnings, and Income Reporting
ENTRIES FOR STOCK DIVIDENDS
To illustrate the accounting for small stock dividends, assume that Medland Corpo-ration has a balance of $300,000 in retained earnings. It declares a 10% stock divi-dend on its 50,000 shares of $10 par value common stock. The current market price of its stock is $15 per share. The number of shares to be issued is 5,000 (10% 3 50,000). Therefore, the total amount to be debited to Stock Dividends is $75,000 (5,000 3 $15). The entry to record the declaration of the stock dividend is as follows.
Medland debits Stock Dividends for the market price of the stock issued ($15 3 5,000). (Similar to Cash Dividends, Stock Dividends decrease retained earnings.) Medland also credits Common Stock Dividends Distributable for the par value of the dividend shares ($10 3 5,000) and credits Paid-in Capital in Excess of Par—Common Stock for the excess of the market price over par ($5 3 5,000). Common Stock Dividends Distributable is a stockholders’ equity account. It is not a liability because assets will not be used to pay the dividend. If the com-pany prepares a balance sheet before it issues the dividend shares, it reports the distributable account under paid-in capital as shown in Illustration 14-4.
Stock Dividends 75,000 Common Stock Dividends Distributable 50,000 Paid-in Capital in Excess of Par—Common Stock 25,000 (To record declaration of 10% stock dividend)
Common Stock Dividends Distributable 50,000 Common Stock 50,000 (To record issuance of 5,000 shares in a stock dividend)
Illustration 14-4Statement presentation of common stock dividends distributable
Paid-in capital Common stock $500,000 Common stock dividends distributable 50,000 Paid-in capital in excess of par—common stock 25,000
Total paid-in capital $575,000
When Medland issues the dividend shares, it debits Common Stock Divi-dends Distributable and credits Common Stock, as follows.
A SEL5 1
275,000 Div 150,000 CS 125,000 CS
Cash Flowsno effect
EFFECTS OF STOCK DIVIDENDS
How do stock dividends affect stockholders’ equity? They change the composi-tion of stockholders’ equity because they transfer a portion of retained earnings to paid-in capital. However, total stockholders’ equity remains the same. Stock dividends also have no effect on the par or stated value per share, but the number of shares outstanding increases. Illustration 14-5 shows these effects for Medland.
Illustration 14-5Stock dividend effects Before After
Dividend Change Dividend
Stockholders’ equity Paid-in capital Common stock, $10 par $ 500,000 $ 50,000 $ 550,000 Paid-in capital in excess of par — 25,000 25,000
Total paid-in capital 500,000 175,000 575,000 Retained earnings 300,000 275,000 225,000
Total stockholders’ equity $800,000 $ 0 $800,000
Outstanding shares 50,000 15,000 55,000
Par value per share $10.00 $ 0 $10.00
A SEL5 1
250,000 CS 150,000 CS
Cash Flowsno effect

Accounting for Stock Dividends and Splits 617
In this example, total paid-in capital increases by $75,000 (50,000 shares 3 10% 3 $15) and retained earnings decreases by the same amount. Note also that total stockholders’ equity remains unchanged at $800,000. The number of shares increases by 5,000 (50,000 3 10%).
Stock Splits
A stock split, like a stock dividend, involves issuance of additional shares to stock-holders according to their percentage ownership. However, a stock split results in a reduction in the par or stated value per share. The purpose of a stock split is to increase the marketability of the stock by lowering its market price per share. This, in turn, makes it easier for the corporation to issue additional stock. The effect of a split on market price is generally inversely proportional to the size of the split. For example, after a 2-for-1 stock split, the market price of Nike’s stock fell from $111 to approximately $55. The lower market price stimu-lated market activity. Within one year, the stock was trading above $100 again. Illustration 14-6 shows the effect of a 4-for-1 stock split for stockholders.
Illustration 14-7Stock split effects Before After
Stock Split Change Stock Split
Stockholders’ equity Paid-in capital Common stock $ 500,000 $ 500,000 Paid-in capital in excess of par –0– –0–
Total paid-in capital 500,000 $ 0 500,000 Retained earnings 300,000 0 300,000
Total stockholders’ equity $800,000 $ 0 $800,000
Outstanding shares 50,000 150,000 100,000
Par value per share $10.00 2$5.00 $5.00
Helpful HintA stock split changes the par value per share but does not affect any balances in stockholders’ equity.
In a stock split, the company increases the number of shares in the same proportion that par or stated value per share decreases. For example, in a 2-for-1 split, the company exchanges one share of $10 par value stock for two shares of $5 par value stock. A stock split does not have any effect on total paid-in cap-ital, retained earnings, or total stockholders’ equity. However, the number of shares outstanding increases, and par value per share decreases. Illustration 14-7 shows these effects for Medland Corporation, assuming that it splits its 50,000 shares of common stock on a 2-for-1 basis.
Illustration 14-6Effect of stock split for stockholders
10shares
10shares
10shares
10shares
ABC Co. ABC Co.
10 10 10 1010 10 10 1010 10 10 1010 10 10 10
“I owned 40shares before and I own160 shares now, but I still
own only 1/4 of the company!”
Number of shares owned increases, butpercentage of company owned remains the same.
Before stock split After stock split
A stock split does not affect the balances in any stockholders’ equity accounts. Therefore, a company does not need to journalize a stock split.

618 14 Corporations: Dividends, Retained Earnings, and Income Reporting
Illustration 14-8 summarizes the differences between stock dividends and stock splits.
Illustration 14-8Differences between the effects of stock dividends and stock splits
Item Stock Dividend Stock Split
Total paid-in capital Increase No changeTotal retained earnings Decrease No changeTotal par value (common stock) Increase No changePar value per share No change DecreaseOutstanding shares Increase IncreaseTotal stockholders’ equity No change No change
A No-Split Philosophy
Warren Buffett’s company, Berkshire Hathaway, has two classes of shares. Until recently, the company had never split either class of stock. As a result, the class A stock had a market price of $97,000 and the class B sold for about $3,200 per share. Because the price per share is so high, the stock does not trade as frequently as the stock of other companies. Buffett has always opposed stock splits because he feels that a lower stock price attracts short-
Dietmar Klement/iStockphoto
Berkshire HathawayInvestor Insight
term investors. He appears to be correct. For example, while more than 6 million shares of IBM are exchanged on the average day, only about 1,000 class A shares of Berkshire are traded. Despite Buffett’s aversion to splits, in order to accomplish a recent acquisition, Berkshire decided to split its class B shares 50 to 1.
Source: Scott Patterson, “Berkshire Nears Smaller Baby B’s,” Wall Street Journal Online (January 19, 2010).
Why does Warren Buffett usually oppose stock splits? (Go to WileyPLUS for this answer and additional questions.)
Sing CD Company has had fi ve years of record earnings. Due to this success, the market price of its 500,000 shares of $2 par value common stock has tripled from $15 per share to $45. During this period, paid-in capital remained the same at $2,000,000. Retained earnings increased from $1,500,000 to $10,000,000. President Joan Elbert is considering either a 10% stock dividend or a 2-for-1 stock split. She asks you to show the before-and-after effects of each option on retained earnings, total stockholders’ equity, shares outstanding, and par value per share.
Solution
DO IT! 2 Stock Dividends and Stock Splits
Related exercise material: BE14-3, BE14-4, E14-4, E14-5, E14-6, E14-7, and DO IT! 14-2.
Action Plan✔ Calculate the stock
dividend’s effect on retained earnings by multiplying the number of new shares times the market price of the stock (or par value for a large stock dividend).
✔ Recall that a stock dividend increases the number of shares without affecting total stockholders’ equity.
✔ Recall that a stock split only increases the number of shares outstanding and decreases the par value per share.
The stock dividend amount is $2,250,000 [(500,000 3 10%) 3 $45]. The new balance in retained earnings is $7,750,000 ($10,000,000 2 $2,250,000). The retained earnings balance after the stock split is the same as it was before the split: $10,000,000. Total stockholders’ equity does not change. The effects on the stockholders’ equity accounts are as follows.
Original After After Balances Dividend Split
Paid-in capital $ 2,000,000 $ 4,250,000 $ 2,000,000Retained earnings 10,000,000 7,750,000 10,000,000
Total stockholders’ equity $12,000,000 $12,000,000 $12,000,000
Shares outstanding 500,000 550,000 1,000,000
Par value per share $2.00 $2.00 $1.00
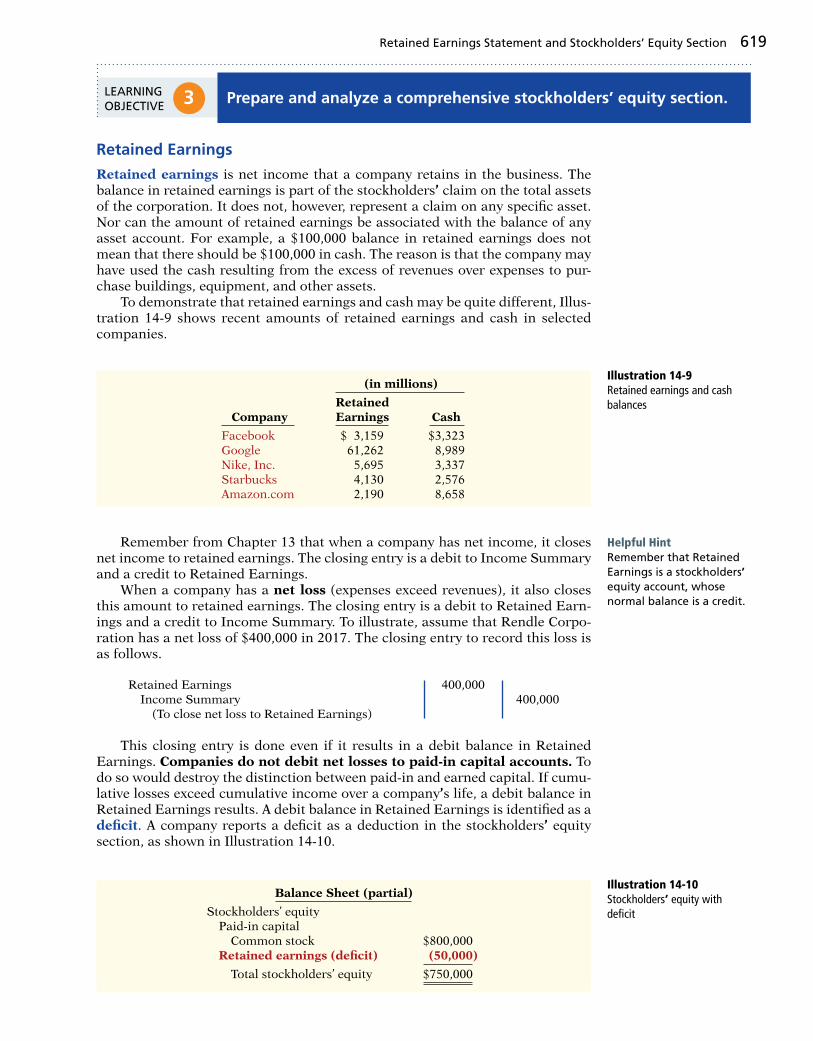
Retained Earnings Statement and Stockholders’ Equity Section 619
3 Prepare and analyze a comprehensive stockholders’ equity section.LEARNING OBJECTIVE
Retained Earnings
Retained earnings is net income that a company retains in the business. The balance in retained earnings is part of the stockholders’ claim on the total assets of the corporation. It does not, however, represent a claim on any specifi c asset. Nor can the amount of retained earnings be associated with the balance of any asset account. For example, a $100,000 balance in retained earnings does not mean that there should be $100,000 in cash. The reason is that the company may have used the cash resulting from the excess of revenues over expenses to pur-chase buildings, equipment, and other assets. To demonstrate that retained earnings and cash may be quite different, Illus-tration 14-9 shows recent amounts of retained earnings and cash in selected companies.
Remember from Chapter 13 that when a company has net income, it closes net income to retained earnings. The closing entry is a debit to Income Summary and a credit to Retained Earnings. When a company has a net loss (expenses exceed revenues), it also closes this amount to retained earnings. The closing entry is a debit to Retained Earn-ings and a credit to Income Summary. To illustrate, assume that Rendle Corpo-ration has a net loss of $400,000 in 2017. The closing entry to record this loss is as follows.
Retained Earnings 400,000 Income Summary 400,000 (To close net loss to Retained Earnings)
This closing entry is done even if it results in a debit balance in Retained Earnings. Companies do not debit net losses to paid-in capital accounts. To do so would destroy the distinction between paid-in and earned capital. If cumu-lative losses exceed cumulative income over a company’s life, a debit balance in Retained Earnings results. A debit balance in Retained Earnings is identifi ed as a defi cit. A company reports a defi cit as a deduction in the stockholders’ equity section, as shown in Illustration 14-10.
Illustration 14-9Retained earnings and cash balances
(in millions)
Retained Company Earnings Cash
Facebook $ 3,159 $3,323Google 61,262 8,989Nike, Inc. 5,695 3,337Starbucks 4,130 2,576Amazon.com 2,190 8,658
Helpful HintRemember that Retained Earnings is a stockholders’ equity account, whose normal balance is a credit.
Illustration 14-10Stockholders’ equity with defi cit
Balance Sheet (partial)
Stockholders’ equity Paid-in capital Common stock $800,000 Retained earnings (defi cit) (50,000)
Total stockholders’ equity $750,000

620 14 Corporations: Dividends, Retained Earnings, and Income Reporting
RETAINED EARNINGS RESTRICTIONS
The balance in retained earnings is generally available for dividend declarations. In some cases, however, there may be retained earnings restrictions. These make a portion of the retained earnings balance currently unavailable for divi-dends. Restrictions result from one or more of the following causes.
1. Legal restrictions. Many states require a corporation to restrict retained earnings for the cost of treasury stock purchased. The restriction keeps intact the corporation’s legal capital that is being temporarily held as treasury stock. When the company sells the treasury stock, the restriction is lifted.
2. Contractual restrictions. Long-term debt contracts may restrict retained earnings as a condition for the loan. The restriction limits the use of corporate assets for payment of dividends. Thus, it increases the likelihood that the cor-poration will be able to meet required loan payments.
3. Voluntary restrictions. The board of directors may voluntarily create retained earnings restrictions for specifi c purposes. For example, the board may autho-rize a restriction for future plant expansion. By reducing the amount of retained earnings available for dividends, the company makes more cash available for the planned expansion.
Companies generally disclose retained earnings restrictions in the notes to the fi nancial statements. For example, as shown in Illustration 14-11, Tektronix Inc., a manufacturer of electronic measurement devices, had total retained earn-ings of $774 million, but the unrestricted portion was only $223.8 million.
Certain of the Company’s debt agreements require compliance with debt covenants. Management believes that the Company is in compliance with such requirements. The Company had unrestricted retained earnings of $223.8 million after meeting those requirements.
TEKTRONIX INC.Notes to the Financial Statements
Real World
Illustration 14-11Disclosure of restriction
PRIOR PERIOD ADJUSTMENTS
Suppose that a corporation has closed its books and issued fi nancial statements. The corporation then discovers that it made a material error in reporting net income of a prior year. How should the company record this situation in the accounts and report it in the fi nancial statements? The correction of an error in previously issued fi nancial statements is known as a prior period adjustment. The company makes the correction directly to Retained Earnings because the effect of the error is now in this account. The net income for the prior period has been recorded in retained earnings through the journalizing and posting of closing entries. To illustrate, assume that General Microwave discovers in 2017 that it under-stated depreciation expense on equipment in 2016 by $300,000 due to computa-tional errors. These errors overstated both net income for 2016 and the current balance in retained earnings. The entry for the prior period adjustment, ignoring all tax effects, is as follows.
Retained Earnings 300,000 Accumulated Depreciation—Equipment 300,000 (To adjust for understatement of depreciation in a prior period)
A debit to an income statement account in 2017 is incorrect because the error pertains to a prior year.
A SEL5 1
2300,000 RE2300,000
Cash Flowsno effect

Retained Earnings Statement and Stockholders’ Equity Section 621
Companies report prior period adjustments in the retained earnings state-ment. They add (or deduct, as the case may be) these adjustments from the begin-ning retained earnings balance. This results in an adjusted beginning balance. For example, assuming a beginning balance of $800,000 in retained earnings, General Microwave reports the prior period adjustment as follows.
Again, reporting the correction in the current year’s income statement would be incorrect because it applies to a prior year’s income statement.
RETAINED EARNINGS STATEMENT
The retained earnings statement shows the changes in retained earnings during the year. The company prepares the statement from the Retained Earnings account. Illustration 14-13 shows (in T-account form) transactions that affect retained earnings.
Illustration 14-12Statement presentation of prior period adjustments
GENERAL MICROWAVERetained Earnings Statement (partial)
Balance, January 1, as reported $ 800,000Correction for overstatement of net income in prior period (depreciation error) (300,000)
Balance, January 1, as adjusted $ 500,000
Retained Earnings
1. Net loss 1. Net income2. Prior period adjustments for 2. Prior period adjustments for
overstatement of net income understatement of net income3. Cash dividends and stock dividends4. Some disposals of treasury stock
Illustration 14-13Debits and credits to retained earnings
As indicated, net income increases retained earnings, and a net loss decreases retained earnings. Prior period adjustments may either increase or decrease retained earnings. Both cash dividends and stock dividends decrease retained earnings. The circumstances under which treasury stock transactions decrease retained earnings are explained in Chapter 13, page 586. A complete retained earnings statement for Graber Inc., based on assumed data, is shown in Illustration 14-14.
Illustration 14-14Retained earnings statementGRABER INC.
Retained Earnings StatementFor the Year Ended December 31, 2017
Balance, January 1, as reported $1,050,000Correction for understatement of net income in prior period (inventory error) 50,000
Balance, January 1, as adjusted 1,100,000Add: Net income 360,000
1,460,000Less: Cash dividends $100,000 Stock dividends 200,000 300,000
Balance, December 31 $1,160,000

622 14 Corporations: Dividends, Retained Earnings, and Income Reporting
Statement Presentation and Analysis
PRESENTATION
Illustration 14-15 presents the stockholders’ equity section of Graber Inc.’s bal-ance sheet. Note the following: (1) “Common stock dividends distributable” is shown under “Capital stock” in “Paid-in capital” and (2) a note (Note R) discloses a retained earnings restriction.
Illustration 14-15Comprehensive stockholders’ equity section
GRABER INC.Balance Sheet (partial)
Stockholders’ equity Paid-in capital Capital stock 9% Preferred stock, $100 par value, cumulative, callable at $120, 10,000 shares authorized, 6,000 shares issued and outstanding $ 600,000 Common stock, no par, $5 stated value, 500,000 shares authorized, 400,000 shares issued and 390,000 shares outstanding $2,000,000 Common stock dividends distributable 50,000 2,050,000
Total capital stock 2,650,000 Additional paid-in capital In excess of par—preferred stock 30,000 In excess of stated value—common stock 1,050,000
Total additional paid-in capital 1,080,000
Total paid-in capital 3,730,000 Retained earnings (see Note R) 1,160,000
Total paid-in capital and retained earnings 4,890,000 Less: Treasury stock (10,000 common shares) 80,000
Total stockholders’ equity $4,810,000
Note R: Retained earnings is restricted for the cost of treasury stock, $80,000.
Instead of presenting a detailed stockholders’ equity section in the balance sheet and a retained earnings statement, many companies prepare a stockholders’ equity statement. This statement shows the changes (1) in each stockholders’ equity account and (2) in total that occurred during the year. An example of a stockholders’ equity statement appears in Apple’s fi nancial statements in Appendix A.
ANALYSIS
Investors and analysts can measure profi tability from the viewpoint of the com-mon stockholder by the return on common stockholders’ equity. This ratio, as shown in Illustration 14-16, indicates how many dollars of net income the company earned for each dollar invested by the common stockholders. It is com-puted by dividing net income available to common stockholders (which is net income minus preferred stock dividends) by average common stockholders’ equity. To illustrate, Walt Disney Company’s beginning-of-the-year and end-of-the-year common stockholders’ equity were $31,820 and $30,753 million, respec-tively. Its net income was $4,687 million, and no preferred stock was outstanding. The return on common stockholders’ equity is computed as follows.

Corporation Income Statements 623
As shown above, if a company has preferred stock, we would deduct the amount of preferred dividends from the company’s net income to compute income available to common stockholders. Also, the par value of preferred stock is deducted from total stockholders’ equity when computing the average com-mon stockholders’ equity.
Illustration 14-16Return on common stockholders’ equity and computation
Vega Corporation has retained earnings of $5,130,000 on January 1, 2017. During the year, Vega earned $2,000,000 of net income. It declared and paid a $250,000 cash divi-dend. In 2017, Vega recorded an adjustment of $180,000 due to the understatement (from a mathematical error) of 2016 depreciation expense. Prepare a retained earnings statement for 2017.
Solution
DO IT! 3 Retained Earnings Statement
Related exercise material: BE14-5, BE14-6, E14-8, E14-9, and DO IT! 14-3.
Action Plan✔ Recall that a retained
earnings statement begins with retained earnings, as reported at the end of the previous year.
✔ Add or subtract any prior period adjust-ments to arrive at the adjusted beginning fi gure.
✔ Add net income and subtract dividends declared to arrive at the ending balance in retained earnings.
VEGA CORPORATIONRetained Earnings Statement
For the Year Ended December 31, 2017
Balance, January 1, as reported $5,130,000Correction for overstatement of net income in prior period (depreciation error) (180,000)
Balance, January 1, as adjusted 4,950,000Add: Net income 2,000,000
6,950,000Less: Cash dividends 250,000
Balance, December 31 $6,700,000
4 Describe the form and content of corporation income statements.LEARNING OBJECTIVE
Income Statement Presentation
Income statements for corporations are the same as the statements for pro-prietorships or partnerships except for one thing: the reporting of income taxes. For income tax purposes, corporations are a separate legal entity. As a result, corporations report income tax expense in a separate section of the cor-poration income statement, before net income. The condensed income statement for Leads Inc. in Illustration 14-17 (page 624) shows a typical presentation. Note that the corporation reports income before income taxes as one line item and income tax expense as another.
Net Income minus 4
Average Common 5
Return on Common
Preferred Dividends Stockholders’ Equity Stockholders’ Equity
($4,687 2 $0) 4
($31,820 1 $30,753) 5 15.0%
2

624 14 Corporations: Dividends, Retained Earnings, and Income Reporting
Companies record income tax expense and the related liability for income taxes payable as part of the adjusting process. Using the data for Leads Inc., in Illustration 14-17, the adjusting entry for income tax expense at December 31, 2017, is as follows.
Illustration 14-17Income statement with income taxes
LEADS INC.Income Statement
For the Year Ended December 31, 2017
Sales revenue $800,000Cost of goods sold 600,000
Gross profi t 200,000Operating expenses 50,000
Income from operations 150,000Other revenues and gains 10,000Other expenses and losses (4,000)
Income before income taxes 156,000Income tax expense 46,800
Net income $109,200
Income Tax Expense 46,800 Income Taxes Payable 46,800 (To record income taxes for 2017)
The income statement of Apple (in Appendix A) presents another illustration of income taxes.
Income Statement Analysis
The fi nancial press frequently reports earnings data. Stockholders and potential investors widely use these data in evaluating the profi tability of a company. A convenient measure of earnings is earnings per share (EPS), which indicates the net income earned by each share of outstanding common stock.
EPS AND PREFERRED DIVIDENDS
The existence of preferred dividends slightly complicates the calculation of EPS. When a corporation has both preferred and common stock, we must subtract the current year’s preferred dividend from net income, to arrive at income available to common stockholders. Illustration 14-18 shows the formula for computing EPS.
ETHICS NOTE
In order to meet market expectations for EPS, some managers engage in elaborate treasury stock transactions. These transactions can be very costly for the remaining shareholders.
Illustration 14-18Formula for earnings per share Net Income Weighted-Average Earnings
minus 4 Common 5 per Preferred Dividends Shares Outstanding Share
To illustrate, assume that Rally Inc. reports net income of $211,000 on its 102,500 weighted-average common shares.1 During the year, it also declares a $6,000 dividend on its preferred stock. Therefore, the amount Rally has available for common stock dividends is $205,000 ($211,000 2 $6,000). Earnings per share is $2 ($205,000 4 102,500). If the preferred stock is cumulative, Rally deducts the dividend for the current year, whether or not it is declared. Remember that com-panies report earnings per share only for common stock.
A SEL5 1
246,800 Exp 146,800
Cash Flowsno effect
1The calculation of the weighted average of common shares outstanding is discussed in advanced accounting courses.

Corporation Income Statements 625
Investors often attempt to link earnings per share to the market price per share of a company’s stock.2 Because of the importance of earnings per share, most companies must report it on the face of the income statement. Generally, companies simply report this amount below net income on the statement. For Rally Inc., the presentation is as follows.
2The ratio of the market price per share to the earnings per share is called the price/earnings (P/E) ratio. The fi nancial media report this ratio for common stocks listed on major stock exchanges.
Illustration 14-19Basic earnings per share disclosure
RALLY INC.Income Statement (partial)
Net income $211,000
Earnings per share $2.00
The Impact of Corporate Social Responsibility
A recent survey conducted by Institutional Shareholder Services, a proxy advisory fi rm, shows that 83% of investors now believe environmental and social factors can signifi cantly impact shareholder value over the long term. This belief is clearly visible in the rising level of support for shareholder proposals requesting action related to social and environmental issues.
The following table shows that the number of corporate social responsibility (CSR)-related shareholder proposals rose from 150 in 2000 to 191 in 2010. Moreover, those proposals received average voting support of 18.4% of votes cast versus just 7.5% a decade earlier.
Source: Investor Responsibility Research Center, Ernst & Young, Seven Questions CEOs and Boards Should Ask About: “Triple Bottom Line” Reporting.
Why are CSR-related shareholder proposals increasing? (Go to WileyPLUS for this answer and additional questions.)
People, Planet, and Profi t Insight
© Robert Churchill/iStockphoto
Trends in Shareholder Proposals on Corporate Responsibility
2000 2005 2010
Number of proposals voted 150 155 191Average voting support 7.5% 9.9% 18.4%Percent proposals receiving .10% support 16.7% 31.2% 52.1%
On January 1, 2017, Siena Corporation purchased 2,000 shares of treasury stock. Other information regarding Siena Corporation is provided below.
2016 2017
Net income $110,000 $110,000Dividends on preferred stock $10,000 $10,000Dividends on common stock $2,000 $1,600Weighted-average number of shares outstanding 10,000 8,000*Common stockholders’ equity, beginning of year $500,000 $400,000*Common stockholders’ equity, end of year $500,000 $400,000
*Adjusted for purchase of treasury stock.
Compute (a) return on common stockholders’ equity for each year and (b) earnings per share for each year, and (c) discuss the changes in each.
DO IT! 4 Stockholders’ Equity and EPS

626 14 Corporations: Dividends, Retained Earnings, and Income Reporting
(a)
Solution
Related exercise material: BE14-10, BE14-11, E14-12, E14-13, E14-14, E14-15, E14-16, E14-17, and DO IT! 14-4.
Action Plan✔ Determine return on
common stockholders’ equity by dividing net income available to common stockholders by the average common stockholders’ equity.
✔ Determine earnings per share by dividing net income available to common stockholders by the weighted-average number of common shares outstanding.
2016 2017
Return on ($110,000 2 $10,000)
5 20% ($110,000 2 $10,000)
5 25% common stock- ($500,000 1 $500,000)/2 ($400,000 1 $400,000)/2 holders’ equity
(b) Earnings per ($110,000 2 $10,000)
5 $10 ($110,000 2 $10,000)
5 $12.50 share 10,000 8,000
(c) Between 2016 and 2017, return on common stockholders’ equity improved from 20% to 25%. Earnings per share increased from $10 to $12.50. While this would appear to be good news for the company’s common stockholders, these increases should be carefully evaluated. It is important to note that net income did not change during this period. The increase in both ratios was due to the purchase of treasury shares, which reduced the denominator of each ratio. As the company repurchases its own shares, it becomes more reliant on debt and thus increases its risk.
Explain how to account for cash dividends. Companies make entries for cash dividends at the declaration date and at the payment date. At the declaration date, the entry is debit Cash Dividends and credit Dividends Payable. At the payment date, the entry is debit Dividends Payable and credit Cash.
Explain how to account for stock dividends and splits. At the declaration date, the entry for a small stock dividend is debit Stock Dividends, credit Paid-in Capital in Excess of Par (or Stated Value)—Common Stock, and credit Common Stock Dividends Distributable.
At the payment date, the entry for a small stock dividend is debit Common Stock Dividends Distribut-able and credit Common Stock. A stock split reduces the par or stated value per share and increases the number of shares but does not affect balances in stockholders’ equity accounts.
Prepare and analyze a comprehensive stockholders’ equity section. Companies report each of the individ-ual debits and credits to retained earnings in the retained earnings statement. Additions consist of net income and prior period adjustments to correct under-statements of prior years’ net income. Deductions
2
3
consist of net loss, prior period adjustments to correct overstatements of prior years’ net income, cash and stock dividends, and some disposals of treasury stock.
A comprehensive stockholders’ equity section includes all stockholders’ equity accounts. It consists of two sections: paid-in capital and retained earnings. It should also include notes to the fi nancial state-ments that explain any restrictions on retained earn-ings and any dividends in arrears. One measure of profi tability is the return on common stockholders’equity. It is calculated by dividing net income minus preferred stock dividends by average common stock-holders’ equity.
Describe the form and content of corporation income statements. The form and content of corporation income statements are similar to the statements of proprietorships and partnerships with one exception: Corporations must report income taxes or income tax expense in a separate section before net income in the income statement.
Companies compute earnings per share by divid-ing net income by the weighted-average number of common shares outstanding during the period. When preferred stock dividends exist, they must be deducted from net income in order to calculate EPS.
4
LEARNING OBJECTIVES REVIEW
1
REVIEW AND PRACTICE

Practice Multiple-Choice Questions 627
Cash dividend A pro rata distribution of cash to stock-holders. (p. 610).
Cumulative dividend A feature of preferred stock enti-tling the stockholder to receive current-year and any unpaid prior-year dividends before common stockhold-ers are paid dividends. (p. 612).
Declaration date The date the board of directors for-mally declares (authorizes) a dividend and announces it to stockholders. (p. 611).
Defi cit A debit balance in retained earnings. (p. 619).Dividend A corporation’s distribution of cash or stock
to its stockholders on a pro rata (proportional) basis. (p. 610).
Earnings per share The net income earned by each share of outstanding common stock. (p. 624).
Liquidating dividend A dividend declared out of paid-in capital. (p. 610).
Payment date The date dividends are transferred to stockholders. (p. 611).
Prior period adjustment The correction of an error in previously issued fi nancial statements. (p. 620).
Record date The date when ownership of outstanding shares is determined for dividend purposes. (p. 611).
Retained earnings Net income that a company retains in the business. (p. 619).
Retained earnings restrictions Circumstances that make a portion of retained earnings currently unavail-able for dividends. (p. 620).
Retained earnings statement A fi nancial statement that shows the changes in retained earnings during the year. (p. 621).
Return on common stockholders’ equity A measure of profi tability that shows how many dollars of net income were earned for each dollar invested by the owners; computed as net income minus preferred divi-dends divided by average common stockholders’ equity. (p. 622).
Stock dividend A pro rata distribution to stockholders of the corporation’s own stock. (p. 615).
Stockholders’ equity statement A statement that shows the changes in each stockholders’ equity account and in total stockholders’ equity during the year. (p. 622).
Stock split The issuance of additional shares of stock to stockholders according to their percentage ownership. It is accompanied by a reduction in the par or stated value per share. (p. 617).
GLOSSARY REVIEW
1. Entries for cash dividends are required on the:(a) declaration date and the payment date.(b) record date and the payment date.(c) declaration date, record date, and payment date.(d) declaration date and the record date.
2. Preferred stock may have priority over common stock except in:(a) dividends.(b) assets in the event of liquidation.(c) cumulative dividend features.(d) voting.
3. Encore Inc. declared an $80,000 cash dividend. It cur-rently has 3,000 shares of 7%, $100 par value cumula-tive preferred stock outstanding. It is one year in arrears on its preferred stock. How much cash will Encore distribute to the common stockholders?(a) $38,000. (c) $59,000.(b) $42,000. (d) None.
4. Which of the following statements about small stock dividends is true?(a) A debit to Retained Earnings for the par value of
the shares issued should be made.(b) A small stock dividend decreases total stock-
holders’ equity.(c) Market price per share should be assigned to the
dividend shares.(d) A small stock dividend ordinarily will have an
effect on par value per share of stock.
(LO 1)
(LO 1)
(LO 1)
(LO 2)
5. Which of the following statements about a 3-for-1 stock split is true?(a) It will triple the market price of the stock.(b) It will triple the amount of total stockholders’
equity.(c) It will have no effect on total stockholders’ equity.(d) It requires the company to distribute cash.
6. Raptor Inc. has retained earnings of $500,000 and total stockholders’ equity of $2,000,000. It has 100,000 shares of $8 par value common stock outstanding, which is currently selling for $30 per share. If Raptor declares a 10% stock dividend on its common stock:(a) net income will decrease by $80,000.(b) retained earnings will decrease by $80,000 and
total stockholders’ equity will increase by $80,000.(c) retained earnings will decrease by $300,000
and total stockholders’ equity will increase by $300,000.
(d) retained earnings will decrease by $300,000 and total paid-in capital will increase by $300,000.
7. Which of the following can cause a restriction in retained earnings?(a) State laws regarding treasury stock.(b) Long-term debt contract terms.(c) Authorizations by the board of directors in light
of planned expansion of corporate facilities.(d) All of these answer choices are correct.
(LO 2)
(LO 2)
(LO 3)
PRACTICE MULTIPLE-CHOICE QUESTIONS

628 14 Corporations: Dividends, Retained Earnings, and Income Reporting
8. All but one of the following is reported in a retained earnings statement. The exception is:(a) cash and stock dividends.(b) net income and net loss.(c) sales revenue.(d) prior period adjustments.
9. A prior period adjustment is:(a) reported in the income statement as a nontypical
item.(b) a correction of an error that is recorded directly
to retained earnings.(c) reported directly in the stockholders’ equity
section.(d) reported in the retained earnings statement as an
adjustment of the ending balance of retained earnings.
10. In the stockholders’ equity section, Common Stock Dividends Distributable is reported as a(n):(a) deduction from total paid-in capital and retained
earnings.(b) addition to additional paid-in capital.(c) deduction from retained earnings.(d) addition to capital stock.
11. The return on common stockholders’ equity is de-fi ned as:(a) net income divided by total assets.(b) cash dividends divided by average common stock-
holders’ equity.(c) income available to common stockholders divided
by average common stockholders’ equity.(d) None of these is correct.
12. Katie Inc. reported net income of $186,000 during 2017 and paid dividends of $26,000 on common stock. It also has 10,000 shares of 6%, $100 par value, noncumulative preferred stock outstanding and paid
(LO 3)
(LO 3)
(LO 3)
(LO 3)
(LO 3)
dividends of $60,000 on preferred stock. Common stockholders’ equity was $1,200,000 on January 1, 2017, and $1,600,000 on December 31, 2017. The company’s return on common stockholders’ equity for 2017 is:(a) 10.0%. (c) 7.1%.(b) 9.0%. (d) 13.3%.
13. During 2017, Talon Inc. had sales revenue $376,000, gross profi t $176,000, operating expenses $66,000, cash dividends $30,000, other expenses and losses $20,000. Its corporate tax rate is 30%. What was Talon’s income tax expense for the year?(a) $18,000. (c) $112,800.(b) $52,800. (d) $27,000.
14. Corporation income statements may be the same as the income statements for unincorporated companies except for:(a) gross profi t. (c) operating income.(b) income tax expense. (d) net sales.
15. If everything else is held constant, earnings per share is increased by:(a) the payment of a cash dividend to common share-
holders.(b) the payment of a cash dividend to preferred share-
holders.(c) the issuance of new shares of common stock.(d) the purchase of treasury stock.
16. The income statement for Nadeen, Inc. shows income before income taxes $700,000, income tax expense $210,000, and net income $490,000. If Nadeen has 100,000 shares of common stock outstanding through-out the year, earnings per share is:(a) $7.00. (c) $2.10.(b) $4.90. (d) No correct answer is given.
(LO 4)
(LO 4)
(LO 4)
(LO 4)
Solutions
1. (a) Entries are required for dividends on the declaration date and the payment date, but not the record date. The other choices are therefore incorrect.
2. (d) Preferred stock usually does not have voting rights and therefore does not have priority over common stock on this issue. The other choices are true statements.
3. (a) The preferred stockholders will receive a total of $42,000 in dividends (3,000 3 .07 3 $100 3 2 years). The common stock-holders will receive $38,000 ($80,000 2 $42,000), not (b) $42,000, (c) $59,000, or (d) none.
4. (c) Because the stock dividend is considered small, the fair value (market price), not the par value, is assigned to the shares. The other choices are incorrect because (a) a debit to Retained Earnings for the fair value of the shares issued should be made; (b) a small stock dividend changes the composition of total stockholders’ equity, but does not change the total; and (d) a small stock dividend will have no effect on par value per share.
5. (c) Stock splits have no effect on total paid-in capital, retained earnings, or total stockholders’ equity. The other choices are incorrect because (a) stock splits reduce the market price per share of stock, (b) stock splits have no effect on total stockholders’ equity, and (d) the company will distribute additional shares of stock, not cash.
6. (d) Retained earnings will decrease by $300,000 and total paid-in capital will increase by $300,000. The other choices are there-fore incorrect because (a) net income is not affected, (b) retained earnings decreases by $300,000, and (c) total stockholders’ equity does not change.
7. (d) All of the answer choices are correct. Although choices (a), (b), and (c) are true statements, choice (d) is the better answer.
8. (c) Sales revenue is not reported on the retained earnings statement. The other choices are true statements.
9. (b) A prior period adjustment is a correction of an error that is recorded directly to retained earnings. The other choices are incorrect because a prior period adjustment is reported in the retained earnings statement, not in the (a) income statement or (c) stockholders’ equity section of the balance sheet. Choice (d) is incorrect because the prior period adjustment is an adjustment of the beginning, not the ending, balance of retained earnings.
10. (d) Common Stock Dividends Distributable is reported as an addition to capital stock, not (a) as a deduction from total paid-in capital and retained earnings, (b) as an addition to additional paid-in capital, or (c) as a deduction from retained earnings.

Practice Exercises 629
11. (c) Return on common stockholders’ equity equals Net income less Preferred dividends (income available to common stock-holders) divided by Average common stockholders’ equity. The other choices are therefore incorrect.
12. (b) Return on common stockholders’ equity is Net income available to common stockholders divided by Average common stock-holders’ equity. Net income available to common stockholders is Net income less Preferred dividends 5 $126,000 [$186,000 2 (10,000 3 .06 3 $100)]. The company’s return on common stockholders’ equity for the year is therefore 9.0% [$126,000/ ($1,200,000 1 $l,600,000)/2)], not (a) 10.0%, (c) 7.1%, or (d) 13.3%.
13. (d) Income before income taxes 5 Gross profi t ($176,000) 2 Operating expenses ($66,000) 2 Other expenses and losses ($20,000) 5 $90,000. Talon’s income tax expense therefore 5 $27,000 ($90,000 3 .30), not (a) $18,000, (b) $52,800, or (c) $112,800.
14. (b) Corporation income statements report income tax expense but income statements for unincorporated fi rms do not. The other choices are true statements.
15. (d) Earnings per share is increased by the purchase of treasury stock because the denominator (the weighted-average common shares outstanding) would decrease with this transaction. The other choices are incorrect because (a) earnings per share is unchanged by the payment of a cash dividend to common shareholders; (b) earnings per share is decreased, not increased, by the payment of a cash dividend to preferred shareholders; and (c) earnings per share is decreased by the issuance of new shares of common stock.
16. (b) Earnings per share equals Net income ($700,000 2 $210,000) less Preferred dividends ($0) divided by Weighted-average common shares outstanding (100,000) 5 $4.90 per share. The other choices are therefore incorrect.
1. At December 31, 2017, Lebron Company distributes $50,000 of cash dividends. Its out-standing common stock has a par value of $400,000, and its 6% preferred stock has a par value of $100,000 at December 31, 2017.
Instructions(a) Show the allocation of dividends to each class of stock, assuming that the preferred
stock dividend is 6% and not cumulative.
(b) Show the allocation of the dividends to each class of stock, assuming the preferred stock dividend of 6% is cumulative and Lebron Company did not pay any dividends on the preferred stock in the preceding 2 years.
(c) Journalize the declaration of the cash dividend at December 31, 2017, assuming the requirements in part (b).
Allocate cash dividends to preferred and common stock.
(LO 1)
PRACTICE EXERCISES
2. On January 1, Michelle Corporation had 95,000 shares of no-par common stock issued and outstanding. The stock has a stated value of $5 per share. During the year, the follow-ing occurred.
Apr. 1 Issued 55,000 additional shares of common stock for $17 per share.June 15 Declared a cash dividend of $1 per share to stockholders of record on June 30.July 10 Paid the $1 cash dividend.Dec. 1 Issued 2,000 additional shares of common stock for $19 per share. 15 Declared a cash dividend on outstanding shares of $1.20 per share to
stockholders of record on December 31.
Journalize cash dividends; indicate statement presentation.
(LO 1, 3)
1. (a) 2017
Total dividend declaration $50,000 Allocation to preferred stock (6% 3 $100,000) (6,000)
Remainder to common stock $44,000
(b) 2017
Total dividend declaration $50,000 Allocation to preferred stock (6% 3 $100,000 3 3) (18,000)
Remainder to common stock $32,000
(c) Dec. 31 Cash Dividends 50,000 Dividends Payable 50,000
Solution

Instructions(a) Prepare the entries, if any, on each of the three dividend dates.
(b) How are dividends and dividends payable reported in the fi nancial statements pre-pared at December 31?
3. Oswald Company reported retained earnings at December 31, 2016, of $400,000. Oswald had 200,000 shares of common stock outstanding throughout 2017. The following transactions occurred during 2017.
1. An error was discovered; in 2015, insurance expense was recorded at $90,000, but the correct amount was $60,000.
2. A cash dividend of $0.50 per share was declared and paid.
3. A 5% stock dividend was declared and distributed when the market price per share was $18 per share.
4. Net income was $310,000.
InstructionPrepare a retained earnings statement for 2017.
Prepare a retained earnings statement.
(LO 3)
630 14 Corporations: Dividends, Retained Earnings, and Income Reporting
2. (a) June 15 Cash Dividends (150,000 3 $1) 150,000 Dividends Payable 150,000
July 10 Dividends Payable 150,000 Cash 150,000
Dec. 15 Cash Dividends (152,000 3 $1.20) 182,400 Dividends Payable 182,400
(b) In the retained earnings statement, dividends of $332,400 will be deducted. In the balance sheet, Dividends Payable of $182,400 will be reported as a current liability.
Solution
Solution
On January 1, 2017, Hayslett Corporation had the following stockholders’ equity accounts.
Common Stock ($10 par value, 260,000 shares issued and outstanding) $2,600,000Paid-in Capital in Excess of Par—Common Stock 1,500,000Retained Earnings 3,200,000
Prepare dividend entries and stockholders’ equity section.
(LO 1, 2, 3)
PRACTICE PROBLEM
OSWALD COMPANYRetained Earnings Statement
For the Year Ended December 31, 2017
Balance, January 1, as reported $400,000Correction for understatement of 2015 net income 30,000
Balance, January 1, as adjusted 430,000Add: Net income 310,000
740,000Less: Cash dividends $100,000* Stock dividends 180,000** 280,000
Balance, December 31 $460,000
*(200,000 3 $.50/sh); **(200,000 3 .05 3 $18/sh)

During the year, the following transactions occurred.
April 1 Declared a $1.50 cash dividend per share to stockholders of record on April 15, payable May 1.
May 1 Paid the dividend declared in April.June 1 Announced a 2-for-1 stock split. Prior to the split, the market price per share
was $24.Aug. 1 Declared a 10% stock dividend to stockholders of record on August 15, distrib-
utable August 31. On August 1, the market price of the stock was $10 per share.
31 Issued the shares for the stock dividend.Dec. 1 Declared a $1.50 per share dividend to stockholders of record on December 15,
payable January 5, 2018. 31 Determined that net income for the year was $600,000.
Instructions(a) Journalize the transactions and the closing entries for net income, stock dividends,
and cash dividends.
(b) Prepare a stockholders’ equity section at December 31.
Practice Problem 631
(a) Apr. 1 Cash Dividends (260,000 3 $1.50) 390,000 Dividends Payable 390,000
May 1 Dividends Payable 390,000 Cash 390,000
June 1 No journal entry needed for stock split
Aug. 1 Stock Dividends (52,000* 3 $10) 520,000 Common Stock Dividends Distributable (52,000 3 $5) 260,000 Paid-in Capital in Excess of Par—Common Stock (52,000 3 $5) 260,000
*520,000 3 .10
31 Common Stock Dividends Distributable 260,000 Common Stock 260,000
Dec. 1 Cash Dividends (572,000** 3 $1.50) 858,000 Dividends Payable 858,000
**(260,000 3 2) 1 52,000
31 Income Summary 600,000 Retained Earnings 600,000
31 Retained Earnings 1,768,000 Stock Dividends 520,000 Cash Dividends ($390,000 1 $858,000) 1,248,000
(b)
Solution
HAYSLETT CORPORATIONBalance Sheet (Partial)
Stockholders’ equity Paid-in capital Capital stock Common stock, $5 par value, 572,000
shares issued and outstanding $2,860,000 Paid-in capital in excess of par—common stock 1,760,000
Total paid-in capital 4,620,000Retained earnings 2,032,000*
Total stockholders’ equity $6,652,000
*$3,200,000 1 $600,000 2 $390,000 2 $520,000 2 $858,000

Brief Exercises, Exercises, DO IT! Exercises, and Problems and many additional resources are available for practice in WileyPLUS
QUESTIONS
1. (a) What is a dividend? (b) “Dividends must be paid in cash.” Do you agree? Explain.
2. Jan Kimler maintains that adequate cash is the only requirement for the declaration of a cash dividend. Is Jan correct? Explain.
3. (a) Three dates are important in connection with cash dividends. Identify these dates, and explain their signifi cance to the corporation and its stock-holders.
(b) Identify the accounting entries that are made for a cash dividend and the date of each entry.
4. Farley Inc. declares a $55,000 cash dividend on December 31, 2017. The required annual dividend on preferred stock is $10,000. Determine the allocation of the dividend to preferred and common stockholders assuming the preferred stock is cumulative and dividends are 1 year in arrears.
5. Contrast the effects of a cash dividend and a stock dividend on a corporation’s balance sheet.
6. Rich Mordica asks, “Since stock dividends don’t change anything, why declare them?” What is your answer to Rich?
7. Gorton Corporation has 30,000 shares of $10 par value common stock outstanding when it announces a 2-for-1 stock split. Before the split, the stock had a market price of $120 per share. After the split, how many shares of stock will be outstanding? What will be the approximate market price per share?
8. The board of directors is considering either a stock split or a stock dividend. They understand that total stockholders’ equity will remain the same under either action. However, they are not sure of the different
effects of the two types of actions on other aspects of stockholders’ equity. Explain the differences to the directors.
9. What is a prior period adjustment, and how is it reported in the fi nancial statements?
10. NAJ Corporation has a retained earnings balance of $230,000 on January 1. During the year, a prior period adjustment of $50,000 is recorded because of the understatement of depreciation in the prior period. Show the retained earnings statement presentation of these data.
11. What is the purpose of a retained earnings restric-tion? Identify the possible causes of retained earnings restrictions.
12. How are retained earnings restrictions generally reported in the fi nancial statements?
13. Identify the events that result in debits and credits to retained earnings.
14. Rafy Furcal believes that both the beginning and end-ing balances in retained earnings are shown in the stockholders’ equity section. Is Rafy correct? Discuss.
15. Dean Percival, who owns many investments in com-mon stock, says, “I don’t care what a company’s net income is. The stock price tells me everything I need to know!” How do you respond to Dean?
16. What is the unique feature of a corporation income statement? Illustrate this feature, using assumed data.
17. Why must preferred stock dividends be subtracted from net income in computing earnings per share?
18. What were the amounts of basic earnings per share of common stock that Apple reported in the years 2009 to 2013?
BRIEF EXERCISES
BE14-1 Greenwood Corporation has 80,000 shares of common stock outstanding. It declares a $1 per share cash dividend on November 1 to stockholders of record on Decem-ber 1. The dividend is paid on December 31. Prepare the entries on the appropriate dates to record the declaration and payment of the cash dividend.
BE14-2 M. Bot Corporation has 10,000 shares of 8%, $100 par value, cumulative pre-ferred stock outstanding at December 31, 2017. No dividends were declared in 2015 or 2016. If M. Bot wants to pay $375,000 of dividends in 2017, what amount of dividends will common stockholders receive?
BE14-3 Langley Corporation has 50,000 shares of $10 par value common stock outstand-ing. It declares a 15% stock dividend on December 1 when the market price per share is $16. The dividend shares are issued on December 31. Prepare the entries for the declara-tion and issuance of the stock dividend.
BE14-4 The stockholders’ equity section of Pretzer Corporation consists of common stock ($10 par) $2,000,000 and retained earnings $500,000. A 10% stock dividend (20,000 shares)
Prepare entries for a cash dividend.
(LO 1)
Determine dividends paid to common stockholders.
(LO 1)
Prepare entries for a stock dividend.
(LO 2)
Show before-and-after effects of a stock dividend.
(LO 2)
632 14 Corporations: Dividends, Retained Earnings, and Income Reporting

Do It! Exercises 633
is declared when the market price per share is $14. Show the before-and-after effects of the dividend on the following.
(a) The components of stockholders’ equity.(b) Shares outstanding.(c) Par value per share.
BE14-5 For the year ending December 31, 2017, Soto Inc. reports net income $170,000 and dividends $85,000. Prepare the retained earnings statement for the year assuming the balance in retained earnings on January 1, 2017, was $220,000.
BE14-6 The balance in retained earnings on January 1, 2017, for Palmer Inc. was $800,000. During the year, the corporation paid cash dividends of $90,000 and distributed a stock dividend of $8,000. In addition, the company determined that it had understated its insur-ance expense in prior years by $50,000. Net income for 2017 was $120,000. Prepare the retained earnings statement for 2017.
BE14-7 SUPERVALU, one of the largest grocery retailers in the United States, is head-quartered in Minneapolis. Suppose the following fi nancial information (in millions) was taken from the company’s 2017 annual report: net sales $40,597, net income $393, begin-ning common stockholders’ equity $2,581, and ending common stockholders’ equity $2,887. Compute the return on common stockholders’ equity.
BE14-8 Whetzel Corporation reported net income of $152,000, declared dividends on common stock of $50,000, and had an ending balance in retained earnings of $360,000. Common stockholders’ equity was $700,000 at the beginning of the year and $820,000 at the end of the year. Compute the return on common stockholders’ equity.
BE14-9 The following information is available for Reinsch Corporation for the year ended December 31, 2017: cost of goods sold $205,000, sales revenue $350,000, other revenues and gains $50,000, and operating expenses $75,000. Assuming a corporate tax rate of 30%, prepare an income statement for the company.
BE14-10 Ziegler Corporation reports net income of $380,000 and a weighted-average of 200,000 shares of common stock outstanding for the year. Compute the earnings per share of common stock.
BE14-11 Income and common stock data for Ziegler Corporation are presented in BE14-10. Assume also that Ziegler has cumulative preferred stock dividends for the current year of $30,000 that were declared and paid. Compute the earnings per share of common stock.
Prepare a retained earnings statement.
(LO 3)
Prepare a retained earnings statement.
(LO 3)
Calculate the return on common stockholders’ equity.
(LO 3)
Compute the return on common stockholders’ equity.
(LO 3)
Prepare a corporate income statement.
(LO 4)
Compute earnings per share.
(LO 4)
Compute earnings per share with cumulative preferred stock.
(LO 4)
Herr Corporation has 3,000 shares of 7%, $100 par value preferred stock out-standing at December 31, 2017. At December 31, 2017, the company declared a $105,000 cash dividend. Determine the dividend paid to preferred stockholders and common stock-holders under each of the following scenarios.
1. The preferred stock is noncumulative, and the company has not missed any dividends in previous years.
2. The preferred stock is noncumulative, and the company did not pay a dividend in each of the two previous years.
3. The preferred stock is cumulative, and the company did not pay a dividend in each of the two previous years.
Jurgens Company has had 4 years of net income. Due to this success, the market price of its 400,000 shares of $3 par value common stock has increased from $12 per share to $46. During this period, paid-in capital remained the same at $2,800,000. Re-tained earnings increased from $1,800,000 to $12,000,000. President E. Rife is considering either a 15% stock dividend or a 2-for-1 stock split. He asks you to show the before-and-after effects of each option on (a) retained earnings and (b) total stockholders’ equity.
Foley Corporation has retained earnings of $3,100,000 on January 1, 2017. During the year, Foley earned $1,200,000 of net income. It declared and paid a $150,000
Determine dividends paid to preferred and common stockholders.
(LO 1)
Determine effects of stock dividend and stock split.
(LO 2)
Prepare a retained earnings statement.
(LO 3)
DO IT! Exercises
DO IT! 14-1
DO IT! 14-2
DO IT! 14-3

cash dividend. In 2017, Foley recorded an adjustment of $110,000 due to the overstate-ment (from mathematical error) of 2016 depreciation expense. Prepare a retained earn-ings statement for 2017.
On January 1, 2017, Vahsholtz Corporation purchased 5,000 shares of trea-sury stock. Other information regarding Vahsholtz Corporation is provided as follows.
2016 2017
Net income $100,000 $110,000Dividends on preferred stock $30,000 $30,000Dividends on common stock $20,000 $25,000Weighted-average number of common shares outstanding 50,000 45,000Common stockholders’ equity beginning of year $600,000 $750,000Common stockholders’ equity end of year $750,000 $830,000
Compute (a) return on common stockholders’ equity for each year and (b) earnings per share for each year, and (c) discuss the changes in each.
Compute return on stockholders’ equity and EPS and discuss changes in each.
(LO 4)
634 14 Corporations: Dividends, Retained Earnings, and Income Reporting
DO IT! 14-4
EXERCISES
E14-1 On January 1, Guillen Corporation had 95,000 shares of no-par common stock issued and outstanding. The stock has a stated value of $5 per share. During the year, the following occurred.
Apr. 1 Issued 25,000 additional shares of common stock for $17 per share.June 15 Declared a cash dividend of $1 per share to stockholders of record on June 30.July 10 Paid the $1 cash dividend.Dec. 1 Issued 2,000 additional shares of common stock for $19 per share. 15 Declared a cash dividend on outstanding shares of $1.20 per share to
stockholders of record on December 31.
Instructions(a) Prepare the entries to record these transactions.(b) How are dividends and dividends payable reported in the fi nancial statements pre-
pared at December 31?
E14-2 Knudsen Corporation was organized on January 1, 2016. During its fi rst year, the corporation issued 2,000 shares of $50 par value preferred stock and 100,000 shares of $10 par value common stock. At December 31, the company declared the following cash divi-dends: 2016, $5,000; 2017, $12,000; and 2018, $28,000.
Instructions(a) Show the allocation of dividends to each class of stock, assuming the preferred stock
dividend is 6% and noncumulative.(b) Show the allocation of dividends to each class of stock, assuming the preferred stock
dividend is 7% and cumulative.(c) Journalize the declaration of the cash dividend at December 31, 2018, under part (b).
E14-3 On January 1, 2017, Frontier Corporation had $1,000,000 of common stock out-standing that was issued at par. It also had retained earnings of $750,000. The company issued 40,000 shares of common stock at par on July 1 and earned net income of $400,000 for the year.
InstructionsJournalize the declaration of a 15% stock dividend on December 10, 2017, for the follow-ing independent assumptions.
(a) Par value is $10, and market price is $18.(b) Par value is $5, and market price is $20.
E14-4 On October 31, the stockholders’ equity section of Heins Company consists of common stock $500,000 and retained earnings $900,000. Heins is considering the following two courses of action: (1) declaring a 5% stock dividend on the 50,000, $10 par value shares outstanding, or (2) effecting a 2-for-1 stock split that will reduce par value to $5 per share. The current market price is $14 per share.
Journalize cash dividends; indicate statement presentation.
(LO 1)
Allocate cash dividends to preferred and common stock.
(LO 1)
Journalize stock dividends.
(LO 2)
Compare effects of a stock dividend and a stock split.
(LO 2)

Exercises 635
InstructionsPrepare a tabular summary of the effects of the alternative actions on the components of stockholders’ equity, outstanding shares, and par value per share. Use the following column headings: Before Action, After Stock Dividend, and After Stock Split.
E14-5 On October 1, Little Bobby Corporation’s stockholders’ equity is as follows.
Common stock, $5 par value $400,000Paid-in capital in excess of par—common stock 25,000Retained earnings 155,000
Total stockholders’ equity $580,000
On October 1, Little Bobby declares and distributes a 10% stock dividend when the market price of the stock is $15 per share.
Instructions(a) Compute the par value per share (1) before the stock dividend and (2) after the stock
dividend.(b) Indicate the balances in the three stockholders’ equity accounts after the stock dividend
shares have been distributed.
E14-6 During 2017, Roblez Corporation had the following transactions and events.
1. Declared a cash dividend.2. Issued par value common stock for cash at par value.3. Completed a 2-for-1 stock split in which $10 par value stock was changed to $5 par
value stock.4. Declared a small stock dividend when the market price was higher than par value.5. Made a prior period adjustment for overstatement of net income.6. Issued the shares of common stock required by the stock dividend declaration in item
no. 4 above.7. Paid the cash dividend in item no. 1 above.8. Issued par value common stock for cash above par value.
InstructionsIndicate the effect(s) of each of the foregoing items on the subdivisions of stockholders’ equity. Present your answer in tabular form with the following columns. Use (I) for increase, (D) for decrease, and (NE) for no effect. Item no. 1 is given as an example.
Paid-in Capital
Capital Retained Item Stock Additional Earnings
1 NE NE D
E14-7 Before preparing fi nancial statements for the current year, the chief accountant for Toso Company discovered the following errors in the accounts.
1. The declaration and payment of $50,000 cash dividend was recorded as a debit to Interest Expense $50,000 and a credit to Cash $50,000.
2. A 10% stock dividend (1,000 shares) was declared on the $10 par value stock when the market price per share was $18. The only entry made was Stock Dividends (Dr.) $10,000 and Dividend Payable (Cr.) $10,000. The shares have not been issued.
3. A 4-for-1 stock split involving the issue of 400,000 shares of $5 par value common stock for 100,000 shares of $20 par value common stock was recorded as a debit to Retained Earnings $2,000,000 and a credit to Common Stock $2,000,000.
InstructionsPrepare the correcting entries at December 31.
E14-8 On January 1, 2017, Eddy Corporation had retained earnings of $650,000. During the year, Eddy had the following selected transactions.
1. Declared cash dividends $120,000.2. Corrected overstatement of 2016 net income because of inventory error $40,000.3. Earned net income $350,000.4. Declared stock dividends $90,000.
InstructionsPrepare a retained earnings statement for the year.
Indicate account balances after a stock dividend.
(LO 2)
Indicate the effects on stockholders’ equity components.
(LO 1, 2, 3)
Prepare correcting entries for dividends and a stock split.
(LO 2)
Prepare a retained earnings statement.
(LO 3)

636 14 Corporations: Dividends, Retained Earnings, and Income Reporting
E14-9 Newland Company reported retained earnings at December 31, 2016, of $310,000. Newland had 200,000 shares of common stock outstanding at the beginning of 2017.
The following transactions occurred during 2017.
1. An error was discovered. In 2015, depreciation expense was recorded at $70,000, but the correct amount was $50,000.
2. A cash dividend of $0.50 per share was declared and paid.3. A 5% stock dividend was declared and distributed when the market price per share was
$15 per share.4. Net income was $285,000.
InstructionsPrepare a retained earnings statement for 2017.
E14-10 Dirk Company reported the following balances at December 31, 2016: common stock $500,000, paid-in capital in excess of par value—common stock $100,000, and retained earnings $250,000. During 2017, the following transactions affected stockholders’ equity.
1. Issued preferred stock with a par value of $125,000 for $200,000.2. Purchased treasury stock (common) for $40,000.3. Earned net income of $180,000.4. Declared and paid cash dividends of $56,000.
InstructionsPrepare the stockholders’ equity section of Dirk Company’s December 31, 2017, balance sheet.
E14-11 The following accounts appear in the ledger of Horner Inc. after the books are closed at December 31.
Common Stock, no par, $1 stated value, 400,000 shares authorized; 300,000 shares issued $ 300,000Common Stock Dividends Distributable 30,000Paid-in Capital in Excess of Stated Value—Common Stock 1,200,000Preferred Stock, $5 par value, 8%, 40,000 shares authorized; 30,000 shares issued 150,000Retained Earnings 800,000Treasury Stock (10,000 common shares) 74,000Paid-in Capital in Excess of Par—Preferred Stock 344,000
InstructionsPrepare the stockholders’ equity section at December 31, assuming retained earnings is restricted for plant expansion in the amount of $100,000.
E14-12 The following information is available for Norman Corporation for the year ended December 31, 2017: sales revenue $700,000, other revenues and gains $92,000, operating expenses $110,000, cost of goods sold $465,000, other expenses and losses $32,000, and preferred stock dividends $30,000. The company’s tax rate was 30%, and it had 50,000 shares outstanding during the entire year.
Instructions(a) Prepare a corporate income statement.(b) Calculate earnings per share.
E14-13 In 2017, Pennington Corporation had net sales of $600,000 and cost of goods sold of $360,000. Operating expenses were $153,000, and interest expense was $7,500. The corporation’s tax rate is 30%. The corporation declared preferred dividends of $15,000 in 2017, and its average common stockholders’ equity during the year was $200,000.
Instructions(a) Prepare an income statement for Pennington Corporation.(b) Compute Pennington Corporation’s return on common stockholders’ equity for 2017.
E14-14 Ringgold Corporation has outstanding at December 31, 2017, 50,000 shares of $20 par value, cumulative, 6% preferred stock and 200,000 shares of $5 par value common stock. All shares were outstanding the entire year. During 2017, Ringgold earned total revenues of $2,000,000 and incurred total expenses (except income taxes) of $1,300,000. Ringgold’s income tax rate is 30%.
Prepare a retained earnings statement.
(LO 3)
Prepare a stockholders’ equity section.
(LO 3)
Prepare a stockholders’ equity section.
(LO 3)
Prepare an income statement and compute earnings per share.
(LO 4)
Prepare an income statement and compute return on equity.
(LO 3, 4)
Compute EPS.
(LO 4)

Problems: Set A 637
InstructionsCompute Ringgold’s 2017 earnings per share.
E14-15 The following fi nancial information is available for Plummer Corporation.
2017 2016
Average common stockholders’ equity $1,200,000 $900,000Dividends paid to common stockholders 50,000 30,000Dividends paid to preferred stockholders 20,000 20,000Net income 290,000 200,000Market price of common stock 20 15
The weighted-average number of shares of common stock outstanding was 80,000 for 2016 and 100,000 for 2017.
InstructionsCalculate earnings per share and return on common stockholders’ equity for 2017 and 2016.
E14-16 This fi nancial information is available for Klinger Corporation.
2017 2016
Average common stockholders’ equity $1,800,000 $1,900,000Dividends paid to common stockholders 90,000 70,000Dividends paid to preferred stockholders 20,000 20,000Net income 200,000 191,000Market price of common stock 20 25
The weighted-average number of shares of common stock outstanding was 180,000 for 2016 and 150,000 for 2017.
InstructionsCalculate earnings per share and return on common stockholders’ equity for 2017 and 2016.
E14-17 At December 31, 2017, Millwood Corporation has 2,000 shares of $100 par value, 8%, preferred stock outstanding and 100,000 shares of $10 par value common stock issued. Millwood’s net income for the year is $241,000.
InstructionsCompute the earnings per share of common stock under the following independent situa-tions. (Round to two decimals.)
(a) The dividend to preferred stockholders was declared. There has been no change in the number of shares of common stock outstanding during the year.
(b) The dividend to preferred stockholders was not declared. The preferred stock is cumu-lative. Millwood held 10,000 shares of common treasury stock throughout the year.
Calculate ratios to evaluate earnings performance.
(LO 3, 4)
Calculate ratios to evaluate earnings performance.
(LO 3, 4)
Compute earnings per share under different assumptions.
(LO 4)
EXERCISES: SET B AND CHALLENGE EXERCISES
Visit the book’s companion website, at www.wiley.com/college/weygandt, and choose the Student Companion site to access Exercises: Set B and Challenge Exercises.
PROBLEMS: SET A
P14-1A On January 1, 2017, Geffrey Corporation had the following stockholders’ equity accounts.
Common Stock ($20 par value, 60,000 shares issued and outstanding) $1,200,000Paid-in Capital in Excess of Par—Common Stock 200,000Retained Earnings 600,000
Prepare dividend entries and stockholders’ equity section.
(LO 1, 2, 3)

638 14 Corporations: Dividends, Retained Earnings, and Income Reporting
During the year, the following transactions occurred.
Feb. 1 Declared a $1 cash dividend per share to stockholders of record on February 15, payable March 1.
Mar. 1 Paid the dividend declared in February.Apr. 1 Announced a 2-for-1 stock split. Prior to the split, the market price per share
was $36.July 1 Declared a 10% stock dividend to stockholders of record on July 15,
distributable July 31. On July 1, the market price of the stock was $13 per share.
31 Issued the shares for the stock dividend.Dec. 1 Declared a $0.50 per share dividend to stockholders of record on December 15,
payable January 5, 2018. 31 Determined that net income for the year was $350,000.
Instructions(a) Journalize the transactions and the closing entries for net income and dividends.(b) Enter the beginning balances, and post the entries to the stockholders’ equity accounts.
(Note: Open additional stockholders’ equity accounts as needed.)(c) Prepare a stockholders’ equity section at December 31.
P14-2A The stockholders’ equity accounts of Karp Company at January 1, 2017, are as follows.
Preferred Stock, 6%, $50 par $600,000Common Stock, $5 par 800,000Paid-in Capital in Excess of Par—Preferred Stock 200,000Paid-in Capital in Excess of Par—Common Stock 300,000Retained Earnings 800,000
There were no dividends in arrears on preferred stock. During 2017, the company had the following transactions and events.
July 1 Declared a $0.60 cash dividend per share on common stock.Aug. 1 Discovered $25,000 understatement of depreciation expense in 2016. (Ignore
income taxes.)Sept. 1 Paid the cash dividend declared on July 1.Dec. 1 Declared a 15% stock dividend on common stock when the market price of the
stock was $18 per share. 15 Declared a 6% cash dividend on preferred stock payable January 15, 2018. 31 Determined that net income for the year was $355,000. 31 Recognized a $200,000 restriction of retained earnings for plant expansion.
Instructions(a) Journalize the transactions, events, and closing entries for net income and dividends.(b) Enter the beginning balances in the accounts, and post to the stockholders’ equity
accounts. (Note: Open additional stockholders’ equity accounts as needed.)(c) Prepare a retained earnings statement for the year.(d) Prepare a stockholders’ equity section at December 31, 2017.
P14-3A The post-closing trial balance of Storey Corporation at December 31, 2017, con-tains the following stockholders’ equity accounts.
Preferred Stock (15,000 shares issued) $ 750,000Common Stock (250,000 shares issued) 2,500,000Paid-in Capital in Excess of Par—Preferred Stock 250,000Paid-in Capital in Excess of Par—Common Stock 400,000Common Stock Dividends Distributable 250,000Retained Earnings 1,042,000
A review of the accounting records reveals the following.
1. No errors have been made in recording 2017 transactions or in preparing the closing entry for net income.
2. Preferred stock is $50 par, 6%, and cumulative; 15,000 shares have been outstanding since January 1, 2016.
3. Authorized stock is 20,000 shares of preferred, 500,000 shares of common with a $10 par value.
(c) Total stockholders’ equity $2,224,000
Journalize and post transactions; prepare retained earnings statement and stockholders’ equity section.
(LO 1, 2, 3)
(c) Ending balance $566,000(d) Total stockholders’ equity
$2,898,000
Prepare retained earnings statement and stockholders’ equity section, and compute allocation of dividends and earnings per share.
(LO 1, 2, 3, 4)
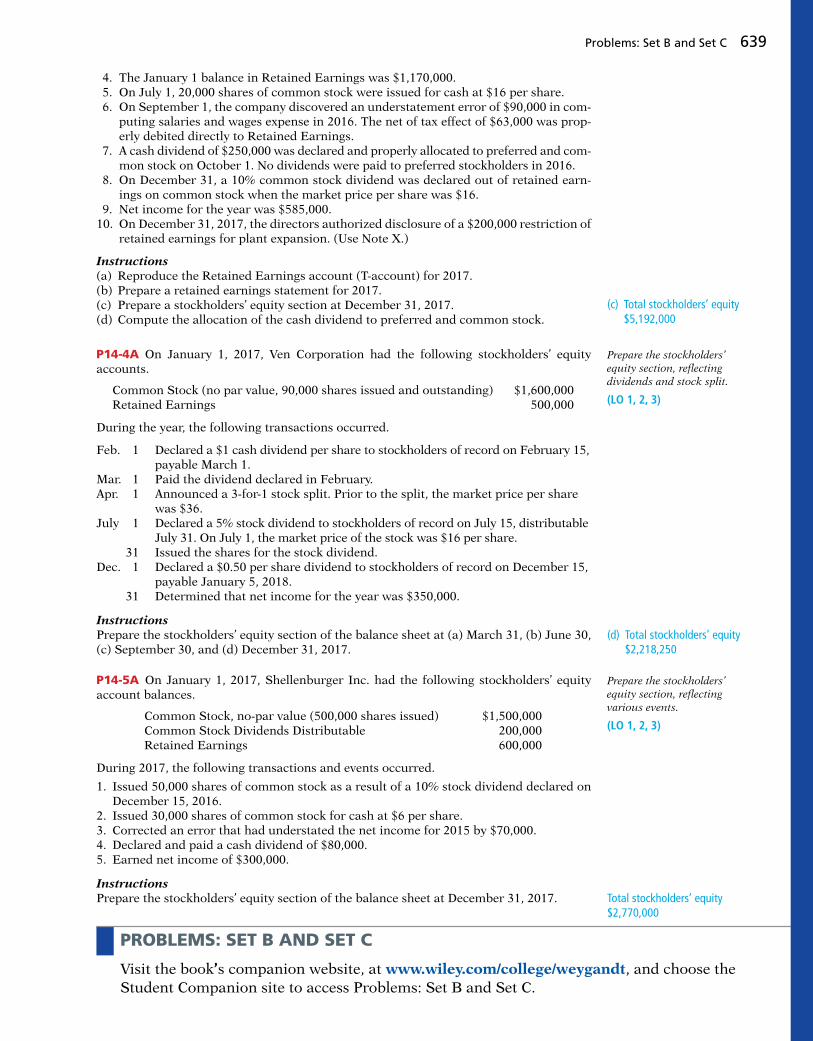
Problems: Set B and Set C 639
4. The January 1 balance in Retained Earnings was $1,170,000. 5. On July 1, 20,000 shares of common stock were issued for cash at $16 per share. 6. On September 1, the company discovered an understatement error of $90,000 in com-
puting salaries and wages expense in 2016. The net of tax effect of $63,000 was prop-erly debited directly to Retained Earnings.
7. A cash dividend of $250,000 was declared and properly allocated to preferred and com-mon stock on October 1. No dividends were paid to preferred stockholders in 2016.
8. On December 31, a 10% common stock dividend was declared out of retained earn-ings on common stock when the market price per share was $16.
9. Net income for the year was $585,000.10. On December 31, 2017, the directors authorized disclosure of a $200,000 restriction of
retained earnings for plant expansion. (Use Note X.)
Instructions(a) Reproduce the Retained Earnings account (T-account) for 2017.(b) Prepare a retained earnings statement for 2017.(c) Prepare a stockholders’ equity section at December 31, 2017.(d) Compute the allocation of the cash dividend to preferred and common stock.
P14-4A On January 1, 2017, Ven Corporation had the following stockholders’ equity accounts.
Common Stock (no par value, 90,000 shares issued and outstanding) $1,600,000Retained Earnings 500,000
During the year, the following transactions occurred.
Feb. 1 Declared a $1 cash dividend per share to stockholders of record on February 15, payable March 1.
Mar. 1 Paid the dividend declared in February.Apr. 1 Announced a 3-for-1 stock split. Prior to the split, the market price per share
was $36.July 1 Declared a 5% stock dividend to stockholders of record on July 15, distributable
July 31. On July 1, the market price of the stock was $16 per share. 31 Issued the shares for the stock dividend.Dec. 1 Declared a $0.50 per share dividend to stockholders of record on December 15,
payable January 5, 2018. 31 Determined that net income for the year was $350,000.
InstructionsPrepare the stockholders’ equity section of the balance sheet at (a) March 31, (b) June 30, (c) September 30, and (d) December 31, 2017.
P14-5A On January 1, 2017, Shellenburger Inc. had the following stockholders’ equity account balances.
Common Stock, no-par value (500,000 shares issued) $1,500,000Common Stock Dividends Distributable 200,000Retained Earnings 600,000
During 2017, the following transactions and events occurred.
1. Issued 50,000 shares of common stock as a result of a 10% stock dividend declared on December 15, 2016.
2. Issued 30,000 shares of common stock for cash at $6 per share.3. Corrected an error that had understated the net income for 2015 by $70,000.4. Declared and paid a cash dividend of $80,000.5. Earned net income of $300,000.
InstructionsPrepare the stockholders’ equity section of the balance sheet at December 31, 2017.
(c) Total stockholders’ equity $5,192,000
Prepare the stockholders’ equity section, refl ecting dividends and stock split.
(LO 1, 2, 3)
(d) Total stockholders’ equity $2,218,250
Prepare the stockholders’ equity section, refl ecting various events.
(LO 1, 2, 3)
Total stockholders’ equity $2,770,000
PROBLEMS: SET B AND SET C
Visit the book’s companion website, at www.wiley.com/college/weygandt, and choose the Student Companion site to access Problems: Set B and Set C.

640 14 Corporations: Dividends, Retained Earnings, and Income Reporting
CONTINUING PROBLEM
COOKIE CREATIONS: AN ENTREPRENEURIAL JOURNEY(Note: This is a continuation of the Cookie Creations problem from Chapters 1 through 13.)
CC14 After establishing their company’s fi scal year-end to be October 31, Natalie and Curtis began operating Cookie & Coffee Creations Inc. on November 1, 2017. On that date, they issued both pre-ferred and common stock. After the fi rst year of operations, Natalie and Curtis want to prepare fi nan-cial information for the year.
Go to the book’s companion website, www.wiley.com/college/weygandt, to see the completion of this problem.
PERSPECTIVEFINANCIAL REPORTING AND ANALYSIS
Financial Reporting Problem: Apple Inc.BYP14-1 The fi nancial statements of Apple Inc. are presented in Appendix A. Instructions for access-ing and using the company’s complete annual report, including the notes to the fi nancial statements, are also provided in Appendix A.
InstructionsRefer to Apple’s fi nancial statements and answer the following question.What amount, if any, did Apple declare in dividends on common stock in the year ended September 28, 2013?
Comparative Analysis Problem: PepsiCo, Inc. vs. The Coca-Cola CompanyBYP14-2 PepsiCo’s fi nancial statements are presented in Appendix B. Financial statements of The Coca-Cola Company are presented in Appendix C. Instructions for accessing and using the complete annual reports of PepsiCo and Coca-Cola, including the notes to the fi nancial statements, are also provided in Appendices B and C, respectively.
Instructions(a) Compute earnings per share and return on common stockholders’ equity for both companies for
2013. Assume PepsiCo’s weighted-average shares were 1,541 million and Coca-Cola’s weighted-average shares were 4,568 million. Can these measures be used to compare the profi tability of the two companies? Why or why not?
(b) What was the total amount of dividends paid by each company in 2013?
Comparative Analysis Problem: Amazon.com, Inc. vs. Wal-Mart Stores, Inc.BYP14-3 Amazon.com, Inc.’s fi nancial statements are presented in Appendix D. Financial statements of Wal-Mart Stores, Inc. are presented in Appendix E. Instructions for accessing and using the com-plete annual reports of Amazon and Wal-Mart, including the notes to the fi nancial statements, are also provided in Appendices D and E, respectively.
Instructions(a) What are the basic earnings per share for both Amazon and Wal-Mart as of December 31, 2013,
and January 31, 2014, respectively?(b) What was the total amount of dividends, if any, paid by Amazon for the year ending December 31,
2013? What was the total dividends paid by Wal-Mart for the year ending January 31, 2014?
Real-World FocusBYP14-4 Use the stockholders’ equity section of an annual report and identify the major components.
Address: www.annualreports.com, or go to www.wiley.com/college/weygandt
BROADENING YOUR
© leungchopan/Shutterstock

Steps1. From the Annual Reports Homepage, choose Search by Alphabet, and choose a letter.2. Select a particular company.3. Choose Annual Report.4. Follow instructions below.
InstructionsAnswer the following questions.
(a) What is the company’s name?(b) What classes of capital stock has the company issued?(c) For each class of stock:
(1) How many shares are authorized, issued, and/or outstanding?(2) What is the par value?
(d) What are the company’s retained earnings?(e) Has the company acquired treasury stock? How many shares?
CRITICAL THINKING
Decision-Making Across the OrganizationBYP14-5 The stockholders’ equity accounts of Gonzalez, Inc., at January 1, 2017, are as follows.
Preferred Stock, no par, 4,000 shares issued $400,000Common Stock, no par, 140,000 shares issued 700,000Retained Earnings 550,000
During 2017, the company had the following transactions and events.
July 1 Declared a $0.50 cash dividend per share on common stock.Aug. 1 Discovered a $72,000 overstatement of 2016 depreciation expense. (Ignore income taxes.)Sept. 1 Paid the cash dividend declared on July 1.Dec. 1 Declared a 10% stock dividend on common stock when the market price of the stock
was $12 per share. 15 Declared a $6 per share cash dividend on preferred stock, payable January 31, 2018. 31 Determined that net income for the year was $320,000.
InstructionsWith the class divided into groups, answer the following questions.
(a) Prepare a retained earnings statement for the year. There are no preferred dividends in arrears.(b) Discuss why the overstatement of 2016 depreciation expense is not treated as an adjustment of the
current year’s income.(c) Discuss the reasons why a company might decide to issue a stock dividend rather than a cash
dividend.
Communication ActivityBYP14-6 In the past year, Gosser Corporation declared a 10% stock dividend, and Jenks, Inc. announced a 2-for-1 stock split. Your parents own 100 shares of each company’s $50 par value com-mon stock. During a recent phone call, your parents ask you, as an accounting student, to explain the differences between the two events.
InstructionsWrite a letter to your parents that explains the effects of the two events on them as stockholders and the effects of each event on the fi nancial statements of each corporation.
Ethics CaseBYP14-7 Molina Corporation has paid 60 consecutive quarterly cash dividends (15 years). The last 6 months, however, have been a cash drain on the company, as profi t margins have been greatly narrowed by increasing competition. With a cash balance suffi cient to meet only day-to-day operating needs, the president, Rob Lowery, has decided that a stock dividend instead of a cash dividend should be declared. He tells Molina’s fi nancial vice president, Debbie Oler, to issue a press release stating that the company is extending its consecutive dividend record with the issuance of a 5% stock dividend. “Write the press release convincing the stockholders that the stock dividend is just as good as a cash dividend,” he orders. “Just watch our stock rise when we announce the stock dividend. It must be a good thing if that happens.”
Broadening Your Perspective 641

A Look at IFRS
5 Compare the accounting for dividends, retained earnings, and income reporting under GAAP and IFRS.
LEARNING OBJECTIVE
The basic accounting for cash and stock dividends is essentially the same under both GAAP and IFRS although IFRS terminology may differ.
Key PointsFollowing are the key similarities and differences between GAAP and IFRS as related to dividends, retained earnings, and income reporting.
Similarities• The accounting related to prior period adjustment is essentially the same under IFRS and GAAP.
• The stockholders’ equity section is essentially the same under IFRS and GAAP. However, terminology used to describe certain components is often different. These differences are discussed in Chapter 13.
• The income statement using IFRS is called the statement of comprehensive income. A statement of comprehensive income is presented in a one- or two-statement format. The single-statement approach includes all items of income and expense, as well as each component of other comprehen-sive income or loss by its individual characteristic. In the two-statement approach, a traditional income statement is prepared. It is then followed by a statement of comprehensive income, which starts with net income or loss and then adds other comprehensive income or loss items. Regardless of which approach is reported, income tax expense is required to be reported.
• The computations related to earnings per share are essentially the same under IFRS and GAAP.
Differences• The term reserves is used in IFRS to indicate all non–contributed (non–paid-in) capital. Reserves
include retained earnings and other comprehensive income items, such as revaluation surplus and unrealized gains or losses on available-for-sale securities.
• IFRS often uses terms such as retained profi ts or accumulated profi t or loss to describe retained earnings. The term retained earnings is also often used.
Instructions(a) Who are the stakeholders in this situation?(b) Is there anything unethical about Lowery’s intentions or actions?(c) What is the effect of a stock dividend on a corporation’s stockholders’ equity accounts? Which
would you rather receive as a stockholder—a cash dividend or a stock dividend? Why?
All About YouBYP14-8 In this textbook, you learned that in response to the Sarbanes-Oxley Act, many companies have implemented formal ethics codes. Many other organizations also have ethics codes.
InstructionsObtain the ethics code from an organization that you belong to (e.g., student organization, business school, employer, or a volunteer organization). Evaluate the ethics code based on how clearly it iden-tifi es proper and improper behavior. Discuss its strengths, and how it might be improved.
FASB Codifi cation ActivityBYP14-9 If your school has a subscription to the FASB Codifi cation, go to http://aaahq.org/ascLogin.cfm to log in and prepare responses to the following.
(a) What is the stock dividend?(b) What is a stock split?(c) At what percentage point does the issuance of additional shares qualify as a stock dividend, as
opposed to a stock split?
642 14 Corporations: Dividends, Retained Earnings, and Income Reporting

• Equity is given various descriptions under IFRS, such as shareholders’ equity, owners’ equity, capital and reserves, and shareholders’ funds.
Looking to the FutureThe IASB and the FASB are currently working on a project related to fi nancial statement presentation. An important part of this study is to determine whether certain line items, subtotals, and totals should be clearly defi ned and required to be displayed in the fi nancial statements. For example, it is likely that the statement of stockholders’ equity and its presentation will be examined closely. Both the IASB and FASB are working toward convergence of any remaining differences related to earnings per share computations. This convergence will deal with highly technical changes beyond the scope of this textbook.
IFRS Practice
IFRS Self-Test Questions
1. The basic accounting for cash dividends and stock dividends:(a) is different under IFRS versus GAAP.(b) is the same under IFRS and GAAP.(c) differs only for the accounting for cash dividends between GAAP and IFRS.(d) differs only for the accounting for stock dividends between GAAP and IFRS.
2. Which item is not considered part of reserves?(a) Unrealized loss on available-for-sale investments.(b) Revaluation surplus.(c) Retained earnings.(d) Issued shares.
3. Under IFRS, a statement of comprehensive income must include:(a) accounts payable. (c) income tax expense.(b) retained earnings. (d) preference stock.
4. Which set of terms can be used to describe total stockholders’ equity under IFRS?(a) Shareholders’ equity, capital and reserves, other comprehensive income.(b) Capital and reserves, shareholders’ equity, shareholders’ funds.(c) Capital and reserves, retained earnings, shareholders’ equity.(d) All of the answer choices are correct.
5. Earnings per share computations related to IFRS and GAAP:(a) are essentially similar.(b) result in an amount referred to as earnings per share.(c) must deduct preferred (preference) dividends when computing earnings per share.(d) All of the answer choices are correct.
International Financial Reporting Problem: Louis Vuitton
IFRS14-1 The fi nancial statements of Louis Vuitton are presented in Appendix F. Instructions for accessing and using the company’s complete annual report, including the notes to its fi nancial state-ments, are also provided in Appendix F.
InstructionsUse the company’s annual report to answer the following questions.
(a) Did the company declare and pay any dividends for the year ended December 31, 2013?(b) Compute the company’s return on ordinary shareholders’ equity for the year ended December 31,
2013.(c) What was Louis Vuitton’s earnings per share for the year ended December 31, 2013?
Answers to IFRS Self-Test Questions
1. b 2. d 3. c 4. b 5. d
A Look at IFRS 643

Debt can help a company acquire the things it needs to grow,
but it is often the very thing that kills a company. A brief
history of Maxwell Car Company illustrates the role of debt in
the U.S. auto industry. In 1920, Maxwell Car Company was on
the brink of fi nancial ruin. Because it was unable to pay its
bills, its creditors stepped in and took over. They hired a
former General Motors (GM) executive named Walter Chrysler
to reorganize the company. By 1925, he had taken over the
company and renamed it Chrysler. By 1933, Chrysler was
booming, with sales surpassing even those of Ford.
But the next few decades saw Chrysler make a series of
blunders. By 1980, with its creditors pounding at the gates,
Chrysler was again on the brink of fi nancial ruin.
At that point, Chrysler brought in a former Ford executive
named Lee Iacocca to save the company. Iacocca argued that
the United States could not afford to let Chrysler fail because
of the loss of jobs. He convinced the federal government to
grant loan guarantees—promises that if Chrysler failed to pay
its creditors, the government would pay them. Iacocca then
streamlined operations and brought out some profi table
products. Chrysler repaid all of its government-guaranteed
loans by 1983, seven years ahead of the scheduled fi nal
payment.
To compete in today’s global vehicle market, you must be
big—really big. So in 1998, Chrysler merged with German
automaker Daimler-Benz to form DaimlerChrysler. For a time,
this left just two U.S.-based auto manufacturers—GM and
Ford. But in 2007, DaimlerChrysler sold 81% of Chrysler to
Cerberus, an investment group, to provide much-needed cash
infusions to the automaker. In 2009, Daimler turned over its
remaining stake to Cerberus. Three days later, Chrysler fi led
for bankruptcy. But by 2010, it was beginning to show signs
of a turnaround.
The car companies are giants. GM and Ford typically rank
among the top fi ve U.S. fi rms in total assets. But GM and Ford
accumulated truckloads of debt on their way to getting big.
Although debt made it possible to get so big, the Chrysler
story, and GM’s recent bankruptcy, make it clear that debt can
also threaten a company’s survival.
And Then There Were Two
As you can see from the Feature Story below, having liabilities can be dangerous in diffi cult economic times. In this chapter, we will explain the accounting for the major types of long-term liabilities reported on the balance sheet. Long-term liabilities are obligations that are expected to be paid more than one year in the future. These liabilities may be bonds, long-term notes, or lease obligations.
CHAPTER PREVIEW
15
FEATURE STORY
Long-Term Liabilities
644

© Henrik Jonsson/iStockphoto
Discuss how long-term liabilities are reported and analyzed.
Explain how to account for bond transactions.
Explain how to account for long-term notes payable.
2
3
4
Describe the major characteristics of bonds.1 Bond TerminologyDO IT! 1
• Types of bonds• Issuing procedures• Determining the market
price of a bond
• Issuing bonds at face value• Discount or premium on bonds• Issuing bonds at a discount• Issuing bonds at a premium• Redeeming and converting bonds
Learning Objectives
Long-Term NotesDO IT! 3• Long-term notes payable• Mortgage notes payable
Lease Liability; Analysis of Long-Term Liabilities
DO IT! 4
• Presentation• Use of ratios• Debt and equity fi nancing• Lease liabilities and off-
balance-sheet fi nancing
Go to the REVIEW AND PRACTICE section at the end of the chapter for a review of key concepts and practice applications with solutions.
Visit WileyPLUS with ORION for additional tutorials and practice opportunities.
CHAPTER OUTLINE
© Henrik Jonsson/iStockphoto
Bond Issuance2aDO IT!
Bond Redemption2b

646 15 Long-Term Liabilities
1 Describe the major characteristics of bonds.LEARNING OBJECTIVE
Long-term liabilities are obligations that a company expects to pay more than one year in the future. In this chapter, we explain the accounting for the principal types of obligations reported in the long-term liabilities section of the balance sheet. These obligations often are in the form of bonds or long-term notes. Bonds are a form of interest-bearing note payable issued by corporations, universities, and governmental agencies. Bonds, like common stock, are sold in small denominations (usually $1,000 or multiples of $1,000). As a result, bonds attract many investors. When a corporation issues bonds, it is borrowing money. The person who buys the bonds (the bondholder) is investing in bonds.
Types of Bonds
Bonds may have many different features. In the following sections, we describe the types of bonds commonly issued.
SECURED AND UNSECURED BONDS
Secured bonds have specifi c assets of the issuer pledged as collateral for the bonds. A bond secured by real estate, for example, is called a mortgage bond. A bond secured by specifi c assets set aside to redeem (retire) the bonds is called a sinking fund bond. Unsecured bonds, also called debenture bonds, are issued against the gen-eral credit of the borrower. Companies with good credit ratings use these bonds extensively. For example, at one time DuPont reported over $2 billion of deben-ture bonds outstanding.
CONVERTIBLE AND CALLABLE BONDS
Bonds that can be converted into common stock at the bondholder’s option are convertible bonds. The conversion feature generally is attractive to bond buyers. Bonds that the issuing company can redeem (buy back) at a stated dollar amount prior to maturity are callable bonds. A call feature is included in nearly all corpo-rate bond issues.
Issuing Procedures
State laws grant corporations the power to issue bonds. Both the board of directors and stockholders usually must approve bond issues. In authorizing the bond issue, the board of directors must stipulate the number of bonds to be authorized, total face value, and contractual interest rate. The total bond authorization often exceeds the number of bonds the company originally issues. This gives the corpora-tion the fl exibility to issue more bonds, if needed, to meet future cash requirements. The face value is the amount of principal due at the maturity date. The maturity date is the date that the fi nal payment is due to the investor from the issuing company. The contractual interest rate, often referred to as the stated rate, is the rate used to determine the amount of cash interest the borrower pays and the investor receives. Usually, the contractual rate is stated as an annual rate. The terms of the bond issue are set forth in a legal document called a bond indenture. The indenture shows the terms and summarizes the rights of the bondholders and their trustees, and the obligations of the issuing company. The trustee (usually a fi nancial institution) keeps records of each bondholder, main-tains custody of unissued bonds, and holds conditional title to pledged property. In addition, the issuing company arranges for the printing of bond certifi cates. The indenture and the certifi cate are separate documents. As shown in Illustration 15-1, a bond certifi cate provides the following information: name of the issuer, face value, contractual interest rate, and maturity date. An investment company that specializes in selling securities generally sells the bonds for the issuing company.
ETHICS NOTE
Some companies try to minimize the amount of debt reported on their balance sheet by not reporting certain types of commitments as liabilities. This subject is of intense interest in the fi nancial community.
Secured Bonds
Unsecured Bonds
NoAsset as
Collateral
BOND
BOND
Convert
Bond
Stock
Callable Bonds
Convertible Bonds
Bond
Bond
Bond“Hey Harv,call in those
bonds”

Major Characteristics of Bonds 647
$1 million
$1 million
2017
2037
≠
Same dollars at differenttimes are not equal.
Illustration 15-1Bond certifi cate
Contractualinterest rate
Face or parvalue
Maturitydate
Issuer ofbonds
Determining the Market Price of a Bond
If you were an investor wanting to purchase a bond, how would you determine how much to pay? To be more specifi c, assume that Coronet, Inc. issues a zero-interest bond (pays no interest) with a face value of $1,000,000 due in 20 years. For this bond, the only cash you receive is a million dollars at the end of 20 years. Would you pay a million dollars for this bond? We hope not! A million dollars received 20 years from now is not the same as a million dollars received today. The term time value of money is used to indicate the relationship between time and money—that a dollar received today is worth more than a dollar prom-ised at some time in the future. If you had $1 million today, you would invest it. From that investment, you would earn interest such that at the end of 20 years, you would have much more than $1 million. Thus, if someone is going to pay you $1 million 20 years from now, you would want to fi nd its equivalent today, or its present value. In other words, you would want to determine the value today of the amount to be received in the future after taking into account current interest rates. The current market price (present value) of a bond is the value at which it should sell in the marketplace. Market price therefore is a function of the three factors that determine present value: (1) the dollar amounts to be received, (2) the length of time until the amounts are received, and (3) the market rate of interest. The market interest rate is the rate investors demand for loaning funds. To illustrate, assume that Acropolis Company on January 1, 2017, issues $100,000 of 9% bonds, due in fi ve years, with interest payable annually at year-end. The purchaser of the bonds would receive the following two types of cash payments: (1) principal of $100,000 to be paid at maturity, and (2) fi ve $9,000

648 15 Long-Term Liabilities
interest payments ($100,000 3 9%) over the term of the bonds. Illustration 15-2 shows a time diagram depicting both cash fl ows.
The current market price of a bond is equal to the present value of all the future cash payments promised by the bond. Illustration 15-3 lists and totals the present values of these amounts, assuming the market rate of interest is 9%.
Tables are available to provide the present value numbers to be used, or these values can be determined mathematically or with fi nancial calculators.1 Appen-dix G, near the end of the textbook, provides further discussion of the concepts and the mechanics of the time value of money computations.
1For those knowledgeable in the use of present value tables, the computations in the example shown in Illustration 15-3 are $100,000 3 .64993 5 $64,993, and $9,000 3 3.88965 5 35,007 (rounded).
Illustration 15-3Computing the market price of bonds
Present value of $100,000 received in 5 years $ 64,993Present value of $9,000 received annually for 5 years 35,007
Market price of bonds $100,000
Running Hot!
Recently, the market for bonds was running hot. For example, consider these two large deals: Apple Inc. sold $17 billion of debt, which at the time was the largest corporate bond ever sold. But shortly thereaf-ter, it was beat by Verizon
Communications Inc., which sold $49 billion of debt. The following chart highlights the increased issuance of bonds.
As one expert noted about these increases, “Companies are taking advantage of this lower-rate environment in the limited period of time it is going to be around.” An interesting aspect of these bond issuances is that compa-nies, like Philip Morris International, Medtronic, Inc., and Simon Properties, are even selling 30-year bonds. These bond issuers are benefi tting from “a massive sentiment shift,” says one bond expert. The belief that the economy will recover is making investors more comfortable holding longer-term bonds, as they search for investments that offer better returns than U.S. Treasury bonds.
Sources: Vipal Monga, “The Big Number,” Wall Street Journal (March 20, 2012), p. B5; and Mike Cherney, “Renewed Embrace of Bonds Sparks Boom,” Wall Street Journal (March 8–9, 2014), p. B5.
What are the advantages for companies of issuing 30-year bonds instead of 5-year bonds? (Go to WileyPLUS for this answer and additional questions.)
© alphaspirit/Shutterstock
Investor Insight
1995
Note: Data reflect each year through March 7.Source: Thomson Reuters.
0
50
100
150
$200
2000 2005 2010 2014
Years
($ in
billio
ns)
$233 billion
Illustration 15-2Time diagram depicting cash fl ows
5-year period0 1 2 3 4 5
$9,000 $9,000 $9,000 $9,000 $9,000 Interest
$100,000 Principal

Accounting for Bond Transactions 649
State whether each of the following statements is true or false.
________ 1. Mortgage bonds and sinking fund bonds are both examples of secured bonds.
________ 2. Unsecured bonds are also known as debenture bonds.
________ 3. The stated rate is the rate investors demand for loaning funds.
________ 4. The face value is the amount of principal the issuing company must pay at the maturity date.
________ 5. The market price of a bond is equal to its maturity value.
Solution
DO IT! 1 Bond Terminology
1. True. 2. True. 3. False. The stated rate is the contractual interest rate used to deter-mine the amount of cash interest the borrower pays. 4. True. 5. False. The market price of a bond is the value at which it should sell in the marketplace. As a result, the market price of the bond and its maturity value are often different.
Related exercise material: E15-1 and DO IT! 15-1.
Action Plan✔ Review the types of
bonds and the basic terms associated with bonds.
2 Explain how to account for bond transactions.LEARNING OBJECTIVE
A corporation records bond transactions when it issues (sells) or redeems (buys back) bonds and when bondholders convert bonds into common stock. If bond-holders sell their bond investments to other investors, the issuing fi rm receives no further money on the transaction, nor does the issuing corporation journalize the transaction (although it does keep records of the names of bondholders in some cases). Bonds may be issued at face value, below face value (discount), or above face value (premium). Bond prices for both new issues and existing bonds are quoted as a percentage of the face value of the bond. Face value is usually $1,000. Thus, a $1,000 bond with a quoted price of 97 means that the selling price of the bond is 97% of face value, or $970.
Issuing Bonds at Face Value
To illustrate the accounting for bonds issued at face value, assume that on Janu-ary 1, 2017, Candlestick, Inc. issues $100,000, fi ve-year, 10% bonds at 100 (100% of face value). The entry to record the sale is as follows.
Candlestick reports bonds payable in the long-term liabilities section of the balance sheet because the maturity date is January 1, 2022 (more than one year away). Over the term (life) of the bonds, companies make entries to record bond interest. Interest on bonds payable is computed in the same manner as interest on notes payable, as explained in Chapter 11 (page 492). Assume that interest is payable annually on January 1 on the Candlestick bonds. In that case, Candlestick accrues interest of $10,000 ($100,000 3 10%) on December 31. At December 31,
Jan. 1 Cash 100,000 Bonds Payable 100,000 (To record sale of bonds at face value)
1100,000 1100,000
Cash Flows1100,000
A SEL5 1

650 15 Long-Term Liabilities
The company classifi es interest payable as a current liability because it is scheduled for payment within the next year. When Candlestick pays the interest on January 1, 2018, it debits (decreases) Interest Payable and credits (decreases) Cash for $10,000. Candlestick records the payment on January 1 as follows.
Dec. 31 Interest Expense 10,000 Interest Payable 10,000 (To accrue bond interest)
Jan. 1 Interest Payable 10,000 Cash 10,000 (To record payment of bond interest)
210,000 Exp 110,000
Cash Flowsno effect
A SEL5 1
Candlestick recognizes the $10,000 of interest expense incurred with the following adjusting entry.
210,000210,000
Cash Flows210,000
A SEL5 1
Discount or Premium on Bonds
The previous example assumed that the contractual (stated) interest rate and the market (effective) interest rate paid on the bonds were the same. Recall that the contractual interest rate is the rate applied to the face (par) value to arrive at the interest paid in a year. The market interest rate is the rate investors demand for loaning funds to the corporation. When the contractual interest rate and the market interest rate are the same, bonds sell at face value (par value). However, market interest rates change daily. The type of bond issued, the state of the economy, current industry conditions, and the company’s performance all affect market interest rates. As a result, contractual and market interest rates often differ. To make bonds salable when the two rates differ, bonds sell below or above face value. To illustrate, suppose that a company issues 10% bonds at a time when other bonds of similar risk are paying 12%. Investors will not be interested in buying the 10% bonds, so their value will fall below their face value. When a bond is sold for less than its face value, the difference between the face value of a bond and its selling price is called a discount. As a result of the decline in the bonds’ selling price, the actual interest rate incurred by the company increases to the level of the current market interest rate. Conversely, if the market rate of interest is lower than the contractual interest rate, investors will have to pay more than face value for the bonds. That is, if the market rate of interest is 8% but the contractual interest rate on the bonds is 10%, the price of the bonds will be bid up. When a bond is sold for more than its face value, the difference between the face value and its selling price is called a premium. Illustration 15-4 shows these relationships.
BondContractual
InterestRate 10%
8%
10%
12%
MarketInterest Rate
Bonds Sellat
Issued when
Premium
Face Value
Discount
Illustration 15-4Interest rates and bond prices

Accounting for Bond Transactions 651
Issuance of bonds at an amount different from face value is quite common. By the time a company prints the bond certifi cates and markets the bonds, it will be a coincidence if the market rate and the contractual rate are the same. Thus, the issuance of bonds at a discount does not mean that the issuer’s fi nancial strength is suspect. Conversely, the sale of bonds at a premium does not indicate that the fi nancial strength of the issuer is exceptional.
Issuing Bonds at a Discount
To illustrate issuance of bonds at a discount, assume that on January 1, 2017, Candlestick, Inc. sells $100,000, fi ve-year, 10% bonds for $98,000 (98% of face value). Interest is payable annually on January 1. The entry to record the issuance is as follows.
Helpful HintDiscount on
Bonds Payable
Increase Decrease Debit Credit
↓ Normal Balance
Jan. 1 Cash 98,000 Discount on Bonds Payable 2,000 Bonds Payable 100,000 (To record sale of bonds at a discount)
198,000 22,000 1100,000
Cash Flows198,000
A SEL5 1
Although Discount on Bonds Payable has a debit balance, it is not an asset. Rather, it is a contra account. This account is deducted from bonds payable on the balance sheet, as shown in Illustration 15-5.
CANDLESTICK, INC.Balance Sheet (partial)
Long-term liabilities Bonds payable $100,000 Less: Discount on bonds payable 2,000 $98,000
Illustration 15-5Statement presentation of discount on bonds payable
The $98,000 represents the carrying (or book) value of the bonds. On the date of issue, this amount equals the market price of the bonds. The issuance of bonds below face value—at a discount—causes the total cost of borrowing to differ from the bond interest paid. That is, the issuing corporation must pay not only the contractual interest rate over the term of the bonds but also the face value (rather than the issuance price) at maturity. Therefore, the difference between the issuance price and face value of the bonds—the discount—is an additional cost of borrowing. The company records this additional cost as interest expense over the life of the bonds. The total cost of borrowing $98,000 for Candlestick, Inc. is therefore $52,000, computed as follows.
Helpful HintCarrying value (book value) of bonds issued at a discount is determined by subtracting the balance of the discount account from the balance of the Bonds Payable account.
Alternatively, we can compute the total cost of borrowing as follows.
Bonds Issued at a Discount
Annual interest payments ($100,000 3 10% 5 $10,000; $10,000 3 5) $ 50,000 Add: Bond discount ($100,000 2 $98,000) 2,000
Total cost of borrowing $52,000
Illustration 15-6Total cost of borrowing—bonds issued at a discount
Bonds Issued at a Discount
Principal at maturity $100,000 Annual interest payments ($10,000 3 5) 50,000
Cash to be paid to bondholders 150,000 Less: Cash received from bondholders 98,000
Total cost of borrowing $ 52,000
Illustration 15-7Alternative computation of total cost of borrowing—bonds issued at a discount

652 15 Long-Term Liabilities
To follow the expense recognition principle, companies allocate bond dis-count to expense in each period in which the bonds are outstanding. This is referred to as amortizing the discount. Amortization of the discount increases the amount of interest expense reported each period. That is, after the company amortizes the discount, the amount of interest expense it reports in a period will exceed the contractual amount. As shown in Illustration 15-6, for the bonds issued by Candlestick, Inc., total interest expense will exceed the contractual interest by $2,000 over the life of the bonds. As the discount is amortized, its balance declines. As a consequence, the carrying value of the bonds will increase, until at maturity the carrying value of the bonds equals their face amount. This is shown in Illustration 15-8. Appen-dices 15A and 15B at the end of this chapter discuss procedures for amortizing bond discount.
Carr
yin
g V
alu
e $100,000
Time$98,000
1 2 3 4 5 Years
Illustration 15-8Amortization of bond discount
Issuing Bonds at a Premium
To illustrate the issuance of bonds at a premium, we now assume the Candlestick, Inc. bonds described above sell for $102,000 (102% of face value) rather than for $98,000. The entry to record the sale is as follows.
Jan. 1 Cash 102,000 Bonds Payable 100,000 Premium on Bonds Payable 2,000 (To record sale of bonds at a premium)
1102,000 1100,000 12,000
Cash Flows1102,000
A SEL5 1
Candlestick adds the premium on bonds payable to the bonds payable amount on the balance sheet, as shown in Illustration 15-9.
CANDLESTICK, INC.Balance Sheet (partial)
Long-term liabilities Bonds payable $100,000 Add: Premium on bonds payable 2,000 $102,000
Illustration 15-9Statement presentation of bond premium
The sale of bonds above face value causes the total cost of borrowing to be less than the bond interest paid. The reason: The borrower is not required to pay the bond premium at the maturity date of the bonds. Thus, the bond pre-mium is considered to be a reduction in the cost of borrowing that reduces
Helpful HintPremium on
Bonds Payable
Decrease Increase Debit Credit
↓ Normal Balance
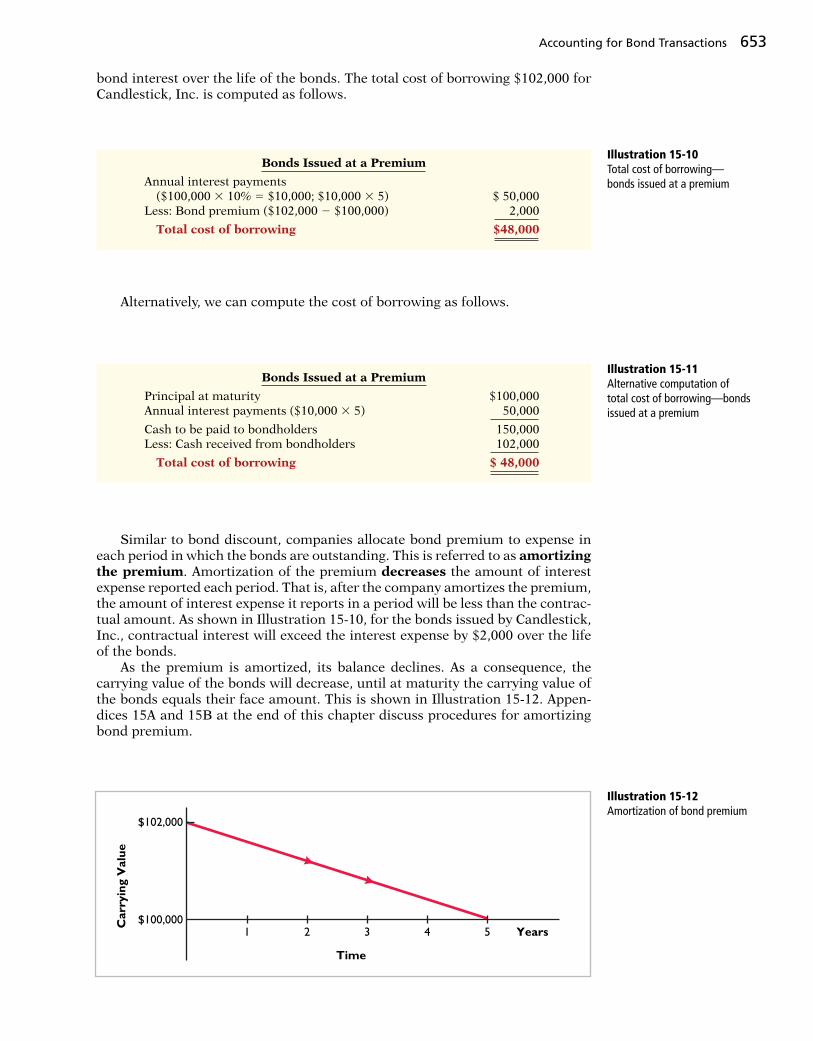
Accounting for Bond Transactions 653
bond interest over the life of the bonds. The total cost of borrowing $102,000 for Candlestick, Inc. is computed as follows.
Alternatively, we can compute the cost of borrowing as follows.
Illustration 15-10Total cost of borrowing—bonds issued at a premium
Similar to bond discount, companies allocate bond premium to expense in each period in which the bonds are outstanding. This is referred to as amortizing the premium. Amortization of the premium decreases the amount of interest expense reported each period. That is, after the company amortizes the premium, the amount of interest expense it reports in a period will be less than the contrac-tual amount. As shown in Illustration 15-10, for the bonds issued by Candlestick, Inc., contractual interest will exceed the interest expense by $2,000 over the life of the bonds. As the premium is amortized, its balance declines. As a consequence, the carrying value of the bonds will decrease, until at maturity the carrying value of the bonds equals their face amount. This is shown in Illustration 15-12. Appen-dices 15A and 15B at the end of this chapter discuss procedures for amortizing bond premium.
Illustration 15-11Alternative computation of total cost of borrowing—bonds issued at a premium
Bonds Issued at a Premium
Principal at maturity $100,000 Annual interest payments ($10,000 3 5) 50,000
Cash to be paid to bondholders 150,000 Less: Cash received from bondholders 102,000
Total cost of borrowing $ 48,000
Bonds Issued at a Premium
Annual interest payments ($100,000 3 10% 5 $10,000; $10,000 3 5) $ 50,000 Less: Bond premium ($102,000 2 $100,000) 2,000
Total cost of borrowing $48,000
Carr
yin
g V
alu
e
$102,000
$100,0001 2 3 4 5 Years
Time
Illustration 15-12Amortization of bond premium

654 15 Long-Term Liabilities
Redeeming and Converting Bonds
REDEEMING BONDS AT MATURITY
Regardless of the issue price of bonds, the book value of the bonds at maturity will equal their face value. Assuming that the company pays and records sepa-rately the interest for the last interest period, Candlestick records the redemption of its bonds at maturity as follows.
Giant Corporation issues $200,000 of bonds for $189,000. (a) Prepare the journal entry to record the issuance of the bonds, and (b) show how the bonds would be reported on the balance sheet at the date of issuance.
Solution
DO IT! 2a Bond Issuance
(a) Cash 189,000 Discount on Bonds Payable 11,000 Bonds Payable 200,000 (To record sale of bonds at a discount)
(b) Long-term liabilities Bonds payable $200,000 Less: Discount on bonds payable 11,000 $189,000
Related exercise material: BE15-1, BE15-2, BE15-3, BE15-4, BE15-5, E15-2, E15-3, E15-4, E15-6, and DO IT! 15-2a.
Action Plan✔ Record cash received,
bonds payable at face value, and the difference as a discount or premium.
✔ Report discount as a deduction from bonds payable and premium as an addition to bonds payable.
Jan. 1 Bonds Payable 100,000 Premium on Bonds Payable 400 Loss on Bond Redemption 2,600 Cash 103,000 (To record redemption of bonds at 103)
Jan. 1 Bonds Payable 100,000 Cash 100,000 (To record redemption of bonds at maturity)
2100,0002100,000
Cash Flows2100,000
A SEL5 1
2100,000 2400 22,600 Exp2103,000
Cash Flows2103,000
A SEL5 1
REDEEMING BONDS BEFORE MATURITY
Bonds may be redeemed before maturity. A company may decide to redeem bonds before maturity to reduce interest cost and to remove debt from its balance sheet. A company should redeem debt early only if it has suffi cient cash resources. When a company redeems bonds before maturity, it is necessary to (1) eliminate the carrying value of the bonds at the redemption date, (2) record the cash paid, and (3) recognize the gain or loss on redemption. The carrying value of the bonds is the face value of the bonds less any remaining bond discount or plus any remaining bond premium at the redemption date. To illustrate, assume that Candlestick, Inc. has sold its bonds at a premium. At the end of the fourth period, Candlestick redeems these bonds at 103 after paying the annual interest. Assume that the carrying value of the bonds at the redemption date is $100,400 (principal $100,000 and premium $400). Candle-stick records the redemption at the end of the fourth interest period (January 1, 2021) as follows.
Helpful HintIf a bond is redeemed prior to its maturity date and its carrying value exceeds its redemption price, this results in a gain.
Note that the loss of $2,600 is the difference between the cash paid of $103,000 and the carrying value of the bonds of $100,400.

Accounting for Bond Transactions 655
CONVERTING BONDS INTO COMMON STOCK
Convertible bonds have features that are attractive both to bondholders and to the issuer. The conversion often gives bondholders an opportunity to benefi t if the market price of the common stock increases substantially. Until conversion, though, the bondholder receives interest on the bond. For the issuer of convertible bonds, the bonds sell at a higher price and pay a lower rate of interest than comparable debt securities without the conversion option. Many corporations, such as Intel, Ford, and Wells Fargo, have convertible bonds outstanding. When the issuing company records a conversion, the company ignores the current market prices of the bonds and stock. Instead, the company transfers the carrying value of the bonds to paid-in capital accounts. No gain or loss is recognized. To illustrate, assume that on July 1, Saunders Associates converts $100,000 bonds sold at face value into 2,000 shares of $10 par value common stock. Both the bonds and the common stock have a market value of $130,000. Saunders makes the following entry to record the conversion.
July 1 Bonds Payable 100,000 Common Stock 20,000 Paid-in Capital in Excess of Par— Common Stock 80,000 (To record bond conversion)
2100,000 120,000 CS 180,000 CS
Cash Flowsno effect
A SEL5 1
Note that the company does not consider the current market value of the bonds and stock ($130,000) in making the entry. This method of recording the bond conversion is often referred to as the carrying (or book) value method.
How About Some Green Bonds?
Unilever recently began pro-ducing popular frozen treats such as Magnums and Cor-nettos, funded by green bonds. Green bonds are debt
used to fund activities such as renewable-energy projects. In Unilever’s case, the proceeds from the sale of green bonds are used to clean up the company’s manufacturing operations and cut waste (such as related to energy consumption).
The use of green bonds has taken off as companies now have guidelines as to how to disclose and report on these green-bond proceeds. These standardized disclosures
provide transparency as to how these bonds are used and their effect on overall profi tability.
Investors are taking a strong interest in these bonds. Investing companies are installing socially responsible investing teams and have started to integrate sustainabil-ity into their investment processes. The disclosures of how companies are using the bond proceeds help investors to make better fi nancial decisions.
Source: Ben Edwards, “Green Bonds Catch On,” Wall Street Jour-nal (April 3, 2014), p. C5.
Why might standardized disclosure help investors to better understand how proceeds from the sale or issu-ance of bonds are used? (Go to WileyPLUS for this answer and additional questions.)
© CarpathianPrince/Shutterstock
UnileverPeople, Planet, and Profi t Insight
R & B Inc. issued $500,000, 10-year bonds at a discount. Prior to maturity, when the carrying value of the bonds is $496,000, the company redeems the bonds at 98. Prepare the entry to record the redemption of the bonds.
DO IT! 2b Bond Redemption

656 15 Long-Term Liabilities
There is a gain on redemption. The cash paid, $490,000 ($500,000 3 98%), is less than the carrying value of $496,000. The entry is:
Bonds Payable 500,000 Discount on Bonds Payable 4,000 Gain on Bond Redemption 6,000 Cash 490,000 (To record redemption of bonds at 98)
Solution
Related exercise material: BE15-6, E15-5, E15-7, E15-8, and DO IT! 15-2b.
Action Plan✔ Determine and elimi-
nate the carrying value of the bonds.
✔ Record the cash paid.✔ Compute and record
the gain or loss (the difference between the fi rst two items).
3 Explain how to account for long-term notes payable.LEARNING OBJECTIVE
Other common types of long-term obligations are notes payable and lease liabilities. We discuss notes payable next.
Long-Term Notes Payable
The use of notes payable in long-term debt fi nancing is quite common. Long-term notes payable are similar to short-term interest-bearing notes payable except that the term of the notes exceeds one year. In periods of unstable interest rates, lenders may tie the interest rate on long-term notes to changes in the market rate for comparable loans. A long-term note may be secured by a mortgage that pledges title to specifi c assets as security for a loan. Individuals widely use mortgage notes payable to purchase homes, and many small and some large companies use them to acquire plant assets. At one time, approximately 18% of McDonald’s long-term debt related to mortgage notes on land, buildings, and improvements. Like other long-term notes payable, the mortgage loan terms may stipulate either a fi xed or an adjustable interest rate. The interest rate on a fi xed-rate mortgage remains the same over the life of the mortgage. The interest rate on an adjustable-rate mortgage is adjusted periodically to refl ect changes in the market rate of interest. Typically, the terms require the borrower to make equal installment payments over the term of the loan. Each payment consists of (1) interest on the unpaid balance of the loan and (2) a reduction of loan principal. While the total amount of the payment remains constant, the interest decreases each period, while the portion applied to the loan principal increases. Companies initially record mortgage notes payable at face value. They subse-quently make entries for each installment payment. To illustrate, assume that Porter Technology Inc. issues a $500,000, 8%, 20-year mortgage note on December 31, 2017, to obtain needed fi nancing for a new research laboratory. The terms provide for annual installment payments of $50,926 (not including real estate taxes and insurance). The installment payment schedule for the fi rst four years is as follows.
(B) (C) (D) (A) Interest Reduction of Principal Interest Cash Expense Principal Balance Period Payment (D) 3 8% (A) 2 (B) (D) 2 (C)
Issue date $500,000 1 $50,926 $40,000 $10,926 489,074 2 50,926 39,126 11,800 477,274 3 50,926 38,182 12,744 464,530 4 50,926 37,162 13,764 450,766
Illustration 15-13Mortgage installment payment schedule

Statement Presentation and Analysis 657
Porter records the mortgage loan on December 31, 2017, as follows.
Dec. 31 Cash 500,000 Mortgage Payable 500,000 (To record mortgage loan)
1500,000 1500,000
Cash Flows1500,000
A SEL5 1
On December 31, 2018, Porter records the fi rst installment payment as follows.
240,000 Exp 210,926250,926
Cash Flows250,926
A SEL5 1
Dec. 31 Interest Expense 40,000 Mortgage Payable 10,926 Cash 50,926 (To record annual payment on mortgage)
In the balance sheet, the company reports the reduction in principal for the next year as a current liability, and it classifi es the remaining unpaid prin-cipal balance as a long-term liability. At December 31, 2018, the total liability is $489,074. Of that amount, $11,800 is current and $477,274 ($489,074 2 $11,800) is long-term.
Cole Research issues a $250,000, 6%, 20-year mortgage note to obtain needed fi nancing for a new lab. The terms call for annual payments of $21,796 each. Prepare the entries to record the mortgage loan and the fi rst payment.
Solution
DO IT! 3 Long-Term Notes
Cash 250,000 Mortgage Payable 250,000 (To record mortgage loan)
Interest Expense 15,000*Mortgage Payable 6,796 Cash 21,796 (To record annual payment on mortgage)
*Interest expense 5 $250,000 3 6% 5 $15,000.
Related exercise material: BE15-7, E15-9, E15-10, and DO IT! 15-3.
Action Plan✔ Record the issuance
of the note as a cash receipt and a liability.
✔ Each installment payment consists of interest and payment of principal.
4 Discuss how long-term liabilities are reported and analyzed.LEARNING OBJECTIVE
Presentation
Companies report long-term liabilities in a separate section of the balance sheet immediately following current liabilities, as shown in Illustration 15-14 (page 658). Alternatively, companies may present summary data in the balance sheet, with detailed data (interest rates, maturity dates, conversion privileges, and assets pledged as collateral) shown in a supporting schedule.

658 15 Long-Term Liabilities
Companies report the current maturities of long-term debt under current liabilities if they are to be paid within one year or the operating cycle, whichever is longer.
Use of Ratios
Two ratios are helpful in better understanding a company’s debt-paying ability and long-term solvency. Long-term creditors and stockholders are interested in a company’s long-run solvency. Of particular interest is the company’s ability to pay interest as it comes due and to repay the face value of the debt at maturity. The debt to assets ratio measures the percentage of the total assets provided by creditors. It is computed by dividing total liabilities (both current and long-term liabilities) by total assets. To illustrate, we use data from a recent Kellogg Company annual report. The company reported total liabilities of $8,925 million, total assets of $11,200 million, interest expense of $295 million, income taxes of $476 million, and net income of $1,208 million. As shown in Illustration 15-15, Kellogg’s debt to assets ratio is 79.7%. The higher the percentage of debt to assets, the greater the risk that the company may be unable to meet its maturing obligation.
LAX CORPORATIONBalance Sheet (partial)
Long-term liabilities Bonds payable 10% due in 2022 $1,000,000 Less: Discount on bonds payable 80,000 $ 920,000 Mortgage payable, 11%, due in 2028 and secured by plant assets 500,000 Lease liability 440,000
Total long-term liabilities $1,860,000
Illustration 15-14Balance sheet presentation of long-term liabilities
Times interest earned indicates the company’s ability to meet interest payments as they come due. It is computed by dividing the sum of net income, interest expense, and income tax expense by interest expense. As shown in Illus-tration 15-16, Kellogg’s times interest earned is 6.71 times. This interest coverage is considered safe.
Total Liabilities 4 Total Assets 5 Debt to Assets Ratio
$8,925 4 $11,200 5 79.7%
Illustration 15-15Debt to assets ratio
Net Income 1 Interest
Times Interest
Interest Expense 1 4 Expense
5 Earned
Income Tax Expense
$1,208 1 $295 1 $476 4 $295 5 6.71 times
Illustration 15-16Times interest earned
Debt and Equity Financing
To obtain large amounts of long-term capital, corporate management has to decide whether to issue additional common stock (equity fi nancing), bonds or notes (debt fi nancing), or a combination of the two. This decision is important to both the company and to investors and creditors. The capital structure of a com-pany provides clues as to the potential profi t that can be achieved and the risks taken by the company. Debt fi nancing offers these advantages over common stock, as shown in Illustration 15-17.

Statement Presentation and Analysis 659
As Illustration 15-17 shows, one reason to issue bonds is that they do not affect stockholder control. Because bondholders do not have voting rights, owners can raise capital with bonds and still maintain corporate control. In addition, bonds are attractive to corporations because the cost of bond interest is tax-deductible. As a result of this tax treatment, which stock dividends do not offer, bonds may result in lower cost of capital than equity fi nancing. To illustrate another advantage of bond fi nancing, assume that Microsys-tems, Inc. is considering two plans for fi nancing the construction of a new $5 million plant. Plan A involves issuance of 200,000 shares of common stock at the current market price of $25 per share. Plan B involves issuance of $5 million, 8% bonds at face value. Income before interest and taxes on the new plant will be $1.5 million. Income taxes are expected to be 30%. Microsystems currently has 100,000 shares of common stock outstanding. Illustration 15-18 shows the alter-native effects on earnings per share.
Stockholder control is not affected.Bondholders do not have voting rights, so current owners(stockholders) retain full control of the company.
1.
Tax savings result.Bond interest is deductible for tax purposes; dividends onstock are not.
2.
Earning per share (EPS) may be higher.Although bond interest expense reduces net income,earning per share is higher under bond financingbecause no additional shares of common stock are issued.
3.
Bond Financing Advantages
Ballot
Tax Bill
Incomestatement
EPS
Illustration 15-17Advantages of bond fi nancing over common stock
Note that net income is $280,000 less ($1,050,000 2 $770,000) with long-term debt fi nancing (bonds). However, earnings per share is higher because there are 200,000 fewer shares of common stock outstanding. A major disadvantage of using debt fi nancing is that a company must pay inter-est on a periodic basis. In addition, the company must also repay principal at the due date. A company with fl uctuating earnings and a relatively weak cash position may have great diffi culty making interest payments when earnings are low. Fur-thermore, when the economy, stock market, or a company’s revenues stagnate, debt payments can gobble up cash quickly and limit a company’s ability to meet its fi nancial obligations.
Lease Liabilities and Off-Balance-Sheet Financing
A lease is a contractual arrangement between a lessor (owner of the property) and a lessee (renter of the property). It grants the right to use specifi c property for a period of time in return for cash payments. Leasing is big business. The global leasing market for capital equipment has recently been over $850 billion. This
Plan A Plan B Issue Stock Issue Bonds
Income before interest and taxes $1,500,000 $1,500,000 Interest (8% 3 $5,000,000) — 400,000
Income before income taxes 1,500,000 1,100,000 Income tax expense (30%) 450,000 330,000
Net income $1,050,000 $ 770,000
Outstanding shares 300,000 100,000 Earnings per share $3.50 $7.70
Illustration 15-18Effects on earnings per share—stocks vs. bonds

660 15 Long-Term Liabilities
represents approximately one-third of equipment fi nanced in a year. The two most common types of leases are operating leases and capital leases.
OPERATING LEASES
The renting of an apartment and the rental of a car at an airport are examples of operating leases. In an operating lease, the intent is temporary use of the property by the lessee, while the lessor continues to own the property. In an operating lease, the lessee records the lease (or rental) payments as an expense. The lessor records the payments as revenue. For example, assume that a sales representative for Western Inc. leases a car from Hertz Car Rental at the Los Angeles airport and that Hertz charges a total of $275. Western, the lessee, records the rental as follows.
Rent Expense 275 Cash 275 (To record payment of lease rental charge)
2275 Exp2275
Cash Flows2275
A SEL5 1
The lessee may incur other costs during the lease period. For example, in the case above, Western will generally incur costs for gas. Western would report these costs as an expense.
CAPITAL LEASES
In most lease contracts, the lessee makes a periodic payment and records that pay-ment in the income statement as rent expense. In some cases, however, the lease contract transfers to the lessee substantially all the benefi ts and risks of ownership. Such a lease is in effect a purchase of the property. This type of lease is a capital lease. Its name comes from the fact that the company capitalizes the present value of the cash payments for the lease and records that amount as an asset. Illustration 15-19 indicates the major difference between operating and capital leases.
RentalAgreement
PARADISE U-DRIVE
Capital
Lease
Operating
Lease
“Have it backby 6:00 Sunday.”
“Only three morepayments and this
baby is ours!”“OK”
Lessor has substantially all of thebenefits and risks of ownership
Lessee has substantially all of thebenefits and risks of ownership
Copy Paper
Jam
PaperJam
Illustration 15-19Types of leases
Helpful HintA capital lease situation is one that, although legally a rental case, is in substance an installment purchase by the lessee. Accounting standards require that substance over form be used in such a situation.
If any one of the following conditions exists, the lessee must record a lease as an asset—that is, as a capital lease:
1. The lease transfers ownership of the property to the lessee. Rationale: If during the lease term the lessee receives ownership of the asset, the lessee should report the leased item as an asset on its books.
2. The lease contains a bargain purchase option. Rationale: If during the term of the lease the lessee can purchase the asset at a price substantially below its

Statement Presentation and Analysis 661
Paul Fleet/Alamy
fair value, the lessee will exercise this option. Thus, the lessee should report the leased item as an asset on its books.
3. The lease term is equal to 75% or more of the economic life of the leased property. Rationale: If the lease term is for much of the asset’s useful life, the lessee should report the leased item as an asset on its books.
4. The present value of the lease payments equals or exceeds 90% of the fair value of the leased property. Rationale: If the present value of the lease payments is equal to or almost equal to the fair value of the asset, the lessee has essentially purchased the asset. As a result, the lessee should report the leased item as an asset on its books.
To illustrate, assume that Gonzalez Company decides to lease new equipment. The lease period is four years. The economic life of the leased equipment is estimated to be fi ve years. The present value of the lease payments is $190,000, which is equal to the fair value of the equipment. There is no transfer of owner-ship during the lease term, nor is there any bargain purchase option. In this example, Gonzalez has essentially purchased the equipment. Conditions 3 and 4 have been met. First, the lease term is 75% or more of the economic life of the asset. Second, the present value of cash payments is equal to the equipment’s fair value. Gonzalez records the transaction as follows.
Leased Asset—Equipment 190,000 Lease Liability 190,000 (To record leased asset and lease liability)
1190,000 1190,000
Cash Flowsno effect
A SEL5 1
The lessee reports a leased asset on the balance sheet under plant assets. It reports the lease liability on the balance sheet as a liability. The portion of the lease liability expected to be paid in the next year is a current liability. The remainder is classifi ed as a long-term liability. Most lessees do not like to report leases on their balance sheets. Why? Because the lease liability increases the company’s total liabilities. This, in turn, may make it more diffi cult for the company to obtain needed funds from lenders. As a result, companies attempt to keep leased assets and lease liabilities off the balance sheet by structuring leases so as not to meet any of the four conditions discussed earlier. The practice of keeping liabilities off the balance sheet is referred to as off-balance-sheet fi nancing.
ETHICS NOTE
Accounting standard-setters are attempting to rewrite rules on lease accounting because of concerns that abuse of the current standards is reducing the usefulness of fi nancial statements.
“Covenant-Lite” DebtInvestor Insight
In many corporate loans and bond issuances, the lending agreement specifi es debt cov-enants. These covenants typi-cally are specifi c fi nancial measures, such as minimum levels of retained earnings,
cash fl ows, times interest earned, or other measures that a company must maintain during the life of the loan. If the company violates a covenant, it is considered to have vio-lated the loan agreement. The creditors can then demand immediate repayment, or they can renegotiate the loan’s terms. Covenants protect lenders because they enable lenders to step in and try to get their money back before the borrower gets too deeply into trouble.
During the 1990s, most traditional loans specifi ed between three to six covenants or “triggers.” In more recent
years, when lots of cash was available, lenders began reduc-ing or completely eliminating covenants from loan agree-ments in order to be more competitive with other lenders. Lending to weaker companies on easy terms is now common as investors’ appetite for higher-yielding debt grows stron-ger and the Federal Reserve keeps money fl owing at ultralow rates. Since the 2008 fi nancial crisis, companies have been able to borrow more without offering investors what were once considered standard protections against possible losses.
Sources: Cynthia Koons, “Risky Business: Growth of ‘Covenant-Lite’ Debt,” Wall Street Journal (June 18, 2007), p. C2; and Katy Burne, “More Loans Come with Few Strings Attached,” Wall Street Journal (June 12, 2014).
How can fi nancial ratios such as those covered in this chapter provide protection for creditors? (Go to WileyPLUS for this answer and additional questions.)

662 15 Long-Term Liabilities
FX Corporation leases new equipment on December 31, 2017. The lease transfers own-ership to FX at the end of the lease. The present value of the lease payments is $240,000. After recording this lease, FX has assets of $2,000,000, liabilities of $1,200,000, and stockholders’ equity of $800,000. (a) Prepare the entry to record the lease, and (b) com-pute and discuss the debt to assets ratio at year-end.
Solution
DO IT! 4 Lease Liability; Analysis of Long-Term Liabilities
(a)Leased Asset—Equipment 240,000 Lease Liability 240,000 (To record leased asset and lease liability)
(b) The debt to assets ratio 5 $1,200,000 4 $2,000,000 5 60%. This means that 60% of its assets were provided by creditors. The higher the percentage of debt to assets, the greater the risk that the company may be unable to meet its maturing obligations.
Related exercise material: BE15-10, E15-13, E15-14, and DO IT! 15-4.
Action Plan✔ Record the present
value of the lease payments as an asset and a liability.
✔ Use the formula for the debt to assets ratio ( Total liabilities divided by Total assets).
5 APPENDIX 15A: Apply the straight-line method of amortizing bond discount and bond premium.
Amortizing Bond Discount
To follow the expense recognition principle, companies allocate bond discount to expense in each period in which the bonds are outstanding. The straight-line method of amortization allocates the same amount to interest expense in each interest period. The calculation is presented in Illustration 15A-1.
LEARNING OBJECTIVE
*
Number Bond
Bond 4 of Interest 5 Discount
Discount
Periods Amortization
Illustration 15A-1Formula for straight-line method of bond discount amortization
In the Candlestick, Inc. example (page 651), the company sold $100,000, fi ve-year, 10% bonds on January 1, 2017, for $98,000. This resulted in a $2,000 bond discount ($100,000 2 $98,000). The bond discount amortization is $400 ($2,000 4 5) for each of the fi ve amortization periods. Candlestick records the fi rst accrual of bond interest and the amortization of bond discount on December 31 as follows.
Dec. 31 Interest Expense 10,400 Discount on Bonds Payable 400 Interest Payable 10,000 (To record accrued bond interest and amortization of bond discount)
210,400 Exp 1400 110,000
Cash Flowsno effect
A SEL5 1
Over the term of the bonds, the balance in Discount on Bonds Payable will decrease annually by the same amount until it has a zero balance at the maturity date of the bonds. Thus, the carrying value of the bonds at maturity will be equal to the face value of the bonds. Preparing a bond discount amortization schedule, as shown in Illustration 15A-2, is useful to determine interest expense, discount amortization, and the carrying
Alternative TerminologyThe amount in the Discount on Bonds Payable account is often referred to as Unamortized Discount on Bonds Payable.

Appendix 15A: Straight-Line Amortization 663
value of the bond. As indicated, the interest expense recorded each period is $10,400. Also note that the carrying value of the bond increases $400 each period until it reaches its face value of $100,000 at the end of period 5.
Dec. 31 Interest Expense 9,600 Premium on Bonds Payable 400 Interest Payable 10,000 (To record accrued bond interest and amortization of bond premium)
Amortizing Bond Premium
The amortization of bond premium parallels that of bond discount. Illustration 15A-3 presents the formula for determining bond premium amortization under the straight-line method.
CANDLESTICK, INC.Bond Discount Amortization Schedule
Straight-Line Method—Annual Interest Payments$100,000 of 10%, 5-Year Bonds
Issue date12345
Formulas Data Review ViewPage LayoutInsert
AP18 fx
B C D E F
Candlestick Inc.xlsCandlestick Inc.xlsHome
1
4
5
6
7
8
9
10
11
12
13
14
15
16
17
18
19
20
21
23
$2,0001,6001,200
800400
0
InterestPeriods
(D)Unamortized
Discount(D) − (C)
(E)Bond
Carrying Value($100,000 − D)
$ 98,00098,40098,80099,20099,600
100,000
Column (A) remains constant because the face value of the bonds ($100,000) is multiplied by theannual contractual interest rate (10%) each period.Column (B) is computed as the interest paid (Column A) plus the discount amortization (Column C).Column (C) indicates the discount amortization each period.Column (D) decreases each period by the same amount until it reaches zero at maturity.Column (E) increases each period by the amount of discount amortization until it equals theface value at maturity.
$ 400 400 400400400
$2,000
(A)Interest to
Be Paid(10% × $100,000)
(B)Interest Expenseto Be Recorded
(A) + (C)
(C)Discount
Amortization($2,000 ÷ 5)
$10,00010,00010,00010,00010,000
$50,000
$10,40010,40010,40010,40010,400
$52,000
Illustration 15A-2Bond discount amortization schedule
Continuing our example, assume Candlestick, Inc., sells the bonds described above for $102,000, rather than $98,000 (see page 652). This results in a bond premium of $2,000 ($102,000 2 $100,000). The premium amortization for each interest period is $400 ($2,000 4 5). Candlestick records the fi rst accrual of interest on December 31 as follows.
Number Bond
Bond 4 of Interest 5 Premium
Premium
Periods Amortization
Illustration 15A-3Formula for straight-line method of bond premium amortization
29,600 Exp 2400 110,000
Cash Flowsno effect
A SEL5 1
A bond premium amortization schedule, as shown in Illustration 15A-4 (page 664), is useful to determine interest expense, premium amortization, and the carrying value of the bond. As indicated, the interest expense Candlestick records

664 15 Long-Term Liabilities
each period is $9,600. Note that the carrying value of the bond decreases $400 each period until it reaches its face value of $100,000 at the end of period 5.
CANDLESTICK, INC.Bond Premium Amortization Schedule
Straight-Line Method—Annual Interest Payments$100,000 of 10%, 5-Year Bonds
Issue date12345
Formulas Data Review ViewPage LayoutInsert
AP18 fx
B C D E F
Candlestick Inc.xlsCandlestick Inc.xlsHome
1
4
5
6
7
8
9
10
11
12
13
14
15
16
17
18
19
20
21
23
$2,0001,6001,200
800400
0
InterestPeriods
(D)Unamortized
Premium(D) − (C)
(E)Bond
Carrying Value($100,000 + D)
$102,000101,600101,200100,800100,400100,000
Column (A) remains constant because the face value of the bonds ($100,000) is multiplied by theannual contractual interest rate (10%) each period.Column (B) is computed as the interest paid (Column A) less the premium amortization (Column C).Column (C) indicates the premium amortization each period.Column (D) decreases each period by the same amount until it reaches zero at maturity.Column (E) decreases each period by the amount of premium amortization until it equals theface value at maturity.
$10,00010,00010,00010,00010,000
$50,000
$ 9,6009,6009,6009,6009,600
$48,000
$ 400 400 400400400
$2,000
(A)Interest to
Be Paid(10% × $100,000)
(B)Interest Expenseto Be Recorded
(A) − (C)
(C)Premium
Amortization($2,000 ÷ 5)
Illustration 15A-4Bond premium amortization schedule
6 APPENDIX 15B: Apply the effective-interest method of amortizing bond discount and bond premium.
To follow the expense recognition principle, companies allocate bond discount to expense in each period in which the bonds are outstanding. However, to com-pletely comply with the expense recognition principle, interest expense as a per-centage of carrying value should not change over the life of the bonds. This percentage, referred to as the effective-interest rate, is established when the bonds are issued and remains constant in each interest period. Unlike the straight-line method, the effective-interest method of amortization accomplishes this result. Under the effective-interest method of amortization, the amortization of bond discount or bond premium results in periodic interest expense equal to a constant percentage of the carrying value of the bonds. The effective-interest method results in varying amounts of amortization and interest expense per period but a constant percentage rate. In contrast, the straight-line method results in constant amounts of amortization and interest expense per period but a varying percentage rate. Companies follow three steps under the effective-interest method:
1. Compute the bond interest expense by multiplying the carrying value of the bonds at the beginning of the interest period by the effective-interest rate.
2. Compute the bond interest paid (or accrued) by multiplying the face value of the bonds by the contractual interest rate.
3. Compute the amortization amount by determining the difference between the amounts computed in steps (1) and (2).
LEARNING OBJECTIVE
*
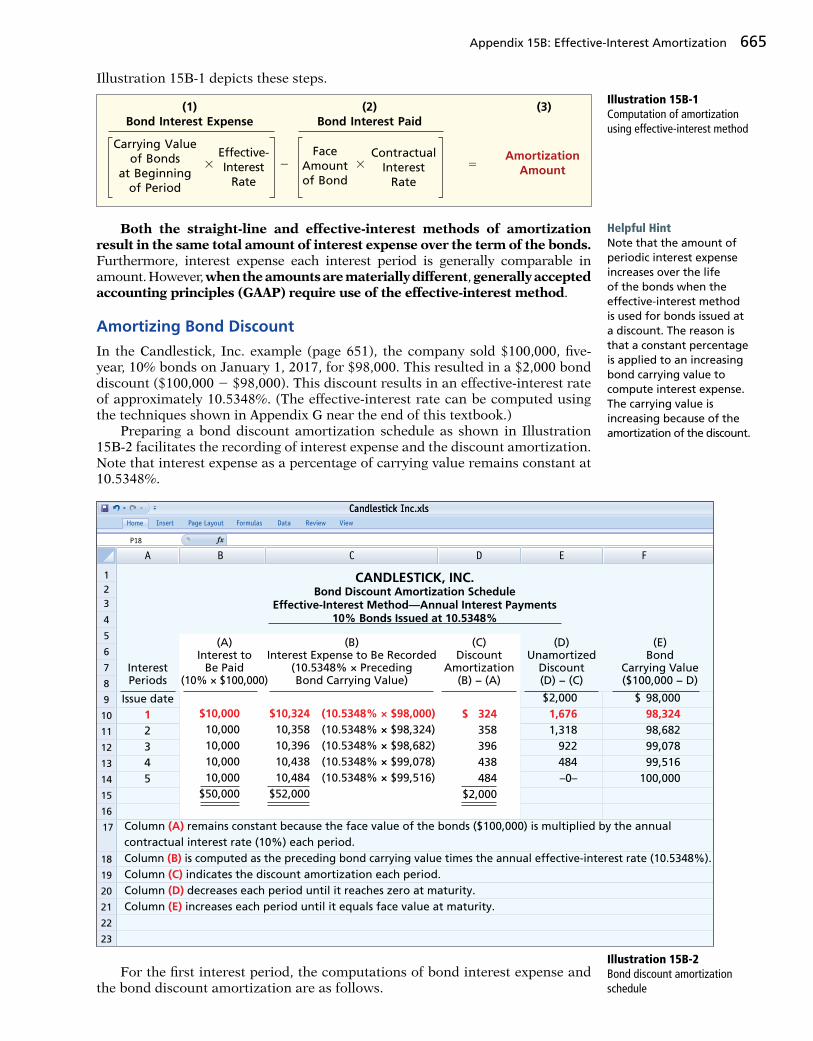
Appendix 15B: Effective-Interest Amortization 665
Illustration 15B-1 depicts these steps.
Both the straight-line and effective-interest methods of amortization result in the same total amount of interest expense over the term of the bonds. Furthermore, interest expense each interest period is generally comparable in amount. However, when the amounts are materially different, generally accepted accounting principles (GAAP) require use of the effective-interest method.
Amortizing Bond Discount
In the Candlestick, Inc. example (page 651), the company sold $100,000, fi ve- year, 10% bonds on January 1, 2017, for $98,000. This resulted in a $2,000 bond discount ($100,000 2 $98,000). This discount results in an effective-interest rate of approximately 10.5348%. (The effective-interest rate can be computed using the techniques shown in Appendix G near the end of this textbook.) Preparing a bond discount amortization schedule as shown in Illustration 15B-2 facilitates the recording of interest expense and the discount amortization. Note that interest expense as a percentage of carrying value remains constant at 10.5348%.
(1) (2) (3) Bond Interest Expense Bond Interest Paid
Carrying Valueof Bonds
at Beginningof Period
3 Effective-Interest
Rate 2
FaceAmountof Bond
3 Contractual
InterestRate
5 Amortization
Amount
Illustration 15B-1Computation of amortization using effective-interest method
Helpful HintNote that the amount of periodic interest expense increases over the life of the bonds when the effective-interest method is used for bonds issued at a discount. The reason is that a constant percentage is applied to an increasing bond carrying value to compute interest expense.The carrying value is increasing because of theamortization of the discount.
Issue date12345
1
4
5
6
7
8
9
10
11
12
13
14
15
16
17
18
19
20
21
22
23
23
$2,0001,6761,318
922484–0–
InterestPeriods
(D)Unamortized
Discount(D) − (C)
(E)Bond
Carrying Value($100,000 − D)
$ 98,00098,32498,68299,07899,516
100,000
$10,00010,00010,00010,00010,000
$50,000
(A)Interest to
Be Paid(10% × $100,000)
(B)Interest Expense to Be Recorded
(10.5348% × PrecedingBond Carrying Value)
(C)Discount
Amortization(B) − (A)
$ 324 358 396438484
$2,000
$10,32410,35810,39610,43810,484
$52,000
(10.5348% × $98,000)(10.5348% × $98,324)(10.5348% × $98,682)(10.5348% × $99,078)
(10.5348% × $99,516)
CANDLESTICK, INC.Bond Discount Amortization Schedule
Effective-Interest Method—Annual Interest Payments10% Bonds Issued at 10.5348%
Formulas Data Review ViewPage LayoutInsert
AP18 fx
B C D E F
Candlestick Inc.xlsCandlestick Inc.xlsHome
Column (A) remains constant because the face value of the bonds ($100,000) is multiplied by the annualcontractual interest rate (10%) each period.Column (B) is computed as the preceding bond carrying value times the annual effective-interest rate (10.5348%).Column (C) indicates the discount amortization each period.Column (D) decreases each period until it reaches zero at maturity.Column (E) increases each period until it equals face value at maturity.
Illustration 15B-2Bond discount amortization schedule
For the fi rst interest period, the computations of bond interest expense and the bond discount amortization are as follows.

666 15 Long-Term Liabilities
Bond interest expense ($98,000 3 10.5348%) $10,324Less: Bond interest paid ($100,000 3 10%) 10,000
Bond discount amortization $ 324
Illustration 15B-3Computation of bond discount amortization
As a result, Candlestick, Inc. records the accrual of interest and amortization of bond discount on December 31 as follows.
Dec. 31 Interest Expense 10,324 Discount on Bonds Payable 324 Interest Payable 10,000 (To record accrued interest and amortization of bond discount)
Dec. 31 Interest Expense 10,358 Discount on Bonds Payable 358
Interest Payable 10,000 (To record accrued interest and amortization of bond discount)
210,324 Exp1324
110,000
Cash Flowsno effect
A SEL5 1
210,358 Exp1358
110,000
Cash Flowsno effect
A SEL5 1
For the second interest period, bond interest expense will be $10,358 ($98,324 310.5348%), and the discount amortization will be $358. At December 31, Candle-stick makes the following adjusting entry.
Amortizing Bond Premium
Continuing our example, assume Candlestick, Inc. sells the bonds described above for $102,000 rather than $98,000 (see page 652). This would result in a bond premium of $2,000 ($102,000 2 $100,000). This premium results in an effective-interest rate of approximately 9.4794%. (The effective-interest rate can be solved for using the techniques shown in Appendix G near the end of this text-book.) Illustration 15B-4 shows the bond premium amortization schedule.
Issue date12345
1
4
5
6
7
8
9
10
11
12
13
14
15
16
17
18
19
20
21
22
23
23
$2,0001,6691,307
910476–0–
InterestPeriods
(D)Unamortized
Premium(D) − (C)
(E)Bond
Carrying Value($100,000 + D)
$102,000101,669101,307100,910100,476100,000
$10,00010,00010,00010,00010,000
$50,000
$ 9,6699,6389,6039,5669,524
$48,000
(9.4794% × $102,000)(9.4794% × $101,669)(9.4794% × $101,307)(9.4794% × $100,910)(9.4794% × $100,476)
(A)Interest to
Be Paid(10% × $100,000)
(B)Interest Expense to Be Recorded
(9.4794% × PrecedingBond Carrying Value)
(C)Premium
Amortization(A) − (B)
$ 331 362 397434476
$2,000
**
CANDLESTICK, INC.Bond Premium Amortization Schedule
Effective-Interest Method—Annual Interest Payments10% Bonds Issued at 9.4794%
Formulas Data Review ViewPage LayoutInsert
AP18 fx
B C D E F
Candlestick Inc.xlsCandlestick Inc.xlsHome
Column (A) remains constant because the face value of the bonds ($100,000) is multiplied by thecontractual interest rate (10%) each period.Column (B) is computed as the carrying value of the bonds times the annual effective-interest rate (9.4794%).Column (C) indicates the premium amortization each period.Column (D) decreases each period until it reaches zero at maturity.Column (E) decreases each period until it equals face value at maturity.
*Rounded to eliminate remaining discount resulting from rounding the effective rate.
Illustration 15B-4Bond premium amortization schedule

Review and Practice 667
For the fi rst interest period, the computations of bond interest expense and the bond premium amortization are as follows.
Bond interest paid ($100,000 3 10%) $10,000Less: Bond interest expense ($102,000 3 9.4794%) 9,669
Bond premium amortization $ 331
Illustration 15B-5Computation of bond premium amortization
Dec. 31 Interest Expense 9,669 Premium on Bonds Payable 331 Interest Payable 10,000 (To record accrued interest and amortization of bond premium)
29,669 Exp2331
110,000
Cash Flowsno effect
A SEL5 1
For the second interest period, interest expense will be $9,638, and the pre-mium amortization will be $362. Note that the amount of periodic interest expense decreases over the life of the bond when companies apply the effective-interest method to bonds issued at a premium. The reason is that a constant per-centage is applied to a decreasing bond carrying value to compute interest expense. The carrying value is decreasing because of the amortization of the premium.
1 Describe the major characteristics of bonds. Bonds can have many different features and may be secured, unsecured, convertible, or callable. The terms of the bond issue are set forth in a bond indenture, and a bond certifi cate provides the specifi c information about the bond itself.
2 Explain how to account for bond transactions. When companies issue bonds, they debit Cash for the cash proceeds and credit Bonds Payable for the face value of the bonds. The account Premium on Bonds Payable shows a bond premium. Discount on Bonds Payable shows a bond discount.
When bondholders redeem bonds at maturity, the issuing company credits Cash and debits Bonds Pay-able for the face value of the bonds. When bonds are redeemed before maturity, the issuing company (a) eliminates the carrying value of the bonds at the redemp-tion date, (b) records the cash paid, and (c) recognizes the gain or loss on redemption. When bonds are con-verted to common stock, the issuing company transfers the carrying (or book) value of the bonds to appropriate paid-in capital accounts. No gain or loss is recognized.
3 Explain how to account for long-term notes payable.Each payment consists of (1) interest on the unpaid balance of the loan and (2) a reduction of loan princi-pal. The interest decreases each period, while the por-tion applied to the loan principal increases.
4 Discuss how long-term liabilities are reported and analyzed. Companies should report the nature and
amount of each long-term debt in the balance sheet or in the notes accompanying the fi nancial statements. Companies may sell bonds to investors to raise long-term capital. Bonds offer the following advantages over common stock: (a) stockholder control is not affected, (b) tax savings result, and (c) earnings per share of common stock may be higher.
Stockholders and long-term creditors are interested in a company’s long-run solvency. Debt to assets and times interest earned are two ratios that provide infor-mation about debt-paying ability and long-run solvency.
A lease grants the right to use specifi c property for a period of time in return for cash payments. For an operating lease, the lessee (renter) records lease (rental) payments as an expense. For a capital lease, the lessee records the asset and related obligation at the present value of the future lease payments.
5 Apply the straight-line method of amortizing bond discount and bond premium. The straight-line method of amortization results in a constant amount of amor-tization and interest expense per period.
6 Apply the effective-interest method of amortizing bond discount and bond premium. The effective-interest method results in varying amounts of amorti-zation and interest expense per period but a constant percentage rate of interest. When the difference between the straight-line and effective-interest method is material, GAAP requires use of the effective-interest method.
*
*
LEARNING OBJECTIVES REVIEW
REVIEW AND PRACTICE

668 15 Long-Term Liabilities
Bond certifi cate A legal document that indicates the name of the issuer, the face value of the bonds, the con-tractual interest rate, and maturity date of the bonds. (p. 646).
Bond indenture A legal document that sets forth the terms of the bond issue. (p. 646).
Bonds A form of interest-bearing notes payable issued by corporations, universities, and governmental entities. (p. 646).
Callable bonds Bonds that are subject to redemption (buy back) at a stated dollar amount prior to maturity at the option of the issuer. (p. 646).
Capital lease A contractual arrangement that transfers substantially all the benefi ts and risks of ownership to the lessee so that the lease is in effect a purchase of the property. (p. 660).
Contractual interest rate Rate used to determine the amount of cash interest the borrower pays and the investor receives. (p. 646).
Convertible bonds Bonds that permit bondholders to convert them into common stock at the bondholders’ option. (p. 646).
Debenture bonds Bonds issued against the general credit of the borrower. Also called unsecured bonds. (p. 646).
Debt to assets ratio A solvency measure that indicates the percentage of total assets provided by creditors; com-puted as total liabilities divided by total assets. (p. 658).
Discount (on a bond) The difference between the face value of a bond and its selling price, when the bond is sold for less than its face value. (p. 650).
Effective-interest method of amortization Amorti-zation of bond discount or bond premium which results in periodic interest expense equal to a constant percentage of the carrying value of the bonds. (p. 664).
Effective-interest rate Rate established when bonds are issued that maintains a constant value for interest expense as a percentage of bond carrying value in each interest period. (p. 664).
*
*
Face value Amount of principal due at the maturity date of the bond. (p. 646).
Long-term liabilities Obligations expected to be paid more than one year in the future. (p. 646).
Market interest rate The rate investors demand for loaning funds to the corporation. (p. 647).
Maturity date The date on which the fi nal payment on the bond is due from the bond issuer to the investor. (p. 646).
Mortgage bond A bond secured by real estate. (p. 646).Mortgage notes payable A long-term note secured by
a mortgage that pledges title to specifi c assets as secu-rity for a loan. (p. 656).
Operating lease A contractual arrangement giving the lessee temporary use of the property, with con-tinued ownership of the property by the lessor. (p. 660).
Premium (on a bond) The difference between the sell-ing price and the face value of a bond, when the bond is sold for more than its face value. (p. 650).
Secured bonds Bonds that have specifi c assets of the issuer pledged as collateral. (p. 646).
Sinking fund bonds Bonds secured by specifi c assets set aside to redeem them. (p. 646).
Straight-line method of amortization Allocates the same amount to interest expense in each interest period. (p. 662).
Times interest earned A solvency measure that indi-cates a company’s ability to meet interest payments; computed by dividing the sum of net income, interest expense, and income tax expense by interest expense. (p. 658).
Time value of money The relationship between time and money. A dollar received today is worth more than a dollar promised at some time in the future. (p. 647).
Unsecured bonds Bonds issued against the general credit of the borrower. Also called debenture bonds. (p. 646).
*
GLOSSARY REVIEW
1. The term used for bonds that are unsecured is:(a) callable bonds. (c) debenture bonds.(b) U.S. Treasury bonds. (d) convertible bonds.
2. The market interest rate:(a) is the contractual interest rate used to determine
the amount of cash interest paid by the borrower.(b) is listed in the bond indenture.(c) is the rate investors demand for loaning funds.(d) More than one of the above is true.
3. Karson Inc. issues 10-year bonds with a maturity value of $200,000. If the bonds are issued at a pre-mium, this indicates that:
(LO 1)
(LO 1)
(LO 2)
(a) the contractual interest rate exceeds the market interest rate.
(b) the market interest rate exceeds the contractual interest rate.
(c) the contractual interest rate and the market inter-est rate are the same.
(d) no relationship exists between the two rates. 4. Four-Nine Corporation issued bonds that pay interest
every January 1. The entry to accrue bond interest at December 31 includes a:(a) debit to Interest Payable.(b) credit to Cash.
(LO 2)
PRACTICE MULTIPLE-CHOICE QUESTIONS

(c) credit to Interest Expense.(d) credit to Interest Payable.
5. Gester Corporation redeems its $100,000 face value bonds at 105 on January 1, following the payment of annual interest. The carrying value of the bonds at the redemption date is $103,745. The entry to record the redemption will include a:(a) credit of $3,745 to Loss on Bond Redemption.(b) debit of $3,745 to Premium on Bonds Payable.(c) credit of $1,255 to Gain on Bond Redemption.(d) debit of $5,000 to Premium on Bonds Payable.
6. Colson Inc. converts $600,000 of bonds sold at face value into 10,000 shares of common stock, par value $1. Both the bonds and the stock have a market value of $760,000. What amount should be credited to Paid-in Capital in Excess of Par—Common Stock as a result of the conversion?(a) $10,000. (c) $600,000.(b) $160,000. (d) $590,000.
7. Howard Corporation issued a 20-year mortgage note payable on January 1, 2017. At December 31, 2017, the unpaid principal balance will be reported as:(a) a current liability.(b) a long-term liability.(c) part current and part long-term liability.(d) interest payable.
8. Andrews Inc. issues a $497,000, 10% 3-year mortgage note on January 1. The note will be paid in three annual installments of $200,000, each payable at the end of the year. What is the amount of interest expense that should be recognized by Andrews Inc. in the second year?(a) $16,567. (c) $34,670.(b) $49,700. (d) $346,700.
9. For 2017, Corn Flake Corporation reported net income of $300,000. Interest expense was $40,000 and income taxes were $100,000. The times interest earned was:(a) 3 times. (c) 7.5 times.(b) 4.4 times. (d) 11 times.
10. Lease A does not contain a bargain purchase option, but the lease term is equal to 90% of the estimated
(LO 2)
(LO 2)
(LO 3)
(LO 3)
(LO 4)
(LO 4)
economic life of the leased property. Lease B does not transfer ownership of the property to the lessee by the end of the lease term, but the lease term is equal to 75% of the estimated economic life of the leased prop-erty. How should the lessee classify these leases? Lease A Lease B(a) Operating lease Capital lease(b) Operating lease Operating lease(c) Capital lease Operating lease(d) Capital lease Capital lease
*11. On December 31, Hurley Corporation issues $500,000, 5-year, 12% bonds at 96 with interest payable on Decem-ber 31, 2017. The entry on December 31, 2018, to record payment of bond interest and the amortization of bond discount using the straight-line method will include a:(a) debit to Interest Expense $30,000.(b) debit to Interest Expense $60,000.(c) credit to Discount on Bonds Payable $4,000.(d) credit to Discount on Bonds Payable $2,000.
*12. For the bonds issued in Question 11, what is the carry-ing value of the bonds at the end of the third interest period?(a) $492,000. (c) $486,000.(b) $488,000. (d) $464,000.
*13. On January 1, Besalius Inc. issued $1,000,000, 9% bonds for $938,554. The market rate of interest for these bonds is 10%. Interest is payable annually on December 31. Besalius uses the effective-interest method of amortizing bond discount. At the end of the fi rst year, Besalius should report unamortized bond discount of:(a) $54,900. (c) $51,610.(b) $57,591. (d) $51,000.
*14. On December 31, Dias Corporation issued $1,000,000, 14%, 5-year bonds with interest payable annually on December 31. The bonds sold for $1,072,096. The market rate of interest for these bonds was 12%. On the fi rst interest date, using the effective-interest method, the debit entry to Interest Expense is for:(a) $120,000. (c) $128,652.(b) $125,581. (d) $140,000.
(LO 5)
(LO 5)
(LO 6)
(LO 6)
Practice Multiple-Choice Questions 669
Solutions
1. (c) Debenture bonds are not secured by any collateral. The other choices are incorrect because (a) callable bonds can be paid off or retired by the issuer before they reach their maturity date, (b) U.S. Treasury bonds are secured by the federal government, and (d) convertible bonds permit bondholders to convert them into common stock at the bondholders’ option.
2. (c) Market interest rate is the rate investors demand for loaning funds. The other choices are incorrect because (a) market inter-est rate is the same as contractual interest rate only if bonds sell at face value (par value) and (b) the contractual interest rate, not the market interest rate, is listed in the bond indenture. Choice (d) is wrong as there is only one correct answer.
3. (a) When bonds are issued at a premium, this indicates that the contractual interest rate is higher than the market interest rate. The other choices are incorrect because (b) when the market interest rate exceeds the contractual interest rate, bonds are sold at a discount; (c) when the contractual interest rate and the market interest rate are the same, bonds will be issued at par; and (d) the relationship between the market rate of interest and the contractual rate of interest determines whether bonds are issued at par, a discount, or a premium.
4. (d) The adjusting entry to accrue bond interest at December 31 includes a debit to Interest Expense and credit to Interest Pay-able. The other choices are therefore incorrect.
5. (b) The entry to record the retirement of bonds will include a debit to Bonds Payable of $100,000, a debit to Premium on Bonds Payable of $3,745 ($103,745 2 $100,000), a credit to Cash of $105,000 ($100,000 3 1.05) and a debit to Loss on Bond Redemption of $1,255 ($105,000 2 $103,745). The other choices are therefore incorrect.

670 15 Long-Term Liabilities
6. (d) First, the market value in this transaction is ignored. Bonds Payable will be debited for $600,000; Common Stock will be credited for $10,000 since this account is always credited for shares issued (10,000) times par value ($1). The remaining amount, $590,000 ($600,000 2 $10,000) is credited to Paid-in Capital in Excess of Par–Common Stock, not (a) $10,000, (b) $160,000, or (c) $600,000.
7. (c) Howard Corporation reports the reduction in principal for the next year as a current liability, and it classifi es the remaining unpaid principal balance as a long-term liability. The other choices are therefore incorrect.
8. (c) In the fi rst year, Andrews will recognize $49,700 of interest expense ($497,000 3 10%). After the fi rst payment is made, the amount remaining on the note will be $346,700 [$497,000 principal 2 ($200,000 payment 2 $49,700 interest)]. The remaining balance ($346,700) is multiplied by the interest rate (10%) to compute the interest expense to be recognized for the second year, $34,670 ($346,700 3 10%), not (a) $16,567, (b) $49,700, or (d) $346,700.
9. (d) Times interest earned 5 Net income 1 Interest expense 1 Income tax expense ($300,000 1 $40,000 1 $100,000 5 $440,000) divided by Interest expense ($40,000), which equals 11 times, not (a) 3, (b) 4.4, or (c) 7.5 times.
10. (d) Both leases should be classifi ed as capital leases because both lease terms are greater than or equal to 75% of the economic life of the respective assets. The other choices are therefore incorrect.
11. (c) [$500,000 2 (96% 3 $500,000)] 5 $20,000; $20,000 4 5 5 $4,000 of discount to amortize annually. As a result, the entry would involve a credit to Discount on Bonds Payable $4,000. The other choices are therefore incorrect.
12. (a) The carrying value of bonds increases by the amount of the periodic discount amortization. Discount amortization using the straight-line method is $4,000 each period. Total discount amortization for three periods is $12,000 ($4,000 3 3 periods) which is added to the initial carrying value ($480,000) to arrive at $492,000, the carrying value at the end of the third interest period, not (b) $488,000, (c) $486,000, or (d) $464,000.
13. (b) The beginning balance of unamortized discount is $61,446 ($1,000,000 2 $938,554). The discount amortization is $3,855, the difference between the cash interest payment of $90,000 ($1,000,000 3 9%) and the interest expense recorded of $93,855 ($938,554 3 10%). This discount amortization ($3,855) is then subtracted from the beginning balance of unamortized discount ($61,446), to arrive at a balance of $57,591 at the end of the fi rst year, not (a) $54,900, (c) $51,610, or (d) $51,000.
14. (c) The debit to Interest Expense 5 $1,072,096 (initial carrying value of bond) 3 12% (market rate) 5 $128,652, not (a) $120,000, (b) $125,581, or (d) $140,000.
*
*
*
*
1. North Airlines Company issued $900,000 of 8%, 10-year bonds on January 1, 2017, at face value. Interest is payable annually on January 1.
InstructionsPrepare the journal entries to record the following events.
(a) The issuance of the bonds.
(b) The accrual of interest on December 31.
(c) The payment of interest on January 1, 2018.
(d) The redemption of bonds at maturity, assuming interest for the last interest period has been paid and recorded.
Prepare entries for bonds issued at face value.
(LO 2)
PRACTICE EXERCISES
1. (a) January 1, 2017 Cash 900,000 Bonds Payable 900,000
(b) December 31, 2017 Interest Expense 72,000 Interest Payable ($900,000 3 8%) 72,000
(c) January 1, 2018 Interest Payable 72,000 Cash 72,000
(d) January 1, 2027 Bonds Payable 900,000 Cash 900,000
Solution

2. Hollenbeck Company issued $3,000,000 of bonds on January 1, 2017.
Instructions(a) Prepare the journal entry to record the issuance of the bonds if they are issued at
(1) 100, (2) 98, and (3) 103.
(b) Prepare the journal entry to record the retirement of the bonds at maturity, assuming the bonds were issued at 100.
(c) Prepare the journal entry to record the retirement of the bonds before maturity at 98. Assume the balance in Premium on Bonds Payable is $18,000.
(d) Prepare the journal entry to record the conversion of the bonds into 70,000 shares of $1 par value common stock. Assume the bonds were issued at par.
Prepare entries for issuance, retirement, and conversion of bonds.
(LO 2)
3. Clipper Company borrowed $500,000 on December 31, 2017, by issuing a $500,000, 7% mortgage note payable. The terms call for annual installment payments of $80,000 on December 31.
Instructions(a) Prepare the journal entries to record the mortgage loan and the fi rst two installment
payments.
(b) Indicate the amount of mortgage note payable to be reported as a current liability and as a long-term liability at December 31, 2018.
Prepare entries to record mortgage note and installment payments.
(LO 3)
3. (a) December 31, 2017 Cash 500,000 Mortgage Payable 500,000
December 31, 2018
Interest Expense ($500,000 3 7%) 35,000 Mortgage Payable 45,000 Cash 80,000
December 31, 2019
Interest Expense [($500,000 2 $45,000) 3 7%] 31,850 Mortgage Payable 48,150 Cash 80,000
(b) Current: $48,150 Long-term: $406,850 ($500,000 2 $45,000 2 $48,150)
Solution
At 1002. (a) (1) Cash ($3,000,000 3 100%) 3,000,000 Bonds Payable 3,000,000
At 98 (2) Cash ($3,000,000 3 98%) 2,940,000 Discount on Bonds Payable 60,000 Bonds Payable 3,000,000
At 103 (3) Cash ($3,000,000 3 103%) 3,090,000 Bonds Payable 3,000,000 Premium on Bonds Payable 90,000
(b) Bonds Payable 3,000,000 Cash 3,000,000
(c) Bonds Payable 3,000,000 Premium on Bonds Payable 18,000 Cash ($3,000,000 3 98%) 2,940,000 Gain on Bond Redemption 78,000
(d) Bonds Payable 3,000,000 Common Stock (70,000 3 $1) 70,000 Paid-in Capital in Excess of Par—Common Stock 2,930,000
Solution
Practice Exercises 671
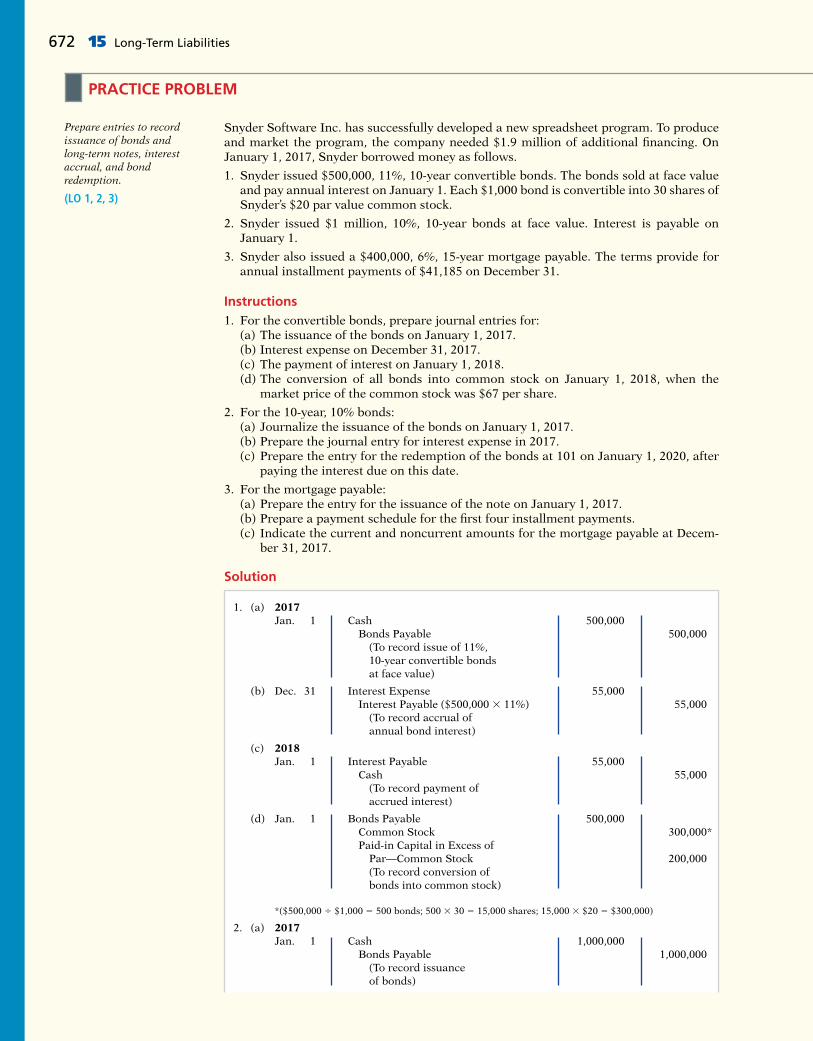
672 15 Long-Term Liabilities
Snyder Software Inc. has successfully developed a new spreadsheet program. To produce and market the program, the company needed $1.9 million of additional fi nancing. On January 1, 2017, Snyder borrowed money as follows.
1. Snyder issued $500,000, 11%, 10-year convertible bonds. The bonds sold at face value and pay annual interest on January 1. Each $1,000 bond is convertible into 30 shares of Snyder’s $20 par value common stock.
2. Snyder issued $1 million, 10%, 10-year bonds at face value. Interest is payable on January 1.
3. Snyder also issued a $400,000, 6%, 15-year mortgage payable. The terms provide for annual installment payments of $41,185 on December 31.
Instructions1. For the convertible bonds, prepare journal entries for: (a) The issuance of the bonds on January 1, 2017. (b) Interest expense on December 31, 2017. (c) The payment of interest on January 1, 2018. (d) The conversion of all bonds into common stock on January 1, 2018, when the
market price of the common stock was $67 per share.
2. For the 10-year, 10% bonds: (a) Journalize the issuance of the bonds on January 1, 2017. (b) Prepare the journal entry for interest expense in 2017. (c) Prepare the entry for the redemption of the bonds at 101 on January 1, 2020, after
paying the interest due on this date.
3. For the mortgage payable: (a) Prepare the entry for the issuance of the note on January 1, 2017. (b) Prepare a payment schedule for the fi rst four installment payments. (c) Indicate the current and noncurrent amounts for the mortgage payable at Decem-
ber 31, 2017.
PRACTICE PROBLEM
Prepare entries to record issuance of bonds and long-term notes, interest accrual, and bond redemption.
(LO 1, 2, 3)
1. (a) 2017 Jan. 1 Cash 500,000 Bonds Payable 500,000 (To record issue of 11%,
10-year convertible bonds at face value)
(b) Dec. 31 Interest Expense 55,000 Interest Payable ($500,000 3 11%) 55,000 (To record accrual of
annual bond interest)
(c) 2018 Jan. 1 Interest Payable 55,000 Cash 55,000 (To record payment of
accrued interest)
(d) Jan. 1 Bonds Payable 500,000 Common Stock 300,000* Paid-in Capital in Excess of Par—Common Stock 200,000 (To record conversion of
bonds into common stock)
*($500,000 4 $1,000 5 500 bonds; 500 3 30 5 15,000 shares; 15,000 3 $20 5 $300,000)
2. (a) 2017 Jan. 1 Cash 1,000,000 Bonds Payable 1,000,000 (To record issuance
of bonds)
Solution

Questions 673
(b) 2017 Dec. 31 Interest Expense 100,000 Interest Payable ($1,000,000 3 10%) 100,000 (To record accrual of
annual interest)
(c) 2020 Jan. 1 Bonds Payable 1,000,000 Loss on Bond Redemption 10,000* Cash 1,010,000 (To record redemption
of bonds at 101)
*($1,010,000 2 $1,000,000)
3. (a) 2017Jan. 1 Cash 400,000
Mortgage Payable 400,000 (To record issuance of
mortgage payable)
(b) Interest Cash Interest Reduction Principal Period Payment Expense of Principal Balance
Issue date $400,000 1 $41,185 $24,000 $17,185 382,815 2 41,185 22,969 18,216 364,599 3 41,185 21,876 19,309 345,290 4 41,185 20,717 20,468 324,822
(c) Current liability: $18,216 Long-term liability: $364,599
Brief Exercises, Exercises, DO IT! Exercises, and Problems and many additional resources are available for practice in WileyPLUS
QUESTIONS
1. (a) What are long-term liabilities? Give three exam-ples. (b) What is a bond?
2. Contrast the following types of bonds: (a) secured and unsecured, and (b) convertible and callable.
3. The following terms are important in issuing bonds: (a) face value, (b) contractual interest rate, (c) bond indenture, and (d) bond certifi cate. Explain each of these terms.
4. Describe the two major obligations incurred by a company when bonds are issued.
5. Assume that Remington Inc. sold bonds with a face value of $100,000 for $104,000. Was the market inter-est rate equal to, less than, or greater than the bonds’ contractual interest rate? Explain.
6. If a 7%, 10-year, $800,000 bond is issued at face value and interest is paid annually, what is the amount of the interest payment at the end of the fi rst year period?
7. If the Bonds Payable account has a balance of $900,000 and the Discount on Bonds Payable account has a balance of $120,000, what is the carrying value of the bonds?
8. Which accounts are debited and which are credited if a bond issue originally sold at a premium is redeemed
before maturity at 97 immediately following the pay-ment of interest?
9. Rattigan Corporation is considering issuing a convert-ible bond. What is a convertible bond? Discuss the advantages of a convertible bond from the standpoint of (a) the bondholders and (b) the issuing corporation.
10. Rob Grier, a friend of yours, has recently purchased a home for $125,000, paying $25,000 down and the remainder fi nanced by a 10.5%, 20-year mortgage, pay-able at $998.38 per month. At the end of the fi rst month, Rob receives a statement from the bank indicating that only $123.38 of principal was paid during the month. At this rate, he calculates that it will take over 67 years to pay off the mortgage. Is he right? Discuss.
11. In general, what are the requirements for the fi nan-cial statement presentation of long-term liabilities?
12. (a) As a source of long-term fi nancing, what are the major advantages of bonds over common stock? (b) What are the major disadvantages in using bonds for long-term fi nancing?
13. (a) What is a lease agreement? (b) What are the two most common types of leases? (c) Distinguish between the two types of leases.
NOTE: All asterisked Questions, Exercises, and Problems relate to material in the appendices to the chapter.

674 15 Long-Term Liabilities
14. Jhutti Company rents a warehouse on a month-to-month basis for the storage of its excess inventory. The company periodically must rent space when its production greatly exceeds actual sales. What is the nature of this type of lease agreement and what accounting treatment should be used?
15. Benedict Company entered into an agreement to lease 12 computers from Haley Electronics, Inc. The pres-ent value of the lease payments is $186,300. Assuming that this is a capital lease, what entry would Benedict Company make on the date of the lease agreement?
16. Did Apple redeem any of its debt during the fi scal year ended September 28, 2013? (Hint: Examine Apple’s statement of cash fl ows.)
*17. Explain the straight-line method of amortizing dis-count and premium on bonds payable.
*18. DeWeese Corporation issues $400,000 of 8%, 5-year bonds on January 1, 2017, at 105. Assuming that the straight-line method is used to amortize the premium, what is the total amount of interest expense for 2017?
*19. Kelli Deane is discussing the advantages of the effective- interest method of bond amortization with her accounting staff. What do you think Kelli is saying?
*20. Windsor Corporation issues $500,000 of 9%, 5-year bonds on January 1, 2017, at 104. If Windsor uses the effective-interest method in amortizing the premium, will the annual interest expense increase or decrease over the life of the bonds? Explain.
BRIEF EXERCISES
BE15-1 Randle Inc. issues $300,000, 10-year, 8% bonds at 98. Prepare the journal entry to record the sale of these bonds on March 1, 2017.
BE15-2 Price Company issues $400,000, 20-year, 7% bonds at 101. Prepare the journal entry to record the sale of these bonds on June 1, 2017.
BE15-3 Meera Corporation issued 4,000, 8%, 5-year, $1,000 bonds dated January 1, 2017, at 100. Interest is paid each January 1.
(a) Prepare the journal entry to record the sale of these bonds on January 1, 2017.(b) Prepare the adjusting journal entry on December 31, 2017, to record interest expense.(c) Prepare the journal entry on January 1, 2018, to record interest paid.
BE15-4 Nasreen Company issues $2 million, 10-year, 8% bonds at 97, with interest pay-able each January 1.
(a) Prepare the journal entry to record the sale of these bonds on January 1, 2017.(b) Assuming instead that the above bonds sold for 104, prepare the journal entry to
record the sale of these bonds on January 1, 2017.
BE15-5 Frankum Company has issued three different bonds during 2017. Interest is pay-able annually on each of these bonds.
1. On January 1, 2017, 1,000, 8%, 5-year, $1,000 bonds dated January 1, 2017, were issued at face value.
2. On July 1, $900,000, 9%, 5-year bonds dated July 1, 2017, were issued at 102.3. On September 1, $400,000, 7%, 5-year bonds dated September 1, 2017, were issued at 98.
Prepare the journal entry to record each bond transaction at the date of issuance.
BE15-6 The balance sheet for Miley Consulting reports the following information on July 1, 2017.
Long-term liabilities Bonds payable $1,000,000 Less: Discount on bonds payable 60,000 $940,000
Miley decides to redeem these bonds at 101 after paying annual interest. Prepare the jour-nal entry to record the redemption on July 1, 2017.
BE15-7 Hanschu Inc. issues an $800,000, 10%, 10-year mortgage note on December 31, 2017, to obtain fi nancing for a new building. The terms provide for annual installment payments of $130,196. Prepare the entry to record the mortgage loan on December 31, 2017, and the fi rst installment payment on December 31, 2018.
Prepare entry for bonds issued.
(LO 2)Prepare entry for bonds issued.
(LO 2)Prepare entries for bonds issued at face value.
(LO 2)
Prepare entries for bonds sold at a discount and a premium.
(LO 2)
Prepare entries for bonds issued.
(LO 2)
Prepare entry for redemption of bonds.
(LO 2)
Prepare entries for long-term notes payable.
(LO 3)

Brief Exercises 675
BE15-8 Presented below are long-term liability items for Lind Company at December 31, 2017. Prepare the long-term liabilities section of the balance sheet for Lind Company.
Bonds payable, due 2019 $600,000Lease liability 70,000Notes payable, due 2022 80,000Discount on bonds payable 45,000
BE15-9 Moby Inc. is considering two alternatives to fi nance its construction of a new $2 million plant.
(a) Issuance of 200,000 shares of common stock at the market price of $10 per share.(b) Issuance of $2 million, 8% bonds at face value.
Complete the following table, and indicate which alternative is preferable.
Issue Stock Issue Bond
Income before interest and taxes $700,000 $700,000Interest expense from bonds
Income before income taxesIncome tax expense (30%)
Net income $ $
Outstanding shares 500,000Earnings per share
BE15-10 Prepare the journal entries that the lessee should make to record the following transactions.
1. The lessee makes a lease payment of $80,000 to the lessor in an operating lease trans-action.
2. Imhoff Company leases a new building from Noble Construction, Inc. The present value of the lease payments is $700,000. The lease qualifi es as a capital lease.
*BE15-11 Sweetwood Company issues $5 million, 10-year, 9% bonds at 96, with interest payable annually on January 1. The straight-line method is used to amortize bond discount.
(a) Prepare the journal entry to record the sale of these bonds on January 1, 2017.(b) Prepare the adjusting journal entry to record interest expense and bond discount
amortization on December 31, 2017.
*BE15-12 Golden Inc. issues $4 million, 5-year, 10% bonds at 102, with interest payable annually on January 1. The straight-line method is used to amortize bond premium.
(a) Prepare the journal entry to record the sale of these bonds on January 1, 2017.(b) Prepare the adjusting journal entry to record interest expense and bond premium
amortization on December 31, 2017.
*BE15-13 Presented below is the partial bond discount amortization schedule for Gomez Corp. Gomez uses the effective-interest method of amortization.
Interest Bond Interest to Expense to Discount Unamortized CarryingInterest Periods Be Paid Be Recorded Amortization Discount Value
Issue date $38,609 $961,391 1 $45,000 $48,070 $3,070 35,539 964,461 2 45,000 48,223 3,223 32,316 967,684
(a) Prepare the journal entry to record the payment of interest and the discount amortiza-tion at the end of period 1.
(b) Explain why interest expense is greater than interest paid.(c) Explain why interest expense will increase each period.
Prepare statement presentation of long-term liabilities.
(LO 4)
Compare bond versus stock fi nancing.
(LO 4)
Contrast accounting for operating and capital leases.
(LO 4)
Prepare entries for bonds issued at a discount.
(LO 5)
Prepare entries for bonds issued at a premium.
(LO 5)
Use effective-interest method of bond amortization.
(LO 2, 6)

676 15 Long-Term Liabilities
State whether each of the following statements is true or false.
_______ 1. Mortgage bonds and sinking fund bonds are both examples of debenture bonds.
_______ 2. Convertible bonds are also known as callable bonds.
_______ 3. The market rate is the rate investors demand for loaning funds.
_______ 4. Annual interest on bonds is equal to the face value times the stated rate.
_______ 5. The present value of a bond is the value at which it should sell in the market.
Eubank Corporation issues $500,000 of bonds for $520,000. (a) Prepare the journal entry to record the issuance of the bonds, and (b) show how the bonds would be reported on the balance sheet at the date of issuance.
Prater Corporation issued $400,000 of 10-year bonds at a discount. Prior to maturity, when the carrying value of the bonds was $390,000, the company redeemed the bonds at 99. Prepare the entry to record the redemption of the bonds.
Detwiler Orchard issues a $700,000, 6%, 15-year mortgage note to obtain needed fi nancing for a new lab. The terms call for annual payments of $72,074 each. Pre-pare the entries to record the mortgage loan and the fi rst installment payment.
Huebner Corporation leases new equipment on December 31, 2017. The lease transfers ownership of the equipment to Huebner at the end of the lease. The present value of the lease payments is $192,000. After recording this lease, Huebner has assets of $1,800,000, liabilities of $1,100,000, and stockholders’ equity of $700,000. (a) Prepare the entry to record the lease, and (b) compute and discuss the debt to assets ratio at year-end.
Evaluate statements about bonds.
(LO 1)
Prepare journal entry for bond issuance and show balance sheet presentation.
(LO 2)
Prepare entry for bond redemption.
(LO 2)Prepare entries for mortgage note and installment payment on note.
(LO 3)
Prepare entry for lease, and compute debt to assets ratio.
(LO 4)
DO IT! Exercises
DO IT! 15-1
DO IT! 15-2a
DO IT! 15-2b
DO IT! 15-3
DO IT! 15-4
EXERCISES
E15-1 Nick Bosch has prepared the following list of statements about bonds.
1. Bonds are a form of interest-bearing notes payable.2. Secured bonds have specifi c assets of the issuer pledged as collateral for the bonds.3. Secured bonds are also known as debenture bonds.4. A conversion feature may be added to bonds to make them more attractive to bond
buyers.5. The rate used to determine the amount of cash interest the borrower pays is called the
stated rate.6. Bond prices are usually quoted as a percentage of the face value of the bond.7. The present value of a bond is the value at which it should sell in the marketplace.
InstructionsIdentify each statement as true or false. If false, indicate how to correct the statement.
E15-2 On January 1, 2017, Klosterman Company issued $500,000, 10%, 10-year bonds at face value. Interest is payable annually on January 1.
InstructionsPrepare journal entries to record the following.
(a) The issuance of the bonds.(b) The accrual of interest on December 31, 2017.(c) The payment of interest on January 1, 2018.
E15-3 On January 1, 2017, Forrester Company issued $400,000, 8%, 5-year bonds at face value. Interest is payable annually on January 1.
InstructionsPrepare journal entries to record the following.
Prepare entries for issuance of bonds, and payment and accrual of bond interest.
(LO 2)
Prepare entries for bonds issued at face value.
(LO 2)
Evaluate statements about bonds.
(LO 1)

Exercises 677
(a) The issuance of the bonds.(b) The accrual of interest on December 31, 2017.(c) The payment of interest on January 1, 2018.
E15-4 Laudie Company issued $400,000 of 9%, 10-year bonds on January 1, 2017, at face value. Interest is payable annually on January 1, 2018.
InstructionsPrepare the journal entries to record the following events.
(a) The issuance of the bonds.(b) The accrual of interest on December 31, 2017.(c) The payment of interest on January 1, 2018.(d) The redemption of bonds at maturity, assuming interest for the last interest period has
been paid and recorded.
E15-5 Swisher Company issued $2,000,000 of bonds on January 1, 2017.
Instructions(a) Prepare the journal entry to record the issuance of the bonds if they are issued at
(1) 100, (2) 98, and (3) 103.(b) Prepare the journal entry to record the redemption of the bonds at maturity, assuming
the bonds were issued at 100.(c) Prepare the journal entry to record the redemption of the bonds before maturity at 98.
Assume the balance in Premium on Bonds Payable is $9,000.(d) Prepare the journal entry to record the conversion of the bonds into 60,000 shares of
$10 par value common stock. Assume the bonds were issued at par.
E15-6 Whitmore Company issued $500,000 of 5-year, 8% bonds at 97 on January 1, 2017. The bonds pay interest annually.
Instructions(a) (1) Prepare the journal entry to record the issuance of the bonds. (2) Compute the total cost of borrowing for these bonds.(b) Repeat the requirements from part (a), assuming the bonds were issued at 105.
E15-7 The following section is taken from Ohlman Corp.’s balance sheet at December 31, 2016.
Current liabilities Interest payable $ 112,000Long-term liabilities Bonds payable, 7%, due January 1, 2021 1,600,000
Bond interest is payable annually on January 1. The bonds are callable on any interest date.
Instructions(a) Journalize the payment of the bond interest on January 1, 2017.(b) Assume that on January 1, 2017, after paying interest, Ohlman calls bonds having a
face value of $600,000. The call price is 103. Record the redemption of the bonds.(c) Prepare the entry to record the accrual of interest on December 31, 2017.
E15-8 Presented below and on page 678 are three independent situations.
1. Longbine Corporation redeemed $130,000 face value, 12% bonds on June 30, 2017, at 102. The carrying value of the bonds at the redemption date was $117,500. The bonds pay annual interest, and the interest payment due on June 30, 2017, has been made and recorded.
2. Tastove Inc. redeemed $150,000 face value, 12.5% bonds on June 30, 2017, at 98. The carrying value of the bonds at the redemption date was $151,000. The bonds pay annual interest, and the interest payment due on June 30, 2017, has been made and recorded.
3. Precision Company has $80,000, 8%, 12-year convertible bonds outstanding. These bonds were sold at face value and pay annual interest on December 31 of each year. The bonds are convertible into 30 shares of Precision $5 par value common stock for each
Prepare entries for bonds issued at face value.
(LO 2)
Prepare entries for issuance, redemption, and conversion of bonds.
(LO 2)
Prepare entries to record issuance of bonds at discount and premium.
(LO 2)
Prepare entries for bond interest and redemption.
(LO 2)
Prepare entries for redemption of bonds and conversion of bonds into common stock.
(LO 2)

678 15 Long-Term Liabilities
$1,000 worth of bonds. On December 31, 2017, after the bond interest has been paid, $20,000 face value bonds were converted. The market price of Precision common stock was $44 per share on December 31, 2017.
InstructionsFor each independent situation above, prepare the appropriate journal entry for the redemption or conversion of the bonds.
E15-9 Jernigan Co. receives $300,000 when it issues a $300,000, 10%, mortgage note pay-able to fi nance the construction of a building at December 31, 2017. The terms provide for annual installment payments of $50,000 on December 31.
InstructionsPrepare the journal entries to record the mortgage loan and the fi rst two payments.
E15-10 Dreiling Company borrowed $300,000 on January 1, 2017, by issuing a $300,000, 8% mortgage note payable. The terms call for annual installment payments of $40,000 on December 31.
Instructions(a) Prepare the journal entries to record the mortgage loan and the fi rst two installment
payments.(b) Indicate the amount of mortgage note payable to be reported as a current liability and
as a long-term liability at December 31, 2017.
E15-11 The adjusted trial balance for Karr Farm Corporation at the end of the current year contained the following accounts.
Interest Payable $ 9,000Lease Liability 89,500Bonds Payable, due 2022 180,000Premium on Bonds Payable 32,000
InstructionsPrepare the long-term liabilities section of the balance sheet.
E15-12 Gilliland Airlines is considering two alternatives for the fi nancing of a purchase of a fl eet of airplanes. These two alternatives are:
1. Issue 90,000 shares of common stock at $30 per share. (Cash dividends have not been paid nor is the payment of any contemplated.)
2. Issue 10%, 10-year bonds at face value for $2,700,000.
It is estimated that the company will earn $800,000 before interest and taxes as a result of this purchase. The company has an estimated tax rate of 30% and has 120,000 shares of common stock outstanding prior to the new fi nancing.
InstructionsDetermine the effect on net income and earnings per share for these two methods of fi nancing.
E15-13 Hatfield Corporation reports the following amounts in its 2017 financial statements:
At December 31, 2017 For the Year 2017
Total assets $1,000,000Total liabilities 580,000Total stockholders’ equity ?Interest expense $ 20,000Income tax expense 100,000Net income 150,000
Instructions(a) Compute the December 31, 2017, balance in stockholders’ equity.(b) Compute the debt to assets ratio at December 31, 2017.(c) Compute times interest earned for 2017.
Prepare entries to record mortgage note and payments.
(LO 3)
Prepare entries to record mortgage note and installment payments.
(LO 3)
Prepare long-term liabilities section.
(LO 4)
Compare two alternatives of fi nancing—issuance of common stock vs. issuance of bonds.
(LO 4)
Compute debt to assets ratio and times interest earned.
(LO 4)
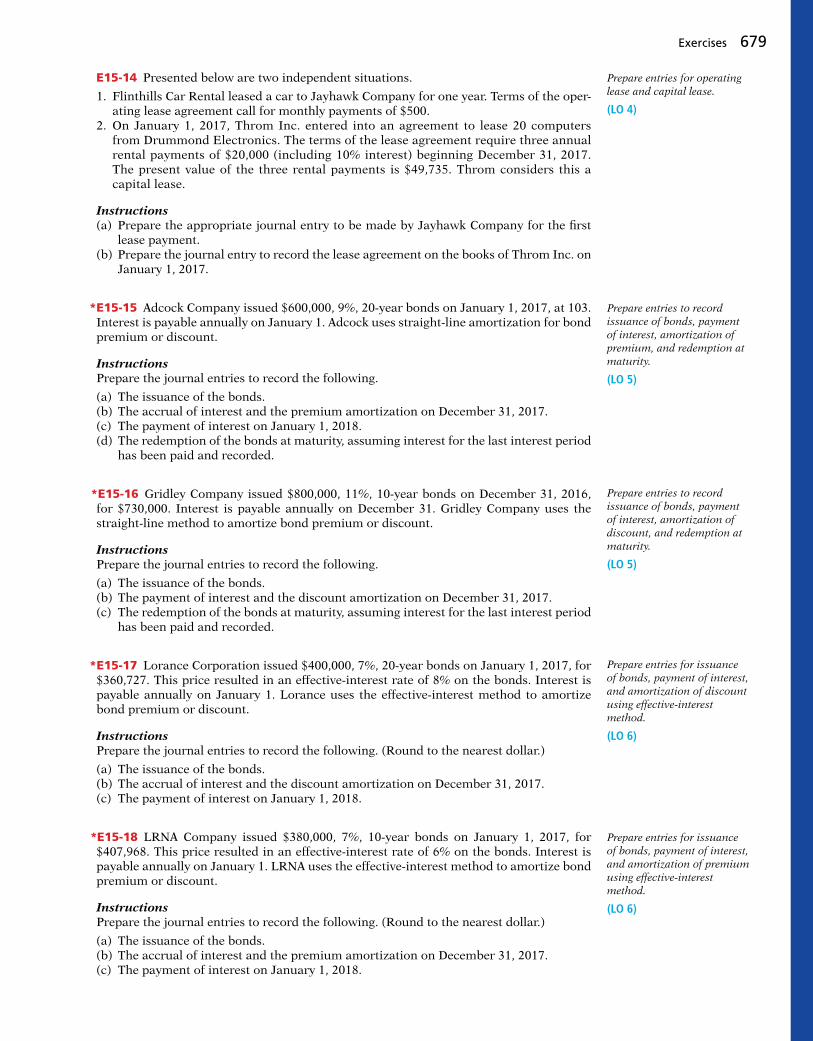
Exercises 679
E15-14 Presented below are two independent situations.
1. Flinthills Car Rental leased a car to Jayhawk Company for one year. Terms of the oper-ating lease agreement call for monthly payments of $500.
2. On January 1, 2017, Throm Inc. entered into an agreement to lease 20 computers from Drummond Electronics. The terms of the lease agreement require three annual rental payments of $20,000 (including 10% interest) beginning December 31, 2017. The present value of the three rental payments is $49,735. Throm considers this a capital lease.
Instructions(a) Prepare the appropriate journal entry to be made by Jayhawk Company for the fi rst
lease payment.(b) Prepare the journal entry to record the lease agreement on the books of Throm Inc. on
January 1, 2017.
*E15-15 Adcock Company issued $600,000, 9%, 20-year bonds on January 1, 2017, at 103. Interest is payable annually on January 1. Adcock uses straight-line amortization for bond premium or discount.
InstructionsPrepare the journal entries to record the following.
(a) The issuance of the bonds.(b) The accrual of interest and the premium amortization on December 31, 2017.(c) The payment of interest on January 1, 2018.(d) The redemption of the bonds at maturity, assuming interest for the last interest period
has been paid and recorded.
*E15-16 Gridley Company issued $800,000, 11%, 10-year bonds on December 31, 2016, for $730,000. Interest is payable annually on December 31. Gridley Company uses the straight-line method to amortize bond premium or discount.
InstructionsPrepare the journal entries to record the following.
(a) The issuance of the bonds.(b) The payment of interest and the discount amortization on December 31, 2017.(c) The redemption of the bonds at maturity, assuming interest for the last interest period
has been paid and recorded.
*E15-17 Lorance Corporation issued $400,000, 7%, 20-year bonds on January 1, 2017, for $360,727. This price resulted in an effective-interest rate of 8% on the bonds. Interest is payable annually on January 1. Lorance uses the effective-interest method to amortize bond premium or discount.
InstructionsPrepare the journal entries to record the following. (Round to the nearest dollar.)
(a) The issuance of the bonds.(b) The accrual of interest and the discount amortization on December 31, 2017.(c) The payment of interest on January 1, 2018.
*E15-18 LRNA Company issued $380,000, 7%, 10-year bonds on January 1, 2017, for $407,968. This price resulted in an effective-interest rate of 6% on the bonds. Interest is payable annually on January 1. LRNA uses the effective-interest method to amortize bond premium or discount.
InstructionsPrepare the journal entries to record the following. (Round to the nearest dollar.)
(a) The issuance of the bonds.(b) The accrual of interest and the premium amortization on December 31, 2017.(c) The payment of interest on January 1, 2018.
Prepare entries for operating lease and capital lease.
(LO 4)
Prepare entries to record issuance of bonds, payment of interest, amortization of premium, and redemption at maturity.
(LO 5)
Prepare entries to record issuance of bonds, payment of interest, amortization of discount, and redemption at maturity.
(LO 5)
Prepare entries for issuance of bonds, payment of interest, and amortization of discount using effective-interest method.
(LO 6)
Prepare entries for issuance of bonds, payment of interest, and amortization of premium using effective-interest method.
(LO 6)

680 15 Long-Term Liabilities
EXERCISES: SET B AND CHALLENGE EXERCISES
Visit the book’s companion website, at www.wiley.com/college/weygandt, and choose the Student Companion site to access Exercises: Set B and Challenge Exercises.
PROBLEMS: SET A
P15-1A On May 1, 2017, Herron Corp. issued $600,000, 9%, 5-year bonds at face value. The bonds were dated May 1, 2017, and pay interest annually on May 1. Financial state-ments are prepared annually on December 31.
Instructions(a) Prepare the journal entry to record the issuance of the bonds.(b) Prepare the adjusting entry to record the accrual of interest on December 31, 2017.(c) Show the balance sheet presentation on December 31, 2017.(d) Prepare the journal entry to record payment of interest on May 1, 2018.(e) Prepare the adjusting entry to record the accrual of interest on December 31, 2018.(f) Assume that on January 1, 2019, Herron pays the accrual bond interest and calls the
bonds. The call price is 102. Record the payment of interest and redemption of the bonds.
P15-2A Kershaw Electric sold $6,000,000, 10%, 10-year bonds on January 1, 2017. The bonds were dated January 1, 2017, and paid interest on January 1. The bonds were sold at 98.
Instructions(a) Prepare the journal entry to record the issuance of the bonds on January 1, 2017.(b) At December 31, 2017, $8,000 of the Discount on Bonds Payable account has been
amortized. Show the balance sheet presentation of the long-term liability at December 31, 2017.
(c) On January 1, 2019, when the carrying value of the bonds was $5,896,000, the com-pany redeemed the bonds at 102. Record the redemption of the bonds assuming that interest for the period has already been paid.
P15-3A The following section is taken from Mareska’s balance sheet at December 31, 2017.
Current liabilities Interest payable $ 40,000Long-term liabilities Bonds payable (8%, due January 1, 2021) 500,000
Interest is payable annually on January 1. The bonds are callable on any annual interest date.
Instructions(a) Journalize the payment of the bond interest on January 1, 2018.(b) Assume that on January 1, 2018, after paying interest, Mareska calls bonds having a
face value of $200,000. The call price is 103. Record the redemption of the bonds.(c) Prepare the adjusting entry on December 31, 2018, to accrue the interest on the
remaining bonds.
P15-4A Talkington Electronics issues a $400,000, 8%, 15-year mortgage note on Decem-ber 31, 2016. The proceeds from the note are to be used in fi nancing a new research labo-ratory. The terms of the note provide for annual installment payments, exclusive of real estate taxes and insurance, of $59,612. Payments are due on December 31.
Instructions(a) Prepare an installment payments schedule for the fi rst 4 years.(b) Prepare the entries for (1) the loan and (2) the fi rst installment payment.
Prepare entries to record issuance of bonds, interest accrual, and bond redemption.
(LO 2, 4)
(d) Int. exp. $18,000
Prepare entries to record issuance of bonds, interest accrual, and bond redemption.
(LO 2, 4)
(c) Loss $224,000
Prepare entries for interest payment, bond redemption, and interest accrual.
(LO 2)
Prepare installment payments schedule and journal entries for a mortgage note payable.
(LO 3, 4)
(b) December 31 debit Mortgage Payable $27,612

Problems: Set A 681
(c) Show how the total mortgage liability should be reported on the balance sheet at December 31, 2017.
P15-5A Presented below are three different lease transactions that occurred for Ruggiero Inc. in 2017. Assume that all lease contracts start on January 1, 2017. In no case does Rug-giero receive title to the properties leased during or at the end of the lease term.
Lessor
Judson Delivery Hester Co. Gunselman Auto
Type of property Computer Delivery equipment AutomobileYearly rental $ 5,000 $ 4,200 $ 3,700Lease term 6 years 4 years 2 yearsEstimated economic life 7 years 7 years 5 yearsFair value of lease asset $27,500 $19,000 $11,000Present value of the lease rental payments $26,000 $13,000 $ 6,400Bargain purchase option None None None
Instructions(a) Which of the leases are operating leases and which are capital leases? Explain.(b) How should the lease transaction for Hester Co. be recorded in 2017?(c) How should the lease transaction for Judson Delivery be recorded on January 1,
2017?
*P15-6A Paris Electric sold $3,000,000, 10%, 10-year bonds on January 1, 2017. The bonds were dated January 1 and pay interest annually on January 1. Paris Electric uses the straight-line method to amortize bond premium or discount. The bonds were sold at 104.
Instructions(a) Prepare the journal entry to record the issuance of the bonds on January 1, 2017.(b) Prepare a bond premium amortization schedule for the fi rst 4 interest periods.(c) Prepare the journal entries for interest and the amortization of the premium in 2017
and 2018.(d) Show the balance sheet presentation of the bond liability at December 31, 2018.
*P15-7A Saberhagen Company sold $3,500,000, 8%, 10-year bonds on January 1, 2017. The bonds were dated January 1, 2017 and pay interest annually on January 1. Saberhagen Company uses the straight-line method to amortize bond premium or discount.
Instructions(a) Prepare all the necessary journal entries to record the issuance of the bonds and bond
interest expense for 2017, assuming that the bonds sold at 104.(b) Prepare journal entries as in part (a) assuming that the bonds sold at 98.(c) Show balance sheet presentation for the bonds at December 31, 2017, for both the
requirements in (a) and (b).
*P15-8A The following is taken from the Colaw Company balance sheet.
COLAW COMPANYBalance Sheet (partial)
December 31, 2017
Current liabilities Interest payable (for 12 months from January 1 to December 31) $ 210,000Long-term liabilities Bonds payable, 7% due January 1, 2028 $3,000,000 Add: Premium on bonds payable 200,000 3,200,000
(c) Current liability—2017 $29,821
Analyze three different lease situations and prepare journal entries.
(LO 4)
Prepare entries to record issuance of bonds, interest accrual, and straight-line amortization for 2 years.
(LO 4, 5)
(b) Amortization $12,000
(d) Premium on bonds payable $96,000
Prepare entries to record issuance of bonds, interest, and straight-line amortization of bond premium and discount.
(LO 4, 5)
(a) Amortization $14,000
(b) Amortization $7,000(c) Premium on bonds
payable $126,000 Discount on bonds payable $63,000
Prepare entries to record interest payments, straight-line premium amortization, and redemption of bonds.
(LO 5)

682 15 Long-Term Liabilities
Interest is payable annually on January 1. The bonds are callable on any annual interest date. Colaw uses straight-line amortization for any bond premium or discount. From December 31, 2017, the bonds will be outstanding for an additional 10 years (120 months).
Instructions(a) Journalize the payment of bond interest on January 1, 2018.(b) Prepare the entry to amortize bond premium and to accrue the interest due on Decem-
ber 31, 2018.(c) Assume that on January 1, 2019, after paying interest, Colaw Company calls bonds
having a face value of $1,200,000. The call price is 101. Record the redemption of the bonds.
(d) Prepare the adjusting entry at December 31, 2019, to amortize bond premium and to accrue interest on the remaining bonds.
*P15-9A On January 1, 2017, Lock Corporation issued $1,800,000 face value, 5%, 10-year bonds at $1,667,518. This price resulted in an effective-interest rate of 6% on the bonds. Lock uses the efective-interest method to amortize bond premium or discount. The bonds pay annual interest January 1.
Instructions(Round all computations to the nearest dollar.)
(a) Prepare the journal entry to record the issuance of the bonds on January 1, 2017.(b) Prepare an amortization table through December 31, 2019 (three interest periods) for
this bond issue.(c) Prepare the journal entry to record the accrual of interest and the amortization of the
discount on December 31, 2017.(d) Prepare the journal entry to record the payment of interest on January 1, 2018.(e) Prepare the journal entry to record the accrual of interest and the amortization of the
discount on December 31, 2018.
*P15-10A On January 1, 2017, Jade Company issued $2,000,000 face value, 7%, 10-year bonds at $2,147,202. This price resulted in a 6% effective-interest rate on the bonds. Jade uses the effective-interest method to amortize bond premium or discount. The bonds pay annual interest on each January 1.
Instructions(a) Prepare the journal entries to record the following transactions. (1) The issuance of the bonds on January 1, 2017. (2) Accrual of interest and amortization of the premium on December 31, 2017. (3) The payment of interest on January 1, 2018. (4) Accrual of interest and amortization of the premium on December 31, 2018.(b) Show the proper long-term liabilities balance sheet presentation for the liability for
bonds payable at December 31, 2018.(c) Provide the answers to the following questions in narrative form. (1) What amount of interest expense is reported for 2018? (2) Would the bond interest expense reported in 2018 be the same as, greater than, or
less than the amount that would be reported if the straight-line method of amorti-zation were used?
(b) Amortization $20,000
(c) Gain $60,000
(d) Amortization $12,000
(c) InterestExpense $100,051
Prepare journal entries to record issuance of bonds, payment of interest, and effective-interest amortization, and balance sheet presentation.
(LO 4, 6)
Prepare journal entries to record issuance of bonds, payment of interest, and amortization of bond discount using effective- interest method.
(LO 6)
PROBLEMS: SET B AND SET C
Visit the book’s companion website, at www.wiley.com/college/weygandt, and choose the Student Companion site to access Problems: Set B and Set C.
(a) (4) InterestExpense $128,162

Comprehensive Problem: Chapters 13 to 15 683
COMPREHENSIVE PROBLEM: CHAPTERS 13 TO 15
CP15 Quigley Corporation’s trial balance at December 31, 2017, is presented below. All 2017 transac-tions have been recorded except for the items described below.
Debit Credit
Cash $ 25,500Accounts Receivable 51,000Inventory 22,700Land 65,000
Unrecorded transactions and adjustments:
1. On January 1, 2017, Quigley issued 1,000 shares of $20 par, 6% preferred stock for $22,000.2. On January 1, 2017, Quigley also issued 1,000 shares of common stock for $23,000.3. Quigley reacquired 300 shares of its common stock on July 1, 2017, for $49 per share.4. On December 31, 2017, Quigley declared the annual cash dividend on the preferred stock and a
$1.50 per share dividend on the outstanding common stock, all payable on January 15, 2018.5. Quigley estimates that uncollectible accounts receivable at year-end is $5,100.6. The building is being depreciated using the straight-line method over 30 years. The salvage value is
$5,000.7. The equipment is being depreciated using the straight-line method over 10 years. The salvage value
is $4,000.8. The unearned rent was collected on October 1, 2017. It was the receipt of 4 months’ rent in advance
(October 1, 2017 through January 31, 2018).9. The 10% bonds payable pay interest every January 1. The interest for the 12 months ended Decem-
ber 31, 2017, has not been paid or recorded.
Instructions(Ignore income taxes.)
(a) Prepare journal entries for the transactions and adjustment listed above.(b) Prepare an updated December 31, 2017, trial balance, refl ecting the journal entries in (a).(c) Prepare a multiple-step income statement for the year ending December 31, 2017.(d) Prepare a retained earnings statement for the year ending December 31, 2017.(e) Prepare a classifi ed balance sheet as of December 31, 2017.
(b) Total $871,200
(e) Total assets $273,400
Buildings 95,000Equipment 40,000Allowance for Doubtful Accounts $ 450Accumulated Depreciation—Buildings 30,000Accumulated Depreciation—Equipment 14,400Accounts Payable 19,300Interest Payable –0–Dividends Payable –0–Unearned Rent Revenue 8,000Bonds Payable (10%) 50,000Common Stock ($10 par) 30,000Paid-in Capital in Excess of Par—Common Stock 6,000Preferred Stock ($20 par) –0–Paid-in Capital in Excess of Par—Preferred Stock –0–Retained Earnings 75,050Treasury Stock –0–Cash Dividends –0–Sales Revenue 570,000Rent Revenue –0–Bad Debt Expense –0–Interest Expense –0–Cost of Goods Sold 400,000Depreciation Expense –0–Other Operating Expenses 39,000Salaries and Wages Expense 65,000
Total $803,200 $803,200

684 15 Long-Term Liabilities
PERSPECTIVEFINANCIAL REPORTING AND ANALYSIS
Financial Reporting Problem: Apple Inc.BYP15-1 The fi nancial statements of Apple Inc. are presented in Appendix A. Instructions for access-ing and using the company’s complete annual report, including the notes to the fi nancial statements, are also provided in Appendix A.
Instructions(a) What were Apple’s total long-term liabilities at September 28, 2013? What was the increase/
decrease in total long-term liabilities from the prior year?(b) Determine whether Apple redeemed (bought back) any long-term liabilities during the fi scal year
ended September 28, 2013.
Comparative Analysis Problem: PepsiCo, Inc. vs. The Coca-Cola CompanyBYP15-2 PepsiCo’s fi nancial statements are presented in Appendix B. Financial statements of The Coca-Cola Company are presented in Appendix C. Instructions for accessing and using the complete annual reports of PepsiCo and Coca-Cola, including the notes to the fi nancial statements, are also provided in Appendices B and C, respectively.
Instructions(a) Based on the information contained in these fi nancial statements, compute the following 2013
ratios for each company. (1) Debt to assets. (2) Times interest earned.(b) What conclusions concerning the companies’ long-run solvency can be drawn from these
ratios?
Comparative Analysis Problem: Amazon.com, Inc. vs. Wal-Mart Stores, Inc.BYP15-3 Amazon.com, Inc.’s fi nancial statements are presented in Appendix D. Financial statements of Wal-Mart Stores, Inc. are presented in Appendix E. Instructions for accessing and using the com-plete annual reports of Amazon and Wal-Mart, including the notes to the fi nancial statements, are also provided in Appendices D and E, respectively.
BROADENING YOUR
CONTINUING PROBLEM
COOKIE CREATIONS: AN ENTREPRENEURIAL JOURNEY(Note: This is a continuation of the Cookie Creations problem from Chapters 1 through 14.)
CC15 Natalie and Curtis have been experiencing great demand for their cookies and muffi ns. As a result, they are now thinking about buying a commercial oven. They know which oven they want and how much it will cost. They have some cash set aside for the purchase and will need to borrow the rest. They met with a bank manager to discuss their options.
Go to the book’s companion website, www.wiley.com/college/weygandt, to see the completion of this problem.
© leungchopan/Shutterstock

Broadening Your Perspective 685
Instructions(a) Based on the information contained in these fi nancial statements, compute the following 2013
ratios for Amazon and 2014 ratios for Wal-Mart. (1) Debt to assets. (2) Times interest earned.(b) What conclusions concerning the companies’ long-run solvency can be drawn from these ratios?
Real-World FocusBYP15-4 Bond or debt securities pay a stated rate of interest. This rate of interest is dependent on the risk associated with the investment. Also, bond prices change when the risks associated with those bonds change. Standard & Poor’s provides ratings for companies that issue debt securities.
Address: www.standardandpoors.com/ratings/defi nitions-and-faqs/en/us, or go towww.wiley.com/college/weygandt
InstructionsGo to the website shown and answer the following questions.
(a) Explain the meaning of an “A” rating. Explain the meaning of a “C” rating.(b) What types of things can cause a change in a company’s credit rating?(c) Explain the relationship between a company’s credit rating and the merit of an investment in that
company’s bonds.
CRITICAL THINKING
Decision-Making Across the Organization *BYP15-5 On January 1, 2015, Glover Corporation issued $2,400,000 of 5-year, 8% bonds at 95. The bonds pay interest annually on January 1. By January 1, 2017, the market rate of interest for bonds of risk similar to those of Glover Corporation had risen. As a result, the market value of these bonds was $2,000,000 on January 1, 2017—below their carrying value. Joanna Glover, president of the company, suggests repurchasing all of these bonds in the open market at the $2,000,000 price. To do so, the company will have to issue $2,000,000 (face value) of new 10-year, 11% bonds at par. The president asks you, as controller, “What is the feasibility of my proposed repurchase plan?”
InstructionsWith the class divided into groups, answer the following.
(a) What is the carrying value of the outstanding Glover Corporation 5-year bonds on January 1, 2017? (Assume straight-line amortization.)
(b) Prepare the journal entry to redeem the 5-year bonds on January 1, 2017. Prepare the journal entry to issue the new 10-year bonds.
(c) Prepare a short memo to the president in response to her request for advice. List the economic factors that you believe should be considered for her repurchase proposal.
Communication ActivityBYP15-6 Sam Masasi, president of Masasi Corporation, is considering the issuance of bonds to fi nance an expansion of his business. He has asked you to (1) discuss the advantages of bonds over common stock fi nancing, (2) indicate the types of bonds he might issue, and (3) explain the issuing procedures used in bond transactions.
InstructionsWrite a memo to the president, answering his request.
Ethics CaseBYP15-7 Ken Iwig is the president, founder, and majority owner of Olathe Medical Corporation, an emerging medical technology products company. Olathe is in dire need of additional capital to keep operating and to bring several promising products to fi nal development, testing, and produc-tion. Ken, as owner of 51% of the outstanding stock, manages the company’s operations. He places heavy emphasis on research and development and on long-term growth. The other principal

686 15 Long-Term Liabilities
stockholder is Barb Lowery who, as a nonemployee investor, owns 40% of the stock. Barb would like to deemphasize the R&D functions and emphasize the marketing function, to maximize short-run sales and profi ts from existing products. She believes this strategy would raise the market price of Olathe’s stock. All of Ken’s personal capital and borrowing power is tied up in his 51% stock ownership. He knows that any offering of additional shares of stock will dilute his controlling interest because he won’t be able to participate in such an issuance. But, Barb has money and would likely buy enough shares to gain control of Olathe. She then would dictate the company’s future direction, even if it meant replacing Ken as president and CEO. The company already has considerable debt. Raising additional debt will be costly, will adversely affect Olathe’s credit rating, and will increase the company’s reported losses due to the growth in interest expense. Barb and the other minority stockholders express opposition to the assumption of additional debt, fearing the company will be pushed to the brink of bankruptcy. Wanting to maintain his control and to preserve the direction of “his” company, Ken is doing everything to avoid a stock issuance. He is contemplating a large issuance of bonds, even if it means the bonds are issued with a high effective-interest rate.
Instructions(a) Who are the stakeholders in this situation?(b) What are the ethical issues in this case?(c) What would you do if you were Ken?
All About YouBYP15-8 Numerous articles have been written that identify early warning signs that you might be getting into trouble with your personal debt load. You can fi nd many good articles on this topic on the Internet.
InstructionsFind an article that identifi es early warning signs of personal debt trouble. Write a summary of the article and bring your summary and the article to class to share.
FASB Codifi cation ActivityBYP15-9 If your school has a subscription to the FASB Codifi cation, go to http://aaahq.org/ascLogin.cfm to log in and prepare responses to the following:
(a) What is the defi nition of long-term obligation?(b) What guidance does the Codifi cation provide for the disclosure of long-term obligations?
A Look at IFRS
7 Compare the accounting for long-term liabilities under GAAP and IFRS.
LEARNING OBJECTIVE
IFRS and GAAP have similar defi nitions of liabilities but have a different approach for accounting certain long-term liabilities.
Key PointsFollowing are the key similarities and difference between GAAP and IFRS as related to accounting for long-term liabilities.

A Look at IFRS 687
Similarities• As indicated in Chapter 11, in general GAAP and IFRS defi ne liabilities similarly.
• IFRS requires that companies classify liabilities as current or noncurrent on the face of the state-ment of fi nancial position (balance sheet), except in industries where a presentation based on liquidity would be considered to provide more useful information (such as fi nancial institutions). When current liabilities (also called short-term liabilities) are presented, they are generally pre-sented in order of liquidity.
• Under IFRS, liabilities are classifi ed as current if they are expected to be paid within 12 months.
• Similar to GAAP, items are normally reported in order of liquidity. Companies sometimes show liabilities before assets. Also, they will sometimes show noncurrent (long-term) liabilities before current liabilities.
• The basic calculation for bond valuation is the same under GAAP and IFRS. In addition, the accounting for bond liability transactions is essentially the same between GAAP and IFRS.
• IFRS requires use of the effective-interest method for amortization of bond discounts and premi-ums. GAAP also requires the effective-interest method, except that it allows use of the straight-line method where the difference is not material. Under IFRS, companies do not use a premium or discount account but instead show the bond at its net amount. For example, if a $100,000 bond was issued at 97, under IFRS a company would record:
Cash 97,000 Bonds Payable 97,000
Differences• The accounting for convertible bonds differs between IFRS and GAAP. Unlike GAAP, IFRS splits the
proceeds from the convertible bond between an equity component and a debt component. The equity conversion rights are reported in equity.
To illustrate, assume that Harris Corp. issues convertible 7% bonds with a face value of $1,000,000 and receives $1,000,000. Comparable bonds without a conversion feature would have required a 9% rate of interest. To determine how much of the proceeds would be allocated to debt and how much to equity, the promised payments of the bond obligation would be discounted at the market rate of 9%. Suppose that this results in a present value of $850,000. The entry to record the issuance would be:
Cash 1,000,000 Bonds Payable 850,000 Share Premium—Conversion Equity 150,000
• The IFRS leasing standard is IAS 17. Both Boards share the same objective of recording leases by lessees and lessors according to their economic substance—that is, according to the defi nitions of assets and liabilities. However, GAAP for leases is much more “rules-based” with specifi c bright-line criteria (such as the “90% of fair value” test) to determine if a lease arrangement transfers the risks and rewards of ownership; IFRS is more conceptual in its provisions. Rather than a 90% cut-off, it asks whether the agreement transfers substantially all of the risks and rewards associated with ownership.
Looking to the FutureThe FASB and IASB are currently involved in two projects, each of which has implications for the accounting for liabilities. One project is investigating approaches to differentiate between debt and equity instruments. The other project, the elements phase of the conceptual framework project, will evaluate the defi nitions of the fundamental building blocks of accounting. The results of these proj-ects could change the classifi cation of many debt and equity securities. In addition to these projects, the FASB and IASB have also identifi ed leasing as one of the most problematic areas of accounting. A joint project is now focused on lessee accounting. One of the fi rst areas studied is, “What are the assets and liabilities to be recognized related to a lease

contract?” Should the focus remain on the leased item or the right to use the leased item? This question is tied to the Boards’ joint project on the conceptual framework—defi ning an “asset” and a “liability.”
IFRS Practice
IFRS Self-Test Questions
1. The accounting for bonds payable is:(a) essentially the same under IFRS and GAAP.(b) differs in that GAAP requires use of the straight-line method for amortization of bond pre-
mium and discount.(c) the same except that market prices may be different because the present value calculations are
different between IFRS and GAAP.(d) not covered by IFRS.
2. Stevens Corporation issued 5% convertible bonds with a total face value of $3,000,000 for $3,000,000. If the bonds had not had a conversion feature, they would have sold for $2,600,000. Under IFRS, the entry to record the transaction would require a credit to:(a) Bonds Payable for $3,000,000.(b) Bonds Payable for $400,000.(c) Share Premium—Conversion Equity for $400,000.(d) Discount on Bonds Payable for $400,000.
3. The leasing standards employed by IFRS:(a) rely more heavily on interpretation of the conceptual meaning of assets and liabilities than
GAAP.(b) are more “rules based” than those of GAAP.(c) employ the same “bright-line test” as GAAP.(d) are identical to those of GAAP.
4. The joint projects of the FASB and IASB could potentially:(a) change the defi nition of liabilities.(b) change the defi nition of equity.(c) change the defi nition of assets.(d) All of the above.
IFRS ExercisesIFRS15-1 Briefl y describe some of the similarities and differences between GAAP and IFRS with respect to the accounting for liabilities.
IFRS15-2 Ratzlaff Company issues (in euros) €2 million, 10-year, 8% bonds at 97, with interest pay-able annually on January 1.
Instructions(a) Prepare the journal entry to record the sale of these bonds on January 1, 2017.(b) Assuming instead that the above bonds sold for 104, prepare the journal entry to record the sale
of these bonds on January 1, 2017.
IFRS15-3 Archer Company issued (in pounds) £4,000,000 par value, 7% convertible bonds at 99 for cash. The net present value of the debt without the conversion feature is £3,800,000. Prepare the jour-nal entry to record the issuance of the convertible bonds.
688 15 Long-Term Liabilities

International Financial Statement Analysis: Louis Vuitton
IFRS15-4 The fi nancial statements of Louis Vuitton are presented in Appendix F. Instructions for accessing and using the company’s complete annual report, including the notes to its fi nancial state-ments, are also provided in Appendix F.
InstructionsUse the company’s annual report to answer the following questions.
(a) According to the notes to the fi nancial statements, what is the composition of long-term gross borrowings?
(b) According to the accounting policy note to the fi nancial statements, how are borrowings mea-sured?
(c) Determine the amount of fi xed-rate and adjustable-rate (fl oating) borrowings (gross) that the company reports.
(d) Identify where non-current liabilities are reported on the company’s balance sheet.
Answers to IFRS Self-Test Questions
1. a 2. c 3. a 4. d
A Look at IFRS 689

In a rapidly changing world, you must keep up or suffer the
consequences. In business, change requires investment.
A case in point is found in the entertainment industry.
Technology is bringing about innovations so quickly that it is
nearly impossible to guess which technologies will last and
which will soon fade away. For example, will both satellite TV
and cable TV survive? Or, will both be replaced by something
else?
Consider the publishing industry as well. Will paper
newspapers and magazines be replaced completely by online
news? If you are a publisher, you have to make your best
guess about what the future holds and invest accordingly.
Time Warner Inc. lives at the center of this arena. It is not an
environment for the timid, and Time Warner’s philosophy is
anything but that. Instead, it might be characterized as, “If we
can’t beat you, we will buy you.” Its mantra is “invest, invest,
invest.” A partial list of Time Warner’s holdings gives an idea
of its reach:
Magazines: Time, Life, Sports Illustrated, and Fortune.
Book publishers: Time-Life Books; Book-of-the-Month
Club; Little, Brown & Co; and Sunset Books.
Television and movies: Warner Bros. (“The Big Bang
Theory” and “The Mentalist”), HBO, and movies like The
Hobbit: The Battle of the Five Armies and Into the Storm.
Broadcasting: TNT, CNN news, and Turner’s library of
thousands of classic movies.
Internet: America Online and AOL Anywhere.
Time Warner owns more information and entertainment
copyrights and brands than any other company in the world.
Recently, Rupert Murdoch, chairman and CEO of 21st Century
Fox, made an unsolicited $80 billion offer to buy the major
media conglomerate. Murdoch’s bid put “a positive light on
Time Warner’s assets,“ says one analyst. Murdoch eventually
withdrew his bid, which resulted in driving down Time
Warner’s stock price. However, analysts expect the stock to
eventually rebound as the long-term institutional investors
start taking advantage of the lower price.
Source: Gene Marcial, “Why Time Warner Will Deliver Superb Growth and
Valuation Despite Murdoch’s Surrender,” Forbes (August 6, 2014).
“Is There Anything Else We Can Buy?”
Time Warner’s management, as the Feature Story below indicates, believes in aggressive growth through investing in the stock of existing companies. Besides purchasing stock, companies also purchase other securities such as bonds issued by corporations or by governments. Companies can make investments for a short or long period of time, as a passive investment, or with the intent to control another company. As you will see in this chapter, the way in which a company accounts for its investments is determined by a number of factors.
CHAPTER PREVIEW
16
FEATURE STORY
690
Investments

Explain how to account for stock investments.
Discuss how debt and stock investments are reported in fi nancial statements.
2
3
Explain how to account for debt investments.1 Debt InvestmentsDO IT! 1• Why corporations invest
• Accounting for debt investments
• Holdings of less than 20%• Holdings between 20% and
50%• Holdings of more than 50%
Learning Objectives
Recording Business Activities
Trading and Available-for-Sale Securities3aFinancial Statement Presentation of Investments3b
• Categories of securities• Balance sheet presentation• Presentation of realized and
unrealized gain or loss• Classifi ed balance sheet
DO IT! 2 Stock Investments
CHAPTER OUTLINE
Robert Voets/CBS via Getty Images
DO IT!
Go to the REVIEW AND PRACTICE section at the end of the chapter for a review of key concepts and practice applications with solutions.
Visit WileyPLUS with ORION for additional tutorials and practice opportunities.

692 16 Investments
1 Explain how to account for debt investments.LEARNING OBJECTIVE
Why Corporations Invest
Corporations purchase investments in debt or stock securities generally for one of three reasons. First, a corporation may have excess cash that it does not need for the immediate purchase of operating assets. For example, many companies experience seasonal fl uctuations in sales. A Cape Cod marina has more sales in the spring and summer than in the fall and winter. The reverse is true for an Aspen ski shop. Thus, at the end of an operating cycle, many companies may have cash on hand that is temporarily idle until the start of another operating cycle. These companies may invest the excess funds to earn—through interest and dividends—a greater return than they would get by just holding the funds in the bank. Illustration 16-1 shows the role that temporary investments play in the operating cycle.
A second reason some companies such as banks purchase investments is to generate earnings from investment income. Although banks make most of their earnings by lending money, they also generate earnings by investing primarily in debt securities. Banks purchase investment securities because loan demand varies both seasonally and with changes in the economic cli-mate. Thus, when loan demand is low, a bank must fi nd other uses for its cash. Some companies attempt to generate investment income through speculative investments. That is, they are speculating that the investment will increase in value and thus result in positive returns. Therefore, they invest mostly in the common stock of other corporations. Third, companies also invest for strategic reasons. A company may pur-chase a noncontrolling interest in another company in a related industry in which it wishes to establish a presence. Or, a company can exercise some infl u-ence over one of its customers or suppliers by purchasing a signifi cant, but not controlling, interest in that company. Another option is for a corporation to purchase a controlling interest in another company in order to enter a new industry without incurring the costs and risks associated with starting from scratch. In summary, businesses invest in other companies for the reasons shown in Illustration 16-2.
Illustration 16-1Temporary investments and the operating cycle
AccountsReceivable
Inventory
InvestTemporaryInvestmentsSellCash

Accounting for Debt Investments 693
Accounting for Debt Investments
Debt investments are investments in government and corporation bonds. In accounting for debt investments, companies make entries to record (1) the acqui-sition, (2) the interest revenue, and (3) the sale.
RECORDING ACQUISITION OF BONDS
At acquisition, debt investments are recorded at cost. Cost includes all expen-ditures necessary to acquire these investments, such as the price paid plus bro-kerage fees (commissions), if any. For example, assume that Kuhl Corporation acquires 50 Doan Inc. 8%, 10-year, $1,000 bonds on January 1, 2017, for $50,000. Kuhl records the invest-ment as:
RECORDING BOND INTEREST
The Doan Inc. bonds pay interest of $4,000 annually on January 1 ($50,000 3 8%). If Kuhl Corporation’s fi scal year ends on December 31, it accrues the interest of $4,000 earned since January 1. The adjusting entry is:
Kuhl reports Interest Receivable as a current asset in the balance sheet. It reports Interest Revenue under “Other revenues and gains” in the income statement. Kuhl reports receipt of the interest on January 1 as follows.
Illustration 16-2Why corporations invest
Low-risk, highly liquid, short-term securitiessuch as government-issued securities
Debt securities (banks and other financial institutions)and stock securities (mutual funds and pension funds)
To generate earnings
To house excess cash until needed
Stocks of companies in a related industry or in anunrelated industry that the company wishes to enter
To meet strategic goals
Reason Typical Investment
I need1,000 Treasurybills by tonight
Jan. 1 Debt Investments (50 3 $1,000) 50,000 Cash 50,000 (To record purchase of 50 Doan Inc. bonds)
Dec. 31 Interest Receivable 4,000 Interest Revenue 4,000 (To accrue interest on Doan Inc. bonds)
Jan. 1 Cash 4,000 Interest Receivable 4,000 (To record receipt of accrued interest)
A credit to Interest Revenue at this time is incorrect because the company earned and accrued interest revenue in the preceding accounting period.
14,000 14,000 Rev
Cash Flowsno effect
A SEL5 1
14,00024,000
Cash Flows14,000
A SEL5 1
150,000250,000
Cash Flows250,000
A SEL5 1

694 16 Investments
RECORDING SALE OF BONDS
When Kuhl sells the bonds, it credits the investment account for the cost of the bonds. Kuhl records as a gain or loss any difference between the net proceeds from the sale (sales price less brokerage fees) and the cost of the bonds. Assume, for example, that Kuhl Corporation receives net proceeds of $54,000 on the sale of the Doan Inc. bonds on January 1, 2018, after receiving the interest due. Since the securities cost $50,000, the company realizes a gain of $4,000. It records the sale as:
Kuhl reports the gain on sale of debt investments under “Other revenues and gains” in the income statement and reports losses under “Other expenses and losses.”
Hey, I Thought It Was Safe!
It is often stated that bond investments are safer than stock investments. After all, with an investment in bonds, you are guaranteed return of principal
and interest payments over the life of the bonds. However, here are some other factors you may want to consider:
• In 2013, the value of bonds fell by 2% due to interest rate risk. That is, when interest rates rise, it makes the yields paid on existing bonds less attractive. As a result, the price of the existing bond you are holding falls.
• While interest rates are currently low, it is likely that they will increase in the future. If you hold bonds, there is a real possibility that the value of your bonds will be reduced.
• Credit risk also must be considered. Credit risk means that a company may not be able to pay back what it borrowed. Former bondholders in companies like General Motors, United Air Lines, and Eastman Kodak saw their bond values drop substantially when these companies declared bankruptcy.
An advantage of a bond investment over stock is that if you hold it to maturity, you will receive your principal and also interest payments over the life of the bond. But if you have to sell your bond investment before maturity, you may be facing a roller coaster regarding its value.
Why is the fl uctuating value of bonds of concern if a company intends to hold them until maturity? (Go to WileyPLUS for this answer and additional questions.)
© Jane0606/Shutterstock
Investor Insight
Waldo Corporation had the following transactions pertaining to debt investments.
Jan. 1, 2017 Purchased 30, $1,000 Hillary Co. 10% bonds for $30,000. Interest is payable annually on January 1.
Dec. 31, 2017 Accrued interest on Hillary Co. bonds in 2017.Jan. 1, 2018 Received interest on Hillary Co. bonds.Jan. 1, 2018 Sold 15 Hillary Co. bonds for $14,600.Dec. 31, 2018 Accrued interest on Hillary Co. bonds in 2018.
Journalize the transactions.
DO IT! 1 Debt Investments
154,000250,000 14,000 Rev
Cash Flows154,000
A SEL5 1
Jan. 1 Cash 54,000 Debt Investments 50,000 Gain on Sale of Debt Investments 4,000 (To record sale of Doan Inc. bonds)

Accounting for Stock Investments 695
Jan. 1 Debt Investments 30,000(2017) Cash 30,000 (To record purchase of 30 Hillary Co. bonds)
Dec. 31 Interest Receivable 3,000(2017) Interest Revenue ($30,000 3 10%) 3,000 (To accrue interest on Hillary Co. bonds)
Jan. 1 Cash 3,000(2018) Interest Receivable 3,000 (To record receipt of interest on Hillary Co. bonds)
Jan. 1 Cash 14,600(2018) Loss on Sale of Debt Investments 400 Debt Investments ($30,000 3 15/30) 15,000 (To record sale of 15 Hillary Co. bonds)
Dec. 31 Interest Receivable 1,500(2018) Interest Revenue ($15,000 3 10%) 1,500 (To accrue interest on Hillary Co. bonds)
Solution
Related exercise material: BE16-1, E16-2, E16-3, and DO IT! 16-1.
Action Plan✔ Record bond
investments at cost.✔ Record interest
when accrued.✔ When bonds are sold,
credit the investment account for the cost of the bonds.
✔ Record any difference between the cost and the net proceeds as a gain or loss.
2 Explain how to account for stock investments.LEARNING OBJECTIVE
Stock investments are investments in the capital stock of other corporations. When a company holds stock (and/or debt) of several different corporations, the group of securities is identifi ed as an investment portfolio. The accounting for investments in common stock depends on the extent of the investor’s infl uence over the operating and fi nancial affairs of the issuing corporation (the investee). Illustration 16-3 shows the general guidelines.
Investor's OwnershipInterest in Investee's
Common StockPresumed Influence
on Investee Accounting Guidelines
Less than 20% Cost methodInsignificant
Between 20%and 50%
Equity methodSignificant
More than 50% Consolidated financialstatements
Controlling
STOCK
STOCK
STOCK
Illustration 16-3Accounting guidelines for stock investments

696 16 Investments
Companies are required to use judgment instead of blindly following the guidelines.1 We explain the application of each guideline next.
Holdings of Less than 20%
In accounting for stock investments of less than 20%, companies use the cost method. Under the cost method, companies record the investment at cost, and recognize revenue only when cash dividends are received.
RECORDING ACQUISITION OF STOCK INVESTMENTS
At acquisition, stock investments are recorded at cost. Cost includes all expenditures necessary to acquire these investments, such as the price paid plus any brokerage fees (commissions), if any. For example, assume that on July 1, 2017, Sanchez Corporation acquires 1,000 shares (10% ownership) of Beal Corporation common stock. Sanchez pays $40 per share. The entry for the purchase is:
Helpful HintThe entries for investments in common stock also apply to investments in preferred stock.
1Among the questions that are considered in determining an investor’s infl uence are these:(1) Does the investor have representation on the investee’s board? (2) Does the investor participate in the investee’s policy-making process? (3) Are there material transactions between the investor and investee? (4) Is the common stock held by other stockholders concentrated or dispersed?
July 1 Stock Investments (1,000 3 $40) 40,000 Cash 40,000 (To record purchase of 1,000 shares of Beal Corporation common stock)
RECORDING DIVIDENDS
During the time Sanchez owns the stock, it makes entries for any cash dividends received. If Sanchez receives a $2 per share dividend on December 31, the entry is:
Dec. 31 Cash (1,000 3 $2) 2,000 Dividend Revenue 2,000 (To record receipt of a cash dividend)
Sanchez reports Dividend Revenue under “Other revenues and gains” in the income statement. Unlike interest on notes and bonds, dividends do not accrue. Therefore, companies do not make adjusting entries to accrue dividends.
RECORDING SALE OF STOCK
When a company sells a stock investment, it recognizes as a gain or a loss the difference between the net proceeds from the sale (sales price less brokerage fees) and the cost of the stock. Assume that Sanchez Corporation receives net proceeds of $39,000 on the sale of its Beal stock on February 10, 2018. Because the stock cost $40,000, Sanchez incurred a loss of $1,000. The entry to record the sale is:
Feb. 10 Cash 39,000 Loss on Sale of Stock Investments 1,000 Stock Investments 40,000 (To record sale of Beal common stock)
Sanchez reports the loss under “Other expenses and losses” in the income state-ment. It would show a gain on sale under “Other revenues and gains.”
Holdings Between 20% and 50%
When an investor company owns only a small portion of the shares of stock of another company, the investor cannot exercise control over the investee. But,
140,000240,000
Cash Flows240,000
A SEL5 1
12,000 12,000 Rev
Cash Flows12,000
A SEL5 1
139,000 21,000 Exp240,000
Cash Flows139,000
A SEL5 1

Accounting for Stock Investments 697
when an investor owns between 20% and 50% of the common stock of a corpora-tion, it is presumed that the investor has signifi cant infl uence over the fi nancial and operating activities of the investee. The investor probably has a representa-tive on the investee’s board of directors. Through that representative, the investor may exercise some control over the investee. The investee company in some sense becomes part of the investor company. For example, even prior to purchasing all of Turner Broadcasting, Time Warner owned 20% of Turner. Because it exercised signifi cant control over major decisions made by Turner, Time Warner used an approach called the equity method. Under the equity method, the investor records its share of the net income of the investee in the year when it is earned. An alternative might be to delay recogniz-ing the investor’s share of net income until the investee declares a cash dividend. But, that approach would ignore the fact that the investor and investee are, in some sense, one company, making the investor better off by the investee’s earned income. Under the equity method, the investor company initially records the investment in common stock at cost. After that, it adjusts the investment account annually to show the investor’s equity in the investee. Each year, the investor does the fol-lowing. (1) It increases (debits) the investment account and increases (credits) revenue for its share of the investee’s net income.2 (2) The investor also decreases (credits) the investment account for the amount of dividends received. The invest-ment account is reduced for dividends received because payment of a dividend decreases the net assets of the investee.
RECORDING ACQUISITION OF STOCK
Assume that Milar Corporation acquires 30% of the common stock of Beck Company for $120,000 on January 1, 2017. The entry to record this transaction is:
Helpful HintUnder the equity method, the investor recognizes revenue on the accrual basis, i.e., when it is earned by the investee.
Jan. 1 Stock Investments 120,000 Cash 120,000 (To record purchase of Beck common stock)
RECORDING REVENUE AND DIVIDENDS
For 2017, Beck reports net income of $100,000. It declares and pays a $40,000 cash dividend. Milar records (1) its share of Beck’s income, $30,000 (30% 3 $100,000) and (2) the reduction in the investment account for the dividends received, $12,000 ($40,000 3 30%). The entries are:
(1)
Dec. 31 Stock Investments 30,000 Revenue from Stock Investments 30,000 (To record 30% equity in Beck’s 2017 net income)
(2)
Dec. 31 Cash 12,000 Stock Investments 12,000 (To record dividends received)
130,000 130,000 Rev
Cash Flowsno effect
A SEL5 1
After Milar posts the transactions for the year, its investment and revenue accounts will show the following.
2Conversely, the investor increases (debits) a loss account and decreases (credits) the investment account for its share of the investee’s net loss.
Revenue from Stock Investments Stock Investments
Jan. 1 120,000 Dec. 31 12,000 Dec. 31 30,000Dec. 31 30,000 Dec. 31 Bal. 138,000
Illustration 16-4Investment and revenue accounts after posting
1120,0002120,000
Cash Flows2120,000
A SEL5 1
112,000212,000
Cash Flows112,000
A SEL5 1
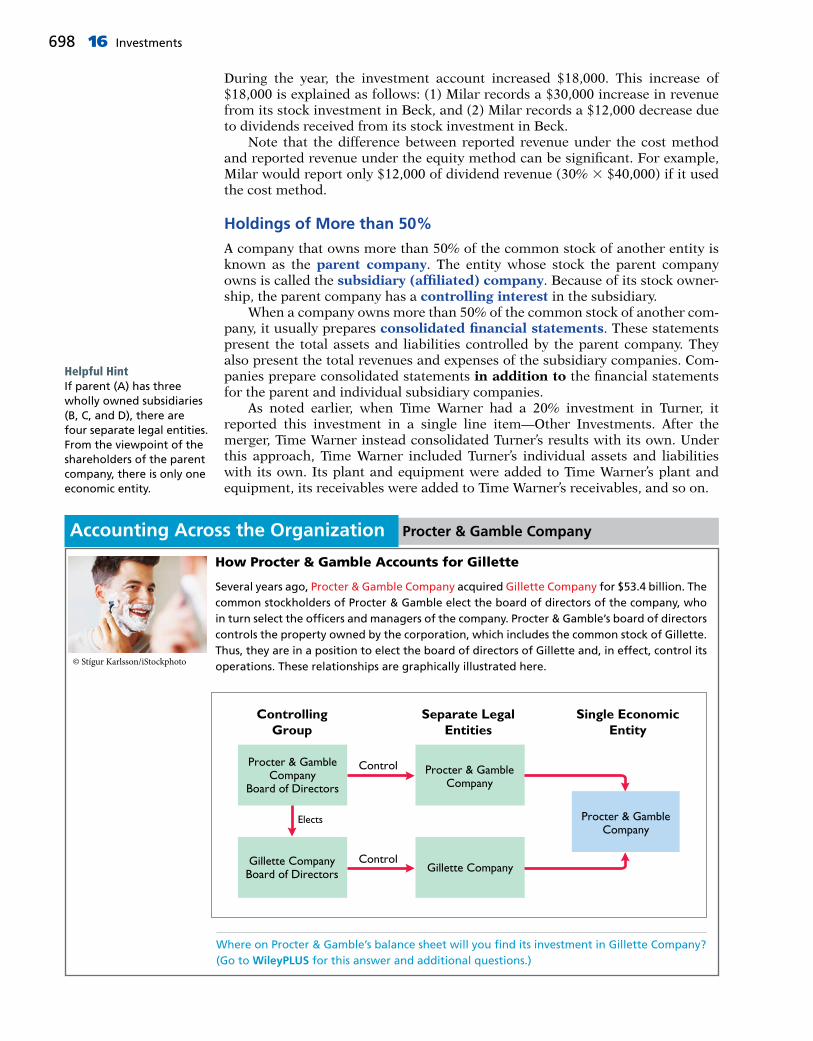
698 16 Investments
During the year, the investment account increased $18,000. This increase of $18,000 is explained as follows: (1) Milar records a $30,000 increase in revenue from its stock investment in Beck, and (2) Milar records a $12,000 decrease due to dividends received from its stock investment in Beck. Note that the difference between reported revenue under the cost method and reported revenue under the equity method can be signifi cant. For example, Milar would report only $12,000 of dividend revenue (30% 3 $40,000) if it used the cost method.
Holdings of More than 50%
A company that owns more than 50% of the common stock of another entity is known as the parent company. The entity whose stock the parent company owns is called the subsidiary (affi liated) company. Because of its stock owner-ship, the parent company has a controlling interest in the subsidiary. When a company owns more than 50% of the common stock of another com-pany, it usually prepares consolidated fi nancial statements. These statements present the total assets and liabilities controlled by the parent company. They also present the total revenues and expenses of the subsidiary companies. Com-panies prepare consolidated statements in addition to the fi nancial statements for the parent and individual subsidiary companies. As noted earlier, when Time Warner had a 20% investment in Turner, it reported this investment in a single line item—Other Investments. After the merger, Time Warner instead consolidated Turner’s results with its own. Under this approach, Time Warner included Turner’s individual assets and liabilities with its own. Its plant and equipment were added to Time Warner’s plant and equipment, its receivables were added to Time Warner’s receivables, and so on.
Helpful HintIf parent (A) has three wholly owned subsidiaries (B, C, and D), there are four separate legal entities. From the viewpoint of the shareholders of the parent company, there is only one economic entity.
How Procter & Gamble Accounts for Gillette
Several years ago, Procter & Gamble Company acquired Gillette Company for $53.4 billion. The common stockholders of Procter & Gamble elect the board of directors of the company, who in turn select the offi cers and managers of the company. Procter & Gamble’s board of directors controls the property owned by the corporation, which includes the common stock of Gillette. Thus, they are in a position to elect the board of directors of Gillette and, in effect, control its operations. These relationships are graphically illustrated here.© Stígur Karlsson/iStockphoto
Procter & Gamble CompanyAccounting Across the Organization
Gillette CompanyBoard of Directors
Procter & GambleCompany
Board of Directors
Gillette Company
Procter & GambleCompany
Procter & GambleCompany
Controlling
Group
Separate Legal
Entities
Single Economic
Entity
Control
Control
Elects
Where on Procter & Gamble’s balance sheet will you fi nd its investment in Gillette Company? (Go to WileyPLUS for this answer and additional questions.)

Accounting for Stock Investments 699
Consolidated statements are useful to the stockholders, board of directors, and management of the parent company. These statements indicate the magnitude and scope of operations of the companies under common control. For example, regulators and the courts undoubtedly used the consolidated statements of AT&T to determine whether a breakup of the company was in the public interest. Illustration 16-5 lists three companies that prepare consolidated statements and some of the companies they have owned.
PepsiCo Cendant The Disney Company
Frito-Lay Howard Johnson Capital Cities/ABC, Inc.Tropicana Ramada Inn Disneyland, Disney WorldQuaker Oats Century 21 Mighty DucksPepsi-Cola Coldwell Banker Anaheim AngelsGatorade Avis ESPN
Illustration 16-5Examples of consolidated companies and their subsidiaries
Presented below are two independent situations.
1. Rho Jean Inc. acquired 5% of the 400,000 shares of common stock of Stillwater Corp. at a total cost of $6 per share on May 18, 2017. On August 30, Stillwater declared and paid a $75,000 dividend. On December 31, Stillwater reported net income of $244,000 for the year.
2. Debbie, Inc. obtained signifi cant infl uence over North Sails by buying 40% of North Sails’ 60,000 outstanding shares of common stock at a cost of $12 per share on Janu-ary 1, 2017. On April 15, North Sails declared and paid a cash dividend of $45,000. On December 31, North Sails reported net income of $120,000 for the year.
Prepare all necessary journal entries for 2017 for (1) Rho Jean Inc. and (2) Debbie, Inc.
Solution
DO IT! 2 Stock Investments
(1) May 18 Stock Investments (400,000 3 5% 3 $6) 120,000 Cash 120,000 (To record purchase of 20,000 shares of Stillwater Co. stock)
Aug. 30 Cash 3,750 Dividend Revenue ($75,000 3 5%) 3,750 (To record receipt of cash dividend)
(2) Jan. 1 Stock Investments (60,000 3 40% 3 $12) 288,000 Cash 288,000 (To record purchase of 24,000 shares of North Sails’ stock)
Apr. 15 Cash 18,000 Stock Investments ($45,000 3 40%) 18,000 (To record receipt of cash dividend)
Dec. 31 Stock Investments ($120,000 3 40%) 48,000 Revenue from Stock Investments 48,000 (To record 40% equity in North Sails’ net income)
Related exercise material: BE16-2, BE16-3, E16-4, E16-5, E16-6, E16-7, E16-8, and DO IT! 16-2.
Action Plan✔ Presume that the
investor has relatively little infl uence over the investee when an investor owns less than 20% of the common stock of another corporation. In this case, net income earned by the investee is not considered a proper basis for recognizing income from the investment by the investor.
✔ Presume signifi cant infl uence for investments of 20%–50%. Therefore, record the investor’s share of the net income of the investee.

700 16 Investments
At fair value with changesreported in net income
Trading(both debt and stock)
At fair value with changes reportedin the stockholders’ equity section
Available-for-Sale(both debt and stock)
At amortized cost
Held-to-Maturity(debt only)
“We’ll sellwithin 10
days.”
“We’ll hold thestock for a while
to see how itperforms.”
“We intend to hold until maturity.”
Illustration 16-6Valuation guidelines for securities
3This category is provided for completeness. The accounting and valuation issues related to held-to-maturity securities are discussed in more advanced accounting courses.
TRADING SECURITIES
Companies hold trading securities with the intention of selling them in a short period (generally less than a month). Trading means frequent buying and selling.
3 Discuss how debt and stock investments are reported in fi nancial statements.
LEARNING OBJECTIVE
The value of debt and stock investments may fl uctuate greatly during the time they are held. For example, in one 12-month period, the stock price of Time Warner hit a high of $58.50 and a low of $9. In light of such price fl uctuations, how should companies value investments at the balance sheet date? Valuation could be at cost, at fair value, or at the lower-of-cost-or-market value. Many people argue that fair value offers the best approach because it rep-resents the expected cash realizable value of securities. Fair value is the amount for which a security could be sold in a normal market. Others counter that unless a security is going to be sold soon, the fair value is not relevant because the price of the security will likely change again.
Categories of Securities
For purposes of valuation and reporting at a fi nancial statement date, companies classify debt investments into three categories:
1. Trading securities are bought and held primarily for sale in the near term to generate income on short-term price differences.
2. Available-for-sale securities are held with the intent of selling them some-time in the future.
3. Held-to-maturity securities are debt securities that the investor has the intent and ability to hold to maturity.3
Stock investments are classifi ed into two categories:
1. Trading securities (as defi ned above).
2. Available-for-sale securities (as defi ned above).
Stock investments have no maturity date. Therefore, they are never classifi ed as held-to-maturity securities. Illustration 16-6 shows the valuation guidelines for these securities. These guidelines apply to all debt securities and all stock investments in which the holdings are less than 20%.

Reporting Investments in Financial Statements 701
As indicated in Illustration 16-7, companies adjust trading securities to fair value at the end of each period (an approach referred to as mark-to-market account-ing). They report changes from cost as part of net income. The changes are reported as unrealized gains or losses because the securities have not been sold. The unrealized gain or loss is the difference between the total cost of trading securities and their total fair value. Companies classify trading securities as current assets. Illustration 16-7 shows the cost and fair values for investments Pace Corpora-tion classifi ed as trading securities on December 31, 2017. Pace has an unrealized gain of $7,000 because total fair value of $147,000 is $7,000 greater than total cost of $140,000.
Pace records fair value and unrealized gain or loss through an adjusting entry at the time it prepares fi nancial statements. In this entry, the company uses a valuation allowance account, Fair Value Adjustment—Trading, to record the difference between the total cost and the total fair value of the securities. The adjusting entry for Pace Corporation is:
Trading Securities, December 31, 2017
Investments Cost Fair Value Unrealized Gain (Loss)
Yorkville Company bonds $ 50,000 $ 48,000 $(2,000)Kodak Company stock 90,000 99,000 9,000
Total $140,000 $147,000 $ 7,000
Illustration 16-7Valuation of trading securities
Dec. 31 Fair Value Adjustment—Trading 7,000 Unrealized Gain—Income 7,000 (To record unrealized gain on trading securities)
17,000 17,000 Rev
Cash Flowsno effect
A SEL5 1
The use of a Fair Value Adjustment—Trading account enables Pace to maintain a record of the investment cost. It needs actual cost to determine the gain or loss realized when it sells the securities. Pace adds the debit balance (or subtracts a credit balance) of the Fair Value Adjustment—Trading account to the cost of the investments to arrive at a fair value for the trading securities. The fair value of the securities is the amount Pace reports on its balance sheet. It reports the unrealized gain in the income statement in the “Other reve-nues and gains” section. The term “Income” in the account title indicates that the gain affects net income. If the total cost of the trading securities is greater than total fair value, an unrealized loss has occurred. In such a case, the adjusting entry is a debit to Unrealized Loss—Income and a credit to Fair Value Adjustment—Trading. Companies report the unrealized loss under “Other expenses and losses” in the income statement. The Fair Value Adjustment—Trading account is carried forward into future accounting periods. The company does not make any entry to the account until the end of each reporting period. At that time, the company adjusts the balance in the account to the difference between cost and fair value. For trading securities, it closes the Unrealized Gain (Loss)—Income account at the end of the reporting period.
AVAILABLE-FOR-SALE SECURITIES
As indicated earlier, companies hold available-for-sale securities with the intent of selling these investments sometime in the future. If the intent is to sell the securities within the next year or operating cycle, the investor classifi es the
ETHICS NOTE
At one time, the SEC accused investment bank Morgan Stanley of overstating the value of certain bond investments by $75 million. The SEC stated that, in applying market value accounting, Morgan Stanley used its own more-optimistic assumptions rather than relying on external pricing sources.

702 16 Investments
securities as current assets in the balance sheet. Otherwise, it classifi es them as long-term assets in the investments section of the balance sheet. Companies report available-for-sale securities at fair value. The procedure for determining fair value and the unrealized gain or loss for these securities is the same as for trading securities. To illustrate, assume that Ingrao Corporation has two securities that it classifi es as available-for-sale. Illustration 16-8 provides information on the cost, fair value, and amount of the unrealized gain or loss on December 31, 2017. There is an unrealized loss of $9,537 because total cost of $293,537 is $9,537 more than total fair value of $284,000.
ETHICS NOTE
Some managers seem to hold their available-for-sale securities that have experienced losses, while selling those that have gains, thus increasing income. Do you think this is ethical?
Illustration 16-8Valuation of available-for-sale securities
Available-for-Sale Securities, December 31, 2017
Investments Cost Fair Value Unrealized Gain (Loss)
Campbell Soup Corporation 8% bonds $ 93,537 $103,600 $10,063Hershey Company stock 200,000 180,400 (19,600)
Total $293,537 $284,000 $(9,537)
Both the adjusting entry and the reporting of the unrealized gain or loss for Ingrao’s available-for-sale securities differ from those illustrated for trading secu-rities. The differences result because Ingrao does not expect to sell these securi-ties in the near term. Thus, prior to actual sale it is more likely that changes in fair value may change either unrealized gains or losses. Therefore, Ingrao does not report an unrealized gain or loss in the income statement. Instead, it reports it as a separate component of stockholders’ equity. In the adjusting entry, Ingrao identifi es the fair value adjustment account with available-for-sale securities, and it identifi es the unrealized gain or loss account with stockholders’ equity. Ingrao records the unrealized loss of $9,537 as follows.
Dec. 31 Unrealized Gain or Loss—Equity 9,537 Fair Value Adjustment—Available-for-Sale 9,537 (To record unrealized loss on available- for-sale securities)
29,537 Exp29,537
Cash Flowsno effect
A SEL5 1
If total fair value exceeds total cost, Ingrao debits Fair Value Adjustment—Available-for-Sale and credits Unrealized Gain or Loss—Equity. For available-for-sale securities, the company carries forward the Unrealized Gain or Loss—Equity account to future periods. At each future balance sheet date, Ingrao adjusts the Fair Value Adjustment—Available-for-Sale account and the Unrealized Gain or Loss—Equity account to show the difference between cost and fair value at that time.
Can Fair Value Be Unfair?
The FASB is considering proposals for how to account for fi nancial instru-ments. The FASB has at one time pro-posed that loans and receivables be accounted for at their fair value (the amount they could currently be sold for), as are most investments. The FASB believes that this would pro-vide a more accurate view of a com-pany’s fi nancial position. It might
be especially useful as an early warning when a bank is in trouble because of poor-quality loans. But, banks argue that fair values are diffi cult to estimate accurately. They are also concerned that volatile fair values could cause large swings in a bank’s reported net income.
Source: David Reilly, “Banks Face a Mark-to-Market Challenge,” Wall Street Journal Online (March 15, 2010).
What are the arguments in favor of and against fair value accounting for loans and receivables? (Go to WileyPLUS for this answer and additional questions.)enciktepstudio/Shutterstock
Investor Insight
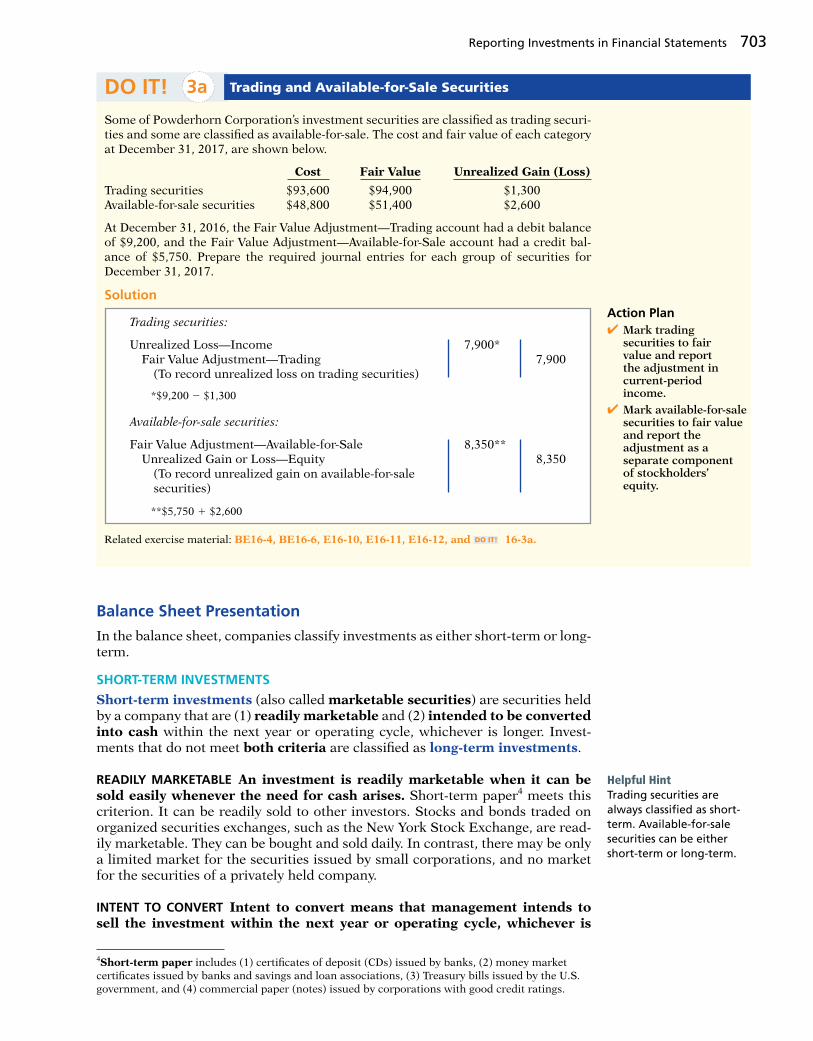
Reporting Investments in Financial Statements 703
Some of Powderhorn Corporation’s investment securities are classifi ed as trading securi-ties and some are classifi ed as available-for-sale. The cost and fair value of each category at December 31, 2017, are shown below.
Cost Fair Value Unrealized Gain (Loss)
Trading securities $93,600 $94,900 $1,300Available-for-sale securities $48,800 $51,400 $2,600
At December 31, 2016, the Fair Value Adjustment—Trading account had a debit balance of $9,200, and the Fair Value Adjustment—Available-for-Sale account had a credit bal-ance of $5,750. Prepare the required journal entries for each group of securities for December 31, 2017.
Solution
DO IT! 3a Trading and Available-for-Sale Securities
Trading securities:
Unrealized Loss—Income 7,900* Fair Value Adjustment—Trading 7,900 (To record unrealized loss on trading securities)
*$9,200 2 $1,300
Available-for-sale securities:
Fair Value Adjustment—Available-for-Sale 8,350** Unrealized Gain or Loss—Equity 8,350 (To record unrealized gain on available-for-sale securities)
**$5,750 1 $2,600
Related exercise material: BE16-4, BE16-6, E16-10, E16-11, E16-12, and DO IT! 16-3a.
Action Plan✔ Mark trading
securities to fair value and report the adjustment in current-period income.
✔ Mark available-for-sale securities to fair value and report the adjustment as a separate component of stockholders’ equity.
Balance Sheet Presentation
In the balance sheet, companies classify investments as either short-term or long-term.
SHORT-TERM INVESTMENTS
Short-term investments (also called marketable securities) are securities held by a company that are (1) readily marketable and (2) intended to be converted into cash within the next year or operating cycle, whichever is longer. Invest-ments that do not meet both criteria are classifi ed as long-term investments.
READILY MARKETABLE An investment is readily marketable when it can be sold easily whenever the need for cash arises. Short-term paper4 meets this criterion. It can be readily sold to other investors. Stocks and bonds traded on organized securities exchanges, such as the New York Stock Exchange, are read-ily marketable. They can be bought and sold daily. In contrast, there may be only a limited market for the securities issued by small corporations, and no market for the securities of a privately held company.
INTENT TO CONVERT Intent to convert means that management intends to sell the investment within the next year or operating cycle, whichever is
Helpful HintTrading securities are always classifi ed as short-term. Available-for-sale securities can be either short-term or long-term.
4Short-term paper includes (1) certifi cates of deposit (CDs) issued by banks, (2) money market certifi cates issued by banks and savings and loan associations, (3) Treasury bills issued by the U.S. government, and (4) commercial paper (notes) issued by corporations with good credit ratings.

704 16 Investments
longer. Generally, this criterion is satisfi ed when the investment is considered a resource that the investor will use whenever the need for cash arises. For example, a ski resort may invest idle cash during the summer months with the intent to sell the securities to buy supplies and equipment shortly before the winter season. This investment is considered short-term even if lack of snow cancels the next ski season and eliminates the need to convert the securities into cash as intended. Because of their high liquidity, short-term investments appear immediately below Cash in the “Current assets” section of the balance sheet. They are reported at fair value. For example, Pace Corporation would report its trading securities as shown in Illustration 16-9.
LONG-TERM INVESTMENTS
Companies generally report long-term investments in a separate section of the balance sheet immediately below “Current assets,” as shown later in Illustration 16-12 (page 706). Long-term investments in available-for-sale securities are reported at fair value. Investments in common stock accounted for under the equity method are reported at equity.
Presentation of Realized and Unrealized Gain or Loss
Companies must present in the fi nancial statements gains and losses on invest-ments, whether realized or unrealized. In the income statement, companies report gains and losses in the nonoperating activities section under the categories listed in Illustration 16-10. Interest and dividend revenue are also reported in that section.
PACE CORPORATIONBalance Sheet (partial)
Current assets Cash $ 21,000 Short-term investments, at fair value 147,000
Illustration 16-9Presentation of short-term investments
As indicated earlier, companies report an unrealized gain or loss on available-for-sale securities as a separate component of stockholders’ equity. To illustrate, assume that Dawson Inc. has common stock of $3,000,000, retained earnings of $1,500,000, and an unrealized loss on available-for-sale securities of $100,000. Illustration 16-11 shows the balance sheet presentation of the unrealized loss.
Illustration 16-10Nonoperating items related to investments
Other Revenues and Gains Other Expenses and Losses
Interest Revenue Loss on Sale of InvestmentsDividend Revenue Unrealized Loss—IncomeGain on Sale of InvestmentsUnrealized Gain—Income
Illustration 16-11Unrealized loss in stockholders’ equity section
DAWSON INC.Balance Sheet (partial)
Stockholders’ equity Common stock $3,000,000 Retained earnings 1,500,000
Total paid-in capital and retained earnings 4,500,000 Less: Unrealized loss on available-for-sale securities 100,000
Total stockholders’ equity $4,400,000

Reporting Investments in Financial Statements 705
Note that the presentation of the loss is similar to the presentation of the cost of treasury stock in the stockholders’ equity section (it decreases stockholders’ equity). An unrealized gain would be added to this section. Reporting the unreal-ized gain or loss in the stockholders’ equity section serves two purposes. (1) It reduces the volatility of net income due to fl uctuations in fair value. (2) It informs the fi nancial statement user of the gain or loss that would occur if the securities were sold at fair value. Companies must report items such as unrealized gains or losses on available-for-sale securities as part of a more inclusive measure called comprehensive income. Unrealized gains and losses on available-for-sale securities therefore affect compre-hensive income (and stockholders’ equity) but are not included in the computation of net income. We discuss comprehensive income more fully in Chapter 18.
Classifi ed Balance Sheet
We have presented many sections of classifi ed balance sheets in this and preced-ing chapters. The classifi ed balance sheet in Illustration 16-12 (page 706) includes, in one place, key topics from previous chapters: the issuance of par value common stock, restrictions of retained earnings, and issuance of long-term bonds. From this chapter, the statement includes (highlighted in red) short-term and long-term investments. The investments in short-term securities are considered trading securities. The long-term investments in stock of less than 20% owned companies are considered available-for-sale securities. Illustration 16-12 also includes a long-term investment reported at equity and descriptive notations within the state-ment, such as the cost fl ow method for valuing inventory and one note to the statement.
Identify where each of the following items would be reported in the fi nancial statements.
1. Interest earned on investments in bonds.
2. Fair value adjustment—available-for-sale.
3. Unrealized loss on available-for-sale securities.
4. Gain on sale of investments in stock.
5. Unrealized gain on trading securities.
Use the following possible categories:
Balance sheet:
Current assets Current liabilitiesInvestments Long-term liabilitiesProperty, plant, and equipment Stockholders’ equityIntangible assets
Income statement:
Other revenues and gains Other expenses and losses
DO IT! 3b Financial Statement Presentation of Investments
Related exercise material: BE16-5, BE16-7, BE16-8, E16-10, E16-11, E16-12, and DO IT! 16-3b.
Action Plan✔ Classify investments
as current assets if they will be held for less than one year.
✔ Report unrealized gains or losses on trading securities in income.
✔ Report unrealized gains or losses on available-for-sale securities in equity.
✔ Report realized gains and losses on investments in the income statement as “Other revenues and gains” or as “Other expenses and losses.”
Item Financial Statement Category
1. Interest earned on investments in bonds. Income statement Other revenues and gains2. Fair value adjustment—available-for-sale Balance sheet Investments3. Unrealized loss on available-for-sale Balance sheet Stockholders’ equity securities4. Gain on sale of investments in stock Income statement Other revenues and gains5. Unrealized gain on trading securities Income statement Other revenues and gains
Solution

706 16 Investments
Illustration 16-12Classifi ed balance sheet
Assets
Current assets Cash $ 21,000 Short-term investments, at fair value 147,000 Accounts receivable $ 84,000 Less: Allowance for doubtful accounts 4,000 80,000
Inventory, at FIFO cost 43,000 Prepaid insurance 23,000
Total current assets 314,000Investments Investments in stock of less than 20% owned companies, at fair value 50,000 Investment in stock of 20–50% owned company, at equity 150,000
Total investments 200,000Property, plant, and equipment Land 200,000 Buildings $800,000 Less: Accumulated depreciation—buildings 200,000 600,000
Equipment 180,000 Less: Accumulated depreciation—equipment 54,000 126,000
Total property, plant, and equipment 926,000Intangible assets Goodwill 270,000
Total assets $1,710,000
Liabilities and Stockholders’ Equity
Current liabilities Accounts payable $ 185,000 Federal income taxes payable 60,000 Interest payable 10,000
Total current liabilities 255,000Long-term liabilities Bonds payable, 10%, due 2024 $ 300,000 Less: Discount on bonds 10,000
Total long-term liabilities 290,000
Total liabilities 545,000Stockholders’ equity Paid-in capital Common stock, $10 par value, 200,000 shares authorized, 80,000 shares issued and outstanding 800,000 Paid-in capital in excess of par— common stock 100,000
Total paid-in capital 900,000 Retained earnings (Note 1) 255,000
Total paid-in capital and retained earnings 1,155,000 Add: Unrealized gain on available-for-sale
securities 10,000
Total stockholders’ equity 1,165,000
Total liabilities and stockholders’ equity $1,710,000
Note 1. Retained earnings of $100,000 is restricted for plant expansion.
PACE CORPORATIONBalance Sheet
December 31, 2017

Review and Practice 707
Explain how to account for debt investments. Compa-nies record investments in debt securities when they purchase bonds, receive or accrue interest, and sell the bonds. They report gains or losses on the sale of bonds in the “Other revenues and gains” or “Other expenses and losses” sections of the income statement.
Explain how to account for stock investments. Compa-nies record investments in common stock when they purchase the stock, receive dividends, and sell the stock. When ownership is less than 20%, the cost method is used. When ownership is between 20% and 50%, the equity method should be used. When owner-ship is more than 50%, companies prepare consoli-dated fi nancial statements. Consolidated fi nancial statements indicate the magnitude and scope of oper-ations of the companies under common control.
Discuss how debt and stock investments are reported in fi nancial statements. Investments in debt securities
2
3
are classifi ed as trading, available-for-sale, or held-to-maturity securities for valuation and reporting pur-poses. Stock investments are classifi ed either as trading or available-for-sale securities. Stock investments have no maturity date and therefore are never classifi ed as held-to-maturity securities. Trading securities are reported as current assets at fair value, with changes from cost reported in net income. Available-for-sale securities are also reported at fair value, with the changes from cost reported in stockholders’ equity. Available-for-sale securities are classifi ed as short-term or long-term, depending on their expected future sale date.
Short-term investments are securities that are (a) readily marketable and (b) intended to be con-verted to cash within the next year or operating cycle, whichever is longer. Investments that do not meet both criteria are classifi ed as long-term investments.
LEARNING OBJECTIVES REVIEW
1
REVIEW AND PRACTICE
Available-for-sale securities Securities that are held with the intent of selling them sometime in the future. (p. 700).
Consolidated fi nancial statements Financial state-ments that present the assets and liabilities controlled by the parent company and the total revenues and expenses of the subsidiary companies. (p. 698).
Controlling interest Ownership of more than 50% of the common stock of another entity. (p. 698).
Cost method An accounting method in which the invest-ment in common stock is recorded at cost, and revenue is recognized only when cash dividends are received. (p. 696).
Debt investments Investments in government and cor-poration bonds. (p. 693).
Equity method An accounting method in which the investment in common stock is initially recorded at cost, and the investment account is then adjusted annually to show the investor’s equity in the investee. (p. 697).
Fair value Amount for which a security could be sold in a normal market. (p. 700).
Held-to-maturity securities Debt securities that the investor has the intent and ability to hold to their matu-rity date. (p. 700).
Investment portfolio A group of stocks and/or debt securities in different corporations held for investment purposes. (p. 695).
Long-term investments Investments that are not read-ily marketable or that management does not intend to convert into cash within the next year or operating cycle, whichever is longer. (p. 703).
Parent company A company that owns more than 50% of the common stock of another entity. (p. 698).
Short-term investments Investments that are readily marketable and intended to be converted into cash within the next year or operating cycle, whichever is longer. (p. 703).
Stock investments Investments in the capital stock of other corporations. (p. 695).
Subsidiary (affi liated) company A company in which more than 50% of its stock is owned by another com-pany. (p. 698).
Trading securities Securities bought and held primarily for sale in the near term to generate income on short-term price differences. (p. 700).
GLOSSARY REVIEW

708 16 Investments
1. Which of the following is not a primary reason why corporations invest in debt and equity securities?(a) They wish to gain control of a competitor.(b) They have excess cash.(c) They wish to move into a new line of business.(d) They are required to by law.
2. Debt investments are initially recorded at:(a) cost.(b) cost plus accrued interest.(c) fair value.(d) face value.
3. Hanes Company sells debt investments costing $26,000 for $28,000. In journalizing the sale, credits are to:(a) Debt Investments and Loss on Sale of Debt Invest-
ments.(b) Debt Investments and Gain on Sale of Debt Invest-
ments.(c) Stock Investments and Gain on Sale of Stock
Investments.(d) No correct answer is given.
4. Pryor Company receives net proceeds of $42,000 on the sale of stock investments that cost $39,500. This transaction will result in reporting in the income statement a:(a) loss of $2,500 under “Other expenses and losses.”(b) loss of $2,500 under “Operating expenses.”(c) gain of $2,500 under “Other revenues and gains.”(d) gain of $2,500 under “Operating revenues.”
5. The equity method of accounting for long-term invest-ments in stock should be used when the investor has signifi cant infl uence over an investee and owns:(a) between 20% and 50% of the investee’s common
stock.(b) 20% or more of the investee’s common stock.(c) more than 50% of the investee’s common stock.(d) less than 20% of the investee’s common stock.
6. Assume that Horicon Corp. acquired 25% of the com-mon stock of Sheboygan Corp. on January 1, 2017, for $300,000. During 2017, Sheboygan Corp. reported net income of $160,000 and paid total dividends of $60,000. If Horicon uses the equity method to account for its investment, the balance in the investment account on December 31, 2017, will be:(a) $300,000. (c) $400,000.(b) $325,000. (d) $340,000.
7. Using the information in Question 6, what entry would Horicon make to record the receipt of the divi-dend from Sheboygan?(a) Debit Cash and credit Revenue from Stock Invest-
ments.(b) Debit Cash Dividends and credit Revenue from
Stock Investments.(c) Debit Cash and credit Stock Investments.(d) Debit Cash and credit Dividend Revenue.
8. You have a controlling interest if:(a) you own more than 20% of a company’s stock.(b) you are the president of the company.
(LO 1)
(LO 1)
(LO 1)
(LO 2)
(LO 2)
(LO 2)
(LO 2)
(LO 2)
(c) you use the equity method.(d) you own more than 50% of a company’s stock.
9. Which of the following statements is false? Consoli-dated fi nancial statements are useful to:(a) determine the profi tability of specifi c subsidiaries.(b) determine the total profi tability of companies
under common control.(c) determine the breadth of a parent company’s
operations.(d) determine the full extent of total obligations of
companies under common control. 10. At the end of the fi rst year of operations, the total cost
of the trading securities portfolio is $120,000. Total fair value is $115,000. The fi nancial statements should show:(a) a reduction of an asset of $5,000 and a realized
loss of $5,000.(b) a reduction of an asset of $5,000 and an unreal-
ized loss of $5,000 in the stockholders’ equity sec-tion.
(c) a reduction of an asset of $5,000 in the current assets section and an unrealized loss of $5,000 in “Other expenses and losses.”
(d) a reduction of an asset of $5,000 in the current assets section and a realized loss of $5,000 in “Other expenses and losses.”
11. At December 31, 2017, the fair value of available-for-sale securities is $41,300 and the cost is $39,800. At January 1, 2017, there was a credit balance of $900 in the Fair Value Adjustment—Available-for-Sale account. The required adjusting entry would be:(a) Debit Fair Value Adjustment—Available-for-Sale
for $1,500 and credit Unrealized Gain or Loss—Equity for $1,500.
(b) Debit Fair Value Adjustment—Available-for-Sale for $600 and credit Unrealized Gain or Loss—Equity for $600.
(c) Debit Fair Value Adjustment—Available-for-Sale for $2,400 and credit Unrealized Gain or Loss—Equity for $2,400.
(d) Debit Unrealized Gain or Loss—Equity for $2,400 and credit Fair Value Adjustment—Available-for-Sale for $2,400.
12. If a company wants to increase its reported income by manipulating its investment accounts, which should it do?(a) Sell its “winner” trading securities and hold its
“loser” trading securities.(b) Hold its “winner” trading securities and sell its
“loser” trading securities.(c) Sell its “winner” available-for-sale securities and
hold its “loser” available-for-sale securities.(d) Hold its “winner” available-for-sale securities and
sell its “loser” available-for-sale securities. 13. In the balance sheet, a debit balance in Unrealized
Gain or Loss—Equity is reported as a(n):(a) increase to stockholders’ equity.(b) decrease to stockholders’ equity.
(LO 2)
(LO 3)
(LO 3)
(LO 3)
(LO 3)
PRACTICE MULTIPLE-CHOICE QUESTIONS

Practice Exercises 709
(c) loss in the income statement.(d) loss in the retained earnings statement.
14. Short-term debt investments must be readily market-able and expected to be sold within:(a) 3 months from the date of purchase.
(LO 3)
(b) the next year or operating cycle, whichever is shorter.
(c) the next year or operating cycle, whichever is longer.
(d) the operating cycle.
Solutions
1. (d) Corporations are not required to by law to invest in debt and equity securities. The other choices are reasons why corpora-tions invest in debt and equity securities.
2. (a) When debt investments are purchased, they are recorded at cost, not (b) cost plus accrued interest, (c) fair value, or (d) face value.
3. (b) Credits are made to Debt Investments $26,000 and Gain on Sale of Debt Investments $2,000 ($28,000 2 $26,000). The other choices are therefore incorrect.
4. (c) Because the cash received ($42,000) is greater than the cost ($39,500), this sale results in a gain, not a loss, which will be reported under “Other revenues and gains” in the income statement. The other choices are therefore incorrect.
5. (a) The equity method is used when the investor can exercise signifi cant infl uence and owns between 20% and 50% of the investee’s common stock. The other choices are therefore incorrect.
6. (b) Horicon records the acquisition of the stock investment by debiting Stock Investments $300,000 and crediting Cash $300,000. Then, Horicon records (1) its share in Sheboygan Corp.’s net income ($160,000 3 .25) by debiting Stock Investments $40,000 and crediting Revenue from Stock Investments $40,000 and (2) the reduction in the investment account for the dividends received ($60,000 3 .25) by debiting Cash $15,000 and crediting Stock Investments $15,000. Thus, the balance in the investment account on December 31 will be $325,000 ($300,000 1 $40,000 2 $15,000), not (a) $300,000, (c) $400,000, or (d) $340,000.
7. (c) Horicon records the receipt of the dividend from Sheboygan by debiting Cash and crediting Stock Investments. The other choices are therefore incorrect.
8. (d) You have a controlling interest if you own more than 50% of a company’s stock, not (a) 20% of a company’s stock, (b) are president of the company, or (c) use the equity method.
9. (a) Consolidated fi nancial statements are not useful in determining the profi tability of specifi c subsidiaries (legal entities) because consolidated fi nancial statements represent the results of the single economic entity. The other choices are true statements.
10. (c) The difference between the fair value ($115,000) and total cost ($120,000) of trading securities at the end of the fi rst year would result in a reduction of an asset of $5,000 through the valuation allowance account in the current assets section and an unrealized loss of $5,000 in “Other expenses and losses.” The other choices are therefore incorrect.
11. (c) In this case, there is an unrealized gain of $1,500 because total fair value of $41,300 is $1,500 greater than the total cost of $39,800. The desired balance in the market adjustment account is $1,500 debit. The required adjusting entry considers the existing credit balance of $900 and is a debit to Fair Value Adjustment—Available-for-Sale for $2,400 ($1,500 1 $900) and a credit to Unre-alized Gain or Loss—Equity for $2,400 ($1,500 1 $900). The other choices are therefore incorrect.
12. (c) When a company sells its winners as related to available-for-sale securities, it has a realized gain that increases net income. Selling the winners will affect the balance in Unrealized Holding Gain or Loss—Equity, but any change in this balance does not affect net income. Choices (a) and (b) are incorrect because trading securities’ gains and losses related to changes in valuation are reported in net income. Thus, when a company sells a trading security, it should have no effect on net income because the value change was recognized in net income previously. Choice (d) is incorrect because selling the losing available-for-sale securities will decrease net income.
13. (b) A debit balance in Unrealized Gain or Loss—Equity is reported on the balance sheet as a separate component of stockhold-ers’ equity, decreasing stockholders’ equity. The other choices are therefore incorrect.
14. (c) Short-term investments are current assets that are expected to be consumed, sold, or converted to cash within one year or the operating cycle, whichever is longer. The other choices are therefore incorrect.
1. Potter Company purchased 50 Quinn Company 6%, 10-year, $1,000 bonds on January 1, 2017, for $50,000. The bonds pay interest annually. On January 1, 2018, after receipt of interest, Potter Company sold 30 of the bonds for $28,100.
InstructionsPrepare the journal entries to record the transactions described above.
Journalize debt investment transactions, accrue interest, and record sale.
(LO 1)
PRACTICE EXERCISES
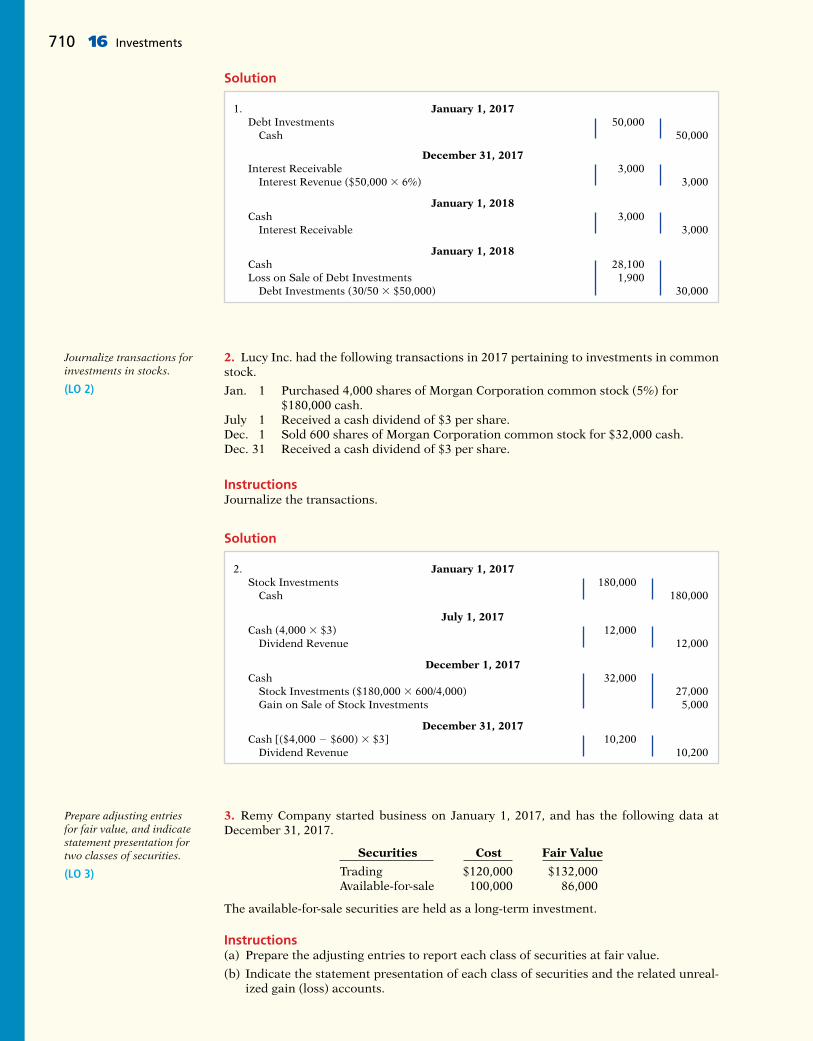
2. Lucy Inc. had the following transactions in 2017 pertaining to investments in common stock.
Jan. 1 Purchased 4,000 shares of Morgan Corporation common stock (5%) for $180,000 cash.
July 1 Received a cash dividend of $3 per share.Dec. 1 Sold 600 shares of Morgan Corporation common stock for $32,000 cash.Dec. 31 Received a cash dividend of $3 per share.
InstructionsJournalize the transactions.
Journalize transactions for investments in stocks.
(LO 2)
3. Remy Company started business on January 1, 2017, and has the following data at December 31, 2017.
Securities Cost Fair Value
Trading $120,000 $132,000 Available-for-sale 100,000 86,000
The available-for-sale securities are held as a long-term investment.
Instructions(a) Prepare the adjusting entries to report each class of securities at fair value.
(b) Indicate the statement presentation of each class of securities and the related unreal-ized gain (loss) accounts.
Prepare adjusting entries for fair value, and indicate statement presentation for two classes of securities.
(LO 3)
710 16 Investments
1. January 1, 2017 Debt Investments 50,000 Cash 50,000
December 31, 2017 Interest Receivable 3,000 Interest Revenue ($50,000 3 6%) 3,000
January 1, 2018 Cash 3,000 Interest Receivable 3,000
January 1, 2018 Cash 28,100 Loss on Sale of Debt Investments 1,900 Debt Investments (30/50 3 $50,000) 30,000
Solution
2. January 1, 2017 Stock Investments 180,000 Cash 180,000
July 1, 2017 Cash (4,000 3 $3) 12,000 Dividend Revenue 12,000
December 1, 2017 Cash 32,000 Stock Investments ($180,000 3 600/4,000) 27,000 Gain on Sale of Stock Investments 5,000
December 31, 2017 Cash [($4,000 2 $600) 3 $3] 10,200 Dividend Revenue 10,200
Solution

3. December 31, 2017
(a) Fair Value Adjustment––Trading ($132,000 2 $120,000) 12,000 Unrealized Gain––Income 12,000
Unrealized Gain or Loss––Equity ($100,000 2 $86,000) 14,000 Fair Value Adjustment––Available-for-Sale 14,000
(b) Balance Sheet
Current assets Short-term investments, at fair value $132,000 Investments
Investment in stock of less than 20% owned companies, at fair value 86,000
Stockholders’ equity Less: Unrealized loss on available-for-sale securities $ (14,000)
Income Statement Other revenues and gains Unrealized gain on trading securities $ 12,000
Solution
Practice Problem 711
In its fi rst year of operations, DeMarco Company had the following selected transactions in stock investments that are considered trading securities.
June 1 Purchased for cash 600 shares of Sanburg common stock at $24 per share.July 1 Purchased for cash 800 shares of Cey Corporation common stock at $33 per
share.Sept. 1 Received a $1 per share cash dividend from Cey Corporation.Nov. 1 Sold 200 shares of Sanburg common stock for cash at $27 per share.Dec. 15 Received a $0.50 per share cash dividend on Sanburg common stock.
At December 31, the fair values per share were Sanburg $25 and Cey $30.
Instructions(a) Journalize the transactions.
(b) Prepare the adjusting entry at December 31 to report the securities at fair value.
Solution
PRACTICE PROBLEM
Journalize transactions and prepare adjusting entry to record fair value.
(LO 2, 3)
(a) June 1 Stock Investments 14,400 Cash (600 3 $24) 14,400 (To record purchase of 600 shares of Sanburg common stock)
July 1 Stock Investments 26,400 Cash (800 3 $33) 26,400 (To record purchase of 800 shares of Cey common stock)
Sept. 1 Cash (800 3 $1.00) 800 Dividend Revenue 800 (To record receipt of $1 per share cash dividend from Cey Corporation)
Nov. 1 Cash (200 3 $27) 5,400 Stock Investments (200 3 $24) 4,800 Gain on Sale of Stock Investments 600 (To record sale of 200 shares of Sanburg common stock)
Dec. 15 Cash [(600 2 200) 3 $0.50] 200 Dividend Revenue 200 (To record receipt of $0.50 per share dividend from Sanburg)

712 16 Investments
(b) Dec. 31 Unrealized Loss—Income 2,000 Fair Value Adjustment—Trading 2,000 (To record unrealized loss on trading securities)
Investment Cost Fair Value Unrealized Gain (Loss)
Sanburg common stock $ 9,600a $10,000b $ 400Cey common stock 26,400c 24,000d (2,400)
Totals $36,000 $34,000 $(2,000)
a400 3 $24; b400 3 $25; c800 3 $33; d800 3 $30
Brief Exercises, Exercises, DO IT! Exercises, and Problems and many additional resources are available for practice in WileyPLUS
QUESTIONS
1. What are the reasons that corporations invest in securities?
2. (a) What is the cost of an investment in bonds? (b) When is interest on bonds recorded? 3. Alex Ramirez is confused about losses and gains on
the sale of debt investments. Explain to Alex (a) how the gain or loss is computed, and (b) the statement presentation of the gains and losses.
4. Seibel Company sells Mayo’s bonds costing $40,000 for $45,000, including $500 of accrued interest. Seibel records a $5,000 gain on this sale. Is this correct? Explain.
5. What is the cost of an investment in stock? 6. To acquire Peoples Corporation stock, J. Rich pays
$62,000 in cash. What entry should be made for this investment?
7. (a) When should a long-term investment in common stock be accounted for by the equity method? (b) When is revenue recognized under this method?
8. Ling Corporation uses the equity method to account for its ownership of 35% of the common stock of Gorman Packing. During 2017, Gorman reported a net income of $80,000 and declares and pays cash dividends of $10,000. What recognition should Ling Corporation give to these events?
9. What constitutes “signifi cant infl uence” when an investor’s fi nancial interest is below the 50% level?
10. Distinguish between the cost and equity methods of accounting for investments in stocks.
11. What are consolidated fi nancial statements? 12. What are the classifi cation guidelines for investments
at a balance sheet date? 13. Jill Hollern is the controller of Chavez Inc. At Decem-
ber 31, the company’s investments in trading securi-ties cost $74,000. They have a fair value of $72,000. Indicate how Jill would report these data in the fi nan-cial statements prepared on December 31.
14. Using the data in Question 13, how would Jill report the data if the investment were long-term and the securities were classifi ed as available-for-sale?
15. Culver Company’s investments in available-for-sale securities at December 31 show total cost of $195,000 and total fair value of $205,000. Prepare the adjusting entry.
16. Using the data in Question 15, prepare the adjusting entry assuming the securities are classifi ed as trading securities.
17. What is the proper statement presentation of the account Unrealized Loss—Equity?
18. What purposes are served by reporting Unrealized Gain or Loss—Equity in the stockholders’ equity section?
19. Deering Wholesale Supply owns stock in Orr Corpo-ration. Deering intends to hold the stock indefi nitely because of some negative tax consequences if sold. Should the investment in Orr be classifi ed as a short-term investment? Why or why not?
20. What does Apple state regarding its accounting policy involving consolidated fi nancial statements?
BRIEF EXERCISES
BE16-1 Ownbey Corporation purchased debt investments for $52,000 on January 1, 2017. On July 1, 2017, Ownbey received cash interest of $2,340. Journalize the purchase and the receipt of interest. Assume that no interest has been accrued.
BE16-2 On August 1, Shaw Company buys 1,000 shares of Estrada common stock for $37,000 cash. On December 1, Shaw sells the stock investments for $40,000 in cash. Jour-nalize the purchase and sale of the common stock.
Journalize entries for debt investments.
(LO 1)
Journalize entries for stock investments.
(LO 2)
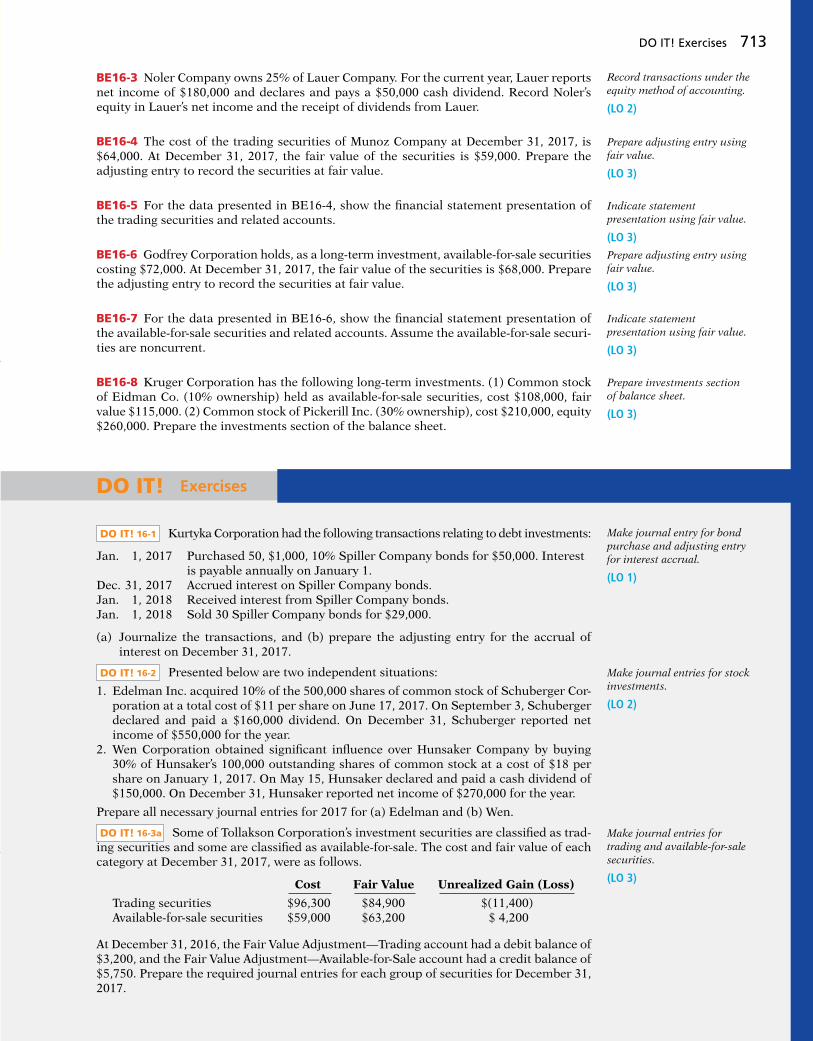
DO IT! Exercises 713
BE16-3 Noler Company owns 25% of Lauer Company. For the current year, Lauer reports net income of $180,000 and declares and pays a $50,000 cash dividend. Record Noler’s equity in Lauer’s net income and the receipt of dividends from Lauer.
BE16-4 The cost of the trading securities of Munoz Company at December 31, 2017, is $64,000. At December 31, 2017, the fair value of the securities is $59,000. Prepare the adjusting entry to record the securities at fair value.
BE16-5 For the data presented in BE16-4, show the fi nancial statement presentation of the trading securities and related accounts.
BE16-6 Godfrey Corporation holds, as a long-term investment, available-for-sale securities costing $72,000. At December 31, 2017, the fair value of the securities is $68,000. Prepare the adjusting entry to record the securities at fair value.
BE16-7 For the data presented in BE16-6, show the fi nancial statement presentation of the available-for-sale securities and related accounts. Assume the available-for-sale securi-ties are noncurrent.
BE16-8 Kruger Corporation has the following long-term investments. (1) Common stock of Eidman Co. (10% ownership) held as available-for-sale securities, cost $108,000, fair value $115,000. (2) Common stock of Pickerill Inc. (30% ownership), cost $210,000, equity $260,000. Prepare the investments section of the balance sheet.
Record transactions under the equity method of accounting.
(LO 2)
Prepare adjusting entry using fair value.
(LO 3)
Indicate statement presentation using fair value.
(LO 3)Prepare adjusting entry using fair value.
(LO 3)
Indicate statement presentation using fair value.
(LO 3)
Prepare investments section of balance sheet.
(LO 3)
Kurtyka Corporation had the following transactions relating to debt investments:
Jan. 1, 2017 Purchased 50, $1,000, 10% Spiller Company bonds for $50,000. Interest is payable annually on January 1.
Dec. 31, 2017 Accrued interest on Spiller Company bonds.Jan. 1, 2018 Received interest from Spiller Company bonds.Jan. 1, 2018 Sold 30 Spiller Company bonds for $29,000.
(a) Journalize the transactions, and (b) prepare the adjusting entry for the accrual of interest on December 31, 2017.
Presented below are two independent situations:
1. Edelman Inc. acquired 10% of the 500,000 shares of common stock of Schuberger Cor-poration at a total cost of $11 per share on June 17, 2017. On September 3, Schuberger declared and paid a $160,000 dividend. On December 31, Schuberger reported net income of $550,000 for the year.
2. Wen Corporation obtained signifi cant infl uence over Hunsaker Company by buying 30% of Hunsaker’s 100,000 outstanding shares of common stock at a cost of $18 per share on January 1, 2017. On May 15, Hunsaker declared and paid a cash dividend of $150,000. On December 31, Hunsaker reported net income of $270,000 for the year.
Prepare all necessary journal entries for 2017 for (a) Edelman and (b) Wen.
Some of Tollakson Corporation’s investment securities are classifi ed as trad-ing securities and some are classifi ed as available-for-sale. The cost and fair value of each category at December 31, 2017, were as follows.
Cost Fair Value Unrealized Gain (Loss)
Trading securities $96,300 $84,900 $(11,400)Available-for-sale securities $59,000 $63,200 $ 4,200
At December 31, 2016, the Fair Value Adjustment—Trading account had a debit balance of $3,200, and the Fair Value Adjustment—Available-for-Sale account had a credit balance of $5,750. Prepare the required journal entries for each group of securities for December 31, 2017.
Make journal entry for bond purchase and adjusting entry for interest accrual.
(LO 1)
Make journal entries for stock investments.
(LO 2)
Make journal entries for trading and available-for-sale securities.
(LO 3)
DO IT! Exercises
DO IT! 16-1
DO IT! 16-2
DO IT! 16-3a

714 16 Investments
Identify where each of the following items would be reported in the fi nancial statements.
1. Loss on sale of investments in stock.2. Unrealized gain on available-for-sale securities.3. Fair value adjustment—trading.4. Interest earned on investments in bonds.5. Unrealized loss on trading securities.
Use the following possible categories:
Balance sheet:
Current assets Current liabilitiesInvestments Long-term liabilitiesProperty, plant, and equipment Stockholders’ equityIntangible assets
Income statement:
Other revenues and gains Other expenses and losses
Indicate fi nancial statement presentation of investments.
(LO 3)
DO IT! 16-3b
EXERCISES
E16-1 Mr. Taliaferro is studying for an accounting test and has developed the following questions about investments.
1. What are three reasons why companies purchase investments in debt or stock securities?2. Why would a corporation have excess cash that it does not need for operations?3. What is the typical investment when investing cash for short periods of time?4. What are the typical investments when investing cash to generate earnings?5. Why would a company invest in securities that provide no current cash fl ows?6. What is the typical stock investment when investing cash for strategic reasons?
InstructionsProvide answers for Mr. Taliaferro.
E16-2 Jenek Corporation had the following transactions pertaining to debt investments.
1. Purchased 50 9%, $1,000 Leeds Co. bonds for $50,000 cash. Interest is payable annually on January 1, 2017.
2. Accrued interest on Leeds Co. bonds on December 31, 2017.3. Received interest on Leeds Co. bonds on January 1, 2018.4. Sold 30 Leeds Co. bonds for $33,000 on January 1, 2018.
InstructionsJournalize the transactions.
E16-3 Flynn Company purchased 70 Rinehart Company 6%, 10-year, $1,000 bonds on January 1, 2017, for $70,000. The bonds pay interest annually on January 1. On January 1, 2018, after receipt of interest, Flynn Company sold 40 of the bonds for $38,500.
InstructionsPrepare the journal entries to record the transactions described above.
E16-4 Hulse Company had the following transactions pertaining to stock investments.
Feb. 1 Purchased 600 shares of Wade common stock (2%) for $7,200 cash.July 1 Received cash dividends of $1 per share on Wade common stock.Sept. 1 Sold 300 shares of Wade common stock for $4,300.Dec. 1 Received cash dividends of $1 per share on Wade common stock.
Instructions(a) Journalize the transactions.(b) Explain how dividend revenue and the gain (loss) on sale should be reported in the
income statement.
Journalize debt investment transactions and accrue interest.
(LO 1)
Journalize debt investment transactions, accrue interest, and record sale.
(LO 1)
Journalize stock investment transactions.
(LO 2)
Understand debt and stock investments.
(LO 1)

Exercises 715
E16-5 Nosker Inc. had the following transactions pertaining to investments in common stock.
Jan. 1 Purchased 2,500 shares of Escalante Corporation common stock (5%) for $152,000 cash.
July 1 Received a cash dividend of $3 per share.Dec. 1 Sold 500 shares of Escalante Corporation common stock for $32,000 cash.Dec. 31 Received a cash dividend of $3 per share.
InstructionsJournalize the transactions.
E16-6 On February 1, Rinehart Company purchased 500 shares (2% ownership) of Givens Company common stock for $32 per share. On March 20, Rinehart Company sold 100 shares of Givens stock for $2,900. Rinehart received a dividend of $1.00 per share on April 25. On June 15, Rinehart sold 200 shares of Givens stock for $7,600. On July 28, Rinehart received a dividend of $1.25 per share.
InstructionsPrepare the journal entries to record the transactions described above.
E16-7 On January 1, Zabel Corporation purchased a 25% equity in Helbert Corporation for $180,000. At December 31, Helbert declared and paid a $60,000 cash dividend and reported net income of $200,000.
Instructions(a) Journalize the transactions.(b) Determine the amount to be reported as an investment in Helbert stock at December 31.
E16-8 Presented below are two independent situations.
1. Gambino Cosmetics acquired 10% of the 200,000 shares of common stock of Nevins Fashion at a total cost of $13 per share on March 18, 2017. On June 30, Nevins declared and paid a $60,000 dividend. On December 31, Nevins reported net income of $122,000 for the year. At December 31, the market price of Nevins Fashion was $15 per share. The stock is classifi ed as available-for-sale.
2. Kanza, Inc., obtained signifi cant infl uence over Rogan Corporation by buying 40% of Rogan’s 30,000 outstanding shares of common stock at a total cost of $9 per share on January 1, 2017. On June 15, Rogan declared and paid a cash dividend of $30,000. On December 31, Rogan reported a net income of $80,000 for the year.
InstructionsPrepare all the necessary journal entries for 2017 for (a) Gambino Cosmetics and (b) Kanza, Inc.
E16-9 Agee Company purchased 70% of the outstanding common stock of Himes Corporation.
Instructions(a) Explain the relationship between Agee Company and Himes Corporation.(b) How should Agee account for its investment in Himes?(c) Why is the accounting treatment described in (b) useful?
E16-10 At December 31, 2017, the trading securities for Storrer, Inc. are as follows.
Security Cost Fair Value
A $17,500 $16,000 B 12,500 14,000 C 23,000 21,000
$53,000 $51,000
Instructions(a) Prepare the adjusting entry at December 31, 2017, to report the securities at fair value.(b) Show the balance sheet and income statement presentation at December 31, 2017,
after adjustment to fair value.
Journalize transactions for investments in stocks.
(LO 2)
Journalize transactions for investments in stocks.
(LO 2)
Journalize and post transactions, under the equity method.
(LO 2)
Journalize entries under cost and equity methods.
(LO 2, 3)
Understand the usefulness of consolidated statements.
(LO 2)
Prepare adjusting entry to record fair value, and indicate statement presentation.
(LO 3)

716 16 Investments
E16-11 Data for investments in stock classifi ed as trading securities are presented in E16-10. Assume instead that the investments are classifi ed as available-for-sale securities. They have the same cost and fair value. The securities are considered to be a long-term investment.
Instructions(a) Prepare the adjusting entry at December 31, 2017, to report the securities at fair value.(b) Show the statement presentation at December 31, 2017, after adjustment to fair value.(c) E. Kretsinger, a member of the board of directors, does not understand the
reporting of the unrealized gains or losses. Write a letter to Ms. Kretsinger explaining the reporting and the purposes that it serves.
E16-12 Uttinger Company has the following data at December 31, 2017.
Securities Cost Fair Value
Trading $120,000 $126,000 Available-for-sale 100,000 96,000
The available-for-sale securities are held as a long-term investment.
Instructions(a) Prepare the adjusting entries to report each class of securities at fair value.(b) Indicate the statement presentation of each class of securities and the related unrealized
gain (loss) accounts.
Prepare adjusting entries for fair value, and indicate statement presentation for two classes of securities.
(LO 3)
Prepare adjusting entry to record fair value, and indicate statement presentation.
(LO 3)
EXERCISES: SET B AND CHALLENGE EXERCISES
Visit the book’s companion website, at www.wiley.com/college/weygandt, and choose the Student Companion site to access Exercises: Set B and Challenge Exercises.
PROBLEMS: SET A
P16-1A Vilander Carecenters Inc. provides fi nancing and capital to the healthcare indus-try, with a particular focus on nursing homes for the elderly. The following selected trans-actions relate to bonds acquired as an investment by Vilander, whose fi scal year ends on December 31.
2017
Jan. 1 Purchased at face value $2,000,000 of Javier Nursing Centers, Inc., 10-year, 8% bonds dated January 1, 2017, directly from Javier.
Dec. 31 Accrual of interest at year-end on the Javier bonds.
(Assume that all intervening transactions and adjustments have been properly recorded and that the number of bonds owned has not changed from December 31, 2017, to December 31, 2019.)
2020
Jan. 1 Received the annual interest on the Javier bonds.Jan. 1 Sold $1,000,000 Javier bonds at 106.Dec. 31 Accrual of interest at year-end on the Javier bonds.
Instructions(a) Journalize the listed transactions for the years 2017 and 2020.(b) Assume that the fair value of the bonds at December 31, 2017, was $2,200,000. These
bonds are classifi ed as available-for-sale securities. Prepare the adjusting entry to record these bonds at fair value.
(c) Based on your analysis in part (b), show the balance sheet presentation of the bonds and interest receivable at December 31, 2017. Assume the investments are considered long-term. Indicate where any unrealized gain or loss is reported in the fi nancial statements.
(a) Gain on sale of debt investment $60,000
Journalize debt investment transactions and show fi nancial statement presentation.
(LO 2, 3)

Problems: Set A 717
P16-2A In January 2017, the management of Kinzie Company concludes that it has suffi -cient cash to permit some short-term investments in debt and stock securities. During the year, the following transactions occurred.
Feb. 1 Purchased 600 shares of Muninger common stock for $32,400.Mar. 1 Purchased 800 shares of Tatman common stock for $20,000.Apr. 1 Purchased 50 $1,000, 7% Yoakem bonds for $50,000. Interest is payable
semiannually on April 1 and October 1.July 1 Received a cash dividend of $0.60 per share on the Muninger common stock.Aug. 1 Sold 200 shares of Muninger common stock at $58 per share.Sept. 1 Received a $1 per share cash dividend on the Tatman common stock.Oct. 1 Received the semiannual interest on the Yoakem bonds.Oct. 1 Sold the Yoakem bonds for $49,000.
At December 31, the fair value of the Muninger common stock was $55 per share. The fair value of the Tatman common stock was $24 per share.
Instructions(a) Journalize the transactions and post to the accounts Debt Investments and Stock
Investments. (Use the T-account form.)(b) Prepare the adjusting entry at December 31, 2017, to report the investment securities
at fair value. All securities are considered to be trading securities.(c) Show the balance sheet presentation of investment securities at December 31, 2017.(d) Identify the income statement accounts and give the statement classifi cation of each
account.
P16-3A On December 31, 2017, Turnball Associates owned the following securities, held as a long-term investment. The securities are not held for infl uence or control of the investee.
Common Stock Shares Cost
Gehring Co. 2,000 $60,000Wooderson Co. 5,000 45,000Kitselton Co. 1,500 30,000
On December 31, 2017, the total fair value of the securities was equal to its cost. In 2018, the following transactions occurred.
Aug. 1 Received $0.50 per share cash dividend on Gehring Co. common stock.Sept. 1 Sold 1,500 shares of Wooderson Co. common stock for cash at $8 per share.Oct. 1 Sold 800 shares of Gehring Co. common stock for cash at $33 per share.Nov. 1 Received $1 per share cash dividend on Kitselton Co. common stock.Dec. 15 Received $0.50 per share cash dividend on Gehring Co. common stock. 31 Received $1 per share annual cash dividend on Wooderson Co. common
stock.
At December 31, the fair values per share of the common stocks were: Gehring Co. $32, Wooderson Co. $8, and Kitselton Co. $18.
Instructions(a) Journalize the 2018 transactions and post to the account Stock Investments. (Use the
T-account form.)(b) Prepare the adjusting entry at December 31, 2018, to show the securities at fair value.
The stock should be classifi ed as available-for-sale securities.(c) Show the balance sheet presentation of the investments at December 31, 2018. At this
date, Turnball Associates has common stock $1,500,000 and retained earnings $1,000,000.
P16-4A Heidebrecht Design acquired 20% of the outstanding common stock of Quayle Company on January 1, 2017, by paying $800,000 for the 30,000 shares. Quayle declared and paid $0.30 per share cash dividends on March 15, June 15, September 15, and Decem-ber 15, 2017. Quayle reported net income of $320,000 for the year. At December 31, 2017, the market price of Quayle common stock was $34 per share.
(a) Gain on sale of stock investment $800
Journalize transactions and adjusting entry for stock investments.
(LO 2, 3)
(b) Unrealized loss $4,100
Prepare entries under the cost and equity methods, and tabulate differences.
(LO 2)
Journalize investment transactions, prepare adjusting entry, and show statement presentation.
(LO 2, 3)

718 16 Investments
Instructions(a) Prepare the journal entries for Heidebrecht Design for 2017 assuming Heidebrecht
Design cannot exercise signifi cant infl uence over Quayle. (Use the cost method and assume that Quayle common stock should be classifi ed as a trading security.)
(b) Prepare the journal entries for Heidebrecht Design for 2017, assuming Heidebrecht Design can exercise signifi cant infl uence over Quayle. Use the equity method.
(c) Indicate the balance sheet and income statement account balances at December 31, 2017, under each method of accounting.
P16-5A The following securities are in Frederick Company’s portfolio of long-term available-for-sale securities at December 31, 2017.
Cost
1,000 shares of Willhite Corporation common stock $52,0001,400 shares of Hutcherson Corporation common stock 84,0001,200 shares of Downing Corporation preferred stock 33,600
On December 31, 2017, the total cost of the portfolio equaled total fair value. Frederick had the following transactions related to the securities during 2018.
Jan. 20 Sold all 1,000 shares of Willhite Corporation common stock at $55 per share. 28 Purchased 400 shares of $70 par value common stock of Liggett Corporation
at $78 per share. 30 Received a cash dividend of $1.15 per share on Hutcherson Corp. common
stock.Feb. 8 Received cash dividends of $0.40 per share on Downing Corp. preferred stock. 18 Sold all 1,200 shares of Downing Corp. preferred stock at $27 per share.July 30 Received a cash dividend of $1.00 per share on Hutcherson Corp. common
stock.Sept. 6 Purchased an additional 900 shares of $10 par value common stock of Liggett
Corporation at $82 per share.Dec. 1 Received a cash dividend of $1.50 per share on Liggett Corporation common
stock.
At December 31, 2018, the fair values of the securities were:
Hutcherson Corporation common stock $64 per shareLiggett Corporation common stock $72 per share
Instructions(a) Prepare journal entries to record the transactions.(b) Post to the investment accounts. (Use T-accounts.)(c) Prepare the adjusting entry at December 31, 2018 to report the portfolio at fair value.(d) Show the balance sheet presentation at December 31, 2018, for the investment-related
accounts.
P16-6A The following data, presented in alphabetical order, are taken from the records of Nieto Corporation.
Accounts payable $ 260,000Accounts receivable 140,000Accumulated depreciation—buildings 180,000Accumulated depreciation—equipment 52,000Allowance for doubtful accounts 6,000Bonds payable (10%, due 2025) 500,000Buildings 950,000Cash 62,000Common stock ($10 par value; 500,000 shares authorized, 150,000 shares issued) 1,500,000Dividends payable 80,000Equipment 275,000Fair value adjustment—available-for-sale securities (Dr) 8,000Goodwill 200,000Income taxes payable 120,000Inventory 170,000Investment in Mara common stock (30% ownership), at equity 380,000
Journalize stock investment transactions and show statement presentation.
(LO 2, 3)
(a) Loss on sale of stock investment $1,200
(c) Unrealized loss $5,800
Prepare a balance sheet.
(LO 3)
(a) Total dividend revenue $36,000
(b) Revenue from stock investments $64,000

Comprehensive Problem: Chapters 12 to 16 719
Investment in Sasse common stock (10% ownership), at cost 278,000Land 390,000Notes payable (due 2018) 70,000Paid-in capital in excess of par—common stock 130,000Premium on bonds payable 40,000Prepaid insurance 16,000Retained earnings 103,000Short-term investments, at fair value (and cost) 180,000Unrealized gain—available-for-sale securities 8,000
The investment in Sasse common stock is considered to be a long-term available-for-sale security.
InstructionsPrepare a classifi ed balance sheet at December 31, 2017. Total assets $2,811,000
PROBLEMS: SET B AND SET C
Visit the book’s companion website, at www.wiley.com/college/weygandt, and choose the Student Companion site to access Problems: Set B and Set C.
COMPREHENSIVE PROBLEM: CHAPTERS 12 TO 16
CP16 Part I Debby Kauffman and her two colleagues, Jamie Hiatt and Ella Rincon, are personal trainers at an upscale health spa/resort in Tampa, Florida. They want to start a health club that spe-cializes in health plans for people in the 501 age range. The growing population in this age range and strong consumer interest in the health benefi ts of physical activity have convinced them they can profi tably operate their own club. In addition to many other decisions, they need to determine what type of business organization they want. Jamie believes there are more advantages to the corporate form than a partnership, but he hasn’t yet convinced Debby and Ella. They have come to you, a small-business consulting specialist, seeking information and advice regarding the choice of starting a partnership versus a corporation.
Instructions(a) Prepare a memo (dated May 26, 2016) that describes the advantages and disadvantages
of both partnerships and corporations. Advise Debby, Jamie, and Ella regarding which organiza-tional form you believe would better serve their purposes. Make sure to include reasons supporting your advice.
Part II After deciding to incorporate, each of the three investors receives 20,000 shares of $2 par common stock on June 12, 2016, in exchange for their co-owned building ($200,000 fair value) and $100,000 total cash they contributed to the business. The next decision that Debby, Jamie, and Ella need to make is how to obtain fi nancing for renovation and equipment. They understand the differ-ence between equity securities and debt securities, but do not understand the tax, net income, and earnings per share consequences of equity versus debt fi nancing on the future of their business.
Instructions(b) Prepare notes for a discussion with the three entrepreneurs in which you will compare the conse-
quences of using equity versus debt fi nancing. As part of your notes, show the differences in interest and tax expense assuming $1,400,000 is fi nanced with common stock, and then alternatively with debt. Assume that when common stock is used, 140,000 shares will be issued. When debt is used, assume the interest rate on debt is 9%, the tax rate is 32%, and income before interest and taxes is $300,000. (You may want to use an electronic spreadsheet.)
Part III During the discussion about fi nancing, Ella mentions that one of her clients, Timothy Hansen, has approached her about buying a signifi cant interest in the new club. Having an interested investor sways the three to issue equity securities to provide the financing they need. On July 21, 2016, Mr. Hansen buys 90,000 shares at a price of $10 per share.
720 16 Investments
The club, LifePath Fitness, opens on January 12, 2017, and after a slow start begins to produce the revenue desired by the owners. The owners decide to pay themselves a stock dividend since cash has been less than abundant since they opened their doors. The 10% stock dividend is declared by the owners on July 27, 2017. The market price of the stock is $3 on the declaration date. The date of record is July 31, 2017 (there have been no changes in stock ownership since the initial issuance), and the issue date is August 15, 2017. By the middle of the fourth quarter of 2017, the cash fl ow of LifePath Fitness has improved to the point that the owners feel ready to pay themselves a cash dividend. They declare a $0.05 cash dividend on December 4, 2017. The record date is December 14, 2017, and the payment date is December 24, 2017.
Instructions(c) (1) Record all of the transactions related to the common stock of LifePath Fitness during the years
2016 and 2017. (2) Indicate how many shares are issued and outstanding after the stock dividend is issued.
Part IV Since the club opened, a major concern has been the pool facilities. Although the existing pool is adequate, Debby, Jamie, and Ella all desire to make LifePath a cutting-edge facility. Until the end of 2017, fi nancing concerns prevented this improvement. However, because there has been steady growth in clientele, revenue, and income since the third quarter of 2017, the owners have explored possible fi nancing options. They are hesitant to issue stock and change the ownership mix because they have been able to work together as a team with great effectiveness. They have formu-lated a plan to issue secured term bonds to raise the needed $600,000 for the pool facilities. By the end of December 2017, everything was in place for the bond issue to go ahead. On January 1, 2018, the bonds were issued for $548,000. The bonds pay annual interest of 6% on January 1 of each year. The bonds mature in 10 years, and amortization is computed using the straight-line method.
Instructions(d) Record (1) the issuance of the secured bonds, (2) the adjusting entry required at December 31,
2018, (3) the interest payment made on January 1, 2019, and (4) the interest accrued on Decem-ber 31, 2019.
Part V Mr. Hansen’s purchase of the stock of LifePath Fitness was done through his business. The stock investment has always been accounted for using the cost method on his fi rm’s books. However, early in 2019 he decided to take his company public. He is preparing an IPO (initial public offering), and he needs to have the fi rm’s fi nancial statements audited. One of the issues to be resolved is to restate the stock investment in LifePath Fitness using the equity method since Mr. Hansen’s owner-ship percentage is greater than 20%.
Instructions(e) (1) Give the entries that would have been made on Hansen’s books if the equity method of account-
ing for investments had been used from the initial investment through 2018. Assume the following data for LifePath.
2016 2017 2018
Net income $30,000 $70,000 $105,000Total cash dividends $ 2,100 $20,000 $ 50,000
(2) Compute the balance in the Stock Investment account (as it relates to LifePath Fitness) at the end of 2018.
CONTINUING PROBLEM
COOKIE CREATIONS: AN ENTREPRENEURIAL JOURNEY(Note: This is a continuation of the Cookie Creations problem from Chapters 1 through 15.)
CC16 Natalie has been approached by Ken Thornton, a shareholder of The Beanery Coffee Inc. Ken wants to retire and would like to sell his 1,000 shares in The Beanery Coffee, which represents 30% of all shares issued. The Beanery is currently operated by Ken’s twin daughters, who each own 35% of the common shares. The Beanery not only operates a coffee shop but also roasts and sells beans to retailers, under the name “Rocky Mountain Beanery.”
© leungchopan/Shutterstock

Broadening Your Perspective 721
PERSPECTIVEFINANCIAL REPORTING AND ANALYSIS
Financial Reporting Problem: Apple Inc.BYP16-1 The annual report of Apple Inc. is presented in Appendix A. Instructions for accessing and using the company’s complete annual report, including the notes to the fi nancial statements, are also provided in Appendix A.
Instructions(a) Determine the percentage increase for (1) short-term marketable securities from 2012 to 2013,
and (2) long-term marketable securities from 2012 to 2013.(b) Using Apple’s consolidated statement of cash fl ows, determine: (1) Purchases of marketable securities during the current year. (2) How much was spent for business acquisitions, net of cash acquired during the current year.
Comparative Analysis Problem: PepsiCo, Inc. vs. The Coca-Cola CompanyBYP16-2 PepsiCo’s fi nancial statements are presented in Appendix B. Financial statements of The Coca-Cola Company are presented in Appendix C. Instructions for accessing and using the complete annual reports of PepsiCo and Coca-Cola, including the notes to the fi nancial statements, are also provided in Appendices B and C, respectively.
Instructions(a) Based on the information contained in these fi nancial statements, determine the following for each
company. (1) Net cash used in investing (investment) activities for the current year (from the statement of
cash fl ows). (2) Cash used for capital expenditures during the current year.(b) Each of PepsiCo’s fi nancial statements is labeled “consolidated.” What has been consolidated?
That is, from the contents of PepsiCo’s annual report, identify by name the corporations that have been consolidated (parent and subsidiaries).
Comparative Analysis Problem: Amazon.com, Inc. vs. Wal-Mart Stores, Inc.BYP16-3 Amazon.com, Inc.’s fi nancial statements are presented in Appendix D. Financial statements of Wal-Mart Stores, Inc. are presented in Appendix E. Instructions for accessing and using the com-plete annual reports of Amazon and Wal-Mart, including the notes to the fi nancial statements, are also provided in Appendices D and E, respectively.
Instructions(a) Based on the information contained in these fi nancial statements, determine the following for
each company. (1) Net cash used for investing (investment) activities for the current year (from the statement of
cash fl ows). (2) Cash used for business acquisitions, net of cash acquired during the current year.
BROADENING YOUR
Ken has met with Curtis and Natalie to discuss the business operation. All have concluded that there would be many advantages for Cookie & Coffee Creations Inc. to acquire an interest in The Beanery Coffee. Despite the apparent advantages, however, Natalie and Curtis are still not convinced that they should participate in this business venture.
Go to the book’s companion website, www.wiley.com/college/weygandt, to see the completion of this problem.

722 16 Investments
(b) Each of Amazon’s fi nancial statements is labeled “consolidated.” What has been consolidated? That is, from the contents of Amazon’s annual report, identify by name the corporations that have been consolidated (parent and subsidiaries).
Real-World FocusBYP16-4 Most publicly traded companies are examined by numerous analysts. These analysts often don’t agree about a company’s future prospects. In this exercise, you will fi nd analysts’ ratings about companies and make comparisons over time and across companies in the same industry. You will also see to what extent the analysts experienced “earnings surprises.” Earnings surprises can cause changes in stock prices.
Address: biz.yahoo.com/i, or go to www.wiley.com/college/weygandt
Steps1. Choose a company.2. Use the index to fi nd the company’s name.3. Choose Research.
Instructions(a) How many analysts rated the company?(b) What percentage rated it a strong buy?(c) What was the average rating for the week?(d) Did the average rating improve or decline relative to the previous week?(e) What was the amount of the earnings surprise percentage during the last quarter?
CRITICAL THINKING
Decision-Making Across the OrganizationBYP16-5 At the beginning of the question-and-answer portion of the annual stockholders’ meeting of Neosho Corporation, stockholder John Linton asks, “Why did management sell the holdings in JMB Company at a loss when this company has been very profi table during the period Neosho held its stock?” Since president Tony Cedeno has just concluded his speech on the recent success and bright future of Neosho, he is taken aback by this question and responds, “I remember we paid $1,300,000 for that stock some years ago. I am sure we sold that stock at a much higher price. You must be mistaken.” Linton retorts, “Well, right here in footnote number 7 to the annual report it shows that 240,000 shares, a 30% interest in JMB, were sold on the last day of the year. Also, it states that JMB earned $520,000 this year and paid out $160,000 in cash dividends. Further, a summary statement indicates that in past years, while Neosho held JMB stock, JMB earned $1,240,000 and paid out $440,000 in div-idends. Finally, the income statement for this year shows a loss on the sale of JMB stock of $180,000. So, I doubt that I am mistaken.” Red-faced, president Cedeno turns to you.
InstructionsWith the class divided into groups, answer the following.
(a) What dollar amount did Neosho receive upon the sale of the JMB stock?(b) Explain why both stockholder Linton and president Cedeno are correct.
Communication ActivityBYP16-6 Fegan Corporation has purchased two securities for its portfolio. The fi rst is a stock investment in Plummer Corporation, one of its suppliers. Fegan purchased 10% of Plummer with the intention of holding it for a number of years, but has no intention of purchasing more shares. The second investment was a purchase of debt securities. Fegan purchased the debt securities because its analysts believe that changes in market interest rates will cause these securities to increase in value in a short period of time. Fegan intends to sell the securities as soon as they have increased in value.
InstructionsWrite a memo to Sam Nichols, the chief fi nancial offi cer, explaining how to account for each of these investments. Explain what the implications for reported income are from this accounting treatment.

A Look at IFRS 723
Ethics CaseBYP16-7 Harding Financial Services Company holds a large portfolio of debt and stock securities as an investment. The total fair value of the portfolio at December 31, 2017, is greater than total cost. Some securities have increased in value and others have decreased. Ann Bales, the fi nancial vice pres-ident, and Kim Reeble, the controller, are in the process of classifying for the fi rst time the securities in the portfolio. Bales suggests classifying the securities that have increased in value as trading securities in order to increase net income for the year. She wants to classify the securities that have decreased in value as long-term available-for-sale securities, so that the decreases in value will not affect 2017 net income. Reeble disagrees. She recommends classifying the securities that have decreased in value as trad-ing securities and those that have increased in value as long-term available-for-sale securities. Reeble argues that the company is having a good earnings year and that recognizing the losses now will help to smooth income for this year. Moreover, for future years, when the company may not be as profi t-able, the company will have built-in gains.
Instructions(a) Will classifying the securities as Bales and Reeble suggest actually affect earnings as each says it
will?(b) Is there anything unethical in what Bales and Reeble propose? Who are the stakeholders affected
by their proposals?(c) Assume that Bales and Reeble properly classify the portfolio. At year-end, Bales proposes to sell
the securities that will increase 2017 net income, and that Reeble proposes to sell the securities that will decrease 2017 net income. Is this unethical?
All About YouBYP16-8 The Securities and Exchange Commission (SEC) is the primary regulatory agency of U.S. fi nancial markets. Its job is to ensure that the markets remain fair for all investors. The following SEC sites provide useful information for investors.
Address: www.sec.gov/answers.shtml and http://www.sec.gov/investor/tools/quiz.htm, or go to www.wiley.com/college/weygandt.
Instructions(a) Go to the fi rst SEC site and fi nd the defi nition of the following terms. (i) Ask price. (ii) Margin. (iii) Prospectus. (iv) Index fund.(b) Go to the second SEC site and take the short quiz.
FASB Codifi cation ActivityBYP16-9 If your school has a subscription to the FASB Codifi cation, go to http://aaahq.org/ascLogin.cfm to log in and prepare responses to the following.
(a) What is the defi nition of a trading security?(b) What is the defi nition of an available-for-sale security?(c) What is defi nition of a holding gain or loss?
A Look at IFRS
4 Compare the accounting for investments under GAAP and IFRS.LEARNING OBJECTIVE
Until recently, when the IASB issued IFRS 9, the accounting and reporting for investments under IFRS and GAAP were for the most part very similar. However, IFRS 9 introduces a new framework for classifying investments.

724 16 Investments
Key PointsFollowing are the similarities and differences between GAAP and IFRS as related to investments.
Similarities• The basic accounting entries to record the acquisition of debt securities, the receipt of interest, and
the sale of debt securities are the same under IFRS and GAAP.
• The basic accounting entries to record the acquisition of stock investments, the receipt of dividends, and the sale of stock securities are the same under IFRS and GAAP.
• Both IFRS and GAAP use the same criteria to determine whether the equity method of accounting should be used—that is, signifi cant infl uence with a general guide of over 20% ownership, IFRS uses the term associate investment rather than equity investment to describe its investment under the equity method.
• Equity investments are generally recorded and reported at fair value under IFRS. Equity invest-ments do not have a fi xed interest or principal payment schedule and therefore cannot be accounted for at amortized cost. In general, equity investments are valued at fair value, with all gains and losses reported in income, similar to GAAP.
• Unrealized gains and losses related to available-for-sale securities are reported in other comprehen-sive income under GAAP and IFRS. These gains and losses that accumulate are then reported in the balance sheet.
Differences• Under IFRS, both the investor and an associate company should follow the same accounting poli-
cies. As a result, in order to prepare fi nancial information, adjustments are made to the associate’s policies to conform to the investor’s books. GAAP does not have that requirement.
• In general, IFRS requires that companies determine how to measure their fi nancial assets based on two criteria:
♦ The company’s business model for managing their fi nancial assets; and
♦ The contractual cash fl ow characteristics of the fi nancial asset.
If a company has (1) a business model whose objective is to hold assets in order to collect contrac-tual cash fl ows and (2) the contractual terms of the fi nancial asset gives specifi ed dates to cash fl ows that are solely payments of principal and interest on the principal amount outstanding, then the company should use cost (often referred to as amortized cost).
For example, assume that Mitsubishi purchases a bond investment that it intends to hold to maturity (held-for-collection). Its business model for this type of investment is to collect interest and then principal at maturity. The payment dates for the interest rate and principal are stated on the bond. In this case, Mitsubishi accounts for the investment at cost. If, on the other hand, Mitsubishi purchased the bonds as part of a trading strategy to speculate on interest rate changes (a trading investment), then the debt investment is reported at fair value. As a result, only debt investments such as receivables, loans, and bond investments that meet the two criteria above are recorded at amortized cost. All other debt investments are recorded and reported at fair value.
Looking to the FutureAs indicated earlier, the IASB has issued a new revised IFRS which deals with the accounting issues related to investment securities. The FASB is now in the fi nal process of issuing a new standard in this area. It is likely that some differences will continue to exist between the IFRS and the FASB regarding investments.
IFRS Practice
IFRS Self-Test Questions
1. The following asset is not considered a fi nancial asset under IFRS:(a) trading securities.(b) equity securities.(c) held-for-collection securities.(d) inventories.

A Look at IFRS 725
2. Under IFRS, the equity method of accounting for long-term investments in common stock should be used when the investor has signifi cant infl uence over an investee and owns:(a) between 20% and 50% of the investee’s common stock.(b) 30% or more of the investee’s common stock.(c) more than 50% of the investee’s common stock.(d) less than 20% of the investee’s common stock.
3. Under IFRS, the unrealized loss on trading investments should be reported:(a) as part of other comprehensive loss reducing net income.(b) on the income statement reducing net income.(c) as part of other comprehensive loss not affecting net income.(d) directly to stockholders’ equity bypassing the income statement.
Answers to IFRS Self-Test Questions
1. d 2. a 3. b

Companies must be ready to respond to changes quickly in
order to survive and thrive. This requires careful management
of cash. One company that managed cash successfully in its
early years was Microsoft. During those years, the company
paid much of its payroll with stock options (rights to purchase
company stock in the future at a given price) instead of cash.
This conserved cash and turned more than a thousand of its
employees into millionaires.
In recent years, Microsoft has had a different kind of cash
problem. Now that it has reached a more “mature” stage
in life, it generates so much cash—roughly $1 billion per
month—that it cannot always fi gure out what to do with it.
At one time, Microsoft had accumulated $60 billion.
The company said it was accumulating cash to invest in new
opportunities, buy other companies, and pay off pending
lawsuits. Microsoft’s stockholders complained that holding all
this cash was putting a drag on the company’s profi tability.
Why? Because Microsoft had the cash invested in very low-
yielding government securities. Stockholders felt that the
company either should fi nd new investment projects that would
bring higher returns, or return some of the cash to stockholders.
Finally, Microsoft announced a plan to return cash to
stockholders by paying a special one-time $32 billion
dividend. This special dividend was so large that, according
to the U.S. Commerce Department, it caused total personal
income in the United States to rise by 3.7% in one
month—the largest increase ever recorded by the agency.
(It also made the holiday season brighter, especially for
retailers in the Seattle area.) Microsoft also doubled its
regular annual dividend to $3.50 per share. Further, it
announced that it would spend another $30 billion buying
treasury stock.
Apple also has encountered this cash “problem.” Recently,
Apple had nearly $100 billion in liquid assets (cash, cash
equivalents, and investment securities). The company was
generating $37 billion of cash per year from its operating
activities but spending only about $7 billion on plant assets
and purchases of patents. Shareholders pressured Apple to
unload some of this cash. In response, Apple announced that
it would begin to pay a quarterly dividend of $2.65 per share
and it would buy back up to $10 billion of its stock. Analysts
noted that the dividend consumes only $10 billion of cash per
year. This leaves Apple wallowing in cash. The rest of us
should have such problems.
Source: “Business: An End to Growth? Microsoft’s Cash Bonanza,” The
Economist (July 23, 2005), p. 61.
Got Cash?
The balance sheet, income statement, and retained earnings statement do not always show the whole picture of the fi nancial condition of a company or institution. In fact, looking at the fi nancial statements of some well-known companies, a thoughtful investor might ask questions like these: How did Eastman Kodak fi nance cash dividends of $649 million in a year in which it earned only $17 million? How could United Air Lines purchase new planes that cost $1.9 billion in a year in which it reported a net loss of over $2 billion? How did the companies that spent a combined fantastic $3.4 trillion on mergers and acquisitions in a recent year fi nance those deals? Answers to these and similar questions can be found in this chapter, which presents the statement of cash fl ows.
CHAPTER PREVIEW
17
FEATURE STORY
Statement of Cash Flows
726

Prepare a statement of cash fl ows using the indirect method.
Analyze the statement of cash fl ows.
2
3
Discuss the usefulness and format of the statement of cash fl ows.1 Classifi cation of Cash
FlowsDO IT! 1
• Usefulness of the statement of cash fl ows
• Classifi cation of cash fl ows• Signifi cant noncash activities• Format of the statement of cash
fl ows
DO IT!
• Indirect and direct methods• Indirect method—Computer
Services Company• Step 1: Operating activities• Summary of conversion to net
cash provided by operating activities
• Step 2: Investing and fi nancing activities
• Step 3: Net change in cash
Learning Objectives
Free Cash FlowDO IT! 3• Free cash fl ow
Go to the REVIEW AND PRACTICE section at the end of the chapter for a review of key concepts and practice applications with solutions.
Visit WileyPLUS with ORION for additional tutorials and practice opportunities.
Cash from Operating Activities
2a
2b Indirect Method
Justin Sullivan/Getty Images, Inc.
CHAPTER OUTLINE

728 17 Statement of Cash Flows
1 Discuss the usefulness and format of the statement of cash fl ows.LEARNING OBJECTIVE
The balance sheet, income statement, and retained earnings statement provide only limited information about a company’s cash fl ows (cash receipts and cash payments). For example, comparative balance sheets show the increase in prop-erty, plant, and equipment during the year. But, they do not show how the addi-tions were fi nanced or paid for. The income statement shows net income. But, it does not indicate the amount of cash generated by operating activities. The retained earnings statement shows cash dividends declared but not the cash div-idends paid during the year. None of these statements presents a detailed sum-mary of where cash came from and how it was used.
Usefulness of the Statement of Cash Flows
The statement of cash fl ows reports the cash receipts, cash payments, and net change in cash resulting from operating, investing, and fi nancing activities during a period. The information in a statement of cash fl ows helps investors, creditors, and others assess the following.
1. The entity’s ability to generate future cash fl ows. By examining relation-ships between items in the statement of cash fl ows, investors can better pre-dict the amounts, timing, and uncertainty of future cash fl ows than they can from accrual-basis data.
2. The entity’s ability to pay dividends and meet obligations. If a company does not have adequate cash, it cannot pay employees, settle debts, or pay dividends. Employees, creditors, and stockholders should be particularly interested in this statement because it alone shows the fl ows of cash in a business.
3. The reasons for the difference between net income and net cash pro-vided (used) by operating activities. Net income provides information on the success or failure of a business. However, some fi nancial statement users are critical of accrual-basis net income because it requires many estimates. As a result, users often challenge the reliability of the number. Such is not the case with cash. Many readers of the statement of cash fl ows want to know the reasons for the difference between net income and net cash provided by oper-ating activities. Then, they can assess for themselves the reliability of the income number.
4. The cash investing and fi nancing transactions during the period. By examining a company’s investing and fi nancing transactions, a fi nancial state-ment reader can better understand why assets and liabilities changed during the period.
Classifi cation of Cash Flows
The statement of cash fl ows classifi es cash receipts and cash payments as operat-ing, investing, and fi nancing activities. Transactions and other events character-istic of each kind of activity are as follows.
1. Operating activities include the cash effects of transactions that create reve-nues and expenses. They thus enter into the determination of net income.
2. Investing activities include (a) acquiring and disposing of investments and property, plant, and equipment, and (b) lending money and collecting the loans.
3. Financing activities include (a) obtaining cash from issuing debt and repay-ing the amounts borrowed, and (b) obtaining cash from stockholders, repur-chasing shares, and paying dividends.
ETHICS NOTE
Though we discourage reliance on cash fl ows to the exclusion of accrual accounting, comparing net cash provided by operating activities to net income can reveal important information about the “quality” of reported net income. Such a comparison can reveal the extent to which net income provides a good measure of actual performance.
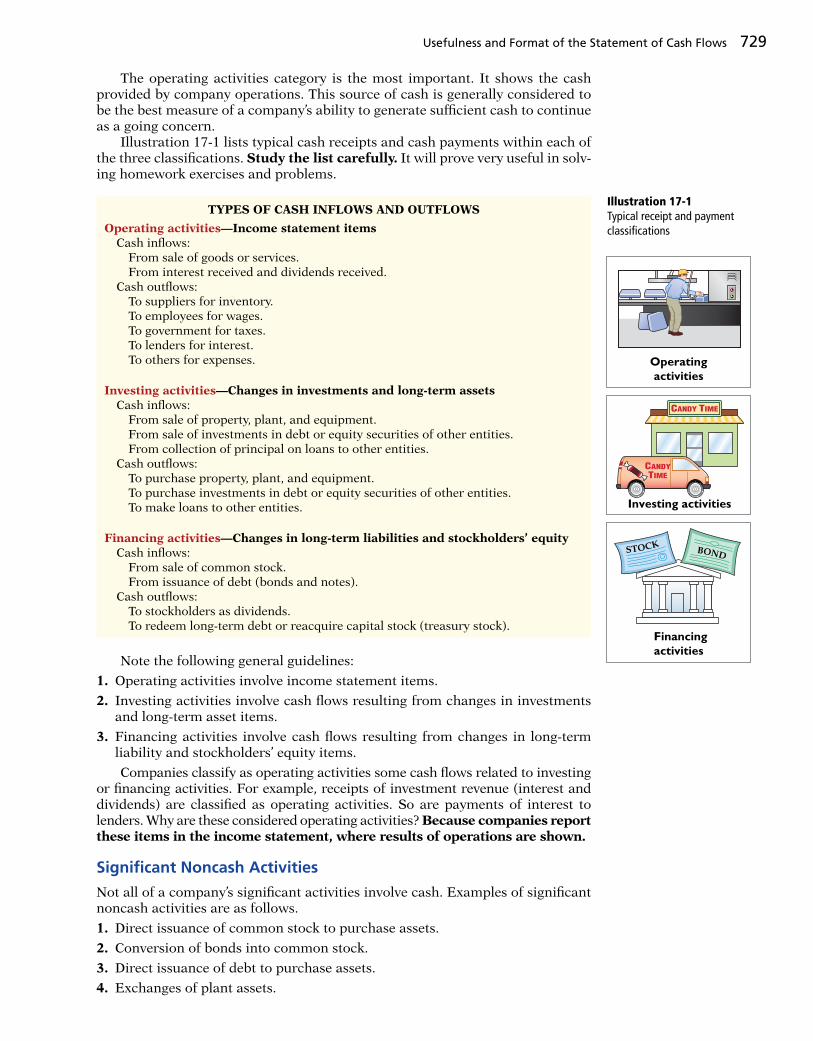
Usefulness and Format of the Statement of Cash Flows 729
The operating activities category is the most important. It shows the cash provided by company operations. This source of cash is generally considered to be the best measure of a company’s ability to generate suffi cient cash to continue as a going concern. Illustration 17-1 lists typical cash receipts and cash payments within each of the three classifi cations. Study the list carefully. It will prove very useful in solv-ing homework exercises and problems.
Illustration 17-1Typical receipt and payment classifi cations
TYPES OF CASH INFLOWS AND OUTFLOWS
Operating activities—Income statement items Cash infl ows: From sale of goods or services. From interest received and dividends received. Cash outfl ows: To suppliers for inventory. To employees for wages. To government for taxes. To lenders for interest. To others for expenses.
Investing activities—Changes in investments and long-term assets Cash infl ows: From sale of property, plant, and equipment. From sale of investments in debt or equity securities of other entities. From collection of principal on loans to other entities. Cash outfl ows: To purchase property, plant, and equipment. To purchase investments in debt or equity securities of other entities. To make loans to other entities.
Financing activities—Changes in long-term liabilities and stockholders’ equity Cash infl ows: From sale of common stock. From issuance of debt (bonds and notes). Cash outfl ows: To stockholders as dividends. To redeem long-term debt or reacquire capital stock (treasury stock).
Operating
activities
Investing activities
BONDSTOCK
Financing
activities
CANDY TIME
CANDYTIME
Note the following general guidelines:
1. Operating activities involve income statement items.
2. Investing activities involve cash fl ows resulting from changes in investments and long-term asset items.
3. Financing activities involve cash fl ows resulting from changes in long-term liability and stockholders’ equity items.
Companies classify as operating activities some cash fl ows related to investing or fi nancing activities. For example, receipts of investment revenue (interest and dividends) are classifi ed as operating activities. So are payments of interest to lenders. Why are these considered operating activities? Because companies report these items in the income statement, where results of operations are shown.
Signifi cant Noncash Activities
Not all of a company’s signifi cant activities involve cash. Examples of signifi cant noncash activities are as follows.
1. Direct issuance of common stock to purchase assets.
2. Conversion of bonds into common stock.
3. Direct issuance of debt to purchase assets.
4. Exchanges of plant assets.
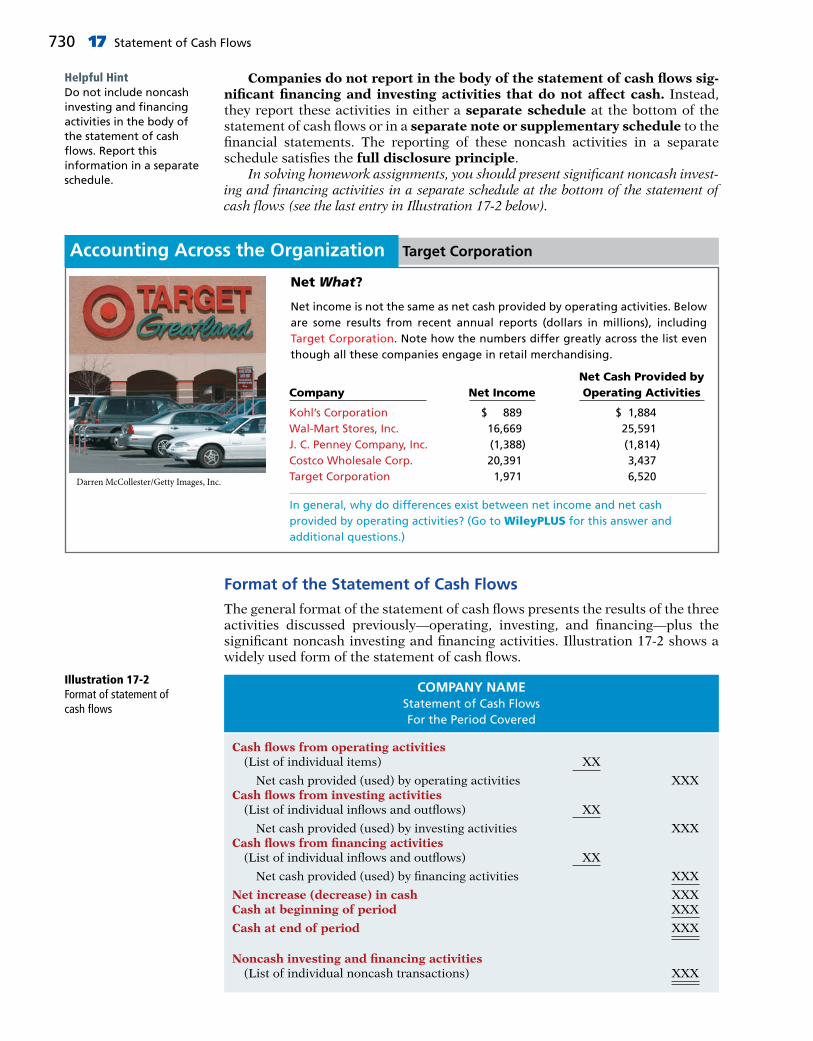
730 17 Statement of Cash Flows
Companies do not report in the body of the statement of cash fl ows sig-nifi cant fi nancing and investing activities that do not affect cash. Instead, they report these activities in either a separate schedule at the bottom of the statement of cash fl ows or in a separate note or supplementary schedule to the fi nancial statements. The reporting of these noncash activities in a separate schedule satisfi es the full disclosure principle. In solving homework assignments, you should present signifi cant noncash invest-ing and fi nancing activities in a separate schedule at the bottom of the statement of cash fl ows (see the last entry in Illustration 17-2 below).
Net What?
Net income is not the same as net cash provided by operating activities. Below are some results from recent annual reports (dollars in millions), including Target Corporation. Note how the numbers differ greatly across the list even though all these companies engage in retail merchandising.
Target CorporationAccounting Across the Organization
Net Cash Provided by Company Net Income Operating Activities
Kohl’s Corporation $ 889 $ 1,884Wal-Mart Stores, Inc. 16,669 25,591J. C. Penney Company, Inc. (1,388) (1,814)Costco Wholesale Corp. 20,391 3,437Target Corporation 1,971 6,520
In general, why do differences exist between net income and net cash provided by operating activities? (Go to WileyPLUS for this answer and additional questions.)
Darren McCollester/Getty Images, Inc.
Helpful HintDo not include noncash investing and fi nancing activities in the body of the statement of cash fl ows. Report this information in a separate schedule.
Format of the Statement of Cash Flows
The general format of the statement of cash fl ows presents the results of the three activities discussed previously—operating, investing, and fi nancing—plus the signifi cant noncash investing and fi nancing activities. Illustration 17-2 shows a widely used form of the statement of cash fl ows.
Illustration 17-2Format of statement of cash fl ows
COMPANY NAMEStatement of Cash FlowsFor the Period Covered
Cash fl ows from operating activities (List of individual items) XX
Net cash provided (used) by operating activities XXXCash fl ows from investing activities (List of individual infl ows and outfl ows) XX
Net cash provided (used) by investing activities XXXCash fl ows from fi nancing activities (List of individual infl ows and outfl ows) XX
Net cash provided (used) by fi nancing activities XXX
Net increase (decrease) in cash XXXCash at beginning of period XXX
Cash at end of period XXX
Noncash investing and fi nancing activities (List of individual noncash transactions) XXX

Preparing the Statement of Cash Flows—Indirect Method 731
The cash fl ows from operating activities section always appears fi rst, followed by the investing activities section and then the fi nancing activities section. The sum of the operating, investing, and fi nancing sections equals the net increase or decrease in cash for the period. This amount is added to the beginning cash balance to arrive at the ending cash balance—the same amount reported on the balance sheet.
During its fi rst week, Duffy & Stevenson Company had these transactions.
1. Issued 100,000 shares of $5 par value common stock for $800,000 cash.
2. Borrowed $200,000 from Castle Bank, signing a 5-year note bearing 8% interest.
3. Purchased two semi-trailer trucks for $170,000 cash.
4. Paid employees $12,000 for salaries and wages.
5. Collected $20,000 cash for services performed.
Classify each of these transactions by type of cash fl ow activity.
Solution
DO IT! 1 Classifi cation of Cash Flows
1. Financing activity. 4. Operating activity.
2. Financing activity. 5. Operating activity.
3. Investing activity.
Related exercise material: BE17-1, BE17-2, BE17-3, E17-1, E17-2, E17-3, and DO IT! 17-1.
Action Plan✔ Identify the three
types of activities used to report all cash infl ows and outfl ows.
✔ Report as operating activities the cash effects of transactions that create revenues and expenses and enter into the determi-nation of net income.
✔ Report as investing activities transactions that (a) acquire and dispose of investments and long-term assets and (b) lend money and collect loans.
✔ Report as fi nancing activities transactions that (a) obtain cash from issuing debt and repay the amounts borrowed and (b) obtain cash from stockholders and pay them dividends.
2 Prepare a statement of cash fl ows using the indirect method.LEARNING OBJECTIVE
Companies prepare the statement of cash fl ows differently from the three other basic fi nancial statements. First, it is not prepared from an adjusted trial balance. It requires detailed information concerning the changes in account balances that occurred between two points in time. An adjusted trial balance will not provide the necessary data. Second, the statement of cash fl ows deals with cash receipts and payments. As a result, the company adjusts the effects of the use of accrual accounting to determine cash fl ows. The information to prepare this statement usually comes from three sources:
• Comparative balance sheets. Information in the comparative balance sheets indicates the amount of the changes in assets, liabilities, and stock-holders’ equities from the beginning to the end of the period.
• Current income statement. Information in this statement helps determine the amount of net cash provided or used by operating activities during the period.
• Additional information. Such information includes transaction data that are needed to determine how cash was provided or used during the period.
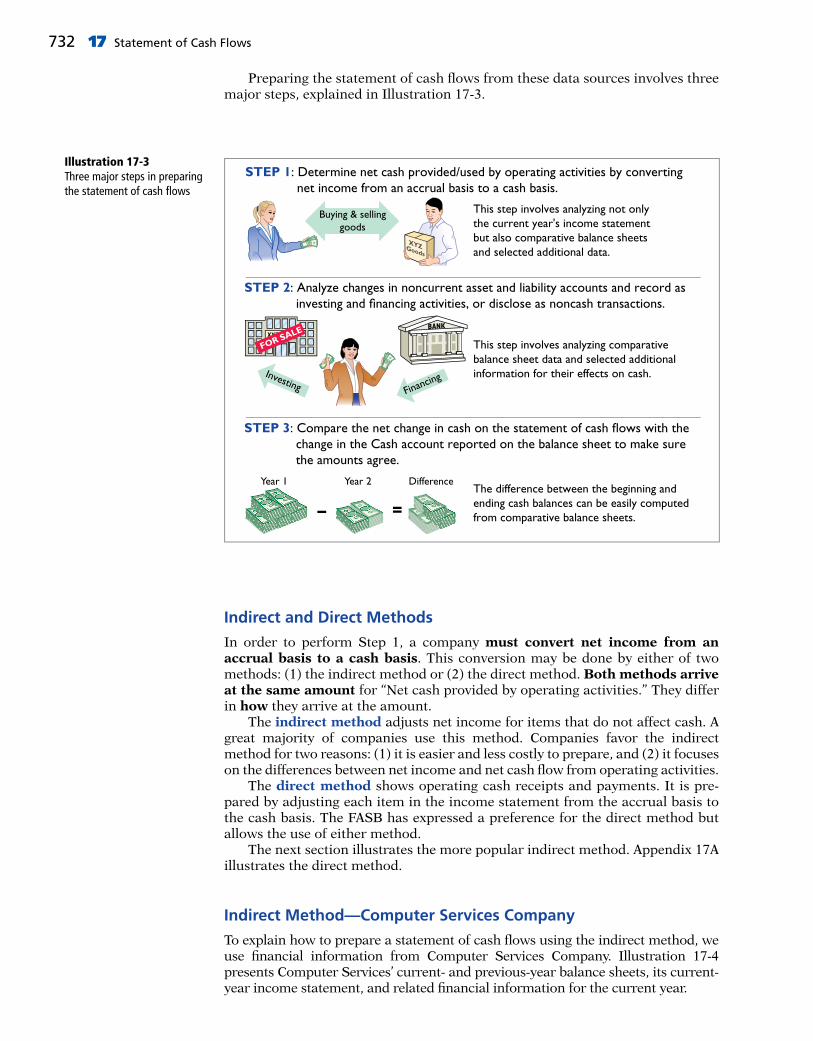
732 17 Statement of Cash Flows
Preparing the statement of cash fl ows from these data sources involves three major steps, explained in Illustration 17-3.
The difference between the beginning andending cash balances can be easily computedfrom comparative balance sheets.
This step involves analyzing not onlythe current year's income statementbut also comparative balance sheetsand selected additional data.
STEP 2: Analyze changes in noncurrent asset and liability accounts and record as investing and financing activities, or disclose as noncash transactions.
STEP 1: Determine net cash provided/used by operating activities by converting net income from an accrual basis to a cash basis.
STEP 3: Compare the net change in cash on the statement of cash flows with the change in the Cash account reported on the balance sheet to make sure the amounts agree.
This step involves analyzing comparativebalance sheet data and selected additionalinformation for their effects on cash.
FinancingInvesting
Buying & sellinggoods
XYZ Corp.
FOR SALE
– =
Year 1 Year 2 Difference
BANK
XYZGoods
Illustration 17-3Three major steps in preparing the statement of cash fl ows
Indirect and Direct Methods
In order to perform Step 1, a company must convert net income from an accrual basis to a cash basis. This conversion may be done by either of two methods: (1) the indirect method or (2) the direct method. Both methods arrive at the same amount for “Net cash provided by operating activities.” They differ in how they arrive at the amount. The indirect method adjusts net income for items that do not affect cash. A great majority of companies use this method. Companies favor the indirect method for two reasons: (1) it is easier and less costly to prepare, and (2) it focuses on the differences between net income and net cash fl ow from operating activities. The direct method shows operating cash receipts and payments. It is pre-pared by adjusting each item in the income statement from the accrual basis to the cash basis. The FASB has expressed a preference for the direct method but allows the use of either method. The next section illustrates the more popular indirect method. Appendix 17A illustrates the direct method.
Indirect Method—Computer Services Company
To explain how to prepare a statement of cash fl ows using the indirect method, we use fi nancial information from Computer Services Company. Illustration 17-4 presents Computer Services’ current- and previous-year balance sheets, its current-year income statement, and related fi nancial information for the current year.

Preparing the Statement of Cash Flows—Indirect Method 733
We now apply the three steps for preparing a statement of cash fl ows to the information provided for Computer Services Company.
Illustration 17-4Comparative balance sheets, income statement, and additional information for Computer Services Company
COMPUTER SERVICES COMPANYComparative Balance Sheets
December 31
Change in Account BalanceAssets 2017 2016 Increase/Decrease
Current assets Cash $ 55,000 $ 33,000 $ 22,000 Increase Accounts receivable 20,000 30,000 10,000 Decrease Inventory 15,000 10,000 5,000 Increase Prepaid expenses 5,000 1,000 4,000 IncreaseProperty, plant, and equipment Land 130,000 20,000 110,000 Increase Buildings 160,000 40,000 120,000 Increase Accumulated depreciation—buildings (11,000) (5,000) 6,000 Increase Equipment 27,000 10,000 17,000 Increase Accumulated depreciation—equipment (3,000) (1,000) 2,000 Increase
Total assets $398,000 $138,000
Liabilities and Stockholders’ Equity
Current liabilities Accounts payable $ 28,000 $ 12,000 $ 16,000 Increase Income taxes payable 6,000 8,000 2,000 DecreaseLong-term liabilities Bonds payable 130,000 20,000 110,000 IncreaseStockholders’ equity Common stock 70,000 50,000 20,000 Increase Retained earnings 164,000 48,000 116,000 Increase
Total liabilities and stockholders’ equity $398,000 $138,000
COMPUTER SERVICES COMPANYIncome Statement
For the Year Ended December 31, 2017
Sales revenue $507,000Cost of goods sold $150,000Operating expenses (excluding depreciation) 111,000Depreciation expense 9,000Loss on disposal of equipment 3,000Interest expense 42,000 315,000
Income before income tax 192,000Income tax expense 47,000
Net income $145,000
Additional information for 2017:1. Depreciation expense was comprised of $6,000 for building and $3,000 for equipment.2. The company sold equipment with a book value of $7,000 (cost $8,000, less
accumulated depreciation $1,000) for $4,000 cash.3. Issued $110,000 of long-term bonds in direct exchange for land.4. A building costing $120,000 was purchased for cash. Equipment costing $25,000
was also purchased for cash.5. Issued common stock for $20,000 cash.6. The company declared and paid a $29,000 cash dividend.

734 17 Statement of Cash Flows
Step 1: Operating Activities
DETERMINE NET CASH PROVIDED/USED BY OPERATING ACTIVITIES BY CONVERTING NET INCOME FROM AN ACCRUAL BASIS TO A CASH BASIS
To determine net cash provided by operating activities under the indirect method, companies adjust net income in numerous ways. A useful starting point is to understand why net income must be converted to net cash provided by operating activities. Under generally accepted accounting principles, most companies use the accrual basis of accounting. This basis requires that companies record revenue when their performance obligation is satisfi ed and record expenses when incurred. Revenues include credit sales for which the company has not yet collected cash. Expenses incurred include some items that it has not yet paid in cash. Thus, under the accrual basis, net income is not the same as net cash provided by operating activities. Therefore, under the indirect method, companies must adjust net income to convert certain items to the cash basis. The indirect method (or reconciliation method) starts with net income and converts it to net cash provided by operating activities. Illustration 17-5 lists the three types of adjustments.
Illustration 17-5Three types of adjustments to convert net income to net cash provided by operating activities
Net Cash Provided/Net Income 1/2 Adjustments 5 Used by Operating Activities • Add back noncash expenses,
such as depreciation expense and amortization expense.
• Deduct gains and add lossesthat resulted from investing andfi nancing activities.
• Analyze changes to noncash current asset and current liability accounts.
We explain the three types of adjustments in the next three sections.
DEPRECIATION EXPENSE
Computer Services’ income statement reports depreciation expense of $9,000. Although depreciation expense reduces net income, it does not reduce cash. In other words, depreciation expense is a noncash charge. The company must add it back to net income to arrive at net cash provided by operating activities. Computer Services reports depreciation expense in the statement of cash fl ows as shown below.
Helpful HintDepreciation is similar to any other expense in that it reduces net income. It differs in that it does not involve a current cash outfl ow. That is why it must be added back to net income to arrive at net cash provided by operating activities.
Illustration 17-6Adjustment for depreciation Cash fl ows from operating activities
Net income $145,000 Adjustments to reconcile net income to net cash provided by operating activities: Depreciation expense 9,000
Net cash provided by operating activities $154,000
As the fi rst adjustment to net income in the statement of cash fl ows, compa-nies frequently list depreciation and similar noncash charges such as amortiza-tion of intangible assets, depletion expense, and bad debt expense.
LOSS ON DISPOSAL OF EQUIPMENT
Illustration 17-1 states that cash received from the sale (disposal) of plant assets is reported in the investing activities section. Because of this, companies eliminate

Preparing the Statement of Cash Flows—Indirect Method 735
from net income all gains and losses related to the disposal of plant assets, to arrive at net cash provided by operating activities. In our example, Computer Services’ income statement reports a $3,000 loss on the disposal of equipment (book value $7,000, less $4,000 cash received from disposal of equipment). The company’s loss of $3,000 should not be included in the operating activities section of the statement of cash fl ows. Illustration 17-7 shows that the $3,000 loss is eliminated by adding $3,000 back to net income to arrive at net cash provided by operating activities.
Illustration 17-7Adjustment for loss on disposal of equipment
Cash fl ows from operating activities Net income $145,000 Adjustments to reconcile net income to net cash provided by operating activities: Depreciation expense $9,000 Loss on disposal of equipment 3,000 12,000
Net cash provided by operating activities $157,000
If a gain on disposal occurs, the company deducts the gain from net income in order to determine net cash provided by operating activities. In the case of either a gain or a loss, companies report as a source of cash in the investing activities section of the statement of cash fl ows the actual amount of cash received from the sale.
CHANGES TO NONCASH CURRENT ASSET AND CURRENT LIABILITY ACCOUNTS
A fi nal adjustment in reconciling net income to net cash provided by operating activities involves examining all changes in current asset and current liability accounts. The accrual-accounting process records revenues in the period in which the performance obligation is satisfi ed and expenses are incurred. For example, Accounts Receivable refl ects amounts owed to the company for sales that have been made but for which cash collections have not yet been received. Prepaid Insurance refl ects insurance that has been paid for but which has not yet expired (therefore has not been expensed). Similarly, Salaries and Wages Payable refl ects salaries and wages expense that has been incurred but has not been paid. As a result, companies need to adjust net income for these accruals and pre-payments to determine net cash provided by operating activities. Thus, they must analyze the change in each current asset and current liability account to deter-mine its impact on net income and cash.
CHANGES IN NONCASH CURRENT ASSETS. The adjustments required for changes in noncash current asset accounts are as follows. Deduct from net income increases in current asset accounts, and add to net income decreases in current asset accounts, to arrive at net cash provided by operating activities. We observe these relationships by analyzing the accounts of Computer Services.
DECREASE IN ACCOUNTS RECEIVABLE Computer Services’ accounts receivable decreased by $10,000 (from $30,000 to $20,000) during the period. For Computer Services, this means that cash receipts were $10,000 higher than sales revenue. The Accounts Receivable account in Illustration 17-8 shows that Computer Services had $507,000 in sales revenue (as reported on the income statement), but it col-lected $517,000 in cash.
Illustration 17-8Analysis of accounts receivable Accounts Receivable
1/1/17 Balance 30,000 Receipts from customers 517,000 Sales revenue 507,000
12/31/17 Balance 20,000

736 17 Statement of Cash Flows
As shown in Illustration 17-9 (below), to adjust net income to net cash pro-vided by operating activities, the company adds to net income the decrease of $10,000 in accounts receivable. When the Accounts Receivable balance increases, cash receipts are lower than sales revenue earned under the accrual basis. There-fore, the company deducts from net income the amount of the increase in accounts receivable, to arrive at net cash provided by operating activities.
INCREASE IN INVENTORY Computer Services’ inventory increased $5,000 (from $10,000 to $15,000) during the period. The change in the Inventory account refl ects the difference between the amount of inventory purchased and the amount sold. For Computer Services, this means that the cost of merchandise purchased exceeded the cost of goods sold by $5,000. As a result, cost of goods sold does not refl ect $5,000 of cash payments made for merchandise. The com-pany deducts from net income this inventory increase of $5,000 during the period, to arrive at net cash provided by operating activities (see Illustration 17-9). If inventory decreases, the company adds to net income the amount of the change, to arrive at net cash provided by operating activities.
INCREASE IN PREPAID EXPENSES Computer Services’ prepaid expenses increased during the period by $4,000. This means that cash paid for expenses is higher than expenses reported on an accrual basis. In other words, the company has made cash payments in the current period but will not charge expenses to income until future periods (as charges to the income statement). To adjust net income to net cash provided by operating activities, the company deducts from net income the $4,000 increase in prepaid expenses (see Illustration 17-9).
Illustration 17-9Adjustments for changes in current asset accounts
Cash fl ows from operating activities Net income $145,000 Adjustments to reconcile net income to net cash provided by operating activities: Depreciation expense $ 9,000 Loss on disposal of equipment 3,000 Decrease in accounts receivable 10,000 Increase in inventory (5,000) Increase in prepaid expenses (4,000) 13,000
Net cash provided by operating activities $158,000
If prepaid expenses decrease, reported expenses are higher than the expenses paid. Therefore, the company adds to net income the decrease in prepaid expenses, to arrive at net cash provided by operating activities.
CHANGES IN CURRENT LIABILITIES. The adjustments required for changes in current liability accounts are as follows. Add to net income increases in current liability accounts and deduct from net income decreases in current liability accounts, to arrive at net cash provided by operating activities.
INCREASE IN ACCOUNTS PAYABLE For Computer Services, Accounts Payable increased by $16,000 (from $12,000 to $28,000) during the period. That means the company received $16,000 more in goods than it actually paid for. As shown in Illustration 17-10, to adjust net income to determine net cash provided by operat-ing activities, the company adds to net income the $16,000 increase in Accounts Payable.
DECREASE IN INCOME TAXES PAYABLE When a company incurs income tax expense but has not yet paid its taxes, it records income taxes payable. A change in the Income Taxes Payable account refl ects the difference between income tax expense incurred and income tax actually paid. Computer Services’ Income Taxes Payable account decreased by $2,000. That means the $47,000 of income tax expense reported on the income statement was $2,000 less than the amount of

Preparing the Statement of Cash Flows—Indirect Method 737
taxes paid during the period of $49,000. As shown in Illustration 17-10, to adjust net income to a cash basis, the company must reduce net income by $2,000.
Illustration 17-10Adjustments for changes in current liability accounts
Cash fl ows from operating activities Net income $145,000 Adjustments to reconcile net income to net cash provided by operating activities: Depreciation expense $ 9,000 Loss on disposal of equipment 3,000 Decrease in accounts receivable 10,000 Increase in inventory (5,000) Increase in prepaid expenses (4,000) Increase in accounts payable 16,000 Decrease in income taxes payable (2,000) 27,000
Net cash provided by operating activities $172,000
Illustration 17-10 shows that after starting with net income of $145,000, the sum of all of the adjustments to net income was $27,000. This resulted in net cash provided by operating activities of $172,000.
Summary of Conversion to Net Cash Provided by Operating Activities—Indirect Method
As shown in the previous illustrations, the statement of cash fl ows prepared by the indirect method starts with net income. It then adds or deducts items to arrive at net cash provided by operating activities. The required adjustments are of three types:
1. Noncash charges such as depreciation and amortization.
2. Gains and losses on the disposal of plant assets.
3. Changes in noncash current asset and current liability accounts.
Illustration 17-11 provides a summary of these changes and required adjustments.
Illustration 17-11Adjustments required to convert net income to net cash provided by operating activities
Adjustments Required to Convert Net Income to Net Cash Provided by Operating Activities
Noncash Depreciation expense Add Charges Amortization expense Add
Gains Loss on disposal of plant assets Add and Losses Gain on disposal of plant assets Deduct
Changes in Increase in current asset account Deduct Current Assets Decrease in current asset account Add and Increase in current liability account Add Current Liabilities Decrease in current liability account Deduct
⎧⎨⎩
⎧⎨⎩
⎧⎪⎨⎪⎩
Josh’s PhotoPlus reported net income of $73,000 for 2017. Included in the income state-ment were depreciation expense of $7,000 and a gain on disposal of equipment of $2,500. Josh’s comparative balance sheets show the following balances.
12/31/16 12/31/17
Accounts receivable $17,000 $21,000Accounts payable 6,000 2,200
Calculate net cash provided by operating activities for Josh’s PhotoPlus.
DO IT! 2a Cash from Operating Activities
Action Plan✔ Add noncash charges
such as depreciation back to net income to compute net cash provided by operating activities.

738 17 Statement of Cash Flows
Step 2: Investing and Financing Activities
ANALYZE CHANGES IN NONCURRENT ASSET AND LIABILITY ACCOUNTS AND RECORD AS INVESTING AND FINANCING ACTIVITIES, OR AS NONCASH INVESTING AND FINANCING ACTIVITIES
INCREASE IN LAND As indicated from the change in the Land account and the additional information, Computer Services purchased land of $110,000 by directly exchanging bonds for land. The issuance of bonds payable for land has no effect on cash. But, it is a signifi cant noncash investing and fi nancing activity that merits disclosure in a separate schedule (see Illustration 17-13).
INCREASE IN BUILDINGS As the additional data indicate, Computer Services acquired an offi ce building for $120,000 cash. This is a cash outfl ow reported in the investing activities section (see Illustration 17-13).
INCREASE IN EQUIPMENT The Equipment account increased $17,000. The addi-tional information explains that this net increase resulted from two transactions: (1) a purchase of equipment of $25,000, and (2) the sale for $4,000 of equipment costing $8,000. These transactions are investing activities. The company should report each transaction separately. Thus, it reports the purchase of equipment as an outfl ow of cash for $25,000. It reports the sale as an infl ow of cash for $4,000. The T-account below shows the reasons for the change in this account during the year.
Related exercise material: BE17-4, BE17-5, BE17-6, E17-4, E17-5, E17-6, and DO IT! 17-2.
Cash fl ows from operating activities Net income $73,000 Adjustments to reconcile net income to net cash provided by operating activities: Depreciation expense $ 7,000 Gain on disposal of equipment (2,500) Increase in accounts receivable (4,000) Decrease in accounts payable (3,800) (3,300)
Net cash provided by operating activities $69,700
SolutionAction Plan (cont.)✔ Deduct from net
income gains on the disposal of plant assets, or add losses back to net income, to compute net cash provided by operating activities.
✔ Use changes in noncash current asset and current liability accounts to compute net cash provided by operating activities.
The following entry shows the details of the equipment sale transaction.
Cash 4,000Accumulated Depreciation—Equipment 1,000Loss on Disposal of Equipment 3,000 Equipment 8,000
INCREASE IN BONDS PAYABLE The Bonds Payable account increased $110,000. As indicated in the additional information, the company acquired land from the issuance of these bonds. It reports this noncash transaction in a separate schedule at the bottom of the statement.
Illustration 17-12Analysis of equipment Equipment
1/1/17 Balance 10,000 Cost of equipment sold 8,000 Purchase of equipment 25,000
12/31/17 Balance 27,000
A SEL5 1
14,00011,000 23,000 Exp28,000
Cash Flows14,000

Preparing the Statement of Cash Flows—Indirect Method 739
INCREASE IN COMMON STOCK The balance sheet reports an increase in Common Stock of $20,000. The additional information section notes that this increase resulted from the issuance of new shares of stock. This is a cash infl ow reported in the fi nancing activities section.
INCREASE IN RETAINED EARNINGS Retained earnings increased $116,000 during the year. This increase can be explained by two factors: (1) net income of $145,000 increased retained earnings, and (2) dividends of $29,000 decreased retained earnings. The company adjusts net income to net cash provided by operating activities in the operating activities section. Payment of the dividends (not the declaration) is a cash outfl ow that the company reports as a fi nancing activity.
STATEMENT OF CASH FLOWS—2017
Using the previous information, we can now prepare a statement of cash fl ows for 2017 for Computer Services Company as shown in Illustration 17-13.
Helpful HintNote that in the investing and fi nancing activities sections, positive numbers indicate cash infl ows (receipts), and negative numbers indicate cash outfl ows (payments).
Helpful HintWhen companies issue stocks or bonds for cash, the actual proceeds will appear in the statement of cash fl ows as a fi nancing infl ow (rather than the par value of the stocks or face value of bonds).
Illustration 17-13Statement of cash fl ows, 2017—indirect method
COMPUTER SERVICES COMPANYStatement of Cash Flows—Indirect Method
For the Year Ended December 31, 2017
Cash fl ows from operating activities Net income $145,000 Adjustments to reconcile net income to net cash provided by operating activities: Depreciation expense $ 9,000 Loss on disposal of equipment 3,000 Decrease in accounts receivable 10,000 Increase in inventory (5,000) Increase in prepaid expenses (4,000) Increase in accounts payable 16,000 Decrease in income taxes payable (2,000) 27,000
Net cash provided by operating activities 172,000Cash fl ows from investing activities Purchase of building (120,000) Purchase of equipment (25,000) Sale of equipment 4,000 Net cash used by investing activities (141,000)Cash fl ows from fi nancing activities Issuance of common stock 20,000 Payment of cash dividends (29,000)
Net cash used by fi nancing activities (9,000)
Net increase in cash 22,000Cash at beginning of period 33,000
Cash at end of period $ 55,000
Noncash investing and fi nancing activities Issuance of bonds payable to purchase land $110,000
Step 3: Net Change in Cash
COMPARE THE NET CHANGE IN CASH ON THE STATEMENT OF CASH FLOWS WITH THE CHANGE IN THE CASH ACCOUNT REPORTED ON THE BALANCE SHEET TO MAKE SURE THE AMOUNTS AGREE
Illustration 17-13 indicates that the net change in cash during the period was an increase of $22,000. This agrees with the change in Cash account reported on the balance sheet in Illustration 17-4 (page 733).

740 17 Statement of Cash Flows
Burning Through Our Cash
Box (cloud storage), Cyan (game creator), Fireeye (cyber security), and Mobile Iron (mobile security of data) are a few of the tech compa-nies that recently have issued or are about to issue stock to the public. Investors now have to determine whether these tech companies have viable products and high chances for success.
An important consider-ation in evaluating a tech company is determining its fi nancial fl exibility—its ability to withstand adversity if an economic setback occurs. One way to measure fi nancial
fl exibility is to assess a company’s cash burn rate, which determines how long its cash will hold out if the company is expending more cash than it is receiving.
Fireeye, for example, burned cash in excess of $50 mil-lion in 2013. But the company also had over $150 million as a cash cushion, so it would take over 30 months before it runs out of cash. And even though Box has a much lower cash burn rate than Fireeye, it still has over a year’s cushion. Compare that to the tech companies in 2000, when over one-quarter of them were on track to run out of cash within a year. And many did. Fortunately, the tech companies of today seem to be better equipped to with-stand an economic setback.
Source: Shira Ovide, “Tech Firms’ Cash Hoards Cool Fears of a Meltdown,” Wall Street Journal (May 14, 2014).
What implications does a company’s cash burn rate have for its survival? (See WileyPLUS for this answer and additional questions.)
Accounting Across the Organization
© Soubrette/iStockphoto
Use the information below and on page 741 to prepare a statement of cash fl ows using the indirect method.
DO IT! 2b Indirect Method
REYNOLDS COMPANYComparative Balance Sheets
December 31
Change Assets 2017 2016 Increase/Decrease
Cash $ 54,000 $ 37,000 $ 17,000 IncreaseAccounts receivable 68,000 26,000 42,000 IncreaseInventory 54,000 –0– 54,000 IncreasePrepaid expenses 4,000 6,000 2,000 DecreaseLand 45,000 70,000 25,000 DecreaseBuildings 200,000 200,000 –0–Accumulated depreciation—buildings (21,000) (11,000) 10,000 IncreaseEquipment 193,000 68,000 125,000 IncreaseAccumulated depreciation—equipment (28,000) (10,000) 18,000 Increase
Totals $569,000 $386,000
Liabilities and Stockholders’ Equity
Accounts payable $ 23,000 $ 40,000 $ 17,000 DecreaseAccrued expenses payable 10,000 –0– 10,000 IncreaseBonds payable 110,000 150,000 40,000 DecreaseCommon stock ($1 par) 220,000 60,000 160,000 IncreaseRetained earnings 206,000 136,000 70,000 Increase
Totals $569,000 $386,000

Preparing the Statement of Cash Flows—Indirect Method 741
Action Plan✔ Determine net cash
provided/used by operating activities by adjusting net income for items that did not affect cash.
✔ Determine net cash provided/used by investing activities and fi nancing activities.
✔ Determine the net increase/decrease in cash.
REYNOLDS COMPANYIncome Statement
For the Year Ended December 31, 2017
Sales revenue $890,000Cost of goods sold $465,000Operating expenses 221,000Interest expense 12,000Loss on disposal of equipment 2,000 700,000
Income before income taxes 190,000Income tax expense 65,000
Net income $125,000
Additional information:1. Operating expenses include depreciation expense of $33,000 and charges from
prepaid expenses of $2,000.2. Land was sold at its book value for cash.3. Cash dividends of $55,000 were declared and paid in 2017.4. Interest expense of $12,000 was paid in cash.5. Equipment with a cost of $166,000 was purchased for cash. Equipment with a
cost of $41,000 and a book value of $36,000 was sold for $34,000 cash.6. Bonds of $10,000 were redeemed at their face value for cash. Bonds of $30,000
were converted into common stock.7. Common stock ($1 par) of $130,000 was issued for cash.8. Accounts payable pertain to merchandise suppliers.
Solution
REYNOLDS COMPANYStatement of Cash Flows—Indirect Method
For the Year Ended December 31, 2017
Cash fl ows from operating activities Net income $ 125,000 Adjustments to reconcile net income to net cash provided by operating activities: Depreciation expense $ 33,000 Loss on disposal of equipment 2,000 Increase in accounts receivable (42,000) Increase in inventory (54,000) Decrease in prepaid expenses 2,000 Decrease in accounts payable (17,000) Increase in accrued expenses payable 10,000 (66,000)
Net cash provided by operating activities 59,000Cash fl ows from investing activities Sale of land 25,000 Sale of equipment 34,000 Purchase of equipment (166,000)
Net cash used by investing activities (107,000)Cash fl ows from fi nancing activities Redemption of bonds (10,000) Sale of common stock 130,000 Payment of dividends (55,000)
Net cash provided by fi nancing activities 65,000
Net increase in cash 17,000Cash at beginning of period 37,000
Cash at end of period $54,000
Noncash investing and fi nancing activities Conversion of bonds into common stock $30,000
Related exercise material: BE17-4, BE17-5, BE17-6, BE17-7, E17-4, E17-5, E17-6, and E17-8.

742 17 Statement of Cash Flows
3 Analyze the statement of cash fl ows.LEARNING OBJECTIVE
Traditionally, investors and creditors used ratios based on accrual accounting. These days, cash-based ratios are gaining increased acceptance among analysts.
Free Cash Flow
In the statement of cash fl ows, net cash provided by operating activities is intended to indicate the cash-generating capability of a company. Analysts have noted, however, that net cash provided by operating activities fails to take into account that a company must invest in new fi xed assets just to maintain its current level of oper-ations. Companies also must at least maintain dividends at current levels to satisfy investors. The measurement of free cash fl ow provides additional insight regarding a company’s cash-generating ability. Free cash fl ow describes the net cash provided by operating activities after adjustment for capital expenditures and dividends. Consider the following example. Suppose that MPC produced and sold 10,000 personal computers this year. It reported $100,000 net cash provided by operating activities. In order to maintain production at 10,000 computers, MPC invested $15,000 in equipment. It chose to pay $5,000 in dividends. Its free cash fl ow was $80,000 ($100,000 2 $15,000 2 $5,000). The company could use this $80,000 either to purchase new assets to expand the business or to pay an $80,000 dividend and continue to produce 10,000 computers. In practice, free cash fl ow is often calcu-lated with the formula in Illustration 17-14. (Alternative defi nitions also exist.)
Illustration 17-14Free cash fl ow Free Cash Net Cash Provided by Capital Cash
Flow 5 Operating Activities 2 Expenditures 2 Dividends
Illustration 17-15 provides basic information (in millions) excerpted from the 2013 statement of cash fl ows of Microsoft Corporation.
Illustration 17-15Microsoft’s cash fl ow information ($ in millions)
MICROSOFT CORPORATIONStatement of Cash Flows (partial)
2013
Cash provided by operating activities $21,863Cash fl ows from investing activities Additions to property and equipment $ (4,257) Purchases of investments (75,396) Sales of investments 52,464 Acquisitions of companies (1,584) Maturities of investments 5,130 Other (168)
Cash used by investing activities (23,811)Cash paid for dividends (7,455)
Real World
Microsoft’s free cash fl ow is calculated as shown in Illustration 17-16.
Illustration 17-16Calculation of Microsoft’s free cash fl ow ($ in millions)
Cash provided by operating activities $21,863Less: Expenditures on property, plant, and equipment 4,257 Dividends paid 7,455
Free cash fl ow $10,151
Microsoft generated approximately $10.15 billion of free cash fl ow. This is a tremendous amount of cash generated in a single year. It is available for the acquisition of new assets, the retirement of stock or debt, or the payment of div-idends. Also note that Microsoft’s cash from operations of $21.8 billion is nearly

Appendix 17A: Statement of Cash Flows—Direct Method 743
identical to its 2013 net income of $21.9 billion. This lends additional credibility to Microsoft’s income number as an indicator of potential future performance.
Chicago Corporation issued the following statement of cash fl ows for 2017.
DO IT! 3 Free Cash Flow
CHICAGO CORPORATIONStatement of Cash Flows—Indirect Method
For the Year Ended December 31, 2017
Cash fl ows from operating activities Net income $ 19,000 Adjustments to reconcile net income to net cash provided by operating activities: Depreciation expense $ 8,100 Loss on disposal of plant assets 1,300 Decrease in accounts receivable 6,900 Increase in inventory (4,000) Decrease in accounts payable (2,000) 10,300
Net cash provided by operating activities 29,300Cash fl ows from investing activities Sale of investments 1,100 Purchase of equipment (19,000)
Net cash used by investing activities (17,900)Cash fl ows from fi nancing activities Issuance of stock 10,000 Payment on long-term note payable (5,000) Payment for dividends (9,000)
Net cash used by fi nancing activities (4,000)
Net increase in cash 7,400Cash at beginning of year 10,000
Cash at end of year $ 17,400
(a) Compute free cash fl ow for Chicago Corporation. (b) Explain why free cash fl ow often provides better information than “Net cash provided by operating activities.”
(a) Free cash fl ow 5 $29,300 2 $19,000 2 $9,000 5 $1,300
(b) Net cash provided by operating activities fails to take into account that a company must invest in new plant assets just to maintain the current level of operations. Companies must also maintain dividends at current levels to satisfy investors. The measurement of free cash fl ow provides additional insight regarding a com-pany’s cash-generating ability.
Related exercise material: BE17-8, BE17-9, BE17-10, BE17-11, E17-7, E17-9, and DO IT! 17-3.
Solution
4 APPENDIX 17A: Prepare a statement of cash fl ows using the direct method.
To explain and illustrate the direct method for preparing a statement of cash fl ows, we use the transactions of Computer Services Company for 2017. Illus-tration 17A-1 (page 744) presents information related to 2017 for the company.
LEARNING OBJECTIVE
*
Action Plan✔ Compute free cash
fl ow as Net cash provided by operating activities 2 Capital expenditures 2 Cash dividends.

744 17 Statement of Cash Flows
COMPUTER SERVICES COMPANYComparative Balance Sheets
December 31
Change in Account BalanceAssets 2017 2016 Increase/Decrease
Current assets Cash $ 55,000 $ 33,000 $ 22,000 Increase Accounts receivable 20,000 30,000 10,000 Decrease Inventory 15,000 10,000 5,000 Increase Prepaid expenses 5,000 1,000 4,000 IncreaseProperty, plant, and equipment Land 130,000 20,000 110,000 Increase Buildings 160,000 40,000 120,000 Increase Accumulated depreciation—buildings (11,000) (5,000) 6,000 Increase Equipment 27,000 10,000 17,000 Increase Accumulated depreciation—equipment (3,000) (1,000) 2,000 Increase
Total assets $398,000 $138,000
Liabilities and Stockholders’ Equity
Current liabilities Accounts payable $ 28,000 $ 12,000 $ 16,000 Increase Income taxes payable 6,000 8,000 2,000 DecreaseLong-term liabilities Bonds payable 130,000 20,000 110,000 IncreaseStockholders’ equity Common stock 70,000 50,000 20,000 Increase Retained earnings 164,000 48,000 116,000 Increase
Total liabilities and stockholders’ equity $398,000 $138,000
COMPUTER SERVICES COMPANYIncome Statement
For the Year Ended December 31, 2017
Sales revenue $507,000Cost of goods sold $150,000Operating expenses (excluding depreciation) 111,000Depreciation expense 9,000Loss on disposal of equipment 3,000Interest expense 42,000 315,000
Income before income tax 192,000Income tax expense 47,000
Net income $145,000
Additional information for 2017:
1. Depreciation expense was comprised of $6,000 for building and $3,000 for equipment.
2. The company sold equipment with a book value of $7,000 (cost $8,000, less accumulated depreciation $1,000) for $4,000 cash.
3. Issued $110,000 of long-term bonds in direct exchange for land.4. A building costing $120,000 was purchased for cash. Equipment costing $25,000
was also purchased for cash.5. Issued common stock for $20,000 cash.6. The company declared and paid a $29,000 cash dividend.
Illustration 17A-1Comparative balance sheets, income statement, and additional information for Computer Services Company

Appendix 17A: Statement of Cash Flows—Direct Method 745
To prepare a statement of cash fl ows under the direct approach, we apply the three steps outlined in Illustration 17-3 (page 732).
Step 1: Operating Activities
DETERMINE NET CASH PROVIDED/USED BY OPERATING ACTIVITIES BY CONVERTING NET INCOME FROM AN ACCRUAL BASIS TO A CASH BASIS
Under the direct method, companies compute net cash provided by operating activities by adjusting each item in the income statement from the accrual basis to the cash basis. To simplify and condense the operating activities section, companies report only major classes of operating cash receipts and cash payments. For these major classes, the difference between cash receipts and cash payments is the net cash provided by operating activities. These relation-ships are as shown in Illustration 17A-2. Illustration 17A-2
Major classes of cash receipts and payments
From sales ofgoods and services
to customers
Cash Receipts – Cash Payments =Net Cash Provided
by Operating Activities
To suppliers
To employees
For operatingexpenses
Net cashprovided by
operating activities
For interest
For taxes
From receiptsof interest and
dividends on loansand investments
Fragile ThisEndUp
An effi cient way to apply the direct method is to analyze the items reported in the income statement in the order in which they are listed. We then determine cash receipts and cash payments related to these revenues and expenses. The following presents the adjustments required to prepare a state-ment of cash fl ows for Computer Services Company using the direct approach.
CASH RECEIPTS FROM CUSTOMERS The income statement for Computer Services reported sales revenue from customers of $507,000. How much of that was cash receipts? To answer that, a company considers the change in accounts receivable during the year. When accounts receivable increase during the year, revenues on an accrual basis are higher than cash receipts from customers. Operations led to revenues, but not all of those revenues resulted in cash receipts.

746 17 Statement of Cash Flows
To determine the amount of cash receipts, a company deducts from sales revenue the increase in accounts receivable. On the other hand, there may be a decrease in accounts receivable. That would occur if cash receipts from custom-ers exceeded sales revenue. In that case, a company adds to sales revenue the decrease in accounts receivable. For Computer Services, accounts receivable decreased $10,000. Thus, cash receipts from customers were $517,000, computed as shown in Illustration 17A-3.
Computer Services can also determine cash receipts from customers from an analysis of the Accounts Receivable account, as shown in Illustration 17A-4.
Helpful HintThe T-account shows that sales revenue plus decrease in accounts receivable equals cash receipts.
Illustration 17A-3Computation of cash receipts from customers
Sales revenue $ 507,000Add: Decrease in accounts receivable 10,000
Cash receipts from customers $517,000
Illustration 17A-4Analysis of accounts receivable Accounts Receivable
1/1/17 Balance 30,000 Receipts from customers 517,000 Sales revenue 507,000
12/31/17 Balance 20,000
Illustration 17A-5Formula to compute cash receipts from customers—direct method
Cash Receipts Sales
1 Decrease in Accounts Receivable from 5
Revenue or
Customers 2 Increase in Accounts Receivable
⎧⎪⎪⎪⎪⎨⎪⎪⎪⎪⎩
Illustration 17A-5 shows the relationships among cash receipts from customers, sales revenue, and changes in accounts receivable.
CASH PAYMENTS TO SUPPLIERS Computer Services reported cost of goods sold of $150,000 on its income statement. How much of that was cash payments to suppliers? To answer that, it is fi rst necessary to fi nd purchases for the year. To fi nd purchases, a company adjusts cost of goods sold for the change in inventory. When inventory increases during the year, purchases for the year have exceeded cost of goods sold. As a result, to determine the amount of purchases, a company adds to cost of goods sold the increase in inventory. In 2017, Computer Services’ inventory increased $5,000. It computes pur-chases as follows.
Illustration 17A-6Computation of purchases Cost of goods sold $ 150,000
Add: Increase in inventory 5,000
Purchases $155,000
Computer Services can also determine purchases from an analysis of the Inventory account, as shown in Illustration 17A-7.
Illustration 17A-7 Analysis of inventory Inventory
1/1/17 Balance 10,000 Cost of goods sold 150,000 Purchases 155,000
12/31/17 Balance 15,000

Appendix 17A: Statement of Cash Flows—Direct Method 747
After computing purchases, a company can determine cash payments to sup-pliers. This is done by adjusting purchases for the change in accounts payable. When accounts payable increase during the year, purchases on an accrual basis are higher than they are on a cash basis. As a result, to determine cash payments to suppliers, a company deducts from purchases the increase in accounts pay-able. On the other hand, if cash payments to suppliers exceed purchases, there will be a decrease in accounts payable. In that case, a company adds to purchases the decrease in accounts payable. For Computer Services, cash payments to sup-pliers were $139,000, computed as follows.
Helpful HintThe T-account shows that purchases less increase in accounts payable equals payments to suppliers.
Illustration 17A-8Computation of cash payments to suppliers
Purchases $ 155,000Deduct: Increase in accounts payable 16,000
Cash payments to suppliers $139,000
Illustration 17A-9Analysis of accounts payableAccounts Payable
Payments to suppliers 139,000 1/1/17 Balance 12,000 Purchases 155,000
12/31/17 Balance 28,000
Illustration 17A-10Formula to compute cash payments to suppliers—direct method
1 Decrease in
Cash Cost 1 Increase in Inventory Accounts Payable
Payments 5 of
or or
to Goods 2 Decrease in Inventory 2 Increase in
Suppliers Sold
Accounts Payable
Computer Services also can determine cash payments to suppliers from an analysis of the Accounts Payable account, as shown in Illustration 17A-9.
Illustration 17A-10 shows the relationships among cash payments to suppliers, cost of goods sold, changes in inventory, and changes in accounts payable.
CASH PAYMENTS FOR OPERATING EXPENSES Computer Services reported on its income statement operating expenses of $111,000. How much of that amount was cash paid for operating expenses? To answer that, we need to adjust this amount for any changes in prepaid expenses and accrued expenses payable. For example, if prepaid expenses increased during the year, cash paid for operating expenses is higher than operating expenses reported on the income statement. To convert operating expenses to cash payments for operating expenses, a company adds the increase in prepaid expenses to operating expenses. On the other hand, if prepaid expenses decrease during the year, it deducts the decrease from oper-ating expenses. Companies must also adjust operating expenses for changes in accrued expenses payable. When accrued expenses payable increase during the year, operating expenses on an accrual basis are higher than they are in a cash basis. As a result, to determine cash payments for operating expenses, a company deducts from operating expenses an increase in accrued expenses payable. On

748 17 Statement of Cash Flows
the other hand, a company adds to operating expenses a decrease in accrued expenses payable because cash payments exceed operating expenses. Computer Services’ cash payments for operating expenses were $115,000, computed as follows.
Illustration 17A-11Computation of cash payments for operating expenses
Operating expenses $ 111,000Add: Increase in prepaid expenses 4,000
Cash payments for operating expenses $115,000
Illustration 17A-12Formula to compute cash payments for operating expenses—direct method
Cash 1 Increase in 1 Decrease in Accrued Payments
Operating Prepaid Expenses Expenses Payable
for 5 or or Operating
Expenses 2 Decrease in 2 Increase in Accrued
Expenses Prepaid Expenses Expenses Payable
Illustration 17A-12 shows the relationships among cash payments for operat-ing expenses, changes in prepaid expenses, and changes in accrued expenses payable.
DEPRECIATION EXPENSE AND LOSS ON DISPOSAL OF EQUIPMENT Computer Services’ depreciation expense in 2017 was $9,000. Depreciation expense is not shown on a statement of cash fl ows under the direct method because it is a non-cash charge. If the amount for operating expenses includes depreciation expense, operating expenses must be reduced by the amount of depreciation to determine cash payments for operating expenses. The loss on disposal of equipment of $3,000 is also a noncash charge. The loss on disposal of equipment reduces net income, but it does not reduce cash. Thus, the loss on disposal of equipment is not shown on the statement of cash fl ows under the direct method. Other charges to expense that do not require the use of cash, such as the amortization of intangible assets, depletion expense, and bad debt expense, are treated in the same manner as depreciation.
CASH PAYMENTS FOR INTEREST Computer Services reported on the income state-ment interest expense of $42,000. Since the balance sheet did not include an accrual for interest payable for 2016 or 2017, the amount reported as expense is the same as the amount of interest paid.
CASH PAYMENTS FOR INCOME TAXES Computer Services reported income tax expense of $47,000 on the income statement. Income taxes payable, however, decreased $2,000. This decrease means that income taxes paid were more than income taxes reported in the income statement. Cash payments for income taxes were therefore $49,000 as shown below.
Income tax expense $ 47,000Add: Decrease in income taxes payable 2,000
Cash payments for income taxes $49,000
Illustration 17A-13Computation of cash payments for income taxes
Computer Services can also determine cash payments for income taxes from an analysis of the Income Taxes Payable account, as shown in Illustration 17A-14.
Illustration 17A-14 Analysis of income taxes payable
Income Taxes Payable
Cash payments for 1/1/17 Balance 8,000 income taxes 49,000 Income tax expense 47,000
12/31/17 Balance 6,000

Appendix 17A: Statement of Cash Flows—Direct Method 749
Illustration 17A-15 shows the relationships among cash payments for income taxes, income tax expense, and changes in income taxes payable.
Illustration 17A-16Operating activities section of the statement of cash fl ows
Cash fl ows from operating activities Cash receipts from customers $517,000 Less: Cash payments: To suppliers $139,000 For operating expenses 115,000 For interest expense 42,000 For income taxes 49,000 345,000
Net cash provided by operating activities $172,000
Cash Income Tax
1 Decrease in Income Taxes Payable Payments for 5 or Income Taxes
Expense 2 Increase in Income Taxes Payable
Illustration 17A-15Formula to compute cash payments for income taxes—direct method
The operating activities section of the statement of cash fl ows of Computer Services is shown in Illustration 17A-16.
When a company uses the direct method, it must also provide in a separate schedule (not shown here) the net cash fl ows from operating activities as com-puted under the indirect method.
Step 2: Investing and Financing Activities
ANALYZE CHANGES IN NONCURRENT ASSET AND LIABILITY ACCOUNTS AND RECORD AS INVESTING AND FINANCING ACTIVITIES, OR DISCLOSE AS NON CASH TRANSACTIONS
INCREASE IN LAND As indicated from the change in the Land account and the ad-ditional information, Computer Services purchased land of $110,000 by directly exchanging bonds for land. The exchange of bonds payable for land has no effect on cash. But, it is a signifi cant noncash investing and fi nancing activity that merits disclosure in a separate schedule (see Illustration 17A-18).
INCREASE IN BUILDINGS As the additional data indicate, Computer Services acquired an offi ce building for $120,000 cash. This is a cash outfl ow reported in the investing activities section (see Illustration 17A-18).
INCREASE IN EQUIPMENT The Equipment account increased $17,000. The addi-tional information explains that this was a net increase that resulted from two transactions: (1) a purchase of equipment of $25,000, and (2) the sale for $4,000 of equipment costing $8,000. These transactions are investing activities. The company should report each transaction separately. The statement in Illustration 17A-18 reports the purchase of equipment as an outfl ow of cash for $25,000. It reports the sale as an infl ow of cash for $4,000. The T-account below shows the reasons for the change in this account during the year.
Helpful HintThe investing and fi nancing activities are measured and reported the same under both the direct and indirect methods.
Equipment
1/1/17 Balance 10,000 Cost of equipment sold 8,000 Purchase of equipment 25,000
12/31/17 Balance 27,000
Illustration 17A-17 Analysis of equipment

750 17 Statement of Cash Flows
The following entry shows the details of the equipment sale transaction.
Cash 4,000Accumulated Depreciation—Equipment 1,000Loss on Disposal of Equipment 3,000 Equipment 8,000
INCREASE IN BONDS PAYABLE The Bonds Payable account increased $110,000. As indicated in the additional information, the company acquired land by directly exchanging bonds for land. Illustration 17A-18 reports this noncash transaction in a separate schedule at the bottom of the statement.
INCREASE IN COMMON STOCK The balance sheet reports an increase in Common Stock of $20,000. The additional information section notes that this increase re-sulted from the issuance of new shares of stock. This is a cash infl ow reported in the fi nancing activities section in Illustration 17A-18.
INCREASE IN RETAINED EARNINGS Retained earnings increased $116,000 during the year. This increase can be explained by two factors: (1) net income of $145,000 increased retained earnings, and (2) dividends of $29,000 decreased retained earnings. The company adjusts net income to net cash provided by operating activities in the operating activities section. Payment of the dividends (not the declaration) is a cash outfl ow that the company reports as a fi nancing activity in Illustration 17A-18.
STATEMENT OF CASH FLOWS—2017
Illustration 17A-18 shows the statement of cash fl ows for Computer Services Company.
A SEL5 1
14,00011,000 23,000 Exp28,000
Cash Flows14,000
COMPUTER SERVICES COMPANYStatement of Cash Flows—Direct Method
For the Year Ended December 31, 2017
Cash fl ows from operating activities Cash receipts from customers $ 517,000 Less: Cash payments: To suppliers $ 139,000 For operating expenses 115,000 For income taxes 49,000 For interest expense 42,000 345,000
Net cash provided by operating activities 172,000Cash fl ows from investing activities Sale of equipment 4,000 Purchase of building (120,000) Purchase of equipment (25,000)
Net cash used by investing activities (141,000)Cash fl ows from fi nancing activities Issuance of common stock 20,000 Payment of cash dividends (29,000) Net cash used by fi nancing activities (9,000)
Net increase in cash 22,000Cash at beginning of period 33,000
Cash at end of period $ 55,000
Noncash investing and fi nancing activities Issuance of bonds payable to purchase land $ 110,000
Illustration 17A-18Statement of cash fl ows, 2017—direct method
Helpful HintWhen companies issue stocks or bonds for cash, the actual proceeds will appear in the statement of cash fl ows as a fi nancing infl ow (rather than the par value of the stocks or face value of bonds).

Appendix 17B: Worksheet for Preparing the Statement of Cash Flows—Indirect Method 751
Step 3: Net Change in Cash
COMPARE THE NET CHANGE IN CASH ON THE STATEMENT OF CASH FLOWS WITH THE CHANGE IN THE CASH ACCOUNT REPORTED ON THE BALANCE SHEET TO MAKE SURE THE AMOUNTS AGREE
Illustration 17A-18 indicates that the net change in cash during the period was an increase of $22,000. This agrees with the change in balances in the Cash account reported on the balance sheets in Illustration 17A-1 (page 744).
5 APPENDIX 17B: Use a worksheet to prepare the statement of cash fl ows using the indirect method.
When preparing a statement of cash fl ows, companies may need to make numerous adjustments of net income. In such cases, they often use a worksheet to assemble and classify the data that will appear on the statement. The worksheet is merely an aid in preparing the statement. Its use is optional. Illustration 17B-1 shows the skeleton format of the worksheet for preparation of the statement of cash fl ows.
LEARNING OBJECTIVE
*
Illustration 17B-1Format of worksheetFormulas Data Review ViewPage LayoutInsert
P18 fx
XYZ Company.xlsHome
12345678910111213141516171819202122232425262728
A B C D E
XYZ COMPANYWorksheet
Statement of Cash Flows For the Year Ended . . .
XX
End ofLast YearBalances
XXXX
XXXXX
XXX
End ofCurrent Year
Balances
XXXX
XXXXXXX
XXX
Balance Sheet AccountsDebit balance accounts
Operating activities Net income Adjustments to net incomeInvesting activities Receipts and paymentsFinancing activities Receipts and payments TotalsIncrease (decrease) in cash Totals
Credit balance accountsTotals
Totals
Statement of CashFlows Effects
Debit
XXXX
XXXX
Credit
XXXX
XXXX
Reconciling Items
(XX)XXX
XXX
XXXX
XX
XX
XX
XX
XX
XXXXX
XXX
The following guidelines are important in preparing a worksheet.
1. In the balance sheet accounts section, list accounts with debit balances sepa-rately from those with credit balances. This means, for example, that Accumu-lated Depreciation appears under credit balances and not as a contra account under debit balances. Enter the beginning and ending balances of each account in the appropriate columns. Enter as reconciling items in the two middle columns the transactions that caused the change in the account balance during the year.
After all reconciling items have been entered, each line pertaining to a balance sheet account should “foot across.” That is, the beginning balance plus or minus the reconciling item(s) must equal the ending balance. When

752 17 Statement of Cash Flows
this agreement exists for all balance sheet accounts, all changes in account balances have been reconciled.
2. The bottom portion of the worksheet consists of the operating, investing, and fi nancing activities sections. It provides the information necessary to prepare the formal statement of cash fl ows. Enter infl ows of cash as debits in the reconciling columns. Enter outfl ows of cash as credits in the reconciling columns. Thus, in this section, the sale of equipment for cash at book value appears as a debit under investing activities. Similarly, the purchase of land for cash appears as a credit under investing activities.
3. The reconciling items shown in the worksheet are not entered in any journal or posted to any account. They do not represent either adjustments or corrections of the balance sheet accounts. They are used only to facilitate the preparation of the statement of cash fl ows.
Preparing the Worksheet
As in the case of worksheets illustrated in earlier chapters, preparing a worksheet involves a series of prescribed steps. The steps in this case are:
1. Enter in the balance sheet accounts section the balance sheet accounts and their beginning and ending balances.
2. Enter in the reconciling columns of the worksheet the data that explain the changes in the balance sheet accounts other than cash and their effects on the statement of cash fl ows.
3. Enter on the cash line and at the bottom of the worksheet the increase or decrease in cash. This entry should enable the totals of the reconciling columns to be in agreement.
To illustrate the preparation of a worksheet, we will use the 2017 data for Computer Services Company. Your familiarity with these data (from the chapter) should help you understand the use of a worksheet. For ease of reference, the comparative balance sheets, income statement, and selected data for 2017 are presented in Illustration 17B-2.
DETERMINING THE RECONCILING ITEMS
Companies can use one of several approaches to determine the reconciling items. For example, they can fi rst complete the changes affecting net cash provided by operating activities, and then can determine the effects of fi nancing and investing transactions. Or, they can analyze the balance sheet accounts in the order in which they are listed on the worksheet. We will follow this latter approach for Computer Services, except for cash. As indicated in Step 3, cash is handled last.
ACCOUNTS RECEIVABLE The decrease of $10,000 in accounts receivable means that cash collections from sales revenue are higher than the sales revenue reported in the income statement. To convert net income to net cash provided by operating activities, we add the decrease of $10,000 to net income. The entry in the reconciling columns of the worksheet is:
(a) Operating—Decrease in Accounts Receivable 10,000 Accounts Receivable 10,000
INVENTORY Computer Services Company’s inventory balance increases $5,000 during the period. The Inventory account refl ects the difference between the amount of inventory that the company purchased and the amount that it sold. For Computer Services, this means that the cost of merchandise purchased exceeds the cost of goods sold by $5,000. As a result, cost of goods sold does not refl ect $5,000 of cash payments made for merchandise. We deduct this inventory increase of $5,000 during the period from net income to arrive at net cash provided by operating activities. The worksheet entry is:
(b) Inventory 5,000 Operating—Increase in Inventory 5,000

Appendix 17B: Worksheet for Preparing the Statement of Cash Flows—Indirect Method 753
Formulas Data Review ViewPage LayoutInsert
AP18
B C D
Computer Services Company.xlsComputer Services Company.xlsHome
1234567891011121314151617181920212223242526272829
$ 22,00010,000
5,0004,000
110,000120,000
6,00017,000
2,000
$ 16,0002,000
110,000
20,000116,000
Change inAccount BalanceIncrease/Decrease
IncreaseDecreaseIncreaseIncrease
IncreaseIncreaseIncreaseIncreaseIncrease
IncreaseDecrease
Increase
IncreaseIncrease
AssetsCurrent assets Cash Accounts receivable Inventory Prepaid expensesProperty, plant, and equipment Land Buildings Accumulated depreciation—buildings Equipment Accumulated depreciation—equipment Total assets
Liabilities and Stockholders’ EquityCurrent liabilities Accounts payable Income taxes payableLong-term liabilities Bonds payableStockholders’ equity Common stock Retained earnings Total liabilities and stockholders’ equity
$ 33,000 30,000 10,000
1,000
20,000 40,000
10,000
$138,000
$ 12,000 8,000
20,000
50,000 48,000
$138,000
20162017
$ 55,000 20,000 15,000
5,000
130,000 160,000
27,000
$398,000
$ 28,000 6,000
130,000
70,000 164,000
$398,000
COMPUTER SERVICES COMPANYComparative Balance Sheets
December 31
fx
(11,000) (5,000)
(1,000)(3,000)
Illustration 17B-2Comparative balance sheets, income statement, and additional information for Computer Services Company
Formulas Data Review ViewPage LayoutInsert
AP18 fx
B C D
Computer Services Company.xlsComputer Services Company.xlsHome
1234567891011121314
Sales revenueCost of goods soldOperating expenses (excluding depreciation)Depreciation expenseLoss on disposal of equipmentInterest expenseIncome before income taxIncome tax expenseNet income
COMPUTER SERVICES COMPANYIncome Statement
For the Year Ended December 31, 2017
$507,000
315,000192,000
47,000$145,000
$150,000111,000
9,0003,000
42,000
Additional information for 2017:1. Depreciation expense was comprised of $6,000 for building and $3,000 for equipment.2. The company sold equipment with a book value of $7,000 (cost $8,000, less accumu-
lated depreciation $1,000) for $4,000 cash.3. Issued $110,000 of long-term bonds in direct exchange for land.4. A building costing $120,000 was purchased for cash. Equipment costing $25,000 was
also purchased for cash.5. Issued common stock for $20,000 cash.6. The company declared and paid a $29,000 cash dividend.
PREPAID EXPENSES An increase of $4,000 in prepaid expenses means that expenses deducted in determining net income are less than expenses that were paid in cash. We deduct the increase of $4,000 from net income in determining net cash provided by operating activities. The worksheet entry is as follows.

754 17 Statement of Cash Flows
(c) Prepaid Expenses 4,000 Operating—Increase in Prepaid Expenses 4,000
LAND The increase in land of $110,000 resulted from a purchase through the issuance of long-term bonds. The company should report this transaction as a signifi cant noncash investing and fi nancing activity. The worksheet entry is:
(d) Land 110,000 Bonds Payable 110,000
BUILDINGS The cash purchase of a building for $120,000 is an investing activity cash outfl ow. The entry in the reconciling columns of the worksheet is:
(e) Buildings 120,000 Investing—Purchase of Building 120,000
EQUIPMENT The increase in equipment of $17,000 resulted from a cash purchase of $25,000 and the disposal of equipment costing $8,000. The book value of the equipment was $7,000, the cash proceeds were $4,000, and a loss of $3,000 was recorded. The worksheet entries are:
(f) Equipment 25,000 Investing—Purchase of Equipment 25,000
(g) Investing—Sale of Equipment 4,000 Operating—Loss on Disposal of Equipment 3,000 Accumulated Depreciation—Equipment 1,000 Equipment 8,000
ACCOUNTS PAYABLE We must add the increase of $16,000 in accounts payable to net income to determine net cash provided by operating activities. The worksheet entry is:
(h) Operating—Increase in Accounts Payable 16,000 Accounts Payable 16,000
INCOME TAXES PAYABLE When a company incurs income tax expense but has not yet paid its taxes, it records income taxes payable. A change in the Income Taxes Payable account reflects the difference between income tax expense incurred and income tax actually paid. Computer Services’ Income Taxes Payable account decreases by $2,000. That means the $47,000 of income tax expense reported on the income statement was $2,000 less than the amount of taxes paid during the period of $49,000. To adjust net income to a cash basis, we must reduce net income by $2,000. The worksheet entry is:
(i) Income Taxes Payable 2,000 Operating—Decrease in Income Taxes Payable 2,000
BONDS PAYABLE The increase of $110,000 in this account resulted from the issuance of bonds for land. This is a signifi cant noncash investing and fi nancing activity. Worksheet entry (d) above is the only entry necessary.
COMMON STOCK The balance sheet reports an increase in Common Stock of $20,000. The additional information section notes that this increase resulted from the issuance of new shares of stock. This is a cash infl ow reported in the fi nancing section. The worksheet entry is:
(j) Financing—Issuance of Common Stock 20,000 Common Stock 20,000
ACCUMULATED DEPRECIATION—BUILDINGS, AND ACCUMULATED DEPRECIA-TION—EQUIPMENT Increases in these accounts of $6,000 and $3,000, respectively,
Helpful HintThese amounts are aster-isked in the worksheet to indicate that they result from a signifi cant noncash transaction.

Appendix 17C: Statement of Cash Flows—T-Account Approach 755
resulted from depreciation expense. Depreciation expense is a noncash charge that we must add to net income to determine net cash provided by operating activities. The worksheet entries are:
(k) Operating—Depreciation Expense 6,000 Accumulated Depreciation—Buildings 6,000
(l) Operating—Depreciation Expense 3,000 Accumulated Depreciation—Equipment 3,000
RETAINED EARNINGS The $116,000 increase in retained earnings resulted from net income of $145,000 and the declaration and payment of a $29,000 cash div-idend. Net income is included in net cash provided by operating activities, and the dividends are a fi nancing activity cash outfl ow. The entries in the reconciling columns of the worksheet are:
(m) Operating—Net Income 145,000 Retained Earnings 145,000
(n) Retained Earnings 29,000 Financing—Payment of Dividends 29,000
DISPOSITION OF CHANGE IN CASH The fi rm’s cash increased $22,000 in 2017. The fi nal entry on the worksheet, therefore, is:
(o) Cash 22,000 Increase in Cash 22,000
As shown in the worksheet, we enter the increase in cash in the reconciling credit column as a balancing amount. This entry should complete the reconciliation of the changes in the balance sheet accounts. Also, it should permit the totals of the reconciling columns to be in agreement. When all changes have been explained and the reconciling columns are in agreement, the reconciling columns are ruled to complete the worksheet. The completed worksheet for Computer Services Company is shown in Illustration 17B-3 (page 756).
6 APPENDIX 17C: Use the T-account approach to prepare a statement of cash fl ows.
Many people like to use T-accounts to provide structure to the preparation of a statement of cash fl ows. The use of T-accounts is based on the accounting equa-tion that you learned in Chapter 1. The basic equation is:
Assets 5 Liabilities 1 Equity
Now, let’s rewrite the left-hand side as:
Cash 1 Noncash Assets 5 Liabilities 1 Equity
Next, rewrite the equation by subtracting Noncash Assets from each side to iso-late Cash on the left-hand side:
Cash 5 Liabilities 1 Equity 2 Noncash Assets
Finally, if we insert the D symbol (which means “change in”), we have:
D Cash 5 D Liabilities 1 D Equity 2 D Noncash Assets
LEARNING OBJECTIVE
*
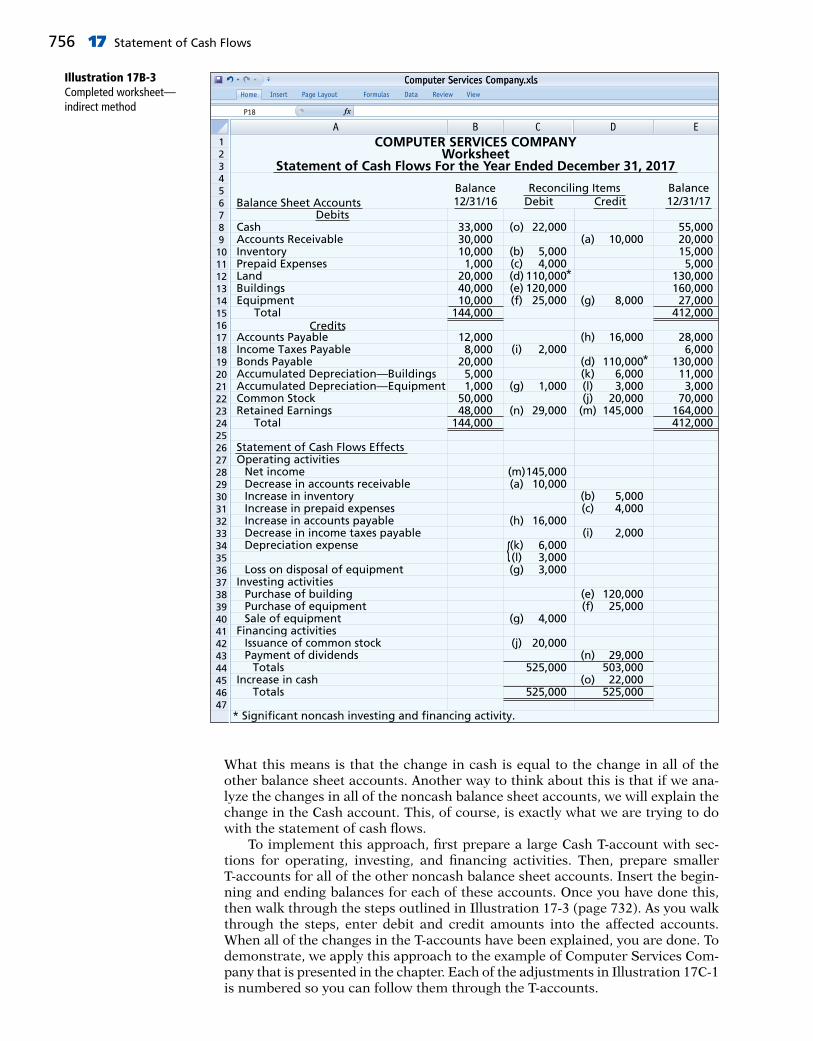
756 17 Statement of Cash Flows
Illustration 17B-3Completed worksheet—indirect method
Formulas Data Review ViewPage LayoutInsert
AP18 fx
B C ED
Computer Services Company.xlsComputer Services Company.xlsHome
Balance12/31/16
33,00030,00010,000
1,00020,00040,00010,000
144,000
12,0008,000
20,0005,0001,000
50,00048,000
144,000
55,00020,00015,000
5,000130,000160,000
27,000412,000
28,0006,000
130,00011,000
3,00070,000
164,000412,000
22,000
5,0004,000
110,000120,000
25,000
2,000
1,000
29,000
145,00010,000
16,000
6,0003,0003,000
4,000
20,000
525,000
525,000
10,000
8,000
16,000
110,0006,0003,000
20,000145,000
5,0004,000
2,000
120,00025,000
29,000503,000
22,000525,000
Reconciling ItemsDebit
* Significant noncash investing and financing activity.
*
*
Credit
(o)
(b)(c)(d)(e)(f)
(i)
(g)
(n)
(m)(a)
(h)
(k)(l)(g)
(g)
(j)
(a)
(g)
(h)
(d)(k)(l)(j)
(m)
(b)(c)
(i)
(e)(f)
(n)
(o)
Balance12/31/17
123456789
1011121314151617181920212223242526272829303132333435363738394041424344454647
Balance Sheet Accounts DebitsCashAccounts ReceivableInventoryPrepaid ExpensesLandBuildingsEquipment Total Accounts PayableIncome Taxes PayableBonds PayableAccumulated Depreciation—BuildingsAccumulated Depreciation—EquipmentCommon StockRetained Earnings Total
Statement of Cash Flows EffectsOperating activities Net income Decrease in accounts receivable Increase in inventory Increase in prepaid expenses Increase in accounts payable Decrease in income taxes payable Depreciation expense Loss on disposal of equipmentInvesting activities Purchase of building Purchase of equipment Sale of equipmentFinancing activities Issuance of common stock Payment of dividends TotalsIncrease in cash Totals
Credits
COMPUTER SERVICES COMPANYWorksheet
Statement of Cash Flows For the Year Ended December 31, 2017
{
What this means is that the change in cash is equal to the change in all of the other balance sheet accounts. Another way to think about this is that if we ana-lyze the changes in all of the noncash balance sheet accounts, we will explain the change in the Cash account. This, of course, is exactly what we are trying to do with the statement of cash fl ows. To implement this approach, fi rst prepare a large Cash T-account with sec-tions for operating, investing, and fi nancing activities. Then, prepare smaller T-accounts for all of the other noncash balance sheet accounts. Insert the begin-ning and ending balances for each of these accounts. Once you have done this, then walk through the steps outlined in Illustration 17-3 (page 732). As you walk through the steps, enter debit and credit amounts into the affected accounts. When all of the changes in the T-accounts have been explained, you are done. To demonstrate, we apply this approach to the example of Computer Services Com-pany that is presented in the chapter. Each of the adjustments in Illustration 17C-1 is numbered so you can follow them through the T-accounts.
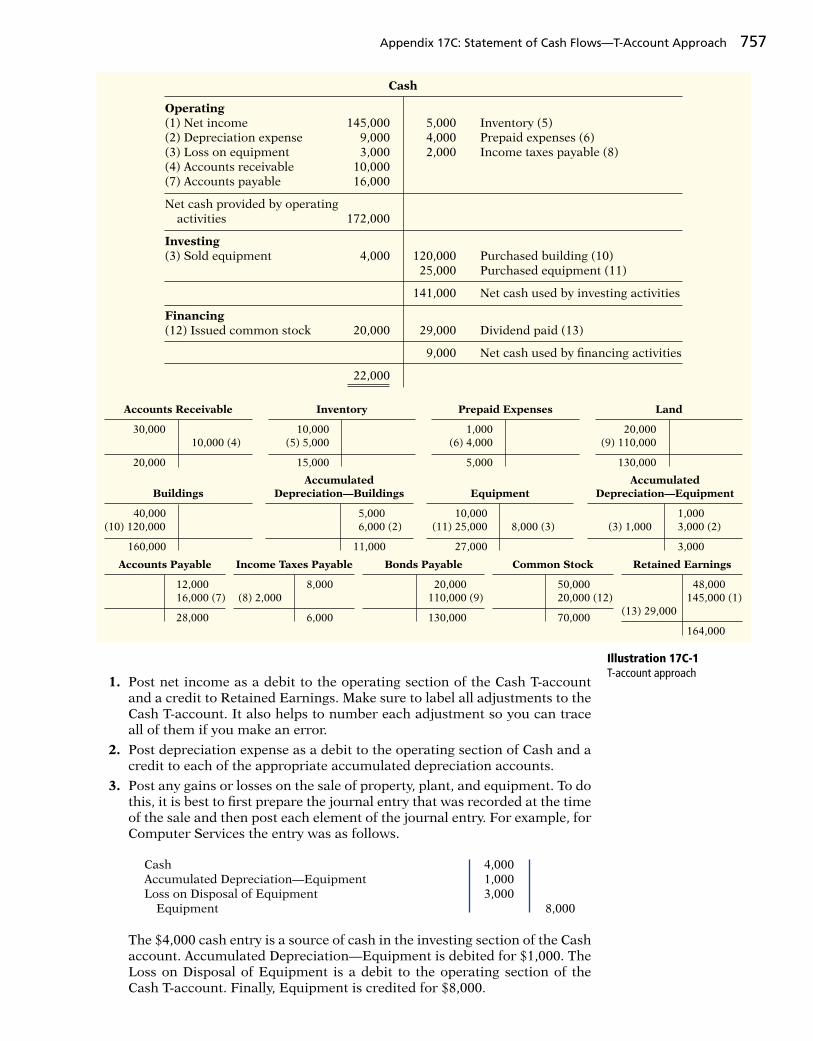
Appendix 17C: Statement of Cash Flows—T-Account Approach 757
1. Post net income as a debit to the operating section of the Cash T-account and a credit to Retained Earnings. Make sure to label all adjustments to the Cash T-account. It also helps to number each adjustment so you can trace all of them if you make an error.
2. Post depreciation expense as a debit to the operating section of Cash and a credit to each of the appropriate accumulated depreciation accounts.
3. Post any gains or losses on the sale of property, plant, and equipment. To do this, it is best to fi rst prepare the journal entry that was recorded at the time of the sale and then post each element of the journal entry. For example, for Computer Services the entry was as follows.
Cash 4,000Accumulated Depreciation—Equipment 1,000Loss on Disposal of Equipment 3,000 Equipment 8,000
The $4,000 cash entry is a source of cash in the investing section of the Cash account. Accumulated Depreciation—Equipment is debited for $1,000. The Loss on Disposal of Equipment is a debit to the operating section of the Cash T-account. Finally, Equipment is credited for $8,000.
Illustration 17C-1T-account approach
Accounts Receivable
30,000 10,000 (4)
20,000
Inventory
10,000 (5) 5,000
15,000
Prepaid Expenses
1,000 (6) 4,000
5,000
Land
20,000 (9) 110,000
130,000
Retained Earnings
48,000 145,000 (1)(13) 29,000
164,000
Accounts Payable
12,000 16,000 (7)
28,000
Income Taxes Payable
8,000 (8) 2,000
6,000
Bonds Payable
20,000 110,000 (9)
130,000
Common Stock
50,000 20,000 (12)
70,000
Buildings
40,000(10) 120,000
160,000
AccumulatedDepreciation—Buildings
5,000 6,000 (2)
11,000
Equipment
10,000 (11) 25,000 8,000 (3)
27,000
Accumulated Depreciation—Equipment
1,000 (3) 1,000 3,000 (2)
3,000
Cash
Operating(1) Net income 145,000 5,000 Inventory (5)(2) Depreciation expense 9,000 4,000 Prepaid expenses (6)(3) Loss on equipment 3,000 2,000 Income taxes payable (8)(4) Accounts receivable 10,000(7) Accounts payable 16,000
Net cash provided by operating activities 172,000
Investing(3) Sold equipment 4,000 120,000 Purchased building (10) 25,000 Purchased equipment (11)
141,000 Net cash used by investing activities
Financing(12) Issued common stock 20,000 29,000 Dividend paid (13)
9,000 Net cash used by fi nancing activities
22,000

758 17 Statement of Cash Flows
4–8. Next, post each of the changes to the noncash current asset and current liability accounts. For example, to explain the $10,000 decline in Computer Services’ accounts receivable, credit Accounts Receivable for $10,000 and debit the operating section of the Cash T-account for $10,000.
9. Analyze the changes in the noncurrent accounts. Land was purchased by issuing bonds payable. This requires a debit to Land for $110,000 and a credit to Bonds Payable for $110,000. Note that this is a signifi cant noncash event that requires disclosure at the bottom of the statement of cash fl ows.
10. Buildings is debited for $120,000, and the investing section of the Cash T-account is credited for $120,000 as a use of cash from investing.
11. Equipment is debited for $25,000 and the investing section of the Cash T-account is credited for $25,000 as a use of cash from investing.
12. Common Stock is credited for $20,000 for the issuance of shares of stock, and the fi nancing section of the Cash T-account is debited for $20,000.
13. Retained Earnings is debited to refl ect the payment of the $29,000 dividend, and the fi nancing section of the Cash T-account is credited to refl ect the use of Cash.
At this point, all of the changes in the noncash accounts have been explained. All that remains is to subtotal each section of the Cash T-account and compare the total change in cash with the change shown on the balance sheet. Once this is done, the information in the Cash T-account can be used to prepare a statement of cash fl ows.
Discuss the usefulness and format of the statement of cash fl ows. The statement of cash fl ows provides infor-mation about the cash receipts, cash payments, and net change in cash resulting from the operating, invest-ing, and fi nancing activities of a company during the period. Operating activities include the cash effects of transactions that enter into the determination of net income. Investing activities involve cash fl ows result-ing from changes in investments and long-term asset items. Financing activities involve cash fl ows resulting from changes in long-term liability and stockholders’ equity items.
Prepare a statement of cash fl ows using the indirect method. The preparation of a statement of cash fl ows involves three major steps. (1) Determine net cash provided/used by operating activities by con-verting net income from an accrual basis to a cash basis. (2) Analyze changes in noncurrent asset and liability accounts and record as investing and fi nanc-ing activities, or disclose as noncash transactions. (3) Compare the net change in cash on the statement of cash fl ows with the change in the Cash account reported on the balance sheet to make sure the amounts agree.
Analyze the statement of cash fl ows. Free cash fl ow indicates the amount of cash a company generated during the current year that is available for the pay-ment of additional dividends or for expansion.
1
2
3
Prepare a statement of cash fl ows using the direct method. The preparation of the statement of cash fl ows involves three major steps. (1) Determine net cash provided/used by operating activities by convert-ing net income from an accrual basis to a cash basis. (2) Analyze changes in noncurrent asset and liability accounts and record as investing and fi nancing activi-ties, or disclose as noncash transactions. (3) Compare the net change in cash on the statement of cash fl ows with the change in the Cash account reported on the balance sheet to make sure the amounts agree. The direct method reports cash receipts less cash payments to arrive at net cash provided by operating activities.
Use a worksheet to prepare the statement of cash fl ows using the indirect method. When there are numerous adjustments, a worksheet can be a helpful tool in preparing the statement of cash fl ows. Key guidelines for using a worksheet are as follows. (1) List accounts with debit balances separately from those with credit balances. (2) In the reconciling columns in the bottom portion of the worksheet, show cash infl ows as debits and cash outfl ows as credits. (3) Do not enter reconciling items in any journal or account, but use them only to help prepare the statement of cash fl ows.
The steps in preparing the worksheet are as follows. (1) Enter beginning and ending balances of balance sheet accounts. (2) Enter debits and credits in reconcil-ing columns. (3) Enter the increase or decrease in cash in two places as a balancing amount.
4*
5*
LEARNING OBJECTIVES REVIEW
1
REVIEW AND PRACTICE

Practice Multiple-Choice Questions 759
Use the T-account approach to prepare a statement of cash fl ows. To use T-accounts to prepare the state-ment of cash fl ows: (1) prepare a large Cash T-account with sections for operating, investing, and fi nancing activities; (2) prepare smaller T-accounts for all other
6* noncash accounts; (3) insert beginning and ending balances for all accounts; and (4) follows the steps in Illustration 17-3 (page 732), entering debit and credit amounts as needed.
Direct method A method of preparing a statement of cash fl ows that shows operating cash receipts and pay-ments, making it more consistent with the objective of the statement of cash fl ows. (pp. 732, 745).
Financing activities Cash fl ow activities that include (a) obtaining cash from issuing debt and repaying the amounts borrowed and (b) obtaining cash from stock-holders, repurchasing shares, and paying dividends. (p. 728).
Free cash fl ow Net cash provided by operating activities adjusted for capital expenditures and dividends paid. (p. 742).
Indirect method A method of preparing a statement of cash fl ows in which net income is adjusted for items that do not affect cash, to determine net cash provided by operating activities. (pp. 732, 734).
* Investing activities Cash fl ow activities that include (a) purchasing and disposing of investments and prop-erty, plant, and equipment using cash and (b) lending money and collecting the loans. (p. 728).
Operating activities Cash fl ow activities that include the cash effects of transactions that create revenues and expenses and thus enter into the determination of net income. (p. 728).
Statement of cash fl ows A basic fi nancial statement that provides information about the cash receipts, cash payments, and net change in cash during a period, resulting from operating, investing, and fi nancing activities. (p. 728).
GLOSSARY REVIEW
1. Which of the following is incorrect about the state-ment of cash fl ows?(a) It is a fourth basic fi nancial statement.(b) It provides information about cash receipts and
cash payments of an entity during a period.(c) It reconciles the ending Cash account balance to
the balance per the bank statement.(d) It provides information about the operating,
investing, and fi nancing activities of the business. 2. Which of the following is not reported in the state-
ment of cash fl ows?(a) The net change in stockholders’ equity during the
year.(b) Cash payments for plant assets during the year.(c) Cash receipts from sales of plant assets during the
year.(d) How acquisitions of plant assets during the year
were fi nanced. 3. The statement of cash fl ows classifi es cash receipts
and cash payments by these activities:(a) operating and nonoperating.(b) investing, fi nancing, and operating.(c) fi nancing, operating, and nonoperating.(d) investing, fi nancing, and nonoperating.
4. Which is an example of a cash fl ow from an operating activity?(a) Payment of cash to lenders for interest.(b) Receipt of cash from the sale of common stock.(c) Payment of cash dividends to the company’s
stockholders.(d) None of the above.
(LO 1)
(LO 1)
(LO 1)
(LO 1)
5. Which is an example of a cash fl ow from an investing activity?(a) Receipt of cash from the issuance of bonds payable.(b) Payment of cash to repurchase outstanding
common stock.(c) Receipt of cash from the sale of equipment.(d) Payment of cash to suppliers for inventory.
6. Cash dividends paid to stockholders are classifi ed on the statement of cash fl ows as:(a) an operating activity.(b) an investing activity.(c) a combination of (a) and (b).(d) a fi nancing activity.
7. Which is an example of a cash fl ow from a fi nancing activity?(a) Receipt of cash from sale of land.(b) Issuance of debt for cash.(c) Purchase of equipment for cash.(d) None of the above
8. Which of the following is incorrect about the state-ment of cash fl ows?(a) The direct method may be used to report net cash
provided by operating activities.(b) The statement shows the net cash provided (used)
for three categories of activity.(c) The operating section is the last section of the
statement.(d) The indirect method may be used to report net
cash provided by operating activities.
(LO 1)
(LO 1)
(LO 1)
(LO 1)
PRACTICE MULTIPLE-CHOICE QUESTIONS

760 17 Statement of Cash Flows
Use the indirect method to solve Questions 9 through 11.
9. Net income is $132,000, accounts payable increased $10,000 during the year, inventory decreased $6,000 during the year, and accounts receivable increased $12,000 during the year. Under the indirect method, what is net cash provided by operating activities?(a) $102,000. (c) $124,000.(b) $112,000. (d) $136,000.
10. Items that are added back to net income in determin-ing net cash provided by operating activities under the indirect method do not include:(a) depreciation expense.(b) an increase in inventory.(c) amortization expense.(d) loss on disposal of equipment.
11. The following data are available for Allen Clapp Corporation.
Net income $200,000 Depreciation expense 40,000 Dividends paid 60,000 Gain on disposal of land 10,000 Decrease in accounts receivable 20,000 Decrease in accounts payable 30,000
Net cash provided by operating activities is:(a) $160,000. (c) $240,000.(b) $220,000. (d) $280,000.
12. The following data are available for Orange Peels Corporation.
Proceeds from sale of land $100,000 Proceeds from sale of equipment 50,000 Issuance of common stock 70,000 Purchase of equipment 30,000 Payment of cash dividends 60,000
Net cash provided by investing activities is:(a) $120,000. (c) $150,000.(b) $130,000. (d) $190,000.
13. The following data are available for Something Strange!
Increase in accounts payable $ 40,000 Increase in bonds payable 100,000 Sale of investment 50,000 Issuance of common stock 60,000 Payment of cash dividends 30,000
(LO 2)
(LO 2)
(LO 2)
(LO 2)
(LO 2)
Net cash provided by fi nancing activities is:(a) $90,000. (c) $160,000.(b) $130,000. (d) $170,000.
14. The statement of cash fl ows should not be used to evaluate an entity’s ability to:(a) earn net income.(b) generate future cash fl ows.(c) pay dividends.(d) meet obligations.
15. Free cash fl ow provides an indication of a company’s ability to:(a) generate net income.(b) generate cash to pay dividends.(c) generate cash to invest in new capital expenditures.(d) Both (b) and (c).
Use the direct method to solve Questions 16 and 17.
16. The beginning balance in accounts receivable is $44,000, the ending balance is $42,000, and sales during the period are $129,000. What are cash receipts from customers?(a) $127,000. (c) $131,000.(b) $129,000. (d) $141,000.
17. Which of the following items is reported on a state-ment of cash fl ows prepared by the direct method?(a) Loss on disposal of building.(b) Increase in accounts receivable.(c) Depreciation expense.(d) Cash payments to suppliers.
18. In a worksheet for the statement of cash fl ows, a decrease in accounts receivable is entered in the rec-onciling columns as a credit to Accounts Receivable and a debit in the:(a) investing activities section.(b) operating activities section.(c) fi nancing activities section.(d) None of the above.
19. In a worksheet for the statement of cash fl ows, a worksheet entry that includes a credit to accumulated depreciation will also include a:(a) credit in the operating activities section and a
debit in another section.(b) debit in the operating activities section.(c) debit in the investing activities section.(d) debit in the fi nancing activities section.
(LO 3)
(LO 3)
(LO 4)*
(LO 4)*
(LO 5)*
(LO 5)*
Solutions
1. (c) The statement of cash fl ows does not reconcile the ending cash balance to the balance per the bank statement. The other choices are true statements.
2. (a) The net change in stockholders’ equity during the year is not reported in the statement of cash fl ows. The other choices are true statements.
3. (b) Operating, investing, and fi nancing activities are the three classifi cations of cash receipts and cash payments used in the statement of cash fl ows. The other choices are therefore incorrect.
4. (a) Payment of cash to lenders for interest is an operating activity. The other choices are incorrect because (b) receipt of cash from the sale of common stock is a fi nancing activity, (c) payment of cash dividends to the company’s stockholders is a fi nancing activity, and (d) there is a correct answer.
5. (c) Receipt of cash from the sale of equipment is an investing activity. The other choices are incorrect because (a) the receipt of cash from the issuance of bonds payable is a fi nancing activity, (b) payment of cash to repurchase outstanding common stock is a fi nancing activity, and (d) payment of cash to suppliers for inventory is an operating activity.
6. (d) Cash dividends paid to stockholders are classifi ed as a fi nancing activity, not (a) an operating activity, (b) an investing activity, or (c) a combination of (a) and (b).

Practice Exercises 761
7. (b) Issuance of debt for cash is a fi nancing activity. The other choices are incorrect because (a) the receipt of cash for the sale of land is an investing activity, (c) the purchase of equipment for cash is an investing activity, and (d) there is a correct answer.
8. (c) The operating section of the statement of cash fl ows is the fi rst, not the last, section of the statement. The other choices are true statements.
9. (d) Net cash provided by operating activities is computed by adjusting net income for the changes in the three current asset/current liability accounts listed. An increase in accounts payable ($10,000) and a decrease in inventory ($6,000) are added to net income ($132,000), while an increase in accounts receivable ($12,000) is subtracted from net income, or $132,000 1 $10,000 1 $6,000 2 $12,000 5 $136,000, not (a) $102,000, (b) $112,000, or (c) $124,000.
10. (b) An increase in inventory is subtracted, not added, to net income in determining net cash provided by operating activities. The other choices are incorrect because (a) depreciation expense, (c) amortization expense, and (d) loss on disposal of equipment are all added back to net income in determining net cash provided by operating activities.
11. (b) Net cash provided by operating activities is $220,000 (Net income $200,000 1 Depreciation expense $40,000 2 Gain on disposal of land $10,000 1 Decrease in accounts receivable $20,000 2 Decrease in accounts payable $30,000), not (a) $160,000, (c) $240,000, or (d) $280,000.
12. (a) Net cash provided by investing activities is $120,000 (Sale of land $100,000 1 Sale of equipment $50,000 2 Purchase of equipment $30,000), not (b) $130,000, (c) $150,000, or (d) $190,000. Issuance of common stock and payment of cash dividends are fi nancing activities.
13. (b) Net cash provided by fi nancing activities is $130,000 (Increase in bonds payable $100,000 1 Issuance of common stock $60,000 2 Payment of cash dividends $30,000), not (a) $90,000, (c) $160,000, or (d) $170,000. Increase in accounts payable is an operating activity and sale of investment is an investing activity.
14. (a) The statement of cash fl ows is not used to evaluate an entity’s ability to earn net income. The other choices are true statements.
15. (d) Free cash fl ow provides an indication of a company’s ability to generate cash to pay dividends and to invest in new capital expenditures. Choice (a) is incorrect because other measures besides free cash fl ow provide the best measure of a company’s ability to earn net income. Choices (b) and (c) are true statements, but (d) is the better answer.
*16. (c) Cash collections from customers amount to $131,000 ($129,000 1 $2,000). The other choices are therefore incorrect.
*17. (d) Cash payments to suppliers are reported on a statement of cash fl ows prepared by the direct method. The other choices are incorrect because (a) loss on disposal of building, (b) increase in accounts receivable, and (c) depreciation expense are reported in the operating activities section of the statement of cash fl ows when the indirect, not direct, method is used.
*18. (b) Because accounts receivable is a current asset, the debit belongs in the operating activities section of the worksheet, not in the (a) investing activities or (c) fi nancing activities section. Choice (d) is incorrect as there is a right answer.
*19. (b) A worksheet entry that includes a credit to accumulated depreciation will also include a debit to depreciation expense. This debit in the operating activities section of the statement of cash fl ows will be added to the net income to determine net cash pro-vided by operating activities. The other choices are therefore incorrect.
1. Furst Corporation had the following transactions.
1. Paid salaries of $14,000.
2. Issued 1,000 shares of $1 par value common stock for equipment worth $16,000.
3. Sold equipment (cost $10,000, accumulated depreciation $6,000) for $3,000.
4. Sold land (cost $12,000) for $16,000.
5. Issued another 1,000 shares of $1 per value common stock for $18,000.
6. Recorded depreciation of $20,000.
InstructionsFor each transaction above, (a) prepare the journal entry, and (b) indicate how it would affect the statement of cash fl ows. Assume the indirect method.
Prepare journal entries to determine effect on statement of cash fl ows.
(LO 2)
PRACTICE EXERCISES
1. 1. (a) Salaries and Wages Expense 14,000 Cash 14,000
(b) Salaries and wages expense is not reported separately on the statement of cash fl ows. It is part of the computation of net income in the income statement and is included in the net income amount on the statement of cash fl ows.
2. (a) Equipment 16,000 Common Stock 1,000
Paid-in Capital in Excess of Par—Common Stock 15,000
Solution

762 17 Statement of Cash Flows
2. Strong Corporation’s comparative balance sheets are presented below.Prepare statement of cash fl ows and compute free cash fl ow.
(LO 2, 3)
(b) The issuance of common stock for equipment ($16,000) is reported as a noncash fi nanc-ing and investing activity at the bottom of the statement of cash fl ows.
3. (a) Cash 3,000 Loss on Disposal of Plant Assets 1,000 Accumulated Depreciation—Equipment 6,000 Equipment 10,000
(b) The cash receipt ($3,000) is reported in the investing section. The loss ($1,000) is added to net income in the operating section.
4. (a) Cash 16,000 Land 12,000 Gain on Disposal of Plant Assets 4,000
(b) The cash receipt ($16,000) is reported in the investing section. The gain ($4,000) is deducted from net income in the operating section.
5. (a) Cash 18,000 Common Stock 1,000 Paid-in Capital in Excess of Par—Common Stock 17,000
(b) The cash receipt ($18,000) is reported in the fi nancing section.
6. (a) Depreciation Expense 20,000 Accumulated Depreciation—Equipment 20,000
(b) Depreciation expense ($20,000) is added to net income in the operating section.
Additional information:
1. Net income was $28,300. Dividends declared and paid were $26,400.
2. Equipment which cost $10,000 and had accumulated depreciation of $1,200 was sold for $4,300.
3. All other changes in noncurrent account balances had a direct effect on cash fl ows, except the change in accumulated depreciation.
Instructions(a) Prepare a statement of cash fl ows for 2017 using the indirect method.
(b) Compute free cash fl ow.
STRONG CORPORATIONComparative Balance Sheets
December 31
2017 2016
Cash $ 28,200 $ 17,700Accounts receivable 24,200 22,300Investments 23,000 16,000Equipment 60,000 70,000Accumulated depreciation—equipment (14,000) (10,000)
Total $121,400 $116,000
Accounts payable $ 19,600 $ 11,100Bonds payable 10,000 30,000Common stock 60,000 45,000Retained earnings 31,800 29,900
Total $121,400 $116,000
2. (a) STRONG CORPORATIONStatement of Cash Flows
For the Year Ended December 31, 2017
Cash fl ows from operating activities Net income $ 28,300 Adjustments to reconcile net income to net cash provided by operating activities:
Solution
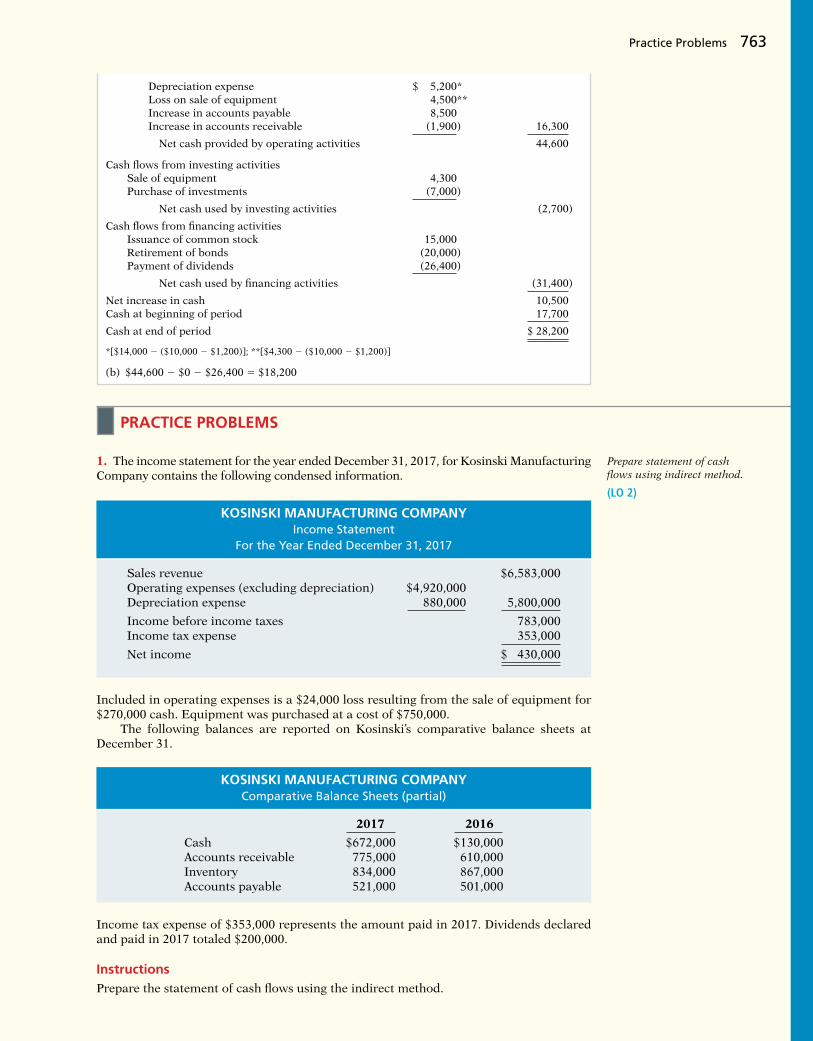
Practice Problems 763
Depreciation expense $ 5,200* Loss on sale of equipment 4,500** Increase in accounts payable 8,500 Increase in accounts receivable (1,900) 16,300
Net cash provided by operating activities 44,600
Cash fl ows from investing activities Sale of equipment 4,300 Purchase of investments (7,000)
Net cash used by investing activities (2,700)
Cash fl ows from fi nancing activities Issuance of common stock 15,000 Retirement of bonds (20,000) Payment of dividends (26,400)
Net cash used by fi nancing activities (31,400)
Net increase in cash 10,500Cash at beginning of period 17,700
Cash at end of period $ 28,200
*[$14,000 2 ($10,000 2 $1,200)]; **[$4,300 2 ($10,000 2 $1,200)]
(b) $44,600 2 $0 2 $26,400 5 $18,200
1. The income statement for the year ended December 31, 2017, for Kosinski Manufacturing Company contains the following condensed information.
Prepare statement of cash fl ows using indirect method.
(LO 2)
PRACTICE PROBLEMS
KOSINSKI MANUFACTURING COMPANYIncome Statement
For the Year Ended December 31, 2017
Sales revenue $6,583,000Operating expenses (excluding depreciation) $4,920,000Depreciation expense 880,000 5,800,000
Income before income taxes 783,000Income tax expense 353,000
Net income $ 430,000
Included in operating expenses is a $24,000 loss resulting from the sale of equipment for $270,000 cash. Equipment was purchased at a cost of $750,000. The following balances are reported on Kosinski’s comparative balance sheets at December 31.
KOSINSKI MANUFACTURING COMPANYComparative Balance Sheets (partial)
2017 2016
Cash $672,000 $130,000Accounts receivable 775,000 610,000Inventory 834,000 867,000Accounts payable 521,000 501,000
Income tax expense of $353,000 represents the amount paid in 2017. Dividends declared and paid in 2017 totaled $200,000.
InstructionsPrepare the statement of cash fl ows using the indirect method.

764 17 Statement of Cash Flows
*2. The income statement for Kosinski Manufacturing Company contains the following condensed information.
Prepare statement of cash fl ows using direct method.
(LO 4)
1.
Solution
KOSINSKI MANUFACTURING COMPANYStatement of Cash Flows—Indirect Method
For the Year Ended December 31, 2017
Cash fl ows from operating activities Net income $ 430,000 Adjustments to reconcile net income to net cash provided by operating activities: Depreciation expense $ 880,000 Loss on disposal of equipment 24,000 Increase in accounts receivable (165,000) Decrease in inventory 33,000 Increase in accounts payable 20,000 792,000
Net cash provided by operating activities 1,222,000Cash fl ows from investing activities Sale of equipment 270,000 Purchase of equipment (750,000)
Net cash used by investing activities (480,000)
Cash fl ows from fi nancing activities Payment of cash dividends (200,000)
Net increase in cash 542,000Cash at beginning of period 130,000
Cash at end of period $ 672,000
Included in operating expenses is a $24,000 loss resulting from the sale of equipment for $270,000 cash. Equipment was purchased at a cost of $750,000. The following balances are reported on Kosinski’s comparative balance sheet at December 31.
KOSINSKI MANUFACTURING COMPANYIncome Statement
For the Year Ended December 31, 2017
Sales revenue $6,583,000Operating expenses, excluding depreciation $4,920,000Depreciation expense 880,000 5,800,000
Income before income taxes 783,000Income tax expense 353,000
Net income $ 430,000
KOSINSKI MANUFACTURING COMPANYComparative Balance Sheets (partial)
2017 2016
Cash $672,000 $130,000Accounts receivable 775,000 610,000Inventory 834,000 867,000Accounts payable 521,000 501,000
Income tax expense of $353,000 represents the amount paid in 2017. Dividends declared and paid in 2017 totaled $200,000.

Questions 765
InstructionsPrepare the statement of cash fl ows using the direct method.
2.
Solution
KOSINSKI MANUFACTURING COMPANYStatement of Cash Flows—Direct Method
For the Year Ended December 31, 2017
Cash fl ows from operating activities Cash collections from customers $6,418,000* Cash payments: For operating expenses $4,843,000** For income taxes 353,000 5,196,000
Net cash provided by operating activities 1,222,000
Cash fl ows from investing activities Sale of equipment 270,000 Purchase of equipment (750,000)
Net cash used by investing activities (480,000)
Cash fl ows from fi nancing activities Payment of cash dividends (200,000)
Net cash used by fi nancing activities (200,000)
Net increase in cash 542,000Cash at beginning of period 130,000
Cash at end of period $ 672,000
Direct-Method Computations:
*Computation of cash collections from customers: Sales revenue $6,583,000 Deduct: Increase in accounts receivable (165,000)
Cash collections from customers $6,418,000
**Computation of cash payments for operating expenses: Operating expenses $4,920,000 Deduct: Loss on disposal of equipment (24,000) Deduct: Decrease in inventories (33,000) Deduct: Increase in accounts payable (20,000)
Cash payments for operating expenses $4,843,000
Brief Exercises, Exercises, DO IT! Exercises, and Problems and many additional resources are available for practice in WileyPLUS
QUESTIONS
1. (a) What is a statement of cash fl ows? (b) Mark Paxson maintains that the statement of
cash fl ows is an optional fi nancial statement. Do you agree? Explain.
2. What questions about cash are answered by the state-ment of cash fl ows?
3. Distinguish among the three types of activities reported in the statement of cash fl ows.
4. (a) What are the major sources (infl ows) of cash in a statement of cash fl ows?
(b) What are the major uses (outfl ows) of cash? 5. Why is it important to disclose certain noncash trans-
actions? How should they be disclosed? 6. Diane Hollowell and Terry Parmenter were discussing
the format of the statement of cash fl ows of Snow Candy Co. At the bottom of Snow Candy’s statement
NOTE: All asterisked Questions, Exercises, and Problems relate to material in the appendices to the chapter.

766 17 Statement of Cash Flows
of cash fl ows was a separate section entitled “Noncash investing and fi nancing activities.” Give three examples of signifi cant noncash transactions that would be reported in this section.
7. Why is it necessary to use comparative balance sheets, a current income statement, and certain transaction data in preparing a statement of cash fl ows?
8. Contrast the advantages and disadvantages of the direct and indirect methods of preparing the statement of cash fl ows. Are both methods acceptable? Which method is preferred by the FASB? Which method is more popular?
9. When the total cash infl ows exceed the total cash out-fl ows in the statement of cash fl ows, how and where is this excess identifi ed?
10. Describe the indirect method for determining net cash provided (used) by operating activities.
11. Why is it necessary to convert accrual-basis net income to cash-basis income when preparing a statement of cash fl ows?
12. The president of Merando Company is puzzled. During the last year, the company experienced a net loss of $800,000, yet its cash increased $300,000 during the same period of time. Explain to the presi-dent how this could occur.
13. Identify fi ve items that are adjustments to convert net income to net cash provided by operating activities under the indirect method.
14. Why and how is depreciation expense reported in a statement of cash fl ows prepared using the indirect method?
15. Why is the statement of cash fl ows useful? 16. During 2017, Doubleday Company converted $1,700,000
of its total $2,000,000 of bonds payable into common stock. Indicate how the transaction would be reported on a statement of cash fl ows, if at all.
17. In its 2013 statement of cash fl ows, what amount did Apple report for net cash (a) provided by operating activities, (b) used for investing activities, and (c) used for fi nancing activities?
*18. Describe the direct method for determining net cash provided by operating activities.
*19. Give the formulas under the direct method for com-puting (a) cash receipts from customers and (b) cash payments to suppliers.
*20. Molino Inc. reported sales revenue of $2 million for 2017. Accounts receivable decreased $200,000 and accounts payable increased $300,000. Compute cash receipts from customers, assuming that the receivable and payable transactions related to operations.
*21. In the direct method, why is depreciation expense not reported in the cash fl ows from operating activities section?
*22. Why is it advantageous to use a worksheet when pre-paring a statement of cash fl ows? Is a worksheet required to prepare a statement of cash fl ows?
BRIEF EXERCISES
BE17-1 Each of the items below must be considered in preparing a statement of cash fl ows for Baskerville Co. for the year ended December 31, 2017. For each item, state how it should be shown in the statement of cash fl ows for 2017.
(a) Issued bonds for $200,000 cash.(b) Purchased equipment for $150,000 cash.(c) Sold land costing $20,000 for $20,000 cash.(d) Declared and paid a $50,000 cash dividend.
BE17-2 Classify each item as an operating, investing, or fi nancing activity. Assume all items involve cash unless there is information to the contrary and the indirect method is used.
(a) Purchase of equipment. (d) Depreciation.(b) Proceeds from sale of building. (e) Payment of dividends.(c) Redemption of bonds. (f) Issuance of common stock.
BE17-3 The following T-account is a summary of the Cash account of Cuellar Company.
Indicate statement presentation of selected transactions.
(LO 1)
Classify items by activities.
(LO 1)
Identify fi nancing activity transactions.
(LO 1) Cash (Summary Form)
Balance, Jan. 1 8,000Receipts from customers 364,000 Payments for goods 200,000Dividends on stock investments 6,000 Payments for operating expenses 140,000Proceeds from sale of equipment 36,000 Interest paid 10,000Proceeds from issuance of Taxes paid 8,000 bonds payable 300,000 Dividends paid 50,000
Balance, Dec. 31 306,000
What amount of net cash provided (used) by fi nancing activities should be reported in the statement of cash fl ows?

Brief Exercises 767
BE17-4 Telfer, Inc. reported net income of $2.8 million in 2017. Depreciation for the year was $160,000, accounts receivable decreased $350,000, and accounts payable decreased $280,000. Compute net cash provided by operating activities using the indirect method.
BE17-5 The net income for Metz Co. for 2017 was $280,000. For 2017, depreciation on plant assets was $70,000, and the company incurred a loss on disposal of plant assets of $12,000. Compute net cash provided by operating activities under the indirect method.
BE17-6 The comparative balance sheets for Montalvo Company show these changes in noncash current asset accounts: accounts receivable decrease $80,000, prepaid expenses increase $28,000, and inventories increase $30,000. Compute net cash provided by operat-ing activities using the indirect method assuming that net income is $300,000.
BE17-7 The T-accounts for Equipment and the related Accumulated Depreciation—Equipment for Luo Company at the end of 2017 are shown here.
Compute net cash provided by operating activities— indirect method.
(LO 2)
Compute net cash provided by operating activities— indirect method.
(LO 2)
Compute net cash provided by operating activities— indirect method.
(LO 2)
Determine cash received from sale of equipment.
(LO 2) Equipment Accumulated Depreciation—Equipment
Beg. bal. 80,000 Disposals 22,000 Disposals 5,500 Beg. bal. 44,500Acquisitions 41,600 Depr. exp. 12,000
End. bal. 99,600 End. bal. 51,000
In addition, Luo Company’s income statement reported a loss on the disposal of equipment of $6,500. What amount was reported on the statement of cash fl ows as “cash fl ow from sale of equipment”?
BE17-8 Assume that during 2017, Cypress Semiconductor Corporation reported net cash provided by operating activities of $155,793,000, net cash used in investing activities of $207,826,000 (including cash spent for plant assets of $132,280,000), and net cash used in fi nancing activities of $33,372,000. Dividends of $5,000,000 were paid. Calculate free cash fl ow.
BE17-9 Hinck Corporation reported net cash provided by operating activities of $360,000, net cash used by investing activities of $250,000 (including cash spent for capital assets of $200,000), and net cash provided by fi nancing activities of $70,000. Dividends of $140,000 were paid. Calculate free cash fl ow.
BE17-10 Suppose in a recent quarter, Alliance Atlantis Communications Inc. reported net cash provided by operating activities of $45,600,000 and revenues of $264,800,000. Cash spent on plant asset additions during the quarter was $1,600,000. No dividends were paid. Calculate free cash fl ow.
BE17-11 The management of Morrow Inc. is trying to decide whether it can increase its dividend. During the current year, it reported net income of $875,000. It had net cash pro-vided by operating activities of $734,000, paid cash dividends of $70,000, and had capital expenditures of $280,000. Compute the company’s free cash fl ow, and discuss whether an increase in the dividend appears warranted. What other factors should be considered?
*BE17-12 Suppose Columbia Sportswear Company had accounts receivable of $206,024,000 at the beginning of a recent year, and $267,653,000 at year-end. Sales revenue was $1,095,307,000 for the year. What is the amount of cash receipts from customers?
*BE17-13 Howell Corporation reported income tax expense of $340,000,000 on its 2017 income statement and income taxes payable of $297,000,000 at December 31, 2016, and $522,000,000 at December 31, 2017. What amount of cash payments were made for income taxes during 2017?
*BE17-14 Sisson Corporation reports operating expenses of $80,000 excluding deprecia-tion expense of $15,000 for 2017. During the year, prepaid expenses decreased $6,600 and accrued expenses payable increased $4,400. Compute the cash payments for operating expenses in 2017.
Calculate free cash fl ow.
(LO 3)
Calculate free cash fl ow.
(LO 3)
Calculate free cash fl ow.
(LO 3)
Calculate and analyze free cash fl ow.
(LO 3)
Compute receipts from customers—direct method.
(LO 4)
Compute cash payments for income taxes—direct method.
(LO 4)
Compute cash payments for operating expenses—direct method.
(LO 4)

768 17 Statement of Cash Flows
*BE17-15 During the year, prepaid expenses decreased $5,600, and accrued expenses increased $2,400. Indicate how the changes in prepaid expenses and accrued expenses payable should be entered in the reconciling columns of a worksheet. Assume that beginning bal-ances were prepaid expenses $18,600 and accrued expenses payable $8,200.
Ragsdell Corporation had the following transactions.
1. Issued $200,000 of bonds payable.2. Paid utilities expense.3. Issued 500 shares of preferred stock for $45,000.4. Sold land and a building for $250,000.5. Lent $30,000 to Tegtmeier Corporation, receiving Tegtmeier’s 1-year, 12% note.
Classify each of these transactions by type of cash fl ow activity (operating, investing, or fi nancing).
Wise Photography reported net income of $130,000 for 2017. Included in the income statement were depreciation expense of $6,000, amortization expense of $2,000, and a gain on disposal of equipment of $3,600. Wise’s comparative balance sheets show the following balances.
12/31/16 12/31/17
Accounts receivable $27,000 $21,000Accounts payable 6,000 9,200
Calculate net cash provided by operating activities for Wise Photography.
Obermeyer Corporation issued the following statement of cash fl ows for 2017.
OBERMEYER CORPORATIONStatement of Cash Flows—Indirect Method
For the Year Ended December 31, 2017
Cash fl ows from operating activities Net income $59,000 Adjustments to reconcile net income to net cash provided by operating activities: Depreciation expense $ 9,100 Loss on disposal of equipment 9,500 Increase in inventory (5,000) Decrease in accounts receivable 3,300 Decrease in accounts payable (2,200) 14,700
Net cash provided by operating activities 73,700Cash fl ows from investing activities Sale of investments 3,100 Purchase of equipment (27,000)
Net cash used by investing activities (23,900)Cash fl ows from fi nancing activities Issuance of stock 20,000 Payment on long-term note payable (10,000) Payment for dividends (15,000)
Net cash used by fi nancing activities (5,000)
Net increase in cash 44,800Cash at beginning of year 13,000
Cash at end of year $57,800
(a) Compute free cash fl ow for Obermeyer Corporation. (b) Explain why free cash fl ow often provides better information than “Net cash provided by operating activities.”
Calculate net cash from operating activities.
(LO 2)
Compute and discuss free cash fl ow.
(LO 3)
DO IT! Exercises
DO IT! 17-1Classify transactions by type of cash fl ow activity.
(LO 1)
DO IT! 17-2
DO IT! 17-3
Indicate entries in worksheet.
(LO 5)

Exercises 769
EXERCISES
E17-1 Tabares Corporation had these transactions during 2017.
(a) Issued $50,000 par value common stock for cash.(b) Purchased a machine for $30,000, giving a long-term note in exchange.(c) Issued $200,000 par value common stock upon conversion of bonds having a face
value of $200,000.(d) Declared and paid a cash dividend of $18,000.(e) Sold a long-term investment with a cost of $15,000 for $15,000 cash.(f) Collected $16,000 of accounts receivable.(g) Paid $18,000 on accounts payable.
InstructionsAnalyze the transactions and indicate whether each transaction resulted in a cash fl ow from operating activities, investing activities, fi nancing activities, or noncash investing and fi nancing activities.
E17-2 An analysis of comparative balance sheets, the current year’s income statement, and the general ledger accounts of Wellman Corp. uncovered the following items. Assume all items involve cash unless there is information to the contrary.
(a) Payment of interest on notes payable. (h) Issuance of common stock.(b) Exchange of land for patent. (i) Amortization of patent.(c) Sale of building at book value. (j) Issuance of bonds for land.(d) Payment of dividends. (k) Purchase of land.(e) Depreciation. (l) Conversion of bonds into common stock.(f) Receipt of dividends on investment (m) Sale of land at a loss. in stock. (n) Retirement of bonds.(g) Receipt of interest on notes receivable.
InstructionsIndicate how each item should be classifi ed in the statement of cash fl ows using these four major classifi cations: operating activity (indirect method), investing activity, fi nancing activity, and signifi cant noncash investing and fi nancing activity.
E17-3 Cushenberry Corporation had the following transactions.
1. Sold land (cost $12,000) for $15,000.2. Issued common stock at par for $20,000.3. Recorded depreciation on buildings for $17,000.4. Paid salaries of $9,000.5. Issued 1,000 shares of $1 par value common stock for equipment worth $8,000.6. Sold equipment (cost $10,000, accumulated depreciation $7,000) for $1,200.
InstructionsFor each transaction above, (a) prepare the journal entry, and (b) indicate how it would affect the statement of cash fl ows using the indirect method.
E17-4 Gutierrez Company reported net income of $225,000 for 2017. Gutierrez also reported depreciation expense of $45,000 and a loss of $5,000 on the disposal of equip-ment. The comparative balance sheet shows a decrease in accounts receivable of $15,000 for the year, a $17,000 increase in accounts payable, and a $4,000 decrease in prepaid expenses.
InstructionsPrepare the operating activities section of the statement of cash fl ows for 2017. Use the indirect method.
E17-5 The current sections of Scoggin Inc.’s balance sheets at December 31, 2016 and 2017, are presented here. Scoggin’s net income for 2017 was $153,000. Depreciation expense was $24,000.
Classify transactions by type of activity.
(LO 1)
Classify transactions by type of activity.
(LO 1)
Prepare journal entry and determine effect on cash fl ows.
(LO 1)
Prepare the operating activities section—indirect method.
(LO 2)
Prepare the operating activities section—indirect method.
(LO 2)

770 17 Statement of Cash Flows
InstructionsPrepare the net cash provided by operating activities section of the company’s statement of cash fl ows for the year ended December 31, 2017, using the indirect method.
E17-6 The three accounts shown below appear in the general ledger of Herrick Corp. during 2017.
Prepare partial statement of cash fl ows—indirect method.
(LO 2)
2017 2016
Current assets Cash $105,000 $ 99,000 Accounts receivable 110,000 89,000 Inventory 158,000 172,000 Prepaid expenses 27,000 22,000
Total current assets $400,000 $382,000
Current liabilities Accrued expenses payable $ 15,000 $ 5,000 Accounts payable 85,000 92,000
Total current liabilities $100,000 $ 97,000
Equipment
Date Debit Credit Balance
Jan. 1 Balance 160,000July 31 Purchase of equipment 70,000 230,000Sept. 2 Cost of equipment constructed 53,000 283,000Nov. 10 Cost of equipment sold 49,000 234,000
Accumulated Depreciation—Equipment
Date Debit Credit Balance
Jan. 1 Balance 71,000Nov. 10 Accumulated depreciation on equipment sold 30,000 41,000Dec. 31 Depreciation for year 28,000 69,000
Retained Earnings
Date Debit Credit Balance
Jan. 1 Balance 105,000Aug. 23 Dividends (cash) 14,000 91,000Dec. 31 Net income 77,000 168,000
InstructionsFrom the postings in the accounts, indicate how the information is reported on a state-ment of cash fl ows using the indirect method. The loss on disposal of equipment was $7,000. (Hint: Cost of equipment constructed is reported in the investing activities section as a decrease in cash of $53,000.)
E17-7 Rojas Corporation’s comparative balance sheets are presented below.
ROJAS CORPORATIONComparative Balance Sheets
December 31
2017 2016
Cash $ 14,300 $ 10,700Accounts receivable 21,200 23,400Land 20,000 26,000Buildings 70,000 70,000Accumulated depreciation—buildings (15,000) (10,000)
Total $110,500 $120,100
Prepare statement of cash fl ows and compute free cash fl ow.
(LO 2, 3)

Exercises 771
Accounts payable $ 12,370 $ 31,100Common stock 75,000 69,000Retained earnings 23,130 20,000
Total $110,500 $120,100
Additional information:
1. Net income was $22,630. Dividends declared and paid were $19,500.2. No noncash investing and fi nancing activities occurred during 2017.3. The land was sold for cash of $4,900.
Instructions(a) Prepare a statement of cash fl ows for 2017 using the indirect method.(b) Compute free cash fl ow.
E17-8 Here are comparative balance sheets for Velo Company. Prepare a statement of cash fl ows—indirect method.
(LO 2)
Additional information:
1. Net income for 2017 was $93,000.2. Cash dividends of $35,000 were declared and paid.3. Bonds payable amounting to $50,000 were redeemed for cash $50,000.4. Common stock was issued for $42,000 cash.5. No equipment was sold during 2017, but land was sold at cost.
InstructionsPrepare a statement of cash fl ows for 2017 using the indirect method.
E17-9 Rodriquez Corporation’s comparative balance sheets are presented below. Prepare statement of cash fl ows and compute free cash fl ow.
(LO 2, 3)RODRIQUEZ CORPORATIONComparative Balance Sheets
December 31
2017 2016
Cash $ 15,200 $ 17,700Accounts receivable 25,200 22,300Investments 20,000 16,000Equipment 60,000 70,000Accumulated depreciation—equipment (14,000) (10,000)
Total $106,400 $116,000
VELO COMPANYComparative Balance Sheets
December 31
Assets 2017 2016
Cash $ 63,000 $ 22,000Accounts receivable 85,000 76,000Inventory 170,000 189,000Land 75,000 100,000Equipment 270,000 200,000Accumulated depreciation—equipment (66,000) (32,000)
Total $597,000 $555,000
Liabilities and Stockholders’ Equity
Accounts payable $ 39,000 $ 47,000Bonds payable 150,000 200,000Common stock ($1 par) 216,000 174,000Retained earnings 192,000 134,000
Total $597,000 $555,000

772 17 Statement of Cash Flows
2017 2016
Accounts payable $ 14,600 $ 11,100Bonds payable 10,000 30,000Common stock 50,000 45,000Retained earnings 31,800 29,900
Total $106,400 $116,000
Additional information:
1. Net income was $18,300. Dividends declared and paid were $16,400.2. Equipment which cost $10,000 and had accumulated depreciation of $1,200 was sold
for $3,300.3. No noncash investing and fi nancing activities occurred during 2017.
Instructions(a) Prepare a statement of cash fl ows for 2017 using the indirect method.(b) Compute free cash fl ow.
E17-10 Macgregor Company completed its fi rst year of operations on December 31, 2017. Its initial income statement showed that Macgregor had revenues of $192,000 and operat-ing expenses of $78,000. Accounts receivable and accounts payable at year-end were $60,000 and $23,000, respectively. Assume that accounts payable related to operating expenses. Ignore income taxes.
InstructionsCompute net cash provided by operating activities using the direct method.
E17-11 Suppose a recent income statement for McDonald’s Corporation shows cost of goods sold $4,852.7 million and operating expenses (including depreciation expense of $1,201 million) $10,671.5 million. The comparative balance sheet for the year shows that inventory increased $18.1 million, prepaid expenses increased $56.3 million, accounts payable (merchandise suppliers) increased $136.9 million, and accrued expenses payable increased $160.9 million.
InstructionsUsing the direct method, compute (a) cash payments to suppliers and (b) cash payments for operating expenses.
E17-12 The 2017 accounting records of Blocker Transport reveal these transactions and events.
Payment of interest $ 10,000 Collection of accounts receivable $182,000Cash sales 48,000 Payment of salaries and wages 53,000Receipt of dividend revenue 18,000 Depreciation expense 16,000Payment of income taxes 12,000 Proceeds from sale of vehicles 12,000Net income 38,000 Purchase of equipment for cash 22,000Payment of accounts payable Loss on disposal of vehicles 3,000 for merchandise 115,000 Payment of dividends 14,000Payment for land 74,000 Payment of operating expenses 28,000
InstructionsPrepare the cash fl ows from operating activities section using the direct method. (Not all of the items will be used.)
E17-13 The following information is taken from the 2017 general ledger of Swisher Company.
Rent Rent expense $ 48,000 Prepaid rent, January 1 5,900 Prepaid rent, December 31 9,000 Salaries Salaries and wages expense $ 54,000 Salaries and wages payable, January 1 10,000 Salaries and wages payable, December 31 8,000
*Compute net cash provided by operating activities—direct method.
(LO 4)
*Compute cash payments— direct method.
(LO 4)
*Compute cash fl ow from operating activities—direct method.
(LO 4)
*Calculate cash fl ows—direct method.
(LO 4)

Problems: Set A 773
Sales Sales revenue $175,000 Accounts receivable, January 1 16,000 Accounts receivable, December 31 7,000
InstructionsIn each case, compute the amount that should be reported in the operating activities sec-tion of the statement of cash fl ows under the direct method.
*E17-14 Comparative balance sheets for International Company are presented below. Prepare a worksheet.
(LO 5)
Additional information:
1. Net income for 2017 was $135,000.2. Cash dividends of $70,000 were declared and paid.3. Bonds payable amounting to $50,000 were redeemed for cash $50,000.4. Common stock was issued for $50,000 cash.5. Depreciation expense was $24,000.6. Sales revenue for the year was $978,000.7. Land was sold at cost, and equipment was purchased for cash.
InstructionsPrepare a worksheet for a statement of cash fl ows for 2017 using the indirect method. Enter the reconciling items directly on the worksheet, using letters to cross-reference each entry.
INTERNATIONAL COMPANYComparative Balance Sheets
December 31
Assets 2017 2016
Cash $ 73,000 $ 22,000Accounts receivable 85,000 76,000Inventory 180,000 189,000Land 75,000 100,000Equipment 250,000 200,000Accumulated depreciation—equipment (66,000) (42,000)
Total $597,000 $545,000
Liabilities and Stockholders’ Equity
Accounts payable $ 34,000 $ 47,000Bonds payable 150,000 200,000Common stock ($1 par) 214,000 164,000Retained earnings 199,000 134,000
Total $597,000 $545,000
EXERCISES: SET B AND CHALLENGE EXERCISES
Visit the book’s companion website, at www.wiley.com/college/weygandt, and choose the Student Companion site to access Exercises: Set B and Challenge Exercises.
PROBLEMS: SET A
P17-1A You are provided with the following transactions that took place during a recent fi scal year. Statement of Cash Infl ow,
Cash Flows Outfl ow, or Transaction Activity Affected No Effect?
(a) Recorded depreciation expense on the plant assets.
(b) Recorded and paid interest expense.(c) Recorded cash proceeds from a disposal
of plant assets.(d) Acquired land by issuing common stock.
Distinguish among operating, investing, and fi nancing activities.
(LO 1)

774 17 Statement of Cash Flows
Statement of Cash Infl ow, Cash Flows Outfl ow, or Transaction Activity Affected No Effect?
(e) Paid a cash dividend to preferred stockholders.
(f) Paid a cash dividend to common stockholders.
(g) Recorded cash sales.(h) Recorded sales on account.(i) Purchased inventory for cash.(j) Purchased inventory on account.
InstructionsComplete the table indicating whether each item (1) affects operating (O) activities, invest-ing (I) activities, fi nancing (F) activities, or is a noncash (NC) transaction reported in a separate schedule, and (2) represents a cash infl ow or cash outfl ow or has no cash fl ow effect. Assume use of the indirect approach.
P17-2A The following account balances relate to the stockholders’ equity accounts of Kerbs Corp. at year-end.
2017 2016
Common stock, 10,500 and 10,000 shares, respectively, for 2017 and 2016 $170,000 $140,000Preferred stock, 5,000 shares 125,000 125,000Retained earnings 300,000 250,000
A small stock dividend was declared and issued in 2017. The market value of the shares was $10,500. Cash dividends were $15,000 in both 2017 and 2016. The common stock has no par or stated value.
Instructions(a) What was the amount of net income reported by Kerbs Corp. in 2017?(b) Determine the amounts of any cash infl ows or outfl ows related to the common stock
and dividend accounts in 2017.(c) Indicate where each of the cash infl ows or outfl ows identifi ed in (b) would be classifi ed
on the statement of cash fl ows.
P17-3A The income statement of Whitlock Company is presented here.
Determine cash fl ow effects of changes in equity accounts.
(LO 2)
(a) Net income $75,500
Prepare the operating activities section—indirect method.
(LO 2)WHITLOCK COMPANY
Income StatementFor the Year Ended November 30, 2017
Sales revenue $7,700,000Cost of goods sold Beginning inventory $1,900,000 Purchases 4,400,000
Goods available for sale 6,300,000 Ending inventory 1,400,000
Total cost of goods sold 4,900,000
Gross profi t 2,800,000Operating expenses 1,150,000
Net income $1,650,000
Additional information:
1. Accounts receivable increased $200,000 during the year, and inventory decreased $500,000.2. Prepaid expenses increased $150,000 during the year.3. Accounts payable to suppliers of merchandise decreased $340,000 during the year.4. Accrued expenses payable decreased $100,000 during the year.5. Operating expenses include depreciation expense of $70,000.

Problems: Set A 775
InstructionsPrepare the operating activities section of the statement of cash fl ows for the year ended November 30, 2017, for Whitlock Company, using the indirect method.
P17-4A Data for Whitlock Company are presented in P17-3A.
InstructionsPrepare the operating activities section of the statement of cash fl ows using the direct method.
P17-5A Zumbrunn Company’s income statement contained the condensed information below.
Cash from operations $1,430,000
* Prepare the operating activities section—direct method.
(LO 4)
Cash from operations $1,430,000
Prepare the operating activities section—indirect method.
(LO 2)
Zumbrunn’s balance sheet contained the comparative data at December 31, shown below.
Accounts payable pertain to operating expenses.
InstructionsPrepare the operating activities section of the statement of cash fl ows using the indirect method.
P17-6A Data for Zumbrunn Company are presented in P17-5A.
InstructionsPrepare the operating activities section of the statement of cash fl ows using the direct method.
P17-7A The following are the fi nancial statements of Nosker Company.
Cash from operations $318,000
* Prepare the operating activities section—direct method.
(LO 4)
Prepare a statement of cash fl ows—indirect method, and compute free cash fl ow.
(LO 2, 3)
ZUMBRUNN COMPANYIncome Statement
For the Year Ended December 31, 2017
Service revenue $970,000Operating expenses, excluding depreciation $624,000Depreciation expense 60,000Loss on disposal of equipment 16,000 700,000
Income before income taxes 270,000Income tax expense 40,000
Net income $230,000
2017 2016
Accounts receivable $75,000 $65,000Accounts payable 46,000 28,000Income taxes payable 11,000 7,000
NOSKER COMPANYComparative Balance Sheets
December 31
Assets 2017 2016
Cash $ 38,000 $ 20,000Accounts receivable 30,000 14,000Inventory 27,000 20,000Equipment 60,000 78,000Accumulated depreciation—equipment (29,000) (24,000)
Total $126,000 $108,000
Liabilities and Stockholders’ Equity
Accounts payable $ 24,000 $ 15,000Income taxes payable 7,000 8,000Bonds payable 27,000 33,000Common stock 18,000 14,000Retained earnings 50,000 38,000
Total $126,000 $108,000
Cash from operations $318,000

776 17 Statement of Cash Flows
NOSKER COMPANYIncome Statement
For the Year Ended December 31, 2017
Sales revenue $242,000Cost of goods sold 175,000
Gross profi t 67,000Operating expenses 24,000
Income from operations 43,000Interest expense 3,000
Income before income taxes 40,000Income tax expense 8,000
Net income $ 32,000
Additional data:
1. Dividends declared and paid were $20,000.2. During the year equipment was sold for $8,500 cash. This equipment cost $18,000 originally
and had a book value of $8,500 at the time of sale.3. All depreciation expense, $14,500, is in the operating expenses.4. All sales and purchases are on account.
Instructions(a) Prepare a statement of cash fl ows using the indirect method.(b) Compute free cash fl ow.
P17-8A Data for Nosker Company are presented in P17-7A. Further analysis reveals the following.
1. Accounts payable pertain to merchandise suppliers.2. All operating expenses except for depreciation were paid in cash.
Instructions(a) Prepare a statement of cash fl ows for Nosker Company using the direct method.(b) Compute free cash fl ow.
P17-9A Condensed fi nancial data of Cheng Inc. follow.
(a) Cash from operations $31,500
*Prepare a statement of cash fl ows—direct method, and compute free cash fl ow.
(LO 3, 4)
(a) Cash from operations $31,500
Prepare a statement of cash fl ows—indirect method.
(LO 2)
CHENG INC.Comparative Balance Sheets
December 31
Assets 2017 2016
Cash $ 80,800 $ 48,400Accounts receivable 92,800 33,000Inventory 117,500 102,850Prepaid expenses 28,400 26,000Investments 143,000 114,000Equipment 270,000 242,500Accumulated depreciation—equipment (50,000) (52,000)
Total $682,500 $514,750
Liabilities and Stockholders’ Equity
Accounts payable $112,000 $ 67,300Accrued expenses payable 16,500 17,000Bonds payable 110,000 150,000Common stock 220,000 175,000Retained earnings 224,000 105,450
Total $682,500 $514,750

Problems: Set A 777
Additional information:
1. New equipment costing $85,000 was purchased for cash during the year.2. Old equipment having an original cost of $57,500 was sold for $1,500 cash.3. Bonds matured and were paid off at face value for cash.4. A cash dividend of $40,350 was declared and paid during the year.
InstructionsPrepare a statement of cash fl ows using the indirect method.
P17-10A Data for Cheng Inc. are presented in P17-9A. Further analysis reveals that accounts payable pertain to merchandise creditors.
InstructionsPrepare a statement of cash fl ows for Cheng Inc. using the direct method.
P17-11A The comparative balance sheets for Rothlisberger Company as of December 31 are presented below.
Cash from operations $180,250
* Prepare a statement of cash fl ows—direct method.
(LO 4)
Cash from operations $180,250
Prepare a statement of cash fl ows—indirect method.
(LO 2)
Additional information:
1. Operating expenses include depreciation expense of $42,000 and charges from prepaid expenses of $5,720.
2. Land was sold for cash at book value.3. Cash dividends of $20,000 were paid.4. Net income for 2017 was $42,000.
CHENG INC.Income Statement
For the Year Ended December 31, 2017
Sales revenue $392,780Less: Cost of goods sold $135,460 Operating expenses, excluding depreciation 12,410 Depreciation expense 46,500 Income tax expense 27,280 Interest expense 4,730 Loss on disposal of plant assets 7,500 233,880
Net income $158,900
ROTHLISBERGER COMPANYComparative Balance Sheets
December 31
Assets 2017 2016
Cash $ 81,000 $ 45,000Accounts receivable 41,000 62,000Inventory 151,450 142,000Prepaid expenses 15,280 21,000Land 105,000 130,000Buildings 200,000 200,000Accumulated depreciation—buildings (60,000) (40,000)Equipment 221,000 155,000Accumulated depreciation—equipment (45,000) (35,000)
Total $709,730 $680,000
Liabilities and Stockholders’ Equity
Accounts payable $ 47,730 $ 40,000Bonds payable 260,000 300,000Common stock, $1 par 200,000 160,000Retained earnings 202,000 180,000
Total $709,730 $680,000

778 17 Statement of Cash Flows
5. Equipment was purchased for $88,000 cash. In addition, equipment costing $22,000 with a book value of $10,000 was sold for $6,000 cash.
6. Bonds were converted at face value by issuing 40,000 shares of $1 par value common stock.
InstructionsPrepare a statement of cash fl ows for the year ended December 31, 2017, using the indirect method.
*P17-12A Condensed fi nancial data of Oakley Company appear below.
Cash from operations $113,000
Prepare a worksheet—indirect method.
(LO 5) OAKLEY COMPANYComparative Balance Sheets
December 31
Assets 2017 2016
Cash $ 82,700 $ 47,250Accounts receivable 90,800 57,000Inventory 126,900 102,650Investments 84,500 87,000Equipment 255,000 205,000Accumulated depreciation—equipment (49,500) (40,000)
$590,400 $458,900
Liabilities and Stockholders’ Equity
Accounts payable $ 57,700 $ 48,280Accrued expenses payable 12,100 18,830Bonds payable 100,000 70,000Common stock 250,000 200,000Retained earnings 170,600 121,790
$590,400 $458,900
OAKLEY COMPANYIncome Statement
For the Year Ended December 31, 2017
Sales revenue $297,500Gain on disposal of equipment 8,750
306,250
Less: Cost of goods sold $99,460 Operating expenses (excluding depreciation expense) 14,670 Depreciation expense 49,700 Income tax expense 7,270 Interest expense 2,940 174,040
Net income $132,210
Additional information:
1. Equipment costing $97,000 was purchased for cash during the year.2. Investments were sold at cost.3. Equipment costing $47,000 was sold for $15,550, resulting in gain of $8,750.4. A cash dividend of $83,400 was declared and paid during the year.
InstructionsPrepare a worksheet for the statement of cash fl ows using the indirect method. Enter the reconciling items directly in the worksheet columns, using letters to cross-reference each entry.
Reconciling items total $610,210
PROBLEMS: SET B AND SET C
Visit the book’s companion website, at www.wiley.com/college/weygandt, and choose the Student Companion site to access Problems: Set B and Set C.

Broadening Your Perspective 779
CONTINUING PROBLEM
COOKIE CREATIONS: AN ENTREPRENEURIAL JOURNEY(Note: This is a continuation of the Cookie Creations problem from Chapters 1 through 16.)
CC17 Natalie has prepared the balance sheet and income statement of Cookie & Coffee Creations Inc. and would like you to prepare the statement of cash fl ows.
Go to the book’s companion website, www.wiley.com/college/weygandt, to see the completion of this problem.
© leungchopan/Shutterstock
PERSPECTIVEFINANCIAL REPORTING AND ANALYSIS
Financial Reporting Problem: Apple Inc.BYP17-1 The fi nancial statements of Apple Inc. are presented in Appendix A. Instructions for accessing and using the company’s complete annual report, including the notes to the fi nancial state-ments, are also provided in Appendix A.
Instructions
(a) What was the amount of net cash provided by operating activities for the year ended September 28, 2013? For the year ended September 29, 2012?
(b) What was the amount of increase or decrease in cash and cash equivalents for the year ended September 28, 2013? For the year ended September 29, 2012?
(c) Which method of computing net cash provided by operating activities does Apple use?(d) From your analysis of the 2013 statement of cash fl ows, did the change in accounts and notes
receivable require or provide cash? Did the change in inventories require or provide cash? Did the change in accounts payable and other current liabilities require or provide cash?
(e) What was the net outfl ow or infl ow of cash from investing activities for the year ended September 28, 2013?
(f) What was the amount of income taxes paid in the year ended September 28, 2013?
Comparative Analysis Problem: PepsiCo, Inc. vs. The Coca-Cola CompanyBYP17-2 PepsiCo’s fi nancial statements are presented in Appendix B. Financial statements of The Coca-Cola Company are presented in Appendix C. Instructions for accessing and using the complete annual reports of PepsiCo and Coca-Cola, including the notes to the fi nancial statements, are also provided in Appendices B and C, respectively.
Instructions(a) Based on the information contained in these fi nancial statements, compute free cash fl ow for each
company.(b) What conclusions concerning the management of cash can be drawn from these data?
Comparative Analysis Problem: Amazon.com, Inc. vs. Wal-Mart Stores, Inc.BYP17-3 Amazon.com, Inc.’s fi nancial statements are presented in Appendix D. Financial statements of Wal-Mart Stores, Inc. are presented in Appendix E. Instructions for accessing and using the com-plete annual reports for Amazon and Wal-Mart, including the notes to the fi nancial statements, are also provided in Appendices D and E, respectively.
Instructions(a) Based on the information contained in these fi nancial statements, compute free cash fl ow for each
company.(b) What conclusions concerning the management of cash can be drawn from these data?
BROADENING YOUR

780 17 Statement of Cash Flows
Decision-Making Across the OrganizationBYP17-4 Tom Epps and Mary Jones are examining the following statement of cash fl ows for Guthrie Company for the year ended January 31, 2017.
Tom claims that Guthrie’s statement of cash fl ows is an excellent portrayal of a superb fi rst year with cash increasing $105,000. Mary replies that it was not a superb fi rst year. Rather, she says, the year was an operating failure, that the statement is presented incorrectly, and that $105,000 is not the actual increase in cash. The cash balance at the beginning of the year was $140,000.
InstructionsWith the class divided into groups, answer the following.
(a) Using the data provided, prepare a statement of cash fl ows in proper form using the indirect method. The only noncash items in the income statement are depreciation and the gain from the sale of the investment.
(b) With whom do you agree, Tom or Mary? Explain your position.
Real-World FocusBYP17-5 Purpose: Learn about the SEC.
Address: www.sec.gov/index.htm, or go to www.wiley.com/college/weygandt
From the SEC homepage, choose About the SEC.
InstructionsAnswer the following questions.
(a) How many enforcement actions does the SEC take each year against securities law violators? What are typical infractions?
(b) After the Depression, Congress passed the Securities Acts of 1933 and 1934 to improve investor confi dence in the markets. What two “common sense” notions are these laws based on?
(c) Who was the President of the United States at the time of the creation of the SEC? Who was the fi rst SEC Chairperson?
BYP17-6 Purpose: Use the Internet to view SEC fi lings.
Address: biz.yahoo.com/i, or go to www.wiley.com/college/weygandt
Steps:1. Type in a company name.2. Choose Profi le.3. Choose SEC Filings. (This will take you to Yahoo-Edgar Online.)
InstructionsAnswer the following questions.
GUTHRIE COMPANYStatement of Cash Flows
For the Year Ended January 31, 2017
Sources of cash From sales of merchandise $380,000 From sale of capital stock 420,000 From sale of investment (purchased below) 80,000 From depreciation 55,000 From issuance of note for truck 20,000 From interest on investments 6,000
Total sources of cash 961,000
Uses of cash For purchase of fi xtures and equipment 330,000 For merchandise purchased for resale 258,000 For operating expenses (including depreciation) 160,000 For purchase of investment 75,000 For purchase of truck by issuance of note 20,000 For purchase of treasury stock 10,000 For interest on note payable 3,000
Total uses of cash 856,000
Net increase in cash $105,000

Broadening Your Perspective 781
(a) What company did you select?(b) Which fi ling is the most recent? What is the date?(c) What other recent SEC fi lings are available for your viewing?
CRITICAL THINKING
Communication ActivityBYP17-7 Will Hardin, the owner-president of Computer Services Company, is unfamiliar with the statement of cash fl ows that you, as his accountant, prepared. He asks for further explanation.
InstructionsWrite him a brief memo explaining the form and content of the statement of cash fl ows as shown in Illustration 17-13 (page 739).
Ethics CaseBYP17-8 Wesley Corp. is a medium-sized wholesaler of automotive parts. It has 10 stockholders who have been paid a total of $1 million in cash dividends for 8 consecutive years. The board’s policy requires that, for this dividend to be declared, net cash provided by operating activities as reported in Wesley’s current year’s statement of cash fl ows must exceed $1 million. President and CEO Samuel Gunkle’s job is secure so long as he produces annual operating cash fl ows to support the usual dividend. At the end of the current year, controller Gerald Rondelli presents president Samuel Gunkle with some disappointing news: The net cash provided by operating activities is calculated by the indirect method to be only $970,000. The president says to Gerald, “We must get that amount above $1 million. Isn’t there some way to increase operating cash fl ow by another $30,000?” Gerald answers, “These fi gures were prepared by my assistant. I’ll go back to my offi ce and see what I can do.” The president replies, “I know you won’t let me down, Gerald.” Upon close scrutiny of the statement of cash fl ows, Gerald concludes that he can get the operating cash fl ows above $1 million by reclassifying a $60,000, 2-year note payable listed in the fi nancing activ-ities section as “Proceeds from bank loan—$60,000.” He will report the note instead as “Increase in pay-ables—$60,000” and treat it as an adjustment of net income in the operating activities section. He returns to the president, saying, “You can tell the board to declare their usual dividend. Our net cash fl ow provided by operating activities is $1,030,000.” “Good man, Gerald! I knew I could count on you,” exults the president.
Instructions(a) Who are the stakeholders in this situation?(b) Was there anything unethical about the president’s actions? Was there anything unethical about
the controller’s actions?(c) Are the board members or anyone else likely to discover the misclassifi cation?
All About YouBYP17-9 In this chapter, you learned that companies prepare a statement of cash fl ows in order to keep track of their sources and uses of cash and to help them plan for their future cash needs. Plan-ning for your own short- and long-term cash needs is every bit as important as it is for a company.
InstructionsRead the article (“Financial Uh-Oh? No Problem”) provided at www.fool.com/personal-fi nance/saving/index.aspx, and answer the following questions. To access this article, it may be necessary to register at no cost.
(a) Describe the three factors that determine how much money you should set aside for short-term needs.(b) How many months of living expenses does the article suggest to set aside?(c) Estimate how much you should set aside based upon your current situation. Are you closer to
Cliff’s scenario or to Prudence’s?
FASB Codifi cation ActivityBYP17-10 If your school has a subscription to the FASB Codifi cation, go to http://aaahq.org/ascLogin.cfm to log in and prepare responses to the following. Use the Master Glossary to determine the proper defi nitions.
(a) What are cash equivalents?(b) What are fi nancing activities?(c) What are investing activities?(d) What are operating activities?
AP

(e) What is the primary objective for the statement of cash fl ow? Is working capital the basis for meeting this objective?
(f) Do companies need to disclose information about investing and fi nancing activities that do not affect cash receipts or cash payments? If so, how should such information be disclosed?
782 17 Statement of Cash Flows
A Look at IFRS
7 Compare the procedures for the statement of cash fl ows under GAAP and IFRS.
LEARNING OBJECTIVE
As in GAAP, the statement of cash fl ows is a required statement for IFRS. In addition, the content and presentation of an IFRS statement of cash fl ows is similar to the one used for GAAP. However, the disclosure requirements related to the statement of cash fl ows are more extensive under GAAP. IAS 7 (“Cash Flow Statements”) provides the overall IFRS requirements for cash fl ow information.
Relevant FactsFollowing are the key similarities and differences between GAAP and IFRS as related to the statement of cash fl ows.
Similarities• Companies preparing fi nancial statements under IFRS must also prepare a statement of cash fl ows
as an integral part of the fi nancial statements.
• Both IFRS and GAAP require that the statement of cash fl ows should have three major sections—operating, investing, and fi nancing activities—along with changes in cash and cash equivalents.
• Similar to GAAP, the statement of cash fl ows can be prepared using either the indirect or direct method under IFRS. In both U.S. and international settings, companies choose for the most part to use the indirect method for reporting net cash fl ows from operating activities.
• The defi nition of cash equivalents used in IFRS is similar to that used in GAAP. A major difference is that in certain situations, bank overdrafts are considered part of cash and cash equivalents under IFRS (which is not the case in GAAP). Under GAAP, bank overdrafts are classifi ed as fi nancing activi-ties in the statement of cash fl ows and are reported as liabilities on the balance sheet.
Differences• IFRS requires that noncash investing and fi nancing activities be excluded from the statement of
cash fl ows. Instead, these noncash activities should be reported elsewhere. This requirement is interpreted to mean that noncash investing and fi nancing activities should be disclosed in the notes to the fi nancial statements instead of in the fi nancial statements. Under GAAP, companies may pres-ent this information on the face of the statement of cash fl ows.
• One area where there can be substantial differences between IFRS and GAAP relates to the classifi cation of interest, dividends, and taxes. The following table indicates the differences between the two approaches.
Item IFRS GAAP
Interest paid Operating or fi nancing OperatingInterest received Operating or investing OperatingDividends paid Operating or fi nancing FinancingDividends received Operating or investing OperatingTaxes paid Operating—unless specifi c Operating identifi cation with fi nancing or investing activity
• Under IFRS, some companies present the operating section in a single line item, with a full recon-ciliation provided in the notes to the fi nancial statements. This presentation is not seen under GAAP.
Looking to the FuturePresently, the FASB and the IASB are involved in a joint project on the presentation and organization of information in the fi nancial statements. One interesting approach, revealed in a published proposal
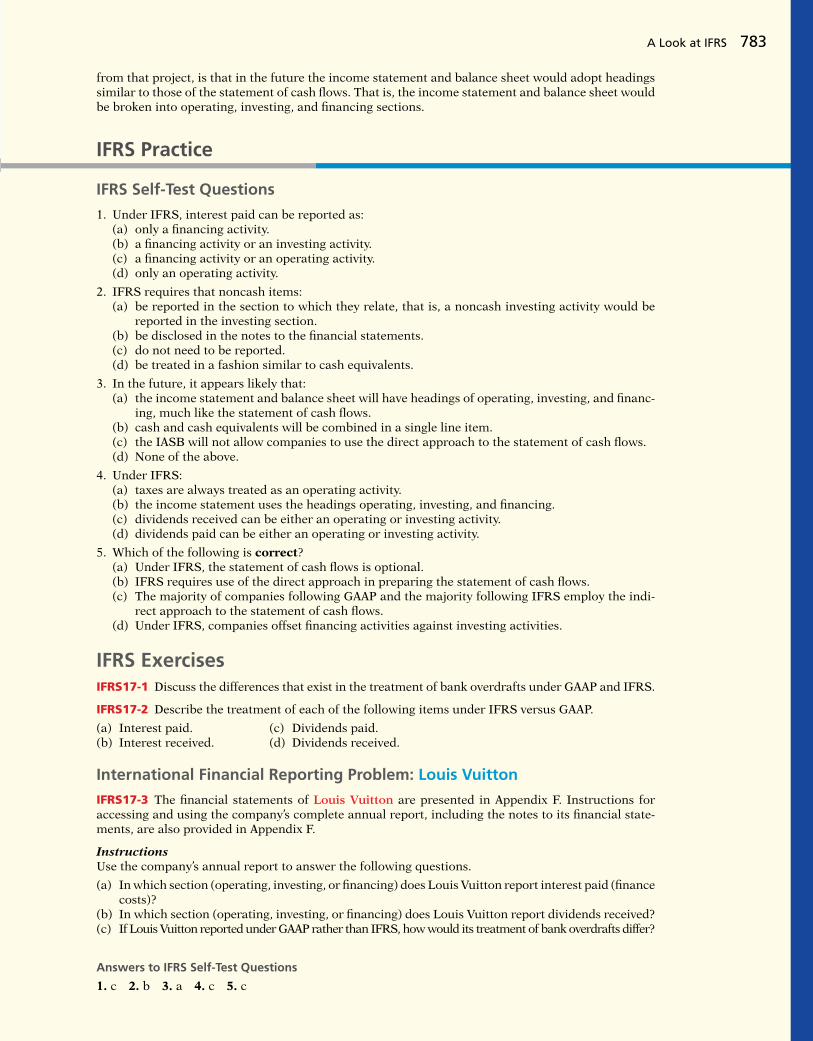
A Look at IFRS 783
from that project, is that in the future the income statement and balance sheet would adopt headings similar to those of the statement of cash fl ows. That is, the income statement and balance sheet would be broken into operating, investing, and fi nancing sections.
IFRS Practice
IFRS Self-Test Questions
1. Under IFRS, interest paid can be reported as:(a) only a fi nancing activity.(b) a fi nancing activity or an investing activity.(c) a fi nancing activity or an operating activity.(d) only an operating activity.
2. IFRS requires that noncash items:(a) be reported in the section to which they relate, that is, a noncash investing activity would be
reported in the investing section.(b) be disclosed in the notes to the fi nancial statements.(c) do not need to be reported.(d) be treated in a fashion similar to cash equivalents.
3. In the future, it appears likely that:(a) the income statement and balance sheet will have headings of operating, investing, and fi nanc-
ing, much like the statement of cash fl ows.(b) cash and cash equivalents will be combined in a single line item.(c) the IASB will not allow companies to use the direct approach to the statement of cash fl ows.(d) None of the above.
4. Under IFRS:(a) taxes are always treated as an operating activity.(b) the income statement uses the headings operating, investing, and fi nancing.(c) dividends received can be either an operating or investing activity.(d) dividends paid can be either an operating or investing activity.
5. Which of the following is correct?(a) Under IFRS, the statement of cash fl ows is optional.(b) IFRS requires use of the direct approach in preparing the statement of cash fl ows.(c) The majority of companies following GAAP and the majority following IFRS employ the indi-
rect approach to the statement of cash fl ows.(d) Under IFRS, companies offset fi nancing activities against investing activities.
IFRS ExercisesIFRS17-1 Discuss the differences that exist in the treatment of bank overdrafts under GAAP and IFRS.
IFRS17-2 Describe the treatment of each of the following items under IFRS versus GAAP.
(a) Interest paid. (c) Dividends paid.(b) Interest received. (d) Dividends received.
International Financial Reporting Problem: Louis Vuitton
IFRS17-3 The fi nancial statements of Louis Vuitton are presented in Appendix F. Instructions for accessing and using the company’s complete annual report, including the notes to its fi nancial state-ments, are also provided in Appendix F.
InstructionsUse the company’s annual report to answer the following questions.
(a) In which section (operating, investing, or fi nancing) does Louis Vuitton report interest paid (fi nance costs)?
(b) In which section (operating, investing, or fi nancing) does Louis Vuitton report dividends received?(c) If Louis Vuitton reported under GAAP rather than IFRS, how would its treatment of bank overdrafts differ?
Answers to IFRS Self-Test Questions
1. c 2. b 3. a 4. c 5. c

A recent issue of Forbes magazine listed Warren Buffett as
the richest person in the world. His estimated wealth was
$62 billion, give or take a few million. How much is $62 billion?
If you invested $62 billion in an investment earning just 4%,
you could spend $6.8 million per day—every day—forever.
So, how does Buffett spend his money? Basically, he doesn’t!
He still lives in the same house that he purchased in Omaha,
Nebraska, in 1958 for $31,500. He still drives his own car (a
Cadillac DTS). And, in case you believe that his kids are riding
the road to Easy Street, think again. Buffett has committed to
donate virtually all of his money to charity before he dies.
How did Buffett amass this wealth? Through careful investing.
He applies the basic techniques he learned in the 1950s from
the great value investor Benjamin Graham. Buffett looks for
companies that have good long-term potential but are
currently underpriced. He invests in companies that have low
exposure to debt and that reinvest their earnings for future
growth. He does not get caught up in fads or the latest trends.
For example, Buffett sat out on the dot-com mania in the
1990s. When other investors put lots of money into fl edgling
high-tech fi rms, Buffett didn’t bite because the dot-com
companies failed to meet his criteria. He didn’t get to enjoy
the stock price boom on the way up, but on the other hand,
he didn’t have to suffer the plummet back down to Earth.
When the dot-com bubble burst, everyone else suffered from
investment shock. Buffett swooped in and scooped up deals
on companies that he had been following for years.
In 2012, when the stock market reached near record highs,
Buffett’s returns signifi cantly lagged behind the market. Only
26% of his investments at that time were in stock, and he
was sitting on $38 billion in cash. One commentator noted
that “if the past is any guide, just when Buffett seems to look
most like a loser, the party is about to end.”
If you think you want to follow Buffett’s example and
transform your humble nest egg into a mountain of cash, be
warned. His techniques have been widely circulated and
emulated, but never practiced with the same degree of
success. You should probably start by honing your fi nancial
analysis skills. A good way for you to begin your career as a
successful investor is to master the fundamentals of fi nancial
analysis discussed in this chapter.
Source: Jason Zweig, “Buffett Is Out of Step,” Wall Street Journal (May 7, 2012).
It Pays to Be Patient
As the Feature Story below highlights, we can all learn an important lesson from Warren Buffett. Study companies carefully if you wish to invest. Do not get caught up in fads but instead fi nd companies that are fi nancially healthy. Using some of the decision tools presented in this textbook, you can perform a rudimentary analysis on any U.S. company and draw basic conclusions about its fi nancial health. Although it would not be wise for you to bet your life savings on a company’s stock relying solely on your current level of knowledge, we strongly encourage you to practice your new skills wherever possible. Only with practice will you improve your ability to interpret fi nancial numbers.
Before unleashing you on the world of high fi nance, we present a few more important concepts and techniques, as well as provide you with one more comprehensive review of corporate fi nancial statements. We use all of the decision tools presented in this textbook to analyze a single company—Macy’s, Inc.—one of the country’s oldest and largest retail store chains.
CHAPTER PREVIEW
18
FEATURE STORY
Financial Statement Analysis
784

Analyze a company’s performance using ratio analysis.
Apply the concept of sustainable income.
2
3
Apply horizontal and vertical analysis to fi nancial statements.1 Horizontal AnalysisDO IT! 1
• Need for comparative analysis• Tools of analysis• Horizontal analysis• Vertical analysis
• Liquidity ratios• Profi tability ratios• Solvency ratios• Summary of ratios
Learning Objectives
Unusual ItemsDO IT! 3• Discontinued operations• Other comprehensive income
Go to the REVIEW AND PRACTICE section at the end of the chapter for a review of key concepts and practice applications with solutions.
Visit WileyPLUS with ORION for additional tutorials and practice opportunities.
CHAPTER OUTLINE
Ratio Analysis 2DO IT!
Daniel Acker/Bloomberg/Getty Images, Inc.

786 18 Financial Statement Analysis
1 Apply horizontal and vertical analysis to fi nancial statements.LEARNING OBJECTIVE
Analyzing fi nancial statements involves evaluating three characteristics: a com-pany’s liquidity, profi tability, and solvency. A short-term creditor, such as a bank, is primarily interested in liquidity—the ability of the borrower to pay obli-gations when they come due. The liquidity of the borrower is extremely import-ant in evaluating the safety of a loan. A long-term creditor, such as a bondholder, looks to profi tability and solvency measures that indicate the company’s ability to survive over a long period of time. Long-term creditors consider such measures as the amount of debt in the company’s capital structure and its ability to meet interest payments. Similarly, stockholders look at the profi tability and solvency of the company. They want to assess the likelihood of dividends and the growth potential of the stock.
Need for Comparative Analysis
Every item reported in a fi nancial statement has signifi cance. When Macy’s, Inc. reports cash and cash equivalents of $2.3 billion on its balance sheet, we know the company had that amount of cash on the balance sheet date. But, we do not know whether the amount represents an increase over prior years, or whether it is adequate in relation to the company’s need for cash. To obtain such informa-tion, we need to compare the amount of cash with other fi nancial statement data. Comparisons can be made on a number of different bases. Three are illus-trated in this chapter.
1. Intracompany basis. Comparisons within a company are often useful to detect changes in fi nancial relationships and signifi cant trends. For example, a comparison of Macy’s current year’s cash amount with the prior year’s cash amount shows either an increase or a decrease. Likewise, a comparison of Macy’s year-end cash amount with the amount of its total assets at year-end shows the proportion of total assets in the form of cash.
2. Industry averages. Comparisons with industry averages provide information about a company’s relative position within the industry. For example, fi nancial statement readers can compare Macy’s fi nancial data with the averages for its industry compiled by fi nancial rating organizations such as Dun & Bradstreet, Moody’s, and Standard & Poor’s, or with information provided on the Internet by organizations such as Yahoo! on its fi nancial site.
3. Intercompany basis. Comparisons with other companies provide insight into a company’s competitive position. For example, investors can compare Macy’s total sales for the year with the total sales of its competitors in retail, such as J.C. Penney.
Tools of Analysis
We use various tools to evaluate the signifi cance of fi nancial statement data. Three commonly used tools are as follows.
• Horizontal analysis evaluates a series of fi nancial statement data over a period of time.
• Vertical analysis evaluates fi nancial statement data by expressing each item in a fi nancial statement as a percentage of a base amount.
• Ratio analysis expresses the relationship among selected items of fi nancial statement data.
Horizontal analysis is used primarily in intracompany comparisons. Two features in published fi nancial statements and annual report information facilitate this
XYZCo.
2016 ↔ 2017
Intracompany
⎫⎪⎪⎪⎪⎪⎪⎬⎪⎪⎪⎪⎪⎪⎭
XYZCo.
ACo.
BCo.
CCo.
Industry averages
A + B + C3
XYZCo.
ACo.
Intercompany

Horizontal and Vertical Analysis 787
type of comparison. First, each of the basic fi nancial statements presents com-parative fi nancial data for a minimum of two years. Second, a summary of selected fi nancial data is presented for a series of fi ve to 10 years or more. Vertical analysis is used in both intra- and intercompany comparisons. Ratio analysis is used in all three types of comparisons. In the following sections, we explain and illustrate each of the three types of analysis.
Horizontal Analysis
Horizontal analysis, also called trend analysis, is a technique for evaluating a series of fi nancial statement data over a period of time. Its purpose is to determine the increase or decrease that has taken place. This change may be expressed as either an amount or a percentage. For example, Illustration 18-1 shows recent net sales fi gures of Macy’s, Inc.
If we assume that 2011 is the base year, we can measure all percentage increases or decreases from this base period amount as follows.
MACY’S, INC.Net Sales (in millions)
2013 2012 2011
$27,931 $27,686 $26,405
Real World
Illustration 18-1Macy’s, Inc.’s net sales
For example, we can determine that net sales for Macy’s increased from 2011 to 2012 approximately 4.9% [($27,686 2 $26,405) 4 $26,405]. Similarly, we can determine that net sales increased from 2011 to 2013 approximately 5.8% [($27,931 2 $26,405) 4 $26,405]. Alternatively, we can express current year sales as a percentage of the base period. We do this by dividing the current year amount by the base year amount, as shown below.
Change Since Current Year Amount 2 Base Year Amount Base Period
5 Base Year Amount
Illustration 18-2Formula for horizontal analysis of changes since base period
Illustration 18-4 presents this analysis for Macy’s for a three-year period using 2011 as the base period.
Current Results in Current Year Amount
Relation to Base Period 5
Base Year Amount
Illustration 18-3Formula for horizontal analysis of current year in relation to base year
Illustration 18-4Horizontal analysis of Macy’s, Inc.’s net sales in relation to base period
MACY’S, INC.Net Sales (in millions)
in relation to base period 2011
2013 2012 2011
$27,931 $27,686 $26,405 105.8% 104.9% 100%
Real World

788 18 Financial Statement Analysis
BALANCE SHEET
To further illustrate horizontal analysis, we will use the fi nancial statements of Quality Department Store Inc., a fi ctional retailer. Illustration 18-5 presents a horizontal analysis of its two-year condensed balance sheets, showing dollar and percentage changes.
The comparative balance sheets in Illustration 18-5 show that a number of signifi cant changes have occurred in Quality Department Store’s fi nancial struc-ture from 2012 to 2013:
• In the assets section, plant assets (net) increased $167,500, or 26.5%.
• In the liabilities section, current liabilities increased $41,500, or 13.7%.
• In the stockholders’ equity section, retained earnings increased $202,600, or 38.6%.
These changes suggest that the company expanded its asset base during 2013 and fi nanced this expansion primarily by retaining income rather than assuming additional long-term debt.
INCOME STATEMENT
Illustration 18-6 presents a horizontal analysis of the two-year condensed income statements of Quality Department Store Inc. for the years 2013 and 2012. Hori-zontal analysis of the income statements shows the following changes:
• Net sales increased $260,000, or 14.2% ($260,000 4 $1,837,000).
• Cost of goods sold increased $141,000, or 12.4% ($141,000 4 $1,140,000).
• Total operating expenses increased $37,000, or 11.6% ($37,000 4 $320,000).
QUALITY DEPARTMENT STORE INC.Condensed Balance Sheets
December 31
Increase or (Decrease) during 2013
2013 2012 Amount PercentAssets
Current assets $1,020,000 $ 945,000 $ 75,000 7.9%Plant assets (net) 800,000 632,500 167,500 26.5%Intangible assets 15,000 17,500 (2,500) (14.3%)
Total assets $1,835,000 $1,595,000 $240,000 15.0%
Liabilities
Current liabilities $ 344,500 $ 303,000 $ 41,500 13.7%Long-term liabilities 487,500 497,000 (9,500) (1.9%)
Total liabilities 832,000 800,000 32,000 4.0%
Stockholders’ Equity
Common stock, $1 par 275,400 270,000 5,400 2.0%Retained earnings 727,600 525,000 202,600 38.6%
Total stockholders’ equity 1,003,000 795,000 208,000 26.2%
Total liabilities and stockholders’ equity $1,835,000 $1,595,000 $240,000 15.0%
Illustration 18-5Horizontal analysis of balance sheets

Horizontal and Vertical Analysis 789
Overall, gross profi t and net income were up substantially. Gross profi t increased 17.1%, and net income, 26.5%. Quality’s profi t trend appears favorable.
RETAINED EARNINGS STATEMENT
Illustration 18-7 presents a horizontal analysis of Quality Department Store’s comparative retained earnings statements. Analyzed horizontally, net income increased $55,300, or 26.5%, whereas dividends on the common stock increased only $1,200, or 2%. We saw in the horizontal analysis of the balance sheet that ending retained earnings increased 38.6%. As indicated earlier, the company retained a signifi cant portion of net income to fi nance additional plant facilities.
Illustration 18-6Horizontal analysis of income statements
QUALITY DEPARTMENT STORE INC.Condensed Income Statements
For the Years Ended December 31
Increase or (Decrease) during 2013
2013 2012 Amount Percent
Sales revenue $2,195,000 $1,960,000 $235,000 12.0%Sales returns and allowances 98,000 123,000 (25,000) (20.3%)
Net sales 2,097,000 1,837,000 260,000 14.2%Cost of goods sold 1,281,000 1,140,000 141,000 12.4%
Gross profi t 816,000 697,000 119,000 17.1%
Selling expenses 253,000 211,500 41,500 19.6%Administrative expenses 104,000 108,500 (4,500) (4.1%)
Total operating expenses 357,000 320,000 37,000 11.6%
Income from operations 459,000 377,000 82,000 21.8%Other revenues and gains Interest and dividends 9,000 11,000 (2,000) (18.2%)Other expenses and losses Interest expense 36,000 40,500 (4,500) (11.1%)
Income before income taxes 432,000 347,500 84,500 24.3%Income tax expense 168,200 139,000 29,200 21.0%
Net income $ 263,800 $ 208,500 $ 55,300 26.5%
Helpful HintNote that though the amount column is additive (the total is $55,300), the percentage column is not additive (26.5% is not the column total). A separate percentage has been calculated for each item.
QUALITY DEPARTMENT STORE INC.Retained Earnings Statements
For the Years Ended December 31
Increase or (Decrease) during 2013
2013 2012 Amount Percent
Retained earnings, Jan. 1 $525,000 $376,500 $148,500 39.4%Add: Net income 263,800 208,500 55,300 26.5%
788,800 585,000 203,800Deduct: Dividends 61,200 60,000 1,200 2.0%
Retained earnings, Dec. 31 $727,600 $525,000 $202,600 38.6%
Illustration 18-7Horizontal analysis of retained earnings statements
Horizontal analysis of changes from period to period is relatively straightfor-ward and is quite useful. But, complications can occur in making the computations. If an item has no value in a base year or preceding year but does have a value in

790 18 Financial Statement Analysis
the next year, we cannot compute a percentage change. Similarly, if a negative amount appears in the base or preceding period and a positive amount exists the following year (or vice versa), no percentage change can be computed.
Vertical Analysis
Vertical analysis, also called common-size analysis, is a technique that expresses each fi nancial statement item as a percentage of a base amount. On a balance sheet, we might say that current assets are 22% of total assets—total assets being the base amount. Or on an income statement, we might say that selling expenses are 16% of net sales—net sales being the base amount.
BALANCE SHEET
Illustration 18-8 presents the vertical analysis of Quality Department Store Inc.’s comparative balance sheets. The base for the asset items is total assets. The base for the liability and stockholders’ equity items is total liabilities and stockholders’ equity.
Vertical analysis shows the relative size of each category in the balance sheet. It also can show the percentage change in the individual asset, liability, and stockholders’ equity items. For example, we can see that current assets decreased from 59.2% of total assets in 2012 to 55.6% in 2013 (even though the absolute dollar amount increased $75,000 in that time). Plant assets (net) have increased from 39.7% to 43.6% of total assets. Retained earnings have increased from 32.9% to 39.7% of total liabilities and stockholders’ equity. These results reinforce the earlier observations that Quality Department Store is choosing to fi nance its growth through retention of earnings rather than through issuing addi-tional debt.
INCOME STATEMENT
Illustration 18-9 shows vertical analysis of Quality Department Store’s income statements. Cost of goods sold as a percentage of net sales declined 1% (62.1% vs. 61.1%), and total operating expenses declined 0.4% (17.4% vs. 17.0%). As a result,
QUALITY DEPARTMENT STORE INC.Condensed Balance Sheets
December 31
2013 2012
Amount Percent Amount Percent
Assets
Current assets $1,020,000 55.6% $ 945,000 59.2%Plant assets (net) 800,000 43.6% 632,500 39.7%Intangible assets 15,000 0.8% 17,500 1.1%
Total assets $1,835,000 100.0% $1,595,000 100.0%
Liabilities
Current liabilities $ 344,500 18.8% $ 303,000 19.0%Long-term liabilities 487,500 26.5% 497,000 31.2%
Total liabilities 832,000 45.3% 800,000 50.2%
Stockholders’ Equity
Common stock, $1 par 275,400 15.0% 270,000 16.9%Retained earnings 727,600 39.7% 525,000 32.9%
Total stockholders’ equity 1,003,000 54.7% 795,000 49.8%
Total liabilities and stockholders’ equity $1,835,000 100.0% $1,595,000 100.0%
Illustration 18-8Vertical analysis of balance sheets
Helpful HintThe formula for calculating these balance sheet percentages is:
Each item on B/S 5 %
Total assets

Horizontal and Vertical Analysis 791
it is not surprising to see net income as a percentage of net sales increase from 11.4% to 12.6%. Quality Department Store appears to be a profi table business that is becoming even more successful. An associated benefi t of vertical analysis is that it enables you to compare companies of different sizes. For example, suppose Quality Department Store’s main competitor is a Macy’s store in a nearby town. Using vertical analysis, we can compare the condensed income statements of Quality Department Store Inc. (a small retail company) with Macy’s, Inc.1 (a giant international retailer), as shown in Illustration 18-10.
QUALITY DEPARTMENT STORE INC.Condensed Income Statements
For the Years Ended December 31
2013 2012
Amount Percent Amount Percent
Sales revenue $2,195,000 104.7% $1,960,000 106.7%Sales returns and allowances 98,000 4.7% 123,000 6.7%
Net sales 2,097,000 100.0% 1,837,000 100.0%Cost of goods sold 1,281,000 61.1% 1,140,000 62.1%
Gross profi t 816,000 38.9% 697,000 37.9%
Selling expenses 253,000 12.0% 211,500 11.5%Administrative expenses 104,000 5.0% 108,500 5.9%
Total operating expenses 357,000 17.0% 320,000 17.4%
Income from operations 459,000 21.9% 377,000 20.5%Other revenues and gains Interest and dividends 9,000 0.4% 11,000 0.6%
Other expenses and losses Interest expense 36,000 1.7% 40,500 2.2%
Income before income taxes 432,000 20.6% 347,500 18.9%Income tax expense 168,200 8.0% 139,000 7.5%
Net income $ 263,800 12.6% $ 208,500 11.4%
Illustration 18-9Vertical analysis of income statements
Helpful HintThe formula for calculating these income statement percentages is: Each item on I/S
5 % Net sales
Condensed Income StatementsFor the Year Ended December 31, 2013
(in thousands)
Quality Department Store Inc. Macy’s, Inc.
Dollars Percent Dollars Percent
Net sales $2,097 100.0% $27,931,000 100.0%Cost of goods sold 1,281 61.1% 16,725,000 59.9%
Gross profi t 816 38.9% 11,206,000 40.1%Selling and administrative expenses 357 17.0% 8,440,000 30.2%
Income from operations 459 21.9% 2,766,000 9.9%Other expenses and revenues (including income taxes) 195 9.3% 1,280,000 4.6%
Net income $ 264 12.6% $ 1,486,000 5.3%
Illustration 18-10Intercompany income statement comparison
12013 Annual Report, Macy’s, Inc. (Cincinnati, Ohio).

792 18 Financial Statement Analysis
Macy’s net sales are 13,320 times greater than the net sales of relatively tiny Quality Department Store. But vertical analysis eliminates this difference in size. The percentages show that Quality’s and Macy’s gross profi t rates were comparable at 38.9% and 40.1%, respectively. However, the percentages related to income from operations were signifi cantly different at 21.9% and 9.9%, respectively. This disparity can be attributed to Quality’s selling and administra-tive expense percentage (17%) which is much lower than Macy’s (30.2%). Although Macy’s earned net income more than 5,629 times larger than Quality’s, Macy’s net income as a percentage of each sales dollar (5.3%) is only 42% of Quality’s (12.6%).
Summary fi nancial information for Rosepatch Company is as follows.
December 31, 2017 December 31, 2016
Current assets $234,000 $180,000Plant assets (net) 756,000 420,000
Total assets $990,000 $600,000
Compute the amount and percentage changes in 2017 using horizontal analysis, assum-ing 2016 is the base year.
Solution
DO IT! 1 Horizontal Analysis
Increase in 2017
Amount Percent
Current assets $ 54,000 30% [($234,000 2 $180,000) 4 $180,000]Plant assets (net) 336,000 80% [($756,000 2 $420,000) 4 $420,000]
Total assets $390,000 65% [($990,000 2 $600,000) 4 $600,000]
Related exercise material: BE18-2, BE18-3, BE18-5, BE18-6, BE18-7, E18-1, E18-3, E18-4, and DO IT! 18-1.
Action Plan✔ Find the percentage
change by dividing the amount of the increase by the 2016 amount (base year).
2 Analyze a company’s performance using ratio analysis.LEARNING OBJECTIVE
Ratio analysis expresses the relationship among selected items of fi nancial statement data. A ratio expresses the mathematical relationship between one quantity and another. The relationship is expressed in terms of either a percentage, a rate, or a simple proportion. To illustrate, in 2013 Nike, Inc. had current assets of $13,626 million and current liabilities of $3,926 million. We can fi nd the relationship between these two measures by dividing current assets by cur-rent liabilities. The alternative means of expression are as follows.
Percentage: Current assets are 347% of current liabilities. Rate: Current assets are 3.47 times current liabilities. Proportion: The relationship of current assets to liabilities is 3.47:1.
To analyze the primary financial statements, we can use ratios to evalu-ate liquidity, profitability, and solvency. Illustration 18-11 describes these classifications.

Ratio Analysis 793
Ratios can provide clues to underlying conditions that may not be apparent from individual fi nancial statement components. However, a single ratio by itself is not very meaningful. Thus, in the discussion of ratios we will use the following types of comparisons.
1. Intracompany comparisons for two years for Quality Department Store.
2. Industry average comparisons based on median ratios for department stores.
3. Intercompany comparisons based on Macy’s, Inc. as Quality Department Store’s principal competitor.
Liquidity Ratios
Liquidity ratios measure the short-term ability of the company to pay its maturing obligations and to meet unexpected needs for cash. Short-term creditors such as bankers and suppliers are particularly interested in assessing liquidity. The ratios we can use to determine the company’s short-term debt-paying ability are the current ratio, the acid-test ratio, accounts receivable turnover, and inventory turnover.
1. CURRENT RATIO
The current ratio is a widely used measure for evaluating a company’s liquidity and short-term debt-paying ability. The ratio is computed by dividing current assets by current liabilities. Illustration 18-12 shows the 2013 and 2012 current ratios for Quality Department Store and 2013 comparative data.
Solvency Ratios
Measure the ability ofthe company to surviveover a long period of time
Liquidity Ratios
Measure short-term abilityof the company to pay itsmaturing obligations and tomeet unexpected needs for cash
Founded in 1892
Profitability Ratios
Measure the income oroperating success of a companyfor a given period of time
Netincome
– =Revenues Expenses
TRUE GRIT Co.
Illustration 18-11Financial ratio classifi cations
Illustration 18-12Current ratio
Current Ratio
5 Current Assets
Current Liabilities
Quality Department Store
2013 2012
$1,020,000 5 2.96:1
$945,000 5 3.12:1
$344,500 $303,000
Industry average Macy’s, Inc.
1.70:1 1.52:1
As more countries adopt international accounting standards, the ability of analysts to compare companies from different countries should improve. However, international standards are open to widelyvarying interpretations. In addition, some countries adopt international standards “with modifi cations.” As a conse-quence, most cross-country comparisons are still not as transparent as within-country comparisons.
International Note
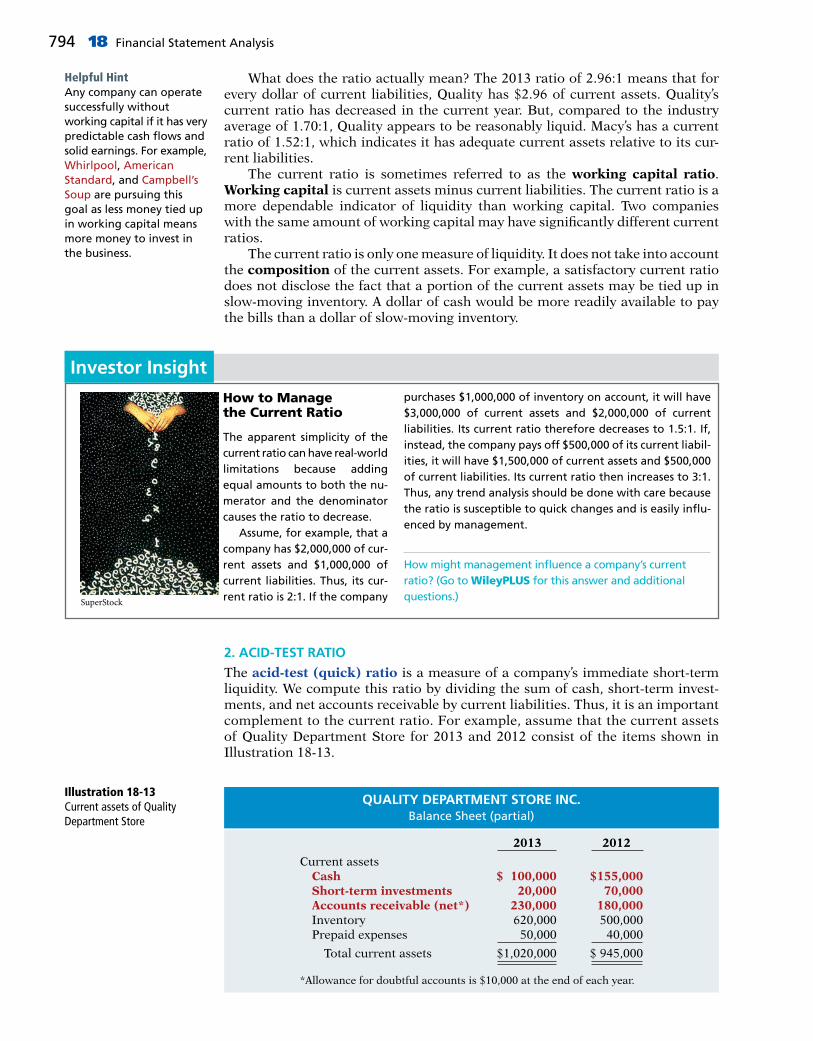
794 18 Financial Statement Analysis
How to Manage the Current Ratio
The apparent simplicity of the current ratio can have real-world limitations because adding equal amounts to both the nu-merator and the denominator causes the ratio to decrease.
Assume, for example, that a company has $2,000,000 of cur-rent assets and $1,000,000 of current liabilities. Thus, its cur-rent ratio is 2:1. If the company
purchases $1,000,000 of inventory on account, it will have $3,000,000 of current assets and $2,000,000 of current liabilities. Its current ratio therefore decreases to 1.5:1. If, instead, the company pays off $500,000 of its current liabil-ities, it will have $1,500,000 of current assets and $500,000 of current liabilities. Its current ratio then increases to 3:1. Thus, any trend analysis should be done with care because the ratio is susceptible to quick changes and is easily infl u-enced by management.
How might management infl uence a company’s current ratio? (Go to WileyPLUS for this answer and additional questions.)SuperStock
What does the ratio actually mean? The 2013 ratio of 2.96:1 means that for every dollar of current liabilities, Quality has $2.96 of current assets. Quality’s current ratio has decreased in the current year. But, compared to the industry average of 1.70:1, Quality appears to be reasonably liquid. Macy’s has a current ratio of 1.52:1, which indicates it has adequate current assets relative to its cur-rent liabilities. The current ratio is sometimes referred to as the working capital ratio. Working capital is current assets minus current liabilities. The current ratio is a more dependable indicator of liquidity than working capital. Two companies with the same amount of working capital may have signifi cantly different current ratios. The current ratio is only one measure of liquidity. It does not take into account the composition of the current assets. For example, a satisfactory current ratio does not disclose the fact that a portion of the current assets may be tied up in slow-moving inventory. A dollar of cash would be more readily available to pay the bills than a dollar of slow-moving inventory.
Helpful HintAny company can operate successfully without working capital if it has very predictable cash fl ows and solid earnings. For example, Whirlpool, American Standard, and Campbell’s Soup are pursuing this goal as less money tied up in working capital means more money to invest in the business.
2. ACID-TEST RATIO
The acid-test (quick) ratio is a measure of a company’s immediate short-term liquidity. We compute this ratio by dividing the sum of cash, short-term invest-ments, and net accounts receivable by current liabilities. Thus, it is an important complement to the current ratio. For example, assume that the current assets of Quality Department Store for 2013 and 2012 consist of the items shown in Illustration 18-13.
QUALITY DEPARTMENT STORE INC.Balance Sheet (partial)
2013 2012
Current assetsCash $ 100,000 $155,000Short-term investments 20,000 70,000Accounts receivable (net*) 230,000 180,000Inventory 620,000 500,000Prepaid expenses 50,000 40,000
Total current assets $1,020,000 $ 945,000
*Allowance for doubtful accounts is $10,000 at the end of each year.
Illustration 18-13Current assets of Quality Department Store
Investor Insight
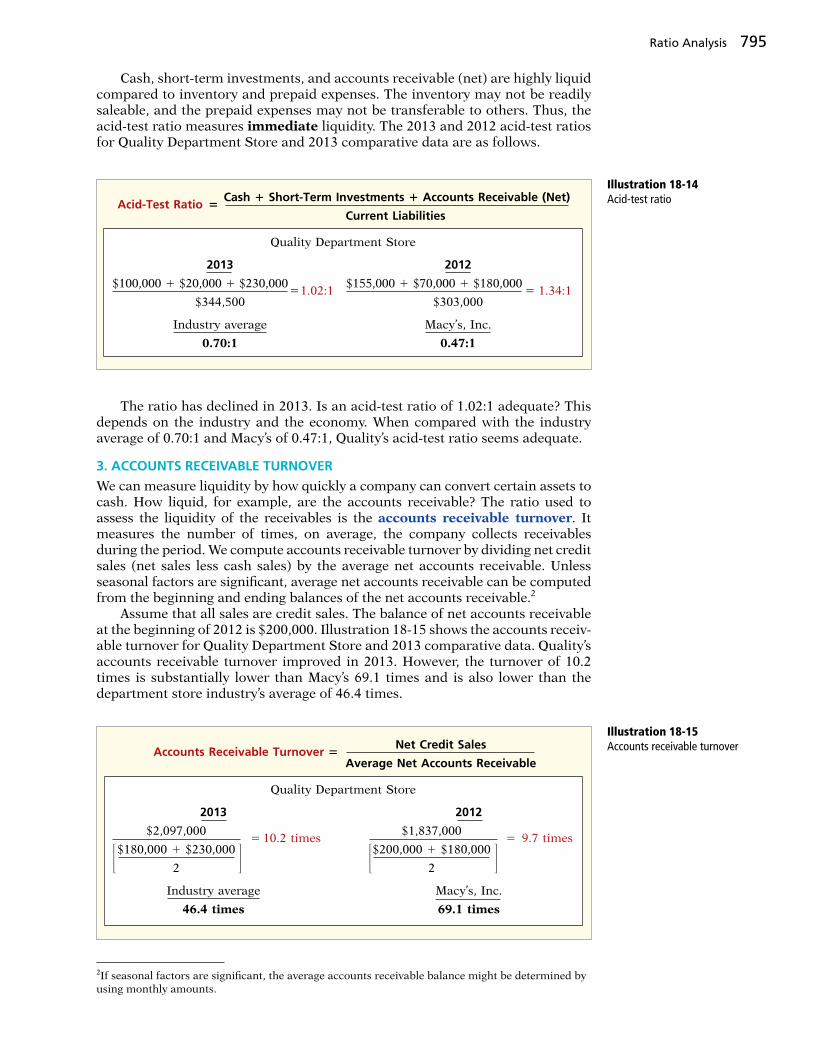
Ratio Analysis 795
Cash, short-term investments, and accounts receivable (net) are highly liquid compared to inventory and prepaid expenses. The inventory may not be readily saleable, and the prepaid expenses may not be transferable to others. Thus, the acid-test ratio measures immediate liquidity. The 2013 and 2012 acid-test ratios for Quality Department Store and 2013 comparative data are as follows.
Illustration 18-14Acid-test ratio
Acid-Test Ratio 5 Cash 1 Short-Term Investments 1 Accounts Receivable (Net)
Current Liabilities
Quality Department Store
2013 2012
$100,000 1 $20,000 1 $230,000 5 1.02:1
$155,000 1 $70,000 1 $180,000 5 1.34:1
$344,500 $303,000
Industry average Macy’s, Inc.
0.70:1 0.47:1
The ratio has declined in 2013. Is an acid-test ratio of 1.02:1 adequate? This depends on the industry and the economy. When compared with the industry average of 0.70:1 and Macy’s of 0.47:1, Quality’s acid-test ratio seems adequate.
3. ACCOUNTS RECEIVABLE TURNOVER
We can measure liquidity by how quickly a company can convert certain assets to cash. How liquid, for example, are the accounts receivable? The ratio used to assess the liquidity of the receivables is the accounts receivable turnover. It measures the number of times, on average, the company collects receivables during the period. We compute accounts receivable turnover by dividing net credit sales (net sales less cash sales) by the average net accounts receivable. Unless seasonal factors are signifi cant, average net accounts receivable can be computed from the beginning and ending balances of the net accounts receivable.2
Assume that all sales are credit sales. The balance of net accounts receivable at the beginning of 2012 is $200,000. Illustration 18-15 shows the accounts receiv-able turnover for Quality Department Store and 2013 comparative data. Quality’s accounts receivable turnover improved in 2013. However, the turnover of 10.2 times is substantially lower than Macy’s 69.1 times and is also lower than the department store industry’s average of 46.4 times.
2If seasonal factors are signifi cant, the average accounts receivable balance might be determined by using monthly amounts.
Accounts Receivable Turnover 5
Net Credit Sales
Average Net Accounts Receivable
Quality Department Store
2013 2012
$2,097,000 5 10.2 times
$1,837,000 5 9.7 times
$180,000 1 $230,000 $200,000 1 $180,000
2 2
Industry average Macy’s, Inc.
46.4 times 69.1 times
Illustration 18-15Accounts receivable turnover
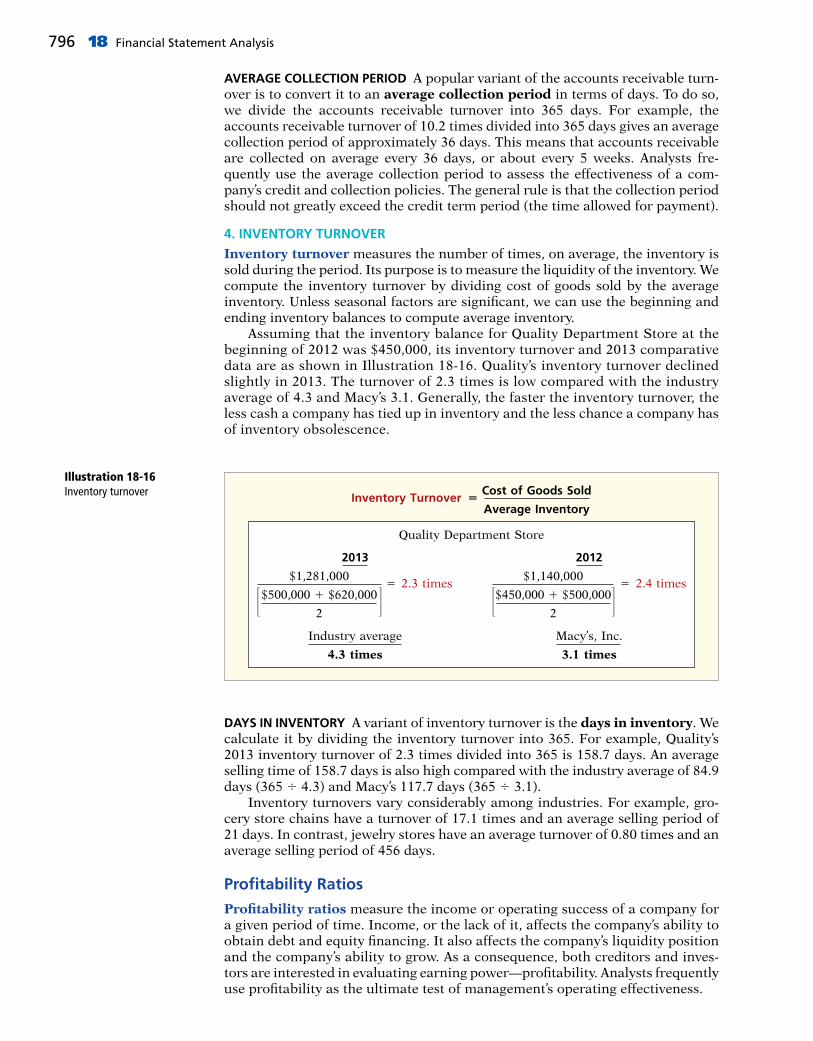
796 18 Financial Statement Analysis
AVERAGE COLLECTION PERIOD A popular variant of the accounts receivable turn-over is to convert it to an average collection period in terms of days. To do so, we divide the accounts receivable turnover into 365 days. For example, the accounts receivable turnover of 10.2 times divided into 365 days gives an average collection period of approximately 36 days. This means that accounts receivable are collected on average every 36 days, or about every 5 weeks. Analysts fre-quently use the average collection period to assess the effectiveness of a com-pany’s credit and collection policies. The general rule is that the collection period should not greatly exceed the credit term period (the time allowed for payment).
4. INVENTORY TURNOVER
Inventory turnover measures the number of times, on average, the inventory is sold during the period. Its purpose is to measure the liquidity of the inventory. We compute the inventory turnover by dividing cost of goods sold by the average inventory. Unless seasonal factors are signifi cant, we can use the beginning and ending inventory balances to compute average inventory. Assuming that the inventory balance for Quality Department Store at the beginning of 2012 was $450,000, its inventory turnover and 2013 comparative data are as shown in Illustration 18-16. Quality’s inventory turnover declined slightly in 2013. The turnover of 2.3 times is low compared with the industry average of 4.3 and Macy’s 3.1. Generally, the faster the inventory turnover, the less cash a company has tied up in inventory and the less chance a company has of inventory obsolescence.
DAYS IN INVENTORY A variant of inventory turnover is the days in inventory. We calculate it by dividing the inventory turnover into 365. For example, Quality’s 2013 inventory turnover of 2.3 times divided into 365 is 158.7 days. An average selling time of 158.7 days is also high compared with the industry average of 84.9 days (365 4 4.3) and Macy’s 117.7 days (365 4 3.1). Inventory turnovers vary considerably among industries. For example, gro-cery store chains have a turnover of 17.1 times and an average selling period of 21 days. In contrast, jewelry stores have an average turnover of 0.80 times and an average selling period of 456 days.
Profi tability Ratios
Profi tability ratios measure the income or operating success of a company for a given period of time. Income, or the lack of it, affects the company’s ability to obtain debt and equity fi nancing. It also affects the company’s liquidity position and the company’s ability to grow. As a consequence, both creditors and inves-tors are interested in evaluating earning power—profi tability. Analysts frequently use profi tability as the ultimate test of management’s operating effectiveness.
Inventory Turnover
5
Cost of Goods Sold
Average Inventory
Quality Department Store
2013 2012
$1,281,000 5 2.3 times
$1,140,000 5 2.4 times
$500,000 1 $620,000 $450,000 1 $500,000
2 2
Industry average Macy’s, Inc.
4.3 times 3.1 times
Illustration 18-16Inventory turnover

Ratio Analysis 797
5. PROFIT MARGIN
Profi t margin is a measure of the percentage of each dollar of sales that results in net income. We can compute it by dividing net income by net sales. Illustration 18-17 shows Quality Department Store’s profi t margin and 2013 comparative data.
Alternative TerminologyProfi t margin is also called the rate of return on sales.
Quality experienced an increase in its profi t margin from 2012 to 2013. Its profi t margin is unusually high in comparison with the industry average of 8% and Macy’s 5.3%. High-volume (high inventory turnover) businesses, such as grocery stores (Safeway or Kroger) and discount stores (Kmart or Wal-Mart), generally experi-ence low profi t margins. In contrast, low-volume businesses, such as jewelry stores (Tiffany & Co.) or airplane manufacturers (Boeing Co.), have high profi t margins.
6. ASSET TURNOVER
Asset turnover measures how effi ciently a company uses its assets to generate sales. It is determined by dividing net sales by average total assets. The resulting number shows the dollars of sales produced by each dollar invested in assets. Unless seasonal factors are signifi cant, we can use the beginning and ending bal-ance of total assets to determine average total assets. Assuming that total assets at the beginning of 2012 were $1,446,000, the 2013 and 2012 asset turnover for Quality Department Store and 2013 comparative data are shown in Illustration 18-18.
Asset turnover shows that in 2013 Quality generated sales of $1.20 for each dollar it had invested in assets. The ratio changed very little from 2012 to 2013. Quality’s asset turnover is below the industry average of 1.4 times and Macy’s ratio of 1.3 times. Asset turnovers vary considerably among industries. For example, a large utility company like Consolidated Edison (New York) has a ratio of 0.4 times, and the large grocery chain Kroger Stores has a ratio of 3.4 times.
Illustration 18-18Asset turnover
Profit Margin 5
Net Income
Net Sales
Quality Department Store
2013 2012
$263,800 5 12.6%
$208,500 5 11.4%
$2,097,000 $1,837,000
Industry average Macy’s, Inc.
8.0% 5.3%
Illustration 18-17Profi t margin
Asset Turnover 5
Net Sales
Average Total Assets
Quality Department Store
2013 2012
$2,097,000 5 1.2 times
$1,837,000 5 1.2 times
$1,595,000 1 $1,835,000 $1,446,000 1 $1,595,000
2 2
Industry average Macy’s, Inc.
1.4 times 1.3 times

798 18 Financial Statement Analysis
7. RETURN ON ASSETS
An overall measure of profi tability is return on assets. We compute this ratio by dividing net income by average total assets. The 2013 and 2012 return on assets for Quality Department Store and 2013 comparative data are shown below.
Return on Assets 5
Net Income
Average Total Assets
Quality Department Store
2013 2012
$263,800 5 15.4%
$208,500 5 13.7%
$1,595,000 1 $1,835,000 $1,446,000 1 $1,595,000
2 2
Industry average Macy’s, Inc.
8.9% 7.0%
Illustration 18-19Return on assets
Quality’s return on assets improved from 2012 to 2013. Its return of 15.4% is very high compared with the department store industry average of 8.9% and Macy’s 7.0%.
8. RETURN ON COMMON STOCKHOLDERS’ EQUITY
Another widely used profi tability ratio is return on common stockholders’ equity. It measures profi tability from the common stockholders’ viewpoint. This ratio shows how many dollars of net income the company earned for each dollar invested by the owners. We compute it by dividing net income by average common stockholders’ equity. Assuming that common stockholders’ equity at the begin-ning of 2012 was $667,000, Illustration 18-20 shows the 2013 and 2012 ratios for Quality Department Store and 2013 comparative data.
Quality’s rate of return on common stockholders’ equity is high at 29.3%, considering an industry average of 18.3% and a rate of 24.2% for Macy’s.
WITH PREFERRED STOCK When a company has preferred stock, we must deduct preferred dividend requirements from net income to compute income available to common stockholders. Similarly, we deduct the par value of preferred stock (or call price, if applicable) from total stockholders’ equity to determine the amount of common stockholders’ equity used in this ratio. The ratio then appears as follows.
Return on Common 5
Net Income
Stockholders’ Equity Average Common Stockholders’ Equity
Quality Department Store
2013 2012
$263,800 5 29.3%
$208,500 5 28.5%
$795,000 1 $1,003,000 $667,000 1 $795,000
2 2
Industry average Macy’s, Inc.
18.3% 24.2%
Illustration 18-20Return on common stockholders’ equity
Return on Common 5
Net Income 2 Preferred Dividends
Stockholders’ Equity Average Common Stockholders’ Equity
Illustration 18-21Return on common stockholders’ equity with preferred stock

Ratio Analysis 799
Note that Quality’s rate of return on stockholders’ equity (29.3%) is substan-tially higher than its rate of return on assets (15.4%). The reason is that Quality has made effective use of leverage. Leveraging or trading on the equity at a gain means that the company has borrowed money at a lower rate of interest than it is able to earn by using the borrowed money. Leverage enables Quality to use money supplied by nonowners to increase the return to the owners. A com-parison of the rate of return on total assets with the rate of interest paid for bor-rowed money indicates the profi tability of trading on the equity. Quality earns more on its borrowed funds than it has to pay in the form of interest. Thus, the return to stockholders exceeds the return on the assets, due to benefi ts from the positive leveraging.
9. EARNINGS PER SHARE (EPS)
Earnings per share (EPS) is a measure of the net income earned on each share of common stock. It is computed by dividing net income less preferred dividends by the number of weighted-average common shares outstanding during the year. A measure of net income earned on a per share basis provides a useful perspec-tive for determining profi tability. Assuming that there is no change in the number of outstanding shares during 2012 and that the 2013 increase occurred midyear, Illustration 18-22 shows the net income per share for Quality Department Store for 2013 and 2012, assuming no preferred dividends.
Note that no industry or specifi c competitive data are presented. Such com-parisons are not meaningful because of the wide variations in the number of shares of outstanding stock among companies. The only meaningful EPS com-parison is an intracompany trend comparison. Here, Quality’s earnings per share increased 20 cents per share in 2013. This represents a 26% increase over the 2012 earnings per share of 77 cents. The terms “earnings per share” and “net income per share” refer to the amount of net income applicable to each share of common stock. Therefore, in computing EPS, if there are preferred dividends declared for the period, we must deduct them from net income to determine income available to the common stockholders.
10. PRICE-EARNINGS RATIO
The price-earnings (P-E) ratio is a widely used measure of the ratio of the market price of each share of common stock to the earnings per share. The price-earnings (P-E) ratio refl ects investors’ assessments of a company’s future earnings. We compute it by dividing the market price per share of the stock by earnings per share. Assuming that the market price of Quality Department Store stock is $8 in 2012 and $12 in 2013, the price-earnings ratio computation is computed as shown in Illustration 18-23 (page 800).
Illustration 18-22Earnings per share Earnings 5
Net Income 2 Preferred Dividends
per Share Weighted-Average Common Shares Outstanding
Quality Department Store
2013 2012
$263,800 5 $0.97
$208,500 5 $0.77
270,000 1 275,400 270,000
2

800 18 Financial Statement Analysis
Price-Earnings Ratio 5
Market Price per Share
Earnings per Share
Quality Department Store
2013 2012
$12.00 5 12.4 times
$8.00 5 10.4 times
$0.97 $0.77
Industry average Macy’s, Inc.
21.3 times 13.5 times
Illustration 18-23Price-earnings ratio
Payout Ratio 5
Cash Dividends Declared on Common Stock
Net Income
Quality Department Store
2013 2012
$61,200 5 23.2%
$60,000 5 28.8%
$263,800 $208,500
Industry average Macy’s, Inc.
16.1% 24.2%
Illustration 18-24Payout ratio
In 2013, each share of Quality’s stock sold for 12.4 times the amount that the company earned on each share. Quality’s price-earnings ratio is lower than the industry average of 21.3 times but much closer to the ratio of 13.5 times for Macy’s. For overall comparison to the market, the average price-earnings ratio for the stocks that constitute the Standard and Poor’s 500 Index (500 largest U.S. fi rms) in mid-2014 was approximately 19.6 times.
11. PAYOUT RATIO
The payout ratio measures the percentage of earnings distributed in the form of cash dividends. We compute it by dividing cash dividends declared on common stock by net income. Companies that have high growth rates generally have low payout ratios because they reinvest most of their net income into the business. The 2013 and 2012 payout ratios for Quality Department Store are computed as shown in Illustration 18-24.
Quality’s payout ratio is higher than the industry average payout ratio of 16.1%.
Solvency Ratios
Solvency ratios measure the ability of a company to survive over a long period of time. Long-term creditors and stockholders are particularly interested in a company’s ability to pay interest as it comes due and to repay the face value of debt at maturity. Debt to assets and times interest earned are two ratios that pro-vide information about debt-paying ability.
12. DEBT TO ASSETS RATIO
The debt to assets ratio measures the percentage of the total assets that credi-tors provide. We compute it by dividing total liabilities (both current and long-term liabilities) by total assets. This ratio indicates the company’s degree of leverage. It also provides some indication of the company’s ability to withstand
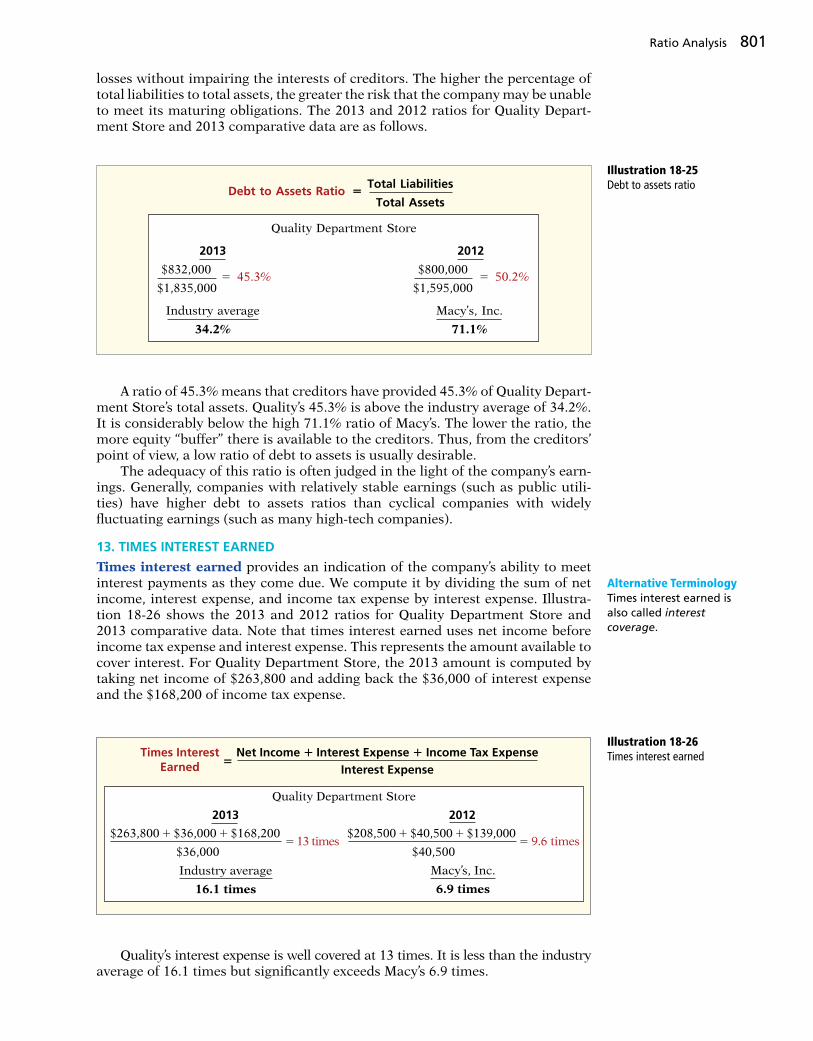
Ratio Analysis 801
losses without impairing the interests of creditors. The higher the percentage of total liabilities to total assets, the greater the risk that the company may be unable to meet its maturing obligations. The 2013 and 2012 ratios for Quality Depart-ment Store and 2013 comparative data are as follows.
A ratio of 45.3% means that creditors have provided 45.3% of Quality Depart-ment Store’s total assets. Quality’s 45.3% is above the industry average of 34.2%. It is considerably below the high 71.1% ratio of Macy’s. The lower the ratio, the more equity “buffer” there is available to the creditors. Thus, from the creditors’ point of view, a low ratio of debt to assets is usually desirable. The adequacy of this ratio is often judged in the light of the company’s earn-ings. Generally, companies with relatively stable earnings (such as public utili-ties) have higher debt to assets ratios than cyclical companies with widely fl uctuating earnings (such as many high-tech companies).
13. TIMES INTEREST EARNED
Times interest earned provides an indication of the company’s ability to meet interest payments as they come due. We compute it by dividing the sum of net income, interest expense, and income tax expense by interest expense. Illustra-tion 18-26 shows the 2013 and 2012 ratios for Quality Department Store and 2013 comparative data. Note that times interest earned uses net income before income tax expense and interest expense. This represents the amount available to cover interest. For Quality Department Store, the 2013 amount is computed by taking net income of $263,800 and adding back the $36,000 of interest expense and the $168,200 of income tax expense.
Alternative TerminologyTimes interest earned is also called interest coverage.
Times Interest Net Income 1 Interest Expense 1 Income Tax Expense Earned
5
Interest Expense
Quality Department Store
2013 2012
$263,800 1 $36,000 1 $168,200 5 13 times
$36,000
$208,500 1 $40,500 1 $139,000 5
9.6 times
$40,500
Industry average
16.1 times
Macy’s, Inc.
6.9 times
Illustration 18-26Times interest earned
Quality’s interest expense is well covered at 13 times. It is less than the industry average of 16.1 times but signifi cantly exceeds Macy’s 6.9 times.
Illustration 18-25Debt to assets ratio
Debt to Assets Ratio 5 Total Liabilities
Total Assets
Quality Department Store
2013 2012
$832,000 5 45.3%
$800,000 5 50.2%
$1,835,000 $1,595,000
Industry average Macy’s, Inc.
34.2% 71.1%
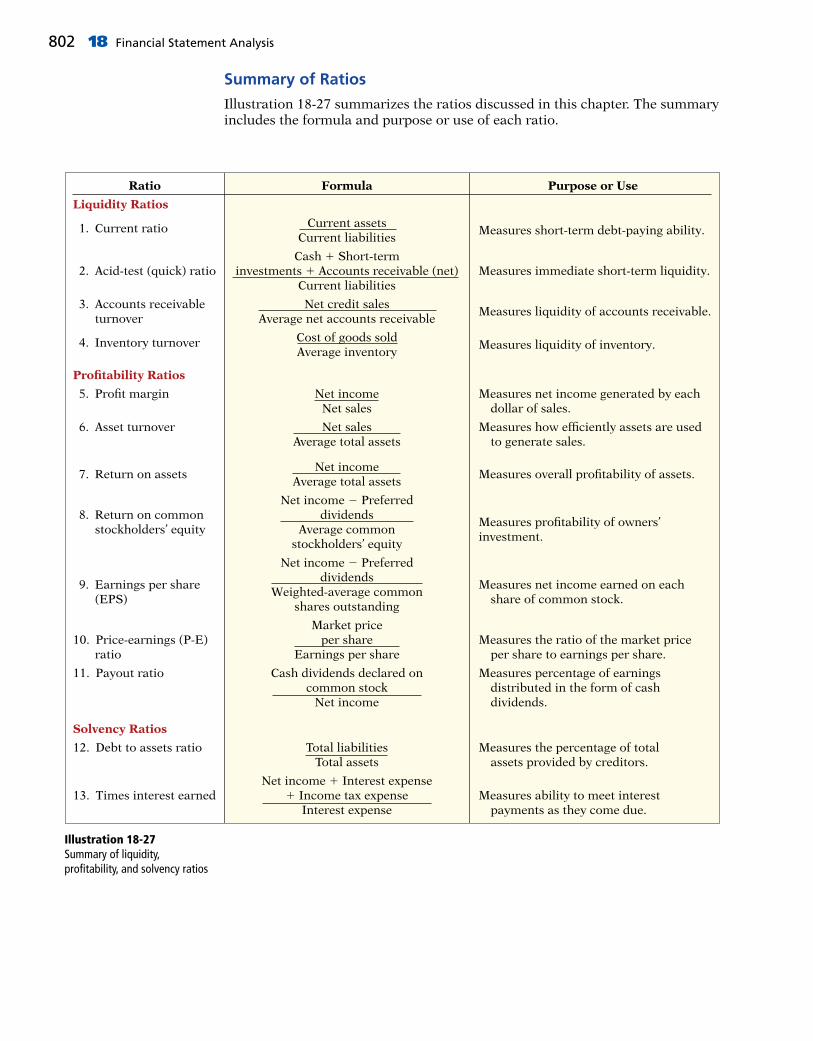
802 18 Financial Statement Analysis
Illustration 18-27Summary of liquidity, profi tability, and solvency ratios
Ratio Formula Purpose or Use
Liquidity Ratios
1. Current ratio Current assets Current liabilities
Measures short-term debt-paying ability.
Cash 1 Short-term 2. Acid-test (quick) ratio investments 1 Accounts receivable (net) Measures immediate short-term liquidity. Current liabilities
3. Accounts receivable Net credit sales turnover Average net accounts receivable
Measures liquidity of accounts receivable.
4. Inventory turnover Cost of goods sold Average inventory
Measures liquidity of inventory.
Profi tability Ratios
5. Profi t margin Net income Measures net income generated by each Net sales dollar of sales.
6. Asset turnover Net sales Measures how effi ciently assets are used Average total assets to generate sales.
7. Return on assets Net income
Average total assets Measures overall profi tability of assets.
Net income 2 Preferred 8. Return on common dividends
Measures profi tability of owners’ stockholders’ equity Average common
investment. stockholders’ equity
Net income 2 Preferred
9. Earnings per share dividends
Measures net income earned on each (EPS)
Weighted-average common share of common stock.
shares outstanding
Market price10. Price-earnings (P-E) per share Measures the ratio of the market price ratio Earnings per share per share to earnings per share.
11. Payout ratio Cash dividends declared on Measures percentage of earnings common stock distributed in the form of cash Net income dividends.
Solvency Ratios
12. Debt to assets ratio Total liabilities Measures the percentage of total Total assets assets provided by creditors.
Net income 1 Interest expense13. Times interest earned 1 Income tax expense Measures ability to meet interest Interest expense payments as they come due.
Summary of Ratios
Illustration 18-27 summarizes the ratios discussed in this chapter. The summary includes the formula and purpose or use of each ratio.

Ratio Analysis 803
The condensed fi nancial statements of John Cully Company, for the years ended June 30, 2017 and 2016, are presented below.
Compute the following ratios for 2017 and 2016.
(a) Current ratio.
(b) Inventory turnover. (Inventory on 6/30/15 was $599.0.)
(c) Profi t margin.
(d) Return on assets. (Assets on 6/30/15 were $3,349.9.)
(e) Return on common stockholders’ equity. (Stockholders’ equity on 6/30/15 was $1,795.9.)
(f) Debt to assets ratio.
(g) Times interest earned.
DO IT! 2 Ratio Analysis
(in thousands)
Assets 2017 2016
Current assets Cash and cash equivalents $ 553.3 $ 611.6 Accounts receivable (net) 776.6 664.9 Inventory 768.3 653.5 Prepaid expenses and other current assets 204.4 269.2
Total current assets 2,302.6 2,199.2Investments 12.3 12.6Property, plant, and equipment (net) 694.2 647.0Intangibles and other assets 876.7 849.3
Total assets $3,885.8 $3,708.1
Liabilities and Stockholders’ Equity
Current liabilities $1,497.7 $1,322.0Long-term liabilities 679.5 637.1Stockholders’ equity—common 1,708.6 1,749.0
Total liabilities and stockholders’ equity $3,885.8 $3,708.1
JOHN CULLY COMPANYBalance Sheets
June 30
(in thousands)
2017 2016
Sales revenue $6,336.3 $5,790.4Costs and expenses Cost of goods sold 1,617.4 1,476.3 Selling and administrative expenses 4,007.6 3,679.0 Interest expense 13.9 27.1
Total costs and expenses 5,638.9 5,182.4
Income before income taxes 697.4 608.0Income tax expense 291.3 232.6
Net income $ 406.1 $ 375.4
JOHN CULLY COMPANYIncome Statements
For the Year Ended June 30

804 18 Financial Statement Analysis
Action Plan✔ Remember that the
current ratio includes all current assets. The acid-test ratio uses only cash, short-term investments, and net accounts receivable.
✔ Use average balances for turnover ratios like inventory, accounts receivable, and return on assets.
Solution
2017 2016
(a) Current ratio: $2,302.6 4 $1,497.7 5 1.5:1 $2,199.2 4 $1,322.0 5 1.7:1
(b) Inventory turnover: $1,617.4 4 [($768.3 1 $653.5) 4 2] 5 2.3 times $1,476.3 4 [($653.5 1 $599.0) 4 2] 5 2.4 times
(c) Profi t margin: $406.1 4 $6,336.3 5 6.4% $375.4 4 $5,790.4 5 6.5%(d) Return on assets: $406.1 4 [($3,885.8 1 $3,708.1) 4 2] 5 10.7% $375.4 4 [($3,708.1 1 $3,349.9) 4 2] 5 10.6%
(e) Return on common stockholders’ equity: ($406.1 2 $0) 4 [($1,708.6 1 $1,749.0) 4 2] 5 23.5% ($375.4 2 $0) 4 [($1,749.0 1 $1,795.9) 4 2] 5 21.2%
(f) Debt to assets ratio: ($1,497.7 1 $679.5) 4 $3,885.8 5 56.0% ($1,322.0 1 $637.1) 4 $3,708.1 5 52.8%
(g) Times interest earned: ($406.1 1 $13.9 1 $291.3) 4 $13.9 5 51.2 times ($375.4 1 $27.1 1 $232.6) 4 $27.1 5 23.4 times
Related exercise material: BE18-9, BE18-10, BE18-12, BE18-13, E18-5, E18-6, E18-7, E18-8, E18-9, E18-10, E18-11, and DO IT! 18-2.
3 Apply the concept of sustainable income.LEARNING OBJECTIVE
The value of a company like Google is a function of the amount, timing, and uncertainty of its future cash fl ows. Google’s current and past income statements are particularly useful in helping analysts predict these future cash fl ows. In using this approach, analysts must make sure that Google’s past income numbers refl ect its sustainable income, that is, do not include unusual (out-of-the-ordinary) revenues, expenses, gains, and losses. Sustainable income is, there-fore, the most likely level of income to be obtained by a company in the future. Sustainable income differs from actual net income by the amount of unusual rev-enues, expenses, gains, and losses included in the current year’s income. Analysts are interested in sustainable income because it helps them derive an estimate of future earnings without the “noise” of unusual items. Fortunately, an income statement provides information on sustainable income by separating operating transactions from nonoperating transactions. This state-ment also highlights intermediate components of income such as income from operations, income before income taxes, and income from continuing operations. In addition, information on unusual items such as gains or losses on discontinued items and components of other comprehensive income are disclosed. Illustration 18-28 presents a statement of comprehensive income for Cruz Company for the year 2017. A statement of comprehensive income includes not only net income but a broader measure of income called comprehensive income. The two major unusual items in this statement are discontinued operations and other comprehensive income (highlighted in red). When estimating future cash fl ows, analysts must consider the implications of each of these components.

Sustainable Income 805
Illustration 18-28Statement of comprehensive income
CRUZ COMPANYStatement of Comprehensive Income
For the year ended 2017
Sales revenue $900,000Cost of goods sold 650,000
Gross profi t 250,000Operating expenses 100,000
Income from operations 150,000Other revenues (expenses) and gains (losses) 20,000
Income before income taxes 170,000Income tax expense 24,000
Income from continuing operations 146,000Discontinued operations (net of tax) 30,000
Net income 176,000Other comprehensive income items (net of tax) 10,000
Comprehensive income $186,000
In looking at Illustration 18-28, note that Cruz Company’s two major types of unusual items, discontinued operations and other comprehensive income, are reported net of tax. That is, Cruz fi rst calculates income tax expense before income from continuing operations. Then, it calculates income tax expense related to the discontinued operations and other comprehensive income. The general concept is, “Let the tax follow the income or loss.” We discuss discontinued oper-ations and other comprehensive income in more detail next.
Discontinued Operations
Discontinued operations refers to the disposal of a signifi cant component of a business, such as the elimination of a major class of customers, or an entire activ-ity. For example, to downsize its operations, General Dynamics Corp. sold its missile business to Hughes Aircraft Co. for $450 million. In its statement of com-prehensive income, General Dynamics reported the sale in a separate section entitled “Discontinued operations.” Following the disposal of a signifi cant component, the company should report on its statement both income from continuing operations and income (or loss) from discontinued operations. The income (loss) from discontinued operations consists of two parts: the income (loss) from operations and the gain (loss) on disposal of the component. To illustrate, assume that during 2017 Acro Energy Inc. has income before income taxes of $800,000. During 2017, Acro discontinued and sold its unprofi t-able chemical division. The loss in 2017 from chemical operations (net of $60,000 taxes) was $140,000. The loss on disposal of the chemical division (net of $30,000 taxes) was $70,000. Assuming a 30% tax rate on income, Illustration 18-29 (page 806) shows Acro’s statement of comprehensive income presentation. Note that the statement uses the caption “Income from continuing opera-tions” and adds a new section “Discontinued operations.” The new section reports both the operating loss and the loss on disposal net of applicable income taxes. This presentation clearly indicates the separate effects of continu-ing operations and discontinued operations on net income.
Other Comprehensive Income
Most revenues, expenses, gains, and losses are included in net income. How-ever, certain gains and losses bypass net income. Instead, companies record these items as direct adjustments to stockholders’ equity. The FASB requires companies to report not only net income but also other comprehensive income.

806 18 Financial Statement Analysis
Other comprehensive income includes all changes in stockholders’ equity during a period except those changes resulting from investments by stockholders and distributions to stockholders.
ILLUSTRATION OF OTHER COMPREHENSIVE INCOME
Accounting standards require that companies adjust most investments in stocks and bonds up or down to their market price at the end of each accounting period. For example, assume that during 2017 Stassi Company purchased IBM stock for $10,000 as an investment. At the end of 2017, Stassi was still holding the invest-ment, but the stock’s market price was now $8,000. In this case, Stassi is required to reduce the recorded value of its IBM investment by $2,000. The $2,000 differ-ence is an unrealized loss. Should Stassi include this $2,000 unrealized loss in net income? It depends on whether Stassi classifi es the IBM stock as a trading security or an available-for-sale security. A trading security is bought and held primarily for sale in the near term to generate income on short-term price differences. Companies report unrealized losses on trading securities in the “Other expenses and losses” section of the income statement. The rationale: It is likely that the company will realize the unrealized loss (or an unrealized gain), so the company should report the loss (gain) as part of net income. If Stassi did not purchase the investment for trading purposes, it is classifi ed as available-for-sale. Available-for-sale securities are held with the intent of sell-ing them sometime in the future. Companies do not include unrealized gains or losses on available-for-sale securities in net income. Instead, they report them as part of “Other comprehensive income.” Other comprehensive income is not included in net income. It bypasses net income and is recorded as a direct adjust-ment to stockholders’ equity.
FORMAT
One format for reporting other comprehensive income is to report a statement of comprehensive income. For example, assuming that Stassi Company has a net income of $300,000, the unrealized loss would be reported below net income as follows.
Income before income taxes $800,000Income tax expense 240,000
Income from continuing operations 560,000Discontinued operations Loss from operation of chemical division,
net of $60,000 income tax savings $140,000 Loss from disposal of chemical division,
net of $30,000 income tax savings 70,000 210,000
Net income $350,000
ACRO ENERGY INC.Statement of Comprehensive Income (partial)
For the Year Ended December 31, 2017
Illustration 18-29Statement presentation of discontinued operations
Helpful HintObserve the dual disclosures: (1) the results of operation of the discontinued division must be eliminated from the results of continuing operations, and (2) the company must also report the disposal of the division.
Illustration 18-30Lower portion of statement of comprehensive income
Net income $ 300,000Unrealized loss on available-for-sale securities (net of tax) 2,000
Comprehensive income $298,000
STASSI CORPORATIONStatement of Comprehensive Income (partial)
For the Year Ended 2017

Sustainable Income 807
Companies also report the unrealized loss on available-for-sale securities as a separate component of stockholders’ equity. To illustrate, assume Stassi Corpora-tion has common stock of $3,000,000, retained earnings of $1,500,000, and an unrealized loss on available-for-sale securities of $2,000. Illustration 18-31 shows the balance sheet presentation of the unrealized loss.
Note that the presentation of the loss is similar to the presentation of the cost of treasury stock in the stockholders’ equity section. (An unrealized gain would be added in this section of the balance sheet.) Reporting the unrealized gain or loss in the stockholders’ equity section serves two important purposes: (1) it reduces the volatility of net income due to fl uctuations in fair value, and (2) it informs the fi nancial statement user of the gain or loss that would occur if the company sold the securities at fair value.
COMPLETE STATEMENT OF COMPREHENSIVE INCOME
The statement of comprehensive income for Pace Corporation in Illustration 18-32 presents the types of items found on this statement, such as net sales, cost of goods sold, operating expenses, and income taxes. In addition, it shows how companies report discontinued operations and other comprehensive income (highlighted in red).
Illustration 18-31Unrealized loss in stockholders’ equity section
Balance Sheet (partial)
Stockholders’ equity Common stock $3,000,000 Retained earnings 1,500,000
Total paid-in capital and retained earnings 4,500,000 Less: Unrealized loss on available-for-sale securities 2,000
Total stockholders’ equity $4,498,000
Net sales $440,000Cost of goods sold 260,000
Gross profi t 180,000Operating expenses 110,000
Income from operations 70,000Other revenues and gains 5,600Other expenses and losses 9,600
Income before income taxes 66,000Income tax expense ($66,000 3 30%) 19,800
Income from continuing operations 46,200Discontinued operations Loss from operation of Plastics Division, net of income tax savings $18,000 ($60,000 3 30%) $42,000 Gain on disposal of Plastics Division, net of $15,000 income taxes ($50,000 3 30%) 35,000 7,000
Net income 39,200Unrealized gain on available-for-sale securities, net of income taxes ($15,000 3 30%) 10,500
Comprehensive income $ 49,700
PACE CORPORATIONStatement of Comprehensive Income
For the Year Ended December 31, 2017
Illustration 18-32Complete statement of comprehensive income

808 18 Financial Statement Analysis
In its proposed 2017 income statement, AIR Corporation reports income before income taxes $400,000, unrealized gain on available-for-sale securities $100,000, income taxes $120,000 (not including unusual items), loss from operation of discontinued fl ower divi-sion $50,000, and loss on disposal of discontinued fl ower division $90,000. The income tax rate is 30%. Prepare a correct statement of comprehensive income, beginning with “Income before income taxes.”
Solution
DO IT! 3 Unusual Items
Action Plan✔ Show discontinued
operations and other comprehensive income net of tax.
AIR CORPORATIONStatement of Comprehensive Income (partial)
For the Year Ended December 31, 2017
Related exercise material: BE18-14, BE18-15, E18-12, E18-13, and DO IT! 18-3.
Income before income taxes $400,000Income tax expense 120,000
Income from continuing operations 280,000Discontinued operations Loss from operation of fl ower division, net of $15,000 income tax savings $35,000 Loss on disposal of fl ower division, net of $27,000 income tax savings 63,000 98,000
Net income 182,000Unrealized gain on available-for-sale securities, net of $30,000 income taxes 70,000
Comprehensive income $252,000
Another Measure of Sustainable Income?
Companies whose stock is pub-licly traded are required to present their income state-ment following GAAP. In re-cent years, many companies now report a second measure
of income, called pro forma income. Pro forma income usu-ally excludes items that the company thinks are unusual or nonrecurring. For example, in a recent year, Cisco Systems (a high-tech company) reported a quarterly net loss under GAAP of $2.7 billion. Cisco reported pro forma income for the same quarter as a profi t of $230 million. This large difference in profi ts between GAAP income numbers and pro forma income is not unusual. For example, during one 9-month period, the 100 largest companies on the Nasdaq stock exchange reported a total pro forma income of $19.1 billion but a total loss as measured by GAAP of $82.3 billion—a difference of about $100 billion!
To compute pro forma income, companies generally exclude any items they deem inappropriate for measuring
their performance. Many analysts and investors are critical of the practice of using pro forma income because these numbers often make companies look better than they really are. As the fi nancial press noted, pro forma numbers might be called “earnings before bad stuff.” Companies, on the other hand, argue that pro forma numbers more clearly indicate sustainable income because they exclude unusual items. “Cisco’s technique gives readers of fi nancial statements a clear picture of Cisco’s normal business activ-ities,” the company said in a statement issued in response to questions about its pro forma income accounting.
Recently, the SEC provided some guidance on how com-panies should present pro forma information. Stay tuned: Everyone seems to agree that pro forma numbers can be useful if they provide insights into determining a company’s sustainable income. However, many companies have abused the fl exibility that pro forma numbers allow and have used the measure as a way to put their companies in a more favorable light.
What incentive do companies have to report pro forma income? (Go to WileyPLUS for this answer and additional questions.)
Investor Insight Cisco Systems
© gosphotodesign/Shutterstock

Review and Practice 809
1 Apply horizontal and vertical analysis to fi nancial statements. There are three bases of comparison: (1) intracompany, which compares an item or fi nancial relationship with other data within a company; (2) industry, which compares company data with industry averages; and (3) intercompany, which compares an item or fi nancial relationship of a company with data of one or more competing companies.
Horizontal analysis is a technique for evaluating a series of data over a period of time to determine the increase or decrease that has taken place, expressed as either an amount or a percentage. Vertical analysis is a technique that expresses each item within a fi nancial statement in terms of a percentage of a relevant total or a base amount.
2 Analyze a company’s performance using ratio analysis. The formula and purpose of each ratio is presented in Illustration 18-27 (page 802).
3 Apply the concept of sustainable income. Sustainable income analysis is useful in evaluating a company’s performance. Sustainable income is the most likely level of income to be obtained by the company in the future. Discontinued operations and other comprehen-sive income are presented on the statement of compre-hensive income to highlight their unusual nature. Items below income from continuing operations must be presented net of tax.
LEARNING OBJECTIVES REVIEW
REVIEW AND PRACTICE
Accounts receivable turnover A measure of the liquid-ity of accounts receivable; computed by dividing net credit sales by average net accounts receivable. (p. 795).
Acid-test (quick) ratio A measure of a company’s imme-diate short-term liquidity; computed by dividing the sum of cash, short-term investments, and net accounts receivable by current liabilities. (p. 794).
Asset turnover A measure of how effi ciently a company uses its assets to generate sales; computed by dividing net sales by average total assets. (p. 797).
Current ratio A measure used to evaluate a company’s liquidity and short-term debt-paying ability; computed by dividing current assets by current liabilities. (p. 793).
Debt to assets ratio Measures the percentage of assets provided by creditors; computed by dividing total lia-bilities by total assets. (p. 800).
Discontinued operations The disposal of a signifi cant component of a business. (p. 805).
Earnings per share (EPS) The net income earned on each share of common stock; computed by dividing net income minus preferred dividends (if any) by the num-ber of weighted-average common shares outstanding. (p. 799).
Horizontal analysis A technique for evaluating a series of fi nancial statement data over a period of time, to determine the increase (decrease) that has taken place, expressed as either an amount or a percentage. (p. 787).
Inventory turnover A measure of the liquidity of inven-tory; computed by dividing cost of goods sold by aver-age inventory. (p. 796).
Leveraging See Trading on the equity. (p. 799).Liquidity ratios Measures of the short-term ability of
the company to pay its maturing obligations and to meet unexpected needs for cash. (p. 793).
Other comprehensive income Includes all changes in stockholders’ equity during a period except those result-ing from investments by stockholders and distributions to stockholders. (p. 806).
Payout ratio Measures the percentage of earnings dis-tributed in the form of cash dividends; computed by dividing cash dividends declared on common stock by net income. (p. 800).
Price-earnings (P-E) ratio Measures the ratio of the market price of each share of common stock to the earnings per share; computed by dividing the market price per share by earnings per share. (p. 799).
Profi t margin Measures the percentage of each dollar of sales that results in net income; computed by dividing net income by net sales. (p. 797).
Profi tability ratios Measures of the income or operating success of a company for a given period of time. (p. 796).
Ratio An expression of the mathematical relationship between one quantity and another. The relationship may be expressed either as a percentage, a rate, or a simple proportion. (p. 792).
Ratio analysis A technique for evaluating fi nancial state-ments that expresses the relationship between selected fi nancial statement data. (p. 792).
Return on assets An overall measure of profi tability; computed by dividing net income by average total assets. (p. 798).
Return on common stockholders’ equity Measures the dollars of net income earned for each dollar invested by the owners; computed by dividing net income minus preferred dividends (if any) by average common stock-holders’ equity. (p. 798).
Solvency ratios Measures of the ability of the company to survive over a long period of time. (p. 800).
GLOSSARY REVIEW

810 18 Financial Statement Analysis
Sustainable income The most likely level of income to be obtained by a company in the future. (p. 804).
Times interest earned Measures a company’s ability to meet interest payments as they come due; computed by dividing the sum of net income, interest expense, and income tax expense by interest expense. (p. 801).
Trading on the equity Borrowing money at a lower rate of interest than can be earned by using the borrowed money. (p. 799).
Vertical analysis A technique for evaluating fi nancial statement data that expresses each item within a fi nan-cial statement as a percentage of a base amount. (p. 790).
1. Comparisons of data within a company are an example of the following comparative basis:(a) Industry averages. (c) Intercompany.(b) Intracompany. (d) Both (b) and (c).
2. In horizontal analysis, each item is expressed as a percentage of the:(a) net income amount.(b) stockholders’ equity amount.(c) total assets amount.(d) base year amount.
3. Sammy Corporation reported net sales of $300,000, $330,000, and $360,000 in the years, 2015, 2016, and 2017, respectively. If 2015 is the base year, what is the trend percentage for 2017?(a) 77%. (c) 120%.(b) 108%. (d) 130%.
4. The following schedule is a display of what type of analysis?
Amount Percent
Current assets $200,000 25% Property, plant,
and equipment 600,000 75%
Total assets $800,000
(a) Horizontal analysis. (c) Vertical analysis.(b) Differential analysis. (d) Ratio analysis.
5. In vertical analysis, the base amount for depreciation expense is generally:(a) net sales.(b) depreciation expense in a previous year.(c) gross profi t.(d) fi xed assets.
6. Which of the following measures is an evaluation of a fi rm’s ability to pay current liabilities?(a) Acid-test ratio. (c) Both (a) and (b).(b) Current ratio. (d) None of the above.
7. A measure useful in evaluating the effi ciency in man-aging inventories is:(a) inventory turnover. (c) Both (a) and (b).(b) days in inventory. (d) None of the above.
Use the following fi nancial statement information as of the end of each year to answer Questions 8-12.
2017 2016
Inventory $ 54,000 $ 48,000Current assets 81,000 106,000Total assets 382,000 326,000
(LO 1)
(LO 1)
(LO 1)
(LO 1)
(LO 1)
(LO 2)
(LO 2)
Current liabilities 27,000 36,000Total liabilities 102,000 88,000Preferred stock 40,000 40,000Common stockholders’ equity 240,000 198,000Net sales 784,000 697,000Cost of goods sold 306,000 277,000Net income 134,000 90,000Income tax expense 22,000 18,000Interest expense 12,000 12,000Dividends paid to preferred stockholders 4,000 4,000Dividends paid to common stockholders 15,000 10,000
8. Compute the days in inventory for 2017.(a) 64.4 days. (c) 6 days.(b) 60.8 days. (d) 24 days.
9. Compute the current ratio for 2017.(a) 1.26:1. (c) 0.80:1.(b) 3.0:1. (d) 3.75:1.
10. Compute the profi t margin for 2017.(a) 17.1%. (c) 37.9%.(b) 18.1%. (d) 5.9%.
11. Compute the return on common stockholders’ equity for 2017.(a) 47.9%. (c) 61.2%.(b) 51.7%. (d) 59.4%.
12. Compute the times interest earned for 2017.(a) 11.2 times. (c) 14.0 times.(b) 65.3 times. (d) 13.0 times.
13. In reporting discontinued operations, the statement of comprehensive income should show in a special section:(a) gains and losses on the disposal of the discontinued
component.(b) other comprehensive income items.(c) Both (a) and (b).(d) None of these answer choices are correct.
14. Scout Corporation has income before taxes of $400,000 and a loss on discontinued operations of $100,000. If the income tax rate is 25% on all items, the statement of comprehensive income should show income from continuing operations and discontinued operations, respectively, of:(a) $325,000 and $100,000.(b) $325,000 and $75,000.(c) $300,000 and $100,000.(d) $300,000 and $75,000.
(LO 2)
(LO 2)
(LO 2)
(LO 2)
(LO 2)
(LO 3)
(LO 3)
PRACTICE MULTIPLE-CHOICE QUESTIONS

Solutions
1. (b) Comparisons of data within a company are called intracompany comparisons, not (a) industry averages, (c) intercompany comparisons, or (d) both intracompany and intercompany comparisons. Intercompany comparisons are among companies.
2. (d) Horizontal analysis converts each succeeding year’s balance to a percentage of the base year amount, not (a) net income amount, (b) stockholders’ equity amount, or (c) total assets amount.
3. (c) The trend percentage for 2017 is 120% ($360,000/$300,000), not (a) 77%, (b) 108%, or (d) 130%.
4. (c) The data in the schedule is a display of vertical analysis because the individual asset items are expressed as a percentage of total assets. The other choices are therefore incorrect. Horizontal analysis is a technique for evaluating a series of data over a period of time.
5. (a) In vertical analysis, net sales is used as the base amount for income statement items, not (b) depreciation expense in a pre-vious year, (c) gross profi t, or (d) fi xed assets.
6. (c) Both the acid-test ratio and the current ratio measure a fi rm’s ability to pay current liabilities. Choices (a) and (b) are correct but (c) is the better answer. Choice (d) is incorrect because there is a correct answer.
7. (c) Both inventory turnover and days in inventory measure a fi rm’s effi ciency in managing inventories. Choices (a) and (b) are correct but (c) is the better answer. Choice (d) is incorrect because there is a correct answer.
8. (b) Inventory turnover 5 Cost of goods sold/Average inventory [$306,000/($54,000 1 $48,000)/2] 5 6 times. Thus, days in inventory 5 60.8 (365/6), not (a) 64.4, (c) 6, or (d) 24 days.
9. (b) Current ratio 5 Current assets/Current liabilities ($81,000/$27,000) 5 3.0:1, not (a) 1.26:1, (c) 0.80:1, or (d) 3.75:1.
10. (a) Profi t margin 5 Net income/Net sales ($134,000/$784,000) 517.1%, not (b) 18.1%, (c) 37.9%, or (d) 5.9%.
11. (d) Return on common stockholders’ equity 5 Net income ($134,000) 2 Dividends to preferred stockholders ($4,000) /Average common stockholders’ equity [($240,000 1 $198,000)/2] 5 59.4%, not (a) 47.9%, (b) 51.7%, or (c) 61.2%.
12. (c) Times interest earned 5 Net income 1 Interest expense 1 Income tax expense divided by Interest expense [($134,000 1 $12,000 1 $22,000)/$12,000] 5 14.0 times, not (a) 11.2, (b) 65.3, or (d) 13.0 times.
13. (c) Gains and losses on the disposal of the discontinued segment and gains and losses from operations of the discontinued component are shown in the special section titled discontinued operations. Other comprehensive income items are reported in a separate section after net income on the statement of comprehensive income. Choices (a) and (b) are therefore correct but (c) is the better answer. Choice (d) is incorrect as there is a correct answer.
14. (d) Income tax expense 5 25% 3 $400,000 5 $100,000; therefore, income from continuing operations 5 $400,000 2 $100,000 5 $300,000. The loss on discontinued operations is shown net of tax, $100,000 3 75% 5 $75,000. The other choices are therefore incorrect.
Practice Exercises 811
1. The comparative condensed balance sheets of Roadway Corporation are presented below. Prepare horizontal and vertical analysis.
(LO 1)
PRACTICE EXERCISES
ROADWAY CORPORATIONCondensed Balance Sheets
December 31
2017 2016
Assets
Current assets $ 76,000 $ 80,000Property, plant, and equipment (net) 99,000 90,000Intangibles 25,000 40,000
Total assets $200,000 $210,000
Liabilities and stockholders’ equity
Current liabilities $ 40,800 $ 48,000Long-term liabilities 143,000 150,000Stockholders’ equity 16,200 12,000
Total liabilities and stockholders’ equity $200,000 $210,000
Instructions(a) Prepare a horizontal analysis of the balance sheet data for Roadway Corporation using
2016 as a base.
(b) Prepare a vertical analysis of the balance sheet data for Roadway Corporation in columnar form for 2017.

812 18 Financial Statement Analysis
1. (a) ROADWAY CORPORATIONCondensed Balance Sheets
December 31
Percent Increase Change 2017 2016 (Decrease) from 2016
Assets Current assets $ 76,000 $ 80,000 $ (4,000) (5.0%) Property, plant, and equipment (net) 99,000 90,000 9,000 10.0% Intangibles 25,000 40,000 (15,000) (37.5%)
Total assets $200,000 $210,000 $(10,000) (4.8%)
Liabilities and stockholders’ equity Current liabilities $ 40,800 $ 48,000 $ (7,200) (15.0%) Long-term liabilities 143,000 150,000 (7,000) (4.7%) Stockholders’ equity 16,200 12,000 4,200 35.0%
Total liabilities and stockholders’ equity $200,000 $210,000 $(10,000) (4.8%)
(b) ROADWAY CORPORATIONCondensed Balance Sheet
December 31, 2017
Amount Percent
Assets Current assets $ 76,000 38.0% Property, plant, and equipment (net) 99,000 49.5% Intangibles 25,000 12.5%
Total assets $200,000 100.0%
Liabilities and stockholders’ equity Current liabilities $ 40,800 20.4% Long-term liabilities 143,000 71.5% Stockholders’ equity 16,200 8.1%
Total liabilities and stockholders’ equity $200,000 100.0%
Solution
2. Rondo Corporation’s comparative balance sheets are presented below.
RONDO CORPORATIONBalance SheetsDecember 31
2017 2016
Cash $ 5,300 $ 3,700Accounts receivable 21,200 23,400Inventory 9,000 7,000Land 20,000 26,000Buildings 70,000 70,000Accumulated depreciation—buildings (15,000) (10,000)
Total $110,500 $120,100
Accounts payable $ 10,370 $ 31,100Common stock 75,000 69,000Retained earnings 25,130 20,000
Total $110,500 $120,100
Rondo’s 2017 income statement included net sales of $120,000, cost of goods sold of $70,000, and net income of $14,000.
InstructionsCompute the following ratios for 2017.
(a) Current ratio. (c) Accounts receivable turnover.(b) Acid-test ratio. (d) Inventory turnover.
Compute ratios.
(LO 2)
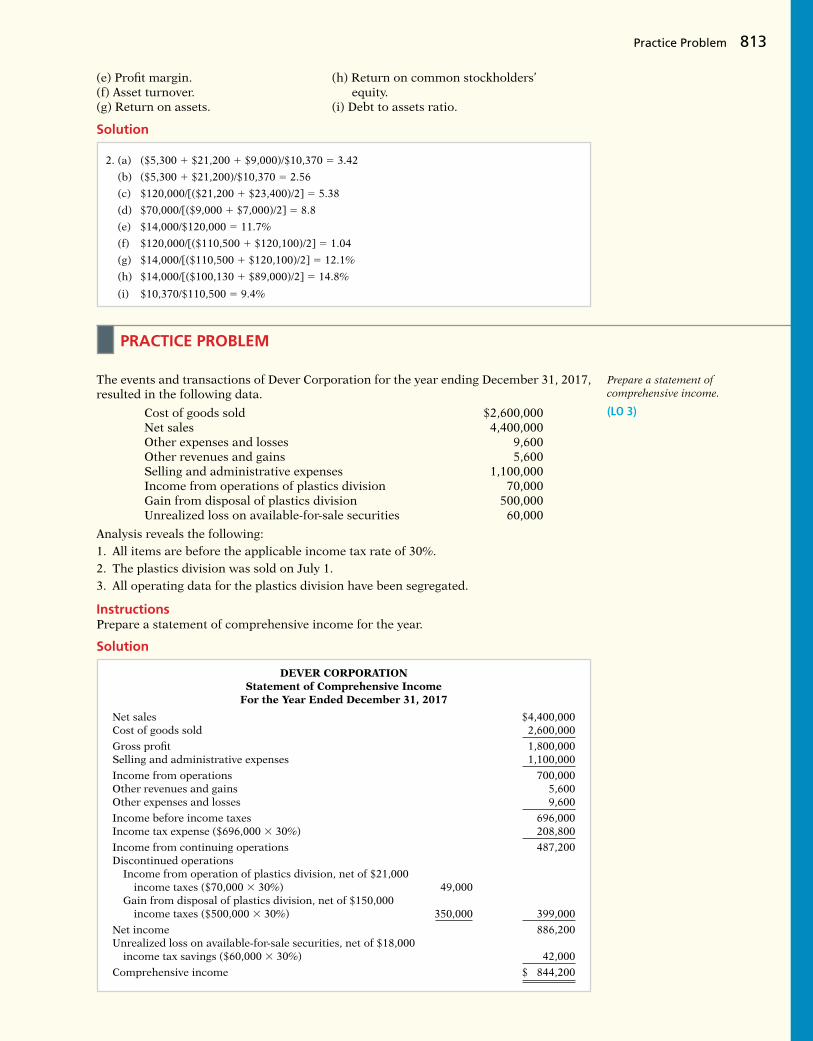
Practice Problem 813
(e) Profi t margin. (h) Return on common stockholders’(f) Asset turnover. equity.(g) Return on assets. (i) Debt to assets ratio.
2. (a) ($5,300 1 $21,200 1 $9,000)/$10,370 5 3.42
(b) ($5,300 1 $21,200)/$10,370 5 2.56
(c) $120,000/[($21,200 1 $23,400)/2] 5 5.38
(d) $70,000/[($9,000 1 $7,000)/2] 5 8.8
(e) $14,000/$120,000 5 11.7%
(f) $120,000/[($110,500 1 $120,100)/2] 5 1.04
(g) $14,000/[($110,500 1 $120,100)/2] 5 12.1%
(h) $14,000/[($100,130 1 $89,000)/2] 5 14.8%
(i) $10,370/$110,500 5 9.4%
Solution
The events and transactions of Dever Corporation for the year ending December 31, 2017, resulted in the following data.
Cost of goods sold $2,600,000Net sales 4,400,000Other expenses and losses 9,600Other revenues and gains 5,600Selling and administrative expenses 1,100,000Income from operations of plastics division 70,000Gain from disposal of plastics division 500,000Unrealized loss on available-for-sale securities 60,000
Analysis reveals the following:1. All items are before the applicable income tax rate of 30%.2. The plastics division was sold on July 1.3. All operating data for the plastics division have been segregated.
InstructionsPrepare a statement of comprehensive income for the year.
Prepare a statement of comprehensive income.
(LO 3)
PRACTICE PROBLEM
DEVER CORPORATIONStatement of Comprehensive Income
For the Year Ended December 31, 2017
Net sales $4,400,000Cost of goods sold 2,600,000
Gross profi t 1,800,000Selling and administrative expenses 1,100,000
Income from operations 700,000Other revenues and gains 5,600Other expenses and losses 9,600
Income before income taxes 696,000Income tax expense ($696,000 3 30%) 208,800
Income from continuing operations 487,200Discontinued operations Income from operation of plastics division, net of $21,000 income taxes ($70,000 3 30%) 49,000 Gain from disposal of plastics division, net of $150,000 income taxes ($500,000 3 30%) 350,000 399,000
Net income 886,200Unrealized loss on available-for-sale securities, net of $18,000 income tax savings ($60,000 3 30%) 42,000
Comprehensive income $ 844,200
Solution

814 18 Financial Statement Analysis
Brief Exercises, Exercises, DO IT! Exercises, and Problems and many additional resources are available for practice in WileyPLUS
QUESTIONS
1. (a) Jose Ramirez believes that the analysis of fi nan-cial statements is directed at two characteristics of a company: liquidity and profi tability. Is Jose correct? Explain.
(b) Are short-term creditors, long-term creditors, and stockholders interested primarily in the same characteristics of a company? Explain.
2. (a) Distinguish among the following bases of com-parison: (1) intracompany, (2) industry averages, and (3) intercompany.
(b) Give the principal value of using each of the three bases of comparison.
3. Two popular methods of fi nancial statement analysis are horizontal analysis and vertical analysis. Explain the difference between these two methods.
4. (a) If Peoples Company had net income of $390,000 in 2017 and it experienced a 24.5% increase in net income for 2018, what is its net income for 2018?
(b) If six cents of every dollar of Peoples’ revenue is net income in 2017, what is the dollar amount of 2017 revenue?
5. What is a ratio? What are the different ways of expressing the relationship of two amounts? What information does a ratio provide?
6. Name the major ratios useful in assessing (a) liquidity and (b) solvency.
7. Roberto Perez is puzzled. His company had a profi t margin of 10% in 2017. He feels that this is an indica-tion that the company is doing well. Julie Beck, his accountant, says that more information is needed to determine the fi rm’s fi nancial well-being. Who is correct? Why?
8. What do the following classes of ratios measure? (a) Liquidity ratios. (b) Profi tability ratios. (c) Solvency ratios.
9. What is the difference between the current ratio and the acid-test ratio?
10. Hizar Company, a retail store, has an accounts receiv-able turnover of 4.5 times. The industry average is 12.5 times. Does Hizar have a collection problem with its accounts receivable?
11. Which ratios should be used to help answer the fol-lowing questions?
(a) How effi cient is a company in using its assets to produce sales?
(b) How near to sale is the inventory on hand? (c) How many dollars of net income were earned for
each dollar invested by the owners? (d) How able is a company to meet interest charges
as they fall due? 12. The price-earnings ratio of General Motors (automo-
bile builder) was 8, and the price-earnings ratio of
Microsoft (computer software) was 38. Which com-pany did the stock market favor? Explain.
13. What is the formula for computing the payout ratio? Would you expect this ratio to be high or low for a growth company?
14. Holding all other factors constant, indicate whether each of the following changes generally signals good or bad news about a company.
(a) Increase in profi t margin. (b) Decrease in inventory turnover. (c) Increase in the current ratio. (d) Decrease in earnings per share. (e) Increase in price-earnings ratio. (f) Increase in debt to assets ratio. (g) Decrease in times interest earned.15. The return on assets for Zhang Corporation is 7.6%.
During the same year, Zhang’s return on common stockholders’ equity is 12.8%. What is the explanation for the difference in the two rates?
16. Which two ratios do you think should be of greatest interest to:(a) A pension fund considering the purchase of
20-year bonds? (b) A bank contemplating a short-term loan?
(c) A common stockholder?17. Why must preferred dividends be subtracted from net
income in computing earnings per share?18. (a) What is meant by trading on the equity?
(b) How would you determine the profi tability of trading on the equity?
19. Lippert Inc. has net income of $160,000, weighted-average shares of common stock outstanding of 50,000, and preferred dividends for the period of $40,000. What is Lippert’s earnings per share of common stock? Kate Lippert, the president of Lippert Inc., believes the computed EPS of the company is high. Comment.
20. Why is it important to report discontinued operations separately from income from continuing operations?
21. You are considering investing in Wingert Transporta-tion. The company reports 2017 earnings per share of $6.50 on income from continuing operations and $4.75 on net income. Which EPS fi gure would you consider more relevant to your investment decision? Why?
22. RAF Inc. reported 2016 earnings per share of $3.20 and had no discontinued operations items. In 2017, EPS on income from continuing operations was $2.99, and EPS on net income was $3.49. Is this a favorable trend?
23. Identify the specifi c sections in Apple’s 2013 annual report where horizontal and vertical analyses of fi nancial data are presented.

Brief Exercises 815
BRIEF EXERCISES
Follow the rounding procedures used in the chapter.
BE18-1 You recently received a letter from your Uncle Sammy. A portion of the letter is presented below.
You know that I have a signifi cant amount of money I saved over the years. I am thinking about starting an investment program. I want to do the investing myself, based on my own research and analysis of fi nancial statements. I know that you are studying accounting, so I have a couple of questions for you. I have heard that different users of fi nancial state-ments are interested in different characteristics of companies. Is this true and, if so, why? Also, some of my friends who are already investing have told me that comparisons involv-ing a company’s fi nancial data can be made on a number of different bases. Can you explain these bases to me?
Instructions Write a letter to your Uncle Sammy which answers his questions.
BE18-2 Schellhammer Corporation reported the following amounts in 2016, 2017, and 2018.
Discuss need for comparative analysis.
(LO 1)
Identify and use tools of fi nancial statement analysis.
(LO 1, 2)
2016 2017 2018
Current assets $200,000 $210,000 $240,000Current liabilities 150,000 168,000 184,000Total assets 500,000 600,000 620,000
Instructions(a) Identify and describe the three tools of fi nancial statement analysis. (b) Perform each of the three types of analysis on Schellhammer’s current assets.
BE18-3 Using the following data from the comparative balance sheet of Goody Company, illustrate horizontal analysis.
Prepare horizontal analysis.
(LO 1)
December 31, 2017 December 31, 2016
Accounts receivable $ 520,000 $ 400,000Inventory 840,000 600,000Total assets 3,000,000 2,500,000
BE18-4 Using the same data presented above in BE18-3 for Goody Company, illustrate vertical analysis.
BE18-5 Net income was $500,000 in 2016, $450,000 in 2017, and $522,000 in 2018. What is the percentage of change from (a) 2016 to 2017 and (b) 2017 to 2018? Is the change an increase or a decrease?
BE18-6 If Sappington Company had net income of $585,000 in 2017 and it experienced a 20% increase in net income over 2016, what was its 2016 net income?
BE18-7 Horizontal analysis (trend analysis) percentages for Dody Company’s sales revenue, cost of goods sold, and expenses are shown below.
Prepare vertical analysis.
(LO 1)
Calculate percentage of change.
(LO 1)
Calculate net income.
(LO 1)
Calculate change in net income.
(LO 1)
2018 2017 2016
Sales revenue 96.2% 106.8% 100.0%Cost of goods sold 102.0 97.0 100.0Expenses 109.6 98.4 100.0
Did Dody’s net income increase, decrease, or remain unchanged over the 3-year period?

816 18 Financial Statement Analysis
BE18-8 Vertical analysis (common size) percentages for Kochheim Company’s sales revenue, cost of goods sold, and expenses are shown below.
Calculate change in net income.
(LO 1) 2018 2017 2016
Sales revenue 100.0% 100.0% 100.0%Cost of goods sold 60.2 62.4 63.5Expenses 25.0 25.6 27.5
Did Kochheim’s net income as a percentage of sales increase, decrease, or remain unchanged over the 3-year period? Provide numerical support for your answer.
BE18-9 Selected condensed data taken from a recent balance sheet of Heidebrecht Inc. are as follows.
Calculate liquidity ratios.
(LO 2)
HEIDEBRECHT INC.Balance Sheet (partial)
Cash $ 8,041,000Short-term investments 4,947,000Accounts receivable 12,545,000Inventory 14,814,000Other current assets 5,571,000
Total current assets $45,918,000
Total current liabilities $40,644,000
What are the (a) working capital, (b) current ratio, and (c) acid-test ratio?
BE18-10 Linebarger Corporation has net income of $11.44 million and net revenue of $95 million in 2017. Its assets are $14 million at the beginning of the year and $18 million at the end of the year. What are Linebarger’s (a) asset turnover and (b) profi t margin?
BE18-11 The following data are taken from the fi nancial statements of Rainsberger Company.
Calculate profi tability ratios.
(LO 2)
Evaluate collection of accounts receivable.
(LO 2) 2018 2017
Accounts receivable (net), end of year $ 550,000 $ 520,000Net sales on account 3,960,000 3,100,000Terms for all sales are 1/10, n/60.
(a) Compute for each year (1) the accounts receivable turnover and (2) the average collec-tion period. At the end of 2016, accounts receivable (net) was $480,000.
(b) What conclusions about the management of accounts receivable can be drawn from these data?
BE18-12 The following data are from the income statements of Haskin Company.Evaluate management of inventory.
(LO 2) 2017 2016
Sales revenue $6,420,000 $6,240,000Beginning inventory 940,000 860,000Purchases 4,340,000 4,661,000Ending inventory 1,020,000 940,000
(a) Compute for each year (1) the inventory turnover and (2) the days in inventory.(b) What conclusions concerning the management of the inventory can be drawn
from these data?
BE18-13 Guo Company has stockholders’ equity of $400,000 and net income of $66,000. It has a payout ratio of 20% and a return on assets of 15%. How much did Guo pay in cash dividends, and what were its average assets?
Calculate amounts from profi tability ratios.
(LO 2)

DO IT! Exercises 817
BE18-14 An inexperienced accountant for Silva Corporation showed the following in the income statement: income before income taxes $450,000 and unrealized gain on available-for-sale securities (before taxes) $70,000. The unrealized gain on available-for-sale securi-ties and income before income taxes are both subject to a 25% tax rate. Prepare a correct statement of comprehensive income.
BE18-15 On June 30, Holloway Corporation discontinued its operations in Europe. During the year, the operating loss was $300,000 before taxes. On September 1, Holloway disposed of its European facilities at a pretax loss of $120,000. The applicable tax rate is 20%. Show the discontinued operations section of the statement of comprehensive income.
Prepare statement of comprehensive income including unusual items.
(LO 3)
Prepare discontinued operations section of statement of comprehensive income.
(LO 3)
Summary fi nancial information for Wolford Company is as follows.
December 31, 2017 December 31, 2016
Current assets $ 199,000 $ 220,000Plant assets 821,000 780,000
Total assets $1,020,000 $1,000,000
Compute the amount and percentage changes in 2017 using horizontal analysis, assuming 2016 is the base year.
The condensed fi nancial statements of Murawski Company for the years 2016 and 2017 are presented below. (Amounts in thousands.)
MURAWSKI COMPANYBalance SheetsDecember 31
2017 2016
Current assets Cash and cash equivalents $ 330 $ 360 Accounts receivable (net) 470 400 Inventory 460 390 Prepaid expenses 120 160
Total current assets 1,380 1,310Investments 10 10Property, plant, and equipment 420 380Intangibles and other assets 530 510
Total assets $2,340 $2,210
Current liabilities $ 900 $ 790Long-term liabilities 410 380Stockholders’ equity—common 1,030 1,040
Total liabilities and stockholders’ equity $2,340 $2,210
MURAWSKI COMPANYIncome Statements
For the Years Ended December 31
2017 2016
Sales revenue $3,800 $3,460Costs and expenses Cost of goods sold 955 890 Selling & administrative expenses 2,400 2,330 Interest expense 25 20
Total costs and expenses 3,380 3,240
Income before income taxes 420 220Income tax expense 126 66
Net income $ 294 $ 154
Prepare horizontal analysis.
(LO 1)
Compute ratios.
(LO 2)
DO IT! Exercises
DO IT! 18-1
DO IT! 18-2

Compute the following ratios for 2017 and 2016.
(a) Current ratio.(b) Inventory turnover. (Inventory on 12/31/15 was $340.)(c) Profi t margin.(d) Return on assets. (Assets on 12/31/15 were $1,900.)(e) Return on common stockholders’ equity. (Stockholders’ equity on 12/31/15 was $900.)(f) Debt to assets ratio.(g) Times interest earned.
In its proposed 2017 income statement, Hrabik Corporation reports income before income taxes $500,000, income taxes $100,000 (not including unusual items), loss on operation of discontinued music division $60,000, gain on disposal of discontinued music division $40,000, and unrealized loss on available-for-sale securities $150,000. The income tax rate is 20%. Prepare a correct statement of comprehensive income, beginning with income before income taxes.
Prepare statement of comprehensive income including unusual items.
(LO 3)
818 18 Financial Statement Analysis
DO IT! 18-3
EXERCISES
Follow the rounding procedures used in the chapter.
E18-1 Financial information for Kurzen Inc. is presented below.Prepare horizontal analysis.
(LO 1)
December 31, 2017 December 31, 2016
Current assets $125,000 $100,000Plant assets (net) 396,000 330,000Current liabilities 91,000 70,000Long-term liabilities 133,000 95,000Common stock, $1 par 161,000 115,000Retained earnings 136,000 150,000
InstructionsPrepare a schedule showing a horizontal analysis for 2017 using 2016 as the base year.
E18-2 Operating data for Navarro Corporation are presented below.Prepare vertical analysis.
(LO 1)
2017 2016
Net sales $750,000 $600,000Cost of goods sold 465,000 390,000Selling expenses 105,000 66,000Administrative expenses 60,000 54,000Income tax expense 36,000 27,000Net income 84,000 63,000
InstructionsPrepare a schedule showing a vertical analysis for 2017 and 2016.
E18-3 The comparative condensed balance sheets of Gurley Corporation are presented on page 819.
Prepare horizontal and vertical analyses.
(LO 1)

Exercises 819
Instructions(a) Prepare a horizontal analysis of the balance sheet data for Gurley Corporation using
2016 as a base.(b) Prepare a vertical analysis of the balance sheet data for Gurley Corporation in columnar
form for 2017.
E18-4 The comparative condensed income statements of Emley Corporation are shown below.
Prepare horizontal and vertical analyses.
(LO 1)
GURLEY CORPORATIONComparative Condensed Balance Sheets
December 31
2017 2016
Assets Current assets $ 74,000 $ 80,000 Property, plant, and equipment (net) 99,000 90,000 Intangibles 27,000 40,000
Total assets $200,000 $210,000
Liabilities and stockholders’ equity Current liabilities $ 42,000 $ 48,000 Long-term liabilities 143,000 150,000 Stockholders’ equity 15,000 12,000
Total liabilities and stockholders’ equity $200,000 $210,000
EMLEY CORPORATIONComparative Condensed Income Statements
For the Years Ended December 31
2017 2016
Net sales $660,000 $600,000Cost of goods sold 483,000 420,000
Gross profi t 177,000 180,000Operating expenses 125,000 120,000
Net income $ 52,000 $ 60,000
Instructions(a) Prepare a horizontal analysis of the income statement data for Emley Corporation
using 2016 as a base. (Show the amounts of increase or decrease.)(b) Prepare a vertical analysis of the income statement data for Emley Corporation in
columnar form for both years.
E18-5 Suppose Nordstrom, Inc., which operates department stores in numerous states, has the following selected fi nancial statement data for a recent year.
Compute liquidity ratios and compare results.
(LO 2)NORDSTROM, INC.
Balance Sheet (partial)
(in millions) End-of-Year Beginning-of-Year
Cash and cash equivalents $ 795 $ 72Accounts receivable (net) 2,035 1,942Inventory 898 900Prepaid expenses 88 93Other current assets 238 210
Total current assets $4,054 $3,217
Total current liabilities $2,014 $1,601
For the year, net sales were $8,258 and cost of goods sold was $5,328 (in millions).

820 18 Financial Statement Analysis
Instructions(a) Compute the four liquidity ratios at the end of the year.(b) Using the data in the chapter, compare Nordstrom’s liquidity with (1) that of Macy’s,
Inc., and (2) the industry averages for department stores.
E18-6 Keener Incorporated had the following transactions occur involving current assets and current liabilities during February 2017.
Feb. 3 Accounts receivable of $15,000 are collected. 7 Equipment is purchased for $28,000 cash. 11 Paid $3,000 for a 3-year insurance policy. 14 Accounts payable of $12,000 are paid. 18 Cash dividends of $5,000 are declared.
Additional information:
1. As of February 1, 2017, current assets were $110,000, and current liabilities were $50,000.2. As of February 1, 2017, current assets included $15,000 of inventory and $2,000 of
prepaid expenses.
Instructions(a) Compute the current ratio as of the beginning of the month and after each transaction.(b) Compute the acid-test ratio as of the beginning of the month and after each transaction.
E18-7 Frizell Company has the following comparative balance sheet data.
Perform current and acid-test ratio analysis.
(LO 2)
Compute selected ratios.
(LO 2) FRIZELL COMPANYBalance SheetsDecember 31
2017 2016
Cash $ 15,000 $ 30,000Accounts receivable (net) 70,000 60,000Inventory 60,000 50,000Plant assets (net) 200,000 180,000
$345,000 $320,000
Accounts payable $ 50,000 $ 60,000Mortgage payable (6%) 100,000 100,000Common stock, $10 par 140,000 120,000Retained earnings 55,000 40,000
$345,000 $320,000
Additional information for 2017:
1. Net income was $25,000.2. Sales on account were $410,000. Sales returns and allowances were $20,000.3. Cost of goods sold was $198,000.
InstructionsCompute the following ratios at December 31, 2017.
(a) Current ratio. (c) Accounts receivable turnover.(b) Acid-test ratio. (d) Inventory turnover.
E18-8 Selected comparative statement data for Queen Products Company are presented below. All balance sheet data are as of December 31.
Compute selected ratios.
(LO 2)
2017 2016
Net sales $750,000 $720,000Cost of goods sold 480,000 440,000Interest expense 7,000 5,000Net income 45,000 42,000Accounts receivable 120,000 100,000Inventory 85,000 75,000Total assets 580,000 500,000Total common stockholders’ equity 430,000 325,000

Exercises 821
InstructionsCompute the following ratios for 2017.
(a) Profi t margin. (c) Return on assets.(b) Asset turnover. (d) Return on common stockholders’ equity.
E18-9 The income statement for Sutherland, Inc., appears below. Compute selected ratios.
(LO 2)
SUTHERLAND, INC.Income Statement
For the Year Ended December 31, 2017
Net sales $400,000Cost of goods sold 230,000
Gross profi t 170,000Expenses (including $16,000 interest and $24,000 income taxes) 105,000
Net income $ 65,000
Additional information:
1. The weighted-average common shares outstanding in 2017 were 30,000 shares.2. The market price of Sutherland, Inc. stock was $13 in 2017.3. Cash dividends of $26,000 were paid, $5,000 of which were to preferred stockholders.
InstructionsCompute the following ratios for 2017.
(a) Earnings per share. (c) Payout ratio.(b) Price-earnings ratio. (d) Times interest earned.
E18-10 Lingenfelter Corporation experienced a fi re on December 31, 2017, in which its fi nancial records were partially destroyed. It has been able to salvage some of the records and has ascertained the following balances.
Compute amounts from ratios.
(LO 2)
December 31, 2017 December 31, 2016
Cash $ 30,000 $ 10,000Accounts receivable (net) 72,500 126,000Inventory 200,000 180,000Accounts payable 50,000 90,000Notes payable 30,000 60,000Common stock, $100 par 400,000 400,000Retained earnings 113,500 101,000
Additional information:
1. The inventory turnover is 4.5 times.2. The return on common stockholders’ equity is 16%. The company had no additional
paid-in capital.3. The accounts receivable turnover is 8.8 times.4. The return on assets is 12.5%.5. Total assets at December 31, 2016, were $655,000.
InstructionsCompute the following for Lingenfelter Corporation.
(a) Cost of goods sold for 2017. (c) Net income for 2017.(b) Net sales (credit) for 2017. (d) Total assets at December 31, 2017.
E18-11 Wiemers Corporation’s comparative balance sheets are presented on the next page. Compute ratios.
(LO 2)

822 18 Financial Statement Analysis
WIEMERS CORPORATIONBalance SheetsDecember 31
2017 2016
Cash $ 4,300 $ 3,700Accounts receivable (net) 21,200 23,400Inventory 10,000 7,000Land 20,000 26,000Buildings 70,000 70,000Accumulated depreciation—buildings (15,000) (10,000)
Total $110,500 $120,100
Accounts payable $ 12,370 $ 31,100Common stock 75,000 69,000Retained earnings 23,130 20,000
Total $110,500 $120,100
Wiemers’s 2017 income statement included net sales of $100,000, cost of goods sold of $60,000, and net income of $15,000.
InstructionsCompute the following ratios for 2017.
(a) Current ratio. (f) Asset turnover.(b) Acid-test ratio. (g) Return on assets.(c) Accounts receivable turnover. (h) Return on common stockholders’ equity.(d) Inventory turnover. (i) Debt to assets ratio.(e) Profi t margin.
E18-12 For its fi scal year ending October 31, 2017, Haas Corporation reports the following partial data shown below.
Prepare a correct statement of comprehensive income.
(LO 3)
Income before income taxes $540,000Income tax expense (20% 3 $420,000) 84,000
Income from continuing operations 456,000Loss on discontinued operations 120,000
Net income $336,000
The loss on discontinued operations was comprised of a $50,000 loss from operations and a $70,000 loss from disposal. The income tax rate is 20% on all items.
Instructions(a) Prepare a correct statement of comprehensive income beginning with income before
income taxes.(b) Explain in memo form why the income statement data are misleading.
E18-13 Trayer Corporation has income from continuing operations of $290,000 for the year ended December 31, 2017. It also has the following items (before considering income taxes).
1. An unrealized loss of $80,000 on available-for-sale securities.2. A gain of $30,000 on the discontinuance of a division (comprised of a $10,000 loss from
operations and a $40,000 gain on disposal).3. A correction of an error in last year’s fi nancial statements that resulted in a $20,000
understatement of 2016 net income.
Assume all items are subject to income taxes at a 20% tax rate.
InstructionsPrepare a statement of comprehensive income, beginning with income from continuing operations.
Prepare statement of comprehensive income.
(LO 3)

Problems 823
EXERCISES: SET B AND CHALLENGE EXERCISES
Visit the book’s companion website, at www.wiley.com/college/weygandt, and choose the Student Companion site to access Exercises: Set B and Challenge Exercises.
PROBLEMS
Follow the rounding procedures used in the chapter.
P18-1 Comparative statement data for Farris Company and Ratzlaff Company, two com-petitors, appear below. All balance sheet data are as of December 31, 2017, and December 31, 2016.
Prepare vertical analysis and comment on profi tability.
(LO 1, 2)
Farris Company Ratzlaff Company
2017 2016 2017 2016
Net sales $1,549,035 $339,038Cost of goods sold 1,080,490 241,000Operating expenses 302,275 79,000Interest expense 8,980 2,252Income tax expense 54,500 6,650Current assets 325,975 $312,410 83,336 $ 79,467Plant assets (net) 521,310 500,000 139,728 125,812Current liabilities 65,325 75,815 35,348 30,281Long-term liabilities 108,500 90,000 29,620 25,000Common stock, $10 par 500,000 500,000 120,000 120,000Retained earnings 173,460 146,595 38,096 29,998
Instructions(a) Prepare a vertical analysis of the 2017 income statement data for Farris Company and
Ratzlaff Company in columnar form.(b) Comment on the relative profi tability of the companies by computing the
return on assets and the return on common stockholders’ equity for both companies.
P18-2 The comparative statements of Painter Tool Company are presented below and on page 824.
Compute ratios from balance sheet and income statement.
(LO 2)
PAINTER TOOL COMPANYIncome Statement
For the Years Ended December 31
2017 2016
Net sales $1,818,500 $1,750,500Cost of goods sold 1,011,500 996,000
Gross profi t 807,000 754,500Selling and administrative expenses 499,000 479,000
Income from operations 308,000 275,500Other expenses and losses Interest expense 18,000 14,000
Income before income taxes 290,000 261,500Income tax expense 87,000 77,000
Net income $ 203,000 $ 184,500

824 18 Financial Statement Analysis
PAINTER TOOL COMPANYBalance SheetsDecember 31
Assets 2017 2016
Current assets Cash $ 60,100 $ 64,200 Short-term investments 69,000 50,000 Accounts receivable (net) 107,800 102,800 Inventory 133,000 115,500
Total current assets 369,900 332,500
Plant assets (net) 600,300 520,300
Total assets $970,200 $852,800
Liabilities and Stockholders’ Equity
Current liabilities Accounts payable $160,000 $145,400 Income taxes payable 43,500 42,000
Total current liabilities 203,500 187,400
Bonds payable 200,000 200,000
Total liabilities 403,500 387,400
Stockholders’ equity Common stock ($5 par) 280,000 300,000 Retained earnings 286,700 165,400
Total stockholders’ equity 566,700 465,400
Total liabilities and stockholders’ equity $970,200 $852,800
All sales were on account.
InstructionsCompute the following ratios for 2017. (Weighted-average common shares in 2017 were 57,000.)
(a) Earnings per share. (f) Accounts receivable turnover.(b) Return on common stockholders’ equity. (g) Inventory turnover.(c) Return on assets. (h) Times interest earned.(d) Current ratio. (i) Asset turnover.(e) Acid-test ratio. (j) Debt to assets ratio.
P18-3 Condensed balance sheet and income statement data for Landwehr Corporation appear below and on page 825.
Perform ratio analysis, and evaluate fi nancial position and operating results.
(LO 2)LANDWEHR CORPORATION
Balance SheetsDecember 31
2018 2017 2016
Cash $ 25,000 $ 20,000 $ 18,000Accounts receivable (net) 50,000 45,000 48,000Other current assets 90,000 95,000 64,000Investments 75,000 70,000 45,000Plant and equipment (net) 400,000 370,000 358,000
$640,000 $600,000 $533,000
Current liabilities $ 75,000 $ 80,000 $ 70,000Long-term debt 80,000 85,000 50,000Common stock, $10 par 340,000 310,000 300,000Retained earnings 145,000 125,000 113,000
$640,000 $600,000 $533,000

Problems 825
LANDWEHR CORPORATIONIncome Statement
For the Years Ended December 31
2018 2017
Sales revenue $740,000 $700,000Less: Sales returns and allowances 40,000 50,000
Net sales 700,000 650,000Cost of goods sold 420,000 400,000
Gross profi t 280,000 250,000Operating expenses (including income taxes) 235,000 220,000
Net income $ 45,000 $ 30,000
Additional information:
1. The market price of Landwehr’s common stock was $4.00, $5.00, and $8.00 for 2016, 2017, and 2018, respectively.
2. All dividends were paid in cash.
Instructions(a) Compute the following ratios for 2017 and 2018.
(1) Profi t margin.(2) Asset turnover.(3) Earnings per share. (Weighted-average common shares in 2018 were 32,000 and
in 2017 were 31,000.)(4) Price-earnings ratio.(5) Payout ratio.(6) Debt to assets ratio.
(b) Based on the ratios calculated, discuss briefl y the improvement or lack thereof in fi nancial position and operating results from 2017 to 2018 of Landwehr Corporation.
P18-4 Financial information for Messersmith Company is presented below and on page 826.
Compute ratios, and comment on overall liquidity and profi tability.
(LO 2)
MESSERSMITH COMPANYBalance SheetsDecember 31
Assets 2017 2016
Cash $ 70,000 $ 65,000Short-term investments 52,000 40,000Accounts receivable (net) 98,000 80,000Inventory 125,000 135,000Prepaid expenses 29,000 23,000Land 130,000 130,000Building and equipment (net) 180,000 175,000
$684,000 $648,000
Liabilities and Stockholders’ Equity
Notes payable $100,000 $100,000Accounts payable 48,000 42,000Accrued liabilities 50,000 40,000Bonds payable, due 2020 150,000 150,000Common stock, $10 par 200,000 200,000Retained earnings 136,000 116,000
$684,000 $648,000

826 18 Financial Statement Analysis
MESSERSMITH COMPANYIncome Statement
For the Years Ended December 31
2017 2016
Net sales $850,000 $790,000Cost of goods sold 620,000 575,000
Gross profi t 230,000 215,000Operating expenses 187,000 173,000
Net income $ 43,000 $ 42,000
Additional information:
1. Inventory at the beginning of 2016 was $118,000.2. Total assets at the beginning of 2016 were $630,000.3. No common stock transactions occurred during 2016 or 2017.4. All sales were on account. Accounts receivable, net at the beginning of 2016, were
$88,000.5. Notes payable are classifi ed as current liabilities.
Instructions(a) Indicate, by using ratios, the change in liquidity and profi tability of Messersmith
Company from 2016 to 2017. (Note: Not all profi tability ratios can be computed.)(b) Given below are three independent situations and a ratio that may be affected. For
each situation, compute the affected ratio (1) as of December 31, 2017, and (2) as of December 31, 2018, after giving effect to the situation. Net income for 2018 was $50,000. Total assets on December 31, 2018, were $700,000.
Situation Ratio
(1) 18,000 shares of common stock were sold Return on common stockholders’at par on July 1, 2018. equity
(2) All of the notes payable were paid in 2018. Debt to assets ratioThe only change in liabilities was that the notes payable were paid.
(3) Market price of common stock was $9 Price-earnings ratioon December 31, 2017, and $12.80 on December 31, 2018.
P18-5 Selected fi nancial data of Target Corporation and Wal-Mart Stores, Inc. for a recent year are presented here (in millions).
Compute selected ratios, and compare liquidity, profi tability, and solvency for two companies.
(LO 2) Target Wal-Mart Corporation Stores, Inc.
Income Statement Data for Year
Net sales $61,471 $374,526Cost of goods sold 41,895 286,515Selling and administrative expenses 16,200 70,847Interest expense 647 1,798Other income (expense) 1,896 4,273Income tax expense 1,776 6,908
Net income $ 2,849 $ 12,731
Balance Sheet Data (End of Year)
Current assets $18,906 $ 47,585Noncurrent assets 25,654 115,929
Total assets $44,560 $163,514
Current liabilities $11,782 $ 58,454Long-term debt 17,471 40,452Total stockholders’ equity 15,307 64,608
Total liabilities and stockholders’ equity $44,560 $163,514

Problems 827
Instructions(a) For each company, compute the following ratios.
(1) Current ratio. (7) Asset turnover.(2) Accounts receivable turnover. (8) Return on assets.(3) Average collection period. (9) Return on common stockholders’ equity.(4) Inventory turnover. (10) Debt to assets ratio.(5) Days in inventory. (11) Times interest earned.(6) Profi t margin.
(b) Compare the liquidity, profi tability, and solvency of the two companies.
P18-6 The comparative statements of Corbin Company are presented below and on page 828.
Compute numerous ratios.
(LO 2)
Target Wal-Mart Corporation Stores, Inc.
Beginning-of-Year Balances
Total assets $37,349 $151,587Total stockholders’ equity 15,633 61,573Current liabilities 11,117 52,148Total liabilities 21,716 90,014
Other Data
Average net accounts receivable $ 7,124 $ 3,247Average inventory 6,517 34,433Net cash provided by operating activities 4,125 20,354
CORBIN COMPANYIncome Statement
For the Years Ended December 31
2017 2016
Net sales (all on account) $595,000 $520,000
Expenses Cost of goods sold 415,000 354,000 Selling and administrative 120,800 114,800 Interest expense 7,800 6,000 Income tax expense 15,000 14,000
Total expenses 558,600 488,800
Net income $ 36,400 $ 31,200
CORBIN COMPANYBalance SheetsDecember 31
Assets 2017 2016
Current assets Cash $ 21,000 $ 18,000 Short-term investments 18,000 15,000 Accounts receivable (net) 91,000 74,000 Inventory 85,000 70,000
Total current assets 215,000 177,000
Plant assets (net) 423,000 383,000
Total assets $638,000 $560,000

828 18 Financial Statement Analysis
Additional data:
The common stock recently sold at $19.50 per share.
InstructionsCompute the following ratios for 2017.
(a) Current ratio. (h) Return on common stockholders’ equity.(b) Acid-test ratio. (i) Earnings per share.(c) Accounts receivable turnover. (j) Price-earnings ratio.(d) Inventory turnover. (k) Payout ratio.(e) Profi t margin. (l) Debt to assets ratio.(f) Asset turnover. (m) Times interest earned.(g) Return on assets.
P18-7 An incomplete income statement and an incomplete comparative balance sheet of Deines Corporation are presented below and on page 829.
Compute missing information given a set of ratios.
(LO 2)
Liabilities and Stockholders’ Equity 2017 2016
Current liabilities Accounts payable $122,000 $110,000 Income taxes payable 23,000 20,000
Total current liabilities 145,000 130,000
Long-term liabilities Bonds payable 120,000 80,000
Total liabilities 265,000 210,000
Stockholders’ equity Common stock ($5 par) 150,000 150,000 Retained earnings 223,000 200,000
Total stockholders’ equity 373,000 350,000
Total liabilities and stockholders’ equity $638,000 $560,000
DEINES CORPORATIONIncome Statement
For the Year Ended December 31, 2017
Net sales $11,000,000Cost of goods sold ?
Gross profi t ?Operating expenses 1,665,000
Income from operations ?Other expenses and losses Interest expense ?
Income before income taxes ?Income tax expense 560,000
Net income $ ?
DEINES CORPORATIONBalance SheetsDecember 31
Assets 2017 2016
Current assets Cash $ 450,000 $ 375,000 Accounts receivable (net) ? 950,000 Inventory ? 1,720,000
Total current assets ? 3,045,000
Plant assets (net) 4,620,000 3,955,000
Total assets $ ? $7,000,000

Problems: Set B 829
Additional information:
1. The accounts receivable turnover for 2017 is 10 times.2. All sales are on account.3. The profi t margin for 2017 is 14.5%.4. Return on assets is 22% for 2017.5. The current ratio on December 31, 2017, is 3.0.6. The inventory turnover for 2017 is 4.8 times.
InstructionsCompute the missing information given the ratios above. Show computations. (Note: Start with one ratio and derive as much information as possible from it before trying another ratio. List all missing amounts under the ratio used to fi nd the information.)
P18-8 Terwilliger Corporation owns a number of cruise ships and a chain of hotels. The hotels, which have not been profi table, were discontinued on September 1, 2017. The 2017 operating results for the company were as follows.
Prepare a statement of comprehensive income.
(LO 3)
Liabilities and Stockholders’ Equity 2017 2016
Current liabilities $ ? $ 825,000Long-term notes payable ? 2,800,000
Total liabilities ? 3,625,000
Common stock, $1 par 3,000,000 3,000,000Retained earnings 400,000 375,000
Total stockholders’ equity 3,400,000 3,375,000
Total liabilities and stockholders’ equity $ ? $7,000,000
Operating revenues $12,850,000Operating expenses 8,700,000
Operating income $ 4,150,000
Analysis discloses that these data include the operating results of the hotel chain, which were operating revenues $1,500,000 and operating expenses $2,400,000. The hotels were sold at a gain of $200,000 before taxes. This gain is not included in the operating results. During the year, Terwilliger had an unrealized loss on its available-for-sale securities of $600,000 before taxes, which is not included in the operating results. In 2017, the com-pany had other revenues and gains of $100,000, which are not included in the operating results. The corporation is in the 30% income tax bracket.
InstructionsPrepare a statement of comprehensive income.
P18-9 The ledger of Jaime Corporation at December 31, 2017, contains the following summary data.
Prepare a statement of comprehensive income.
(LO 3)Net sales $1,700,000 Cost of goods sold $1,100,000Selling expenses 120,000 Administrative expenses 150,000Other revenues and gains 20,000 Other expenses and losses 28,000
Your analysis reveals the following additional information that is not included in the above data.
1. The entire Puzzles Division was discontinued on August 31. The income from operation for this division before income taxes was $20,000. The Puzzles Division was sold at a loss of $90,000 before income taxes.
2. The company had an unrealized gain on available-for-sale securities of $120,000 before income taxes for the year.
3. The income tax rate on all items is 25%.
InstructionsPrepare a statement of comprehensive income for the year ended December 31, 2017.
PROBLEMS: SET B
Visit the book’s companion website, at www.wiley.com/college/weygandt, and choose the Student Companion site to access Problems: Set B.

830 18 Financial Statement Analysis
CONTINUING PROBLEM
COOKIE CREATIONS: AN ENTREPRENEURIAL JOURNEY(Note: This is a continuation of the Cookie Creations problem from Chapters 1 through 17.)
CC18 Natalie and Curtis have the balance sheet and income statement for the fi rst year of operations for Cookie & Coffee Creations Inc. They have been told that they can use these fi nancial statements to prepare horizontal and vertical analyses, and to calculate fi nancial ratios, to determine how their business is doing and to make some decisions they have been considering.
Go to the book’s companion website, www.wiley.com/college/weygandt, to see the completion of this problem.
© leungchopan/Shutterstock
PERSPECTIVEFINANCIAL REPORTING AND ANALYSIS
Financial Reporting Problem: Apple Inc.BYP18-1 Your parents are considering investing in Apple Inc. common stock. They ask you, as an accounting expert, to make an analysis of the company for them. Apple’s fi nancial statements are presented in Appendix A. Instructions for accessing and using the company’s complete annual report, including the notes to the fi nancial statements, are also provided in Appendix A.Instructions(Follow the approach in the chapter for rounding numbers.)
(a) Make a 3-year trend analysis, using 2011 as the base year, of (1) net sales and (2) net income. Comment on the signifi cance of the trend results.
(b) Compute for 2013 and 2012 the (1) profi t margin, (2) asset turnover, (3) return on assets, and (4) return on common stockholders’ equity. How would you evaluate Apple’s profi tability? Total assets at September 24, 2011, were $116,371 and total stockholders’ equity at September 24, 2011, was $76,615.
(c) Compute for 2013 and 2012 the (1) debt to assets ratio and (2) times interest earned. How would you evaluate Apple’s long-term solvency?
(d) What information outside the annual report may also be useful to your parents in making a deci-sion about Apple?
Comparative Analysis Problem: PepsiCo, Inc. vs. The Coca-Cola CompanyBYP18-2 PepsiCo’s fi nancial statements are presented in Appendix B. Financial statements of TheCoca-Cola Company are presented in Appendix C. Instructions for accessing and using the complete annual reports of PepsiCo and Coca-Cola, including the notes to the fi nancial statements, are also provided in Appendices B and C, respectively.Instructions(a) Based on the information contained in these fi nancial statements, determine each of the following
for each company.(1) The percentage increase (decrease) in (i) net sales and (ii) net income from 2012 to 2013.(2) The percentage increase in (i) total assets and (ii) total common stockholders’ (shareholders’)
equity from 2012 to 2013.(3) The basic earnings per share and price-earnings ratio for 2013. (For both PepsiCo and
Coca-Cola, use the basic earnings per share.) Coca-Cola’s common stock had a market price of $41.31 at the end of fi scal-year 2013, and PepsiCo’s common stock had a market price of $82.71.
(b) What conclusions concerning the two companies can be drawn from these data?
Comparative Analysis Problem: Amazon.com, Inc. vs. Wal-Mart Stores, Inc.BYP18-3 Amazon.com, Inc.’s fi nancial statements are presented in Appendix D. Financial statements of Wal-Mart Stores, Inc. are presented in Appendix E. Instructions for accessing and using the complete
BROADENING YOUR

annual reports of Amazon and Wal-Mart, including the notes to be fi nancial statements, are also pro-vided in Appendices D and E, respectively.
Instructions(a) Based on the information contained in these fi nancial statements, determine each of the following
for each company. (1) The percentage increase (decrease) in (i) net sales and (ii) net income from 2012 to 2013. (2) The percentage increase in (i) total assets and (ii) total common stockholders’ (shareholders’)
equity from 2012 to 2013. (3) The basic earnings per share and price-earnings ratio for 2013. (For both Amazon and Wal-Mart,
use the basic earnings per share.) Amazon’s common stock had a market price of $398.79 at the end of fi scal-year 2013, and Wal-Mart’s common stock had a market price of $74.68.
(b) What conclusions concerning the two companies can be drawn from these data?
Decision-Making Across the OrganizationBYP18-4 As the CPA for Gandara Manufacturing Inc., you have been asked to develop some key ratios from the comparative fi nancial statements. This information is to be used to convince creditors that the company is solvent and will continue as a going concern. The data requested and the compu-tations developed from the fi nancial statements follow.
2017 2016
Current ratio 3.1 times 2.1 timesAcid-test ratio .8 times 1.4 timesAsset turnover 2.8 times 2.2 timesNet income Up 32% Down 8%Earnings per share $3.30 $2.50
InstructionsWith the class divided into groups, complete the following.
Gandara Manufacturing Inc. asks you to prepare a list of brief comments stating how each of these items supports the solvency and going-concern potential of the business. The company wishes to use these com-ments to support its presentation of data to its creditors. You are to prepare the comments as requested, giving the implications and the limitations of each item separately. Then prepare a collective inference that may be drawn from the individual items about Gandara’s solvency and going-concern potential.
Real-World FocusBYP18-5 The Management Discussion and Analysis section of an annual report addresses corporate performance for the year and sometimes uses fi nancial ratios to support its claims.
Address: www.ibm.com/investor/tools/index.phtml, or go to www.wiley.com/college/weygandt
Steps1. Choose How to read annual reports (in the Guides section).2. Choose Anatomy.
InstructionsUsing the information from the above site, answer the following questions.
(a) What are the optional elements that are often included in an annual report?(b) What are the elements of an annual report that are required by the SEC?(c) Describe the contents of the Management Discussion.(d) Describe the contents of the Auditors’ Report.(e) Describe the contents of the Selected Financial Data.
CRITICAL THINKING
Communication ActivityBYP18-6 Abby Landis is the CEO of Pletcher’s Electronics. Landis is an expert engineer but a novice in accounting. She asks you to explain the bases for comparison in analyzing Pletcher’s fi nancial statements.
InstructionsWrite a letter to Abby Landis that explains the bases for comparison.
Broadening Your Perspective 831

832 18 Financial Statement Analysis
Ethics CaseBYP18-7 Dave Schonhardt, president of Schonhardt Industries, wishes to issue a press release to bolster his company’s image and maybe even its stock price, which has been gradually falling. As con-troller, you have been asked to provide a list of 20 fi nancial ratios along with some other operating statistics relative to Schonhardt Industries’ fi rst quarter fi nancials and operations. Two days after you provide the ratios and data requested, Steven Verlin, the public relations director of Schonhardt, asks you to prove the accuracy of the fi nancial and operating data contained in the press release written by the president and edited by Steven. In the press release, the president highlights the sales increase of 25% over last year’s fi rst quarter and the positive change in the current ratio from 1.5:1 last year to 3:1 this year. He also emphasizes that production was up 50% over the prior year’s fi rst quarter. You note that the press release contains only positive or improved ratios and none of the negative or deteriorated ratios. For instance, no mention is made that the debt to assets ratio has increased from 35% to 55%, that inventories are up 89%, and that while the current ratio improved, the acid-test ratio fell from 1:1 to 0.5:1. Nor is there any mention that the reported profi t for the quarter would have been a loss had not the estimated lives of Schonhardt’s plant and machinery been increased by 30%. Steven emphasizes, “The prez wants this release by early this afternoon.”
Instructions(a) Who are the stakeholders in this situation?(b) Is there anything unethical in president Schonhardt’s actions?(c) Should you as controller remain silent? Does Steven have any responsibility?
All About YouBYP18-8 In this chapter, you learned how to use many tools for performing a fi nancial analysis of a com-pany. When making personal investments, however, it is most likely that you won’t be buying stocks and bonds in individual companies. Instead, when most people want to invest in stock, they buy mutual funds. By investing in a mutual fund, you reduce your risk because the fund diversifi es by buying the stock of a variety of different companies, bonds, and other investments, depending on the stated goals of the fund. Before you invest in a fund, you will need to decide what type of fund you want. For example, do you want a fund that has the potential of high growth (but also high risk), or are you looking for lower risk and a steady stream of income? Do you want a fund that invests only in U.S. companies, or do you want one that invests globally? Many resources are available to help you with these types of decisions.
InstructionsGo to http://web.archive.org/web/20050210200843/http://www.cnb1.com/invallocmdl.htm and complete the investment allocation questionnaire. Add up your total points to determine the type of investment fund that would be appropriate for you.
FASB Codifi cation ActivityBYP18-9 If your school has a subscription to the FASB Codifi cation, go to http://aaahq.org/ascLogin.cfm to log in and prepare responses to the following. Use the Master Glossary for deter-mining the proper defi nitions.
(a) Discontinued operations.(b) Comprehensive income.
A Look at IFRS
4 Compare fi nancial statement analysis and income statement presentation under GAAP and IFRS.
LEARNING OBJECTIVE
The tools of fi nancial statement analysis, covered in the fi rst section of this chapter, are the same throughout the world. Techniques such as vertical and horizontal analysis, for example, are tools used by analysts regardless of whether GAAP- or IFRS-related fi nancial statements are being evalu-ated. In addition, the ratios provided in the textbook are the same ones that are used internationally.

A Look at IFRS 833
The latter part of this chapter relates to the income statement and irregular items. As in GAAP, the income statement is a required statement under IFRS. In addition, the content and presentation of an IFRS income statement is similar to the one used for GAAP.
Relevant FactsFollowing are the key similarities between GAAP and IFRS as related to fi nancial statement analysis and income statement presentation. There are no signifi cant differences between the two standards.
• The tools of fi nancial statement analysis covered in this chapter are universal and therefore no signifi cant differences exist in the analysis methods used.
• The basic objectives of the income statement are the same under both GAAP and IFRS. A very important objective is to ensure that users of the income statement can evaluate the sustainable income of the company.
• The basic accounting for discontinued operations is the same under IFRS and GAAP.• The accounting for changes in accounting principles and changes in accounting estimates are the
same for both GAAP and IFRS.• Both GAAP and IFRS follow the same approach in reporting comprehensive income.
Looking to the FutureThe FASB and the IASB are working on a project that would rework the structure of fi nancial state-ments. Recently, the IASB decided to require a statement of comprehensive income, similar to what was required under GAAP.
IFRS Practice
IFRS Self-Test Questions
1. The basic tools of fi nancial analysis are the same under both GAAP and IFRS except that:(a) horizontal analysis cannot be done because the format of the statements is sometimes different.(b) analysis is different because vertical analysis cannot be done under IFRS.(c) the current ratio cannot be computed because current liabilities are often reported before
current assets in IFRS statements of position.(d) None of the above.
2. Presentation of comprehensive income must be reported under IFRS in:(a) the statement of stockholders’ equity. (c) the notes to the fi nancial statements.(b) the income statement ending with net income. (d) a statement of comprehensive income.
3. In preparing its income statement for 2017, Parmalane assembles the following information.
Sales revenue $500,000Cost of goods sold 300,000Operating expenses 40,000Loss on discontinued operations 20,000
Ignoring income taxes, what is Parmalane’s income from continuing operations for 2017 under IFRS?
(a) $260,000. (c) $240,000.(b) $250,000 (d) $160,000.
International Financial Reporting Problem: Louis Vuitton
IFRS18-1 The fi nancial statements of Louis Vuitton are presented in Appendix F. Instructions for accessing and using the company’s complete annual report, including the notes to its fi nancial state-ments, are also provided in Appendix F.
InstructionsUse the company’s 2013 annual report to answer the following questions.
(a) What was the company’s profi t margin for 2013? Has it increased or decreased from 2011?(b) What was the company’s operating profi t for 2013?(c) The company reported comprehensive income of €4,255 billion in 2013. What are the other com-
prehensive gains and losses recorded in 2013?
Answers to IFRS Self-Test Questions1. d 2. d 3. d

Mike Cichanowski grew up on the Mississippi River in Winona,
Minnesota. At a young age, he learned to paddle a canoe so
he could explore the river. Before long, Mike began crafting
his own canoes from bent wood and fi berglass in his dad’s
garage. Then, when his canoe-making shop outgrew the
garage, he moved it into an old warehouse. When that was
going to be torn down, Mike came to a critical juncture in his
life. He took out a bank loan and built his own small shop,
giving birth to the company Wenonah Canoe.
Wenonah Canoe soon became known as a pioneer in
developing techniques to get the most out of new materials
such as plastics, composites, and carbon fi bers—maximizing
strength while minimizing weight.
In the 1990s, as kayaking became popular, Mike made
another critical decision when he acquired Current Designs,
a premier Canadian kayak manufacturer. This venture allowed
Wenonah to branch out with new product lines while
providing Current Designs with much-needed capacity
expansion and manufacturing expertise. Mike moved Current
Designs’ headquarters to Minnesota and made a big (and
potentially risky) investment in a new production facility.
Today, the company’s 90 employees produce about 12,000
canoes and kayaks per year. These are sold across the country
and around the world.
Mike will tell you that business success is “a three-legged
stool.” The fi rst leg is the knowledge and commitment to
make a great product. Wenonah’s canoes and Current
Designs’ kayaks are widely regarded as among the very best.
The second leg is the ability to sell your product. Mike’s
company started off making great canoes, but it took a little
longer to fi gure out how to sell them. The third leg is not
something that most of you would immediately associate
with entrepreneurial success. It is what goes on behind the
scenes—accounting. Good accounting information is
absolutely critical to the countless decisions, big and small,
that ensure the survival and growth of the company.
Bottom line: No matter how good your product is, and no
matter how many units you sell, if you don’t have a fi rm grip
on your numbers, you are up a creek without a paddle.
Source: www.wenonah.com.
Just Add Water … and Paddle
This chapter focuses on issues illustrated in the Feature Story below about Current Designs and its parent company Wenonah Canoe. To succeed, the company needs to determine and control the costs of material, labor, and overhead, and understand the relationship between costs and profi ts. Managers often make decisions that determine their company’s fate—and their own. Managers are evaluated on the results of their decisions. Managerial accounting provides tools to assist management in making decisions and to evaluate the effectiveness of those decisions.
CHAPTER PREVIEW
19
FEATURE STORY
Managerial Accounting
834
Watch the What Is Managerial Accounting? video in WileyPLUS for an introduction to managerial accounting and the topics presented in Chapters 19–26.
▲

Discuss trends in managerial accounting.
Describe the classes of manufacturing costs and the differences between product and period costs.
Demonstrate how to compute cost of goods manufactured and prepare fi nancial statements for a manufacturer.
2
3
4
Identify the features of managerial accounting and the functions of management.
1 Managerial Accounting Overview
DO IT! 1
• Comparing managerial and fi nancial accounting
• Management functions• Organizational structure
• Manufacturing costs• Product vs. period costs• Illustration of cost concepts
Learning Objectives
Cost of Goods ManufacturedDO IT! 3
• Income statement• Cost of goods manufactured
schedule• Balance sheet
Trends in Managerial Accounting
DO IT! 4
• Service industries• Value chain• Balanced scorecard• Business ethics• Corporate social responsibility
Go to the REVIEW AND PRACTICE section at the end of the chapter for a review of key concepts and practice applications with solutions.
Visit WileyPLUS with ORION for additional tutorials and practice opportunities.
CHAPTER OUTLINE
© iNoppadal/Shutterstock
Managerial Cost Concepts2DO IT!

836 19 Managerial Accounting
1 Identify the features of managerial accounting and the functions of management.
LEARNING OBJECTIVE
Managerial accounting provides economic and fi nancial information for man-agers and other internal users. The skills that you learn in this course will be vital to your future success in business. You don’t believe us? Let’s look at some exam-ples of some of the crucial activities of employees at Current Designs and where those activities are addressed in this textbook. In order to know whether it is making a profi t, Current Designs needs accu-rate information about the cost of each kayak (Chapters 20 and 21). To be profi t-able, Current Designs adjusts the number of kayaks it produces in response to changes in economic conditions and consumer tastes. It needs to understand how changes in the number of kayaks it produces impact its production costs and profi tability (Chapter 22). Further, Current Designs’ managers often consider alternative courses of action. For example, should the company accept a special order from a customer, produce a particular kayak component internally or out-source it, or continue or discontinue a particular product line (Chapter 26)? In order to plan for the future, Current Designs prepares budgets (Chapter 23), and it then compares its budgeted numbers with its actual results to evaluate performance and identify areas that need to change (Chapters 24 and 25). Finally, it sometimes needs to make substantial investment decisions, such as the build-ing of a new plant or the purchase of new equipment (Chapter 26). Someday, you are going to face decisions just like these. You may end up in sales, marketing, management, production, or fi nance. You may work for a com-pany that provides medical care, produces software, or serves up mouth-watering meals. No matter what your position is and no matter what your product, the skills you acquire in this class will increase your chances of business success. Put another way, in business you can either guess or you can make an informed decision. As a CEO of Microsoft once noted: “If you’re supposed to be making money in business and supposed to be satisfying customers and building mar-ket share, there are numbers that characterize those things. And if somebody can’t speak to me quantitatively about it, then I’m nervous.” This course gives you the skills you need to quantify information so you can make informed business decisions.
Comparing Managerial and Financial Accounting
There are both similarities and differences between managerial and fi nancial accounting. First, each fi eld of accounting deals with the economic events of a business. For example, determining the unit cost of manufacturing a product is part of managerial accounting. Reporting the total cost of goods manufactured and sold is part of fi nancial accounting. In addition, both managerial and fi nancial accounting require that a company’s economic events be quantifi ed and commu-nicated to interested parties. Illustration 19-1 summarizes the principal differ-ences between fi nancial accounting and managerial accounting.
Management Functions
Managers’ activities and responsibilities can be classifi ed into three broad functions:
1. Planning.
2. Directing.
3. Controlling.
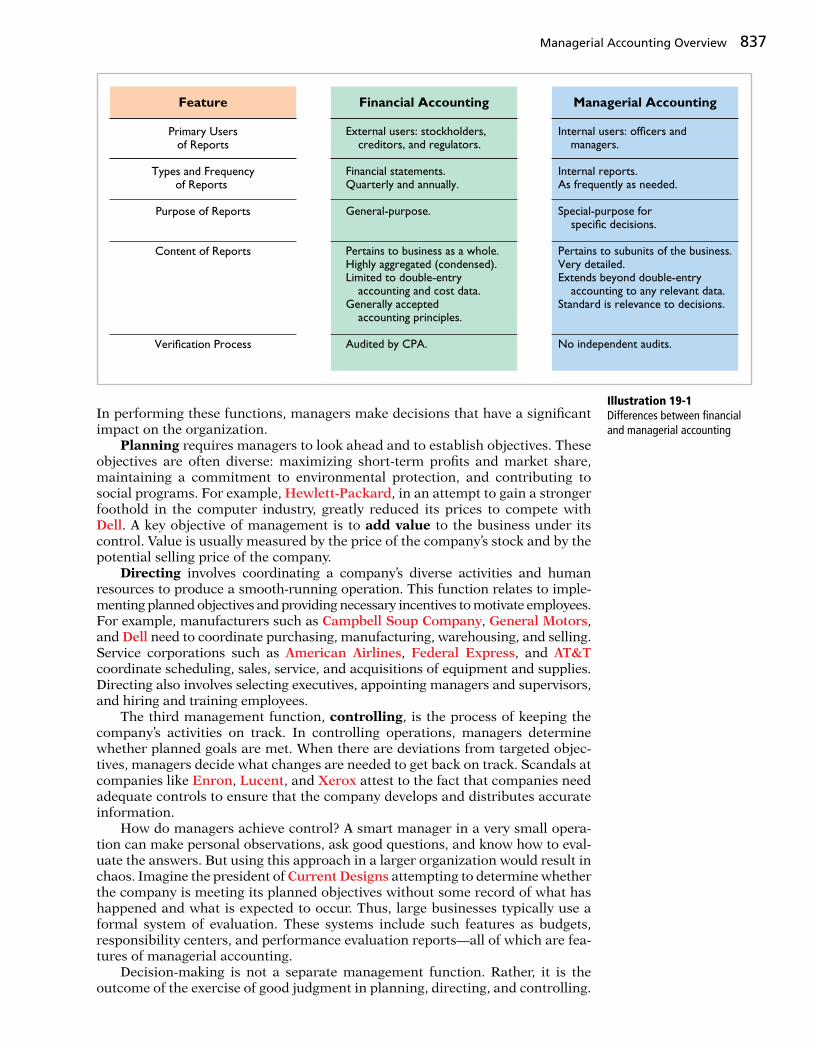
Managerial Accounting Overview 837
In performing these functions, managers make decisions that have a signifi cant impact on the organization. Planning requires managers to look ahead and to establish objectives. These objectives are often diverse: maximizing short-term profi ts and market share, maintaining a commitment to environmental protection, and contributing to social programs. For example, Hewlett-Packard, in an attempt to gain a stronger foothold in the computer industry, greatly reduced its prices to compete with Dell. A key objective of management is to add value to the business under its control. Value is usually measured by the price of the company’s stock and by the potential selling price of the company. Directing involves coordinating a company’s diverse activities and human resources to produce a smooth-running operation. This function relates to imple-menting planned objectives and providing necessary incentives to motivate employees. For example, manufacturers such as Campbell Soup Company, General Motors, and Dell need to coordinate purchasing, manufacturing, warehousing, and selling. Service corporations such as American Airlines, Federal Express, and AT&T coordinate scheduling, sales, service, and acquisitions of equipment and supplies. Directing also involves selecting executives, appointing managers and supervisors, and hiring and training employees. The third management function, controlling, is the process of keeping the company’s activities on track. In controlling operations, managers determine whether planned goals are met. When there are deviations from targeted objec-tives, managers decide what changes are needed to get back on track. Scandals at companies like Enron, Lucent, and Xerox attest to the fact that companies need adequate controls to ensure that the company develops and distributes accurate information. How do managers achieve control? A smart manager in a very small opera-tion can make personal observations, ask good questions, and know how to eval-uate the answers. But using this approach in a larger organization would result in chaos. Imagine the president of Current Designs attempting to determine whether the company is meeting its planned objectives without some record of what has happened and what is expected to occur. Thus, large businesses typically use a formal system of evaluation. These systems include such features as budgets, responsibility centers, and performance evaluation reports—all of which are fea-tures of managerial accounting. Decision-making is not a separate management function. Rather, it is the outcome of the exercise of good judgment in planning, directing, and controlling.
External users: stockholders, creditors, and regulators.
Financial statements.Quarterly and annually.
General-purpose.
Pertains to business as a whole. Highly aggregated (condensed).Limited to double-entry accounting and cost data.Generally accepted accounting principles.
Audited by CPA.
Primary Usersof Reports
Types and Frequencyof Reports
Purpose of Reports
Content of Reports
Verification Process
Feature Financial Accounting
Internal users: officers and managers.
Internal reports.As frequently as needed.
Special-purpose for specific decisions.
Pertains to subunits of the business.Very detailed.Extends beyond double-entry accounting to any relevant data.Standard is relevance to decisions.
No independent audits.
Managerial Accounting
Illustration 19-1Differences between fi nancial and managerial accounting

838 19 Managerial Accounting
Even the Best Have to Get Better
Luxury-goods manufacturers used to consider stockouts to be a good thing. But recently, Louis Vuitton, a French manu-facturer of high-end handbags, wallets, and suitcases, changed its attitude. The company adopted “lean” processes used by car manufacturers and elec-tronics companies to speed up production of “hot” products.
Work is done by fl exible teams, with jobs organized based on how long a task takes. By reducing wasted time and eliminating bottlenecks, what used to take 20 to 30 workers eight days to do now takes only 6 to 12 workers one day.
Other efforts included organizing 10-person factory teams into U-shaped clusters. This arrangement freed up fl oor space, allowing Louis Vuitton to hire 300 additional employees. The company also selectively employs robots to
bring items to human workers, saving valuable time. In addition, computer programs are now used to identify fl aws in leather skins, enabling the company to identify the best way to cut pieces from the leather to increase quality and minimize waste.
Finally, Louis Vuitton stores around the world feed sales information to the company’s headquarters in France. Pro-duction is then adjusted accordingly to ensure that would-be buyers aren’t left empty-handed. With these new produc-tion processes, Louis Vuitton is already seeing improved results—returns of some products are down by two-thirds.
Sources: Christina Passariello, “Louis Vuitton Tries Modern Methods on Factory Lines,” Wall Street Journal (October 9, 2006); and Christina Passariello, “At Vuitton, Growth in Small Batches,” Wall Street Journal (June 27, 2011).
What are some of the steps that this company has taken in order to ensure that production meets demand? (Go to WileyPLUS for this answer and additional questions.)
© Camilia Wisbauer/iStockphoto
Management Insight Louis Vuitton
Organizational Structure
Most companies prepare organization charts to show the interrelationships of activities and the delegation of authority and responsibility within the company. Illustration 19-2 shows a typical organization chart.
Vice PresidentHuman
Resources
Vice PresidentOperations
Vice PresidentFinance/Chief
Financial Officer
Vice PresidentMarketing
GeneralCounsel/Secretary
Treasurer Controller
Board ofDirectors
Stockholders
Chief ExecutiveOfficer andPresident
Illustration 19-2A typical corporate organization chart

Managerial Accounting Overview 839
Stockholders own the corporation, but they manage it indirectly through a board of directors they elect. The board formulates the operating policies for the company or organization. The board also selects offi cers, such as a president and one or more vice presidents, to execute policy and to perform daily management functions. The chief executive offi cer (CEO) has overall responsibility for managing the business. As the organization chart in Illustration 19-2 shows, the CEO dele-gates responsibilities to other offi cers. Responsibilities within the company are frequently classifi ed as either line or staff positions. Employees with line positions are directly involved in the company’s primary revenue-generating operating activities. Examples of line positions include the vice president of operations, vice president of marketing, plant managers, supervisors, and production personnel. Employees with staff positions are involved in activities that support the efforts of the line employees. In a company like General Electric or Facebook, employees in fi nance, legal, and human resources have staff positions. While activities of staff employees are vital to the company, these employees are nonetheless there to serve the line employees who engage in the company’s primary operations. The chief fi nancial offi cer (CFO) is responsible for all of the accounting and fi nance issues the company faces. The CFO is supported by the controller and the treasurer. The controller’s responsibilities include (1) maintaining the accounting records, (2) ensuring an adequate system of internal control, and (3) preparing fi nancial statements, tax returns, and internal reports. The treasurer has custody of the corporation’s funds and is responsible for maintaining the company’s cash position. Also serving the CFO is the internal audit staff. The staff’s responsibilities include reviewing the reliability and integrity of fi nancial information provided by the controller and treasurer. Staff members also ensure that internal control systems are functioning properly to safeguard corporate assets. In addition, they investigate compliance with policies and regulations. In many companies, these staff members also determine whether resources are used in the most economical and effi cient fashion. The vice president of operations oversees employees with line positions. For example, the company might have multiple plant managers, each of whom reports to the vice president of operations. Each plant also has department managers, such as fabricating, painting, and shipping, each of whom reports to the plant manager.
Indicate whether the following statements are true or false. If false, explain why.
1. Managerial accountants have a single role within an organization: collecting and reporting costs to management.
2. Financial accounting reports are general-purpose and intended for external users.
3. Managerial accounting reports are special-purpose and issued as frequently as needed.
4. Managers’ activities and responsibilities can be classifi ed into three broad functions: cost accounting, budgeting, and internal control.
5. Managerial accounting reports must now comply with generally accepted accounting principles (GAAP).
Solution
DO IT! 1 Managerial Accounting Overview
1. False. Managerial accountants determine product costs. In addition, managerial accountants are now held responsible for evaluating how well the company employs its resources. As a result, when the company makes critical strategic deci-sions, managerial accountants serve as team members alongside personnel from production, marketing, and engineering.
Action Plan✔ Understand that man-
agerial accounting is a fi eld of accounting that provides economic and fi nancial information for managers and other internal users.
✔ Understand that fi nancial accounting provides information for external users.
✔ Analyze which users require which different types of information.

840 19 Managerial Accounting
2. True.
3. True.
4. False. Managers’ activities are classifi ed into three broad functions: planning, directing, and controlling. Planning requires managers to look ahead to establish objectives. Directing involves coordinating a company’s diverse activities and human resources to produce a smooth-running operation. Controlling keeps the company’s activities on track.
5. False. Managerial accounting reports are for internal use and thus do not have to comply with GAAP.
Related exercise material: BE19-1, BE19-2, E19-1, and DO IT! 19-1.
2 Describe the classes of manufacturing costs and the differences between product and period costs.
LEARNING OBJECTIVE
In order for managers at a company like Current Designs to plan, direct, and control operations effectively, they need good information. One very important type of information relates to costs. Managers should ask questions such as the following.
1. What costs are involved in making a product or performing a service?
2. If we decrease production volume, will costs decrease?
3. What impact will automation have on total costs?
4. How can we best control costs?
To answer these questions, managers obtain and analyze reliable and relevant cost information. The fi rst step is to understand the various cost categories that companies use.
Manufacturing Costs
Manufacturing consists of activities and processes that convert raw materials into fi nished goods. Contrast this type of operation with merchandising, which sells products in the form in which they are purchased. Manufacturing costs are classifi ed as direct materials, direct labor, and manufacturing overhead.
DIRECT MATERIALS
To obtain the materials that will be converted into the fi nished product, the man-ufacturer purchases raw materials. Raw materials are the basic materials and parts used in the manufacturing process. Raw materials that can be physically and directly associated with the fi nished product during the manufacturing process are direct materials. Examples include fl our in the baking of bread, syrup in the bottling of soft drinks, and steel in the making of automobiles. A primary direct material of many Current Designs’ kayaks is polyethylene powder. Some of its high-performance kayaks use Kevlar®. Some raw materials cannot be easily associated with the fi nished product. These are called indirect materials. Indirect materials have one of two charac-teristics. (1) They do not physically become part of the fi nished product (such as polishing compounds used by Current Designs for the fi nishing touches on kayaks). Or, (2) they are impractical to trace to the fi nished product because their physical association with the fi nished product is too small in terms of cost (such as cotter pins and lock washers). Companies account for indirect materials as part of manufacturing overhead.
$ $Direct Materials

Managerial Cost Concepts 841
DIRECT LABOR
The work of factory employees that can be physically and directly associated with converting raw materials into fi nished goods is direct labor. Bottlers at Coca-Cola, bakers at Sara Lee, and equipment operators at Current Designs are employees whose activities are usually classifi ed as direct labor. Indirect labor refers to the work of employees that has no physical association with the fi nished product or for which it is impractical to trace costs to the goods produced. Examples include wages of factory maintenance people, factory time-keepers, and factory super-visors. Like indirect materials, companies classify indirect labor as manufacturing overhead.
MANUFACTURING OVERHEAD
Manufacturing overhead consists of costs that are indirectly associated with the manufacture of the fi nished product. Overhead costs also include manufacturing costs that cannot be classifi ed as direct materials or direct labor. Manufacturing overhead includes indirect materials, indirect labor, depreciation on factory build-ings and machines, and insurance, taxes, and maintenance on factory facilities. One study of manufactured goods found the following magnitudes of the three different product costs as a percentage of the total product cost: direct materials 54%, direct labor 13%, and manufacturing overhead 33%. Note that the direct labor component is the smallest. This component of product cost is drop-ping substantially because of automation. Companies are working hard to increase productivity by decreasing labor. In some companies, direct labor has become as little as 5% of the total cost. Allocating direct materials and direct labor costs to specifi c products is fairly straightforward. Good recordkeeping can tell a company how much plastic it used in making each type of gear, or how many hours of factory labor it took to assemble a part. But allocating overhead costs to specifi c products presents prob-lems. How much of the purchasing agent’s salary is attributable to the hundreds of different products made in the same plant? What about the grease that keeps the machines humming, or the computers that make sure paychecks come out on time? Boiled down to its simplest form, the question becomes: Which products cause the incurrence of which costs? In subsequent chapters, we show various methods of allocating overhead to products.
$ $
Direct Labor
$ $Manufacturing
Overhead
Why Manufactur-ing Matters for U.S. Workers
Prior to 2010, U.S. man-ufacturing employment fell at an average rate of 0.1% per year for 60 years. At the same time, U.S. factory out-put increased by an average rate of 3.4%. As manufacturers relied more heavily on auto-mation, the number of people they needed
declined. However, factory jobs are important because the average hourly wage of a factory worker is $22, twice the average wage of employees in the service sector. Fortu-nately, manufacturing jobs in the United States increased
by 1.2% in 2010, and they were forecast to continue to increase through at least 2015. Why? Because companies like Whirlpool, Caterpillar, and Dow are building huge new plants in the United States to replace old, ineffi cient U.S. facilities. For many products that are ultimately sold in the United States, it makes more sense to produce them domestically and save on the shipping costs. In addition, these effi cient new plants, combined with an experienced workforce, will make it possible to compete with manu-facturers in other countries, thereby increasing export potential.
Sources: Bob Tita, “Whirlpool to Invest in Tennessee Plant,” Wall Street Journal Online (September 1, 2010); and James R. Hagerty, “U.S. Factories Buck Decline,” Wall Street Journal Online (January 19, 2011).
In what ways does the shift to automated factories change the amount and composition of product costs? (Go to WileyPLUS for this answer and additional questions.)
bikeriderlondon/Shutterstock
Management Insight Whirlpool
Alternative TerminologySome companies use terms such as factory overhead, indirect manufacturing costs, and burden instead of manufacturing overhead.
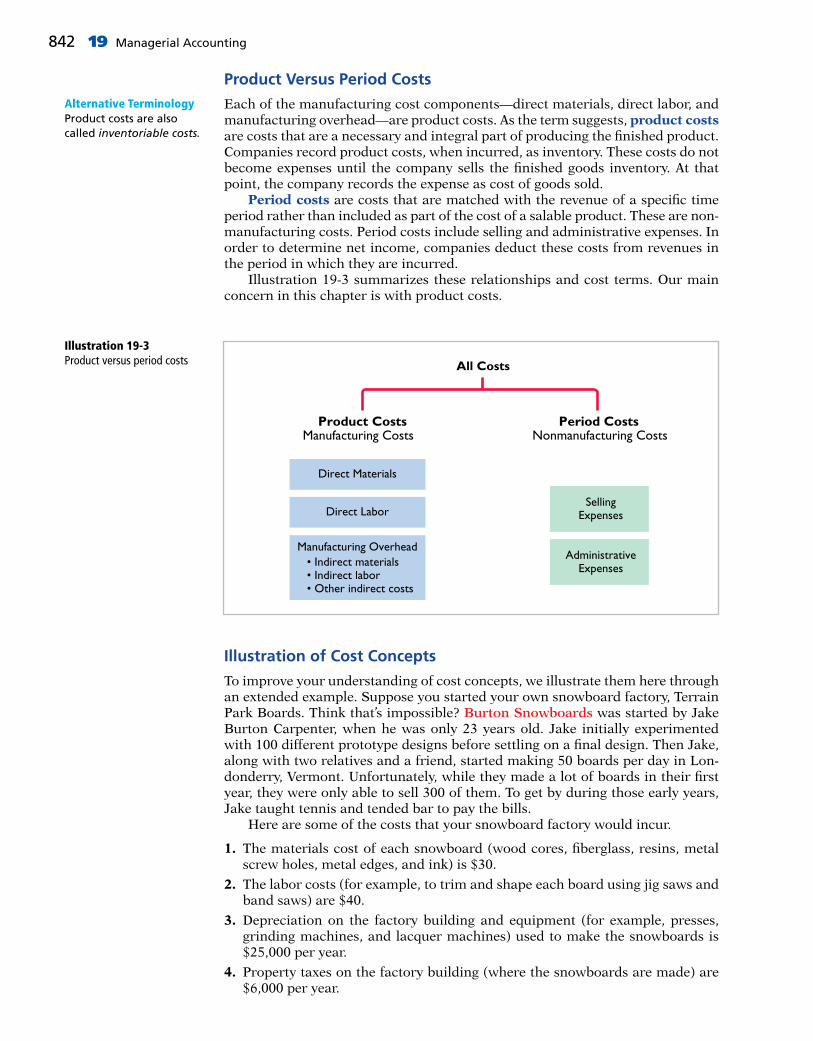
842 19 Managerial Accounting
Product Versus Period Costs
Each of the manufacturing cost components—direct materials, direct labor, and manufacturing overhead—are product costs. As the term suggests, product costs are costs that are a necessary and integral part of producing the fi nished product. Companies record product costs, when incurred, as inventory. These costs do not become expenses until the company sells the fi nished goods inventory. At that point, the company records the expense as cost of goods sold. Period costs are costs that are matched with the revenue of a specifi c time period rather than included as part of the cost of a salable product. These are non-manufacturing costs. Period costs include selling and administrative expenses. In order to determine net income, companies deduct these costs from revenues in the period in which they are incurred. Illustration 19-3 summarizes these relationships and cost terms. Our main concern in this chapter is with product costs.
Alternative TerminologyProduct costs are also called inventoriable costs.
Direct Materials
Direct Labor
Manufacturing Overhead• Indirect materials• Indirect labor• Other indirect costs
Manufacturing Costs
All Costs
Product Costs Period Costs
SellingExpenses
AdministrativeExpenses
Nonmanufacturing Costs
Illustration 19-3Product versus period costs
Illustration of Cost Concepts
To improve your understanding of cost concepts, we illustrate them here through an extended example. Suppose you started your own snowboard factory, Terrain Park Boards. Think that’s impossible? Burton Snowboards was started by Jake Burton Carpenter, when he was only 23 years old. Jake initially experimented with 100 different prototype designs before settling on a fi nal design. Then Jake, along with two relatives and a friend, started making 50 boards per day in Lon-donderry, Vermont. Unfortunately, while they made a lot of boards in their fi rst year, they were only able to sell 300 of them. To get by during those early years, Jake taught tennis and tended bar to pay the bills. Here are some of the costs that your snowboard factory would incur.
1. The materials cost of each snowboard (wood cores, fi berglass, resins, metal screw holes, metal edges, and ink) is $30.
2. The labor costs (for example, to trim and shape each board using jig saws and band saws) are $40.
3. Depreciation on the factory building and equipment (for example, presses, grinding machines, and lacquer machines) used to make the snowboards is $25,000 per year.
4. Property taxes on the factory building (where the snowboards are made) are $6,000 per year.
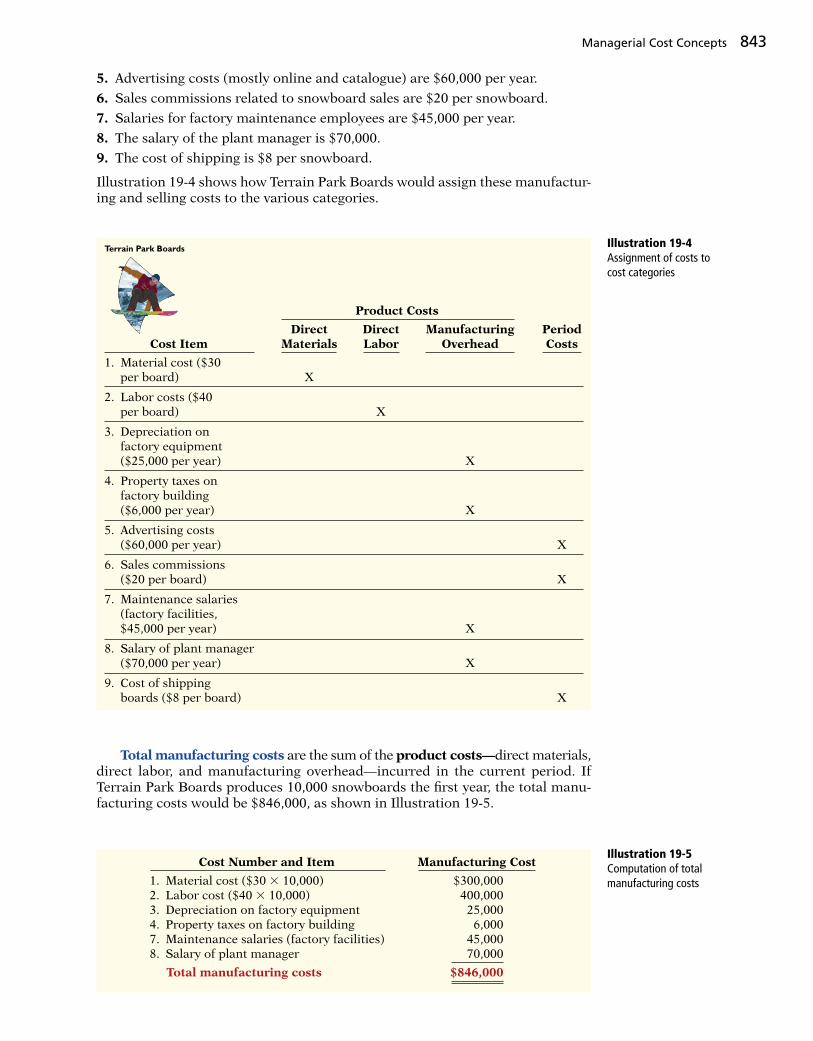
Managerial Cost Concepts 843
5. Advertising costs (mostly online and catalogue) are $60,000 per year.
6. Sales commissions related to snowboard sales are $20 per snowboard.
7. Salaries for factory maintenance employees are $45,000 per year.
8. The salary of the plant manager is $70,000.
9. The cost of shipping is $8 per snowboard.
Illustration 19-4 shows how Terrain Park Boards would assign these manufactur-ing and selling costs to the various categories.
Product Costs
Direct Direct Manufacturing Period Cost Item Materials Labor Overhead Costs
1. Material cost ($30 per board) X
2. Labor costs ($40 per board) X
3. Depreciation on factory equipment ($25,000 per year) X
4. Property taxes on factory building ($6,000 per year) X
5. Advertising costs ($60,000 per year) X
6. Sales commissions ($20 per board) X
7. Maintenance salaries (factory facilities, $45,000 per year) X
8. Salary of plant manager($70,000 per year) X
9. Cost of shipping boards ($8 per board) X
Terrain Park BoardsIllustration 19-4Assignment of costs to cost categories
Total manufacturing costs are the sum of the product costs—direct materials, direct labor, and manufacturing overhead—incurred in the current period. If Terrain Park Boards produces 10,000 snowboards the fi rst year, the total manu-facturing costs would be $846,000, as shown in Illustration 19-5.
Cost Number and Item Manufacturing Cost
1. Material cost ($30 3 10,000) $300,0002. Labor cost ($40 3 10,000) 400,0003. Depreciation on factory equipment 25,0004. Property taxes on factory building 6,0007. Maintenance salaries (factory facilities) 45,0008. Salary of plant manager 70,000
Total manufacturing costs $846,000
Illustration 19-5Computation of total manufacturing costs

844 19 Managerial Accounting
Once it knows the total manufacturing costs, Terrain Park Boards can com-pute the manufacturing cost per unit. Assuming 10,000 units, the cost to produce one snowboard is $84.60 ($846,000 4 10,000 units). In subsequent chapters, we use extensively the cost concepts discussed in this chapter. So study Illustration 19-4 carefully. If you do not understand any of these classifi cations, go back and reread the appropriate section.
3 Demonstrate how to compute cost of goods manufactured and prepare fi nancial statements for a manufacturer.
LEARNING OBJECTIVE
The fi nancial statements of a manufacturer are very similar to those of a mer-chandiser. For example, you will fi nd many of the same sections and same accounts in the fi nancial statements of Procter & Gamble that you fi nd in the fi nancial statements of Dick’s Sporting Goods. The principal differences between their fi nancial statements occur in two places: the cost of goods sold section in the income statement and the current assets section in the balance sheet.
Income Statement
Under a periodic inventory system, the income statements of a merchandiser and a manufacturer differ in the cost of goods sold section. Merchandisers compute cost of goods sold by adding the beginning inventory to the cost of goods purchased and subtracting the ending inventory. Manufacturers compute cost of goods sold by adding the beginning fi nished goods inventory to the cost of goods manufactured and subtracting the ending fi nished goods inventory. Illustration 19-6 shows these different methods. A number of accounts are involved in determining the cost of goods manu-factured. To eliminate excessive detail, income statements typically show only the total cost of goods manufactured. A separate statement, called a Cost of Goods Manufactured Schedule, presents the details. (See the discussion on page 846 and Illustration 19-9.)
A bicycle company has these costs: tires, salaries of employees who put tires on the wheels, factory building depreciation, advertising expenditures, lubricants, spokes, salary of factory manager, salary of accountant, handlebars, and salaries of factory maintenance employees. Classify each cost as direct materials, direct labor, overhead, or a period cost.
Solution
DO IT! 2 Managerial Cost Concepts
Tires, spokes, and handlebars are direct materials. Salaries of employees who put tires on the wheels are direct labor. Factory building depreciation, lubricants, salary of factory manager, and salary of factory maintenance employees are manufacturing overhead. Advertising expenditures and salary of accountant are period costs.
Related exercise material: BE19-3, BE19-4, BE19-5, BE19-6, E19-2, E19-3, E19-4, E19-5, E19-6, E19-7, and DO IT! 19-2.
Action Plan✔ Classify as direct
materials any raw materials physically and directly associated with the fi nished product.
✔ Classify as direct labor the work of factory employees physically and directly associated with the fi nished product.
✔ Classify as manufac-turing overhead any costs indirectly associ-ated with the fi nished product.

Manufacturer Financial Statements 845
Illustration 19-7 shows the different presentations of the cost of goods sold sections for merchandising and manufacturing companies. The other sections of an income statement are similar for merchandisers and manufacturers.
BeginningInventory
EndingFinished Goods
Inventory
–
+ –
Cost ofGoods
Purchased+ =
=
Cost ofGoods Sold
BeginningFinished Goods
Inventory
Cost ofGoods
Manufactured
EndingInventory
Manufacturer
MerchandiserIllustration 19-6Cost of goods sold components
Helpful HintWe assume a periodic inventory system in this illustration.
Cost of Goods Manufactured
An example may help show how companies determine the cost of goods manu-factured. Assume that on January 1, Current Designs has a number of kayaks in various stages of production. In total, these partially completed units are called beginning work in process inventory. The costs the company assigns to begin-ning work in process inventory are based on the manufacturing costs incurred in the prior period. Current Designs fi rst incurs manufacturing costs in the current year to com-plete the work that was in process on January 1. It then incurs manufacturing costs for production of new orders. The sum of the direct materials costs, direct labor costs, and manufacturing overhead incurred in the current year is the total manufacturing costs for the current period. We now have two cost amounts: (1) the cost of the beginning work in process and (2) the total manufacturing costs for the current period. The sum of these costs is the total cost of work in process for the year. At the end of the year, Current Designs may have some kayaks that are only partially completed. The costs of these units become the cost of the ending work in process inventory. To fi nd the cost of goods manufactured, we subtract this cost from the total cost of work in process. Illustration 19-8 (page 846) shows the formula for determining the cost of goods manufactured.
MERCHANDISING COMPANY MANUFACTURING COMPANY Income Statement (partial) Income Statement (partial) For the Year Ended December 31, 2017 For the Year Ended December 31, 2017
Cost of goods sold Cost of goods sold Inventory, Jan. 1 $ 70,000 Finished goods inventory, Jan. 1 $ 90,000 Cost of goods purchased 650,000 Cost of goods manufactured (see Illustration 19-9) 370,000
Cost of goods available for sale 720,000 Cost of goods available for sale 460,000 Less: Inventory, Less: Finished goods inventory, Dec. 31 400,000 Dec. 31 80,000
Cost of goods sold $ 320,000 Cost of goods sold $ 380,000
Illustration 19-7Cost of goods sold sections of merchandising and manufacturing income statements

846 19 Managerial Accounting
Beginning Total Total Cost of Work in Process 1 Manufacturing 5 Work in Process Inventory Costs
Total Cost of Ending Cost of Goods Work in Process 2 Work in Process 5 Manufactured Inventory
Illustration 19-8Cost of goods manufactured formula
Cost of Goods Manufactured Schedule
The cost of goods manufactured schedule reports cost elements used in calcu-lating cost of goods manufactured. Illustration 19-9 shows the schedule for Current Designs (using assumed data). The schedule presents detailed data for direct materials and for manufacturing overhead.
Review Illustration 19-8 and then examine the cost of goods manufactured schedule in Illustration 19-9. You should be able to distinguish between “Total manufacturing costs” and “Cost of goods manufactured.” The difference is the effect of the change in work in process during the period.
Balance Sheet
The balance sheet for a merchandising company shows just one category of inventory. In contrast, the balance sheet for a manufacturer may have three inventory accounts, as shown in Illustration 19-10 for Current Designs’ kayak inventory.
CURRENT DESIGNSCost of Goods Manufactured ScheduleFor the Year Ended December 31, 2017
Work in process, January 1 $ 18,400Direct materials Raw materials inventory, January 1 $ 16,700 Raw materials purchases 152,500
Total raw materials available for use 169,200 Less: Raw materials inventory, December 31 22,800
Direct materials used $146,400Direct labor 175,600Manufacturing overhead Indirect labor 14,300 Factory repairs 12,600 Factory utilities 10,100 Factory depreciation 9,440 Factory insurance 8,360
Total manufacturing overhead 54,800
Total manufacturing costs 376,800
Total cost of work in process 395,200Less: Work in process, December 31 25,200
Cost of goods manufactured $370,000
Illustration 19-9Cost of goods manufactured schedule

Manufacturer Financial Statements 847
Finished Goods Inventory is to a manufacturer what Inventory is to a merchan-diser. Each of these classifi cations represents the goods that the company has avail-able for sale. The current assets sections presented in Illustration 19-11 contrast the presentations of inventories for merchandising and manufacturing companies. The remainder of the balance sheet is similar for the two types of companies.
Illustration 19-10Inventory accounts for a manufacturer
Urethane
Raw Materials
Inventory
Work in Process
Inventory
Finished Goods
Inventory
Shows the cost of rawmaterials on hand.
Shows the cost applicable tounits that have been startedinto production but are onlypartially completed.
Shows the cost of completedgoods on hand.
Illustration 19-11Current assets sections of mer-chandising and manufacturing balance sheets
MERCHANDISING COMPANY MANUFACTURING COMPANY Balance Sheet Balance Sheet December 31, 2017 December 31, 2017
Current assets Current assets Cash $100,000 Cash $180,000 Accounts receivable (net) 210,000 Accounts receivable (net) 210,000 Inventory 400,000 Inventory Prepaid expenses 22,000 Finished goods $80,000
Total current assets $732,000 Work in process 25,200 Raw materials 22,800 128,000
Prepaid expenses 18,000
Total current assets $536,000
Each step in the accounting cycle for a merchandiser applies to a manufac-turer. For example, prior to preparing fi nancial statements, manufacturers make adjusting entries. The adjusting entries are essentially the same as those of a merchandiser. The closing entries are also similar for manufacturers and mer-chandisers.
The following information is available for Keystone Company.
March 1 March 31
Raw materials inventory $12,000 $10,000Work in process inventory 2,500 4,000Materials purchased in March $ 90,000Direct labor in March 75,000Manufacturing overhead in March 220,000
Prepare the cost of goods manufactured schedule for the month of March 2017.
DO IT! 3 Cost of Goods Manufactured

848 19 Managerial Accounting
4 Discuss trends in managerial accounting.LEARNING OBJECTIVE
The business environment never stands still. Regulations are always changing, global competition continues to intensify, and technology is a source of constant upheaval. In this rapidly changing world, managerial accounting needs to continue to innovate in order to provide managers with the information they need.
Service Industries
Much of the U.S. economy has shifted toward an emphasis on services. Today, more than 50% of U.S. workers are employed by service companies. Airlines, marketing agencies, cable companies, and governmental agencies are just a few examples of service companies. How do service companies differ from manufac-turing companies? One difference is that services are consumed immediately. For example, when a restaurant produces a meal, that meal is not put in inventory but is instead consumed immediately. An airline uses special equipment to pro-vide its product, but again, the output of that equipment is consumed immedi-ately by the customer in the form of a fl ight. And a marketing agency performs services for its clients that are immediately consumed by the customer in the form of a marketing plan. For a manufacturing company, like Boeing, it often has a long lead time before its airplane is used or consumed by the customer. This chapter’s examples featured manufacturing companies because account-ing for the manufacturing environment requires the use of the broadest range of accounts. That is, the accounts used by service companies represent a subset of those used by manufacturers because service companies are not producing inven-tory. Neither the restaurant, the airline, or the marketing agency discussed above produces an inventoriable product. However, just like a manufacturer, each needs to keep track of the costs of its services in order to know whether it is generating a profi t. A successful restaurateur needs to know the cost of each offering on the menu, an airline needs to know the cost of fl ight service to each destination, and a marketing agency needs to know the cost to develop a marketing plan. Thus,
KEYSTONE COMPANYCost of Goods Manufactured ScheduleFor the Month Ended March 31, 2017
Work in process, March 1 $ 2,500Direct materials Raw materials, March 1 $ 12,000 Raw material purchases 90,000
Total raw materials available for use 102,000 Less: Raw materials, March 31 10,000
Direct materials used $ 92,000Direct labor 75,000Manufacturing overhead 220,000
Total manufacturing costs 387,000
Total cost of work in process 389,500Less: Work in process, March 31 4,000
Cost of goods manufactured $385,500
Action Plan✔ Start with beginning
work in process as the fi rst item in the cost of goods manufactured schedule.
✔ Sum direct materials used, direct labor, and manufacturing overhead to determine total manufacturing costs.
✔ Sum beginning work in process and total manufacturing costs to determine total cost of work in process.
✔ Cost of goods manu-factured is the total cost of work in process less ending work in process.
Related exercise material: BE19-7, BE19-8, BE19-9, BE19-10, E19-8, E19-9, E19-10, E19-11, E19-12, E19-13, E19-14, E19-15, E19-16, E19-17, and DO IT! 19-3.
Solution
ETHICS NOTE
Do telecommunications companies have an obligation to provide service to remote or low-user areas for a fee that may be less than the cost of the service?

Managerial Accounting Trends 849
the techniques shown in this chapter, to accumulate manufacturing costs to determine manufacturing inventory, are equally useful for determining the costs of performing services. For example, let’s consider the costs that Hewlett-Packard (HP) might incur on a consulting engagement. A signifi cant portion of its costs would be salaries of consulting personnel. It might also incur travel costs, materials, software costs, and depreciation charges on equipment. In the same way that it needs to keep track of the cost of manufacturing its computers and printers, HP needs to know what its costs are on each consulting job. It could prepare a cost of services per-formed schedule similar to the cost of goods manufactured schedule in Illustra-tion 19-9 (page 846). The structure would be essentially the same as the cost of goods manufactured schedule, but section headings would be refl ective of the costs of the particular service organization. Many of the examples we present in subsequent chapters will be based on service companies. To highlight the relevance of the techniques used in this course for service companies, we have placed a service company icon (see margin) next to those items in the text and end-of-chapter materials that relate to non-manufacturing companies.
Low Fares but Decent Profi ts
When other airlines were cutting fl ight service due to recession, Allegiant Airlines increased capac-ity by 21%. Sounds crazy, doesn’t it? But it must know something because while the other airlines were losing money, it was generating profi ts. In fact, it often has the
industry’s highest profi t margins. Consider also that its average one-way fare is only $83. So how does it make money? As a low-budget airline, it focuses on controlling costs.
Allegiant purchases used planes for $3 million each rather than new planes for $40 million. It fl ies out of small towns, so wages are low and competition is nonexistent. It minimizes hotel costs by having its fl ight crews fi nish their day in their home cities. The company also only fl ies a route if its 150-passenger planes are nearly full (it averages about 90% of capacity). The bottom line is that Allegiant knows its costs to the penny. Knowing what your costs are might not be glamorous, but it sure beats losing money.
Sources: Susan Carey, “For Allegiant, Getaways Mean Profi ts,” Wall Street Journal Online (February 18, 2009); and Scott Mayerowitz, “Tiny Allegiant Air Thrives on Low Costs, High Fees,” http://bigstory.ap.org (June 28, 2013).
What are some of the line items that would appear in the cost of services performed schedule of an airline? (Go to WileyPLUS for this answer and additional questions.)
© Stephen Strathdee/iStockphoto
Service Company Insight Allegiant Airlines
Focus on the Value Chain
The value chain refers to all business processes associated with providing a product or performing a service. Illustration 19-12 depicts the value chain for a manufacturer. Many of the most signifi cant business innovations in recent years
UnlimitedWarranty
xxxxxxxxxx
xxxxxxxxxx
xxxxxxxxx
. . . .
.........
Research &developmentand product
design
Acquisition ofraw materials
Production Sales andmarketing
Delivery Customerrelations andsubsequent
services
Illustration 19-12A manufacturer’s value chain
SERVICE

850 19 Managerial Accounting
have resulted either directly, or indirectly, from a focus on the value chain. For example, so-called lean manufacturing, originally pioneered by Japanese auto-mobile manufacturer Toyota but now widely practiced, reviews all business pro-cesses in an effort to increase productivity and eliminate waste, all while continually trying to improve quality. Just-in-time (JIT) inventory methods, which have signifi cantly lowered inventory levels and costs for many companies, are one innovation that resulted from the focus on the value chain. Under the JIT inventory method, goods are manufactured or purchased just in time for sale. For example, Dell can produce and deliver a custom computer within 48 hours of a customer’s order. However, JIT also necessitates increased emphasis on product quality. Because JIT compa-nies do not have excess inventory on hand, they cannot afford to stop production because of defects or machine breakdowns. If they stop production, deliveries will be delayed and customers will be unhappy. For example, a design fl aw in an Intel computer chip was estimated to cost the company $1 billion in repairs and reduced revenue. As a consequence, many companies now focus on total quality management (TQM) to reduce defects in fi nished products, with the goal of zero defects. The TQM philosophy has been employed by some of the most successful businesses to improve all aspects of the value chain. Another innovation, the theory of constraints, involves identifi cation of “bot-tlenecks”—constraints within the value chain that limit a company’s profi tability. Once a major constraint has been identifi ed and eliminated, the company moves on to fi x the next most signifi cant constraint. General Motors found that by elim-inating bottlenecks, it improved its use of overtime labor while meeting customer demand. Technology has played a big role in the focus on the value chain and the implementation of lean manufacturing. For example, enterprise resource plan-ning (ERP) systems, such as those provided by SAP, provide a comprehensive, centralized, integrated source of information to manage all major business processes—from purchasing, to manufacturing, to sales, to human resources. ERP systems have, in some large companies, replaced as many as 200 individual software packages. In addition, the focus on improving effi ciency in the value chain has also resulted in adoption of automated manufacturing processes. Many companies now use computer-integrated manufacturing. These systems often reduce the reliance on manual labor by using robotic equipment. This increases overhead costs as a percentage of total product costs. As overhead costs increased because of factory automation, the accuracy of overhead cost allocation to specifi c products became more important. Mana-gerial accounting devised an approach, called activity-based costing (ABC), which allocates overhead based on each product’s use of particular activities in making the product. In addition to providing more accurate product costing, ABC also can contribute to increased effi ciency in the value chain. For example, suppose one of a company’s overhead pools is allocated based on the number of setups that each product requires. If a particular product’s cost is high because it is allocated a lot of overhead due to a high number of setups, management will be motivated to try to reduce the number of setups and thus reduce its overhead allocation. ABC is discussed further in Chapter 21.
Balanced Scorecard
As companies implement various business practice innovations, managers some-times focus too enthusiastically on the latest innovation, to the detriment of other areas of the business. For example, by focusing on total quality management, companies sometimes lose sight of cost/benefi t considerations. Similarly, in focusing on reducing inventory levels through just-in-time inventory methods, companies sometimes lose sales due to inventory shortages. The balanced score-card corrects for this limited perspective: This approach uses both fi nancial and nonfi nancial measures to evaluate all aspects of a company’s operations in an integrated fashion. The performance measures are linked in a cause-and-effect

Managerial Accounting Trends 851
fashion to ensure that they all tie to the company’s overall objectives. For exam-ple, to increase return on assets, the company could try to increase sales. To increase sales, the company could try to increase customer satisfaction. To increase customer satisfaction, the company could try to reduce product defects. Finally, to reduce product defects, the company could increase employee training. The balanced scorecard, which is discussed further in Chapter 25, is now used by many companies, including Hilton Hotels, Wal-Mart Stores, Inc., and HP.
Business Ethics
All employees within an organization are expected to act ethically in their busi-ness activities. Given the importance of ethical behavior to corporations and their owners (stockholders), an increasing number of organizations provide codes of business ethics for their employees.
CREATING PROPER INCENTIVES
Companies like Amazon.com, IBM, and Nike use complex systems to monitor, control, and evaluate the actions of managers. Unfortunately, these systems and controls sometimes unwittingly create incentives for managers to take unethical actions. For example, because budgets are also used as an evaluation tool, some managers try to “game’’ the budgeting process by underestimating their division’s predicted performance so that it will be easier to meet their performance targets. On the other hand, if budgets are set at unattainable levels, managers sometimes take unethical actions to meet the targets in order to receive higher compensa-tion or, in some cases, to keep their jobs. For example, at one time, airline manufacturer Boeing was plagued by a series of scandals including charges of over-billing, corporate espionage, and illegal confl icts of interest. Some long-time employees of Boeing blamed the decline in ethics on a change in the corporate culture that took place after Boeing merged with McDonnell Douglas. They suggested that evaluation systems implemented after the merger to evaluate employee performance gave employees the impres-sion that they needed to succeed no matter what actions were required to do so. As another example, manufacturing companies need to establish production goals for their processes. Again, if controls are not effective and realistic, prob-lems develop. To illustrate, Schering-Plough, a pharmaceutical manufacturer, found that employees were so concerned with meeting production quantity stan-dards that they failed to monitor the quality of the product, and as a result the dosages were often wrong.
CODE OF ETHICAL STANDARDS
In response to corporate scandals, the U.S. Congress enacted the Sarbanes-Oxley Act (SOX) to help prevent lapses in internal control. One result of SOX was to clarify top management’s responsibility for the company’s fi nancial statements. CEOs and CFOs are now required to certify that fi nancial statements give a fair presentation of the company’s operating results and its fi nancial condition. In addition, top man-agers must certify that the company maintains an adequate system of internal con-trols to safeguard the company’s assets and ensure accurate fi nancial reports. Another result of SOX is that companies now pay more attention to the com-position of the board of directors. In particular, the audit committee of the board of directors must be comprised entirely of independent members (that is, non-employees) and must contain at least one fi nancial expert. Finally, the law sub-stantially increases the penalties for misconduct. To provide guidance for managerial accountants, the Institute of Manage-ment Accountants (IMA) has developed a code of ethical standards, entitled IMA Statement of Ethical Professional Practice. Management accountants should not commit acts in violation of these standards. Nor should they condone such acts by others within their organizations. We include the IMA code of ethical stan-dards in Appendix H. Throughout the textbook, we will address various ethical issues managers face.

852 19 Managerial Accounting
Corporate Social Responsibility
The balanced scorecard attempts to take a broader, more inclusive view of corpo-rate profi tability measures. Many companies, however, have begun to evaluate not just corporate profi tability but also corporate social responsibility. In addition to profi tability, corporate social responsibility considers a company’s efforts to employ sustainable business practices with regard to its employees, society, and the environment. This is sometimes referred to as the triple bottom line because it evaluates a company’s performance with regard to people, planet, and profi t. Recent reports indicate that over 50% of the 500 largest U.S. companies provide sustainability reports. Make no mistake, these companies are still striving to max-imize profi ts—in a competitive world, they won’t survive long if they don’t. In fact, you might recognize a few of the names on a recent Forbes.com list of the 100 most sustainable companies in the world. Are you surprised that General Elec-tric, adidas, Toyota, Coca-Cola, or Starbucks made the list? These companies have learned that with a long-term, sustainable approach, they can maximize profi ts while also acting in the best interest of their employees, their communities, and the environment. At various points within this textbook, we will discuss situ-ations where real companies use the very skills that you are learning to evaluate decisions from a sustainable perspective, such as in the following Insight box.
Sustainable business practices present numerous issues for management and managerial accountants. First, companies need to decide what items need to be measured, generally those that are of utmost importance to its stakeholders. For example, a particular company might be most concerned with minimizing water pollution or maximizing employee safety. Then, for each item identifi ed, the com-pany determines measurable attributes that provide relevant information regard-ing the company’s performance with regard to that item, such as the amount of waste released into public waterways or the number of accidents per 1,000 hours worked. Finally, the company needs to consider the materiality of the item, the cost of measuring these attributes, and the reliability of the measurements. If the com-pany uses this information to make decisions, then accuracy is critical. Of particu-lar concern is whether the measurements can be verifi ed by an outside third party. Unlike fi nancial reporting, which is overseen by the Financial Accounting Standards Board, the reporting of sustainable business practices currently has no agreed-upon standard-setter. A number of organizations have, however, published
People Matter
Many clothing factories in developing countries are known for unsafe buildings, poor working conditions, and wage and labor violations. One of the owners of Phantom
Tac, a clothing manufacturer in Bangladesh, did make efforts to develop sustainable business practices. This owner, David Mayor, provided funding for a training program for female workers. He also developed a website to educate customers about the workers’ conditions. But Phantom Tac also had to make a profi t. Things got tight when one of its customers canceled orders because Phantom Tac failed a social compliance audit. The company had to quit funding the training program and the website.
Recently, Bangladesh’s textile industry has seen some sig-nifi cant improvements in working conditions and safety stan-dards. As Brad Adams, Asia director of Human Rights Watch, notes, “The (Dhaka) government has belatadly begun to reg-ister unions, which is an important fi rst step, but it now needs to ensure that factory owners stop persecuting their leaders and actually allow them to function.”
Sources: Jim Yardley, “Clothing Brands Sidestep Blame for Safety Lapses,” The New York Times Online (December 30, 2013); and Palash Ghosh, “Despite Low Pay, Poor Work Conditions, Garment Factories Empowering Millions of Bangladeshi Women,” Interna-tional Business Times (March 25, 2014).
What are some of the common problems for many clothing factories in developing countries? (Go to WileyPLUS for this answer and additional questions.)
People, Planet, and Profi t Insight Phantom Tac
Geanina Bechea/Shutterstock
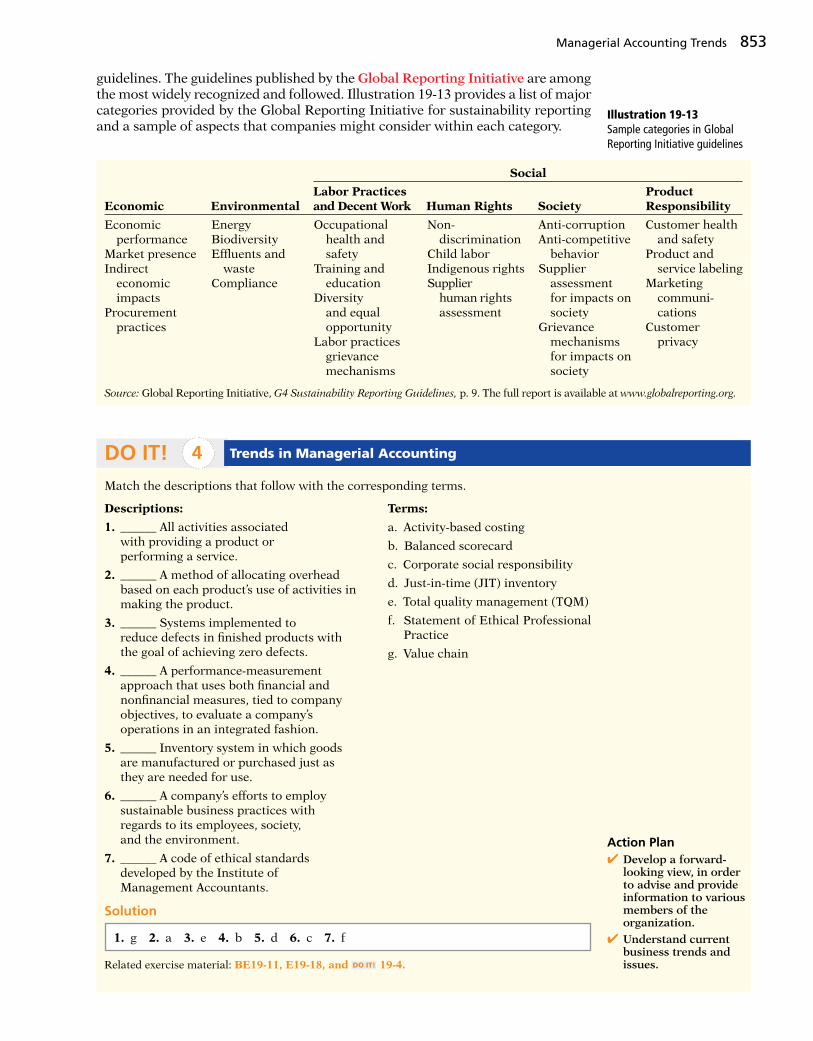
Managerial Accounting Trends 853
guidelines. The guidelines published by the Global Reporting Initiative are among the most widely recognized and followed. Illustration 19-13 provides a list of major categories provided by the Global Reporting Initiative for sustainability reporting and a sample of aspects that companies might consider within each category.
Illustration 19-13Sample categories in Global Reporting Initiative guidelines
Labor Practices Product Economic Environmental and Decent Work Human Rights Society Responsibility
Economic performance
Market presenceIndirect
economicimpacts
Procurementpractices
EnergyBiodiversityEffl uents and
wasteCompliance
Occupational health and safety
Training and education
Diversity and equal opportunity
Labor practices grievance
mechanisms
Non-discrimination
Child laborIndigenous rightsSupplier
human rights assessment
Anti-corruptionAnti-competitive
behaviorSupplier
assessment for impacts on society
Grievance mechanisms for impacts on society
Customer health and safety
Product and service labeling
Marketing communi- cations
Customer privacy
Source: Global Reporting Initiative, G4 Sustainability Reporting Guidelines, p. 9. The full report is available at www.globalreporting.org.
Social
Match the descriptions that follow with the corresponding terms.
Descriptions: Terms:
1. ______ All activities associated with providing a product or performing a service.
2. ______ A method of allocating overhead based on each product’s use of activities in making the product.
3. ______ Systems implemented to reduce defects in fi nished products with the goal of achieving zero defects.
4. ______ A performance-measurement approach that uses both fi nancial and nonfi nancial measures, tied to company objectives, to evaluate a company’s operations in an integrated fashion.
5. ______ Inventory system in which goodsare manufactured or purchased just as they are needed for use.
6. ______ A company’s efforts to employ sustainable business practices with regards to its employees, society,and the environment.
7. ______ A code of ethical standards developed by the Institute of Management Accountants.
Solution
DO IT! 4 Trends in Managerial Accounting
1. g 2. a 3. e 4. b 5. d 6. c 7. f
Action Plan✔ Develop a forward-
looking view, in order to advise and provide information to various members of the organization.
✔ Understand current business trends and issues.
a. Activity-based costing
b. Balanced scorecard
c. Corporate social responsibility
d. Just-in-time (JIT) inventory
e. Total quality management (TQM)
f. Statement of Ethical Professional Practice
g. Value chain
Related exercise material: BE19-11, E19-18, and DO IT! 19-4.

854 19 Managerial Accounting
1 Identify the features of managerial accounting and the functions of management. The primary users of managerial accounting reports, issued as frequently as needed, are internal users, who are offi cers, department heads, managers, and supervisors in the company. The purpose of these reports is to provide special-purpose information for a particular user for a specifi c decision. The content of managerial accounting reports pertains to subunits of the business. It may be very detailed, and may extend beyond the double-entry accounting system. The reporting standard is relevance to the decision being made. No independent audits are required in managerial accounting.
The functions of management are planning, direct-ing, and controlling. Planning requires management to look ahead and to establish objectives. Directing involves coordinating the diverse activities and human resources of a company to produce a smooth-running operation. Controlling is the process of keeping the activities on track.
Describe the classes of manufacturing costs and the differences between product and period costs. Manu-facturing costs are typically classifi ed as either (1) direct materials, (2) direct labor, or (3) manufacturing over-head. Raw materials that can be physically and directly associated with the fi nished product during the manu-facturing process are called direct materials. The work of factory employees that can be physically and directly associated with converting raw materials into fi nished goods is considered direct labor. Manufacturing over-head consists of costs that are indirectly associated with the manufacture of the fi nished product.
Product costs are costs that are a necessary and integral part of producing the fi nished product. Prod-uct costs are also called inventoriable costs. These costs do not become expenses until the company sells the fi nished goods inventory. Period costs are costs
2
that are identifi ed with a specifi c time period rather than with a salable product. These costs relate to nonmanufacturing costs and therefore are not inven-toriable costs.
Demonstrate how to compute cost of goods manufac-tured and prepare fi nancial statements for a manu-facturer. Companies add the cost of the beginning work in process to the total manufacturing costs for the current year to arrive at the total cost of work in process for the year. They then subtract the ending work in process from the total cost of work in process to arrive at the cost of goods manufactured.
The difference between a merchandising and a manufacturing income statement is in the cost of goods sold section. A manufacturing cost of goods sold section shows beginning and ending fi nished goods inventories and the cost of goods manufactured.
The difference between a merchandising and a manufacturing balance sheet is in the current assets section. The current assets section of a manufacturing company’s balance sheet presents three inventory accounts: fi nished goods inventory, work in process inventory, and raw materials inventory.
Discuss trends in managerial accounting. Managerial accounting has experienced many changes in recent years, including a shift toward service companies as well as an emphasis on ethical behavior. Improved practices include a focus on managing the value chain through techniques such as just-in-time inventory, total quality management, activity-based costing, and theory of constraints. The balanced scorecard is now used by many companies in order to attain a more comprehen-sive view of the company’s operations. Finally, compa-nies are now evaluating their performance with regard to their corporate social responsibility.
3
4
LEARNING OBJECTIVES REVIEW
1
REVIEW AND PRACTICE
Activity-based costing (ABC) A method of allocating overhead based on each product’s use of activities in making the product. (p. 850).
Balanced scorecard A performance-measurement approach that uses both fi nancial and nonfi nancial measures, tied to company objectives, to evaluate a company’s opera-tions in an integrated fashion. (p. 850).
Board of directors The group of offi cials elected by the stockholders of a corporation to formulate operating policies and select officers who will manage the company. (p. 839).
Chief executive offi cer (CEO) Corporate offi cer who has overall responsibility for managing the business
and delegates responsibilities to other corporate officers. (p. 839).
Chief fi nancial offi cer (CFO) Corporate offi cer who is responsible for all of the accounting and fi nance issues of the company. (p. 839).
Controller Financial offi cer responsible for a company’s accounting records, system of internal control, and preparation of fi nancial statements, tax returns, and internal reports. (p. 839).
Corporate social responsibility The efforts of a company to employ sustainable business practices with regard to its employees, society, and the environ-ment. (p. 852).
GLOSSARY REVIEW

Practice Multiple-Choice Questions 855
Cost of goods manufactured Total cost of work in process less the cost of the ending work in process inven-tory. (p. 845).
Direct labor The work of factory employees that can be physically and directly associated with converting raw materials into fi nished goods. (p. 841).
Direct materials Raw materials that can be physically and directly associated with manufacturing the fi nished product. (p. 840).
Enterprise resource planning (ERP) system Software that provides a comprehensive, centralized, integrated source of information used to manage all major busi-ness processes. (p. 850).
Indirect labor Work of factory employees that has no physical association with the fi nished product or for which it is impractical to trace the costs to the goods produced. (p. 841).
Indirect materials Raw materials that do not physically become part of the fi nished product or for which it is impractical to trace to the fi nished product because their physical association with the fi nished product is too small. (p. 840).
Just-in-time (JIT) inventory Inventory system in which goods are manufactured or purchased just in time for sale. (p. 850).
Line positions Jobs that are directly involved in a com-pany’s primary revenue-generating operating activi-ties. (p. 839).
Managerial accounting A fi eld of accounting that pro-vides economic and fi nancial information for managers and other internal users. (p. 836).
Manufacturing overhead Manufacturing costs that are indirectly associated with the manufacture of the fi nished product. (p. 841).
Period costs Costs that are matched with the revenue of a specifi c time period and charged to expense as incurred. (p. 842).
Product costs Costs that are a necessary and integral part of producing the fi nished product. (p. 842).
Sarbanes-Oxley Act (SOX) Law passed by Congress intended to reduce unethical corporate behavior. (p. 851).
Staff positions Jobs that support the efforts of line employees. (p. 839).
Theory of constraints A specifi c approach used to iden-tify and manage constraints in order to achieve the company’s goals. (p. 850).
Total cost of work in process Cost of the beginning work in process plus total manufacturing costs for the current period. (p. 845).
Total manufacturing costs The sum of direct materi-als, direct labor, and manufacturing overhead incurred in the current period. (p. 843).
Total quality management (TQM) Systems implemented to reduce defects in fi nished products with the goal of achieving zero defects. (p. 850).
Treasurer Financial offi cer responsible for custody of a company’s funds and for maintaining its cash position. (p. 839).
Triple bottom line The evaluation of a company’s social responsibility performance with regard to people, planet, and profi t. (p. 852).
Value chain All business processes associated with pro-viding a product or performing a service. (p. 849).
1. Managerial accounting:(a) is governed by generally accepted accounting
principles.(b) places emphasis on special-purpose information.(c) pertains to the entity as a whole and is highly
aggregated.(d) is limited to cost data.
2. The management of an organization performs several broad functions. They are:(a) planning, directing, and selling.(b) planning, directing, and controlling.(c) planning, manufacturing, and controlling.(d) directing, manufacturing, and controlling.
3. Direct materials are a:
Product Manufacturing Period Cost Overhead Cost Cost
(a) Yes Yes No(b) Yes No No(c) Yes Yes Yes(d) No No No
4. Which of the following costs would a computer man-ufacturer include in manufacturing overhead?
(LO 1)
(LO 1)
(LO 2)
(LO 2)
(a) The cost of the disk drives.(b) The wages earned by computer assemblers.(c) The cost of the memory chips.(d) Depreciation on testing equipment.
5. Which of the following is not an element of manufac-turing overhead?(a) Sales manager’s salary.(b) Plant manager’s salary.(c) Factory repairman’s wages.(d) Product inspector’s salary.
6. Indirect labor is a:(a) nonmanufacturing cost.(b) raw material cost.(c) product cost.(d) period cost.
7. Which of the following costs are classifi ed as a period cost?(a) Wages paid to a factory custodian.(b) Wages paid to a production department supervisor.(c) Wages paid to a cost accounting department
supervisor.(d) Wages paid to an assembly worker.
(LO 2)
(LO 2)
(LO 2)
PRACTICE MULTIPLE-CHOICE QUESTIONS

8. For the year, Redder Company has cost of goods man-ufactured of $600,000, beginning fi nished goods inventory of $200,000, and ending fi nished goods inventory of $250,000. The cost of goods sold is:(a) $450,000. (c) $550,000.(b) $500,000. (d) $600,000.
9. Cost of goods available for sale is a step in the calcu-lation of cost of goods sold of:(a) a merchandising company but not a manufacturing
company.(b) a manufacturing company but not a merchandising
company.(c) a merchandising company and a manufacturing
company.(d) neither a manufacturing company nor a merchan-
dising company. 10. A cost of goods manufactured schedule shows begin-
ning and ending inventories for:(a) raw materials and work in process only.(b) work in process only.(c) raw materials only.(d) raw materials, work in process, and fi nished goods.
11. The formula to determine the cost of goods manu-factured is:(a) Beginning raw materials inventory 1 Total manu-
facturing costs 2 Ending work in process inventory.(b) Beginning work in process inventory 1 Total manu-
facturing costs 2 Ending fi nished goods inventory.(c) Beginning fi nished good inventory 1 Total manu-
facturing costs 2 Ending fi nished goods inventory.(d) Beginning work in process inventory 1 Total manu-
facturing costs 2 Ending work in process inventory.
(LO 3)
(LO 3)
(LO 3)
(LO 3)
12. After passage of the Sarbanes-Oxley Act:(a) reports prepared by managerial accountants must
by audited by CPAs.(b) CEOs and CFOs must certify that fi nancial state-
ments give a fair presentation of the company’s operating results.
(c) the audit committee, rather than top manage-ment, is responsible for the company’s fi nancial statements.
(d) reports prepared by managerial accountants must comply with generally accepted accounting prin-ciples (GAAP).
13. Which of the following managerial accounting tech-niques attempts to allocate manufacturing overhead in a more meaningful fashion?(a) Just-in-time inventory.(b) Total quality management.(c) Balanced scorecard.(d) Activity-based costing.
14. Corporate social responsibility refers to:(a) the practice by management of reviewing all busi-
ness processes in an effort to increase productiv-ity and eliminate waste.
(b) an approach used to allocate overhead based on each product’s use of activities.
(c) the attempt by management to identify and elim-inate constraints within the value chain.
(d) efforts by companies to employ sustainable busi-ness practices with regard to employees and the environment.
(LO 4)
(LO 4)
(LO 4)
856 19 Managerial Accounting
Solutions
1. (b) Managerial accounting emphasizes special-purpose information. The other choices are incorrect because (a) fi nancial accounting is governed by generally accepted accounting principles, (c) fi nancial accounting pertains to the entity as a whole and is highly aggregated, and (d) cost accounting and cost data are a subset of management accounting.
2. (b) Planning, directing, and controlling are the broad functions performed by the management of an organization. The other choices are incorrect because (a) selling is performed by the sales group in the organization, not by management; (c) manufacturing is performed by the manufacturing group in the organization, not by management; and (d) manufacturing is performed by the manufacturing group in the organization, not by management.
3. (b) Direct materials are a product cost only. Therefore, choices (a), (c), and (d) are incorrect as direct materials are not manufac-turing overhead or a period cost.
4. (d) Depreciation on testing equipment would be included in manufacturing overhead because it is indirectly associated with the fi nished product. The other choices are incorrect because (a) disk drives would be direct materials, (b) computer assembler wages would be direct labor, and (c) memory chips would be direct materials.
5. (a) The sales manager’s salary is not directly or indirectly associated with the manufacture of the fi nished product. The other choices are incorrect because (b) the plant manager’s salary, (c) the factory repairman’s wages, and (d) the product inspector’s salary are all elements of manufacturing overhead.
6. (c) Indirect labor is a product cost because it is part of the effort required to produce a product. The other choices are incorrect because (a) indirect labor is a manufacturing cost because it is part of the effort required to produce a product, (b) indirect labor is not a raw material cost because raw material costs only include direct materials and indirect materials, and (d) indirect labor is not a period cost because it is part of the effort required to produce a product.
7. (c) Wages paid to a cost accounting department supervisor would be included in administrative expenses and classifi ed as a period cost. The other choices are incorrect because (a) factory custodian wages are indirect labor which is manufacturing over-head and a product cost, (b) production department supervisor wages are indirect labor which is manufacturing overhead and a product cost, and (d) assembly worker wages is direct labor and is a product cost.
8. (c) Cost of goods sold is computed as Beginning fi nished goods inventory ($200,000) 1 Cost of goods manufactured ($600,000) 2 Ending fi nished goods inventory ($250,000), or $200,000 1 $600,000 2 $250,000 5 $550,000. Therefore, choices (a) $450,000, (b) $500,000, and (d) $600,000 are incorrect.
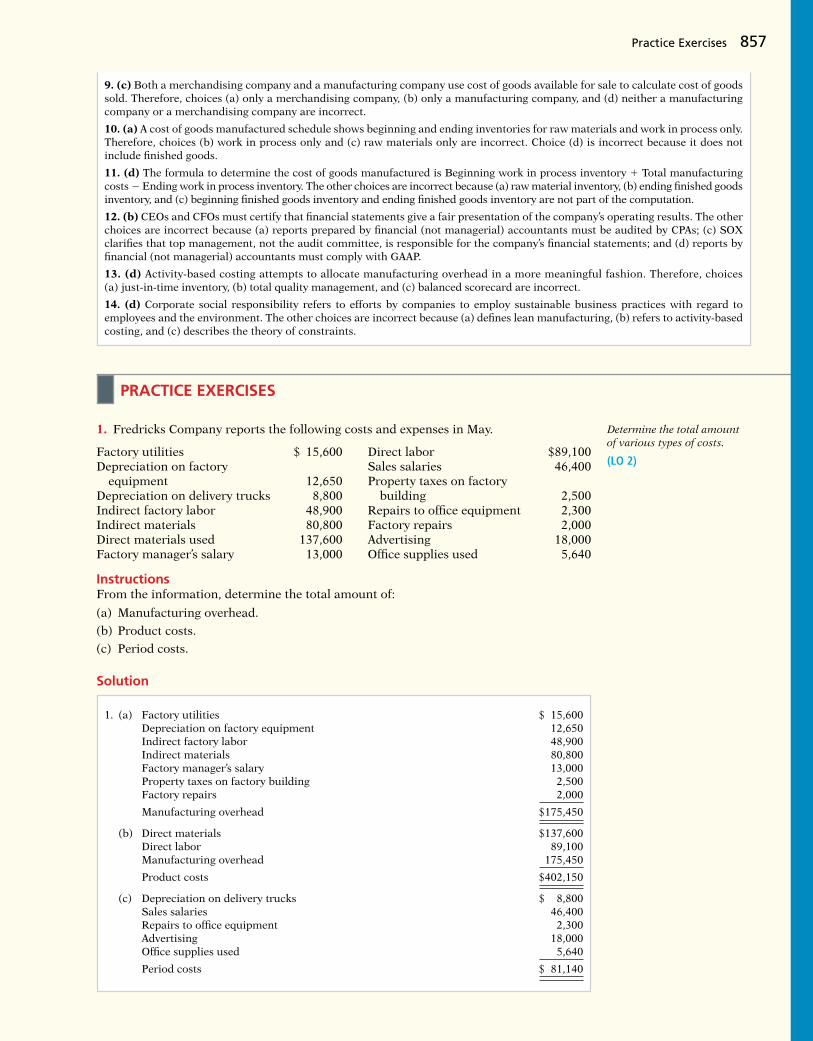
Practice Exercises 857
9. (c) Both a merchandising company and a manufacturing company use cost of goods available for sale to calculate cost of goods sold. Therefore, choices (a) only a merchandising company, (b) only a manufacturing company, and (d) neither a manufacturing company or a merchandising company are incorrect.
10. (a) A cost of goods manufactured schedule shows beginning and ending inventories for raw materials and work in process only. Therefore, choices (b) work in process only and (c) raw materials only are incorrect. Choice (d) is incorrect because it does not include fi nished goods.
11. (d) The formula to determine the cost of goods manufactured is Beginning work in process inventory 1 Total manufacturing costs 2 Ending work in process inventory. The other choices are incorrect because (a) raw material inventory, (b) ending fi nished goods inventory, and (c) beginning fi nished goods inventory and ending fi nished goods inventory are not part of the computation.
12. (b) CEOs and CFOs must certify that fi nancial statements give a fair presentation of the company’s operating results. The other choices are incorrect because (a) reports prepared by fi nancial (not managerial) accountants must be audited by CPAs; (c) SOX clarifi es that top management, not the audit committee, is responsible for the company’s fi nancial statements; and (d) reports by fi nancial (not managerial) accountants must comply with GAAP.
13. (d) Activity-based costing attempts to allocate manufacturing overhead in a more meaningful fashion. Therefore, choices (a) just-in-time inventory, (b) total quality management, and (c) balanced scorecard are incorrect.
14. (d) Corporate social responsibility refers to efforts by companies to employ sustainable business practices with regard to employees and the environment. The other choices are incorrect because (a) defi nes lean manufacturing, (b) refers to activity-based costing, and (c) describes the theory of constraints.
1. Fredricks Company reports the following costs and expenses in May.
Factory utilities $ 15,600 Direct labor $89,100Depreciation on factory Sales salaries 46,400 equipment 12,650 Property taxes on factoryDepreciation on delivery trucks 8,800 building 2,500Indirect factory labor 48,900 Repairs to offi ce equipment 2,300Indirect materials 80,800 Factory repairs 2,000Direct materials used 137,600 Advertising 18,000Factory manager’s salary 13,000 Offi ce supplies used 5,640
InstructionsFrom the information, determine the total amount of:
(a) Manufacturing overhead.
(b) Product costs.
(c) Period costs.
Determine the total amount of various types of costs.
(LO 2)
PRACTICE EXERCISES
Solution
1. (a) Factory utilities $ 15,600 Depreciation on factory equipment 12,650 Indirect factory labor 48,900 Indirect materials 80,800 Factory manager’s salary 13,000 Property taxes on factory building 2,500 Factory repairs 2,000
Manufacturing overhead $175,450
(b) Direct materials $137,600 Direct labor 89,100 Manufacturing overhead 175,450
Product costs $402,150
(c) Depreciation on delivery trucks $ 8,800 Sales salaries 46,400 Repairs to offi ce equipment 2,300 Advertising 18,000 Offi ce supplies used 5,640
Period costs $ 81,140

2. Tommi Corporation incurred the following costs while manufacturing its product.
Materials used in product $120,000 Advertising expense $45,000Depreciation on plant 60,000 Property taxes on plant 19,000Property taxes on store 7,500 Delivery expense 21,000Labor costs of assembly-line workers 110,000 Sales commissions 35,000Factory supplies used 25,000 Salaries paid to sales clerks 50,000
Work-in-process inventory was $10,000 at January 1 and $14,000 at December 31. Finished goods inventory was $60,500 at January 1 and $50,600 at December 31.
Instructions(a) Compute cost of goods manufactured.
(b) Compute cost of goods sold.
Compute cost of goods manufactured and sold.
(LO 3)
858 19 Managerial Accounting
Solution
2. (a) Work-in-process, 1/1 $ 10,000 Direct materials used $120,000 Direct labor 110,000 Manufacturing overhead Depreciation on plant $60,000 Factory supplies used 25,000 Property taxes on plant 19,000
Total manufacturing overhead 104,000
Total manufacturing costs 334,000
Total cost of work-in-process 344,000 Less: Ending work-in-process 14,000
Cost of goods manufactured $330,000
(b) Finished goods, 1/1 $ 60,500 Cost of goods manufactured 330,000
Cost of goods available for sale 390,500 Less: Finished goods, 12/31 50,600
Cost of goods sold $339,900
Superior Company has the following cost and expense data for the year ending December 31, 2017.
Raw materials, 1/1/17 $ 30,000 Insurance, factory $ 14,000Raw materials, 12/31/17 20,000 Property taxes, factory building 6,000Raw materials purchases 205,000 Sales revenue 1,500,000Indirect materials 15,000 Delivery expenses 100,000Work in process, 1/1/17 80,000 Sales commissions 150,000Work in process, 12/31/17 50,000 Indirect labor 90,000Finished goods, 1/1/17 110,000 Factory machinery rent 40,000Finished goods, 12/31/17 120,000 Factory utilities 65,000Direct labor 350,000 Depreciation, factory building 24,000Factory manager’s salary 35,000 Administrative expenses 300,000
Instructions(a) Prepare a cost of goods manufactured schedule for Superior Company for 2017.
(b) Prepare an income statement for Superior Company for 2017.
(c) Assume that Superior Company’s accounting records show the balances of the follow-ing current asset accounts: Cash $17,000, Accounts Receivable (net) $120,000, Prepaid Expenses $13,000, and Short-Term Investments $26,000. Prepare the current assets section of the balance sheet for Superior Company as of December 31, 2017.
Prepare a cost of goods manufactured schedule, an income statement, and a partial balance sheet.
(LO 3)
PRACTICE PROBLEM

Practice Problem 859
Solution
(a) SUPERIOR COMPANYCost of Goods Manufactured ScheduleFor the Year Ended December 31, 2017
Work in process, 1/1 $ 80,000Direct materials Raw materials inventory, 1/1 $ 30,000 Raw materials purchases 205,000
Total raw materials available for use 235,000 Less: Raw materials inventory, 12/31 20,000
Direct materials used $215,000Direct labor 350,000Manufacturing overhead Indirect labor 90,000 Factory utilities 65,000 Factory machinery rent 40,000 Factory manager’s salary 35,000 Depreciation, factory building 24,000 Indirect materials 15,000 Insurance, factory 14,000 Property taxes, factory building 6,000
Total manufacturing overhead 289,000
Total manufacturing costs 854,000
Total cost of work in process 934,000Less: Work in process, 12/31 50,000
Cost of goods manufactured $ 884,000
(b) SUPERIOR COMPANYIncome Statement
For the Year Ended December 31, 2017
Sales revenue $1,500,000Cost of goods sold Finished goods inventory, January 1 $110,000 Cost of goods manufactured 884,000
Cost of goods available for sale 994,000 Less: Finished goods inventory,
December 31 120,000
Cost of goods sold 874,000
Gross profi t 626,000Operating expenses Administrative expenses 300,000 Sales commissions 150,000 Delivery expenses 100,000
Total operating expenses 550,000
Net income $ 76,000
(c) SUPERIOR COMPANYBalance Sheet (partial)
December 31, 2017
Current assets Cash $ 17,000 Short-term investments 26,000 Accounts receivable (net) 120,000 Inventory Finished goods $120,000 Work in process 50,000 Raw materials 20,000 190,000
Prepaid expenses 13,000
Total current assets $366,000

860 19 Managerial Accounting
Brief Exercises, Exercises, DO IT! Exercises, and Problems and many additional resources are available for practice in WileyPLUS
QUESTIONS
1. (a) “Managerial accounting is a fi eld of accounting that provides economic information for all inter-ested parties.” Do you agree? Explain.
(b) Joe Delong believes that managerial accounting serves only manufacturing fi rms. Is Joe correct? Explain.
2. Distinguish between managerial and fi nancial account-ing as to (a) primary users of reports, (b) types and frequency of reports, and (c) purpose of reports.
3. How do the content of reports and the verifi cation of reports differ between managerial and fi nancial accounting?
4. Linda Olsen is studying for the next accounting mid-term examination. Summarize for Linda what she should know about management functions.
5. “Decision-making is management’s most important function.” Do you agree? Why or why not?
6. Explain the primary difference between line positions and staff positions, and give examples of each.
7. Tony Andres is studying for his next accounting examination. Explain to Tony what he should know about the differences between the income state-ments for a manufacturing and for a merchandising company.
8. Jerry Lang is unclear as to the difference between the balance sheets of a merchandising company and a man-ufacturing company. Explain the difference to Jerry.
9. How are manufacturing costs classifi ed?10. Mel Finney claims that the distinction between direct
and indirect materials is based entirely on physical association with the product. Is Mel correct? Why?
11. Tina Burke is confused about the differences between a product cost and a period cost. Explain the differ-ences to Tina.
12. Identify the differences in the cost of goods sold sec-tion of an income statement between a merchandis-ing company and a manufacturing company.
13. The determination of the cost of goods manufactured involves the following factors: (A) beginning work in
process inventory, (B) total manufacturing costs, and (C) ending work in process inventory. Identify the meaning of x in the following formulas:(a) A 1 B 5 x(b) A 1 B 2 C 5 x
14. Sealy Company has beginning raw materials inven-tory $12,000, ending raw materials inventory $15,000, and raw materials purchases $170,000. What is the cost of direct materials used?
15. Tate Inc. has beginning work in process $26,000, direct materials used $240,000, direct labor $220,000, total manufacturing overhead $180,000, and ending work in process $32,000. What are the total manufac-turing costs?
16. Using the data in Question 15, what are (a) the total cost of work in process and (b) the cost of goods man-ufactured?
17. In what order should manufacturing inventories be listed in a balance sheet?
18. How does the output of manufacturing operations differ from that of service operations?
19. Discuss whether the product costing techniques dis-cussed in this chapter apply equally well to manufac-turers and service companies.
20. What is the value chain? Describe, in sequence, the main components of a manufacturer’s value chain.
21. What is an enterprise resource planning (ERP) sys-tem? What are its primary benefi ts?
22. Why is product quality important for companies that implement a just-in-time inventory system?
23. Explain what is meant by “balanced” in the balanced scorecard approach.
24. In what ways can the budgeting process create incen-tives for unethical behavior?
25. What new rules were enacted under the Sarbanes- Oxley Act to address unethical accounting practices?
26. What is activity-based costing, and what are its poten-tial benefi ts?
BRIEF EXERCISES
BE19-1 Complete the following comparison table between managerial and fi nancial accounting.
Financial Accounting Managerial Accounting
Primary users of reportsTypes of reportsFrequency of reportsPurpose of reportsContent of reportsVerifi cation process
Distinguish between managerial and fi nancial accounting.
(LO 1)

Brief Exercises 861
BE19-2 Listed below are the three functions of the management of an organization.1. Planning 2. Directing 3. ControllingIdentify which of the following statements best describes each of the above functions.(a) ______ requires management to look ahead and to establish objectives. A key objective
of management is to add value to the business.(b) ______ involves coordinating the diverse activities and human resources of a company
to produce a smooth-running operation. This function relates to the implementation of planned objectives.
(c) ______ is the process of keeping the activities on track. Management determines whether goals are being met and what changes are necessary when there are devia-tions.
BE19-3 Determine whether each of the following costs should be classifi ed as direct materials (DM), direct labor (DL), or manufacturing overhead (MO).(a) ______ Frames and tires used in manufacturing bicycles.(b) ______ Wages paid to production workers.(c) ______ Insurance on factory equipment and machinery.(d) ______ Depreciation on factory equipment.
BE19-4 Indicate whether each of the following costs of an automobile manufacturer would be classifi ed as direct materials, direct labor, or manufacturing overhead.(a) ______ Windshield. (e) ______ Factory machinery lubricants.(b) ______ Engine. (f) ______ Tires.(c) ______ Wages of assembly line worker. (g) ______ Steering wheel.(d) ______ Depreciation of factory machinery. (h) ______ Salary of painting supervisor.
BE19-5 Identify whether each of the following costs should be classifi ed as product costs or period costs.(a) ______ Manufacturing overhead. (d) ______ Advertising expenses.(b) ______ Selling expenses. (e) ______ Direct labor.(c) ______ Administrative expenses. (f) ______ Direct materials.
BE19-6 Presented below are Rook Company’s monthly manufacturing cost data related to its tablet computer product.(a) Utilities for manufacturing equipment $116,000(b) Raw material (CPU, chips, etc.) $ 85,000(c) Depreciation on manufacturing building $880,000(d) Wages for production workers $191,000
Enter each cost item in the following table, placing an “X” under the appropriate headings.
Identify the three management functions.
(LO 1)
Classify manufacturing costs.
(LO 2)
Classify manufacturing costs.
(LO 2)
Identify product and period costs.
(LO 2)
Classify manufacturing costs.
(LO 2)
BE19-7 Francum Company has the following data: direct labor $209,000, direct ma-terials used $180,000, total manufacturing overhead $208,000, and beginning work in process $25,000. Compute (a) total manufacturing costs and (b) total cost of work in process.
BE19-8 In alphabetical order below are current asset items for Roland Company’s balance sheet at December 31, 2017. Prepare the current assets section (including a complete heading).
Accounts receivable $200,000Cash 62,000Finished goods 91,000Prepaid expenses 38,000Raw materials 83,000Work in process 87,000
Compute total manufacturing costs and total cost of work in process.
(LO 3)
Prepare current assets section.
(LO 3)
Product Costs
Direct Direct Factory Materials Labor Overhead
(a)(b)(c)(d)

862 19 Managerial Accounting
BE19-9 Presented below are incomplete manufacturing cost data. Determine the missing amounts for three different situations.
Determine missing amounts in computing total manufacturing costs.
(LO 3)
BE19-10 Use the same data from BE19-9 above and the data below. Determine the missing amounts.
Determine missing amounts in computing cost of goods manufactured.
(LO 3)
BE19-11 The Sarbanes-Oxley Act (SOX) has important implications for the fi nancial community. Explain two implications of SOX.
Identify important regulatory changes.
(LO 4)
Direct Direct Total Materials Labor Factory Manufacturing Used Used Overhead Costs
(1) $40,000 $61,000 $ 50,000 ?(2) ? $75,000 $140,000 $296,000(3) $55,000 ? $111,000 $310,000
Total Work Work Cost of Manufacturing in Process in Process Goods Costs (1/1) (12/31) Manufactured
(1) ? $120,000 $82,000 ?(2) $296,000 ? $98,000 $331,000(3) $310,000 $463,000 ? $715,000
Indicate whether the following statements are true or false.
1. Managerial accounting reports focus on manufacturing and nonmanufacturing costs, but are also used in the budget process.
2. Financial accounting reports pertain to subunits of the business and are very detailed.
3. Managerial accounting reports must follow GAAP and are audited by CPAs.
4. Managers’ activities and responsibilities can be classifi ed into three broad functions: planning, directing, and controlling.
A music company has these costs:
Advertising Paper inserts for CD casesBlank CDs CD plastic casesDepreciation of CD image Salaries of sales representatives burner Salaries of factory maintenance employeesSalary of factory manager Salaries of employees who burn music onto CDsFactory supplies used
Classify each cost as a period or a product cost. Within the product cost category, indicate if the cost is part of direct materials (DM), direct labor (DL), or manufacturing overhead (MO).
The following information is available for Tomlin Company.
April 1 April 30
Raw materials inventory $10,000 $14,000Work in process inventory 5,000 3,500
Materials purchased in April $ 98,000Direct labor in April 80,000Manufacturing overhead in April 160,000
Prepare the cost of goods manufactured schedule for the month of April.
Identify managerial accounting concepts.
(LO 1)
Identify managerial cost classifi cations.
(LO 2)
Prepare cost of goods manufactured schedule.
(LO 3)
DO IT! Exercises
DO IT! 19-1
DO IT! 19-2
DO IT! 19-3

Exercises 863
Match the descriptions that follow with the corresponding terms.
Descriptions:
1. ______ Inventory system in which goods are manufactured or purchased just as they are needed for sale.
2. ______ A method of allocating overhead based on each product’s use of activities in making the product.
3. ______ Systems that are especially important to fi rms adopting just-in-time inventory methods.
4. ______ Provides guidelines for companies to describe their sustainable business prac-tices to external parties.
5. ______ Part of the value chain for a manufacturing company.6. ______ The U.S. economy is trending toward this.7. ______ A performance-measurement approach that uses both fi nancial and nonfi nan-
cial measures, tied to company objectives, to evaluate a company’s operations in an integrated fashion.
8. ______ Requires that top managers certify that the company maintains an adequate system of internal controls.
Terms:
(a) Activity-based costing (e) Service industries(b) Balanced scorecard (f) Just-in-time (JIT) inventory(c) Total quality management (TQM) (g) Sarbanes-Oxley Act (SOX)(d) Research and development, and product design (h) Global Reporting Initiative
Identify trends in managerial accounting.
(LO 4)
DO IT! 19-4
EXERCISES
E19-1 Justin Bleeber has prepared the following list of statements about managerial accounting, fi nancial accounting, and the functions of management.
1. Financial accounting focuses on providing information to internal users. 2. Staff positions are directly involved in the company’s primary revenue-generating
activities. 3. Preparation of budgets is part of fi nancial accounting. 4. Managerial accounting applies only to merchandising and manufacturing companies. 5. Both managerial accounting and fi nancial accounting deal with many of the same
economic events. 6. Managerial accounting reports are prepared only quarterly and annually. 7. Financial accounting reports are general-purpose reports. 8. Managerial accounting reports pertain to subunits of the business. 9. Managerial accounting reports must comply with generally accepted accounting
principles.10. The company treasurer reports directly to the vice president of operations.
InstructionsIdentify each statement as true or false. If false, indicate how to correct the statement.
E19-2 Presented below is a list of costs and expenses usually incurred by Barnum Corpo-ration, a manufacturer of furniture, in its factory.
1. Salaries for assembly line inspectors. 2. Insurance on factory machines. 3. Property taxes on the factory building. 4. Factory repairs. 5. Upholstery used in manufacturing furniture. 6. Wages paid to assembly line workers. 7. Factory machinery depreciation. 8. Glue, nails, paint, and other small parts used in production. 9. Factory supervisors’ salaries.10. Wood used in manufacturing furniture.
Identify distinguishing features of managerial accounting.
(LO 1)
Classify costs into three classes of manufacturing costs.
(LO 2)

864 19 Managerial Accounting
InstructionsClassify the above items into the following categories: (a) direct materials, (b) direct labor, and (c) manufacturing overhead.
E19-3 Trak Corporation incurred the following costs while manufacturing its bicycles.
Bicycle components $100,000 Advertising expense $45,000Depreciation on plant 60,000 Property taxes on plant 14,000Property taxes on store 7,500 Delivery expense 21,000Labor costs of assembly-line workers 110,000 Sales commissions 35,000Factory supplies used 13,000 Salaries paid to sales clerks 50,000
Instructions(a) Identify each of the above costs as direct materials, direct labor, manufacturing over-
head, or period costs.(b) Explain the basic difference in accounting for product costs and period costs.
E19-4 Knight Company reports the following costs and expenses in May.
Factory utilities $ 15,500 Direct labor $69,100Depreciation on factory Sales salaries 46,400 equipment 12,650 Property taxes on factoryDepreciation on delivery trucks 3,800 building 2,500Indirect factory labor 48,900 Repairs to offi ce equipment 1,300Indirect materials 80,800 Factory repairs 2,000Direct materials used 137,600 Advertising 15,000Factory manager’s salary 8,000 Offi ce supplies used 2,640
InstructionsFrom the information, determine the total amount of:
(a) Manufacturing overhead.(b) Product costs.(c) Period costs.
E19-5 Gala Company is a manufacturer of laptop computers. Various costs and expenses associated with its operations are as follows.
1. Property taxes on the factory building. 2. Production superintendents’ salaries. 3. Memory boards and chips used in assembling computers. 4. Depreciation on the factory equipment. 5. Salaries for assembly-line quality control inspectors. 6. Sales commissions paid to sell laptop computers. 7. Electrical components used in assembling computers. 8. Wages of workers assembling laptop computers. 9. Soldering materials used on factory assembly lines.10. Salaries for the night security guards for the factory building.
The company intends to classify these costs and expenses into the following categories: (a) direct materials, (b) direct labor, (c) manufacturing overhead, and (d) period costs.
InstructionsList the items (1) through (10). For each item, indicate the cost category to which it belongs.
E19-6 The administrators of Crawford County’s Memorial Hospital are interested in iden-tifying the various costs and expenses that are incurred in producing a patient’s X-ray. A list of such costs and expenses is presented below.
1. Salaries for the X-ray machine technicians. 2. Wages for the hospital janitorial personnel. 3. Film costs for the X-ray machines. 4. Property taxes on the hospital building. 5. Salary of the X-ray technicians’ supervisor. 6. Electricity costs for the X-ray department. 7. Maintenance and repairs on the X-ray machines. 8. X-ray department supplies. 9. Depreciation on the X-ray department equipment.10. Depreciation on the hospital building.
Identify types of cost and explain their accounting.
(LO 2)
Determine the total amount of various types of costs.
(LO 2)
Classify various costs into different cost categories.
(LO 2)
Classify various costs into different cost categories.
(LO 2)
SERVICE

Exercises 865
The administrators want these costs and expenses classified as (a) direct materials, (b) direct labor, or (c) service overhead.
InstructionsList the items (1) through (10). For each item, indicate the cost category to which the item belongs.
E19-7 National Express reports the following costs and expenses in June 2017 for its delivery service.
Indirect materials $ 6,400 Drivers’ salaries $16,000Depreciation on delivery equipment 11,200 Advertising 4,600Dispatcher’s salary 5,000 Delivery equipment repairs 300Property taxes on offi ce building 870 Offi ce supplies 650CEO’s salary 12,000 Offi ce utilities 990Gas and oil for delivery trucks 2,200 Repairs on offi ce equipment 180
InstructionsDetermine the total amount of (a) delivery service (product) costs and (b) period costs.
E19-8 Lopez Corporation incurred the following costs while manufacturing its product.
Materials used in product $120,000 Advertising expense $45,000Depreciation on plant 60,000 Property taxes on plant 14,000Property taxes on store 7,500 Delivery expense 21,000Labor costs of assembly-line Sales commissions 35,000 workers 110,000 Salaries paid to sales Factory supplies used 23,000 clerks 50,000
Work in process inventory was $12,000 at January 1 and $15,500 at December 31. Finished goods inventory was $60,000 at January 1 and $45,600 at December 31.
Instructions(a) Compute cost of goods manufactured.(b) Compute cost of goods sold.
E19-9 An incomplete cost of goods manufactured schedule is presented below.
Classify various costs into different cost categories.
(LO 2)
Compute cost of goods manufactured and sold.
(LO 3)
Determine missing amounts in cost of goods manufactured schedule.
(LO 3)
SERVICE
HOBBIT COMPANYCost of Goods Manufactured ScheduleFor the Year Ended December 31, 2017
Work in process (1/1) $210,000Direct materials Raw materials inventory (1/1) $ ? Add: Raw materials purchases 158,000
Total raw materials available for use ? Less: Raw materials inventory (12/31) 22,500
Direct materials used $180,000Direct labor ?Manufacturing overhead Indirect labor 18,000 Factory depreciation 36,000 Factory utilities 68,000
Total overhead 122,000
Total manufacturing costs ?
Total cost of work in process ?Less: Work in process (12/31) 81,000
Cost of goods manufactured $540,000
InstructionsComplete the cost of goods manufactured schedule for Hobbit Company.

866 19 Managerial Accounting
E19-10 Manufacturing cost data for Copa Company are presented below.
Case A Case B Case C
Direct materials used $ (a) $68,400 $130,000Direct labor 57,000 86,000 (g)Manufacturing overhead 46,500 81,600 102,000Total manufacturing costs 195,650 (d) 253,700Work in process 1/1/17 (b) 16,500 (h)Total cost of work in process 221,500 (e) 337,000Work in process 12/31/17 (c) 11,000 70,000Cost of goods manufactured 185,275 (f) (i)
InstructionsIndicate the missing amount for each letter (a) through (i).
E19-11 Incomplete manufacturing cost data for Horizon Company for 2017 are presented as follows for four different situations.
Total Cost of Direct Direct Manufac- Manufac- Work in Work in Goods Materials Labor turing turing Process Process Manufac- Used Used Overhead Costs 1/1 12/31 tured
(1) $117,000 $140,000 $ 87,000 $ (a) $33,000 $ (b) $360,000(2) (c) 200,000 132,000 450,000 (d) 40,000 470,000(3) 80,000 100,000 (e) 265,000 60,000 80,000 (f)(4) 70,000 (g) 75,000 288,000 45,000 (h) 270,000
Instructions(a) Indicate the missing amount for each letter.(b) Prepare a condensed cost of goods manufactured schedule for situation (1) for the
year ended December 31, 2017.
E19-12 Cepeda Corporation has the following cost records for June 2017.
Indirect factory labor $ 4,500 Factory utilities $ 400Direct materials used 20,000 Depreciation, factory equipment 1,400Work in process, 6/1/17 3,000 Direct labor 40,000Work in process, 6/30/17 3,800 Maintenance, factory equipment 1,800Finished goods, 6/1/17 5,000 Indirect materials 2,200Finished goods, 6/30/17 7,500 Factory manager’s salary 3,000
Instructions(a) Prepare a cost of goods manufactured schedule for June 2017.(b) Prepare an income statement through gross profi t for June 2017 assuming sales revenue
is $92,100.
E19-13 Keisha Tombert, the bookkeeper for Washington Consulting, a political consult-ing fi rm, has recently completed a managerial accounting course at her local college. One of the topics covered in the course was the cost of goods manufactured schedule. Keisha wondered if such a schedule could be prepared for her fi rm. She realized that, as a service-oriented company, it would have no work in process inventory to consider.
Listed below are the costs her fi rm incurred for the month ended August 31, 2017.
Supplies used on consulting contracts $ 1,700Supplies used in the administrative offi ces 1,500Depreciation on equipment used for contract work 900Depreciation used on administrative offi ce equipment 1,050Salaries of professionals working on contracts 15,600Salaries of administrative offi ce personnel 7,700Janitorial services for professional offi ces 700Janitorial services for administrative offi ces 500Insurance on contract operations 800Insurance on administrative operations 900Utilities for contract operations 1,400Utilities for administrative offi ces 1,300
Determine the missing amount of different cost items.
(LO 3)
Determine the missing amount of different cost items, and prepare a condensed cost of goods manufactured schedule.
(LO 3)
Prepare a cost of goods manufactured schedule and a partial income statement.
(LO 3)
Classify various costs into different categories and prepare cost of services performed schedule.
(LO 2, 3)
SERVICE

Exercises 867
Instructions(a) Prepare a schedule of cost of contract services performed (similar to a cost of goods
manufactured schedule) for the month.(b) For those costs not included in (a), explain how they would be classifi ed and reported
in the fi nancial statements.
E19-14 The following information is available for Aikman Company. January 1, 2017 2017 December 31, 2017
Raw materials inventory $21,000 $30,000Work in process inventory 13,500 17,200Finished goods inventory 27,000 21,000Materials purchased $150,000Direct labor 220,000Manufacturing overhead 180,000Sales revenue 910,000
Instructions(a) Compute cost of goods manufactured.(b) Prepare an income statement through gross profi t.(c) Show the presentation of the ending inventories on the December 31, 2017, balance sheet.(d) How would the income statement and balance sheet of a merchandising company be
different from Aikman’s fi nancial statements?
E19-15 University Company produces collegiate apparel. From its accounting records, it prepares the following schedule and fi nancial statements on a yearly basis.
(a) Cost of goods manufactured schedule.(b) Income statement.(c) Balance sheet.
The following items are found in its ledger and accompanying data.
1. Direct labor 2. Raw materials inventory, 1/1 3. Work in process inventory, 12/31 4. Finished goods inventory, 1/1 5. Indirect labor 6. Depreciation on factory machinery 7. Work in process, 1/1 8. Finished goods inventory, 12/31 9. Factory maintenance salaries 10. Cost of goods manufactured 11. Depreciation on delivery equipment12. Cost of goods available for sale13. Direct materials used14. Heat and electricity for factory15. Repairs to roof of factory building16. Cost of raw materials purchases
InstructionsList the items (1)–(16). For each item, indicate by using the appropriate letter or letters, the schedule and/or fi nancial statement(s) in which the item will appear.
E19-16 An analysis of the accounts of Roberts Company reveals the following manufac-turing cost data for the month ended June 30, 2017.
Inventory Beginning Ending
Raw materials $9,000 $13,100Work in process 5,000 7,000Finished goods 9,000 8,000
Costs incurred: raw materials purchases $54,000, direct labor $47,000, manufacturing overhead $19,900. The specifi c overhead costs were: indirect labor $5,500, factory insur-ance $4,000, machinery depreciation $4,000, machinery repairs $1,800, factory utilities $3,100, and miscellaneous factory costs $1,500. Assume that all raw materials used were direct materials.
Instructions(a) Prepare the cost of goods manufactured schedule for the month ended June 30, 2017.(b) Show the presentation of the ending inventories on the June 30, 2017, balance sheet.
Prepare a cost of goods manufactured schedule and a partial income statement.
(LO 3)
Indicate in which schedule or fi nancial statement(s) different cost items will appear.
(LO 3)
Prepare a cost of goods manufactured schedule, and present the ending inventories on the balance sheet.
(LO 3)

868 19 Managerial Accounting
E19-17 McQueen Motor Company manufactures automobiles. During September 2017, the company purchased 5,000 head lamps at a cost of $15 per lamp. McQueen withdrew 4,650 lamps from the warehouse during the month. Fifty of these lamps were used to replace the head lamps in autos used by traveling sales staff. The remaining 4,600 lamps were put in autos manufactured during the month.
Of the autos put into production during September 2017, 90% were completed and transferred to the company’s storage lot. Of the cars completed during the month, 70% were sold by September 30.
Instructions(a) Determine the cost of head lamps that would appear in each of the following accounts
at September 30, 2017: Raw Materials, Work in Process, Finished Goods, Cost of Goods Sold, and Selling Expenses.
(b) Write a short memo to the chief accountant, indicating whether and where each of the accounts in (a) would appear on the income statement or on the balance sheet at September 30, 2017.
E19-18 The following is a list of terms related to managerial accounting practices.
1. Activity-based costing.2. Just-in-time inventory.3. Balanced scorecard.4. Value chain.
InstructionsMatch each of the terms with the statement below that best describes the term.
(a) ______ A performance-measurement technique that attempts to consider and evaluate all aspects of performance using fi nancial and nonfi nancial measures in an integrated fashion.
(b) ______ The group of activities associated with providing a product or performing a service.
(c) ______ An approach used to reduce the cost associated with handling and holding inventory by reducing the amount of inventory on hand.
(d) ______ A method used to allocate overhead to products based on each product’s use of the activities that cause the incurrence of the overhead cost.
Determine the amount of cost to appear in various accounts, and indicate in which fi nancial statements these accounts would appear.
(LO 3)
Identify various managerial accounting practices.
(LO 4)
EXERCISES: SET B AND CHALLENGE EXERCISES
Visit the book’s companion website, at www.wiley.com/college/weygandt, and choose the Student Companion site to access Exercises: Set B and Challenge Exercises.
PROBLEMS: SET A
P19-1A Ohno Company specializes in manufacturing a unique model of bicycle helmet. The model is well accepted by consumers, and the company has enough orders to keep the factory production at 10,000 helmets per month (80% of its full capacity). Ohno’s monthly manufacturing cost and other expense data are as follows.
Rent on factory equipment $11,000Insurance on factory building 1,500Raw materials (plastics, polystyrene, etc.) 75,000Utility costs for factory 900Supplies for general offi ce 300Wages for assembly line workers 58,000Depreciation on offi ce equipment 800Miscellaneous materials (glue, thread, etc.) 1,100Factory manager’s salary 5,700Property taxes on factory building 400Advertising for helmets 14,000Sales commissions 10,000Depreciation on factory building 1,500
Classify manufacturing costs into different categories and compute the unit cost
(LO 2)

Problems: Set A 869
Instructions(a) Prepare an answer sheet with the following column headings.
Product Costs
Cost Direct Direct Manufacturing Period Item Materials Labor Overhead Costs
Enter each cost item on your answer sheet, placing the dollar amount under the appro-priate headings. Total the dollar amounts in each of the columns.
(b) Compute the cost to produce one helmet.
P19-2A Bell Company, a manufacturer of audio systems, started its production in October 2017. For the preceding 3 years, Bell had been a retailer of audio systems. After a thorough survey of audio system markets, Bell decided to turn its retail store into an audio equipment factory.
Raw materials cost for an audio system will total $74 per unit. Workers on the produc-tion lines are on average paid $12 per hour. An audio system usually takes 5 hours to complete. In addition, the rent on the equipment used to assemble audio systems amounts to $4,900 per month. Indirect materials cost $5 per system. A supervisor was hired to oversee production; her monthly salary is $3,000.
Factory janitorial costs are $1,300 monthly. Advertising costs for the audio system will be $9,500 per month. The factory building depreciation expense is $7,800 per year. Prop-erty taxes on the factory building will be $9,000 per year.
Instructions(a) Prepare an answer sheet with the following column headings.
Product Costs
Cost Direct Direct Manufacturing PeriodItem Materials Labor Overhead Costs
Assuming that Bell manufactures, on average, 1,500 audio systems per month, enter each cost item on your answer sheet, placing the dollar amount per month under the appropriate headings. Total the dollar amounts in each of the columns.
(b) Compute the cost to produce one audio system.
P19-3A Incomplete manufacturing costs, expenses, and selling data for two different cases are as follows.
Case
1 2
Direct materials used $ 9,600 $ (g)Direct labor 5,000 8,000Manufacturing overhead 8,000 4,000Total manufacturing costs (a) 16,000Beginning work in process inventory 1,000 (h)Ending work in process inventory (b) 3,000Sales revenue 24,500 (i)Sales discounts 2,500 1,400Cost of goods manufactured 17,000 24,000Beginning fi nished goods inventory (c) 3,300Goods available for sale 22,000 (j)Cost of goods sold (d) (k)Ending fi nished goods inventory 3,400 2,500Gross profi t (e) 7,000Operating expenses 2,500 (l)Net income (f) 5,000
Instructions(a) Indicate the missing amount for each letter.(b) Prepare a condensed cost of goods manufactured schedule for Case 1.(c) Prepare an income statement and the current assets section of the balance sheet for
Case 1. Assume that in Case 1 the other items in the current assets section are as follows: Cash $3,000, Receivables (net) $15,000, Raw Materials $600, and Prepaid Expenses $400.
(a) DM $75,000 DL $58,000 MO $22,100 PC $25,100
Classify manufacturing costs into different categories and compute the unit cost.
(LO 2)
(a) DM $111,000 DL $ 90,000 MO $ 18,100 PC $ 9,500
Indicate the missing amount of different cost items, and prepare a condensed cost of goods manufactured schedule, an income statement, and a partial balance sheet.
(LO 3)
(b) Ending WIP $ 6,600(c) Current assets $29,000

870 19 Managerial Accounting
P19-4A The following data were taken from the records of Clarkson Company for the fi scal year ended June 30, 2017.
Raw Materials Factory Insurance $ 4,600 Inventory 7/1/16 $ 48,000 Factory MachineryRaw Materials Depreciation 16,000 Inventory 6/30/17 39,600 Factory Utilities 27,600Finished Goods Offi ce Utilities Expense 8,650 Inventory 7/1/16 96,000 Sales Revenue 534,000Finished Goods Sales Discounts 4,200 Inventory 6/30/17 75,900 Plant Manager’s Salary 58,000Work in Process Factory Property Taxes 9,600 Inventory 7/1/16 19,800 Factory Repairs 1,400Work in Process Raw Materials Purchases 96,400 Inventory 6/30/17 18,600 Cash 32,000Direct Labor 139,250Indirect Labor 24,460Accounts Receivable 27,000
Instructions(a) Prepare a cost of goods manufactured schedule. (Assume all raw materials used were
direct materials.)(b) Prepare an income statement through gross profi t.(c) Prepare the current assets section of the balance sheet at June 30, 2017.
P19-5A Empire Company is a manufacturer of smart phones. Its controller resigned in October 2017. An inexperienced assistant accountant has prepared the following income statement for the month of October 2017.
EMPIRE COMPANYIncome Statement
For the Month Ended October 31, 2017
Sales revenue $780,000Less: Operating expenses Raw materials purchases $264,000 Direct labor cost 190,000 Advertising expense 90,000 Selling and administrative salaries 75,000 Rent on factory facilities 60,000 Depreciation on sales equipment 45,000 Depreciation on factory equipment 31,000 Indirect labor cost 28,000 Utilities expense 12,000 Insurance expense 8,000 803,000
Net loss $ (23,000)
Prior to October 2017, the company had been profi table every month. The company’s president is concerned about the accuracy of the income statement. As her friend, you have been asked to review the income statement and make necessary corrections. After examining other manufacturing cost data, you have acquired additional information as follows.
1. Inventory balances at the beginning and end of October were:
October 1 October 31
Raw materials $18,000 $29,000Work in process 20,000 14,000Finished goods 30,000 50,000
2. Only 75% of the utilities expense and 60% of the insurance expense apply to factory operations. The remaining amounts should be charged to selling and administrative activities.
Prepare a cost of goods manufactured schedule, a partial income statement, and a partial balance sheet.
(LO 3)
(a) CGM $386,910
(b) Gross profi t $122,790(c) Current assets $193,100
Prepare a cost of goods manufactured schedule and a correct income statement.
(LO 3)

Continuing Problems 871
Instructions(a) Prepare a schedule of cost of goods manufactured for October 2017.(b) Prepare a correct income statement for October 2017.
(a) CGM $581,800(b) NI $ 2,000
PROBLEMS: SET B AND SET C
Visit the book’s companion website, at www.wiley.com/college/weygandt, and choose the Student Companion site to access Problems: Set B and Set C.
CONTINUING PROBLEMS
CURRENT DESIGNSCD19 Mike Cichanowski founded Wenonah Canoe and later purchased Current Designs, a company that designs and manufactures kayaks. The kayak-manufacturing facility is located just a few minutes from the canoe company’s headquarters in Winona, Minnesota. Current Designs makes kayaks using two different processes. (See www.cdkayak.com/craftsmanship/index.php for the details of each method.) The rotational molding process uses high temperature to melt polyethylene powder in a closed rotating metal mold to produce a complete kayak hull and deck in a single piece. These kayaks are less labor-intensive and less expensive for the company to produce and sell. Its other kayaks use the vacuum-bagged composite lamination process (which we will refer to as the composite process). Layers of fi berglass or Kevlar® are carefully placed by hand in a mold and are bonded with resin. Then, a high-pressure vacuum is used to eliminate any excess resin that would otherwise add weight and reduce strength of the fi nished kayak. These kayaks require a great deal of skilled labor as each boat is individually fi nished. The exquisite fi nish of the vacuum-bagged composite kayaks gave rise to Current Designs’ tag line, “A work of art, made for life.” Current Designs has the following managers:
Mike Cichanowski, CEO Diane Buswell, Controller Deb Welch, Purchasing Manager Bill Johnson, Sales Manager Dave Thill, Kayak Plant Manager Rick Thrune, Production Manager for Composite Kayaks
Instructions(a) What are the primary information needs of each manager?(b) Name one special-purpose management accounting report that could be designed for each man-
ager. Include the name of the report, the information it would contain, and how frequently it should be issued.
(c) When Diane Buswell, controller for Current Designs, reviewed the accounting records for a recent period, she noted the following items. Classify each item as a product cost or a period cost. If an item is a product cost, note if it is a direct materials, direct labor, or manufacturing overhead item.
(Note: Chapters 19–26 include a hypothetical exercise featuring Current Designs, the company described at the beginning of this chapter. Students can also work through this exercise following an Excel tutorial available in WileyPLUS and the book’s companion website. Each chapter’s tutorial focuses on a different Excel function or feature.)
EXCEL TUTORIAL

872 19 Managerial Accounting
1
3
2
4
5
6
7
8
9
10
11
12
13
14
15
16
17
AP18 fx
B C D
Formulas Data Review ViewPage LayoutInsertHome
Payee Purpose
Product CostsDirect
MaterialsDirectLabor
PeriodCostsManufacturing
OverheadWinona Agency
Bill Johnson(sales manager)
Xcel EnergyWinona Printing
Property insurance for themanufacturing plant
Payroll check—payment to salesmanager
Electricity for manufacturing plantPrice lists for salespeople
Jim Kaiser (salesrepresentative)
Sales commissions
Dave Thill(plant manager)
Payroll check—payment toplant manager
Dana Schultz(kayak assembler)
Payroll check—payment tokayak assembler
Composite One Bagging film used when kayaks areassembled; it is discarded after use
Fastenal Shop supplies—brooms, papertowels, etc.
Ravago Polyethylene powder which is themain ingredient for the rotationalmolded kayaks
Winona County Property taxes on manufacturing plantNorth AmericanComposites
Kevlar® fabric for composite kayaks
WasteManagement
Trash disposal for the companyoffice building
None Journal entry to record depreciationof manufacturing equipment
Current Designs.xls
WATERWAYS(Note: The Waterways problem starts in this chapter and continues in the remaining chapters. You will fi nd the complete problem for each chapter at the book’s companion website.)
WP19 Waterways Corporation is a private corporation formed for the purpose of providing the products and the services needed to irrigate farms, parks, commercial projects, and pri-vate lawns. It has a centrally located factory in a U.S. city that manufactures the products it markets to retail outlets across the nation. It also maintains a division that performs installa-tion and warranty servicing in six metropolitan areas. The mission of Waterways is to manufacture quality parts that can be used for effective irrigation projects that also conserve water. By that effort, the company hopes to satisfy its customers, perform rapid and responsible service, and serve the community and the employees who represent them in each community. The company has been growing rapidly, so management is considering new ideas to help the company continue its growth and maintain the high quality of its products. Waterways was founded by Will Winkman, who is the company president and chief execu-tive offi cer (CEO). Working with him from the company’s inception is Will’s brother, Ben, whose sprinkler designs and ideas about the installation of proper systems have been a major basis of the company’s success. Ben is the vice president who oversees all aspects of design and produc-tion in the company. The factory itself is managed by Todd Senter who hires his line managers to supervise the factory employees. The factory makes all of the parts for the irrigation systems. The purchasing department is managed by Helen Hines. The installation and training division is overseen by vice president Henry Writer, who supervises the managers of the six local installation operations. Each of these local managers hires his or her own local service people. These service employees are trained by the home offi ce under Henry Writer’s direction because of the uniqueness of the company’s products.

There is a small human resources department under the direction of Sally Fenton, a vice president who handles the employee paperwork, though hiring is actually performed by the separate departments. Teresa Totter is the vice president who heads the sales and marketing area; she oversees 10 well-trained salespeople. The accounting and fi nance division of the company is run by Ann Headman, who is the chief fi nancial offi cer (CFO) and a company vice president. She is a member of the Institute of Management Accountants and holds a certifi cate in management accounting. She has a small staff of accountants, including a controller and a treasurer, and a staff of accounting input oper-ators who maintain the fi nancial records. A partial list of Waterways’ accounts and their balances for the month of November follows.
Accounts Receivable $ 275,000Advertising Expenses 54,000Cash 260,000Depreciation—Factory Equipment 16,800Depreciation—Offi ce Equipment 2,400Direct Labor 42,000Factory Supplies Used 16,800Factory Utilities 10,200Finished Goods Inventory, November 30 68,800Finished Goods Inventory, October 31 72,550Indirect Labor 48,000Offi ce Supplies Expense 1,600Other Administrative Expenses 72,000Prepaid Expenses 41,250Raw Materials Inventory, November 30 52,700Raw Materials Inventory, October 31 38,000Raw Materials Purchases 184,500Rent—Factory Equipment 47,000Repairs—Factory Equipment 4,500Salaries 325,000Sales Revenue 1,350,000Sales Commissions 40,500Work in Process Inventory, October 31 52,700Work in Process Inventory, November 30 42,000
Instructions(a) Based on the information given, construct an organizational chart of Waterways Corporation.(b) A list of accounts and their values are given above. From this information, prepare a
cost of goods manufactured schedule, an income statement, and a partial balance sheet for Waterways Corporation for the month of November.
Broadening Your Perspective 873
PERSPECTIVEMANAGEMENT DECISION-MAKING
Decision-Making Across the OrganizationBYP19-1 Wendall Company specializes in producing fashion outfi ts. On July 31, 2017, a tornado touched down at its factory and general offi ce. The inventories in the warehouse and the factory were completely destroyed as was the general offi ce nearby. Next morning, through a careful search of the disaster site, however, Bill Francis, the company’s controller, and Elizabeth Walton, the cost accoun-tant, were able to recover a small part of manufacturing cost data for the current month. “What a horrible experience,” sighed Bill “And the worst part is that we may not have enough records to use in fi ling an insurance claim.” “It was terrible,” replied Elizabeth. “However, I managed to recover some of the manufactur-ing cost data that I was working on yesterday afternoon. The data indicate that our direct labor cost in July totaled $250,000 and that we had purchased $365,000 of raw materials. Also, I recall that the amount of raw materials used for July was $350,000. But I’m not sure this information will help. The rest of our records are blown away.”
BROADENING YOUR

“Well, not exactly,” said Bill. “I was working on the year-to-date income statement when the tornado warning was announced. My recollection is that our sales in July were $1,240,000 and our gross profi t ratio has been 40% of sales. Also, I can remember that our cost of goods available for sale was $770,000 for July.” “Maybe we can work something out from this information!” exclaimed Elizabeth. “My expe-rience tells me that our manufacturing overhead is usually 60% of direct labor.” “Hey, look what I just found,” cried Elizabeth. “It’s a copy of this June’s balance sheet, and it shows that our inventories as of June 30 are Finished goods $38,000, Work in process $25,000, and Raw materials $19,000.” “Super,” yelled Bill. “Let’s go work something out.” In order to fi le an insurance claim, Wendall Company needs to determine the amount of its inven-tories as of July 31, 2017, the date of the tornado touchdown.
InstructionsWith the class divided into groups, determine the amount of cost in the Raw Materials, Work in Process, and Finished Goods inventory accounts as of the date of the tornado touchdown.
Managerial AnalysisBYP19-2 Tenrack is a fairly large manufacturing company located in the southern United States. The company manufactures tennis rackets, tennis balls, tennis clothing, and tennis shoes, all bear-ing the company’s distinctive logo, a large green question mark on a white fl ocked tennis ball. The company’s sales have been increasing over the past 10 years. The tennis racket division has recently implemented several advanced manufacturing tech-niques. Robot arms hold the tennis rackets in place while glue dries, and machine vision systems check for defects. The engineering and design team uses computerized drafting and testing of new products. The following managers work in the tennis racket division:
Jason Dennis, Sales Manager (supervises all sales representatives)Peggy Groneman, Technical Specialist (supervises computer programmers)Dave Marley, Cost Accounting Manager (supervises cost accountants)Kevin Carson, Production Supervisor (supervises all manufacturing employees)Sally Renner, Engineer (supervises all new-product design teams)
Instructions(a) What are the primary information needs of each manager?(b) Which, if any, fi nancial accounting report(s) is each likely to use?(c) Name one special-purpose management accounting report that could be designed for each man-
ager. Include the name of the report, the information it would contain, and how frequently it should be issued.
Real-World FocusBYP19-3 The Institute of Management Accountants (IMA) is an organization dedicated to excel-lence in the practice of management accounting and fi nancial management.
Address: www.imanet.org, or go to www.wiley.com/college/weygandt
InstructionsAt the IMA’s home page, locate the answers to the following questions.
(a) How many members does the IMA have, and what are their job titles?(b) What are some of the benefi ts of joining the IMA as a student?(c) Use the chapter locator function to locate the IMA chapter nearest you, and fi nd the name of the
chapter president.
CRITICAL THINKING
Communication ActivityBYP19-4 Refer to P19-5A and add the following requirement.
Prepare a letter to the president of the company, Shelly Phillips, describing the changes you made. Explain clearly why net income is different after the changes. Keep the following points in mind as you compose your letter.
874 19 Managerial Accounting

1. This is a letter to the president of a company, who is your friend. The style should be generally formal, but you may relax some requirements. For example, you may call the president by her fi rst name.
2. Executives are very busy. Your letter should tell the president your main results fi rst (for example, the amount of net income).
3. You should include brief explanations so that the president can understand the changes you made in the calculations.
Ethics CaseBYP19-5 Steve Morgan, controller for Newton Industries, was reviewing production cost reports for the year. One amount in these reports continued to bother him—advertising. During the year, the company had instituted an expensive advertising campaign to sell some of its slower-moving products. It was still too early to tell whether the advertising campaign was successful. There had been much internal debate as how to report advertising cost. The vice president of fi nance argued that advertising costs should be reported as a cost of production, just like direct mate-rials and direct labor. He therefore recommended that this cost be identifi ed as manufacturing over-head and reported as part of inventory costs until sold. Others disagreed. Morgan believed that this cost should be reported as an expense of the current period, so as not to overstate net income. Others argued that it should be reported as prepaid advertising and reported as a current asset. The president fi nally had to decide the issue. He argued that these costs should be reported as inventory. His arguments were practical ones. He noted that the company was experiencing fi nancial diffi culty and expensing this amount in the current period might jeopardize a planned bond offering. Also, by reporting the advertising costs as inventory rather than as prepaid advertising, less attention would be directed to it by the fi nancial community.
Instructions(a) Who are the stakeholders in this situation?(b) What are the ethical issues involved in this situation?(c) What would you do if you were Steve Morgan?
All About YouBYP19-6 The primary purpose of managerial accounting is to provide information useful for man-agement decisions. Many of the managerial accounting techniques that you learn in this course will be useful for decisions you make in your everyday life.
InstructionsFor each of the following managerial accounting techniques, read the defi nition provided and then provide an example of a personal situation that would benefi t from use of this technique.
(a) Break-even point (page 971).(b) Budget (page 1006).(c) Balanced scorecard (page 850).(d) Capital budgeting (page 1159).
Considering Your Costs and Benefi tsBYP19-7 As noted in this chapter, because of global competition, companies have become increas-ingly focused on reducing costs. To reduce costs and remain competitive, many companies are turn-ing to outsourcing. Outsourcing means hiring an outside supplier to provide elements of a product or service rather than producing them internally. Suppose you are the managing partner in a CPA fi rm with 30 full-time staff. Larger fi rms in your community have begun to outsource basic tax-return preparation work to India. Should you out-source your basic tax-return work to India as well? You estimate that you would have to lay off six staff members if you outsource the work. The basic arguments for and against are as follows.
YES: The wages paid to Indian accountants are very low relative to U.S. wages. You will not be able to compete unless you outsource.NO: Tax-return data is highly sensitive. Many customers will be upset to learn that their data is being emailed around the world.
InstructionsWrite a response indicating your position regarding this situation. Provide support for your view.
Broadening Your Perspective 875

Have you ever had the chance to tour a movie studio? There’s
a lot going on! Lots of equipment and lots of people with a
variety of talents. Running a fi lm studio, whether as an
independent company or part of a major corporation, is a
complex and risky business. Consider Disney, which has
produced such classics as Snow White and the Seven Dwarfs
and such colossal successes as Frozen. The movie studio has,
however, also seen its share of losses. Disney’s Lone Ranger
movie brought in revenues of $260 million, but its production
and marketing costs were a combined $375 million—a loss
of $115 million.
Every time Disney or another movie studio makes a new
movie, it is creating a unique product. Ideally, each new movie
should be able to stand on its own, that is, the fi lm should
generate revenues that exceed its costs. And in order to know
whether a particular movie is profi table, the studio must keep
track of all of the costs incurred to make and market the fi lm.
These costs include such items as salaries of the writers,
actors, director, producer, and production team (e.g., fi lm
crew); licensing costs; depreciation on equipment; music;
studio rental; and marketing and distribution costs. If you’ve
ever watched the credits at the end of a movie, you know the
list goes on and on.
The movie studio isn’t the only one with an interest in knowing
a particular project’s profi tability. Many of the people involved
in making the movie, such as the screenwriters, actors, and
producers, have at least part of their compensation tied to its
profi tability. As such, complaints about inaccurate accounting
are common in the movie industry.
In particular, a few well-known and widely attended movies
reported low profi ts, or even losses, once the accountants got
done with them. How can this be? The issue is that a large
portion of a movie’s costs are overhead costs that can’t be
directly traced to a fi lm, such as depreciation of fi lm
equipment and sets, facility maintenance costs, and
executives’ salaries. Actors and others often suggest that
these overhead costs are overallocated to their movie and
therefore negatively affect their compensation.
To reduce the risk of fi nancial fl ops, many of the big studios
now focus on making sequels of previous hits. This might
explain why, shortly after losing money on the Lone Ranger,
Disney announced plans to make The Avengers 2—a much
safer bet.
Profi ting from the Silver Screen
The Feature Story below about Disney describes how important accurate costing is to movie studios. In order to submit accurate bids on new fi lm projects and to know whether it profi ted from past fi lms, the company needs a good costing system. This chapter illustrates how costs are assigned to specifi c jobs, such as the production of The Avengers 2. We begin the discussion in this chapter with an overview of the fl ow of costs in a job order cost accounting system. We then use a case study to explain and illustrate the documents, entries, and accounts in this type of cost accounting system.
CHAPTER PREVIEW
20
FEATURE STORY
Job Order Costing
876
Watch the Making a Hollywood Movie video in WileyPLUS to learn more about job order costing in the real world.
▲

1
Prepare entries for manufacturing and service jobs completed and sold.
Use a job cost sheet to assign costs to work in process.
Demonstrate how to determine and use the predetermined overhead rate.
Distinguish between under- and overapplied manufacturing overhead.
2
3
5
4
Describe cost systems and the fl ow of costs in a job order system.
CHAPTER OUTLINE
Accumulating Manufacturing Costs
DO IT! 1
• Process cost system• Job order cost system• Job order cost fl ow• Accumulating manufacturing
costs
Work in ProcessDO IT! 2• Raw materials costs• Factory labor costs
Learning Objectives
Predetermined Overhead RateDO IT! 3
Completion and Sale of JobsDO IT! 4
Applied Manufacturing OverheadDO IT! 5
• Under- or overapplied manufacturing overhead
• Finished goods• Cost of goods sold• Summary• Job order for service companies• Pros and cons of job order costing
Go to the REVIEW AND PRACTICE section at the end of the chapter for a review of key concepts and practice applications with solutions.
Visit WileyPLUS with ORION for additional tutorials and practice opportunities.
© Pictorial Press Ltd/Alamy

878 20 Job Order Costing
1 Describe cost systems and the fl ow of costs in a job order system.LEARNING OBJECTIVE
Cost accounting involves measuring, recording, and reporting product costs. Companies determine both the total cost and the unit cost of each product. The accuracy of the product cost information is critical to the success of the company. Companies use this information to determine which products to produce, what prices to charge, and how many units to produce. Accurate product cost informa-tion is also vital for effective evaluation of employee performance. A cost accounting system consists of accounts for the various manufacturing costs. These accounts are fully integrated into the general ledger of a company. An important feature of a cost accounting system is the use of a perpetual inventory system. Such a system provides immediate, up-to-date information on the cost of a product. There are two basic types of cost accounting systems: (1) a process cost system and (2) a job order cost system. Although cost accounting systems differ widely from company to company, most involve one of these two traditional product costing systems.
Process Cost System
A company uses a process cost system when it manufactures a large volume of similar products. Production is continuous. Examples of a process cost system are the manufacture of cereal by Kellogg, the refi ning of petroleum by ExxonMobil, and the production of ice cream by Ben & Jerry’s. Process costing accumulates product-related costs for a period of time (such as a week or a month) instead of assigning costs to specifi c products or job orders. In process costing, compa-nies assign the costs to departments or processes for the specifi ed period of time. Illustration 20-1 shows examples of the use of a process cost system. We will dis-cuss the process cost system further in Chapter 21.Illustration 20-1
Process cost system
Process Cost SystemPotato Chips Production
Similar products are produced over a specified time period.
1. Harvest 2. Clean 3. Slice 4. Fry 5. Bagg5. Bag
Job Order Cost System
Under a job order cost system, the company assigns costs to each job or to each batch of goods. An example of a job is the manufacture of a jet by Boeing, the produc-tion of a movie by Disney, or the making of a fi re truck by American LaFrance. An example of a batch is the printing of 225 wedding invitations by a local print shop, or the printing of a weekly issue of Fortune magazine by a high-tech printer such as Quad Graphics. An important feature of job order costing is that each job or batch has its own distinguishing characteristics. For example, each house is custom built, each consulting engagement by a CPA fi rm is unique, and each printing job is different. The objective is to compute the cost per job. At each point in manufacturing a product or performing a service, the company can identify the job and its

Cost Accounting Systems 879
associated costs. A job order cost system measures costs for each completed job, rather than for set time periods. Illustration 20-2 shows the recording of costs in a job order cost system for Disney as it produced two different fi lms at the same time: an animated fi lm and an action thriller.
Can a company use both types of cost systems? Yes. For example, General Motors uses process cost accounting for its standard model cars, such as Malibus and Corvettes, and job order cost accounting for a custom-made limousine for the President of the United States. The objective of both cost accounting systems is to provide unit cost informa-tion for product pricing, cost control, inventory valuation, and fi nancial statement presentation.
Job Order Cost Flow
The fl ow of costs (direct materials, direct labor, and manufacturing overhead) in job order cost accounting parallels the physical fl ow of the materials as they are converted into fi nished goods. As shown in Illustration 20-3 (page 880), companies fi rst accumulate manufacturing costs in the form of raw materials, factory labor, or manufacturing overhead. They then assign manufacturing costs to the Work in Process Inventory account. When a job is completed, the company transfers the cost of the job to Finished Goods Inventory. Later when the goods are sold, the company transfers their cost to Cost of Goods Sold.
Jobs Won, Money Lost
Many companies suffer from poor cost accounting. As a result, they some-times make prod-ucts they should not be selling at all, or they buy product components that they could more
profi tably make themselves. Also, inaccurate cost data leads companies to misallocate capital and frustrates efforts by plant managers to improve effi ciency.
For example, consider the case of a diversifi ed company in the business of rebuilding diesel locomotives. The man-agers thought they were making money, but a consulting fi rm found that the company had seriously underestimated costs. The company bailed out of the business and not a moment too soon. Says the consultant who advised the company, “The more contracts it won, the more money it lost.” Given that situation, a company cannot stay in busi-ness very long!
What type of costs do you think the company had been underestimating? (Go to WileyPLUS for this answer and additional questions.)
© Tony Tremblay/iStockphoto
Management Insight
Illustration 20-2Job order cost system for Disney
100010001100010101011010000101000111010101110010100010001100010101011110000101000111010101100101100010001100010101011100000101000111010101100101
Musical Score
INSURANCEPOLICYWe guarantee to insurethe undersigned for hisdangerous work, including but not limitedthe following activities:Parachuting, water stuntsfights, horseback riding
Job Order Cost System
Two jobs: Animated Film and Action Thriller
Each job has distinguishing characteristics and related costs.Job #9501 Job #9502
• Animation talent
• Computer programmers
• Actors
• Stuntpeople
• Set design
• Food caterers
• Stuntperson insurance
• Location fees
• Musical composers
• Voice-over talent

880 20 Job Order Costing
Illustration 20-3 provides a basic overview of the fl ow of costs in a manufac-turing setting for production of a fi re truck. A more detailed presentation of the fl ow of costs is summarized near the end of this chapter in Illustration 20-15. There are two major steps in the fl ow of costs: (1) accumulating the manufactur-ing costs incurred, and (2) assigning the accumulated costs to the work done. The following discussion shows that the company accumulates manufacturing costs incurred by debits to Raw Materials Inventory, Factory Labor, and Manufactur-ing Overhead. When the company incurs these costs, it does not attempt to asso-ciate the costs with specifi c jobs. The company makes additional entries to assign manufacturing costs incurred to specifi c jobs. In the remainder of this chapter, we will use a case study to explain how a job order cost system operates.
Accumulating Manufacturing Costs
To illustrate a job order cost system, we will use the January transactions of Wallace Company, which makes custom electronic sensors for corporate safety applica-tions (such as fi re and carbon monoxide) and security applications (such as theft and corporate espionage).
RAW MATERIALS COSTS
When Wallace receives the raw materials it has purchased, it debits the cost of the materials to Raw Materials Inventory. The company debits this account for the invoice cost of the raw materials and freight costs chargeable to the pur-chaser. It credits the account for purchase discounts taken and purchase returns and allowances. Wallace makes no effort at this point to associate the cost of materials with specifi c jobs or orders. To illustrate, assume that Wallace purchases 2,000 lithium batteries (Stock No. AA2746) at $5 per unit ($10,000) and 800 electronic modules (Stock No. AA2850) at $40 per unit ($32,000) for a total cost of $42,000 ($10,000 1 $32,000). The entry to record this purchase on January 4 is:
(1)1
Jan. 4 Raw Materials Inventory 42,000 Accounts Payable 42,000 (Purchase of raw materials on account)
Manufacturing Costs
Work in Process
Inventory
Finished Goods
Inventory Cost of Goods Sold
Assignedto Completed Sold
$ $
ManufacturingOverhead
Factory Labor
$ $
Raw Materials
$ $
Illustration 20-3Flow of costs in job order costing
Raw Materials Inventory
42,000
1The numbers placed above the entries for Wallace Company are used for reference purposes in the summary provided in Illustration 20-15.

Cost Accounting Systems 881
At this point, Raw Materials Inventory has a balance of $42,000, as shown in the T-account in the margin. As we will explain later in the chapter, the company subsequently assigns direct raw materials inventory to work in process and indi-rect raw materials inventory to manufacturing overhead.
FACTORY LABOR COSTS
Some of a company’s employees are involved in the manufacturing process, while others are not. As discussed in Chapter 19, wages and salaries of nonmanufactur-ing employees are expensed as period costs (e.g., Salaries and Wages Expense). Costs related to manufacturing employees are accumulated in Factory Labor to ensure their treatment as product costs. Factory labor consists of three costs: (1) gross earnings of factory workers, (2) employer payroll taxes on these earn-ings, and (3) fringe benefi ts (such as sick pay, pensions, and vacation pay) incurred by the employer. Companies debit labor costs to Factory Labor as they incur those costs. To illustrate, assume that Wallace incurs $32,000 of factory labor costs. Of that amount, $27,000 relates to wages payable and $5,000 relates to payroll taxes payable in February. The entry to record factory labor for the month is:
(2)Jan. 31 Factory Labor 32,000 Factory Wages Payable 27,000 Employer Payroll Taxes Payable 5,000 (To record factory labor costs)
At this point, Factory Labor has a balance of $32,000, as shown in the T-account in the margin. The company subsequently assigns direct factory labor to work in process and indirect factory labor to manufacturing overhead.
MANUFACTURING OVERHEAD COSTS
A company has many types of overhead costs. If these overhead costs, such as property taxes, depreciation, insurance, and repairs, relate to overhead costs of a nonmanufacturing facility, such as an offi ce building, then these costs are expensed as period costs (e.g., Property Tax Expense, Depreciation Expense, Insurance Expense, and Maintenance and Repairs Expense). If the costs relate to the manufacturing process, then they are accumulated in Manufacturing Over-head to ensure their treatment as product costs. Using assumed data, the summary entry for manufacturing overhead in Wallace Company is:
(3)Jan. 31 Manufacturing Overhead 13,800 Utilities Payable 4,800 Prepaid Insurance 2,000 Accounts Payable (for repairs) 2,600 Accumulated Depreciation 3,000 Property Taxes Payable 1,400 (To record overhead costs)
At this point, Manufacturing Overhead has a balance of $13,800, as shown in the T-account in the margin. The company subsequently assigns manufacturing overhead to work in process.
Factory Labor
32,000
Manufacturing Overhead
13,800

882 20 Job Order Costing
2 Use a job cost sheet to assign costs to work in process.LEARNING OBJECTIVE
Assigning manufacturing costs to work in process results in the following entries.
1. Debits made to Work in Process Inventory.
2. Credits made to Raw Materials Inventory, Factory Labor, and Manufacturing Overhead.
An essential accounting record in assigning costs to jobs is a job cost sheet, as shown in Illustration 20-4. A job cost sheet is a form used to record the costs chargeable to a specifi c job and to determine the total and unit costs of the com-pleted job. Companies keep a separate job cost sheet for each job. The job cost sheets constitute the subsidiary ledger for the Work in Process Inventory account. A subsidiary ledger consists of individual records for each individual item—in this case, each job. The Work in Process account is referred to as a control account because it summarizes the detailed data regarding specifi c jobs con-tained in the job cost sheets. Each entry to Work in Process Inventory must be accompanied by a corresponding posting to one or more job cost sheets.
During the current month, Ringling Company incurs the following manufacturing costs:
(a) Raw material purchases of $4,200 on account.
(b) Factory labor of $18,000. Of that amount, $15,000 relates to wages payable and $3,000 relates to payroll taxes payable.
(c) Factory utilities of $2,200 are payable, prepaid factory insurance of $1,800 has expired, and depreciation on the factory building is $3,500.
Prepare journal entries for each type of manufacturing cost.
DO IT! 1 Accumulating Manufacturing Costs
Related exercise material: BE20-1, BE20-2, E20-1, E20-7, E20-8, E20-11, and DO IT! 20-1.
Action Plan✔ In accumulating
manufacturing costs, debit at least one of three accounts: Raw Materials Inventory, Factory Labor, and Manufacturing Overhead.
✔ Manufacturing over-head costs may be recognized daily. Or, manufacturing over-head may be recorded periodically through a summary entry.
(a) Raw Materials Inventory 4,200 Accounts Payable 4,200 (Purchases of raw materials on account)
(b) Factory Labor 18,000 Factory Wages Payable 15,000 Employer Payroll Taxes Payable 3,000 (To record factory labor costs)
(c) Manufacturing Overhead 7,500 Utilities Payable 2,200 Prepaid Insurance 1,800 Accumulated Depreciation 3,500 (To record overhead costs)
Solution

Assigning Manufacturing Costs 883
Raw Materials Costs
Companies assign raw materials costs to jobs when their materials storeroom issues the materials in response to requests. Requests for issuing raw materials are made on a prenumbered materials requisition slip. The materials issued may be used directly on a job, or they may be considered indirect materials. As Illustra-tion 20-5 shows, the requisition should indicate the quantity and type of materials withdrawn and the account to be charged. The company will charge direct materials to Work in Process Inventory, and indirect materials to Manufacturing Overhead.
The company may use any of the inventory costing methods (FIFO, LIFO, or average-cost) in costing the requisitions to the individual job cost sheets.
Date
Cost of completed job Direct materials Direct labor Manufacturing overheadTotal costUnit cost (total dollars ÷ quantity)
Job Cost Sheet
Job No.ItemFor
QuantityDate RequestedDate Completed
DirectMaterials
DirectLabor
ManufacturingOverhead
$
$$
Illustration 20-4Job cost sheet
Helpful HintCompanies typically maintain job cost sheets as computer fi les.
Quantity
Wallace CompanyMaterials Requisition Slip
Deliver to:Charge to:
Req. No.Date:
Assembly DepartmentWork in Process–Job No. 101
R2471/6/17
Description Stock No. Cost per Unit Total
200 Lithium batteries AA2746 $5.00 $1,000
Requested by
Approved by
Received by
Costed by
Illustration 20-5Materials requisition slip
Helpful HintNote the specifi c job (in this case, Job No. 101) to be charged.
ETHICS NOTE
The internal control principle of documentation includes prenumbering to enhance accountability.
ETHICS NOTE
Approvals are an important internal control feature of a requisition slip because they establish individual accountability over inventory.

884 20 Job Order Costing
Periodically, the company journalizes the requisitions. For example, if Wallace uses $24,000 of direct materials and $6,000 of indirect materials in January, the entry is:
(4)Jan. 31 Work in Process Inventory 24,000 Manufacturing Overhead 6,000 Raw Materials Inventory 30,000 (To assign materials to jobs and
overhead)
This entry reduces Raw Materials Inventory by $30,000, increases Work in Pro-cess Inventory by $24,000, and increases Manufacturing Overhead by $6,000, as shown below.
Illustration 20-6 shows the posting of requisition slip R247 to Job No. 101 and other assumed postings to the job cost sheets for materials. The requisition slips provide the basis for total direct materials costs of $12,000 for Job No. 101, $7,000 for Job No. 102, and $5,000 for Job No. 103. After the company has completed all postings, the sum of the direct materials columns of the job cost sheets (the
Helpful HintCompanies post to control accounts monthly, and post to job cost sheets daily.
Illustration 20-6Job cost sheets–posting of direct materials
1/31
GENERAL LEDGER
1/61/121/26
Work in Process Inventory
24,000
$24,000 assigned to
SUBSIDIARY LEDGERJob Cost Sheets
Job No. 101 Quantity 1,000 Units
Date DirectMaterials
DirectLabor
ManufacturingOverhead
1,0007,0004,000
1/101/17
Job No. 102 Quantity 1,500 Units
Date DirectMaterials
DirectLabor
ManufacturingOverhead
3,8003,200
1/27
Job No. 103 Quantity 2,000 Units
Date DirectMaterials
DirectLabor
ManufacturingOverhead
5,000
7,000
12,000
5,000
Source documents forposting to job cost sheets andWork in Process Inventory:Materials requisition slips
specific jobs
Helpful HintProve the $24,000 direct materials charge to Work in Process Inventory by totaling the charges by jobs:
101 $12,000102 7,000103 5,000
$24,000
Raw Materials Inventory
42,000 30,000
Work in Process Inventory
24,000
Manufacturing Overhead
13,800 6,000

Assigning Manufacturing Costs 885
Factory Labor Costs
Companies assign factory labor costs to jobs on the basis of time tickets pre-pared when the work is performed. The time ticket indicates the employee, the hours worked, the account and job to be charged, and the total labor cost. Many companies accumulate these data through the use of bar coding and scanning devices. When they start and end work, employees scan bar codes on their identi-fi cation badges and bar codes associated with each job they work on. When direct labor is involved, the time ticket must indicate the job number, as shown in Illus-tration 20-7. The employee’s supervisor should approve all time tickets.
The Cost of an iPhone? Just Tear One Apart
All companies need to know what it costs to make their own products—but a lot of companies would also like to know the cost of their competitors’ products as well. That’s where iSuppli steps in. For a price, iSuppli will tear apart sophisticated electronic devices to
tell you what it would cost to replicate. In the case of smartphones, which often have more than 1,000 tiny com-ponents, that is no small feat. As shown in the chart to the right, the components of a recent iPhone model cost about $170. Assembly adds only about another $6.50. However, the difference between what you pay (about double the
total component cost) and the “cost” is not all profi t. You also have to consider the additional nonproduction costs of research, design, marketing, patent fees, and selling costs.
Components Apple iPhonea
Integrated circuits $ 91.38Display/touchscreen 34.65Mechanicalb 17.80Camera 9.35Battery 5.07Other 11.82
Total $170.07
aLatest data available. bIncludes electromechanical.Source: iSuppli.
Source: “The Business of Dissecting Electronics: The Lowdown on Teardowns,” The Economist.com (January 21, 2010).
What type of costs are marketing and selling costs, and how are they treated for accounting purposes? (Go to WileyPLUS for this answer and additional questions.)
© TommL/iStockphoto
Management Insight iSuppli
subsidiary account amounts of $12,000, $7,000, and $5,000) should equal the direct materials debited to Work in Process Inventory (the control account amount of $24,000).
Wallace CompanyTime Ticket
EmployeeCharge to:
Date:Employee No.
Job No.John Nash
Work in Process
Time HourlyRate
TotalCost
0800 1200 4
Approved by Costed by
Start Stop Total Hours
10.00 40.00
1/6/17124101
Illustration 20-7Time ticket

886 20 Job Order Costing
The time tickets are later sent to the payroll department, which applies the employee’s hourly wage rate and computes the total labor cost. Finally, the com-pany journalizes the time tickets. It debits the account Work in Process Inventory for direct labor and debits Manufacturing Overhead for indirect labor. For example, if the $32,000 total factory labor cost consists of $28,000 of direct labor and $4,000 of indirect labor, the entry is:
(5)Jan. 31 Work in Process Inventory 28,000 Manufacturing Overhead 4,000 Factory Labor 32,000 (To assign labor to jobs and overhead)
As a result of this entry, Factory Labor is reduced by $32,000 so it has a zero balance, and labor costs are assigned to the appropriate manufacturing accounts. The entry increases Work in Process Inventory by $28,000 and increases Manu-facturing Overhead by $4,000, as shown below.
Factory Labor
32,000 32,000
Work in Process Inventory
24,000 28,000
Manufacturing Overhead
13,800 6,000 4,000
Let’s assume that the labor costs chargeable to Wallace’s three jobs are $15,000, $9,000, and $4,000. Illustration 20-8 shows the Work in Process Inventory
1/311/31
GENERAL LEDGER
1/61/101/121/261/31
Work in Process Inventory
24,00028,000
$28,000 assigned to
specific jobs
SUBSIDIARY LEDGERJob Cost Sheets
Job No. 101 Quantity 1,000 Units
Date DirectMaterials
DirectLabor
ManufacturingOverhead
1,000
7,0004,000
12,000 15,000
1/101/151/171/22
Job No. 102 Quantity 1,500 Units
Date DirectMaterials
DirectLabor
ManufacturingOverhead
3,800
3,200
1/271/29
Job No. 103 Quantity 2,000 Units
Date DirectMaterials
DirectLabor
ManufacturingOverhead
5,000Source documents forposting to job cost sheets andWork in Process Inventory:Time tickets
9,000
6,000
4,000
5,000
4,000
7,000 9,000
5,000 4,000
Illustration 20-8Job cost sheets–direct labor
Helpful HintProve the $28,000 direct labor charge to Work in Process Inventory by totaling the charges by jobs:
101 $15,000102 9,000103 4,000
$28,000

Predetermined Overhead Rate 887
and job cost sheets after posting. As in the case of direct materials, the postings to the direct labor columns of the job cost sheets should equal the posting of direct labor to Work in Process Inventory.
Estimated Annual Expected Annual Predetermined Overhead Costs 4 Operating Activity 5 Overhead Rate
Illustration 20-9Formula for predetermined overhead rate
3 Demonstrate how to determine and use the predetermined overhead rate.
LEARNING OBJECTIVE
Companies charge the actual costs of direct materials and direct labor to specifi c jobs. In contrast, manufacturing overhead relates to production operations as a whole. As a result, overhead costs cannot be assigned to specifi c jobs on the basis of actual costs incurred. Instead, companies assign manufacturing overhead to work in process and to specifi c jobs on an estimated basis through the use of a predetermined overhead rate. The predetermined overhead rate is based on the relationship between estimated annual overhead costs and expected annual operating activity, expressed in terms of a common activity base. The company may state the activ-ity in terms of direct labor costs, direct labor hours, machine hours, or any other measure that will provide an equitable basis for applying overhead costs to jobs. Companies establish the predetermined overhead rate at the beginning of the year. Small companies often use a single, company-wide predetermined overhead rate. Large companies often use rates that vary from department to department. The formula for a predetermined overhead rate is as follows.
Danielle Company is working on two job orders. The job cost sheets show the following:
Direct materials—Job 120 $6,000; Job 121 $3,600Direct labor—Job 120 $4,000; Job 121 $2,000Manufacturing overhead—Job 120 $5,000; Job 121 $2,500
Prepare the three summary entries to record the assignment of costs to Work in Process from the data on the job cost sheets.
DO IT! 2 Work in Process
The three summary entries are:
Work in Process Inventory ($6,000 1 $3,600) 9,600 Raw Materials Inventory 9,600 (To assign materials to jobs)
Work in Process Inventory ($4,000 1 $2,000) 6,000 Factory Labor 6,000 (To assign labor to jobs)
Work in Process Inventory ($5,000 1 $2,500) 7,500 Manufacturing Overhead 7,500 (To assign overhead to jobs)
Action Plan✔ Recognize that Work
in Process Inventory is the control account for all unfi nished job cost sheets.
✔ Debit Work in Process Inventory for the materials, labor, and overhead charged to the job cost sheets.
✔ Credit the accounts that were debited when the manufac-turing costs were accumulated.
Solution
Related exercise material: BE20-3, BE20-4, BE20-5, E20-2, E20-7, E20-8, and DO IT! 20-2.

888 20 Job Order Costing
Overhead relates to production operations as a whole. To know what “the whole” is, the logical thing is to wait until the end of the year’s operations. At that time, the company knows all of its costs for the period. As a practical matter, though, managers cannot wait until the end of the year. To price products effec-tively as they are completed, managers need information about product costs of specifi c jobs completed during the year. Using a predetermined overhead rate enables a cost to be determined for the job immediately. Illustration 20-10 indi-cates how manufacturing overhead is assigned to work in process.
ActualActivity
BaseUsed
isassigned
toJob 1 Job 2 Job 3
Work in Process
PredeterminedOverhead
Rate×
Illustration 20-10Using predetermined overhead rates
Wallace Company uses direct labor cost as the activity base. Assuming that the company expects annual overhead costs to be $280,000 and direct labor costs for the year to be $350,000, the overhead rate is 80%, computed as follows.
Illustration 20-11Calculation of predetermined overhead rate
Estimated Annual Expected Direct Predetermined Overhead Costs 4 Labor Cost 5 Overhead Rate
$280,000 4 $350,000 5 80%
This means that for every dollar of direct labor, Wallace will assign 80 cents of manufacturing overhead to a job. The use of a predetermined overhead rate enables the company to determine the approximate total cost of each job when it completes the job. Historically, companies used direct labor costs or direct labor hours as the activity base. The reason was the relatively high correlation between direct labor and manufacturing overhead. Today, more companies are using machine hours as the activity base, due to increased reliance on automation in manufacturing operations. Or, as mentioned in Chapter 19 (and discussed in Chapter 21), many companies now use activity-based costing to more accurately allocate overhead costs based on the activities that give rise to the costs. A company may use more than one activity base. For example, if a job is man-ufactured in more than one factory department, each department may have its own overhead rate. In the Feature Story, Disney might use two bases in assigning overhead to fi lm jobs: direct materials dollars for indirect materials, and direct labor hours for such costs as insurance and supervisor salaries. Wallace Company applies manufacturing overhead to work in process when it assigns direct labor costs. It also applies manufacturing overhead to specifi c jobs at the same time. For January, Wallace applied overhead of $22,400 in response to its assignment of $28,000 of direct labor costs (direct labor cost of $28,000 3 80%). The following entry records this application.
(6)Jan. 31 Work in Process Inventory 22,400
Manufacturing Overhead 22,400 (To assign overhead to jobs)

Predetermined Overhead Rate 889
The overhead that Wallace applies to each job will be 80% of the direct labor cost of the job for the month. Illustration 20-12 shows the Work in Process Inventory account and the job cost sheets after posting. Note that the debit of $22,400 to Work in Process Inventory equals the sum of the overhead applied to jobs: Job No. 101 $12,000 1 Job No. 102 $7,200 1 Job No. 103 $3,200.
Manufacturing Overhead
13,800 22,400 6,000 4,000
Work in Process Inventory
24,000 28,000 22,400
At the end of each month, the balance in Work in Process Inventory should equal the sum of the costs shown on the job cost sheets of unfi nished jobs. Illustration 20-13 presents proof of the agreement of the control and subsidiary accounts in Wallace. (It assumes that all jobs are still in process.)
1/311/311/31
GENERAL LEDGER
1/61/101/121/261/31
Work in Process Inventory
24,00028,00022,400
SUBSIDIARY LEDGERJob Cost Sheets
Job No. 101 Quantity 1,000 Units
Date DirectMaterials
DirectLabor
ManufacturingOverhead Total
1/101/151/171/22
Job No. 102 Quantity 1,500 Units
3,800
3,200
1/271/29
Job No. 103 Quantity 2,000 Units
5,000
4,000
5,000
4,000
7,200
4,800
12,000 39,000
23,200
9,000
6,000
15,000
1,000
7,0004,000
12,000
7,2009,0007,000
12,2003,2004,0005,000
3,200
4,000
3,200
Source documents forposting to job cost sheets:Predetermined overhead rate(80% of direct labor cost)
Date DirectMaterials
DirectLabor
ManufacturingOverhead Total
Date DirectMaterials
DirectLabor
ManufacturingOverhead Total
$22,400 assigned to
specific jobs
Illustration 20-12Job cost sheets–manufacturing overhead applied
This entry reduces the balance in Manufacturing Overhead and increases Work in Process Inventory by $22,400, as shown below.
Illustration 20-13Proof of job cost sheets to work in process inventory
Work in Process Inventory Job Cost Sheets
Jan. 31 24,000 No. 101 $ 39,000 31 28,000 102 23,200 31 22,400 103 12,200
74,400 $74,400

890 20 Job Order Costing
4 Prepare entries for manufacturing and service jobs completed and sold.
LEARNING OBJECTIVE
Assigning Costs to Finished Goods
When a job is completed, Wallace Company summarizes the costs and completes the lower portion of the applicable job cost sheet. For example, if we assume that Wallace completes Job No. 101, a batch of electronic sensors, on January 31, the job cost sheet appears as shown in Illustration 20-14.
Date
Cost of completed job Direct materials Direct labor Manufacturing overheadTotal costUnit cost ($39,000 ÷ 1,000)
Job Cost Sheet
Job No.ItemFor
QuantityDate RequestedDate Completed
DirectMaterials
DirectLabor
ManufacturingOverhead
$
$$
101Electronic SensorsTanner Company
1,000January 5January 31
1/61/101/121/261/31
$ 1,000
7,0004,000
$12,000
$ 9,000
6,000
$15,000
$ 7,200
4,800
$12,000
12,00015,00012,00039,00039.00
Illustration 20-14Completed job cost sheet
Stanley Company produces specialized safety devices. For the year, manufacturing over-head costs are expected to be $160,000. Expected machine usage is 40,000 hours. The com-pany assigns overhead based on machine hours. Job No. 302 used 2,000 machine hours.
Compute the predetermined overhead rate, determine the amount of overhead to allocate to Job No. 302, and prepare the entry to assign overhead to Job No. 302 on March 31.
DO IT! 3 Predetermined Overhead Rate
Predetermined overhead rate 5 $160,000 4 40,000 hours 5 $4.00 per machine hourAmount of overhead assigned to Job No. 302 5 2,000 hours 3 $4.00 5 $8,000
The entry to record the assignment of overhead to Job No. 302 on March 31 is:
Work in Process Inventory 8,000 Manufacturing Overhead 8,000 (To assign overhead to jobs)
Related exercise material: BE20-6, BE20-7, E20-5, E20-6, and DO IT! 20-3.
Action Plan✔ Predetermined over-
head rate is estimated annual overhead cost divided by expected annual operating activity.
✔ Assignment of overhead to jobs is determined by multiplying the actual activity base used by the predetermined overhead rate.
✔ The entry to record the assignment of overhead transfers an amount out of Manu-facturing Overhead into Work in Process Inventory.
Solution
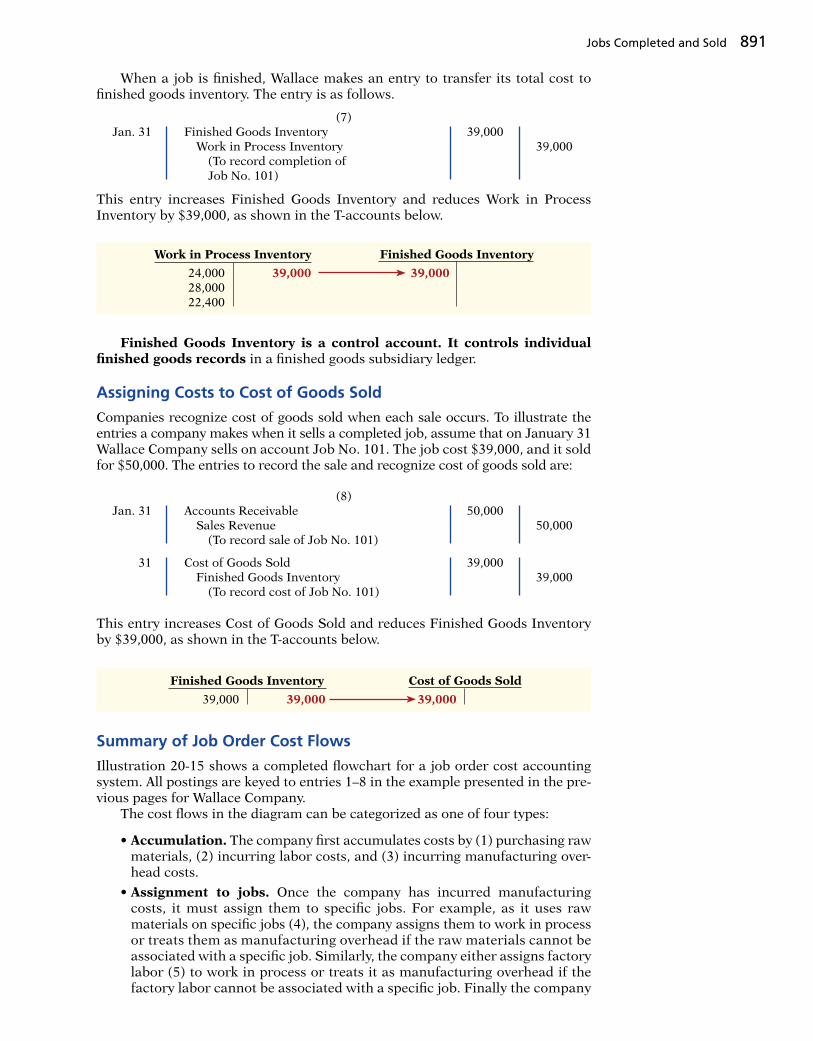
Jobs Completed and Sold 891
Work in Process Inventory
24,000 39,000 28,000 22,400
Finished Goods Inventory
39,000
When a job is fi nished, Wallace makes an entry to transfer its total cost to fi nished goods inventory. The entry is as follows.
(7)Jan. 31 Finished Goods Inventory 39,000
Work in Process Inventory 39,000 (To record completion of Job No. 101)
This entry increases Finished Goods Inventory and reduces Work in Process Inventory by $39,000, as shown in the T-accounts below.
Finished Goods Inventory is a control account. It controls individual fi nished goods records in a fi nished goods subsidiary ledger.
Assigning Costs to Cost of Goods Sold
Companies recognize cost of goods sold when each sale occurs. To illustrate the entries a company makes when it sells a completed job, assume that on January 31 Wallace Company sells on account Job No. 101. The job cost $39,000, and it sold for $50,000. The entries to record the sale and recognize cost of goods sold are:
(8)Jan. 31 Accounts Receivable 50,000
Sales Revenue 50,000 (To record sale of Job No. 101)
31 Cost of Goods Sold 39,000 Finished Goods Inventory 39,000 (To record cost of Job No. 101)
This entry increases Cost of Goods Sold and reduces Finished Goods Inventory by $39,000, as shown in the T-accounts below.
Finished Goods Inventory
39,000 39,000
Cost of Goods Sold
39,000
Summary of Job Order Cost Flows
Illustration 20-15 shows a completed fl owchart for a job order cost accounting system. All postings are keyed to entries 1–8 in the example presented in the pre-vious pages for Wallace Company. The cost fl ows in the diagram can be categorized as one of four types:
• Accumulation. The company fi rst accumulates costs by (1) purchasing raw materials, (2) incurring labor costs, and (3) incurring manufacturing over-head costs.
• Assignment to jobs. Once the company has incurred manufacturing costs, it must assign them to specifi c jobs. For example, as it uses raw materials on specifi c jobs (4), the company assigns them to work in processor treats them as manufacturing overhead if the raw materials cannot be associated with a specifi c job. Similarly, the company either assigns factory labor (5) to work in process or treats it as manufacturing overhead if the factory labor cannot be associated with a specifi c job. Finally the company

892 20 Job Order Costing
assigns manufacturing overhead (6) to work in process using a predeter-mined overhead rate. This deserves emphasis: Do not assign overhead using actual overhead costs but instead use a predetermined rate.
• Completed jobs. As jobs are completed (7), the company transfers the cost of the completed job out of work in process inventory into fi nished goods inventory.
• When goods are sold. As specifi c items are sold (8), the company transfers their cost out of fi nished goods inventory into cost of goods sold.
42,000
Raw Materials Inventory
(4)
Manufacturing Overhead
Factory Labor
(1) 30,000
32,000 (5)(2) 32,000
(6) 22,40013,800(3)
6,000(4)
4,000(5)
24,000
Work in Process Inventory
(7)(4) 39,000
28,000(5)
22,400(6)
39,000
Finished Goods Inventory
(8)(7) 39,000
39,000
Cost of Goods Sold
(8)
Flow of Costs
6
Accumulation Assignment
1. Purchase raw materials2. Incur factory labor3. Incur manufacturing overhead
4. Raw materials are used5. Factory labor is used6. Overhead is applied7. Completed goods are recognized8. Cost of goods sold is recognized
Key to entries:
7 8
5
4
Bal. 12,000
Bal. 1,400
Bal. 35,400
Illustration 20-15Flow of costs in a job order cost system
Illustration 20-16Flow of documents in a job order cost system
Flow of DocumentsSource Documents
Job CostSheet
Labor TimeTickets
MaterialsRequisition Slips
PredeterminedOverhead Rate
The job cost sheetsummarizes the cost ofjobs completed and notcompleted at the endof the accounting period.Jobs completed aretransferred to finishedgoods to await sale.
Illustration 20-16 summarizes the fl ow of documents in a job order cost system.

Jobs Completed and Sold 893
Job Order Costing for Service Companies
Our extended job order costing example focuses on a manufacturer so that you see the fl ow of costs through the inventory accounts. It is important to under-stand, however, that job order costing is also commonly used by service companies. While service companies do not have inventory, the techniques of job order cost-ing are still quite useful in many service-industry environments. Consider, for example, the Mayo Clinic (healthcare), PriceWaterhouseCoopers (accounting), and Goldman Sachs (investment banking). These companies need to keep track of the cost of jobs performed for specifi c customers to evaluate the profi tability of medical treatments, audits, or investment banking engagements. Many service organizations bill their customers using cost-plus contracts. Cost-plus contracts mean that the customer’s bill is the sum of the costs incurred on the job, plus a profi t amount that is calculated as a percentage of the costs incurred. In order to minimize confl ict with customers and reduce potential con-tract disputes, service companies that use cost-plus contracts must maintain accurate and up-to-date costing records. Up-to-date cost records enable a service company to immediately notify a customer of cost overruns due to customer requests for changes to the original plan or unexpected complications. Timely recordkeeping allows the contractor and customer to consider alternatives before it is too late. A service company that uses a job order cost system does not have inventory accounts. It does, however, use an account similar to Work in Process Inventory, referred to here as Service Contracts in Process, to record job costs prior to com-pletion. To illustrate the journal entries for a service company under a job order cost system, consider the following transactions for Dorm Decor, an interior design company. The entry to record the assignment of $9,000 of supplies to projects ($7,000 direct and $2,000 indirect) is:
Service Contracts in Process 7,000Operating Overhead 2,000 Supplies 9,000 (To assign supplies to projects)
The entry to record the assignment of service salaries and wages of $100,000 ($84,000 direct and $16,000 indirect) is:
Service Contracts in Process 84,000Operating Overhead 16,000 Service Salaries and Wages 100,000 (To assign personnel costs to projects)
Dorm Decor applies operating overhead at a rate of 50% of direct labor costs. The entry to record the application of overhead ($84,000 3 50%) based on the direct labor costs is:
Service Contracts in Process 42,000 Operating Overhead 42,000 (To assign operating overhead to projects)
Upon completion of a design project (for State University) the job cost sheet shows a total cost of $34,000. The entry to record completion of this project is:
Cost of Completed Service Contracts 34,000 Service Contracts in Process 34,000 (To record completion of State University project)
SERVICE

894 20 Job Order Costing
Job cost sheets for a service company keep track of materials, labor, and over-head used on a particular job similar to a manufacturer. Several exercises at the end of this chapter apply job order costing to service companies.
Sales Are Nice, but Service Revenue Pays the Bills
Jet engines are one of the many products made by the industrial opera-tions division of General Electric (GE). At prices as high as $30 million per engine, you can bet that GE does its best to keep track of costs. It might surprise you that GE doesn’t make much profi t on the sale of each engine. So why does it bother making them? For the
service revenue. During one recent year, about 75% of the division’s revenues came from servicing its own products. One estimate is that the $13 billion in aircraft engines sold
during a recent three-year period will generate about $90 billion in service revenue over the 30-year life of the engines. Because of the high product costs, both the engines themselves and the subsequent service are most likely accounted for using job order costing. Accurate service cost records are important because GE needs to generate high profi t margins on its service jobs to make up for the low margins on the original sale. It also needs good cost records for its service jobs in order to control its costs. Otherwise, a competitor, such as Pratt and Whitney, might submit lower bids for service contracts and take lucrative service jobs away from GE.
Source: Paul Glader, “GE’s Focus on Services Faces Test,” Wall Street Journal Online (March 3, 2009).
Explain why GE would use job order costing to keep track of the cost of repairing a malfunctioning engine for a major airline. (Go to WileyPLUS for this answer and additional questions.)
© Christian Lagereek/iStockphoto
Service Company Insight General Electric
Advantages and Disadvantages of Job Order Costing
Job order costing is more precise in the assignment of costs to projects than pro-cess costing. For example, assume that a construction company, Juan Company, builds 10 custom homes a year at a total cost of $2,000,000. One way to determine the cost of the homes is to divide the total construction cost incurred during the year by the number of homes produced during the year. For Juan Company, an average cost of $200,000 ($2,000,000 4 10) is computed. If the homes are nearly identical, then this approach is adequate for purposes of determining profi t per home. But if the homes vary in terms of size, style, and material types, using the average cost of $200,000 to determine profi t per home is inappropriate. Instead, Juan Company should use a job order cost system to determine the specifi c cost incurred to build each home and the amount of profi t made on each. Thus, job order costing provides more useful information for determining the profi tability of particular projects and for estimating costs when preparing bids on future jobs. However, job order costing requires a signifi cant amount of data entry. For Juan Company, it is much easier to simply keep track of total costs incurred during the year than it is to keep track of the costs incurred on each job (home built). Recording this information is time-consuming, and if the data is not entered accurately, then the product costs are incorrect. In recent years, technological advances, such as bar-coding devices for both labor costs and materials, have increased the accuracy and reduced the effort needed to record costs on specifi c jobs. These innovations expand the opportunities to apply job order costing in a wider variety of business settings, thus improving management’s ability to control costs and make better informed decisions. A common problem of all costing systems is how to allocate overhead to the fi nished product. Overhead often represents more than 50% of a product’s cost, and this cost is often diffi cult to allocate meaningfully to the product. How, for example, is the salary of a project manager at Juan Company allocated to the various

Applied Manufacturing Overhead 895
homes, which may differ in size, style, and cost of materials used? The accuracy of the job order cost system is largely dependent on the accuracy of the overhead allo-cation process. Even if the company does a good job of keeping track of the specifi c amounts of materials and labor used on each job, if the overhead costs are not allo-cated to individual jobs in a meaningful way, the product costing information is not useful. We address this issue in Chapter 21.
5 Distinguish between under- and overapplied manufacturing overhead.
LEARNING OBJECTIVE
At the end of a period, companies prepare fi nancial statements that present aggregate data on all jobs manufactured and sold. The cost of goods manufac-tured schedule in job order costing is the same as in Chapter 19 with one excep-tion: The schedule shows manufacturing overhead applied, rather than actual overhead costs. The company adds this amount to direct materials and direct labor to determine total manufacturing costs. Companies prepare the cost of goods manufactured schedule directly from the Work in Process Inventory account. Illustration 20-17 shows a condensed schedule for Wallace Company for January.
Helpful HintCompanies usually prepare monthly fi nancial statements for management use only.
During the current month, Onyx Corporation completed Job 109 and Job 112. Job 109 cost $19,000 and Job 112 cost $27,000. Job 112 was sold on account for $42,000. Journalize the entries for the completion of the two jobs and the sale of Job 112.
DO IT! 4 Completion and Sale of Jobs
Finished Goods Inventory 46,000 Work in Process Inventory 46,000 (To record completion of Job 109, costing $19,000 and Job 112, costing $27,000)
Accounts Receivable 42,000 Sales Revenue 42,000 (To record sale of Job 112)
Cost of Goods Sold 27,000 Finished Goods Inventory 27,000 (To record cost of goods sold for Job 112)
Related exercise material: BE20-9, BE20-10, E20-2, E20-3, E20-6, E20-7, E20-10, and DO IT! 20-4.
Action Plan✔ Debit Finished Goods
Inventory for the cost of completed jobs.
✔ Debit Cost of Goods Sold for the cost of jobs sold.
Solution
WALLACE COMPANYCost of Goods Manufactured Schedule For the Month Ending January 31, 2017
Work in process, January 1 $ 202Direct materials used $ 24,000Direct labor 28,000Manufacturing overhead applied 22,400
Total manufacturing costs 74,400
Total cost of work in process 74,400Less: Work in process, January 31 35,400
Cost of goods manufactured $39,000
Illustration 20-17Cost of goods manufactured schedule

896 20 Job Order Costing
YEAR-END BALANCE
At the end of the year, all manufacturing overhead transactions are complete. There is no further opportunity for offsetting events to occur. At this point, Wallace Company eliminates any balance in Manufacturing Overhead by an adjusting entry. It considers under- or overapplied overhead to be an adjust-ment to cost of goods sold. Thus, Wallace debits underapplied overhead to Cost of Goods Sold. It credits overapplied overhead to Cost of Goods Sold. To illustrate, assume that Wallace has a $2,500 credit balance in Manufacturing Overhead at December 31. The adjusting entry for the overapplied overhead is:
Dec. 31 Manufacturing Overhead 2,500 Cost of Goods Sold 2,500 (To transfer overapplied overhead to cost of goods sold)
Note that the cost of goods manufactured ($39,000) agrees with the amount transferred from Work in Process Inventory to Finished Goods Inventory in journal entry No. 7 in Illustration 20-15 (page 892). The income statement and balance sheet are the same as those illustrated in Chapter 19. For example, Illustration 20-18 shows the partial income statement for Wallace for the month of January.
WALLACE COMPANYIncome Statement (partial)
For the Month Ending January 31, 2017
Sales revenue $50,000Cost of goods sold Finished goods inventory, January 1 $ –0– Cost of goods manufactured (see Illustration 20-17) 39,000
Cost of goods available for sale 39,000 Less: Finished goods inventory, January 31 –0–
Cost of goods sold 39,000
Gross profi t $11,000
Illustration 20-18Partial income statement
Actual(Costs incurred)
Applied(Costs assigned)
If actual is greater than applied,manufacturing overhead is underapplied.
If actual is less than applied,manufacturing overhead is overapplied.
Manufacturing Overhead
$ $Manufacturing
Overhead
Illustration 20-19Under- and overapplied overhead
Under- or Overapplied Manufacturing Overhead
Recall that overhead is applied based on an estimate of total annual overhead costs. This estimate will rarely be exactly equal to actual overhead incurred. Therefore, at the end of the year, after overhead has been applied to specifi c jobs, the Manufacturing Overhead account will likely have a remaining balance. When Manufacturing Overhead has a debit balance, overhead is said to be underapplied. Underapplied overhead means that the overhead assigned to work in process is less than the overhead incurred. Conversely, when manufac-turing overhead has a credit balance, overhead is overapplied. Overapplied overhead means that the overhead assigned to work in process is greater than the overhead incurred. Illustration 20-19 shows these concepts.

Review and Practice 897
For Karr Company, the predetermined overhead rate is 140% of direct labor cost. During the month, Karr incurred $90,000 of factory labor costs, of which $80,000 is direct labor and $10,000 is indirect labor. Actual overhead incurred was $119,000.
Compute the amount of manufacturing overhead applied during the month. Determine the amount of under- or overapplied manufacturing overhead.
DO IT! 5 Applied Manufacturing Overhead
Related exercise material: BE20-10, E20-4, E20-5, E20-12, E20-13, and DO IT! 20-5.
Action Plan✔ Calculate the amount
of overhead applied by multiplying the prede-termined overhead rate by actual activity.
✔ If actual manufactur-ing overhead is greater than applied, manu-facturing overhead is underapplied.
✔ If actual manufactur-ing overhead is less than applied, manu-facturing overhead is overapplied.
Manufacturing overhead applied 5 (140% 3 $80,000) 5 $112,000Underapplied manufacturing overhead 5 ($119,000 2 $112,000) 5 $7,000
Solution
After Wallace posts this entry, Manufacturing Overhead has a zero balance. In preparing an income statement for the year, Wallace reports cost of goods sold after adjusting it for either under- or overapplied overhead. Conceptually, some argue that under- or overapplied overhead at the end of the year should be allocated among ending work in process, fi nished goods, and cost of goods sold. The discussion of this possible allocation approach is left to more advanced courses.
Describe cost systems and the fl ow of costs in a job order system. Cost accounting involves the proce-dures for measuring, recording, and reporting product costs. From the data accumulated, companies deter-mine the total cost and the unit cost of each product. The two basic types of cost accounting systems are process cost and job order cost.
In job order costing, companies fi rst accumulate manufacturing costs in three accounts: Raw Materials Inventory, Factory Labor, and Manufacturing Over-head. They then assign the accumulated costs to Work in Process Inventory and eventually to Finished Goods Inventory and Cost of Goods Sold.
Use a job cost sheet to assign costs to work in process.A job cost sheet is a form used to record the costs chargeable to a specifi c job and to determine the total and unit costs of the completed job. Job cost sheets constitute the subsidiary ledger for the Work in Process Inventory control account.
Demonstrate how to determine and use the prede-termined overhead rate. The predetermined overhead
1
2
3
rate is based on the relationship between estimated annual overhead costs and expected annual operating activity. This is expressed in terms of a common activ-ity base, such as direct labor cost. Companies use this rate to assign overhead costs to work in process and to specifi c jobs.
Prepare entries for manufacturing and service jobs completed and sold. When jobs are completed, com-panies debit the cost to Finished Goods Inventory and credit it to Work in Process Inventory. When a job is sold, the entries are (a) debit Cash or Accounts Receiv-able and credit Sales Revenue for the selling price, and (b) debit Cost of Goods Sold and credit Finished Goods Inventory for the cost of the goods.
Distinguish between under- and overapplied manu-facturing overhead. Underapplied manufacturing overhead indicates that the overhead assigned to work in process is less than the overhead incurred. Overapplied overhead indicates that the overhead assigned to work in process is greater than the overhead incurred.
4
5
LEARNING OBJECTIVES REVIEW
REVIEW AND PRACTICE

898 20 Job Order Costing
1. Cost accounting involves the measuring, recording, and reporting of:(a) product costs.(b) future costs.(c) manufacturing processes.(d) managerial accounting decisions.
2. A company is more likely to use a job order cost system if:(a) it manufactures a large volume of similar products.(b) its production is continuous.(c) it manufactures products with unique charac-
teristics.(d) it uses a periodic inventory system.
3. In accumulating raw materials costs, companies debit the cost of raw materials purchased in a perpetual system to:(a) Raw Materials Purchases.(b) Raw Materials Inventory.(c) Purchases.(d) Work in Process.
4. When incurred, factory labor costs are debited to:(a) Work in Process.(b) Factory Wages Expense.(c) Factory Labor.(d) Factory Wages Payable.
5. The fl ow of costs in job order costing:(a) begins with work in process inventory and ends
with fi nished goods inventory.(b) begins as soon as a sale occurs.(c) parallels the physical fl ow of materials as they are
converted into fi nished goods.(d) is necessary to prepare the cost of goods manu-
factured schedule. 6. Raw materials are assigned to a job when:
(a) the job is sold.(b) the materials are purchased.
(LO 1)
(LO 1)
(LO 1)
(LO 1)
(LO 1)
(LO 2)
(c) the materials are received from the vendor.(d) the materials are issued by the materials storeroom.
7. The source of information for assigning costs to job cost sheets are:(a) invoices, time tickets, and the predetermined
overhead rate.(b) materials requisition slips, time tickets, and the
actual overhead costs.(c) materials requisition slips, payroll register, and
the predetermined overhead rate.(d) materials requisition slips, time tickets, and the
predetermined overhead rate. 8. In recording the issuance of raw materials in a job
order cost system, it would be incorrect to:(a) debit Work in Process Inventory.(b) debit Finished Goods Inventory.(c) debit Manufacturing Overhead.(d) credit Raw Materials Inventory.
9. The entry when direct factory labor is assigned to jobs is a debit to:(a) Work in Process Inventory and a credit to Factory
Labor.(b) Manufacturing Overhead and a credit to Factory
Labor.(c) Factory Labor and a credit to Manufacturing
Overhead.(d) Factory Labor and a credit to Work in Process
Inventory. 10. The formula for computing the predetermined manu-
facturing overhead rate is estimated annual overhead costs divided by an expected annual operating activity, expressed as:(a) direct labor cost. (c) machine hours.(b) direct labor hours. (d) Any of the above.
11. In Crawford Company, the predetermined overhead rate is 80% of direct labor cost. During the month,
(LO 2)
(LO 2)
(LO 2)
(LO 3)
(LO 3)
PRACTICE MULTIPLE-CHOICE QUESTIONS
Cost accounting An area of accounting that involves mea-suring, recording, and reporting product costs. (p. 878).
Cost accounting system Manufacturing-cost accounts that are fully integrated into the general ledger of a company. (p. 878).
Job cost sheet A form used to record the costs charge-able to a specifi c job and to determine the total and unit costs of the completed job. (p. 882).
Job order cost system A cost accounting system in which costs are assigned to each job or batch. (p. 878).
Materials requisition slip A document authorizing the issuance of raw materials from the storeroom to production. (p. 883).
Overapplied overhead A situation in which overhead assigned to work in process is greater than the over-head incurred. (p. 896).
Predetermined overhead rate A rate based on the relationship between estimated annual overhead costs and expected annual operating activity, expressed in terms of a common activity base. (p. 887).
Process cost system A cost accounting system used when a company manufactures a large volume of simi-lar products. (p. 878).
Time ticket A document that indicates the employee, the hours worked, the account and job to be charged, and the total labor cost. (p. 885).
Underapplied overhead A situation in which overhead assigned to work in process is less than the overhead incurred. (p. 896).
GLOSSARY REVIEW

Practice Multiple-Choice Questions 899
Crawford incurs $210,000 of factory labor costs, of which $180,000 is direct labor and $30,000 is indirect labor. Actual overhead incurred was $200,000. The amount of overhead debited to Work in Process Inven-tory should be:(a) $200,000. (b) $144,000. (c) $168,000.(d) $160,000.
12. Mynex Company completes Job No. 26 at a cost of $4,500 and later sells it for $7,000 cash. A correct entry is:(a) debit Finished Goods Inventory $7,000 and credit
Work in Process Inventory $7,000.(b) debit Cost of Goods Sold $7,000 and credit Fin-
ished Goods Inventory $7,000.(c) debit Finished Goods Inventory $4,500 and credit
Work in Process Inventory $4,500.(d) debit Accounts Receivable $7,000 and credit Sales
Revenue $7,000. 13. At the end of an accounting period, a company using
a job order cost system calculates the cost of goods manufactured:(a) from the job cost sheet.(b) from the Work in Process Inventory account.(c) by adding direct materials used, direct labor
incurred, and manufacturing overhead incurred.(d) from the Cost of Goods Sold account.
14. Which of the following statements is true?(a) Job order costing requires less data entry than
process costing.
(LO 4)
(LO 5)
(LO 4)
(b) Allocation of overhead is easier under job order costing than process costing.
(c) Job order costing provides more precise costing for custom jobs than process costing.
(d) The use of job order costing has declined because more companies have adopted automated account-ing systems.
15. At end of the year, a company has a $1,200 debit bal-ance in Manufacturing Overhead. The company:(a) makes an adjusting entry by debiting Manufac-
turing Overhead Applied for $1,200 and crediting Manufacturing Overhead for $1,200.
(b) makes an adjusting entry by debiting Manufac-turing Overhead Expense for $1,200 and crediting Manufacturing Overhead for $1,200.
(c) makes an adjusting entry by debiting Cost of Goods Sold for $1,200 and crediting Manufacturing Over-head for $1,200.
(d) makes no adjusting entry because differences between actual overhead and the amount applied are a normal part of job order costing and will average out over the next year.
16. Manufacturing overhead is underapplied if:(a) actual overhead is less than applied.(b) actual overhead is greater than applied.(c) the predetermined rate equals the actual rate.(d) actual overhead equals applied overhead.
(LO 5)
(LO 5)
Solutions
1. (a) Cost accounting involves the measuring, recording, and reporting of product costs, not (b) future costs, (c) manufacturing processes, or (d) managerial accounting decisions.
2. (c) A job costing system is more likely for products with unique characteristics. The other choices are incorrect because a pro-cess cost system is more likely for (a) large volumes of similar products or (b) if production is continuous. (d) is incorrect because the choice of a costing system is not dependent on whether a periodic or perpetual inventory system is used.
3. (b) In a perpetual system, purchases of raw materials are debited to Raw Materials Inventory, not (a) Raw Materials Purchases, (c) Purchases, or (d) Work in Process.
4. (c) When factory labor costs are incurred, they are debited to Factory Labor, not (a) Work in Process, (b) Factory Wages Expense, or (d) credited to Factory Labor (they are debited to Factory Labor and credited to Factory Wages Payable).
5. (c) Job order costing parallels the physical fl ow of materials as they are converted into fi nished goods. The other choices are incorrect because job order costing begins (a) with raw materials, not work in process, and ends with fi nished goods; and (b) as soon as raw materials are purchased, not when the sale occurs. (d) is incorrect because the cost of goods manufactured schedule is prepared from the Work in Process account and is only a portion of the costs in a job order system.
6. (d) Raw materials are assigned to a job when the materials are issued by the materials storeroom, not when (a) the job is sold, (b) the materials are purchased, or (c) the materials are received from the vendor.
7. (d) Materials requisition slips are used to assign direct materials, time tickets are used to assign direct labor, and the predetermined overhead rate is used to assign manufacturing overhead to job cost sheets. The other choices are incorrect because (a) materials requisition slips, not invoices, are used to assign direct materials; (b) the predetermined overhead rate, not the actual overhead costs, is used to assign manufacturing overhead; and (c) time tickets, not the payroll register, are used to assign direct labor.
8. (b) Finished Goods Inventory is debited when goods are transferred from work in process to fi nished goods, not when raw mate-rials are issued for a job. Choices (a), (c), and (d) are true statements.
9. (a) When direct factory labor is assigned to jobs, the entry is a debit to Work in Process Inventory and a credit to Factory Labor. The other choices are incorrect because (b) Work in Process Inventory, not Manufacturing Overhead, is debited; (c) Work in Process Inventory, not Factory Labor, is debited and Factory Labor, not Manufacturing Overhead, is credited; and (d) Work in Process Inven-tory, not Factory Labor, is debited and Factory Labor, not Work in Process Inventory, is credited.
10. (d) Any of the activity measures mentioned can be used in computing the predetermined manufacturing overhead rate. Choices (a) direct labor cost, (b) direct labor hours), and (c) machine hours can all be used in computing the predetermined manufacturing overhead rate, but (d) is a better answer.

1. A job order cost sheet for Michaels Company is shown below.Analyze a job cost sheet and prepare entries for manufacturing costs.
(LO 1, 2, 3, 4)
Instructions(a) Answer the following questions.
(1) What was the balance in Work in Process Inventory on January 1 if this was the only unfi nished job?
(2) If manufacturing overhead is applied on the basis of direct labor cost, what over-head rate was used in each year?
(b) Prepare summary entries at January 31 to record the current year’s transactions per-taining to Job No. 92.
PRACTICE EXERCISES
Job No. 92 For 2,000 Units
Direct Direct Manufacturing Date Materials Labor Overhead
Beg. bal. Jan. 1 3,925 6,000 4,200 8 6,000 12 8,500 6,375 25 2,000 27 4,000 3,000
11,925 18,500 13,575
Cost of completed job: Direct materials $11,925 Direct labor 18,500 Manufacturing overhead 13,575
Total cost $44,000
Unit cost ($44,000 4 2,000) $ 22.00
11. (b) Work in Process Inventory should be debited for $144,000 ($180,000 3 80%), the amount of manufacturing overhead applied, not (a) $200,000, (c) $168,000, or (d) $160,000.
12. (c) When a job costing $4,500 is completed, Finished Goods Inventory is debited and Work in Process Inventory is credited for $4,500. Choices (a) and (b) are incorrect because the amounts should be for the cost of the job ($4,500), not the sale amount ($7,000). Choice (d) is incorrect because the debit should be to Cash, not Accounts Receivable.
13. (b) At the end of an accounting period, a company using a job costing system prepares the cost of goods manufactured from the Work in Process Inventory account, not (a) the job cost sheet; (c) by adding direct materials used, direct labor incurred, and manufac-turing overhead incurred; or (d) from the Cost of Goods Sold Account.
14. (c) Job order costing provides more precise costing for custom jobs than process costing. The other choices are incorrect because (a) job order costing often requires signifi cant data entry, (b) overhead allocation is a problem for all costing systems, and (d) the use of job order costing has increased due to automated accounting systems.
15. (c) The company would make an adjusting entry for the underapplied overhead by debiting Cost of Goods Sold for $1,200 and crediting Manufacturing Overhead for $1,200, not by debiting (a) Manufacturing Overhead Applied for $1,200 or (b) Manufacturing Overhead Expense for $1,200. Choice (d) is incorrect because at the end of the year, a company makes an entry to eliminate any balance in Manufacturing Overhead.
16. (b) Manufacturing overhead is underapplied if actual overhead is greater than applied overhead. The other choices are incor-rect because (a) if actual overhead is less than applied, then manufacturing overhead is overapplied; (c) if the predetermined rate equals the actual rate, the actual overhead costs incurred equal the overhead costs applied, neither over- nor underapplied; and (d) if the actual overhead equals the applied overhead, neither over- nor underapplied occurs.
Solution
1. (a) 1. $14,125, or ($3,925 1 $6,000 1 $4,200).
2. Last year 70%, or ($4,200 4 $6,000); this year 75% (either $6,375 4 $8,500 or $3,000 4 $4,000).
900 20 Job Order Costing

Practice Problem 901
2. Kwik Kopy Company applies operating overhead to photocopying jobs on the basis of machine hours used. Overhead costs are expected to total $290,000 for the year, and machine usage is estimated at 125,000 hours.
For the year, $295,000 of overhead costs are incurred and 130,000 hours are used.
Instructions(a) Compute the service overhead rate for the year.
(b) What is the amount of under- or overapplied overhead at December 31?
(c) Assuming the under- or overapplied overhead for the year is not allocated to inventory accounts, prepare the adjusting entry to assign the amount to cost of jobs fi nished.
Compute the overhead rate and under- or overapplied overhead.
(LO 3, 5)
Cardella Company applies overhead on the basis of direct labor costs. The company esti-mates annual overhead costs will be $760,000 and annual direct labor costs will be $950,000. During February, Cardella works on two jobs: A16 and B17. Summary data concerning these jobs are as follows.
Manufacturing Costs Incurred
Purchased $54,000 of raw materials on account.Factory labor $76,000, plus $4,000 employer payroll taxes.Manufacturing overhead exclusive of indirect materials and indirect labor $59,800.
Assignment of Costs
Direct materials: Job A16 $27,000, Job B17 $21,000Indirect materials: $3,000Direct labor: Job A16 $52,000, Job B17 $26,000Indirect labor: $2,000
The company completed Job A16 and sold it on account for $150,000. Job B17 was only partially completed.
Instructions(a) Compute the predetermined overhead rate.
(b) Journalize the February transactions in the sequence followed in the chapter.
(c) What was the amount of under- or overapplied manufacturing overhead?
Compute predetermined overhead rate, apply overhead, and calculate under- or overapplied overhead.
(LO 3, 5)
PRACTICE PROBLEM
(b) Jan. 31 Work in Process Inventory 8,000 Raw Materials Inventory 8,000 ($6,000 1 $2,000)
31 Work in Process Inventory 12,500 Factory Labor 12,500 ($8,500 1 $4,000)
31 Work in Process Inventory 9,375 Manufacturing Overhead 9,375 ($6,375 1 $3,000)
31 Finished Goods Inventory 44,000 Work in Process Inventory 44,000
Solution
2. (a) $2.32 per machine hour ($290,000 4 125,000).
(b) ($295,000) 2 ($2.32 3 130,000 machine hours) $295,000 2 $301,600 5 $6,600 overapplied
(c) Operating Overhead 6,600 Cost of Goods Sold 6,600

902 20 Job Order Costing
Solution
(a) Estimated annual 4
Expected annual 5
Predetermined overhead costs operating activity overhead rate $760,000 4 $950,000 5 80%
(b) (1)Feb. 28 Raw Materials Inventory 54,000 Accounts Payable 54,000 (Purchase of raw materials on account)
(2) 28 Factory Labor 80,000 Factory Wages Payable 76,000 Employer Payroll Taxes Payable 4,000 (To record factory labor costs)
(3) 28 Manufacturing Overhead 59,800 Accounts Payable, Accumulated Depreciation, and Prepaid Insurance 59,800 (To record overhead costs)
(4) 28 Work in Process Inventory 48,000 Manufacturing Overhead 3,000 Raw Materials Inventory 51,000 (To assign raw materials to production)
(5) 28 Work in Process Inventory 78,000 Manufacturing Overhead 2,000 Factory Labor 80,000 (To assign factory labor to production)
(6) 28 Work in Process Inventory 62,400 Manufacturing Overhead 62,400 (To assign overhead to jobs— 80% 3 $78,000)
(7) 28 Finished Goods Inventory 120,600 Work in Process Inventory 120,600 (To record completion of Job A16: direct materials $27,000, direct labor $52,000, and manufacturing overhead $41,600)
(8) 28 Accounts Receivable 150,000 Sales Revenue 150,000 (To record sale of Job A16)
28 Cost of Goods Sold 120,600 Finished Goods Inventory 120,600 (To record cost of sale for Job A16)
(c) Manufacturing Overhead has a debit balance of $2,400 as shown below.
Manufacturing Overhead
(3) 59,800 (6) 62,400(4) 3,000(5) 2,000
Bal. 2,400
Thus, manufacturing overhead is underapplied for the month.

Brief Exercises 903
Brief Exercises, Exercises, DO IT! Exercises, and Problems and many additional resources are available for practice in WileyPLUS
QUESTIONS
1. (a) Mary Barett is not sure about the difference between cost accounting and a cost accounting system. Explain the difference to Mary.
(b) What is an important feature of a cost accounting system?
2. (a) Distinguish between the two types of cost account-ing systems.
(b) Can a company use both types of cost accounting systems?
3. What type of industry is likely to use a job order cost system? Give some examples.
4. What type of industry is likely to use a process cost system? Give some examples.
5. Your roommate asks your help in understanding the major steps in the fl ow of costs in a job order cost system. Identify the steps for your roommate.
6. There are three inventory control accounts in a job order system. Identify the control accounts and their subsidiary ledgers.
7. What source documents are used in accumulating direct labor costs?
8. “Entries to Manufacturing Overhead normally are only made daily.” Do you agree? Explain.
9. Stan Kaiser is confused about the source documents used in assigning materials and labor costs. Identify the documents and give the entry for each document.
10. What is the purpose of a job cost sheet? 11. Indicate the source documents that are used in
charging costs to specifi c jobs. 12. Explain the purpose and use of a “materials requisi-
tion slip” as used in a job order cost system. 13. Sam Bowden believes actual manufacturing overhead
should be charged to jobs. Do you agree? Why or why not?
14. What elements are involved in computing a predeter-mined overhead rate?
15. How can the agreement of Work in Process Inventory and job cost sheets be verifi ed?
16. Jane Neff believes that the cost of goods manufac-tured schedule in job order cost accounting is the same as shown in Chapter 19. Is Jane correct? Explain.
17. Matt Litkee is confused about under- and overapplied manufacturing overhead. Defi ne the terms for Matt, and indicate the balance in the manufacturing over-head account applicable to each term.
18. “At the end of the year, under- or overapplied over-head is closed to Income Summary.” Is this correct? If not, indicate the customary treatment of this amount.
BRIEF EXERCISES
BE20-1 Dieker Company begins operations on January 1. Because all work is done to customer specifi cations, the company decides to use a job order cost system. Prepare a fl owchart of a typical job order system with arrows showing the fl ow of costs. Identify the eight transactions.
BE20-2 During January, its fi rst month of operations, Dieker Company accumulated the following manufacturing costs: raw materials $4,000 on account, factory labor $6,000 of which $5,200 relates to factory wages payable and $800 relates to payroll taxes payable, and utilities payable $2,000. Prepare separate journal entries for each type of manufacturing cost.
BE20-3 In January, Dieker Company requisitions raw materials for production as follows: Job 1 $900, Job 2 $1,200, Job 3 $700, and general factory use $600. Prepare a summary journal entry to record raw materials used.
BE20-4 Factory labor data for Dieker Company is given in BE20-2. During January, time tickets show that the factory labor of $6,000 was used as follows: Job 1 $2,200, Job 2 $1,600, Job 3 $1,400, and general factory use $800. Prepare a summary journal entry to record factory labor used.
BE20-5 Data pertaining to job cost sheets for Dieker Company are given in BE20-3 and BE20-4. Prepare the job cost sheets for each of the three jobs. (Note: You may omit the column for Manufacturing Overhead.)
Prepare a fl owchart of a job order cost accounting system and identify transactions.
(LO 1)
Prepare entries in accumulating manufacturing costs.
(LO 1)
Prepare entry for the assignment of raw materials costs.
(LO 2)
Prepare entry for the assignment of factory labor costs.
(LO 2)
Prepare job cost sheets.
(LO 2)

904 20 Job Order Costing
BE20-6 Marquis Company estimates that annual manufacturing overhead costs will be $900,000. Estimated annual operating activity bases are direct labor cost $500,000, direct labor hours 50,000, and machine hours 100,000. Compute the predetermined overhead rate for each activity base.
BE20-7 During the fi rst quarter, Francum Company incurs the following direct labor costs: January $40,000, February $30,000, and March $50,000. For each month, prepare the entry to assign overhead to production using a predetermined rate of 70% of direct labor cost.
BE20-8 In March, Stinson Company completes Jobs 10 and 11. Job 10 cost $20,000 and Job 11 $30,000. On March 31, Job 10 is sold to the customer for $35,000 in cash. Journal-ize the entries for the completion of the two jobs and the sale of Job 10.
BE20-9 Ruiz Engineering Contractors incurred service salaries and wages of $36,000 ($28,000 direct and $8,000 indirect) on an engineering project. The company applies over-head at a rate of 25% of direct labor. Record the entries to assign service salaries and wages and to apply overhead.
BE20-10 At December 31, balances in Manufacturing Overhead are Shimeca Company—debit $1,200, Garcia Company—credit $900. Prepare the adjusting entry for each com-pany at December 31, assuming the adjustment is made to cost of goods sold.
Compute predetermined overhead rates.
(LO 3)
Assign manufacturing overhead to production.
(LO 3)
Prepare entries for completion and sale of completed jobs.
(LO 4)
Prepare entries for service salaries and wages and operating overhead.
(LO 4)
Prepare adjusting entries for under- and overapplied overhead.
(LO 5)
During the current month, Wacholz Company incurs the following manufac-turing costs.
(a) Purchased raw materials of $18,000 on account.(b) Incurred factory labor of $40,000. Of that amount, $31,000 relates to wages payable
and $9,000 relates to payroll taxes payable.(c) Factory utilities of $3,100 are payable, prepaid factory property taxes of $2,700 have
expired, and depreciation on the factory building is $9,500.
Prepare journal entries for each type of manufacturing cost. (Use a summary entry to record manufacturing overhead.)
Milner Company is working on two job orders. The job cost sheets show the following. Job 201 Job 202
Direct materials $7,200 $9,000Direct labor 4,000 8,000Manufacturing overhead 5,200 9,800
Prepare the three summary entries to record the assignment of costs to Work in Process from the data on the job cost sheets.
Washburn Company produces earbuds. During the year, manufacturing overhead costs are expected to be $200,000. Expected machine usage is 2,500 hours. The company assigns overhead based on machine hours. Job No. 551 used 90 machine hours. Compute the predetermined overhead rate, determine the amount of overhead to allocate to Job No. 551, and prepare the entry to assign overhead to Job No. 551 on January 15.
During the current month, Standard Corporation completed Job 310 and Job 312. Job 310 cost $70,000 and Job 312 cost $50,000. Job 312 was sold on account for $90,000. Journalize the entries for the completion of the two jobs and the sale of Job 312.
For Eckstein Company, the predetermined overhead rate is 130% of di-rect labor cost. During the month, Eckstein incurred $100,000 of factory labor costs, of which $85,000 is direct labor and $15,000 is indirect labor. Actual overhead incurred was $115,000. Compute the amount of manufacturing overhead applied during the month. Determine the amount of under- or overapplied manufacturing overhead.
DO IT! Exercises
Prepare journal entries for manufacturing costs.
(LO 1)
DO IT! 20-1
Assign costs to work in process.
(LO 2)
Compute and apply the predetermined overhead rate.
(LO 3)
Prepare entries for completion and sale of jobs.
(LO 4)
Apply manufacturing overhead and determine under- or overapplication.
(LO 5)
DO IT! 20-2
DO IT! 20-3
DO IT! 20-4
DO IT! 20-5

Exercises 905
EXERCISES
E20-1 The gross earnings of the factory workers for Larkin Company during the month of January are $76,000. The employer’s payroll taxes for the factory payroll are $8,000. The fringe benefi ts to be paid by the employer on this payroll are $6,000. Of the total accumulated cost of factory labor, 85% is related to direct labor and 15% is attributable to indirect labor.
Instructions(a) Prepare the entry to record the factory labor costs for the month of January.(b) Prepare the entry to assign factory labor to production.
E20-2 Stine Company uses a job order cost system. On May 1, the company has a balance in Work in Process Inventory of $3,500 and two jobs in process: Job No. 429 $2,000, and Job No. 430 $1,500. During May, a summary of source documents reveals the following.
Materials LaborJob Number Requisition Slips Time Tickets
429 $2,500 $1,900 430 3,500 3,000 431 4,400 $10,400 7,600 $12,500
General use 800 1,200
$11,200 $13,700
Stine Company applies manufacturing overhead to jobs at an overhead rate of 60% of direct labor cost. Job No. 429 is completed during the month.
Instructions(a) Prepare summary journal entries to record (1) the requisition slips, (2) the time tickets,
(3) the assignment of manufacturing overhead to jobs, and (4) the completion of Job No. 429.
(b) Post the entries to Work in Process Inventory, and prove the agreement of the control account with the job cost sheets. (Use a T-account.)
E20-3 A job order cost sheet for Ryan Company is shown below.
Prepare entries for factory labor.
(LO 1, 2)
Prepare journal entries for manufacturing costs.
(LO 1, 2, 3, 4)
Analyze a job cost sheet and prepare entries for manufacturing costs.
(LO 1, 2, 3, 4)
Instructions(a) On the basis of the foregoing data, answer the following questions. (1) What was the balance in Work in Process Inventory on January 1 if this was the
only unfi nished job? (2) If manufacturing overhead is applied on the basis of direct labor cost, what over-
head rate was used in each year?(b) Prepare summary entries at January 31 to record the current year’s transactions per-
taining to Job No. 92.
Job No. 92 For 2,000 Units
Direct Direct Manufacturing Date Materials Labor Overhead
Beg. bal. Jan. 1 5,000 6,000 4,200 8 6,000 12 8,000 6,400 25 2,000 27 4,000 3,200
13,000 18,000 13,800
Cost of completed job: Direct materials $13,000 Direct labor 18,000 Manufacturing overhead 13,800
Total cost $44,800
Unit cost ($44,800 4 2,000) $22.40

906 20 Job Order Costing
E20-4 Manufacturing cost data for Orlando Company, which uses a job order cost system, are presented below.
Case A Case B Case C
Direct materials used $ (a) $ 83,000 $ 63,150Direct labor 50,000 140,000 (h)Manufacturing overhead applied 42,500 (d) (i)Total manufacturing costs 145,650 (e) 213,000Work in process 1/1/17 (b) 15,500 18,000Total cost of work in process 201,500 (f) (j)Work in process 12/31/17 (c) 11,800 (k)Cost of goods manufactured 192,300 (g) 222,000
InstructionsIndicate the missing amount for each letter. Assume that in all cases manufacturing over-head is applied on the basis of direct labor cost and the rate is the same.
E20-5 Ikerd Company applies manufacturing overhead to jobs on the basis of machine hours used. Overhead costs are expected to total $300,000 for the year, and machine usage is estimated at 125,000 hours. For the year, $322,000 of overhead costs are incurred and 130,000 hours are used.
Instructions(a) Compute the manufacturing overhead rate for the year.(b) What is the amount of under- or overapplied overhead at December 31?(c) Prepare the adjusting entry to assign the under- or overapplied overhead for the year
to cost of goods sold.
E20-6 A job cost sheet of Sandoval Company is given below.
Analyze costs of manufacturing and determine missing amounts.
(LO 1, 5)
Compute the manufacturing overhead rate and under- or overapplied overhead.
(LO 3, 5)
Analyze job cost sheet and prepare entry for completed job.
(LO 1, 2, 3, 4)
Instructions(a) Answer the following questions. (1) What are the source documents for direct materials, direct labor, and manufactur-
ing overhead costs assigned to this job? (2) What is the predetermined manufacturing overhead rate? (3) What are the total cost and the unit cost of the completed job? (Round unit cost to
nearest cent.)(b) Prepare the entry to record the completion of the job.
E20-7 Crawford Corporation incurred the following transactions.
1. Purchased raw materials on account $46,300.2. Raw materials of $36,000 were requisitioned to the factory. An analysis of the materials
requisition slips indicated that $6,800 was classifi ed as indirect materials.
Prepare entries for manufacturing and nonmanufacturing costs.
(LO 1, 2, 3, 4)
Job Cost Sheet
JOB NO. 469 Quantity 2,500
ITEM White Lion Cages Date Requested 7/2
FOR Todd Company Date Completed 7/31
Direct Direct ManufacturingDate Materials Labor Overhead
7/10 700 12 900 15 440 550 22 380 475 24 1,600 27 1,500 31 540 675
Cost of completed job: Direct materials Direct labor Manufacturing overheadTotal cost
Unit cost

Exercises 907
3. Factory labor costs incurred were $59,900, of which $51,000 pertained to factory wages payable and $8,900 pertained to employer payroll taxes payable.
4. Time tickets indicated that $54,000 was direct labor and $5,900 was indirect labor.5. Manufacturing overhead costs incurred on account were $80,500.6. Depreciation on the company’s offi ce building was $8,100.7. Manufacturing overhead was applied at the rate of 150% of direct labor cost.8. Goods costing $88,000 were completed and transferred to fi nished goods.9. Finished goods costing $75,000 to manufacture were sold on account for $103,000.
InstructionsJournalize the transactions. (Omit explanations.)
E20-8 Enos Printing Corp. uses a job order cost system. The following data summarize the operations related to the fi rst quarter’s production.
1. Materials purchased on account $192,000, and factory wages incurred $87,300.2. Materials requisitioned and factory labor used by job:
Job Number Materials Factory Labor
A20 $ 35,240 $18,000 A21 42,920 22,000 A22 36,100 15,000 A23 39,270 25,000 General factory use 4,470 7,300
$158,000 $87,300
3. Manufacturing overhead costs incurred on account $49,500.4. Depreciation on factory equipment $14,550.5. Depreciation on the company’s offi ce building was $14,300.6. Manufacturing overhead rate is 90% of direct labor cost.7. Jobs completed during the quarter: A20, A21, and A23.
InstructionsPrepare entries to record the operations summarized above. (Prepare a schedule showing the individual cost elements and total cost for each job in item 7.)
E20-9 At May 31, 2017, the accounts of Lopez Company show the following.
1. May 1 inventories—fi nished goods $12,600, work in process $14,700, and raw materials $8,200.
2. May 31 inventories—fi nished goods $9,500, work in process $15,900, and raw materials $7,100.
3. Debit postings to work in process were direct materials $62,400, direct labor $50,000, and manufacturing overhead applied $40,000.
4. Sales revenue totaled $215,000.
Instructions(a) Prepare a condensed cost of goods manufactured schedule.(b) Prepare an income statement for May through gross profi t.(c) Indicate the balance sheet presentation of the manufacturing inventories at May 31, 2017.
E20-10 Tierney Company begins operations on April 1. Information from job cost sheets shows the following.
Manufacturing Costs Assigned
Job Month Number April May June Completed
10 $5,200 $4,400 May 11 4,100 3,900 $2,000 June 12 1,200 April 13 4,700 4,500 June 14 5,900 3,600 Not complete
Job 12 was completed in April. Job 10 was completed in May. Jobs 11 and 13 were com-pleted in June. Each job was sold for 25% above its cost in the month following completion.
Prepare entries for manufacturing and nonmanufacturing costs.
(LO 1, 2, 3, 4)
Prepare a cost of goods manufactured schedule and partial fi nancial statements.
(LO 1, 5)
Compute work in process and fi nished goods from job cost sheets.
(LO 2, 4)

908 20 Job Order Costing
Instructions(a) What is the balance in Work in Process Inventory at the end of each month?(b) What is the balance in Finished Goods Inventory at the end of each month?(c) What is the gross profi t for May, June, and July?
E20-11 The following are the job cost related accounts for the law fi rm of Colaw Associates and their manufacturing equivalents:
Law Firm Accounts Manufacturing Firm Accounts
Supplies Raw MaterialsSalaries and Wages Payable Factory Wages PayableOperating Overhead Manufacturing OverheadService Contracts in Process Work in ProcessCost of Completed Service Contracts Cost of Goods Sold
Cost data for the month of March follow.
1. Purchased supplies on account $1,800.2. Issued supplies $1,200 (60% direct and 40% indirect).3. Assigned labor costs based on time cards for the month which indicated labor costs of
$70,000 (80% direct and 20% indirect).4. Operating overhead costs incurred for cash totaled $40,000.5. Operating overhead is applied at a rate of 90% of direct labor cost.6. Work completed totaled $75,000.
Instructions(a) Journalize the transactions for March. (Omit explanations.)(b) Determine the balance of the Service Contracts in Process account. (Use a T-account.)
E20-12 Don Lieberman and Associates, a CPA fi rm, uses job order costing to capture the costs of its audit jobs. There were no audit jobs in process at the beginning of November. Listed below are data concerning the three audit jobs conducted during November.
Lynn Brian Mike
Direct materials $600 $400 $200Auditor labor costs $5,400 $6,600 $3,375Auditor hours 72 88 45
Overhead costs are applied to jobs on the basis of auditor hours, and the predetermined overhead rate is $50 per auditor hour. The Lynn job is the only incomplete job at the end of November. Actual overhead for the month was $11,000.
Instructions(a) Determine the cost of each job.(b) Indicate the balance of the Service Contracts in Process account at the end of November.(c) Calculate the ending balance of the Operating Overhead account for November.
E20-13 Tombert Decorating uses a job order cost system to collect the costs of its interior decorating business. Each client’s consultation is treated as a separate job. Overhead is applied to each job based on the number of decorator hours incurred. Listed below are data for the current year.
Estimated overhead $960,000Actual overhead $982,800Estimated decorator hours 40,000Actual decorator hours 40,500
The company uses Operating Overhead in place of Manufacturing Overhead.
Instructions(a) Compute the predetermined overhead rate.(b) Prepare the entry to apply the overhead for the year.(c) Determine whether the overhead was under- or overapplied and by how much.
Prepare entries for costs of services provided.
(LO 1, 3, 4)
Determine cost of jobs and ending balance in work in process and overhead accounts.
(LO 2, 3, 4)
Determine predetermined overhead rate, apply overhead, and determine whether balance under- or overapplied.
(LO 3, 5)
SERVICE
SERVICE
SERVICE
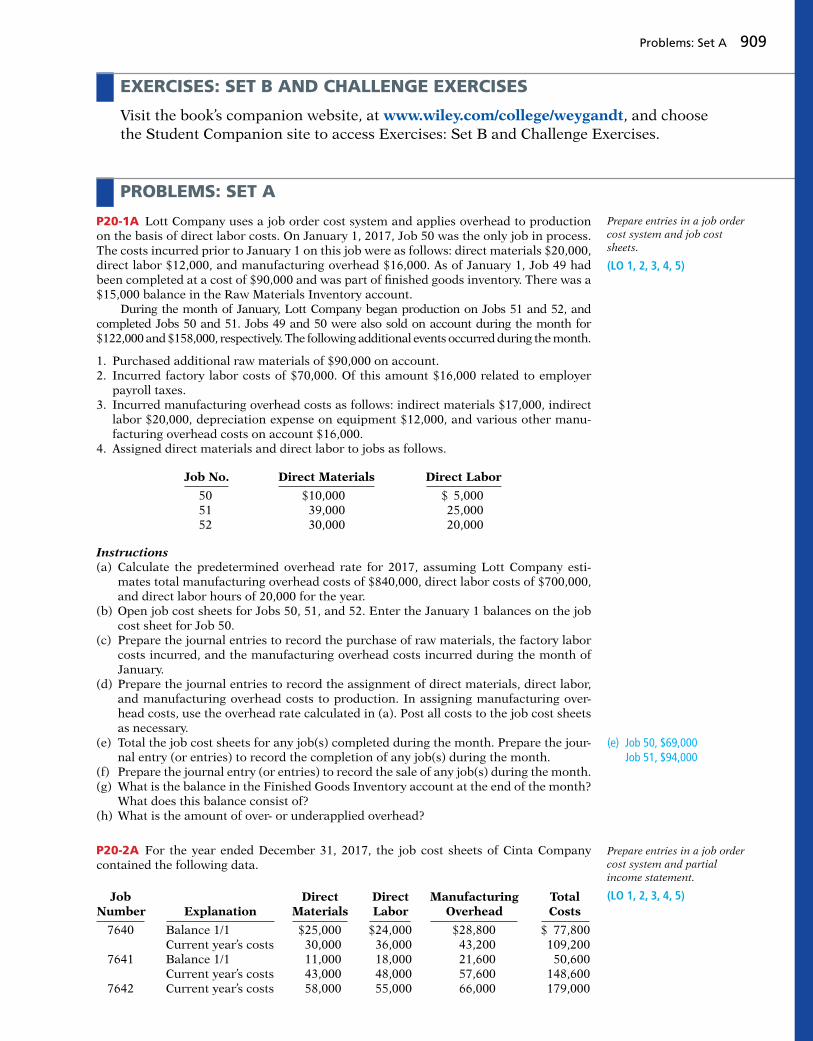
Problems: Set A 909
EXERCISES: SET B AND CHALLENGE EXERCISES
Visit the book’s companion website, at www.wiley.com/college/weygandt, and choose the Student Companion site to access Exercises: Set B and Challenge Exercises.
PROBLEMS: SET A
P20-1A Lott Company uses a job order cost system and applies overhead to production on the basis of direct labor costs. On January 1, 2017, Job 50 was the only job in process. The costs incurred prior to January 1 on this job were as follows: direct materials $20,000, direct labor $12,000, and manufacturing overhead $16,000. As of January 1, Job 49 had been completed at a cost of $90,000 and was part of fi nished goods inventory. There was a $15,000 balance in the Raw Materials Inventory account. During the month of January, Lott Company began production on Jobs 51 and 52, and completed Jobs 50 and 51. Jobs 49 and 50 were also sold on account during the month for $122,000 and $158,000, respectively. The following additional events occurred during the month.
1. Purchased additional raw materials of $90,000 on account.2. Incurred factory labor costs of $70,000. Of this amount $16,000 related to employer
payroll taxes.3. Incurred manufacturing overhead costs as follows: indirect materials $17,000, indirect
labor $20,000, depreciation expense on equipment $12,000, and various other manu-facturing overhead costs on account $16,000.
4. Assigned direct materials and direct labor to jobs as follows.
Prepare entries in a job order cost system and job cost sheets.
(LO 1, 2, 3, 4, 5)
Instructions(a) Calculate the predetermined overhead rate for 2017, assuming Lott Company esti-
mates total manufacturing overhead costs of $840,000, direct labor costs of $700,000, and direct labor hours of 20,000 for the year.
(b) Open job cost sheets for Jobs 50, 51, and 52. Enter the January 1 balances on the job cost sheet for Job 50.
(c) Prepare the journal entries to record the purchase of raw materials, the factory labor costs incurred, and the manufacturing overhead costs incurred during the month of January.
(d) Prepare the journal entries to record the assignment of direct materials, direct labor, and manufacturing overhead costs to production. In assigning manufacturing over-head costs, use the overhead rate calculated in (a). Post all costs to the job cost sheets as necessary.
(e) Total the job cost sheets for any job(s) completed during the month. Prepare the jour-nal entry (or entries) to record the completion of any job(s) during the month.
(f) Prepare the journal entry (or entries) to record the sale of any job(s) during the month.(g) What is the balance in the Finished Goods Inventory account at the end of the month?
What does this balance consist of?(h) What is the amount of over- or underapplied overhead?
P20-2A For the year ended December 31, 2017, the job cost sheets of Cinta Company contained the following data.
(e) Job 50, $69,000 Job 51, $94,000
Prepare entries in a job order cost system and partial income statement.
(LO 1, 2, 3, 4, 5)
Job No. Direct Materials Direct Labor
50 $10,000 $ 5,000 51 39,000 25,000 52 30,000 20,000
Job Direct Direct Manufacturing TotalNumber Explanation Materials Labor Overhead Costs
7640 Balance 1/1 $25,000 $24,000 $28,800 $ 77,800 Current year’s costs 30,000 36,000 43,200 109,200 7641 Balance 1/1 11,000 18,000 21,600 50,600 Current year’s costs 43,000 48,000 57,600 148,600 7642 Current year’s costs 58,000 55,000 66,000 179,000

910 20 Job Order Costing
Other data:
1. Raw materials inventory totaled $15,000 on January 1. During the year, $140,000 of raw materials were purchased on account.
2. Finished goods on January 1 consisted of Job No. 7638 for $87,000 and Job No. 7639 for $92,000.
3. Job No. 7640 and Job No. 7641 were completed during the year.4. Job Nos. 7638, 7639, and 7641 were sold on account for $530,000.5. Manufacturing overhead incurred on account totaled $120,000.6. Other manufacturing overhead consisted of indirect materials $14,000, indirect labor
$18,000, and depreciation on factory machinery $8,000.
Instructions(a) Prove the agreement of Work in Process Inventory with job cost sheets pertaining
to unfi nished work. (Hint: Use a single T-account for Work in Process Inventory.) Calculate each of the following, then post each to the T-account: (1) beginning bal-ance, (2) direct materials, (3) direct labor, (4) manufacturing overhead, and (5) com-pleted jobs.
(b) Prepare the adjusting entry for manufacturing overhead, assuming the balance is allocated entirely to Cost of Goods Sold.
(c) Determine the gross profi t to be reported for 2017.
P20-3A Case Inc. is a construction company specializing in custom patios. The patios are constructed of concrete, brick, fi berglass, and lumber, depending upon customer preference. On June 1, 2017, the general ledger for Case Inc. contains the following data.
Raw Materials Inventory $4,200 Manufacturing Overhead Applied $32,640Work in Process Inventory $5,540 Manufacturing Overhead Incurred $31,650
Subsidiary data for Work in Process Inventory on June 1 are as follows.
(a) $179,000; Job 7642: $179,000
(b) Amount 5 $6,800
(c) $158,600
Prepare entries in a job order cost system and cost of goods manufactured schedule.
(LO 1, 2, 3, 4, 5)
During June, raw materials purchased on account were $4,900, and all wages were paid. Additional overhead costs consisted of depreciation on equipment $900 and miscel-laneous costs of $400 incurred on account.
A summary of materials requisition slips and time tickets for June shows the following.
Overhead was charged to jobs at the same rate of $1.25 per dollar of direct labor cost. The patios for customers Rodgers, Stevens, and Linton were completed during June and sold for a total of $18,900. Each customer paid in full.
Instructions(a) Journalize the June transactions: (1) for purchase of raw materials, factory labor costs
incurred, and manufacturing overhead costs incurred; (2) assignment of direct materials, labor, and overhead to production; and (3) completion of jobs and sale of goods.
Job Cost Sheets
Customer Job
Cost Element Rodgers Stevens Linton
Direct materials $ 600 $ 800 $ 900 Direct labor 320 540 580 Manufacturing overhead 400 675 725
$1,320 $2,015 $2,205
Customer Job Materials Requisition Slips Time Tickets
Rodgers $ 800 $ 850 Koss 2,000 800 Stevens 500 360 Linton 1,300 1,200 Rodgers 300 390
4,900 3,600 General use 1,500 1,200
$6,400 $4,800
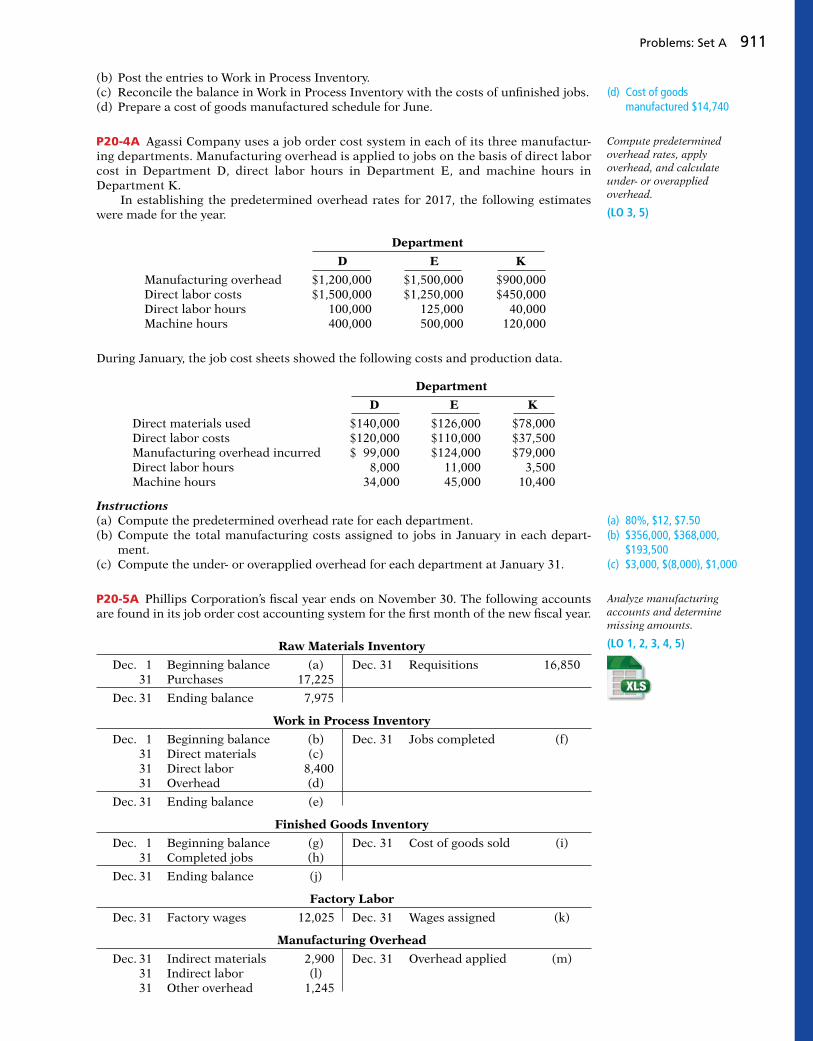
Problems: Set A 911
(b) Post the entries to Work in Process Inventory.(c) Reconcile the balance in Work in Process Inventory with the costs of unfi nished jobs.(d) Prepare a cost of goods manufactured schedule for June.
P20-4A Agassi Company uses a job order cost system in each of its three manufactur-ing departments. Manufacturing overhead is applied to jobs on the basis of direct labor cost in Department D, direct labor hours in Department E, and machine hours in Department K.
In establishing the predetermined overhead rates for 2017, the following estimates were made for the year.
Department
D E K
Manufacturing overhead $1,200,000 $1,500,000 $900,000Direct labor costs $1,500,000 $1,250,000 $450,000Direct labor hours 100,000 125,000 40,000Machine hours 400,000 500,000 120,000
During January, the job cost sheets showed the following costs and production data.
Department
D E K
Direct materials used $140,000 $126,000 $78,000Direct labor costs $120,000 $110,000 $37,500Manufacturing overhead incurred $ 99,000 $124,000 $79,000Direct labor hours 8,000 11,000 3,500Machine hours 34,000 45,000 10,400
Instructions(a) Compute the predetermined overhead rate for each department.(b) Compute the total manufacturing costs assigned to jobs in January in each depart-
ment.(c) Compute the under- or overapplied overhead for each department at January 31.
P20-5A Phillips Corporation’s fi scal year ends on November 30. The following accounts are found in its job order cost accounting system for the fi rst month of the new fi scal year.
Raw Materials Inventory
Dec. 1 Beginning balance (a) Dec. 31 Requisitions 16,850 31 Purchases 17,225
Dec. 31 Ending balance 7,975
Work in Process Inventory
Dec. 1 Beginning balance (b) Dec. 31 Jobs completed (f) 31 Direct materials (c) 31 Direct labor 8,400 31 Overhead (d)
Dec. 31 Ending balance (e)
Finished Goods Inventory
Dec. 1 Beginning balance (g) Dec. 31 Cost of goods sold (i) 31 Completed jobs (h)
Dec. 31 Ending balance (j)
Factory Labor
Dec. 31 Factory wages 12,025 Dec. 31 Wages assigned (k)
Manufacturing Overhead
Dec. 31 Indirect materials 2,900 Dec. 31 Overhead applied (m) 31 Indirect labor (l) 31 Other overhead 1,245
(d) Cost of goods manufactured $14,740
Compute predetermined overhead rates, apply overhead, and calculate under- or overapplied overhead.
(LO 3, 5)
(a) 80%, $12, $7.50(b) $356,000, $368,000,
$193,500(c) $3,000, $(8,000), $1,000
Analyze manufacturing accounts and determine missing amounts.
(LO 1, 2, 3, 4, 5)

912 20 Job Order Costing
Other data:
1. On December 1, two jobs were in process: Job No. 154 and Job No. 155. These jobs had combined direct materials costs of $9,750 and direct labor costs of $15,000. Overhead was applied at a rate that was 75% of direct labor cost.
2. During December, Job Nos. 156, 157, and 158 were started. On December 31, Job No. 158 was unfi nished. This job had charges for direct materials $3,800 and direct labor $4,800, plus manufacturing overhead. All jobs, except for Job No. 158, were completed in December.
3. On December 1, Job No. 153 was in the fi nished goods warehouse. It had a total cost of $5,000. On December 31, Job No. 157 was the only job fi nished that was not sold. It had a cost of $4,000.
4. Manufacturing overhead was $1,470 underapplied in December.
InstructionsList the letters (a) through (m) and indicate the amount pertaining to each letter.
(c) $13,950
(f) $52,450
(i) $53,450
PROBLEMS: SET B AND SET C
Visit the book’s companion website, at www.wiley.com/college/weygandt, and choose the Student Companion site to access Problems: Set B and Set C.
CONTINUING PROBLEMS
CURRENT DESIGNSCD20 Huegel Hollow Resort has ordered 20 rotomolded kayaks from Current Designs. Each kayak will be formed in the rotomolded oven, cooled, and then the excess plastic trimmed away. Then, the hatches, seat, ropes, and bungees will be attached to the kayak. Dave Thill, the kayak plant manager, knows that manufacturing each kayak requires 54 pounds of polyethylene powder and a fi nishing kit (rope, seat, hardware, etc.). The polyethylene powder used in these kayaks costs $1.50 per pound, and the fi nishing kits cost $170 each. Each kayak will use two kinds of labor: 2 hours of more-skilled type I labor from people who run the oven and trim the plastic, and 3 hours of less-skilled type II labor from people who attach the hatches and seat and other hardware. The type I employees are paid $15 per hour, and the type II employees are paid $12 per hour. For pur-poses of this problem, assume that overhead is allocated to all jobs at a rate of 150% of direct labor costs.
InstructionsDetermine the total cost of the Huegel Hollow order and the cost of each individual kayak in the order. Identify costs as direct materials, direct labor, or manufacturing overhead.
WATERWAYS
WP20 Waterways has two major public-park projects to provide with comprehensive irriga-tion in one of its service locations this month. Job J57 and Job K52 involve 15 acres of land-scaped terrain which will require special-order sprinkler heads to meet the specifi cations of the project. This problem asks you to help Waterways use a job order cost system to account for production of these parts.
Go to the book’s companion website, at www.wiley.com/college/weygandt, to fi nd the com-pletion of this problem.
(Note: This is a continuation of the Waterways problem from Chapter 19.)
Greetings Inc., a nationally recognized retailer of greeting cards and small gift items, decides to employ Internet technology to expand its sales opportunities. For this case, you will employ tradi-tional job order costing techniques and then evaluate the resulting product costs.
Go to the book’s companion website, at www.wiley.com/college/weygandt, for complete case details and instructions.
COMPREHENSIVE CASE
EXCEL TUTORIAL

Broadening Your Perspective 913
PERSPECTIVEMANAGEMENT DECISION-MAKING
Decision-Making Across the OrganizationBYP20-1 Khan Products Company uses a job order cost system. For a number of months, there has been an ongoing rift between the sales department and the production department concerning a special-order product, TC-1. TC-1 is a seasonal product that is manufactured in batches of 1,000 units. TC-1 is sold at cost plus a markup of 40% of cost. The sales department is unhappy because fl uctuating unit production costs signifi cantly affect selling prices. Sales personnel complain that this has caused excessive customer complaints and the loss of considerable orders for TC-1. The production department maintains that each job order must be fully costed on the basis of the costs incurred during the period in which the goods are produced. Production personnel maintain that the only real solution is for the sales department to increase sales in the slack periods. Andrea Parley, president of the company, asks you as the company accountant to collect quarterly data for the past year on TC-1. From the cost accounting system, you accumulate the following pro-duction quantity and cost data.
InstructionsWith the class divided into groups, answer the following questions.
(a) What manufacturing cost element is responsible for the fl uctuating unit costs? Why?(b) What is your recommended solution to the problem of fl uctuating unit cost?(c) Restate the quarterly data on the basis of your recommended solution.
Managerial AnalysisBYP20-2 In the course of routine checking of all journal entries prior to preparing year-end reports, Betty Eller discovered several strange entries. She recalled that the president’s son Joe had come in to help out during an especially busy time and that he had recorded some journal entries. She was relieved that there were only a few of his entries, and even more relieved that he had included rather lengthy explanations. The entries Joe made were:
(1)
Work in Process Inventory 25,000 Cash 25,000
(This is for materials put into process. I don’t fi nd the record that we paid for these, so I’m crediting Cash because I know we’ll have to pay for them sooner or later.)
(2)
Manufacturing Overhead 12,000 Cash 12,000
(This is for bonuses paid to salespeople. I know they’re part of overhead, and I can’t fi nd an account called “Non-Factory Overhead” or “Other Overhead” so I’m putting it in Manufacturing Overhead. I have the check stubs, so I know we paid these.)
BROADENING YOUR
Quarter
Costs 1 2 3 4
Direct materials $100,000 $220,000 $ 80,000 $200,000Direct labor 60,000 132,000 48,000 120,000Manufacturing overhead 105,000 153,000 97,000 125,000
Total $265,000 $505,000 $225,000 $445,000
Production in batches 5 11 4 10
Unit cost (per batch) $ 53,000 $ 45,909 $ 56,250 $ 44,500

(3)
Wages Expense 120,000 Cash 120,000
(This is for the factory workers’ wages. I have a note that employer payroll taxes are $18,000. I still think that’s part of wages expense and that we’ll have to pay it all in cash sooner or later, so I credited Cash for the wages and the taxes.)
(4)
Work in Process Inventory 3,000 Raw Materials Inventory 3,000
(This is for the glue used in the factory. I know we used this to make the products, even though we didn’t use very much on any one of the products. I got it out of inventory, so I credited an inventory account.)
Instructions(a) How should Joe have recorded each of the four events?(b) If an entry was not corrected, which fi nancial statements (income statement or balance sheet)
would be affected? What balances would be overstated or understated?
Real-World FocusBYP20-3 The Institute of Management Accountants sponsors a certifi cation for management accoun-tants, allowing them to obtain the title of Certifi ed Management Accountant.
Address: www.imanet.org, or go to www.wiley.com/college/weygandt
Steps 1. Go to the site shown above. 2. Choose CMA Certifi cation, then Become a CMA, and then How to Get Started. Answer part (a)
below. 3. Choose CMA Resource Center and then Continuing Education for CMAs. Answer part (b) below.
Instructions(a) What is the experience qualifi cation requirement?(b) How many hours of continuing education are required, and what types of courses qualify?
CRITICAL THINKING
Communication ActivityBYP20-4 You are the management accountant for Williams Company. Your company does custom carpentry work and uses a job order cost system. Williams sends detailed job cost sheets to its customers, along with an invoice. The job cost sheets show the date materials were used, the dollar cost of materi-als, and the hours and cost of labor. A predetermined overhead application rate is used, and the total overhead applied is also listed. Nancy Kopay is a customer who recently had custom cabinets installed. Along with her check in payment for the work done, she included a letter. She thanked the company for including the detailed cost information but questioned why overhead was estimated. She stated that she would be interested in knowing exactly what costs were included in overhead, and she thought that other customers would, too.
InstructionsPrepare a letter to Ms. Kopay (address: 123 Cedar Lane, Altoona, KS 66651) and tell her why you did not send her information on exact costs of overhead included in her job. Respond to her suggestion that you provide this information.
Ethics CaseBYP20-5 LRF Printing provides printing services to many different corporate clients. Although LRF bids most jobs, some jobs, particularly new ones, are negotiated on a “cost-plus” basis. Cost-plus means that the buyer is willing to pay the actual cost plus a return (profi t) on these costs to LRF.
914 20 Job Order Costing

Alice Reiley, controller for LRF, has recently returned from a meeting where LRF’s president stated that he wanted her to fi nd a way to charge more costs to any project that was on a cost-plus basis. The president noted that the company needed more profi ts to meet its stated goals this period. By charging more costs to the cost-plus projects and therefore fewer costs to the jobs that were bid, the company should be able to increase its profi t for the current year. Alice knew why the president wanted to take this action. Rumors were that he was looking for a new position and if the company reported strong profi ts, the president’s opportunities would be enhanced. Alice also recognized that she could probably increase the cost of certain jobs by changing the basis used to allocate manufacturing overhead.
Instructions(a) Who are the stakeholders in this situation?(b) What are the ethical issues in this situation?(c) What would you do if you were Alice Reiley?
All About YouBYP20-6 Many of you will work for a small business. Some of you will even own your own business. In order to operate a small business, you will need a good understanding of managerial accounting, as well as many other skills. Much information is available to assist people who are interested in start-ing a new business. A great place to start is the website provided by the Small Business Administra-tion, which is an agency of the federal government whose purpose is to support small businesses.
InstructionsGo to www.sba.gov/smallbusinessplanner/index.html and in the Small Business Planner, Plan Your Business link, review the material under “Get Ready.” Answer the following questions.
(a) What are some of the characteristics required of a small business owner?(b) What are the top 10 reasons given for business failure?
Considering Your Costs and Benefi tsBYP20-7 After graduating, you might decide to start a small business. As discussed in this chapter, owners of any business need to know how to calculate the cost of their products. In fact, many small businesses fail because they don’t accurately calculate their product costs, so they don’t know if they are making a profi t or losing money—until it’s too late. Suppose that you decide to start a landscape business. You use an old pickup truck that you’ve fully paid for. You store the truck and other equipment in your parents’ barn, and you store trees and shrubs on their land. Your parents will not charge you for the use of these facilities for the fi rst two years, but beginning in the third year they will charge a reasonable rent. Your mother helps you by answering phone calls and providing customers with information. She doesn’t charge you for this service, but she plans on doing it for only your fi rst two years in business. In pricing your services, should you include charges for the truck, the barn, the land, and your mother’s services when calculating your product cost? The basic arguments for and against are as follows.
YES: If you don’t include charges for these costs, your costs are understated and your profi tability is overstated.NO: At this point, you are not actually incurring costs related to these activities; therefore, you shouldn’t record charges.
InstructionsWrite a response indicating your position regarding this situation. Provide support for your view.
Broadening Your Perspective 915
SERVICE

It isn’t easy for a small company to get a foothold in the
bottled beverage business. The giants, The Coca-Cola
Company and PepsiCo Inc., vigilantly defend their turf,
constantly watching for new trends and opportunities. It is
nearly impossible to get shelf space in stores, and consumer
tastes can change faster than a bottle of soda can lose its
fi zz. But Jones Soda Co., headquartered in Seattle, has
overcome these and other obstacles to make a name for
itself. Its corporate motto is, “Run with the little guy . . .
create some change.”
The company started as a Canadian distributor of other
companies’ beverages. Soon, it decided to make its own
products under the corporate name Urban Juice and Soda
Company. Eventually, its name changed to Jones Soda—the
name of its most popular product. From the very start, Jones
Soda was different. It sold soda from machines placed in
tattoo parlors and piercing shops, and it sponsored a punk
rock band as well as surfers and snowboarders. At one time,
the company’s product was the offi cial drink at the Seattle
Seahawks’ stadium and was served on Alaskan Airlines.
Today, Jones Soda makes a wide variety of products: soda-
fl avored candy, energy drinks, and product-promoting gear
that includes t-shirts, sweatshirts, caps, shorts, and calendars.
Its most profi table product is still its multi-fl avored, pure cane
soda with its creative labeling. If you’ve seen Jones Soda on a
store shelf, then you know that it appears to have an infi nite
variety of labels. The bottle labels are actually created by
customers and submitted on the company’s website.
(To see some of the best labels from the past, see the Gallery
at www.jonessoda.com.) If you would like some soda with a
custom label of your own, you can design and submit a label
and order a 12-pack.
Because Jones Soda has a dizzying array of product variations,
keeping track of costs is of vital importance. Recently,
management developed a reorganization plan that involved
cost-cutting from top to bottom and eliminating unprofi table
products. No matter how good your products are, if you don’t
keep your costs under control, you are likely to fail. Jones
Soda’s managers need accurate cost information regarding
each primary product and each variation to ensure
profi tability. So while its marketing approach differs
dramatically from the giants, Jones Soda needs the same
kind of cost information as the big guys.
The Little Guy Who Could
As the Feature Story below describes, the cost accounting system used by companies such as Jones Soda is process cost accounting. In contrast to job order cost accounting, which focuses on the individual job, process cost accounting focuses on the processes involved in mass-producing products that are identical or very similar in nature. The primary objective of this chapter is to explain and illustrate process costing.
CHAPTER PREVIEW
21
FEATURE STORY
Process Costing
916
Watch the Jones Soda video in WileyPLUS to learn more about process costing in the real world.
▲

Go to the REVIEW AND PRACTICE section at the end of the chapter for a review of key concepts and practice applications with solutions.
Visit WileyPLUS with ORION for additional tutorials and practice opportunities.
Elaine Th ompson/AP Photo
CHAPTER OUTLINE
Explain the fl ow of costs in a process cost system and the journal entries to assign manufacturing costs.
Compute equivalent units.
2
3
Complete the four steps to prepare a production cost report.4
Discuss the uses of a process cost system and how it compares to a job order system.
1 Compare Job Order and Process Cost SystemsDO IT! 1
• Uses of process cost systems• Process costing for service
companies• Comparing job order and process
cost systems
Manufacturing Costs in Process Costing
DO IT! 2• Process cost fl ow• Assigning manufacturing costs
Learning Objectives
Equivalent UnitsDO IT! 3
Cost Reconciliation ScheduleDO IT! 4
• Weighted-average method• Refi nements on the weighted-
average method
• Physical unit fl ow• Equivalent units of production• Unit production costs• Cost reconciliation schedule• Production cost report
Explain just-in-time (JIT) processing and activity-based costing (ABC).5 JIT and ABCDO IT! 5• Just-in-time processing
• Activity-based costing

918 21 Process Costing
1 Discuss the uses of a process cost system and how it compares to a job order system.
LEARNING OBJECTIVE
Uses of Process Cost Systems
Companies use process cost systems to apply costs to similar products that are mass-produced in a continuous fashion. Jones Soda Co. uses a process cost system: Production of the soda, once it begins, continues until the soda emerges. The processing is the same for the entire run—with precisely the same amount of materials, labor, and overhead. Each fi nished bottle of soda is indistinguishable from another. A company such as USX uses process costing in the manufacturing of steel. Kellogg and General Mills use process costing for cereal production; ExxonMobil uses process costing for its oil refi ning. Sherwin Williams uses process costing for its paint products. At a bottling company like Jones Soda, the manufacturing process begins with the blending of ingredients. Next, automated machinery moves the bottles into position and fi lls them. The production process then caps, packages, and forwards the bottles to the fi nished goods warehouse. Illustration 21-1 shows this process.
ManufacturingProcesses
Labeling
SODA
FillingBlending
For Jones Soda, as well as the other companies just mentioned, once produc-tion begins, it continues until the fi nished product emerges. Each unit of fi nished product is like every other unit. In comparison, a job order cost system assigns costs to a specifi c job. Exam-ples are the construction of a customized home, the making of a movie, or the manufacturing of a specialized machine. Illustration 21-2 provides examples of companies that primarily use either a process cost system or a job order cost system.
Illustration 21-1Manufacturing processes
Process Cost SystemCompany Product
Job Order Cost SystemCompany Product
Soft drinks Advertising
Oil Movies
Computer chips Ice rinks
Jones Soda,PepsiCo
ExxonMobil,Royal Dutch Shell
Intel,Advanced Micro Devices
Dow Chemical,DuPont Chemicals
Young & Rubicam,J. Walter Thompson
Disney,Warner Brothers
Center Ice Consultants,Ice Pro
Kaiser,Mayo Clinic
Patient healthcare
SODACOLA
Illustration 21-2Process cost and job order cost companies and products

Overview of Process Cost System 919
Process Costing for Service Companies
When considering service companies, you might initially think of specifi c, non-routine tasks, such as rebuilding an automobile engine, consulting on a business acquisition, or defending a major lawsuit. However, many service companies per-form repetitive, routine work. For example, Jiffy Lube regularly performs oil changes. H&R Block focuses on the routine aspects of basic tax practice. Service companies that perform individualized, nonroutine services will probably benefi t from using a job order cost system. Those that perform routine, repetitive ser-vices will probably be better off with a process cost system.
Similarities and Differences Between Job Order Cost and Process Cost Systems
In a job order cost system, companies assign costs to each job. In a process cost system, companies track costs through a series of connected manufacturing processes or departments, rather than by individual jobs. Thus, companies use process cost systems when they produce a large volume of uniform or relatively homogeneous products. Illustration 21-3 shows the basic fl ow of costs in these two systems.
Finished GoodsInventory
Cost of GoodsSold
Job Order Cost Flow
Direct MaterialsDirect LaborManufacturing
Overhead
Work in ProcessInventory
Job No. 101Job No. 102Job No. 103
Finished GoodsInventory
Cost of GoodsSold
Process Cost Flow
Direct MaterialsDirect LaborManufacturing
Overhead
Work in Process—
Department A
Work in Process—
Department B
Illustration 21-3Job order cost and process cost fl ow
The following analysis highlights the basic similarities and differences between these two systems.
SIMILARITIES
Job order cost and process cost systems are similar in three ways:
1. The manufacturing cost elements. Both costing systems track three manu-facturing cost elements—direct materials, direct labor, and manufacturing overhead.
2. The accumulation of the costs of materials, labor, and overhead. Both costing systems debit raw materials to Raw Materials Inventory, factory labor to Factory Labor, and manufacturing overhead costs to Manufacturing Over-head.
SERVICE

920 21 Process Costing
3. The fl ow of costs. As noted above, both systems accumulate all manufacturing costs by debits to Raw Materials Inventory, Factory Labor, and Manufacturing Overhead. Both systems then assign these costs to the same accounts—Work in Process, Finished Goods Inventory, and Cost of Goods Sold. The methods of assigning costs, however, differ signifi cantly. These differences are explained and illustrated later in the chapter.
DIFFERENCES
The differences between a job order cost and a process cost system are as follows.
1. The number of work in process accounts used. A job order cost system uses only one work in process account. A process cost system uses multiple work in process accounts.
2. Documents used to track costs. A job order cost system charges costs to individual jobs and summarizes them in a job cost sheet. A process cost system summarizes costs in a production cost report for each department.
3. The point at which costs are totaled. A job order cost system totals costs when the job is completed. A process cost system totals costs at the end of a period of time.
4. Unit cost computations. In a job order cost system, the unit cost is the total cost per job divided by the units produced. In a process cost system, the unit cost is total manufacturing costs for the period divided by the equivalent units produced during the period.
Illustration 21-4 summarizes the major differences between a job order cost and a process cost system.
Indicate whether each of the following statements is true or false.
1. A law fi rm is likely to use process costing for major lawsuits.
2. A manufacturer of paintballs is likely to use process costing.
3. Both job order and process costing determine product costs at the end of a period of time, rather than when a product is completed.
4. Process costing does not keep track of manufacturing overhead.
Solution
DO IT! 1 Compare Job Order and Process Cost Systems
1. False. 2. True. 3. False. 4. False.
Related exercise material: E21-1 and DO IT! 21-1.
Action Plan✔ Use job order costing
in situations where unit costs are high, unit volume is low, and products are unique.
✔ Use process costing when there is a large volume of relatively homogeneous products.
Illustration 21-4Job order versus process cost systems
Multiple work in process accounts
Each period
Production cost reports
Total manufacturing costs ÷ Equivalent units produced during the period
Process Cost System
One work in process account
Job cost sheets
Each job
Cost of each job ÷ Units produced for the job
Job Order Cost SystemFeature
Work in processaccounts
Documents used
Determination of totalmanufacturing costs
Unit-costcomputations

Process Cost Flow 921
2 Explain the fl ow of costs in a process cost system and the journal entries to assign manufacturing costs.
LEARNING OBJECTIVE
Process Cost Flow
Illustration 21-5 shows the fl ow of costs in the process cost system for Tyler Com-pany. Tyler manufactures roller blade and skateboard wheels that it sells to man-ufacturers and retail outlets. Manufacturing consists of two processes: machining and assembly. The Machining Department shapes, hones, and drills the raw materials. The Assembly Department assembles and packages the parts.
Raw MaterialsFactory LaborManufacturing Overhead
ManufacturingCosts
Work in Process—Machining Department
Coststransferredout to
Finished GoodsInventory
Cost of goodssold
Cost of Goods Sold
Work in Process—Assembly Department
Cost ofcompletedwork
Assignedto
Illustration 21-5Flow of costs in process cost system
$ $Materials
As the fl ow of costs indicates, the company can add materials, labor, and manufacturing overhead in both the Machining and Assembly Departments. When it fi nishes its work, the Machining Department transfers the partially com-pleted units to the Assembly Department. The Assembly Department fi nishes the goods and then transfers them to the fi nished goods inventory. Upon sale, Tyler removes the goods from the fi nished goods inventory. Within each department, a similar set of activities is performed on each unit processed.
Assigning Manufacturing Costs—Journal Entries
As indicated, the accumulation of the costs of materials, labor, and manufactur-ing overhead is the same in a process cost system as in a job order cost system. That is, both systems follow these procedures:
• Companies debit all raw materials to Raw Materials Inventory at the time of purchase.
• They debit all factory labor to Factory Labor as the labor costs are incurred.
• They debit overhead costs to Manufacturing Overhead as these costs are incurred.
However, the assignment of the three manufacturing cost elements to Work in Process in a process cost system is different from a job order cost system. Here we’ll look at how companies assign these manufacturing cost elements in a pro-cess cost system.
MATERIALS COSTS
All raw materials issued for production are a materials cost to the producing department. A process cost system may use materials requisition slips, but it gener-ally requires fewer requisitions than in a job order cost system. The materials are used for processes rather than for specifi c jobs and therefore typically are for larger quantities. At the beginning of the fi rst process, a company usually adds most of the materials needed for production. However, other materials may be added at various points. For example, in the manufacture of Hershey candy bars, the chocolate and other ingredients are added at the beginning of the fi rst process, and the wrappers

922 21 Process Costing
and cartons are added at the end of the packaging process. Tyler Company adds materials at the beginning of each process. Tyler makes the following entry to record the materials used.
Work in Process—Machining XXXXWork in Process—Assembly XXXX Raw Materials Inventory XXXX (To record materials used)
Work in Process—Machining XXXXWork in Process—Assembly XXXX Factory Labor XXXX (To assign factory labor to production)
Work in Process—Machining XXXXWork in Process—Assembly XXXX Manufacturing Overhead XXXX (To assign overhead to production)
$ $
Factory Labor
$ $Manufacturing
Overhead
Ice cream maker Ben & Jerry’s adds materials in three departments: milk and fl avoring in the mixing department, extras such as cherries and dark chocolate in the prepping department, and cardboard containers in the pinting (packaging) department.
FACTORY LABOR COSTS
In a process cost system, as in a job order cost system, companies may use time tickets to determine the cost of labor assignable to production departments. Since they assign labor costs to a process rather than a job, they can obtain, from the payroll register or departmental payroll summaries, the labor cost chargeable to a process. Labor costs for the Machining Department include the wages of employees who shape, hone, and drill the raw materials. The entry to assign labor costs to machining and assembly for Tyler Company is:
MANUFACTURING OVERHEAD COSTS
The objective in assigning overhead in a process cost system is to allocate the overhead costs to the production departments on an objective and equitable basis. That basis is the activity that “drives” or causes the costs. A primary driver of overhead costs in continuous manufacturing operations is machine time used, not direct labor. Thus, companies widely use machine hours in allocating manufacturing overhead costs using predetermined overhead rates. Tyler Company’s entry to allocate overhead to the two processes is:
Choosing a Cost Driver
In one of its auto-mated cost cen-ters, Caterpillar feeds work into the cost center, where robotic machines process it and transfer the fi nished job
to the next cost center without human intervention. One person tends all of the machines and spends more time maintaining machines than operating them. In such cases, overhead rates based on direct labor hours may be mis-leading. Surprisingly, some companies continue to assign manufacturing overhead on the basis of direct labor despite the fact that there is no cause-and-effect relation-ship between labor and overhead.
What is the result if a company uses the wrong “cost driver” to assign manufacturing overhead? (Go to WileyPLUS for this answer and additional questions.)
Management Insight Caterpillar
© SweetyMommy/iStockphoto

Process Cost Flow 923
TRANSFER TO NEXT DEPARTMENT
At the end of the month, Tyler Company needs an entry to record the cost of the goods transferred out of the Machining Department. In this case, the transfer is to the Assembly Department, and Tyler makes the following entry.
Ruth Company manufactures ZEBO through two processes: blending and bottling. In June, raw materials used were Blending $18,000 and Bottling $4,000. Factory labor costs were Blending $12,000 and Bottling $5,000. Manufacturing overhead costs were Blending $6,000 and Bottling $2,500. The company transfers units completed at a cost of $19,000 in the Blending Department to the Bottling Department. The Bottling Department trans-fers units completed at a cost of $11,000 to Finished Goods. Journalize the assignment of these costs to the two processes and the transfer of units as appropriate.
Solution
DO IT! 2 Manufacturing Costs in Process Costing
The entries are:
Work in Process—Blending 18,000Work in Process—Bottling 4,000 Raw Materials Inventory 22,000 (To record materials used)
Work in Process—Blending 12,000Work in Process—Bottling 5,000 Factory Labor 17,000 (To assign factory labor to production)
Work in Process—Blending 6,000Work in Process—Bottling 2,500 Manufacturing Overhead 8,500 (To assign overhead to production)
Work in Process—Bottling 19,000 Work in Process—Blending 19,000 (To record transfer of units to the Bottling
Department)
Finished Goods Inventory 11,000 Work in Process—Bottling 11,000 (To record transfer of units to fi nished goods)
Related exercise material: BE21-1, BE21-2, BE21-3, E21-2, E21-4, and DO IT! 21-2.
Action Plan✔ In process cost
accounting, keep separate work in process accounts for each process.
✔ When the costs are assigned to produc-tion, debit the sepa-rate work in process accounts.
✔ Transfer cost of com-pleted units to the next process or to Finished Goods.
Finished Goods Inventory XXXXX Work in Process—Assembly XXXXX (To record transfer of units to fi nished goods)
Cost of Goods Sold XXXXX Finished Goods Inventory XXXXX (To record cost of units sold)
TRANSFER TO FINISHED GOODS
When the Assembly Department completes the units, it transfers them to the fi nished goods warehouse. The entry for this transfer is as follows.
TRANSFER TO COST OF GOODS SOLD
When Tyler Company sells the fi nished goods, it records the cost of goods sold as follows.
Work in Process—Assembly XXXXX Work in Process—Machining XXXXX (To record transfer of units to the Assembly
Department)

924 21 Process Costing
3 Compute equivalent units.LEARNING OBJECTIVE
Suppose you have a work-study job in the offi ce of your college’s president, and she asks you to compute the cost of instruction per full-time equivalent student at your college. The college’s vice president for fi nance provides the following information.
Illustration 21-6Information for full-time student example
Costs: Total cost of instruction $9,000,000
Student population: Full-time students 900 Part-time students 1,000
Part-time students take 60% of the classes of a full-time student during the year. To compute the number of full-time equivalent students per year, you would make the following computation.
Illustration 21-8Equivalent units of production formula
Units Completed and Equivalent Units of Equivalent Units of Transferred out 1 Ending Work in 5 Production Process
The cost of instruction per full-time equivalent student is therefore the total cost of instruction ($9,000,000) divided by the number of full-time equivalent students (1,500), which is $6,000 ($9,000,000 4 1,500). A process cost system uses the same idea, called equivalent units of produc-tion. Equivalent units of production measure the work done during the period, expressed in fully completed units. Companies use this measure to determine the cost per unit of completed product.
Weighted-Average Method
The formula to compute equivalent units of production is as follows.
Illustration 21-7Full-time equivalent unit computation
Full-Time Equivalent Units Full-Time Equivalent Students 1 of Part-Time Students 5 Students
900 1 (1,000 3 60%) 5 1,500
To better understand this concept of equivalent units, consider the following two separate examples.
Example 1. In a specifi c period, the entire output of Sullivan Company’s Blend-ing Department consists of ending work in process of 4,000 units which are 60% complete as to materials, labor, and overhead. The equivalent units of pro-duction for the Blending Department are therefore 2,400 units (4,000 3 60%).Example 2. The output of Kori Company’s Packaging Department during the period consists of 10,000 units completed and transferred out, and 5,000 units in ending work in process which are 70% completed. The equivalent units of production are therefore 13,500 [10,000 1 (5,000 3 70%)].

Equivalent Units 925
This method of computing equivalent units is referred to as the weighted-average method. It considers the degree of completion (weighting) of the units completed and transferred out and the ending work in process.
Refi nements on the Weighted-Average Method
Kellogg Company has produced Eggo® Waffl es since 1970. Three departments produce these waffl es: Mixing, Baking, and Freezing/Packaging. The Mixing Department combines dry ingredients, including fl our, salt, and baking powder, with liquid ingredients, including eggs and vegetable oil, to make waffl e batter. Illustration 21-9 provides information related to the Mixing Department at the end of June.
Illustration 21-9 indicates that the beginning work in process is 100% com-plete as to materials cost and 70% complete as to conversion costs. Conversion costs are the sum of labor costs and overhead costs. In other words, Kellogg adds both the dry and liquid ingredients (materials) at the beginning of the waffl e-making process, and the conversion costs (labor and overhead) related to the mix-ing of these ingredients are incurred uniformly and are 70% complete. The end-ing work in process is 100% complete as to materials cost and 60% complete as to conversion costs. We then use the Mixing Department information to determine equivalent units. In computing equivalent units, the beginning work in process is not part of the equivalent-units-of-production formula. The units transferred out to the Baking Department are fully complete as to both materials and conversion costs. The ending work in process is fully complete as to materials, but only 60% complete as to conversion costs. We therefore need to make two equivalent unit compu-tations: one for materials, and the other for conversion costs. Illustration 21-10 shows these computations.
Illustration 21-9Information for Mixing Department
MIXING DEPARTMENT
Percentage Complete
Physical Units Materials Conversion Costs
Work in process, June 1 100,000 100% 70%Started into production 800,000
Total units 900,000
Units transferred out 700,000Work in process, June 30 200,000 100% 60%
Total units 900,000
Helpful HintSeparate unit cost computations are needed for materials and conversion costs whenever the two types of costs do not occur in the process at the same time.
ETHICS NOTE
An unethical manager might use incorrect completion percentages when determining equivalent units. This results in either raising or lowering costs. Since completion percentages are somewhat subjective, this form of income manipulation can be diffi cult to detect.
Illustration 21-10Computation of equivalent units—Mixing Department
MIXING DEPARTMENT
Equivalent Units
Materials Conversion Costs
Units transferred out 700,000 700,000Work in process, June 30 200,000 3 100% 200,000 200,000 3 60% 120,000
Total equivalent units 900,000 820,000
We can refi ne the earlier formula used to compute equivalent units of produc-tion (Illustration 21-8, page 924) to show the computations for materials and for conversion costs, as follows.

926 21 Process Costing
Units Completed and Equivalent Units of Equivalent Units of Transferred Out— 1 Ending Work in 5 Production— Materials Process—Materials Materials
Units Completed and Equivalent Units of Equivalent Units of Transferred Out— 1 Ending Work in 5 Production— Conversion Costs Process—Conversion Conversion Costs Costs
Illustration 21-11Refi ned equivalent units of production formula
The Fabricating Department for Outdoor Essentials has the following production and cost data for the current month.
Beginning Units Ending Work in Process Transferred Out Work in Process
–0– 15,000 10,000
Materials are entered at the beginning of the process. The ending work in process units are 30% complete as to conversion costs. Compute the equivalent units of production for (a) materials and (b) conversion costs.
DO IT! 3 Equivalent Units
Related exercise material: BE21-4, BE21-5, E21-5, E21-6, E21-8, E21-9, E21-10, E21-11, E21-13, E21-14, E21-15, and DO IT! 21-3.
Action Plan✔ To measure the work
done during the period, expressed in fully completed units, compute equivalent units of production.
✔ Use the appropriate formula: Units com-pleted and transferred out 1 Equivalent units of ending work in process 5 Equivalent units of production.
(a) Since materials are entered at the beginning of the process, the equivalent units of ending work in process are 10,000. Thus, 15,000 units 1 10,000 units 5 25,000 equivalent units of production for materials.
(b) Since ending work in process is only 30% complete as to conversion costs, the equiv-alent units of ending work in process are 3,000 (10,000 units 3 30%). Thus, 15,000 units 1 3,000 units 5 18,000 equivalent units of production for conversion costs.
Solution
Haven’t I Seen That Before?
For a variety of reasons, many companies, includ-ing General Electric, are making a big push to remanufacture goods that have been thrown away. Items getting a
second chance include cell phones, computers, home appli-ances, car parts, vacuum cleaners, and medical equipment. Businesses have fi gured out that profi t margins on reman-ufactured goods are signifi cantly higher than on new goods. As commodity prices such as copper and steel increase, reusing parts makes more sense. Also, as more local governments initiate laws requiring that electronics
and appliances be recycled rather than thrown away, the cost of remanufacturing declines because the gathering of used goods becomes far more effi cient. Besides benefi t-ting the manufacturer, remanufacturing provides goods at a much lower price to consumers, reduces waste going to landfi lls, saves energy, reuses scarce resources, and reduces emissions. For example, it was estimated that a remanufac-tured car starter results in about 50% less carbon dioxide emissions than making a new one.
Source: James R. Hagerty and Paul Glader, “From Trash Heap to Store Shelf,” Wall Street Journal Online (January 24, 2011).
In what ways might the relative composition (materials, labor, and overhead) of a remanufactured product’s cost differ from that of a newly made product? (Go to WileyPLUS for this answer and additional questions.)
People, Planet, and Profi t Insight General Electric
© Nicole Hofmann/iStockphoto

Production Cost Report 927
4 Complete the four steps to prepare a production cost report.LEARNING OBJECTIVE
As mentioned earlier, companies prepare a production cost report for each department. A production cost report is the key document that management uses to understand the activities in a department; it shows the production quantity and cost data related to that department. For example, in producing Eggo® Waffl es, Kellogg Company uses three production cost reports: Mixing, Baking, and Freezing/Packaging. Illustration 21-12 shows the fl ow of costs to make an Eggo® Waffl e and the related production cost reports for each department.
In order to complete a production cost report, the company must perform four steps, which as a whole make up the process cost system.
1. Compute the physical unit fl ow.
2. Compute the equivalent units of production.
3. Compute unit production costs.
4. Prepare a cost reconciliation schedule.
Illustration 21-13 shows assumed data for the Mixing Department at Kellogg Company for the month of June. We will use this information to complete a pro-duction cost report for the Mixing Department.
Illustration 21-12Flow of costs in making Eggo® Waffl es
Production Cost Report Production Cost ReportProduction Cost Report
WIP WIPBakingDepartment
Freezing/PackagingDepartment
FinishedGoods
Raw MaterialsFactory Labor
Manufacturing Overhead
MixingDepartment
Illustration 21-13Unit and cost data—Mixing Department
MIXING DEPARTMENT
UnitsWork in process, June 1 100,000 Direct materials: 100% complete Conversion costs: 70% completeUnits started into production during June 800,000Units completed and transferred out to Baking Department 700,000Work in process, June 30 200,000 Direct materials: 100% complete Conversion costs: 60% complete

928 21 Process Costing
Compute the Physical Unit Flow (Step 1)
Physical units are the actual units to be accounted for during a period, irrespec-tive of any work performed. To keep track of these units, add the units started (or transferred) into production during the period to the units in process at the beginning of the period. This amount is referred to as the total units to be accounted for. The total units then are accounted for by the output of the period. The output consists of units transferred out during the period and any units in process at the end of the period. This amount is referred to as the total units accounted for. Illustration 21-14 shows the fl ow of physical units for Kellogg’s Mixing Depart-ment for the month of June.
The records indicate that the Mixing Department must account for 900,000 units. Of this sum, 700,000 units were transferred to the Baking Department and 200,000 units were still in process.
Compute the Equivalent Units of Production (Step 2)
Once the physical fl ow of the units is established, Kellogg must measure the Mixing Department’s productivity in terms of equivalent units of production. The Mixing Department adds materials at the beginning of the process, and it incurs conversion costs uniformly during the process. Thus, we need two computations of equivalent units: one for materials and one for conversion costs. The equiva-lent unit computation is as follows.
CostsWork in process, June 1 Direct materials: 100% complete $ 50,000 Conversion costs: 70% complete 35,000
Cost of work in process, June 1 $ 85,000
Costs incurred during production in June Direct materials $400,000 Conversion costs 170,000
Costs incurred in June $570,000
Illustration 21-13(cont’d.)
Illustration 21-14Physical unit fl ow—Mixing Department
MIXING DEPARTMENT
Physical Units
Units to be accounted for Work in process, June 1 100,000 Started (transferred) into production 800,000
Total units 900,000Units accounted for Completed and transferred out 700,000 Work in process, June 30 200,000
Total units 900,000
Helpful HintMaterials are not always added at the beginning of the process. For example, materials are sometimes added uniformly during the process.

Production Cost Report 929
Compute Unit Production Costs (Step 3)
Armed with the knowledge of the equivalent units of production, we can now compute the unit production costs. Unit production costs are costs expressed in terms of equivalent units of production. When equivalent units of production are different for materials and conversion costs, we compute three unit costs: (1) materials, (2) conversion, and (3) total manufacturing. The computation of total materials cost related to Eggo® Waffl es is as follows.
The computation of unit materials cost is as follows.
Illustration 21-18 shows the computation of total conversion costs.
The computation of unit conversion cost is as follows.
Total manufacturing cost per unit is therefore computed as shown in Illustra-tion 21-20 (page 930).
Illustration 21-15Computation of equivalent units—Mixing Department
Equivalent Units
Materials Conversion Costs
Units transferred out 700,000 700,000Work in process, June 30 200,000 3 100% 200,000 200,000 3 60% 120,000
Total equivalent units 900,000 820,000
Helpful HintRemember that we ignore the beginning work in pro-cess in this computation.
Work in process, June 1 Direct materials cost $ 50,000Costs added to production during June Direct materials cost 400,000
Total materials cost $450,000
Illustration 21-16Total materials cost computation
Illustration 21-19Unit conversion cost computation
Work in process, June 1 Conversion costs $ 35,000Costs added to production during June Conversion costs 170,000
Total conversion costs $205,000
Illustration 21-18Total conversion costs computation
Illustration 21-17Unit materials cost computation Total Materials Equivalent Units Unit Materials
Cost 4 of Materials 5 Cost
$450,000 4 900,000 5 $0.50
Total Conversion Equivalent Units of Unit Conversion Costs 4 Conversion Costs 5 Cost
$205,000 4 820,000 5 $0.25

930 21 Process Costing
The company then prepares a cost reconciliation schedule to assign these costs to (a) units transferred out to the Baking Department and (b) ending work in process.
Kellogg uses the total manufacturing cost per unit, $0.75, in costing the units completed and transferred to the Baking Department. In contrast, the unit cost of materials and the unit cost of conversion are needed in costing units in process. The cost reconciliation schedule shows that the total costs accounted for (Illustration 21-22) equal the total costs to be accounted for (Illustration 21-21).
Preparing the Production Cost Report
At this point, Kellogg is ready to prepare the production cost report for the Mixing Department. As indicated earlier, this report is an internal document for management that shows production quantity and cost data for a pro-duction department. Illustration 21-23 shows the completed production cost report for the Mixing Department and identifi es the four steps used in preparing it. Production cost reports provide a basis for evaluating the productivity of a department. In addition, managers can use the cost data to assess whether unit costs and total costs are reasonable. By comparing the quantity and cost data with predetermined goals, top management can also judge whether current per-formance is meeting planned objectives.
Costs to be accounted for Work in process, June 1 $ 85,000 Started into production 570,000
Total costs $655,000
Illustration 21-21Costs charged to Mixing Department
Prepare a Cost Reconciliation Schedule (Step 4)
We are now ready to determine the cost of goods transferred out of the Mixing Department to the Baking Department and the costs in ending work in process. Kellogg charged total costs of $655,000 to the Mixing Department in June, calcu-lated as follows.
Illustration 21-20Total manufacturing cost per unit
Illustration 21-22Cost reconciliation schedule—Mixing Department
MIXING DEPARTMENTCost Reconciliation Schedule
Costs accounted for Transferred out (700,000 3 $0.75) $ 525,000 Work in process, June 30 Materials (200,000 3 $0.50) $100,000 Conversion costs (120,000 3 $0.25) 30,000 130,000
Total costs $655,000
Unit Materials Unit Conversion Total Manufacturing Cost 1 Cost 5 Cost per Unit
$0.50 1 $0.25 5 $0.75

Production Cost Report 931
Costing Systems—Final Comments
Companies often use a combination of a process cost and a job order cost system. Called operations costing, this hybrid system is similar to process costing in its assumption that standardized methods are used to manufacture the product. At the same time, the product may have some customized, individual features that require the use of a job order cost system. Consider, for example, Ford Motor Company. Each vehicle at a given plant goes through the same assembly line, but Ford uses different materials (such as seat coverings, paint, and tinted glass) for different vehicles. Similarly, Kellogg’s Pop-Tarts® toaster pastries go through numerous standardized processes—mixing, fi lling, baking, frosting, and packaging. The pastry dough, though, comes in different fl avors—plain, chocolate, and graham—and fi llings include Smucker’s® real fruit, chocolate fudge, vanilla creme, brown sugar cinnamon, and s’mores. A cost-benefi t trade-off occurs as a company decides which costing system to use. A job order cost system, for example, provides detailed information related to the cost of the product. Because each job has its own distinguishing character-istics, the system can provide an accurate cost per job. This information is useful in controlling costs and pricing products. However, the cost of implementing a job order cost system is often expensive because of the accounting costs involved.
1
2
3
4
5
6
7
8
9
10
11
12
13
14
15
16
17
18
19
20
21
22
23
24
25
26
27
28
29
30
31
AP18 fx
C EB D
Formulas Data Review ViewPage LayoutInsertHome
Mixing Department.xls
(200,000 � 60%)
$655,000
$0.75
$ 85,000570,000
$655,000
$525,000
130,000$655,000
100,000800,000900,000
700,000200,000900,000
(a)(b)
700,000200,000900,000
$450,000900,000
$0.50
700,000120,000820,000
$205,000820,000
$0.25
$100,00030,000
QuantitiesUnits to be accounted for Work in process, June 1 Started into productionTotal unitsUnits accounted for Transferred out Work in process, June 30Total unitsCosts
Unit costs
Total cost Equivalent units Unit costs [(a) � (b)]Costs to be accounted for Work in process, June 1 Started into productionTotal costsCost Reconciliation ScheduleCosts accounted for Transferred out (700,000 � $0.75) Work in process, June 30 Materials (200,000 � $0.50) Conversion costs (120,000 � $0.25)Total costs
MIXING DEPARTMENTProduction Cost Report
For the Month Ended June 30, 2017Equivalent Units
PhysicalUnits
MaterialsConversion
Costs
Step 1 Step 2
Step 3
Step 4
MaterialsConversion
Costs Total
Illustration 21-23Production cost report
Helpful HintThe four steps in pre-paring a production cost report:
1. Compute the physical unit fl ow.
2. Compute the equivalent units of production.
3. Compute unit production costs.
4. Prepare a cost reconciliation schedule.

932 21 Process Costing
On the other hand, for a company like Intel, is there a benefi t in knowing whether the cost of the one-hundredth computer chip produced is different from the one-thousandth chip produced? Probably not. An average cost of the product will suffi ce for control and pricing purposes. In summary, when deciding to use one of these systems or a combination system, a company must weigh the costs of implementing the system against the benefi ts from the additional information provided.
Action Plan✔ Assign the total manu-
facturing cost of $15 per unit to the 12,000 units transferred out.
✔ Assign the materials cost and conversion costs based on equiva-lent units of produc-tion to units in ending work in process.
The assignment of costs is as follows.
Costs accounted for Transferred out (12,000 3 $15) $180,000 Work in process, March 31 Materials (800 3 $6) $4,800 Conversion costs (200* 3 $9) 1,800 6,600
Total costs $186,600
*800 3 25%
Related exercise material: BE21-6, BE21-7, BE21-8, BE21-9, E21-3, E21-5, E21-6, E21-7, E21-8, E21-9, E21-10, E21-11, E21-13, E21-14, E21-15, and DO IT! 21-4.
Solution
In March, Rodayo Manufacturing had the following unit production costs: materials $6 and conversion costs $9. On March 1, it had no work in process. During March, Rodayo transferred out 12,000 units. As of March 31, 800 units that were 25% complete as to conversion costs and 100% complete as to materials were in ending work in process. Assign the costs to the units transferred out and in process.
DO IT! 4 Cost Reconciliation Schedule
5 Explain just-in-time (JIT) processing and activity-based costing (ABC).LEARNING OBJECTIVE
Just-in-Time Processing
Traditionally, continuous process manufacturing has been based on a just-in-case philosophy: Inventories of raw materials are maintained just in case some items are of poor quality or a key supplier is shut down by a strike. Similarly, subassembly parts are manufactured and stored just in case they are needed later in the manufacturing process. Finished goods are completed and stored just in case unexpected and rush customer orders are received. This philosophy often results in a “push approach,” in which raw materials and subassembly parts are pushed through each process. Traditional processing often results in the buildup of extensive manufacturing inventories. Primarily in response to foreign competition, many U.S. fi rms have switched to just-in-time (JIT) processing. JIT manufacturing is dedicated to having the right amount of materials, parts, or products just as they are needed. JIT fi rst hit the United States in the early 1980s when automobile companies adopted it to compete with foreign automakers. Many companies, including Dell, Caterpillar, and Harley-Davidson, now successfully use JIT. Under JIT processing, compa-nies receive raw materials just in time for use in production, they complete sub-assembly parts just in time for use in fi nished goods, and they complete fi nished goods just in time to be sold. Illustration 21-24 shows the sequence of activities in just-in-time processing.

Just-in-Time Processing and Activity-Based Costing 933
Warehouse
Warehouse
Receive Sales Order
Order Raw Materials
Manufactured Goods Ship Goods to Customer
Susan’sSoccer
Sneakers
“100 pairsof sneakers...
got it.”
“Send rubberand shoe lacesdirectly to the
factory.”
Shoe
Laces
Rubber
Co.
Illustration 21-24Just-in-time processing
OBJECTIVE OF JIT PROCESSING
A primary objective of JIT is to eliminate all manufacturing inventories. Invento-ries have an adverse effect on net income because they tie up funds and storage space that could be put to more productive uses. JIT strives to eliminate invento-ries by using a “pull approach” in manufacturing. This approach begins with the customer placing an order with the company, which starts the process of pulling the product through the manufacturing process. A computer at the fi nal worksta-tion sends a signal to the preceding workstation. This signal indicates the exact materials (parts and subassemblies) needed to complete the production of a spec-ifi ed product for a specifi ed time period, such as an eight-hour shift. The next-preceding process, in turn, sends its signal to other processes back up the line. The goal is a smooth continuous fl ow in the manufacturing process, with no buildup of inventories at any point.
ELEMENTS OF JIT PROCESSING
There are three important elements in JIT processing:
1. Dependable suppliers. Suppliers must be willing to deliver on short notice exact quantities of raw materials according to precise quality specifi cations (even including multiple deliveries within the same day). Suppliers must also be willing to deliver the raw materials at specifi ed workstations rather than at a central receiving department. This type of purchasing requires constant and direct communication. Such communication is facilitated by an online com-puter linkage between the company and its suppliers.
2. A multiskilled work force. Under JIT, machines are often strategically grouped into work cells or workstations. Much of the work is automated. As a result, one worker may operate and maintain several different types of machines.
3. A total quality control system. The company must establish total quality control throughout the manufacturing operations. Total quality control means no defects. Since the pull approach signals only required quantities, any
Helpful HintBuyer leverage is important in fi nding dependable sup-pliers. Companies like GM and GE have more success than smaller companies.
Helpful HintWithout its emphasis on quality control, JIT would be impractical or even impossible. In JIT, quality is engineered into the production process.

934 21 Process Costing
defects at any workstation will shut down operations at subsequent worksta-tions. Total quality control requires continuous monitoring by both line employees and supervisors at each workstation.
BENEFITS OF JIT PROCESSING
The major benefi ts of implementing JIT processing are as follows.
1. Signifi cant reduction or elimination of manufacturing inventories.
2. Enhanced product quality.
3. Reduction or elimination of rework costs and inventory storage costs.
4. Production cost savings from the improved fl ow of goods through the processes.
The effects in many cases have been dramatic. For example, after using JIT for two years, a major division of Hewlett-Packard found that work in process inventories (in dollars) were down 82%, scrap/rework costs were down 30%, space utilization improved by 40%, and labor effi ciency improved 50%. As indi-cated, JIT not only reduces inventory but also enables a company to manufacture a better product faster and with less waste. One of the major accounting benefi ts of JIT is the elimination of separate raw materials and work in process inventory accounts. These accounts are replaced by one account, Raw and In-Process Inventory. All materials and con-version costs are charged to this account. The reduction (or elimination) of in-process inventories results in a simpler computation of equivalent units of production.
Activity-Based Costing
Activity-based costing (ABC) focuses on the activities required to produce a product or perform a service. An ABC system is similar to conventional costing systems in accounting for direct materials and direct labor, but it differs in regard to manufacturing overhead. A conventional cost system uses a single unit-level basis to allocate overhead costs to products. The basis may be direct labor or machine hours used to man-ufacture the product. The assumption in this approach is that as volume of units produced increases, so does the cost of overhead. However, in recent years the amount of direct labor used in many industries has greatly decreased, and total overhead costs resulting from depreciation on expensive equipment and machin-ery, utilities, repairs, and maintenance have signifi cantly increased. In ABC, the cost of a product is equal to the sum of the costs of all activities performed to manufacture it. ABC recognizes that to have accurate and meaning-ful cost data, more than one basis of allocating activity costs to products is needed. In selecting the allocation basis, ABC seeks to identify the cost drivers that measure the activities performed on the product. A cost driver may be any factor or activity that has a direct cause–effect relationship with the resources con-sumed. Examples of activities and possible cost drivers are as follows.
Activity Cost Driver
Ordering raw materials Ordering hours; number of orders Receiving raw materials Receiving hours; number of shipments Materials handling Number of requisitions; weight of materials; handling hours Production scheduling Number of orders Machine setups Setup hours; number of setups Machining (fabricating, assembling, etc.) Machine hours Quality control inspections Number of inspections Factory supervision Number of employees
Illustration 21-25Activities and cost drivers in ABC

Just-in-Time Processing and Activity-Based Costing 935
Two important assumptions must be met in order to obtain accurate product costs under ABC:
1. All overhead costs related to the activity must be driven by the cost driver used to assign costs to products.
2. All overhead costs related to the activity should respond proportionally to changes in the activity level of the cost driver.
For example, if there is little or no correlation between changes in the cost driver and consumption of the overhead cost, inaccurate product costs are inevitable. An example of the use of ABC is illustrated in the appendix at the end of this chapter. Activity-based costing may be used with either a job order or a process cost accounting system. The primary benefi t of ABC is more accurate and meaningful product costing. Also, improved cost data about an activity can lead to reduced costs for the activity. In sum, ABC makes managers realize that it is activities, and not products, that determine the profi tability of a company—a realization that should lead to better management decisions.
ABC Evaluated
Surveys of com-panies often show ABC usage of approximately 50%. Yet, in recent years, arti-cles about ABC have expressed
mixed opinions regarding its usefulness. To evaluate ABC practices and user satisfaction with ABC, a survey was con-ducted of 348 companies worldwide. Some of the interest-ing fi ndings included the following: ABC methods are widely used across the entire value chain, rather than being primarily used to allocate production-specifi c costs; only 25% of non-ABC companies think they are accurately
tracing the costs of activities, while 70% of ABC compa-nies think their company does this well; and respondents felt that ABC provides greater support for fi nancial, oper-ational, and strategic decisions. More than 87% of respon-dents said that their ideal costing system would include some form of ABC. Since this signifi cantly exceeds the 50% of the respondents actually using it, ABC usage may well increase in the future.
Source: William Stratton, Denis Desroches, Raef Lawson, and Toby Hatch, “Activity-Based Costing: Is It Still Relevant?” Management Accounting Quarterly (Spring, 2009), pp. 31–39.
What might explain why so many companies say that ideally they would use ABC, but they haven’t adopted it yet? (Go to WileyPLUS for this answer and additional questions.)
© CGinspiration/iStockphoto
Management Insight
Indicate whether each of the following statements is true or false.
1. Continuous process manufacturing often results in a reduction of inventory.
2. Companies that use just-in-time processing complete and store fi nished goods all the time to meet rush orders from customers.
3. A major benefi t of just-in-time processing is production cost savings from the improved fl ow of goods through the processes.
4. An ABC system is similar to traditional costing systems in accounting for manufactur-ing costs but differs in regard to period costs.
5. The primary benefi t of ABC is more accurate and meaningful costs.
6. In recent years, the amount of direct labor used in many industries has greatly increased and total overhead costs have signifi cantly decreased.
Solution
DO IT! 5 JIT and ABC
1. False. 2. False. 3. True. 4. False. 5. True. 6. False.
Related exercise material: BE21-10 and DO IT! 21-5.
Action Plan✔ JIT manufacturing is
dedicated to having the right amounts of materials, parts, or products just as they are needed.
✔ ABC focuses on the activities performed in producing a product. It recognizes that to have accurate and meaningful cost data, more than one basis of allocating costs to products is needed.

936 21 Process Costing
6 APPENDIX 21A: Apply activity-based costing to a manufacturer.
In this appendix, we present a simple case example that compares activity-based costing with traditional costing. It illustrates how ABC eliminates the distortion that can occur in traditional overhead cost allocation. As you study this example, you should understand that ABC does not replace an existing job order or process cost system. What ABC does is to segregate overhead into various cost pools in an effort to provide more accurate cost information. As a result, ABC supplements—rather than replaces—these cost systems. Assume that Atlas Company produces two abdominal fi tness products—the Ab Bench and the Ab Coaster. Each year, the company produces 25,000 Ab Benches but only 5,000 Ab Coasters. Each unit produced requires one hour of direct labor, for a total of 30,000 labor hours (25,000 1 5,000). The direct labor cost is $12 per unit for each product. The direct materials cost per unit is $40 for the Ab Bench and $30 for the Ab Coaster. Atlas also expects to incur annual manufacturing overhead costs of $900,000. Atlas allocates overhead using a single predetermined overhead rate based on the 30,000 direct labor hours it expects to use. Thus, the predetermined overhead rate is $30 per direct labor hour ($900,000 / 30,000 direct labor hours). Since both products require one direct labor hour per unit, both products are allocated overhead costs of $30 per unit under traditional costing. Illustration 21A-1 shows the total unit costs for the Ab Bench and the Ab Coaster.
LEARNING OBJECTIVE
*
With this information, we can now calculate unit costs under ABC for the Ab Bench and the Ab Coaster. Activity-based costing involves the following four steps.
1. Identify and classify the activities involved in the manufacture of specifi c products and assign overhead to cost pools.
2. Identify the cost driver that has a strong correlation to the costs accumu-lated in each cost pool.
3. Compute the activity-based overhead rate for each cost pool.
4. Allocate overhead costs to products using the overhead rates determined for each cost pool.
Identify and Classify Activities and Assign Overhead to Cost Pools (Step 1)
Activity-based costing starts with an analysis of the activities needed to manufac-ture a product or perform a service. This analysis should identify all resource-
consuming activities. It requires documenting every activity undertaken to accomplish a task. Atlas Company identifi es fi ve activity cost pools: manufacturing, setups, purchase ordering, product development, and property and plant.
Illustration 21A-1Total unit costs—traditional costing
1
2
3
4
5
6
7
AP18 fx
B C
Atlas Company.xlsAtlas Company.xlsFormulas Data Review ViewPage LayoutInsertHome
Manufacturing Costs
Direct materials
Direct labor
Total direct cost per unit
$40
12
$82
$30
12
ATLAS COMPANY
Ab Bench Ab Coaster
$72
Overhead 30 30

Appendix 21A: Applying Activity-Based Costing 937
Next, the company assigns overhead costs directly to the appropriate activity cost pool. For example, Atlas assigns all overhead costs directly associated with machine setups (such as salaries, supplies, and depreciation) to the setup cost pool. Illustration 21A-2 shows the fi ve cost pools, along with the estimated over-head assigned to each cost pool.
ATLAS COMPANY1
2
3
4
5
6
7
9
8
AP18 fx
B C
Atlas Company.xlsAtlas Company.xlsFormulas Data Review ViewPage LayoutInsertHome
Activity Cost Pools
Setups
Manufacturing
Purchase ordering
Property and plant
Total
Product development
Estimated Overhead
50,000
100,000
$500,000
200,000
$900,000
50,000
Illustration 21A-2Activity cost pools and estimated overhead
Identify Cost Drivers (Step 2)
After costs are assigned to the activity cost pools, the company must identify the cost drivers for each cost pool. The cost driver must accurately measure the actual consumption of the activity by the various products. To achieve accurate costing, a high degree of correlation must exist between the cost driver and the actual consumption of the overhead costs in the cost pool. Illustration 21A-3 shows the cost drivers that Atlas Company identifi es and their total expected use per activity cost pool.
Illustration 21A-3Cost drivers and their expected use
Expected Use of Cost DriversActivity Cost Pools Cost Drivers per Activity
Manufacturing Machine hours 50,000 machine hoursSetups Number of setups 2,000 setupsPurchase ordering Number of purchase orders 2,500 purchase ordersProduct development Products developed 2 products developedProperty and plant Square footage 25,000 square feet
Availability and ease of obtaining data relating to the cost driver is an important factor that must be considered in its selection.
Compute Activity-Based Overhead Rates (Step 3)
Next, the company computes an activity-based overhead rate per cost driver by dividing the estimated overhead per activity by the number of cost drivers expected to be used per activity. Illustration 21A-4 shows the formula for this computation.
Illustration 21A-4Formula for computing activity-based overhead rate
Estimated Overhead per Activity 5
Activity-Based Expected Use of Cost Drivers per Activity Overhead Rate
Atlas Company computes its activity-based overhead rates by using the esti-mated overhead per activity cost pool, shown in Illustration 21A-2, and the expected use of cost drivers per activity, shown in Illustration 21A-3. These com-putations are presented in Illustration 21A-5 (page 938).

938 21 Process Costing
Allocate Overhead Costs to Products (Step 4)
In allocating overhead costs, the company must know the expected use of cost drivers for each product. Because of its low volume and higher number of com-ponents, the Ab Coaster requires more setups and purchase orders than the Ab Bench. Illustration 21A-6 shows the expected use of cost drivers per product for each of Atlas Company’s products.
1
2
3
4
5
6
7
8
9
AP18 fx
C EB D F
Atlas Company.xlsAtlas Company.xlsFormulas Data Review ViewPage LayoutInsertHome
Activity Cost Pools � �EstimatedOverhead
Expected Use of CostDrivers per Activity
Activity-BasedOverhead Rates
ManufacturingSetupsPurchase orderingProduct developmentPlant and propertyTotal
$500,000100,00050,000
200,00050,000
50,000 machine hours2,000 setups
2,500 purchase orders2 products developed
25,000 square feet
$10 per machine hour$50 per setup$20 per order
$100,000 per product$2 per square foot
ATLAS COMPANY
$900,000
Illustration 21A-5Computation of activity-based overhead rates
Illustration 21A-6Expected use of cost drivers per product
Expected Use of Cost Expected Use of Cost Drivers per Product
Activity Cost Pools Cost Drivers Drivers per Activity Ab Bench Ab Coaster
Manufacturing Machine hours 50,000 machine hours 30,000 20,000Setups Number of setups 2,000 setups 500 1,500Purchase ordering Number of purchase orders 2,500 purchase orders 750 1,750Product development Products developed 2 products developed 1 1Property and plant Square feet 25,000 square feet 10,000 15,000
To allocate overhead costs to each product, Atlas multiplies the activity-based overhead rates per cost driver (Illustration 21A-5) by the number of cost drivers expected to be used per product (Illustration 21A-6). Illustration 21A-7 shows the overhead cost allocated to each product.
Illustration 21A-7Allocation of activity cost pools to products
1
2
3
4
5
6
7
8
9
10
11
12
AP18 fx
C E I KB D F HG J L
Atlas Company.xlsAtlas Company.xlsFormulas Data Review ViewPage LayoutInsertHome
Activity Cost Pools� � � �
Expected Useof Cost Drivers
per Product
Activity-BasedOverhead
RatesCost
Allocated
Expected Useof Cost Drivers
per Product
Activity-BasedOverhead
RatesCost
AllocatedManufacturingSetupsPurchase orderingProduct developmentProperty and plantTotal costs allocated (a)Units produced (b)Overhead cost per unit[(a)�(b)], rounded
30,000500750
110,000
$10$50$20
$100,000$2.00
$300,00025,00015,000
100,00020,000
$460,000
25,000
$18.40
20,0001,5001,750
115,000
$10$50$20
$100,000 100,00030,000$2.00
$200,00075,00035,000
$440,000
5,000
Ab BenchATLAS COMPANY
Ab Coaster
$88.00
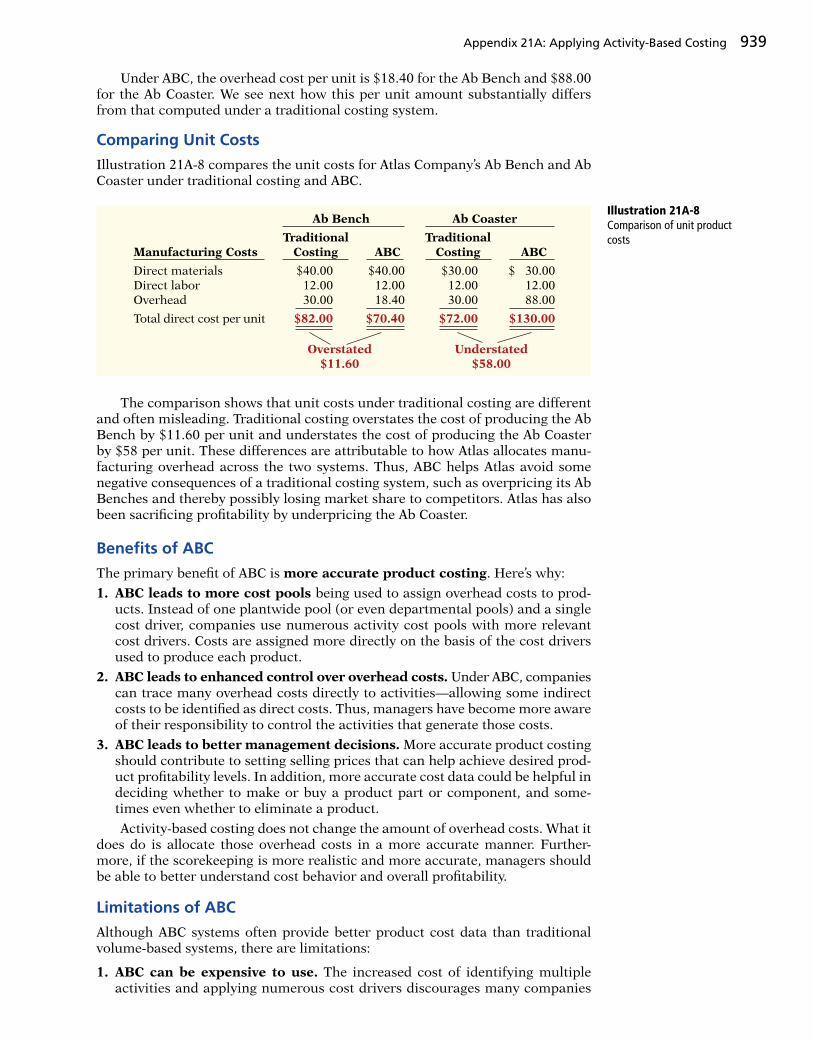
Appendix 21A: Applying Activity-Based Costing 939
Under ABC, the overhead cost per unit is $18.40 for the Ab Bench and $88.00 for the Ab Coaster. We see next how this per unit amount substantially differs from that computed under a traditional costing system.
Comparing Unit Costs
Illustration 21A-8 compares the unit costs for Atlas Company’s Ab Bench and Ab Coaster under traditional costing and ABC.
Illustration 21A-8Comparison of unit product costs
Ab Bench Ab Coaster
Traditional TraditionalManufacturing Costs Costing ABC Costing ABC
Direct materials $40.00 $40.00 $30.00 $ 30.00Direct labor 12.00 12.00 12.00 12.00Overhead 30.00 18.40 30.00 88.00
Total direct cost per unit $82.00 $70.40 $72.00 $130.00
Overstated Understated $11.60 $58.00
The comparison shows that unit costs under traditional costing are different and often misleading. Traditional costing overstates the cost of producing the Ab Bench by $11.60 per unit and understates the cost of producing the Ab Coaster by $58 per unit. These differences are attributable to how Atlas allocates manu-facturing overhead across the two systems. Thus, ABC helps Atlas avoid some negative consequences of a traditional costing system, such as overpricing its Ab Benches and thereby possibly losing market share to competitors. Atlas has also been sacrifi cing profi tability by underpricing the Ab Coaster.
Benefi ts of ABC
The primary benefi t of ABC is more accurate product costing. Here’s why:
1. ABC leads to more cost pools being used to assign overhead costs to prod-ucts. Instead of one plantwide pool (or even departmental pools) and a single cost driver, companies use numerous activity cost pools with more relevant cost drivers. Costs are assigned more directly on the basis of the cost drivers used to produce each product.
2. ABC leads to enhanced control over overhead costs. Under ABC, companies can trace many overhead costs directly to activities—allowing some indirect costs to be identifi ed as direct costs. Thus, managers have become more aware of their responsibility to control the activities that generate those costs.
3. ABC leads to better management decisions. More accurate product costing should contribute to setting selling prices that can help achieve desired prod-uct profi tability levels. In addition, more accurate cost data could be helpful in deciding whether to make or buy a product part or component, and some-times even whether to eliminate a product.
Activity-based costing does not change the amount of overhead costs. What it does do is allocate those overhead costs in a more accurate manner. Further-more, if the scorekeeping is more realistic and more accurate, managers should be able to better understand cost behavior and overall profi tability.
Limitations of ABC
Although ABC systems often provide better product cost data than traditional volume-based systems, there are limitations:
1. ABC can be expensive to use. The increased cost of identifying multiple activities and applying numerous cost drivers discourages many companies

940 21 Process Costing
from using ABC. Activity-based costing systems are more complex than tra-ditional costing systems—sometimes signifi cantly more complex. So companies must ask, is the cost of implementation greater than the benefi t of greater accuracy? Sometimes it may be. For some companies, there may be no need to consider ABC at all because their existing system is suffi cient. If the costs of ABC outweigh the benefi ts, then the company should not implement ABC.
2. Some arbitrary allocations continue. Even though more overhead costs can be assigned directly to products through ABC’s multiple activity cost pools, certain overhead costs remain to be allocated by means of some arbitrary volume-based cost driver such as labor or machine hours.
Discuss the uses of a process cost system and how it compares to a job order system. Companies that mass- produce similar products in a continuous fashion use pro-cess cost systems. Once production begins, it continues until the fi nished product emerges. Each unit of fi nished product is indistinguishable from every other unit.
Job order cost systems are similar to process cost sys-tems in three ways. (1) Both systems track the same cost elements—direct materials, direct labor, and manufac-turing overhead. (2) Both accumulate costs in the same accounts—Raw Materials Inventory, Factory Labor, and Manufacturing Overhead. (3) Both assign accumulated costs to the same accounts—Work in Process, Finished Goods Inventory, and Cost of Goods Sold. However, the method of assigning costs differs signifi cantly.
There are four main differences between the two cost systems. (1) A process cost system uses separate accounts for each department or manufacturing process, rather than only one work in process account used in a job order cost system. (2) A process cost system summarizes costs in a production cost report for each department. A job order cost system charges costs to individual jobs and summarizes them in a job cost sheet. (3) Costs are totaled at the end of a time period in a process cost system but at the completion of a job in a job order cost system. (4) A process cost system calculates unit cost as Total manufacturing costs for the period 4 Units pro-duced during the period. A job order cost system calcu-lates unit cost as Total cost per job 4 Units produced.
Explain the fl ow of costs in a process cost system and the journal entries to assign manufacturing costs. A process cost system assigns manufacturing costs for raw materials, labor, and overhead to work in process accounts for various departments or manufacturing processes. It transfers the costs of partially completed units from one department to another as those units move through the manufacturing process. The system transfers the costs of completed work to Finished Goods Inventory. Finally, when inventory is sold, the system transfers the costs to Cost of Goods Sold.
Entries to assign the costs of raw materials, labor, and overhead consist of a credit to Raw Materials Inventory,
1
2
Factory Labor, and Manufacturing Overhead, and a debit to Work in Process for each department. Entries to record the cost of goods transferred to another department are a credit to Work in Process for the department whose work is fi nished and a debit to the department to which the goods are transferred. The entry to record units com-pleted and transferred to the warehouse is a credit to Work in Process for the department whose work is fi n-ished and a debit to Finished Goods Inventory. The entry to record the sale of goods is a credit to Finished Goods Inventory and a debit to Cost of Goods Sold.
Compute equivalent units. Equivalent units of produc-tion measure work done during a period, expressed in fully completed units. Companies use this measure to determine the cost per unit of completed product. Equiv-alent units are the sum of units completed and trans-ferred out plus equivalent units of ending work in process.
Complete the four steps to prepare a production cost report. The four steps to complete a production cost report are as follows. (1) Compute the physical unit fl ow—that is, the total units to be accounted for. (2) Com-pute the equivalent units of production. (3) Compute the unit production costs, expressed in terms of equiv-alent units of production. (4) Prepare a cost recon-ciliation schedule, which shows that the total costs accounted for equal the total costs to be accounted for.
The production cost report contains both quantity and cost data for a production department. There are four sections in the report: (1) number of physical units, (2) equivalent units determination, (3) unit costs, and (4) cost reconciliation schedule.
Explain just-in-time (JIT) processing and activity- based costing (ABC). JIT is a manufacturing tech-nique dedicated to producing the right products at the right time as needed. One of the principal account-ing effects is that a Raw and In-Process Inventory account replaces both the raw materials and work in process inventory accounts. ABC is a method of prod-uct costing that focuses on the activities performed to produce products. It assigns the cost of the activities to products by using cost drivers that measure the
3
4
5
LEARNING OBJECTIVES REVIEW
1
REVIEW AND PRACTICE

Practice Multiple-Choice Questions 941
activities performed. The primary objective of ABC is accurate and meaningful product costs.
Apply activity-based costing to a manufacturer. In applying ABC, it is necessary to compute the over-
6*
head rate for each activity by dividing total expected overhead by the total expected usage of the cost driver. The overhead cost for each activity is then assigned to products on the basis of each product’s use of the cost driver.
Activity-based costing (ABC) A costing system that focuses on the activities required to produce a product or perform a service. (p. 934).
Conversion costs The sum of labor costs and overhead costs. (p. 925).
Cost driver Any factor or activity that has a direct cause-effect relationship with the resources consumed. (p. 934)
Cost reconciliation schedule A schedule that shows that the total costs accounted for equal the total costs to be accounted for. (p. 930).
Equivalent units of production A measure of the work done during the period, expressed in fully completed units. (p. 924).
Just-in-time (JIT) processing A processing system ded-icated to having the right amount of materials, parts, or products arrive as they are needed, thereby reducing the amount of inventory. (p. 932).
Operations costing A combination of a process cost and a job order cost system in which products are man-ufactured primarily by standardized methods, with some customization. (p. 931).
Physical units Actual units to be accounted for during a period, irrespective of any work performed. (p. 928).
Process cost system An accounting system used to apply costs to similar products that are mass-produced in a continuous fashion. (p. 918).
Production cost report An internal report for manage-ment that shows both production quantity and cost data for a production department. (p. 927).
Total units (costs) accounted for The sum of the units (costs) transferred out during the period plus the units (costs) in process at the end of the period. (p. 928).
Total units (costs) to be accounted for The sum of the units (costs) started (or transferred) into production during the period plus the units (costs) in process at the beginning of the period. (p. 928).
Unit production costs Costs expressed in terms of equiv-alent units of production. (p. 929).
Weighted-average method Method of computing equiv-alent units of production which considers the degree of completion (weighting) of the units completed and trans-ferred out and the ending work in process. (p. 925).
GLOSSARY REVIEW
1. Which of the following items is not characteristic of a process cost system?(a) Once production begins, it continues until the fi n-
ished product emerges.(b) The products produced are heterogeneous in
nature.(c) The focus is on continually producing homoge-
neous products.(d) When the fi nished product emerges, all units have
precisely the same amount of materials, labor, and overhead.
2. Indicate which of the following statements is not correct.(a) Both a job order and a process cost system track
the same three manufacturing cost elements—direct materials, direct labor, and manufacturing overhead.
(b) A job order cost system uses only one work in pro-cess account, whereas a process cost system uses multiple work in process accounts.
(c) Manufacturing costs are accumulated the same way in a job order and in a process cost system.
(d) Manufacturing costs are assigned the same way in a job order and in a process cost system.
(LO 1)
(LO 1)
3. In a process cost system, the fl ow of costs is:(a) work in process, cost of goods sold, fi nished goods.(b) fi nished goods, work in process, cost of goods sold.(c) fi nished goods, cost of goods sold, work in process.(d) work in process, fi nished goods, cost of goods sold.
4. In making journal entries to assign raw materials costs, a company using process costing:(a) debits Finished Goods Inventory.(b) often debits two or more work in process accounts.(c) generally credits two or more work in process
accounts.(d) credits Finished Goods Inventory.
5. In a process cost system, manufacturing overhead:(a) is assigned to fi nished goods at the end of each
accounting period.(b) is assigned to a work in process account for each
job as the job is completed.(c) is assigned to a work in process account for each
production department on the basis of a predeter-mined overhead rate.
(d) is assigned to a work in process account for each production department as overhead costs are incurred.
(LO 2)
(LO 2)
(LO 2)
PRACTICE MULTIPLE-CHOICE QUESTIONS

6. Conversion costs are the sum of:(a) fi xed and variable overhead costs.(b) labor costs and overhead costs.(c) direct material costs and overhead costs.(d) direct labor and indirect labor costs.
7. The Mixing Department’s output during the period consists of 20,000 units completed and transferred out, and 5,000 units in ending work in process 60% complete as to materials and conversion costs. Begin-ning inventory is 1,000 units, 40% complete as to materials and conversion costs. The equivalent units of production are:(a) 22,600. (c) 24,000.(b) 23,000. (d) 25,000.
8. In RYZ Company, there are zero units in beginning work in process, 7,000 units started into production, and 500 units in ending work in process 20% com-pleted. The physical units to be accounted for are:(a) 7,000. (c) 7,500.(b) 7,360. (d) 7,340.
9. Mora Company has 2,000 units in beginning work in process, 20% complete as to conversion costs, 23,000 units transferred out to fi nished goods, and 3,000 units in ending work in process 331
3 % complete as to conver-sion costs.
The beginning and ending inventory is fully com-plete as to materials costs. Equivalent units for ma-terials and conversion costs are, respectively:(a) 22,000, 24,000. (c) 26,000, 24,000.(b) 24,000, 26,000. (d) 26,000, 26,000.
10. Fortner Company has no beginning work in process; 9,000 units are transferred out and 3,000 units in end-ing work in process are one-third fi nished as to con-version costs and fully complete as to materials cost. If total materials cost is $60,000, the unit materials cost is:(a) $5.00.(b) $5.45 rounded.(c) $6.00.(d) No correct answer is given.
11. Largo Company has unit costs of $10 for materials and $30 for conversion costs. If there are 2,500 units in ending work in process, 40% complete as to con-version costs, and fully complete as to materials cost, the total cost assignable to the ending work in process inventory is:(a) $45,000. (c) $75,000.(b) $55,000. (d) $100,000.
12. A production cost report:(a) is an external report.(b) shows both the production quantity and cost data
related to a department.
(LO 3)
(LO 3)
(LO 4)
(LO 4)
(LO 4)
(LO 4)
(LO 4)
(c) shows equivalent units of production but not physical units.
(d) contains six sections. 13. In a production cost report, units to be accounted for
are calculated as:(a) Units started into production 1 Units in ending
work in process.(b) Units started into production 2 Units in begin-
ning work in process.(c) Units transferred out 1 Units in beginning work
in process.(d) Units started into production 1 Units in begin-
ning work in process.14. Under just-in-time processing:
(a) raw materials are received just in time for use in production.
(b) subassembly parts are completed just in time for use in assembling fi nished goods.
(c) fi nished goods are completed just in time to be sold.
(d) All of the above. 15. The primary objective of just-in-time processing is
to:(a) accumulate overhead in activity cost pools.(b) eliminate or reduce all manufacturing inventories.(c) identify relevant activity cost drivers.(d) identify value-added activities.
16. Activity-based costing:(a) assumes that the cost of a product is equal to the
sum of the costs of all activities performed to manufacture it.
(b) has become more widespread as overhead costs have been decreasing relative to materials and labor costs.
(c) is similar to a conventional cost accounting system in accounting for direct labor and manufacturing overhead but differs in regard to direct materials.
(d) uses a single unit-level basis to allocate overhead costs to products.
17. Activity-based costing (ABC):(a) can be used only in a process cost system.(b) focuses on units of production.(c) focuses on activities required to produce a product
or perform a service.(d) uses only a single basis of allocation.
*18. The overhead rate for Machine Setups is $100 per setup. Products A and B have 80 and 60 setups, respec-tively. The overhead assigned to each product is:(a) Product A $8,000, Product B $8,000.(b) Product A $8,000, Product B $6,000.(c) Product A $6,000, Product B $6,000.(d) Product A $6,000, Product B $8,000.
(LO 4)
(LO 5)
(LO 5)
(LO 5)
(LO 5)
(LO 6)
942 21 Process Costing
Solutions
1. (b) The products produced are homogeneous, not heterogeneous, in nature. Choices (a), (c), and (d) are incorrect because they all represent characteristics of a process cost system.
2. (d) Manufacturing costs are not assigned the same way in a job order and in a process cost system. Choices (a), (b), and (c) are true statements.
3. (d) In a process cost system, the fl ow of costs is work in process, fi nished goods, cost of goods sold. Therefore, choices (a), (b), and (c) are incorrect.

Practice Exercises 943
4. (b) The debit is often to two or more work in process accounts, not (a) a debit to Finished Goods Inventory, (c) credits to two or more work in process accounts, or (d) a credit to Finished Goods Inventory.
5. (c) In a process cost system, manufacturing overhead is assigned to a work in process account for each production department on the basis of a predetermined overhead rate, not (a) a fi nished goods account, (b) as the job is completed, or (d) as overhead costs are incurred.
6. (b) Conversion costs are the sum of labor costs and overhead costs, not (a) the sum of fi xed and variable overhead costs, (c) direct material costs and overhead costs, or (d) direct labor and indirect labor costs.
7. (b) The equivalent units of production is the sum of units completed and transferred out (20,000) and the equivalent units of ending work in process inventory (5,000 units 3 60%), or 20,000 1 3,000 5 23,000 units, not (a) 22,600 units, (c) 24,000 units, or (d) 25,000 units.
8. (a) There are 7,000 physical units to be accounted for (0 units in beginning inventory 1 7,000 units started), not (b) 7,360, (c) 7,500, or (d) 7,340.
9. (c) The equivalent units for materials are 26,000 (23,000 units transferred out plus 3,000 in ending work in process inventory). The equivalent units for conversion costs are 24,000 (23,000 transferred out plus 331y3% of the ending work in process inventory or 1,000). Therefore, choices (a) 22,000, 24,000; (b) 24,000, 26,000; and (d) 26,000, 26,000 are incorrect.
10. (a) $60,000 4 (9,000 1 3,000 units) 5 $5.00 per unit, not (b) $5.45 (rounded), (c) $6.00, or (d) no correct answer is given.
11. (b) [(2,500 units 3 100% complete) 3 $10] 1 [(2,500 units 3 40% complete) 3 $30] or $25,000 1 $30,000 5 $55,000, not (a) $45,000, (c) $75,000, or (d) $100,000.
12. (b) A production cost report shows costs charged to a department and costs accounted for. The other choices are incorrect because a production cost report (a) is an internal, not external, report; (c) does show physical units; and (d) is prepared in four steps and does not contain six sections.
13. (d) In a production cost report, units to be accounted for are calculated as Units started in production 1 Units in beginning work in process, not (a) Units in ending work in process, (b) minus Units in beginning work in process, or (c) Units transferred out.
14. (d) Under just-in-time processing, raw materials are received just in time for use in production, subassembly parts are com-pleted just in time for use in assembling fi nished goods, and fi nished goods are completed just in time to be sold.
15. (b) The primary objective of just-in-time processing is to eliminate or reduce all manufacturing inventories. Choices (a), (c), and (d) refer to activity-based costing.
16. (a) Activity-based costing assumes that the cost of a product is equal to the sum of all the costs of all activities performed to manufacture it. The other choices are incorrect.
17. (c) Activity-based costing focuses on activities required to produce a product or perform a service. The other choices are incorrect.
18. (b) Product A $8,000 ($100 3 80) and Product B $6,000 ($100 3 60), not (a) Product A $8,000, Product B $8,000; (c) Product A $6,000, Product B $6,000; or (d) Product A $6,000, Product B $8,000.
*
1. Armando Company manufactures pizza sauce through two production departments: Cooking and Canning. In each process, materials and conversion costs are incurred evenly throughout the process. For the month of April, the work in process accounts show the following debits.
Journalize transactions.
(LO 2)
PRACTICE EXERCISES
Cooking Canning
Beginning work in process $ –0– $ 4,000Materials 25,000 8,000Labor 8,500 7,500Overhead 29,000 25,800Costs transferred in 55,000
InstructionsJournalize the April transactions.

2. The Sanding Department of Jo Furniture Company has the following production and manufacturing cost data for March 2017, the fi rst month of operation.
Production: 11,000 units fi nished and transferred out; 4,000 units started that are 100% complete as to materials and 25% complete as to conversion costs.Manufacturing costs: Materials $48,000; labor $42,000; and overhead $36,000.
InstructionsPrepare a production cost report.
Prepare a production cost report.
(LO 3, 4)
944 21 Process Costing
Solution
1. (a) April 30 Work in Process—Cooking 25,000 Work in Process—Canning 8,000 Raw Materials Inventory 33,000
30 Work in Process—Cooking 8,500 Work in Process—Canning 7,500 Factory Labor 16,000
30 Work in Process—Cooking 29,000 Work in Process—Canning 25,800 Manufacturing Overhead 54,800
30 Work in Process—Canning 55,000 Work in Process—Cooking 55,000
Solution
JO FURNITURE COMPANYSanding Department
Production Cost ReportFor the Month Ended March 31, 2017
Equivalent Units
Physical ConversionQuantities Units Materials Costs
Units to be accounted for Work in process, March 1 0 Started into production 15,000
Total units 15,000
Units accounted for Transferred out 11,000 11,000 11,000 Work in process, March 31 4,000 4,000 1,000 (4,000 3 25%)
Total units 15,000 15,000 12,000
ConversionCosts Materials Costs Total
Unit costs Costs in March $48,000 $78,000* $126,000
Equivalent units 15,000 12,000
Unit costs [(a) 1 (b)] $3.20 $6.50 $9.70Costs to be accounted for Work in process, March 1 $ 0 Started into production 126,000
Total costs $126,000
Cost Reconciliation Schedule
Costs accounted for Transferred out (11,000 3 $9.70) $106,700 Work in process, March 31 Materials (4,000 3 $3.20) $12,800 Conversion costs (1,000 3 $6.50) 6,500 19,300
Total costs $126,000
*$42,000 1 $36,000
2.

Karlene Industries produces plastic ice cube trays in two processes: heating and stamping. All materials are added at the beginning of the Heating Department process. Karlene uses the weighted-average method to compute equivalent units.
On November 1, the Heating Department had in process 1,000 trays that were 70% complete. During November, it started into production 12,000 trays. On November 30, 2017, 2,000 trays that were 60% complete were in process.
The following cost information for the Heating Department was also available.
Work in process, November 1: Costs incurred in November: Materials $ 640 Material $3,000 Conversion costs 360 Labor 2,300 Cost of work in process, Nov. 1 $1,000 Overhead 4,050
Instructions(a) Prepare a production cost report for the Heating Department for the month of Novem-
ber 2017, using the weighted-average method.
(b) Journalize the transfer of costs to the Stamping Department.
Prepare a production cost report and journalize.
(LO 3, 4)
PRACTICE PROBLEM
Practice Problem 945
Solution
(a) KARLENE INDUSTRIES Heating Department Production Cost Report For the Month Ended November 30, 2017
Equivalent Units
Physical Conversion Units Materials Costs
Quantities Step 1 Step 2
Units to be accounted for Work in process, November 1 1,000 Started into production 12,000
Total units 13,000
Units accounted for Transferred out 11,000 11,000 11,000 Work in process, November 30 2,000 2,000 1,200
Total units 13,000 13,000 12,200
Costs ConversionUnit costs Step 3 Materials Costs Total
Total cost (a) $ 3,640* $ 6,710** $10,350
Equivalent units (b) 13,000 12,200
Unit costs [(a) 4 (b)] $0.28 $0.55 $0.83
Costs to be accounted for Work in process, November 1 $ 1,000 Started into production 9,350
Total costs $10,350
*$640 1 $3,000**$360 1 $2,300 1 $4,050
Cost Reconciliation Schedule Step 4
Costs accounted for Transferred out (11,000 3 $0.83) $ 9,130 Work in process, November 30 Materials (2,000 3 $0.28) $560 Conversion costs (1,200 3 $0.55) 660 1,220
Total costs $10,350
(b) Work in Process—Stamping 9,130 Work in Process—Heating 9,130 (To record transfer of units to the Stamping Department)

946 21 Process Costing
Brief Exercises, Exercises, DO IT! Exercises, and Problems and many additional resources are available for practice in WileyPLUS
QUESTIONS
1. Identify which costing system—job order or process cost—the following companies would primarily use: (a) Quaker Oats, (b) Jif Peanut Butter, (c) Gulf Craft(luxury yachts), and (d) Warner Bros. Motion Pictures.
2. Contrast the primary focus of job order cost account-ing and of process cost accounting.
3. What are the similarities between a job order and a process cost system?
4. Your roommate is confused about the features of process cost accounting. Identify and explain the dis-tinctive features for your roommate.
5. Sam Bowyer believes there are no signifi cant differ-ences in the fl ow of costs between job order cost accounting and process cost accounting. Is Bowyer correct? Explain.
6. (a) What source documents are used in assigning (1) materials and (2) labor to production in a process cost system?
(b) What criterion and basis are commonly used in allocating overhead to processes?
7. At Ely Company, overhead is assigned to production departments at the rate of $5 per machine hour. In July, machine hours were 3,000 in the Machining Department and 2,400 in the Assembly Department. Prepare the entry to assign overhead to production.
8. Mark Haley is uncertain about the steps used to pre-pare a production cost report. State the procedures that are required in the sequence in which they are performed.
9. John Harbeck is confused about computing physical units. Explain to John how physical units to be accounted for and physical units accounted for are determined.
10. What is meant by the term “equivalent units of production”?
11. How are equivalent units of production computed? 12. Coats Company had zero units of beginning work in
process. During the period, 9,000 units were com-pleted, and there were 600 units of ending work in process. What were the units started into production?
13. Sanchez Co. has zero units of beginning work in pro-cess. During the period, 12,000 units were completed, and there were 500 units of ending work in process one-fi fth complete as to conversion cost and 100% complete as to materials cost. What were the equivalent units of production for (a) materials and (b) conversion costs?
14. Hindi Co. started 3,000 units during the period. Its beginning inventory is 500 units one-fourth complete as to conversion costs and 100% complete as to materials costs. Its ending inventory is 300 units one-fi fth com-plete as to conversion costs and 100% complete as to materials costs. How many units were transferred out this period?
15. Clauss Company transfers out 14,000 units and has 2,000 units of ending work in process that are 25% complete. Materials are entered at the beginning of the process and there is no beginning work in pro-cess. Assuming unit materials costs of $3 and unit conversion costs of $5, what are the costs to be assigned to units (a) transferred out and (b) in ending work in process?
16. (a) Ann Quinn believes the production cost report is an external report for stockholders. Is Ann cor-rect? Explain.
(b) Identify the sections in a production cost report. 17. What purposes are served by a production cost report? 18. At Trent Company, there are 800 units of ending work
in process that are 100% complete as to materials and 40% complete as to conversion costs. If the unit cost of materials is $3 and the total costs assigned to the 800 units is $6,000, what is the per unit conversion cost?
19. What is the difference between operations costing and a process cost system?
20. How does a company decide whether to use a job order or a process cost system?
21. (a) Describe the philosophy and approach of just-in-time processing.
(b) Identify the major elements of JIT processing. 22. (a) What are the principal differences between
activity-based costing (ABC) and traditional product costing?
(b) What assumptions must be met for ABC to be useful?
23. Chopra Co. identifi es the following activities that per-tain to manufacturing overhead: Materials Handling, Machine Setups, Factory Machine Maintenance, Fac-tory Supervision, and Quality Control. For each activ-ity, identify an appropriate cost driver.
*24. (a) What steps are involved in developing an activity-based costing system?
(b) What are the benefi ts of ABC?
BRIEF EXERCISES
BE21-1 Warner Company purchases $50,000 of raw materials on account, and it incurs $60,000 of factory labor costs. Journalize the two transactions on March 31, assuming the labor costs are not paid until April.
BE21-2 Data for Warner Company are given in BE21-1. Supporting records show that (a) the Assembly Department used $24,000 of raw materials and $35,000 of the factory labor,
Journalize entries for accumulating costs.
(LO 2)
Journalize the assignment of materials and labor costs.
(LO 2)
NOTE: All asterisked Questions, Exercises, and Problems relate to material in the appendix to the chapter.

Brief Exercises 947
and (b) the Finishing Department used the remainder. Journalize the assignment of the costs to the processing departments on March 31.
BE21-3 Factory labor data for Warner Company are given in BE21-2. Manufacturing overhead is assigned to departments on the basis of 160% of labor costs. Journalize the assignment of overhead to the Assembly and Finishing Departments.
BE21-4 Goode Company has the following production data for selected months.
Ending Work in Process
Beginning Units % Complete as toMonth Work in Process Transferred Out Units Conversion Cost
January –0– 35,000 10,000 40%March –0– 40,000 8,000 75July –0– 45,000 16,000 25
Compute equivalent units of production for materials and conversion costs, assuming materials are entered at the beginning of the process.
BE21-5 The Smelting Department of Kiner Company has the following production data for November.
Beginning work in process 2,000 units that are 100% complete as to materials and 20% complete as to conversion costs; units transferred out 9,000 units; and ending work in process 7,000 units that are 100% complete as to materials and 40% complete as to conversion costs.
Compute the equivalent units of production for (a) materials and (b) conversion costs for the month of November.
BE21-6 In Mordica Company, total materials costs are $33,000, and total conversion costs are $54,000. Equivalent units of production are materials 10,000 and conversion costs 12,000. Compute the unit costs for materials, conversion costs, and total manufacturing costs.
BE21-7 Trek Company has the following production data for April: units transferred out 40,000, and ending work in process 5,000 units that are 100% complete for materials and 40% complete for conversion costs. If unit materials cost is $4 and unit conversion cost is $7, determine the costs to be assigned to the units transferred out and the units in ending work in process.
BE21-8 Production costs chargeable to the Finishing Department in June in Hollins Com-pany are materials $12,000, labor $29,500, and overhead $18,000. Equivalent units of production are materials 20,000 and conversion costs 19,000. Compute the unit costs for materials and conversion costs.
BE21-9 Data for Hollins Company are given in BE21-8. Production records indicate that 18,000 units were transferred out, and 2,000 units in ending work in process were 50% complete as to conversion costs and 100% complete as to materials. Prepare a cost recon-ciliation schedule.
BE21-10 Sam Snead has formulated the following list of statements about contemporary developments in managerial accounting.
1. Just-in-time processing results in a push approach; that is, raw materials are pushed through each process.
2. A primary objective of just-in-time processing is to eliminate all manufacturing inventories.3. A major disadvantage of just-in-time processing is lower product quality.4. A primary benefi t of activity-based costing is more accurate and meaningful product
costing.5. A major advantage of activity-based costing is that it uses a single unit-level basis, such
as direct labor or machine hours, to allocate overhead.
Journalize the assignment of overhead costs.
(LO 2)
Compute equivalent units of production.
(LO 3)
Compute equivalent units of production.
(LO 3)
Compute unit costs of production.
(LO 4)
Assign costs to units transferred out and in process.
(LO 4)
Compute unit costs.
(LO 4)
Prepare cost reconciliation schedule.
(LO 4)
JIT processing and ABC.
(LO 5)

948 21 Process Costing
Identify each statement as true or false. If false, indicate how to correct the statement to make it true.
*BE21-11 Mordica Company identifi es three activities in its manufacturing process: machine setups, machining, and inspections. Estimated annual overhead cost for each activity is $150,000, $325,000, and $87,500, respectively. The cost driver for each activity and the expected annual usage are number of setups 2,500, machine hours 25,000, and number of inspections 1,750. Compute the overhead rate for each activity.
Compute activity-based overhead rates.
(LO 6)
Indicate whether each of the following statements is true or false.
1. Many hospitals use job order costing for small, routine medical procedures.2. A manufacturer of computer fl ash drives would use a job order cost system.3. A process cost system uses multiple work in process accounts.4. A process cost system keeps track of costs on job cost sheets.
Kopa Company manufactures CH-21 through two processes: mixing and packaging. In July, the following costs were incurred.
Mixing Packaging
Raw materials used $10,000 $28,000Factory labor costs 8,000 36,000Manufacturing overhead costs 12,000 54,000
Units completed at a cost of $21,000 in the Mixing Department are transferred to the Pack-aging Department. Units completed at a cost of $106,000 in the Packaging Department are transferred to Finished Goods. Journalize the assignment of these costs to the two processes and the transfer of units as appropriate.
The Assembly Department for Right pens has the following production data for the current month.
Beginning Units Ending Work in Process Transferred Out Work in Process
–0– 20,000 10,000
Materials are entered at the beginning of the process. The ending work in process units are 70% complete as to conversion costs. Compute the equivalent units of production for (a) materials and (b) conversion costs.
In March, Kelly Company had the following unit production costs: materials $10 and conversion costs $8. On March 1, it had no work in process. During March, Kelly transferred out 22,000 units. As of March 31, 4,000 units that were 40% complete as to conversion costs and 100% complete as to materials were in ending work in process.
(a) Compute the total units to be accounted for.(b) Compute the equivalent units of production.(c) Prepare a cost reconciliation schedule, including the costs of materials transferred out
and the costs of materials in process.
Indicate whether each of the following statements is true or false.
1. Just-in-time processing is also known as just-in-case processing.2. Companies that use just-in-time processing complete fi nished goods just in time to be sold.3. A major benefi t of just-in-time processing is enhanced product quality.4. An ABC system is similar to conventional costing systems in accounting for period
costs but differs in regard to manufacturing costs.5. The primary benefi t of ABC is signifi cant reduction or elimination of manufacturing
inventories.6. In recent years, the amount of direct labor used in many industries has greatly decreased
and total overhead costs have signifi cantly increased.
Compare job order and process cost systems.
(LO 1)
Assign and journalize manufacturing costs.
(LO 2)
Compute equivalent units.
(LO 3)
Prepare cost reconciliation schedule.
(LO 4)
Answer questions about JIT and ABC.
(LO 5)
DO IT! Exercises
DO IT! 21-1
DO IT! 21-2
DO IT! 21-3
DO IT! 21-4
DO IT! 21-5

Exercises 949
EXERCISES
E21-1 Robert Wilkins has prepared the following list of statements about process cost accounting.
1. Process cost systems are used to apply costs to similar products that are mass-produced in a continuous fashion.
2. A process cost system is used when each fi nished unit is indistinguishable from another. 3. Companies that produce soft drinks, movies, and computer chips would all use
process cost accounting. 4. In a process cost system, costs are tracked by individual jobs. 5. Job order costing and process costing track different manufacturing cost elements. 6. Both job order costing and process costing account for direct materials, direct labor,
and manufacturing overhead. 7. Costs fl ow through the accounts in the same basic way for both job order costing and
process costing. 8. In a process cost system, only one work in process account is used. 9. In a process cost system, costs are summarized in a job cost sheet. 10. In a process cost system, the unit cost is total manufacturing costs for the period
divided by the equivalent units produced during the period.
InstructionsIdentify each statement as true or false. If false, indicate how to correct the statement.
E21-2 Harrelson Company manufactures pizza sauce through two production depart-ments: Cooking and Canning. In each process, materials and conversion costs are incurred evenly throughout the process. For the month of April, the work in process accounts show the following debits.
Understand process cost accounting.
(LO 1)
Journalize transactions.
(LO 2)
Cooking Canning
Beginning work in process $ –0– $ 4,000Materials 21,000 9,000Labor 8,500 7,000Overhead 31,500 25,800Costs transferred in 53,000
Work in Process—Painting
5/1 Balance 3,590 5/31 Transferred out ?5/31 Materials 5,1605/31 Labor 2,5305/31 Overhead 1,380
5/31 Balance ?
InstructionsJournalize the April transactions.
E21-3 The ledger of American Company has the following work in process account. Answer questions on costs and production.
(LO 2, 3, 4)
Production records show that there were 400 units in the beginning inventory, 30% com-plete, 1,600 units started, and 1,700 units transferred out. The beginning work in process had materials cost of $2,040 and conversion costs of $1,550. The units in ending inventory were 40% complete. Materials are entered at the beginning of the painting process.
Instructions(a) How many units are in process at May 31?(b) What is the unit materials cost for May?(c) What is the unit conversion cost for May?(d) What is the total cost of units transferred out in May?(e) What is the cost of the May 31 inventory?

950 21 Process Costing
E21-4 Schrager Company has two production departments: Cutting and Assembly. July 1 inventories are Raw Materials $4,200, Work in Process—Cutting $2,900, Work in Process— Assembly $10,600, and Finished Goods $31,000. During July, the following transactions occurred.
1. Purchased $62,500 of raw materials on account.2. Incurred $60,000 of factory labor. (Credit Wages Payable.)3. Incurred $70,000 of manufacturing overhead; $40,000 was paid and the remainder is
unpaid.4. Requisitioned materials for Cutting $15,700 and Assembly $8,900.5. Used factory labor for Cutting $33,000 and Assembly $27,000.6. Applied overhead at the rate of $18 per machine hour. Machine hours were Cutting
1,680 and Assembly 1,720.7. Transferred goods costing $67,600 from the Cutting Department to the Assembly
Department.8. Transferred goods costing $134,900 from Assembly to Finished Goods.9. Sold goods costing $150,000 for $200,000 on account.
InstructionsJournalize the transactions. (Omit explanations.)
E21-5 In Shady Company, materials are entered at the beginning of each process. Work in process inventories, with the percentage of work done on conversion costs, and produc-tion data for its Sterilizing Department in selected months during 2017 are as follows.
Journalize transactions for two processes.
(LO 2)
Compute physical units and equivalent units of production.
(LO 3, 4) Beginning Ending Work in Process Work in Process
Conversion Units ConversionMonth Units Cost% Transferred Out Units Cost%
January –0– — 11,000 2,000 60March –0– — 12,000 3,000 30May –0– — 14,000 7,000 80July –0– — 10,000 1,500 40
Production Costs
1. Transferred out 12,000 units. Beginning work in process $ –0–2. Started 3,000 units that are 60% Materials 45,000 complete as to conversion Labor 16,200 costs and 100% complete as Manufacturing overhead 18,300 to materials at July 31.
Instructions(a) Compute the physical units for January and May.(b) Compute the equivalent units of production for (1) materials and (2) conversion costs
for each month.
E21-6 The Cutting Department of Cassel Company has the following production and cost data for July.
Determine equivalent units, unit costs, and assignment of costs.
(LO 3, 4)
Materials are entered at the beginning of the process. Conversion costs are incurred uni-formly during the process.
Instructions(a) Determine the equivalent units of production for (1) materials and (2) conversion costs.(b) Compute unit costs and prepare a cost reconciliation schedule.
E21-7 The Sanding Department of Quik Furniture Company has the following production and manufacturing cost data for March 2017, the fi rst month of operation.
Production: 7,000 units fi nished and transferred out; 3,000 units started that are 100% complete as to materials and 20% complete as to conversion costs.
Manufacturing costs: Materials $33,000; labor $21,000; and overhead $36,000.
Prepare a production cost report.
(LO 3, 4)

Exercises 951
InstructionsPrepare a production cost report.
E21-8 The Blending Department of Luongo Company has the following cost and produc-tion data for the month of April.
Determine equivalent units, unit costs, and assignment of costs.
(LO 3, 4)Costs: Work in process, April 1 Direct materials: 100% complete $100,000 Conversion costs: 20% complete 70,000
Cost of work in process, April 1 $170,000
Costs incurred during production in April Direct materials $ 800,000 Conversion costs 365,000
Costs incurred in April $1,165,000
Units transferred out totaled 17,000. Ending work in process was 1,000 units that are 100% complete as to materials and 40% complete as to conversion costs.
Instructions(a) Compute the equivalent units of production for (1) materials and (2) conversion costs
for the month of April.(b) Compute the unit costs for the month.(c) Determine the costs to be assigned to the units transferred out and in ending work in
process.
E21-9 Baden Company has gathered the following information. Determine equivalent units, unit costs, and assignment of costs.
(LO 3, 4)Units in beginning work in process –0–Units started into production 36,000Units in ending work in process 6,000Percent complete in ending work in process: Conversion costs 40% Materials 100%Costs incurred: Direct materials $72,000 Direct labor $61,000 Overhead $101,000
Units in beginning work in process 20,000Units started into production 164,000Units in ending work in process 24,000Percent complete in ending work in process: Conversion costs 60% Materials 100%Costs incurred: Direct materials $101,200 Direct labor $164,800 Overhead $184,000
Instructions(a) Compute equivalent units of production for materials and for conversion costs.(b) Determine the unit costs of production.(c) Show the assignment of costs to units transferred out and in process.
E21-10 Overton Company has gathered the following information. Determine equivalent units, unit costs, and assignment of costs.
(LO 3, 4)
Instructions(a) Compute equivalent units of production for materials and for conversion costs.(b) Determine the unit costs of production.(c) Show the assignment of costs to units transferred out and in process.

952 21 Process Costing
E21-11 The Polishing Department of Major Company has the following production and manufacturing cost data for September. Materials are entered at the beginning of the process.
Production: Beginning inventory 1,600 units that are 100% complete as to materials and 30% complete as to conversion costs; units started during the period are 42,900; ending inventory of 5,000 units 10% complete as to conversion costs.
Manufacturing costs: Beginning inventory costs, comprised of $20,000 of materials and $43,180 of conversion costs; materials costs added in Polishing during the month, $175,800; labor and overhead applied in Polishing during the month, $125,680 and $257,140, respectively.
Instructions(a) Compute the equivalent units of production for materials and conversion costs for the
month of September.(b) Compute the unit costs for materials and conversion costs for the month.(c) Determine the costs to be assigned to the units transferred out and in process.
E21-12 David Skaros has recently been promoted to production manager. He has just started to receive various managerial reports, including the production cost report that you prepared. It showed that his department had 2,000 equivalent units in ending inven-tory. His department has had a history of not keeping enough inventory on hand to meet demand. He has come to you, very angry, and wants to know why you credited him with only 2,000 units when he knows he had at least twice that many on hand.
Instructions Explain to him why his production cost report showed only 2,000 equivalent units in
ending inventory. Write an informal memo. Be kind and explain very clearly why he is mistaken.
E21-13 The Welding Department of Healthy Company has the following production and man-ufacturing cost data for February 2017. All materials are added at the beginning of the process.
Compute equivalent units, unit costs, and costs assigned.
(LO 3, 4)
Explain the production cost report.
(LO 4)
Prepare a production cost report.
(LO 3, 4)
Containers in transit, April 1 0Containers loaded 1,200Containers in transit, April 30 350, 40% of direct materials and 20% of conversion costs
Manufacturing Costs Production Data
Beginning work in process Beginning work in process 15,000 units Materials $18,000 1/10 complete Conversion costs 14,175 $ 32,175 Units transferred out 55,000Materials 180,000 Units started 51,000Labor 67,380 Ending work in process 11,000 unitsOverhead 61,445 1/5 complete
InstructionsPrepare a production cost report for the Welding Department for the month of February.
E21-14 Remington Inc. is contemplating the use of process costing to track the costs of its operations. The operation consists of three segments (departments): Receiving, Ship-ping, and Delivery. Containers are received at Remington’s docks and sorted according to the ship they will be carried on. The containers are loaded onto a ship, which carries them to the appropriate port of destination. The containers are then off-loaded and delivered to the Receiving Department. Remington wants to begin using process costing in the Shipping Department. Direct materials represent the fuel costs to run the ship, and “Containers in transit” represents work in process. Listed below is information about the Shipping Department’s fi rst month’s activity.
Compute physical units and equivalent units of production.
(LO 3, 4)
Instructions(a) Determine the physical fl ow of containers for the month.(b) Calculate the equivalent units for direct materials and conversion costs.
E21-15 Santana Mortgage Company uses a process cost system to accumulate costs in its Application Department. When an application is completed, it is forwarded to the Loan Department for fi nal processing. The following processing and cost data pertain to September.
Determine equivalent units, unit costs, and assignment of costs.
(LO 3, 4)
SERVICE
SERVICE

Exercises 953
1. Applications in process on Beginning WIP: September 1: 100. Direct materials $ 1,0002. Applications started in Conversion costs 3,960 September: 1,000. September costs:3. Completed applications during Direct materials $ 4,500 September: 800. Direct labor 12,0004. Applications still in process at Overhead 9,520 September 30: 100%
complete as to materials (forms) and 60% complete as to conversion costs.
Materials are the forms used in the application process, and these costs are incurred at the beginning of the process. Conversion costs are incurred uniformly during the process.
Instructions(a) Determine the equivalent units of service (production) for materials and conversion costs.(b) Compute the unit costs and prepare a cost reconciliation schedule.
*E21-16 Major Instrument, Inc. manufactures two products: missile range instruments and space pressure gauges. During April, 50 range instruments and 300 pressure gauges were produced, and overhead costs of $94,500 were estimated. An analysis of estimated overhead costs reveals the following activities.
Activities Cost Drivers Total Cost
1. Materials handling Number of requisitions $40,0002. Machine setups Number of setups 27,5003. Quality inspections Number of inspections 27,000
$94,500
The cost driver volume for each product was as follows.
Cost Drivers Instruments Gauges Total
Number of requisitions 400 600 1,000Number of setups 200 300 500Number of inspections 200 400 600
Instructions(a) Determine the overhead rate for each activity.(b) Assign the manufacturing overhead costs for April to the two products using activity-
based costing.(c) Write a memorandum to the president of Major Instrument explaining the
benefi ts of activity-based costing.
*E21-17 Kowalski Company manufactures a number of specialized machine parts. Part Compo-24 uses $35 of direct materials and $15 of direct labor per unit. Kowalski’s esti-mated manufacturing overhead is as follows.
Materials handling $150,000Machining 180,000Factory supervision 138,000
Total $468,000
Overhead is applied based on direct labor costs, which were estimated at $200,000. Kowalski is considering adopting activity-based costing. The cost drivers are estimated at:
Activity Cost Driver Expected Use
Materials handling Weight of materials 50,000 poundsMachining Machine hours 20,000 hoursFactory supervision Direct labor hours 12,000 hours
Instructions(a) Compute the cost of 1,000 units of Compo-24 using the current traditional costing system.(b) Compute the cost of 1,000 units of Compo-24 using the proposed activity-based cost-
ing system. Assume the 1,000 units use 2,500 pounds of materials, 500 machine hours, and 1,000 direct labor hours.
Compute overhead rates and assign overhead using ABC.
(LO 6)
Compute product cost using traditional costing and ABC.
(LO 6)

954 21 Process Costing
EXERCISES: SET B AND CHALLENGE EXERCISES
Visit the book’s companion website, at www.wiley.com/college/weygandt, and choose the Student Companion site to access Exercises: Set B and Challenge Exercises.
PROBLEMS: SET A
P21-1A Fire Out Company manufactures its product, Vitadrink, through two manufac-turing processes: Mixing and Packaging. All materials are entered at the beginning of each process. On October 1, 2017, inventories consisted of Raw Materials $26,000, Work in Process—Mixing $0, Work in Process—Packaging $250,000, and Finished Goods $289,000. The beginning inventory for Packaging consisted of 10,000 units that were 50% complete as to conversion costs and fully complete as to materials. During October, 50,000 units were started into production in the Mixing Department and the following transactions were completed.
1. Purchased $300,000 of raw materials on account.2. Issued raw materials for production: Mixing $210,000 and Packaging $45,000.3. Incurred labor costs of $278,900.4. Used factory labor: Mixing $182,500 and Packaging $96,400.5. Incurred $810,000 of manufacturing overhead on account.6. Applied manufacturing overhead on the basis of $23 per machine hour. Machine hours
were 28,000 in Mixing and 6,000 in Packaging.7. Transferred 45,000 units from Mixing to Packaging at a cost of $979,000.8. Transferred 53,000 units from Packaging to Finished Goods at a cost of $1,315,000.9. Sold goods costing $1,604,000 for $2,500,000 on account.
InstructionsJournalize the October transactions.
P21-2A Rosenthal Company manufactures bowling balls through two processes: Molding and Packaging. In the Molding Department, the urethane, rubber, plastics, and other materials are molded into bowling balls. In the Packaging Department, the balls are placed in cartons and sent to the fi nished goods warehouse. All materials are entered at the begin-ning of each process. Labor and manufacturing overhead are incurred uniformly through-out each process. Production and cost data for the Molding Department during June 2017 are presented below.
Journalize transactions.
(LO 2)
Complete four steps necessary to prepare a production cost report.
(LO 3, 4)
Production Data June
Beginning work in process units –0–Units started into production 22,000Ending work in process units 2,000Percent complete—ending inventory 40%
Cost Data
Materials $198,000Labor 53,600Overhead 112,800
Total $364,400
Instructions(a) Prepare a schedule showing physical units of production.(b) Determine the equivalent units of production for materials and conversion costs.(c) Compute the unit costs of production.(d) Determine the costs to be assigned to the units transferred out and in process for June.(e) Prepare a production cost report for the Molding Department for the month of June.
P21-3A Thakin Industries Inc. manufactures dorm furniture in separate processes. In each process, materials are entered at the beginning, and conversion costs are incurred uniformly. Production and cost data for the fi rst process in making two products in two different manufacturing plants are as follows.
(c) Materials $9.00CC $8.00
(d) Transferred out $340,000WIP $ 24,400
Complete four steps necessary to prepare a production cost report.
(LO 3, 4)

Problems: Set A 955
Cutting Department
Plant 1 Plant 2Production Data—July T12-Tables C10-Chairs
Work in process units, July 1 –0– –0–Units started into production 20,000 18,000Work in process units, July 31 3,000 500Work in process percent complete 60 80
Cost Data—July
Work in process, July 1 $ –0– $ –0–Materials 380,000 288,000Labor 234,400 110,000Overhead 104,000 104,800
Total $718,400 $502,800
Instructions(a) For each plant: (1) Compute the physical units of production. (2) Compute equivalent units of production for materials and for conversion costs. (3) Determine the unit costs of production. (4) Show the assignment of costs to units transferred out and in process.(b) Prepare the production cost report for Plant 1 for July 2017.
P21-4A Rivera Company has several processing departments. Costs charged to the Assembly Department for November 2017 totaled $2,280,000 as follows.
(a) (3) T12: Materials $19CC $18
(4) T12: Transferred out $629,000WIP $ 89,400
Assign costs and prepare production cost report.
(LO 3, 4)Work in process, November 1 Materials $79,000 Conversion costs 48,150 $ 127,150
Materials added 1,589,000Labor 225,920Overhead 337,930
Production records show that 35,000 units were in beginning work in process 30% com-plete as to conversion costs, 660,000 units were started into production, and 25,000 units were in ending work in process 40% complete as to conversion costs. Materials are entered at the beginning of each process.
Instructions(a) Determine the equivalent units of production and the unit production costs for the
Assembly Department.(b) Determine the assignment of costs to goods transferred out and in process.(c) Prepare a production cost report for the Assembly Department.
P21-5A Polk Company manufactures basketballs. Materials are added at the beginning of the production process and conversion costs are incurred uniformly. Production and cost data for the month of July 2017 are as follows.
(b) Transferred out $2,211,000WIP $ 69,000
Determine equivalent units and unit costs and assign costs.
(LO 3, 4) Percentage Production Data—Basketballs Units Complete
Work in process units, July 1 500 60%Units started into production 1,000Work in process units, July 31 600 40%
Cost Data—Basketballs
Work in process, July 1 Materials $750 Conversion costs 600 $1,350Direct materials 2,400Direct labor 1,580Manufacturing overhead 1,240

956 21 Process Costing
Instructions(a) Calculate the following. (1) The equivalent units of production for materials and conversion costs. (2) The unit costs of production for materials and conversion costs. (3) The assignment of costs to units transferred out and in process at the end of the
accounting period.(b) Prepare a production cost report for the month of July for the basketballs.
P21-6A Hamilton Processing Company uses a weighted-average process cost system and manufactures a single product—an industrial carpet shampoo and cleaner used by many universities. The manufacturing activity for the month of October has just been com-pleted. A partially completed production cost report for the month of October for the Mixing and Cooking Department is shown below.
Compute equivalent units and complete production cost report.
(LO 3, 4)
HAMILTON PROCESSING COMPANYMixing and Cooking Department
Production Cost ReportFor the Month Ended October 31
Equivalent Units
Physical ConversionQuantities Units Materials Costs
Units to be accounted for Work in process, October 1 (all materials, 70% conversion costs) 20,000 Started into production 150,000
Total units 170,000
Units accounted for Transferred out 120,000 ? ? Work in process, October 31 (60% materials, 40% conversion costs) 50,000 ? ?
Total units accounted for 170,000 ? ?
Costs
Unit costs Conversion Materials Costs Total
Total cost $240,000 $105,000 $345,000
Equivalent units ? ?
Unit costs $ ? 1 $ ? 5 $ ?
Costs to be accounted for Work in process, October 1 $ 30,000 Started into production 315,000
Total costs $345,000
Cost Reconciliation Schedule
Costs accounted for Transferred out $ ? Work in process, October 31 Materials $ ? Conversion costs ? ?
Total costs $ ?
(a) (2) Materials $2.10 (3) Transferred out $4,590 WIP $1,980
(a) Materials $1.60(b) Transferred
out $282,000WIP $ 63,000
Instructions(a) Prepare a schedule that shows how the equivalent units were computed so that you
can complete the “Quantities: Units accounted for” equivalent units section shown in the production cost report, and compute October unit costs.
(b) Complete the “Cost Reconciliation Schedule” part of the production cost report.

Continuing Problems 957
*P21-7A Schultz Electronics manufactures two large-screen television models: the Royale which sells for $1,600, and a new model, the Majestic, which sells for $1,300. The production cost computed per unit under traditional costing for each model in 2017 was as follows.
Traditional Costing Royale Majestic
Direct materials $ 700 $420Direct labor ($20 per hour) 120 100Manufacturing overhead ($38 per DLH) 228 190
Total per unit cost $1,048 $710
In 2017, Schultz manufactured 25,000 units of the Royale and 10,000 units of the Majestic. The overhead rate of $38 per direct labor hour was determined by dividing total expected manufacturing overhead of $7,600,000 by the total direct labor hours (200,000) for the two models. Under traditional costing, the gross profi t on the models was Royale $552 or ($1,600 2 $1,048), and Majestic $590 or ($1,300 2 $710). Because of this difference, management is con-sidering phasing out the Royale model and increasing the production of the Majestic model. Before fi nalizing its decision, management asks Schultz’s controller to prepare an analysis using activity-based costing (ABC). The controller accumulates the following information about overhead for the year ended December 31, 2017.
Activity- Expected Based Estimated Use of Overhead Activities Cost Drivers Overhead Cost Drivers Rate
Purchasing Number of orders $1,200,000 40,000 $30/orderMachine setups Number of setups 900,000 18,000 $50/setupMachining Machine hours 4,800,000 120,000 $40/hourQuality control Number of inspections 700,000 28,000 $25/inspection
The cost drivers used for each product were:
Cost Drivers Royale Majestic Total
Purchase orders 17,000 23,000 40,000Machine setups 5,000 13,000 18,000Machine hours 75,000 45,000 120,000Inspections 11,000 17,000 28,000
Instructions(a) Assign the total 2017 manufacturing overhead costs to the two products using activity-
based costing (ABC) and determine the overhead cost per unit.(b) What was the cost per unit and gross profi t of each model using ABC?(c) Are management’s future plans for the two models sound? Explain.
Assign overhead to products using ABC and evaluate decision.
(LO 6)
PROBLEMS: SET B AND SET C
Visit the book’s companion website, at www.wiley.com/college/weygandt, and choose the Student Companion site to access Problems: Set B and Set C.
CONTINUING PROBLEMS
CURRENT DESIGNSCD21 At the beginning of April, Current Designs had 30 kayaks in process in the Fabrication Depart-ment. Rick Thrune, the production manager, estimated that about 80% of the materials costs had been added to these boats, which were about 50% complete with respect to the conversion costs. The cost of this inventory had been calculated to be $8,400 in materials and $9,000 in conversion costs. During April, 72 boats were started. At the end of the month, the 35 kayaks in the ending inven-tory had 20% of the materials and 40% of the conversion costs already added to them. A review of the accounting records for April showed that materials with a cost of $17,500 had been requisitioned by the Fabrication Department and that the conversion costs for the month were $39,600.
EXCEL TUTORIAL

PERSPECTIVEMANAGEMENT DECISION-MAKING
Decision-Making Across the OrganizationBYP21-1 Florida Beach Company manufactures sunscreen, called NoTan, in 11-ounce plastic bottles. NoTan is sold in a competitive market. As a result, management is very cost-conscious. NoTan is man-ufactured through two processes: mixing and fi lling. Materials are entered at the beginning of each process, and labor and manufacturing overhead occur uniformly throughout each process. Unit costs are based on the cost per gallon of NoTan using the weighted-average costing approach. On June 30, 2017, Mary Ritzman, the chief accountant for the past 20 years, opted to take early retirement. Her replacement, Joe Benili, had extensive accounting experience with motels in the area but only limited contact with manufacturing accounting. During July, Joe correctly accumulated the following production quantity and cost data for the Mixing Department.
Production quantities: Work in process, July 1, 8,000 gallons 75% complete; started into production 100,000 gallons; work in process, July 31, 5,000 gallons 20% complete. Materials are added at the beginning of the process.
Production costs: Beginning work in process $88,000, comprised of $21,000 of materials costs and $67,000 of conversion costs; incurred in July: materials $573,000, conversion costs $765,000.
Joe then prepared a production cost report on the basis of physical units started into production. His report showed a production cost of $14.26 per gallon of NoTan. The management of Florida Beach was surprised at the high unit cost. The president comes to you, as Mary’s top assistant, to review Joe’s report and prepare a correct report if necessary.
InstructionsWith the class divided into groups, answer the following questions.
(a) Show how Joe arrived at the unit cost of $14.26 per gallon of NoTan.(b) What error(s) did Joe make in preparing his production cost report?(c) Prepare a correct production cost report for July.
Managerial AnalysisBYP21-2 Harris Furniture Company manufactures living room furniture through two departments: Framing and Upholstering. Materials are entered at the beginning of each process. For May, the follow-ing cost data are obtained from the two work in process accounts.
Framing Upholstering
Work in process, May 1 $ –0– $ ?Materials 450,000 ?Conversion costs 261,000 330,000Costs transferred in –0– 600,000Costs transferred out 600,000 ?Work in process, May 31 111,000 ?
BROADENING YOUR
WATERWAYS(Note: This is a continuation of the Waterways problem from Chapters 19–20.)
InstructionsComplete a production cost report for April 2017 for the Fabrication Department using the weighted-average method.
WP21 Because most of the parts for its irrigation systems are standard, Waterways handles the majority of its manufacturing as a process cost system. There are multiple process departments. Three of these departments are the Molding, Cutting, and Welding Departments. All items eventually end up in the Packaging Department, which prepares items for sale in kits or individually. This problem asks you to help Waterways calculate equivalent units and prepare a production cost report.
Go to the book’s companion website, at www.wiley.com/college/weygandt, to see the completion of this problem.
958 21 Process Costing

InstructionsAnswer the following questions.
(a) If 3,000 sofas were started into production on May 1 and 2,500 sofas were transferred to Upholster-ing, what was the unit cost of materials for May in the Framing Department?
(b) Using the data in (a) above, what was the per unit conversion cost of the sofas transferred to Upholstering?
(c) Continuing the assumptions in (a) above, what is the percentage of completion of the units in process at May 31 in the Framing Department?
Real-World FocusBYP21-3 Paintball is now played around the world. The process of making paintballs is actually quite similar to the process used to make certain medical pills. In fact, paintballs were previously often made at the same factories that made pharmaceuticals.
Address: Go to www.youtube.com/watch?v52hKrv60PJKE#t5129 to access the video.
InstructionsView that video at the site listed above and then answer the following questions.
(a) Describe in sequence the primary steps used to manufacture paintballs.(b) Explain the costs incurred by the company that would fall into each of the following categories:
materials, labor, and overhead. Of these categories, which do you think would be the greatest cost in making paintballs?
(c) Discuss whether a paintball manufacturer would use job order costing or process costing.
CRITICAL THINKING
Ethics CaseBYP21-4 R. B. Dillman Company manufactures a high-tech component used in Bluetooth speakers that passes through two production processing departments, Molding and Assembly. Department managers are partially compensated on the basis of units of products completed and transferred out relative to units of product put into production. This was intended as encouragement to be effi cient and to minimize waste. Jan Wooten is the department head in the Molding Department, and Tony Ferneti is her quality control inspector. During the month of June, Jan had three new employees who were not yet technically skilled. As a result, many of the units produced in June had minor molding defects. In order to maintain the depart-ment’s normal high rate of completion, Jan told Tony to pass through inspection and on to the Assembly Department all units that had defects nondetectable to the human eye. “Company and industry tolerances on this product are too high anyway,” says Jan. “Less than 2% of the units we produce are subjected in the market to the stress tolerance we’ve designed into them. The odds of those 2% being any of this month’s units are even less. Anyway, we’re saving the company money.”
Instructions(a) Who are the potential stakeholders involved in this situation?(b) What alternatives does Tony have in this situation? What might the company do to prevent this
situation from occurring?
Considering People, Planet, and Profi tBYP21-5 In a recent year, an oil refi nery in Texas City, Texas, on the Houston Ship Channel exploded. The explosion killed 14 people and sent a plume of smoke hundreds of feet into the air. The blast started as a fi re in the section of the plant that increased the octane of the gasoline that was produced at the refi nery. The Houston Ship Channel is the main waterway that allows commerce to fl ow from the Gulf of Mexico into Houston. The Texas Commission on Environmental Quality expressed concern about the release of nitrogen oxides, benzene, and other known carcinogens as a result of the blast. Neighbors of the plant com-plained that the plant had been emitting carcinogens for years and that the regulators had ignored their complaints about emissions and unsafe working conditions.
InstructionsAnswer the following questions.
(a) Outline the costs that the company now faces as a result of the accident.(b) How could the company have reduced the costs associated with the accident?
Broadening Your Perspective 959
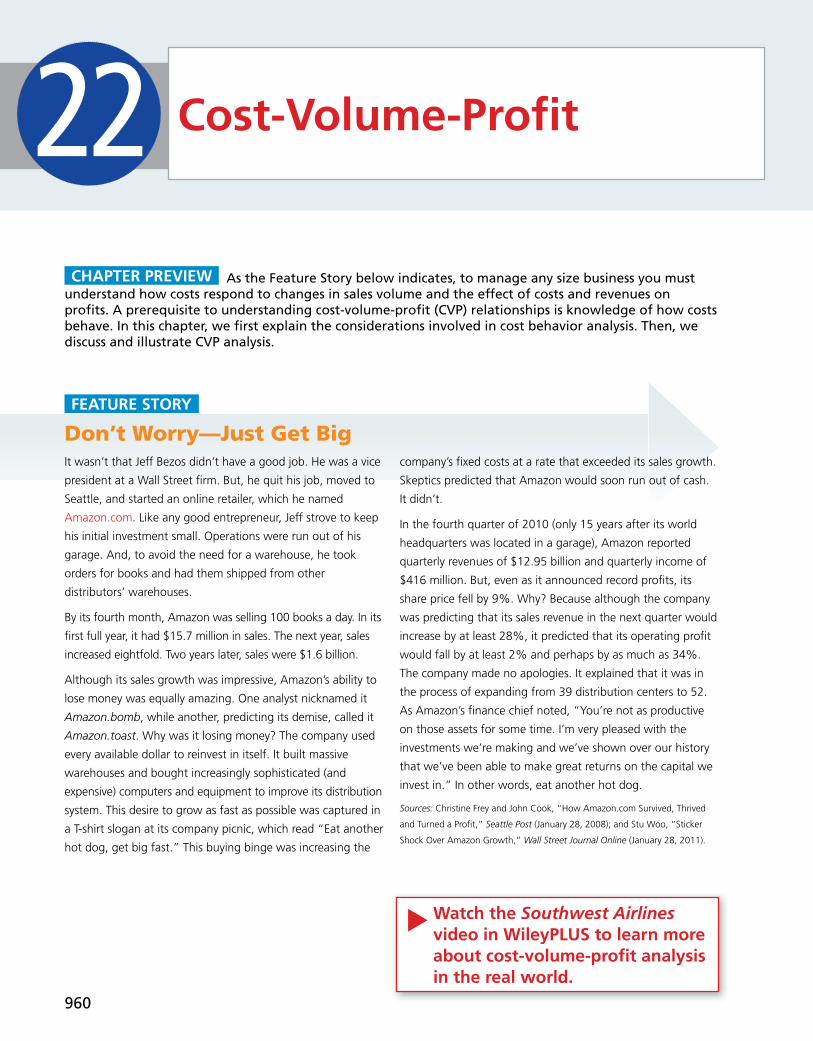
It wasn’t that Jeff Bezos didn’t have a good job. He was a vice
president at a Wall Street fi rm. But, he quit his job, moved to
Seattle, and started an online retailer, which he named
Amazon.com. Like any good entrepreneur, Jeff strove to keep
his initial investment small. Operations were run out of his
garage. And, to avoid the need for a warehouse, he took
orders for books and had them shipped from other
distributors’ warehouses.
By its fourth month, Amazon was selling 100 books a day. In its
fi rst full year, it had $15.7 million in sales. The next year, sales
increased eightfold. Two years later, sales were $1.6 billion.
Although its sales growth was impressive, Amazon’s ability to
lose money was equally amazing. One analyst nicknamed it
Amazon.bomb, while another, predicting its demise, called it
Amazon.toast. Why was it losing money? The company used
every available dollar to reinvest in itself. It built massive
warehouses and bought increasingly sophisticated (and
expensive) computers and equipment to improve its distribution
system. This desire to grow as fast as possible was captured in
a T-shirt slogan at its company picnic, which read “Eat another
hot dog, get big fast.” This buying binge was increasing the
company’s fi xed costs at a rate that exceeded its sales growth.
Skeptics predicted that Amazon would soon run out of cash.
It didn’t.
In the fourth quarter of 2010 (only 15 years after its world
headquarters was located in a garage), Amazon reported
quarterly revenues of $12.95 billion and quarterly income of
$416 million. But, even as it announced record profi ts, its
share price fell by 9%. Why? Because although the company
was predicting that its sales revenue in the next quarter would
increase by at least 28%, it predicted that its operating profi t
would fall by at least 2% and perhaps by as much as 34%.
The company made no apologies. It explained that it was in
the process of expanding from 39 distribution centers to 52.
As Amazon’s fi nance chief noted, “You’re not as productive
on those assets for some time. I’m very pleased with the
investments we’re making and we’ve shown over our history
that we’ve been able to make great returns on the capital we
invest in.” In other words, eat another hot dog.
Sources: Christine Frey and John Cook, “How Amazon.com Survived, Thrived
and Turned a Profi t,” Seattle Post (January 28, 2008); and Stu Woo, “Sticker
Shock Over Amazon Growth,” Wall Street Journal Online (January 28, 2011).
Don’t Worry—Just Get Big
As the Feature Story below indicates, to manage any size business you must understand how costs respond to changes in sales volume and the effect of costs and revenues on profi ts. A prerequisite to understanding cost-volume-profi t (CVP) relationships is knowledge of how costs behave. In this chapter, we fi rst explain the considerations involved in cost behavior analysis. Then, we discuss and illustrate CVP analysis.
CHAPTER PREVIEW
22
FEATURE STORY
Cost-Volume-Profi t
960
Watch the Southwest Airlines video in WileyPLUS to learn more about cost-volume-profi t analysis in the real world.
▲

Go to the REVIEW AND PRACTICE section at the end of the chapter for a review of key concepts and practice applications with solutions.
Visit WileyPLUS with ORION for additional tutorials and practice opportunities.
Eric Gerrard/iStockphoto
CHAPTER OUTLINE
Prepare a CVP income statement to determine contribution margin.
3
Explain variable, fi xed, and mixed costs and the relevant range.1 Types of CostsDO IT! 1
• Variable costs• Fixed costs• Relevant range• Mixed costs
High-Low Method
Learning Objectives
CVP Income StatementDO IT! 3• Basic components• CVP income statement
Apply the high-low method to determine the components of mixed costs.
2 DO IT! 2• High-low method• Identify variable and fi xed costs
Determine the sales required to earn target net income and determine margin of safety.
Use CVP analysis to respond to changes in the business environment.
5
6
Break-Even, Margin of Safety, and Target Net Income
CVP Analysis
DO IT! 5
DO IT! 6
• Target net income• Margin of safety
• Offering a discount• Investing in new equipment• Determining required sales• CVP income statement revisited
Compute the break-even point using three approaches.4 Break-Even AnalysisDO IT! 4
• Mathematical equation• Contribution margin technique• Graphic presentation

962 22 Cost-Volume-Profi t
1 Explain variable, fi xed, and mixed costs and the relevant range.LEARNING OBJECTIVE
Cost behavior analysis is the study of how specifi c costs respond to changes in the level of business activity. As you might expect, some costs change, and others remain the same. For example, for an airline company such as Southwest or United, the longer the fl ight, the higher the fuel costs. On the other hand, Massa-chusetts General Hospital’s costs to staff the emergency room on any given night are relatively constant regardless of the number of patients treated. A knowledge of cost behavior helps management plan operations and decide between alterna-tive courses of action. Cost behavior analysis applies to all types of entities. The starting point in cost behavior analysis is measuring the key business activities. Activity levels may be expressed in terms of sales dollars (in a retail com-pany), miles driven (in a trucking company), room occupancy (in a hotel), or dance classes taught (by a dance studio). Many companies use more than one measure-ment base. A manufacturer, for example, may use direct labor hours or units of output for manufacturing costs, and sales revenue or units sold for selling expenses. For an activity level to be useful in cost behavior analysis, changes in the level or volume of activity should be correlated with changes in costs. The activity level selected is referred to as the activity (or volume) index. The activity index iden-tifi es the activity that causes changes in the behavior of costs. With an appropri-ate activity index, companies can classify the behavior of costs in response to changes in activity levels into three categories: variable, fi xed, or mixed.
Variable Costs
Variable costs are costs that vary in total directly and proportionately with changes in the activity level. If the level increases 10%, total variable costs will increase 10%. If the level of activity decreases by 25%, variable costs will decrease 25%. Examples of variable costs include direct materials and direct labor for a manufacturer; cost of goods sold, sales commissions, and freight-out for a mer-chandiser; and gasoline in airline and trucking companies. A variable cost may also be defi ned as a cost that remains the same per unit at every level of activity. To illustrate the behavior of a variable cost, assume that Damon Company manufactures tablet computers that contain $10 cameras. The activity index is the number of tablet computers produced. As Damon manufactures each tablet, the total cost of cameras used increases by $10. As part (a) of Illustration 22-1
0 2 4 6 8 100
20
40
60
80
$100
0 2 4 6 8 100
5
10
15
20
$25
Tablet Computers Produced (in 000)Tablet Computers Produced (in 000)
Cos
t (0
00)
Cos
t (p
er u
nit)
(b)
(Cameras)
(a)
(Cameras)Total Variable Costs Variable Costs per Unit
Illustration 22-1Behavior of total and unit variable costs
Helpful HintVariable costs per unit remain constant at all levels of activity.
SERVICE

Cost Behavior Analysis 963
shows, total cost of the cameras will be $20,000 if Damon produces 2,000 tablets, and $100,000 when it produces 10,000 tablets. We also can see that a variable cost remains the same per unit as the level of activity changes. As part (b) of Illustration 22-1 shows, the unit cost of $10 for the cameras is the same whether Damon produces 2,000 or 10,000 tablets. Companies that rely heavily on labor to manufacture a product, such as Nike or Reebok, or to perform a service, such as Hilton or Marriott, are likely to have many variable costs. In contrast, companies that use a high proportion of machin-ery and equipment in producing revenue, such as AT&T or Duke Energy Co., may have few variable costs.
Fixed Costs
Fixed costs are costs that remain the same in total regardless of changes in the activity level. Examples include property taxes, insurance, rent, supervisory salaries, and depreciation on buildings and equipment. Because total fi xed costs remain constant as activity changes, it follows that fi xed costs per unit vary inversely with activity: As volume increases, unit cost declines, and vice versa. To illustrate the behavior of fi xed costs, assume that Damon Company leases its productive facilities at a cost of $10,000 per month. Total fi xed costs of the facilities will remain constant at every level of activity, as part (a) of Illustration 22-2 shows. But, on a per unit basis, the cost of rent will decline as activity increases, as part (b) of Illustration 22-2 shows. At 2,000 units, the unit cost per tablet computer is $5 ($10,000 4 2,000). When Damon produces 10,000 tablets, the unit cost of the rent is only $1 per tablet ($10,000 4 10,000).
The trend for many manufacturers is to have more fi xed costs and fewer vari-able costs. This trend is the result of increased use of automation and less use of employee labor. As a result, depreciation and lease charges (fi xed costs) increase, whereas direct labor costs (variable costs) decrease.
Illustration 22-2Behavior of total and unit fi xed costs
0 2 4 6 8 100
5
10
15
20
$25
0 2 4 6 8 100
1
2
3
4
$5
Tablet Computers Produced (in 000)Tablet Computers Produced (in 000)
Cos
t (0
00)
Cos
t (p
er u
nit)
(b)
(Rent Expense)
(a)
(Rent Expense)Total Fixed Costs Fixed Costs per Unit

964 22 Cost-Volume-Profi t
Relevant Range
In Illustration 22-1 part (a) (page 962), a straight line is drawn throughout the entire range of the activity index for total variable costs. In essence, the assump-tion is that the costs are linear. If a relationship is linear (that is, straight-line), then changes in the activity index will result in a direct, proportional change in the variable cost. For example, if the activity level doubles, the cost doubles. It is now necessary to ask: Is the straight-line relationship realistic? In most business situations, a straight-line relationship does not exist for variable costs throughout the entire range of possible activity. At abnormally low levels of activity, it may be impossible to be cost-effi cient. Small-scale operations may not allow the company to obtain quantity discounts for raw materials or to use specialized labor. In contrast, at abnormally high levels of activity, labor costs may increase sharply because of overtime pay. Also, at high activity levels, materials costs may jump signifi cantly because of excess spoilage caused by worker fatigue. As a result, in the real world, the relationship between the behavior of a variable cost and changes in the activity level is often curvilinear, as shown in part (a) of Illustration 22-3. In the curved sections of the line, a change in the activity index will not result in a direct, proportional change in the variable cost. That is, a doubling of the activity index will not result in an exact doubling of the variable cost. The variable cost may more than double, or it may be less than double. Total fi xed costs also do not have a straight-line relationship over the entire range of activity. Some fi xed costs will not change. But it is possible for manage-ment to change other fi xed costs. For example, in some instances, salaried employees (fi xed) are replaced with freelance workers (variable). Illustration 22-3, part (b), shows an example of the behavior of total fi xed costs through all poten-tial levels of activity. For most companies, operating at almost zero or at 100% capacity is the exception rather than the rule. Instead, companies often operate over a somewhat
Helpful HintFixed costs that may be changeable include research, such as new product development, and management training programs.
Gardens in the Sky
Because of population increases, the United Nations’ Food and Agri-culture Organization estimates that food production will need to increase by 70% by 2050. Also, by 2050, roughly 70% of people will live in cities, which means more food needs to be hauled further to get it
to the consumer. To address the lack of farmable land and reduce the cost of transporting produce, some companies, such as New York-based BrightFarms, are building urban greenhouses.
This sounds great, but do the numbers work? Some variable costs would be reduced. For example, the use of pesticides, herbicides, fuel costs for shipping, and water would all drop. Soil erosion would be a non-issue since
plants would be grown hydroponically (in a solution of water and minerals), and land requirements would be reduced because of vertical structures. But, other costs would be higher. First, there is the cost of the building. Also, any multistory building would require artifi cial light-ing for plants on lower fl oors.
Until these cost challenges can be overcome, it appears that these urban greenhouses may not break even. On the other hand, rooftop greenhouses on existing city struc-tures already appear fi nancially viable. For example, a 15,000 square-foot rooftop greenhouse in Brooklyn already produces roughly 30 tons of vegetables per year for local residents.
Sources: “Vertical Farming: Does It Really Stack Up?” The Economist (December 9, 2010); and Jane Black, “BrightFarms Idea: Green-houses That Cut Short the Path from Plant to Grocery Shelf,” The Washington Post (May 7, 2013).
What are some of the variable and fi xed costs that are impacted by hydroponic farming? (Go to WileyPLUS for this answer and additional questions.)
People, Planet, and Profi t Insight BrightFarms
© Jani Bryson/iStockphoto

Cost Behavior Analysis 965
narrower range, such as 40–80% of capacity. The range over which a company expects to operate during a year is called the relevant range of the activity index. Within the relevant range, as both diagrams in Illustration 22-4 show, a straight-line relationship generally exists for both variable and fi xed costs.
As you can see, although the linear (straight-line) relationship may not be completely realistic, the linear assumption produces useful data for CVP analysis as long as the level of activity remains within the relevant range.
Mixed Costs
Mixed costs are costs that contain both a variable- and a fi xed-cost element. Mixed costs, therefore, change in total but not proportionately with changes in the activity level. The rental of a U-Haul truck is a good example of a mixed cost. Assume that local rental terms for a 17-foot truck, including insurance, are $50 per day plus 50 cents per mile. When determining the cost of a one-day rental, the per day charge is a fi xed cost (with respect to miles driven), whereas the mileage charge is a variable cost. The graphic presentation of the rental cost for a one-day rental is shown in Illustration 22-5 (page 966).
Illustration 22-3Nonlinear behavior of variable and fi xed costs
0 20 40 60 80 100
Cos
t ($
)
Cos
t ($
)
0 20 40 60 80 100Activity Level (%)Activity Level (%)
(b)
Nonlinear
(a)
CurvilinearTotal Variable Costs Total Fixed Costs
Alternative TerminologyThe relevant range is also called the normal or practical range.
Illustration 22-4Linear behavior within relevant range
0 20 40 60 80 100 0 20 40 60 80 100Activity Level (%)Activity Level (%)
(b)Total Fixed Costs
(a)Total Variable Costs
RelevantRange
RelevantRange
Cos
t ($
)
Cos
t ($
)
SERVICE

966 22 Cost-Volume-Profi t
0 50 100 150 200 250
$200
Miles300
Fixed-Cost Element
Variable-CostElement
Total-Cost Line
150
100
50
0C
ost
⎫⎪⎪⎪⎪⎪⎪⎪⎬⎪⎪⎪⎪⎪⎪⎪⎭⎫⎪⎬⎪⎭
Illustration 22-5Behavior of a mixed cost
Helena Company reports the following total costs at two levels of production.
10,000 Units 20,000 Units
Direct materials $20,000 $40,000Maintenance 8,000 10,000Direct labor 17,000 34,000Indirect materials 1,000 2,000Depreciation 4,000 4,000Utilities 3,000 5,000Rent 6,000 6,000
Classify each cost as variable, fi xed, or mixed.
DO IT! 1 Types of Costs
Related exercise material: BE22-1, BE22-2, BE22-3, E22-1, E22-3, and DO IT! 22-1.
Action Plan✔ Recall that a variable
cost varies in total directly and propor-tionately with each change in activity level.
✔ Recall that a fi xed cost remains the same in total with each change in activity level.
✔ Recall that a mixed cost changes in total but not proportionately with each change in activity level.
Direct materials, direct labor, and indirect materials are variable costs.Depreciation and rent are fi xed costs.Maintenance and utilities are mixed costs.
Solution
In this case, the fi xed-cost element is the cost of having the service available. The variable-cost element is the cost of actually using the service. Utility costs such as for electricity are another example of a mixed cost. Each month the electric bill includes a fl at service fee plus a usage charge.
2 Apply the high-low method to determine the components of mixed costs.
LEARNING OBJECTIVE
For purposes of cost-volume-profi t analysis, mixed costs must be classifi ed into their fi xed and variable elements. How does management make the classifi cation? One possibility is to determine the variable and fi xed compo-nents each time a mixed cost is incurred. But because of time and cost con-straints, this approach is rarely followed. Instead, the usual approach is to

Mixed Costs Analysis 967
collect data on the behavior of the mixed costs at various levels of activity. Analysts then identify the fi xed- and variable-cost components. Companies use various types of analysis. One type of analysis, called the high-low method, is discussed next.
High-Low Method
The high-low method uses the total costs incurred at the high and low levels of activity to classify mixed costs into fi xed and variable components. The difference in costs between the high and low levels represents variable costs, since only the variable-cost element can change as activity levels change. The steps in computing fi xed and variable costs under this method are as follows.
1. Determine variable cost per unit from the following formula.
To illustrate, assume that Metro Transit Company has the following mainte-nance costs and mileage data for its fl eet of buses over a 6-month period.
Illustration 22-6Formula for variable cost per unit using high-low method
Change in High minus Low Variable Cost Total Costs 4 Activity Level 5 per Unit
Miles Total Miles Total Month Driven Cost Month Driven Cost
January 20,000 $30,000 April 50,000 $63,000February 40,000 48,000 May 30,000 42,000March 35,000 49,000 June 43,000 61,000
Illustration 22-7Assumed maintenance costs and mileage data
Formulas Data Review ViewPage LayoutInsert
1
2
3
4
5
6
7
8
9
10
AP18 fx
CB D
Total costLess:
Total fixed costs
METRO TRANSIT
Variable costs50,000 � $1.1020,000 � $1.10
$63,000
55,000
$ 8,000
$30,000
22,000$ 8,000
Activity LevelHigh Low
Home
Metro Transit.xls Illustration 22-8High-low method computation of fi xed costs
The high and low levels of activity are 50,000 miles in April and 20,000 miles in January. The maintenance costs at these two levels are $63,000 and $30,000, respectively. The difference in maintenance costs is $33,000 ($63,000 2 $30,000), and the difference in miles is 30,000 (50,000 2 20,000). Therefore, for Metro Transit, variable cost per unit is $1.10, computed as follows.
$33,000 4 30,000 5 $1.10
2. Determine the fi xed costs by subtracting the total variable costs at either the high or the low activity level from the total cost at that activity level.
For Metro Transit, the computations are shown in Illustration 22-8.
SERVICE

968 22 Cost-Volume-Profi t
Maintenance costs are therefore $8,000 per month of fi xed costs plus $1.10 per mile of variable costs. This is represented by the following formula:
Maintenance costs 5 $8,000 1 ($1.10 3 Miles driven)
For example, at 45,000 miles, estimated maintenance costs would be $8,000 fi xed and $49,500 variable ($1.10 3 45,000) for a total of $57,500. The graph in Illustration 22-9 plots the 6-month data for Metro Transit Company. The red line drawn in the graph connects the high and low data points, and therefore represents the equation that we just solved using the high-low method. The red, “high-low” line intersects the y-axis at $8,000 (the fi xed-cost level), and it rises by $1.10 per unit (the variable cost per unit). Note that a completely different line would result if we chose any two of the other data points. That is, by choosing any two other data points, we would end up with a different estimate of fi xed costs and a different variable cost per unit. Thus, from this scatter plot, we can see that while the high-low method is simple, the result is rather arbitrary. A better approach, which uses information from all the data points to estimate fi xed and variable costs, is called regression analysis. A discussion of regression analysis is provided in a supplement on the book’s companion website.
Illustration 22-9Scatter plot for Metro Transit Company
20,000
30,000
40,000
50,000
60,000
$70,000
10,000
0 20,000 40,000 60,000Miles Driven
Cos
t
Skilled Labor Is Truly Essential
The recent recession had devastating implications for employment. But one surprise was that for some manufacturers, the num-ber of jobs lost was actu-
ally lower than in previous recessions. One of the main explanations for this was that in the years preceding the recession, many companies, such as Tempur Sealy Interna-tional, adopted lean manufacturing practices. This meant that production relied less on large numbers of low-skilled workers and more on machines and a few highly skilled workers. As a result of this approach, a single employee
supports far more dollars in sales. Thus, it requires a larger decline in sales before an employee would need to be laid-off in order for the company to continue to break even. Also, because the employees are highly skilled, employers are reluctant to lose them. Instead of lay-offs, many manu-facturers now resort to cutting employees’ hours when necessary.
Source: Timothy Aeppel and Justin Lahart, “Lean Factories Find It Hard to Cut Jobs Even in a Slump,” Wall Street Journal Online (March 9, 2009).
Would you characterize labor costs as being a fi xed cost, a variable cost, or something else in this situation? (Go to WileyPLUS for this answer and additional questions.)
Bloomberg/Getty Images
Management Insight Tempur Sealy International

Mixed Costs Analysis 969
Importance of Identifying Variable and Fixed Costs
Why is it important to segregate mixed costs into variable and fi xed elements? The answer may become apparent if we look at the following four business decisions.
1. If American Airlines is to make a profi t when it reduces all domestic fares by 30%, what reduction in costs or increase in passengers will be required? Answer: To make a profi t when it cuts domestic fares by 30%, American Air-lines will have to increase the number of passengers or cut its variable costs for those fl ights. Its fi xed costs will not change.
2. If Ford Motor Company meets workers’ demands for higher wages, what increase in sales revenue will be needed to maintain current profit levels? Answer: Higher wages at Ford Motor Company will increase the variable costs of manufacturing automobiles. To maintain present profit levels, Ford will have to cut other variable costs or increase the price of its auto-mobiles.
3. If United States Steel Corp.’s program to modernize plant facilities through signifi cant equipment purchases reduces the work force by 50%, what will be the effect on the cost of producing one ton of steel?
Answer: The modernizing of plant facilities at United States Steel Corp. changes the proportion of fi xed and variable costs of producing one ton of steel. Fixed costs increase because of higher depreciation charges, whereas variable costs decrease due to the reduction in the number of steelworkers.
4. What happens if Kellogg’s increases its advertising expenses but cannot increase prices because of competitive pressure?
Answer: Sales volume must be increased to cover the increase in fi xed adver-tising costs.
Byrnes Company accumulates the following data concerning a mixed cost, using units produced as the activity level.
Units Produced Total Cost
March 9,800 $14,740 April 8,500 13,250 May 7,000 11,100 June 7,600 12,000 July 8,100 12,460
(a) Compute the variable-cost and fi xed-cost elements using the high-low method.
(b) Estimate the total cost if the company produces 8,000 units.
DO IT! 2 High-Low Method
(a) Variable cost: ($14,740 2 $11,100) 4 (9,800 2 7,000) 5 $1.30 per unit Fixed cost: $14,740 2 $12,740* 5 $2,000 or $11,100 2 $9,100** 5 $2,000 *$1.30 3 9,800 units **$1.30 3 7,000 units
(b) Total cost to produce 8,000 units: $2,000 1 $10,400 ($1.30 3 8,000 units) 5 $12,400
Related exercise material: BE22-4, E22-2, and DO IT! 22-2.
Action Plan✔ Determine the highest
and lowest levels of activity.
✔ Compute variable cost per unit as Change in total costs 4 (High 2 low activity level) 5 Variable cost per unit.
✔ Compute fi xed cost as Total cost 2 (Variable cost per unit 3 Units produced) 5 Fixed cost.
Solution

970 22 Cost-Volume-Profi t
The following assumptions underlie each CVP analysis.
1. The behavior of both costs and revenues is linear throughout the relevant range of the activity index.
2. Costs can be classifi ed accurately as either variable or fi xed.
3. Changes in activity are the only factors that affect costs.
4. All units produced are sold.
5. When more than one type of product is sold, the sales mix will remain con-stant. That is, the percentage that each product represents of total sales will stay the same. Sales mix complicates CVP analysis because different products will have different cost relationships. In this chapter, we assume a single product.
When these assumptions are not valid, the CVP analysis may be inaccurate.
CVP Income Statement
Because CVP is so important for decision-making, management often wants this information reported in a cost-volume-profi t (CVP) income statement format for internal use. The CVP income statement classifi es costs as variable or fi xed and computes a contribution margin. Contribution margin (CM) is the amount of revenue remaining after deducting variable costs. It is often stated both as a total amount and on a per unit basis. We will use Vargo Video Company to illustrate a CVP income statement. Vargo Video produces a high-defi nition digital camcorder with 153 optical zoom and a wide-screen, high-resolution LCD monitor. Relevant data for the camcorders sold by this company in June 2017 are as follows.
3 Prepare a CVP income statement to determine contribution margin.LEARNING OBJECTIVE
Cost-volume-profi t (CVP) analysis is the study of the effects of changes in costs and volume on a company’s profi ts. CVP analysis is important in profi t planning. It also is a critical factor in such management decisions as setting selling prices, determining product mix, and maximizing use of production facilities.
Basic Components
CVP analysis considers the interrelationships among the components shown in Illustration 22-10.
SALES
Volume or level
of activity
Variable costs
per unit
Total fixed
costs
Sales mixUnit selling
prices
Units
Cos
t (p
er u
nit) Raw materials,
variable labor,etc.
$
$$
Units
Cos
t
Utilities, taxes,depreciation,
etc.
Illustration 22-10Components of CVP analysis
Unit selling price of camcorder $500Unit variable costs $300Total monthly fi xed costs $200,000Units sold 1,600
Illustration 22-11Assumed selling and cost data for Vargo Video
The CVP income statement for Vargo therefore would be reported as follows.

CVP Analysis 971
Illustration 22-12CVP income statement, with net income
VARGO VIDEO COMPANYCVP Income Statement
For the Month Ended June 30, 2017
Total
Sales (1,600 camcorders) $ 800,000Variable costs 480,000
Contribution margin 320,000Fixed costs 200,000
Net income $120,000
Illustration 22-14CVP income statement, with zero net income
VARGO VIDEO COMPANYCVP Income Statement
For the Month Ended June 30, 2017
Total Per Unit
Sales (1,000 camcorders) $ 500,000 $ 500Variable costs 300,000 300
Contribution margin 200,000 $200Fixed costs 200,000
Net income $ –0–
Illustration 22-13Formula for unit contribution margin
Unit Selling Unit Variable Unit Contribution Price 2 Costs 5 Margin
$500 2 $300 5 $200
Unit contribution margin indicates that for every camcorder sold, the selling price exceeds the variable costs by $200. Vargo generates $200 per unit sold to cover fi xed costs and contribute to net income. Because Vargo has fi xed costs of $200,000, it must sell 1,000 camcorders ($200,000 4 $200) to cover its fi xed costs. At the point where total contribution margin exactly equals fi xed costs, Vargo will report net income of zero. At this point, referred to as the break-even point, total costs (variable plus fi xed) exactly equal total revenue. Illustration 22-14 shows Vargo’s CVP income statement at the point where net income equals zero. It shows a contribution margin of $200,000, and a unit contribution margin of $200 ($500 2 $300).
A traditional income statement and a CVP income statement both report the same net income of $120,000. However, a traditional income statement does not classify costs as variable or fi xed, and therefore it does not report a contribution margin. In addition, sometimes per unit amounts and percentage of sales amounts are shown in separate columns on a CVP income statement to facilitate CVP analysis. Homework assignments specify which columns to present. In the applications of CVP analysis that follow, we assume that the term “cost” includes all costs and expenses related to production and sale of the product. That is, cost includes manufacturing costs plus selling and administrative expenses.
UNIT CONTRIBUTION MARGIN
The formula for unit contribution margin and the computation for Vargo Video are as follows.

972 22 Cost-Volume-Profi t
It follows that for every camcorder sold above the break-even point of 1,000 units, net income increases by the amount of the unit contribution margin, $200. For example, assume that Vargo sold one more camcorder, for a total of 1,001 camcorders sold. In this case, Vargo reports net income of $200, as shown in Illustration 22-15.
CONTRIBUTION MARGIN RATIO
Some managers prefer to use a contribution margin ratio in CVP analysis. The contribution margin ratio is the contribution margin expressed as a percentage of sales, as shown in Illustration 22-16.
Alternatively, the contribution margin ratio can be determined by dividing the unit contribution margin by the unit selling price. For Vargo Video, the ratio is as follows.
The contribution margin ratio of 40% means that Vargo generates 40 cents of contribution margin with each dollar of sales. That is, $0.40 of each sales dollar (40% 3 $1) is available to apply to fi xed costs and to contribute to net income. This expression of contribution margin is very helpful in determining the effect of changes in sales on net income. For example, if Vargo’s sales increase $100,000, net income will increase $40,000 (40% 3 $100,000). Thus, by using the contribution margin ratio, managers can quickly determine increases in net income from any change in sales.
Illustration 22-15CVP income statement, with net income and per unit data
VARGO VIDEO COMPANYCVP Income Statement
For the Month Ended June 30, 2017
Total Per Unit
Sales (1,001 camcorders) $500,500 $500Variable costs 300,300 300
Contribution margin 200,200 $200Fixed costs 200,000
Net income $ 200
Illustration 22-16CVP income statement, with net income and percent of sales data
VARGO VIDEO COMPANYCVP Income Statement
For the Month Ended June 30, 2017
Total Percent of Sales
Sales (1,001 camcorders) $500,500 100%Variable costs 300,300 60
Contribution margin 200,200 40%Fixed costs 200,000
Net income $ 200
Illustration 22-17Formula for contribution margin ratio
Unit Contribution Unit Selling Contribution Margin Margin 4 Price 5 Ratio
$200 4 $500 5 40%

CVP Analysis 973
We can also see this effect through a CVP income statement. Assume that Vargo’s current sales are $500,000 and it wants to know the effect of a $100,000 (200-unit) increase in sales. Vargo prepares a comparative CVP income statement analysis as follows. Illustration 22-18
Comparative CVP income statements
VARGO VIDEO COMPANYCVP Income Statements
For the Month Ended June 30, 2017
No Change With Change
Percent of Percent of Total Per Unit Sales Total Per Unit Sales
Sales $500,000 $500 100% $600,000 $ 500 100%Variable costs 300,000 300 60 360,000 300 60
Contribution margin 200,000 $200 40% 240,000 $200 40%Fixed costs 200,000 200,000
Net income $ –0– $ 40,000
The $40,000 increase in net income can be calculated on either a unit contri-bution margin basis (200 units 3 $200 per unit) or using the contribution margin ratio times the increase in sales dollars (40% 3 $100,000). Note that the unit contribution margin and contribution margin as a percentage of sales remain unchanged by the increase in sales. Study these CVP income statements carefully. The concepts presented in these statements are used extensively in this and later chapters.
Ampco Industries produces and sells a cell phone-operated thermostat. Information regarding the costs and sales of thermostats during September 2017 are provided below.
Unit selling price of thermostat $85Unit variable costs $32Total monthly fi xed costs $190,000Units sold 4,000
Prepare a CVP income statement for Ampco Industries for the month of September. Provide per unit values and total values.
Solution
DO IT! 3 CVP Income Statement
AMPCO INDUSTRIESCVP Income Statement
For the Month Ended September 30, 2017
Total Per Unit
Sales $340,000 $85Variable costs 128,000 32
Contribution margin 212,000 $53Fixed costs 190,000
Net income $ 22,000
Action Plan✔ Provide a heading
with the name of the company, name of statement, and period covered.
✔ Subtract variable costs from sales to determine contribution margin. Subtract fi xed costs from contribution margin to determine net income.
✔ Express sales, variable costs and contribution margin on a per unit basis.Related exercise material: BE22-5, E22-4, and DO IT! 22-3.

974 22 Cost-Volume-Profi t
As shown in Illustration 22-14 (page 971), net income equals zero when the con-tribution margin (sales minus variable costs) is equal to fi xed costs. To refl ect this, Illustration 22-20 rewrites the equation with contribution margin (sales minus variable costs) on the left side, and fi xed costs and net income on the right. We can compute the break-even point in units by using unit selling prices and unit variable costs. The computation for Vargo Video is as follows.
4 Compute the break-even point using three approaches.
A key relationship in CVP analysis is the level of activity at which total revenues equal total costs (both fi xed and variable)—the break-even point. At this volume of sales, the company will realize no income but will suffer no loss. The process of fi nding the break-even point is called break-even analysis. Knowledge of the break-even point is useful to management when it considers decisions such as whether to introduce new product lines, change sales prices on established products, or enter new market areas. The break-even point can be:
1. Computed from a mathematical equation.
2. Computed by using contribution margin.
3. Derived from a cost-volume-profi t (CVP) graph.
The break-even point can be expressed either in sales units or sales dollars.
Mathematical Equation
The fi rst line of Illustration 22-19 shows a common equation used for CVP analysis. When net income is set to zero, this equation can be used to calculate the break-even point.
Illustration 22-20Computation of break-even point in units
Required Variable Fixed Net Sales
2 Costs
2 Costs
5 Income
$500Q 2 $300Q 2 $200,000 5 $0
$500Q 2 $300Q 5 $200,000 1 $0
$200Q 5 $200,000
Q 5 $200,000
5 Fixed Costs
$200 Unit Contribution Margin
Q 5 1,000 units
where
Q 5 sales volume in units $500 5 selling price $300 5 variable costs per unit $200,000 5 total fi xed costs
Thus, Vargo must sell 1,000 units to break even. To fi nd the amount of sales dollars required to break even, we multiply the units sold at the break-even point times the selling price per unit, as shown below.
1,000 3 $500 5 $500,000 (break-even sales dollars)
LEARNING OBJECTIVE
Illustration 22-19Basic CVP equation Required Variable Fixed Net
Sales 2
Costs 2
Costs 5
Income
$500Q 2 $300Q 2 $200,000 5 $0
Break-Even Analysis 975
Contribution Margin Technique
Many managers employ the contribution margin to compute the break-even point.
CONTRIBUTION MARGIN IN UNITS
The fi nal step in Illustration 22-20 divides fi xed costs by the unit contribution margin (highlighted in red). Thus, rather than walk through all of the steps of the equation approach, we can simply employ this formula shown in Illustration 22-21.
Illustration 22-22Formula for break-even point in dollars using contribution margin ratio
Fixed Contribution Break-Even Costs 4 Margin Ratio 5 Point in Dollars
$200,000 4 40% 5 $500,000
Why does this formula work? The unit contribution margin is the net amount by which each sale exceeds the variable costs per unit. Every sale generates this much money to pay off fi xed costs. Consequently, if we divide fi xed costs by the unit contribution margin, we know how many units we need to sell to break even.
CONTRIBUTION MARGIN RATIO
When a company has numerous products, it is not practical to determine the unit contribution margin for each product. In this case, using the contribution mar-gin ratio is very useful for determining the break-even point in total dollars (rather than units). Recall that the contribution margin ratio is the percentage of each dollar of sales that is available to cover fi xed costs and generate net income. Therefore, to determine the sales dollars needed to cover fi xed costs, we divide fi xed costs by the contribution margin ratio, as shown in Illustration 22-22.
To apply this formula to Vargo Video, consider that its 40% contribution margin ratio means that for every dollar sold, it generates 40 cents of contribution margin. The question is, how many dollars of sales does Vargo need in order to generate total contribution margin of $200,000 to pay off fi xed costs? We divide the fi xed costs of $200,000 by the 40 cents of contribution margin generated by each dollar of sales to arrive at $500,000 ($200,000 4 40%). To prove this result, if we generate 40 cents of contribution margin for each dollar of sales, then the total contribution margin generated by $500,000 in sales is $200,000 ($500,000 3 40%).
Illustration 22-21Formula for break-even point in units using unit contribution margin
Fixed Unit Contribution Break-Even Costs 4 Margin 5 Point in Units
$200,000 4 $200 5 1,000 units
Charter Flights Offer a Good Deal
The Internet is wringing ineffi ciencies out of nearly every industry. While commercial air-craft spend roughly 4,000 hours a year in the air, chartered aircraft are fl own only 500 hours annually. That means that they are sitting on the ground—not making any money—about 90%
of the time. One company, Flightserve, saw a business oppor-tunity in that fact. For about the same cost as a fi rst-class ticket, Flightserve matches up executives with charter fl ights in small “private jets.” The executive gets a more comfort-able ride and avoids the hassle of big airports. Flightserve noted that the average charter jet has eight seats. When all eight seats are full, the company has an 80% profi t margin. It breaks even at an average of 3.3 full seats per fl ight.
Source: “Jet Set Go,” The Economist (March 18, 2000), p. 68.
How did Flightserve determine that it would break even with 3.3 seats full per fl ight? (Go to WileyPLUS for this answer and additional questions.)
Service Company Insight Flightserve
Digital Vision/Getty Images

976 22 Cost-Volume-Profi t
Graphic Presentation
An effective way to fi nd the break-even point is to prepare a break-even graph. Because this graph also shows costs, volume, and profi ts, it is referred to as a cost-volume-profi t (CVP) graph. As the CVP graph in Illustration 22-23 shows, sales volume is recorded along the horizontal axis. This axis should extend to the maximum level of expected sales. Both total revenues (sales) and total costs (fi xed plus variable) are recorded on the vertical axis.
200 600 1,000 1,400 1,600
$900
Units of Sales1,800
Fixed Costs
Variable Costs
Sales Line
700
600
400
Dol
lars
(in
tho
usan
ds)
⎫⎪⎪⎪⎪⎪⎪⎪⎬⎪⎪⎪⎪⎪⎪⎪⎭
⎫⎪⎪⎬⎪⎪⎭
Total-Cost Line
Fixed-Cost Line
LossArea
ProfitArea
800
500
300
100
200
Break-even pointin dollars
Break-even pointin units
400 800 1,200
Illustration 22-23CVP graph
The construction of the graph, using the data for Vargo Video, is as follows.
1. Plot the sales line, starting at the zero activity level. For every camcorder sold, total revenue increases by $500. For example, at 200 units, sales are $100,000. At the upper level of activity (1,800 units), sales are $900,000. The revenue line is assumed to be linear through the full range of activity.
2. Plot the total fi xed costs using a horizontal line. For the camcorders, this line is plotted at $200,000. The fi xed costs are the same at every level of activity.
3. Plot the total-cost line. This starts at the fi xed-cost line at zero activity. It increases by the variable costs at each level of activity. For each camcorder, variable costs are $300. Thus, at 200 units, total variable costs are $60,000 ($300 3 200) and the total cost is $260,000 ($60,000 1 $200,000). At 1,800 units, total variable costs are $540,000 ($300 3 1,800) and total cost is $740,000 ($540,000 1 $200,000). On the graph, the amount of the variable costs can be derived from the difference between the total-cost and fi xed-cost lines at each level of activity.
4. Determine the break-even point from the intersection of the total-cost line and the sales line. The break-even point in dollars is found by drawing a horizontal line from the break-even point to the vertical axis. The break-even point in

Target Net Income and Margin of Safety 977
units is found by drawing a vertical line from the break-even point to the hori-zontal axis. For the camcorders, the break-even point is $500,000 of sales, or 1,000 units. At this sales level, Vargo will cover costs but make no profi t.
The CVP graph also shows both the net income and net loss areas. Thus, the amount of income or loss at each level of sales can be derived from the sales and total-cost lines. A CVP graph is useful because the effects of a change in any element in the CVP analysis can be quickly seen. For example, a 10% increase in selling price will change the location of the sales line. Likewise, the effects on total costs of wage increases can be quickly observed.
Lombardi Company has a unit selling price of $400, variable costs per unit of $240, and fi xed costs of $180,000. Compute the break-even point in units using (a) a mathematical equation and (b) unit contribution margin.
Solution
DO IT! 4 Break-Even Analysis
(a) The equation is $400Q 2 $240Q 2 $180,000 5 $0; ($400Q 2 $240Q) 5 $180,000. The break-even point in units is 1,125. (b) The unit contribution margin is $160 ($400 2 $240). The formula therefore is $180,000 4 $160, and the break-even point in units is 1,125.
Related exercise material: BE22-6, BE22-7, E22-5, E22-6, E22-7, E22-8, E22-9, E22-10, and DO IT! 22-4.
Action Plan✔ Apply the formula:
Sales 2 Variable costs 2 Fixed costs 5 Net income.
✔ Apply the formula: Fixed costs 4 Unit contribution margin 5 Break-even point in units.
5 Determine the sales required to earn target net income and determine margin of safety.
LEARNING OBJECTIVE
Target Net Income
Rather than simply “breaking even,” management usually sets an income objec-tive often called target net income. It then determines the sales necessary to achieve this specifi ed level of income. Companies determine the sales necessary to achieve target net income by using one of the three approaches discussed earlier.
MATHEMATICAL EQUATION
We know that at the break-even point no profi t or loss results for the company. By adding an amount for target net income to the same basic equation, we obtain the following formula for determining required sales.
Illustration 22-24Formula for required sales to meet target net income
Required Variable Fixed Target Net Sales
2 Costs
2 Costs
5 Income
Recall that once the break-even point has been reached so that fi xed costs are covered, each additional unit sold increases net income by the amount of the unit contribution margin. We can rewrite the equation with contribution margin (required sales minus variable costs) on the left-hand side, and fi xed costs and target net income on the right. Assuming that target net income is $120,000 for Vargo Video, the computation of required sales in units is as shown in Illustration 22-25 (page 978).

978 22 Cost-Volume-Profi t
Vargo must sell 1,600 units to achieve target net income of $120,000. The sales dollars required to achieve the target net income is found by multiplying the units sold by the unit selling price [(1,600 3 $500) 5 $800,000].
CONTRIBUTION MARGIN TECHNIQUE
As in the case of break-even sales, we can compute in either units or dollars the sales required to meet target net income. The formula to compute required sales in units for Vargo Video using the unit contribution margin can be seen in the fi nal step of the equation approach in Illustration 22-25 (shown in red). We simply divide the sum of fi xed costs and target net income by the unit contribution margin. Illustration 22-26 shows this for Vargo.
Illustration 22-25Computation of required sales Required Variable Fixed Target Net
Sales 2
Costs 2
Costs 5
Income
$500Q 2 $300Q 2 $200,000 5 $120,000
$500Q 2 $300Q 5 $200,000 1 $120,000
$200Q 5 $200,000 1 $120,000
Q 5 $200,000 1 $120,000
5 Fixed Costs 1 Target Net Income
$200 Unit Contribution Margin
Q 5 1,600
where
Q 5 sales volume $500 5 selling price $300 5 variable costs per unit $200,000 5 total fi xed costs $120,000 5 target net income
Illustration 22-27Formula for required sales in dollars using contribution margin ratio
Fixed Costs 1 Contribution Required Sales Target Net Income 4 Margin Ratio 5 in Dollars
($200,000 1 $120,000) 4 40% 5 $800,000
_
_
Illustration 22-26Formula for required sales in units using unit contribution margin
Fixed Costs 1 Unit Contribution Required Sales Target Net Income 4 Margin 5 in Units
($200,000 1 $120,000) 4 $200 5 1,600 units
_
_
To achieve its desired target net income of $120,000, Vargo must sell 1,600 camcorders. The formula to compute the required sales in dollars for Vargo using the contribution margin ratio is shown below.
To achieve its desired target net income of $120,000, Vargo must generate sales of $800,000.
GRAPHIC PRESENTATION
We also can use the CVP graph in Illustration 22-23 (on page 976) to fi nd the sales required to meet target net income. In the profi t area of the graph, the distance between the sales line and the total-cost line at any point equals net income. We can fi nd required sales by analyzing the differences between the two lines until the desired net income is found.

Target Net Income and Margin of Safety 979
For example, suppose Vargo Video sells 1,400 camcorders. Illustration 22-23 shows that a vertical line drawn at 1,400 units intersects the sales line at $700,000 and the total-cost line at $620,000. The difference between the two amounts rep-resents the net income (profi t) of $80,000.
Margin of Safety
Margin of safety is the difference between actual or expected sales and sales at the break-even point. It measures the “cushion” that a particular level of sales provides. It tells us how far sales could fall before the company begins operating at a loss. The margin of safety is expressed in dollars or as a ratio. The formula for stating the margin of safety in dollars is actual (or expected) sales minus break-even sales. Assuming that actual (expected) sales for Vargo Video are $750,000, the computation is as follows.
Illustration 22-28Formula for margin of safety in dollars
Actual (Expected) Break-Even Margin of Safety Sales 2 Sales 5 in Dollars
$750,000 2 $500,000 5 $250,000
Illustration 22-29Formula for margin of safety ratio
Margin of Safety Actual (Expected) Margin of Safety in Dollars 4 Sales 5 Ratio
$250,000 4 $750,000 5 33%
Vargo’s margin of safety is $250,000. Its sales could fall $250,000 before it oper-ates at a loss. The margin of safety ratio is the margin of safety in dollars divided by actual (or expected) sales. Illustration 22-29 shows the formula and computation for determining the margin of safety ratio.
This means that the company’s sales could fall by 33% before it operates at a loss. The higher the dollars or the percentage, the greater the margin of safety. Management continuously evaluates the adequacy of the margin of safety in terms of such factors as the vulnerability of the product to competitive pres-sures and to downturns in the economy.
How a Rolling Stones’ Tour Makes Money
Computations of break-even and margin of safety are important for service companies. Consider how the promoter for the Rolling Stones’ tour used the break-even point and margin of safety. For example, say one outdoor show should bring 70,000 individuals for a gross of $2.45 million. The pro-moter guarantees $1.2 million to
the Rolling Stones. In addition, 20% of gross goes to the stadium in which the performance is staged. Add another $400,000 for other expenses such as ticket takers, parking attendants, advertising, and so on. The promoter also shares in sales of T-shirts and memorabilia for which the promoter will net over $7 million during the tour. From a successful Rolling Stones’ tour, the promoter could make $35 million!
What amount of sales dollars are required for the promoter to break even? (Go to WileyPLUS for this answer and additional questions.)
Service Company Insight Rolling Stones
Yael/Retna

980 22 Cost-Volume-Profi t
Zootsuit Inc. makes travel bags that sell for $56 each. For the coming year, management expects fi xed costs to total $320,000 and variable costs to be $42 per unit. Compute the following: (a) break-even point in dollars using the contribution margin (CM) ratio; (b) the margin of safety and margin of safety ratio assuming actual sales are $1,382,400; and (c) the sales dollars required to earn net income of $410,000.
Solution
DO IT! 5 Break-Even, Margin of Safety, and Target Net Income
(a) Contribution margin ratio 5 [($56 2 $42) 4 $56] 5 25% Break-even sales in dollars 5 $320,000 4 25% 5 $1,280,000
(b) Margin of safety 5 $1,382,400 2 $1,280,000 5 $102,400 Margin of safety ratio 5 $102,400 4 $1,382,400 5 7.4%
(c) Required sales in dollars 5 ($320,000 1 $410,000) 4 25% 5 $2,920,000
Related exercise material: BE22-8, BE22-9, BE22-10, E22-11, E22-12, E22-13, and DO IT! 22-5.
Action Plan✔ Apply the formula for
the break-even point in dollars.
✔ Apply the formulas for the margin of safety in dollars and the margin of safety ratio.
✔ Apply the formula for the required sales in dollars.
6 Use CVP analysis to respond to changes in the business environment.
LEARNING OBJECTIVE
When the personal computer was introduced, it sold for $2,500. Today, similar computers sell for much less. When oil prices rise, the break-even point for air-line companies such as American and Delta Air Lines also rise. Because of lower prices for imported steel, the demand for domestic steel dropped signifi cantly. The point should be clear: Business conditions change rapidly, and management must respond intelligently to these changes. CVP analysis can help. To better understand how CVP analysis works, let’s look at three independent situations that might occur at Vargo Video. Each case uses the original camcorder sales and cost data, which were as follows.
Unit selling price $500Unit variable cost $300Total fi xed costs $200,000Break-even sales $500,000 or 1,000 units
Illustration 22-30Original camcorder sales and cost data
Case I: Offering a Discount
A competitor is offering a 10% discount on the selling price of its camcorders. Management must decide whether to offer a similar discount.
Question: What effect will a 10% discount on selling price have on the break-even point for camcorders?
Answer: A 10% discount on selling price reduces the selling price per unit to $450 [$500 2 ($500 3 10%)]. Variable costs per unit remain unchanged at $300. Thus, the unit contribution margin is $150. Assuming no change in fi xed costs, break-even sales are 1,333 units, computed as follows.
Fixed Costs 4 Unit Contribution Margin 5 Break-Even Sales
$200,000 4 $150 5 1,333 units (rounded)
Illustration 22-31Computation of break-even sales in units

CVP Analysis and the Business Environment 981
For Vargo, this change requires monthly sales to increase by 333 units, or 331/3%, in order to break even. In reaching a conclusion about offering a 10% discount to customers, management must determine how likely it is to achieve the increased sales. Also, management should estimate the possible loss of sales if the competitor’s discount price is not matched.
Case II: Investing in New Equipment
To meet the threat of foreign competition, management invests in new robotic equipment that will lower the amount of direct labor required to make camcord-ers. The company estimates that total fi xed costs will increase 30% and that vari-able cost per unit will decrease 30%.
Question: What effect will the new equipment have on the sales volume required to break even?
Answer: Total fi xed costs become $260,000 [$200,000 1 (30% 3 $200,000)]. The variable cost per unit becomes $210 [$300 2 (30% 3 $300)]. The new break-even point is approximately 897 units, computed as shown in Illustration 22-32.
These changes appear to be advantageous for Vargo. The break-even point is reduced by approximately 10%, or 100 units.
Case III: Determining Required Sales
Vargo’s principal supplier of raw materials has just announced a price increase. The higher cost is expected to increase the variable cost of camcorders by $25 per unit. Management decides to hold the line on the selling price of the camcorders. It plans a cost-cutting program that will save $17,500 in fi xed costs per month. Vargo is currently realizing monthly net income of $80,000 on sales of 1,400 cam-corders.
Question: What increase in units sold will be needed to maintain the same level of net income?
Answer: The variable cost per unit increases to $325 ($300 1 $25). Fixed costs are reduced to $182,500 ($200,000 2 $17,500). Because of the change in variable cost, the unit contribution margin becomes $175 ($500 2 $325). The required number of units sold to achieve the target net income is computed as follows.
Fixed Costs 4 Unit Contribution
5 Break-Even Sales Margin
$260,000 4 ($500 2 $210) 5 897 units (rounded)
Illustration 22-32Computation of break-even sales in units
To achieve the required sales, Vargo Video will have to sell 1,500 camcorders, an increase of 100 units. If this does not seem to be a reasonable expectation, management will either have to make further cost reductions or accept less net income if the selling price remains unchanged.
Illustration 22-33Computation of required sales
Fixed Costs 1 Target Unit Contribution Required Sales Net Income 4 Margin 5 in Units
($182,500 1 $80,000) 4 $175 5 1,500
_
_

982 22 Cost-Volume-Profi t
CVP Income Statement Revisited
Earlier in the chapter, we presented a simple CVP income statement. When com-panies prepare a CVP income statement, they provide more detail about specifi c variable and fi xed-cost items.
To illustrate a more detailed CVP income statement, we will assume that Vargo Video reaches its target net income of $120,000 (see Illustration 22-25 on page 978). The following information is obtained on the $680,000 of costs that were incurred in June to produce and sell 1,600 units.
Variable Fixed Total
Cost of goods sold $400,000 $120,000 $520,000Selling expenses 60,000 40,000 100,000Administrative expenses 20,000 40,000 60,000
$480,000 $200,000 $680,000
Illustration 22-34Assumed cost and expense data
The detailed CVP income statement for Vargo is shown below.
VARGO VIDEO COMPANYCVP Income Statement
For the Month Ended June 30, 2017
Total Per Unit
Sales $ 800,000 $ 500Variable expenses Cost of goods sold $400,000 Selling expenses 60,000 Administrative expenses 20,000 Total variable expenses 480,000 300
Contribution margin 320,000 $200
Fixed expenses Cost of goods sold 120,000 Selling expenses 40,000 Administrative expenses 40,000 Total fi xed expenses 200,000
Net income $120,000
Illustration 22-35Detailed CVP income statement
Don’t Just Look—Buy Something
When analyzing an Internet business such as Amazon.com, analysts closely watch the so-called “conversion rate.” This rate is calcu-lated by dividing the num-ber of people who actually take action at an Internet site (buy something) by the total number of people
who visit the site. Average conversion rates are from 3% to 5%. A rate below 2% is poor, while a rate above 10% is great.
Conversion rates have an obvious effect on the break-even point. Suppose you spend $10,000 on your site, which
then attracts 5,000 visitors. If you get a 2% conversion rate (100 purchases), your site costs $100 per purchase ($10,000 4 100). A 4% conversion rate lowers your cost to $50 per transaction, and an 8% conversion rate gets you down to $25. Studies show that conversion rates increase if the site has an easy-to-use interface, fast-performing screens, a convenient ordering process, and advertising that is both clever and clear.
Sources: J. William Gurley, “The One Internet Metric That Really Counts” Fortune (March 6, 2000), p. 392; and Milind Mody, “Chief Mentor: How Startups Can Win Customers Online,” Wall Street Journal Online, (May 11, 2011).
Besides increasing their conversion rates, what steps can online merchants use to lower their break-even points? (Go to WileyPLUS for this answer and additional questions.)
Warchi/iStockphoto
Management Insight Amazon.com

Appendix 22A: Absorption Costing vs. Variable Costing 983
Krisanne Company reports the following operating results for the month of June.
KRISANNE COMPANYCVP Income Statement
For the Month Ended June 30, 2017
Total Per Unit
Sales (5,000 units) $300,000 $60Variable costs 180,000 36
Contribution margin 120,000 $24Fixed expenses 100,000
Net income $ 20,000
To increase net income, management is considering reducing the selling price by 10%, with no changes to unit variable costs or fi xed costs. Management is confi dent that this change will increase unit sales by 25%.
Using the contribution margin technique, compute the break-even point in units and dollars and margin of safety in dollars (a) assuming no changes to sales price or costs, and (b) assuming changes to sales price and volume as described above. (c) Comment on your fi ndings.
Solution
DO IT! 6 CVP Analysis
Action Plan✔ Apply the formula for
the break-even point in units.
✔ Apply the formula for the break-even point in dollars.
✔ Apply the formula for the margin of safety in dollars.
(a) Assuming no changes to sales price or costs: Break-even point in units 5 4,167 units (rounded) ($100,000 4 $24) Break-even point in sales dollars 5 $250,000 ($100,000 4 .40a) Margin of safety in dollars 5 $50,000 ($300,000 2 $250,000) a$24 4 $60
(b) Assuming changes to sales price and volume: Break-even point in units 5 5,556 units (rounded) ($100,000 4 $18b) Break-even point in sales dollars 5 $300,000 ($100,000 4 ($18 4 $54c)) Margin of safety in dollars 5 $37,500 ($337,500d 2 $300,000) b$60 2 (.10 3 $60) 2 36 5 $18 c$60 2 (.10 3 $60) d5,000 1 (.25 3 5,000) 5 6,250 units, 6,250 units 3 $54 5 $337,500
(c) The increase in the break-even point and the decrease in the margin of safety indicate that management should not implement the proposed change. The increase in sales volume will result in contribution margin of $112,500 (6,250 3 $18), which is $7,500 less than the current amount.
Related exercise material: BE22-11, E22-14, and DO IT! 22-6.
7 APPENDIX 22A: Explain the differences between absorption costing and variable costing.
In the earlier chapters, we classifi ed both variable and fi xed manufacturing costs as product costs. In job order costing, for example, a job is assigned the costs of direct materials, direct labor, and both variable and fi xed manufacturing over-head. This costing approach is referred to as full or absorption costing. It is so named because all manufacturing costs are charged to, or absorbed by, the product. Absorption costing is the approach used for external reporting under generally accepted accounting principles.
LEARNING OBJECTIVE
*

984 22 Cost-Volume-Profi t
An alternative approach is to use variable costing. Under variable costing, only direct materials, direct labor, and variable manufacturing overhead costs are considered product costs. Companies recognize fi xed manufacturing overhead costs as period costs (expenses) when incurred. The difference between absorp-tion costing and variable costing is shown graphically as follows.
Absorption Costing Variable Costing
Fixed Product Cost Manufacturing Period Cost Overhead
Illustration 22A-1Difference between absorption costing and variable costing
Under both absorption and variable costing, selling and administrative expenses are period costs. Companies may not use variable costing for external fi nancial reports because generally accepted accounting principles require that fi xed manufacturing over-head be accounted for as a product cost.
Example Comparing Absorption Costing with Variable Costing
To illustrate absorption and variable costing, assume that Premium Products Corporation manufactures a polyurethane sealant, called Fix-It, for car wind-shields. Relevant data for Fix-It in January 2017, the fi rst month of production, are shown in Illustration 22A-2.
Selling price $20 per unit.Units Produced 30,000; sold 20,000; beginning inventory zero.Variable unit costs Manufacturing $9 (direct materials $5, direct labor $3,
and variable overhead $1). Selling and administrative expenses $2.Fixed costs Manufacturing overhead $120,000. Selling and administrative expenses $15,000.
Illustration 22A-2Sealant sales and cost data for Premium Products Corporation
The per unit manufacturing cost under each costing approach is computed in Illustration 22A-3.
Type of Cost Absorption Costing Variable Costing
Direct materials $ 5 $5Direct labor 3 3Variable manufacturing overhead 1 1Fixed manufacturing overhead ($120,000 4 30,000 units produced) 4 0
Manufacturing cost per unit $13 $9
Illustration 22A-3Computation of per unit manufacturing cost
The manufacturing cost per unit is $4 higher ($13 2 $9) for absorption cost-ing. This occurs because fi xed manufacturing overhead costs are a product cost under absorption costing. Under variable costing, they are, instead, a period cost, and so they are expensed. Based on these data, each unit sold and each unit remaining in inventory is costed under absorption costing at $13 and under variable costing at $9.
ABSORPTION COSTING EXAMPLE
Illustration 22A-4 shows the income statement for Premium Products using absorp-tion costing. It shows that cost of goods manufactured is $390,000, computed

Appendix 22A: Absorption Costing vs. Variable Costing 985
by multiplying the 30,000 units produced times the manufacturing cost per unit of $13 (see Illustration 22A-3). Cost of goods sold is $260,000, after subtracting ending inventory of $130,000. Under absorption costing, $40,000 of the fi xed overhead (10,000 units 3 $4) is deferred to a future period as part of the cost of ending inventory.
PREMIUM PRODUCTS CORPORATIONIncome Statement
For the Month Ended January 31, 2017Absorption Costing
Sales (20,000 units 3 $20) $400,000Cost of goods sold Inventory, January 1 $ –0– Cost of goods manufactured (30,000 units 3 $13) 390,000
Cost of goods available for sale 390,000 Less: Inventory, January 31 (10,000 units 3 $13) 130,000 Cost of goods sold (20,000 units 3 $13) 260,000
Gross profi t 140,000Variable selling and administrative expenses (20,000 3 $2) 40,000Fixed selling and administrative expenses 15,000 55,000
Net income $ 85,000
Illustration 22A-4Absorption costing income statement
Helpful HintThe income statement format in Illustration 22A-4 is the same as that used under generally accepted accounting principles.
VARIABLE COSTING EXAMPLE
As Illustration 22A-5 shows, companies use the cost-volume-profi t format in preparing a variable costing income statement. The variable manufacturing cost of $270,000 is computed by multiplying the 30,000 units produced times variable manufacturing cost of $9 per unit (see Illustration 22A-3). As in absorption cost-ing, both variable and fi xed selling and administrative expenses are treated as period costs.
PREMIUM PRODUCTS CORPORATIONIncome Statement
For the Month Ended January 31, 2017Variable Costing
Sales (20,000 units 3 $20) $400,000Variable cost of goods sold Inventory, January 1 $ –0– Variable cost of goods manufactured
(30,000 units 3 $9) 270,000
Variable cost of goods available for sale 270,000 Less: Inventory, January 31 (10,000 units 3 $9) 90,000
Variable cost of goods sold 180,000 Variable selling and administrative expenses
(20,000 units 3 $2) 40,000 220,000
Contribution margin 180,000Fixed manufacturing overhead 120,000Fixed selling and administrative expenses 15,000 135,000
Net income $ 45,000
Illustration 22A-5Variable costing income statement
Helpful HintNote the difference in the computation of the ending inventory: $9 per unit here, $13 per unit in Illustration 22A-4.
There is one primary difference between variable and absorption costing: Under variable costing, companies charge the fi xed manufacturing overhead as an expense in the current period. Fixed manufacturing overhead costs of the

986 22 Cost-Volume-Profi t
current period, therefore, are not deferred to future periods through the ending inventory. As a result, absorption costing will show a higher net income number than variable costing whenever units produced exceed units sold. This differ-ence can be seen in the income statements in Illustrations 22A-4 and 22A-5. There is a $40,000 difference in the ending inventories ($130,000 under absorption cost-ing versus $90,000 under variable costing). Under absorption costing, $40,000 of the fi xed overhead costs (10,000 units 3 $4) has been deferred to a future period as part of inventory. In contrast, under variable costing, all fi xed manufacturing costs are expensed in the current period. The following relationships apply:
• When units produced exceed units sold, income under absorption costing is higher then variable costing.
• When units produced are less than units sold, income under absorption costing is lower then variable costing.
• When units produced and sold are the same, net income will be equal under the two costing approaches. In this case, there is no increase in ending inventory. So fi xed overhead costs of the current period are not deferred to future periods through the ending inventory.
Illustration 22A-6 summarizes the foregoing effects of the two costing approaches from operations.
Circumstances Income under
Toothbrushes Produced = Toothbrushes Sold
Absorption Costing Variable Costing
Toothbrushes Produced > Toothbrushes Sold
Toothbrushes Produced < Toothbrushes Sold
=
>
<
Illustration 22A-6Summary of income effects under absorption costing and variable costing
Rationale for Variable Costing
The purpose of fi xed manufacturing costs is to have productive facilities avail-able for use. A company incurs these costs whether it operates at zero or at 100% of capacity. Thus, proponents of variable costing argue that these costs are period costs and therefore should be expensed when incurred.
Supporters of absorption costing defend the assignment of fi xed manufactur-ing overhead costs to inventory. They say that these costs are as much a cost of getting a product ready for sale as direct materials or direct labor. Accordingly, they contend, these costs should not be matched with revenues until the product is sold.
The use of variable costing is acceptable only for internal use by manage-ment. It cannot be used in determining product costs in fi nancial statements prepared in accordance with generally accepted accounting principles because it understates inventory costs. To comply with the matching principle, a company must use absorption costing for its work in process and fi nished goods invento-ries. Similarly, companies must use absorption costing for income tax purposes.

Review and Practice 987
Explain variable, fi xed, and mixed costs and the rele-vant range. Variable costs are costs that vary in total directly and proportionately with changes in the activ-ity index. Fixed costs are costs that remain the same in total regardless of changes in the activity index.
The relevant range is the range of activity in which a company expects to operate during a year. It is impor-tant in CVP analysis because the behavior of costs is assumed to be linear throughout the relevant range.
Mixed costs change in total but not proportion-ately with changes in the activity level. For purposes of CVP analysis, mixed costs must be classifi ed into their fi xed and variable elements.
Apply the high-low method to determine the compo-nents of mixed costs. Determine the variable costs per unit by dividing the change in total costs at the highest and lowest levels of activity by the difference in activ-ity at those levels. Then, determine fi xed costs by sub-tracting total variable costs from the amount of total costs at either the highest or lowest level of activity.
Prepare a CVP income statement to determine contri-bution margin. The fi ve components of CVP analysis are (1) volume or level of activity, (2) unit selling prices, (3) variable costs per unit, (4) total fi xed costs, and (5) sales mix. Contribution margin is the amount of revenue remaining after deducting variable costs. It is identifi ed in a CVP income statement, which classifi es costs as variable or fi xed. It can be expressed as a total amount, as a per unit amount, or as a ratio.
1
2
3
Compute the break-even point using three ap -proaches. The break-even point can be (a) computed from a mathematical equation, (b) computed by using a contribution margin technique, and (c) derived from a CVP graph.
Determine the sales required to earn target net income and determine margin of safety. The general formula for required sales is Required sales 2 Variable costs 2 Fixed costs 5 Target net income. Two other formulas are (1) Required sales in units 5 (Fixed costs 1 Target net income) 4 Unit contribution margin, and (2) Required sales in dollars 5 (Fixed costs 1 Target net income) 4 Contribution margin ratio.
Margin of safety is the difference between actual or expected sales and sales at the break-even point. The formulas for margin of safety are (1) Actual (expected) sales 2 Break-even sales 5 Margin of safety in dollars, and (2) Margin of safety in dollars 4 Actual (expected) sales 5 Margin of safety ratio.
Use CVP analysis to respond to changes in the busi-ness environment. Management uses CVP analysis, such as calculating the break-even point or determin-ing the sales required to earn target net income, to decide how best to respond to changes in the business environment.
Explain the difference between absorption costing and variable costing. Under absorption costing, fi xed manufacturing costs are product costs. Under variable costing, fi xed manufacturing costs are period costs.
4
5
6
7*
LEARNING OBJECTIVES REVIEW
REVIEW AND PRACTICE
Absorption costing A costing approach in which all manufacturing costs are charged to the product.(p. 983).
Activity index The activity that causes changes in the behavior of costs. (p. 962).
Break-even point The level of activity at which total revenue equals total costs. (p. 971).
Contribution margin (CM) The amount of revenue remaining after deducting variable costs. (p. 970).
Contribution margin ratio The percentage of each dol-lar of sales that is available to apply to fi xed costs and contribute to net income; calculated as unit contribu-tion margin divided by unit selling price. (p. 972).
Cost behavior analysis The study of how specifi c costs respond to changes in the level of business activity. (p. 962).
Cost-volume-profi t (CVP) analysis The study of the effects of changes in costs and volume on a company’s profi ts. (p. 970).
Cost-volume-profi t (CVP) graph A graph showing the relationship between costs, volume, and profi ts. (p. 976).
* Cost-volume-profi t (CVP) income statement A state-ment for internal use that classifi es costs as fi xed or variable and reports contribution margin in the body of the statement. (p. 970).
Fixed costs Costs that remain the same in total regard-less of changes in the activity level. (p. 963).
High-low method A mathematical method that uses the total costs incurred at the high and low levels of activity to classify mixed costs into fi xed and variable compo-nents. (p. 967).
Margin of safety The difference between actual or expected sales and sales at the break-even point. (p. 979).
Mixed costs Costs that contain both a variable- and a fi xed-cost element and change in total but not pro-portionately with changes in the activity level. (p. 965).
Relevant range The range of the activity index over which the company expects to operate during the year. (p. 965).
GLOSSARY REVIEW

Target net income The income objective set by manage-ment. (p. 977).
Unit contribution margin The amount of revenue remain-ing per unit after deducting variable costs; calculated as unit selling price minus unit variable costs. (p. 971).
Variable costing A costing approach in which only variable manufacturing costs are product costs, and fi xed manu-facturing costs are period costs (expenses). (p. 984).
Variable costs Costs that vary in total directly and pro-portionately with changes in the activity level. (p. 962).
*
988 22 Cost-Volume-Profi t
1. Variable costs are costs that:(a) vary in total directly and proportionately with
changes in the activity level.(b) remain the same per unit at every activity level.(c) Neither of the above.(d) Both (a) and (b) above.
2. The relevant range is:(a) the range of activity in which variable costs will
be curvilinear.(b) the range of activity in which fi xed costs will be
curvilinear.(c) the range over which the company expects to
operate during a year.(d) usually from zero to 100% of operating capacity.
3. Mixed costs consist of a:(a) variable-cost element and a fi xed-cost element.(b) fi xed-cost element and a controllable-cost element.(c) relevant-cost element and a controllable-cost element.(d) variable-cost element and a relevant-cost element.
4. Your cell phone service provider offers a plan that is classifi ed as a mixed cost. The cost per month for 1,000 minutes is $50. If you use 2,000 minutes this month, your cost will be:(a) $50. (c) more than $100.(b) $100. (d) between $50 and $100.
5. Which of the following is not involved in CVP analysis?(a) Sales mix.(b) Unit selling prices.(c) Fixed costs per unit.(d) Volume or level of activity.
6. When comparing a traditional income statement to a CVP income statement:(a) net income will always be greater on the tradi-
tional statement.(b) net income will always be less on the traditional
statement.(c) net income will always be identical on both.(d) net income will be greater or less depending on
the sales volume. 7. Contribution margin:
(a) is revenue remaining after deducting variable costs.(b) may be expressed as unit contribution margin.(c) is selling price less cost of goods sold.(d) Both (a) and (b) above.
8. Gossen Company is planning to sell 200,000 pliers for $4 per unit. The contribution margin ratio is 25%. If
(LO 1)
(LO 1)
(LO 2)
(LO 2)
(LO 3)
(LO 3)
(LO 3)
(LO 4)
Gossen will break even at this level of sales, what are the fi xed costs?(a) $100,000. (c) $200,000.(b) $160,000. (d) $300,000.
9. Brownstone Company’s contribution margin ratio is 30%. If Brownstone’s sales revenue is $100 greater than its break-even sales in dollars, its net income:(a) will be $100.(b) will be $70.(c) will be $30.(d) cannot be determined without knowing fi xed costs.
10. The mathematical equation for computing required sales to obtain target net income is Required sales 5(a) Variable costs 1 Target net income.(b) Variable costs 1 Fixed costs 1 Target net income.(c) Fixed costs 1 Target net income.(d) No correct answer is given.
11. Margin of safety is computed as:(a) Actual sales 2 Break-even sales.(b) Contribution margin 2 Fixed costs.(c) Break-even sales 2 Variable costs.(d) Actual sales 2 Contribution margin.
12. Marshall Company had actual sales of $600,000 when break-even sales were $420,000. What is the margin of safety ratio?(a) 25%. (c) 331⁄3%.(b) 30%. (d) 45%.
13. On a CVP income statement:(a) Sales 2 Cost of goods sold 5 Contribution margin.(b) Sales 2 Variable costs 2 Fixed costs 5 Contribu-
tion margin.(c) Sales 2 Variable costs 5 Contribution margin.(d) Sales 2 Fixed costs 5 Contribution margin.
14. Cournot Company sells 100,000 wrenches for $12 a unit. Fixed costs are $300,000, and net income is $200,000. What should be reported as variable expenses in the CVP income statement?(a) $700,000. (c) $500,000.(b) $900,000. (d) $1,000,000.
*15. Under variable costing, fi xed manufacturing costs are classifi ed as:(a) period costs.(b) product costs.(c) both period and product costs.(d) neither period nor product costs.
(LO 4)
(LO 5)
(LO 5)
(LO 5)
(LO 6)
(LO 6)
(LO 7)
PRACTICE MULTIPLE-CHOICE QUESTIONS
Solutions
1. (d) Variable costs vary in total directly and proportionately with changes in the activity level and remain the same per unit at every activity level. Choices (a) and (b) are correct, but (d) is the better and more complete answer. Since (a) and (b) are both true statements, choice (c) is incorrect.

2. (c) The relevant range is the range over which the company expects to operate during a year. The other choices are incorrect because the relevant range is the range over which (a) variable costs are expected to be linear, not curvilinear, and (b) the company expects fi xed costs to remain the same. Choice (d) is incorrect because this answer does not specifi cally defi ne relevant range.
3. (a) Mixed costs consist of a variable-cost element and a fi xed-cost element, not (b) a controllable-cost element, (c) a relevant-cost element or a controllable-cost element, or (d) a relevant-cost element.
4. (d) Your cost will include the fi xed-cost component (fl at service fee) which does not increase plus the variable cost (usage charge) for the additional 1,000 minutes which will increase your cost to between $50 and $100. Therefore, choices (a) $50, (b) $100, and (c) more than $100 are incorrect.
5. (c) Total fi xed costs, not fi xed costs per unit, are involved in CVP analysis. Choices (a) sales mix, (b) unit selling prices, and (d) volume or level of activity are all involved in CVP analysis.
6. (c) Net income will always be identical on both a traditional income statement and a CVP income statement. Therefore, choices (a), (b), and (d) are incorrect statements.
7. (d) Contribution margin is revenue remaining after deducting variable costs and it may be expressed on a per unit basis. Choices (a) and (b) are accurate, but (d) is a better answer. Choice (c) is incorrect because it defi nes gross margin, not contribution margin.
8. (c) Unit contribution margin is $1 ($4 3 25%). Fixed costs 4 Unit contribution margin 5 Break-even point in units. Solving for fi xed costs, 200,000 units 3 $1 per unit 5 $200,000, not (a) $100,000, (b) $160,000, or (d) $300,000.
9. (c) If Brownstone’s sales revenue is $100 greater than its break-even sales in dollars, its net income will be $30 or ($100 3 30%), not (a) $100 or (b) $70. Choice (d) is incorrect because net income can be determined without knowing fi xed costs.
10. (b) The correct equation is Required sales 5 Variable costs 1 Fixed costs 1 Target net income. The other choices are incorrect because (a) needs fi xed costs added, (b) needs variable costs added, and (d) there is a correct answer given (b).
11. (a) Margin of safety is computed as Actual sales 2 Break-even sales. Therefore, choices (b) Contribution margin 2 Fixed costs, (c) Break-even sales 2 Variable costs, and (d) Actual sales 2 Contribution margin are incorrect.
12. (b) The margin of safety ratio is computed by dividing the margin of safety in dollars of $180,000 ($600,000 2 $420,000) by actual sales of $600,000. The result is 30% ($180,000 4 $600,000), not (a) 25%, (c) 331⁄3%, or (d) 45%.
13. (c) On a CVP income statement, Sales 2 Variable costs 5 Contribution margin. The other choices are therefore incorrect.
14. (a) Variable expenses are [(100,000 3 $12) 2 ($300,000 1 $200,000)] equals $700,000, not (b) $900,000, (c) $500,000, or (d) $1,000,000.
*15. (a) Under variable costing, fixed manufacturing costs are classified as period costs. The other choices are therefore incorrect.
Practice Exercises 989
1. The controller of Teton Industries has collected the following monthly expense data for use in analyzing the cost behavior of maintenance costs.
Total Total Month Maintenance Costs Machine Hours
January $2,900 300 February 3,000 400 March 3,600 600 April 4,300 790 May 3,200 500 June 4,500 800
Instructions(a) Determine the fixed-cost and variable-cost components using the high-low
method.
(b) Prepare a graph showing the behavior of maintenance costs, and identify the fi xed-cost and variable-cost elements. Use 200 unit increments and $1,000 cost increments.
Determine fi xed and variable costs using the high-low method and prepare graph.
(LO 1, 2)
PRACTICE EXERCISES
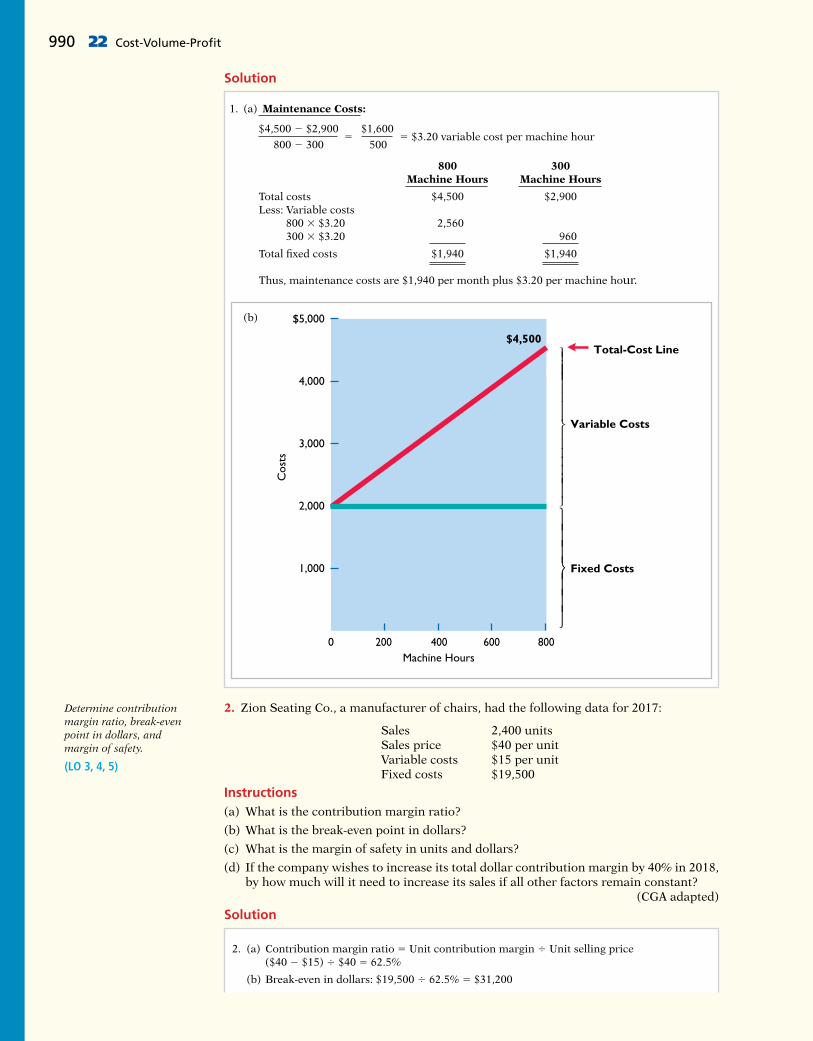
1. (a) Maintenance Costs:
$4,500 2 $2,900 $1,600 5 5 $3.20 variable cost per machine hour 800 2 300 500
800 300 Machine Hours Machine Hours
Total costs $4,500 $2,900Less: Variable costs 800 3 $3.20 2,560 300 3 $3.20 960
Total fi xed costs $1,940 $1,940
Thus, maintenance costs are $1,940 per month plus $3.20 per machine hour.
Solution
990 22 Cost-Volume-Profi t
800Machine Hours
Fixed Costs
Variable Costs
$4,500
4,000
$5,000
Cos
ts
⎪⎪⎪
⎫⎪⎪⎪
⎪⎪⎪⎬⎪⎪⎪⎪⎪⎪⎪⎪⎭
⎫⎪⎪⎬⎪⎪⎭
Total-Cost Line
3,000
1,000
0
2,000
200 400 600
2. Zion Seating Co., a manufacturer of chairs, had the following data for 2017:
Sales 2,400 unitsSales price $40 per unitVariable costs $15 per unitFixed costs $19,500
Instructions(a) What is the contribution margin ratio?
(b) What is the break-even point in dollars?
(c) What is the margin of safety in units and dollars?
(d) If the company wishes to increase its total dollar contribution margin by 40% in 2018, by how much will it need to increase its sales if all other factors remain constant?
(CGA adapted)
Determine contribution margin ratio, break-even point in dollars, and margin of safety.
(LO 3, 4, 5)
Solution
2. (a) Contribution margin ratio 5 Unit contribution margin 4 Unit selling price ($40 2 $15) 4 $40 5 62.5%
(b) Break-even in dollars: $19,500 4 62.5% 5 $31,200
(b)

Questions 991
(c) Margin of safety 5 (2,400 3 $40) 2 $31,200 5 $64,800 $64,800 4 $40 5 1,620 in units
(d) Current contribution margin is $40 2 $15 5 $25 Total contribution margin is $25 3 2,400 5 $60,000 40% increase in contribution margin is $60,000 3 40% 5 $24,000 Total increase in sales required is $24,000 4 62.5% 5 $38,400
Mabo Company makes calculators that sell for $20 each. For the coming year, management expects fi xed costs to total $220,000 and variable costs to be $9 per unit.
Instructions(a) Compute break-even point in units using the mathematical equation.
(b) Compute break-even point in dollars using the contribution margin (CM) ratio.
(c) Compute the margin of safety percentage assuming actual sales are $500,000.
(d) Compute the sales required in dollars to earn net income of $165,000.
Compute break-even point, contribution margin ratio, margin of safety, and sales for target net income.
(LO 4, 5)
(a) Required sales 2 Variable costs 2 Fixed costs 5 Net income $20Q 2 $9Q 2 $220,000 5 $0 $11Q 5 $220,000 Q 5 20,000 units
(b) Unit contribution margin 5 Unit selling price 2 Unit variable costs $11 5 $20 2 $9 Contribution margin ratio 5 Unit contribution margin 4 Unit selling price 55% 5 $11 4 $20 Break-even point in dollars 5 Fixed costs 4 Contribution margin ratio 5 $220,000 4 55% 5 $400,000
(c) Margin of safety 5 Actual sales 2 Break-even sales
Actual sales
5 $500,000 2 $400,000
$500,000
5 20%
(d) Required sales 2 Variable costs 2 Fixed costs 5 Net income $20Q 2 $9Q 2 $220,000 5 $165,000 $11Q 5 $385,000 Q 5 35,000 units
35,000 units 3 $20 5 $700,000 required sales
Solution
PRACTICE PROBLEM
Brief Exercises, Exercises, DO IT! Exercises, and Problems and many additional resources are available for practice in WileyPLUS
QUESTIONS
1. (a) What is cost behavior analysis? (b) Why is cost behavior analysis important to man-
agement? 2. (a) Scott Winter asks your help in understanding the
term “activity index.” Explain the meaning and importance of this term for Scott.
(b) State the two ways that variable costs may be defi ned.
3. Contrast the effects of changes in the activity level on total fi xed costs and on unit fi xed costs.
4. J. P. Alexander claims that the relevant range concept is important only for variable costs.
(a) Explain the relevant range concept. (b) Do you agree with J. P.’s claim? Explain. 5. “The relevant range is indispensable in cost behavior
analysis.” Is this true? Why or why not?
NOTE: All asterisked Questions, Exercises, and Problems relate to material in the appendix to the chapter.

992 22 Cost-Volume-Profi t
6. Adam Antal is confused. He does not understand why rent on his apartment is a fi xed cost and rent on a Hertz rental truck is a mixed cost. Explain the differ-ence to Adam.
7. How should mixed costs be classifi ed in CVP analysis? What approach is used to effect the appropriate classifi cation?
8. At the high and low levels of activity during the month, direct labor hours are 90,000 and 40,000, respectively. The related costs are $165,000 and $100,000. What are the fi xed and variable costs at any level of activity?
9. “Cost-volume-profi t (CVP) analysis is based entirely on unit costs.” Do you agree? Explain.
10. Faye Dunn defi nes contribution margin as the amount of profi t available to cover operating expenses. Is there any truth in this defi nition? Discuss.
11. Marshall Company’s GWhiz calculator sells for $40. Variable costs per unit are estimated to be $26. What are the unit contribution margin and the contribution margin ratio?
12. “Break-even analysis is of limited use to management because a company cannot survive by just breaking even.” Do you agree? Explain.
13. Total fi xed costs are $26,000 for Daz Inc. It has a unit contribution margin of $15, and a contribution
margin ratio of 25%. Compute the break-even sales in dollars.
14. Peggy Turnbull asks your help in constructing a CVP graph. Explain to Peggy (a) how the break-even point is plotted, and (b) how the level of activity and dollar sales at the break-even point are determined.
15. Defi ne the term “margin of safety.” If Revere Com-pany expects to sell 1,250 units of its product at $12 per unit, and break-even sales for the product are $13,200, what is the margin of safety ratio?
16. Huang Company’s break-even sales are $500,000. Assuming fi xed costs are $180,000, what sales volume is needed to achieve a target net income of $90,000?
17. The traditional income statement for Pace Company shows sales $900,000, cost of goods sold $600,000, and operating expenses $200,000. Assuming all costs and expenses are 70% variable and 30% fi xed, pre-pare a CVP income statement through contribution margin.
*18. Distinguish between absorption costing and variable costing.
*19. (a) What is the major rationale for the use of variable costing? (b) Discuss why variable costing may not be used for fi nancial reporting purposes.
BRIEF EXERCISES
BE22-1 Monthly production costs in Dilts Company for two levels of production are as follows.
Cost 2,000 Units 4,000 Units
Indirect labor $10,000 $20,000 Supervisory salaries 5,000 5,000 Maintenance 4,000 6,000
Indicate which costs are variable, fi xed, and mixed, and give the reason for each answer.
BE22-2 For Lodes Company, the relevant range of production is 40–80% of capacity. At 40% of capacity, a variable cost is $4,000 and a fi xed cost is $6,000. Diagram the behavior of each cost within the relevant range assuming the behavior is linear.
BE22-3 For Wesland Company, a mixed cost is $15,000 plus $18 per direct labor hour. Diagram the behavior of the cost using increments of 500 hours up to 2,500 hours on the horizontal axis and increments of $15,000 up to $60,000 on the vertical axis.
BE22-4 Bruno Company accumulates the following data concerning a mixed cost, using miles as the activity level.
Miles Total Miles Total Driven Cost Driven Cost
January 8,000 $14,150 March 8,500 $15,000 February 7,500 13,500 April 8,200 14,490
Compute the variable- and fi xed-cost elements using the high-low method.
BE22-5 Determine the missing amounts.
Classify costs as variable, fi xed, or mixed.
(LO 1)
Diagram the behavior of costs within the relevant range.
(LO 1)
Diagram the behavior of a mixed cost.
(LO 1)
Determine variable- and fi xed-cost elements using the high-low method.
(LO 2)
Determine missing amounts for contribution margin.
(LO 3) Unit Selling Unit Variable Unit Contribution Contribution Price Costs Margin Margin Ratio
1. $640 $352 (a) (b) 2. $300 (c) $93 (d) 3. (e) (f) $325 25%

DO IT! Exercises 993
BE22-6 Rice Company has a unit selling price of $520, variable costs per unit of $286, and fi xed costs of $163,800. Compute the break-even point in units using (a) the mathematical equation and (b) unit contribution margin.
BE22-7 Presto Corp. had total variable costs of $180,000, total fi xed costs of $110,000, and total revenues of $300,000. Compute the required sales in dollars to break even.
BE22-8 For Flynn Company, variable costs are 70% of sales, and fi xed costs are $195,000. Management’s net income goal is $75,000. Compute the required sales in dollars needed to achieve management’s target net income of $75,000. (Use the contribution margin approach.)
BE22-9 For Astoria Company, actual sales are $1,000,000, and break-even sales are $800,000. Compute (a) the margin of safety in dollars and (b) the margin of safety ratio.
BE22-10 Deines Corporation has fi xed costs of $480,000. It has a unit selling price of $6, unit variable costs of $4.40, and a target net income of $1,500,000. Compute the required sales in units to achieve its target net income.
BE22-11 Hamby Inc. has sales of $2,000,000 for the fi rst quarter of 2017. In making the sales, the company incurred the following costs and expenses.
Compute the break-even point.
(LO 4)
Compute the break-even point.
(LO 4)
Compute sales for target net income.
(LO 5)
Compute the margin of safety and the margin of safety ratio.
(LO 5)Compute the required sales in units for target net income.
(LO 5)
Prepare CVP income statement.
(LO 6)
Prepare a CVP income statement for the quarter ended March 31, 2017.
*BE22-12 Harris Company’s fi xed overhead costs are $4 per unit, and its variable overhead costs are $8 per unit. In the fi rst month of operations, 50,000 units are produced, and 46,000 units are sold. Write a short memo to the chief fi nancial offi cer explaining which costing approach will produce the higher income and what the difference will be.
Compute net income under absorption and variable costing.
(LO 7)
Variable Fixed
Cost of goods sold $760,000 $600,000Selling expenses 95,000 60,000Administrative expenses 79,000 66,000
Amanda Company reports the following total costs at two levels of production.
5,000 Units 10,000 Units
Indirect labor $ 3,000 $ 6,000Property taxes 7,000 7,000Direct labor 28,000 56,000Direct materials 22,000 44,000Depreciation 4,000 4,000Utilities 5,000 8,000Maintenance 9,000 11,000
Classify each cost as variable, fi xed, or mixed.
Westerville Company accumulates the following data concerning a mixed cost, using units produced as the activity level.
Classify types of costs.
(LO 1)
Compute costs using high-low method and estimate total cost.
(LO 2)
DO IT! Exercises
DO IT! 22-1
DO IT! 22-2
Units Produced Total Cost
March 10,000 $18,000April 9,000 16,650May 10,500 18,580June 8,800 16,200July 9,500 17,100

994 22 Cost-Volume-Profi t
Unit selling price of security control $45Unit variable costs $22Total monthly fi xed costs $120,000Units sold 8,000
(a) Compute the variable- and fi xed-cost elements using the high-low method.(b) Estimate the total cost if the company produces 9,200 units.
Cedar Grove Industries produces and sells a cell phone-operated home security control. Information regarding the costs and sales of security controls during May 2017 are provided below.
Prepare CVP income statement.
(LO 3)
Prepare a CVP income statement for Cedar Grove Industries for the month of May. Provide per unit values and total values.
Snow Cap Company has a unit selling price of $250, variable costs per unit of $170, and fi xed costs of $160,000. Compute the break-even point in units using (a) the mathematical equation and (b) unit contribution margin.
Presto Company makes radios that sell for $30 each. For the coming year, management expects fi xed costs to total $220,000 and variable costs to be $18 per unit.
(a) Compute the break-even point in dollars using the contribution margin (CM) ratio.(b) Compute the margin of safety ratio assuming actual sales are $800,000.(c) Compute the sales dollars required to earn net income of $140,000.
Victoria Company reports the following operating results for the month of April.
VICTORIA COMPANYCVP Income Statement
For the Month Ended April 30, 2017
Total Per Unit
Sales (9,000 units) $450,000 $50Variable costs 270,000 30
Contribution margin 180,000 $20Fixed expenses 150,000
Net income $ 30,000
Management is considering the following course of action to increase net income: Reduce the selling price by 4%, with no changes to unit variable costs or fi xed costs. Management is confi dent that this change will increase unit sales by 20%. Using the contribution margin technique, compute the break-even point in units and dollars and margin of safety in dollars:
(a) Assuming no changes to selling price or costs, and(b) Assuming changes to sales price and volume as described above.
Comment on your fi ndings.
Compute break-even point in units.
(LO 4)
Compute break-even point, margin of safety ratio, and sales for target net income.
(LO 5)
Compute the break-even point and margin of safety under different alternatives.
(LO 6)
DO IT! 22-3
DO IT! 22-4
DO IT! 22-5
DO IT! 22-6
EXERCISES
E22-1 Bonita Company manufactures a single product. Annual production costs incurred in the manufacturing process are shown below for two levels of production.
Defi ne and classify variable, fi xed, and mixed costs.
(LO 1) Costs Incurred
Production in Units 5,000 10,000
Total Cost/ Total Cost/Production Costs Cost Unit Cost Unit
Direct materials $8,000 $1.60 $16,000 $1.60Direct labor 9,500 1.90 19,000 1.90Utilities 2,000 0.40 3,300 0.33Rent 4,000 0.80 4,000 0.40Maintenance 800 0.16 1,400 0.14Supervisory salaries 1,000 0.20 1,000 0.10

Exercises 995
Instructions(a) Defi ne the terms variable costs, fi xed costs, and mixed costs.(b) Classify each cost above as either variable, fi xed, or mixed.
E22-2 The controller of Norton Industries has collected the following monthly expense data for use in analyzing the cost behavior of maintenance costs.
Determine fi xed and variable costs using the high-low method and prepare graph.
(LO 1, 2)
Instructions(a) Determine the fi xed- and variable-cost components using the high-low method.(b) Prepare a graph showing the behavior of maintenance costs, and identify the fi xed-
and variable-cost elements. Use 100-hour increments and $1,000 cost increments.
E22-3 Family Furniture Corporation incurred the following costs.
1. Wood used in the production of furniture. 2. Fuel used in delivery trucks. 3. Straight-line depreciation on factory building. 4. Screws used in the production of furniture. 5. Sales staff salaries. 6. Sales commissions. 7. Property taxes. 8. Insurance on buildings. 9. Hourly wages of furniture craftsmen. 10. Salaries of factory supervisors. 11. Utilities expense. 12. Telephone bill.
InstructionsIdentify the costs above as variable, fi xed, or mixed.
E22-4 Marty Moser wants Moser Company to use CVP analysis to study the effects of changes in costs and volume on the company. Marty has heard that certain assumptions must be valid in order for CVP analysis to be useful.
Instructions Prepare a memo to Marty Moser concerning the assumptions that underlie CVP
analysis.
E22-5 All That Blooms provides environmentally friendly lawn services for homeowners. Its operating costs are as follows.
Classify variable, fi xed, and mixed costs.
(LO 1)
Explain assumptions underlying CVP analysis.
(LO 3)
Compute break-even point in units and dollars.
(LO 3, 4)
Total Total Month Maintenance Costs Machine Hours
January $2,700 300 February 3,000 350 March 3,600 500 April 4,500 690 May 3,200 400 June 5,500 700
SERVICE
Depreciation $1,400 per monthAdvertising $200 per monthInsurance $2,000 per monthWeed and feed materials $12 per lawnDirect labor $10 per lawnFuel $2 per lawn
All That Blooms charges $60 per treatment for the average single-family lawn.
InstructionsDetermine the company’s break-even point in (a) number of lawns serviced per month and (b) dollars.

996 22 Cost-Volume-Profi t
E22-6 The Palmer Acres Inn is trying to determine its break-even point during its off-peak season. The inn has 50 rooms that it rents at $60 a night. Operating costs are as follows.
Compute break-even point.
(LO 3, 4)
Salaries $5,900 per monthUtilities $1,100 per monthDepreciation $1,000 per monthMaintenance $100 per monthMaid service $14 per roomOther costs $28 per room
InstructionsDetermine the inn’s break-even point in (a) number of rented rooms per month and (b) dollars.
E22-7 In the month of March, Style Salon services 560 clients at an average price of $120. During the month, fi xed costs were $21,024 and variable costs were 60% of sales.
Instructions(a) Determine the contribution margin in dollars, per unit, and as a ratio.(b) Using the contribution margin technique, compute the break-even point in dollars and
in units.
E22-8 Spencer Kars provides shuttle service between four hotels near a medical center and an international airport. Spencer Kars uses two 10-passenger vans to offer 12 round trips per day. A recent month’s activity in the form of a cost-volume-profi t income state-ment is shown below.
Compute contribution margin and break-even point.
(LO 3, 4)
Compute break-even point.
(LO 3, 4)
Instructions(a) Calculate the break-even point in (1) dollars and (2) number of fares.(b) Without calculations, determine the contribution margin at the break-even point.
E22-9 In 2016, Manhoff Company had a break-even point of $350,000 based on a selling price of $5 per unit and fi xed costs of $112,000. In 2017, the selling price and the variable costs per unit did not change, but the break-even point increased to $420,000.
Instructions(a) Compute the variable costs per unit and the contribution margin ratio for 2016.(b) Compute the increase in fi xed costs for 2017.
E22-10 Billings Company has the following information available for September 2017.
Compute variable costs per unit, contribution margin ratio, and increase in fi xed costs.
(LO 3, 4)
Prepare CVP income statements.
(LO 3, 4) Unit selling price of video game consoles $ 400Unit variable costs $ 280Total fi xed costs $54,000Units sold 600
Instructions(a) Compute the unit contribution margin.(b) Prepare a CVP income statement that shows both total and per unit amounts.(c) Compute Billings’ break-even point in units.(d) Prepare a CVP income statement for the break-even point that shows both total and
per unit amounts.
SERVICE
SERVICE
SERVICE
Fare revenues (1,500 fares) $36,000Variable costs Fuel $ 5,040 Tolls and parking 3,100 Maintenance 860 9,000
Contribution margin 27,000Fixed costs Salaries 15,700 Depreciation 1,300 Insurance 1,000 18,000
Net income $ 9,000

Exercises 997
E22-11 Naylor Company had $210,000 of net income in 2016 when the selling price per unit was $150, the variable costs per unit were $90, and the fi xed costs were $570,000. Management expects per unit data and total fi xed costs to remain the same in 2017. The president of Naylor Company is under pressure from stockholders to increase net income by $52,000 in 2017.
Instructions(a) Compute the number of units sold in 2016.(b) Compute the number of units that would have to be sold in 2017 to reach the stock-
holders’ desired profi t level.(c) Assume that Naylor Company sells the same number of units in 2017 as it did in 2016.
What would the selling price have to be in order to reach the stockholders’ desired profi t level?
E22-12 Yams Company reports the following operating results for the month of August: sales $400,000 (units 5,000), variable costs $240,000, and fi xed costs $90,000. Manage-ment is considering the following independent courses of action to increase net income.
1. Increase selling price by 10% with no change in total variable costs or units sold.2. Reduce variable costs to 55% of sales.
InstructionsCompute the net income to be earned under each alternative. Which course of action will produce the higher net income?
E22-13 Glacial Company estimates that variable costs will be 62.5% of sales, and fi xed costs will total $600,000. The selling price of the product is $4.
Instructions(a) Prepare a CVP graph, assuming maximum sales of $3,200,000. (Note: Use $400,000
increments for sales and costs and 100,000 increments for units.)(b) Compute the break-even point in (1) units and (2) dollars.(c) Assuming actual sales are $2 million, compute the margin of safety in (1) dollars and
(2) as a ratio.
E22-14 Carey Company had sales in 2016 of $1,560,000 on 60,000 units. Variable costs totaled $900,000, and fi xed costs totaled $500,000. A new raw material is available that will decrease the variable costs per unit by 20% (or $3). However, to process the new raw material, fi xed operating costs will increase by $100,000. Management feels that one-half of the decline in the variable costs per unit should be passed on to customers in the form of a sales price reduction. The marketing department expects that this sales price reduction will result in a 5% increase in the num-ber of units sold.
InstructionsPrepare a projected CVP income statement for 2017 (a) assuming the changes have not been made, and (b) assuming that changes are made as described.
*E22-15 Crate Express Co. produces wooden crates used for shipping products by ocean liner. In 2017, Crate Express incurred the following costs.
Compute various components to derive target net income under different assumptions.
(LO 4, 5)
Compute net income under different alternatives.
(LO 5)
Prepare a CVP graph and compute break-even point and margin of safety.
(LO 4, 5)
Prepare a CVP income statement before and after changes in business environment.
(LO 6)
Compute manufacturing cost under absorption and variable costing and explain difference.
(LO 7)
Wood used in crate production $54,000Nails (considered insignifi cant and a variable expense) $ 350Direct labor $43,000Utilities for the plant: $1,500 each month, plus $0.50 for each kilowatt-hour used each monthRent expense for the plant for the year $21,400
Assume Crate Express used an average 500 kilowatt-hours each month over the past year.
Instructions(a) What is Crate Express’s total manufacturing cost if it uses a variable costing approach?(b) What is Crate Express’s total manufacturing cost if it uses an absorption costing approach?(c) What accounts for the difference in manufacturing costs between these two costing
approaches?

998 22 Cost-Volume-Profi t
*E22-16 Montier Corporation produces one product. Its cost includes direct materials ($10 per unit), direct labor ($8 per unit), variable overhead ($5 per unit), fi xed manufacturing ($225,000), and fi xed selling and administrative ($30,000). In October 2017, Montier produced 25,000 units and sold 20,000 at $50 each.
Instructions(a) Prepare an absorption costing income statement.(b) Prepare a variable costing income statement.(c) Explain the difference in net income in the two income statements.
Prepare absorption cost and variable cost income statements.
(LO 7)
PROBLEMS: SET A
P22-1A Vin Diesel owns the Fredonia Barber Shop. He employs four barbers and pays each a base rate of $1,250 per month. One of the barbers serves as the manager and receives an extra $500 per month. In addition to the base rate, each barber also receives a commission of $4.50 per haircut. Other costs are as follows.
Determine variable and fi xed costs, compute break-even point, prepare a CVP graph, and determine net income.
(LO 1, 2, 3, 4)
SERVICEAdvertising $200 per monthRent $1,100 per monthBarber supplies $0.30 per haircutUtilities $175 per month plus $0.20 per haircutMagazines $25 per month
Vin currently charges $10 per haircut.
Instructions(a) Determine the variable costs per haircut and the total monthly fi xed costs.(b) Compute the break-even point in units and dollars.(c) Prepare a CVP graph, assuming a maximum of 1,800 haircuts in a month. Use incre-
ments of 300 haircuts on the horizontal axis and $3,000 on the vertical axis.(d) Determine net income, assuming 1,600 haircuts are given in a month.
P22-2A Jorge Company bottles and distributes B-Lite, a diet soft drink. The beverage is sold for 50 cents per 16-ounce bottle to retailers, who charge customers 75 cents per bottle. For the year 2017, management estimates the following revenues and costs.
(a) VC $5
Prepare a CVP income statement, compute break-even point, contribution margin ratio, margin of safety ratio, and sales for target net income.
(LO 3, 4, 5)
Sales $1,800,000 Selling expenses—variable $70,000Direct materials 430,000 Selling expenses—fi xed 65,000Direct labor 360,000 Administrative expenses—Manufacturing overhead— variable 20,000 variable 380,000 Administrative expenses—Manufacturing overhead— fi xed 60,000 fi xed 280,000
Instructions(a) Prepare a CVP income statement for 2017 based on management’s estimates. (Show
column for total amounts only.)(b) Compute the break-even point in (1) units and (2) dollars.(c) Compute the contribution margin ratio and the margin of safety ratio. (Round to nearest
full percent.)(d) Determine the sales dollars required to earn net income of $180,000.
P22-3A Tanek Corp.’s sales slumped badly in 2017. For the fi rst time in its history, it oper-ated at a loss. The company’s income statement showed the following results from selling 500,000 units of product: sales $2,500,000, total costs and expenses $2,600,000, and net loss $100,000. Costs and expenses consisted of the amounts shown on page 999.
(b) (1) 2,700,000 units(c) CM ratio 30%
Compute break-even point under alternative courses of action.
(LO 4)
EXERCISES: SET B AND CHALLENGE EXERCISES
Visit the book’s companion website, at www.wiley.com/college/weygandt, and choose the Student Companion site to access Exercises: Set B and Challenge Exercises.

Problems: Set A 999
Management is considering the following independent alternatives for 2018.
1. Increase unit selling price 20% with no change in costs, expenses, and sales volume.2. Change the compensation of salespersons from fi xed annual salaries totaling $150,000
to total salaries of $60,000 plus a 5% commission on sales.
Instructions(a) Compute the break-even point in dollars for 2017.(b) Compute the break-even point in dollars under each of the alternative courses of
action. (Round all ratios to nearest full percent.) Which course of action do you recommend?
P22-4A Mary Willis is the advertising manager for Bargain Shoe Store. She is currently working on a major promotional campaign. Her ideas include the installation of a new lighting system and increased display space that will add $24,000 in fi xed costs to the $270,000 currently spent. In addition, Mary is proposing that a 5% price decrease ($40 to $38) will produce a 20% increase in sales volume (20,000 to 24,000). Variable costs will remain at $24 per pair of shoes. Management is impressed with Mary’s ideas but concerned about the effects that these changes will have on the break-even point and the margin of safety.
Instructions(a) Compute the current break-even point in units, and compare it to the break-even point
in units if Mary’s ideas are used.(b) Compute the margin of safety ratio for current operations and after Mary’s changes
are introduced. (Round to nearest full percent.)(c) Prepare a CVP income statement for current operations and after Mary’s changes are
introduced. (Show column for total amounts only.) Would you make the changes sug-gested?
P22-5A Viejol Corporation has collected the following information after its fi rst year of sales. Sales were $1,600,000 on 100,000 units, selling expenses $250,000 (40% variable and 60% fi xed), direct materials $490,000, direct labor $290,000, administrative expenses $270,000 (20% variable and 80% fi xed), and manufacturing overhead $380,000 (70% vari-able and 30% fi xed). Top management has asked you to do a CVP analysis so that it can make plans for the coming year. It has projected that unit sales will increase by 10% next year.
Instructions(a) Compute (1) the contribution margin for the current year and the projected year, and
(2) the fi xed costs for the current year. (Assume that fi xed costs will remain the same in the projected year.)
(b) Compute the break-even point in units and sales dollars for the current year.(c) The company has a target net income of $200,000. What is the required sales in dollars
for the company to meet its target?(d) If the company meets its target net income number, by what percentage could its sales
fall before it is operating at a loss? That is, what is its margin of safety ratio?
*P22-6A Jackson Company produces plastic that is used for injection-molding applica-tions such as gears for small motors. In 2016, the fi rst year of operations, Jackson pro-duced 4,000 tons of plastic and sold 3,500 tons. In 2017, the production and sales results were exactly reversed. In each year, the selling price per ton was $2,000, variable manufac-turing costs were 15% of the sales price of units produced, variable selling expenses were 10% of the selling price of units sold, fi xed manufacturing costs were $2,800,000, and fi xed administrative expenses were $500,000.
(b) Alternative 1 $2,023,810
Compute break-even point and margin of safety ratio, and prepare a CVP income statement before and after changes in business environment.
(LO 3, 4, 5)
(b) Current margin of safety ratio 16%
Compute contribution margin, fi xed costs, break-even point, sales for target net income, and margin of safety ratio.
(LO 3, 4, 5)
(b) 120,000 units
Prepare income statements under absorption costing and variable costing for a company with beginning inventory, and reconcile differences.
(LO 7)
Total Variable Fixed
Cost of goods sold $2,140,000 $1,590,000 $550,000Selling expenses 250,000 92,000 158,000Administrative expenses 210,000 68,000 142,000
$2,600,000 $1,750,000 $850,000

1000 22 Cost-Volume-Profi t
CONTINUING PROBLEMS
CURRENT DESIGNSCD22 Bill Johnson, sales manager, and Diane Buswell, controller, at Current Designs are beginning to analyze the cost considerations for one of the composite models of the kayak division. They have provided the following production and operational costs necessary to produce one composite kayak.
Bill and Diane have asked you to provide a cost-volume-profi t analysis, to help them fi nalize the budget projections for the upcoming year. Bill has informed you that the selling price of the composite kayak will be $2,000.
Instructions(a) Calculate variable costs per unit.(b) Determine the unit contribution margin.(c) Using the unit contribution margin, determine the break-even point in units for this product line.(d) Assume that Current Designs plans to earn $270,600 on this product line. Using the unit contribu-
tion margin, calculate the number of units that need to be sold to achieve this goal.(e) Based on the most recent sales forecast, Current Designs plans to sell 1,000 units of this model.
Using your results from part (c), calculate the margin of safety and the margin of safety ratio.
WATERWAYS
WP22 The Vice President for Sales and Marketing at Waterways Corporation is planning for production needs to meet sales demand in the coming year. He is also trying to determine how the company’s profi ts might be increased in the coming year. This problem asks you to use cost-volume-profi t concepts to help Waterways understand contribution margins of some of its products and decide whether to mass-produce any of them.
Go to the book’s companion website, www.wiley.com/college/weygandt, to fi nd the remainder of this problem.
(Note: This is a continuation of the Waterways problem from Chapters 19–21.)
EXCEL TUTORIAL
Formulas Data Review ViewPage LayoutInsert
1
2
3
4
5
6
7
8
AB7 fx
B CKevlar®
Resin and suppliesFinishing kit (seat, rudder, ropes, etc.)LaborSelling and administrative expenses—variableSelling and administrative expenses—fixedManufacturing overhead—fixed
$250 per kayak$100 per kayak$170 per kayak$420 per kayak$400 per kayak$119,700 per year$240,000 per year
Home
Current Designs.xls
Instructions(a) Prepare income statements for each year using variable costing. (Use the format from
Illustration 22A-5.)(b) Prepare income statements for each year using absorption costing. (Use the format
from Illustration 22A-4.)(c) Reconcile the differences each year in net income under the two costing approaches.(d) Comment on the effects of production and sales on net income under the two
costing approaches.
(a) 2017 $2,700,000
(b) 2017 $2,350,000
PROBLEMS: SET B AND SET C
Visit the book’s companion website, at www.wiley.com/college/weygandt, and choose the Student Companion site to access Problems: Set B and Set C.

PERSPECTIVEMANAGEMENT DECISION-MAKING
Decision-Making Across the OrganizationBYP22-1 Creative Ideas Company has decided to introduce a new product. The new product can be manufactured by either a capital-intensive method or a labor-intensive method. The manufacturing method will not affect the quality of the product. The estimated manufacturing costs by the two methods are as follows.
Capital- Labor- Intensive Intensive
Direct materials $5 per unit $5.50 per unitDirect labor $6 per unit $8.00 per unitVariable overhead $3 per unit $4.50 per unitFixed manufacturing costs $2,524,000 $1,550,000
Creative Ideas’ market research department has recommended an introductory unit sales price of $32. The incremental selling expenses are estimated to be $502,000 annually plus $2 for each unit sold, regardless of manufacturing method.
InstructionsWith the class divided into groups, answer the following.
(a) Calculate the estimated break-even point in annual unit sales of the new product if Creative Ideas Company uses the:
(1) Capital-intensive manufacturing method. (2) Labor-intensive manufacturing method.(b) Determine the annual unit sales volume at which Creative Ideas Company would be indifferent
between the two manufacturing methods.(c) Explain the circumstance under which Creative Ideas should employ each of the two manufactur-
ing methods.(CMA adapted)
Managerial AnalysisBYP22-2 The condensed income statement for the Peri and Paul partnership for 2017 is as follows.
PERI AND PAUL COMPANYIncome Statement
For the Year Ended December 31, 2017
Sales (240,000 units) $1,200,000Cost of goods sold 800,000
Gross profi t 400,000Operating expensesSelling $280,000Administrative 150,000 430,000
Net loss $ (30,000)
A cost behavior analysis indicates that 75% of the cost of goods sold are variable, 42% of the selling expenses are variable, and 40% of the administrative expenses are variable.
Instructions(Round to nearest unit, dollar, and percentage, where necessary. Use the CVP income statement format in computing profi ts.)
(a) Compute the break-even point in total sales dollars and in units for 2017.(b) Peri has proposed a plan to get the partnership “out of the red” and improve its profi tability. She
feels that the quality of the product could be substantially improved by spending $0.25 more per unit on better raw materials. The selling price per unit could be increased to only $5.25 because of competitive pressures. Peri estimates that sales volume will increase by 25%. What effect would Peri’s plan have on the profi ts and the break-even point in dollars of the partnership? (Round the contribution margin ratio to two decimal places.)
BROADENING YOUR
Broadening Your Perspective 1001

1002 22 Cost-Volume-Profi t
THE COCA-COLA COMPANYManagement Discussion
Our gross margin declined to 61 percent this year from 62 percent in the prior year, primarily due to costs for materials such as sweeteners and packaging.
The increases [in selling expenses] in the last two years were primarily due to higher marketing expenditures in support of our Company’s volume growth.
We measure our sales volume in two ways: (1) gallon shipments of concentrates and syrups and (2) unit cases of fi nished product (bottles and cans of Coke sold by bottlers).
InstructionsAnswer the following questions.
(a) Are sweeteners and packaging a variable cost or a fi xed cost? What is the impact on the contribu-tion margin of an increase in the per unit cost of sweeteners or packaging? What are the implica-tions for profi tability?
(b) In your opinion, are Coca-Cola’s marketing expenditures a fi xed cost, variable cost, or mixed cost? Give justifi cation for your answer.
(c) Which of the two measures cited for measuring volume represents the activity index as defi ned in this chapter? Why might Coca-Cola use two different measures?
BYP22-4 The May 21, 2010, edition of the Wall Street Journal includes an article by Jeffrey Trachtenberg entitled “E-Books Rewrite Bookselling.”
InstructionsRead the article and answer the following questions.
(a) What aspect of Barnes and Noble’s current structure puts it at risk if electronic books become a signifi cant portion of book sales?
(b) What was Barnes and Noble’s primary competitive advantage in a “paper book” world? How has this advantage been eliminated by e-books?
(c) What event do the authors say might eventually be viewed as the big turning point for e-books?(d) What amount does Barnes and Noble earn on a $25 hardcover book? How much would it likely
earn on an e-book version of the same title? What implications does this have for Barnes and Noble versus its competitors?
(e) What two mistakes does the author suggest that Barnes and Noble made that left it ill-prepared for an e-book environment?
CRITICAL THINKING
Communication ActivityBYP22-5 Your roommate asks for your help on the following questions about CVP analysis formulas.
(a) How can the mathematical equation for break-even sales show both sales units and sales dollars?(b) How do the formulas differ for unit contribution margin and contribution margin ratio?(c) How can contribution margin be used to determine break-even sales in units and in dollars?
(c) Paul was a marketing major in college. He believes that sales volume can be increased only by inten-sive advertising and promotional campaigns. He therefore proposed the following plan as an alter-native to Peri’s: (1) increase variable selling expenses to $0.59 per unit, (2) lower the selling price per unit by $0.25, and (3) increase fi xed selling expenses by $40,000. Paul quoted an old marketing research report that said that sales volume would increase by 60% if these changes were made. What effect would Paul’s plan have on the profi ts and the break-even point in dollars of the partnership?
(d) Which plan should be accepted? Explain your answer.
Real-World FocusBYP22-3 The Coca-Cola Company hardly needs an introduction. A line taken from the cover of a recent annual report says it all: If you measured time in servings of Coca-Cola, “a billion Coca-Cola’s ago was yesterday morning.” On average, every U.S. citizen drinks 363 8-ounce servings of Coca-Cola products each year. Coca-Cola’s primary line of business is the making and selling of syrup to bottlers. These bottlers then sell the fi nished bottles and cans of Coca-Cola to the consumer. In the annual report of Coca-Cola, the information shown below was provided.

InstructionsWrite a memo to your roommate stating the relevant formulas and answering each question.
Ethics CaseBYP22-6 Scott Bestor is an accountant for Westfi eld Company. Early this year, Scott made a highly favorable projection of sales and profi ts over the next 3 years for Westfi eld’s hot-selling computer PLEX. As a result of the projections Scott presented to senior management, the company decided to expand production in this area. This decision led to dislocations of some plant personnel who were reassigned to one of the company’s newer plants in another state. However, no one was fi red, and in fact the company expanded its workforce slightly. Unfortunately, Scott rechecked his projection computations a few months later and found that he had made an error that would have reduced his projections substantially. Luckily, sales of PLEX have exceeded projections so far, and management is satisfi ed with its decision. Scott, however, is not sure what to do. Should he confess his honest mistake and jeopardize his possible promotion? He suspects that no one will catch the error because PLEX sales have exceeded his projections, and it appears that profi ts will materialize close to his projections.
Instructions
(a) Who are the stakeholders in this situation?(b) Identify the ethical issues involved in this situation.(c) What are the possible alternative actions for Scott? What would you do in Scott’s position?
All About YouBYP22-7 Cost-volume-profi t analysis can also be used in making personal fi nancial decisions. For example, the purchase of a new car is one of your biggest personal expenditures. It is important that you carefully analyze your options. Suppose that you are considering the purchase of a hybrid vehicle. Let’s assume the following facts. The hybrid will initially cost an additional $4,500 above the cost of a traditional vehicle. The hybrid will get 40 miles per gallon of gas, and the traditional car will get 30 miles per gallon. Also, assume that the cost of gas is $3.60 per gallon.
InstructionsUsing the facts above, answer the following questions.
(a) What is the variable gasoline cost of going one mile in the hybrid car? What is the variable cost of going one mile in the traditional car?
(b) Using the information in part (a), if “miles” is your unit of measure, what is the “contribution margin” of the hybrid vehicle relative to the traditional vehicle? That is, express the variable cost savings on a per-mile basis.
(c) How many miles would you have to drive in order to break even on your investment in the hybrid car?
(d) What other factors might you want to consider?
Broadening Your Perspective 1003

The best business plans often result from meeting a basic
human need. Many people would argue that cupcakes
aren’t necessarily essential to support life. But if you found
out that allergies were going to deprive you forever of
cupcakes, you might view baked goods in a whole new
light. Such was the dilemma faced by Erin McKenna. When
she found that her wheat allergies prevented her from
consuming most baked sweets, she decided to open a
bakery that met her needs. Her vegan and kosher bakery,
BabyCakes NYC, advertises that it is refi ned-sugar-free,
gluten-free, wheat-free, soy-free, dairy-free, and egg-free.
So if you’re one of the more than 10 million Americans with
a food allergy or some other dietary constraint, this is
probably the bakery for you.
Those of you that have spent a little time in the kitchen might
wonder what kind of ingredients BabyCakes uses. To avoid
the gluten in wheat, the company uses Bob’s Red Mill rice
fl our, a garbanzo/fava bean mix, or oat fl ours. How does
BabyCakes get all those great frosting colors without artifi cial
dyes? The company achieves pink with beets, green with
chlorophyll, yellow with turmeric, and blue/purple with red
cabbage. To eliminate dairy and soy, the bakers use rice and
coconut milk. And fi nally, to accomplish over-the-top
deliciousness without refi ned sugar, BabyCakes uses agave
nectar (a sweetener derived from cactus) and evaporated
cane juice (often referred to as organic or unrefi ned sugar).
With cupcakes priced at over $3 per item and a brisk business,
you might think that making money is easy for BabyCakes.
But all of these specialty ingredients don’t come cheap. In
addition, BabyCakes’ shops are located in Manhattan, Los
Angeles, and Orlando, so rent isn’t exactly inexpensive either.
Despite these costs, Erin’s fi rst store made a profi t its fi rst year
and did even better in later years. To achieve this profi tability,
Erin relies on careful budgeting. First, she needs to estimate
how many items she will sell. Then, she determines her needs
for materials, labor, and overhead. Prices for BabyCakes’
materials can fl uctuate signifi cantly, so Erin needs to update
her budget accordingly. Finally, she has to budget for other
products such as her cookbooks, baking kits, and T-shirts.
Without a budget, Erin’s business might not be so sweet.
What’s in Your Cupcake?
As the Feature Story below about BabyCakes NYC indicates, budgeting is critical to fi nancial well-being. As a student, you budget your study time and your money. Families budget income and expenses. Governmental agencies budget revenues and expenditures. Businesses use budgets in planning and controlling their operations.
Our primary focus in this chapter is budgeting—specifi cally, how budgeting is used as a planning tool by management. Through budgeting, it should be possible for management to maintain enough cash to pay creditors as well as have suffi cient raw materials to meet production requirements and adequate fi nished goods to meet expected sales.
CHAPTER PREVIEW
23
FEATURE STORY
Budgetary Planning
1004
Watch the BabyCakes NYC video in WileyPLUS to learn more about real-world budgetary planning.
▲

Go to the REVIEW AND PRACTICE section at the end of the chapter for a review of key concepts and practice applications with solutions.
Visit WileyPLUS with ORION for additional tutorials and practice opportunities.
Deidre Schoo/Th e New York Times/Redux Pictures
CHAPTER OUTLINE
Prepare budgets for sales, production, and direct materials.
Prepare budgets for direct labor, manufacturing overhead, and selling and administrative expenses, and a budgeted income statement.
2
3
Prepare a cash budget and a budgeted balance sheet.4
State the essentials of effective budgeting and the components of the master budget.
1 Budget TerminologyDO IT! 1
• Budgeting and accounting• Benefi ts of budgeting• Effective budgeting essentials• Master budget
Sales, Production, and Direct Materials Budgets
DO IT! 2• Sales budget• Production budget• Direct materials budget
Learning Objectives
Budgeted Income StatementDO IT! 3
Cash BudgetDO IT! 4
• Direct labor budget• Manufacturing overhead budget• Selling and administrative
expense budget• Budgeted income statement
• Cash budget• Budgeted balance sheet
Apply budgeting principles to nonmanufacturing companies.5 Merchandise Purchases
BudgetDO IT! 5
• Merchandisers• Service companies• Not-for-profi t organizations

1006 23 Budgetary Planning
1 State the essentials of effective budgeting and the components of the master budget.
LEARNING OBJECTIVE
One of management’s major responsibilities is planning. As explained in Chapter 19, planning is the process of establishing company-wide objectives. A successful organization makes both long-term and short-term plans. These plans establish the objectives of the company and the proposed way of accom-plishing them. A budget is a formal written statement of management’s plans for a specifi ed future time period, expressed in fi nancial terms. It represents the primary method of communicating agreed-upon objectives throughout the organization. Once adopted, a budget becomes an important basis for evaluating performance. It promotes effi ciency and serves as a deterrent to waste and ineffi ciency. We con-sider the role of budgeting as a control device in Chapter 24.
Budgeting and Accounting
Accounting information makes major contributions to the budgeting process. From the accounting records, companies can obtain historical data on revenues, costs, and expenses. These data are helpful in formulating future budget goals. Normally, accountants have the responsibility for presenting management’s budgeting goals in fi nancial terms. In this role, they translate management’s plans and communicate the budget to employees throughout the company. They prepare periodic budget reports that provide the basis for measuring performance and comparing actual results with planned objectives. The budget itself and the administration of the budget, however, are entirely management responsibilities.
The Benefi ts of Budgeting
The primary benefi ts of budgeting are as follows.
1. It requires all levels of management to plan ahead and to formalize goals on a recurring basis.
2. It provides defi nite objectives for evaluating performance at each level of responsibility.
3. It creates an early warning system for potential problems so that management can make changes before things get out of hand.
4. It facilitates the coordination of activities within the business. It does this by correlating the goals of each segment with overall company objectives. Thus, the company can integrate production and sales promotion with expected sales.
5. It results in greater management awareness of the entity’s overall operations and the impact on operations of external factors, such as economic trends.
6. It motivates personnel throughout the organization to meet planned objectives.
A budget is an aid to management; it is not a substitute for management. A budget cannot operate or enforce itself. Companies can realize the benefi ts of budgeting only when managers carefully administer budgets.
Essentials of Effective Budgeting
Effective budgeting depends on a sound organizational structure. In such a structure, authority and responsibility for all phases of operations are clearly defi ned. Budgets based on research and analysis are more likely to result in

Effective Budgeting and the Master Budget 1007
realistic goals that will contribute to the growth and profi tability of a company. And, the effectiveness of a budget program is directly related to its acceptance by all levels of management. Once adopted, the budget is an important tool for evaluating performance. Managers should systematically and periodically review variations between actual and expected results to determine their cause(s). However, individuals should not be held responsible for variations that are beyond their control.
LENGTH OF THE BUDGET PERIOD
The budget period is not necessarily one year in length. A budget may be pre-pared for any period of time. Various factors infl uence the length of the budget period. These factors include the type of budget, the nature of the organization, the need for periodic appraisal, and prevailing business conditions. The budget period should be long enough to provide an attainable goal under normal business conditions. Ideally, the time period should minimize the impact of seasonal or cyclical fl uctuations. On the other hand, the budget period should not be so long that reliable estimates are impossible. The most common budget period is one year. The annual budget, in turn, is often supplemented by monthly and quarterly budgets. Many companies use continuous 12-month budgets. These budgets drop the month just ended and add a future month. One benefi t of continuous budgeting is that it keeps manage-ment planning a full year ahead.
Businesses Often Feel Too Busy to Plan for the Future
A study by Wil-lard & Shullman Group Ltd. found that fewer than 14% of busi-nesses with less than 500 employ-ees do an annual budget or have a written business plan. For many
small businesses, the basic assumption is that, “As long as I sell as much as I can, and keep my employees paid, I’m doing OK.” A few small business owners even say that they see no need for budgeting and planning. Most small busi-ness owners, though, say that they understand that bud-geting and planning are critical for survival and growth. But given the long hours that they already work address-ing day-to-day challenges, they also say that they are “just too busy to plan for the future.”
Describe a situation in which a business “sells as much as it can” but cannot “keep its employees paid.” (Go to WileyPLUS for this answer and additional questions.)
Accounting Across the Organization
Th inkstock/Comstock/Getty Images, Inc.
THE BUDGETING PROCESS
The development of the budget for the coming year generally starts several months before the end of the current year. The budgeting process usually begins with the collection of data from each organizational unit of the company. Past performance is often the starting point from which future budget goals are formulated. The budget is developed within the framework of a sales forecast. This fore-cast shows potential sales for the industry and the company’s expected share of such sales. Sales forecasting involves a consideration of various factors: (1) gen-eral economic conditions, (2) industry trends, (3) market research studies, (4) anticipated advertising and promotion, (5) previous market share, (6) changes

1008 23 Budgetary Planning
in prices, and (7) technological developments. The input of sales personnel and top management is essential to the sales forecast. In small companies like BabyCakes NYC, the budgeting process is often informal. In larger companies, a budget committee has responsibility for coor-dinating the preparation of the budget. The committee ordinarily includes the president, treasurer, chief accountant (controller), and management personnel from each of the major areas of the company, such as sales, production, and research. The budget committee serves as a review board where managers can defend their budget goals and requests. Differences are reviewed, modifi ed if nec-essary, and reconciled. The budget is then put in its fi nal form by the budget committee, approved, and distributed.
BUDGETING AND HUMAN BEHAVIOR
A budget can have a signifi cant impact on human behavior. If done well, it can inspire managers to higher levels of performance. However, if done poorly, bud-gets can discourage additional effort and pull down the morale of managers. Why do these diverse effects occur? The answer is found in how the budget is devel-oped and administered. In developing the budget, each level of management should be invited to participate. This “bottom-to-top” approach is referred to as participative bud-geting. One benefi t of participative budgeting is that lower-level managers have more detailed knowledge of their specifi c area and thus are able to provide more accurate budgetary estimates. Also, when lower-level managers participate in the budgeting process, they are more likely to perceive the resulting budget as fair. The overall goal is to reach agreement on a budget that the managers con-sider fair and achievable, but which also meets the corporate goals set by top management. When this goal is met, the budget will provide positive motivation for the managers. In contrast, if managers view the budget as unfair and unreal-istic, they may feel discouraged and uncommitted to budget goals. The risk of having unrealistic budgets is generally greater when the budget is developed from top management down to lower management than vice versa. Illustration 23-1 graphically displays the fl ow of budget data from bottom to top under partic-ipative budgeting.Illustration 23-1
Flow of budget data under participative budgeting
President
Vice President
Production
Manager
Plant A
Department
Manager
Department
Manager
Department
Manager
Department
Manager
Manager
Plant B
For example, at one time, in an effort to revive its plummeting stock price, Time Warner’s top management determined and publicly announced bold new fi nancial goals for the coming year. Unfortunately, these goals were not reached.

Effective Budgeting and the Master Budget 1009
The next year, the company got a new CEO who said the company would now actually set reasonable goals that it could meet. The new budgets were devel-oped with each operating unit setting what it felt were optimistic but attainable goals. In the words of one manager, using this approach created a sense of teamwork. Participative budgeting does, however, have potential disadvantages. First, the “give and take” of participative budgeting is time-consuming (and thus more costly). Under a “top-down” approach, the budget is simply developed by top management and then dictated to lower-level managers. A second disadvantage is that participative budgeting can foster budgetary “gaming” through budgetary slack. Budgetary slack occurs when managers intentionally underestimate bud-geted revenues or overestimate budgeted expenses in order to make it easier to achieve budgetary goals. To minimize budgetary slack, higher-level managers must carefully review and thoroughly question the budget projections provided to them by employees whom they supervise. For the budget to be effective, top management must completely support the budget. The budget is an important basis for evaluating performance. It also can be used as a positive aid in achieving projected goals. The effect of an evaluation is positive when top management tempers criticism with advice and assistance. In contrast, a manager is likely to respond negatively if top manage-ment uses the budget exclusively to assess blame. A budget should not be used as a pressure device to force improved performance. In sum, a budget can be a manager’s friend or foe.
BUDGETING AND LONG-RANGE PLANNING
Budgeting and long-range planning are not the same. One important difference is the time period involved. The maximum length of a budget is usually one year, and budgets are often prepared for shorter periods of time, such as a month or a quarter. In contrast, long-range planning usually encompasses a period of at least fi ve years. A second signifi cant difference is in emphasis. Budgeting focuses on achiev-ing specifi c short-term goals, such as meeting annual profi t objectives. Long-range planning, on the other hand, identifi es long-term goals, selects strategies to achieve those goals, and develops policies and plans to implement the strate-gies. In long-range planning, management also considers anticipated trends in the economic and political environment and how the company should cope with them. The fi nal difference between budgeting and long-range planning relates to the amount of detail presented. Budgets, as you will see in this chapter, can be very detailed. Long-range plans contain considerably less detail. The data in long-range plans are intended more for a review of progress toward long-term goals than as a basis of control for achieving specifi c results. The primary objective of long-range planning is to develop the best strategy to maximize the company’s performance over an extended future period.
The Master Budget
The term “budget” is actually a shorthand term to describe a variety of budget documents. All of these documents are combined into a master budget. The master budget is a set of interrelated budgets that constitutes a plan of action for a specifi ed time period. The master budget contains two classes of budgets. Operating budgets are the individual budgets that result in the preparation of the budgeted income statement. These budgets establish goals for the company’s sales and production personnel. In contrast, fi nancial budgets focus primarily on the cash resources needed to fund expected operations and planned capital expenditures. Financial
ETHICS NOTE
Unrealistic budgets can lead to unethical employee behavior such as cutting corners on the job or distorting internal fi nancial reports.
Helpful HintIn comparing a budget with a long-range plan, a budget has more detail and is more concerned with short-term goals, while a long-range plan is done for a longer period of time.

1010 23 Budgetary Planning
Illustration 23-2Components of the master budget
Hayes Co.Budget
Rightride
Operating
Budgets
Financial
Budgets
CapitalExpenditure
BudgetCash Budget
BudgetedBalanceSheet
Selling andAdministrativeExpense Budget
BudgetedIncome
Statement
DirectMaterialsBudget
DirectLabor
Budget
ProductionBudget
Sales Budget
ManufacturingOverhead
Budget
Use this list of terms to complete the sentences that follow.
Long-range planning Participative budgetingSales forecast Operating budgetsMaster budget Financial budgets
1. A ________________ shows potential sales for the industry and a company’s expected share of such sales.
2. __________________ are used as the basis for the preparation of the budgeted income statement.
3. The _______________ is a set of interrelated budgets that constitutes a plan of action for a specifi ed time period.
4. ___________________ identifi es long-term goals, selects strategies to achieve these goals, and develops policies and plans to implement the strategies.
DO IT! 1 Budget Terminology
budgets include the capital expenditure budget, the cash budget, and the bud-geted balance sheet. Illustration 23-2 shows the individual budgets included in a master budget, and the sequence in which they are prepared. The company fi rst develops the operating budgets, beginning with the sales budget. Then, it prepares the fi nan-cial budgets. We will explain and illustrate each budget shown in Illustration 23-2 except the capital expenditure budget. That budget is discussed under the topic of capital budgeting in Chapter 26.

Sales, Production, and Direct Materials Budgets 1011
2 Prepare budgets for sales, production, and direct materials.LEARNING OBJECTIVE
We use a case study of Hayes Company in preparing the operating budgets. Hayes manufactures and sells a single product, an ergonomically designed bike seat with multiple customizable adjustments, called the Rightride. The budgets are prepared by quarters for the year ending December 31, 2017. Hayes Company begins its annual budgeting process on September 1, 2016, and it completes the budget for 2017 by December 1, 2016. The company begins by preparing the bud-gets for sales, production, and direct materials.
Sales Budget
As shown in the master budget in Illustration 23-2, the sales budget is prepared fi rst. Each of the other budgets depends on the sales budget. The sales budget is derived from the sales forecast. It represents management’s best estimate of sales revenue for the budget period. An inaccurate sales budget may adversely affect net income. For example, an overly optimistic sales budget may result in excessive inventories that may have to be sold at reduced prices. In contrast, an unduly pes-simistic sales budget may result in loss of sales revenue due to inventory shortages. For example, at one time Amazon.com signifi cantly underestimated demand for its e-book reader, the Kindle. As a consequence, it did not produce enough Kindles and was completely sold out well before the holiday shopping season. Not only did this represent a huge lost opportunity for Amazon, but it exposed the company to potential competitors, who were eager to provide customers with alternatives to the Kindle. Forecasting sales is challenging. For example, consider the forecasting chal-lenges faced by major sports arenas, whose revenues depend on the success of the home team. Madison Square Garden’s revenues from April to June were $193 million during a year when the Knicks made the NBA playoffs. But revenues were only $133.2 million a couple of years later when the team did not make the play-offs. Or, consider the challenges faced by Hollywood movie producers in predict-ing the complicated revenue stream produced by a new movie. Movie theater ticket sales represent only 20% of total revenue. The bulk of revenue comes from global sales, DVDs, video-on-demand, merchandising products, and videogames, all of which are diffi cult to forecast. The sales budget is prepared by multiplying the expected unit sales volume for each product by its anticipated unit selling price. Hayes Company expects sales volume to be 3,000 units in the fi rst quarter, with 500-unit increases in each succeeding quarter. Illustration 23-3 (page 1012) shows the sales budget for the year, by quarter, based on a sales price of $60 per unit.
Helpful HintFor a retail or manufac-turing company, the sales budget is the starting point for the master budget. It sets the level of activity for other functions such as production and purchasing.
Action Plan✔ Understand the budget-
ing process, including the importance of the sales forecast.
✔ Understand the difference between an operating budget and a fi nancial budget.
✔ Differentiate budgeting from long-range planning.
✔ Realize that the master budget is a set of interrelated budgets.
Solution
1. Sales forecast. 4. Long-range planning.
2. Operating budgets. 5. Participative budgeting.
3. Master budget. 6. Financial budgets.
5. Lower-level managers are more likely to perceive results as fair and achievable under a ________________ approach.
6. ___________________ focus primarily on the cash resources needed to fund expected operations and planned capital expenditures.
Related exercise material: BE23-1, E23-1, and DO IT! 23-1.
SERVICE

1012 23 Budgetary Planning
Some companies classify the anticipated sales revenue as cash or credit sales and by geographical regions, territories, or salespersons.
The Impli-cations of Budgetary Optimism
Companies aren’t the only ones that have to estimate revenues. Govern-ments at all levels (e.g., local, state
or federal) prepare annual budgets. Most are required to submit balanced budgets, that is, estimated revenues are supposed to cover anticipated expenditures. Unfortunately, estimating government revenues can be as diffi cult as, or even more diffi cult than, estimating company revenues. For example, during a recent year, the median state government
overestimated revenues by 10.2%, with four state govern-ments missing by more than 25%. What makes estimation so diffi cult for these govern-ments? Most states rely on income taxes, which fl uctuate widely with economic gyrations. Some states rely on sales taxes, which are problematic because the laws regarding sales taxes haven’t adjusted for the shift from manufacturing to service companies and from brick-and-mortar stores to online sales.
Source: Conor Dougherty, “States Fumble Revenue Forecasts,” Wall Street Journal Online (March 2, 2011).
Why is it important that government budgets accurately estimate future revenues during economic downturns? (Go to WileyPLUS for this answer and additional questions.)
Marcela Barsse/iStockphoto
Service Company Insight
Production Budget
The production budget shows the number of units of a product to produce to meet anticipated sales demand. Production requirements are determined from the following formula.1
1This formula ignores any work in process inventories, which are assumed to be nonexistent in Hayes Company.
Illustration 23-4Production requirements formula
Desired Ending Beginning Required
Budgeted 1 Finished 2 Finished 5 Production
Sales Units
Goods Units Goods Units Units
Illustration 23-3Sales budget Formulas Data Review ViewPage LayoutInsert
1
2
3
4
5
67
8
AP18 fx
C E FB D
Hayes Company Sales Budget.xlsHayes Company Sales Budget.xls
Expected unit salesUnit selling priceTotal sales
3,0003 $60
$180,000
13,5003 $60
$210,000
4,0003 $60
$240,000
4,5003 $60
$270,000
15,0003 $60
$900,000
Home
HAYES COMPANYSales Budget
For the Year Ending December 31, 2017
Quarter
2 3 4 Year

Sales, Production, and Direct Materials Budgets 1013
The production budget, in turn, provides the basis for the budgeted costs for each manufacturing cost element, as explained in the following pages.
Direct Materials Budget
The direct materials budget shows both the quantity and cost of direct materials to be purchased. The quantities of direct materials are derived from the following formula.
A realistic estimate of ending inventory is essential in scheduling pro-duction requirements. Excessive inventories in one quarter may lead to cut-backs in production and employee layoffs in a subsequent quarter. On the other hand, inadequate inventories may result either in added costs for overtime work or in lost sales. Hayes Company believes it can meet future sales requirements by maintaining an ending inventory equal to 20% of the next quarter’s budgeted sales volume. For example, the ending fi nished goods inventory for the fi rst quarter is 700 units (20% 3 anticipated second-quarter sales of 3,500 units). Illustration 23-5 shows the production budget.
Units of Finished Goods Inventory
Beg. Inv.
Required SalesProd. Units
End. Inv.
Formulas Data Review ViewPage LayoutInsert
1
2
3
4
5
6
7
8
9
10
11
12
13
14
AP18 fx
B C FE HG I JD
Expected unit sales (Illustration 23-3)
Required production unitsLess: Beginning finished goods unitsTotal required unitsAdd: Desired ending finished goods unitsa
a20% of next quarter’s sales
c20% of estimated first-quarter 2017 sales units
bExpected 2018 first-quarter sales, 5,000 units 3 20%
1
4,5001,000b
5,500900
4,600
4,000900
4,900800
4,100
3,500800
4,300700
3,600
3,000700
3,700600c
3,100
15,400
Home
HAYES COMPANYProduction Budget
For the Year Ending December 31, 2017Quarter
2 3 4 Year
Hayes Company Production Budget.xls
Illustration 23-5Production budget
Units of Finished Goods
Inventory
600
3,100 3,000
700
Illustration 23-6Formula for direct materials quantities
Direct Desired Ending Beginning
Required Materials Units
1
Direct 2 Direct
5 Direct Materials
Required for Materials Units Materials Units
Units to Production Be Purchased
After the company determines the number of units to purchase, it can compute the budgeted cost of direct materials to be purchased. It does so by multiplying the required units of direct materials by the anticipated cost per unit.

1014 23 Budgetary Planning
Units of Direct Materials (1st Qtr.)
620
6,300 6,200
720
Formulas Data Review ViewPage LayoutInsert
1
2
3
4
5
6
7
8
9
10
11
12
13
14
15
16
AP18 fx
B C FE HG I J KD
Direct materials purchasesCost per poundTotal cost of direct materials purchases
Less: Beginning direct materials (pounds)Total materials requiredAdd: Desired ending direct materials (pounds)aTotal pounds needed for production
Units to be produced (Illustration 23-5)Direct materials per unit
a10% of next quarter’s production requirementsb10% of estimated first-quarter pounds needed for production
13,100
3 26,200
7206,920
620b
6,3003 $4
$25,200
3,6003 2
7,200820
8,020720
7,3003 $4
$29,200
4,1003 2
8,200920
9,120820
8,3003 $4
$33,200
4,6003 2
9,2001,020
10,220920
9,3003 $4
$37,200 $124,800
Home
HAYES COMPANYDirect Materials Budget
For the Year Ending December 31, 2017Quarter
2 3 4 Year
17
18
Hayes Company Direct Materials Budget.xls
Illustration 23-7Direct materials budget
Betting That Prices Won’t Fall
Sometimes things happen that cause managers to reevaluate their normal purchasing patterns. Con-sider, for example, the predicament that busi-nesses faced when the price of many raw materi-als recently skyrocketed. Rubber, cotton, oil, corn, wheat, steel, copper, and
spices—prices for seemingly everything were going straight up. Anticipating that prices might continue to go up, many
managers decided to stockpile much larger quantities of raw materials to avoid paying even higher prices in the future. For example, after cotton prices rose 92%, one manager of a printed T-shirt manufacturer decided to stockpile a huge supply of plain T-shirts in anticipation of additional price increases. While he normally has about 30 boxes of T-shirts in inventory, he purchased 2,500 boxes.
Source: Liam Pleven and Matt Wirz, “Companies Stock Up as Commodities Prices Rise,” Wall Street Journal Online (February 3, 2011).
What are the potential downsides of stockpiling a huge amount of raw materials? (Go to WileyPLUS for this answer and additional questions.)
© William Wang/iStockphoto
Management Insight
The desired ending inventory is again a key component in the budgeting process. For example, inadequate inventories could result in temporary shut-downs of production. Because of its close proximity to suppliers, Hayes Com-pany maintains an ending inventory of raw materials equal to 10% of the next quarter’s production requirements. The manufacture of each Rightride requires 2 pounds of raw materials, and the expected cost per pound is $4. Illustration 23-7 shows the direct materials budget. Assume that the desired ending direct materi-als amount is 1,020 pounds for the fourth quarter of 2017.
Units of Direct Materials
Beg. Inv.
Direct DirectMaterials to MaterialsPurchase Required for Prod.
End. Inv.

Sales, Production, and Direct Materials Budgets 1015
Soriano Company is preparing its master budget for 2017. Relevant data pertaining to its sales, production, and direct materials budgets are as follows.
Sales. Sales for the year are expected to total 1,200,000 units. Quarterly sales, as a percentage of total sales, are 20%, 25%, 30%, and 25%, respectively. The sales price is expected to be $50 per unit for the fi rst three quarters and $55 per unit beginning in the fourth quarter. Sales in the fi rst quarter of 2018 are expected to be 10% higher than the budgeted sales for the fi rst quarter of 2017.
Production. Management desires to maintain the ending fi nished goods inventories at 25% of the next quarter’s budgeted sales volume.
Direct materials. Each unit requires 3 pounds of raw materials at a cost of $5 per pound. Management desires to maintain raw materials inventories at 5% of the next quarter’s production requirements. Assume the production requirements for the fi rst quarter of 2018 are 810,000 pounds.
Prepare the sales, production, and direct materials budgets by quarters for 2017.
Solution
DO IT! 2 Sales, Production, and Direct Materials Budgets
Formulas Data Review ViewPage LayoutInsert
1
2
3
4
5
67
8
AP18 fx
C E FB D
Expected unit salesUnit selling priceTotal sales
240,0003 $50
$12,000,000
1300,000
3 $50$15,000,000
360,0003 $50
$18,000,000
300,0003 $55
$16,500,000
1,200,000
$61,500,000
Home
SORIANO COMPANYSales Budget
For the Year Ending December 31, 2017
Quarter2 3 4 Year
Soriano Company Sales Budget.xls
Formulas Data Review ViewPage LayoutInsert
1
2
3
4
5
67
8
9
10
11
12
13
14
AP18 fx
B D FEC
240,00075,000
315,00060,000c
255,000
300,00090,000
390,00075,000
315,000
360,00075,000
435,00090,000
345,000
300,00066,000b
366,00075,000
291,000 1,206,000
Home
SORIANO COMPANYProduction Budget
For the Year Ending December 31, 2017
Quarter1 2 3 4 Year
Expected unit salesAdd: Desired ending finished goods unitsa
Total required unitsLess: Beginning finished goods unitsRequired production units
a25% of next quarter's unit salesbEstimated first-quarter 2018 sales units: 240,000 � (240,000 � 10%) � 264,000: 264,000 � 25%c25% of estimated first-quarter 2017 sales units (240,000 � 25%)
Soriano Company Production Budget.xls
Action Plan✔ Know the form and
content of the sales budget.
✔ Prepare the sales bud-get fi rst, as the basis for the other budgets.
✔ Determine the units that must be produced to meet anticipated sales.
✔ Know how to compute the beginning and ending fi nished goods units.
✔ Determine the materi-als required to meet production needs.
✔ Know how to compute the begin-ning and ending direct materials units.

1016 23 Budgetary Planning
Formulas Data Review ViewPage LayoutInsert
1
2
3
4
5
67
8
9
10
11
12
13
14
15
16
17
18
AP18 fx
B D F G HEC
255,0003 3
765,000
47,250812,250
38,250b
774,0003 $5
$3,870,000
315,0003 3
945,000
51,750996,750
47,250949,500
3 $5
$4,747,500
345,0003 3
1,035,000
43,6501,078,650
51,7501,026,900
3 $5
$5,134,500
291,0003 3
873,000
40,500a
913,500
43,650869,850
3 $5
$4,349,250 $18,101,250
Home
SORIANO COMPANYDirect Materials Budget
For the Year Ending December 31, 2017
Quarter
1 2 3 4 YearUnits to be producedDirect materials per unitTotal pounds needed for productionAdd: Desired ending direct materials (pounds)Total materials requiredLess: Beginning direct materials (pounds)Direct materials purchasesCost per poundTotal cost of direct materials purchases
aEstimated first-quarter 2018 production requirements: 810,000 3 5% 5 40,500b5% of estimated first-quarter pounds needed for production
Soriano Company Direct Materials Budget.xls
Related exercise material: BE23-2, BE23-3, BE23-4, E23-2, E23-3, E23-4, E23-5, E23-6, E23-7, E23-8, and DO IT! 23-2.
3 Prepare budgets for direct labor, manufacturing overhead, and selling and administrative expenses, and a budgeted income statement.
LEARNING OBJECTIVE
As shown in Illustration 23-2 (page 1010), the operating budgets culminate with preparation of the budgeted income statement. Before we can do that, we need to prepare budgets for direct labor, manufacturing overhead, and selling and admin-istrative expenses.
Direct Labor Budget
Like the direct materials budget, the direct labor budget contains the quantity (hours) and cost of direct labor necessary to meet production requirements. The total direct labor cost is derived from the following formula.
Direct labor hours are determined from the production budget. At Hayes Company, two hours of direct labor are required to produce each unit of fi nished goods. The anticipated hourly wage rate is $10. Illustration 23-9 shows these data.
Units to Direct Labor Direct Labor Be 3 Hours 3 Cost 5
Total Direct
Produced per Unit per Hour Labor Cost
Illustration 23-8Formula for direct labor cost

Direct Labor, Manufacturing Overhead, and S&A Expense Budgets 1017
Formulas Data Review ViewPage LayoutInsert
1
2
3
4
5
67
8
9
10
11
AP18 fx
CB GF JIHED
3,1003 2
6,2003 $10
$62,000
3,6003 2
7,2003 $10
$72,000
4,1003 2
8,2003 $10
$82,000
4,6003 2
9,2003 $10
$92,000 $308,000
Home
HAYES COMPANYDirect Labor Budget
For the Year Ending December 31, 2017Quarter
1 2 3 4 YearUnits to be produced (Illustration 23-5)Direct labor time (hours) per unitTotal required direct labor hoursDirect labor cost per hourTotal direct labor cost
Hayes Company Direct Labor Budget.xls
Illustration 23-9Direct labor budget
Helpful HintAn important assumption in Illustration 23-9 is that the company can add to and subtract from its work force as needed so that the $10 per hour labor cost applies to a wide range of possible production activity.
Formulas Data Review ViewPage LayoutInsert
1
2
3
4
5
6
7
8
9
10
11
12
13
14
15
16
17
18
19
20
21
AP18 fx
CB FED
$ 6,2008,6802,4801,240
18,600
20,0003,8009,0005,700
38,500$57,100
6,200
$ 7,20010,080
2,8801,440
21,600
20,0003,8009,0005,700
38,500$60,100
7,200
$ 8,20011,480
3,2801,640
24,600
20,0003,8009,0005,700
38,500$63,100
8,200
$ 9,20012,880
3,6801,840
27,600
20,0003,8009,0005,700
38,500$66,100
9,200
$ 30,80043,12012,320
6,16092,400
80,00015,20036,00022,800
154,000$246,400
30,800$8
Home
HAYES COMPANYManufacturing Overhead Budget
For the Year Ending December 31, 2017Quarter
1 2 3 4 YearVariable costs Indirect materials ($1.00/hour) Indirect labor ($1.40/hour) Utilities ($0.40/hour) Maintenance ($0.20/hour) Total variable costsFixed costs Supervisory salaries Depreciation Property taxes and insurance Maintenance Total fixed costsTotal manufacturing overheadDirect labor hours (Illustration 23-9)Manufacturing overhead rate per direct labor hour ($246,400 4 30,800)
Hayes Company Manufacturing Overhead Budget.xls Illustration 23-10Manufacturing overhead budget
The direct labor budget is critical in maintaining a labor force that can meet the expected levels of production.
Manufacturing Overhead Budget
The manufacturing overhead budget shows the expected manufacturing over-head costs for the budget period. As Illustration 23-10 shows, this budget distin-guishes between variable and fi xed overhead costs. Hayes Company expects variable costs to fl uctuate with production volume on the basis of the following rates per direct labor hour: indirect materials $1.00, indirect labor $1.40, utilities $0.40, and maintenance $0.20. Thus, for the 6,200 direct labor hours to produce 3,100 units, budgeted indirect materials are $6,200 (6,200 3 $1), and budgeted indirect labor is $8,680 (6,200 3 $1.40). Hayes also recognizes that some mainte-nance is fi xed. The amounts reported for fi xed costs are assumed for our example.

1018 23 Budgetary Planning
The accuracy of budgeted overhead cost estimates can be greatly improved by employing activity-based costing. At Hayes Company, overhead is applied to production on the basis of direct labor hours. Thus, as Illustration 23-10 shows, the budgeted annual rate is $8 per hour ($246,400 4 30,800).
Selling and Administrative Expense Budget
Hayes Company combines its operating expenses into one budget, the selling and administrative expense budget. This budget projects anticipated selling and administrative expenses for the budget period. This budget (Illustration 23-11) also classifi es expenses as either variable or fi xed. In this case, the variable expense rates per unit of sales are sales commissions $3 and freight-out $1. Vari-able expenses per quarter are based on the unit sales from the sales budget (see Illustration 23-3, page 1012). For example, Hayes expects sales in the fi rst quarter to be 3,000 units. Thus, sales commissions expense is $9,000 (3,000 3 $3), and freight-out is $3,000 (3,000 3 $1). Fixed expenses are based on assumed data.
Formulas Data Review ViewPage LayoutInsert
1
2
3
4
5
6
7
8
9
10
11
12
13
14
15
16
17
18
19
AP18 fx
CB FED
Home
Quarter1 2 3 4 Year
HAYES COMPANYSelling and Administrative Expense Budget
For the Year Ending December 31, 2017
Budgeted sales in units (Illustration 23-3)Variable expenses Sales commissions ($3 per unit) Freight-out ($1 per unit) Total variable expensesFixed expenses Advertising Sales salaries Office salaries Depreciation Property taxes and insurance Total fixed expensesTotal selling and administrative expenses
3,000
$ 9,0003,000
12,000
5,00015,000
7,5001,0001,500
30,000
$42,000
3,500
$10,5003,500
14,000
5,00015,000
7,5001,0001,500
30,000
$44,000
4,000
$12,0004,000
16,000
5,00015,000
7,5001,0001,500
30,000
$46,000
4,500
$13,5004,500
18,000
5,00015,000
7,5001,0001,500
30,000
$48,000
15,000
$ 45,00015,00060,000
20,00060,00030,000
4,0006,000
120,000
$180,000
Hayes Company Manufacturing Selling and Administrative Expense Budget.xls
Illustration 23-11Selling and administrative expense budget
Budgeted Income Statement
The budgeted income statement is the important end-product of the operating budgets. This budget indicates the expected profi tability of operations for the budget period. The budgeted income statement provides the basis for evaluating company performance. Budgeted income statements often act as a call to action. For example, a board member at XM Satellite Radio Holdings felt that budgeted costs were too high relative to budgeted revenues. When management refused to cut its marketing and programming costs, the board member resigned. He felt that without the cuts, the company risked fi nancial crisis. As you would expect, the budgeted income statement is prepared from the various operating budgets. For example, to fi nd the cost of goods sold, Hayes Company must fi rst determine the total unit cost of producing one Rightride, as follows.
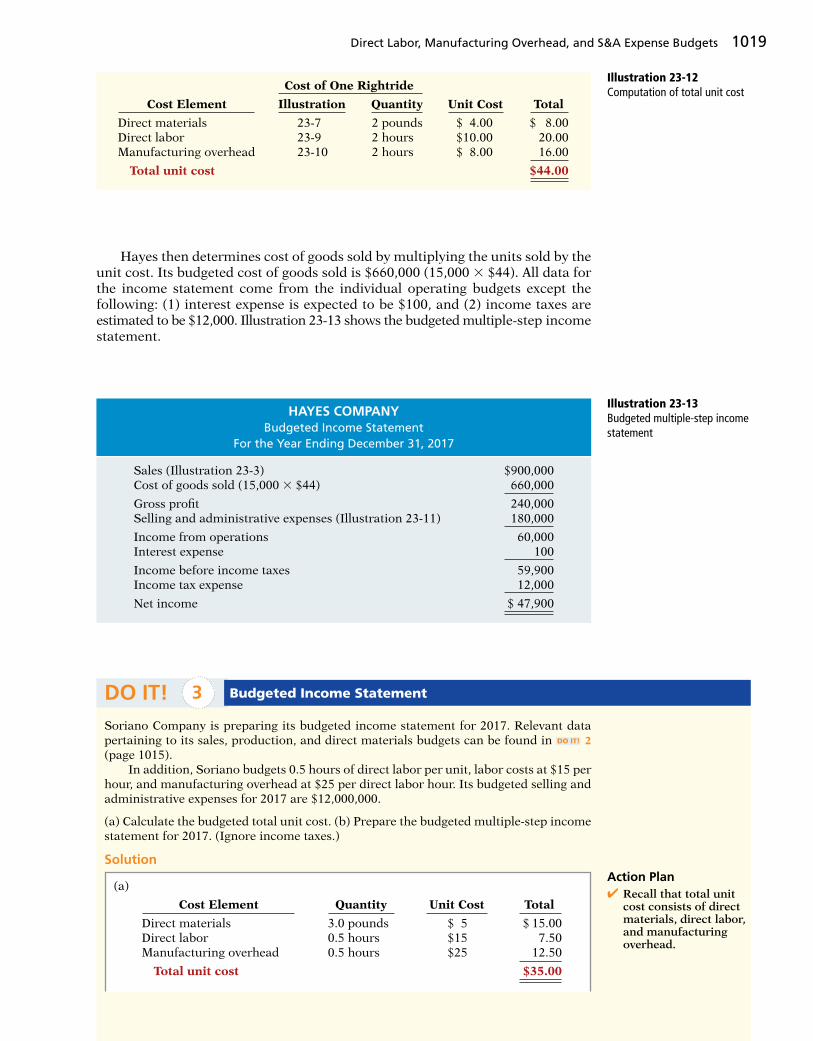
Direct Labor, Manufacturing Overhead, and S&A Expense Budgets 1019
Hayes then determines cost of goods sold by multiplying the units sold by the unit cost. Its budgeted cost of goods sold is $660,000 (15,000 3 $44). All data for the income statement come from the individual operating budgets except the following: (1) interest expense is expected to be $100, and (2) income taxes are estimated to be $12,000. Illustration 23-13 shows the budgeted multiple-step income statement.
Cost of One Rightride
Cost Element Illustration Quantity Unit Cost Total
Direct materials 23-7 2 pounds $ 4.00 $ 8.00 Direct labor 23-9 2 hours $10.00 20.00 Manufacturing overhead 23-10 2 hours $ 8.00 16.00
Total unit cost $44.00
Illustration 23-12Computation of total unit cost
HAYES COMPANYBudgeted Income Statement
For the Year Ending December 31, 2017
Sales (Illustration 23-3) $900,000Cost of goods sold (15,000 3 $44) 660,000
Gross profi t 240,000Selling and administrative expenses (Illustration 23-11) 180,000
Income from operations 60,000Interest expense 100
Income before income taxes 59,900Income tax expense 12,000
Net income $ 47,900
Illustration 23-13Budgeted multiple-step income statement
Soriano Company is preparing its budgeted income statement for 2017. Relevant data pertaining to its sales, production, and direct materials budgets can be found in DO IT! 2 (page 1015).
In addition, Soriano budgets 0.5 hours of direct labor per unit, labor costs at $15 per hour, and manufacturing overhead at $25 per direct labor hour. Its budgeted selling and administrative expenses for 2017 are $12,000,000.
(a) Calculate the budgeted total unit cost. (b) Prepare the budgeted multiple-step income statement for 2017. (Ignore income taxes.)
Solution
DO IT! 3 Budgeted Income Statement
(a)
Cost Element Quantity Unit Cost Total
Direct materials 3.0 pounds $ 5 $ 15.00Direct labor 0.5 hours $15 7.50Manufacturing overhead 0.5 hours $25 12.50
Total unit cost $35.00
Action Plan✔ Recall that total unit
cost consists of direct materials, direct labor, and manufacturing overhead.

1020 23 Budgetary Planning
(b)
SORIANO COMPANYBudgeted Income Statement
For the Year Ending December 31, 2017
Sales (1,200,000 units from sales budget, page 1015) $61,500,000Cost of goods sold (1,200,000 3 $35.00/unit) 42,000,000
Gross profi t 19,500,000
Selling and administrative expenses 12,000,000
Net income $ 7,500,000
Action Plan (cont.)✔ Recall that direct
materials costs are included in the direct materials budget.
✔ Know the form and content of the income statement.
✔ Use the total unit sales information from the sales budget to compute annual sales and cost of goods sold.
Related exercise material: BE23-8, E23-11, E23-13, and DO IT! 23-3.
4 Prepare a cash budget and a budgeted balance sheet.LEARNING OBJECTIVE
As shown in Illustration 23-2 (page 1010), the fi nancial budgets consist of the capital expenditure budget, the cash budget, and the budgeted balance sheet. We will discuss the capital expenditure budget in Chapter 26.
Cash Budget
The cash budget shows anticipated cash fl ows. Because cash is so vital, this budget is often considered to be the most important fi nancial budget. The cash budget contains three sections (cash receipts, cash disbursements, and fi nancing) and the beginning and ending cash balances, as shown in Illustration 23-14.
Formulas Data Review ViewPage LayoutInsert
1
2
3
4
5
67
8
9
AP18 fx
B C
Any Company Cash Budget.xlsAny Company Cash Budget.xls
Beginning cash balanceAdd: Cash receipts (itemized)Total available cashLess: Cash disbursements (itemized)Excess (deficiency) of available cash over cash disbursementsFinancingEnding cash balance
$X,XXXX,XXXX,XXXX,XXXX,XXXX,XXX
$X,XXX
Home
ANY COMPANYCash Budget
Illustration 23-14Basic form of a cash budget
Helpful HintThe cash budget is pre-pared after the other budgets because the information generated by the other budgets dictates the expected infl ows and outfl ows of cash.
The cash receipts section includes expected receipts from the company’s principal source(s) of revenue. These are usually cash sales and collections from customers on credit sales. This section also shows anticipated receipts of interest and dividends, and proceeds from planned sales of investments, plant assets, and the company’s capital stock. The cash disbursements section shows expected cash payments. Such pay-ments include direct materials, direct labor, manufacturing overhead, and selling

Cash Budget and Budgeted Balance Sheet 1021
and administrative expenses. This section also includes projected payments for income taxes, dividends, investments, and plant assets. The fi nancing section shows expected borrowings and the repayment of the borrowed funds plus interest. Companies need this section when there is a cash defi ciency or when the cash balance is below management’s minimum required balance. Data in the cash budget are prepared in sequence. The ending cash balance of one period becomes the beginning cash balance for the next period. Compa-nies obtain data for preparing the cash budget from other budgets and from information provided by management. In practice, cash budgets are often pre-pared for the year on a monthly basis. To minimize detail, we will assume that Hayes Company prepares an annual cash budget by quarters. Its cash budget is based on the following assumptions.
1. The January 1, 2017, cash balance is expected to be $38,000. Hayes wishes to maintain a balance of at least $15,000.
2. Sales (Illustration 23-3, page 1012): 60% are collected in the quarter sold and 40% are collected in the following quarter. Accounts receivable of $60,000 at December 31, 2016, are expected to be collected in full in the fi rst quarter of 2017.
3. Short-term investment securities are expected to be sold for $2,000 cash in the fi rst quarter.
4. Direct materials (Illustration 23-7, page 1014): 50% are paid in the quarter purchased and 50% are paid in the following quarter. Accounts payable of $10,600 at December 31, 2016, are expected to be paid in full in the fi rst quarter of 2017.
5. Direct labor (Illustration 23-9, page 1017): 100% is paid in the quarter incurred.
6. Manufacturing overhead (Illustration 23-10, page 1017) and selling and administrative expenses (Illustration 23-11, page 1018): All items except depreciation are paid in the quarter incurred.
7. Management plans to purchase a truck in the second quarter for $10,000 cash.
8. Hayes makes equal quarterly payments of its estimated $12,000 annual income taxes.
9. Loans are repaid in the earliest quarter in which there is suffi cient cash (that is, when the cash on hand exceeds the $15,000 minimum required balance).
In preparing the cash budget, it is useful to prepare schedules for collections from customers (assumption 2) and cash payments for direct materials (assumption 4). These schedules are shown in Illustrations 23-15 (below) and 23-16 (page 1022).
Formulas Data Review ViewPage LayoutInsert
1
2
3
4
5
67
8
9
10
11
12
13
AP18 fx
C E FB D
Hayes Company.xlsHayes Company.xls
Accounts receivable, 12/31/16First quarterSecond quarterThird quarterFourth quarter Total collections
aPer Illustration 23-3; b$180,000 � .60; c$180,000 � .40
$180,000
$168,000 $198,000 $228,000 $258,000
210,000 126,000240,000 144,000
162,000270,000
108,000b
Salesa
$ 60,000
$ 72,000c
$ 84,000$ 96,000
Home
HAYES COMPANYSchedule of Expected Collections from Customers
Collections by Quarter
1 2 3 4
Illustration 23-15Collections from customers

1022 23 Budgetary Planning
Illustration 23-17 shows the cash budget for Hayes Company. The budget indicates that Hayes will need $3,000 of fi nancing in the second quarter to main-tain a minimum cash balance of $15,000. Since there is an excess of available cash over disbursements of $22,500 at the end of the third quarter, the borrow-ing, plus $100 interest, is repaid in this quarter.
Illustration 23-16Payments for direct materials Formulas Data Review ViewPage LayoutInsert
1
2
3
4
5
67
8
9
10
11
12
13
AP18 fx
C E FB D
Hayes Company.xlsHayes Company.xls
Accounts payable, 12/31/16First quarterSecond quarterThird quarterFourth quarter Total payments
aPer Illustration 23-7; b$25,200 3 .50; c$25,200 3 .50
$25,200
$23,200 $27,200 $31,200 $35,200
29,200 14,60033,200 16,600
18,60037,200
12,600b
Purchasesa
$10,600
$12,600c
$14,600$16,600
Home
HAYES COMPANYSchedule of Expected Payments for Direct Materials
Payments by Quarter
1 2 3 4
Illustration 23-17Cash budget
Formulas Data Review ViewPage LayoutInsert
1
2
3
4
5
6
7
8
9
10
11
12
13
14
15
16
17
18
19
20
21
22
23
24
25
26
27
AP18 fx
B E F G H I JDC
Home
Quarter
Assumption1
23
456678
9
1 2 3 4Beginning cash balanceAdd: Receipts Collections from customers Sale of investment securities Total receiptsTotal available cashLess: Disbursements Direct materials Direct labor Manufacturing overhead Selling and administrative expenses Purchase of truck Income tax expense Total disbursementsExcess (deficiency) of available cash over cash disbursementsFinancing Add: Borrowings Less: Repayments including interestEnding cash balance
a$57,100 2 $3,800 depreciationb$42,000 2 $1,000 depreciation
$ 38,000
168,0002,000
170,000208,000
23,20062,00053,300a
41,000b
03,000
182,500
25,500
00
$ 25,500
$ 25,500
198,0000
198,000223,500
27,20072,00056,30043,00010,000
3,000211,500
12,000
3,0000
$ 15,000
$ 15,000
228,0000
228,000243,000
31,20082,00059,30045,000
03,000
220,500
22,500
03,100
$ 19,400
$ 19,400
258,0000
258,000277,400
35,20092,00062,30047,000
03,000
239,500
37,900
00
$ 37,900
HAYES COMPANYCash Budget
For the Year Ending December 31, 2017
Hayes Company Cash Budget.xls
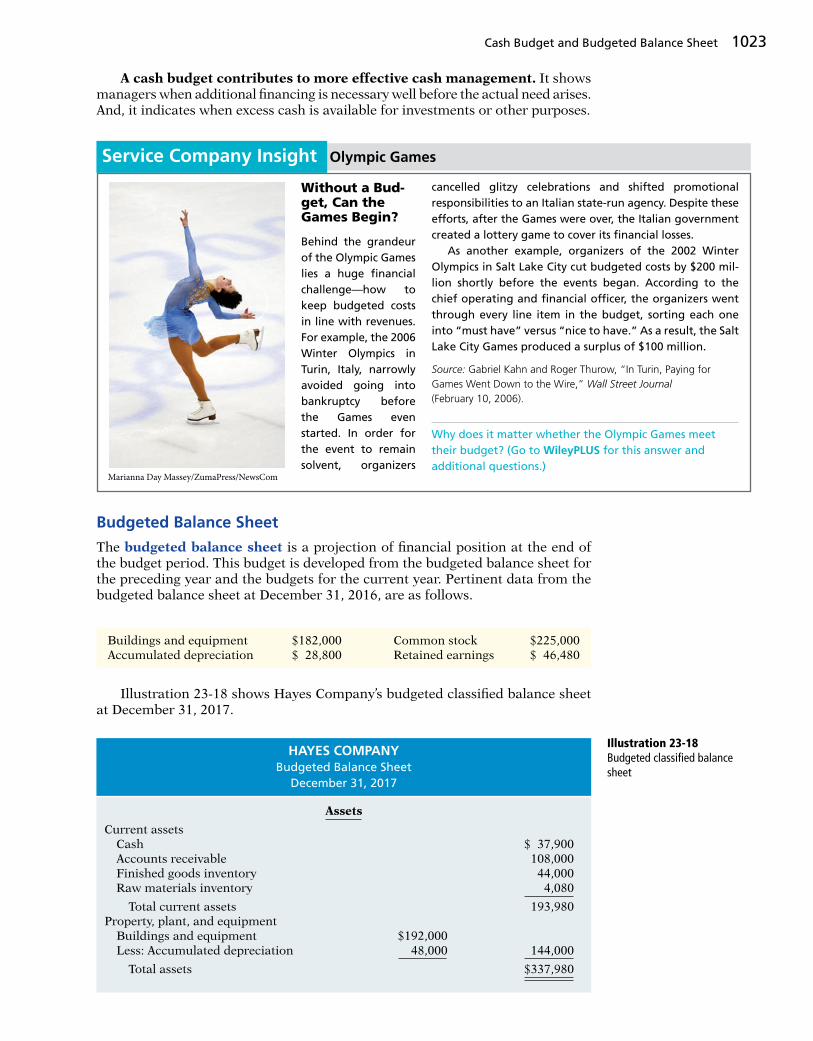
Cash Budget and Budgeted Balance Sheet 1023
A cash budget contributes to more effective cash management. It shows managers when additional fi nancing is necessary well before the actual need arises. And, it indicates when excess cash is available for investments or other purposes.
Without a Bud-get, Can the Games Begin?
Behind the grandeur of the Olympic Games lies a huge fi nancial challenge—how to keep budgeted costs in line with revenues. For example, the 2006 Winter Olympics in Turin, Italy, narrowly avoided going into bankruptcy before the Games even started. In order for the event to remain solvent, organizers
cancelled glitzy celebrations and shifted promotional responsibilities to an Italian state-run agency. Despite these efforts, after the Games were over, the Italian government created a lottery game to cover its fi nancial losses.
As another example, organizers of the 2002 Winter Olympics in Salt Lake City cut budgeted costs by $200 mil-lion shortly before the events began. According to the chief operating and fi nancial offi cer, the organizers went through every line item in the budget, sorting each one into “must have” versus “nice to have.” As a result, the Salt Lake City Games produced a surplus of $100 million.
Source: Gabriel Kahn and Roger Thurow, “In Turin, Paying for Games Went Down to the Wire,” Wall Street Journal (February 10, 2006).
Why does it matter whether the Olympic Games meet their budget? (Go to WileyPLUS for this answer and additional questions.)
Marianna Day Massey/ZumaPress/NewsCom
Service Company Insight Olympic Games
Budgeted Balance Sheet
The budgeted balance sheet is a projection of fi nancial position at the end of the budget period. This budget is developed from the budgeted balance sheet for the preceding year and the budgets for the current year. Pertinent data from the budgeted balance sheet at December 31, 2016, are as follows.
Buildings and equipment $182,000 Common stock $225,000Accumulated depreciation $ 28,800 Retained earnings $ 46,480
Illustration 23-18 shows Hayes Company’s budgeted classifi ed balance sheet at December 31, 2017.
HAYES COMPANYBudgeted Balance Sheet
December 31, 2017
Assets
Current assets Cash $ 37,900 Accounts receivable 108,000 Finished goods inventory 44,000 Raw materials inventory 4,080
Total current assets 193,980Property, plant, and equipment Buildings and equipment $192,000 Less: Accumulated depreciation 48,000 144,000
Total assets $337,980
Illustration 23-18Budgeted classifi ed balance sheet

1024 23 Budgetary Planning
The computations and sources of the amounts are explained below.
Cash: Ending cash balance $37,900, shown in the cash budget (Illustration 23-17, page 1022).
Accounts receivable: 40% of fourth-quarter sales $270,000, shown in the schedule of expected collections from customers (Illustration 23-15, page 1021).
Finished goods inventory: Desired ending inventory 1,000 units, shown in the production budget (Illustration 23-5, page 1013) times the total unit cost $44 (shown in Illustration 23-12, page 1019).
Raw materials inventory: Desired ending inventory 1,020 pounds, times the cost per pound $4, shown in the direct materials budget (Illustration 23-7, page 1014).
Buildings and equipment: December 31, 2016, balance $182,000, plus pur-chase of truck for $10,000 (Illustration 23-17, page 1022).
Accumulated depreciation: December 31, 2016, balance $28,800, plus $15,200 depreciation shown in manufacturing overhead budget (Illustration 23-10, page 1017) and $4,000 depreciation shown in selling and administra-tive expense budget (Illustration 23-11, page 1018).
Accounts payable: 50% of fourth-quarter purchases $37,200, shown in schedule of expected payments for direct materials (Illustration 23-16, page 1022).
Common stock: Unchanged from the beginning of the year.
Retained earnings: December 31, 2016, balance $46,480, plus net income $47,900, shown in budgeted income statement (Illustration 23-13, page 1019).
After budget data are entered into the computer, Hayes prepares the various budgets (sales, cash, etc.), as well as the budgeted fi nancial statements. Using spreadsheets, management can also perform “what if ” (sensitivity) analyses based on different hypothetical assumptions. For example, suppose that sales managers project that sales will be 10% higher in the coming quarter. What impact does this change have on the rest of the budgeting process and the fi nanc-ing needs of the business? The impact of the various assumptions on the budget is quickly determined by the spreadsheet. Armed with these analyses, managers make more informed decisions about the impact of various projects. They also anticipate future problems and business opportunities. As seen in this chapter, budgeting is an excellent use of computer spreadsheets.
Liabilities and Stockholders’ Equity
Liabilities Accounts payable $ 18,600Stockholders’ equity Common stock $225,000 Retained earnings 94,380
Total stockholders’ equity 319,380
Total liabilities and stockholders’ equity $337,980
Martian Company management wants to maintain a minimum monthly cash balance of $15,000. At the beginning of March, the cash balance is $16,500, expected cash receipts for March are $210,000, and cash disbursements are expected to be $220,000. How much cash, if any, must be borrowed to maintain the desired minimum monthly balance?
DO IT! 4 Cash Budget

Budgeting in Nonmanufacturing Companies 1025
5 Apply budgeting principles to nonmanufacturing companies.LEARNING OBJECTIVE
Budgeting is not limited to manufacturers. Budgets are also used by merchandisers, service companies, and not-for-profi t organizations.
Merchandisers
As in manufacturing operations, the sales budget for a merchandiser is both the starting point and the key factor in the development of the master budget. The major differences between the master budgets of a merchandiser and a manufac-turer are as follows.
1. A merchandiser uses a merchandise purchases budget instead of a pro-duction budget.
2. A merchandiser does not use the manufacturing budgets (direct materials, direct labor, and manufacturing overhead).
The merchandise purchases budget shows the estimated cost of goods to be purchased to meet expected sales. The formula for determining budgeted mer-chandise purchases is as follows.
Illustration 23-19Merchandise purchases formula
Budgeted Desired Ending Beginning Required Cost of 1 Merchandise 2 Merchandise 5 Merchandise Goods Sold Inventory Inventory Purchases
Solution
Formulas Data Review ViewPage LayoutInsert
1
2
3
4
5
67
8
9
10
AP18 fx
B C
Martian Company Cash Budget.xlsMartian Company Cash Budget.xls
Beginning cash balanceAdd: Cash receipts for MarchTotal available cashLess: Cash disbursements for MarchExcess (deficiency) of available cash over cash disbursementsFinancingEnding cash balance
To maintain the desired minimum cash balance of $15,000, Martian Company must borrow$8,500 of cash.
$ 16,500210,000226,500220,000
6,500
8,500
$ 15,000
Home
MARTIAN COMPANYCash Budget
For the Month Ending March 31, 2017
11
Related exercise material: BE23-9, E23-14, E23-15, E23-16, and DO IT! 23-4.
Action Plan✔ Write down the basic
form of the cash budget, starting with the beginning cash balance, adding cash receipts for the period, deducting cash dis-bursements, and identifying the needed fi nancing to achieve the desired minimum ending cash balance.
✔ Insert the data given into the outlined form of the cash budget.
To illustrate, assume that the budget committee of Lima Company is prepar-ing the merchandise purchases budget for July 2017. It estimates that budgeted sales will be $300,000 in July and $320,000 in August. Cost of goods sold is expected to be 70% of sales—that is, $210,000 in July (.70 3 $300,000) and $224,000 in August (.70 3 $320,000). The company’s desired ending inventory is
SERVICE

1026 23 Budgetary Planning
30% of the following month’s cost of goods sold. Required merchandise pur-chases for July are $214,200, computed as follows.
Formulas Data Review ViewPage LayoutInsert
1
2
3
4
5
67
8
AP18 fx
B C
Lima Company Merchandise Purchases Budget.xlsLima Company Merchandise Purchases Budget.xls
Budgeted cost of goods sold ($300,000 3 70%)Add: Desired ending merchandise inventory ($224,000 3 30%)TotalLess: Beginning merchandise inventory ($210,000 3 30%)Required merchandise purchases for July
$210,00067,200
277,20063,000
$214,200
Home
LIMA COMPANYMerchandise Purchases Budget
For the Month Ending July 31, 2017
Illustration 23-20Merchandise purchases budget
When a merchandiser is departmentalized, it prepares separate budgets for each department. For example, a grocery store prepares sales budgets and pur-chases budgets for each of its major departments, such as meats, dairy, and pro-duce. The store then combines these budgets into a master budget for the store. When a retailer has branch stores, it prepares separate master budgets for each store. Then, it incorporates these budgets into master budgets for the company as a whole.
Service Companies
In a service company, such as a public accounting fi rm, a law offi ce, or a medical practice, the critical factor in budgeting is coordinating professional staff needs with anticipated services. If a fi rm is overstaffed, several problems may result: Labor costs are disproportionately high. Profi ts are lower because of the additional salaries. Staff turnover sometimes increases because of lack of chal-lenging work. In contrast, if a service company is understaffed, it may lose reve-nue because existing and prospective client needs for service cannot be met. Also, professional staff may seek other jobs because of excessive work loads. Suppose that Stephan Lawn and Plowing Service estimates that it will service 300 small lawns, 200 medium lawns, and 100 large lawns during the month of July. It estimates its direct labor needs as 1 hour per small lawn, 1.75 hours for a medium lawn, and 2.75 hours for a large lawn. Its average cost for direct labor is $15 per hour. Stephan prepares a direct labor budget as follows.
DairyDept.
MeatDept.
ProduceDept.
Master Budgetfor Grocery
Store
Departmentalized
budgets
Illustration 23-21Direct labor budget for service company
Formulas Data Review ViewPage LayoutInsert
1
2
3
4
5
67
8
9
AP18 fx
C EB D
Stephan Lawn and Plowing Service Direct Labor Budget.xlsStephan Lawn and Plowing Service Direct Labor Budget.xls
Lawns to be servicedDirect labor time (hours) per lawnTotal required direct labor hoursDirect labor cost per hourTotal direct labor cost
Small3003 1300
3 $15$4,500
Medium200
3 1.75350
3 $15$5,250
Large100
3 2.75275
3 $15$4,125
Total
$13,875
Home
STEPHAN LAWN AND PLOWING SERVICEDirect Labor Budget
For the Month Ending July 31, 2017

Budgeting in Nonmanufacturing Companies 1027
Service companies can obtain budget data for service revenue from expected output or expected input. When output is used, it is necessary to determine the expected billings of clients for services performed. In a public accounting fi rm, for example, output is the sum of its billings in auditing, tax, and consulting ser-vices. When input data are used, each professional staff member projects his or her billable time. The fi rm then applies billing rates to billable time to produce expected service revenue.
Not-for-Profi t Organizations
Budgeting is just as important for not-for-profi t organizations as for profi t-oriented businesses. The budget process, however, is different. In most cases, not-for-profi t entities budget on the basis of cash fl ows (expenditures and receipts), rather than on a revenue and expense basis. Further, the starting point in the process is usually expenditures, not receipts. For the not-for-profi t entity, management’s task generally is to fi nd the receipts needed to support the planned expenditures. The activity index is also likely to be signifi cantly different. For example, in a not-for-profi t entity, such as a university, budgeted faculty positions may be based on full-time equivalent students or credit hours expected to be taught in a department. For some governmental units, voters approve the budget. In other cases, such as state governments and the federal government, legislative approval is required. After the budget is adopted, it must be followed. Overspending is often illegal. In governmental budgets, authorizations tend to be on a line-by-line basis. That is, the budget for a municipality may have a specifi ed authorization for police and fi re protection, garbage collection, street paving, and so on. The line-item autho-rization of governmental budgets signifi cantly limits the amount of discretion management can exercise. The city manager often cannot use savings from one line item, such as street paving, to cover increased spending in another line item, such as snow removal.
Budget Short-falls as Far as the Eye Can See
All organizations need to stick to budgets. The Museum of Con-temporary Art in Los Angeles learned this the hard way. Over a 10-year period, its endowment shrunk from $50 million to $6 million as its newly hired director strove to build the museum’s reputation through spending. The direc-tor consistently ran budget defi cits, which
eventually threatened the museum’s survival.The most recent recession created budgeting challenges
for nearly all governmental agencies. Tax revenues dropped
rapidly as earnings declined and unemployment skyrock-eted. At the same time, sources of debt fi nancing dried up. Even Princeton University, with the largest endowment per student of any U.S. university ($2 million per student), experienced a 25% drop in the value of its endowment when the fi nancial markets plunged. Because the endow-ment supports 45% of the university’s $1.25 billion budget, when the endowment fell the university had to make cuts. Many raises were capped at $2,000, administrative budgets were cut by 5%, and major construction projects were put on hold.
Sources: Edward Wyatt and Jori Finkel, “Soaring in Art, Museum Trips Over Finances,” Wall Street Journal Online (December 4, 2008); Stu Woo, “California’s Plans to Close Gap Become More Drastic,” Wall Street Journal Online (January 8, 2009); and John Hechinger, “Princeton Cuts Budget as Endowment Slides,” Wall Street Journal Online (January 9, 2009).
Why would a university’s budgeted scholarships probably fall when the stock market suffers a serious drop? (Go to WileyPLUS for this answer and additional questions.)
©ZUMA Press/Newscom/NewsCom
Service Company Insight Museum of Contemporary Art

1028 23 Budgetary Planning
Becker Company estimates that 2017 sales will be $15,000 in quarter 1, $20,000 in quarter 2, and $25,000 in quarter 3. Cost of goods sold is 80% of sales. Management desires to have ending fi nished goods inventory equal to 15% of the next quarter’s expected cost of goods sold. Prepare a merchandise purchases budget by quarter for the fi rst six months of 2017.
Solution
DO IT! 5 Merchandise Purchases Budget
Formulas Data Review ViewPage LayoutInsert
1
2
3
4
5
6
8
10
AP18 fx
CB D
Becker Company Merchandise Purchases Budget.xlsBecker Company Merchandise Purchases Budget.xls
Budgeted cost of goods sold (sales 3 .80)Add: Desired ending merchandise inventory (15% of next quarter’s cost of goods sold)TotalLess: Beginning merchandise inventory (15% this quarter’s cost of goods sold)Required merchandise purchases
$12,000
14,400
1,800$12,600
Quarter
$16,000
19,000
2,400$16,600
Home
BECKER COMPANYMerchandise Purchases Budget
For the Six Months Ending June 30, 2017
1 2 Six Months
$29,200
7
9
2,400 3,000
Related exercise material: BE23-10, E23-19, E23-20, E23-21, and DO IT! 23-5.
Action Plan✔ Begin with budgeted
cost of goods sold.✔ Add desired ending
merchandise inventory.
✔ Subtract beginning merchandise inventory.
State the essentials of effective budgeting and the components of the master budget. The primary bene-fi ts of budgeting are that it (a) requires management to plan ahead, (b) provides defi nite objectives for evaluating performance, (c) creates an early warning system for potential problems, (d) facilitates coordi-nation of activities, (e) results in greater management awareness, and (f) motivates personnel to meet planned objectives. The essentials of effective budgeting are (a) sound organizational structure, (b) research and analysis, and (c) acceptance by all levels of management.
The master budget consists of the following bud-gets: (a) sales, (b) production, (c) direct materials, (d) direct labor, (e) manufacturing overhead, (f) selling and administrative expense, (g) budgeted income statement, (h) capital expenditure budget, (i) cash budget, and (j) budgeted balance sheet.
Prepare budgets for sales, production, and direct materials. The sales budget is derived from sales fore-casts. The production budget starts with budgeted sales units, adds desired ending fi nished goods inven-tory, and subtracts beginning fi nished goods inventory
1
2
to arrive at the required number of production units. The direct materials budget starts with the direct ma-terials units (e.g., pounds) required for budgeted pro-duction, adds desired ending direct materials units, and subtracts beginning direct materials units to arrive at required direct materials units to be purchased. This amount is multiplied by the direct materials cost (e.g., cost per pound) to arrive at the total cost of direct materials purchases.
Prepare budgets for direct labor, manufacturing over-head, and selling and administrative expenses, and a budgeted income statement. The direct labor budget starts with the units to be produced as determined in the production budget. This amount is multiplied by the direct labor hours per unit and the direct labor cost per hour to arrive at the total direct labor cost. The manufacturing overhead budget lists all of the individ-ual types of overhead costs, distinguishing between fi xed and variable costs. The selling and administrative expense budget lists all of the individual types of sell-ing and administrative expense items, distinguishing between fi xed and variable costs. The budgeted income
3
LEARNING OBJECTIVES REVIEW
1
REVIEW AND PRACTICE

Practice Multiple-Choice Questions 1029
statement is prepared from the various operating budgets. Cost of goods sold is determined by calculat-ing the budgeted cost to produce one unit, then multi-plying this amount by the number of units sold.
Prepare a cash budget and a budgeted balance sheet. The cash budget has three sections (receipts, dis-bursements, and fi nancing) and the beginning and ending cash balances. Receipts and payments sections are determined after preparing separate schedules for collections from customers and payments to suppliers.
4
The budgeted balance sheet is developed from the budgeted balance sheet from the preceding year and the various budgets for the current year.
Apply budgeting principles to nonmanufacturing companies. Budgeting may be used by merchandisers for development of a merchandise purchases budget. In service companies, budgeting is a critical factor in coordinating staff needs with anticipated services. In not-for-profi t organizations, the starting point in bud-geting is usually expenditures, not receipts.
5
Budget A formal written statement of management’s plans for a specifi ed future time period, expressed in fi nancial terms. (p. 1006).
Budgetary slack The amount by which a manager inten-tionally underestimates budgeted revenues or overesti-mates budgeted expenses in order to make it easier to achieve budgetary goals. (p. 1009).
Budget committee A group responsible for coordinat-ing the preparation of the budget. (p. 1008).
Budgeted balance sheet A projection of fi nancial posi-tion at the end of the budget period. (p. 1023).
Budgeted income statement An estimate of the expected profi tability of operations for the budget period. (p. 1018).
Cash budget A projection of anticipated cash fl ows. (p. 1020).Direct labor budget A projection of the quantity and cost
of direct labor necessary to meet production require-ments. (p. 1016).
Direct materials budget An estimate of the quantity and cost of direct materials to be purchased. (p. 1013).
Financial budgets Individual budgets that focus pri-marily on the cash resources needed to fund expected operations and planned capital expenditures. (p. 1009).
Long-range planning A formalized process of identify-ing long-term goals, selecting strategies to achieve
those goals, and developing policies and plans to imple-ment the strategies. (p. 1009).
Manufacturing overhead budget An estimate of expected manufacturing overhead costs for the budget period. (p. 1017).
Master budget A set of interrelated budgets that consti-tutes a plan of action for a specifi c time period. (p. 1009).
Merchandise purchases budget The estimated cost of goods to be purchased by a merchandiser to meet expected sales. (p. 1025).
Operating budgets Individual budgets that result in a budgeted income statement. (p. 1009).
Participative budgeting A budgetary approach that starts with input from lower-level managers and works upward so that managers at all levels participate. (p. 1008).
Production budget A projection of the units that must be produced to meet anticipated sales. (p. 1012).
Sales budget An estimate of expected sales revenue for the budget period. (p. 1011).
Sales forecast The projection of potential sales for the industry and the company’s expected share of such sales. (p. 1007).
Selling and administrative expense budget A projec-tion of anticipated selling and administrative expenses for the budget period. (p. 1018).
GLOSSARY REVIEW
1. Which of the following is not a benefi t of budgeting?(a) Management can plan ahead.(b) An early warning system is provided for potential
problems.(c) It enables disciplinary action to be taken at every
level of responsibility.(d) The coordination of activities is facilitated.
2. A budget:(a) is the responsibility of management accountants.(b) is the primary method of communicating agreed-
upon objectives throughout an organization.(c) ignores past performance because it represents
management’s plans for a future time period.(d) may promote effi ciency but has no role in evaluat-
ing performance.
(LO 1)
(LO 1)
3. The essentials of effective budgeting do not include:(a) top-down budgeting.(b) management acceptance.(c) research and analysis.(d) sound organizational structure.
4. Compared to budgeting, long-range planning generally has the:(a) same amount of detail. (c) same emphasis.(b) longer time period. (d) same time period.
5. A sales budget is:(a) derived from the production budget.(b) management’s best estimate of sales revenue for
the year.(c) not the starting point for the master budget.(d) prepared only for credit sales.
(LO 1)
(LO 1)
(LO 2)
PRACTICE MULTIPLE-CHOICE QUESTIONS

6. The formula for the production budget is budgeted sales in units plus:(a) desired ending merchandise inventory less begin-
ning merchandise inventory.(b) beginning fi nished goods units less desired ending
fi nished goods units.(c) desired ending direct materials units less beginning
direct materials units.(d) desired ending fi nished goods units less beginning
fi nished goods units. 7. Direct materials inventories are kept in pounds in
Byrd Company, and the total pounds of direct ma-terials needed for production is 9,500. If the begin-ning inventory is 1,000 pounds and the desired ending inventory is 2,200 pounds, the total pounds to be purchased is:(a) 9,400. (c) 9,700.(b) 9,500. (d) 10,700.
8. The formula for computing the direct labor budget is to multiply the direct labor cost per hour by the:(a) total required direct labor hours.(b) physical units to be produced.(c) equivalent units to be produced.(d) No correct answer is given.
9. Each of the following budgets is used in preparing the budgeted income statement except the:(a) sales budget.(b) selling and administrative expense budget.(c) capital expenditure budget.(d) direct labor budget.
10. The budgeted income statement is:(a) the end-product of the operating budgets.(b) the end-product of the fi nancial budgets.(c) the starting point of the master budget.(d) dependent on cash receipts and cash disbursements.
11. The budgeted balance sheet is:(a) developed from the budgeted balance sheet for the
preceding year and the budgets for the current year.
(LO 2)
(LO 2)
(LO 3)
(LO 3)
(LO 3)
(LO 4)
(b) the last operating budget prepared.(c) used to prepare the cash budget.(d) All of the above.
12. The format of a cash budget is:(a) Beginning cash balance 1 Cash receipts 1 Cash
from fi nancing 2 Cash disbursements 5 Ending cash balance.
(b) Beginning cash balance 1 Cash receipts 2 Cash dis-bursements 1/2 Financing 5 Ending cash balance.
(c) Beginning cash balance 1 Net income 2 Cash dividends 5 Ending cash balance.
(d) Beginning cash balance 1 Cash revenues 2 Cash expenses 5 Ending cash balance.
13. Expected direct materials purchases in Read Com-pany are $70,000 in the fi rst quarter and $90,000 in the second quarter. Forty percent of the purchases are paid in cash as incurred, and the balance is paid in the following quarter. The budgeted cash pay-ments for purchases in the second quarter are:(a) $96,000. (c) $78,000.(b) $90,000. (d) $72,000.
14. The budget for a merchandiser differs from a budget for a manufacturer because:(a) a merchandise purchases budget replaces the
production budget.(b) the manufacturing budgets are not applicable.(c) None of the above.(d) Both (a) and (b) above.
15. In most cases, not-for-profi t entities:(a) prepare budgets using the same steps as those
used by profi t-oriented businesses.(b) know budgeted cash receipts at the beginning
of a time period, so they budget only for expen-ditures.
(c) begin the budgeting process by budgeting expen-ditures rather than receipts.
(d) can ignore budgets because they are not expected to generate net income.
(LO 4)
(LO 4)
(LO 5)
(LO 5)
1030 23 Budgetary Planning
SERVICE
Solutions
1. (c) Budgeting does not necessarily enable disciplinary action to be taken at every level of responsibility. The other choices are all benefi ts of budgeting.
2. (b) A budget is the primary method of communicating agreed-upon objectives throughout an organization. The other choices are incorrect because (a) a budget is the responsibility of all levels of management, not management accountants; (c) past perfor-mance is not ignored in the budgeting process but instead is the starting point from which future budget goals are formulated; and (d) the budget not only may promote effi ciency but is an important tool for evaluating performance.
3. (a) Top-down budgeting is not one of the essentials of effective budgeting. The other choices are true statements.
4. (b) Long-range planning generally encompasses a period of at least 5 years whereas budgeting usually covers a period of 1 year. The other choices are incorrect because budgeting and long-range planning (a) do not have the same amount of detail, (c) do not have the same emphasis, and (d) do not cover the same time period.
5. (b) A sales budget is management’s best estimate of sales revenue for the year. The other choices are incorrect because a sales budget (a) is the fi rst budget prepared and is the one budget that is not derived from any other budget, (c) is the starting point for the master budget, and (d) is prepared for both cash and credit sales.
6. (d) The formula for the production budget is budgeted sales in units plus desired ending fi nished goods units less beginning fi nished goods units. The other choices are therefore incorrect.
7. (d) Pounds to be purchased 5 Amount needed for production (9,500) 1 Desired ending inventory (2,200) 2 Beginning inventory (1,000) 5 10,700, not (a) 9,400, (b) 9,500, or (c) 9,700.
8. (a) Direct labor cost 5 Direct labor cost per hour 3 Total required direct labor hours. The other choices are therefore incorrect.
9. (c) The capital expenditure budget is not used in preparing the budgeted income statement. The other choices are true statements.

10. (a) The budgeted income statement is the end-product of the operating budgets, not (b) the fi nancial budgets, (c) the starting point of the master budget, or (d) dependent on cash receipts and cash disbursements.
11. (a) The budgeted balance sheet is developed from the budgeted balance sheet for the preceding year and the budgets for the current year. The other choices are therefore incorrect.
12. (b) The format of a cash budget is Beginning cash balance 1 Cash receipts 2 Cash disbursements 1/2 Financing 5 Ending cash balance. The other choices are therefore incorrect.
13. (c) Budgeted cash payments for the second quarter 5 Purchases for the fi rst quarter ($42,000; $70,000 3 60%) 1 40% of the purchases for the second quarter ($36,000; $90,000 3 40%) 5 $78,000, not (a) $96,000, (b) $90,000, or (d) $72,000.
14. (d) The budget for a merchandiser uses a merchandise purchases budget in place of a production budget, and the manufac-turing budgets are not applicable for a merchandiser. Therefore, as both choices (a) and (b) are correct, choice (d) is the best answer.
15. (c) In most cases, not-for-profit entities begin the budgeting process by budgeting expenditures rather than receipts. The other choices are incorrect because in most cases not-for-profit entities (a) prepare budgets using different, not the same, steps as those used by profit-oriented enterprises; (b) budget for both expenditures and receipts; and (d) cannot ignore budgets.
Practice Exercises 1031
1. (a)
Solution
1. On January 1, 2017 the Heche Company budget committee has reached agreement on the following data for the 6 months ending June 30, 2017.
Sales units: First quarter 5,000; second quarter 6,000; third quarter 7,000
Ending raw materials inventory: 40% of the next quarter’s production requirements
Ending fi nished goods inventory: 30% of the next quarter’s expected sales units Third-quarter 2017 production: 7,500 units
The ending raw materials and fi nished goods inventories at December 31, 2016, follow the same percentage relationships to production and sales that occur in 2017. Two pounds of raw materials are required to make each unit of fi nished goods. Raw materials purchased are expected to cost $5 per pound.
Instructions(a) Prepare a production budget by quarters for the 6-month period ended June 30,
2017.(b) Prepare a direct materials budget by quarters for the 6-month period ended June 30,
2017.
Prepare production and direct materials budgets by quarter for 6 months.
(LO 2)
PRACTICE EXERCISES
Formulas Data Review ViewPage LayoutInsert
1
2
34
5
6
7
8
9
10
11
12
AP18 fx
D ECB F
Heche Company Production Budget.xlsHeche Company Production Budget.xls
Expected unit salesAdd: Desired ending finished goods unitsTotal required unitsLess: Beginning finished goods unitsRequired production units
(1)30% 3 6,000; (2)30% 3 7,000; (3)30% 3 5,000
5,0001,8006,8001,5005,300
6,0002,1008,1001,8006,300
Quarter
Home
HECHE COMPANYProduction Budget
For the Six Months Ending June 30, 2017
1 2 Six Months
11,600
(1) (2)
(3)

2. Jake Company expects to have a cash balance of $45,000 on January 1, 2017. Relevant monthly budget data for the fi rst 2 months of 2017 are as follows.
Collections from customers: January $100,000. February $160,000.Payments for direct materials: January $60,000, February $80,000.Direct labor: January $30,000, February $45,000. Wages are paid in the month they are incurred.Manufacturing overhead: January $26,000, February $31,000. These costs include depre-ciation of $1,000 per month. All other overhead costs are paid as incurred.Selling and administrative expenses: January $15,000. February $20,000. These costs are exclusive of depreciation. They are paid as incurred.
Sales of marketable securities in January are expected to realize $10,000 in cash. Jake Company has a line of credit at a local bank that enables it to borrow up to $25,000. The company wants to maintain a minimum monthly cash balance of $25,000.
InstructionsPrepare a cash budget for January and February.
Solution
Prepare a cash budget for 2 months.
(LO 4)
Formulas Data Review ViewPage LayoutInsert
1
2
34
5
6
7
8
10
11
12
13
14
15
1617
AP18 fx
D ECB F
Heche Company Direct Materials Budget.xlsHeche Company Direct Materials Budget.xls
Units to be producedDirect materials per unitTotal pounds needed for productionAdd: Desired ending direct materials (pounds)Total materials requiredLess: Beginning direct materials (pounds)Direct materials purchaseCost per poundTotal cost of direct materials purchase
(1)40% 3 12,600; (2)7,500 3 (2 3 40%); (3)40% 3 10,600
5,3003 2
10,600
5,04015,640
4,24011,400
3 $5$57,000
6,3003 2
12,600
6,00018,600
5,04013,560
3 $5$67,800
Quarter
Home
HECHE COMPANYDirect Materials Budget
For the Six Months Ending June 30, 2017
1 2 Six Months
$124,800
(1) (2)
(3)
9
(b)
Formulas Data Review ViewPage LayoutInsert
1
2
34
5
6
7
8
9
10
11
12
13
14
15
16
17
18
19
20
21
22
23
AP18 fx
CB
Jake Company Cash Budget.xlsJake Company Cash Budget.xls
Beginning cash balanceAdd: Receipts
Total available cashLess: Disbursements
Excess (deficiency) of available cash over cash
Financing
Ending cash balance
Collections from customersSale of marketable securities
Direct materialsDirect laborManufacturing overheadSelling and administrative expenses
Disbursements
BorrowingsRepayments
Total receipts
Total disbursements
January$ 45,000
100,00010,000
110,000155,000
60,00030,00025,00015,000
130,000
25,000
00
$ 25,000
February$ 25,000
160,0000
160,000185,000
80,00045,00030,00020,000
175,000
10,000
15,0000
$ 25,000
Home
JAKE COMPANYCash Budget
For the Two Months Ending February 28, 2017
2.
1032

Practice Problems 1033
1. Asheville Company is preparing its master budget for 2017. Relevant data pertaining to its sales and production budgets are as follows.
Sales. Sales for the year are expected to total 2,100,000 units. Quarterly sales, as a percentage of total sales, are 15%, 25%, 35%, and 25%, respectively. The sales price is expected to be $70 per unit for the fi rst three quarters and $75 per unit beginning in the fourth quarter. Sales in the fi rst quarter of 2018 are expected to be 10% higher than the budgeted sales volume for the fi rst quarter of 2017.
Production. Management desires to maintain ending fi nished goods inventories at 20% of the next quarter’s budgeted sales volume.
InstructionsPrepare the sales budget and production budget by quarters for 2017.
Prepare sales and production budgets.
(LO 2)
PRACTICE PROBLEMS
Solution
Formulas Data Review ViewPage LayoutInsert
1
2
34
5
67
8
10
9
11
11
12
13
1415
16
17
AP18 fx
B D F G HEC
315,0003 $70
$22,050,000
315,000
105,000420,000
63,000357,000
525,0003 $70
$36,750,000
525,000
147,000672,000
105,000567,000
735,0003 $70
$51,450,000
735,000
105,000840,000
147,000693,000
525,0003 $75
$39,375,000
525,000
69,300594,300
105,000489,300
2,100,000
$149,625,000
2,106,300
Home
ASHEVILLE COMPANYFor the Year Ending December 31, 2017
Sales Budget
Quarter
1 2 3 4 Year
a
b
Expected unit salesUnit selling priceTotal sales
Expected unit salesAdd: Desired ending finished goods unitsTotal required unitsLess: Beginning finished goods unitsRequired production units
aEstimated first-quarter 2018 sales volume 315,000 1 (315,000 3 10%) 5 346,500; 346,500 3 20%b20% of estimated first-quarter 2017 sales units (315,000 3 20%)
Asheville Company Sales Budget and Production Budget.xls
Production Budget
1.
2. Barrett Company has completed all operating budgets other than the income statement for 2017. Selected data from these budgets follow.
Sales: $300,000Purchases of raw materials: $145,000Ending inventory of raw materials: $15,000Direct labor: $40,000Manufacturing overhead: $73,000, including $3,000 of depreciation expenseSelling and administrative expenses: $36,000 including depreciation expense of $1,000Interest expense: $1,000Principal payment on note: $2,000Dividends declared: $2,000Income tax rate: 30%
Other information:
Assume that the number of units produced equals the number sold.Year-end accounts receivable: 4% of 2017 sales.
Prepare budgeted cost of goods sold, income statement, and balance sheet.
(LO 3, 4)

1034 23 Budgetary Planning
BARRETT COMPANYBalance Sheet
December 31, 2016
Assets
Current assets Cash $20,000 Raw materials inventory 10,000
Total current assets 30,000Property, plant, and equipment Equipment $40,000 Less: Accumulated depreciation 4,000 36,000
Total assets $66,000
Liabilities and Stockholders’ Equity
Liabilities Accounts payable $ 5,000 Notes payable 22,000
Total liabilities $27,000Stockholders’ equity Common stock 25,000 Retained earnings 14,000 Total stockholders’ equity 39,000
Total liabilities and stockholders’ equity $66,000
Instructions(a) Calculate budgeted cost of goods sold.
(b) Prepare a budgeted multiple-step income statement for the year ending December 31, 2017.
(c) Prepare a budgeted classifi ed balance sheet as of December 31, 2017.
Year-end accounts payable: 50% of ending inventory of raw materials.Interest, direct labor, manufacturing overhead, and selling and administrative expenses other than depreciation are paid as incurred.Dividends declared and income taxes for 2017 will not be paid until 2018.
2. (a) Beginning raw materials 1 Purchases 2 Ending raw materials 5 Cost of direct materials used ($10,000 1 $145,000 2 $15,000 5 $140,000)
Direct materials used 1 Direct labor 1 Manufacturing overhead 5 Cost of goods sold ($140,000 1 $40,000 1 $73,000 5 $253,000)
(b)BARRETT COMPANY
Budgeted Income StatementFor the Year Ending December 31, 2017
Sales $300,000Cost of goods sold 253,000
Gross profi t 47,000Selling and administrative expenses 36,000
Income from operations 11,000Interest expense 1,000
Income before income tax expense 10,000Income tax expense (30%) 3,000
Net income $ 7,000
Solution

Questions 1035
(c)
BARRETT COMPANYBudgeted Balance Sheet
December 31, 2017
Assets
Current assets Cash(1) $17,500 Accounts receivable (4% 3 $300,000) 12,000 Raw materials inventory 15,000
Total current assets 44,500Property, plant and equipment Equipment $40,000 Less: Accumulated depreciation 8,000 32,000
Total assets $76,500
(1)Beginning cash balance $ 20,000Add: Collections from customers (96% 3 $300,000 sales) 288,000
Total available cash 308,000
Less: Disbursements Direct materials ($5,000 1 $145,000 2 $7,500) $142,500 Direct labor 40,000 Manufacturing overhead 70,000 Selling and administrative expenses 35,000Total disbursements 287,500
Excess of available cash over cash disbursements 20,500Financing Less: Repayment of principal and interest 3,000
Ending cash balance $ 17,500
Liabilities and Stockholders’ Equity
Liabilities Accounts payable (50% 3 $15,000) $ 7,500 Income taxes payable 3,000 Dividends payable 2,000 Note payable 20,000
Total liabilities $32,500Stockholders’ equity Common stock 25,000 Retained earnings(2) 19,000
Total stockholders’ equity 44,000
Total liabilities and stockholders’ equity $76,500
(2)Beginning retained earnings 1 Net income 2 Dividends declared 5 Ending retained earnings ($14,000 1 $7,000 2 $2,000 5 $19,000)
Brief Exercises, Exercises, DO IT! Exercises, and Problems and many additional resources are available for practice in WileyPLUS
QUESTIONS
1. (a) What is a budget? (b) How does a budget contribute to good manage-
ment?2. Kate Cey and Joe Coulter are discussing the bene-
fits of budgeting. They ask you to identify the
primary benefits of budgeting. Comply with their request.
3. Jane Gilligan asks your help in understanding the essentials of effective budgeting. Identify the essen-tials for Jane.
1036 23 Budgetary Planning
4. (a) “Accounting plays a relatively unimportant role in budgeting.” Do you agree? Explain.
(b) What responsibilities does management have in budgeting?
5. What criteria are helpful in determining the length of the budget period? What is the most common budget period?
6. Lori Wilkins maintains that the only difference between budgeting and long-range planning is time. Do you agree? Why or why not?
7. What is participative budgeting? What are its poten-tial benefi ts? What are its potential disadvantages?
8. What is budgetary slack? What incentive do manag-ers have to create budgetary slack?
9. Distinguish between a master budget and a sales forecast.
10. What budget is the starting point in preparing the master budget? What may result if this budget is inac-curate?
11. “The production budget shows both unit production data and unit cost data.” Is this true? Explain.
12. Alou Company has 20,000 beginning fi nished goods units. Budgeted sales units are 160,000. If manage-ment desires 15,000 ending fi nished goods units, what are the required units of production?
13. In preparing the direct materials budget for Quan Company, management concludes that required pur-chases are 64,000 units. If 52,000 direct materials units are required in production and there are 9,000 units of beginning direct materials, what is the desired units of ending direct materials?
14. The production budget of Justus Company calls for 80,000 units to be produced. If it takes 45 minutes to make one unit and the direct labor rate is $16 per hour, what is the total budgeted direct labor cost?
15. Ortiz Company’s manufacturing overhead budget shows total variable costs of $198,000 and total fi xed costs of $162,000. Total production in units is expected to be 150,000. It takes 20 minutes to make one unit, and the direct labor rate is $15 per hour. Express the manufacturing overhead rate as (a) a percentage of direct labor cost, and (b) an amount per direct labor hour.
16. Everly Company’s variable selling and administra-tive expenses are 12% of net sales. Fixed expenses are $50,000 per quarter. The sales budget shows expected sales of $200,000 and $240,000 in the fi rst and second quarters, respectively. What are the total budgeted selling and administrative expenses for each quarter?
17. For Goody Company, the budgeted cost for one unit of product is direct materials $10, direct labor $20, and manufacturing overhead 80% of direct labor cost. If 25,000 units are expected to be sold at $65 each, what is the budgeted gross profi t?
18. Indicate the supporting schedules used in preparing a budgeted income statement through gross profi t for a manufacturer.
19. Identify the three sections of a cash budget. What bal-ances are also shown in this budget?
20. Noterman Company has credit sales of $600,000 in January. Past experience suggests that 40% is col-lected in the month of sale, 50% in the month fol-lowing the sale, and 10% in the second month following the sale. Compute the cash collections from January sales in January, February, and March.
21. What is the formula for determining required mer-chandise purchases for a merchandiser?
22. How may expected revenues in a service company be computed?
BRIEF EXERCISES
BE23-1 Maris Company uses the following budgets: balance sheet, capital expenditure, cash, direct labor, direct materials, income statement, manufacturing overhead, production, sales, and selling and administrative expense. Prepare a diagram of the interrelationships of the budgets in the master budget. Indicate whether each budget is an operating or a fi nancial budget.
BE23-2 Paige Company estimates that unit sales will be 10,000 in quarter 1, 14,000 in quarter 2, 15,000 in quarter 3, and 18,000 in quarter 4. Using a sales price of $70 per unit, prepare the sales budget by quarters for the year ending December 31, 2017.
BE23-3 Sales budget data for Paige Company are given in BE23-2. Management desires to have an ending fi nished goods inventory equal to 25% of the next quarter’s expected unit sales. Prepare a production budget by quarters for the fi rst 6 months of 2017.
BE23-4 Perine Company has 2,000 pounds of raw materials in its December 31, 2016, ending inventory. Required production for January and February of 2017 are 4,000 and 5,000 units, respectively. Two pounds of raw materials are needed for each unit, and the estimated cost per pound is $6. Management desires an ending inventory equal to 25% of next month’s materials requirements. Prepare the direct materials budget for January.
Prepare a diagram of a master budget.
(LO 1)
Prepare a sales budget.
(LO 2)
Prepare a production budget for 2 quarters.
(LO 2)
Prepare a direct materials budget for 1 month.
(LO 2)

DO IT! Exercises 1037
BE23-5 For Gundy Company, units to be produced are 5,000 in quarter 1 and 7,000 in quar-ter 2. It takes 1.6 hours to make a fi nished unit, and the expected hourly wage rate is $15 per hour. Prepare a direct labor budget by quarters for the 6 months ending June 30, 2017.
BE23-6 For Roche Inc., variable manufacturing overhead costs are expected to be $20,000 in the fi rst quarter of 2017, with $5,000 increments in each of the remaining three quar-ters. Fixed overhead costs are estimated to be $40,000 in each quarter. Prepare the manu-facturing overhead budget by quarters and in total for the year.
BE23-7 Elbert Company classifi es its selling and administrative expense budget into vari-able and fi xed components. Variable expenses are expected to be $24,000 in the fi rst quar-ter, and $4,000 increments are expected in the remaining quarters of 2017. Fixed expenses are expected to be $40,000 in each quarter. Prepare the selling and administrative expense budget by quarters and in total for 2017.
BE23-8 North Company has completed all of its operating budgets. The sales budget for the year shows 50,000 units and total sales of $2,250,000. The total unit cost of making one unit of sales is $25. Selling and administrative expenses are expected to be $300,000. Interest is estimated to be $10,000. Income taxes are estimated to be $200,000. Prepare a budgeted multiple-step income statement for the year ending December 31, 2017.
BE23-9 Kaspar Industries expects credit sales for January, February, and March to be $220,000, $260,000, and $300,000, respectively. It is expected that 75% of the sales will be collected in the month of sale, and 25% will be collected in the following month. Compute cash collections from customers for each month.
BE23-10 Moore Wholesalers is preparing its merchandise purchases budget. Budgeted sales are $400,000 for April and $480,000 for May. Cost of goods sold is expected to be 65% of sales. The company’s desired ending inventory is 20% of the following month’s cost of goods sold. Compute the required purchases for April.
Prepare a direct labor budget for 2 quarters.
(LO 3)
Prepare a manufacturing overhead budget.
(LO 3)
Prepare a selling and administrative expense budget.
(LO 3)
Prepare a budgeted income statement for the year.
(LO 3)
Prepare data for a cash budget.
(LO 4)
Determine required merchandise purchases for 1 month.
(LO 5)
Use this list of terms to complete the sentences that follow.
Long-range plans Participative budgeting Sales forecast Operating budgets Master budget Financial budgets
1. _____________ establish goals for the company’s sales and production personnel.
2. The _____________ is a set of interrelated budgets that constitutes a plan of action for a specifi ed time period.
3. _____________ reduces the risk of having unrealistic budgets.
4. _____________ include the cash budget and the budgeted balance sheet.
5. The budget is formed within the framework of a _____________.
6. _____________ contain considerably less detail than budgets.
Pargo Company is preparing its master budget for 2017. Relevant data pertaining to its sales, production, and direct materials budgets are as follows.
Sales. Sales for the year are expected to total 1,000,000 units. Quarterly sales are 20%, 25%, 25%, and 30%, respectively. The sales price is expected to be $40 per unit for the fi rst three quarters and $45 per unit beginning in the fourth quarter. Sales in the fi rst quarter of 2018 are expected to be 20% higher than the budgeted sales for the fi rst quarter of 2017.
Identify budget terminology.
(LO 1)
Prepare sales, production, and direct materials budgets.
(LO 2)
DO IT! Exercises
DO IT! 23-1
DO IT! 23-2

Production. Management desires to maintain the ending fi nished goods inventories at 25% of the next quarter’s budgeted sales volume.
Direct materials. Each unit requires 2 pounds of raw materials at a cost of $12 per pound. Management desires to maintain raw materials inventories at 10% of the next quarter’s production requirements. Assume the production requirements for fi rst quarter of 2018 are 450,000 pounds.
Prepare the sales, production, and direct materials budgets by quarters for 2017.
Pargo Company is preparing its budgeted income statement for 2017. Rele-vant data pertaining to its sales, production, and direct materials budgets can be found in DO IT! 23-2 . In addition, Pargo budgets 0.3 hours of direct labor per unit, labor costs at $15 per hour, and manufacturing overhead at $20 per direct labor hour. Its budgeted selling and administrative expenses for 2017 are $6,000,000.
(a) Calculate the budgeted total unit cost.
(b) Prepare the budgeted multiple-step income statement for 2017. (Ignore income taxes.)
Batista Company management wants to maintain a minimum monthly cash balance of $25,000. At the beginning of April, the cash balance is $25,000, ex-pected cash receipts for April are $245,000, and cash disbursements are expected to be $255,000. How much cash, if any, must be borrowed to maintain the desired minimum monthly balance?
Zeller Company estimates that 2017 sales will be $40,000 in quarter 1, $48,000 in quarter 2, and $58,000 in quarter 3. Cost of goods sold is 50% of sales. Manage-ment desires to have ending fi nished goods inventory equal to 10% of the next quarter’s expected cost of goods sold. Prepare a merchandise purchases budget by quarter for the fi rst 6 months of 2017.
Calculate budgeted total unit cost and prepare budgeted income statement.
(LO 3)
Determine amount of fi nancing needed.
(LO 4)
Prepare merchandise purchases budget.
(LO 5)
DO IT! 23-3
DO IT! 23-4
DO IT! 23-5
EXERCISES
E23-1 Trusler Company has always done some planning for the future, but the company has never prepared a formal budget. Now that the company is growing larger, it is consid-ering preparing a budget.
Instructions Write a memo to Jim Dixon, the president of Trusler Company, in which you defi ne bud-geting, identify the budgets that comprise the master budget, identify the primary benefi ts of budgeting, and discuss the essentials of effective budgeting.
E23-2 Edington Electronics Inc. produces and sells two models of pocket calculators, XQ-103 and XQ-104. The calculators sell for $15 and $25, respectively. Because of the intense competition Edington faces, management budgets sales semiannually. Its projec-tions for the fi rst 2 quarters of 2017 are as follows.
Explain the concept of budgeting.
(LO 1)
Prepare a sales budget for 2 quarters.
(LO 2)
Unit Sales
Product Quarter 1 Quarter 2
XQ-103 20,000 22,000XQ-104 12,000 15,000
No changes in selling prices are anticipated.
InstructionsPrepare a sales budget for the 2 quarters ending June 30, 2017. List the products and show for each quarter and for the 6 months, units, selling price, and total sales by product and in total.
E23-3 Thome and Crede, CPAs, are preparing their service revenue (sales) budget for the coming year (2017). The practice is divided into three departments: auditing, tax, and consulting. Billable hours for each department, by quarter, are as follows.
Prepare a sales budget for 4 quarters.
(LO 2)
SERVICE
1038 23 Budgetary Planning

Exercises 1039
Average hourly billing rates are auditing $80, tax $90, and consulting $110.
InstructionsPrepare the service revenue (sales) budget for 2017 by listing the departments and show-ing for each quarter and the year in total, billable hours, billable rate, and total revenue.
E23-4 Turney Company produces and sells automobile batteries, the heavy-duty HD-240. The 2017 sales forecast is as follows.
Prepare quarterly production budgets.
(LO 2)
Department Quarter 1 Quarter 2 Quarter 3 Quarter 4
Auditing 2,300 1,600 2,000 2,400 Tax 3,000 2,200 2,000 2,500 Consulting 1,500 1,500 1,500 1,500
Quarter HD-240
1 5,000 2 7,000 3 8,000 4 10,000
The January 1, 2017, inventory of HD-240 is 2,000 units. Management desires an ending inventory each quarter equal to 40% of the next quarter’s sales. Sales in the fi rst quarter of 2018 are expected to be 25% higher than sales in the same quarter in 2017.
InstructionsPrepare quarterly production budgets for each quarter and in total for 2017.
E23-5 DeWitt Industries has adopted the following production budget for the fi rst 4 months of 2017.
Prepare a direct materials purchases budget.
(LO 2) Month Units Month Units
January 10,000 March 5,000 February 8,000 April 4,000
Each unit requires 2 pounds of raw materials costing $3 per pound. On December 31, 2016, the ending raw materials inventory was 4,000 pounds. Management wants to have a raw materials inventory at the end of the month equal to 20% of next month’s production requirements.
InstructionsPrepare a direct materials purchases budget by month for the fi rst quarter.
E23-6 On January 1, 2017, the Hardin Company budget committee has reached agree-ment on the following data for the 6 months ending June 30, 2017.
Sales units: First quarter 5,000; second quarter 6,000; third quarter 7,000.
Ending raw materials inventory: 40% of the next quarter’s production requirements.
Ending fi nished goods inventory: 25% of the next quarter’s expected sales units.
Third-quarter production: 7,200 units.
The ending raw materials and fi nished goods inventories at December 31, 2016, follow the same percentage relationships to production and sales that occur in 2017. Three pounds of raw materials are required to make each unit of fi nished goods. Raw materials pur-chased are expected to cost $4 per pound.
Instructions(a) Prepare a production budget by quarters for the 6-month period ended June 30, 2017.(b) Prepare a direct materials budget by quarters for the 6-month period ended June 30,
2017.
E23-7 Rensing Ltd. estimates sales for the second quarter of 2017 will be as follows.
Month Units
April 2,550May 2,675June 2,390
Prepare production and direct materials budgets by quarters for 6 months.
(LO 2)
Calculate raw materials purchases in dollars.
(LO 2)

1040 23 Budgetary Planning
The target ending inventory of fi nished products is as follows.
March 31 2,000April 30 2,230May 31 2,200June 30 2,310
Two units of material are required for each unit of fi nished product. Production for July is estimated at 2,700 units to start building inventory for the fall sales period. Rensing’s policy is to have an inventory of raw materials at the end of each month equal to 50% of the following month’s production requirements. Raw materials are expected to cost $4 per unit throughout the period.
InstructionsCalculate the May raw materials purchases in dollars.
(CGA adapted)
E23-8 Fuqua Company’s sales budget projects unit sales of part 198Z of 10,000 units in January, 12,000 units in February, and 13,000 units in March. Each unit of part 198Z requires 4 pounds of materials, which cost $2 per pound. Fuqua Company desires its end-ing raw materials inventory to equal 40% of the next month’s production requirements, and its ending fi nished goods inventory to equal 20% of the next month’s expected unit sales. These goals were met at December 31, 2016.
Instructions(a) Prepare a production budget for January and February 2017.(b) Prepare a direct materials budget for January 2017.
E23-9 Rodriguez, Inc., is preparing its direct labor budget for 2017 from the following production budget based on a calendar year.
Quarter Units Quarter Units
1 20,000 3 35,000 2 25,000 4 30,000
Each unit requires 1.5 hours of direct labor.
InstructionsPrepare a direct labor budget for 2017. Wage rates are expected to be $16 for the fi rst 2 quarters and $18 for quarters 3 and 4.
E23-10 Lowell Company makes and sells artistic frames for pictures. The controller is responsible for preparing the master budget and has accumulated the following informa-tion for 2017.
January February March April May
Estimated unit sales 12,000 14,000 13,000 11,000 11,000Sales price per unit $50.00 $47.50 $47.50 $47.50 $47.50Direct labor hours per unit 2.0 2.0 1.5 1.5 1.5Wage per direct labor hour $8.00 $8.00 $8.00 $9.00 $9.00
Lowell has a labor contract that calls for a wage increase to $9.00 per hour on April 1. New labor-saving machinery has been installed and will be fully operational by March 1. Lowell expects to begin the year with 17,600 frames on hand and has a policy of car-rying an end-of-month inventory of 100% of the following month’s sales, plus 40% of the second following month’s sales.
InstructionsPrepare a production budget and a direct labor budget for Lowell Company by month and for the fi rst quarter of the year. The direct labor budget should include direct labor hours.
(CMA-Canada adapted)
E23-11 Atlanta Company is preparing its manufacturing overhead budget for 2017. Rele-vant data consist of the following.
Units to be produced (by quarters): 10,000, 12,000, 14,000, 16,000.
Direct labor: time is 1.5 hours per unit.
Prepare a production and a direct materials budget.
(LO 2)
Prepare a direct labor budget.
(LO 3)
Prepare production and direct labor budgets.
(LO 2, 3)
Prepare a manufacturing overhead budget for the year.
(LO 3)

Exercises 1041
Variable overhead costs per direct labor hour: indirect materials $0.80; indirect labor $1.20; and maintenance $0.50.
Fixed overhead costs per quarter: supervisory salaries $35,000; depreciation $15,000; and maintenance $12,000.
InstructionsPrepare the manufacturing overhead budget for the year, showing quarterly data.
E23-12 Kirkland Company combines its operating expenses for budget purposes in a sell-ing and administrative expense budget. For the fi rst 6 months of 2017, the following data are available.
1. Sales: 20,000 units quarter 1; 22,000 units quarter 2.2. Variable costs per dollar of sales: sales commissions 5%, delivery expense 2%, and
advertising 3%.3. Fixed costs per quarter: sales salaries $12,000, offi ce salaries $8,000, depreciation
$4,200, insurance $1,500, utilities $800, and repairs expense $500.4. Unit selling price: $20.
InstructionsPrepare a selling and administrative expense budget by quarters for the fi rst 6 months of 2017.
E23-13 Fultz Company has accumulated the following budget data for the year 2017.
1. Sales: 30,000 units, unit selling price $85.2. Cost of one unit of fi nished goods: direct materials 1 pound at $5 per pound, direct
labor 3 hours at $15 per hour, and manufacturing overhead $5 per direct labor hour.3. Inventories (raw materials only): beginning, 10,000 pounds; ending, 15,000 pounds.4. Selling and administrative expenses: $170,000; interest expense: $30,000.5. Income taxes: 30% of income before income taxes.
Instructions(a) Prepare a schedule showing the computation of cost of goods sold for 2017.(b) Prepare a budgeted multiple-step income statement for 2017.
E23-14 Danner Company expects to have a cash balance of $45,000 on January 1, 2017. Relevant monthly budget data for the fi rst 2 months of 2017 are as follows.
Collections from customers: January $85,000, February $150,000.
Payments for direct materials: January $50,000, February $75,000.
Direct labor: January $30,000, February $45,000. Wages are paid in the month they are incurred.
Manufacturing overhead: January $21,000, February $25,000. These costs include depreciation of $1,500 per month. All other overhead costs are paid as incurred.
Selling and administrative expenses: January $15,000, February $20,000. These costs are exclusive of depreciation. They are paid as incurred.
Sales of marketable securities in January are expected to realize $12,000 in cash. Danner Company has a line of credit at a local bank that enables it to borrow up to $25,000. The company wants to maintain a minimum monthly cash balance of $20,000.
InstructionsPrepare a cash budget for January and February.
E23-15 Deitz Corporation is projecting a cash balance of $30,000 in its December 31, 2016, balance sheet. Deitz’s schedule of expected collections from customers for the fi rst quarter of 2017 shows total collections of $185,000. The schedule of expected payments for direct materials for the fi rst quarter of 2017 shows total payments of $43,000. Other information gathered for the fi rst quarter of 2017 is sale of equipment $3,000, direct labor $70,000, manufacturing overhead $35,000, selling and administrative expenses $45,000, and purchase of securities $14,000. Deitz wants to maintain a balance of at least $25,000 cash at the end of each quarter.
InstructionsPrepare a cash budget for the fi rst quarter.
Prepare a selling and administrative expense budget for 2 quarters.
(LO 3)
Prepare a budgeted income statement for the year.
(LO 3)
Prepare a cash budget for 2 months.
(LO 4)
Prepare a cash budget.
(LO 4)

1042 23 Budgetary Planning
E23-16 The controller of Trenshaw Company wants to improve the company’s control system by preparing a month-by-month cash budget. The following information is for the month ending July 31, 2017.
June 30, 2017, cash balance $45,000Dividends to be declared on July 15* 12,000Cash expenditures to be paid in July for operating expenses 40,800Amortization expense in July 4,500Cash collections to be received in July 90,000Merchandise purchases to be paid in cash in July 56,200Equipment to be purchased for cash in July 20,000
*Dividends are payable 30 days after declaration to shareholders of record on the declaration date.
Trenshaw Company wants to keep a minimum cash balance of $25,000.
Instructions(a) Prepare a cash budget for the month ended July 31, 2017, and indicate how much
money, if any, Trenshaw Company will need to borrow to meet its minimum cash requirement.
(b) Explain how cash budgeting can reduce the cost of short-term borrowing.(CGA adapted)
E23-17 Nieto Company’s budgeted sales and direct materials purchases are as follows.
Budgeted Sales Budgeted D.M. Purchases
January $200,000 $30,000February 220,000 36,000March 250,000 38,000
Nieto’s sales are 30% cash and 70% credit. Credit sales are collected 10% in the month of sale, 50% in the month following sale, and 36% in the second month following sale; 4% are uncollectible. Nieto’s purchases are 50% cash and 50% on account. Purchases on account are paid 40% in the month of purchase, and 60% in the month following purchase.
Instructions(a) Prepare a schedule of expected collections from customers for March.(b) Prepare a schedule of expected payments for direct materials for March.
E23-18 Green Landscaping Inc. is preparing its budget for the fi rst quarter of 2017. The next step in the budgeting process is to prepare a cash receipts schedule and a cash pay-ments schedule. To that end the following information has been collected. Clients usually pay 60% of their fee in the month that service is performed, 30% the month after, and 10% the second month after receiving service.
Actual service revenue for 2016 and expected service revenues for 2017 are November 2016, $80,000; December 2016, $90,000; January 2017, $100,000; February 2017, $120,000; and March 2017, $140,000.
Purchases of landscaping supplies (direct materials) are paid 60% in the month of purchase and 40% the following month. Actual purchases for 2016 and expected pur-chases for 2017 are December 2016, $14,000; January 2017, $12,000; February 2017, $15,000; and March 2017, $18,000.
Instructions(a) Prepare the following schedules for each month in the fi rst quarter of 2017 and for the
quarter in total: (1) Expected collections from clients. (2) Expected payments for landscaping supplies.(b) Determine the following balances at March 31, 2017: (1) Accounts receivable. (2) Accounts payable.
E23-19 Pletcher Dental Clinic is a medium-sized dental service specializing in family den-tal care. The clinic is currently preparing the master budget for the fi rst 2 quarters of 2017. All that remains in this process is the cash budget. The following information has been collected from other portions of the master budget and elsewhere.
Prepare cash budget for a month.
(LO 4)
Prepare schedules of expected collections and payments.
(LO 4)
Prepare schedules for cash receipts and cash payments, and determine ending balances for balance sheet.
(LO 4)
Prepare a cash budget for 2 quarters.
(LO 4, 5) SERVICE
SERVICE

Problems: Set A 1043
Beginning cash balance $ 30,000Required minimum cash balance 25,000Payment of income taxes (2nd quarter) 4,000Professional salaries: 1st quarter 140,000 2nd quarter 140,000Interest from investments (2nd quarter) 7,000Overhead costs: 1st quarter 77,000 2nd quarter 100,000Selling and administrative costs, including $2,000 depreciation: 1st quarter 50,000 2nd quarter 70,000Purchase of equipment (2nd quarter) 50,000Sale of equipment (1st quarter) 12,000Collections from patients: 1st quarter 235,000 2nd quarter 380,000Interest payments (2nd quarter) 200
InstructionsPrepare a cash budget for each of the fi rst two quarters of 2017.
E23-20 In May 2017, the budget committee of Grand Stores assembles the following data in preparation of budgeted merchandise purchases for the month of June.
1. Expected sales: June $500,000, July $600,000.2. Cost of goods sold is expected to be 75% of sales.3. Desired ending merchandise inventory is 30% of the following (next) month’s cost of
goods sold.4. The beginning inventory at June 1 will be the desired amount.
Instructions(a) Compute the budgeted merchandise purchases for June.(b) Prepare the budgeted multiple-step income statement for June through gross profi t.
E23-21 Emeric and Ellie’s Painting Service estimates that it will paint 10 small homes, 5 medium homes, and 2 large homes during the month of June 2017. The company esti-mates its direct labor needs as 40 hours per small home, 70 hours for a medium home, and 120 hours for a large home. Its average cost for direct labor is $18 per hour.
InstructionsPrepare a direct labor budget for Emeric and Ellie’s Painting Service for June 2017.
Prepare a purchases budget and budgeted income statement for a merchandiser.
(LO 5)
Prepare a direct labor budget for a service company.
(LO 5)
SERVICE
EXERCISES: SET B AND CHALLENGE EXERCISES
Visit the book’s companion website, at www.wiley.com/college/weygandt, and choose the Student Companion site to access Exercises: Set B and Challenge Exercises.
PROBLEMS: SET A
P23-1A Cook Farm Supply Company manufactures and sells a pesticide called Snare. The following data are available for preparing budgets for Snare for the fi rst 2 quarters of 2017.
1. Sales: quarter 1, 40,000 bags; quarter 2, 56,000 bags. Selling price is $60 per bag.2. Direct materials: each bag of Snare requires 4 pounds of Gumm at a cost of $3.80 per
pound and 6 pounds of Tarr at $1.50 per pound.3. Desired inventory levels:
Type of Inventory January 1 April 1 July 1
Snare (bags) 8,000 15,000 18,000Gumm (pounds) 9,000 10,000 13,000Tarr (pounds) 14,000 20,000 25,000
Prepare budgeted income statement and supporting budgets.
(LO 2, 3)

1044 23 Budgetary Planning
4. Direct labor: direct labor time is 15 minutes per bag at an hourly rate of $16 per hour.5. Selling and administrative expenses are expected to be 15% of sales plus $175,000 per quarter.6. Interest expense is $100,000.7. Income taxes are expected to be 30% of income before income taxes.
Your assistant has prepared two budgets: (1) the manufacturing overhead budget shows expected costs to be 125% of direct labor cost, and (2) the direct materials budget for Tarr shows the cost of Tarr purchases to be $297,000 in quarter 1 and $439,500 in quarter 2.
InstructionsPrepare the budgeted multiple-step income statement for the fi rst 6 months and all required operating budgets by quarters. (Note: Use variable and fi xed in the selling and administrative expense budget.) Do not prepare the manufacturing overhead budget or the direct materials budget for Tarr.
P23-2A Deleon Inc. is preparing its annual budgets for the year ending December 31, 2017. Accounting assistants furnish the data shown below.
Product JB 50 Product JB 60
Sales budget: Anticipated volume in units 400,000 200,000 Unit selling price $20 $25Production budget: Desired ending fi nished goods units 30,000 15,000 Beginning fi nished goods units 25,000 10,000Direct materials budget: Direct materials per unit (pounds) 2 3 Desired ending direct materials pounds 30,000 10,000 Beginning direct materials pounds 40,000 15,000 Cost per pound $3 $4Direct labor budget: Direct labor time per unit 0.4 0.6 Direct labor rate per hour $12 $12Budgeted income statement: Total unit cost $13 $20
An accounting assistant has prepared the detailed manufacturing overhead budget and the selling and administrative expense budget. The latter shows selling expenses of $560,000 for product JB 50 and $360,000 for product JB 60, and administrative expenses of $540,000 for product JB 50 and $340,000 for product JB 60. Interest expense is $150,000 (not allocated to products). Income taxes are expected to be 30%.
InstructionsPrepare the following budgets for the year. Show data for each product. Quarterly budgets should not be prepared.(a) Sales. (d) Direct labor.(b) Production. (e) Multiple-step income statement (Note: income taxes are(c) Direct materials. not allocated to the products).
P23-3A Hill Industries had sales in 2016 of $6,800,000 and gross profi t of $1,100,000. Man-agement is considering two alternative budget plans to increase its gross profi t in 2017.
Plan A would increase the selling price per unit from $8.00 to $8.40. Sales volume would decrease by 10% from its 2016 level. Plan B would decrease the selling price per unit by $0.50. The marketing department expects that the sales volume would increase by 100,000 units.
At the end of 2016, Hill has 40,000 units of inventory on hand. If Plan A is accepted, the 2017 ending inventory should be equal to 5% of the 2017 sales. If Plan B is accepted, the ending inventory should be equal to 60,000 units. Each unit produced will cost $1.80 in direct labor, $1.40 in direct materials, and $1.20 in variable overhead. The fi xed over-head for 2017 should be $1,895,000.
Instructions(a) Prepare a sales budget for 2017 under each plan.(b) Prepare a production budget for 2017 under each plan.(c) Compute the production cost per unit under each plan. Why is the cost per unit different
for each of the two plans? (Round to two decimals.)(d) Which plan should be accepted? (Hint: Compute the gross profi t under each plan.)
Net income $881,160Cost per bag $33.20
Prepare sales, production, direct materials, direct labor, and income statement budgets.
(LO 2, 3)
(a) Total sales $13,000,000(b) Required production
units: JB 50, 405,000 JB 60, 205,000
(c) Total cost of direct materials purchases $4,840,000
(d) Total direct labor cost $3,420,000
(e) Net income $1,295,000
Prepare sales and production budgets and compute cost per unit under two plans.
(LO 2)
(c) Unit cost: Plan A $6.88 Plan B $6.35
(d) Gross profi t: Plan A $1,162,800 Plan B $1,092,500

Problems: Set A 1045
P23-4A Colter Company prepares monthly cash budgets. Relevant data from operating budgets for 2017 are as follows.
January February
Sales $360,000 $400,000Direct materials purchases 120,000 125,000Direct labor 90,000 100,000Manufacturing overhead 70,000 75,000Selling and administrative expenses 79,000 85,000
All sales are on account. Collections are expected to be 50% in the month of sale, 30% in the fi rst month following the sale, and 20% in the second month following the sale. Sixty percent (60%) of direct materials purchases are paid in cash in the month of purchase, and the balance due is paid in the month following the purchase. All other items above are paid in the month incurred except for selling and administrative expenses that include $1,000 of depreciation per month.
Other data:
1. Credit sales: November 2016, $250,000; December 2016, $320,000.2. Purchases of direct materials: December 2016, $100,000.3. Other receipts: January—collection of December 31, 2016, notes receivable $15,000;
February—proceeds from sale of securities $6,000.4. Other disbursements: February—payment of $6,000 cash dividend.
The company’s cash balance on January 1, 2017, is expected to be $60,000. The company wants to maintain a minimum cash balance of $50,000.
Instructions(a) Prepare schedules for (1) expected collections from customers and (2) expected pay-
ments for direct materials purchases for January and February.(b) Prepare a cash budget for January and February in columnar form.
P23-5A The budget committee of Suppar Company collects the following data for its San Miguel Store in preparing budgeted income statements for May and June 2017.
1. Sales for May are expected to be $800,000. Sales in June and July are expected to be 5% higher than the preceding month.
2. Cost of goods sold is expected to be 75% of sales.3. Company policy is to maintain ending merchandise inventory at 10% of the following
month’s cost of goods sold.4. Operating expenses are estimated to be as follows:
Sales salaries $35,000 per monthAdvertising 6% of monthly salesDelivery expense 2% of monthly salesSales commissions 5% of monthly salesRent expense $5,000 per monthDepreciation $800 per monthUtilities $600 per monthInsurance $500 per month
5. Interest expense is $2,000 per month. Income taxes are estimated to be 30% of income before income taxes.
Instructions(a) Prepare the merchandise purchases budget for each month in columnar form.(b) Prepare budgeted multiple-step income statements for each month in columnar form.
Show in the statements the details of cost of goods sold.
Prepare cash budget for 2 months.
(LO 4)
(a) January: collections $326,000 payments $112,000
(b) Ending cash balance: January $51,000 February $50,000
Prepare purchases and income statement budgets for a merchandiser.
(LO 5)
(a) Purchases: May $603,000 June $633,150
(b) Net income: May $36,470 June $39,830

1046 23 Budgetary Planning
P23-6A Krause Industries’ balance sheet at December 31, 2016, is presented below.
KRAUSE INDUSTRIESBalance Sheet
December 31, 2016
Assets
Current assets Cash $ 7,500 Accounts receivable 73,500 Finished goods inventory (1,500 units) 24,000
Total current assets 105,000Property, plant, and equipment Equipment $40,000 Less: Accumulated depredation 10,000 30,000
Total assets $135,000
Liabilities and Stockholders’ Equity
Liabilities Notes payable $ 25,000 Accounts payable 45,000
Total liabilities 70,000Stockholders’ equity Common stock $40,000 Retained earnings 25,000
Total stockholders’ equity 65,000
Total liabilities and stockholders’ equity $135,000
Budgeted data for the year 2017 include the following.
2017
Quarter 4 Total
Sales budget (8,000 units at $32) $76,800 $256,000Direct materials used 17,000 62,500Direct labor 12,500 50,900Manufacturing overhead applied 10,000 48,600Selling and administrative expenses 18,000 75,000
To meet sales requirements and to have 2,500 units of fi nished goods on hand at December 31, 2017, the production budget shows 9,000 required units of output. The total unit cost of production is expected to be $18. Krause uses the fi rst-in, fi rst-out (FIFO) inventory costing method. Interest expense is expected to be $3,500 for the year. Income taxes are expected to be 40% of income before income taxes. In 2017, the company expects to declare and pay an $8,000 cash dividend.
The company’s cash budget shows an expected cash balance of $5,880 at December 31, 2017. All sales and purchases are on account. It is expected that 60% of quarterly sales are collected in cash within the quarter and the remainder is collected in the following quar-ter. Direct materials purchased from suppliers are paid 50% in the quarter incurred and the remainder in the following quarter. Purchases in the fourth quarter were the same as the materials used. In 2017, the company expects to purchase additional equipment costing $9,000. $4,000 of depreciation expense on equipment is included in the budget data and split equally between manufacturing overhead and selling and administrative expenses. Krause expects to pay $8,000 on the outstanding notes payable balance plus all interest due and payable to December 31 (included in interest expense $3,500, above). Accounts payable at December 31, 2017, includes amounts due suppliers (see above) plus other accounts payable of $7,200. Unpaid income taxes at December 31 will be $5,000.
InstructionsPrepare a budgeted statement of cost of goods sold, budgeted multiple-step income state-ment and retained earnings statement for 2017, and a budgeted classifi ed balance sheet at December 31, 2017.
Prepare budgeted cost of goods sold, income statement, retained earnings, and balance sheet.
(LO 3, 4)
Net income $21,900Total assets $116,600
Comprehensive Case 1047
PROBLEMS: SET B AND SET C
Visit the book’s companion website, at www.wiley.com/college/weygandt, and choose the Student Companion site to access Problems: Set B and Set C.
CONTINUING PROBLEMS
CURRENT DESIGNSCD23 Diane Buswell is preparing the 2017 budget for one of Current Designs’ rotomolded kayaks. Extensive meetings with members of the sales department and executive team have resulted in the following unit sales projections for 2017.
Quarter 1 1,000 kayaksQuarter 2 1,500 kayaksQuarter 3 750 kayaksQuarter 4 750 kayaks
Current Designs’ policy is to have fi nished goods ending inventory in a quarter equal to 20% of the next quarter’s anticipated sales. Preliminary sales projections for 2018 are 1,100 units for the fi rst quarter and 1,500 units for the second quarter. Ending inventory of fi nished goods at December 31, 2016, will be 200 rotomolded kayaks. Production of each kayak requires 54 pounds of polyethylene powder and a fi nishing kit (rope, seat, hardware, etc.). Company policy is that the ending inventory of polyethylene powder should be 25% of the amount needed for production in the next quarter. Assume that the ending inventory of polyethylene powder on December 31, 2016, is 19,400 pounds. The fi nishing kits can be assembled as they are needed. As a result, Current Designs does not maintain a signifi cant inventory of the fi nishing kits. The polyethylene powder used in these kayaks costs $1.50 per pound, and the fi nishing kits cost $170 each. Production of a single kayak requires 2 hours of time by more experienced, type I employees and 3 hours of fi nishing time by type II employees. The type I employees are paid $15 per hour, and the type II employees are paid $12 per hour. Selling and administrative expenses for this line are expected to be $45 per unit sold plus $7,500 per quarter. Manufacturing overhead is assigned at 150% of labor costs.
InstructionsPrepare the production budget, direct materials budget, direct labor budget, manufacturing overhead budget, and selling and administrative budget for this product line by quarter and in total for 2017.
EXCEL TUTORIAL
WATERWAYS
WP23 Waterways Corporation is preparing its budget for the coming year, 2017. The fi rst step is to plan for the fi rst quarter of that coming year. The company has gathered informa-tion from its managers in preparation of the budgeting process. This problem asks you to prepare the various budgets that comprise the master budget for 2017.
Go to the book’s companion website, at www.wiley.com/college/weygandt, to see the comple-tion of this problem.
(Note: This is a continuation of the Waterways problem from Chapters 19–22.)
Sweats Galore is a new business venture that will make custom sweatshirts using a silk-screen process. In helping the company’s owner, Michael Woods, set up his business, you will have the opportunity to apply your understanding of CVP relationships (Chapter 22) and budgetary planning (Chapter 23).
Go to the book’s companion website, at www.wiley.com/college/weygandt, for complete case details and instructions.
COMPREHENSIVE CASE

1048 23 Budgetary Planning
PERSPECTIVEMANAGEMENT DECISION-MAKING
Decision-Making Across the OrganizationBYP23-1 Palmer Corporation operates on a calendar-year basis. It begins the annual budgeting pro-cess in late August when the president establishes targets for the total dollar sales and net income before taxes for the next year. The sales target is given fi rst to the marketing department. The marketing manager formulates a sales budget by product line in both units and dollars. From this budget, sales quotas by product line in units and dollars are established for each of the corporation’s sales districts. The marketing manager also estimates the cost of the marketing activities required to support the target sales volume and prepares a tentative marketing expense budget. The executive vice president uses the sales and profi t targets, the sales budget by product line, and the tentative marketing expense budget to determine the dollar amounts that can be devoted to manu-facturing and corporate offi ce expense. The executive vice president prepares the budget for corporate expenses. She then forwards to the production department the product-line sales budget in units and the total dollar amount that can be devoted to manufacturing. The production manager meets with the factory managers to develop a manufacturing plan that will produce the required units when needed within the cost constraints set by the executive vice pres-ident. The budgeting process usually comes to a halt at this point because the production department does not consider the fi nancial resources allocated to be adequate. When this standstill occurs, the vice president of fi nance, the executive vice president, the mar-keting manager, and the production manager meet together to determine the fi nal budgets for each of the areas. This normally results in a modest increase in the total amount available for manufacturing costs and cuts in the marketing expense and corporate offi ce expense budgets. The total sales and net income fi gures proposed by the president are seldom changed. Although the participants are seldom pleased with the compromise, these budgets are fi nal. Each executive then develops a new detailed budget for the operations in his or her area. None of the areas has achieved its budget in recent years. Sales often run below the target. When budgeted sales are not achieved, each area is expected to cut costs so that the president’s profi t target can be met. However, the profi t target is seldom met because costs are not cut enough. In fact, costs often run above the original budget in all functional areas (marketing, production, and corporate offi ce). The president is disturbed that Palmer has not been able to meet the sales and profi t targets. He hired a consultant with considerable experience with companies in Palmer’s industry. The consultant reviewed the budgets for the past 4 years. He concluded that the product line sales budgets were reason-able and that the cost and expense budgets were adequate for the budgeted sales and production levels.
InstructionsWith the class divided into groups, answer the following.
(a) Discuss how the budgeting process employed by Palmer Corporation contributes to the failure to achieve the president’s sales and profi t targets.
(b) Suggest how Palmer Corporation’s budgeting process could be revised to correct the problems.(c) Should the functional areas be expected to cut their costs when sales volume falls below budget?
Explain your answer.(CMA adapted)
Managerial AnalysisBYP23-2 Elliot & Hesse Inc. manufactures ergonomic devices for computer users. Some of its more popular products include anti-glare fi lters and privacy fi lters (for computer monitors) and keyboard stands with wrist rests. Over the past 5 years, it experienced rapid growth, with sales of all products increasing 20% to 50% each year. Last year, some of the primary manufacturers of computers began introducing new products with some of the ergonomic designs, such as anti-glare fi lters and wrist rests, already built in. As a result, sales of Elliot & Hesse’s accessory devices have declined somewhat. The company believes that the privacy fi lters will probably continue to show growth, but that the other products will probably con-tinue to decline. When the next year’s budget was prepared, increases were built into research and development so that replacement products could be developed or the company could expand into some other product line. Some product lines being considered are general-purpose ergonomic devices including back supports, foot rests, and sloped writing pads.
BROADENING YOUR

The most recent results have shown that sales decreased more than was expected for the anti-glare fi lters. As a result, the company may have a shortage of funds. Top management has therefore asked that all expenses be reduced 10% to compensate for these reduced sales. Summary budget informa-tion is as follows.
Direct materials $240,000Direct labor 110,000Insurance 50,000Depreciation 90,000Machine repairs 30,000Sales salaries 50,000Offi ce salaries 80,000Factory salaries (indirect labor) 50,000
Total $700,000
InstructionsUsing the information above, answer the following questions.
(a) What are the implications of reducing each of the costs? For example, if the company reduces direct materials costs, it may have to do so by purchasing lower-quality materials. This may affect sales in the long run.
(b) Based on your analysis in (a), what do you think is the best way to obtain the $70,000 in cost savings requested? Be specifi c. Are there any costs that cannot or should not be reduced? Why?
Real-World FocusBYP23-3 Information regarding many approaches to budgeting can be found online. The following activity investigates the merits of “zero-based” budgeting, as discussed by Michael LaFaive, Director of Fiscal Policy of the Mackinac Center for Public Policy.
Address: www.mackinac.org/5928, or go to www.wiley.com/college/weygandt
InstructionsRead the article at the website and answer the following questions.
(a) How does zero-based budgeting differ from standard budgeting procedures?(b) What are some potential advantages of zero-based budgeting?(c) What are some potential disadvantages of zero-based budgeting?(d) How often do departments in Oklahoma undergo zero-based budgeting?
CRITICAL THINKING
Communication ActivityBYP23-4 In order to better serve their rural patients, Drs. Joe and Rick Parcells (brothers) began giving safety seminars. Especially popular were their “emergency-preparedness” talks given to farmers. Many people asked whether the “kit” of materials the doctors recommended for common farm emergencies was commercially available. After checking with several suppliers, the doctors realized that no other company offered the sup-plies they recommended in their seminars, packaged in the way they described. Their wives, Megan and Sue, agreed to make a test package by ordering supplies from various medical supply companies and assembling them into a “kit” that could be sold at the seminars. When these kits proved a runaway success, the sisters-in-law decided to market them. At the advice of their accountant, they organized this venture as a separate company, called Life Protection Products (LPP), with Megan Parcells as CEO and Sue Parcells as Secretary-Treasurer. LPP soon started receiving requests for the kits from all over the country, as word spread about their availability. Even without advertising, LPP was able to sell its full inventory every month. How-ever, the company was becoming fi nancially strained. Megan and Sue had about $100,000 in savings, and they invested about half that amount initially. They believed that this venture would allow them to make money. However, at the present time, only about $30,000 of the cash remains, and the company is constantly short of cash.
Broadening Your Perspective 1049
SERVICE

Megan has come to you for advice. She does not understand why the company is having cash fl ow problems. She and Sue have not even been withdrawing salaries. However, they have rented a local building and have hired two more full-time workers to help them cope with the increasing demand. They do not think they could handle the demand without this additional help. Megan is also worried that the cash problems mean that the company may not be able to support itself. She has prepared the cash budget shown below. All seminar customers pay for their products in full at the time of purchase. In addition, several large companies have ordered the kits for use by employees who work in remote sites. They have requested credit terms and have been allowed to pay in the month following the sale. These large purchasers amount to about 25% of the sales at the present time. LPP purchases the materials for the kits about 2 months ahead of time. Megan and Sue are considering slowing the growth of the company by simply purchasing less materials, which will mean selling fewer kits. The workers are paid weekly. Megan and Sue need about $15,000 cash on hand at the beginning of the month to pay for purchases of raw materials. Right now they have been using cash from their savings, but as noted, only $30,000 is left.
LIFE PROTECTION PRODUCTSCash Budget
For the Quarter Ending June 30, 2017
April May June
Cash balance, beginning $15,000 $15,000 $15,000
Cash received From prior month sales 5,000 7,500 12,500 From current sales 15,000 22,500 37,500
Total cash on hand 35,000 45,000 65,000
Cash payments To employees 3,000 3,000 3,000 For products 25,000 35,000 45,000 Miscellaneous expenses 5,000 6,000 7,000 Postage 1,000 1,000 1,000
Total cash payments 34,000 45,000 56,000
Cash balance $ 1,000 $ 0 $ 9,000
Borrow from savings $14,000 $15,000 $ 1,000
Borrow from bank? $ 0 $ 0 $ 5,000
InstructionsWrite a response to Megan Parcells. Explain why LPP is short of cash. Will this company be able to support itself? Explain your answer. Make any recommendations you deem appropriate.
Ethics CaseBYP23-5 You are an accountant in the budgetary, projections, and special projects department of Fernetti Conductor, Inc., a large manufacturing company. The president, Richard Brown, asks you on very short notice to prepare some sales and income projections covering the next 2 years of the com-pany’s much heralded new product lines. He wants these projections for a series of speeches he is making while on a 2-week trip to eight East Coast brokerage fi rms. The president hopes to bolster Fernetti’s stock sales and price. You work 23 hours in 2 days to compile the projections, hand-deliver them to the president, and are swiftly but graciously thanked as he departs. A week later, you fi nd time to go over some of your computations and discover a miscalculation that makes the projections grossly overstated. You quickly inquire about the president’s itinerary and learn that he has made half of his speeches and has half yet to make. You are in a quandary as to what to do.
Instructions(a) What are the consequences of telling the president of your gross miscalculations?(b) What are the consequences of not telling the president of your gross miscalculations?(c) What are the ethical considerations to you and the president in this situation?
1050 23 Budgetary Planning

All About YouBYP23-6 In order to get your personal fi nances under control, you need to prepare a personal budget. Assume that you have compiled the following information regarding your expected cash fl ows for a typical month.
Rent payment $ 500 Miscellaneous costs $210Interest income 50 Savings 50Income tax withheld 300 Eating out 150Electricity bill 85 Telephone and Internet costs 125Groceries 100 Student loan payments 375Wages earned 2,500 Entertainment costs 250Insurance 100 Transportation costs 150
InstructionsUsing the information above, prepare a personal budget. In preparing this budget, use the format found at http://fi nancialplan.about.com/cs/budgeting/l/blbudget.htm. Just skip any unused line items.
Considering Your Costs and Benefi tsBYP23-7 You might hear people say that they “need to learn to live within a budget.” The funny thing is that most people who say this haven’t actually prepared a personal budget, nor do they intend to. Instead, what they are referring to is a vaguely defi ned, poorly specifi ed collection of rough ideas of how much they should spend on various aspects of their lives. However, you can’t live within or even outside of something that doesn’t exist. With that in mind, let’s take a look at one aspect of personal-budget templates. Many personal-budget worksheet templates that are provided for college students treat student loans as an income source. See, for example, the template provided at http://fi nancialplan.about.com/cs/budgeting/l/blmocolbud.htm. Based on your knowledge of accounting, is this correct?
YES: Student loans provide a source of cash, which can be used to pay costs. As the saying goes, “It all spends the same.” Therefore, student loans are income.NO: Student loans must eventually be repaid; therefore, they are not income. As the name suggests, they are loans.
InstructionsWrite a response indicating your position regarding this situation. Provide support for your view.
Broadening Your Perspective 1051

Perhaps no place in the world has a wider variety of
distinctive, high-end accommodations than New York City. It’s
tough to set yourself apart in the Big Apple, but unique is
what the Tribeca Grand Hotel is all about.
When you walk through the doors of this triangular-shaped
building, nestled in one of Manhattan’s most affl uent
neighborhoods, you immediately encounter a striking
eight-story atrium. Although the hotel was completely
renovated, it still maintains its funky mid-century charm. Just
consider the always hip Church Bar. Besides serving up
cocktails until 2 a.m., Church’s also provides food. These are
not the run-of-the-mill, chain hotel, borderline edibles.
Church’s chef is famous for tantalizing delectables such as
duck rillettes, sea salt baked branzino, housemade
pappardelle, and pumpkin madeleines.
Another thing that really sets the Tribeca Grand apart is its
private screening room. As a guest, you can enjoy plush
leather seating, state-of-the-art projection, and digital
surround sound, all while viewing a cult classic from the
hotel’s fi lm series. In fact, on Sundays, free screenings are
available to guests and non-guests alike on a fi rst-come-fi rst-
served basis.
To attract and satisfy a discerning clientele, the Tribeca Grand’s
management incurs higher and more unpredictable costs than
those of your standard hotel. As fun as it might be to run a
high-end hotel, management can’t be cavalier about spending
money. To maintain profi tability, management closely monitors
costs and revenues to make sure that they track with
budgeted amounts. Further, because of unexpected
fl uctuations (think Hurricane Sandy or a bitterly cold stretch of
winter weather), management must sometimes revise
forecasts and budgets and adapt quickly. To evaluate
performance when things happen that are beyond
management’s control, the budget needs to be fl exible.
Pumpkin Madeleines and a Movie
In Chapter 23, we discussed the use of budgets for planning. We now consider how budgets are used by management to control operations. In the Feature Story below on the Tribeca Grand Hotel, we see that management uses the budget to adapt to the business environment. This chapter focuses on two aspects of management control: (1) budgetary control and (2) responsibility accounting.
CHAPTER PREVIEW
24
FEATURE STORY
Budgetary Control and Responsibility Accounting
1052
Watch the Tribeca Grand video in WileyPLUS to learn more about real-world budgeting.
▲

Go to the REVIEW AND PRACTICE section at the end of the chapter for a review of key concepts and practice applications with solutions.
Visit WileyPLUS with ORION for additional tutorials and practice opportunities.
Eviled/Shutterstock
Evaluate performance in investment centers.
Prepare fl exible budget reports.
Apply responsibility accounting to cost and profi t centers.
2
3
4
Describe budgetary control and static budget reports.1 Static Budget ReportsDO IT! 1• Budgetary control
• Static budget reports
• Why fl exible budgets?• Developing the fl exible budget• Flexible budget—a case study• Flexible budget reports
Learning Objectives
Profi t Center Responsibility ReportDO IT! 3
• Controllable vs. noncontrollable revenues and costs
• Principles of performance evaluation
• Responsibility reporting system• Types of responsibility centers
Performance EvaluationDO IT! 4
• Return on investment (ROI)• Responsibility report• Judgmental factors in ROI• Improving ROI
Flexible Budgets2DO IT!
CHAPTER OUTLINE

1054 24 Budgetary Control and Responsibility Accounting
1 Describe budgetary control and static budget reports.LEARNING OBJECTIVE
Budgetary Control
One of management’s functions is to control company operations. Control con-sists of the steps taken by management to see that planned objectives are met. We now ask: How do budgets contribute to control of operations? The use of budgets in controlling operations is known as budgetary control. Such control takes place by means of budget reports that compare actual results with planned objectives. The use of budget reports is based on the belief that planned objectives lose much of their potential value without some monitoring of progress along the way. Just as your professors give midterm exams to evaluate your progress, top management requires periodic reports on the progress of department managers toward their planned objectives. Budget reports provide management with feedback on operations. The feedback for a crucial objective, such as having enough cash on hand to pay bills, may be made daily. For other objectives, such as meeting budgeted annual sales and operating expenses, monthly budget reports may suffi ce. Budget reports are prepared as frequently as needed. From these reports, management analyzes any differences between actual and planned results and determines their causes. Management then takes corrective action, or it decides to modify future plans. Budgetary control involves the activities shown in Illustration 24-1.
Analyze differencesbetween actual and budget
Take corrective action
Develop budget
Modify future plans
xxxxxxxxxxxxxxxx
xxxxxxxxxxxxxxxxxxxxxxxxxxxxxxxxxxxxxxxxxxxxxxxxxx
xxxxxxxxxxxxxxxxxxxxxxxxxxxxxxxxxxxxxxxxxxxxxxxxxx
xxxxxxxxxxxxxxxxxxxxxxxxxxxxxxxx
xxxxxxxxxxxxxxxxxxxxxxxxxxxxxxxxxxxxxxxxxxxxxxxxxx
xxxxxxxxxxxxxxxx
BudgetActual
We need tocut production
costs and increasesales.
Illustration 24-1Budgetary control activities
Budgetary control works best when a company has a formalized reporting system. The system does the following:
1. Identifi es the name of the budget report, such as the sales budget or the manu-facturing overhead budget.
2. States the frequency of the report, such as weekly or monthly.
3. Specifi es the purpose of the report.
4. Indicates the primary recipient(s) of the report.
Illustration 24-2 provides a partial budgetary control system for a manu-facturing company. Note the frequency of the reports and their emphasis on control. For example, there is a daily report on scrap and a weekly report on labor.

Budgetary Control and Static Budget Reports 1055
Static Budget Reports
You learned in Chapter 23 that the master budget formalizes management’s planned objectives for the coming year. When used in budgetary control, each budget included in the master budget is considered to be static. A static budget is a projection of budget data at one level of activity. These budgets do not con-sider data for different levels of activity. As a result, companies always compare actual results with budget data at the activity level that was used in developing the master budget.
EXAMPLES
To illustrate the role of a static budget in budgetary control, we will use selected data prepared for Hayes Company in Chapter 23. Budget and actual sales data for the Rightride product in the fi rst and second quarters of 2017 are as follows.
The sales budget report for Hayes’ fi rst quarter is shown below. The right-most column reports the difference between the budgeted and actual amounts.
The report shows that sales are $1,000 under budget—an unfavorable result. This difference is less than 1% of budgeted sales ($1,000 4 $180,000 5 .0056). Top management’s reaction to unfavorable differences is often infl uenced by the materiality (signifi cance) of the difference. Since the difference of $1,000 is immaterial in this case, we assume that Hayes management takes no specifi c corrective action.
Illustration 24-2Budgetary control reporting system
Name of Report Frequency Purpose Primary Recipient(s)
Sales Weekly Determine whether sales goals Top management and sales manager are met
Labor Weekly Control direct and indirect labor costs Vice president of production and production department managers
Scrap Daily Determine effi cient use of materials Production manager
Departmental Monthly Control overhead costs Department manager overhead costs
Selling expenses Monthly Control selling expenses Sales manager
Income statement Monthly and Determine whether income goals Top management quarterly are met
Illustration 24-3Budget and actual sales data Sales First Quarter Second Quarter Total
Budgeted $180,000 $210,000 $390,000Actual 179,000 199,500 378,500
Difference $ 1,000 $ 10,500 $ 11,500
Alternative TerminologyThe difference between budget and actual is sometimes called a budget variance.
Illustration 24-4Sales budget report—fi rst quarter
Formulas Data Review ViewPage LayoutInsert
1
2
3
4
5
67
8
9
AP18 fx
CB D
$180,000 $179,000 $1,000 U
Home
HAYES COMPANYSales Budget Report
For the Quarter Ended March 31, 2017
BudgetProduct Line ActualFavorable F
Unfavorable U
Hayes Company Sales Budget Report.xls
Rightridea
Difference
aIn practice, each product line would be included in the report.

1056 24 Budgetary Control and Responsibility Accounting
Illustration 24-5 shows the budget report for the second quarter. It contains one new feature: cumulative year-to-date information. This report indicates that sales for the second quarter are $10,500 below budget. This is 5% of budgeted sales ($10,500 4 $210,000). Top management may now conclude that the differ-ence between budgeted and actual sales requires investigation.
Management’s analysis should start by asking the sales manager the cause(s) of the shortfall. Managers should consider the need for corrective action. For example, management may decide to spur sales by offering sales incentives to customers or by increasing the advertising of Rightrides. Or, if management concludes that a downturn in the economy is responsible for the lower sales, it may modify planned sales and profi t goals for the remainder of the year.
USES AND LIMITATIONS
From these examples, you can see that a master sales budget is useful in evaluat-ing the performance of a sales manager. It is now necessary to ask: Is the master budget appropriate for evaluating a manager’s performance in controlling costs? Recall that in a static budget, data are not modifi ed or adjusted, regardless of changes in activity. It follows, then, that a static budget is appropriate in evaluat-ing a manager’s effectiveness in controlling costs when:
1. The actual level of activity closely approximates the master budget activity level, and/or
2. The behavior of the costs in response to changes in activity is fi xed.
A static budget report is, therefore, appropriate for fi xed manufacturing costs and for fi xed selling and administrative expenses. But, as you will see shortly, static budget reports may not be a proper basis for evaluating a manager’s perfor-mance in controlling variable costs.
Static budgets reporta single level of activity
Cos
ts
Units
Lawler Company expects to produce 5,000 units of product CV93 during the current month. Budgeted variable manufacturing costs per unit are direct materials $6, direct labor $15, and overhead $24. Monthly budgeted fi xed manufacturing overhead costs are $10,000 for depreciation and $5,000 for supervision. In the current month, Lawler actually produced 5,500 units and incurred the follow-ing costs: direct materials $33,900, direct labor $74,200, variable overhead $120,500, depreciation $10,000, and supervision $5,000. Prepare a static budget report. (Hint: The Budget column is based on estimated pro-duction of 5,000 units while the Actual column is the actual costs incurred during the period.) Were costs controlled? Discuss limitations of this budget.
DO IT! 1 Static Budget Reports
Illustration 24-5Sales budget report—second quarter
Formulas Data Review ViewPage LayoutInsert
1
2
3
4
5
67
8
9
AP18 fx
CB D E F G H
$210,000 $199,500 $10,500 U
Home
HAYES COMPANYSales Budget Report
For the Quarter Ended June 30, 2017
BudgetProduct Line ActualFavorable F
Unfavorable U
Second Quarter Year-to-Date
Hayes Company Sales Budget Report.xls
Rightride $390,000 $378,500 $11,500 U
Budget ActualFavorable F
Unfavorable U
DifferenceDifference

Flexible Budget Reports 1057
Action Plan✔ Classify each cost as
variable or fi xed.✔ Determine the differ-
ence as favorable or unfavorable.
✔ Determine the differ-ence in total variable costs, total fi xed costs, and total costs.
Solution
Formulas Data Review ViewPage LayoutInsert
AP18 fx
CB D
Lawler Company.xlsLawler Company.xlsHome
1
2
3
4
5
6
7
8
9
10
11
12
13
14
15
16
17
18
Production in units
Variable costs Direct materials ($6) Direct labor ($15) Overhead ($24) Total variable costs
Fixed costs Depreciation Supervision Total fixed costs Total costs
5,500
$ 33,90074,200
120,500228,600
10,0005,000
15,000$243,600
5,000
$ 30,00075,000
120,000225,000
10,0005,000
15,000$240,000
$3,900800500
3,600
000
$3,600
Budget Actual
UFUU
U
DifferenceFavorable - F
Unfavorable - U
The static budget indicates that actual variable costs exceeded budgeted amounts by $3,600. Fixed costs were exactly as budgeted. The static budget gives the impression that the company did not control its variable costs. However, the static budget does not give consideration to the fact that the company produced 500 more units than planned. As a result, the static budget is not a good tool to evaluate variable costs. It is, however, a good tool to evaluate fi xed costs as those should not vary with changes in production volume.
Related exercise material: BE24-1, BE24-2, E24-1, E24-2, and DO IT! 24-1.
2 Prepare fl exible budget reports.LEARNING OBJECTIVE
In contrast to a static budget, which is based on one level of activity, a fl exible budget projects budget data for various levels of activity. In essence, the fl exible budget is a series of static budgets at different levels of activity. The fl exible budget recognizes that the budgetary process is more useful if it is adaptable to changed operating conditions. Flexible budgets can be prepared for each of the types of budgets included in the master budget. For example, Marriott Hotels can budget revenues and net income on the basis of 60%, 80%, and 100% of room occupancy. Similarly, American Van Lines can budget its operating expenses on the basis of various levels of truck-miles driven. Duke Energy can budget revenue and net income on the basis of estimated billions of kwh (kilowatt hours) of residential, commercial, and industrial electricity generated. In the following pages, we will illustrate a fl exible budget for manufacturing overhead.
Why Flexible Budgets?
Assume that you are the manager in charge of manufacturing overhead in the Assembly Department of Barton Robotics. In preparing the manufacturing
Flexible budgets arestatic budgets at
different activity levels
Cos
ts
Units

1058 24 Budgetary Control and Responsibility Accounting
overhead budget for 2017, you prepare the following static budget based on a production volume of 10,000 units of robotic controls.
Fortunately for the company, the demand for robotic controls has increased, and Barton produces and sells 12,000 units during the year rather than 10,000. You are elated! Increased sales means increased profi tability, which should mean a bonus or a raise for you and the employees in your department. Unfortunately, a comparison of Assembly Department actual and budgeted costs has put you on the spot. The budget report is shown below.
This comparison uses budget data based on the original activity level (10,000 robotic controls). It indicates that the Assembly Department is signifi cantly over budget for three of the six overhead costs. There is a total unfavorable difference of $132,000, which is 12% over budget ($132,000 4 $1,100,000). Your supervisor is very unhappy. Instead of sharing in the company’s success, you may fi nd your-self looking for another job. What went wrong?
Helpful HintThe master budget described in Chapter 23 is based on a static budget.
Illustration 24-6Static overhead budget Formulas Data Review ViewPage LayoutInsert
1
2
3
4
5
6
7
8
9
10
11
12
13
14
AP18 fx
B
Barton Robotics.xls
10,000
$ 250,000260,000190,000280,000
70,00050,000
$1,100,000
Home
BARTON ROBOTICSManufacturing Overhead Budget (Static)
Assembly Department For the Year Ended December 31, 2017
15
Budgeted production in units (robotic controls)
Budgeted costs Indirect materials Indirect labor Utilities Depreciation Property taxes Supervision
Illustration 24-7Overhead static budget report Formulas Data Review ViewPage LayoutInsert
1
2
3
4
5
6
7
8
9
10
11
12
13
14
15
16
AP18 fx
B C D E
Barton Robotics.xls
$ 45,00052,00035,000
000
$132,000
UUU
U
12,000
$ 295,000312,000225,000280,000
70,00050,000
$1,232,000
10,000
$ 250,000260,000190,000280,000
70,00050,000
$1,100,000
Home
BARTON ROBOTICSManufacturing Overhead Static Budget Report
For the Year Ended December 31, 2017
DifferenceFavorable - F
Unfavorable - UBudget Actual
Production in units
Costs
Indirect materials Indirect labor Utilities Depreciation Property taxes Supervision

Flexible Budget Reports 1059
When you calm down and carefully examine the manufacturing overhead budget, you identify the problem: The budget data are not relevant! At the time the budget was developed, the company anticipated that only 10,000 units would be produced, not 12,000. Comparing actual with budgeted variable costs is meaningless. As production increases, the budget allowances for variable costs should increase proportionately. The variable costs in this example are indirect materials, indirect labor, and utilities. Analyzing the budget data for these costs at 10,000 units, you arrive at the following per unit results.
Illustration 24-9 calculates the budgeted variable costs at 12,000 units.
Because fi xed costs do not change in total as activity changes, the budgeted amounts for these costs remain the same. Illustration 24-10 shows the budget report based on the fl exible budget for 12,000 units of production. (Compare this with Illustration 24-7.)
Illustration 24-8Variable costs per unit Item Total Cost Per Unit
Indirect materials $250,000 $25Indirect labor 260,000 26Utilities 190,000 19
$700,000 $70
Illustration 24-9Budgeted variable costs, 12,000 units
Item Computation Total
Indirect materials $25 3 12,000 $300,000Indirect labor 26 3 12,000 312,000Utilities 19 3 12,000 228,000
$840,000
Illustration 24-10Overhead fl exible budget report
Formulas Data Review ViewPage LayoutInsert
1
2
3
4
5
6
7
8
9
10
11
12
13
14
15
16
18
19
20
17
AP18 fx
B C D E
Barton Robotics.xls
$5,0000
3,0008,000
0000
$8,000
F
FF
F
12,000
$ 295,000312,000225,000832,000
280,00070,00050,000
400,000$1,232,000
12,000
$ 300,000312,000228,000840,000
280,00070,00050,000
400,000$1,240,000
Home
BARTON ROBOTICSManufacturing Overhead Flexible Budget Report
For the Year Ended December 31, 2017
DifferenceFavorable - F
Unfavorable - UBudget Actual
Production in units
Variable costs
Indirect materials ($25) Indirect labor ($26) Utilities ($19)
Total variable costs
Fixed costs Depreciation Property taxes Supervision Total fixed costs
Total costs
Helpful HintA static budget is not useful for performance evaluation if a company has substantial variable costs.

1060 24 Budgetary Control and Responsibility Accounting
Just What the Doctor Ordered?
Nobody is immune from the effects of declining revenues—not even movie stars. When the number of viewers of the television show “House,” a medical drama, declined by almost 20%, Fox Broadcasting said it wanted to cut the license fee that it paid to NBCUniversal by 20%. What would NBCUniversal do
This report indicates that the Assembly Department’s costs are under budget—a favorable difference. Instead of worrying about being fi red, you may be in line for a bonus or a raise after all! As this analysis shows, the only appropriate comparison is between actual costs at 12,000 units of production and budgeted costs at 12,000 units. Flexible budget reports provide this comparison.
Developing the Flexible Budget
The fl exible budget uses the master budget as its basis. To develop the fl exible budget, management uses the following steps.
1. Identify the activity index and the relevant range of activity.
2. Identify the variable costs, and determine the budgeted variable cost per unit of activity for each cost.
3. Identify the fi xed costs, and determine the budgeted amount for each cost.
4. Prepare the budget for selected increments of activity within the relevant range.
The activity index chosen should signifi cantly infl uence the costs being bud-geted. For manufacturing overhead costs, for example, the activity index is usu-ally the same as the index used in developing the predetermined overhead rate—that is, direct labor hours or machine hours. For selling and administrative expenses, the activity index usually is sales or net sales. The choice of the increment of activity is largely a matter of judgment. For example, if the relevant range is 8,000 to 12,000 direct labor hours, increments of 1,000 hours may be selected. The fl exible budget is then prepared for each incre-ment within the relevant range.
Flexible Budget—A Case Study
To illustrate the fl exible budget, we use Fox Company. Fox’s management uses a fl exible budget for monthly comparisons of actual and budgeted manufactur-ing overhead costs of the Finishing Department. The master budget for the year ending December 31, 2017, shows expected annual operating capacity of 120,000 direct labor hours and the following overhead costs.
Illustration 24-11Master budget data Variable Costs Fixed Costs
Indirect materials $180,000 Depreciation $180,000Indirect labor 240,000 Supervision 120,000Utilities 60,000 Property taxes 60,000
Total $480,000 Total $360,000
in response? It might cut the size of the show’s cast, which would reduce the payroll costs associated with the show. Or, it could reduce the number of episodes that take advantage of the full cast. Alternatively, it might threaten to quit providing the show to Fox altogether and instead present the show on its own NBC-affi liated channels.
Source: Sam Schechner, “Media Business Shorts: NBCU, Fox Taking Scalpel to ‘House’,” Wall Street Journal Online (April 17, 2011).
Explain how the use of fl exible budgets might help to identify the best solution to this problem. (Go to WileyPLUS for this answer and additional questions.)
Fox BroadcastingCompany/Album/Newscom
Service Company Insight NBCUniversal

Flexible Budget Reports 1061
The four steps for developing the fl exible budget are applied as follows.
STEP 1. Identify the activity index and the relevant range of activity. The activity index is direct labor hours. The relevant range is 8,000–12,000 direct labor hours per month.
STEP 2. Identify the variable costs, and determine the budgeted variable cost per unit of activity for each cost. There are three variable costs. The vari-able cost per unit is found by dividing each total budgeted cost by the direct labor hours used in preparing the annual master budget (120,000 hours). Illustration 24-12 shows the computations for Fox Company.
Illustration 24-12Computation of variable cost per direct labor hour
Variable Cost per Variable Costs Computation Direct Labor Hour
Indirect materials $180,000 4 120,000 $1.50Indirect labor $240,000 4 120,000 2.00Utilities $ 60,000 4 120,000 0.50
Total $4.00
STEP 3. Identify the fi xed costs, and determine the budgeted amount for each cost. There are three fi xed costs. Since Fox desires monthly budget data, it divides each annual budgeted cost by 12 to fi nd the monthly amounts. There-fore, the monthly budgeted fi xed costs are depreciation $15,000, supervision $10,000, and property taxes $5,000.
STEP 4. Prepare the budget for selected increments of activity within the relevant range. Management prepares the budget in increments of 1,000 direct labor hours.
Illustration 24-13 shows Fox’s fl exible budget.
Formulas Data Review ViewPage LayoutInsert
1
2
3
4
5
6
7
8
9
10
11
12
13
14
15
16
17
18
19
AP18 fx
B C D E F
Fox Company.xls
10,000
$15,00020,000
5,00040,000
15,00010,000
5,00030,000
$70,000
11,000
$16,50022,000
5,50044,000
15,00010,000
5,00030,000
$74,000
12,000
$18,00024,000
6,00048,000
15,00010,000
5,00030,000
$78,000
9,000
$13,50018,000
4,50036,000
15,00010,000
5,00030,000
$66,000
8,000
$12,000b
16,000c
4,000d
32,000
15,000 10,000 5,000
30,000 $62,000
Home
FOX COMPANYMonthly Manufacturing Overhead Flexible Budget
Finishing Department For Months During the Year 2017
Activity level Direct labor hoursVariable costs Indirect materials ($1.50)a
Indirect labor ($2.00)a
Utilities ($0.50)a
Total variable costsFixed costs Depreciation Supervision Property taxes Total fixed costsTotal costs
aCost per direct labor hour; b8,000 x $1.50; c8,000 x $2.00; d8,000 x $0.50
Illustration 24-13Monthly overhead fl exible budget

1062 24 Budgetary Control and Responsibility Accounting
Fox uses the formula below to determine total budgeted costs at any level of activity.
Illustration 24-14Formula for total budgeted costs
Total
Fixed 1
Variable 5 Budgeted
Costs Costs* Costs
*Total variable cost per unit of activity 3 Activity level.
Helpful HintUsing the data given for Fox, the amount of total costs to be budgeted for 10,600 direct labor hours would be $30,000 fi xed 1 $42,400 variable (10,600 3 $4) 5 $72,400 total.
For Fox, fi xed costs are $30,000, and total variable cost per direct labor hour is $4 ($1.50 1 $2.00 1 $0.50). At 9,000 direct labor hours, total budgeted costs are $66,000 [$30,000 1 ($4 3 9,000)]. At 8,622 direct labor hours, total budgeted costs are $64,488 [$30,000 1 ($4 3 8,622)]. Total budgeted costs can also be shown graphically, as in Illustration 24-15. In the graph, the horizontal axis represents the activity index, and costs are indi-cated on the vertical axis. The graph highlights two activity levels (10,000 and 12,000). As shown, total budgeted costs at these activity levels are $70,000 [$30,000 1 ($4 3 10,000)] and $78,000 [$30,000 1 ($4 3 12,000)], respectively.
2 4 6 8 10 14Direct Labor Hours (in 000)
Budgeted FixedCosts
Budgeted VariableCosts
Total BudgetedCost Line
70
50
20
10
Cos
ts (
in 0
00)
12
30
40
60
80
$90
Illustration 24-15Graphic fl exible budget data highlighting 10,000 and 12,000 activity levels
Flexible Budget Reports
Flexible budget reports are another type of internal report. The fl exible budget report consists of two sections: (1) production data for a selected activity index, such as direct labor hours, and (2) cost data for variable and fi xed costs. The report provides a basis for evaluating a manager’s performance in two areas: pro-duction control and cost control. Flexible budget reports are widely used in pro-duction and service departments. Illustration 24-16 shows a budget report for the Finishing Department of Fox Company for the month of January. In this month, 9,000 hours are worked. The budget data are therefore based on the fl exible budget for 9,000 hours in Illustra-tion 24-13 (page 1061). The actual cost data are assumed. How appropriate is this report in evaluating the Finishing Department man-ager’s performance in controlling overhead costs? The report clearly provides a reliable basis. Both actual and budget costs are based on the activity level worked during January. Since variable costs generally are incurred directly by the depart-ment, the difference between the budget allowance for those hours and the actual costs is the responsibility of the department manager.

Flexible Budget Reports 1063
In subsequent months, Fox Company will prepare other fl exible budget reports. For each month, the budget data are based on the actual activity level attained. In February that level may be 11,000 direct labor hours, in July 10,000, and so on. Note that this fl exible budget is based on a single cost driver. A more accurate budget often can be developed using the activity-based costing concepts explained in Chapter 21.
Formulas Data Review ViewPage LayoutInsert
1
2
3
4
5
6
7
8
9
10
11
12
13
14
15
16
18
19
2021
22
17
AP18 fx
B C D E
Fox Company.xlsHome
FOX COMPANYManufacturing Overhead Flexible Budget Report
Finishing Department For the Month Ended January 31, 2017
$ 5001,000
100400
0000
$ 400
UFUF
F
$14,00017,000
4,60035,600
15,00010,000
5,00030,000
$65,600
$13,50018,000
4,50036,000
15,00010,000
5,00030,000
$66,000
DifferenceFavorable - F
Unfavorable - UDirect labor hours (DLH)
Variable costs Indirect materials ($1.50)a
Indirect labor ($2.00)a Utilities ($0.50)a
Total variable costs
Fixed costs Depreciation Supervision Property taxes Total fixed costsTotal costs
aCost per direct labor hour
9,000 DLH 9,000 DLHBudget at Actual costs at
Illustration 24-16Overhead fl exible budget report
Budgets and the Exotic Newcastle Disease
Exotic Newcastle Disease, one of the most infec-tious bird diseases in the world, kills
so swiftly that many victims die before any symptoms appear. When it broke out in Southern California, it could have spelled disaster for the San Diego Zoo. “We have one of the most valuable collections of birds in the world, if not the most valuable,” says Paula Brock, CFO of the Zoological Society of San Diego, which operates the zoo. Bird exhibits were closed to the public for several months (the disease, which is harmless to humans, can be carried on clothes and shoes). The tires of arriving delivery trucks were sanitized, as were the shoes of anyone visiting the zoo’s nonpublic areas. Zookeeper uniforms had to be
changed and cleaned daily. And ultimately, the zoo, with $150 million in revenues, spent almost half a million dollars on quarantine measures. It worked: No birds got sick. Better yet, the damage to the rest of the zoo’s budget was minimized by another protective measure: the monthly budget reforecast. “When we get a hit like this, we still have to fi nd a way to make our bottom line,” says Brock. Thanks to a new plan-ning process Brock had introduced a year earlier, the zoo’s scientists were able to raise the fi nancial alarm as they redirected resources to ward off the disease. “Because we had timely awareness,” she says, “we were able to make adjustments to weather the storm.”
Source: Tim Reason, “Budgeting in the Real World,” CFO Magazine (July 12, 2005), www.cfodirect.com/cfopublic.nsf/vContentPrint/ 649A82C8FF8AB06B85257037004 (accessed July 2005).
What is the major benefi t of tying a budget to the overall goals of the company? (Go to WileyPLUS for this answer and additional questions.)
Service Company Insight San Diego Zoo
Eric Isselée/iStockphoto

1064 24 Budgetary Control and Responsibility Accounting
In Strassel Company’s fl exible budget graph, the fi xed cost line and the total budgeted cost line intersect the vertical axis at $36,000. The total budgeted cost line is $186,000 at an activity level of 50,000 direct labor hours. Compute total budgeted costs at 30,000 direct labor hours.
DO IT! 2 Flexible Budgets
Using the graph, fi xed costs are $36,000, and variable costs are $3 per direct labor hour [($186,000 2 $36,000) 4 50,000]. Thus, at 30,000 direct labor hours, total bud-geted costs are $126,000 [$36,000 1 ($3 3 30,000)].
Related exercise material: BE24-4, E24-3, E24-5, and DO IT! 24-2.
Action Plan✔ Apply the formula:
Fixed costs 1 Variable costs (Total variable cost per unit 3 Activity level) 5 Total budgeted costs.
10 20 30 40 50Direct Labor Hours (in 000)
$150
50
Cos
ts (
in 0
00)
100
Solution
3 Apply responsibility accounting to cost and profi t centers.LEARNING OBJECTIVE
Like budgeting, responsibility accounting is an important part of management accounting. Responsibility accounting involves accumulating and reporting costs (and revenues, where relevant) on the basis of the manager who has the authority to make the day-to-day decisions about the items. Under responsibility accounting, a manager’s performance is evaluated on matters directly under that manager’s control. Responsibility accounting can be used at every level of man-agement in which the following conditions exist.
1. Costs and revenues can be directly associated with the specifi c level of man-agement responsibility.
2. The costs and revenues can be controlled by employees at the level of respon-sibility with which they are associated.
3. Budget data can be developed for evaluating the manager’s effectiveness in controlling the costs and revenues.
Illustration 24-17 depicts levels of responsibility for controlling costs. Under responsibility accounting, any individual who controls a specifi ed set of activities can be a responsibility center. Thus, responsibility accounting may
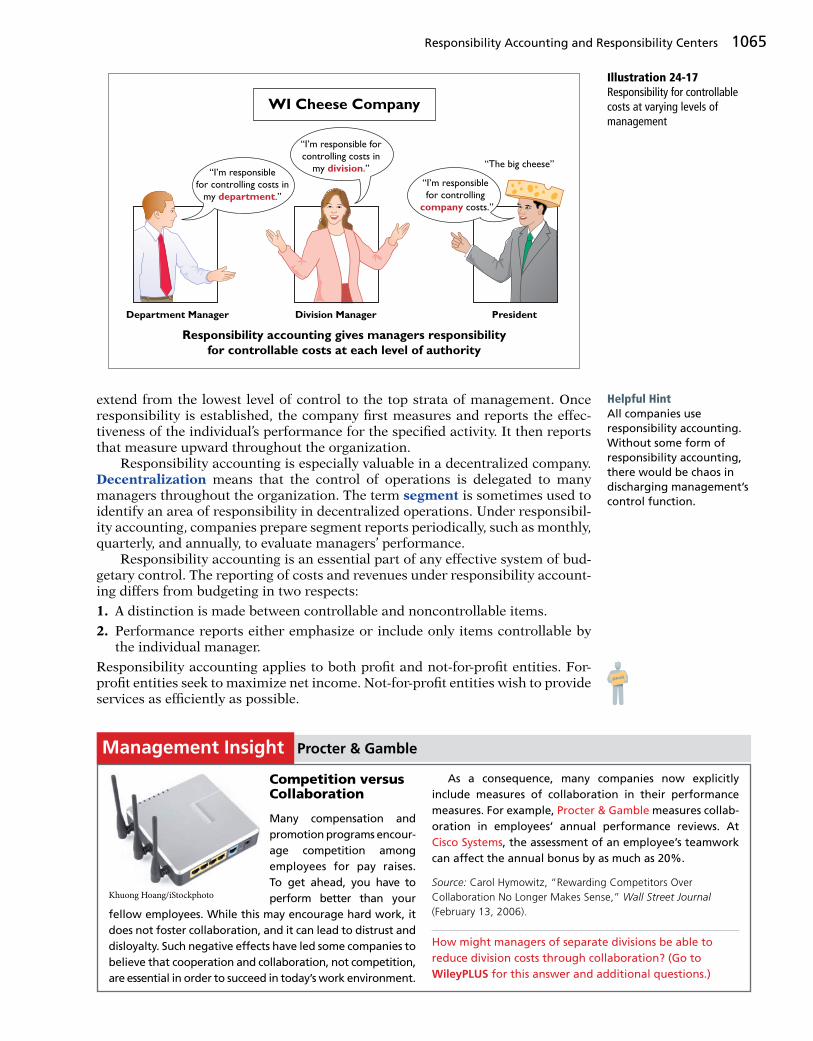
Responsibility Accounting and Responsibility Centers 1065
extend from the lowest level of control to the top strata of management. Once responsibility is established, the company fi rst measures and reports the effec-tiveness of the individual’s performance for the specifi ed activity. It then reports that measure upward throughout the organization. Responsibility accounting is especially valuable in a decentralized company. Decentralization means that the control of operations is delegated to many managers throughout the organization. The term segment is sometimes used to identify an area of responsibility in decentralized operations. Under responsibil-ity accounting, companies prepare segment reports periodically, such as monthly, quarterly, and annually, to evaluate managers’ performance. Responsibility accounting is an essential part of any effective system of bud-getary control. The reporting of costs and revenues under responsibility account-ing differs from budgeting in two respects:
1. A distinction is made between controllable and noncontrollable items.
2. Performance reports either emphasize or include only items controllable by the individual manager.
Responsibility accounting applies to both profi t and not-for-profi t entities. For-profi t entities seek to maximize net income. Not-for-profi t entities wish to provide services as effi ciently as possible.
Helpful HintAll companies use responsibility accounting. Without some form of responsibility accounting, there would be chaos in discharging management’s control function.
Illustration 24-17Responsibility for controllable costs at varying levels of management
WI Cheese Company
Responsibility accounting gives managers responsibility
for controllable costs at each level of authority
Department Manager Division Manager President
“I’m responsible forcontrolling costs in
my division.” “The big cheese”
“I’m responsible for controlling
company costs.”
“I’m responsiblefor controlling costs in
my department.”
Competition versus Collaboration
Many compensation and promotion programs encour-age competition among employees for pay raises. To get ahead, you have to perform better than your
fellow employees. While this may encourage hard work, it does not foster collaboration, and it can lead to distrust and disloyalty. Such negative effects have led some companies to believe that cooperation and collaboration, not competition, are essential in order to succeed in today’s work environment.
As a consequence, many companies now explicitly include measures of collaboration in their performance measures. For example, Procter & Gamble measures collab-oration in employees’ annual performance reviews. At Cisco Systems, the assessment of an employee’s teamwork can affect the annual bonus by as much as 20%.
Source: Carol Hymowitz, “Rewarding Competitors Over Collaboration No Longer Makes Sense,” Wall Street Journal (February 13, 2006).
How might managers of separate divisions be able to reduce division costs through collaboration? (Go to WileyPLUS for this answer and additional questions.)
Management Insight Procter & Gamble
Khuong Hoang/iStockphoto
SERVICE

1066 24 Budgetary Control and Responsibility Accounting
Controllable versus Noncontrollable Revenues and Costs
All costs and revenues are controllable at some level of responsibility within a company. This truth underscores the adage by the CEO of any organization that “the buck stops here.” Under responsibility accounting, the critical issue is whether the cost or revenue is controllable at the level of responsibility with which it is associated. A cost over which a manager has control is called a controllable cost. From this defi nition, it follows that:
1. All costs are controllable by top management because of the broad range of its authority.
2. Fewer costs are controllable as one moves down to each lower level of mana-gerial responsibility because of the manager’s decreasing authority.
In general, costs incurred directly by a level of responsibility are controllable at that level. In contrast, costs incurred indirectly and allocated to a responsibility level are noncontrollable costs at that level.
Principles of Performance Evaluation
Performance evaluation is at the center of responsibility accounting. It is a man-agement function that compares actual results with budget goals. It involves both behavioral and reporting principles.
MANAGEMENT BY EXCEPTION
Management by exception means that top management’s review of a budget report is focused either entirely or primarily on differences between actual results and planned objectives. This approach enables top management to focus on problem areas. For example, many companies now use online reporting systems for employees to fi le their travel and entertainment expense reports. In addition to cutting reporting time in half, the online system enables managers to quickly analyze variances from travel budgets. This cuts down on expense account “padding” such as spending too much on meals or falsifying documents for costs that were never actually incurred. Management by exception does not mean that top management will investi-gate every difference. For this approach to be effective, there must be guidelines for identifying an exception. The usual criteria are materiality and controllability.
MATERIALITY Without quantitative guidelines, management would have to investigate every budget difference regardless of the amount. Materiality is usu-ally expressed as a percentage difference from budget. For example, manage-ment may set the percentage difference at 5% for important items and 10% for other items. Managers will investigate all differences either over or under bud-get by the specifi ed percentage. Costs over budget warrant investigation to determine why they were not controlled. Likewise, costs under budget merit investigation to determine whether costs critical to profi tability are being cur-tailed. For example, if maintenance costs are budgeted at $80,000 but only $40,000 is spent, major unexpected breakdowns in productive facilities may occur in the future. Alternatively, as discussed earlier, cost might be under budget due to budgetary slack. Alternatively, a company may specify a single percentage difference from budget for all items and supplement this guideline with a minimum dollar limit. For example, the exception criteria may be stated at 5% of budget or more than $10,000.
CONTROLLABILITY OF THE ITEM Exception guidelines are more restrictive for con-trollable items than for items the manager cannot control. In fact, there may be
Helpful HintThere are more, not fewer, controllable costs as you move to higher levels of management.
Helpful HintThe longer the time span, the more likely that the cost becomes controllable.

Responsibility Accounting and Responsibility Centers 1067
no guidelines for noncontrollable items. For example, a large unfavorable differ-ence between actual and budgeted property tax expense may not be fl agged for investigation because the only possible causes are an unexpected increase in the tax rate or in the assessed value of the property. An investigation into the differ-ence would be useless: The manager cannot control either cause.
BEHAVIORAL PRINCIPLES
The human factor is critical in evaluating performance. Behavioral principles include the following.
1. Managers of responsibility centers should have direct input into the pro-cess of establishing budget goals of their area of responsibility. Without such input, managers may view the goals as unrealistic or arbitrarily set by top management. Such views adversely affect the managers’ motivation to meet the targeted objectives.
2. The evaluation of performance should be based entirely on matters that are controllable by the manager being evaluated. Criticism of a manager on matters outside his or her control reduces the effectiveness of the evalua-tion process. It leads to negative reactions by a manager and to doubts about the fairness of the company’s evaluation policies.
3. Top management should support the evaluation process. As explained earlier, the evaluation process begins at the lowest level of responsibility and extends upward to the highest level of management. Managers quickly lose faith in the process when top management ignores, overrules, or bypasses established procedures for evaluating a manager’s performance.
4. The evaluation process must allow managers to respond to their evalua-tions. Evaluation is not a one-way street. Managers should have the opportunity to defend their performance. Evaluation without feedback is both impersonal and ineffective.
5. The evaluation should identify both good and poor performance. Praise for good performance is a powerful motivating factor for a manager. This is especially true when a manager’s compensation includes rewards for meeting budget goals.
REPORTING PRINCIPLES
Performance evaluation under responsibility accounting should be based on certain reporting principles. These principles pertain primarily to the internal reports that provide the basis for evaluating performance. Performance reports should:
1. Contain only data that are controllable by the manager of the responsibility center.
2. Provide accurate and reliable budget data to measure performance.
3. Highlight signifi cant differences between actual results and budget goals.
4. Be tailor-made for the intended evaluation.
5. Be prepared at reasonable time intervals.
In recent years, companies have come under increasing pressure from infl uential shareholder groups to do a better job of linking executive pay to corporate performance. For example, software maker Siebel Systems unveiled a new incentive plan after lengthy discussions with the California Public Employees’ Retirement System. One unique feature of the plan is that managers’ targets will be publicly disclosed at the beginning of each year for investors to evaluate.

1068 24 Budgetary Control and Responsibility Accounting
Responsibility Reporting System
A responsibility reporting system involves the preparation of a report for each level of responsibility in the company’s organization chart. To illustrate such a system, we use the partial organization chart and production departments of Francis Chair Company in Illustration 24-18.
Flexible Man-ufacturing Re-quires Flexible Accounting
Flexible budgeting is useful because it enables managers to evaluate perfor-
mance in light of changing conditions. But the ability to react quickly to changing conditions is even more import-ant. Among automobile manufacturing facilities in the U.S., few plants are more fl exible than Honda. The manufacturing facilities of some auto companies can make slight alterations to the features of a vehicle in response to changes in demand for particular features. But for most plants, to switch from production of one type of
vehicle to a completely different one typically takes months and costs hundreds of millions of dollars. At the Honda plant, however, the switch takes minutes. For example, it takes about fi ve minutes to install different hand-like parts on the robots so they can switch from making Civic com-pacts to the longer, taller CR-V crossover. This ability to adjust quickly to changing demand gave Honda a huge advantage when gas prices surged and demand for more fuel-effi cient cars increased quickly.
Source: Kate Linebaugh, “Honda’s Flexible Plants Provide Edge,” Wall Street Journal Online (September 23, 2008).
What implications do these improvements in production capabilities have for management accounting information and performance evaluation within the organization? (Go to WileyPLUS for this answer and additional questions.)
Management Insight Honda
Kyodo/©AP/Wide World Photos
Illustration 24-18Partial organization chart
Fabricating Assembly Enameling
Detroit plant Chicago plant St. Louis plant
VICE PRESIDENT, FINANCEVICE PRESIDENT, PRODUCTIONVICE PRESIDENT, SALES
PRESIDENT
Report A
President sees summarydata of vice presidents.
Report B
Vice president sees sum-mary of controllable costsin his/her functional area.
Report C
Plant manager sees sum-mary of controllable costsfor each department in theplant.
Report D
Department managersees controllable costs ofhis/her department.
The responsibility reporting system begins with the lowest level of responsi-bility for controlling costs and moves upward to each higher level. Illustration 24-19 details the connections between levels.

Responsibility Accounting and Responsibility Centers 1069
Formulas Data Review ViewPage LayoutInsert
AP18 fx
CB D E
Report A.xlsReport A.xlsHome
123
4
5
6
7
8
9
1011
U
UUUU
To PresidentControllable Costs:PresidentVice Presidents: Sales Production Finance Total
Month: JanuaryBudget Actual$ 150,000
185,0001,179,000
100,000$1,614,000
$ 151,500
187,0001,186,300
101,000$1,625,800
$ 1,500
2,0007,3001,000
$11,800
Fav/UnfavReport APresident sees summarydata of vice presidents.
Report BVice president sees sum-mary of controllable costsin his/her functional area.
Report CPlant manager sees sum-mary of controllable costsfor each department in theplant.
Report DDepartment manager seescontrollable costs ofhis/her department.
Report A
Formulas Data Review ViewPage LayoutInsert
AP18 fx
CB D E
Report B.xlsHome
123
4
5
6
7
89
1011
U
FUUU
To Vice President ProductionControllable Costs:VP ProductionAssembly Plants: Detroit Chicago St. Louis Total
Month: JanuaryBudget Actual
$ 125,000
420,000304,000330,000
$1,179,000
$ 126,000
418,000309,300333,000
$1,186,300
$ 1,000
2,0005,3003,000
$ 7,300
Fav/Unfav
Report B
Formulas Data Review ViewPage LayoutInsert
AP18 fx
CB D E
Report C.xlsReport C.xlsHome
U
UUFU
To Plant Manager-ChicagoControllable Costs:Chicago PlantDepartments: Fabricating Enameling Assembly Total
Month: JanuaryBudget Actual$110,000
84,00062,00048,000
$304,000
$113,000
85,30064,00047,000
$309,300
$3,000
1,3002,0001,000
$5,300
Fav/Unfav
Report C
Formulas Data Review ViewPage LayoutInsert
AP18 fx
CB D E
Report D.xlsReport D.xlsHome
UUFU
To Fabricating Dept. ManagerControllable Costs:Direct MaterialsDirect LaborOverhead Total
Month: JanuaryBudget Actual
$20,00040,00024,000
$84,000
$20,50041,00023,800
$85,300
$ 5001,000
200$1,300
Fav/Unfav
Report D
123
4
5
6
7
89
1011
123
4
5
6
7
89
Illustration 24-19Responsibility reporting system

1070 24 Budgetary Control and Responsibility Accounting
A brief description of the four reports for Francis Chair is as follows.
1. Report D is typical of reports that go to department managers. Similar reports are prepared for the managers of the Assembly and Enameling Departments.
2. Report C is an example of reports that are sent to plant managers. It shows the costs of the Chicago plant that are controllable at the second level of responsibility. In addition, Report C shows summary data for each depart-ment that is controlled by the plant manager. Similar reports are prepared for the Detroit and St. Louis plant managers.
3. Report B illustrates the reports at the third level of responsibility. It shows the controllable costs of the vice president of production and summary data on the three assembly plants for which this offi cer is responsible. Similar reports are prepared for the vice presidents of sales and fi nance.
4. Report A is typical of reports that go to the top level of responsibility—the president. It shows the controllable costs and expenses of this offi ce and sum-mary data on the vice presidents that are accountable to the president.
A responsibility reporting system permits management by exception at each level of responsibility. And, each higher level of responsibility can obtain the detailed report for each lower level of responsibility. For example, the vice presi-dent of production in Francis Chair may request the Chicago plant manager’s report because this plant is $5,300 over budget. This type of reporting system also permits comparative evaluations. In Illus-tration 24-19, the Chicago plant manager can easily rank the department managers’ effectiveness in controlling manufacturing costs. Comparative rankings provide further incentive for a manager to control costs.
Types of Responsibility Centers
There are three basic types of responsibility centers: cost centers, profi t centers, and investment centers. These classifi cations indicate the degree of responsibility the manager has for the performance of the center. A cost center incurs costs (and expenses) but does not directly generate rev-enues. Managers of cost centers have the authority to incur costs. They are eval-uated on their ability to control costs. Cost centers are usually either production departments or service departments. Production departments participate directly in making the product. Service departments provide only support ser-vices. In a Ford Motor Company automobile plant, the welding, painting, and assembling departments are production departments. Ford’s maintenance, cafe-teria, and human resources departments are service departments. All of them are cost centers. A profi t center incurs costs (and expenses) and also generates revenues. Managers of profi t centers are judged on the profi tability of their centers. Examples of profi t centers include the individual departments of a retail store, such as clothing, furniture, and automotive products, and branch offi ces of banks. Like a profi t center, an investment center incurs costs (and expenses) and generates revenues. In addition, an investment center has control over decisions regarding the assets available for use. Investment center managers are evaluated on both the profi tability of the center and the rate of return earned on the funds invested. Investment centers are often associated with subsidiary companies. Utility Duke Energy has operating divisions such as electric utility, energy trad-ing, and natural gas. Investment center managers control or signifi cantly infl u-ence investment decisions related to such matters as plant expansion and entry into new market areas. Illustration 24-20 depicts the three types of responsibility centers.
Helpful HintThe jewelry department of Macy’s department store is a profi t center, while the props department of a movie studio is a cost center.
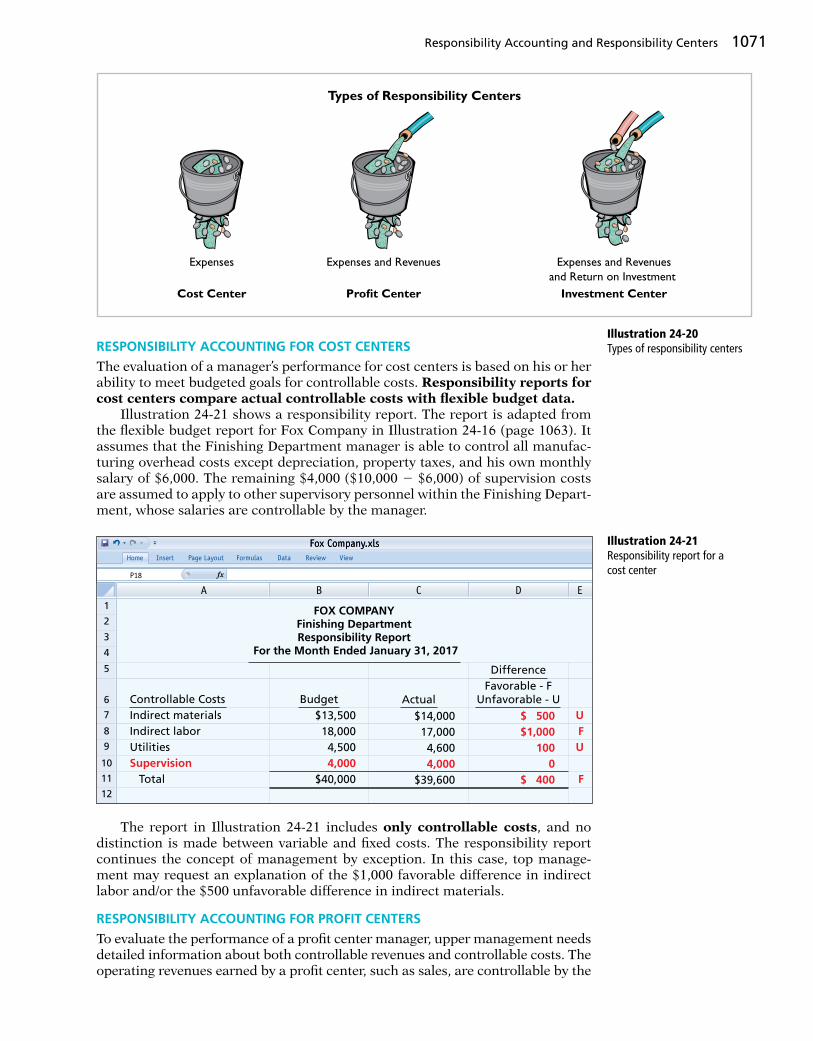
Responsibility Accounting and Responsibility Centers 1071
RESPONSIBILITY ACCOUNTING FOR COST CENTERS
The evaluation of a manager’s performance for cost centers is based on his or her ability to meet budgeted goals for controllable costs. Responsibility reports for cost centers compare actual controllable costs with fl exible budget data. Illustration 24-21 shows a responsibility report. The report is adapted from the fl exible budget report for Fox Company in Illustration 24-16 (page 1063). It assumes that the Finishing Department manager is able to control all manufac-turing overhead costs except depreciation, property taxes, and his own monthly salary of $6,000. The remaining $4,000 ($10,000 2 $6,000) of supervision costs are assumed to apply to other supervisory personnel within the Finishing Depart-ment, whose salaries are controllable by the manager.
Expenses
Cost Center Investment Center
Types of Responsibility Centers
Expenses and Revenuesand Return on Investment
Profit Center
Expenses and Revenues
Illustration 24-20Types of responsibility centers
Illustration 24-21Responsibility report for a cost center
Formulas Data Review ViewPage LayoutInsert
1
2
3
4
5
6
7
8
9
10
11
12
AP18 fx
CB D E
Fox Company.xlsFox Company.xlsHome
FOX COMPANYFinishing DepartmentResponsibility Report
For the Month Ended January 31, 2017
Controllable CostsIndirect materialsIndirect laborUtilitiesSupervision Total
$13,50018,000
4,5004,000
$40,000
$14,00017,000
4,6004,000
$39,600
$ 500$1,000
1000
$ 400
UFU
F
Budget Actual
DifferenceFavorable - F
Unfavorable - U
The report in Illustration 24-21 includes only controllable costs, and no distinction is made between variable and fi xed costs. The responsibility report continues the concept of management by exception. In this case, top manage-ment may request an explanation of the $1,000 favorable difference in indirect labor and/or the $500 unfavorable difference in indirect materials.
RESPONSIBILITY ACCOUNTING FOR PROFIT CENTERS
To evaluate the performance of a profi t center manager, upper management needs detailed information about both controllable revenues and controllable costs. The operating revenues earned by a profi t center, such as sales, are controllable by the

1072 24 Budgetary Control and Responsibility Accounting
manager. All variable costs (and expenses) incurred by the center are also control-lable by the manager because they vary with sales. However, to determine the controllability of fi xed costs, it is necessary to distinguish between direct and indi-rect fi xed costs.
DIRECT AND INDIRECT FIXED COSTS A profi t center may have both direct and indirect fi xed costs. Direct fi xed costs relate specifi cally to one center and are incurred for the sole benefi t of that center. Examples of such costs include the salaries established by the profi t center manager for supervisory personnel and the cost of a timekeeping department for the center’s employees. Since these fi xed costs can be traced directly to a center, they are also called traceable costs. Most direct fi xed costs are controllable by the profi t center manager. In contrast, indirect fi xed costs pertain to a company’s overall operating activities and are incurred for the benefi t of more than one profi t center. Manage-ment allocates indirect fi xed costs to profi t centers on some type of equitable basis. For example, property taxes on a building occupied by more than one center may be allocated on the basis of square feet of fl oor space used by each center. Or, the costs of a company’s human resources department may be allocated to profi t cen-ters on the basis of the number of employees in each center. Because these fi xed costs apply to more than one center, they are also called common costs. Most indirect fi xed costs are not controllable by the profi t center manager.
RESPONSIBILITY REPORT The responsibility report for a profi t center shows bud-geted and actual controllable revenues and costs. The report is prepared using the cost-volume-profi t income statement explained in Chapter 22. In the report:
1. Controllable fi xed costs are deducted from contribution margin.
2. The excess of contribution margin over controllable fi xed costs is identifi ed as controllable margin.
3. Noncontrollable fi xed costs are not reported.
Illustration 24-22 shows the responsibility report for the manager of the Marine Division, a profi t center of Mantle Company. For the year, the Marine Division also had $60,000 of indirect fi xed costs that were not controllable by the profi t center manager.
Helpful HintRecognize that we are emphasizing fi nancial measures of performance. Companies are now making an effort to also stress nonfi nancial performance measures such as product quality, labor productivity, market growth, materials’ yield, manufacturing fl exibility, and technological capability.
Formulas Data Review ViewPage LayoutInsert
1
2
3
4
5
6
7
8
9
10
11
12
13
14
15
16
17
18
AP18 fx
CB D E
Mantle Company.xlsMantle Company.xlsHome
MANTLE COMPANYMarine Division
Responsibility Report For the Year Ended December 31, 2017
SalesVariable costs Cost of goods sold Selling and administrative TotalContribution marginControllable fixed costs Cost of goods sold Selling and administrative TotalControllable margin
$1,200,000
500,000160,000660,000540,000
100,00080,000
180,000$ 360,000
$1,150,000
490,000156,000646,000504,000
100,00080,000
180,000$ 324,000
$50,000
10,0004,000
14,00036,000
000
$36,000
U
FFFU
U
Budget Actual
DifferenceFavorable - F
Unfavorable - U
Illustration 24-22Responsibility report for profi t center

Evaluating Investment Centers 1073
Controllable margin is considered to be the best measure of the manager’s performance in controlling revenues and costs. The report in Illustration 24-22 shows that the manager’s performance was below budgeted expectations by 10% ($36,000 4 $360,000). Top management would likely investigate the causes of this unfavorable result. Note that the report does not show the Marine Division’s noncontrollable fi xed costs of $60,000. These costs would be included in a report on the profi tability of the profi t center. Management also may choose to see monthly responsibility reports for profi t centers. In addition, responsibility reports may include cumulative year-to-date results.
4 Evaluate performance in investment centers.LEARNING OBJECTIVE
As explained earlier, an investment center manager can control or signifi cantly infl uence the investment funds available for use. Thus, the primary basis for eval-uating the performance of a manager of an investment center is return on invest-ment (ROI). The return on investment is considered to be a useful performance measurement because it shows the effectiveness of the manager in utilizing the assets at his or her disposal.
Return on Investment (ROI)
The formula for computing ROI for an investment center, together with assumed illustrative data, is shown in Illustration 24-23 (page 1074).
Midwest Division operates as a profi t center. It reports the following for the year:
Prepare a responsibility report for the Midwest Division for December 31, 2017.
Solution
DO IT! 3 Profi t Center Responsibility Report
Formulas Data Review ViewPage LayoutInsert
1
2
3
4
6
7
8
9
10
11
AP18 fx
CB D E
Midwest Division Responsibility Report.xlsMidwest Division Responsibility Report.xlsHome
MIDWEST DIVISIONResponsibility Report
For the Year Ended December 31, 2017
SalesVariable costsContribution marginControllable fixed costsControllable margin
$1,500,000700,000800,000400,000
$ 400,000
$1,700,000800,000900,000400,000
$ 500,000
$200,000100,000100,000
0$100,000
FUF
F
Budget Actual
DifferenceFavorable F
Unfavorable U5
Action Plan✔ Deduct variable costs
from sales to show contribution margin.
✔ Deduct controllable fi xed costs from the contribution margin to show controllable margin.
✔ Do not report noncon-trollable fi xed costs.
Related exercise material: BE24-7, E24-15, and DO IT! 24-3.
Budget Actual
Sales $1,500,000 $1,700,000Variable costs 700,000 800,000Controllable fi xed costs 400,000 400,000Noncontrollable fi xed costs 200,000 200,000

1074 24 Budgetary Control and Responsibility Accounting
Both factors in the formula are controllable by the investment center man-ager. Operating assets consist of current assets and plant assets used in opera-tions by the center and controlled by the manager. Nonoperating assets such as idle plant assets and land held for future use are excluded. Average operating assets are usually based on the cost or book value of the assets at the beginning and end of the year.
Responsibility Report
The scope of the investment center manager’s responsibility signifi cantly affects the content of the performance report. Since an investment center is an indepen-dent entity for operating purposes, all fi xed costs are controllable by its man-ager. For example, the manager is responsible for depreciation on investment center assets. Therefore, more fi xed costs are identifi ed as controllable in the performance report for an investment center manager than in a performance report for a profi t center manager. The report also shows budgeted and actual ROI below controllable margin. To illustrate this responsibility report, we will now assume that the Marine Division of Mantle Company is an investment center. It has budgeted and actual average operating assets of $2,000,000. The manager can control $60,000 of fi xed costs that were not controllable when the division was a profi t center. Illustration 24-24 shows the division’s responsibility report.
Illustration 24-23ROI formula Return on
Controllable 4
Average Operating 5 Investment
Margin Assets
(ROI)
$1,000,000 4 $5,000,000 5 20%
Illustration 24-24Responsibility report for investment center
Formulas Data Review ViewPage LayoutInsert
1
2
3
4
5
6
7
8
9
10
11
12
13
14
15
16
17
18
19
20
21
22
23
AP18 fx
CB D E
Mantle Company.xlsMantle Company.xlsHome
MANTLE COMPANYMarine Division
Responsibility Report For the Year Ended December 31, 2017
SalesVariable costs Cost of goods sold Selling and administrative TotalContribution marginControllable fixed costs Cost of goods sold Selling and administrative Other fixed costs TotalControllable marginReturn on investment
$ 1,200,000
500,000160,000660,000540,000
100,00080,00060,000
240,000$ 300,000
15.0%(a)
(a) $ 300,000$2,000,000
$ 1,150,000
490,000156,000646,000504,000
100,00080,00060,000
240,000$ 264,000
13.2%(b)
(b) $ 264,000$2,000,000
$ 50,000
10,0004,000
14,00036,000
0000
$ 36,0001.8%
(c)
(c) $ 36,000$2,000,000
U
FFFU
UU
Budget Actual
DifferenceFavorable - F
Unfavorable - U

Evaluating Investment Centers 1075
The report shows that the manager’s performance based on ROI was below budget expectations by 1.8% (15.0% versus 13.2%). Top management would likely want explanations for this unfavorable result.
Judgmental Factors in ROI
The return on investment approach includes two judgmental factors:
1. Valuation of operating assets. Operating assets may be valued at acquisition cost, book value, appraised value, or fair value. The fi rst two bases are readily available from the accounting records.
2. Margin (income) measure. This measure may be controllable margin, income from operations, or net income.
Each of the alternative values for operating assets can provide a reliable basis for evaluating a manager’s performance as long as it is consistently applied between reporting periods. However, the use of income measures other than controllable margin will not result in a valid basis for evaluating the performance of an investment center manager.
Improving ROI
The manager of an investment center can improve ROI by increasing controlla-ble margin, and/or reducing average operating assets. To illustrate, we will use the following assumed data for the Laser Division of Berra Company.
Illustration 24-25Assumed data for Laser Division
Sales $2,000,000Variable costs 1,100,000
Contribution margin (45%) 900,000Controllable fi xed costs 300,000
Controllable margin (a) $ 600,000
Average operating assets (b) $5,000,000Return on investment (a) 4 (b) 12%
INCREASING CONTROLLABLE MARGIN
Controllable margin can be increased by increasing sales or by reducing variable and controllable fi xed costs as follows.
1. Increase sales 10%. Sales will increase $200,000 ($2,000,000 3 .10). Assum-ing no change in the contribution margin percentage of 45%, contribution margin will increase $90,000 ($200,000 3 .45). Controllable margin will increase by the same amount because controllable fi xed costs will not change. Thus, controllable margin becomes $690,000 ($600,000 1 $90,000). The new ROI is 13.8%, computed as follows.
An increase in sales benefi ts both the investment center and the company if it results in new business. It would not benefi t the company if the increase was achieved at the expense of other investment centers.
2. Decrease variable and fi xed costs 10%. Total costs decrease $140,000 [($1,100,000 1 $300,000) 3 .10]. This reduction results in a corresponding increase in controllable margin. Thus, controllable margin becomes $740,000 ($600,000 1 $140,000). The new ROI is 14.8%, computed as follows.
Illustration 24-26ROI computation—increase in sales
ROI
5
Controllable margin 5
$690,000 5
13.8%
Average operating assets $5,000,000
Illustration 24-27ROI computation—decrease in costs
ROI
5
Controllable margin 5
$740,000 5
14.8%
Average operating assets $5,000,000

1076 24 Budgetary Control and Responsibility Accounting
This course of action is clearly benefi cial when the reduction in costs is the result of eliminating waste and ineffi ciency. But, a reduction in costs that results from cutting expenditures on vital activities, such as required mainte-nance and inspections, is not likely to be acceptable to top management.
REDUCING AVERAGE OPERATING ASSETS
Assume that average operating assets are reduced 10% or $500,000 ($5,000,000 3.10). Average operating assets become $4,500,000 ($5,000,000 2 $500,000). Since controllable margin remains unchanged at $600,000, the new ROI is 13.3%, com-puted as follows.
Illustration 24-28ROI computation—decrease in operating assets
ROI
5
Controllable margin 5
$600,000 5
13.3%
Average operating assets $4,500,000
Reductions in operating assets may or may not be prudent. It is benefi cial to eliminate overinvestment in inventories and to dispose of excessive plant assets. However, it is unwise to reduce inventories below expected needs or to dispose of essential plant assets.
Does Hollywood Look at ROI?
If Hollywood were run like a real business, where things like return on investment mattered, there would be one unchallenged,
sacred principle that studio chieftains would never violate: Make lots of G-rated movies.
No matter how you slice the movie business—by star vehicles, by budget levels, or by sequels or franchises—by far the best return on investment comes from the not-so-glamorous world of G-rated fi lms. The problem is, these movies represent only 3% of the total fi lms made in a typical year.
On the fl ip side are the R-rated fi lms, which dominate the total releases and yet yield the worst return on invest-ment. A whopping 646 R-rated fi lms were released in a recent year—69% of the total output—but only four of the top-20 grossing movies of the year were R-rated fi lms.
This trend—G-rated movies are good for business but underproduced, R-rated movies are bad for business and yet overdone—is something that has been driving econo-mists batty for the past several years.
Source: David Grainger, “The Dysfunctional Family-Film Business,” Fortune (January 10, 2005), pp. 20–21.
What might be the reason that movie studios do not produce G-rated movies as much as R-rated ones? (Go to WileyPLUS for this answer and additional questions.)
Accounting Across the Organization Hollywood
brentmelissa/iStockphoto
The service division of Metro Industries reported the following results for 2017.
Sales $400,000Variable costs 320,000Controllable fi xed costs 40,800Average operating assets 280,000
Management is considering the following independent courses of action in 2018 in order to maximize the return on investment for this division.
1. Reduce average operating assets by $80,000, with no change in controllable margin.
2. Increase sales $80,000, with no change in the contribution margin percentage.
(a) Compute the controllable margin and the return on investment for 2017.
(b) Compute the controllable margin and the expected return on investment for each proposed alternative.
DO IT! 4 Performance Evaluation

Review and Practice 1077
(a) Return on investment for 2017:
Sales $400,000Variable costs 320,000
Contribution margin 80,000Controllable fi xed costs 40,800
Controllable margin $ 39,200
Return on investment $39,200
5 14% $280,000
(b) Expected return on investment for alternative 1:
$39,200 5
19.6%
$280,000 2 $80,000 Expected return on investment for alternative 2:
Sales ($400,000 1 $80,000) $480,000 Variable costs ($320,000/$400,000 3 $480,000) 384,000
Contribution margin 96,000 Controllable fi xed costs 40,800
Controllable margin $ 55,200
Return on investment $55,200
5 19.7% $280,000
Action Plan✔ Recall key formulas:
Sales 2 Variable costs 5 Contribution margin.
✔ Contribution margin 4 Sales 5 Contribution margin percentage.
✔ Contribution margin 2 Controllable fi xed costs 5 Controllable margin.
✔ Return on investment 5 Controllable margin 4 Average operating assets.
Related exercise material: BE24-8, BE24-9, BE24-10, E24-16, E24-17, and DO IT! 24-4.
Solution
Describe budgetary control and static budget reports.Budgetary control consists of (a) preparing periodic budget reports that compare actual results with planned objectives, (b) analyzing the differences to determine their causes, (c) taking appropriate corrective action, and (d) modifying future plans, if necessary.
Static budget reports are useful in evaluating the progress toward planned sales and profi t goals. They are also appropriate in assessing a manager’s effec-tiveness in controlling costs when (a) actual activity closely approximates the master budget activity level, and/or (b) the behavior of the costs in response to changes in activity is fi xed.
Prepare fl exible budget reports. To develop the fl exi-ble budget it is necessary to: (a) Identify the activity index and the relevant range of activity. (b) Identify the variable costs, and determine the budgeted vari-able cost per unit of activity for each cost. (c) Identify the fi xed costs, and determine the budgeted amount for each cost. (d) Prepare the budget for selected incre-ments of activity within the relevant range. Flexible budget reports permit an evaluation of a manager’s performance in controlling production and costs.
1
2
Apply responsibility accounting to cost and profi t centers. Responsibility accounting involves accumu-lating and reporting revenues and costs on the basis of the individual manager who has the authority to make the day-to-day decisions about the items. The evaluation of a manager’s performance is based on the matters directly under the manager’s control. In responsibility accounting, it is necessary to distin-guish between controllable and noncontrollable fi xed costs and to identify three types of responsibility cen-ters: cost, profi t, and investment.
Responsibility reports for cost centers compare actual costs with fl exible budget data. The reports show only controllable costs, and no distinction is made between variable and fi xed costs. Responsibil-ity reports show contribution margin, controllable fi xed costs, and controllable margin for each profi t center.
Evaluate performance in investment centers. The pri-mary basis for evaluating performance in investment centers is return on investment (ROI). The formula for computing ROI for investment centers is Control-lable margin 4 Average operating assets.
3
4
LEARNING OBJECTIVES REVIEW
REVIEW AND PRACTICE
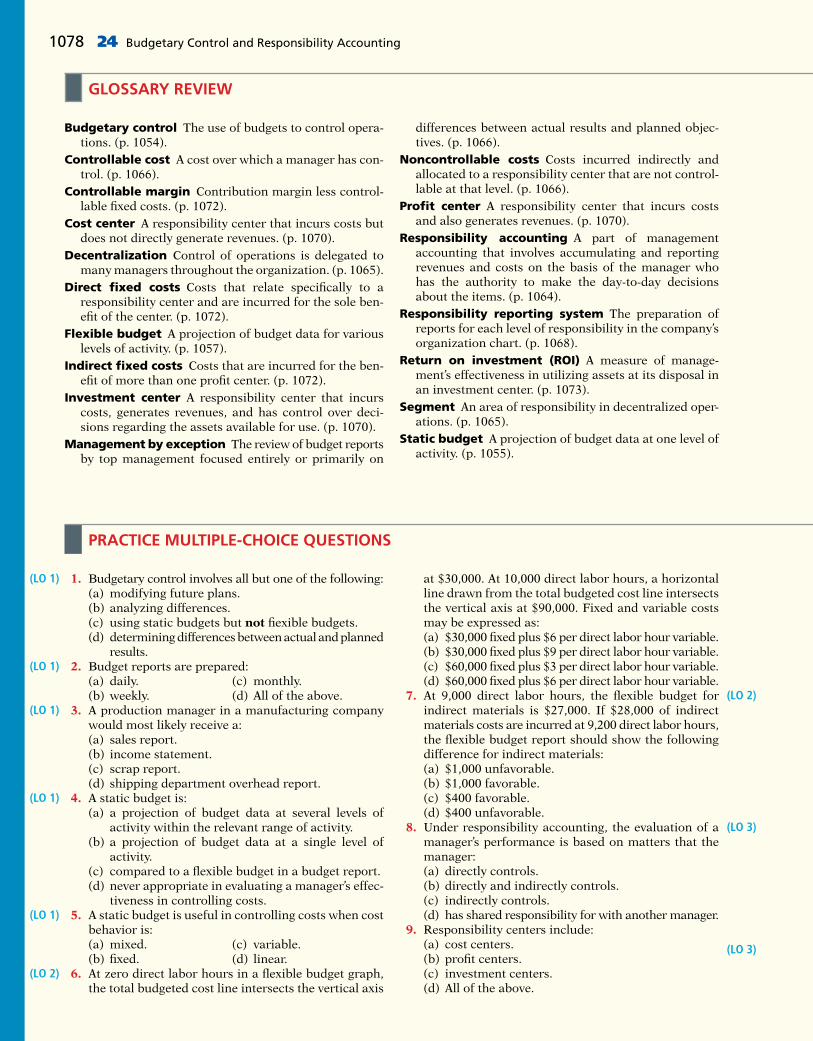
1078 24 Budgetary Control and Responsibility Accounting
Budgetary control The use of budgets to control opera-tions. (p. 1054).
Controllable cost A cost over which a manager has con-trol. (p. 1066).
Controllable margin Contribution margin less control-lable fi xed costs. (p. 1072).
Cost center A responsibility center that incurs costs but does not directly generate revenues. (p. 1070).
Decentralization Control of operations is delegated to many managers throughout the organization. (p. 1065).
Direct fi xed costs Costs that relate specifi cally to a responsibility center and are incurred for the sole ben-efi t of the center. (p. 1072).
Flexible budget A projection of budget data for various levels of activity. (p. 1057).
Indirect fi xed costs Costs that are incurred for the ben-efi t of more than one profi t center. (p. 1072).
Investment center A responsibility center that incurs costs, generates revenues, and has control over deci-sions regarding the assets available for use. (p. 1070).
Management by exception The review of budget reports by top management focused entirely or primarily on
differences between actual results and planned objec-tives. (p. 1066).
Noncontrollable costs Costs incurred indirectly and allocated to a responsibility center that are not control-lable at that level. (p. 1066).
Profi t center A responsibility center that incurs costs and also generates revenues. (p. 1070).
Responsibility accounting A part of management accounting that involves accumulating and reporting revenues and costs on the basis of the manager who has the authority to make the day-to-day decisions about the items. (p. 1064).
Responsibility reporting system The preparation of reports for each level of responsibility in the company’s organization chart. (p. 1068).
Return on investment (ROI) A measure of manage-ment’s effectiveness in utilizing assets at its disposal in an investment center. (p. 1073).
Segment An area of responsibility in decentralized oper-ations. (p. 1065).
Static budget A projection of budget data at one level of activity. (p. 1055).
GLOSSARY REVIEW
1. Budgetary control involves all but one of the following:(a) modifying future plans.(b) analyzing differences.(c) using static budgets but not fi exible budgets.(d) determining differences between actual and planned
results. 2. Budget reports are prepared:
(a) daily. (c) monthly.(b) weekly. (d) All of the above.
3. A production manager in a manufacturing company would most likely receive a:(a) sales report.(b) income statement.(c) scrap report.(d) shipping department overhead report.
4. A static budget is:(a) a projection of budget data at several levels of
activity within the relevant range of activity.(b) a projection of budget data at a single level of
activity.(c) compared to a fl exible budget in a budget report.(d) never appropriate in evaluating a manager’s effec-
tiveness in controlling costs. 5. A static budget is useful in controlling costs when cost
behavior is:(a) mixed. (c) variable.(b) fi xed. (d) linear.
6. At zero direct labor hours in a fl exible budget graph, the total budgeted cost line intersects the vertical axis
(LO 1)
(LO 1)
(LO 1)
(LO 1)
(LO 1)
(LO 2)
at $30,000. At 10,000 direct labor hours, a horizontal line drawn from the total budgeted cost line intersects the vertical axis at $90,000. Fixed and variable costs may be expressed as:(a) $30,000 fi xed plus $6 per direct labor hour variable.(b) $30,000 fi xed plus $9 per direct labor hour variable.(c) $60,000 fi xed plus $3 per direct labor hour variable.(d) $60,000 fi xed plus $6 per direct labor hour variable.
7. At 9,000 direct labor hours, the fl exible budget for indirect materials is $27,000. If $28,000 of indirect materials costs are incurred at 9,200 direct labor hours, the fl exible budget report should show the following difference for indirect materials:(a) $1,000 unfavorable.(b) $1,000 favorable.(c) $400 favorable.(d) $400 unfavorable.
8. Under responsibility accounting, the evaluation of a manager’s performance is based on matters that the manager:(a) directly controls.(b) directly and indirectly controls.(c) indirectly controls.(d) has shared responsibility for with another manager.
9. Responsibility centers include:(a) cost centers.(b) profi t centers.(c) investment centers.(d) All of the above.
(LO 2)
(LO 3)
(LO 3)
PRACTICE MULTIPLE-CHOICE QUESTIONS

10. Responsibility reports for cost centers:(a) distinguish between fi xed and variable costs.(b) use static budget data.(c) include both controllable and noncontrollable costs.(d) include only controllable costs.
11. The accounting department of a manufacturing com-pany is an example of:(a) a cost center.(b) a profi t center.(c) an investment center.(d) a contribution center.
12. To evaluate the performance of a profi t center manager, upper management needs detailed information about:(a) controllable costs.(b) controllable revenues.(c) controllable costs and revenues.(d) controllable costs and revenues and average oper-
ating assets.13. In a responsibility report for a profi t center, controlla-
ble fi xed costs are deducted from contribution margin to show:
(LO 3)
(LO 3)
(LO 3)
(LO 3)
(a) profi t center margin.(b) controllable margin.(c) net income.(d) income from operations.
14. In the formula for return on investment (ROI), the factors for controllable margin and operating assets are, respectively:(a) controllable margin percentage and total operat-
ing assets.(b) controllable margin dollars and average operat-
ing assets.(c) controllable margin dollars and total assets.(d) controllable margin percentage and average oper-
ating assets.15. A manager of an investment center can improve
ROI by:(a) increasing average operating assets.(b) reducing sales.(c) increasing variable costs.(d) reducing variable and/or controllable fi xed costs.
(LO 4)
(LO 4)
Practice Multiple-Choice Questions 1079
Solutions
1. (c) Budgetary control involves using fl exible budgets and sometimes static budgets. The other choices are all part of budgetary control.
2. (d) Budget reports are prepared daily, weekly, or monthly. The other choices are correct, but choice (d) is the better answer.
3. (c) A production manager in a manufacturing company would most likely receive a scrap report. The other choices are incorrect because (a) top management or a sales manager would most likely receive a sales report, (b) top management would most likely receive an income statement, and (d) a department manager would most likely receive a shipping department overhead report.
4. (b) A static budget is a projection of budget data at a single level of activity. The other choices are incorrect because a static budget (a) is a projection of budget data at a single level of activity, not at several levels of activity within the relevant range of activity; (c) is not compared to a fl exible budget in a budget report; and (d) is appropriate in evaluating a manager’s effectiveness in controlling fi xed costs.
5. (b) A static budget is useful for controlling fi xed costs. The other choices are incorrect because a static budget is not useful for controlling (a) mixed costs, (c) variable costs, or (d) linear costs.
6. (a) The intersection point of $90,000 is total budgeted costs, or budgeted fi xed costs plus budgeted variable costs. Fixed costs are $30,000 (amount at zero direct labor hours), so budgeted variable costs are $60,000 [$90,000 (Total costs) 2 $30,000 (Fixed costs)]. Budgeted variable costs ($60,000) divided by total activity level (10,000 direct labor hours) gives the variable cost per unit of $6 per direct labor hour. The other choices are therefore incorrect.
7. (d) Budgeted indirect materials per direct labor hour (DLH) is $3 ($27,000/9,000). At an activity level of 9,200 direct labor hours, budgeted indirect materials are $27,600 (9,200 3 $3 per DLH) but actual indirect materials costs are $28,000, resulting in a $400 unfavorable difference. The other choices are therefore incorrect.
8. (a) The evaluation of a manager’s performance is based only on matters that the manager directly controls. The other choices are therefore incorrect as they include indirect controls and shared responsibility.
9. (d) Cost centers, profi t centers, and investment centers are all responsibility centers. The other choices are correct, but choice (d) is the better answer.
10. (d) Responsibility reports for cost centers report only controllable costs; they (a) do not distinguish between fi xed and variable costs; (b) use fl exible budget data, not static budget data; and (c) do not include noncontrollable costs.
11. (a) The accounting department of a manufacturing company is an example of a cost center, not (b) a profi t center, (c) an invest-ment center, or (d) contribution center.
12. (c) To evaluate the performance of a profi t center manager, upper management needs detailed information about controllable costs and revenues, not just (a) controllable costs or (b) controllable revenues. Choice (d) is incorrect because upper management does not need information about average operating assets.
13. (b) Contribution margin less controllable fi xed costs is the controllable margin, not (a) the profi t center margin, (c) net income, or (d) income from operations.
14. (b) The factors in the formula for ROI are controllable margin dollars and average operating assets. The other choices are therefore incorrect.
15. (d) Reducing variable or controllable fi xed costs will cause the controllable margin to increase, which is one way a manager of an investment center can improve ROI. The other choices are incorrect because (a) increasing average operating assets will lower ROI; (b) reducing sales will cause contribution margin to go down, thereby decreasing controllable margin since there will be less contribution margin to cover controllable fi xed costs and resulting in lower ROI; and (c) increasing variable costs will cause the contribution margin to be lower, thereby decreasing controllable margin and resulting in lower ROI.
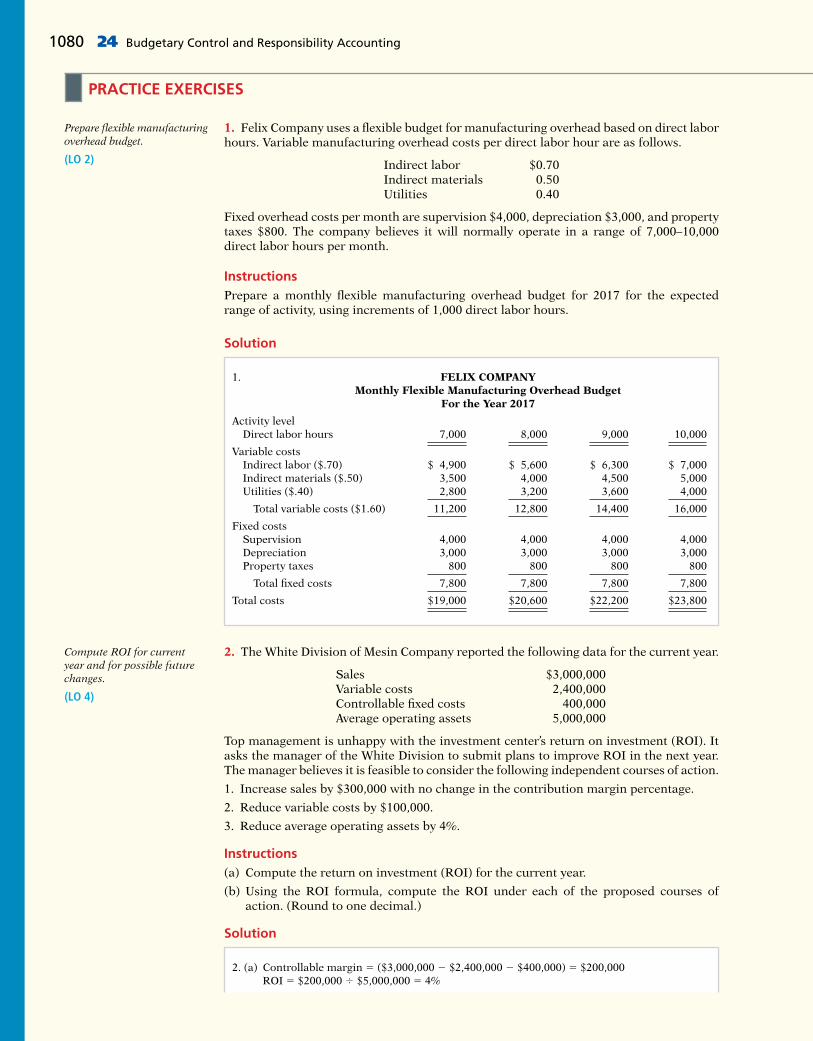
1. Felix Company uses a fl exible budget for manufacturing overhead based on direct labor hours. Variable manufacturing overhead costs per direct labor hour are as follows.
Indirect labor $0.70Indirect materials 0.50Utilities 0.40
Fixed overhead costs per month are supervision $4,000, depreciation $3,000, and property taxes $800. The company believes it will normally operate in a range of 7,000–10,000 direct labor hours per month.
InstructionsPrepare a monthly fl exible manufacturing overhead budget for 2017 for the expected range of activity, using increments of 1,000 direct labor hours.
Prepare fl exible manufacturing overhead budget.
(LO 2)
PRACTICE EXERCISES
1080 24 Budgetary Control and Responsibility Accounting
Solution
FELIX COMPANYMonthly Flexible Manufacturing Overhead Budget
For the Year 2017
Activity level Direct labor hours 7,000 8,000 9,000 10,000
Variable costs Indirect labor ($.70) $ 4,900 $ 5,600 $ 6,300 $ 7,000 Indirect materials ($.50) 3,500 4,000 4,500 5,000 Utilities ($.40) 2,800 3,200 3,600 4,000
Total variable costs ($1.60) 11,200 12,800 14,400 16,000
Fixed costs Supervision 4,000 4,000 4,000 4,000 Depreciation 3,000 3,000 3,000 3,000 Property taxes 800 800 800 800
Total fi xed costs 7,800 7,800 7,800 7,800
Total costs $19,000 $20,600 $22,200 $23,800
1.
2. The White Division of Mesin Company reported the following data for the current year.
Sales $3,000,000Variable costs 2,400,000Controllable fi xed costs 400,000Average operating assets 5,000,000
Top management is unhappy with the investment center’s return on investment (ROI). It asks the manager of the White Division to submit plans to improve ROI in the next year. The manager believes it is feasible to consider the following independent courses of action.
1. Increase sales by $300,000 with no change in the contribution margin percentage.
2. Reduce variable costs by $100,000.
3. Reduce average operating assets by 4%.
Instructions(a) Compute the return on investment (ROI) for the current year.
(b) Using the ROI formula, compute the ROI under each of the proposed courses of action. (Round to one decimal.)
Compute ROI for current year and for possible future changes.
(LO 4)
Solution
2. (a) Controllable margin 5 ($3,000,000 2 $2,400,000 2 $400,000) 5 $200,000 ROI 5 $200,000 4 $5,000,000 5 4%

Practice Problem 1081
(b) (1) Contribution margin percentage is 20%, or ($600,000 4 $3,000,000) Increase in controllable margin 5 $300,000 3 20% 5 $60,000
ROI 5 ($200,000 1 $60,000) 4 $5,000,000 5 5.2%
(2) ($200,000 1 $100,000) 4 $5,000,000 5 6%
(3) $200,000 4 [$5,000,000 2 ($5,000,000 3 .04)] 5 4.2%
Glenda Company uses a fl exible budget for manufacturing overhead based on direct labor hours. For 2017, the master overhead budget for the Packaging Department based on 300,000 direct labor hours was as follows.
Variable Costs Fixed Costs
Indirect labor $360,000 Supervision $ 60,000Supplies and lubricants 150,000 Depreciation 24,000Maintenance 210,000 Property taxes 18,000Utilities 120,000 Insurance 12,000
$840,000 $114,000
During July, 24,000 direct labor hours were worked. The company incurred the following variable costs in July: indirect labor $30,200, supplies and lubricants $11,600, mainte-nance $17,500, and utilities $9,200. Actual fi xed overhead costs were the same as monthly budgeted fi xed costs.
InstructionsPrepare a fl exible budget report for the Packaging Department for July.
Prepare fl exible budget report.
(LO 2)
PRACTICE PROBLEM
Solution
GLENDA COMPANYManufacturing Overhead Budget Report (Flexible)
Packaging DepartmentFor the Month Ended July 31, 2017
Difference
Budget Actual Costs Favorable FDirect labor hours (DLH) 24,000 DLH 24,000 DLH Unfavorable U
Variable costs Indirect labor ($1.20a) $28,800 $30,200 $1,400 U Supplies and lubricants ($0.50a) 12,000 11,600 400 F Maintenance ($0.70a) 16,800 17,500 700 U Utilities ($0.40a) 9,600 9,200 400 F
Total variable 67,200 68,500 1,300 U
Fixed costs Supervision $ 5,000b $ 5,000 –0– Depreciation 2,000b 2,000 –0– Property taxes 1,500b 1,500 –0– Insurance 1,000b 1,000 –0–
Total fi xed 9,500 9,500 –0–
Total costs $76,700 $78,000 $1,300 U
a($360,000 4 300,000; $150,000 4 300,000; $210,000 4 300,000; $120,000 4 300,000).bAnnual cost divided by 12.
1082 24 Budgetary Control and Responsibility Accounting
Brief Exercises, Exercises, DO IT! Exercises, and Problems and many additional resources are available for practice in WileyPLUS
QUESTIONS
1. (a) What is budgetary control? (b) Fred Barone is describing budgetary control. What
steps should be included in Fred’s description? 2. The following purposes are part of a budgetary
reporting system: (a) Determine effi cient use of materials. (b) Control overhead costs. (c) Determine whether income objectives are being met. For each purpose, indicate the name of the report, the fre-quency of the report, and the primary recipient(s) of the report.
3. How may a budget report for the second quarter dif-fer from a budget report for the fi rst quarter?
4. Ken Bay questions the usefulness of a master sales budget in evaluating sales performance. Is there justi-fi cation for Ken’s concern? Explain.
5. Under what circumstances may a static budget be an appropriate basis for evaluating a manager’s effective-ness in controlling costs?
6. “A fl exible budget is really a series of static budgets.” Is this true? Why?
7. The static manufacturing overhead budget based on 40,000 direct labor hours shows budgeted indirect labor costs of $54,000. During March, the department incurs $64,000 of indirect labor while working 45,000 direct labor hours. Is this a favorable or unfavorable performance? Why?
8. A static overhead budget based on 40,000 direct labor hours shows Factory Insurance $6,500 as a fi xed cost. At the 50,000 direct labor hours worked in March, factory insurance costs were $6,300. Is this a favor-able or unfavorable performance? Why?
9. Megan Pedigo is confused about how a fl exible bud-get is prepared. Identify the steps for Megan.
10. Cali Company has prepared a graph of fl exible budget data. At zero direct labor hours, the total budgeted cost line intersects the vertical axis at $20,000. At 10,000 direct labor hours, the line drawn from the total budgeted cost line intersects the vertical axis at
$85,000. How may the fi xed and variable costs be expressed?
11. The fl exible budget formula is fi xed costs $50,000 plus variable costs of $4 per direct labor hour. What is the total budgeted cost at (a) 9,000 hours and (b) 12,345 hours?
12. What is management by exception? What criteria may be used in identifying exceptions?
13. What is responsibility accounting? Explain the pur-pose of responsibility accounting.
14. Eve Rooney is studying for an accounting examina-tion. Describe for Eve what conditions are necessary for responsibility accounting to be used effectively.
15. Distinguish between controllable and noncontrollable costs.
16. How do responsibility reports differ from budget reports?
17. What is the relationship, if any, between a responsi-bility reporting system and a company’s organization chart?
18. Distinguish among the three types of responsibility centers.
19. (a) What costs are included in a performance report for a cost center? (b) In the report, are variable and fi xed costs identifi ed?
20. How do direct fi xed costs differ from indirect fi xed costs? Are both types of fi xed costs controllable?
21. Jane Nott is confused about controllable margin reported in an income statement for a profi t center. How is this margin computed, and what is its primary purpose?
22. What is the primary basis for evaluating the perfor-mance of the manager of an investment center? Indicate the formula for this basis.
23. Explain the ways that ROI can be improved.24. Indicate two behavioral principles that pertain
to (a) the manager being evaluated and (b) top management.
BRIEF EXERCISES
BE24-1 For the quarter ended March 31, 2017, Croix Company accumulates the following sales data for its newest guitar, The Edge: $315,000 budget; $305,000 actual. Prepare a static budget report for the quarter.
BE24-2 Data for Croix Company are given in BE24-1. In the second quarter, budgeted sales were $380,000, and actual sales were $384,000. Prepare a static budget report for the second quarter and for the year to date.
BE24-3 In Rooney Company, direct labor is $20 per hour. The company expects to operate at 10,000 direct labor hours each month. In January 2017, direct labor totaling $206,000 is incurred in working 10,400 hours. Prepare (a) a static budget report and (b) a fl exible budget report. Evaluate the usefulness of each report.
Prepare static budget report.
(LO 1)
Prepare static budget report for 2 quarters.
(LO 1)
Show usefulness of fl exible budgets in evaluating performance.
(LO 2)

DO IT! Exercises 1083
BE24-4 Gundy Company expects to produce 1,200,000 units of Product XX in 2017. Monthly production is expected to range from 80,000 to 120,000 units. Budgeted variable manufacturing costs per unit are direct materials $5, direct labor $6, and overhead $8. Budgeted fi xed manufacturing costs per unit for depreciation are $2 and for supervision are $1. Prepare a fl exible manufacturing budget for the relevant range value using 20,000 unit increments.
BE24-5 Data for Gundy Company are given in BE24-4. In March 2017, the company incurs the following costs in producing 100,000 units: direct materials $520,000, direct labor $596,000, and variable overhead $805,000. Actual fi xed costs were equal to budgeted fi xed costs. Prepare a fl exible budget report for March. Were costs controlled?
BE24-6 In the Assembly Department of Hannon Company, budgeted and actual manufac-turing overhead costs for the month of April 2017 were as follows.
Budget Actual
Indirect materials $16,000 $14,300Indirect labor 20,000 20,600Utilities 10,000 10,850Supervision 5,000 5,000
All costs are controllable by the department manager. Prepare a responsibility report for April for the cost center.
BE24-7 Torres Company accumulates the following summary data for the year ending December 31, 2017, for its Water Division, which it operates as a profi t center: sales— $2,000,000 budget, $2,080,000 actual; variable costs—$1,000,000 budget, $1,050,000 actual; and controllable fi xed costs—$300,000 budget, $305,000 actual. Prepare a respon-sibility report for the Water Division.
BE24-8 For the year ending December 31, 2017, Cobb Company accumulates the follow-ing data for the Plastics Division which it operates as an investment center: contribution margin—$700,000 budget, $710,000 actual; controllable fi xed costs—$300,000 budget, $302,000 actual. Average operating assets for the year were $2,000,000. Prepare a respon-sibility report for the Plastics Division beginning with contribution margin.
BE24-9 For its three investment centers, Gerrard Company accumulates the following data:
I II III
Sales $2,000,000 $4,000,000 $ 4,000,000Controllable margin 1,400,000 2,000,000 3,600,000Average operating assets 5,000,000 8,000,000 10,000,000
Compute the return on investment (ROI) for each center.
BE24-10 Data for the investment centers for Gerrard Company are given in BE24-9. The centers expect the following changes in the next year: (I) increase sales 15%, (II) decrease costs $400,000, and (III) decrease average operating assets $500,000. Compute the expected return on investment (ROI) for each center. Assume center I has a controllable margin percentage of 70%.
Prepare a fl exible budget for variable costs.
(LO 2)
Prepare fl exible budget report.
(LO 2)
Prepare a responsibility report for a cost center.
(LO 3)
Prepare a responsibility report for a profi t center.
(LO 3)
Prepare a responsibility report for an investment center.
(LO 4)
Compute return on investment using the ROI formula.
(LO 4)
Compute return on investment under changed conditions.
(LO 4)
Wade Company estimates that it will produce 6,000 units of product IOA during the current month. Budgeted variable manufacturing costs per unit are direct materials $7, direct labor $13, and overhead $18. Monthly budgeted fi xed manufacturing overhead costs are $8,000 for depreciation and $3,800 for supervision. In the current month, Wade actually produced 6,500 units and incurred the following costs: direct materials $38,850, direct labor $76,440, variable overhead $116,640, depreci-ation $8,000, and supervision $4,000.
Prepare and evaluate a static budget report.
(LO 1)
DO IT! Exercises
DO IT! 24-1

Prepare a static budget report. Hint: The Budget column is based on estimated produc-tion while the Actual column is the actual cost incurred during the period. (Note: You do not need to prepare the heading.) Were costs controlled? Discuss limitations of the budget.
In Pargo Company’s fl exible budget graph, the fi xed cost line and the total budgeted cost line intersect the vertical axis at $90,000. The total budgeted cost line is $350,000 at an activity level of 50,000 direct labor hours. Compute total budgeted costs at 65,000 direct labor hours.
The Rockies Division operates as a profi t center. It reports the following for the year.
Budget Actual
Sales $2,000,000 $1,890,000Variable costs 800,000 760,000Controllable fi xed costs 550,000 550,000Noncontrollable fi xed costs 250,000 250,000
Prepare a responsibility report for the Rockies Division at December 31, 2017.
The service division of Raney Industries reported the following results for 2017.
Sales $500,000Variable costs 300,000Controllable fi xed costs 75,000Average operating assets 625,000
Management is considering the following independent courses of action in 2018 in order to maximize the return on investment for this division.
1. Reduce average operating assets by $125,000, with no change in controllable margin.2. Increase sales $100,000, with no change in the contribution margin percentage.
(a) Compute the controllable margin and the return on investment for 2017. (b) Compute the controllable margin and the expected return on investment for each proposed alternative.
Compute total budgeted costs in fl exible budget.
(LO 2)
Prepare a responsibility report.
(LO 3)
Compute ROI and expected return on investments.
(LO 4)
1084 24 Budgetary Control and Responsibility Accounting
DO IT! 24-2
DO IT! 24-3
DO IT! 24-4
EXERCISES
E24-1 Connie Rice has prepared the following list of statements about budgetary control.
1. Budget reports compare actual results with planned objectives. 2. All budget reports are prepared on a weekly basis. 3. Management uses budget reports to analyze differences between actual and planned
results and determine their causes. 4. As a result of analyzing budget reports, management may either take corrective action
or modify future plans. 5. Budgetary control works best when a company has an informal reporting system. 6. The primary recipients of the sales report are the sales manager and the production
supervisor. 7. The primary recipient of the scrap report is the production manager. 8. A static budget is a projection of budget data at one level of activity. 9. Top management’s reaction to unfavorable differences is not infl uenced by the materi-
ality of the difference. 10. A static budget is not appropriate in evaluating a manager’s effectiveness in controlling
costs unless the actual activity level approximates the static budget activity level or the behavior of the costs is fi xed.
InstructionsIdentify each statement as true or false. If false, indicate how to correct the statement.
E24-2 Crede Company budgeted selling expenses of $30,000 in January, $35,000 in Febru-ary, and $40,000 in March. Actual selling expenses were $31,200 in January, $34,525 in February, and $46,000 in March.
Understand the concept of budgetary control.
(LO 1, 2)
Prepare and evaluate static budget report.
(LO 1)

Exercises 1085
Instructions(a) Prepare a selling expense report that compares budgeted and actual amounts by
month and for the year to date.(b) What is the purpose of the report prepared in (a), and who would be the primary recipient?(c) What would be the likely result of management’s analysis of the report?
E24-3 Myers Company uses a fl exible budget for manufacturing overhead based on direct labor hours. Variable manufacturing overhead costs per direct labor hour are as follows.
Indirect labor $1.00Indirect materials 0.70Utilities 0.40
Fixed overhead costs per month are supervision $4,000, depreciation $1,200, and property taxes $800. The company believes it will normally operate in a range of 7,000–10,000 direct labor hours per month.
InstructionsPrepare a monthly manufacturing overhead fl exible budget for 2017 for the expected range of activity, using increments of 1,000 direct labor hours.
E24-4 Using the information in E24-3, assume that in July 2017, Myers Company incurs the following manufacturing overhead costs.
Variable Costs Fixed Costs
Indirect labor $8,800 Supervision $4,000Indirect materials 5,800 Depreciation 1,200Utilities 3,200 Property taxes 800
Instructions(a) Prepare a fl exible budget performance report, assuming that the company worked
9,000 direct labor hours during the month.(b) Prepare a fl exible budget performance report, assuming that the company worked
8,500 direct labor hours during the month.(c) Comment on your fi ndings.
E24-5 Fallon Company uses fl exible budgets to control its selling expenses. Monthly sales are expected to range from $170,000 to $200,000. Variable costs and their percentage rela-tionship to sales are sales commissions 6%, advertising 4%, traveling 3%, and delivery 2%. Fixed selling expenses will consist of sales salaries $35,000, depreciation on delivery equipment $7,000, and insurance on delivery equipment $1,000.
InstructionsPrepare a monthly fl exible budget for each $10,000 increment of sales within the relevant range for the year ending December 31, 2017.
E24-6 The actual selling expenses incurred in March 2017 by Fallon Company are as follows.
Variable Expenses Fixed Expenses
Sales commissions $11,000 Sales salaries $35,000Advertising 6,900 Depreciation 7,000Travel 5,100 Insurance 1,000Delivery 3,450
Instructions(a) Prepare a fl exible budget performance report for March using the budget data in E24-5,
assuming that March sales were $170,000.(b) Prepare a fl exible budget performance report, assuming that March sales were
$180,000.(c) Comment on the importance of using fl exible budgets in evaluating the per-
formance of the sales manager.
Prepare fl exible manufacturing overhead budget.
(LO 2)
Prepare fl exible budget reports for manufacturing overhead costs, and comment on fi ndings.
(LO 2)
Prepare fl exible selling expense budget.
(LO 2)
Prepare fl exible budget reports for selling expenses.
(LO 2)

1086 24 Budgetary Control and Responsibility Accounting
E24-7 Appliance Possible Inc. (AP) is a manufacturer of toaster ovens. To improve control over operations, the president of AP wants to begin using a fl exible budgeting system, rather than use only the current master budget. The following data are available for AP’s expected costs at production levels of 90,000, 100,000, and 110,000 units.
Variable costs Manufacturing $6 per unit Administrative $4 per unit Selling $3 per unitFixed costs Manufacturing $160,000 Administrative $ 80,000
Instructions(a) Prepare a fl exible budget for each of the possible production levels: 90,000, 100,000,
and 110,000 units.(b) If AP sells the toaster ovens for $16 each, how many units will it have to sell to make a
profi t of $60,000 before taxes?(CGA adapted)
E24-8 Rensing Groomers is in the dog-grooming business. Its operating costs are described by the following formulas:
Grooming supplies (variable) y 5 $0 1 $5xDirect labor (variable) y 5 $0 1 $14xOverhead (mixed) y 5 $10,000 1 $1x
Milo, the owner, has determined that direct labor is the cost driver for all three categories of costs.
Instructions(a) Prepare a fl exible budget for activity levels of 550, 600, and 700 direct labor hours.(b) Explain why the fl exible budget is more informative than the static budget.(c) Calculate the total cost per direct labor hour at each of the activity levels specifi ed in
part (a).(d) The groomers at Rensing normally work a total of 650 direct labor hours during each
month. Each grooming job normally takes a groomer 1.3 hours. Milo wants to earn a profi t equal to 40% of the costs incurred. Determine what he should charge each pet owner for grooming.
(CGA adapted)
E24-9 As sales manager, Joe Batista was given the following static budget report for selling expenses in the Clothing Department of Soria Company for the month of October.
SORIA COMPANYClothing Department
Budget ReportFor the Month Ended October 31, 2017
Difference
Favorable F Budget Actual Unfavorable U
Sales in units 8,000 10,000 2,000 F
Variable expenses Sales commissions $ 2,400 $ 2,600 $ 200 U Advertising expense 720 850 130 U Travel expense 3,600 4,100 500 U Free samples given out 1,600 1,400 200 F
Total variable 8,320 8,950 630 U
Fixed expenses Rent 1,500 1,500 –0– Sales salaries 1,200 1,200 –0– Offi ce salaries 800 800 –0– Depreciation—autos (sales staff) 500 500 –0–
Total fi xed 4,000 4,000 –0–
Total expenses $12,320 $12,950 $ 630 U
Prepare fl exible budget report.
(LO 2)
Prepare fl exible budget report; compare fl exible and static budgets.
(LO 1, 2)
SERVICE
Prepare fl exible budget report, and answer question.
(LO 1, 2)

Exercises 1087
As a result of this budget report, Joe was called into the president’s offi ce and congratu-lated on his fi ne sales performance. He was reprimanded, however, for allowing his costs to get out of control. Joe knew something was wrong with the performance report that he had been given. However, he was not sure what to do, and comes to you for advice.
Instructions(a) Prepare a budget report based on fl exible budget data to help Joe.(b) Should Joe have been reprimanded? Explain.
E24-10 Chubbs Inc.’s manufacturing overhead budget for the fi rst quarter of 2017 con-tained the following data.
Variable Costs Fixed Costs
Indirect materials $12,000 Supervisory salaries $36,000Indirect labor 10,000 Depreciation 7,000Utilities 8,000 Property taxes and insurance 8,000Maintenance 6,000 Maintenance 5,000
Actual variable costs were indirect materials $13,500, indirect labor $9,500, utilities $8,700, and maintenance $5,000. Actual fi xed costs equaled budgeted costs except for property taxes and insurance, which were $8,300. The actual activity level equaled the budgeted level. All costs are considered controllable by the production department manager except for depreciation, and property taxes and insurance.
Instructions(a) Prepare a manufacturing overhead fl exible budget report for the fi rst quarter.(b) Prepare a responsibility report for the fi rst quarter.
E24-11 UrLink Company is a newly formed company specializing in high-speed Internet service for home and business. The owner, Lenny Kirkland, had divided the company into two segments: Home Internet Service and Business Internet Service. Each segment is run by its own supervisor, while basic selling and administrative services are shared by both segments. Lenny has asked you to help him create a performance reporting system that will allow him to measure each segment’s performance in terms of its profi tability. To that end, the following information has been collected on the Home Internet Service segment for the fi rst quarter of 2017.
Budget Actual
Service revenue $25,000 $26,200Allocated portion of: Building depreciation 11,000 11,000 Advertising 5,000 4,200 Billing 3,500 3,000 Property taxes 1,200 1,000Material and supplies 1,600 1,200Supervisory salaries 9,000 9,500Insurance 4,000 3,900Wages 3,000 3,250Gas and oil 2,800 3,400Equipment depreciation 1,500 1,300
Instructions(a) Prepare a responsibility report for the fi rst quarter of 2017 for the Home Internet
Service segment.(b) Write a memo to Lenny Kirkland discussing the principles that should be
used when preparing performance reports.
E24-12 Venetian Company has two production departments, Fabricating and Assem-bling. At a department managers’ meeting, the controller uses fl exible budget graphs to explain total budgeted costs. Separate graphs based on direct labor hours are used for each department. The graphs show the following.
1. At zero direct labor hours, the total budgeted cost line and the fi xed cost line intersect the vertical axis at $50,000 in the Fabricating Department and $40,000 in the Assem-bling Department.
Prepare fl exible budget and responsibility report for manufacturing overhead.
(LO 2, 3)
Prepare and discuss a responsibility report.
(LO 2, 3)
SERVICE
State total budgeted cost formulas, and prepare fl exible budget graph.
(LO 2)

1088 24 Budgetary Control and Responsibility Accounting
2. At normal capacity of 50,000 direct labor hours, the line drawn from the total budgeted cost line intersects the vertical axis at $150,000 in the Fabricating Department, and $120,000 in the Assembling Department.
Instructions(a) State the total budgeted cost formula for each department.(b) Compute the total budgeted cost for each department, assuming actual direct labor
hours worked were 53,000 and 47,000, in the Fabricating and Assembling Depart-ments, respectively.
(c) Prepare the fl exible budget graph for the Fabricating Department, assuming the maxi-mum direct labor hours in the relevant range is 100,000. Use increments of 10,000 direct labor hours on the horizontal axis and increments of $50,000 on the vertical axis.
E24-13 Fey Company’s organization chart includes the president; the vice president of production; three assembly plants—Dallas, Atlanta, and Tucson; and two departments within each plant—Machining and Finishing. Budget and actual manufacturing cost data for July 2017 are as follows.
Finishing Department—Dallas: direct materials $42,500 actual, $44,000 budget; direct labor $83,400 actual, $82,000 budget; manufacturing overhead $51,000 actual, $49,200 budget.
Machining Department—Dallas: total manufacturing costs $220,000 actual, $219,000 budget.
Atlanta Plant: total manufacturing costs $424,000 actual, $420,000 budget.
Tucson Plant: total manufacturing costs $494,200 actual, $496,500 budget.
The Dallas plant manager’s offi ce costs were $95,000 actual and $92,000 budget. The vice president of production’s offi ce costs were $132,000 actual and $130,000 budget. Offi ce costs are not allocated to departments and plants.
InstructionsUsing the format shown in Illustration 24-19 (page 1069), prepare the reports in a respon-sibility system for:
(a) The Finishing Department—Dallas.(b) The plant manager—Dallas.(c) The vice president of production.
E24-14 The Mixing Department manager of Malone Company is able to control all over-head costs except rent, property taxes, and salaries. Budgeted monthly overhead costs for the Mixing Department, in alphabetical order, are:
Indirect labor $12,000 Property taxes $ 1,000Indirect materials 7,700 Rent 1,800Lubricants 1,675 Salaries 10,000Maintenance 3,500 Utilities 5,000
Actual costs incurred for January 2017 are indirect labor $12,250; indirect materials $10,200; lubricants $1,650; maintenance $3,500; property taxes $1,100; rent $1,800; sala-ries $10,000; and utilities $6,400.
Instructions(a) Prepare a responsibility report for January 2017.(b) What would be the likely result of management’s analysis of the report?
E24-15 Horatio Inc. has three divisions which are operated as profi t centers. Actual oper-ating data for the divisions listed alphabetically are as follows.
Operating Data Women’s Shoes Men’s Shoes Children’s Shoes
Contribution margin $270,000 (3) $180,000Controllable fi xed costs 100,000 (4) (5)Controllable margin (1) $ 90,000 95,000Sales 600,000 450,000 (6)Variable costs (2) 320,000 250,000
Prepare reports in a responsibility reporting system.
(LO 3)
Prepare a responsibility report for a cost center.
(LO 3)
Compute missing amounts in responsibility reports for three profi t centers, and prepare a report.
(LO 3)

Exercises 1089
Instructions(a) Compute the missing amounts. Show computations.(b) Prepare a responsibility report for the Women’s Shoes Division assuming (1) the data
are for the month ended June 30, 2017, and (2) all data equal budget except variable costs which are $5,000 over budget.
E24-16 The Sports Equipment Division of Harrington Company is operated as a profi t center. Sales for the division were budgeted for 2017 at $900,000. The only variable costs budgeted for the division were cost of goods sold ($440,000) and selling and administra-tive ($60,000). Fixed costs were budgeted at $100,000 for cost of goods sold, $90,000 for selling and administrative, and $70,000 for noncontrollable fi xed costs. Actual results for these items were:
Sales $880,000Cost of goods sold Variable 408,000 Fixed 105,000Selling and administrative Variable 61,000 Fixed 66,000Noncontrollable fi xed 90,000
Instructions(a) Prepare a responsibility report for the Sports Equipment Division for 2017.(b) Assume the division is an investment center, and average operating assets were
$1,000,000. The noncontrollable fi xed costs are controllable at the investment center level. Compute ROI.
E24-17 The South Division of Wiig Company reported the following data for the current year.
Sales $3,000,000Variable costs 1,950,000Controllable fi xed costs 600,000Average operating assets 5,000,000
Top management is unhappy with the investment center’s return on investment (ROI). It asks the manager of the South Division to submit plans to improve ROI in the next year. The manager believes it is feasible to consider the following independent courses of action.
1. Increase sales by $300,000 with no change in the contribution margin percentage.2. Reduce variable costs by $150,000.3. Reduce average operating assets by 4%.
Instructions(a) Compute the return on investment (ROI) for the current year.(b) Using the ROI formula, compute the ROI under each of the proposed courses of
action. (Round to one decimal.)
E24-18 The Dinkle and Frizell Dental Clinic provides both preventive and orthodontic dental services. The two owners, Reese Dinkle and Anita Frizell, operate the clinic as two separate investment centers: Preventive Services and Orthodontic Services. Each of them is in charge of one of the centers: Reese for Preventive Services and Anita for Orthodontic Services. Each month, they prepare an income statement for the two centers to evaluate performance and make decisions about how to improve the operational effi ciency and profi tability of the clinic. Recently, they have been concerned about the profi tability of the Preventive Services operations. For several months, it has been reporting a loss. The responsibility report for the month of May 2017 is shown on page 1090.
Prepare a responsibility report for a profi t center, and compute ROI.
(LO 3, 4)
Compute ROI for current year and for possible future changes.
(LO 4)
Prepare a responsibility report for an investment center.
(LO 4)
SERVICE

1090 24 Budgetary Control and Responsibility Accounting
Difference from Actual Budget
Service revenue $ 40,000 $1,000 F
Variable costs Filling materials 5,000 100 U Novocain 3,900 100 U Supplies 1,900 350 F Dental assistant wages 2,500 –0– Utilities 500 110 U
Total variable costs 13,800 40 F
Fixed costs Allocated portion of receptionist’s salary 3,000 200 U Dentist salary 9,800 400 U Equipment depreciation 6,000 –0– Allocated portion of building depreciation 15,000 1,000 U
Total fi xed costs 33,800 1,600 U
Operating income (loss) $ (7,600) $ 560 U
In addition, the owners know that the investment in operating assets at the beginning of the month was $82,400, and it was $77,600 at the end of the month. They have asked for your assistance in evaluating their current performance reporting system.
Instructions(a) Prepare a responsibility report for an investment center as illustrated in the chapter.(b) Write a memo to the owners discussing the defi ciencies of their current report-
ing system.
E24-19 The Ferrell Transportation Company uses a responsibility reporting system to measure the performance of its three investment centers: Planes, Taxis, and Limos. Segment performance is measured using a system of responsibility reports and return on investment calculations. The allocation of resources within the company and the segment managers’ bonuses are based in part on the results shown in these reports. Recently, the company was the victim of a computer virus that deleted portions of the company’s accounting records. This was discovered when the current period’s responsibil-ity reports were being prepared. The printout of the actual operating results appeared as follows.
Planes Taxis Limos
Service revenue $ ? $500,000 $ ?Variable costs 5,500,000 ? 300,000Contribution margin ? 250,000 480,000Controllable fi xed costs 1,500,000 ? ?Controllable margin ? 80,000 210,000Average operating assets 25,000,000 ? 1,500,000Return on investment 12% 10% ?
InstructionsDetermine the missing pieces of information above.
Prepare missing amounts in responsibility reports for three investment centers.
(LO 4)
SERVICE
EXERCISES: SET B AND CHALLENGE EXERCISES
Visit the book’s companion website, at www.wiley.com/college/weygandt, and choose the Student Companion site to access Exercises: Set B and Challenge Exercises.

Problems: Set A 1091
PROBLEMS: SET A
P24-1A Bumblebee Company estimates that 300,000 direct labor hours will be worked during the coming year, 2017, in the Packaging Department. On this basis, the following budgeted manufacturing overhead cost data are computed for the year.
Fixed Overhead Costs Variable Overhead Costs
Supervision $ 96,000 Indirect labor $126,000Depreciation 72,000 Indirect materials 90,000Insurance 30,000 Repairs 69,000Rent 24,000 Utilities 72,000Property taxes 18,000 Lubricants 18,000
$240,000 $375,000
It is estimated that direct labor hours worked each month will range from 27,000 to 36,000 hours. During October, 27,000 direct labor hours were worked and the following overhead costs were incurred.
Fixed overhead costs: supervision $8,000, depreciation $6,000, insurance $2,460, rent $2,000, and property taxes $1,500.
Variable overhead costs: indirect labor $12,432, indirect materials $7,680, repairs $6,100, utilities $6,840, and lubricants $1,920.
Instructions(a) Prepare a monthly manufacturing overhead fl exible budget for each increment of
3,000 direct labor hours over the relevant range for the year ending December 31, 2017.
(b) Prepare a fl exible budget report for October.(c) Comment on management’s effi ciency in controlling manufacturing overhead
costs in October.
P24-2A Zelmer Company manufactures tablecloths. Sales have grown rapidly over the past 2 years. As a result, the president has installed a budgetary control system for 2017. The following data were used in developing the master manufacturing overhead budget for the Ironing Department, which is based on an activity index of direct labor hours.
Rate per Direct Variable Costs Labor Hour Annual Fixed Costs
Indirect labor $0.40 Supervision $48,000Indirect materials 0.50 Depreciation 18,000Factory utilities 0.30 Insurance 12,000Factory repairs 0.20 Rent 30,000
The master overhead budget was prepared on the expectation that 480,000 direct labor hours will be worked during the year. In June, 41,000 direct labor hours were worked. At that level of activity, actual costs were as shown below.
Variable—per direct labor hour: indirect labor $0.44, indirect materials $0.48, factory utilities $0.32, and factory repairs $0.25.
Fixed: same as budgeted.
Instructions(a) Prepare a monthly manufacturing overhead fl exible budget for the year ending Decem-
ber 31, 2017, assuming production levels range from 35,000 to 50,000 direct labor hours. Use increments of 5,000 direct labor hours.
(b) Prepare a budget report for June comparing actual results with budget data based on the fl exible budget.
(c) Were costs effectively controlled? Explain.(d) State the formula for computing the total budgeted costs for the Ironing Department.(e) Prepare the fl exible budget graph, showing total budgeted costs at 35,000 and 45,000
direct labor hours. Use increments of 5,000 direct labor hours on the horizontal axis and increments of $10,000 on the vertical axis.
Prepare fl exible budget and budget report for manufacturing overhead.
(LO 2)
(a) Total costs: DLH 27,000, $53,750; DLH 36,000, $65,000
(b) Total $1,182 U
Prepare fl exible budget, budget report, and graph for manufacturing overhead.
(LO 2)
(a) Total costs: 35,000 DLH, $58,000; 50,000 DLH, $79,000
(b) Budget $66,400 Actual $70,090

1092 24 Budgetary Control and Responsibility Accounting
P24-3A Ratchet Company uses budgets in controlling costs. The August 2017 budget report for the company’s Assembling Department is as follows.
RATCHET COMPANYBudget Report
Assembling DepartmentFor the Month Ended August 31, 2017
Difference
Favorable FManufacturing Costs Budget Actual Unfavorable U
Variable costs Direct materials $ 48,000 $ 47,000 $1,000 F Direct labor 54,000 51,200 2,800 F Indirect materials 24,000 24,200 200 U Indirect labor 18,000 17,500 500 F Utilities 15,000 14,900 100 F Maintenance 12,000 12,400 400 U
Total variable 171,000 167,200 3,800 F
Fixed costs Rent 12,000 12,000 –0– Supervision 17,000 17,000 –0– Depreciation 6,000 6,000 –0–
Total fi xed 35,000 35,000 –0–
Total costs $206,000 $202,200 $3,800 F
The monthly budget amounts in the report were based on an expected production of 60,000 units per month or 720,000 units per year. The Assembling Department manager is pleased with the report and expects a raise, or at least praise for a job well done. The com-pany president, however, is unhappy with the results for August because only 58,000 units were produced.
Instructions(a) State the total monthly budgeted cost formula.(b) Prepare a budget report for August using fl exible budget data. Why does this report pro-
vide a better basis for evaluating performance than the report based on static budget data?(c) In September, 64,000 units were produced. Prepare the budget report using fl exible
budget data, assuming (1) each variable cost was 10% higher than its actual cost in August, and (2) fi xed costs were the same in September as in August.
P24-4A Clarke Inc. operates the Patio Furniture Division as a profi t center. Operating data for this division for the year ended December 31, 2017, are as shown below.
Difference Budget from Budget
Sales $2,500,000 $50,000 FCost of goods sold Variable 1,300,000 41,000 F Controllable fi xed 200,000 3,000 USelling and administrative Variable 220,000 6,000 U Controllable fi xed 50,000 2,000 UNoncontrollable fi xed costs 70,000 4,000 U
In addition, Clarke incurs $180,000 of indirect fi xed costs that were budgeted at $175,000. Twenty percent (20%) of these costs are allocated to the Patio Furniture Division.
Instructions(a) Prepare a responsibility report for the Patio Furniture Division for the year.(b) Comment on the manager’s performance in controlling revenues and costs.(c) Identify any costs excluded from the responsibility report and explain why they were
excluded.
State total budgeted cost formula, and prepare fl exible budget reports for 2 time periods.
(LO 1, 2)
(b) Budget $200,300
(c) Budget $217,400Actual $218,920
Prepare responsibility report for a profi t center.
(LO 3)
(a) Contribution margin $85,000 F Controllable margin $80,000 F

Problems: Set A 1093
P24-5A Optimus Company manufactures a variety of tools and industrial equipment. The company operates through three divisions. Each division is an investment center. Operat-ing data for the Home Division for the year ended December 31, 2017, and relevant budget data are as follows.
Actual Comparison with Budget
Sales $1,400,000 $100,000 favorableVariable cost of goods sold 665,000 45,000 unfavorableVariable selling and administrative expenses 125,000 25,000 unfavorableControllable fi xed cost of goods sold 170,000 On targetControllable fi xed selling and administrative expenses 80,000 On target
Average operating assets for the year for the Home Division were $2,000,000 which was also the budgeted amount.
Instructions(a) Prepare a responsibility report (in thousands of dollars) for the Home Division.(b) Evaluate the manager’s performance. Which items will likely be investigated by top
management?(c) Compute the expected ROI in 2017 for the Home Division, assuming the following
independent changes to actual data. (1) Variable cost of goods sold is decreased by 5%. (2) Average operating assets are decreased by 10%. (3) Sales are increased by $200,000, and this increase is expected to increase contri-
bution margin by $80,000.
P24-6A Durham Company uses a responsibility reporting system. It has divisions in Denver, Seattle, and San Diego. Each division has three production departments: Cutting, Shaping, and Finishing. The responsibility for each department rests with a manager who reports to the division production manager. Each division manager reports to the vice president of production. There are also vice presidents for marketing and fi nance. All vice presidents report to the president. In January 2017, controllable actual and budget manufacturing overhead cost data for the departments and divisions were as shown below.
Manufacturing Overhead Actual Budget
Individual costs—Cutting Department—Seattle Indirect labor $ 73,000 $ 70,000 Indirect materials 47,900 46,000 Maintenance 20,500 18,000 Utilities 20,100 17,000 Supervision 22,000 20,000
$183,500 $171,000
Total costs Shaping Department—Seattle $158,000 $148,000 Finishing Department—Seattle 210,000 205,000 Denver division 678,000 673,000 San Diego division 722,000 715,000
Additional overhead costs were incurred as ollows: Seattle division production manager— actual costs $52,500, budget $51,000; vice president of production—actual costs $65,000, budget $64,000; president—actual costs $76,400, budget $74,200. These expenses are not allocated. The vice presidents who report to the president, other than the vice president of production, had the following expenses.
Vice President Actual Budget
Marketing $133,600 $130,000Finance 109,000 104,000
Instructions(a) Using the format in Illustration 24-19 (page 1069), prepare the following responsibility
reports. (1) Manufacturing overhead—Cutting Department manager—Seattle division. (2) Manufacturing overhead—Seattle division manager.
Prepare responsibility report for an investment center, and compute ROI.
(LO 4)
(a) Controllable margin: Budget $330; Actual $360
Prepare reports for cost centers under responsibility accounting, and comment on performance of managers.
(LO 3)
(a) (1) $12,500 U (2) $29,000 U

1094 24 Budgetary Control and Responsibility Accounting
(3) Manufacturing overhead—vice president of production. (4) Manufacturing overhead and expenses—president.(b) Comment on the comparative performances of: (1) Department managers in the Seattle division. (2) Division managers. (3) Vice presidents.
PROBLEMS: SET B AND SET C
Visit the book’s companion website, at www.wiley.com/college/weygandt, and choose the Student Companion site to access Problems: Set B and Set C.
CONTINUING PROBLEMS
CURRENT DESIGNSCD24 The Current Designs staff has prepared the annual manufacturing budget for the rotomolded line based on an estimated annual production of 4,000 kayaks during 2017. Each kayak will require 54 pounds of polyethylene powder and a fi nishing kit (rope, seat, hardware, etc.). The polyethylene powder used in these kayaks costs $1.50 per pound, and the fi nishing kits cost $170 each. Each kayak will use two kinds of labor—2 hours of type I labor from people who run the oven and trim the plastic, and 3 hours of work from type II workers who attach the hatches and seat and other hardware. The type I employees are paid $15 per hour, and the type II are paid $12 per hour. Manufacturing overhead is budgeted at $396,000 for 2017, broken down as follows.
Variable costs Indirect materials $ 40,000 Manufacturing supplies 53,800 Maintenance and utilities 88,000
181,800
Fixed costs Supervision 90,000 Insurance 14,400 Depreciation 109,800
214,200
Total $396,000
During the fi rst quarter, ended March 31, 2017, 1,050 units were actually produced with the following costs.
Polyethylene powder $ 87,000Finishing kits 178,840Type I labor 31,500Type II labor 39,060Indirect materials 10,500Manufacturing supplies 14,150Maintenance and utilities 26,000Supervision 20,000Insurance 3,600Depreciation 27,450
Total $438,100
Instructions(a) Prepare the annual manufacturing budget for 2017, assuming that 4,000 kayaks will be produced.(b) Prepare the fl exible budget for manufacturing for the quarter ended March 31, 2017. Assume
activity levels of 900, 1,000, and 1,050 units.(c) Assuming the rotomolded line is treated as a profi t center, prepare a fl exible budget report for
manufacturing for the quarter ended March 31, 2017, when 1,050 units were produced.
EXCEL TUTORIAL
(3) $42,000 U (4) $52,800 U

Broadening Your Perspective 1095
WATERWAYS
WP24 Waterways Corporation is continuing its budget preparations. This problem gives you static budget information as well as actual overhead costs, and asks you to calculate amounts related to budgetary control and responsibility accounting.
Go to the book’s companion website, at www.wiley.com/college/weygandt, to fi nd the com-pletion of this problem.
(Note: This is a continuation of the Waterways problem from Chapters 19–23.)
PERSPECTIVEMANAGEMENT DECISION-MAKING
Decision-Making Across the OrganizationBYP24-1 Green Pastures is a 400-acre farm on the outskirts of the Kentucky Bluegrass, specializing in the boarding of broodmares and their foals. A recent economic downturn in the thoroughbred industry has led to a decline in breeding activities, and it has made the boarding business extremely competitive. To meet the competition, Green Pastures planned in 2017 to entertain clients, advertise more exten-sively, and absorb expenses formerly paid by clients such as veterinary and blacksmith fees. The budget report for 2017 is presented below. As shown, the static income statement budget for the year is based on an expected 21,900 boarding days at $25 per mare. The variable expenses per mare per day were budgeted: feed $5, veterinary fees $3, blacksmith fees $0.25, and supplies $0.55. All other budgeted expenses were either semifi xed or fi xed. During the year, management decided not to replace a worker who quit in March, but it did issue a new advertising brochure and did more entertaining of clients.1
GREEN PASTURESStatic Budget Income Statement
For the Year Ended December 31, 2017
Actual Master Budget Difference
Number of mares 52 60 8 U
Number of boarding days 19,000 21,900 2,900 U
Sales $380,000 $547,500 $167,500 ULess: Variable expenses Feed 104,390 109,500 5,110 F Veterinary fees 58,838 65,700 6,862 F Blacksmith fees 4,984 5,475 491 F Supplies 10,178 12,045 1,867 F
Total variable expenses 178,390 192,720 14,330 F
Contribution margin 201,610 354,780 153,170 U
Less: Fixed expenses Depreciation 40,000 40,000 –0– Insurance 11,000 11,000 –0– Utilities 12,000 14,000 2,000 F Repairs and maintenance 10,000 11,000 1,000 F Labor 88,000 95,000 7,000 F Advertisement 12,000 8,000 4,000 U Entertainment 7,000 5,000 2,000 U
Total fi xed expenses 180,000 184,000 4,000 F
Net income $ 21,610 $170,780 $149,170 U
BROADENING YOUR
SERVICE
1Data for this case are based on Hans Sprohge and John Talbott, “New Applications for Variance Analysis,” Journal of Accountancy (AICPA, New York), April 1989, pp. 137–141.

InstructionsWith the class divided into groups, answer the following.
(a) Based on the static budget report: (1) What was the primary cause(s) of the loss in net income? (2) Did management do a good, average, or poor job of controlling expenses? (3) Were management’s decisions to stay competitive sound?(b) Prepare a fl exible budget report for the year.(c) Based on the fl exible budget report, answer the three questions in part (a) above.(d) What course of action do you recommend for the management of Green Pastures?
Managerial AnalysisBYP24-2 Lanier Company manufactures expensive watch cases sold as souvenirs. Three of its sales departments are Retail Sales, Wholesale Sales, and Outlet Sales. The Retail Sales Department is a profi t center. The Wholesale Sales Department is a cost center. Its managers merely take orders from customers who purchase through the company’s wholesale catalog. The Outlet Sales Department is an investment center because each manager is given full responsibility for an outlet store location. The manager can hire and discharge employees, purchase, maintain, and sell equipment, and in general is fairly independent of company control. Mary Gammel is a manager in the Retail Sales Department. Stephen Flott manages the Whole-sale Sales Department. Jose Gomez manages the Golden Gate Club outlet store in San Francisco. The following are the budget responsibility reports for each of the three departments.
Budget
Retail Wholesale Outlet Sales Sales Sales
Sales $ 750,000 $ 400,000 $200,000Variable costs Cost of goods sold 150,000 100,000 25,000 Advertising 100,000 30,000 5,000 Sales salaries 75,000 15,000 3,000 Printing 10,000 20,000 5,000 Travel 20,000 30,000 2,000
Fixed costs Rent 50,000 30,000 10,000 Insurance 5,000 2,000 1,000 Depreciation 75,000 100,000 40,000Investment in assets 1,000,000 1,200,000 800,000
Actual Results
Retail Wholesale Outlet Sales Sales Sales
Sales $ 750,000 $ 400,000 $200,000Variable costs Cost of goods sold 192,000 122,000 26,500 Advertising 100,000 30,000 5,000 Sales salaries 75,000 15,000 3,000 Printing 10,000 20,000 5,000 Travel 14,000 21,000 1,500
Fixed costs Rent 40,000 50,000 12,300 Insurance 5,000 2,000 1,000 Depreciation 80,000 90,000 56,000Investment in assets 1,000,000 1,200,000 800,000
Instructions(a) Determine which of the items should be included in the responsibility report for each of the three
managers.(b) Compare the budgeted measures with the actual results. Decide which results should be called to
the attention of each manager.
1096 24 Budgetary Control and Responsibility Accounting

Real-World FocusBYP24-3 Computer Associates International, Inc., the world’s leading business software company, delivers the end-to-end infrastructure to enable e-business through innovative technology, services, and education. Recently, Computer Associates had 19,000 employees worldwide and revenue of over $6 billion. The following information is from the company’s annual report.
Instructions(a) Why don’t the company’s costs increase proportionately as the revenues increase in the third and
fourth quarters?
(b) What type of budgeting seems appropriate for the Computer Associates situation?
BYP24-4 There are many useful resources regarding budgeting available on websites. The following activity investigates the results of a comprehensive budgeting study.
Address: http://www.accountingweb.com/whitepapers/centage_ioma.pdf, or go to www.wiley.com/college/weygandt
InstructionsGo to the address above and then answer the following questions.
(a) What are cited as the two most common “pain points” of budgeting?(b) What percentage of companies that participated in the survey said that they prepare annual budgets?
Of those that prepare budgets, what percentage say that they start the budgeting process by fi rst generating sales projections?
(c) What is the most common amount of time for the annual budgeting process?(d) When evaluating variances from budgeted amounts, what was the most commonly defi ned range
of acceptable tolerance levels?(e) The study defi nes three types of consequences for varying from budgeted amounts. How does it
describe “severe” consequences?
CRITICAL THINKING
Communication ActivityBYP24-5 The manufacturing overhead budget for Fleming Company contains the following items.
Variable costs Fixed costs Indirect materials $22,000 Supervision $17,000 Indirect labor 12,000 Inspection costs 1,000 Maintenance expense 10,000 Insurance expense 2,000 Manufacturing supplies 6,000 Depreciation 15,000
Total variable $50,000 Total fi xed $35,000
The budget was based on an estimated 2,000 units being produced. During the past month, 1,500 units were produced, and the following costs incurred.
Broadening Your Perspective 1097
COMPUTER ASSOCIATES INTERNATIONAL, INC.Management Discussion
The Company has experienced a pattern of business whereby revenue for its third and fourth fi scal quarters refl ects an increase over fi rst- and second-quarter revenue. The Company attributes this increase to clients’ increased spending at the end of their calendar year budgetary periods and the culmination of its annual sales plan. Since the Company’s costs do not increase proportionately with the third- and fourth-quarters’ increase in revenue, the higher revenue in these quarters results in greater profi t margins and income. Fourth-quarter profi tability is traditionally affected by signifi cant new hirings, training, and education expenditures for the succeeding year.

Variable costs Fixed costs Indirect materials $22,500 Supervision $18,400 Indirect labor 13,500 Inspection costs 1,200 Maintenance expense 8,200 Insurance expense 2,200 Manufacturing supplies 5,000 Depreciation 14,700
Total variable $49,200 Total fi xed $36,500
Instructions(a) Determine which items would be controllable by Fred Bedner, the production manager.(b) How much should have been spent during the month for the manufacture of the 1,500 units?(c) Prepare a fl exible manufacturing overhead budget report for Mr. Bedner.(d) Prepare a responsibility report. Include only the costs that would have been controllable by
Mr. Bedner. Assume that the supervision cost above includes Mr. Bedner’s salary of $10,000, both at budget and actual. In an attached memo, describe clearly for Mr. Bedner the areas in which his performance needs to be improved.
Ethics CaseBYP24-6 American Products Corporation participates in a highly competitive industry. In order to meet this competition and achieve profi t goals, the company has chosen the decentralized form of organization. Each manager of a decentralized investment center is measured on the basis of profi t contribution, market penetration, and return on investment. Failure to meet the objectives estab-lished by corporate management for these measures has not been acceptable and usually has resulted in demotion or dismissal of an investment center manager. An anonymous survey of managers in the company revealed that the managers feel the pressure to compromise their personal ethical standards to achieve the corporate objectives. For example, at certain plant locations there was pressure to reduce quality control to a level which could not assure that all unsafe products would be rejected. Also, sales personnel were encouraged to use questionable sales tactics to obtain orders, including gifts and other incentives to purchasing agents. The chief executive offi cer is disturbed by the survey fi ndings. In his opinion, such behavior cannot be condoned by the company. He concludes that the company should do something about this problem.
Instructions(a) Who are the stakeholders (the affected parties) in this situation?(b) Identify the ethical implications, confl icts, or dilemmas in the above described situation.(c) What might the company do to reduce the pressures on managers and decrease the ethical
confl icts?(CMA adapted)
All About YouBYP24-7 It is one thing to prepare a personal budget; it is another thing to stick to it. Financial planners have suggested various mechanisms to provide support for enforcing personal budgets. One approach is called “envelope budgeting.”
InstructionsRead the article provided at http://en.wikipedia.org/wiki/Envelope_budgeting, and answer the following questions.
(a) Summarize the process of envelope budgeting.(b) Evaluate whether you think you would benefi t from envelope budgeting. What do you think are its
strengths and weaknesses relative to your situation?
Considering Your Costs and Benefi tsBYP24-8 Preparing a personal budget is a great fi rst step toward control over your personal fi nances. It is especially useful to prepare a budget when you face a big decision. For most people, the biggest decision they will ever make is whether to purchase a house. The percentage of people in the United States who own a home is high compared to many other countries. This is partially the result of U.S. government programs and incentives that encourage home ownership. For example, the interest on a home mortgage is tax-deductible.
1098 24 Budgetary Control and Responsibility Accounting

Broadening Your Perspective 1099
Before purchasing a house, you should fi rst consider whether buying it is the best choice for you. Suppose you just graduated from college and are moving to a new community. Should you immedi-ately buy a new home?
YES: If I purchase a home, I am making my housing cost more like a “fi xed cost,” thus minimiz-ing increases in my future housing costs. Also, I benefi t from the appreciation in my home’s value. Although recent turbulence in the economy has caused home prices in many communities to decline, I know that over the long term, home prices have increased across the country.NO: I just moved to a new town, so I don’t know the housing market. I am new to my job, so I don’t know whether I will like it or my new community. Also, if my job does go well, it is likely that my income will increase in the next few years, so I will able to afford a better house if I wait. Therefore, the fl exibility provided by renting is very valuable to me at this point in my life.
InstructionsWrite a response indicating your position regarding this situation. Provide support for your view.
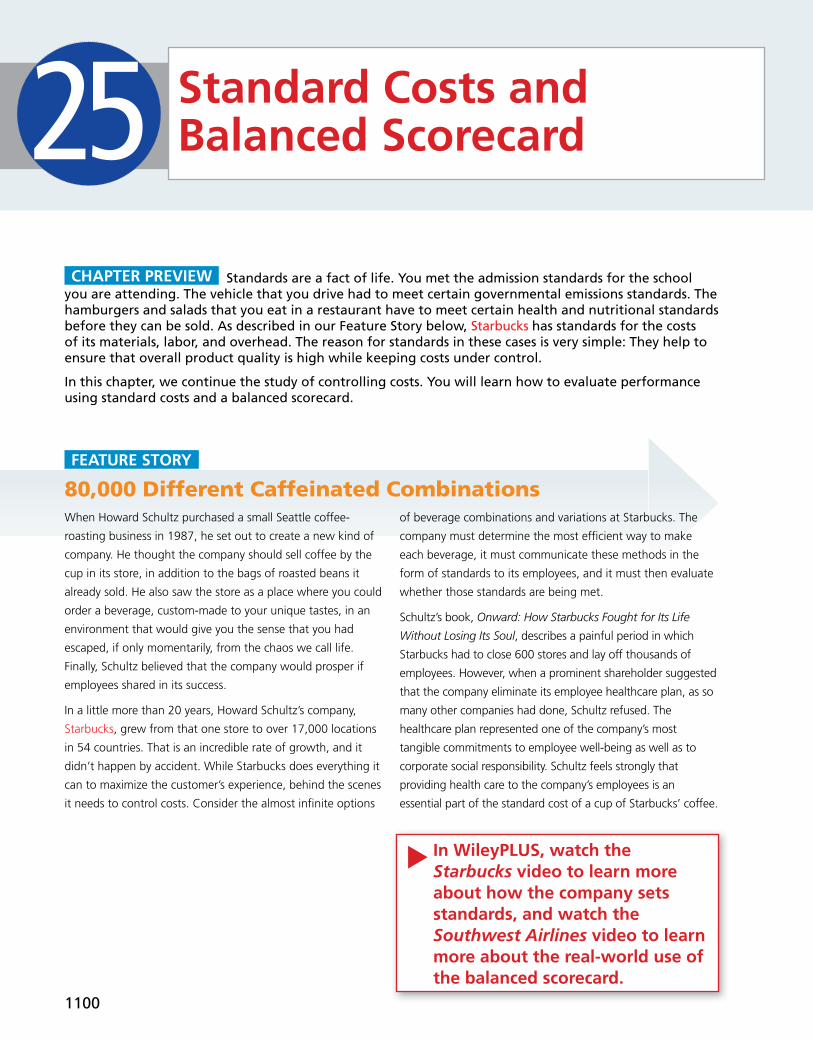
When Howard Schultz purchased a small Seattle coffee-
roasting business in 1987, he set out to create a new kind of
company. He thought the company should sell coffee by the
cup in its store, in addition to the bags of roasted beans it
already sold. He also saw the store as a place where you could
order a beverage, custom-made to your unique tastes, in an
environment that would give you the sense that you had
escaped, if only momentarily, from the chaos we call life.
Finally, Schultz believed that the company would prosper if
employees shared in its success.
In a little more than 20 years, Howard Schultz’s company,
Starbucks, grew from that one store to over 17,000 locations
in 54 countries. That is an incredible rate of growth, and it
didn’t happen by accident. While Starbucks does everything it
can to maximize the customer’s experience, behind the scenes
it needs to control costs. Consider the almost infi nite options
of beverage combinations and variations at Starbucks. The
company must determine the most effi cient way to make
each beverage, it must communicate these methods in the
form of standards to its employees, and it must then evaluate
whether those standards are being met.
Schultz’s book, Onward: How Starbucks Fought for Its Life
Without Losing Its Soul, describes a painful period in which
Starbucks had to close 600 stores and lay off thousands of
employees. However, when a prominent shareholder suggested
that the company eliminate its employee healthcare plan, as so
many other companies had done, Schultz refused. The
healthcare plan represented one of the company’s most
tangible commitments to employee well-being as well as to
corporate social responsibility. Schultz feels strongly that
providing health care to the company’s employees is an
essential part of the standard cost of a cup of Starbucks’ coffee.
80,000 Different Caffeinated Combinations
Standards are a fact of life. You met the admission standards for the school you are attending. The vehicle that you drive had to meet certain governmental emissions standards. The hamburgers and salads that you eat in a restaurant have to meet certain health and nutritional standards before they can be sold. As described in our Feature Story below, Starbucks has standards for the costs of its materials, labor, and overhead. The reason for standards in these cases is very simple: They help to ensure that overall product quality is high while keeping costs under control.
In this chapter, we continue the study of controlling costs. You will learn how to evaluate performance using standard costs and a balanced scorecard.
CHAPTER PREVIEW
25
FEATURE STORY
Standard Costs and Balanced Scorecard
1100
In WileyPLUS, watch the Starbucks video to learn more about how the company sets standards, and watch the Southwest Airlines video to learn more about the real-world use of the balanced scorecard.
▲
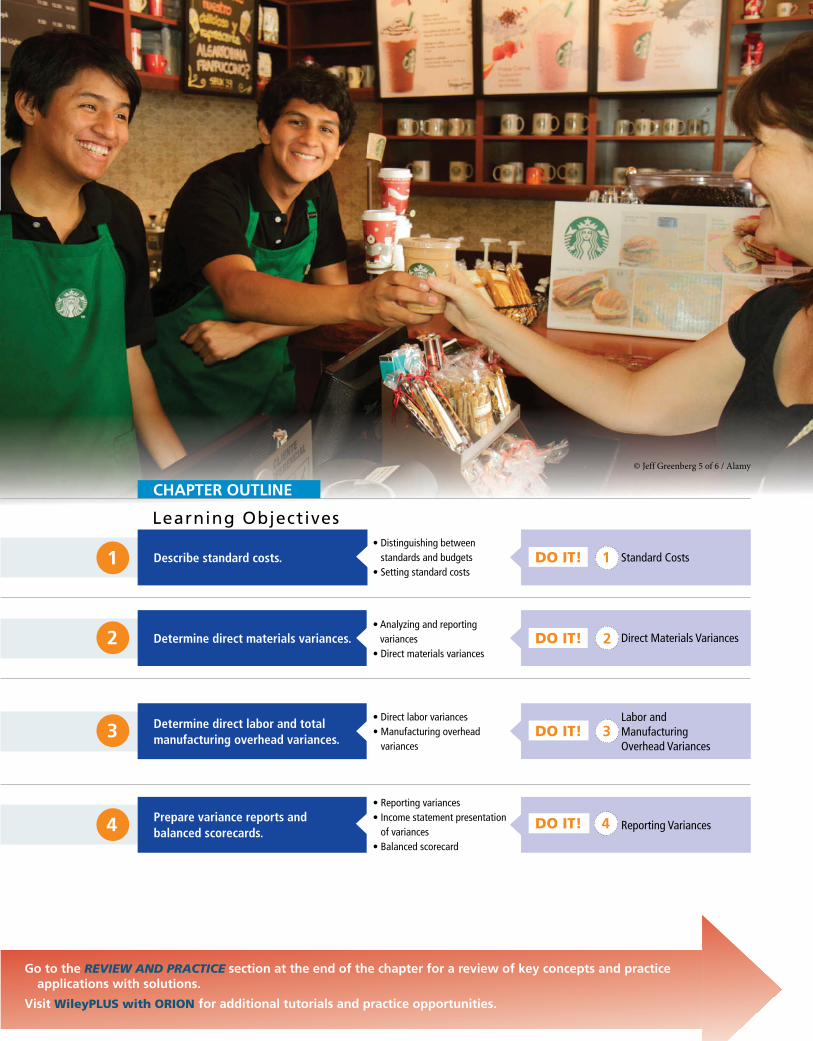
Go to the REVIEW AND PRACTICE section at the end of the chapter for a review of key concepts and practice applications with solutions.
Visit WileyPLUS with ORION for additional tutorials and practice opportunities.
© Jeff Greenberg 5 of 6 / Alamy
Prepare variance reports and balanced scorecards.
Determine direct materials variances.
Determine direct labor and total manufacturing overhead variances.
2
3
4
Describe standard costs.1 Standard CostsDO IT! 1• Distinguishing between
standards and budgets• Setting standard costs
• Analyzing and reporting variances
• Direct materials variances
Learning Objectives
Labor and Manufacturing Overhead Variances
DO IT! 3• Direct labor variances• Manufacturing overhead
variances
Reporting VariancesDO IT! 4
• Reporting variances• Income statement presentation
of variances• Balanced scorecard
Direct Materials Variances2DO IT!
CHAPTER OUTLINE

1102 25 Standard Costs and Balanced Scorecard
1 Describe standard costs.LEARNING OBJECTIVE
Standards are common in business. Those imposed by government agencies are often called regulations. They include the Fair Labor Standards Act, the Equal Employment Opportunity Act, and a multitude of environmental standards. Standards established internally by a company may extend to personnel matters, such as employee absenteeism and ethical codes of conduct, quality control stan-dards for products, and standard costs for goods and services. In managerial accounting, standard costs are predetermined unit costs, which companies use as measures of performance. We focus on manufacturing operations in this chapter. But you should rec-ognize that standard costs also apply to many types of service businesses as well. For example, a fast-food restaurant such as McDonald’s knows the price it should pay for pickles, beef, buns, and other ingredients. It also knows how much time it should take an employee to fl ip hamburgers. If the company pays too much for pickles or if employees take too much time to prepare Big Macs, McDonald’s notices the deviations and takes corrective action. Not-for-profi t entities, such as universities, charitable organizations, and governmental agencies, also may use standard costs as measures of performance. Standard costs offer a number of advantages to an organization, as shown in Illustration 25-1. The organization will realize these advantages only when stan-dard costs are carefully established and prudently used. Using standards solely as
SERVICE
Facilitate management planning Promote greater economy bymaking employees more
“cost-conscious ”
Useful in setting selling prices
Contribute to managementcontrol by providing basis for
evaluation of cost control
Useful in highlighting variancesin management by exception
Simplify costing of inventoriesand reduce clerical costs
Advantages of Standard Costs
SALESStandard vs. Actual
Actual
Standard
Exception Report
Actual Standard Variancexxxxxxxxxxxxxxxxxxxxxxxxxxxxxxxxxxxxxxxxxxxxxxxxxxxxxxxxxxxxxxxxxxxxxxxxxxxxx
xxxxxxxxxxxxxxxxxxxxxxxxxxxxxxxxxxxxxxxxxxxxxxxxxxxxxxxxxxxxxxxxxxxxxxxxxxxxx
xxxxxxxxxxxxxxxxxxxxxxxxxxxxxxxxxxxxxxxxxxxxxxxxxxxxxxxxxxxxxxxxxxxxxxxxxxxxx
$
Illustration 25-1Advantages of standard costs
Standard Costs 1103
a way to place blame can have a negative effect on managers and employees. To minimize this effect, many companies offer wage incentives to those who meet the standards.
Distinguishing Between Standards and Budgets
Both standards and budgets are predetermined costs, and both contribute to management planning and control. There is a difference, however, in the way the terms are expressed. A standard is a unit amount. A budget is a total amount. Thus, it is customary to state that the standard cost of direct labor for a unit of product is, say, $10. If the company produces 5,000 units of the product, the $50,000 of direct labor is the budgeted labor cost. A standard is the budgeted cost per unit of product. A standard is therefore concerned with each individual cost component that makes up the entire budget. There are important accounting differences between budgets and standards. Except in the application of manufacturing overhead to jobs and processes, bud-get data are not journalized in cost accounting systems. In contrast, as we illus-trate in the appendix to this chapter, standard costs may be incorporated into cost accounting systems. Also, a company may report its inventories at standard cost in its fi nancial statements, but it would not report inventories at budgeted costs.
Setting Standard Costs
The setting of standard costs to produce a unit of product is a diffi cult task. It requires input from all persons who have responsibility for costs and quantities. To determine the standard cost of direct materials, management consults pur-chasing agents, product managers, quality control engineers, and production supervisors. In setting the standard cost for direct labor, managers obtain pay rate data from the payroll department. Industrial engineers generally determine the labor time requirements. The managerial accountant provides important input for the standard-setting process by accumulating historical cost data and by knowing how costs respond to changes in activity levels. To be effective in controlling costs, standard costs need to be current at all times. Thus, standards are under continuous review. They should change when-ever managers determine that the existing standard is not a good measure of performance. Circumstances that warrant revision of a standard include changed wage rates resulting from a new union contract, a change in product specifi ca-tions, or the implementation of a new manufacturing method.
IDEAL VERSUS NORMAL STANDARDS
Companies set standards at one of two levels: ideal or normal. Ideal standards represent optimum levels of performance under perfect operating conditions. Normal standards represent effi cient levels of performance that are attainable under expected operating conditions. Some managers believe ideal standards will stimulate workers to ever- increasing improvement. However, most managers believe that ideal standards lower the morale of the entire workforce because they are diffi cult, if not impos-sible, to meet. Very few companies use ideal standards. Most companies that use standards set them at a normal level. Properly set, normal standards should be rigorous but attainable. Normal standards allow for rest periods, machine breakdowns, and other “normal” contingencies in the production process. In the remainder of this chapter, we will assume that stan-dard costs are set at a normal level.
ETHICS NOTE
When standards are set too high, employees sometimes feel pressure to consider unethical practices to meet these standards.

1104 25 Standard Costs and Balanced Scorecard
A CASE STUDY
To establish the standard cost of producing a product, it is necessary to establish standards for each manufacturing cost element—direct materials, direct labor, and manufacturing overhead. The standard for each element is derived from the standard price to be paid and the standard quantity to be used. To illustrate, we use an extended example. Xonic Beverage Company uses standard costs to measure performance at the production facility of its caffein-ated energy drink, Xonic Tonic. Xonic produces one-gallon containers of con-centrated syrup that it sells to coffee and smoothie shops, and other retail outlets. The syrup is mixed with ice water or ice “slush” before serving. The potency of the beverage varies depending on the amount of concentrated syrup used.
DIRECT MATERIALS The direct materials price standard is the cost per unit of direct materials that should be incurred. This standard is based on the purchas-ing department’s best estimate of the cost of raw materials. This cost is fre-quently based on current purchase prices. The price standard also includes an amount for related costs such as receiving, storing, and handling. The materials price standard per pound of material for Xonic Tonic is as follows.
The direct materials quantity standard is the quantity of direct materials that should be used per unit of fi nished goods. This standard is expressed as a physical measure, such as pounds, barrels, or board feet. In setting the standard, management considers both the quality and quantity of materials required to manufacture the product. The standard includes allowances for unavoidable waste and normal spoilage. The standard quantity per unit for Xonic Tonic is shown in Illustration 25-3.
How Do Standards Help a Business?
A number of organiza-tions, including corpora-tions, consultants, and governmental agencies, share information regard- ing performance stan-
dards in an effort to create a standard set of measures for thousands of business processes. The group, referred to as
the Open Standards Benchmarking Collaborative, includes IBM, Procter and Gamble, the U.S. Navy, and the World Bank. Companies that are interested in participating can go to the group’s website and enter their information.
Source: Becky Partida, “Benchmark Your Manufacturing Performance,” Control Engineering (February 4, 2013).
How will the creation of such standards help a business or organization? (Go to WileyPLUS for this answer and additional questions.)
Accounting Across the Organization U.S. Navy
SpotX/iStockphoto
Illustration 25-2Setting direct materials price standard
Item Price
Purchase price, net of discounts $ 2.70Freight 0.20Receiving and handling 0.10
Standard direct materials price per pound $3.00

Standard Costs 1105
The standard direct materials cost per unit is the standard direct ma-terials price times the standard direct materials quantity. For Xonic, the standard direct materials cost per gallon of Xonic Tonic is $12.00 ($3 3 4 pounds).
DIRECT LABOR The direct labor price standard is the rate per hour that should be incurred for direct labor. This standard is based on current wage rates, adjusted for anticipated changes such as cost of living adjustments (COLAs). The price standard also generally includes employer payroll taxes and fringe benefi ts, such as paid holidays and vacations. For Xonic, the direct labor price standard is as follows.
Alternative TerminologyThe direct labor price standard is also called the direct labor rate standard.
The direct labor quantity standard is the time that should be required to make one unit of the product. This standard is especially critical in labor- intensive companies. Allowances should be made in this standard for rest periods, cleanup, machine setup, and machine downtime. Illustration 25-5 shows the direct labor quantity standard for Xonic.
Alternative TerminologyThe direct labor quantity standard is also called the direct labor effi ciency standard.
The standard direct labor cost per unit is the standard direct labor rate times the standard direct labor hours. For Xonic, the standard direct labor cost per gallon is $30 ($15 3 2 hours).
MANUFACTURING OVERHEAD For manufacturing overhead, companies use a standard predetermined overhead rate in setting the standard. This overhead rate is determined by dividing budgeted overhead costs by an expected standard activity index. For example, the index may be standard direct labor hours or stan-dard machine hours.
Illustration 25-3Setting direct materials quantity standardItem
Quantity (Pounds)
Required materials 3.5Allowance for waste 0.4Allowance for spoilage 0.1
Standard direct materials quantity per unit 4.0
Illustration 25-4Setting direct labor price standard
Item Price
Hourly wage rate $ 12.50COLA 0.25Payroll taxes 0.75Fringe benefi ts 1.50
Standard direct labor rate per hour $15.00
ItemQuantity (Hours)
Actual production time 1.5Rest periods and cleanup 0.2Setup and downtime 0.3
Standard direct labor hours per unit 2.0
Illustration 25-5Setting direct labor quantity standard
Calculating theoverhead rate
Overhead Standardactivityindex
÷

1106 25 Standard Costs and Balanced Scorecard
As discussed in Chapter 21, many companies employ activity-based costing (ABC) to allocate overhead costs. Because ABC uses multiple activity indices to allocate overhead costs, it results in a better correlation between activities and costs incurred than do other methods. As a result, the use of ABC can signifi -cantly improve the usefulness of standard costing for management decision- making. Xonic uses standard direct labor hours as the activity index. The company expects to produce 13,200 gallons of Xonic Tonic during the year at normal capacity. Normal capacity is the average activity output that a company should experience over the long run. Since it takes two direct labor hours for each gallon, total standard direct labor hours are 26,400 (13,200 gallons 3 2 hours). At normal capacity of 26,400 direct labor hours, overhead costs are expected to be $132,000. Of that amount, $79,200 are variable and $52,800 are fi xed. Illus-tration 25-6 shows computation of the standard predetermined overhead rates for Xonic.
The standard manufacturing overhead cost per unit is the predetermined overhead rate times the activity index quantity standard. For Xonic, which uses direct labor hours as its activity index, the standard manufacturing over-head cost per gallon of Xonic Tonic is $10 ($5 3 2 hours).
TOTAL STANDARD COST PER UNIT After a company has established the standard quantity and price per unit of product, it can determine the total standard cost. The total standard cost per unit is the sum of the standard costs of direct materials, direct labor, and manufacturing overhead. The total standard cost per gallon of Xonic Tonic is $52, as shown on the following standard cost card.
The company prepares a standard cost card for each product. This card provides the basis for determining variances from standards.
Illustration 25-6Computing predetermined overhead rates
Budgeted Overhead
Costs Amount 4
Standard Direct
Labor Hours 5
Overhead Rate per Direct
Labor Hour
Variable $ 79,200 26,400 $3.00Fixed 52,800 26,400 2.00
Total $132,000 26,400 $5.00
Illustration 25-7Standard cost per gallon of Xonic Tonic Product: Xonic Tonic Unit Measure: Gallon
ManufacturingCost Elements
StandardQuantity
Direct materialsDirect laborManufacturing overhead
4 pounds2 hours2 hours
StandardPrice� �
$ 3.00$ 15.00$ 5.00
StandardCost
$12.0030.0010.00
$52.00 Xonic Tonic
Xonic Tonic

Direct Materials Variances 1107
Ridette Inc. accumulated the following standard cost data concerning product Cty31.
Direct materials per unit: 1.5 pounds at $4 per poundDirect labor per unit: 0.25 hours at $13 per hour.Manufacturing overhead: allocated based on direct labor hours at a predetermined rate of $15.60 per direct labor hour.
Compute the standard cost of one unit of product Cty31.
DO IT! 1 Standard Costs
Related exercise material: BE25-2, BE25-3, E25-1, E25-2, E25-3, and DO IT! 25-1.
Action Plan✔ Know that standard
costs are predetermined unit costs.
✔ To establish the standard cost of producing a product, establish the standard for each manufacturing cost element—direct materials, direct labor, and manufacturing overhead.
✔ Compute the standard cost for each element from the standard price to be paid and the standard quantity to be used.
Manufacturing Cost Element
Standard Quantity 3
Standard Price 5
Standard Cost
Direct materials 1.5 pounds $ 4.00 $ 6.00Direct labor 0.25 hours $13.00 3.25Manufacturing overhead 0.25 hours $15.60 3.90
Total $13.15
Solution
2 Determine direct materials variances.LEARNING OBJECTIVE
Analyzing and Reporting Variances
One of the major management uses of standard costs is to identify variances from standards. Variances are the differences between total actual costs and total standard costs. To illustrate, assume that in producing 1,000 gallons of Xonic Tonic in the month of June, Xonic incurred the following costs.
Alternative TerminologyIn business, the term variance is also used to indicate differences between total budgeted and total actual costs.
Companies determine total standard costs by multiplying the units produced by the standard cost per unit. The total standard cost of Xonic Tonic is $52,000 (1,000 gallons 3 $52). Thus, the total variance is $3,000, as shown below.
Note that the variance is expressed in total dollars, not on a per unit basis. When actual costs exceed standard costs, the variance is unfavorable. The $3,000 variance in June for Xonic Tonic is unfavorable. An unfavorable variance has a negative connotation. It suggests that the company paid too much for one
Illustration 25-8Actual production costs
Direct materials $13,020Direct labor 31,080Variable overhead 6,500Fixed overhead 4,400
Total actual costs $55,000
Actual costs $55,000Less: Standard costs 52,000
Total variance $ 3,000
Illustration 25-9Computation of total variance

1108 25 Standard Costs and Balanced Scorecard
or more of the manufacturing cost elements or that it used the elements ineffi -ciently. If actual costs are less than standard costs, the variance is favorable. A favor-able variance has a positive connotation. It suggests effi ciencies in incurring manufacturing costs and in using direct materials, direct labor, and manufactur-ing overhead. However, be careful: A favorable variance could be obtained by using inferior materials. In printing wedding invitations, for example, a favorable variance could result from using an inferior grade of paper. Or, a favorable variance might be achieved in installing tires on an automobile assembly line by tightening only half of the lug bolts. A variance is not favorable if the company has sacrifi ced quality control standards. To interpret a variance, you must analyze its components. A variance can result from differences related to the cost of materials, labor, or overhead. Illus-tration 25-10 shows that the total variance is the sum of the materials, labor, and overhead variances.
Illustration 25-10Components of total variance Materials Variance 1 Labor Variance 1 Overhead Variance 5 Total Variance
In the following discussion, you will see that the materials variance and the labor variance are the sum of variances resulting from price differences and quantity differences. Illustration 25-11 shows a format for computing the price and quantity variances.
Total Materials or Labor Variance
Actual Cost
Actual Quantity×
Actual Price
Actual Quantity
×Standard Price
Standard Cost
Standard Quantity
×Standard Price
Price Variance Quantity Variance
Illustration 25-11Breakdown of materials or labor variance into price and quantity variances
Note that the left side of the matrix is actual cost (actual quantity times actual price). The right hand is standard cost (standard quantity times standard price). The only additional element you need in order to compute the price and quantity variances is the middle element, the actual quantity at the standard price.
Direct Materials Variances
Part of Xonic’s total variance of $3,000 is due to a materials variance. In com-pleting the order for 1,000 gallons of Xonic Tonic, the company used 4,200 pounds of direct materials. The direct materials were purchased at a price of $3.10 per unit. From Illustration 25-3, we know that Xonic’s standards require it
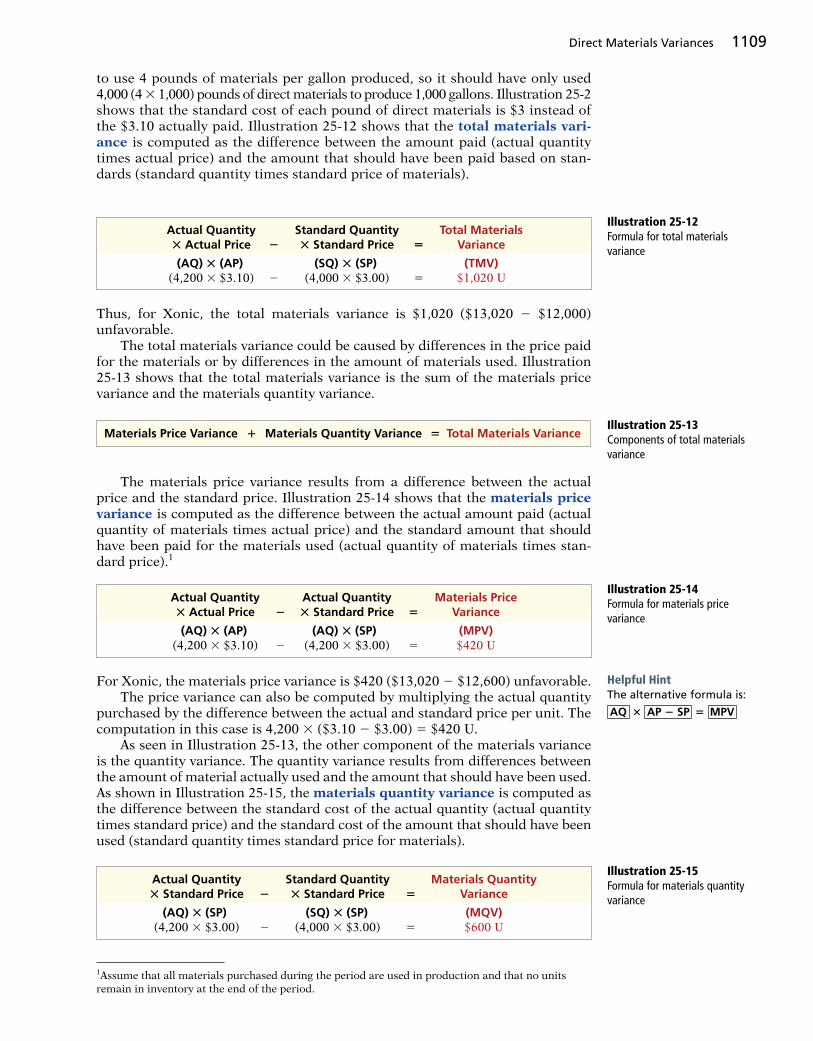
Direct Materials Variances 1109
to use 4 pounds of materials per gallon produced, so it should have only used 4,000 (4 3 1,000) pounds of direct materials to produce 1,000 gallons. Illustration 25-2 shows that the standard cost of each pound of direct materials is $3 instead of the $3.10 actually paid. Illustration 25-12 shows that the total materials vari-ance is computed as the difference between the amount paid (actual quantity times actual price) and the amount that should have been paid based on stan-dards (standard quantity times standard price of materials).
Illustration 25-12Formula for total materials variance
Actual Quantity Standard Quantity Total Materials 3 Actual Price 2 3 Standard Price 5 Variance
(AQ) 3 (AP) (SQ) 3 (SP) (TMV) (4,200 3 $3.10) 2 (4,000 3 $3.00) 5 $1,020 U
Illustration 25-14Formula for materials price variance
Actual Quantity Actual Quantity Materials Price 3 Actual Price 2 3 Standard Price 5 Variance
(AQ) 3 (AP) (AQ) 3 (SP) (MPV) (4,200 3 $3.10) 2 (4,200 3 $3.00) 5 $420 U
Illustration 25-15Formula for materials quantity variance
Actual Quantity Standard Quantity Materials Quantity 3 Standard Price 2 3 Standard Price 5 Variance
(AQ) 3 (SP) (SQ) 3 (SP) (MQV) (4,200 3 $3.00) 2 (4,000 3 $3.00) 5 $600 U
Thus, for Xonic, the total materials variance is $1,020 ($13,020 2 $12,000) unfavorable. The total materials variance could be caused by differences in the price paid for the materials or by differences in the amount of materials used. Illustration 25-13 shows that the total materials variance is the sum of the materials price variance and the materials quantity variance.
Illustration 25-13Components of total materials variance
Materials Price Variance 1 Materials Quantity Variance 5 Total Materials Variance
The materials price variance results from a difference between the actual price and the standard price. Illustration 25-14 shows that the materials price variance is computed as the difference between the actual amount paid (actual quantity of materials times actual price) and the standard amount that should have been paid for the materials used (actual quantity of materials times stan-dard price).1
For Xonic, the materials price variance is $420 ($13,020 2 $12,600) unfavorable. The price variance can also be computed by multiplying the actual quantity purchased by the difference between the actual and standard price per unit. The computation in this case is 4,200 3 ($3.10 2 $3.00) 5 $420 U. As seen in Illustration 25-13, the other component of the materials variance is the quantity variance. The quantity variance results from differences between the amount of material actually used and the amount that should have been used. As shown in Illustration 25-15, the materials quantity variance is computed as the difference between the standard cost of the actual quantity (actual quantity times standard price) and the standard cost of the amount that should have been used (standard quantity times standard price for materials).
Helpful HintThe alternative formula is:
AQ 3 AP 2 SP 5 MPV
1Assume that all materials purchased during the period are used in production and that no units remain in inventory at the end of the period.

1110 25 Standard Costs and Balanced Scorecard
Helpful HintThe alternative formula is:
SP 3 AQ 2 SQ 5 MQV
Illustration 25-16Summary of materials variances
Materials price variance $ 420 UMaterials quantity variance 600 U
Total materials variance $1,020 U
PurchasingDept.
“What causedmaterials price
variances?”
Actual Quantity× Actual Price
(AQ) × (AP)4,200 × $3.10 = $13,020
Actual Quantity× Standard Price
(AQ) × (SP)4,200 × $3.00 = $12,600
Standard Quantity× Standard Price
(SQ) × (SP)4,000 × $3.00 = $12,000
Price Variance$13,020 – $12,600 = $420 U
Quantity Variance$12,600 – $12,000 = $600 U
Total Materials Variance$13,020 – $12,000 = $1,020 U
Illustration 25-17Matrix for direct materials variances
Thus, for Xonic, the materials quantity variance is $600 ($12,600 2 $12,000) unfavorable. The quantity variance can also be computed by applying the standard price to the difference between actual and standard quantities used. The computation in this example is $3.00 3 (4,200 2 4,000) 5 $600 U. The total materials variance of $1,020 U, therefore, consists of the following.
Companies sometimes use a matrix to analyze a variance. When the matrix is used, a company computes the amounts using the formulas for each cost element fi rst and then computes the variances. Illustration 25-17 shows the completed matrix for the direct materials variance for Xonic. The matrix pro-vides a convenient structure for determining each variance.
CAUSES OF MATERIALS VARIANCES
What are the causes of a variance? The causes may relate to both internal and external factors. The investigation of a materials price variance usually begins in the purchasing department. Many factors affect the price paid for raw ma-terials. These include availability of quantity and cash discounts, the quality of the materials requested, and the delivery method used. To the extent that these factors are considered in setting the price standard, the purchasing department is responsible for any variances. However, a variance may be beyond the control of the purchasing depart-ment. Sometimes, for example, prices may rise faster than expected. Moreover, actions by groups over which the company has no control, such as the OPEC nations’ oil price increases, may cause an unfavorable variance. For example,

Direct Labor and Manufacturing Overhead Variances 1111
during a recent year, Kraft Foods and Kellogg Company both experienced unfa-vorable materials price variances when the cost of dairy and wheat products jumped unexpectedly. There are also times when a production department may be responsible for the price variance. This may occur when a rush order forces the company to pay a higher price for the materials. The starting point for determining the cause(s) of a signifi cant materials quantity variance is in the production department. If the variances are due to inexperienced workers, faulty machinery, or carelessness, the production department is responsible. However, if the materials obtained by the purchasing department were of inferior quality, then the purchasing department is responsible.
ProductionDept.
“What causedmaterials quantity
variances?”
The standard cost of Wonder Walkers includes two units of direct materials at $8.00 per unit. During July, the company buys 22,000 units of direct materials at $7.50 and uses those materials to produce 10,000 Wonder Walkers. Compute the total, price, and quantity variances for materials.
Solution
DO IT! 2 Direct Materials Variances
Standard quantity 5 10,000 3 2Substituting amounts into the formulas, the variances are:
Total materials variance 5 (22,000 3 $7.50) 2 (20,000 3 $8.00) 5 $5,000 unfavorableMaterials price variance 5 (22,000 3 $7.50) 2 (22,000 3 $8.00) 5 $11,000 favorableMaterials quantity variance 5 (22,000 3 $8.00) 2 (20,000 3 $8.00) 5 $16,000 unfavorable
Related exercise material: BE25-4, E25-5, and DO IT! 25-2.
Action PlanUse the formulas for computing each of the materials variances:✔ Total materials vari-
ance 5 (AQ 3 AP) 2 (SQ 3 SP)
✔ Materials price vari-ance 5 (AQ 3 AP) 2 (AQ 3 SP)
✔ Materials quantity vari-ance 5 (AQ 3 SP) 2 (SQ 3 SP)
3 Determine direct labor and total manufacturing overhead variances.LEARNING OBJECTIVE
Direct Labor Variances
The process of determining direct labor variances is the same as for determining the direct materials variances. In completing the Xonic Tonic order, the company incurred 2,100 direct labor hours at an average hourly rate of $14.80. The stan-dard hours allowed for the units produced were 2,000 hours (1,000 gallons 3 2 hours). The standard labor rate was $15 per hour. The total labor variance is the difference between the amount actually paid for labor versus the amount that should have been paid. Illustration 25-18 shows that the total labor variance is computed as the difference between the amount actually paid for labor (actual hours times actual rate) and the amount that should have been paid (standard hours times standard rate for labor).
Illustration 25-18Formula for total labor variance Actual Hours Standard Hours Total Labor
3 Actual Rate 2 3 Standard Rate 5 Variance
(AH) 3 (AR) (SH) 3 (SR) (TLV) (2,100 3 $14.80) 2 (2,000 3 $15.00) 5 $1,080 U

1112 25 Standard Costs and Balanced Scorecard
The total labor variance is $1,080 ($31,080 2 $30,000) unfavorable. The total labor variance is caused by differences in the labor rate or difference in labor hours. Illustration 25-19 shows that the total labor variance is the sum of the labor price variance and the labor quantity variance.
Illustration 25-19Components of total labor variance
Labor Price Variance 1 Labor Quantity Variance 5 Total Labor Variance
The labor price variance results from the difference between the rate paid to workers versus the rate that was supposed to be paid. Illustration 25-20 shows that the labor price variance is computed as the difference between the actual amount paid (actual hours times actual rate) and the amount that should have been paid for the number of hours worked (actual hours times standard rate for labor).
Illustration 25-20Formula for labor price variance
Actual Hours Actual Hours Labor Price 3 Actual Rate 2 3 Standard Rate 5 Variance
(AH) 3 (AR) (AH) 3 (SR) (LPV) (2,100 3 $14.80) 2 (2,100 3 $15.00) 5 $420 F
Illustration 25-21Formula for labor quantity variance
Actual Hours Standard Hours Labor Quantity 3 Standard Rate 2 3 Standard Rate 5 Variance
(AH) 3 (SR) (SH) 3 (SR) (LQV) (2,100 3 $15.00) 2 (2,000 3 $15.00) 5 $1,500 U
For Xonic, the labor price variance is $420 ($31,080 2 $31,500) favorable. The labor price variance can also be computed by multiplying actual hours worked by the difference between the actual pay rate and the standard pay rate. The computation in this example is 2,100 3 ($15.00 2 $14.80) 5 $420 F. The other component of the total labor variance is the labor quantity variance. The labor quantity variance results from the difference between the actual num-ber of labor hours and the number of hours that should have been worked for the quantity produced. Illustration 25-21 shows that the labor quantity variance is computed as the difference between the amount that should have been paid for the hours worked (actual hours times standard rate) and the amount that should have been paid for the amount of hours that should have been worked (standard hours times standard rate for labor).
Helpful HintThe alternative formula is:
AH 3 AR 2 SR 5 LPV
Thus, for Xonic, the labor quantity variance is $1,500 ($31,500 2 $30,000) unfavorable. The same result can be obtained by multiplying the standard rate by the difference between actual hours worked and standard hours allowed. In this case, the computation is $15.00 3 (2,100 2 2,000) 5 $1,500 U. The total direct labor variance of $1,080 U, therefore, consists of the following.
Helpful HintThe alternative formula is:
SR 3 AH 2 SH 5 LQV
Illustration 25-22Summary of labor variances Labor price variance $ 420 F
Labor quantity variance 1,500 U
Total direct labor variance $1,080 U

Direct Labor and Manufacturing Overhead Variances 1113
CAUSES OF LABOR VARIANCES
Labor price variances usually result from two factors: (1) paying workers dif-ferent wages than expected, and (2) misallocation of workers. In companies where pay rates are determined by union contracts, labor price variances should be infrequent. When workers are not unionized, there is a much higher likelihood of such variances. The responsibility for these variances rests with the manager who authorized the wage change. Misallocation of the workforce refers to using skilled workers in place of unskilled workers and vice versa. The use of an inexperienced worker instead of an experienced one will result in a favorable price variance because of the lower pay rate of the unskilled worker. An unfavorable price variance would result if a skilled worker were substituted for an inexperienced one. The production depart-ment generally is responsible for labor price variances resulting from misalloca-tion of the workforce. Labor quantity variances relate to the effi ciency of workers. The cause of a quantity variance generally can be traced to the production department. The causes of an unfavorable variance may be poor training, worker fatigue, faulty machinery, or carelessness. These causes are the responsibility of the production department. However, if the excess time is due to inferior materials, the respon-sibility falls outside the production department.
Manufacturing Overhead Variances
The total overhead variance is the difference between the actual overhead costs and overhead costs applied based on standard hours allowed for the amount of goods produced. As indicated in Illustration 25-8 (page 1107), Xonic incurred overhead costs of $10,900 to produce 1,000 gallons of Xonic Tonic in June. The computation of the actual overhead is comprised of a variable and a fi xed com-ponent. Illustration 25-24 (page 1114) shows this computation.
These results can also be obtained from the matrix in Illustration 25-23.
Personneldecisions
“What causedlabor pricevariances?”
Actual Hours× Actual Rate
(AH) × (AR)2,100 × $14.80 = $31,080
Actual Hours× Standard Rate
(AH) × (SR)2,100 × $15 = $31,500
Standard Hours× Standard Rate
(SH) × (SR)2,000 × $15 = $30,000
Price Variance$31,080 – $31,500 = $420 F
Quantity Variance$31,500 – $30,000 = $1,500 U
Total Labor Variance$31,080 – $30,000 = $1,080 U
Illustration 25-23Matrix for direct labor variances
ProductionDept.
“What causedlabor quantity
variances?”

1114 25 Standard Costs and Balanced Scorecard
Illustration 25-24Actual overhead costs Variable overhead $ 6,500
Fixed overhead 4,400
Total actual overhead $10,900
Illustration 25-25Formula for total overhead variance
Actual Overhead
Total
Overhead 2
Applied* 5 Overhead
Variance
$10,900 2 $10,000 5 $900 U ($6,500 1 $4,400) ($5 3 2,000 hours)
*Based on standard hours allowed.
ProductionDept.
orSales Dept.
“What causedmanufacturing
overhead variances?”
To fi nd the total overhead variance in a standard costing system, we deter-mine the overhead costs applied based on standard hours allowed. Standard hours allowed are the hours that should have been worked for the units pro-duced. Overhead costs for Xonic Tonic are applied based on direct labor hours. Because it takes two hours of direct labor to produce one gallon of Xonic Tonic, for the 1,000-gallon Xonic Tonic order, the standard hours allowed are 2,000 hours (1,000 gallons 3 2 hours). We then apply the predetermined overhead rate to the 2,000 standard hours allowed. Recall from Illustration 25-6 (page 1106) that the amount of budgeted over-head costs at normal capacity of $132,000 was divided by normal capacity of 26,400 direct labor hours, to arrive at a predetermined overhead rate of $5 ($132,000 4 26,400). The predetermined rate of $5 is then multiplied by the 2,000 standard hours allowed, to determine the overhead costs applied. Illustration 25-25 shows the formula for the total overhead variance and the calculation for Xonic for the month of June.
Thus, for Xonic, the total overhead variance is $900 unfavorable. The overhead variance is generally analyzed through a price and a quantity variance. (These computations are discussed in more detail in advanced courses.) The name usually given to the price variance is the overhead controllable vari-ance; the quantity variance is referred to as the overhead volume variance. Appendix 25B discusses how the total overhead variance can be broken down into these two variances.
CAUSES OF MANUFACTURING OVERHEAD VARIANCES
One reason for an overhead variance relates to over- or underspending on over-head items. For example, overhead may include indirect labor for which a com-pany paid wages higher than the standard labor price allowed. Or, the price of electricity to run the company’s machines increased, and the company did not anticipate this additional cost. Companies should investigate any spending vari-ances to determine whether they will continue in the future. Generally, the responsibility for these variances rests with the production department. The overhead variance can also result from the ineffi cient use of overhead. For example, because of poor maintenance, a number of the manufacturing machines are experiencing breakdowns on a consistent basis, leading to reduced production. Or, the fl ow of materials through the production process is impeded because of a lack of skilled labor to perform the necessary production tasks, due to a lack of planning. In both of these cases, the production department is respon-sible for the cause of these variances. On the other hand, overhead can also be underutilized because of a lack of sales orders. When the cause is a lack of sales orders, the responsibility rests outside the production department. For example,

Variance Reports and Balanced Scorecards 1115
at one point Chrysler experienced a very signifi cant unfavorable overhead vari-ance because plant capacity was maintained at excessively high levels, due to overly optimistic sales forecasts.
What’s Brewing at Starbucks?
It’s easy for a company to say it’s committed to corporate social respon-sibility. But Starbucks actually spells out mea-surable goals. Recently, the company published
its annual Global Responsibility Report in which it describes its goals, achievements, and even its shortcomings related to corporate social responsibility. For example, Starbucks achieved its goal of getting more than 50% of its electric-ity from renewable sources. It also has numerous goals related to purchasing coffee from sources that are certi-fi ed as responsibly grown and ethically traded; providing funds for loans to coffee farmers; and fostering partnerships
with Conservation International to provide training to farmers on ecologically friendly growing.
The report also candidly explains that the company did not meet its goal to cut energy consumption by 25%. It also fell far short of its goal of getting customers to reuse their cups. In those instances where it didn’t achieve its goals, Starbucks set new goals and described steps it would take to achieve them. You can view the company’s Global Responsibility Report at www.starbucks.com.
Source: “Starbucks Launches 10th Global Responsibility Report,” Business Wire (April 18, 2011).
What implications does Starbucks’ commitment to corporate social responsibility have for the standard cost of a cup of coffee? (Go to WileyPLUS for this answer and additional questions.)
People, Planet, and Profi t Insight Starbucks
Archer Colin/SIPA/NewsCom
The standard cost of Product YY includes 3 hours of direct labor at $12.00 per hour. The predetermined overhead rate is $20.00 per direct labor hour. During July, the company incurred 3,500 hours of direct labor at an average rate of $12.40 per hour and $71,300 of manufacturing overhead costs. It produced 1,200 units.
(a) Compute the total, price, and quantity variances for labor. (b) Compute the total over-head variance.
Solution
DO IT! 3 Labor and Manufacturing Overhead Variances
Substituting amounts into the formulas, the variances are:
Total labor variance 5 (3,500 3 $12.40) 2 (3,600 3 $12.00) 5 $200 unfavorable
Labor price variance 5 (3,500 3 $12.40) 2 (3,500 3 $12.00) 5 $1,400 unfavorable
Labor quantity variance 5 (3,500 3 $12.00) 2 (3,600 3 $12.00) 5 $1,200 favorable
Total overhead variance 5 $71,300 2 $72,000* 5 $700 favorable
*(1,200 3 3 hours) 3 $20.00
Related exercise material: BE25-5, BE25-6, E25-4, E25-6, E25-7, E25-8, E25-11, and DO IT! 25-3.
Action Plan✔ Use the formulas for
computing each of the variances: Total labor variance 5 (AH 3 AR) 2 (SH 3 SR) Labor price variance 5 (AH 3 AR) 2 (AH 3 SR) Labor quantity variance 5 (AH 3 SR) 2 (SH 3 SR) Total overhead variance 5 Actual overhead 2 Overhead applied*
*Based on standard hours allowed.
4 Prepare variance reports and balanced scorecards.LEARNING OBJECTIVE
Reporting Variances
All variances should be reported to appropriate levels of management as soon as possible. The sooner managers are informed, the sooner they can evaluate problems and take corrective action.

1116 25 Standard Costs and Balanced Scorecard
Illustration 25-26Materials price variance report XONIC
Variance Report—Purchasing DepartmentFor Week Ended June 8, 2017
Type of Quantity Actual Standard Price Materials Purchased Price Price Variance Explanation
X100 4,200 lbs. $3.10 $3.00 $ 420 U Rush order X142 1,200 units 2.75 2.80 60 F Quantity discount A85 600 doz. 5.20 5.10 60 U Regular supplier on strike
Total price variance $420 U
Illustration 25-27Variances in income statement for management
XONICIncome Statement
For the Month Ended June 30, 2017
Sales revenue $70,000Cost of goods sold (at standard) 52,000
Gross profi t (at standard) 18,000Variances Materials price $ 420 U Materials quantity 600 U Labor price 420 F Labor quantity 1,500 U Overhead 900 U
Total variance unfavorable 3,000
Gross profi t (actual) 15,000Selling and administrative expenses 3,000
Net income $12,000
The form, content, and frequency of variance reports vary considerably among companies. One approach is to prepare a weekly report for each depart-ment that has primary responsibility for cost control. Under this approach, ma-terials price variances are reported to the purchasing department, and all other variances are reported to the production department that did the work. The fol-lowing report for Xonic, with the materials for the Xonic Tonic order listed fi rst, illustrates this approach.
The explanation column is completed after consultation with the purchasing department manager. Variance reports facilitate the principle of “management by exception” explained in Chapter 24. For example, the vice president of purchasing can use the report shown above to evaluate the effectiveness of the purchasing depart-ment manager. Or, the vice president of production can use production depart-ment variance reports to determine how well each production manager is controlling costs. In using variance reports, top management normally looks for signifi cant variances. These may be judged on the basis of some quantitative measure, such as more than 10% of the standard or more than $1,000.
Income Statement Presentation of Variances
In income statements prepared for management under a standard cost account-ing system, cost of goods sold is stated at standard cost and the variances are disclosed separately. Unfavorable variances increase cost of goods sold, while favorable variances decrease cost of goods sold. Illustration 25-27 shows

Variance Reports and Balanced Scorecards 1117
the presentation of variances in an income statement. This income statement is based on the production and sale of 1,000 units of Xonic Tonic at $70 per unit. It also assumes selling and administrative costs of $3,000. Observe that each vari-ance is shown, as well as the total net variance. In this example, variations from standard costs reduced net income by $3,000. Standard costs may be used in fi nancial statements prepared for stockholders and other external users. The costing of inventories at standard costs is in accor-dance with generally accepted accounting principles when there are no signifi -cant differences between actual costs and standard costs. Hewlett-Packard and Jostens, Inc., for example, report their inventories at standard costs. However, if there are signifi cant differences between actual and standard costs, the fi nancial statements must report inventories and cost of goods sold at actual costs. It is also possible to show the variances in an income statement prepared in the variable costing (CVP) format. To do so, it is necessary to analyze the over-head variances into variable and fi xed components. This type of analysis is explained in cost accounting textbooks.
Balanced Scorecard
Financial measures (measurement of dollars), such as variance analysis and return on investment (ROI), are useful tools for evaluating performance. How-ever, many companies now supplement these fi nancial measures with nonfi nan-cial measures to better assess performance and anticipate future results. For example, airlines like Delta and United use capacity utilization as an important measure to understand and predict future performance. Companies that publish the New York Times and the Chicago Tribune newspapers use circulation fi gures as another measure by which to assess performance. Penske Automotive Group, the owner of 300 dealerships, rewards executives for meeting employee retention targets. Illustration 25-28 lists some key nonfi nancial measures used in various industries.
Customer satisfaction data.Factors affecting customer product selection.Number of patents and trademarks held.Customer brand awareness.
Source: Financial Accounting Standards Board, Business Reporting: Insights into Enhancing Voluntary Disclosures(Norwalk, Conn.: FASB, 2001).
Number of ATMs by state.Number of products used by average customer.Percentage of customer service calls handled by interactive voice response units.Personnel cost per employee.Credit card retention rates.
Capacity utilization of plants.Average age of key assets.Impact of strikes.Brand-loyalty statistics.
Industry
Automobiles
Chemicals
Computer Systems
Regional Banks
Measure
Market profile of customer end-products.Number of new products.Employee stock ownership percentages.Number of scientists and technicians used in R&D.
BANK
Illustration 25-28Nonfi nancial measures used in various industries

1118 25 Standard Costs and Balanced Scorecard
Most companies recognize that both fi nancial and nonfi nancial measures can provide useful insights into what is happening in the company. As a result, many companies now use a broad-based measurement approach, called the balanced scorecard, to evaluate performance. The balanced scorecard incorporates fi nancial and nonfi nancial measures in an integrated system that links perfor-mance measurement with a company’s strategic goals. Nearly 50% of the largest companies in the United States, including Unilever, Chase, and Wal-Mart Stores Inc., are using the balanced scorecard approach. The balanced scorecard evaluates company performance from a series of “perspectives.” The four most commonly employed perspectives are as follows.
1. The fi nancial perspective is the most traditional view of the company. It employs fi nancial measures of performance used by most fi rms.
2. The customer perspective evaluates the company from the viewpoint of those people who buy its products or services. This view compares the com-pany to competitors in terms of price, quality, product innovation, customer service, and other dimensions.
3. The internal process perspective evaluates the internal operating processes critical to success. All critical aspects of the value chain—including product development, production, delivery, and after-sale service—are evaluated to ensure that the company is operating effectively and effi ciently.
4. The learning and growth perspective evaluates how well the company devel-ops and retains its employees. This would include evaluation of such things as employee skills, employee satisfaction, training programs, and information dissemination.
Within each perspective, the balanced scorecard identifi es objectives that contribute to attainment of strategic goals. Illustration 25-29 shows examples of objectives within each perspective.
The objectives are linked across perspectives in order to tie performance mea-surement to company goals. The fi nancial-perspective objectives are normally set fi rst, and then objectives are set in the other perspectives in order to accomplish the fi nancial goals.
Percentage of defect-free products.Stockouts.Labor utilization rates.Waste reduction.Planning accuracy.
Percentage of employees leaving in less than one year.Number of cross-trained employees.Ethics violations.Training hours.Reportable accidents.
Return on assets.Net income.Credit rating.Share price.Profit per employee.
Perspective
Financial
Internal Process
Customer
Learning and Growth
Objective
Percentage of customers who would recommend product.Customer retention.Response time per customer request.Brand recognition.Customer service expense per customer.
Illustration 25-29Examples of objectives within the four perspectives of balanced scorecard

Variance Reports and Balanced Scorecards 1119
For example, within the fi nancial perspective, a common goal is to increase profi t per dollars invested as measured by ROI. In order to increase ROI, a customer- perspective objective might be to increase customer satisfaction as measured by the percentage of customers who would recommend the product to a friend. In order to increase customer satisfaction, an internal-process-perspective objective might be to increase product quality as measured by the percentage of defect-free units. Finally, in order to increase the percentage of defect-free units, the learning-and-growth-perspective objective might be to reduce factory employee turnover as measured by the percentage of employees leaving in under one year. Illustration 25-30 illustrates this linkage across perspectives.
Learningand Growth
InternalProcess
CustomerFinancial
Illustration 25-30Linked process across balanced scorecard perspectives
Through this linked process, the company can better understand how to achieve its goals and what measures to use to evaluate performance. In summary, the balanced scorecard does the following:
1. Employs both fi nancial and nonfi nancial measures. (For example, ROI is a fi nancial measure; employee turnover is a nonfi nancial measure.)
2. Creates linkages so that high-level corporate goals can be communicated all the way down to the shop fl oor.
3. Provides measurable objectives for nonfi nancial measures such as product quality, rather than vague statements such as “We would like to improve quality.”
4. Integrates all of the company’s goals into a single performance measurement system, so that an inappropriate amount of weight will not be placed on any single goal.
It May Be Time to Fly United Again
Many of the benefi ts of a balanced score-card approach are evi-dent in the improved operations at United Airlines. At the time it
fi led for bankruptcy, United had a reputation for some of the worst service in the airline business. But when Glenn Tilton took over as United’s chief executive offi cer, he recognized that things had to change.
He implemented an incentive program that allows all of United’s 63,000 employees to earn a bonus of 2.5% or more of their wages if the company “exceeds its goals for
on-time fl ight departures and for customer intent to fl y United again.” After instituting this program, the company’s on-time departures were among the best, its customer complaints were reduced considerably, and the number of customers who said that they would fl y United again was at its highest level ever.
Sources: Susan Carey, “Friendlier Skies: In Bankruptcy, United Airlines Forges a Path to Better Service,” Wall Street Journal (June 15, 2004); and Emre Serpen, “More to Maintain,” Airline Business (November 2012), pp. 38–40.
Which of the perspectives of a balanced scorecard were the focus of United’s CEO? (Go to WileyPLUS for this answer and additional questions.)
Service Company Insight United Airlines
PhotoDisc, Inc./Getty Images

1120 25 Standard Costs and Balanced Scorecard
Polar Vortex Corporation experienced the following variances: materials price $250 F, materials quantity $1,100 F, labor price $700 U, labor quantity $300 F, and overhead $800 F. Sales revenue was $102,700, and cost of goods sold (at standard) was $61,900. Determine the actual gross profi t.
Solution
DO IT! 4 Reporting Variances
Sales revenue $102,700Cost of goods sold (at standard) 61,900
Standard gross profi t 40,800Variances Materials price $ 250 F Materials quantity 1,100 F Labor price 700 U Labor quantity 300 F Overhead 800 F
Total variance favorable 1,750
Gross profi t (actual) $ 42,550
Related exercise material: E25-10, E25-14, E25-15, and DO IT! 25-4.
Action Plan✔ Gross profi t at stan-
dard is sales revenue less cost of goods sold at standard.
✔ Adjust standard gross profi t by adding a net favorable variance or subtracting a net unfavorable variance.
5 APPENDIX 25A: Identify the features of a standard cost accounting system.
LEARNING OBJECTIVE
*
A standard cost accounting system is a double-entry system of accounting. In this system, companies use standard costs in making entries, and they formally recognize variances in the accounts. Companies may use a standard cost system with either job order or process costing. In this appendix, we will explain and illustrate a standard cost, job order cost accounting system. The system is based on two important assumptions:
1. Variances from standards are recognized at the earliest opportunity.
2. The Work in Process account is maintained exclusively on the basis of stan-dard costs.
In practice, there are many variations among standard cost systems. The system described here should prepare you for systems you see in the “real world.”
Journal Entries
We will use the transactions of Xonic to illustrate the journal entries. Note as you study the entries that the major difference between the entries here and those for the job order cost accounting system in Chapter 20 is the variance accounts.
1. Purchase raw materials on account for $13,020 when the standard cost is $12,600.
Raw Materials Inventory 12,600Materials Price Variance 420 Accounts Payable 13,020 (To record purchase of materials)

Appendix 25A: Standard Cost Accounting System 1121
Xonic debits the inventory account for actual quantities at standard cost. This enables the perpetual materials records to show actual quantities. Xonic debits the price variance, which is unfavorable, to Materials Price Variance.
2. Incur direct labor costs of $31,080 when the standard labor cost is $31,500.
Factory Labor 31,500 Labor Price Variance 420 Factory Wages Payable 31,080 (To record direct labor costs)
Like the raw materials inventory account, Xonic debits Factory Labor for actual hours worked at the standard hourly rate of pay. In this case, the labor variance is favorable. Thus, Xonic credits Labor Price Variance.
3. Incur actual manufacturing overhead costs of $10,900.
Manufacturing Overhead 10,900 Accounts Payable/Cash/Acc. Depreciation 10,900 (To record overhead incurred)
The controllable overhead variance (see Appendix 25B) is not recorded at this time. It depends on standard hours applied to work in process. This amount is not known at the time overhead is incurred.
4. Issue raw materials for production at a cost of $12,600 when the standard cost is $12,000.
Work in Process Inventory 12,000Materials Quantity Variance 600 Raw Materials Inventory 12,600 (To record issuance of raw materials)
Xonic debits Work in Process Inventory for standard materials quantities used at standard prices. It debits the variance account because the variance is unfavor-able. The company credits Raw Materials Inventory for actual quantities at stan-dard prices.
5. Assign factory labor to production at a cost of $31,500 when standard cost is $30,000.
Work in Process Inventory 30,000Labor Quantity Variance 1,500 Factory Labor 31,500 (To assign factory labor to jobs)
Xonic debits Work in Process Inventory for standard labor hours at standard rates. It debits the unfavorable variance to Labor Quantity Variance. The credit to Factory Labor produces a zero balance in this account.
6. Apply manufacturing overhead to production $10,000.
Work in Process Inventory 10,000 Manufacturing Overhead 10,000 (To assign overhead to jobs)
Xonic debits Work in Process Inventory for standard hours allowed multiplied by the standard overhead rate.
7. Transfer completed work to fi nished goods $52,000.
Finished Goods Inventory 52,000 Work in Process Inventory 52,000 (To record transfer of completed work to
fi nished goods)
In this example, both inventory accounts are at standard cost.
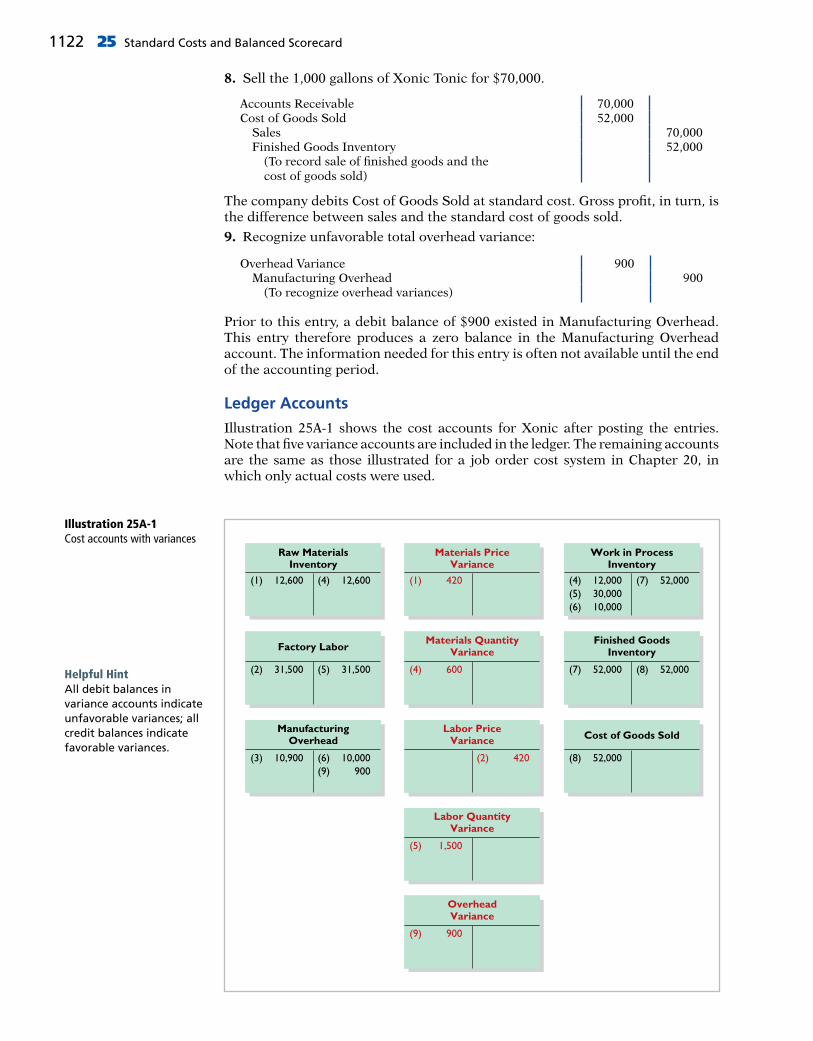
1122 25 Standard Costs and Balanced Scorecard
8. Sell the 1,000 gallons of Xonic Tonic for $70,000.
Accounts Receivable 70,000Cost of Goods Sold 52,000 Sales 70,000 Finished Goods Inventory 52,000 (To record sale of fi nished goods and the
cost of goods sold)
The company debits Cost of Goods Sold at standard cost. Gross profi t, in turn, is the difference between sales and the standard cost of goods sold.
9. Recognize unfavorable total overhead variance:
Overhead Variance 900 Manufacturing Overhead 900 (To recognize overhead variances)
Prior to this entry, a debit balance of $900 existed in Manufacturing Overhead. This entry therefore produces a zero balance in the Manufacturing Overhead account. The information needed for this entry is often not available until the end of the accounting period.
Ledger Accounts
Illustration 25A-1 shows the cost accounts for Xonic after posting the entries. Note that fi ve variance accounts are included in the ledger. The remaining accounts are the same as those illustrated for a job order cost system in Chapter 20, in which only actual costs were used.
Illustration 25A-1Cost accounts with variances
12,600
Raw MaterialsInventory
(4)
Factory Labor
(1) 12,600
31,500 (5)(2) 31,500
ManufacturingOverhead
10,900 (6)(9)
(3) 10,000900
420
Materials PriceVariance
Materials QuantityVariance
(1)
600(4)
Labor PriceVariance
(2) 420
Labor QuantityVariance
1,500(5)
OverheadVariance
900(9)
12,00030,00010,000
Work in ProcessInventory
(7)
Finished GoodsInventory
(4)(5)(6)
52,000
52,000 (8)(7) 52,000
Cost of Goods Sold
52,000(8)
Helpful HintAll debit balances in variance accounts indicate unfavorable variances; all credit balances indicate favorable variances.

Appendix 25B: Overhead Controllable and Volume Variances 1123
6 APPENDIX 25B: Compute overhead controllable and volume variances.
LEARNING OBJECTIVE
*
As indicated in the chapter, the total overhead variance is generally analyzed through a price variance and a quantity variance. The name usually given to the price variance is the overhead controllable variance; the quantity variance is referred to as the overhead volume variance.
Overhead Controllable Variance
The overhead controllable variance shows whether overhead costs are effectively controlled. To compute this variance, the company compares actual overhead costs incurred with budgeted costs for the standard hours allowed. The budgeted costs are determined from a fl exible manufacturing overhead budget. The concepts related to a fl exible budget were discussed in Chapter 24. For Xonic, the budget formula for manufacturing overhead is variable manu-facturing overhead cost of $3 per hour of labor plus fi xed manufacturing overhead costs of $4,400 ($52,800 4 12, per Illustration 25-6 on page 1106). Illustration 25B-1 shows the monthly fl exible budget for Xonic.
As shown, the budgeted costs for 2,000 standard hours are $10,400 ($6,000 vari-able and $4,400 fi xed). Illustration 25B-2 shows the formula for the overhead controllable variance and the calculation for Xonic at 1,000 units of output (2,000 standard labor hours).
Illustration 25B-1Flexible budget using standard direct labor hours
Formulas Data Review ViewPage LayoutInsert
1
2
3
4
5
6
7
8
9
10
11
12
13
14
15
16
17
AP18 fx
B C D E
Xonic.xlsXonic.xlsHome
XONICFlexible Manufacturing Overhead Monthly Budget
Standard direct labor hours
Variable costs Indirect materials Indirect labor Utilities Total variable costs
Fixed costs Supervision Depreciation Total fixed costsTotal costs
1,800
$1,8002,700
9005,400
3,0001,4004,400
$9,800
2,000
$ 2,0003,0001,0006,000
3,0001,4004,400
$10,400
2,200
$ 2,2003,3001,1006,600
3,0001,4004,400
$11,000
2,400
$ 2,4003,6001,2007,200
3,0001,4004,400
$11,600
Activity Index
Costs
Illustration 25B-2Formula for overhead controllable variance
Overhead
Actual 2
Overhead 5 Controllable
Overhead
Budgeted*
Variance
$10,900 2 $10,400 5 $500 U ($6,500 1 $4,400) ($6,000 1 $4,400)
*Based on standard hours allowed.

1124 25 Standard Costs and Balanced Scorecard
The overhead controllable variance for Xonic is $500 unfavorable. Most controllable variances are associated with variable costs, which are controllable costs. Fixed costs are often known at the time the budget is prepared and are therefore not as likely to deviate from the budgeted amount. In Xonic’s case, all of the overhead controllable variance is due to the difference between the actual variable overhead costs ($6,500) and the budgeted variable costs ($6,000). Management can compare actual and budgeted overhead for each manufac-turing overhead cost that contributes to the controllable variance. In addition, management can develop cost and quantity variances for each overhead cost, such as indirect materials and indirect labor.
Overhead Volume Variance
The overhead volume variance is the difference between normal capacity hours and standard hours allowed times the fi xed overhead rate. The overhead volume variance relates to whether fi xed costs were under- or overapplied during the year. For example, the overhead volume variance answers the question of whether Xonic effectively used its fi xed costs. If Xonic produces less Xonic Tonic than normal capacity would allow, an unfavorable variance results. Conversely, if Xonic produces more Xonic Tonic than what is considered normal capacity, a favorable variance results. The formula for computing the overhead volume variance is as follows.
To illustrate the fi xed overhead rate computation, recall that Xonic budgeted fi xed overhead cost for the year of $52,800 (Illustration 25-6 on page 1106). At nor-mal capacity, 26,400 standard direct labor hours are required. The fi xed overhead rate is therefore $2 per hour ($52,800 4 26,400 hours). Xonic produced 1,000 units of Xonic Tonic in June. The standard hours allowed for the 1,000 gallons produced in June is 2,000 (1,000 gallons 3 2 hours). For Xonic, normal capacity for June is 1,100, so standard direct labor hours for June at normal capacity is 2,200 (26,400 annual hours 4 12 months). The com-putation of the overhead volume variance in this case is as follows.
Illustration 25B-3Formula for overhead volume variance
Fixed Normal Standard Overhead Overhead 3 Capacity 2 Hours 5 Volume Rate Hours Allowed Variance
_
_
Illustration 25B-4Computation of overhead volume variance for Xonic
Fixed Normal Standard Overhead Overhead 3 Capacity 2 Hours 5 Volume Rate Hours Allowed Variance
$2 3 (2,200 2 2,000) 5 $400 U
_
_
In Xonic’s case, a $400 unfavorable volume variance results. The volume vari-ance is unfavorable because Xonic produced only 1,000 gallons rather than the normal capacity of 1,100 gallons in the month of June. As a result, it underap-plied fi xed overhead for that period. In computing the overhead variances, it is important to remember the following.
1. Standard hours allowed are used in each of the variances.
2. Budgeted costs for the controllable variance are derived from the fl exible budget.
3. The controllable variance generally pertains to variable costs.
4. The volume variance pertains solely to fi xed costs.

Review and Practice 1125
LEARNING OBJECTIVES REVIEW
REVIEW AND PRACTICE
Describe standard costs. Both standards and budgets are predetermined costs. The primary difference is that a standard is a unit amount, whereas a budget is a total amount. A standard may be regarded as the budgeted cost per unit of product.
Standard costs offer a number of advantages. They (a) facilitate management planning, (b) promote greater economy, (c) are useful in setting selling prices, (d) contribute to management control, (e) permit “management by exception,” and (f) simplify the cost-ing of inventories and reduce clerical costs.
The direct materials price standard should be based on the delivered cost of raw materials plus an allow-ance for receiving and handling. The direct materials quantity standard should establish the required quan-tity plus an allowance for waste and spoilage.
The direct labor price standard should be based on current wage rates and anticipated adjustments such as COLAs. It also generally includes payroll taxes and fringe benefi ts. Direct labor quantity standards should be based on required production time plus an allow-ance for rest periods, cleanup, machine setup, and machine downtime.
For manufacturing overhead, a standard predeter-mined overhead rate is used. It is based on an expected standard activity index such as standard direct labor hours or standard machine hours.
Determine direct materials variances. The formulas for the direct materials variances are as follows.
TotalActual quantity
2 Standard quantity
5 materials3 Actual price 3 Standard price
variance
MaterialsActual quantity
2 Actual quantity
5 price 3 Actual price 3 Standard price
variance
MaterialsActual quantity
2 Standard quantity
5 quantity3 Standard price 3 Standard price
variance
Determine direct labor and total manufacturing overhead variances. The formulas for the direct labor variances are as follows.
1
2
3
Total Actual hours
2 Standard hours
5 labor3 Actual rate 3 Standard rate
variance
Labor Actual hours
2 Actual hours
5 price3 Actual rate 3 Standard rate
variance
Labor Actual hours
2 Standard hours
5 quantity3 Standard rate 3 Standard rate
variance
The formula for the total manufacturing overhead variance is as follows.
Overhead Actual
2 applied at
5 Total overhead
overhead standard hours variance allowed
Prepare variance reports and balanced scorecards. Vari-ances are reported to management in variance reports. The reports facilitate management by exception by highlighting signifi cant differences. Under a standard costing system, an income statement prepared for management will report cost of goods sold at standard cost and then disclose each variance separately.
The balanced scorecard incorporates fi nancial and nonfi nancial measures in an integrated system that links performance measurement and a company’s stra-tegic goals. It employs four perspectives: fi nancial, cus-tomer, internal process, and learning and growth. Objectives are set within each of these perspectives that link to objectives within the other perspectives.
Identify the features of a standard cost accounting system. In a standard cost accounting system, com-panies journalize and post standard costs, and they maintain separate variance accounts in the ledger.
Compute overhead controllable and volume variances.The total overhead variance is generally analyzed through a price variance and a quantity variance. The name usually given to the price variance is the over-head controllable variance. The quantity variance is referred to as the overhead volume variance.
4
* 5
* 6_ _
_ _
_
_
_
_
_
_
_
_
_ _
_ _
_ _
_ _
_ _
_ _
_ _
__
Balanced scorecard An approach that incorporates fi nancial and nonfi nancial measures in an integrated system that links performance measurement and a company’s strategic goals. (p. 1118).
Customer perspective A viewpoint employed in the balanced scorecard to evaluate the company from the perspective of those people who buy and use its prod-ucts or services. (p. 1118).
GLOSSARY REVIEW

Direct labor price standard The rate per hour that should be incurred for direct labor. (p. 1105).
Direct labor quantity standard The time that should be required to make one unit of product. (p. 1105).
Direct materials price standard The cost per unit of direct materials that should be incurred. (p. 1104).
Direct materials quantity standard The quantity of direct materials that should be used per unit of fi nished goods. (p. 1104).
Financial perspective A viewpoint employed in the bal-anced scorecard to evaluate a company’s performance using fi nancial measures. (p. 1118).
Ideal standards Standards based on the optimum level of performance under perfect operating conditions. (p. 1103).
Internal process perspective A viewpoint employed in the balanced scorecard to evaluate the effectiveness and effi ciency of a company’s value chain, including product development, production, delivery, and after-sale service. (p. 1118).
Labor price variance The difference between the actual hours times the actual rate and the actual hours times the standard rate for labor. (p. 1112).
Labor quantity variance The difference between actual hours times the standard rate and standard hours times the standard rate for labor. (p. 1112).
Learning and growth perspective A viewpoint employed in the balanced scorecard to evaluate how well a company develops and retains its employees. (p. 1118).
Materials price variance The difference between the actual quantity times the actual price and the actual quan-tity times the standard price for materials. (p. 1109).
Materials quantity variance The difference between the actual quantity times the standard price and the standard quantity times the standard price for materials. (p. 1109).
Normal capacity The average activity output that a com-pany should experience over the long run. (p. 1106).
Normal standards Standards based on an effi cient level of performance that are attainable under expected operating conditions. (p. 1103).
Overhead controllable variance The difference between actual overhead incurred and overhead budgeted for the standard hours allowed. (p. 1123).
Overhead volume variance The difference between normal capacity hours and standard hours allowed times the fi xed overhead rate. (p. 1124).
Standard cost accounting system A double-entry sys-tem of accounting in which standard costs are used in making entries, and variances are recognized in the accounts. (p. 1120).
Standard costs Predetermined unit costs which compa-nies use as measures of performance. (p. 1102).
Standard hours allowed The hours that should have been worked for the units produced. (p. 1114).
Standard predetermined overhead rate An overhead rate determined by dividing budgeted overhead costs by an expected standard activity index. (p. 1105).
Total labor variance The difference between actual hours times the actual rate and standard hours times the standard rate for labor. (p. 1111).
Total materials variance The difference between the actual quantity times the actual price and the standard quantity times the standard price of materials. (p. 1109).
Total overhead variance The difference between actual overhead costs and overhead costs applied to work done, based on standard hours allowed. (p. 1113).
Variance The difference between total actual costs and total standard costs. (p. 1107).
*
*
*
1126 25 Standard Costs and Balanced Scorecard
1. Standards differ from budgets in that:(a) budgets but not standards may be used in valuing
inventories.(b) budgets but not standards may be journalized
and posted.(c) budgets are a total amount and standards are a
unit amount.(d) only budgets contribute to management planning
and control. 2. Standard costs:
(a) are imposed by governmental agencies.(b) are predetermined unit costs which companies
use as measures of performance.(c) can be used by manufacturing companies but not
by service or not-for-profi t companies.(d) All of the above.
3. The advantages of standard costs include all of the following except:(a) management by exception may be used.(b) management planning is facilitated.
(LO 1)
(LO 1)
(LO 1)
(c) they may simplify the costing of inventories.(d) management must use a static budget.
4. Normal standards:(a) allow for rest periods, machine breakdowns, and
setup time.(b) represent levels of performance under perfect
operating conditions.(c) are rarely used because managers believe they
lower workforce morale.(d) are more likely than ideal standards to result in
unethical practices. 5. The setting of standards is:
(a) a managerial accounting decision.(b) a management decision.(c) a worker decision.(d) preferably set at the ideal level of performance.
6. Each of the following formulas is correct except:(a) Labor price variance 5 (Actual hours 3 Actual
rate) 2 (Actual hours 3 Standard rate).
(LO 1)
(LO 1)
(LO 2)
PRACTICE MULTIPLE-CHOICE QUESTIONS

(b) Total overhead variance 5 Actual overhead 2 Overhead applied.
(c) Materials price variance 5 (Actual quantity 3 Actual price) 2 (Standard quantity 3 Standard price).
(d) Labor quantity variance 5 (Actual hours 3 Stan-dard rate) 2 (Standard hours 3 Standard rate).
7. In producing product AA, 6,300 pounds of direct materials were used at a cost of $1.10 per pound. The standard was 6,000 pounds at $1.00 per pound. The direct materials quantity variance is:(a) $330 unfavorable. (c) $600 unfavorable.(b) $300 unfavorable. (d) $630 unfavorable.
8. In producing product ZZ, 14,800 direct labor hours were used at a rate of $8.20 per hour. The standard was 15,000 hours at $8.00 per hour. Based on these data, the direct labor:(a) quantity variance is $1,600 favorable.(b) quantity variance is $1,600 unfavorable.(c) price variance is $3,000 favorable.(d) price variance is $3,000 unfavorable.
9. Which of the following is correct about the total overhead variance?(a) Budgeted overhead and overhead applied are the
same.(b) Total actual overhead is composed of variable
overhead, fi xed overhead, and period costs.(c) Standard hours actually worked are used in com-
puting the variance.(d) Standard hours allowed for the work done is the
measure used in computing the variance. 10. The formula for computing the total overhead vari-
ance is:(a) actual overhead less overhead applied.(b) overhead budgeted less overhead applied.(c) actual overhead less overhead budgeted.(d) No correct answer is given.
11. Which of the following is incorrect about variance reports?(a) They facilitate “management by exception.”(b) They should only be sent to the top level of man-
agement.(c) They should be prepared as soon as possible.(d) They may vary in form, content, and frequency
among companies.
(LO 2)
(LO 3)
(LO 3)
(LO 3)
(LO 4)
12. In using variance reports to evaluate cost control, management normally looks into:(a) all variances.(b) favorable variances only.(c) unfavorable variances only.(d) both favorable and unfavorable variances that
exceed a predetermined quantitative measure such as a percentage or dollar amount.
13. Generally accepted accounting principles allow a company to:(a) report inventory at standard cost but cost of goods
sold must be reported at actual cost.(b) report cost of goods sold at standard cost but
inventory must be reported at actual cost.(c) report inventory and cost of goods sold at stan-
dard cost as long as there are no signifi cant dif-ferences between actual and standard cost.
(d) report inventory and cost of goods sold only at actual costs; standard costing is never per-mitted.
14. Which of the following would not be an objective used in the customer perspective of the balanced scorecard approach?(a) Percentage of customers who would recommend
product to a friend.(b) Customer retention.(c) Brand recognition.(d) Earnings per share.
15. Which of the following is incorrect about a standard cost accounting system?(a) It is applicable to job order costing.(b) It is applicable to process costing.(c) It reports only favorable variances.(d) It keeps separate accounts for each variance.
16. The formula to compute the overhead volume vari-ance is:(a) Fixed overhead rate 3 (Standard hours 2 Actual
hours).(b) Fixed overhead rate 3 (Normal capacity hours 2
Actual hours).(c) Fixed overhead rate 3 (Normal capacity hours 2
Standard hours allowed).(d) (Variable overhead rate 1 Fixed overhead rate) 3
(Normal capacity hours 2 Standard hours allowed).
(LO 4)
(LO 4)
(LO 4)
* (LO 5)
* (LO 6)
Practice Multiple-Choice Questions 1127
Solutions
1. (c) Budgets are expressed in total amounts, and standards are expressed in unit amounts. The other choices are incorrect because (a) standards, not budgets, may be used in valuing inventories; (b) standards, not budgets, may be journalized and posted; and (d) both budgets and standards contribute to management planning and control.
2. (b) Standard costs are predetermined units costs which companies use as measures of performance. The other choices are incorrect because (a) only those that are called regulations are imposed by governmental agencies, (c) standard costs can be used by all types of companies, and (d) choices (a) and (c) are incorrect.
3. (d) Standard costs are separate from a static budget. The other choices are all advantages of using standard costs.
4. (a) Normal standards allow for rest periods, machine breakdowns, and setup time. The other choices are incorrect because they describe ideal standards, not normal standards.
5. (b) Standards are set by management. The other choices are incorrect because setting standards requires input from (a) man-agerial accountants and (c) sometimes workers, but the fi nal decision is made by management. Choice (d) is incorrect because setting standards at the ideal level of performance is uncommon because of the perceived negative effect on worker morale.
6. (c) Materials price variance 5 (Actual quantity 3 Actual price) 2 (Actual quantity (not Standard quantity) 3 Standard price). The other choices are correct formulas.

7. (b) The direct materials quantity variance is (6,300 3 $1.00) 2 (6,000 3 $1.00) 5 $300. This variance is unfavorable because more material was used than prescribed by the standard. The other choices are therefore incorrect.
8. (a) The direct labor quantity variance is (14,800 3 $8) 2 (15,000 3 $8) 5 $1,600. This variance is favorable because less labor was used than prescribed by the standard. The other choices are therefore incorrect.
9. (d) Standard hours allowed for work done is the measure used in computing the variance. The other choices are incorrect because (a) budgeted overhead is used to calculate the predetermined overhead rate while overhead applied is equal to standard hours allowed times the predetermined overhead rate, (b) overhead is a product cost and does not include period costs, and (c) standard hours allowed, not hours actually worked, are used in computing the overhead variance.
10. (a) Total overhead variance equals actual overhead less overhead applied. The other choices are therefore incorrect.
11. (b) Variance reports should be sent to the level of management responsible for the area in which the variance occurred so it can be remedied as quickly as possible. The other choices are correct statements.
12. (d) In using variance reports to evaluate cost control, management normally looks into both favorable and unfavorable vari-ances that exceed a predetermined quantitative measure such as percentage or dollar amount. The other choices are therefore incorrect.
13. (c) GAAP allows a company to report both inventory and cost of goods sold at standard cost as long as there are no signifi cant differences between actual and standard cost. The other choices are therefore incorrect.
14. (d) Earnings per share is not an objective used in the customer perspective of the balanced scorecard approach. The other choices are all true statements.
*15. (c) A standard cost accounting system reports both favorable and unfavorable variances. The other choices are all correct statements.
*16. (c) The formula to compute the overhead volume variance is Fixed overhead rate 3 (Normal capacity hours 2 Standard hours allowed). The other choices are therefore incorrect.
1128 25 Standard Costs and Balanced Scorecard
1. Hector Inc., which produces a single product, has prepared the following standard cost sheet for one unit of the product.
Direct materials (6 pounds at $2.50 per pound) $15.00Direct labor (3.1 hours at $12.00 per hour) $37.20
During the month of April, the company manufactures 250 units and incurs the fol-lowing actual costs.
Direct materials purchased and used (1,600 pounds) $4,192Direct labor (760 hours) $8,740
InstructionsCompute the total, price, and quantity variances for materials and labor.
Compute materials and labor variances.
(LO 2, 3)
PRACTICE EXERCISES
Solution
1. Total materials variance: (AQ 3 AP) 2 (SQ 3 SP) (1,600 3 $2.62*) (1,500** 3 $2.50) $4,192 2 $3,750 5 $442 U
*$4,192 4 1,600 **250 3 6
Materials price variance: (AQ 3 AP) 2 (AQ 3 SP) (1,600 3 $2.62) (1,600 3 $2.50) $4,192 2 $4,000 5 $192 U
Materials quantity variance: (AQ 3 SP) 2 (SQ 3 SP) (1,600 3 $2.50) (1,500 3 $2.50) $4,000 2 $3,750 5 $250 U
Total labor variance: (AH 3 AR) 2 (SH 3 SR) (760 3 $11.50*) (775** 3 $12.00) $8,740 2 $9,300 5 $560 F
*$8,740 4 760 **250 3 3.1

2. Manufacturing overhead data for the production of Product H by Yamato Company are as follows.
Overhead incurred for 35,000 actual direct labor hours worked $140,000Overhead rate (variable $3; fi xed $1) at normal capacity of 36,000
direct labor hours $4Standard hours allowed for work done 34,000
InstructionsCompute the total overhead variance.
Compute overhead variances.
(LO 3)
Practice Problem 1129
Labor price variance: (AH 3 AR) 2 (AH 3 SR) (760 3 $11.50) (760 3 $12.00) $8,740 2 $9,120 5 $380 F
Labor quantity variance: (AH 3 SR) 2 (SH 3 SR) (760 3 $12.00) (775 3 $12.00) $9,120 2 $9,300 5 $180 F
Solution
2. Total overhead variance: Actual Overhead 2 Overhead Applied $140,000 2 $136,000 5 $4,000 U (34,000 3 $4)
Manlow Company makes a cologne called Allure. The standard cost for one bottle of Allure is as follows.
Standard
Manufacturing Cost Elements Quantity 3 Price 5 Cost
Direct materials 6 oz. 3 $ 0.90 5 $ 5.40Direct labor 0.5 hrs. 3 $12.00 5 6.00Manufacturing overhead 0.5 hrs. 3 $ 4.80 5 2.40
$13.80
During the month, the following transactions occurred in manufacturing 10,000 bottles of Allure.
1. 58,000 ounces of materials were purchased at $1.00 per ounce.
2. All the materials purchased were used to produce the 10,000 bottles of Allure.
3. 4,900 direct labor hours were worked at a total labor cost of $56,350.
4. Variable manufacturing overhead incurred was $15,000 and fi xed overhead incurred was $10,400.
The manufacturing overhead rate of $4.80 is based on a normal capacity of 5,200 direct labor hours. The total budget at this capacity is $10,400 fi xed and $14,560 variable.
Instructions(a) Compute the total variance and the variances for direct materials and direct labor
elements.
(b) Compute the total variance for manufacturing overhead.
Compute variances.
(LO 2, 3)
PRACTICE PROBLEM

1130 25 Standard Costs and Balanced Scorecard
Solution
(a) Total Variance
Actual costs incurredDirect materials $ 58,000Direct labor 56,350Manufacturing overhead 25,400
139,750Standard cost (10,000 3 $13.80) 138,000
Total variance $ 1,750 U
Direct Materials Variances
Total 5 $58,000 (58,000 3 $1.00) 2 $54,000 (60,000* 3 $0.90) 5 $4,000 UPrice 5 $58,000 (58,000 3 $1.00) 2 $52,200 (58,000 3 $0.90) 5 $5,800 UQuantity 5 $52,200 (58,000 3 $0.90) 2 $54,000 (60,000 3 $0.90) 5 $1,800 F
*10,000 3 6
Direct Labor Variances
Total 5 $56,350 (4,900 3 $11.50*) 2 $60,000 (5,000** 3 $12.00) 5 $3,650 FPrice 5 $56,350 (4,900 3 $11.50) 2 $58,800 (4,900 3 $12.00) 5 $2,450 FQuantity 5 $58,800 (4,900 3 $12.00) 2 $60,000 (5,000 3 $12.00) 5 $1,200 F
*56,350 4 4,900; **10,000 3 0.5
(b) Overhead Variance
Total 5 $25,400 ($15,000 1 $10,400) 2 $24,000 (5,000 3 $4.80) 5 $1,400 U
Brief Exercises, Exercises, DO IT! Exercises, and Problems and many additional resources are available for practice in WileyPLUS
QUESTIONS
1. (a) “Standard costs are the expected total cost of completing a job.” Is this correct? Explain.
(b) “A standard imposed by a governmental agency is known as a regulation.” Do you agree? Explain.
2. (a) Explain the similarities and differences between standards and budgets.
(b) Contrast the accounting for standards and budgets.
3. Standard costs facilitate management planning. What are the other advantages of standard costs?
4. Contrast the roles of the management accountant and management in setting standard costs.
5. Distinguish between an ideal standard and a normal standard.
6. What factors should be considered in setting (a) the direct materials price standard and (b) the direct materials quantity standard?
7. “The objective in setting the direct labor quantity standard is to determine the aggregate time required to make one unit of product.” Do you agree? What allowances should be made in setting this standard?
8. How is the predetermined overhead rate determined when standard costs are used?
9. What is the difference between a favorable cost vari-ance and an unfavorable cost variance?
10. In each of the following formulas, supply the words that should be inserted for each number in parentheses.
(a) (Actual quantity 3 (1)) 2 (Standard quantity 3(2)) 5 Total materials variance
(b) ((3) 3 Actual price) 2 (Actual quantity 3 (4)) 5Materials price variance
(c) (Actual quantity 3 (5)) 2 ((6) 3 Standard price) 5Materials quantity variance
11. In the direct labor variance matrix, there are three factors: (1) Actual hours 3 Actual rate, (2) Actual hours 3 Standard rate, and (3) Standard hours 3Standard rate. Using the numbers, indicate the for-mulas for each of the direct labor variances.
12. Mikan Company’s standard predetermined overhead rate is $9 per direct labor hour. For the month of June, 26,000 actual hours were worked, and 27,000 standard hours were allowed. How much overhead was applied?
13. How often should variances be reported to manage-ment? What principle may be used with variance reports?
14. What circumstances may cause the purchasing department to be responsible for both an unfavorable materials price variance and an unfavorable materi-als quantity variance?
NOTE: All asterisked Questions, Exercises, and Problems relate to material in the appendices to the chapter.

Brief Exercises 1131
15. What are the four perspectives used in the balanced scorecard? Discuss the nature of each, and how the perspectives are linked.
16. Kerry James says that the balanced scorecard was created to replace fi nancial measures as the primary mechanism for performance evaluation. He says that it uses only nonfi nancial measures. Is this true?
17. What are some examples of nonfi nancial measures used by companies to evaluate performance?
18. (a) How are variances reported in income statements prepared for management? (b) May standard costs be used in preparing fi nancial statements for stockholders? Explain.
19. (a) Explain the basic features of a standard cost accounting system. (b) What type of balance will exist in the variance account when (1) the materials price
*
variance is unfavorable and (2) the labor quantity variance is favorable?
20. If the $9 per hour overhead rate in Question 12 includes $5 variable, and actual overhead costs were $248,000, what is the overhead controllable variance for June? The normal capacity hours were 28,000. Is the variance favorable or unfavorable?
21. What is the purpose of computing the overhead volume variance? What is the basic formula for this variance?
22. Alma Ortiz does not understand why the overhead vol-ume variance indicates that fi xed overhead costs are under- or overapplied. Clarify this matter for Alma.
23. John Hsu is attempting to outline the important points about overhead variances on a class examination. List four points that John should include in his outline.
*
*
*
*
BRIEF EXERCISES
BE25-1 Lopez Company uses both standards and budgets. For the year, estimated produc-tion of Product X is 500,000 units. Total estimated cost for materials and labor are $1,400,000 and $1,700,000. Compute the estimates for (a) a standard cost and (b) a budgeted cost.
BE25-2 Tang Company accumulates the following data concerning raw materials in mak-ing one gallon of fi nished product. (1) Price—net purchase price $2.30, freight-in $0.20, and receiving and handling $0.10. (2) Quantity—required materials 3.6 pounds, allowance for waste and spoilage 0.4 pounds. Compute the following.(a) Standard direct materials price per gallon.(b) Standard direct materials quantity per gallon.(c) Total standard materials cost per gallon.
BE25-3 Labor data for making one gallon of fi nished product in Bing Company are as follows. (1) Price—hourly wage rate $14.00, payroll taxes $0.80, and fringe benefi ts $1.20. (2) Quantity—actual production time 1.1 hours, rest periods and cleanup 0.25 hours, and setup and downtime 0.15 hours. Compute the following.(a) Standard direct labor rate per hour.(b) Standard direct labor hours per gallon.(c) Standard labor cost per gallon.
BE25-4 Simba Company’s standard materials cost per unit of output is $10 (2 pounds 3 $5). During July, the company purchases and uses 3,200 pounds of materials costing $16,192 in making 1,500 units of fi nished product. Compute the total, price, and quantity materials variances.
BE25-5 Mordica Company’s standard labor cost per unit of output is $22 (2 hours 3 $11 per hour). During August, the company incurs 2,150 hours of direct labor at an hourly cost of $10.80 per hour in making 1,000 units of fi nished product. Compute the total, price, and quantity labor variances.
BE25-6 In October, Pine Company reports 21,000 actual direct labor hours, and it incurs $118,000 of manufacturing overhead costs. Standard hours allowed for the work done is 20,600 hours. The predetermined overhead rate is $6 per direct labor hour. Compute the total overhead variance.
BE25-7 The four perspectives in the balanced scorecard are (1) fi nancial, (2) customer, (3) internal process, and (4) learning and growth. Match each of the following objectives with the perspective it is most likely associated with: (a) plant capacity utilization, (b) employee work days missed due to injury, (c) return on assets, and (d) brand recognition.
BE25-8 Journalize the following transactions for Combs Company.(a) Purchased 6,000 units of raw materials on account for $11,500. The standard cost was $12,000.(b) Issued 5,600 units of raw materials for production. The standard units were 5,800.
Distinguish between a standard and a budget.
(LO 1)
Set direct materials standard.
(LO 1)
Set direct labor standard.
(LO 1)
Compute direct materials variances.
(LO 2)
Compute direct labor variances.
(LO 3)
Compute total overhead variance.
(LO 3)
Match balanced scorecard perspectives.
(LO 4)
* Journalize materials variances.
(LO 5)

1132 25 Standard Costs and Balanced Scorecard
BE25-9 Journalize the following transactions for Shelton, Inc.(a) Incurred direct labor costs of $24,000 for 3,000 hours. The standard labor cost was $24,900.(b) Assigned 3,000 direct labor hours costing $24,000 to production. Standard hours were
3,150.
BE25-10 Some overhead data for Pine Company are given in BE25-6. In addition, the fl exible manufacturing overhead budget shows that budgeted costs are $4 variable per direct labor hour and $50,000 fi xed. Compute the overhead controllable variance.
BE25-11 Using the data in BE25-6 and BE25-10, compute the overhead volume variance. Normal capacity was 25,000 direct labor hours.
*Journalize labor variances.
(LO 5)
*Compute the overhead controllable variance.
(LO 6)
*Compute overhead volume variance.
(LO 6)
Larkin Company accumulated the following standard cost data concerning product I-Tal.
Direct materials per unit: 2 pounds at $5 per poundDirect labor per unit: 0.2 hours at $16 per hourManufacturing overhead: Allocated based on direct labor hours at a predetermined rate of
$20 per direct labor hour
Compute the standard cost of one unit of product I-Tal.
The standard cost of product 777 includes 2 units of direct materials at $6.00 per unit. During August, the company bought 29,000 units of materials at $6.30 and used those materials to produce 16,000 units. Compute the total, price, and quantity variances for materials.
The standard cost of product 5252 includes 1.9 hours of direct labor at $14.00 per hour. The predetermined overhead rate is $22.00 per direct labor hour. During July, the company incurred 4,000 hours of direct labor at an average rate of $14.30 per hour and $81,300 of manufacturing overhead costs. It produced 2,000 units.
(a) Compute the total, price, and quantity variances for labor. (b) Compute the total overhead variance.
Tropic Zone Corporation experienced the following variances: materials price $350 U, materials quantity $1,700 F, labor price $800 F, labor quantity $500 F, and overhead $1,200 U. Sales revenue was $92,100, and cost of goods sold (at standard) was $51,600. Determine the actual gross profi t.
Compute standard cost.
(LO 1)
Compute materials variance.
(LO 2)
Compute labor and manufacturing overhead variances.
(LO 3)
Prepare variance report.
(LO 4)
DO IT! Exercises
DO IT! 25-1
DO IT! 25-2
DO IT! 25-3
DO IT! 25-4
EXERCISES
E25-1 Parsons Company is planning to produce 2,000 units of product in 2017. Each unit requires 3 pounds of materials at $5 per pound and a half-hour of labor at $16 per hour. The overhead rate is 70% of direct labor.
Instructions(a) Compute the budgeted amounts for 2017 for direct materials to be used, direct labor,
and applied overhead.(b) Compute the standard cost of one unit of product.(c) What are the potential advantages to a corporation of using standard costs?
E25-2 Hank Itzek manufactures and sells homemade wine, and he wants to develop a standard cost per gallon. The following are required for production of a 50-gallon batch.
3,000 ounces of grape concentrate at $0.06 per ounce54 pounds of granulated sugar at $0.30 per pound60 lemons at $0.60 each50 yeast tablets at $0.25 each50 nutrient tablets at $0.20 each2,600 ounces of water at $0.005 per ounce
Compute budget and standard.
(LO 1)
Compute standard materials costs.
(LO 1)

Exercises 1133
Hank estimates that 4% of the grape concentrate is wasted, 10% of the sugar is lost, and 25% of the lemons cannot be used.
InstructionsCompute the standard cost of the ingredients for one gallon of wine. (Carry computations to two decimal places.)
E25-3 Stefani Company has gathered the following information about its product.
Direct materials. Each unit of product contains 4.5 pounds of materials. The average waste and spoilage per unit produced under normal conditions is 0.5 pounds. Materials cost $5 per pound, but Stefani always takes the 2% cash discount all of its suppliers offer. Freight costs average $0.25 per pound.
Direct labor. Each unit requires 2 hours of labor. Setup, cleanup, and downtime average 0.4 hours per unit. The average hourly pay rate of Stefani’s employees is $12. Payroll taxes and fringe benefi ts are an additional $3 per hour.
Manufacturing overhead. Overhead is applied at a rate of $7 per direct labor hour.
InstructionsCompute Stefani’s total standard cost per unit.
E25-4 Monte Services, Inc. is trying to establish the standard labor cost of a typical oil change. The following data have been collected from time and motion studies conducted over the past month.
Actual time spent on the oil change 1.0 hourHourly wage rate $12Payroll taxes 10% of wage rateSetup and downtime 20% of actual labor timeCleanup and rest periods 30% of actual labor timeFringe benefi ts 25% of wage rate
Instructions(a) Determine the standard direct labor hours per oil change.(b) Determine the standard direct labor hourly rate.(c) Determine the standard direct labor cost per oil change.(d) If an oil change took 1.6 hours at the standard hourly rate, what was the direct labor
quantity variance?
E25-5 The standard cost of Product B manufactured by Pharrell Company includes three units of direct materials at $5.00 per unit. During June, 29,000 units of direct materials are purchased at a cost of $4.70 per unit, and 29,000 units of direct materials are used to pro-duce 9,400 units of Product B.
Instructions(a) Compute the total materials variance and the price and quantity variances.(b) Repeat (a), assuming the purchase price is $5.15 and the quantity purchased and used
is 28,000 units.
E25-6 Lewis Company’s standard labor cost of producing one unit of Product DD is 4 hours at the rate of $12.00 per hour. During August, 40,600 hours of labor are incurred at a cost of $12.15 per hour to produce 10,000 units of Product DD.
Instructions(a) Compute the total labor variance.(b) Compute the labor price and quantity variances.(c) Repeat (b), assuming the standard is 4.1 hours of direct labor at $12.25 per hour.
E25-7 Levine Inc., which produces a single product, has prepared the following standard cost sheet for one unit of the product.
Direct materials (8 pounds at $2.50 per pound) $20Direct labor (3 hours at $12.00 per hour) $36
Compute standard cost per unit.
(LO 1)
Compute labor cost and labor quantity variance.
(LO 3)
Compute materials price and quantity variances.
(LO 2)
Compute labor price and quantity variances.
(LO 3)
Compute materials and labor variances.
(LO 2, 3)
SERVICE

1134 25 Standard Costs and Balanced Scorecard
During the month of April, the company manufactures 230 units and incurs the following actual costs.
Direct materials purchased and used (1,900 pounds) $5,035Direct labor (700 hours) $8,120
InstructionsCompute the total, price, and quantity variances for materials and labor.
E25-8 The following direct materials and direct labor data pertain to the operations of Laurel Company for the month of August.
Costs Quantities
Actual labor rate $13 per hour Actual hours incurred and used 4,150 hours
Actual materials price $128 per ton Actual quantity of materials purchased and used 1,220 tons
Standard labor rate $12.50 per hour Standard hours used 4,300 hoursStandard materials price $130 per ton Standard quantity of
materials used 1,200 tons
Instructions(a) Compute the total, price, and quantity variances for materials and labor.(b) Provide two possible explanations for each of the unfavorable variances calcu-
lated above, and suggest where responsibility for the unfavorable result might be placed.
E25-9 You have been given the following information about the production of Usher Co., and are asked to provide the plant manager with information for a meeting with the vice president of operations.
Standard Cost Card
Direct materials (5 pounds at $4 per pound) $20.00Direct labor (0.8 hours at $10) 8.00Variable overhead (0.8 hours at $3 per hour) 2.40Fixed overhead (0.8 hours at $7 per hour) 5.60
$36.00
The following is a variance report for the most recent period of operations.
Variances
Costs Total Standard Cost Price Quantity
Direct materials $410,000 $2,095 F $9,000 UDirect labor 180,000 3,840 U 6,000 U
Instructions(a) How many units were produced during the period?(b) How many pounds of raw materials were purchased and used during the period?(c) What was the actual cost per pound of raw materials?(d) How many actual direct labor hours were worked during the period?(e) What was the actual rate paid per direct labor hour?
(CGA adapted)
E25-10 During March 2017, Toby Tool & Die Company worked on four jobs. A review of direct labor costs reveals the following summary data.
JobNumber
Actual Standard Total
Hours Costs Hours Costs Variance
A257 221 $4,420 225 $4,500 $ 80 FA258 450 9,450 430 8,600 850 UA259 300 6,180 300 6,000 180 UA260 116 2,088 110 2,200 112 F
Total variance $838 U
Compute the materials and labor variances and list reasons for unfavorable variances.
(LO 2, 3)
Determine amounts from variance report.
(LO 2, 3)
Prepare a variance report for direct labor.
(LO 3, 4)

Exercises 1135
Analysis reveals that Job A257 was a repeat job. Job A258 was a rush order that required overtime work at premium rates of pay. Job A259 required a more experienced replace-ment worker on one shift. Work on Job A260 was done for one day by a new trainee when a regular worker was absent.
InstructionsPrepare a report for the plant supervisor on direct labor cost variances for March. The report should have columns for (1) Job No., (2) Actual Hours, (3) Standard Hours, (4) Quantity Variance, (5) Actual Rate, (6) Standard Rate, (7) Price Variance, and (8) Explanation.
E25-11 Manufacturing overhead data for the production of Product H by Shakira Com-pany are as follows.
Overhead incurred for 52,000 actual direct labor hours worked $263,000Overhead rate (variable $3; fi xed $2) at normal capacity of 54,000 direct labor hours $5Standard hours allowed for work done 52,000
InstructionsCompute the total overhead variance.
E25-12 Byrd Company produces one product, a putter called GO-Putter. Byrd uses a stan-dard cost system and determines that it should take one hour of direct labor to produce one GO-Putter. The normal production capacity for this putter is 100,000 units per year. The total budgeted overhead at normal capacity is $850,000 comprised of $250,000 of variable costs and $600,000 of fi xed costs. Byrd applies overhead on the basis of direct labor hours. During the current year, Byrd produced 95,000 putters, worked 94,000 direct labor hours, and incurred variable overhead costs of $256,000 and fi xed overhead costs of $600,000.
Instructions(a) Compute the predetermined variable overhead rate and the predetermined fi xed over-
head rate.(b) Compute the applied overhead for Byrd for the year.(c) Compute the total overhead variance.
E25-13 Ceelo Company purchased (at a cost of $10,200) and used 2,400 pounds of materials during May. Ceelo’s standard cost of materials per unit produced is based on 2 pounds per unit at a cost $5 per pound. Production in May was 1,050 units.
Instructions(a) Compute the total, price, and quantity variances for materials.(b) Assume Ceelo also had an unfavorable labor quantity variance. What is a possible
scenario that would provide one cause for the variances computed in (a) and the unfa-vorable labor quantity variance?
E25-14 Picard Landscaping plants grass seed as the basic landscaping for business cam-puses. During a recent month, the company worked on three projects (Remington, Chang, and Wyco). The company is interested in controlling the materials costs, namely the grass seed, for these plantings projects. In order to provide management with useful cost control information, the company uses standard costs and prepares monthly variance reports. Analysis reveals that the pur-chasing agent mistakenly purchased poor-quality seed for the Remington project. The Chang project, however, received higher-than-standard-quality seed that was on sale. The Wyco project received standard-quality seed. However, the price had increased and a new employee was used to spread the seed. Shown below are quantity and cost data for each project.
Actual Standard TotalVarianceProject Quantity Costs Quantity Costs
Remington 500 lbs. $1,200 460 lbs. $1,150 $ 50 UChang 400 920 410 1,025 105 FWyco 550 1,430 480 1,200 230 U
Total variance $175 U
Compute overhead variance.
(LO 3)
Compute overhead variances.
(LO 3)
Compute variances for materials.
(LO 2, 3)
Prepare a variance report.
(LO 2, 4)
SERVICE

1136 25 Standard Costs and Balanced Scorecard
Instructions(a) Prepare a variance report for the purchasing department with the following columns:
(1) Project, (2) Actual Pounds Purchased, (3) Actual Price per Pound, (4) Standard Price per Pound, (5) Price Variance, and (6) Explanation.
(b) Prepare a variance report for the production department with the following columns: (1) Project, (2) Actual Pounds, (3) Standard Pounds, (4) Standard Price per Pound, (5) Quantity Variance, and (6) Explanation.
E25-15 Urban Corporation prepared the following variance report.
URBAN CORPORATIONVariance Report—Purchasing Department
For the Week Ended January 9, 2017
Type of Materials
Quantity Purchased
Actual Price
Standard Price
Price Variance Explanation
Rogue11 ? lbs. $5.20 $5.00 $5,500 ? Price increaseStorm17 7,000 oz. ? 3.30 1,050 U Rush orderBeast29 22,000 units 0.40 ? 660 F Bought larger quantity
InstructionsFill in the appropriate amounts or letters for the question marks in the report.
E25-16 Fisk Company uses a standard cost accounting system. During January, the com-pany reported the following manufacturing variances.
Materials price variance $1,200 U Labor quantity variance $750 UMaterials quantity variance 800 F Overhead variance 800 ULabor price variance 550 U
In addition, 8,000 units of product were sold at $8 per unit. Each unit sold had a standard cost of $5. Selling and administrative expenses were $8,000 for the month.
InstructionsPrepare an income statement for management for the month ended January 31, 2017.
E25-17 The following is a list of terms related to performance evaluation.
1. Balanced scorecard 5. Customer perspective2. Variance 6. Internal process perspective3. Learning and growth perspective 7. Ideal standards4. Nonfi nancial measures 8. Normal standards
InstructionsMatch each of the following descriptions with one of the terms above.
(a) The difference between total actual costs and total standard costs.(b) An efficient level of performance that is attainable under expected operating
conditions.(c) An approach that incorporates fi nancial and nonfi nancial measures in an integrated
system that links performance measurement and a company’s strategic goals.(d) A viewpoint employed in the balanced scorecard to evaluate how well a company
develops and retains its employees.(e) An evaluation tool that is not based on dollars.(f) A viewpoint employed in the balanced scorecard to evaluate the company from the
perspective of those people who buy its products or services.(g) An optimum level of performance under perfect operating conditions.(h) A viewpoint employed in the balanced scorecard to evaluate the effi ciency and effec-
tiveness of the company’s value chain.
E25-18 Indicate which of the four perspectives in the balanced scorecard is most likely associated with the objectives that follow.
1. Percentage of repeat customers.2. Number of suggestions for improvement from employees.
Complete variance report.
(LO 4)
Prepare income statement for management.
(LO 4)
Identify performance evaluation terminology.
(LO 1, 4)
Identity balanced scorecard perspectives.
(LO 4)

Exercises 1137
3. Contribution margin.4. Brand recognition.5. Number of cross-trained employees.6. Amount of setup time.
E25-19 Indicate which of the four perspectives in the balanced scorecard is most likely associated with the objectives that follow.
1. Ethics violations.2. Credit rating.3. Customer retention.4. Stockouts.5. Reportable accidents.6. Brand recognition.
E25-20 Vista Company installed a standard cost system on January 1. Selected transactions for the month of January are as follows.
1. Purchased 18,000 units of raw materials on account at a cost of $4.50 per unit. Stan-dard cost was $4.40 per unit.
2. Issued 18,000 units of raw materials for jobs that required 17,500 standard units of raw materials.
3. Incurred 15,300 actual hours of direct labor at an actual rate of $5.00 per hour. The standard rate is $5.50 per hour. (Credit Factory Wages Payable.)
4. Performed 15,300 hours of direct labor on jobs when standard hours were 15,400.5. Applied overhead to jobs at the rate of 100% of direct labor cost for standard hours allowed.
InstructionsJournalize the January transactions.
E25-21 Lopez Company uses a standard cost accounting system. Some of the ledger accounts have been destroyed in a fi re. The controller asks your help in reconstructing some missing entries and balances.
InstructionsAnswer the following questions.
(a) Materials Price Variance shows a $2,000 unfavorable balance. Accounts Payable shows $138,000 of raw materials purchases. What was the amount debited to Raw Materials Inventory for raw materials purchased?
(b) Materials Quantity Variance shows a $3,000 favorable balance. Raw Materials Inven-tory shows a zero balance. What was the amount debited to Work in Process Inventory for direct materials used?
(c) Labor Price Variance shows a $1,500 favorable balance. Factory Labor shows a debit of $145,000 for wages incurred. What was the amount credited to Factory Wages Payable?
(d) Factory Labor shows a credit of $145,000 for direct labor used. Labor Quantity Vari-ance shows a $900 favorable balance. What was the amount debited to Work in Process for direct labor used?
(e) Overhead applied to Work in Process totaled $165,000. If the total overhead variance was $1,200 favorable, what was the amount of overhead costs debited to Manufactur-ing Overhead?
E25-22 Data for Levine Inc. are given in E25-7.
InstructionsJournalize the entries to record the materials and labor variances.
E25-23 The information shown below was taken from the annual manufacturing over-head cost budget of Connick Company.
Variable manufacturing overhead costs $34,650Fixed manufacturing overhead costs $19,800Normal production level in labor hours 16,500Normal production level in units 4,125Standard labor hours per unit 4
Identify balance scorecard perspectives.
(LO 4)
* Journalize entries in a standard cost accounting system.
(LO 5)
* Answer questions concerning missing entries and balances.
(LO 2, 3, 5)
* Journalize entries for materials and labor variances.
(LO 5)
* Compute manufacturing overhead variances and interpret fi ndings.
(LO 6)

1138 25 Standard Costs and Balanced Scorecard
During the year, 4,050 units were produced, 16,100 hours were worked, and the actual manufacturing overhead was $55,500. Actual fi xed manufacturing overhead costs equaled budgeted fi xed manufacturing overhead costs. Overhead is applied on the basis of direct labor hours.
Instructions(a) Compute the total, fi xed, and variable predetermined manufacturing overhead rates.(b) Compute the total, controllable, and volume overhead variances.(c) Briefl y interpret the overhead controllable and volume variances computed
in (b).
E25-24 The loan department of Calgary Bank uses standard costs to determine the over-head cost of processing loan applications. During the current month, a fi re occurred, and the accounting records for the department were mostly destroyed. The following data were salvaged from the ashes.
Standard variable overhead rate per hour $9Standard hours per application 2Standard hours allowed 2,000Standard fi xed overhead rate per hour $6Actual fi xed overhead cost $12,600Variable overhead budget based on standard hours allowed $18,000Fixed overhead budget $12,600Overhead controllable variance $ 1,200 U
Instructions(a) Determine the following. (1) Total actual overhead cost. (2) Actual variable overhead cost. (3) Variable overhead costs applied. (4) Fixed overhead costs applied. (5) Overhead volume variance.(b) Determine how many loans were processed.
E25-25 Seacrest Company’s overhead rate was based on estimates of $200,000 for over-head costs and 20,000 direct labor hours. Seacrest’s standards allow 2 hours of direct labor per unit produced. Production in May was 900 units, and actual overhead incurred in May was $19,500. The overhead budgeted for 1,800 standard direct labor hours is $17,600 ($5,000 fi xed and $12,600 variable).
Instructions(a) Compute the total, controllable, and volume variances for overhead.(b) What are possible causes of the variances computed in part (a)?
*Compute overhead variances.
(LO 6)
*Compute variances.
(LO 6)
SERVICE
EXERCISES: SET B AND CHALLENGE EXERCISES
Visit the book’s companion website, at www.wiley.com/college/weygandt, and choose the Student Companion site to access Exercises: Set B and Challenge Exercises.
PROBLEMS: SET A
P25-1A Rogen Corporation manufactures a single product. The standard cost per unit of product is shown below.
Compute variances.
(LO 2, 3)
Direct materials—1 pound plastic at $7.00 per pound $ 7.00Direct labor—1.6 hours at $12.00 per hour 19.20Variable manufacturing overhead 12.00Fixed manufacturing overhead 4.00
Total standard cost per unit $42.20

Problems: Set A 1139
The predetermined manufacturing overhead rate is $10 per direct labor hour ($16.00 4 1.6). It was computed from a master manufacturing overhead budget based on normal production of 8,000 direct labor hours (5,000 units) for the month. The master budget showed total variable costs of $60,000 ($7.50 per hour) and total fi xed overhead costs of $20,000 ($2.50 per hour). Actual costs for October in producing 4,800 units were as follows.
Direct materials (5,100 pounds) $ 36,720Direct labor (7,400 hours) 92,500Variable overhead 59,700Fixed overhead 21,000
Total manufacturing costs $209,920
The purchasing department buys the quantities of raw materials that are expected to be used in production each month. Raw materials inventories, therefore, can be ignored.
Instructions(a) Compute all of the materials and labor variances.(b) Compute the total overhead variance.
P25-2A Ayala Corporation accumulates the following data relative to jobs started and fi nished during the month of June 2017.
Costs and Production Data Actual Standard
Raw materials unit cost $2.25 $2.10Raw materials units used 10,600 10,000Direct labor payroll $120,960 $120,000Direct labor hours worked 14,400 15,000Manufacturing overhead incurred $189,500Manufacturing overhead applied $193,500Machine hours expected to be used at normal capacity 42,500Budgeted fi xed overhead for June $55,250Variable overhead rate per machine hour $3.00Fixed overhead rate per machine hour $1.30
Overhead is applied on the basis of standard machine hours. Three hours of machine time are required for each direct labor hour. The jobs were sold for $400,000. Selling and administrative expenses were $40,000. Assume that the amount of raw materials purchased equaled the amount used.
Instructions(a) Compute all of the variances for (1) direct materials and (2) direct labor.(b) Compute the total overhead variance.(c) Prepare an income statement for management. (Ignore income taxes.)
P25-3A Rudd Clothiers is a small company that manufactures tall-men’s suits. The company has used a standard cost accounting system. In May 2017, 11,250 suits were produced. The following standard and actual cost data applied to the month of May when normal capacity was 14,000 direct labor hours. All materials purchased were used.
Cost Element Standard (per unit) Actual
Direct materials 8 yards at $4.40 per yard $375,575 for 90,500 yards ($4.15 per yard)Direct labor 1.2 hours at $13.40 per hour $200,925 for 14,250 hours ($14.10 per hour)Overhead 1.2 hours at $6.10 per hour $49,000 fi xed overhead (fi xed $3.50; variable $2.60) $37,000 variable overhead
Overhead is applied on the basis of direct labor hours. At normal capacity, budgeted fi xed overhead costs were $49,000, and budgeted variable overhead was $36,400.
Instructions(a) Compute the total, price, and quantity variances for (1) materials and (2) labor.(b) Compute the total overhead variance.(c) Which of the materials and labor variances should be investigated if manage-
ment considers a variance of more than 4% from standard to be signifi cant?
(a) MPV $1,020 U
Compute variances, and prepare income statement.
(LO 2, 3, 4)
(a) LQV $4,800 F
Compute and identify signifi cant variances.
(LO 2, 3, 4)
(a) MPV $22,625 F

1140 25 Standard Costs and Balanced Scorecard
P25-4A Kansas Company uses a standard cost accounting system. In 2017, the company produced 28,000 units. Each unit took several pounds of direct materials and 1.6 standard hours of direct labor at a standard hourly rate of $12.00. Normal capacity was 50,000 direct labor hours. During the year, 117,000 pounds of raw materials were purchased at $0.92 per pound. All materials purchased were used during the year.
Instructions(a) If the materials price variance was $3,510 favorable, what was the standard materials
price per pound?(b) If the materials quantity variance was $4,750 unfavorable, what was the standard
materials quantity per unit?(c) What were the standard hours allowed for the units produced?(d) If the labor quantity variance was $7,200 unfavorable, what were the actual direct
labor hours worked?(e) If the labor price variance was $9,080 favorable, what was the actual rate per hour?(f) If total budgeted manufacturing overhead was $360,000 at normal capacity, what was
the predetermined overhead rate?(g) What was the standard cost per unit of product?(h) How much overhead was applied to production during the year?(i) Using one or more answers above, what were the total costs assigned to work in process?
P25-5A Hart Labs, Inc. provides mad cow disease testing for both state and federal govern-mental agricultural agencies. Because the company’s customers are governmental agencies, prices are strictly regulated. Therefore, Hart Labs must constantly monitor and control its testing costs. Shown below are the standard costs for a typical test.
Direct materials (2 test tubes @ $1.46 per tube) $ 2.92Direct labor (1 hour @ $24 per hour) 24.00Variable overhead (1 hour @ $6 per hour) 6.00Fixed overhead (1 hour @ $10 per hour) 10.00
Total standard cost per test $42.92
The lab does not maintain an inventory of test tubes. As a result, the tubes purchased each month are used that month. Actual activity for the month of November 2017, when 1,475 tests were conducted, resulted in the following.
Direct materials (3,050 test tubes) $ 4,270Direct labor (1,550 hours) 35,650Variable overhead 7,400Fixed overhead 15,000
Monthly budgeted fi xed overhead is $14,000. Revenues for the month were $75,000, and selling and administrative expenses were $5,000.
Instructions(a) Compute the price and quantity variances for direct materials and direct labor.(b) Compute the total overhead variance.(c) Prepare an income statement for management.(d) Provide possible explanations for each unfavorable variance.
*P25-6A Jorgensen Corporation uses standard costs with its job order cost accounting system. In January, an order (Job No. 12) for 1,900 units of Product B was received. The standard cost of one unit of Product B is as follows.
Direct materials 3 pounds at $1.00 per pound $ 3.00Direct labor 1 hour at $8.00 per hour 8.00Overhead 2 hours (variable $4.00 per machine hour;
fi xed $2.25 per machine hour) 12.50
Standard cost per unit $23.50
Normal capacity for the month was 4,200 machine hours. During January, the following transactions applicable to Job No. 12 occurred.
1. Purchased 6,200 pounds of raw materials on account at $1.05 per pound.2. Requisitioned 6,200 pounds of raw materials for Job No. 12.3. Incurred 2,000 hours of direct labor at a rate of $7.80 per hour.4. Worked 2,000 hours of direct labor on Job No. 12.
Answer questions about variances.
(LO 2, 3)
(b) 4.0 pounds
(f) $7.20 per DLH
Compute variances, prepare an income statement, and explain unfavorable variances.
(LO 2, 3, 4)
(a) LQV $1,800 U
Journalize and post standard cost entries, and prepare income statement.
(LO 2, 3, 4, 5)
SERVICE

Continuing Problems 1141
5. Incurred manufacturing overhead on account $25,000.6. Applied overhead to Job No. 12 on basis of standard machine hours allowed.7. Completed Job No. 12.8. Billed customer for Job No. 12 at a selling price of $65,000.
Instructions(a) Journalize the transactions.(b) Post to the job order cost accounts.(c) Prepare the entry to recognize the total overhead variance.(d) Prepare the January 2017 income statement for management. Assume selling and
administrative expenses were $2,000.
*P25-7A Using the information in P25-1A, compute the overhead controllable variance and the overhead volume variance.
*P25-8A Using the information in P25-2A, compute the overhead controllable variance and the overhead volume variance.
*P25-9A Using the information in P25-3A, compute the overhead controllable variance and the overhead volume variance.
*P25-10A Using the information in P25-5A, compute the overhead controllable variance and the overhead volume variance.
(d) NI $15,890
Compute overhead controllable and volume variances.
(LO 6)Compute overhead controllable and volume variances.
(LO 6)Compute overhead controllable and volume variances.
(LO 6)Compute overhead controllable and volume variances.
(LO 6)
PROBLEMS: SET B AND SET C
Visit the book’s companion website, at www.wiley.com/college/weygandt, and choose the Student Companion site to access Problems: Set B and Set C.
CONTINUING PROBLEMS
CURRENT DESIGNSCD25 The executive team at Current Designs has gathered to evaluate the company’s operations for the last month. One of the topics on the agenda is the special order from Huegel Hollow, which was presented in CD2. Recall that Current Designs had a special order to produce a batch of 20 kayaks for a client, and you were asked to determine the cost of the order and the cost per kayak. Mike Cichanowski asked the others if the special order caused any particular problems in the production process. Dave Thill, the production manager, made the following comments: “Since we wanted to complete this order quickly and make a good fi rst impression on this new customer, we had some of our most experienced type I workers run the rotomold oven and do the trimming. They were very effi cient and were able to complete that part of the manufacturing process even more quickly than the regular crew. However, the fi nishing on these kayaks required a different technique than what we usually use, so our type II workers took a little longer than usual for that part of the process.” Deb Welch, who is in charge of the purchasing function, said, “We had to pay a little more for the polyethylene powder for this order because the customer wanted a color that we don’t usually stock. We also ordered a little extra since we wanted to make sure that we had enough to allow us to calibrate the equipment. The calibration was a little tricky, and we used all of the powder that we had purchased. Since the number of kayaks in the order was fairly small, we were able to use some rope and other parts that were left over from last year’s production in the fi nishing kits. We’ve seen a price increase for these components in the last year, so using the parts that we already had in inventory cut our costs for the fi nishing kits.”
Instructions
(a) Based on the comments above, predict whether each of the following variances will be favorable or unfavorable. If you don’t have enough information to make a prediction, use “NEI” to indicate “Not Enough Information.”
EXCEL TUTORIAL

(1) Quantity variance for polyethylene powder. (5) Quantity variance for type I workers. (2) Price variance for polyethylene powder. (6) Price variance for type I workers. (3) Quantity variance for fi nishing kits. (7) Quantity variance for type II workers. (4) Price variance for fi nishing kits. (8) Price variance for type II workers.
(b) Diane Buswell examined some of the accounting records and reported that Current Designs pur-chased 1,200 pounds of pellets for this order at a total cost of $2,040. Twenty (20) fi nishing kits were assembled at a total cost of $3,240. The payroll records showed that the type I employees worked 38 hours on this project at a total cost of $570. The type II fi nishing employees worked 65 hours at a total cost of $796.25. A total of 20 kayaks were produced for this order.
The standards that had been developed for this model of kayak were used in CD2 and are reproduced here. For each kayak:
54 pounds of polyethylene powder at $1.50 per pound
1 fi nishing kit (rope, seat, hardware, etc.) at $170
2 hours of type I labor from people who run the oven and trim the plastic at a standard wage rate of $15 per hour
3 hours of type II labor from people who attach the hatches and seat and other hardware at a standard wage rate of $12 per hour.
Calculate the eight variances that are listed in part (a) of this problem.
1142 25 Standard Costs and Balanced Scorecard
WATERWAYS
WP25 Waterways Corporation uses very stringent standard costs in evaluating its manu-facturing effi ciency. These standards are not “ideal” at this point, but management is working toward that as a goal. This problem asks you to calculate and evaluate the company’s variances.
Go to the book’s companion website, at www.wiley.com/college/weygandt, to fi nd the completion of this problem.
(This is a continuation of the Waterways problem from Chapters 19–24.)
PERSPECTIVEMANAGEMENT DECISION-MAKING
Decision-Making Across the OrganizationBYP25-1 Milton Professionals, a management consulting fi rm, specializes in strategic planning for fi nancial institutions. James Hahn and Sara Norton, partners in the fi rm, are assembling a new stra-tegic planning model for use by clients. The model is designed for use on most personal computers and replaces a rather lengthy manual model currently marketed by the fi rm. To market the new model, James and Sara will need to provide clients with an estimate of the number of labor hours and com-puter time needed to operate the model. The model is currently being test-marketed at fi ve small fi nancial institutions. These fi nancial institutions are listed below, along with the number of com-bined computer/labor hours used by each institution to run the model one time.
Computer/Labor HoursFinancial Institutions Required
Midland National 25First State 45Financial Federal 40Pacifi c America 30Lakeview National 30
Total 170
Average 34
Any company that purchases the new model will need to purchase user manuals for the system. User manuals will be sold to clients in cases of 20, at a cost of $320 per case. One manual must be used
BROADENING YOUR
SERVICE
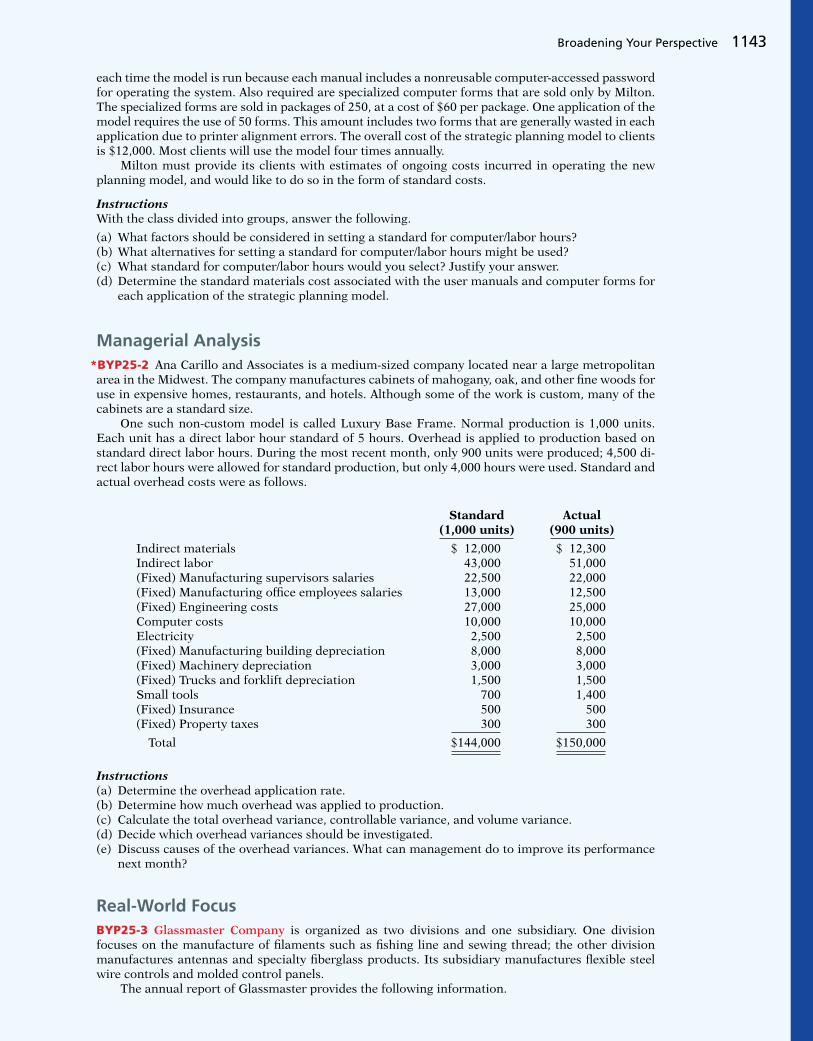
each time the model is run because each manual includes a nonreusable computer-accessed password for operating the system. Also required are specialized computer forms that are sold only by Milton. The specialized forms are sold in packages of 250, at a cost of $60 per package. One application of the model requires the use of 50 forms. This amount includes two forms that are generally wasted in each application due to printer alignment errors. The overall cost of the strategic planning model to clients is $12,000. Most clients will use the model four times annually. Milton must provide its clients with estimates of ongoing costs incurred in operating the new planning model, and would like to do so in the form of standard costs.
InstructionsWith the class divided into groups, answer the following.
(a) What factors should be considered in setting a standard for computer/labor hours?(b) What alternatives for setting a standard for computer/labor hours might be used?(c) What standard for computer/labor hours would you select? Justify your answer.(d) Determine the standard materials cost associated with the user manuals and computer forms for
each application of the strategic planning model.
Managerial Analysis *BYP25-2 Ana Carillo and Associates is a medium-sized company located near a large metropolitan area in the Midwest. The company manufactures cabinets of mahogany, oak, and other fi ne woods for use in expensive homes, restaurants, and hotels. Although some of the work is custom, many of the cabinets are a standard size. One such non-custom model is called Luxury Base Frame. Normal production is 1,000 units. Each unit has a direct labor hour standard of 5 hours. Overhead is applied to production based on standard direct labor hours. During the most recent month, only 900 units were produced; 4,500 di-rect labor hours were allowed for standard production, but only 4,000 hours were used. Standard and actual overhead costs were as follows.
Standard Actual (1,000 units) (900 units)
Indirect materials $ 12,000 $ 12,300Indirect labor 43,000 51,000(Fixed) Manufacturing supervisors salaries 22,500 22,000(Fixed) Manufacturing offi ce employees salaries 13,000 12,500(Fixed) Engineering costs 27,000 25,000Computer costs 10,000 10,000Electricity 2,500 2,500(Fixed) Manufacturing building depreciation 8,000 8,000(Fixed) Machinery depreciation 3,000 3,000(Fixed) Trucks and forklift depreciation 1,500 1,500Small tools 700 1,400(Fixed) Insurance 500 500(Fixed) Property taxes 300 300
Total $144,000 $150,000
Instructions(a) Determine the overhead application rate.(b) Determine how much overhead was applied to production.(c) Calculate the total overhead variance, controllable variance, and volume variance.(d) Decide which overhead variances should be investigated.(e) Discuss causes of the overhead variances. What can management do to improve its performance
next month?
Real-World FocusBYP25-3 Glassmaster Company is organized as two divisions and one subsidiary. One division focuses on the manufacture of fi laments such as fi shing line and sewing thread; the other division manufactures antennas and specialty fi berglass products. Its subsidiary manufactures fl exible steel wire controls and molded control panels. The annual report of Glassmaster provides the following information.
Broadening Your Perspective 1143

Instructions(a) Is it apparent from the information whether Glassmaster utilizes standard costs?(b) Do you think the price variance experienced should lead to changes in standard costs for the next
fi scal year?
BYP25-4 The Balanced Scorecard Institute (www.balancedscorecard.org) is a great resource for infor-mation about implementing the balanced scorecard. One item of interest provided at its website is an example of a balanced scorecard for a regional airline.
Address: http://www.balancedscorecard.org/portals/0/pdf/regional_airline.pdf, or go to www.wiley.com/college/weygandt
InstructionsGo to the address above and answer the following questions.
(a) What are the objectives identifi ed for the airline for each perspective?(b) What measures are used for the objectives in the customer perspective?(c) What initiatives are planned to achieve the objective in the learning perspective?
BYP25-5 The December 22, 2009, edition of the Wall Street Journal has an article by Kevin Kelliker entitled “In Risky Move, GM to Run Plants Around Clock.”
InstructionsRead the article and answer the following questions.
(a) According to the article, what is the normal industry standard for plants to be considered operat-ing at full capacity?
(b) What ideal standard is the company hoping to achieve?(c) What reasons are given in the article for why most companies do not operate a third shift? How
does GM propose to overcome these issues?(d) What are some potential drawbacks of the midnight shift? What implications does this have for
variances from standards?(e) What potential sales/marketing disadvantage does the third shift create?
CRITICAL THINKING
Communication ActivityBYP25-6 The setting of standards is critical to the effective use of standards in evaluating performance.
InstructionsExplain the following in a memo to your instructor.
(a) The comparative advantages and disadvantages of ideal versus normal standards.(b) The factors that should be included in setting the price and quantity standards for direct materials,
direct labor, and manufacturing overhead.
1144 25 Standard Costs and Balanced Scorecard
GLASSMASTER COMPANYManagement Discussion
Gross profi t margins for the year improved to 20.9% of sales compared to last year’s 18.5%. All operations reported improved margins due in large part to improved operating effi ciencies as a result of cost reduction measures implemented during the second and third quarters of the fi scal year and increased manufacturing throughout due to higher unit volume sales. Contributing to the improved margins was a favorable materials price variance due to competitive pricing by suppliers as a result of soft demand for petrochemical-based products. This favorable variance is temporary and will begin to reverse itself as stronger worldwide demand for commodity products improves in tandem with the economy. Partially offsetting these positive effects on profi t margins were competitive pressures on sales prices of certain product lines. The company responded with pricing strategies designed to maintain and/or increase market share.
SERVICE
Ethics CaseBYP25-7 At Symond Company, production workers in the Painting Department are paid on the basis of productivity. The labor time standard for a unit of production is established through periodic time studies conducted by Douglas Management Consultants. In a time study, the actual time required to complete a specifi c task by a worker is observed. Allowances are then made for preparation time, rest periods, and cleanup time. Bill Carson is one of several veterans in the Painting Department. Bill is informed by Douglas that he will be used in the time study for the painting of a new prod-uct. The fi ndings will be the basis for establishing the labor time standard for the next 6 months. During the test, Bill deliberately slows his normal work pace in an effort to obtain a labor time stan-dard that will be easy to meet. Because it is a new product, the Douglas representative who conducted the test is unaware that Bill did not give the test his best effort.
Instructions(a) Who was benefi ted and who was harmed by Bill’s actions?(b) Was Bill ethical in the way he performed the time study test?(c) What measure(s) might the company take to obtain valid data for setting the labor time standard?
All About YouBYP25-8 From the time you fi rst entered school many years ago, instructors have been measuring and evaluating you by imposing standards. In addition, many of you will pursue professions that administer professional examinations to attain recognized certifi cation. A federal commission presented proposals suggesting all public colleges and universities should require standardized tests to measure their students’ learning.
InstructionsRead the article at www.signonsandiego.com/uniontrib/20060811/news_1n11colleges.html, and answer the following questions.
(a) What areas of concern did the panel’s recommendations address?(b) What are possible advantages of standard testing?(c) What are possible disadvantages of standard testing?(d) Would you be in favor of standardized tests?
Considering Your Costs and Benefi tsBYP25-9 Do you think that standard costs are used only in making products like wheel bearings and hamburgers? Think again. Standards infl uence virtually every aspect of our lives. For example, the next time you call to schedule an appointment with your doctor, ask the receptionist how many min-utes the appointment is scheduled for. Doctors are under increasing pressure to see more patients each day, which means the time spent with each patient is shorter. As insurance companies and employers push for reduced medical costs, every facet of medicine has been standardized and ana-lyzed. Doctors, nurses, and other medical staff are evaluated in every part of their operations to ensure maximum effi ciency. While keeping medical treatment affordable seems like a worthy goal, what are the potential implications for the quality of health care? Does a focus on the bottom line result in a reduction in the quality of health care? A simmering debate has centered on a very basic question: To what extent should accountants, through fi nancial measures, infl uence the type of medical care that you receive? Suppose that your local medical facility is in danger of closing because it has been losing money. Should the facility put in place incentives that provide bonuses to doctors if they meet certain standard-cost targets for the cost of treating specifi c ailments?
YES: If the facility is in danger of closing, then someone should take steps to change the medical practices to reduce costs. A closed medical facility is of no use to me, my family, or the community.NO: I don’t want an accountant deciding the right medical treatment for me. My family and I deserve the best medical care.
InstructionsWrite a response indicating your position regarding this situation. Provide support for your view.
Broadening Your Perspective 1145

When you think of new, fast-growing, San Francisco companies, you probably think of fun products like smartphones, social networks, and game apps. You don’t tend to think of soap. In fact, given that some of the biggest, most powerful companies in the world dominate the soap market (e.g., Proctor & Gamble, Clorox, and Unilever), starting a new soap company seems like an outrageously bad idea. But that didn’t dissuade Adam Lowry and Eric Ryan from giving it a try. The long-time friends and former roommates combined their skills (Adam’s chemical engineering and Eric’s design and marketing) to start Method Products. Their goal: selling environmentally friendly soaps that actually remove dirt.
Within a year of its formation, the company had products on the shelves at Target stores. Within 5 years, Method was cited by numerous business publications as one of the fastest-growing companies in the country. It was easy—right? Wrong. Running a company is never easy, and given Method’s commitment to sustainability, all of its business decisions are just a little more complex than usual. For example, the company wanted to use solar power to charge the batteries for the forklifts used in its factories. No problem, just put solar panels on the buildings. But because Method outsources its manufacturing, it doesn’t actually own factory buildings. In fact, the company that does Method’s manufacturing doesn’t own the buildings either. Solution—
Method parked old semi-trailers next to the factories and installed solar panels on those.
Since Method insists on using natural products and sustainable production practices, its production costs are higher than companies that don’t adhere to these standards. Adam and Eric insist, however, that this actually benefi ts them because they have to be far more careful about controlling costs and far more innovative in solving problems. For example, when the cost of the raw materials used for soap production recently jumped by as much as 40%, Method actually viewed it as an opportunity to grab market share. It determined that it could offset the cost increases in other places in its supply chain, thus absorbing the cost much easier than its big competitors.
In these and other instances, Adam and Eric identifi ed their alternative courses of action, determined what was relevant to each choice and what wasn’t, and then carefully evaluated the incremental costs of each alternative. When you are small and your competitors have some of the biggest marketing budgets
in the world, you can’t afford to make very many mistakes.
Keeping It Clean
An important purpose of management accounting is to provide managers with relevant information for decision-making. Companies of all sorts must make product decisions. Oral-B Laboratories opted to produce a new, higher-priced toothbrush. General Motors announced the closure of its Oldsmobile Division. Quaker Oats decided to sell off a line of beverages, at a price more than $1 billion less than it paid for that product line only a few years before.
This chapter begins with an explanation of management’s decision-making process and a decision-making approach called incremental analysis. It then considers the topic of capital budgeting.
CHAPTER PREVIEW
26
FEATURE STORY
Incremental Analysis and Capital Budgeting
1146
Watch the Method Products video and the Holland America Line video in WileyPLUS to learn more about incremental analysis and capital budgeting in the real world.
▲

Go to the REVIEW AND PRACTICE section at the end of the chapter for a review of key concepts and practice applications with solutions.
Visit WileyPLUS with ORION for additional tutorials and practice opportunities.
Gabriela Hasbun/Redux
Distinguish between the net present value and internal rate of return methods.
Analyze the relevant costs in various decisions involving incremental analysis.
Contrast annual rate of return and cash payback in capital budgeting.
2
3
4
Describe management’s decision-making process and incremental analysis.
1 Incremental AnalysisDO IT! 1
• Incremental analysis approach • How incremental analysis
works• Types of incremental analysis
• Special price order• Make or buy• Sell or process further• Repair, retain, or replace
equipment• Eliminate an unprofi table
segment or product
Learning Objectives
DO IT!• Capital budgeting• Evaluation process of capital
budgeting• Annual rate of return• Cash payback
Discounted Cash FlowDO IT! 4
• Net present value method• Internal rate of return method• Comparing discounted cash
fl ow methods
DO IT!
CHAPTER OUTLINE
Annual Rate of Return3a
Cash Payback Period3b
Special Orders2a
Make or Buy2b
Sell or Process Further2c
Repair or Replace Equipment2d
Unprofi table Segments2e

1148 26 Incremental Analysis and Capital Budgeting
1 Describe management’s decision-making process and incremental analysis.
LEARNING OBJECTIVE
Making decisions is an important management function. Management’s decision-making process does not always follow a set pattern because decisions vary signifi -cantly in their scope, urgency, and importance. It is possible, though, to identify some steps that are frequently involved in the process. These steps are shown in Illustration 26-1.
Accounting’s contribution to the decision-making process occurs primarily in Steps 2 and 4—evaluating possible courses of action and reviewing results. In Step 2, for each possible course of action, relevant revenue and cost data are pro-vided. These show the expected overall effect on net income. In Step 4, internal reports are prepared that review the actual impact of the decision. In making business decisions, management ordinarily considers both fi nan-cial and nonfi nancial information. Financial information is related to revenues and costs and their effect on the company’s overall profi tability. Nonfi nancial information relates to such factors as the effect of the decision on employee turn-over, the environment, or the overall image of the company in the community. (These are considerations that we touched on in our Chapter 19 discussion of corporate social responsibility.) Although nonfi nancial information can be as important as fi nancial information, we will focus primarily on fi nancial informa-tion that is relevant to the decision.
Incremental Analysis Approach
Decisions involve a choice among alternative courses of action. Suppose you face the personal fi nancial decision of whether to purchase or lease a car. The fi nancial data relate to the cost of leasing versus the cost of purchasing. For example, leasing involves periodic lease payments; purchasing requires “up-front” payment of the purchase price. In other words, the fi nancial information relevant to the decision are the data that vary in the future among the possible alternatives. The process used to identify the fi nancial data that change under alternative courses of action is called incremental analysis. In some cases, you will fi nd that when you use incremental analysis, both costs and revenues vary. In other cases, only costs or revenues vary. Just as your decision to buy or lease a car affects your future fi nancial situa-tion, similar decisions, on a larger scale, affect a company’s future. Incremental analysis identifi es the probable effects of those decisions on future earnings. Such analysis inevitably involves estimates and uncertainty. Gathering data for incremental analyses may involve market analysts, engineers, and accountants. In quantifying the data, the accountant must produce the most reliable informa-tion available.
Identify theproblem and assignresponsibility
.2.1 Determine and evaluatepossible courses of action
3. Make a decision 4. Review resultsof the decision
Choice AChoice B
Choice C
SALESChoice AChoice B
Choice C
Illustration 26-1Management’s decision-making process
Alternative TerminologyIncremental analysis is also called differential analysis because the analysis focuses on differences.

Decision-Making and Incremental Analysis 1149
How Incremental Analysis Works
The basic approach in incremental analysis is illustrated in the following example.
Formulas Data Review ViewPage LayoutInsert
AP18 fx
CB D
RevenuesCostsNet income
$110,00080,000
$ 30,000
$125,000100,000
$ 25,000
$ (15,000)20,000
$ 5,000
Home
1
2
3
4
5
Incremental Analysis.xls
Alternative A Alternative BNet Income
Increase (Decrease)
Illustration 26-2Basic approach in incremental analysis
• Relevant cost In incremental analysis, the only factors to be considered are those costs and revenues that differ across alternatives. Those factors are called relevant costs. Costs and revenues that do not differ across alternatives can be ignored when trying to choose between alternatives.
• Sunk cost Costs that have already been incurred and will not be changed or avoided by any present or future decisions are referred to as sunk costs. For example, the amount you spent in the past to purchase or repair a laptop should have no bearing on your decision whether to buy a new laptop. Sunk costs are not relevant costs.
Too bad
#1ALT
#2ALT
Knock,
Knock
.
Illustration 26-3Key cost concepts in incremental analysis
1Although income taxes are sometimes important in incremental analysis, they are ignored in the chapter for simplicity’s sake.
This example compares Alternative B with Alternative A. The net income col-umn shows the differences between the alternatives. In this case, incremental revenue will be $15,000 less under Alternative B than under Alternative A. But a $20,000 incremental cost savings will be realized.1 Thus, Alternative B will produce $5,000 more net income than Alternative A. In the following pages, you will encounter three important cost concepts used in incremental analysis, as defi ned and discussed in Illustration 26-3.

1150 26 Incremental Analysis and Capital Budgeting
Incremental analysis sometimes involves changes that at fi rst glance might seem contrary to your intuition. For example, sometimes variable costs do not change under the alternative courses of action. Also, sometimes fi xed costs do change. For example, direct labor, normally a variable cost, is not an incremental cost in deciding between two new factory machines if each asset requires the same amount of direct labor. In contrast, rent expense, normally a fi xed cost, is an incremental cost in a decision whether to continue occupancy of a building or to purchase or lease a new building. It is also important to understand that the approaches to incremental analysis discussed in this chapter do not take into consideration the time value of money. That is, amounts to be paid or received in future years are not discounted for the cost of interest. Time value of money is addressed later in this chapter as well as in Appendix G.
American Express
That Letter from AmEx Might Not Be a Bill
No doubt every one of you has received an invi-tation from a credit card company to open a new account—some of you have probably received three in one day. But how many of you have received an offer of $300 to close out your
credit card account? American Express decided to offer some of its customers $300 if they would give back their credit card. You could receive the $300 even if you hadn’t paid off your balance yet, as long as you agreed to give up your credit card.
Source: Aparajita Saha-Bubna and Lauren Pollock, “AmEx Offers Some Holders $300 to Pay and Leave,” Wall Street Journal Online (February 23, 2009).
What are the relevant costs that American Express would need to know in order to determine to whom to make this offer? (Go to WileyPLUS for this answer and additional questions.)
Tina Spruce/iStockphoto
Service Company Insight
Types of Incremental Analysis
A number of different types of decisions involve incremental analysis. The more common types of decisions are whether to:
1. Accept an order at a special price.
2. Make or buy component parts or fi nished products.
3. Sell products or process them further.
4. Repair, retain, or replace equipment.
5. Eliminate an unprofi table business segment or product.
We consider each of these types of decisions in the following pages.
Owen T Corporation is comparing two different options. The company currently follows Option 1, with revenues of $80,000 per year, maintenance expenses of $5,000 per year, and operating expenses of $38,000 per year. Option 2 provides revenues of $80,000 per year, maintenance expenses of $12,000 per year, and operating expenses of $32,000 per year. Option 1 employs a piece of equipment that was upgraded 2 years ago at a cost of $22,000. If Option 2 is chosen, it will free up resources that will increase revenues by $3,000. Complete the following table to show the change in income from choosing Option 2 versus Option 1. Designate any sunk costs with an “S.”
DO IT! 1 Incremental Analysis

Decisions Involving Incremental Analysis 1151
Net Income Increase Option 1 Option 2 (Decrease) Sunk (S)
Revenues $80,000 $80,000 $ 0Maintenance expenses 5,000 12,000 (7,000)Operating expenses 38,000 32,000 6,000Equipment upgrade 22,000 0 0 SOpportunity cost 3,000 0 3,000
$ 2,000
Solution
Net Income Increase Option 1 Option 2 (Decrease) Sunk (S)
RevenuesMaintenance expensesOperating expensesEquipment upgradeOpportunity cost
Action Plan✔ Past costs that cannot
be changed are sunk costs.
✔ Benefi ts lost by choosing one option over another are opportunity costs.
Related exercise material: BE26-1, BE26-2, E26-1, and DO IT! 26-1.
2 Analyze the relevant costs in various decisions involving incremental analysis.
LEARNING OBJECTIVE
Special Price Order
Sometimes a company has an opportunity to obtain additional business if it is willing to make a price concession to a specifi c customer. To illustrate, assume that Sunbelt Company produces 100,000 Smoothie blenders per month, which is 80% of plant capacity. Variable manufacturing costs are $8 per unit. Fixed manufacturing costs are $400,000, or $4 per unit. The Smoothie blenders are normally sold directly to retailers at $20 each. Sunbelt has an offer from Kensington Co. (a foreign whole-saler) to purchase an additional 2,000 blenders at $11 per unit. Acceptance of the offer would not affect normal sales of the product, and the additional units can be manufactured without increasing plant capacity. What should management do? If management makes its decision on the basis of the total cost per unit of $12 ($8 variable 1 $4 fi xed), the order would be rejected because costs per unit ($12) exceed revenues per unit ($11) by $1 per unit. However, since the units can be produced within existing plant capacity, the special order will not increase fi xed costs. Let’s identify the relevant data for the decision. First, the variable manu-facturing costs increase $16,000 ($8 3 2,000). Second, the expected revenue increases $22,000 ($11 3 2,000). Thus, as shown in Illustration 26-4, Sunbelt increases its net income by $6,000 by accepting this special order.
Helpful HintThis is a good example of different costs for different purposes. In the long run all costs are relevant, but for this decision only costs that change are relevant.
Illustration 26-4Incremental analysis—accepting an order at a special price
Formulas Data Review ViewPage LayoutInsert
1
2
3
4
5
AP18 fx
CB D
RevenuesCostsNet income
$22,00016,000
$ 6,000
$00
$0
$ 22,000 (16,000)$ 6,000
Home
Reject Order Accept OrderNet Income
Increase (Decrease)
Incremental Analysis - Accepting an order at a special price.xls

1152 26 Incremental Analysis and Capital Budgeting
Two points should be emphasized. First, we assume that sales of the product in other markets would not be affected by this special order. If other sales were affected, then Sunbelt would have to consider the lost sales in making the decision. Second, if Sunbelt is operating at full capacity, it is likely that the spe-cial order would be rejected. Under such circumstances, the company would have to expand plant capacity. In that case, the special order would have to absorb these additional fi xed manufacturing costs, as well as the variable manufacturing costs.
Cobb Company incurs costs of $28 per unit ($18 variable and $10 fi xed) to make a prod-uct that normally sells for $42. A foreign wholesaler offers to buy 5,000 units at $25 each. The special order results in additional shipping costs of $1 per unit. Compute the increase or decrease in net income Cobb realizes by accepting the special order, assuming Cobb has excess operating capacity. Should Cobb Company accept the special order?
Solution
DO IT! 2a Special Orders
Net Income Reject Accept Increase (Decrease)
Revenues $–0– $125,000* $125,000Costs –0– 95,000** (95,000)
Net income $–0– $ 30,000 $ 30,000
*5,000 3 $25**(5,000 3 $18) 1 (5,000 3 $1)
The analysis indicates net income increases by $30,000; therefore, Cobb Company should accept the special order.
Related exercise material: BE26-3, E26-2, E26-3, and DO IT! 26-2a.
Action Plan✔ Identify all revenues
that change as a result of accepting the order.
✔ Identify all costs that change as a result of accepting the order, and net this amount against the change in revenues.
Make or Buy
When a manufacturer assembles component parts in producing a fi nished product, management must decide whether to make or buy the components. The decision to buy parts or services is often referred to as outsourcing. For example, as dis-cussed in the Feature Story, a company such as Method Products may either make or buy the soaps used in its products. Similarly, Hewlett-Packard Corpora-tion may make or buy the electronic circuitry, cases, and printer heads for its printers. Boeing recently sold some of its commercial aircraft factories in an effort to cut production costs and focus on engineering and fi nal assembly rather than manufacturing. The decision to make or buy components should be made on the basis of incremental analysis. Baron Company makes motorcycles and scooters. It incurs the following annual costs in producing 25,000 ignition switches for scooters.
Illustration 26-5Annual product cost data Direct materials $ 50,000
Direct labor 75,000Variable manufacturing overhead 40,000Fixed manufacturing overhead 60,000Total manufacturing costs $225,000
Total cost per unit ($225,000 4 25,000) $9.00
Instead of making its own switches, Baron Company might purchase the ignition switches from Ignition, Inc. at a price of $8 per unit. What should man-agement do?

Decisions Involving Incremental Analysis 1153
At fi rst glance, it appears that management should purchase the ignition switches for $8 rather than make them at a cost of $9. However, a review of oper-ations indicates that if the ignition switches are purchased from Ignition, Inc., all of Baron’s variable costs but only $10,000 of its fi xed manufacturing costs will be eliminated (avoided). Thus, $50,000 of the fi xed manufacturing costs remain if the ignition switches are purchased. The relevant costs for incremental analysis, therefore, are as shown below. Illustration 26-6
Incremental analysis—make or buy
Formulas Data Review ViewPage LayoutInsert
AP18
CB D
Direct materialsDirect laborVariable manufacturing costsFixed manufacturing costsPurchase price (25,000 � $8) Total annual cost
$ 000
50,000200,000
$250,000
$ 50,00075,00040,00060,000
0$225,000
$ 50,000 75,000 40,000 10,000
(200,000)$ (25,000)
Home
1
2
3
4
5
6
7
8
fx
Make BuyNet Income
Increase (Decrease)
Incremental Analysis - Make or buy.xls
This analysis indicates that Baron Company incurs $25,000 of additional costs by buying the ignition switches rather than making them. Therefore, Baron should continue to make the ignition switches even though the total manufacturing cost is $1 higher per unit than the purchase price. The primary cause of this result is that, even if the company purchases the ignition switches, it will still have fi xed costs of $50,000 to absorb.
OPPORTUNITY COST
The foregoing make-or-buy analysis is complete only if it is assumed that the productive capacity used to make the ignition switches cannot be converted to another purpose. If there is an opportunity to use this productive capacity in some other manner, then this opportunity cost must be considered. As indicated earlier, opportunity cost is the potential benefi t that may be obtained by following an alternative course of action. To illustrate, assume that through buying the switches, Baron Company can use the released productive capacity to generate additional income of $38,000 from producing a different product. This lost income is an additional cost of con-tinuing to make the switches in the make-or-buy decision. This opportunity cost is therefore added to the “Make” column for comparison. As shown in Illustration 26-7, it is now advantageous to buy the ignition switches. The company’s income would increase by $13,000.
ETHICS NOTE
In the make-or-buy decision, it is important for management to take into account the social impact of its choice. For instance, buying may be the most economically feasible solution, but such action could result in the closure of a manufacturing plant that employs many good workers.
Illustration 26-7Incremental analysis—make or buy, with opportunity cost
Formulas Data Review ViewPage LayoutInsert
AP18 fx
CB D
Total annual costOpportunity costTotal cost
$250,0000
$250,000
$225,00038,000
$263,000
$(25,000)38,000
$ 13,000
Home
1
2
3
4
5
Make BuyNet Income
Increase (Decrease)
Incremental Analysis - Make or buy with opportunity cost.xls

1154 26 Incremental Analysis and Capital Budgeting
The qualitative factors in this decision include the possible loss of jobs for employees who produce the ignition switches. In addition, management must assess the supplier’s ability to satisfy the company’s quality control standards at the quoted price per unit.
Giving Away the Store?
In an earlier chapter, we discussed Amazon.com’s incredible growth. How-ever, some analysts have questioned whether some of the methods that Amazon uses to increase its sales make good business sense. For
example, a few years ago, Amazon initiated a “Prime” free-shipping subscription program. For a $79 fee per year, Amazon’s customers get free shipping on as many goods as they want to buy. At the time, CEO Jeff Bezos promised that the program would be costly in the short-term but benefi t
the company in the long-term. Six years later, it was true that Amazon’s sales had grown considerably. It was also estimated that its Prime customers buy two to three times as much as non-Prime customers. But, its shipping costs rose from 2.8% of sales to 4% of sales, which is remarkably similar to the drop in its gross margin from 24% to 22.3%. Perhaps even less easy to justify is a proposal by Mr. Bezos to start providing a free Internet movie-streaming service to Amazon’s Prime customers. Perhaps some incremental analysis is in order?
Source: Martin Peers, “Amazon’s Prime Numbers,” Wall Street Journal Online (February 3, 2011).
What are the relevant revenues and costs that Amazon should consider relative to the decision whether to offer the Prime free-shipping subscription? (Go to WileyPLUS for this answer and additional questions.)
Service Company Insight Amazon.com
iStockphoto
Juanita Company must decide whether to make or buy some of its components for the appliances it produces. The costs of producing 166,000 electrical cords for its appliances are as follows.
Direct materials $90,000 Variable overhead $32,000Direct labor $20,000 Fixed overhead $24,000
Instead of making the electrical cords at an average cost per unit of $1.00 ($166,000 4 166,000), the company has an opportunity to buy the cords at $0.90 per unit. If the company purchases the cords, all variable costs and one-fourth of the fi xed costs are eliminated.
(a) Prepare an incremental analysis showing whether the company should make or buy the electrical cords. (b) Will your answer be different if the released productive capacity will generate additional income of $5,000?
Solution
DO IT! 2b Make or Buy
(a) Net Income Make Buy Increase (Decrease)
Direct materials $ 90,000 $ –0– $ 90,000Direct labor 20,000 –0– 20,000Variable manufacturing costs 32,000 –0– 32,000Fixed manufacturing costs 24,000 18,000* 6,000Purchase price –0– 149,400** (149,400)
Total cost $166,000 $167,400 $ (1,400)
*$24,000 3 .75 **166,000 3 $0.90
This analysis indicates that Juanita Company will incur $1,400 of additional costs if it buys the electrical cords rather than making them.
Action Plan✔ Look for the costs that
change.✔ Ignore the costs that
do not change.✔ Use the format in
the chapter for your answer.
✔ Recognize that opportunity cost can make a difference.

Decisions Involving Incremental Analysis 1155
(b) Net Income Make Buy Increase (Decrease)
Total cost $166,000 $167,400 $(1,400)Opportunity cost 5,000 –0– 5,000
Total cost $171,000 $167,400 $ 3,600
Yes, the answer is different. The analysis shows that net income increases by $3,600 if Juanita Company purchases the electrical cords rather than making them.
Related exercise material: BE26-4, E26-4, and DO IT! 26-2b.
Sell or Process Further
Many manufacturers have the option of selling products at a given point in the production cycle or continuing to process with the expectation of selling them at a later point at a higher price. For example, a bicycle manufacturer such as Trek could sell its bicycles to retailers either unassembled or assembled. A furniture manufacturer such as Ethan Allen could sell its dining room sets to furniture stores either unfi nished or fi nished. The sell-or-process-further decision should be made on the basis of incremental analysis. The basic decision rule is: Process further as long as the incremental revenue from such processing exceeds the incremental processing costs. Assume, for example, that Woodmasters Inc. makes tables. It sells unfi nished tables for $50. The cost to manufacture an unfi nished table is $35, computed as follows.
Illustration 26-8Per unit cost of unfi nished tableDirect materials $15
Direct labor 10Variable manufacturing overhead 6Fixed manufacturing overhead 4
Manufacturing cost per unit $35Helpful HintCurrent net income is known. Net income from processing further is an estimate. In making its decision, management could add a “risk” factor for the estimate.
Woodmasters currently has unused productive capacity that is expected to continue indefi nitely. Some of this capacity could be used to fi nish the tables and sell them at $60 per unit. For a fi nished table, direct materials will increase $2 and direct labor costs will increase $4. Variable manufacturing overhead costs will increase by $2.40 (60% of direct labor). No increase is anticipated in fi xed manufacturing overhead. Should the company sell the unfi nished tables, or should it process them further? The incremental analysis on a per unit basis is as follows.
Formulas Data Review ViewPage LayoutInsert
1
2
3
4
5
6
7
8
9
10
AP18 fx
CB D
Sales price per unitCost per unit Direct materials Direct labor Variable manufacturing overhead Fixed manufacturing overhead TotalNet income per unit
$60.00
17.0014.00
8.404.00
43.40$ 16.60
$50.00
15.0010.00
6.004.00
35.00$ 15.00
$10.00
(2.00)(4.00)(2.40)0.00
(8.40)$ 1.60
Home
Sell Unfinished Process FurtherNet Income
Increase (Decrease)
Incremental Analysis - Sell or process further.xls
Illustration 26-9Incremental analysis—sell or process further
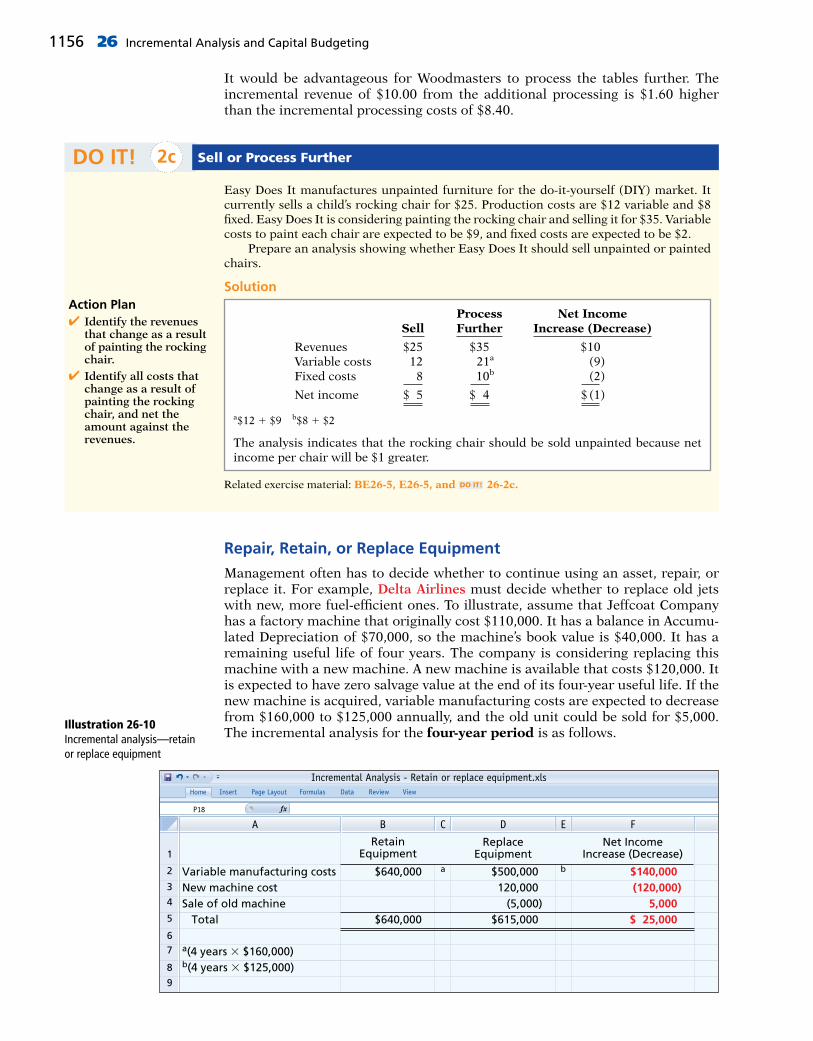
1156 26 Incremental Analysis and Capital Budgeting
It would be advantageous for Woodmasters to process the tables further. The incremental revenue of $10.00 from the additional processing is $1.60 higher than the incremental processing costs of $8.40.
Easy Does It manufactures unpainted furniture for the do-it-yourself (DIY) market. It currently sells a child’s rocking chair for $25. Production costs are $12 variable and $8 fi xed. Easy Does It is considering painting the rocking chair and selling it for $35. Variable costs to paint each chair are expected to be $9, and fi xed costs are expected to be $2. Prepare an analysis showing whether Easy Does It should sell unpainted or painted chairs.
Solution
DO IT! 2c Sell or Process Further
Process Net Income Sell Further Increase (Decrease)
Revenues $25 $35 $10Variable costs 12 21a (9)Fixed costs 8 10b (2)
Net income $ 5 $ 4 $ (1)
a$12 1 $9 b$8 1 $2
The analysis indicates that the rocking chair should be sold unpainted because net income per chair will be $1 greater.
Related exercise material: BE26-5, E26-5, and DO IT! 26-2c.
Action Plan✔ Identify the revenues
that change as a result of painting the rocking chair.
✔ Identify all costs that change as a result of painting the rocking chair, and net the amount against the revenues.
Repair, Retain, or Replace Equipment
Management often has to decide whether to continue using an asset, repair, or replace it. For example, Delta Airlines must decide whether to replace old jets with new, more fuel-effi cient ones. To illustrate, assume that Jeffcoat Company has a factory machine that originally cost $110,000. It has a balance in Accumu-lated Depreciation of $70,000, so the machine’s book value is $40,000. It has a remaining useful life of four years. The company is considering replacing this machine with a new machine. A new machine is available that costs $120,000. It is expected to have zero salvage value at the end of its four-year useful life. If the new machine is acquired, variable manufacturing costs are expected to decrease from $160,000 to $125,000 annually, and the old unit could be sold for $5,000. The incremental analysis for the four-year period is as follows.
Formulas Data Review ViewPage LayoutInsert
1
2
3
4
5
67
8
9
AP18 fx
C E FB D
Variable manufacturing costsNew machine costSale of old machine Total
a(4 years � $160,000)b(4 years � $125,000)
$500,000 120,000
(5,000)$615,000
$640,000
$640,000
$140,000 (120,000)
5,000 $ 25,000
Home
RetainEquipment
ReplaceEquipment
Net IncomeIncrease (Decrease)
a b
Incremental Analysis - Retain or replace equipment.xls
Illustration 26-10Incremental analysis—retain or replace equipment

Decisions Involving Incremental Analysis 1157
In this case, it would be to the company’s advantage to replace the equip-ment. The lower variable manufacturing costs due to replacement more than offset the cost of the new equipment. Note that the $5,000 received from the sale of the old machine is relevant to the decision because it will only be received if the company chooses to replace its equipment. In general, any trade-in allowance or cash disposal value of existing assets is relevant to the decision to retain or replace equipment. One other point should be mentioned regarding Jeffcoat’s decision: The book value of the old machine does not affect the decision. Book value is a sunk cost, which is a cost that cannot be changed by any present or future decision. Sunk costs are not relevant in incremental analysis. In this example, if the asset is retained, book value will be depreciated over its remaining useful life. Or, if the new unit is acquired, book value will be recognized as a loss of the current period. Thus, the effect of book value on cumulative future earnings is the same regardless of the replacement decision.
Rochester Roofi ng is faced with a decision. The company relies very heavily on the use of its 60-foot extension lift for work on large homes and commercial properties. Last year, the company spent $60,000 refurbishing the lift. It has just determined that another $40,000 of repair work is required. Alternatively, Rochester Roofi ng has found a newer used lift that is for sale for $170,000. The company estimates that both the old and new lifts would have useful lives of 6 years. However, the new lift is more effi cient and thus would reduce operating expenses by about $20,000 per year. The company could also rent out the new lift for about $2,000 per year. The old lift is not suitable for rental. The old lift could currently be sold for $25,000 if the new lift is purchased. Prepare an incremental analysis that shows whether the company should repair or replace the equipment.
Solution
DO IT! 2d Repair or Replace Equipment
Retain Replace Net Income Equipment Equipment Increase (Decrease)
Operating expenses $120,000* $120,000Repair costs 40,000 40,000Rental revenue $ (12,000)** 12,000New machine cost 170,000 (170,000)Sale of old machine (25,000) 25,000
Total cost $160,000 $133,000 $ 27,000*(6 years 3 $20,000)**(6 years 3 $2,000)
The analysis indicates that purchasing the new machine would increase net income for the 6-year period by $27,000.
Related exercise material: BE26-6, E26-6, and DO IT! 26-2d.
Action Plan✔ Those costs and
revenues that differ across the alternatives are relevant to the decision.
✔ Past costs that cannot be changed are sunk costs.
Eliminate an Unprofi table Segment or Product
Management sometimes must decide whether to eliminate an unprofi table business segment or product. For example, in recent years, many airlines quit servicing certain cities or cut back on the number of fl ights. Goodyear quit producing several brands in the low-end tire market. Again, the key is to focus on the relevant costs—the data that change under the alternative courses of action. To illus-trate, assume that Venus Company manufactures tennis racquets in three models: Pro, Master, and Champ. Pro and Master are profi table lines. Champ (highlighted in red in the following table) operates at a loss. Condensed income statement data are as follows.

1158 26 Incremental Analysis and Capital Budgeting
Illustration 26-11Segment income data Pro Master Champ Total
Sales $800,000 $300,000 $100,000 $1,200,000Variable costs 520,000 210,000 90,000 820,000
Contribution margin 280,000 90,000 10,000 380,000Fixed costs 80,000 50,000 30,000 160,000
Net income $200,000 $ 40,000 $ (20,000) $ 220,000
Helpful HintA decision to discontinue a segment based solely on the bottom line—net loss—is inappropriate.
You might think that total net income will increase by $20,000 to $240,000 if the unprofi table Champ line of racquets is eliminated. However, net income may actually decrease if the Champ line is discontinued. The reason is that if the fi xed costs allocated to the Champ racquets cannot be eliminated, they will have to be absorbed by the other products. To illustrate, assume that the $30,000 of fi xed costs applicable to the unprofi table segment are allocated 2⁄3 to the Pro model and 1⁄3 to the Master model if the Champ model is eliminated. Fixed costs will increase to $100,000 ($80,000 1 $20,000) in the Pro line and to $60,000 ($50,000 1 $10,000) in the Master line. The revised income statement is as follows.
Total net income has decreased $10,000 ($220,000 2 $210,000). This result is also obtained in the following incremental analysis of the Champ racquets.
Illustration 26-12Income data after eliminating unprofi table product line
Pro Master Total
Sales $800,000 $300,000 $1,100,000Variable costs 520,000 210,000 730,000
Contribution margin 280,000 90,000 370,000Fixed costs 100,000 60,000 160,000
Net income $180,000 $ 30,000 $ 210,000
The loss in net income is attributable to the Champ line’s contribution margin ($10,000) that will not be realized if the segment is discontinued. In deciding on the future status of an unprofi table segment, management should consider the effect of elimination on related product lines. It may be possible for continuing product lines to obtain some or all of the sales lost by the discontinued product line. In some businesses, services or products may be linked—for example, free checking accounts at a bank, or coffee at a donut shop. In addition, management should consider the effect of eliminating the product line on employees who may have to be discharged or retrained.
Illustration 26-13Incremental analysis— eliminating unprofi table segment with no reduction in fi xed costs
Formulas Data Review ViewPage LayoutInsert
1
2
3
4
5
6
7
AP18 fx
C DB
SalesVariable costsContribution marginFixed costsNet income
$ 0 0 0
30,000 $(30,000)
$100,000 90,000 10,000 30,000
$(20,000)
$(100,000) 90,000
(10,000)0
$ (10,000)
Home
Continue EliminateNet Income
Increase (Decrease)
Incremental Analysis - Eliminating an unprofitable segment.xls

Annual Rate of Return and Cash Payback 1159
Lambert, Inc. manufactures several types of accessories. For the year, the knit hats and scarves line had sales of $400,000, variable expenses of $310,000, and fi xed expenses of $120,000. Therefore, the knit hats and scarves line had a net loss of $30,000. If Lambert eliminates the knit hats and scarves line, $20,000 of fi xed costs will remain. Prepare an analysis showing whether the company should eliminate the knit hats and scarves line.
Solution
DO IT! 2e Unprofi table Segments
Net Income Continue Eliminate Increase (Decrease)
Sales $400,000 $ 0 $(400,000)Variable costs 310,000 0 310,000Contribution margin 90,000 0 (90,000)Fixed costs 120,000 20,000 100,000
Net income $ (30,000) $(20,000) $ 10,000
The analysis indicates that Lambert should eliminate the knit hats and scarves line because net income will increase $10,000.
Related exercise material: BE26-7, E26-7, E26-8, and DO IT! 26-2e.
Action Plan✔ Identify the revenues
that change as a result of eliminating a product line.
✔ Identify all costs that change as a result of eliminating a product line, and net the amount against the revenues.
3 Contrast annual rate of return and cash payback in capital budgeting.
Capital Budgeting
Individuals make capital expenditures when they buy a new home, car, or television set. Similarly, businesses make capital expenditures when they modernize plant facilities or expand operations. Companies like Holland America Line must constantly determine how to invest their resources. As another example, Dell announced plans to spend $1 billion on data centers for cloud computing. In business, as for individuals, the amount of possible capital expenditures usually exceeds the funds available for such expenditures. Thus, the resources available must be allocated (budgeted) among the competing alternatives. The process of making capital expenditure decisions in business is known as capital budgeting. Capital budgeting involves choosing among various capital projects to fi nd the one(s) that will maximize a company’s return on its fi nancial investment.
Evaluation Process of Capital Budgeting
Many companies follow a carefully prescribed process in capital budgeting. At least once a year, top management requests proposals for projects from each department. A capital budgeting committee screens the proposals and submits its fi ndings to the offi cers of the company. The offi cers, in turn, select the projects they believe to be most worthy of funding. They submit this list to the board of directors. Ultimately, the directors approve the capital expenditure budget for the year. Illustration 26-14 (page 1160) shows this process.
LEARNING OBJECTIVE

1160 26 Incremental Analysis and Capital Budgeting
The involvement of top management and the board of directors in the pro-cess demonstrates the importance of capital budgeting decisions. These decisions often have a signifi cant impact on a company’s future profi tability. In fact, poor capital budgeting decisions have led to the bankruptcy of some companies. Accounting data are indispensable in assessing the probable effects of capital expenditures. To provide management with relevant data for capital budgeting decisions, you should be familiar with the quantitative techniques that may be used. The three most common techniques are (1) annual rate of return, (2) cash payback, and (3) discounted cash fl ow. We demonstrate each of these techniques in the following sections. To illustrate the three quantitative techniques, assume that Reno Company is considering an investment of $130,000 in new equipment. The new equipment is expected to last 5 years and have zero salvage value at the end of its useful life. Reno uses the straight-line method of depreciation for accounting purposes. The expected annual revenues and costs of the new product that will be produced from the investment are as follows.
1. Project proposals are requested from departments, plants, and authorized personnel.
2. Proposals are screened by a capital budget committee.
3. Officers determine which projects are worthy of funding.
4. Board of directors approves capital budget.
CapitalBudget
Are youworthy?
Illustration 26-14Corporate capital budget authorization process
Illustration 26-15Estimated annual net income from capital expenditure
Sales revenue $200,000Less: Costs and expenses Manufacturing costs (exclusive of depreciation) $132,000 Depreciation expenses ($130,000 4 5) 26,000 Selling and administrative expenses 22,000 180,000
Income before income taxes 20,000Income tax expense 7,000
Net income $ 13,000
Annual Rate of Return
The annual rate of return method is based directly on accrual accounting data rather than on cash fl ows. It indicates the profi tability of a capital expenditure by dividing expected annual net income by the average investment. Illustration 26-16 shows the formula for computing annual rate of return.
Expected annual net income is obtained from the projected income statement. Reno Company’s expected annual net income is $13,000. Average investment is derived from the following formula.
Illustration 26-16Annual rate of return formula Expected Annual
4 Average
5 Annual Rate
Net Income Investment of Return

Annual Rate of Return and Cash Payback 1161
The value at the end of useful life is the asset’s salvage value, if any. For Reno Company, average investment is $65,000 [($130,000 1 $0) 4 2]. The expected annual rate of return for Reno’s investment in new equipment is therefore 20%, computed as follows.
$13,000 4 $65,000 5 20%
Management then compares this annual rate of return with its required rate of return for investments of similar risk. The required rate of return is generally based on the company’s cost of capital. The cost of capital is the rate of return that management expects to pay on all borrowed and equity funds. The cost of capital is a company-wide (or sometimes a division-wide) rate; it does not relate to the cost of funding a specifi c project. The annual rate of return decision rule is: A project is acceptable if its rate of return is greater than management’s required rate of return. It is unac-ceptable when the reverse is true. When companies use the rate of return technique in deciding among several acceptable projects, the higher the rate of return for a given risk, the more attractive the investment. The principal advantages of this method are the simplicity of its calculation and management’s familiarity with the accounting terms used in the computa-tion. A major limitation of the annual rate of return method is that it does not consider the time value of money. For example, no consideration is given as to whether cash infl ows will occur early or late in the life of the investment. As explained in Appendix G, recognition of the time value of money can make a signifi cant difference between the future value and the discounted present value of an investment. A second disadvantage is that this method relies on accrual accounting numbers rather than expected cash fl ows.
Illustration 26-17Formula for computing average investment
Original Investment 1 Value at End of Useful Life 5 Average Investment
2
Watertown Paper Corporation is considering adding another machine for the manufac-ture of corrugated cardboard. The machine would cost $900,000. It would have an esti-mated life of 6 years and no salvage value. The company estimates that annual revenue would increase by $400,000 and that annual expenses excluding depreciation would increase by $190,000. It uses the straight-line method to compute depreciation expense. Management has a required rate of return of 9%. Compute the annual rate of return.
Solution
DO IT! 3a Annual Rate of Return
Revenues $400,000Less: Expenses (excluding depreciation) $190,000 Depreciation ($900,000/6 years) 150,000 340,000
Annual net income $ 60,000
Average investment 5 ($900,000 1 0)/2 5 $450,000.Annual rate of return 5 $60,000/$450,000 5 13.3%.
Since the annual rate of return (13.33%) is greater than Watertown’s required rate of return (9%), the proposed project is acceptable.
Related exercise material: BE26-9, E26-10, and DO IT! 26-3a.
Action Plan✔ Expected annual net
income 5 Annual revenues 2 Annual expenses (including depreciation expense).
✔ Annual rate of return 5Expected annual net income/Average investment.
✔ Average investment 5 (Original investment 1Value at end of useful life)/2.
Helpful HintA capital budgeting decision based on only one technique may be misleading. It is often wise to analyze the investment from a number of differ-ent perspectives.

1162 26 Incremental Analysis and Capital Budgeting
The cash payback period in this example is therefore 3.33 years, computed as follows.
$130,000 4 $39,000 5 3.33 years
Evaluation of the payback period is often related to the expected useful life of the asset. For example, assume that at Reno Company a project is unacceptable if the payback period is longer than 60% of the asset’s expected useful life. The 3.33-year payback period in this case is 67% of the project’s expected useful life. Thus, the project is unacceptable. It follows that when the payback method is used to decide among acceptable alternative projects, the shorter the payback period, the more attractive the investment. This is true for two reasons. First, the earlier the investment is recovered, the sooner the company can use the cash funds for other purposes. Second, the risk of loss from obsolescence and changed economic conditions is less in a shorter payback period. The preceding computation of the cash payback period assumes equal net annual cash fl ows in each year of the investment’s life. In many cases, this assump-tion is not valid. In the case of uneven net annual cash fl ows, the company deter-mines the cash payback period when the cumulative net cash fl ows from the investment equal the cost of the investment. To illustrate, assume that Chen Company proposes an investment in a new website that is estimated to cost $300,000. Illustration 26-20 shows the proposed investment cost, net annual cash fl ows, cumulative net cash fl ows, and the cash payback period.
Cash Payback
The cash payback technique identifi es the time period required to recover the cost of the capital investment from the net annual cash fl ow produced by the investment. Illustration 26-18 presents the formula for computing the cash pay-back period assuming equal annual cash fl ows.
Helpful HintNet annual cash fl ow can also be approximated by net cash provided by operating activities from the statement of cash fl ows.
Net annual cash fl ow is approximated by taking net income and adding back depreciation expense. Depreciation expense is added back because depreci-ation on the capital expenditure does not involve an annual outfl ow of cash. Accordingly, the depreciation deducted in determining net income must be added back to determine net annual cash fl ows. In the Reno Company example, net annual cash fl ow is $39,000, as shown below.
Illustration 26-19Computation of net annual cash fl ow
Net income $ 13,000Add: Depreciation expense 26,000
Net annual cash fl ow $39,000
Illustration 26-20Net annual cash fl ow schedule Year Investment Net Annual Cash Flow Cumulative Net Cash Flow
0 $300,000 1 $ 60,000 $ 60,000 2 90,000 150,000 3 90,000 240,000 4 120,000 360,000 5 100,000 460,000 Cash payback period 5 3.5 years
Illustration 26-18Cash payback formula Cost of Capital
4 Net Annual
5 Cash Payback
Investment Cash Flow Period

Annual Rate of Return and Cash Payback 1163
As Illustration 26-20 shows, at the end of year 3, cumulative net cash fl ow of $240,000 is less than the investment cost of $300,000. However, at the end of year 4, the cumulative net cash fl ow of $360,000 exceeds the investment cost. The net cash fl ow needed in year 4 to equal the investment cost is $60,000 ($300,000 2 $240,000). Assuming the net cash fl ow occurs evenly during year 4, we then divide this amount by the net annual cash fl ow in year 4 ($120,000) to determine the point during the year when the cash payback occurs. Thus, we get 0.50 ($60,000/$120,000), or half of the year, and the cash payback period is 3.5 years. The cash payback method may be useful as an initial screening tool. It may be the most critical factor in the capital budgeting decision for a company that desires a fast turnaround of its investment because of a weak cash position. Like the annual rate of return, cash payback is relatively easy to compute and understand. However, cash payback is not ordinarily the only basis for the capital budget-ing decision because it ignores the expected profi tability of the project. To illustrate, assume that Projects A and B have the same payback period, but Project A’s useful life is double that of Project B’s. Project A’s earning power, therefore, is twice as long as Project B’s. A further—and major—disadvantage of this tech-nique is that it ignores the time value of money.
Can You Hear Me—Better?
What’s better than 3G wireless service? 4G. But the question for wireless service providers is whether customers will be will-
ing to pay extra for that improvement. Verizon has spent billions on upgrading its networks in the past few years, so it now offers 4G LTE service to 97% of the nation. Verizon is hoping that its investment in 4G works out better than its $23 billion investment in its FIOS fi ber-wired network for TV and ultrahigh-speed Internet. One analyst estimates
that the present value of each FIOS customer is $800 less than the cost of the connection.
Sources: Martin Peers, “Investors: Beware Verizon’s Generation GAP,” Wall Street Journal Online (January 26, 2010); and Chad Fraser, “What Warren Buffett Sees in Verizon,” Investing Daily (May 30, 2014).
If customers are slow to initially adopt 4G, how might the conclusions of a cash payback analysis of Verizon’s 4G investment differ from a present value analysis? (Go to WileyPLUS for this answer and additional questions.)
Trevor Smith/iStockphoto
Management Insight Verizon
Watertown Paper Corporation is considering adding another machine for the manufac-ture of corrugated cardboard. The machine would cost $900,000. It would have an esti-mated life of 6 years and no salvage value. The company estimates that annual cash infl ows would increase by $400,000 and that annual cash outfl ows would increase by $190,000. Compute the cash payback period.
Solution
DO IT! 3b Cash Payback Period
Estimated annual cash infl ows $400,000Estimated annual cash outfl ows 190,000
Net annual cash fl ow $210,000
Cash payback period 5 $900,000/$210,000 5 4.3 years.
Related exercise material: BE26-8, E26-9, E26-10, and DO IT! 26-3b.
Action Plan✔ Annual cash infl ows 2
Annual cash outfl ows 5 Net annual cash fl ow.
✔ Cash payback period 5Cost of capital investment/Net annual cash fl ow.

1164 26 Incremental Analysis and Capital Budgeting
4 Distinguish between the net present value and internal rateof return methods.
LEARNING OBJECTIVE
The discounted cash fl ow technique is generally recognized as the best concep-tual approach to making capital budgeting decisions. This technique considers both the estimated total net cash fl ows from the investment and the time value of money. The expected total net cash fl ow consists of the sum of the annual net cash fl ows plus the estimated liquidation proceeds when the asset is sold for sal-vage at the end of its useful life. But because liquidation proceeds are generally immaterial, we ignore them in subsequent discussions. Two methods are used with the discounted cash fl ow technique: (1) net pres-ent value and (2) internal rate of return. Before we discuss the methods, we recommend that you examine Appendix G if you need a review of present value concepts.
Net Present Value Method
The net present value (NPV) method involves discounting net cash fl ows to their present value and then comparing that present value with the capital out-lay required by the investment. The difference between these two amounts is referred to as net present value (NPV). Company management determines what interest rate to use in discounting the future net cash fl ows. This rate, often referred to as the discount rate or required rate of return, is discussed in a later section. The NVP decision rule is this: A proposal is acceptable when net present value is zero or positive. At either of those values, the rate of return on the investment equals or exceeds the required rate of return. When net present value is negative, the project is unacceptable. Illustration 26-21 shows the net present value decision criteria.
Present Value ofNet Cash Flows
AcceptProposal
RejectProposal
Capital Investment
Net Present Value
Equals
Less
If zero or positive: If negative:
Illustration 26-21Net present value decision criteria

Net Present Value and Internal Rate of Return 1165
When making a selection among acceptable proposals, the higher the positive net present value, the more attractive the investment. The application of this method to two cases is described in the next two sections. In each case, we assume that the investment has no salvage value at the end of its useful life.
EQUAL NET ANNUAL CASH FLOWS
Reno Company’s net annual cash fl ows are $39,000. If we assume this amount is uniform over the asset’s useful life, we can compute the present value of the net annual cash fl ows by using the present value of an annuity of 1 for 5 payments (in Table 2, Appendix G). The computation at a rate of return of 12% is as follows.
The analysis of the proposal by the net present value method is shown in Illustra-tion 26-23.
Illustration 26-22Present value of net annual cash fl ows
Present Value at 12%
Discount factor for 5 periods 3.60478Present value of net annual cash fl ows: $39,000 3 3.60478 $140,586
Illustration 26-23Computation of net present value
12%
Present value of net annual cash fl ows $140,586Capital investment 130,000
Net present value $ 10,586
Illustration 26-24Computation of present value of unequal annual cash fl ows
Discount Factor Present Value
Assumed Net Year Annual Cash Flows 12% 12%
(1) (2) (1) 3 (2) 1 $ 54,000 .89286 $ 48,214 2 47,000 .79719 37,468 3 43,000 .71178 30,607 4 31,000 .63552 19,701 5 20,000 .56743 11,349
$195,000 $147,339
ETHICS NOTE
Discounted future cash fl ows may not take into account all of the important considerations needed to make an informed capital budgeting decision. Other issues, for example, could include worker safety, product quality, and environmental impact.
The proposed capital expenditure is acceptable at a required rate of return of 12% because the net present value is positive.
UNEQUAL NET ANNUAL CASH FLOWS
When net annual cash fl ows are unequal, we cannot use annuity tables to calcu-late their present value. Instead, we use tables showing the present value of a single future amount for each net annual cash fl ow. To illustrate, assume that Reno Company management expects the same aggregate net annual cash fl ow ($195,000) over the life of the investment. But because of a declining market demand for the new product over the life of the equipment, the net annual cash fl ows are higher in the early years and lower in the later years. The present value of the net annual cash fl ows is calculated as follows using Table 1 in Appendix G.
Helpful HintThe ABC Co. expects equal net annual cash fl ows over an asset’s 5-year useful life. To determine present values if management wants (1) a 12% return or (2) a 15% return, useTable 2. The factors are (1) 3.60478 and (2) 3.35216.

1166 26 Incremental Analysis and Capital Budgeting
Therefore, the analysis of the proposal by the net present value method is as follows.
In this example, the present value of the net annual cash fl ows is greater than the $130,000 capital investment. Thus, the project is acceptable at a 12% required rate of return. The difference between the present values using the 12% rate under equal net annual cash fl ows ($140,586) and unequal net annual cash fl ows ($147,339) is due to the pattern of the net cash fl ows.
Internal Rate of Return Method
The internal rate of return method differs from the net present value method in that it fi nds the interest yield of the potential investment. The internal rate of return (IRR) is the interest rate that will cause the present value of the pro-posed capital expenditure to equal the present value of the expected net annual cash fl ows. Because it recognizes the time value of money, the internal rate of return method is (like the NPV method) a discounted cash fl ow technique. The determination of the internal rate of return involves two steps.
Step 1. Compute the internal rate of return factor. The formula for this factor is as follows.
The computation for Reno Company, assuming equal net annual cash fl ows,2 is:
$130,000 4 $39,000 5 3.3333
2When net annual cash fl ows are equal, the internal rate of return factor is the same as the cash payback period.
12%
Present value of net annual cash fl ows $147,339Capital investment 130,000
Net present value $ 17,339
Illustration 26-25Analysis of proposal using net present value method
Illustration 26-26Formula for internal rate of return factor
Capital 4
Net Annual 5
Internal Rate Investment Cash Flow of Return Factor
Wide-Screen Capacity
Building a new factory to produce 60-inch TV screens can cost $4 bil-lion. But for more than 10 years, manufacturers of these screens have
continued to build new plants. By building so many plants, they have expanded productive capacity at a rate that has exceeded the demand for big-screen TVs. In fact, during one recent year, the supply of big-screen TVs was estimated to exceed demand by 12%, rising to 16% in the future.
One state-of-the-art plant built by Sharp was estimated to be operating at only 50% of capacity. Experts say that the price of big-screen TVs will have to fall much further than they already have before demand may eventually catch up with productive capacity.
Source: James Simms, “Sharp’s Payoff Delayed,” Wall Street Journal Online (September 14, 2010).
What implications does the excess capacity have for the cash payback and net present value calculations of these investments? (Go to WileyPLUS for this answer and additional questions.)
Management Insight Sharp
Matjaz Boncina/iStockphoto

Net Present Value and Internal Rate of Return 1167
Step 2. Use the factor and the present value of an annuity of 1 table to fi nd the internal rate of return. Table 2 of Appendix G is used in this step. The inter-nal rate of return is the discount factor that is closest to the internal rate of return factor for the time period covered by the net annual cash fl ows. For Reno Company, the net annual cash fl ows are expected to continue for 5 years. Thus, it is necessary to read across the period-5 row in Table 2 to fi nd the discount factor. The row for 5 periods is reproduced below for your convenience.
In this case, the closest discount factor to 3.3333 is 3.35216, which represents an interest rate of approximately 15%. The rate of return can be further deter-mined by interpolation, but since we are using estimated net annual cash fl ows, such precision is seldom required. Once managers know the internal rate of return, they compare it to the com-pany’s required rate of return (the discount rate). The IRR decision rule is as follows: Accept the project when the internal rate of return is equal to or greater than the required rate of return. Reject the project when the inter-nal rate of return is less than the required rate of return. Illustration 26-27 below shows these relationships. Assuming the required rate of return is 10% for Reno Company, the project is acceptable because the 15% internal rate of return is greater than the required rate.
TABLE 2PRESENT VALUE OF AN ANNUITY OF 1
(n) Periods 5% 6% 7% 8% 9% 10% 11% 12% 15%
5 4.32948 4.21236 4.10020 3.99271 3.88965 3.79079 3.69590 3.60478 3.35216
The IRR method is widely used in practice. Most managers fi nd the internal rate of return easy to interpret.
Illustration 26-27Internal rate of return decision criteria
AcceptProposal
RejectProposal
Internal Rate ofReturn
RequiredRate of Return
Compared to
If equal toor greater than: If less than:

1168 26 Incremental Analysis and Capital Budgeting
Comparing Discounted Cash Flow Methods
Illustration 26-28 compares the two discounted cash fl ow methods—net present value and internal rate of return. When properly used, either method provides management with relevant quantitative data for making capital budgeting decisions.
Net Present Value Internal Rate of Return
1. Objective Compute net present value Compute internal rate of (a dollar amount). return (a percentage).
2. Decision rule If net present value is zero or If internal rate of return is positive, accept the equal to or greater than the proposal. required rate of return, If net present value is accept the proposal. negative, reject the If internal rate of return is proposal less than the required rate of return, reject the
proposal.
Illustration 26-28Comparison of discounted cash fl ow methods
Watertown Paper Corporation is considering adding another machine for the manufac-ture of corrugated cardboard. The machine would cost $900,000. It would have an esti-mated life of 6 years and no salvage value. The company estimates that annual cash infl ows would increase by $400,000 and that annual cash outfl ows would increase by $190,000. Management has a required rate of return of 9%.
(a) Calculate the net present value on this project, and discuss whether it should be accepted.
(b) Calculate the internal rate of return on this project, and discuss whether it should be accepted.
Solution
DO IT! 4 Discounted Cash Flow
(a) Estimated annual cash infl ows $400,000 Estimated annual cash outfl ows 190,000
Net annual cash fl ow $210,000
Cash Flow 9% Discount Factor Present Value
Present value of net annual cash fl ows $210,000 4.48592* $942,043 Capital investment 900,000
Net present value $ 42,043
*Table 2, Appendix G
Since the net present value is greater than zero, Watertown should accept the project.
(b) $900,000 4 210,000 5 4.285714. Using Table 2 of Appendix G and the factors that correspond with the six-period row, 4.285714 is between the factors for 10% and 11%. Since the project has an internal rate that is greater than 10% and the required rate of return is only 9%, Watertown should accept the project.
Related exercise material: BE26-11, BE26-12, E26-10, E26-11, E26-12, and DO IT! 26-4.
Action Plan✔ Compute net annual
cash fl ow: Estimated annual cash infl ows 2 Estimated annual cash outfl ows.
✔ Use the NPV technique to calculate the difference between net cash fl ows and the initial investment.
✔ Accept the project if the net present value is positive.
✔ Compute the IRR factor: Capital investment 4 Net annual cash fl ows.
✔ Look up the factor in the present value of an annuity table to fi nd the internal rate of return.
✔ Accept the project if the internal rate of return is equal to or greater than the required rate of return.

Review and Practice 1169
Describe management’s decision-making process and incremental analysis. Management’s decision-making process consists of (a) identifying the problem and assigning responsibility for the decision, (b) determin-ing and evaluating possible courses of action, (c) mak-ing the decision, and (d) reviewing the results of the decision. Incremental analysis identifi es fi nancial data that change under alternative courses of action. These data are relevant to the decision because they vary across the possible alternatives.
Analyze the relevant costs in various decisions involv-ing incremental analysis. The relevant information in accepting an order at a special price is the difference between the variable manufacturing costs to produce the special order and expected revenues. Any changes in fi xed costs, opportunity cost, or other incremental costs or savings (such as additional shipping) should be con-sidered. In a make-or-buy decision, the relevant costs are (a) the variable manufacturing costs that will be saved as well as changes to fi xed manufacturing costs, (b) the purchase price, and (c) opportunity cost.
The decision rule for whether to sell or process materials further is: Process further as long as the incremental revenue from processing exceeds the incremental processing costs. The relevant costs to be considered in determining whether equipment should be repaired, retained, or replaced are the effects on variable costs and the cost of the new equipment. Also, any disposal value of the existing asset must be considered.
1
2
In deciding whether to eliminate an unprofi table segment or product, the relevant costs are the vari-able costs that drive the contribution margin, if any, produced by the segment or product. Opportunity cost and reduction of fi xed expenses must also be considered.
Contrast annual rate of return and cash payback in capital budgeting. The annual rate of return is obtained by dividing expected annual net income by the average investment. The higher the rate of return, the more attractive the investment. The cash payback technique identifi es the time period to recover the cost of the investment. The formula is Cost of capital expen-diture divided by Estimated net annual cash fl ow equals Cash payback period. The shorter the payback period, the more attractive the investment.
Distinguish between the net present value and inter-nal rate of return methods. Under the net present value (NPV) method, compare the present value of future net cash fl ows with the capital investment to determine net present value. The NPV decision rule is: Accept the project if net present value is zero or positive. Reject the investment if net present value is negative.
Under the internal rate of return method, fi nd the interest yield of the potential investment. The IRR deci-sion rule is: Accept the project when the internal rate of return is equal to or greater than the required rate of return. Reject the project when the internal rate of return is less than the required rate.
3
4
LEARNING OBJECTIVES REVIEW
REVIEW AND PRACTICE
Annual rate of return method Determines the profi t-ability of a capital expenditure by dividing expected annual net income by the average investment. (p. 1160).
Capital budgeting The process of making capital expen-diture decisions in business. (p. 1159).
Cash payback technique Identifi es the time period required to recover the cost of a capital investment from the net annual cash fl ow produced by the invest-ment. (p. 1162).
Cost of capital The rate of return that management expects to pay on all borrowed and equity funds. (p. 1161).
Discounted cash fl ow technique Considers both the estimated total net cash fl ows from the investment and the time value of money. (p. 1164).
Incremental analysis The process of identifying the fi nancial data that change under alternative courses of action. (p. 1148).
Internal rate of return (IRR) The rate that will cause the present value of the proposed capital expenditure
to equal the present value of the expected net annual cash fl ows. (p. 1166).
Internal rate of return (IRR) method Finds the interest yield of the potential investment. (p. 1166).
Net present value (NPV) The difference that results when the original capital outlay is subtracted from the discounted net cash fl ows. (p. 1164).
Net present value (NPV) method Discounts net cash fl ows to their present value and then compares that present value to the capital outlay required by the investment. (p. 1164).
Opportunity cost The potential benefi t that may be obtained from following an alternative course of action. (p. 1149).
Relevant costs Those costs and revenues that differ across alternatives. (p. 1149).
Required rate of return The rate that is generally based on the company’s cost of capital. (p. 1161).
Sunk cost A cost that cannot be changed by any present or future decision. (p. 1149).
GLOSSARY REVIEW

1. Three of the steps in management’s decision-making process are (1) review results of decision, (2) deter-mine and evaluate possible courses of action, and (3) make the decision. The steps are prepared in the following order:(a) (1), (2), (3).(b) (3), (2), (1).(c) (2), (1), (3).(d) (2), (3), (1).
2. Incremental analysis is the process of identifying the fi nancial data that:(a) do not change under alternative courses of action.(b) change under alternative courses of action.(c) are mixed under alternative courses of action.(d) No correct answer is given.
3. It costs a company $14 of variable costs and $6 of fi xed costs to produce product Z200 that sells for $30. A foreign buyer offers to purchase 3,000 units at $18 each. If the special offer is accepted and produced with unused capacity, net income will:(a) decrease $6,000.(b) increase $6,000.(c) increase $12,000.(d) increase $9,000.
4. Jobart Company is currently operating at full capacity. It is considering buying a part from an outside supplier rather than making it in-house. If Jobart purchases the part, it can use the released productive capacity to generate additional income of $30,000 from produc-ing a different product. When conducting incremental analysis in this make-or-buy decision, the company should:(a) ignore the $30,000.(b) add $30,000 to other costs in the “Make” column.(c) add $30,000 to other costs in the “Buy” column.(d) subtract $30,000 from the other costs in the “Make”
column. 5. In a make-or-buy decision, relevant costs include:
(a) manufacturing costs that will be saved.(b) the purchase price of the units.(c) the opportunity cost.(d) All of the above.
6. The decision rule in a sell-or-process-further decision is: process further as long as the incremental revenue from processing exceeds:(a) incremental processing costs.(b) variable processing costs.(c) fi xed processing costs.(d) No correct answer is given.
7. Walton, Inc. makes an unassembled product that it currently sells for $55. Production costs are $20. Walton is considering assembling the product and selling it for $68. The cost to assemble the product is estimated at $12. What decision should Walton make?(a) Sell before assembly; net income per unit will be
$12 greater.
(LO 1)
(LO 1)
(LO 2)
(LO 2)
(LO 2)
(LO 2)
(LO 2)
(b) Sell before assembly; net income per unit will be $1 greater.
(c) Process further; net income per unit will be $13 greater.
(d) Process further; net income per unit will be $1 greater.
8. In a decision to retain or replace equipment, the book value of the old equipment is a (an):(a) opportunity cost.(b) sunk cost.(c) incremental cost.(d) marginal cost.
9. If an unprofi table segment is eliminated:(a) net income will always increase.(b) variable costs of the eliminated segment will have
to be absorbed by other segments.(c) fi xed costs allocated to the eliminated segment
will have to be absorbed by other segments.(d) net income will always decrease.
10. A segment of Hazard Inc. has the following data.
Sales $200,000Variable expenses 140,000Fixed expenses 100,000
If this segment is eliminated, what will be the effect on the remaining company? Assume that 50% of the fi xed expenses will be eliminated and the rest will be allocated to the segments of the remaining company.(a) $120,000 increase.(b) $10,000 decrease.(c) $50,000 increase.(d) $10,000 increase.
11. Which of the following is incorrect about the annual rate of return technique?(a) The calculation is simple.(b) The accounting terms used are familiar to man-
agement.(c) The timing of the cash infl ows is not considered.(d) The time value of money is considered.
12. What is a weakness of the cash payback approach?(a) It uses accrual-based accounting numbers.(b) It ignores the time value of money.(c) It ignores the useful life of alternative projects.(d) Both (b) and (c) are true.
13. A project should be accepted if its internal rate of return exceeds:(a) zero.(b) the rate of return on a government bond.(c) the company’s required rate of return.(d) the rate the company pays on borrowed funds.
14. A positive net present value means that the:(a) project’s rate of return is less than the cutoff rate.(b) project’s rate of return exceeds the required rate
of return.(c) project’s rate of return equals the required rate of
return.(d) project is unacceptable.
(LO 2)
(LO 2)
(LO 2)
(LO 3)
(LO 3)
(LO 4)
(LO 4)
PRACTICE MULTIPLE-CHOICE QUESTIONS
1170 26 Incremental Analysis and Capital Budgeting
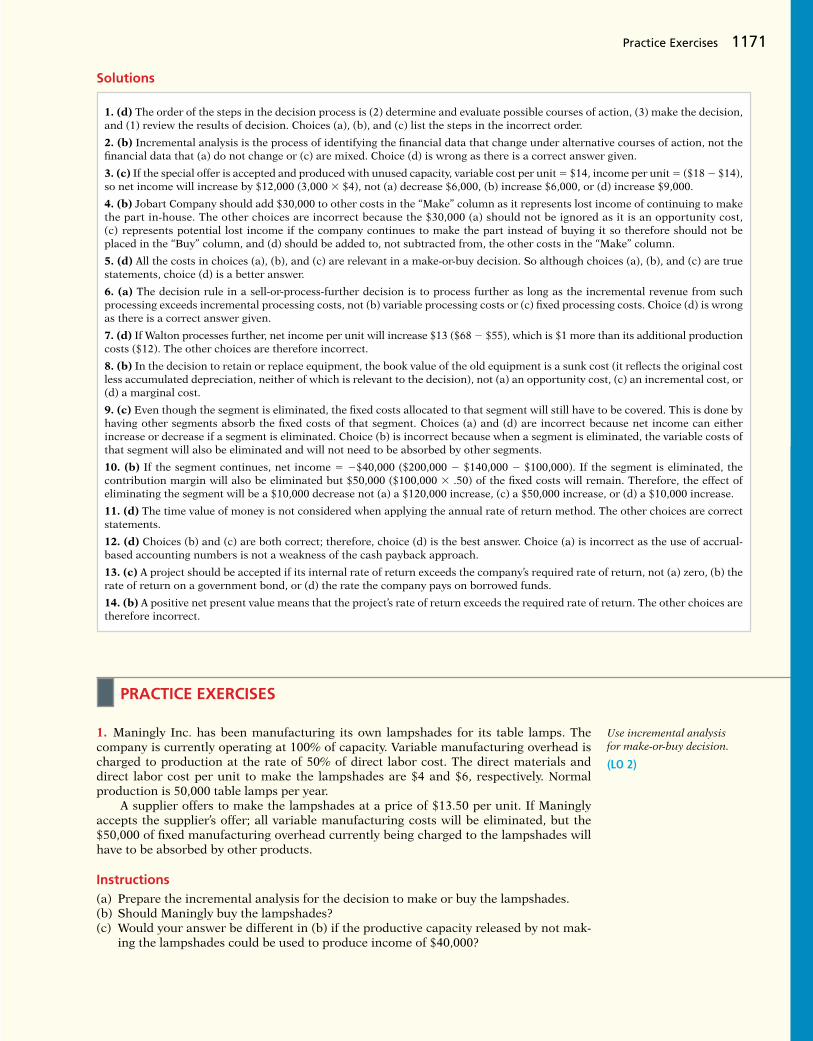
Practice Exercises 1171
Solutions
1. (d) The order of the steps in the decision process is (2) determine and evaluate possible courses of action, (3) make the decision, and (1) review the results of decision. Choices (a), (b), and (c) list the steps in the incorrect order.
2. (b) Incremental analysis is the process of identifying the fi nancial data that change under alternative courses of action, not the fi nancial data that (a) do not change or (c) are mixed. Choice (d) is wrong as there is a correct answer given.
3. (c) If the special offer is accepted and produced with unused capacity, variable cost per unit 5 $14, income per unit 5 ($18 2 $14), so net income will increase by $12,000 (3,000 3 $4), not (a) decrease $6,000, (b) increase $6,000, or (d) increase $9,000.
4. (b) Jobart Company should add $30,000 to other costs in the “Make” column as it represents lost income of continuing to make the part in-house. The other choices are incorrect because the $30,000 (a) should not be ignored as it is an opportunity cost, (c) represents potential lost income if the company continues to make the part instead of buying it so therefore should not be placed in the “Buy” column, and (d) should be added to, not subtracted from, the other costs in the “Make” column.
5. (d) All the costs in choices (a), (b), and (c) are relevant in a make-or-buy decision. So although choices (a), (b), and (c) are true statements, choice (d) is a better answer.
6. (a) The decision rule in a sell-or-process-further decision is to process further as long as the incremental revenue from such processing exceeds incremental processing costs, not (b) variable processing costs or (c) fi xed processing costs. Choice (d) is wrong as there is a correct answer given.
7. (d) If Walton processes further, net income per unit will increase $13 ($68 2 $55), which is $1 more than its additional production costs ($12). The other choices are therefore incorrect.
8. (b) In the decision to retain or replace equipment, the book value of the old equipment is a sunk cost (it refl ects the original cost less accumulated depreciation, neither of which is relevant to the decision), not (a) an opportunity cost, (c) an incremental cost, or (d) a marginal cost.
9. (c) Even though the segment is eliminated, the fi xed costs allocated to that segment will still have to be covered. This is done by having other segments absorb the fi xed costs of that segment. Choices (a) and (d) are incorrect because net income can either increase or decrease if a segment is eliminated. Choice (b) is incorrect because when a segment is eliminated, the variable costs of that segment will also be eliminated and will not need to be absorbed by other segments.
10. (b) If the segment continues, net income 5 2$40,000 ($200,000 2 $140,000 2 $100,000). If the segment is eliminated, the contribution margin will also be eliminated but $50,000 ($100,000 3 .50) of the fi xed costs will remain. Therefore, the effect of eliminating the segment will be a $10,000 decrease not (a) a $120,000 increase, (c) a $50,000 increase, or (d) a $10,000 increase.
11. (d) The time value of money is not considered when applying the annual rate of return method. The other choices are correct statements.
12. (d) Choices (b) and (c) are both correct; therefore, choice (d) is the best answer. Choice (a) is incorrect as the use of accrual-based accounting numbers is not a weakness of the cash payback approach.
13. (c) A project should be accepted if its internal rate of return exceeds the company’s required rate of return, not (a) zero, (b) the rate of return on a government bond, or (d) the rate the company pays on borrowed funds.
14. (b) A positive net present value means that the project’s rate of return exceeds the required rate of return. The other choices are therefore incorrect.
1. Maningly Inc. has been manufacturing its own lampshades for its table lamps. The company is currently operating at 100% of capacity. Variable manufacturing overhead is charged to production at the rate of 50% of direct labor cost. The direct materials and direct labor cost per unit to make the lampshades are $4 and $6, respectively. Normal production is 50,000 table lamps per year.
A supplier offers to make the lampshades at a price of $13.50 per unit. If Maningly accepts the supplier’s offer; all variable manufacturing costs will be eliminated, but the $50,000 of fi xed manufacturing overhead currently being charged to the lampshades will have to be absorbed by other products.
Instructions(a) Prepare the incremental analysis for the decision to make or buy the lampshades.(b) Should Maningly buy the lampshades?(c) Would your answer be different in (b) if the productive capacity released by not mak-
ing the lampshades could be used to produce income of $40,000?
Use incremental analysis for make-or-buy decision.
(LO 2)
PRACTICE EXERCISES

1172 26 Incremental Analysis and Capital Budgeting
1. (a)
Net Income Increase Make Buy (Decrease)
Direct materials (50,000 3 $4.00) $200,000 $ 0 $ 200,000Direct labor (50,000 3 $6.00) 300,000 0 300,000Variable manufacturing costs ($300,000 3 50%) 150,000 0 150,000Fixed manufacturing costs 50,000 50,000 0Purchase price (50,000 3 $13.50) 0 675,000 (675,000)
Total annual cost $700,000 $725,000 $ (25,000)
(b) No, Maningly should not purchase the lampshades. As indicated by the incremental analysis, it would cost the company $25,000 more to purchase the lampshades.
(c) Yes, by purchasing the lampshades, a total cost saving of $15,000 will result as shown below.
Net Income Increase Make Buy (Decrease)
Total annual cost (from (a)) $700,000 $725,000 $(25,000)Opportunity cost 40,000 0 40,000
Total cost $740,000 $725,000 $ 15,000
Solution
If sold now, the current machine would have a salvage value of $5,000. If operated for the remainder of its useful life, the current machine would have zero salvage value. The new machine is expected to have zero salvage value after 6 years.
Instructions
Should the current machine be replaced? (Ignore the time value of money.)
Current Machine New Machine
Original purchase cost $15,000 $25,000Accumulated depreciation 6,000 —Estimated operating costs 25,000 20,000Useful life 6 years 6 years
Solution
2. Net Income Retain Replace Increase Machine Machine (Decrease)
Operating costs $150,000* $120,000** $30,000New machine cost (depr.) 0 25,000 (25,000)Salvage value (old) 0 (5,000) 5,000
Total $150,000 $140,000 $10,000
*$25,000 3 6**$20,000 3 6
The current machine should be replaced. The incremental analysis shows that net income for the 6-year period will be $10,000 higher by replacing the current machine.
2. Tek Enterprises uses a computer to handle its sales invoices. Lately, business has been so good that it takes an extra 3 hours per night, plus every third Saturday, to keep up with the volume of sales invoices. Management is considering updating its computer with a faster model that would eliminate all of the overtime processing.
Use incremental analysis for retaining or replacing equipment.
(LO 2)
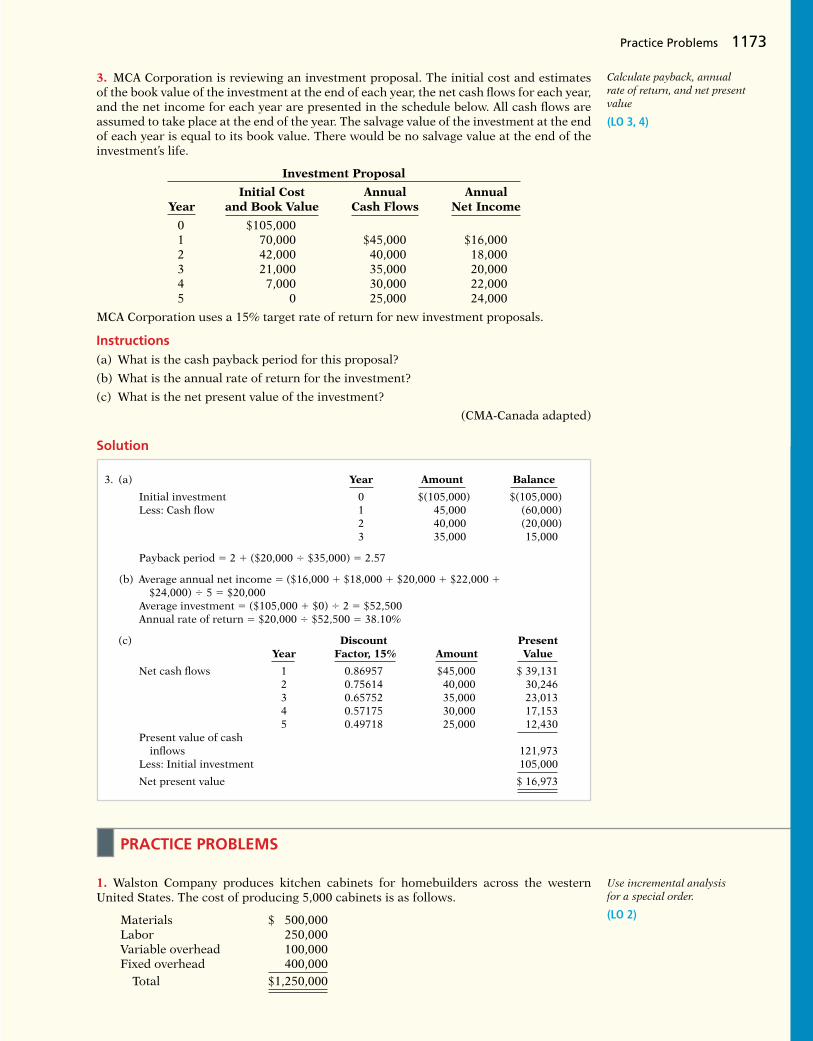
Practice Problems 1173
3. MCA Corporation is reviewing an investment proposal. The initial cost and estimates of the book value of the investment at the end of each year, the net cash fl ows for each year, and the net income for each year are presented in the schedule below. All cash fl ows are assumed to take place at the end of the year. The salvage value of the investment at the end of each year is equal to its book value. There would be no salvage value at the end of the investment’s life.
Investment Proposal
Initial Cost Annual Annual Year and Book Value Cash Flows Net Income
0 $105,000 1 70,000 $45,000 $16,000 2 42,000 40,000 18,000 3 21,000 35,000 20,000 4 7,000 30,000 22,000 5 0 25,000 24,000
MCA Corporation uses a 15% target rate of return for new investment proposals.
Instructions(a) What is the cash payback period for this proposal?
(b) What is the annual rate of return for the investment?
(c) What is the net present value of the investment?
(CMA-Canada adapted)
Calculate payback, annual rate of return, and net present value
(LO 3, 4)
Solution
3. (a) Year Amount Balance
Initial investment 0 $(105,000) $(105,000) Less: Cash fl ow 1 45,000 (60,000)
2 40,000 (20,000) 3 35,000 15,000
Payback period 5 2 1 ($20,000 4 $35,000) 5 2.57
(b) Average annual net income 5 ($16,000 1 $18,000 1 $20,000 1 $22,000 1 $24,000) 4 5 5 $20,000
Average investment 5 ($105,000 1 $0) 4 2 5 $52,500 Annual rate of return 5 $20,000 4 $52,500 5 38.10%
(c) Discount Present Year Factor, 15% Amount Value
Net cash fl ows 1 0.86957 $45,000 $ 39,131 2 0.75614 40,000 30,246 3 0.65752 35,000 23,013 4 0.57175 30,000 17,153 5 0.49718 25,000 12,430 Present value of cash infl ows 121,973 Less: Initial investment 105,000
Net present value $ 16,973
1. Walston Company produces kitchen cabinets for homebuilders across the western United States. The cost of producing 5,000 cabinets is as follows.
Materials $ 500,000Labor 250,000Variable overhead 100,000Fixed overhead 400,000 Total $1,250,000
Use incremental analysis for a special order.
(LO 2)
PRACTICE PROBLEMS

1174 26 Incremental Analysis and Capital Budgeting
Solution
1. (a) Relevant costs per unit would be:Materials $500,000/5,000 5 $100Labor 250,000/5,000 5 50Variable overhead 100,000/5,000 5 20Selling expenses 5
Total relevant cost per unit $175
Net Income Reject Order Accept Order Increase (Decrease)
Revenues $0 $165,000* $165,000Costs 0 175,000** (175,000)
Net income $0 $ (10,000) $ (10,000)
*$165 3 1,000; **$175 3 1,000
(b) Walston should reject the offer. The incremental benefi t of $165 per cabinet is less than the incremental cost of $175. By accepting the order, Walston’s net income would actually decline by $10,000.
Walston also incurs selling expenses of $20 per cabinet. Wellington Corp. has offered Walston $165 per cabinet for a special order of 1,000 cabinets. The cabinets would be sold to homebuilders in the eastern United States and thus would not confl ict with Walston’s current sales. Selling expenses per cabinet would be only $5 per cabinet. Walston has available capacity to do the work.
Instructions(a) Prepare an incremental analysis for the special order.
(b) Should Walston accept the special order? Why or why not?
2. Cornfi eld Company is considering a long-term capital investment project in laser equip-ment. This will require an investment of $280,000, and it will have a useful life of 5 years. Annual net income is expected to be $16,000 a year. Depreciation is computed by the straight-line method with no salvage value. The company’s cost of capital is 10%. (Hint: Assume cash fl ows can be computed by adding back depreciation expense.)
Compute annual rate of return, cash payback, and net present value.
(LO 3, 4)
Instructions(Round all computations to two decimal places unless directed otherwise.)
(a) Compute the cash payback period for the project.
(b) Compute the net present value for the project. (Round to nearest dollar.)
(c) Compute the annual rate of return for the project.
(d) Should the project be accepted? Why?
Solution
2. (a) $280,000 4 $72,000 ($16,000 1 $56,000) 5 3.89 years
(b) Present Value at 10%
Discount factor for 5 payments 3.79079
Present value of net cash fl ows: $72,000 3 3.79079 $272,937
Less: Capital investment 280,000
Negative net present value $ (7,063)
(c) $16,000 4 $140,000 ($280,000 4 2) 5 11.4%
(d) The annual rate of return of 11.4% is good. However, the cash payback period is 78% of the project’s useful life, and net present value is negative. The recommendation is to reject the project.

Brief Exercises 1175
Brief Exercises, Exercises, DO IT! Exercises, and Problems and many additional resources are available for practice in WileyPLUS
QUESTIONS
1. What steps are frequently involved in management’s decision-making process?
2. Your roommate, Anna Polis, contends that account-ing contributes to most of the steps in management’s decision-making process. Is your roommate correct? Explain.
3. “Incremental analysis involves the accumulation of information concerning a single course of action.” Do you agree? Why?
4. Sydney Greene asks for your help concerning the relevance of variable and fi xed costs in incremental analysis. Help Sydney with her problem.
5. What data are relevant in deciding whether to accept an order at a special price?
6. Emil Corporation has an opportunity to buy parts at $9 each that currently cost $12 to make. What manufacturing costs are relevant to this make-or-buy decision?
7. Defi ne the term “opportunity cost.” How may this cost be relevant in a make-or-buy decision?
8. What is the decision rule in deciding whether to sell a product or process it further?
9. Your roommate, Gale Dunham, is confused about sunk costs. Explain to your roommate the meaning of sunk costs and their relevance to a decision to retain or replace equipment.
10. Huang Inc. has one product line that is unprofi table. What circumstances may cause overall company net
income to be lower if the unprofi table product line is eliminated?
11. Describe the process a company may use in screening and approving the capital expenditure budget.
12. Your classmate, Mike Dawson, is confused about the factors that are included in the annual rate of return technique. What is the formula for this technique?
13. Sveta Pace is trying to understand the term “cost of capital.” Defi ne the term and indicate its relevance to the decision rule under the internal rate of return technique.
14. Tom Wells claims the formula for the cash payback technique is the same as the formula for the annual rate of return technique. Is Tom correct? What is the formula for the cash payback technique?
15. What are the advantages and disadvantages of the cash payback technique?
16. Two types of present value tables may be used with the discounted cash fl ow techniques. Identify the tables and the circumstance(s) when each table should be used.
17. What is the decision rule under the net present value method?
18. Identify the steps required in using the internal rate of return method.
19. El Cajon Company uses the internal rate of return method. What is the decision rule for this method?
BRIEF EXERCISES
BE26-1 The steps in management’s decision-making process are listed in random order below. Indicate the order in which the steps should be executed.
________ Make a decision. ________ Review results of the decision.
________ Identify the problem and assign ________ Determine and evaluate possible responsibility. courses of action.
BE26-2 Bogart Company is considering two alternatives. Alternative A will have revenues of $160,000 and costs of $100,000. Alternative B will have revenues of $180,000 and costs of $125,000. Compare Alternative A to Alternative B showing incremental revenues, costs, and net income.
BE26-3 At Bargain Electronics, it costs $30 per unit ($20 variable and $10 fi xed) to make an MP3 player that normally sells for $45. A foreign wholesaler offers to buy 3,000 units at $25 each. Bargain Electronics will incur special shipping costs of $3 per unit. Assuming that Bargain Electronics has excess operating capacity, indicate the net income (loss) Bargain Electronics would realize by accepting the special order.
BE26-4 Manson Industries incurs unit costs of $8 ($5 variable and $3 fi xed) in making an assembly part for its fi nished product. A supplier offers to make 10,000 of the assembly part at $6 per unit. If the offer is accepted, Manson will save all variable costs but no fi xed costs. Prepare an analysis showing the total cost saving, if any, Manson will realize by buying the part.
Identify the steps in management’s decision-making process.
(LO 1)
Determine incremental changes.
(LO 1)
Determine whether to accept a special order.
(LO 2)
Determine whether to make or buy a part.
(LO 2)

1176 26 Incremental Analysis and Capital Budgeting
BE26-5 Pine Street Inc. makes unfi nished bookcases that it sells for $62. Production costs are $36 variable and $10 fi xed. Because it has unused capacity, Pine Street is considering fi nishing the bookcases and selling them for $70. Variable fi nishing costs are expected to be $6 per unit with no increase in fi xed costs. Prepare an analysis on a per unit basis show-ing whether Pine Street should sell unfi nished or fi nished bookcases.
BE26-6 Bryant Company has a factory machine with a book value of $90,000 and a remaining useful life of 5 years. It can be sold for $30,000. A new machine is available at a cost of $400,000. This machine will have a 5-year useful life with no salvage value. The new machine will lower annual variable manufacturing costs from $600,000 to $500,000. Prepare an analysis showing whether the old machine should be retained or replaced.
BE26-7 Lisah, Inc., manufactures golf clubs in three models. For the year, the Big Bart line has a net loss of $10,000 from sales $200,000, variable costs $180,000, and fi xed costs $30,000. If the Big Bart line is eliminated, $20,000 of fi xed costs will remain. Prepare an analysis showing whether the Big Bart line should be eliminated.
BE26-8 Rihanna Company is considering purchasing new equipment for $450,000. It is expected that the equipment will produce net annual cash fl ows of $60,000 over its 10-year useful life. Annual depreciation will be $45,000. Compute the cash payback period.
BE26-9 Swift Oil Company is considering investing in a new oil well. It is expected that the oil well will increase annual revenues by $130,000 and will increase annual expenses by $70,000 including depreciation. The oil well will cost $490,000 and will have a $10,000 salvage value at the end of its 10-year useful life. Calculate the annual rate of return.
BE26-10 McKnight Company is considering two different, mutually exclusive capital expenditure proposals. Project A will cost $400,000, has an expected useful life of 10 years, a salvage value of zero, and is expected to increase net annual cash fl ows by $70,000. Project B will cost $310,000, has an expected useful life of 10 years, a salvage value of zero, and is expected to increase net annual cash fl ows by $55,000. A discount rate of 9% is appropriate for both projects. Compute the net present value of each project. Which project should be accepted?
BE26-11 Kanye Company is evaluating the purchase of a rebuilt spot-welding machine to be used in the manufacture of a new product. The machine will cost $176,000, has an estimated useful life of 7 years, a salvage value of zero, and will increase net annual cash fl ows by $35,000. What is its approximate internal rate of return?
BE26-12 Hsung Company accumulates the following data concerning a proposed capital investment: cash cost $215,000, net annual cash fl ows $40,000, and present value factor of cash infl ows for 10 years 5.65 (rounded). Determine the net present value, and indicate whether the investment should be made.
Determine whether to sell or process further.
(LO 2)
Determine whether to retain or replace equipment.
(LO 2)
Determine whether to eliminate an unprofi table segment.
(LO 2)
Compute the cash payback period for a capital investment.
(LO 3)
Compute annual rate of return.
(LO 3)
Compute net present value of an investment.
(LO 4)
Calculate internal rate of return.
(LO 4)
Compute net present value of an investment.
(LO 4)
Nathan T Corporation is comparing two different options. Nathan T cur-rently uses Option 1, with revenues of $65,000 per year, maintenance expenses of $5,000 per year, and operating expenses of $26,000 per year. Option 2 provides revenues of $60,000 per year, maintenance expenses of $5,000 per year, and operating expenses of $22,000 per year. Option 1 employs a piece of equipment which was upgraded 2 years ago at a cost of $17,000. If Option 2 is chosen, it will free up resources that will bring in an additional $4,000 of revenue. Complete the following table to show the change in income from choosing Option 2 versus Option 1. Designate Sunk costs with an “S.”
Determine incremental costs.
(LO 1)DO IT! 26-1
DO IT! Exercises

Net Income Increase Option 1 Option 2 (Decrease) Sunk (S)
RevenuesMaintenance expensesOperating expensesEquipment upgradeOpportunity cost
Maize Company incurs a cost of $35 per unit, of which $20 is variable, to make a product that normally sells for $58. A foreign wholesaler offers to buy 6,000 units at $30 each. Maize will incur additional costs of $4 per unit to imprint a logo and to pay for shipping. Compute the increase or decrease in net income Maize will realize by accept-ing the special order, assuming Maize has suffi cient excess operating capacity. Should Maize Company accept the special order?
Wilma Company must decide whether to make or buy some of its compo-nents. The costs of producing 60,000 switches for its generators are as follows.
Direct materials $30,000 Variable overhead $45,000Direct labor $42,000 Fixed overhead $60,000
Instead of making the switches at an average cost of $2.95 ($177,000 4 60,000), the com-pany has an opportunity to buy the switches at $2.70 per unit. If the company purchases the switches, all the variable costs and one-fourth of the fi xed costs will be eliminated. (a) Prepare an incremental analysis showing whether the company should make or buy the switches. (b) Would your answer be different if the released productive capacity will generate additional income of $34,000?
Mesa Verde manufactures unpainted furniture for the do-it-yourself (DIY) market. It currently sells a table for $75. Production costs are $40 variable and $10 fi xed. Mesa Verde is considering staining and sealing the table to sell it for $100. Variable costs to fi nish each table are expected to be $19, and fi xed costs are expected to be $3. Prepare an analysis showing whether Mesa Verde should sell unpainted or fi nished tables.
Darcy Roofi ng is faced with a decision. The company relies very heavily on the use of its 60-foot extension lift for work on large homes and commercial properties. Last year, Darcy Roofi ng spent $60,000 refurbishing the lift. It has just determined that another $40,000 of repair work is required. Alternatively, it has found a newer used lift that is for sale for $170,000. The company estimates that both lifts would have useful lives of 6 years. The new lift is more effi cient and thus would reduce operating expenses by about $20,000 per year. Darcy Roofi ng could also rent out the new lift for about $10,000 per year. The old lift is not suitable for rental. The old lift could currently be sold for $25,000 if the new lift is purchased. Prepare an incremental analysis showing whether the company should repair or replace the equipment.
Gator Corporation manufactures several types of accessories. For the year, the gloves and mittens line had sales of $500,000, variable expenses of $370,000, and fi xed expenses of $150,000. Therefore, the gloves and mittens line had a net loss of $20,000. If Gator eliminates the line, $38,000 of fi xed costs will remain. Prepare an analysis showing whether the company should eliminate the gloves and mittens line.
Wayne Company is considering a long-term investment project called ZIP. ZIP will require an investment of $120,000. It will have a useful life of 4 years and no salvage value. Annual revenues would increase by $80,000, and annual expenses (excluding depreciation) would increase by $41,000. Wayne uses the straight-line method to compute depreciation expense. The company’s required rate of return is 12%. Compute the annual rate of return.
Wayne Company is considering a long-term investment project called ZIP. ZIP will require an investment of $140,000. It will have a useful life of 4 years and no salvage value. Annual cash infl ows would increase by $80,000, and annual cash outfl ows would increase by $40,000. Compute the cash payback period.
Wayne Company is considering a long-term investment project called ZIP. ZIP will require an investment of $120,000. It will have a useful life of 4 years and no salvage value. Annual cash infl ows would increase by $80,000, and annual cash outfl ows would increase by $40,000. The company’s required rate of return is 12%. (a) Calculate the net present value on this project and discuss whether it should be accepted. (b) Calculate the internal rate of return on this project and discuss whether it should be accepted.
Evaluate special order.
(LO 2)
DO IT! 26-2a
Evaluate make-or-buy opportunity.
(LO 2)
DO IT! 26-2b
Sell or process further.
(LO 2)
DO IT! 26-2c
Repair or replace equipment.
(LO 2)
DO IT! 26-2d
Analyze whether to eliminate unprofi table segment.
(LO 2)
DO IT! 26-2e
Calculate annual rate of return.
(LO 3)
DO IT! 26-3a
Compute the cash payback period for an investment.
(LO 3)
DO IT! 26-3b
Calculate net present value and internal rate of return of an investment.
(LO 4)
DO IT! 26-4
DO IT! Exercises 1177

1178 26 Incremental Analysis and Capital Budgeting
EXERCISES
E26-1 As a study aid, your classmate Pascal Adams has prepared the following list of statements about decision-making and incremental analysis.
1. The fi rst step in management’s decision-making process is, “Determine and evaluate possible courses of action.”
2. The fi nal step in management’s decision-making process is to actually make the decision.3. Accounting’s contribution to management’s decision-making process occurs primarily
in evaluating possible courses of action and in reviewing the results.4. In making business decisions, management ordinarily considers only fi nancial informa-
tion because it is objectively determined.5. Decisions involve a choice among alternative courses of action.6. The process used to identify the fi nancial data that change under alternative courses of
action is called incremental analysis.7. Costs that are the same under all alternative courses of action sometimes affect the decision.8. When using incremental analysis, some costs will always change under alternative
courses of action, but revenues will not.9. Variable costs will change under alternative courses of action, but fi xed costs will not.
InstructionsIdentify each statement as true or false. If false, indicate how to correct the statement.
E26-2 Gruden Company produces golf discs which it normally sells to retailers for $7 each. The cost of manufacturing 20,000 golf discs is:
Materials $ 10,000Labor 30,000Variable overhead 20,000Fixed overhead 40,000
Total $100,000
Gruden also incurs 5% sales commission ($0.35) on each disc sold. McGee Corporation offers Gruden $4.80 per disc for 5,000 discs. McGee would sell the discs under its own brand name in foreign markets not yet served by Gruden. If Gruden accepts the offer, its fi xed overhead will increase from $40,000 to $46,000 due to the purchase of a new imprinting machine. No sales commission will result from the special order.
Instructions(a) Prepare an incremental analysis for the special order.(b) Should Gruden accept the special order? Why or why not?(c) What assumptions underlie the decision made in part (b)?
E26-3 Moonbeam Company manufactures toasters. For the fi rst 8 months of 2017, the company reported the following operating results while operating at 75% of plant capacity:
Sales (350,000 units) $4,375,000Cost of goods sold 2,600,000
Gross profi t 1,775,000Operating expenses 840,000
Net income $ 935,000
Cost of goods sold was 70% variable and 30% fi xed; operating expenses were 80% variable and 20% fi xed. In September, Moonbeam receives a special order for 15,000 toasters at $7.60 each from Luna Company of Ciudad Juarez. Acceptance of the order would result in an addi-tional $3,000 of shipping costs but no increase in fi xed costs.
Instructions(a) Prepare an incremental analysis for the special order.(b) Should Moonbeam accept the special order? Why or why not?
E26-4 Pottery Ranch Inc. has been manufacturing its own fi nials for its curtain rods. The company is currently operating at 100% of capacity, and variable manufacturing overhead is charged to production at the rate of 70% of direct labor cost. The direct materials and direct labor cost per unit to make a pair of fi nials are $4 and $5, respectively. Normal pro-duction is 30,000 curtain rods per year.
Analyze statements about decision-making and incremental analysis.
(LO 1)
Use incremental analysis for special-order decision.
(LO 2)
Use incremental analysis for special-order decision.
(LO 2)
Use incremental analysis for make-or-buy decision.
(LO 2)

Exercises 1179
A supplier offers to make a pair of fi nials at a price of $12.95 per unit. If Pottery Ranch accepts the supplier’s offer, all variable manufacturing costs will be eliminated, but the $45,000 of fi xed manufacturing overhead currently being charged to the fi nials will have to be absorbed by other products.
Instructions(a) Prepare the incremental analysis for the decision to make or buy the fi nials.(b) Should Pottery Ranch buy the fi nials?(c) Would your answer be different in (b) if the productive capacity released by not making
the fi nials could be used to produce income of $20,000?
E26-5 Anna Garden recently opened her own basketweaving studio. She sells fi nished baskets in addition to the raw materials needed by customers to weave baskets of their own. Anna has put together a variety of raw material kits, each including materials at various stages of completion. Unfortunately, owing to space limitations, Anna is unable to carry all varieties of kits originally assembled and must choose between two basic packages. The basic introductory kit includes undyed, uncut reeds (with dye included) for weav-ing one basket. This basic package costs Anna $16 and sells for $30. The second kit, called Stage 2, includes cut reeds that have already been dyed. With this kit the customer need only soak the reeds and weave the basket. Anna is able to produce the second kit by using the basic materials included in the fi rst kit and adding one hour of her own time, which she values at $18 per hour. Because she is more effi cient at cutting and dying reeds than her average customer, Anna is able to make two kits of the dyed reeds, in one hour, from one kit of undyed reeds. The Stage 2 kit sells for $36.
InstructionsDetermine whether Anna’s basketweaving studio should carry the basic introductory kit with undyed and uncut reeds or the Stage 2 kit with reeds already dyed and cut. Prepare an incremental analysis to support your answer.
E26-6 Johnson Enterprises uses a computer to handle its sales invoices. Lately, business has been so good that it takes an extra 3 hours per night, plus every third Saturday, to keep up with the volume of sales invoices. Management is considering updating its computer with a faster model that would eliminate all of the overtime processing.
Current Machine New Machine
Original purchase cost $15,000 $25,000Accumulated depreciation $ 6,000 —Estimated annual operating costs $25,000 $20,000Remaining useful life 5 years 5 years
If sold now, the current machine would have a salvage value of $6,000. If operated for the remainder of its useful life, the current machine would have zero salvage value. The new machine is expected to have zero salvage value after 5 years.
InstructionsShould the current machine be replaced?
E26-7 Veronica Mars, a recent graduate of Bell’s accounting program, evaluated the oper-ating performance of Dunn Company’s six divisions. Veronica made the following presen-tation to Dunn’s board of directors and suggested the Percy Division be eliminated. “If the Percy Division is eliminated,” she said, “our total profi ts would increase by $26,000.”
The Other Percy Five Divisions Division Total
Sales $1,664,200 $100,000 $1,764,200Cost of goods sold 978,520 76,000 1,054,520
Gross profi t 685,680 24,000 709,680Operating expenses 527,940 50,000 577,940
Net income $ 157,740 $ (26,000) $ 131,740
In the Percy Division, cost of goods sold is $61,000 variable and $15,000 fi xed, and operat-ing expenses are $30,000 variable and $20,000 fi xed. None of the Percy Division’s fi xed costs will be eliminated if the division is discontinued.
InstructionsIs Veronica right about eliminating the Percy Division? Prepare a schedule to support your answer.
Use incremental analysis for further processing of materials decision.
(LO 2)
Use incremental analysis for retaining or replacing equipment decision.
(LO 2)
Use incremental analysis concerning elimination of division.
(LO 2)

1180 26 Incremental Analysis and Capital Budgeting
E26-8 Cawley Company makes three models of tasers. Information on the three products is given below.
Tingler Shocker Stunner
Sales $300,000 $500,000 $200,000Variable expenses 150,000 200,000 145,000
Contribution margin 150,000 300,000 55,000Fixed expenses 120,000 230,000 95,000
Net income $ 30,000 $ 70,000 $ (40,000)
Fixed expenses consist of $300,000 of common costs allocated to the three products based on relative sales, and additional fi xed expenses of $30,000 (Tingler), $80,000 (Shocker), and $35,000 (Stunner). The common costs will be incurred regardless of how many mod-els are produced. The other fi xed expenses would be eliminated if a model is phased out. James Watt, an executive with the company, feels the Stunner line should be discon-tinued to increase the company’s net income.
Instructions(a) Compute current net income for Cawley Company.(b) Compute net income by product line and in total for Cawley Company if the company
discontinues the Stunner product line. (Hint: Allocate the $300,000 common costs to the two remaining product lines based on their relative sales.)
(c) Should Cawley eliminate the Stunner product line? Why or why not?
E26-9 Doug’s Custom Construction Company is considering three new projects, each requiring an equipment investment of $22,000. Each project will last for 3 years and pro-duce the following net annual cash fl ows.
Year AA BB CC
1 $ 7,000 $10,000 $13,000 2 9,000 10,000 12,000 3 12,000 10,000 11,000
Total $28,000 $30,000 $36,000
The equipment’s salvage value is zero, and Doug uses straight-line depreciation. Doug will not accept any project with a cash payback period over 2 years. Doug’s required rate of return is 12%.
Instructions(a) Compute each project’s payback period, indicating the most desirable project and the
least desirable project using this method. (Round to two decimals and assume in your computations that cash fl ows occur evenly throughout the year.)
(b) Compute the net present value of each project. Does your evaluation change? (Round to nearest dollar.)
E26-10 Vilas Company is considering a capital investment of $190,000 in additional produc-tive facilities. The new machinery is expected to have a useful life of 5 years with no salvage value. Depreciation is by the straight-line method. During the life of the investment, annual net income and net annual cash fl ows are expected to be $12,000 and $50,000, respectively. Vilas has a 12% cost of capital rate, which is the required rate of return on the investment.
Instructions(Round to two decimals.)
(a) Compute (1) the cash payback period and (2) the annual rate of return on the pro-posed capital expenditure.
(b) Using the discounted cash fl ow technique, compute the net present value.
E26-11 Iggy Company is considering three capital expenditure projects. Relevant data for the projects are as follows.
Annual Life of Project Investment Income Project
22A $240,000 $15,500 6 years 23A 270,000 20,600 9 years 24A 280,000 15,700 7 years
Use incremental analysis for elimination of a product line.
(LO 2)
Compute cash payback period and net present value.
(LO 3)
Compute annual rate of return, cash payback period, and net present value.
(LO 3, 4)
Determine internal rate of return.
(LO 4)

Problems: Set A 1181
Annual income is constant over the life of the project. Each project is expected to have zero salvage value at the end of the project. Iggy Company uses the straight-line method of depreciation.
Instructions(a) Determine the internal rate of return for each project. Round the internal rate of
return factor to three decimals.(b) If Iggy Company’s required rate of return is 10%, which projects are acceptable?
E26-12 Leung Corporation is considering investing in two different projects. It could invest in both, neither, or just one of the projects. The forecasts for the projects are as follows.
Project A Project B
Capital investment $200,000 $300,000Net annual cash fl ows $50,000 $65,000Length of project 5 years 7 years
The required rate of return acceptable to Leung is 9%.
Instructions(a) Compute the net present value of the two projects.(b) What capital budgeting decision should Leung make?(c) Project A could be modifi ed. By spending $25,000 more initially, the net annual cash
fl ows could be increased by $10,000 per year. Would this change Leung’s decision?
Compute net present value and recommend project.
(LO 4)
EXERCISES: SET B AND CHALLENGE EXERCISES
Visit the book’s companion website, at www.wiley.com/college/weygandt, and choose the Student Companion site to access Exercises: Set B and Challenge Exercises.
PROBLEMS: SET A
P26-1A ThreePoint Sports Inc. manufactures basketballs for the Women’s National Basket-ball Association (WNBA). For the fi rst 6 months of 2017, the company reported the follow-ing operating results while operating at 80% of plant capacity and producing 120,000 units.
Use incremental analysis for special order and identify nonfi nancial factors in the decision.
(LO 2) Amount
Sales $4,800,000Cost of goods sold 3,600,000Selling and administrative expenses 405,000
Net income $ 795,000
Fixed costs for the period were cost of goods sold $960,000, and selling and administrative expenses $225,000. In July, normally a slack manufacturing month, ThreePoint Sports receives a special order for 10,000 basketballs at $28 each from the Greek Basketball Association (GBA). Acceptance of the order would increase variable selling and administrative expenses $0.75 per unit because of shipping costs but would not increase fi xed costs and expenses.
Instructions(a) Prepare an incremental analysis for the special order.(b) Should ThreePoint Sports Inc. accept the special order? Explain your answer.(c) What is the minimum selling price on the special order to produce net income of $5.00
per ball?(d) What nonfi nancial factors should management consider in making its decision?
P26-2A The management of Shatner Manufacturing Company is trying to decide whether to continue manufacturing a part or to buy it from an outside supplier. The part, called CISCO, is a component of the company’s fi nished product. The following information was collected from the accounting records and production data for the year ending December 31, 2017.
1. 8,000 units of CISCO were produced in the Machining Department.
(a) NI increase $37,500
Use incremental analysis related to make or buy, consider opportunity cost, and identify nonfi nancial factors.
(LO 2)

1182 26 Incremental Analysis and Capital Budgeting
2. Variable manufacturing costs applicable to the production of each CISCO unit were: direct materials $4.80, direct labor $4.30, indirect labor $0.43, utilities $0.40.
3. Fixed manufacturing costs applicable to the production of CISCO were:
Cost Item Direct Allocated
Depreciation $2,100 $ 900 Property taxes 500 200 Insurance 900 600
$3,500 $1,700
All variable manufacturing and direct fi xed costs will be eliminated if CISCO is pur-chased. Allocated costs will have to be absorbed by other production departments.
4. The lowest quotation for 8,000 CISCO units from a supplier is $80,000.5. If CISCO units are purchased, freight and inspection costs would be $0.35 per unit,
and receiving costs totaling $1,300 per year would be incurred by the Machining Department.
Instructions(a) Prepare an incremental analysis for CISCO. Your analysis should have columns for
(1) Make CISCO, (2) Buy CISCO, and (3) Net Income Increase/(Decrease).(b) Based on your analysis, what decision should management make?(c) Would the decision be different if Shatner Company has the opportunity to produce
$3,000 of net income with the facilities currently being used to manufacture CISCO? Show computations.
(d) What nonfi nancial factors should management consider in making its decision?
P26-3A Last year (2016), Richter Condos installed a mechanized elevator for its tenants. The owner of the company, Ron Richter, recently returned from an industry equipment exhibition where he watched a computerized elevator demonstrated. He was impressed with the elevator’s speed, comfort of ride, and cost effi ciency. Upon returning from the exhibition, he asked his purchasing agent to collect price and operating cost data on the new elevator. In addition, he asked the company’s accountant to provide him with cost data on the company’s elevator. This information is presented below.
(a) NI (decrease) $(1,160)
(c) NI increase $1,840
Compute gain or loss, and determine if equipment should be replaced.
(LO 2)
Old Elevator New Elevator
Purchase price $120,000 $160,000Estimated salvage value 0 0Estimated useful life 5 years 4 yearsDepreciation method Straight-line Straight-lineAnnual operating costs other than depreciation: Variable $ 35,000 $ 10,000 Fixed 23,000 8,500
Annual revenues are $240,000, and selling and administrative expenses are $29,000, regardless of which elevator is used. If the old elevator is replaced now, at the beginning of 2017, Richter Condos will be able to sell it for $25,000.
Instructions(a) Determine any gain or loss if the old elevator is replaced.(b) Prepare a 4-year summarized income statement for each of the following assumptions: (1) The old elevator is retained. (2) The old elevator is replaced.(c) Using incremental analysis, determine if the old elevator should be replaced.(d) Write a memo to Ron Richter explaining why any gain or loss should be
ignored in the decision to replace the old elevator.
P26-4A Brislin Company has four operating divisions. During the fi rst quarter of 2017, the company reported aggregate income from operations of $213,000 and the following divisional results.
(b) (2) NI $539,000(c) NI increase $23,000
Prepare incremental analysis concerning elimination of divisions.
(LO 2)
SERVICE

Problems: Set A 1183
Division
I II III IV
Sales $250,000 $200,000 $500,000 $450,000Cost of goods sold 200,000 192,000 300,000 250,000Selling and administrative expenses 75,000 60,000 60,000 50,000
Income (loss) from operations $ (25,000) $ (52,000) $140,000 $150,000
Analysis reveals the following percentages of variable costs in each division.
I II III IV
Cost of goods sold 70% 90% 80% 75%Selling and administrative expenses 40 60 50 60
Discontinuance of any division would save 50% of the fi xed costs and expenses for that division. Top management is very concerned about the unprofi table divisions (I and II). Con-sensus is that one or both of the divisions should be discontinued.
Instructions(a) Compute the contribution margin for Divisions I and II.(b) Prepare an incremental analysis concerning the possible discontinuance of (1) Divi-
sion I and (2) Division II. What course of action do you recommend for each division?(c) Prepare a columnar condensed income statement for Brislin Company, assuming
Division II is eliminated. (Use the CVP format.) Division II’s unavoidable fi xed costs are allocated equally to the continuing divisions.
(d) Reconcile the total income from operations ($213,000) with the total income from operations without Division II.
P26-5A U3 Company is considering three long-term capital investment proposals. Each investment has a useful life of 5 years. Relevant data on each project are as follows.
Project Bono Project Edge Project Clayton
Capital investment $160,000 $175,000 $200,000 Annual net income:
Year 1 14,000 18,000 27,000 2 14,000 17,000 23,000 3 14,000 16,000 21,000 4 14,000 12,000 13,000 5 14,000 9,000 12,000
Total $ 70,000 $ 72,000 $ 96,000
Depreciation is computed by the straight-line method with no salvage value. The company’s cost of capital is 15%. (Assume that cash fl ows occur evenly throughout the year.)
Instructions(a) Compute the cash payback period for each project. (Round to two decimals.)(b) Compute the net present value for each project. (Round to nearest dollar.)(c) Compute the annual rate of return for each project. (Round to two decimals.) (Hint:
Use average annual net income in your computation.)(d) Rank the projects on each of the foregoing bases. Which project do you recommend?
P26-6A Lon Timur is an accounting major at a midwestern state university located approximately 60 miles from a major city. Many of the students attending the university are from the metropolitan area and visit their homes regularly on the weekends. Lon, an entrepreneur at heart, realizes that few good commuting alternatives are available for students doing weekend travel. He believes that a weekend commuting service could be organized and run profi tably from several suburban and downtown shopping mall loca-tions. Lon has gathered the following investment information.
1. Five used vans would cost a total of $75,000 to purchase and would have a 3-year useful life with negligible salvage value. Lon plans to use straight-line depreciation.
2. Ten drivers would have to be employed at a total payroll expense of $48,000.3. Other annual out-of-pocket expenses associated with running the commuter service
would include Gasoline $16,000, Maintenance $3,300, Repairs $4,000, Insurance $4,200, and Advertising $2,500.
(a) I $80,000
(c) Income III $142,800
Compute annual rate of return, cash payback, and net present value.
(LO 3, 4)
(b) E $(7,312); C $2,163
Compute annual rate of return, cash payback, and net present value.
(LO 3, 4)
SERVICE

1184 26 Incremental Analysis and Capital Budgeting
COMPREHENSIVE PROBLEM: CHAPTERS 19 TO 26
CP26 You would like to start a business manufacturing a unique model of bicycle helmet. In prepa-ration for an interview with the bank to discuss your fi nancing needs, you need to provide the follow-ing information. A number of assumptions are required; clearly note all assumptions that you make.
Instructions(a) Identify the types of costs that would likely be involved in making this product.(b) Set up fi ve columns as indicated.
Product Costs
Direct Direct Manufacturing Item Materials Labor Overhead Period Costs
Classify the costs you identifi ed in (a) into the manufacturing cost classifi cations of product costs (direct materials, direct labor, and manufacturing overhead) and period costs.
(c) Assign hypothetical monthly dollar fi gures to the costs you identifi ed in (a) and (b).(d) Assume you have no raw materials or work in process beginning or ending inventories. Prepare
a projected cost of goods manufactured schedule for the fi rst month of operations.(e) Project the number of helmets you expect to produce the fi rst month of operations. Compute the
cost to produce one bicycle helmet. Review the result to ensure it is reasonable; if not, return to part (c) and adjust the monthly dollar fi gures you assigned accordingly.
4. Lon has visited several fi nancial institutions to discuss funding. The best interest rate he has been able to negotiate is 15%. Use this rate for cost of capital.
5. Lon expects each van to make ten round trips weekly and carry an average of six students each trip. The service is expected to operate 30 weeks each year, and each student will be charged $12.00 for a round-trip ticket.
Instructions(a) Determine the annual (1) net income and (2) net annual cash fl ows for the commuter
service.(b) Compute (1) the cash payback period and (2) the annual rate of return. (Round to two
decimals.)(c) Compute the net present value of the commuter service. (Round to the nearest dollar.)(d) What should Lon conclude from these computations?
P26-7A Brooks Clinic is considering investing in new heart-monitoring equipment. It has two options. Option A would have an initial lower cost but would require a signifi cant expenditure for rebuilding after 4 years. Option B would require no rebuilding expendi-ture, but its maintenance costs would be higher. Since the Option B machine is of initial higher quality, it is expected to have a salvage value at the end of its useful life. The fol-lowing estimates were made of the cash fl ows. The company’s cost of capital is 8%.
Option A Option B
Initial cost $160,000 $227,000Annual cash infl ows $71,000 $80,000Annual cash outfl ows $30,000 $31,000Cost to rebuild (end of year 4) $50,000 $0Salvage value $0 $8,000Estimated useful life 7 years 7 years
Instructions(a) Compute the (1) net present value and (2) internal rate of return for each option. (Hint:
To solve for internal rate of return, experiment with alternative discount rates to arrive at a net present value of zero.)
(b) Which option should be accepted?
(a) (1) $5,000
(b) (1) 2.5 years
Compute net present value and internal rate of return.
(LO 3, 4)
(a) (1) NPV A $16,709 (2) IRR B 12%
PROBLEMS: SET B AND SET C
Visit the book’s companion website, at www.wiley.com/college/weygandt, and choose the Student Companion site to access Problems: Set B and Set C.
SERVICE

Continuing Problems 1185
(f) What type of cost accounting system will you likely use—job order or process costing?(g) Explain how you would assign costs in either the job order or process costing system you plan to use.(h) Classify your costs as either variable or fi xed costs. For simplicity, assign all costs to either variable
or fi xed, assuming there are no mixed costs, using the format shown.
Item Variable Costs Fixed Costs Total Costs
(i) Compute the unit variable cost, using the production number you determined in (e).(j) Project the number of helmets you anticipate selling the fi rst month of operations. Set a unit sell-
ing price, and compute both the contribution margin per unit and the contribution margin ratio.(k) Determine your break-even point in dollars and in units.(l) Prepare projected operating budgets (sales, production, direct materials, direct labor, manufac-
turing overhead, selling and administrative expense, and income statement). You will need to make assumptions for each of the following:
Direct materials budget: Quantity of direct materials required to produce one helmet; cost per unit of quantity; desired ending direct materials (assume none).
Direct labor budget: Direct labor time required per helmet; direct labor cost per hour. Budgeted income statement: Income tax expense is 45% of income from operations.
(m) Prepare a cash budget for the month. Assume the percentage of sales that will be collected from cus-tomers is 75%, and the percentage of direct materials that will be paid in the current month is 75%.
(n) Determine a relevant range of activity, using the number of helmets produced as your activity index. Recast your manufacturing overhead budget into a fl exible monthly budget for two addi-tional activity levels.
(o) Identify one potential cause of materials, direct labor, and manufacturing overhead variances for your product.
(p) Assume that you wish to purchase production equipment that costs $720,000. Determine the cash payback period, utilizing the monthly cash fl ow that you computed in part (m) multiplied by 12 months (for simplicity).
(q) Identify any nonfi nancial factors that should be considered before commencing your business venture.
CONTINUING PROBLEMS
CURRENT DESIGNSCD26-1 Recently, Mike Cichanowski, owner and CEO of Current Designs, received a phone call from the president of a brewing company. He was calling to inquire about the possibility of Current Designs producing “fl oating coolers” for a promotion his company was planning. These coolers resemble a kayak but are about one-third the size. They are used to fl oat food and beverages while paddling down the river on a weekend leisure trip. The company would be interested in purchasing 100 coolers for the upcoming summer. It is willing to pay $250 per cooler. The brewing company would pick up the coolers upon completion of the order. Mike met with Diane Buswell, controller, to identify how much it would cost Current Designs to produce the coolers. After careful analysis, the following costs were identifi ed.
Direct materials $80/unit Variable overhead $20/unitDirect labor $60/unit Fixed overhead $1,000
Current Designs would be able to modify an existing mold to produce the coolers. The cost of these modifi cations would be approximately $2,000.
Instructions(a) Prepare an incremental analysis to determine whether Current Designs should accept this special
order to produce the coolers.(b) Discuss additional factors that Mike and Diane should consider if Current Designs is currently
operating at full capacity.
CD26-2 A company that manufactures recreational pedal boats has approached Mike Cichanowski to ask if he would be interested in using Current Designs’ rotomold expertise and equipment to produce some of the pedal boat components. Mike is intrigued by the idea and thinks it would be an interesting way of complementing the present product line.
EXCEL TUTORIAL

1186 26 Incremental Analysis and Capital Budgeting
One of Mike’s hesitations about the proposal is that the pedal boats are a different shape than the kayaks that Current Designs produces. As a result, the company would need to buy an additional roto-mold oven in order to produce the pedal boat components. This project clearly involves risks, and Mike wants to make sure that the returns justify the risks. In this case, since this is a new venture, Mike thinks that a 15% discount rate is appropriate to use to evaluate the project. As an intern at Current Designs, Mike has asked you to prepare an initial evaluation of this pro-posal. To aid in your analysis, he has provided the following information and assumptions.
1. The new rotomold oven will have a cost of $256,000, a salvage value of $0, and an 8-year useful life. Straight-line depreciation will be used.
2. The projected revenues, costs, and results for each of the 8 years of this project are as follows.
Sales $220,000 Less: Manufacturing costs $140,000 Depreciation 32,000 Shipping and administrative costs 22,000 194,000
Income before income taxes 26,000 Income tax expense 10,800
Net income $ 15,200
Instructions(a) Compute the annual rate of return. (Round to two decimal places.)(b) Compute the payback period. (Round to two decimal places.)(c) Compute the net present value using a discount rate of 9%. (Round to nearest dollar.) Should the
proposal be accepted using this discount rate?(d) Compute the net present value using a discount rate of 15%. (Round to nearest dollar.) Should the
proposal be accepted using this discount rate?
WATERWAYS
WP26 Waterways Corporation puts much emphasis on cash fl ow when it plans for capital investments. The company chose its discount rate of 8% based on the rate of return it must pay its owners and creditors. Using that rate, Waterways then uses different methods to determine the best decisions for making capital outlays. Waterways is considering buying fi ve new backhoes to replace the backhoes it now has. This problem asks you to evaluate that decision, using various capital budgeting techniques.
Go to the book’s companion website, www.wiley.com/college/weygandt, to fi nd the remainder of this problem.
(Note: This is a continuation of the Waterways problem from Chapters 19–25.)
CC26-1 Auburn Circular Club is planning a major fundraiser that it hopes will become a successful annual event: sponsoring a professional rodeo. For this case, you will encounter many managerial accounting issues that would be common for a start-up business, such as CVP analysis, incremental analysis, and budgetary planning.
CC26-2 For this case, revisit the Greetings Inc. company presented in earlier chapters. The company is now searching for new opportunities for growth. This case will provide you with the opportunity to evaluate a proposal based on initial estimates as well as conduct sensitivity analysis. It also requires evaluation of the underlying assumptions used in the analysis.
CC26-3 Armstrong Helmet Company needs to determine the cost for a given product. For this case, you will have the opportunity to explore cost-volume-profi t relationships and prepare a set of budgets.
Go to the book’s companion website, at www.wiley.com/college/weygandt, for details and instructions for each of these cases.
COMPREHENSIVE CASES
SERVICE

Broadening Your Perspective 1187
PERSPECTIVEMANAGEMENT DECISION-MAKING
Decision-Making Across the OrganizationBYP26-1 Aurora Company is considering the purchase of a new machine. The invoice price of the machine is $140,000, freight charges are estimated to be $4,000, and installation costs are expected to be $6,000. Salvage value of the new equipment is expected to be zero after a useful life of 5 years. Existing equipment could be retained and used for an additional 5 years if the new machine is not purchased. At that time, the salvage value of the equipment would be zero. If the new machine is purchased now, the existing machine would have to be scrapped. Aurora’s accountant, Lisah Huang, has accumulated the following data regarding annual sales and expenses with and without the new machine.
1. Without the new machine, Aurora can sell 12,000 units of product annually at a per unit selling price of $100. If the new machine is purchased, the number of units produced and sold would increase by 10%, and the selling price would remain the same.
2. The new machine is faster than the old machine, and it is more effi cient in its usage of materials. With the old machine the gross profi t rate will be 25% of sales, whereas the rate will be 30% of sales with the new machine.
3. Annual selling expenses are $180,000 with the current equipment. Because the new equipment would produce a greater number of units to be sold, annual selling expenses are expected to increase by 10% if it is purchased.
4. Annual administrative expenses are expected to be $100,000 with the old machine, and $113,000 with the new machine.
5. The current book value of the existing machine is $36,000. Aurora uses straight-line depreciation.
InstructionsWith the class divided into groups, prepare an incremental analysis for the 5 years showing whether Aurora should keep the existing machine or buy the new machine. (Ignore income tax effects.)
Managerial AnalysisBYP26-2 MiniTek manufactures private-label small electronic products, such as alarm clocks, calcu-lators, kitchen timers, stopwatches, and automatic pencil sharpeners. Some of the products are sold as sets, and others are sold individually. Products are studied as to their sales potential, and then cost estimates are made. The Engineering Department develops production plans, and then production begins. The company has generally had very successful product introductions. Only two products introduced by the company have been discontinued. One of the products currently sold is a multi-alarm clock. The clock has four alarms that can be programmed to sound at various times and for varying lengths of time. The company has experienceda great deal of diffi culty in making the circuit boards for the clocks. The production process has never operated smoothly. The product is unprofi table at the present time, primarily because of warranty repairs and product recalls. Two models of the clocks were recalled, for example, because they some-times caused an electric shock when the alarms were being shut off. The Engineering Department is attempting to revise the manufacturing process, but the revision will take another 6 months at least. The clocks were very popular when they were introduced, and since they are private-label, the company has not suffered much from the recalls. Presently, the company has a very large order for several items from Kmart Stores. The order includes 5,000 of the multi-alarm clocks. When the com-pany suggested that Kmart purchase the clocks from another manufacturer, Kmart threatened to rescind the entire order unless the clocks were included. The company has therefore investigated the possibility of having another company make the clocks for them. The clocks were bid for the Kmart order based on an estimated $6.90 cost to manufacture:
Circuit board, 1 each @ $2.00 $2.00Plastic case, 1 each @ $0.80 0.80Alarms, 4 @ $0.15 each 0.60Labor, 15 minutes @ $12/hour 3.00Overhead, $2.00 per labor hour 0.50
MiniTek could purchase clocks to fi ll the Kmart order for $10 from Trans-Tech Asia, a Korean manufacturer with a very good quality record. Trans-Tech has offered to reduce the price to $7.50 after MiniTek has been a customer for 6 months, placing an order of at least 1,000 units per month. If MiniTek becomes a “preferred customer” by purchasing 15,000 units per year, the price would be reduced still further to $4.50.
BROADENING YOUR

Omega Products, a local manufacturer, has also offered to make clocks for MiniTek. They have offered to sell 5,000 clocks for $5 each. However, Omega Products has been in business for only 6 months. They have experienced signifi cant turnover in their labor force, and the local press has reported that the owners may face tax evasion charges soon. The owner of Omega Products is an electronic engineer, however, and the quality of the clocks is likely to be good. If MiniTek decides to purchase the clocks from either Trans-Tech or Omega, all the costs to manufacture could be avoided, except a total of $1,000 in overhead costs for machine depreciation. The machinery is fairly new, and has no alternate use.
Instructions(a) What is the difference in profi t under each of the alternatives if the clocks are to be sold for
$14.50 each to Kmart?(b) What are the most important nonfi nancial factors that MiniTek should consider when making this
decision?(c) What do you think MiniTek should do in regard to the Kmart order? What should it do in regard
to continuing to manufacture the multi-alarm clocks? Be prepared to defend your answer.
Real-World FocusBYP26-3 Founded in 1983 and foreclosed in 1996, Beverly Hills Fan Company was located in Woodland Hills, California. With 23 employees and sales of less than $10 million, the company was relatively small. In 1992, management felt that there was potential for growth in the upscale market for ceiling fans and lighting. They were particularly optimistic about growth in Mexican and Canadian markets. Presented below is information from the president’s letter in one of the company’s last annual reports.
Instructions
(a) What points did the company management need to consider before deciding to offer the special-order fans to customers?
(b) How would have incremental analysis been employed to assist in this decision?
BYP26-4 Campbell Soup Company is an international provider of soup products. Management is very interested in continuing to grow the company in its core business, while “spinning off” those businesses that are not part of its core operation.
Address: www.campbellsoups.com, or go to www.wiley.com/college/weygandt
Steps1. Go to the home page of Campbell Soup Company at the address shown above.2. Choose the current annual report.
InstructionsReview the fi nancial statements and management’s discussion and analysis, and answer the following questions.
(a) What was the total amount of capital expenditures in the current year, and how does this amount compare with the previous year? In your response, note what year you are using.
(b) What interest rate did the company pay on new borrowings in the current year?(c) Assume that this year’s capital expenditures are expected to increase cash fl ows by $50 million.
What is the expected internal rate of return (IRR) for these capital expenditures? (Assume a 10-year period for the cash fl ows.)
1188 26 Incremental Analysis and Capital Budgeting
BEVERLY HILLS FAN COMPANYPresident’s Letter
An aggressive product development program was initiated during the past year resulting in new ceiling fan models planned for introduction this year. Award winning industrial designer Ron Rezek created several new fan models for the Beverly Hills Fan and L.A. Fan lines, including a new Showroom Collection, designed specifi cally for the architectural and designer markets. Each of these models has received critical acclaim, and order commitments for this year have been outstanding. Additionally, our Custom Color and special order fans continued to enjoy increasing popularity and sales gains as more and more customers desire fans that match their specifi c interior decors. Currently, Beverly Hills Fan Company offers a product line of over 100 models of contemporary, traditional, and transitional ceiling fans.

CRITICAL THINKING
Communication ActivityBYP26-5 Refer back to E26-10 to address the following.
InstructionsPrepare a memo to Maria Fierro, your supervisor. Show your calculations from E26-10 (a) and (b). In one or two paragraphs, discuss important nonfi nancial considerations. Make any assumptions you believe to be necessary. Make a recommendation based on your analysis.
Ethics CaseBYP26-6 NuComp Company operates in a state where corporate taxes and workers’ compensation insurance rates have recently doubled. NuComp’s president has just assigned you the task of prepar-ing an economic analysis and making a recommendation relative to moving the entire operation to Missouri. The president is slightly in favor of such a move because Missouri is his boyhood home and he also owns a fi shing lodge there. You have just completed building your dream house, moved in, and sodded the lawn. Your chil-dren are all doing well in school and sports and, along with your spouse, want no part of a move to Missouri. If the company does move, so will you because the town is a one-industry community and you and your spouse will have to move to have employment. Moving when everyone else does will cause you to take a big loss on the sale of your house. The same hardships will be suffered by your coworkers, and the town will be devastated. In compiling the costs of moving versus not moving, you have latitude in the assumptions you make, the estimates you compute, and the discount rates and time periods you project. You are in a position to infl uence the decision singlehandedly.
Instructions
(a) Who are the stakeholders in this situation?(b) What are the ethical issues in this situation?(c) What would you do in this situation?
All About YouBYP26-7 Managerial accounting techniques can be used in a wide variety of settings. As we have fre-quently pointed out, you can use them in many personal situations. They also can be useful in trying to fi nd solutions for societal issues that appear to be hard to solve.
InstructionsRead the Fortune article, “The Toughest Customers: How Hardheaded Business Metrics Can Help the Hard-core Homeless,” by Cait Murphy, available at http://money.cnn.com/magazines/fortune/fortune_archive/2006/04/03/8373067/index.htm. Answer the following questions.
(a) How does the article defi ne “chronic” homelessness?(b) In what ways does homelessness cost a city money? What are the estimated costs of a chronic
homeless person to various cities?(c) What are the steps suggested to address the problem?(d) What is the estimated cost of implementing this program in New York? What results have been seen?(e) In terms of incremental analysis, frame the relevant costs in this situation.
Broadening Your Perspective 1189


Once each year, a corporation communicates to its stockholders and other inter-ested parties by issuing a complete set of audited fi nancial statements. The annual report , as this communication is called, summarizes the fi nancial results of the company’s operations for the year and its plans for the future. Many annual reports are attractive, multicolored, glossy public relations pieces, containing pictures of corporate offi cers and directors as well as photos and descriptions of new products and new buildings. Yet the basic function of every annual report is to report fi nancial information, almost all of which is a product of the corpora-tion’s accounting system. The content and organization of corporate annual reports have become fairly standardized. Excluding the public relations part of the report (pictures, prod-ucts, etc.), the following are the traditional fi nancial portions of the annual report:
• Financial Highlights
• Letter to the Stockholders
• Management’s Discussion and Analysis
• Financial Statements
• Notes to the Financial Statements
• Management’s Responsibility for Financial Reporting
• Management’s Report on Internal Control over Financial Reporting
• Report of Independent Registered Public Accounting Firm
• Selected Financial Data
The offi cial SEC fi ling of the annual report is called a Form 10-K, which often omits the public relations pieces found in most standard annual reports. On the following pages, we present Apple Inc.’s fi nancial statements taken from the company’s 2013 Form 10-K. To access Apple’s Form 10-K, including notes to the fi nancial statements, follow these steps:
1. Go to http://investor.apple.com.
2. Select the Financial Information tab.
3. Select the 10-K annual report dated September 28, 2013.
4. The Notes to Consolidated Financial Statements begin on page 50.
Specimen Financial Statements: Apple Inc.
Appendix A
A-1

A-2 Appendix A Specimen Financial Statements: Apple Inc.
CONSOLIDATED STATEMENTS OF OPERATIONS(In millions, except number of shares which are reflected in thousands and per share amounts)
See accompanying Notes to Consolidated Financial Statements.
Years ended September 28, 2013 September 29, 2012 September 24, 2011 Net sales $ 170,910 $ 156,508 $ 108,249 Cost of sales 106,606 87,846 64,431
Gross margin 64,304 68,662 43,818
Operating expenses: Research and development 4,475 3,381 2,429 Selling, general and administrative 10,830 10,040 7,599
Total operating expenses 15,305 13,421 10,028
Operating income 48,999 55,241 33,790 Other income/(expense), net 1,156 522 415
Income before provision for income taxes 50,155 55,763 34,205 Provision for income taxes 13,118 14,030 8,283
Net income $ 37,037 $ 41,733 $ 25,922
Earnings per share: Basic $ 40.03 $ 44.64 $ 28.05 Diluted $ 39.75 $ 44.15 $ 27.68
Shares used in computing earnings per share: Basic 925,331 934,818 924,258 Diluted 931,662 945,355 936,645
Cash dividends declared per common share $ 11.40 $ 2.65 $ 0.00
CONSOLIDATED STATEMENTS OF COMPREHENSIVE INCOME(In millions)
Years ended
September 28,2013
September 29,2012
September 24,2011
Net income . . . . . . . . . . . . . . . . . . . . . . . . . . . . . . . . . . . . . . . . . . . . . . . . . . . . . . . . . . . . $37,037 $41,733 $25,922
Other comprehensive income/(loss):Change in foreign currency translation, net of tax effects of $35, $13 and $18,
respectively . . . . . . . . . . . . . . . . . . . . . . . . . . . . . . . . . . . . . . . . . . . . . . . . . . . . . . . . . (112) (15) (12)
Change in unrecognized gains/losses on derivative instruments:Change in fair value of derivatives, net of tax benefit/(expense) of $(351), $73 and
$(50), respectively . . . . . . . . . . . . . . . . . . . . . . . . . . . . . . . . . . . . . . . . . . . . . . . . . . 522 (131) 92Adjustment for net losses/(gains) realized and included in net income, net of tax
expense/(benefit) of $255, $220 and $(250), respectively . . . . . . . . . . . . . . . . . . . (458) (399) 450
Total change in unrecognized gains/losses on derivative instruments, net of tax . . . . 64 (530) 542
Change in unrealized gains/losses on marketable securities:Change in fair value of marketable securities, net of tax benefit/(expense) of $458,
$(421) and $17, respectively . . . . . . . . . . . . . . . . . . . . . . . . . . . . . . . . . . . . . . . . . . (791) 715 29Adjustment for net losses/(gains) realized and included in net income, net of tax
expense/(benefit) of $82, $68 and $(40), respectively . . . . . . . . . . . . . . . . . . . . . . (131) (114) (70)
Total change in unrealized gains/losses on marketable securities, net of tax . . . . . . . (922) 601 (41)
Total other comprehensive income/(loss) . . . . . . . . . . . . . . . . . . . . . . . . . . . . . . . . . . . . (970) 56 489
Total comprehensive income . . . . . . . . . . . . . . . . . . . . . . . . . . . . . . . . . . . . . . . . . . . . . . $36,067 $41,789 $26,411
See accompanying Notes to Consolidated Financial Statements.
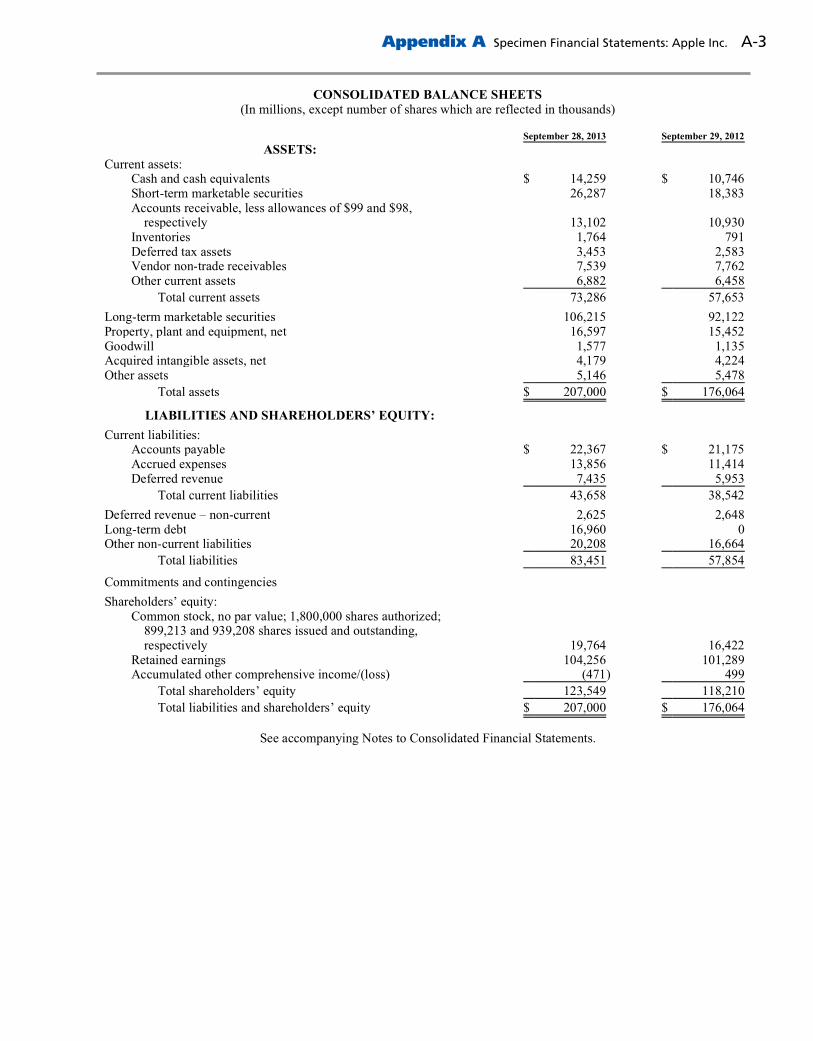
Appendix A Specimen Financial Statements: Apple Inc. A-3
CONSOLIDATED BALANCE SHEETS(In millions, except number of shares which are reflected in thousands)
See accompanying Notes to Consolidated Financial Statements.
September 28, 2013 September 29, 2012 ASSETS:
Current assets: Cash and cash equivalents $ 14,259 $ 10,746 Short-term marketable securities 26,287 18,383 Accounts receivable, less allowances of $99 and $98,
respectively 13,102 10,930 Inventories 1,764 791 Deferred tax assets 3,453 2,583 Vendor non-trade receivables 7,539 7,762 Other current assets 6,882 6,458
Total current assets 73,286 57,653 Long-term marketable securities 106,215 92,122 Property, plant and equipment, net 16,597 15,452 Goodwill 1,577 1,135 Acquired intangible assets, net 4,179 4,224 Other assets 5,146 5,478
Total assets $ 207,000 $ 176,064
LIABILITIES AND SHAREHOLDERS’ EQUITY:
Current liabilities: Accounts payable $ 22,367 $ 21,175 Accrued expenses 13,856 11,414 Deferred revenue 7,435 5,953
Total current liabilities 43,658 38,542 Deferred revenue – non-current 2,625 2,648 Long-term debt 16,960 0 Other non-current liabilities 20,208 16,664
Total liabilities 83,451 57,854
Commitments and contingencies
Shareholders’ equity: Common stock, no par value; 1,800,000 shares authorized;
899,213 and 939,208 shares issued and outstanding, respectively 19,764 16,422
Retained earnings 104,256 101,289 Accumulated other comprehensive income/(loss) (471 ) 499
Total shareholders’ equity 123,549 118,210
Total liabilities and shareholders’ equity $ 207,000 $ 176,064

A-4 Appendix A Specimen Financial Statements: Apple Inc.
CONSOLIDATED STATEMENTS OF SHAREHOLDERS’ EQUITY (In millions, except number of shares which are reflected in thousands)
See accompanying Notes to Consolidated Financial Statements.
Common Stock
Retained Earnings
Accum-ulated Other
Compre-hensiveIncome/ (Loss)
Total Share-
holders’Equity
Shares Amount Balances as of September 25, 2010 915,970 $ 10,668 $ 37,169 $ (46) $ 47,791
Net income 0 0 25,922 0 25,922 Other comprehensive income/(loss) 0 0 0 489 489 Share-based compensation 0 1,168 0 0 1,168 Common stock issued under stock plans, net of shares
withheld for employee taxes 13,307 561 (250 ) 0 311 Tax benefit from equity awards, including transfer
pricing adjustments 0 934 0 0 934
Balances as of September 24, 2011 929,277 13,331 62,841 443 76,615
Net income 0 0 41,733 0 41,733 Other comprehensive income/(loss) 0 0 0 56 56 Dividends and dividend equivalent rights declared 0 0 (2,523 ) 0 (2,523 ) Share-based compensation 0 1,740 0 0 1,740 Common stock issued under stock plans, net of shares
withheld for employee taxes 9,931 200 (762 ) 0 (562 ) Tax benefit from equity awards, including transfer
pricing adjustments 0 1,151 0 0 1,151
Balances as of September 29, 2012 939,208 16,422 101,289 499 118,210
Net income 0 0 37,037 0 37,037 Other comprehensive income/(loss) 0 0 0 (970 ) (970 ) Dividends and dividend equivalent rights declared 0 0 (10,676 ) 0 (10,676 ) Repurchase of common stock (46,976 ) 0 (22,950 ) 0 (22,950 ) Share-based compensation 0 2,253 0 0 2,253 Common stock issued under stock plans, net of shares
withheld for employee taxes 6,981 (143 ) (444 ) 0 (587 ) Tax benefit from equity awards, including transfer
pricing adjustments 0 1,232 0 0 1,232
Balances as of September 28, 2013 899,213 $ 19,764 $ 104,256 $ (471) $ 123,549

Appendix A Specimen Financial Statements: Apple Inc. A-5
CONSOLIDATED STATEMENTS OF CASH FLOWS(In millions)
See accompanying Notes to Consolidated Financial Statements.
Years ended
September 28,
2013 September 29,
2012 September 24,
2011 Cash and cash equivalents, beginning of the year $ 10,746 $ 9,815 $ 11,261
Operating activities: Net income 37,037 41,733 25,922 Adjustments to reconcile net income to cash generated by operating
activities: Depreciation and amortization 6,757 3,277 1,814 Share-based compensation expense 2,253 1,740 1,168 Deferred income tax expense 1,141 4,405 2,868
Changes in operating assets and liabilities: Accounts receivable, net (2,172 ) (5,551 ) 143 Inventories (973 ) (15 ) 275 Vendor non-trade receivables 223 (1,414 ) (1,934 ) Other current and non-current assets 1,080 (3,162 ) (1,391 ) Accounts payable 2,340 4,467 2,515 Deferred revenue 1,459 2,824 1,654 Other current and non-current liabilities 4,521 2,552 4,495
Cash generated by operating activities 53,666 50,856 37,529
Investing activities: Purchases of marketable securities (148,489 ) (151,232 ) (102,317 ) Proceeds from maturities of marketable securities 20,317 13,035 20,437 Proceeds from sales of marketable securities 104,130 99,770 49,416 Payments made in connection with business acquisitions, net (496 ) (350 ) (244 ) Payments for acquisition of property, plant and equipment (8,165 ) (8,295 ) (4,260 ) Payments for acquisition of intangible assets (911 ) (1,107 ) (3,192 ) Other (160 ) (48 ) (259 )
Cash used in investing activities (33,774 ) (48,227 ) (40,419 )
Financing activities: Proceeds from issuance of common stock 530 665 831 Excess tax benefits from equity awards 701 1,351 1,133 Taxes paid related to net share settlement of equity awards (1,082 ) (1,226 ) (520 ) Dividends and dividend equivalent rights paid (10,564 ) (2,488 ) 0 Repurchase of common stock (22,860 ) 0 0 Proceeds from issuance of long-term debt, net 16,896 0 0
Cash generated by/(used in) financing activities (16,379 ) (1,698 ) 1,444
Increase/(decrease) in cash and cash equivalents 3,513 931 (1,446 )
Cash and cash equivalents, end of the year $ 14,259 $ 10,746 $ 9,815
Supplemental cash flow disclosure: Cash paid for income taxes, net $ 9,128 $ 7,682 $ 3,338


Consolidated Statement of IncomePepsiCo, Inc. and SubsidiariesFiscal years ended December 28, 2013, December 29, 2012 and December 31, 2011 (in millions except per share amounts)
2013 2012 2011Net Revenue $ 66,415 $ 65,492 $ 66,504Cost of sales 31,243 31,291 31,593Selling, general and administrative expenses 25,357 24,970 25,145Amortization of intangible assets 110 119 133Operating Profit 9,705 9,112 9,633Interest expense (911) (899) (856)Interest income and other 97 91 57Income before income taxes 8,891 8,304 8,834Provision for income taxes 2,104 2,090 2,372Net income 6,787 6,214 6,462Less: Net income attributable to noncontrolling interests 47 36 19Net Income Attributable to PepsiCo $ 6,740 $ 6,178 $ 6,443Net Income Attributable to PepsiCo per Common Share
Basic $ 4.37 $ 3.96 $ 4.08Diluted $ 4.32 $ 3.92 $ 4.03
Weighted-average common shares outstandingBasic 1,541 1,557 1,576Diluted 1,560 1,575 1,597
Cash dividends declared per common share $ 2.24 $ 2.1275 $ 2.025
See accompanying notes to consolidated financial statements.
PepsiCo, Inc. is a world leader in convenient snacks, foods, and beverages. The following are PepsiCo’s fi nancial statements as presented in its 2013 annual report. To access PepsiCo’s complete annual report, including notes to the fi nancial state-ments, follow these steps:
1. Go to www.pepsico.com.
2. Select Annual Reports and Proxy Information under the Investors tab.
3. Select the 2013 Annual Report.
4. The Notes to Consolidated Financial Statements begin on page 73.
Specimen Financial Statements: PepsiCo, Inc.
Appendix B
B-1

B-2 Appendix B Specimen Financial Statements: PepsiCo, Inc.
Consolidated Statement of Comprehensive IncomePepsiCo, Inc. and SubsidiariesFiscal years ended December 28, 2013, December 29, 2012 and December 31, 2011 (in millions)
2013Pre-tax
amounts Tax amountsAfter-taxamounts
Net income $ 6,787Other Comprehensive Income
Currency translation adjustment $ (1,303) $ — (1,303)Cash flow hedges:
Reclassification of net losses to net income 45 (17) 28Net derivative losses (20) 10 (10)
Pension and retiree medical:Net prior service cost (23) 8 (15)Net gains 2,540 (895) 1,645
Unrealized gains on securities 57 (28) 29Other — (16) (16)
Total Other Comprehensive Income $ 1,296 $ (938) 358Comprehensive income 7,145
Comprehensive income attributable to noncontrolling interests (45)Comprehensive Income Attributable to PepsiCo $ 7,100
2012Pre-taxamounts Tax amounts
After-taxamounts
Net income $ 6,214Other Comprehensive Income
Currency translation adjustment $ 737 $ — 737Cash flow hedges:
Reclassification of net losses to net income 90 (32) 58Net derivative losses (50) 10 (40)
Pension and retiree medical:Net prior service cost (32) 12 (20)Net losses (41) (11) (52)
Unrealized gains on securities 18 — 18Other — 36 36
Total Other Comprehensive Income $ 722 $ 15 737Comprehensive income 6,951
Comprehensive income attributable to noncontrolling interests (31)Comprehensive Income Attributable to PepsiCo $ 6,920
2011Pre-taxamounts Tax amounts
After-taxamounts
Net income $ 6,462Other Comprehensive Loss
Currency translation adjustment $ (1,464) $ — (1,464)Cash flow hedges:
Reclassification of net losses to net income 5 4 9Net derivative losses (126) 43 (83)
Pension and retiree medical:Net prior service cost (18) 8 (10)Net losses (1,468) 501 (967)
Unrealized losses on securities (27) 19 (8)Other (16) 5 (11)
Total Other Comprehensive Loss $ (3,114) $ 580 (2,534)Comprehensive income 3,928
Comprehensive income attributable to noncontrolling interests (84)Comprehensive Income Attributable to PepsiCo $ 3,844
See accompanying notes to consolidated financial statements.

Appendix B Specimen Financial Statements: PepsiCo, Inc. B-3
Financing ActivitiesProceeds from issuances of long-term debt $ 4,195 $ 5,999 $ 3,000Payments of long-term debt (3,894) (2,449) (1,596)Debt repurchase — — (771)Short-term borrowings, by original maturity
More than three months – proceeds 23 549 523More than three months – payments (492) (248) (559)Three months or less, net 1,634 (1,762) 339
Cash dividends paid (3,434) (3,305) (3,157)Share repurchases – common (3,001) (3,219) (2,489)Share repurchases – preferred (7) (7) (7)Proceeds from exercises of stock options 1,123 1,122 945Excess tax benefits from share-based payment arrangements 117 124 70Acquisition of noncontrolling interests (20) (68) (1,406)Other financing (33) (42) (27)Net Cash Used for Financing Activities (3,789) (3,306) (5,135)Effect of exchange rate changes on cash and cash equivalents (196) 62 (67)Net Increase/(Decrease) in Cash and Cash Equivalents 3,078 2,230 (1,876)Cash and Cash Equivalents, Beginning of Year 6,297 4,067 5,943Cash and Cash Equivalents, End of Year $ 9,375 $ 6,297 $ 4,067
See accompanying notes to consolidated financial statements.
Consolidated Statement of Cash FlowsPepsiCo, Inc. and SubsidiariesFiscal years ended December 28, 2013, December 29, 2012 and December 31, 2011 (in millions)
2013 2012 2011Operating Activities
Net income $ 6,787 $ 6,214 $ 6,462Depreciation and amortization 2,663 2,689 2,737Stock-based compensation expense 303 278 326Merger and integration costs 10 16 329Cash payments for merger and integration costs (25) (83) (377)Restructuring and impairment charges 163 279 383Cash payments for restructuring charges (133) (343) (31)Restructuring and other charges related to the transaction with Tingyi — 176 —Cash payments for restructuring and other charges related to the transaction with Tingyi (26) (109) —Non-cash foreign exchange loss related to Venezuela devaluation 111 — —Excess tax benefits from share-based payment arrangements (117) (124) (70)Pension and retiree medical plan contributions (262) (1,865) (349)Pension and retiree medical plan expenses 663 796 571Deferred income taxes and other tax charges and credits (1,058) 321 495Change in accounts and notes receivable (88) (250) (666)Change in inventories 4 144 (331)Change in prepaid expenses and other current assets (51) 89 (27)Change in accounts payable and other current liabilities 1,007 548 520Change in income taxes payable 86 (97) (340)Other, net (349) (200) (688)Net Cash Provided by Operating Activities 9,688 8,479 8,944
Investing Activities
Capital spending (2,795) (2,714) (3,339)Sales of property, plant and equipment 109 95 84Acquisition of WBD, net of cash and cash equivalents acquired — — (2,428)Investment in WBD — — (164)Cash payments related to the transaction with Tingyi (3) (306) —Other acquisitions and investments in noncontrolled affiliates (109) (121) (601)Divestitures 133 (32) 780Short-term investments, by original maturity
More than three months – maturities — — 21Three months or less, net 61 61 45
Other investing, net (21) 12 (16)Net Cash Used for Investing Activities (2,625) (3,005) (5,618)

B-4 Appendix B Specimen Financial Statements: PepsiCo, Inc.
Consolidated Balance SheetPepsiCo, Inc. and SubsidiariesDecember 28, 2013 and December 29, 2012 (in millions except per share amounts)
2013 2012ASSETSCurrent AssetsCash and cash equivalents $ 9,375 $ 6,297Short-term investments 303 322Accounts and notes receivable, net 6,954 7,041Inventories 3,409 3,581Prepaid expenses and other current assets 2,162 1,479
Total Current Assets 22,203 18,720Property, Plant and Equipment, net 18,575 19,136Amortizable Intangible Assets, net 1,638 1,781Goodwill 16,613 16,971Other nonamortizable intangible assets 14,401 14,744
Nonamortizable Intangible Assets 31,014 31,715Investments in Noncontrolled Affiliates 1,841 1,633Other Assets 2,207 1,653
Total Assets $ 77,478 $ 74,638
LIABILITIES AND EQUITYCurrent LiabilitiesShort-term obligations $ 5,306 $ 4,815Accounts payable and other current liabilities 12,533 11,903Income taxes payable — 371
Total Current Liabilities 17,839 17,089Long-Term Debt Obligations 24,333 23,544Other Liabilities 4,931 6,543Deferred Income Taxes 5,986 5,063
Total Liabilities 53,089 52,239Commitments and contingenciesPreferred Stock, no par value 41 41Repurchased Preferred Stock (171) (164)PepsiCo Common Shareholders’ EquityCommon stock, par value 12/3¢ per share (authorized 3,600 shares, issued, net of repurchased common stock at par value: 1,529 and 1,544 shares, respectively) 25 26Capital in excess of par value 4,095 4,178Retained earnings 46,420 43,158Accumulated other comprehensive loss (5,127) (5,487)Repurchased common stock, in excess of par value (337 and 322 shares, respectively) (21,004) (19,458)
Total PepsiCo Common Shareholders’ Equity 24,409 22,417Noncontrolling interests 110 105
Total Equity 24,389 22,399Total Liabilities and Equity $ 77,478 $ 74,638
See accompanying notes to consolidated financial statements.

Appendix B Specimen Financial Statements: PepsiCo, Inc. B-5
Consolidated Statement of EquityPepsiCo, Inc. and SubsidiariesFiscal years ended December 28, 2013, December 29, 2012 and December 31, 2011 (in millions)
2013 2012 2011Shares Amount Shares Amount Shares Amount
Preferred Stock 0.8 $ 41 0.8 $ 41 0.8 $ 41Repurchased Preferred Stock
Balance, beginning of year (0.6) (164) (0.6) (157) (0.6) (150)Redemptions — (7) — (7) — (7)Balance, end of year (0.6) (171) (0.6) (164) (0.6) (157)
Common StockBalance, beginning of year 1,544 26 1,565 26 1,582 26Repurchased common stock (15) (1) (21) — (17) —Balance, end of year 1,529 25 1,544 26 1,565 26
Capital in Excess of Par ValueBalance, beginning of year 4,178 4,461 4,527Stock-based compensation expense 303 278 326Stock option exercises/RSUs and PEPUnits converted (a) (287) (431) (361)Withholding tax on RSUs converted (87) (70) (56)Other (12) (60) 25Balance, end of year 4,095 4,178 4,461
Retained EarningsBalance, beginning of year 43,158 40,316 37,090Net income attributable to PepsiCo 6,740 6,178 6,443Cash dividends declared – common (3,451) (3,312) (3,192)Cash dividends declared – preferred (1) (1) (1)Cash dividends declared – RSUs (26) (23) (24)Balance, end of year 46,420 43,158 40,316
Accumulated Other Comprehensive LossBalance, beginning of year (5,487) (6,229) (3,630)Currency translation adjustment (1,301) 742 (1,529)Cash flow hedges, net of tax:
Reclassification of net losses to net income 28 58 9Net derivative losses (10) (40) (83)
Pension and retiree medical, net of tax:Reclassification of net losses to net income 230 421 133Remeasurement of net liabilities and translation 1,400 (493) (1,110)
Unrealized gains/(losses) on securities, net of tax 29 18 (8)Other (16) 36 (11)Balance, end of year (5,127) (5,487) (6,229)
Repurchased Common StockBalance, beginning of year (322) (19,458) (301) (17,870) (284) (16,740)Share repurchases (37) (3,000) (47) (3,219) (39) (2,489)Stock option exercises 20 1,301 24 1,488 20 1,251Other 2 153 2 143 2 108Balance, end of year (337) (21,004) (322) (19,458) (301) (17,870)
Total PepsiCo Common Shareholders’ Equity 24,409 22,417 20,704Noncontrolling Interests
Balance, beginning of year 105 311 312Net income attributable to noncontrolling interests 47 36 19Distributions to noncontrolling interests, net (34) (37) (24)Currency translation adjustment (2) (5) 65Acquisitions and divestitures (6) (200) (57)Other, net — — (4)Balance, end of year 110 105 311
Total Equity $ 24,389 $ 22,399 $ 20,899
(a) Includes total tax benefits of $45 million in 2013, $84 million in 2012 and $43 million in 2011.
See accompanying notes to consolidated financial statements.


The Coca-Cola Company is a global leader in the beverage industry. It offers hundreds of brands, including soft drinks, fruit juices, sports drinks and other beverages in more than 200 countries. The following are Coca-Cola’s fi nancial state-ments as presented in its 2013 annual report. To access Coca-Cola’s complete annual report, including notes to the fi nancial statements, follow these steps:
1. Go to www.coca-colacompany.com.
2. Select the Investors link near the bottom of the page, and then select Financial Reports & Information.
3. Select the 2013 Annual Report on Form 10-K.
4. The Notes to Consolidated Financial Statements begin on page 79.
Specimen Financial Statements: The Coca-Cola Company
Appendix C
C-1
THE COCA-COLA COMPANY AND SUBSIDIARIES
CONSOLIDATED STATEMENTS OF INCOME
Year Ended December 31, 2013 2012 2011(In millions except per share data)
NET OPERATING REVENUES $ 46,854 $ 48,017 $ 46,542Cost of goods sold 18,421 19,053 18,215
GROSS PROFIT 28,433 28,964 28,327Selling, general and administrative expenses 17,310 17,738 17,422Other operating charges 895 447 732
OPERATING INCOME 10,228 10,779 10,173Interest income 534 471 483Interest expense 463 397 417Equity income (loss) — net 602 819 690Other income (loss) — net 576 137 529
INCOME BEFORE INCOME TAXES 11,477 11,809 11,458Income taxes 2,851 2,723 2,812
CONSOLIDATED NET INCOME 8,626 9,086 8,646Less: Net income attributable to noncontrolling interests 42 67 62
NET INCOME ATTRIBUTABLE TO SHAREOWNERS OF THE COCA-COLA COMPANY $ 8,584 $ 9,019 $ 8,584
BASIC NET INCOME PER SHARE1 $ 1.94 $ 2.00 $ 1.88
DILUTED NET INCOME PER SHARE1 $ 1.90 $ 1.97 $ 1.85
AVERAGE SHARES OUTSTANDING 4,434 4,504 4,568Effect of dilutive securities 75 80 78
AVERAGE SHARES OUTSTANDING ASSUMING DILUTION 4,509 4,584 4,646
1 Calculated based on net income attributable to shareowners of The Coca-Cola Company.
Refer to Notes to Consolidated Financial Statements.

C-2 Appendix C Specimen Financial Statements: The Coca-Cola Company
THE COCA-COLA COMPANY AND SUBSIDIARIES
CONSOLIDATED STATEMENTS OF COMPREHENSIVE INCOME
Year Ended December 31, 2013 2012 2011(In millions)
CONSOLIDATED NET INCOME $ 8,626 $ 9,086 $ 8,646Other comprehensive income:
Net foreign currency translation adjustment (1,187) (182) (692)Net gain (loss) on derivatives 151 99 145Net unrealized gain (loss) on available-for-sale securities (80) 178 (7)Net change in pension and other benefit liabilities 1,066 (668) (763)
TOTAL COMPREHENSIVE INCOME 8,576 8,513 7,329Less: Comprehensive income (loss) attributable to noncontrolling interests 39 105 10
TOTAL COMPREHENSIVE INCOME ATTRIBUTABLE TO SHAREOWNERS OFTHE COCA-COLA COMPANY $ 8,537 $ 8,408 $ 7,319
Refer to Notes to Consolidated Financial Statements.
THE COCA-COLA COMPANY AND SUBSIDIARIES
CONSOLIDATED BALANCE SHEETS
December 31, 2013 2012(In millions except par value)
ASSETSCURRENT ASSETS
Cash and cash equivalents $ 10,414 $ 8,442Short-term investments 6,707 5,017
TOTAL CASH, CASH EQUIVALENTS AND SHORT-TERM INVESTMENTS 17,121 13,459
Marketable securities 3,147 3,092Trade accounts receivable, less allowances of $61 and $53, respectively 4,873 4,759Inventories 3,277 3,264Prepaid expenses and other assets 2,886 2,781Assets held for sale — 2,973
TOTAL CURRENT ASSETS 31,304 30,328
EQUITY METHOD INVESTMENTS 10,393 9,216OTHER INVESTMENTS, PRINCIPALLY BOTTLING COMPANIES 1,119 1,232OTHER ASSETS 4,661 3,585PROPERTY, PLANT AND EQUIPMENT — net 14,967 14,476TRADEMARKS WITH INDEFINITE LIVES 6,744 6,527BOTTLERS’ FRANCHISE RIGHTS WITH INDEFINITE LIVES 7,415 7,405GOODWILL 12,312 12,255OTHER INTANGIBLE ASSETS 1,140 1,150
TOTAL ASSETS $ 90,055 $ 86,174
LIABILITIES AND EQUITYCURRENT LIABILITIES
Accounts payable and accrued expenses $ 9,577 $ 8,680Loans and notes payable 16,901 16,297Current maturities of long-term debt 1,024 1,577Accrued income taxes 309 471Liabilities held for sale — 796
TOTAL CURRENT LIABILITIES 27,811 27,821
LONG-TERM DEBT 19,154 14,736OTHER LIABILITIES 3,498 5,468DEFERRED INCOME TAXES 6,152 4,981THE COCA-COLA COMPANY SHAREOWNERS’ EQUITY
Common stock, $0.25 par value; Authorized — 11,200 shares;Issued — 7,040 and 7,040 shares, respectively 1,760 1,760
Capital surplus 12,276 11,379Reinvested earnings 61,660 58,045Accumulated other comprehensive income (loss) (3,432) (3,385)Treasury stock, at cost — 2,638 and 2,571 shares, respectively (39,091) (35,009)
EQUITY ATTRIBUTABLE TO SHAREOWNERS OF THE COCA-COLA COMPANY 33,173 32,790EQUITY ATTRIBUTABLE TO NONCONTROLLING INTERESTS 267 378
TOTAL EQUITY 33,440 33,168
TOTAL LIABILITIES AND EQUITY $ 90,055 $ 86,174
Refer to Notes to Consolidated Financial Statements.

Appendix C Specimen Financial Statements: The Coca-Cola Company C-3
THE COCA-COLA COMPANY AND SUBSIDIARIES
CONSOLIDATED STATEMENTS OF CASH FLOWS
Year Ended December 31, 2013 2012 2011(In millions)
OPERATING ACTIVITIESConsolidated net income $ 8,626 $ 9,086 $ 8,646Depreciation and amortization 1,977 1,982 1,954Stock-based compensation expense 227 259 354Deferred income taxes 648 632 1,035Equity (income) loss — net of dividends (201) (426) (269)Foreign currency adjustments 168 (130) 7Significant (gains) losses on sales of assets — net (670) (98) (220)Other operating charges 465 166 214Other items 234 254 (354)Net change in operating assets and liabilities (932) (1,080) (1,893)
Net cash provided by operating activities 10,542 10,645 9,474
INVESTING ACTIVITIESPurchases of investments (14,782) (14,824) (4,798)Proceeds from disposals of investments 12,791 7,791 5,811Acquisitions of businesses, equity method investments and nonmarketable securities (353) (1,486) (971)Proceeds from disposals of businesses, equity method investments and nonmarketable securities 872 20 398Purchases of property, plant and equipment (2,550) (2,780) (2,920)Proceeds from disposals of property, plant and equipment 111 143 101Other investing activities (303) (268) (145)
Net cash provided by (used in) investing activities (4,214) (11,404) (2,524)
FINANCING ACTIVITIESIssuances of debt 43,425 42,791 27,495Payments of debt (38,714) (38,573) (22,530)Issuances of stock 1,328 1,489 1,569Purchases of stock for treasury (4,832) (4,559) (4,513)Dividends (4,969) (4,595) (4,300)Other financing activities 17 100 45
Net cash provided by (used in) financing activities (3,745) (3,347) (2,234)
EFFECT OF EXCHANGE RATE CHANGES ON CASH AND CASH EQUIVALENTS (611) (255) (430)
CASH AND CASH EQUIVALENTSNet increase (decrease) during the year 1,972 (4,361) 4,286Balance at beginning of year 8,442 12,803 8,517
Balance at end of year $ 10,414 $ 8,442 $ 12,803
Refer to Notes to Consolidated Financial Statements.

C-4 Appendix C Specimen Financial Statements: The Coca-Cola Company
THE COCA-COLA COMPANY AND SUBSIDIARIES
CONSOLIDATED STATEMENTS OF SHAREOWNERS’ EQUITY
Year Ended December 31, 2013 2012 2011(In millions except per share data)
EQUITY ATTRIBUTABLE TO SHAREOWNERS OF THE COCA-COLA COMPANYNUMBER OF COMMON SHARES OUTSTANDING
Balance at beginning of year 4,469 4,526 4,583Purchases of treasury stock (121) (121) (127)Treasury stock issued to employees related to stock compensation plans 54 64 70
Balance at end of year 4,402 4,469 4,526
COMMON STOCK $ 1,760 $ 1,760 $ 1,760
CAPITAL SURPLUSBalance at beginning of year 11,379 10,332 9,177
Stock issued to employees related to stock compensation plans 569 640 724Tax benefit (charge) from stock compensation plans 144 144 79Stock-based compensation 227 259 354Other activities (43) 4 (2)
Balance at end of year 12,276 11,379 10,332
REINVESTED EARNINGSBalance at beginning of year 58,045 53,621 49,337
Net income attributable to shareowners of The Coca-Cola Company 8,584 9,019 8,584Dividends (per share — $1.12, $1.02 and $0.94 in 2013, 2012 and 2011, respectively) (4,969) (4,595) (4,300)
Balance at end of year 61,660 58,045 53,621
ACCUMULATED OTHER COMPREHENSIVE INCOME (LOSS)Balance at beginning of year (3,385) (2,774) (1,509)
Net other comprehensive income (loss) (47) (611) (1,265)
Balance at end of year (3,432) (3,385) (2,774)
TREASURY STOCKBalance at beginning of year (35,009) (31,304) (27,762)
Stock issued to employees related to stock compensation plans 745 786 830Purchases of treasury stock (4,827) (4,491) (4,372)
Balance at end of year (39,091) (35,009) (31,304)
TOTAL EQUITY ATTRIBUTABLE TO SHAREOWNERS OF THE COCA-COLA COMPANY $ 33,173 $ 32,790 $ 31,635
EQUITY ATTRIBUTABLE TO NONCONTROLLING INTERESTSBalance at beginning of year $ 378 $ 286 $ 314
Net income attributable to noncontrolling interests 42 67 62Net foreign currency translation adjustment (3) 38 (52)Dividends paid to noncontrolling interests (58) (48) (38)Acquisition of interests held by noncontrolling owners (34) (15) —Contributions by noncontrolling interests 6 — —Business combinations 25 50 —Deconsolidation of certain entities (89) — —
TOTAL EQUITY ATTRIBUTABLE TO NONCONTROLLING INTERESTS $ 267 $ 378 $ 286
Refer to Notes to Consolidated Financial Statements.

Amazon.com, Inc. is the world’s largest online retailer. It also produces con-sumer electronics—notably the Kindle e-book reader and the Kindle Fire Tablet computer—and is a major provider of cloud computing services. The following are Amazon’s fi nancial statements as presented in the company’s 2013 annual report. To access Amazon’s complete annual report, including notes to the fi nan-cial statements, follow these steps:
1. Go to www.amazon.com.
2. Select the Investor Relations link at the bottom of the page and then select the 2013 Annual Report under Annual Reports and Proxies.
3. The Notes to Consolidated Financial Statements begin on page 40.
Specimen Financial Statements: Amazon.com, Inc.
Appendix D
D-1
AMAZON.COM, INC.
CONSOLIDATED STATEMENTS OF CASH FLOWS(in millions)
Year Ended December 31, 2013 2012 2011CASH AND CASH EQUIVALENTS, BEGINNING OF PERIOD $ 8,084 $ 5,269 $ 3,777OPERATING ACTIVITIES:Net income (loss) 274 (39) 631Adjustments to reconcile net income (loss) to net cash from operating activities:
Depreciation of property and equipment, including internal-use software andwebsite development, and other amortization 3,253 2,159 1,083Stock-based compensation 1,134 833 557Other operating expense (income), net 114 154 154Losses (gains) on sales of marketable securities, net 1 (9) (4)Other expense (income), net 166 253 (56)Deferred income taxes (156) (265) 136Excess tax benefits from stock-based compensation (78) (429) (62)
Changes in operating assets and liabilities:Inventories (1,410) (999) (1,777)Accounts receivable, net and other (846) (861) (866)Accounts payable 1,888 2,070 2,997Accrued expenses and other 736 1,038 1,067Additions to unearned revenue 2,691 1,796 1,064Amortization of previously unearned revenue (2,292) (1,521) (1,021)
Net cash provided by (used in) operating activities 5,475 4,180 3,903INVESTING ACTIVITIES:Purchases of property and equipment, including internal-use software and websitedevelopment (3,444) (3,785) (1,811)Acquisitions, net of cash acquired, and other (312) (745) (705)Sales and maturities of marketable securities and other investments 2,306 4,237 6,843Purchases of marketable securities and other investments (2,826) (3,302) (6,257)
Net cash provided by (used in) investing activities (4,276) (3,595) (1,930)FINANCING ACTIVITIES:Excess tax benefits from stock-based compensation 78 429 62Common stock repurchased — (960) (277)Proceeds from long-term debt and other 394 3,378 177Repayments of long-term debt, capital lease, and finance lease obligations (1,011) (588) (444)
Net cash provided by (used in) financing activities (539) 2,259 (482)Foreign-currency effect on cash and cash equivalents (86) (29) 1Net increase (decrease) in cash and cash equivalents 574 2,815 1,492CASH AND CASH EQUIVALENTS, END OF PERIOD $ 8,658 $ 8,084 $ 5,269SUPPLEMENTAL CASH FLOW INFORMATION:Cash paid for interest on long-term debt $ 97 $ 31 $ 14Cash paid for income taxes (net of refunds) 169 112 33Property and equipment acquired under capital leases 1,867 802 753Property and equipment acquired under build-to-suit leases 877 29 259
See accompanying notes to consolidated financial statements.

D-2 Appendix D Specimen Financial Statements: Amazon.com, Inc.
AMAZON.COM, INC.
CONSOLIDATED STATEMENTS OF OPERATIONS(in millions, except per share data)
Year Ended December 31, 2013 2012 2011
Net product sales $ 60,903 $ 51,733 $ 42,000Net services sales 13,549 9,360 6,077
Total net sales 74,452 61,093 48,077Operating expenses (1):
Cost of sales 54,181 45,971 37,288Fulfillment 8,585 6,419 4,576Marketing 3,133 2,408 1,630Technology and content 6,565 4,564 2,909General and administrative 1,129 896 658Other operating expense (income), net 114 159 154
Total operating expenses 73,707 60,417 47,215Income from operations 745 676 862Interest income 38 40 61Interest expense (141) (92) (65)Other income (expense), net (136) (80) 76
Total non-operating income (expense) (239) (132) 72Income before income taxes 506 544 934Provision for income taxes (161) (428) (291)Equity-method investment activity, net of tax (71) (155) (12)Net income (loss) $ 274 $ (39) $ 631Basic earnings per share $ 0.60 $ (0.09) $ 1.39Diluted earnings per share $ 0.59 $ (0.09) $ 1.37Weighted average shares used in computation of earnings per share:
Basic 457 453 453Diluted 465 453 461
_____________(1) Includes stock-based compensation as follows:
FulfillmentMarketingTechnology and contentGeneral and administrative
$ 29488
603149
$ 21261
434126
$ 13339
29293
See accompanying notes to consolidated financial statements.

Appendix D Specimen Financial Statements: Amazon.com, Inc. D-3
AMAZON.COM, INC.
CONSOLIDATED STATEMENTS OF COMPREHENSIVE INCOME(in millions)
Year Ended December 31, 2013 2012 2011
Net income (loss) $ 274 $ (39) $ 631Other comprehensive income (loss):
Foreign currency translation adjustments, net of tax of $(20), $(30),and $20 63 76 (123)Net change in unrealized gains on available-for-sale securities:
Unrealized gains (losses), net of tax of $3, $(3), and $1 (10) 8 (1)Reclassification adjustment for losses (gains) included in “Otherincome (expense), net,” net of tax of $(1), $3, and $1 1 (7) (2)
Net unrealized gains (losses) on available-for-sale securities(9) 1 (3)
Total other comprehensive income (loss) 54 77 (126)Comprehensive income $ 328 $ 38 $ 505
See accompanying notes to consolidated financial statements.

D-4 Appendix D Specimen Financial Statements: Amazon.com, Inc.
AMAZON.COM, INC.
CONSOLIDATED BALANCE SHEETS(in millions, except per share data)
December 31, 2013 2012
ASSETSCurrent assets:
Cash and cash equivalents $ 8,658 $ 8,084Marketable securities 3,789 3,364Inventories 7,411 6,031Accounts receivable, net and other 4,767 3,817
Total current assets 24,625 21,296Property and equipment, net 10,949 7,060Goodwill 2,655 2,552Other assets 1,930 1,647
Total assets $ 40,159 $ 32,555LIABILITIES AND STOCKHOLDERS’ EQUITY
Current liabilities:Accounts payable $ 15,133 $ 13,318Accrued expenses and other 6,688 4,892Unearned revenue 1,159 792
Total current liabilities 22,980 19,002Long-term debt 3,191 3,084Other long-term liabilities 4,242 2,277Commitments and contingenciesStockholders’ equity:
Preferred stock, $0.01 par value:Authorized shares — 500Issued and outstanding shares — none — —
Common stock, $0.01 par value:Authorized shares — 5,000Issued shares — 483 and 478Outstanding shares — 459 and 454 5 5
Treasury stock, at cost (1,837) (1,837)Additional paid-in capital 9,573 8,347Accumulated other comprehensive loss (185) (239)Retained earnings 2,190 1,916
Total stockholders’ equity 9,746 8,192Total liabilities and stockholders’ equity $ 40,159 $ 32,555
See accompanying notes to consolidated financial statements.

Appendix D Specimen Financial Statements: Amazon.com, Inc. D-5
AMAZON.COM, INC.
CONSOLIDATED STATEMENTS OF STOCKHOLDERS' EQUITY(in millions)
Common Stock
Shares AmountTreasury
Stock
AdditionalPaid-InCapital
AccumulatedOther
ComprehensiveIncome (Loss)
RetainedEarnings
TotalStockholders’
Equity
Balance as of January 1, 2011 451 $ 5 $ (600) $ 6,325 $ (190) $ 1,324 $ 6,864Net income — — — — — 631 631Other comprehensive income (loss) — — — — (126) — (126)Exercise of common stock options 5 — — 7 — — 7Repurchase of common stock (1) — (277) — — — (277)Excess tax benefits from stock-basedcompensation — — — 62 — — 62Stock-based compensation and issuance ofemployee benefit plan stock — — — 569 — — 569Issuance of common stock for acquisitionactivity — — — 27 — — 27Balance as of December 31, 2011 455 5 (877) 6,990 (316) 1,955 7,757Net income (loss) — — — — — (39) (39)Other comprehensive income — — — — 77 — 77Exercise of common stock options 4 — — 8 — — 8Repurchase of common stock (5) — (960) — — — (960)Excess tax benefits from stock-basedcompensation — — — 429 — — 429Stock-based compensation and issuance ofemployee benefit plan stock — — — 854 — — 854Issuance of common stock for acquisitionactivity — — — 66 — — 66Balance as of December 31, 2012 454 5 (1,837) 8,347 (239) 1,916 8,192Net income — — — — — 274 274Other comprehensive income — — — — 54 — 54Exercise of common stock options 5 — — 4 — — 4Repurchase of common stock — — — — — — —Excess tax benefits from stock-basedcompensation — — — 73 — — 73Stock-based compensation and issuance ofemployee benefit plan stock — — — 1,149 — — 1,149Balance as of December 31, 2013 459 $ 5 $ (1,837) $ 9,573 $ (185) $ 2,190 $ 9,746
See accompanying notes to consolidated financial statements.


The following are Wal-Mart Stores, Inc.’s fi nancial statements as presented in the company’s 2014 annual report. To access Wal-Mart’s complete annual report, including notes to the fi nancial statements, follow these steps:
1. Go to http://corporate.walmart.com.
2. Select Annual Reports under the Investors tab.
3. Select the 2014 Annual Report (Wal-Mart’s fi scal year ends January 31).
4. The Notes to Consolidated Financial Statements begin on page 40.
Specimen Financial Statements: Wal-Mart Stores, Inc.
Appendix E
E-1
Fiscal Years Ended January 31,
(Amounts in millions, except per share data) 2014 2013 2012
Revenues: Net sales $473,076 $465,604 $443,416 Membership and other income 3,218 3,047 3,093
Total revenues 476,294 468,651 446,509Costs and expenses: Cost of sales 358,069 352,297 334,993 Operating, selling, general and administrative expenses 91,353 88,629 85,025
Operating income 26,872 27,725 26,491Interest: Debt 2,072 1,977 2,034 Capital leases 263 272 286 Interest income (119) (186) (161)
Interest, net 2,216 2,063 2,159
Income from continuing operations before income taxes 24,656 25,662 24,332Provision for income taxes: Current 8,619 7,976 6,722 Deferred (514) (18) 1,202
Total provision for income taxes 8,105 7,958 7,924
Income from continuing operations 16,551 17,704 16,408Income (loss) from discontinued operations, net of income taxes 144 52 (21)
Consolidated net income 16,695 17,756 16,387Less consolidated net income attributable to noncontrolling interest (673) (757) (688)
Consolidated net income attributable to Walmart $ 16,022 $ 16,999 $ 15,699
Basic net income per common share: Basic income per common share from continuing operations attributable to Walmart $ 4.87 $ 5.03 $ 4.55 Basic income (loss) per common share from discontinued operations attributable to Walmart 0.03 0.01 (0.01)
Basic net income per common share attributable to Walmart $ 4.90 $ 5.04 $ 4.54
Diluted net income per common share: Diluted income per common share from continuing operations attributable to Walmart $ 4.85 $ 5.01 $ 4.53 Diluted income (loss) per common share from discontinued operations attributable to Walmart 0.03 0.01 (0.01)
Diluted net income per common share attributable to Walmart $ 4.88 $ 5.02 $ 4.52
Weighted-average common shares outstanding: Basic 3,269 3,374 3,460 Diluted 3,283 3,389 3,474
Dividends declared per common share $ 1.88 $ 1.59 $ 1.46
See accompanying notes.
Consolidated Statements of Income

E-2 Appendix E Specimen Financial Statements: Wal-Mart Stores, Inc.
As of January 31,
(Amounts in millions) 2014 2013
ASSETS
Current assets: Cash and cash equivalents $ 7,281 $ 7,781
Receivables, net 6,677 6,768
Inventories 44,858 43,803
Prepaid expenses and other 1,909 1,551
Current assets of discontinued operations 460 37
Total current assets 61,185 59,940
Property and equipment: Property and equipment 173,089 165,825
Less accumulated depreciation (57,725) (51,896)
Property and equipment, net 115,364 113,929
Property under capital leases: Property under capital leases 5,589 5,899
Less accumulated amortization (3,046) (3,147)
Property under capital leases, net 2,543 2,752
Goodwill 19,510 20,497
Other assets and deferred charges 6,149 5,987
Total assets $204,751 $203,105
LIABILITIES, REDEEMABLE NONCONTROLLING INTEREST AND EQUITY
Current liabilities: Short-term borrowings $ 7,670 $ 6,805
Accounts payable 37,415 38,080
Accrued liabilities 18,793 18,808
Accrued income taxes 966 2,211
Long-term debt due within one year 4,103 5,587
Obligations under capital leases due within one year 309 327
Current liabilities of discontinued operations 89 —
Total current liabilities 69,345 71,818
Long-term debt 41,771 38,394
Long-term obligations under capital leases 2,788 3,023
Deferred income taxes and other 8,017 7,613
Redeemable noncontrolling interest 1,491 519
Commitments and contingencies
Equity: Common stock 323 332
Capital in excess of par value 2,362 3,620
Retained earnings 76,566 72,978
Accumulated other comprehensive income (loss) (2,996) (587)
Total Walmart shareholders’ equity 76,255 76,343
Nonredeemable noncontrolling interest 5,084 5,395
Total equity 81,339 81,738
Total liabilities, redeemable noncontrolling interest and equity $204,751 $203,105
See accompanying notes.
Consolidated Balance Sheets
Consolidated Statements of Comprehensive Income Fiscal Years Ended January 31,
(Amounts in millions) 2014 2013 2012
Consolidated net income $16,695 $17,756 $16,387 Less consolidated net income attributable to nonredeemable noncontrolling interest (606) (684) (627) Less consolidated net income attributable to redeemable noncontrolling interest (67) (73) (61)
Consolidated net income attributable to Walmart 16,022 16,999 15,699
Other comprehensive income (loss), net of income taxes Currency translation and other (3,146) 1,042 (2,758) Derivative instruments 207 136 (67) Minimum pension liability 153 (166) 43
Other comprehensive income (loss), net of income taxes (2,786) 1,012 (2,782) Less other comprehensive income (loss) attributable to nonredeemable noncontrolling interest 311 (138) 660 Less other comprehensive income (loss) attributable to redeemable noncontrolling interest 66 (51) 66
Other comprehensive income (loss) attributable to Walmart (2,409) 823 (2,056)
Comprehensive income, net of income taxes 13,909 18,768 13,605 Less comprehensive income (loss) attributable to nonredeemable noncontrolling interest (295) (822) 33 Less comprehensive income (loss) attributable to redeemable noncontrolling interest (1) (124) 5
Comprehensive income attributable to Walmart $13,613 $17,822 $13,643
See accompanying notes.

Appendix E Specimen Financial Statements: Wal-Mart Stores, Inc. E-3
Accumulated Total
Capital in Other Walmart Nonredeemable Redeemable
Common Stock Excess of Retained Comprehensive Shareholders’ Noncontrolling Total Noncontrolling
(Amounts in millions) Shares Amount Par Value Earnings Income (Loss) Equity Interest Equity Interest
Balances as of February 1, 2011 3,516 $352 $ 3,577 $63,967 $ 646 $68,542 $2,705 $71,247 $ 408
Consolidated net income — — — 15,699 — 15,699 627 16,326 61
Other comprehensive loss,
net of income taxes — — — — (2,056) (2,056) (660) (2,716) (66)
Cash dividends declared
($1.46 per share) — — — (5,048) — (5,048) — (5,048) —
Purchase of Company stock (113) (11) (229) (5,930) — (6,170) — (6,170) —
Nonredeemable noncontrolling
interest of acquired entity — — — — — — 1,988 1,988 —
Other 15 1 344 3 — 348 (214) 134 1
Balances as of January 31, 2012 3,418 342 3,692 68,691 (1,410) 71,315 4,446 75,761 404
Consolidated net income — — — 16,999 — 16,999 684 17,683 73
Other comprehensive income,
net of income taxes — — — — 823 823 138 961 51
Cash dividends declared
($1.59 per share) — — — (5,361) — (5,361) — (5,361) —
Purchase of Company stock (115) (11) (357) (7,341) — (7,709) — (7,709) —
Nonredeemable noncontrolling
interest of acquired entity — — — — — — 469 469 —
Other 11 1 285 (10) — 276 (342) (66) (9)
Balances as of January 31, 2013 3,314 332 3,620 72,978 (587) 76,343 5,395 81,738 519
Consolidated net income — — — 16,022 — 16,022 595 16,617 78
Other comprehensive loss,
net of income taxes — — — — (2,409) (2,409) (311) (2,720) (66)
Cash dividends declared
($1.88 per share) — — — (6,139) — (6,139) — (6,139) —
Purchase of Company stock (87) (9) (294) (6,254) — (6,557) — (6,557) —
Redemption value adjustment
of redeemable
noncontrolling interest — — (1,019) — — (1,019) — (1,019) 1,019
Other 6 — 55 (41) — 14 (595) (581) (59)
Balances as of January 31, 2014 3,233 $323 $ 2,362 $76,566 $(2,996) $76,255 $5,084 $81,339 $1,491
Consolidated Statements of Shareholders’ Equity
—8 6 66eer 4t 98 0O 11 1 5 1 7 442888 0 2 66 3 2 6666 99O ( ) ( ) ( ) ( )h
a — — — — — — —6 6e e o q ed ei ui i yn eres o aacqq re en 4 4t t t t 9 944 44i i i 6699 6699ddf
ao edee b e o o o gionre eemaa e noncon ro nggt iN dd bbl ll
, , ,a a — — —e o o p ou yrc aase o omppaan s oc 4t 9 90 0P 115 11 57 7 441 7 7 7 73 3 099 099P C ( ) ( ) ( ) ( ) ( ) ( )h kf
. , , ,a — — — — — —6 6 6pe epper s aare91 5 5 1 5 1 5 199 366 366 366( ) ( ) ( ) ( )h$
a ad de d de ediviaas en s ec aarei iC h dd dd dd dd l dd
a — — — — 8 8 8 6e o o e ei xne o ncome aa est t 98 8 81 1 51i 88823 88823 3888 9966f
,e o p e e e o eiv ier comppre ens e ncometO i iO h h
, , ,a — — — — 8 86 6 6 6o o d ed e o ei ionso aa e ne ncome 4t t 999 999 8 81 1 44 17 7i i 66 999999 66 999999 66888 668883 3C l dd dd
, , , , , , ,,a a a a aB 8 86 6 6 6 6oe u ya ances as o an ar 0 4 4 4 4 44 4 4B 9 98 8 0 01 1 441 44 1 1 441 71 15 44 4444 75 7 1 44 443 20 2 3 888 3 2 3 66992 66888 6699 0 3 66 66 0JB ( )l f
— 8eer 44 4 4 4t 8O 15 1 4444 44 144 1 44 13 3 3 888 2 3O ( )h
, ,a — — — — — — —88 88e e o q ed ei ui i yn eres o aacqq re ent t t t 9 988 881 1i i i 99888888 99888888ddf
ao edee b e o o o gionre eemaa e noncon ro nggt iN dd bbl ll
, , ,a a — — —6 6e o o p ou yrc aase o omppaan s oct 9 9 0 0 0P 11 11 5 17 173 2299 9930 66 0 66 0P C ( ) ( ) ( ) ( ) ( ) ( )h kf
. , , ,a — — — — — —8 8 86 pe epper s aare4 4 4 40 8 0 8 0 81 44 5 44 5 44 5 4466 0 888 0 888 0 888( ) ( ) ( ) ( )h$
a ad de d de ediviaas en s ec aarei iC h dd dd dd dd l dd
, , ,a — — — — 6 6 66 6 66e o o e ei xne o ncome aa est t 0 0 05 5 71i 2 0 66 2 0 66 66660 2 66 6666( ) ( ) ( ) ( ) ( )f
,e o p e e e oiver comppre ens e osstO iO h h l
, , ,a — — — —6 6 6 6 6 6o o d ed e o ei ionso aa e ne ncomet t 99 9915 15 7 1 1i i 669999 669999 662 66 3266 66C l dd dd
, , , , , ,,a a a aB 8 86 6 6 6 6 6boe e u ya ances as o e r ar 0 4 4 4 4B 9 8 0 081 11 51 5 577 7 44 544 7 5 71 447 4420 3 66 3 2 3 663 9966 66 66 66888 2 2 0 2 0888FB l bf $ $ $ $ $ $ $ $

E-4 Appendix E Specimen Financial Statements: Wal-Mart Stores, Inc.
Fiscal Years Ended January 31,
(Amounts in millions) 2014 2013 2012
Cash flows from operating activities:
Consolidated net income $ 16,695 $ 17,756 $ 16,387
Income (loss) from discontinued operations, net of income taxes (144) (52) 21
Income from continuing operations 16,551 17,704 16,408
Adjustments to reconcile income from continuing operations to net cash
provided by operating activities:
Depreciation and amortization 8,870 8,478 8,106
Deferred income taxes (279) (133) 1,050
Other operating activities 938 602 468
Changes in certain assets and liabilities, net of effects of acquisitions:
Receivables, net (566) (614) (796)
Inventories (1,667) (2,759) (3,727)
Accounts payable 531 1,061 2,687
Accrued liabilities 103 271 (935)
Accrued income taxes (1,224) 981 994
Net cash provided by operating activities 23,257 25,591 24,255
Cash flows from investing activities:
Payments for property and equipment (13,115) (12,898) (13,510)
Proceeds from the disposal of property and equipment 727 532 580
Investments and business acquisitions, net of cash acquired (15) (316) (3,548)
Other investing activities 105 71 (131)
Net cash used in investing activities (12,298) (12,611) (16,609)
Cash flows from financing activities:
Net change in short-term borrowings 911 2,754 3,019
Proceeds from issuance of long-term debt 7,072 211 5,050
Payments of long-term debt (4,968) (1,478) (4,584)
Dividends paid (6,139) (5,361) (5,048)
Dividends paid to and stock purchases of noncontrolling interest (722) (414) (526)
Purchase of Company stock (6,683) (7,600) (6,298)
Other financing activities (488) (84) (71)
Net cash used in financing activities (11,017) (11,972) (8,458)
Effect of exchange rates on cash and cash equivalents (442) 223 (33)
Net increase (decrease) in cash and cash equivalents (500) 1,231 (845)
Cash and cash equivalents at beginning of year 7,781 6,550 7,395
Cash and cash equivalents at end of year $ 7,281 $ 7,781 $ 6,550
Supplemental disclosure of cash flow information:
Income taxes paid $ 8,641 $ 7,304 $ 5,899
Interest paid 2,362 2,262 2,346
See accompanying notes.
Consolidated Statements of Cash Flows

Louis Vuitton is a French company and is one of the leading international fashion houses in the world. Louis Vuitton has been named the world’s most valuable luxury brand. Note that its fi nancial statements are IFRS-based and are presented in euros (€). To access the company’s complete fi nancial statements, follow these steps:
1. Go to www.lvmh.com/investor-relations.
2. Select 2013 Annual report, and then select the Finance tab once the Intro has played.
3. Note that the comments (notes) to the fi nancial statements are placed after each corresponding statement.
Specimen Financial Statements: Louis Vuitton
Appendix F
F-1
(EUR millions) 2013 2012(1) 2011(1)
Brands and other intangible assets 11,458 11,510 11,482
Goodwill 9,959 7,806 6,957
Property, plant and equipment 9,602 8,769 8,017
Investments in associates 152 163 170
Non-current available for sale fi nancial assets 7,080 6,004 5,982
Other non-current assets 432 519 478
Deferred tax 909 954 760
NON-CURRENT ASSETS 39,592 35,725 33,846
Inventories and work in progress 8,586 8,080 7,510
Trade accounts receivable 2,189 1,985 1,878
Income taxes 235 201 121
Other current assets 1,851 1,811 1,455
Cash and cash equivalents 3,221 2,196 2,303
CURRENT ASSETS 16,082 14,273 13,267
ASSETS
TOTAL ASSETS 55,674 49,998 47,113
CONSOLIDATED BALANCE SHEET
(Continued.)

F-2 Appendix F Specimen Financial Statements: Louis Vuitton
(EUR millions) 2013 2012(1) 2011(1)
Share capital 152 152 152
Share premium account 3,849 3,848 3,801
Treasury shares and LVMH-share settled derivatives (451) (414) (485)
Cumulative translation adjustment (8) 342 431
Revaluation reserves 3,900 2,731 2,637
Other reserves 15,817 14,341 12,770
Net profi t, Group share 3,436 3,424 3,065
Equity, Group share 26,695 24,424 22,371
Minority interests 1,028 1,084 1,055
TOTAL EQUITY 27,723 25,508 23,426
Long term borrowings 4,159 3,836 4,132
Provisions 1,755 1,756 1,530
Deferred tax 3,934 3,960 3,925
Other non-current liabilities 6,403 5,456 4,506
NON-CURRENT LIABILITIES 16,251 15,008 14,093
Short term borrowings 4,688 2,976 3,134
Trade accounts payable 3,308 3,134 2,952
Income taxes 382 442 443
Provisions 322 335 349
Other current liabilities 3,000 2,595 2,716
CURRENT LIABILITIES 11,700 9,482 9,594
TOTAL LIABILITIES AND EQUITY 55,674 49,998 47,113
LIABILITIES AND EQUITY
(1) The balance sheets as of December 31, 2012 and 2011 have been restated to refl ect the retrospective application as of January 1, 2011 of IAS 19 Employee Benefi ts as amended.
(Continued.)
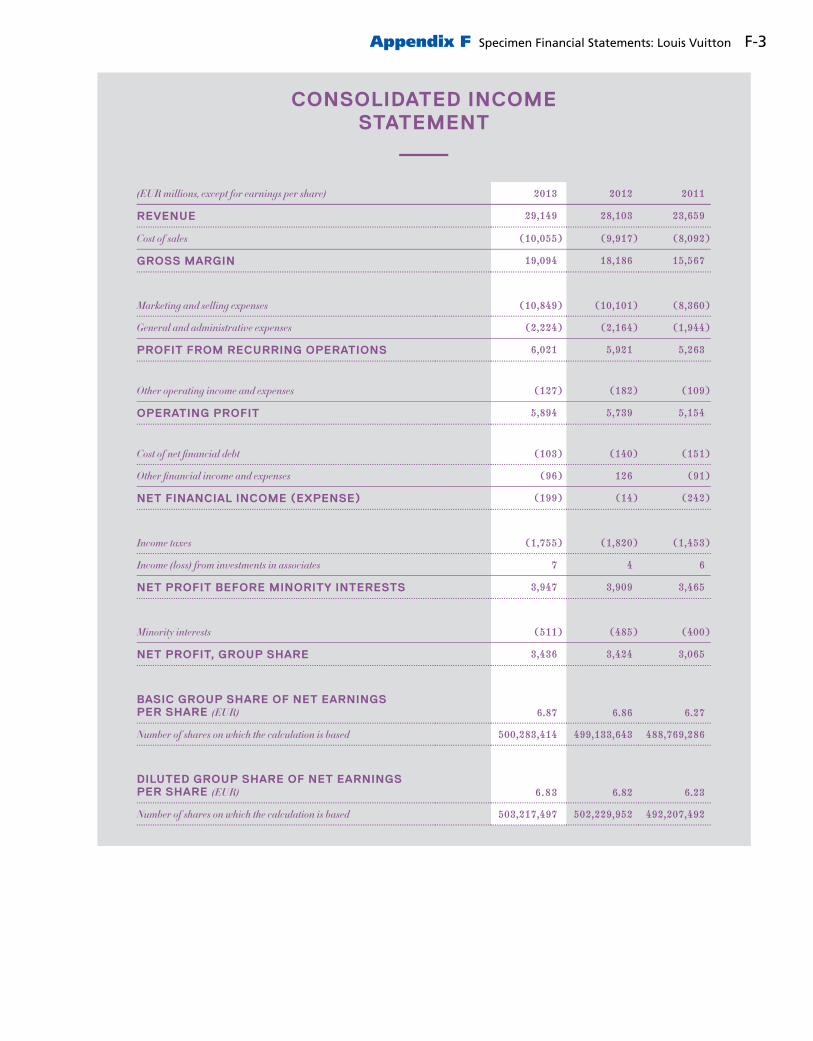
Appendix F Specimen Financial Statements: Louis Vuitton F-3

F-4 Appendix F Specimen Financial Statements: Louis Vuitton
CONSOLIDATED STATEMENT OFCOMPREHENSIVE GAINS AND LOSSES
(EUR millions) 2013 2012 (1) 2011(1)
NET PROFIT BEFORE MINORITY INTERESTS 3,947 3,909 3,465
Translation adjustments (346) (99) 190
Tax impact (48) (18) 47
(394) (117) 237
Change in value of available for sale fi nancial assets 963 (27) 1,634
Amounts transferred to income statement (16) (14) (38)
Tax impact (35) (6) (116)
912 (47) 1,480
Change in value of hedges of future foreign currency cash fl ows 304 182 95
Amounts transferred to income statement (265) 13 (168)
Tax impact (17) (50) 21
22 145 (52)
GAINS AND LOSSES RECOGNIZED IN EQUITY, TRANSFERABLE TO INCOME STATEMENT 540 (19) 1,665
Change in value of vineyard land 369 85 25
Tax impact (127) (28) (11)
242 57 14
Employee benefi t commitments: change in value resulting from actuarial gains and losses 80 (101) (45)
Tax impact (22) 29 13
58 (72) (32)
GAINS AND LOSSES RECOGNIZED IN EQUITY, NOT TRANSFERABLE TO INCOME STATEMENT 300 (15) (18)
COMPREHENSIVE INCOME 4,787 3,875 5,112
Minority interests (532) (470) (429)
COMPREHENSIVE INCOME, GROUP SHARE 4,255 3,405 4,683
(1) The consolidated statements of comprehensive gains and losses as of December 31, 2012 and 2011 have been restated to refl ect the retrospective application as of January 1, 2011 of IAS 19 Employee Benefi ts as amended.

Appendix F Specimen Financial Statements: Louis Vuitton F-5
CONSOLIDATED CASH FLOW STATEMENT
(EUR millions) 2013 2012 2011
I. OPERATING ACTIVITIES AND OPERATING INVESTMENTSOperating profi tNet increase in depreciation, amortization and provisionsOther computed expensesDividends receivedOther adjustments
5,894 1,454 (29) 86
(76)
5,739 1,299 (62) 188 (51)
5,154 999 (45) 61
(32)
CASH FROM OPERATIONS BEFORE CHANGES IN WORKING CAPITAL 7,329 7,113 6,137
Cost of net fi nancial debt: interest paidIncome taxes paid
(112) (1,979)
(154) (1,970)
(152) (1,544)
NET CASH FROM OPERATING ACTIVITIES BEFORE CHANGES IN WORKING CAPITAL 5,238 4,989 4,441
Change in working capital (617) (813) (534)
NET CASH FROM OPERATING ACTIVITIES 4,621 4,176 3,907
Operating investments (1,663) (1,702) (1,730)
NET CASH FROM OPERATING ACTIVITIES AND OPERATING INVESTMENTS (free cash fl ow) 2,958 2,474 2,177
II. FINANCIAL INVESTMENTSPurchase of non-current available for sale fi nancial assetsProceeds from sale of non-current available for sale fi nancial assetsImpact of purchase and sale of consolidated investments
(197)
38
(2,158)
(131)
36
(45)
(518)
17
(785)(1)
NET CASH FROM (used in) FINANCIAL INVESTMENTS (2,317) (140) (1,286)
III. TRANSACTIONS RELATING TO EQUITYCapital increases of LVMH
Capital increases of subsidiaries subscribed by minority interestsAcquisition and disposals of treasury shares and LVMH-share settled derivativesInterim and fi nal dividends paid by LVMHInterim and fi nal dividends paid to minority interests in consolidated subsidiariesPurchase and proceeds from sale of minority interests
66
7
(113)
(1,501)
(220)
(150)
94
8
5
(1,447)
(314)
(206)
94(1)
3
2
(1,069)
(189)
(1,413)
NET CASH FROM (used in) TRANSACTIONS RELATING TO EQUITY (1,911) (1,860) (2,572)
CHANGE IN CASH BEFORE FINANCING ACTIVITIES (1,270) 474 (1,681)
IV. FINANCING ACTIVITIESProceeds from borrowingsRepayment of borrowingsPurchase and proceeds from sale of current available for sale fi nancial assets
3,145 (1,099)
101
1,068 (1,526)
(67)
2,659 (1,005)
6
NET CASH FROM (used in) FINANCING ACTIVITIES 2,147 (525) 1,660
V. EFFECT OF EXCHANGE RATE CHANGES 46 (42) 60
NET INCREASE (decrease) IN CASH AND CASH EQUIVALENTS (I + II + III + IV + V) 923 (93) 39
CASH AND CASH EQUIVALENTS AT BEGINNING OF PERIODCASH AND CASH EQUIVALENTS AT END OF PERIOD
1,988 2,911
2,081 1,988
2,042 2,081
Transactions included in the table above, generating no change in cash:– acquisition of assets by means of fi nance leases 7 5 3
(1) Not including the impact of the amount attributable to the acquisition of Bulgari remunerated by the capital increase of LVMH SA as of June 30, 2011, which did not generate any cash fl ows.

(EU
R m
illio
ns)
Num
ber
of sh
ares
Shar
e cap
ital
Shar
e pre
miu
m
acco
unt
Trea
sury
shar
es
and L
VMH
-sh
are s
ettled
de
rivat
ives
Cum
ulat
ive
trans
latio
n ad
justm
ent
AS
OF
DE
CE
MB
ER
31,
20
12A
FT
ER
RE
ST
AT
EM
EN
T508,163,349
152
3,848
(414)
342
Gain
s and
losse
s rec
ogni
zed i
n eq
uity
(350)
Net p
rofi t
CO
MP
RE
HE
NS
IVE
IN
CO
ME
--
-(350)
Stoc
k opt
ion
plan
and s
imila
r exp
ense
s
(Acq
uisit
ion)
/disp
osal
of tr
easu
ry sh
ares
an
d LVM
H-sh
are s
ettled
deriv
ativ
es(103)
Exer
cise
of L
VMH
shar
e sub
scri
ptio
n op
tions
1,025,418
67
Retir
emen
t of L
VMH
shar
es(1,395,106)
(66)
66
Capi
tal i
ncre
ase i
n su
bsid
iari
es
Inte
rim
and
fina
l div
iden
ds p
aid
Chan
ges i
n co
ntro
l of c
onso
lidat
ed
entit
ies
Acqu
isiti
on a
nd d
ispo
sal o
f min
ority
in
tere
sts’
shar
es
Purc
hase
com
mitm
ents
for m
inor
ity
inte
rest
s’ sh
ares
AS
OF
DE
CE
MB
ER
31,
20
13507,793,661
152
3,849
(451)
(8)
Reva
luat
ion
rese
rves
Net p
rofi t
an
d ot
her
rese
rves
Tota
l equ
ity
Avai
labl
e fo
r sal
e fi n
ancia
l ass
ets
Hed
ges o
f fu
ture
fore
ign
curr
ency
ca
sh fl
ows
Vine
yard
la
ndEm
ploy
ee
bene
fi t
com
mitm
ents
Grou
p sh
are
Min
ority
in
teres
tsTo
tal
1,943
118
758
(88)
17,765
24,424
1,084
25,508
912
18
188
51
819
21
840
3,436
3,436
511
3,947
912
18
188
51
3,436
4,255
532
4,787
31
31
3
34
(7)
(110)
-
(110)
67
-
67
-
-
-
-
8
8
(1,500)
(1,500)
(228)
(1,728)
1
1
50
51
(73)
(73)
(76)
(149)
(400)
(400)
(345)
(745)
2,855
136
946
(37)
19,253
26,695
1,028
27,723
CO
NS
OL
IDA
TE
D S
TA
TE
ME
NT
OF
CH
AN
GE
S I
N E
QU
ITY

Would you rather receive $1,000 today or a year from now? You should prefer to receive the $1,000 today because you can invest the $1,000 and then earn interest on it. As a result, you will have more than $1,000 a year from now. What this example illustrates is the concept of the time value of money. Everyone prefers to receive money today rather than in the future because of the interest factor.
APPENDIX PREVIEW
Time Value of MoneyAppendix G
1 Compute interest and future values.• Nature of interest• Future value of a single amount • Future value of an annuity
2 Compute present values.• Present value variables• Present value of a single amount• Present value of an annuity• Time periods and discounting• Present value of a long-term note or bond
3 Compute the present value in capital budgeting situations.• Using alternative discount rates
4 Use a fi nancial calculator to solve time value ofmoney problems.• Present value of a single sum• Present value of an annuity• Useful fi nancial calculator applications
LEARNING OBJECTIVES
1 Compute interest and future values.LEARNING OBJECTIVE
Nature of Interest
Interest is payment for the use of another person’s money. It is the difference between the amount borrowed or invested (called the principal) and the amount repaid or collected. The amount of interest to be paid or collected is usually stated as a rate over a specifi c period of time. The rate of interest is generally stated as an annual rate. The amount of interest involved in any fi nancing transaction is based on three elements:
1. Principal (p): The original amount borrowed or invested.
2. Interest Rate (i): An annual percentage of the principal.
3. Time (n): The number of periods that the principal is borrowed or invested.
G-1

G-2 Appendix G Time Value of Money
COMPOUND INTEREST
Compound interest is computed on principal and on any interest earned that has not been paid or withdrawn. It is the return on (or growth of) the principal for two or more time periods. Compounding computes interest not only on the principal but also on the interest earned to date on that principal, assuming the interest is left on deposit. To illustrate the difference between simple and compound interest, assume that you deposit $1,000 in Bank Two, where it will earn simple interest of 9% per year, and you deposit another $1,000 in Citizens Bank, where it will earn compound interest of 9% per year compounded annually. Also assume that in both cases you will not withdraw any cash until three years from the date of deposit. Illustration G-2 shows the computation of interest to be received and the accumulated year-end balances.
Illustration G-1Interest computation
Interest 5 Principal
3 Rate
3 Time
p i n
For example, if you borrowed $5,000 for 2 years at a simple interest rate of 12% annually, you would pay $1,200 in total interest, computed as follows.
Interest 5 p 3 i 3 n
5 $5,000 3 .12 3 2 5 $1,200
Simple InterestCalculation
Year 1
Year 2
Year 3
$1,000.00 × 9%
$1,000.00 × 9%
$1,000.00 × 9%
$
$
90.00
90.00
90.00
270.00
$1,090.00
$1,180.00
$1,270.00
$25.03Difference
SimpleInterest
AccumulatedYear-EndBalance
Bank Two
Compound InterestCalculation
Year 1
Year 2
Year 3
$1,000.00 × 9%
$1,090.00 × 9%
$1,188.10 × 9%
$
$
90.00
98.10
106.93
295.03
$1,090.00
$1,188.10
$1,295.03
CompoundInterest
AccumulatedYear-EndBalance
Citizens Bank
Illustration G-2Simple versus compound interest
SIMPLE INTEREST
Simple interest is computed on the principal amount only. It is the return on the principal for one period. Simple interest is usually expressed as shown in Illustration G-1.
Note in Illustration G-2 that simple interest uses the initial principal of $1,000 to compute the interest in all three years. Compound interest uses the accumu-lated balance (principal plus interest to date) at each year-end to compute interest in the succeeding year—which explains why your compound interest account is larger. Obviously, if you had a choice between investing your money at simple interest or at compound interest, you would choose compound interest, all other things—especially risk—being equal. In the example, compounding provides $25.03 of additional interest income. For practical purposes, compounding assumes that

Interest and Future Values G-3
unpaid interest earned becomes a part of the principal, and the accumulated bal-ance at the end of each year becomes the new principal on which interest is earned during the next year. Illustration G-2 indicates that you should invest your money at the bank that compounds interest. Most business situations use compound interest. Simple interest is generally applicable only to short-term situations of one year or less.
Future Value of a Single Amount
The future value of a single amount is the value at a future date of a given amount invested, assuming compound interest. For example, in Illustration G-2, $1,295.03 is the future value of the $1,000 investment earning 9% for three years. The $1,295.03 is determined more easily by using the following formula.
Illustration G-3Formula for future valueFV 5 p 3 (1 1 i)n
where: FV 5 future value of a single amount p 5 principal (or present value; the value today) i 5 interest rate for one period n 5 number of periods
The $1,295.03 is computed as follows.
FV 5 p 3 (1 1 i)n
5 $1,000 3 (1 1 .09)3
5 $1,000 3 1.29503 5 $1,295.03
The 1.29503 is computed by multiplying (1.09 3 1.09 3 1.09). The amounts in this example can be depicted in the time diagram shown in Illustration G-4.
Present Value (p)
0$1,000
1 2 3$1,295.03
i = 9% FutureValue
n = 3 years
Illustration G-4Time diagram
Another method used to compute the future value of a single amount involves a compound interest table. This table shows the future value of 1 for n periods. Table 1 (page G-4) is such a table. In Table 1, n is the number of compounding periods, the percentages are the periodic interest rates, and the 5-digit decimal numbers in the respective columns are the future value of 1 factors. To use Table 1, you multiply the principal amount by the future value factor for the specifi ed number of periods and interest rate. For example, the future value factor for two periods at 9% is 1.18810. Multiplying this factor by $1,000 equals $1,188.10—which is the accumulated balance at the end of year 2 in the Citizens Bank example in Illustration G-2. The $1,295.03 accumulated

G-4 Appendix G Time Value of Money
balance at the end of the third year is calculated from Table 1 by multiplying the future value factor for three periods (1.29503) by the $1,000. The demonstration problem in Illustration G-5 shows how to use Table 1.
TABLE 1 Future Value of 1
(n) Periods 4% 5% 6% 7% 8% 9% 10% 11% 12% 15%
0 1.00000 1.00000 1.00000 1.00000 1.00000 1.00000 1.00000 1.00000 1.00000 1.00000 1 1.04000 1.05000 1.06000 1.07000 1.08000 1.09000 1.10000 1.11000 1.12000 1.15000 2 1.08160 1.10250 1.12360 1.14490 1.16640 1.18810 1.21000 1.23210 1.25440 1.32250 3 1.12486 1.15763 1.19102 1.22504 1.25971 1.29503 1.33100 1.36763 1.40493 1.52088 4 1.16986 1.21551 1.26248 1.31080 1.36049 1.41158 1.46410 1.51807 1.57352 1.74901 5 1.21665 1.27628 1.33823 1.40255 1.46933 1.53862 1.61051 1.68506 1.76234 2.01136
6 1.26532 1.34010 1.41852 1.50073 1.58687 1.67710 1.77156 1.87041 1.97382 2.31306 7 1.31593 1.40710 1.50363 1.60578 1.71382 1.82804 1.94872 2.07616 2.21068 2.66002 8 1.36857 1.47746 1.59385 1.71819 1.85093 1.99256 2.14359 2.30454 2.47596 3.05902 9 1.42331 1.55133 1.68948 1.83846 1.99900 2.17189 2.35795 2.55803 2.77308 3.51788 10 1.48024 1.62889 1.79085 1.96715 2.15892 2.36736 2.59374 2.83942 3.10585 4.04556
11 1.53945 1.71034 1.89830 2.10485 2.33164 2.58043 2.85312 3.15176 3.47855 4.65239 12 1.60103 1.79586 2.01220 2.25219 2.51817 2.81267 3.13843 3.49845 3.89598 5.35025 13 1.66507 1.88565 2.13293 2.40985 2.71962 3.06581 3.45227 3.88328 4.36349 6.15279 14 1.73168 1.97993 2.26090 2.57853 2.93719 3.34173 3.79750 4.31044 4.88711 7.07571 15 1.80094 2.07893 2.39656 2.75903 3.17217 3.64248 4.17725 4.78459 5.47357 8.13706
16 1.87298 2.18287 2.54035 2.95216 3.42594 3.97031 4.59497 5.31089 6.13039 9.35762 17 1.94790 2.29202 2.69277 3.15882 3.70002 4.32763 5.05447 5.89509 6.86604 10.76126 18 2.02582 2.40662 2.85434 3.37993 3.99602 4.71712 5.55992 6.54355 7.68997 12.37545 19 2.10685 2.52695 3.02560 3.61653 4.31570 5.14166 6.11591 7.26334 8.61276 14.23177 20 2.19112 2.65330 3.20714 3.86968 4.66096 5.60441 6.72750 8.06231 9.64629 16.36654
Illustration G-5Demonstration problem—Using Table 1 for FV of 1
0$20,000
1 2 3 4 5 6 7 8 9 10 11 12 13 14 15 16 17 18
i = 6%Future
Value = ?Present Value (p)
n = 18 years
John and Mary Rich invested $20,000 in a savings account paying 6% interest at the time their son,Mike, was born. The money is to be used by Mike for his college education. On his 18th birthday, Mike withdraws the money from his savings account. How much did Mike withdraw from his account?
Answer: The future value factor from Table 1 is 2.85434 (18 periods at 6%). The future value of$20,000 earning 6% per year for 18 years is $57,086.80 ($20,000 × 2.85434).
Future Value of an Annuity
The preceding discussion involved the accumulation of only a single principal sum. Individuals and businesses frequently encounter situations in which a

Interest and Future Values G-5
series of equal dollar amounts are to be paid or received at evenly spaced time intervals (periodically), such as loans or lease (rental) contracts. A series of pay-ments or receipts of equal dollar amounts is referred to as an annuity. The future value of an annuity is the sum of all the payments (receipts) plus the accumulated compound interest on them. In computing the future value of an annuity, it is necessary to know (1) the interest rate, (2) the number of pay-ments (receipts), and (3) the amount of the periodic payments (receipts). To illustrate the computation of the future value of an annuity, assume that you invest $2,000 at the end of each year for three years at 5% interest compounded annually. This situation is depicted in the time diagram in Illustration G-6.
The $2,000 invested at the end of year 1 will earn interest for two years (years 2 and 3), and the $2,000 invested at the end of year 2 will earn interest for one year (year 3). However, the last $2,000 investment (made at the end of year 3) will not earn any interest. Using the future value factors from Table 1, the future value of these periodic payments is computed as shown in Illustration G-7.
0 1 2 3
$2,000PresentValue $2,000 $2,000
i = 5% FutureValue = ?
n = 3 years
Illustration G-6Time diagram for a three-year annuity
The fi rst $2,000 investment is multiplied by the future value factor for two periods (1.1025) because two years’ interest will accumulate on it (in years 2 and 3). The second $2,000 investment will earn only one year’s interest (in year 3) and therefore is multiplied by the future value factor for one year (1.0500). The fi nal $2,000 investment is made at the end of the third year and will not earn any inter-est. Thus, n 5 0 and the future value factor is 1.00000. Consequently, the future value of the last $2,000 invested is only $2,000 since it does not accumulate any interest. Calculating the future value of each individual cash fl ow is required when the periodic payments or receipts are not equal in each period. However, when the periodic payments (receipts) are the same in each period, the future value can be computed by using a future value of an annuity of 1 table. Table 2 (page G-6) is such a table.
Illustration G-7Future value of periodic payment computation
Invested at Number of End of Compounding Amount Future Value of Future Year Periods Invested 3 1 Factor at 5% 5 Value
1 2 $2,000 1.10250 $ 2,205 2 1 2,000 1.05000 2,100 3 0 2,000 1.00000 2,000
3.15250 $6,305

G-6 Appendix G Time Value of Money
Table 2 shows the future value of 1 to be received periodically for a given number of payments. It assumes that each payment is made at the end of each period. We can see from Table 2 that the future value of an annuity of 1 factor for three payments at 5% is 3.15250. The future value factor is the total of the three individual future value factors as shown in Illustration G-7. Multiplying this amount by the annual investment of $2,000 produces a future value of $6,305. The demonstration problem in Illustration G-8 shows how to use Table 2.
TABLE 2 Future Value of an Annuity of 1
(n) Payments 4% 5% 6% 7% 8% 9% 10% 11% 12% 15%
1 1.00000 1.00000 1.00000 1.0000 1.00000 1.00000 1.00000 1.00000 1.00000 1.00000 2 2.04000 2.05000 2.06000 2.0700 2.08000 2.09000 2.10000 2.11000 2.12000 2.15000 3 3.12160 3.15250 3.18360 3.2149 3.24640 3.27810 3.31000 3.34210 3.37440 3.47250 4 4.24646 4.31013 4.37462 4.4399 4.50611 4.57313 4.64100 4.70973 4.77933 4.99338 5 5.41632 5.52563 5.63709 5.7507 5.86660 5.98471 6.10510 6.22780 6.35285 6.74238
6 6.63298 6.80191 6.97532 7.1533 7.33592 7.52334 7.71561 7.91286 8.11519 8.75374 7 7.89829 8.14201 8.39384 8.6540 8.92280 9.20044 9.48717 9.78327 10.08901 11.06680 8 9.21423 9.54911 9.89747 10.2598 10.63663 11.02847 11.43589 11.85943 12.29969 13.72682 9 10.58280 11.02656 11.49132 11.9780 12.48756 13.02104 13.57948 14.16397 14.77566 16.78584 10 12.00611 12.57789 13.18079 13.8164 14.48656 15.19293 15.93743 16.72201 17.54874 20.30372
11 13.48635 14.20679 14.97164 15.7836 16.64549 17.56029 18.53117 19.56143 20.65458 24.34928 12 15.02581 15.91713 16.86994 17.8885 18.97713 20.14072 21.38428 22.71319 24.13313 29.00167 13 16.62684 17.71298 18.88214 20.1406 21.49530 22.95339 24.52271 26.21164 28.02911 34.35192 14 18.29191 19.59863 21.01507 22.5505 24.21492 26.01919 27.97498 30.09492 32.39260 40.50471 15 20.02359 21.57856 23.27597 25.1290 27.15211 29.36092 31.77248 34.40536 37.27972 47.58041
16 21.82453 23.65749 25.67253 27.8881 30.32428 33.00340 35.94973 39.18995 42.75328 55.71747 17 23.69751 25.84037 28.21288 30.8402 33.75023 36.97351 40.54470 44.50084 48.88367 65.07509 18 25.64541 28.13238 30.90565 33.9990 37.45024 41.30134 45.59917 50.39593 55.74972 75.83636 19 27.67123 30.53900 33.75999 37.3790 41.44626 46.01846 51.15909 56.93949 63.43968 88.21181 20 29.77808 33.06595 36.78559 40.9955 45.76196 51.16012 57.27500 64.20283 72.05244 102.44358
0 1 2 3 4
$2,500PresentValue $2,500 $2,500 $2,500
i = 6% FutureValue = ?
n = 4 years
John and Char Lewis’s daughter, Debra, has just started high school. They decide to start acollege fund for her and will invest $2,500 in a savings account at the end of each year she isin high school (4 payments total). The account will earn 6% interest compounded annually. How much will be in the college fund at the time Debra graduates from high school?
Answer: The future value factor from Table 2 is 4.37462 (4 payments at 6%). The future value of$2,500 invested each year for 4 years at 6% interest is $10,936.55 ($2,500 × 4.37462).
Illustration G-8Demonstration problem—Using Table 2 for FV of an annuity of 1

Present Values G-7
The computation of $1,000 discounted at 10% for one year is as follows.
PV 5 FV 4 (1 1 i)n
5 $1,000 4 (1 1 .10)1
5 $1,000 4 1.10 5 $909.09
The future amount ($1,000), the discount rate (10%), and the number of periods (1) are known. The variables in this situation are depicted in the time diagram in Illustration G-10.
2 Compute present values.LEARNING OBJECTIVE
Present Value Variables
The present value is the value now of a given amount to be paid or received in the future, assuming compound interest. The present value, like the future value, is based on three variables: (1) the dollar amount to be received (future amount), (2) the length of time until the amount is received (number of periods), and (3) the interest rate (the discount rate). The process of determining the present value is referred to as discounting the future amount. Present value computations are used in measuring many items. For example, the present value of principal and interest payments is used to determine the market price of a bond. Determining the amount to be reported for notes payable and lease liabilities also involves present value computations. In addition, capital budgeting and other investment proposals are evaluated using present value computations. Finally, all rate of return and internal rate of return computations involve present value techniques.
Present Value of a Single Amount
To illustrate present value, assume that you want to invest a sum of money today that will provide $1,000 at the end of one year. What amount would you need to invest today to have $1,000 one year from now? If you want a 10% rate of return, the investment or present value is $909.09 ($1,000 4 1.10). The formula for cal-culating present value is shown in Illustration G-9.
Illustration G-9Formula for present valuePresent Value (PV ) 5 Future Value (FV ) 4 (1 1 i )n
Illustration G-10Finding present value if discounted for one period
i = 10%
n = 1 year
PresentValue (?)
$909.09
FutureValue
$1,000
If the single amount of $1,000 is to be received in two years and discounted at 10% [PV 5 $1,000 4 (1 1 .10)2], its present value is $826.45 [($1,000 4 1.21), depicted in Illustration G-11 (page G-8).

G-8 Appendix G Time Value of Money
The present value of 1 may also be determined through tables that show the present value of 1 for n periods. In Table 3 (see below), n is the number of dis-counting periods involved. The percentages are the periodic interest rates or dis-count rates, and the 5-digit decimal numbers in the respective columns are the present value of 1 factors. When using Table 3, the future value is multiplied by the present value factor specifi ed at the intersection of the number of periods and the discount rate.
i = 10%
1
PresentValue (?)
0
FutureValue
2n = 2 years$826.45 $1,000
Illustration G-11Finding present value if discounted for two periods
TABLE 3 Present Value of 1
(n) Periods 4% 5% 6% 7% 8% 9% 10% 11% 12% 15%
1 .96154 .95238 .94340 .93458 .92593 .91743 .90909 .90090 .89286 .86957 2 .92456 .90703 .89000 .87344 .85734 .84168 .82645 .81162 .79719 .75614 3 .88900 .86384 .83962 .81630 .79383 .77218 .75132 .73119 .71178 .65752 4 .85480 .82270 .79209 .76290 .73503 .70843 .68301 .65873 .63552 .57175 5 .82193 .78353 .74726 .71299 .68058 .64993 .62092 .59345 .56743 .49718
6 .79031 .74622 .70496 .66634 .63017 .59627 .56447 .53464 .50663 .43233 7 .75992 .71068 .66506 .62275 .58349 .54703 .51316 .48166 .45235 .37594 8 .73069 .67684 .62741 .58201 .54027 .50187 .46651 .43393 .40388 .32690 9 .70259 .64461 .59190 .54393 .50025 .46043 .42410 .39092 .36061 .28426 10 .67556 .61391 .55839 .50835 .46319 .42241 .38554 .35218 .32197 .24719
11 .64958 .58468 .52679 .47509 .42888 .38753 .35049 .31728 .28748 .21494 12 .62460 .55684 .49697 .44401 .39711 .35554 .31863 .28584 .25668 .18691 13 .60057 .53032 .46884 .41496 .36770 .32618 .28966 .25751 .22917 .16253 14 .57748 .50507 .44230 .38782 .34046 .29925 .26333 .23199 .20462 .14133 15 .55526 .48102 .41727 .36245 .31524 .27454 .23939 .20900 .18270 .12289
16 .53391 .45811 .39365 .33873 .29189 .25187 .21763 .18829 .16312 .10687 17 .51337 .43630 .37136 .31657 .27027 .23107 .19785 .16963 .14564 .09293 18 .49363 .41552 .35034 .29586 .25025 .21199 .17986 .15282 .13004 .08081 19 .47464 .39573 .33051 .27615 .23171 .19449 .16351 .13768 .11611 .07027 20 .45639 .37689 .31180 .25842 .21455 .17843 .14864 .12403 .10367 .06110
For example, the present value factor for one period at a discount rate of 10% is .90909, which equals the $909.09 ($1,000 3 .90909) computed in Illustration G-10. For two periods at a discount rate of 10%, the present value factor is .82645, which equals the $826.45 ($1,000 3 .82645) computed previously. Note that a higher discount rate produces a smaller present value. For exam-ple, using a 15% discount rate, the present value of $1,000 due one year from now is $869.57, versus $909.09 at 10%. Also note that the further removed from the present the future value is, the smaller the present value. For example, using the same discount rate of 10%, the present value of $1,000 due in fi ve years is $620.92. The present value of $1,000 due in one year is $909.09, a difference of $288.17.

Present Values G-9
The following two demonstration problems (Illustrations G-12 and G-13) illustrate how to use Table 3.
i = 8%
2
PV = ?
Now
$10,000
3 years1
Suppose you have a winning lottery ticket and the state gives you theoption of taking $10,000 3 years from now or taking the presentvalue of $10,000 now. The state uses an 8% rate in discounting. Howmuch will you receive if you accept your winnings now?
Answer: The present value factor from Table 3 is .79383(3 periods at 8%). The present value of $10,000 to be received in3 years discounted at 8% is $7,938.30 ($10,000 × .79383).
n = 3
Illustration G-12Demonstration problem—Using Table 3 for PV of 1
i = 9%
3
PV = ?
Today
$5,000
4 years1
Determine the amount you must deposit today in your supersavings account, paying 9% interest, in order to accumulate $5,000for a down payment 4 years from now on a new car.
Answer: The present value factor from Table 3 is .70843(4 periods at 9%). The present value of $5,000 to be received in4 years discounted at 9% is $3,542.15 ($5,000 × .70843).
2n = 4
Illustration G-13Demonstration problem—Using Table 3 for PV of 1
Present Value of an Annuity
The preceding discussion involved the discounting of only a single future amount. Businesses and individuals frequently engage in transactions in which a series of equal dollar amounts are to be received or paid at evenly spaced time intervals (periodically). Examples of a series of periodic receipts or payments are loan agreements, installment sales, mortgage notes, lease (rental) contracts, and pen-sion obligations. As discussed earlier, these periodic receipts or payments are annuities. The present value of an annuity is the value now of a series of future receipts or payments, discounted assuming compound interest. In computing the present value of an annuity, it is necessary to know (1) the discount rate, (2) the number of payments (receipts), and (3) the amount of the periodic receipts or payments. To illustrate the computation of the present value of an annuity, assume that you

G-10 Appendix G Time Value of Money
will receive $1,000 cash annually for three years at a time when the discount rate is 10%. This situation is depicted in the time diagram in Illustration G-14. Illus-tration G-15 shows the computation of its present value in this situation.
i = 10%
2Today 3 years
PV = ? $1,000 $1,000$1,000
1n = 3
Illustration G-14Time diagram for a three-year annuity
TABLE 4 Present Value of an Annuity of 1
(n) Payments 4% 5% 6% 7% 8% 9% 10% 11% 12% 15%
1 .96154 .95238 .94340 .93458 .92593 .91743 .90909 .90090 .89286 .86957 2 1.88609 1.85941 1.83339 1.80802 1.78326 1.75911 1.73554 1.71252 1.69005 1.62571 3 2.77509 2.72325 2.67301 2.62432 2.57710 2.53130 2.48685 2.44371 2.40183 2.28323 4 3.62990 3.54595 3.46511 3.38721 3.31213 3.23972 3.16986 3.10245 3.03735 2.85498 5 4.45182 4.32948 4.21236 4.10020 3.99271 3.88965 3.79079 3.69590 3.60478 3.35216
6 5.24214 5.07569 4.91732 4.76654 4.62288 4.48592 4.35526 4.23054 4.11141 3.78448 7 6.00205 5.78637 5.58238 5.38929 5.20637 5.03295 4.86842 4.71220 4.56376 4.16042 8 6.73274 6.46321 6.20979 5.97130 5.74664 5.53482 5.33493 5.14612 4.96764 4.48732 9 7.43533 7.10782 6.80169 6.51523 6.24689 5.99525 5.75902 5.53705 5.32825 4.77158 10 8.11090 7.72173 7.36009 7.02358 6.71008 6.41766 6.14457 5.88923 5.65022 5.01877
11 8.76048 8.30641 7.88687 7.49867 7.13896 6.80519 6.49506 6.20652 5.93770 5.23371 12 9.38507 8.86325 8.38384 7.94269 7.53608 7.16073 6.81369 6.49236 6.19437 5.42062 13 9.98565 9.39357 8.85268 8.35765 7.90378 7.48690 7.10336 6.74987 6.42355 5.58315 14 10.56312 9.89864 9.29498 8.74547 8.24424 7.78615 7.36669 6.98187 6.62817 5.72448 15 11.11839 10.37966 9.71225 9.10791 8.55948 8.06069 7.60608 7.19087 6.81086 5.84737
16 11.65230 10.83777 10.10590 9.44665 8.85137 8.31256 7.82371 7.37916 6.97399 5.95424 17 12.16567 11.27407 10.47726 9.76322 9.12164 8.54363 8.02155 7.54879 7.11963 6.04716 18 12.65930 11.68959 10.82760 10.05909 9.37189 8.75563 8.20141 7.70162 7.24967 6.12797 19 13.13394 12.08532 11.15812 10.33560 9.60360 8.95012 8.36492 7.83929 7.36578 6.19823 20 13.59033 12.46221 11.46992 10.59401 9.81815 9.12855 8.51356 7.96333 7.46944 6.25933
Illustration G-15Present value of a series of future amounts computation
Present Value of 1 Future Amount 3 Factor at 10% 5 Present Value
$1,000 (1 year away) .90909 $ 909.09 1,000 (2 years away) .82645 826.45 1,000 (3 years away) .75132 751.32
2.48686 $2,486.86
This method of calculation is required when the periodic cash fl ows are not uniform in each period. However, when the future receipts are the same in each period, an annuity table can be used. As illustrated in Table 4 below, an annuity table shows the present value of 1 to be received periodically for a given number of payments. It assumes that each payment is made at the end of each period.

Present Values G-11
Table 4 shows that the present value of an annuity of 1 factor for three pay-ments at 10% is 2.48685.1 This present value factor is the total of the three indi-vidual present value factors, as shown in Illustration G-15. Applying this amount to the annual cash fl ow of $1,000 produces a present value of $2,486.85. The following demonstration problem (Illustration G-16) illustrates how to use Table 4.
i = 12%
4
PV = ?
Today
$6,000
5 years1
Kildare Company has just signed a capitalizable lease contract for equip-ment that requires rental payments of $6,000 each, to be paid at the endof each of the next 5 years. The appropriate discount rate is 12%. Whatis the present value of the rental payments—that is, the amount used tocapitalize the leased equipment?
Answer: The present value factor from Table 4 is 3.60478(5 payments at 12%). The present value of 5 payments of $6,000 eachdiscounted at 12% is $21,628.68 ($6,000 × 3.60478).
$6,000 $6,000
2 3
$6,000 $6,000
n = 5
Illustration G-16Demonstration problem— Using Table 4 for PV of an annuity of 1
Time Periods and Discounting
In the preceding calculations, the discounting was done on an annual basis using an annual interest rate. Discounting may also be done over shorter periods of time such as monthly, quarterly, or semiannually. When the time frame is less than one year, it is necessary to convert the annual interest rate to the applicable time frame. Assume, for example, that the investor in Illustration G-14 received $500 semiannually for three years instead of $1,000 annually. In this case, the number of periods becomes six (3 3 2), the discount rate is 5% (10% 4 2), the present value factor from Table 4 is 5.07569 (6 periods at 5%), and the present value of the future cash fl ows is $2,537.85 (5.07569 3 $500). This amount is slightly higher than the $2,486.86 computed in Illustration G-15 because interest is computed twice during the same year. That is, during the second half of the year, interest is earned on the fi rst half-year’s interest.
Present Value of a Long-Term Note or Bond
The present value (or market price) of a long-term note or bond is a function of three variables: (1) the payment amounts, (2) the length of time until the amounts are paid, and (3) the discount rate. Our example uses a fi ve-year bond issue. The fi rst variable (dollars to be paid) is made up of two elements: (1) a series of interest payments (an annuity) and (2) the principal amount (a single sum). To
1The difference of .00001 between 2.48686 and 2.48685 is due to rounding.

G-12 Appendix G Time Value of Money
compute the present value of the bond, both the interest payments and the prin-cipal amount must be discounted—two different computations. The time diagrams for a bond due in fi ve years are shown in Illustration G-17.
When the investor’s market interest rate is equal to the bond’s contractual interest rate, the present value of the bonds will equal the face value of the bonds. To illustrate, assume a bond issue of 10%, fi ve-year bonds with a face value of $100,000 with interest payable semiannually on January 1 and July 1. If the dis-count rate is the same as the contractual rate, the bonds will sell at face value. In this case, the investor will receive (1) $100,000 at maturity and (2) a series of ten $5,000 interest payments [($100,000 3 10%) 4 2] over the term of the bonds. The length of time is expressed in terms of interest periods—in this case—10, and the discount rate per interest period, 5%. The following time diagram (Illustration G-18) depicts the variables involved in this discounting situation.
Interest Rate (i)
1 yr.
PV = ?
Today
PrincipalAmount
5 yr.
Diagramfor
Principal2 yr. 3 yr. 4 yr.
Annuity
1 yr.
PV = ?
Today 5 yr.
Diagramfor
Interest2 yr. 3 yr. 4 yr.
Interest Rate (i)Annuity Annuity Annuity Annuity
n = 5
n = 5
Illustration G-17Time diagrams for the present value of a bond
i = 5%
1
PV = ?
Today
PrincipalAmount$100,000
10
Diagramfor
Principal5 6
1
PV = ?
Today 10
Diagramfor
Interest5 6
i = 5%$5,000
2
2
3
3
4
4
7
7
8
8
9
9
$5,000 $5,000 $5,000 $5,000$5,000 $5,000 $5,000 $5,000
n = 10
n = 10
$5,000
InterestPayments
Illustration G-18Time diagram for present value of a 10%, fi ve-year bond paying interest semiannually

Present Values G-13
Illustration G-19 shows the computation of the present value of these bonds.
Illustration G-19Present value of principal and interest—face value
10% Contractual Rate—10% Discount Rate
Present value of principal to be received at maturity $100,000 3 PV of 1 due in 10 periods at 5% $100,000 3 .61391 (Table 3) $ 61,391Present value of interest to be received periodically over the term of the bonds $5,000 3 PV of 1 due periodically for 10 periods at 5% $5,000 3 7.72173 (Table 4) 38,609*
Present value of bonds $100,000
*Rounded
Illustration G-20Present value of principal and interest—discount
10% Contractual Rate—12% Discount Rate
Present value of principal to be received at maturity $100,000 3 .55839 (Table 3) $ 55,839Present value of interest to be received periodically over the term of the bonds $5,000 3 7.36009 (Table 4) 36,800
Present value of bonds $92,639
Illustration G-21Present value of principal and interest—premium
10% Contractual Rate—8% Discount Rate
Present value of principal to be received at maturity $100,000 3 .67556 (Table 3) $ 67,556Present value of interest to be received periodicallyover the term of the bonds $5,000 3 8.11090 (Table 4) 40,555
Present value of bonds $108,111
Now assume that the investor’s required rate of return is 12%, not 10%. The future amounts are again $100,000 and $5,000, respectively, but now a discount rate of 6% (12% 4 2) must be used. The present value of the bonds is $92,639, as computed in Illustration G-20.
Conversely, if the discount rate is 8% and the contractual rate is 10%, the present value of the bonds is $108,111, computed as shown in Illustration G-21.
The above discussion relied on present value tables in solving present value problems. Calculators may also be used to compute present values without the use of these tables. Many calculators, especially fi nancial calculators, have present value (PV) functions that allow you to calculate present values by merely inputting the proper amount, discount rate, periods, and pressing the PV key. We discuss the use of fi nancial calculators in a later section.

G-14 Appendix G Time Value of Money
Notice from the diagrams that computing the present value of the net operating cash fl ows ($40,000 at the end of each year) is discounting an annuity (Table 4), while computing the present value of the $35,000 salvage value is discounting a single sum (Table 3). The computation of these present values is shown in Illustration G-23.
3 Compute the present value in capital budgeting situations.LEARNING OBJECTIVE
The decision to make long-term capital investments is best evaluated using dis-counting techniques that recognize the time value of money. To do this, many companies calculate the present value of the cash fl ows involved in a capital investment. To illustrate, Nagel-Siebert Trucking Company, a cross-country freight carrier in Montgomery, Illinois, is considering adding another truck to its fl eet because of a purchasing opportunity. Navistar Inc., Nagel-Siebert’s primary supplier of overland rigs, is overstocked and offers to sell its biggest rig for $154,000 cash payable upon delivery. Nagel-Siebert knows that the rig will produce a net cash fl ow per year of $40,000 for fi ve years (received at the end of each year), at which time it will be sold for an estimated salvage value of $35,000. Nagel-Siebert’s dis-count rate in evaluating capital expenditures is 10%. Should Nagel-Siebert commit to the purchase of this rig? The cash fl ows that must be discounted to present value by Nagel-Siebert are as follows.
Cash payable on delivery (today): $154,000.
Net cash fl ow from operating the rig: $40,000 for 5 years (at the end of each year).
Cash received from sale of rig at the end of 5 years: $35,000.
The time diagrams for the latter two cash fl ows are shown in Illustration G-22.
i = 10%
1 yr.
PV = ?
Today
Net OperatingCash Flows
$40,000
5 yr.
Diagramfor Net
OperatingCash Flows 2 yr. 3 yr. 4 yr.
$40,000 $40,000 $40,000 $40,000
1 yr.Today 5 yr.
Diagramfor
SalvageValue 2 yr. 3 yr. 4 yr.
i = 10%Cash
from Sale$35,000
n = 5
n = 5
PV = ?
Illustration G-22Time diagrams for Nagel-Siebert Trucking Company

Using Financial Calculators G-15
Because the present value of the cash receipts (infl ows) of $173,363.80 ($151,631.60 1 $21,732.20) exceeds the present value of the cash payments (out-fl ows) of $154,000.00, the net present value of $19,363.80 is positive, and the decision to invest should be accepted. Now assume that Nagle-Siebert uses a discount rate of 15%, not 10%, because it wants a greater return on its investments in capital assets. The cash receipts and cash payments by Nagel-Siebert are the same. The present values of these receipts and cash payments discounted at 15% are shown in Illustration G-24.
Illustration G-23Present value computations at 10%
Present Values Using a 10% Discount Rate
Present value of net operating cash fl ows received annually over 5 years $40,000 3 PV of 1 received annually for 5 years at 10% $40,000 3 3.79079 (Table 4) $ 151,631.60Present value of salvage value (cash) to be received in 5 years $35,000 3 PV of 1 received in 5 years at 10% $35,000 3 .62092 (Table 3) 21,732.20
Present value of cash infl ows 173,363.80Present value of cash outfl ows (purchase price due today at 10%) $154,000 3 PV of 1 due today $154,000 3 1.00000 (154,000.00)
Net present value $ 19,363.80
Illustration G-24Present value computations at 15%
Present Values Using a 15% Discount Rate
Present value of net operating cash fl ows received annuallyover 5 years at 15% $40,000 3 3.35216 (Table 4) $ 134,086.40Present value of salvage value (cash) to be received in 5 years at 15% $35,000 3 .49718 (Table 3) 17,401.30
Present value of cash infl ows 151,487.70Present value of cash outfl ows (purchase price due today at 15%) $154,000 3 1.00000 (154,000.00)
Net present value $ (2,512.30)
Because the present value of the cash payments (outfl ows) of $154,000.00 exceeds the present value of the cash receipts (infl ows) of $151,487.70 ($134,086.40 1 $17,401.30), the net present value of $2,512.30 is negative, and the investment should be rejected. The above discussion relied on present value tables in solving present value problems. As we show in the next section, calculators may also be used to com-pute present values without the use of these tables. Financial calculators have present value (PV) functions that allow you to calculate present values by merely identifying the proper amount, discount rate, periods, and pressing the PV key.
4 Use a fi nancial calculator to solve time value of money problems.LEARNING OBJECTIVE
Business professionals, once they have mastered the underlying time value of money concepts, often use a fi nancial calculator to solve these types of problems. In most cases, they use calculators if interest rates or time periods do not corre-spond with the information provided in the compound interest tables.
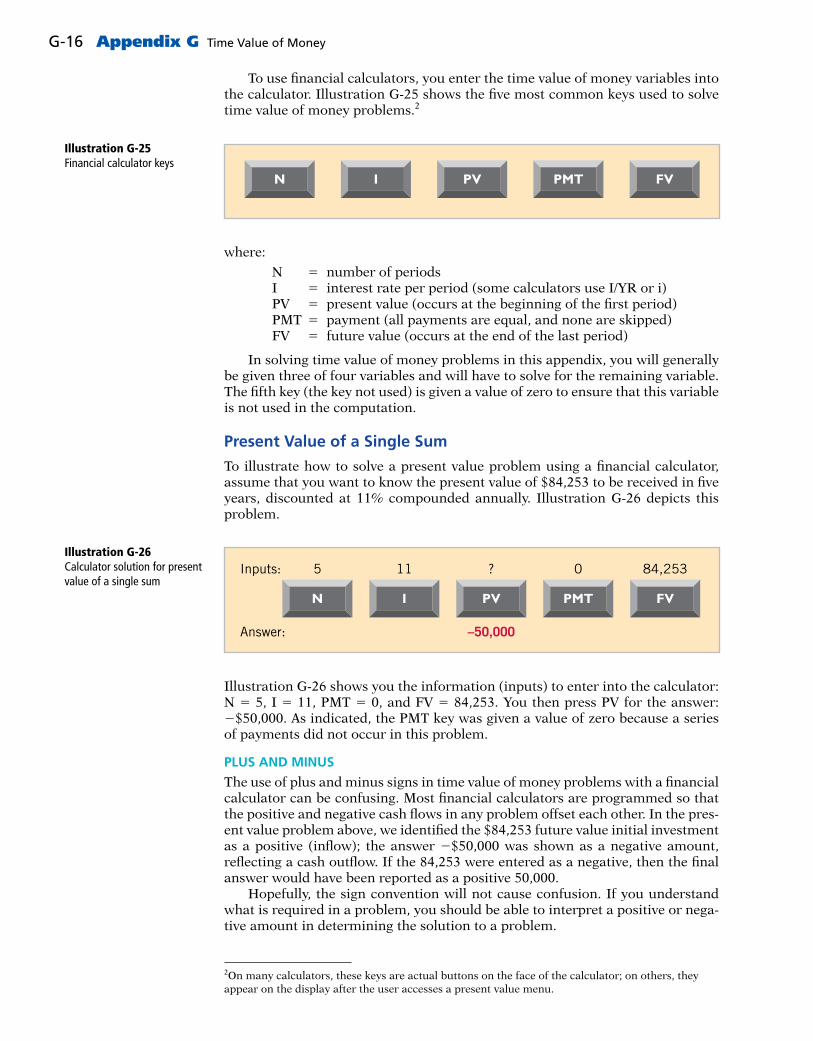
G-16 Appendix G Time Value of Money
To use fi nancial calculators, you enter the time value of money variables into the calculator. Illustration G-25 shows the fi ve most common keys used to solve time value of money problems.2
Illustration G-25Financial calculator keys
N FVPMTPVI
where:
N 5 number of periods I 5 interest rate per period (some calculators use I/YR or i) PV 5 present value (occurs at the beginning of the fi rst period) PMT 5 payment (all payments are equal, and none are skipped) FV 5 future value (occurs at the end of the last period)
In solving time value of money problems in this appendix, you will generally be given three of four variables and will have to solve for the remaining variable. The fi fth key (the key not used) is given a value of zero to ensure that this variable is not used in the computation.
Present Value of a Single Sum
To illustrate how to solve a present value problem using a fi nancial calculator, assume that you want to know the present value of $84,253 to be received in fi ve years, discounted at 11% compounded annually. Illustration G-26 depicts this problem.
Illustration G-26Calculator solution for present value of a single sum
? 0 84,253
–50,000
Inputs: 5
Answer:
11
N FVPMTPVI
Illustration G-26 shows you the information (inputs) to enter into the calculator: N 5 5, I 5 11, PMT 5 0, and FV 5 84,253. You then press PV for the answer: 2$50,000. As indicated, the PMT key was given a value of zero because a series of payments did not occur in this problem.
PLUS AND MINUS
The use of plus and minus signs in time value of money problems with a fi nancial calculator can be confusing. Most fi nancial calculators are programmed so that the positive and negative cash fl ows in any problem offset each other. In the pres-ent value problem above, we identifi ed the $84,253 future value initial investment as a positive (infl ow); the answer 2$50,000 was shown as a negative amount, refl ecting a cash outfl ow. If the 84,253 were entered as a negative, then the fi nal answer would have been reported as a positive 50,000. Hopefully, the sign convention will not cause confusion. If you understand what is required in a problem, you should be able to interpret a positive or nega-tive amount in determining the solution to a problem.
2On many calculators, these keys are actual buttons on the face of the calculator; on others, they appear on the display after the user accesses a present value menu.

Using Financial Calculators G-17
COMPOUNDING PERIODS
In the previous problem, we assumed that compounding occurs once a year. Some fi nancial calculators have a default setting, which assumes that compound-ing occurs 12 times a year. You must determine what default period has been programmed into your calculator and change it as necessary to arrive at the proper compounding period.
ROUNDING
Most fi nancial calculators store and calculate using 12 decimal places. As a result, because compound interest tables generally have factors only up to fi ve decimal places, a slight difference in the fi nal answer can result. In most time value of money problems, the fi nal answer will not include more than two decimal places.
Present Value of an Annuity
To illustrate how to solve a present value of an annuity problem using a fi nancial calculator, assume that you are asked to determine the present value of rental receipts of $6,000 each to be received at the end of each of the next fi ve years, when discounted at 12%, as pictured in Illustration G-27.
In this case, you enter N 5 5, I 5 12, PMT 5 6,000, FV 5 0, and then press PV to arrive at the answer of 2$21,628.66.
Useful Applications of the Financial Calculator
With a fi nancial calculator, you can solve for any interest rate or for any number of periods in a time value of money problem. Here are some examples of these applications.
AUTO LOAN
Assume you are fi nancing the purchase of a used car with a three-year loan. The loan has a 9.5% stated annual interest rate, compounded monthly. The price of the car is $6,000, and you want to determine the monthly payments, assuming that the payments start one month after the purchase. This problem is pictured in Illustration G-28.
Inputs: 5 12 ? 6,000 0
Answer: –21,628.66
N FVPMTPVI
Illustration G-27Calculator solution for present value of an annuity
To solve this problem, you enter N 5 36 (12 3 3), I 5 9.5, PV 5 6,000, FV 5 0, and then press PMT. You will fi nd that the monthly payments will be $192.20. Note that the payment key is usually programmed for 12 payments per year. Thus, you must change the default (compounding period) if the payments are other than monthly.
Inputs: 36 9.5 6,000 ? 0
Answer:
N FVPVI
–192.20
PMT
Illustration G-28Calculator solution for auto loan payments

G-18 Appendix G Time Value of Money
MORTGAGE LOAN AMOUNT
Say you are evaluating fi nancing options for a loan on a house (a mortgage). You decide that the maximum mortgage payment you can afford is $700 per month. The annual interest rate is 8.4%. If you get a mortgage that requires you to make monthly payments over a 15-year period, what is the maximum home loan you can afford? Illustration G-29 depicts this problem.
Inputs: 180 8.4 ? 0
Answer:
N FVPMTPVI
–700
71,509.81
Illustration G-29Calculator solution for mortgage amount
You enter N 5 180 (12 3 15 years), I 5 8.4, PMT 5 2700, FV 5 0, and press PV. With the payments-per-year key set at 12, you fi nd a present value of $71,509.81— the maximum home loan you can afford, given that you want to keep your mort-gage payments at $700. Note that by changing any of the variables, you can quickly conduct “what-if ” analyses for different situations.
Compute interest and future values. Simple interest is computed on the principal only, while compound interest is computed on the principal and any interest earned that has not been withdrawn.
To solve for future value of a single amount, pre-pare a time diagram of the problem. Identify the prin-cipal amount, the number of compounding periods, and the interest rate. Using the future value of 1 table, multiply the principal amount by the future value factor specifi ed at the intersection of the number of periods and the interest rate.
To solve for future value of an annuity, prepare a time diagram of the problem. Identify the amount of the periodic payments (receipts), the number of pay-ments (receipts), and the interest rate. Using the future value of an annuity of 1 table, multiply the amount of the payments by the future value factor specifi ed at the intersection of the number of periods and the interest rate.
Compute present value. The following three variables are fundamental to solving present value problems: (1) the future amount, (2) the number of periods, and (3) the interest rate (the discount rate).
To solve for present value of a single amount, pre-pare a time diagram of the problem. Identify the future amount, the number of discounting periods, and the discount (interest) rate. Using the present value of a single amount table, multiply the future
1
2
amount by the present value factor specifi ed at the intersection of the number of periods and the dis-count rate.
To solve for present value of an annuity, prepare a time diagram of the problem. Identify the amount of future periodic receipts or payments (annuities), the number of payments (receipts), and the discount (interest) rate. Using the present value of an annuity of 1 table, multiply the amount of the annuity by the present value factor specifi ed at the intersection of the number of payments and the interest rate.
To compute the present value of notes and bonds,determine the present value of the principal amount and the present value of the interest payments. Multiply the principal amount (a single future amount) by the pres-ent value factor (from the present value of 1 table) intersecting at the number of periods (number of interest payments) and the discount rate. To deter-mine the present value of the series of interest pay-ments, multiply the amount of the interest payment by the present value factor (from the present value of an annuity of 1 table) intersecting at the number of periods (number of interest payments) and the dis-count rate. Add the present value of the principal amount to the present value of the interest payments to arrive at the present value of the note or bond.
Compute the present value in capital budgeting situations. Compute the present values of all cash
3
LEARNING OBJECTIVES REVIEW
REVIEW

Brief Exercises G-19
infl ows and all cash outfl ows related to the capital budgeting proposal (an investment-type decision). If the net present value is positive, accept the proposal (make the investment). If the net present value is neg-ative, reject the proposal (do not make the investment).
Use a fi nancial calculator to solve time value of money problems. Financial calculators can be used to solve the same and additional problems as those
4
solved with time value of money tables. Enter into the fi nancial calculator the amounts for all of the known elements of a time value of money problem (periods, interest rate, payments, future or present value), and it solves for the unknown element. Particularly useful situations involve interest rates and compounding periods not presented in the tables.
Annuity A series of equal dollar amounts to be paid or received at evenly spaced time intervals (periodically). (p. G-5).
Compound interest The interest computed on the prin-cipal and any interest earned that has not been paid or withdrawn. (p. G-2).
Discounting the future amount(s) The process of determining present value. (p. G-7).
Future value of an annuity The sum of all the pay-ments (receipts) plus the accumulated compound interest on them. (p. G-5).
Future value of a single amount The value at a future date of a given amount invested, assuming compound interest. (p. G-3).
Interest Payment for the use of another person’s money. (p. G-1).
Present value The value now of a given amount to be paid or received in the future, assuming compound interest. (p. G-7).
Present value of an annuity The value now of a series of future receipts or payments, discounted assuming compound interest. (p. G-9).
Principal The amount borrowed or invested. (p. G-1).Simple interest The interest computed on the principal
only. (p. G-2).
GLOSSARY REVIEW
Brief Exercises and many additional resources are available for practice in WileyPLUS
BRIEF EXERCISES
(Use tables to solve exercises BEG-1 to BEG-23.)
BEG-1 Jozy Altidore invested $6,000 at 5% annual interest, and left the money invested without withdrawing any of the interest for 12 years. At the end of the 12 years, Jozy with-drew the accumulated amount of money. (a) What amount did Jozy withdraw, assuming the investment earns simple interest? (b) What amount did Jozy withdraw, assuming the investment earns interest compounded annually?
BEG-2 For each of the following cases, indicate (a) what interest rate columns and (b) what number of periods you would refer to in looking up the future value factor.
(1) In Table 1 (future value of 1):
Annual Number of Rate Years Invested Compounded
Case A 5% 3 AnnuallyCase B 12% 4 Semiannually
(2) In Table 2 (future value of an annuity of 1):
Annual Number of Rate Years Invested Compounded
Case A 3% 8 AnnuallyCase B 8% 6 Semiannually
Compute the future value of a single amount.
(LO 1)
Use future value tables.
(LO 1)

G-20 Appendix G Time Value of Money
BEG-3 Liam Company signed a lease for an offi ce building for a period of 12 years. Under the lease agreement, a security deposit of $9,600 is made. The deposit will be returned at the expiration of the lease with interest compounded at 4% per year. What amount will Liam receive at the time the lease expires?
BEG-4 Bates Company issued $1,000,000, 10-year bonds and agreed to make annual sink-ing fund deposits of $78,000. The deposits are made at the end of each year into an account paying 6% annual interest. What amount will be in the sinking fund at the end of 10 years?
BEG-5 Andrew and Emma Garfi eld invested $8,000 in a savings account paying 5% annual interest when their daughter, Angela, was born. They also deposited $1,000 on each of her birthdays until she was 18 (including her 18th birthday). How much was in the savings account on her 18th birthday (after the last deposit)?
BEG-6 Hugh Curtin borrowed $35,000 on July 1, 2017. This amount plus accrued interest at 8% compounded annually is to be repaid on July 1, 2022. How much will Hugh have to repay on July 1, 2022?
BEG-7 For each of the following cases, indicate (a) what interest rate columns and (b) what number of periods you would refer to in looking up the discount rate.
(1) In Table 3 (present value of 1):
Annual Number of Discounts Rate Years Involved per Year
Case A 12% 7 AnnuallyCase B 8% 11 AnnuallyCase C 10% 8 Semiannually
(2) In Table 4 (present value of an annuity of 1):
Annual Number of Number of Frequency of Rate Years Involved Payments Involved Payments
Case A 10% 20 20 AnnuallyCase B 10% 7 7 AnnuallyCase C 6% 5 10 Semiannually
BEG-8 (a) What is the present value of $25,000 due 9 periods from now, discounted at 10%? (b) What is the present value of $25,000 to be received at the end of each of 6 periods,
discounted at 9%?
BEG-9 Messi Company is considering an investment that will return a lump sum of $900,000 6 years from now. What amount should Messi Company pay for this investment to earn an 8% return?
BEG-10 Lloyd Company earns 6% on an investment that will return $450,000 8 years from now. What is the amount Lloyd should invest now to earn this rate of return?
BEG-11 Robben Company is considering investing in an annuity contract that will return $40,000 annually at the end of each year for 15 years. What amount should Robben Com-pany pay for this investment if it earns an 8% return?
BEG-12 Kaehler Enterprises earns 5% on an investment that pays back $80,000 at the end of each of the next 6 years. What is the amount Kaehler Enterprises invested to earn the 5% rate of return?
BEG-13 Dempsey Railroad Co. is about to issue $400,000 of 10-year bonds paying an 11% interest rate, with interest payable semiannually. The discount rate for such securities is 10%. How much can Dempsey expect to receive for the sale of these bonds?
Compute the future value of a single amount.
(LO 1)
Compute the future value of an annuity.
(LO 1)
Compute the future value of a single amount and of an annuity.
(LO 1)
Compute the future value of a single amount.
(LO 1)
Use present value tables.
(LO 2)
Determine present values.
(LO 2)
Compute the present value of a single amount investment.
(LO 2)
Compute the present value of a single amount investment.
(LO 2)Compute the present value of an annuity investment.
(LO 2)
Compute the present value of an annual investment.
(LO 2)
Compute the present value of bonds.
(LO 2)

Brief Exercises G-21
BEG-14 Assume the same information as BEG-13 except that the discount rate is 12% instead of 10%. In this case, how much can Dempsey expect to receive from the sale of these bonds?
BEG-15 Neymar Taco Company receives a $75,000, 6-year note bearing interest of 4% (paid annually) from a customer at a time when the discount rate is 6%. What is the present value of the note received by Neymar?
BEG-16 Gleason Enterprises issued 6%, 8-year, $2,500,000 par value bonds that pay inter-est semiannually on October 1 and April 1. The bonds are dated April 1, 2017, and are issued on that date. The discount rate of interest for such bonds on April 1, 2017, is 8%. What cash proceeds did Gleason receive from issuance of the bonds?
BEG-17 Frazier Company issues a 10%, 5-year mortgage note on January 1, 2017, to obtain fi nancing for new equipment. Land is used as collateral for the note. The terms provide for semiannual installment payments of $48,850. What are the cash proceeds received from the issuance of the note?
BEG-18 If Colleen Mooney invests $4,765.50 now and she will receive $12,000 at the end of 12 years, what annual rate of interest will Colleen earn on her investment? (Hint: Use Table 3.)
BEG-19 Tim Howard has been offered the opportunity of investing $36,125 now. The investment will earn 11% per year and at the end of that time will return Tim $75,000. How many years must Tim wait to receive $75,000? (Hint: Use Table 3.)
BEG-20 Joanne Quick made an investment of $10,271.38. From this investment, she will receive $1,200 annually for the next 15 years starting one year from now. What rate of interest will Joanne’s investment be earning for her? (Hint: Use Table 4.)
BEG-21 Kevin Morales invests $7,793.83 now for a series of $1,300 annual returns begin-ning one year from now. Kevin will earn a return of 9% on the initial investment. How many annual payments of $1,300 will Kevin receive? (Hint: Use Table 4.)
BEG-22 Barney Googal owns a garage and is contemplating purchasing a tire retreading machine for $12,820. After estimating costs and revenues, Barney projects a net cash infl ow from the retreading machine of $2,700 annually for 7 years. Barney hopes to earn a return of 9% on such investments. What is the present value of the retreading operation? Should Barney Googal purchase the retreading machine?
BEG-23 Snyder Company is considering purchasing equipment. The equipment will pro-duce the following cash infl ows: Year 1, $25,000; Year 2, $30,000; and Year 3, $40,000. Snyder requires a minimum rate of return of 11%. What is the maximum price Snyder should pay for this equipment?
BEG-24 Carly Simon wishes to invest $18,000 on July 1, 2017, and have it accumulate to $50,000 by July 1, 2027. Use a fi nancial calculator to determine at what exact annual rate of interest Carly must invest the $18,000.
BEG-25 On July 17, 2016, Keith Urban borrowed $42,000 from his grandfather to open a clothing store. Starting July 17, 2017, Keith has to make 10 equal annual payments of $6,500 each to repay the loan. Use a fi nancial calculator to determine what interest rate Keith is paying.
BEG-26 As the purchaser of a new house, Carrie Underwood has signed a mortgage note to pay the Nashville National Bank and Trust Co. $8,400 every 6 months for 20 years, at the end of which time she will own the house. At the date the mortgage is signed, the pur-chase price was $198,000 and Underwood made a down payment of $20,000. The fi rst payment will be made 6 months after the date the mortgage is signed. Using a fi nancial calculator, compute the exact rate of interest earned on the mortgage by the bank.
Compute the present value of bonds.
(LO 2)
Compute the present value of a note.
(LO 2)
Compute the present value of bonds.
(LO 2)
Compute the present value of a note.
(LO 2)
Compute the interest rate on a single amount.
(LO 2)
Compute the number of periods of a single amount.
(LO 2)
Compute the interest rate on an annuity.
(LO 2)
Compute the number of periods of an annuity.
(LO 2)
Compute the present value of a machine for purposes of making a purchase decision.
(LO 3)
Compute the maximum price to pay for a machine.
(LO 3)
Determine interest rate.
(LO 4)
Determine interest rate.
(LO 4)
Determine interest rate.
(LO 4)

G-22 Appendix G Time Value of Money
BEG-27 Using a fi nancial calculator, solve for the unknowns in each of the following situations.
(a) On June 1, 2016, Jennifer Lawrence purchases lakefront property from her neighbor, Josh Hutcherson, and agrees to pay the purchase price in seven payments of $16,000 each, the fi rst payment to be payable June 1, 2017. (Assume that interest compounded at an annual rate of 7.35% is implicit in the payments.) What is the purchase price of the property?
(b) On January 1, 2016, Gerrard Corporation purchased 200 of the $1,000 face value, 8% coupon, 10-year bonds of Sterling Inc. The bonds mature on January 1, 2026, and pay interest annually beginning January 1, 2017. Gerrard purchased the bonds to yield 10.65%. How much did Gerrard pay for the bonds?
BEG-28 Using a fi nancial calculator, provide a solution to each of the following situations.
(a) Lynn Anglin owes a debt of $42,000 from the purchase of her new sport utility vehicle. The debt bears annual interest of 7.8% compounded monthly. Lynn wishes to pay the debt and interest in equal monthly payments over 8 years, beginning one month hence. What equal monthly payments will pay off the debt and interest?
(b) On January 1, 2017, Roger Molony offers to buy Dave Feeney’s used snowmobile for $8,000, payable in fi ve equal annual installments, which are to include 7.25% interest on the unpaid balance and a portion of the principal. If the fi rst payment is to be made on December 31, 2017, how much will each payment be?
Various time value of money situations.
(LO 4)
Various time value of money situations.
(LO 4)

Standards of Ethical Conduct for Management Accountants
Appendix H
Management accountants have an obligation to the organizations they serve, their profession, the public, and themselves to maintain the highest standards of ethical conduct. In recognition of this obligation, the Institute of Management Accountants has published and promoted the following standards of ethical conduct for management accountants.
APPENDIX PREVIEW
H-1
IMA Statement of Ethical Professional Practice
Members of IMA shall behave ethically. A commitment to ethical professional practice includes: overarching principles that express our values, and standards that guide our conduct.
Principles
IMA’s overarching ethical principles include: Honesty, Fairness, Objectivity, and Responsibility. Members shall act in accordance with these principles and shall encourage others within their organizations to adhere to them.
Standards
A member’s failure to comply with the following standards may result in disci-plinary action.
I. COMPETENCE
Each member has a responsibility to:
1. Maintain an appropriate level of professional expertise by continually devel-oping knowledge and skills.
2. Perform professional duties in accordance with relevant laws, regulations, and technical standards.
3. Provide decision support information and recommendations that are accurate, clear, concise, and timely.
4. Recognize and communicate professional limitations or other constraints that would preclude responsible judgment or successful performance of an activity.
II. CONFIDENTIALITY
Each member has a responsibility to:
1. Keep information confi dential except when disclosure is authorized or legally required.
2. Inform all relevant parties regarding appropriate use of confi dential informa-tion. Monitor subordinates’ activities to ensure compliance.
3. Refrain from using confi dential information for unethical or illegal advantage.

H-2 Appendix H Standards of Ethical Conduct for Management Accountants
III. INTEGRITY
Each member has a responsibility to:
1. Mitigate actual confl icts of interest, regularly communicate with business associates to avoid apparent confl icts of interest. Advise all parties of any potential confl icts.
2. Refrain from engaging in any conduct that would prejudice carrying out duties ethically.
3. Abstain from engaging in or supporting any activity that might discredit the profession.
IV. CREDIBILITY
Each member has a responsibility to:
1. Communicate information fairly and objectively.
2. Disclose all relevant information that could reasonably be expected to infl u-ence an intended user’s understanding of the reports, analyses, or recommen-dations.
3. Disclose delays or defi ciencies in information, timeliness, processing, or internal controls in conformance with organization policy and/or applicable law.
Resolution of Ethical Confl ict
In applying the Standards of Ethical Professional Practice, you may encounter problems identifying unethical behavior or resolving an ethical confl ict. When faced with ethical issues, you should follow your organization’s established poli-cies on the resolution of such confl ict. If these policies do not resolve the ethical confl ict, you should consider the following courses of action:
1. Discuss the issue with your immediate supervisor except when it appears that the supervisor is involved. In that case, present the issue to the next level. If you cannot achieve a satisfactory resolution, submit the issue to the next man-agement level. If your immediate superior is the chief executive offi cer or equivalent, the acceptable reviewing authority may be a group such as the audit committee, executive committee, board of directors, board of trustees, or owners. Contact with levels above the immediate superior should be initi-ated only with your superior’s knowledge, assuming he or she is not involved. Communication of such problems to authorities or individuals not employed or engaged by the organization is not considered appropriate, unless you believe there is a clear violation of the law.
2. Clarify relevant ethical issues by initiating a confi dential discussion with an IMA Ethics Counselor or other impartial advisor to obtain a better under-standing of possible courses of action.
3. Consult your own attorney as to legal obligations and rights concerning the ethical confl ict.
Source: Institute of Management Accountants. Reprinted by permission. Go to www.imanet.org/about_ima/our_mission.aspx to learn more about the IMA’s commitment to ethical professional practices and its available resources, including an Ethics Helpline.

Company Index
AAce Hardware, 285Adelphia, 10adidas, 570, 852Advanced Micro, 577Ag-Chem, 382Ahold NV, 146AIG, 7Alaskan Airlines, 916Alcoa (Aluminum Company of
America), 598Allegiant Airlines, 849Alliance Atlantis Communications
Inc., 767Aluminum Company of America
(Alcoa), 598Amazon.com, Inc., 4, 43, 87, 143,
199, 208, 210, 256, 306–307, 400, 439, 485, 528, 602, 640, 684–685, 721–722, 779, 830–831, 851, 960, 982, 1011, 1154
American Airlines, 494, 837, 969, 980American Cancer Society, 572American Exploration Company, 486American Express, 408, 415, 490, 1150American LaFrance, 878American Standard, 794American Van Lines, 1057Anheuser-Busch InBev, 279Apple Inc., 4, 5, 11, 33, 43, 77, 86–87,
143, 185, 199, 205, 243, 256, 294, 306, 388, 399, 429, 460, 484, 527, 561, 572, 594, 602, 604, 622, 624, 632, 640, 648, 674, 684, 712, 721, 726, 766, 779, 814, 830
AT&T, 4, 699, 837, 963Avis, 442, 449
BBaan NV, 146BabyCakes NYC, 1004, 1008Bank of America, 414Bank One Corporation, 69Barriques, 354Ben & Jerry’s, 878, 922Berkshire Hathaway, 618Best Buy, 9, 103, 119, 258, 459
Beverly Hills Fan Company, 1188BHP Billiton, 459Bill and Melinda Gates Foundation, 26Bob’s Red Mill, 1004Boeing Capital Corporation, 447Boeing Company, 456, 797, 848,
851, 878, 1152Bogan Communications, 507Boise Cascade, 452BorderStylo LLC, 462Box, 740BP, 276BrightFarms, 964Bristol-Myers Squibb, 274Budget, 442Burton Snowboards, 842
CCampbell Soup Company, 274, 451,
794, 837, 1188Capt’n Eli Root Beer Company, 200Cargill Inc., 572Caterpillar Inc., 262, 264, 275, 572,
841, 922, 932CBS, 461Cerberus, 644Chase, 69, 1118Cheerwine, 200Chevron, 452Chicago Bears, 53Chicago Cubs, 53Chrysler, 644, 1115Cisco Systems, 162, 307, 422–423,
808, 1065Citicorp, 11Citigroup, 11Clif Bar & Company, 2, 45–46The Coca-Cola Company, 4, 43, 46,
87, 143, 199, 256, 306, 400, 439, 484–485, 527–528, 602, 640, 684, 721, 779, 830, 841, 852, 916, 1002
Columbia Sportswear Company, 767Commonwealth Edison, 612Computer Associates International,
Inc., 96, 1097ConAgra Foods, 224, 610ConocoPhilips, 459
Conservation International, 1115Consolidated Edison, 797Continental Bank, 447Cooper Tire & Rubber Company, 171Costco Wholesale Corp., 218, 499, 730Countrywide Financial
Corporation, 422Craig Consumer Electronics, 266Credit Suisse Group, 58Crocs, Inc., 10Current Designs, 834, 836, 837, 840,
841, 845, 871, 912, 957–958, 1000, 1047, 1094, 1141–1142, 1185–1186
Cypress Semiconductor Corporation, 767
DDaimler-Benz, 644DaimlerChrysler, 644Dell, 60, 264–265, 837, 850, 932, 1159Dell Financial Services, 447Delta Air Lines, 94, 101, 382, 456,
1117, 1156Dewey & LeBoeuf LLP, 8Dick’s Sporting Goods, 844Discover, 414Disney, see The Walt Disney CompanyDow, 841Duke Energy Co., 963, 1057, 1070Dun & Bradstreet, 786DuPont, 646
EEarthlink, 612Eastman Kodak, 694, 726eBay, 225Eli Lily, 357Enron, 7, 25, 225, 573, 837Equifax, 404Ethan Allen, 1155Evan Inc., 498ExxonMobil Corporation, 11, 276,
878, 918
FFacebook, 4, 575, 839Fannie Mae, 69, 106
I-1

I-2 Company Index
Federal Express, 837Fiat/Chrysler, 46Fireeye, 740Flightserve, 975Ford Motor Company, 11, 209, 265,
279, 459, 644, 655, 931, 969, 1070Fox Broadcasting, 461, 1060
GGap Inc., 10General Dynamics Corp., 805General Electric (GE), 6, 216, 610,
839, 852, 894, 926General Mills, 451, 918General Motors Corporation (GM), 5,
429, 495, 575, 644, 694, 814, 837, 850, 879, 1144, 1146
Gillette Company, 698Glassmaster Company, 1143–1144GM, see General Motors CorporationGoldman Sachs, 11, 893Goodyear, 1157Google, 12, 26, 119, 462, 572, 578, 804Green Bay Packers, 48, 88Groupon, 92Gulf Craft, 946Gulf Oil, 575
HHarley-Davidson, 932HealthSouth, 7Hershey, 921Hertz Car Rental, 442, 660Hewlett-Packard (HP), 837, 849, 851,
934, 1117, 1152Hilton Hotels, 447, 851, 963Holland America Line, 1159Home Depot, 4, 265, 285, 445Honda, 1068Household International, 321HP, see Hewlett-PackardH&R Block, 919Hughes Aircraft Co., 805
IIBM, 225, 462, 572, 576n.1, 594, 618,
851, 1104Institutional Shareholder Services, 625Intel, 46, 655, 850, 932InterContinental, 447International Outsourcing Services,
LLC, 54Intuit Inc., 310, 313iSuppli, 885
JJ. Crew, 10J.C. Penney Company, Inc., 407,
730, 786Jiffy Lube, 919Jif Peanut Butter, 946John Deere Capital Corporation, 447Jones Soda Co., 916, 918
Jostens, Inc., 1117J.P. Morgan Leasing, 447JP Morgan Chase, 414
KKellogg Company, 658, 878, 918, 925,
927–931, 969, 1111Kmart Stores, 797, 1187Kohl’s Corporation, 730Kraft Foods, 1111Krispy Kreme, 96Kroger Stores, 209, 274, 797
LLeslie Fay, 266, 308Lockheed Martin Corp., 162, 456Loews Corporation, 578Louis Vuitton Moët Hennessy, 4, 47,
91, 147, 205, 261, 309, 403, 441, 489, 531, 607, 643, 689, 783, 833, 838
Lucent, 837
MMacy’s, Inc., 784, 786, 787, 791, 793,
820, 1070Madison Square Garden, 1011Major League Baseball Players
Association, 6Manville Corp., 496Marcus Corporation, 173Marriott Hotels, 447, 451, 963, 1057Massachusetts General Hospital, 962MasterCard, 414, 415Maxwell Car Company, 644Mayo Clinic, 893McDonald’s Corporation, 11, 46, 460,
473, 572, 656, 772, 1102McDonnell Douglas, 851McKesson Corporation, 208, 308, 382Medtronic, Inc., 648Merrill Lynch, 11Method Products, 1146, 1152MF Global Holdings Ltd, 48, 68, 573Microsoft Corporation, 5, 56, 216, 225,
459, 460, 726, 742–743, 814, 836Minnesota Mining and Manufacturing
Company (3M), 431, 522Mitsubishi, 724Mobile Iron, 740Moody’s, 786Morgan Stanley, 701Morrow Snowboards, Inc., 211Motorola, 274Museum of Contemporary Art
(Los Angeles, California), 1027
NNBC, 461NBCUniversal, 1060NEC, 146Nestlé, 46NFL, 461
Nike, Inc., 4, 570, 572, 573, 576, 578, 579, 584, 610, 792, 851, 963
Nordstrom, Inc., 174, 416, 819–820Northwest Airlines, 980
OOffi ce Depot, 208Oracle, 313Oral-B Laboratories, 1146Owens-Illinois, 464
PParmalat, 402Penske Automotive Group, 1117PepsiCo, Inc., 4, 5, 12, 26, 43, 87, 94,
143, 199, 219, 256, 276, 306, 400, 439, 484–485, 527–528, 572, 602, 612, 640, 684, 721, 779, 830, 916
P&G, see The Procter & Gamble Company
Phantom Tac, 852Philip Morris International, 648Pilgrim’s Pride, 224Pratt and Whitney, 894PriceWaterhouseCoopers, 893Princeton University, 1027The Procter & Gamble Company
(P&G), 11, 173–174, 463–465, 579, 698, 844, 1065, 1104, 1146
Prudential Real Estate, 11
QQuad Graphics, 878Quaker Oats, 276, 946, 1146
RRadio Shack, 89Razor & Tie Music, 532Red Cross, 26Reebok International Ltd., 274, 570,
587, 963REI (Recreational Equipment
Incorporated), 206, 208, 212, 216REL Consultancy Group, 173Rent-A-Wreck, 442, 444–446, 449,
460, 461, 486Republic Carloading, 168Rhino Foods, Inc., 6, 148Rite Aid, 406Royal Ahold, 402Royal Dutch Shell, 276, 459
SSafeNet, 588Safeway, 358, 797The Sage Group, 313Salvation Army, 572San Diego Zoo, 1063SAP AG, 313, 850Sara Lee, 841Satyam Computer Services, 402Schering-Plough, 851Seattle Seahawks, 916

Company Index I-3
Sharp, 1166Shell, 461. See also Royal Dutch
ShellSherwin-Williams, 918Siebel Systems, 1067Simon Properties, 648Skype, 225Sony, 46, 56, 281Southwest Airlines Co., 94, 101,
170, 962Sports Illustrated, 494Sprint Corporation, 493Standard & Poor’s, 685, 786Stanley Black & Decker Manufacturing
Company, 274, 496Starbucks, 26, 274, 852, 1100, 1115Subway, 461
TTarget Corporation, 265, 330, 373,
475, 730, 826–827, 1146Tektronix Inc., 620Tempur Sealy International, 968Telsa, 6Texaco Oil Company, 4293M (Minnesota Mining and
Manufacturing Company), 431, 522Tiffany & Co., 797
Time Warner, Inc., 6, 172, 690, 697, 700, 1008–1009
Toyota, 46, 850, 852Trek, 11, 1155Tribeca Grand Hotel, 1052True Value Hardware, 265Turner Broadcasting, 69721st Century Fox, 690
UU-Haul, 965–966Unilever, 655, 1118, 1146United Airlines, 6, 101, 494, 694, 726,
962, 1117, 1119U.S. Navy, 1104United States Steel Corp., 969United Stationers, 208US Bancorp Equipment
Finance, 447USX, 918
VVan Meter Inc., 608Verizon Communications Inc.,
648, 1163Visa, 414–416Vodafone/Mannesmann, 46
WWachovia, 408Walgreen Drugs, 208, 274Wal-Mart Stores, Inc., 4, 11, 43, 87,
143, 199, 206, 208, 256, 266, 280, 285, 306–307, 373, 400, 439, 485, 528, 602, 640, 684–685, 721–722, 730, 779, 797, 826–827, 830–831, 851, 1118
The Walt Disney Company, 6, 94, 459, 622, 876, 878, 888
Warner Brothers Motion Pictures, 946Waste Management Inc., 69Wells Fargo Bank, 356, 408, 414, 655Wendy’s International, 274Wenonah Canoe, 834, 871Whirlpool, 794, 841Whitehall-Robins, 404, 413World Bank, 1104WorldCom, Inc., 7, 25, 363, 447, 573
XXerox, 837XM Satellite Radio Holdings, 1018
YYahoo! Inc., 171, 786Yale Express, 168


Subject Index
AABC, see Activity-based costingAbsorption costing, 983–986Accelerated-depreciation
method, 453Accounts, 50–54
chart of, 60correct titles for, 56permanent, 159temporary, 158
Accounting, 4–11accrual- vs. cash-basis, 94activities of, 4–5assumptions in, 9–11career opportunities in, 25–26cost, 878ethics in, 7–8fi nancial, 836generally accepted accounting
principles, 8–9managerial, 26. See also
Managerial accountingpayroll, 499–510as recruiting tool, 6responsibility, see Responsibility
accountingusers of accounting data, 5–6
Accounting cycle, 166–168, 538–539. See also specifi c steps in cycle
Accounting equation, see Basic accounting equation
Accounting information, in budgeting process, 1006
Accounting information systems (accounting systems), 310–331
cash payments journal, 326–328cash receipts journal, 320–324computerized, 312–314general ledger, 312–313IFRS and GAAP for, 353manual, 314purchases journal, 324–326sales journal, 318–320special journals, 317–329, 331subsidiary ledgers, 315–317
Accounting reports, 4, 5. See also Financial statements
Accounts payable, 12as current liabilities, 492for statement of cash fl ows, 754transaction analysis for, 18
Accounts payable (creditors’) subsidiary ledger, 315–317
Accounts receivable, 406–416disposing of, 414–416recognizing, 406–408for statement of cash fl ows, 752valuing, 408–414
Accounts receivable (customers’) subsidiary ledger, 315–317
Accounts receivable turnover, 422, 795
Accruals, 96adjusting entries for, 104–111expenses, 96, 106–108liabilities, 492revenues, 96, 104–105
Accrual-basis accounting, 94Accumulated depreciation, 171Accumulated profi t or loss, 642Accuracy, in fi nancial reporting, 69Acid-test ratio, 794–795Activity base, 887Activity-based costing (ABC),
850, 934–940Activity index (CVP), 962Additions and improvements, 447Adjustable interest rates, 656Adjusted trial balance, 111–115,
152–155Adjusting entries, 97–111
in accounting cycle, 220for accruals, 104–111for deferrals, 97–104, 115–118IFRS and GAAP for, 146–147for merchandising companies,
220–222prior period, 620–621relationships of, 109types of, 96–97on worksheet, 152–155, 234–236from worksheets, 158
Admission of partners, 549–552Affi liated company, 698
Agents, of corporations, 572–573Aggregated data, 4Aging schedule, 413Aging the accounts receivable, 413Airlines, costs and profi ts of, 849Allowances:
purchase, 214, 231sales, 217–218, 232
Allowance for Doubtful Accounts, 414Allowance method, 409–414Amortization, 460
of bond discount, 652, 665–666of bond premium, 653, 666–667effective-interest method,
664–667straight-line, 662–664
Analysis of information, 4Annual rate of return, 1160–1161Appel, Jennifer, 537Arm’s-length transactions, 406Articles of co-partnership, 537Articles of incorporation, 575Assets:
in accounting equation, 12capital leases, 660–661on classifi ed balance sheet,
169–171current, 170–171depreciation of, 100–101in double-entry system, 51–52fi xed, 171intangible, 171–172, 460–463natural resources, 458–459of partnerships, 534–535pension, 512property, plant, and equipment,
see Plant assetsAsset misappropriation, 372Asset turnover, 464–465, 797Associate investments, 724Assumptions in accounting, 9–11Assumptions in fi nancial reporting,
119–120Auditing, 25Auditors, internal, 363Audit trail, 313Authorized stock, 577
I-5
I-6 Subject Index
Available-for-sale securities, 700–703, 806
Average collection period, 423, 796Average-cost method, 269–270,
273–274, 283–284
BBackground checks, 364Bad debts, see Uncollectible accountsBalanced scorecard, 850–851,
1117–1119Balanced Scorecard Institute, 1144Balance sheet, 22, 23
budget, 1023–1024classifi ed, 169–174effect of cost fl ow methods on, 275and errors in inventory
accounting, 278horizontal analysis of, 788investments on, 704merchandising and manufacturing
costs on, 846–847for partnerships, 542–543recovery of bad debts on, 410stockholders’ equity section of, 588transfer to worksheet, 234unpaid notes payable on, 657vertical analysis of, 790write-off of bad debts on, 411–412
Balsam, Craig, 532Bangladesh, 852Banks, 373–381
for internal control, 373making deposits, 373–374reconciling bank account, 376–381statements from, 375–376writing checks, 374–375
Bank reconciliations, 373, 376–381, 407–408
Bank service charge, 376, 378Bank statements, 375–376Barnum, P.T., 7Basic accounting equation, 12–20
assets and liabilities in, 12owner’s equity in, 13–14in transaction analysis, 14–20
Batch jobs, 878Best-efforts contracts, 577n.2Bezos, Jeff, 960Blank, Arthur, 4Board of directors, 839Bonds, 646–656
amortization of, 662–667amortizing the discount, 652,
665–666amortizing the premium, 653,
666–667converting into common stock, 655discount/premium on, 650–652green, 655hot market for, 648interest payments, 648issued for credit, 738
issuing, 646–647market value of, 647–648principal, 647recording transactions with, 693–694redeeming, 654–656safety of, 694types of, 646
Bond amortization, 662–667effective-interest method, 664–667straight-line, 662–664
Bond certifi cates, 646Bond indentures, 646Bonding of employees, 363Bond interest expense, 693Bond issues, 646–654
at a discount, 650–651at face value, 649–650at a premium, 650, 652–654procedures for, 646–647
Bonds payable, 750, 754Bonuses:
on admission of a partner, 550–552as fringe benefi ts, 500on withdrawal of a partner, 554–555
Bookkeeping, 5Book (carrying) value, 101, 448,
452, 651Bowerman, Bill, 570Break-even analysis, 974–980Break-even point, 974, 980Brock, Paula, 1063Budgets, 1006
continuous 12-month, 1007fl exible, 1057–1064standards vs., 1103static, 1055–1057
Budgetary control, 1054–1064fl exible budgets, 1057–1064static budgets, 1055–1057
Budgetary optimism, 1012Budgetary planning, 1006–1028
accounting information in, 1006budget balance sheet, 1023–1024budget income statement,
1019–1020cash budget, 1020–1023direct labor budget, 1016–1017direct materials budget,
1013–1014foundation for, 1006–1007and human behavior, 1008–1009length of budget period, 1007and long-range planning, 1009manufacturing overhead budget,
1017–1018master budget, 1009–1010for merchandisers, 1025–1026in non-manufacturing companies,
1025–1027for not-for-profi t organizations,
1027process for, 1007–1008production budget, 1012–1013
sales and administrative expense budget, 1018
sales budget, 1011–1012for service enterprises, 1026–1027
Budgetary slack, 1009Budget balance sheet, 1023–1024Budget committee, 1008Budget income statement,
1018–1020Budget period, length of, 1007Budget reforecasting, 1063Budget reports, 1054, 1056,
1062–1063Budget shortfalls, 1027Buffett, Warren, 618, 784Buildings, 445, 754Burden, 841Business documents, 54, 216Business transactions, 14. See also
Transaction analysisin double-entry system, 51–53in partnerships, 538purchasing, 211–215recording, 46sales, 216–219
By-laws of corporations, 575
CCalendar years, 94Callable bonds, 646Capital:
corporate acquisition of, 573owner’s, 13working, 498
Capital budgeting, 1159–1168annual rate of return, 1160–1161cash payback, 1162–1163discounted cash fl ow, 1164–1168evaluation process in, 1159–1160
Capital defi ciency (partnership liquidation), 546–548
Capital expenditures, 447, 1160Capital leases, 660–661Capital ratios, for partnerships,
540–541Capital stock, 587Careers in accounting, 25–26Carrying value, see Book valueCarrying (book) value method, 655Cash, 381
and fraud, 366net change in, 739reporting, 381–382for statement of cash fl ows, 755
Cash-basis accounting, 94Cash bonuses, 500Cash budget, 1020–1023Cash controls, 366–373Cash disbursements, internal
controls for, 369–370Cash discounts, 406Cash dividends, 610–615Cash equivalents, 381–382, 782

Subject Index I-7
Cash fl ows. See also Statement of cash fl ows
ability to generate, 728classifi cation of, 728–729free, 742–743
Cash management, 1023Cash payback, 1162–1163Cash payments:
in direct method, 746–749schedule of, 545–546
Cash payments (cash disbursements) journal, 326–328
Cash purchases, transaction analysis for, 15–16
Cash (net) realizable value, 279, 280, 410, 420
Cash receipts:in direct method, 745–746internal controls for, 366–368transaction analysis for, 18–19
Cash receipts journal, 320–324Cash register tapes, 216Cash withdrawals, transaction
analysis for, 19Castle, Ted, 148CEO (chief executive offi cer), 573, 839Certifi ed public accountants (CPAs),
25, 26CFO (chief fi nancial offi cer), 839Charter, corporate, 574–575Chart of accounts, 60Checks:
altered, 360for payroll, 504–505writing, 374–375
Check register, 370Chenfi eld, Cliff, 532Chief executive offi cer (CEO), 573, 839Chief fi nancial offi cer (CFO), 839China, 171, 535Chrysler, Walter, 644Cichanowski, Michael, 834Claims, fi ctitious, 358–359Classifi ed balance sheet, 169–174
IFRS and GAAP for, 202–203investments on, 705–706for merchandising companies,
222, 226Closely held corporations, 572. See
also Privately held corporationsClosing entries:
in accounting cycle, 220–221for merchandising companies,
220–221, 233–234for partnerships, 539–540posting, 161–162preparing, 159–161
Closing the books, 158–165post-closing trial balance, 163–165posting closing entries, 161–162preparing closing entries, 159–161with virtual closes, 162
CM (credit memorandum), 376
Code of ethics, 851Collaboration, 1065Collusion, 365Commercial substance (exchanges),
465Common-size analysis, 790. See also
Vertical analysisCommon stock, 576, 581–584
allocating cash dividends to, 613–614
converting bonds into, 655earnings per share for, 624–625no-par value, 582par value, 581–582for services or noncash assets,
582–583for statement of cash fl ows, 750, 754
Communication, 4, 5, 357Comparability, 119Competitive environment, 849Components, make-or-buy decisions
for, 1152–1155Component depreciation, 488Compound entries, 56Comprehensive income, 705Computerized accounting systems,
312–314Computer recycling, 108Conservatism, 279Consigned goods, ownership of, 267Consistency concept, 275Consistency principle, 119Consolidated fi nancial statements,
698–699Constraints, theory of, 850Construction of buildings, 445Consumer cooperatives (co-ops), 206Contingent liabilities, 495–497, 530Continuous 12-month budgets, 1007Contra accounts:
for assets, 100–101for bonds at a discount, 651for revenue, 218for stockholders’ equity, 585
Contractual interest rate, 646, 650Contributed capital, 587. See also
Paid-in capitalContribution margin (CM), 970, 975Contribution margin ratio (CVP
analysis), 972–973, 975, 978Control, internal, see Internal controlControl accounts, 315, 882Control environment, 357Controllability of items, 1066–1067Controllable margin, 1072, 1073,
1075–1076Controllable revenues/costs, 1066Controllable variance (overhead),
1114, 1123–1124Controllers, 573, 839Controlling interest, 698Convergence, 9Conversion rates, 982
Convertible bonds, 646, 655Co-ops, 206Co-ownership of property, 534–535Copyrights, 461Corporate capital, 579–581Corporate social responsibility, 24,
172, 852, 1115Corporations, 10–11, 46, 572–580
characteristics of, 572–574corporate capital, 579–581forming, 575multinational, 46owner’s equity accounts in, 174ownership rights of stockholders,
576reasons for investing, 692–693stock issues, 576–579. See also Stocksubchapter S, 536
Corporation income statement, 623–626
Correcting entries, 167–168, 378Corruption, 372Cost(s):
in computation of depreciation, 449controllable vs. noncontrollable,
1066of copyrights, 461depreciable, 450factory labor, 881, 885–887fi xed, see Fixed costsfreight, 213, 231in incremental analysis, 1151–1159inventoriable, 842labor, 841, 881, 885–887, 919–922in managerial accounting, 840–844manufacturing, see Manufacturing
costsmaterial, 840, 880, 883–885, 919–922mixed, 965–966in noncash transactions, 582opportunity, 1153–1154organization, 575overhead, 938of patents, 460–461period, 842for plant assets, 444–448product, 842research and development,
462–463standard, see Standard costsunit production, 929–930variable, 962–963, 1017, 1061warranty, 496–497
Cost accounting systems, 878–879Cost behavior analysis, 962–966Cost centers, 1070, 1071Cost constraints, 121Cost drivers, 922, 934Cost fl ows:
in merchandising companies, 209–211
in process vs. job order cost systems, 919

I-8 Subject Index
Cost fl ow assumptions/methods:average-cost, 273–274effects of, 274–275fi rst-in, fi rst-out, 270–271in inventory costing, 269–276last-in, fi rst-out, 272–273in perpetual inventory systems,
282–284Costing:
absorption, 983–986activity-based, 850, 934–940full, 983inventory, see Inventory costingjob order, see Job order costingoperations, 931variable, 983–986
Cost method:for stock investments, 696for treasury stock, 584–585
Cost of goods manufactured, 844–848Cost of goods manufactured
schedule, 846Cost of goods purchased, 844Cost of goods sold, 208–209, 230, 891Cost-plus contracts, 893Cost principle, see Historical cost
principleCost reconciliation schedule, 930Cost-volume-profi t (CVP) analysis,
966–983break-even analysis, 974–980and changes in business
environment, 980–982classifying mixed costs, 966–969CVP income statement, 970–973,
982–983margin of safety, 979–980target net income, 977–979
Cost-volume-profi t (CVP) graph, 976–979
Cost-volume-profi t (CVP) relationships, 962–969
cost behavior analysis, 962–966fi xed costs, 963identifying cost types in, 962–966mixed costs, 965–966relevant range in, 964–965variable costs, 962–963
Covenants, 661CPAs (certifi ed public accountants),
25, 26Credits, 50–54, 68Credit agreements, 407Credit balance, 50Credit cards, 414–416, 490Credit crisis, 422Crediting accounts, 50–51Credit losses, 408Credit memorandum (CM), 376Creditors, 12Creditors’ subsidiary ledger, 315–317Credit purchases, 16, 17, 324–325Credit risk, 694
Credit terms, 214Cross-footing a journal, 323Cumulative dividends, 612–613Current assets, 170–171, 735Current liabilities, 492–499
bond interest payable, 650on classifi ed balance sheet,
172–173current maturities of long-term
debt, 494–495leases, 659–661noncash, 735notes payable, 492–493order of listing, 497reporting, 495–499sales taxes payable, 493statement presentation and
analysis, 495–499unearned revenues, 494
Current ratio, 498, 793–794Current replacement cost, 280Customers, as external users, 6Customers’ subsidiary ledger,
315–317CVP analysis, see Cost-volume-profi t
analysisCVP graph, 976–979CVP income statement, 970–973,
982, 983CVP relationships, see Cost-
volume-profi t relationshipsCybercrime, 313, 330Cyber security risks, 330–331
DDays in inventory, 280, 796Debenture bonds, 646Debits, 50–54, 68Debit balance, 50Debiting accounts, 50–51Debit memorandum (DM), 376Debt covenants, 661Debt fi nancing, 658–659Debt investments, 692–695Debt to assets ratio, 658, 800–801Decentralized companies, 1065Decision-making, see Management
decision-makingDeclaration date (cash dividends),
611, 612Declining-balance depreciation,
452–453Deferrals, 96
adjusting entries for, 97–104, 115–118
alternative treatment of, 115–118basic relationships for, 118
Defi ned-benefi t plans, 513Defi ned-contribution plans,
512–513Depletion (natural resources),
458–459Deposits in transit, 377
Depreciable cost, 450Depreciation:
accumulated, 171adjusting entries for, 100–101computing, 449declining-balance method,
452–453and income taxes, 454indirect method, 748of plant assets, 448–455recognizing, 449revising estimates of, 454–455for statement of cash fl ows,
754–755straight-line method, 450–451, 454units-of-activity method,
451–452, 455Depreciation expense, 734Depreciation schedule, 450Differential analysis, 1148. See also
Incremental analysisDirect fi xed costs, 1072Direct labor, 841Direct labor budget, 1016–1017Direct labor price standard, 1105Direct labor quantity, 1105Direct labor variances, 1111–1113Direct materials, 840Direct materials budget, 1013–1014Direct materials price standard, 1104Direct materials quantity standard,
1104–1105Direct materials variances,
1108–1111Direct method (statement of cash
fl ows), 732, 743–750investing and fi nancing activities,
749–750net change in cash, 751operating activities, 745–749
Direct write-off method, 409Disbursements, 369–373Disbursements journal, 326–328Disclosure(s):
clarity of fi nancial, 224inventory, 279
Discontinued operations, 805Discounts:
bond, 650–652, 662–663, 665–666cash, 406purchase, 214–215sales, 218–219
Discounted cash fl ow method, 1164–1168
Discount period, 214Discount rate, 1164Dishonored notes, 421Disposal:
of accounts receivable, 414–416of notes receivable, 420–422of plant assets, 455–456of treasury stock, 585–586
Divestments, owner’s drawings as, 19

Subject Index I-9
Dividends, 610–618ability to pay, 728in arrears, 612–613cash, 610–614cumulative, 612–613IFRS and GAAP for, 642–643stock, 615–618from stock investments, 696–698
DM (debit memorandum), 376Documentation procedures,
360–361, 447Dollar signs, use of, 69Double-declining-balance method,
453Double-entry system, 51–53Double taxation, 574Drawings (by owners), 13, 19, 52Dual posting, 329Duties:
rotating, 363–364segregation of, 359–360
EEarnings per share (EPS),
624–625, 799Earnings statement, 21. See also
Income statementEbbers, Bernie, 447Economic entity assumption, 10, 120Effective-interest amortization,
664–667Effective-interest rate, 664Electronic funds transfers (EFTs), 380Electronic spreadsheets, 148. See
also WorksheetsEmployee compensation, see Payroll
accountingEmployee earnings record, 503Employee theft, 365, 372Employer payroll taxes, 506–507Employer-provided pension plans,
511–512Enterprise resource planning (ERP)
systems, 313, 850Envelope budgeting, 1098EPS (earnings per share),
624–625, 799Equal Employment Opportunity Act,
1102Equipment:
cost of, 445–446repairing, retaining, or replacing,
1156–1157for statement of cash fl ows, 748, 754
Equity fi nancing, 658–659Equity method (stock investments),
696–697Equivalent units, 924–926, 928–929ERP (enterprise resource planning)
systems, 313, 850Errors:
in bank accounts, 378correcting entries for, 167–168
inventory, 277–278irregularities vs., 68in trial balances, 69
Estimating:depreciation, 454inventories, 284–286uncollectible accounts, 410
Ethics issues:appearance of liquidity, 172approval of requisitions, 883arm’s-length transactions, 406available-for-sale securities, 702comparing cash from operations
to net income, 728computer-system tampering, 314credit agreements, 407cyber security, 313disclosure of details, 225discounted future cash fl ows, 1165documentation control, 883and economic entity assumption, 10errors in statements, 167expectations for EPS, 624fi nancial manipulations, 8in fi nancial reporting, 7–8, 216fraudulent documents, 54inventory fraud, 265, 277lease accounting, 661in managerial accounting, 851meeting standards, 1103minimizing debt reported, 646motivating employees, 500non-owner managers, 573occupational fraud, 372overstating market value, 701partnership agreements, 537partnership liquidations, 544petty cash control, 371purchase price allocation, 448specifi c identifi cation method, 269telecommunications to remote
areas, 848treasury stock purchase, 585unrealistic budgets, 1009
European Union, 9Evaluation of companies, 742–743.
See also Financial statement analysis
Exchange of plant assets, 465–467Exotic Newcastle Disease, 1063Expenses:
accrued, 96, 106–108in double-entry system, 53owner’s equity decrease from, 13payroll, 504prepaid, 98–101, 116–117, 753–754recognizing, 95–96on single-step income statement, 224transaction analysis for, 18
Expense recognition principle, 95, 121Expense reports, fraudulent, 362, 363External transactions, 14External users, 6
FFace value:
of bonds, 646, 650of notes, 429
Factors, 415Factory labor costs, 881Factory overhead, 841Fair Labor Standards Act, 1102Fair value, 700, 702Fair value principle, 9, 120Faithful representation, of fi nancial
information, 9FASB, see Financial Accounting
Standards BoardFederal Bureau of Investigation
(FBI), 26Federal Insurance Contribution Act
(FICA), 500–501Federal Reserve, 661Federal Trade Commission, 6Federal unemployment taxes, 506Federal Unemployment Tax Act
(FUTA), 506Fees, 499FICA (Federal Insurance
Contribution Act), 500–501FICA taxes, 500–501, 506FIFO, see First-in, fi rst-outFinancial accounting, managerial
accounting vs., 836Financial Accounting Standards
Board (FASB), 9, 46, 47defi nitional structure of, 90on fi nancial instrument accounting,
441, 687–688, 702, 724fi nancial statement presentation
project of, 203, 643, 782–783fi nancial statement structure
project of, 260, 833framework for accounting
standards of, 353, 687–688other comprehensive income
requirements, 805pension project of, 531revenue recognition project of, 147
Financial budgets, 1009–1010Financial markets, 46Financial reporting:
assumptions in, 119–120concepts of, 119–121principles in, 120–121
Financial statements, 4, 21–25. See also individual statements
accuracy of, 69from adjusted trial balance,
111–115balance sheet, 22, 23consolidated, 698–699current liabilities on, 495–499depreciation on, 101effect of cost fl ow methods on,
274–275going beyond, 24

I-10 Subject Index
Financial statements (Continued)income statement, 21, 22intangible assets on, 463–465inventories on, 277–280investments on, 700–706long-term liabilities on, 657–658manufacturing costs in, 844–845for merchandising companies,
223–228monthly, 882natural resources on, 463–465owner’s equity statement, 21–23partners’ capital statement, 541–542for partnerships, 542–543plant assets on, 463–465receivables on, 422–423statement of cash fl ows, 21–24stockholders’ equity on, 588–589,
622–623time periods for, 94from worksheets, 157–158
Financial statement analysis, 784–808
comprehensive income, 804–805discontinued operations, 805horizontal, 787–790, 792IFRS and GAAP for, 832need for, 786other comprehensive income,
805–807ratio analysis, 792–804sustainable income, 804–808vertical, 790–792
Financial statement fraud, 372Financing activities, 728, 729,
738–739, 749–750Finished goods, 264Finished goods inventory, 264,
890–891First-in, fi rst-out (FIFO), 269–271,
274–276, 282–283First-in, still here (FISH), 272Fiscal year, 94FISH (fi rst-in, still here), 272Fixed assets, 171, 444. See also
Plant assetsFixed costs:
in CVP, 963in fl exible budget, 1061identifying, 969in manufacturing overhead
budget, 1017–1018for profi t centers, 1072static budget reports for, 1056
Fixed interest rates, 656Fixed ratios (income), 540Flexible budgets, 1057–1064
case study of, 1060–1062developing, 1060and management by exception,
1066and manufacturing, 1068uses of, 1057–1060
Flexible budget reports, 1062–1063FOB (free on board), 213FOB destination, 213, 267FOB shipping point, 213, 266, 267Food production, 964Footing a journal, 323Forensic accounting, 26For-profi t corporations, 572401(k) plans, 512Franchises, 461Fraud, 356–357
altered checks, 360bank reconciliation, 407–408cash as susceptible to, 366employee theft, 365fake expense reports, 362, 363fake invoices, 360fi ctitious claims, 358–359and forensic accounting, 26in hotel housekeeping, 364and IFRS, 402–403inventory, 265, 267, 277involving payroll, 508–509net income, 447occupational, 372and payroll accounting, 508reimbursement requests, 361sales commissions, 362software controls for, 314and stock options, 588theft of merchandise, 217
Fraud triangle, 356Free cash fl ow, 742–743Free on board (FOB), 213Freight costs, 213, 231Freight-in, 231Fringe benefi ts, 506, 510–513.
See also Payroll accountingFull costing, 983Full disclosure principle, 121, 730FUTA (Federal Unemployment Tax
Act), 506
GGAAP, see Generally accepted
accounting principlesGains, 456, 457, 544, 701, 704–705,
805Geneen, Harold, 2General journal, 55–57
adjusting entries in, 109–110closing entries in, 159, 161effects of special journals on, 329posting to ledger from, 59
General ledger, 57–60chart of accounts in, 60control account in, 315and post-closing trial balance,
163–165posting to, 59, 319, 320standard form of account in, 58
General ledger accounting systems, 312–313
Generally accepted accounting principles (GAAP), 8–9
for accounting information systems, 353
and accrual-basis accounting, 94for adjusting accounts, 146–147for allowance method, 410for classifi ed balance sheet, 202–203for dividends, 642–643and effective-interest method, 665for fi nancial statement analysis,
832–833fi nancial statements required by, 21IFRS vs., 46for inventories, 308–309and inventory writedowns, 280for investments, 723–724for liabilities, 530–531, 686–687for merchandising operations,
259–260for plant, property, and equipment,
487–488for receivables, 441recording process for, 90for revenue/expense recognition, 95for statement of cash fl ows, 782and stockholders’ equity, 605–606
General partners, 536Gift cards, accounting for, 103Global Reporting Initiative, 853Going concern assumption, 120Goods in transit, ownership of,
266–267Goodwill, 171, 172, 460, 462“Google Glass,” 462Government accounting careers, 26Governmental budgets, 1027Graham, Benjamin, 784Green, selling, 219Green bonds, 655Greenhouses, 964Gross earnings, 499Gross profi t, 223Gross profi t method, 284–285
HHacktivists, 330Health insurance, 511Held-to-maturity securities, 700High-low method (CVP), 967–968Historical cost principle, 9, 120, 444Honored notes, 420Horizontal analysis, 787–790, 792Human behavior:
and budgetary planning, 1008–1009and performance evaluation, 1067
Human resource controls, 217, 364, 508
Human Rights Watch, 852
IIAASB (International Auditing and
Assurance Standards Board), 403

Subject Index I-11
Iacocca, Lee, 644IASB, see International Accounting
Standards BoardIdeal standards, 1103Identifi cation of economic events, 4–5IFRS, see International Financial
Reporting StandardsIg Nobel Prize, 402IMA, see Institute of Management
AccountantsIMA Statement of Ethical Professional
Practice, 851Imprest system, 370Incentives, creating, 851Income, 266
comprehensive, 705net, see Net incomeother comprehensive, 259,
805–808sustainable, 804–808
Income from operations, 224Income ratios, 540–541, 545Income statement, 21, 22
budget, 1018–1020corporation, 623–626CVP, 970–973, 982, 983effect of cost fl ow methods on,
274–275and errors in inventory
accounting, 277–278horizontal analysis of, 788–789merchandising and manufacturing
costs in, 844–845for merchandising companies,
222–226multiple-step, 223–225sustainable income on, 804transfer to worksheet, 236variances on, 1116–1117vertical analysis of, 790–792
Income taxes:on corporation income
statements, 623for corporations, 574and depreciation, 454payroll deductions for, 500, 501
Income taxes payable, 736–737, 754Incremental analysis, 1148–1159
for accepting an order at a special price, 1151–1152
costs in, 1151–1159for eliminating unprofi table
segments, 1157–1159for making vs. buying, 1152–1155management decision-making
process in, 1148–1151for repairing, retaining, or
replacing equipment, 1156–1157for selling vs. processing further,
1155–1156types of decisions involving, 1150
Indefi nite life, 460Independent contractors, 499
Independent internal verifi cation, 362–363
of bank reconciliations, 408and inventory fraud, 267of net income, 447of payroll expenses, 508
Indirect fi xed costs, 1072Indirect labor, 841Indirect manufacturing costs, 841Indirect materials, 840Indirect method (statement of cash
fl ows), 731–741investing and fi nancing activities,
738–739net change in cash, 739–740operating activities, 734–738worksheet for, 751–755
Industry averages (norms), 786Information, for internal control, 357Information technology, 46Initial public offering (IPO), 575Insiders, cybercrime by, 330Institute of Management
Accountants (IMA), 851, 914Insurance:
adjusting entries for, 99–100health, 511
Intangible assets, 460–463accounting for, 460–462on classifi ed balance sheet,
171–172and research and development
costs, 462–463statement presentation and
analysis of, 463–465Intercompany comparisons, 786Interest, 106
accrued, 106on bonds, 648, 659, 693on buildings, 445on notes receivable, 418–419to partners, 541–542on partners’ capital, 541
Interest coverage, 801Interest rates:
for bonds, 646, 649–650, 664for mortgages, 656–657
Internal auditors, 363Internal control, 356–381
with accounting software, 313, 314for bank reconciliations, 408components of, 357and fraud, 314, 356–357and inventory fraud, 267limitations of, 365for net income, 447over cash, 366–373for payroll, 508–509principles of, 358–364and Sarbanes-Oxley Act, 25,
46, 96and theft of merchandise, 217using banks for, 373–381
Internal rate of return (IRR) method, 1166–1168
Internal Revenue Service (IRS), 6, 26, 454, 508
Internal transactions, 14Internal users, 5International Accounting Standards
Board (IASB), 9, 46defi nitional structure of, 90on fi nancial instrument
accounting, 441, 687–688, 724fi nancial statement presentation
project of, 203, 643, 782–783fi nancial statement structure
project of, 260, 833framework for accounting
standards of, 353, 687–688on liabilities, 531pension project of, 531revenue recognition project of, 147
International Auditing and Assurance Standards Board (IAASB), 403
International Financial Reporting Standards (IFRS), 9, 46, 47
for accounting information systems, 353
for adjusting accounts, 146–147China’s adoption of, 171for classifi ed balance sheet, 202–203for dividends, 642–643for fi nancial statement analysis,
832–833fi nancial statements required by, 21and fraud, 402–403for inventories, 308–309for investments, 723–724for liabilities, 530–531, 686–687for merchandising operations,
259–260for plant, property, and equipment,
487–488for receivables, 441recording process for, 90for statement of cash fl ows, 782and stockholders’ equity, 605–606
Internet, value chain and, 850Interpretation of information, 4, 5Intracompany comparisons, 786Inventoriable costs, 842Inventory(-ies), 262–282
classifying, 264–265cost fl ow methods, 282–284. See
also Inventory costingdetermining quantities, 265–267errors in accounting for, 277–278estimating, 284–286excessive levels of, 281in fi nancial statements, 277–280IFRS and GAAP for, 308–309and income, 266for manufacturing companies,
846–847

I-12 Subject Index
Inventory(-ies) (Continued)for merchandising companies,
846–847periodic system for, 210, 235perpetual system for, 209–211for statement of cash fl ows, 752
Inventory costing, 268–276consistency concept in, 275–276cost fl ow assumptions, 269–276fi nancial statement and tax effects
of methods, 274–275lower-of-cost-or-market,
279–282perpetual system, 282–284specifi c identifi cation method, 269
Inventory turnover, 280–282, 796Investing activities:
cash fl ows from, 728, 729direct method for, 749–750indirect method for, 738–739noncash, 729–730
Investments, 690–706associate, 724on classifi ed balance sheet, 171debt investments, 692–695IFRS and GAAP for, 723–724long-term, 704by owner, 13, 15in partnerships, 550–551reasons for making, 692–693short-term, 703–704speculative, 692stock investments, 695–699valuing and reporting, 700–706
Investment centers, 1070, 1073–1077
Investment portfolio, 695Invoices:
fake, 360purchase, 212sales, 216
IPO (initial public offering), 575Irregularities, 68IRR (internal rate of return) method,
1166–1168IRS, see Internal Revenue Service
JJIT (just-in-time) inventory,
264–265, 850JIT (just-in-time) processing,
932–934Job cost data, reporting, 895–897Job cost sheet, 882, 883Job order cost fl ow, 879–895
accumulating manufacturing costs, 879–882
assigning costs to cost of goods sold, 891
assigning costs to fi nished goods, 890–891
assigning manufacturing costs to work in process, 882–887
Job order costing, 878–879advantages and disadvantages,
894–895cost accounting systems,
878–879job order cost fl ow, 879–895reporting job cost data, 895–897for service companies, 893–894
Job order cost systems, 878–879, 919process cost systems vs., 919–920standard cost accounting system
with, 1120–1122Journals, 55–57. See also General
journalcash payments (disbursements),
326–328cash receipts, 320–324cross-footing, 323footing, 323posting to, see Postingpurchases, 324–326sales, 318–320simple and compound entries in, 56special, see Special journals
Journalizing, 55–56adjusting entries, 109–110, 158cash payments transactions,
326–328cash receipts transactions,
321–323closing entries, 159–161, 233–234credit purchases, 324–325credit sales, 318–319illustration of, 61–66special journals for, 317–318with standard cost accounting
system, 1120–1122Just-in-time (JIT) inventory,
264–265, 850Just-in-time (JIT) processing, 932–934
KKnight, Philip “Phil,” 4, 570, 573
LLabor costs, 841, 881, 885–887,
919–922Labor unions, as external users, 6Labor variances:
direct, 1111–1113price, 1112, 1113, 1115quantity, 1112, 1113total, 1111–1112
Land, 444–445, 448, 749, 754Land improvements, 445Last-in, fi rst-out (LIFO), 272–273
fi nancial statement and tax effects, 274–275
in GAAP and in IFRS, 309in periodic inventory systems,
269–270in perpetual inventory systems, 283
Last-in, still here (LISH), 271
LCM (lower-of-cost-or-market), 279–282
Lean manufacturing, 838, 850Leases, 659–661Leasing, 447Ledgers, 57–60. See also General
ledger; Subsidiary ledgersproving, 319, 321, 324with standard cost accounting
system, 1122Lenders, information from, 422Leveraging, 799Liabilities (fi nancial):
in accounting equation, 12accrued, 106on classifi ed balance sheet, 169,
172–173contingent, 495–497, 530current, 172–173, 492–499in double-entry system, 51–52IFRS and GAAP for, 530–531,
686–687long-term, 173–174, 492. See also
Long-term liabilitiespayroll, 504pension, 512
Liability (legal), in partnerships, 535–536
Licenses, 461, 575Life insurance benefi ts, 511Life of a corporation, 573LIFO, see Last-in, fi rst-outLIFO conformity rule, 275Limited liability, 10, 535–536,
572–573Limited liability companies (LLCs),
535, 536Limited liability partnerships (LLPs),
535, 536Limited life, 460Limited partners, 536Limited partnerships (Ltd., LP),
535–536Line positions, 839Liquidating dividends, 610Liquidation, of partnerships,
543–548Liquidity:
defi ned, 173, 497–498excess, 173listing current liabilities in order
of, 497of receivables, 423short-term creditor interest in, 786
Liquidity ratios, 793–796, 802LISH (last-in, still here), 271LLCs (limited liability companies),
535, 536LLPs (limited liability partnerships),
535, 536Loans, bad, 422Long-range planning, budgetary
planning and, 1009

Subject Index I-13
Long-term creditor, 786Long-term debt, 494–495Long-term debt due within one
year, 495Long-term investments, 171, 704Long-term liabilities, 492, 644–662
bond amortization, 662–667bonds, 646–656on classifi ed balance sheet, 173debt and equity fi nancing, 658–659on fi nancial statements, 657–658leases, 659–662notes payable, long-term, 656–657ratios, 658
Losses:from discontinued operations, 805on disposal of plant assets,
456–458realized, 544, 704–705on sale of equipment, 734–735unrealized, 701, 704–705
Lower-of-cost-or-market (LCM), 279–282
Lowry, Adam, 1146LPs (limited partnerships), 535–536Ltd. (limited partnerships), 535–536
MMachine time used, 922MACRS (Modifi ed Accelerated Cost
Recovery System), 454Madoff, Bernard, 380Mail receipts, cash, 368Make-or-buy decisions, 1152–1155Maker (promissory notes), 417Management accounting,
see Managerial accountingManagement by exception, 1066Management consulting, 25Management decision-making:
for accepting an order at a special price, 1151–1152
for eliminating unprofi table segments, 1157–1159
fi nancial and nonfi nancial information in, 1148
incremental analysis for, 1148–1151
for making vs. buying, 1152–1155for retaining vs. replacing
equipment, 1156–1157for selling vs. processing further,
1155–1156Management of corporations, 573Managers, functions of, 836–840Managerial accounting, 26, 834–853
activities in, 836business ethics in, 851cost concepts in, 840–844fi nancial accounting vs., 836managers’ functions in, 836–840manufacturing costs, 840–841,
844–848
organizational structure, 838–839product vs. period costs, 842trends in, 848–853
Manual accounting systems, 314Manufacturing companies, 840–841
activity-based costing for, 936–940classifying inventory in, 264–265fl exible budgets for, 1068lean manufacturing by, 850process cost systems for, 918units-of-activity depreciation for,
451–452Manufacturing costs, 840–841.
See also Job order cost fl ow; Process cost system
accumulating, 879–882assigning, to work in process,
882–887in balance sheet, 846–847cost concepts, 842–844and costing for service industries,
848–849cost of goods manufactured,
844–848in income statement, 844–848in job order cost system, 919journal entries for, 922in process cost system, 919–923
Manufacturing overhead, 840–841, 881
under activity-based costing, 936–937
journal entries for, 921–923process vs. job order cost systems
for, 919under- or overapplied, 896
Manufacturing overhead budget, 1017–1018
Manufacturing overhead variance, 1113–1115
Margin of safety, 979, 980Margin of safety ratio (CVP), 979, 980Marketable securities, 703Market interest rate, 647, 650Market value:
of bonds, 647–648of stock, 578
Marshall, John, 572Master budget, 1009–1010Matching principle (expense
recognition principle), 95Materials, sell-vs.-processing further
decisions for, 1155–1156Materials costs, 840, 880, 883–885
journal entries for, 921–922process vs. job order cost systems
for, 919–920Materiality, 447, 1066Materiality principle, 447Materials variances, direct, 1108–1111
price, 1109, 1110quantity, 1109–1111total, 1109
Maturity date:for bonds, 646, 654for notes receivable, 417–418
Mayor, David, 852Measurement principles, 9, 120Medicare deductions, 501Members (LLCs), 535Merchandise, theft of, 217Merchandise inventory, 264Merchandise purchases budget,
1025–1026, 1028Merchandising, 264Merchandising companies,
208–236adjusting entries for, 220–222budgetary planning for,
1025–1026closing entries for, 220–221,
233–234cost of goods in, 844–848fl ow of costs in, 209–211forms of fi nancial statements for,
223–228IFRS and GAAP for, 259–260operating cycles in, 208–209periodic inventory system for,
229–236recording purchases of
merchandise, 211–215recording sales of merchandise,
216–219worksheets for, 228–229, 234–236
Merchandising profi t, 223Mergers and acquisitions, 46Mixed costs, in CVP, 965–966Modifi ed Accelerated Cost Recovery
System (MACRS), 454Monetary unit assumption,
9–10, 120Monitoring, for internal control, 357Mortgages, 656–657Mortgage bonds, 646Motion Picture Association of
America, 1076Moving-average method, 283–284Multinational corporations, 46Multiple-step income statement,
223–225Murdoch, Rupert, 690Murdock, Wilbert, 490Mutual agency, in partnerships, 534
NNation-states, cybercrime by, 330Natural resources, 458–459,
463–465Neal, Ray, 15Net annual cash fl ow, 1162Net cash from operating activities,
net income vs., 730Net change in cash:
direct method, 751indirect method, 739

I-14 Subject Index
Net income, 21converting from accrual to cash
basis, 732, 734–738, 745–749and fraud, 447on multiple-step income
statement, 224net cash from operating activities
vs., 730for partnerships, 535, 539–542target, 977–980on worksheet, 156
Net losses, 21closing entry for, 619for partnerships, 535, 539–542on worksheet, 156
Net pay, 502Net present value (NPV) method,
1164–1166Net (cash) realizable value, 410, 420Net sales, 223Net 30, 214New York Stock Exchange
(NYSE), 578No capital defi ciency (partnership
liquidation), 544–546Nominal accounts, 159. See also
Temporary accountsNoncash activities, 729–730Noncash current assets,
changes to, 735Noncash current liabilities,
changes to, 735Noncontrollable revenues/costs, 1066Non-manufacturing companies,
budgetary planning for, 1025–1027Nonoperating activities, on
multiple-step income statement, 224–225
No-par value stocks, 579, 582Normal balances, in double-entry
system, 51Normal capacity, 1106Normal range, see Relevant rangeNormal standards, 1103Notes payable, 12
as current liabilities, 492–493long-term, 656–657
Notes receivable, 406, 417–422computing interest on, 418–419disposing of, 420–422maturity date for, 417–418recognizing, 419valuing, 420
Not-for-profi t corporations/organizations, 572, 1027, 1102
Not suffi cient funds (NSF) checks, 376
NPV (net present value) method, 1164–1166
NSF (not suffi cient funds) checks, 376
NYSE (New York Stock Exchange), 578
OObsolescence, 449Occupational fraud, 372Off-balance-sheet fi nancing, 661Olympic Games, 1023Operating activities, 226
cash fl ows from, 728, 729direct method, 745–749indirect method, 732, 734–738
Operating budgets, 1009, 1010Operating cycles, 170, 208–209Operating expenses, on multiple-step
income statement, 224–225
Operating leases, 660Operations costing, 931Opportunity costs, 1149, 1153–1154Ordinary repairs, 446Organizational structure, 838–839Organization charts, 838Organization costs, 575Organized crime, cybercrime
and, 330Other comprehensive income,
259, 805–808Other expenses and losses, for
merchandising companies, 224Other receivables, 406Other revenues and gains, for
merchandising companies, 224Outstanding checks, 377Overhead:
under activity-based costing, 936–937
journal entries for, 921–923manufacturing, 840, 841,
881, 896predetermined, 887–890process vs. job order cost systems
for, 919standard predetermined, 1105
Overhead variances, 1123–1124controllable, 1114, 1123–1124manufacturing, 1113–1115total, 1113–1114volume, 1114, 1124
Over-the-counter cash receipts, 366–368
Owner’s capital, 13, 52, 53Owner’s equity. See also Corporate
capitalin accounting equation, 13–14on classifi ed balance sheet, 169,
170, 174decreases in, 13in double-entry system, 52increases in, 13
Owner’s equity statement, 21–23Ownership of goods, 266–268Ownership rights:
in corporations, 572, 573preemptive, 576of stockholders, 576
PPacioli, Luca, 5n.2Paid absences, 510–511Paid-in capital, 579, 587, 610Paid-in capital in excess of par value,
581–582Paper (phantom) profi t, 275Parent company, 698Participative budgeting, 1008–1009Partners, 536
admission of, 549–552withdrawal of, 552–555
Partners’ capital statement, 541–542Partnerships, 10, 46, 534–555
admission/withdrawal of partners, 549–555
advantages and disadvantages of, 537
characteristics of, 534–535dividing net income/net loss,
539–542fi nancial statements for, 542–543forming, 538–539liquidation of, 543–548owner’s equity account in, 174partnership agreements, 537types of, 535–536
Partnership agreements, 537Partnership dissolution, 534Partnership liquidation, 543–548
capital defi ciency, 546–548no capital defi ciency, 544–546realization for, 544
Par value, 578, 581–582Patents, 460–461Payee (promissory notes), 417Payment date (cash dividends),
611, 612Payout ratio, 800Payroll accounting, 499–510
determining payroll, 499–502employer payroll taxes, 506–507fi ling/remitting payroll taxes, 508and fraud, 508fringe benefi ts, 510–513internal control for, 508–510recording payroll, 503–505
Payroll deductions, 500–502Payroll processing centers, 506Payroll register, 503Payroll taxes, 506–510Payroll tax expense, 506PCAOB (Public Company Accounting
Oversight Board), 356Pensions, 511–512P/E (price/earnings) ratio, 625n.3,
799–800Percentage of receivables basis
(uncollectibles), 413–414Percentage of sales basis
(uncollectibles), 412–413Performance evaluation,
1066–1067, 1103

Subject Index I-15
Performance obligations, 95, 101Period costs, 842Periodic inventory systems, 210,
229–236, 265, 269–270Periodicity assumption, 94.
See also Time period assumptionPermanent accounts, 159, 163–164Perpetual inventory systems,
209–220in cost accounting systems, 878cost fl ow methods in, 221–222,
282–284determining quantities in, 265entries for periodic system vs.,
232–233merchandising entries with, 221–222recording purchases under, 211–215recording sales under, 216–220
Petty cash fund controls, 370–373Phantom profi t, 275Physical controls, 217, 361–362Physical inventory, 265–266Physical units, 928Physical unit fl ow, 928Pickard, Thomas, 4Plan administrators, 511Plant and equipment, 444. See also
Plant assetsPlant assets, 171, 444–467
buildings, 445depreciation of, 448–455determining cost of, 444–448disposal of, 455–456equipment, 445–446exchange of, 465–467expenditures during useful life of,
446–447land, 444–445land improvements, 445statement presentation and
analysis of, 463–465Ponzi schemes, 380Post-closing trial balance, 163–165Posting, 59
of adjusting entries, 109–110, 158cash payments journal, 327, 328cash receipts journal, 323–324of closing entries, 159, 161–162,
233–234of correcting entries, 167dual, 329illustration of, 61–67purchases journal, 325–326sales journal, 319, 320special journals for, 317–318
Post-retirement benefi ts, 511–513Practical range, see Relevant rangePredetermined overhead, 887–890Preferred stock, 583, 612–614,
798–799Premium:
on bonds, 650, 652–654, 666–667on stock, 581
Prenumbering documents, 361Prepaid expenses (prepayments), 96
adjusting entries for, 98–101alternative treatment of, 116–117for statement of cash fl ows, 753–754
Present value, 647of bonds, 647of leases, 661
Price/earnings (P/E) ratio, 625n.3, 799–800
Price variances:labor, 1112, 1113, 1115materials, 1109, 1110
Principal (bonds), 647Principles in fi nancial reporting,
120–121Prior period adjustments, 620–621Private accounting, 26. See also
Managerial accountingPrivately held corporations, 572Process cost fl ow, 921Process cost system, 878–879, 918–935
and activity-based costing, 934–935assigning manufacturing costs,
921–923equivalent units, 924–926example of, 927–931job order cost systems vs., 919–920and just-in-time processing, 932–934process cost fl ow, 921for service companies, 919uses of, 918
Products, sell-vs.-processing further decisions for, 1155–1156
Product costs, 842Production budget, 1012–1013Production cost report, 927–931Product warranties, 496–497Profi ts, retained, 642Profi tability, creditor interest in, 786Profi tability ratios, 796–800, 802Profi t and loss statement, 21. See also
Income statementProfi t centers, 1070–1073Profi t margin, 797Promissory notes, 417. See also Notes
receivableProperty, plant, and equipment, 171,
444, 487–488. See also Plant assets
Proprietorships, 10, 46, 174Proving ledgers, 319, 321, 324Provisions, 531Public accounting, 25Public Company Accounting
Oversight Board (PCAOB), 356Publicly held corporations, 572Pull approach to manufacturing, 933Purchases:
of buildings, 445of merchandise, recording, 211–215recording, 231transaction analysis for, 15–16
Purchase allowances, 214, 231Purchase discounts, 214–215, 232Purchase invoice, 212Purchases journal, 324–326Purchase of an interest
(partnerships), 549–550Purchase returns, 214, 231Push approach to manufacturing, 932
QQuantity variances:
labor, 1112, 1113materials, 1109–1111
Quarterly tax reports, 508QuickBooks®, 310, 312, 313Quick ratio, 794–795. See also
Acid-test ratio
RRatio analysis, 786, 792–804
liquidity ratios, 793–796, 802long-term liabilities, 658profi tability ratios, 796–800, 802solvency ratios, 800–802
Raw materials, 264, 840Raw materials costs, 880, 883–885R&D (research and development)
costs, 462–463Real accounts, 159. See also
Permanent accountsReal estate taxes payable, 12Realized gain/loss, 704–705Reasonable assurance concept, 365Receivables, 404–423
accounts receivable, 406–416on fi nancial statements, 422–423IFRS and GAAP for, 441notes receivable, 417–422types of, 406
Reconciling bank accounts, 376–381electronic funds transfers, 380entries from, 379–380illustration of, 379–380procedure for, 376–381
Reconciling items, for statement of cash fl ows, 752–755
Record date (cash dividends), 611, 612Recording process, 48–70, 232–233
accounts in, 50–54activities in, 4, 5debits and credits in, 50–54for employer payroll taxes, 506–507illustrated, 60–67for payroll, 503–505with periodic inventory system,
230–233for purchases of merchandise,
211–215for sales of merchandise, 216–219for special and general journals,
329steps in, 54–60trial balance in, 68–70

I-16 Subject Index
Recordkeeping, segregation of physical custody and, 360, 367
Recycling, 108, 926Redeeming bonds, 654–656Regression analysis, 968Regular partnerships, 535Regulations, government, 1102
for corporations, 574as standards, 1102. See also
Standard costsRegulatory agencies, 6Reimbursement requests, fraud
involving, 361Relevance:
of fi gures, 9of fi nancial information, 119
Relevant costs, 1149Relevant range, 964–965, 1061Repairs, ordinary, 446Repurchase of shares, 587Required rate of return, 1161, 1164Research and development (R&D)
costs, 462–463Reserves, 605, 642Residual claims, 576Residual equity, 13. See also Owner’s
equityResidual value, 488Responsibility, establishment of, 358Responsibility accounting,
1064–1073controllable vs. noncontrollable
revenues/costs, 1066responsibility centers, 1070–1073responsibility reporting system,
1067–1070Responsibility centers, 1070–1073Responsibility reporting system,
1067–1070Restricted cash, 382Retailers, 208Retail inventory method, 285–286Retained earnings, 579–580,
619–621payment of cash dividends from,
610prior period adjustments, 620–621restrictions on, 620for statement of cash fl ows, 750, 755
Retained earnings statement, 621, 623, 789–790
Retained profi ts, 642Retirement of plant assets, 456Returns:
purchase, 214sales, 217–218
Return on assets, 798Return on common stockholders’
equity, 622, 798Return on investment (ROI),
1073–1075, 1119Revenues, 13
accrued, 96, 104–105
controllable vs. noncontrollable, 1066
in double-entry system, 53recognizing, 95–96for service companies, 894on single-step income
statement, 224from stock investments, 697–698unearned, see Unearned revenues
Revenue expenditures, 446Revenue recognition principle,
95, 121Reversing entries, 166–168, 175–176Risk assessment, 357Risk levels of activities, 365Rodgers, Aaron, 48, 49ROI, see Return on investmentRolling Stones, 979Rowlings, J.K., 460Ryan, Eric, 1146
SSafe cash payments schedule, 545.
See also Schedule of cash payments
Sage 50, 312, 313Salaries, 499, 500. See also Payroll
accountingaccrued, 106–108to partners, 541–542
Salaries and wages payable, 12Sales:
of bonds, 693–694credit card, 414–416of equipment, loss on, 734–735of merchandise, recording, 216–219of notes receivable, 421of plant assets, 456–458of receivables, 415recording, 232–233of stocks, 696
Sales and administrative expense budget, 1018
Sales budget, 1011–1012Sales commissions, fraud involving,
362Sales discounts, 218–219, 232Sales dollars, 974Sales forecasts, 1007–1008,
1011–1012Sales invoices, 216Sales journal, 318–320Sales returns and allowances,
217–218, 232Sales revenue (sales), 208Sales taxes payable, 12, 493Sales units, 974Salvage value, 449, 452SAP ERP, 313Sarbanes-Oxley Act:
and accuracy of fi nancial reports, 69and corporation management, 573and ethics, 7
and fraud, 356–357, 402, 403and human resources, 364and internal auditor’s job, 26and internal control, 25, 46, 96, 314and software audit trails, 313
Schedule of cash payments, 545–546
Schultz, Howard, 1100Scudamore, Brian, 1122SEC, see Securities and Exchange
CommissionSecured bonds, 646Securities:
available-for-sale, 700–703, 806held-to-maturity, 700marketable, 703trading, 700–701, 703, 806
Securities and Exchange Commission (SEC), 6, 9, 26, 380, 701, 723
Segments, in responsibility accounting, 1065
Segregation of duties, 359–360, 408Service companies:
budgetary planning for, 1026–1027job order costing in, 893–894and managerial accounting,
848–849operating cycles for, 208process cost systems for, 919process vs. job order cost systems
for, 919revenue for, 894
Service revenue, 894Shares, sale of, 10Shareholders’ equity, 579. See also
Corporate capitalShort-term creditor, 786Short-term investments, 703–704Short-term paper, 703n4Simple entries, 56Single-step income statement, 224Sinking fund bonds, 646“Slush” funds, 370Social responsibility, see Corporate
social responsibilitySocial Security, 511Social Security taxes, 501Software:
for customization, 313entry-level, 313for fraud control, 314for internal control, 313network compatibility of, 313
Solvency, creditor interest in, 786Solvency ratios, 800–802SOX, see Sarbanes-Oxley ActSpecial journals, 317–329, 331
cash payments, 326–328cash receipts, 320–324effects on general journal, 329purchases, 324–326sales, 318–320

Subject Index I-17
Special order-price decisions, 1151–1152
Specifi c identifi cation method (inventory), 269
Speculative investments, 692Staff positions, 839Standards. See also Standard costs
budgets vs., 1103government, 1102ideal vs. normal, 1103
Standard costs, 1100–1115analyzing and reporting variances,
1107–1108balanced scorecard, 1117–1119direct labor variances, 1110–1113direct materials variances,
1108–1111manufacturing overhead
variances, 1113–1115need for, 1102, 1103reporting variances from,
1115–1120setting, 1103–1107and standards vs. budgets, 1103
Standard cost accounting system, 1120–1122
Standard hours, 1114Standard predetermined overhead,
1105State income taxes, 501Statement of cash fl ows, 21–24,
728–743classifi cation of cash fl ows, 728–729company evaluation based on,
743–750direct method for, 732, 743–750format of, 730–731IFRS and GAAP for, 782indirect method for, 731–741preparation of, 731–741signifi cant noncash activities,
729–730T-account approach, 755–758usefulness of, 728worksheet for, 751–755
Statement of comprehensive income, 642, 804–807
Statement of earnings, 504–505Statement of operations, 21. See also
Income statementState unemployment taxes, 506Static budgets, 1055–1057Static budget reports, 1055–1057Stocks, 576–579
authorized, 577capital, 587common, 576, 581–584direct issues, 577indirect issues, 577issued for credit, 739market value of, 578no-par value, 579par value of, 578
preferred, 583, 612–614of tech companies, 740treasury, 584–587
Stock certifi cates, 576–577Stock dividends, 615–618Stockholders, 786
limited liability of, 572–573ownership rights of, 576preferred, 612
Stockholders’ equity, 174, 579. See also Corporate capital
on balance sheet, 588–589contra account for, 585effect of dividends on, 616–617on fi nancial statements, 622–623and IFRS/GAAP, 605–606preparing and analyzing, 619–623
Stock investments, 695–699Stock option plans, 500, 588Stockouts, 838Stockpiling, 1014Stock splits, 617–618Straight-line amortization, 662–664Straight-line depreciation,
450–451, 454Su, Vivi, 404Subchapter S corporations, 536Subsidiary (affi liated) company, 698Subsidiary ledgers, 315–317
job cost sheets as, 882, 884posting from cash receipts journal
to, 323–324posting from purchases journal to,
325–326Summa de Arithmetica, Geometria,
Proportione et Proportionalite (Luca Pacioli), 5n.2
Summary entries, 881Sunk costs, 1149Supplies, adjusting entries for, 98–99Sustainability reporting, 357, 459Sustainable business practices,
852–853Sustainable income, 804–808
defi ned, 804discontinued operations, 805other comprehensive income,
805–808
TTabular summaries, 50T accounts, 50–51, 755–758Take-home pay, 502. See also Net pay“Tapping the cookie jar,” 414Target net income, 977–980Taxes:
as accounting area, 25on corporations, 574and depreciation, 454double taxation, 574effect of cost fl ow methods on,
274, 275on employers, 506–510
FICA, 500–501income, see Income taxesfor partnerships, 534payroll, 500–502, 506–510sales taxes payable, 493and time period divisions, 94
Taxing authorities, 6Tech company stock, 740Technology:
cyber security, 330–331investment in, 1163value chain and, 850
Temporary accounts, 158, 164–165Theft, 217, 365, 372Theory of constraints, 850Three-column form of account, 58Tilton, Glenn, 1119Times interest earned, 658, 801Timeliness, 119Time period assumption, 94–97,
120, 146Time value of money, 647Total quality management
(TQM), 850Total standard cost per unit, 1106Total variance, 1107–1108
labor, 1111–1112materials, 1109overhead, 1113–1114
TQM (total quality management), 850
Trademarks, 461, 462Trade names, 461Trade receivables, 406. See also
Accounts receivable; Notes receivable
Trading on the equity, 799Trading securities, 700–701, 703, 806Transaction analysis, 14–20, 61–65.
See also Business transactionsTransparency, in fi nancial reporting, 46Transportation-in, 231Transposition error, 69Treasurers, 573, 839Treasury stock, 584–587Trend analysis, 787. See also
Horizontal analysisTrial balances, 68–70
adjusted, 111–115limitations of, 68–69locating errors in, 90outdated information in, 96post-closing, 163–165on worksheet, 151–155, 234–235
Triple bottom line, 852Trustees (bonds), 646
UUncollectible accounts, 408–416
allowance method, 409–414direct write-off method, 409
Understandability, 119Underwriting, 577–578

I-18 Subject Index
Unearned revenues, 96adjusting entries for, 101–103alternative treatment of, 117–118as current liabilities, 494
Unemployment taxes, 506Unit contribution margin (CVP
analysis), 971–972, 975, 978United Nations, 964Units-of-activity depreciation
(units-of-production method), 451–452, 455
Unit production costs, 928–930Unlimited liability, 535–537Unprofi table segment elimination
decisions, 1157–1159Unrealized gains/losses, 701, 704–705Unsecured bonds, 646Useful fi nancial information, 119Useful life, 447, 449Users of accounting data, 5–6
VVacations, required, 363–364Valuation:
of accounts receivable, 408–414cost allocation vs., 448of investments, 700–706of notes receivable, 420
Value chain, 849–850Variable costs:
in CVP, 962–963
in fl exible budget, 1061identifying, 969in manufacturing overhead
budget, 1017Variable costing, 983–986Variances from standards,
1107–1108direct labor variances, 1111–1113direct materials variances,
1108–1111manufacturing overhead variance,
1113–1115overhead, 1123–1124reporting, 1115–1120
Venture capital fi rms, 535Verifi ability, 119Verifi cation, independent internal,
see Independent internal verifi cation
Vertical analysis, 786, 790–792Virtual closes, 162Voucher register, 370Voucher system controls, 370
WWages, 499–500. See also Payroll
accountingWage and Tax Statement (Form
W-2), 508–509Warranties, product, 496–497Wear and tear, 448
Weighted-average method, 924–926
Weighted-average unit cost, 273West, Laura, 310West, Paul, 310Wholesalers, 208Withdrawal of partners, 552–555Working capital, 498, 794Work in process, 264, 882–887Work in process inventory, 845Worksheets, 150–158
for merchandising companies, 228–229, 234–236
preparing adjusting entries from, 158
preparing fi nancial statements from, 157–158
for statement of cash fl ows, 751–755
steps in preparing, 150–156
YYears, fi scal, 94Year-end, 23Year-end balance, 896–897
ZZero-interest bonds, 647Zuckerberg, Mark, 575

RAPID REVIEWChapter Content
ACCOUNTING EQUATION (Chapter 2)
Assets Owner’s Equity+Basic
Equation
Expanded
Equation = + – + –
Debit / Credit
Effects
Liabilities=
Dr.+
Assets
Cr.–
Dr.–
Liabilities
Cr.+
Dr.–
Owner’sCapital
Cr.+
Dr.+
Owner’sDrawing
Cr.–
Dr.–
Revenues
Cr.+
Dr.+
Expenses
Cr.–
ADJUSTING ENTRIES (Chapter 3)
7
Prepare financialstatements:
Income statementOwner’s equity statement
Balance sheet
5
Journalize and postadjusting entries:
deferrals/accruals6
Prepare an adjustedtrial balance
Optional steps: If a worksheet is prepared, Steps 4, 5, and 6 are incorporated in the worksheet .If reversing entries are prepared, they occur between Steps 9 and 1.
4
Prepare atrial balance
3
Post toledger accounts
2
Journalize thetransactions
1
Analyze businesstransactions
9
Prepare a post-closingtrial balance
8
Journalize andpost closing entries
Type Adjusting Entry
Deferrals 1. Prepaid expenses Dr. Expenses Cr. Assets 2. Unearned revenues Dr. Liabilities Cr. Revenues
Accruals 1. Accrued r evenues Dr. Assets Cr. Revenues 2. Accrued expenses Dr. Expenses Cr. Liabilities
Note: Each adjusting entry will affect one or more income statement accounts and one or more balance sheet accounts.
Interest Computation
Interest = Face value of note 3 Annual interest rate 3 Time in terms of one year
CLOSING ENTRIES (Chapter 4)
Purpose: (1) Update the Owner’s Capital account in the ledger by transferring net income (loss) and Owner’s Drawings to Owner’s Capital. (2) Prepare the temporary accounts (revenue, expense, Owner’s Drawings) for the next period’s postings by reducing their balances to zero.
Process
1. Debit each revenue account for its balance (assuming normal balances), and credit Income Summary for total revenues.
2. Debit Income Summary for total expenses, and credit each expense account for its balance (assuming normal balances).
STOP AND CHECK: Does the balance in your Income Summary account equal the net income (loss) reported in the income statement?
3. Debit (credit) Income Summary, and credit (debit) Owner’s Capital for the amount of net income (loss).
4. Debit Owner’s Capital for the balance in the Owner’s Drawings account, and credit Owner’s Drawings for the same amount.
STOP AND CHECK: Does the balance in your Owner’s Capital account equal the ending balance reported in the balance sheet and the owner’s equity statement? Are all of your temporary account balances zero?
ACCOUNTING CYCLE (Chapter 4)
Perpetual vs. Periodic Journal Entries
Event Perpetual Periodic*
Purchase of goods Inventory Purchases Cash (A/P) Cash (A/P)
Freight (shipping point) Inventory Freight-In Cash Cash
Return of goods Cash (or A/P) Cash (or A/P) Inventory Purchase Ret. and All.
Sale of goods Cash (or A/R) Cash (or A/R) Sales Revenue Sales Revenue Cost of Goods Sold No entry Inventory
Sales returns and Sales Ret. and All. Sales Ret. and All. allowances Accounts Receivable Accounts Receivable Inventory No entry Cost of Goods Sold
Sales discounts Cash Cash Sales Discounts Sales Discounts Accounts Receivable Accounts Receivable
End of period No entry Closing or adjusting entry required
Ownership of goods on Freight Terms public carrier resides with: Who pays freight costs:
FOB shipping point Buyer Buyer
FOB destination Seller Seller
INVENTORY (Chapters 5 and 6)
Ownership
Bank Books
Balance per bank statement Balance per booksAdd: Deposit in transit Add: Unrecorded credit memoranda from bank statementDeduct: Outstanding checks Deduct: Unrecorded debit memoranda from bank statementAdjusted cash balance Adjusted cash balance
Note: 1. Errors should be offset (added or deducted) on the side that made the error. 2. Adjusting journal entries should only be made on the books.
STOP AND CHECK: Does the adjusted cash balance in the Cash account equal the reconciled balance?
Cost Flow Methods
• Specific identification • Weighted-average• First-in, first-out (FIFO) • Last-in, first-out (LIFO)
FRAUD, INTERNAL CONTROL, AND CASH (Chapter 8)
The Fraud Triangle Principles of Internal Control Activities
• Establishment of responsibility • Segregation of duties • Documentation procedures • Physical controls • Independent internal verification • Human resource controlsBank Reconciliation
Financial pressure
Opportunity
Rationalization
*Covered in appendix.

PLANT ASSETS (Chapter 10)
Presentation
INVESTMENTS (Chapter 16)
Comparison of Long-Term Bond Investment and Liability Journal Entries
Tangible Assets Intangible Assets
Property, plant, and equipment Intangible assets (patents, copyrights, trademarks, franchises, goodwill)
Natural resources
Computation of Annual Depreciation Expense
Note: If depreciation is calculated for partial periods, the straight-line and declining-balance methods must be adjusted for the relevant proportion of the year. Multiply the annual depreciation expense by the number of months expired in the year divided by 12 months.
SHAREHOLDERS’ EQUITY (Chapter 13)
Comparison of Equity Accounts
Proprietorship Partnership Corporation
Owner’s equity Partner’s equity Stockholders’ equity Owner’s capital Name, Capital Common stock Name, Capital Retained earnings
No-Par Value vs. Par Value Stock Journal Entries
No-Par Value Par Value
Cash Cash Common Stock Common Stock (par value) Paid-in Capital in Excess of Par—Common Stock
DIVIDENDS (Chapter 14)
Comparison of Dividend Effects
Cash Common Stock Retained Earnings
Cash dividend ↓ No effect ↓
Stock dividend No effect ↑ ↓
Stock split No effect No effect No effect
BONDS (Chapter 15)
Premium Market interest rate , Contractual interest rate
Face Value Market interest rate 5 Contractual interest rate
Discount Market interest rate . Contractual interest rate
Event Investor Investee
Purchase / issue of bonds Debt Investments Cash Cash Bonds Payable
Interest receipt / payment Cash Interest Expense Interest Revenue Cash
Comparison of Cost and Equity Methods of Accounting for Long-Term Stock Investments
Event Cost Equity
Acquisition Stock Investments Stock Investments Cash Cash
Investee reports No entry Stock Investments earnings Revenue from Stock Investments
Investee pays Cash Cash dividends Dividend Revenue Stock Investments
STATEMENT OF CASH FLOWS (Chapter 17)
Cash flows from operating activities (indirect method) Net income Add: Losses on disposals of assets $ X Amortization and depreciation X Decreases in current assets X Increases in current liabilities X Deduct: Gains on disposals of assets (X) Increases in current assets (X) Decreases in current liabilities (X) Net cash provided (used) by operating activities $ X
Cash flows from operating activities (direct method) Cash receipts (Examples: from sales of goods and services to customers, from
receipts of interest and dividends on loans and investments) $ X Cash payments (Examples: to suppliers, for operating expenses, for interest, for taxes) (X)Net cash provided (used) by operating activities $ X
RAPID REVIEWChapter Content
RECEIVABLES (Chapter 9)
Methods to Account for Uncollectible Accounts
Direct write-off method Record bad debt expense when the company determines a particular account to be uncollectible.
Allowance methods: At the end of each period, estimate the amount of Percentage-of-sales credit sales uncollectible. Debit Bad Debt Expense
and credit Allowance for Doubtful Accounts for this amount. As specific accounts become uncollectible, debit Allowance for Doubtful Accounts and credit Accounts Receivable.
Percentage-of-receivables At the end of each period, estimate the amount of uncollectible receivables. Debit Bad Debt Expense and credit Allowance for Doubtful Accounts in an amountthat results in a balance in the allowance account equal to the estimate of uncollectibles. As specific accounts become uncollectible, debit Allowance for Doubtful Accounts and credit Accounts Receivable.
Trading Report at fair value with changes reported in net income.
Available-for- Report at fair value with changes reported in the stockholders’ sale equity section.
Trading and Available-for-Sale Securities
Prior period adjustments Statement of retained earnings (adjustment of(Chapter 14) beginning retained earnings)
Discontinued operations Income statement (presented separately after “Income from continuing operations”)
Changes in accounting principle In most instances, use the new method in current period and restate previous year’s results using new method. For changes in depreciation and amortization methods, use the new method in the current period but do not restate previous periods.
PRESENTATION OF NON-TYPICAL ITEMS (Chapter 18)
Straight-line
Cost 2 Salvage value}}}Useful life (in years)
Units-of-activity Depreciable cost
}}}Useful life (in units)
3 Units of activity during year
Declining-balance Book value at beginning of year 3 Declining balance rate* *Declining-balance rate 5 1 4 Useful life (in years)

Types of Manufacturing Costs
MANAGERIAL ACCOUNTING (Chapter 19)
Characteristics of Managerial Accounting
Primary users Internal users
Reports Internal reports issued as needed
Purpose Special purpose for a particular user
Content Pertains to subunits, may be detailed, use of relevant data
Verification No independent audits
Direct materials Raw materials directly associated with finished product
Direct labor Work of employees directly associated with turning raw materials into finished product
Manufacturing Costs indirectly associated with manufacture of finishedoverhead product
JOB ORDER AND PROCESS COSTING (Chapters 20 and 21)
Types of Accounting Systems
Job order Costs are assigned to each unit or each batch of goods
Process cost Costs are applied to similar products that are mass-produced in a continuous fashion
Job Order and Process Cost Flow
Finished GoodsInventory
Cost of GoodsSold
Job Order Cost Flow
Direct MaterialsDirect LaborManufacturing
Overhead
Work in ProcessInventory
Job No. 101Job No. 102Job No. 103
Finished GoodsInventory
Cost of GoodsSold
Process Cost Flow
Direct MaterialsDirect LaborManufacturing
Overhead
Work in Process
RAPID REVIEWChapter Content
COST-VOLUME-PROFIT (Chapter 22)
Types of Costs
Variable costs Vary in total directly and proportionately with changes in activity level
Fixed costs Remain the same in total regardless of change in activity level
Mixed costs Contain both a fixed and a variable element
CVP Income Statement Format
Total Per Unit
Sales $xx $xxVariable costs xx xx
Contribution margin xx $xxFixed costs xx
Net income $xx
Break-even point in units
5
Fixedcosts
4
Unit contributionmargin
Required sales in unitsfor target net income
5
(Fixed costs 1 Target net income)
4
Unit contributionmargin
Unit contributionmargin
5
Unit sellingprice
2
Unit variablecosts

RAPID REVIEWChapter Content
RESPONSIBILITY ACCOUNTING (Chapter 24)
Types of Responsibility Centers
Return on Investment
Return on Investment center
Averageinvestment 5
controllable margin 4 investment center
(ROI) operating assets
STANDARD COSTS (Chapter 25)
Standard Cost Variances
Total Materials Materialsmaterials 5 price 1 quantityvariance variance variance
Total Labor Laborlabor 5 price 1 quantity
variance variance variance
Total Overhead Overheadoverhead 5 controllable 1 volumevariance variance variance
Cost Profit Investment
Expenses only Expenses and Revenues Expenses and Revenues and ROI
BUDGETS (Chapter 23)
Components of the Master Budget
Materials price variance 5 AQ 3 AP 2 AQ 3 SP
Materials quantity variance 5 AQ 3 SP 2 SQ 3 SP
Labor price variance 5 AH 3 AR 2 AH 3 SR
Labor quantity variance 5 AH 3 SR 2 SH 3 SR
Overhead controllable variance 5 Actual overhead 2 Overhead budgeted
Overhead volume variance 5 Fixed overhead rate 3 Normal capacity hours 2Standard hours allowed
Learningand Growth
InternalProcess
CustomerFinancial
Linked process across perspectives:
Balanced Scorecard
*
*
*Appendix coverage
Hayes Co.Budget
Rightride
Operating
Budgets
Financial
Budgets
CapitalExpenditure
BudgetCash Budget
BudgetedBalanceSheet
Selling andAdministrativeExpense Budget
BudgetedIncome
Statement
DirectMaterialsBudget
DirectLabor
Budget
ProductionBudget
Sales Budget
ManufacturingOverhead
Budget
INCREMENTAL ANALYSIS AND CAPITAL BUDGETING (Chapter 26)
Annual rate 5
Expected annual 4
Averageof return net income investment
Cash Payback
Cash payback 5
Cost of capital 4
Net annualperiod investment cash flow
Discounted Cash Flow Approaches
Net Present Value
Compute net prese nt value (a dollar amount).If net present value is zero or positive,
accept the proposal. If net present value is negative, reject the proposal.
Internal Rate of Return
Compute internal rate of return (a percentage).If internal rate of return is equal to or
greater than the minimum required rate of return, accept the proposal. If internal rate of return is less than the minimum rate, reject the proposal.
Incremental Analysis
1. Identify the relevant costs associated with each alternative. Relevant costs are those costs and revenues that differ across alternatives. Choose the alternative that maximizes net income.
2. Opportunity costs are those benefits that are given up when one alternative is chosen instead of another one. Opportunity costs are relevant costs.
3. Sunk costs have already been incurred and will not be changed or avoided by any future decision. Sunk costs are not relevant costs.
Annual Rate of Return

RAPID REVIEWFinancial Statements
Order of Preparation
Statement Type Date
1. Income statement For the period ended
2. Retained earnings statement For the period ended
3. Balance sheet As of the end of the period
4. Statement of cash flows For the period ended
Income Statement (perpetual inventory system)
COMPANY NAMEIncome Statement
For the Period Ended
Sales Sales revenue $ X Less: Sales returns and allowances X Sales discounts X Net sales $ XCost of goods sold XGross profit XOperating expenses (Examples: store salaries, advertising, delivery, rent, depreciation, utilities, insurance) XIncome from operations XOther revenues and gains (Examples: interest, gains) XOther expenses and losses (Examples: interest, losses) X XIncome before income taxes XIncome tax expense XNet income $ X
Income Statement (periodic inventory system)
COMPANY NAMEIncome Statement
For the Period Ended
Sales Sales revenue $ X Less: Sales returns and allowances X Sales discounts X Net sales $ XCost of goods sold Beginning inventory X Purchases $ X Less: Purchase returns and allowances X Net purchases X Add: Freight-in X Cost of goods purchased X Cost of goods available for sale X Less: Ending inventory X Cost of goods sold XGross profit XOperating expenses (Examples: store salaries, advertising, delivery, rent, depreciation, utilities, insurance) XIncome from operations XOther revenues and gains (Examples: interest, gains) XOther expenses and losses (Examples: interest, losses) X XIncome before income taxes XIncome tax expense XNet income $ X
Retained Earnings Statement
COMPANY NAMERetained Earnings Statement
For the Period Ended
Retained earnings, beginning of period $ XAdd: Net income (or deduct net loss) X XDeduct: Dividends XRetained earnings, end of period $ X
STOP AND CHECK: Net income (loss) presented on the retained earnings statement must equal the net income (loss) presented on the income statement.
Balance Sheet
COMPANY NAMEBalance Sheet
As of the End of the Period
Assets
Current assets (Examples: cash, short-term debt investments, accounts receivable, inventory, prepaids) $ XLong-term investments (Examples: investments in bonds, investments in stocks) XProperty, plant, and equipment Land $ X Buildings and equipment $ X Less: Accumulated depreciation X X XIntangible assets X Total assets $ X
Liabilities and Stockholders’ Equity
Liabilities Current liabilities (Examples: notes payable, accounts payable, accruals, unearned revenues, current portion of notes payable) $ X Long-term liabilities (Examples: notes payable, bonds payable) X Total liabilities XStockholders’ equity Common stock X Retained earnings X Total liabilities and stockholders’ equity $ X
STOP AND CHECK: Total assets on the balance sheet must equal total liabilities and stockholders’ equity; and, ending retained earnings on the balance sheet must equal ending retained earnings on the retained earnings statement.
Statement of Cash Flows
COMPANY NAMEStatement of Cash Flows
For the Period Ended
Cash flows from operating activities (Note: May be prepared using the direct or indirect method) Net cash provided (used) by operating activities $ XCash flows from investing activities (Examples: purchase / sale of long-term assets) Net cash provided (used) by investing activities XCash flows from financing activities (Examples: issue / repayment of long-term liabilities, issue of stock, payment of dividends) Net cash provided (used) by financing activities X
Net increase (decrease) in cash XCash, beginning of the period X
Cash, end of the period $ X
STOP AND CHECK: Cash, end of the period, on the statement of cash flows must equal cash presented on the balance sheet.

RAPID REVIEWUsing the Information in the Financial Statements
Ratio Formula Purpose or Use
Liquidity Ratios
1. Current ratio Current assets}}}Current liabilities
Measures short-term debt-paying ability.
2. Acid-test (quick) Cash 1 Short-term investments 1 Accounts receivable (net)}}}}}}}
Current liabilities Measures immediate short-term liquidity.
3. Accounts receivable Net credit sales}}}}Average net accounts receivable
Measures liquidity of receivables.
4. Inventory turnover Cost of goods sold}}}Average inventory
Measures liquidity of inventory.
Profitability Ratios
5. Profit margin Net income}}
Net sales Measures net income generated by each
dollar of sales.
6. Asset turnover Net sales}}}}Average total assets
Measures how efficiently assets are used to generate sales.
7. Return on assets Net income}}}}Average total assets
Measures overall profitability of assets.
8. Return on common stockholders’ equity
Net income 2 Preferred dividends}}}}}}Average common stockholders’ equity
Measures profitability of owners’ investment.
9. Earnings per share Net income 2 Preferred dividends}}}}}}Weighted-average common shares outstanding Measures net income earned on each
share of common stock.
10. Price-earnings (P-E) Market price per share of stock}}}}
Earnings per share Measures ratio of the market price per
share to earnings per share.
11. Payout ratio Cash dividends}}
Net income Measures percentage of earnings
distributed in the form of cash dividends.
Solvency Ratios
12. Debt to assets ratio Total liabilities}}}
Total assets Measures percentage of total assets
13. Times interest earned Net income + Interest expense + Income tax expense}}}}}}}
Interest expense Measures ability to meet interest
payments as they come due.
14. Free cash flow Net cash provided by operating activities 2 Measures the amount of cash generated Capital expenditures 2 Cash dividends during the current year that is available
for the payment of additional dividends or for expansion.
turnover
ratio
(EPS)
ratio
provided by creditors.

WILEY END USER LICENSE AGREEMENTGo to www.wiley.com/go/eula to access Wiley’s ebook EULA.