Accessible Housing in Cambridge
66
Accessible Housing in Cambridge A study into accessible housing requirements in Cambridge for the emerging Local Plan. January 2017
-
Upload
khangminh22 -
Category
Documents
-
view
1 -
download
0
Transcript of Accessible Housing in Cambridge

Accessible Housing in Cambridge
A study into accessible housing
requirements in Cambridge for the
emerging Local Plan.
January 2017
fransc
Typewritten Text
Appendix E
fransc
Typewritten Text
fransc
Typewritten Text
fransc
Typewritten Text
fransc
Typewritten Text
fransc
Typewritten Text

Page | I
Contents
Contents
Contents ...................................................................................................................................... i
Use of PANSI and POPPI data: ........................................................................................... 3
1. Background: Accessible Housing Standards ...................................................................... 1
Local Policy Context ............................................................................................................... 1
Government Guidance ........................................................................................................... 2
What are the Mandatory and Optional Building Regulations? ............................................. 3
Evidence Requirements ......................................................................................................... 5
2. Existing Housing Stock ....................................................................................................... 6
National Accessible and Adaptable Dwellings ....................................................................... 6
Local Accessible and Adaptable Dwellings ............................................................................ 8
Estimated Existing Household Need ...................................................................................... 9
Summary .............................................................................................................................. 10
3. The Need for Accessible and Adaptable Homes Across Tenures .................................... 12
Local Accessible and Adaptable Dwellings by Tenure ......................................................... 12
Summary .............................................................................................................................. 14
4. Evidence of Need: Ageing Population ............................................................................. 15
Cambridgeshire County Council’s Population Forecast to 2031 ......................................... 16
Mobility in Older People ...................................................................................................... 17
Self-Care and Older People .................................................................................................. 18
Predicted Falls in the Older Population ............................................................................... 19
Summary .............................................................................................................................. 20
5. Evidence of Need: Long-Term Health and Disability ....................................................... 21
Long-Term Health and Disability in the 18-64 Age Group: Moderate and Serious Disability
.............................................................................................................................................. 22
Summary .............................................................................................................................. 25
6. Wheelchair Accessible Housing Need .............................................................................. 26
Appendix E
Page | II
7. Profile of Council and Housing Association Tenants: Supplementary Information ........ 30
Cambridge City Council Household Adaptions .................................................................... 31
8. Adaptions to Homes: Disabled Facilities Grants .............................................................. 33
9. Specialist Housing ............................................................................................................ 34
10. Further Considerations ................................................................................................. 35
Viability ................................................................................................................................ 35
Lift Access ............................................................................................................................. 36
Need for Updates ................................................................................................................. 37
11. Conclusion ..................................................................................................................... 38
Appendix 1: Excerpt from English Housing Survey – Profile of English Housing 2013 ............ 41
Appendix 2: Level of Work Required to Make Homes Visitable .............................................. 42
Appendix 3: Forecasts of Older People’s Needs for Cambridge .............................................. 44
Appendix 4: Forecasts of Disability Needs for Cambridge ....................................................... 50
Appendix 5: Number of Home-Link Properties in Cambridge Let to Households with Different
Mobility Ratings Through Home-Link. ..................................................................................... 53
Appendix 6: Anecdotal Evidence From Home-Link Staff ......................................................... 54
Glossary .................................................................................................................................... 55
Bibliography ............................................................................................................................. 59
Appendix E

Page | III
Use of PANSI and POPPI data:
The licence to use either the PANSI and/or POPPI systems does not extend to any third party
use. Therefore, you may not, for the use by a third party, distribute, modify, copy, transmit,
display, reuse, reproduce, publish, license, create derivative works from, transfer, sell or
otherwise use content without the Department of Health’s prior written permission
Appendix E

Page | 1
1. Background: Accessible Housing Standards
1.1. On 25 March 2015, the Government issued a Written Ministerial Statement
introducing new steps designed to “streamline the planning system, support
economic growth and assist locally-led decision-making” (CLG [online], 2015).
1.2. The Written Ministerial Statement removed the ability of Local Planning Authorities
to set a policy requirement for Lifetime Homes and Wheelchair Housing Design
standards1, and introduced both mandatory and optional Building Regulations, which
came into force on 1 October 2015.
1.3. Cambridge City Council has produced this study in order to align Policy 51: Lifetime
Homes and Lifetime Neighbourhoods of the emerging Local Plan with current
Government guidance for M4(2): Accessible and adaptable dwellings standard and
M4(3): Wheelchair user dwellings standard and assess the current need in the city for
accessible and adaptable homes.
1.4. The need for accessible and adaptable housing across the country has been
reiterated by Habinteg’s accessible housing toolkit (2016) which notes that there is a
clear case for building 100% of new housing to M4(2): Accessible and adaptable
dwellings standard, except for 10% that is built to M4(3): Wheelchair user dwellings
standard. This is broadly the policy that has been followed for several years in
London. This standard gave developers clarity and certainty regarding the
requirements for new build properties and was complied with in London.
1.5. The Council acknowledges that as a result of improved life expectancy nationally,
people may be living longer with mobility impairments and long-term health and
disability issues. It is beneficial for the wider community for housing to be built to
inexpensive and inclusive principles.
Local Policy Context
1.6. The Cambridge Local Plan 2014: Proposed Submission (the Plan) was submitted to
the Secretary of State for examination on 28 March 2014. The Plan included Policy
51: Lifetime Homes and Lifetime Neighbourhoods which required 100% of new
homes to be built to Lifetime Homes standard and 5% of any housing scheme
providing 20 or more self-contained homes to meet the Wheelchair Housing Design
Standard2.
1 Lifetime Homes [online], 2016.
2 Delivered in accordance with British Standards Institution's BS 8300: 2009 Design of buildings and their
approaches to meet the needs of disabled people.
Appendix E

Page | 2
1.7. Following the Written Ministerial Statement, the National Planning Practice
Guidance (PPG) introduced the following guidance regarding optional technical
housing standards notes:
“Where a local planning authority adopts a policy to provide enhanced accessibility
or adaptability they should do so only by reference to Requirement M4 (2) and / or
M4 (3) of the optional requirements in the Building Regulations and should not
impose any additional information requirements …. They should clearly state in their
Local Plan what proportion of new dwellings should comply with the requirements.”3
1.8. In a letter from the Inspectors dated 20 May 20154, the Inspectors examining the
Local Plan requested a review of Local Plan policies in light of the publication of
Written Ministerial Statements in order to bring them up to date with recent
changes in Government guidance and policy. Policy 51 has therefore been reviewed
to establish the current need in the city for accessible and adaptable homes.
Government Guidance
1.9. Paragraph 58 of the National Planning Policy Framework (NPPF) states that planning
policies and decisions should aim to ensure that developments create safe and
accessible environments and promote community cohesion.
1.10. In addition, paragraph 50 (first bullet point) of the NPPF also requires that local
authorities plan for a mix of housing and housing needs, including that of older
people and people with disabilities.
1.11. On 25 March 2015, the Government issued a Written Ministerial Statement which
set out a new approach to the application of Local Plan Policies in respect of
accessible and adaptable home standards and requirements.
1.12. This Written Ministerial Statement was followed by the introduction of specific
guidance on Housing – Optional Space Standards within the Government’s National
Planning Practice Guidance (PPG)5.
1.13. On 1 October 2015, the Government introduced mandatory and optional Building
Regulations covering new dwellings. These regulations can be found in Part M,
Volume 1 of the Government’s Building Regulations6.
3 Reference 56-008-20160519 (CLG [online], 2016).
4 https://www.cambridge.gov.uk/sites/default/files/documents/RD-GEN-170.pdf (Planning Inspectorate
[online], 2015). 5 (CLG [online], 2016).
6 (HM Government [online], 2010).
Appendix E

Page | 3
1.14. Mandatory Building Regulations are contained within Regulation M4(1): Visitable
Dwellings and cover the physical security of dwellings.
1.15. Two further optional Building Regulations were also established: M4(2): Accessible
and adaptable dwellings and M4(3): Wheelchair user dwellings.
1.16. Local planning authorities have the option to include these standards within Local
Plan policies. The PPG notes that: “Local planning authorities will need to gather
evidence to determine whether there is a need for additional standards in their area,
and justify setting appropriate policies in their Local Plans.”7 This evidence
requirement is discussed in more detail later in this report.
1.17. The PPG also notes that Local Plan policies for wheelchair accessible homes (optional
requirement M4(3)) can only be applied to dwellings where the local authority is
responsible for allocating, or nominating a person to live in that dwelling. This
indicates that the wheelchair user dwellings standard could only be applied to
affordable housing.
What are the Mandatory and Optional Building Regulations?
1.18. Mandatory Building Regulation M4(1): Visitable Dwellings covers the physical
security of dwellings. It requires that reasonable provision should be made for most
people, including wheelchair users, to approach and enter the dwelling and to
access habitable rooms and sanitary facilities on the entrance storey.
1.19. Optional Building Regulation M4(2): Accessible and adaptable dwellings enables
Councils to stipulate through planning policy that a specific percentage of dwellings
in a development should meet the differing needs of occupants (including older or
disabled people) and can be adapted over time to meet these changing needs. It
requires that reasonable provision should be made to enable most people to access
the dwelling. The dwelling should incorporate features that make it potentially
suitable for a wide range of occupants, including older people, those with reduced
mobility and some wheelchair users.
1.20. Optional Building Regulation M4(3): Wheelchair user dwellings enables Councils to
stipulate through planning policy that a specific percentage of dwellings in a
development should meet the needs of wheelchair users and allow for the simple
adaption of the dwelling for wheelchair users. It requires wheelchair users to be
able to live in the dwelling and use any associated private outdoor space, parking
and communal facilities that may be provided for the use of the occupants. This
7 Reference 56-002-20160519 (CLG [online], 2016).
Appendix E

Page | 4
Regulation can only be applied to dwellings where the local authority is responsible
for allocating, or nominating a person to live in that dwelling8.
1.21. A summary of the criteria needed to meet these requirements can be found in Table
1.
Table 1: Summary of provisions required to meet the mandatory and optional Part
M Building Regulations (Volume 1)
Mandatory Requirement Optional Requirement Optional Requirement
M4(1): Visitable Dwellings M4(2): Accessible and Adaptable Dwellings
M4(3): Wheelchair User Dwellings
a. Within the curtilage of the dwelling or the building containing the dwelling, it is possible to approach and gain access to the dwelling.
a. Within the curtilage of the dwelling, or of the building containing the dwelling, it is possible to approach and gain step-free access to the dwelling and to any associated parking space and communal facilities intended for the occupants to use.
a. Within the curtilage of the dwelling or of the building containing the dwelling, a wheelchair user can approach and gain step-free access to every private entrance to the dwelling and to every associated private outdoor space, parking space and communal facility for occupants’ use.
b. It is possible to gain access to the dwelling, or the building containing the dwelling, from the most likely point of alighting from a car.
b. There is step-free access to the WC and other accommodation within the entrance storey, and to any associated private outdoor space directly connected to the entrance storey.
b. Access to the WC and other accommodation within the entrance storey is step-free and the dwelling is designed to have the potential for step-free access to all other parts.
c. A disabled person who is able to walk is able to visit any dwelling in a building containing one or more dwellings.
c. A wide range of people, including older and disabled people and some wheelchair users, are able to use the accommodation and its sanitary facilities.
c. There is sufficient internal space to make accommodation within the dwelling suitable for a wheelchair user.
d. Visitors can access and use the habitable rooms and a WC within the entrance storey of the dwelling (or the principal storey where the entrance storey does not contain a habitable room).
d. Features are provided to enable common adaptations to be carried out in future to increase the accessibility and functionality of the dwelling.
d. The dwelling is wheelchair adaptable such that key parts of the accommodation, including sanitary facilities and kitchens, could be easily altered to meet the needs of a wheelchair user or, where required by a local planning authority, the dwelling is wheelchair accessible.
e. Where the habitable rooms and the WC are located on the entrance storey, access between them is step free.
e. Wall-mounted switches, socket outlets and other controls are reasonably accessible to people who have reduced reach
e. Wall-mounted switches, controls and socket outlets are accessible to people who have reduced reach.
f. Wall-mounted switches and socket outlets in habitable rooms are reasonably accessible to people who have reduced reach.
8 Paragraph: 009, Reference ID: 56-009-20150327 (CLG [online], 2016).
Appendix E

Page | 5
Evidence Requirements
1.22. The Planning Practice Guidance notes that it is for local planning authorities to set
out how they intend to demonstrate need for the optional Building Regulations.
“Based on their housing needs assessment and other available datasets it will be for
local planning authorities to set out how they intend to approach demonstrating the
need for Requirement M4(2) (accessible and adaptable dwellings), and / or M4(3)
(wheelchair user dwellings), of the Building Regulations. There is a wide range of
published official statistics and factors which local planning authorities can consider
and take into account, including:
the likely future need for housing for older and disabled people (including
wheelchair user dwellings).
size, location, type and quality of dwellings needed to meet specifically
evidenced needs (for example retirement homes, sheltered homes or care
homes).
the accessibility and adaptability of existing housing stock.
how needs vary across different housing tenures.
the overall impact on viability.”9
(CLG [online], 2016)
1.23. In addition, the Government produced a Guide to available disability data10 which
also provides potential useful data and sources of further information which
planning authorities can use to inform their assessments.
9 Reference ID: 56-007-20150327 (CLG [online], 2016).
10 (CLG [online], 2015a).
Appendix E

Page | 6
2. Existing Housing Stock
2.1. This section assesses the current situation with regard to accessible and adaptable
housing in Cambridge.
2.2. In assessing the current situation in Cambridge, a range of data has been considered.
It is a complex area of study, given that data has been collected for a range of
purposes and does not necessarily lend itself to use for the purposes of assessing
need for accessible homes.
2.3. In order to ascertain the accessibility and adaptability standards of housing stock in
Cambridge, an analysis will be made using the findings from the English Housing
Survey and applying them at a local level to current household figures.
2.4. It should also be noted that the Council undertook a Cambridge Private Sector House
Condition Survey in 2015. At that time, it was noted that 14% of all homes and 18%
of privately rented homes in the city contained a category one hazard11. A category
one hazard is a ‘serious hazard’ as defined through the national Housing Health and
Safety Rating System and includes, physiological hazards related to damp, cold, heat
and pollutants; psychological hazards such as over-crowding, security, noise and
infectious hazards related to hygiene sanitation and water supply. This implies that
regardless of existing accessibility and adaptability requirements, a significant
proportion of homes in Cambridge require remedial work to eliminate hazards in the
home that could potentially contribute towards ill health (physical or psychological)
and/or hospitalisation. These hazards may also affect the health and well-being of
the elderly and those with long-term illness or disability who are also most in need of
homes built to accessible and adaptable standards.
National Accessible and Adaptable Dwellings
2.5. The English Housing Survey Profile of English housing 2014-15 (EHS) was
commissioned by the Department for Communities and Local Government (CLG) and
assesses housing conditions and housing circumstances in England. The survey
results and their associated data annexes are provided through a suite of documents
all published in July 201612:
English Housing Survey 2014 To 2015: Adaptations And Accessibility Of
Homes Report;
11
Source: Cambridge City Council Strategic Housing Key Facts, September 2016, indicator GD7 (CCC [online], 2016). 12
(CLG [online], 2016a).
Appendix E

Page | 7
English Housing Survey 2014: Energy Report;
English Housing Survey 2014 To 2015: First Time Buyers And Potential Home
Owners Report;
English Housing Survey 2014: Housing And Well-Being Report;
English Housing Survey 2014 To 2015: Housing For Older People Report;
English Housing Survey 2014 To 2015: Private Rented Sector Report;
English Housing Survey 2014 To 2015: Housing Stock Report;
English Housing Survey 2014 To 2015: Smoke Alarms In English Homes
Report;
English Housing Survey 2014 To 2015: Social Rented Sector Report;
English Housing Survey 2014 To 2015: Headline Report;
English Housing Survey 2014 To 2015: Questionnaire And Physical Survey
Form.
2.6. A physical survey of 12,297 occupied or vacant dwellings across England was
completed to gather data which related to information regarding the physical
aspects of dwellings. Information was gathered for the survey between April 2013
and March 2015, creating a ‘mid-point’ of April 2014 from which to base results
upon.
2.7. 13,174 households were also contacted as part of the fieldwork carried out for the
EHS between April 2014 and March 2015. This survey work asked questions of
households to address issues which could not be covered by the purely physical
survey.
2.8. The EHS Adaptations and Accessibility of Homes Report13 evaluates the accessibility
of dwellings and disability adaptions. Visitability of dwellings is based on four key
features which form the basis for the requirements in Part M of the Building
Regulations, these are expanded upon in Appendix 1 and include:
1. Level access;
2. Flush threshold;
3. Sufficiently wide doors and circulation space;
4. WC at entrance level.
2.9. The visitability standards in the EHS do not replicate exactly the more detailed
standards in Part M4 of the Building Regulations14, but do provide an indication of
what key features were considered to be the most important in enabling people with
mobility difficulties to access a home.
13
(CLG [online], 2016b). 14
(HM Government [online], 2010).
Appendix E
Page | 8
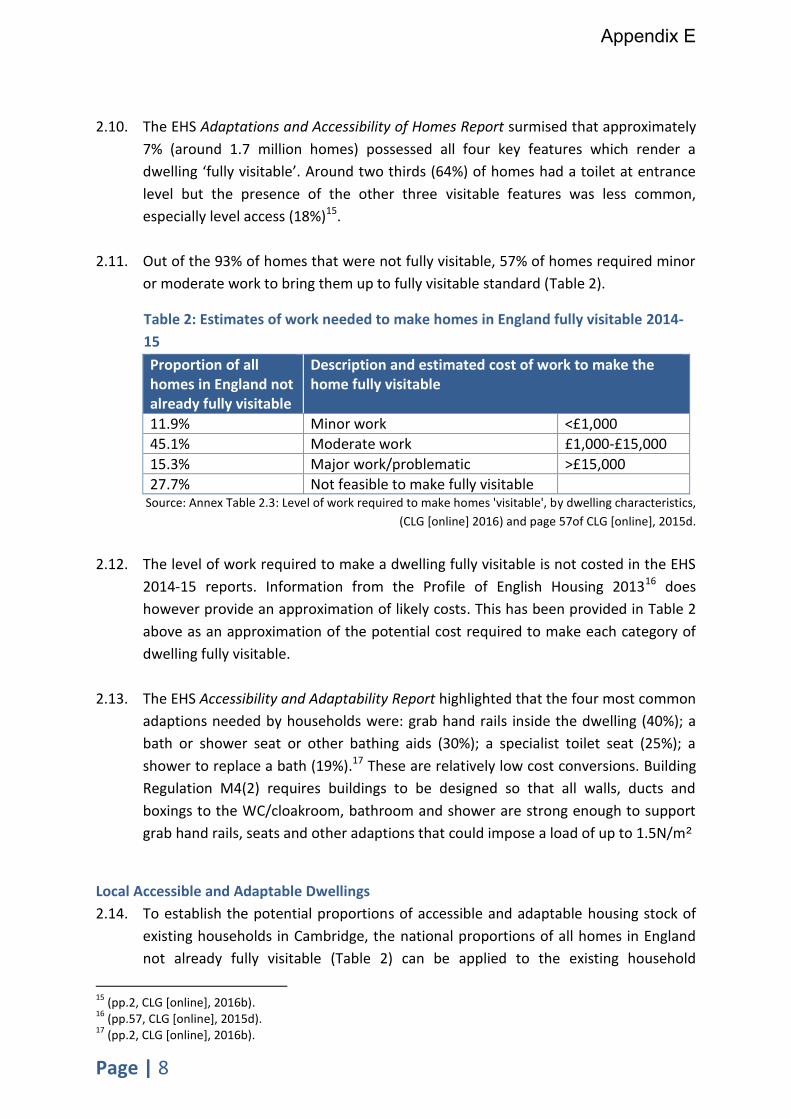
2.10. The EHS Adaptations and Accessibility of Homes Report surmised that approximately
7% (around 1.7 million homes) possessed all four key features which render a
dwelling ‘fully visitable’. Around two thirds (64%) of homes had a toilet at entrance
level but the presence of the other three visitable features was less common,
especially level access (18%)15.
2.11. Out of the 93% of homes that were not fully visitable, 57% of homes required minor
or moderate work to bring them up to fully visitable standard (Table 2).
Table 2: Estimates of work needed to make homes in England fully visitable 2014-
15
Proportion of all homes in England not already fully visitable
Description and estimated cost of work to make the home fully visitable
11.9% Minor work <£1,000
45.1% Moderate work £1,000-£15,000
15.3% Major work/problematic >£15,000
27.7% Not feasible to make fully visitable Source: Annex Table 2.3: Level of work required to make homes 'visitable', by dwelling characteristics,
(CLG [online] 2016) and page 57of CLG [online], 2015d.
2.12. The level of work required to make a dwelling fully visitable is not costed in the EHS
2014-15 reports. Information from the Profile of English Housing 201316 does
however provide an approximation of likely costs. This has been provided in Table 2
above as an approximation of the potential cost required to make each category of
dwelling fully visitable.
2.13. The EHS Accessibility and Adaptability Report highlighted that the four most common
adaptions needed by households were: grab hand rails inside the dwelling (40%); a
bath or shower seat or other bathing aids (30%); a specialist toilet seat (25%); a
shower to replace a bath (19%).17 These are relatively low cost conversions. Building
Regulation M4(2) requires buildings to be designed so that all walls, ducts and
boxings to the WC/cloakroom, bathroom and shower are strong enough to support
grab hand rails, seats and other adaptions that could impose a load of up to 1.5N/m²
Local Accessible and Adaptable Dwellings
2.14. To establish the potential proportions of accessible and adaptable housing stock of
existing households in Cambridge, the national proportions of all homes in England
not already fully visitable (Table 2) can be applied to the existing household
15
(pp.2, CLG [online], 2016b). 16
(pp.57, CLG [online], 2015d). 17
(pp.2, CLG [online], 2016b).
Appendix E
Page | 9
population in Cambridge as established through the 2011 Census. The 2011 Census
counts the number of households in Cambridge at 46,71418.
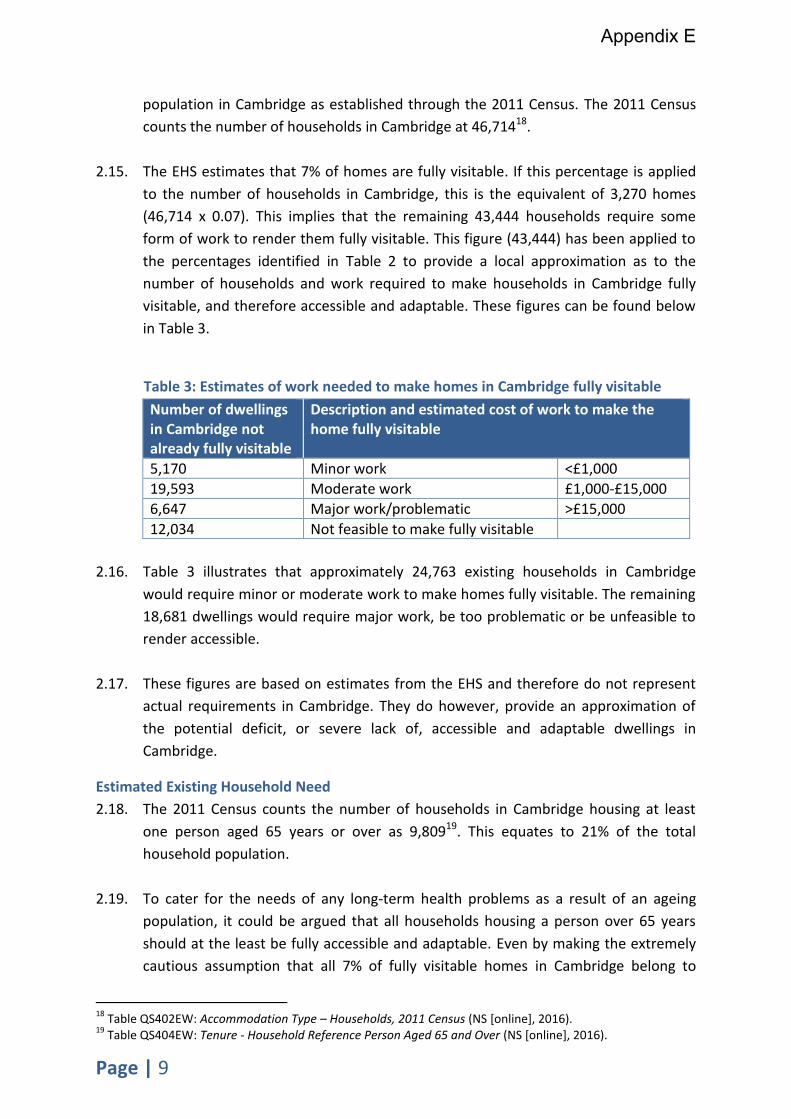
2.15. The EHS estimates that 7% of homes are fully visitable. If this percentage is applied
to the number of households in Cambridge, this is the equivalent of 3,270 homes
(46,714 x 0.07). This implies that the remaining 43,444 households require some
form of work to render them fully visitable. This figure (43,444) has been applied to
the percentages identified in Table 2 to provide a local approximation as to the
number of households and work required to make households in Cambridge fully
visitable, and therefore accessible and adaptable. These figures can be found below
in Table 3.
Table 3: Estimates of work needed to make homes in Cambridge fully visitable
Number of dwellings in Cambridge not already fully visitable
Description and estimated cost of work to make the home fully visitable
5,170 Minor work <£1,000
19,593 Moderate work £1,000-£15,000
6,647 Major work/problematic >£15,000
12,034 Not feasible to make fully visitable
2.16. Table 3 illustrates that approximately 24,763 existing households in Cambridge
would require minor or moderate work to make homes fully visitable. The remaining
18,681 dwellings would require major work, be too problematic or be unfeasible to
render accessible.
2.17. These figures are based on estimates from the EHS and therefore do not represent
actual requirements in Cambridge. They do however, provide an approximation of
the potential deficit, or severe lack of, accessible and adaptable dwellings in
Cambridge.
Estimated Existing Household Need
2.18. The 2011 Census counts the number of households in Cambridge housing at least
one person aged 65 years or over as 9,80919. This equates to 21% of the total
household population.
2.19. To cater for the needs of any long-term health problems as a result of an ageing
population, it could be argued that all households housing a person over 65 years
should at the least be fully accessible and adaptable. Even by making the extremely
cautious assumption that all 7% of fully visitable homes in Cambridge belong to
18
Table QS402EW: Accommodation Type – Households, 2011 Census (NS [online], 2016). 19
Table QS404EW: Tenure - Household Reference Person Aged 65 and Over (NS [online], 2016).
Appendix E

Page | 10
households who house at least one person over 65 years, a current need would still
remain to make 6,539 homes fully visitable (a further 14% of the existing housing
stock).
For Example:
Number of households housing someone over 65 years – current number of houses
that are fully visitable = potential existing need for accessible and adaptable homes
9,809 – 3,270 = 6,539
2.20. Unfortunately, data within the 2011 Census do not confirm the number of
households which house someone with a long-term health problem or disability that
limits their day to day activities a lot, as the 2011 Census provides information on a
population basis rather than a household basis. Further information relating to
existing household need for adaptable dwellings based on long-term health or
disability issues cannot therefore be factored into the above assumption.
Summary
2.21. The ‘conservative’ need for a potential 6,539 households living in accessible and
adaptable homes is substantial, especially when taken in the context of the number
of households to be built to 2031.
2.22. The emerging Cambridge Local Plan identifies that 14,000 new homes are required
by 2031, this is the Council’s objectively assessed housing need figure which is
currently being tested through the Local Plan examination. Information provided by
Cambridgeshire County Council’s Business Intelligence Service estimates that this
equates to 13,540 households, this figure is rounded to the nearest ten. The method
of calculation was derived from identifying the dwelling to household ratio from the
2011 Census and applying this to the Council’s objectively assessed housing need
14,000.
For Example
Number of households in 2011 Census20 / Number of dwellings in 2011 Census21 =
dwelling to household ratio
46,714 / 48,288= 0.967
Cambridge City Council objectively assessed housing need22 x dwelling to household
ratio = number of households formed in Cambridge during the Plan period
20
Table QS402EW: Accommodation Type – Households, 2011 Census (NS [online], 2016). 21
Table: Cambridge Dwelling Stock by Tenure and condition (NS [online], 2016).
Appendix E

Page | 11
14,000 x 0.967 = 13,543.65 or 13,540 rounded to the nearest ten households
2.23. This implies that before even taking into account future need for accessible and
adaptable homes, 48% of new households would be required to be fully accessible
and adaptable to meet existing need.
For Example:
Estimated existing need for fully accessible and adaptable homes / number of
households to be created to 2013 = percentage of new households built that would
need to be fully accessible to meet existing accessibility need
6,539 / 13,540 = 48%
2.24. This is a simplistic estimate of existing accessible housing need and does not take
into account the needs of households with people who have long-term health or
disability issues, or the variables associated with long-term health problems,
disability and age. It does however, illustrate the potential percentage of new
households built between 2011/12 and 2030/31 that would be required to meet this
standard to meet existing unmet need in Cambridge.
2.25. It should also be noted that between 2011/12 and 2015/16, 3,744 new dwellings
have been built23 none of which have been required through planning policy to be
built to Lifetime Homes standard or M4(2) Building Regulation specification. This
increases the percentage of new homes required to be built to Building Regulation
M4(2) to 67% to meet existing need.24
22
2011 to 2031. 23
Cambridge City Council Housing Trajectory Dwelling Completions within the Cambridge City Council Annual Monitoring Report 2016: https://www.cambridge.gov.uk/content/annual-monitoring-reports 24
Estimated existing need for adaptable homes / (Estimated household increase to 2031 – Housing completions 2011/12 to 2015/16), or 6,539/(13,540-3,744) = 67%
Appendix E

Page | 12
3. The Need for Accessible and Adaptable Homes across Tenures
3.1. This section assesses the current situation with regard to accessible and adaptable
housing in Cambridge by tenure. It is a complex area of study, given that data has
been collected for a range of purposes and does not necessarily lend itself to use for
the purposes of assessing need for accessible homes.
3.2. The need for accessible and adaptable homes varies across tenures on a national
level. Of all households that required adaptions: “Compared with other tenures,
private renters (32%) were the most likely to feel that their accommodation was
unsuitable for their needs. Around a fifth of social renters (22% of housing
association tenants and 23% local authority tenants) stated their accommodation
was unsuitable. Owner occupiers were the least likely to feel that their
accommodation was unsuitable (15%).”25
3.3. This illustrates that the need for accessible homes is not solely limited to those in
social and local authority housing and could imply that private rented
accommodation is currently falling behind other tenures in the provision of
accessible and adaptable dwellings.
3.4. To ascertain the accessibility and adaptability standards of housing stock by tenure in
Cambridge, an analysis will be made using the findings from the English Housing
Survey’s Adaptations and Accessibility of Homes Report26 and supporting figures and
annexes which detail the level of work that is required to make dwellings in England
fully visitable (Appendix 2). This information will then be applied a local level to 2011
Census figures relating to housing stock by tenure in Cambridge.
Local Accessible and Adaptable Dwellings by Tenure
3.5. The English Housing Survey’s Adaptations and Accessibility of Homes Report and
supporting figures and annexes identify the level of work required to make dwellings
fully visitable by tenure. An extract of these tables can be found in Appendix 2 of this
document.
3.6. Tables within this report (also found in Appendix 2) identify the national position
regarding accessible housing, and show that only 7% of all homes are fully visitable.
Findings from the report are also summarised below in Table 4.
25
(pp.3, CLG [online], 2016b). 26
(pp.3, CLG [online], 2016b).
Appendix E

Page | 13
Table 4: Level Of work required to make dwelling fully 'visitable' on a national
basis
Tenure Minor work only
Moderate work only
Major/ problematic
Not feasible
No Work Required
Owner Occupied 12.84% 46.74% 11.59% 23.68% 5.15%
Private Rented 8.11% 30.92% 17.77% 35.21% 7.99%
Local Authority 7.80% 39.39% 24.85% 21.45% 6.51%
Housing Association 8.10% 34.41% 16.48% 22.71% 18.29%
(Appendix 2, Table A2:2)
3.7. Table 4 identifies that housing association properties are least likely to require work
to render properties fully visitable; 18% of housing association properties require no
work and 43% only require minor or moderate work. Owner occupied dwellings are
least likely to be fully visitable.
3.8. The 2011 Census identifies that 26% of Cambridge households are privately rented
accommodation, 25% are housing association or local authority dwellings and 49%
are owner-occupier or living rent free.
Table 5: Number and percentage of households in Cambridge by tenure
Number of households
Percentage of households
Rents Privately 12,258 26%
Rents from Housing Association /Registered Social Landlord
3,914 8%
Rents from Local Authority 7,109 15%
Shared Ownership 526 1%
Owner-Occupier 22,171 47%
Lives Rent Free 736 2%
Total 46,714 Source: Census 2011 - Households by Tenure (NS [online], 2016)
3.9. To understand the level of work required to make dwellings fully visitable by tenure
in Cambridge, the national percentages identified in Table 4 can be applied to the
number of households in Cambridge by tenure in Table 5. These figures can be found
below in Table 6.
3.10. In order to match the categories in Table 4 assumptions have been made that living
rent free is equivalent to owner occupied and shared ownership is Local Authority
owned housing. It should also be noted that the number of properties requiring
minor work, moderate work, major work etc. established in Table 6 will not directly
relate to those in Table 3 (section 2). This is because the numbers are derived from
Appendix E

Page | 14
national percentages and therefore only provide an approximation of the number of
dwellings requiring adaptions.
Table 6: Estimated level of work required to make dwellings fully 'visitable' by
tenure in Cambridge
Tenure Minor work only
Moderate work only
Major/ problematic
Not feasible
No work required (fully visitable)
Total
Owner Occupied
2,940 10,706 2,655 5,425 1,180 22,907
Private Rented
994 3,790 2,179 4,316 979 12,258
Local Authority
596 3,007 1,897 1,638 497 7,635
Housing Association
317 1,347 645 889 716 3,914
Summary
3.11. Table 6 predicts that approximately 13,646 owner occupier households, 5,267
housing association or local authority households and 4,784 privately rented
households would require minor or moderate work to meet full visitability
requirements. These existing households could be considered feasible to convert to
accessible dwellings if considering the costs identified in Table 2 (section 2 of this
document). However, by providing 100% accessible and adaptable new dwellings
through Part M4(2) of the Building Regulations, the future need and cost associated
with accessibility adaptions to those homes could be reduced for residents and a
better range of alternative new-build accommodation would be available for those in
properties where adaptions would be problematic or unfeasible. Choice for
residents would therefore be increased.
3.12. Table 6 also demonstrates a lack of accessible homes across all tenures and identifies
the greatest need for accessible and adaptable homes (due to the lack of fully
visitable homes) is not in the affordable housing sector27, but in the private sector.
3.13. By demonstrating that the historic lack of accessible homes is spread across all
tenure types and that the greatest deficiency in accessible homes is in the private
housing sector, it could be argued that all housing stock irrespective of tenure should
meet the optional accessibility requirements within Part M4(2) of the Building
Regulations.
27
Local Authority or Housing Association properties.
Appendix E

Page | 15
4. Evidence of Need: Ageing Population
4.1. This section aims to understand the likely need for accessible and adaptable housing
for older people to 203128. Unfortunately, no significant data is currently available
that correlates the household needs of those over 65 years with mobility and health
issues and therefore accessible housing need. The following section instead provides
a population based indication of the number of those over 65 years who may require
accessible and adaptable housing.
4.2. Cambridgeshire County Council produces mid-year population estimates and
forecasts for Cambridge to 2031.
4.3. The Projecting Older People Population Information System (POPPI) provides useful
projections to 2030 of the needs and mobility levels of those over 65. The
projections are based on Office for National Statistics (ONS) population projections
with a base year of 2012 projected forward to 2030.
4.4. The POPPI population projections used to identify needs and mobility levels in the
over 65 age group do not correlate exactly with Cambridgeshire County Council’s
population forecasts. POPPI population projections are trend-based projections,
meaning future levels of births, deaths and migration are based on observed levels
mainly over the previous five years. The projections do not take into account any
policy changes that have not yet occurred, or those that have not yet had an impact
on observed trends. Therefore POPPI’s predicted population by age is lower than
that of the County Council’s data.
4.5. As this section aims to understand the potential future need of older people within
the Plan period, it seems reasonable to base the estimated need on population
forecasts provided by Cambridgeshire County Council. Therefore, to ascertain the
mobility, accessibility and adaptability needs in Cambridge of the over 65 age group
to 2031, assumptions will be made using the findings from the POPPI projections and
applying them at a local level to Cambridgeshire County Council’s population
forecast for Cambridge.
4.6. This section will start by examining the Cambridgeshire County Council population
forecasts for Cambridge before looking at the specific issues of mobility, self-care
and predicted falls and applying POPPI trends to Cambridge population forecasts.
28
The Cambridge Local Plan 2014: Proposed Submission Plan period runs from 2011/12 to 2030/31.
Appendix E

Page | 16
Cambridgeshire County Council’s Population Forecast to 2031
4.7. Cambridgeshire County Council produce mid-year population estimates and
forecasts for Cambridgeshire. At the time of writing, the 2015 based population
forecasts had not been published and therefore 2013 based estimates have been
used.
4.8. 2013 population forecasts estimate a resident population in Cambridge of 123,900 at
the start of the Plan period in 2011; this figure is expected to rise to 154,200 by
203129. Table 7 illustrates the estimated growth in population by age.
Table 7: Population forecast for Cambridge local authority area by age30
2011 2031 % Increase 2011 to 2031 Age Population % Population %
0-4 6,700 5.41% 7,400 4.80% 10.45%
5-14 10,100 8.15% 14,700 9.53% 45.54%
15-24 28,300 22.84% 33,100 21.47% 16.96%
25-44 40,800 32.93% 44,500 28.86% 9.07%
45-64 23,300 18.81% 30,800 19.97% 32.19%
65-74 6,900 5.57% 11,000 7.13% 59.42%
75-84 5,000 4.04% 7,700 4.99% 54.00%
85+ 2,700 2.18% 5,000 3.24% 85.19%
Total 123,900 100.00% 154,200 100.00% 24.56% (Cambridgeshire Insight [online], 2013)
4.9. Table 7 demonstrates an increase in the proportion of people in the over 65 age
group from 11.8% to 15.4% based on the proportion of the total Cambridge
population from 2011 to 2031, this equates to an additional 9,100 residents.
29
(Cambridgeshire Insight [online], 2013). 30
All figures are rounded and therefore may not necessarily add up to the total population figure displayed. For more information on the methodology behind the data see bibliography reference: Cambridgeshire Insight [online], 2013.
Appendix E

Page | 17
Figure 1: Percentage of population in Cambridge by age
(Cambridgeshire Insight [online], 2013)
4.10. Figure 1, provides a pictorial representation of the population shift towards
demonstrating an ageing population. As the population of Cambridge ages, the
need for more accessible and adaptable housing will increase. Evidence from the
Government further substantiates these claims by pointing out that ‘the prevalence
of disability rises with age’31.
Mobility in Older People
4.11. The Projecting Older People Population Information System (POPPI) provides useful
projections of the needs of Cambridge residents over 65 years and their ability to
manage at least one mobility activity on their own. This information can be found in
Table A3:4a (Appendix 3) and is grouped in age bands of ten years from the age of 65
onwards. These activities include going outdoors and walking down the road, getting
up and down stairs, moving around the house on the level, getting to the toilet and
in and out of bed and have been calculated as a proportion of those in each band
who are unable to manage at least one mobility activity.
4.12. The POPPI proportions of those in each band who are unable to manage at least one
mobility activity (Table A3:4a) have then been applied to Cambridgeshire County
Council’s population estimates for people in Cambridge over 65 and can be found
below in Table 8.
31
(pp. 15, Habinteg [online], 2016).
0%
5%
10%
15%
20%
25%
30%
35%
Age 0-4 5-14 15-24 25-44 45-64 65-74 75-84 85+
Pe
rce
nta
ge o
f p
op
ula
tio
n
Age Range
Percentage of Population by Age
Percentage of population 2011 Percentage of population 2031
Appendix E

Page | 18
Table 8: Estimated percentage of people over 65 in Cambridge who will be unable
to manage at least one mobility activity on their own in 2031
A B C
Percentage of population unable to manage at least
one mobility activity (POPPI projections)
Cambridge population
estimates to 2031
Number of people in Cambridge estimated
to be unable to manage one mobility activity on their own
(A + B)
People aged 65-74 11% 11,000 1,161
People aged 75-84 20% 7,700 1,524
People aged 85 and over
44% 5,500 2,420
4,985
4.13. Table 8 approximates that, in 2031, a potential 4,985 people aged 65 years and over
will be unable to manage one mobility activity on their own; these people may
therefore be in need of specialist care or in house adaptions such as level or step-
free access and access ramps to improve their mobility and quality of life within their
home.
4.14. These findings illustrate a demonstrable need for adaptable homes to meet the
requirements of an ageing population in Cambridge. Unfortunately, no significant
data is currently available that correlates the household needs of those over 65 years
with mobility issues and therefore accessible housing need. As such, a population
based indication of the number of people of over 65 years who may require
accessible and adaptable housing has been provided. However, it is of interest to
note that, in 2011, 5,194 households in Cambridge out of a total of 46,714
households were one person households consisting of a person aged 65 years and
over. This represents 11% of all households32. 9,809 households included at least one
person over 65 years old33.
Self-Care and Older People
4.15. POPPI also provides useful projections of the needs of Cambridge residents over 65
years and their ability to manage at least one self-care activity on their own. This
information can be found in Table A3:2a (Appendix 3) and is grouped in age bands
of ten years from the age of 65 onwards. These activities including bathing,
32
Table QS113EW - Household composition – Households (NS [online], 2016). 33
Table OS404EW Tenure – Household Reference Persons Aged 65 and Over (NS [online], 2016).
Appendix E

Page | 19
showering or washing all over, dressing and undressing, washing their face and
hands, feeding, cutting their toenails and taking medicines.
4.16. The POPPI proportions of those in each band who are unable to manage at least one
self-care activity (Table A3:2a) have then been applied to Cambridgeshire County
Council’s population estimates for people in Cambridge over 65 and can be found
below in Table 9.
Table 9: Estimated percentage of people over 65 in Cambridge who will be unable
to manage at least one self-care activity on their own in 2031
A B C
Percentage of population unable to manage at least
one self-care activity (POPPI
projections)
Cambridge population
estimates to 2031
Number of people in Cambridge estimated
to be unable to manage one self-care activity on their own
(A + B)
People aged 65-74 22% 11,000 2,400
People aged 75-84 38% 7,700 2,927
People aged 85 and over
65% 5,500 3,564
8,755
4.17. Table 9 calculates that, in 2031, a potential 8,755 people aged 65 years and over in
Cambridge will be unable to manage at least one self-care activity on their own.
These people would therefore be in need of specialist care or in house adaptions
such as step-free access to a toilet and sanitary facilities to improve their mobility
and quality of life within their home.
4.18. It also establishes that adaptability requirements for those over 65 years are more
prevalent in the self-care category as opposed to the mobility category (Tables 8
and 9).
Predicted Falls in the Older Population
4.19. Issues relating to mobility in the elderly also manifest in trips and falls within the
home. These falls can result in hospital admissions and/or longer term impacts on
health and mobility. The proportion of those over 65 years who are predicted to
have a trip or fall can be found in Table A3:6a (Appendix 3).The table is grouped in
age bands of ten years from the age of 65 onwards.
4.20. The POPPI proportions of those in each band who are predicted to have a trip or
fall (Table A3:2a) have then been applied to Cambridgeshire County Council’s
Appendix E

Page | 20
population estimates for people in Cambridge over 65 and can be found below in
Table 10.
Table 10: Estimated percentage of people over 65 predicted to have a trip or fall in
2031
A B C
Percentage of population
predicted to have a trip or fall (POPPI
projections)
Cambridge population
estimates to 2031
Number of people in Cambridge estimated to have a trip or fall
(A + B)
People aged 65-74 22% 11,000 2,407
People aged 75-84 27% 7,700 2,082
People aged 85 and over
43% 5,500 2,365
6,755
4.21. Table 10 shows that in 2031 approximately 6,755 people aged 65 years and over will
be likely to have a trip or fall. Hospital admissions and further care as a result of
trips and falls in the home put a further strain on the NHS. The Care Act 2014
(Article 19) promotes preventative action in housing, including home adaptions,
which is a core principle of the promotion of wellbeing.
4.22. These findings therefore illustrate a demonstrable need for adaptable homes to
meet the requirements of an ageing population in Cambridge, and to reduce the
strain on other local government services.
Summary
4.23. The data analysed in this section illustrates a demonstrable need for the provision
of accessible and adaptable homes to support an ageing population in Cambridge.
Although some of these needs may already be catered for by home adaptions and
specialist or home care, there is a projected need for future accessible and
adaptable homes to keep up with a growing older population, meet the
requirements of The Care Act 2014, and to reduce the strain on other local services.
4.24. Adaptions to homes to meet mobility issues would require the installation of or
availability of dwellings with step-free or level access, and access ramps. A growing
number of people over 65 years will also require in house adaptions to assist in self-
care activities such as step-free access to a toilet and sanitary facilities.
Appendix E

Page | 21
5. Evidence of Need: Long-Term Health and Disability
5.1. Section 149 of the Equality Act 2010 requires public bodies (including local
authorities) to have ‘due regard’ to the need to promote equality of opportunity for
disabled people. In order to demonstrate they have paid ‘due regard’, local
authorities should ensure that they assess the impact of decisions they take on
disabled people.
5.2. Information from the 2011 Census identifies that Cambridge has 10,392 residents
with a long-term health problem or disability. 6,160 of Cambridge’s population in
2011 had a long-term health problem or disability that limited their ‘day to day
activities a lot’34. Some of these people will be 65 or over and will be the result of an
‘elderly’ population; this need has been discussed in section 4 of this study.
5.3. The projected needs of residents with a long-term health problem or disability that
limits their ‘day to day activities a lot’ (6,160) will no doubt impact upon future and
existing accessible and adaptable housing needs. However, it is unknown what the
future impact will be on the need for accessible housing for the 8,537 residents who
have ‘day to day activities limited a little’ as they age, or how old they are. Table 11
however, does demonstrate that the number of people with long-term health issues
or disability is not restricted to a particular tenure.
Table 11: Number of residents in households with a long-term illness or disability
by tenure
All categories: Long-term health
problem or disability
Day-to-day activities
limited a lot
Day-to-day activities limited a
little
Day-to-day activities not
limited
Tenure Count % Count % Count % Count %
All tenure categories
107,345 100% 6,160 6% 8,537 8% 92,648 86%
Owned or shared ownership
52,630 49% 2,704 5% 4,565 9% 45,361 86%
Social rented 23,727 22% 2,903 12% 2,859 12% 17,965 76%
Private rented or living rent free
30,988 29% 553 2% 1,113 4% 29,322 94%
(Number of residents in households with a long-term illness or disability (Census 2011: NS [online],
2016)
34
Terminology used in the 2011 Census.
Appendix E

Page | 22
5.4. As explained above, some of the people in Table 11 will be 65 or over; this need has
already been discussed in section 4 of this study. This section aims to add further
detail to the likely need for accessible and adaptable housing by looking at the long-
term health and disability needs of people aged 18 to 64 years to 2031. No
significant data is currently available that correlates the household needs of those
aged 18 to 64 years with long-term health and disability issues and therefore
accessible housing need. As such, this section instead provides a population based
indication of the number of those aged 18 to 64 years who may require accessible
and adaptable housing.
5.5. The Projecting Adult Needs and Service Information system (PANSI) was designed to
help explore the possible impact that demography and certain conditions may have
on people aged 18 to 64. It provides useful projections of the long-term health and
disability needs of those aged 18 to 64 based on disability and long-term health
problems.
5.6. PANSI projections are trend-based projections and based on Office for National
Statistics (ONS) population projections with a base year of 2012 that are projected
forward to 2030. The projections do not take into account any policy changes that
have not yet occurred, or those that have not yet had an impact on observed
trends.
5.7. As this section aims to understand the potential future need for accessible and
adaptable homes of those aged 18 to 64 within the Plan period, it seems reasonable
to base the estimated number of people aged 18 to 64 with long-term health or
disability problems on population forecasts provided by Cambridgeshire County
Council (Table 7) as these take into account the effects of Local Plan policy.
Therefore, to ascertain the long-term health and disability difficulties of those aged
18 to 64 to 2031 assumptions will be made by using the findings from the PANSI
projections and applying them at a local level to Cambridgeshire County Council’s
population forecast for Cambridge.
5.8. These figures can be considered in addition to the needs of older people (aged 65
and over) discussed in section 4 of this document.
Long-Term Health and Disability in the 18-64 Age Group: Moderate and Serious Disability
5.9. PANSI provides projections of the estimated number of people in Cambridge aged 18
to 64 who have a moderate or serious disability.
5.10. Table 12 summarises the percentage of those in Cambridge who have a moderate or
serious disability according to PANSI projections. This information has been taken
Appendix E

Page | 23
from Table A4:2a in Appendix 4. Unfortunately, Cambridgeshire County Council
Population Projections do not fall exactly into the same age brackets as the PANSI
data, but the table does give an idea of the percentages of people nationally aged 18
to 24, or 35 to 44 for example, who have a long-term health problem or disability,
some of whom may require accessible and adaptable homes to assist in day to day
activities.
5.11. By taking the total forecast population for Cambridge to 2031 of 154,200 (Table 7)
and applying it to the percentage of those aged 18-64 who have a physical disability
as a percentage of total population35, an approximation can be made to ascertain the
potential number of people who have a moderate or serious disability. These
calculations can be found in Table 12 below.
5.12. 7,073 of people in Cambridge aged 18 to 64 are estimated to have a moderate
disability by 2031, this equates to 4.59% of the total population. An estimated 1,959
people aged 18 to 64 will be living with a serious disability by 2031, this equates to
1.27% of the total population.
35
Taken from Table A4:2a, Appendix 4.
Appendix E

Page | 24
Table 12: Estimated % of people in Cambridge aged 18-64 predicted to have a moderate or serious disability in 2031
A B C D E F
Percentage of population predicted to
have a moderate physical disability
(PANSI projections)
Cambridge population
estimates to 2031
Number of people estimated to have
a moderate physical disability
(A + B)
Percentage of population predicted
to have a serious physical disability
(PANSI projections)
Cambridge population
estimates to 2031
Number of people estimated to have a serious physical disability
(D + E)
People aged 18-24 4.10%
0.80%
People aged 25-34 4.20%
0.40%
People aged 35-44 5.60%
1.70%
People aged 45-54 9.70%
2.70%
People aged 55-64 14.90%
5.80%
Percentage of those aged 18-64 who have a physical disability as a % of total population
4.59% 154,200 7,073 1.27% 154,200 1,959
5.13. Those who have a moderate disability may be in need of adaptions to their home now or in the future. Potential adaptions could include
electrical modifications such as wall-mounted switches, socket outlets and other controls accessible to people with reduced reach. Those
with more serious disabilities may require specialist homecare and the provision of a range of adaptions.
Appendix E

Page | 25
5.14. Not all people with moderate disabilities will need in-house adaptions and some
may be in specialist care facilities. It is also difficult (due to the lack of household
data relating to disability) to estimate the number of households that contain
people aged 18 to 64 who have a moderate or serious disability. However, as the 18
to 64 population ages, some of their needs will increase over time and homes will
be required to be sufficiently adaptable to provide additional aids to meet these
needs. Evidence from the Government further substantiates these claims by
pointing out that ‘the prevalence of disability rises with age’36.
Summary
5.15. The information provided in this section demonstrates that there is also a need for
accessible and adaptable homes to meet the needs of those aged 18 to 64 who have
a moderate or serious disability, now and in the future. A total of 9,032 Cambridge
residents are estimated to be likely to be affected by a moderate or serious
disability by 2031. Although some of these residents may already have in house
adaptions, or specialist care, many will not and the need for further adaptions may
increase over time as part of the ageing process.
5.16. In order to meet Government requirements (Section 149 of the Equality Act 2010)
and to reduce the strain on other local services, it is reasonable to assume that a
significant number of the population will require dwellings built to Building
Regulation M4(2) to meet their needs.
36
(pp. 15, Habinteg [online], 2016).
Appendix E

Page | 26
6. Wheelchair Accessible Housing Need
6.1. Optional regulation M4(3): Wheelchair user dwellings enables Councils to stipulate
through planning policy that a specific percentage of dwellings in a development
should meet the needs of wheelchair users and allow for the simple adaption of the
dwelling for wheelchair users. It requires that wheelchair users should be able to live
in the dwelling and use any associated private outdoor space, parking and communal
facilities that may be provided for the use of the occupants.
6.2. Optional requirement M4(3) can only be applied to dwellings where the local
authority is responsible for allocating, or nominating a person to live in that
dwelling37.
6.3. Advice provided by Habinteg: Towards Accessible Housing – A Toolkit for Planning
Policy, provides a methodology for calculating the number of wheelchair user
households with unmet housing need38 i.e. not wheelchair adaptable. The report
estimates that 2% of all households in the East of England are wheelchair user
households and 9% of wheelchair user households have unmet wheelchair housing
need. By using the 2011 Census count of a 46,71439 households, the calculations
(below) establish an unmet need of 84.08 wheelchair accessible homes.
Figure 2: Number of wheelchair user households with unmet need
Step 1: Number of households in local authority area X % of all households that are wheelchair user households Step 2: Step one X number of wheelchair user households with unmet housing need. 46,714 x 0.02 = 934.28 934.28 x 0.09 = 84.09
6.4. Using the estimated household figure to 2031 of 13,540 (see paragraph 2.22) and
multiplying this figure by wheelchair housing need (2%) provides the future
wheelchair housing need to 2031. This establishes a future need of 270.80 dwellings.
37
Reference ID: 56-009-20150327 (CLG [online], 2016). 38
(pp. 18-19, Habinteg [online], 2016). 39
Table QS402EW: Accommodation Type – Households, 2011 Census (NS [online], 2016).
Appendix E

Page | 27
Figure 3: Future wheelchair user households need
Step 1: Future estimated number of households X % of all households that are wheelchair user households 13,540 x 0.02 = 270.80
6.5. By combining unmet need with future need, the total wheelchair housing need is
estimated as 354.89 households (84.09 + 270.80).
6.6. As noted above, optional requirement M4(3) can only be applied to dwellings where
the local authority is responsible for allocating, or nominating a person to live in that
dwelling. Therefore any requirement for wheelchair accessible housing should be
calculated based on the estimated proportion of households that live in affordable
housing.
6.7. The Council currently has an affordable housing policy for the provision of 40%
affordable housing on sites of 0.5 hectares or more or 15 dwellings or more40. This
however, does not infer that 40% of all new households will be affordable as many
approved applications and housing completions may be under 0.5 hectares or 15
dwellings. Therefore to ascertain the potential average affordable housing build to
2031, the following methodology has been devised. The average affordable housing
completion rate (established within the current Plan period) is equivalent to 24.4% of
all total net housing completions (see Figure 4 Step 1). If applied to Cambridgeshire
County Council’s estimated household increase of 13,540, this implies that 3,303.76
affordable households will be formed by 2031. By dividing the unmet and future
wheelchair housing need (354.89) by the estimated future affordable housing
(3,303.76) it can be established that 10.74% of affordable housing would need to be
wheelchair accessible to meet unmet and future wheelchair housing need.
40
Policy 5/5 Meeting Housing Needs in the Cambridge Local Plan 2006.
Appendix E

Page | 28
Figure 4: Unmet and Future Wheelchair User Household Need
Step 1: Establish affordable housing provision based on past net housing
completions for the Plan41 period commencing in 2011/12 to 2015/16 (most recent
monitoring year). Affordable housing net completions divided by total net
completions.
2011/12 = 54/352 = 15.3% 2012/13 = 68/471 = 14.4% 2013/14 = 424/1,325 = 32.0% 2014/15 = 190/713 = 26.6% 2015/16 = 297/884 = 33.6% Step 2: Calculate the average affordable housing percentage from 2011/12 to 2015/16. (15.3 + 14.4 + 32.0 + 26.6 + 33.6)/5 = 24.4% Step 3: Apply estimated future household provision to 2031 to estimated affordable housing completion rate 13,540 X 24.4% = 3,303.76 Step 4: Unmet and future wheelchair housing divided by estimated future affordable housing provision (step 3) 354.89 / 3,303.76 = 10.74%
6.8. Not every resident with wheelchair housing need will be housed in Council or
housing association housing. However, information established in section 5 of this
document within Table 11: Number of Residents in households with a long-term
illness or disability by tenure highlights the fact that households whose day-to0day
activities are ‘limited a lot’ through long-term illness or disability is more prevalent
for residents in Housing Association or Council housing. It is therefore considered
conservative to require 5% wheelchair accessible housing through the application of
optional building regulation M4(3): Wheelchair user dwellings to affordable housing.
Requiring 5% of wheelchair user dwellings on developments with 20 affordable
housing units or more allows for the provision of one full unit and eliminates the
need for fractions of dwellings less than one unit.
6.9. It has been established within this section that the required wheelchair housing
need is more substantial than 5% of all new affordable housing. It could therefore
41
Data taken from Housing Completions in Cambridge 2016 (CCoC [online], 2016).
Appendix E

Page | 29
be argued that the building of a certain amount of wheelchair accessible homes
should also be encouraged within market housing completions. Although this could
not be included in any revisions to the text within Policy 51 due to Government
restrictions in the PPG, support for provision of wheelchair user housing in market
housing developments has been included within the supporting text to the policy.
Appendix E

Page | 30
7. Profile of Council and Housing Association Tenants:
Supplementary Information
7.1. This section provides a brief overview of known data on Council and Housing
Association tenants. It has not been used to derive predicted need for accessible
homes, but provides an overview of the current accessibility, mobility and
adaptability requirements of Council and Housing Association tenants as a snapshot
in time, providing evidence of current demonstrable need for accessible and
adaptable dwellings and the Council’s response to these needs.
7.2. As of August 2016, a count of lead tenants in Cambridge City Council properties
revealed that 35.8% are over 65 years. This profile is higher than that of the general
population illustrated in Cambridgeshire County Council’s Table 7: Population
Forecast for Cambridge Local Authority by Age (11.8% in 2011). This illustrates the
need for the provision of a higher percentage of affordable accessible and adaptable
homes for to cater for the needs of elderly residents.
Table 14: Age of lead tenant
Age of lead tenant Number Percentage
Under 65 4,406 64.2%
Over 65 2,457 35.8%
Total 6,863 100% Source: Cambridge City Council, Orchard Monitoring Software
7.3. Data from Cambridge City Council’s Orchard monitoring software also reveals that
549 tenants (around 8%) have a disability. This is thought to be under recorded, and
can cover a whole range of disabilities. There is no specific data on wheelchair use.
7.4. Home-Link, a choice-based letting scheme for Council and housing associations
properties, records the mobility ratings of those on the Home-Link system using a
mobility rating category:
Mobility 1 = wheelchair user indoors or outdoors;
Mobility 2 = cannot manage steps or stairs, and may use wheelchair some of
the day;
Mobility 3 = only able to manage one or two steps or stairs (currently listed
separately but due to be merged with mobility 2).
Appendix E

Page | 31
7.5. Of the 1,959 people registered on the Home-Link register42 for Cambridge, 93%
have no mobility rating and the remaining 7% have mobility issues which could
require adaptions to homes such as ramps.
Table 15: Mobility rating of people on the Home-Link register in Cambridge
Mobility category of household (December 2016)
Number of applicant households
Percentage
Mobility 1 18 0.9%
Mobility 2 10 0.5%
Mobility 3 109 5.6%
No mobility rating 1822 93.0%
Total 1,959 100.00% Source: Home-Link, December 2016
7.6. Appendix 5 illustrates the number of properties let to households based on dwelling
type, mobility category of the dwelling, and number of bedrooms. The number of
households with Mobility 3 needs (only able to manage one or two steps or stairs)
could be reflective of an ageing population and the need for more adaptable homes,
which could provide for a household over their lifetime.
7.7. Anecdotal evidence from Home-Link staff (found in full in Appendix 6) reveals the
unsuitability of new build and existing properties for people requiring an adaptable
home. Instead of finding the best solution for an adaptable home, Home-Link often
have to look towards meeting the basic needs of tenants within the properties
available. The information also reveals a need for 3-4 bed single level
accommodation and more wheelchair adaptable dwellings.
7.8. This snapshot of Council and Housing Association tenants reveals that the need for
accessible and adaptable homes is still required in affordable properties.
Cambridge City Council Household Adaptions
7.9. Data from Cambridge City Council Housing Services (City Homes) reveals that 520
adaptions were carried out in 2014/15. Some adaptions may be to the same
properties, for example one dwelling may have received a modular ramp and level
access shower. This does, however, illustrate the extent of adaptions undertaken in
Council houses in Cambridge.
58 level access showers
25 over bath showers
15 modular ramps, 4 automatic door openers, widened a number of
doorways
42
All people on the Home-Link Register have applied for housing; some are already housed in social housing but are on the register in order to transfer to more suitable accommodation.
Appendix E

Page | 32
21 stair lifts and 1 through floor lift
11 fencing jobs
5 specialist WCs and 1 WC lifter
2 property extensions
381 minor jobs (rails, half steps, lever taps etc.)
7.10. Of the adaptions completed between 2013/14 and 2015/16, on average 84% of
adaptions were completed for adult household members and 16% were for
children. As at November 2016, 8% of referrals for adaptions were for children, 51%
for those aged 18-64 and 51% for those aged over 65 years.
7.11. Over the past five years 2010/11 to 2015/16, Cambridge City Council has spent
£4.3m on dwelling adaptions43.
7.12. Requiring all homes to meet accessible and adaptable Building Regulation standard
M4(2) would not only decrease financial burden on Housing Associations and
Council housing, but also on private tenants.
43
Source: Cambridge City Council, Housing Services.
Appendix E

Page | 33
8. Adaptions to Homes: Disabled Facilities Grants
8.1. The Disabled Facilities Grant covers any adaptions costing over £1,000 to a dwelling
for people living in the private sector and in Housing Association properties.
Adaptions to properties range from level access showers and stair lifts to ground
floor house extensions.
8.2. The Disabled Facilities Grant does not equate to the number of people or
households who have applied for a grant as applicants may apply for more than one
grant. The grants are also means-tested and will therefore not identify the number
of dwelling adaptions carried about by people above the financial eligibility
threshold.
8.3. The number of completed grants in Cambridge from 2010/11 to 2015/16 total 352.
Within the emerging Local Plan period thus far, this equates to 278 completed
adaptions (2011/12 to 2015/16).
Table 16: Number of completed Disabled Facilities Grants
Financial year Completed disabled facilities grants
2010/11 74
2011/12 60
2012/13 68
2013/14 86
2014/15 64
Total 352 Source: Cambridge City Council
8.4. These figures show the consistent need for dwelling adaptions of existing properties
and the number of households who are unable to undertake them without financial
assistance.
Appendix E

Page | 34
9. Specialist Housing
9.1. Although specialist housing is available for those with long term health problems,
disabilities, and the elderly, specialist housing cannot meet growing needs of all
residents with health or mobility problems. The Cambridgeshire Joint Strategic
Needs Assessment44 – Phase 6 Summary Report45 looks towards a reconfiguration of
services to support older people to live in a community setting as long as possible,
avoid admission to hospital and care homes, and return to a community setting
after discharge from hospital.
9.2. The report notes that “housing is a major factor determining physically disabled
people’s health and wellbeing. It appears from national reports that most disabled
people live in unsuitable accommodation.”46
9.3. This approach meets the requirements of Section 149 of the Equality Act 2010
which requires public bodies (including local authorities) to have ‘due regard’ to the
need to promote equality of opportunity for disabled people.
9.4. The approach also directs local authorities towards the positive impact that
preventative action, i.e. the provision of accessible and adaptable homes, can have
on the population in line with the requirements of Article 19 of The Care Act 2014.
44
Produced by Cambridgeshire County Council and NHS Cambridgeshire. 45
(pp. 18, CCCNHS [online], 2012). 46
(pp.28, CCCNHS [online], 2012).
Appendix E

Page | 35
10. Further Considerations
Viability
10.1. The impact of viability on the implementation of optional Building Regulations
M4(2): Accessible and adaptable dwellings and M4(3): Wheelchair user dwellings
has not been addressed in detail as part of this study. However, research from
Habinteg’s Accessible Housing Standards 201547 suggests that Building Regulation
M4(2) is less onerous to implement than the Lifetime Homes standard currently
proposed under Policy 51 of the emerging Cambridge Local Plan. This implies that
the implementation of Building Regulations M4(2): Accessible and adaptable
dwellings could therefore be considered less costly to implement than its
predecessor (Lifetime Homes).
“We have often referred to Category 2 as broadly equivalent to Lifetime Homes –
although … we do have some concerns over omissions or reductions in certain
aspects.”
(pp.2,Habinteg [online], 2015)
10.2. Cambridge City Council’s Statement of Consultation and Audit Trails48 explained the
viability impact of the Council’s requirement for 100% Lifetime homes and 5%
wheelchair housing which was to be applied to all new homes through Policy 51:
Lifetime Homes and Lifetime Neighbourhoods.
10.3. The potential impacts on viability were taken into account in a suite of viability
documents produced on behalf of the council. These were the:
Cambridge City Council Local Plan – Community Infrastructure Levy Viability
Assessment;49
Cambridge City Council Local Plan - SHLAA and Potential Site Allocations High
Level Viability Assessment;50 and
Cambridge City Council Local Plan – Student Housing Affordable Housing
Study51.
47
(pp.2,Habinteg [online], 2015). 48
(CCC [online], 2013). 49
(CCC [online], 2013b). 50
(CCC [online], 2013c). 51
(CCC [online], 2013d).
Appendix E

Page | 36
10.4. These reports considered the implementation of a Lifetime Homes standard to be
viable and achievable. Paragraphs 2.6.4 to 2.6.6 of the Cambridge City Council Local
Plan – Community Infrastructure Levy Viability Assessment52 summarises the
approach taken to this and also explained that an additional allowance of 5 to 7% of
build costs was factored into the calculations to cover any contingencies.
10.5. Cambridge City Council’s Statement of Consultation and Audit Trails also adds that
“At present, local authorities and health authorities bear the cost of adapting
housing and re-housing people who become disabled. This budget is unlikely to
expand and will encounter more demand with an ageing population and people
living longer with profound disabilities and illnesses. Lifetime Home provision will
help reduce future costs and will not require considerable resources to make
further adaptations for people who become disabled….As Lifetime Homes design
standards can be incorporated into development at an early stage and are already
required for all affordable housing delivered in the city, it is considered appropriate
to set out a requirement for all homes to comply with Lifetime Homes standards”53.
10.6. It is therefore considered that the implementation of optional Building Regulations
M4(2): Accessible and adaptable dwellings and M4(3): Wheelchair user dwellings, as
Policy 51, will not be detrimental to the delivery of homes.
10.7. The Greater London Authority (GLA) adjusted its policy in light of the new national
standards and proposed that 90 per cent of new housing be built to M4(2) (Lifetime
Homes equivalent) and 10 per cent to M4(3) (wheelchair accessible or adaptable)
standards. The viability study commissioned by the GLA showed that there was no
additional cost involved in implementing Categories 2 and 3 compared to the
existing London Plan standards. Further GLA data on the unmet need for accessible
housing can be seen at: http://www.habinteg.org.uk/toolkit-the-case-in-london.
Lift Access
10.8. Building Regulation M4(2) requires that step free access should be provided. In the
case of blocks of four storeys or less, the Greater London Plan determined that the
implementation of lift access could cause potential viability issues54. In these cases,
it was considered that a development specific viability assessment should be
undertaken and consideration should be given as to the implication of ongoing
maintenance costs on the affordability of service charges for residents.
52
(CCC [online], 2013b). 53
(pp.449-450, CCC [online], 2013a). 54
https://www.london.gov.uk/what-we-do/planning/london-plan/current-london-plan/london-plan-chapter-3/policy-38-housing-choice
Appendix E

Page | 37
10.9. This is considered a sensible approach to assessing the need for lift access in flatted
developments and allows flexibility within the policy, however the remaining
requirements of M4(2) could still apply where applicable.
Need for Updates
10.10. Cambridgeshire County Council, in collaboration with the Cambridgeshire local
authorities, is currently in the process of undertaking a Joint Strategic Needs
Assessment regarding specialist housing need. The process began in late 2014. This
project is expected to be completed in Spring 2017.
10.11. The project will identify what provision currently exists within the housing sub-
region for people with disabilities or mental ill health, and ascertain the future need
for such homes or schemes. This information will provide more robust and location
specific data by local authority area, will be justified by cross-organisational
collaboration and cooperation and include organisations such as Cambridgeshire
County Council’s Research Group, housing, health and social care commissioners
from other agencies – in particular Cambridgeshire and Suffolk Adult Social Care
services and Home Improvement Agencies.
10.12. This assessment will be used as an evidence base for the creation of future planning
policies concerning specialist housing need and provision.
Appendix E

Page | 38
11. Conclusion
11.1. This document has reassessed the need and requirement to allow optional Building
Regulations M4(2): Accessible and adaptable dwellings and M4(3): Wheelchair user
dwellings to be applied in lieu of the Lifetime Homes Standard and Wheelchair
Housing Design Standard. The Council believes it prudent to apply optional
requirement M4(2) to all new build homes and optional requirement M4(3) to 5% of
all affordable housing developments of 20 units or more.
11.2. Wheelchair housing and disability need spans all tenures and therefore the
provision of wheelchair accessible housing should also be encouraged in market
housing. Although this could not be included in any revisions to the text within
Policy 51, it has been included within the supporting text to the policy.
11.3. The recommendation to require 100% of all new homes to be built to regulation
M4(2): Accessible and adaptable dwellings is based on the following evidence
provided within the Accessible Housing in Cambridge evidence document:
o It is estimated that only 7% of homes in Cambridge (3,270 households)
currently meet the equivalent of M4(2). 5,170 households in Cambridge
would require minor work to meet this standard and 19,593 would require
moderate work. The remaining 18,681 homes would require major work or
are unable to be adapted.
o There is a potential unmet need for 6,539 accessible and adaptable homes.
This implies that before even taking into account future need for accessible
and adaptable homes, 48% of new planned homes between 2011/12 and
2031/31 would be required to be fully accessible and adaptable to meet
existing need. As 3,744 homes have already been built within the plan period
(2011/12 to 2015/16), this unmet need could rise to up to 67% of all
remaining homes to be built to 2031.
o The lack of accessible and adaptable homes is spread across all tenures.
o Cambridge’s population is expected to rise to 154,200 by 2031. The
proportion of people over 65 years is also expected to rise from 11.8% in
2011 to 15.4% by 2031. This illustrates an ageing population, as the older
population increases, so does the need for accessible and adaptable housing.
o It is estimated that 4,985 people aged 65 and over will be need of specialist
care or in house adaptions to improve their mobility and quality of life within
their home. Likewise 8,755 people over 65 years are estimated to be unable
Appendix E

Page | 39
to manage a self-care activity on their own55. Predicted trips or falls by the
Cambridge residents over 65 years are estimated to reach 6,755 by 2031.
Hospital admissions and further care as a result of trips or falls in the home
also put a further strain on the NHS.
o Article 19 of The Care Act 2014 directs local authorities towards the
implementation of preventative action through housing i.e. the provision of
accessible and adaptable homes
o The number of people with long-term health issues or disability is not
restricted to a particular tenure.
o An estimated 7,073 people aged 18 to 64 years in Cambridge will be living
with a moderate disability in 2031 and 1,959 with a serious disability.
o As the 18 to 64 years population ages their in-home needs will increase over
time and homes will be required to be sufficiently adaptable to provide
additional aids to meet these needs.
11.4. At present, local authorities and health authorities bear the cost of adapting
housing and re-housing people who become disabled. This budget is unlikely to
expand and will encounter more demand with an ageing population and people
living longer with profound disabilities and illnesses. Accessible housing provision
will help to reduce future costs and will not require considerable resources to make
further adaptations for people who become disabled. The optional Building
Regulations can be incorporated into development at an early stage and the
equivalent Lifetime Homes standard was until recently required for all affordable
housing delivered in the city, it is considered appropriate to set out a requirement
for all homes to comply with optional regulation M4(2): Accessible and adaptable
dwellings.
11.5. The recommendation to require that M4(3): Wheelchair user dwellings be applied
to 5% of all affordable housing developments of 20 units or more and to encourage
the application of wheelchair accessible dwellings in market housing is based on the
following evidence provided within the accessible housing in Cambridge evidence
document:
o It is estimated that unmet and future wheelchair user household need to
2031 will be 354.89 households. This is equivalent to 10.74% of all affordable
housing completions to 2031. Long-term health issues or disability is more
prevalent in Housing Association or Council Housing. It is therefore
considered conservative to require 5% wheelchair accessible housing through
55
This includes bathing, showering or washing all over, dressing and undressing, washing their face and hands, feeding, cutting their toenails, taking medicines.
Appendix E

Page | 40
the application of optional building regulation M4(3): Wheelchair user
dwellings to affordable housing. Wheelchair housing and disability need
spans all tenures and therefore the provision of wheelchair accessible
housing should also be encouraged in market housing, although this could
not be included in any revisions to the text within Policy 51 due to the
government’s restriction on the use of M4(3), it has been included within the
supporting text to the policy.
11.6. Although specialist housing is available for those with long term health problems,
disabilities and the elderly, specialist housing cannot meet growing needs of all
residents with health or mobility problems. The Cambridgeshire Joint Strategic
Needs Assessment looks towards a reconfiguration of services to support older
people to live in a community setting as long as possible, avoid admission to
hospital and care homes, and return to a community setting after discharge from
hospital. This approach meets the requirements of Section 149 of the Equality Act
2010 which requires public bodies (including local authorities) to have ‘due regard’
to the need to promote equality of opportunity for disabled people.
11.7. It is considered that the implementation of optional Building Regulations M4(2):
Accessible and adaptable dwellings and M4(3): Wheelchair user dwellings, will not
be detrimental to the delivery of homes.
11.8. The requirements of M4(2): Accessible and adaptable dwellings and M4(3)
Wheelchair user dwellings, are not dissimilar to that of the requirements in the
Council’s Policy 51: Lifetime Homes and Lifetime Neighbourhoods, they are in fact
less onerous on housebuilders and could therefore also be considered to be less
costly. The viability impacts of applying Lifetime Homes and Wheelchair Housing
Design standards to new dwellings were previously taken into account through a
suite of viability documents produced on behalf of the Council. It was considered
that the implementation of this policy was viable and achievable. It is therefore
considered that the implementation of M4(2): Accessible and adaptable dwellings
and M4(3): Wheelchair user dwellings would also be achievable.
Appendix E

Page | 41
Appendix 1: Excerpt from English Housing Survey – Profile of
English Housing 2013
Box 2.2 - Visitability: four key features
Visitability comprises four key features which are considered to be the most important for
enabling people with mobility problems to either access their home or visit someone else’s
home. These four features form the basis for the requirements in part M of the Building
Regulations, although the EHS cannot exactly mirror the detailed requirements contained
there.
1. Level access: For all dwellings with a private or shared plot, there are no steps between
the gate/pavement and the front door into the house or block of flats to negotiate. This
includes level access to the entrance of the survey module (i.e. a group of flats containing
the surveyed flat). Dwellings without a plot are excluded from the analysis as access is, in
effect, the pavement/road adjacent to the dwelling.
2. Flush threshold: a wheelchair can be wheeled directly into the dwelling from outside the
entrance door with no steps to negotiate and no obstruction higher than 15mm.
3. Sufficiently wide doors and circulation space: the doors and circulation space serving
habitable rooms, kitchen, bathroom and WC comply with the requirements of part M of the
Building Regulations.
4. WC at entrance level: there is an inside WC located on the entrance floor to the dwelling.
(pp.54, CLG [online], 2015d)
Appendix E

Page | 42
Appendix 2: Level of Work Required to Make Homes Visitable Data extracted from Annex Table 2.2: 'Visitability' features, by dwelling characteristics, 2014 and Annex Table 2.3: Level of work required to
make homes 'visitable', by dwelling characteristics, 2014 found in the English Housing Survey Adaptations and Accessibility Report, July 2016.
Table A1:1 – Level of work required to make a dwelling fully visitable (by thousands of dwellings)
Level Of work required to make dwelling fully 'visitable' (in thousands)
Minor work only Moderate work only
Major/ problematic
Not feasible
Fully visitable
Total stock
Sample size
% Fully visitable
Tenure
Owner Occupied 1,894 6,897 1,710 3,495 760 14,757 4,662 5%
Private Rented 371 1,415 813 1,611 365 4,575 2,387 8%
Local Authority 131 661 417 360 109 1,679 1,961 7%
Housing Association 191 812 389 536 432 2,360 2,291 18%
Total 1,667 23,371
7%
Dwelling Type
Terraced House 449 2,183 759 3,329 316 7,037 3,879 4%
Semi-Detached House 574 3,615 1,100 964 160 6,413 3,145 2%
Detached House 1,140 3,010 151 679 281 5,262 1,715 5%
Flat 424 977 1,320 1,029 909 4,659 2,562 20%
Total 1,667 23,371
7%
Dwelling Age
Pre 1919 282 1,098 717 2,570 32 4,698 1,934 1%
1919-44 327 2,075 599 866 36 3,903 1,810 1%
1945-64 458 2,580 625 756 54 4,473 2,880 1%
1965-80 639 2,487 671 817 161 4,775 2,638 3%
1981-90 292 719 313 397 120 1,841 922 7%
post 1990 590 827 405 596 1,264 3,681 1,117 34%
Total 1,667 23,371
7%
Appendix E

Page | 43
Table A1:2 – Level of work required to make a dwelling fully visitable (by %)
Level Of work required to make dwelling fully 'visitable'
Minor work
only Moderate work only
Major/ problematic
Not feasible
No work required
Tenure
Owner Occupied 12.84% 46.74% 11.59% 23.68% 5.15% 100%
Private Rented 8.11% 30.92% 17.77% 35.21% 7.99% 100%
Local Authority 7.80% 39.39% 24.85% 21.45% 6.51% 100%
Housing Association 8.10% 34.41% 16.48% 22.71% 18.29% 100%
Dwelling Type
Terraced House 6.38% 31.03% 10.78% 47.32% 4.49% 100%
Semi-Detached House 8.95% 56.37% 17.15% 15.03% 2.50% 100%
Detached House 21.67% 57.20% 2.87% 12.91% 5.35% 100%
Flat 9.11% 20.97% 28.34% 22.08% 19.50% 100%
Dwelling Age
pre 1919 5.99% 23.38% 15.25% 54.70% 0.68% 100%
1919-44 8.37% 53.16% 15.35% 22.20% 0.92% 100%
1945-64 10.25% 57.67% 13.98% 16.90% 1.20% 100%
1965-80 13.39% 52.08% 14.05% 17.11% 3.37% 100%
1981-90 15.84% 39.05% 17.01% 21.58% 6.52% 100%
post 1990 16.02% 22.47% 11.00% 16.18% 34.33% 100%
Note: terraced, semi-detached and detached dwelling types include bungalows
Source: (CLG [online], 2016b)
Appendix E

Page | 44
Appendix 3: Forecasts of Older People’s Needs for Cambridge
This data is provided by POPPI (Projecting Older People Population Information System). The
data provided was originally developed by the Institute of Public Care (IPC) for the Care
Services Efficiency Delivery Programme (CSED). The system is now provided solely by the
Institute of Public Care on licence from the Department of Health. The data are derived
from population based analysis.
Figures are taken from Office for National Statistics (ONS) subnational population
projections by persons, males and females, by single year of age. The latest subnational
population projections available for England, published 29 May 2014, are full 2012-based
and project forward the population from 2012 to 2037.
Long-term subnational population projections are an indication of the future trends in
population by age and sex over the next 25 years. They are trend-based projections, this
means assumptions for future levels of births, deaths and migration are based on observed
levels mainly over the previous five years. They show what the population will be if recent
trends continue.
The projections do not take into account any policy changes that have not yet occurred, nor
those that have not yet had an impact on observed trends.
Table A3:1: Population in Cambridge aged 65 and over, projected to 2030
2014 2015 2020 2025 2030
People aged 65-69 4,500 4,500 4,500 4,800 5,500
People aged 70-74 3,200 3,400 4,100 4,100 4,400
People aged 75-79 2,800 2,800 3,100 3,800 3,800
People aged 80-84 2,300 2,300 2,400 2,700 3,500
People aged 85-89 1,700 1,700 1,800 2,000 2,300
People aged 90 and over 1,200 1,200 1,500 1,800 2,200
Total population 65 and over 15,700 15,900 17,400 19,200 21,700
Figures may not sum due to rounding. Crown copyright 2014
Appendix E

Page | 45
Table A3:2: People in Cambridge aged 65 and over unable to manage at least one self-care
activity on their own, by age and gender, projected to 2030. Activities include: bathe,
shower or wash all over, dress and undress, wash their face and hands, feed, cut their
toenails, take medicines
2014 2015 2020 2025 2030
Males aged 65-69 unable to manage at least one self-care activity on their own
396 396 396 432 504
Males aged 70-74 unable to manage at least one self-care activity on their own
285 304 380 361 399
Males aged 75-79 unable to manage at least one self-care activity on their own
348 348 406 522 493
Males aged 80-84 unable to manage at least one self-care activity on their own
297 330 330 396 495
Males aged 85 and over unable to manage at least one self-care activity on their own
510 510 612 765 918
Females aged 65-69 unable to manage at least one self-care activity on their own
483 483 483 504 567
Females aged 70-74 unable to manage at least one self-care activity on their own
510 540 660 660 690
Females aged 75-79 unable to manage at least one self-care activity on their own
624 585 663 780 780
Females aged 80-84 unable to manage at least one self-care activity on their own
689 689 742 795 1,007
Females aged 85 and over unable to manage at least one self-care activity on their own
1,332 1,406 1,480 1,702 1,998
Total population aged 65 and over unable to manage at least one self-care activity on their own
5,474 5,591 6,152 6,917 7,851
Figures may not sum due to rounding. Crown copyright 2014
Appendix E

Page | 46
Table A3:2a: People in Cambridge aged 65 and over unable to manage at least one self-
care activity on their own as a percentage of the population projected to 2030.
These figures have been calculated by summing all adults by age band who are unable to
manage at least one self-care activity on their own (from Table A3:2) and comparing them
to the estimated population in 2030 by age band (Table A3:1) to identify what proportion of
each age band is unable to manage at least one mobility activity on their own.
Unable to manage at least one mobility activity
Total estimated population
% of population
People aged 65-74 2,160 9,900 22%
People aged 75-84 2,775 7,300 38%
People aged 85 and over 2,916 4,500 65%
Table A3:3: Rates for men and women unable to manage on their own at least one self-
care activity
Age range % males % females
65-69 18 21
70-74 19 30
75-79 29 39
80-84 33 53
85+ 51 74
Figures are taken from Living in Britain Survey (2001), table 35.
The prevalence rates have been applied to ONS population projections of the 65 and over
population to give estimated numbers predicted to be unable to manage at least one of the
self-care activities listed, to 2030.
Appendix E

Page | 47
Table A3:4: People in Cambridge aged 65 and over unable to manage at least one mobility
activity on their own, by age and gender, projected to 2030. Activities include: going out
doors and walking down the road; getting up and down stairs; getting around the house
on the level; getting to the toilet; getting in and out of bed
2014 2015 2020 2025 2030
People aged 65-69 unable to manage at least one mobility activity on their own
383 383 383 408 467
People aged 70-74 unable to manage at least one mobility activity on their own
422 448 552 542 578
People aged 75-79 unable to manage at least one mobility activity on their own
480 459 525 636 624
People aged 80-84 unable to manage at least one mobility activity on their own
539 557 586 651 821
People aged 85 and over unable to manage at least one mobility activity on their own
1,250 1,300 1,420 1,675 1,980
Total population aged 65 and over unable to manage at least one mobility activity on their own
3,074 3,147 3,466 3,912 4,470
Figures may not sum due to rounding. Crown copyright 2014
Table A3:4a: People in Cambridge aged 65 and over unable to manage at least one
mobility activity on their own as a percentage of the population projected to 2030.
These figures have been calculated by summing all adults by age band who are unable to
manage at least one mobility activity on their own (from Table A3:4) and comparing them to
the estimated population in 2030 by age band (Table A3:1) to identify what proportion of
each age band is unable to manage at least one mobility activity on their own.
Unable to manage at least one mobility activity
Total estimated population
% of population
People aged 65-74 1,045 9,900 11%
People aged 75-84 1,445 7,300 20%
People aged 85 and over 1,980 4,500 44%
Appendix E

Page | 48
Table A3:5: Rates for those who are unable to manage at least one of the mobility tasks
listed are as follows:
Age range % males % females
65-69 8 9
70-74 10 16
75-79 12 21
80-84 18 29
85+ 35 50
Figures are taken from Living in Britain Survey (2001), table 29.
The prevalence rates have been applied to ONS population projections of the 65 and over
population to give estimated numbers predicted to be unable to manage at least one of the
mobility tasks listed, to 2030.
Table A3:6: People aged 65 and over in Cambridge predicted have a fall, by age and
gender, projected to 2030
2014 2015 2020 2025 2030
People aged 65-69 predicted to have a fall 925 925 925 984 1,125
People aged 70-74 predicted to have a fall 759 806 994 974 1,041
People aged 75-79 predicted to have a fall 660 633 725 882 863
People aged 80-84 predicted to have a fall 721 752 786 882 1,111
People aged 85 and over predicted to have a fall 1,204 1,247 1,376 1,634 1,935
Total population aged 65 and over predicted to have a fall
4,269 4,363 4,806 5,356 6,075
Figures may not sum due to rounding. Crown copyright 2014
Appendix E

Page | 49
Table A3:6a: People aged 65 and over in Cambridge predicted have a fall, by age and
gender, projected to 2030 by percentage of population.
These figures have been calculated by summing all adults by age band who are predicted to
have a trip or fall (from Table A3:6) and comparing them to the estimated population in
2030 by age band (Table A3:1) to identify what proportion of each age band is predicted to
have a trip or fall.
Number of people predicted to have a trip or fall
Total estimated population
% of population
People aged 65-74 2,166 9,900 22%
People aged 75-84 1,974 7,300 27%
People aged 85 and over 1,935 4,500 43%
Table A3:7 Rates for people who report at least one fall during the last 12 months are as
follows:
Age range % males % females
65-69 18 23
70-74 20 27
75-79 19 27
80-84 31 34
85+ 43 43
Figures are taken from Health Survey for England (2005), volume 2, table 2.1: Prevalence
and number of falls in last 12 months, by age and sex.
The prevalence rates have been applied to ONS population projections of the 65 and over
population to give estimated numbers of those predicted to be have fallen at least once in
the last 12 months, to 2030.
(POPPI [online], 2016)
Appendix E

Page | 50
Appendix 4: Forecasts of Disability Needs for Cambridge
This data is provided by PANSI (Protecting Adult Needs and Service Information. The data
provided was originally developed by the Institute of Public Care (IPC) for the Care Services
Efficiency Delivery Programme (CSED). The system is now provided solely by the Institute of
Public Care on licence from the Department of Health. The data are derived from population
based analysis.
Figures are taken from Office for National Statistics (ONS) subnational population
projections by persons, males and females, by single year of age. The latest subnational
population projections available for England, published 29 May 2014, are full 2012-based
and project forward the population from 2012 to 2037.
Long-term subnational population projections are an indication of the future trends in
population by age and sex over the next 25 years. They are trend-based projections, this
means assumptions for future levels of births, deaths and migration are based on observed
levels mainly over the previous five years. They show what the population will be if recent
trends continue.
The projections do not take into account any policy changes that have not yet occurred, nor
those that have not yet had an impact on observed trends.
Table A4:1: Population in Cambridge aged 18-64, projected to 2030
2014 2015 2020 2025 2030
People aged 18-24 23,800 23,700 23,300 23,600 26,100
People aged 25-34 23,600 23,000 21,300 20,500 19,800
People aged 35-44 16,300 16,400 16,600 16,400 16,100
People aged 45-54 13,800 13,900 14,000 13,900 14,200
People aged 55-64 10,600 10,600 11,700 12,600 12,700
Total population aged 18-64 88,100 87,600 86,900 87,000 88,900
Total population - all ages 124,900 125,100 126,500 128,800 132,400
Figures may not sum due to rounding. Crown copyright 2014
Appendix E

Page | 51
Table A4:2: People in Cambridge aged 18-64 predicted to have a moderate or serious
physical disability, by age, projected to 2030
2014 2015 2020 2025 2030
People aged 18-24 predicted to have a moderate physical disability
976 972 955 968 1,070
People aged 25-34 predicted to have a moderate physical disability
991 966 895 861 832
People aged 35-44 predicted to have a moderate physical disability
913 918 930 918 902
People aged 45-54 predicted to have a moderate physical disability
1,339 1,348 1,358 1,348 1,377
People aged 55-64 predicted to have a moderate physical disability
1,579 1,579 1,743 1,877 1,892
Total population aged 18-64 predicted to have a moderate physical disability
5,798 5,784 5,881 5,973 6,073
People aged 18-24 predicted to have a serious physical disability
190 190 186 189 209
People aged 25-34 predicted to have a serious physical disability
94 92 85 82 79
People aged 35-44 predicted to have a serious physical disability
277 279 282 279 274
People aged 45-54 predicted to have a serious physical disability
373 375 378 375 383
People aged 55-64 predicted to have a serious physical disability
615 615 679 731 737
Total population aged 18-64 predicted to have a serious physical disability
1,549 1,551 1,610 1,656 1,682
Figures may not sum due to rounding. Crown copyright 2014
This table is based on the prevalence data for moderate and serious disability by age and sex
included in the Health Survey for England, 2001.
Appendix E

Page | 52
Table A4:2a: estimated % of people in Cambridge aged 18-64 predicted to have a
moderate or serious disability in 2030
These figures have been calculated by summing all adults by age band who are predicted to
have a moderate and serious disability (from Table A4:2) and comparing them to the
estimated population in 2030 by age band (Table A4:1) to identify what proportion of each
age band has a moderate or serious disability.
Moderate physical disability
Total estimated population
% Serious physical disability
Total estimated population
%
People aged 18-24 1,070 26,100 4.10% 209 26,100 0.80%
People aged 25-34 832 19,800 4.20% 79 19,800 0.40%
People aged 35-44 902 16,100 5.60% 274 16,100 1.70%
People aged 45-54 1,377 14,200 9.70% 383 14,200 2.70%
People aged 55-64 1,892 12,700 14.90% 737 12,700 5.80%
Total population aged 18-64
6,073 88,900 6.83% 1,682 88,900 1.89%
Percentage of those aged 18-64 who have a physical disability as a percentage of total population
6,073 132,400 4.59% 1,682 132,400 1.27%
Table A4:3: Rates given in the survey for moderate and serious physical disability are as
follows:
Age range % moderate % serious
18-24 4.1 0.8
25-34 4.2 0.4
35-44 5.6 1.7
45-54 9.7 2.7
55-64 14.9 5.8
The prevalence rates have been applied to ONS population projections of the 18 to 64
population to give estimated numbers predicted to have a moderate or serious physical
disability to 2030.
(PANSI [online], 2016)
Appendix E

Page | 53
Appendix 5: Number of Home-Link Properties in Cambridge Let to
Households with Different Mobility Ratings Through Home-Link.
Table A5:1: Number of people housed in Mobility 1 properties
Number of people housed in Mobility 1 properties
Year 2008 2009 2010 2011 2012 2013 2014 2015
One bed 4 4 9 3 7 3 4 4
Two bed 1 3 3 4 1 2 4
Three bed 2 2 3 2 2
Four+ beds 3 1 1 2
Total 7 7 15 10 8 9 8 10
Table A5:2: Number of people housed in Mobility 2 properties
Number of people housed in Mobility 2 properties
Year 2008 2009 2010 2011 2012 2013 2014 2015
One bed 4 10 14 6 6 8 6
Two bed 2 1 3 2 2 4 7
Three bed 3 1 1 1 3 2 2
Four+ beds 1 1
Total 4 15 16 10 10 14 12 9
Table A5:3: Number of people housed in Mobility 3 properties
Number of people housed in Mobility 3 properties
Year 2008 2009 2010 2011 2012 2013 2014 2015
One bed 14 21 25 16 27 66 97 78
Two bed 1 4 9 5 8 20 26 23
Three bed 1 2 1 2 3 7 14 5
Four+ beds 1 4
Total 16 27 35 23 38 94 137 110
Source: Cambridge Home-Link
Appendix E

Page | 54
Appendix 6: Anecdotal Evidence From Home-Link Staff
Comments received from Home-Link staff. These comments are qualitative data and cannot
be quantified by the number of comments of a similar nature that have been received.
3/4-bed need families in requirement of single level accommodation can be waiting
indefinitely as there are no 3/4-bed flats. 3/4-bed dwellings on the register are all
houses and often hard to adapt with a through-floor lift. Floor lifts often cannot be
installed within the footprint of the property. Additionally these houses often don’t
have the ‘turning circles’ for wheelchair users.
A lot of houses (especially new-builds which can be over 3 floors) are unsuitable for
adaptation.
New build properties will not allow adaptions within the first year of occupancy.
Stairlifts cannot be installed in properties with children under seven, or for people
who are very obese.
A lot of metal frame and other houses cannot be fitted with hoisting equipment (even
some new builds).
Applicants in need of 2-bed properties can get housed very quickly – Home-Link
receive many 2-bed wheelchair flats and have to hunt around to find a suitable match
and convince the applicants to take the offer. Reasons for applicants not wishing to
take the property include distance from support networks or schools.
There are not many 1-bed wheelchair properties available, but there isn’t a
particularly high demand for these.
Bungalows are generally only suitable for tenants within the mobility 2 and 3
categories, as they are too small for wheelchair users
Adapted flats are often poorly planned, for example, two new build Council properties
at Scholars Court are wheelchair accessible but have baths. Anyone in a wheelchair
will find a bath very difficult to access and would ideally require a level-access shower
instead of a bath. Other new builds have changed during the construction phase for
example, changes to the toilet location within the bathroom renders the property
unusable for people requiring transfer.
Home-Link are often looking at meeting the basic needs rather than offering the best
solution, for example, using 3-bed parlour houses to create a downstairs bedroom.
Appendix E

Page | 55
Glossary
Term/Abbreviation Definition
Affordable Housing Housing provided for people whose income levels mean they cannot access suitable market properties to rent or buy locally to meet their housing needs. It includes social rented, affordable rented and intermediate housing. Affordable housing should:
meet the needs of eligible households including availability at a cost low enough for them to afford, determined with regard to local incomes and local house prices; and
include provision for the home to remain at an affordable price for future eligible households or, if these restrictions are lifted, for the subsidy to be recycled for alternative affordable housing provision.
Affordable rented housing
Rented housing provided by local authorities and private registered providers of social housing to households that are eligible for social rented housing. Affordable rent is subject to rent controls that require a rent of no more than 80 per cent of the local market rent (including service charges, where applicable). From April 2012, most new homes funded by government grant have to be offered at affordable rents, to generate funding for further new affordable housing. Some existing social rent homes may also be converted to affordable rents
CIL Community Infrastructure Levy. CIL is a levy that local authorities in England and Wales can choose to charge on new developments in their area. In areas where CIL is in force, landowners and developers must pay the levy to the local Council. CIL charges, set by the local Council, are based on the size and type of the new development. The money raised can be used to support development by funding infrastructure that the Council, local community and neighbourhoods would like.
CLG Department for Communities and Local Government
EHS The English Housing Survey Profile of English housing 2013 (EHS): commissioned by the CLG. The survey assesses housing conditions and housing circumstances. Information gathering for the 2014-15 survey was undertaken between April 2013 and March 2015 creating a ‘mid-point’ of April 2014 from which to base results upon. (CLG [online], 2016a). The survey findings are split into a suite of documents that
Appendix E

Page | 56
Term/Abbreviation Definition
can be found at: https://www.gov.uk/government/collections/english-housing-survey
Habinteg An affordable housing provider that provides and promoting accessible homes and neighbourhoods. The organisation also provides and researches into disability accessibility standards within housing. https://www.habinteg.org.uk/
HMO Housing in Multiple Occupation An HMO, depending on the number of occupants, is classed as either:
a small HMO – this is a shared dwelling house which is occupied by between three and six unrelated individuals who share basic amenities such as a kitchen or bathroom. This falls into use class C4 under the Town and Country Planning (Use Classes) Order 2010; or
a larger HMO – This is when there are more than six unrelated individuals sharing basic amenities such as a kitchen or bathroom. This falls into the sui generis class under the Town and Country Planning (Use Classes) Order 2010.
Home-Link A choice-based lettings scheme for Council and housing association properties across the Cambridgeshire and West Suffolk area. The scheme covers all the available Council and housing association properties, including housing for older people. https://www.home-link.org.uk/
Household A household is defined as one person living alone, or a group of people (not necessarily related) living at the same address who share cooking facilities and share a living room, sitting room or dining area.
Intermediate Housing Homes for sale and rent provided at a cost above social rent, but below market levels, and which meet the criteria for affordable housing (above). These can include shared equity (shared ownership and equity loans), other low-cost homes for sale and intermediate rent, but not affordable rented housing.
Lead Tenants An individual tenant that acts on behalf of all other tenants resident in a property.
Lifetime Homes Standard This is a widely-used national standard, which uses technical advice to ensure that the spaces and features in new homes can readily meet the needs of most people, including those with reduced mobility. http://www.lifetimehomes.org.uk/
Appendix E

Page | 57
Term/Abbreviation Definition
NPPF National Planning Policy Framework was published on 27 March 2012 and sets out the Government’s planning policies for England and how these are expected to be applied.
ONS Office of National Statistics The UK's largest independent producer of official statistics and the recognised national statistical institute of the UK. https://www.ons.gov.uk/
PANSI A view-only system developed by the Institute of Public Care (IPC). For use by local authority planners and commissioners of social care provision in England, together with providers. It is a programme designed to help explore the possible impact that demography and certain conditions may have on populations aged 18 to 64. Prevalence rates from research are used to estimate the impact of conditions such as: learning disabilities, moderate or serious physical disability including personal care, visual impairment etc.
the Plan Cambridge Local Plan 2014: Proposed Submission. https://www.cambridge.gov.uk/local-plan-core-documents-library
POPPI A view-only system developed by the Institute of Public Care (IPC). It is for use by local authority planners and commissioners of social care provision in England, together with providers. It is a programme designed to help explore the possible impact that demography and certain conditions may have on populations aged 65 and over.
PPG National Planning Practice Guidance was published in March 2014 it adds further context to the National Planning Policy Framework. The PPG replaces over 7,000 pages of planning guidance that was previously published in separate documents.
Shared Ownership A form of intermediate tenure low cost home ownership housing. Homes in which the occupier owns a share of the equity and pays rent on the remaining share.
Sheltered/extra Care Housing
Accommodation with varying levels of care and support available on site. People who live in this housing have their own self-contained homes, their own front doors and a legal right to occupy the property.
Social Housing let at lower than market rents to people in housing need. It includes social rent, affordable rent and intermediate housing tenures and is usually provided by not-for profit organisations including housing associations and Councils
Social rented Rented housing owned by local authorities and private registered providers, for which guideline target rents are determined through the national rent regime. It may also be owned by other persons and provided under equivalent rental arrangements to the above, as agreed with the local
Appendix E

Page | 58
Term/Abbreviation Definition
authority or with the Homes and Communities Agency.
Specialist Housing Housing that has been specifically designed to meet the needs of people with particular needs. It can refer to housing that has been purpose designed or designated for a particular client group to assist tenants to live independently. This may include people with physical disabilities, learning difficulties or mental health issues and is sometimes referred to as 'Supported Housing'. Specialist Housing can also refer to housing designated to meet the needs of older people. This is characterised as housing that includes special design features and/or access to support to assist tenants to live independently for as long as possible in their own home.
Appendix E

Page | 59
Bibliography
BRITISH STANDARDS INSTITUTION (BSI) (2009) BS 8300: 2009 Design of buildings and
their approaches to meet the needs of disabled people.
CAMBRIDGE CITY COUNCIL (CCC) (2006) Cambridge Local Plan 2006 [online].
Available at: https://www.cambridge.gov.uk/local-plan-2006 [Accessed December
2016].
CAMBRIDGE CITY COUNCIL (CCC) (2013) Cambridge Local Plan 2014: Proposed
Submission – July 2013 [online]. Available at: https://www.cambridge.gov.uk/local-
plan-core-documents-library [Accessed December 2016].
CAMBRIDGE CITY COUNCIL (CCC) (2013a) Cambridge City Council Statement of
Consultation and Audit Trails [online]. Available at:
https://www.cambridge.gov.uk/local-plan-core-documents-library [Accessed
December 2016].
CAMBRIDGE CITY COUNCIL (CCC) (2013b) Cambridge City Council Local Plan –
Community Infrastructure Levy Viability Assessment, February 2013 [online].
Available at: https://www.cambridge.gov.uk/community-infrastructure-levy
[Accessed January 2017].
CAMBRIDGE CITY COUNCIL (CCC) (2013c) Cambridge City Council Local Plan - SHLAA
and Potential Site Allocations High Level Viability Assessment 2013 [online]. Available
at: https://www.cambridge.gov.uk/content/strategic-housing-land-availability-
assessment [Accessed January 2017].
CAMBRIDGE CITY COUNCIL (CCC) (2013d) Cambridge City Council Local Plan –
Student Housing Affordable Housing Study, May 2013 [online]. Available at:
https://www.cambridge.gov.uk/content/background-documents [Accessed January
2017].
CAMBRIDGE CITY COUNCIL (CCC) (2016) Strategic Housing Key Facts – September
2016 [online]. Available at: https://www.cambridge.gov.uk/housing-research
[Accessed December 2016].
CAMBRIDGE CITY COUNCIL (CCC) (2016a) Annual Monitoring Report 2016 [online].
Available at: https://www.cambridge.gov.uk/content/annual-monitoring-reports
[Accessed January 2017].
CAMBRIDGESHIRE COUNTY COUNCIL (CCoC) (2013) Population, Housing and
Employment Forecasts Technical Report [online]. Available at:
Appendix E

Page | 60
http://cambridgeshireinsight.org.uk/housing/current-
version/PopHseEmp_TechReport2013 Cambridge: Cambridgeshire Insight [Accessed
December 2016]
CAMBRIDGESHIRE COUNTY COUNCIL (CCoC) (2016) Housing Completions in
Cambridgeshire 2016 [online]. Available at:
http://www4.cambridgeshire.gov.uk/info/20099/planning_and_development/234/p
lanning/9 [Accessed January 2017]
CAMBRIDGESHIRE COUNTY COUNCIL & CAMBRIDGESHIRE & PETERBOROUGH JOINT
STRATEGIC PLANNING UNIT (CoCC & JSPU) (2013) Strategic Housing Market
Assessment 2013for the Cambridgeshire housing sub-region 2013 [online]. Available
at: http://cambridgeshireinsight.org.uk/housing/shma/shma-current-version
Cambridge: Cambridgeshire Insight [Accessed December 2016]
CAMBRIDGESHIRE COUNTY COUNCIL AND NHS CAMBRIDGESHIRE (COCCNHS) (2012)
Cambridgeshire Joint Strategic Needs Assessment56 – Phase 6 Summary Report.
Available at: http://cambridgeshireinsight.org.uk/currentreports/jsna-older-peoples-
services-and-financial-revie [Accessed December 2016].
CAMBRIDGESHIRE INSIGHT (2013) Population Forecasts 2013, Districts and Wards
[online]. Available at: http://cambridgeshireinsight.org.uk/population-and-
demographics/population-forecasts [Accessed December 2016].
DEPARTMENT OF COMMUNITIES AND LOCAL GOVERNMENT (CLG) (2006) A Decent
Home: Definition and guidance for implementation – June 2006 update [online].
Available at: https://www.gov.uk/government/publications/a-decent-home-
definition-and-guidance [Accessed December 2016].
DEPARTMENT OF COMMUNITIES AND LOCAL GOVERNMENT (CLG) (2012) National
Planning Policy Framework [online]. Available at:
http://planningguidance.communities.gov.uk/ [Accessed December 2016].
DEPARTMENT OF COMMUNITIES AND LOCAL GOVERNMENT (CLG) (2015) Written
Ministerial Statement Planning Update 25 March 2015 [online]. Available at:
https://www.gov.uk/government/speeches/planning-update-march-2015 [Accessed
December 2016].
DEPARTMENT OF COMMUNITIES AND LOCAL GOVERNMENT (CLG) (2015a) Guide to
available disability data- March 2015 [online]. Available at:
https://www.gov.uk/government/uploads/system/uploads/attachment_data/file/41
56
Produced by Cambridgeshire County Council and NHS Cambridgeshire.
Appendix E

Page | 61
6475/150323_Guide_to_disability_data___final_web_version.pdf [Accessed
December 2016].
DEPARTMENT OF COMMUNITIES AND LOCAL GOVERNMENT (CLG) (2015c) English
Housing Survey: Headline Report, February 2015 [online]. Available at:
https://www.gov.uk/government/statistics/english-housing-survey-2013-to-2014-
headline-report London: Department of Communities and Local Government.
DEPARTMENT OF COMMUNITIES AND LOCAL GOVERNMENT (CLG) (2015d) English
Housing Survey Profile of English Housing 2013, July 2015 [online]. Available at:
https://www.gov.uk/government/uploads/system/uploads/attachment_data/file/44
5370/EHS_Profile_of_English_housing_2013.pdf [Accessed December 2016] London:
Department of Communities and Local Government.
DEPARTMENT OF COMMUNITIES AND LOCAL GOVERNMENT (CLG) (2016) Planning
Practice Guidance [online]. Available at:
http://planningguidance.communities.gov.uk/ [Accessed December 2016].
DEPARTMENT OF COMMUNITIES AND LOCAL GOVERNMENT (CLG) (2016a) English
Housing Survey 2014-15, July 2016 [online]. Available at:
https://www.gov.uk/government/collections/english-housing-survey [Accessed
December 2016] London: Department of Communities and Local Government.
DEPARTMENT OF COMMUNITIES AND LOCAL GOVERNMENT (CLG) (2016b) English
Housing Survey Adaptations and Accessibility Report, 2014-15, July 2016 [online].
Available at: https://www.gov.uk/government/collections/english-housing-survey
[Accessed December 2016] London: Department of Communities and Local
Government.
HABINTEG (2015) Accessible Housing Standards 2015, June 2016 [online]. Available
at: https://www.habinteg.org.uk/accessible-housing-standards [Accessed January
2017].
HABINTEG (2016) Towards Accessible Housing: A Toolkit for Planning Policy [online].
Available at: https://www.habinteg.org.uk/toolkit-introduction [Accessed January
2017].
HM GOVERNMENT (2010) The Building Regulations 2010 – Access to and use of
buildings – Approved Document M: Volume 1: Dwellings (2015 edition incorporating
2016 amendments – for use in England [online]. Available at:
https://www.gov.uk/government/publications/access-to-and-use-of-buildings-
approved-document-m [Accessed December 2016].
Appendix E

Page | 62
LIFETIME HOMES (2016) Lifetime Homes [online]. Available at:
http://www.lifetimehomes.org.uk/ [Accessed December 2016].
NEIGHBOURHOOD STATISTICS (NS) (2016) Neighbourhood Statistics [online].
Available at: http://www.neighbourhood.statistics.gov.uk/ [Accessed December
2016].
NOMIS (2016) Official Labour Market Statistics [online]. Available at:
https://www.nomisweb.co.uk/census/2011/qs303ew [Accessed December 2016]
PANSI (2016) Projecting Adult Needs and Service Information [online]. Available at:
http://www.pansi.org.uk/ [Accessed January 2017].
Planning Inspectorate (2015) RD/GEN/140: Cambridge District Council Local Plan
Examinations: Letter to the Inspector dated 3 November 2014 (Section 20(7) Request)
[online]. Available at: https://www.cambridge.gov.uk/post-submission-
correspondence-with-the-inspector [Accessed January 2017].
POPI (2016) Projecting Older People Population Information [online]. Available at:
http://www.poppi.org.uk/ [Accessed January 2017].
Appendix E