
ACADEMY OF STRATEGIC MANAGEMENT JOURNAL
105
Volume 15, Special Issue Print ISSN 1544-1458 Online ISSN 1939-6104 ACADEMY OF STRATEGIC MANAGEMENT JOURNAL Editor Dr. Rezeda Muhtarovna Kundakchyan Kazan Federal University The Academy of Strategic Management Journal is owned and published by Jordan Whitney Enterprises, Inc. Editorial content is under the control of the Allied Academies, Inc., a non-profit association of scholars, whose purpose is to support and encourage research and the sharing and exchange of ideas and insights throughout the world.
-
Upload
khangminh22 -
Category
Documents
-
view
0 -
download
0
Transcript of ACADEMY OF STRATEGIC MANAGEMENT JOURNAL

Volume 15, Special Issue Print ISSN 1544-1458
Online ISSN 1939-6104
ACADEMY OF
STRATEGIC MANAGEMENT JOURNAL
Editor
Dr. Rezeda Muhtarovna Kundakchyan
Kazan Federal University
The Academy of Strategic Management Journal is owned and published by Jordan Whitney
Enterprises, Inc. Editorial content is under the control of the Allied Academies, Inc., a non-profit
association of scholars, whose purpose is to support and encourage research and the sharing and
exchange of ideas and insights throughout the world.

Authors execute a publication permission agreement and assume all liabilities. Neither
Jordan Whitney Enterprises nor Allied Academies is responsible for the content of the
individual manuscripts. Any omissions or errors are the sole responsibility of the
authors. The Editorial Board is responsible for the selection of manuscripts for
publication from among those submitted for consideration. The Publishers accept final
manuscripts in digital form and make adjustments solely for the purposes of pagination
and organization.
The Academy of Strategic Management Journal is owned and published by Jordan
Whitney Enterprises, Inc., PO Box 1032, Weaverville, NC 28787, USA. Those
interested in communicating with the Journal, should contact the Executive Director of
the Allied Academies at [email protected].
Copyright 2016 by Jordan Whitney Enterprises, Inc., USA

EDITORIAL REVIEW BOARD
Dr. Gallyamova
Kazan Federal University
Ajdar Tufetulov
Kazan Federal University
Alexander Rozentsvaig
Kazan Federal University
Vladimir Nesterov
Kazan Federal University
Michail Panasyuk
Kazan Federal University
Alexei Isavnin
Kazan Federal University
Rezeda Kundakchyan
Kazan Federal University
TABLE OF CONTENTS
LEADERSHIP STYLES IN TRANSITIONAL ECONOMIES…………………………………,.1
Asiya F. Validova, Kazan (Volga-region) Federal University
Erna Pulaj, Justus Liebig University Giessen
RUSSIA IN THE GLOBAL ECONOMY AFTER THE OLYMPIC GAMES: MYTHS AND
REALITIES……………………………………………………………………………………….8
Irina Malganova, Kazan Federal University
Adelina Rakhimova, Kazan Federal University
E-LEARNING PRACTICE USING MOODLE BY LEADING UNIVERSITIES IN THE
RUSSIAN REGION……………………………………………………………………………14
Irina Malganova, Kazan Federal University
Adelina Rahkimova, Kazan Federal University
ALGORITHMS OF PARAMETRIC ESTIMATION OF POLYNOMIAL TREND MODELS
OF TIME SERIES ON DISCRETE TRANSFORMS……………………………………….......20
Ismagilov I.I, Kazan Federal University
Khasanova S.F, Kazan Federal University
COMPREHENSIVE ASSESSMENT OF THE RELIABILITY OF THE BANK WITH THE
APPLICATION OF STATISTICAL METHODS……………………………………………....28
Gulnara Albertovna Gareeva, Kazan Federal University
Diana Ramilevna Grigoreva, Kazan Federal University
THE TOOLS IMPROVING THE EFFECTIVENESS OF MANAGEMENT SYSTEM OF
ENTERPRISE……………………………………………………………………………………33
Izida Ildarovna Ishmuradova, Kazan Federal University
Gulnaz Rashitovna Sibaeva, Kazan Federal University
CLASSIFICATION APPROACH IN DETERMINATION OF KNOWLEDGE IN CONTEXT
OF ORGANIZATION…………………………………………………………………………...39
I.I. Makhmutov, Kazan Federal University
A.G. Isavnin, A.N, Kazan Federal University
Karamyshev, S.A. Sych, Kazan Federal University
MARKET RISKS OF FINANCIAL SECTOR AND THEIR IMPACT ON THE REGIONAL
INSTITUTIONS*………………………………………………………………………………..46
E.P. Duvalova, Kazan Federal University
Y.I. Duvalova, Kazan Federal University
L.R. Ikhsanova, Kazan Federal University
A.M. Tufetulov, Kazan Federal University

DEVELOPMENT OF INTERNET BANKING ON BANKING SERVICES
MARKET……………………………………………………………………………………….53
E.P. Duvalova, kazan Federal University
O.V. Andreeva, kazan Federal University
Y.I. Duvalova, Kazan Federal University
I. Ivasiv, Kyiv National Economic University
DIAGNOSTICS OF REGIONAL BANKING SYSTEMS STABILITY AS AN INSTRUMENT
OF INTEGRATION……………………………………………………………………………..59
J.A. Klaas, Kazan Federal University
M.H. Khalilova, Kazan Federal University
A.M. Tufetulov, Saint Petersburg State University
THE MODELING OF INDUSTRIAL ENTITY’S DYNAMICS STAFF COSTS …………….68
Sungatullina L.B, Kazan Federal University
Faizrahmanova G.R, Kazan Federal University
THE FEATURES OF CREDIT INSTITUTIONS REFINANCING IN THE RUSSIAN
FEDERATION DURING THE CRISIS………………………………………………………....76
Ksenia Selivanova, Kazan Federal University
Ekaterina Protsko, Kazan Federal University
Johanna Koczar, Wroclaw University of Economics
TRANSPORT INFRASTRUCTURE AS A DRIVER OF SUSTAINABLE DEVELOPMENT
OF REGIONAL ECONOMIC SYSTEMS………………………………………………………85
Kseniia Terenteva, Kazan Federal University
Venera Vagizova, Kazan Federal University
Kseniia Selivanova, Kazan Federal University
INTERACTION OF BANKS AND THE REAL SECTOR OF THE ECONOMY AS A
FACTOR FOR VOLGA REGION’S SUSTAINABLE DEVELOPMENT…………………….94
VeneraVagizova, Kazan Federal University
Kseniia Terenteva, Kyiv National Economic University

Academy of Strategic Management Journal Volume 15, Special Issue, 2016
1
LEADERSHIP STYLES IN TRANSITIONAL
ECONOMIES
Asiya F. Validova, Kazan (Volga-region) Federal University
Erna Pulaj, Justus Liebig University Giessen
ABSTRACT
Leaders are modelled by cultural background and environmental constrains (Hofstede
1993). However, in post-communist transitional countries, leadership dwells in between the
autocracy practiced in the labor market (Elenkov 1998, Michailova 2002) and another
dimension of transformational leaders promoted by the Western theories. Russia and Albania are
two countries that shared a common political, economic and cultural background as elements of
a system that drew the frames of what leadership and entrepreneurship, not allowing them to
naturally develop in the “natural habitat” of the free market. The aim of this study is to explore
how persistent the common historical background is in today’s leadership style by comparing
different aspects of leadership in countries with transitional economy. This cross-cultural study
uses a survey method to explore the leadership dilemma of MBA students distinguishing
employee-leaders from entrepreneur-leaders. The study uses a sample of MBA students who have
academic knowledge of leadership and active in the labor market. The main finding of the paper
is that the similar background of Russia and Albania prevails in spite of the changes that the
countries went through after the fall of the old system. It is also shown that once put in an
entrepreneur’ position respondents lean towards a more authoritarian leadership style. These
initial results can be enhanced in the future research in other countries with transitional
economy.
Key Words: Leadership Style, Transformational Leadership, Authoritarian Leadership,
Entrepreneurship, Transitional Economy
INTRODUCTION
Leadership has gained an increasing interest in the last decades in the context of rapid
environmental and technological change. Though in the midst of a globalization and the
borderless knowledge movement of the 21st century that holds in its core transformational and
transactional leadership (Bass 1997), the academic discourse and ongoing research keeps
supplying evidence and data of the importance of the cultural background. It has been a long way
since 1967, when Hofstede conducted the first cross-cultural research in 50 countries (Hofstede
1983). Restlessly the results have been enhanced, the valuation criteria (also known as
dimensions) extended and the portfolio of countries diversified. However, questions arises about
countries that impose system and regimes which model every area of the society including their
identities – as communism had done in the past and as other dictatorships are doing in the
present. Hofstede (1983) argues that nations are more than political units - they are rooted in
history, the citizens derive value and identity from it, and the thinking too is conditioned by the
national culture factors. Seeing it through leadership lenses, it becomes challenging to determine
where leadership itself stands currently in some Eastern/South-Eastern countries that have for a
long time been part of the stronghold of systems that have marked their national identity, in a

Academy of Strategic Management Journal Volume 15, Special Issue, 2016
2
time when Western based theories have trespassed borders not only in academia, but also on the
enterprise level.
One of the most widely accepted definitions of the 20th
century views leadership as “the
ability of an individual to influence, motivate and enable others to contribute towards the
effectiveness and success of the organizations of which they are members” (Dickson et al., 2012,
House et al., 2002). Defining culture becomes more challenging than defining leadership, since
we refer to it as a term to describe many things like different groupings in the society or the set
of parameters used to differentiate one society from another (Dickson et al., 2012, House et al.,
2002). In leadership investigations culture has been used to define shared motives, values,
beliefs, identities and interpretations of meanings of significant events that result from common
experiences of members of collectives and transmitted across age generations (House et al.,
2002).
LITERATURE REVIEW
Two positions on the nature of leadership have risen in the academic debate. On one side,
scholars like Bass support the idea of its universality. They argue that although leadership
theories were founded in the United States, leadership is a universal phenomenon, due to its
presence in all communities, technological and information exchange, and English as an
international language (Bass 1997). Different leadership styles are suggested in the literature.
Transactional leadership refers to a kind of relationship between the leader and the follower
where both engage in order to pursue and accomplish their self-interest (Ardichvili and Kuchinke
2002). It takes the form of contingency reward when the leader explains the follower (with or
without his participation) what she should do in order to be rewarded, or it takes the form of
management-by-exception, where the leader intervenes when the follower fails to meet the aim.
Transformational leadership tries to put into alignment the interest of the followers with those of
the organization. The movement past self-interest is reached through charisma, inspiration,
intellectual stimulation or individualized consideration (Bass 1997).
This position was supported by the Globe Project (Global Leadership and Organizational
Behavior Effectiveness), a program that has been exploring 61 cultures for more than 21 years,
and has identified six dimensions that can be considered culturally generalizing. However, some
researchers hesitate to call them “universally desirable" due to significant variability across the
countries (Dorfman et al 2012). On the same subject other studies suggest that leadership is best
predicted by amalgamation of attributes that would make its effectiveness consistent in case of
culture rotation (Gordon and Yukl 2004; Zaccaro 2007) and that the attributes should reflect fast
response to the different situations presented, adaptability and flexibility (Zaccaro 2007).
On the other side of the debate stand scholars like Hofstede who point at the
controversies in management and leadership theories (Hofstede 1980, 1983, 1993). In his view
management theorists are humans – raised in a particular society, and their ideas were influenced
by the environment (Hofstede 1993). To support his idea empirically he developed four initial
criteria referred to as “dimensions”; the level of acceptance of the unequally distributed power
(Power Distance), the level of uncertainty avoidance (Uncertainty Avoidance), tendency for
caring for acquisitions and money vs. caring for people and life quality (Masculinity vs.
Femininity) and tendency to care for the family/group vs. the tendency to care only for oneself
(Individualism vs. Collectivism). From the cultural perspective leadership behaviors will change
depending on different cultural profiles. For example, in some cultures strong decisive actions

Academy of Strategic Management Journal Volume 15, Special Issue, 2016
3
are valued in a leader, and in the others democratic approach can be a prerequisite (Den Hartog et
al 1999; van Emmerik et al. 2008).
The GLOBE project demonstrated that cultural influences leadership behaviors through
expectations of the societies; leaders who try to lead in a manner that is consistent with the
cultural expectations are more effective (Dorfman et al 2012). For instance, in societies with
performance oriented values they desire leaders who are charismatic, participative and
independent. These expectations are positively related to cultural values of performance
orientation, gender and human equality, and negatively related to power distance (Dorfman et al
2012).
RUSSIA AND ALBANIA IN EMPIRICAL STUDIES
Russia and Albania are two countries that have shared the same ideology in the past,
which was deeply rooted and became legacy for the future. In the 1970's Russia were a strong
economic and political alley, a technology and education provider, as well as a designer of many
others areas of the Albanian society.
Clearly it has been challenging for Russian business leaders to operate within changing
European environment with the load of the legacy of soviet management, especially those who
had developed their views during the Soviet era (McCarthy et al., 2005). Different studies give a
good appreciation of the leadership transition dynamics in Russia, but no clear results are given
on a defined style.
Elenkov (1998) was one of the scholars who studied the dimensions in the context of
development of Russian business culture. According to him, as there is a high power distance
and strong collective mentalities in the society employees expect a traditional strong
authoritarian leader. Other scholars critically view the implementation of the Western based
styles of leadership in Russian companies. Michaelova (2002) concluded in her study that
Russian companies face one-man authority, anti-individualism, strong hierarchy that make
empowerment problematic. Other researchers (Fei et al., 2001) found that in Russia the
employees preferred a leader who would focus on how to achieve organizational goals, through
employee commitment and involvement, but with a centralized command.
These results are, however, controversial, as cultural values may not be stable overtime,
and may differ by the country (Ardichvill and Kuchinke 2002). In a comparative leadership study
between ex-Soviet Union countries - Russia, Georgia, Kazakhstan and Kyrgyzstan and Germany,
the authors found that contingent reward and inspirational management received the highest
points in all the ex-Soviet countries (Ardichvill and Kuchike 2002), meaning that elements of
both transformational and transactional leadership were present.
As for Albania, the country is less explored in academic discourse in terms of leadership.
Albania was included in the later stages of the GLOBE project of Central and East European
countries with a focus on middle managers in the industries of food processing, financial services
and telecommunication (Koopman et al., 1999). In terms of leadership it was grouped with other
South-East countries scoring high in such managerial characteristics as administrative
competence, autocracy conflict inducement, diplomacy, face-saving, non-participation and status
consciousness (Kompan et al., 1999).
As shown in the studies, Russia has been compared against many countries, Western and
from the Eastern Block, in terms of leadership. The comparison that was left unexplored is with
countries like Albania who voluntarily “sovietized” itself and underwent the system’s
metamorphosis for many years, but after its fall took completely different path (while Russia is

Academy of Strategic Management Journal Volume 15, Special Issue, 2016
4
big and “stubborn” player in the international arena, Albania became a West oriented country and
has recently received the status of a candidate country to enter the European Union).
THEORETICAL FRAMEWORK
This study aims to explore if the common political, economic and cultural background of
Russia and Albania is still reflected in present leadership style. From this perspective, there are
three research questions that authors aim to answer in order to analyse different aspects of
leadership in two countries.
Research question 1
What is the present 'leadership style' in the countries with transitional economy, and is the
similar cultural background of Russia and Albania reflected in the characteristics of the present
leader?
Research Question 2
Is there a relationship between a direction of career (entrepreneur or manager in
organisation) and perceived leadership style?
This question will help to understand the leadership style perceived by entrepreneurs and
managers in organisation and to see if there are differences. In both countries entrepreneurship
did not evolve gradually in a “natural habitat”, nor was it cultivated or taught in universities or
forged by the dynamics of free market like it is in our days.
Research Question 3
What kind of leader do students aspire to be and to what extent their aspiration is affected
by the present supervisor? Would they be a different kind of leader if they were to be
entrepreneurs and bear the risk of the business activity?
To answer this question authors looked if there is a connection between the kind of
leadership students face today and the kind of leader they would want to be in the future, and if it
affects their efficiency and performance.
METHOD
Based on the majority of prior studies on both countries and the results of the GLOBE
research project, Russia and Albania are in the same group of leadership prototypes, were
authoritarian leadership style and leaders who keep centralized control prevail.
Therefore, the variable of interest in the study is the 'leadership style', and more precisely
the type of leader preferred by different groups of respondents in two countries with similar
background: transformational leader or authoritarian leader.
The research design chosen to answer the research questions is a cross-sectional research
design (social survey). For the survey researchers targeted a sample of MBA students. The
rationale behind the choice is the following: students are “caught in transition” between the
Western-based academic knowledge they receive in college, and the leadership style that they
find in the labor market. It is pre-determined that the respondents are active in the labor market,

Academy of Strategic Management Journal Volume 15, Special Issue, 2016
5
as the timetable is tailored in a way that allows them to attend classes in the evening after they
complete their working hours.
The cities selected for the research were Kazan in the Republic of Tatarstan, Russian
Federation and Tirana in the Republic of Albania – two cities with high university concentration.
Kazan has a long tradition of being one of the centres of education, not only for the Russian
Federation and most Central Asian countries, but also for international students. Tirana on the
other hand, as the capital of a developing country, is the centre of the most prestigious private
and public university education. In the case of Kazan the random sample of MBA students was
selected from the registrar of Kazan Federal University, and the selected students were reached
by e-mail. The Albanian respondents were chosen from the Department of Economics of the
University of Tirana (as the representative of public education) and the European University of
Tirana (one of the most well-known private universities of the capital). Parts of the
questionnaires were distributed with the assistance of the faculty as print-outs, and part was sent
by e-mail by students' coordinators.
Primary data collection method was used, and a structured questionnaire was designed
with questions that implicitly address all the variables necessary for the analysis: country of
study, years of work experience, preferred direction of career (manager in organisation or
entrepreneur), and 'leadership style'. The aim was to tap two main concepts - leadership and
entrepreneurship. The data was entered into SPSS program to test the following hypotheses:
1. Similar cultural background of Albania and Russia is reflected in their present leadership styles.
2. There is a relationship between career path chosen and perceived leadership style.
3. The leadership style that students face in the labor market influences the aspired leadership style
for the future.
Frequency distributions were produced to evaluate the presence of the students in the
labor market. The results showed that 50.9% of students had been active in the labor market
before they started their Master's degree. 23.7 % of the respondents had a work experience less
than a year, which meant they started their work after they had enrolled to the MBA program.
Descriptive statistics were used to see how high the entrepreneur's spirit was among the
respondents. Results showed that only 32% of the respondents preferred an entrepreneurial
future direction compared to 67.3% that preferred to be Manager/Employees, in other words
preferred stability of a job where they could make a career in managerial positions. Respondents
were asked to rank reasons for choosing an entrepreneur career path. Respondents put the
following reasons on the first place: Personal achievement (49.1%), Economic reasons (25.5%),
Need for Independence (20%) and Dissatisfaction from previous jobs (5.5%).
RESULTS
Hypothesis 1
In order to understand if similar cultural background of Albania and Russia is reflected in
their present leadership styles, first, respondents' 'present leadership style' was determined. The
questionnaire was designed incorporating well validated measure for a dependent variable
'present leadership style' which was calculated from the answers to eight different questions –
each tapped on a three-point scale (0-2). Total score measured respondents' perceived leadership
style ranged from 0 to 16, the higher was the score the more respondent was disposed towards
autocratic present leadership style, and, conversely, the lower the score the more she was

Academy of Strategic Management Journal Volume 15, Special Issue, 2016
6
disposed towards transformational present leadership style. The results showed that the mean
score on the perceived leadership style was rather high (10.30), with a standard deviation of 2.32,
which was consistent with the previous studies, that characterize present leadership style in post-
communist countries as authoritarian.
Following determination of the present leadership style, researchers aimed to see if the
mean score is similar in Russia and Albania. The following hypothesis was tested with a use of a
t-test.
H0: There is no significant difference in the leadership style in Albania and Russia.
H1: There is a significant difference in the leadership style in Albania and Russia.
The results showed a t-value of -.756 with 35 degrees of freedom, and a probability of
.455. As this is greater than .05, there is no significant difference between Russian and Albanian
MBA students in how they perceive the present leadership style.
Hypothesis 2
H0: There is no relationship between direction of career (entrepreneurs or manager/employee) and the
perceived leadership style (autocratic, transformational or very liberal).
H1: There is a relationship between the direction of career and the perceived leadership style.
Chi-square test was done to test if the career path is independent to the leadership style
respondents choose. The results reported that there is no significant relationship at 5%
significance level between career path and perceived leadership style, hence, hypothesis 2 has
not been substantiated (χ2 = 3.393, df = 2, p = .181).
Hypothesis 3
H0: Present leadership student’s face in the labor market does not have an influence on the kind of leader
students want to be.
H1: Present leadership found in the labor market influences the kind of leader students want to be.
For the third hypothesis qualitative approach was followed and unstructured interviews
were chosen for primary data collection. The research was aimed to explore why students aspired
in engaging in participative leadership forms when the culture and the labor market suggest the
opposite. Students affirmed that they were not satisfied with present autocracy and would like to
find a more participative leadership style. As well they stated that often the supervisors did not
have a clear vision of where the company was supposed to go, and this was reflected in manager-
employee relationship. It was not uncommon that tasks delegated to the employees were
contradictory and that the supervisors seemed “not to know what they want”. However, the
results also showed that being put into entrepreneur position, MBA students lean towards more
autocratic leadership style, and prefer control over activity through direct supervision.
CONCLUSIONS
As shown from the analysis, Russia and Albania share common autocratic leadership
style in the market today, but the future generation of manager professionals aspire to engage in a
more transformational leadership style. Results also show that career path that students choose

Academy of Strategic Management Journal Volume 15, Special Issue, 2016
7
does not relate with the perceived leadership style. However, further in-depth interviews might
shed light on the factors that affect leadership style.
Among other unexplored reasons, that provide a good basis for future studies, is the
conclusion that present autocratic leadership they face in their working relationships causes them
to want to be the opposite. They aspire for a leader that has a clear vision of the future of the
organization and transmits it to the followers; this helps them to understand their tasks better and
perform them more efficiently. With regards to students' desire to make a managerial career we
predict that they might find it difficult to achieve their aim while dealing with autocratic leaders,
who are not keen to engage with employees, and thus impede the employees’ skills to manifest.
Another conclusion made is that when students are being put in an entrepreneurial
position their vision of the role of leader goes to the other extreme. They become an autocratic
entrepreneur/manager. Being familiar with the difficulties and the inconsistency of the
environment in transitional economy, and the business policies applied by the government, they
try to lean towards having full control over the business and determining manager-employee
relationships and activities by well-defined procedures, scopes of work and reward schemes.
REFERENCES
Ardichvili, A. & Kuchinke K.P. (2002). Leadership styles and cultural values among managers and subordinates: a
comparative study of four countries of the former Soviet Union, Germany and the US. Human Research
Development, 5(1), 99-117
Bass, B.M. (2007). Does transactional-transformational leadership paradigm transcend organizational and national
boundaries, American Psychologist, 52, 130-139.
Den Hartog, D., House, R.J., Hanges, P.J., & Ruiz-Quintanilla S.A. (1999). Culture specific and corss-culturally
generalizable implicit leadership theories: Are attributes of charismatic transformational leadership
universally endorsed?. Leadership Quarterly, 10(2), 219-256.
Dickson, M.W., Castaña N., Magomaeva A., & Den Hartog, D.N. (2012). Conceptualizing leadership across
cultures. Journal of World Business, 47, 483-492.
Dorfman, P., Javidan M., Hanges, P., Dastmalchian, A., & House, R. (2012). A twenty year journey into the
intriguing world of culture and leadership. Journal of World Business, 47, 504-518.
Elenkov, D.S. (1998). Can American management concepts work in Russia? A cross-comparative study. California
Management Review, 40, 133-156.
Fey C.F., Adeava, M., & Vitkoskaya A. (2001). Developing a model of leadership styles: What works best in Russia.
International Business Review, 10(6), 615-643.
Gordon A.. & Yukl G. (2004). The future of leadership research: challenges and opportunities. German Journal of
Human Resource Research, 18, 359-365.
Hofstede, G. (1980). Motivation, leadership and organization. Organizational Dynamics, 9, 42-63.
Hofstede, G. (1983). The cultural relativity of organizational practices and theories. Journal of International
Business Studies, 14, 75-89.
Hofstede, G. (1993). Cultural constraints in management theories. Academy of management Executives, 7, 81-94.
House, R., Janivan, M., Hanges, P., & Dorfman, P. (2002). Understanding cultures and implicit leadership theories
across the globe: an introduction to the project GLOBE. Journal of World Business, 37, 3-10.
Kopman P.L., Den Hartog, D., Konrad, E., et al. (1999). National culture and leadership profiles in Europe: Some
results from the GLOBE study, European Journal of Work and Organizational Psychology, 8(4), 503-520.
McCarthy, D.J., Puffer, S.M., Vikhansi, O.S., Naumov, A.I. (2005). Russian managers in the new Europe: Need for a
new management style. Organizational Dynamics, 34, 231-246.
Michaelova, S., (2000). When common sense becomes uncommon: Participation and empowerment in Russian
companies with West participation. Journal of World Business, 37, 180-187.
Van Emmerik, IJ. H., Euwema, M.C &Wendt H. (2008). Leadership behaviors around the world: The relative
importance of gender versus cultural background. International Journal of Cross Cultural Management,
8(3), 297-315.

Academy of Strategic Management Journal Volume 15, Special Issue, 2016
8
RUSSIA IN THE GLOBAL ECONOMY AFTER
THE OLYMPIC GAMES: MYTHS AND REALITIES
Irina Malganova, Kazan Federal University
Adelina Rakhimova, Kazan Federal University
ABSTRACT
This work was created during the XXII Olympic Games in Sochi (Russia). On the one
hand, some experts wondered about what happen to Russian economy after the competition of
this expensive project. On the other hand, academics note that the Games has a very small, but
positive effect on the economy. The growth of GDP will remain at a low level, but in the positive
zone.
In this regard, the purpose of this research is conducting a systematic, comparative
analysis and to make an assessment of the Russian economy after the Olympics at the global
level. This research contains a statistical analysis of the dynamics of macroeconomic indicators
before and during the Games, the analysis of national accounts of the Russian Federation. Also,
in this research was made a review with opinions of foreign experts of economy and economics
students of Kazan Federal University (poll conducted among students of 2nd year, 86 people).
Obtained results allow to make a few of assumptions of foreign and domestic experts
grouped into two main groups «Myths of the economy» and «economic reality». The first group
of myths related assumption that the Games will be a catalyst of economic problems. In our point
of view, as a result of the preparation for the Olympic Games, Sochi has been turned into a
world class resort; revenues generated by this federal budget will be spent on solving social
problems somewhere else. Among the findings of the «economic reality» - to assess the level of
infrastructure development in the regions of Russia, as well as the principles for the development
of international economic relations in modern after Olympic Russia.
Key Words: Olympic Games, Economic Analysis, Myths, Economic Reality, Interviews
INTRODUCTION
As you know Russia is a country of winter. And winter sports are really popular here.
There are a lot of sports facilities, sports grounds, developed infrastructure and serious
investments. So our committee decided to make Olympic Games in city, called Sochi. Because
Sochi is one of the cities, that had all the possibilities, places for making Olympics. By the way,
Sochi is the largest resort city in Russia, an important transportation hub as well as major
economic and cultural center of the Black Sea coast of Russia. In Sochi the summer is really hot
and sunny. The sea is very warm and there are a lot of tourists that visit Sochi, most of them
Russians (almost 4 million tourists visited Sochi in 2013). But after Olympics, Sochi became a
world famous resort not even in summer, but also in winter. Number of tourists in future will
increase by 30%.
When the games weren’t even opened, Sochi Olympics got into the history of the
Olympic movement and became the most expensive Olympiad in human history. Expenses
became more than 50 billion of US dollars.

Academy of Strategic Management Journal Volume 15, Special Issue, 2016
9
The Winter Olympic Games Sochi-2014 which already belongs to history showed that the
Russian Federation government and society are able to successfully implement international
projects of the highest level.
MATERIALS AND METHODS
In summer 2007 our president V.V. Putin said, that the overall cost of the Sochi Olympics
will be $ 12 billion.
This statement is kind of shocked everybody because in fact, Putin openly declared, that
he is ready to spend much more money, than it offered Russian competitors: the Austrians and
South Koreans. As we mentioned before, final figure costs are 50 billion of US dollars -
exceeded Putin’s named summary more than in four times.
So, where is the whole these moneys? First of all, they are in construction costs. Down
here, we can see the costs for the construction of sports complexes. For comparison, we have
included the cost of other Olympics (Fig.1, Fig.2).
Second, the cost rising of the Sochi Winter Olympics more than in twice is abnormal and
can be explained by the banal theft, corruption, embezzlement and complete lack of
professionalism of performers. Figure 1
THE COSTS ON CONSTRUCTION THE CENTRAL OLYMPIC STADIUM (THOUSANDS $ UPON
SPECTATOR)
Experts of the international rating agency Moody’s stated that the Olympic Games in
Sochi will not bring visible benefits to the Russian economy. The Moody’s says that the effect of
the Olympics will be unequal for different subjects of economy. Probably, it will be neutral for
state-owned corporations, because their brands have already recognized and do not need in
additional promotion and Olympic costs are low, comparing to the overall scale of activity. In
the retail sector expecting a sales growth during the Games, but this positive effect will be short
and will not have much impact on businesses.
Possibly, the telecommunication companies will be able to recoup quickly their
investments by covering unmet demand in the region. Energy companies are only slightly got a
benefit from the modernization of infrastructure, which is financed mainly by public funds.

Academy of Strategic Management Journal Volume 15, Special Issue, 2016
10
Figure 2
IN HOW MUCH HAS THE COSTS INCREASED DURING THE CONSTRUCTION
International Sponsors will benefit from the Olympics due to obtained exclusive
marketing rights. Media companies will be able to increase the amount of advertising sold with
its growing popularity of digital interactive display broadcasts on computers and smartphones.
The report says Moody' says, that the Olympics will have negative impact on the financial
condition of the Russian state-owned banks that provide loans and capital invested in Olympic
developers.
The main economic risks associated with the cost of the Games are the uncertain
prospects of the Olympic legacy, which eliminates all the short-term positive effect. So, for
example, the city of Sochi and the entire Krasnodar region received tangible benefits from
government subsidies allocated for the preparation for the Games. But later they will have to
provide the content of the Olympic facilities, and established in the Olympic infrastructure
project, judging by emerging in recent days in huge quantities reviews, leaves much to be
desired.
This applies, in particular, to the quality of the onshore facilities and road networks.
Chances are good that soon a significant part of infrastructure will require additional funds for
rehabilitation and completion that will further lengthen the payback period of record ($ 50
billion) Olympic investment.
RESULTS
Among the advantages, disadvantages and the main problems with the program of the
Winter Olympics in Sochi, mentioned by experts (professors of Kazan federal university, Russia)
and students (76 people), we have combined into two groups: «Myths of the economy» and
«Economic reality» (Tab.1, Tab.2).
Also, students mentioned myth about disinformation in social networks. The information
spreads stubbornly In Social Networks, in which the authors divide the cost of the Olympics to
the number of citizens of Russia and claim that instead of the Olympics could be distributed to
every Russian 4 million rubles.
In fact, a simple calculation shows that this is not true. If you multiply 4 million rubles to
143 million people in Russia we get 572 trillion rubles (almost 16 trillion of U.S.$) - an

Academy of Strategic Management Journal Volume 15, Special Issue, 2016
11
astronomical sum, which corresponds approximately to the entire U.S. public debt. In reality, on
the Olympics have been spent in 10,000 times less than budget money.
Another common myth, that the students have identified - the Olympic Games do not
need Russian regions from an economic standpoint. It is not! At least, with tourist and
recreational points of view.
Table 1
THE RESULTS OF POST-OLYMPIC SURVEY 2ND YEAR STUDENTS MAJORING IN "ECONOMICS"
OF KAZAN FEDERAL UNIVERSITY
Myths of the economy
It’s myth.
«Agree»/
«Disagree»
Economic reality
It’s reality.
«Agree»/
«Disagree»
I. Advantages
1) the creation of jobs;
II. Disadvantages
2) significant problem of quality
of construction, the principal risk
is that the main sports facilities
are being built in the Imereti
lowland, which means in fact, in
the swamp;
3) Sochi isn’t gain from the rush
of Olympic construction, which is
mainly in the triangle Adler -
Krasnaya Polyana - Imereti
lowland;
4) undeveloped infrastructure,
poor environment, dirty beaches
and coastal waters will further
contribute to the reduction of
interest in Sochi after the
Olympics, stressing the problem
of lack of demand for facilities
under construction;
5) the pollution environment;
49% / 51%
49% / 51%
29% / 71%
40% / 60%
I. Advantages
6) increasing the prestige of Russia
and it’s positioning in a worldwide
7) massive increasing interest in
sports among the population,
provision of sports facilities in the
region;
8) colossal development of
infrastructure in Sochi, his resort
and tourist potential;
II. Disadvantages
9) The most serious problem in
Russia, as in other countries, that
taking Olympiads, Universiades, is
the demand of Olympic venues after
the games. Given half a million
populations and seasonally Sochi
resort importance of the region, take
place a high risks of not having a
payback of objects.
84% / 16%
95% / 5%
77% / 23%
48% / 52%
CONCLUSIONS
Among the experts of Kazan Federal University majority (83%) agree that the economic
situation of the myths are 3) and 4) economic reality - 6) and 8) (91% of respondents agreed)
(Tab.2).

Academy of Strategic Management Journal Volume 15, Special Issue, 2016
12
Table 2
THE RESULTS OF POST-OLYMPIC SURVEY OF EXPERTS OF KAZAN FEDERAL UNIVERSITY
Myths of the economy
It’s myth.
«Agree»/
«Disagree»
Economic reality
It’s reality.
«Agree»/
«Disagree»
I. Advantages
1) the creation of jobs;
II. Disadvantages
2) significant problem of quality
of construction, the principal risk
is that the main sports facilities
are being built in the Imereti
lowland, which means in fact, in
the swamp;
3) Sochi isn’t gain from the rush
of Olympic construction, which is
mainly in the triangle Adler -
Krasnaya Polyana - Imereti
lowland;
4) undeveloped infrastructure,
poor environment, dirty beaches
and coastal waters will further
contribute to the reduction of
interest in Sochi after the
Olympics, stressing the problem
of lack of demand for facilities
under construction;
5) the pollution environment;
20% / 80%
63% / 47%
50% / 50%
39% / 61%
I. Advantages
6) increasing the prestige of Russia
and it’s positioning in a worldwide
7) massive increasing interest in
sports among the population,
provision of sports facilities in the
region;
8) colossal development of
infrastructure in Sochi, his resort
and tourist potential;
II. Disadvantages
9) The most serious problem in
Russia, as in other countries, that
taking Olympiads, Universiades, is
the demand of Olympic venues after
the games. Given half a million
populations and seasonally Sochi
resort importance of the region, take
place a high risks of not having a
payback of objects.
91% / 9%
88% / 12%
91% / 9%
80% / 20%
CONCLUSION
The first group of myths related assumption that the Games will be a catalyst of economic
problems. In our point of view, as a result of the preparation for the Olympic Games, Sochi has
been turned into a world class resort; revenues generated by this federal budget will be spent on
solving social problems somewhere else. Among the findings of the «economic reality» - the
high level of infrastructure development in the regions of Russia, as well as the principles for the
development of international economic relations in modern after Olympic Russia.
REFERENCES
Pestereva N. (2015) University Network of Volunteer Training Centers as a Social Project of the Sochi-2014
Olympic Winter Games Heritage. Procedia - Social and Behavioral Sciences 214, 279 – 284.
Parent Milena, MacDonald Darlene & Gabriel Goulet (2014). The theory and practice of knowledge management
and transfer: The case of the Olympic Games. Sport Management Review 17, 205–218.

Academy of Strategic Management Journal Volume 15, Special Issue, 2016
13
Willick S., Lexell J. (2014) Stories From Sochi: Sun, Sea, Snow, and Salt. PM&R, Volume 6, Issue 8, Supplement,
S76-S79.
Sokolov A. (2013). Zatraty na Olimpiadu v Sochi rekordnye za vsyu istoriyu Rossii.
http://igpr.ru/articles/zatraty_na_olimpiadu_v_sochi.
Khalmurzoev S. (2014). Olimpiadu sochli bespoleznoj dlya economiki. Utro. -
http://www.utro.ru/articles/2014/02/06/1173365.shtml
Annual report on the activities of Sochi 2014.
Seiler S. (2014). Same citius, altius, fortiu more women, crashes, and McTwists? International Jornal of Sports
Physiology and Performance, 9 (1), 122-127.
Olegovna K.E., Naumova O.B.(2013). Avalanche risk estimation for Adler-Krasnaya Polyana-Pslukh road,
Northwest Caucasus, Russia. World Applied Sciences Lournal, 28(8), 1061-1064.
Moretti A. (2013). The interference of politics in the Olympic Games, and how the U.S. media contribute to it.
Global Media Journal, Canadian Edition, 6(2), 5-18.
Kolesnikov S.I., Tlekhas Z.R., Tatlok R.K., Kazeev K.S. (2013). Evaluation of resistance of mountain meadow
subalpine soils of the caucasus to pollution with heavy metals, crude oil and oil products by biological
indicators. Middle East Journal of Scientific Research, 16(8), 1088-1093.

Academy of Strategic Management Journal Volume 15, Special Issue, 2016
14
E-LEARNING PRACTICE USING MOODLE BY
LEADING UNIVERSITIES IN THE RUSSIAN REGION
Irina Malganova, Kazan Federal University
Adelina Rahkimova, Kazan Federal University
ABSTRACT
The aim of this work was to analyze the principles and to use e-learning practices in 70
of the best universities in the world in development of copyright-based distance learning courses
in Moodle of Institute of Governance and Territorial Development KFU. Wherein, we used the
methods of grouping and regional analysis. Since 2008, the "Modular Object-Oriented Dynamic
Learning Environment" used at Kazan federal university (Russia, Kazan) on three main areas:
"Zilant", "Bars" and "Tulpar". The author and his colleagues developed a series of e-learning
resources in disciplines of "Economic geography", "Regional Economics and Management", etc.
The analysis of using the system of Moodle in above universities for teaching economic subjects
revealed a number of features:
a) The simplicity and popularity of the LMS «Moodle» resonates with students from many
universities. For example, the London School of Economics and Political Science and the
University of London was originally used as a commercial product (WebCT), but at the moment
the the transition of the Moodle system was almost completed, acting on a uncommercial basis,
and b) nowadays plug language packs allow you to achieve full localization in 43 languages
Moodle. The plan of the KFU science group is using the system in Tatar language, c) The
Princeton Regional Schools Moodle Server shows us one more time about the consistency of the
system: flexibility, interactivity, cooperation and motivation. Moodle can combine the creation,
editing, and reviewing training materials of the teacher and the student.
INTRODUCTION
Education in the 21st century requires the use of creativity and innovation in teaching
technology. In the world’s leading universities, including the top 100 QS World University
Rankings [3], the tendency is observed of increasing the development work of students and the
decreasing of classroom lessons. Therefore, Learning Management Systems (LMS), which form
the basis of effective provision of distance education, are quickly developing. For LMS
information we can refer to:
- Open source software: Moodle, Sakai, ATutor, Whiteboard;
- Commercial: WebCT / Black board, Gradepoint, Desire2Learn, Learn.com.
The vast amount of functions and possibilities within the system of education
management have made Moodle (Modular Object-Oriented Dynamic Learning Environment) a
vital virtual learning space used in major universities such as Massachusetts, Stanford, Princeton,
Oxford, London School of Economics, etc. Courses on a variety of subjects, including economic
disciplines, are available on the universities' servers.

Academy of Strategic Management Journal Volume 15, Special Issue, 2016
15
MATERIALS AND METHODS
In the presented work a review was carried out of the top 70 universities in the world
(TOP-100) on the application of the open LMS Moodle for teaching economic subjects. The
review was done in order to analyze the principles and practices of the use of e-learning by the
investigated world Universities in the development of copyrighted distance learning courses on
the basis of Moodle in the Institute of Management, Economics and Finance of Kazan Federal
University (Russia, Republic of Tatarstan, Kazan).
The review includes a system of economic disciplines, which are publicly available and
are free. This invaluable humanitarian venture in universities enabled the use of the foreign
practice of e-learning in Kazan Federal University for teaching students of the specialty of
"Regional Economics and Management" and "World Economics".
Since 2008, the "Modular Object-Oriented Dynamic Learning Environment" has been used in
Kazan Federal University in three main areas: "Zilant", "Bars" and "Tulpar." The names of the
areas are from Tatar legends and fairy tales.
Zilant - a mythological creature that has the appearance of a dragon or snake. In 1781, by
imperial decree, Zilant was placed on the coat of arms of the Kazan province. Since then Zilant
has been the symbol of the city of Kazan. "Zilant" - "historically" the first platform in Kazan
Federal University, which was established in 2008 on the basis of the Faculty of Computational
Mathematics and Cybernetics (currently a member of the Institute of Computational
Mathematics and Information Technology). ZILANT uses MOODLE version 1.9.x.
"Bars" - the central image of the coat of arms of the Republic of Tatarstan. In ancient times, the
Volga Bulgars’ deity of fertility and patron of children. On the coat of arms of the Republic of
Tatarstan "Bars" is the patron of the citizens of the Republic and its people. The platform "Bars"
was established in the Tatar State Humanitarian and Pedagogical University (TSHPU), which
became part of Kazan Federal University in 2009.
"Tulpar" - a winged horse in Tatar and Bashkir mythologies, which corresponds to
Pegasus in Greek mythology. This platform has been in use since 2012, and it is equipped with
MOODLE 2.x.
The author in collaboration with colleagues developed a number of electronic educational
resources on “Regional Economics and Management” (Fig. 1), “Economic Geography” (Fig. 2),
etc.

Academy of Strategic Management Journal Volume 15, Special Issue, 2016
16
Figure 1
SCREENSHOT OF THE ELECTRONIC EDUCATIONAL RESOURCE “REGIONAL ECONOMICS AND
MANAGEMENT” BY MALGANOVA I., MAKAROVA E
Figure 2
SCREENSHOT OF THE ELECTRONIC EDUCATIONAL RESOURCE “ECONOMIC GEOGRAPHY”
BY MALGANOVA I., BUTOV G

Academy of Strategic Management Journal Volume 15, Special Issue, 2016
17
The presented electronic educational resources were compiled on the basis of the E-
learning practice using Moodle of leading universities.
RESULTS
The analysis of Moodle usage for teaching economic disciplines in the above mentioned
universities revealed a number of peculiarities:
A. The simplicity, popularity and interactivity of LMS «Moodle» find a response among
students from many universities. For example, the London School of Economics and Political
Science of the University of London originally also used a commercial product (WebCT),
however at the moment the transition to the Moodle system is practically completed, acting on a
nonprofit basis. Of interest is the online market place MITOPENCOURSEWARE of
Massachusetts Institute of Technology, which once again confirms the 1st place of the university
in the Top-100 ranking. On the web-site 62 opened courses on Economics are available (among
them 35 Bachelor courses, 27 – Masters).
In general, at universities the number of open courses for undergraduate studies ranges
from 15 to 55, for masters from 10 to 46, although the concern is not the quantity but the quality
of available resources. In virtually all 70 universities such classic economics courses as
«Macroeconomics», «Microeconomics», «Econometrics», «Statistical Methods in Economics»,
etc. are presented of the 70 universities (from Massachusetts to the London School of
Economics), 68% of educational establishments offer open courses of economics at the global
level: «The World Economy», «International Economics», «International Trade», «International
Finance», «International Political Economics». All these disciplines are used by students of KFU
specializing in "World Economy" as an additional resource when preparing for a seminar on
"Regional Economics and Management."
However, for the course on Regional Economics only one open access source was found,
«Urban and Regional Economics» of the University of Toronto (Canada). From our point of
view the reason is that the notion “region” in terms of globalization becomes a multi-scale
concept. In Russia all 83 members of the Russian Federation are considered as regions, which
are highly contrasted in terms of territory, administrative arrangement, population and economic
potential (Moscow, Saint-Petersburg, the Sverdlovsk region, the Chechen Republic, Perm
Territory, the Republic of Tatarstan, Chukot Autonomous Area, etc.). On the other hand, there are
cross-border regions («Benelux», «Neisse», «SaarLorLux»), as well as world regions that have
supranational institutions.
In general, the principles used in the LMS Moodle by foreign universities are transmitted
to the experience of electronic educational sources introduction in regions of Russia and allow
the provision of: multiple information representation; the interactivity of the education; multiple
repetition of the studied material; the creation of an always-on reference system; effective control
of studies; privacy of education; conformity to the principles of effective studying.
B. Pluggable language packs allow the achievement of complete localization; nowadays
43 languages are used in Moodle. The scientific group of KFU plans to develop an electronic
educational source in the Tatar language. 36% of all Tatars that live in Russia are residents of the
Tatarstan Republic, the rest are scattered in 30 regions of Russia. The total amount of Tatars is
about 8 million people.
C. Within the electronic educational resource “Economic Geography” students attending
this course also have an opportunity to use geo-information systems (MapInfoProf.7.5) for
developing thematic base maps (Fig.3). The usage of geoinformation systems is caused by the

Academy of Strategic Management Journal Volume 15, Special Issue, 2016
18
interdisciplinarity of the “Economic geography” course. Map development and geographical
analysis are not of a recent origin. However hybrid technology provides a modern, more
effective, graphic and fast approach to the analysis and solution of problems facing humanity as
a whole and economic organizations or groups of economists in particular. It automates the
procedure of the analysis and prognosis. Figure 3
A BASE MAP. TERRITORIAL DIFFERENTIATION OF THE POPULATION’S QUALITY OF LIFE IN
ADMINISTRATIVE REGIONS OF TATARSTAN REPUBLIC. MODERATELY OPTIMISTIC SCENARIO
Due to the use of hybrid technology in electronic educational resources, students can:
have an idea of hybrid technology, the process of their development and work with electronic
maps; create economic data bases for any region and work with them; know the main aims of
hybrid technology and the possible use of them in different economic spheres; learn to work with
hybrid technology software.
CONCLUSIONS
In the work general opportunities were outlined, available for the professors compiling
courses in Moodle of the universities under study, as well as of the Kazan Federal University: the
possibility of having online study materials; the usage of the sources both in full-time and part-
time attendance; the opportunity to create bridging programs, in which the syllabus is defined by
the end of the academic activity; the capacity of monitoring the process of education and work
individually with each student; the possibility of exchanging study courses with other professors
working in Moodle.
Social aspects: The authorial courses presented in the work allow students to study at
convenient but limited times (this is very important for disabled-students and those who missed
classes through illness, etc.). Moreover, students have an opportunity to create educational

Academy of Strategic Management Journal Volume 15, Special Issue, 2016
19
audio/video resources in several languages (Russian, Tatar, and English) in coordination. This
leads to the development of creative and research activities of students in a multicultural region.
The experience of leading universities in the usage of the given LMS lets us take into account
both its social and technical aspects: in Moodle it is possible to develop, edit and review teaching
material in combination between a professor and a student. Joint creativity provides scientific
progress.
CONCLUSION
A survey conducted among first-year students of the Institute of Management, Economics
and Finance studying “Economics” (groups 7331-1,7331-2,7331-3; 91 students) showed that
despite not using electronic educational services in the schools of 93% of responders, students
have a positive attitude towards the usage of the LMS Moodle in their studies (94% were “for”,
6% - had no information). 82% of those questioned would be happy to use open access courses
of the world’sleading universities while preparing for their practical classes and independent
works (12% have a language barrier).
The flexibility, interactivity, educational cooperation and social importance of the
electronic educational resources should be supported by the openness of professors that introduce
their courses to Moodle, and the motivation of students to advance their educational level by all
accessible, effective and modern means.
REFERENCES
Andreev A.V., S. Andreeva, Dotsenko I.B. (2008). The practice of using e-learning Moodle (pp. 124-134).Taganrog:
Publish. house. TTISFU.
Ustyugova V.N. (2010). Practicum of learning opportunities for working in the Moodle distance teaching system.
(pp.34-44). Kazan The tutorial. TGGPU.
http://www.topuniversities.com/university-rankings
www.moodle.org
www.sakaiproject.org
www.atutor.ca
www.whiteboard.Sourceforge.net
www.blackboard.com
www.gradepoint.net
www.desire2learn.com
www.learn.com
http://zilant.kpfu.ru/
http://bars.kpfu.ru/
http://tulpar.kpfu.ru/
http://ocw.mit.edu/index.htm

Academy of Strategic Management Journal Volume 15, Special Issue, 2016
20
ALGORITHMS OF PARAMETRIC ESTIMATION OF
POLYNOMIAL TREND MODELS OF TIME SERIES ON
DISCRETE TRANSFORMS
Ismagilov I.I, Kazan Federal University
Khasanova S.F, Kazan Federal University
ABSTRACT
A forecasting of economic and financial indicators is the actual problem of strategic
management. A time series forecasting often uses simple econometric models. The trend and
seasonal trend models are among the popular models for forecasting. In some cases researchers
need to analyze vector time series. The traditional algorithms of estimating time series models
may be associated with a sufficiently high computational complexity. We propose the
applications of oblique discrete Walsh transform to the synthesis of estimation algorithms of
polynomial trend models' parameters of time series. Algorithms evaluate polynomial models that
not above the third degree in a non-orthogonal basis of discrete exponential functions and
orthogonal basis of discrete Chebyshev polynomials. The advantage of these algorithms is the
computational efficiency, which associated with a significant reduction of the multiplicative
complexity of algorithms in comparing with direct estimation of polynomial trend models.
Key Words: Time Series, Polynomial Trend Models, Parametric Estimation, Discrete
Transforms, Oblique Discrete Walsh Transformations
INTRODUCTION
Time series analysis and forecasting are the actual problems of finance, marketing,
strategic planning and management. In the strategic management the most actual problem is
forecasting strategic competitiveness of company. In the aim of solving this problem analytics
need to forecasting financial and economic indicators of companies and markets. The main
researches use one of two ways for analysis and forecasting time series: parametric and
nonparametric econometrics. The parametric approach often bases on one-dimensional time
series models as trend and seasonal trend models, ARMA and ARIMA. The nonparametric
approaches use modern ways of analysis and forecasting as neural network, fuzzy logic etc.
These methods also show high efficiency on financial markets.
An effective solution to a wide range of applications of time series analysis (TSA) is
bases on the use of discrete transformations (DT). These transformations are the acknowledged
tools for creating computationally efficient algorithms for solving problems of time series
analysis (fast algorithms, algorithms with a reduced computational complexity of algorithms
with balanced computational complexity).
In TSA, the discrete orthogonal transformations (DOT) are widely used in the different
orderings of discrete Walsh functions (DWF). We propose a number of generalizations of DWF
systems including the oblique ways. Among the oblique DWF should be noted discrete systems
of inclined Walsh functions and piecewise exponential functions. These generalizations of
oblique discrete Walsh systems are bases on the systems of orthogonal and non-orthogonal
Rademacher functions. In introduced the oblique systems of discrete functions entitled "discrete

Academy of Strategic Management Journal Volume 15, Special Issue, 2016
21
bases of piecewise exponential functions". However, these can be build using the shifted inclined
Rademacher functions, and we presume should be call as «discrete bases of shifted inclined
Walsh functions". For brevity, we will use the name for these bases "oblique discrete Walsh
bases".
In the frame of this work, we realize under the DT is the transformation introduced by
multiplying a vector by a matrix whose rows are the basis vectors of an orthogonal or oblique
discrete basis with nN 2 dimension: ,fBF N
where TNiif }1,0),({ f - N- dimensional time series vector; TNiiF }1,0),({ F - N-
dimensional vector of coefficients DT.
In this work, we develop efficient (computationally) algorithms for parametric estimation
of polynomial trend models of time series based on the oblique DT.
TREND MODELS OF TIME SERIES
Effective application DT is in the creating time series models for solving problems of
analysis and forecasting. Many problems of TSA have deal with regular time series (TS). In the
analysis of time series structures often take the typical model in the form of an additive sum of
four components: trend, seasonal fluctuations, cyclical component and random component.
Frequently, depending on the particular situation the truncated models are used. Thus, some
applications limited to using the form model:
1,0),()()( Njjjpjf ,
where )( jp - trend (function deterministic trend); )( j - stationary random component.
The task of allocation trend, in which it reduces to identify the class of adequate models,
is important in many TSA applications. Among these time series processing tasks may be noted
the problem of identification, smoothing, extrapolation, components extraction and spectral
analysis of time series. This is because in TSA tasks the time series is divided to the components
and further the components are studied. Even when a trend in itself is not of interest, it is
necessary to study the allocation of the spectrum at higher frequencies. Many researchers have
noted the importance of taking into account the trend in the spectral analysis of time series. In
recommend taking into account the trend at all stages of the analysis. There are also methodical
guidelines of another nature. For example, in case when the decision on removal of the trend is
made on the selection of the researcher, this case also assumes that in the procedures of the time
series analysis must be phase of analysis of trend.
The task of trend determination is important in the construction of regression models
based on data as TS. It is necessary to take into account the presence or absence of stochastic
(non-deterministic) trend in the analyzed series and set the class of each of the series. There are
two classes of TS:
1) TS (trend stationary) series - stationary relative to the deterministic trend;
2) DS (difference stationary) series - the series with a stochastic trend (perhaps with a deterministic trend)
and leads to a stationary form only by a single or k-fold differentiation.
As a mathematical model trends usually use parametric models in the class of
polynomial, harmonic, polyharmonic and exponential functions, spline and spline-like models.
However, in cases where the time series has no obvious trend or character of the trend may

Academy of Strategic Management Journal Volume 15, Special Issue, 2016
22
changes over time, researchers use the smoothing methods based on the low-frequency digital
filtering. Method of non-recursive polynomial filtering is widely spread. Smoothing method for
the isolation of trends must be used with caution; in some situations, it may not be appropriate
due to distortion of residual time series component. Note that the methods of allocation of the
trend based on piecewise polynomial approximation structures (spline and spline-like models)
represent a compromise between the method of filtering and the polynomial model (PM) trends.
In practice, describing of the polynomial model uses a finite degree of discrete power
function. Polynomial trend models are often limited by small degrees (no more than the third)
and parameter estimation uses method of least squares (OLS).
PM TS trends can be described in two ways: in the basis of discrete exponential functions
and in the basis of discrete Chebyshev orthogonal polynomials. PM trend
k-th degree in the basis of discrete exponential functions given by
k
i
ii Mjjajf
0
.1,0,)(
An expansion of a system of orthogonal polynomials of a discrete variable
}1,0,,0),,({ MjkijipM introduces the orthogonal PM with k-th degree on a regular grid in
form:
k
iM MjjipiCjf
0
,1,0),,()()(
where
1
0
);,()()/1()(M
jMi jipjfdiC
1
0
22
2).,()(
M
jMMi jipid p
This expansion determines the result of the approximation of the time series vector, the
optimum in terms of the OLS criterion. It uses discrete polynomials on a regular grid, orthogonal
with unit weight function - a discrete Chebyshev polynomials (DCP).
EVALUATION OF POLYNOMIAL TREND MODELS BASED ON DISCRETE
MOMENTAL TRANSFORMATIONS
The classic algorithm for estimating the PM trend by OLS is associated with the
calculation of the components of vector of the initial degree moments (hereinafter just moments)
of time series vector (method of normal equations of the right side of the system), which we
denote .},0,{ T
i kim m The i-th moment of the order given by the formula:
1
0
).(M
j
ii jfjm

Academy of Strategic Management Journal Volume 15, Special Issue, 2016
23
Solution of the normal equations at low degrees of PM is the explicit formula for
calculating the estimated coefficients. The formulas for calculating the coefficients of the third
degree of PM in the compensation form (the coefficients of higher orders) using the results of the
discrete moment transform are as follows:
3
2
210004
1
6
121
2
)1(a
MMa
MMa
Mmwa
3
21011
10
4313
1)21(
aMM
aMmmMwa
3
21022
2
13
)61621(
aM
mmMmMMwa
)20130
32164321(
32
1033
mmM
mNMmNMMwa
where 3210 ,,, wwww - weighting coefficients of the form:
)),4)(1(/(30
)),1(/(6,/1
22
2
2
11
MMMw
MMwMw)).6)(6)(1(/(140 222
3 MMMMMMw
The algorithm uses a discrete momentary transform of the time series vector and it
contains the main computational costs. Direct algorithm for computing the moments
characterized by the following estimates of the computational complexity (excluding the cost of
generating power functions): ).2(,12)1( MkMukMkAd
Reducing the complexity of the procedure of calculating the moments can be achieved by
using a recursive algorithm that does not require multiplication for its realization. However, in
case of calculated moments above two, the additional complexity of recursive algorithm is
significant and exceeds the total number of basic arithmetic operations of direct algorithm. We
note also that the recursive algorithm has a smaller numerical tolerance for the faults of rounding
and requires the full sample of time series to the start time of the calculations. Sometimes this
can lead to a delay the time of issuing calculation results that is often unacceptable for time
series processing in real-time mode.
For the effective (computationally) algorithms of the PM coefficients assessment can use
the spectral approach, based on the orthogonal discrete transforms of time series vector. In
studied and developed this approach to the synthesis of algorithms for estimation of PM's
coefficients. The main results of this work relates to the synthesis of OLS estimation algorithms
(when nM 2 ) based on the traditional Walsh transformation. These algorithms have practical
importance as the effective implementation of binary arithmetic tools. At low degrees of PM
these algorithms can reduce the multiplicative complexity compared to direct algorithms. The
development of the spectral approach was in, where were the issues of synthesis algorithms for
estimating the PM by OLS and its generalizations on the basis of transforms in the Walsh-like
bases of piecewise polynomial functions. Orthogonal PM trends can also be constructed using
generalized orthogonal discrete Walsh transforms that introduced in. These results are of general
nature and synthesize algorithms with different complexity characteristics as in a one-
dimensional and multi-dimensional formulation. Further DT generalizations use discrete Walsh
functions for the synthesis of the considered class of algorithms.
ESTIMATION OF POLYNOMIAL TREND MODELS BASED ON THE DISCRETE
OBLIQUE WALSH TRANSFORMS
Let us introduce an approach to the parametric estimation of PM trend of time series
based on discrete transformations of orthogonal and oblique (non-orthogonal) generalizations of

Academy of Strategic Management Journal Volume 15, Special Issue, 2016
24
Walsh functions. Further for such DT generally will stick to the name discrete Walsh transform
(DWT), implying a generalized discrete transformations as orthogonal and oblique ways. We
restrict ourselves to the consideration of the one-dimensional case.
Let f - N-dimensional time series vector. We put him in the line N-dimensional
( nrrrN ...21 , MN ) advanced time series vector TMN },{*
0ff , where L0 - L-dimensional zero
vector.
Obviously, the initial degree of time series points and the extended time series vectors are
equal. This allows recording the classic vector-matrix ratio to calculate the vector of parameter
PM Ti kia },0,{ a , where },...,1,0{ minrk , },1,min{min nirr i by OLS in the following form:
,)( ,11
1,1, FVXXa NkkMT
kM
where 1, kMX - matrix of independent variables (structural matrix) of the form
)(1
1
0
1, ik
M
i
kM
xX
),0,()(1 kjii j
k x ;
Nk ,1V - matrix of weighting coefficients;
F - DT extended vector of the time series vector.
Values of i-th rows elements of the matrices can be determined using analytical
descriptions of the properties of discrete power functions lower than i-th order using Walsh
functions.
This transform of the time series vector equals to the basis vectors, which the right
truncated to dimension M. The possibility of constructing estimation algorithms for random
dimension time series vector of smaller dimension of DWF significantly expands the tools of
algorithmic parametric identification of PM. This creates favorable conditions for the widespread
introduction of the PM assessment algorithms based on the DWF in the practice of processing
digital data.
Obviously, in terms of feasibility, special attention should be paid to the use of DWT in
dimension nN 2 . Let us more detail on the algorithms for estimating the PM of the third degree
inclusive, using the oblique discrete Walsh transforms (ODWT).
The results of synthesis of algorithms estimating the PM is lower than the second degree
of the trend by ODWT in the basis of discrete power functions are presented in. However, in not
point at the advisability of using oblique version of the discrete Walsh-Hadamard transformation.
This is because fast algorithms of these transformations are the most rational in complexity of
realization among different transformation algorithms for ordered oblique systems of discrete
Walsh functions in dimension nN 2 . In this case, the formula for estimating the coefficients of
the PM of the third degree is as follows:
3
2
21)0(
0004
1
6
121
2
)1(a
MMa
MMa
MSwa
,
32)1(
1)0(
01110
43131)21( a
MMaMSSMwa
,
3)1,1(
2)2(
1)1(
1)0(
0222
13))4(61621( a
MSSSMSMMwa
,

Academy of Strategic Management Journal Volume 15, Special Issue, 2016
25
)),)1(486(20)4(13032164321()1,1,1(
32,)1,2(
3)3(
1)1,1(
2)2(
1)1(
1)0(
033 SSSSSMSMMSMMMwa n
where
;3,1,)2(2);0(1
0
)(
1
)0(
0
kFSFS
n kk
;
)22(2 21
1 12
212
0
1
1
1)1,1(2
FS
n n;
),2212()2121 12
212()2212(1
122
212122
01
1121
01
012)1,2(
2
FFS
n nn n
)222(2 321
1 12 23
3213
0
2
1
1
1
3)1,1,1(
3
n n nFS
Consider the problem of synthesis of algorithms for calculating the coefficients of the
expansion in the basis DCP dimension M, which is lower than the third degree using by ODWT
in dimension. The explicit form of the formulas for calculating the coefficients of the expansion
at low degrees of DCP easy to obtain based on their analytical descriptions in a power function.
The resulting formula for calculating the coefficients of the expansion by DCP not higher than
the third degree without taking into account the normalization operations can be written in the
following form:
,)0( )0(
0SC ,211 )1(1
)0(0 SSMC )4(616212 )1,1(
2)1(
2)1(
1)0(
0 SSSMSMMC
),)1(486(20)4(130321643213)1,1,1(
32,)1,2(
3)1(
3)1,1(
2)1(
2)1(
1)0(
0 SSSSSMSMMSMMMC n
Where )(vkS - values, which were given above in the description of the algorithm of
estimation of PM in the basis of discrete power functions.
The resulting algorithmic solutions can be effectively used for the estimation of non-
linear models of other classes’ trends. Here are some non-linear models in estimating trends,
which can be effective for PM estimation algorithms based on ODWT. These trends are non-
linear models, which reducible to polynomial with discrete degree. Information about such non-
linear trends is in the table. Table 1
Dependence Conversation Linearized dependence
taby
yY ln
btaY ln
btaey
yY ln
btaY
btay
1
yY /1
btaY
2)( btay
yY
btaY
2
y ttcab
yY ln
ctbtaY lnlnln 2
In carried the comparative analysis of the computational complexity of algorithms for
calculating the PM trends of time series, which not higher than the second degree based on DT.
An analysis of the computational complexity of algorithms for estimating the PM of low degrees
shows the following. A sharp decline in the multiplicative complexity with some increase in the
additive complexity is in higher degrees of the time series vector comparing with the traditional
direct algorithms. However, the total amount of basic arithmetic operations in these algorithms is

Academy of Strategic Management Journal Volume 15, Special Issue, 2016
26
less than in the direct algorithm. So ODWT based algorithms have a relatively high
computational efficiency than algorithms based on orthogonal DPU. This is because ODWT has
a low computational complexity. This algorithms are not use the subtraction and reduce
computational cost on the generation of the weighting factors and if the generation was in tabular
manner, algorithm uses constant volume of the storage device. At higher degrees of time series
vector the memory savings is quite large (the amount of permanent storage device determined by
the number of multiplications).
CONCLUSION
This study shows that the developed algorithms for estimating the PM of time series
trends by OLS have the computational efficiency. The use of these algorithms will speed up the
solution of the problem of extraction trends of certain classes and detrending time series. This
algorithms orient for efficient hardware implementation of a binary arithmetic means. This is
mainly due to the relatively low computational cost for the implementation of fast algorithms
truncated ODWT and the possibility of replacing the multiplications for the integer degree of two
by binary shift operations.
REFERENCES
Ismagilov, I.I & Khasanova, S.F (2014). Rating assessment of companys competitiveness based on fuzzy sets
approach. SGEM Political sciences, law, finance, economics and tourism, vol III: International
Multidisciplinary Scientific Conferences on Social Sciences and Arts. 465-472. DOI:
10.5593/sgemsocial2014B24
Box, G.E.P., Jenkins, G.M. (1976) Time Series Analysis: Forecasting and Control. (revised ed) San Francisco
Holden-Day.
Ismagilov, I.I. Khasanova, S.F., Short-Term Fuzzy Forecasting of Brent Oil Prices. (2015) Asian Social Science,
11(11), 60-67. DOI: 10.5539/ass.v11n11p60
H. F. Harmuth (1977) Sequency Theory: Foundations and Applications Academic, New York.
Ahmed N., Rao K.R. (1975) Orthogonal transforms fordigital signal processing. Springer- Verlag,
Berlin,Heidelberg, New York.
Golubov, B.I. (2008) Walsh series and transforms: theory and application. Izdatelstvo LKI, Moscow.
Smirnov, Y.M. (1984) Design of specialized information systems. Higher School, Moscow.
Ismagilov, I.I. Discrete transformations in the bases of the Walsh-like functions: Basic theory and application in
digital signal processing. (2003) Fatherland, Kazan.
Ismagilov, I. I. An approach to ordering of systems of the walsh discrete functions. (2006) Radioelectronics and
Communications Systems, 49(1), 46-50.
Ismagilov, I. I. Slant rademacher functions: Properties and application to the problems of digital signal processing.
(1996) Izvestiya VUZ: Radioelektronika, 39(12), 11-16.
Ismagilov, I. I. Discrete transforms in the bases of piecewise-exponential functions and their properties (2001)
Izvestiya Vysshikh Uchebnykh Zavedenij.Radioelektronika, 44(3), 54-60.
Ismagilov, I.I. On a generalization of the system of discrete Rademacher functions (1996) Reports of the Academy
of Sciences of the Republic of Uzbekistan, (8), 16-18.
Ismagilov, I. I. Oblique generalizations of the walsh basis (2010) Radioelectronics and Communications Systems,
53(12), p. 625-635. doi:10.3103/S0735272710120010
Marpl-j. S. L. (1987) Digital spectral analysis. New Jersey, Prentice Hall.
Nikiforov, A.F. Suslov, S.K. Uvarov, V.B. (1985) Classical orthogonal polynomials of a discrete variable, Nauka,
Moscow.
Chen, K. Efficient parallel algorithms for the computation of two-dimensional image moments (1990) Pattern
Recognition, 23(1-2), p. 109-119. doi:10.1016/0031-3203(90)90053-N
Ismagilov, I. I. A class of discrete orthogonal bases for representing and processing digital signals (1996) Automatic
Control and Computer Sciences, 30(3), 62-66.

Academy of Strategic Management Journal Volume 15, Special Issue, 2016
27
Ismagilov, I.I. Agliullin, I.N. Kirpichnikov, A.P. Kostromin, A.V. (2015). Polynomial models of digital signals
trends: algorithms based on the estimation of discrete transformation and comparative analysis of their
computational complexity. Bulletin of Kazan Technological University, 18(12), 132-138.

Academy of Strategic Management Journal Volume 15, Special Issue, 2016
28
COMPREHENSIVE ASSESSMENT OF THE
RELIABILITY OF THE BANK WITH THE
APPLICATION OF STATISTICAL METHODS
Gulnara Albertovna Gareeva, Kazan Federal University
Diana Ramilevna Grigoreva, Kazan Federal University
ABSTRACT
Russian banks are forced to work in conditions of high risks and often find themselves in
crisis situations. This is due to inadequate assessment of their own financial situation, attracted
and placed funds, the reliability and stability of clients. The indicators used for the characteristic
of activity of banks, should assess the reliability and efficiency of work.
The article gives the reliability prediction of commercial Bank by using statistical
analysis methods. Reliability analysis of a commercial Bank is to calculate various indicators of
banks ' financial condition based on data from its financial statements, which allow to receive
representation about the basic performance of the Bank using regression, correlation, cluster,
factor analysis. Different methods and approaches that have been proposed by Russian authors
for the analysis and assessment of reliability of commercial banks, testify to the importance of
this problem. The authors in the work of the Bank's reliability is meant the probability that the
Bank's operations for some period of time to meet certain criteria, i.e. the probability that the
Bank will manifest itself as a reliable. The author used General scientific methods: analysis and
synthesis, comparisons, generalizations, system approach. In the process of the actual study
material used methods of economic and statistical analysis. As a result the main tendencies,
problems of reliability of the banking sector.
Key Words: Reliability, Statistical Methods, Forecasting, Mathematical Model of Indicators of
Banks, Financial Condition
INTRODUCTION
Currently the banking system of the Russian Federation subject to serious modifications
and the main problem is the stability and reliability of commercial banks. The financial crisis has
exposed the deficiencies and inconsistencies of the management practices of commercial banks.
As a result, some banks suffered losses, and some went bankrupt.
To date, there are different points of view on the economic content of the concept of
"reliability" of a commercial bank. So, V.V. Ivanov believes that the reliability seen in the
performance of their obligations, as well as equals and reliability of the bank's creditworthiness.
O.B. Nesterenko, A. Buzdalin, A.A. Novikov is meant by a comprehensive assessment of the
reliability of the bank that meets certain criteria for a certain period of time. Generalizing all
interpreted by the author’s opinion, it can be concluded that the reliability of a commercial bank
depends on its stability. These concepts should not be in opposition.
Reliability analysis of a commercial bank is to calculate various indicators of the
financial condition of banks on the basis of its financial statements, which provide an overview
of the main results of the Bank by means of regression, correlation, and cluster and factor

Academy of Strategic Management Journal Volume 15, Special Issue, 2016
29
analysis. However, the practical application of methods focused on the detection of the current
problems of the banks and do not have important predictive purposes and neglected depending
on the reliability of individual banks on the financial stability of the banking system as a whole.
The Purpose of the Work
The aim of the work is to study the concept of "reliability", and considering the
application of statistical methods of analysis and forecasting for finding the reliability of OJSC
"AK BARS" Bank.
The paper addresses the following tasks: review of the Russian banking system, a place
of "AK BARS" Bank in her study of the concept of "reliability", analysis of the main trends and
factors of reliability of commercial banks, the choice of the basic methods of analysis and
prediction of the reliability of OJSC "AK BARS" BANK calculations to determine the reliability
of the bank.
METHODS
In modeling the socio-economic dynamics objectively have to deal with multifactorial
dependencies.
Multi-Factor Model:
)(ˆ xitfY (1),
where Yt - the projected figure,
xit - factors affecting the indicator
Linear multifactor model has the form:
xaxaxaxaaY ntntititttt......
22110 (2)
In order to build such a model, you must first select the factors that have the greatest
impact on the resulting indicator. It is necessary to select the most significant of them using
correlation analysis.
Correlation analysis serves only an additional tool for studying the relationship between
the factors, since the main factor correlation analysis - the coefficient of pair correlation -
characterizes the degree of approximation of dependence between two random factors in linear
form. In the linear multivariate model the task of assessing the extent to which the relationship
between the factors is approximately linear.
For the advanced detection of troubled banks using factor analysis - statistical analysis,
which helps to identify the minimum number of factors.
RESULTS
In our study, in order to find a comprehensive assessment of the reliability of the bank
were taken the following factors for the 10 largest banks in Russia: cash bank (x1), total assets
(x2), total liabilities (x3), the share capital (x4), means a credit institution in CBR (x5), due from

Academy of Strategic Management Journal Volume 15, Special Issue, 2016
30
credit institutions (x6), issued debt (x7), net loans (x8) and general safety factor (x9) (as
described in the specification is Kromonova CBR "Capital adequacy" (H1)).
All calculations were carried out in the application program Statistica. As a result of the
method of principal components 8 major components formed two main components: f1
(composed of x1, x2, x3, and x5) and f2 (composed of x4, x6, and x7). The analysis found that
for the 10 largest banks in the value of the deposit makes the component f1, total liabilities
characterize the sources of funds, they determine the direction of the use of resources, and cash
assets (f2) characterize the investment funds available in the bank's financial transactions. If we
apply the results of our object under study, OJSC "AK BARS" Bank, the Bank for 2015 held a
leading position in the field of lending.
The analysis found that in 2015 for the 10 largest banks in Russia the greatest value on
the contribution to the total dispersion was the first principal component f1. Her explanation was
attended 5 of 8 original variables - x1, x2; x3; x5; x8. Had the greatest load - x1.
To identify common features of banks can be divided them into homogeneous groups that help
us clustering method. As a result, 10 banks hearth-poured into 6 clusters. OJSC "AK BARS"
Bank one cluster with the bank "Russian Standard", which is natural, since they occupy in terms
of assets 20th and 19th places respectively.
Predicting the reliability of OJSC "AK BARS" Bank was conducted using the method of
multifactor models. The result was a quantitative value equal to 12,8, which is as close to the
general safety factor for Kromonov equal to 12,7.
As a result, it was concluded that for the next 2016 funds, the total assets, the share
capital increase, and total liabilities decline slightly, which shows a slight easing in financial
transactions on the foreign market.
Figure 1
PREDICTING THE RELIABILITY OF OJSC "AK BARS" BANK
Line Plot of у
Spreadsheet30 1v*30c
12,6
12,8
13,0
13,2
13,4
13,6
13,8
14,0
у

Academy of Strategic Management Journal Volume 15, Special Issue, 2016
31
Following the results of the analysis revealed that the OJSC "AK BARS" Bank reliable
level "above average" (highlighting the main component in the group, together with the bank, it
is better for some indicators). Bank earns the trust for the immediate future, as the final safety
factor of 12,8.
DISCUSSION
Factors of affecting complex assessment of the reliability of the Bank, as a result, of the
analysis the highest value on the contribution of the component containing the funds of the Bank,
total assets, total liabilities amounts due to credit institutions.
To increase equity and improve the reliability of the Bank recommended increasing the share
capital increase profitability by reducing costs. Despite a number of problems, OJSC "AK
BARS" Bank every year above rises among the largest banks in Russia, and thus increasing its
reliability.
Integrated use of multivariate statistical methods pos-will is not only to identify
homogeneous in the financial condition of banks, which is important for the evaluation of
competitiveness, but also to study objectively existing relationship between indicators of
financial and economic activity of banks in peer groups.
The frequency of such research will follow the dynamics of the banking activities, based on
which to build a forecast of the banking system as a whole.
In banking practice, further work is needed to improve the methods for constructing
summary measure that would accumulate the main part of the information on changing economic
conditions over time. Promising in this respect is the use of statistical methods of analysis,
allowing doing a comprehensive study of the activities of commercial banks.
REFERENCES
Buchstaber C. M., Horseflies, I., Shevchenko S. N. (1998). Statistical approach to the problem of assessing the
reliability of commercial banks. HSE economic journal. (1), 67-83.
Gotovchikov I. F (2005). Mathematical methods of assessment of banks ' credit ratings. Finance and credit,
23(113), 33-37.
Zelenin, T. A. assessment of the sustainability of the commercial Bank to macroeconomic shocks T. A. Zelenin
Vestnik Orenburg state University. - 2011. No.13. - S. 173-177. - 0,33 p. L. Economic library -
http://economy-lib.com/modeli-otsenki-i-upravleniya-kreditnym-riskom-kommercheskogo-
banka#ixzz3JaWlWV47
Nesterenko O. B (2001). Reliability of the commercial Bank and the factors determining it. Money and credit, 10,
38-40.
Presizer M (2010). Methodological aspects of forecasting Bank failures during the financial crisis. The audit and
financial analysis, (2), 12-20
Sukhov M. I (2013). Banking sector: some emerging regulatory issues. Money and credit, 4, 13-19.
Fetisov Gg (1999). The stability of the commercial Bank and the rating system of its evaluation. Finance and
statistics 2, 32-39.
Batrakova L (2000). The Methodology of statistical research of the reliability of the activity of commercial banks.
The dissertation on competition of a scientific degree of the doctor of economic Sciences. - M.: MESI.
Galus E. A (2003). Reliability Analysis and investment attractiveness of the commercial Bank.//The dissertation on
competition of a scientific degree of candidate of economic Sciences. - SPb.: SPBU Aerocom.
instrumentation.
Kovalev, T. L (2012). Improving the reliability of commercial banks based on the use of economic-mathematical
methods.//The dissertation on competition of a scientific degree of candidate of economic Sciences. - M.:
State. University of management.
Batrakova L (2005). Economic analysis of commercial Bank activity: Textbook. - M.: LOGOS.
Dubrova T. A (2004). Statistical forecasting methods in Economics: Textbook/ MESI. – M.

Academy of Strategic Management Journal Volume 15, Special Issue, 2016
32
Furs P. C (1995). The Methodology for ranking Century Romanova. - M.: LOGOS.
Tikhonov, E. A ( 2006). Forecasting Methods in market conditions: a Textbook. - M.: LOGOS.
Official website of the Bank "AK BARS" [electronic resource]. - URL: http://www.akbars.ru/.
Official website of the Central Bank of the Russian Federation [electronic resource]. - URL: http://www.cbr.ru/.
Scientific Library KiberLeninka: http://cyberleninka.ru/article/n/ nadezhnost-bankovskogo-sektora-rossiyskoy-
federatsii-na-sovremennom-etape-tendentsii-i-problemy#ixzz3JasCBEQf.
Tan, A. (2009, July 10). DBS Sued by Investors for Losses Tied to Lehman Notes (Update 1). Retrieved July 13,
2009, from
Bloomberg.com:http://www.bloomberg.com/apps/news?pid=newsarchive&sid=ayRIru1HUMZM
Tkaczyk, C. (2009, June 1). The 10 largest U.S. bankruptcies. Retrieved October 20, 2009, from CNN Money,
Fortune: http://money.cnn.com/galleries/2009/fortune/0905/gallery.largest_bankruptcies.fortune/index.
html
Wolf, M. (2008, February 20). America’s economy risks mother of all meltdowns. Retrieved September 21, 2009,
from Financial Times, Economists' Forum:http://blogs.ft.com/economistsforum/2008/02/americas-
economy-risks-mother-of-allmeltdowns.

Academy of Strategic Management Journal Volume 15, Special Issue, 2016
33
THE TOOLS IMPROVING THE EFFECTIVENESS OF
MANAGEMENT SYSTEM OF ENTERPRISE
Izida Ildarovna Ishmuradova, Kazan Federal University
Gulnaz Rashitovna Sibaeva, Kazan Federal University
ABSTRACT
Modern economy requires adequate control systems at all levels, sectors of economy.
Being the subject of commodity-money relations, having wide economic independence and
responsibility for the results of its operations, enterprises should form such a management
system which ensures them high efficiency of operations, competitiveness and sustainable
position in the market. Increasing effectiveness of management is essential for improving final
results.
Productivity of work of the enterprise depends on production efficiency of business
products; therefore effectiveness of system of management of the enterprise depends on the used
tools. The most effective instrument and the integral component of management is information
system. The more information system is focused on real business challenges and conforms to the
standard of business management the higher is its effectiveness. Thus, business management on
the basis of process-product approach has to be exercised by means of the product-focused
information system with every task realization and developed on the basis of the standard of
management of the enterprise.
Key Words: Reengineering, Information System, Business Challenge, Business Product,
Business Process, Efficiency Indicators.
INTRODUCTION
The tools improving management and cost-effectiveness of business activity are actual
for all economic subjects in the market. At the same time the criteria of management
effectiveness of enterprises in conditions of market economy are decisive. The tools to achieve
effectiveness depend on the specifics of industry, market conditions. The enterprise itself
determines what activities need to be improved and accept the appropriate methodology.
Reengineering is a process of fundamental rethinking and reconstruction of business; it
converts all of the existing structures and embodies new ways of doing work. Business processes
of enterprises are main business segments which provide for creation of added value and realized
products. Business processes are allocated at all segments of enterprises, business objectives are
defined by the major activities of products.
Modern enterprise is often considered not only as organizational structures as well as
systems of interconnected business processes to achieve certain goals. This approach ensures the
integrity of information. This makes it possible to increase the speed of transmission of
operational information, to maintain a high level of data accuracy, to improve the quality of data
and to optimize the effectiveness of the decisions taken.

Academy of Strategic Management Journal Volume 15, Special Issue, 2016
34
METHODOLOGY
Modeling business processes allows temporarily abstract the structure of enterprises and
to focus on its core tasks. This model must comply with the formalization of processes; identify
the process disadvantages affecting the effectiveness; contain varying parameters and structural
characteristics of the processes.
The enterprise management standard is a documented procedure of all processes, their
relationships, rules of management decision-making and quality meters and the number of these
processes (technical and economic indicators). The enterprise management standard developed
on the basis of the process-product approach, describes enterprises as a system of interconnected
business objectives. Thus produced for internal and external use products become links that unite
business goals and business processes together and reflect the attitude of the company with the
external environment.
The figures of effectiveness are quantitative characteristics of the process being studied to
assess the performance of individual tasks, business processes and enterprises as a whole. The
effectiveness indicator system is based on the analysis of business processes and tasks to be
solved by them. As a result are determined important fields for enterprises in which are
appointed indicators to be regularly measured.
Identification and analysis of key business processes are rather complicated, time-
consuming and nevertheless are necessary. On the basis of comprehensive analysis of the
activities of one enterprise that provides transport services, we identified the main business
processes and a set of indicators by which can be determined its effectiveness characteristic for
enterprises of this type:
1. implementation of road transport (traffic volume, traffic coefficient; traffic capacity factor; average
traffic density);
2. provision of services for maintenance (costs per ruble of production);
3. Driving School (the result of provision of services for vehicle driving training, driving school costs
for provision of driving instruction);
4. logistics (the cost of the creation and storage of stocks);
5. marketing (market size, market share, profitability of the channel of sales; the group indicator of
competitiveness of goods);
6. finances (profitability of production, sales, capital);
7. accounting (cost of commodity products, balance sheet profit);
8. provision of human resources (average number per month; factors of turnover, staff retirement,
staff stability);
9. provision of transport (utilization of mileage vehicles);
10. energy supply (savings in depreciation charge resulting in improved time of used equipment);
11. maintenance (factors of the installed equipment, intensity of used equipment);
12. information provision (degree of automation) and others.
Management of the systems of business tasks is based on an analysis of indicators of the
effectiveness of their decisions or equivalently the technical and economic characteristics of the
produced business products. On the basis of these indicators is carried out planning,
organization, accounting and analysis of the company. The number of indicators depends on the
management and every task has at least two types of the results of effectiveness time spent and
cost of resources (financial, material, labor). Business processes also have their own parameters
for estimation calculated by aggregating the values of parameters within their business tasks.
Thus, allocation of the solved tasks and their results, analysis of the relationship between

Academy of Strategic Management Journal Volume 15, Special Issue, 2016
35
business tasks based on business exchange of products allow us to construct the map of the
relationship between the parameters of the business tasks. Designed according this method the
card is one of the elements of the enterprise management standard.
Proper implementation of this system will provide a number of advantages: increase the
company's control, competitiveness and quality of products and services, reduce costs, and make
a company more customer focus.
The efficiency of any system problem arises naturally due to the need to save maximum
resources of the system. In market economy is a problem for all economic systems is a priority.
The aim of use of an effective management system is in achieving high commercial
results, using the latest achievements in accordance with the precise implementation of the
chosen strategy.
However, it should be understood that the innovation and creation of an effective
management system requires significant financial investments that can afford not all enterprises.
It is known that the problem of allocated funds shortage and low efficiency of recruitment and
use of investments are the main problems of enterprises. It is known that financial resources are
not important elements of reproduction and are included in the enterprise management system,
but they are also resource for enterprises in the field of modernization and innovation.
Effective management system should solve the following issues:
- modernization of material-technical base;
- introduction of resource-saving technologies;
- Optimization of costs and resources.
Each enterprise itself solved the issue on the choice of tools to increase the efficiency of
management, depending on the specifics of the activities and characteristics of the established
management system. However for any manager is important to realize that the greatest efficiency
of administrative activity will be reached in the event of using of different methods in
combination orienting on the goals and the enterprises development strategy.
RESULTS
On the basis of process approach is designed the system of management of the enterprise
which in difference of the existing systems is focused on the effective solution of business
challenges and management of business products of all segments of activity of the industrial
enterprises.
Process approach consists in representation of activity of any organization in the form of
the interconnected system of business processes in which the leaving element of one process will
be transformed to the entering element of other process. When speaking about the process
approach we mean first of all that management of process and each of work entering it (activity,
sub process, process of the second or the subsequent levels or function) happens to application of
special methodical receptions, there is enough well developed and allowing to exclude many
mistakes.
Process approach reflects communication of the main functions of management: planning
- definition is more whole than the uniform direction of efforts; the organization of activity -
horizontal and vertical division of labor, distribution of powers and responsibility; motivation -
combination of the organizational and personal purposes of workers; control - check of
achievement of the objectives and updating of plans; binding processes: communications and
decision-making.

Academy of Strategic Management Journal Volume 15, Special Issue, 2016
36
Formation of system of management on the basis of process-task of approach requires
allocation of business processes and business challenges.
Allocation of business processes of the enterprise for the principles of completeness,
determinancy, normalness, coherence, autonomy, resource intensity, efficiency, dynamism. For
manufacturing enterprise the main business processes are: production preparation, main
production, auxiliary production, material support, marketing, sale, finance, accounting,
providing with a manpower, transport service, power providing, repair providing, social security,
ensuring primary activity, information support, management.
For development of an effective enterprise of management system of business processes
are presented in the form of set of elements. Solvable problems and the carried-out complexes of
work can be basic elements of business processes. As the performed work can be considered as
the solution of tasks in the subsequent concept of a task is used as making the business process
element.
The manufacturing enterprise or the enterprise rendering any services is considered. For
such enterprises there are standard business processes with rather unified scheme of realization.
Generally the following business processes can be a part of concrete business process of the
enterprise (multilevel numbering of business processes and their elements will be used further:
the 1st level - instant No.; the 2nd level - No. of sub process (payment order); the 3rd level.
Allocation of business challenges of the enterprise on the basis of the same principles
which are used for allocation of business processes. Business process includes four classes of
business challenges: analytical, organizational, and technological and registration. The business
challenge is the unique element of business process creating a business product (cost) and
possessing eight properties (completeness, determinancy, normalness, coherence, resource
intensity, efficiency, autonomy, dynamism). The business challenge is allocated owing to the fact
that it is a point of emergence of expenses. Communication of business challenges of the
enterprise is displayed in figure 1.
Figure 1
ORDER OF THE SOLUTION OF PROBLEMS OF BUSINESS PROCESSES
Communication of business challenges and information system of the enterprise is
displayed in figure 2.
Calculation, analysis,
planning
Organization Realization of
technological tasks
Accounting of a
condition of
businesses

Academy of Strategic Management Journal Volume 15, Special Issue, 2016
37
Figure 2
INTERRELATION OF TASKS AND REALIZATION OF IS
According to this document, process is defined as the set of interconnected and
interacting kinds of activity transforming entrances to exits. Production which is grouped in four
general categories is result of process: services, software, technical means and the processed
materials. The established way of implementation of process is called procedure. Thus, today on
hand business of analysts is available rich tools for the formalized description and the system
analysis of business processes. The most widespread standard methodologies for modeling of
activity of the organization and processes making it are: IDEF methodology, language of
modeling of UML and architecture of information ARIS systems.
The method of reengineering of business processes has designed information
infrastructure and information system as the tool of system of management of the industrial
enterprise. According to purpose of information system of the enterprise its main objectives are
defined: ensuring accurately integrated performance of functions of management of process at
the enterprise and acceptance of an integrated solution on production control depending on a
condition of internal and external environment.
The effectiveness of management is a complex economic category, study of which
involves consideration of various factors that influence the management process. The
effectiveness of enterprise management system depends on the instruments used. The most
effective tool and an integral part of the management is information system. The more the
(Calculation, analysis,
planning)
Organizational tasks
Registration tasks
Сurrent state
(manual,
incomplete
realization of IS)
Information
management
systems

Academy of Strategic Management Journal Volume 15, Special Issue, 2016
38
information system is focused on real business problems and meets the standard of enterprise
management, the greater is its effectiveness.
CONCLUSION
Process -task approach allows you to:
1. Develop effective management of the enterprise standards, continuous management, quality
management;
2. Design, develop and implement a process-tasking information system, implement standard
management;
3. Design, develop information and a mathematical model of the enterprise to study the most
effective scenarios.
The effectiveness of the enterprise depends on the efficiency of the production of
business products, hence the effectiveness of the company's management system depends on the
instruments used. The most effective tool and an integral part of management is information
system. The more the information system focused on real business problems and meets the
standard of enterprise management, the greater is its effectiveness. Thus, management of the
enterprise on the basis of process-product approach should be carried out by means of product-
oriented information system task by task implementation and developed on the basis of
enterprise management standard.
REFERENCES
Antropova T.G., Ishmuradova I.I., Minsabirova V.N., Gazizova F.S. (2015). Economic Security in the Conditions of
Innovative Transformation of Economy, Review of European Studies, 7(1), 195-199.
Demchenko S.G., Sibayeva G.R. (2014). Business: problems and conditions of development: the monograph. S.G.
Demchenko, G.R. Sibayeva - Ryazan: Kontseption publishing house, 108.
Eremina I.I., Sibaeva G.R., Ishmuradova I.I. (2014). Analysis of Results of Experimental Control of Information
Communication Competency Development Diagnostic Program for To-Be IT-Professionals Via Federal
University Information Educational Environment Means. G.R. Sibaeva, I.I. Eremina, I.I. Ishmuradova. Life
Science Journal, 1(9), 778 - 783.
Gafiyatullina A.Z., Nikonova T.V., Vagin S.G., Kharisovan R.R., Pavlova E.I., Khayrutdinov R.R., Ishmuradova I.I.
(2015). Review of European Studies, 7(4), 13-19.
Levina E.Y., Pyrkova G.K., Zakirova C.H., Ishmuradova I.I., Semikova O.R., Nabiullina K.R. (2015). Socio-
Economic Systems Strategic Development Managing, Journal of Sustainable Development, 8(6), 76-82.
Shinkevich A.I., Galimulina F.F., Moiseyev V.O., Avilova V.V., Kuramshina K.S., Ishmuradova I.I. (2016).
Features of Integrative Relations between Science, State and Industry in Russia and Abroad. International
Review of Management and Marketing, 6(S2), 142-148.
Shinkevich M.V., Shinkevich A.I., Chudnovskiy A.D., Lushchik I.V., Ishmuradova I.I. (2015). Formalization of
Sustainable Innovative Development Process in the Model of Innovations Diffusion. International Journal
of Economics and Financial Issues, 6(1), 179 - 184.
Sibaeva G.R. (2015). Model of state regulation and support of Entrepreneurship. In the World of Scientific
Discoveries, 65(5.1), 454-461.
Sibaeva G.R., (2009). Entrepreneurship description business as, Entrepreneurship, 2, 168 - 172.
Sibaeva G.R., (2009). Essence and value, Vestnik of the Kazan State Finance and Economics Institute, 3, 4 - 10.
Sibaeva G.R., Eremina I.I., Ishmuradova I.I. (2014). Conceptual model of state regulation and support of
entrepreneurship, Fundamental and Applied Studies in Pacific and Atlantic Oceans Countries, the 1st
International Academic Congress.– Tokyo: Tokyo University Press, 1(1), 75-81.

Academy of Strategic Management Journal Volume 15, Special Issue, 2016
39
CLASSIFICATION APPROACH IN DETERMINATION
OF KNOWLEDGE IN CONTEXT OF ORGANIZATION
I.I. Makhmutov, Kazan Federal University
A.G. Isavnin, A.N, Kazan Federal University
Karamyshev, S.A. Sych, Kazan Federal University
ABSTRACT
The role of knowledge in developed countries is high. Scientific knowledge is the basis of
the economy of the XXI century. Knowledge has become a new factor of production, the signifi-
cance of which in competition will only increase.
In the scientific literature they write about knowledge as an important competitive ad-
vantage, strategic asset, but at the same time, it is extremely rare to find a clear definition of
"knowledge". In scientific and business literature a large number of different interpretations of
this definition are observed. In this article attempt to generalize the different points of view and
to group them in approaches is made.
The following attributes of the concept "knowledge" were identified: quality, relevance
and descriptive characteristics.
Analysis of the "knowledge" concept was conducted from the perspective of structural, in-
tegrated, systematic-informational, systematic-functional, systematic-genetic, and systematic and
management approaches. On the basis of this analysis there was proposed the author’s defini-
tion of the "knowledge" concept.
Key Words: Management of Knowledge; Knowledge, Intelligence, Non-Material Resources,
Economy of Knowledge
INTRODUCTION
The intellectual component of labor plays fundamental role, which largely depends on the
importance of organization, region or even a country in the world market. Examples of devel-
oped countries are Japan, Finland, and Germany. In the global ranking of competitiveness of
countries, compiled annually by the World Economic Forum in 2012, Japan occupied the 10th
place, Finland - 3rd place, and Germany – 6th. In comparison, Russia occupies 67th place in the
ranking (Russia lags behind all countries of the BRICS). In all three countries there is a high
proportion of products with high added value and substantial contribution of intelligence in its
qualitative characteristics. "Made in Japan" or "Made in Germany" - in the consumer's mind is
identified with high-tech products.
TEXT OF ARTICLE
The role of knowledge in developed countries is high. Scientific knowledge is the basis of
the economy of the XXI century. Some researchers believe that the production of knowledge is
the only sustainable source of economic growth. Traders on the stock markets prefer (when as-
sessing the prospects of securities) knowledge to a greater extent than the material assets of the
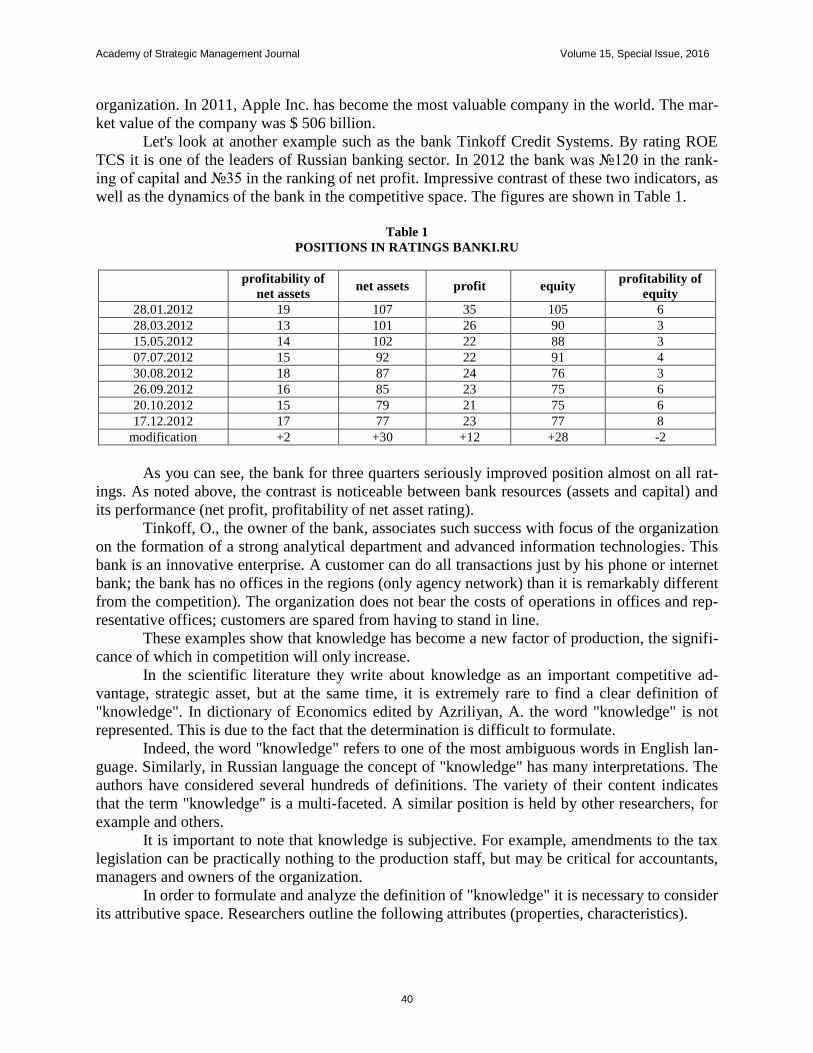
Academy of Strategic Management Journal Volume 15, Special Issue, 2016
40
organization. In 2011, Apple Inc. has become the most valuable company in the world. The mar-
ket value of the company was $ 506 billion.
Let's look at another example such as the bank Tinkoff Credit Systems. By rating ROE
TCS it is one of the leaders of Russian banking sector. In 2012 the bank was №120 in the rank-
ing of capital and №35 in the ranking of net profit. Impressive contrast of these two indicators, as
well as the dynamics of the bank in the competitive space. The figures are shown in Table 1.
Table 1
POSITIONS IN RATINGS BANKI.RU
profitability of
net assets net assets profit equity
profitability of
equity
28.01.2012 19 107 35 105 6
28.03.2012 13 101 26 90 3
15.05.2012 14 102 22 88 3
07.07.2012 15 92 22 91 4
30.08.2012 18 87 24 76 3
26.09.2012 16 85 23 75 6
20.10.2012 15 79 21 75 6
17.12.2012 17 77 23 77 8
modification +2 +30 +12 +28 -2
As you can see, the bank for three quarters seriously improved position almost on all rat-
ings. As noted above, the contrast is noticeable between bank resources (assets and capital) and
its performance (net profit, profitability of net asset rating).
Tinkoff, O., the owner of the bank, associates such success with focus of the organization
on the formation of a strong analytical department and advanced information technologies. This
bank is an innovative enterprise. A customer can do all transactions just by his phone or internet
bank; the bank has no offices in the regions (only agency network) than it is remarkably different
from the competition). The organization does not bear the costs of operations in offices and rep-
resentative offices; customers are spared from having to stand in line.
These examples show that knowledge has become a new factor of production, the signifi-
cance of which in competition will only increase.
In the scientific literature they write about knowledge as an important competitive ad-
vantage, strategic asset, but at the same time, it is extremely rare to find a clear definition of
"knowledge". In dictionary of Economics edited by Azriliyan, A. the word "knowledge" is not
represented. This is due to the fact that the determination is difficult to formulate.
Indeed, the word "knowledge" refers to one of the most ambiguous words in English lan-
guage. Similarly, in Russian language the concept of "knowledge" has many interpretations. The
authors have considered several hundreds of definitions. The variety of their content indicates
that the term "knowledge" is a multi-faceted. A similar position is held by other researchers, for
example and others.
It is important to note that knowledge is subjective. For example, amendments to the tax
legislation can be practically nothing to the production staff, but may be critical for accountants,
managers and owners of the organization.
In order to formulate and analyze the definition of "knowledge" it is necessary to consider
its attributive space. Researchers outline the following attributes (properties, characteristics).

Academy of Strategic Management Journal Volume 15, Special Issue, 2016
41
Quality (Compound Characteristic)
1. reliability (connects the reality and the content of information);
2. accuracy (measure of closeness of information) to reality;
3. completeness (reflecting the sufficiency or insufficiency of information);
4. correctness (form and content permit clear perception of information by consumers)
Demand
1. the value, usefulness (to what extent one can solve the problem);
2. relevance (reflecting importance, significance of knowledge at the moment);
3. cost (cost of production, price which a consumer is willing to pay).
Descriptive characteristics
1. carrier source (human material, or electronic media);
2. presentation (text, graphic, numeric, audio, video data);
3. volume (amount of information, data and knowledge measured in bits, bytes, kilobytes, and so
on);
4. specialization (to which field it concerns).
The boundaries between the concepts of data, information and knowledge are difficult to
determine, because these concepts are not well established, but on the other hand are closely
linked. For example, the author of gives a comprehensive list of definitions for the concept of
"information", but noted that the generally accepted definition is currently unavailable. Accord-
ing to the authors, knowledge is a broader and more complex concept than information and data.
This view is shared by the authors and others.
The most interesting feature among mentioned above are value and usefulness. On the
one hand, valuable knowledge, information and data bear research interest. On the other hand,
signs of "value" and "utility" are common to all three concepts. Useful or valuable software,
competence information, patents, technology, and even corporate culture, in the end add up or-
ganizational competitive advantage.
In the study, the authors examined the different definition of "knowledge" and identified
specific approaches to definitions, the totality of which was classified according to the theory of
systems:
The structural approach, system-element approach. Definitions, reflecting the internal
structure and composition of the notion of "knowledge".
1. "Knowledge is the awareness of something or someone, and can include facts, data, information, descrip-
tion, skills”.
2. "Knowledge consists of truths and ideas, concepts, judgments and viewpoints, methodologies and know-
how. We accumulate knowledge, organize it, interpret and store for a long time, in order to apply it to solve
specific problems and situations".
3. "Corporate knowledge includes know-how with respect to products, technologies, operating procedures and
rules, as well as individual skills of each individual employee".
4. "Knowledge is somewhat more than data and information. Knowledge also includes beliefs, moral values,
ideas and inventions, judgments, skills, professional knowledge, theory, rules, attitudes, opinions, past ex-
periences”.
5. Knowledge is a set of professional skills, abilities, experience and wisdom, business and personal contacts,
which are used by people to achieve the objectives.

Academy of Strategic Management Journal Volume 15, Special Issue, 2016
42
The approach considering the "knowledge" as a result of actions
1. Knowledge is the result of intellectual efforts, the absolute use of information in order to achieve a certain
result. It may be extracted or generated from information only by logical deduction".
2. According to the Ozhegov's dictionary "knowledge is the result of cognition, scientific data, and the totality
of information in any field".
3. "Knowledge is information that has been obtained by a person or group of people and processed them for
distribution".
4. Any product of labor can be seen not only as a product, but also as means of production. In this way, you
can also talk about the knowledge.
5. Knowledge is a product of social labor and mental activity of people, which is a perfect reproduction in the
language form of objective, natural connections of practically transformed objective world.
6. Knowledge is a form of existence and systematization of the results of human cognitive activity.
Integrated, system-structural approach (takes into account not only the elements, but also
their relationship).
1. "Knowledge is a combination of practical experience, individual values, contextual information, intuition
of experts creating a basic framework for the evaluation and integration of new experiences and infor-
mation. Knowledge appears and gains practical meaning in our minds. The organization of knowledge lies
not only in the database, but also in the way of the organization, its processes and standards. Knowledge
belongs to the employees and the organization".
2. "Knowledge is a constantly changing mix of structured experience, values, contextual information, and in-
sight and is the basis for the assessment and assimilation of new experiences and information. It arises and
is used in the heads of their carriers. The organization of knowledge exists not only in documents or reposi-
tories but also in established policies, processes, practices and norms".
"Knowledge" as ability or skill
1. Knowledge is the ability to make effective decisions and do the right conclusions based on the information
and find trends.
2. Knowledge (know-how), human experience is a deep understanding of the subject and use the available da-
ta to assess new information. Knowledge works intuitively, allowing people to understand the situation and
make quick decisions.
3. Knowledge is a set of skills, abilities, experience and wisdom, business and personal contacts, which are
used by people to achieve the objectives.
The approach considering the "knowledge" as a system factor of the organization (eco-
nomic advantage, unique factor, power).
1. J. Welch noted that "the ultimate source of our competitive advantages is the desire and ability of an organ-
ization to learn and quickly convert knowledge into action". Here is emphasized that not knowledge itself is
valuable, but the ability to quickly apply it in practice. The same thought was expressed by Archangelsky,
G. in audiobook "Drive Time": "Knowledge itself is not a value. Value is the knowledge embedded in prac-
tice".
2. "The essence of the company is its ability to create, transfer aggregate, integrate and exploit knowledge".
3. "Knowledge distinguishes one business from another, does not give rapid reproduction. This is a sustaina-
ble competitive advantage".
4. Knowledge has become a strategically important asset. Organizations increasingly attribute it to the intan-
gible assets; many of them even believe that its value is higher than the tangible assets, including financial
assets.
5. Organizational skills are strategic resources.

Academy of Strategic Management Journal Volume 15, Special Issue, 2016
43
The system-information approach, information approach
1. "Knowledge includes information but referees it to the context of judgment and understanding".
2. Knowledge is the information based on which, with logical reasoning, one can obtain certain conclusions.
Knowledge is the result of proven practice cognition of reality, its reflection in the human mind.
3. Knowledge is information that has been obtained by a person or group of people and processed them for
distribution.
4. Negentropy concept, antithesis of entropy.
Systemic-functional approach. Used for system in terms of its behavior in the environ-
ment to achieve the goals.
1. "From the view point of view of the purpose, knowledge is the intelligence used in the work. Knowledge
that is not used becomes obsolete. And the knowledge that is exchanged and distributed is generating new
knowledge. Knowledge is seen as a strategic resource"
2. Organizational skills are strategic resources
3. Knowledge is the basis for decision-making management. Knowledge is the basic laws of the field, allow-
ing a person to solve specific industrial, scientific and other tasks, as well as decision-making strategies in
this area
Thus "knowledge" is often regarded as specially treated information. The word "infor-
mation" often appears in the above definitions.
It should be noted that knowledge is sometimes considered as morals, opinions, judg-
ments, education, that are some qualities of specific people, their individual properties.
Almost every aspect of knowledge can be formalized in the information or data. And the
reverse transformation is also possible. Thus, the information and data is core of knowledge.
Knowledge is a complex and multifaceted concept. We also identified that the basic properties of
knowledge are value and usefulness to achieve practical results.
Thus, we come to the following definition:
Knowledge is a complex organized (organized in a certain way) information that a person
enables or organization efficiently do their practice.
FINDINGS
So, in the article the classification of approaches to the definition of "knowledge", pre-
sented in the diversity and complexity of the internal structure of this concept, as well as the au-
thor's definition is presented on the basis of information approach.
Beyond the scope of this article the following question remain: classification of
knowledge, valuation and quality of knowledge, competence profile of knowledge manager, and
the question of building a system of knowledge management. These issues will be considered in
future publications.
CONCLUSION
In the context of global competition knowledge becomes one of the key factors affecting
the competitiveness of a company in many aspects of business. The companies most effectively
using knowledge reach leadership positions.

Academy of Strategic Management Journal Volume 15, Special Issue, 2016
44
Use of the knowledge based management concept faces a number of theoretical and prac-
tical difficulties. This happens also due to the fact, among other things, that the knowledge itself
is a multisided and complex conception.
The article analyses the existing definitions of "knowledge", features the approaches to
grouping the definitions of this term and their classification attributes. Furthermore, the article
identifies basic features of knowledge and suggests the author's definition of "knowledge" con-
ception.
The analysis fulfilled is the basis for further research in terms of solving the problems of
practical application of the management concept based on knowledge and its development.
REFERENCES
Bresman, H., Birkinshaw, J., Nobel, R. (1999). Knowledge transfer in international acquisitions. Journal of Interna-
tional Business Studies.
Burton-Jones, A. (1999). Knowledge capitalism: Business, work, and learning in the new economy. Oxford, Oxford
University Press.
Davepont, T.H., Prusak, L. (1998). Working knowledge: How organizations manage what they know. Boston, Har-
vard Business School Press.
Dixon, N.M. (2000). Common knowledge: How Companies thrive by sharing what they know. Boston, Harvard
Business School Press.
Filemon, A., Uriarte, Jr. (2008). Introduction to KM. ASEAN Foundation, Supported by National Academy of Sci-
ence of Japan.
Machlup, F. (1980). Knowledge and knowledge production. Princeton, NJ, Princeton University Press.
Nonaka, I., Takeuchi, H. (1995). The knowledge-creating company. New York, Oxford University Press.
Wikipedia. Knowledge. (2012). Retrieved from http://en.wikipedia.org/
Azriliyan, A.N., Azriliyan, O.M., Kalashnikova, E.V., Kvardakova, O.V. (2008). Ekonomicheskiy slovar’. Moscow,
Institut novoy ekonomiki.
Arkhangelsky, G. (2005). Audiobook «Time-drive». Moscow, Mann Ivanov i Ferber.
Birger, P. (2010). Grafik dnya: Apple po pribyl’nosti oboshla neftegazovykh gigantov. Retrieved from http://slon.ru/
Blauberg, I.V., Pantina, I.K. (1979). Kratkiy slovar’ po filosofii. Moscow, Politizdat.
Bychkov, V. (2008). Effektivnoe upravlenie znaniyami. Upravlenie kompaniey. Moscow, ACD
Vilgelm, E.V. (2010). Stanovlenie ekonomiki znaniy v Rossii: problemy i perspektivy. Retrieved from http://pr-
rm.com/2010/06/16/
Vilgelm, E.V. (2009). Upravlenie znaniyami kak instrument razvitiya sovremennoy kompanii. Moscow, Sistemnoe
upravlenie.
Gavrilova, T.A., Chervinskaya, K.R. (1992). Izvlechenie i strukturirovanie znaniy dlya ekspertnykh sistem. Mos-
cow, Radio.
Dzhanetto, K., Uiler, E. (2009). Upravlenie znaniyami. Moscow, UNITI-DANA.
Pesterevoy, M. (2005). Rukovodstvo po razrabotke i vnedreniyu korporativnoy strategii upravleniya znaniyami.
Moscow, Dobraya kniga.
Dresvyannikov, V.A. (2010). Upravlenie znaniyami organizatsii: uchebnoe posobie. Moscow, KNORUS.
Zhukov, A. (2011). Kapitalizatsiya Apple bol’she, chem u neftyanykh kompaniy. Retrieved from http://www.x-
drivers.ru/
Kachala, V.V. (2007). Osnovy teorii sistem i sistemnogo analiza. Ucheb- noe posobie dlya vuzov. Moscow,
Goryachaya liniya – Telekom.
Konyukhovskiy, P., Kolesovd, N. (2000). Ekonomicheskaya informatika. St. Petersburg, Piter.
Kokhanovskiy, V.P., Zolotukhina,V.V., Leshkevich, T.G. (2003). Filosofiya dlya aspirantov. Rostov-na-Donu,
Feniks.
Labotskiy, V.V. (2006). Upravlenie znaniyami. Moscow.: BGEU.
Leonenkov, A.V. (2005). Nechetkoe modelirovanie v srede MATLAB St. Petersburg, BKhV-Peterburg.
Milner B.Z. (2003). Upravlenie znaniyami. Moscow, INFRA-M.
Glocto, Z. (2010). Rossiya v mirovom reytinge konkurentosposobnosti. Poka est’ kuda padat’. Retrieved from
http://rating.rbc.ru/

Academy of Strategic Management Journal Volume 15, Special Issue, 2016
45
Smirnova, V. (2008).Protsessy i funktsii upravleniya znaniyami. Problemy teorii i praktiki upravleniya, 2009 (8) 25-
28.
Petrova, Yu. (2011). Deneg T’ma, Sekret Firmy, 2011. (12). 11-16.
Zhuravlev, G. (2013). Stanovlenie ekonomiki znaniy v Rossii. Retrieved http://forum3000.ru/229/

Academy of Strategic Management Journal Volume 15, Special Issue, 2016
46
MARKET RISKS OF FINANCIAL SECTOR AND THEIR
IMPACT ON THE REGIONAL INSTITUTIONS*
E.P. Duvalova, Kazan Federal University
Y.I. Duvalova, Kazan Federal University
L.R. Ikhsanova, Kazan Federal University
A.M. Tufetulov, Kazan Federal University
ABSTRACT
The article considers the impact of components of market risk on its dynamics and
structure of the Russian finance industry. It estimates change in the structure and in the number
of financial institutions calculating market risk. It also identifies cause and effect link between
the changes studied. The reasons of decline in the share of market risk in the general risks of the
banking sector and a small growth of the market risk for the 2013-2014. Identifies the source
and reasons for changes in the basic structure of the market risk and the built causal
relationships change of market risk in the dynamics during the analyzed period. The article
analyzes the market risk framework to determine the significance of market risk components in
the domestic banking sector. Also referred to the importance of market risk for the medium and
large banks that have built risk management policy and who are interested in the prediction of
bank risks. In this article are revealed the causes of currency and stock market risk for the 2013-
2014 and identified the relative growth of the two risks in the structure of the market risk for
2014. In addition, the article pointed out that throughout the analyzed period, interest rate risk
and market risk in the structure of dominance has been defined.
Key Words: Market Risk, Interest Rate Risk, Equity Risk, Currency Risk, Finance Industry,
Financial Institutions, Macroeconomic Analysis
INTRODUCTION
Market risks are the subject of growing attention from the international community. The
Bank of Russia made certain steps toward the formation of effective systems of internal control
over of financial institutions. Financial instruments have the elements of market risk with a
specific market and the price or benchmark (index, average value) based on which the
participants can assess their position.
However, the availability of the market and of the instruments does not point to the
existence of a threat to the financial institution. A financial institution carries out a transaction
which results in the fact that it will become the owner of a financial asset, carry the risk, or will
assume an obligation to perform certain actions with the asset in the future. But, nevertheless, the
market risk exists objectively, regardless of the wishes of the financial institution that may
control them, but cannot affect its existence.
Along with thorough supervision and regulation, the Central Bank of the Russian
Federation in the framework of monitoring the activities of Russian financial institutions pays
great attention to risk-contributing events that result in different kinds of risks in the national
finance industry which directly affect the financial performance of any financial institution.

Academy of Strategic Management Journal Volume 15, Special Issue, 2016
47
THEORY
At the end of each calendar year the official website of the Bank of Russia provides
annual report on the development of the finance industry and financial supervision. In its second
section the Bank of Russia summarizes the results of the calendar year within typical financial
risks faced by the national finance industry. It includes market risk as well.
Market risk refers to the risk of financial losses and off balance sheet operations of the
financial institution due to adverse changes in the level of market prices. Consequently, market
risks, in our view include both, the risks associated with financial instruments sensitive to
changes in current market prices, foreign exchange rates and prices of precious metals and
foreign exchange and commodity risks for all operations of the financial institution.
This approach is the most comprehensive since the market risk is due to the possible
impact of market factors affecting the value of assets, liabilities and off-balance sheet operations
of financial institutions.
Figures of annual reports of the Central Bank on the development of the finance industry
and financial supervision will be used to analyze market risk of the Russian finance industry for
2013-2014. Methods of quantitative and qualitative analysis will be applied to do that.
Macroeconomic analysis should include the following stages:
1. analyzing the dynamics and structure of the market risk by the components of the market risk;
2. assessing changes in the number of financial institutions which calculate market risk by its components;
3. identifying the causes that contributed to the change in market risk and analyzing these factors.
RESULTS
To begin with, we have to define market risk and its share in total financial risks of the
national finance industry. Figure 1 shows the necessary data for economic analysis.
Figure 1
DYNAMICS OF MARKET RISK AND ITS SHARE IN TOTAL FINANCIAL RISKS OF THE DOMESTIC
FINANCE INDUSTRY
bln.rub. %
2647
3101
2735
5.9 5.9
4.3
4
5
6
2400
2800
3200
marker risk share of market risk in total financial risks of the national banking sector

Academy of Strategic Management Journal Volume 15, Special Issue, 2016
48
Figure 1 shows that after a slight increase of market risk by 454 billion rubles in 2013 in
the national finance industry, in 2014 it showed a downward trend by 366 billion rubles, thus
reducing its share in the total risk of the finance industry from 5.9% at the beginning of 2013-
2014 to 4.3% at the beginning of 2015. The decline in the share of market risk in the total
financial risks and a slight growth of market risk for 2013-2014 is caused by three factors -
firstly, outpacing growth of other common risks for the period, primarily, credit risk outpaced
market risk, which grew by only 88 billion rubles or 3.33% for the period. Secondly, in 2014
there was a slowdown of financial operations, which partly depended on market conditions. In
particular, the slowdown affected securities trading (which influences the equity risk), the
volume of loans granted to the population and enterprises in 2014 accounted for a smaller
amount than in 2013 (which determined the impact on interest rate risk), however, at the end of
2014 dealings in foreign exchange boosted, which naturally affected the foreign exchange risk.
Thirdly, this dynamics of market risk could also be influenced by the finance industry
participants who calculate the amount of market risk and report to the Bank of Russia. Thus, the
reduction in the number of financial institutions could reflect the incompleteness of the
magnitude of the true market risk, so we will further calculate this and other indicators and show
all estimates in Fig.2. Figure 2
THE NUMBER OF FINANCIAL INSTITUTIONS WHICH CALCULATE MARKET RISK AND THEIR
SHARE IN THE TOTAL NUMBER OF FINANCIAL INSTITUTIONS IN THE RUSSIAN FINANCE
INDUSTRY IN 2013-2014
Nos %
According to Figure 2, there is a decrease in the number of financial institutions with the
right to perform financial transactions, due to the fact that the Bank of Russia implemented the
consolidation policy of the Russian finance industry and as a financial regulator of the country,
in recent years it used to revoke licenses of financial institutions which do not fulfill the
requirements of the Bank of Russia. In particular, this forced smaller financial institutions to join
to larger ones, which resulted in the increase of M&A transactions in the Russian finance
industry. Due to this, financial institutions are becoming larger, and after mergers and
acquisitions the number of financial institutions that calculate market risk becomes smaller a
priori.
956
923
834
613 655
598 64.1
71 71.7
92.5
97.5 97.8
60
80
100
500
750
1000
01/01/2013 01/01/2014 01/01/2015
the number of credit institutions having the right to perform financial operations, Nos
the number of credit institutions calculating market risk, Nos
the share of credit institutions calculating market risk in their total number, %
the share of credit organizations’ assets calculating market risk in their total number, %

Academy of Strategic Management Journal Volume 15, Special Issue, 2016
49
Figure 2 shows that there is a decrease in the number of financial institutions which
calculate market risk for 2013-2014, the total number of financial institutions decreased by 15
and made 598. Given the large reduction in the total number of financial institutions, the share of
financial institutions calculating the value of market risk increased from 64.1% in early 2013 to
71.7% in early 2014, the growth rate of the index for the period under review increased by
11.82%. The key and the most important conclusion is that 598 financial institutions (by the end
of 2014; and calculating market risk) accounted for 97.8% of assets in the national finance
industry, that is, it turns out that the remaining 236 financial institutions accounted for only 2.2%
of the Russian finance industry assets.
This means that only large and medium-sized financial institutions are forced to calculate
market risk, they have a risk management policy built and they are interested in predicting
financial risks, since the markets where these financial institutions operate, are exposed to risk
and sensitive to it. In the meantime small financial institutions often do not even have divisions
and departments for managing financial risks required for the study and evaluation of the risks
such as a market risk. Thus, our earlier assumption that the reduction in the number of financial
institutions that calculate market risk is one of the causes for the decline of market risk in the
Russian finance industry was right.
Next, it is necessary to analyze the structure of market risk in order to determine the
significance of the components of market risk in the national finance industry. The structure of
the market risk in dynamics is shown in Figure 3.
Figure 3
THE STRUCTURE OF MARKET RISK OF THE RUSSIAN FINANCE INDUSTRY IN DYNAMICS, AS A
PERCENTAGE OF
Date %
According to Figure 3, we can conclude that the dominance of the interest rate risk in the
structure of Russian financial institutions’ market risk is obvious throughout the analyzed period.
Interest rate risk occurs in each financial institution in the normal course of business, because
79.5
82.9
76
10.3
7.3
12.6
10.2
9.8
11.4
0 25 50 75 100
01/01/2013
01/01/2014
01/01/2015
interest rate risk equity risk currency risk

Academy of Strategic Management Journal Volume 15, Special Issue, 2016
50
each financial institution possesses sensitive assets and liabilities, while transactions in financial
instruments (including securities) and in foreign exchange (including precious metals and
stones), which respectively determine the change of the stock and foreign exchange risks, are not
carried out by all financial institutions in Russia.
Given that in 2013-2014 equity and currency risks decreased as a percentage in the
structure of market risk, as well as in absolute terms (equity risk - by 52.9 billion rubles, at the
beginning of 2015 it is 281.7 billion rubles, and currency risk - by 22.7 billion rubles amounting
to 279 billion rubles by the beginning of 2015), one could see an increase in the interest rate risk
by 3.5 points in the structure of market risk, and in absolute terms the figure rose to 163.7 billion
rubles, reaching 2 174.3 billion rubles by the beginning of 2015.
Next, we will identify the causes of reducing the currency and equity risk for 2013-2014,
as well as determine the relative growth of two risks in the structure of market risk for 2014.
First, we have to note that a local currency crisis in Russia was only during the 4th quarter 2014
of the period analyzed, therefore, the negative situation with the fall of the ruble exchange rate
against the euro and the US dollar, leading foreign currencies, affected the change of the
currency risk not so significantly as it could affect, supposing, if the ruble was weakened, at the
beginning of 2014. On this basis, we can conclude that Russian financial institutions carried out
less exchange transactions over 2013-2014 than with the ruble, this is seen as the cause of
reducing the currency risk for the analyzed period (for 2014 currency risk decreased by 24.9
billion rubles). However, this reduction is reflected in the relative growth of currency risk in the
structure of market risk by 3 percentage points over 2014, as the decrease in the interest rate risk
in 2014 was even more significant - 396.4 billion rubles.
Reduced interest risk in 2014 was largely due to greater stability in interest rates on
lending and deposits, as growth occurred in the 4th quarter of 2014, when the Bank of Russia
increased the key rate to 17% (from 16.12. 2014) and almost all financial institutions in Russia
revised their interest rate policy raising both credit and deposit rates. It is common that when the
country keeps stable interest rates for a long period, the financial institutions are less sensitive to
interest rate risk, which was the reason for the decline of interest rate risk in 2014.
If the country has a stable economy, the stock and bonds of resident issuers are becoming
attractive, since their quotations on the stock exchange rise and the volume of securities
transactions, including financial operations, are increasing in the dynamics. This, in our opinion,
explains the increase in the equity risk for 2014 by 55.3 billion rubles, as the volume of
transactions with financial instruments with the participation of financial institutions increased,
due to their attractiveness.
In addition, it is necessary to note another aspect of the equity and currency risks
contingency as a part of market risk and its impact on the interest rate risk. To begin with, one
can reveal some inverse correlation between the currency and equity risk from the annual
dynamics (we consider 2013 and 2014 separately), since with the growth of currency risk in
2013 (2.2 billion rubles), the value of equity risk decreased (108.2 billion rubles). Whereas in
2014, with an increase in equity risk by 55.3 billion rubles, the value of the currency risk reduced
by 24.9 billion rubles. The fact is that the Russian market of financial instruments is designed so
that with the growth of share price of resident issuers, foreign currency weakens against the
ruble. Whereas in case of problems with the capitalization of the organization, including the
attractiveness of securities to investors from the income augmentation point of view, there is
weakening of the ruble observed. Therefore, with one component of the market risk growing, the
other one of market risk falls. While both risks in any case have an impact on interest rate risk, as
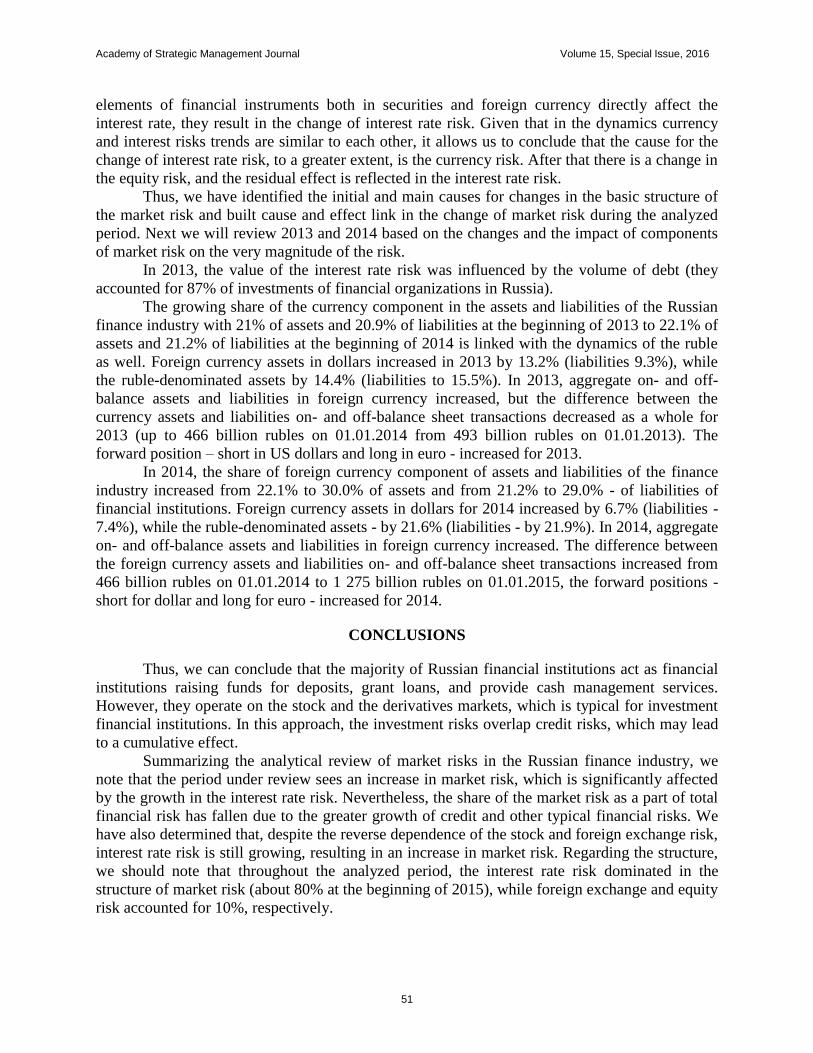
Academy of Strategic Management Journal Volume 15, Special Issue, 2016
51
elements of financial instruments both in securities and foreign currency directly affect the
interest rate, they result in the change of interest rate risk. Given that in the dynamics currency
and interest risks trends are similar to each other, it allows us to conclude that the cause for the
change of interest rate risk, to a greater extent, is the currency risk. After that there is a change in
the equity risk, and the residual effect is reflected in the interest rate risk.
Thus, we have identified the initial and main causes for changes in the basic structure of
the market risk and built cause and effect link in the change of market risk during the analyzed
period. Next we will review 2013 and 2014 based on the changes and the impact of components
of market risk on the very magnitude of the risk.
In 2013, the value of the interest rate risk was influenced by the volume of debt (they
accounted for 87% of investments of financial organizations in Russia).
The growing share of the currency component in the assets and liabilities of the Russian
finance industry with 21% of assets and 20.9% of liabilities at the beginning of 2013 to 22.1% of
assets and 21.2% of liabilities at the beginning of 2014 is linked with the dynamics of the ruble
as well. Foreign currency assets in dollars increased in 2013 by 13.2% (liabilities 9.3%), while
the ruble-denominated assets by 14.4% (liabilities to 15.5%). In 2013, aggregate on- and off-
balance assets and liabilities in foreign currency increased, but the difference between the
currency assets and liabilities on- and off-balance sheet transactions decreased as a whole for
2013 (up to 466 billion rubles on 01.01.2014 from 493 billion rubles on 01.01.2013). The
forward position – short in US dollars and long in euro - increased for 2013.
In 2014, the share of foreign currency component of assets and liabilities of the finance
industry increased from 22.1% to 30.0% of assets and from 21.2% to 29.0% - of liabilities of
financial institutions. Foreign currency assets in dollars for 2014 increased by 6.7% (liabilities -
7.4%), while the ruble-denominated assets - by 21.6% (liabilities - by 21.9%). In 2014, aggregate
on- and off-balance assets and liabilities in foreign currency increased. The difference between
the foreign currency assets and liabilities on- and off-balance sheet transactions increased from
466 billion rubles on 01.01.2014 to 1 275 billion rubles on 01.01.2015, the forward positions -
short for dollar and long for euro - increased for 2014.
CONCLUSIONS
Thus, we can conclude that the majority of Russian financial institutions act as financial
institutions raising funds for deposits, grant loans, and provide cash management services.
However, they operate on the stock and the derivatives markets, which is typical for investment
financial institutions. In this approach, the investment risks overlap credit risks, which may lead
to a cumulative effect.
Summarizing the analytical review of market risks in the Russian finance industry, we
note that the period under review sees an increase in market risk, which is significantly affected
by the growth in the interest rate risk. Nevertheless, the share of the market risk as a part of total
financial risk has fallen due to the greater growth of credit and other typical financial risks. We
have also determined that, despite the reverse dependence of the stock and foreign exchange risk,
interest rate risk is still growing, resulting in an increase in market risk. Regarding the structure,
we should note that throughout the analyzed period, the interest rate risk dominated in the
structure of market risk (about 80% at the beginning of 2015), while foreign exchange and equity
risk accounted for 10%, respectively.

Academy of Strategic Management Journal Volume 15, Special Issue, 2016
52
REFERENCES
Economic Portal Eco Univer [electronic resource]: Interest rate risk. - The Official Website of economic portal Eco
Univer, 2015. - Access: http://www.ecouniver.com.
The Central Bank of the Russian Federation [Electronic resource]: report on the development of the finance industry
and financial supervision for 2012, 2013, 2014. - The official website of the Central Bank of the Russian
Federation, 2015. - Access: http://www.cbr.ru
Vasyutovich A., Sotnikova Yu (2014). Market risk: measurement and control. Vasyutovich A., Sotnikova Yu.
Banking technologies, 1.
On the procedure of calculating market risk by credit organizations [electronic resource]: the Bank of Russia from
28.09.2012, 387 (rev. 01/09/2015 city). Reference legal system "Consultant Plus". Professional version. -
Last updated 05/10/2015.
Retunskaya D (2015). Methods of assessing the market risks [electronic resource]: Forex articles. The official
website of information-analytical portal and of the best forex broker ForexTimes & InstaForex. Access:
http://www.forextimes.ru
PwC (2012). Centre for the Study of Financial Innovation (CSFI). Banking Banana Skins. The system in peril. г.
Tsvetkova E.V, I.O. Arlyukova 2012). Risks to economic activity: Textbook. Tsvetkova E.V., I.O. Arlyukova – SPb
Peter.
Center for Statistical Studies [electronic resource]: Risk measures. - The official website of the Center for Statistical
Studies, 2015. - Access: http://www.riskcontrol.ru
Ikhsanova L.R., Lurie К.M., Bikchantaeva D.K (2014). Quality of banking services as a tool for building “Bank-
Real sector” effective business models. Investment Management and Financial Innovations, 4(11), 149-
156.
Kaufman G.G. and Scott K.E (2003). What Is Systemic Risk, and Do Bank Regulators Retard or Contribute to It?
The Independent Review, v. VII, n. 3, г.
Sokolinskaya N.E (2013). Key management techniques stock risks: Banking. Sokolinskaya N.E. 4.
The Central Bank of the Russian Federation [Electronic resource]: Bulletin of Banking Statistics. - The official
website of the Central Bank of the Russian Federation, 2015. - Access: http://www.cbr.ru
Vagizova V.I., Karimullina A.I (2015). Performance Evaluation of Lending Instruments Within the Interaction of
Banking and Construction Economy Sectors. International Business Management, 9, 740-743.
Vagizova, V.I, Klaas, J.A., Batorshina, A.F (2013). Financial stability assessment of regional banking sector under
modern conditions by means of operating procedures of its determination. Investment Management and
Financial Innovations, 3, 89-97.

Academy of Strategic Management Journal Volume 15, Special Issue, 2016
53
DEVELOPMENT OF INTERNET BANKING ON
BANKING SERVICES MARKET
E.P. Duvalova, kazan Federal University
O.V. Andreeva, kazan Federal University
Y.I. Duvalova, Kazan Federal University
I. Ivasiv, Kyiv National Economic University
ABSTRACT
This article considers banking sector development, which is connected with the
improvement of doing banking business through the use of Internet technology. The problem of
introducing and developing modern banking technologies in the Russian Federation is very
topical. The paper points to a number of advantages when introducing banking computerized
systems and the most common ways of on-line payments and client identification in Russia. The
structure of accounts with remote access that are opened by individuals and legal entities with
Russian credit organizations are analyzed. Some measures to develop Internet technologies
markets are proposed. A new method is Internet banking or telebanking, which allows expanding
bank’s customer base, to reduce business expenses and provide structure innovatization of
economic development of the real and financial sectors of the Russian economy. Modernization
will become a key expenditure item for the banks in the future. There are also considers
improving the legal framework, development of the insurance system, implementation of an
integrated approach to risk management, institutional changes in the activities of credit
institutions, improving the financial literacy of the population and increasing citizens’ skills in
managing personal finances.
Key Words: Internet Banking, Banking Services, Online Payments, the Banking Computerized
Systems, Credit Organization
INTRODUCTION
Under current economic conditions, banks are forced to look for new ways to provide
their services; it is primarily connected with the transformation of banking activity due to the
introduction of modern information technologies. A new method is Internet banking or
telebanking which allows not only to expand bank’s customer base, to reduce business expenses,
but also, in general, to provide structure innovatization of economic development of the real and
financial sectors of the Russian economy. Provision of banking services requires large
consumption of material resources. At the same time, focus on profit forces banks to seek to
reduce the costs of providing services. This reflects the basic problem of slowing the
introduction of the Internet technologies.
With the rapid development of the Internet technologies, credit institution customer is
able to enjoy a significant number of banking services using only the web browser. To gain
access to your personal account, you only need to have a personal computer and a mobile phone
connected to the Internet. Thus, the global network has allowed eliminating barriers between
bank and client. Credit institutions with a broad range of customers can reduce the maintenance

Academy of Strategic Management Journal Volume 15, Special Issue, 2016
54
cost of their branch network, thereby reducing the cost of their services. Using telebanking via
the Internet leads to increased costs of technology, but they pay off due to economies of scale.
THEORY
The question of introduction and development of modern banking technologies in the
Russian Federation is relevant; this is indicated in the Statement of the Government of the
Russian Federation and the Central Bank of April 5, 2011 № 1472p-P13, 01-001 / 1280 "On the
banking sector development strategy of the Russian Federation for the period up to 2015."
According to the statement, the current banking activities are impossible without the introduction
of advanced information technologies to improve the quality of the credit institution services and
expand their list. The introduction of information technology in banking can increase the
efficiency of the bank's activities.
Implementation of bank computerized systems provides credit organization with several
advantages:
1. The economic benefits due to reducing the cost of customer service - when using telebanking, costs are
significantly lower than when providing services in bank branches and affiliates. Here, the bank requires
significant investment to introduce computerized systems, but they pay off quickly within a given period, it
triggers the economies of scale: the more customers are, the lower are costs;
2. More efficient servicing of bank customers, this is due to the fact that any single bank branch cannot handle
tens of thousands of customers in a short period of time, while using innovative banking technologies, this
becomes possible;
3. Solving the problem of bank network development to ensure the availability of banking services to
customers of credit institution;
4. New geographical segments which allow the credit institution to expand its customer base;
5. Increasing the speed and quality of services provided;
6. Reduction of the bank's operational risk due to the increased accuracy of the bank operations done;
7. A bank has an opportunity to create fundamentally new banking products and services, which result in
improving competitiveness of the bank.
RESULTS
According to a survey conducted by the National Agency for Financial Studies, the
highest priority factor in the use of Internet banking is security. According to surveys, about 25%
of the Russian Internet users are not sure about the reliability of banking online systems.
Modernization will become a key expenditure item for the banks in the future. Half of the
banks surveyed expect growth in spending on modernization in the next two years. For example,
banks of France and Germany planned to increase spending on cyber security by 61% in 2014,
and banks in Britain are showing increased interest in the transition to digital banking.
SMS-code is still the most common way of bank users’ authentication over the last few
years (Fig. 2). The banks, seeking to ensure the safety of telebanking operation started a massive
shift to the technology of two-factor protection, while using it the customer enters the necessary
data: login and password and one-time SMS-code.

Academy of Strategic Management Journal Volume 15, Special Issue, 2016
55
Figure 1
THE MOST COMMON WAYS OF IDENTIFYING THE CLIENT
When selecting different telebanking technologies, a credit institution should examine its
attendant risks in detail, which may pose a potential threat to the bank's activities, as well as to
evaluate management of the technology and to ensure control over its use. Also, it should be
noted that the use of Internet banking increases anonymity of services, which entails a significant
increase in traditional banking risks.
Despite many risks associated with banking activities on the Internet, year after year, an
increasing number of payments are conducted online. Currently, 46% of Russian city residents
use Internet banking services regularly (Fig. 2). In the US, 61% of the adult population uses
online banking. Figure 2
THE MOST COMMON TYPES OF ONLINE PAYMENTS IN RUSSIA

Academy of Strategic Management Journal Volume 15, Special Issue, 2016
56
According to data published on the official website of the Central Bank for 2013, we can
draw conclusions about the positive development dynamics of modern technologies in the
banking market.
The number of accounts with remote access opened with credit institutions from 2011 to
2013 increased by half (from 59,042.7 thousand units to 102,872.9 thousand units) (Fig. 3). Also,
it should be noted that this trend is typical for individuals to a greater extent than for businesses.
In turn, the number of accounts with access via the Internet has more than doubled. This trend
can be explained by the computerization of banking operations and by an increase in the number
of Internet banking users. Figure 3
STRUCTURE OF THE ACCOUNTS OPENED BY INDIVIDUALS WITH CREDIT INSTITUTIONS IN
RUSSIA
For several years from 2008 to 2010, the number of accounts opened by individuals over
the Internet has been constant. At the same time, this figure is increasing annually and in 2013 it
amounted to about 40% of all accounts opened. If the trend continues, by 2015 more than 50% of
accounts will be opened via the Internet. This fact indicates a growing need for services provided
by banking computerized systems.
The structure of bank accounts opened by legal entities looks a little different (Fig. 4).
Currently an increasing number of clients among legal entities use the services of the
bank with the help of the Internet instead of the "Client-Bank" system. This dynamics proves that
users prefer the thin client system which is much more convenient to use. If the dynamics is
maintained in the coming years, the "Bank-Client" system will soon leave the market of banking
services, as bank computerized systems are developing very rapidly and allow credit institutions
to provide services of higher quality than using outdated "Bank-client" system.

Academy of Strategic Management Journal Volume 15, Special Issue, 2016
57
Figure 4
THE STRUCTURE OF THE ACCOUNTS WITH REMOTE ACCESS OPENED TO LEGAL ENTITIES -
NON-CREDIT INSTITUTIONS IN CREDIT INSTITUTIONS IN RUSSIA
It should also be noted that much of the calculations carried out in 2013 was transferred
via the Internet (total number of payments - 2 221.2 mln.units, including 754.8 mln.units via the
Internet). For example, over the past year the Russian market of Internet banking rose to 590
billion rubles. In the long term, in 2017 the market of Internet banking may amount to 1.6-1.8
trillion. rub. Thus, the Internet banking in Russia is developing, at the same time the pace of its
development should be activated.
CONCLUSIONS
The measures to develop Internet technologies market may include:
1. improving the legal framework:
- the introduction of standards for reliable information exchange in electronic banking services;
- regulation of the rights, responsibilities and legitimate interests of all parties that use electronic
banking technologies.
2. development of the insurance system:
- insurance of information risks by banks
3. implementation of an integrated approach to risk management:
- revaluation of traditional control methods and development of new ones over banking risks and
their management with the new sources and components of banking information contours.
4. institutional changes in the activities of credit institutions:
- to activate the channels of public information systems about electronic banking;
- to train the staff and customers of a bank to ensure the confidentiality and security of the system.
5. to improve the financial literacy of the population;

Academy of Strategic Management Journal Volume 15, Special Issue, 2016
58
6. to increase citizens’ skills in managing personal finances.
REFERENCES
Vagizova V. I (2009). Infrastructural support innovative collaboration between business, government and society in
the modern economy. Problems of Modern Economics, (3), 17-21.
Chernenko V. A, Reznik I. A(2010). Electronic Banking Services: international experience and national practice. -
SPb .: Info YES,. - 212 .
Ikhsanova L.R., Lurie К.M & Bikchantaeva D.K (2014). Quality of banking services as a tool for building “Bank-
Real sector” effective business models. Investment Management and Financial Innovations, V.4 (11), 149-
156.
Klaas J & Vagizova V (2014). Formation of sustainable development strategy of credit organizations based on
Balanced Scorecard. Investment Management and Financial Innovations, (1), 88-97.
Vagizova V. I (2009). Creative for financiers. Innovatization financial infrastructure of regional economy. Creative
Economy (5), 131-139.
On the banking sector development strategy of the Russian Federation for the period up to 2015 [electronic
resource]: Statement of the Government of the Russian Federation and the Central Bank of April 5, 2011
NN 1472p-P13, 01-001 / 1280 // Reference legal system "Garant".
Duvalova E. P (2012). Analysis of non-interest expenses of a commercial bank in terms of card products. "Herald"
TISBI " (4), 146-150.
www.cbr.ru - the official website of the Central Bank of the Russian Federation (Bank of Russia) www.bankir.ru -
site of the financial and economic issues.
Recommendations on the management of risks arising in the implementation of credit institutions transactions using
Internet banking systems [electronic resource]: Letter of the Bank of Russia on March 31, 2008 № 36-T //
Reference legal system "Consultant".
www.bankdbo.ru/preimushhestva-dbo - RB - remote banking services.

Academy of Strategic Management Journal Volume 15, Special Issue, 2016
59
DIAGNOSTICS OF REGIONAL BANKING SYSTEMS
STABILITY AS AN INSTRUMENT OF INTEGRATION
J.A. Klaas, Kazan Federal University
M.H. Khalilova, Kazan Federal University
A.M. Tufetulov, Saint Petersburg State University
ABSTRACT
This paper deals with the problem of increase the efficiency of the integration of regional
banking systems. Today, small and medium regional banks are not able to ensure the regional
economy banking products and services. In this regard, there is a need of the integration of
regional credit institutions and regional banking systems. At the same time there is the
inefficiency of joint banks associated with incorrect assessment of candidates for integration. To
solve this problem, we tested a methodology of the rating agency «Expert» on the example of
regional banking systems of the Volga Federal District. By results of the implementation of this
methodological approach we revealed two trends in activity of regional banking systems, namely
reduction in efficiency of operation and reduction of capitalization. And the most attractive for
integration regional banking systems are the Perm Krai, the Republic of Mari El, Mordovia,
Ulyanovsk region, the Chuvash Republic.
Key Words: Regional Banking Systems, Financial Stability, Evaluation, Integration
INTRODUCTION
One of the key factors of development of the regional economy and, as a consequence,
the Russian economy are effectively functioning regional banks and banking systems. Regional
banks are closer to the real economy, their relationship with the companies has a long-term basis,
and they better consider the interests of small enterprises. Therefore, the main activities and
prospects of development of regional banks are directly connected with their active participation
in financing of manufacturing, small and medium businesses, financial support programs for the
economic development of the regions.
However today small and medium regional banks are not able to ensure the regional
economy banking products and services. In this regard, there is a need for a regional bank that
meets the needs of the regional economy. One of the options for creation of such bank is the
integration of regional credit institutions and regional banking systems. At the same time, the
experience shows that despite the intensification of integration processes in the banking sector,
there is the inefficiency of joint banks. One reason for the inefficiency is incorrect assessment of
candidates for integration.
LITERATURE REVIEW
In modern literature allocate some author’s approaches to the selection of candidates for
the integration of the banking business, thus these approaches have several limitations for
practical application. I.V. Larionov includes in the process of an assessment of candidates:
analysis of financial performance and technical specifications, evaluation of corporate culture

Academy of Strategic Management Journal Volume 15, Special Issue, 2016
60
and human resource capacity of the object, analysis of characteristics of organizational structure,
evaluation of the information systems in terms of their convertibility and compatibility. A.I.
Sedin proposes five key categories for the analysis of the candidates: financial performance,
compatibility of products and structure of presence in the market, compatibility of corporate
cultures, compatibility of information and management systems, aspects of state regulation. A.I.
Sedin and I.V. Larionov pay considerable attention to the detailed analysis of several most
probable candidates for integration, but have not developed specific theoretical and
methodological approaches to definition of the «short» list of banks. At the same time at the
beginning of 2015 in Russia operated 834 credit institutions and 85 banking systems, so
development of approaches to the selection of candidates from a large number of banks and
systems has been actual.
To solve this problem, we approve the methodology of an assessment of bank financial
stability of the rating agency «Expert» on the example of regional banking systems of the Volga
Federal District.
OBJECT
The Volga Federal District (further- VFD) includes 14 subjects of the Russian Federation,
including 6 republics (Bashkortostan, Mari-El, Mordovia, Tatarstan, Udmurtia, Chuvashia), 7
regions (Kirov, Nizhny Novgorod, Orenburg, Penza, Samara, Saratov, Ulyanovsk), and Perm
Krai (the region includes Perm region and Komi-Perm Autonomous District).
On the territory of the Volga Federal District 92 credit institutions function on January 1,
2015. Distribution of the credit institutions for subjects is presented in table 1.
Table 1
DISTRIBUTION OF THE CREDIT ORGANIZATIONS FOR SUBJECTS
amount Subjects 01.01.2015 01.04.2015 01.07.2015 01.10.2015
Kirov region 3 3 3 3
Nizhny Novgorod Region 10 10 10 10
Orenburg region 7 7 7 7
Penza region 1 1 1 1
Perm Krai 4 4 4 4
Republic of Bashkortostan 7 7 7 6
Republic of Mari El 2 2 2 2
Republic of Mordovia 4 3 3 3
Republic of Tatarstan 22 22 22 22
Samara region 15 15 15 15
Saratov region 9 9 9 9
Udmurt Republic 2 2 2 2
Ulyanovsk region 2 2 2 2
Chuvash Republic 4 4 4 3
METHODOLOGY
To assess the financial stability of regional banking systems of Volga Federal District we
use method of rating agency «Expert».
The approach used in the rating of the rating agency «Expert» is a bit different from other
Russian techniques. This technique is an attempt to create a comprehensive comparative ranking.

Academy of Strategic Management Journal Volume 15, Special Issue, 2016
61
Procedure consists of two main parts. The first (static) part involves the comparison of the banks
in the coordinate system of «profitability-reliability». The rate of profitability and an indicator of
the reliability are carried out on the following formula:
(1)
(2)
The results of two-criterion analysis of the current condition of the banks are put on a
plane with the x-ax corresponds to the index of reliability, and the y-ax corresponds to the
indicator of profitability, as a result the coordinate space is divided into four segments. The
coordinate system of «profitability-reliability» is presented in figure 1.
Figure 1
THE COORDINATE SYSTEM OF «PROFITABILITY-RELIABILITY»
The second part is to analyze the dynamics of changes in the parameters of profitability
and reliability over time.
To monitor the financial stability of credit institutions the Bank of Russia regulates
indicators of their financial stability:
1. capital appreciation - appreciation of adequacy of own funds (capital), aggregate capital adequacy, capital
quality control;
2. assets appreciation – appreciation of quality of loans, risk of loss, share of bad loans, size of loan loss and
other assets provision;
3. yield appreciation – appreciation of assets and capital earning power, costs structure, net interest margin,
net credit operations spread;
4. liquidity appreciation – appreciation of short-term, quick and current liquidity, structure of borrowed funds,
risk of their own bill liabilities, nonbanking loans, averaging-out reserve requirements and risk of major
creditors and depositors;
5. quality of management appreciation - appreciation of risk management and internal audit system, strategy
risk management, risk management of personnel financial motivation;
6. appreciation of structure transparency – appreciation of disclosure adequacy, availability of information
about individuals, who have a significant influence on the decisions taken by the bank control authorities of
a significant impact on the bank management by the offshore residents.
Capitalize
Star
Depressive
Profit-oriented
reliability
profitability

Academy of Strategic Management Journal Volume 15, Special Issue, 2016
62
RESULTS
We have analyzed the banking systems of subjects of the Volga Federal District,
according to the methodology of the rating agency «Expert» for 4 reporting dates (January 1,
2015, April 1, 2015, July 1, 2015 and October 1, 2015). The results of calculations of
profitability and reliability are reflected in table 2. Location of regional banking systems of the
Volga Federal District in the coordinate system «profitability-reliability» is shown in figures 2-5.
Table 2
THE RESULTS OF CALCULATIONS OF PROFITABILITY AND RELIABILITY OF THE REGIONAL
BANKING SYSTEMS
Subject Profitability Reliability
01.01.2015 01.04.2015 01.07.2015 01.10.2015 01.01.2015 01.04.2015 01.07.2015 01.10.2015
Kirov region 2,462 0,096 -0,153 -0,296 20,426 21,478 21,089 20,731
Nizhny
Novgorod
Region
2,199 1,040 1,255 -0,886 21,331 22,464 20,867 17,811
Orenburg region 1,174 0,144 0,141 0,063 26,422 26,219 24,731 24,187
Penza region 1,151 0,102 0,002 0,027 17,150 18,112 14,602 15,802
Perm Krai 0,202 0,330 0,344 0,181 16,663 17,831 18,831 18,451
Republic of
Bashkortostan 0,913 0,090 0,347 -10,514 12,684 12,600 12,006 -6,659
Republic of
Mari El 1,265 0,415 0,770 0,854 18,561 18,176 19,283 19,681
Republic of
Mordovia 0,003 0,642 1,224 0,864 16,820 15,486 16,288 15,894
Republic of
Tatarstan 0,515 0,018 -0,246 -0,551 21,406 20,989 20,380 21,589
Samara region 0,380 -0,136 -0,184 -0,710 24,570 26,114 25,572 22,378
Saratov region 1,099 -0,013 -0,592 -2,595 13,108 13,140 12,838 7,171
Udmurt
Republic 0,472 0,173 0,113 0,102 14,554 15,835 16,280 16,342
Ulyanovsk
region 0,582 0,265 0,196 0,386 27,707 27,810 26,153 24,369
Chuvash
Republic 0,582 0,071 0,152 0,220 17,932 18,102 17,708 16,306
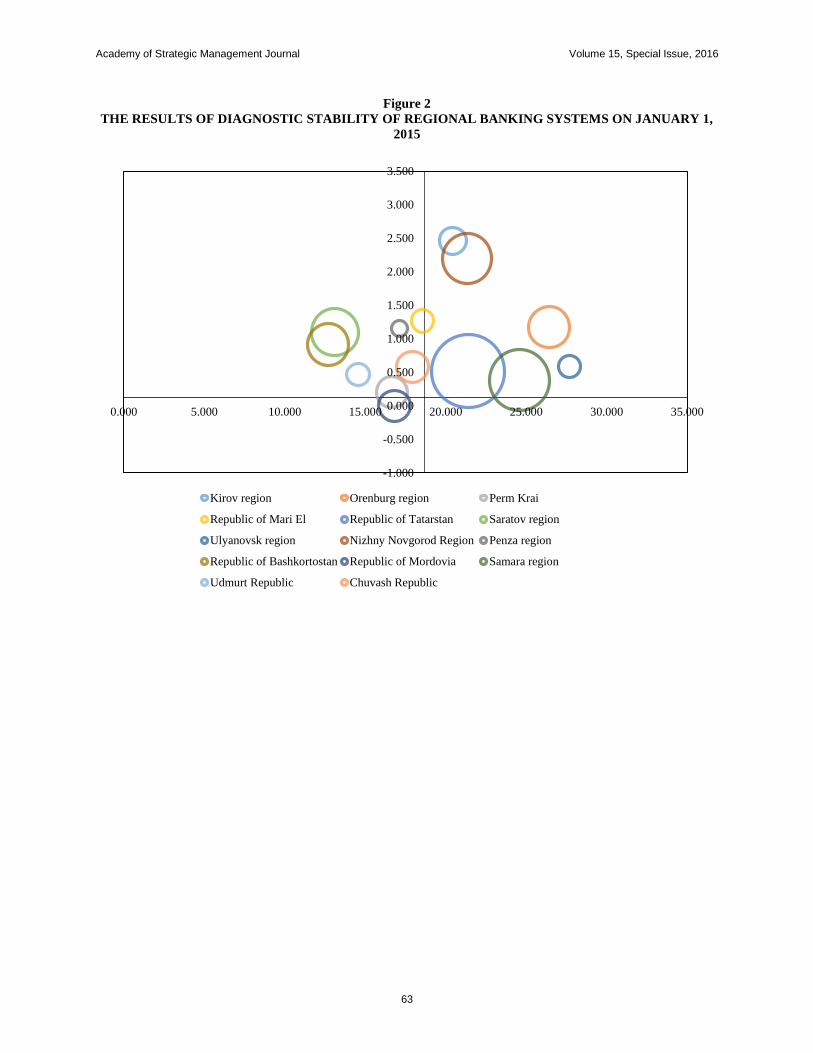
Academy of Strategic Management Journal Volume 15, Special Issue, 2016
63
Figure 2
THE RESULTS OF DIAGNOSTIC STABILITY OF REGIONAL BANKING SYSTEMS ON JANUARY 1,
2015
-1.000
-0.500
0.000
0.500
1.000
1.500
2.000
2.500
3.000
3.500
0.000 5.000 10.000 15.000 20.000 25.000 30.000 35.000
Kirov region Orenburg region Perm Krai
Republic of Mari El Republic of Tatarstan Saratov region
Ulyanovsk region Nizhny Novgorod Region Penza region
Republic of Bashkortostan Republic of Mordovia Samara region
Udmurt Republic Chuvash Republic

Academy of Strategic Management Journal Volume 15, Special Issue, 2016
64
Figure 3
THE RESULTS OF DIAGNOSTIC STABILITY OF REGIONAL BANKING SYSTEMS ON APRIL 1, 2015
Figure 4
THE RESULTS OF DIAGNOSTIC STABILITY OF REGIONAL BANKING SYSTEMS IN THE JULY 1,
2015
-1.000
-0.600
-0.200
0.200
0.600
1.000
1.400
1.800
0.000 5.000 10.000 15.000 20.000 25.000 30.000 35.000
Kirov region Orenburg region Perm Krai
Republic of Mari El Republic of Tatarstan Saratov region
Ulyanovsk region Nizhny Novgorod Region Penza region
Republic of Bashkortostan Republic of Mordovia Samara region
Udmurt Republic Chuvash Republic

Academy of Strategic Management Journal Volume 15, Special Issue, 2016
65
Figure 5
THE RESULTS OF DIAGNOSTIC STABILITY OF REGIONAL BANKING SYSTEMS ON OCTOBER 1,
2015
As we can see from the figures 2-5 there is negative trend in activity of regional banking
systems in terms of the sustainability. On January 1, 2015 in the banking sector of the Volga
Federal District dominated «star» regional banking systems which profitability and reliability
were higher than average (share the «star» systems on January 1, 2015 - 43%) and «profit-
oriented» banking systems with a highly profitable use of relatively large amounts of funds
(share of the «profit-oriented» systems on January 1, 2015 - 50%). Оn October 1, 2015 the
situation was diametrically opposite: 36% of the banking sector of the Volga Federal District was
the «depressive» banking systems, whose reliability was below average, and there was low
profitability of use of significant amounts of raised funds, and 29% «capitalized» regional
banking systems which are characterized by high capital adequacy.
The presence of 36% of «depressive» regional banking systems within the banking sector
of the Volga Federal District doesn't allow drawing a conclusion about its sustainability. Low
profitability, and in certain cases unprofitability of the active operations performed by banks
which varies for «depressive» systems from -10,5% to 0,1% on October 1, 2015 while for «star»
and «profit-oriented» banking systems the level of profitability reaches 0,85% and 0,86%
respectively is one of the major reason of domination of «depressive» banking systems.
Reliability index of the bank which determines the degree of coverage of funds by equity
is no less important. The value of this indicator was in the range from -6,66% to 17,81% on 1
October 2015 for «depressive» banking systems, due to their significant under capitalization,
given the fact that the profit is one of the most reliable sources of capital, and «depressed» banks
-12.000
-8.000
-4.000
0.000-10.000 -5.000 0.000 5.000 10.000 15.000 20.000 25.000 30.000
Kirov region Orenburg region
Perm Krai Republic of Mari El
Republic of Tatarstan Saratov region
Ulyanovsk region Nizhny Novgorod Region
Penza region Republic of Bashkortostan
Republic of Mordovia Udmurt Republic
Chuvash Republic Samara region
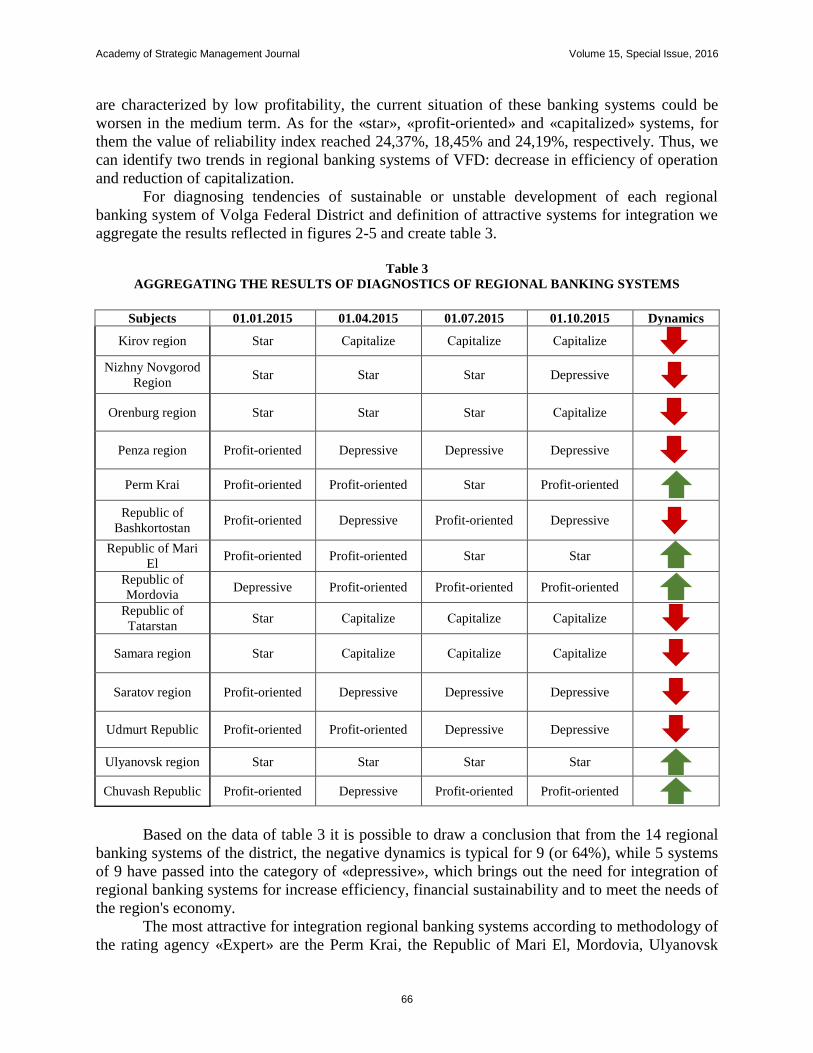
Academy of Strategic Management Journal Volume 15, Special Issue, 2016
66
are characterized by low profitability, the current situation of these banking systems could be
worsen in the medium term. As for the «star», «profit-oriented» and «capitalized» systems, for
them the value of reliability index reached 24,37%, 18,45% and 24,19%, respectively. Thus, we
can identify two trends in regional banking systems of VFD: decrease in efficiency of operation
and reduction of capitalization.
For diagnosing tendencies of sustainable or unstable development of each regional
banking system of Volga Federal District and definition of attractive systems for integration we
aggregate the results reflected in figures 2-5 and create table 3.
Table 3
AGGREGATING THE RESULTS OF DIAGNOSTICS OF REGIONAL BANKING SYSTEMS
Subjects 01.01.2015 01.04.2015 01.07.2015 01.10.2015 Dynamics
Kirov region Star Сapitalize Сapitalize Сapitalize
Nizhny Novgorod
Region Star Star Star Depressive
Orenburg region Star Star Star Сapitalize
Penza region Profit-oriented Depressive Depressive Depressive
Perm Krai Profit-oriented Profit-oriented Star Profit-oriented
Republic of
Bashkortostan Profit-oriented Depressive Profit-oriented Depressive
Republic of Mari
El Profit-oriented Profit-oriented Star Star
Republic of
Mordovia Depressive Profit-oriented Profit-oriented Profit-oriented
Republic of
Tatarstan Star Сapitalize Сapitalize Сapitalize
Samara region Star Сapitalize Сapitalize Сapitalize
Saratov region Profit-oriented Depressive Depressive Depressive
Udmurt Republic Profit-oriented Profit-oriented Depressive Depressive
Ulyanovsk region Star Star Star Star
Chuvash Republic Profit-oriented Depressive Profit-oriented Profit-oriented
Based on the data of table 3 it is possible to draw a conclusion that from the 14 regional
banking systems of the district, the negative dynamics is typical for 9 (or 64%), while 5 systems
of 9 have passed into the category of «depressive», which brings out the need for integration of
regional banking systems for increase efficiency, financial sustainability and to meet the needs of
the region's economy.
The most attractive for integration regional banking systems according to methodology of
the rating agency «Expert» are the Perm Krai, the Republic of Mari El, Mordovia, Ulyanovsk

Academy of Strategic Management Journal Volume 15, Special Issue, 2016
67
region, the Chuvash Republic. A characteristic feature of these systems is a small number of
regional banks in the system.
CONCLUSION
In modern conditions, small and medium regional banks cannot provide the banking
services in the region's economy. In this regard, there is a need to integrate regional credit
institutions and regional banking systems. Thus for effective functioning of the joint banks, it is
necessary a correct assessment of candidates for integration. In order to solve this problem, we
tested a methodology of financial stability assessment of the rating agency «Expert» on the
example of regional banking systems of the Volga Federal District. By results of the
implementation of this methodological approach we revealed two trends in activity of regional
banking systems, namely reduction in efficiency of operation and reduction of capitalization.
And the most attractive for integration regional banking systems according to methodology of
the rating agency «Expert» are the Perm Krai, the Republic of Mari El, Mordovia, Ulyanovsk
region, the Chuvash Republic.
REFERENCES
Ikhsanova L.R., Lurie К.M., Bikchantaeva D.K. Quality of banking services as a tool for building Bank-Real sector
effective business models. Investment Management and Financial Innovations, .4 (11), 149-156.
Vagizova V.I., Lurie K.M & Ivasiv I.B (2014). Clustering of Russian banks: business models of interaction of the
banking sector and the real economy. Problems and perspectives in management, 72-82.
Naveh, M.H., Torosyan & T., Jalaee, S.A (2012). Regional economic integration and its effects on economic growth
and economic welfare. World Applied Sciences Journal, 17(10), 1349-1355
Li J., Rajan R.S & Hattari R (2016). Drivers of intraregional M&As within developing Asia. Journal of the Asia
Pacific Economy, 21(1), 116-131.
Bank of Russia [electronic resource]: Information on Credit Institutions. Official site of the Bank of Russia, 2016.
http://www.cbr.ru.
Klaas J.A (2014). The definition of financial stability of regional banks by the testing of existing methodologies to
assess. Finance and business (3), 49-60.
Brauers, W.K.M., Ginevičius, R & Podviezko, A (2014). Development of a methodology of evaluation of financial
stability of commercial banks. Panoeconomicus (3), 349-367
De Haas, R & Van Lelyveld, I (2014). Multinational banks and the global financial crisis: Weathering the perfect
storm? Journal of Money, Credit and Banking (46), 33-364.
Gómez, F (2015). Failed bank takeovers and financial stability. Journal of Financial Stability (16), 45-58.
Klaas, J & Vagizova, V (2014). Tools for assessing and forecasting financial stability of the commercial bank under
conditions of instability. Investment Management and Financial Innovations (4), 157-163.
Lavrushin O.I., Mamonova I (2011). Assessment of the financial stability of the credit institution. O.I. Lavrushin -
Moscow: KNORUS,.
Tarhanova E.A (2003). The stability of commercial banks. E.A. Tarhanova - Tyumen: Publishing Vector Book.
Timofeev Z.A (2003). Estimation of financial stability of commercial by banks supervisors: Monograph.
Kaliningrad: The Baltic Institute of Economics and Finance.

Academy of Strategic Management Journal Volume 15, Special Issue, 2016
68
THE MODELING OF INDUSTRIAL ENTITY’S
DYNAMICS STAFF COSTS
Sungatullina L.B, Kazan Federal University
Faizrahmanova G.R, Kazan Federal University
ABSTRACT
This article is devoted to a necessity of perspective value of staff costs in according to
strategic business principles. The scientific and practice aspects of modeling of trends of
changing staff costs of industrial entity are researched. The possibilities of models of time
domain applying are estimated. The using of additive models such as moving average, smoothing
fluctuations and sharing out the main trends of staff costs dynamics and also the model of
exponential smoothing considering various value of a temporary row are reviewed. The
appointment and features of each type of numerical modeling of staff costs level are allocated.
The possibilities of applying of models of time domain for the perspective estimates of staff costs
of industrial entity for forming analytical information for goals of making management decision
are considered.
Key Words: Staff Costs, Rewards, Human Capital, Time Domain, The Model Of Moving
Average, The Model Of Exponential Smoothing, The Perspective Estimate, Management
Decisions
INTRODUCTION
In the changing economic conditions of business, the questions of managing decisions
link with the staff costs of industrial entity in perspective are became special actual.
Determination the strategy of such management costs means the dynamics of human capital
development that is competitive advantage of commercial organization. In this context it is
necessary to review costs both on attraction and on allowance and motivation of personnel to
effective activity. In this case the investment into accumulation of personnel knowledge, abilities
and skills are become important. Many researches point out this fact. J.Octavian and D. Nicoleta
note that investment into education is one of way to human capital development and also to
entity competitive advantage. V. Sum determines advantages in personnel abilities and skills like
one of company development form which based on knowledge. So this form promotes to quality
increase and efficiency of activity. In this case the development of personnel stimulation system
is necessary, i.e. determination of principles and rules of personnel rewards into interrelation
with strategic company goals. Y.H. Hsieh and H.M. Chen note that namely strategic accordance
between business strategy and human capital strategy promotes to personnel motivation and
effective activity. P. Boxall emphasizes the competitive advantage achievement as interrelation
business strategy and system of rewards. B.K. Boyd and A. Salamin clarify that the bonus
programs are one of the key aspects for the determination of this link. The future project of that
program is a factor of stable company development. Other researchers in particular H.-M. Chen
and Y.-H. Hsieh consider the necessity of interrelation personnel incentive bonus with
company’s life cycle stages. All of that promote to increase company competitiveness. Many
specialists in particular M.B. Hargis, D.B. Bradley III, R. Barrett, S. Mayson, J.G. Messersmith

Academy of Strategic Management Journal Volume 15, Special Issue, 2016
69
and J.P. Guthrie emphasize that such interrelation is important for companies both on stage of
maturity and on origin and formation stages. Because of changes in business the evaluation of
personnel rewards strategy is needed in business requirements and as a consequence the system
of costs on personnel is also needed. Consequently, as W.-J.A. Chang and T.C. Huang stress the
projecting for the future all of important elements of system costs on personnel including all
kinds of rewards and personnel incentive bonuses. T.J. Bush has a similar opinion. He maintains
that the bonuses system is important factor for increasing efficiency activity of company. This
system motivates the personnel to improve their own professional skills; therefore the question
of information about the perspectives of personnel bonuses system development is important for
company. R. White has a similar view on this question, so he points out the necessity of a
strategic approach to a determination of a logical personnel bonuses system. T.-C. Huang
emphasized that the link between personnel managing with incentive bonuses is one of the
element of managing system of total costs on personnel. D.-S. Wang and C.-L. Shyu share out
the main factors of conformity between company developments and influence such link on the
effectivity of personnel activity in perspective.
In this way the staff costs project on perspective is one of the key stages of determination
of management human capital strategy in accordance with long-term and short-term business
tasks. The modeling of dynamics and optimization perspectives trends serves as instruments to
achievement goals. The modeling process allows finding out the changing direction of
researching object, to optimize its state in future and demonstrate consecutive changes of total
staff costs. It is necessary because of many processes which have impact on costs are in
perpetual variation. Besides that, the dynamics costs on personnel modeling promotes to
determination of changing character of financial resources in perspective directing for attraction,
allowance and motivation of personnel on responsibility centers and the company’s personnel
categories.
METHOD
The necessity of costs on personnel dynamics modeling determines the problem of choice
of concrete model of company perspective activity estimate. The information technology modern
development allows using different methods of economic and statistic researches in the field of
managing industrial company. In particular, it allows managing by innovative activity, finding
out factors, which have influence on company’s profitability, determination of optimization
personnel reward strategy, budgeting of compensating and stimulating costs on personnel. This
choice depends on variety factors: presence of data, the period of estimate, accuracy of trend
determination and costs on modeling.
One of analytical information qualitative methods is a modeling of dynamic domains,
which reflects stable trends of researching object. The costs on personnel are complex for
regulation because of its changing in real calculation. In the same time that costs stable enough
in long-term perspective, i.e. it’s changing under the effect of transformation of forms and
methods of attraction and personnel allowance. As a rule, such changes of company are
consecutive with lack of interference both on outside (for example: other rates of insurance
payments, the order repeals from large buyers, the appearance on strong competitor’s market,
high level of inflation etc.), and on inside (essential staff reduction, changing in professional
personnel staff, essential corrections of tariff rates, piecework payments and salary and etc.).
In this way, the expediency of time domain application for the determination of costs on
personnel character determines by dynamic rows, which allow estimating costs with goal of

Academy of Strategic Management Journal Volume 15, Special Issue, 2016
70
finding out the trend of its changing. This is made in terms of costs planning on to follow
accounting period (for example: month, quarter, year etc.) and also for correction of current plan
and determination of managing of company human capital.
On the whole, depends on current goals the different models of time domain can be used.
In our opinion, for the perspective estimation of costs on personnel expediently to use such
models as: a) smoothing fluctuations and allocating the main tendencies of change of level of a
row; b) the adaptive models considering various value of a temporary row.
The simple moving average model, which belong to first type of dynamic rows are made
on the base of value averaging of researching object for few last periods. This model doesn’t
allow getting exact direction of events development. It more applies for the data with small
accidental errors from constant or trivial changing indicator where the last observations have a
weight as previous. For removing such shortcoming, the application of weighted moving average
model is possible. This model is based on the idea about that the later data have larger weight
than earlier.
For the data processing of time domain, the last period information is more important, i.e.
for estimation costs on personnel it is necessary to know about current trend development but not
about average trend from researching period of times. Namely in this context the information is
estimated with using of exponential smoothing model, which allows to take into account
different information value of time domain level and to eliminate the degree of obsolete primary
data. It is possible because of in terms of factual value addition the error of project value is
estimated (difference between real and planned value). This error by means of feedback comes to
model and is considered according to process of transformation from one state in another. Thus,
the self-correcting model which quickly reacts to conditions changes through the results
accounting received during the previous action is determined. Owing to the specified properties,
in our opinion, the model of exponential smoothing is most pertinent when forming information
for adoption of management decisions.
RESULT
We investigate methodical methods of time domain models application for a perspective
assessment of staff costs on the example of one of the largest Russian enterprises of
petrochemical field.
Mathematically value of staff costs for future period can be expressed through model of
the weighed moving average as follows:
, (1)
or
, 1
1k
i
i k n
w
(2)
Where:
; (3)
fk – value of the estimated (projected) staff costs for k period;
xk-i – staff costs for k-i period;
wk-i – weights, reflecting the level of influences of xk-i sum of staff costs on the size of
staff costs estimated by xk;
Academy of Strategic Management Journal Volume 15, Special Issue, 2016
71
n – quantity of components.
At the same time, it is supposed that wi doesn't increase. It reflects our opinion that than
in the past are spaced far apart values of staff costs from the projected (estimated) size, subjects
less it influences on future xk value of size of costs on personnel. The quantity of components is
accepted by us equal three (n = 3).
Analytical calculations need to be performed, leaning on primary values of costs on
personnel for the research period and on a certain combination of scales. On the found optimum
set of scales, it is possible to estimate in the long term costs on personnel for the next period on
the enterprise or structural division: a) in general, without breakdowns on groups of costs on
attraction and the personnel allowance; b) separately by types of expenses and further by its
summarizing to calculate the total projected value of costs on personnel on the enterprise or
structural unit.
We offer to allocate the following groups of scales:
One of the problems arising at application of this model is the question of optimum
combination of scales determination. For this purpose, we recommend calculation of the modules
differences sum by following formula:
∑| |
(4)
where: xk – costs on personnel for k period;
fk – has the same value as in a formula 2.
The received value is accepted to a deviation between the actual and planned value of
costs on personnel for every period. By means of comparison of numbers, proceeding from the
size of the values sum modules calculated by a formula 4 the optimum set of scales among
above-stated is defined. We accept that the optimum combination of scales is a set with the
smallest sum.
We will present calculations for a producing department of plant on production of butyl
rubber of the petrochemical enterprise on the basis of primary data for twelve periods. As the
chosen quantity of components equally three, the first design value of costs on personnel
calculates for k-9 period according to a formula 2. According to this formula values of costs on
personnel on each combination of scales are estimated. And, considering the smallest value of
modules differences, according to a formula 4 is defined that the most optimum set of scales is
the following group of scales: w1=0,4; w2=0,3; w3=0,3.
The design size of costs on personnel of a producing department of plant on production of
butyl rubber of the petrochemical enterprise for k period at this combination of scales will be
following:

Academy of Strategic Management Journal Volume 15, Special Issue, 2016
72
The carried-out calculations are presented in the table 1.
Table 1
STAFF COSTS PERSPECTIVE ASSESSMENT OF A PRODUCING DEPARTMENT OF BUTYL
RUBBER PRODUCTION PLANT OF THE PETROCHEMICAL ENTERPRISE AT AN OPTIMUM
COMBINATION OF SCALES ON THE BASIS OF CALCULATION OF THE SUMS OF DIFFERENCES
OF MODULES OF A ROW VALUES
Period Costs on personnel (rub.) Deviation (the
difference between
modules), rub. Real value Planned value
k-12- period 844219,54
k-11- period 800140,75
k-10 - period 941371,31
k-9- period 816723,88 869856,61 53132,73
k-8- period 800889,29 849143,17 48253,88
k-7- period 810445,49 847784,27 37338,78
k-6- period 752856,42 809462,15 56605,73
k-5- period 806700,33 784543,00 22157,33
k-4- period 821833,09 791670,71 30162,39
k-3- period 828464,43 796600,26 31864,17
k-2- period 911144,06 819945,80 91198,26
k-1- period 1036107,33 859546,88 176560,45
k- period - 936325,48 547273,72
Further we will consider the process of costs on personnel modeling with use of
exponential smoothing model. Earlier we specified that this model allows considering a
deviation of the previous design size from the actual value. And, thereby to consider the
tendency which has developed not on average for all analyzed interval of time, but during the
periods approximate to current time.
Mathematically the size of costs on personnel for the next estimated period on the basis
of exponential smoothing model is expressed as follows:
( ) , (5)
Where: fk, xk-1 – have the same value, as in a formula 2;
α – the smoothing coefficient defined empirically.
Value of a α constant defines extent of smoothing and is subject to the condition 0<α<1
and, as a rule, is selected by a universal trial and error method. It is connected with the fact that
with reduction α the deviation of exponential average decreases and increases unlike dispersion
of a row. Therefore, it is necessary, on the one hand to increase the weight of fresher supervision
(at increase α), and on the other hand, for alignment of casual deviations size α should be
reduced. These requirements are in contradict. In this regard search of compromise size α makes
a problem of model optimization.

Academy of Strategic Management Journal Volume 15, Special Issue, 2016
73
We will consider the possibilities of this model application for a perspective costs on
personnel assessment of the same petrochemical enterprise and compare the received results with
the values calculated by means of model of the weighed moving average. When forming
information about costs on personnel of the research enterprise on their groups the quantity of
components, as well as in the previous case, is accepted equal three (n = 3).
Because of the constant α is defined experimentally, possible sizes of costs on personnel
groups for k period are calculated proceeding from values α = 0,1; α = 0,2, etc. to α = 0,9.
Further the sizes of the modules differences sum like as ∑ | | taken for distance between the actual and estimated (design) values are counted.
After that by the way of direct comparison of these sizes the optimum coefficient of smoothing α
between values from 0,1 to 0,9 is defined. At the same time, we accept the value of coefficient of
smoothing as the number with the smallest sum. Taking into account optimum value α possible
sizes of costs on personnel on its separate groups are established, and for each group of expenses
the coefficient of smoothing is selected by the empirical way separately. Results of a perspective
assessment of costs on personnel with use of exponential smoothing and moving average models
are presented in table 2. Table 2
STAFF COSTS PERSPECTIVE ASSESSMENT OF A PRODUCING DEPARTMENT OF BUTYL
RUBBER PRODUCTION PLANT OF THE PETROCHEMICAL ENTERPRISE ON THE BASIS OF
MODELS OF THE WEIGHED SLIDING AVERAGE AND EXPONENTIAL SMOOTHING
Indicator Weighted moving average
model
Exponential smoothing
model
Deviation of
planned value
(rub.) Optimum
group of
weights (w)
Planned value
for k period,
rub.
Smoothing
coefficient
(α)
Planned value
for k period,
rub.
1 2 3 4 5 6=5-3
1. Salary and piecework
payment 0,8; 0,1; 0,1 47 004,61 0,9 47 176,87 172,26
2. Overtime Payments 0,8; 0,1; 0,1 115 721,16 0,9 116 852,14 1 130,98
3. Bonus 0,6; 0,3; 0,1 605 661,27 0,6 603 887,56 -1 773,71
4. Social Charges 0,4; 0,3; 0,3 97 771,31 0,3 93 284,24 -4 487,07
5. Reserve For Vacations 0,8; 0,1; 0,1 1 375,00 0,9 771,75 -603,25
6. Compensation
Payments 0,5; 0,3; 0,2 10 889,00 0,6 12 196,49 1 307,49
7. Working Clothes and
Equipment of Household
Rooms
0,4; 0,3; 0,3 2 321,00 0,4 4 289,68 1 968,68
8. Costs on Workers
Relocation 0,5; 0,4; 0,1 86 356,42 0,2 68 951,20 -17 405,22
9. Incentive Gifts to
Workers 0,8; 0,1; 0,1 1 954,00 0,9 2 032,90 78,9
10. Costs of personnel
training 0,8; 0,1; 0,1 300 854,01 0,9 306 832,67 5 978,66
Total Costs on Personnel - 1 279 907,78 - 1 266 275,50 -13 632,22
By comparison of costs on personnel perspective assessment results of the research
division of the petrochemical enterprise which is carried out with use of two different models of
time domain it is visible that at exponential smoothing on all levels of a row the average values
are received. It has an impact on the accuracy of the end result. It is connected with the fact that
at exponential smoothing all previous supervision are considered, and previous supervisions are

Academy of Strategic Management Journal Volume 15, Special Issue, 2016
74
considered with the greatest possible weight and preceding it – with the smallest. Thus, earlier
supervision has impact on the estimated (projected) values with the minimum statistical weight.
In this regard the model of exponential smoothing allows receiving an assessment of costs on
personnel trend parameters. This trend finds out not the average level of the research process, but
the tendency created by the time of the last supervision that increases reliability of the carried-
out analysis.
CONCLUSION
For modeling dynamics of costs on personnel on the basis of the analysis of time domain,
it is necessary to apply the methods increasing quality of the end results – more flexible in the
characteristic of the research processes, simple from the point of view of computing operations
and considering the character of the direction which has developed by the time of the last
supervision.
Models of time domain can be applied not only at a perspective assessment of costs on
personnel. Measurement of levels of a row and tendencies of its variation allows defining
stability of a temporary number of costs on personnel that is existence of a desirable tendency of
development of the analyzed object with the minimum influence of adverse circumstances.
Identification of a favorable tendency in costs on personnel dynamics allows to enter corrections
into the system of expenses of the enterprise and to optimize its planned values.
Generalizing the above, it is possible to make a conclusion that models of temporary
ranks allow to open features and properties of change of costs on personnel trends and to allocate
the components of a number of the research expenses forming its level. The considered methods
of numerical modeling of costs on personnel dynamics give the chance to estimate research
object taking into account its reached level. Also these methods increase analytical properties of
the formed information, promote data preparation for adoption of relevant administrative
decisions at a principles and rules formulation of workers rewards, and as a result promote to
form a company human capital management strategy.
REFERENCES
Barrett R. & Mayson S. (2007). Human resource management in growing small firms. Journal of Small Business
and Enterprise Development, 14(2), 307-320
Boxall P (1998). Achieving competitive advantage through human resource strategy: Towards a theory of industry
dynamics. Human Resource Management Review, 8, 265-288.
Boyd B.K & Salamin A (2001). Strategic reward systems: A contingency model of pay system design. Strategic
Management Journal, 22(8), 777-792.
Bush T.J (2003). Leverage employee rewards to drive performance. Hoosier Banker, 87(4), 26-29.
Chang W.-J.A., Huang T.C (2005). Relationship between strategic human resource management and firm
performance: A contingency perspective. International Journal of Manpower, 26(5), 434-449.
Chen H.-M & Hsieh Y.-H (2005). Incentive reward with organizational life cycle from competitive advantage
viewpoint. Human Systems Management, 24(2), 155-163.
Faizrahmanova G.R. & Kozlova N.N (2015). The System of Indicators of Enterprise’s Innovative Activity. Asian
Social Science-Special Issue, 11, 183-187.
Hargis M.B Bradley III D.B (2011). Strategic human resource management in small and growing firms: Aligning
valuable resources. Academy of Strategic Management Journal, 10(2), 105-125.
Hsieh Y.H & Chen H.M (2011). Strategic fit among business competitive strategy, human resource strategy, and
reward system. Academy of Strategic Management Journal, 10(2), 11-32.

Academy of Strategic Management Journal Volume 15, Special Issue, 2016
75
Huang T.C. (2001). The effects of linkage between business and human resource management strategies. Personnel
Review, 30(2), 132-151.
Messersmith J.G. & Guthrie J.P (2010). High performance work systems in emergent organizations. Implications for
firm performance Human Resource Management, 49(2), 241-264.
Ndinguri E., Prieto L & Machtmes K (2012). Human capital development dynamics: The knowledge based
approach. Academy of Strategic Management Journal, 11(2), 121-136.
Nesterov, V.N., Neizvestnaya, D.V (2014). Application of optimization models in prediction of inland water
transport organizations' profit. Mediterranean Journal of Social Sciences –. Special Issue, 154-160.
Octavian J., Nicoleta D (2010). Investment in human capital- an investment in future. Annals of the University Of
Oradea, Economic Science Series, 19 (2), 270-276.
Sum V (2010).The role of training and firm's competitiveness in the knowledge-based economy. Review of Business
and Technology Research, 3(1), 1-12.
Sungatullina L.B (2014). Application of Linear Programming in Budgeting Costs for the Compensation of
Employees. Mediterranean Journal of Social Sciences, 5(25), 388-392.
Sungatullina L.B & Sokolov A.Y (2015). Applying Game Theory to Optimize Expenses for Employees’
Remuneration. Asian Social Science-Special Issue, 11(11), 364-368.
Wang D.-S & Shyu C.-L (2008). Will the strategic fit between business and HRM strategy influence HRM
effectiveness and organizational performance? International Journal of Manpower, 29(2), 92-110.
White R (2005). A strategic approach to building a consistent global rewards program. Compensation and Benefits
Review, 23-39.

Academy of Strategic Management Journal Volume 15, Special Issue, 2016
76
THE FEATURES OF CREDIT INSTITUTIONS
REFINANCING IN THE RUSSIAN FEDERATION
DURING THE CRISIS
Ksenia Selivanova, Kazan Federal University
Ekaterina Protsko, Kazan Federal University
Johanna Koczar, Wroclaw University of Economics
ABSTRACT
The article analyses the dependence between the policy of interaction between the
banking and real sectors of the economy and the volume of unsecured refinancing funds received
by the credit institutions from the Bank of Russia during the banking system crisis using the data
from the largest banks in the country. The relationship between the amount of funds received by
the credit institutions and the policy of cooperation with the real sector and the population in the
area of raising funds and allocation of resources of different maturities was revealed. The
analysis was performed during the period of the global financial crisis in 2008-2010. The
conclusions of the study reveal weaknesses in the Bank of Russia refinancing system during the
crisis of 2008 and allow using this experience in current economic crisis.
Key Words: Interaction between the Banking and Real Sectors of the Economy, the Bank of
Russia Refinancing, Liquidity Crisis, Correlation Analysis, Liquidity Ratios
INTRODUCTION
In order to identify the main policy of interaction between banks, the real sector of the
economy and the population during the crisis, the research about resource allocation of credit
institutions, which have shown high activity in receiving the funds from the refinancing
procedure of the Bank of Russia in 2008, was conducted. Introduced as part of anti-crisis
measures from the Bank of Russia unsecured loans were provided under the Federal Law № 171
- FZ, dated October 13, 2008 "On Amendments to Article 46 of the Federal Law "About the
Central Bank of the Russian Federation (Bank of Russia)" and according to the regulations of the
Bank of Russia on October 16, 2008 №323-P "On the provision of unsecured loans by the Bank
of Russia to Russian credit institutions".
This article will attempt to determine the reasons of the failure of the Bank of Russia
measures to support the real sector of the economy and the population during the crisis through
the financing of the banking system.
METHOD
Correlation analysis as the main research method was conducted. The method allows
determining the relationship and its degree between the studied variables. The formula for
calculating the Pearson correlation coefficient as follows:
∑( ) ( )
√∑( ) ∑( ) ( )
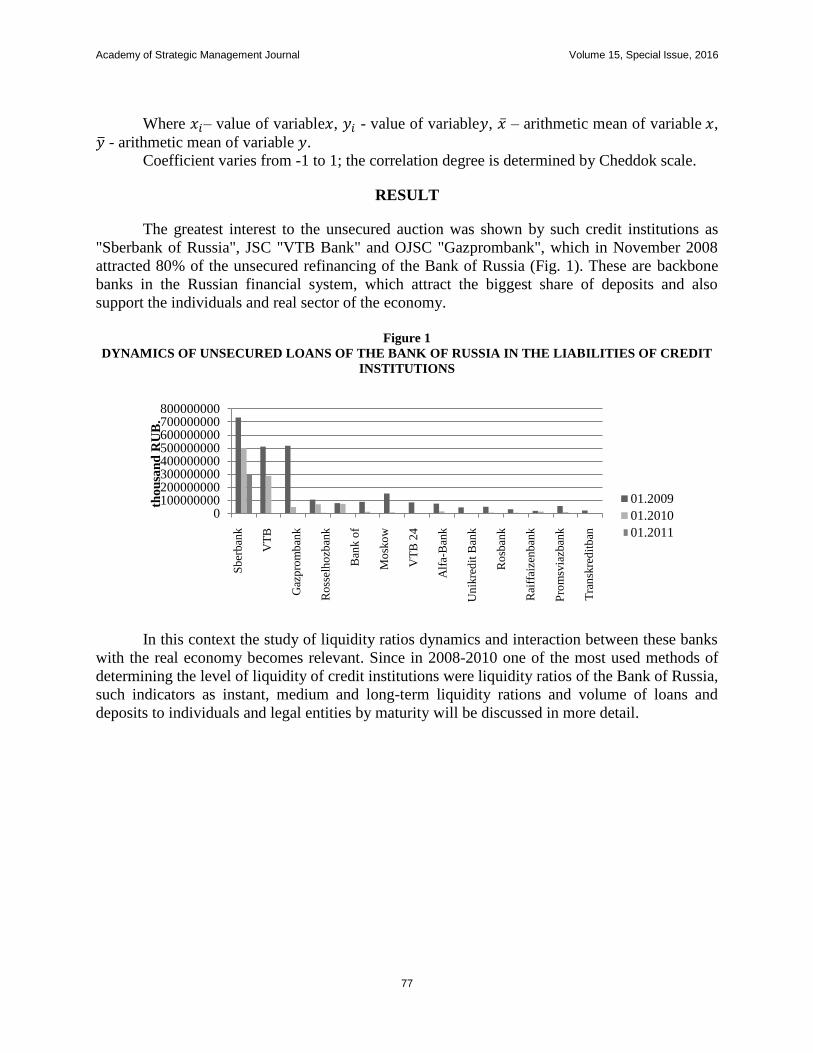
Academy of Strategic Management Journal Volume 15, Special Issue, 2016
77
Where – value of variable , - value of variable , – arithmetic mean of variable ,
- arithmetic mean of variable .
Coefficient varies from -1 to 1; the correlation degree is determined by Cheddok scale.
RESULT
The greatest interest to the unsecured auction was shown by such credit institutions as
"Sberbank of Russia", JSC "VTB Bank" and OJSC "Gazprombank", which in November 2008
attracted 80% of the unsecured refinancing of the Bank of Russia (Fig. 1). These are backbone
banks in the Russian financial system, which attract the biggest share of deposits and also
support the individuals and real sector of the economy.
Figure 1
DYNAMICS OF UNSECURED LOANS OF THE BANK OF RUSSIA IN THE LIABILITIES OF CREDIT
INSTITUTIONS
In this context the study of liquidity ratios dynamics and interaction between these banks
with the real economy becomes relevant. Since in 2008-2010 one of the most used methods of
determining the level of liquidity of credit institutions were liquidity ratios of the Bank of Russia,
such indicators as instant, medium and long-term liquidity rations and volume of loans and
deposits to individuals and legal entities by maturity will be discussed in more detail.
0100000000200000000300000000400000000500000000600000000700000000800000000
tho
usa
nd
RU
B.
01.2009
01.2010
01.2011
Sb
erb
ank
VT
B
Gaz
pro
mb
ank
Ro
ssel
ho
zban
k
Ban
k o
f
Mo
sko
w
VT
B 2
4
Alf
a-B
ank
Un
ikre
dit
Ban
k
Ro
sban
k
Rai
ffai
zen
ban
k
Pro
msv
iazb
ank
Tra
nsk
red
itb
an

Academy of Strategic Management Journal Volume 15, Special Issue, 2016
78
Figure 2
DYNAMICS OF INSTANT LIQUIDITY RATIOS CHANGE
Instant liquidity ratio of such credit institutions as Sberbank and Gazprombank during the
period from 01.01.2009 to 01.01.2010 shows a positive trend, while the VTB Bank experienced
a sharp decline, which was replaced by a significant increase on 01.01.2011.
If we consider the correlation analysis of the impact of Bank of Russia loans to certain
performance indicators and instant liquidity ratios of studied credit institutions, it may be noted
that the highest correlation of the selected indicators visible for Sberbank of Russia, followed by
VTB and Gazprombank.
Instant liquidity ratio of Sberbank of Russia has the highest correlation with the volume
of loans taken from the Bank of Russia, but this relationship is negative (-0.85), which suggests
increase of the Instant liquidity ratio while reducing the volume of unsecured lending (Table 1).
It should be noted that the return of the amounts of this type of refinancing increases the activity
of credit transactions on the accounts as a whole and deposit transactions on the accounts of
individuals.
Table 1
CORRELATION ANALYSIS OF THE IMPACT OF BANK OF RUSSIA LOANS ON SHORT-TERM
INDICATORS OF CREDIT INSTITUTIONS
Sberbank VTB Bank Gazprombank
Credits to individuals -0,504255457 -0,753176789 -0,722886398
Credits to legal entities -0,990672199 0,826291619 0,944543042
Deposits of individuals -0,981956462 0,881226553 -0,789811522
Deposits of legal entities 0,86217133 -0,666939065 -0,618090712
Instant liquidity ratio -0,847631975 0,666278773 -0,267562692
In our opinion, this happened due to the fact that the return of the funds received from the
Bank of Russia leads to the need of credit organizations to replace these funds with other types
of borrowed resources. That means the increase of the volume of deposits on the accounts of
individuals (- 0.98) by increasing the attractiveness of payroll and other projects. However, the
funds in the accounts of legal entities have a reverse trend (0.86) (Figure 3).
53.56
83.18 80.56
127.5
29.1
54
32.2
44.3
29.6
0
50
100
150
01.2009 01.2010 01.2011
%
Сбербанк ВТБ Газпромбанк Sderba VT
B
Gazpromba
nk

Academy of Strategic Management Journal Volume 15, Special Issue, 2016
79
Figure 3
THE DYNAMICS OF DEMAND DEPOSITS OF SBERBANK OF RUSSIA BY THE TYPE OF
CUSTOMER
At the same time, the need for placement of attracted funds is increasing, therefore the
volume of lending to legal entities (-0.99) and individuals (-0.5) is increasing also (Figure 4).
Figure 4
OVERDRAFT DYNAMICS OF SBERBANK OF RUSSIA BY TYPE OF CUSTOMER
The opposite situation is observed in terms of short-term activities of VTB Bank. Here
the Instant liquidity ratio ratio has a less strong and positive relationship with the amount of
unsecured lending by the Bank of Russia (0.67), which indicates a certain degree of dependence
of the bank regarding short-term activities from refinancing during the global financial crisis. So,
with a reduction of attracted funds from the Central Bank of the Russian Federation, VTB Bank
is reducing the volume of overdraft to legal entities (0.83), at the same time reducing dynamics
of raising funds in the accounts of individuals (0.88) and increasing the volume of deposits of
legal entities (-0 67).
Table 2
DYNAMICS OF INDICATORS OF SHORT-TERM PERFORMANCE OF VTB BANK
Thousand rubles
Indicator Credits to
individuals
Credits to legal
entities
Deposits of
individuals
Deposits of legal
entities
01.2009 779 7 921 325 5 945 262 124 860 041
01.2010 605 348 009 2 291 469 317 426 685
01.2011 1 244 370 122 1 825 628 268 857 708
On January 1, 2010, in terms of overdraft to legal entities of VTB Bank, a sharp decline
from 7.9 trillion rubles up to 348 billion rubles was observed, and on January 1, 2011, this
indicator increased slightly to 370 billion rubles. We can conclude that the credit institution
0
1,000,000,000
01.2009 01.2010 01.2011тыс.
руб
.
deposits of individuals deposits of legal entities
0
5000000
10000000
15000000
01.2009 01.2010 01.2011
ты
с. р
уб
.
credits to individuals credits to legal entities
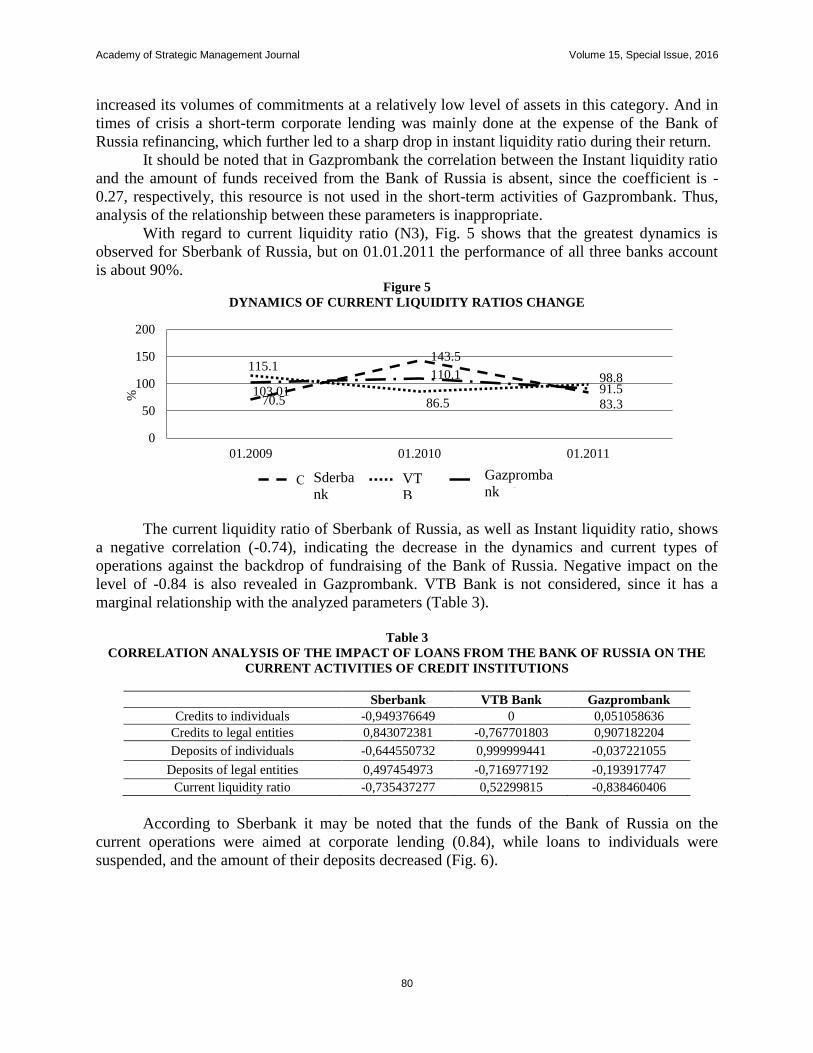
Academy of Strategic Management Journal Volume 15, Special Issue, 2016
80
increased its volumes of commitments at a relatively low level of assets in this category. And in
times of crisis a short-term corporate lending was mainly done at the expense of the Bank of
Russia refinancing, which further led to a sharp drop in instant liquidity ratio during their return.
It should be noted that in Gazprombank the correlation between the Instant liquidity ratio
and the amount of funds received from the Bank of Russia is absent, since the coefficient is -
0.27, respectively, this resource is not used in the short-term activities of Gazprombank. Thus,
analysis of the relationship between these parameters is inappropriate.
With regard to current liquidity ratio (N3), Fig. 5 shows that the greatest dynamics is
observed for Sberbank of Russia, but on 01.01.2011 the performance of all three banks account
is about 90%. Figure 5
DYNAMICS OF CURRENT LIQUIDITY RATIOS CHANGE
The current liquidity ratio of Sberbank of Russia, as well as Instant liquidity ratio, shows
a negative correlation (-0.74), indicating the decrease in the dynamics and current types of
operations against the backdrop of fundraising of the Bank of Russia. Negative impact on the
level of -0.84 is also revealed in Gazprombank. VTB Bank is not considered, since it has a
marginal relationship with the analyzed parameters (Table 3).
Table 3
CORRELATION ANALYSIS OF THE IMPACT OF LOANS FROM THE BANK OF RUSSIA ON THE
CURRENT ACTIVITIES OF CREDIT INSTITUTIONS
Sberbank VTB Bank Gazprombank
Credits to individuals -0,949376649 0 0,051058636
Credits to legal entities 0,843072381 -0,767701803 0,907182204
Deposits of individuals -0,644550732 0,999999441 -0,037221055
Deposits of legal entities 0,497454973 -0,716977192 -0,193917747
Current liquidity ratio -0,735437277 0,52299815 -0,838460406
According to Sberbank it may be noted that the funds of the Bank of Russia on the
current operations were aimed at corporate lending (0.84), while loans to individuals were
suspended, and the amount of their deposits decreased (Fig. 6).
70.5
143.5
83.3
115.1
86.5
98.8 103.01
110.1 91.5
0
50
100
150
200
01.2009 01.2010 01.2011
%
Сбербанк ВТБ Газпромбанк Sderba
nk VT
B
Gazpromba
nk
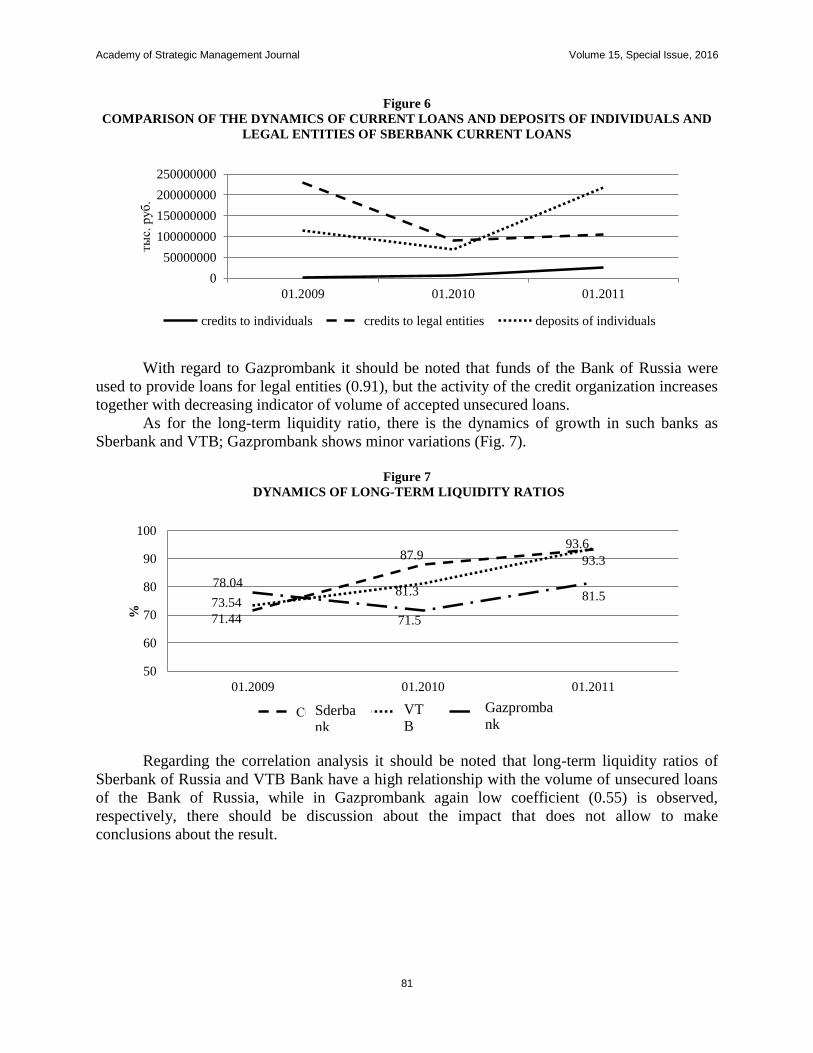
Academy of Strategic Management Journal Volume 15, Special Issue, 2016
81
Figure 6
COMPARISON OF THE DYNAMICS OF CURRENT LOANS AND DEPOSITS OF INDIVIDUALS AND
LEGAL ENTITIES OF SBERBANK CURRENT LOANS
With regard to Gazprombank it should be noted that funds of the Bank of Russia were
used to provide loans for legal entities (0.91), but the activity of the credit organization increases
together with decreasing indicator of volume of accepted unsecured loans.
As for the long-term liquidity ratio, there is the dynamics of growth in such banks as
Sberbank and VTB; Gazprombank shows minor variations (Fig. 7).
Figure 7
DYNAMICS OF LONG-TERM LIQUIDITY RATIOS
Regarding the correlation analysis it should be noted that long-term liquidity ratios of
Sberbank of Russia and VTB Bank have a high relationship with the volume of unsecured loans
of the Bank of Russia, while in Gazprombank again low coefficient (0.55) is observed,
respectively, there should be discussion about the impact that does not allow to make
conclusions about the result.
0
50000000
100000000
150000000
200000000
250000000
01.2009 01.2010 01.2011
тыс.
руб
.
credits to individuals credits to legal entities deposits of individuals
71.44
87.9 93.3
73.54 81.3
93.6
78.04
71.5
81.5
50
60
70
80
90
100
01.2009 01.2010 01.2011
%
Сбербанк ВТБ Газпромбанк Sderba
nk
VT
B
Gazpromba
nk

Academy of Strategic Management Journal Volume 15, Special Issue, 2016
82
Table 4
DYNAMICS OF LONG-TERM ACTIVITIES INDICATORS OF THE CREDIT INSTITUTIONS
Sberbank VTB Bank Gazprombank
Credits to individuals 0,097074421 0,902696161 -0,380359397
Credits to legal entities -0,996571069 0,0001698 -0,967714179
Deposits of individuals -0,988120509 -0,999193669 -0,859946823
Deposits of legal entities -0,03790463 -0,913610327 -0,91019253
Long-term liquidity ratio -0,968608469 0,999199823 0,554795898
The situation of strong inverse relationship between the long-term liquidity ratio and
funds of refinancing of the Bank of Russia (-0.97) is again observed in Sberbank. That means the
bank also increases the activity and long-term types of operations while reducing the volume of
funds of the Central Bank of the Russian Federation in its liabilities.
Connection with the indicator in this case exists in long-term corporate loans (-0.997) and
long-term deposits of individuals (-0.988). Both coefficients are negative, that is, the bank begin
to issue risky long-term resources to legal entities only during the periods of the Bank of Russia
refunds and replaces these liabilities by increasing the attractiveness of long-term deposits for
individuals (Fig. 8).
Figure 8
COMPARISON OF THE DYNAMICS OF LONG-TERM CORPORATE LOANS AND LONG-TERM
INVESTMENTS OF INDIVIDUALS IN SBERBANK
According to the VTB Bank correlation analysis, the funds of the Bank of Russia were
used to a greater extent in order to maintain long-term liquidity ratio (0.999). In the period of
entitlement of the funds in the credit institution, decline in raising funds from both the legal (-
0.91) and from individuals (-0.999) is observed. Additionally, the funding for individuals (0.9)
increased, however, since the activities of VTB Bank aims to work with legal entities, this
growth is negligible. Accordingly, under this credit institution can be concluded, that using the
funds from the Bank of Russia together with outflow of long-term resources of individuals, VTB
Bank supported the long-term liquidity ratio ration at the required level.
CONCLUSION
Thus, we can conclude that the greatest need for funds of the Bank of Russia was
noticeable in VTB Bank, which spent the received resources to maintain Instant liquidity ratio
and long-term liquidity ratio, while there is considerable dependence of the bank on the received
unsecured loans, which indicates the presence of certain lack of liquidity problems in the credit
institution.
0
2000000
4000000
01.2009 01.2010 01.2011
млн
. р
уб
.
credits to legal entities deposits of individuals

Academy of Strategic Management Journal Volume 15, Special Issue, 2016
83
Relatively Sberbank of Russia it can be argued that the credit institution had no urgent
need to refinance its activities. This conclusion follows from the fact that all the correlation
indicators inversely proportional to the volume of loans from the Bank of Russia. That means,
while increasing this indicator, the bank reduced the amount of their own activities, and during
the time of refunds to the Central Bank of Russia once again increased.
Gazprombank used the received funds for the medium-term corporate lending. That
means that obtained resources were necessary for the bank to maintain the current liquidity ratio.
Accordingly, during the crisis credit institutions have used received refinancing funds
from the Bank of Russia aimed at supporting the real economy and the population to save their
own activities. Long-term financing for the period of 2009 was actually suspended and started to
renew at sufficiently low rate only in 2010.
At the same time, refinancing funds of the Bank of Russia were intended to support the
real sector of the economy and population during the crisis. In practice, they have been used to
maintain the activity of the banks. Accordingly, the main problem of refinancing during the crisis
of 2008 was a discrepancy of the objectives among the Central Bank and commercial banks and
the lack of interaction between banks, real sector of the economy and population. In the current
situation it is necessary to take into account the mistakes of the 2008 crisis, to limit the
possibility of speculation of credit institutions, to encourage them to interact with the real sector
of the economy and population. Thus, considering the retrospective review, in the current
economic situation it is possible to create an effective and efficient policy of refinancing.
During the current economical situation it is important to use the experience from crisis
of 2008. Government has allowed now investing no more than 10% of the Russian National
Wealth Fund in the backbone banks, where Sberbank of Russia, VTB Bank and Gazprombank
are part of these banks. This will help to increase the banking system capital up to 13%.
REFERENCES
Andreeva O.V., Terenteva K.L., Khakimovа L.I. (2014). Financial and industrial clustering in Russia: the China
experience. Investment Management and Financial Innovations, 4(11), 45-55.
Vagizova V., Homenko V., Akhmetova G. (2014). Cluster initiatives of interaction of banking and real sectors of the
Volga region. Investment Management and Financial Innovations, 4(11), 8-14.
Beaupain, R., Durré, A. (2013). Central bank reserves and interbank market liquidity in the euro area. Journal of
Financial Intermediation, 22(2), 259-284.
Polterauer, P. (2011). Expansive money supply in the financial crisis: Necessity and risks. OCEANS'11 - MTS/IEEE
Kona, Program Book
Sberbank of Russia [Online website] (2015). Official Sberbank Group website. Website: http://
http://www.sberbank.ru/
VTB Group [Online website] (2015). Official VTB Group website. Website: http:// http://www.vtb.com/
Gazprombank [Online website] (2015). Official website of Gazprombank. Website: http://
http://www.gazprombank.ru/
Yevenko, T.I. (2013). Management of banking institutions liquidity. Economic Annals-XXI, V1-2(2), .27-30
Mamatzakis, E., Bermpei, T. (2014). What drives investment bank performance? The role of risk, liquidity and fees
prior to and during the crisis. International Review of Financial Analysis, 35,102-117.
Gauthier, C., Souissi, M., Liu, X. (2014). Introducing funding liquidity risk in a macro stress-testing framework.
International Journal of Central Banking, 10(4),105-141.
Papaika, O.O., Kosogov, V.A. (2014). Bank and market liquidity as indicators of financial stability. Actual
Problems of Economics, 156(6), 380-388.
Fungáčová, Z., Weill, L. (2012). Bank liquidity creation in Russia. Eurasian Geography and Economics, 53(2), 285-
299
Matz, L., Neu, P. (2012). Liquidity Risk Measurement and Management: A practitioner's guide to global best
practices.

Academy of Strategic Management Journal Volume 15, Special Issue, 2016
84
Postaljuk M.P., Vagizova V.I., Postaljuk T. M. (2013). Implementation forms of institutional support for traditional
and innovative development of national economic systems. Investment Management and Financial
Innovations, 4, 88-94.
Vesti Finance [Online website] (2015). Backbone bank will receive the financial support from the Russian National
Wealth Fund. Official website of Vesti Finance. Website: http:// www.vestifinance.ru/

Academy of Strategic Management Journal Volume 15, Special Issue, 2016
85
TRANSPORT INFRASTRUCTURE AS A DRIVER OF
SUSTAINABLE DEVELOPMENT OF REGIONAL
ECONOMIC SYSTEMS
Kseniia Terenteva, Kazan Federal University
Venera Vagizova, Kazan Federal University
Kseniia Selivanova, Kazan Federal University
ABSTRACT
The purpose of this research is to study the dependence of social and economic
development on the regional transport infrastructure. The authors’ position is based on the fact
that it has a complex impact both on the general vector of the region’ development, and on the
functioning conditions of individual economic agents. This influence is manifested through
ensuring the needs of spatial economic structures in advanced development; coordination of
social and economic processes development; adaptation of global economic processes in
transport sphere to regional conditions, as well as meeting the needs of economic agents in
transport and logistics services. The study presents a methodology of integral multi-level
assessment of the development level of regional infrastructure based on the capacity of the
transport system, covering various aspects of its operation and promoting complex vision about
the prospects of its further development; it serves as a basis for calculating the indicator on the
example of the Republic of Tatarstan. The methodology enables to evaluate not only the
development degree of individual indicators of the regional transport infrastructure, but also the
level of its development in general. This approach helps to identify aspects that impede the
effective development of transport infrastructure and to take measures to eliminate them. In
addition, this technique enables to rank the regions according to the development degree of
various functioning aspects of their transport infrastructure.
Key Words: Regional Transport Infrastructure, the Economy of the Region, Socio-Economic
Development of the Region, an Integrated Assessment of Transport Infrastructure, the
Development Indicators of Regional Transport Infrastructure
INTRODUCTION
The regional transport infrastructure represents a framework of operation and long-term
development, as well as it forms the level of economic systems in the international transport and
logistics services market. In the Russian Federation transport infrastructure plays an important
role due to the size of its territory (17 million sq. km) and to the need to cover all the country
with transport networks.
Intensive development of innovative processes which ensure the consolidation of the
regions necessitates a comprehensive in-depth theoretical and practical study of the development
laws of regional transport infrastructures. It should be borne in mind that in terms of economic
processes integration, it is important to consider the regional transport infrastructure in close
cooperation scheme.

Academy of Strategic Management Journal Volume 15, Special Issue, 2016
86
Rapid development of the region’s economy depends largely on the development level of
its transport infrastructure which has a complex impact both on the general vector of the region’s
development and on the functioning conditions of individual economic agents. In its turn, the
impact of the region's economy on transport infrastructure is manifested through a number of
factors including: shaping the demand for transport services; management and regulation of
traffic flows in the region; determining the structure of financial support for transport
infrastructure development; the presence of material, technical and human resources that are
necessary for its development.
The following study is concerned with an integral assessment of the development of
regional transport infrastructure, as well as with measuring the impact of its development on
socio-economic indicators of the region.
LITERATURE REVIEW
Recognizing the significance of the regional transport infrastructure to ensure sustainable
development of the economy has caused considerable scholar interest in this problem. Russian
and foreign experts considered its various aspects. Early 1990s saw active theoretical and
empirical study of infrastructure impact on economic growth, the level and quality of life of the
population. One of the first works that attracted attention to this issue, belonged to Aschauer D.
who linked the slowdown in US economic growth to a reduction of investment in infrastructure.
Researches in this area were continued by P. Evans and G. Karras, D. Canning and P. Pedroni,
which believed that to determine the optimal conditions for economic development it is
necessary to analyze the link between the availability of micro-economic infrastructure and the
nature of the production process.
Subsequently, international studies revealed the relationship between the financing of
infrastructure and increasing the efficiency of firms and regions. Thus, according to studies by P.
Arbués, J.F. Baños & M. Mayor, a direct impact of transport infrastructure on the economy
manifests itself through an increase in employment in the construction sector during the
development of infrastructure, reducing fuel consumption, saving time, reducing environmental
problems. While indirect effect includes productivity growth of the regional economy,
optimizing the location of companies, increasing the efficiency of the household, the change in
real estate prices.
Rodrigue & Notteboom argue that the induced effect of transport infrastructure on
economic development is the result of its impact on employment and growth of surplus value.
They view the induced impact as the result of the multiplier effect where the price rise for goods
and services, extension of offering range, as well as other related consequences are the result of
economic operations of firms which use efficient transport services. Furthermore, these authors
believe that the transport infrastructure provides time and cost savings.
According to Lakshmanan, improved transport infrastructure tends to reduce the average
travel time, transport costs, and, consequently, to increase transport accessibility. This in turn
leads to a decrease in the marginal cost of producers and an increase in the mobility of
households and the demand for goods and services.
It should be noted that the improvement of existing or the introduction of new
infrastructure can have both positive and negative consequences. For some economic sectors
growth in the availability of products and services can lead to increased competition in the
domestic market, reducing local productivity, profitability and employment.
Transport infrastructure in itself is not a sufficient condition for economic development.

Academy of Strategic Management Journal Volume 15, Special Issue, 2016
87
At the same time, its lack can be a deterrent to it. Low quality of transport services may have a
negative impact on the competitiveness of regions and businesses.
From this brief review of the literature it can be concluded that so far researchers were
interested mostly in the impact of infrastructure on the macro- and micro-economic
development, while the problems of infrastructure development and the interdependence of
mesolevel economic systems are paid insufficient attention. In this paper we consider the
development of transport infrastructure as one of the essential factors of economic growth in the
region, which raises the need for its comprehensive assessment and analysis.
DEPENDENCE ANALYSIS OF THE ECONOMY OF THE REPUBLIC OF
TATARSTAN ON THE LEVEL OF TRANSPORT INFRASTRUCTURE
DEVELOPMENT
To date, the Republic of Tatarstan is the leader of "Volga-Kama" development area, a
most important area of economic growth of the Russian Federation. The Republic of Tatarstan
ranks the third in the ranking of Russian competitive regions, calculated on the basis of AV
Regions Competition Index (RCI) methodologies.
Tatarstan has a developed transport infrastructure, including road, rail, air and water
transport. The advantage of the region is a natural water endowment consisting of the Volga and
Kama rivers. In addition, the republic has an established and extensive pipeline network for oil
and gas transportation. Over 2009 to 2014 the positive dynamics of key indicators of regional
transport infrastructure is observed (Fig. 1).
Figure 1
MAIN INDICATORS OF TRANSPORT INFRASTRUCTURE OF THE REPUBLIC OF TATARSTAN
0
200000
400000
600000
800000
1000000
1200000
2009 2010 2011 2012 2013
Number of lorries
Number of buses
Number of passenger cars
Length of railway lines, km.
Length of motorways, km.
Length of common carrier pipeline,
km.
Length of navigable waterways, km.
carriage of passengers, mln.pers.
Cargo transportation mln.ton-km.

Academy of Strategic Management Journal Volume 15, Special Issue, 2016
88
In order to justify the empirical dependence of the main socio-economic indicators of the
Republic of Tatarstan on the level of its transport infrastructure development, a model of
correlative regression analysis was built. As independent variables the model included factors
that characterize the transport infrastructure development, such as the number of vehicles, the
length and density of railways, the intensity of passenger and freight traffic.
An indicator that best represents the contribution of a particular economic activity in the
region’s development is its contribution to the region's GRP. Therefore, GRP of Tatarstan was
considered as the first dependent variable. The contribution of “Transport and Communication”
industry to the gross product was taken as a second dependent variable. The modeling resulted in
coefficients of interdependence (K), whose value ranges from (-1) to 1 (Table 1).
Table 1
INDICATORS OF THE INTERDEPENDENCE OF TRANSPORT INFRASTRUCTURE DEVELOPMENT
AND SOCIO-ECONOMIC INDICATORS OF THE REPUBLIC OF TATARSTAN
GR
P,
mln
.ru
b.
Do
mes
tic
pro
du
ct
ma
nu
fact
ure
d b
y
“tr
an
spo
rt a
nd
com
mu
nic
ati
on
s”
Po
pu
lati
on
, th
ou
s.p
eop
le.
Av
era
ge
nu
mb
er o
f
emp
loy
ed i
n t
he
eco
no
my
,
ths.
per
s.
Av
era
ge
per
ca
pit
a
inco
me
(per
mo
nth
), r
ub
.
Th
e su
bsi
sten
ce
min
imu
m i
n t
he
av
era
ge
per
ca
pit
a (
per
mo
nth
),
rub
les.
Fix
ed a
sset
s in
th
e
eco
no
my
, m
ln.
rub
.
New
fix
ed a
sset
s, m
ln.
rub
.
Inv
estm
ents
in
fix
ed
cap
ita
l, m
ln.
rub
.
Th
e v
olu
me
of
wo
rk
per
form
ed b
y t
he
act
ivit
y
"C
on
stru
ctio
n"
, m
ln.
rub
les.
Ag
ricu
ltu
ral
pro
du
ctio
n,
mln
. ru
b.
Ret
ail
tra
de
turn
ov
er,
mln
. ru
b.
Cre
dit
ex
po
sure
in
th
e
eco
no
my
, m
ln.
rub
.
Ba
lan
ced
fin
an
cia
l res
ult
in t
he
eco
no
my
, m
ln.
rub
.
Fo
reig
n t
rad
e tu
rno
ver
,
mln
. U
SD
The number of
lorries 0,99 0,99 0,91 0,35 0,94 0,96 0,96 0,90 0,96 0,94 0,91 0,95 0,98 0,96 0,99
The number of
buses 0,36 0,45 0,11 0,32 0,20 0,36 0,67 0,66 0,24 0,14 0,33 0,20 0,33 0,30 0,58
The number of
passenger cars
0,96 0,94 1,00 0,09 0,99 0,97 0,80 0,77 0,99 0,97 0,86 0,99 0,97 0,91 0,88
Length of
railway lines,
km 0,70 0,58 0,75 0,41 0,76 0,58 0,43 0,31 0,75 0,84 0,65 0,77 0,69 0,80 0,53
Length of
motorways, km 0,79 0,70 0,90 0,21 0,89 0,75 0,50 0,41 0,87 0,91 0,65 0,89 0,79 0,82 0,64
The length of
roads paved, km. 0,83 0,73 0,90 0,32 0,91 0,76 0,57 0,45 0,89 0,94 0,68 0,91 0,82 0,88 0,70
The density of
surfaced roads,
km / 1000 km2
0,83 0,74 0,90 0,33 0,91 0,77 0,57 0,46 0,89 0,94 0,69 0,91 0,82 0,88 0,71
Length of
common carrier
pipeline, km 0,77 0,77 0,93 -0,28 0,86 0,85 0,53 0,56 0,84 0,82 0,67 0,85 0,81 0,66 0,63
Length of
navigable
waterways, km 0,69 0,71 0,58 0,44 0,68 0,69 0,77 0,66 0,68 0,60 0,45 0,65 0,66 0,67 0,85
Carriage of
passengers,
mln.pers.
-
0,80 -0,73
-
0,89 -0,10
-
0,86 -0,76
-
0,53
-
0,49
-
0,85 -0,91
-
0,77
-
0,87
-
0,82 -0,81
-
0,61
Haulage, mln.
ton-km 0,79 0,79 0,56 0,50 0,61 0,68 0,89 0,87 0,67 0,68 0,90 0,66 0,77 0,80 0,79
Academy of Strategic Management Journal Volume 15, Special Issue, 2016
89
In general, there is a high level of dependence of the selected dependent variables on the
independent variables. Dependence level of the Republic of Tatarstan’s GRP is maximal on the
following factors in their order of importance: the number of lorries, number of passenger cars,
the length and density of roads paved, the carriage of passengers. One can see maximum
dependence of the “Transport and communications” contribution to gross product on the
following indicators: number of lorries, number of passenger cars, haulage, length of common
carrier pipeline, and the density of roads paved. GRP of Tatarstan depends the least on factors
such as length of navigable waterways, and the number of buses. In turn, the gross product
produced by activity “Transport and Communications” is associated less with such factors as the
length of railway lines and the number of buses.
Thus, it is proved that there is a strong relationship between the GRP of the Republic of
Tatarstan and the development of regional transport infrastructure.
RESEARCH METHODOLOGY
It seems appropriate to work out a methodology of integral multi-level assessment of the
development level of regional infrastructure based on the capacity of the transport system,
covering various aspects of its operation (contribution of the transport infrastructure subjects to
the GRP; the demand for transportation services; infrastructure logistics; profitability and
financial stability of transport infrastructure subjects; social and demographic conditions for the
development of transport infrastructure, financing transport infrastructure) and promoting
complex vision about the prospects of its further development.
The technique enables to evaluate not only the development degree of individual
indicators of the regional transport infrastructure, but also the level of development in general.
This approach helps to identify aspects that impede the effective development of transport
infrastructure and to take measures to eliminate them. In addition, this technique enables to rank
the regions according to the development degree of various functioning aspects of their transport
infrastructure.
An integral indicator of regional transport infrastructure development is calculated on the
basis of groups of indicators included in its composition: the contribution of the subjects of
transport infrastructure to GRP; demand for transport services; infrastructure logistics;
profitability and financial stability of transport infrastructure subjects; social and demographic
conditions for the development of transport infrastructure; financing of transport infrastructure
(Table 2). The selection of indicators, their distribution by groups and ranking of groups of
indicators were considered within hierarchical structure: region – infrastructure - transport
infrastructure - financial infrastructure.

Academy of Strategic Management Journal Volume 15, Special Issue, 2016
90
Table 2
INDICATORS OF INTEGRAL ASSESSMENT OF THE DEVELOPMENT LEVEL OF
INFRASTRUCTURE IN THE REGION (BASED ON THE CAPACITY OF THE TRANSPORT SYSTEM)
Indicators Indicator
weight
Weight of a
group of
indicators
1. The share of GRP produced by transport infrastructure subjects 0,2
Gross product produced by transport infrastructure subjects, mln.rub. 0,5
Exports of transport services, ths. US 0,3
Imports of transport services, ths. US 0,2
2. Demand for transport services 0,15
Carriage of passengers all modes of transport, mln. people 0,15
Passenger turnover of all modes of transport, mln. passenger-km. 0,2
Cargo transportation by all modes of transport, mln. tons 0,1
Freight ton-miles by all modes of transport, mln. ton-km. 0,2
Index of tariffs for cargo transportation, % 0,15
The volume of paid transportation services, mln. rub. 0,2
3. Infrastructure logistics 0,2
Freight rolling stock, units 0,05
Passenger rolling stock, units 0,05
Length of railway lines, km 0,1
Length of common carrier pipeline for oil transportation, km 0,1
Length of navigable waterways, km 0,05
Length of motorways, km 0,1
Density of railways km/1000 km2 0,1
Density of paved motorways, km./1000 km2 0,1
Density of navigable waterways, km, km./1000 km2 0,05
The cost of fixed assets of transport infrastructure organizations, mln.rub. 0,1
Depreciation of fixed assets of transport infrastructure organizations, % 0,1
4. Profitability and financial stability of transport infrastructure subjects 0,2
Balanced financial result of enterprises and organizations of transport
infrastructure, mln. rub. 0,3
Ratio of unprofitable organizations of transport infrastructure, % 0,1
Current liquidity ratio of transport infrastructure enterprises and organizations 0,2
Working capital financed by equity to total assets ratio of transport infrastructure
enterprises and organizations 0,2
Equity-assets ratio of transport infrastructure enterprises and organizations 0,1
5. Social and demographic conditions of transport infrastructure development 0,1
Average number of employees of the transport infrastructure, pers. 0,4
The average monthly nominal wage of employees of the transport infrastructure,
rub. 0,3
Number of cars, pcs. / 1,000 pers. 0,3
6. The financing of transport infrastructure 0,15
The total investment in fixed assets of organizations of transport infrastructure,
mln. rub. 0,6
The volume of investments made by foreign investors in transport infrastructure,
ths.US dollars 0,4
The group is formed of particular indices. Based on expert assessments each parameter is
assigned weight, which characterizes the degree of its impact on the group of indicators as a
whole. Generalized values of groups of indicators of regional transport infrastructure
development are calculated based on the formula:

Academy of Strategic Management Journal Volume 15, Special Issue, 2016
91
GIRTID = ∑ , (1)
where GIRTID - group of indicators of regional transport infrastructure development;
αi - weight of ith
indicator;
xi - ith
indicator.
The result of assessing the development of regional transport infrastructure is the integral
index calculated by the formula:
IATID = ∑ , (2)
where IATID is integral assessment of the level of regional transport infrastructure
development;
βj - weight of jth
group of indicators;
yj - jth
group of indicators.
RESULTS
On the basis of the technique developed an integral indicator of the development level of
transport infrastructure of the Republic of Tatarstan is calculated (Table 3).
Table 3
INTEGRAL ASSESSMENT OF THE DEVELOPMENT LEVEL OF INFRASTRUCTURE OF THE
REPUBLIC OF TATARSTAN (ON THE BASIS OF THE TRANSPORT SYSTEM CAPACITY)
Group of indicators 2009 2010 2011 2012 2013
Contribution of the transport infrastructure subjects to
the GRP 41378,78 45111,60 56863,27 56656,51 75357,76
Demand for transportation services 44851,22 45224,58 46534,63 47532,02 46401,01
Infrastructure logistics 78999,90 80870,56 84690,90 90004,97 94479,83
Profitability and financial stability of transport
infrastructure subjects 3181,31 3162,94 3853,78 3196,23 4341,90
Social and demographic conditions of transport
infrastructure development 45294,26 46560,50 48008,26 48722,41 47543,86
Financing transport infrastructure 24576,86 29676,04 47490,10 49949,64 50655,86
The overall level of transport infrastructure
development 39655,64 41720,16 47986,13 49466,03 54148,82
Positive dynamics of the overall level of transport infrastructure development of the
Republic for the period under review is observed. In particular, there was a significant increase
in the following indices: the contribution of the of transport infrastructure subjects to the GRP,
infrastructure logistics, financing transport infrastructure.
In order to identify the most important groups of indicators that affect transport
infrastructure development of the Republic of Tatarstan, a pie-chart was built (Fig. 2).
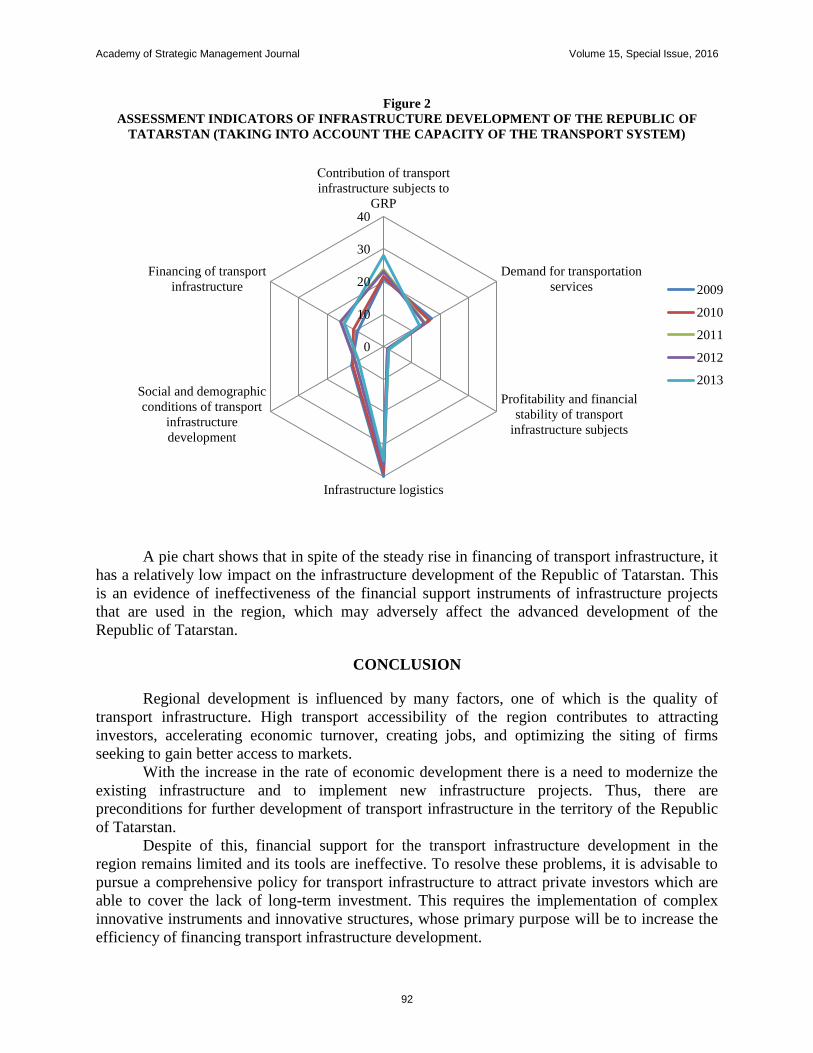
Academy of Strategic Management Journal Volume 15, Special Issue, 2016
92
Figure 2
ASSESSMENT INDICATORS OF INFRASTRUCTURE DEVELOPMENT OF THE REPUBLIC OF
TATARSTAN (TAKING INTO ACCOUNT THE CAPACITY OF THE TRANSPORT SYSTEM)
A pie chart shows that in spite of the steady rise in financing of transport infrastructure, it
has a relatively low impact on the infrastructure development of the Republic of Tatarstan. This
is an evidence of ineffectiveness of the financial support instruments of infrastructure projects
that are used in the region, which may adversely affect the advanced development of the
Republic of Tatarstan.
CONCLUSION
Regional development is influenced by many factors, one of which is the quality of
transport infrastructure. High transport accessibility of the region contributes to attracting
investors, accelerating economic turnover, creating jobs, and optimizing the siting of firms
seeking to gain better access to markets.
With the increase in the rate of economic development there is a need to modernize the
existing infrastructure and to implement new infrastructure projects. Thus, there are
preconditions for further development of transport infrastructure in the territory of the Republic
of Tatarstan.
Despite of this, financial support for the transport infrastructure development in the
region remains limited and its tools are ineffective. To resolve these problems, it is advisable to
pursue a comprehensive policy for transport infrastructure to attract private investors which are
able to cover the lack of long-term investment. This requires the implementation of complex
innovative instruments and innovative structures, whose primary purpose will be to increase the
efficiency of financing transport infrastructure development.
0
10
20
30
40
Сontribution of transport
infrastructure subjects to
GRP
Demand for transportation
services
Profitability and financial
stability of transport
infrastructure subjects
Infrastructure logistics
Social and demographic
conditions of transport
infrastructure
development
Financing of transport
infrastructure 2009
2010
2011
2012
2013

Academy of Strategic Management Journal Volume 15, Special Issue, 2016
93
REFERENCES
Aschauer, D (1990). Highway Capacity and Economic Growth. Economic Perspectives, 14(5), 4-24.
Evans, P., Karras, G (1994). Are Government Activities Productive? Evidence from A Panel of U.S. States. Review
of Economics and Statistics, 76, 1-11.
Canning, D., Pedroni, P (2004). The Effect of Infrastructure on Long Run Economic Growth. Harvard: Harvard
University.
Arbués, P., Baños, J.F. & Mayor, M (2015). The spatial productivity of transportation infrastructure. Transportation
Research Part A: Policy and Practice 75, 166-177.
Rodrigue, J-P & Notteboom, T (2010). Comparative North American and European Gateway Logistics: The
Regionalism of Freight Distribution. Journal of Transport Geography, 18, 497-507.
Lakshmanan, T.R (2011). The broader economic consequences of transport infrastructure investments. Journal of
Transport Geography,19(1), 1-12.
Oosterhaven J & Knaap T (2003). Spatial economic impacts of transport infrastructure investments. Transport
projects, programmes and policies: Evaluation, needs and capabilities. Aldershot: Ashgate, 87-105.
Rodrigue, J.P & Comtois, C., Slack, B (2013). The geography of transport systems, New York: Routledge.
Vakhitova, T.M. & Gadelshina, L.A (2014). Directions of the region transport infrastructure development in the
context of its competitiveness. Mediterranean Journal of Social Sciencesm, 5, 313-316.
Postaliuk, M., Vagizova & V., Postaliuk, T (2013). Implementation forms of institutional support for traditional and
innovative development of national economic systems. Investment Management and Financial Innovations.
10, 88-94.
Albarran, P (2011). Domestic transport infrastructure and firms’ export market participation. Small Business
Economics, 40(4), 879-898.
Salas-Olmedo, M.H., García, P. & Gutiérrez, J (2015). Accessibility and transport infrastructure improvement
assessment: The role of borders and multilateral resistance. Transportation Research Part A: Policy and
Practice, 82, 110-129.

Academy of Strategic Management Journal Volume 15, Special Issue, 2016
94
INTERACTION OF BANKS AND THE REAL SECTOR
OF THE ECONOMY AS A FACTOR FOR VOLGA
REGION’S SUSTAINABLE DEVELOPMENT
VeneraVagizova, Kazan Federal University
Kseniia Terenteva, Kyiv National Economic University
ABSTRACT
The problem of creating the conditions for mutually beneficial cooperation between
financial and real sectors of the Russian economy is becoming essential in modern conditions of
globalization. In this article, we attempt to estimate the closeness of interaction between credit
institutions and real sector of the economy on the example of the Volga region through the
analysis of the various instruments of such interaction. Special attention is paid to deposit and
settlement, credit and investment areas. Also the issue of the lack of long-term financing for
sustainable economic development is touched. Based on the analysis of a large data array, the
article reveals the basic problems in the field of interaction between financial and real sectors of
the Volga region economy. Such problems include: lack of long-term financing, the lack of
strong relations between entities of the financial and real sectors of the economy and the
unattractiveness of the real sector of the Volga region for investments.
Key Words: Volga Region Economy, Credit Institutions, Real Sector of Economy, Cross-
Sectoral Cooperation, Long-Term Financing, Economy's Competitiveness
INTRODUCTION
The real sector’s development is one of the most important factors of Russian
Federation’s economic stability improving, and the banking system must coordinate this process
by means of involving its resources in implementation of the economic entities’ investment
activity, but to date, this function is performed by the banking system not fully.
The establishment of mutually beneficial partnership of banking and real sectors remains
one of the priority directions of the Russian economy’s elaboration for many years. At the
moment, there is considerable difficulty in this process due to the high volatility of the economic
situation in the country, as well as the lack of sufficient incentives for credit institutions and
enterprises of the real sector for the establishment of such partnership. Credit institutions aim to
rapid and least risky profit, while the real sector needs long-term investment. It should also be
noted that credit institutions’ credit activities promote primarily those economic areas that were
sufficiently profitable: trade and services, as well as mining. At the same time such significant
sectors of the economy, as agriculture and manufacturing industries suffer from lack of the
financial resources.
Despite the fact that important role in the revitalization of the interaction between credit
institutions and the real sector of the Russian economy is given to the regions, analysis of this
process in the regional context demonstrates its significant territorial differentiation.
The target of this study is to identify the main trends in the interaction of credit
institutions and the real sector of the Volga region’s economy. The study is based on modern

Academy of Strategic Management Journal Volume 15, Special Issue, 2016
95
methods of data collection, processing, compilation and analysis of statistical material.
The information base of research includes data from official sources, such as the Central
Bank of the Russian Federation and the Federal State Statistics Service.
GENERAL INFORMATION
Volga region is one of the most cost-effective regions of the Russian Federation. The
number of credit institutions operating in the region during last four years decreased slightly,
which can be explained as a consequence of the Russian banking system consolidation process
(Table 1).
Table 1
VOLGA REGION’S SECURITY WITH BANKING SERVICES
Region 2010 2011 2012 2013
Number of
credit
institutions
The index
of the
region's
security
with
banking
services
Number of
credit
institutions
The index
of the
region's
security
with
banking
services
Number of
credit
institutions
The
index of
the
region's
security
with
banking
services
Number of
credit
institutions
The
index of
the
region's
security
with
banking
services
Astrakhan
region
5 0.62 5 0.61 5 0.73 5 0.73
Volgograd
region
4 0.60 4 0.58 4 0.77 10 0.76
Penza
region
2 0.66 1 0.68 1 0.78 1 0.78
Samara
region
20 0.99 20 1.01 20 0.92 17 0.92
Saratov
region
10 0.67 9 0.69 9 0.85 9 0.88
Ulyanovsk
region
4 0.79 4 0.77 3 0.87 3 0.89
Republic
of
Kalmykia
2 0.53 2 0.60 2 0.76 2 0.79
Republic
of
Tatarstan
26 0.84 25 0.84 23 0.89 22 0.87
Total: 73 70 67 69
At the same time it should be noted, that in 2013 the number of credit institutions in the
region increased again. Despite the decline in the total number of credit institutions in the region
in comparison with 2010, the availability of banking services in the region remains at a high
level. So, it grows in Penza, Saratov, Volgograd and Ulyanovsk regions, as well as in the
republics of Tatarstan and Kalmykia. In Astrakhan region a decline of this indicator observed in
2011, but in 2012 it rose again, reaching 0.73, and retained that position in 2013. And only in the
Samara region the dynamics of this indicator is negative.
Financial results of the credit institutions of the Volga region (Table 2) show the dynamic
of the banking sector development in the region.

Academy of Strategic Management Journal Volume 15, Special Issue, 2016
96
Table 2
FINANCIAL RESULTS OF THE VOLGA REGION CREDIT INSTITUTIONS (MLN. RUBLES)
Region/ Year 2010 2011 2012 2013
Astrakhan region 78.6 92.4 71.9 146.1
Volgograd region 185.2 248.9 313.9 382.0
Penza region 68.5 53.6 35.6 49.3
Samara region 5 476.2 6 096.1 6 210.3 1 721.9
Saratov region 1 224.1 890.5 1 392.0 1 129.4
Ulyanovsk region 9.0 -100,2 40.5 -15.5
Republic of Kalmykia 8.8 11,7 6.0 -17.3
Republic of Tatarstan 1 817.3 3 804,4 3 827.7 4 475.0
Total: 8 867.7 7 293.0 11 897.9 7 870.9
Positive dynamics of Volgograd and Astrakhan regions credit institutions’ profitability is
observed. The same can be said of the credit institutions of the Republic of Tatarstan. With
regard to Penza, Ulyanovsk region and the Republic of Kalmykia, there is a clear negative trend
of this indicator. In 2013 there was a sharp downturn in financial results of Saratov region credit
institutions and it almost reached the level of 2011, but the most significant negative trend of
profitability is observed in the Samara region.
RESULTS
Russian, including the Volga region, economic potential up building, is inextricably
linked with the real economy development, and the banking system must play a coordinating role
in this process, participating in the investment activity of economic entities of all forms of
ownership. In order to understand the possibility of achieving this goal, the interaction of the
credit institutions and the main areas of the Volga region’s real sector of economy must be
analysed.
The function of cash management services for companies, organizations of various forms
of ownership is fundamental among the credit institutions’ activities (Table 3). Credit institutions
are interested in attraction of customers, both legal entities and individuals for settlement and
cash services, and this interest stems from the fact that the resources raised form the bank
customers form its funds, which are placed in order to maximize profits for the benefit of bank’s
customers and shareholders.
Table 3
THE VOLUME OF VOLGA REGION’S ORGANIZATIONS’ FUNDS PLACED TO THE ACCOUNTS IN
CREDIT INSTITUTIONS (MLN. RUBLES)
Region/ Year 2010 2011 2012 2013
Astrakhan region 7 401 9 254 7 707 9 123
Volgograd region 18 519 25 655 22 870 26 921
Penza region 10 304 12 946 11 451 12 554
Samara region 57 795 64 563 61 890 67 712
Saratov region 21 059 27 170 26 247 28 780
Ulyanovsk region 12 572 14 252 12 108 115 022
Republic of Kalmykia 772 894 896 1 140
Republic of Tatarstan 119 541 124 987 106 962 103 162
Total: 247 963 279 721 250 131 364 414

Academy of Strategic Management Journal Volume 15, Special Issue, 2016
97
There is a common trend of changes in the volume of the Volga region’s real sector
assets, placed to the accounts in credit institutions: a decrease in 2012 and the subsequent
increase in 2013 to approximately the level of 2011. Only in the Republic of Tatarstan there is a
constant negative dynamics of this indicator and its significant reduction in comparison with
2010 is observed. The amount of funds deposited by the real sector on the bank accounts
depends on the economic conditions and customer confidence in the banking system.
Consequently, this area of interaction between banking and real sectors of the economy in the
face of instability in the Russian financial markets is quite volatile.
As a part of cash management services credit institutions provide a wide range of
services, the most popular of which in the Volga region are the following:
1. Opening of bank accounts in rubles and foreign currency;
2. Settlements on behalf of clients in Russia and abroad;
3. Urgent payments of corporate customers on a bank system
Transfer of funds to the payee's bank account in the shortest possible time. The service
provides primary treatment of urgent payment at all stages of the payment on the bank clearing
system, and also crediting the payment to the payee in the period from 30 minutes to 3 hours and
50 minutes after the submission of the bank payment document, as well as the possibility of
obtaining the payer notice of the exact time of funds’ transfer to the beneficiary's account. Also
in recent years, many credit institutions of the Volga region began to introduce remote customer
service because of the need to improve the traditional services provided in order to be
competitive.
Let us turn to the next direction of the interaction between credit institutions and the real
sector of economy. The major share in the assets of the Volga region’s credit institutions is taken
by the credit operations.
The leading companies of the Volga region cannot afford to get large loans somewhere
except international capital markets, as domestic credit institutions find it difficult to issue such
loans. The role of the banking sector in the investment process is still not as significant, while in
developed countries the share of bank lending in the investment averages 20-30%.
The dynamics of loans issued by credit institutions of the Volga region (Figure 1) shows
that in the period from 2010 to 2013 the volume of lending to the real sector had gradually
increased: in 2013 compared to 2010, the total volume of loans increased by 1.5 times. Despite
the fact that in 2012, under the influence of the unstable economic situation in the world volume
of lending to the real sector declined marginally, in 2013, it exceeded the performance of 2011.
Figure 1
THE DYNAMICS OF LENDING TO THE VOLGA REGION’S REAL SECTOR, MLN. RUBLES

Academy of Strategic Management Journal Volume 15, Special Issue, 2016
98
At the same time, the overall downward trend in the share of loans to the real sector in
total loan portfolio shows a negative trend. For example, if in early 2010, loans to enterprises
accounted for about 60% of the total volume of loans, at the beginning of 2014 the figure was
58.2%. Despite its growth in absolute terms over the last ten years, the share of loans to the real
sector is now less than a half of bank assets. Therefore, credit in the economy of the Volga
region fulfils its redistributive function not fully at the present time.
The distribution of credit resources between the economic sectors is not conducive to the
development of the real economy (Figure 2).
Such branches of the Volga region’s economy as wholesale and retail trade (24.38%) and
manufacturing (21.37%) remain most attractive for lending. This suggests that the flow of capital
from high-yielding sectors of the Volga region, which are gradually exhausting their potential, to
the promising high-tech industries is extremely difficult.
It should also be noted that the term structure of credits to the real sector of the Volga
region’s economy does not meet its growing needs in the long-term financing. In conditions of
high volatility of the Russian financial market credit institutions have no incentives for long-term
investment, since this kind of active operations entails higher risks.
Fig. 2
LOANS TO THE REAL ECONOMY OF THE VOLGA REGION, BY SECTORS ON 01.01.2014, %
Despite the fact that in recent years there has been some intensification of lending to the
real sector of the Volga region, the credit institutions’ contribution to its development remains
insignificant. More often companies do not resort to credit institutions’ funds to invest in
projects, thus, over the past 5-7 years services of leasing companies have acquired a sufficiently
high demand. Despite the fact that credit institutions are gradually abandoning the lessors’ role,
many of them are trying to participate in leasing operations through their affiliates.
Another important area of cooperation between credit institutions and the real sector of
economy is the attraction of its deposits; as such deposits are remaining one of the most
important sources of bank resources. So the volume of deposits of the real sector of the economy
enterprises in the credit institutions of the Volga region is gradually increasing (Table 4).

Academy of Strategic Management Journal Volume 15, Special Issue, 2016
99
Table 4
THE VOLUME OF ATTRACTED DEPOSITS OF THE VOLGA REGIONS COMPANIES (MLN.
RUBLES)
Region/ Year 2010 2011 2012 2013
Astrakhan region 3 147 5 985 3 383 8 602
Volgograd region 9 512 11 640 9 691 10 421
Penza region 3 580 5 373 5 130 6 758
Samara region 27 472 42 458 52 023 67 913
Saratov region 7 610 10 377 13 499 15 964
Ulyanovsk region 5 958 6 503 4 895 6 484
Republic of Kalmykia 642 600 353 272
Republic of Tatarstan 87 212 127 233 122 730 143 861
Total: 145 133 210 169 211 704 260 275
Another important source of credit institutions’ funding is the placement of securities,
such as certificates of deposit and savings, bonds (Table 5).
Table 5
THE VOLUME OF SAVINGS CERTIFICATES AND BONDS, ISSUED BY CREDIT INSTITUTIONS
(MLN. RUBLES)
Region Deposit certificates Savings certificates Bonds
2011 2012 2013 2011 2012 2013 2011 2012 2013
Astrakhan region 0.0 0.0 0.0 101.8 824.8 1293.8 0.0 0.0 0.0
Volgograd
region
0.0 0.0 0.0 168.6 2 724.0 4044.2 0.0 0.0 0.0
Penza region 3.3 0.1 0.1 156.3 618.5 1011.0 0.0 0.0 0.0
Samara region 196.7 240.0 11.2 356.7 4 576.6 4046.1 14 644.4 24 642.1 30303.5
Saratov region 0.5 0.0 2.1 101.4 1 520.5 2891.0 0.0 0.0 0.0
Ulyanovsk
region
3.4 38.5 45.2 150.3 820.0 1220.7 0.0 0.0 0.0
Republic of
Kalmykia
0.0 0.0 0.0 2.0 109.2 123.8 0.0 0.0 0.0
Republic of
Tatarstan
52.0 313.5 31.5 33.0 3 964.7 4934.2 14 542.9 24 312.1 32964.3
Total: 255.9 592.1 90.1 1 070.1 15 158.3 19 564.8 29 169.3 48 954.2 63 267.8
Сredit institutions of the Volga region use deposit certificates extremely inactive. Thus,
the credit organizations of the Astrakhan and Volgograd regions, and also of the Republic of
Kalmykia don't use this type of securities for attraction of additional resources at all. Even less
popular type of securities are bonds: during the considered period, this type of securities was
only used by credit institutions of the Samara region and the Republic of Tatarstan. The most
popular among the Volga region’s credit institutions type of securities are savings certificates,
for which there is a positive trend during the period under review is observed.
Despite the fact that in connection with the gradual development of the Russian securities
market this type of interaction between the banking and real sectors of the economy of the region
becoming more and more attractive for banks, currently the securities’ market potential of raising
the additional resources is not used by credit institutions to the full.

Academy of Strategic Management Journal Volume 15, Special Issue, 2016
100
CONCLUSION
The interaction of banking and real sectors is gradually entering a new phase, but quite
slowly for many reasons. Despite the fact that there is well developed banking sector in Volga
region, the real sector still lacks the leverage for large investment projects. The banking system
in the Volga region has the resources necessary for lending to the real sector of the economy, but
the credit institutions have no incentives for investing funds into the economy.
Therefore the coordination of the interests of these sectors is one of the priorities of the
Russian economy in the long term. In this regard, during the period until 2018 it is planned the
execution of several federal programs whose primary purpose is to create an enabling
environment to attract private capital into the real economy.
REFERENCES
Nannan, Yu, Jong, M., Storm, S & Mi, J. (2012). Transport Infrastructure, Spatial Clusters and Regional Economic
Growth in China. Transport Reviews, 32, 3-28.
Xu, M., Grant-Muller S. & Gao, Z (2015). Evolution and assessment of economic regulatory policies for
expressway infrastructure in China. Transport Policy, 41, 42-49.
Bounouala, R., Rihane, C. (2014). Commercial banks in microfinance: Entry strategies and keys of
success.Investment Management and Financial Innovations, 11(1), 146-156.
Gabbi, G., Iori, G., Jafarey, S., Porter, J. (2014). Financial regulations and bank credit to the real economy.Journal
of Economic Dynamics and Control.
Égert, B., Sutherland, D. (2014). The Nature of Financial and Real Business Cycles: The Great Moderation and
Banking Sector Pro-Cyclicality. Scottish Journal of Political Economy, 61(1), 98-117.
Huang, H.-C.R., Fang, W., Miller, S.M. (2014). Banking market structure, liquidity needs, and industrial growth
volatility.Journal of Empirical Finance, 26, 1-12.
Allen, F., Carletti, E., Gale, D. (2014). Money, financial stability and efficiency. Journal of Economic Theory,
149(1), 100-127.
Holton, S., Lawless, M., McCann, F. (2014). Firm credit in the euro area: a tale of three crises.Applied Economics,
46(2), 190-211.
Beck, T., Büyükkarabacak, B., Rioja, F.K., Valev, N.T. (2014). Who gets the credit? and does it matter? Household
vs. firm lending across countries.B.E. Journal of Macroeconomics, 12(1).
Sandri, D., Valencia, F. (2014) Financial Crises and Recapitalizations.Journal of Money, Credit and Banking, 45(2),
59-86.
Nguena, C.L., Nanfosso, R.T. (2014). Banking activity sensitivity to macroeconomic shocks and financial policies
implications: The Case of CEMAC Sub-region.African Development Review, 26(1),. 102-117.
Ueda, K., Valencia, F. (2014). Central bank independence and macro-prudential regulation. Economics Letters,
125(2), 327-330.
Postaliuk, M., Akhmetshina, G. (2014). Economic systems sustainable development spatial structures
innovatization.Investment management and financial innovations, 11(4), 127-133.
Paun, C., Topan, V., Musetescu, R. (2014). Financial contracts and financial crisis: The case of demand and term
deposits.International Journal of Private Law, 7(3), 271-285.