ABSTRACT RAULSTON, CHARLES IAN. Analysis of the Market ...
284
ABSTRACT RAULSTON, CHARLES IAN. Analysis of the Market Potential and Effectiveness of Upstream Textile Advertising. (Under the direction of Dr. Nancy Cassill and Dr. William Oxenham). The United States’ (U.S.) textile industry has traditionally competed on cost measures in order to gain market share in the global market. However, because of increased globalization and influences from foreign competition, using a low cost strategy has become more difficult and firms are now looking for less price sensitive methods of differentiation. Advertising has been identified as an effective method of differentiating products and building value for the firm. Upstream firms, such as those involved in fibers, yarns, and fabrics, which do not directly sell to the final consumer, often have trouble communicating product benefits to the end users, as well as their immediate customers in their supply chain. The purpose of this study was to determine how U.S. textile firms can use advertising to differentiate their products and how to communicate product benefits to their customers and the end consumer effectively through media choices and advertisement content. This study was completed using quantitative surveys among end use consumers and interviews with firms with successful upstream advertising strategies. The results of this research were used to develop a procedural model that U.S. textile firms can use to develop effective advertising strategies to differentiate their products in the market and increase competitiveness. The results provided companies with a framework they can use to develop their advertising strategy by guiding them though the advertisement development methodology in order to take advantage of market opportunities and to minimize potential risks.
-
Upload
khangminh22 -
Category
Documents
-
view
2 -
download
0
Transcript of ABSTRACT RAULSTON, CHARLES IAN. Analysis of the Market ...

ABSTRACT
RAULSTON, CHARLES IAN. Analysis of the Market Potential and Effectiveness of
Upstream Textile Advertising. (Under the direction of Dr. Nancy Cassill and Dr. William
Oxenham).
The United States’ (U.S.) textile industry has traditionally competed on cost measures in
order to gain market share in the global market. However, because of increased globalization
and influences from foreign competition, using a low cost strategy has become more difficult
and firms are now looking for less price sensitive methods of differentiation. Advertising has
been identified as an effective method of differentiating products and building value for the
firm. Upstream firms, such as those involved in fibers, yarns, and fabrics, which do not
directly sell to the final consumer, often have trouble communicating product benefits to the
end users, as well as their immediate customers in their supply chain.
The purpose of this study was to determine how U.S. textile firms can use advertising to
differentiate their products and how to communicate product benefits to their customers and
the end consumer effectively through media choices and advertisement content. This study
was completed using quantitative surveys among end use consumers and interviews with
firms with successful upstream advertising strategies. The results of this research were used
to develop a procedural model that U.S. textile firms can use to develop effective advertising
strategies to differentiate their products in the market and increase competitiveness. The
results provided companies with a framework they can use to develop their advertising
strategy by guiding them though the advertisement development methodology in order to
take advantage of market opportunities and to minimize potential risks.

The results of the study identified online advertising as a potentially effective way to
communicate messages to consumers and entities in the textile supply chain. The benefits,
challenges, opportunities and potential of upstream textile advertising were identified. In
addition, the study identified effective strategies for communicating with end consumers,
supply chain representatives, and the industry. Consumer and supply chain level
perspectives were also collected related to the effectiveness of current advertising campaigns.
The framework developed during the study highlights methodology and considerations
specific to the upstream segment of textile industry and provides a sequential model for
advertisement development.

Analysis of the Market Potential and Effectiveness of Upstream Textile Advertising
by
Charles Ian Raulston
A thesis submitted to the Graduate Faculty of
North Carolina State University
in partial fulfillment of the
requirements for the Degree of
Master of Science
Textiles
Raleigh, North Carolina
2009
APPROVED BY:
___________________________ ___________________________
Dr. Nancy L. Cassill Dr. William Oxenham
Co-Chair of Advisory Committee Co-Chair of Advisory Committee
___________________________ ___________________________
Dr. Erin Parrish Dr. W. Gilbert O’Neal
Committee Member Committee Member

ii
BIOGRAPHY
Ian Raulston was born in High Point, North Carolina to Keith and Resa Raulston in
1985. After graduating from Thomasville High School in 2003, he enrolled at the North
Carolina State University’s College of Textiles. Having been awarded two full scholarships,
the Park and Centennial Scholarship, his undergraduate career was focused on academics and
community service. During his summers, Raulston has had the privilege of working for the
Institute of Textile Technology in 2005, and Glen Raven in 2006 and 2007. Raulston
graduated as a valedictorian with a Bachelor of Science in Textile Management with a
concentration in branding and marketing, in 2008. After graduation, Raulston became an
Institute of Textile Technology Fellow, choosing to pursue his Masters of Science in Textile
Technology Management. He interned with Highland Industries during the summer of 2008.
Upon graduation, Raulston will be seeking employment in the field of marketing or
advertising. In his spare time, Raulston is an active barefoot runner, whitewater kayaker, and
exercise enthusiast.

iii
ACKNOWLEDGEMENTS
I would first like to express my appreciation to my co-chairs Dr. Nancy Cassill and
Dr. William Oxenham. Their guidance, encouragement, dedication, and patience provided
me with the tools and the strength to complete this study. I would also like to thank Dr. Erin
Parrish for her commitment to helping me to make sense of it all and to succeed in my
endeavor. I want to thank Patrice Hill and Merisa Velebir for their support and laughs over
the last two years. I would also like to express my appreciation to the Staff of the Institute of
Textile Technology and the membership for putting together a challenging and fulfilling
academic program. I would also like to thank my fellow ITT classmates for their support,
their encouragement, and the love that we have shared during our ITT experience. They have
been like a second family to me, and I hope we never lose touch with one another.
Last, but most importantly, I would like to express my deepest gratitude to my Mom,
Dad, family, and friends for their support and unconditional love. I really appreciate you all
pushing me to be the best person I can be and for accompanying me along my life’s journey.

iv
TABLE OF CONTENTS
LIST OF FIGURES ............................................................................................................. xiii
LIST OF TABLES ............................................................................................................... xiv
INTRODUCTION....................................................................................................................1
CHAPTER I .............................................................................................................................1
Purpose of Research ...............................................................................................................2
Research Objectives ...............................................................................................................3
Significance of Study .............................................................................................................6
Limitations .............................................................................................................................6
Definitions of Relevant Terms ...............................................................................................7
CHAPTER II ..........................................................................................................................11
LITERATURE REVIEW .....................................................................................................11
Conceptual Framework ........................................................................................................11
Frameworks Used to Adapt Study’s Conceptual Framework ..........................................11
Performance Textiles .........................................................................................................21
Sports and Leisure Segment and the Outdoor Market .....................................................21
Defining Upstream and Upstream Advertising ...............................................................23
Advertising Effectiveness Theory .....................................................................................25
Effectiveness Evaluation Methods ....................................................................................27
Advertising Success ............................................................................................................28
Advertising Effects .............................................................................................................29
Positive Benefits ...............................................................................................................29
Negative Impacts ..............................................................................................................29
Advertising Challenges ......................................................................................................30
Differences Between B2B and B2C Advertising ..............................................................30
Current Strategies for Differentiation..............................................................................31
General Methodology for Textile Advertisement Development .......................................31
Upstream Tactics- Ingredient Advertising .......................................................................32

v
Direct Marketing ..............................................................................................................33
Affiliate Advertising ..........................................................................................................34
Summary .............................................................................................................................35
CHAPTER III ........................................................................................................................36
METHODOLOGY ................................................................................................................36
Purpose of Research .............................................................................................................36
Research Objectives .............................................................................................................38
Research Design..................................................................................................................40
Strategies and Theories ....................................................................................................40
Four Phase Approach: Explanation of Significance ....................................................42
Phase I: Exploratory ........................................................................................................43
Data Collection: Phase I (Step 1) .................................................................................43
Data Collection: Phase I (Step 2) .................................................................................43
Data Collection: Phase I (Step 3) .................................................................................45
Data Collection: Phase I (Step 4) .................................................................................47
Data Collection: Phase I (Step 6-8)..............................................................................49
Phase 1 Sample Selection: ............................................................................................50
Phase II: Inductive Logic .................................................................................................53
Data Collection: Phase II .............................................................................................53
Sample Selection: Phase II ...........................................................................................53
Instrument Development: Phase II ...............................................................................60
Data Analysis ................................................................................................................62
Phase III- Deductive Logic ...............................................................................................62
Data Collection: Phase III ............................................................................................62
Sample Selection: Phase III ..........................................................................................64
Instrument Development: Phase III ..............................................................................64
Data Analysis ................................................................................................................70
Instrument Approval .....................................................................................................70

vi
Phase IV- Model Development .........................................................................................70
CHAPTER IV.........................................................................................................................71
RESULTS AND DISCUSSION ............................................................................................71
Phase I: Exploratory ..........................................................................................................71
Phase I: Initial Product Scan Results ...............................................................................71
Objectives ......................................................................................................................71
Key Findings .................................................................................................................71
Introduction...................................................................................................................72
Product Scan Discussion ..............................................................................................76
Phase I: Print Advertising Media Scan Results ...............................................................78
Objectives ......................................................................................................................78
Key Findings .................................................................................................................79
Phase 1: Competitive Analysis .........................................................................................79
Objectives ......................................................................................................................79
Key Finding ...................................................................................................................79
Introduction...................................................................................................................80
Discussion .....................................................................................................................80
Phase I: Case Studies .......................................................................................................83
Objectives ......................................................................................................................83
Key Findings: ................................................................................................................84
Case Study: Intel’s Intel Inside Campaign ...........................................................84
Introduction ...........................................................................................................84
Opportunity ............................................................................................................84
Challenges and Media Tactics ...............................................................................85
Benefits ..................................................................................................................87
Case Study: Cotton Incorporated’s Fabric of Our Lives Campaign .................87
Introduction ...........................................................................................................87
Challenges and Goals ............................................................................................88

vii
Tactics and Media Strategy ...................................................................................88
Benefits and Successes ..........................................................................................89
Discussion: Case Studies ..............................................................................................89
Phase II- Industry Interview Results: Inductive Logic ..................................................90
Objectives .........................................................................................................................90
Key Findings .....................................................................................................................91
Advertising in the Sports and Leisure Market ..................................................................93
Discussion: Advertising in the Sports and Leisure Market ..........................................93
Advertising Benefits ..........................................................................................................96
Discussion: Advertising Benefits ..................................................................................96
Advertising Challenges .....................................................................................................99
Discussion: Advertising Challenges ...........................................................................101
Advertising Opportunities ..............................................................................................101
Discussion: Advertising Opportunities .......................................................................101
Advertising Potential ......................................................................................................104
Discussion: Advertising Potential...............................................................................104
Advertisement Development Methodology .....................................................................107
Discussion: Advertisement Development Methodology ............................................109
Advertising Effectiveness from a Supply Chain Perspective ..........................................110
Discussion: Advertising Effectiveness from a Supply Chain Perspective..................113
Phase III- Consumer Survey Results: Deductive Logic ................................................113
Objectives .......................................................................................................................113
Key Findings ...................................................................................................................114
Introduction ....................................................................................................................115
Discussion: Advertisement A Survey Results- Individual Questions.........................118
Discussion: Advertisement B Survey Results- Individual Questions .........................121
Discussion: Advertisement C Survey Results- Individual Questions .........................124
Discussion: Advertisement A, B, and C Comparison Survey Results-
Individual Questions ...................................................................................................126

viii
Discussion: General Advertising Preferences Survey Results ....................................126
Phase IV- Conceptual Framework Revisions ................................................................131
Objectives .......................................................................................................................131
Discussion: Model Development ....................................................................................133
CHAPTER V ........................................................................................................................137
SUMMARY, CONCLUSIONS, AND RECOMMENDATIONS ....................................137
Summary of Research ......................................................................................................137
Summary of Results .........................................................................................................138
Benefits, Potential, and Challenges of Upstream Advertising .......................................138
Strategies used in the Performance Market ...................................................................140
Effective Strategies for Communicating with Industry, Customers, and Consumers ..142
Cost Benefit Relationship ...............................................................................................144
Conclusions .......................................................................................................................145
Limitations ........................................................................................................................148
Recommendations ............................................................................................................149
REFERENCES .....................................................................................................................151
APPENDIX ...........................................................................................................................154
APPENDIX A: INITIAL COMPANY SAMPLE .............................................................155
APPENDIX B: INTERVIEW INSTRUMENT .................................................................168
APPENDIX C: CONSUMER SURVEY ............................................................................171
APPENDIX D: IRB SUBMISSION FORM ......................................................................179
APPENDIX E: IRB CONSENT FORMS ..........................................................................192
APPENDIX F: INITIAL CONTACT LETTERS .............................................................199
APPENDIX G: IRB EXEMPTION LETTER ..................................................................203
APPENDIX H: PRODUCT SCAN RESULTS..................................................................205
APPENDIX I: COMPANY INTERVIEW RESULTS:
ADVERTISING IN THE SPORTS AND LEISURE MARKET .....................................209
Appendix I1: Company A Interview Results .................................................................210
Appendix I2: Company B Interview Results .................................................................211
ix
Appendix I3: Company C Interview Results .................................................................211
Appendix I4: Company D Interview Results .................................................................212
Appendix I5: Company E Interview Results .................................................................213
Appendix I6: Company F Interview Results .................................................................214
Appendix I8: Company H Interview Results .................................................................216
Appendix I9: Company I Interview Results ..................................................................216
Appendix I10: Company J Interview Results ................................................................217
Appendix I11: Company K Interview Results ................. Error! Bookmark not defined.
APPENDIX J: COMPANY INTERVIEW RESULTS:
ADVERTISING BENEFITS...............................................................................................218
Appendix J1: Company A Interview Results ................................................................219
Appendix J2: Company B Interview Results .................................................................220
Appendix J3: Company C Interview Results ................................................................221
Appendix J4: Company D Interview Results ................................................................221
Appendix J5: Company E Interview Results .................................................................221
Appendix J6: Company F Interview Results .................................................................222
Appendix J7: Company G Interview Results ................................................................222
Appendix J8: Company H Interview Results ................................................................223
Appendix J9: Company I Interview Results ..................................................................223
Appendix J10: Company J Interview Results ...............................................................224
Appendix J11: Company K Interview Results ..............................................................224
APPENDIX K: COMPANY INTERVIEW RESULTS:
ADVERTISING CHALLENGES ......................................................................................225
Appendix K1: Company A Interview Results ...............................................................226
Appendix K2: Company B Interview Results ...............................................................226
Appendix K3: Company C Interview Results ...............................................................226
Appendix K4: Company D Interview Results ...............................................................227
Appendix K5: Company E Interview Results ...............................................................227
Appendix K6: Company F Interview Results ................................................................227

x
Appendix K7: Company G Interview Results ...............................................................228
Appendix K8: Company H Interview Results ...............................................................228
Appendix K9: Company I Interview Results .................................................................229
Appendix K10: Company J Interview Results ..............................................................229
Appendix K11: Company K Interview Results .............................................................230
APPENDIX L: COMPANY INTERVIEW RESULTS:
ADVERTISING OPPORTUNITIES .................................................................................231
Appendix L1: Company A Interview Results ................................................................232
Appendix L2: Company B Interview Results ................................................................233
Appendix L3: Company C Interview Results ................................................................233
Appendix L4: Company D Interview Results ................................................................234
Appendix L5: Company E Interview Results ................................................................234
Appendix L6: Company F Interview Results ................................................................235
Appendix L7: Company G Interview Results ...............................................................236
Appendix L8: Company H Interview Results ...............................................................236
Appendix L9: Company I Interview Results .................................................................237
Appendix L10: Company J Interview Results ...............................................................237
Appendix L11: Company K Interview Results .............................................................237
APPENDIX M: COMPANY INTERVIEW RESULTS:
ADVERTISING POTENTIAL ...........................................................................................238
Appendix M1: Company A Interview Results ...............................................................239
Appendix M2: Company B Interview Results ...............................................................239
Appendix M3: Company C Interview Results ...............................................................240
Appendix M4: Company D Interview Results ...............................................................240
Appendix M5: Company E Interview Results ...............................................................241
Appendix M6: Company F Interview Results ...............................................................241
Appendix M7: Company G Interview Results ..............................................................242
Appendix M8: Company H Interview Results ..............................................................242
Appendix M9: Company I Interview Results ................................................................243
xi
Appendix M10: Company J Interview Results .............................................................243
Appendix M11: Company K Interview Results ............................................................244
APPENDIX N: COMPANY INTERVIEW RESULTS: METHODOLOGY ................245
Appendix N1: Company A Interview Results................................................................246
Appendix N2: Company B Interview Results ................................................................247
Appendix N3: Company C Interview Results................................................................247
Appendix N5: Company E Interview Results ................................................................249
Appendix N6: Company F Interview Results ................................................................250
Appendix N7: Company G Interview Results ...............................................................251
Appendix N8: Company H Interview Results ...............................................................252
Appendix N9: Company I Interview Results .................................................................253
Appendix N10: Company J Interview Results ..............................................................253
Appendix N11: Company K Interview Results .............................................................254
APPENDIX O: COMPANY INTERVIEW RESULTS:
ADVERTISING EFFECTIVENESS .................................................................................255
Appendix O1: Company A Interview Results ...............................................................256
Appendix O2: Company B Interview Results ...............................................................256
Appendix O3: Company C Interview Results ...............................................................257
Appendix O4: Company D Interview Results ...............................................................257
Appendix O5: Company E Interview Results ...............................................................258
Appendix O6: Company F Interview Results ................................................................258
Appendix O7: Company G Interview Results ...............................................................259
Appendix O8: Company H Interview Results ...............................................................260
Appendix O9: Company I Interview Results .................................................................260
Appendix O10: Company J Interview Results ..............................................................261
Appendix O11: Company K Interview Results .............................................................261
APPENDIX P: CONSUMER SURVEY RESULTS:
INDIVIDUAL ADVERTISEMENT...................................................................................262
Appendix P1: Consumer Survey Results- Response Totals for Question 1 ................263
xii
Appendix P2: Consumer Survey Results- Response Totals for Question 2 ................263
Appendix P3: Consumer Survey Results- Response Totals for Question 3 ................263
Appendix P4: Consumer Survey Results- Response Totals for Question 4 ................264
Appendix P5: Consumer Survey Results- Response Totals for Question 5 ................264
Appendix P6: Consumer Survey Results- Response Totals for Question 6 ................264
Appendix P7: Consumer Survey Results- Response Totals for Question 7 ................265
Appendix P8: Consumer Survey Results- Response Totals for Question 8 ................265
Appendix P9: Consumer Survey Results- Response Totals for Question 9 ................265
Appendix P10: Consumer Survey Results- Response Totals for Question 10 ............266
Appendix P11: Consumer Survey Results- Response Totals for Question 11 ............266
Appendix P12: Consumer Survey Results- Response Totals for Question 12 ............266
Appendix P13: Consumer Survey Results- Response Totals for Question 13 ............267
Appendix P14: Consumer Survey Results- Response Totals for Question 14 ............267
Appendix P15: Consumer Survey Results- Response Totals for Question 15 ............267
Appendix P16: Consumer Survey Results- Response Totals for Question 16 ............268
Appendix P17: Consumer Survey Results- Response Totals for Question 17 ............268
Appendix P18: Consumer Survey Results- Response Totals for Question 18 ............268

xiii
LIST OF FIGURES
Figure 1: Adapted Advertising Methodology Model ..........................................................12
Figure 2: Schultz and Barn’s Advertising Campaign Planning Process ..........................15
Figure 3: Sandage, Fryburger, & Rotzoll Advertising Components Model ....................16
Figure 4: Cooper’s Strategic Analysis Framework ............................................................18
Figure 5: Keller’s Factors for Effective Advertisements ....................................................20
Figure 6: Dickerson’s Textile and Appareal Production-Distribution Chain ..................24
Figure 8:Inductive Research Approach ...............................................................................41
Figure 9: Deductive Research Approach .............................................................................41
Figure 10: Visual Depiction of Steps to Select Successful Companies ..............................49
Figure 11: Case Study Company Selection Criteria ...........................................................51
Figure 12: Industry Interview Sample Selection Process ...................................................54
Figure 13: Advertisement A ..................................................................................................68
Figure 14: Advertisement B ..................................................................................................69
Figure 15: Advertisement C ..................................................................................................69
Figure 16: Advertisement Content Credibility Source Preferences ................................128
Figure 18: Percentage of Consumers Preferring Branded Textiles Over Generics ......129
Figure 19: Consumer Information Source Preferences ...................................................130
Figure 20: Upstream Textile Performance Product Advertisement
Development Process Model ...............................................................................................132
xiv
LIST OF TABLES
Table 1: Framework Evaluation...........................................................................................13
Table 2: Phase I Instrument- Secondary Data Collection ..................................................44
Table 3: Companies Participating in the Sports and Leisure ............................................56
Table 4: Companies Participating in the Sports and Leisure Using Branded Products .57
Table 5: Validated Companies Participating in the Sports and Leisure Using Branded
Products and Advertising in the Consumer and/or Industrial Segments .........................58
Table 6: Companies Selected based Upon Leadership and Visibility in Advertising or
Expertise in Advertising with Textile Companies...............................................................60
Table 7: Interview Instrument-
Question Source and Research Objective Correlation .......................................................61
Table 8: Consumer Survey Instrument-
Question to Research Objective Correlation .......................................................................65
Table 9: Product Scan Summary Findings by Product Type ............................................73
Table 10: Competitive Analysis Results ..............................................................................81
Table 11: Advertising in the Sports and Leisure Market- Summary of Results .............94
Table 12: Advertising Benefits- Summary Results .............................................................97
Table 13:Advertising Challenges- Summary Results .......................................................100
Table 14: Advertising Opportunities- Summary Results .................................................102
Table 15: Advertising Potential- Summary Results .........................................................105
Table 16: Advertisement Development Methodology- Summary Results ......................108
Table 17: Advertising Effectives from a Supply Chain Perspective-
Summary Results .................................................................................................................111
Table 18: Consumer Survey Results- Demographic Information ...................................116
Table 19: Consumer Survey Results: Advertisement A - Individual Questions ............117
Table 20: Consumer Survey Results: Advertisement B- Individual Questions .............120
Table 21: Consumer Survey Results: Advertisement C- Individual Questions .............123
Table 22: Consumer Survey Results: Advertisement A, B, and C Comparisons ..........125
Table 23: General Advertising Preferences Survey Results- Individual Questions ......127

1
CHAPTER I
INTRODUCTION
The United States’ (U.S.) textile industry has traditionally competed on cost measures in
order to gain market share in the global market. However, because of increased globalization
and influences from foreign competition, using a low cost strategy has become more difficult
(Dickerson, 1999). Firms are now looking for new ways to differentiate their products that
are not price sensitive. For apparel, branding and private labels are an obvious choice to
distinguish their products. However, upstream firms, such as those involved in fibers, yarns,
and fabrics, which do not directly sell to the final consumer, often have trouble
communicating product benefits to the end users, as well as their immediate customers in
their supply chain.
In order to effectively differentiate their products and to reverse this poor communication
trend, firms must create both customer and consumer level demand for upstream products.
By creating a value–added proposition, apparel and textile retailers may be able to justify a
higher price. This can be accomplished through promotional activities such as pull/pull
marketing, public relations (PR), sales promotion, and advertising. The best way to
communicate product benefits to customers and consumers is through effective advertising
(Keller, 2003). However, each company and target customer is unique and not all strategies
are universally successful. Therefore, in order to create a viable business strategy that U.S.
textile firms can use to determine the market potential for an advertising campaign, current
advertising methods must be assessed.

2
Advertising effectiveness is a measurement of the tangible contributions advertising
makes to the brand or the company (Wright-Isak, Faber, & Horner, 1997). There is no
universally agreed upon procedure for assessing the standard of performance for advertising.
Most businesses use sales volume as a measurement of success, but this procedure fails to
capture the nonmonetary benefits of advertising such as awareness and perceptions. It has
been suggested that both qualitative and quantitative measures should be employed to access
advertising effectiveness. However, with the diverse benefits and roles of advertising, there
are no standards for advertising success (Wright-Isak, Faber, & Horner, 1997). Typically, it
is up to the individual company to measure and evaluate their own set standards. Much like
the procedure for measuring effective advertising, there is no set standard for what
constitutes a successful advertising campaign. From the literature, it has been stated that it is
up to the individual company to determine whether an advertising campaign was successful
or not (Wright-Isak, Faber, & Horner, 1997).
Purpose of Research
The purpose of this research was to examine upstream textile firms that effectively
used advertising to differentiate their products in the market. The broad research question
was how could U.S. upstream textile firms use advertising to increase their competitiveness
and differentiate their products from low cost competitors in the global market? From the
broad research question, the narrowed focus was to determine the most effective advertising
strategies for reaching customers, consumers, and the industry. Specific research questions,
which were developed from the narrowed question include:

3
1. What are the benefits, challenges, opportunities and potential of upstream
advertising?
2. What are some different strategies used in the performance market? Focusing on
the sports and leisure market and outdoor apparel and equipment subsegment?
3. What are the most effective strategies for U.S. textile firms to use in order to
communicate with the customer and the end-use consumer? What perspectives do
the following groups have about advertising:
a. End consumers;
b. Customers;
c. Industry?
4. How can this knowledge be presented to help upstream textile firms create value
and differentiate their products?
5. What is the cost/benefit relationship between money spent on advertising and
realized gains for the firm?
Research Objectives
Phase I: Exploratory
RO1: Define advertising success and identify companies with successful advertising
strategies.
RO2: Complete a competitive analysis, using secondary data, on the advertising strategies of
upstream textile manufacturers in addition to the strategies of upstream firms from other
industries in order to:

4
RO2A: Develop an understanding of the current advertising campaigns.
RO2B: Assess the strategies used by the selected companies.
Phase II: Inductive Logic
Phase II and III will be conducted concurrently.
RO3: Examine differences in the marketing strategies used by the performance textile
market, focusing specifically on the outdoor apparel and equipment subsegment of the sports
and leisure market segment.
RO3A: Assess benefits
RO3B: Assess challenges
RO3C: Assess opportunities
RO3D: Assess potential
RO3E: Advertising methodology
RO4: Examine the effectiveness from a supply chain perspective to determine:
RO4A: Which media types the population views most frequently
RO4B: What advertising media has the best response rate
RO4C: What part of the advertisement causes the population to
seek additional information
RO4D: What features of the advertisement are most effective
RO4E: What factors the population considers before purchasing
RO4F: Where the population seeks product information

5
Phase III: Deductive Logic
RO5: Examine the effectiveness of upstream advertising from an end consumer perspective
to determine:
RO5A: If the population is aware of the advertised ingredient product
RO5B: If the population knows the functionality of the ingredient product
RO5C: What features of the advertisement the population feels are most effective
RO5D: If the population looks for the ingredient when purchasing products
RO5E. If the population is willing to pay more
RO5E: Where the population seeks product information
RO6: Develop an understanding of the potential of upstream textile advertising focusing on
different advertising opportunities including:
RO6A: Print
RO6B: Television
RO6C: Internet
Phase IV: Model Development
RO7: Develop a framework that U.S. textile companies can use to develop a successful
upstream advertising campaign.
RO7A: Provide ITT member companies with the knowledge and guidelines
differentiate themselves through advertising in a highly competitive market.

6
Significance of Study
The significance of this study is fourfold. First, the results of this research will
provide knowledge of the benefits, challenges, opportunities, and potential of upstream
advertising. This knowledge will aid companies in determining the cost/benefit relationship
of advertising for their company and could aid in managerial decision-making.
Second, it will determine the most effective strategies for U.S. textile firms to use in
order to communicate with the customer and the end-use consumer for the performance
market. This will allow firms to determine what advertising communication media type best
fits their target market.
Third, it will provide a framework for U.S. textile firms to use when implementing an
upstream advertising strategy.
Finally, it will provide a means for U.S. textile firms to create perceived value and
differentiation. By understanding the nature of the upstream advertising, U.S. producers will
be ideally positioned to gain a competitive advantage through differentiation.
Limitations
1. This study was specifically limited to the upstream textile firms participating in the
sports and leisure segment of the performance textile market. Companies interviewed
are representative of the upstream segment of the industry, but not the entire industry.
Therefore, the results presented in this report cannot be generalized for all segments
or all product categories.

7
2. Participants in the consumer survey are limited, but are representative of the
population. Because a non-probability convenience sample was used during the study,
the results presented in this report cannot be generalized for the entire population.
Biases in awareness may have occurred due to fact that upstream companies have
sponsored events and programs on the College of Textiles campus.
3. Respondent bias may be present in surveys and interviews, due to their willingness or
unwillingness to disclose certain data.
4. Advertising is only one component of promotional activities. While companies can
achieve success through other promotional avenues, this study only focuses on the
advertising portion of the mix.
5. Due to the markets and consumer preferences of Raleigh/Cary, North Carolina area,
the availability and selection of products and publications identified in this study are
limited. Therefore, the results of this study are geographically limited and cannot be
applied to all geographic areas.
Definitions of Relevant Terms
1. Advertising Failure: Campaigns or individual advertisements that do not meet pre-
established company objectives that may take the form of increased sales, new
customers, increased market share, or increased brand/product/service/company
awareness (adapted from Vass, 2005).
2. Advertising Success: Campaigns or individual advertisements that meet pre-
established company objectives that may take the form of increased sales, new

8
customers, increased market share, or increased brand/product/service/company
awareness (adapted from Vass, 2005).
3. Brand: A representation of promises, images, or experiences associated with a
product in the mind of the consumer (Kegan, 2005).
4. Brand image: Complex array of images associated with a product and the maker of
that product (Kegan, 2005).
5. Channel of Distribution: The collection of agencies that perform the actives required
to link producers with users (Kegan, 2005).
6. Collateral: Printed company or product brochures or pamphlets, distributed to
potential customers.
7. Competitive Advantage: The meeting of the firm’s core competencies and the factors
required to yield significant customer value (Kegan, 2005).
8. Differentiation: The ability of a firm to serve a large market and be perceived as
having unique products, often allowing for premium pricing (Kegan, 2005).
9. Downstream: Relates to the relative position of a company in relation to other
companies. These companies are further along in the supply chain, close to the
consumer. Companies may include finished goods companies, marketer, wholesalers,
and retailers (adapted from Dickerson, 1999).
10. Host Brand: Product or brand that allows another company’s brand to be promoted on
or with their product, in an effort to build brand equity and creditability for the
hosting product (Desai, 2002).

9
11. Ingredient textile: Includes any fiber, yarn, fabric, or finish used to create a product
(Desai, 2002).
12. Outdoor Market Segment: Segment of the sports and leisure includes: Apparel (sport
and weather resistant jackets, vests, and pants); Accessories (hats, socks and gloves);
Footwear (hiking shoes and hiking/hunting boots); and Equipment (tents, sleeping
bags, and backpacks/daypacks) (adapted from NC Textile Connect, 2008).
13. Performance Textiles: Classification of textile products that combine technical
performance with esthetic dimensions to fulfill specific end uses and niches. These
products include those used in the agriculture, construction, apparel, geotextile, home
furnishings, military, industrial, medical, transportation, environmental, packaging,
and sports and leisure sub sectors. Non-performance products may include
commodity goods (Nelson, 2008).
14. Positioning: Creating certain associations in the mind of users compared to
competitors (Kegan, 2005).
15. Public Relations (PR): Component of the marketing mix that monitor and evaluate
public opinion about a company or its products (Keegan & Green, 2005).
16. Sports and Leisure Segment: Product category includes any recreational and
consumer goods including tents, backpacks, fabric covered sport balls, awnings,
umbrellas, etc. (NC Textile Connect, 2008).
17. Supply Chain: Group of agencies that facilitate the conversion of raw materials into
finished good for consumption (Kegan, 2005).
10
18. Targeting: Act of evaluating market segments and concentrating marketing efforts on
a specific country, area, or consumer group (Kegan, 2005).
19. Upstream: Companies that produce or support the production of textile fibers, yarns,
and fabrics (both finished and greige) (adapted from Dickerson, 1999).
20. Upstream Advertising: The act of communicating a sponsored or paid message
through a non-personal channel including trade shows, showrooms, hang tags, print
advertisements, Internet advertisements, and sponsored events. Messages can be
product, company, or service oriented (adapted from Kegan, 2005).
21. Value: A consumer’s perception of benefits from a firm’s product or service relative
to the cost of the good or service (Kegan, 2005).
11
CHAPTER II
LITERATURE REVIEW
Conceptual Framework
The conceptual framework used for this research study was a modified version of the
Shultz and Barn’s Advertising Campaign Planning Process Model (1999). This adapted
model, Figure 1, illustrates the advertising planning process from the inception, through the
implementation and feedback stages, including secondary considerations such as public
relations and sales activities. This adapted model was developed using several inputs from
other advertising strategy models, including the Sandage, Fryburger, & Rotzoll Advertising
Component Model (Sandage, Fryburger, & Rotzoll, 1983), the Cooper Strategic Analysis
Framework (Cooper, 1997), and Keller’s Factors in Designing Effective Advertising
Campaigns (Keller, 2003). The segments added from these models were denoted by bolded
boxes in Figure 1. Justification for these additions can be found in the following section.
Frameworks Used to Adapt Study’s Conceptual Framework
The synthesis of this model was developed by combining elements from four
different strategy perspectives, each with unique elements that were incorporated into the
final model. The Schultz and Barn’s Advertising Campaign Planning Process (Schultz &
Barns, 1999) acted as the basis for the adapted model. Table 1 outlines the framework
evaluation process and identifies the strengths and weakness of each model, as well as the
components deemed important or useful in creating the adapted model.

12
Figure 1: Adapted Advertising Methodology Model
Source: Adapted by I. Raulston (2009) Schultz, D. E., & Barns, B. E. (1999). Strategic
Brand Communication Campaigns. Chicago, IL: NTC Business Books. 68.
Table 1

13
Framework Evaluation
Framework Evaluation
Model Components Strengths Weaknesses
Schultz &
Barns
Environmental scan Detailed methodology Does not describe
management’s role
Defining goals Specifically mentions
activities within steps
Does not mention what
makes an effective
advertisement
Budgeting Includes budgets earl y in the
process Does not identify root business problem
Targeting Considers prior advertising
and competitors early Does not call for trail
testing
Media planning Calls for evaluation of
strategy post implementation
Secondary
considerations Mentions auxiliary
considerations
Evaluation
Conclusions
Sandage,
Fryburger
& Rotzoll
Research Simple model Lacks detail
Strategic planning Considers the major
components of planning No evaluation or testing
step
Tactics Includes intellectual property
issues
Does not mention what
makes an effective
advertisement
Advertisement
construction Includes looking at marketing
mix
Cooper
Problem definition Consideration of reasons to
advertise and its potential role Does not consider
budgets, media planning
Marketing mix Considers branding and the
customer’s relationship with
the brand
Only takes the process
through conceptualization
Environmental scan Takes into consideration the
environment Does not call for post
evaluation or trial testing
Define role of
advertising
Defines the underlying
business problem to determine
if advertising is the right
course of action
Does not mention what
makes an effective
advertisement
Advertising objectives Incorporates marketing mix Does not call for post
evaluation or trial testing
Keller Components of
effective advertisements
Details what should be
included in the actual
advertisement
Does not account for the
rest of the strategic
process.

14
Figure 2, was used as the basis for the modified conceptual framework. This model
depicts the entire advertising development process from the planning stages through
playback and evaluation. The major strength of this model is its organization. Primary
activities and subsequent sub-activities within that heading are listed in a way that allows for
a succinct implementation methodology. This model also highlights the importance of proper
customer and market research prior to any actual advertising or media strategy development.
The final strength of the Shultz and Barn’s Advertising Campaign Planning Process Model
(1999) is that it considers in the planning process secondary activities such as public
relations, sales promotion, and post implementation evaluation.
The Sandage, Fryburger, & Rotzoll Advertising Components Model (1983), Figure 3,
represents a very simplistic view of the advertising development process. The strength of this
model is that it considers intellectual property rights and protection as part of the
development process. As advertising attempts to reach new audiences, especially through
digital communications, the risks of not protecting company media increases dramatically.
Many companies that participate in the online community are not aware of the potential risks
of fraud, slander, and piracy (Bartkiewicz, 2008). Therefore, it is critical to include
intellectual property issues when developing and implementing an advertising strategy,
especially when using online media communication strategies. From this model, an
additional component for intellectual property was added to the Shultz and Barn’s
Advertising Campaign Planning Process Model (1999).

15
Figure 2: Schultz and Barn’s Advertising Campaign Planning Process
Source: Schultz, D. E., & Barns, B. E. (1999). Strategic Brand Communication
Campaigns. Chicago, IL: NTC Business Books.

16
Figure 3: Sandage, Fryburger, & Rotzoll Advertising Components Model
Source: Sandage, C. H., Fryburger, V., & Rotzoll, K. (1983). Advertising Theory and
Practice. Homewood, IL: Richard D. Irwin, Inc. p. 6.

17
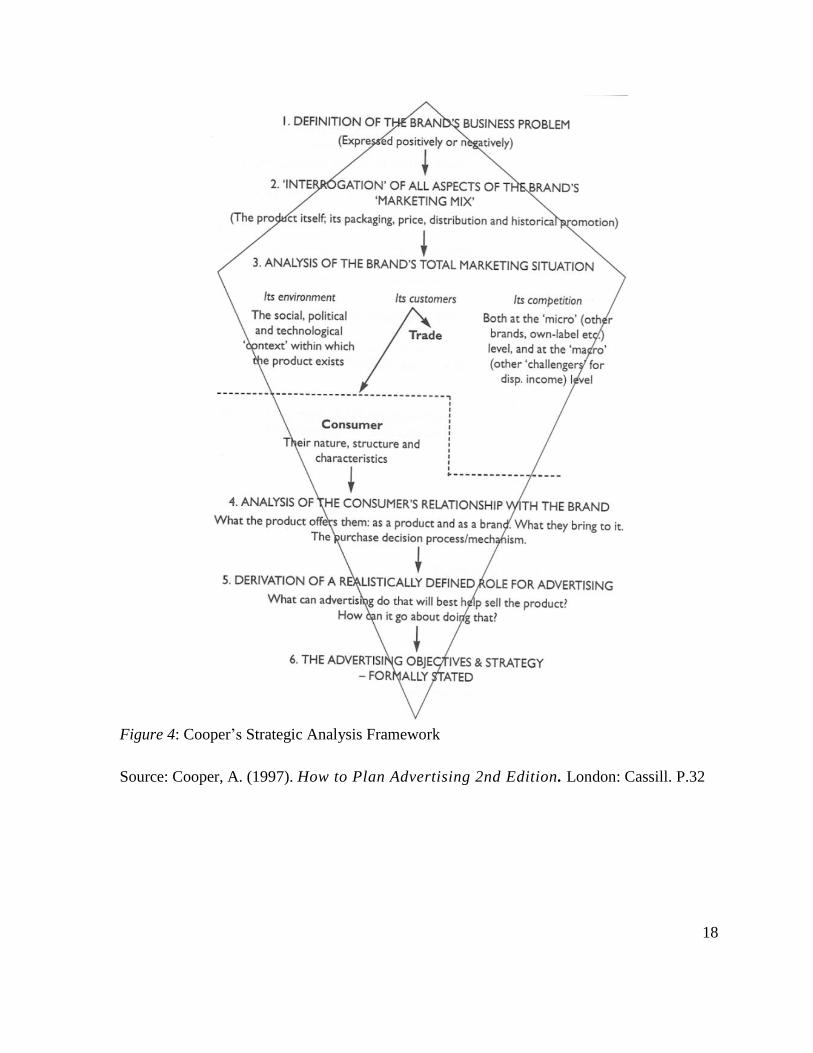
The next model considered for inclusion in the research project was the Cooper
Strategic Analysis Framework (Cooper, 1997), Figure 4. This model attempts to understand
the underlying reasons to advertise and its potential role to solve the core business problem.
Understanding the root business cause or problem allows the advertising development team
to better develop strategies that are tailored to promote certain outcomes. This step should be
carried out early in the strategic planning process to ensure that appropriate goals and
strategies reflect the overall business goal (Cooper, 1993).
The weaknesses of the Shultz and Barns, Sandage, Fryburger, and Rotzoll, and
Cooper models were that none of them mentioned what goes into creating an effective
advertising campaign. According to Kevin Keller (2003), though the effectiveness of an
advertisement is largely dependent on the product, the target market, and the nature of
competition, there are elements that help to ensure the success of an advertisement. In
Keller’s Factors in Designing Effective Advertising Campaigns (2003), Figure 5, he lists
components that can be used to define the positioning of the product, as well as the
communication strategy (Keller, 2003). This source was selected to be incorporated in the
adapted model because it was the only one that listed specific elements included in an
advertisement.
18
Figure 4: Cooper’s Strategic Analysis Framework
Source: Cooper, A. (1997). How to Plan Advertising 2nd Edition. London: Cassill. P.32

19
Keller’s Factors in Designing Effective Advertising Campaigns (2003) identifies both
product and market level considerations, as well as creative and perceptual attributes, which
are both critical for advertising success. Traditional business to businesses advertising
strategies have been product with supportive copy points. Several authors, including Steve
McKee from Business Week Online (McKee, 2008) and Daniela Andrews from Marketing
Magazine (Andrews, 2005), are advocating adapting consumer based advertising techniques
for use in business to business communications. This new tactic stems from their argument
that companies do not buy products, people buy products for companies and because they are
still acting like traditional consumers, except in a business setting, the advertising strategy to
reach them must reflect those preferences. Although business customers have unique buying
procedures, it is the buyer that has the initial contact with the advertisement and if they, on a
consumer level, are not interested in the advertisement, then there is no connection.
Therefore, Keller’s Factors in Designing Effective Advertising Campaigns (2003) works well
in demonstrating the need for both informational and psychological elements in B2B and
B2C advertising.
From the adapted Shultz and Barn’s Advertising Campaign Planning Process Model
(1999)., it should be possible to determine the effectiveness and potential of advertising by
examining successful campaigns for the factors listed in Keller’s Model and then referencing
those companies in respect to their development and implementation strategy, and their
assessment of the relative success of the campaign.

20
Factors in Designing Effective Advertising Campaigns
Define Positioning to Establish Brand Equity
Competitive frame of reference
Nature of competition
Target market
Point-of-parity attributes or benefits
Necessary
Competitive
Point-of-difference
Desirable
Deliverable
Identify Creative Strategy to Communicate Positioning Concept
Informational (benefit elaboration)
Problem-solution
Demonstration
Product comparison
Testimonial (celebrity or unknown consumer)
Transformational (imagery portrayal)
Typical or aspirational usage situation
Typical or aspirational user of product
Brand personality and values
Motivational (“borrowed interest” techniques)
Humor
Warmth
Sex appeal
Music
Fear
Special effects
Figure 5: Keller’s Factors for Effective Advertisements
Source: Keller, Kevin, L. (2003). Strategic Brand Management, 2nd ed. New Delhi, India:
Prentice-Hall of India
21
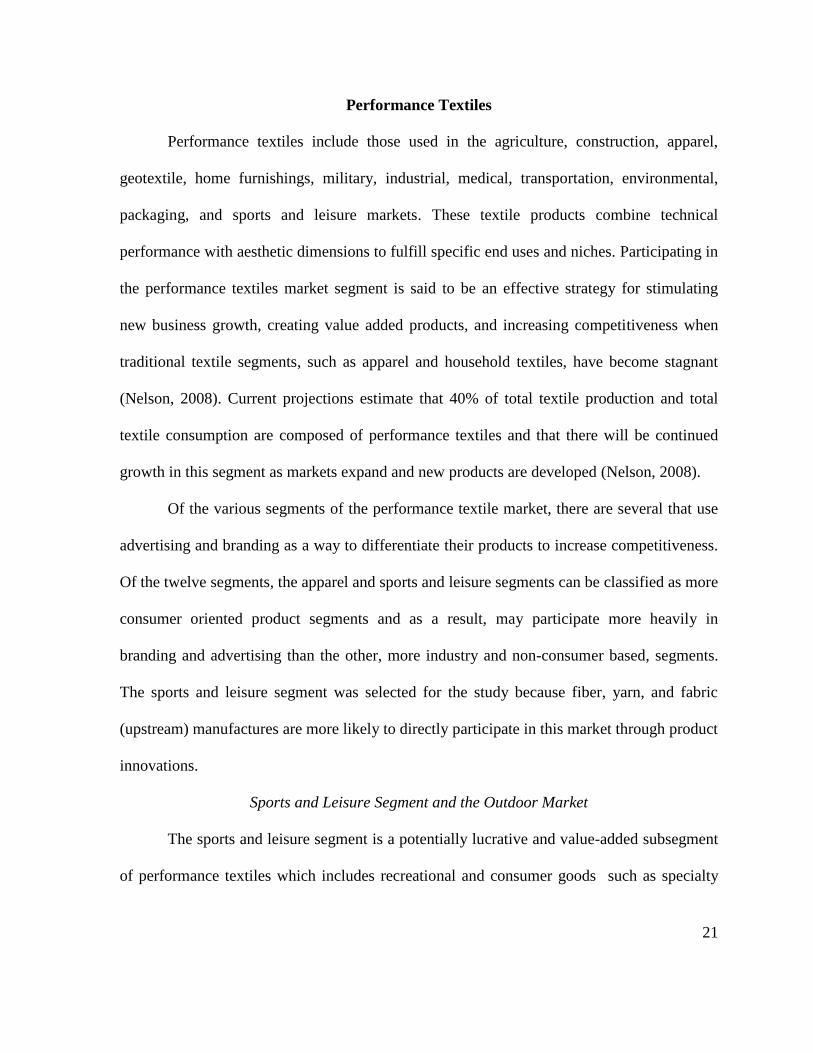
Performance Textiles
Performance textiles include those used in the agriculture, construction, apparel,
geotextile, home furnishings, military, industrial, medical, transportation, environmental,
packaging, and sports and leisure markets. These textile products combine technical
performance with aesthetic dimensions to fulfill specific end uses and niches. Participating in
the performance textiles market segment is said to be an effective strategy for stimulating
new business growth, creating value added products, and increasing competitiveness when
traditional textile segments, such as apparel and household textiles, have become stagnant
(Nelson, 2008). Current projections estimate that 40% of total textile production and total
textile consumption are composed of performance textiles and that there will be continued
growth in this segment as markets expand and new products are developed (Nelson, 2008).
Of the various segments of the performance textile market, there are several that use
advertising and branding as a way to differentiate their products to increase competitiveness.
Of the twelve segments, the apparel and sports and leisure segments can be classified as more
consumer oriented product segments and as a result, may participate more heavily in
branding and advertising than the other, more industry and non-consumer based, segments.
The sports and leisure segment was selected for the study because fiber, yarn, and fabric
(upstream) manufactures are more likely to directly participate in this market through product
innovations.
Sports and Leisure Segment and the Outdoor Market
The sports and leisure segment is a potentially lucrative and value-added subsegment
of performance textiles which includes recreational and consumer goods such as specialty

22
apparel, tents, backpacks, fabric covered sport balls, awnings, and umbrellas (adapted from
NC Textile Connect, 2008; Nelson, 2008). Over the past several years, there has been an
increasing consumer demand for performance apparel as specialty finishes and performance
enhanced attributes of products become more desirable (Nelson, 2008). Though the growth
rate for this segment is projected to be lower in comparison to other performance segments,
there is potential for lucrative business opportunities as the end products with these textile
components tend to command higher price points (Nelson, 2008).
A growing market for sports and leisure products is the outdoor market. The outdoor
market subsegment includes consumer apparel, accessories, footwear, and equipment used
for sport and recreation in an outdoor setting. This market is made up of hardcore enthusiasts
and aspirational consumers of predominantly Baby Boomers and Millennials (Outdoor
Industry Association, 2006). In 2007, there were 10.6 million brands in the outdoors and
recreation segment, an increase of 5.6% since 2006, and 15.2% since 2005 (Perry, 2008).
According to a report conducted by the Outdoor Industry Association (2007), the
largest non-profit trade association for the active outdoor recreation businesses, the outdoor
market is strong and growing (Outdoor Industry Association, 2007). According to their
annual report for 2006, 66% of Americans participated in outdoor activities, which include
camping, hiking, cycling, fishing, hunting, surfing, and skiing/snowboarding. The outdoor
market was valued at $33 billion in 2005, with sales stemming from specialty, chain,
department, mass merchant/discount stores, and Internet/catalog sales (Outdoor Industry
Association, 2006).
23
Not only is this a growing and profitable segment, but according to David Matz,
President of the Retailers of the Outdoor Industry, outdoor product sales typically improve
during economic downturns as consumers choose camping and other outdoor activities as
vacation substitutes. Other trends include Eco friendly products, which are gaining ground in
this segment, as well as incorporation of technical features, which are important to hikers,
climbers, and snow sport enthusiasts. Eco trends include natural/synthetic fiber blends and
recycled fibers (Lloyd, 2008).
Defining Upstream, Downstream and Upstream Advertising
The textile complex, Figure 6, represents the textile supply chain, from fiber to
finished good. The complex was adapted from Dickerson’s Textile and Appareal Production-
Distribution Chain (Dickerson, 1999). The adapted complex is divided into two sectors, the
upstream and the downstream. Upstream activities are characterized as activities in the early
stages of the supply chain. These activities include the fiber industry (manufactured fibers
and natural fibers) and the textile industry (spinning, weaving, knitting, finishing, and
nonwovens operations). Downstream activities involve end uses (interior furnishings, apparel
industry, industrial goods) and distribution (wholesale and retail activities) (Dickerson,
1999). However, the relative position of the firm in the supply chain determines whether
another firm is upstream or downstream from that company. The focus of this study is the
upstream portion of the supply chain.

24
Figure 6: Dickerson’s Textile and Appareal Production-Distribution Chain
Adapted from: Dickerson, K. G. (1999). Textiles and Apparel in the Global Economy.
2nd
Ed. Upper Saddle River, NJ: Prentice Hall. 19.
Upstream textile advertising describes the efforts of an ingredient component
manufacturer attempting to promote their textile component to another firm in their supply
chain. An upstream firm may advertise to their customers (push strategy), or retailers and end
use consumers (pull strategy) in order to create demand for their products. These products
may include promotions for fibers, yarns, or fabrics, depending on their position in supply
chain (Dickerson, 1999). These promotions may take the form of print advertisements in
trade publications or consumer magazines, hang tags on final products, television
commercials or sponsored events, or various forms of online media including websites,
blogs, and online advertisements (Keller, 2003).

25
Advertising Effectiveness Theory
According to an article by Christine Wright-Isak, Ronald Faber, and Lewis Horner
(1997), there is no universally agreed upon method for evaluating the effectiveness of an
advertisement. Advertising effectiveness is a measurement of the tangible contributions
advertising makes to the brand or the company. This means that advertising effectiveness is
not based upon a single advertisement or campaign, but the aggregate contribution of these
efforts over a period of time. These activities include all advertising activities or promotional
activities created by the firm or other outside entities over the life span of the company or
brand. Therefore, the cost of these efforts in aggregate must be less than the overall benefit to
the brand or company. With this definition, advertising is meant to increase the long-term
goodwill of the company or brand. It is then the task of the company to determine what
specific effects contribute to the overall effectiveness of the campaign and determine what
effects are universally beneficial. A successful advertising campaign is founded upon careful
market research, sufficient managerial and financial support, careful media selection and
planning, and communicating messages that are perceived to be unique and creative to the
target audience (Wright-Isak, Faber, & Horner, 1997).
There is no universally agreed upon procedure to assessing the standard for
performance of effective advertising. Firms typically use sales based evaluations since return
on investment (ROI) is such a prominent focus in business. However, it has been said that
sales volume indicators may not be the best way to evaluate the effectiveness of advertising,
since so many other factors can contribute to sales volume (Wright-Isak, Faber, & Horner,

26
1997). According to the Wright-Isak, Faber and Horner (1997), in order to understand real-
world impacts, several variables need to be accounted for:
1. The probability that the intended target received the message
2. The circumstances that prevented the advertisement from impacting the target
3. Whether or not the viewing of the advertisement impacted the purchase
behavior
4. The market share versus the share of voice i.e. what is the ratio between the
company’s share of the advertising market over the company’s share of the
sales market
5. The message in context with the media in which the message was delivered
An effective way to measure advertising success is to set specific goals for the advertising
campaign before implementation. This establishes expectations for advertising specifically,
instead of attempting to evaluate the effectiveness of the entire marketing mix through
advertising. Advertising campaigns should also be assessed for indirect impacts that may
positively affect the overall business goal. Finally, recognizing both the short term and long-
term value of advertising is critical for assessing the overall effectiveness of the
advertisements (Wright-Isak, Faber, & Horner, 1997).
Advertising effectiveness can be broken down into two segments: short term and long
term. Short-term evaluations allow researchers to see what changes have occurred in the
business due to the presence or absence of advertising by measuring the effect advertising
has had on sales volume, brand or company perception, and awareness (Wright-Isak, Faber,
& Horner, 1997). These timing distinctions are important as the benefits of advertising may
27
take long periods of time before the effects are realized (Shultz & Barns, 1999). These
evaluations are typically completed by surveying both targeted and non-targeted customers
or consumers (Wright-Isak, Faber, & Horner, 1997).
Long-term assessment requires understanding how advertising efforts have affected
the overall perceptions and attitudes held by customers and consumers over time. However, it
is more difficult to assess advertising’s specific role since so many other factors contribute to
these perceptions. Long-term evaluation allows researchers to assess what specific factors or
elements in the advertising are most effective. This can be completed by comparing a
company to their competitors and determining which has the strongest linkage between the
company’s advertised message and the common market attribute (Wright-Isak, Faber, &
Horner, 1997).
Effectiveness Evaluation Methods
Advertising evaluation can be broken down into two segments: efficiency and
effectiveness. Efficiency involves reaching the greatest number of persons for at the lowest
cost. This strategy is good for blanket or mass media advertising for universal appeal.
However, this method does not take into account individual preferences of the population.
Effectiveness evaluation pertains to the receptiveness of the target audience and the results of
the campaign, with less emphasis on the cost (Shultz & Barns, 1999).
According Wright-Isak, Faber, and Horner there is no universally agreed upon
method for evaluating the effectiveness of an advertisement. With the diverse benefits and
roles of advertising, there are no standards for advertising success. Typically, it is up to the
individual company to measure and evaluate by their own standards. Often, the question for

28
most decision makers and budgeting personnel is what the expected return is for each dollar
spent on advertising. It is often difficult to assess what advertising direct impact is to the
firm, since advertising efforts are intertwined with other marketing mix activities such as
public relations (Wright-Isak, Faber,& Horner, 1997).
Advertising effectiveness can be measured using many different methods. In general,
the process for measuring advertising effectiveness must be repeatable, substantiated through
prior baseline data, evaluated over specific time frame, and measured against what benefits
would have been received had the investment not been made (Shultz & Barns, 1999).
Evaluation methods can be broken down into two segments: qualitative and quantitative.
Qualitative research uses the observations of subjects to identify general theories based on
the views of the participants of the study (Creswell, 2003). In advertising, qualitative
research typically takes the form of interviews and focus groups, which researchers use to
gather consumer options about a product, brand or company.
For most firms, return on investment and sales are the two most important quantitative
indicators of advertising success. However, awareness must be built first in order to drive
sales. According to Rett Haigler, Senior Account Executive for CORDURA brand,
companies often concentrate on creating sales through their advertising efforts, but creating
awareness and interest should be the center point for new media campaigns. After awareness
has been established, then sales oriented advertisements should be created (Haigler, 2008).
Advertising Success
Much like the procedure for measuring effective advertising, there is no set standard
for what constitutes a successful advertising campaign. From the literature, it has been said
29
that it is up to the individual company to determine whether an advertising campaign fulfilled
the pre-established goals and objectives (Wright-Isak, Faber, & Horner, 1997). If the goals
and objectives were met, then the campaign would be deemed successful (Shultz& Barns,
1999). Others view advertising as delivering the right message to the target consumer and
influencing them to purchase the advertised product or service.
Advertising Effects
Positive Benefits
There are several benefits associated with advertising. From an economic standpoint,
advertising encourages growth and competition among market players. For the advertising
company, advertising builds awareness and visibility of products, reduces the risk of new
products, and has the potential for a large return on investment. From a consumer’s
perspective, advertising provides free information about products and companies that they
may not have heard of otherwise. Advertising also functions to increase product demand and
ushers in higher standards of living through its messages (Sandage, Fryburger, & Rotzoll,
1983).
Negative Impacts
Advertising can also have negative effects. Advertising expenditures could be
considered wasteful and resource depleting, while creating non-price competition.
Advertising also works to create barriers of entry and increases prices. Consumers may also
be mislead by advertising, which can diminish over all perceptions and value (Sandage,
Fryburger, & Rotzoll, 1983).

30
Advertising Challenges
According to Haigler (2008), companies tend to exhibit similar challenges while planning
their advertising strategy. Haigler states that most brands do not understand the value that
they are bringing their customer or consumer. In order to be successful, the company or
brand must work to determine what the core benefits of their products are and what the
consumer/customer values most. Making advertisements relevant to the target audience is
one of the most challenging aspects of advertising (Haigler, 2008).
Additional challenges include:
1. Savvy Customers and Consumers- Populations are aware of advertising tactics
(Keller, 2003)
2. Breaking Through Advertising Noise- The average consumer is exposed to over
3,000 advertisements a day, and most consumers must see a message twenty
seven times before considering to do business with a company (Vass, 2005)
3. Increasing Costs- Limited budgets (Keller, 2003)
4. Uniqueness- Creativity, relevancy, and message (Haigler, 2008)
5. Trusting the Data- Acting on research results and not emotion (Haigler, 2008)
6. Having Patience- Developing advertisements fully and not pushing
advertisements through to have something in the market (Haigler 2008)
Differences Between B2B and B2C Advertising
According to one source from Marketing Magazine (Andrews, 2005), there are several
widely held misconceptions about business-to-business (trade) advertising. The author states
that business-to-business advertising and business-to-consumer advertising are

31
fundamentally the same. Both advertising segments require gathering knowledge about their
target customers, target markets, and products. Andrews (2005) points out that business
customers are fundamentally different from typical consumers. Business customers are
typically more informed, more willing to listen, and more formal. These customers typically
have prior knowledge about a variety of products and have specific needs that the product
must deliver. Though the business customer is well informed, they still have emotional
connections and unique experiences that determine their attitudes and purchasing habits.
Understanding how these characteristics work together is a critical factor for advertising
effectively (Andrews, 2005).
In addition to these characteristics, the author points out business customers have unique
purchasing procedures that are typically formal and require multiple levels of approval before
the final purchase. Because of this added complexity, firms that understand these differences
and similarities are better positioned for advertising success. To facilitate this potentially
lengthy process, advertisers should provide sufficient information and guidance in the
advertisement to acknowledge potential bottlenecks in the purchasing process immediately.
Finally, products sold to business customers are typically more complex in nature. This
creates a challenge for advertisers to describe the product in a statement that is brief yet gives
sufficient information to persuade the customer to purchase the product (Andrews, 2005).
Current Strategies for Differentiation
General Methodology for Textile Advertisement Development
According to Kathy Vass of Textile World, advertisements should be created in order to
increase sales. She states that many companies approach advertising campaigns as just a way

32
to keep the company’s name out in the market or as a response to competitors. Successful
advertising strategies are founded upon specific and measurable objectives, which will allow
a company to access what tactics work with what target groups (Vass, 2005).
When developing the objective strategy, it is important to list specific outcomes that will
aid in determining the effectiveness of the advertisement. This will help guide the creative
process to ensure that the specified goals are being met. Some secondary objectives of
advertising may be to attract new customers, increase market share, promote new products
and services, or to increase company interest (Vass, 2005).
There are six steps involved in developing a new advertisement:
i. Develop objectives
ii. Design advertisements around those objectives
iii. Test the advertisements to determine if they will meet the objectives
iv. Redesign or modify the advertisement based upon testing results
v. Run the advertisement for as long as the objectives are being met
vi. Terminate the advertisement when it begins to fail at meeting the
objectives or the objectives become obsolete (Vass, 2005)
Upstream Tactics- Ingredient Advertising
Ingredient advertising is a technique commonly used in upstream advertising. Since many
upstream firms do not sell directly to the end consumer, it is often difficult to relate the
attributes and benefits of the ingredient. Ingredient advertising places ads developed by the
upstream component supplier on the final product sold to consumers, in an effort to educate
the consumer. The theory behind ingredient advertising is that if the consumer understands

33
and recognizes the brand and associated performance benefits the upstream ingredient
provides, then that consumer begins to prefer and look for that ingredient when purchase new
products. This allows the host product or brand to borrow equity from the ingredient brand,
as well as gives the ingredient brand more visibility in the end consumer market. For the
hosting product, the ingredient helps to build confidence for a particular attribute of their
product, by relying on the ingredient product’s equity in the market (Desai & Keller, 2002).
In order for this type of partnership to develop and be effective, the message or
ingredient product must be relevant to the host brand, in addition to the final consumer. This
means that the hosting brand must be supported or enhanced by collaborating with the
upstream company in order for this type of advertising to be a viable choice. Ingredient
advertising helps to differentiate products in the market, but increases the advertising
expenditures for the ingredient or upstream company. There are also certain risks associated
with ingredient advertising including uncertainty of advertising duration, risks of association,
and potential lack of control of advertising strategy (Desai & Keller, 2002).
Direct Marketing
Direct marketing offers a way for marketing managers to directly measure the
effectiveness of their advertisements and predict future outcomes. There is a fundamental
difference between traditional image marketing, which is used to build knowledge and
familiarity with either a product or brand, and direct marketing (Rosenberg, 2005). In an
“image” based advertising program, the goal is to present many advertisements repeatedly in
a variety of places in hopes of influencing the consumer at the time of purchase. The first
fundamental difference between image marketing and direct marketing is that direct

34
marketing presents advertisements at a specific time, to a target customer, when they can be
influenced most easily. Because there is a one to one interaction between the advertisement
and the customer, it is possible to track the effectiveness of the advertisement, which is the
second fundamental difference. Having the ability to measure the advertisements
effectiveness allows marketers to make decisions based on precedent and facts. The third
difference is that direct marketing is repeatable. Because there is trackable data for mangers
to use, there is now a concrete basis for generating assessments of the ads. Once effective
strategies are identified for a set of parameters, that strategy can be implemented in the future
with some degree of predictability. The challenge of this strategy is the initial planning stage
and putting the advertisement in the right place and the right time (Rosenberg, 2005).
Affiliate Advertising
Affiliate marketing is a viable online advertising strategy. The concept of affiliate
marketing was introduced in the mid 1990’s by Amazon, an online retailer of new and used
goods, when they began paying other websites to refer customers to amazon.com. When a
customer purchased a product from amazon.com, 15% of the sale went back to the original
site that sent the customer. Websites participating in affiliate marketing could easily post
links or ads for Amazon and continually receive revenue with little effort. However, the real
winner in this strategy is Amazon. Amazon now had many websites advertising for them and
Amazon only had to pay 15% of the sale for the referrals that actually yielded customers.
Once the customers visited amazon.com, it is unlikely that they would go through the
affiliate once again and just go directly to amazon.com (Dysart, 2005).

35
Summary
From the literature, several perceived benefits, challenges, and opportunities
associated with advertising were identified. Methodologies, tactics, and advertising theory
were also explored. However, no specific reports could be found regarding to the role of
advertising as it relates to upstream textile advertising.

36
CHAPTER III
METHODOLOGY
Purpose of Research
The purpose of this research was to examine upstream textile firms that effectively
used advertising to differentiate their products in the market. The broad research question
was how could U.S. upstream textile firms use advertising to increase their competitiveness
and differentiate their products from low cost competitors in the global market? From the
broad research question, the narrowed focus was to determine the most effective advertising
strategies for reaching customers, consumers, and the industry. Specific research questions,
which were developed from the narrowed question include:
1. What are the benefits, challenges, opportunities and potential of upstream
advertising?
2. What are some different strategies used in the performance market? Focusing on
the sports and leisure market and outdoor apparel and equipment subsegment?
3. What are the most effective strategies for U.S. textile firms to use in order to
communicate with the customer and the end-use consumer? What perspectives do
the following groups have about advertising:
a. End consumers;
b. Customers;
c. Industry?

37
4. How can this knowledge be presented to help upstream textile firms create value
and differentiate their products?
5. What is the cost/benefit relationship between money spent on advertising and
realized gains for the firm?
Figure 7 is a visual depiction of the research question.
Figure 7: Visual Depiction of the Research Question

38
Research Objectives
Phase I: Exploratory
RO1: Define advertising success and identify companies with successful advertising
strategies.
RO2: Complete a competitive analysis, using secondary data, on the advertising strategies of
upstream textile manufacturers in addition to the strategies of upstream firms from other
industries in order to:
RO2A: Develop an understanding of the current advertising campaigns.
RO2B: Assess the strategies used by the selected companies.
Phase II: Inductive Logic
Phase II and III will be conducted concurrently.
RO3: Examine differences in the marketing strategies used by the performance textile
market, focusing specifically on the outdoor apparel and equipment subsegment of the sports
and leisure market segment.
RO3A: Assess benefits
RO3B: Assess challenges
RO3C: Assess opportunities
RO3D: Assess potential
RO3E: Advertising methodology
RO4: Examine the effectiveness from a supply chain perspective to determine:
RO4A: Which media types the population views most frequently

39
RO4B: What advertising media has the best response rate
RO4C: What part of the advertisement causes the population to
seek additional information
RO4D: What features of the advertisement are most effective
RO4E: What factors the population considers before purchasing
RO4F: Where the population seeks product information
Phase III: Deductive Logic
RO5: Examine the effectiveness of upstream advertising from an end consumer perspective
to determine:
RO5A: If the population is aware of the advertised ingredient product
RO5B: If the population knows the functionality of the ingredient product
RO5C: What features of the advertisement the population feels are most effective
RO5D: If the population looks for the ingredient when purchasing products
RO5E. If the population is willing to pay more
RO5E: Where the population seeks product information
RO6: Develop an understanding of the potential of upstream textile advertising focusing on
different advertising opportunities including:
RO6A: Print
RO6B: Television
RO6C: Internet

40
Phase IV: Model Development
RO7: Develop a framework that U.S. textile companies can use to develop a successful
upstream advertising campaign.
RO7A: Provide ITT member companies with the knowledge and guidelines
differentiate themselves through advertising in a highly competitive market.
Research Design
Strategies and Theories
Phase I was exploratory in nature. The main objective of this phase was to understand
current upstream advertising strategies used by both upstream textile firms and non-textile
firms in order to fulfill RO1 and RO2.
Phase II of the study used an inductive research approach, Figure 8. By definition, this
methodology is a qualitative research method, which uses the observations of subjects to
identify general theories based on the views of the participants of the study (Creswell, 2003).
Consumer and industry level advertising campaigns were observed in order to assess what
strategies upstream textile firms competing in the sports and leisure segment were currently
using. Phase III used a deductive approach based on the findings of Phase I. A deductive
research approach used research and data analysis to confirm or further a theory. The
deductive approach is highlighted in Figure 9. The results of the consumer survey were used
to verify findings from industry interviews and case studies in order to gain insights into
effective advertising strategies.

41
Figure 8: Inductive Research Approach
Souce: Creswell, J. (2003). Research Design: Quantitative, Qualitative, and Mixed Methods
Approaches. Thousand Oaks, CA: Sage Publications. 125
Figure : Deductive Research Approach
Souce: Creswell, J. (2003). Research Design: Quantitative, Qualitative, and Mixed Methods
Approaches. Thousand Oaks, CA: Sage Publications. 125

42
Four Phase Approach: Explanation of Significance
Research was conducted using a four-phase approach. The first phase (Phase I) was
exploratory in nature. The main objective of this phase was to understand current upstream
advertising strategies used by both upstream textile firms and non-textile firms in order to
fulfill RO1 and RO2.
The second and third phases (Phase II and III) of the study were conducted
simultaneously. Phase II used an inductive research method using informational interviews
with upstream textile firms. During this phase, the data was used to develop an understanding
of the benefits, challenges, and potential of upstream textile advertising focusing on different
advertising opportunities including print, television, and Internet in order to fulfill RO3,
RO4, and RO6.
Phase III was completed using a deductive research approach by which consumer
data was collected to identify behaviors that could be used to identify effective
communication strategy elements. The instrument for this phase consisted of a survey
administered to end-use consumers in order to examine the effectiveness of upstream
advertising from an end-user perspective. The data was used to develop an understanding of
the potential of upstream textile advertising focusing on different advertising opportunities
including print, television, and Internet in addition to the added impact (or lack thereof) of
celebrity spokespersons in order to fulfill RO5 and RO6
Phase IV combined the results from Phase I, Phase II, and Phase III in order to
develop a framework (RO7). The framework was constructed in order to provide the U.S.

43
textile and apparel companies with the knowledge and guidelines for how to differentiate
themselves through advertising in a highly competitive market.
Phase I: Exploratory
In Phase I, both qualitative and quantitative data were collected on the advertising
campaigns of upstream textile and non-textile firms. This phase was completed to determine
what elements constitute effective advertising strategies through secondary data, a
competitive analysis, and case studies. By understanding the strategies of successful textile
and non-textile companies, common strategies and successful methods can be uncovered
through these secondary sources. Phase I was divided into eight steps. Table 2 summarizes
the activities of Phase I and their contributions to the study.
Table 2
Data Collection: Phase I (Step 1)
The first step in Phase I was to define clearly, in terms of the project, what constitutes
an upstream firm and what was considered an upstream advertisement. Trade publications,
Dickerson (1999), and dialogue with advertising agencies were used to develop these
definitions.
Data Collection: Phase I (Step 2)
Secondary data sources were used to identify a conceptual framework to guide the
research. This resource established what major elements and activities were required to
create a successful advertising campaign. This step helped to guide the overall research, as
well as establish the criteria for company selection and evaluation.

44
Phase I Instrument- Secondary Data Collection
Step Process Sources Used Contribution to
Research Objective
1 Define upstream and
advertising
• Dickerson, 1999 Identify companies
with successful
advertising strategies
(RO1)
• Consulted advertising
agency
2
Identify a representative
framework to determine
factors necessary for a
successful advertising
campaign
• Keller, 2003 Identify companies
with successful
advertising strategies
(RO1)
• Advertising Age • Literature • Internet research
3
Perform a product scan of
companies and products
participating in upstream
advertising in the outdoor
products segment
• Internet research
Complete a
competitive analysis of
successful advertising
strategies (RO2)
• REI • Dick’s Sporting Goods • Target • Wal-Mart • The Great Outdoor Provision
Company
4
Perform a media scan to
understand were upstream
companies are currently
advertising.
• Trade publications Identify companies
with successful
advertising strategies
(RO1)
• Consumer publications • Online
5
Identify companies with
successful advertising
strategies through a
competitive analysis
• Trade journals Identify companies
with successful
advertising strategies
(RO1)
• Interbrand • EFFIE • Brandweek
6 Assess selected strategies
using qualitative and
quantitative measures
• Trade journals Assess the strategies
used by the selected
companies (RO2B) • Industry interviews • EFFIE
7
Develop an understanding of
the current advertising
campaigns of selected
companies through case
studies
• Trade publications Assess the strategies
used by the selected
companies (RO2B)
• Trade journals
Journal articles, textbooks, and consultation with advertising agencies were the
primary sources for the initial data. From this data, the Shultz and Barn’s Advertising
Campaign Planning Process Model (1999) was selected and then adapted to fit the study.
This adapted model was developed using several inputs from other advertising strategy
45
models, including the Sandage, Fryburger, & Rotzoll Advertising Component Model
(Sandage, Fryburger, & Rotzoll, 1983), the Cooper Strategic Analysis Framework (Cooper,
1997), and Keller’s Factors in Designing Effective Advertising Campaigns (Keller, 2003)
(see pages 12-19). This phase was completed between Spring 2008- Fall 2008 and was used
to help complete RO1.
Data Collection: Phase I (Step 3)
A product scan was conducted across different retail stores to access what products
and companies were participating in the outdoor market and help in answering RO1 and
RO2. The goals of the scan were to:
1. Observe what product types and brands utilize upstream advertising in their
products.
2. Determine what methods upstream firms are using to promote their products to
the consumer and how it compares to the host brand’s advertising efforts.
3. Access the content of the upstream advertisement.
4. Reveal any differences in the advertising methods or tactics across retail store
types.
5. Access whether or not price point plays a role in the presence or type of
upstream advertisements used.
6. Find out which upstream companies are utilizing advertising at the product
level.
The sample for this scan was outdoor products consisting of: 1) Apparel (includes
jackets, vests, and pants); 2) Accessories (includes hats, socks and gloves); 3) Footwear

46
(includes hiking shoes and hiking/hunting boots); and 4) Equipment (includes tents, sleeping
bags, and backpacks/daypacks). Athletic/sports equipment and athletic/sports apparel was not
considered, as most of the brands in this category have proprietary fabric and finish
technologies and have little upstream advertising associated with their products. Five stores
were accessed in the study, each store carrying at least one of each product of the above
product types. Stores included two mass/big box retailers (Target, Wal-Mart), two national
specialty chains (REI, Dick’s Sporting Goods), and one local, privately held specialty
boutique (The Great Outdoor Provision Co.). These stores were selected because they offer a
wide selection of outdoor products and cater a to variety of consumer interest levels:
Mass/Big Box: Caters to casual interest, limited selection, generic products,
limited staff knowledge
National Specialty: Caters to moderate interest, large selection, mix of generic,
moderate and high-end products, some staff knowledge
Specialty Boutique: Caters to enthusiasts, limited selection of moderate and high-
end items, knowledgeable staff
All stores were located in the Raleigh, North Carolina and Cary, North Carolina areas. The
scan was conducted on December 20, 2008.
The scan itself involved walking around the selected retail locations and observing
what products contained advertisements from upstream textile firms. Each store visit lasted
approximately one hour and both men’s and women’s products were observed. Though not
all products in the store were observed, care was taken to observe as many products as
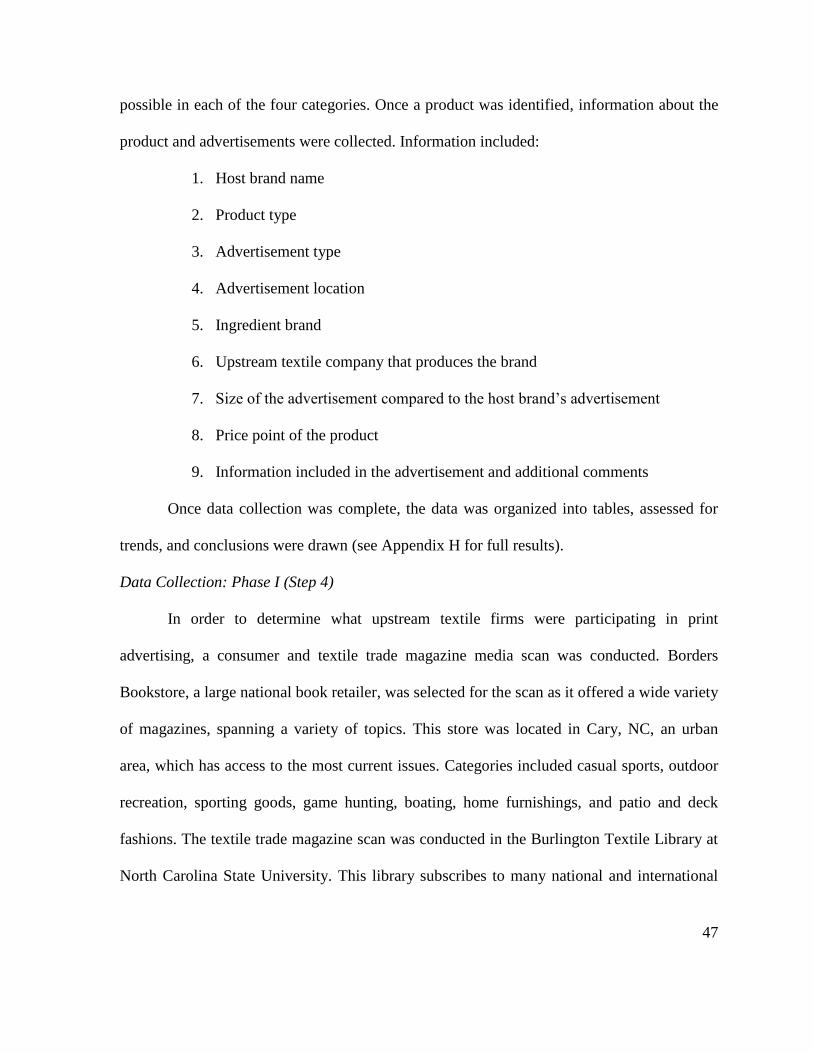
47
possible in each of the four categories. Once a product was identified, information about the
product and advertisements were collected. Information included:
1. Host brand name
2. Product type
3. Advertisement type
4. Advertisement location
5. Ingredient brand
6. Upstream textile company that produces the brand
7. Size of the advertisement compared to the host brand’s advertisement
8. Price point of the product
9. Information included in the advertisement and additional comments
Once data collection was complete, the data was organized into tables, assessed for
trends, and conclusions were drawn (see Appendix H for full results).
Data Collection: Phase I (Step 4)
In order to determine what upstream textile firms were participating in print
advertising, a consumer and textile trade magazine media scan was conducted. Borders
Bookstore, a large national book retailer, was selected for the scan as it offered a wide variety
of magazines, spanning a variety of topics. This store was located in Cary, NC, an urban
area, which has access to the most current issues. Categories included casual sports, outdoor
recreation, sporting goods, game hunting, boating, home furnishings, and patio and deck
fashions. The textile trade magazine scan was conducted in the Burlington Textile Library at
North Carolina State University. This library subscribes to many national and international

48
publications on a variety of industry related topics. Categories of interest included
performance textiles, industrial textiles, textile trade, textile management, fashion and design,
national and international scientific journals. From the consumer advertisements identified
during the scan, some were selected for use in the consumer survey portion of the study (see
Instrument Development: Phase III).
Data Collection: Phase I (Step 5)
To gain a broad perspective of effective advertising, a competitive analysis was
completed. The analysis served to provide real life examples of effective advertising as well
as qualifying advertising benefits with quantitative data. In addition, the results of the
competitive analysis, helped to establish the criteria for case study company selection. The
sample for the competitive analysis consisted of a selection of the 2008 Gold Effie
advertising award winners, which include brands from various markets and product
categories. The Effie awards recognized creative advertising campaigns that achieved and
surpassed managerial goals. The companies highlighted in the analysis were global in nature
and represent a variety of industries and product categories. The sample was selected based
upon available published cases, type of evaluation methodology used, and availability of
quantitative output. Of the 16 published gold level winners, 14 were selected for use in the
case studies. The two cases not selected did not provide sufficient quantitative data to be
relevant for use in the study. The analysis consisted of determining the objectives, strategies,
tactics, and evaluation methods used by the selected companies. The analysis also included
quantitative evaluations of the effective advertising campaign, both pre and post

49
implementation. This phase was completed between Spring 2008- Spring 2009 and was used
to complete RO1 and RO2.
Quantitative metrics were varied but included:
1. Sales volume comparisons
2. Revenue comparisons
3. Website traffic tracking
4. Return on investment
Data Collection: Phase I (Steps 6-8)
Based on definitions, the conceptual framework, and the results of the product and
media scans, upstream firms with successful advertising campaigns were identified for case
studies, see Figure 10. Secondary data sources such as trade publications, journals, databases,
and company websites data were used to gather information of the advertising campaigns of
selected firms. This phase was completed between Spring 2008- Spring 2009 and was used to
complete RO1 and RO2.
Figure 10: Visual Depiction of Steps to Select Successful Companies
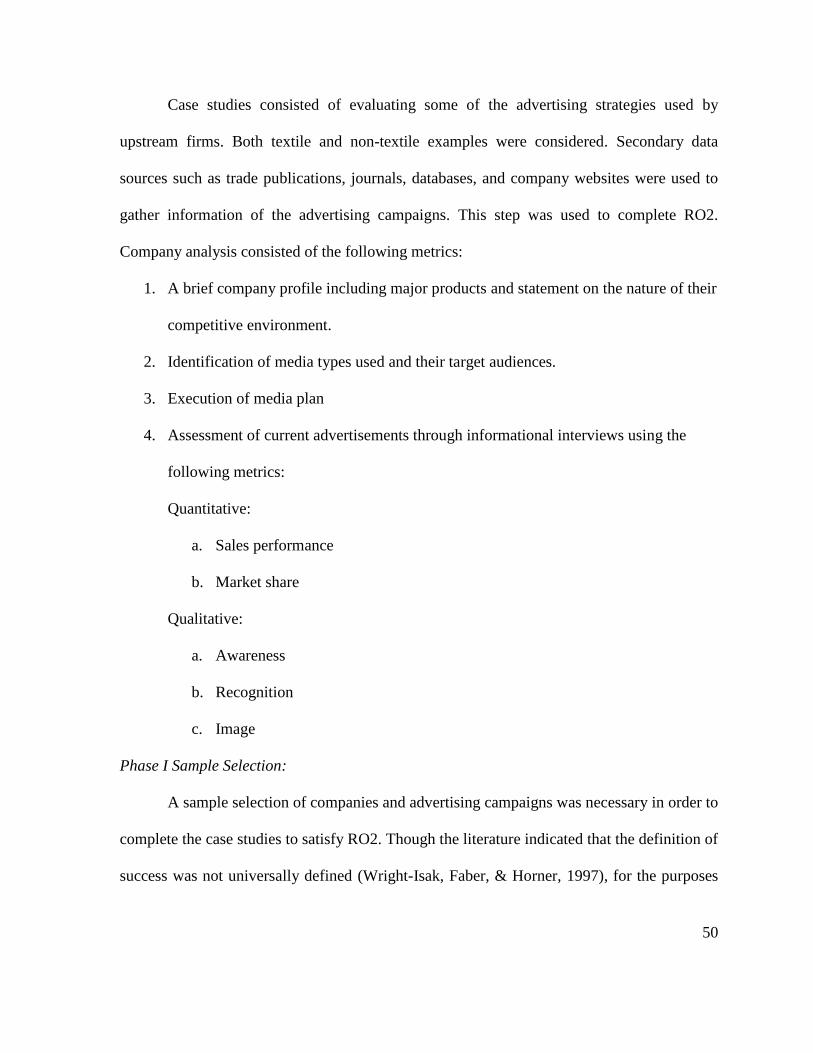
50
Case studies consisted of evaluating some of the advertising strategies used by
upstream firms. Both textile and non-textile examples were considered. Secondary data
sources such as trade publications, journals, databases, and company websites were used to
gather information of the advertising campaigns. This step was used to complete RO2.
Company analysis consisted of the following metrics:
1. A brief company profile including major products and statement on the nature of their
competitive environment.
2. Identification of media types used and their target audiences.
3. Execution of media plan
4. Assessment of current advertisements through informational interviews using the
following metrics:
Quantitative:
a. Sales performance
b. Market share
Qualitative:
a. Awareness
b. Recognition
c. Image
Phase I Sample Selection:
A sample selection of companies and advertising campaigns was necessary in order to
complete the case studies to satisfy RO2. Though the literature indicated that the definition of
success was not universally defined (Wright-Isak, Faber, & Horner, 1997), for the purposes

51
of this study and as a way to select companies and develop cases analyses, a standard set of
indicators was developed. The difficulty in establishing success criteria was due to the
multidimensional benefits of advertising as well as availability of prior data with which to
make comparisons over time. Another consideration was to ensure that both young,
innovative companies as well as mature, stable companies were not excluded from
consideration by setting standards too high or too low since many standards are market or
segment specific. The standard was established be robust enough to include companies from
all industries as well as specific enough to exclude those companies that are
underperforming. Figure 11 outlines the selection process.
Figure 11: Case Study Company Selection Criteria
Based on the results of the competitive analysis, which listed quantitative evaluations
of advertising effectiveness, campaigns were considered successful if the company gained
either a 10% growth in sales, market share, recognition, or awareness within one year of the

52
campaign’s launch and that could be traced back to the advertising efforts. By requiring a
company to meet only one of the three criteria, it allows all sizes and markets to be
considered. A threshhold of 10% was chosen so that companies that already have higher
levels of market share and awareness would still be eligible for consideration. Achieving a
10% gain in these categories indicates a significant business achievement over a relatively
short period.
The second requirement was that the company must be considered an ingredient
product manufacturer or support organization. Because this study was focused on upstream
textile firms, which can be classified as an ingredient supplier depending on the application,
methods used by other ingredient supplier was easily transferable to the upstream textile
industry. A third requirement for consideration was that the company must participate in
ingredient branding and advertising. Branding and advertising were said to be effective ways
to communicate product benefits, increase awareness, and manipulate public image (Keller,
2003). By including companies that actively participate in these, the company demonstrates
its eagerness to differentiate their products and increase competitiveness.
The fourth requirement was that the company must be universally perceived as a
major player in their respective product category, or has at least 10% market share in the
advertised category. This stipulation limited eligible companies to those that were viable and
competitive in their respective product category. Finally, the company must have targeted
both end consumers and industry audiences with their advertising. This stipulation was
included because one of the focuses of the study is to determine the best methods to
communicate effectively to both industrial customers and end consumers.

53
Companies both inside and outside of the textile complex were considered for case
studies. Possible companies were found using several different sources such as Interbrand’s
Top 100 Brands list, advertising award winners, Advertising Age’s Top 100, and other
sources. Companies were selected upon the five criteria established previously. From these
lists, the following companies and advertising campaigns were selected:
1. Intel Corporation- “Intel Inside”
2. Cotton Incorporated- “Fabric of Our Lives®”
The case study for the Fabric of Our Lives® campaign was verified by a representative of
Cotton Incorporated.
Phase II: Inductive Logic
Data Collection: Phase II
Phase II consisted of conducting industry interviews in order to gain primary
qualitative information about the benefits, challenges, and opportunities of upstream
advertising. In addition, companies were asked to provide perspectives as a customer related
to the effectiveness of current advertising efforts. Information was collected through either
in-person interviews or phone calls depending on scheduling limitations.
Sample Selection: Phase II
The initial population considered for the study included all North Carolina textile
firms listed in the North Carolina Textile Connect website. This sample of companies
included approximately 2,300 companies. North Carolina was selected due to convenience
and the large sample of textile companies in the area. Based on the study’s definition of an
upstream firm, the initial population was reduced to 413 companies that were listed as either

54
fiber, yarn, or fabric manufactures or supporting agencies across market segmentations. All
twelve sectors of performance textiles were included in this initial population. For a complete
list of the 413 upstream companies, see Appendix A. Figure 12, is a visual representation of
the sample selection requirements and the populations of those samples.
Figure 12: Industry Interview Sample Selection Process
From these 413 upstream firms competing across segments, companies identified as
serving the sports and leisure markets were selected. This was completed by viewing
company websites and information provided by North Carolina Textile Connect. Based on
the definition of sports and leisure and product offerings, 36 companies were identified as

55
participating in the sports and leisure market. The 36 companies selected are provided in
Table 3.
From the 36 companies servicing the sports and leisure segment, companies that used
branding and advertising as a differentiation method were identified. Companies were
considered for participation if they either supplied their market segment with their own
privately held brands such as Sunbrella® from Glen Raven, or by using other ingredient
brands such as US Supima Outlast® by Buhler Quality Yarns (Supima® and Outlast® are
third party ingredient brands). Of the 36 companies, 30 firms were found to use branding to
compete in the sports and leisure segment. The six companies not considered for the studies
were removed because they did not offer branded products, only commodity, unnamed or
unregistered products under their generic descriptive name (example: 20’s singles 60/40
polyester/cotton yarn). A complete listing of the 30 companies is provided in Table 4.
Mini case studies were performed on the 30 identified firms in Table 4. For each
company, products and markets of interest were identified as well as specific brands used to
compete in the sports and leisure segment. Companies were also evaluated on their
participation in consumer and/or industry level advertising. Companies that were identified
as advertising in either of these two markets were considered for interviews. A consumer and
trade magazine scan was used to identify companies advertising to these segments. Print
advertisements were examined in publications held in the Burlington Textile Library at North
Carolina State University and Borders bookstore located in Cary, NC.
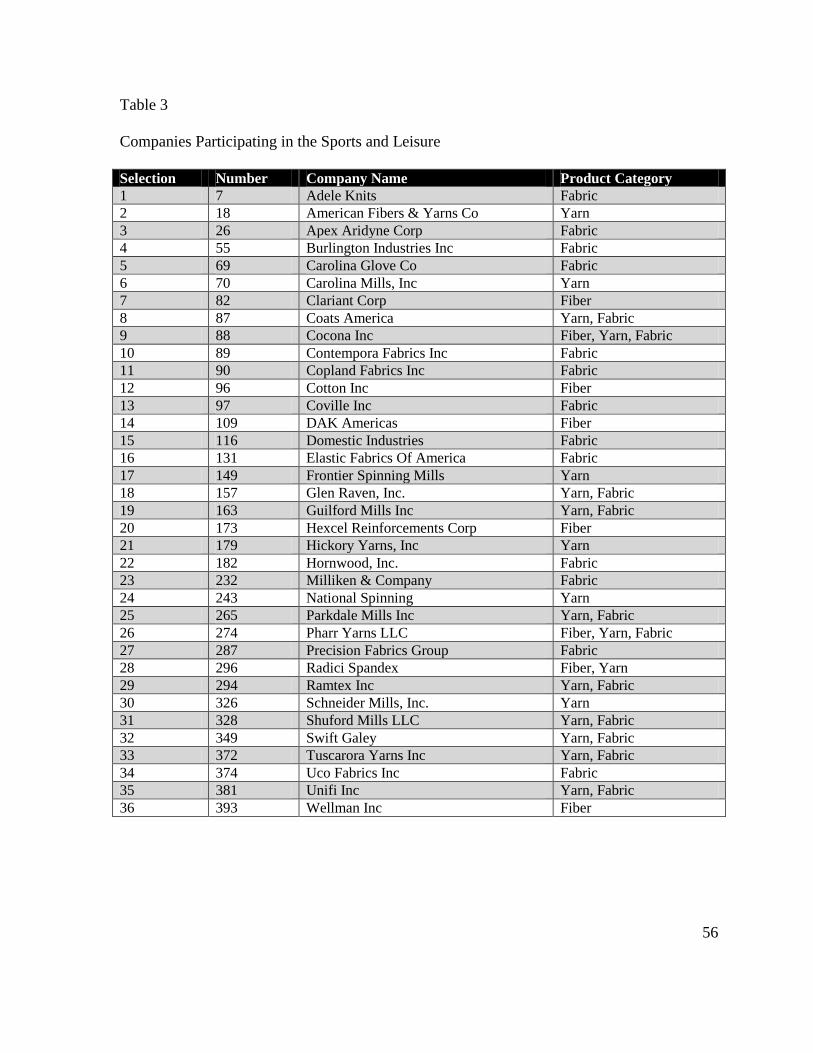
56
Table 3
Companies Participating in the Sports and Leisure
Selection Number Company Name Product Category 1 7 Adele Knits Fabric 2 18 American Fibers & Yarns Co Yarn 3 26 Apex Aridyne Corp Fabric 4 55 Burlington Industries Inc Fabric 5 69 Carolina Glove Co Fabric 6 70 Carolina Mills, Inc Yarn 7 82 Clariant Corp Fiber 8 87 Coats America Yarn, Fabric 9 88 Cocona Inc Fiber, Yarn, Fabric 10 89 Contempora Fabrics Inc Fabric 11 90 Copland Fabrics Inc Fabric 12 96 Cotton Inc Fiber 13 97 Coville Inc Fabric 14 109 DAK Americas Fiber 15 116 Domestic Industries Fabric 16 131 Elastic Fabrics Of America Fabric 17 149 Frontier Spinning Mills Yarn 18 157 Glen Raven, Inc. Yarn, Fabric 19 163 Guilford Mills Inc Yarn, Fabric 20 173 Hexcel Reinforcements Corp Fiber 21 179 Hickory Yarns, Inc Yarn 22 182 Hornwood, Inc. Fabric 23 232 Milliken & Company Fabric 24 243 National Spinning Yarn 25 265 Parkdale Mills Inc Yarn, Fabric 26 274 Pharr Yarns LLC Fiber, Yarn, Fabric 27 287 Precision Fabrics Group Fabric 28 296 Radici Spandex Fiber, Yarn 29 294 Ramtex Inc Yarn, Fabric 30 326 Schneider Mills, Inc. Yarn 31 328 Shuford Mills LLC Yarn, Fabric 32 349 Swift Galey Yarn, Fabric 33 372 Tuscarora Yarns Inc Yarn, Fabric 34 374 Uco Fabrics Inc Fabric 35 381 Unifi Inc Yarn, Fabric 36 393 Wellman Inc Fiber

57
Table 4
Companies Participating in the Sports and Leisure Using Branded Products
Selection Number Company Name Product Category 1 7 Adele Knits Fabric 2 18 American Fibers & Yarns Co Yarn 3 55 Burlington Industries Inc/ITG Fabric 4 70 Carolina Mills, Inc Yarn 5 82 Clariant Corp Fiber 6 87 Coats America Yarn, Fabric 7 88 Cocona Inc Fiber, Yarn, Fabric 8 89 Contempora Fabrics Inc Fabric 9 90 Copland Fabrics Inc Fabric 10 96 Cotton Inc Fiber 11 97 Coville Inc Fabric 12 109 DAK Americas Fiber 13 116 Domestic Industries Fabric 14 131 Elastic Fabrics Of America Fabric 15 157 Glen Raven, Inc. Yarn, Fabric 16 173 Hexcel Reinforcements Corp Fiber 17 179 Hickory Yarns, Inc Yarn 18 182 Hornwood, Inc. Fabric 19 232 Milliken & Company Fabric 20 243 National Spinning Yarn 21 265 Parkdale Mills Inc Yarn, Fabric 22 287 Precision Fabrics Group Fabric 23 296 Radici Spandex Fiber, Yarn 24 294 Ramtex Inc Yarn, Fabric 25 328 Shuford Mills LLC Yarn, Fabric 26 349 Swift Galey Yarn, Fabric 27 372 Tuscarora Yarns Inc Yarn, Fabric 28 374 Uco Fabrics Inc Fabric 29 381 Unifi Inc Yarn, Fabric 30 393 Wellman Inc Fiber
Trade magazines spanned all segments of the supply chain including chemical, fiber,
yarn, fabric, apparel and fashion publications. Consumer publications included sports and
leisure magazines in the areas of home décor, hunting and fishing, marine boating, and sports
and fitness. Of the 30 identified companies, 23 companies were selected for interviews. The

58
23 companies selected showed strong signs of advertising prescience in either the consumer
or industrial markets. The eliminated companies failed to show clear signs of advertising
activity or were found to be no longer in business at the time of the study. A complete listing
of these companies is provided in Table 5.
Table 5
Validated Companies Participating in the Sports and Leisure Using Branded Products and
Advertising in the Consumer and/or Industrial Segments
Selection Number Company Name Product Category 1 7 Adele Knits Fabric 2 18 American Fibers & Yarns Co Yarn 3 55 Burlington Industries Inc/ITG Fabric 4 70 Carolina Mills, Inc Yarn 5 82 Clariant Corp Fiber 6 87 Coats America Yarn, Fabric 7 88 Cocona Inc Fiber, Yarn, Fabric 8 89 Contempora Fabrics Inc Fabric 9 90 Copland Fabrics Inc Fabric 10 96 Cotton Inc Fiber 11 109 DAK Americas Fiber 12 116 Domestic Industries Fabric 13 131 Elastic Fabrics Of America Fabric 14 157 Glen Raven, Inc. Yarn, Fabric 15 232 Milliken & Company Fabric 16 243 National Spinning Yarn 17 265 Parkdale Mills Inc Yarn, Fabric 18 287 Precision Fabrics Group Fabric 19 296 Radici Spandex Fiber, Yarn 20 294 Ramtex Inc Yarn, Fabric 21 328 Shuford Mills LLC Yarn, Fabric 22 372 Tuscarora Yarns Inc Yarn, Fabric 23 381 Unifi Inc Yarn, Fabric
In addition to the North Carolina companies identified in the scan, seven additional
companies were included in the interview sample, bringing the total sample size to 30
companies. From researching trade magazines, Buhler Quality Yarns Corp was identified as

59
a major upstream advertiser with print advertisements in many prominent industry
magazines. Buhler also promotes their yarns with product level hangtags and participates in
various trade shows around the world. In addition, Lycra® and CORDURA®, both Invista
brands, were selected due to their prominence in industry and consumer advertising. Lycra is
a strong, global brand that promotes its products across target audiences through print,
product level, and international sponsored events. CORDURA®, another prominent brand,
was identified through consumer magazines, on-product advertisements, and sponsored
events across the country. W.L. Gore with its Gore-Tex® brand was identified as a key
advertising player as it was the most heavily advertised product in the product scan. W.L.
Gore places hangtags on nearly all consumer level products that use their fabrics, as well as
sponsoring many outdoor sporting events and awards. Finally, to gain perspectives from a
purely advertising point of view, Bosch and Co. and French West Vaughn were selected.
These companies have researched and created advertising campaigns for companies such as
Burlington Worldwide and Coco Cola®. Highland Industries and CloverTex were also
considered, due to their success in their respective product categories. A complete listing of
these additional companies is provided in Table 6.
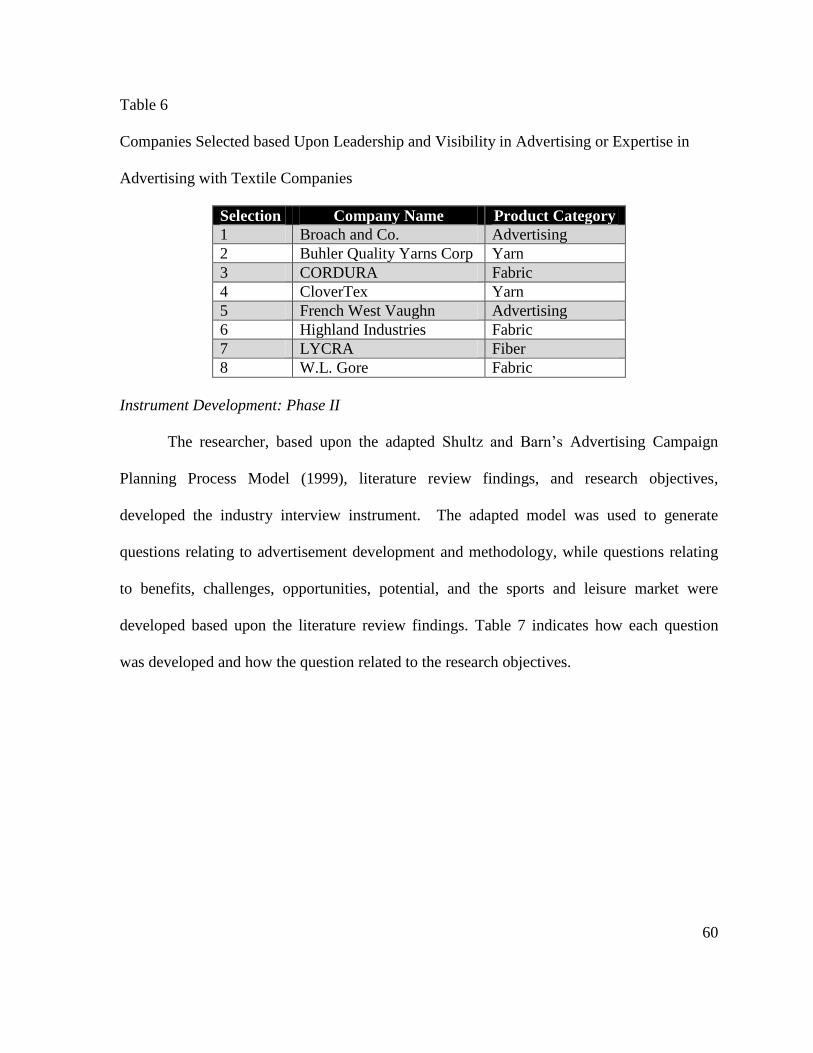
60
Table 6
Companies Selected based Upon Leadership and Visibility in Advertising or Expertise in
Advertising with Textile Companies
Selection Company Name Product Category
1 Broach and Co. Advertising
2 Buhler Quality Yarns Corp Yarn
3 CORDURA Fabric
4 CloverTex Yarn
5 French West Vaughn Advertising
6 Highland Industries Fabric
7 LYCRA Fiber
8 W.L. Gore Fabric
Instrument Development: Phase II
The researcher, based upon the adapted Shultz and Barn’s Advertising Campaign
Planning Process Model (1999), literature review findings, and research objectives,
developed the industry interview instrument. The adapted model was used to generate
questions relating to advertisement development and methodology, while questions relating
to benefits, challenges, opportunities, potential, and the sports and leisure market were
developed based upon the literature review findings. Table 7 indicates how each question
was developed and how the question related to the research objectives.

61
Table 7
Interview Instrument- Question Source and Research Objective Correlation
Question Brief Development
Source Corresponding
Research Objective
1 Biggest advertising success and failure Researcher
developed RO3A, RO3B,
RO3C
2 Benefits of advertising- which are most valued Researcher
developed RO3A
4 Identify effective ingredient advertisers Researcher
developed RO1
5 Necessary to advertise in sports and leisure
market Researcher
developed RO3
6 Differences in tactics across products segments Researcher
developed RO3
7 Opinion of which segments are over and under
advertised Researcher
developed RO3C
8 Advertisement development methodology- most
challenging step Adapted Shultz and
Barns Model (1997) RO3E
10 Activities considered in initial situation analysis Adapted Shultz and
Barns Model (1997) RO3E
11 Primary goals across campaigns Wright-Isak,
Faber,& Horner,
(1997) RO3E
12 Frequency of goal reevaluation Wright-Isak,
Faber,& Horner
(1997) RO3E
13 Defining and evaluating advertising success Wright-Isak,
Faber,& Horner
(1997) RO3A, RO3D
14 New media opportunities- how will the company
take advantage Researcher
developed RO3C
15 Opportunities in advertising directly to end
consumer as well as industrial consumers Andrews (2005) RO3C
16 Most effective media to communicate
product/company information Researcher
developed RO3C
17 How effective are your current campaigns Researcher
developed RO3C
18 Elements of effective b2b and b2c advertisements Keller (2003) RO3C
19 Tactics applied across trade and consumer
advertisements Researcher
developed RO3C
20 Areas advertising has the potential to influence Researcher
developed RO3D
21 Which media type have the best return on
investment Researcher
developed RO3D

62
Table 7: Continued
22 Are advertising and marketing the best ways to
influence customers and differentiate products Researcher
developed RO3D
23 Typical expected return on investment and
payback period Researcher
developed RO3D
24 Biggest challenges in reaching consumers and
industrial customers Researcher
developed RO3B
25 Underdeveloped areas of advertising- company
and industry Haigler (2008) RO3B, RO3E
26 Reasons for seeking new information about
products or companies Researcher
developed RO4E
27 Where do you seek information Researcher
developed RO4F
28 Does advertising influence which companies you
seek first Researcher
developed RO4A, RO4F
29 Looking for certain elements or information in
advertisements Researcher
developed RO4D, RO4C
30 Advertising media preferences Researcher
developed RO4B
31 What factors influence supplier selection- other
than cost Researcher
developed RO4E
32 Willingness to pay more for branded or heavily
advertised products Researcher
developed RO3D
Data Analysis
Interview responses were collected via paper and pen or recorded on an audio device.
Data was then was then transcribed into Microsoft Excel and organized by company
respondent. The data was then organized and analyzed in order to identify trends. Findings
were then summarized and conclusions were drawn.
Phase III- Deductive Logic
Data Collection: Phase III
In Phase III, primary research was conducted in order to gain insight into the potential
of upstream advertising from a consumer perspective. This research took the form of a
quantitative survey administered to selected end-use consumers. The sample population for

63
the survey was comprised of a convenience sample of 165 North Carolina State University,
College of Textiles students (see Sample Selection: Phase III). Survey data was also used to
develop an understanding of the potential of upstream textile advertising focusing on
different advertising opportunities including print, television, and the Internet. Participants in
the study were given an image-based survey where participants were asked to relate their
opinions about selected features of an on screen advertisement.
Students were given a hard copy of the survey and images were projected onto a
screen for viewing. Students were told that they were not obligated to participate and that
their privacy would be kept secure. Students then signed a copy of the participant
acknowledgement form.
The survey was divided into three sections. In the first section, three advertisements
were displayed (one at a time) and students were asked to fill out a questionnaire based upon
their opinions of the advertisement. Once all participants were finished evaluating the first
advertisement, the second advertisement was projected and the process repeated until all
three were displayed. The three upstream advertisements each represented a different style of
print advertisement: one text heavy, one image heavy, one with a balance of both text and
images. The names of the companies and products were removed from the advertisements in
order to prevent biasing the participants. Respondents used a Likert scale to answer the
survey questions, with answer choices of strongly disagree, disagree, neither agree or
disagree equaling, agree, and strongly agree.
In the second segment of the survey, students were asked to compare the same three
advertisements presented as a group. Students were then asked to compare the
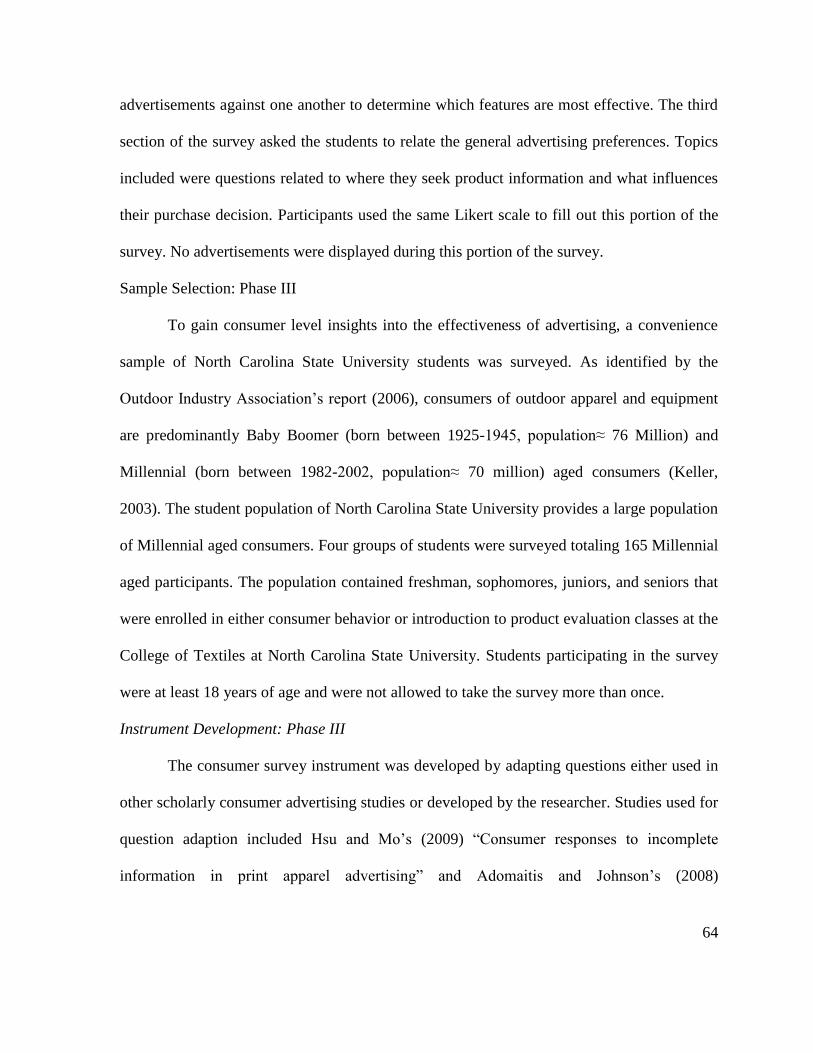
64
advertisements against one another to determine which features are most effective. The third
section of the survey asked the students to relate the general advertising preferences. Topics
included were questions related to where they seek product information and what influences
their purchase decision. Participants used the same Likert scale to fill out this portion of the
survey. No advertisements were displayed during this portion of the survey.
Sample Selection: Phase III
To gain consumer level insights into the effectiveness of advertising, a convenience
sample of North Carolina State University students was surveyed. As identified by the
Outdoor Industry Association’s report (2006), consumers of outdoor apparel and equipment
are predominantly Baby Boomer (born between 1925-1945, population≈ 76 Million) and
Millennial (born between 1982-2002, population≈ 70 million) aged consumers (Keller,
2003). The student population of North Carolina State University provides a large population
of Millennial aged consumers. Four groups of students were surveyed totaling 165 Millennial
aged participants. The population contained freshman, sophomores, juniors, and seniors that
were enrolled in either consumer behavior or introduction to product evaluation classes at the
College of Textiles at North Carolina State University. Students participating in the survey
were at least 18 years of age and were not allowed to take the survey more than once.
Instrument Development: Phase III
The consumer survey instrument was developed by adapting questions either used in
other scholarly consumer advertising studies or developed by the researcher. Studies used for
question adaption included Hsu and Mo’s (2009) “Consumer responses to incomplete
information in print apparel advertising” and Adomaitis and Johnson’s (2008)

65
“Advertisements: interpreting images used to sell to young adults”. These studies provided a
sample of the survey instrument questions used to complete their research. Questions were
modified and adapted to fulfill the requirements of this research study. Table 8 presents how
each question was derived and how it related to the research objectives. A copy of the survey
can be found in Appendix B.
The advertisements used as visual aids were selected based upon those found during
the print media scan. Three upstream advertisements were selected from those identified in
sports and leisure related consumer magazines found in Borders Bookstore. All company
advertisements were selected based upon the company’s participation in the sports and
leisure market. Product and company names were blocked out of the advertisements to
minimize biases. Advertisment text was transcribed on the side of the presented image.
Table 8
Consumer Survey Instrument- Question to Research Objective Correlation
Individual Advertisement Questions
Question Brief Adapted From Source Corresponding
Research Objective
1 Advertisement awareness Hsu & Mo (2009) RO5A 2 Understand what product is promoted Hsu & Mo (2009) RO5B 3 Advertisement information is useful Hsu & Mo (2009) RO5B
4 Consumer identifies with presented
content Hsu & Mo (2009) RO5C
5 Communicates information effectively Hsu & Mo (2009) RO5B 6 Communicates benefits effectively Hsu & Mo (2009) RO5B 7 Creativeness of advertisement Hsu & Mo (2009) RO5C 8 Advertisement evokes product curiosity Hsu & Mo (2009) RO5C 9 Advertisement evokes company curiosity Hsu & Mo (2009) RO5C
10 Advertisement appeals to consumer on
personal level Hsu & Mo (2009) RO5C
11 Advertisement evokes perceptions of
quality Hsu & Mo (2009) RO5C
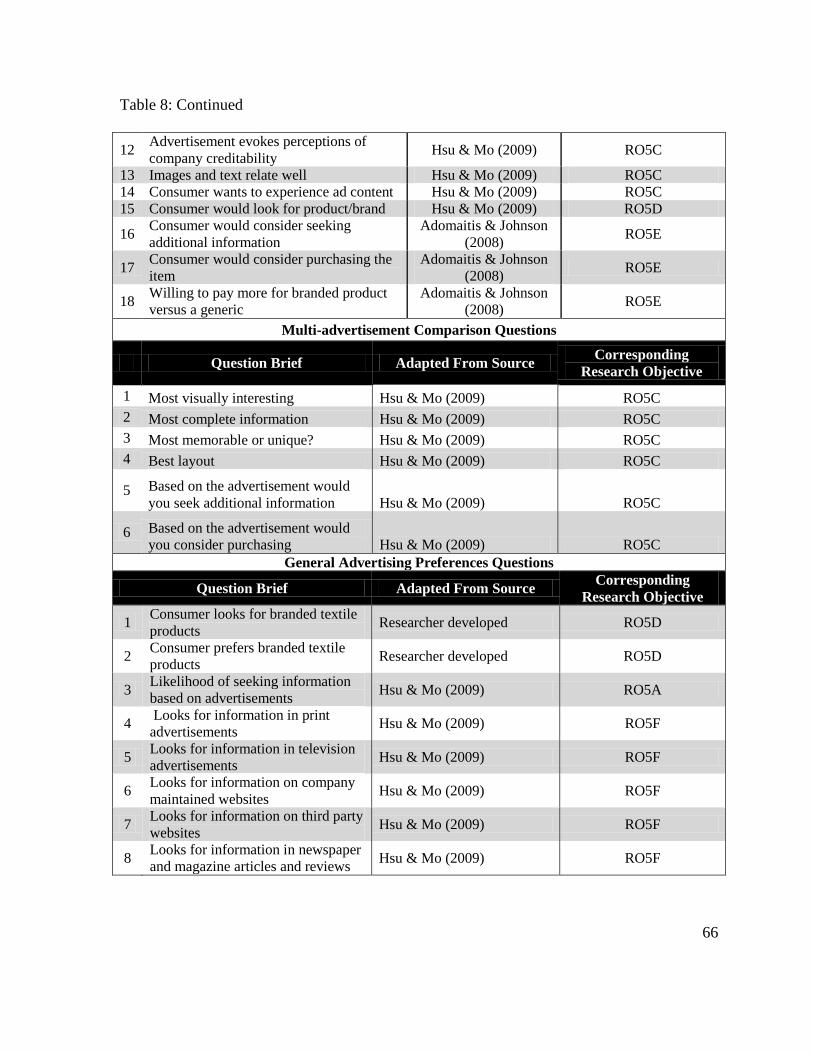
66
Table 8: Continued
12 Advertisement evokes perceptions of
company creditability Hsu & Mo (2009) RO5C
13 Images and text relate well Hsu & Mo (2009) RO5C 14 Consumer wants to experience ad content Hsu & Mo (2009) RO5C 15 Consumer would look for product/brand Hsu & Mo (2009) RO5D
16 Consumer would consider seeking
additional information Adomaitis & Johnson
(2008) RO5E
17 Consumer would consider purchasing the
item Adomaitis & Johnson
(2008) RO5E
18 Willing to pay more for branded product
versus a generic Adomaitis & Johnson
(2008) RO5E
Multi-advertisement Comparison Questions
Question Brief Adapted From Source Corresponding
Research Objective
1 Most visually interesting Hsu & Mo (2009) RO5C
2 Most complete information Hsu & Mo (2009) RO5C
3 Most memorable or unique? Hsu & Mo (2009) RO5C
4 Best layout Hsu & Mo (2009) RO5C
5 Based on the advertisement would
you seek additional information Hsu & Mo (2009) RO5C
6 Based on the advertisement would
you consider purchasing Hsu & Mo (2009) RO5C General Advertising Preferences Questions
Question Brief Adapted From Source Corresponding
Research Objective
1 Consumer looks for branded textile
products Researcher developed RO5D
2 Consumer prefers branded textile
products Researcher developed RO5D
3 Likelihood of seeking information
based on advertisements Hsu & Mo (2009) RO5A
4 Looks for information in print
advertisements Hsu & Mo (2009) RO5F
5 Looks for information in television
advertisements Hsu & Mo (2009) RO5F
6 Looks for information on company
maintained websites Hsu & Mo (2009) RO5F
7 Looks for information on third party
websites Hsu & Mo (2009) RO5F
8 Looks for information in newspaper
and magazine articles and reviews Hsu & Mo (2009) RO5F
67
Table 8: Continued
9 Looks for information on in-store advertisements
Hsu & Mo (2009) RO5F
10 Looks for information from store
sales personnel Hsu & Mo (2009) RO5F
11 Looks for information on on-
product hangtags and labels Hsu & Mo (2009) RO5F
12 Looks for information on the
product’s packaging Hsu & Mo (2009) RO5F
13 Looking for additional product
information Adomaitis & Johnson (2008) RO5C
14 Looking for additional company
information Adomaitis & Johnson (2008) RO5C
15 Product comparisons provide
credibility Researcher developed RO5C
16 Showing real-life problem/
solutions provide credibility Researcher developed RO5C
17 Celebrity spokes persons provide credibility
Researcher developed RO5C
18 Technical information provide
credibility Researcher developed RO5C
Advertisement A was an advertisement for Glen Raven’s Sunbrella® marine fabric
line. This advertisement was selected because it was a text heavy advertisement. The text
represented an effective value statement, as well as points of parity and points of difference.
The advertisements also presented several lifestyle photos that helped to promote the marine
lifestyle with its products. Figure 13 was the image that participants used during the
completion of their survey.
Advertisement B was an advertisement for wrinkle resistant cotton developed by
Cotton Incorporated. This advertisement was selected because it was very image heavy and
had very little text compared to the other advertisements selected for the survey. This
advertisement was very visually appealing and unique in its layout. Figure 14 was the image
survey participants used during the competition of their survey.

68
Advertisement C was an advertisement for Gore-Tex® developed by W.L. Gore. The
advertisement featured some technical and performance graphics along with text and a life
style image. The advertisement represented a good mix of technical performance
information, text, and aspirational images. Figure 15 was the image survey participants used
during the competition of their survey. A copy of the survey can be found in Appendix K.
Figure 13: Advertisement A
Source: Sunbrella®, Glen Raven, Inc (2009).Advertisement. Motor Boating. p. 33.

69
Figure 14: Advertisement B
Source: Wrinkle, Cotton Incorporated. (2009) Advertisement. Cotton Incorporated Website.
retrieved from http://www.cottoninc.com/Consumer-Ads/images/WRINKLE.jpg
Figure 15: Advertisement C
70
Source: Gore-Tex®, W. L. Gore (2009). Advertisement. Trail Runner. P. 32
Data Analysis
Survey responses were transcribed into Microsoft Excel. Excel files were imported
into SPSS Statistics 17.0. In SPSS, frequency tables were created along with mean, median,
and mode analyses. The data was then organized and analyzed in order to identify trends.
Findings were then summarized and conclusions were drawn.
Instrument Approval
Since the study required the participation of human subjects, both the interview
instrument and consumer survey required the approval of the Institutional Review Board of
the Use of Human Subjects in Research (IRB). Copies of the IRB submission form
(Appendix D), IRB consent forms (Appendix E), initial contact letters (Appendix F), and the
IRB exemption letter (Appendix G) are provided in the appendix.
Phase IV- Model Development
A procedural model was developed utilizing data collected during Phases I-III. These
phases identified effective methodologies, consumer and industry perspectives on
effectiveness, media strategies, as well as benefits, challenges, opportunities, and potential of
advertising. The Adapted Advertising Methodology Model was revised to reflect the study’s
findings. Selected participants from Phase II interviews provided additional feedback for the
development of the model as well as external validation post development. Representatives
from DAK Americas, Cotton Incorporated, and CORDURA® were selected to give feedback
and external validation because their companies showed an established advertising
development methodology.

71
CHAPTER IV
RESULTS AND DISCUSSION
Phase I: Exploratory
Phase I: Initial Product Scan Results
Objectives
1. Observe what product types and brands utilize upstream advertising in their
products.
2. Determine what methods upstream firms are using to promote their products to
the consumer and how it compares to the host brand’s advertising efforts.
3. Access the content of the upstream advertisement.
4. Reveal any differences in the advertising methods or tactics across retail store
types.
5. Access whether or not price point plays a role in the presence or type of
upstream advertisements used.
6. Find out which upstream companies are utilizing advertising at the product
level.
Key Findings:
1. Footwear items contained the most occurrences of upstream advertising at the product
level (20), followed by accessories (16), apparel (15), and equipment categories (4).
There is potentially an opportunity for companies to include product information on
equipment items since they are generally higher cost and durable items.

72
2. There is an opportunity for companies to include product information on equipment
items since they are generally higher cost and durable items.
3. On-product hangtags were the most popular way to communicate product benefits to
the end consumer (36 of 57 advertisements). Most hangtags provided ingredient
performance attributes and directed the consumer to a product or company website
for more information. Some used graphics while others used words to communicate
messages, neither seemed more effective than the other.
4. The national specialty stores and specialty boutiques had the largest selection of
outdoor products as well as carried the most products with upstream advertisements
attached or fixed to the products.
5. Most national brands promoted their own proprietary fabrics and finishes.
6. Price point was not a factor in what type or if advertising was used.
7. Thinsulate by 3M, Gore-Tex by W. L. Gore, and Polartec by Polartec, LLC, were the
most prevalent upstream advertisers.
Introduction
Table 9 presents the summary findings by product type from the initial product scan.
The scan was conducted in Cary, North Carolina and Raleigh, North Carolina on December
20, 2008. The data is arranged by attribute, with the frequency of the occurrence of that
attribute, when applicable, listed to the right of the attribute description. Full, non-
summarized product scan results are located in Appendix H.

73
Table 9
Product Scan Summary Findings by Product Type
Retail Channel
Frequency
of Product
Type
Host
Brand
Type
Frequency
of Brand
Type
Type of AdFrequency of
Ad TypeAd Location
Location
Frequency
Size of Ad
Compared to
Host Product
Ad
Size
Frequency
Information Included
in Ad (In Addition to
Brand Name)
Top Two
Advertising
Companies in
Product Type
Frequency
of Ads
Company
Supply
Chain
Segment
Average
Price
Point
Median
Price
Point
Smaller 0
Same size 6
Larger 3
Smaller 1
Same size 0
Larger 0
Smaller 1 W. L. Gore 1 Fabric
Same size 1
Larger 0 Fabric
Mass/Big Box
Retailer- TargetNone None None None None None None None None None None None None None None
Mass/Big Box
Retailer- Wal-
Mart
None None None None None None None None None None None None None None None
Smaller 2 Ingredient Attributes W. L. Gore 2 Fabric
Same size 1 Technical Graphics
Larger 0Limited Company
Information
9
Hangtag
Sticker
9
1 ExOffico
3
2
$119.63
National
Private
7
2
3On-product
1$112.50 $112.50
$70.00
$114.00
On-product
On-product
9
1
Ingredient Attributes
Technical Graphics
Limited Company
Information
3
Hangtag 2 On-product 2
National
Specialty Chain-
REI
National
Specialty Chain-
Dick's Sporting
Goods
ReviveX 1
Polartec Fabric
Finish
Finish
2 National 2
$111.33
Product Scan Summary Results- Apparel
Hangtag3National 3
Local Specialty
Boutique- Great
Outdoor Provision
Co.
Ingredient AttributesPolartec

74
Table 9: Continued
Retail Channel
Frequency
of Product
Type
Host
Brand
Type
Frequency
of Brand
Type
Type of AdFrequency of
Ad TypeAd Location
Location
Frequency
Size of Ad
Compared to
Host Product
Ad
Size
Frequency
Information Included
in Ad (In Addition to
Brand Name)
Top Two
Advertising
Companies in
Product Type
Frequency
of Ads
Company
Supply
Chain
Segment
Average
Price
Point
Median
Price
Point
National Specialty
Chain- REI1 National 1 Hangtag 1 On-product 1 Same size 1 Ingredient Attributes W. L. Gore 1 Fabric $79.99 $79.99
Hangtag 1 On-product 1 Smaller 0
sewn in 2 On-package 2 Same size 0
Printed on
packaging6 Permanent 6 Larger 0 Logo 3M 4 Fiber
Mass/Big Box
Retailer- TargetNone None None None None None None None None None None None None None None
Hangtag 3 On-product 3 Smaller 3
sewn in 3 Permanent 3 Larger 0
Printed on
packaging3 On-package 3 Same size 2 Logo SympaTex 3 Fabric
Local Specialty
Boutique- Great
Outdoor
Provision Co.
2 National 2 sewn in 2 On-product 2 Same size 2 Logo W.L. Gore 2 Fabric $127.50 $127.50
Fiber
$53.00 $57.00
National Specialty
Chain- Dick's
Sporting Goods
Mass/Big Box
Retailer- Wal-
Mart
Ingredient attributes W. L. Gore 5 Fabric
3 Private 3
Ingredient attributes 3M 6
6 National 6
Product Scan Summary Results- Footwear
$116.33 $90.00
Retail Channel
Frequency
of Product
Type
Host
Brand
Type
Frequency
of Brand
Type
Type of AdFrequency of
Ad TypeAd Location
Location
Frequency
Size of Ad
Compared to
Host Product
Ad
Size
Frequency
Information Included
in Ad (In Addition to
Brand Name)
Top Two
Advertising
Companies in
Product Type
Frequency
of Ads
Company
Supply
Chain
Segment
Average
Price
Point
Median
Price
Point
ADVANSA 1 Fiber
Invista 1 Fiber
Smaller 0 Ingredient attributes
1 National 1 1 On-package 1 Same size 0 ADVANSA 1 $39.99 $39.99
Larger 0
Mass/Big Box
Retailer- TargetNone None None None None None None None None None None None None None None
Mass/Big Box
Retailer-
Wal-Mart
None None None None None None None None None None None None None None None
Local Specialty
Boutique-
Great Outdoor
Provision Co.
1 National 1 Hangtag 1 On-product 1 Smaller 1 CORDURA CORDURA 1 Fabric $90.00 $90.00
1 Private 1 Hangtag
Printed on
packaging
Product Scan Summary Results- Equipment
Logo
National Specialty
Chain- REI
National Specialty
Chain- Dick's
Sporting Goods
Fiber
Larger 22 On-product 2 Ingredient Attributes $59.00 $59.00
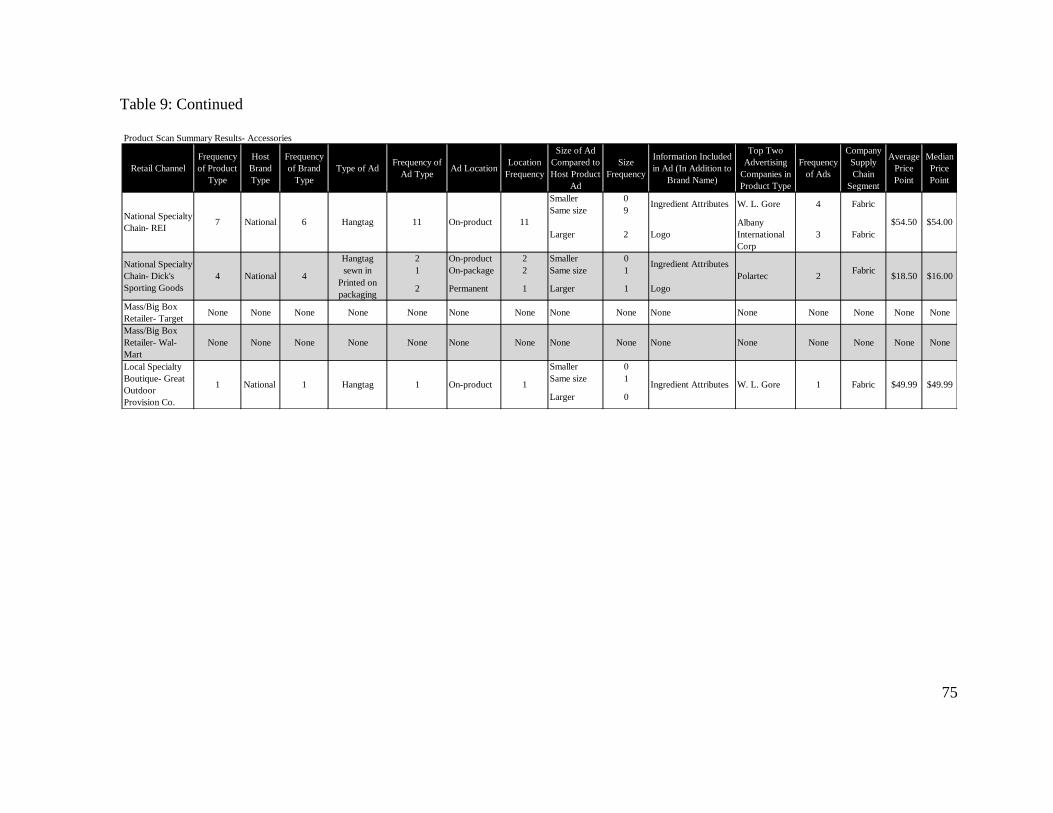
75
Table 9: Continued
Retail Channel
Frequency
of Product
Type
Host
Brand
Type
Frequency
of Brand
Type
Type of AdFrequency of
Ad TypeAd Location
Location
Frequency
Size of Ad
Compared to
Host Product
Ad
Size
Frequency
Information Included
in Ad (In Addition to
Brand Name)
Top Two
Advertising
Companies in
Product Type
Frequency
of Ads
Company
Supply
Chain
Segment
Average
Price
Point
Median
Price
Point
Smaller 0
Same size 9
Larger 2 Logo
Albany
International
Corp
3 Fabric
Hangtag 2 On-product 2 Smaller 0
sewn in 1 On-package 2 Same size 1 Fabric
Printed on
packaging2 Permanent 1 Larger 1 Logo
Mass/Big Box
Retailer- TargetNone None None None None None None None None None None None None None None
Mass/Big Box
Retailer- Wal-
Mart
None None None None None None None None None None None None None None None
Smaller 0
Same size 1
Larger 0
National Specialty
Chain- REI
National Specialty
Chain- Dick's
Sporting Goods
Local Specialty
Boutique- Great
Outdoor
Provision Co.
7 Hangtag 11
4 National
Product Scan Summary Results- Accessories
1 National $49.99 $49.99W. L. Gore 1
$54.00
4
Ingredient Attributes
Polartec
Ingredient Attributes W. L. Gore 4
1 On-product 1 Ingredient Attributes
On-product 11National 6 $54.50
2
Fabric
$18.50
Fabric
1 Hangtag
$16.00

76
Discussion
There were forty products identified across the five retail locations in Raleigh/Cary,
North Carolina. A total of 14 apparel, 12 footwear, 12 accessory, and 3 equipment products
were identified. Some retail locations sold no products containing upstream advertisements
while others carried many. The most common adverting strategy was on-product ingredient
adverting, taking the form of hangtags and sewn-in labels on products. From the number of
advertisements found in the scan, it suggests that consumer shopping for these items are
interested in the functional attributes of their products and thus require more product
information before making their purchase decision. Other than on-product ingredient
advertisements, no other forms of advertising were found during the scan.
From the observations of the product scan, it was determined that footwear items
contained the most occurrences of upstream advertising at the product level (20). Accessories
had the second largest number of upstream advertisements (16), followed closely by apparel
(15), while there were very few examples in equipment category (4). A total of 57
advertisements were identified during the scan. The most common type of advertisement
used across product types were hangtags fixed to the product along with the host brand’s tag
(36). There were 12 instances of advertisements on packaging, 8 sewn in labels, and 1
sticker. The majority of hangtags found in the scan either were the same size or smaller than
the host brand’s tag. Hangtags typically gave the performance properties of textile
component, the logo of the product, the name of the upstream company, and a website for
more information. In addition to the general information, only one of the hangtags found

77
provided full manufacturer information, which included a contact address and a phone
number.
In the footwear category, most advertisements took the form of sewn in labels and
metal plates permanently fixed to the product. The accessory categories had a mix of both
hangtags and sewn in labels. Hangtags were the most common form of advertising found on
apparel items. In the equipment category, the majority of the advertisements were presented
on the box or on a hangtag. There was no clear reason why there were very few
advertisements on the outdoor equipment products, as their fabric technologies and
constructions are similar to those used in the apparel items.
The national specialty and specialty boutiques had the largest selection of outdoor
products as well as carried the most products with upstream advertisements attached or fixed
to the products (37). These store types specifically cater to outdoor enthusiasts and carry
well-known national brands such as The North Face®, Columbia®, Patagonia®, Mountain
Hardware®, and Marmot®. These stores offered activity specific items as well as
multipurpose outdoor goods. The mass or big box stores had a much narrower selection, as
these stores do not specifically target the outdoor market (3). These stores stocked general
commodity type products with very few products in each product type. Many of the brands in
these retail stores were private label goods with a few national brands such as Coleman®.
In the specialty channels, most established apparel brands, such as The North Face®,
Patagonia®, Columbia® and others did not use upstream product advertisements. These
outdoor brands advertised their own proprietary fabric and finish technologies instead of the
upstream ingredient. Other, lesser-known brands and store brands typically had more

78
upstream advertisements on their products, most likely to increase their appeal over the
national brands. These stores also carried the only instances of advertising in the equipment
and accessories categories. However, across retail channels, footwear contained a high
numbers of products containing upstream advertisements. Sewn in labels and metal plates
were present on footwear across retail locations and price points.
There were three main upstream companies that participated in on-product ingredient
adverting. In terms of visibility across retail locations and retail channels of all orientations,
Thinsulate®, by 3M, product hang tags and sewn in labels could be found on eight of the
forty products in the scan, including those found in the national specialty, boutique, and mass
channels. This brand was the only brand to be found in all three channel types. In terms of
frequency of advertisements, Gore-Tex®, by W. L. Gore, advertisements were found on
sixteen of the forty products. Gore-Tex® advertisements were frequent in the apparel and
footwear categories across the specialty retail locations. Apparel products used hangtags
while shoes and boots typically used metal plates and sewn in labels to distinguish the host’s
product. Polartec®, by Polartec, LLC, was the final major player, with advertisements found
on six of the forty products. Their hangtags could be found on various fleece goods, while
hangtags and sewn in labels were used in the accessory category.
Phase I: Print Advertising Media Scan Results
Objectives
1. Identify additional potential industry interview participants.
2. Identify advertisements for use in the consumer survey.
79
Key Findings:
1. Buhler Quality Yarns, CORDURA®, and Lycra® were added to the list of companies
to contact for interviews.
2. Glen Raven, Cotton Inc., and W. L. Gore advertisements were selected for use with
the consumer surveys.
The print media scan was conducted in order to aid in completing RO1 as well as
identify potential advertisements to be used as examples in the consumer survey. From this
scan, Buhler Quality Yarns, CORDURA®, and Lycra® were added to the list of companies
to contact for interviews. Three consumer magazine advertisements were selected to be used
in the consumer survey, see Figures 13-15.
Phase I: Competitive Analysis
Objectives
RO1: Define advertising success and identify companies with successful advertising
strategies.
RO2: Complete a competitive analysis, using secondary data, on the advertising strategies of
upstream textile manufacturers in addition to the strategies of firms from other industries in
order to:
RO2A: Develop an understanding of the current advertising campaigns.
RO2B: Assess the strategies used by the selected companies.
Key Finding
1. Advertisement content supported or enhanced by interactive online content was an
effective strategy.

80
2. Television commercials were an effective, yet expensive, advertising method.
3. Successful campaigns identified what their customer/consumer felt was the core value
of their product and then developed their campaign around those findings.
4. Creating involvement between the company and the target audience can lead to
increased success.
Introduction
A competitive analysis was completed to develop an understanding of current
advertising strategies used by both textile and non-textile firms. The results of the
competitive analysis are presented in the Table 10. The results table highlights the strategies
and tactics used by companies to address market problems and achieve goals. The results
also present quantitative data quantifying the effects of advertising post implementation.
Discussion
The majority of the companies began their advertising development by talking with
and observing their customers/consumers and how they used and identified with their
products. This step identified the core benefits and relationships the customer had with the
product or brand. From these observations, the companies created a central theme or set of
attributes that took into account these preferences in order to help frame the development of
their campaign. This strategy helped to ensure that the campaign was be meaningful to the
target audience, by specifically focusing on attributes that resonate with the target group.

81
Table 10
Competitive Analysis Results
Source: Effie Awards. (2008). Effie Awards Winners Showcase. Retrieved Mar. 10, 2009, from
http://www.effie.org/ideas_that_work
Company ProductCampaign
DurationProblem(s) Strategy Tactics Goal(s) Evaluation Metric
Pre-Campaign
Score
Post-Campaign
ScoreExpenditure
1 Create ads that speak to
multiple audiencesQualitative survey
2 Match revenue
contribution of previous
products
Sales volume
comparison
Old product
version- 56% of
total revenues
New product
version- 64% of
total revenues
3 Restore confidence in
acquisitionsEarnings per share Not given
Up 113% from
previous year
The Alliance
Theatre
Cuttin' Up at
the Alliance
Theatre
2006-2007 Lack of patronageBuild awareness among media
personalities to promote the show.
Street teams, props,
PR, print flyers,
outdoor
1 Increase ticket salesDaily ticket sales
comparison$400 $2,400 $5,000
1 Reposition product
among 21-29 year oldsPerception surveys 35% positive 57% positive
2 Change product
perceptions
Sales volume
comparisonNot given 10% Increase
Fisher-Price
FriendsFisher-Price 2006-2007
Limited technology growth,
increased competition from
substitutes
Build anticipation for product by
keeping the product as secret as
possible, to the point the consumer
did not get to see the product until
after the purchase
Television, product
design, packaging,
cinema, retail
experience, PR
1 Create product buzz
Initial product
launch sales
Hoped for 60,000
units sold in the
first week
Sold 300,000 the
first day$2–5 Million
1 Improve growth,
popularity, loyalty, and
equity for the brand
Consumer Survey
2 Increase sales by 5% Sales volume
comparisonNot given 13% growth
1 Regain market position Sales volume
comparisonNot given 36% growth YOY
2 Increase market share Market share
analysis
12% gap between
main competitorReduce to 4% gap
3 Change brand
perceptionsBrand perception
surveyNot given
10% increase
across brand image
metrics
1 Create internet chatter Nielsen
BuzzMetricsNot Measured
150% more in
favor
2 Build brand awareness Consumer Survey 51% 66.75%
3 Increase market share Market share
analysisNo given
0.5% increase -
$50M
$999
Thousand – $2
Million
All audiences, no matter what
professional level responded well to
Print, Interactive
online content,
sponsorship
Price and promotion based
competition, no
differentiation among
consumers, limited impact
of media advertising
2005-2007
Online, interactive
online content, print,
on product ads, PR
Events
Under
$500,000
Television, interactive
online content,
sponsorship, print
$40 Million
and over
Popularity- 10% growth, loyalty- 13%
growth, equity- 11% growth
Television, interactive
online content,
packaging, PR,
consumer involvement
$20-40
Million
Hewlett
PackardHewlett Packard
Make the PC personal again, by
promoting the personal relationship
people have with their computers.
Used celebrity spokes people to
promote message.
Adobe Systems Adobe 2006-2007
Top current successful
products, appeal to multiple
audience with diverse needs
Demonstrate the versatility of the
product from an amateur all the way
up to the professional level.
2006-2007Carlo Rossi
Vineyards
E&J Gallo
Winery
Brought in designers to create art
from packaging. Show cased art
work on line and tour around
country. Provided ideas on
Brand irrelevancy, poor
product perception, product
value-price vs. shelf space,
limited promotional budget
Kimberly-Clark1/2007-
6/2007
Connect back to consumers, by
allowing them to create advertising
media, create new products, and
connect to the brand on line
Frito-Lay Doritos 2006-2007
Purchase frequency
declining, flat sales volume,
brand popularly and loyalty
down
$10-20
Million
Connect the brand with consumers
on an emotional level, to reposition
the brand as a comfort item
Radio, interactive
print, in theater, live
event, banner ads, PR,
web sites
Product considered
commodity, decreasing
market share
Kleenex

82
Table 10: Continued
Source: Effie Awards. (2008). Effie Awards Winners Showcase. Retrieved Mar. 10, 2009, from
http://www.effie.org/ideas_that_work
1 Increase base volume Sales volume
comparisonNot given
11.6% growth over
previous year
2 Increase market share Market share
analysisNot given
1.7 point share
increase
3 Increase web trafficWeb traffic tracking Not given
314% growth over
pervious year
4 Build awarenessConsumer Survey Not given
268,679,000
impressions
5 Increase brand metrics Not Given Not given Not given
1 Increase awareness Member tracking None 4,000+ members
2 Decrease teen smoking
rates by 5%Survey Not given
19.1% smoking
drop
3 Create a sustainable
messageN/A
1 Increase sales Sales volume
comparisonNot given 300% increase
2 Close sales gap between
leading competitorsCompetitive sales
comparisonNot given
Closes gap by 50%
among top
competitors and
became #3
supplier
3 Improve brand image Consumer brand
metric survey
Average rating
46.65%
Average rating
55.56%
1 Increase awareness
Web traffic tracking Not given 11% one day spike
2 Increase outside financial
support
Donations
comparisonNot given
39% increase over
previous year
1 Increase sales by 3.2% Sales volume
comparisonNot given 7.6% increase
2 Create positive product
perceptions,
Perception of
contributing to
healthy living
20% yes 59% yes
3 Create dialogue about
"real" foodROI
1 Increase differentiationAwareness survey Not given
30% increase over
previous year
2 Increase sales Sales volume
comparisonNot given Up 9.1%
3 Increase interaction with
brandWeb traffic tracking Not given 1.3 million visits
Hellmann'sUnilever 2006-2007
Toyota Motor
Sales
Rage Against
the Haze (SC
DHEC)
SC Department
of
Environmental
Health &
Control
2006-2007
Interactive online
content, PR,
television, print,
consumer involvement
$10-20
Million
Grow mature brand, change
unhealthy product
perception
Found consumers valued
real/wholesome food choices.
Partners with Yahoo! Food to create
online video highlighting real food
from around the country.
Repositioned product as a more
wholesome ingredient.
For every $1.00 spent yielded $2.50 in
incremental revenue
$40 Million
and over
Television, print, PR,
interactive online,
sponsorship,
Prove product superiority compared
to competitors through extreme
product demonstration and
sponsorship of consumer relevant
events and activities
Consumers extremely loyal
to competitor's products,
past failures, skeptical
market perceptions
Toyota1/2007-
8/2007
$500 - $999
Thousand
Print, direct, outdoor,
radio, television,
interactive online
content
As the broader community to submit
questions for the faculty and staff to
answer in order to build credibility
and an atmosphere of discovery
Unfavorable public
perception, lacks relevance
University of
Minnesota
University
Relations
University of
Minnesota2006-2007
Ocean Spray
Ocean Spray
Cranberries,
Inc.
$500-999
Thousand
Involve teens in the planning and
development of the campaign. Use
those teens to empower others and
create community
Events, street teams,
interactive online
content, print
Limited staying power of
similar advertisements,
limited budget
2006-2007
Program still active
$20-40
Million
Television, radio,
interactive online
content, outdoor
Promote hidden product attributes to
appeal to health conscious
consumers. Used traditional l
advertising with online media and
PR to develop the story and the
product benefits.
Product considered
unhealthy, industry in
decline
Television, interactive
online content, print,
direct, outdoor
Over $40
Million2006-2007UPSUPS New entrants into market
Break down specific products and
services to show ease of use and
business integration

83
The tactics used to implement their strategies were varied, but most companies relied
on television and online advertising to communicate with their customers. Companies would
often create advertisements then supplement those advertisements with interactive online
media, which included forums, games, and other content specially developed for that
campaign. Many companies mentioned that creating involvement between the company and
the customer in the campaign lead to increased success.
Evaluation methods were varied, but most companies used awareness surveys, market
share and sales volume comparisons, and web traffic tracking as their primary metrics to
evaluate the success of the campaign. Most companies averaged approximately a 10%
increase in these areas depending on their initial goals and strategies, but there was no
standard across companies or product categories.
Phase I: Case Studies
Objectives
RO1: Define advertising success and identify companies with successful advertising
strategies.
RO2: Complete a competitive analysis, using secondary data, on the advertising strategies of
upstream textile manufacturers in addition to the strategies of upstream firms from other
industries in order to:
RO2A: Develop an understanding of the current advertising campaigns
RO2B: Assess the strategies used by the selected companies.

84
Key Findings:
1. Both companies primarily used television advertisements as their main form of
communication.
2. Both companies used auditory signals or jingles tied to their advertisements.
3. Advertising is an effective way to differentiate products and build awareness.
Case Study: Intel’s “Intel Inside” Campaign
Introduction
Intel Corporation, founded in 1968 (Maddox, 2004) launched its “Intel Inside”
advertising campaign in 1991, which was marked as the first time a PC component
manufacturer successfully advertised to the end consumer (Intel Corp., 2009). Intel
Corporation has appeared in the top seven Most Valuable Global Brands since 2001, as
identified by Interbrand (Interbrand, 2009). The “Intel Inside” campaign has been listed as
the number two best B2B advertising campaign by Advertising Age’s Business Marketing
magazine (50 Greatest B to B Ads. 1999). Now, Intel is one of the largest cooperative
advertisers in the world. Intel has successfully used advertising to increase its brand
awareness, product visibility, and revenues in both the consumer and industrial segments.
Opportunity
Prior to the launch of their now famous campaign, Intel relied solely on their
computer vendors to promote their components. Because of Intel’s relative distance from the
end consumer, Intel had little brand identification or product awareness among users. During
the late 1980’s, Intel used a number series such as 386 or 486 to identify its microprocessors,
which they assumed were protected under U.S. trademark law (Intel Corp., 2009). However,

85
by 1991, there were several new microprocessor companies competing and they were
beginning to produce their own 386 and 486 processors (Arnott, 1994). When Intel attempted
to take these companies to court for trademark infringement, the courts ruled that the 376 and
486 names were not trademarks, which left Intel’s products vulnerable. In light of these
proceedings, Intel realized that they needed to link the benefits and brand equity of its
products directly to the company itself, in order to differentiate their products and increase
their awareness (Intel Corp., 2009).
Challenges and Media Tactics
To accomplish their goals, Intel examined the consumer advertising tactics of other
component advertisers across product markets. Intel decided to model their advertising
campaign after Monsanto Co.'s NutraSweet, an artificial sweetener. Intel’s goal was to build
product awareness to create brand preference among users. In 1989, the marketing team at
Intel tested their first advertising campaign promoting their 386SX chip, a product that only
Intel was providing, in Denver, Co. Known as “Red X” campaign, Intel employed a six-
month, guerrilla style campaign using print, retail, and outdoor advertisements to attempt to
jump start sales. The campaign included eye catching print and outdoor advertisements that
resembled graffiti. Ads depicting the 286 were “spray painted” over with 386SX. This
marked Intel’s first attempted to advertise to computer buyers instead of computer
manufacturers (Johnson, 1991).
Intel knew that in order to succeed in the consumer market, they would need to
coordinate their efforts with PC manufactures (Intel Corp., 2009). After the success of the
Denver trial, Intel launched “Intel Inside”, its first full scale cooperative advertisement, with
86
IBM in April 1991 (Elkin, 2001). The goal of this campaign was to build consumer
confidence in the Intel brand by associating itself with popular computer brands. By co-
advertising with popular computer manufacturers such as IBM and Compaq, Intel was able to
borrow their established brand equity in order to build its own (Arnott, 1994). The
cooperative advertising campaign was an incentive based program by which Intel would take
a percentage of the purchase price of the processor and put that money into an account for the
host brand to be use to promote the Intel name along with their own products. This incentive
was offered to all computer manufacturers that used advertisements that included the Intel
Inside logo, including both print and product level advertisements (Intel Corp., 2009). The
visibility of the Intel brand in printed publications reached 8,000 pages a month in 1994.
These advertisements were either Intel’s own efforts or those from computer manufacturers
(Arnott, 1994).
In addition to the product and print advertisements, in 1992, Intel created a widely
successful commercial with the help of George Lucas's Industrial Light and Magic. The
commercial took the viewer through the internals of a computer and then focused on Intel’s
fast and powerful new microprocessor. According to Intel, television commercials proved to
be the most effective communication method (Intel Corp., 2009). In 1994, Intel began
working with composer Walter Werzowa to create an auditory jingle to identify their brand
(Mucha, 2005). After many versions, the now classic four-note jingle debuted in 1992. This
tone was played at the end of each of Intel’s commercials, paired with the Intel Inside logo
(Intel Corp., 2009). According to one source, in 2005, the Intel jingle was played around the
world about once every 40 seconds (Mucha, 2005). In 1997, Intel began to promote its logo

87
on permanent displays inside retail locations such as Best Buy, Circuit City, and Comp USA.
These displays included end caps, full wall displays, as well as product demonstrations
showing how fast computers using Intel processors could perform (Stevens, Graves, 1997).
Benefits
The success of the Intel Inside campaign was largely due to the successful
recruitment of computer manufacturers. Without their participation, computer buyers would
have had difficulty in identifying computers containing Intel processors. Computer
manufactures not only benefited from the shared advertising expenses, but the Intel name on
their products gave consumers a sense of comfort in knowing that their software was
compatible, which in turn yielded additional profits and market share for participants. The
success of the Intel Inside campaign was significant and in 1992, the first full year of the
campaign, Intel’s global sales had increased by 63% to $4 billion. By 1993, Intel announced
that their brand preference rating had increased from 60% in 1992 to nearly 80% (Arnott,
1994).
Case Study: Cotton Incorporated’s “Fabric of Our Lives®” Campaign
Introduction
Over the years, Cotton Incorporated has used many different media types to promote
cotton fibers. One of their most successful endeavors was the “Fabric of Our Lives®”
campaign. The campaign began in 1989, when Cotton Incorporated debuted their first series
of television commercials on Thanksgiving Day. The advertisements featured the jingle “The
touch, the feel of cotton, the fabric of our lives”, which is now synonymous with the brand.
The Fabric of Our Lives® campaign featured an iconic styled advertisement that attempted to
88
tie the benefits of cotton and cotton fabrics with the American experience (Cotton Inc, 2009).
The advertisement campaign helped to support cotton market share growth, which had
peaked in 1996 at 59% (EFFIE, 2000).
Challenges and Goals
By 1998, cotton market share growth had stagnated and Cotton Incorporated
attributed this to two occurrences. First, Cotton Incorporated’s research indicated that the
appeal of manmade fibers was on the rise. Synthetic fiber producers and garment
manufactures had begun to develop specialized products that offered benefits that cotton had
difficulty competing in, such as stretch recovery and drape. Second, “The Fabric of Our
Lives”® campaign had successfully created brand awareness and loyalty in the Baby Boomer
market, but the campaign was not nearly as successful in the teenage to 20’s market segment.
While this consumer group was buying cotton products, they had little awareness of what
fiber composed their garment. In light of these challenges, Cotton Incorporated determined
that it needed to assess the current awareness and recall of the cotton brand in the market,
especially in the 16 to 24 years old demographic. Once this baseline was established, Cotton
Incorporated could evaluate the changes in awareness post campaign implementation
(EFFIE, 2000).
Tactics and Media Strategy
The previous “Fabric of Our Lives®” campaigns still had many strengths and
maintained high levels of recognition among Boomer groups. Cotton Incorporated’s task then
became to create a campaign that kept the elements that appealed to the Boomers, yet make
the advertisements more relevant and appealing to the young demographics. Cotton

89
Incorporated also had to define the brand in the lives of the consumer, and they were
planning to use product examples to make the message more relatable, which had not been
attempted in the past. Cotton’s strategy consisted of new television advertisements on cable,
syndicated, and nontraditional avenues. This allowed them to reach a broad population, while
at the same targeting a specific viewing demographic. Cotton Incorporated chose to place
advertisements during highly viewed shows such as the Emmy Awards, as well as popular
television channels such as MTV and The WB where the viewership was much younger
(EFFIE, 2000).
Benefits and Successes
Over the course of the campaign and based upon preliminary evaluations, market
share for cotton grew to 60%, the highest recorded value since the introduction of manmade
fibers. Overall awareness in the market grew from 74% to 85% among women aged 25-49,
30% growth among 16-19 year olds, and 10% growth in the 20-24 age group. In 1999,
Brandweek listed Cotton Inc #570 in their America’s Top 2000 Brands ranking, this was a
108 place jump from their 1998 ranking of 678 (America's top 2000 brands, 1998;
Brandweek, 1999). In 1998, Cotton Inc won a Silver EFFIE award for their 1997 campaign.
The award was a national juried advertising award that recognized advertising campaigns
that were not only creative, but exceed managerial goals for the campaign (Cotton Inc, 1999).
Discussion: Case Studies
Both of these companies used very similar tactics to build awareness, recognition, and
preference for their products. From the results of these case studies, television advertising
was an effective way to communicate with the end consumer. Both of these company’s

90
advertisements also contained sound bites or jingles that became synonymous with the brand.
It can be inferred that using these two media tactics in conjunction could be an effective way
to build recognition in the marketplace.
One major difference between the two companies was their methods of measuring
effectiveness. Intel used mostly quantitative measures such as market share and sales volume
to measure the effectiveness. Cotton Incorporated on the other hand used slightly different
tactics. Cotton began by establishing a baseline or initial measurement of awareness and
recognition of the target market. Though they too used market share as an indicator, Cotton
mainly used qualitative measures, focus groups and surveys, to track the changes in
awareness and recognition. Both tactics are valid for establish effectiveness measures.
Phase II- Industry Interview Results: Inductive Logic
Objectives
RO3A: Examine differences in the marketing strategies of used by the performance textile
market, focusing specifically on the outdoor apparel and equipment subsegment of the sports
and leisure market segments.
RO3A: Benefits
RO3A2: Challenges
RO3C: Opportunities
RO3D: Potential
RO3E: Advertising Methodology
RO4: Examine the effectiveness from a supply chain perspective to determine:
RO4A: Which media types the population views most frequently

91
RO4B: What advertising media has the best response rate
RO4C: What part of the advertisement causes the population to seek additional
information
RO4D: What features of the advertisement are most effective
RO4E: What factors the population considers before purchasing
RO4F: Where the population seeks product information
Key Findings:
1. The majority (7 of 11) respondents said it was necessary to advertise in the sports and
leisure market segment in order to be competitive, due to the number of well-
established brands in this segment. Companies tended to spend more advertising
dollars in this segment than other product categories.
2. Respondents most frequently identified Lycra®, W.L. Gore, and Intel as successful
ingredient advertisers.
3. Most of both B2B and B2C companies cited that the measure of advertising success
was customer or consumer awareness of products or the company name prior to the
firm contacting them formally. Increasing sales was the second most frequent answer.
Benefits of advertising included building awareness and company image or
credibility. Increasing sales was the third most frequent response.
4. For B2B communications, the top two elements to include in an advertisement for the
sports and leisure segment were performance attributes and acknowledgment of
customer’s interests.

92
5. Both B2B and B2C companies agreed (10 of 11) stated that online media held the
largest opportunity for advertising and but PR and face-to-face interactions were the
most effective forms of advertising.
6. Most B2B respondents stated that the opportunities in consumer advertising were not
clear and that the costs associated with reaching that group may out weight the
benefits. At the supply chain level, the some of B2B respondents did not feel there
were many opportunities at the fiber, yarn, and fabric level but there was opportunity
downstream with brands, designers, and retailers.
7. For both B2B and B2C companies, the majority (8 of 11) respondents stated that the
Internet was the main information source for new company information, if they had
not done business with them in the past.
8. Across B2B and B2C respondents, factors they considered, other than cost, when
determining new suppliers were the status of the company including factors such as
longevity, industry commitment, and credibility.
Sample Description
Company Primary Advertising Type Major Advertising Methods
B-2-B B-2-C B-2-B & B-2-C Print Online Event On-product PR Television
A X X X X X X
B X X X X X
C X X
D X X X X
E X X X X X
F X X X X X X
G X X X X X X
H X X X X X X X
I X X X X
J X X X X X
K X X X X

93
Advertising in the Sports and Leisure Market
Table 15 relates the results of the advertising in the sports and leisure market
questions. These questions dealt with how the company viewed the relative necessity of
advertising their products in the sports and leisure market in order to be competitive or
successful in that market. This section of the interview was created and completed in order to
satisfy research objective RO3.
Discussion: Advertising in the Sports and Leisure Market
When asked about the necessity of participating in advertising activities in order to be
competitive in the sports and leisure market segment, seven companies said that it was
important. Of the participants answering yes, many said when competing with national or
established brands, advertising was a good way to build visibility for their products and
company. The four companies that said advertising was not necessary in order to be
Company
IDPosition
Years in
Position
Years with
Company
Years in
Industry
Company Position in
Supply Chain
A Director of Marketing 14 21 25 Fabric
B Advertising Agency Owner 1 1 15 Advertising/Fiber
C Directory of New Business Development 2 10 34 Yarn
D Marketing Manager 3 10 10 Yarn
Marketing Manger 4 9 20 Fiber
VP of Client Relations 5 8 10 Public Relations/Fiber
Global Marketing Manager 2 2 20 Fabric
Senior Account Executive 2 2 6 Advertising/Fabric
VP of Sales 8 8 26 Yarn
Textile Engineer/Sales/ Customer Support 3 3 37 Yarn
H Director of New Business Development 3 14 14 Fiber
I Director of Sales and Marketing 7 15 15 Fabric
Vice President of Sales, 2 12 28 Fabric
Vice President of Customer Development 2 2 13 Fabric
K Global Marketing Manager 3 3 14 Yarn
J
F
E
G

94
competitive stated that quality products and company name were the main differentiating
factors.
Table 11
Advertising in the Sports and Leisure Market- Summary of Results
Topic Comments Regarding Advertising in the Sports and Leisure Market
Competitive
necessity
A: Yes- Market penetration, product by product basis B: No- Unless developing consumer brands C: No- Not for our products D: No- Can be done through other means E: Yes- Important to stay visible F: Yes- Consumers are brand conscious G: Yes- Increase competitiveness H: Yes- Increase competitiveness I: No- Sales force and quality products J: Yes- Increase competitiveness against established brands K: Yes- Segment has tremendous growth potential
Differences
in tactics
A: Performance segment receives more advertising dollars than other segments.
Performance ads are product focused and use more diverse media types. Non-
performance products use company focused ads and may be only promoted
through print ads or face-to-face integrations. B: New markets may require focused advertising to make an impact. The company
must be established in the market first, then individual products. C: We do not differentiate our advertising for different product segments. D: Tactics are product specific. Some performance products receive more
advertising focus, depending on competition, growth potential, and goals. E: Tactics are customer and market specific. Ad development is based upon
customer and market preferences. Ads are focused on the end use application. F: The general approach is the same. Ads are adapted to fit market segment. G: None. H: Performance products use images of people who are active in the trade or
consumer segment. Other product classifications are different and we use
different ad media and tactics. I: Performance products are more heavily promoted. J: Performance products are the only advertised products, all others are promoted
by direct mail or face-to-face interactions. K: Tactics are similar, more emphasis on performance products. Ads are targeted,
direct, and present product-in-use images. Emotional images were not effective.
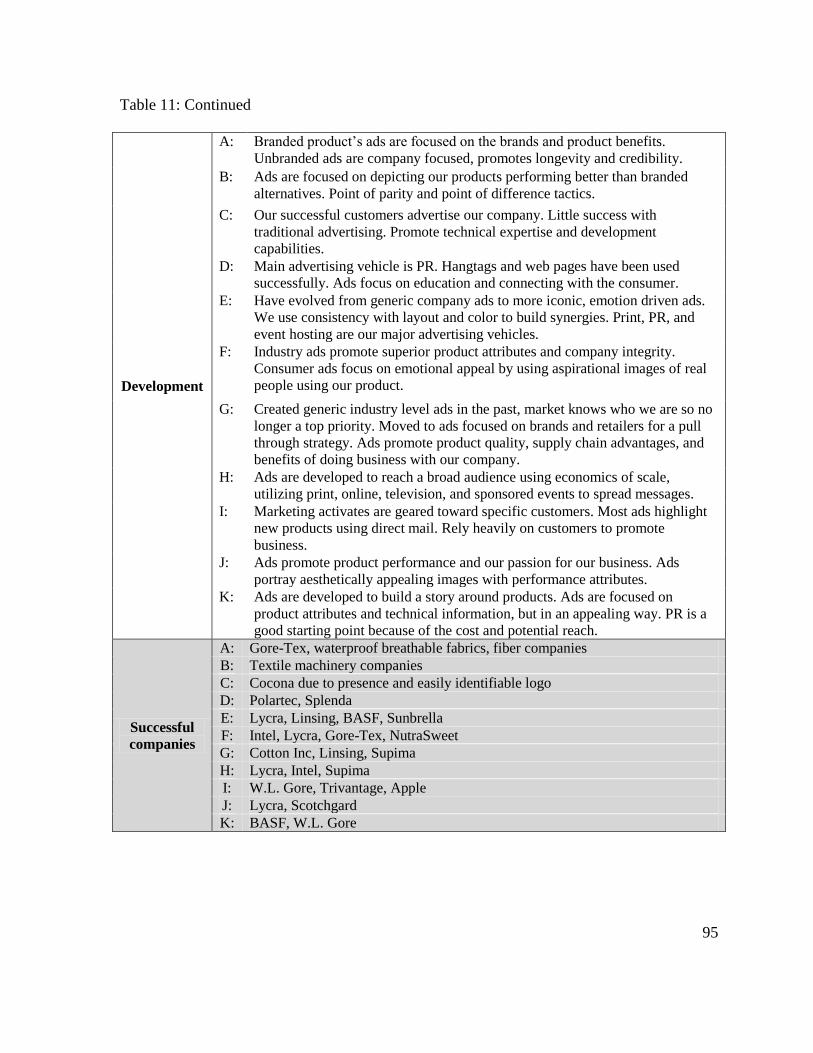
95
Table 11: Continued
Development
A: Branded product’s ads are focused on the brands and product benefits.
Unbranded ads are company focused, promotes longevity and credibility.
B: Ads are focused on depicting our products performing better than branded
alternatives. Point of parity and point of difference tactics.
C: Our successful customers advertise our company. Little success with
traditional advertising. Promote technical expertise and development
capabilities. D: Main advertising vehicle is PR. Hangtags and web pages have been used
successfully. Ads focus on education and connecting with the consumer. E: Have evolved from generic company ads to more iconic, emotion driven ads.
We use consistency with layout and color to build synergies. Print, PR, and
event hosting are our major advertising vehicles. F: Industry ads promote superior product attributes and company integrity.
Consumer ads focus on emotional appeal by using aspirational images of real
people using our product.
G: Created generic industry level ads in the past, market knows who we are so no
longer a top priority. Moved to ads focused on brands and retailers for a pull
through strategy. Ads promote product quality, supply chain advantages, and
benefits of doing business with our company. H: Ads are developed to reach a broad audience using economics of scale,
utilizing print, online, television, and sponsored events to spread messages. I: Marketing activates are geared toward specific customers. Most ads highlight
new products using direct mail. Rely heavily on customers to promote
business. J: Ads promote product performance and our passion for our business. Ads
portray aesthetically appealing images with performance attributes. K: Ads are developed to build a story around products. Ads are focused on
product attributes and technical information, but in an appealing way. PR is a
good starting point because of the cost and potential reach.
Successful
companies
A: Gore-Tex, waterproof breathable fabrics, fiber companies B: Textile machinery companies C: Cocona due to presence and easily identifiable logo D: Polartec, Splenda E: Lycra, Linsing, BASF, Sunbrella F: Intel, Lycra, Gore-Tex, NutraSweet G: Cotton Inc, Linsing, Supima H: Lycra, Intel, Supima I: W.L. Gore, Trivantage, Apple J: Lycra, Scotchgard K: BASF, W.L. Gore

96
However, nearly all companies agreed that advertising alone could not differentiate their
products, personal relationships and face-to-face interactions were still very important.
In terms of differences in tactics, there was a trend that most companies invested
more of their adverting budget on performance and sports and leisure products than other
product categories. Many companies indicated that other, more commodity products were
promoted through direct mail and face-to-face interactions. Most companies tried to highlight
product benefits and performance aspects over other product attributes. Though the tactics
seemed to follow a trend, the development of advertisements for this segment was quite
different. Each company had a different development strategy, but most seemed to develop
advertisements for specific target customers or product end uses. When asked what
companies they believed were successful ingredient advertisers Lycra, W.L. Gore, and Intel
were cited most frequently.
RO3A-Advertising Benefits
Table 12 relates the results of the advertising benefits questions. Questions dealt with
what the companies viewed as the benefits of advertising and what they considered success.
Discussion: Advertising Benefits
When defining success, five companies cited either customer or consumer awareness
of their products or company prior to them contacting or speaking with them to be the
measure of advertising success. Building awareness was the top benefit of advertising; only
three companies specifically cited increasing sales as a benefit of advertising.
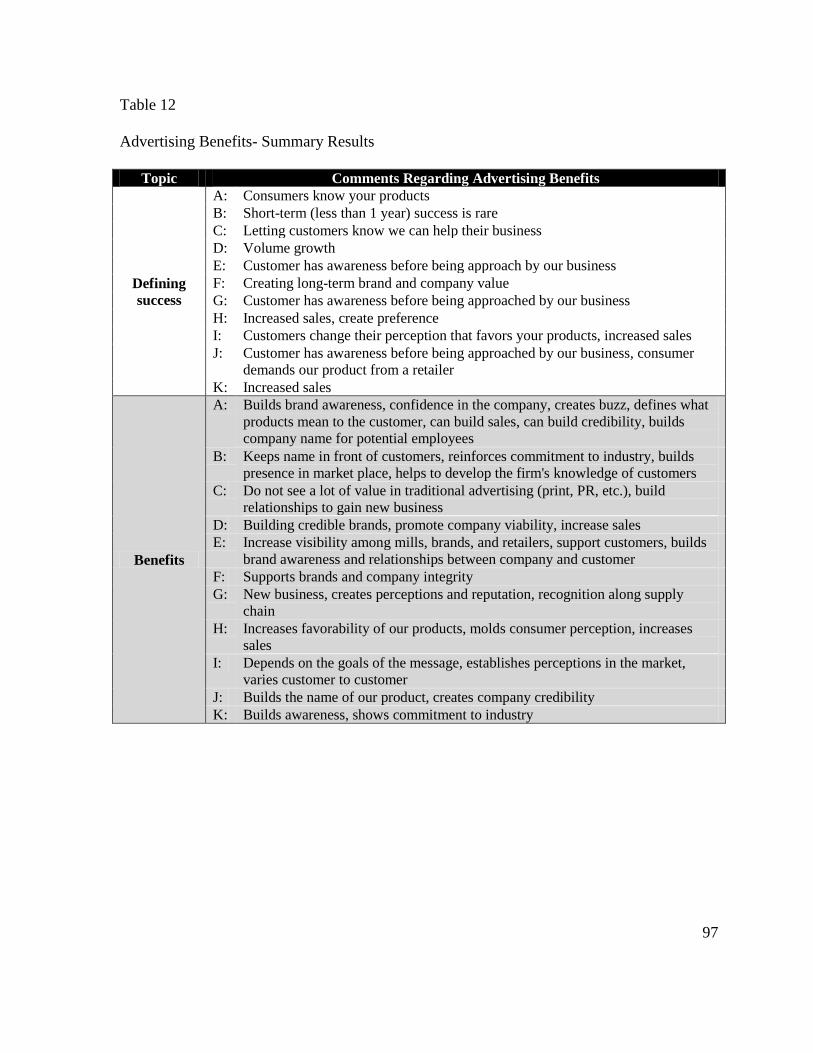
97
Table 12
Advertising Benefits- Summary Results
Topic Comments Regarding Advertising Benefits
Defining
success
A: Consumers know your products B: Short-term (less than 1 year) success is rare C: Letting customers know we can help their business D: Volume growth E: Customer has awareness before being approach by our business F: Creating long-term brand and company value G: Customer has awareness before being approached by our business H: Increased sales, create preference I: Customers change their perception that favors your products, increased sales J: Customer has awareness before being approached by our business, consumer
demands our product from a retailer K: Increased sales
Benefits
A: Builds brand awareness, confidence in the company, creates buzz, defines what
products mean to the customer, can build sales, can build credibility, builds
company name for potential employees B: Keeps name in front of customers, reinforces commitment to industry, builds
presence in market place, helps to develop the firm's knowledge of customers C: Do not see a lot of value in traditional advertising (print, PR, etc.), build
relationships to gain new business D: Building credible brands, promote company viability, increase sales E: Increase visibility among mills, brands, and retailers, support customers, builds
brand awareness and relationships between company and customer F: Supports brands and company integrity G: New business, creates perceptions and reputation, recognition along supply
chain H: Increases favorability of our products, molds consumer perception, increases
sales I: Depends on the goals of the message, establishes perceptions in the market,
varies customer to customer J: Builds the name of our product, creates company credibility K: Builds awareness, shows commitment to industry
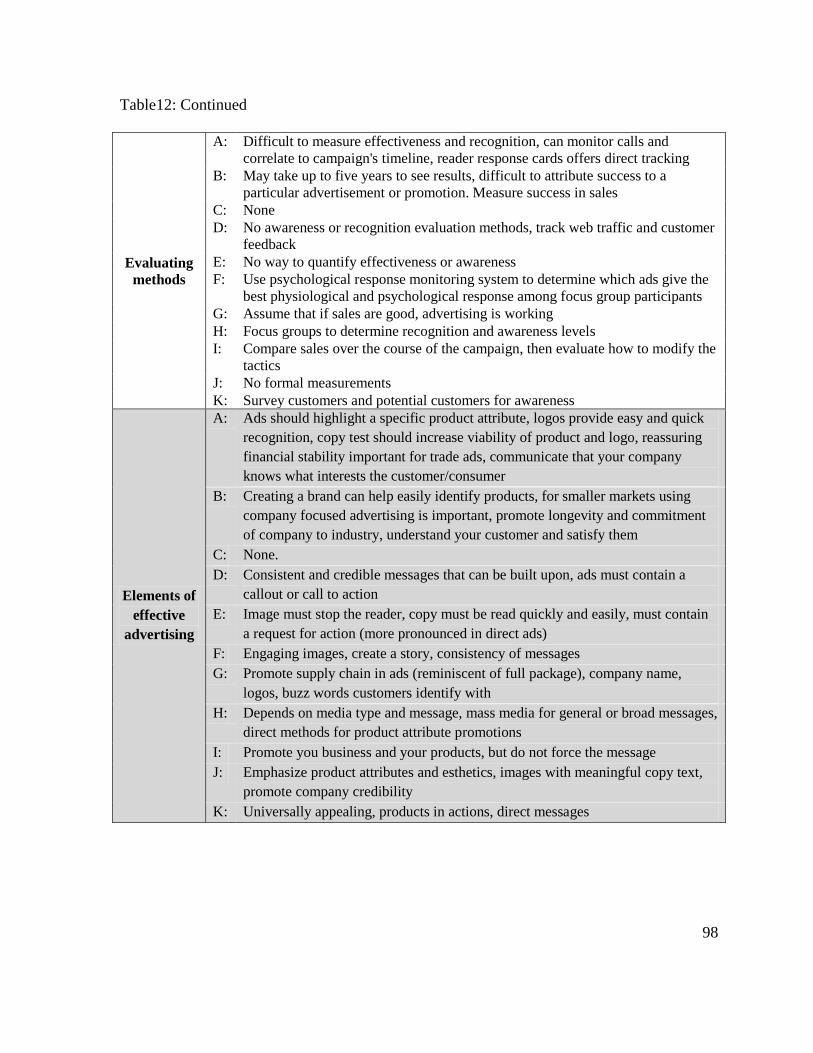
98
Table12: Continued
Evaluating
methods
A: Difficult to measure effectiveness and recognition, can monitor calls and
correlate to campaign's timeline, reader response cards offers direct tracking B: May take up to five years to see results, difficult to attribute success to a
particular advertisement or promotion. Measure success in sales C: None D: No awareness or recognition evaluation methods, track web traffic and customer
feedback E: No way to quantify effectiveness or awareness F: Use psychological response monitoring system to determine which ads give the
best physiological and psychological response among focus group participants G: Assume that if sales are good, advertising is working H: Focus groups to determine recognition and awareness levels I: Compare sales over the course of the campaign, then evaluate how to modify the
tactics J: No formal measurements K: Survey customers and potential customers for awareness
Elements of
effective
advertising
A: Ads should highlight a specific product attribute, logos provide easy and quick
recognition, copy test should increase viability of product and logo, reassuring
financial stability important for trade ads, communicate that your company
knows what interests the customer/consumer
B: Creating a brand can help easily identify products, for smaller markets using
company focused advertising is important, promote longevity and commitment
of company to industry, understand your customer and satisfy them
C: None.
D: Consistent and credible messages that can be built upon, ads must contain a
callout or call to action
E: Image must stop the reader, copy must be read quickly and easily, must contain
a request for action (more pronounced in direct ads)
F: Engaging images, create a story, consistency of messages
G: Promote supply chain in ads (reminiscent of full package), company name,
logos, buzz words customers identify with
H: Depends on media type and message, mass media for general or broad messages,
direct methods for product attribute promotions
I: Promote you business and your products, but do not force the message
J: Emphasize product attributes and esthetics, images with meaningful copy text,
promote company credibility
K: Universally appealing, products in actions, direct messages

99
Companies made no distinction between long-term and short-term success; however, most
were quick to add that as long as sales for their product were strong, they assumed that the
advertising was effective.
As for the benefits of advertising, five respondents cited building awareness as a
benefit of advertising. Four, the second most frequent response, said building credibility for
the company was an important benefit. Finally, three respondents cited changing market
perceptions as a benefit of advertising. A note worthy benefit, mentioned by company A was
that advertising helps build the company name to potential employees.
There was a broad response to questions relating to the evaluation of advertising
success. The most frequent response (4 of 11), was that no formal tracking was used.
However, companies F, H, and K would be considered advanced as they us focus groups or
other proactive approaches to measure effectives. Other companies fall in the middle,
meaning they perform some tracking through automated means, but do not fully embrace
effectiveness evaluation methods. Elements of effective advertising included performance
attributes and acknowledgment of customer’s interests.
RO3B-Advertising Challenges
Table 13 relates the results of the advertising challenges questions. Questions dealt
with what the companies viewed as some of the challenges of developing advertisements and
campaigns.
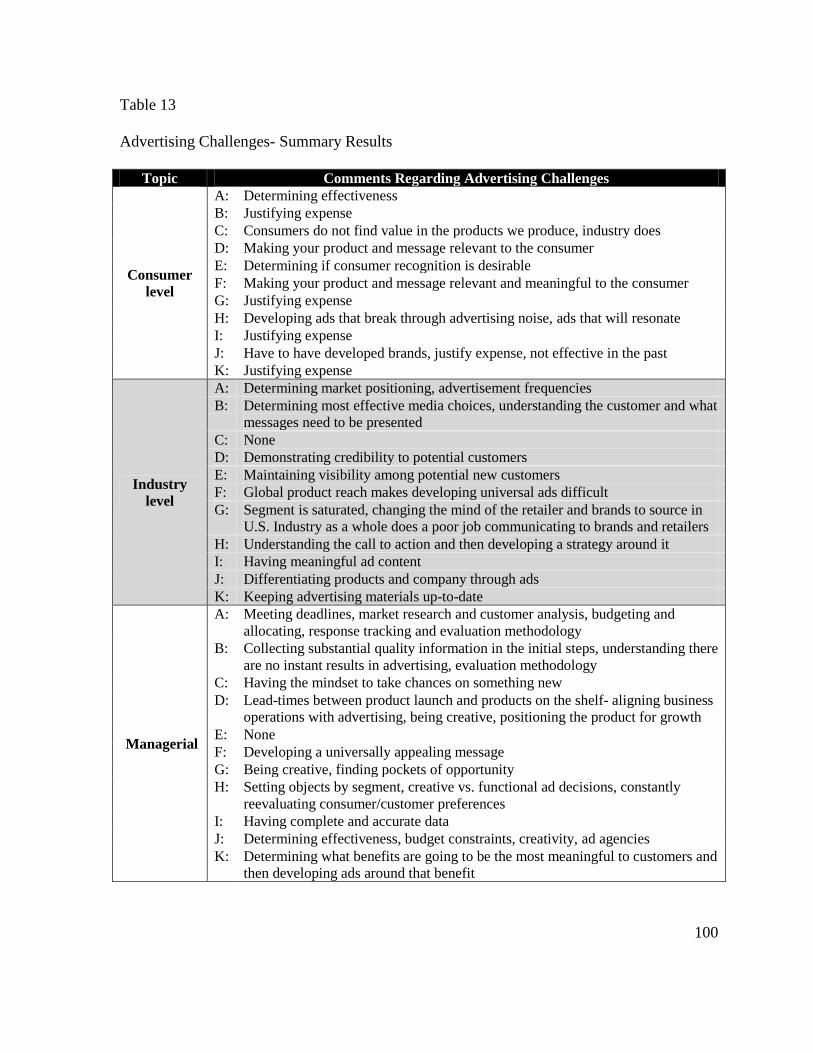
100
Table 13
Advertising Challenges- Summary Results
Topic Comments Regarding Advertising Challenges
Consumer
level
A: Determining effectiveness B: Justifying expense C: Consumers do not find value in the products we produce, industry does D: Making your product and message relevant to the consumer E: Determining if consumer recognition is desirable F: Making your product and message relevant and meaningful to the consumer G: Justifying expense H: Developing ads that break through advertising noise, ads that will resonate I: Justifying expense J: Have to have developed brands, justify expense, not effective in the past K: Justifying expense
Industry
level
A: Determining market positioning, advertisement frequencies B: Determining most effective media choices, understanding the customer and what
messages need to be presented C: None D: Demonstrating credibility to potential customers E: Maintaining visibility among potential new customers F: Global product reach makes developing universal ads difficult G: Segment is saturated, changing the mind of the retailer and brands to source in
U.S. Industry as a whole does a poor job communicating to brands and retailers H: Understanding the call to action and then developing a strategy around it I: Having meaningful ad content J: Differentiating products and company through ads K: Keeping advertising materials up-to-date
Managerial
A: Meeting deadlines, market research and customer analysis, budgeting and
allocating, response tracking and evaluation methodology B: Collecting substantial quality information in the initial steps, understanding there
are no instant results in advertising, evaluation methodology C: Having the mindset to take chances on something new D: Lead-times between product launch and products on the shelf- aligning business
operations with advertising, being creative, positioning the product for growth E: None F: Developing a universally appealing message G: Being creative, finding pockets of opportunity H: Setting objects by segment, creative vs. functional ad decisions, constantly
reevaluating consumer/customer preferences I: Having complete and accurate data J: Determining effectiveness, budget constraints, creativity, ad agencies K: Determining what benefits are going to be the most meaningful to customers and
then developing ads around that benefit

101
Discussion: Advertising Challenges
The most frequently cited consumer level challenge was justifying the advertising
expense. Many companies cited that for the money they would spend on a consumer
advertisement, they could produce several industry advertisements that could potentially lead
to direct sales. The other major challenge related was making advertisements relevant to the
end consumer. As for the industry level, there was a variety of responses, with no clear trend.
Most companies cited making advertisements relevant was the biggest challenge.
Managerially, the two most cited challenges were collecting accurate information during the
initial situation analysis and evaluating effectiveness of the campaign.
RO3C-Advertising Opportunities
Table 14 relates the results of advertising opportunities questions. Questions dealt
with what the companies viewed as some of the opportunities they felt advertising presented.
Discussion: Advertising Opportunities
In general, based on the respondent’s past advertising campaigns, the most successful
media choices have been concentrated around online content, including websites, blogs, and
email communications. Respondents used online content for direct advertisements as well as
more mass media approaches. The majority (10 of 11) respondents said that online media
held the largest opportunity for advertising and that their companies planned to take
advantage of this media type in the future. Many stated that online media was easy to control,
update, and distribute to any potential customer or end consumer.

102
Table 14
Advertising Opportunities- Summary Results
Topic Comments Regarding Advertising Opportunities
Media
choices
A: Online direct mail- meaningful and infrequent, celebrity spokes persons or
partnering, placing ads in publications that have longevity, product specific
websites that link back to web pages- customers to see other products as well B: Websites, trade journals- catch all approach as well as targeted, and online
media, promote transparency C: Partnering with other organizations- shared costs, supporting customers at events D: Web based content E: Digital communications, ads not always sales driven- presence is often enough F: Web 2.0 and mobile media, emotional media with real connections to targets G: Trade advertisements- targeting supply chain, retailers, brands, and designers.
Websites, blogs, and direct email have been effective, trade brochures are
quickly outdated-ineffective H: Nothing specific I: Event level advertising focused on specific customers, "feet on the street"
marketing through sales force, for non-branded product direct mail works best,
trade shows and personal interactions also effective J: Search engines- customers promoting our products on the web K: Online communications- easy to maintain and user controlled
Consumer
A: Life style branding B: Web content must be easy to understand by both consumers and customers alike,
can communicate to consumers through host brands-hang tags C: None D: Creating partnerships with firms downstream to communicate with consumers E: Nothing specific F: Drives pull marketing G: Opportunities are there-but difficult to reach successfully for cost H: Be as close to purchase decision as possible- hangtags, in store promotions, etc. I: Opportunities are there-but difficult to reach successfully for cost J: Nothing specific K: Consumers do not find value in our advertising

103
Table 14: Continued
Supply
chain
segment
A: No specifics B: Trade publications most effective, strong web presence is also important C: None D: Establish credibility E: Nothing specific F: Creating relationships with customers to promote our products as we promote
them G: Market is saturated- most companies know each other, many opportunities
downstream with designers, retailers, and brands H: Nothing specific I: Nothing specific J: Substantiated ads K: Nothing specific
Most
effective
A: Face to face interactions, collateral, PR and speaking at trade shows/events-
makes you the expert and leader, online direct mail-easy and quick updates,
hangtags- ads at the time of purchase B: Reaffirming commitment to industry, trade publications have broad reach and
readership, web materials are effective- tracking ability, user controlled content,
constant availability C: Word of mouth D: Industry level- PR most effective, consumer level-web most effective E: Print and online media, grass roots and relationship building are also critical F: Ads that are meaningful across segments G: Publishing ads in designer and retailer publications, blogs are easily updated and
available to anyone with web access H: Sponsored events and outreach programs are effective- captive audience I: Product placement in movies- large targeted audience, longevity, product in
action. For companies that know us grass roots and face-to-face is the best tactic,
for new companies the website is effective J: Sending out flyers to customers before trade shows to inform of presence at
show and promote new things about the business K: PR and white papers are most effective
At the consumer level, many companies stated that the opportunities in consumer
advertising were not clear and that the costs associated with reaching that group may out
weight the benefits. For those that said there were opportunities, making the content
available, meaningful, and close to the purchase decision were important. At the supply
chain level, the many of respondents did not feel there were many opportunities at the fiber,

104
yarn, and fabric level. One company went as far to state that the opportunity had shifted
downstream to the designers, retailers, and brands because most upstream textile companies
were aware of each other. The most effective advertising methods were PR and face-to-face
interactions. According to the respondents, being perceived as a leader and building
relationships with customers was important component in a successful advertising campaign.
RO3D- Advertising Potential
Table 15 relates the results of the advertising potential questions. Questions dealt with
what the companies viewed to be the potential of advertising for their business and in the
market.
Discussion: Advertising Potential
Areas advertising could potentially influence, other than sales and awareness, were
said to that advertising promoted a company to potential employees, built moral for sales
force, increased shareholder value, and increased customer knowledge. As a differentiation
method, the majority of respondents said that advertising was the most effective way to
differentiate their company’s products in the market. For companies that said no, most felt
that face-to-face interactions and quality products were the best way to differentiate their
products.

105
Table 15
Advertising Potential- Summary Results
Topic Comments Regarding Advertising Potential
Areas
advertising
can influence
A: Advertises your business to potential employees B: Helps build moral in company, "name in lights" mentality C: Nothing specific D: Share holder value E: Builds relationships and supports customers, recognition downstream F: Credibility and substantiation G: Build brand name, educate retailers and designers H: Perceptions about products and company I: Perceptions about products and company J: Building a positive image, building company credibility K: Requires you to intrinsically know your customer, which is a benefit in itself
Advertising as
a
differentiation
method
A: Yes, advertising tells your customer why you are better than other competitors B: Yes, advertising demonstrates commitment to industry and credibility C: Yes, traditional print advertising has that potential, but it was not effective in
our company D: Yes, if the message is unique and targeted E: No, quality products and partnerships with companies are most effective F: Yes G: No, in addition to advertising, grass roots, face-to-face interactions must
verify ad claims. Ads are only as good as the companies and products behind
them H: Yes, ads can build a story around your products and help relate them to your
customer/consumer I: Potentially, ads are a good way to differentiate, but products and company are
the main factors J: Nothing specific K: Yes, since our ads are linked to our sales pitch

106
Table 15: Continued
Advertising 's
ability to
influence
sales
A: Yes, advertising can spark interest that may lead to calls and sales. Advertising
promotes company viability and health to the market. B: Potentially, we want to generate interest in our product and receive calls, but
do not always result in sales. Have to position your company to take advantage
of all opportunities that arise C: Nothing specific D: Yes E: Yes, but it is the relationships that drives the sales F: Yes G: Potentially, we hope advertising translates to sales, but we do not how it does
specifically, there are so many promotions going on from different sources,
almost impossible to track without explicitly asking a customer H: Yes I: Yes, but we rely more heavily on our sales force for face-to-face interactions to
sell the product J: Yes, if ad claims can be substantiated K: Yes, since our ads are linked to our sales pitch
Typical
return on
investment
and payback
A: The cost of advertising is built into the product, it is hard to judge ROI and
payback B: Payback is not immediate, may be years before advertising has real impact.
Want to have calls come in and whether they lead to sales or not is
uncontrollable. ROI and payback differs company to company. Difficult to
track and because most companies do not put forth the effort C: None D: Evaluate each product and make adjustments to tactics, its different for every
company, depends on budgets, allocations and where money is spent E: ROI and payback are dependent on the goals set for that customer F: Different for every company G: We do not track ROI or payback, we have benchmarks for sales to each
customer H: No set ROI or payback for campaigns, if goals are achieved then tactics do not
change I: ROI goals are on a product level- measured through sales figures, typically
want to see a payback in under a year J: Look for a 12-18 month payback K: We use product level ROI, PR has best cost/benefit relationship
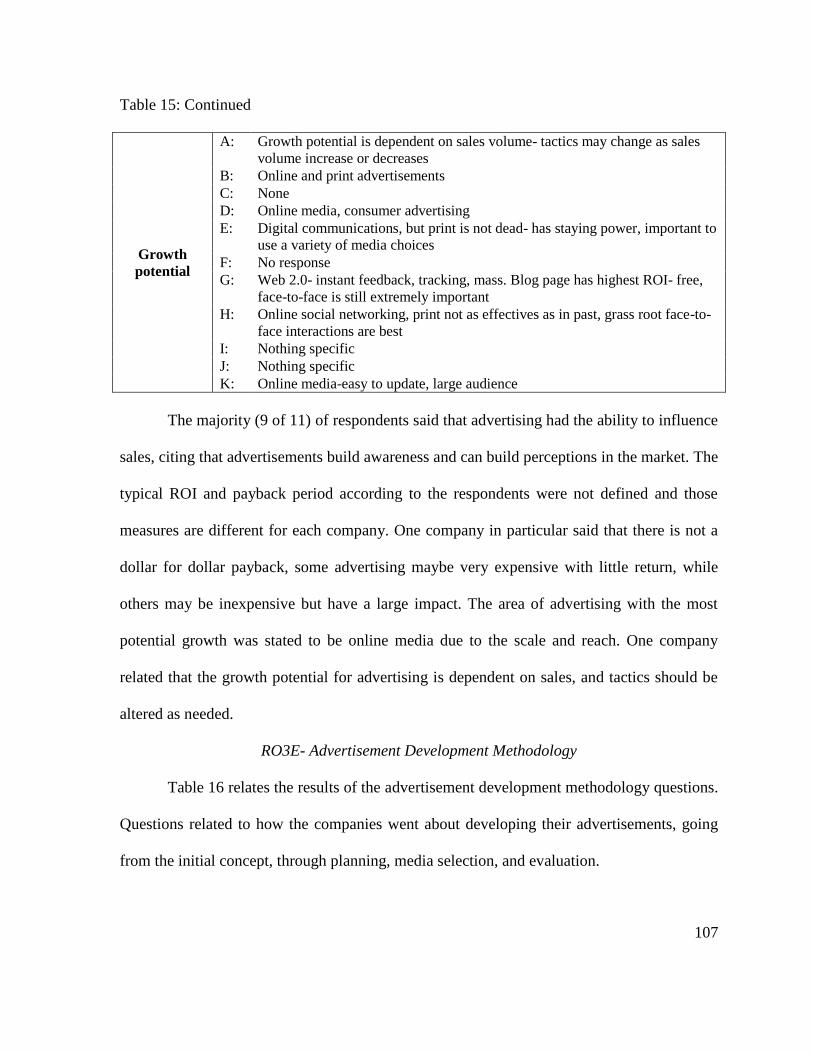
107
Table 15: Continued
Growth
potential
A: Growth potential is dependent on sales volume- tactics may change as sales
volume increase or decreases B: Online and print advertisements C: None D: Online media, consumer advertising E: Digital communications, but print is not dead- has staying power, important to
use a variety of media choices F: No response G: Web 2.0- instant feedback, tracking, mass. Blog page has highest ROI- free,
face-to-face is still extremely important H: Online social networking, print not as effectives as in past, grass root face-to-
face interactions are best I: Nothing specific J: Nothing specific K: Online media-easy to update, large audience
The majority (9 of 11) of respondents said that advertising had the ability to influence
sales, citing that advertisements build awareness and can build perceptions in the market. The
typical ROI and payback period according to the respondents were not defined and those
measures are different for each company. One company in particular said that there is not a
dollar for dollar payback, some advertising maybe very expensive with little return, while
others may be inexpensive but have a large impact. The area of advertising with the most
potential growth was stated to be online media due to the scale and reach. One company
related that the growth potential for advertising is dependent on sales, and tactics should be
altered as needed.
RO3E- Advertisement Development Methodology
Table 16 relates the results of the advertisement development methodology questions.
Questions related to how the companies went about developing their advertisements, going
from the initial concept, through planning, media selection, and evaluation.
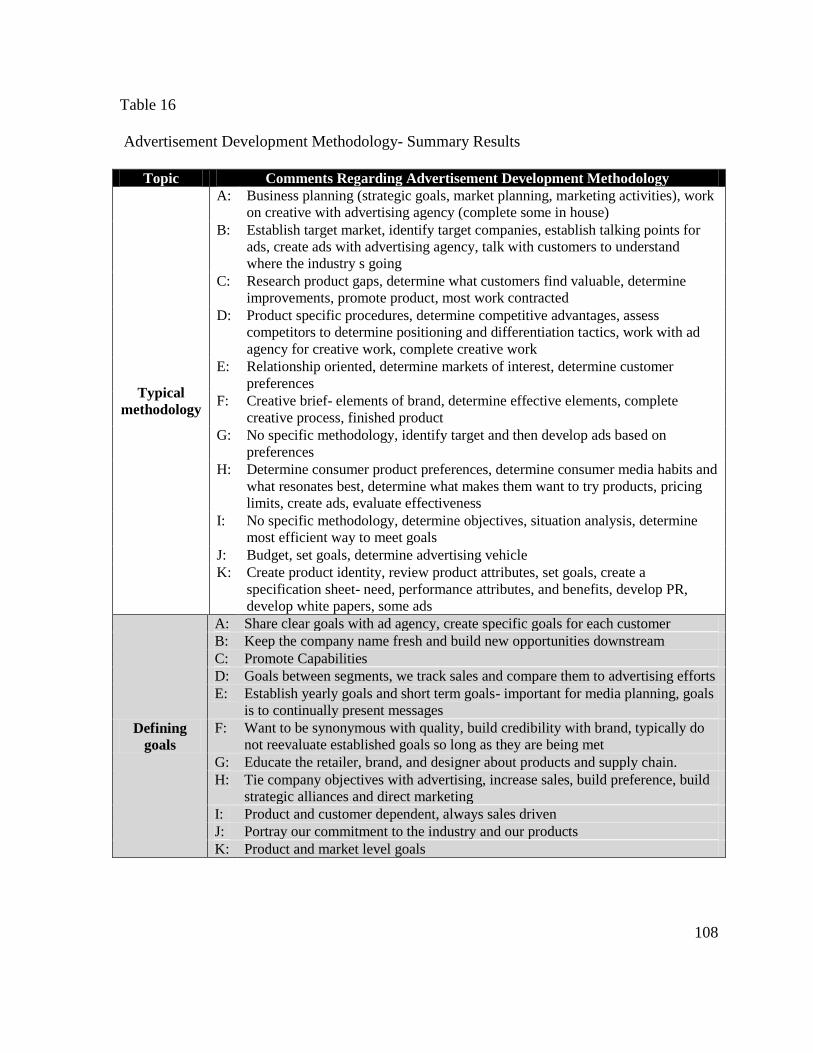
108
Table 16
Advertisement Development Methodology- Summary Results
Topic Comments Regarding Advertisement Development Methodology
Typical
methodology
A: Business planning (strategic goals, market planning, marketing activities), work
on creative with advertising agency (complete some in house) B: Establish target market, identify target companies, establish talking points for
ads, create ads with advertising agency, talk with customers to understand
where the industry s going C: Research product gaps, determine what customers find valuable, determine
improvements, promote product, most work contracted D: Product specific procedures, determine competitive advantages, assess
competitors to determine positioning and differentiation tactics, work with ad
agency for creative work, complete creative work E: Relationship oriented, determine markets of interest, determine customer
preferences F: Creative brief- elements of brand, determine effective elements, complete
creative process, finished product G: No specific methodology, identify target and then develop ads based on
preferences H: Determine consumer product preferences, determine consumer media habits and
what resonates best, determine what makes them want to try products, pricing
limits, create ads, evaluate effectiveness I: No specific methodology, determine objectives, situation analysis, determine
most efficient way to meet goals J: Budget, set goals, determine advertising vehicle K: Create product identity, review product attributes, set goals, create a
specification sheet- need, performance attributes, and benefits, develop PR,
develop white papers, some ads
Defining
goals
A: Share clear goals with ad agency, create specific goals for each customer B: Keep the company name fresh and build new opportunities downstream C: Promote Capabilities D: Goals between segments, we track sales and compare them to advertising efforts E: Establish yearly goals and short term goals- important for media planning, goals
is to continually present messages F: Want to be synonymous with quality, build credibility with brand, typically do
not reevaluate established goals so long as they are being met G: Educate the retailer, brand, and designer about products and supply chain. H: Tie company objectives with advertising, increase sales, build preference, build
strategic alliances and direct marketing I: Product and customer dependent, always sales driven J: Portray our commitment to the industry and our products K: Product and market level goals
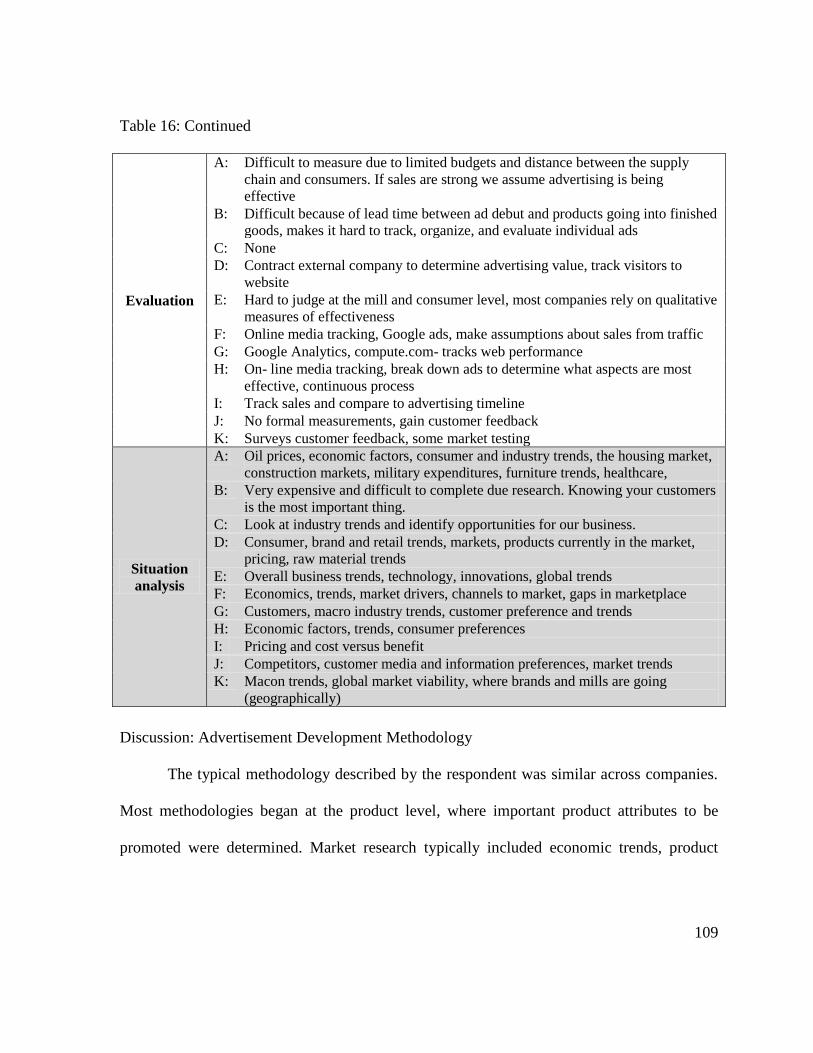
109
Table 16: Continued
Evaluation
A: Difficult to measure due to limited budgets and distance between the supply
chain and consumers. If sales are strong we assume advertising is being
effective B: Difficult because of lead time between ad debut and products going into finished
goods, makes it hard to track, organize, and evaluate individual ads C: None D: Contract external company to determine advertising value, track visitors to
website E: Hard to judge at the mill and consumer level, most companies rely on qualitative
measures of effectiveness F: Online media tracking, Google ads, make assumptions about sales from traffic G: Google Analytics, compute.com- tracks web performance H: On- line media tracking, break down ads to determine what aspects are most
effective, continuous process I: Track sales and compare to advertising timeline J: No formal measurements, gain customer feedback K: Surveys customer feedback, some market testing
Situation
analysis
A: Oil prices, economic factors, consumer and industry trends, the housing market,
construction markets, military expenditures, furniture trends, healthcare, B: Very expensive and difficult to complete due research. Knowing your customers
is the most important thing. C: Look at industry trends and identify opportunities for our business. D: Consumer, brand and retail trends, markets, products currently in the market,
pricing, raw material trends E: Overall business trends, technology, innovations, global trends F: Economics, trends, market drivers, channels to market, gaps in marketplace G: Customers, macro industry trends, customer preference and trends H: Economic factors, trends, consumer preferences I: Pricing and cost versus benefit J: Competitors, customer media and information preferences, market trends K: Macon trends, global market viability, where brands and mills are going
(geographically)
Discussion: Advertisement Development Methodology
The typical methodology described by the respondent was similar across companies.
Most methodologies began at the product level, where important product attributes to be
promoted were determined. Market research typically included economic trends, product

110
innovations, competitors, and various market tends identified as important to their target
customer; however, few companies mentioned looking at global trends or advertising trends.
When defining goals, many companies had customer specific goals for sales growth
and other factors, yet others were more concerned with remaining visible in the market. Most
companies did say that they rarely went back and redefined goals as the campaign
progressed. One company in particular stated that they set goals that are more general so as
long as their advertisements furthered those goals, they were not changed.
When asked about evaluating the success of an advertising campaign, the majority of
the companies said that those activities were difficult and expensive to track. Therefore, most
assumed that as long as sales were still strong, advertising was effective. Some companies
used tracking software and contracted agencies, but most were undeveloped in this area.
Only one company used consumer/customer feedback from the beginning of the
devolvement process to establish a baseline before creating the campaign. This company was
also the only company to evaluate the campaign formally post implementation. In the
situation analysis, most companies concentrated on economic, technology, consumer, and
industry trends. Only one company mentioned cost, global trends, or geographic shifts in
production.
RO4A-F- Advertising Effectiveness from a Supply Chain Perspective
Table 17 relates the results of the advertisement effectiveness from a supply chain
perspective questions. Questions relate to the company’s perspectives about advertising from

111
a customer’s point of view, meaning what preferences these companies have when looking at
advertisements in the market.
Table 17
Advertising Effectives from a Supply Chain Perspective- Summary Results
Topic Comments Regarding Advertising Effectives from a Supply Chain Perspective
Reasons for
seeking
information
A: Business fit, product information, commercial viability B: Business fit, product information C: Business prospects D: New product innovations, pricing, collaborative efforts E: Most companies come to us F: New business G: Business fit, product information, commercial viability H: Business fit I: Efficiency, cost, innovativeness, sustainability, potential partnerships J: Nothing specific K: Products, collaborative efforts
Information
sources
A: Vendors B: Online content, unless prior relationships exist C: Trade shows, trade publications, and past contacts D: Online, print, trade shows E: Internal sources F: Internet, Google, and other online media G: Trade shows, online, trader magazines H: Online, search engines, internal sources I: Trade shows J: Internet, websites K: Internet, print
Most
effective
media types
A: Face-to-face interactions, printed brochures, advertisements B: Websites, trade publications, trade shows. C: Trade shows, print publications D: Magazines, web E: None F: White papers, PR G: Direct mail, Google alerts H: Print, trade shows I: Trade shows J: Brand names, Internet, websites K: Internet, magazines

112
Table 17: Continued
Determining
new suppliers
A: Fit with current operations, can we use a product to improve company
position or expand markets? B: Quality for cost, companies with longevity and commitment C: Integrity, financial viability, and innovativeness D: Relationships, past experiences, price E: Reliability, quantity, quality F: Relationships, trust, credibility, compliance, and reliability G: Cost for quality, reputation H: Geographic location, costing, availability, credibility, company fit I: Innovation leaders, cost leaders J: Quality, price, relationships, credibility, viability, supply K: Cost, relevance to company, performance focused, company stability,
expertise
Elements to
look for in
advertisements
A: Contact information, point of action B: Relevant, easy to remember contact information, some textual information,
call to action C: Nothing specific D: Clean, full page, images that "pop" E: Nothing specific F: Engaging images, limited text, call to action, some technical information G: Nothing specific H: Visual appeal, contacts, technical information I: Nothing specific, contact information J: Contact information K: Products in action, contact information, call to action, small blurb about what
the business is about
Willingness to
pay more
A: Not as much as in the past- yes, if the market demands branded product B: Yes, if quality or benefits are worth the extra cost C: No, we want to be the innovators D: No, we are the brander in this situation E: No, we look more at the company and supply of the product F: Possibly, but we do not look specifically for brands G: Yes, as long as they add value or we can add value to the product H: No, we typically stick with generic products which allows us to create pricing
tiers I: Yes, if it generates value J: No, not in our business K: No, typically

113
Discussion: Advertising Effectiveness from a Supply Chain Perspective
Reasons for seeking information included new business opportunities or determining
business fit was a reason for seeking company or product information (9 of 11). Including
information that facilities new business development or shows interest in these types of
activities may be useful when developing new supply chain oriented advertisements (RO4C).
The primary information sources cited were the Internet (8 of 11), trade shows (4 of 11), and
print (3 or 11) (RO4F). When asked which media type was most effective, the trend was
similar, five preferred online advertisements, five preferred printed advertisement, and four
preferred tradeshows (RO4B, RO4A). Including a website or link to additional online media
may be important to include in supply chain advertisements, since many stated they respond
well to online advertisements or seek information online. When respondents were asked what
factors they considered, other than cost, when determining new suppliers, most were
concerned about the status of the company including factors such as longevity, industry
commitment, and credibility (RO4E). This type of information correlates to what some
respondents stated they already included in their supply chain advertisements. Elements
respondents were looking for in advertisements included a call to action and company
contact information (RO4D).
Phase III- Consumer Survey Results: Deductive Logic
Objectives
RO5: Conduct a quantitative survey to examine the effectiveness of upstream advertising
from an end consumer perspective to determine:
RO5A. If the population is aware advertised ingredient product
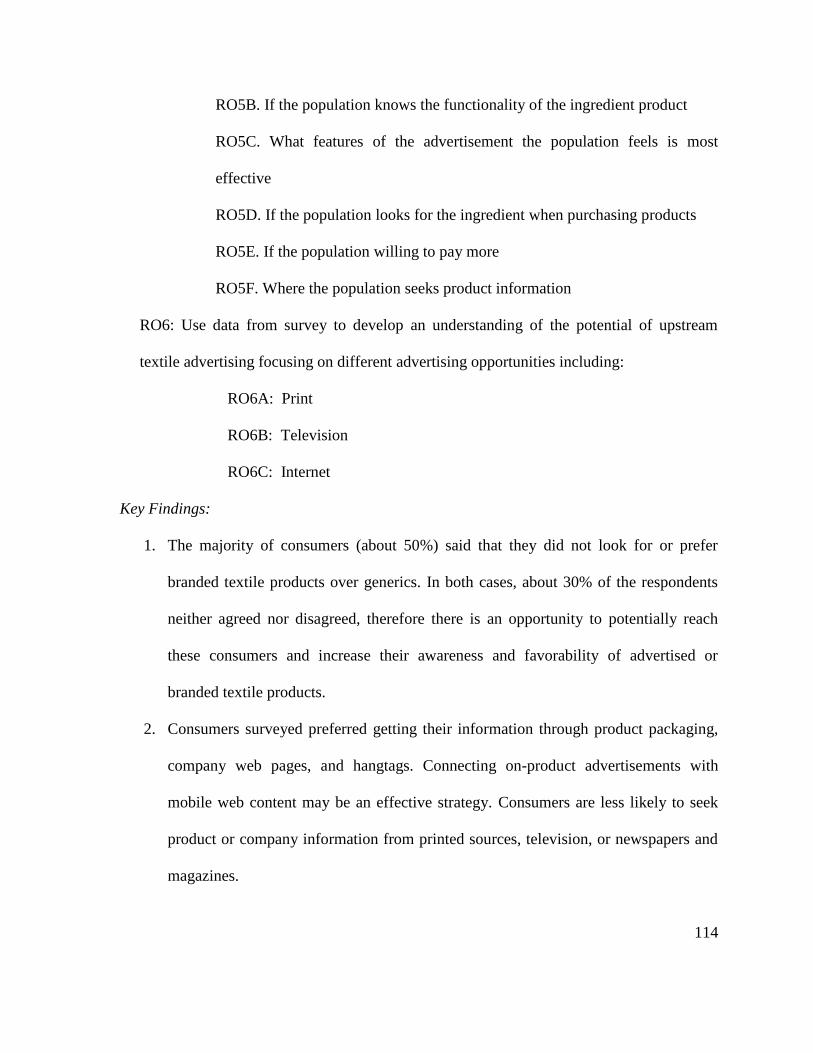
114
RO5B. If the population knows the functionality of the ingredient product
RO5C. What features of the advertisement the population feels is most
effective
RO5D. If the population looks for the ingredient when purchasing products
RO5E. If the population willing to pay more
RO5F. Where the population seeks product information
RO6: Use data from survey to develop an understanding of the potential of upstream
textile advertising focusing on different advertising opportunities including:
RO6A: Print
RO6B: Television
RO6C: Internet
Key Findings:
1. The majority of consumers (about 50%) said that they did not look for or prefer
branded textile products over generics. In both cases, about 30% of the respondents
neither agreed nor disagreed, therefore there is an opportunity to potentially reach
these consumers and increase their awareness and favorability of advertised or
branded textile products.
2. Consumers surveyed preferred getting their information through product packaging,
company web pages, and hangtags. Connecting on-product advertisements with
mobile web content may be an effective strategy. Consumers are less likely to seek
product or company information from printed sources, television, or newspapers and
magazines.

115
3. For B2C firms, consumers stated that using product comparisons or communicating
how the product can solve a problem were sources of advertisement credibility. Only
46.6% of consumers surveyed thought celebrity spokesperson built product or
company creditability.
Sample Description
A convenience sample of 165 North Carolina State University students was surveyed.
The participants were between the ages of 18 and 23 and up, the average age was 19.38, with
a mode of 19. The population was 81.8% female and 18.2% male. See Table 18 for
demographic details. As identified by the Outdoor Industry Association’s report, consumers
of outdoor apparel and equipment are predominantly Baby Boomer (born between 1925-
1945, population≈ 76Million) and Millennial (born between 1982-2002, population≈ 70
million) aged consumers (Keller, 2003). The student population of North Carolina State
University provided a large population of Millennial aged consumers. Output summary
Tables 19-20 are the results for the individual advertisement questions. Table 2123 present
survey results, the population for each question may very as some participants failed to
answer all questions. The discussion for each section follows each summary table. A copy of
the survey can be found in Appendix C and raw survey data can be found in Appendix P.

116
Table 18
Consumer Survey Results- Demographic Information
Age Valid 165
Missing 0 Mean 19.38
Median 19.00 Mode 19
Age Frequency
Age Frequency Percent
18 41 24.8 19 60 36.4 20 37 22.4 21 18 10.9 22 6 3.6
23+ 3 1.8 Total 165 100.0
Gender Frequency
Gender Frequency Percent
Male 30 18.2 Female 135 81.8 Total 165 100.0

117
Table 19
Consumer Survey Results: Advertisement A - Individual Questions
1 Advertisement awareness 56.7% ( n= 93 ) 36.0% ( n= 59 ) 3.7% ( n= 15 ) 3.0% ( n= 5 ) 0.6% ( n= 1 ) 1.54
2 Understand what product is promoted 4.2% ( n= 7 ) 13.3% ( n= 22 ) 9.1% ( n= 8 ) 57.6% ( n= 95 ) 15.8% ( n= 26 ) 3.67
3 Advertisement information is useful 2.5% ( n= 4 ) 6.1% ( n= 10 ) 14.7% ( n= 24 ) 66.3% ( n= 108 ) 10.4% ( n= 17 ) 3.72
4 Consumer identifies with presented content 7.3% ( n= 12 ) 28.5% ( n= 47 ) 23.0% ( n= 38 ) 35.2% ( n= 58 ) 6.1% ( n= 10 ) 3.04
5 Communicates information effectively 3.6% ( n= 6 ) 16.4% ( n= 27 ) 18.8% ( n= 31 ) 50.3% ( n= 83 ) 10.9% ( n= 18 ) 3.48
6 Communicates benefits effectively 2.4% ( n= 4 ) 15.2% ( n= 25 ) 21.3% ( n= 35 ) 51.2% ( n= 84 ) 9.8% ( n= 16 ) 3.51
7 Creativeness of advertisement 6.7% ( n= 11 ) 39.0% ( n= 64 ) 31.7% ( n= 52 ) 20.1% ( n= 33 ) 2.4% ( n= 4 ) 2.73
8 Advertisement evokes product curiosity 1.8% ( n= 3 ) 26.7% ( n= 44 ) 24.8% ( n= 41 ) 41.2% ( n= 68 ) 5.5% ( n= 9 ) 3.22
9 Advertisement evokes company curiosity 4.2% ( n= 7 ) 4.2% ( n= 49 ) 4.2% ( n= 36 ) 38.8% ( n= 64 ) 5.5% ( n= 9 ) 3.12
10 Advertisement appeals to consumer on personal level 16.5% ( n= 27 ) 41.5% ( n= 68 ) 22.0% ( n= 36 ) 13.4% ( n= 22 ) 6.7% ( n= 11 ) 2.52
11 Advertisement evokes perceptions of quality 0.0% ( n= 0 ) 1.8% ( n= 3 ) 12.1% ( n= 20 ) 69.1% ( n= 114 ) 17.0% ( n= 28 ) 4.01
12 Advertisement evokes perceptions of company creditability 0.6% ( n= 1 ) 3.7% ( n= 6 ) 21.3% ( n= 35 ) 62.8% ( n= 103 ) 11.6% ( n= 19 ) 3.81
13 Images and text relate well 0.6% ( n= 1 ) 7.3% ( n= 12 ) 14.0% ( n= 23 ) 62.8% ( n= 103 ) 15.2% ( n= 25 ) 3.85
14 Consumer wants to experience ad content 1.2% ( n= 2 ) 20.0% ( n= 33 ) 20.0% ( n= 33 ) 43.6% ( n= 72 ) 15.2% ( n= 25 ) 3.52
15 Consumer would look for product/brand 8.5% ( n= 14 ) 36.4% ( n= 60 ) 32.7% ( n= 54 ) 19.4% ( n= 32 ) 3.0% ( n= 5 ) 2.72
16 Consumer would consider seeking additional information 3.6% ( n= 6 ) 26.1% ( n= 43 ) 33.9% ( n= 56 ) 33.3% ( n= 55 ) 3.0% ( n= 5 ) 3.06
17 Consumer would consider purchasing the item 5.5% ( n= 9 ) 28.7% ( n= 47 ) 36.0% ( n= 59 ) 26.8% ( n= 44 ) 3.0% ( n= 5 ) 2.93
18 Willing to pay more for branded product versus a generic 7.9% ( n= 13 ) 26.7% ( n= 44 ) 38.8% ( n= 64 ) 22.4% ( n= 37 ) 4.2% ( n= 7 ) 2.88
Advertisement A- Sunbrella, Glen Raven
Survey Question Agree Strongly Agree
Likert Scale
MeanNeither Agree or
DisagreeStrongly Disagree Disagree

118
Discussion: Advertisement A Survey Results- Individual Questions
RO5A- Is the population is aware of the advertised ingredient product?
The majority of consumers (92.2%) had not seen Advertisement A before.
RO5B- Does the population know the functionality of the ingredient product?
The majority of participants (73.4%) understood what product was being sold, which
means that without the pictures or logos, the text and images conveyed what product was
being promoted effectively. Most consumers (75.8 %) thought the copy text was useful and
78% of consumers said that the text and images related well with each other. Many
respondents (61.2%) thought that there was adequate product performance information and
61% thought the there was adequate product benefit information. This advertisement had the
most textual content of all the advertisements used in the survey.
RO5C- What features of the advertisement are most effective?
Only 41.3% of respondents said they indentified with the images or activities in the
advertisement, 35.8% did not, and 23.0% had no opinion. Many respondents (58.8%) said
that they would like to experience the activities presented in the advertisement, but 58% did
not identify personally with the contents of the advertisement. This advertisement used
lifestyle-branding methods to convey feelings about boating and using their product, which
could be an effective way to develop relationships. Many consumers (46.7%) said they were
curious about the product and 44.3% said they were interested in the company based on the
advertisement. This information was explained in the copy text very thoroughly and
blatantly. However, 45.7% of consumers said that the advertisement was not unique or
119
memorable, 31.7% had no opinion, and 22.5% said it was unique or memorable. This
advertisement used classical pictures and layout with no one element superseding another.
However, the advertisement may not have been targeted toward younger consumers as it was
taken from a boating/yachting magazine. If the advertisement was targeted toward older
consumers, using the combination of the value statement with classical images resonates with
Company I’s remark regarding how they perceived older and younger consumers seeking
information differently (i.e. older consumers need more explicit information while younger
consumer tend to want to discover it on their own).
RO5E- Is the population willing to pay more?
Based upon the advertisement content, 22.4% of consumers said they would consider
looking for the product in a store, 36.3% would seek additional information, 29.8% would
consider purchasing the product based on the advertisement, and 26.6% said they would
choose over generic products.
As a whole, the content of the Advertisement A was well received, but it did not
encourage the consumer to seek additional information or considered purchasing the product.
Of the three advertisements presented, Advertisement A was selected as having the most
useful information, the most adequate product information, and product benefit information.
Using a short paragraph, or value proposition, the company was able to communicate the
product benefits and performance attributes of the product quickly. Advertisement A
received the highest average rating for relating text and images and wanting to experience the
images presented in the advertisement. Consumers also ranked this advertisement the highest
for perceptions of product quality and company credibility.
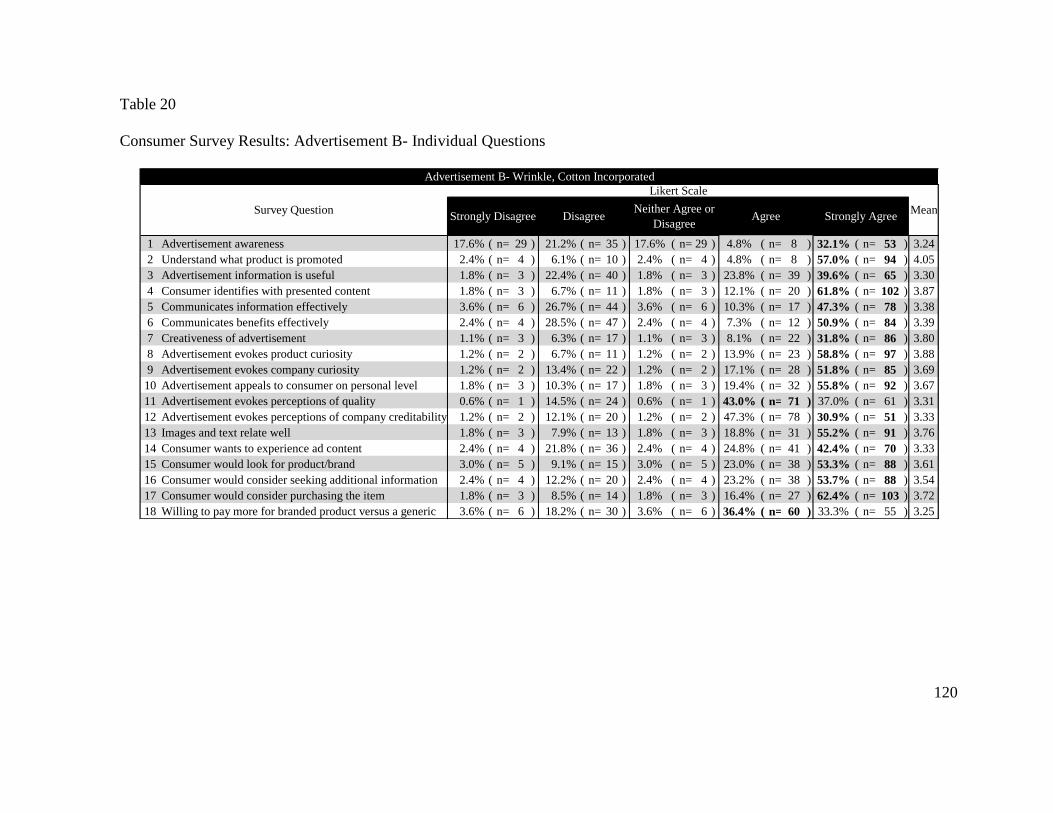
120
Table 20
Consumer Survey Results: Advertisement B- Individual Questions
1 Advertisement awareness 17.6% ( n= 29 ) 21.2% ( n= 35 ) 17.6% ( n= 29 ) 4.8% ( n= 8 ) 32.1% ( n= 53 ) 3.24
2 Understand what product is promoted 2.4% ( n= 4 ) 6.1% ( n= 10 ) 2.4% ( n= 4 ) 4.8% ( n= 8 ) 57.0% ( n= 94 ) 4.05
3 Advertisement information is useful 1.8% ( n= 3 ) 22.4% ( n= 40 ) 1.8% ( n= 3 ) 23.8% ( n= 39 ) 39.6% ( n= 65 ) 3.30
4 Consumer identifies with presented content 1.8% ( n= 3 ) 6.7% ( n= 11 ) 1.8% ( n= 3 ) 12.1% ( n= 20 ) 61.8% ( n= 102 ) 3.87
5 Communicates information effectively 3.6% ( n= 6 ) 26.7% ( n= 44 ) 3.6% ( n= 6 ) 10.3% ( n= 17 ) 47.3% ( n= 78 ) 3.38
6 Communicates benefits effectively 2.4% ( n= 4 ) 28.5% ( n= 47 ) 2.4% ( n= 4 ) 7.3% ( n= 12 ) 50.9% ( n= 84 ) 3.39
7 Creativeness of advertisement 1.1% ( n= 3 ) 6.3% ( n= 17 ) 1.1% ( n= 3 ) 8.1% ( n= 22 ) 31.8% ( n= 86 ) 3.80
8 Advertisement evokes product curiosity 1.2% ( n= 2 ) 6.7% ( n= 11 ) 1.2% ( n= 2 ) 13.9% ( n= 23 ) 58.8% ( n= 97 ) 3.88
9 Advertisement evokes company curiosity 1.2% ( n= 2 ) 13.4% ( n= 22 ) 1.2% ( n= 2 ) 17.1% ( n= 28 ) 51.8% ( n= 85 ) 3.69
10 Advertisement appeals to consumer on personal level 1.8% ( n= 3 ) 10.3% ( n= 17 ) 1.8% ( n= 3 ) 19.4% ( n= 32 ) 55.8% ( n= 92 ) 3.67
11 Advertisement evokes perceptions of quality 0.6% ( n= 1 ) 14.5% ( n= 24 ) 0.6% ( n= 1 ) 43.0% ( n= 71 ) 37.0% ( n= 61 ) 3.31
12 Advertisement evokes perceptions of company creditability 1.2% ( n= 2 ) 12.1% ( n= 20 ) 1.2% ( n= 2 ) 47.3% ( n= 78 ) 30.9% ( n= 51 ) 3.33
13 Images and text relate well 1.8% ( n= 3 ) 7.9% ( n= 13 ) 1.8% ( n= 3 ) 18.8% ( n= 31 ) 55.2% ( n= 91 ) 3.76
14 Consumer wants to experience ad content 2.4% ( n= 4 ) 21.8% ( n= 36 ) 2.4% ( n= 4 ) 24.8% ( n= 41 ) 42.4% ( n= 70 ) 3.33
15 Consumer would look for product/brand 3.0% ( n= 5 ) 9.1% ( n= 15 ) 3.0% ( n= 5 ) 23.0% ( n= 38 ) 53.3% ( n= 88 ) 3.61
16 Consumer would consider seeking additional information 2.4% ( n= 4 ) 12.2% ( n= 20 ) 2.4% ( n= 4 ) 23.2% ( n= 38 ) 53.7% ( n= 88 ) 3.54
17 Consumer would consider purchasing the item 1.8% ( n= 3 ) 8.5% ( n= 14 ) 1.8% ( n= 3 ) 16.4% ( n= 27 ) 62.4% ( n= 103 ) 3.72
18 Willing to pay more for branded product versus a generic 3.6% ( n= 6 ) 18.2% ( n= 30 ) 3.6% ( n= 6 ) 36.4% ( n= 60 ) 33.3% ( n= 55 ) 3.25
Survey Question
Advertisement B- Wrinkle, Cotton Incorporated
Neither Agree or
DisagreeAgree Strongly Agree
Mean
Likert Scale
Strongly Disagree Disagree

121
Discussion: Advertisement B Survey Results- Individual Questions
RO5A- Is the population is aware of the advertised ingredient product?
Most of the consumers surveyed (56%) had seen Advertisement B before, the highest
recognition rate of advertisement tested.
RO5B- Does the population know the functionality of the ingredient product?
The majority (86.67%) of the population stated they understood what product was
being promoted and 73.94% identified with the images presented in the advertisement.
RO5C- What features of the advertisement are most effective?
However, only 49.7% of participants found the advertising text useful. Most
(57.58%) said that the advertisement communicated adequate product performance
information and 58.18% said the advertisement communicated adequate product benefit
information. This advertisement contained the least amount of text of the advertisements
used in the survey. Instead of using a paragraph as Advertisement A did, Advertisement B
used very simple and short text to communicate product benefits, along with a very strong
image. The majority (80%) of respondents said that the product looked high quality, and
78.18% said that the company looked reputable. Many (67.27%) consumers said that they
related to the presented images. Given that the population was over 80% female, there may
be a gender bias with this advertisement. Most (76.36%) of consumers surveyed said that
based on the advertisement, they would consider looking for this product in consumer goods.
This advertisement presents a strong image associated with their product claim. The
businessperson is depicted smashing her cloths into a suitcase, not seeming to care because
her products are wrinkle resistant. She is presenting an image of a consumer that is very

122
confident in the product’s ability to deliver performance. The woman is also very well
dressed, looks successful, and attractive which may influence the likeability of this
advertisement among the sample population.
RO5E- Is the population willing to pay more?
The majority of respondents (78.79%) said they would consider purchasing this
product and 69.7% said they would choose this product over a generic substitute.
Overall, this advertisement was the most well received across advertisements tested.
The advertisement was unique in its design as well as in its presentation. The advertisement
embraced the product performance attribute and made the entire advertisement revolve
around it. Notice that the background and all objects in the image, with the except for the
model and the cloths in the suitcase, have the “wrinkled paper’ effect overlay. This sends a
strong message about the performance of the product, in a unique and memorable way. In
addition, the advertisement was presented as a “hangtag” in that it looked like a hangtag on a
garment, complete with string. These features made this advertisement unique.

123
Table 21
Consumer Survey Results: Advertisement C- Individual Questions
1 Advertisement awareness 30.3% ( n= 50 ) 46.1% ( n= 76 ) 7.9% ( n= 13 ) 15.2% ( n= 25 ) 0.6% ( n= 1 ) 2.10
2 Understand what product is promoted 2.4% ( n= 4 ) 27.3% ( n= 45 ) 9.7% ( n= 16 ) 53.9% ( n= 89 ) 6.7% ( n= 11 ) 3.35
3 Advertisement information is useful 1.8% ( n= 3 ) 23.6% ( n= 39 ) 20.6% ( n= 34 ) 50.9% ( n= 84 ) 3.0% ( n= 5 ) 3.30
4 Consumer identifies with presented content 2.5% ( n= 4 ) 17.2% ( n= 28 ) 17.2% ( n= 28 ) 54.6% ( n= 89 ) 8.6% ( n= 14 ) 3.50
5 Communicates information effectively 1.2% ( n= 2 ) 28.5% ( n= 47 ) 13.3% ( n= 22 ) 49.7% ( n= 82 ) 7.3% ( n= 12 ) 3.3
6 Communicates benefits effectively 1.2% ( n= 2 ) 27.3% ( n= 45 ) 20.0% ( n= 33 ) 46.7% ( n= 77 ) 4.8% ( n= 8 ) 3.27
7 Creativeness of advertisement 5.5% ( n= 9 ) 38.2% ( n= 63 ) 26.1% ( n= 43 ) 26.7% ( n= 44 ) 3.6% ( n= 6 ) 2.85
8 Advertisement evokes product curiosity 1.2% ( n= 2 ) 20.0% ( n= 33 ) 15.2% ( n= 25 ) 60.0% ( n= 99 ) 3.6% ( n= 6 ) 3.45
9 Advertisement evokes company curiosity 2.4% ( n= 4 ) 22.4% ( n= 37 ) 25.5% ( n= 42 ) 46.1% ( n= 76 ) 3.6% ( n= 6 ) 3.26
10 Advertisement appeals to consumer on personal level 6.1% ( n= 10 ) 31.5% ( n= 52 ) 21.8% ( n= 36 ) 32.7% ( n= 54 ) 7.9% ( n= 13 ) 3.05
11 Advertisement evokes perceptions of quality 1.8% ( n= 3 ) 11.6% ( n= 19 ) 37.2% ( n= 61 ) 45.7% ( n= 75 ) 3.7% ( n= 6 ) 3.38
12 Advertisement evokes perceptions of company creditability 0.6% ( n= 1 ) 12.7% ( n= 21 ) 46.7% ( n= 77 ) 38.2% ( n= 63 ) 1.8% ( n= 3 ) 3.28
13 Images and text relate well 0.6% ( n= 1 ) 8.5% ( n= 14 ) 17.0% ( n= 28 ) 65.5% ( n= 108 ) 8.5% ( n= 14 ) 3.73
14 Consumer wants to experience ad content 3.6% ( n= 6 ) 25.5% ( n= 42 ) 26.7% ( n= 44 ) 37.6% ( n= 62 ) 6.7% ( n= 11 ) 3.18
15 Consumer would look for product/brand 1.8% ( n= 3 ) 33.9% ( n= 56 ) 26.1% ( n= 43 ) 35.8% ( n= 59 ) 2.4% ( n= 4 ) 3.03
16 Consumer would consider seeking additional information 1.8% ( n= 3 ) 23.6% ( n= 39 ) 27.3% ( n= 45 ) 45.5% ( n= 75 ) 1.8% ( n= 3 ) 3.22
17 Consumer would consider purchasing the item 2.4% ( n= 4 ) 26.7% ( n= 44 ) 30.3% ( n= 50 ) 37.6% ( n= 62 ) 3.0% ( n= 5 ) 3.12
18 Willing to pay more for branded product versus a generic 6.7% ( n= 11 ) 30.3% ( n= 50 ) 36.4% ( n= 60 ) 21.2% ( n= 35 ) 5.5% ( n= 9 ) 2.88
Advertisement C: Gore-Tex, W. L. Gore
Agree Strongly Agree
Likert Scale
MeanStrongly Disagree Disagree
Survey Question Neither Agree or
Disagree
124
Discussion: Advertisement C Survey Results- Individual Questions
RO5A- Is the population is aware of the advertised ingredient product?
Most of the respondents 76.36% had not seen this advertisement in the past.
RO5B- Does the population know the functionality of the ingredient product?
Most of the respondents (60.60%) understood what product was being promoted.
Many of those surveyed (56.97%) thought the advertisement presented enough product
performance information and 51.52% thought it proved enough product benefit information.
RO5C- What features of the advertisement are most effective?
Many of the consumers surveyed (39.4%) said that the information provided in the
advertisement was useful and 63.19% identified with the images presented. Many of the
respondents (43.64%) said that the advertisement was not unique or memorable. Most
respondents (63.64%) were curious about the product and 49.7% were curious about the
company. Only 40.61% of participants said the advertisement appealed to them on a personal
level. Many consumers (49.39%) surveyed thought the product was high quality and 40%
thought the company was credible. Only 44.24% of participants wanted to experience the
images presented in the advertisement.
RO5E- Is the population willing to pay more?
Based on the advertisement, 38.18% of participants said they would consider looking
for the product in a consumer good, and 47.37% said they would seek additional information
based on advertisement content. Many consumers (40.61%) said they would consider
purchasing the product but only 26.67% said they would purchase the item over a generic.

125
In most of the questions, this advertisement received the lowest scores of the three
advertisements tested. This advertisement used a large image of its logo in a prominent place
on the advertisement, indicating that it was relying heavily on the consumer to recognize the
company logo and have some prior knowledge of benefits. This advertisement uses more
technically oriented graphics to indicate performance level, but as the survey indicates, the
attributes were not communicated well enough to entice the consumer to investigate further.
Table 22
Consumer Survey Results: Advertisement A, B, and C Comparisons
Multi-Advertisement Comparison Question 1: Which advertisement is most visually interesting?
Advertisement A- Glen Raven Advertisement B- Cotton Inc Advertisement C- W. L. Gore
24.8% 63.6% 10.9%
Multi-Advertisement Comparison Question 2: Which advertisement provides the most complete
information?
Advertisement A- Glen Raven Advertisement B- Cotton Inc Advertisement C- W. L. Gore
81.8% 11.5% 6.7%
Multi-Advertisement Comparison Question 3: Which advertisement is most memorable or unique?
Advertisement A- Glen Raven Advertisement B- Cotton Inc Advertisement C- W. L. Gore
14.5% 74.5% 9.7%
Multi-Advertisement Comparison Question 4: Which advertisement has the best layout? (i.e. text vs.
image balance, colors, images etc.)
Advertisement A- Glen Raven Advertisement B- Cotton Inc Advertisement C- W. L. Gore
40.6% 40.0% 17.6%
Multi-Advertisement Comparison Question 5: Based on the advertisement alone, and not if you are
personally interested in the product, which products would you seek additional information? (mark all
that apply)
Advertisement A- Glen Raven Advertisement B- Cotton Inc Advertisement C- W. L. Gore
43.6% 55.8% 56.4%
Multi-Advertisement Comparison Question 6: Based on the advertisement alone, and not if you are
personally interested in the product, which products would consider purchasing? (mark all that apply)
Advertisement A- Glen Raven Advertisement B- Cotton Inc Advertisement C- W. L. Gore
40.0% 73.3% 46.1%

126
Discussion: Advertisement A, B, and C Comparison Survey Results- Individual Questions
Advertisement B was selected as the most visually interesting and the most unique,
63.6% and 74.5% respectively. The majority (81.8%) of those surveyed believed
Advertisement A, provided the most complete information. Advertisements A and B were
close in the number of participants that selected them as having the best layout, 40.6% and
40.0%. When asked which advertisement they would seek additional information for, 56.4%
of respondents selected Advertisement C and 55.8% selected Advertisement B. Based on the
advertisement alone, 73.3% of participants said that would consider purchasing
Advertisement B’s product.
Discussion: General Advertising Preferences Survey Results
RO5C- What features of the advertisement are most effective?
The majority (78.6%) of respondents agreed that product comparisons and using real
life examples of the product in use were a good way to establish credibility. This indicates
that including this type of information could persuade this group of consumers to consider
purchasing a product. Only 46.6% of those surveyed said that endorsements and celebrity
spokes persons built credibility. Based on this sample and their preferences, it may not be as
effective to use celebrity endorsements or spokes persons to promote products to this group.
Most (68.7%) of consumers surveyed said that technical data helped to establish credibility
(See Figure 16).

127
Table 23
General Advertising Preferences Survey Results- Individual Questions
1 Consumer looks for branded textile products 4.8% ( n= 8 ) 30.9% ( n= 51 ) 27.3% ( n= 45 ) 28.5% ( n= 47 ) 8.5% ( n= 14 ) 3.05
2 Consumer prefers branded textile products 3.0% ( n= 5 ) 23.0% ( n= 38 ) 37.0% ( n= 61 ) 30.3% ( n= 50 ) 6.7% ( n= 11 ) 3.15
3 Likelihood of seeking information based on advertisements 1.2% ( n= 2 ) 16.4% ( n= 27 ) 20.0% ( n= 33 ) 55.8% ( n= 92 ) 6.7% ( n= 11 ) 3.50
4 Looks for information in print advertisements 1.8% ( n= 3 ) 35.8% ( n= 59 ) 29.7% ( n= 49 ) 30.9% ( n= 51 ) 1.8% ( n= 3 ) 2.95
5 Looks for information in television advertisements 3.0% ( n= 5 ) 26.7% ( n= 44 ) 27.3% ( n= 45 ) 41.8% ( n= 69 ) 1.2% ( n= 2 ) 3.1
6 Looks for information on company maintained websites 0.0% ( n= 0 ) 8.5% ( n= 14 ) 12.1% ( n= 20 ) 60.0% ( n= 99 ) 19.4% ( n= 32 ) 3.90
7 Looks for information on third party websites 6.1% ( n= 10 ) 31.1% ( n= 51 ) 22.6% ( n= 37 ) 32.3% ( n= 53 ) 7.9% ( n= 13 ) 3.05
8 Looks for information in newspaper and magazine articles and reviews 2.4% ( n= 4 ) 26.7% ( n= 44 ) 17.0% ( n= 28 ) 47.9% ( n= 79 ) 6.1% ( n= 10 ) 3.28
9 Looks for information on in-store advertisements 0.6% ( n= 1 ) 18.8% ( n= 31 ) 23.6% ( n= 39 ) 49.7% ( n= 82 ) 7.3% ( n= 12 ) 3.44
10 Looks for information from store sales personnel 1.2% ( n= 2 ) 21.2% ( n= 35 ) 21.8% ( n= 36 ) 49.7% ( n= 82 ) 6.1% ( n= 10 ) 3.38
11 Looks for information on on-product hangtags and labels 0.0% ( n= 0 ) 7.3% ( n= 12 ) 15.8% ( n= 26 ) 61.2% ( n= 101 ) 15.8% ( n= 26 ) 3.85
12 Looks for information on the product’s packaging 0.0% ( n= 0 ) 8.0% ( n= 13 ) 10.4% ( n= 17 ) 66.3% ( n= 108 ) 15.3% ( n= 25 ) 3.89
13 Looking for additional product information 0.0% ( n= 0 ) 5.5% ( n= 9 ) 14.1% ( n= 23 ) 65.0% ( n= 106 ) 15.3% ( n= 25 ) 3.90
14 Looking for additional company information 1.2% ( n= 2 ) 33.1% ( n= 54 ) 32.5% ( n= 53 ) 29.4% ( n= 48 ) 3.7% ( n= 6 ) 3.01
15 Product comparisons provide credibility 0.0% ( n= 0 ) 2.5% ( n= 4 ) 19.0% ( n= 31 ) 70.6% ( n= 115 ) 8.0% ( n= 13 ) 3.84
16 Showing real-life problem/ solutions provide credibility 0.0% ( n= 0 ) 3.7% ( n= 6 ) 17.8% ( n= 29 ) 71.2% ( n= 116 ) 7.4% ( n= 12 ) 3.82
17 Celebrity spokes persons provide credibility 4.9% ( n= 8 ) 22.1% ( n= 36 ) 26.4% ( n= 43 ) 40.5% ( n= 66 ) 6.1% ( n= 10 ) 3.21
18 Technical information provide credibility 0.6% ( n= 1 ) 6.1% ( n= 10 ) 24.5% ( n= 40 ) 54.6% ( n= 89 ) 14.1% ( n= 23 ) 3.75
MeanStrongly Disagree Disagree
Neither Agree or
DisagreeAgree Strongly Agree
Survey Question
Likert Scale
General Advertising Preferences

128
Figure 16: Advertisement Content Credibility Source Preferences
RO5D- Does the population look for the ingredient when purchasing products?
There was no clear trend in whether or not the consumer looks for branded
textile components in their products, 37% said yes, 27.3% were neutral, and 35.7% said
no (see Figure 17). The trend was similar when consumers were asked if they preferred
branded textile components over generics, 37% said yes, 37% were neutral, and 26%
said no (see Figure 18). However, 62.5% of those surveyed said they are likely to seek
additional information about a product seen in an advertisement.
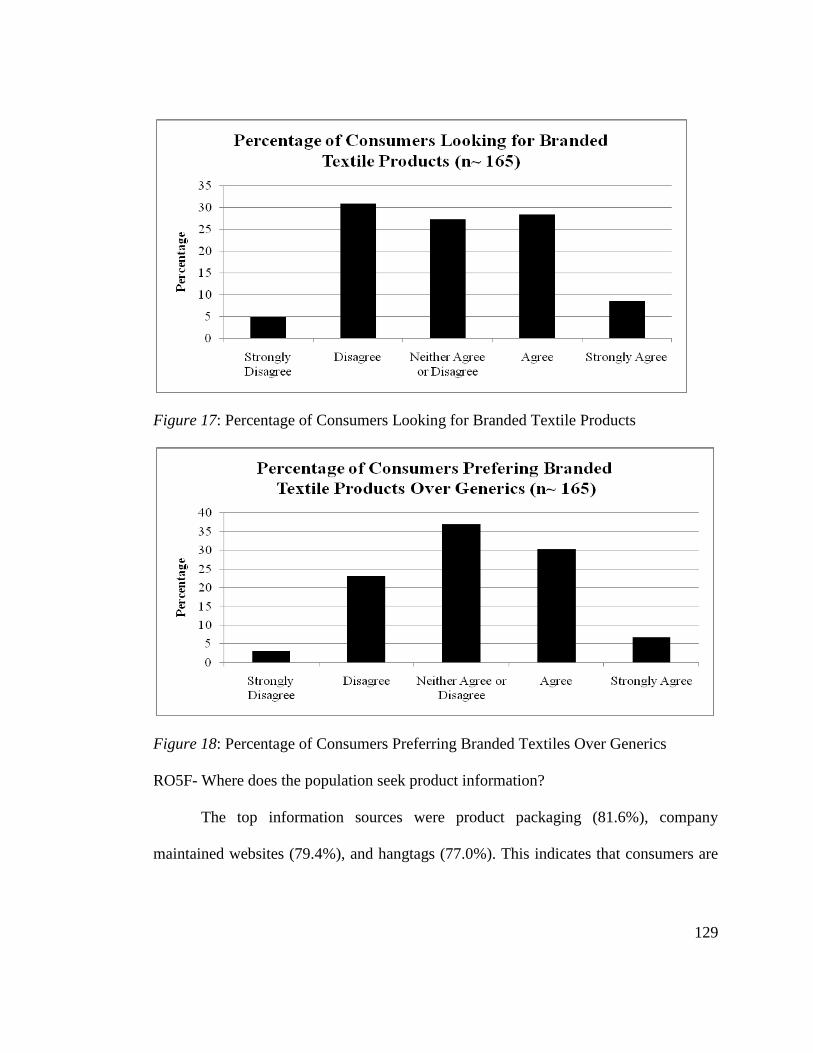
129
Figure 17: Percentage of Consumers Looking for Branded Textile Products
Figure 18: Percentage of Consumers Preferring Branded Textiles Over Generics
RO5F- Where does the population seek product information?
The top information sources were product packaging (81.6%), company
maintained websites (79.4%), and hangtags (77.0%). This indicates that consumers are

130
usually looking for information at the time of purchase, which could mean there are
opportunities in including product information on hangtags that link to online resources
as Company F indicated. Conversely, the least favored information sources were print
(32.7%), third party websites (40.2), and television (43.0%) (see Figure 19). The
majority (80.4%) of participants said that when they are looking for information, it is
product related, and 33.1% said it was company related.
Figure 19: Consumer Information Source Preferences
131
Phase IV- Conceptual Framework Revisions
Objectives
RO7: Develop a framework that U.S. textile companies can use to develop an upstream
advertising campaign.
RO7A: Provide ITT member companies with the knowledge and guidelines
differentiate themselves through advertising in a highly competitive market.
From the findings of the research study, a new model was developed that was
specifically created to address the methodology, considerations, and market preferences
associated with advertising performance textile products (see Figure 20).

132
Figure 20: Upstream Textile Performance Product Advertisement Development Process Model

133
Discussion: Model Development
The Upstream Textile Performance Product Advertisement Development Process
Model was developed using the results from Phases I-III. The model was created specifically
to account for the considerations of upstream textile firms developing advertisements for the
performance textile market. Like the Adapted Advertising Methodology Model (2009), the
advertising process was sequential in nature, meaning each activity needed to be completed
before the next could commence. However, unlike Adapted Advertising Methodology
Model (2009) which was and an open loop process, the new model was changed to a closed
loop model by creating decision making points that would route the process depending on the
answer.
The model is divided into four sections labeled A, B, C and D. Section A is the
Situation Analysis and Goal Setting stage. During this stage, firms, identify if advertising is
the correct course of action, determine the budget and conduct the situation analysis. The
activities performed during situation analysis are dependent the firm’s marketing strategy.
For a pull strategy, more downstream considerations are required, such as the designer,
retailer, and consumer evaluations. For push strategies, firms should concentrate more on the
customer. For both push and pull strategies, product evaluation, advertising history, and
managerial goal should be included during this step. Companies implementing a push/pull
strategy should consider all items listed. Form the situation analysis marketing goals are set.
Section B is the Development Considerations segment. In this section, the firm uses
the marketing goals to determine the advertising message, determine media types and
complete creative work. Once the marketing goals are established the firm can either consult

134
and advertising agency or commence advertising planning in-house or both. During creative
development, point of parity and point of difference are established based upon the product
evaluation and target market preferences. The competitive frame of reference involves
determining how to position the product in the market, this too is dependent on product and
target considerations. From there creative development begins which is split into media and
advertising recommendations. Both of these processes interact with the creative portion of
the advertisement.
Section C is the Executions stage of the process. Once the message and has been
developed and the media plan determined, the execution of the message must be developed.
This step determines which media type to use in order to communicate with the target
audience effectively. Executions were broken down by target audience (b2b, b2c and
b2b/b2c) and media types that were identified as significant are identified with an asterisk.
From the result so Phases I-III, it was found that many B2C companies pretested their
advertising media with target groups in order to gain their feedback before full
implementation. Therefore, the “Advertisement Test Successful?” decision diamond was
added. Once the advertisement has been successfully tested, the advertisement can be
implemented.
Section D is the Evaluation and Conclusions stage. Although the benefits of
advertising may not be immediate, evaluation of the effectiveness of the campaign is
important to determine in order to improve future campaigns. Qualitative and quantitative
measures should be used depending on the goals set out for the campaign. Results from
these metrics should be compared to those of previous finding identified during the situation
135
analysis. From the literature review and company interviews it was stated that advertising
should be evaluated to see if the media was achieving the goals set forth by management.
Based upon these findings the “Campaign Meeting Goals?” block was added. If the
advertisement is meeting marketing goals, then the campaign should continue and be
reevaluated at a later date. If the campaign is no longer meeting goals, then it should
modified or terminated and conclusions drawn for that campaign. Conclusions drawn from
previous campaigns should be accounted for during the situation analysis of the next
campaign.
It was found that many upstream textile firms used advertising agencies to help them
create advertisements, which was not represented in the adapted model. This step was added
to Revised Adapted Advertising Methodology Model (2009) early in the development
process. After the firms identify critical factors in their situation analysis, an advertising
agency can help to determine marketing goals and assist with activities later in the process.
Although many companies said that advertisement consultation is expensive and time
consuming, it may be an important step, depending on the experience level of the company.
With regard to the opportunities identified in the study, customer and retailer/designer
evaluations were added to the situation analysis. This stems from interview respondents
stating that new opportunities existed downstream in the supply chain, closer to the
consumer. Media recommendations were expanded to show the steps within that activity in
order to provide additional clarity. The creative portion of the process was given its own
step, as it can be done in-house or external from the company. Another area of the Adapted
Advertising Methodology Model (2009) that was missing was there were no examples of

136
executions. Specific advertising media types were added along with indicators of whether to
use that media type in B2B or B2C communications or both. Online media choices were
specifically highlighted due their potential for growth, mass appeal, tracking ability, and ease
of maintenance. Both consumers and industry representatives, stated that online media was
an effective information source and vehicle for advertising.
The Adapted Advertising Methodology Model (2009) also lacked evaluation
methodology methods, which from the results of the interviews, was an area many
companies struggled. From the industry interviews, the budget step was moved closer to the
beginning of the framework because most textile firms begin with a set budget and then
determine their advertising activities based upon that budget. Managerial goals were added to
ensure that the advertising objectives coincide with the overall objective of the company.
The advertisement development recommendations step was split into advertisement planning
and creative development to add clarity to the step.

137
CHAPTER V
SUMMARY, CONCLUSIONS, AND RECOMMENDATIONS
Summary of Research
The purpose of this research was to examine upstream textile firms that effectively use
advertising to differentiate their products in the market. The overall research questions were
what factors contribute to an effective advertisement and what are the best techniques to
facilitate communication with the customer and final consumer. The study focused on
determining the benefits, potential, and challenges of upstream advertising and the most
effective strategies of communication with the customer and the end-use consumer. Another
research objective was to develop a framework that upstream textile firms can use create to
effective advertising strategies to differentiate their products.
To accomplish these goals, a four-phase methodology was employed. Phase I was
exploratory in nature and worked to identify companies with successful advertising
strategies. Competitive analyses and case studies were used to develop an understanding of
current advertising strategies and gather quantitative information about the effectiveness of
advertising. Phase II consisted of conducting industry interviews in order to gain primary
qualitative information about the benefits, challenges, and opportunities of upstream
advertising. In addition, companies were asked to provide a customer perspective of the
effectiveness of current advertising efforts. In Phase III, primary research was conducted in
order to gain insight into the potential of upstream advertising from a downstream
perspective. This research took the form of a quantitative survey administered to selected
end-use consumers. Survey data was used to develop an understanding of the potential of

138
upstream textile advertising focusing on different advertising opportunities including print,
television, and the Internet. Finally, Phase IV used the results of Phases 1, II, and III to
develop a framework that U.S. textile companies can utilize to develop an upstream
advertising campaign.
The results of this research provide knowledge of the benefits, potential, and
challenges of upstream advertising. By understanding these factors, it will assist companies
in determining the cost/benefit relationship of advertising and aid in managerial decision-
making. This research will also help to guide companies in their selection of the best media
type to fit their target market. In addition, the research will provide a framework for U.S.
textile firms to use when implementing an upstream advertising strategy. Finally, this study
will provide a means for U.S. textile firms to create perceived value and differentiation. By
understanding the nature of the upstream advertising, U.S. producers will be ideally
positioned to gain a competitive advantage through differentiation.
Summary of Results
Benefits, Potential, Challenge, and Opportunities of Upstream Advertising
Both B2B and B2C companies have the opportunity to use advertising to differentiate
their products from commodity goods in the performance textile market. Advertising
provides a means to communicate product benefits, or other messages, to a target audience.
Advertising offers a variety of communication vehicles that can be developed based upon the
target’s preferences. It has been shown that effective advertising can generate real,
measurable changes in product awareness and sales volume. By using advertising to create
market perceptions and interactions between products and customers/consumers, companies

139
can differentiate and create preferences for advertised products, which may lead to increased
viability, sales, and product loyalty.
From research and communications with various representatives from both the textile
and advertising industries, it was found that there was general agreement about the benefits
of advertising. The literature review cited building awareness, increasing profits, and
building brands as the benefits of advertising (Sandage, Fryburger, & Rotzoll, 1983, Wright-
Isak, Faber, & Horner, 1997). These findings were confirmed by the competitive analysis and
case study findings, as well as the industry interview results. From the interviews and case
studies, additional benefits included: building credibility, connecting with
customers/consumers, and increasing involvement with brands. The most important benefits
were found to be building awareness and increasing sales, however, many were quick to say
that increasing sales was the ultimate goal. Overall, the results from Phases I-III confirmed
the literature in that the benefits and success of an advertising campaign are relative to the
goals set out for that campaign by the company (Wright-Isak, Faber, & Horner, 1997).
The literature review cited many challenges including market level and financial level
considerations (Sandage, Fryburger, & Rotzoll, 1983; Keller, 2003; Vass, 2005; Haigler,
2008). From the case studies and interviews, both B2B and B2C oriented companies stated
that the main challenge was creating relevant advertisements that would connect with the
customer/consumer in an effective and lasting manner. Other challenges included costs
associated with advertising and data gathering methodologies.
The perceived potential of advertising was varied. The literature and case studies
portrayed advertising as an effective way to grow revenues, market share, and awareness by

140
either collaborating with other firms or creating large scale, multimedia type campaigns
(Keller, 2003; Desai & Keller, 2002). However, from conversations with industry
representatives, it was clear that the potential for advertising was not as great. Many B2B
firms felt that the potential benefit of advertising to the end consumer did not out weigh the
cost. This is partially due to the perception that end consumers did not find value in their
products and therefore, it would be difficult to make their advertisements relevant. Thus,
companies should work to gain customer or consumer level perspectives in order to
understand their preferences which can be used to develop more effective advertising
campaigns.
From a supply chain standpoint, many companies felt that advertising was only
directed toward companies with whom they had not done business in the past. Some
companies went as far to say that they knew most of the largest players in their segment of
the industry and that there were few new opportunities, however, there may be potential
downstream to make connections with brands, designers, and retailers by educating and
building preference among those groups. This method seems to be the next logical step,
moving from the manufacturing level further through the supply chain and eventually to the
end consumer for a pull through strategy.
Strategies Used in the Performance Textile Market
The data from case studies revealed that television advertising was an effective
method to build awareness and increase sales relatively quickly in B2C markets. However,
this method is very expensive and may not be appropriate for all companies. For B2B,
141
printed advertisements were more successful in the supply chain segment than the consumer
segment. However, Internet advertising was found to have potential across both groups.
From the product scan, it was found that hangtags and sewn in labels were the main
forms of upstream advertising used in B2C marketing. These advertisements place product
information in front of the consumer at the time of purchase in an effort to increase the
buying potential of the product. Upstream companies concentrated more advertising efforts
in the specialty and boutique level stores, which catered to outdoor enthusiasts specifically
and sold higher priced goods. If companies are providing products for consumer goods in
these locations, hangtags may increase the likelihood of purchase over products with no
information. Opportunities also exist in the mass channel, where hangtags are less prevalent;
companies could potentially differentiate their products quickly as there are few other
ingredient products being promoted. However, communicating product or company benefits
to the customer or end consumer was universally cited across data sources as the most
important function of advertising, no matter what media vehicle was used.
Industry interviews revealed a variety of advertising tactics ranging from hangtags to
sponsored events, but most companies, especially B2B, relied on online, print, and PR as
their main media vehicles. This was later confirmed by the supply chain survey where most
customers stated they preferred online and printed advertisements. It was said that PR
activities can validate advertising claims for potential customer or consumers, which makes
using both activities in tandem an effective strategy. Many companies participating in B2C
marketing stated that they were willing to provide on-product advertising content to their
customers, but most did not insist upon it. If a company’s product is close to the end

142
consumer, hangtags may be an effective differentiation strategy, as nearly all consumers
surveyed stated that they looked for on-product advertisements for product information.
Effective Strategies for Communicating with Industry, Customers, and Consumers
Companies focusing on B2B advertisements should concentrate on online media,
trade shows, and printed advertisements. The respondents confirmed this by stating that they
typically look for company or product information on the Internet, at trade shows, and in
printed publications, but the Internet was the number one response. Therefore,
advertisements using these types of medias may be an effective strategy to build visibility
and credibility, as well as differentiate products.
In terms of the content of B2B advertisements, including product performance
attributes, using a point of parity and point of difference strategy, as well as acknowledging
the interests of the target audience may be an effective strategy. B2B companies also stated
that, when looking for information, they were typically trying to determine business fit,
related to the possibility of new business ventures. Therefore, as the literature review
suggested, creating B2B advertising content that facilitates the business process may be an
effective strategy as well. When selecting new suppliers, companies were looking for
company credibility, commitment to the industry, and company longevity. Including
advertisement content that communicates these attributes, could entice potential customers to
initiate contact. The majority of customer respondents (both B2B and B2C) were looking for
a call to action and contact information in their advertisements, in addition to product and
company information.

143
For B2C focused strategies, the inclusion of online content should be strongly
considered. Consumers surveyed were looking for product information online, through
company maintained websites, and on-product hangtags and packaging. Very few looked for
information in printed sources, unlike industry customers. This indicates that many
consumers are gathering their product information at the time of purchase. Therefore, placing
advertisements as close as possible to the time of purchase may entice consumers to purchase
one product over another. With mobile web access growing, promoting mobile-web friendly
web pages (web pages easily viewable on handheld devices) on hangtags may be an efficient
way to provide product information quickly at the purchase decision. Consumers in the sports
and leisure segments, especially outdoor apparel and equipment, are interested in the
performance attributes of their products and are conscious of brands (including upstream and
downstream brands).
As these college-aged consumers move into the work force, they will take these
information-gathering habits into their job. Therefore, in order to advertise to these
individuals effectively, it will be important to have a strong web presence. As the literature
review indicated consumer habits often cross over into the business world, therefore, as the
next generation of technology savvy individuals begins to take prominent positions in the
industry, taking into account these preferences will be critical (Andrews, 2005). As the case
studies and some companies revealed, consumers are looking for ways to connect to their
products and companies and, as found through the literature review, outdoor product
consumers felt very strongly about the brands they purchased. Again, as with the B2B

144
strategies, creating these interactions can differentiate products by building relationship and
loyalty.
When considering what content should be included in B2C advertisements,
consumers surveyed said that product comparisons and relating how products can solve real
world problems were the best ways to create credibility for a product or company. Therefore,
advertisements that communicate these qualities have the potential to be effective with this
consumer segment.
Strategies that include both B2B and B2C audiences should use online advertisements
as part of their advertising strategy. Both industry customers and consumers use the online
information source to gain product and company information and nearly all company
respondents agreed that online media held the most potential for future advertisements. This
was also apparent from the case studies where companies would supplement their print and
television advertisements with online content. Companies with larger budgets, typically more
B2C oriented firms, created entire websites dedicated to a particular campaign, which hosted
online content such as games, forums, and other interactive content in an effort to connect
with the customer/consumer. Online advertising can be effective for both B2B and B2C
audiences, as it can provide targeted messages when coupled with consumer/customer data.
Online content can also be distributed on a mass scale, updated quickly, and made available
at all times.
Cost Benefit Relationship
Through data collection and the literature review (Wright-Isak, Faber, & Horner,
1997), it was concluded that the cost benefit relationship was unique to each company and

145
each campaign, therefore a universal cost benefit measure was unable to be determined.
Companies typically knew how much money was spent on an advertisement, but most
seemed to do little post campaign evaluation, which makes determining the cost benefit
relationship difficult. Quantifying the benefits of advertising was also difficult due to the
qualitative benefits of advertising, which are difficult to quantify. For companies to
determine the cost benefit relationship more accurately, more effort must be placed in
quantifying the effects that advertising has had on their business. From the competitive
analysis and case studies, there were several metrics used including sales volume
comparisons, web traffic tracking, and surveys. Nevertheless, whatever method is chosen,
the evaluation methodology must be repeatable, compared with previous data, measured over
a specific time frame, and compared against having not invested advertising at all. Care must
be taken when determining the time period for evaluation, as the effects of advertising are not
immediate.
Conclusions
1. Advertising has the ability to differentiate products by promoting specific attributes or
product characteristics that can distinguish a product in the market. It was also found that
advertising has the ability to influence sales by building awareness and creating
perceptions of value in the market.
2. Companies indicated that advertising succeeded when a potential customer or consumer
was aware of their products before being formally approached. However, sales were still
the main indicator of success and most companies agreed that if sales were not strong,
advertising tactics would be changed or terminated.

146
3. For B2B oriented campaigns, the research indicates that companies should focus on
online media, tradeshows, and printed advertisements; however, it is also important to
include PR and face-to-face interactions in the overall advertising strategy.
Advertisements should promote company credibility and interest in new business, while
at the same time communicating product benefits and acknowledging of the target’s
interests. Advertisements to B2B audiences should also attempt to facilitate the business
process by providing contact information and a call to action.
4. For B2C oriented campaigns, the research indicates that companies should focus on
online and on-product advertisements, as these were main sources of new product and
company information among this sample consumer population. The sample also
indicated that advertisements that used product comparisons and related how the product
could solve a problem were effective at building company credibility.
5. For both B2B and B2C advertising strategies, online advertising was said to have the
most potential for growth. Online advertisements provide a constant resource for
customers and consumers to find information and interact with the brand, which is key
for building relationships and differentiating products. Websites provide the opportunity
to reach a large audience and the content is company controlled. Online media also
provides automated tracking services that can help evaluate effectiveness and determine
the demographics of visitors to the site.
6. The use of on-product hangtags was a popular communication strategy for upstream
textile companies participating in the outdoor products market. Surveyed consumers
confirmed that they used hangtags as an information source. However, most of the

147
companies interviewed stated that they would provide hangtags only if the customers
requested them. It may be advantageous to promote the use of upstream component
hangtags to entities downstream as consumers are using them when making their
purchase decision.
7. Both B2B and B2C companies said that making advertisement content relevant was a
challenge. Companies can increase the relevancy potential by communicating and
surveying their potential customers and consumers in order to determine their advertising
preferences and feelings about the product. Many B2B companies stated that advertising
to the end consumer was too expensive and that effectiveness was difficult to track.
Online and on-product advertisements may be a viable, low cost solution. There were
also comments that creativity was a challenge.
8. Many B2B companies felt that there was limited growth potential in the supply chain
segment. With the number of textile companies in this country decreasing, many
companies are already aware of other businesses in the industry. While it is important to
maintain visibility, expanding efforts into the brand, retailer, and consumer segments
seems to be the next logical step in building awareness and relationships. Developing
messages and products relevant to entities downstream is important for building long-
term brand equity and facilitating a pull marketing strategy.
9. As the literature review suggested, a standard cost benefit relationship for upstream
textile companies could not be determined for the following reasons:
a. Companies stated there was no typical ROI or payback period.
b. Goals and benefits of advertising were company specific, if not customer specific.
148
c. Not all benefits can be given finite value equivalents and most were not formally
measured.
d. Most companies did not evaluate the cost benefit relationship formally.
e. Most companies tracked sales volume changes over the duration of the campaign
to assess effectiveness, but the effects of advertising are aggregate which limits
the accuracy of this method
Limitations
1. This study was specifically limited to the upstream textile firms participating in the
sports and leisure segment of the performance textile market. Companies interviewed
are representative of the upstream segment of the industry, but not the entire industry.
Therefore, the results presented in this report cannot be generalized for all segments
or all product categories.
2. Participants in the consumer survey are limited, but are representative of the
population. Because a non-probability convenience sample was used during the study,
the results presented in this report cannot be generalized for the entire population.
Biases in awareness may have occurred due to fact that upstream companies have
sponsored events and programs on the College of Textiles campus.
3. Respondent bias may be present in surveys and interviews, due to their willingness or
unwillingness to disclose certain data.
4. Advertising is only one component of promotional activities. While companies can
achieve success through other promotional avenues, this study only focuses on the
advertising portion of the mix.

149
5. Due to the markets and consumer preferences of the Raleigh/Cary, North Carolina
area, the availability and selection of products and publications identified in this study
are limited. Therefore, the results of this study are geographically limited and cannot
be applied to all geographic areas.
Recommendations
1. The research sample was restricted to upstream customers but companies said that
there were opportunities to collaborate with firms downstream. Future studies could
include retailers, brands, and designers in their interview and survey populations.
2. Across data sources, online advertising was said to have the most potential. Future
work could concentrate on this specific media type.
3. PR was said to be an effective advertising method. Future studies could focus on this
media type specifically.
4. Hangtags and on-product promotions seemed to be a common, yet underutilized
advertising media. Future studies could focus on this form of advertising to determine
what consumers look for in on-product advertisements and what products have the
most opportunity to utilize this form of advertising.
5. Many companies said they did little to measure advertising effectiveness. Future
studies could research what measurements are most efficient at measuring certain
effectiveness attributes for specific market segments.
6. Many companies said they chose to work with advertising agencies. Future studies
could investigate how to go about selecting advertising firms and what activities
companies should be outsourcing verses completing in-house.

150
7. As consumers reduce their spending, and are more conscious of where their money is
spent, “cause marketing” may be a viable strategy. Future studies could explore the
viability of this method as it relates to the textile industry.
8. Online social networking sites are a growing avenue for advertisers, future studies
could examine the applicability of using these in a strategy for advertising textile
products.

151
REFERENCES
50 Greatest B to B Ads. (1999, September). Advertising Age's Business Marketing,
Retrieved January 10, 2009, from Business Source Premier database.
Adomaitis, A. D. & Johnson, K. P. (2008). Advertisements: Interpreting images used to sell
to young adults. Journal off Fashion Marketing and Management; 12(2), 182-
192.
Andrews, D. (2005, September 26). Buying into B-to-B. Marketing Magazine, 110(31),
33-33.
Arnott, N. (1994, February). Inside Intel's marketing coup. Sales & Marketing
Management, 146(2), 78.
Brandweek. (1999). America's Top 2000 Brands. Retrieved Mar. 10, 2009, from
http://findarticles.com/p/articles/mi_m0BDW/is_25_40/ai_55090044
Cooper, A. (1997). How to Plan Advertising 2nd edition. London: Cassill.
Cotton Inc. (1999). Cotton Incorporated's Fabric of Our Lives® Campaign Wins 1998
Silver Retrieved Mar. 10, 2009, from
http://www.cottoninc.com/PressReleases/?articleID=189
Cotton Inc. (2009). Company History. Retrieved Mar. 10, 2009, from
http://www.cottoninc.com/AboutCotton/CompanyHistory/
Creswell, J. (2003). Research design: Quantitative, Qualitative, and Mixed Methods
Approaches. Thousand Oaks, CA: Sage Publications.
Desai, K., & Keller, K. (2002, January). The effects of ingredient branding strategies on
host brand extendibility. Journal of Marketing, 66(1), 73-93.
Dickerson, K. G. (1999). Textiles and Apparel in the Global Economy. Upper Saddle
River, NJ: Prentice Hall.
Dysart, J. (2005, August). Affiliate marketing. Industrial Fabric Products Review, 90(9), 50-
52
EFFIE. (2000). EFFIE Awards Brief of Effectiveness. Retrieved Mar. 10, 2009, from
http://s3.amazonaws.com/effie_assets/2000/634/2000_634_pdf_1.pdf
152
EFFIE (2008) EFFIE Winners Showcase. Retrieved Mar 10, 2009, from
http://www.effie.org/ideas_that_work
Elkin, T. (2001) Intel inside at 10. Advertising Age, 72(18), 4-31
Gore-Tex®, W. L. Gore (2009). Advertisement. Trail Runner. p. 32
Haigler, Rett (personal communication, December 5, 2008)
Hsu, J. L. & Mo, R. H. (2009). Consumer responses to incomplete information in print
apparel advertising. Journal of Fashion Marketing and Management, 13(1), 66-79.
Intel Corporation. (2009). Intel Inside(R) Program: Anatomy of a Brand Campaign.
Retrieved Feb. 9, 2008, from http://www.intel.com/pressroom/intel_inside.htm
Interbrand. (2009). Best global brands 2008 rankings. Retrieved Feb. 9, 2008, from
http://www.interbrand.com/best_global_brands.aspx
Johnson, B. (1991). The preferred chip; Intel employs NutraSweet branding strategy.
Advertising Age, 22-23.
Keegan, W. J., & Green, M. C. (2005). Global Marketing fourth edition. New Jersey,
USA: Prentice Hall.
Keller, Kevin, L. (2003). Strategic Brand Management, 2nd ed. New Delhi, India:
Prentice-Hall of India
Lloyd, B. (2008). The Great Outdoors Retailers in the Outdoors Segment Record Strong
Growth Despite A Broad Softening in the Economic Environment. DNR: Daily News
Record, 38(6), 35-35. Retrieved December 16, 2008, from Textile Technology Index
database.
Maddox, K. (2004, October 25). Brand gives Intel inside track. B to B, 89(12), 25-25.
Mucha, T. (2005, May). The new sounds of selling. Business 2.0, 6(4), 58-60.
NC Textile Connect. (2008). NC Textile Connect. Retrieved Jan. 8, 2009, from
http://www.nctextileconnect.com/
Nelson, H. G. (2008). Building the Performance Cluster in North Carolina: Providing
Assistance to Enhance Global Market Competitiveness of the North Carolina Textile
Industry. Retrieved Jan. 8, 2009, from http://www.lib.ncsu.edu/theses/available/etd
-03272008-080956/

153
Outdoor Industry Association. (2006). Outdoor Industry Association: State of the Industry
Report 2006. Retrieved Jan. 9, 2009, from
http://www.docstoc.com/docs/946714/State- of-the-outdoor-industry-report-2006
Outdoor Industry Association. (2007). Outdoor Industry Association. Retrieved Jan. 9,
2009, from http://www.outdoorindustry.org/index.php
Parry, T. (2008). Taking to the great outdoors. Multichannel Merchant, 4(4), 9-9.
Retrieved December 16, 2008, from Business Source Premier database.
Rosenberg, R. (2005). Direct marketing direct results. Industrial Fabric Products Review,
90(11), 48-50
Sandage, C. H., Fryburger, V., & Rotzoll, K. (1983). Advertising Theory and Practice.
Homewood, IL: Richard D. Irwin, Inc.
Schultz, D. E., & Barns, B. E. (1999). Strategic Brand Communication Campaigns.
Chicago, IL: NTC Business Books.
Spooner, J. (1997, July 14). Intel looks to take `Intel inside' onto the web. Adweek
Western Edition, 47(28), 30.
Stevens, S., & Graves, L. (1997, July 14). Intel carves retail face. Brandweek, 38(28), 5.
Sunbrella®, Glen Raven, Inc (2009).Advertisement. Motor Boating. p. 33.
Vass, K. (2005, September). Ads should be designed to increase sales. Textile World,
155(8), 24-25.
Wright-Isak, C., Faber, R. J., & Horner, L. R. (1997). Effects and effectiveness. In W. D.
Wells (Ed.), Measuring Advertising Effectiveness (pp. 3-12). : Psychology Press.
Wrinkle, Cotton Incorporated. (2009) Advertisement. Cotton Incorporated Website.
Retrieved from http://www.cottoninc.com/Consumer-Ads/images/WRINKLE.jpg

154
APPENDIX

155
APPENDIX A: INITIAL COMPANY SAMPLE

156
Number Company Name Product Category
1 A. B. Carter, Inc. Yarn, Fabric
2 Abercrombie's Textiles Fabric
3 ABJ Enterprises Inc Fabric
4 Ace Plastics Inc Fiber
5 Acme Distributor Sales Fabric
6 Action Plastics Inc Fiber
7 Adele Knits Fabric
8 AEP Industries Inc Fiber
9 Alamac American Knits LLC Yarn, Fabric
10 Allandale Knitting Co Inc Yarn, Fabric
11 Albemarle Cotton Grower Co-Op Fiber
12 Alexander Fabrics Inc Fabric
13 Allen & Jordan Fabric
14 Alliance-Carolina Tool & Mold Fiber
15 Amcot Inc Fabric
16 American & Efird Inc Yarn
17 American Fabrics International Inc. Fabric
18 American Fibers & Yarns Co Yarn
19 American Home Furnishings Alliance Fabric
20 American Knitting Co Inc Fabric
21 American Lockstitch Fabric
22 American Olympus Fiberglass Fiber
23 Ameritex Yarn Corp Yarn
24 Amesbury Group Inc Fabric
25 Amital Spinning Corp Yarn
26 Apex Aridyne Corp Fabric
27 Applied Thermoplastic Rsrcs Fiber
28 Archer Trim Fabric
29 ASC Intl Fabric
30 Ash Kourt Industries Fabric
31 Asheboro Elastics Corp Fabric
32 Ashland Distribution Fiber
33 Association of the Nonwoven Fabrics Industry Fabric
34 ATEX Technologies, Inc Fabric
35 Autoverters Inc Fabric
36 Axis Technical Fabrics Fabric
37 Badger Sportswear Inc Fabric
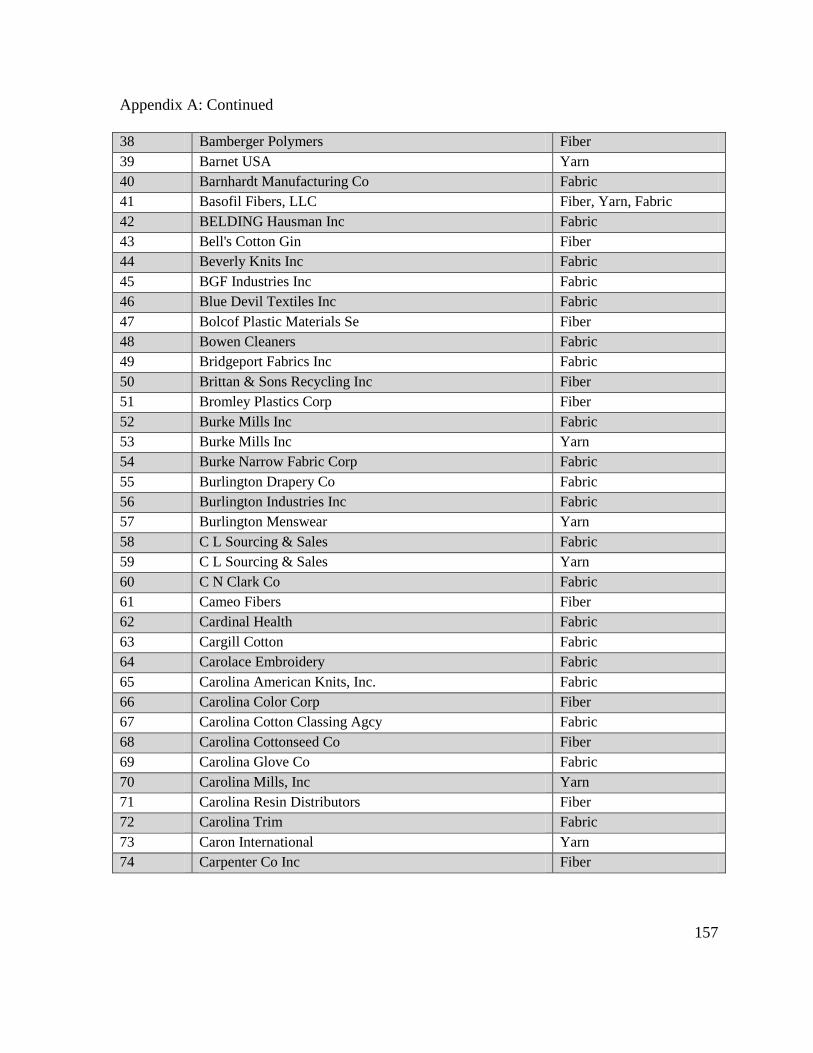
157
Appendix A: Continued
38 Bamberger Polymers Fiber
39 Barnet USA Yarn
40 Barnhardt Manufacturing Co Fabric
41 Basofil Fibers, LLC Fiber, Yarn, Fabric
42 BELDING Hausman Inc Fabric
43 Bell's Cotton Gin Fiber
44 Beverly Knits Inc Fabric
45 BGF Industries Inc Fabric
46 Blue Devil Textiles Inc Fabric
47 Bolcof Plastic Materials Se Fiber
48 Bowen Cleaners Fabric
49 Bridgeport Fabrics Inc Fabric
50 Brittan & Sons Recycling Inc Fiber
51 Bromley Plastics Corp Fiber
52 Burke Mills Inc Fabric
53 Burke Mills Inc Yarn
54 Burke Narrow Fabric Corp Fabric
55 Burlington Drapery Co Fabric
56 Burlington Industries Inc Fabric
57 Burlington Menswear Yarn
58 C L Sourcing & Sales Fabric
59 C L Sourcing & Sales Yarn
60 C N Clark Co Fabric
61 Cameo Fibers Fiber
62 Cardinal Health Fabric
63 Cargill Cotton Fabric
64 Carolace Embroidery Fabric
65 Carolina American Knits, Inc. Fabric
66 Carolina Color Corp Fiber
67 Carolina Cotton Classing Agcy Fabric
68 Carolina Cottonseed Co Fiber
69 Carolina Glove Co Fabric
70 Carolina Mills, Inc Yarn
71 Carolina Resin Distributors Fiber
72 Carolina Trim Fabric
73 Caron International Yarn
74 Carpenter Co Inc Fiber

158
Appendix A: Continued
75 Carriff Corporation Inc Fabric
76 Casual Knit Fabric
77 Cavalier Specialty Yarn Co USA Fabric
78 Cavalier Specialty Yarn Co USA Yarn
79 Cedar Valley Fabrics Co Fabric
80 Chambers Fabrics Inc Fabric
81 Charles Craft Inc Yarn, Fabric
82 Charles D Owen Mfg Co Fabric
83 Cinderella Knitting Mills Fabric
84 Clariant Corp Fiber
85 Coastal Carolina Gin Fiber
86 Coastal Plains Gin Co Fiber
87 Coats America Yarn, Fabric
88 Cocona Inc Fiber, Yarn, Fabric
89 Collins & Aikman Corp Fabric
90 Cone Mills Corp Fabric
91 Contempora Fabrics Inc Fabric
92 Copland Fabrics Inc Fabric
93 Corner Cotton Gin Inc Fiber
94 Cortina Fabrics Inc Fabric
95 Cotton Growers Warehouses Fabric
96 Cotton Inc Fiber
97 Coville Inc Fabric
98 Covington Upholstery Fabrics Fabric
99 Craftex Mills Inc Of PA Fabric
100 Craven County Gin & Cotton Co Fiber
101 Cs Systems Co Inc Fiber
102 CT-Nassau Corp Fabric
103 Culp Inc Fabric
104 Culp Ticking Fabric
105 Cumulus Fibers Inc Fabric
106 Custom Fabrics Inc Fabric
107 Custom Products Inc Fiber
108 D. M. Gunn Consulting Services, LLC Yarn, Fabric
109 DAK Americas Fiber
110 Dak Americas LLC Fiber
111 Dawn Processing Co Inc Yarn

159
Appendix A: Continued
112 Decorator Industries Inc Fabric
113 Delta Apparel Co-Maiden Plant Fabric
114 Designer's Workroom Inc Fabric
115 Dicey Fabrics Inc Fabric
116 Domestic Industries Fabric
117 Drapery Boutique Inc Fabric
118 Drapery Studio Fabric
119 Drum Filter Media Inc Fabric
120 Du Pont Melinar Resins Fiber
121 DU Pont Teijin Films Fiber
122 Dynayarn USA Admin & Daytime Yarn
123 Dynea Fiber
124 Early Bird Knitting Mills Fabric
125 Eastern Plastics Co Fiber
126 EAT Inc. Fabric
127 Ebbitide Polymers Corp Fiber
128 Eden Yarns Inc Fabric
129 Edgecombe Cotton Growers Inc Fiber
130 Edwards Cotton Co Fabric
131 Elastic Fabrics Of America Fabric
132 Elastic Products Div Fabric
133 Eldon-Psi Fiber
134 Enfield Cotton Gin Inc Fiber
135 Ensley Corp Fiber, Fabric
136 Fabriccraft Fabric
137 Fabron Limited Fabric
138 Facemate Corp Fabric
139 Fairystone Fabrics Inc Fabric
140 Farmers Gin Co Fiber
141 Feil & Davidson, Inc. Yarn
142 Fiber Associates Fabric
143 Fiber Dynamics Inc Fabric
144 Fiber Society Fiber
145 Flag Factory Inc Fabric
146 Flexlon Fabrics Inc Fabric
147 Forster Textile Mills Inc Fabric
148 Freudenberg Nonwovens LP Fabric

160
Appendix A: Continued
149 Frontier Spinning Mills Yarn
150 Galey & Lord Industries Inc Fabric
151 Gates Cotton Gin Inc Fiber
152 Gem Knitting Fabric
153 General Elastic Corp Yarn
154 George C Moore Co Fabric
155 Georgia-Pacific Corp Fiber
156 Gersan Industries Inc Fiber
157 Glen Raven, Inc. Yarn, Fabric
158 Graham Plant Yarn
159 Green Spun Textured Knits Fabric
160 Green Valley Co LLC Fiber
161 Griffin Tubing Co Inc Fabric
162 Growers Ginning Co Fiber
163 Guilford Mills Inc Yarn, Fabric
164 H & T Sales & Distribution Inc Fabric
165 H K Research Fiber
166 Hamrick Industries Fabric
167 Hanes Dye & Finishing Fabric
168 Hanes Narrow Fabrics Fabric
169 Hanesbrands Inc Fabric
170 Harvey Gin & Cotton Co Fiber
171 Heritage Cabinets & Woodwork Fabric
172 Heritage Knitting Co LLC Fabric
173 Hexcel Reinforcements Corp Fiber
174 Hexion Specialty Chemicals Fiber
175 Hickory Brands Inc Fabric
176 Hickory Springs Mfg Co Fiber
177 Hickory Throwing Co Yarn, Fabric
178 Hickory Yarns Yarn
179 Hickory Yarns, Inc Yarn
180 Hoke Cotton Warehouse Fabric
181 Hoke LTD Fabric
182 Hornwood, Inc. Fabric
183 Huber Textile Inc Fabric
184 Hurricane Accu Sports Inc Fiber
185 Inno Knits, LLC Fabric

161
Appendix A: Continued
186 Innofa USA Fabric
187 Interface Fabrics Group Fabric
188 International Fabrics, Inc. Fabric
189 International Textile Market Fabric
190 Invista Fiber
191 IPS Fabric
192 Irwin-Leatherman Cotton Co Fabric
193 J & J Knitting Fabric
194 J & K Fashions Inc Fabric
195 J D Stanley & Co Inc Fabric
196 Jackson's Hairs & Nails Fabric
197 Jacob's Textile Sales Yarn
198 Jazzy Textiles Inc Fabric
199 Joan Fabrics Corp Fabric
200 Johnson, Alsey B Fabric
201 Jones County Cotton Gin Inc Fiber
202 Karastan Yarn
203 Karl Mayer North America Fabric
204 Kem-Wove Inc Fabric
205 Ken Smith Yarn Co Yarn
206 Kimberly-Clark Fabric
207 Kings Mountain Knit Fabrics Fabric
208 Klockner Petaplast Fiber
209 Knit Creations Fabric
210 Knit-Wear Fabrics Inc Fabric
211 Kordsa INC Fabric
212 Label Service Inc Fabric
213 LANETEX INC Fabric
214 Lantal Textiles Inc Fabric
215 Lan-Tex Inc Fabric
216 Leviton Manufacturing Co Fabric
217 Lexington Industries Inc Fabric
218 Lin Pac Plastics Fiber
219 Lin-Tex Fabric
220 LIT Industries Inc Fiber
221 Magnolia Manufacturing Yarn
222 Mallard Creek Polymers Inc Fiber

162
Appendix A: Continued
223 Mastercraft Fabrics LLC Yarn, Fabric
224 Mayo Knitting Mill, Inc. Fabric
225 Mc Kenzie Taxidermy Supplies Fiber
226 Mc Michael Mills Inc Yarn, Fabric
227 Mc Murray Fabrics Inc Fabric
228 Meder Textile Co Inc Fabric
229 Miami Thread Yarn
230 Michael S Becker Inc Yarn, Fabric
231 Midway Gin Co Fiber
232 Milliken & Company Fabric
233 Miltex Industries Fabric
234 Mini-Bin Storage Fabric
235 Mitchell Industries Fiber
236 Modern Densifying Fiber
237 Mohawk Industries Inc Yarn
238 Mohican Mills Inc Fabric
239 N J Enterprises Fabric
240 NAMPAC Packaging Div Fiber
241 Nancy King Textile Co Fabric
242 Narrow Fabric Industries Fabric
243 Natex Inc Fabric
244 National Mastercraft Inds Inc Fabric
245 National Spinning Yarn
246 National Spinning Co Yarn
247 National Textiles LLC Yarn, Fabric
248 Neptco Inc Fabric
249 Neptune Incorp Fiber
250 New Century Yarns Yarn
251 New River Fabrics Inc Fabric
252 Nonwovens Cooperative Research Center Fabric
253 Norco Textiles Inc Yarn
254 North Carolina Spinning Mills Yarn
255 Northampton Warehouse Fabric
256 Norwood Yarn Sales Yarn
257 Nova Knitting Machinery Fabric
258 Nova Yarns Yarn, Fabric
259 Noveon Inc Fiber

163
Appendix A: Continued
260 Oakdale Cotton Mills Yarn, Fabric
261 Old Town Drapery Shop Inc Fabric
262 O'Mara Inc Fabric
263 O'Mara Texturing Corp Yarn, Fabric
264 Outdura Fabric
265 P Collins LTD Fabrics Fabric
266 Paola Yarns Inc Yarn
267 Parkdale Mills Inc Yarn, Fabric
268 Parrott Canvas Co Fabric
269 Patrick Yarn Mills Inc Yarn
270 Paxar Corp Fabric
271 Pearson Textiles Inc Fabric
272 Perfection Fabrics Fabric
273 Performance Fibers Yarn
274 Pharr Yarns LLC Fiber, Yarn, Fabric
275 Pioneer Plant Fabric
276 Pitt County Gin Fiber
277 Plastic Express Corp Fiber
278 Plastics Connection Inc Fiber
279 Plastiflex Co Inc Fiber
280 Podisco Inc Fiber
281 Polygal Inc Fiber
282 Polymer Group Inc Fabric
283 Polymer Resources LTD Fiber
284 Polyreps Inc Fiber
285 PPG Industries Inc Fiber
286 PPG Industries, Inc. Yarn, Fiber
287 Precision Fabrics Group Fabric
288 Preserve Resources, Inc. Fiber, Yarn, Fabric
289 Prestige Fabricators Inc Fabric
290 Producer's Gins & Warehouse Fiber
291 Pure Country Inc Fabric
292 QST Industries Inc Fabric
293 Quality Gin Co Inc Fiber
294 Quality Textile Co Fabric
295 Queen City Mfg Inc Fiber
296 Radici Spandex Fiber, Yarn

164
Appendix A: Continued
297 Ramtex Inc Yarn, Fabric
298 Randolph Knitting Inc Fabric
299 Reichhold Inc Fiber
300 Rem-Tex Fabric
301 Resinall Corporation Fiber
302 Rhino Linings Of Charlotte Fiber
303 Ribbon Enterprises Inc Fabric
304 Rich Square Cotton Gin Inc Fiber
305 Richmond Yarns Inc Yarn
306 Riddle & Co LLC Fabric
307 Robela Knit Shop LTD Fabric
308 Rocky Mount Cord Co Fabric
309 Roger's Knitting Co Fabric
310 Rohm & Haas Co Fiber
311 Rolling Hills Cotton Gin Fiber
312 Roman Knit Inc Fabric
313 Roselon Industries of NC Inc Fabric
314 Rosemary Bonded Warehouse Fabric
315 Royal Home Fashions Inc Fabric
316 Russ-Knits Fabric
317 Rutland Plastic Tech Inc Fiber
318 Sack-Ups Fabric
319 Saertex USA Fabric
320 Sample Group Inc Fabric
321 Sampson Gin Co Inc Fiber
322 Sapona Manufacturing Co Inc Yarn, Fabric
323 Saunders Thread Co Yarn
324 Saunders Thread Company Yarn
325 Sca Packaging Fiber
326 Schneider Mills, Inc. Yarn
327 Seaboard Textile Inc Fabric
328 Securall Inc Fabric
329 Shenandoah Furniture Inc Yarn
330 Sherman Textile Co Fabric
331 Shuford Mills LLC Yarn, Fabric
332 Shurtape Technologies Inc Yarn, Fabric
333 Simon Textile Co Fabric

165
Appendix A: Continued
334 Slosman Corp Fabric
335 Smith Cotton Gin Fiber
336 South Eastern Protein Inc Fiber
337 South Fork Industries Inc Fabric
338 Southern Gin & Fertilizer Co Fiber
339 Southern Hosiery Mills Inc Fabric
340 Southern Resin Inc Fiber
341 Specialty Textiles Inc Fabric
342 Spray Cotton Mills Yarn
343 Spruce Pine Mica Co Fiber
344 Standard Tytape Co Fabric
345 Stevenson & Vestal Fabric
346 Stitch Count Fabric
347 Sun Belt Textiles Inc Yarn
348 Sunray Inc Fiber
349 Supreme Corp Yarn
350 Supreme Knits Inc Fabric
351 Susan Roediger Knits Fabric
352 Swift Galey Yarn, Fabric
353 Syncot Plastics Inc Fiber
354 Synthetic Yarn and Fiber Association (SYFA) Fiber
355 Synthetic Yarn and Fiber Association (SYFA) Yarn
356 Tailored Chemical Products Inc Fiber
357 Tarheel Cotton Co Fiber
358 TC2 Fabric
359 Textile and Apparel Manufacturers and Merchants Yarn, Fabric
360 Textile Extension Education (TexED) Fiber, Yarn, Fabric
361 Textile Inc Fabric
362 Textile Network Concepts, Inc. Yarn
363 Textile Piece Dyeing Inc Fabric
364 Textile Tape Weavers Co Fabric
365 Textile Technology Center at Gaston College Yarn, Fabric
366 The Jacquard Center Fabric
367 The Oriole Mill Fabric
368 The Quantum Group Fabric
369 Thomasville Dexel Inc Fiber
370 Tietex Interiors Fabric

166
Appendix A: Continued
371 TK Holdings Fabric
372 Toho Carbon Fibers Fiber
373 Triangle Polymers Inc Fiber
374 Tri-County Gin Inc Fiber
375 Tri-Tex Inc Fabric
376 Tuscarora Yarns Inc Fabric
377 Tuscarora Yarns Inc Yarn
378 U S Fiberglass Products Inc Fiber
379 Uco Fabrics Inc Fabric
380 Ultra-Flex Fabric
381 Unifi Inc Yarn, Fabric
382 Unifour Finishers Inc Fabric
383 Unifour Finishers Upholstery Fabric
384 Universal Fiber Systems Fiber, Yarn
385 Universal Fibers Yarn
386 Valdese Manufacturing Co Fabric
387 Valdese Weavers Inc Fabric
388 Viking Polymers LLC Fiber
389 W & W Gin Inc Fiber
390 W J Carey & ASSOC LLC Fiber
391 Wade Manufacturing Co Fabric
392 Ward & Nixon Cotton Gin Inc Fiber
393 Warp Knit Mills Fabric
394 Warp Technologies Inc Yarn
395 Washington Penn Plastics Fiber
396 Waverly Mills Inc Yarn
397 Weldon Gin Co Fiber
398 Wellman Inc Fiber
399 West Point Home Inc Fabric
400 Whitakers Gin Co Inc Fiber
401 Williamston Yarns Yarn
402 Wilson County Gin & Cotton Co Fiber
403 Windsor Wood Inc Yarn
404 Wolfe Brothers Distributing Co Fiber
405 Wolfe Industries Fiber
406 Woodland Mills Yarn
407 Woodville Supply Inc Fiber

167
Appendix A: Continued
408 World Elastic Corp Fabric
409 World Fibers Yarn
410 Worldtex Inc Yarn
411 Wrap Spun Yarns Inc Yarn
412 Xerium Technologies Inc Fabric
413 Yarntex Corp Yarn

168
APPENDIX B: INTERVIEW INSTRUMENT

169
Respondent Name:
Company:
Position:
Years in Position
Years with Company:
Years in Industry:
The focus of this survey is access the benefits, challenges, and potential of upstream
advertising (sometimes called ingredient advertising). Upstream advertising may include
fiber, yarn, or fabric promotions depending on supply chain position. Some examples of
successful advertising companies and brands include W.L. Gore’s Gore-Tex®, Invista’s
Lycra®, and Intel® microprocessors.
1. What have been your company’s biggest advertising success and failure and what
lessons have you taken from them? What does your company view as the benefits of
advertising? Which areas does your company value most? What companies do you
believe are effective ingredient advertisers?
2. Do you believe that advertising is necessary for success in the sports and leisure
market segment? Do the tactics for this segment differ from other product segments?
In general, what market segments do you believe are under and over advertised?
3. What is your typical methodology for taking the advertising concept through
implementation and evaluation? What step is most challenging? When developing
your initial situation analysis what activities do you consider?
4. What are your primary goals across all campaigns? How often do you reevaluate
these goals? How does your company define and evaluate advertising success?
5. What media opportunities do you foresee as being influential in the coming years and
what steps is your company taking to take advantage of these opportunities? Does
your company believe that there are opportunities in advertising directly to end
consumer as well as industrial consumers? Why or why not?
6. What type of advertising media do you feel is most effective at communicating
product or company information? Do your target consumers/customers respond well
to your current advertising efforts? What elements do you think make an effective
b2b and b2c advertisement? What tactics can be applied across trade and consumer
advertisements?
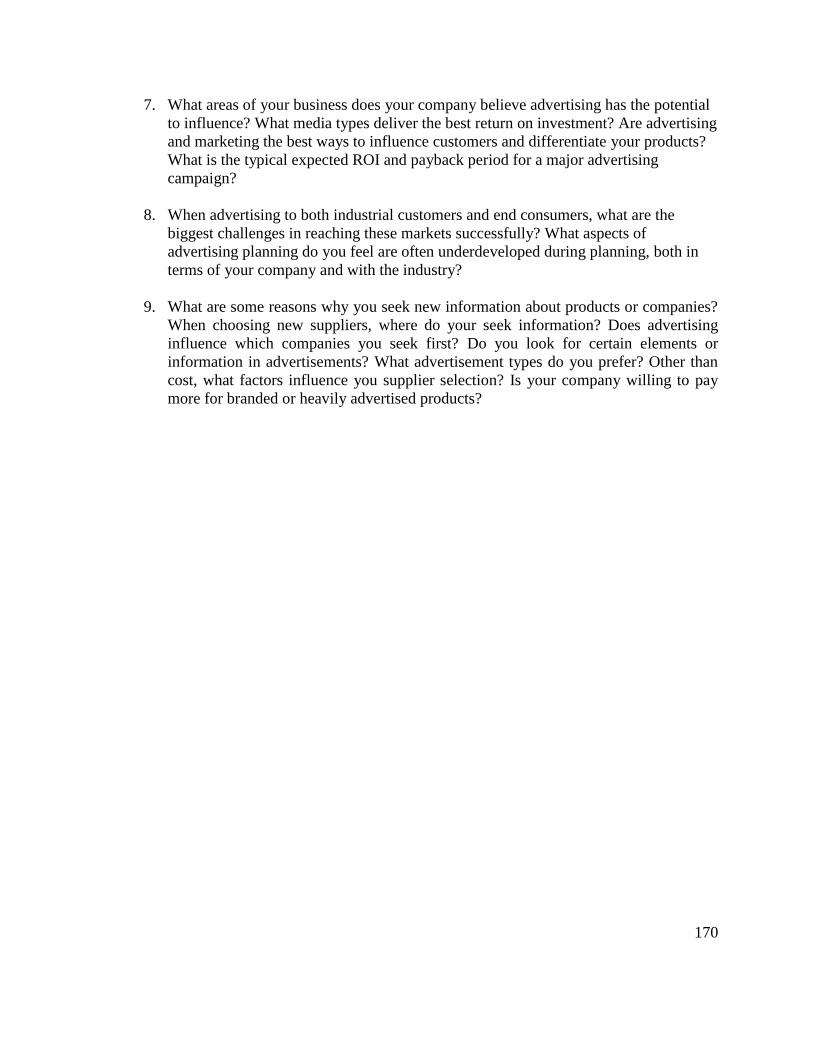
170
7. What areas of your business does your company believe advertising has the potential
to influence? What media types deliver the best return on investment? Are advertising
and marketing the best ways to influence customers and differentiate your products?
What is the typical expected ROI and payback period for a major advertising
campaign?
8. When advertising to both industrial customers and end consumers, what are the
biggest challenges in reaching these markets successfully? What aspects of
advertising planning do you feel are often underdeveloped during planning, both in
terms of your company and with the industry?
9. What are some reasons why you seek new information about products or companies?
When choosing new suppliers, where do your seek information? Does advertising
influence which companies you seek first? Do you look for certain elements or
information in advertisements? What advertisement types do you prefer? Other than
cost, what factors influence you supplier selection? Is your company willing to pay
more for branded or heavily advertised products?

171
APPENDIX C: CONSUMER SURVEY

172
Study Information:
The focus of this study is to evaluate the effectiveness of upstream textile
advertisements. Upstream advertisements are those advertisements that promote fiber, yarn,
or fabric components to be used in the production of consumer goods. The fibers, yarns, and
fabrics depicted in these advertisements are not sold directly to consumers, but through other
company’s products. For example, Gore-Tex is sold to The North Face for production of
jackets, consumers purchase the jacket, and therefore the consumer is purchasing Gore-Tex.
The following questionnaire asks you to relate your opinions about the upstream textile
advertisements presented on the screen. The advertisements are from consumer magazines
and depict products offered by upstream textile companies (i.e. fiber yarn and fabric
manufactures). These advertisements are designed to promote the upstream manufactures’
product so that consumer will look for their brands in the product they purchase. The
company and product names have been removed from the advertisements to prevent any
biases.
Approximate time to complete survey: 15-20 minutes
Part 1 Directions:
Complete the questionnaire for Advertisements A-C as the advertisements are presented on
the screen. There are three advertisements used in the study and each advertisement will be
presented on the screen individually. Once all participations have completed each survey for
the presented advertisement, the next advertisement will be presented until all are complete.
Please shade in the box corresponding with your answer. When you have finished each
section, please wait for further instruction.
Part 2 Directions:
Advertisements A-C will be shown again on the same screen. Please compare the
advertisements and answer the following questionnaire. Please shade in the box
corresponding with your answer. When you finish part 2, proceed to part 3.
Part 3- Directions:
Please answer the following questions related to your personal information gathering
preferences. Please shade in the box corresponding with your answer. Once you have
completed this section, you are finished with the survey.

173
Please circle the appropriate information:
Gender
Male
Female
Age
18
19
20
21
22
23+

174
Part 1- Advertisement A Questions (1/3)
Questions Strongly
Agree Agree
Neither
Agree or
Disagree
Disagree Strongly
Disagree
1 I have seen advertisements for this
product in the past
2 I understand what product is being
promoted
3 The information in the advertisement is
useful
4 I identify with the products or activities
presented
5
The advertisement communicates enough
product performance information to
interest me in the product
6
The advertisement communicates enough
product benefit information to interest
me in the product
7 The advertisement is memorable or unique
8 The advertisement makes me curious
about the product in the ad
9 The advertisement makes me curious
about the company in the ad
10 The advertisement appeals to me on a
personal level
11 Based on the advertisement's content, the
product seems to be high quality
12
Based on the advertisement's content, the
company appears to be creditable and
reputable company
13 The images used in the advertisement
relate well to the text information
14
The images used in the advertisement
make me want to experience what is
pictured (either by performing an activity
or purchasing the product)
15
Based on the advertisement's content, I
would consider looking for this
product/brand when making my next
purchase
16
If a product in a store contained this
brand/product I would consider seeking
additional information
17
If a product in a store contained this
brand/product I would consider
purchasing the item
18
If a product contained this brand/product I
would consider paying more for that
product than a product containing generic
products (ex. a branded fiber vs.
polyester)

175
Part 1- Advertisement B Questions (2/3)
Questions Strongly
Agree Agree
Neither
Agree or
Disagree
Disagree Strongly
Disagree
1 I have seen advertisements for this product
in the past
2 I understand what product is being
promoted
3 The information in the advertisement is
useful
4 I identify with the products or activities
presented
5
The advertisement communicates enough
product performance information to
interest me in the product
6
The advertisement communicates enough
product benefit information to interest
me in the product
7 The advertisement is memorable or unique
8 The advertisement makes me curious
about the product in the ad
9 The advertisement makes me curious
about the company in the ad
10 The advertisement appeals to me on a
personal level
11 Based on the advertisement's content, the
product seems to be high quality
12
Based on the advertisement's content, the
company appears to be creditable and
reputable company
13 The images used in the advertisement
relate well to the text information
14
The images used in the advertisement
make me want to experience what is
pictured (either by performing an activity
or purchasing the product)
15
Based on the advertisement's content, I
would consider looking for this
product/brand when making my next
purchase
16
If a product in a store contained this
brand/product I would consider seeking
additional information
17
If a product in a store contained this
brand/product I would consider
purchasing the item
18
If a product contained this brand/product I
would consider paying more for that
product than a product containing generic
products (ex. a branded fiber vs. polyester)

176
Part 1- Advertisement C Questions (3/3)
Questions Strongly
Agree Agree
Neither
Agree or
Disagree
Disagree Strongly
Disagree
1 I have seen advertisements for this product
in the past
2 I understand what product is being
promoted
3 The information in the advertisement is
useful
4 I identify with the products or activities
presented
5
The advertisement communicates enough
product performance information to
interest me in the product
6
The advertisement communicates enough
product benefit information to interest
me in the product
7 The advertisement is memorable or unique
8 The advertisement makes me curious
about the product in the ad
9 The advertisement makes me curious
about the company in the ad
10 The advertisement appeals to me on a
personal level
11 Based on the advertisement's content, the
product seems to be high quality
12
Based on the advertisement's content, the
company appears to be creditable and
reputable company
13 The images used in the advertisement
relate well to the text information
14
The images used in the advertisement
make me want to experience what is
pictured (either by performing an activity
or purchasing the product)
15
Based on the advertisement's content, I
would consider looking for this
product/brand when making my next
purchase
16
If a product in a store contained this
brand/product I would consider seeking
additional information
17
If a product in a store contained this
brand/product I would consider
purchasing the item
18
If a product contained this brand/product I
would consider paying more for that
product than a product containing generic
products (ex. a branded fiber vs. polyester)

177
Part 2- Multi-Advertisement Questions (1/1)
Questions Advertisement
A B C
1 Which advertisement is most visually interesting?
2 Which advertisement provides the most complete information?
3 Which advertisement is most memorable or unique?
4 Which advertisement has the best layout? (i.e. text vs. image balance, colors, images etc.)
5 Based on the advertisement alone, and not if you are personally interested in the product,
which products would you seek additional information? (mark all that apply)
6 Based on the advertisement alone, and not if you are personally interested in the product,
which products would consider purchasing? (mark all that apply)
Part 3- General Questions (1/3)
Questions Strongly
Agree Agree
Neither
Agree or
Disagree
Disagree Strongly
Disagree
1
I typically look for branded fibers, yarns,
and fabrics when purchasing performance
based products (ex. Gore-Tex®, Lycra,
etc.)
2
I prefer purchasing products containing
branded fibers, yarns, and fabrics (ex.
Gore-Tex®, Lycra, etc.)
3
It is likely that I will seek additional
product/company information based on an
advertisement
4
When I am looking for additional product
information or what products contain the
branded textile component, I look for
print advertisements
5
When I am looking for additional product
information or what product contain the
branded textile component, I look for
television advertisements
6
When I am looking for additional product
information or what product contain the
branded textile component, I look for
company maintained websites
7
When I am looking for additional product
information or what products contain the
branded textile component, I look for
third party websites
8
When I am looking for additional product
information or what products contain the
branded textile component, I look for
newspaper and magazine articles and
reviews
9
When I am looking for additional product
information or what products contain the
branded textile component, I look for in-
store advertisements

178
10
When I am looking for additional product
information or what products contain the
branded textile component, I look for
store sales personnel
11
When I am looking for additional product
information or what products contain the
branded textile component, I look for on-
product hangtags and labels
12
When I am looking for additional product
information or what products contain the
branded textile component, I look for
information on the product's packaging
13
When I seek additional information, I am
typically looking for more product
information before purchasing
14
When I seek additional information, I am
typically looking for more company
information before purchasing
15 Product comparisons provides
product/company credibility
16
Showing how the product can solve a
real-life problem provides
product/company credibility
17 Celebrity spokes persons or national icons
provide product/company credibility
18 Technical information and graphics
provide product/company credibility

179
APPENDIX D: IRB SUBMISSION FORM

180
North Carolina State University
Institutional Review Board for the Use of Human Subjects in Research
Submission for New Studies
GENERAL INFORMATION
1. Date Submitted: 2-2-2009
2. Title of Project: Analysis of the Market Potential and Effectiveness of Upstream
Textile Advertising
3. Principal Investigator: Charles Ian Raulston
4. Department: TATM
5. Campus Box Number: 2418
6. Email: [email protected]
7. Phone Number: 336-803-0125
8. Fax Number: 919-882-9410
9. Faculty Sponsor Name and Email Address if Student Submission: Nancy Cassill
10. Source of Funding? (required information): Institute of Textile Technology
11. Is this research receiving federal funding?: No
12. If Externally funded, include sponsor name and university account number:
13. RANK:
Faculty
Student: Undergraduate; X Masters; or PhD
Other (specify):
As the principal investigator, my signature testifies that I have read and understood the
University Policy and Procedures for the Use of Human Subjects in Research. I assure the
Committee that all procedures performed under this project will be conducted exactly as
outlined in the Proposal Narrative and that any modification to this protocol will be
submitted to the Committee in the form of an amendment for its approval prior to
implementation.
Principal Investigator:
Charles Ian Raulston * 2-2-2009
(typed/printed name) (signature) (date)

181
As the faculty sponsor, my signature testifies that I have reviewed this application thoroughly
and will oversee the research in its entirety. I hereby acknowledge my role as the principal
investigator of record.
Faculty Sponsor:
Nancy Cassill * 2-2-2009
(typed/printed name) (signature) (date)
*Electronic submissions to the IRB are considered signed via an electronic signature
Please complete this application and email as an attachment to: [email protected] or
send by mail to: Institutional Review Board, Box 7514, NCSU Campus (Administrative
Services III). Please include consent forms and other study documents with your
application and submit as one document.
***************************************************************************
**********************
For SPARCS office use only
Reviewer Decision (Expedited or Exempt Review)
Exempt Approved Approved pending modifications Table
Expedited Review Category: 1 2 3 4 5 6 7 8a
8b 8c 9
_______________________________________ _______________________________
Reviewer Name Signature Date

182
North Carolina State University
Institutional Review Board for the Use of Human Subjects in Research
GUIDELINES FOR A PROPOSAL NARRATIVE
In your narrative, address each of the topics outlined below. Every application for IRB
review must contain a proposal narrative, and failure to follow these directions will
result in delays in reviewing/processing the protocol.
A. INTRODUCTION
1. Briefly describe in lay language the purpose of the proposed research and why it
is important.
The purpose of this research is to examine upstream textile firms that effectively use
advertising to differentiate their products in the market. The overall research question is
what factors contribute to an effective advertisement and what are the best techniques to
facilitate communication with the customer and final consumer. The study will focus on
determining the benefits, potential, and challenges of upstream advertising and the most
effective strategies of communication with the customer and the end-use consumer.
Another research objective is to develop a frame work that upstream textile firms can use
create effective advertising strategies differentiate their products.
To accomplish these goals a four-phase methodology will be employed. Phase I is
exploratory in nature and identifies companies with successful advertising strategies. Case
studies will be used to perform a competitive analysis to develop an understanding of
current advertising strategies. Phase II consists of conducting industry interviews in order
to gain primary qualitative and quantitative information about the benefits, challenges,
and opportunities of upstream advertising. In addition, companies will be asked to provide
perspectives as customer related to the effectiveness of current advertising efforts. In
Phase III, primary research will be conducted in order to gain insight into the potential of
upstream advertising from a downstream perspective. This research will take the form of a
quantitative survey administered to selected end-use consumers. Survey data will also
used to develop an understanding of the potential of upstream textile advertising focusing
on different advertising opportunities including print, television, and the Internet. Finally,
Phase IV will use the results of Phases 1, II, and III to develop a framework that U.S.
textile companies can use to develop an upstream advertising campaign.
The results of this research will provide knowledge of the benefits, potential, and
challenges of upstream advertising. By understanding these factors, it will assist
companies in determining the cost/benefit relationship of advertising and aid in

183
managerial decision making. This research will also help to guide companies in their
selection of the best media type to fit their target market. In addition, the research will
provide a framework for U.S. textile firms to use when implementing an upstream
advertising strategy. Finally, this study will provide a means for U.S. textile firms to create
perceived value and differentiation. By understanding the nature of the upstream
advertising, U.S. producers will be ideally positioned to gain a competitive advantage
through differentiation.
2. If student research, indicate whether for a course, thesis, dissertation, or
independent research.
Thesis
B. SUBJECT POPULATION
1. How many subjects will be involved in the research?
In person and phone interviews :31
End consumer surveys: 195
2. Describe how subjects will be recruited. Please provide the IRB with any
recruitment materials that will be used.
In person and phone interview subjects:
Subjects be contacted via letter, e-mail, or phone depending on available contact
information. Contact letter is attached.
End consumer surveys:
Subjects will be recruited through email solicitation. Contact letter is attached.
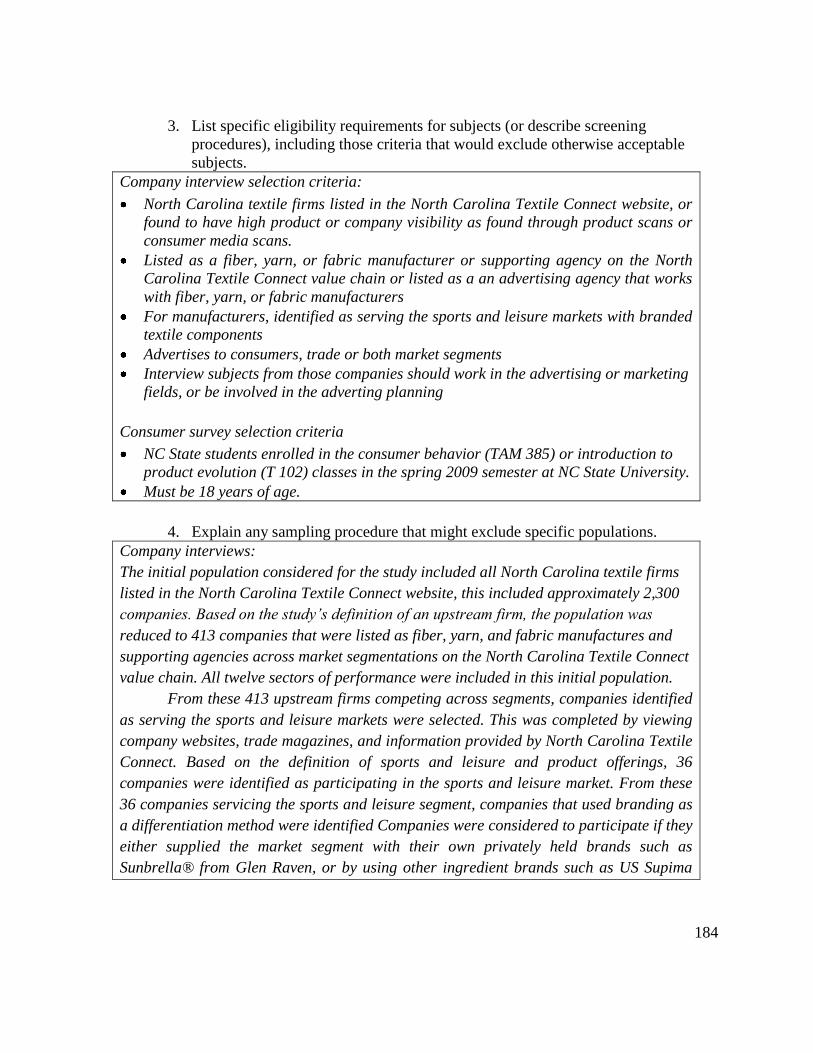
184
3. List specific eligibility requirements for subjects (or describe screening
procedures), including those criteria that would exclude otherwise acceptable
subjects.
Company interview selection criteria:
North Carolina textile firms listed in the North Carolina Textile Connect website, or
found to have high product or company visibility as found through product scans or
consumer media scans.
Listed as a fiber, yarn, or fabric manufacturer or supporting agency on the North
Carolina Textile Connect value chain or listed as a an advertising agency that works
with fiber, yarn, or fabric manufacturers
For manufacturers, identified as serving the sports and leisure markets with branded
textile components
Advertises to consumers, trade or both market segments
Interview subjects from those companies should work in the advertising or marketing
fields, or be involved in the adverting planning
Consumer survey selection criteria
NC State students enrolled in the consumer behavior (TAM 385) or introduction to
product evolution (T 102) classes in the spring 2009 semester at NC State University.
Must be 18 years of age.
4. Explain any sampling procedure that might exclude specific populations.
Company interviews:
The initial population considered for the study included all North Carolina textile firms
listed in the North Carolina Textile Connect website, this included approximately 2,300
companies. Based on the study’s definition of an upstream firm, the population was
reduced to 413 companies that were listed as fiber, yarn, and fabric manufactures and
supporting agencies across market segmentations on the North Carolina Textile Connect
value chain. All twelve sectors of performance were included in this initial population.
From these 413 upstream firms competing across segments, companies identified
as serving the sports and leisure markets were selected. This was completed by viewing
company websites, trade magazines, and information provided by North Carolina Textile
Connect. Based on the definition of sports and leisure and product offerings, 36
companies were identified as participating in the sports and leisure market. From these
36 companies servicing the sports and leisure segment, companies that used branding as
a differentiation method were identified Companies were considered to participate if they
either supplied the market segment with their own privately held brands such as
Sunbrella® from Glen Raven, or by using other ingredient brands such as US Supima

185
Outlast® by Buhler Quality Yarns (Supima® and Outlast® are third party ingredient
brands). Of the 36 companies, 30 firms used branding to compete in the sports and
leisure segment.
Mini case studies were performed on the 30 identified firms. For each company,
products and markets of interest were identified as well as specific brands used to
compete in the sports and leisure segment. Companies were also evaluated on their
participation in consumer and/or industry level advertising. Companies that were
identified as advertising in either of these two markets were considered for interviews. A
consumer and trade magazine scan was used to identify companies advertising to these
segments. Print advertisements were examined in publications held in the Burlington
Textile Library at North Carolina State University and Boarders bookstore located In
Cary, NC. Trade magazines spanned all segments of the supply chain including,
chemical, fiber, yarn, fabric, apparel and fashion publications. Consumer publications
included sports and leisure magazines in the areas of home décor, hunting and fishing,
marine boating, and sports and fitness. Of the 30 identified companies, 19 companies
were selected for interviews.
In addition to the North Carolina companies identified in the scan, five additional
companies were included in the interview sample. From researching trade magazines,
Buhler Quality Yarns Corp was identified as a major upstream advertiser with print
advertisements in many prominent industry magazines. Buhler also promotes their yarns
with product level hangtags and participates in various trade shows around the world. In
addition, Lycra and CORDURA, both Invista brands, were selected due to their
prominence in industry and consumer advertising. Lycra is a strong global brand that
promotes its products across target audiences through print, product level, and
internationally sponsored events. CORDURA, another prominent brand, was identified
in consumer magazines, on products, and sponsored events across the country. W.L.
Gore with its Gore-Tex brand was identified as a key advertising player as it was the
most heavily advertised product in the product scan. W.L. Gore places hangtags on
nearly all consumer level products that use their fabrics, as well as sponsoring many
outdoor sporting events and awards. Finally, to gain perspectives from a purely
advertising point of view, Bosch and Co. and French West Vaughn were selected. These
companies have researched and created advertising campaigns for companies such as
Burlington Worldwide and Coco Cola.
Consumer survey:
Student populations were identified based on the faculty’s openness to participate in the
study. Faculty and student populations were selected based upon the course content and
relative knowledge of advertising and products. Students enrolled in TAM 385 or T 102

186
during the spring 2009 semester at NC State University were selected based upon their
knowledge of advertising tactics as well as familiarity with textiles in general. In order to
participate in the survey, student must be enrolled in either of the two classes and be at
least 18 years of age. Students will not be allowed to take the survey more than once.
5. Disclose any relationship between researcher and subjects - such as,
teacher/student; employer/employee.
None
6. Check any vulnerable populations included in study:
minors (under age 18) - if so, have you included a line on the consent
form for the parent/guardian signature
fetuses
pregnant women
persons with mental, psychiatric or emotional disabilities
persons with physical disabilities
economically or educationally disadvantaged
prisoners
elderly
students from a class taught by principal investigator
other vulnerable population.
7. If any of the above are used, state the necessity for doing so. Please indicate the
approximate age range of the minors to be involved.
C. PROCEDURES TO BE FOLLOWED
1. In lay language, describe completely all procedures to be followed during the
course of the experimentation. Provide sufficient detail so that the Committee is
able to assess potential risks to human subjects. In order for the IRB to completely
understand the experience of the subjects in your project, please provide a

187
detailed outline of everything subjects will experience as a result of participating
in your project. Please be specific and include information on all aspects of the
research, through subject recruitment and ending when the subject's role in the
project is complete. All descriptions should include the informed consent process,
interactions between the subjects and the researcher, and any tasks, tests, etc. that
involve subjects. If the project involves more than one group of subjects (e.g.
teachers and students, employees and supervisors), please make sure to provide
descriptions for each subject group.
Company interviews:
1. The 31 selected companies will first receive a notice email explaining the nature of the
project and requesting their optional participation. See attached email sample. The
email will also contain a list of questions to be answered during the interview.
2. If the company confirms their participation they will receive another email
confirmation with a listing of available times in which to interview. Companies will
then select the time and return the email. If a time cannot be reached, then phone
interviews will be arranged. If the company declines, a thank you letter will be sent.
3. In person interviews will be conducted either at the company location or at the College
of Textiles depending on convenience. At that time the consent form will be signed and
dated. For phone interviews, an electronic copy of the consent from will be sent for
their review and a signed copy will then be mailed back prior to the interview.
4. Interviewees will be asked a series of questions related to advertising and marketing
(see attached questionnaire).
5. Once the interview is complete, the secession will end and a thank you letter will be
sent.
6. No additional contact with the interviewee is required.
Consumer survey:
1. Faculty teaching the TAM 385 and T 102 class will be contacted via email asking for
their participation in the survey. The letter will request that the faculty allow the
researcher to administer a survey to their class during the lecture.
2. A copy of the consent form will be presented to each student prior to each survey.
3. Once completed, survey will begin. During the survey, three advertisements will be
presented to the students with the company and product names blocked out. The
participants will then fill out the survey based on their opinions about the ads. In the
next section of the survey, students will be asked to compare the same three ads and
make comparisons. Finally, the last section asks the participants to relate their media
and information gathering preference. Once they complete this section the survey is
over.
4. Once the participants have finished with the survey no additional contact is required.

188
2. How much time will be required of each subject?
Survey: 15-20 minutes
Interview: 1 hour to 1:30 , depending on answer detail
D. POTENTIAL RISKS
1. State the potential risks (physical, psychological, financial, social, legal or other)
connected with the proposed procedures and explain the steps taken to minimize
these risks.
Possible legal risks exist due to subjects disclosing confidential information. However,
respondents will be asked not to divulge any information they are uncomfortable sharing.
In addition, the sample population will be masked and any information that could identify
subjects (or companies) will be removed.
2. Will there be a request for information that subjects might consider to be personal
or sensitive (e.g. private behavior, economic status, sexual issues, religious
beliefs, or other matters that if made public might impair their self-esteem or
reputation or could reasonably place the subjects at risk of criminal or civil
liability)?
No
a. If yes, please describe and explain the steps taken to minimize these risks.
b. Could any of the study procedures produce stress or anxiety, or be
considered offensive, threatening, or degrading? If yes, please describe
why they are important and what arrangements have been made for
handling an emotional reaction from the subject.
No
3. How will data be recorded and stored?
Survey responses will be taken in hard copy format and then transcribed into excel.
Interview responses will be recorded via paper and pencil, as well as a tape recorded.
Papers and recording devices will be kept in a locked filing cabinet at the research’s
residence. When project is complete, all materials will be destroyed.

189
a. How will identifiers be used in study notes and other materials?
Survey results will be stored with survey number, only to track the response rate for the
survey. Any information linking survey numbers with consumers or company respondents
will be destroyed after Phase III data collection (survey) is complete. Interview results
will be alphabetically coded to mask company identifiers. Any information linking code
letter and company names will be destroyed upon completion of the study. The only
identifiers of interview results will be the level of the respondent in the company and the
years of experience in the company and the industry.
b. How will reports will be written, in aggregate terms, or will individual
responses be described?
Results will be reported in aggregate and generic terms. In the case that an individual
response is noted, reference will be made to the alphanumeric company code (i.e.,
“Company A has used this tactic successfully”).
4. If audio or videotaping is done how will the tapes be stored and how/when will
the tapes be destroyed at the conclusion of the study.
The recording device used will be kept at my personal residence in a locked drawer.
Digital audio files will be kept in a folder on my password protected PC at my personal
residence. Once the interviews are completed and transcribed, the audio files will be
permanently deleted from the device as well as the computer.
5. Is there any deception of the human subjects involved in this study? If yes, please
describe why it is necessary and describe the debriefing procedures that have been
arranged.
No

190
E. POTENTIAL BENEFITS
This does not include any form of compensation for participation.
1. What, if any, direct benefit is to be gained by the subject? If no direct benefit is
expected, but indirect benefit may be expected (knowledge may be gained that
could help others), please explain.
Indirect benefits include understanding the market potential and effectiveness of current
advertising campaigns in various segments of the supply chain. This includes
perspectives from end consumers and, customers. This research will also help in
determining what aspects of different advertising media these groups find appealing and
encourages them to seek additional product or company information. Industry interviews
will help determine what are the benefits, challenges, opportunities and potential of
upstream advertising, as well as giving insights into their strategic planning
methodology. These insights will help other companies be more effective in their
advertising efforts and help the textile industry as a whole.
F. COMPENSATION
1. Explain compensation provisions if the subject withdraws prior to completion of
the study.
None
2. If class credit will be given, list the amount and alternative ways to earn the same
amount of credit.
None
G COLLABORATORS
1. If you anticipate that additional investigators (other than those named on Cover
Page) may be involved in this research, list them here indicating their institution,
department and phone number.
None

191
2. Will anyone besides the PI or the research team have access to the data (including
completed surveys) from the moment they are collected until they are destroyed.
No
H. CONFLICT OF INTEREST
1. Do you have a significant financial interest or other conflict of interest in the
sponsor of this project? No
2. Does your current conflicts of interest management plan include this relationship
and is it being properly followed? No
I. ADDITIONAL INFORMATION
1. If a questionnaire, survey or interview instrument is to be used, attach a copy to
this proposal.
2. Attach a copy of the informed consent form to this proposal.
3. Please provide any additional materials that may aid the IRB in making its
decision.
J. HUMAN SUBJECT ETHICS TRAINING
*Please consider taking the Collaborative Institutional Training Initiative (CITI), a
free, comprehensive ethics training program for researchers conducting research with
human subjects. Just click on the underlined link.
Attachments:
1. Interview initial contact letter
2. Consumer survey initial contact letter
3. Informed consent forms for interviews (one for face-to-face interviews and one for phone
interviews)
4. Informed consent forms for consumer surveys
5. Interview instrument
6. Consumer survey
7. Images associated with consumer survey

192
APPENDIX E: IRB CONSENT FORMS
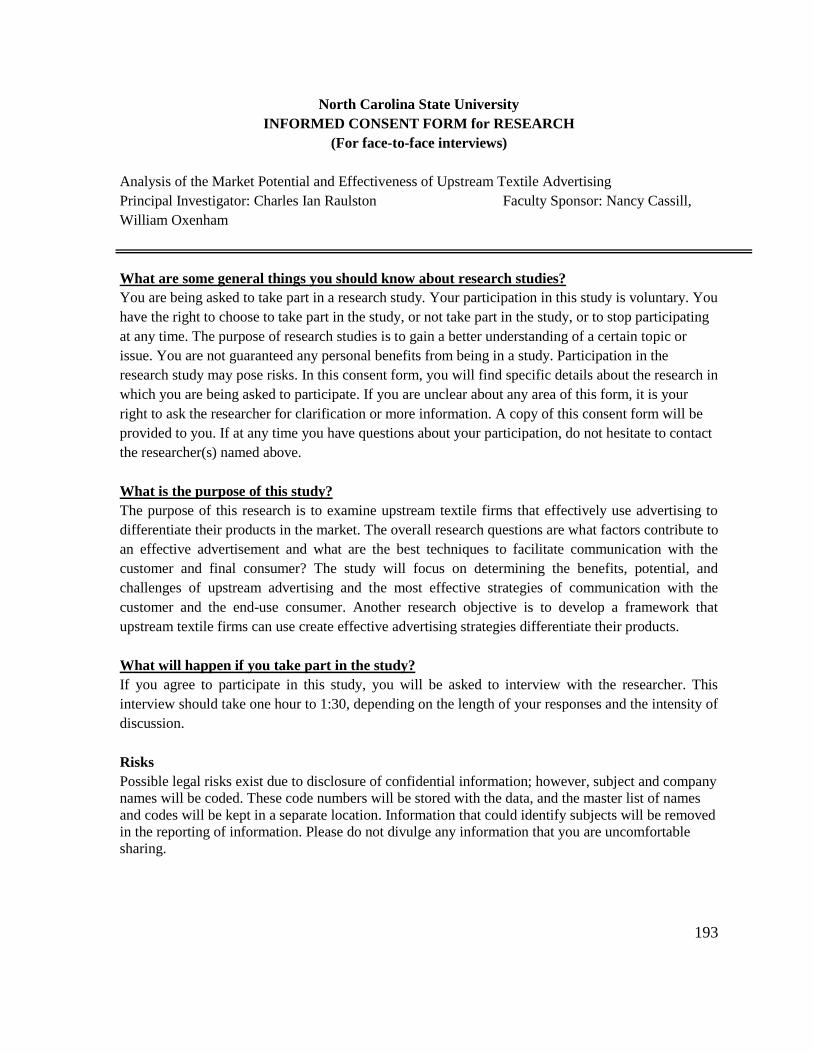
193
North Carolina State University
INFORMED CONSENT FORM for RESEARCH
(For face-to-face interviews)
Analysis of the Market Potential and Effectiveness of Upstream Textile Advertising
Principal Investigator: Charles Ian Raulston Faculty Sponsor: Nancy Cassill,
William Oxenham
What are some general things you should know about research studies?
You are being asked to take part in a research study. Your participation in this study is voluntary. You
have the right to choose to take part in the study, or not take part in the study, or to stop participating
at any time. The purpose of research studies is to gain a better understanding of a certain topic or
issue. You are not guaranteed any personal benefits from being in a study. Participation in the
research study may pose risks. In this consent form, you will find specific details about the research in
which you are being asked to participate. If you are unclear about any area of this form, it is your
right to ask the researcher for clarification or more information. A copy of this consent form will be
provided to you. If at any time you have questions about your participation, do not hesitate to contact
the researcher(s) named above.
What is the purpose of this study?
The purpose of this research is to examine upstream textile firms that effectively use advertising to
differentiate their products in the market. The overall research questions are what factors contribute to
an effective advertisement and what are the best techniques to facilitate communication with the
customer and final consumer? The study will focus on determining the benefits, potential, and
challenges of upstream advertising and the most effective strategies of communication with the
customer and the end-use consumer. Another research objective is to develop a framework that
upstream textile firms can use create effective advertising strategies differentiate their products.
What will happen if you take part in the study?
If you agree to participate in this study, you will be asked to interview with the researcher. This
interview should take one hour to 1:30, depending on the length of your responses and the intensity of
discussion.
Risks
Possible legal risks exist due to disclosure of confidential information; however, subject and company
names will be coded. These code numbers will be stored with the data, and the master list of names
and codes will be kept in a separate location. Information that could identify subjects will be removed
in the reporting of information. Please do not divulge any information that you are uncomfortable
sharing.

194
Benefits
The benefit of this research is that it will provide a model for upstream textile manufactures to use in
developing successful advertising campaigns. This model could be used as a way for these companies
to differentiate their products in the market.
Confidentiality
The information in the study records will be kept strictly confidential. Data will be stored securely in
on the researcher’s personal computer, which are password protected and firewalled, and under lock
and key. Code numbers will be created for your name and company name; these code numbers will
be the only identifiers stored with the data. The master list linking codes to subject and company
names will be kept in a separate location than the data in order to minimize the potential of linking the
data to you and your company. Any identifying information, such as product brand names, company
names and you name will be removed when reporting the data. No reference will be made in oral or
written reports, which could link you to the study.
Compensation
There is no compensation for participating in the study.
What if you have questions about this study?
If you have questions at any time about the study or the procedures, you may contact the researcher,
Charles Ian Raulston, at 2401 Research Drive, Box 8301, Raleigh, NC 27695, [email protected], or
336-803-0125.
What if you have questions about your rights as a research participant?
If you feel you have not been treated according to the descriptions in this form, or your rights as a
participant in research have been violated during the course of this project, you may contact Dr.
Arnold Bell, Chair of the NCSU IRB for the Use of Human Subjects in Research Committee, Box
7514, NCSU Campus (919/515-4420) or Mr. Matthew Ronning, Assistant Vice Chancellor, Research
Administration, Box 7514, NCSU Campus (919/513-2148).
Consent To Participate
“I have read and understand the above information. I have received a copy of this form. I agree to
participate in this study with the understanding that I may withdraw at any time.”
Subject's signature_______________________________ Date _________________
Investigator's signature___________________________ Date _________________

195
North Carolina State University
INFORMED CONSENT FORM for RESEARCH
(For phone interviews)
Analysis of the Market Potential and Effectiveness of Upstream Textile Advertising
Principal Investigator: Charles Ian Raulston Faculty Sponsor: Nancy Cassill,
William Oxenham
What are some general things you should know about research studies?
You are being asked to take part in a research study. Your participation in this study is voluntary. You
have the right to choose to take part in the study, or not take part in the study, or to stop participating
at any time. The purpose of research studies is to gain a better understanding of a certain topic or
issue. You are not guaranteed any personal benefits from being in a study. Participation in the
research study may pose risks. In this consent form, you will find specific details about the research in
which you are being asked to participate. If you are unclear about any area of this form, it is your
right to ask the researcher for clarification or more information. A copy of this consent form will be
provided to you. If at any time you have questions about your participation, do not hesitate to contact
the researcher(s) named above.
What is the purpose of this study?
The purpose of this research is to examine upstream textile firms that effectively use advertising to
differentiate their products in the market. The overall research questions are what factors contribute to
an effective advertisement and what are the best techniques to facilitate communication with the
customer and final consumer? The study will focus on determining the benefits, potential, and
challenges of upstream advertising and the most effective strategies of communication with the
customer and the end-use consumer. Another research objective is to develop a framework that
upstream textile firms can use create effective advertising strategies differentiate their products.
What will happen if you take part in the study?
If you agree to participate in this study, you will be asked to interview with the researcher. This
interview should take one hour to 1:30, depending on the length of your responses and the intensity of
discussion.
Risks
Possible legal risks exist due to disclosure of confidential information; however, subject and company
names will be coded. These code numbers will be stored with the data, and the master list of names
and codes will be kept in a separate location. Information that could identify subjects will be removed
in the reporting of information. Please do not divulge any information that you are uncomfortable
sharing.

196
Benefits
The benefit of this research is that it will provide a model for upstream textile manufactures to use in
developing successful advertising campaigns. This model could be used as a way for these companies
to differentiate their products in the market.
Confidentiality
The information in the study records will be kept strictly confidential. Data will be stored securely in
on the researcher’s personal computer, which are password protected and firewalled, and under lock
and key. Code numbers will be created for your name and company name; these code numbers will
be the only identifiers stored with the data. The master list linking codes to subject and company
names will be kept in a separate location than the data in order to minimize the potential of linking the
data to you and your company. Any identifying information, such as product brand names, company
names and you name will be removed when reporting the data. No reference will be made in oral or
written reports, which could link you to the study.
Compensation
There is no compensation for participating in the study.
What if you have questions about this study?
If you have questions at any time about the study or the procedures, you may contact the researcher,
Charles Ian Raulston, at 2401 Research Drive, Box 8301, Raleigh, NC 27695, [email protected], or
336-803-0125.
What if you have questions about your rights as a research participant?
If you feel you have not been treated according to the descriptions in this form, or your rights as a
participant in research have been violated during the course of this project, you may contact Dr.
Arnold Bell, Chair of the NCSU IRB for the Use of Human Subjects in Research Committee, Box
7514, NCSU Campus (919/515-4420) or Mr. Matthew Ronning, Assistant Vice Chancellor, Research
Administration, Box 7514, NCSU Campus (919/513-2148).
Consent To Participate
“I have read and understand the above information. I have received a copy of this form. I agree to
participate in this study with the understanding that I may withdraw at any time.”
Subject's signature_______________________________ Date _________________
Investigator's signature___________________________ Date _________________

197
North Carolina State University
INFORMED CONSENT FORM for RESEARCH
(For consumer surveys)
Analysis of the Market Potential and Effectiveness of Upstream Textile Advertising
Principal Investigator: Charles Ian Raulston Faculty Sponsor: Nancy Cassill,
William Oxenham
What are some general things you should know about research studies?
You are being asked to take part in a research study. Your participation in this study is voluntary. You
have the right to choose to take part in the study, or not take part in the study, or to stop participating
at any time. The purpose of research studies is to gain a better understanding of a certain topic or
issue. You are not guaranteed any personal benefits from being in a study. Participation in the
research study may pose risks. In this consent form, you will find specific details about the research in
which you are being asked to participate. If you are unclear about any area of this form, it is your
right to ask the researcher for clarification or more information. A copy of this consent form will be
provided to you. If at any time you have questions about your participation, do not hesitate to contact
the researcher(s) named above.
What is the purpose of this study?
The purpose of this research is to examine upstream textile firms that effectively use advertising to
differentiate their products in the market. The overall research questions are what factors contribute to
an effective advertisement and what are the best techniques to facilitate communication with the
customer and final consumer? The study will focus on determining the effectiveness of current
upstream advertisements in the market, as well as determining what communication media types are
most effective at influencing product or company interest. This information will be used to develop a
framework that upstream textile firms can use create effective advertising strategies differentiate their
products.
What will happen if you take part in the study?
If you agree to participate in this study, you will be asked to complete an online survey. This survey
should take between 10 and 20 minutes.
Risks
There are no risks to you or your privacy by participating in the survey. You are not required to
divulge any information that you do not feel comfotable reveailing.

198
Benefits
The benefit of this research is that it will help develop a model for upstream textile manufactures to
use in developing successful advertising campaigns. This model could be used as a way for these
companies to differentiate their products in the market.
Confidentiality
The information in the study records will be kept strictly confidential. Data will be stored securely in
on the researcher’s personal computer, which are password protected and firewalled, and under lock
and key. Other than a number assigned to each survey for response rate tracking, no identifiers will be
used to link your spcific answers to any survey. No reference will be made in oral or written reports,
which could link you to the study.
Compensation
There is no compensation for participating in the study.
What if you have questions about this study?
If you have questions at any time about the study or the procedures, you may contact the researcher,
Charles Ian Raulston, at 2401 Research Drive, Box 8301, Raleigh, NC 27695, [email protected], or
336-803-0125.
What if you have questions about your rights as a research participant?
If you feel you have not been treated according to the descriptions in this form, or your rights as a
participant in research have been violated during the course of this project, you may contact Dr.
Arnold Bell, Chair of the NCSU IRB for the Use of Human Subjects in Research Committee, Box
7514, NCSU Campus (919/515-4420) or Mr. Matthew Ronning, Assistant Vice Chancellor, Research
Administration, Box 7514, NCSU Campus (919/513-2148).
Consent To Participate
“I have read and understand the above information. I have received a copy of this form. I agree to
participate in this study with the understanding that I may withdraw at any time. I am at least 18
years of age.”
Subject's signature_______________________________ Date _________________
Investigator's signature___________________________ Date _________________

199
APPENDIX F: INITIAL CONTACT LETTERS

200
Interview Initial Contact Email
Date
Contact Name
Salutation if no specific contact name
I received your contact information through (insert source) and I am contacting you regarding my
graduate research study. Through my initial research, your company has demonstrated leadership and
success in advertising to both end consumers as well as companies in your supply chain. My study
focuses on how advertising can be used as a differentiation method for upstream textile firms (those
providing fibers, yarns, and fabrics to downstream entities), including the benefits, potential, and
challenges of implementing an effective advertising strategy as well as perspectives on current
advertising practices. I would like to extend an invitation to your company to participate in this study
in an effort to improve the overall performance of the US textile supply chain. Your participation is
voluntary. I feel that your company will serve as a strong example of the possibilities and potential of
upstream advertising. If your company does choose to participate, your confidentiality will be secured
and your company name will not be mentioned in any published or presented materials.
I will be conducting interviews in your area on the week of ___. I would like to set up a time to meet
with members of your advertising, marketing, promotional department, or outsourced advertising firm
during this week if possible. If an on-sight visit is not possible during that week, I would like to
schedule a conference call when convenient. The questionnaire that will be administered during the
meeting is attached for your review. I will be following up with you via phone or email in the new
few days. Please let me know if you will be available to participate during that week or if there is
another individual that I should contact.
Sincerely,
Ian Raulston
Graduate Student
NCSU/ITT
Under the guidance of:
Nancy L. Cassill, Ph.D.
Department Head
Professor –NCSU
William Oxenham, Ph.D
Associate Dean
Professor- NCSU

201
W. Gilbert O’Neil, Ph.D
President ITT
P.E.
Erin Parrish Ph.D
Associate Professor- ECU
President – ITT

202
Consumer Survey Initial Contact Email
Date
Contact name,
I am Ian Raulston a NC State graduate student at the College of Textiles and I am interested in
working with you and your (insert course name) class to aid me in my thesis research. My thesis
focuses on analyzing the effectiveness and potential of upstream textile advertising. Part of my
research objectives are to gather insights from consumer groups about what they consider effective
advertisements as well as what specific elements of those ads are most appealing. I would like to
come into your classroom in mid to late February and present some images and a questionnaire to
your students and gather their feedback. It should take less than 30 minutes total and we can schedule
the survey at your convenience. If you have any questions about the survey or study please email me
at the address below.
Thank you for your consideration,
Ian Raulston
Graduate Student
NCSU/ITT
Under the guidance of:
Nancy L. Cassill, Ph.D.
Department Head
Professor –NCSU
William Oxenham, Ph.D
Associate Dean
Professor- NCSU
W. Gilbert O’Neil, Ph.D
President ITT
P.E.
Erin Parrish Ph.D
Associate Professor- ECU
President – ITT

203
APPENDIX G: IRB EXEMPTION LETTER
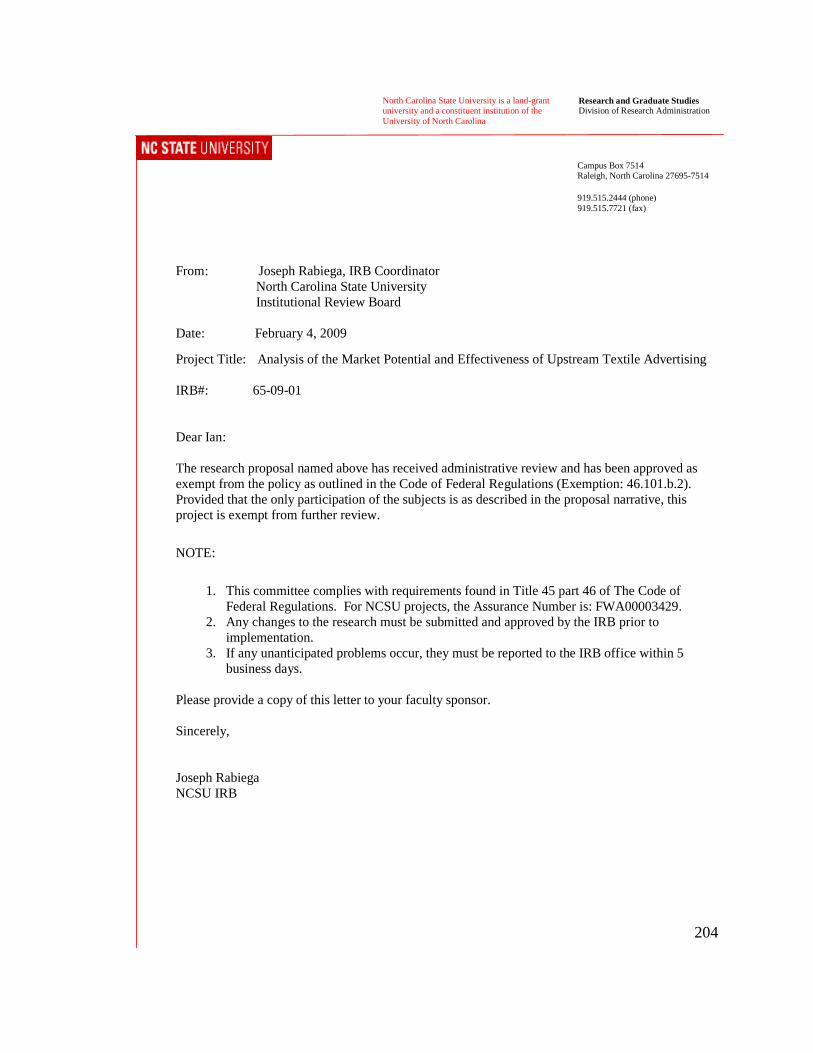
204
North Carolina State University is a land-grant university and a constituent institution of the
University of North Carolina
Research and Graduate Studies Division of Research Administration
Campus Box 7514 Raleigh, North Carolina 27695-7514 919.515.2444 (phone)
919.515.7721 (fax)
From: Joseph Rabiega, IRB Coordinator
North Carolina State University
Institutional Review Board
Date: February 4, 2009
Project Title: Analysis of the Market Potential and Effectiveness of Upstream Textile Advertising
IRB#: 65-09-01
Dear Ian:
The research proposal named above has received administrative review and has been approved as
exempt from the policy as outlined in the Code of Federal Regulations (Exemption: 46.101.b.2).
Provided that the only participation of the subjects is as described in the proposal narrative, this
project is exempt from further review.
NOTE:
1. This committee complies with requirements found in Title 45 part 46 of The Code of
Federal Regulations. For NCSU projects, the Assurance Number is: FWA00003429.
2. Any changes to the research must be submitted and approved by the IRB prior to
implementation.
3. If any unanticipated problems occur, they must be reported to the IRB office within 5
business days.
Please provide a copy of this letter to your faculty sponsor.
Sincerely,
Joseph Rabiega
NCSU IRB

205
APPENDIX H: PRODUCT SCAN RESULTS

206
National Specialty Chain- REI
Product Host Brand Product Type Ad Type Ad LocationTextile Ingredient
BrandUpstream Firm
Size of Ad Compared to
Host Brand's AdPrice Point Additional Comments
Hang tag Attached3M Scotch Light
Reflective3M same Ingredient attributes
Hang tag Attached Tecore LX
Tahsin
Industrial
Corp
larger
Ingredient attributes
and contact
information
2 REI Jacket Hang tag Attached Polartec Thermal Pro Polartec larger $75.00 Ingredient attributes
Sticker Attached Insect Shield ExOffico smaller
Hang tag Attached Insect Shield ExOffico same Ingredient attributes
4Mountain
HardwareBaselayer shirt Hang tag Attached
Visa Endurance Smart
FabricMilliken same $45.00 Ingredient attributes
5 REI Jacket Hang tag Attached PrimaLoft
Albany
International
Corp
same $199.00 Ingredient attributes
6 Arc' Teryx Bottoms Hang tag Attached Polartec Polartec larger $175.00 Ingredient attributes
7The North
FaceJacket Hang tag Attached Polartec Polartec same $155.00 Ingredient attributes
Hang tag Attached Thermolite ADVANSA larger Ingredient attributes
Hang tag Attached Tactel Invista larger Ingredient attributes
9 Merrill Hiking shoe Hang tag Attached Gore-Tex W.L. Gore same $79.99 Ingredient attributes
10Black
DiamondGloves Hang tag Attached Gore-Tex W.L. Gore larger $56.00 Ingredient attributes
Hang tag Attached PrimaLoft
Albany
International
Corp
same Ingredient attributes
Hang tag Attached Comfortmax Radiant Du Ponte same Ingredient attributes
Hang tag Attached Typora Insert iKOLON same Ingredient attributes
Hang tag Attached PrimaLoft
Albany
International
Corp
same Ingredient attributes
Hang tag Attached Wind Stopper W.L. Gore same Ingredient attributes
13 Burton Gloves Hang tag Attached Gore-Tex W.L. Gore same $54.00 Ingredient attributes
14Outdoor
ResearchGloves Hang tag Attached Gore-Tex W.L. Gore same $79.99 Ingredient attributes
15 Seirus Gloves Hang tag Attached Thinsulate 3M same $32.00 Ingredient attributes
Hang tag Attached PrimaLoft
Albany
International
Corp
same Ingredient attributes
Hang tag Attached eVent Fabric eVent larger Ingredient attributes
17 Kokatet Weightier Hang tag Attached Neoprene Du Ponte same $129.00 Ingredient attributes
National Specialty Chain- REI
3 Patagonia Baselayer shirt $80.00
$99.00
Gloves $70.00
$59.00
GlovesManzella
REI Cap
1
8 REI Sleeping bag
16
12
Swany11
Bellwether Jacket
$50.00
$39.50

207
National Specialty Chain- Dick’s Sporting Goods
Mass/Big Box Retailer- Target
Product Host Brand Product Type Ad Type Ad LocationTextile Ingredient
BrandUpstream Firm
Size of Ad Compared to
Host Brand's AdPrice Point Additional Comments
1The North
FaceCap Hang tag Attached Lycra Invista same $20.00 Ingredient attributes
2The North
FaceJacket Hang tag Attached Polartec Polartec same $165.00 Ingredient attributes
Hang tag Attached Polartec Power Stretch Polartec larger Ingredient attributes
Sew in
labelOn product Polartec Polartec N/A
4Field and
streamJacket Hang tag Attached Hydroproof Ultra W.L. Gore small $59.99 Ingredient attributes
5Field and
streamSleeping bag Logo On package Thermolite ADVANSA N/A $39.99 Ingredient attributes
6 Wigwam Sock Logo On package Cotton Cotton, Inc. N/A $12.00
7 Wigwam Sock Logo On package Coolmax ADVANSA N/A $12.00 Ingredient attributes
8 Merrill Hiking shoe Hang tag Attached Gore-Tex W.L. Gore N/A $89.99 Ingredient attributes
9 Wolverine Hiking boot Sticker On package Thinsulate 3M N/A $159.99 Ingredient attributes
Sticker On package Gore-Tex W.L. Gore N/A Ingredient attributes
Sew in
labelOn product Thinsulate ultra 3M N/A Ingredient attributes
Sew in
labelOn product Gore-Tex W.L. Gore N/A Ingredient attributes
Sew in
labelOn product Thinsulate 3M N/A Ingredient attributes
12 Timberland Hiking bootMetal
plateOn product Gore-Tex W.L. Gore N/A $90.00 Ingredient attributes
Metal
plateOn product Gore-Tex W.L. Gore N/A Ingredient attributes
Sew in
labelOn product Thinsulate 3M N/A Ingredient attributes
National Specialty Chain- Dick's Sporting Goods
GlovesThe North
Face$30.00
10
11Field and
StreamHunting boot
$199.0013 Wolverine Hunting boot
$70.00
$89.00
3
Field and
StreamHunting boot
Product Host Brand Product Type Ad Type Ad LocationTextile Ingredient
BrandUpstream Firm
Size of Ad Compared to
Host Brand's AdPrice Point Additional Comments
N/A N/A N/A N/A N/A N/A N/A N/A N/A
Mass Big Box Retailer- Target
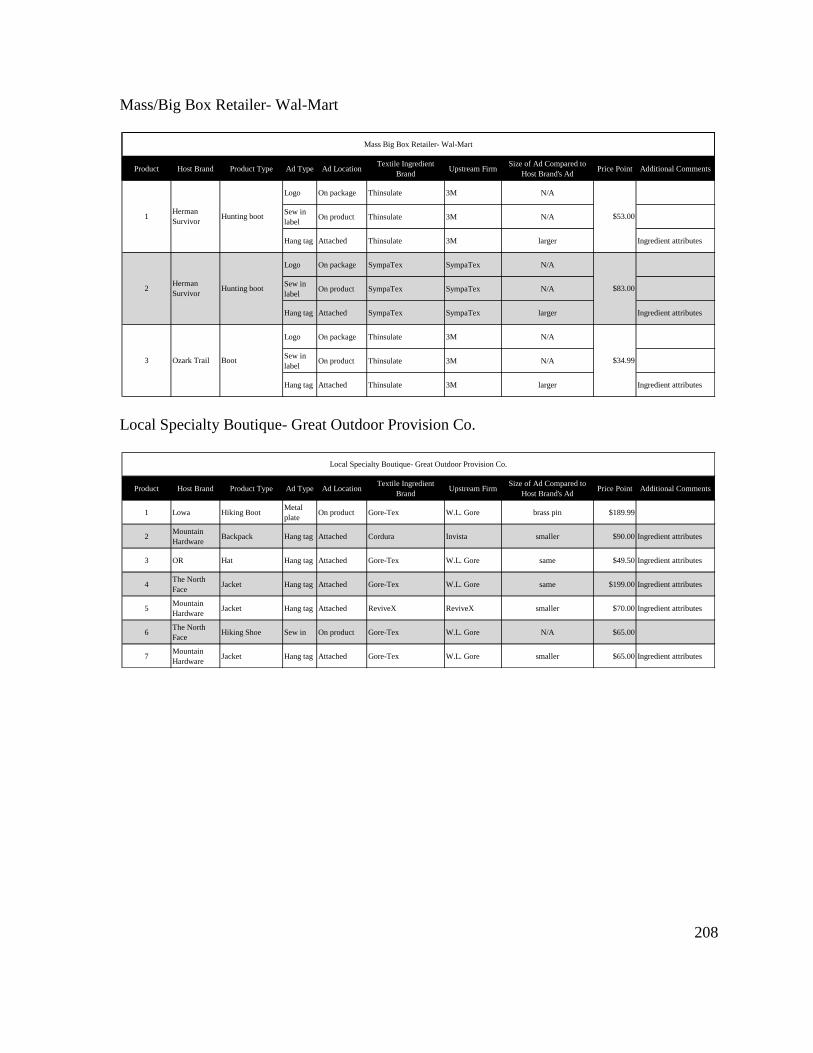
208
Mass/Big Box Retailer- Wal-Mart
Local Specialty Boutique- Great Outdoor Provision Co.
Product Host Brand Product Type Ad Type Ad LocationTextile Ingredient
BrandUpstream Firm
Size of Ad Compared to
Host Brand's AdPrice Point Additional Comments
Logo On package Thinsulate 3M N/A
Sew in
labelOn product Thinsulate 3M N/A
Hang tag Attached Thinsulate 3M larger Ingredient attributes
Logo On package SympaTex SympaTex N/A
Sew in
labelOn product SympaTex SympaTex N/A
Hang tag Attached SympaTex SympaTex larger Ingredient attributes
Logo On package Thinsulate 3M N/A
Sew in
labelOn product Thinsulate 3M N/A
Hang tag Attached Thinsulate 3M larger Ingredient attributes
3 Ozark Trail Boot $34.99
$83.00
Hunting boot $53.001Herman
Survivor
2Herman
SurvivorHunting boot
Mass Big Box Retailer- Wal-Mart
Product Host Brand Product Type Ad Type Ad LocationTextile Ingredient
BrandUpstream Firm
Size of Ad Compared to
Host Brand's AdPrice Point Additional Comments
1 Lowa Hiking BootMetal
plateOn product Gore-Tex W.L. Gore brass pin $189.99
2Mountain
HardwareBackpack Hang tag Attached Cordura Invista smaller $90.00 Ingredient attributes
3 OR Hat Hang tag Attached Gore-Tex W.L. Gore same $49.50 Ingredient attributes
4The North
FaceJacket Hang tag Attached Gore-Tex W.L. Gore same $199.00 Ingredient attributes
5Mountain
HardwareJacket Hang tag Attached ReviveX ReviveX smaller $70.00 Ingredient attributes
6The North
FaceHiking Shoe Sew in On product Gore-Tex W.L. Gore N/A $65.00
7Mountain
HardwareJacket Hang tag Attached Gore-Tex W.L. Gore smaller $65.00 Ingredient attributes
Local Specialty Boutique- Great Outdoor Provision Co.

209
APPENDIX I: COMPANY INTERVIEW RESULTS: ADVERTISING
IN THE SPORTS AND LEISURE MARKET

210
Appendix I1: Company A Interview Results-
Topic Company A's Comments Regarding Advertising in the
Sports and Leisure Market
Competitive
necessity
Advertising is necessary for product categories that require more market
penetration or recognition in order to be competitive against larger, or more well
known brands. Advertising necessity should be determined by product segment, some segments
make more sense than others. Products close to the end consumer typically receive more advertising dollars. PR plays a large role along with advertising.
Differences in
tactics
Sports and leisure products receive more advertising focus because the segment is
typically more competitive and yields higher margins. Advertisements for sports and leisure products typically include more product-
focused content while commodity product ads are more company focused. Sports and leisure products use print ads, brochures, hangtags and on-product
labels, trade shows, face-to-face interactions, websites and direct mailers to
communicate while commodity products typically only use direct mailings and
face-to-face talks.
Development
Promotions are typically determined by market and tailored to the preference of
that market. For products where brand name or product name is important, it is less important
to promote the company name, however, when customers are more concerned
about the quality or longevity of the company, it is more appropriate to build the
company name. The customer must see value in advertising or it is not necessary to advertising that
product. Direct mail and face-to-face communications would suffice in those
situations.
Successful
companies
Gore-Tex Waterproof breathable fabrics Fiber companies seem to promote their products more heavily than other segments

211
Appendix I2: Company B Interview Results
Topic Company B's Comments Regarding Advertising
in the Sports and Leisure Market
Competitive
necessity
No, we are not trying to build a consumer brand at this time, but if a company is
interested in competition, we will provide support through logos and hangtags. We do more business-to-business advertising, but we will help our host brands in
any way we can.
Differences in
tactics
It depends on what markets you are most interested in. If it is a new market for the
company and there is a large opportunity, it may be best to focus advertising in
that market and try to dive in for a big impact. Have to establish the company first and then promote individual brands or
products. Builds credibility for the company which increases product acceptance. We provide hangtags and signage for host brand companies that ask for it. Mostly
for performance and sports markets.
Development
We try to develop ads that show our product performing as good as or better than
the branded alternative. This helps to position our products as a low cost
alternative and our advertisements that point of parity with the quality and the cost
as a point of difference.
Successful
companies
From our company's perspective, machinery companies tend to have good
advertisements. Exxon Chemical and Eastman Chemical do a good job staying in
front of the customer. Apparel is typically over advertised just because the segment is struggling in the
U.S. because of overseas competition Polyester fibers do not seem to be advertising as much as other fibers types.
Appendix I3: Company C Interview Results
Topic Company C's Comments Regarding Advertising
in the Sports and Leisure Market
Differences in
tactics We do not differentiate our advertising for different product.
Development
Our advertising has been through our successful customers.
We have seen little success with print or trade magazine advertisements.
Where we have gotten feedback is from companies asking how we can use our
technology to help their business.
We promote our expertise, capabilities, and ability to solve problems and make
products better.
Successful
companies
Combination of exposure in trade shows and advertising. Cocona is an effective
company because not only do their products have hangtags on them but they have
an easily identifiable symbol that they have become synonymous with their
company.

212
Appendix I4: Company D Interview Results
Topic Company D's Comments Regarding Advertising
in the Sports and Leisure Market
Competitive
necessity
No, traditional advertising is not necessary so long as you are presenting your
message in an unique way that is meaningful to the customer or consumer. Today, it can be done through PR and relationship development. But 5 years ago
then I would say yes advertising is essential
Differences in
tactics
Yes and no, we look at the segment and the competition in that market. We specifically target each market segment differently. For most products, we use PR or one on one relationship building. For performance products, we use a variety of media types ranging from hangtags,
to PR, to product level websites.
Development
Our main media vehicle is PR, which is either put out by our company or jointly
with companies we collaborate with. We also use hangtags on end use products, which are linked to our website. We
wanted to create a connection with consumers and we are accomplishing this by
educating the consumer, through the hangtags, and adding supplemental
information to what our host brands present. We also designed our hangtags to be
interactive, where consumers can go online and enter a code to access a special
feature about the product. Traditionally, our company has not use print advertising
Successful
companies Polartec Splenda

213
Appendix I5: Company E Interview Results
Topic Company E's Comments Regarding Advertising
in the Sports and Leisure Market
Competitive
necessity
Right now is the time for advertising to be effective. It’s important to be visible when the economy is in a down turn to let customers
know you are still there and able to help their business
Differences in
tactics
We try to tailor our ads to speak to specific groups by researching and talking with
customers and finding out what is important to them, what trends they are
following, and what their preferences are. We combine that information with the message we want to present so that we can
position ourselves to be as successful as we can be. When putting together the campaign we take into account the differences between
the product segments, the copy text and images may be different, but our message
is still consistent. Even though it is the same product, it has many uses and we try to tailor our
advertisements to the specific end use.
Development
We have evolved from a blanket style advertising approach using a more generic
ad to a very iconic, emotional pitch. We have a specific ad image, which is not
related to the product specifically, that has become associated with our company
and our brands. This image is now tied very close to our company and highly
recognized in our industry. We use PR events and event type promotions that promote our company and our
message. We may not see direct sales from those events, but it still reminds our
customers that we are still a viable and healthy company. To build synergies, we use specific colors and images in our ads that are consistent
with our company colors across market segments.
Successful
companies
Lycra Linsing BASF Sunbrella

214
Appendix I6: Company F Interview Results
Topic Company F's Comments Regarding Advertising
in the Sports and Leisure Market
Competitive
necessity
Yes, the outdoor consumer is very aware of brands and they like to be told about
the products and feel connected with their brands. We advertise our product in action and build a story behind it. We typically
present strong images that the target would respond well to.
Differences in
tactics
The general approach is the same, but we adapt our ads to fit the market
segments and what they find meaningful. You have to know your target intrinsically in order to be effective.
Development
We try to create awareness for our products by promoting our superior product
attributes. We use consistency in our ads as well as promoting our integrity and compliance
in our industry ads. We are very careful with what claims we make in our marketing and advertising We try to develop ads that are appealing on the emotional level by tailoring our
message in a way that resonate with our target. We want to create an aspirational ad that depicts real people using the product
that makes the target want to complete the story for themselves
Successful
companies
Intel Lycra Gore-Tex NutraSweet

215
Appendix I7: Company G Interview Results
Topic Company G’s Comments Regarding Advertising
in the Sports and Leisure Market
Competitive
necessity
It seems like in order to be successful in this segment you have to advertise. The
really successful companies all make advertising claims about superiority and then
deliver. That is what we are trying to do. Our tactics do not change across product categories just because we are not large
enough yet. We use direct advertisements in the performance product area since it is still new
to that business. We trying to promote out company in general, we use "catch all" print
advertisements in strategic publications. But we do not advertise the products that we do not have a direct U.S. supply chain
partnership with (i.e. products that we sell to retailers that are later processed in
other countries)
Development
Our tactics have evolved as our company has grown and changed. We used to
create generic advertisements in trade magazine but everyone knows our company
in the industry. We want to promote the quality of our product and the services gained by doing
business with our company. Not only are we providing a top quality product that
will enhance the quality of the end product, we offer sourcing help. We promote other manufacturers that we work that we know will add value to the
product and make it more successful.
Successful
companies
Cotton Inc Supima Lansing

216
Appendix I8: Company H Interview Results
Topic Company H’s Comments Regarding Advertising
in the Sports and Leisure Market Competitive
necessity Because of our unique position in the market, it is important to advertise in this
segment.
Differences in
tactics
We use different advertising tactics depending on the product category or end use.
For performance products, we try to use people who are active in the trade or
consumer segment to promote our products. But we may use different tactics in the
home furnishings or apparel segments, it just depends on what the target finds
meaningful. As for trade, we put out white papers and mostly printed media and events to
promote our products and brands.
Development Our ads attempt to reach a broad audience using economies of scale. We focused on spreading our message through a variety of media types including,
print, online, television, and sponsored events.
Successful
companies
Lycra Supima Intel Cotton Inc.
Appendix I9: Company I Interview Results
Topic Company I's Comments Regarding Advertising
in the Sports and Leisure Market
Competitive
necessity
If you have a superior product, and your sales team is effective at promoting and
selling the product then it is not as necessary to advertise in this segment. Because we are so customer focused and target them individually, it less important
to blanket the market with ads for our company.
Differences in
tactics
We promote our performance-based products more heavily than others, especially
those that have been engineered to fit certain markets. We try to advertise ourselves as a solutions company.
Development
Our marketing activities are geared toward specific customers. We typically develop a promotional piece for new products, mostly to direct mail
to customers. We rely heavily on our customers to promote our products downstream.
Successful
companies
W.L. Gore Trivantage In general, Apple is a very effective advertiser because through their products and
advertisements they are attempting to build loyalty that will last a lifetime.
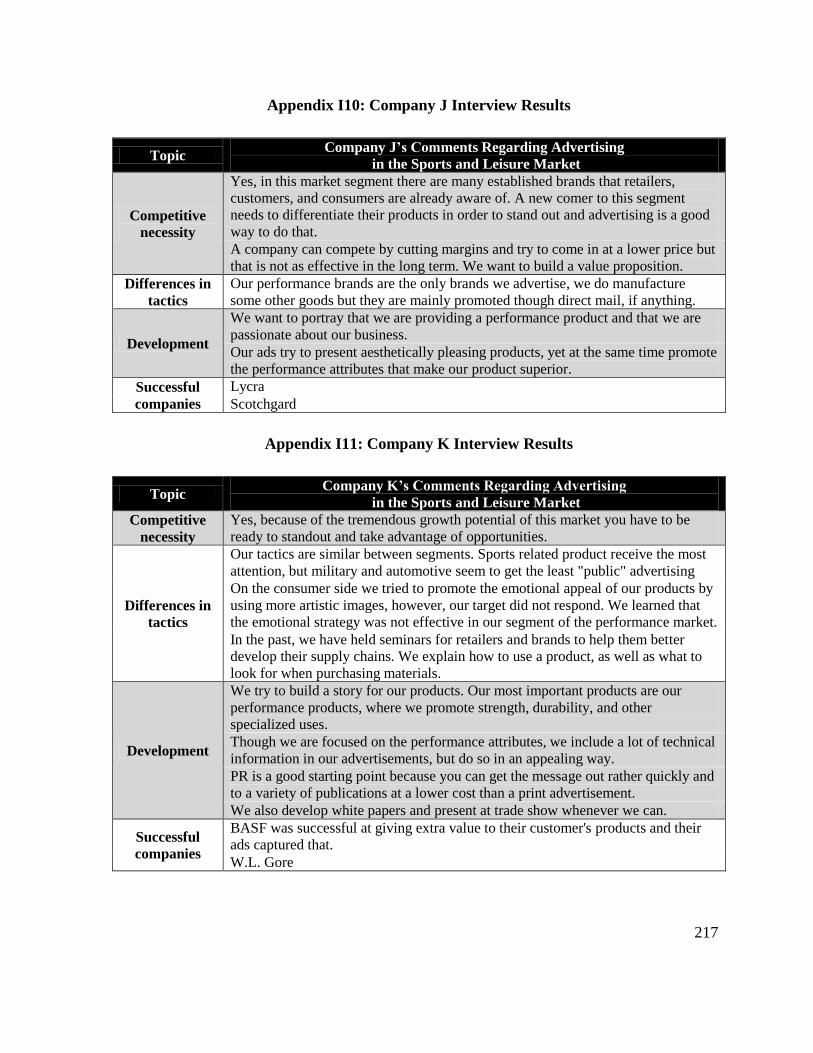
217
Appendix I10: Company J Interview Results
Topic Company J’s Comments Regarding Advertising
in the Sports and Leisure Market
Competitive
necessity
Yes, in this market segment there are many established brands that retailers,
customers, and consumers are already aware of. A new comer to this segment
needs to differentiate their products in order to stand out and advertising is a good
way to do that. A company can compete by cutting margins and try to come in at a lower price but
that is not as effective in the long term. We want to build a value proposition. Differences in
tactics Our performance brands are the only brands we advertise, we do manufacture
some other goods but they are mainly promoted though direct mail, if anything.
Development
We want to portray that we are providing a performance product and that we are
passionate about our business. Our ads try to present aesthetically pleasing products, yet at the same time promote
the performance attributes that make our product superior. Successful
companies Lycra Scotchgard
Appendix I11: Company K Interview Results
Topic Company K’s Comments Regarding Advertising
in the Sports and Leisure Market Competitive
necessity Yes, because of the tremendous growth potential of this market you have to be
ready to standout and take advantage of opportunities.
Differences in
tactics
Our tactics are similar between segments. Sports related product receive the most
attention, but military and automotive seem to get the least "public" advertising On the consumer side we tried to promote the emotional appeal of our products by
using more artistic images, however, our target did not respond. We learned that
the emotional strategy was not effective in our segment of the performance market. In the past, we have held seminars for retailers and brands to help them better
develop their supply chains. We explain how to use a product, as well as what to
look for when purchasing materials.
Development
We try to build a story for our products. Our most important products are our
performance products, where we promote strength, durability, and other
specialized uses. Though we are focused on the performance attributes, we include a lot of technical
information in our advertisements, but do so in an appealing way. PR is a good starting point because you can get the message out rather quickly and
to a variety of publications at a lower cost than a print advertisement. We also develop white papers and present at trade show whenever we can.
Successful
companies
BASF was successful at giving extra value to their customer's products and their
ads captured that. W.L. Gore

218
APPENDIX J: COMPANY INTERVIEW RESULTS: ADVERTISING BENEFITS

219
Appendix J1: Company A Interview Results
Topic Company A's Comments Regarding Advertising Benefits
Defining
success
Success in advertising is when consumers know your product in the market. Advertising is the initial touch with a customer and it is meant to generate interest
that may lead to sales. Ads are not designed to close the sale. Typically assume that 1/2 of advertising is effective.
Benefits
Builds brand awareness and recognition among potential buyers. Builds confidence in the company by promoting stability and longevity Creates buzz about products. Defines what the products mean to the consumer/customer Advertising has the potential to build the brand, the company, and sales Advertising can also create credibility and buzz about the product and give the
feeling that a company is everywhere. Builds company name for potential employees.
Evaluating
methods
It is difficult to measure effectiveness or recognition so far back in the supply
chain. Can monitor volumes of customer calls and correlate that to the campaign's
timeline. Use publications that offer reader response cards, this allows for direct tracking
Elements of
effective
advertising
Advertisements should highlight a specific product attribute that makes it superior
to other products in the market. Developing and including logos for product advertisements makes your product
easily recognizable without having to read text. Logos are also more memorable
than text alone. The message in the advertisement should build the name and increase visibility of
the product name and logo. For company focused advertisements, the ad must reassure customers that the
company is taking steps to remain competitive and financially stable. Advertisements must contain a point of action, contact information, a website, or
some other directive text that tells the customer what to do next or where to find
information or products. Advertisements are a good way to communicate that the firm is aware and
knowledgeable about trends in the market.

220
Appendix J2: Company B Interview Results
Topic Company B's Comments Regarding Advertising Benefits
Defining
success
Success for our company would be while the promotions are going on the sales
team is getting some leads but to actually see "success" in the short term (under a
year) is very rare. Because if this lead-time, our company typically focuses on company centered
advertisements that keep the company name inform of the customer. An advertising campaign would be considered a success if the company can get its
product out into the market in a reasonable period of time, whether advertising was
the reason or not.
Benefits
Sometimes it is what does not happen, that is the benefit. Keeps their name in front of their customers. Advertising is worth it even if we are not getting new direct sales, it reinforces that
we are committed to textiles and the industry. Makes you look at your customers and really get to know them which lead to other
benefits. Builds your presence in the market so when opportunities arise and new markets
become available your company is already known, and through the previous
advertising will hopefully be accepted as a leader. Evaluating
methods Have to look up to 5 years back to see the results of a campaign and by that time, it
is very difficult to attribute success to one advertisement or another.
Elements of
effective
advertising
Creating trade brands, especially for commodity products help easy identify your
products in the market. Branding the company was especially important when competing in small markets
with few competitors Need to let them know about the longevity of the company and commitment to the
industry Not so much specific text or images, it's understanding what the customer wants
and pulling together the product and the message that satisfies the customer.

221
Appendix J3: Company C Interview Results
Topic Company C's Comments Regarding Advertising Benefits Defining
success We want to send a message that we are here and we can help with your business
Benefits
We do not see a lot of value advertising through traditional advertising methods.
We seem to have a better response by word of mouth through our customers. We
provide products to several leading companies and they are our biggest promoters. One on one relationships with leading companies are most important, through their
contacts we gain new business.
Appendix J4: Company D Interview Results
Topic Company D's Comments Regarding Advertising Benefits Defining
success For promotional success, volume growth is key.
Benefits Building credible brand awareness, promoting company viability, increasing sales. Evaluating
methods We do not specifically measure how effective our ads are, we track traffic to our
websites and get feedback, but we do not measure awareness or recognition.
Elements of
effective
advertising
Consistent messages that can be built upon. We focus on brand or product level
advertisements, not so much on company advertising. Ads must have callout or call to action. Being credible is also important.
Appendix J5: Company E Interview Results
Topic Company E's Comments Regarding Advertising Benefits Defining
success When someone we have not done business with already knows about us.
Benefits
Keeping the company visible to the mills, brands, and retailers. We have aligned
our business to try to take advantage of the opportunities each of these groups
present. We want the our customers to know we support them but at the same time
we want the brand or retailer to recognize our product when its presented or
mentioned. Building awareness and the relationships between our company and our customers.
Evaluating
methods
We do not have any way to quantify the effectiveness of our advertising because
they do not always lead to sales calls or inquires. We should know every company that may use our product, so our ads are mainly
focused on maintaining visibility and awareness of our products.
Elements of
effective
advertising
Image needs to stop people in their tracks and cause them to look. The image
needs to be compelling with valuable copy text. The copy needs to present the message quickly and easily. There has to be a request for action. For direct ads it is more pronounced.

222
Appendix J6: Company F Interview Results
Topic Company F's Comments Regarding Advertising Benefits
Defining
success
Creating long-term brand and company value. We consider it a success if we are
100% sure our message is true and that we feel comfortable presenting it to the
market. We dive into substantiation of marketing claims, it is very important to our
company. Benefits Supports our brand and our company by promoting the integrity of our claims.
Evaluating
methods
We use a physiological response monitoring systems in focus groups that detects
different physiologic responses participants experience while looking at ads. This
allows us to see which are being effective and causing a real response with the
participant.
Elements of
effective
advertising
Engaging images that appeal to the target. We like to use images that create a story
and make the target want to experience what is in the image. Consistency in the
message and developing the brand image is also important for creating long-term
brand equity.
Appendix J7: Company G Interview Results
Topic Company G's Comments Regarding Advertising Benefits Defining
success We define success as when we approach someone that we have never done
business with or contacted and they already know about our company.
Benefits
Advertisements hopefully generate new business for the company and promote our
band. We want to be known as THE supplier in our product category and
advertising is a good way to create those perceptions in the market, so long as the
products are performing at that level. Promoting our company and product names to build recognition. We want to set
up the initial connection between us and the designers and retailers. We want to
help educate them about the abilities our company and what we can offer them.
Most designers or retailers do not know what factors affect the quality of the final
product. We want to build the reputation of our company and products through our ads so
that when we talk to them we have some pre-established credibility.
Evaluating
methods
We never know how effective we really are. We assume that when sales are good
we are being effective in our advertising. We rely a lot on our customers to promote our business.
Elements of
effective
advertising
We promote our supply chain and our customers with our ads. We want to offer
the whole package when a company chooses us as their supplier. Ads include company name and logos and we use customer buzz words to let the
consumer know we understand what they want

223
Appendix J8: Company H Interview Results- Advertising Benefits
Topic Company H's Comments Regarding Advertising Benefits
Defining
success
Our ads are geared to increase sales by appealing to consumers through a
particular product attribute. We want the consumer to take notice of the ad and then remember it at the time of
purchase. If we can accomplish that goal then the campaign was a success.
Benefits We use advertising to increase the favorability of our product in the market, mold
consumer perception, and increase sales. Evaluating
methods Use focus groups to gain feedback and assess the effectiveness of our campaign.
Elements of
effective
advertising
The media type we choose is dependent on the message we are trying to convey.
For universal messages that will have appeal across market segments and
customers, we use a mass media approach. However, if we are trying to highlight a
particular attribute about our product we may use a direct approach by placing ads
in specific magazines or journals that potential customers are likely to read.
Appendix J9: Company I Interview Results
Topic Company I's Comments Regarding Advertising Benefits Defining
success When we change a perception in the marketplace to one that favors our products.
However, all success is still ultimately measured by sales.
Benefits
It depends on the message; generally, advertising helps to establish a marketing
message in the mind of the target. The benefit is what you set out to accomplish and that varies from customer to
customer.
Evaluating
methods
After we implement the decision, we allow the media to take affect and then
compare sales over the period. Depending on the results of the analysis, we
determine whether to scale up, pull back, hold steady, or terminate the campaign.
Elements of
effective
advertising
We want to "lead our customers to water" not exactly make them drink. We want
to tell them about our capabilities, our products, and what we are about, but we do
not want to force our message on them. We want them to draw their own
conclusions and then contact us when they are ready. We find that with younger people, they like to draw their own conclusions, but
with older people, we seem to have to lay our message out a little more
aggressively.

224
Appendix J10: Company J Interview Results
Topic Company J's Comments Regarding Advertising Benefits
Defining
success
Sales are the main thing. We also consider advertising successful, when we have never approached someone
specifically and they either contact us or already know about our products or
company. For a consumer to come into a store and ask for our product by name is the
ultimate success.
Benefits It builds awareness with retailers. Building awareness and keeping our name in front of customers is important. We
want people to see our name and know who we are. Evaluating
methods We do not measure effectiveness formally.
Elements of
effective
advertising
Emphasizing product attributes as well as the esthetic appeal of our products. We want bring out the product attributes that sets our products apart from the
competition. Images and strong copy text. Some technical information depending on the target audience. Promoting company credibility.
Appendix J11: Company K Interview Results
Topic Company K's Comments Regarding Advertising Benefits Defining
success Increasing sales is the ultimate success, at the end of the day, which is what
matters most.
Benefits
Building awareness among customers by letting them know you are an invested
player in the market. Advertising shows commitment to the industry, people are always looking to see if
you are still innovative, active, and committed.
Evaluating
methods
We use surveys of our customers as well as potential customers to test their
awareness, but it is difficult to understand why a customer contacted you without
explicitly asking.
Elements of
effective
advertising
Our ads are very product attribute heavy because our market responds well to that
type of advertisement. We try to make our ads universally appealing because
though we target certain groups, others may see our ads and we want them to be
just as interested as our target. We typically use images of our products in action, using more of a direct message.

225
APPENDIX K: COMPANY INTERVIEW RESULTS:
ADVERTISING CHALLENGES

226
Appendix K1: Company A Interview Results
Topic Company A's Comments Regarding Advertising Challenges Consumer
level Determining how effective the advertisements really are among groups.
Industry level Determining where you need to be in terms of where you need to place your
advertisements in order to have the biggest impact. Establishing what frequencies and what publications to place advertisements.
Managerial
Meeting deadlines for trade shows and publications is the most difficult part of the
planning process. Market research and customer analysis. Research gathering must be collaborative
between marketing, sales, and management to ensure that the information is as
correct and complete as possible. Determining where the budget can be spent most effectively. Tracking who is seeing the ads and then measuring how effective they are. Evaluation methodology.
Appendix K2: Company B Interview Results
Topic Company B's Comments Regarding Advertising Challenges
Consumer
level
It is very expensive. We do use some hangtags with product or website information, but we do not push
it.
Industry level Determining which media channels or avenues will put the company where it
needs to be in order to take advantage of opportunities. Understanding what the customers want and what messages need to be presented.
Managerial
Finding enough quality information in the first steps of the research. You have to understand that there is no instant gratification, especially when you
have a long lead-time between ad implementation and product to market. Research and evaluation are typically the areas that are least developed.
Appendix K3: Company C Interview Results
Topic Company C's Comments Regarding Advertising Challenges
Consumer
level
We do not feel that the consumer finds value in the products we produce; they are
more concerned with the product level attributes. Industry however, is very
interested.
Managerial Having the mindset to go out and take a chance on something new, which breaks
with traditional textile companies.

227
Appendix K4: Company D Interview Results
Topic Company D's Comments Regarding Advertising Challenges Consumer
level Making your product and your message relevant to the consumer.
Industry level
Making sure we are doing business with companies that are going to be around. Demonstrating to these companies that your company is a credible company. It is
getting tougher to distinguish, which means it is more important for us, a credible
company, to promote that.
Managerial
Because of our position in the supply chain, the lead-time is very long between
product launch and the product becoming part of a product in a store. Therefore,
aligning all the media and promotional items to follow the other business
operations is a real challenge. Coming up with a creative angle that will be unique and find resonance with your
target. Determining how to position the product to promote growth. How do we keep challenging ourselves to be creative?
Appendix K5: Company E Interview Results
Topic Company E's Comments Regarding Advertising Challenges Consumer
level Is consumer recognition desirable? It depends on what company you talk to.
Industry level
Meeting the requirements of the physical properties for the application of our
product and finding new applications and potential customers for our product. We have to keep our name in front of potential customers and active seek new
opportunities.
Appendix K6: Company F Interview Results
Topic Company F's Comments Regarding Advertising Challenges
Consumer
level
Not as prevalent in ingredient advertising. We are currently expanding into this
area. We are always looking for new ways to reach our targets customers in a way
that is meaningful, emotionally stimulating, and will resonate long term. Finding
the best way to do this is the biggest challenge.
Industry level We assess the value chain and appeal to specific markets accordingly. Because we
are a global company, it is difficult to assess potential customers and keep track of
them all, which makes advertising difficult.
Managerial Finding that one message that speaks universally to all groups because you are
putting so much money behind it you cannot afford to wrong.
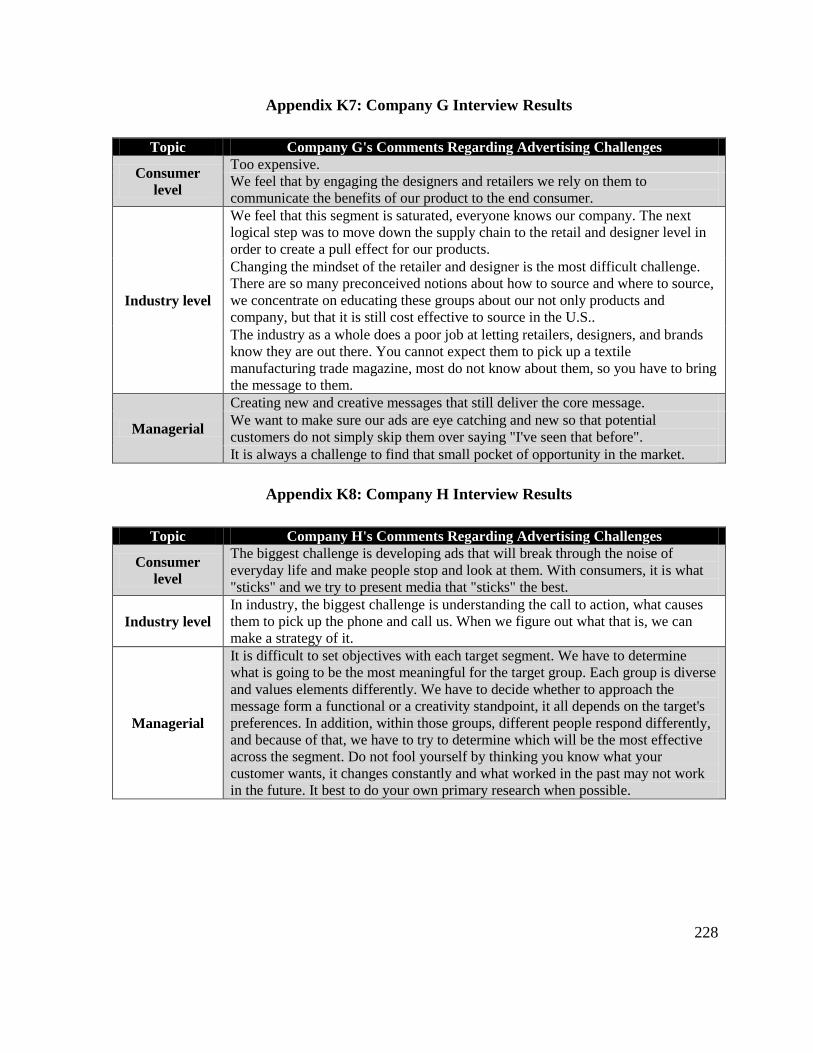
228
Appendix K7: Company G Interview Results
Topic Company G's Comments Regarding Advertising Challenges
Consumer
level
Too expensive. We feel that by engaging the designers and retailers we rely on them to
communicate the benefits of our product to the end consumer.
Industry level
We feel that this segment is saturated, everyone knows our company. The next
logical step was to move down the supply chain to the retail and designer level in
order to create a pull effect for our products. Changing the mindset of the retailer and designer is the most difficult challenge.
There are so many preconceived notions about how to source and where to source,
we concentrate on educating these groups about our not only products and
company, but that it is still cost effective to source in the U.S.. The industry as a whole does a poor job at letting retailers, designers, and brands
know they are out there. You cannot expect them to pick up a textile
manufacturing trade magazine, most do not know about them, so you have to bring
the message to them.
Managerial
Creating new and creative messages that still deliver the core message. We want to make sure our ads are eye catching and new so that potential
customers do not simply skip them over saying "I've seen that before". It is always a challenge to find that small pocket of opportunity in the market.
Appendix K8: Company H Interview Results
Topic Company H's Comments Regarding Advertising Challenges
Consumer
level
The biggest challenge is developing ads that will break through the noise of
everyday life and make people stop and look at them. With consumers, it is what
"sticks" and we try to present media that "sticks" the best.
Industry level In industry, the biggest challenge is understanding the call to action, what causes
them to pick up the phone and call us. When we figure out what that is, we can
make a strategy of it.
Managerial
It is difficult to set objectives with each target segment. We have to determine
what is going to be the most meaningful for the target group. Each group is diverse
and values elements differently. We have to decide whether to approach the
message form a functional or a creativity standpoint, it all depends on the target's
preferences. In addition, within those groups, different people respond differently,
and because of that, we have to try to determine which will be the most effective
across the segment. Do not fool yourself by thinking you know what your
customer wants, it changes constantly and what worked in the past may not work
in the future. It best to do your own primary research when possible.

229
Appendix K9: Company I Interview Results
Topic Company I's Comments Regarding Advertising Challenges Consumer
level Consumer ads are very limited other than the product placements we have done.
But for consumers it is hard to justify the expense.
Industry level Finding something to talk about. We have to have a reason to make an
advertisement, and sometimes things do not change. We know some customers
find ads useful and some do not and we develop our strategy around that.
Managerial Having complete and accurate information, without it, you are dooming yourself
from the beginning.
Appendix K10: Company J Interview Results
Topic Company J's Comments Regarding Advertising Challenges
Consumer
level
When we advertised to the consumer, all we had was some requests for colors and
samples, but we did not feel that the campaign was effective. Have to be pretty far along in your brand development to be effective on the
consumer level. We feel that it is not fair to advertise at the consumer level because they do not
have access to the products and cannot purchase them through us. For a fraction of the cost we can advertise to people that actually buy our product
directly.
Industry level
Differentiating your product in a market that has many products that claim to be as
good as yours but actually fall short. Erodes the industry as a whole and makes it more difficult for companies that do
perform to seem credible.
Managerial
Determining effectiveness Having the capital to support your advertising goals and aspirations. Creativity is also an issue. Our goal is to sell our textile component, and often we
present our product by showing a finished good. When you do that, the ad looks
like it is for the end product not our product. However, when you just present your
product, it looks very industrial, which is not what we are looking for. It is difficult
to sell your product and not the finished good. It is hard for an ad agency to come in and live and breathe your product the way
your company does, so sometimes it is easier for you to do the work in house.
Using agencies are also time consuming and expensive. It seems that by the time
we get an agency up to speed and develop an ad that we like, we could have done
it ourselves for half the cost.

230
Appendix K11: Company K Interview Results
Topic Company K's Comments Regarding Advertising Challenges Consumer
level The consumer has pushed prices down which leaves little extra revenue to
advertise, especially consumer advertising which is the most expensive.
Industry level It is hard to keep all your promotional and advertising materials up to date.
Businesses change and products change, overhauls may be necessary.
Managerial
The most difficult thing is determining all the benefits of the product. We may not
know about a benefit that the customer may find really important. We do use
customer feedback, but we may miss the big picture in the advertisement. Testing is important, but even then you do not know if you are pitching the right
angle.

231
APPENDIX L: COMPANY INTERVIEW RESULTS:
ADVERTISING OPPORTUNITIES

232
Appendix L1: Company A Interview Results
Topic Company A's Comments Regarding Advertising Opportunities
Media choices
There are new possibilities with online direct mailings, so long as they are
meaningful and infrequent. Too many mailings and they no longer serve their
purpose and become a nuisance to the recipient. Using celebrity spokes persons or involving them in creating products can lead to
mass exposure for the brand. It is important to place advertisements in publications that will stay with a
customer for long durations such as catalogues or directories that a customer may
keep and refer back to time and again. This allows the customer to see your
advertisement over and over. Creating web addresses of product names that link back to the company's product
page is a good way to redirect traffic back to the home site without having to
maintain separate websites. (Ex. www.productname.com links back to the main
company page highlighting that product). By routing back to the home page, it
allows the customer to see the other products your company produces.
Consumer
segment
Life style branding creates a unique opportunity to connect with customers. It
allows a company to promote their products by showing them in action while at
the same time appealing to the personal interests of their customers
Most effective
The best way to influence customers is through face-to-face interactions. Collateral or leave behinds brochures have the best return on investment. PR is also effective because it makes our company the expert, whether we are or
not. Direct electronic mailings are also a good way to remind customers of your
products and brands so long as the frequency is correct. Hangtags are also very effective because they place ads in front of potential
customers at the time of the purchase decision.

233
Appendix L2: Company B Interview Results
Topic Company B's Comments Regarding Advertising Opportunities
Media choices
Websites, trade journals, trade shows and online media. Industry trade journals are a good method for a catch all approach because a wide
variety of potential customers that read them. However, product specific trade
journals offer the chance to market specifically certain products or product
attributes. You just have to determine where the company needs to be and where the
customers will find the information useful. Because the textile industry is more traditional, publications and trade shows are
still important but online content is growing and will continue in the future. Have to be transparent and let people know your company is out there.
Consumer
segment
With online content, you want to have information presented in a way that anyone
can understand it, but at the same time have enough information that customers
will find it useful. This is especially important if you have customers over a wide
geographic area. We use a trickle through method to communicate with end consumers through host
brands. As of now, the expense of consumer advertising out weights the benefits. There is
opportunity there, but at this time, we do not think it is a good move for us. Supply chain
segment Trade publications are the most effective way to advertise to industrial customers.
A strong web presence is also important.
Most effective
Being able to provide innovative products and reaffirming the company's
commitment to the industry is the key to effective advertising Web materials are effective because the company can track traffic, control the
content, and the cost is known. It is easily maintained and it makes all parties
involved happy because it is always there and ready. The trade publications have the greatest potential because so many people in the
industry read them.
Appendix L3: Company C Interview Results
Topic Company C's Comments Regarding Advertising Opportunities
Media choices
We do some collaborating with organizations that allow us co co-advertise and
promote our products jointly. These are mostly print brochures and product
highlights. Though we do pay for a portion of it, we do very little promotions
solely on our own. We participate in trade shows to support our customers and provide information.
Most effective Word of mouth.

234
Appendix L4: Company D Interview Results
Topic Company D's Comments Regarding Advertising Opportunities
Media choices Web based advertising and websites are growing, but we expect big changes in the
way companies advertise in the next few months
Consumer
segment
Yes, there is potential to build brands and create partnerships with firms
downstream. However, you have to convey your message in a unique way to
standout in the market.
Supply chain
segment Establishing credibility.
Most effective In terms of industry level ads, PR is the best. For consumers, web seems to be working the best. We try to drive consumer traffic
to our website and make that content meaningful for them.
Appendix L5: Company E Interview Results
Topic Company E's Comments Regarding Advertising Opportunities
Media choices
Must factor in a PR component. Your media choices do not always have to be focused on driveling the sale, just
being present is sometimes enough. Digital communications are of the most importance. You have to keep the media
fresh and relevant to all potential audiences.
Most effective Print and online media have been the most successful for our company. Grass roots and trade shows are crucial for that relationship building aspect of the
business.

235
Appendix L6: Company F Interview Results
Topic Company F's Comments Regarding Advertising Opportunities
Media choices
Web 2.0 and speed of information is growing. People want it yesterday and when
they are looking for products, many are going online in the store to gain product
information and having your messages easily accessible may help the customer
choose your product or host product. Grass roots marketing and getting out into the market are also important. We want
to create programs that reach out to people and make them feel connected. It is part
of our emotional approach to our branding. People want something to be
meaningful for them and if we can do that, we build a long-term relationship
between our products and those customers.
Consumer
segment
Consumer advertising is important because they tell the retailer what they want,
the retailer, tells the supplier, and the supplier tells the mills and so on down the
stream, so creating that relationship with the consumer to demand your products is
critical for a pull through marketing strategy.
Supply chain
segment Creating relationships with our customers to promote our brands as we promote
them.
Most effective Ads that are meaningful across segments.

236
Appendix L7: Company G Interview Results
Topic Company G's Comments Regarding Advertising Opportunities
Media choices
Trade advertisements are a big part of our strategy; we have seen a lot of success
in advertising in apparel sourcing magazines in strategic geographic areas. We also
use online media, through our direct emailers and blog. We have found that most
retailers and brands do not know where to look for U.S. suppliers or
advertisements, so we bring our ads to them and have been extremely successful. The designers and retailers don’t purchase our product, they purchase the finished
good, our company approaches the business as if you specify our product in your
product, we will do everything we can to support your company and supply chain. We use hangtags when customers request them. Most requests are from smaller
companies. Direct email and trade magazines have been the most successful. These medias
have the potential to be seen by a large audience and still deliver a tailored
message. Trade brochures are not as timely and are quickly out dated; because of this, we
tend not to use as many collateral prices in our advertising efforts.
Consumer
segment
There are opportunities in consumer advertising, but it is difficult to reach them
effectively. If we had the budget, we would love to do it, but some companies do
not want consumers to know who their suppliers are. Supply chain
segment This market is saturated and most people know who each other are. Therefore, the
opportunities lie further down the supply chain. This results in a pull type strategy.
Most effective Publishing ads in designer and retailer publications has been the most successful. Our web blog is also a big communicator that we can send all potential clients to.
Appendix L8: Company H Interview Results
Topic Company H's Comments Regarding Advertising Opportunities Consumer
segment You want to be as close to the purchase decision as possible. This may include in
store promotions, on-product promotions, or other media.
Most effective We participate in a lot of sponsorships and event planning as a form of outreach to
consumers, we find that this allows us to promote the various attributes of our
product effectively to a captive audience.
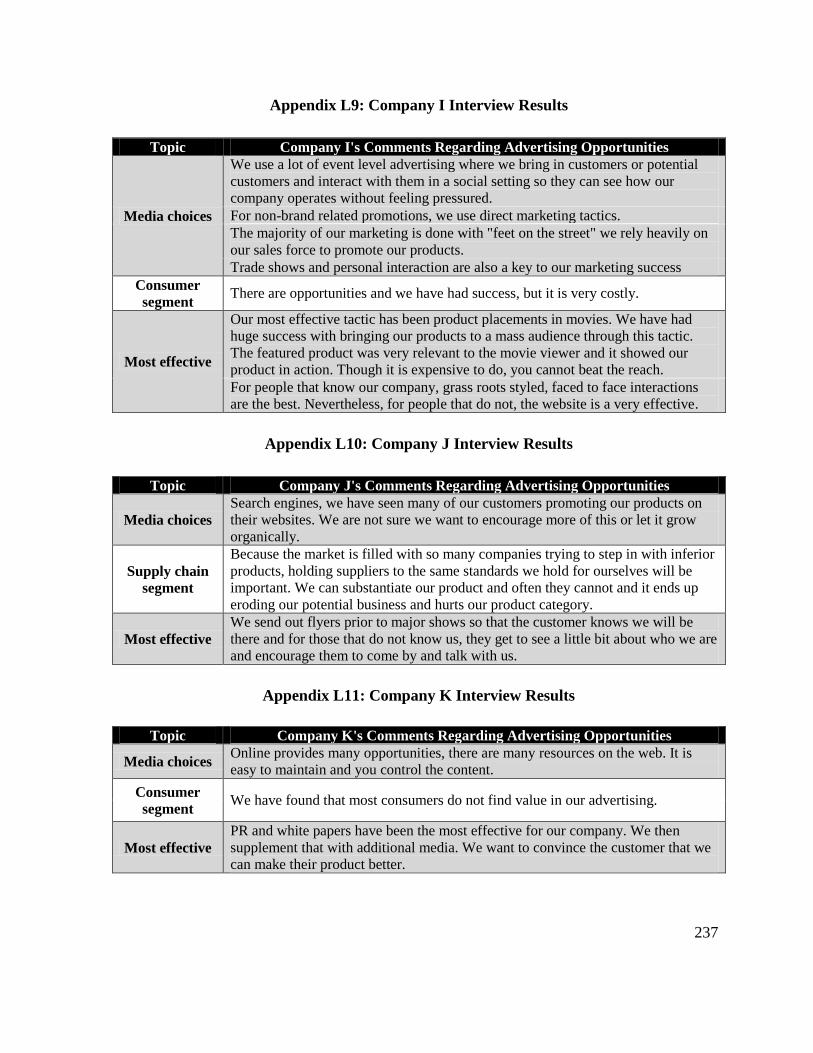
237
Appendix L9: Company I Interview Results
Topic Company I's Comments Regarding Advertising Opportunities
Media choices
We use a lot of event level advertising where we bring in customers or potential
customers and interact with them in a social setting so they can see how our
company operates without feeling pressured. For non-brand related promotions, we use direct marketing tactics. The majority of our marketing is done with "feet on the street" we rely heavily on
our sales force to promote our products. Trade shows and personal interaction are also a key to our marketing success
Consumer
segment There are opportunities and we have had success, but it is very costly.
Most effective
Our most effective tactic has been product placements in movies. We have had
huge success with bringing our products to a mass audience through this tactic.
The featured product was very relevant to the movie viewer and it showed our
product in action. Though it is expensive to do, you cannot beat the reach. For people that know our company, grass roots styled, faced to face interactions
are the best. Nevertheless, for people that do not, the website is a very effective.
Appendix L10: Company J Interview Results
Topic Company J's Comments Regarding Advertising Opportunities
Media choices Search engines, we have seen many of our customers promoting our products on
their websites. We are not sure we want to encourage more of this or let it grow
organically.
Supply chain
segment
Because the market is filled with so many companies trying to step in with inferior
products, holding suppliers to the same standards we hold for ourselves will be
important. We can substantiate our product and often they cannot and it ends up
eroding our potential business and hurts our product category.
Most effective We send out flyers prior to major shows so that the customer knows we will be
there and for those that do not know us, they get to see a little bit about who we are
and encourage them to come by and talk with us.
Appendix L11: Company K Interview Results
Topic Company K's Comments Regarding Advertising Opportunities
Media choices Online provides many opportunities, there are many resources on the web. It is
easy to maintain and you control the content.
Consumer
segment We have found that most consumers do not find value in our advertising.
Most effective PR and white papers have been the most effective for our company. We then
supplement that with additional media. We want to convince the customer that we
can make their product better.

238
APPENDIX M: COMPANY INTERVIEW RESULTS: ADVERTISING POTENTIAL

239
Appendix M1: Company A Interview Results
Topic Company A's Comments Regarding Advertising Potential Areas
advertising can
influence Advertises your business to potential employees.
Advertising as
a
differentiation
method
Advertising tells your customer why you are better than anyone else in the market.
Companies that advertise demonstrate that they are viable and healthy which can
differentiate them for competitors.
Advertising 's
ability to
influence sales
Advertising is an effective differentiation method because it has the ability to spark
interest which then can lead to company calls and eventually sales.
Typical ROI
and payback
Because the cost of the advertising is built into the price of the product, the
advertising budget should be 1-2% of projected sales It is hard to judge the payback for a campaign since it is difficult to track the
response rate or effectiveness of the advertising.
Growth
potential
The growth potential for advertising is dependent on the sales. If a product is doing
well then it is typically safe to assume that the advertising is working. However, if
sales are declining, it may not be the fault of the advertiser, but the best option may
be to scale back advertising.
Appendix M2: Company B Interview Results
Topic Company B's Comments Regarding Advertising Potential
Areas
advertising can
influence
Helps to build moral in the company. Seeing your name in lights mentality. For the sales force, the advertisements make them feel confident in their company
and their products because they know that their company is reputable and they
have all these brochures and collateral to back them up. Advertising as
a
differentiation
method
It is a good way to differentiate your company, because by advertising you are
saying that the company is committed to the market, the industry, and that the
business is in it for the long haul, which signals to customers that the company is
worth doing business with. Advertising 's
ability to
influence sales
From a purely advertising point of view, we want the phones to ring for our client.
Moreover, what the client chooses to do with the calls is not up to us, but we want
to make sure that they have the ability to take advantage of every opportunity.
Typical ROI
and payback
The effects of advertising will mostly likely not be immediate, it make take months
or years for the advertising to make an impact. It just depends how far back the
company is in the supply chain before the advertisements turn into sales. The ROI and payback depends from company to company, typically confidential. It is difficult to track because most companies do not want to take the time or
effort required to find out their ROI or payback. Growth
potential Online media and print.

240
Appendix M3: Company C Interview Results
Topic Company C's Comments Regarding Advertising Potential Advertising as
a
differentiation
method
Traditional print advertising in general does have that influence, but for our
company we did not find that to be true
Appendix M4: Company D Interview Results
Topic Company D's Comments Regarding Advertising Potential Areas
advertising can
influence Share holder value.
Advertising as
a
differentiation
method
Yes, especially if you can deliver your message in a unique way that your target
responds well to.
Advertising 's
ability to
influence sales Advertising can influence sales and that is the measure at the end of the day.
Typical ROI
and payback
We evaluate each product, determine if it is still financially viable, and adjust
tactics and strategies based on our findings. As long as we can justify the investment, we will do it. It is different for every company. It depends on budgets, how it is allocated, and
how you spend your money. Growth
potential Online media and consumer advertising
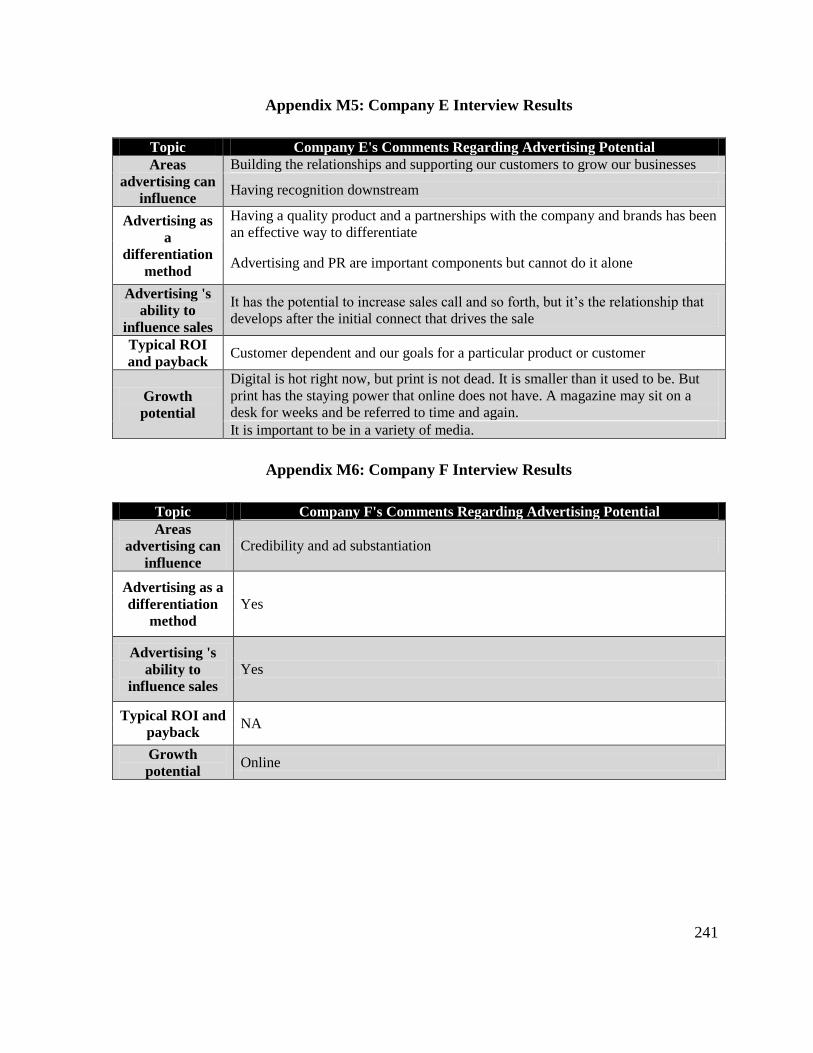
241
Appendix M5: Company E Interview Results
Topic Company E's Comments Regarding Advertising Potential Areas
advertising can
influence
Building the relationships and supporting our customers to grow our businesses
Having recognition downstream
Advertising as
a
differentiation
method
Having a quality product and a partnerships with the company and brands has been
an effective way to differentiate
Advertising and PR are important components but cannot do it alone
Advertising 's
ability to
influence sales
It has the potential to increase sales call and so forth, but it’s the relationship that
develops after the initial connect that drives the sale
Typical ROI
and payback Customer dependent and our goals for a particular product or customer
Growth
potential
Digital is hot right now, but print is not dead. It is smaller than it used to be. But
print has the staying power that online does not have. A magazine may sit on a
desk for weeks and be referred to time and again. It is important to be in a variety of media.
Appendix M6: Company F Interview Results
Topic Company F's Comments Regarding Advertising Potential Areas
advertising can
influence Credibility and ad substantiation
Advertising as a
differentiation
method Yes
Advertising 's
ability to
influence sales Yes
Typical ROI and
payback NA
Growth
potential Online

242
Appendix M7: Company G Interview Results
Topic Company G's Comments Regarding Advertising Potential Areas
advertising can
influence
We use advertising to build the brand name of the company and promote our
products. We want to educate the retailer and designer about our product and
then hopefully influence them to adopt and specify our products.
Advertising as a
differentiation
method
Advertising cannot do it alone. There must also be the grass roots, face-to-face
conversations that verify the ad's claims. Advertising is only as good as the products and company behind it
Advertising 's
ability to
influence sales
We hope that advertising translates into sales, but we do not know how
advertising specifically influences sales figures. There are so many activities and
promotions we get through our customers that we do not know where the
awareness comes from but if it results in a sale then advertising has done its job,
one way or another. Typical ROI and
payback Our ROI and payback are not specifically tacked. Goals and benchmarks for sales are more customer specific.
Growth
potential
Web 2.0 is great because of the instant feedback it can provide. We can track a
variety of metrics such as who is coming to our site and in what volumes. Our blog page has the highest return on investment since it was free and we tell
everyone to check it out. We post new things about our company and what trade
shows or magazine we will be in etc. Online avenues allows us to communicate with the mass market, but face to face
interactions are still extremely important
Appendix M8: Company H Interview Results
Topic Company H's Comments Regarding Advertising Potential Areas
advertising can
influence Sales, perceptions, awareness
Advertising as a
differentiation
method
Advertising can help build your brand's or product's story and helps you to relate
your brand or product to the customer or consumer. This relationship will
hopefully differentiate your product or brand in the market.
Advertising 's
ability to
influence sales Yes
Typical ROI and
payback We do not have a set ROI or payback period for an ad campaign. If we are
making our goals, we typically just continue with what we are doing.
Growth
potential
Online social networking may be effective with other mass media costs
increasing. Print methods are not as effective as they used to be, but it depends
on the message. However, sometimes you do not know what the objective is and that is when
grassroots, face-to-face interactions are best.

243
Appendix M9: Company I Interview Results
Topic Company I's Comments Regarding Advertising Potential Areas
Advertising
can influence For our company, we mostly look at sales and market perceptions
Advertising as
a
differentiation
method
Ads are a good way, but the product and the company are the real differentiating
factors. You can have great ads but if your product or company is not there to back it up,
then you will not be successful in the long run. Advertising 's
ability to
influence sales
Ads do have that ability to influence sales, but we rely more on our sales team and
face-to-face interactions to close the deal.
Typical ROI
and payback We have ROI goals on a product level, measured through sales figures, and we
typically want to see a payback in under a year.
Appendix M10: Company J Interview Results
Topic Company J's Comments Regarding Advertising Potential Areas
advertising can
influence Sales, awareness, building a positive image, and credibility for our company.
Advertising as a
differentiation
method
It is effective, if you do it right, meaning that you can substantiate your claims
through your product's performance. In this product segment, there are many
players and sometimes, when your company is trying to make a name for itself,
advertising may be the quickest way to grow visibility. Typical ROI and
payback With our target audience, we look for a 12-18 month payback period.

244
Appendix M11: Company K Interview Results
Topic Company K's Comments Regarding Advertising Potential Areas
advertising can
influence
Being effective in advertising really requires you to know your customer, which
in itself is a great tool.
Advertising as a
differentiation
method It is a good way, since our advertisements are very close to our sales pitch.
Advertising 's
ability to
influence sales We link our advertising messages with our sales pitches.
Typical ROI and
payback We have product level ROI, but as far as advertising, the best form is PR since
the cost is reasonable and the reach is potentially large. Growth
potential Online media because it is easy to update and it can be seen by a large audience.

245
APPENDIX N: COMPANY INTERVIEW RESULTS:
DEVELOPMENT METHODOLOGY

246
Appendix N1: Company A Interview Results
Topic Company A's Comments Regarding
Advertisement Development Methodology
Typical
methodology
The process begins with a business plan, which lays out the strategic goals of the
company and where the company wants to go. The plan looks at projected sales by
market, market viability, budgets, and what advertising and marketing activities
the company wants to participate in. It is typically best to handle as much of the advertising design and layout
development through email in order to keep costs low. The more advertisement development that can be done in house, the less expensive
the campaign will be. When competing with an established competitor or product an effective strategy is
to model your product's advertising strategy around theirs.
Defining goals
When working with an advertising agency, have clear goals and ambitions about
what product attributes need to be promoted and what excites the customer. Creating customer or market segment write up with specific inventory increases
for selected customer or blanket sales goals is an effective way to set and achieve
specific goals
Evaluation
Evaluation is difficult because of limited budgets, time and distance between the
supply chain segments and the final consumer. Typically, if product sales are stable or growing, we assume that the advertising is
being effective.
Situation
analysis
Our situation analysis considers, oil prices, economic factors, consumer and
industry trends, the housing market, construction markets, military expenditures,
furniture trends, healthcare, and others to get a feel where markets are going in the
future. Strategic competitive and customer analyses are also completed during this phase

247
Appendix N2: Company B Interview Results
Topic Company B's Comments Regarding
Advertisement Development Methodology
Typical
methodology
Assuming it is a new product, we have an establish target market before the
product is created. We try to understand what segments we want compete in and
what companies we are trying to go after in order to make the best strategic
advertising decisions. We then try to establish the talking points about the product. We then go back and forth with the advertising agency. We do some guerrilla style research, meaning talking with customers and other
suppliers to get an idea where the industry is going.
Defining goals
The goal for the company is to sell products but because of the lead times between
when the advertisements debut and when the product make it to market the goal of
the advertising is to keep the name fresh and continue to build new opportunities
while the product continues down the value chain. Some pounds per year goals but the advertisements do not affect those goals much.
Evaluation
It is very difficult because the advertising campaign may come out a year or more
before any of the product actually makes it into a consumer product on the shelf. There is such a long lag time it makes it difficult to evaluate the effectiveness of a
specific advertisement. Because of the lead-time, it is difficult to track and
organize.
Situation
analysis
Very difficult and expensive to research. Understanding what the customer's needs are going to be and adapt advertisements
to reflect the satisfaction of these needs is critical.
Appendix N3: Company C Interview Results
Topic Company C's Comments Regarding Advertisement Development
Methodology
Typical
methodology
We knock on doors and research how to make some technologies happen that
customers find valuable. We determine if we can improve a product in the market and if we can, we set out
promoting that product. But most of our work is done through customer requests.
Once other companies hear about the work we have done for these companies, we
typically get calls that may turn into new business. Situation
analysis We look at what is going on in the industry and identify opportunities for our
business.

248
Appendix N4: Company D Interview Results
Topic Company D's Comments Regarding Advertisement Development
Methodology
Typical
methodology
The procedure we use depends on the product. Once the product is about 70% of
the way developed, the marketing department and research and development come
together and try to determine our competitive edge. We also look at competitors, to determine how we can differentiate our products in
the market. Once we have our brand story 80% finished we meet with an agency to being
creative work. However, it depends on the product and goals to what we do with
the campaign. Our marketing team tries to get our ideas as fleshed out as possible
before we begin working with an agency.
Defining goals
It varies, from segment to segment. Where we can, we track our product to
determine sales volume compared to advertising efforts. Our main goals are to promote our products and build credibility and awareness
for our brands.
Evaluation
We pay for a company to calculate our advertising value from our media coverage,
meaning how many advertising dollars would we had to have spent to get the same
coverage that the media coverage generated. Because we use a code system that is linked to our website, we can track to see
how many people are buying the product and going to our website. It is very
effective.
Situation
analysis
Consumer trends, markets, products currently in the market, pricing, raw material
trends. We also look at trends from brands and retailers.

249
Appendix N5: Company E Interview Results
Topic Company E's Comments Regarding Developing a Strategy or Campaign
Typical
methodology
Our methodology is more relationship oriented, working toward building our
relationship with specific customers. When we determine a market we want to focus on, we jump in and try to
determine what those customers are looking for, whether it is trends or information
preferences. For example, we include more technical information in our
manufacturing advertisements, while we may leave that out in a retail oriented
advertisement.
Defining goals
We establish yearly goals as well as short terms goals. Especially in media
planning where we must determine which shows we want to be in or what
magazines we want to work with. We typically try to maintain our current level of recognition in the manufacturing
segment but at the same time grow in the retail and brand segments. Our goal is to continually present messages.
Evaluation
An individual buying a product in a store with our product in it may or may not
know our company or our product. We cannot really track this. At the mill level it is still hard to judge Research companies do exist that track consumer habits, but there is very little
done in the supplier or retail level. Most companies rely on more qualitative measures such as word of mouth and
others to judge how effective their advertisements are.

250
Appendix N6: Company F Interview Results
Topic Company F's Comments Regarding Developing a Strategy or Campaign
Typical
methodology
We start with general outreach to our segments. We look for ways to grow our
business either through new products, product extensions or modifications. The process starts with the brand understanding where they fit into the market
place and what elements about the brand are most important. We complete a
creative brief, which lays out all the elements the brand is looking for. The creative
team then decides which elements are most effective, have the best emotional
appeal, and resonate best with the target. Then we go about the creative work and eventually produce a finished product.
Defining goals
We want to become synonymous with quality and durability. We want to own the
names. Building a credible message that resonates with the target. We do not typically reevaluate our goals, we try to have broader overall goals and
work towards them and so long as the message is not straying then we typically
keep doing what we are doing.
Evaluation
We use online media tracking. We use Google ads, which monitors clicks and
traffic. We can see location and even IP address which is not available with print
ads. With our online sites, we want to transfer interest to sales. While we cannot
say what sales were a result of the ads, we can track the traffic and then make an
assumption of about what percentage resulted in sales. We try to design those checks into the campaign.
Situation
analysis We look at economics, trends, and market drivers. We also evaluate channels to market and identify gaps in the market place.
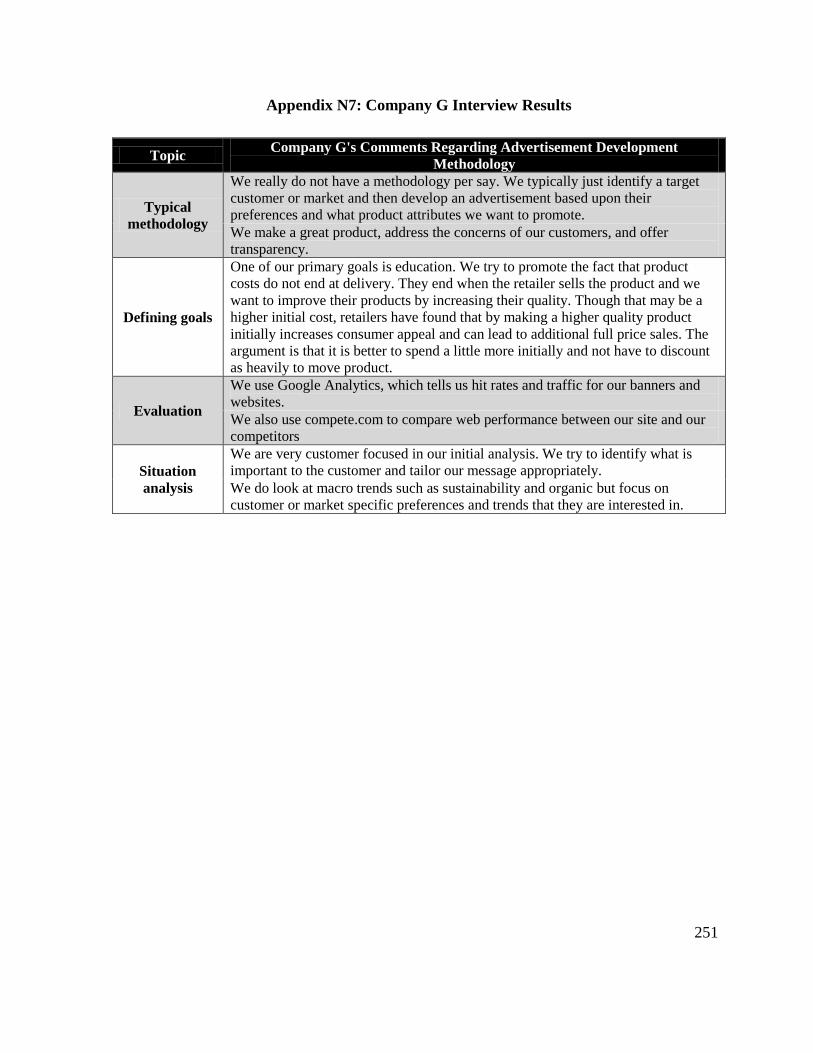
251
Appendix N7: Company G Interview Results
Topic Company G's Comments Regarding Advertisement Development
Methodology
Typical
methodology
We really do not have a methodology per say. We typically just identify a target
customer or market and then develop an advertisement based upon their
preferences and what product attributes we want to promote. We make a great product, address the concerns of our customers, and offer
transparency.
Defining goals
One of our primary goals is education. We try to promote the fact that product
costs do not end at delivery. They end when the retailer sells the product and we
want to improve their products by increasing their quality. Though that may be a
higher initial cost, retailers have found that by making a higher quality product
initially increases consumer appeal and can lead to additional full price sales. The
argument is that it is better to spend a little more initially and not have to discount
as heavily to move product.
Evaluation
We use Google Analytics, which tells us hit rates and traffic for our banners and
websites. We also use compete.com to compare web performance between our site and our
competitors
Situation
analysis
We are very customer focused in our initial analysis. We try to identify what is
important to the customer and tailor our message appropriately. We do look at macro trends such as sustainability and organic but focus on
customer or market specific preferences and trends that they are interested in.

252
Appendix N8: Company H Interview Results
Topic Company H's Comments Regarding Advertisement Development
Methodology
Typical
methodology
In our situation analysis, our company begins by talking with the end consumer to
determine what they like about the product. This can be done through surveys or
focus groups. We then find out what their media habits are, where they seek
information, and what resonates with them best. Then we try to determine what
makes them want to try a product and how much they are willing to spend. This
information allows us to construct an advertisement based on a variety of metrics
for maximum impact. We then evaluate the effectiveness of the campaign through a variety of metrics,
which we then validate and make changes to the campaign.
Defining goals
We try to tie our company objectives with our advertising. Our goals are to increase sales and build preference for our product. We also try to
build strategic alliances for sales promotions and direct marketing. To achieve these goals, we must look for the driver that is most effective, identify
which need it satisfies, and understand it limits.
Evaluation
We use advertising tracking programs with our online media to measure traffic,
favorability, and clicks. We monitor this continuously and compare changes over
time and against major promotions. We try to break down the advertisements to understand what specific elements
customers or consumers find most appealing. We may have several versions of an
advertisement with small changes in each, which we then assess which is most
effective. Situation
analysis We look at economic factors, trends, and consumer preferences.

253
Appendix N9: Company I Interview Results
Topic Company I's Comments Regarding Advertisement Development Methodology
Typical
methodology
We do not follow a specific methodology that covers all advertising. But we
typically develop our advertisement around a single product. We then determine
our objectives and situation analysis. We then decided the most efficient method of
meeting those objectives. The methodology depends on the market segment and what we hope to accomplish
through our ads. With our unbranded products, we use more company and capability advertising,
while with branded products we promote the brand name. We want to build momentum until it sticks and then back off a bit and reassess our
goals.
Defining goals Goals depend on the market or product segment we are promoting, but our
consistent goal is to drive sales.
Evaluation
We typically track sales over time and then compare it to when we believe the
advertisements took effect. This allows us to see the timeline of our advertisements
as well as their effects on sales. When we complete these studies, we do account for market factors and seasonality
of product sales. Situation
analysis We look at pricing mostly. We want to determine if it is better to create ads or
keep that money to grow the business. Advertising is a luxury.
Appendix N10: Company J Interview Results
Topic Company J's Comments Regarding Advertisement Development
Methodology
Typical
methodology
We look at our budget, set our goals based upon the market we are participating in,
and then determine what advertising vehicle will be most effective at
accomplishing those goals.
Defining goals Our goal is to present our ads and our company in a way that portrays our
commitment to the industry and our products.
Evaluation We do not evaluate our advertising effectiveness formally, but we do talk to our
customers and get feedback from them. Situation
analysis We look at competitors and benchmarks, we survey customers to find out their
media and information habits, and we research market trends.

254
Appendix N11: Company K Interview Results
Topic Company K's Comments Regarding Advertisement Development
Methodology
Typical
methodology
We start at the brand level; we create a product identity to differentiate our
products from commodity goods. We then go through a review of product
attributes and set goals for the product. Once that is complete, we have a specification sheet that then becomes the basis
for the sales flyer, which explains the need, performance attributes, and benefits.
The flyer is then posted on our website and given to sales personnel. Flyer are also
emailed to a customer list that we feel would respond well. Then working with a PR agency, a PR piece is written which is sent out to a list of
20-30 editors of print and online publications. We still use products as our main
anchor point. We then write white papers to get the word out to the product market.
Defining goals We define our goals based upon the product and where we want to be in that
particular market.
Evaluation We use surveys and talk with customers to get feedback about how we are doing
and their awareness of our products. We do some market testing of products and
ads to see what is most important to customers
Situation
analysis
We do not typically look at macro issues. We look globally to determine where
potential new markets are and then decided if we want to advertise in that region. We look to see where the brands and mills are going and try to promote our
products and services by competing on availability, capacity, and geographic
location.

255
APPENDIX O: COMPANY INTERVIEW RESULTS:
ADVERTISING EFFETENESS

256
Appendix O1: Company A Interview Results
Topic Company A's Comments Regarding Advertising Effectiveness
from a Supply Chain Perspective Reasons for
seeking
information
To determine if the product fits core competencies of the company, will it enhance
a market we are already servicing, would it enhance current products so that they
could expand into a new market.
Information
sources
The best information comes from vendors, because they tell you what competitors
are doing. Sometimes a company can leak certain information into market place through
vendors because one knows they are telling the competitors what one says. Most effective
media types Face to face and printed brochures and advertisements
Determining
new suppliers Primarily based upon fit with current activities and machinery. Determine if the product can improve or expand out current markets.
Elements to
look for in
advertisements Contact information or point of action
Willingness to
pay more
Not as much as we used to. If the generic product performed the same and was cheaper, we would go with the
unbranded product unless the end market demands the branded component.
Appendix O2: Company B Interview Results
Topic Company B's Comments Regarding Advertising Effectiveness
from a Supply Chain Perspective Reasons for
seeking
information
Business fit
Product information Information
sources The web is the most dominate information source, unless there are prior
relationships.
Most effective
media types Websites, trade publications, and trade shows.
Determining
new suppliers
Looking for quality for the cost. We look for companies that have longevity and commitment but it depends on the
product of interest. Elements to
look for in
advertisements
Relevant contact information that is easy to remember.
Enough information to catch interest and then a clear call to action.
Willingness to
pay more If the quality or benefits are worth the extra cost, then yes.

257
Appendix O3: Company C Interview Results
Topic Company C's Comments Regarding Advertising Effectiveness
from a Supply Chain Perspective Reasons for
seeking
information Business prospects
Information
sources Trade shows, trade publications, and past contacts
Most effective
media types Trade shows and print publications let you see what is going on very quickly.
Determining
new suppliers We do look at advertisements and evaluate if they are in line with our business We look for integrity, financial viability, and innovativeness
Willingness to
pay more No, we want to be the innovators.
Appendix O4: Company D Interview Results
Topic Company D's Comments Regarding Advertising Effectiveness
from a Supply Chain Perspective
Reasons for
seeking
information
New product innovations Pricing Collaborative efforts
Information
sources
Online Print Trade shows
Most effective
media types
Magazines Web Typically, I do not like to be bombarded with advertisements, I like to go and seek
the information for myself.
Determining
new suppliers
Relationship Past experiences Price
Elements to
look for in
advertisements Clean ads, full page, images that "pop"
Willingness to
pay more No, we are the brander in this situation.
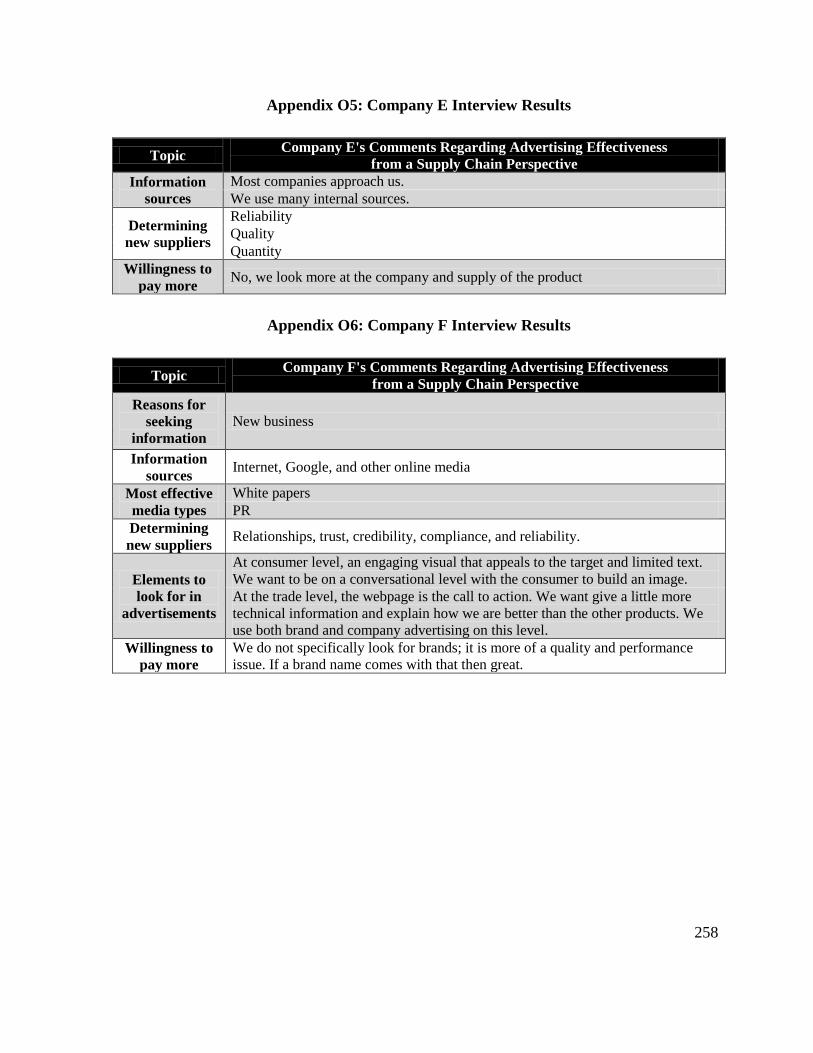
258
Appendix O5: Company E Interview Results
Topic Company E's Comments Regarding Advertising Effectiveness
from a Supply Chain Perspective
Information
sources Most companies approach us. We use many internal sources.
Determining
new suppliers
Reliability Quality Quantity
Willingness to
pay more No, we look more at the company and supply of the product
Appendix O6: Company F Interview Results
Topic Company F's Comments Regarding Advertising Effectiveness
from a Supply Chain Perspective
Reasons for
seeking
information New business
Information
sources Internet, Google, and other online media
Most effective
media types White papers PR
Determining
new suppliers Relationships, trust, credibility, compliance, and reliability.
Elements to
look for in
advertisements
At consumer level, an engaging visual that appeals to the target and limited text.
We want to be on a conversational level with the consumer to build an image. At the trade level, the webpage is the call to action. We want give a little more
technical information and explain how we are better than the other products. We
use both brand and company advertising on this level. Willingness to
pay more We do not specifically look for brands; it is more of a quality and performance
issue. If a brand name comes with that then great.

259
Appendix O7: Company G Interview Results
Topic Company G's Comments Regarding Advertising Effectiveness
from a Supply Chain Perspective
Reasons for
seeking
information
Does it fit into our current operations? Is the company product reputable? Will the product enhance our current products Will the product enhance the end product for our customers Is it commercially viable?
Information
sources
Trade shows Online Trade magazines
Most effective
media types Direct email and Google alerts are ways that we can get information without
having to look for it, it is very convenient.
Determining
new suppliers We look for quality for the cost and the reputation of the business
Elements to
look for in
advertisements We do not look for anything in particular.
Willingness to
pay more Yes, as long as they add value or we can add value to the product.

260
Appendix O8: Company H Interview Results
Topic Company H's Comments Regarding Advertising Effectiveness
from a Supply Chain Perspective Reasons for
seeking
information Is it a product I need or can I use it in my business
Information
sources Online, search engines, contacts within our company
Most effective
media types Print and trade shows
Determining
new suppliers
Geographic location Costing Availability Credibility Fit with company
Elements to
look for in
advertisements Visual appeal, contacts, and technical information for trade ads.
Willingness to
pay more No, we typically stick with generic products, which allow us to create pricing tiers.
Appendix O9: Company I Interview Results
Topic Company I's Comments Regarding Advertising Effectiveness
from a Supply Chain Perspective Reasons for
seeking
information
We look for efficiency, cost, innovativeness, sustainability, and potential
partnerships.
Information
sources Our company prefers trade shows, because of the interactive nature.
Most effective
media types Trade shows Determining
new suppliers We look for innovation leaders, cost leaders, and what value they can bring to our
company. Elements to
look for in
advertisements
Nothing specific
Contact information
Willingness to
pay more Yes and No. If a branded or well know product generates value for our company
then yes we would consider purchasing it over a generic product.

261
Appendix O10: Company J Interview Results
Topic Company J's Comments Regarding Advertising Effectiveness
from a Supply Chain Perspective Information
sources Internet, websites
Most effective
media types Brand names, Internet, websites
Determining
new suppliers Quality and price are the main drivers, relationships, credibility, viability, supply
Elements to
look for in
advertisements Contact information
Appendix O11: Company K Interview Results
Topic Company K's Comments Regarding Advertising Effectiveness
from a Supply Chain Perspective Reasons for
seeking
information Products, collaborative efforts
Information
sources We go to the Internet if we do not know them, or look in a magazine.
Most effective
media types Online ads and PR
Determining
new suppliers Cost, relevance to company, performance focused, company stability, expertise
Elements to
look for in
advertisements
Specific examples of products in action Contact information Call to action Small blurb or what the business is about
Willingness to
pay more Typically no.

262
APPENDIX P: CONSUMER SURVEY RESULTS: INDIVIDUAL ADVERTISEMENT
ASSESSMENT RESPONSES

263
Appendix P1: Consumer Survey Results- Response Totals for Question 1
Statistics For Question 1 Results Across All Three Advertisements
“I have seen advertisements for this product in the past”
A1 B1 C1
N Valid 165 165 165
Missing 0 0 0
Mean 1.54 3.24 2.10
Median 1.00 4.00 2.00
Mode 1 4 2
Appendix P2: Consumer Survey Results- Response Totals for Question 2
Statistics For Question 2 Results Across All Three Advertisements
“I understand what product is being promoted”
A2 B2 C2
N Valid 165 165 165
Missing 0 0 0
Mean 3.67 4.05 3.35
Median 4.00 4.00 4.00
Mode 4 4 4
Appendix P3: Consumer Survey Results- Response Totals for Question 3
Statistics For Question 3 Results Across All Three Advertisements
“The information in the advertisement is useful”
A3 B3 C3
N Valid 165 165 165
Missing 0 0 0
Mean 3.72 3.30 3.30
Median 4.00 3.00 4.00
Mode 4 4 4
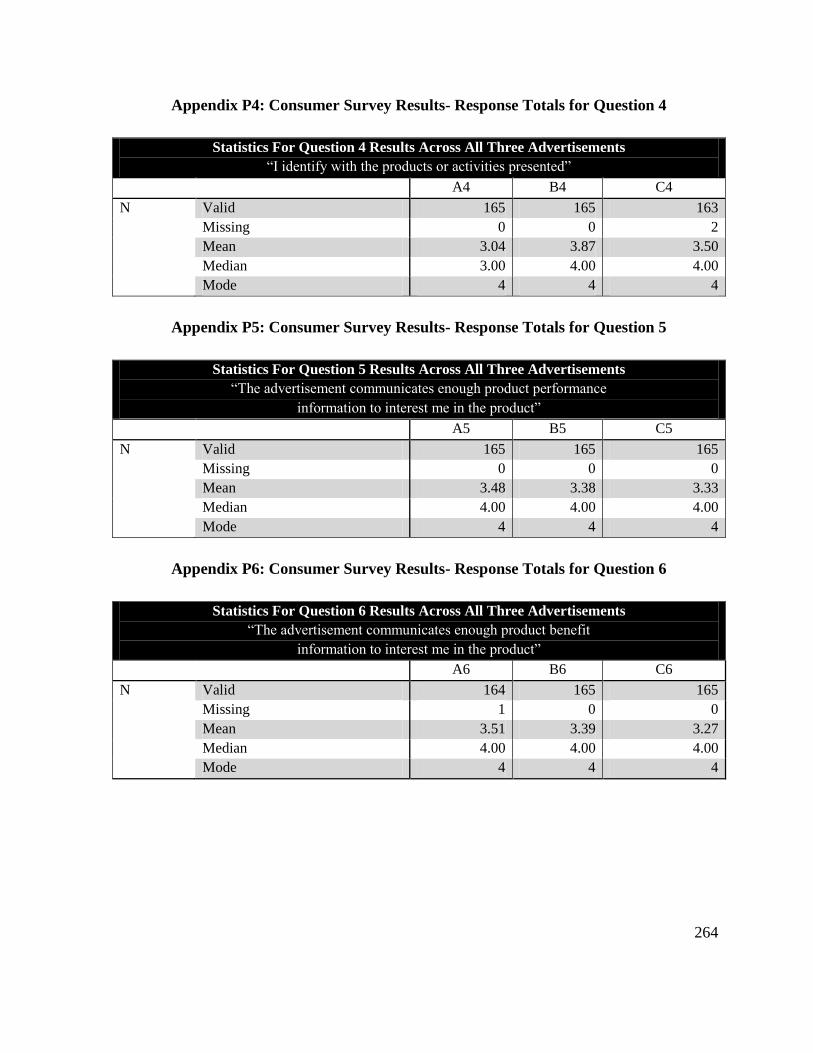
264
Appendix P4: Consumer Survey Results- Response Totals for Question 4
Statistics For Question 4 Results Across All Three Advertisements
“I identify with the products or activities presented”
A4 B4 C4
N Valid 165 165 163
Missing 0 0 2
Mean 3.04 3.87 3.50
Median 3.00 4.00 4.00
Mode 4 4 4
Appendix P5: Consumer Survey Results- Response Totals for Question 5
Statistics For Question 5 Results Across All Three Advertisements
“The advertisement communicates enough product performance
information to interest me in the product”
A5 B5 C5
N Valid 165 165 165
Missing 0 0 0
Mean 3.48 3.38 3.33
Median 4.00 4.00 4.00
Mode 4 4 4
Appendix P6: Consumer Survey Results- Response Totals for Question 6
Statistics For Question 6 Results Across All Three Advertisements
“The advertisement communicates enough product benefit
information to interest me in the product”
A6 B6 C6
N Valid 164 165 165
Missing 1 0 0
Mean 3.51 3.39 3.27
Median 4.00 4.00 4.00
Mode 4 4 4
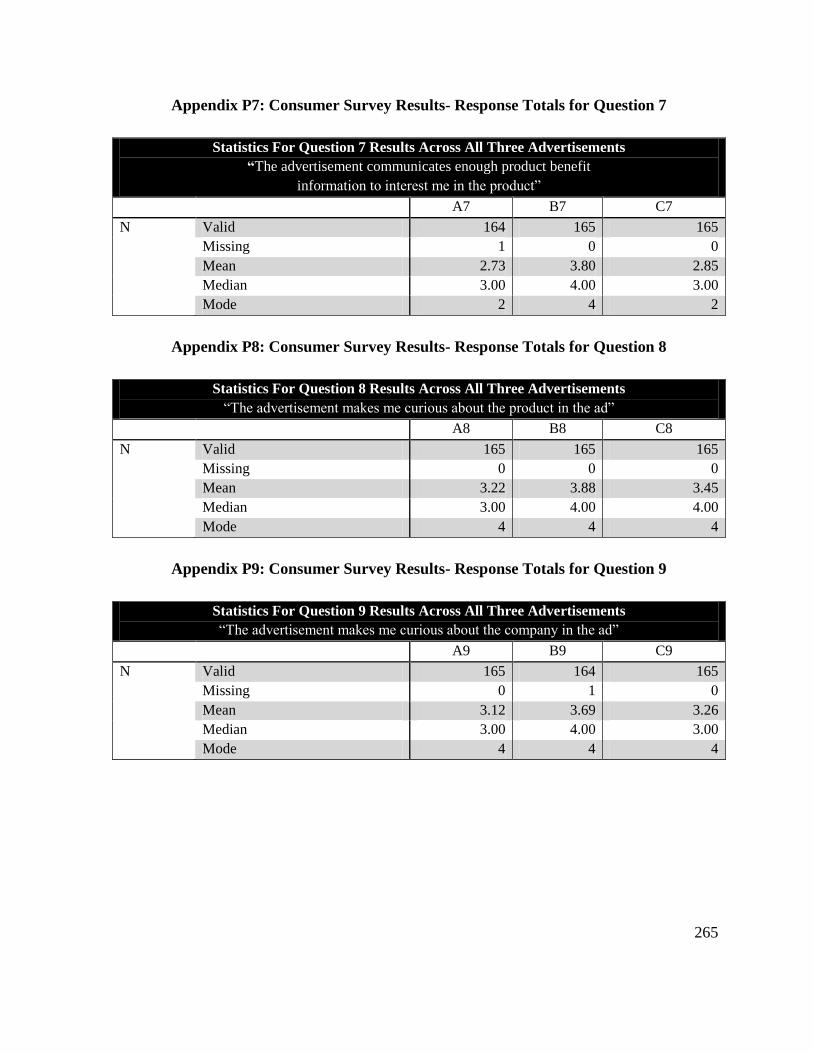
265
Appendix P7: Consumer Survey Results- Response Totals for Question 7
Statistics For Question 7 Results Across All Three Advertisements
“The advertisement communicates enough product benefit
information to interest me in the product”
A7 B7 C7
N Valid 164 165 165
Missing 1 0 0
Mean 2.73 3.80 2.85
Median 3.00 4.00 3.00
Mode 2 4 2
Appendix P8: Consumer Survey Results- Response Totals for Question 8
Statistics For Question 8 Results Across All Three Advertisements
“The advertisement makes me curious about the product in the ad”
A8 B8 C8
N Valid 165 165 165
Missing 0 0 0
Mean 3.22 3.88 3.45
Median 3.00 4.00 4.00
Mode 4 4 4
Appendix P9: Consumer Survey Results- Response Totals for Question 9
Statistics For Question 9 Results Across All Three Advertisements
“The advertisement makes me curious about the company in the ad”
A9 B9 C9
N Valid 165 164 165
Missing 0 1 0
Mean 3.12 3.69 3.26
Median 3.00 4.00 3.00
Mode 4 4 4

266
Appendix P10: Consumer Survey Results- Response Totals for Question 10
Statistics For Question 10 Results Across All Three Advertisements
“The advertisement appeals to me on a personal level”
A10 B10 C10
N Valid 164 165 165
Missing 1 0 0
Mean 2.52 3.67 3.05
Median 2.00 4.00 3.00
Mode 2 4 4
Appendix P11: Consumer Survey Results- Response Totals for Question 11
Statistics For Question 11 Results Across All Three Advertisements
“Based on the advertisement's content, the product seems to be high quality”
A11 B11 C11
N Valid 165 165 164
Missing 0 0 1
Mean 4.01 3.31 3.38
Median 4.00 3.00 3.00
Mode 4 3 4
Appendix P12: Consumer Survey Results- Response Totals for Question 12
Statistics For Question 12 Results Across All Three Advertisements
“Based on the advertisement's content, the company appears
to be creditable and reputable company”
A12 B12 C12
N Valid 164 165 165
Missing 1 0 0
Mean 3.81 3.33 3.28
Median 4.00 3.00 3.00
Mode 4 3 3

267
Appendix P13: Consumer Survey Results- Response Totals for Question 13
Statistics For Question 13 Results Across All Three Advertisements
“The images used in the advertisement relate well to the text information”
A13 B13 C13
N Valid 164 165 165
Missing 1 0 0
Mean 3.85 3.76 3.73
Median 4.00 4.00 4.00
Mode 4 4 4
Appendix P14: Consumer Survey Results- Response Totals for Question 14
Statistics For Question 14 Results Across All Three Advertisements
“The images used in the advertisement make me want to experience what is pictured (either by
performing an activity or purchasing the product)”
A14 B14 C14
N Valid 165 165 165
Missing 0 0 0
Mean 3.52 3.33 3.18
Median 4.00 4.00 3.00
Mode 4 4 4
Appendix P15: Consumer Survey Results- Response Totals for Question 15
Statistics For Question 15 Results Across All Three Advertisements
“Based on the advertisement's content, I would consider looking
For this product/brand when making my next purchase”
A15 B15 C15
N Valid 165 165 165
Missing 0 0 0
Mean 2.72 3.61 3.03
Median 3.00 4.00 3.00
Mode 2 4 4

268
Appendix P16: Consumer Survey Results- Response Totals for Question 16
Statistics For Question 16 Results Across All Three Advertisements
“If a product in a store contained this brand/product I
would consider seeking additional information”
A16 B16 C16
N Valid 165 164 165
Missing 0 1 0
Mean 3.06 3.54 3.22
Median 3.00 4.00 3.00
Mode 3 4 4
Appendix P17: Consumer Survey Results- Response Totals for Question 17
Statistics For Question 17 Results Across All Three Advertisements
“If a product in a store contained this brand/product I would consider purchasing the item”
A17 B17 C17
N Valid 164 165 165
Missing 1 0 0
Mean 2.93 3.72 3.12
Median 3.00 4.00 3.00
Mode 3 4 4
Appendix P18: Consumer Survey Results- Response Totals for Question 18
Statistics For Question 18 Results Across All Three Advertisements
“If a product contained this brand/product I would consider paying more for that product than a
product containing generic products (ex. a branded fiber vs. polyester)”
A18 B18 C18
N Valid 165 165 165
Missing 0 0 0
Mean 2.88 3.25 2.88
Median 3.00 3.00 3.00
Mode 3 3 3