“Un poco de razón, un poco de espejismo. Entrevista a Javier Bello”,
Upload
khangminh22Category
view
0download
0
ABSTRACT
PACHECO DOMINGUEZ, WILMER JAVIER. Effect of Particle Size and Inclusion Level
of DDGS, and Pellet Quality on Nutrient Digestibility, Gastrointestinal Development, and
Live Performance of Broilers and Swine. (Under the direction of Drs. John Brake and Peter
Ferket).
Distillers dried grains with solubles (DDGS) is the co-product that remains after
fermenting the starch fraction of grains to produce ethanol. Previous research studies have
shown that the main limitations for using DDGS in poultry and swine diets were reduced
pellet quality and increased nutrient variability. Our working hypothesis was that further
grinding of DDGS would improve pellet quality and live performance in poultry and swine
and that the optimum dietary inclusion would depend upon feed formulation strategies. The
first study (Chapter 2) was designed to evaluate the effect of inclusion level and particle size
of DDGS as well as soybean meal (SBM) particle size on pellet durability index (PDI). Diets
containing DDGS exhibited improved (P≤0.05) PDI relative to diets without DDGS. Further
grinding of SBM in diets with DDGS also improved (P≤0.05) PDI. Adding 30% DDGS to
corn-soy diets improved PDI and further grinding of SBM, but not DDGS, improved pellet
quality.
The second study (Chapter 3) evaluated the effect of particle size and DDGS
inclusion on pellet quality and live performance of broilers fed diets formulated on a
digestible amino acid (AA) basis. Birds fed diets with fine DDGS consumed more feed
(P≤0.05) and exhibited greater BW (P≤0.05) at 42 d than birds fed diets with coarse DDGS
with no difference in feed efficiency. Birds fed pelleted diets with fines removed exhibited
greater BW at 35 and 42 d than birds fed pelleted diets with 50% fines. Birds fed diets
containing 30% DDGS consumed more feed (P≤0.05) but exhibited poorer feed efficiency
(P≤0.05) at 42 d than birds fed 15% DDGS with no differences in BW. The results observed
on this experiment demonstrated that broilers exhibited improved live performance when fed
finely ground DDGS (482 µm) with no fines in the feed and that up to 30% DDGS could be
fed when diets were formulated on a digestible AA basis.
The third study (Chapter 4) evaluated the effect of dietary DDGS inclusion and the
method of crude fat analysis on pellet quality, nutrient digestibility, incidence of footpad
lesions, and broiler live performance in diets formulated on a total AA basis. Increasing
dietary inclusion of DDGS to 30% reduced pellet quality, BW, and protein digestibility as
well as increased footpad lesions. Feed efficiency was also poorer. Evidently, broilers can be
fed up to 15% DDGS in diets formulated on total AA basis while the method of estimating
crude fat had a marginal effect on live performance.
The final experiment (Chapter 5) evaluated the effect of DDGS particle size and
percentage fines on grower-finisher pig performance. Particle size of DDGS and percentage
fines in the feed did not impact (P≥0.05) daily gain, daily feed intake, or feed efficiency. It
was determined that the particle size of DDGS did not improve overall live performance so
DDGS did not need to be further ground upon receipt at the feed mill. In addition, up to 25%
pellet fines could be fed without affecting grower-finisher pig performance.
Based on the results of these 4 studies, it was concluded that: (1) further grinding
DDGS did not influence pellet quality and grower-finisher pig live performance; (2) grinding
SBM improved pellet quality; (3) feed containing up to 25% fines could be fed to broilers or

grower-finisher pigs without adverse effects on live performance; (4) and use of digestible
AA values during feed formulation allowed for higher DDGS inclusion.

© Copyright 2014 Wilmer J. Pacheco Dominguez
All Rights Reserved

Effect of Particle Size, DDGS Inclusion, and Pellet Quality on Nutrient Digestibility,
Gastrointestinal Development, and Live Performance of Broilers and Swine
by
Wilmer Javier Pacheco Dominguez
A dissertation submitted to the Graduate Faculty of
North Carolina State University
in partial fulfillment of the
requirements for the Degree of
Doctor of Philosophy
Physiology and Nutrition
Raleigh, North Carolina
2014
APPROVED BY:
_______________________________ ______________________________
John T. Brake, Ph.D. Peter R. Ferket, Ph.D.
Co-chair Co-chair
________________________________ ________________________________
Charles R. Stark, Ph.D. Vernon Felts, Ph.D.
________________________________
Mark Knauer, Ph.D.

ii
DEDICATION
To
God who strengthens me in times of weakness
My dear family; my mother Juana (QDDG), my father Virgilio, my brothers; Johnny, Hector,
Jorge, Rodolfo, Virgilio, Rodilio, Antonio (QDDG),
and my sisters; Lina (QDDG), and Lessy.
My beloved girlfriend Indira Medina.
All my friends who made this journey an enjoyable one.
“I am because of you”
iii
BIOGRAPHY
Wilmer J. Pacheco was born in Las Vegas, Santa Barbara, Honduras, on June 9th
,
1983. He spent the first years of his life studying in this small town in the mountains of
Honduras. During his childhood he collaborated in the farm activities helping his father to
grow corn and beans. After elementary school, he moved to San Pedro Sula where he studied
in the Honduran-German Technical Center where he learned the general concepts of
maintenance of industrial machines. In 2002, he was granted a scholarship to study in the
Pan-american school of agriculture (Zamorano), which is one of the most prestigious
agricultural schools in the area. At Zamorano, he was trained in areas related to food
technology with specialization in processing of dairy and meat products. After his graduation
from Zamorano he moved to Laurinburg, NC, where he started a manager trainee program
with Murphy Brown. The two main reasons for leaving his country were to learn the English
language and to pursue higher education degree in a US university. After one year in the
training program he was promoted as night shift supervisor and was the responsible to
oversee the production of approximately 10,000 tons of pelleted feed per week. In 2009, he
was granted a research assistantship in the Department of Poultry Science at North Carolina
State University (NCSU). At NCSU, Wilmer has focused on the interrelationships between
feed milling, nutrition, and physiology in poultry and swine. He is also a member of a team
that investigates a wide range of husbandry, nutrition, and feed milling issues.
iv
ACKNOWLEDGMENTS
I would like to thank my advisory committee Dr. John Brake, Dr. Peter Ferket, Dr. Charles
Stark, Dr. Mark Knauer, and Dr. Vernon Felts as well as Dr. Adam Fahrenholz for their
support and advice. A special appreciation is expressed to Dr. Charles Stark for giving me
the opportunity to come to the U.S. initially to work with Murphy Brown and then for
accepting me as his graduate student. I would like to express my sincere gratitude to Dr. John
Brake and Dr. Peter Ferket for being excellent mentors, friends, and advisors. I would like to
express my most sincere gratitude to Dr. Diego Bohorquez and Dr. Leonel Mejia for having
encouraged me to continue with my studies and for their continual support through my years
as graduate student. Thanks to my beloved girlfriend Indira Medina for her unconditional
love and support. Thanks to the graduate students in the Poultry and Animal Science
Departments Manuel Costa, Marcelo Dalmagro, Basheer, Satid, Amy, Marissa, Coltin,
Ayuub, Ilana, Rasha, Frank, David Rosero, Michael Shields, Santa Maria Mendoza, Oswaldo
Medina, Tiago Pasquetti and others for their friendship and for making my time at NC State
an unforgettable experience. Thanks to the feed mill manager Shawn Bradshaw, the farm
crew Terry, Lory, and Scott as well as all the undergraduates students that assisted me during
my research trials.

v
TABLE OF CONTENTS
LIST OF TABLES ................................................................................................................. x
LIST OF FIGURES.............................................................................................................. xii
CHAPTER I. LITERATURE REVIEW.............................................................................. 1
1.1. INTRODUCTION................................................................................................. 2
1.2. CORN STRUCTURE AND COMPOSITION...................................................... 4
1.3. ETHANOL PRODUCTION.................................................................................. 6
1.3.1. Grain receiving........................................................................................ 8
1.3.2. Grinding.................................................................................................. 8
1.3.3. Cooking and liquefaction........................................................................ 9
1.3.4. Saccharification and fermentation........................................................ 10
1.3.5. Distillation and further co-product processing..................................... 11
1.4. DDGS IN ANIMAL NUTRITION...................................................................... 12
1.4.1. Nutrient variability of DDGS................................................................ 13
1.4.2. Amino acid content and digestibility of DDGS.................................... 17
1.4.3. Metabolizable energy level of DDGS................................................... 19
1.4.4. Flow and storage of DDGS................................................................... 20
1.5. PELLETING........................................................................................................ 22
1.5.1. Measuring pellet quality....................................................................... 24
1.5.2. Pellet quality and feed mill efficiency.................................................. 25
1.6. PARTICLE SIZE REDUCTION......................................................................... 26
1.7. HYPOTHESES AND RESEARCH OBJECTIVES............................................ 28

vi
1.8. REFERENCES.................................................................................................... 32
CHAPTER II. EFFECT OF FURTHER GRINDING DDGS AND SBM ON PELLET
QUALITY IN SWINE DIETS............................................................................................. 47
2.1. ABSTRACT......................................................................................................... 48
2.2. INTRODUCTION............................................................................................... 49
2.3. MATERIAL AND METHODS........................................................................... 51
2.3.1. Diets...................................................................................................... 51
2.3.2. Data collection and laboratory analyses............................................... 52
2.3.2. Statistical analyses................................................................................ 53
2.4. RESULTS AND DISCUSSION.......................................................................... 54
2.5. TABLES AND FIGURES................................................................................... 58
2.6. REFERENCES.................................................................................................... 64
CHAPTER III. EFFECT OF PARTICLE SIZE, DDGS INCLUSION, AND PELLET
QUALITY ON BROILER LIVE PERFORMANCE AND GASTROINTESTINAL
DEVELOPMENT................................................................................................................. 68
3.1. ABSTRACT......................................................................................................... 69
3.2. INTRODUCTION............................................................................................... 70
3.3. MATERIAL AND METHODS........................................................................... 72
3.3.1. DDGS analyses..................................................................................... 72
3.3.2. Diets...................................................................................................... 72
3.3.3. Bird husbandry...................................................................................... 73
3.3.4. Data collection and laboratory analyses............................................... 74
3.3.5. Ileal analyses......................................................................................... 76
vii
3.3.6. Statistical analyses................................................................................ 76
3.4. RESULTS AND DISCUSSION.......................................................................... 76
3.4.1. Feed manufacturing.............................................................................. 76
3.4.2. Broiler live performance....................................................................... 77
3.4.3. Organ development............................................................................... 79
3.4.4. Nitrogen and energy digestibility.......................................................... 80
3.5. TABLES AND FIGURES................................................................................... 82
3.6. REFERENCES.................................................................................................... 89
CHAPTER IV. EFFECT OF INCLUSION LEVEL AND METHOD OF ANALYSIS
FOR CRUDE FAT OF DDGS ON NUTRIENT DIGESTIBILITY, FOOTPAD
LESIONS, AND BROILER LIVE PERFORMANCE DEVELOPMENT..................... 95
4.1. ABSTRACT......................................................................................................... 96
4.2. INTRODUCTION............................................................................................... 97
4.3. MATERIAL AND METHODS........................................................................... 99
4.3.1. DDGS analyses..................................................................................... 99
4.3.2. Diets...................................................................................................... 99
4.3.3. Bird husbandry.................................................................................... 100
4.3.4. Data collection and laboratory analyses............................................. 101
4.3.5. Ileal analyses....................................................................................... 103
4.3.6. Statistical analyses.............................................................................. 103
4.4. RESULTS AND DISCUSSION........................................................................ 104
4.4.1. Feed manufacturing............................................................................ 104
4.4.2. Broiler live performance..................................................................... 106

viii
4.4.3. Nutrient digestibility and footpad lesions........................................... 108
4.5. TABLES AND FIGURES................................................................................. 110
4.6. REFERENCES.................................................................................................. 117
CHAPTER V. EFFECT OF DDGS PARTICLE SIZE AND PELLET QUALITY ON
GROWER-FINISHER PIG PERFORMANCE.............................................................. 121
5.1. ABSTRACT....................................................................................................... 122
5.2. INTRODUCTION............................................................................................. 123
5.3. MATERIAL AND METHODS......................................................................... 124
5.3.1. Diets.................................................................................................... 124
5.3.2. Animal husbandry............................................................................... 125
5.3.3. Data collection and laboratory analyses............................................. 127
5.3.4. Statistical analyses.............................................................................. 128
5.4. RESULTS AND DISCUSSION........................................................................ 128
5.4.1. Feed manufacturing............................................................................ 128
5.4.2. Swine performance............................................................................. 130
5.5. TABLES AND FIGURES................................................................................. 133
5.6. REFERENCES.................................................................................................. 141
CHAPTER VI. INTEGRATION OF CONCEPTS AND FINDINGS FROM
RESEARCH STUDIES...................................................................................................... 145
6.1. INTRODUCTION............................................................................................. 146
6.2. EFFECTS OF DDGS INCLUSION ON PELLET QUALITY ........................ 147
6.3. EFFECTS OF FURTHER GRINDING DDGS ON PELLET QUALITY AND
BROILER AND SWINE PERFORMANCE........................................................... 148
ix
6.4. EFFECT OF PERCENTAGE PELLET FINES ON BROILER AND SWINE
LIVE PERFORMANCE........................................................................................... 150
6.5. MAXIMUM INCLUSION OF DDGS BASED UPON FORMULATION
STRATEGIES........................................................................................................... 151
6.6. REFERENCES.................................................................................................. 153

x
LIST OF TABLES
CHAPTER I
Table 1. Average proximate composition of corn (% dry matter)............................... 3
Table 2. Average nutrient composition of DDGS from ethanol plants...................... 15
Table 3. Comparison of gross energy (GE), DE, and ME estimates among DDGS
sources in pig diets ..................................................................................................... 17
Table 4. The stepwise regression equation to predict amino acid levels based on the
proximate values of moisture, crude protein (CP), fat, and fiber .............................. 18
CHAPTER II
Table 1. Composition and calculated contents of the experimental diets (% as fed
basis)........................................................................................................................... 58
Table 2. Descriptive statistics of the experimental diet............................................. 59
Table 3. Particle size distribution of corn, soybean meal, and DDGS ...................... 60
Table 4. Effect of particle size and inclusion of DDGS on pellet durability index
(PDI) and feed production rate .................................................................................. 61
CHAPTER III
Table 1. Determined and calculated chemical composition of the distillers dried grain
with solubles (DDGS) (% as-fed basis, unless stated otherwise) as received from the
supplier........................................................................................................................ 82
Table 2. Composition and calculated contents of the experimental diets (% as fed
basis)........................................................................................................................... 83
Table 3. Effect of particle size and DDGS inclusion on pellet durability index (PDI)
and feed pellet production rate.................................................................................... 84
Table 4. Effect of particle size, DDGS inclusion, and percentage feed fines on BW,
feed intake, and feed conversion ratio (FCR) of broilers from 1 to 42 d of
age…………………………………………………………………………………... 85
Table 5. Effect of particle size, DDGS inclusion, and percentage feed fines on
relative gizzard and proventriculus weight at 42 d of age ........................................ 86

xi
Table 6. Effect of particle size, DDGS inclusion, and percentage feed fines on
nitrogen (N), crude protein (CP), and energy utilization (AME, AMEn, and GE) of
male broilers from 1 to 42 d of age ............................................................................ 87
CHAPTER IV
Table 1. Composition and calculated contents of the experimental diets (% as fed
basis)......................................................................................................................... 110
Table 2. Effect of inclusion level and metabolizable energy value of DDGS on pellet
durability index (PDI) and pellet production rate..................................................... 111
Table 3. Effect of inclusion level and metabolizable energy value of DDGS on BW,
feed intake, and feed conversion ratio (FCR) of broilers from 1 to 49 d of age....... 112
Table 4. Effect of inclusion level and metabolizable energy value of DDGS on
protein, fat digestibility, and footpad lesion score at 49 d of age............................. 113
CHAPTER V
Table 1. Determined and calculated chemical composition of the distillers dried grain
with solubles (DDGS) (% as-fed basis, unless stated otherwise) as received from the
supplier...................................................................................................................... 133
Table 2. Composition and calculated contents of the grower, developer, and finisher
diets (% as fed basis)................................................................................................. 134
Table 3. Particle size distribution of the distillers dried grains with solubles (DDGS)
used during the experiment....................................................................................... 135
Table 4. Descriptive statistics for pellet quality....................................................... 136
Table 5. Effect of the particle size of distillers dried grain with solubles (DDGS) on
percentage fines and standard and modified pellet durability index (PDI).............. 137
Table 6. Descriptive statistics for pig live performance........................................... 138
Table 7. Effect of the particle size of distillers dried grains with solubles (DDGS) and
percentage pellet fines on body weight of grower-finisher pigs............................... 139
Table 8. Effect of the particle size of distillers dried grains with solubles (DDGS) and
percentage pellet fines on average daily gain, average daily feed intake, and feed:gain
of grower-finisher pigs.............................................................................................. 140

xii
LIST OF FIGURES
CHAPTER I
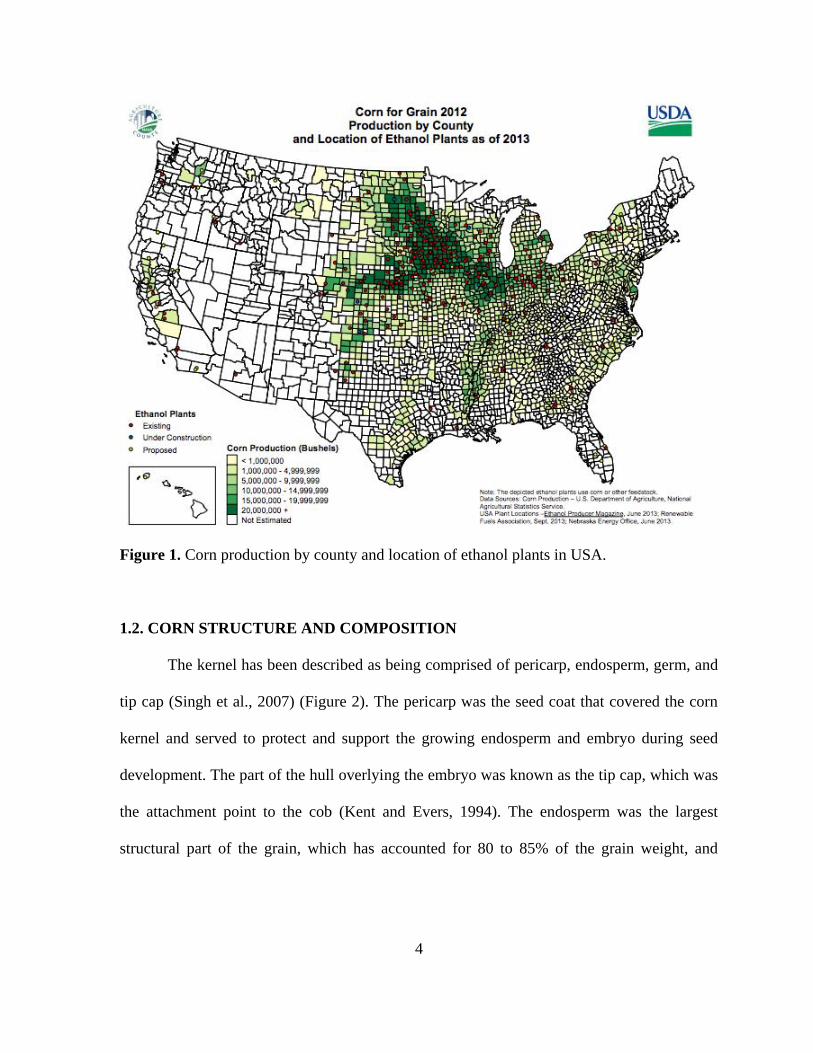
Figure 1. Corn production by county and location of ethanol plants in USA ............. 4
Figure 2. Components of the corn kernel .................................................................... 6
Figure 3. Overview of dry grind process of ethanol production ............................... 12
CHAPTER II
Figure 1. Average particle size and particle size distribution of soybean meal used in
swine finishing diets as received (coarse-1070 µm) and after grinding (fine-467 µm)
in a hammermill equipped with a 1.6 mm screen ...................................................... 62
Figure 2. Average particle size and particle size distribution of DDGS used in swine
finishing diets as received (coarse-677 µm) and after grinding (fine-483 µm) in a
hammermill equipped with a 1.6 mm screen ............................................................. 63
CHAPTER III
Figure 1. Average particle size and particle size distribution of DDGS used in broiler
diets during the grower period as received (coarse-745 µm) and after grinding (fine-
482 µm) in a hammermill equipped with a 1.6 mm screen........................................ 88
CHAPTER IV
Figure 1. Relationship between pellet durability index (PDI) and amount of fat added
in the mixer in grower diets containing 0, 15, and 30% DDGS analyzed by two
methods of crude fat analysis (Acid hydrolysis (AH)-method 154.02 and ether extract
(EE)-method 990.03; AOAC, 2006))........................................................................ 114
Figure 2. Relationship between pellet durability index (PDI) and amount of fat added
in the mixer in finisher diets containing 0, 15, and 30% DDGS analyzed by two
methods of crude fat analysis (Acid hydrolysis (AH)-method 154.02 and ether extract
(EE)-method 990.03; AOAC, 2006))........................................................................ 115
Figure 3. Relationship between nitrogen digestibility and incidence of footpad
lesions (FPL) as measured by the footpad lesion score in diets containing 0, 15, and
30% DDGS analyzed by two methods of crude fat analysis (Acid hydrolysis (AH)-
method 154.02 and ether extract (EE)-method 990.03; AOAC, 2006))................... 116

1
CHAPTER I
LITERATURE REVIEW

2
1.1. INTRODUCTION
The increased usage of animal feed ingredients as raw materials for the production of
ethanol has increased U.S. production of biofuels by 82% from 2000 to 2008 (Schmidt et al.,
2012). Increased ethanol production has resulted into increased production of distillers dried
grains with solubles (DDGS) (Shurson, 2003). Distillers dried grains have been produced
after fermenting the starch fraction of grains to produce ethanol and have become the main
co-product of the ethanol and beverage industries. The residues that have remained after
fermentation have been termed “distillers wet grains or whole stillage” and have been
blended with the “condensed distillers solubles” (CDS, also know as syrup) to produce the
final DDGS. If the whole stillage was dried without adding the solubles, the product was
called distillers dried grains (DDG) (Pahm et al., 2008a).
Condensed distillers solubles has been reported to contain high levels of vitamins, fat,
and protein with low levels of fiber, and have yielded around 91% of the digestible energy
value of corn (Cruz et al., 2005). The DDGS have contained mainly the non-fermentable
components of the grains used to produce ethanol, but since the fermentation has not been
100% efficient, DDGS has also contained some residual sugars (Spiehs et al., 2002; Belyea
et al., 2004; Singh et al., 2005). Therefore, DDGS has become a valuable source of energy,
protein, water-soluble vitamins, and minerals (Batal and Dale, 2006; Ganesan et al., 2009;
Shalash et al., 2009) in poultry and swine diets.
Corn has been the major feed ingredient used for ethanol production and has
accounted for approximately 97% of the total grains used, followed by sorghum, which has
accounted for 2%, with the remaining 1% produced from other crops or by-products of

3
beverage production (Nichols and Bothast, 2008). The choice to use a particular ingredient
has depended upon the geographical location, costs, and availability among other factors.
Most ethanol plants have been concentrated in the Midwest and north-central portions of the
United States, where most of the corn has been produced (Figure 1). However, in recent
years ethanol facilities have been built in other states closer to the ethanol markets.
On a dry matter basis the corn kernel has been reported to contain approximately 75%
starch, 8.9% protein, 4.0% oil, 1.5% ash, 1.7% simple sugars, and 8.9% fiber (Watson,
2003), but since most of the starch has been fermented to produce ethanol the remaining non-
fermentable nutrients became concentrated about three-fold in the DDGS.
Table 1. Average proximate composition of corn (% dry matter)
Component Starch Fat Protein Ash Sugar Fiber
Whole Kernel 73.4 4.4 9.1 1.4 1.9 9.5
Kernel Fractions ———————————— (%) ————————————
Endosperm 98.1 15.4 73.3 17.9 28.6 27.00
Germ 1.5 82.6 26.2 78.4 69.3 16.00
Pericarp 0.6 1.3 2.6 2.9 1.2 51.00
Tip Cap 0.1 0.8 0.9 1.0 0.8 0.01
Source: Watson (2003)
4
Source: USDA, 2012.
Figure 1. Corn production by county and location of ethanol plants in USA.
1.2. CORN STRUCTURE AND COMPOSITION
The kernel has been described as being comprised of pericarp, endosperm, germ, and
tip cap (Singh et al., 2007) (Figure 2). The pericarp was the seed coat that covered the corn
kernel and served to protect and support the growing endosperm and embryo during seed
development. The part of the hull overlying the embryo was known as the tip cap, which was
the attachment point to the cob (Kent and Evers, 1994). The endosperm was the largest
structural part of the grain, which has accounted for 80 to 85% of the grain weight, and

5
contained large amounts of starch and storage proteins (Watson, 1994; Reyes et al., 2011).
The nutrients in the endosperm were mobilized to support growth of the embryonic axis at
the onset of germination (Fincher, 1989). Starch has been found to be the most abundant
carbohydrate in corn and the main form of stored energy (Liu, 2012). In the production of
ethanol, starch has been the key component as it has been converted into glucose molecules,
which could be fermented to produce ethanol and CO2 (Bothast and Schlicher, 2005). In
addition, the endosperm contained around 6.9-10.4% protein stored in the endoplasmic
reticulum (Earle et al., 1946).
The aleurone tissue was reported to be a layer of single cells found just below the
pericarp and surrounding the starchy endosperm (Kent and Evers, 1994). Aleurone cells
exhibited high concentrations of proteins, lipids, vitamins, and minerals and provided sites
for synthesis and secretion of alpha amylase and a range of hydrolytic enzymes responsible
for solubilizing of the energy reserves of the grain at the onset of germination (Baulcombe et
al., 1984; Liu, 2012). Contrasted to the starchy endosperm, aleurone cells accumulated their
proteins inside vacuoles instead of the endoplasmic reticulum (Reyes et al., 2011).
The germ or embryo has been described as comprising between 8 – 10% of the dry
weight of the kernel and contained protein, oil, as well as starch (Watson, 1994).
Approximately 83% of the fat and 26% of the protein of the corn kernel were contained in
the germ (Earle et al., 1946). Indeed, there has been a positive correlation between the
percentage embryo and the lipid content of the corn kernel (Hopkins et al., 1974).
Proteins in corn have been classified based on their solubility with albumins soluble
in water, globulins soluble in salt solutions, prolamins soluble in alcohol/water solutions, and

6
glutelins soluble in acids (Shewry and Thatam, 1990). Albumins and globulins were
concentrated in germ, aleurone, and pericarp with small amounts found in the endosperm
(Hoseney, 1994). During the fermentation process to produce ethanol the proteins in the corn
have typically remained unchanged and have become concentrated around three-fold in the
DDGS. Therefore, if the initial protein content in the corn was 9%, the final DDGS contained
approximately 27% protein. In addition, lipids exhibited minimal change during the
fermentation process and have ended up mostly in the DDGS.
Figure 2. Components of the corn kernel (U.S. Grains Council, 2011).
1.3. ETHANOL PRODUCTION
At the time of this writing the USA had 211 ethanol facilities and more than 90% of
them used corn as their ingredient (RFA, 2014). Indeed, approximately 27.3% of corn
produced in the U.S. was diverted to ethanol production (National Corn Growers
Association, 2012). Corn was converted into ethanol primarily by two processes: wet milling

7
and dry grinding (Rausch and Belyea, 2006). The wet milling process required high capital
investment, was required to process large quantities of corn, and produced large volumes of
ethanol and co-products to justify production costs (Belyea et al., 2004). In wet milling, corn
was fractionated into its components, which included starch, fiber, gluten, and germ (Bothast
and Schlicher, 2005). The starch was then converted into simple sugars and used to produce
glucose, dextrose, high fructose corn or ethanol by yeast fermentation. The germ was de-
oiled to produce corn oil or dehydrated to produce germ meal. Proteins were also
concentrated and used mainly in feeds for non-ruminants and companion animals (Raush and
Belyea, 2006). The wet milling industry had greater flexibility due to the amount of co-
products produced (Bothast and Schlicher, 2005).
The most popular process recently used to produce ethanol in the USA has been
recently the dry grind process (Figure 3), which has accounted for over 80% of the total
ethanol production (RFA, 2009). In dry grind processing, the corn kernel was ground into a
coarse flour of around 600 µm in particle size without fractionating. Dry-grind facilities
required less equipment and were less capital intensive, but fewer co-products were produced
than the wet milling process (Raush and Belyea, 2006). In both processes, unfermented
nutrients (protein, fiber, and minerals) were converted into DDGS. Dry grind ethanol
manufacturing has typically resulted in three main products that included ethanol, DDGS,
and carbon dioxide (CO2). As a rule of thumb, for every bushel of corn (~56 lbs; 25.4 kg)
approximately 2.8 gallons of ethanol (8.2 kg), 18 lbs (8.2 kg) of DDGS, and roughly 18 lbs
(8.2 kg) of CO2 were produced. Dry grinding consisted of several key steps including grain
receiving, distribution, grinding, cooking, liquefaction, saccharification, fermentation (mostly

8
simultaneous saccharification and fermentation), distillation, and co-product recovery (Naidu
et al., 2007; Liu, 2009).
1.3.1. Grain Receiving
Corn was typically delivered into the ethanol plant by truck or by rail. Before
unloading, the grain was sampled and tested for mycotoxins, moisture, foreign material, and
mold damage. Mycotoxin levels were monitored carefully as these typically became
concentrated by approximately three fold in DDGS (Bothast et al., 1992; Bennett and
Richard, 1996; Zhang et al., 2009). This has been a major concern because mycotoxins have
been reported to significantly decrease the performance of poultry and swine species (Doerr
et al., 1983; Verma et al., 2004; Verma et al., 2007). After testing, the grain was dumped into
an underground receiving pit and sent to the grain storage area.
1.3.2. Grinding
The purpose of grinding was to reduce particle size and facilitate water penetration
during the cooking process. The whole kernel was ground by passing it through hammermills
equipped with screens with relatively small openings of approximately 3.2–4.8 mm diameter
(Bothast and Schlicher, 2005) or through roller mills with one or two sets of rolls. Grinding
also increased the surface area of the starch substrate particles available to enzymes and yeast
in the subsequent ethanol production steps. Although roller mills were more energy efficient
than hammermills and tended to produce more uniform particles with fewer fines, roller mills
were not often used in ethanol plants as they had higher initial costs of installation (Koch,
2002). Hammermills were the most common grinding equipment due to their higher
9
throughput capacity and efficiency. The particles produced with a hammermill were
generally spherical and their distribution varied widely with mostly small particles and some
large particles (Koch, 2002). The resulting average particle size and distribution was affected
by a number of factors such as screen size, hammer tip speed, number of hammers, air
assisted equipment, roll openings, moisture content, sharpness of the hammers, size and
integrity of the screens, presence of foreign material among others (Dupin et al., 1997).
Particle size and particle size distribution were reported to affect ethanol yield and the final
nutritional composition of the DDGS (Kelsall and Lyons, 2003; Naidu et al., 2007). In fact,
Kelsall and Lyons (1999) reported that by reducing the screen size of the hammermill from 8
mm to 5 mm, there was an increase in the ethanol yield from 2.45 to 2.65 gallons per bushel
(~ 56 lbs) of corn.
1.3.3. Cooking and Liquefaction
After grinding, corn flour was mixed with water and recycled stillage to form slurry
with approximately 30% solids (Rosentrater et al., 2012). This process initiated the
separation of soluble proteins from non-starch bound lipids and sugars. The slurry was
pumped into a cooking system (jet cooker) where it was heated to temperatures of 110-150ºC
using pressurized steam. Cooking sterilized the mash, broke down the crystalline structure of
the starch granules as well as the chemical bonds between proteins and sugars, initiated
starch gelatinization, and reduced the viscosity of the slurry (Kelsall and Lyons, 2003;
Rosentrater et al., 2012). During the cooking process, the pH was adjusted to between 5.5
and 6.0 through the addition of sulfuric acid (H2SO4) or ammonia. Cooking also killed lactic
10
acid producing bacteria in the grain, which have been reported to negatively affect ethanol
production by reducing the pH of the medium and creating an unfavorable environment for
yeast (Makanjuola et al., 1992; Huang et al., 1996; Franchi et al., 2003; Graves et al., 2006).
After cooking, the slurry was sent to a liquefaction tank where it was cooled to
around 60ºC. Gelatinization of the starch occurred at temperatures between 50 to 70ºC and
was controlled by the addition of amylolytic enzymes at a rate of between 0.04 and 0.08%.
The rate of starch gelatinization influenced the extent of conversion of starch into glucose
chains in the subsequent steps (Lin and Tanaka, 2006)
1.3.4. Saccharification and Fermentation
During the saccharification step α-amylase was added to degrade starch polymers into
short chain molecules and form a mash. The addition of amylolytic enzymes accounted for
around 10-20% of the total ethanol production costs (Gregg et al., 1998). Once the starch was
cleaved into small dextrins, the mixture was sent to a fermentation tank. Residence times in
the fermentation tank ranged from 40 to 72 h, depending upon the temperature and initial
particle size of the grains. Since particle size greatly influenced the fermentation efficiency,
ethanol facilities have reduced the particle size of the flour in order to increase the ethanol
yield. Glucoamylase and yeast (Saccharomyces cerevisiae) were added in the fermentation
tank where glucoamylase hydrolyzed the α-1,4 and α-1,6 bonds in dextrins into glucose and
maltose and the yeast converted these mono and disaccharides into ethanol and CO2.

11
1.3.5. Distillation and Further Co-products Processing
At the end of fermentation the product was termed “beer” and contained around 12%
ethanol. The beer was stored in a tank called a “beer well” until transferred to distillation
columns where the ethanol was separated from the whole stillage (non-fermented solids of
corn, yeast, and water). The separation of the water and ethanol was accomplished by the use
of a rectifier column that produced 190-proof ethanol (95%), which was then sent to a
molecular sieve column and converted to 200-proof ethanol (100%).
The whole stillage with 13 to 17% solids (protein, minerals, fiber, fat, etc.) was
withdrawn from the bottom of the distillation unit and centrifuged to produce wet cake and
thin stillage (Raush and Belyea, 2006). The wet cake, which was a more concentrated form
of whole stillage, contained between 35 to 50% solids. The thin stillage that contained
between 5 to 10% solids was sent through an evaporator where solids were concentrated into
syrup that contained 25 to 55% solids. The syrup was subsequently blended with the wet
cake before entering the drier. The mixture of wet cake and syrup was dried to generate the
DDGS, which typically contained 31.3% crude protein, 11.9% crude fat, 10.2% fiber, and
4.6% ash (Belyea et al., 2004). On a dry matter basis 100 kg corn has typically yielded 70 kg
starch, which produced 77.8 kg of glucose. The glucose was subsequently fermented to
produce 39.8 kg of ethanol and 38.0 kg of carbon dioxide (Maisch, 2003). Quality control
procedures have assured consistency in the amount of protein, fat, fiber, and moisture as well
as to control mycotoxin levels.

12
Figure 3. Overview of dry grind process of ethanol production. Reproduced from Nichols et
al. (2006).
1.4. DDGS IN ANIMAL NUTRITION
Distillers dried grains with solubles was not typically included in poultry and swine
diets, but increased production of ethanol increased the supply of DDGS while decreasing the
supply of corn and encouraged the use of higher percentages of DDGS in livestock diets
(Waldroup, 2007). As the usage of DDGS increased, there was the necessity to study the
maximum inclusion of DDGS that could be fed without affecting animal performance,
animal welfare, and feed efficiency. Recently, there has been an abundance of research to
precisely determine the nutrient content of DDGS in order to take full advantage of its value
in poultry and swine diets (Fiene et al., 2006). According to Lumpkins et al. (2004), up to 6%

13
DDGS could be included in broiler starter diets and 12 to 15% in grower and finisher diets.
In another study, Loar et al. (2010) reported that 8% DDGS could be included from 0 to 14 d
of age and 15% from 14 to 42 d of age without adverse effects on broiler live performance
and feed efficiency. In diets for commercial layers approximately 10-12% could be fed
without affecting egg production (Lumpkins et al., 2005). The maximum inclusion of DDGS
has been influenced by the methodology used during feed formulation. If the metabolizable
energy (ME) content of diets was maintained constant by the addition of supplemental fat, up
to 25% DDGS could be used without adverse effects on live performance and feed efficiency
(Waldroup et al., 1981), but if the ME was allowed to decline as the inclusion of DDGS
increased, only 15% could be fed. Some concerns regarding DDGS usage were related to
nutrient variability, particularly when high levels were used (Noll et al., 2007b). The major
concerns were variation in ME content, bioavailability of amino acids such as lysine,
bioavailability of phosphorus, and variation in sodium content (Waldroup et al., 2007). From
the feed milling perspective, the major concerns were related to poor ingredient flow
characteristics and decreased pellet quality. Therefore, it has become essential to precisely
know the nutritional value and pelleting characteristics of DDGS in order to utilize this
ingredient effectively in poultry and swine diets.
1.4.1. Nutrient Variability of DDGS
The nutrient content of DDGS has varied considerably from different sources (Spiehs
et al., 2002; Belyea et al., 2010; Liu, 2008). Many factors have been found to influence
nutrient variability of DDGS including cereal type and variety, amylose and amylopectin
14
content (Singh and Graeber, 2005; Sharma et al., 2007), location of the ethanol plant
(Whitney et al., 2000; Fastinger and Mahan, 2006), type and amount of additives used during
fermentation, water quality, and concentration of solids (Rausch and Belyea, 2006) among
others. However, the main factor that influenced the nutrient content of DDGS was the
amount of distillers solubles (thin stillage) added to the whole stillage (Goodson and
Fontaine, 2004; Waldroup et al., 2007). Noll et al. (2007a) observed that as the amount of
thin stillage added to the whole stillage was increased, there was an increase in fat and ash
content in the final DDGS. In the same study, protein and amino acid content did not change
appreciably, but true amino acid digestibility coefficients were negatively correlated with
solubles addition, likely because a more severe heat treatment was required to decrease the
moisture level in the final DDGS. Heat treatment has been reported to deteriorate protein
quality by destroying heat-sensitive amino acids, particularly lysine. The Maillard reaction,
which is the most common type of heat damage, involves the reduction of the ε-NH2 group
of lysine with a carbonyl group of a reducing sugar (Pahm et al., 2008a). Previous research
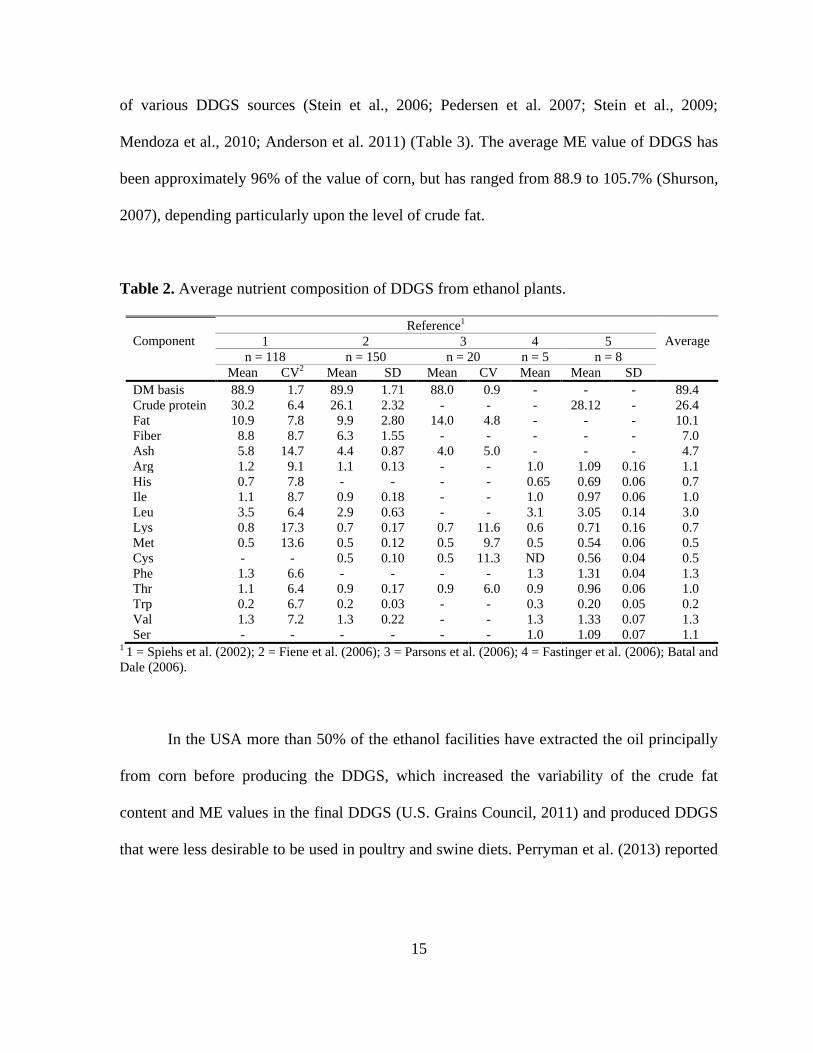
demonstrated that the components of DDGS with the highest nutritional variation were crude
fiber, ADF, NDF, ash, phosphorus, and lysine (Table 2).
There has been a considerable variability in many of the essential nutrients in DDGS,
particularly with regards to certain amino acids such as arginine, leucine, and lysine.
According to Waldroup el at. (2007), corn itself has varied in nutrient content and since the
nutrients in corn other than starch became concentrated in DDGS about three fold, any
variation in corn would exacerbate the nutrient variability in the DDGS. The swine industry
has conducted several research trials to establish the digestible energy (DE) and ME values
15
of various DDGS sources (Stein et al., 2006; Pedersen et al. 2007; Stein et al., 2009;
Mendoza et al., 2010; Anderson et al. 2011) (Table 3). The average ME value of DDGS has
been approximately 96% of the value of corn, but has ranged from 88.9 to 105.7% (Shurson,
2007), depending particularly upon the level of crude fat.
Table 2. Average nutrient composition of DDGS from ethanol plants.
Component
Reference1
Average 1 2 3 4 5
n = 118 n = 150 n = 20 n = 5 n = 8
Mean CV2 Mean SD Mean CV Mean Mean SD
DM basis 88.9 1.7 89.9 1.71 88.0 0.9 - - - 89.4
Crude protein 30.2 6.4 26.1 2.32 - - - 28.12 - 26.4
Fat 10.9 7.8 9.9 2.80 14.0 4.8 - - - 10.1
Fiber 8.8 8.7 6.3 1.55 - - - - - 7.0
Ash 5.8 14.7 4.4 0.87 4.0 5.0 - - - 4.7
Arg 1.2 9.1 1.1 0.13 - - 1.0 1.09 0.16 1.1
His 0.7 7.8 - - - - 0.65 0.69 0.06 0.7
Ile 1.1 8.7 0.9 0.18 - - 1.0 0.97 0.06 1.0
Leu 3.5 6.4 2.9 0.63 - - 3.1 3.05 0.14 3.0
Lys 0.8 17.3 0.7 0.17 0.7 11.6 0.6 0.71 0.16 0.7
Met 0.5 13.6 0.5 0.12 0.5 9.7 0.5 0.54 0.06 0.5
Cys - - 0.5 0.10 0.5 11.3 ND 0.56 0.04 0.5
Phe 1.3 6.6 - - - - 1.3 1.31 0.04 1.3
Thr 1.1 6.4 0.9 0.17 0.9 6.0 0.9 0.96 0.06 1.0
Trp 0.2 6.7 0.2 0.03 - - 0.3 0.20 0.05 0.2
Val 1.3 7.2 1.3 0.22 - - 1.3 1.33 0.07 1.3
Ser - - - - - - 1.0 1.09 0.07 1.1 1 1 = Spiehs et al. (2002); 2 = Fiene et al. (2006); 3 = Parsons et al. (2006); 4 = Fastinger et al. (2006); Batal and
Dale (2006).
In the USA more than 50% of the ethanol facilities have extracted the oil principally
from corn before producing the DDGS, which increased the variability of the crude fat
content and ME values in the final DDGS (U.S. Grains Council, 2011) and produced DDGS
that were less desirable to be used in poultry and swine diets. Perryman et al. (2013) reported

16
a MEn of 1,975, 2,644, and 3,137 kcal/kg for low (6.06% ether extract (EE)), medium
(8.80% EE), and high (11.59% EE) DDGS when fed to broilers from 21 to 30 d of age.
Prediction equations have been developed to estimate ME based on the chemical composition
(Batal and Dale, 2006; Cozannet et al., 2010). Although the use of prediction equations have
ameliorated the adverse consequences of nutrient variability between DDGS sources, the
ethanol industry did not have guidelines or recommendations regarding the most appropriate
analytical methods to measure the chemical composition of DDGS. This has led to confusion
and misinterpretation of data for proximate analysis and formulation issues regarding to the
ME values assigned to the nutrient matrix of DDGS. The American Feed Industry
Association (AFIA, 2007) conducted a study to evaluate the efficacy, applicability, and
variability (both intra and inter laboratory variation) of the most common methods used for
analysis of moisture/loss on drying, crude protein, crude fat, and crude fiber. The final
recommendations were based upon the coefficient of variation for both the intra and inter
laboratory variations. The recommended methods were NFTA 2.2.2.5 Lab Dry Matter (105
ºC/3 hr) for moisture analyses, AOAC 990.03 and AOAC 2001.11 for crude protein, AOAC
945.16 for ether extract, and AOAC 978.10 for crude fiber (AOAC, 2005). Nevertheless, the
influence of the variation in these methods has not been tested to determine their effect on the
performance of poultry.

17
Table 3. Comparison of gross energy (GE), DE, and ME estimates among DDGS sources in
pig diets.
Component
Reference1
1 2 3 4 5
n = 10 n = 10 n = 4 n = 17 n = 6
Mean Range Mean Range Mean Range Mean Range Mean Range
GE
(kcal/kg)
5,426 5,372-
5,500
5,434 5,272-
5,592
5,593 5,483-
5,691
5,311 5,177-
5,421
5,420 5,314-
5,550
DE (Kcal/kg) 3,556 3,382-
3,811
4140 3,947-
4,593
4,029 3,920-
4,252
3,954 3,663-
4,107
4072 3,705-
4,332
ME (Kcal/kg) -
-
3,897 3,674-
4,336
3,790 3,575-
3,976
3,700 3,381-
3,876
3,750 3,414-
4,141
CP (%) 30.9 28.2-
32.7
32.2 29.8-
36.1
31.8 30.5-
33.1
30.3 27.3-
33.3
31.3 29.5-
34.1
NDF (%) 45.2 41.8-
49.1
27.6 23.1-
29.7
40.1 35.1-
45.2
34.6 25.3-
43.1
40.4 33.4-
49.1
Crude Fat
(%)
-
-
11.7 10.2-
12.1
13.2 10.9-
14.1
11.7 8.7-
14.6
11.4 10.2-
12.1 11 = Stein et al. (2006); 2 = Pedersen et al. (2007); 3 = Stein et al. (2009); 4 = Mendoza et al. (2010); Anderson
et al. (2011).
1.4.2. Amino Acid Content and Digestibility of DDGS
Poultry and swine nutritionists have been concerned not only with the variation in the
total amount of amino acids but also with variation in their digestibility, which has varied
depending upon the type and source of grain that has been used to produce the ethanol.
Nevertheless, studies have shown that variation has existed even in DDGS produced from the
same type of grain (Fastinger and Mahan, 2006; Pahm et al., 2008b). Lysine has been defined
as the first or second limiting amino acid in swine and poultry diets. Hence, its digestibility
has been a major concern when a high level of DDGS has been used (Noll et al., 2007b). The
digestibility of lysine in DDGS has usually been lower as compared to that in corn and SBM
(Batal and Dale, 2006).

18
During the drying process of DDGS, the material was exposed to high temperatures
increasing the Maillard reaction between lysine and reducing sugars (McGinnis and Evans,
1947; Warnick and Anderson, 1968; Cromwell et al., 1993). In one study, Fastinger and
Mahan (2005) reported DDGS to have an apparent ileal digestibility of lysine of only 27%,
which suggested that some sources of DDGS might be severely overheated. In a previous
study, Spiehs et al. (2002) measured the amino acids variability in DDGS and reported that
lysine exhibited the highest variability (CV = 17.3%) followed by methionine (CV = 13.6%).
Table 4 shows regression equations used to predict total amino acid content of DDGS from
proximate analyses values that included moisture, crude protein, fat, and fiber.
Table 4. The stepwise regression equation to predict amino acid levels based on the
proximate values of moisture, crude protein (CP), fat, and fiber.
Amino Acid Equation R2
Arginine Y = 0.07926 + 0.0398*CP 0.48
Cystine Y = 0.11159 + 0.01610*CP + 9.00244*Fat 0.52
Isoleucine Y= -0.23961 + 0.04084*CP + 0.01227*Fat 0.86
Leucine Y= -1.15573 + 0.13082*CP + 0.06983*Fat 0.86
Lysine Y= -0.41534 + 0.04177*CP + 0.00913*Fiber 0.45
Methionine Y= -0.17997 + 0.02167*CP + 0.01299*Fat 0.78
TSAA Y= -0.12987 + 0.03499*CP + 0.05344*Fat – 0.00229*Fat2
0.73
Threonine Y= -0.05630 + 0.03343*CP + 0.02989*Fat – 0.00141*Fat2
0.87
Tryptophan Y= 0.01676 + 0.0073*CP 0.31
Valine Y= 0.01237 + 0.04731*CP + 0.00054185*Fat2
0.81
Source = Fiene et al. (2006)
The amino acids above with high R2
values (Ile, Leu, Met, TSAA, and Val) were
predicted with most accuracy using the proximate analyses data. The use of color
measurements has been used as a tool to predict lysine digestibility: dark-colored DDGS has

19
been reported to have lower amino acid digestibility when compared with light colored
DDGS (Cromwell et al., 1993; Fastinger and Mahan, 2006).
Formulation decisions could also influence performance, especially if diets were
formulated on a crude protein basis rather than digestible amino acid basis. Shim et al. (2011)
conducted an experiment in which the diets were formulated on a digestible amino acid basis
and did not find statistical differences for BW gain, FCR, and mortality at 42 d of age in diets
containing 0, 8, 16, or 24% DDGS. In the study the authors utilized fixed formulation
minimums for Met, TSAA, Thr, Trp, Val, Ile, and Arg in order to maintain ideal digestible
amino acid ratios relative to Lys, hence protein level increased as the DDGS inclusion
increased in order to compensate the for the lower amino acid digestibility of DDGS as
compared to corn or SBM. In contrast, Lumpkins et al. (2004) formulated diets to a minimum
crude protein level and on a total amino acid basis and concluded that only 6% DDGS could
be safely used in starter diets followed by 12 to 15% in grower and finisher diets. According
to Shim et al. (2011), diets in earlier trials using DDGS were formulated using total amino
acids rather that digestible amino acids and minimum amino acids constraints were only set
for lysine, methionine, and TSAA.
1.4.3. Metabolizable Energy Levels of DDGS
Use of the correct ME level for DDGS during feed formulation has had a
considerable impact on the performance of poultry and swine (Fiene et al., 2006). Fastinger
et al. (2006) reported an average of 2,871 kcal/kg for five samples, which ranged from 2,484
to 3,014 kcal/kg. Using a larger sample size, Batal and Dale (2006) reported an average true
20
metabolizable energy (TME) value of 2,820 ± 82 kcal/kg, with a range of 2,490 to 3,190
kcal/kg for 17 samples. The same authors applied regression analyses and developed
prediction equations to calculate the TMEn of DDGS based on its proximate composition
(fat, protein, fiber, and ash). The major differences between the samples were in crude fat
content with lower variability in fiber and ash content. The best single indicator for TMEn
was the fat content (R2
= 0.29) but the addition of second, third, and fourth variables (fiber,
protein, and ash) improved the accuracy of the prediction equation (R2 = 0.43, 0.44, and 0.45,
respectively). For swine diets, Spiehs et al. (2002) calculated the DE and ME to be 3,990 and
3,749 kcal/kg, respectively, which were also higher than NRC values, likely due to higher
crude fat content (NRC, 1998). Stein et al. (2006) reported an average DE of 3,556 kcal/kg
with a range of 3,382 to 3,811 kcal/kg of DM (Table 3).
1.4.4. Flow and Storage of DDGS
Storage and handling of DDGS was initially very troublesome due to its poor
flowability during loading and unloading into storage bins (AURI and MCGA, 2005;
Rosentrater, 2006; Bhadra et al., 2009). During shipping, DDGS often caked and bridged,
which decreased its flow characteristics in the feed mill and resulted in additional shipping
costs (Schlicher, 2005; Bhadra et al., 2009) because of increased labor, machinery, and time
required to unload and handle the material (Rock and Schwedes, 2005). The use of anti-
caking agents such as calcium carbonate, which were previously used to enhance flow of
SBM have not been not approved to be used in DDGS because there were questions
regarding how they would perform in this application (Behnke, 2007). Poor flowability
21
characteristics also led to damage of the railcars during unloading as sledgehammers were
frequently used to hit the cars and induce flow (Ganesan et al., 2009).
Strategies such as controlling the amount of condensed distillers solubles added to the
wet cake and controlling the drying process were proposed to reduce flowability problems
(Kleinschmit et al., 2006). According to Behnke (2007) storing the DDGS at the ethanol
facility for five to seven days or until moisture equilibration was completed increased the
flowability of DDGS. Bhadra et al. (2009) reported that flowability decreased as moisture
content of DDGS increased. In a more recent study, Bhadra et al. (2013) concluded that the
flowability problems of DDGS were primarily due to variability of temperature during drying
and quantity of condensed distillers added to the wet cake, with a lesser effect of cooling
temperature. Another approach to improve flowability and decrease caking was to pellet the
DDGS at the ethanol facility, however this approach could increase grinding costs at the
receiving feed mill (Behnke, 2007). Rosentrater (2007) conducted a study in which 100% of
DDGS were pelleted using a commercial pellet mill and he reported that pelleting did not
affect its nutritional value. In addition, Tumuluru et al. (2010) reported the effects of process
variables on pellet quality of wheat DDGS and reported a higher pellet density, lower pellet
moisture, and higher pellet durability at low initial moisture content of the DDGS in the
presence of a high die temperature.

22
1.5. PELLETING
Pelleting was developed to force and shape bulk material through a die in order to
improve its physical characteristics and nutritional content (Kokić et al., 2013). As the
benefits of pelleting became more recognized in recent years, there has been an enormous
increase in the amount of feed that was pelleted by the swine and poultry industries (Zang et
al., 2009). Pelleting has been reported to be a combination of heat, friction, pressure, and
particle size reduction and has been shown to increase feed consumption (Abdollahi et al.,
2011), improve feed efficiency (Jensen, 2000), and increase BW (Frikha et al., 2009).
Pelleting has also been related to an improvement of dietary AME and apparent digestibility
of dry matter (Kilburn and Edwards, 2001; Svihus et al., 2004). The increased temperature
accomplished during pelleting has been shown to positively influence protein unfolding,
starch gelatinization, feed throughput, and pellet quality (Ravindran and Amerah, 2008).
Protein unfolding and partial denaturation of the native structure of protein has exposed
peptides linkages to enzymatic attack by endogenous proteases (Voragen et al., 1995;
Amerah et al., 2011). Heat treatment during pelleting has also increased starch gelatinization
to some extent. Gelatinization has been reported to increase the digestion and absorption of
the starch by enhancing its ability to absorb water and hence increased the speed at which the
amylolytic enzymes (endogenous and exogenous) disrupted the linkages of starch (alpha 1-4
and alpha 1-6) and converted it into simple sugars (Ravindran and Amerah, 2008).
In addition to increased starch gelatinization and protein denaturation, pelleting
improves performance and feed efficiency through decreased feed wastage and reduced
selective feeding. When giving an option to choose birds consumed coarse particles first

23
particularly as birds aged and became larger (Moran, 1982). Therefore, pelleting has
improved the likelihood of feeding a more uniform and balanced diet (Fahrenholz, 2012).
Pelleting has also improved performance by reducing the length of time and energy costs of
feeding periods. Poultry and swine have been reported to consume pelleted feed faster than
mash feed. In addition, Skoch et al. (1983) suggested that pelleting made the feed more
palatable by increasing its bulk density and by reducing dustiness, which increased feed
consumption and reduced time that the animals spent at the feeder. Indeed, Jensen et al.
(1962) reported that chicks fed mash diets spent 14.3% of their time at the feeder, while
chicks fed pelleted feed only spent 4.7%. Pelleting has improved performance efficiency
through decreased ingredient segregation, increased bulk density and reduced bridging
problems in bins. Agglomeration of the ingredients in the pellet enabled poultry and swine to
consume all ingredients and nutrients simultaneously and discouraged selective feeding.
Pelleting has also been reported to decrease nutrient segregation during transportation and
during storage in the bins (Behnke, 1994). Furthermore, pelleting has facilitated the inclusion
of ingredients with poor flowability characteristics (Stark, 2012).
Pelleted feed has allowed poultry and swine to consume their meals during their
limited time at the feeder. Behnke and Beyer (2002) reported that chicks fed pelleted diets
spend around 5% of their times eating at the feeder as compared to 15% for chicks fed mash
diets. Under conditions of ad libitum feeding, the total rate of growth was the major
determinant of feed efficiency as it resulted in a reduction in daily maintenance costs that use
feed and water without yielding product in terms of eggs, meat, etc. A chicken or pig
growing slowly would have similar daily maintenance costs as a chick or pig that was

24
growing more rapidly, but would produce less meat to counteract the fixed cost of
maintenance (Kleyn, 2013).
1.5.1. Measuring Pellet Quality
Pellet quality analyses have helped to assure that consistent quality feed was
produced at the feed mill. Pellet quality has been measured using various standard methods.
The two most popular methods used to measure pellet quality have been the Kansas State
University (KSU) method and the Holmen method. The KSU method or tumbling can test
was accepted as the standard method by the American Society of Engineers after it showed
an excellent correlation with the Stoke hardness test. This was a simple test in which the
pellets were tumbled in a specially designated box for 10 min in order to simulate the transfer
and handling of the feed (Fairfield, 1994). Pellet durability index (PDI) was calculated as the
ratio of fines after tumbling to the amount of whole pellets at the start of the test. Feed with a
higher PDI indicated that the manufactured pellets were more likely to remain intact before
feeding (Behnke and Beyer, 2002). The main purpose of the KSU tumble box method was to
predict the actual percentage of fines generated as the pelleted feed was subjected to abrasive
impact forces as it moved from the feed mill to the farm bin and then to the feeder in front of
the birds or pigs. However companies and nutritionists have modified the KSU method by
adding hex nuts or other modifiers in order to increase the impact forces inside the tester and
improve the ability to predict the true quality of the feed at the farm.
Holmen Pellet Tester was developed in England and therefore has been more
frequently used by the European feed industry. The Holmen method circulated pellets

25
through an air conveyance system for 30-120 second. Pellets were subjected to shear and
impact, which simulated the pneumatic transport used mainly in European countries rather
than the mechanical conveyance used in USA feed mills.
1.5.2. Pellet Quality and Feed Mill Efficiency
The addition of DDGS to poultry and swine diets has produced mixed results with
regards to pellet quality. According to Noll et al. (2007b), the addition of DDGS to pelleted
feed has had negative effects on feed mill performance. The main concerns during feed
manufacturing were the negative effect on pellet quality and pellet mill throughput (Behnke,
2007). Shim et al. (2011) reported a decrease in pellet quality from 81 to 61% in grower feed
and 74 to 50% in finisher feed when the inclusion of DDGS increased from 0 to 24%.
Fahrenholz et al. (2008) conducted two experiments varying the inclusion of DDGS from 0
to 40%. In the first experiment, the author reported no differences on pellet durability for
both standard and modified methods, however diets that contained 40% DDGS resulted in
10% lower production rate as compared to the control. In the second experiment the author
reported a decrease in pellet quality for the standard (90.3 to 86.6%) and modified (88.6 to
84.3%) PDI methods and decreased production rate (13%) as the inclusion of DDGS was
increased from 0 to 40%. Using similar levels, Stender and Honeyman (2008) reported a
decrease in pellet quality from 78.9 to 47.4% as the inclusion of DDGS was increased from 0
to 40%. The decrease in pellet quality of diets containing DDGS has been attributed to lower
starch content and consequently poorer binding properties (Behnke and Beyer, 2002). In
addition, DDGS possessed lower ME value than corn, therefore higher inclusions of DDGS

26
always required a higher amount of added fat in the mixer if caloric density had to be
maintained. Fat has been reported to work as a lubricant during the pelleting process to
reduce friction in the pellet die and impair pellet binding (Stark, 1994; Thomas et al., 1998).
Wang et al. (2007) reported an increase in the percentage of fines when more fat was added
to diets containing DDGS in order to retain isocaloric diets, but less variation in the
percentage fines when the level of fat was kept constant (Wang et al., 2008).
1.6. PARTICLE SIZE REDUCTION
Many feed ingredients such as cereal grains (corn, wheat, etc.) have been ground to
reduce particle size before their incorporation into poultry and swine diets (Zang et al.,
2009). The reduction in the particle size of grains during grinding has involved the disruption
of the outer seed coat and fracture of the endosperm (Amerah et al., 2007). The influence of
particle size on pellet quality and poultry and swine performance has been extensively
studied (Kilburn and Edwards, 2001; Peron et al., 2005; Parsons et al., 2006). Decreased
particle size increased the surface area of the digesta available for interaction with digestive
enzymes and was associated with improved digestibility (Goodband et al., 2002). Previously,
particle size was defined in general terms as fine, medium, and coarse (Goodband et al.,
2002). Currently there has been more interest in studying the effect of dietary particle size on
animal performance and a more accurate measurement of particle size has been developed
utilizing the geometric mean of the particles as well as size distribution (ASAE, 1973). A
better definition of particle size has allowed better recommendations regarding the particle
size required to optimize poultry and swine performance.
27
The effects of particle size on nutrient digestibility and live performance of poultry
and swine have been studied by several groups (Wondra et al., 1995; Fastinger and Mahan,
2003; Parsons et al., 2006), but the results have been contradictory. Parsons et al. (2006)
reported a decrease in digesta passage rate and increase in nitrogen retention when the
particle size of corn was increased. In addition, Favero et al. (2012) reported an improvement
in total tract apparent digestibility of dry matter, nitrogen, and crude fiber as the particle size
of corn was increased from 380 µm to 606 and 806 µm. On the other hand, Wondra et al.
(1995) reported a lineal increase in the fecal digestibility of dry matter, nitrogen, and gross
energy when the particle size of corn was decreased.
The results of the previous studies suggested that the response to different particle
sizes of feed ingredients differ depending on the species, age, and feed form. Poultry have
been reported to require large particles of cereal grains that can stimulate gizzard
development and reverse peristalsis in order to compensate for a short intestine (Nir et al.,
1994). Reverse peristalsis has been reported to be important to increase the exposure of the
intestinal digesta to enzymatic secretions in order to improve digestion in the upper and
lower section of the gastrointestinal tract (Duke, 1992; Nir et al., 1995). The gizzard has been
the organ that regulated intestinal motility as influenced by particle size of the feed
ingredients (Nir et al., 1995). Conversely, the growth performance of swine has been
improved as the proportions of dietary fine feed particles were fed (Steinhart, 2012).
Research had shown that when particle size was reduced from 1000 microns to 400 µm there
was an improvement in swine feed efficiency of approximately 1.3% for every 100-µm
reduction in particle size (Wondra et al., 1995; Hancock and Behnke, 2001).

28
1.7. HYPOTHESES AND RESEARCH OBJECTIVES
Feed costs represents 65 to 75% of total livestock production costs (Goodband, 2002).
Because corn usage for ethanol production has increased by 82% from 2000 to 2008, the
availability of DDGS as a feed ingredient has increased accordingly (Shurson, 2003; Schmidt
et al., 2012). During this period, the potential of DDGS to be used as a source of protein,
energy, and phosphorus to replace more expensive ingredients, such as corn, SBM, and
dicalcium phosphate in poultry and swine diets has increased tremendously (Hoffman and
Baker, 2011). However, the nutrient content of DDGS varies considerably among ethanol
plants, with crude fiber, acid detergent fiber (ADF), neutral-detergent fiber (NDF), ash,
phosphorus, and heat sensitive essential amino acids being the nutrients with the highest
variation (Speihs et al., 2002; Belyea et al., 2004; Batal and Dale, 2006; Fastinger et al.,
2006; Fiene et al., 2006; Parsons et al., 2006; Liu, 2008). Lysine has been defined as the first
and second limiting amino acid in swine and poultry diets, respectively, and has been a major
concern when a high dietary inclusion level of DDGS is used (Noll et al., 2007b). The
digestibility of lysine in DDGS has been reported to be lower than in corn and SBM (Batal
and Dale, 2006). During the drying process of DDGS the epsilon amino group of lysine has
been reported to react with the carbonyl group of reducing sugars and be rendered
unavailable (McGinnis and Evans, 1947; Warnick and Anderson, 1968; Cromwell et al.,
1993; Pahm et al., 2008a). Fastinger and Mahan (2005) reported DDGS to have an apparent
ileal digestibility of lysine of only 27%, indicating that some commercial sources of DDGS
might be severely over-heated.
The effects of particle size on nutrient digestibility and live performance of poultry

29
and swine have been studied by several groups in recent years (Wondra et al., 1995;
Fastinger and Mahan, 2003; Parsons et al., 2006), but the results have been somewhat
contradictory. While poultry species require large particles of cereal grains to stimulate
gizzard development and reverse peristalsis, swine require small particles to increase the
surface area of contact between digesta and digestive enzymes and thus increase nutrient
digestibility (Goodband et al., 2002). This apparent paradox provides an interesting subject
of research study.
Therefore, our working hypothesis was that the dietary inclusion level of DDGS in
broilers and pigs diets depends upon formulation strategies and particle size manipulation
and could be used to influence pellet durability, nutrient digestibility, and overall
performance of poultry and swine. To accomplish our working hypothesis, our research
objectives were divided into four specific hypotheses described below.
CHAPTER 2
Specific hypothesis 1. Further grinding of SBM and DDGS will improve pellet quality.
Objective 1. To evaluate the effect of further grinding of SBM on pellet quality in
finisher diets for swine.
Objective 2. To evaluate the effects of further grinding DDGS on pellet quality in
finisher diets for swine.
CHAPTER 3
Specific hypothesis 2. Broiler diets can contain up to 30% DDGS if pellet quality is
controlled closely and diets are formulated on a digestible amino acid basis.

30
Objective 1. To evaluate the effect of further grinding DDGS on pellet quality and
broiler live performance when the mixer-added fat is kept constant.
Objective 2. To determine the effect of DDGS inclusion on broiler performance in
diets formulated on a digestible amino acid basis.
Objective 3. To determine the effect percentage fines in the feed on broiler
performance.
CHAPTER 4
Specific hypothesis 3. In diets formulated on a total amino acid basis, the live performance
of broilers decreases and footpad lesions increase as dietary inclusion level of DDGS
increases.
Objective 1. To evaluate the effect of dietary DDGS inclusion level on pellet quality
when supplemental fat is added in the mixer.
Objective 2. To evaluate the effect of method of DDGS fat analysis (ether extract
versus ether extract with acid hydrolysis pretreatment) on pellet quality and broiler
live performance.
Objective 3. To evaluate the effect of dietary DDGS inclusion level on broiler growth
performance when diets are formulated on a total amino acid basis.
Objective 4. To evaluate the effect of dietary DDGS inclusion level on nutrient
digestibility and incidence of footpad lesions.

31
CHAPTER 5
Specific hypothesis 4. Further grinding of SBM and DDGS and pelleted feed without fines
improves pig live performance.
Objective 1. To evaluate the effect of further grinding SBM and DDGS on pig live
performance.
Objective 2. To evaluate the effect of percentage feed fines on pig performance.

32
1.8. REFERENCES
AOAC. 2005a. AOAC Official Method 990.03. Protein (Crude) in Animal Feed. In Official
Methods of Analysis of AOAC International (OMA). AOAC International.
Gaithersburg, MD.
AOAC. 2005b. AOAC Official Method 2001.11. Protein (Crude) in Animal Feed, Forage
(Plant Tissue), Grain and Oilseeds. In Official Methods of Analysis of AOAC
International (OMA). AOAC International. Gaithersburg, MD.
AOAC. 2005c. AOAC Official Method 945.16. Oil in Cereal Adjunts. In Official Methods of
Analysis of AOAC International (OMA). AOAC International. Gaithersburg, MD.
AOAC. 2005d. AOAC Official Method 978.10. Fiber (Crude) in Animal Feed and Pet Food.
In Official Methods of Analysis of AOAC International (OMA). AOAC International.
Gaithersburg, MD.
Abdollahi, M. R., V. Ravindran, T. J. Wester, G. Ravindran, and D. V. Thomas. 2011.
Influence of feed form and conditioning temperature on performance, apparent
metabolisable energy and ileal digestibility of starch and nitrogen in broiler starters
fed wheat-based diet. Anim. Feed Sci. Technol. 168:88-99.
AFIA. 2007. Evaluation of analytical methods for analysis of dried distillers grains with
solubles. Am. Feed Ind. Assn., Arlington, VA.
Amerah, A. M., V. Ravindran, R. G. Lentle, and D. G. Thomas. 2007. Influence of feed
particle size and feed form on the performance, energy utilization, digestive tract
development, and digesta parameters of broiler starters. Poult. Sci. 86:2615-2623.
Amerah, A. M., C. Gilbert, P. H. Simmins, and V. Ravindran. 2011. Influence of feed
processing on the efficacy of exogenous enzymes in broiler diets. World’s Poult. Sci.
J. 67:29-46.

33
Anderson, P. V., B. J. Kerr, T. E. Weber, C. J. Ziemer, and G. C. Shurson. 2011.
Determination and prediction of energy from chemical analysis of corn co-products
fed to finishing pigs. J. Anim. Sci. 90:1242-1254.
ASAE. 1973. Method of determining and expressing fineness of feed materials by sieving.
Am. Soc. Agric. Eng. St. Joseph, MI.
AURI, and MCGA. 2005. Methods to improve the flowability and pelleting of distillers dried
grains with solubles (DDGS). Prepared by AURI for MCGA.
http://www.auri.org/research/Flowability_summary_10_17_05.pdf. Accessed 03
February 2014.
Batal, A. B., and N. M. Dale. 2006. True ME and amino acid digestibility of distillers dried
grains with solubles. J. Appl. Poult. Res. 15:89-93.
Baulcombe, D., C. Lazarus, and R. Martienssen. 1984. Gibberellins and gene control in
cereal aleurone cells. J. Embryol. Exp. Morph. 83:119-135.
Behnke, K. C. 1994. Factors affecting pellet quality. Pages 44-54 in Proc. Md. Nutr. Conf.
Feed Manuf. College Park, MD.
Behnke, K. C., and R. S. Beyer. 2002. Effect of feed processing on broiler performance.
Proc. VIII Intl. Sem. on Poult. Prod. and Pathol., Santiago, Chile.
Behnke, K. C. 2007. Feed manufacturing considerations for using DDGS in poultry and
livestock diets. Pages 77-81 in Proc. 5th
Mid-Atlantic Nutr. Conf., Timonium, MD.
Belyea, R. L., K. D. Rausch, and M. E. Tumbleson. 2004. Composition of corn and distillers
dried grains with solubles from dry grind ethanol processing. Bioresource Technol.
94:293-298.
Belyea, R. L., K. D. Rausch, T. E. Clevenger, V. Singh, D. B. Johnston, and M. E.
Tumbleson. 2010. Sources of variation in composition of DDGS. Bioresource
Technol. 159:122-130.

34
Bennett, G. A., and J. L. Richard. 1996. Influence of processing on fusarium mycotoxins in
contaminated grains. Food Technol. 50:235-238.
Bhadra, R., K. Muthukumarappan, and K. A. Rosentrater. 2009. Flowability properties of
commercial distillers dried grains with solubles (DDGS). Cereal Chem. 86:170-180.
Bhadra, R., K. Muthukumarappan, and K. A. Rosentrater. 2013. Effects of varying CDS
levels and drying and cooling temperatures on flowability properties of DDGS.
Cereal Chem. 90:35-46.
Bothast, R. J., G. A. Bennett, J. E. Vancauwenberge, and J. L. Richard. 1992. Fate of
fumonisin B1 in naturally contaminated corn during ethanol fermentation. Appl.
Environ. Microbiol. 58:233-236.
Bothast, R. J., and M. A. Schlicher. 2005. Biotechnological processes for conversion of corn
into ethanol. Appl. Microbiol. Biotechnol. 67:19-25.
Cozannet, P., M. Lessire, C. Gady, J. P. Métayer, Y. Primot, F. Skiba, and J. Noblet. 2010.
Energy value of wheat dried distillers grains with solubles in roosters, broilers, layers,
and turkeys. Poult. Sci. 89:2230-2241.
Cromwell, G. L., K. L. Herkelman, and T. S. Stahly. 1993. Physical, chemical, and
nutritional characteristics of distillers dried grain with solubles fed to chicks and pigs.
J. Anim. Sci. 71:679-686.
Cruz, C. R., M. J. Brouk, and D. J. Schingoethe. 2005. Lactational response of cows fed
condensed corn distillers solubles. J. Dairy Sci. 88:4000-4006.
Doerr, J. A., W. E. Huff, C. J. Wabeck, G. W. Chalouka, J. D. May, and J. W. Merkley.
1983. Effects of low level chronic aflatoxicosis in broiler chickens. Poult. Sci.
62:1971-1977.
Duke, G. E. 1992. Recent studies on regulation of gastric motility in turkeys. Poult. Sci. 81:1-
8.

35
Dupin, I. V. S., B. M. McKinnon, C. Ryan, M. Boulay, A. J. Markides, P. J. Graham, P.
Fang, I. Boloni, E. Haque, and C. K. Spillman. 1997. Comparison of energy
efficiency between roller mill and a hammer mill. Appl. Engineer. Agric. 13:631-635.
Earle, F. R., J. J. Curtis, and J. E. Hubbard. 1946. Composition of the component parts of the
corn kernel. Cereal Chem. 23:504-511.
Fahrenholz, A. C. 2008. The effects of DDGS inclusion on pellet quality and pelleting
performance. M. S. Thesis. Kansas State University, Manhattan, KS.
Fahrenholz, A. C. 2012. Evaluating factors affecting pellet durability and energy
consumption in a pilot feed mill and comparing methods for evaluating pellet
durability. Ph.D. Dissertation. Kansas State University, Manhattan, KS.
Fairfield, D. 1994. Pelleting cost center. Pages 121-122 in Feed Manufacturing Technology
IV. McEllhiney R. Ed. American Feed Industry Association. Arlington, VA.
Fastinger, N. and Mahan, D. 2003. Effect of soybean meal particle size on amino acid and
energy digestibility in grower-finisher swine. J. Anim. Sci. 81:697-704.
Fastinger, N. D., and D. C. Mahan. 2005. Apparent and true ileal amino acid and energy
digestibility and weanling pig performance of five sources of distillers dried grain
with solubles. J. Anim. Sci. 83 (Suppl. 2):54.
Fastinger, N. D., and D. C. Mahan. 2006. Determination of the ileal amino acid and energy
digestibilities of corn distillers dried grains with solubles using grower-finisher pigs.
J. Anim. Sci. 84:1722-1728.
Fastinger, N. D., J. D. Latshaw, and D. C. Mahan. 2006. Amino acid availability and true ME
content of corn distillers dried grains with solubles in adult cecectomized roosters.
Poult. Sci. 85:1212-1216.
Favero, A., A. Maiorka, A. V. F. da Silva, F. L. de Paula Valle, S. A. dos Santos, and K.
Muramatsu. 2012. Influence of feed form and corn particle size on nutrient
digestibility and energy utilization by young turkeys. R. Bras. Zootec. 41:86-90.

36
Fiene, S. P., T. W. York, and C. Shasteen. 2006. Correlation of DDGS IDEA™ digestibility
assay for poultry with cockerel true amino acid digestibility. Pages 82-89. In: Proc.
4th
Mid-Atlantic Nutr. Conf. University of Maryland, College Park, MD.
Fincher, G. B. 1989. Molecular and cellular biology associated with endosperm mobilization
in germinating cereal grains. Ann. Rev. Plant Physiol. Plant Mol. Biol. 40:305-346.
Franchi, M. A., G. E. Serra, and M. Cristianini. 2003. The use of biopreservatives in the
control of bacterial contaminants of sugarcane alcohol fermentation. J. Food Sci.
68:2310-2315.
Frikha, M., H. M. Safaa, M. P. Serrano, X. Arbe, and G. G. Mateos. 2009. Influence of the
main cereal and feed form of the diet on performance and digestive tract of brown-
egg laying pullets. Poult. Sci. 88:994-1002.
Ganesan, V., K. A. Rosentrater, and K. Muthukumarappan. 2009. Physical and flow
properties of regular and reduced fat distillers dried grains with solubles (DDGS).
Food Bioprocess. Technol. 2:156-166.
Goodband, R. D., M. D. Tokach, and J. L. Nelssen. 2002. The effects of diet particle size on
animal performance. MF-2050. Feed Manufacturing. Dept. Grain Sci. Ind., Kansas
State Univ., Manhattan, KS.
Goodson, J., and J. F. Fontaine. 2004. Variability in DDGS from ethanol plants. Feed
Manage. 55:20-25.
Graves, T., N. V. Narendranath, K. Dawson, and R. Power. 2006. Effect of pH and lactic or
acetic acid on ethanol productivity by Saccharomyces cerevisiae in corn mash. J. Ind.
Microbiol. Biotech. 33:469-474.
Gregg, D. J., A. Boussaid, and J. N. Saddler. 1998. Techno-economic evaluations of a
generic wood-to-ethanol process: effect of increased cellulose yields and enzyme
recycle. Bioresource Technol. 63:7-12.

37
Hancock, J. D. and K. C. Behnke. 2001. Use of ingredient and diet processing technologies
(grinding, mixing, pelleting, and extruding) to produce quality feeds for pigs. Pages
469-497 in Swine Nutrition, 2nd
Edition. A.J Lewis and L.L. Southern. CRC Press.
Boca Raton, Fl.
Hoffman, L.A. and A. Baker. 2011. Estimating the Substitution of Distillers’ Grains for Corn
and Soybean Meal in the U.S. Feed Complex, Report, USDA-ERS.
Hopkins, C. G., L. H. Smith, and E. M. East. 1974. The structure of the corn kernel and the
composition of its different parts. Pages 33-63 in Seventy Generations of Selection
for Oil and Protein Maize. Dubley, J. W. Ed. Crop Sci. Amer., Inc. Madison, WI.
Hoseney, R. R. 1994. Proteins of cereals. Pages 65-79 in Principles of Cereal Sciences and
Technology, 2nd
ed. Am. Assoc. Cereal Chem., St. Paul, MN.
Huang, Y. C., C. G. Edwards, J. C. Peterson, and K. M. Haag. 1996. Relationship between
sluggish fermentations and the antagonism of yeast by lactic acid bacteria. Am. J.
Enol. Vitic. 47:1-10.
Jensen, L. S. 2000. Influence of pelleting on the nutritional needs of poultry. Asian-Austral.
J. Anim. Sci. 13:35-46.
Jensen, L. S., L. H. Merrill, C. V. Reddy, and J. McGinnis. 1962. Observations on eating
patterns and rate of food passage of birds fed pelleted and unpelleted diets. Poult. Sci.
41:1414-1419.
Kelsall, D. R., and T. P. Lyons. 1999. Grain dry milling and cooking for alcohol production:
designing for 23% ethanol and maximum yield. Chapter 2 in The Alcohol Textbook.
3rd
ed. Jacques, K. A., T. P. Lyons, and D. R. Kelsall. Eds. Nottingham University
Press, Nottingham, UK.
Kelsall, D. R., and T. P. Lyons. 2003. Grain dry milling and cooking procedures: extracting
sugar in preparation for fermentation. Chapter 2 in The Alcohol Textbook. 4th
ed.
Jacques, K. A., T. P. Lyons, and D. R. Kelsall. Eds. Nottingham University Press,
Nottingham, UK.

38
Kent, N. L., and A. D. Evers. 1994. Botanical aspects of cereals. Pages 29-52 in Kent’s
Technology of Cereals. 4th
ed. Oxford. Pergamon Press Ltd, Oxford, UK.
Kilburn J., and H. M. Edwards. 2001. The response of broilers feeding of mash or pelleted
diets containing maize of varying particle sizes. Br. Poult. Sci. 42:484-492.
Kleinschmit, D. H., D. J. Schingoethe, K. F. Kalscheur, and A. R. Hippen. 2006. Evaluation
of various sources of corn distillers dried grain plus solubles (DDGS) for lactating
dairy cattle. J. Dairy Sci. 89:4784-4794.
Kleyn, R. 2013. Broiler nutrition in Chicken Nutrition: A guide for nutritionists and poultry
professionals. Context Products Ltd. Leicestershire, UK.
Koch, K. 2002. Hammermills and roller mills in MF-2048. Feed Manufacturing. Dept. Grain
Sci. Ind., Kansas State Univ., Manhattan, KS.
Kokić, B. M., J. D. Lević, M. Chrenková, Z. Formelová, M. Poláĉiková, M. Rajský, and R.
D. Jovanović. 2013. Influence of thermal treatments on starch gelatinization and in
vitro organic matter digestibility of corn. Food and Feed Res. 40:93-99.
Lin, Y., and S. Tanaka. 2006. Ethanol fermentation from biomass resources: current state and
prospects. Appl. Microbiol. Biotechnol. 69:627-642.
Liu, K. S. 2008. Particle size distribution of distillers dried grains with solubles (DDGS) and
relationships to compositional and color properties. Bioresource Technol. 99:8421-
8428.
Liu, K. S. 2009. Effects of particle size distribution, compositional and color properties of
ground corn on quality of distillers dried grains with solubles (DDGS). Bioresource
Technol. 100:4433-4440.
Liu, K. S. 2012. Grain structure and composition. Chapter 4 in Distillers Grains Production,
Properties, and Utilization. Liu, K., and K. Rosentrater. Eds. CRC Press. Taylor and
Francis Group, Boca Raton, FL.

39
Loar, R. E., J. S. Moritz, J. R. Donaldson, and A. Corzo. 2010. Effects of feeding distillers
dried grains with solubles to broilers from 0 to 28 days posthatch on broiler
performance, feed manufacturing efficiency, and selected intestinal characteristics.
Poult. Sci. 89:2242-2250.
Lumpkins, B. S., A. B. Batal, and N. M. Dale. 2004. Evaluation of distillers dried grains with
solubles as a feed ingredient for broilers. Poult. Sci. 83:1891-1896.
Lumpkins, B. S., A. B. Batal, and N. M. Dale. 2005. Use of distillers dried grains plus
solubles in laying hen diets. J. Appl. Poult. Res. 14:25-31.
Maisch, W. F. 2003. Fermentation processes and products. Pages 695-721 in Corn:
Chemistry and Technology. White P. J., and L. A. Johnson. Eds. Am. Assoc. of
Cereal Chemists, Inc. St. Paul, MN.
Makanjuola, D. B., A. Tymon, and D. G. Springham. 1992. Some effects of lactic acid
bacteria on laboratory scale yeast fermentations. Enzyme Microb. Technol. 14:350-
357.
McGinnis, J., and R. J. Evans. 1947. Amino acid deficiencies in raw and overheated soybean
meal. J. Nutr. 34:725-732.
Mendoza, O. F., M. Ellis, A. M. Gaines, M. Kocher, T. Sauber, and D. Jones. 2010.
Development of equations to predict the ME content of distillers dried grains with
solubles (DDGS) samples from a wide variety of sources. J. Anim. Sci. 88 (Suppl.
3):54.
Moran, E. T. 1982. Comparative nutrition of fowl and swine: The gastrointestinal systems.
Office for Educational Practice. University of Guelph, Guelph, Ontario, Canada.
Naidu, K., V. Singh, D. B. Johnston, K. D. Rausch, and M. E. Tumbleson. 2007. Effects of
ground corn particle size on ethanol yield and thin stillage soluble solids. Cereal
Chem. 84:6-9.

40
National Corn Growers Association. 2012. Corn. Rooted in Human History. Washington,
DC: National Corn Growers Association.
Nichols, N. N., B. S. Dien, R. J. Bothast, and M. A. Cotta. 2006. The corn ethanol industry.
Pages 59-78 in Alcoholic Fuels. Minteer, S. Ed. CRC Press. Taylor and Francis
Group, Boca Raton, FL.
Nichols, N. N., and R. J. Bothast. 2008. Production of ethanol from grain. Chapter 3 in
Genetic Improvement of Bioenergy Crops. Vermerris, W. Ed. Springer Science and
Business Media, LLC. New York.
Nir, I., R. Hillel, G. Shefet, and Z. Nitsan. 1994. Effect of grain particle size on performance.
2. Grain texture interactions. Poult. Sci. 73:781-791.
Nir, I., R. Hillel, I. Ptichi, and G. Shefet. 1995. Effect of particle size on performance .3.
Grinding pelleting interactions. Poult. Sci. 74:771-783.
Noll, S. L., C. M. Parsons, and J. Brannon. 2007a. Nutritional value of corn distillers dried
grains with solubles: Influence of solubles addition. Poult. Sci. 86 (Suppl. 1):204.
Noll, S. E., C. M. Parsons, and W. A. Dozier. 2007b. Formulating poultry diets with
DDGS—How far can we go? Proceedings of the 5th Mid Atlantic Nutrition
Conference. N. G. Zimmerman, ed. University of Maryland, College Park
NRC. 1994. Nutrient Requirements of Poultry. 9th
rev. ed. Natl. Acad. Press, Washington,
DC.
NRC. 1998. Pages 110-142 in Nutrient Requirements of Swine. 10th
rev. ed. Natl. Acad.
Press, Washington, DC.
Pahm, A., C. Pedersen, D. Hoehler, and H. H. Stein. 2008a. Factors affecting the variability
in ileal amino acid digestibility in corn distillers dried grains with solubles fed to
growing pigs. J. Anim. Sci. 86:2180-2189.

41
Pahm, A., C. Pedersen, and H. H. Stein. 2008b. Application of the reactive lysine procedure
to estimate lysine digestibility in distillers dried grains with solubles fed to growing
pigs. J. Agri. Food Chem. 56:9441-9446.
Parsons, A. S., N. Buchanan, K. Blemings, M. Wilson, and J. Moritz. 2006. Effect of corn
particle size and pellet texture on broiler performance in the growing phase. J. Appl.
Poult. Res. 15:245-255.
Pedersen, C., M. G. Boersma, and H. H. Stein. 2007. Digestibility of energy and phosphorus
in ten samples of distillers dried grains with solubles fed to growing pigs. J. Anim.
Sci. 85:1168-1176.
Peron, A., D. Bastianelli, F. X. Oury, J. Gomez, and B. Carre. 2005. Effects of food
deprivation and particle size of ground wheat on digestibility of food components in
broilers fed on a pelleted diet. Br. Poult. Sci. 46:223-230.
Perryman, K. R., J. B. Hess, and W. A. Dozier. 2013. Nitrogen corrected apparent ME and
apparent ileal amino acid digestibility of reduced-oil distillers dried grains with
solubles fed to broilers from 21 to 30 days of age. Poult. Sci. 91 (Suppl. 1):25.
Rausch, K. D., and R. L. Belyea. 2006. The future of co-products from corn processing.
Appl. Biochem. Biotechnol. 128:47-86.
Ravindran, V., and A. M. Amerah. 2008. Improving the nutritive value of feedstuffs using
new technologies. In Proc. 23rd
World Poult. Sci. Congr. Brisbane, Australia.
Reyes, F. C., T. Chung, D. Holding, R. Jung, R. Vierstra, and M. S. Oteguia. 2011. Delivery
of prolamins to the protein storage vacuole in maize aleurone cells. Plant Cell.
23:769-784.
RFA. 2009. Growing Innovation: Ethanol Industry Outlook. Washington, DC. Available at:
www.ethanolrfa.org/pages/annual-industry-outlook.

42
RFA. 2014. Biorefinery Locations. Washington, DC. Available at: http://ethanolrfa.org/bio-
refinery-locations/.
Rock, M., and J. Schwedes. 2005. Investigations on the caking behavior of bulk solids-Macro
scale experiments. Powder Technol. 157:121-127.
Rosentrater, K. A. 2006. Some physical properties of distillers dried grains with solubles
(DDGS). Appl. Engineer. Agricul. 224:589-595.
Rosentrater, K. A. 2007. Ethanol byproducts pelletized. U.S. Department of Agriculture.
Available at: http://www.ars.usda.gov/is/pr/2007/070625.htm.
Rosentrater, K. A., K. Ileleji, and D. B. Johnston. 2012. Manufacturing of fuel ethanol and
distiller grains – Current and evolving processes. Chapter 5 in Distillers Grains
Production, Properties, and Utilization. Liu, K., and K. Rosentrater. Eds. CRC Press.
Taylor and Francis Group. Boca Raton, FL.
Schlicher, M. 2005. The flowability factor. Ethanol Producer Magazine. 11:90-93.
Shalash, S. M., M. N. Ali, M. A. Sayed, H. E. El-Gabry, and M. Shabaan. 2009. Novel
method for improving the utilization of corn distillers grains with solubles in broiler
diets. Intl. J. Poult. Sci. 6:545-552.
Sharma, V., K. V. Rausch, M. E. Tumbleson, and V. Singh. 2007. Comparison between
granular starch hydrolyzing enzyme and conventional enzymes for ethanol production
from maize starch with different amylase:amylopectin ratios. Starch/Starke. 59:549-
556.
Shewry, P. R., and A. S. Tatham. 1990. The prolamin storage proteins of cereal seeds;
structure and evolution. Biochem. J. 267:1-12.

43
Shim, M. Y., G. M. Pesti, R. I. Bakalli, P. B. Tillman, and R. L. Payne. 2011. Evaluation of
corn distillers dried grains with solubles as an alternative ingredient for broilers.
Poult. Sci. 90:369-376.
Shurson, J. S. 2003. The value and use of distillers dried grains with solubles (DDGS) in
livestock and poultry ration. http://www.ddgs.umn.edu/ Accessed Jan. 2014.
Shurson, G. C. 2007. New technologies to aid in evaluation of alternative feedstuffs. Proc.
72nd
Minn. Nutr. Conf. University of Minnesota. Owatonna, MN.
Singh, V., and J. V. Graeber. 2005. Effect of corn hybrid variability and planting location on
dry grind ethanol production. Am. Soc. Agric. Eng. 48:709-714.
Singh, V., D. B. Johnston, K. Naidu, K. D. Rausch, R. L. Belyea, and M. E. Tumbleson.
2005. Comparison of modified dry-grind corn processes for fermentation
characteristics and DDGS composition. Cereal Chem. 82:187-190.
Singh V., C. Parsons, and J. Pettigrew. 2007. Process and engineering effect on DDGS
products-Present and future. Pages 88-90 in Proc. 5th Mid. Atlantic Nutr. Conf.
Baltimore, MD.
Schmidt, M., M. Porcar, V. Schachter, A. Danchin, and M. Ismail. 2012. Biofuels. Chapter 1
in Synthetic Biology: Industrial and Environmental Applications. Schmidt, M. Ed.
Wiley-VCH. Weinheirn, Germany.
Skoch, E. R., S. F. Binder, C. W. Deyoe, G. L. Allee, and K. C. Behnke. 1983. Effects of
pelleting conditions on performance of pigs fed a corn-soybean meal diet. J. Anim.
Sci. 57:922-928.
Speihs, M. J., M. H. Whitney, and G. C. Shurson. 2002. Nutrient database for distillers dried
grains with solubles produced from new ethanol plants in Minnesota and South
Dakota. J. Anim. Sci. 80:2639-2645.

44
Stark, C. R. 1994. Pellet quality and its effect on swine performance; functional
characteristics of ingredients in the formation of quality pellets. Ph.D. Dissertation.
Kansas State Univ., Manhattan, KS.
Stark, C. R. 2012. Feed manufacturing to lower feed cost. Pages 127-133 in Allen D. Leman
Swine Conf. Minneapolis. MN.
Stein, H. H., M. L. Gibson, C. Pedersen, and M. G. Boersma. 2006. Amino acid and energy
digestibility in ten samples of distillers dried grain with solubles fed to growing pigs.
J. Anim. Sci. 84:853-860.
Stein, H. H., S. P. Connot, and C. Pedersen. 2009. Energy and nutrient digestibility in four
sources of distillers dried grains with solubles produced from corn grown within a
narrow geographical area and fed to growing pigs. Asian-Austral. J. Anim. Sci.
22:1016-1025.
Steinhart, T. L. 2012. Swine Feed Efficiency: Influence of particle size. Iowa Pork Industry
Center Fact Sheets. Paper 13. http://lib.dr.aistate.edu/ipic_factsheets/13
Stender, D. and M. S. Honeyman. 2008. Feeding pelleted DDGS-based diets to finishing pigs
in deep-bedded hoop barns. J. Anim. Sci. 86 (Suppl. 3): 84.
Svihus, B., K. H. Klovstad, V. Perez, O. Zimonja, S. Sahlstrom, R. B. Schuller, W. K.
Jeksrud, and E. Prestlokken. 2004. Physical and nutritional effects of pelleting of
broiler chicken diets made from wheat ground to different coarseness by the use of
roller mill and hammer mill. Anim. Feed Sci. Technol. 117:281-293.
Thomas, M., T. van Vliet, and A. F. B. van der Poel. 1998. Physical quality of pelleted
animal feed. 3. Contribution of feedstuff components. Anim. Feed Sci. Technol.
70:59-78.
Tumuluru, J. S., L. Tabil, A. Opoku, M. R. Mosqueda, and O. Fadeyi. 2010. Effect of process
variables on the quality characteristics of pelleted wheat distillers dried grains with
solubles. Biosyst. Eng. 105:466-475.

45
U.S. Grains Council. 2011. Ethanol Production and its co products – front-end fractionation
and back-end oil extraction technologies. Chapter 3 in A Guide to Distillers Dried
Grains with Solubles. U. S. Grain Council. Washington, DC.
Verma, J., T. S. Johri, B. K. Swain, and S. Ameena. 2004. Effect of graded levels of
aflatoxin, ochratoxin and their combinations on the performance and immune
response of broilers. Br. Poult. Sci. 45:512-518.
Verma, J., T. S. Johri, and B. K. Swain. 2007. Effect of aflatoxin, ochratoxin and their
combination on protein and energy utilisation in white leghorn laying hens. J. Sci.
Food Agric. 87:760-764.
Voragen, A. G., H. Gruppen, G. J. Marsman, and A. J. Mul. 1995. Effect of some
manufacturing technologies on chemical, physical, and nutritional properties of feed.
Pages 93-126 in Recent Advances in Animal Nutrition. Eds. Garnsworthy, P. C., and
D. J. Cole. Nottingham University Press.
Waldroup, P. W., J. A. Owen, B. E. Ramsy, and D. L. Whelchel. 1981. The use of high levels
of distillers dried grains plus solubles in broiler diets. Poult. Sci. 60:1479-1484.
Waldroup, P. 2007. Biofuels and broilers – competitors or cooperators? Pages 25-34 in Proc.
5th
Mid- Atlantic Nutr. Conf. Timonium, MD.
Waldroup, P. W., Z. Wang, C. Coto, S. Cerrate, and F. Yan. 2007. Development of a
standardized nutrient matrix for corn distillers dried grains with solubles. Intl. J.
Poult. Sci. 6:478-483.
Wang, Z., S. Cerrate, C. Coto, F. Yan, and P. W. Waldroup. 2007. Use of constant or
increasing levels of distillers dried grains with solubles (DDGS) in broiler diets. Intl.
J. Poult. Sci. 6:501-507.
Wang, Z., S. Cerrate, C. Coto, F. Yan, F. P. Costa, A. Abdel-Maksoud, and P. W. Waldroup.
2008. Evaluation of corn distillers dried grains with solubles in broiler diets
formulated to be isocaloric at industry energy levels or formulated to optimum
density with constant 1% fat. Intl. J. Poult. Sci. 7:630-637.
46
Warnick, R. E., and J. O. Anderson. 1968. Limiting essential amino acids in soybean meal
for growing chickens and effects of heat upon availability of essential amino acids.
Poult. Sci. 47:281-287.
Watson, S. A. 1994. Structure and composition of corn. Chapter 3 in Corn: Chemistry and
Technology. Watson, S. A., and P. E. Ramstad. Eds. Am. Assoc. Cereal Chem. St.
Paul, MN.
Watson, S. A. 2003. Description, development, structure and composition of the corn kernel.
Pages 69-106 in Corn: Chemistry and Technology. 2nd
edition. White, P. J., and L. A.
Johnson. Eds. Am. Assoc. Cereal Chem. St. Paul, MN.
Whitney, M. H., M. J. Spiehs, G. C. Shurson, and S. K. Baidoo. 2000. Apparent ileal amino
acid digestibilities of corn distillers dried grains with solubles produced from new
ethanol plants in Minnesota and South Dakota. J. Anim. Sci. 78 (Suppl. 1):185.
Wondra, K., J. Hancock, K. Behnke, R. Hines, and C. Stark. 1995. Effects of particle size
and pelleting on growth performance, nutrient digestibility, and stomach morphology
in finishing pigs. J. Anim. Sci. 73:757-763.
Zhang, Y., J. Caupert, P. M. Imerman, J. L. Richards, and G. C. Shurson. 2009. The
occurrence and concentration of mycotoxins in U.S. distillers dried grains with
solubles. J. Agric. Food Chem. 57:9828-9837.
Zang, J. J., X. S. Piao, D. S. Huang, J. J. Wang, X. Ma and Y. X. Ma. 2009. Effects of feed
particle size and feed form on growth performance, nutrient metabolizability and
intestinal morphology in broiler chickens. Asian-Aust. J. Anim. Sci. 22: 107-112.

47
CHAPTER II
EFFECT OF FURTHER GRINDING DDGS AND SBM ON PELLET QUALITY IN
SWINE DIETS

48
2.1. ABSTRACT
The objective of the study was to evaluate the effect of further grinding of major feed
ingredients on pellet quality in swine finisher diets. Feed was produced at the NC State
University Feed Mill Educational Unit. Corn-soy diets contained 69.4% corn, 22.3% soybean
meal (SBM), and 6.5% poultry fat. Diets containing corn Distillers dried grains with solubles
(DDGS) were comprised of 53% corn, 30% DDGS, 8.0% SBM, and 6.5% poultry fat. Of the
6.5% poultry fat in each diet, 1.5% was added in the mixer and 5.0% was added post-
pelleting. Six dietary treatments consisted of two inclusion of DDGS (0% and 30%), two
particle sizes of DDGS (677 and 483 µm), and two particle sizes of SBM (1070 and 467
µm). All diets were steam conditioned for 45 seconds and a temperature of 82°C. A 4.4 mm
× 35 mm pellet die was used during pelleting. Each diet was replicated 4 times. Data were
analyzed using PROC GLM in SAS. Batch was the experimental unit. Models for pellet
durability index (PDI) and modified PDI included fixed effects of diet and time of day.
Contrasts were used to evaluate DDGS inclusion and regrinding DDGS and SBM on pellet
quality. Across all diets, average standard and modified PDI was 90.4 and 68.2%,
respectively. Diets containing DDGS exhibited greater (P≤0.05) standard and modified PDI
in comparison to diets without DDGS (1.6% and 9.5%, respectively). However, further
grinding of DDGS using a hammer mill equipped with 1.6 mm screen had no effect (P≥0.05)
on standard or modified PDI. Further grinding of SBM using a hammer mill equipped with
1.6 mm screen in diets without DDGS numerically (P≤0.07) improved standard and modified
PDI (2.3% and 5.8%, respectively). Within DDGS containing diets, further grinding of SBM
did not improve standard PDI (P=0.19), but improved (P≤0.05) modified PDI by 4.3%.

49
Across all diets, further grinding of SBM improved (P≤0.05) both standard and modified PDI
(1.5% and 4.7%, respectively). Adding 30% DDGS to corn-soy diets improved PDI when the
percentage of added fat in the mixer was maintain constant, regardless of the inclusion of
DDGS, and that further grinding of SBM improved pellet quality.
Key words: DDGS, particle size, pellet quality, soybean meal, regrinding
2.2. INTRODUCTION
Feed costs have represented about 60-70% of the total livestock production costs
(Patience et al., 1995). With increasing ethanol production into the future these costs are
expected to continue to increase correspondently. Improvement in feed efficiency has
reduced production costs and increased the economic return by reducing the amount of feed
required per unit of gain (Willems et al., 2013). According to Behnke and Beyer (2002), feed
processing offered an opportunity to reduce feed costs by increasing animal growth and
improving feed efficiency beyond simple feed nutritional value.
Pelleting technology has been used for many years as a tool to improve feed
efficiency and reduce production costs. Use of pelleted diets have resulted in better growth
performance and feed efficiency in comparison to mash diets (Stark, 1994; Wondra et al.,
1995) and pelleted diets have offered many economic, physical, and nutritional benefits. The
physical benefits of pelleting feed include reduced ingredient segregation during
transportation and storage and increased bulk density. Skoch et al. (1983) suggested that
pelleted feed was more palatable and reported improved feed efficiency and energy
digestibility as compared to mash diets. In addition, pelleting has allowed the inclusion of

50
ingredients with poor flowability characteristics (Stark, 2012). Poultry and swine have been
reported to consume pelleted feed in a shorter amount of time than mash feed. Chicks fed
pelleted diets spent around 5% of their times eating at the feeder as compared to 15% for
chicks fed mash diets (Behnke and Beyer, 2002). The nutritional benefits of pelleting have
been associated with increased protein digestibility by providing heat, moisture, and shear
that results in protein unfolding and partial denaturation of native structures, thus exposing
peptides linkages to enzymatic attack by endogenous proteases (Voragen et al., 1995).
According to Behnke (2001), the major factors affecting pellet quality include diet
composition (40%), particle size (20%), conditioning temperature (20%), die specification
(15%), and cooling (5%). Stark (2011) considered feed throughput as an additional factor
that affects pellet quality. Nevertheless, diet composition is considered the most dominant
single factor that influences pellet quality. The addition of fat prior to pelleting has been
reported to reduce pellet quality (Cavalcanti and Behnke, 2005a, 2005b; Fahrenholz, 2012).
In contrast, high levels of raw undenatured protein improves particle binding and pellet
quality (Briggs et al., 1999). Loar et al. (2010) showed that increasing the dietary inclusion of
DDGS reduced pellet quality. The authors reported a pellet durability of 74, 67, and 62% and
percentage fines of 31, 42, and 54% with 0, 15, and 30% DDGS, respectively.
Particle size manipulation has been an important mechanical process used to
improved pellet quality and the nutritional value of grains and other feed ingredients. Small
particle size has better particle size distribution and less segregation during mixing than
coarser particles, and it has resulted in superior pellet durability and overall growth
performance in pigs (McEllhiney, 1992; Wondra et al., 1995; Laurinen et al., 2000; Lahaye

51
et al., 2004). The increased surface area associated with particle size reduction has been
reported to enhance moisture and heat penetration to the core of the feed particle during feed
conditioning, increased starch gelatinization on the surface of the pellets, and formation of
highly durable pellets (Reimer, 1992; Dozier, 2001). Wondra et al. (1995) reported an
improvement in pellet quality from 78.8 to 86.4% as corn particle size was reduced from
1,000 to 400 microns. In general, particle size reduction of corn and other cereal grains has
been shown to improve feed efficiency in swine diets (Fastinger and Mahan, 2003).
However, there is scarce information regarding the effect of particle size of other feed
ingredients, such as SBM and DDGS, on pellet quality. The objective of this study was to
evaluate two dietary inclusion levels of DDGS (0 and 30%) at two particle sizes (677 and
482 µm) and two particle sizes of SBM (1,070 and 467 µm) on pellet quality parameters.
2.3. MATERIALS AND METHODS
2.3.1. Diets
The experimental diets consisted mainly of corn, SBM, and DDGS (Table 1). Feed
was manufactured at the North Carolina State University Feed Mill Educational Unit
(Raleigh, NC) following current Good Manufacturing Practices (GMP). The coarse DDGS
and SBM were used in the diets as received from the supplier. The fine DDGS and SBM
were obtained by grinding the coarse material using a hammermill (Model 1522, Roskamp
Champion, Waterloo, IA) equipped with a 1.6 mm screen. Dry ingredients were blended in a
counterpoise mixer (Model: TRDB126060, Hayes & Stolz, Fort Worth, TX) with 1.5%

52
added fat to follow industry practices and produce high quality pellets. The remaining fat
(5%) was added post-pelleting. Feed was steam conditioned at 82°C for 45 seconds prior to
pelleting using a 30.5 x 121.9 cm steam conditioner. Treatments were pelleted using a 30 HP
California Pellet Mill (Model PM1112-2, California Pellet Mill Co., Crawfordsville, IN)
equipped with a 4.4 mm x 35 mm pellet die. Pellets were cooled using a counter flow cooler
(Model VK09x09KL, Geelen Counterflow USA Inc., Orlando, Florida).
2.3.2. Data Collection and Laboratory Analyses
Dry sieving according to ASAE method S319.3 (ASABE, 2007) was used to
determine the particle size of the coarse and fine DDGS and SBM with the addition of sieve
agitators and 0.5 g of dispersing agent per 100 g of sample. The particle size distribution of
the coarse and fine DDGS and SBM are shown in Figures 1 and 2, respectively. Production
rate, conditioning temperature, and hot pellet temperature were monitored during pelleting
(Table 2). Hot pellet temperature was evaluated to measure the amount of frictional heat
gained in the die as feed passed thought it. The durability of the pellets was determined
according to the ASABE standard method S269.4 (ASABE, 2007). Approximately 3.5 kg of
sample were collected for each batch of feed (227 kg) at evenly spaced intervals upon
discharge from the pellet mill and cooled immediately by placing the sample of hot pellets
into cooling trays at a depth of approximately 1 cm and then cooled with ambient air using a
counter flow pellet cooler. The tumble box method was used to calculate the pellet durability
index (PDI) in accordance with the ASAE standard method. Four sub-samples of pellets were
screened using a US #6 sieve (3.35 mm) to remove the fines produced during the pelleting

53
process and 500 g of each placed into 1 of the 4 compartments of the tumble box. For the
modified method, three hex nuts (50 g/nut) were added in each tumble box compartment in
order to increase the impact forces inside the tumble box and improve the ability to predict
the true pellet quality of the feed at the farm. The sub-samples were tumbled at 50 rpm for 10
min. After tumbling, each sub-sample was sifted again using the US #6 sieve to remove the
fines and the re-weighed. The PDI was calculated as the ratio of the weight of the pellets that
remained in the sieve after tumbling relative to the initial weight before tumbling (500 g) and
reported as a percentage. The compartments in the tumble box were cleaned by hand after
each PDI test in order to remove fines that accumulated in the corners.
2.3.3. Statistical Analyses
The batch of manufactured feed served as the experimental unit for statistical analysis
of the feed processing data. Data were analyzed by analysis of variance using the General
Linear Model (GLM) procedure of SAS (SAS Institute, 2006). Six dietary treatments were
used and consisted of two dietary inclusion levels of DDGS (0% and 30%), two particle sizes
of DDGS (677 and 483 µm), and two particle sizes of SBM (1070 and 467 µm). Each dietary
treatment was replicated by 4 batches, with each batch representing an experimental unit
(909 kg/batch). Dietary treatments were randomly ordered within each feed processing
replication. Models for standard and modified PDI included fixed effects of diet and time of
day. Contrasts were used to evaluate DDGS inclusion level and further grinding of DDGS
and SBM on PDI. Statements of statistical differences were based upon P≤0.05, unless
otherwise indicated. Differences between means were separated by the least significant

54
difference test.
2.4. RESULTS AND DISCUSSION
Across all diets, average standard and modified PDI was 90.4 (SD = 2.15) and 68.2
(SD = 6.81), respectively. The average production rate was 849 kg/hr (SD=22) for all diets
(Table 2). Diets containing DDGS had greater (P≤0.05) modified PDI in comparison to diets
without DDGS (71.38 versus 61.38%). Wang et al. (2007) reported that broiler diets
containing 15% DDGS had similar visually apparent quality as compared to control corn-
SBM diets, but the diets containing 30% DDGS appeared to have lower pellet quality with
higher percentage fines. Loar et al. (2010) reported a decreased standard PDI from 74.4 to
66.8 and 62.1% and a decreased modified PDI from 56.3 to 43.5 and 34.1% when DDGS
were included at 15 and 30% of the diet as compared to the corn-SBM control diet. Similarly,
Min et al. (2008) reported a linear increase in the percentage of fines as the dietary inclusion
level of DDGS was increased from 0 to 15 and 30%, particularly in the finisher feeds, that
were made with a pellet die having bigger diameter holes than the starter diet (4.76 versus
2.38 mm). The increased percentage of fines was expected as more poultry oil was added to
the DDGS-containing diets in order to maintain a caloric equivalency among diets. Wang et
al. (2008) reported less variation in percentage fines as the dietary inclusion level of DDGS
increased when the percentage fat in the mixer was kept constant. Supplemental fat has been
reported to impair pellet binding by inhibiting the penetration of steam into the core of feed
particles and by reducing the friction between the die wall and feed ingredients (Thomas and
van der Poel, 1996; Briggs et al., 1999; Rollins, 2002; Cavalcanti and Behnke, 2005b;

55
Fahrenholz, 2012). In our study, we maintained added fat in the mixer at 1.5%, regardless of
the DDGS inclusion level. Stender and Honeyman (2008) reported a decrease in PDI from
78.9 to 47.4% as DDGS was increased from 0 to 40% in swine diets. In contrast, Fahrenholz
(2008) studied the effect of adding 0, 10, 20, 30, and 40% DDGS and reported that dietary
DDGS inclusion level had no effect on either standard or modified PDI, but increasing the
inclusion of DDGS to 40% resulted in a 10% decrease in the pelleting production rate as
compared to the corn-SBM control. In contrast, Feoli (2008) reported an improvement in PDI
from 88.5 to 93.0% in diets containing 30% DDGS as compared to the corn-SBM control
diet.
The dietary inclusion level of DDGS did not affect feed production rate in this
experiment (Table 4). However, diets that contained 30% DDGS had a higher increment in
die frictional heat (P≤0.05) than the control corn-SBM diet. In order to maintain similar
available phosphorus contents among all diets, diets containing 30% DDGS did not include
defluorinated phosphate as compared to the 0.53% defluorinated phosphate included in the
diets without DDGS. Defluorinated phosphate is abrasive and keeps the surface of the die
polished, thereby minimizing frictional resistance as mash passes through the die and
increase pellet production rate. Behnke (1981) reported >20% increased pellet mill
throughput at similar motor load when either coarse or fine deflourinated phosphate replaced
similar amount of monocalcium phosphate, which is not as abrasive.
Further grinding of DDGS had no effect (P≥0.05) on the standard or modified PDIs.
The particle size distribution between the coarse and the fine ground DDGS (Figure 2)
overlapped to a greater extent than the particle size distribution of the coarse and fine SBM

56
(Figure 1). Fahrenholz (2008) reported that regrinding previously pelleted DDGS increased
standard and modified PDI. Further grinding DDGS at the feed mill decreased the particle
size 194 µm as compared to the DDGS as received (677 versus 483 µm). Several researchers
observed increased PDI and decreased percentage pellet fines as the particle grind size of
cereal grains included in the feed was reduced (McEllhiney, 1992; Stark, 1994; Wondra et
al., 1995; Chewning, 2010), likely due to increased surface area and more contact points per
unit of volume within the pellet matrix (Behnke, 2001). Moreover, heat and moisture may
penetrate more quickly to the center of smaller particles than larger ones during conditioning.
According to Dozier (2001), the particle size of corn-SBM diets fed to broilers should be
approximately 650-700 µm in order to obtain good pellet quality, while particles larger than
1,000 or 1500 µm have been associated with an increase in the number of fracture points
(Franke, 2006). Muramatsu et al. (2013) reported an increase in PDI from 74.6 to 77.3%
when the average particle size of the whole diet was decreased from 1,041 to 743 µm.
Further grinding of SBM in diets without DDGS tended (P≤0.07) to improve standard
and modified PDIs (2.3% and 5.8%, respectively). Pacheco (2011) reported improvements in
pellet quality of 10 and 13% when solvent extracted and expeller extracted SBM was ground
in corn-SBM diets. Proteins derived from cereal grains with dough-forming capabilities such
as rye, barley, and wheat (Moran, 1989; Winowiski, 2006) and SBM (Cavalcanti, 2004) have
been reported to improve pellet durability. Within diets that contained DDGS, regrinding
SBM did not improve (P=0.19) standard PDI, but improved (P≤0.05) modified PDI by 4.3%.
Across all diets, further grinding of SBM improved (P≤0.05) both standard and modified
PDIs (1.5% and 4.7%, respectively). Further grinding of SBM may have increased the

57
surface area of the SBM protein for pellet binding and overall PDI. Adding 30% DDGS to
corn-SBM diets improved PDI when the amount of added fat in the mixer was kept constant.
In addition, further grinding of SBM improved PDI in diets with or without DDGS.

58
2.5 TABLES AND FIGURES
Table 1. Composition and calculated contents of the experimental diets (% as fed basis)
Item
Dietary DDGS Inclusion Level
0% 30%
Ingredient ———————— (% of diets) ———————— Corn 69.41 52.99
Soybean meal, 48% CP — 8.05
DDGS 22.30 30.00
Deflourinated phosphate, 18.5% P 0.53 —
Poultry fat 6.50 6.50
Limestone 0.85 1.69
Salt 0.30 0.35
L-Threonine — 0.01
L-Lysine-HCl, 78% — 0.30
Vitamin premix1 0.02 0.02
Mineral premix2 0.05 0.05
Selenium premix3 0.03 0.03
Stafac 204 0.01 0.01
Phytase 0.01 0.01
Calculated nutrients
Metabolizable energy, kcal/g 3.61 3.52
Crude protein, % 15.91 15.74
Crude fat, % 9.24 10.96
Calcium, % 0.57 0.69
Available phosphorus, % 0.24 0.28
Lysine, % 0.82 0.87
Methionine, % 0.27 0.29
Methionine + Cysteine, % 0.54 0.58
Threonine, % 0.61 0.59
Tryptophan, % 0.18 0.15 1 Vitamin premix provided the following per kg of diet: 6171 IU of vitamin A, 880 IU of vitamin D, 35 IU of vitamin E,
0.02 mg/kg of vitamin B12, 0.18 mg/kg of biotin, 2.91 mg/kg of vitamin K, 4.40 mg/kg of riboflavin, 17.64 mg/kg of
pantothenic acid, 26.45 mg/kg of niacin, 1.32 mg/kg of folate. 2 Mineral premix provided the following per kg of diet: 16.5 mg/kg of Cu, 165.3 mg/kg of Fe, 39.60 mg/kg of Mn, 165.30
mg/kg of Zn, 0.30 mg/kg of I, 0.30 mg/kg of Se. 3 Selenium premix provided 0.2 mg/kg Se. 4 Virginiamycin was included at 5.5 mg/kg (Stafac 20, Phibro Animal Health Corporation, Ridgefield Park, NJ, USA).

59
Table 2. Descriptive statistics of the experimental diet
Item No. of batches Mean Standard deviation
Feed production rate, kg/hour 24 849.0 22.0
Conditioning temperature, °C 24 82.3 1.6
Hot pellet temperature, °C 24 85.8 1.9
Standard pellet durability index, % 24 90.4 2.1
Modified pellet durability index, % 24 68.2 6.8
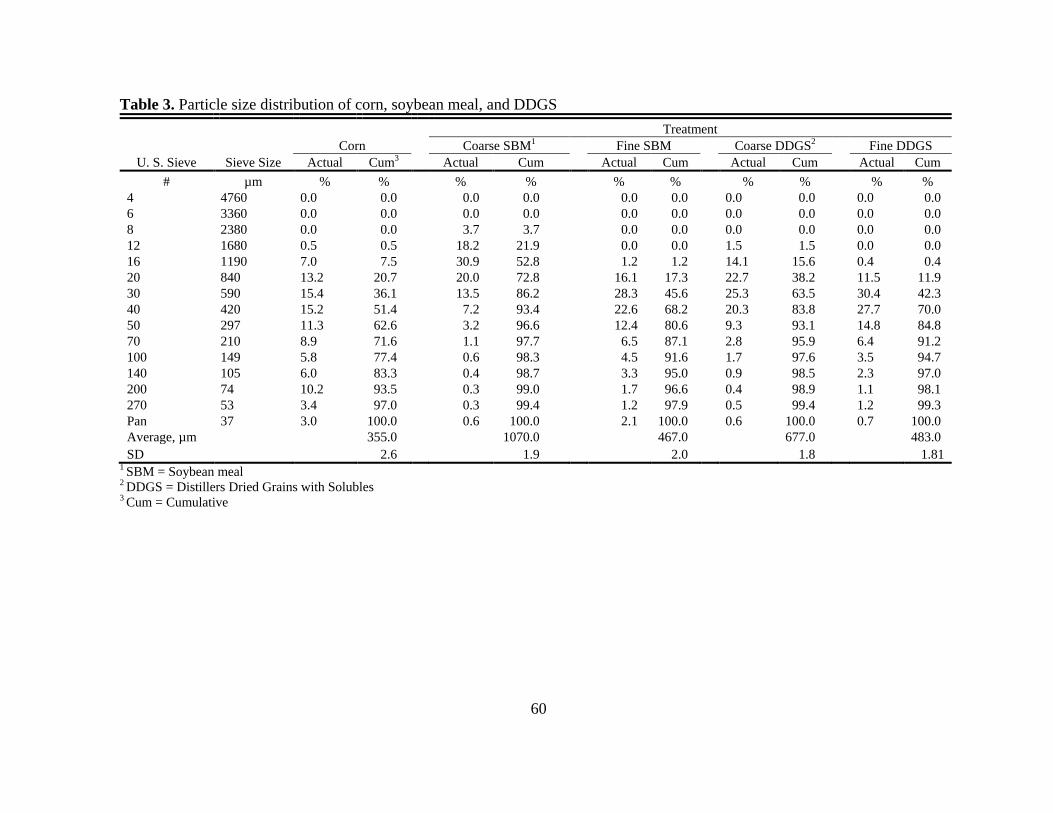
60
Table 3. Particle size distribution of corn, soybean meal, and DDGS
Treatment
Corn Coarse SBM1 Fine SBM Coarse DDGS2 Fine DDGS
U. S. Sieve Sieve Size Actual Cum3 Actual Cum Actual Cum Actual Cum Actual Cum
# µm % % % % % % % % % %
4 4760 0.0 0.0 0.0 0.0 0.0 0.0 0.0 0.0 0.0 0.0
6 3360 0.0 0.0 0.0 0.0 0.0 0.0 0.0 0.0 0.0 0.0
8 2380 0.0 0.0 3.7 3.7 0.0 0.0 0.0 0.0 0.0 0.0
12 1680 0.5 0.5 18.2 21.9 0.0 0.0 1.5 1.5 0.0 0.0
16 1190 7.0 7.5 30.9 52.8 1.2 1.2 14.1 15.6 0.4 0.4
20 840 13.2 20.7 20.0 72.8 16.1 17.3 22.7 38.2 11.5 11.9
30 590 15.4 36.1 13.5 86.2 28.3 45.6 25.3 63.5 30.4 42.3
40 420 15.2 51.4 7.2 93.4 22.6 68.2 20.3 83.8 27.7 70.0
50 297 11.3 62.6 3.2 96.6 12.4 80.6 9.3 93.1 14.8 84.8
70 210 8.9 71.6 1.1 97.7 6.5 87.1 2.8 95.9 6.4 91.2
100 149 5.8 77.4 0.6 98.3 4.5 91.6 1.7 97.6 3.5 94.7
140 105 6.0 83.3 0.4 98.7 3.3 95.0 0.9 98.5 2.3 97.0
200 74 10.2 93.5 0.3 99.0 1.7 96.6 0.4 98.9 1.1 98.1
270 53 3.4 97.0 0.3 99.4 1.2 97.9 0.5 99.4 1.2 99.3
Pan 37 3.0 100.0 0.6 100.0 2.1 100.0 0.6 100.0 0.7 100.0
Average, µm 355.0 1070.0 467.0 677.0 483.0
SD 2.6 1.9 2.0 1.8 1.81 1 SBM = Soybean meal 2 DDGS = Distillers Dried Grains with Solubles 3 Cum = Cumulative

61
Table 4. Effect of particle size and inclusion of DDGS on pellet durability index (PDI) and feed production rate
a-b Means with different superscripts in the same column differ significantly (P ≤ 0.05).
A-B Means with different superscripts in the same column differ significantly (P ≤ 0.01).
1 DDGS as received had a particle size of 677 µm and 483 µm after grinding using a hammer mill equipped with a 1.6 mm screen
2 SBM as received had a particle size of 1,070 µm and 467 µm after grinding using a hammer mill equipped with a 1.6 mm screen
3 Standard PDI = (weight of fines/weight of initial sample) x 100 after tumbling 500 g of whole pellet at 50 rpm for 10 min
4 Modified PDI = (weight of fines/weight of initial sample) x 100 after tumbling 500 g of whole pellet at 50 rpm for 10 min with the addition of 3 hex nuts (50g/nut)
5 Increase in temperature due to frictional forces as feed moves through the pellet die during the pelleting process
DDGS DDGS
Particle Size1 SBM
Particle Size2
PDI Production
Rate
Conditioning
Temperature
Hot Pellet
Temperature
Die
Friction5
Standard3 Modified4
————— (%) ————— —— (µm) —— —— (µm) —— ——— (%) —— — (kg/hr) — — (F) — — (F) — — (F) —
0 89.4 61.9B 852 180.4 185.4 5.0B
30 90.9 71.4A 847 179.9 186.9 7.0A
SEM 0.7 1.8 3 0.6 0.6 0.7
677 91.6 72.5 847 180.3 186.9 6.6
483 90.3 70.3 847 179.6 187.0 7.4
SEM 0.5 1.3 4 0.4 0.7 0.7
30 1070 90.4 69.3B 849 179.9 186.8 6.9
30 467 91.5 73.5A 845 180.0 187.1 7.1
SEM 0.5 1.3 4 0.4 0.7 0.7
0 1070 88.3 59.0 851 181.3 185.0 3.8
0 467 90.5 64.8 854 179.5 185.8 6.3
SEM 1.4 3.2 6 1.2 0.9 0.9
30 677 1070 91.3 71.5 850 180.0 187.3 7.3
30 677 467 92.0 73.5 845 180.5 186.5 6.0
30 483 1070 89.5 67.0 848 179.8 186.3 6.5
30 483 467 91.0 73.5 846 179.5 187.8 8.3
SEM 0.7 1.9 5 0.6 1.0 0.9
Source of variation ——————————————————— P-value ————————————————
DDGS Inclusion 0.093 0.001 0.221 0.543 0.060 0.031
Soybean meal particle size - 0% DDGS 0.302 0.060 0.787 0.323 0.589 0.111
DDGS particle size - 30% DDGS 0.064 0.248 0.921 0.337 0.900 0.441
Soybean meal particle size - 30% DDGS 0.121 0.041 0.532 0.845 0.706 0.795
DDGS x soybean meal particle size - 30% DDGS 0.588 0.248 0.817 0.560 0.269 0.137

62
Figure 1. Average particle size and particle size distribution of soybean meal used in swine
finishing diets as received (coarse-1070 µm) and after grinding (fine-467 µm) in a
hammermill equipped with a 1.6 mm screen.

63
Figure 2. Average particle size and particle size distribution of DDGS used in swine
finishing diets as received (coarse-677 µm) and after grinding (fine-483 µm) in a
hammermill equipped with a 1.6 mm screen.

64
2.6. REFERENCES
ASABE. 2007. Method of Determining and Expressing Fineness of Feed Materials by
Sieving. Am. Soc. Agric. Eng., St. Joseph, MI.
ASABE. 2007. Cubes, Pellets and Crumbles-Definitions and Methods for Determining
Density, Durability, and Moisture Content. Am. Soc. Agric. Eng. St. Joseph, MI.
Behnke, K. C. 1981. Pellet mill performance as affected by mineral source. Feedstuffs.
53:34-36.
Behnke, K. C. 2001. Factors influencing pellet quality. Feed Technol. 5:19-22.
Behnke, K. C., and R. S. Beyer. 2002. Effect of feed processing on broiler performance. Intl.
Seminar Poult. Prod. and Pathol. Santiago, Chile.
Briggs, J. L., D. E. Maier, B. A. Watkins, and K. C. Behnke. 1999. Effects of ingredients and
processing parameters on pellet quality. Poult. Sci. 78:1464-1471.
Cavalcanti, W. B. 2004. The effect of ingredient composition on the physical quality of
pelleted feeds: a mixture experimental approach. Ph.D. Dissertation, Kansas State
University, Manhattan, KS.
Cavalcanti, W. B. and K. C. Behnke. 2005a. Effect of composition of feed model systems on
pellet quality: mixture experimental approach. I. Cereal Chem. 82:455-461.
Cavalcanti, W. B., and K. C. Behnke. 2005b. Effect of composition of feed model systems on
pellet quality: mixture experimental approach. II. Cereal Chem. 82:462-467.
Chewning, C. G. 2010. Evaluation of post pellet liquid application, particle size, and feed
form on broiler performance. M.S. Thesis. North Carolina State University, Raleigh,
NC.
Dozier, W. A. 2001. Cost effective pellet quality for meat birds. Feed Management. 52:1-3.

65
Fahrenholz, A. C. 2008. The effects of DDGS inclusion on pellet quality and pellet mill
performance. M. S. Thesis. Kansas State University, Manhattan, KS.
Fahrenholz A. C. 2012. Evaluating factors affecting pellet durability and energy consumption
in a pilot feed mill and comparing methods for evaluating pellet durability. Ph.D.
Dissertation, Kansas State University, Manhattan, KS.
Feoli, C. 2008. Use of corn- and sorghum-based distillers dried grains with solubles in diets
for nursery and finishing pigs. Ph.D. Dissertation, Kansas State University,
Manhattan, KS.
Fastinger, N. D., and D. C. Mahan. 2003. Effect of soybean meal particle size on amino acid
and energy digestibility in grower-finisher swine. J. Anim. Sci. 81:697-704.
Franke, M., and A. Rey. 2006. Improving pellet quality and efficiency. Feed Tech. 10:12-15.
Lahaye, L., P. Ganier, J. N. Thibault, and B. Seve. 2004. Technological processes of feed
manufacturing affect protein endogenous losses and amino acid availability for body
protein deposition in pigs. Anim. Feed Sci. Technol. 113:141-156.
Laurinen, P., H. Siljander-Rasi, J. Karhunen, T. Alaviuhkola, M. Nasi, and K. Tuppi. 2000.
Effects of different grinding methods and particle size of barley and wheat on pig
performance and digestibility. Anim. Feed Sci. Technol. 83:1-16.
Loar, R. E., J. S. Moritz, J. R. Donaldson, and A. Corzo. 2010. Effects of feeding distillers
dried grains with solubles to broilers from 0 to 28 days post hatch on broiler
performance, feed manufacturing efficiency, and selected intestinal characteristics.
Poult. Sci. 89:2242-2250.
McEllhiney, R. 1992. What is the optimum particle size for pelleting? Feed Management
46:9-19.
Min, Y. N., F. Z. Liu, Z. Wang, C. Coto, S. Cerrate, F. P. Costa, F. Yan, and P. W.
Waldroup. 2008. Evaluation of distillers dried grains with solubles in combination
with glycerin in broiler diets. Intl. J. Poult. Sci. 7:646-654.

66
Moran, E. T. 1989. Effect of pellet quality on the performance of meat birds. Pages 87-108 in
Recent Advances in Animal Nutrition. Haresign, W., and D. J. Cole, Eds.
Butterworths Publishing, London, England.
Muramatsu, K., A. Maiorka, I. C. Mores, R. N. Reis, F. Dahlke, A. A. Pinto, U. A. Dias, M.
Bueno, and M. Imagawa. 2013. Impact of particle size, thermal processing, fat
inclusion and moisture addition on pellet quality and protein solubility of broiler
feeds. J. Agric. Sci. Technol. 3:1017-1028.
Pacheco, W. J. 2011. Evaluation of trypsin inhibitors levels and particle size of expeller-
extracted soybean meal on broiler performance. M.S. Thesis. North Carolina State
University, Raleigh, NC.
Patience, J. F., P. Thacker, and C. F. M. de Lange. 1995. Swine Nutrition Guide 2nd
ed.
Prairie Swine Centre Inc., Univ. of Saskatchewan, Saskatoon, Canada.
Reimer, L. 1992. Conditioning. In: Proc. Northern Crops Institute Feed Mill Management
and Feed Manufacturing Technol. Short Course. California Pellet Mill Co.
Crawfordsville, IN.
Rollins, D. 2002. The pelleting process. Arkansas Poult. Symp., Fayetteville, AR.
SAS. 2006. SAS/STAT User's guide, SAS Institute, Inc., SAS Press, Cary, NC.
Skoch, E. R., S. F. Binder, C. W. Deyoe, G. L. Allee, and K. C. Behnke. 1983. Effects of
pelleting conditions on performance of pigs fed a corn-soybean meal diet. J. Anim.
Sci. 57:922-928.
Stark, C. R. 1994. Pellet quality I. Pellet quality and its effects on swine performance. Ph.D.
Dissertation, Kansas State University, Manhattan.
Stark, C. R. 2011. Feed processing to maximize feed efficiency. Pages 131-151 in Feed
Efficiency in Swine. Patience, J. F. Ed. Wageningen Academic Publisher.
Netherlands.

67
Stark, C. R. 2012. Feed processing to improve poultry performance. Arkansas Nutrition
Conference. Rogers, AR.
Stender, D. and M. S. Honeyman. 2008. Feeding pelleted DDGS-based diets to finishing pigs
in deep-bedded hoop barns. J. Anim. Sci. 86 (Suppl. 3):84.
Thomas, M., and A. F. B. van der Poel. 1996. Physical quality of pelleted animal feed. 1.
Criteria for pellet quality. Anim. Feed Sci. Technol. 61:89-112.
Voragen, A. G., H. Gruppen, G. J. Marsman, and A. J. Mul. 1995. Effect of some
manufacturing technologies on chemical, physical, and nutritional properties of feed.
Pages 93-126 in Recent Advances in Animal Nutrition. Feed Manufacturers Conf.,
Nottingham University Press. Nottingham, UK.
Wang, Z., S. Cerrate, C. Coto, F. Yan, and P. W. Waldroup. 2007. Use of constant or
increasing levels of distillers dried grains with solubles (DDGS) in broiler diets. Int. J.
Poult. Sci. 6:501-507.
Wang, Z., S. Cerrate, C. Coto, F. Yan, F. P. Costa, A. Abdel-Maksoud, and P. W. Waldroup.
2008. Evaluation of corn distillers dried grains with solubles in broiler diets
formulated to be isocaloric at industry energy levels or formulated to optimum
density with constant 1% fat. Int. J. Poult. Sci. 7:630-637.
Willems, O. W., S. P. Miller, and B. J. Wood. 2013. Aspects of selection for feed efficiency
in meat producing poultry. World's Poult. Sci. J. 69:77-87.
Winowiski, T. 1988. Wheat and pellet quality. Feed Management 39:58-64.
Wondra, K. J., J. D. Hancock, K. C. Behnke, R. H. Hines, and C. R. Stark. 1995. Effect of
particle size and pelleting on growth performance, nutrient digestibility, and stomach
morphology in finishing pigs. J. Anim. Sci. 73:757-763.

68
CHAPTER III
EFFECT OF PARTICLE SIZE, DDGS INCLUSION, AND PELLET QUALITY ON
BROILER LIVE PERFORMANCE AND GASTROINTESTINAL DEVELOPMENT

69
3.1. ABSTRACT
Previous research has shown that one of the main limitations of DDGS inclusion in poultry
diets was the reduction in pellet quality. Researchers have also shown that coarse feed
ingredients particles could alter GIT development, nutrient digestion, and overall poultry
performance. The objective of this study was to evaluate the effect of particle size and
inclusion level of DDGS on pellet quality, organ development, nutrient digestibility, and
broiler live performance. A total of 2,304 male broilers were randomly distributed among 12
treatments with 6 replicate pens per treatment, which constituted a 2x2x3 factorial
arrangement of 2 DDGS particle grind sizes (coarse grind-745 and fine grind-482 µm), 2
DDGS inclusion levels (15 and 30%), and 3 levels of fines in the finished feed (0, 25, and
50%). The starter diets were fed in crumbled form and the grower diets were fed in pelleted
form. Feed consumption and BW were determined at 14, 35, and 42 d of age and feed
conversion ratio (FCR) calculated by including the BW of all dead birds. At 42 d, gizzard
and proventriculus were collected to determine their relative weights. Particle size and pellet
quality had an effect on BW. Birds fed fine DDGS had a greater feed intake (P≤0.05) and
higher BW (P≤0.05) at 42 d than birds fed coarse DDGS, with no difference in FCR. Birds
fed diets with no fines exhibited greater BW at 35 and 42 d than birds fed diets with 50%
fines (P≤0.05). Birds fed 30% DDGS exhibited greater feed consumption (P≤0.05) but
poorer FCR (P≤0.05) at 42 d than birds fed 15% DDGS. Birds fed 30% DDGS possessed
greater proventriculus weight (P≤0.05) than birds fed 15% DDGS. Birds fed coarse DDGS
(745 µm) had greater gizzard weight (P≤0.05) than birds fed fine DDGS (482 µm). The
70
results of this experiment demonstrated that birds performed better when fed fine ground
DDGS (482 µm) with no fines in the feed.
Key words: DDGS, particle size, fines, gizzard, proventriculus
3.2. INTRODUCTION
High global feed prices has forced nutritionists to search for low cost feed ingredients
as feed has accounted for around 60-70% of total production costs in the U.S. poultry
industry (Coon, 2002). In addition, the increased usage of corn as a raw material for ethanol
production has led to an increased supply of distillers dried grains with solubles (DDGS)
(Noll et al., 2007). DDGS have become a source of protein, energy, and phosphorus
(Martinez Amezcua et al., 2004) that has replaced more costly feed ingredients as its price
has declined into a favorable range for many different types of livestock and poultry
(Hoffman and Baker, 2010). For diets formulated on a total amino acid basis, Lumpkins et al.
(2004) reported that up to 6% DDGS could be used in starter diets and 12-15% in grower and
finisher diets without adverse effects on live performance. However, Shim et al. (2011)
conducted an experiment in which diets were formulated on a digestible amino acid basis and
reported no significant differences in BW gain, FCR, and mortality at 42 d of age in diets that
contained 0, 8, 16, or 24% DDGS.
Previous research has also shown that the main constraints of DDGS usage in poultry
diets were nutrient variability, particularly lysine and mineral content (Cromwell et al., 1993;
Spiehs et al., 2002), caking during transportation that caused flowability problems at feed
mills, and reduced pellet quality (Min et al., 2008; Stender and Honeyman, 2008).
71
Improvements in pellet quality has increased bulk density, improved flowability, and allowed
the inclusion of ingredients with poor flowability characteristics (Stark, 2012). In addition,
feed with high pellet quality has been reported to increase feed intake (Nir et al., 1995;
Chewning, 2010), improve FCR (Amerah et al., 2008), and improve overall broiler live
performance. Thus, pellet quality must be considered in order to guarantee optimum broiler
live performance (Briggs et al., 1999). According to Behnke (1994), the main factors that
have influenced pellet quality have been feed formulation, conditioning temperature, die
specification, cooling, and particle size.
Previous research with cereal grains and proteins meals have shown the importance of
large feed particle size on nutrient digestibility (Pacheco et al., 2013), mineral utilization
(Kilburn and Edwards, 2004), organ development (Jacobs et al., 2010; Amerah et al., 2007),
and overall poultry performance. Other authors have shown a decrease proventricular
swelling and better compartmentalization between gizzard and proventriculus when large
particles were included in the feed. (Jones and Taylor, 2001). However, currently there is a
lack of information regarding the effect of particle size of DDGS on broiler live performance.
This study was designed to evaluate the effect of particle size, DDGS inclusion, and pellet
quality on nutrient digestibility, gizzard and proventriculus weight, and broiler live
performance.

72
3.3. MATERIALS AND METHODS
3.3.1. DDGS Analyses
DDGS were obtained from a local elevator in Selma, NC and were analyzed for ether
extract after acid hydrolysis (method 954.02), crude protein (N x 6.25) (method 990.03), and
crude fiber (method 962.09; AOAC, 2006) prior to feed formulation (Table 1). Dry sieving
according to ASAE method S319.3 (ASABE, 2007) was used to determine the particle size
of DDGS with the addition of sieve agitators and 0.5 g of dispersing agent per 100 g of
sample.
3.3.2. Diets
Starter and grower diets (Table 2) were composed mainly of corn, SBM, and DDGS
and were formulated to meet or exceed suggested minimum requirements of Ross 708
broilers (Aviagen, 2007) and were formulated on a digestible amino acids basis. Amino acid
digestibility coefficients for DDGS were based on values reported by Batal and Dale (2006)
and Fiene et al. (2006). The grower diet contained 0.5% titanium dioxide, which was used as
an indigestible marker for determination of nutrient digestibility. Feed was produced at the
North Carolina State University Feed Mill Educational Unit (Raleigh, NC) following current
Good Manufacturing Practices (GMP). The coarse DDGS was used in the diets as received
from the supplier. The fine ground DDGS was obtained by grinding the coarse DDGS using
a hammermill (Model 1522, Roskamp Champion, Waterloo, IA) equipped with a 1.6 mm
screen. Dry ingredients were blended in a counterpoise mixer (Model TRDB126060, Hayes
& Stolz, Fort Worth, TX) with 1% added fat in order to produce high quality pellets with

73
fewer fines. Mash diets were conditioned at 85°C for 45 seconds and then pelleted using a
pellet mill (Model PM1112-2, California Pellet Mill Co., Crawfordsville, IN) equipped with
a 4.4 mm x 35 mm die. Pellets were cooled using a counter flow cooler (Model VK09x09KL,
Geelen Counterflow USA Inc., Orlando, Florida). The fines produced during the pelleting
process were separated using feed screeners and were analyzed to ascertain that they had the
same nutritional composition as the pellets. Variable levels of pellets, fines, and remaining
fat were mixed using a 227 kg double ribbon mixer (Model SRM 304, Scott Equipment Co.,
New Prague, MN) to accomplish the desired percentage of fines in the final feed.
3.3.3. Bird Husbandry
The care of the birds used in this trial conformed to the Guide for Care and Use of
Animals in Agricultural Research and Teaching (FASS, 2010). A total of 2,304 male broilers
(Ross 708, Aviagen Inc., Huntsville, AL) were obtained from the university broiler breeder
flock. Birds were hatched at the research location and reared in a curtain-sided, heated, and
fan ventilated broiler house until 42 d of age. Birds were randomly allocated with 32 chicks
per pen to 72 pens in total. Every pen (120 x 380 cm) contained one bell-type drinker and
two tube feeders and was assigned to one of 12 dietary treatments combinations with 6
replicate pens per combination. Chicks were raised on new litter and had ad libitum access to
feed and water throughout the study. Three supplemental feeder flats were used until 7 d of
age, 2 feeder flats until 10 d, and 1 feeder flat until 14 d of age. Small amounts of feed were
added twice daily to the feeder flats to guarantee appropriate feed consumption. Feed that
remained in the feeder flat at 14 d was screened and added to the tube feeders before weigh

74
back. A common starter diet that contained 6% DDGS was used to 14 d of age in order to
adapt the gastrointestinal tract (GIT) of the birds to efficiently digest DDGS and to avoid
sudden changes in the nutrition and feeding program. Chicks were provided 0.9 kg starter
feed/chick and 3.9 kg grower feed/chick. Starter diets were fed as crumbles and grower diets
were fed as 5-mm pellets. Starter feed was adjusted for mortality to provide the same
quantity of feed per bird in order to maintain a similar cumulative nutrient package across
pens. Feed additions were weighed, recorded, and added in 454 g (1 lbs.) increments per bird
alive. Feeders were shaken twice per day from 1 to 14 d and three times per day from 15 to
42 d to maintain fresh feed in front of the chicks, as well as stimulate and prevent variation in
feed intake due to feed flow characteristics. Photoperiods were 23L:1D from 1 to 7 d,
22L:2D to 14 d, 20L:4D to 21 d, and natural light from 22 to 42 d of age. High and low air
temperatures were recorded daily and stirring fans were used to maintain a consistent
temperature in the entire house. The target temperatures were 32°C from placement to 7 d,
29ºC to 14 d, 27ºC to 21 d, and ambient thereafter. High and low temperatures were recorded
twice daily.
3.3.4. Data Collection and Laboratory Analyses
Standard processing data such as pellet production rate and conditioning temperature,
were controlled closely during feed manufacturing. The durability of the pellets was
determined according to the American Society of Agricultural Engineers standard method
S269.4 (ASABE, 2007). Approximately 2,500 g of feed was collected and cooled
immediately upon discharge from the pellet mill and placed into cooling trays at a depth of

75
approximately 1 cm and then cooled with ambient air using a counterflow pellet cooler. The
standard tumble box method was used employing a device locally constructed and operated
in accordance with the ASAE standard.
Two sub-samples of pellets were screened using a US #6 sieve (3.35 mm) to remove
the fines produced during the pelleting process and 500 g of each was placed into 1 of the 4
compartments of the tumbling box. For the modified method three hex nuts (50 g/nut) were
added in the tumble box compartment. The sub-samples were tumbled at 50 rpm for 10 min.
After tumbling, each sub-sample was sifted again using the US #6 sieve to remove the fines
and then re-weighed. The pellet durability index was calculated as the ratio of the weight of
the pellets that remained in the sieve after tumbling relative to the initial weight before
tumbling (500 g) and reported as a percentage. The compartments in the tumbling box were
cleaned by hand after each pellet durability test in order to remove any fines that
accumulated in the corners.
Feed consumption and BW by pen were recorded at 14, 35, and 42 d of age. Mortality
was removed, weighed, and recorded twice daily. Feed conversion ratio (FCR) was
calculated by adding the BW of dead birds to the BW of live birds in each pen. Cumulative
FCR was calculated for the periods 1-14, 1-35, and 1-42 d. At 42 d gizzard, proventriculus,
and ileal samples were collected. Ileal digesta was collected (2 cm posterior of Meckel’s
diverticulum to 2 cm anterior of the ileal-cecal junction) by gently squeezing the ileal
contents in a manner that provided sufficient sample for digestibility analysis. Gizzard and
proventriculus were excised, external fat and internal contents removed, rinsed, and blotted
dry and their weights were expressed relative to BW.

76
3.3.5. Ileal Analyses
Titanium dioxide analysis was used to calculate ileal digestibility of energy, fat, and
protein (Fan et al., 1994; Marty et al., 1994). The pellets and the fines were analyzed for
gross energy (Merrill and Watt, 1973), moisture (method 934.01), ether extract after acid
hydrolysis (method 954.02), and crude protein (N x 6.25) (method 990.03, AOAC, 2006).
3.3.6. Statistical Analyses
A pen of broilers served as the experimental unit for statistical analysis. Data were
analyzed using PROC GLM (SAS, 2006) as a randomized complete block design with a 2 x
2 x 3 factorial arrangement to identify main effects and interactions. The analysis consisted
of two particle sizes (745 and 482 µm) of DDGS, two inclusion levels (15 and 30%) of
DDGS, and three percentages of feed fines (0, 25, and 50%). Statements of statistical
differences were based upon P≤0.05 unless otherwise indicated. Differences between means
were separated by the least significant difference test.
3.4. RESULTS AND DISCUSSION
3.4.1. Feed Manufacturing
There was a significant interaction (P≤0.01) between the particle size and the
inclusion level of DDGS on pellet durability index (PDI) (Table 3). Pellet durability was
negatively related to the proportion of DDGS and the diets that contained 15% DDGS had a
greater pellet durability (P≤0.01) as compared to diets that contained 30% DDGS at 482 and
745 µm. However, pellet durability decreased more in diets with 745 µm DDGS (5.1 versus

77
1.75%), as compared to diets that contained 482 µm DDGS, when the inclusion of DDGS
was increased from 15% to 30%. Previous authors have reported an improvement in pellet
quality as the particle size of cereal grains and SBM was decreased (Reece et al., 1986;
Wondra et al., 1995; Pacheco et al., 2013). According to Behnke (1994), small particles
increase the surface area and the number of contact points within the pellet matrix. In the
current study, grinding the DDGS from 745 µm to 482 µm resulted in reduced PDI (P≤0.01).
This was not expected, and the only explanation was that grinding the 9.8% crude fat DDGS
could have released fat from the protein matrix and thus impeded particle size agglomeration
during pelleting. Fat has been reported to function as a lubricant in the pellet die (Stark,
1994; Jones et al., 1995; Thomas et al., 1998; Cutlip et al., 2008), which may have decreased
die friction and pellet binding. Indeed, grinding the DDGS from 745 µm to 482 µm produced
a higher feed pellet production rate (P≤0.01). According to Moritz et al. (2003) die
lubrication contributed to reduce electrical energy usage and manufacturing costs required to
pellet broiler feed.
3.4.2. Broiler Live Performance
Diets that contained the higher inclusion of DDGS contained higher percentage of
crude protein (22.2 versus 21.1%), because they were formulated to maintain a minimum
digestible amino acid level. DDGS have been reported to contain a lower lysine digestibility
value than corn and SBM. During the drying process of DDGS, high temperatures are used in
order to reduce the moisture content to around 10%, which decreases transportation costs and
increases self-life (Kwiatkowski et al., 2006). However, severe heating is associated with

78
decreased protein quality and reduced digestibility of certain amino acids. The free amino
group of lysine can react with reducing sugars in the Maillard reaction in the presence of heat
to form undigestible complexes (Cromwell et al., 1993; Spiehs et al., 2002; Batal and Dale
2006; Fontaine et al., 2007). Variability in the proportion of wet cake and thin stillage added
during DDGS production also contributes to the observed variability in the digestibility of
protein and amino acids in the final DDGS (Belyea et al., 1998).
There were no significant interactions between DDGS inclusion, DDGS particle size,
and percentage of feed fines, thus only main effects were discussed below (Table 4). Birds
fed diets with 30% DDGS exhibited greater feed consumption (P≤0.05), but poorer FCR
(P≤0.05) than birds fed diets with 15% DDGS, which resulted in no significant differences in
bird BW at 42 d of age. Shim et al. (2011) reported higher feed consumption from 19 to 28 d
of age as the inclusion of DDGS was increased from 0 to 24%.
Birds fed 482-µm-DDGS had greater feed consumption (P≤0.05) and BW (P≤0.05) at
42 d of age than birds fed 745-µm-DDGS, but no differences were observed for FCR.
Previous studies have shown that coarse particles of cereal grains and protein meals altered
gastrointestinal tract (GIT) development, nutrient digestion and absorption, and overall
poultry live performance (Engberg et al., 2002; Parsons et al., 2006; Pacheco et al., 2013).
However, in this study the particle size distribution (Fig. 1) between 745 and 482 µm
overlapped significantly, which probably made it difficult to find significant differences in
FCR. Parsons et al. (2006) reported greater feed intake, but poorer FCR when birds were fed
coarse mash diets. Favero et al. (2009) reported greater feed intake and BW from 7 to 21 d of
79
age when poults were fed medium particle size corn at 606 µm as compared to coarse (806
µm) or fine (380 µm) corn.
The percentage of feed fines did not affect feed intake. Cutlip et al. (2008) reported
increased feed intake and BW gain when broilers were fed pelleted diets as compared to
mash diets. Parsons et al. (2006) reported increased BW and improved FCR when hard
pellets (90.4% PDI) were fed as compared to soft pellets (86.2% PDI). Reduction in feed
intake in the presence of high levels of fines has been typically related to feed flow problems
at the feeder. Feeders were shaken three times daily after 14 d of age in order to keep feed
available at all times, regardless of the amount of fines in the feed. However, the percentage
of feed fines had a negative effect on BW at 35 and 42 d of age. Birds fed diets with 0% fines
had a greater BW than birds fed diets with 50% fines. Dozier et al. (2010) reported increased
growth rate and feed consumption during the grower and finisher phases when broilers
received pelleted diets as compared to broilers fed mash diets. Previous studies had reported
improved FCR with pelleted diets as compared to mash or diets with poorer pellet quality
(Jensen, 2000; Nir and Ptichi, 2001). According to Jensen (2000), as the pellet quality was
improved there was decreased feed wastage and energy expenditure during eating.
3.4.3. Organ Development
Birds that consumed diets with 30% DDGS exhibited greater relative proventriculus
weight (P≤0.05) than birds fed diets with 15% DDGS. The proventriculus or “gastric
stomach” has been reported to be responsible for gastric acid secretion required for protein
denaturation and activation of pepsinogen to pepsin (Rynsburger, 2009). Since the diets with

80
30% DDGS possessed greater crude protein, pepsinogen and hydrochloric acid secretion
were likely stimulated, which resulted in greater proventriculus weight. Birds fed diets with
coarse DDGS (745 µm) had greater relative gizzard weight (P≤0.05) than birds that
consumed diets with fine DDGS (482 µm) at 42 d of age. Jacobs et al. (2010) reported a
linear increase in gizzard weight in three different experiments as the particle size of corn
was increased from 557 to 1,387 µm. Nir et al. (1994) reported an increase of 26 and 41% in
gizzard weight when birds were fed medium (1,132 µm) and coarse (2,028 µm) mash as
compared to birds fed fine mash (627 µm). In addition, as the percentage of fines in the feed
increased, there was an increase in the relative weight of the gizzard. According to Behnke
(1994), pelleting increased bulk density of the mash. Diets with 25 and 50% fines likely
required a greater volume to accommodate the same amount of feed in the gizzard.
3.4.4. Nitrogen and Energy Digestibility
The results of this experiment showed that the percentage of fines in the feed did not
have any influence on nitrogen and energy digestibility. The results also demonstrated that
the inclusion level of DDGS in the feed had no significant effects on excreta nitrogen, crude
protein content, gross energy, or overall gross energy digestibility. Min et al. (2011) reported
an increased excreta nitrogen and crude protein from diets that contained 30% DDGS when
compared to a control diet without DDGS. In addition, the particle size of the DDGS had no
significant effects on excreta nitrogen, crude protein, and gross energy. As shown in Table 6,
the results demonstrated that inclusion of 30% DDGS in the diet significantly decreased
apparent metabolizable energy (AME) and nitrogen corrected apparent metabolizable energy

81
(AMEn) (P≤0.05) of the diet.
There was a numerical trend with reference to particle size of DDGS on nitrogen
retention (P=0.057). The birds fed 482-µm-DDGS exhibited numerically greater nitrogen
retention than birds fed 745-µm-DDGS. In addition, birds fed 482-µm-DDGS had improved
AME, AMEn, and overall gross energy digestibility as compared to birds fed 745-µm-
DDGS. Small particles have been associated with an enlarged surface area and greater
interaction with digestive enzymes, which may have increased nutrient digestibility
(Goodband et al., 2002). In addition, Parsons et al. (2006) reported decreased nitrogen and
lysine retention in broilers when the particle size of corn decreased from 2,242 to 781 µm.
The percentage of fines in the final feed did not have an influence on nitrogen retention and
digestibility or AMEn.
The results of this study indicated that up to 30% dietary DDGS could be feed in
broiler diets from 1-42 d of age if diets are formulated on a digestible amino acid basis.
Further grinding of DDGS had a negative affect on pellet quality likely due to fat liberation
of the protein matrix and poor pellet agglomeration. In addition, increasing the dietary
inclusion of DDGS had a slightly negative effect on pellet quality, but in general the pellet
quality of all diets was excellent (>80% PDI), which suggested that fat addition prior
pelleting must be monitored closely if high dietary inclusion of DDGS are used. In general,
birds performed better when fed fine-grind DDGS with no more than 25% fines in the feed as
compared to birds that consumed coarse-grind DDGS diets with 50% fines.
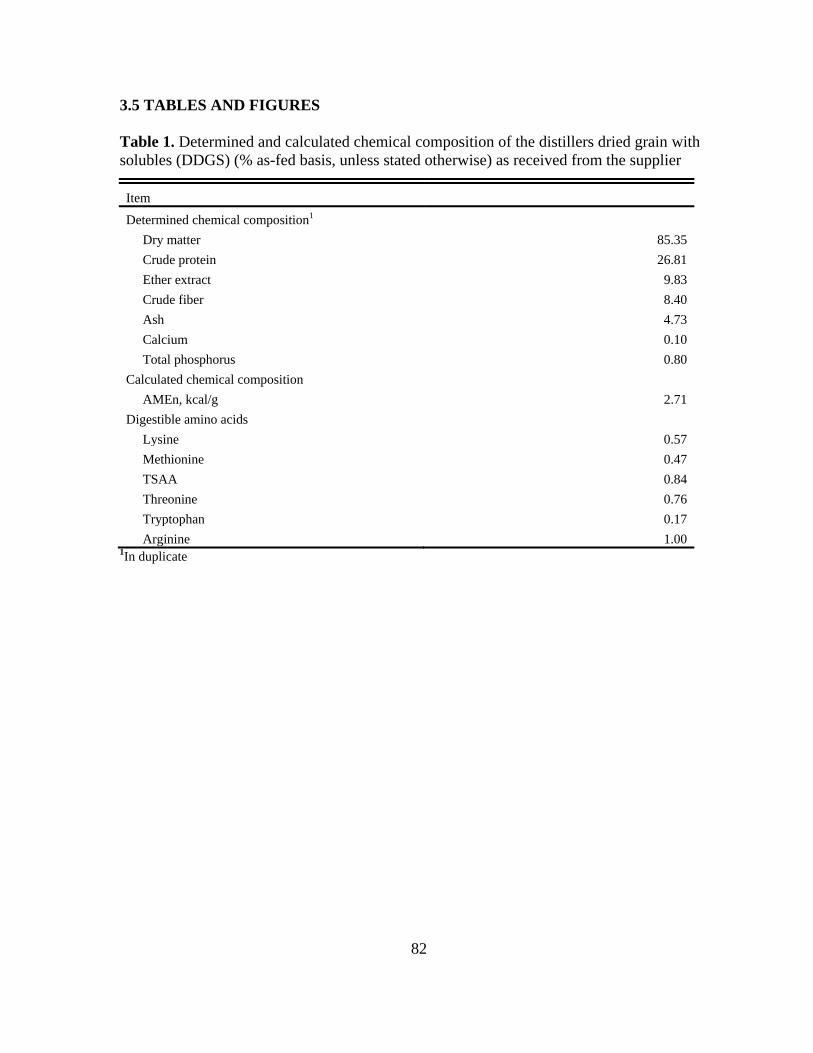
82
3.5 TABLES AND FIGURES
Table 1. Determined and calculated chemical composition of the distillers dried grain with
solubles (DDGS) (% as-fed basis, unless stated otherwise) as received from the supplier
Item
Determined chemical composition1
Dry matter 85.35
Crude protein 26.81
Ether extract 9.83
Crude fiber 8.40
Ash 4.73
Calcium 0.10
Total phosphorus 0.80
Calculated chemical composition
AMEn, kcal/g 2.71
Digestible amino acids
Lysine 0.57
Methionine 0.47
TSAA 0.84
Threonine 0.76
Tryptophan 0.17
Arginine 1.00 1In duplicate

83
Table 2. Composition and calculated contents of the experimental diets (% as fed basis)
Item Starter Grower 15% DDGS Grower 30% DDGS
Ingredient ——————————— (%) ——————————
Corn 50.05 49.48 38.18
Soybean meal, 48% CP 36.25 27.00 22.56
DDGS 6.00 15.00 30.00
Dicalcium phosphate, 18.5% P 1.98 1.55 1.184
Poultry fat 3.00 4.42 5.39
Limestone 1.36 1.21 1.39
Salt 0.38 0.41 0.36
L-Threonine, 99% 0.06 0.05 0.03
DL-Methionine, 99% 0.37 0.29 0.24
L-Lysine-HCl, 78% 0.19 0.24 0.30
Vitamin premix1 0.05 0.05 0.05
Mineral premix2 0.10 0.10 0.10
Choline chloride, 60% 0.10 0.10 0.10
Selenium premix3 0.05 0.05 0.05
Coccidiostat4 0.05 0.05 0.05
Titanium Dioxide 0.00 0.50 0.50
Calculated nutrients
Metabolizable energy, kcal/g 3.04 3.15 3.15
Crude protein 23.20 21.10 22.20
Crude fat 5.41 7.62 9.66
Calcium 1.05 0.90 0.90
Available phosphorus 0.50 0.45 0.45
Digestible lysine 1.27 1.10 1.10
Digestible TSAA 0.94 0.84 0.84
Digestible threonine 0.84 0.73 0.73
Digestible arginine 1.39 1.18 1.15 1 Vitamin premix provided the following per kg of diet: vitamin A, 6600 IU; cholecalciferol, 1.980 IU; niacin, 55 mg; α-
tocopherol, 33 mg; pantothenic acid 11 mg; riboflavin, 6.6 mg; pyridoxine, 4 mg; menadione, 2 mg; folic acid, 1.1 mg;
thiamin, 2 mg; vitamin B12, 0.02 mg; and biotin, 0.13 mg. 2 Mineral premix provided the following per kg of diet: Zn, 120 mg; Mn, 120 mg; Fe, 80 mg; Cu, 10 mg; I, 2.5 mg; Co, 1.0
mg. 3 Selenium premix provided 0.2 mg/kg Se. 4 Monensin was included at 99 mg/kg (Coban 90, Elanco Animal Health, Indianapolis IN, USA).

84
Table 3. Effect of particle size and DDGS inclusion on pellet durability index (PDI) and feed
pellet production rate
DDGS
Inclusion1 DDGS Particle
Size1 PDI
Pellet Production
Rate
(%) (µm) (%) (kg/hr)
Main Effects
15 85.68A 845a
30 82.28B 814b
SEM2 0.31 7
745 85.77A 808B
482 82.20B 851A
SEM2 0.31 7
Interaction Effects
15 745 88.30A 836A
15 482 83.07B 854A
30 745 83.24B 780B
30 482 81.33C 848A
SEM3 0.40 8
Source of variation ——————————— P-value ———————————
DDGS inclusion 0.001 0.015
DDGS particle size 0.001 0.002
DDGS inclusion x DDGS particle size 0.002 0.009 a-b Means with different superscripts in the same column differ significantly (P ≤ 0.05). A-C Means with different superscripts in the same column differ significantly (P ≤ 0.01). 1 Treatments consisted of two inclusions (15 and 30%) and two particle sizes (745 and 482 µm) of DDGS. 2 Standard error of the means for DDGS inclusion and DDGS particle size effect (n = 12). 3 Standard error of the means for the interaction of DDGS inclusion and DDGS particle size effect (n = 6).

85
Table 4. Effect of particle size, DDGS inclusion, and percentage of fines on feed on BW, feed intake, and feed conversion ratio
(FCR) of broilers from 1 to 42 d of age.
a-b Means with different superscripts in the same column differ significantly (P ≤ 0.05). A-B Means with different superscripts in the same column differ significantly (P ≤ 0.01). 1 Treatments consisted of two inclusions of DDGS (15 and 30%), two particle sizes of DDGS (coarse-745 µm and fine-482 µm), and 3 percentages of feed
fines (0, 25, and 50%). 2 FCR = Feed intake per pen/total pen BW gain, including weights of mortality that occurred during each time period. 3 Standard error of the means for DDGS inclusion and DDGS particle size effect (n = 36). 4 Standard error of the means for percentage of fines in the feed (n = 24).
DDGS
Inclusion1 DDGS Particle
Size1 Fines in
Feed1
BW
Feed Intake
FCR2
14 d 35 d 42 d 1-14 d 1-35 d 1-42 d 1-14 d 1-35 d 1-42 d
(%) (µm) (%) ————— (g) ————— ————— (g) ————— ——— (g:g) ———
Main Effects
15 368 2066 2860 461 3121 4533b 1.28 1.54 1.60b
30 370 2067 2850 459 3145 4601a 1.27 1.54 1.63a
SEM3 2 11 16 4 19 25 0.01 0.01 0.01
745 367 2060 2832b 457 3111 4534b 1.27 1.54 1.62
482 370 2073 2877a 463 3156 4600a 1.27 1.54 1.62
SEM3 2 11 16 4 19 25 0.01 0.01 0.01
0 368 2097a 2897A 461 3175 4597 1.28 1.53 1.60
25 368 2060ab 2855AB 458 3102 4560 1.28 1.54 1.62
50 370 2042b 2810B 461 3152 4544 1.27 1.55 1.62
SEM4 3 14 19 4 24 30 0.01 0.01 0.01
Source of variation ————————————————— P-value —————————————————
DDGS inclusion 0.590 0.904 0.635 0.742 0.370 0.050 0.455 0.797 0.023
DDGS particle size 0.422 0.420 0.047 0.308 0.108 0.050 0.653 0.623 0.838
Fines in feed 0.784 0.022 0.009 0.930 0.282 0.481 0.555 0.459 0.780

86
Table 5. Effect of particle size, DDGS inclusion, and percentage of feed fines on relative
gizzard and proventriculus weight at 42 d of age
DDGS
Inclusion1
DDGS Particle
Size1
Fines in
Feed
Relative Weight
Gizzard Proventriculus
(%) (µm) (%) (g/100g BW)
Main Effects
15 9.75 2.47b
30 9.64 2.64a
SEM2 0.16 0.05
745 9.96a 2.57
482 9.44b 2.54
SEM2 0.16 0.05
0 9.09B 2.64
25 9.85A 2.51
50 10.15A 2.52
SEM3 0.20 0.06
Source of variation ———— P-value ————
DDGS inclusion 0.553 0.012
DDGS particle size 0.031 0.632
Fines in feed 0.007 0.195 a-b Means with different superscripts in the same column differ significantly (P ≤ 0.05). A-B Means with different superscripts in the same column differ significantly (P ≤ 0.01). 1 Treatments consisted of two inclusion levels of DDGS (15 and 30%), two particle sizes of DDGS (coarse-745
µm and fine-482 µm), and 3 percentages of feed fines (0, 25, and 50%). 2 Standard error of the means for DDGS inclusion and DDGS particle size effect (n = 144). 3 Standard error of the means for percentage of feed fines (n = 96).

87
Table 6. Effect of particle size, DDGS inclusion, and percentage of feed fines on nitrogen (N), crude protein (CP), and energy
utilization (AME, AMEn, and GE) of male broilers from 1 to 42 d of age
DDGS
Inclusion
DDGS Particle
Size1
Fines in
Feed
N
Excreta
CP
Excreta
N
Retention
GE
Excreta
AME
AMEn
GE
Digestibility
(%) (µm) (%) (%) (%) (%) (kcal/kg) (kcal/kg) (kcal/kg) (%)
Main Effects
15 2.82 17.64 70.65 3810 2832b 2809b 74.45
30 2.88 17.96 69.79 3788 2868a 2845a 75.79
SEM2 0.04 0.23 0.39 18 12 12 0.58
745 2.85 17.81 69.68 3816 2816B 2793B 73.86B
482 2.85 17.80 70.76 3782 2884A 2861A 76.39A
SEM2 0.04 0.23 0.39 18 12 12 0.58
0 2.87 17.93 70.49 3837 2859 2836 74.58
25 2.85 17.81 69.99 3786 2842 2819 75.20
50 2.83 17.67 70.18 3774 2850 2827 75.58
SEM3 0.05 0.30 0.49 23 15 15 0.74
Source of variation ———————————————— P-value ——————————————
DDGS inclusion 0.341 0.335 0.128 0.416 0.037 0.035 0.111
DDGS particle size 0.991 0.977 0.057 0.181 0.001 0.001 0.004
Fines in feed 0.629 0.820 0.757 0.102 0.695 0.701 0.607 a-b Means with different superscripts in the same column differ significantly (P ≤ 0.05). A-B Means with different superscripts in the same column differ significantly (P ≤ 0.01). 1 Treatments consisted of two inclusions of DDGS (15 and 30%), two particle sizes of DDGS (coarse-745 µm and fine-482 µm), and 3 percentages of feed
fines (0, 25, and 50%). 2 Standard error of the means for DDGS inclusion and DDGS particle size effect (n = 144). 3 Standard error of the means for percentage of feed fines (n = 96).

88
Figure 1. Average particle size and particle size distribution of DDGS used in broiler diets
during the grower period as received (coarse-745 µm) and after grinding (fine-482 µm) in a
hammer mill equipped with 1.6 mm screen.

89
3.6. REFERENCES
Amerah, A. M., V. Ravindran, R. G. Lentle, and D. G. Thomas. 2007. Influence of feed
particle size and feed form on the performance, energy utilization, digestive tract
development, and digesta parameters of broiler starters. Poult. Sci. 86:2615-2623.
Amerah, A. M., V. Ravindran, R. G. Lentle, and D. G. Thomas. 2008. Influence of feed
particle size on the performance, energy utilization, digestive tract development and
digesta parameters of broiler starters fed wheat-and corn-based diets. Poult. Sci.
87:2320-2328.
AOAC International. 2006. Official Methods of Analysis. 18th ed. AOAC Intl.,
Gaithersburg, MD.
ASABE. 2007. Method of Determining and Expressing Fineness of Feed Materials by
Sieving. Am. Soc. Agric. Eng., St. Joseph, MI.
ASABE. 2007. Cubes, Pellets and Crumbles-Definitions and Methods for Determining
Density, Durability, and Moisture Content. Am. Soc. Agric. Eng. St. Joseph, MI.
Aviagen. 2007. Broiler nutrition specifications. Accessed on November 15th
, 2013.
http://en.aviagen.com/assets/Tech_Center/Ross_Broiler/Ross_708_Broiler_Nutrition_
Spec.pdf
Batal, A. B., and N. M. Dale. 2006. True metabolizable energy and amino acids digestibility
of distillers dried grains with solubles. J. Appl. Poult. Res. 15:89-93.
Behnke, K. C. 1994. Factors affecting pellet quality. in Maryland Nutrition Conference,
Dept. of Poultry Science and Animal Science, College of Agriculture, University of
Maryland, College Park.
Belyea, R., S. Eckhoff, M. Wallig, and M. Tumbleson. 1998. Variability in the nutritional
quality of distillers solubles. Bioresource Technol. 66:207-212.

90
Briggs, J. L., D. E. Maier, L. D. Watkins, and K. C. Behnke, 1999. Effect of ingredients and
processing parameters on pellet quality. Poult. Sci. 78:1464-1471.
Chewning, C. G. 2010. Evaluation of post pellet liquid application, particle size, and feed
form on broiler performance. M.S. Thesis. North Carolina State University. Raleigh,
NC.
Coon, C. N. 2002. Feeding egg type replacement pullet. Pages 267-285 in Commercial
Chicken and Egg Production. Bell, D. D., and W. D Weaver. Eds. Cluwer Academic
Publishers, Dort-thirty Recht. Netherland.
Cromwell, G. L., K. L. Herkelman, and T. S. Stahly. 1993. Physical, chemical and nutritional
characteristics of distillers dried grains with solubles for chicks and pigs. J. Anim.
Sci. 71:679-686.
Cutlip, S. E., J. M. Hott, N. P. Buchanan, A. L. Rack, J. D. Latshaw, and J. S. Moritz. 2008.
The effect of steam-conditioning practices on pellet quality and growing broiler
nutritional value. J. Appl. Poult. Res. 17:249-261.
Dozier, W. A., K. C. Behnke, C. K. Gehring, and S. L. Branton. 2010. Effects of feed form
on growth performance and processing yields of broiler chickens during a 42-day
production period. J. Appl. Poult. Res. 19:219-226.
Engberg, R. M., M. S. Hedermann, and B. B. Jensen. 2002. The influence of grinding and
pelleting of feed on the microbial composition and activity in the digestive tract of
broiler chickens. Br. Poult. Sci. 44:569-579.
Fan, M. Z., W. C. Sauer, R. T. Hardin, and K. A. Lien. 1994. Determination of apparent ileal
amino acid digestibility in pigs: Effect of dietary amino acid level. J. Anim. Sci.
72:2851-2859.
FASS. 2010. Guide for the Care and Use of Agricultural Animals in Research and Teaching.
3rd
ed. Fed. Anim. Sci. Soc., Champaign, IL.

91
Favero, A., A. Maiorka, F. Dahlke, R. F. P. Meurer, R. S. Oliveira, and R. F. Sens. 2009.
Influence of feed form and corn particle size on the live performance and digestive
tract development of turkeys. J. Appl. Poult. Res. 18:772-779.
Fiene, S. P., T. W. York, and C. Shasteen. 2006. Correlation of DDGS IDEA™ digestibility
assay for poultry with cockerel true amino acid digestibility. Pages 82-89. In: Proc.
4th
Mid-Atlantic Nutr. Conf. University of Maryland, College Park, MD.
Fontaine, J., U. Zimmer, P. J. Moughan, and S. M. Rutherfurd. 2007. Effect of heat damage
in an autoclave on the reactive lysine contents of soy products and corn distillers
dried grains with solubles: Use of the results to check on lysine damage in common
qualities of these ingredients. J. Agric. Food Chem. 55:10737-10743.
Hoffman, A., and A. Baker. 2010. Market Issues and Prospects for U.S. Distillers Grains
Supply, Use, and Price Relationships. U.S. Department of Agriculture, Economic
Research Service, http://www.ers.usda.gov/Publications/FDS/2010/11Nov/.
Jacobs, C. M., P. L. Utterback, and C. M. Parsons. 2010. Effect of corn particle size on
growth performance and nutrient utilization in young chicks. Poult. Sci. 89:539-544.
Jensen, L. S. 2000. Influence of pelleting on the nutritional needs of poultry. Asian-Austral.
J. Anim. Sci. 13: 35-46.
Jones, F. T., K. E. Anderson, and P. R. Ferket. 1995. Effect of extrusion on feed
characteristics and broiler chicken performance. J. Appl. Poult. Res. 4:300-309.
Jones, G., and R. D. Taylor. 2001. The incorporation of whole grain into pelleted broiler
chicken diets production and physiological responses. Br. Poult. Sci 42:477-483.
Goodband, R. D., M. D. Tokach, and J. L. Nelssen. 2002. The effects of diet particle size on
animal performance. MF-2050. Feed Manufacturing. Dept. Grain Sci. Ind., Kansas
State Univ., Manhattan, KS.

92
Kilburn, J., and H. M. Edwards. 2004. The effect of particle size of commercial soybean
meal on performance and nutrient utilization of broiler chicks. Poult. Sci. 83:428-432.
Kwiatkowski, J. R., A. J. McAloon, F. Taylor, and D. B. Johnston. 2006. Modeling the
process and costs of fuel ethanol production by the corn dry-grind process. Ind. Crops
Prod. 23:288-296.
Lumpkins, B. S., A. B. Batal, and N. M. Dale. 2004. Evaluation of distillers dried grains with
solubles as a feed ingredient for broilers. Poult. Sci. 83:1891-1896.
Martinez Amezcua, C., C. M. Parsons, and D. H. Baker. 2004. Content and relative
bioavailability of phosphorus in distillers dried grains with solubles in chicks. Poult.
Sci. 83:971-976.
Marty, B. J., E. R. Chavez, and C. F. Lange. 1994. Recovery of amino acids at the distal
ileum for determining apparent and true ileal amino acid digestibilities in growing
pigs fed various heat-processed full-fat soybeans products. J. Anim. Sci. 72:2029-
2037.
Merrill, A. L., and B. K. Watt. 1973. Energy Value of Foods - Basis and Derivation.
Agriculture Handbook. US Goverment Printing Office, Washington, DC.
Min, Y. N., F. Z. Liu, Z. Wang, C. Coto, S. Cerrate, F. P. Costa, F. Yan, and P. W.
Waldroup. 2008. Evaluation of distillers dried grains with solubles in combination
with glycerin in broiler diets. Intl. J. Poult. Sci. 7:646-654.
Moritz, J. S., K. R. Cramer, K. J. Wilson, and R. S. Beyer. 2003. Feed manufacture and
feeding of rations with graded levels of added moisture formulated to different energy
densities. J. Appl. Poult. Res. 12:371-381.
Nir, I., R. Hillel, G. Shefet, and Z. Nitsan. 1994. Effect of grain particle size on performance.
2. Grain texture interactions. Poult. Sci. 73:781-791.

93
Nir, I., R. Hillel, I. Ptichi, and G. Shefet. 1995. Effect of particle size on performance. 3.
Grinding pelleting interactions. Poult. Sci. 74:771-783.
Nir, I., and I. Ptichi. 2001. Feed particle size and hardness: Influence on performance,
nutritional, behavioral and metabolic aspects. Pages 157-186 in Proc. 1st World Feed
Conf., Utrecht, Netherlands.
Noll, S., C. M. Parsons, and W. Dozier. 2007. Formulating poultry diets with DDGS- How
far can we go?. Pages 91-99 in Proc. 5th
Mid-Atlantic Nutr. Conf. Timonium, MD.
Pacheco, W. J., C. R. Stark, P. R. Ferket, and J. Brake. 2013. Evaluation of soybean meal
source and particle size on broiler performance, nutrient digestibility, and gizzard
development. Poult. Sci. 92:2914-2922.
Parsons, A. S., N. P. Buchannan, K. P. Bleming, M. E. Wilson, and J. S. Moritz. 2006. Effect
of corn particle size and pellet texture on broiler performance in the growing phase. J.
Appl. Poult. Res. 15:245-255.
Reece, F. N., B. D. Lott, and J. W. Deaton. 1986. Effects of environmental temperature and
corn particle size on response of broilers to pelleted feed. Poult. Sci. 65:636-641.
Rynsburger, J. M. 2009. Physiology and nutritional factors affecting protein digestion in
broiler chickens. M.S. Thesis. University of Saskatchewan, Saskatoon, Canada.
SAS. 2006. SAS/STAT User's guide, SAS Institute, Inc., SAS Press, Cary, NC.
Shim, M. Y., G. M. Pesti, R. I. Bakalli, P. B. Tillman, and R. L. Payne. 2011. Evaluation of
corn distillers dried grains with solubles as an alternative ingredient for broilers.
Poult. Sci. 90:369-376.
Spiehs, M. J., M. H. Whitney, and G. C. Shurson. 2002. Nutrient database for distillers dried
grains with solubles produced from new ethanol plants in Minnesota and South
Dakota. J. Anim. Sci. 80:2639-2645.

94
Stark, C. R. 1994. Pellet quality I. Pellet quality and its effects on swine performance. Ph.D.
Dissertation, Kansas State University, Manhattan.
Stark, C. R. 2012. Feed manufacturing to lower feed cost. Pages 127-133 in Allen D. Leman
Swine Conf. Minneapolis. MN.
Stender, D., and M. S. Honeyman. 2008. Feeding pelleted DDGS-based diets for finishing
pigs in deep-bedded hoop barns. J. Anim. Sci. 86 (Suppl. 2):50.
Thomas, M., T. van Vliet, and A. F. B. van der Poel. 1998. Physical quality of pelleted
animal feed. 3. Contribution of feedstuff components. Anim. Feed Sci. Technol.
70:59-78.
Wondra, K. J., J. D. Hancock, K. C. Behnke, R. H. Hines, and C. R. Stark. 1995. Effects of
particle size and pelleting on growth performance, nutrient digestibility, and stomach
morphology in finishing pigs. J. Anim. Sci. 73:757-763.

95
CHAPTER IV
EFFECT OF INCLUSION LEVEL AND METHOD OF ANALYSIS FOR CRUDE
FAT OF DDGS ON NUTRIENT DIGESTIBILITY, FOOTPAD LESIONS, AND
BROILER LIVE PERFORMANCE

96
4.1. ABSTRACT
Research has shown that up to 30% of DDGS could be used when broiler diets were
formulated on a digestible amino acid basis, but the maximum inclusion level of DDGS
when diets were formulated on a crude protein basis remained unclear. The ME value of
DDGS has typically been calculated based on crude fat, crude protein, and fiber content.
Crude fat of DDGS has been determined by ether extract (AOAC 920.39) or by including an
acid hydrolysis pretreatment (AOAC 954.02), which has generally yields about 2% higher
crude fat values and thus about 2.2% higher ME values. The objective of this study was to
evaluate the effect of DDGS inclusion level and the method of CF analysis on pellet quality,
nutrient digestibility, incidence of footpad lesions, and broiler live performance. A total of
1,050 male broiler chicks were randomly distributed among 5 treatments with 6 replicate
pens per treatment and 35 birds per pen. The treatments consisted of a control diet without
DDGS and a factorial arrangement of two analytical methods for CF analysis (AOAC 920.39
and AOAC 954.02) and two DDGS inclusion levels (15 and 30%). The DDGS ME values
used for feed formulation were 2,631 and 2,689 kcal/kg based upon these two analytical
methods. Feed consumption and BW were determined at 14, 35, and 49 d of age, and FCR
calculated. At 35 and 49 d ileal samples were obtained for nutrient digestibility analyses.
Footpad lesion scores were evaluated at 50 d of age. The analytical method AOAC 954.02
resulted in lower mixer fat addition and improved pellet quality (P≤0.01). In contrast,
increasing DDGS inclusion level to 30% reduced pellet quality (P≤0.01), BW (P≤0.01), feed
efficiency (P≤0.01), protein digestibility (P≤0.01), and increased footpad lesion score
(P≤0.01). It was concluded that broilers could be fed up to 15% DDGS when diets were

97
formulated on a crude protein basis, while the method of estimating crude fat and ME had a
marginal effect on live performance.
Key words: digestibility, energy, footpad, pellets
4.2. INTRODUCTION
The rapid increase in production of corn-based ethanol has resulted in increased
amounts of distillers dried grains with solubles (DDGS) entering poultry feed formulations as
a source of protein, phosphorus, and energy to replace corn and soybean meal (SBM). In
poultry diets, DDGS had been reported to possess lower amino acid bioavailability,
especially lysine and tryptophan (Baker, 2009). DDGS has been reported to contain a high
level of non-starch polysaccharides (NSP), which limits its inclusion in poultry diets (Choct,
2006). Lumpkins et al. (2004) reported that broilers could be fed 6% DDGS in the starter
phase and up to 12 and 15% during the grower and finisher phases without affecting live
performance.
Energy and essential amino acids have been identified as the most costly and essential
nutrients for live performance (Leeson, 2009). It has become essential to precisely measure
the available energy content of an ingredient in order to make precise feed formulations.
According to Batal and Bregendahl (2011), the most common method to determine the
energy value of an ingredient was the nitrogen corrected metabolizable energy (MEn). The
MEn of DDGS has been calculated based on its chemical composition, which has included
crude fat, crude protein, crude fiber, and possibly ash content. According to Batal and Dale
(2006), crude fat content is the best single indicator for MEn (r2 = 0.29), but the addition of

98
other chemical components, such as crude protein, fiber, and ash, improves the accuracy of
the prediction equation (r2
= 0.45). However, the best method to analyze crude fat content of
DDGS remains unclear. The most common methods of crude fat determination in feed
ingredients are AOAC methods 920.39 and 954.02 (AOAC, 2006). Method 954.02, which
involves an initial acid hydrolysis step, results in approximately 2% higher crude fat content
than method 920.39, which uses ether extract only. Previous research conducted in our
laboratory (unpublished data) found that when diets were formulated on a digestible amino
acid level, birds could be fed up to 30% DDGS without affecting live performance. However,
there is the necessity to investigate maximum inclusion of DDGS when the diets were
formulated on a crude protein or total amino acid basis. High dietary inclusion of DDGS has
been reported to reduce nitrogen retention and increased nitrogen excretion into the litter of
poultry (Roberts at al., 2007; Applegate et al., 2009). Shepherd and Fairchild (2010) reported
that litter quality and nutrition were the major factors that influenced footpad dermatitis
(FPD) in poultry. Increased ammonia in the litter, particularly in wet litter conditions, has
also been associated with increased incidence of footpad lesions in poultry. The objective of
this study was to evaluate the effect of dietary inclusion levels and metabolizable energy
value estimation method of DDGS on nutrient digestibility, footpad lesion score, and broiler
live performance.
99
4.3. MATERIALS AND METHODS
4.3.1. DDGS analyses
A lot of DDGS was obtained from a local elevator in Selma, NC and a sample of it
was analyzed for ether extract (method 920.39), ether extract after HCl acid hydrolysis
(method 954.02), crude protein (N x 6.25) (method 990.03), and crude fiber (method 962.09;
AOAC, 2006) prior to feed formulation. Dry sieving according to ASAE method S319.3
(ASABE, 2007) was used to determine the particle size of DDGS with the addition of sieve
agitators and 0.5 g of dispersing agent per 100 g of sample.
4.3.2. Diets
Diets composed mainly of corn, SBM, and DDGS were formulated to meet or exceed
suggested minimum requirements of Ross 708 broilers (Aviagen, 2007) (Table 1). Diets were
formulated on a crude protein basis and were calculated to be isocaloric and isonitrogenous.
The grower and finisher diets contained 0.5% titanium dioxide, which was used as an
indigestible marker for nutrient digestibility determination. Feed was produced at the North
Carolina State University Feed Mill Educational Unit (Raleigh, NC) following current Good
Manufacturing Practices (GMP). Dry ingredients were mixed using a counterpoise mixer
(Model: TRDB126060, Hayes & Stolz, Fort Worth, TX). The mixed diets were conditioned
to 88°C for 45 seconds, and then pelleted using a pellet mill (Model PM1112-2, California
Pellet Mill Co., Crawfordsville, IN) equipped with a 3.5 mm x 36 mm die. Pellets were
cooled with ambient air in a counter-flow cooler (Model VK09x09KL, Geelen Counterflow
USA Inc., Orlando, Florida).

100
4.3.3. Bird Husbandry
The care of the animals used in this trial conformed to the Guide for Care and Use of
Animals in Agricultural Research and Teaching (FASS, 2010). A total of 1,050 male Ross
708 broilers (Aviagen Inc., Huntsville, AL) were obtained from the university broiler breeder
flock. Birds were hatched at the research location and then reared in a curtain-sided, heated,
and fan ventilated broiler house until 49 d of age. Birds were randomly allocated with 35
birds per pen to 30 pens in total. Each pen (120 x 380 cm) contained one bell-type drinker
and two tube feeders and was assigned to 1 of 5 dietary treatment combinations with 6
replicate pens per combination. Birds were raised on used litter that was top-dressed with
new wood shavings at the start of the study and had ad libitum access to water and feed
throughout the study. Three supplemental feeder flats were used until 7 d of age, 2 feeder
flats until 10 d, and 1 feeder flat until 14 d of age. Small amounts of feed were added twice
daily to the feeder flats to guarantee appropriate feed consumption. Feed that remained in the
feeder flat at 14 d was screened and added to the tube feeders before weigh back. A common
starter diet that contained 6% DDGS was used until 14 d of age in order to adapt the
gastrointestinal tract (GIT) of the birds to efficiently digest DDGS and to avoid sudden
changes in the nutrition and feeding program. Birds were fed 0.9 kg/bird of starter, 2.7
kg/bird of grower, and 4.1 kg/bird of finisher feed. Starter diets were fed as crumbles, and
grower and finisher diets were fed as pellets. Starter and grower feed were adjusted to
provide the same quantity of each feed per bird in order to maintain a similar cumulative
nutrient package.

101
Feed additions were weighed, recorded, and added in 454 g (1 lbs.) increments per
bird alive. Feeders were shaken once per day from 1 to 14 d, and three times per day from 15
to 49 d to maintain fresh feed in front of the birds, as well as to stimulate and prevent
variation in feed intake due to feed flow characteristics. Photoperiods were 23L:1D from 1 to
7 d, 22L:2D to 14 d, and 20L:4D to 21 d with natural light employed from 22 to 42 d of age.
High and low temperatures were recorded daily and stirring fans were used to maintain a
uniform temperature in the entire house. The target temperatures were 32°C from placement
to 7 d, 29ºC to 14 d, 27ºC to 21 d, and ambient thereafter.
4.3.4. Data Collection and Laboratory Analyses
Standard processing data, such as pellet production rate and conditioning temperature,
were controlled closely during feed manufacturing. The durability of the pellets was
determined according to the American Society of Agricultural Engineers standard method
S269.4 (ASABE, 2007). Prior to testing, approximately 2,500 g of pellets were collected
from each treatment with 6 samples taken at evenly spaced time intervals upon discharge
from the pellet mill and placed into cooling trays at a depth of approximately 1 cm and
cooled for 8 minutes with ambient air using a counter flow pellet cooler. The standard tumble
box method was used a device locally constructed and operated in accordance with the
ASABE standard. Two sub-samples of pellets were screened using a US #6 sieve (3.35 mm)
to remove the fines produced during the pelleting process and 500 g of each placed into 1 of
the 4 compartments of the tumbling box. For the modified method three hex nuts (50 g/nut)
were added in the tumble box compartment. The sub-samples were tumbled at 50 rpm for 10

102
min. After tumbling each sub-sample was sifted again using a US #6 sieve to remove the
fines and the re-weighed. The pellet durability index was calculated as the ratio of the weight
of the pellets that remained in the sieve after tumbling relative to the initial weight before
tumbling (500 g) and reported as a percentage. The compartments in the tumbling box were
cleaned by hand after each pellet durability test in order to remove any fines build-up in the
corners.
Feed and average BW on a pen basis were recorded at the beginning of the
experiment and at the end of the starter, grower, and finisher periods for determination of
BW gain, feed consumption, and feed conversion ratio (FCR). Mortality was monitored and
recorded twice daily and the BW of birds that died was used to adjust the FCR. Cumulative
FCR was calculated for the periods of 1-14, 1-35, and 1-49 d of age.
At 35 and 49 d of age, three birds in each pen were killed by cervical dislocation and
ileal digesta was collected (2 cm posterior of Meckel’s diverticulum to 2 cm anterior of the
ileal-cecal junction) by gently squeezing the ileal contents in a manner that provided
sufficient sample for digestibility analysis. Ileal digesta was placed on ice, and subsequently
frozen at -20ºC. Ileal samples were lyophilized and subsequently ground through a 0.5 mm
screen. At 50 d of age, footpad lesion scores on each bird in each pen were evaluated using a
10-point visual scale from 0 to 9 following the methodology of Allain et al. (2009).

103
4.3.5. Ileal analyses
Titanium dioxide analysis was used to calculate ileal digestibility of energy, fat, and
protein (Fan et al., 1994; Marty et al., 1994). Fat analysis of feed and ileal samples were
performed using the crude fat extraction method (AOAC 920.39) and the total fat extraction
method (AOAC 954.02), which included a previous acid hydrolysis with 5N HCl (AOAC,
2006). Crude fat analyses were performed using the Ankom XT15
extractor and the AnkomHCl
hydrolysis system (Ankom Technology, Macedon, NY). Nitrogen content of the feed and
ileal samples (AOAC 990.03) was determined using a LECO model FP 2000 N combustion
analyzer (LECO Corp., St. Joseph, MI) (AOAC, 2006). Dry matter content of the ground
diets and the freeze-dried ileal samples was determined using method 930.15 by drying the
samples at 135ºC for 2 h (AOAC, 2005).
4.3.6. Statistical Analyses
The experiment was analyzed as ANOVA using a randomized complete block design
to identify main effects and interactions. The treatments consisted of a factorial arrangement
of 3 inclusion levels of DDGS (0, 15, and 30% DDGS) and two analytical methods to
analyze the crude fat content of DDGS (method 920.39 and method 954.02, AOAC, 2006). A
pen of broilers served as the experimental unit for the statistical analysis of the live
performance data. Data were analyzed using PROC GLM (SAS, 2006). Statements of
statistical differences were based upon P≤0.05 unless otherwise indicated. Differences
between means were separated with the least significant difference test.

104
4.4. RESULTS AND DISCUSSION
4.4.1. Feed Manufacturing
There was a significant effect of the dietary inclusion level of DDGS on pellet
durability (P≤0.01) of the grower and finisher diets. Pellet durability was negatively affected
when the inclusion level of DDGS was increased (Table 2). As the inclusion level of DDGS
increased from 0% to 30%, pellet durability decreased from 85% to 75% in the grower diets
and from 79% to 61% in the finisher diets. The main factor that likely contributed to the
reduced pellet quality was a higher amount of poultry fat added in the mixer to compensate
for the lower ME level as the dietary inclusion level of DDGS increased (Fig. 1 and 2).
DDGS replaced corn and SBM in the experimental diets and since DDGS had lower ME
content than corn, more fat was added to the diet in the mixer as the inclusion level of DDGS
increased. Fat functions as a lubricant as the conditioned mash passes through the die (Stark,
1994; Thomas et al., 1998), thus decreasing friction and feed pellet compression. Richardson
and Day (1976) reported that increasing the percentage of added fat into the mixer from 1 to
4% increased the percentage of feed fines in the pelleted feed from 18 to 31.6% and it also
increased production rate from 11.6 to 13.2 ton/hr. Fahrenholz (2008) reported a decrease in
pellet quality when the inclusion level of DDGS increased from 0 to 20%. However, the
pellet quality of diets containing 10% DDGS did not differ from the control diets without
DDGS.
The analytical method of crude fat analysis had an effect on pellet quality (P≤0.01)
and feed production rate (P≤0.05). Diets in which the level of fat in the DDGS was analyzed

105
using method 154.02 had a higher PDI (P≤0.01) but lower production rate as compared to
diets in which DDGS were analyzed using method 990.03. This was logical since method
154.02 presumed a greater fat level in the DDGS. Hence, less fat was added in the mixer in
order to obtain the desired dietary ME level. Stark (1994) reported that increasing the amount
of added fat in the mixer by 1.5 and 3% decreased pellet quality by 2% and 5%, respectively.
Salmon (1985) reported a decrease in pellet durability with increased inclusion of added fat
in the mixer. In contrast, Wang et al. (2008a) reported less variation in percentage fines
generated in DDGS containing diets when the amount of fat added in the mixer was
maintained constant.
An interaction was observed between DDGS inclusion level and the analytical
method (P≤0.05) on pellet quality in the grower and finisher diets. When the DDGS was
analyzed using method 154.02, there were no differences in pellet durability between diets
that contained either 15 or 30% DDGS. However, when DDGS was analyzed using method
990.03 the pellet durability decreased as the dietary inclusion of DDGS increased from 15 to
30%. In addition, an interaction between dietary DDGS inclusion and analytical method
(P≤0.01) on feed production rate was observed in the grower feed. The feed production rate
was not different at either 15 or 30% dietary inclusion of DDGS when the DDGS sample was
analyzed using method 990.03. However, when the DDGS sample was analyzed using
method 154.02, the feed production rate increased (P≤0.01) as the inclusion of DDGS was
increased from 15 to 30%. Altered levels of added fat in the mixer explained these results.
When diets were formulated using method 154.02, the difference in mixer fat addition

106
between 15 and 30% DDGS diets was approximately 0.45%, but when diets were formulated
using method 990.03 the difference was approximately 0.64% (Table 1).
4.4.2. Broiler Live Performance
No differences were observed for BW, FCR, and feed consumption at 14 d of age.
This was expected since all birds received a common starter diet that contained 6% DDGS.
Loar et al. (2010) reported an interaction between the starter and grower diets regarding the
inclusion of DDGS as birds that consumed diets with 8% DDGS in the starter maintained a
normal feed consumption when the dietary inclusion of DDGS was increased to 22.5 or 30%
in the grower feed. However, birds that consumed diets without DDGS in the starter diet
exhibited decreased feed consumption when DDGS were increased to 22.5 and 30% in the
grower diet.
There was a main effect of dietary inclusion level of DDGS on BW and FCR at 35
and 49 d of age (Table 3). Birds fed the control diet without DDGS or 15% DDGS had a
greater BW than birds fed the diets containing 30% DDGS (P≤0.01) at 35 d of age. These
results were in agreement with Wang et al. (2008b), who showed that there was as significant
decrease in BW gain in the grower period when dietary inclusion of DDGS exceeded 20%.
Loar et al. (2010) reported similar results with no differences in BW gain from 14 to 28 days
of age when DDGS comprised 15% of the diet. Wang et al. (2007) reported that feeding diets
containing 30% DDGS decreased live performance and breast meat yield, but diets
containing 15% DDGS had performance comparable to the control diet without DDGS. At
49 d of age, the birds fed diets without DDGS had a greater BW than birds fed diets

107
containing 15 or 30% DDGS (P≤0.01). The increased BW in diets without DDGS was not
related to increased feed consumption, thus improving FCR significantly (P≤0.01). At 35 and
49 d of age, birds fed diets without DDGS or 15% DDGS exhibited improved FCR than birds
fed diets that contained 30% DDGS (P≤0.01). Wang et al. (2008) reported reduced feed
efficiency as the dietary inclusion of DDGS increased from 20 to 30% in the grower phase.
During the ethanol processing, DDGS are exposed to a drying process, thus the risk of heat
damaged proteins. Fiene et al. (2006) measured lysine digestibility from eight different
sources and reported values that ranged from 56.9 to 72.2%. The poor feed efficiency
observed in diets that contained 30% DDGS may have been related to poor amino acid
digestibility. If the drying process of DDGS is not monitored closely, overheating could
initiate the Maillard reaction, which has been reported to be very detrimental to the
nutritional quality of DDGS by causing reducing carbohydrates and amino acids to react and
become chemically bound (Noll et al., 2001).
The analytical method used to measure the crude fat in DDGS did not have an effect
on broiler live performance throughout the study, which suggested that the crude fat could be
analyzed using either method. The ME values of DDGS were 2,689 kcal/kg for method
154.02 and 2,631 kcal/kg for method 990.03. However, analyzing the crude fat content of
DDGS using ether extract alone is a more conservative method to guarantee optimum broiler
performance. The American Feed Industry Association (AFIA, 2007) has recommended the
method AOAC 945.16 (Soxhlet extraction with petroleum ether) without acid hydrolysis to
analyze crude fat in the DDGS.

108
4.4.3. Nutrient Digestibility and Footpad Lesion Scores
The dietary inclusion level of DDGS and the analytical method used to measure the
crude fat in DDGS did not have an effect on crude fat digestibility. However, the dietary
DDGS inclusion level did have a significant effect on nitrogen digestibility. Birds fed diets
without DDGS or 15% DDGS had greater nitrogen digestibility at 35 (P≤0.05) and 49
(P≤0.01) d of age than birds fed diets containing 30% DDGS. Min et al. (2011) reported that
diets containing 30% DDGS increased the levels of nitrogen and protein in the excreta and
decreased nitrogen retention as compared to diets without DDGS. The decreased nitrogen
digestibility in diets containing 30% DDGS could be related to reduced amino acids
digestibility, particularly lysine as it is most susceptible to Maillard reactions with reducing
sugars upon heat processing. Since poultry do not possess enzymes that break the lysine-
sugar complex bond, the lysine is rendered nutritionally unavailable (Batal and Bregendahl,
2011). Aldeola and Ilelegi (2009) reported that increasing the inclusion of DDGS from 0 to
300 and 600 g/kg in broiler diets from 14 to 21 d of age decreased nitrogen retention from
65.15% to 51.12 and 33.6 %, respectively. Although analytical method to measure the crude
fat content of DDGS did not affect footpad lesions score in this study, the inclusion level of
DDGS in the diet did significantly affect footpad lesions score (P≤0.01) at 50 d of age. Birds
fed diets containing 30% DDGS exhibited greater severity of footpad lesions than birds fed
diets without or with 15% DDGS; this could be related to lower nitrogen digestibility (Fig.
3).
Pellet durability in this study was negatively affected when the inclusion level of
DDGS was increased from 0 to 30% principally due to a higher fat addition prior to pellet in

109
order compensate for a lower ME of DDGS compared to corn and to keep the diets
isocaloric. Generally speaking, the protein in DDGS is denatured by heat processing during
the drying process of DDGS and possible by alcohol during the fermentation process and
therefore is not longer functional as pellet binder during particle agglomeration. Additionally,
the higher amount free fat added in DDGS containing diets before pelleting interferes with
moisture and heat penetration into feed particles during mash conditioning and thus prevents
the hydrogen bonding during particle agglomeration during pellet compression in the die.
Since fat also increase the lubrication of the die and reduce frictional heat, less starch
gelatinization occurs in the surface of the pellet. The method 154.02 of fat analysis had a
positive effect on PDI, but lower production rate as this method presumed a higher
percentage of fat in the DDGS and thus less fat added prior to pelleting in order to keep diets
isocaloric. However, the method of fat analysis did not have a positive or negative effect on
nutrient digestibility, incidence of footpad lesions and broiler live performance. The
inclusion of 30% DDGS decreased nitrogen retention and increased the incidence of footpad
lesions. The results of this study indicated that up to 15% DDGS could be fed when diets
were formulated on a total amino acid basis.

110
4.5 TABLES AND FIGURES
Table 1. Composition and calculated contents of the experimental diets (% as fed basis)
Item Starter
Grower Finisher
0 DDGS
15 DDGS 30 DDGS
0 DDGS
15 DDGS 30 DDGS
AOAC
154.02
AOAC
990.03
AOAC
154.02
AOAC
990.03
AOAC
154.02
AOAC
990.03
AOAC
154.02
AOAC
990.03
Ingredient Name ——————————————————— (%) ————————————————————————
Corn 52.73 62.97 54.66 54.44 46.38 45.92 66.92 58.62 58.41 50.32 49.88
Soybean meal, 48% CP 33.25 30.92 23.74 23.78 16.56 16.63 26.17 19.00 19.03 11.82 11.89
DDGS 6.00 0.00 15.00 15.00 30.00 30.00 0.00 15.00 15.00 30.00 30.00
Poultry fat 3.62 1.11 1.56 1.74 2.00 2.38 1.83 2.28 2.46 2.73 3.10
Dicalcium phosphate 1.95 1.73 1.57 1.57 1.41 1.41 1.77 1.61 1.61 1.45 1.45
Vermiculite 0.00 0.50 0.50 0.50 0.50 0.50 0.50 0.50 0.50 0.50 0.50
Titanium dioxide 0.00 0.50 0.50 0.50 0.50 0.50 0.50 0.50 0.50 0.50 0.50
Limestone 0.96 0.85 0.96 0.96 1.06 1.08 0.86 0.98 0.98 1.09 1.09
Salt 0.50 0.50 0.50 0.50 0.50 0.50 0.50 0.50 0.50 0.50 0.50
DL-Methionine, 99% 0.22 0.21 0.14 0.14 0.08 0.08 0.17 0.11 0.11 0.05 0.05
Vitamin premix1 0.05 0.05 0.05 0.05 0.05 0.05 0.05 0.05 0.05 0.05 0.05
Mineral premix2 0.20 0.20 0.20 0.20 0.20 0.20 0.20 0.20 0.20 0.20 0.20
Choline chloride, 60% 0.20 0.20 0.20 0.20 0.20 0.20 0.20 0.20 0.20 0.20 0.20
L-Lysine-HCl, 78% 0.13 0.10 0.24 0.24 0.37 0.37 0.13 0.26 0.26 0.40 0.40
L-Threonine 0.10 0.07 0.07 0.07 0.07 0.08 0.09 0.09 0.09 0.09 0.09
Selenium premix3 0.05 0.05 0.05 0.05 0.05 0.05 0.05 0.05 0.05 0.05 0.05
Coccidiostat4 0.05 0.05 0.05 0.05 0.05 0.05 0.05 0.05 0.05 0.05 0.05
Calculated nutrients
ME, kcal/g 2.95 2.87 2.87 2.87 2.87 2.87 2.95 2.95 2.95 2.95 2.95
Crude protein 22.00 20.00 20.00 20.00 20.00 20.00 18.00 18.00 18.00 18.00 18.00
Calcium 0.90 0.80 0.80 0.80 0.80 0.80 0.80 0.80 0.80 0.80 0.80
Available P 0.45 0.40 0.40 0.40 0.40 0.40 0.40 0.40 0.40 0.40 0.40
Lysine 1.26 1.14 1.14 1.14 1.14 1.14 1.03 1.03 1.03 1.03 1.03
TSAA 0.92 0.83 0.83 0.83 0.83 0.83 0.75 0.75 0.75 0.75 0.75
Threonine 0.83 0.74 0.74 0.74 0.74 0.74 0.69 0.69 0.69 0.69 0.69 1 Vitamin premix provided the following per kg of diet: vitamin A, 6600 IU; cholecalciferol, 1.980 IU; niacin, 55 mg; α-tocopherol, 33 mg; pantothenic acid 11 mg;
riboflavin, 6.6 mg; pyridoxine, 4 mg; menadione, 2 mg; folic acid, 1.1 mg; thiamin, 2 mg; vitamin B12, 0.02 mg; and biotin, 0.13 mg. 2 Mineral premix provided the following per kg of diet: Zn, 120 mg; Mn, 120 mg; Fe, 80 mg; Cu, 10 mg; I, 2.5 mg; Co, 1.0 mg. 3 Selenium premix provided 0.2 mg/kg Se. 4 Monensin was included at 99 mg/kg (Coban 90, Elanco Animal Health, Indianapolis IN, USA).

111
Table 2. Effect of inclusion level of DDGS and metabolizable energy value of DDGS on
pellet durability index (PDI) and pellet production rate
DDGS Inclusion
Level1 AOAC Method1
PDI2
Pellet Production Rate
Grower
Finisher
Grower Finisher
(%) ———— (%) ———— —— (kg/hr) ——
Main effects
0 85.23A 78.67A 679B 905
15 79.48B 69.25B 740A 915
30 75.07C 61.00C 744A 915
SEM3 0.57 0.73 2 4
AOAC 990.03 74.65B 61.83B 755A 920a
AOAC 154.02 79.90A 68.42A 728B 909b
SEM3 0.57 0.73 2 4
Interaction effects
15 AOAC 990.03 77.77b 68.17A 759A 919
30 AOAC 990.03 71.53c 55.50B 752A 921
15 AOAC 154.02 81.20a 70.33A 721C 910
30 AOAC 154.02 78.60ab 66.50A 735B 908
SEM4 0.81 1.03 2 5
Source of variation ————————— P-value ————————
DDGS inclusion level 0.001 0.001 0.001 0.079
Analytical method 0.001 0.001 0.001 0.029
DDGS inclusion level x analytical method 0.036 0.004 0.002 0.699 a-c Means with different superscripts in the same column differ significantly (P≤0.05). A-C Means with different superscripts in the same column differ significantly (P≤0.01). 1 Treatments consisted of three inclusion levels of DDGS (0, 15, and 30%) with two energy values of DDGS
that were determined by ether extract (2,631 kcal/kg) or acid hydrolysis (2,689 kcal/kg). 2 Pellet durability was measured according to American Society of Agricultural Engineers standard method
S269.4. 3 Standard error of the mean for DDGS inclusion level and method of fat analysis (n = 12). 4 Standard error of the mean for the interaction of DDGS inclusion level and method of fat analysis (n= 6).

112
Table 3. Effect of inclusion level of DDGS and metabolizable energy value of DDGS on BW, feed intake, and feed conversion
ratio (FCR) of broilers from 1 to 49 d of age
DDGS Inclusion
Level1
AOAC Method1
BW
Feed Intake
FCR2
14 d 35 d 49 d 1-14 d 1-35 d 1-49 d 1-14 d 1-35 d 1-49 d
(%) ———— (g) ———— ———— (g) ———— ————— (g:g) —————
Main effects
0 507 2693A 4356
A 660 4192 7765 1.44 1.59
B 1.91
C
15 504 2668A 4290
B 656 4133 7696 1.44 1.58
B 1.93
B
30 510 2605B 4193
C 661 4142 7688 1.43 1.62
A 1.97
A
SEM3
3 8 15 5 19 37 0.01 0.01 0.01
AOAC 990.03 507 2644 4249 658 4139 7705 1.44 1.60 1.94
AOAC 154.02 506 2629 4234 659 4137 7679 1.44 1.61 1.95
SEM3
3 8 15 5 19 37 0.01 0.01 0.01
Interaction effects
15 AOAC 990.03 503 2671 4287 655 4132 7688 1.44 1.59 1.93
15 AOAC 154.02 504 2666 4293 657 4135 7703 1.44 1.58 1.92
30 AOAC 990.03 512 2617 4211 662 4145 7722 1.43 1.61 1.96
30 AOAC 154.02 508 2592 4175 660 4139 7654 1.44 1.63 1.97
SEM4
4 11 22 7 27 52 0.01 0.01 0.01
Source of variation —————————————————— P-value —————————————————
DDGS inclusion level 0.174 0.001 0.002 0.477 0.745 0.880 0.434 0.001 0.002
Analytical method 0.722 0.201 0.491 0.978 0.947 0.616 1.000 0.389 0.825
DDGS inclusion level x analytical method 0.528 0.386 0.347 0.809 0.880 0.434 0.530 0.139 0.510 a-c Means with different superscripts in the same column differ significantly (P ≤ 0.05). A-C Means with different superscripts in the same column differ significantly (P ≤ 0.01). 1 Treatments consisted of three inclusion levels of DDGS (0, 15, and 30%) with two energy values of DDGS that were determined by ether extract (2,631
kcal/kg) or acid hydrolysis (2,689 kcal/kg). 2 FCR = Feed intake per pen/total pen BW gain, including BW of mortality that occurred during each time period. 3 Standard error of the mean for DDGS inclusion level and method of fat analysis (n = 12). 4 Standard error of the mean for the interaction of DDGS inclusion level and method of fat analysis (n= 6).

113
Table 4. Effect of inclusion level of DDGS and metabolizable energy value of DDGS on protein, fat digestibility, and footpad
lesion score at 49 d of age
DDGS Inclusion
Level1 Analytical Method1
Digestibility at 35 d Digestibility at 49 d Footpad Lesion Score
Protein Fat Protein Fat (35 d) (49 d)
(%) ———— (%) ———— ————— (%) ———— ——— (Range 0-9) ———
Main effects
0 73.51a 87.63 69.66A 90.88 1.52b 3.51C
15 70.03b 87.86 69.84A 88.39 1.59b 3.77B
30 65.96c 87.35 62.03B 89.98 1.74a 4.32A
SEM3 1.33 1.43 1.87 1.72 0.05 0.09
AOAC 990.03 68.49 85.96 65.24 88.43 1.68 4.10
AOAC 154.02 67.50 89.25 66.63 89.94 1.73 4.01
SEM3 1.33 1.43 1.87 1.72 0.05 0.09
Interaction effects
15 AOAC 990.03 69.73 86.06 68.17 87.08 1.56 3.86
30 AOAC 990.03 67.25 85.86 62.31 89.78 1.65 4.33
15 AOAC 154.02 70.34 89.66 71.50 89.70 1.63 3.69
30 AOAC 154.02 64.67 88.83 61.76 90.18 1.84 4.32
SEM4 1.87 2.02 2.64 2.44 0.07 0.13
Source of variation —————————————————— P-value ——————————————————
DDGS inclusion level 0.043 0.802 0.007 0.521 0.025 0.001
Analytical method 0.606 0.119 0.603 0.544 0.452 0.513
DDGS inclusion level x analytical method 0.407 0.877 0.470 0.653 0.382 0.528 a-c Means with different superscripts in the same column differ significantly (P ≤ 0.05). A-C Means with different superscripts in the same column differ significantly (P ≤ 0.01). 1 Treatments consisted of three inclusion levels of DDGS (0, 15, and 30%) with two energy values of DDGS that were determined ether extract (2,631
kcal/kg) or acid hydrolysis (2,689 kcal/kg). 2 Footpads lesions were evaluated using a 10-point visual scale considering the severity of the lesion and the area of the footpad affected. 3 Standard error of the mean for DDGS inclusion level and method of fat analysis (n = 36). 4 Standard error of the mean for the interaction of DDGS inclusion level and method of fat analysis (n= 18).

114
Figure 1. Relationship between pellet durability index (PDI) and amount of fat added in the
mixer in grower diets containing 0, 15, and 30% DDGS analyzed by two methods of crude
fat analysis (Acid hydrolysis (AH)*-method 154.02 and ether extract (EE)**-method 990.03;
AOAC, 2006)).

115
Figure 2. Relationship between pellet durability index (PDI) and amount of fat added in the
mixer in finisher diets containing 0, 15, and 30% DDGS analyzed by two methods of crude
fat analysis (Acid hydrolysis (AH)*-method 154.02 and ether extract (EE)**-method 990.03;
AOAC, 2006)).

116
Figure 3. Relationship between nitrogen digestibility and incidence of footpad lesions (FPL)
as measured by the footpad lesion score in diets containing 0, 15, and 30% DDGS analyzed
by two methods of crude fat analysis (Acid hydrolysis (AH)*-method 154.02 and ether
extract (EE)**-method 990.03; AOAC, 2006)).
117
4.6. REFERENCES
Allain, V., L. Mirabito, C. Arnould, M. Colas, S. Le Bouquin, C. Lupo, and V. Michel. 2009.
Skin lesions in broiler chickens measured at the slaughterhouse: relationships
between lesions and between their prevalence and rearing factors. Br. Poult. Sci.
50:407-417.
Aldeola, O., and K. E. Ileleji. 2009. Comparison of two diet types in the determination of
metabolizable energy content of corn distillers dried grains with solubles for broiler
chickens by regression method. Poult. Sci. 88:579-585.
American Feed Industry Association. 2007. Evaluation of analytical methods for analysis of
dried distillers grains with solubles. Am. Feed Ind. Assn., Arlington, VA.
AOAC International. 2005. Dry Matter on Oven Drying for Feed (at 135ºC for 2 hours).
Official Methods of AOAC International (OMA). AOAC Intl. Gaithersburg, MD.
AOAC International. 2006. Official Methods of Analysis. 18th
ed. AOAC Intl. Gaithersburg,
MD.
Applegate, T. J., C. Troche, Z. Jiang, and T. Johnson. 2009. The nutritional value of high-
protein corn distillers dried grains for broiler chickens and its effects on nutrient
excretion. Poult. Sci. 88:354-359.
ASABE. 2007. Method of Determining and Expressing Fineness of Feed Materials by
Sieving. Am. Soc. Agric. Eng., St. Joseph, MI.
ASABE. 2007. Cubes, Pellets and Crumbles-Definitions and Methods for Determining
Density, Durability, and Moisture Content. Am. Soc. Agric. Eng. St. Joseph, MI.
Aviagen. 2007. Broiler nutrition specifications. Accessed on November 15th
, 2013.
http://en.aviagen.com/assets/Tech_Center/Ross_Broiler/Ross_708_Broiler_Nutrition_
Spec.pdf

118
Baker, D. H. 2009. Advances in protein-amino acid nutrition in poultry. Amino Acids, 37:29-
41.
Batal, A. B., and N. M. Dale. 2006. True metabolizable energy and amino acids digestibility
of distillers dried grains with solubles. J. Appl. Poult. Res. 15:89-93.
Batal, A., and K. Bregendahl. 2011. Feeding Ethanol Coproducts to Poultry. Pages 317-338
in Distillers Grains: Production, Properties, and Utilization. KeShun, L., and K. A.
Rosentrater. Eds. AOCS Publishing, Boca Raton, FL.
Choct, M. 2006. Enzymes for the feed industry: Past, present, and future. World’s Poult. Sci.
J. 62:5-16.
Fahrenholz, A. C. 2008. The effects of DDGS inclusion on pellet quality and pelleting
performance. M.S. Thesis. Kansas State University, Manhattan, KS.
Fan, M. Z., W. C. Sauer, R. T. Hardin, and K. A. Lien. 1994. Determination of apparent ileal
amino acid digestibility in pigs: Effect of dietary amino acid level. J. Anim. Sci.
72:2851-2859.
FASS. 2010. Guide for the Care and Use of Agricultural Animals in Research and Teaching.
3rd
ed. Fed. Anim. Sci. Soc., Champaign, IL.
Fiene, S. P., T. W. York, and C. Shasteen. 2006. Correlation of DDGS IDEA™ digestibility
assay for poultry with cockerel true amino acid digestibility. Pages 82-89. In: Proc.
4th
Mid-Atlantic Nutr. Conf. University of Maryland, College Park, MD.
Leeson, S. 2009. Nutrition and Health; Poultry. Feedstuffs, 80:45-52.
Loar, R. E., J. S. Moritz, J. R. Donaldson, and A. Corzo. 2010. Effects of feeding distillers
dried grains with solubles to broilers from 0 to 28 days posthatch on broiler
performance, feed manufacturing efficiency, and selected intestinal characteristics.
Poult. Sci. 89:2242–2250.

119
Lumpkins, B. S., A. B. Batal, and N. M. Dale. 2004. Evaluation of distillers dried grains with
solubles as a feed ingredient for broilers. Poult. Sci. 83:1891-1896.
Marty, B. J., E. R. Chavez, and C. F. Lange. 1994. Recovery of amino acids at the distal
ileum for determining apparent and true ileal amino acid digestibilities in growing
pigs fed various heat-processed full-fat soybeans products. J. Anim. Sci. 72:2029-
2037.
Min, Y. N., F. Z. Liu, A. Karimi, C. Coto, C. Lu, F. Yan, and P. W. Waldroup. 2011. Effect
of Rovabio® Max AP on performance, energy and nitrogen digestibility of diets high
in distillers dried grains with solubles (DDGS) in broilers. Int. J. Poult. Sci. 10:796-
803.
Noll, S., V. Stangeland, G. Speers, and J. Brannon. 2001. Distillers grains in poultry diets.
62nd
Minnesota Nutrition Conference and Minnesota Corn Growers Association
Technical Symposium. Bloomington, MN.
Richardson, W., and E. J. Day. 1976. Effect of varying levels of added fat in broiler diets on
pellet quality. Feedstuffs (May 17):24
Roberts, S. A., H. Xin, B. J. Kerr, J. R. Russell, and K. Bregendahl. 2007. Effects of dietary
fiber and reduced crude protein in ammonia emission from laying-hen manure. Poult.
Sci. 86:1625-1632.
Salmon, R. E. 1985. Effects of pelleting, added sodium bentonite and fat in a wheat-based
diet on performance and carcass characteristics of small white turkeys. Anim. Feed
Sci. Technol. 12:223-232.
SAS. 2006. SAS/STAT User's guide, SAS Institute, Inc., SAS Press, Cary, NC.
Shepherd, E. M., and B. D. Fairchild. 2010. Footpad dermatitis in poultry. Poult. Sci.
89:2043-2053.

120
Stark, C. R. 1994. Pellet quality and its effect on swine performance; functional
characteristics of ingredients in the formation of quality pellets. Ph.D. Dissertation.
Kansas State Univ., Manhattan, KS.
Thomas, M., T. van Vliet, and A. F. B. van der Poel. 1998. Physical quality of pelleted
animal feed. 3. Contribution of feedstuff components. Anim. Feed Sci. Technol.
70:59-78.
Wang, Z., S. Cerrate, C. Coto, F. Yan, and P. W. Waldroup. 2007. Use of constant or
increased levels of distillers dried grains with solubles (DDGS) in broiler diets. Int. J.
Poult. Sci. 6:501-507.
Wang, Z., S. Cerrate, C. Coto, F. Yan, F. P. Costa, A. Abdel-Maksoud, and P. W. Waldroup.
2008a. Evaluation of corn distillers dried grains with solubles in broiler diets
formulated to be isocaloric at industry energy levels or formulated to optimum
density with constant 1% fat. Int. J. Poult. Sci. 7:630-637.
Wang, Z., S. Cerrate, C. Coto, F. Yan, and P. W. Waldroup. 2008b. Evaluation of high levels
of distillers dried grains with solubles (DDGS) in broiler diets. Int. J. Poult. Sci.
7:990-996.

121
CHAPTER V
EFFECT OF DDGS PARTICLE SIZE AND PELLET QUALITY ON GROWER-
FINISHER PIG PERFORMANCE

122
5.1. ABSTRACT
The objective of the study was to evaluate the effect of further grinding distillers dried grains
with solubles (DDGS) and the percentage feed fines on grower-finisher pig performance. A
total of 760 mixed sex pigs (28.8 ± 3.1 kg) were housed in a curtain-sided barn with
mechanical ventilation and totally slatted flooring. The experimental design consisted of a 2
x 2 factorial design with 2 particle sizes of DDGS (640 vs. 450 µm) and 2 levels of fines (0
and 25%). The four treatments were randomly distributed among 40 pens with 10 replicates
per treatment. Pigs were fed a common diet containing 30% DDGS and 6.5% supplemental
fat in 3 dietary phases grower (1 to 40 d), developer (41 to 83 d), and finisher (84 to 116 d).
Of the 6.5% supplemental fat in each diet, 1.5% was added in the mixer and 5.0% was added
post-pelleting. Diets were conditioned at 77°C for 45 seconds and then pelleted using a pellet
mill equipped with a 3.5 mm x 36 mm die. The fines produced during the pelleting process
were separated using a pellet screener and then mixed back with the whole pellets to obtain
the desired percentage fines in the final feed. Feeds were delivered and pen feed intake
recorded using an automatic feed delivery system (FeedPro). Feed consumption and BW
were determined at 1, 18, 40, 83, and 116 d on test and gain to feed (G:F) calculated. Data
was analyzed using PROC GLM in SAS. Pen was the experimental unit. Fixed effects
included DDGS particle size, percentage fines, and their interaction. The particle size of
DDGS did not impact (P > 0.05) overall ADG (836 vs. 842 g; P=0.65), ADFI (2205 vs. 2222
g; P=0.66), or G:F (2.64 vs. 2.64; P=0.95). Diets with 0% fines did not improve (P > 0.05)
ADG (843 vs. 835 g; P=0.48), ADFI (2224 vs. 2204 g; P=0.59), or G:F (2.64 vs. 2.64;
P=0.97) in comparison to diets with 25% fines. Results indicated that DDGS does not need
to be further ground at the feed mill and that up to 25% feed fines could be fed without
adverse effects on pig performance.
Key words: DDGS, particle size, fines, grinding

123
5.2. INTRODUCTION
Feed costs have represented a significant fraction of the production cost in swine
farming. Thus, producers have been constantly evaluating ways to improve live performance
and feed efficiency (Myers et al., 2013). Pelleting and particle size reduction are feed
processing methods to improve feed efficiency. The pelleting process has become an
important practice for the feed industry as an alternative to increase feed efficiency and
livestock performance (Zang et al., 2009). It allows for the inclusion of feedstuffs that have
poor flow characteristics (Stark, 2012), and reduces feed costs by facilitating the use of a
greater variety of low-cost feed ingredients without noticeable changes in the physical
properties of the feed (Behnke, 1996). Pelleting grower and finisher diets has been reported
to increase daily weight gain, feed intake, and improve feed efficiency of swine and poultry
(Wondra et al., 1995a; Jensen, 2000; Frikha et al., 2009; Abdollahi et al., 2011).
Increased inclusion of distiller’s dried grains with solubles (DDGS) in swine diets has
coincided with increased ethanol production, while reduced supply and increased prices of
corn and soybean meal (SBM), which has encouraged the use of higher quantities of DDGS
in swine diets. In fact, the swine industry has been the fastest growing sector in the U.S.A.
for DDGS use (Shurson and Noll, 2005). Dietary inclusion has been demonstrated to be as
high as 30% DDGS without affecting live performance and overall feed efficiency of
growing pigs (DeDecker et al., 2005; Cook et al., 2005). However, such high dietary
inclusion of DDGS has been reported to decrease pellet quality and feed mill throughput
(Behnke, 2007). DDGS contains less starch and more denatured protein than corn or SBM,
which contributes to reduce the pellet binding characteristics (Behnke and Beyer, 2002).
124
Reducing DDGS particle grind size may be an effective alternative to increase its inclusion in
swine diets without adverse effects on pellet quality and pellet mill operation efficiency.
Many feed ingredients, especially cereal grains, have been ground before their incorporation
into swine diets (Zang et al., 2009). Particle size reduction has been reported to improve
pellet quality and live performance in nursery and growing-finishing pigs (Healy et al., 1994;
Wondra et al., 1995a) by increasing the surface area of the digesta available for interaction
with digestive enzymes, and by allowing the digestive enzymes to release the nutrients more
effectively (Goodband et al., 2002; Fastinger and Mahan, 2003). In a preliminary study,
DeJong et al. (2011) reported a numerical improvement of 1.1% in F:G when DDGS were
further ground at the feed mill from 787 to 692 µm and incorporated into diets fed to
finishing pigs. However, this 95 µm difference in particle size of the DDGS was not
sufficient to affect overall pig growth performance. Therefore, the objective of the study
reported herein was to evaluate the effects of DDGS particle grind size and percentage pellet
fines on grower-finisher pig performance.
5.3. MATERIALS AND METHODS
5.3.1. Diets
DDGS was obtained from a local elevator in Selma, NC and the calculated proximate
analyses are presented in Table 1. Experimental diet composition and analyzed nutrient
concentrations are presented in Table 2 for the 3 dietary phases used during the grower-
finisher period. Experimental diets within each phase of growth were formulated to meet or

125
exceed NRC suggested requirements (NRC, 1998) and contained the same nutrient
concentrations. The only factors that changed between the experimental diets were particle
size of the DDGS and the percentage fines in the final feed. Half of the DDGS (control diet)
were used as received from the supplier; the other half was further ground using a
hammermill (Model 1522, Roskamp Champion, Waterloo, IA) equipped with a 1.6 mm
screen to obtain fines particles. All diets were fed in pellet form during the entire grower to
finisher period.
Feed was produced at the North Carolina State University Feed Mill Educational Unit
(Raleigh, NC) following current Good Manufacturing Practices (GMPs). Dry ingredients
were blended in a counterpoise mixer (Model TRDB126060, Hayes & Stolz, Fort Worth,
TX) with 1.5% fat added in the mixer in order to follow normal industry practices and
produce high quality pellets. The remaining fat was added post-pelleting. Mash diets were
conditioned at 77°C for 45 seconds and then pelleted using a pellet mill (Model PM1112-2,
California Pellet Mill Co., Crawfordsville, IN) equipped with a 3.5 mm x 36 mm die. Pellets
were cooled using a counter flow pellet cooler (Model VK09x09KL, Geelen Counterflow
USA Inc., Orlando, Florida). The fines produced during the pelleting process were separated
using a pellet screener and then mixed back with the whole pellets to obtain the desired
percentage fines in the final feed.
5.3.2. Animal Husbandry
Pigs used in this experiment were Smithfield Premium Genetics (SPG) Landrace x
Large White dams mated to SPG Duroc pigs (Smithfield Premium Genetics, Roanoke

126
Rapids, NC). The experiment was conducted at a commercial research nursery to finishing
facility near Harrels, NC from July to November 2013. A total of 760 pigs with an initial BW
of 28.8 ± 3.1 kg were randomly allotted to 1 of 4 experimental treatments in a curtain sided
barn with mechanical ventilation. There were 19 pigs per pen and 10 pens per treatment.
Pens were located over a totally slatted floor with a deep pit for manure storage and each
contained 1 four-space self-feeder and 1 nipple drinker. Pigs were provided with ad libitum
access to feed and water for the duration of the study. Feed additions to each pen were
accomplished by a computerized feeding system (FeedPro; Feedlogic Corp., Willmar, MN)
capable of delivering and measuring feed additions for individual pens. Conventional dry
feeders were used with a minimum gap width of 1.78-cm to control feed flowability.
Treatments were arranged in a 2 x 2 factorial with the main effects of particle size of DDGS
(as received and further ground) and percentage fines in the final feed (0 and 25%).
Pigs were fed a common diet containing 30% DDGS in 3 dietary phases (29 to 40 kg
grower, 40 to 60 developer, and 60 to 95 kg finisher, respectively). The only difference
between diets was the particle size of DDGS and percentage fines in the feed. The grower
diet was fed 18 days while developer and finisher were fed 22 and 76 days, respectively.
Average daily gain (ADG), average daily feed intake (ADFI), and feed to gain (F:G) were
determined at the end of each feeding phase by weighing pigs and measuring feed
disappearance at 0, 18, 40, 83, and 116 d of the test period. Mortality and pig removals were
monitored and recorded twice daily and the BW of pigs that died was used to adjust the F:G.

127
5.3.3. Data Collection and Laboratory Analyses
Samples of DDGS were taken as received from the supplier and after further grinding
using a hammermill equipped with 1.6 mm screen and particle size analysis was performed.
Dry sieving according to ASAE method S319.3 (ASABE, 2007) was used to determine the
particle size of DDGS. Particle size analyses were conducted using 14 sieves (U. S. standard
sieve numbers 4, 6, 8, 12, 16, 20, 30, 40, 50, 70, 100, 140, 270) and a pan with the addition
of sieve agitators and 0.5 g of dispersing agent per 100 g of sample (Table 3).
Feed samples were collected during truck loading to calculate the percentage fines
and pellet durability index (PDI). Percentage of fines in each pelleted feed sample was
determined before testing pellets for durability. A US #6 sieve (3.35-mm holes) was used to
sift off the fines from the initial feed sample (~ 5 kg) that contained pellets and fines. The
percentage fines in the feed was calculated as the ratio of the weight of fines obtained after
sample screening relative to the weight of the initial sample using the following formula:
weight of fines/weight of sample × 100.
Pellet durability was determined following the standard method S269.4 of the
American Society of Agricultural Engineers (ASABE, 2007). The standard tumble box
method was the device used to calculate the PDI in accordance with the ASABE
methodology. Four sub-samples of 500 g of whole pellets were placed into each of the 4
compartments of the tumbling box. For the modified method, three hex nuts (50 g/nut) were
added in the tumble box compartment along with the whole pellets in order to increase the
impact forces and improve the ability to predict the true quality of the feed at the farm.
According to Stark (2012), the modified method creates a more aggressive test that is more

128
representative of the impact forces the pellets were exposed to during the manufacturing and
delivery process. The sub-samples were tumbled at 50 rpm for 10 min. After tumbling, each
sub-sample was sifted using a US #6 sieve to remove the fines produced during the tumbling
process and then re-weighed. Pellet durability index was calculated as the ratio of the weight
of the pellets that remained in the sieve after tumbling relative to the initial weight before
tumbling. Every compartment in the tumbling box was swept out by hand after each pellet
durability test in order to remove any fines that accumulated in the corners and avoid cross-
contamination between pellet analyses.
5.3.4. Statistical Analyses
Data were analyzed by analysis of variance using PROC GLM of SAS (SAS Institute,
2006). Pen of pigs was the experimental unit for statistical analysis. Fixed effects included
DDGS particle size (594 and 414 µm), percentage fines in the feed (0 and 25%) and their
interaction. A value of P≤0.05 was considered statistically significant in all tests. Descriptive
statistics are presented in Table 4.
5.4. RESULTS AND DISCUSSION
5.4.1. Feed Manufacturing
Particle size analyses revealed the particle of DDGS as received and after further
grinding to have an average particle size of 594 µm and 414 µm, respectively. The
percentage pellet fines were 30.8, 28.8, and 33.2% and 12.6, 11.4, and 10.2% for the grower,
developer, and finisher, respectively (Table 5). In the grower feed, there was an interaction of
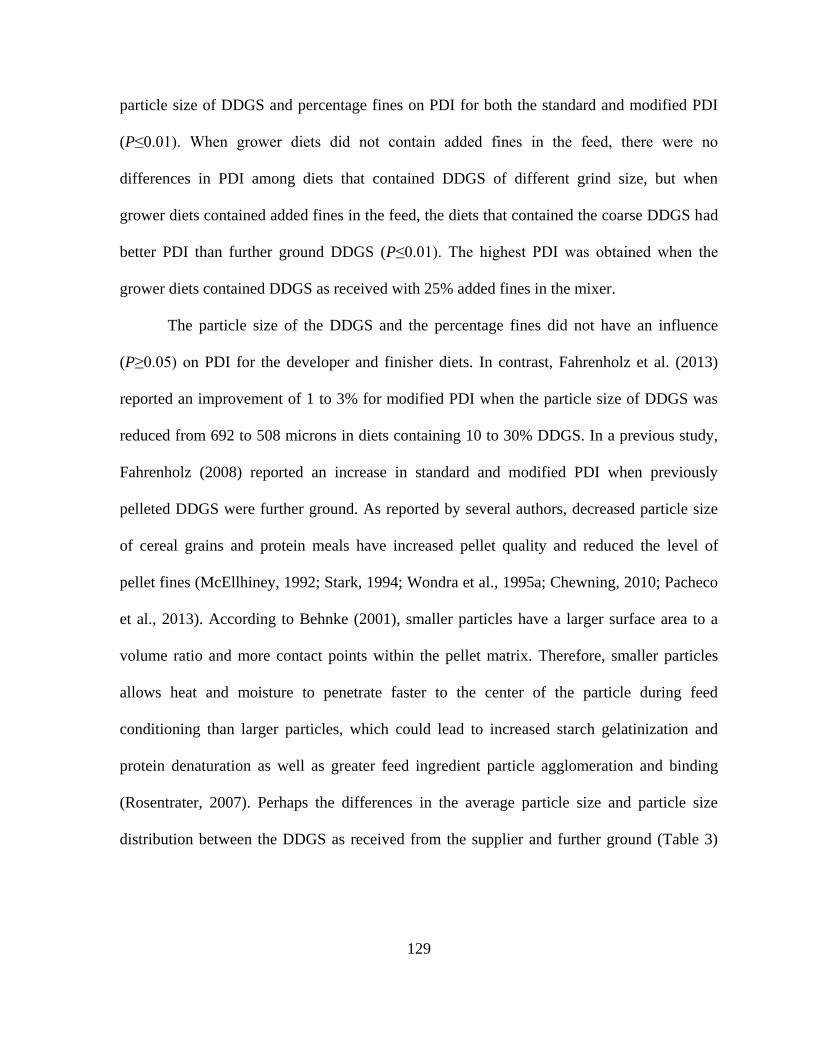
129
particle size of DDGS and percentage fines on PDI for both the standard and modified PDI
(P≤0.01). When grower diets did not contain added fines in the feed, there were no
differences in PDI among diets that contained DDGS of different grind size, but when
grower diets contained added fines in the feed, the diets that contained the coarse DDGS had
better PDI than further ground DDGS (P≤0.01). The highest PDI was obtained when the
grower diets contained DDGS as received with 25% added fines in the mixer.
The particle size of the DDGS and the percentage fines did not have an influence
(P≥0.05) on PDI for the developer and finisher diets. In contrast, Fahrenholz et al. (2013)
reported an improvement of 1 to 3% for modified PDI when the particle size of DDGS was
reduced from 692 to 508 microns in diets containing 10 to 30% DDGS. In a previous study,
Fahrenholz (2008) reported an increase in standard and modified PDI when previously
pelleted DDGS were further ground. As reported by several authors, decreased particle size
of cereal grains and protein meals have increased pellet quality and reduced the level of
pellet fines (McEllhiney, 1992; Stark, 1994; Wondra et al., 1995a; Chewning, 2010; Pacheco
et al., 2013). According to Behnke (2001), smaller particles have a larger surface area to a
volume ratio and more contact points within the pellet matrix. Therefore, smaller particles
allows heat and moisture to penetrate faster to the center of the particle during feed
conditioning than larger particles, which could lead to increased starch gelatinization and
protein denaturation as well as greater feed ingredient particle agglomeration and binding
(Rosentrater, 2007). Perhaps the differences in the average particle size and particle size
distribution between the DDGS as received from the supplier and further ground (Table 3)

130
were similar and overlapped to a considerable extent, reducing the possibility to obtain
statistical differences in pellet quality.
5.4.2. Swine Performance
Further grinding of DDGS did not improve (P≥0.05) overall ADG, ADFI, or F:G in
grower-finisher pigs. De Jong et al. (2011) reported no differences in overall growth
performance of finishing pigs when DDGS was further ground from 787 to 692 µm using a
roller mill, but they did reported a 1.1% improvement in overall F:G. Previous studies have
reported benefits related to reducing particle size of cereal grains, mainly due to higher
nutrient digestibility. Goodband and Hines (1988) reported greater ADG and improved F:G
in starter pigs when the particle size of barley was reduced from 789 to 676 µm. Healy et al.
(1994) reported a 7% improvement in feed efficiency in starter pigs when the particle size of
corn was reduced from 900 to 500 µm. Wondra et al. (1995a) reported that F:G in finisher
pigs was improved by 8% when the particle size of corn was reduced from 1,000 to 400 µm.
In diets for lactating sows, Wondra (1995b) did not find differences in litter size, pig
survivability, sow weight loss, and sow back fat loss during lactation when the particle size
of the corn was reduced from 1,200 to 400 µm using either hammermill or roller mill, but
litter BW gain increased 11% (46.9 vs. 50.1 kg). There was also a 6% increase in feed intake
as the particle size of the corn was decreased. Lawrence et al. (2003) reported no differences
on ADG or F:G when SBM was further ground. Consequently, Fastinger and Mahan (2003)
suggested that the improvement in F:G when feed ingredients were further ground was likely

131
related to improved starch digestibility and, to a lesser extent due to improved amino acid
digestibility.
In general, ethanol producers have continued to reduce the particle size of the corn
and other cereal grains before the production of ethanol in order to reduce fermentation tank
residence time and to increase the ethanol yield. Kelsall and Lyons (1999) reported that by
reducing the screen size of the hammermill from 8 mm to 5 mm, there was an increase in the
ethanol yield from 2.45 to 2.65 gallons per bushel of corn. In addition, Naidu et al. (2007)
reported a 22% increase in the ethanol concentration when corn was ground using a 0.5 mm
screen in comparison to a 5 mm screen. If the particle size of the initial grain was too large,
there was a reduction in starch gelatinization and enzyme action on the starch was reduced,
which resulted in reduced production of fermentable sugars (Liu, 2011). However, if the
particles were too small, energy expense for grinding increased, the amount of solids in the
thin stillage increased, and centrifuge efficiency decreased (Naidu et al., 2007). The goal of
ethanol producers is to optimize particle grind size of cereal grains in order to maximize
ethanol yield and minimize solids content in the thin stillage.
Removing feed pellet fines did not improve (P≥0.05) overall ADG, ADFI, or F:G of
pigs in comparison to those fed diets that contained at least 25% pellet fines. Stark (1994)
conducted experiments on two nursery diets and one finisher diet to determine the effect of
meal form (pellet or mash) and the percentage pellet fines (0 to 30% fines). In the nursery
diet experiments, there was an improvement in ADG and F:G when pelleted diets were fed,
but the percentage pellet fines did not affect F:G or ADG. In finisher diet experiment,
improved F:G was observed from 2.82 to 2.65 as percentage fines decreased from 60% to

132
0%. Furthermore, Schell and van Heugten (1998) reported improved feed efficiency when
percentage pellet fines decreased from 37% to 3% in grower pigs. Nemechek et al. (2013)
reported feed efficiency was 2.67 to 2.55 for pigs fed 50% and 0% fines, respectively.
Further grinding DDGS did not improve pig performance, likely due to the small difference
in the average particle size and particle size distribution between DDGS as received and after
grinding. The results of this study showed that removing fines produced during the pelleting
process and further grinding DDGS at the feed mill did not improve grower-finisher pig
performance.

133
5.5 TABLES AND FIGURES
Table 1. Determined and calculated chemical composition of the distillers dried grain with
solubles (DDGS) (% as-fed basis, unless stated otherwise) as received from the supplier
Item
Determined chemical composition1
Dry matter 88.00
Crude protein 25.34
Ether extract 8.33
Crude fiber 6.35
Ash 4.83
Total calcium 0.20
Total phosphorus 0.77
Available phosphorus 0.56
Gross Energy, kcal/g 4.20
Calculated chemical composition
Metabolizable energy for swine, kcal/kg 3,084.52
Digestible amino acids for swine
Lysine 0.51
Methionine 0.40
TSAA 0.70
Threonine 0.62
Tryptophan 0.16 1In duplicate

134
Table 2. Composition and calculated content of the grower, developer, and finisher diets
(% as fed basis)1
* Diets were fed in pellet form for 116 d. 1 Phase 1 (29 to 40 kg), Phase 2 (40 to 60 kg), Phase 3 (60 to 95 kg). 2 Distillers dried grains with solubles. 3 Vitamin premix provided the following per kg of diet: 6171 IU of vitamin A, 880 IU of vitamin D, 35 IU of vitamin E,
0.02 mg/kg of vitamin B12, 0.18 mg/kg of biotin, 2.91 mg/kg of vitamin K, 4.40 mg/kg of riboflavin, 17.64 mg/kg of
pantothenic acid, 26.45 mg/kg of niacin, 1.32 mg/kg of folate. 4 Mineral premix provided the following per kg of diet: 16.5 mg/kg of Cu, 165.3 mg/kg of Fe, 39.60 mg/kg of Mn, 165.30
mg/kg of Zn, 0.30 mg/kg of I, 0.30 mg/kg of Se. 5 Selenium premix provided 0.2 mg/kg Se. 6 Chlortetracycline was included at 440 mg/kg (CTC 100, Zoetis, Florham Park, NJ) 7 Tiamulin hydrogen fumarate was included at 38.5 mg/kg (Denagard 10, Novartis Animal Health, Larchwood IA) 8 Virginiamycin was included at 5.5 mg/kg (Stafac 20, Phibro Animal Health, Ridgefield Park, NJ) 8 Bambermycin was included at 2.2 mg/kg (Flavomycin 4, Huvepharma Inc., Peachtree City, GA)
Item1 Grower Developer
Finisher
Grower 1 Grower 2
Ingredient ———————————————— (%) ——————————————
Corn 45.17 45.02 48.02 52.99
Soybean meal (48% CP) 15.50 15.45 12.90 8.05
DDGS2 30.00 30.00 30.00 30.00
Poultry fat 6.50 6.50 6.50 6.50
Limestone 1.57 1.56 1.67 1.67
Salt 0.35 0.35 0.35 0.35
Vitamin premix3 0.03 0.03 0.03 0.02
Mineral premix4 0.05 0.05 0.05 0.05
L-Lysine-HCl 0.40 0.40 0.37 0.30
L-Threonine 0.08 0.08 0.06 0.01
Selenium premix5 0.03 0.03 0.03 0.03
CTC 1006 0.00 0.20 0.00 0.00
Denagard 107 0.18 0.18 0.00 0.00
Stafac 207 0.00 0.00 0.00 0.01
Flavomycin 48 0.00 0.00 0.03 0.00
Phytase 0.01 0.01 0.01 0.01
Synthetic Red 0.15 0.15 0.00 0.00
Calculated nutrients
ME, kcal/kg 3504.14 3497.69 3512.92 3515.95
Crude protein 18.86 18.83 17.79 15.74
Calcium 0.67 0.66 0.70 0.70
Phosphorus 0.44 0.44 0.43 0.41
Lysine 1.15 1.14 1.05 0.87
TSAA 0.67 0.66 0.64 0.59
Threonine 0.77 0.77 0.72 0.59
Tryptophan 0.19 0.19 0.17 0.15

135
Table 3. Particle size distribution of the distillers dried grain with solubles (DDGS) used during the experiment
Particle Size of the DDGS
Lot #1 Lot #2 Lot #3 Lot #4
U. S. Sieve Sieve Size Coarse Fine Coarse Fine Coarse Fine Coarse Fine
Retained on sieve Retained on sieve Retained on sieve Retained on sieve
# µm % % % % % % % %
4 4760 0.00 0.00 0.00 0.00 0.00 0.00 0.00 0.00
6 3360 0.07 0.00 0.12 0.00 0.19 0.00 0.00 0.00
8 2380 0.08 0.00 0.20 0.00 0.37 0.00 0.05 0.00
12 1680 1.77 0.00 1.50 0.00 1.30 0.09 1.91 0.00
16 1190 14.68 0.39 13.90 0.30 2.88 0.38 17.50 0.67
20 840 22.55 11.50 21.90 11.30 4.84 2.18 22.32 13.71
30 590 25.26 30.43 24.50 30.10 13.12 11.74 20.51 24.83
40 420 19.39 27.71 20.10 28.30 21.77 22.63 16.49 22.15
50 297 9.11 14.80 9.90 18.30 23.44 25.19 9.95 15.63
70 210 3.32 6.36 3.70 8.40 15.26 17.23 4.93 10.64
100 149 1.52 3.49 1.30 2.60 8.65 10.04 2.11 3.93
140 105 0.83 2.34 0.90 2.00 5.67 6.82 1.61 3.45
200 74 0.41 1.06 1.10 1.80 1.86 2.56 1.11 2.49
270 53 0.44 1.17 0.70 1.30 0.37 0.85 0.70 1.25
Pan 37 0.56 0.74 0.60 0.80 0.28 0.28 0.80 1.25
Average, µm 682.0 418.0 655.0 467.0 383.0 330.0 653.0 439.0
SD 1.83 1.81 1.89 1.82 1.93 1.79 2.01 1.98

136
Table 4. Descriptive statistics for pellet quality
Item No. of batches Mean Standard deviation
—————————— (%) ——————————
Pellet fines1 44 20.3 11.6
Standard pellet durability index (PDI)2 44 98.5 0.5
Modified pellet durability index(PDI)3 44 80.6 5.1 1 Pellet fines = (weight of fines/weight of initial sample) x 100 2 Standard PDI = (weight of fines/weight of initial sample) x 100 after tumbling 500 g of whole pellet at 50 rpm
for 10 min 3 Modified PDI = (weight of fines/weight of initial sample) x 100 after tumbling 500 g of whole pellet at 50 rpm
for 10 min with the addition of 3 hex nuts (50 g/nut)

137
Table 5. Effect of the particle size of distillers dried grain with solubles (DDGS) on percentage fines and standard and modified
pellet durability index (PDI)
DDGS
Particle Size1
Percentage
Fines1
Percentage Fines
Standard PDI
Modified PDI
Grower Developer Finisher Grower Developer Finisher Grower Developer Finisher
(%) —————— (%) —————— —————— (%) —————— —————— (%) ——————
Coarse 19.46 11.35 10.16a 98.30 98.75 98.38 82.73 82.45 76.56
Fine 23.52 12.50 5.64b 98.85 98.65 98.68 79.75 81.83 78.30
SEM 5.08 3.14 1.48 0.19 0.18 0.17 1.03 1.20 1.76
0 12.60b 11.35B 10.16B 98.30b 98.75 98.38 79.95 82.45 76.56
25 30.38a 28.83A 33.20A 99.00a 98.83 97.94 82.53 84.40 78.20
SEM 5.08 3.14 1.48 0.19 0.18 0.17 1.03 1.20 1.76
Coarse 0 14.43 11.35 10.16 98.30B 98.75 98.38 78.85b 82.45 76.56
Fine 0 10.77 12.50 5.64 98.85A 98.65 98.68 81.05b 81.83 78.30
Coarse 25 24.49 28.83 33.20 99.00A 98.83 97.94 86.60a 84.40 78.20
Fine 25 36.27 33.05 26.35 98.10B 98.40 98.42 78.45b 84.68 79.94
SEM 5.08 3.14 1.48 0.19 0.18 0.17 1.03 1.20 1.76
Source of variation ——————————————————— P-value ———————————————————
DDGS particle size 0.637 0.800 0.047 0.062 0.774 0.081 0.157 0.715 0.489
Fines in feed 0.023 0.002 0.001 0.022 0.702 0.229 0.002 0.259 0.514
DDGS particle size x percentage fines 0.204 0.634 0.443 0.002 0.383 0.607 0.003 0.710 1.000 a-b Means with different superscripts in the same column differ significantly (P ≤ 0.05). A-B Means with different superscripts in the same column differ significantly (P ≤ 0.01). 1 Percentage fines was calculated during truck unloading as = (weight of fines/weight of the sample) x 100 2 Standard PDI = (weight of fines/weight of initial sample) x 100 after tumbling 500 g of whole pellets at 50 rpm for 10 min 3 Modified PDI = (weight of fines/weight of initial sample) x 100 after tumbling 500 g of whole pellets at 50 rpm for 10 min with the addition of 3 hex nuts
(50g/nut)

138
Table 6. Descriptive statistics for pig live performance1
Feeding Phase
Grower Developer Finisher Total
Average Daily Gain
————————————————————— (kg) —————————————————————
0-18 d 19-40 d 41-83 d 84-116 d 0-116 d
0.77±0.072 0.90±0.08 0.81±0.07 0.87±0.09 0.84±0.04
Feeding Phase
Grower Developer Finisher Total
Average Daily Feed Intake
————————————————————— (kg) —————————————————————
0-18 d 19-40 d 41-83 d 84-116 d 0-116 d
1.40±0.14 1.87±0.20 2.26±0.23 2.80±0.18 2.22±0.16
Feeding Phase
Grower Developer Finisher Total
Feed:Gain3
——————————————————— (kg:kg) ———————————————————
0-18 d 19-40 d 41-83 d 84-116 d 0-116 d
1.82±0.18 2.09±0.15 2.78±0.20 3.23±0.31 2.62±0.13 1 A total of 760 (initial BW, 28.8±3.1 kg), with 19 pigs per pen and 10 pens per treatment
2 Standard error of the mean (n = 40). 3 Feed:Gain (F:G) = Total pen BW gain/feed intake per pen, including BW of mortality that occurred during
each time period.

139
Table 7. Effect of the particle size of distillers dried grains with solubles (DDGS) and
percentage pellet fines on body weight of grower-finisher pigs1
DDGS
Particle Size2
Feed
Fines2
Body Weight
0 d 18 d 40 d 83 d 116 d
(µm) (%) —————————— (kg) ——————————
Main effects
Coarse 28.9 40.2 59.6 94.9 123.9
Fine 28.5 40.2 60.3 95.7 124.3
SEM 0.7 1.4 1.6 2.0 1.8
0 28.8 40.1 59.9 95.4 124.4
25 28.5 40.2 60.0 95.1 123.8
SEM 0.7 1.4 1.6 2.0 1.8
Interaction effects
Coarse 0 28.6 40.2 59.4 94.7 123.2
Coarse 25 29.2 40.3 59.8 95.0 124.7
Fine 0 29.0 40.1 60.4 96.2 125.6
Fine 25 27.9 40.2 60.2 95.2 123.0
SEM 1.0 2.0 2.3 2.8 2.5
Source of variation ————————— P-value —————————
DDGS particle size 0.463 0.979 0.776 0.765 0.677
Feed fines 0.656 0.964 0.971 0.917 0.969
DDGS particle size x feed fines 0.129 0.993 0.905 0.812 0.577 a-c Means with different superscripts in the same column differ significantly (P ≤ 0.05). 1 A total of 760 (initial BW, 28.8 kg), with 19 pigs per pen and 10 pens per treatment. 2 Treatments consisted of two DDGS particle sizes coarse and fine and two percentages of pellet fines (0 and
25% fines).

140
Table 8. Effect of the particle size of distillers dried grains with solubles (DDGS) and percentage pellet fines on average daily
gain, average daily feed intake, and feed:gain of grower-finisher pigs1
DDGS
Particle Size
Feed
Fines
Average Daily Gain Average Daily Feed Intake Feed:Gain
1-18 d 19-40 d 41-83 d 84-116 d Total 1-18 d 19-40 d 41-83 d 84-116 d Total 1-18 d 19-40 d 41-83 d 84-116 d Total
(µm) (%) —————— (g) —————— —————— (g) —————— —————— (g:g) ——————
Main Effects
Coarse 779 876 810 869 836 1403 1854 2229 2783 2205 1.81 2.12 2.76 3.23 2.64
Fine 762 909 811 871 842 1375 1874 2264 2793 2222 1.81 2.06 2.79 3.23 2.64
SEM 32 27 32 36 18 54 50 77 77 54 0.07 0.05 0.06 0.10 0.03
0 778 892 816 873 843 1404 1860 2269 2788 2224 1.81 2.09 2.78 3.22 2.64
25 763 893 805 867 835 1375 1868 2224 2788 2204 1.81 2.09 2.77 3.24 2.64
SEM 32 27 32 36 18 54 50 77 77 54 0.07 0.05 0.06 0.10 0.03
Interaction effects
Coarse 0 794 865 806 862 833 1437 1830 2245 2748 2201 1.81 2.12 2.79 3.22 2.64
Coarse 25 764 887 814 877 840 1370 1879 2213 2819 2210 1.81 2.12 2.72 3.23 2.63
Fine 0 761 919 827 885 854 1372 1891 2293 2829 2247 1.80 2.06 2.77 3.22 2.63
Fine 25 762 899 795 857 830 1379 1857 2235 2757 2197 1.81 2.06 2.82 3.24 2.65
SEM 44 40 46 52 23 77 68 107 106 77 0.10 0.07 0.09 0.15 0.05
Source of variation ——————————————————————————————————— P-value ———————————————————————————————————
DDGS particle size 0.441 0.107 0.956 0.941 0.652 0.465 0.564 0.519 0.854 0.664 0.998 0.121 0.471 0.972 0.951
Feed fines 0.514 0.971 0.610 0.804 0.480 0.438 0.832 0.410 0.995 0.598 0.919 0.960 0.824 0.812 0.978
DDGS particle size x feed fines 0.492 0.305 0.381 0.420 0.190 0.335 0.233 0.814 0.184 0.450 0.948 0.928 0.216 0.932 0.582
a-c Means with different superscripts in the same column differ significantly (P ≤ 0.05). 1 A total of 760 (initial BW, 28.8 kg), with 19 pigs per pen and 10 pens per treatment. 2 Treatments consisted of two DDGS particle sizes coarse and fine and two percentages of pellet fines (0 and 25% fines). 3 FCR = Feed intake per pen/total pen BW gain, including BW of mortality that occurred during each time period.

141
5.6. REFERENCES
Abdollahi, M. R., V. Ravindran, T. J. Wester, G. Ravindran, and D. V. Thomas. 2011.
Influence of feed form and conditioning temperature on performance, apparent
metabolisable energy and ileal digestibility of starch and nitrogen in broiler starters
fed wheat-based diet. Anim. Feed Sci. Technol. 168:88-99.
ASABE. 2007. Method of Determining and Expressing Fineness of Feed Materials by
Sieving. Am. Soc. Agric. Eng., St. Joseph, MI.
ASABE. 2007. Cubes, Pellets and Crumbles - Definitions and Methods for Determining
Density, Durability, and Moisture Content. Am. Soc. Agric. Eng. St. Joseph, MI.
Behnke, K .C. 1996. Feed manufacturing technology: current issues and challenges. Anim.
Feed Sci. Technol. 62:49-57.
Behnke, K. C. 2001. Factors influencing pellet quality. Feed Technol. 5:19-22.
Behnke, K. C., and R. S. Beyer. 2002. Effect of feed processing on broiler performance. VIII
Intl. Sem. on Poult. Prod. and Pathol., Santiago, Chile.
Behnke, K. C. 2007. Feed manufacturing considerations for using DDGS in poultry and
livestock diets. Pages 77-81 in Proc. 5th
Mid-Atlantic Nutr. Conf., Timonium, MD.
Chewning, C. G. 2010. Evaluation of post pellet liquid application, particle size, and feed
form on broiler performance. M.S. Thesis. North Carolina State University, Raleigh,
NC.
Cook, D., N. Paton, and M. Gibson. 2005. Effect of dietary level of distillers dried grains
with solubles (DDGS) on growth performance, mortality, and carcass characteristics
on grow-finish barrows and gilts. J. Anim. Sci. 83 (Suppl. 1):335 (Abstr.).
DeDecker, J. M., M. Ellis, B. F. Wolter, J. Spencer, D. M. Webel, C. R. Bertelsen, and B. A.
Peterson. 2005. Effects of dietary level of distillers dried grains with solubles and fat
on the growth performance of growing pigs. J. Anim. Sci. 83 (Suppl. 2):79 (Abstr.).

142
DeJong, J. A., S. S. Dritz, M. D. Tokach, J. M. DeRouchey, J. L. Nelssen, and R. D.
Goodband. 2011. Effect of regrinding dried distillers grains with solubles on finishing
pig growth performance. Pages 197-201 in Finishing nutrition and management.
Kansas Swine Industry Day Report of Progress. Manhattan, KS.
Fahrenholz, A. C. 2008. The effects of DDGS inclusion on pellet quality and pellet mill
performance. M. S. Thesis. Kansas State University, Manhattan, KS.
Fahrenholz, A. C., K. C. Behnke, L. J. McKinney. 2013. Processing of pelleted feeds using
pelleted DDGS as an ingredient. Appl. Eng. Agric. 29:89-92.
Fastinger, N. D., and D. C. Mahan. 2003. Effect of soybean meal particle size on amino acid
and energy digestibility in grower-finisher swine. J. Anim. Sci. 81:697-704.
Frikha, M., H. M. Safaa, M. P. Serrano, X. Arbe, and G. G. Mateos. 2009. Influence of the
main cereal and feed form of the diet on performance and digestive tract of brown-
egg laying pullets. Poult. Sci. 88:994-1002.
Goodband, R. D., and R. H. Hines. 1988. An evaluation of barley in starter diets for swine. J.
Anim. Sci. 66:3086-3091.
Goodband, R. D., M. D. Tokach, and J. L. Nelssen. 2002. The effects of diet particle size on
animal performance. MF-2050. Feed Manufacturing. Dept. Grain Sci. Ind., Kansas
State Univ., Manhattan, KS.
Healy, B. J., J. D. Hancock, G. A. Kennedy, P. J. Bramel-Cox, K. C. Behnke, and R. H.
Hines. 1994. Optimum particle size of corn and hard and soft sorghum for nursery
pigs. J. Anim. Sci. 72: 2227-2236.
Jensen, L. S. 2000. Influence of pelleting on the nutritional needs of poultry. Asian Austral. J.
Anim. Sci. 13:35-46.

143
Kelsall, D. R., and T. P. Lyons. 1999. Grain dry milling and cooking for alcohol production:
designing for 23% ethanol and maximum yield. Chapter 2 in The Alcohol Textbook.
3rd
ed. Jacques, K. A., T. P. Lyons, and D. R. Kelsall. Eds. Nottingham University
Press, Nottingham, UK.
Lawrence, K. R., C. W. Hastad, R. D. Goodband, M. D. Tokach, S. S. Dritz, J. L. Nelssen, J.
M. DeRouchey, and M. J. Webster. 2003. Effects of soybean meal particle size on
growth performance of nursery pigs. J. Anim. Sci. 81:2118-2122.
Liu, K. 2011. Chemical composition of DDGS. Pages 143-178 in Distillers Dried Grains:
Production, Properties, and Utilization. Liu, K. S., and K. A. Rosentrater. Eds. CRC
Press, Boca Raton, FL.
McEllhiney, R. 1992. What is the optimum particle size for pelleting? Feed Management
9:19-23.
Myers, A. J., R. D. Goodband, M. D. Tokach, S. S. Dritz, J. M. DeRouchey, and J. L.
Nelssen. 2013. The effects of diet form and feeder design on the growth performance
of finishing pigs. J. Anim. Sci. 91:3420-3428.
Naidu, K., V. Singh, D. B. Johnston, K. D. Rausch, and M. E. Tumbleson. 2007. Effects of
ground corn particle size on ethanol yield and thin stillage soluble solids. Cereal
Chem. 84:6-9.
Nemechek, J., M. Tokach, E. Frugé, E. Hansen, S. Dritz, R. Goodband, J. DeRouchey, and J.
Nelssen. 2013. Effect of pellet quality and feeder adjustment on growth performance
on finishing pigs. J. Anim. Sci. 91 (Suppl. 2):69.
NRC. 1998. Nutrient requirements of swine. 10th
ed. Natl. Acad. Press, Washington, DC.
Pacheco, W. J., C. R. Stark, P. R. Ferket, and J. Brake. 2013. Evaluation of soybean meal
source and particle size on broiler performance, nutrient digestibility, and gizzard
development. Poult. Sci. 92:2914-2922.

144
SAS. 2006. SAS/STAT User's guide, SAS Institute, Inc., SAS Press, Cary, NC.
Schell, T. C., and E. van Heugten. 1998. The effect of pellet quality on growth performance
of grower pigs. J. Anim. Sci. 76 (Suppl. 1):185.
Shurson, J., and S. Noll. 2005. Feed and Alternative Uses for DDGS. Pages 1-11 in Energy
from Agriculture; New Technologies, Innovative Programs and Successes Conf. St.,
Louis, MO.
Stark, C. R. 1994. Pellet quality and its effect on swine performance; functional
characteristics of ingredients in the formation of quality pellets. Ph.D. Dissertation.
Kansas State Univ., Manhattan, KS.
Stark, C. R. 2012. Feed manufacturing to lower feed cost. Pages 127-133 in Allen D. Leman
Swine Conf. Minneapolis. MN.
Rosentrater, K. A. 2007. Can we really pellet DDGS. Distillers Grains Quarterly. 3:16-21.
Wondra, K. J., J. D. Hancock, K. C. Behnke, R. H. Hines, and C. R. Stark. 1995a. Effect of
particle size and pelleting on growth performance, nutrient digestibility, and stomach
morphology in finishing pigs. J. Anim. Sci. 73:757-763.
Wondra, K. J., J D. Hancock, G. A. Kennedy, R. H. Hines, and K. C. Behnke. 1995b.
Reducing particle size of corn in lactation diets from 1,200 to 400 micrometers
improves sow and litter performance. J. Anim. Sci. 73:421-426.
Zang, J. J., X. S. Piao, D. S. Huang, J. J. Wang, X. Ma, and Y. X. Ma. 2009. Effects of feed
particle size and feed form on growth performance, nutrient metabolizability and
intestinal morphology in broiler chickens. Asian-Aust. J. Anim. Sci. 22: 107-112.

145
CHAPTER VI
INTEGRATION OF CONCEPTS AND FINDINGS FROM RESEARCH STUDIES

146
6.1. INTRODUCTION
Feed costs represent a significant fraction of the total production costs in swine and
poultry farming. Therefore, producers are constantly evaluating ways to reduce feed costs
and improve live performance and feed efficiency (Myers et al., 2013), either by changing
feed processing techniques, such as pelleting or particle size manipulation, or by including
alternative ingredients (Stein and Shurson, 2009), such as distiller dried grains with solubles
(DDGS). Currently, DDGS are frequently used as a source of protein, energy, and
phosphorus in poultry and swine diets and replace some of the more expensive dietary
ingredients, such as corn, SBM, and dicalcium phosphate. However, the usage of DDGS has
created new challenges associated with nutrient variability, particularly amino acid
digestibility, and feed-processing challenges related to decreased pellet quality and feed mill
throughput (Behnke, 2007). Reducing DDGS particle size may be a strategy to increase the
dietary inclusion of DDGS without adversely affecting pellet quality and/or animal
performance.
The following hypothesis was tested in this dissertation: the benefit of dietary
inclusion of DDGS depends upon feed formulation strategies and particle size manipulation
that could influence pellet durability, nutrient digestibility, and overall live performance of
poultry and swine. Certain experiments described in the previous chapters have been
designed to understand the effects of different inclusions levels of DDGS in broiler diets
based on various formulation strategies. In addition, it was determined important to test the
influence of the analytical methodology to measure crude fat content of DDGS on pellet
quality and broiler performance. The influence of the percentage fines in pelleted feed and

147
particle size of DDGS on broiler and swine performance was also measured. Understanding
the effects of dietary inclusion of DDGS on pellet quality and broiler performance, and the
influence of the particle size and percentage fines on broiler and grower-finisher swine
performance would allow us to take a better advantage of a feed ingredient that will continue
to be available as a co-product of the ethanol production.
We demonstrated that adjustments in feed processing and feed formulation could be
made to improve the utilization of DDGS in broiler and swine diets. The objectives of the
present chapter are as follows: 1) to summarize the most important findings of the research
studies; 2) to discuss the influence of dietary DDGS inclusion and particle size on pellet
quality on the growth performance of broilers and grower-finisher swine; and 3) to suggest
recommendations regarding the maximum dietary inclusion of DDGS in broiler diets based
on various formulation strategies.
6.2. EFFECTS OF DDGS INCLUSION ON PELLET QUALITY
The inclusion of DDGS produced diverse results in swine and broiler diets. As
reported in Chapter II, swine finisher diets containing 30% DDGS had better pellet quality,
as measured by pellet durability index (PDI), than diets that did not contain DDGS. However
in the broiler trials (Chapters III and IV), PDI was observed to decrease as the inclusion of
DDGS increased from 0 to 30% or from 15 to 30%. The decreased PDI in the broiler trials
was confounded by a greater amount of fat added in the mixer prior to pelleting due to the
lower metabolizable energy in DDGS as compared to corn or SBM. Based on the results
obtained from these trials, we concluded that decreased pellet quality in broiler diets

148
containing DDGS was due to: 1) the protein in DDGS becoming denatured by heat
processing during the drying process and likely by alcohol during the fermentation process
such that it was no longer functional as a pellet binder during particle agglomeration or
pelleting; and 2) diets with greater inclusion of DDGS usually contained a higher amount of
added fat prior to pelleting. Fat has been reported to increase lubrication, reduce frictional
heat between the feed and the pellet die wall, and hence reduced starch gelatinization and
binding at the surface of the pellet. Obviously, we could not control the degree of protein
denaturation of DDGS during drying or the quantity of starch before it arrived to the feed
mill. But the amount of added fat in the mixer prior to pelleting could be the most practical
alternative to maintain pellet durability in diets containing DDGS.
6.3. EFFECTS OF FURTHER GRINDING DDGS ON PELLET QUALITY AND
BROILER AND SWINE PERFORMANCE
As observed in the experiment with finisher pigs diets (Chapter II) and broilers diets
(Chapter III), further grinding of DDGS after it was received at the feed mill did not have a
positive effect on pellet durability. The main purpose of particle size reduction is to increase
relative surface area and create more contact points per unit volume within the pellet matrix
(Behnke, 2001). Therefore, particle size has had a significant influence on pellet durability
and, generally finer particles have resulted in higher pellet durability (Behnke, 1994; Kaliyan
and Morey, 2009). In addition, fine particle size of cereal grains has been reported to improve
live performance and feed efficiency in nursery and growing-finishing pigs (Healy et al.,
1994) by increasing the surface area of the digesta available for interaction with digestive

149
enzymes, thus allowing digestive enzymes to release nutrients more effectively (Goodband et
al., 2002; Fastinger and Mahan, 2003). In these trials, further grinding of DDGS produced a
trend towards decreased pellet quality. The explanation was that grinding DDGS with
approximately 9.8% crude fat could have released fat previously stored in the protein matrix
(T. Winowiski, personal communication, August, 2013), which impeded particle size
agglomeration during pelleting. Fat has been reported to work as a lubricant during the
pelleting process (Stark, 1994; Thomas et al., 1998; Cutlip et al., 2008). In addition, being
hydrophobic, fat has reduced the binding properties of water-soluble nutrients such as
protein, starch, and fiber (Thomas et al., 1998). In Chapter III, further grinding of DDDS
resulted in greater feed consumption and BW of broilers from 1-42 d of age than birds fed
DDGS as received, but no differences were observed for FCR. However, further grinding of
DDGS did not impact average daily gain (ADG), average daily feed intake (ADFI), or feed
to gain (F:G) of grower-finisher pigs.
In general, the average particle size and particle size distribution between the DDGS
as received at the feed mill and the particle of the DDGS after grinding, using a 1.6 mm
hammer mill screen, was similar and overlapped to a considerable extent in these
experiments (see figures in previous chapters). Ethanol producers have reduced the particle
size of the corn and other cereal grains in order to reduce the fermentation time and increase
ethanol yield. Based on the results of these studies, we concluded that DDGS did not need to
be further ground at the feed mill, as it did not improve pellet quality or overall poultry and
swine feed efficiency.

150
6.4. EFFECT OF PERCENTAGE PELLET FINES ON BROILER AND SWINE LIVE
PERFORMANCE
The percentage feed fines did not affect feed intake in broilers and swine (Chapter III,
and V). In previous broiler studies, feed consumption has been observed to decrease as the
percentage fines in pelleted feed increased (Cutlip et al., 2008). This reduction in feed
consumption of pelleted feed with a high percentage fines has been associated with
flowability problems at the feeder and limited access to ad libitum feed consumption.
However, in our broiler studies, feeders were shaken three times daily after 14 d of age in
order to keep access to feed available at all times. In the swine study, the use of an automatic
feeder provided the opportunity to add feed at multiple times daily, which stimulated feed
intake because there was fresh feed in front of the pigs at all times, regardless of the
percentage feed fines. Broilers and grower-finisher pigs fed diets that contained 25% fines
exhibited a live performance similar to broiler or pigs fed diets with 0% fines. However,
broilers fed diets with 50% fines exhibited a lower BW than birds fed diets with 0% feed
fines. Stark (1994) reported that feeding pigs pelleted diets that contained 60% fines
produced a FCR similar to feeding mash diets and concluded that feed with a high percentage
fines diminished the benefits of pelleting. According to Stark (2012), integrated operations
do not remove the fines produced during the pelleting process and feed can contain 10 to
50% fines by the time it is finally delivered to the feeders at the farm. Based on both studies,
we concluded that with appropriate feeder management, up to 25% feed fines could be fed
without a negative effect on BW and feed efficiency. Nutritionists, feed mill managers, and
purchasing agents could use the data obtained from our research trials to make decisions
151
during ingredient procurement and/or feed manufacturing that would allow them to reduce
overall feed and/or feed manufacturing costs.
6.5. MAXIMUM INCLUSION OF DDGS BASED UPON FORMULATION
STRATEGIES
In general, DDGS have been reported to contain lower amino acid digestibility than
corn and SBM. The temperatures applied during the drying process of DDGS have been
reported to decrease protein quality and reduce digestibility of certain amino acids (Noll et
al., 2001; Fastinger and Mahan, 2006; Stein et al., 2006; Pahm et al., 2008). The free amino
group of lysine may react with reducing sugars in the presence of heat, and causes the
formation of undigestible complexes (Cromwell et al., 1993; Spiehs et al., 2002; Batal and
Dale 2006; Parsons et al., 2006; Fontaine et al., 2007). In Chapter III, broiler diets were
formulated on a digestible amino acid basis to account for the differences in amino acid
digestibility between DDGS, corn, and SBM. In this trial, no differences in BW or nitrogen
digestibility were observed when diets contained either 15 or 30% DDGS. The results of this
study indicated that up to 30% DDGS could be fed in broiler diets from 1-42 d of age if diets
were formulated on a digestible amino acid basis.
In the subsequent trial (Chapter IV), diets were formulated on a total amino acid basis
and this trial demonstrated that birds fed the control diet without DDGS or 15% DDGS had a
greater BW than birds fed the diets containing 30% DDGS at 35 d of age. Furthermore, birds
fed diets without DDGS weighed more at 49 d of age than birds fed diets containing 15 or
30% DDGS. The greater BW was not related to increased feed consumption, but instead

152
associated with improved FCR. In addition, birds fed diets without DDGS or 15% DDGS had
greater nitrogen digestibility during the grower (15-35 d) and finisher (36-49 d) periods than
birds fed diets containing 30% DDGS, and they had a lower incidence of footpad lesions.
Given that lysine was the most susceptible amino acid to heat damage, and since poultry do
not possess enzymes that would break the lysine-sugar complex bond, heat damaged lysine is
typically rendered nutritionally unavailable (Batal and Bregendahl, 2011). Therefore, we
concluded that the maximum dietary inclusion of DDGS would depend upon formulation
strategies, and the usage of the digestible amino acid methodology warranted a higher
inclusion of DDGS. Distiller dried grains will continue to be available as a co-product of
ethanol industry. Therefore, adjustments in feed processing and feed formulation will need to
be made in order to improve DDGS utilization in poultry and swine diets. Once this has been
done, the decisions regarding DDGS usage in poultry and swine diets will depend upon
economic return alone.

153
6.6. REFERENCES
Batal, A., and K. Bregendahl. 2011. Feeding Ethanol Coproducts to Poultry. Pages 317-338
in Distillers Grains: Production, Properties, and Utilization. KeShun, L., and K. A.
Rosentrater. Eds. AOCS Publishing, Boca Raton, FL.
Batal, A. B., and N. M. Dale. 2006. True ME and amino acid digestibility of distillers dried
grains with solubles. J. Appl. Poult. Res. 15:89-93.
Behnke, K. C. 1994. Factors affecting pellet quality. Pages 44-54 in Proc. Md. Nutr. Conf.
Feed Manuf. College Park, MD.
Behnke, K. C. 2001. Factors influencing pellet quality. Feed Technol. 5:19-22.
Behnke, K. C. 2007. Feed manufacturing considerations for using DDGS in poultry and
livestock diets. Pages 77-81 in Proc. 5th
Mid-Atlantic Nutr. Conf., Timonium, MD.
Cromwell, G. L., K. L. Herkelman, and T. S. Stahly. 1993. Physical, chemical, and
nutritional characteristics of distillers dried grain with solubles fed to chicks and pigs.
J. Anim. Sci. 71:679-686.
Cutlip, S. E., J. M. Hott, N. P. Buchanan, A. L. Rack, J. D. Latshaw, and J. S. Moritz. 2008.
The effect of steam-conditioning practices on pellet quality and growing broiler
nutritional value. J. Appl. Poult. Res. 17:249-261.
Fastinger, N. D., and D. C. Mahan. 2003. Effect of soybean meal particle size on amino acid
and energy digestibility in grower-finisher swine. J. Anim. Sci. 81:697-704.
Fastinger, N. D., and D. C. Mahan. 2006. Determination of the ileal amino acid and energy
digestibilities of corn distillers dried grains with solubles using grower-finisher pigs.
J. Anim. Sci. 84:1722-1728.
Fontaine, J., U. Zimmer, P. J. Moughan, and S. M. Rutherfurd. 2007. Effect of heat damage
in an autoclave on the reactive lysine contents of soy products and corn distillers
dried grains with solubles: Use of the results to check on lysine damage in common
qualities of these ingredients. J. Agric. Food Chem. 55:10737-10743.

154
Goodband, R. D., M. D. Tokach, and J. L. Nelssen. 2002. The effects of diet particle size on
animal performance. MF-2050. Feed Manufacturing. Dept. Grain Sci. Ind., Kansas
State Univ., Manhattan, KS.
Healy, B. J., J. D. Hancock, G. A. Kennedy, P. J. Bramel-Cox, K. C. Behnke, and R. H.
Hines. 1994. Optimum particle size of corn and hard and soft sorghum for nursery
pigs. J. Anim. Sci. 72:2227-2236.
Kaliyan, N., and R. V. Morey, 2009. Factors affecting strength and durability of densified
biomass products. Biomass Bioenergy. 33:337-359.
Myers, A. J., R. D. Goodband, M. D. Tokach, S. S. Dritz, J. M. DeRouchey, and J. L.
Nelssen. 2013. The effects of diet form and feeder design on the growth performance
of finishing pigs. J. Anim. Sci. 91:3420-3428.
Noll, S., V. Stangeland, G. Speers, and J. Brannon. 2001. Distillers grains in poultry diets.
Pages 53-61 in Proc. 62nd
Minnesota Nutr. Conf. and Minnesota Corn Growers Assn.
Technical Symposium. Bloomington, MN.
Pahm, A. A., C. Pedersen, D. Hoehler, and H. H. Stein. 2008. Factors affecting the variability
in ileal amino acid digestibility in corn distillers dried grains with solubles fed to
growing pigs. J. Anim. Sci. 86:2180-2189.
Parsons, A. S., N. Buchanan, K. Blemings, M. Wilson, and J. Moritz. 2006. Effect of corn
particle size and pellet texture on broiler performance in the growing phase. J. Appl.
Poult. Res. 15:245-255.
Spiehs, M. J., M. H. Whitney, and G. C. Shurson. 2002. Nutrient database for distillers dried
grains with solubles produced from new ethanol plants in Minnesota and South
Dakota. J. Anim. Sci. 80:2639-2645.
Stark, C. R. 1994. Pellet quality and its effect on swine performance; functional
characteristics of ingredients in the formation of quality pellets. Ph.D. Dissertation.
Kansas State Univ., Manhattan, KS.
155
Stark, C. R. 2012. Feed manufacturing to lower feed cost. Pages 127-133 in Allen D. Leman
Swine Conf. Minneapolis. MN.
Stein, H. H., C. Pedersen, M. L. Gibson, and M. G. Boersma. 2006. Amino acid and energy
digestibility in ten samples of distillers dried grain with solubles by growing pigs. J.
Anim. Sci. 84:853-860.
Stein, H. H., and G. C. Shurson. 2009. Board invited review: The use and application of
distillers dried grains with solubles (DDGS) in swine diets. J. Anim. Sci. 87:1292-
1303.
Thomas M., T. van Vliet, and A. F. B. van der Poel. 1998. Physical quality of pelleted animal
feed. 3. Contribution of feedstuff components. Anim. Feed Sci. Technol. 76:59-78.
Copyright © 2022 FDOKUMEN