A Voltage Sag Severity Evaluation Method for the System Side ...
21
energies Article A Voltage Sag Severity Evaluation Method for the System Side Which Considers the Influence of the Voltage Tolerance Curve and Sag Type Yonghai Xu, Xingguan Fan * , Siying Deng and Chunhao Niu Citation: Xu, Y.; Fan, X.; Deng, S.; Niu, C. A Voltage Sag Severity Evaluation Method for the System Side Which Considers the Influence of the Voltage Tolerance Curve and Sag Type. Energies 2021, 14, 5065. https://doi.org/10.3390/en14165065 Academic Editors: Abu-Siada Ahmed and Nicu Bizon Received: 2 July 2021 Accepted: 15 August 2021 Published: 17 August 2021 Publisher’s Note: MDPI stays neutral with regard to jurisdictional claims in published maps and institutional affil- iations. Copyright: © 2021 by the authors. Licensee MDPI, Basel, Switzerland. This article is an open access article distributed under the terms and conditions of the Creative Commons Attribution (CC BY) license (https:// creativecommons.org/licenses/by/ 4.0/). State Key Laboratory of Alternate Electrical Power System with Renewable Energy Sources, School of Electrical and Electronic Engineering (SEEE), North China Electric Power University (NCEPU), Beijing 102206, China; [email protected] (Y.X.); [email protected] (S.D.); [email protected] (C.N.) * Correspondence: [email protected] Abstract: Considering the influence of user equipment voltage tolerance characteristics and sag types on the evaluation results, this paper proposes a voltage sag severity evaluation method for the system side which considers the influence of the voltage tolerance curve and sag type. As such, a quantitative evaluation of the severity of voltage sag events can be achieved. Firstly, the user’s voltage tolerance curve is used to construct the comparison reference value of the energy index, in order to realize the rapid analysis of the severity of the sag event in the normal area and the abnormal area. Secondly, aiming at the problem of insufficient descriptions of the severity difference of sag events in uncertain areas, an improved energy index evaluation model combined with user tolerance characteristics is established through an interval division and interval weight calculation, so as to divide and evaluate the severity of sag events in uncertain areas. Considering the influence of the sag type on the voltage tolerance curve and user equipment, the energy index correction factor is then constructed, and the measurement function is used for an interval evaluation to obtain the ranking result of the voltage sag severity, which is more in line with the actual situation. Finally, the rationality and effectiveness of the proposed method are verified by analyzing 24 voltage sag events at a monitoring node. Keywords: energy index; tolerance characteristics; grade division; sag type; interval number ranking; severity assessment 1. Introduction In recent years, the large-scale integration of renewable energy, based on power electronics and automatic control technology into the grid, has caused many power quality problems. Among them, voltage sag is the most important problem [1–3]. At the same time, high-end manufacturing processes, such as semiconductor manufacturing and automobile manufacturing, utilize many sensitive devices, which are very sensitive to voltage sag. A short-term voltage sag may lead to abnormal operation of the equipment, and in severe cases, may cause equipment outage. Moreover, these types of equipment play a pivotal role in the operation of enterprises. In the event of an abnormal situation, an enterprise may suffer huge economic losses [4,5]. The design of the user economic loss evaluation and sag control scheme is based on the accurate evaluation of the severity of voltage sag events. Thus, it is necessary to study how voltage sag severity is evaluated. To date, a large number of studies have been carried out in academia and industry around the severity evaluation of voltage sags, and a relatively complete voltage sag evaluation index system has been formed based on the characteristics of grid-side sags or the load perceptual characteristics of user-side sags. Reference [6] proposes a multi-level index architecture of a single event-node-system, in which the node voltage sag index is the core basis for quantitatively evaluating the voltage sag level. This index architecture Energies 2021, 14, 5065. https://doi.org/10.3390/en14165065 https://www.mdpi.com/journal/energies
-
Upload
khangminh22 -
Category
Documents
-
view
1 -
download
0
Transcript of A Voltage Sag Severity Evaluation Method for the System Side ...

energies
Article
A Voltage Sag Severity Evaluation Method for the System SideWhich Considers the Influence of the Voltage Tolerance Curveand Sag Type
Yonghai Xu, Xingguan Fan * , Siying Deng and Chunhao Niu
�����������������
Citation: Xu, Y.; Fan, X.; Deng, S.;
Niu, C. A Voltage Sag Severity
Evaluation Method for the System
Side Which Considers the Influence
of the Voltage Tolerance Curve and
Sag Type. Energies 2021, 14, 5065.
https://doi.org/10.3390/en14165065
Academic Editors: Abu-Siada Ahmed
and Nicu Bizon
Received: 2 July 2021
Accepted: 15 August 2021
Published: 17 August 2021
Publisher’s Note: MDPI stays neutral
with regard to jurisdictional claims in
published maps and institutional affil-
iations.
Copyright: © 2021 by the authors.
Licensee MDPI, Basel, Switzerland.
This article is an open access article
distributed under the terms and
conditions of the Creative Commons
Attribution (CC BY) license (https://
creativecommons.org/licenses/by/
4.0/).
State Key Laboratory of Alternate Electrical Power System with Renewable Energy Sources,School of Electrical and Electronic Engineering (SEEE), North China Electric Power University (NCEPU),Beijing 102206, China; [email protected] (Y.X.); [email protected] (S.D.); [email protected] (C.N.)* Correspondence: [email protected]
Abstract: Considering the influence of user equipment voltage tolerance characteristics and sagtypes on the evaluation results, this paper proposes a voltage sag severity evaluation method forthe system side which considers the influence of the voltage tolerance curve and sag type. As such,a quantitative evaluation of the severity of voltage sag events can be achieved. Firstly, the user’svoltage tolerance curve is used to construct the comparison reference value of the energy index, inorder to realize the rapid analysis of the severity of the sag event in the normal area and the abnormalarea. Secondly, aiming at the problem of insufficient descriptions of the severity difference of sagevents in uncertain areas, an improved energy index evaluation model combined with user tolerancecharacteristics is established through an interval division and interval weight calculation, so as todivide and evaluate the severity of sag events in uncertain areas. Considering the influence of thesag type on the voltage tolerance curve and user equipment, the energy index correction factor isthen constructed, and the measurement function is used for an interval evaluation to obtain theranking result of the voltage sag severity, which is more in line with the actual situation. Finally, therationality and effectiveness of the proposed method are verified by analyzing 24 voltage sag eventsat a monitoring node.
Keywords: energy index; tolerance characteristics; grade division; sag type; interval number ranking;severity assessment
1. Introduction
In recent years, the large-scale integration of renewable energy, based on powerelectronics and automatic control technology into the grid, has caused many power qualityproblems. Among them, voltage sag is the most important problem [1–3]. At the same time,high-end manufacturing processes, such as semiconductor manufacturing and automobilemanufacturing, utilize many sensitive devices, which are very sensitive to voltage sag. Ashort-term voltage sag may lead to abnormal operation of the equipment, and in severecases, may cause equipment outage. Moreover, these types of equipment play a pivotalrole in the operation of enterprises. In the event of an abnormal situation, an enterprisemay suffer huge economic losses [4,5]. The design of the user economic loss evaluationand sag control scheme is based on the accurate evaluation of the severity of voltage sagevents. Thus, it is necessary to study how voltage sag severity is evaluated.
To date, a large number of studies have been carried out in academia and industryaround the severity evaluation of voltage sags, and a relatively complete voltage sagevaluation index system has been formed based on the characteristics of grid-side sags orthe load perceptual characteristics of user-side sags. Reference [6] proposes a multi-levelindex architecture of a single event-node-system, in which the node voltage sag index isthe core basis for quantitatively evaluating the voltage sag level. This index architecture
Energies 2021, 14, 5065. https://doi.org/10.3390/en14165065 https://www.mdpi.com/journal/energies
Energies 2021, 14, 5065 2 of 21
mainly includes the sag amplitude index ESM and the sag frequency index SARFI [7], withthe sag severity index Se [8,9] and the sag energy index Evs. The sag amplitude index ESMor the sag frequency index SARFI only quantitatively describes the severity of voltagesag events from the perspective of the sag amplitude or frequency, causing a one-sidedcharacterization of the voltage sag level. Although the sag severity index Se considers boththe equipment sensitivity and the sag feature, it is difficult to obtain user information andthe index ignores the difference between the voltage tolerance capabilities of different typesof sensitive equipment, which may lead to misjudgment of the consequence status of theequipment. At the same time, because the sag severity index Se selects the lowest effectivevalue of the three-phase voltage during the sag process as the sag amplitude, it may causean over-evaluation of the non-rectangular sag.
The sag energy index Evs considers the characteristics of the sag amplitude, duration,and sag waveform, and quantitatively analyzes the voltage sag. Due to the compatibilityand universality of Evs, it has attracted widespread attention [10–12]. In reference [13],the graphical method is used to determine the voltage energy loss under an asymmetricsag, which can both present the evaluation results intuitively and quickly and evaluatethe magnitude of comparison more easily. The ultimate purpose of the voltage sag eventevaluation is to reflect degree that user equipment is influenced by sag events; that is,whether the consequence state of the user equipment has changed. In reference [14], theauthors make a statistical analysis based on the multi-amplitude duration function andcombine it with the voltage tolerance curve, thus revealing the dynamic characteristics ofthe voltage sag on the voltage tolerance curve and realizing the high accuracy of the severityevaluation of the voltage sag. Reference [15] proposes a novel classification of the severitylevel through using the reference values to more intuitively describe the severity degree.Reference [16] proposes an improved energy index to calculate the severity of the voltagesag under the influence of the voltage tolerance curve of ASD with different sag types,however the practicability of user-side evaluation is poor and the influence of non-sensitiveequipment on the evaluation results is not considered. The sag energy index only evaluatessag events according to its own sag characteristics, although the magnitude and durationof the sag are closely related to the affected status of the user equipment, the functionalexpression of the sag energy index cannot fully reflect the affected status of the userequipment. If the influence of the user equipment can be considered comprehensively inthe sag energy index—that is, if the voltage tolerance characteristics of the user equipmentcan be considered—the sag severity can be evaluated more reasonably.
The evaluation methods of the severity of the voltage sag are mainly divided intoprobability evaluations and fuzzy evaluations. In reference [17], a system method basedon the vulnerable region of fault-induced voltage sag is introduced, which can effectivelyevaluate the performance of the system, although its numerical method is complicated tocalculate. Reference [18] proposes a new method for transforming rigorously performedstatistical data into a fuzzy possibility distribution function. Here, the concept of fuzzyprobability is used to calculate the fuzzy trip probability or equipment failure probability,but its computational complexity is large, and it is not suitable for large-scale evaluations.Reference [19] proposes a probabilistic methodology that takes into account the voltage-tolerance ranges for each type of equipment in order to quantify the annual equipmenttrips due to voltage sags and momentary interruptions for each customer in the distri-bution network. However, this method requires the voltage tolerance curve of sensitiveequipment [20–22], which is difficult to apply in practice.
Reference [23] proposes a method in which the tolerance curve of sensitive equipmentconsiders the sag type, and reference [24] proposes a method in which the tolerance charac-teristic curve of the frequency converter is different under different sag types. However,the key factor of the influence of the sag type on user equipment has not been consideredin the study of the sag energy index. At the same time, because the power supply phaseof the user equipment is different when it is connected to the grid node, the equipmentconsequence status and failure probability are different even when caused by the same

Energies 2021, 14, 5065 3 of 21
sag event. Existing studies have ignored the important influence of the equipment powersupply relative to the results of sag evaluation. Thus, the sag type should be reasonablyincluded in evaluations of the sag energy index.
In order to solve the above problems, this paper proposes a voltage sag severity evalu-ation method for the system side which considers the influence of the voltage tolerancecurve and sag type, as this can reflect the influence of different types of sag events ondifferent types of equipment and achieve hierarchical evaluations in uncertain areas. Byconstructing comparison benchmark values and weight coefficients, an improved energyindex evaluation model is established in order to achieve the classification of the severityof sag events. Comprehensively considering the influence of the sag type on the userequipment to construct an energy index correction factor, and according to the measure-ment function, the improved energy interval index considering the influence of sag typeis sorted by the severity of multiple sag events, so as to achieve reasonable and accuratequantification of the severity of sag events. The overall organizational framework of thearticle is shown in Figure 1.
Energies 2021, 14, 5065 3 of 22
However, the key factor of the influence of the sag type on user equipment has not been considered in the study of the sag energy index. At the same time, because the power supply phase of the user equipment is different when it is connected to the grid node, the equipment consequence status and failure probability are different even when caused by the same sag event. Existing studies have ignored the important influence of the equip-ment power supply relative to the results of sag evaluation. Thus, the sag type should be reasonably included in evaluations of the sag energy index.
In order to solve the above problems, this paper proposes a voltage sag severity evaluation method for the system side which considers the influence of the voltage tol-erance curve and sag type, as this can reflect the influence of different types of sag events on different types of equipment and achieve hierarchical evaluations in uncertain areas. By constructing comparison benchmark values and weight coefficients, an improved energy index evaluation model is established in order to achieve the classification of the severity of sag events. Comprehensively considering the influence of the sag type on the user equipment to construct an energy index correction factor, and according to the measurement function, the improved energy interval index considering the influence of sag type is sorted by the severity of multiple sag events, so as to achieve reasonable and accurate quantification of the severity of sag events. The overall organizational frame-work of the article is shown in Figure 1.
Start
End
Calculate the voltage sag energy index and obtain the user's voltage tolerance curve
Judging the severity of the sag event in the normal area and the abnormal area based on the energy
index of the comparison reference value
Divide intervals and construct interval weights, classify the severity of sag events in uncertain
areas, and conduct hierarchical evaluation
Consider the influence of sag type on voltage tolerance curve and user equipment, construct
energy index correction factor
Sort the severity of sag events based on the measurement function and perform interval
evaluation
Interval assessment of the severity of voltage sags at each node on the power grid system side
Grading evaluation of voltage sag severity
combined with user tolerance characteristics
Evaluation of the severity interval of voltage sag
considering the influence of sag type
Figure 1. The overall organizational framework of the article.
The rest part of this paper is organized as follows. Section 2 describes the improved energy index combined with the voltage tolerance curve. Section 3 presents the energy index correction factor considering the sag type. Section 4 shows the node voltage sag evaluation based on an improved energy index. A case study in Section 5 proves the correctness of the theoretical analysis. Finally, the conclusions are drawn in Section 6.
2. Improved Energy Index of Voltage Sag Combined with Voltage Tolerance Curve In this section, the comparison reference value of the energy index is obtained
based on the voltage tolerance curve, and the two-dimensional space formed by the sag
Figure 1. The overall organizational framework of the article.
The rest part of this paper is organized as follows. Section 2 describes the improvedenergy index combined with the voltage tolerance curve. Section 3 presents the energyindex correction factor considering the sag type. Section 4 shows the node voltage sagevaluation based on an improved energy index. A case study in Section 5 proves thecorrectness of the theoretical analysis. Finally, the conclusions are drawn in Section 6.

Energies 2021, 14, 5065 4 of 21
2. Improved Energy Index of Voltage Sag Combined with Voltage Tolerance Curve
In this section, the comparison reference value of the energy index is obtained based onthe voltage tolerance curve, and the two-dimensional space formed by the sag amplitudeand duration is divided into 6 sub-regions. The distance from the upper and lower limitsof the tolerance curve to the voltage sag event is then used as the weight coefficient, so asto establish an improved energy index model and quantify the severity of each sub-region.On this basis, the severity of voltage sag events is graded. This can effectively guide usersto manage voltage sag events and has practical engineering significance.
2.1. Voltage Sag Energy Index
The energy index is derived from the distribution characteristics of CBEMA curve,which can essentially reflect the tolerance level of sensitive equipment to voltage sags; itcan also indirectly reflect the severity of the voltage sag event from the point of view of thereduced value of the energy transferred from the system to the load, which is reasonableand universal. According to the power quality monitoring equipment, the characteristicquantities, such as the sag amplitude and duration, can be obtained, and the voltage sagenergy index Evs [6] can then be calculated, as shown in Equation (1):
Evs =∫ T
0
{1−
[U
UN
]2}
dt (1)
where, U is the voltage sag magnitude; UN is the rated voltage; T is the voltage sag duration.
2.2. Voltage Tolerance Curve
The Voltage Tolerance Curve (VTC) can be roughly divided into two categories. Thefirst category is related to the user-side-oriented sensitive equipment, in which the VTCis obtained through a large number of repetitive experimental tests. However, due tothe wide variety of the actual equipment utilized by users, there are differences in sagtolerance characteristics, which makes it difficult to collect user information and limitsthe engineering practicability. The second category is related to system side node users,in which, in accordance with the requirements and regulations of industry equipmentmanufacturers, VTC is given in a single curve form so that it is easy to execute. At present,the single curves that are widely used at home and abroad are mainly ITIC curves whichare suitable for computers and SEMI F47 curves which are suitable for use in semiconductormanufacturing equipment. However, there are regions of uncertainty in essence [25–27].Therefore, this paper is oriented to the research and analysis of the grid system side.Starting from the perspective of a user composed of multiple pieces of equipment, thespecific voltage sag tolerance characteristics of the user’s internal equipment are no longerbe considered, and the SEMI F47 curve, ITIC curve and the sensitive equipment tolerancecurve proposed by the C4.110 working group are summarized and aggregated into theupper and lower limits of the user voltage tolerance curve, as shown in Figure 2. In thisway, the user’s overall sag tolerance characteristics are represented. The severity of theamount that equipment is affected by the sag is then indirectly reflected, solving problemaround the difficulty in collecting equipment information. In Figure 2, when U > 0.80 p.u.or T < 0.02 s, the equipment is in the normal operation region; when U < 0.40 p.u. andT > 0.50 s, the equipment is in the fault abnormal region; and other regions are regarded tobe uncertain regions. In the following studies, the user voltage tolerance curve is used asthe voltage tolerance curve.

Energies 2021, 14, 5065 5 of 21Energies 2021, 14, 5065 5 of 22
0.10 0.20 0.30 0.40 0.50 0.60 0.70 0.80 0.90 1.000.02duration /s
sag amplitu
de /p.u. 0.20
0.40
0.60
0.80
1.00
0
SEMI F47 curve
ITIC curve
C4.110 curve
0.90
II region
I region
III region VI region
V region
IV region
b c
fe
dao0
Figure 2. User voltage tolerance curve.
2.3. Problems with Energy Index and Voltage Tolerance Curve The distribution of 6576 voltage sag events that occurred in a city from January 2019
to July 2020 is shown in Figure 3a. Among them, the number of voltage sag events in the normal operation region is 3979, the number of voltage sag events in the uncertain re-gion is 2185, and the number of voltage sag events in the abnormal region is 412. The value of the energy index in Figure 3b–d also reflects the severity of the voltage sag to a certain extent.
By comparing Figure 3b with Figure 3d, it is found that the energy index value of some voltage sag events occurring in the normal operation region is greater than that of some voltage sag events occurring in the fault anomaly region, because the distribution characteristics of the energy index are determined by the energy index function itself. However, the user equipment has certain tolerance characteristics, and within the toler-ance range, the response of the user equipment to the sag event is not affected. It can be seen that the energy index can only reflect the severity of the sag event, which may lead to over-evaluation according to the results. Only when the sag event is considered in terms of the user equipment—that is, when the equipment tolerance characteristics are considered—can the influence of the voltage sag on the actual equipment be understood. Therefore, the voltage tolerance characteristics and sag event characteristics of user equipment should be comprehensively considered in order to evaluate the severity of sag events.
It can be seen from the voltage tolerance curve that when T > 0.50 s, the severity of the sag event is only related to the sag amplitude. If it is at the same sag amplitude, the voltage tolerance curve will reflect the same severity as the voltage sag. However, from Figure 3c, it can be seen that with the change of T, the severity of the sag event in the uncertainty region also changes. Therefore, the impact of sag events on user equipment in the uncertain region of voltage tolerance curve needs further quantitative analysis.
Figure 2. User voltage tolerance curve.
2.3. Problems with Energy Index and Voltage Tolerance Curve
The distribution of 6576 voltage sag events that occurred in a city from January 2019to July 2020 is shown in Figure 3a. Among them, the number of voltage sag events in thenormal operation region is 3979, the number of voltage sag events in the uncertain region is2185, and the number of voltage sag events in the abnormal region is 412. The value of theenergy index in Figure 3b–d also reflects the severity of the voltage sag to a certain extent.
By comparing Figure 3b with Figure 3d, it is found that the energy index value ofsome voltage sag events occurring in the normal operation region is greater than that ofsome voltage sag events occurring in the fault anomaly region, because the distributioncharacteristics of the energy index are determined by the energy index function itself.However, the user equipment has certain tolerance characteristics, and within the tolerancerange, the response of the user equipment to the sag event is not affected. It can be seenthat the energy index can only reflect the severity of the sag event, which may lead toover-evaluation according to the results. Only when the sag event is considered in terms ofthe user equipment—that is, when the equipment tolerance characteristics are considered—can the influence of the voltage sag on the actual equipment be understood. Therefore, thevoltage tolerance characteristics and sag event characteristics of user equipment should becomprehensively considered in order to evaluate the severity of sag events.
It can be seen from the voltage tolerance curve that when T > 0.50 s, the severity of thesag event is only related to the sag amplitude. If it is at the same sag amplitude, the voltagetolerance curve will reflect the same severity as the voltage sag. However, from Figure 3c,it can be seen that with the change of T, the severity of the sag event in the uncertaintyregion also changes. Therefore, the impact of sag events on user equipment in the uncertainregion of voltage tolerance curve needs further quantitative analysis.

Energies 2021, 14, 5065 6 of 21Energies 2021, 14, 5065 6 of 22
0 1 2 3 4 5 6 7 8 9 100
0.20
0.40
0.60
0.80
1.00
durations
sag amplitu
de/p.u.
0 1000 2000 3000 4000
0
1
2
3
sag energy index/s
number of voltage sag events (a) (b)
0 365 730 1095 1460 1825 21900
1
2
3
4
5
sag energy index/s
number of voltage sag events
0123456789
10
0 70 140 210 280 350 420number of voltage sag events
sag energy index/s
(c) (d)
Figure 3. Distribution characteristics of voltage sag events and energy index values: (a) Scatter plot of sag event distribu-tion; (b) Energy index value of the sag event in the normal area; (c) Energy index value of the sag event in the uncertainty area; (d) Energy index value of the sag event in the abnormal area.
2.4. Sag Energy Index Based on Voltage Tolerance Curve 2.4.1. Construction of Comparison Benchmark Values
The voltage tolerance curve is composed of the upper limit curve oabc and the lower limit curve odef, as shown by the thick solid line in Figure 2, which can judge the distri-bution of the consequence state of the user equipment under the sag event. When the sag event is above the upper limit curve, the user equipment is not affected by the sag event in the normal operation region; when the sag event is below the lower limit curve, the user equipment must fall in the abnormal fault region; and when the sag event is between the upper limit curve and the lower limit curve, the consequence state of user equipment is difficult to be determined in the uncertain region. At the same time, due to the lack of a comparative benchmark value of the sag energy index, the severity of a sin-gle sag event cannot be reflected by the calculation results. Based on this, this paper se-lects the upper limit curve and the lower limit curve of the voltage tolerance curve in order to construct the comparison reference value of the energy index. According to the physical meaning of the energy index, in this paper, the comparison reference value based on the upper limit curve is defined as the energy reduction value during the en-ergy transmission from the system side to the user side, from the start time to the time when the load is just affected by the voltage sag, as shown in Equation (2). The compar-ison reference value based on the lower limit curve is defined as the energy reduction
Figure 3. Distribution characteristics of voltage sag events and energy index values: (a) Scatter plot of sag event distribution;(b) Energy index value of the sag event in the normal area; (c) Energy index value of the sag event in the uncertainty area;(d) Energy index value of the sag event in the abnormal area.
2.4. Sag Energy Index Based on Voltage Tolerance Curve2.4.1. Construction of Comparison Benchmark Values
The voltage tolerance curve is composed of the upper limit curve oabc and the lowerlimit curve odef, as shown by the thick solid line in Figure 2, which can judge the distributionof the consequence state of the user equipment under the sag event. When the sag eventis above the upper limit curve, the user equipment is not affected by the sag event inthe normal operation region; when the sag event is below the lower limit curve, the userequipment must fall in the abnormal fault region; and when the sag event is between theupper limit curve and the lower limit curve, the consequence state of user equipment isdifficult to be determined in the uncertain region. At the same time, due to the lack of acomparative benchmark value of the sag energy index, the severity of a single sag eventcannot be reflected by the calculation results. Based on this, this paper selects the upperlimit curve and the lower limit curve of the voltage tolerance curve in order to constructthe comparison reference value of the energy index. According to the physical meaning ofthe energy index, in this paper, the comparison reference value based on the upper limitcurve is defined as the energy reduction value during the energy transmission from thesystem side to the user side, from the start time to the time when the load is just affected bythe voltage sag, as shown in Equation (2). The comparison reference value based on thelower limit curve is defined as the energy reduction value during the energy transmission

Energies 2021, 14, 5065 7 of 21
from the system side to the user side, from the beginning to the time when the load justexceeds the ability to tolerance voltage sag, as shown in Equation (3):
Evsc1 =
[1− (
UULCUN
)2]· T (2)
Evsc2 =
[1− (
ULLCUN
)2]· T (3)
where, UULC and ULLC are the reference voltage values in the upper limit curve oabc andthe lower limit curve odef in Figure 2. When T is different, the two should take the voltagevalues on the curve in the corresponding time period, respectively, where UULC is 0 or 0.80,ULLC is 0 or 0.40; Evsc1 and Evsc2 are the comparison reference values of energy index basedon the upper limit curve oabc and the lower limit curve odef.
After obtaining the comparison reference value of the energy index, the multiplerelationship between the actual reduction value of the user’s energy transmission duringthe sag time and the energy reduction value during the sag time when the load startsto be affected by the voltage sag, as shown in Equation (4), should first be calculated.Subsequently, the multiple relationship between the actual reduction value of the user’senergy transmission during the sag time and the reduction value of the energy duringthe sag time that just exceeds the load capacity to tolerance the voltage sag, as shown inEquation (5), should then be calculated.
Evs = Evs/Evsc1 (4)
Evs = Evs/Evsc2 (5)
where, Evs and Evs are the energy index values based on the comparison reference valuesof the upper limit curve oabc and the lower limit curve odef, respectively.
It is clear that when Evs < 1, Evs < 1, it indicates that the user equipment is in thenormal operation region. When Evs > 1, Evs > 1, it indicates that the user equipment isin the abnormal region. Therefore, based on the energy index of the baseline value, notonly can the problem of the unreasonable distribution of the energy index function in thenormal operation region as a result of the long duration be solved, but also the quantitativeevaluation of the severity of a single sag event can be realized. However, when Evs > 1 andEvs < 1, the sag event is in an uncertain region and its severity cannot be judged, so furtherquantitative analysis is needed.
2.4.2. Determination of Improved Energy Index
When the severity of the sag event in the uncertain region is evaluated, the severityof sag events in the normal operation region and the abnormal fault region should alsobe considered in order to achieve the unification of the evaluation results. At the sametime, since the critical tolerance level of the user equipment to the voltage sag event isdescribed by the voltage sag curve, the consequence state of the user equipment affectedby the voltage sag is presented by the distribution of the voltage sag event in the voltagetolerance curve. Therefore, according to the distribution of voltage sag events in the voltagetolerance curve and the relative position of voltage sag events with the upper limit curveand the lower limit curve, the two-dimensional space composed of the sag amplitude andduration is divided into six sub-regions: I, II, III, IV, V and VI for evaluation, as shown inFigure 2.
Since the upper limit curve and the lower limit curve in each sub-region are not thesame, the influence of the two on the energy index, based on the comparison referencevalue, is also different. When the sag event is close to the upper limit curve, the severity ofthe sag event should, in theory, be smaller; when the sag event is close to the lower limitcurve, the severity of the sag event should, in theory, be greater. Therefore, the distance

Energies 2021, 14, 5065 8 of 21
between the upper limit curve and the lower limit curve to the sag event can be used as theweight coefficients of their respective sub-regions, as shown in Equations (6) and (7). Onthis basis, the energy index based on the comparison reference value is combined with theweight coefficient, and the influence of sag time is considered in order to obtain the energyindex in the sub-region corresponding to the sag event, which is defined as the improvedenergy index in this paper, as shown in Equation (8):
α =
αIαIIαIIIαIVαVαVI
=
1/2(Umax −U)/Umax(U −Umax)/(2U −Umax)(Umin −U)/(Umin + Umax − 2U)(Umax −U)/(Umax −Umin)(U −Umax)/(2U −Umin −Umax)
(6)
β =
βIβIIβIIIβIVβVβVI
=
1/2U/UmaxU/(2U −Umax)(Umax −U)/(Umin + Umax − 2U)(U −Umin)/(Umax −Umin)(U −Umin)/(2U −Umin −Umax)
(7)
E′vs = [α, β]
[EvsEvs
]· T (8)
where, α and β are the weight coefficients of the energy index based on the upper limitcurve and the lower limit curve, respectively; αi and βi are the weight coefficients of theenergy index based on the upper limit curve and the lower limit curve in the sub-regioni (i = I, II, III, IV, V, VI), respectively, where, since region IV is located below the upperlimit curve and the lower limit curve, other regions are located above the upper limit curveor the lower limit curve and thus the change trend of the weight coefficient of region IVshould be mirror-symmetrical with other regions; Umax and Umin are the maximum andminimum voltage of the voltage tolerance curve, respectively, where Umax is 0.80 and Uminis 0.40. E′vs is the improved energy index value of voltage sag events. The E′vs values of allregions shows a positive trend from small to large, and the minimum value of region IVis the maximum value of region V. Therefore, the E′vs value of region IV should start toincrease from the maximum value of region V.
2.4.3. Severity Classification of Sag Events
Based on the above analysis, the E′vs values of voltage sag events in different sub-regions can be obtained by sorting out Equations (1)–(8), as shown in Equation (9):
E′vs =
T(1−U2)T(1−U2) · [(25− 20U)/9]T(1−U2) · [(34U − 20)/(18U − 7.2)]T(1−U2) · [(910− 1750U)/(226.8− 378U)]T(1−U2) · [(275− 250U)/63]T(1−U2) · [(250U − 170)/(126U − 75.6)]
(9)
In region I, E′vs−max = T, which indicates that no matter how the sag amplitudechanges, the severity of the sag is very small due to the small value of T. In region III andregion VI, with the decrease of sag amplitude and the increase of sag duration, the value ofE′vs also increases, and after calculation, E′vs−max = 0.43T. When the value of T is large, thevalue of E′vs−max is also large, but considering that user equipment is basically unaffectedby the sag event when the voltage value is high, it is considered that the severity of thesag in region III and region VI is also small. In summary, when the sag event is located inregion I, region III and region VI—that is, in the normal operation region—the severity of

Energies 2021, 14, 5065 9 of 21
the sag event is very small and is defined as region A. When the voltage sag event is locatedin region IV—that is, in the fault abnormal region— E′vs−min = 2.33T. Since Tmin = 0.50 s,the value of E’vs is large, and the severity of the sag is very large at this time and is definedas region F.
When the voltage sag event is located in region II and region V it is considered to bein the uncertain region. At this point, in region II, E′vs ∈ [0.36T, 2.78T]; and in region V,E′vs ∈ [0.43T, 2.33T]. Since the severity of sag events are different in uncertain regions, andusers only care about the sag events that may affect them, evaluating the severity of all sagevents in the uncertain regions will result in a waste of human and financial resources. Atthis time, only the sag events with larger severity are selected. Therefore, the severity levelof sag events in the uncertain region can be classified into grades in order to realize therapid selection and reasonable evaluation of sag events with different severity levels.
First of all, a reasonable threshold should be selected as the judgment basis for thequalitative analysis of severity. When T > 0.50 s or U < 0.40 p.u., the equipment may faildue to the sag event. At this time, the coordinate point (0.50 s, 0.40 p.u.) can be consideredas the critical failure point. According to the E′vs expressions of region II and region V, thecritical fault function relationship between U and T in the uncertain region can be obtained,as shown in Equations (10) and (11):
T1 =7.137
20U13 − 25U1
2 − 20U1 + 25(10)
T2 =73.5
250U23 − 275U22 − 250U2 + 275(11)
where, the value range of U1 is [0, 0.40]; the value range of T1 is [0.29, 0.50]; the value rangeof U2 is [0.40, 0.80]; and the value range of T2 is [0.50, 2.72].
According to the critical fault function, the critical fault curve can be drawn in theuncertain region. At the same time, the 75% probability value and 50% probability value ofthe critical fault value are selected as the classification standard. Three determined curvescan then be obtained for U and T in the uncertain region. The severity of the voltage sagevents in the uncertain region is divided into four regions: B, C, D and E. The normaloperation region and fault anomaly region are then considered, so as to obtain the severityclassification region of voltage sag events, as shown in Figure 4.
When voltage sag events are in different regions, their severity levels are different,as shown in Table 1. When the voltage sag event is located in area A, it means that thesag event is located in the normal operation area. This means that the voltage sag eventbasically has no impact on the user and the severity of the sag event is extremely low;therefore, its severity level is defined to be extremely low. When the sag event is locatedin area B, it can be seen from Figure 4 that the probability of equipment failure caused bythese sag events is less than 50%. Thus they have little impact on users and the severity ofthe sag event is small; therefore, the severity level is defined as low. When the sag eventis located in area C, it can be seen from Figure 4 that the probability of equipment failurecaused by these sag events is greater than 50% but less than 75%. As such, they have littleimpact on users and the severity of the sag event is slightly small; therefore, the severitylevel is defined as slightly low. When the sag event is located in area D, it can be seen fromFigure 4 that the probability of equipment failure caused by these sag events is greater than75% but less than 100%. Thus, they have a great impact on users and the severity of the sagevent is slightly large; therefore, its severity level is defined as slightly high. When the sagevents are located in area E, it can be seen from Figure 4 that the probability of equipmentfailure caused by these sag events is 100%, but since they are still in the uncertain area, theseverity of the sag events is slightly lower than that in the abnormal area. They have a greatimpact on users and the severity of the sag events is large and, for this purpose, its severitylevel is defined as high. When the voltage sag event is located in area F, it means that thesag event is located in the abnormal operation area; the event will cause user failure and

Energies 2021, 14, 5065 10 of 21
the severity of the sag event is extremely high, therefore, its severity level is defined asextremely high.
Energies 2021, 14, 5065 10 of 22
severity of the sag event is slightly large; therefore, its severity level is defined as slightly high. When the sag events are located in area E, it can be seen from Figure 4 that the probability of equipment failure caused by these sag events is 100%, but since they are still in the uncertain area, the severity of the sag events is slightly lower than that in the abnormal area. They have a great impact on users and the severity of the sag events is large and, for this purpose, its severity level is defined as high. When the voltage sag event is located in area F, it means that the sag event is located in the abnormal operation area; the event will cause user failure and the severity of the sag event is extremely high, therefore, its severity level is defined as extremely high.
Figure 4. Graded regions of the severity of voltage sag events.
Table 1. Grading of the severity of voltage sag events.
Event Region A B C D E F Severity evaluation level extremely low low slightly low slightly high high extremely high
3. Energy Index Correction Factor Considering Sag Type 3.1. The Necessity of Revising the Energy Index Based on the Sag Type
The vast majority of voltage sag events in the power system are caused by short-circuit faults. Due to the different types of faults, the sag types are also different. Thus, the international joint working group CIGRE/CIRED/UIE C4.110 divides voltage sags into three categories: one is the single-phase sag (Type I) caused by the single-phase ground fault, which is mainly characterized by a one-phase sag while the other two phases are normal; the second is the two-phase sag (Type II) caused by the two-phase short circuit fault or two-phase ground fault, which is mainly characterized by a two-phase sag while the remaining one-phase is normal; the third is the three-phase Sag (type III) caused by three-phase ground short circuit fault, which is mainly characterized by the sag occurring in all three phases. For the above three types of voltage sags [23], the working group also gave their corresponding equipment voltage tolerance curves, as shown in Figure 5.
0.50 1.00 1.50 2.00 2.50 3.000
0.10
0.20
0.30
0.40
0.50
0.60
0.70
0.80
duration /s
. 100%
75%50%
0.90
1.00
A
B
CD
E
F
3.50
sag amplitude /p.u.
0
Figure 4. Graded regions of the severity of voltage sag events.
Table 1. Grading of the severity of voltage sag events.
Event Region A B C D E F
Severity evaluation level extremely low low slightly low slightly high high extremely high
3. Energy Index Correction Factor Considering Sag Type3.1. The Necessity of Revising the Energy Index Based on the Sag Type
The vast majority of voltage sag events in the power system are caused by short-circuitfaults. Due to the different types of faults, the sag types are also different. Thus, theinternational joint working group CIGRE/CIRED/UIE C4.110 divides voltage sags intothree categories: one is the single-phase sag (Type I) caused by the single-phase groundfault, which is mainly characterized by a one-phase sag while the other two phases arenormal; the second is the two-phase sag (Type II) caused by the two-phase short circuitfault or two-phase ground fault, which is mainly characterized by a two-phase sag whilethe remaining one-phase is normal; the third is the three-phase Sag (type III) caused bythree-phase ground short circuit fault, which is mainly characterized by the sag occurringin all three phases. For the above three types of voltage sags [23], the working group alsogave their corresponding equipment voltage tolerance curves, as shown in Figure 5.
In fact, user equipment is not only affected by the sag amplitude and duration, butalso by the sag type. When two sag events with the same sag amplitude and durationbut with different sag types occur, although the Evs are the same, the influence on theuser equipment may be completely different, which cannot reflect the actual situation. Forexample, in the case of two sag events with a sag amplitude of 60% and a duration of 0.10s,if one sag event is sag type I, the user equipment will be in a normal operation state, and ifthe other sag event is sag Type III, the user equipment will be in an abnormal operationarea. In addition, a lot of user equipment is usually connected to the bus node, which isdivided into a single-phase load and a three-phase load, according to the number of power

Energies 2021, 14, 5065 11 of 21
supply phases connected to the power grid. These loads are affected differently by thevoltage sag under the same sag type. For example, when the A-phase grounding faultoccurs, there is basically no effect on the single-phase load (whose power supply phaseis B-phase or C-phase), and only the single-phase load or three-phase load (whose powersupply phase is A-phase) can cause equipment failure. Thus, when using a sag energyindex to evaluate voltage sag events, the influence of sag type should be considered, sothat the evaluation result is more in line with objective reality.
Energies 2021, 14, 5065 11 of 22
0 0.20 0.50 1.00 1.50 2.00 2.50 3.000102030405060708090
100
0 0.20 0.50 1.00 1.50 2.00 2.50 3.000102030405060708090
100
duration /s(a)
duration /s(b)
sag amplitu
de /p.u.
sag amplitu
de /p.u.
Figure 5. Voltage sag tolerance curve of equipment to sag type I/II/III: (a) sag type I/II; (b) sag type III.
In fact, user equipment is not only affected by the sag amplitude and duration, but also by the sag type. When two sag events with the same sag amplitude and duration but with different sag types occur, although the Evs are the same, the influence on the user equipment may be completely different, which cannot reflect the actual situation. For example, in the case of two sag events with a sag amplitude of 60% and a duration of 0.10s, if one sag event is sag type I, the user equipment will be in a normal operation state, and if the other sag event is sag Type III, the user equipment will be in an abnormal operation area. In addition, a lot of user equipment is usually connected to the bus node, which is divided into a single-phase load and a three-phase load, according to the num-ber of power supply phases connected to the power grid. These loads are affected dif-ferently by the voltage sag under the same sag type. For example, when the A-phase grounding fault occurs, there is basically no effect on the single-phase load (whose power supply phase is B-phase or C-phase), and only the single-phase load or three-phase load (whose power supply phase is A-phase) can cause equipment failure. Thus, when using a sag energy index to evaluate voltage sag events, the influence of sag type should be con-sidered, so that the evaluation result is more in line with objective reality.
3.2. Energy Index Correction Factor Considering Sag Type In this section, we first consider the differences in probability distribution of voltage
sag events in the equipment tolerance curve caused by different sag types, and then ob-tain the probability value of the user affected by sag events under different sag types based on the different wiring modes of equipment, and, finally, the correction factor of energy index is obtained by considering the above relationship between them.
3.2.1. Correction Factor of the Influence of Sag Type on Voltage Tolerance Curve It can be seen from Figure 5 that the voltage tolerance curves of the user equipment
under different sag types are different, and the difference between the voltage tolerance curves can be used to quantitatively describe the influence of the sag type on the user equipment. Thus, this paper proposes that the probability value of the voltage sag event in the abnormal operation area under each sag type is equal to the ratio of the area under the curve to the area of the whole sag amplitude-duration plane, as shown in Equation (12):
ii
Sp =
S (12)
where, Si is the area below the voltage tolerance curve under three types of sags, i = I, II, III; S is the area of the whole plane; and pi is the probability value of user equipment failure under three sag types, which is calculated as shown in Table 2.
Figure 5. Voltage sag tolerance curve of equipment to sag type I/II/III: (a) sag type I/II; (b) sag type III.
3.2. Energy Index Correction Factor Considering Sag Type
In this section, we first consider the differences in probability distribution of voltagesag events in the equipment tolerance curve caused by different sag types, and then obtainthe probability value of the user affected by sag events under different sag types based onthe different wiring modes of equipment, and, finally, the correction factor of energy indexis obtained by considering the above relationship between them.
3.2.1. Correction Factor of the Influence of Sag Type on Voltage Tolerance Curve
It can be seen from Figure 5 that the voltage tolerance curves of the user equipmentunder different sag types are different, and the difference between the voltage tolerancecurves can be used to quantitatively describe the influence of the sag type on the userequipment. Thus, this paper proposes that the probability value of the voltage sag event inthe abnormal operation area under each sag type is equal to the ratio of the area under thecurve to the area of the whole sag amplitude-duration plane, as shown in Equation (12):
pi =SiS
(12)
where, Si is the area below the voltage tolerance curve under three types of sags, i = I, II, III;S is the area of the whole plane; and pi is the probability value of user equipment failureunder three sag types, which is calculated as shown in Table 2.
Table 2. Probability value of equipment failure under each sag type.
Sag Type Type I Type II Type III
Equipment failure rate pi/% 76.33 76.33 79.33
3.2.2. Correction Factor for the Influence of Sag Type on Load
Whether the single-phase load is affected by the sag event depends mainly on whetherthe sag phase is the power supply phase. When the sag type is Type I, the single-phaseequipment is only affected by the sag event when the power supply phase is the sag phase,
Energies 2021, 14, 5065 12 of 21
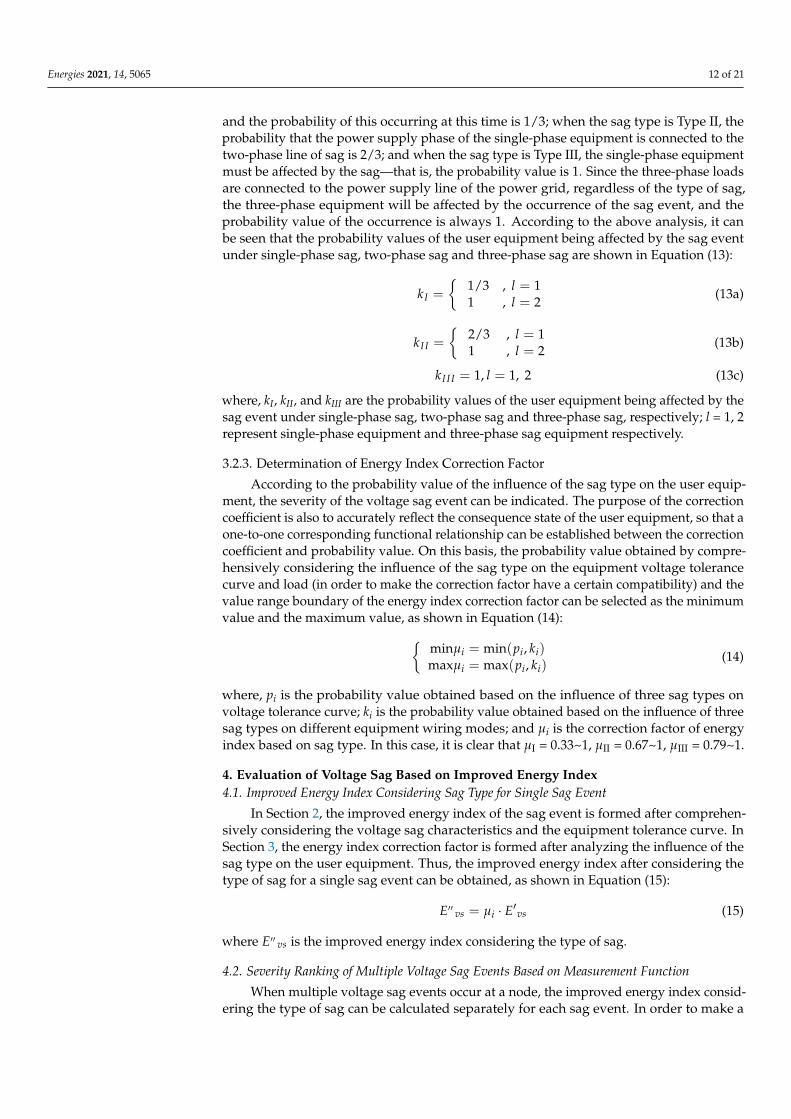
and the probability of this occurring at this time is 1/3; when the sag type is Type II, theprobability that the power supply phase of the single-phase equipment is connected to thetwo-phase line of sag is 2/3; and when the sag type is Type III, the single-phase equipmentmust be affected by the sag—that is, the probability value is 1. Since the three-phase loadsare connected to the power supply line of the power grid, regardless of the type of sag,the three-phase equipment will be affected by the occurrence of the sag event, and theprobability value of the occurrence is always 1. According to the above analysis, it canbe seen that the probability values of the user equipment being affected by the sag eventunder single-phase sag, two-phase sag and three-phase sag are shown in Equation (13):
kI =
{1/3 , l = 11 , l = 2
(13a)
kI I =
{2/3 , l = 11 , l = 2
(13b)
kI I I = 1, l = 1, 2 (13c)
where, kI, kII, and kIII are the probability values of the user equipment being affected by thesag event under single-phase sag, two-phase sag and three-phase sag, respectively; l = 1, 2represent single-phase equipment and three-phase sag equipment respectively.
3.2.3. Determination of Energy Index Correction Factor
According to the probability value of the influence of the sag type on the user equip-ment, the severity of the voltage sag event can be indicated. The purpose of the correctioncoefficient is also to accurately reflect the consequence state of the user equipment, so that aone-to-one corresponding functional relationship can be established between the correctioncoefficient and probability value. On this basis, the probability value obtained by compre-hensively considering the influence of the sag type on the equipment voltage tolerancecurve and load (in order to make the correction factor have a certain compatibility) and thevalue range boundary of the energy index correction factor can be selected as the minimumvalue and the maximum value, as shown in Equation (14):{
minµi = min(pi, ki)maxµi = max(pi, ki)
(14)
where, pi is the probability value obtained based on the influence of three sag types onvoltage tolerance curve; ki is the probability value obtained based on the influence of threesag types on different equipment wiring modes; and µi is the correction factor of energyindex based on sag type. In this case, it is clear that µI = 0.33~1, µII = 0.67~1, µIII = 0.79~1.
4. Evaluation of Voltage Sag Based on Improved Energy Index4.1. Improved Energy Index Considering Sag Type for Single Sag Event
In Section 2, the improved energy index of the sag event is formed after comprehen-sively considering the voltage sag characteristics and the equipment tolerance curve. InSection 3, the energy index correction factor is formed after analyzing the influence of thesag type on the user equipment. Thus, the improved energy index after considering thetype of sag for a single sag event can be obtained, as shown in Equation (15):
E′′ vs = µi · E′vs (15)
where E′′ vs is the improved energy index considering the type of sag.
4.2. Severity Ranking of Multiple Voltage Sag Events Based on Measurement Function
When multiple voltage sag events occur at a node, the improved energy index consid-ering the type of sag can be calculated separately for each sag event. In order to make a

Energies 2021, 14, 5065 13 of 21
quantitative comparison and ranking of the severity of each sag event, in this paper themeasurement function ζ is used to measure the order relationship between the intervalnumbers [28]. Assuming that [x] and [y] are interval numbers, then the measurementfunction ζ([x], [y]) is defined as shown in Equation (16):
ζ([x], [y]) =
m[y] −m[x] + 2sgn(m[y] −m[x])
(r[y] + r[x] = 0)m[y]−m[x]r[y]+r[x]
+ sgn(m[y] −m[x])
(m[y] 6= m[x], r[y] + r[x] 6= 0)r[y]−r[x]
max(r[x] ,r[y])
(m[y] = m[x], r[y] + r[x] 6= 0)
(16)
sgn(x) =
−1 , x < 00 , x = 01 , x > 0
(17)
where, m[x] and m[y] are the midpoint of interval numbers [x] and [y], respectively. That is,m[x] = (x + x)/2, m[y] = (y + y)/2 r[x] and r[y] are the radius of interval number [x] and[y], respectively, that is, r[x] = (x− x)/2, r[y] = (y− y)/2. Based on Equations (16) and(17), the order relationship between interval numbers [x] and [y] can be determined, asshown in Equation (18), and thus the severity of multiple voltage sag events can be sorted.
ζ([x], [y]) = 0⇒ [y] = [x]ζ([x], [y]) > 0⇒ [y] > [x]ζ([x], [y]) < 0⇒ [y] < [x]
(18)
In addition, if there is a voltage sag event with multiple nodes in the power grid,when the overall situation and average situation of the severity of the sag at the node areconsidered, the improved energy index (after considering the type of sag) can be calculatedbased on the monitoring data of each node in the system. The average improved energyindex value and the total improved energy index value at each node can then be calculated,as shown in Equations (19) and (20).
E′′ vsav =1nb
nb
∑f=1
µi · E′vs (19)
E′′ vssum =nb
∑f=1
µi · E′vs (20)
where, E′′ vsav is the average improved energy index value; E′′ vssum is the total improvedenergy index value; and nb is the number of voltage sag events at node b. On this basis,the above node indexes are calculated according to Formulas (16) and (17), and the sagseverity ranking results between the multiple nodes are obtained.
4.3. Voltage Sag Evaluation Process Based on Improved Energy Index
Based on the above analysis, the steps required to evaluate the severity of voltage sagevents based on the improved energy index proposed in this paper mainly include:
• The sag events and sag characteristic quantities, according to the measured data, areinput;
• According to the characteristic quantities of each sag event, the corresponding energyindex is calculated and the distribution in the comprehensive load tolerance curve isobtained;
• According to the distribution characteristics of each sag event, the correspondingcomparison benchmark value and weight coefficient are selected to form an improved

Energies 2021, 14, 5065 14 of 21
energy index, and, on this basis, the zoning and grading evaluation of the severity ofthe sag event is carried out;
• The correction factor of energy index is formed based on the type of each sag event,and the improved energy index considering the type of sag is obtained by combiningthe improved energy index;
• The sorting result of the severity of multiple sag events of a single node and the sortingresult of the average improved energy index of multiple nodes are output. The specificprocess is shown in Figure 6.
Energies 2021, 14, 5065 15 of 22
Start
Actual data
Enter the number of sag events and the sag feature quantity
Calculate the energy index of voltage sag by formula (1)
Distribution characteristics of sag events in voltage tolerance curve
For each sag event, establish a comparative benchmark value through equations (2) and (3)
Obtain the node index from equations (19) and (20)
End
Gets the type of dips
Calculate the energy index correction factor of each sag event by formulas (12)-(14)
Formula (8) forms the improved energy index value for each sag
event
For each sag event, select the weight coefficient through equations (6) and (7)
According to formula (9), the severity of each sag
event is described by region
The sag events in the uncertain area are classified according to
formulas (10) and (11)
From equation (15), the improved energy index of each sag event
considering the type of sag is obtained
Sort the severity by formulas (16)-(18)
Whether it is a single node that sags
Yes
No
Grading assessment of the severity of the sag event
Figure 6. Evaluation process of voltage sag based on improved energy index.
5. Case Studies 5.1. Monitoring Data Acquisition
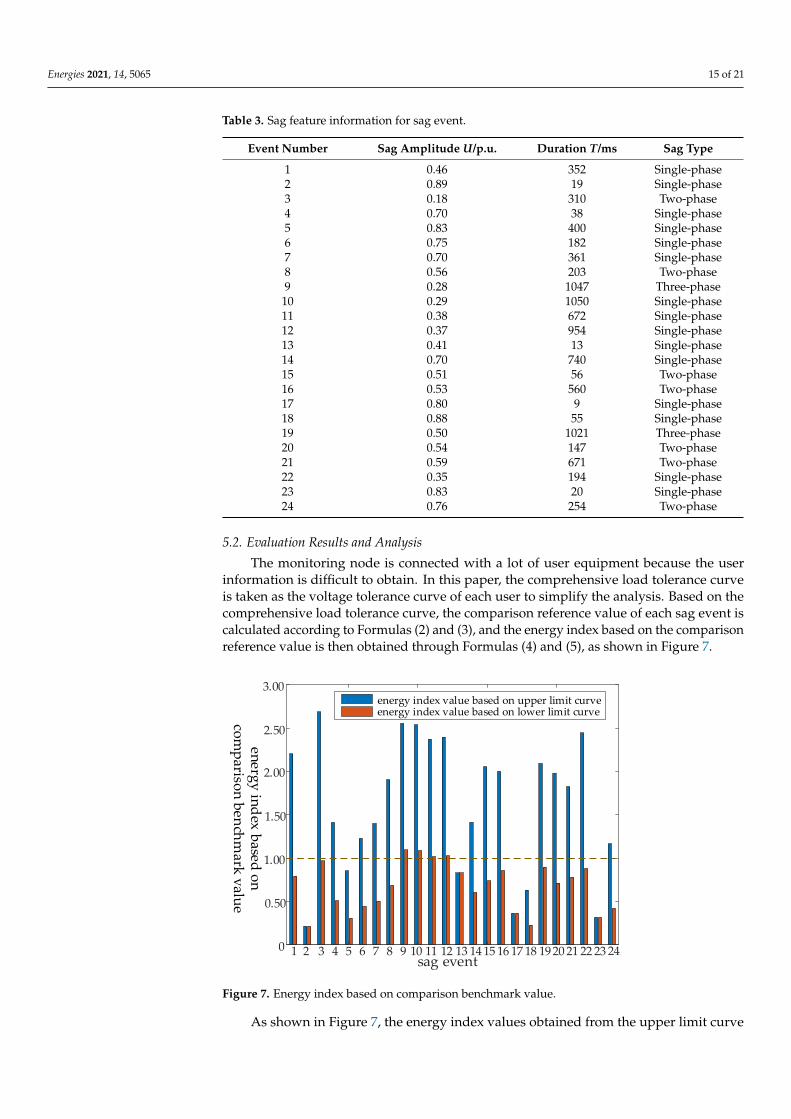
In this paper, 24 voltage sag data at a monitoring node are taken as an example for analysis. The sag amplitude, duration, and sag type of each sag event are shown in Table 3.
Table 3. Sag feature information for sag event.
Event Number Sag Amplitude U/p.u. Duration T/ms Sag Type 1 0.46 352 Single-phase 2 0.89 19 Single-phase 3 0.18 310 Two-phase 4 0.70 38 Single-phase 5 0.83 400 Single-phase 6 0.75 182 Single-phase
Figure 6. Evaluation process of voltage sag based on improved energy index.
5. Case Studies5.1. Monitoring Data Acquisition
In this paper, 24 voltage sag data at a monitoring node are taken as an example foranalysis. The sag amplitude, duration, and sag type of each sag event are shown in Table 3.
Energies 2021, 14, 5065 15 of 21
Table 3. Sag feature information for sag event.
Event Number Sag Amplitude U/p.u. Duration T/ms Sag Type
1 0.46 352 Single-phase2 0.89 19 Single-phase3 0.18 310 Two-phase4 0.70 38 Single-phase5 0.83 400 Single-phase6 0.75 182 Single-phase7 0.70 361 Single-phase8 0.56 203 Two-phase9 0.28 1047 Three-phase10 0.29 1050 Single-phase11 0.38 672 Single-phase12 0.37 954 Single-phase13 0.41 13 Single-phase14 0.70 740 Single-phase15 0.51 56 Two-phase16 0.53 560 Two-phase17 0.80 9 Single-phase18 0.88 55 Single-phase19 0.50 1021 Three-phase20 0.54 147 Two-phase21 0.59 671 Two-phase22 0.35 194 Single-phase23 0.83 20 Single-phase24 0.76 254 Two-phase
5.2. Evaluation Results and Analysis
The monitoring node is connected with a lot of user equipment because the userinformation is difficult to obtain. In this paper, the comprehensive load tolerance curveis taken as the voltage tolerance curve of each user to simplify the analysis. Based on thecomprehensive load tolerance curve, the comparison reference value of each sag event iscalculated according to Formulas (2) and (3), and the energy index based on the comparisonreference value is then obtained through Formulas (4) and (5), as shown in Figure 7.
Energies 2021, 14, 5065 16 of 22
7 0.70 361 Single-phase 8 0.56 203 Two-phase 9 0.28 1047 Three-phase
10 0.29 1050 Single-phase 11 0.38 672 Single-phase 12 0.37 954 Single-phase 13 0.41 13 Single-phase 14 0.70 740 Single-phase 15 0.51 56 Two-phase 16 0.53 560 Two-phase 17 0.80 9 Single-phase 18 0.88 55 Single-phase 19 0.50 1021 Three-phase 20 0.54 147 Two-phase 21 0.59 671 Two-phase 22 0.35 194 Single-phase 23 0.83 20 Single-phase 24 0.76 254 Two-phase
5.2. Evaluation Results and Analysis The monitoring node is connected with a lot of user equipment because the user
information is difficult to obtain. In this paper, the comprehensive load tolerance curve is taken as the voltage tolerance curve of each user to simplify the analysis. Based on the com-prehensive load tolerance curve, the comparison reference value of each sag event is calcu-lated according to Formulas (2) and (3), and the energy index based on the comparison ref-erence value is then obtained through Formulas (4) and (5), as shown in Figure 7.
0
0.50
1.00
1.50
2.00
2.50
3.00energy index value based on upper limit curveenergy index value based on lower limit curve
1 2 3 4 5 6 7 8 9 10 11 12 13 14 15 16 17 18 1920 21 22 23 24sag event
energy index based on com
parison benchmark value
Figure 7. Energy index based on comparison benchmark value.
As shown in Figure 7, the energy index values obtained from the upper limit curve and the lower limit curve are compared with the value 1 respectively, it can be seen that the sag events 2, 5, 13, 17, 18 and 23 are in the normal operation region; the sag events 9, 10, 11 and 12 are in the abnormal region of the fault; and the other sag events are in the uncertain region. Therefore, the problem of single sag events not being able to be quanti-fied due to the lack of comparative reference value of energy index is solved, indicating the feasibility of the comparison reference value based on the construction of voltage tolerance curve.
Figure 7. Energy index based on comparison benchmark value.
As shown in Figure 7, the energy index values obtained from the upper limit curve

Energies 2021, 14, 5065 16 of 21
and the lower limit curve are compared with the value 1 respectively, it can be seen that thesag events 2, 5, 13, 17, 18 and 23 are in the normal operation region; the sag events 9, 10, 11and 12 are in the abnormal region of the fault; and the other sag events are in the uncertainregion. Therefore, the problem of single sag events not being able to be quantified due tothe lack of comparative reference value of energy index is solved, indicating the feasibilityof the comparison reference value based on the construction of voltage tolerance curve.
According to the sag amplitude and duration in Table 3, the voltage sag energy indexbefore improvement can be calculated through Formula (1). Based on the comprehensiveload tolerance curve, the weight coefficient of each sag event is calculated according to thevoltage sag event distribution characteristics and combined with the energy index basedon the comparison reference value, from which the improved energy index can be obtained.From this, the severity level of the voltage sag event can be obtained, as shown in Figure 8.Meanwhile, the energy index is compared before and after improvement, as shown inFigure 9.
Energies 2021, 14, 5065 17 of 22
According to the sag amplitude and duration in Table 3, the voltage sag energy in-dex before improvement can be calculated through Formula (1). Based on the compre-hensive load tolerance curve, the weight coefficient of each sag event is calculated ac-cording to the voltage sag event distribution characteristics and combined with the en-ergy index based on the comparison reference value, from which the improved energy index can be obtained. From this, the severity level of the voltage sag event can be ob-tained, as shown in Figure 8. Meanwhile, the energy index is compared before and after improvement, as shown in Figure 9.
0 1 2 30
0.20
0.40
0.60
0.80
1.00
duration /s
sag amplitude /p.u.
Figure 8. Distribution and severity levels of voltage sag events.
From Figure 8, the distribution of voltage sag events located in the uncertainty region in each severity level region can be seen: sag events 4, 6, 7, 8, 15, 20, 22 and 24 are located in re-gion B and the severity level is excellent; sag events 1 and 14 are located in region C, and the severity level is good; sag events 3, 16 and 21 are located in region D, and the severity level is medium; and sag event 19 is located in region E, and the severity level is poor. As such, the graded evaluation of the severity of the sag event in the uncertain region is realized, which is considered to be advanced. In addition, it also can be seen from Figure 7 that sag events 2, 5, 13, 17, 18 and 23 are located in region A, and that the severity level is particularly excellent; and sag events 9, 10, 11 and 12 are located in region F, and the severity level is particularly poor. Thus, the unification of the grading evaluation of the sag event in the whole plane is realized.
5 10 15 200
0.50
1.00
1.50
2.00
2.50
3.00
3.50
after improvement
1 2 3 4 6 7 8 9 11 12 13 14 16 17 18 19 21 22 23 24
before improvement
sag event
voltage sag energy index
Figure 9. Comparison of voltage sag energy index before and after improvement.
Figure 8. Distribution and severity levels of voltage sag events.
Energies 2021, 14, 5065 17 of 22
According to the sag amplitude and duration in Table 3, the voltage sag energy in-dex before improvement can be calculated through Formula (1). Based on the compre-hensive load tolerance curve, the weight coefficient of each sag event is calculated ac-cording to the voltage sag event distribution characteristics and combined with the en-ergy index based on the comparison reference value, from which the improved energy index can be obtained. From this, the severity level of the voltage sag event can be ob-tained, as shown in Figure 8. Meanwhile, the energy index is compared before and after improvement, as shown in Figure 9.
0 1 2 30
0.20
0.40
0.60
0.80
1.00
duration /s
sag amplitude /p.u.
Figure 8. Distribution and severity levels of voltage sag events.
From Figure 8, the distribution of voltage sag events located in the uncertainty region in each severity level region can be seen: sag events 4, 6, 7, 8, 15, 20, 22 and 24 are located in re-gion B and the severity level is excellent; sag events 1 and 14 are located in region C, and the severity level is good; sag events 3, 16 and 21 are located in region D, and the severity level is medium; and sag event 19 is located in region E, and the severity level is poor. As such, the graded evaluation of the severity of the sag event in the uncertain region is realized, which is considered to be advanced. In addition, it also can be seen from Figure 7 that sag events 2, 5, 13, 17, 18 and 23 are located in region A, and that the severity level is particularly excellent; and sag events 9, 10, 11 and 12 are located in region F, and the severity level is particularly poor. Thus, the unification of the grading evaluation of the sag event in the whole plane is realized.
5 10 15 200
0.50
1.00
1.50
2.00
2.50
3.00
3.50
after improvement
1 2 3 4 6 7 8 9 11 12 13 14 16 17 18 19 21 22 23 24
before improvement
sag event
voltage sag energy index
Figure 9. Comparison of voltage sag energy index before and after improvement. Figure 9. Comparison of voltage sag energy index before and after improvement.

Energies 2021, 14, 5065 17 of 21
From Figure 8, the distribution of voltage sag events located in the uncertainty regionin each severity level region can be seen: sag events 4, 6, 7, 8, 15, 20, 22 and 24 are locatedin region B and the severity level is excellent; sag events 1 and 14 are located in regionC, and the severity level is good; sag events 3, 16 and 21 are located in region D, and theseverity level is medium; and sag event 19 is located in region E, and the severity levelis poor. As such, the graded evaluation of the severity of the sag event in the uncertainregion is realized, which is considered to be advanced. In addition, it also can be seen fromFigure 7 that sag events 2, 5, 13, 17, 18 and 23 are located in region A, and that the severitylevel is particularly excellent; and sag events 9, 10, 11 and 12 are located in region F, andthe severity level is particularly poor. Thus, the unification of the grading evaluation of thesag event in the whole plane is realized.
It can be seen from Figure 9 that the change trend of the voltage sag energy indexbefore and after the improvement is the same, but the change range is different, because thespatial distribution of the sag event and the upper and lower limits of the voltage tolerancecurve are considered in the improved energy index, and the severity of sag event can bedistinguished. That is, for the sag event with small change range, its severity is small; andfor the sag event with large variation range, its severity is large. Sag events 1, 3, 9, 10, 11,12, 14, 16, 19, 21 and 22 have a large range of changes before and after improvement. Theseverity of these sag events is greater than the 50% probability value of the critical faultvalue, and the severity increases with the increase of the energy index value, which alsoverifies the rationality and feasibility of the method proposed in this paper.
Based on the above research, the energy index correction factors of the user equipmentare obtained after considering the influence of single-phase sag, two-phase sag and three-phase sag on the user equipment, and the improved energy index value after consideringthe sag type can then be obtained through Equation (15), as shown in Table 4.
Table 4. Improved energy index after considering sag type.
Event Number E”vs/s Event Number E”
vs/s
1 [0.164,0.493] 13 [0.004,0.011]2 [0.001,0.004] 14 [0.198,0.594]3 [0.475,0.713] 15 [0.045,0.068]4 [0.008,0.024] 16 [0.609,0.913]5 [0.044,0.131] 17 [0.001,0.003]6 [0.030,0.090] 18 [0.005,0.014]7 [0.073,0.220] 19 [1.457,1.836]8 [0.142,0.213] 20 [0.111,0.166]9 [2.639,3.327] 21 [0.599,0.899]10 [1.094,3.282] 22 [0.114,0.343]11 [0.560,1.679] 23 [0.002,0.006]12 [0.825,2.473] 24 [0.077,0.116]
It can be seen from Table 4 that the improved energy index value after considering thetype of sag is an interval number, where the maximum value of the interval number is theimproved energy index when the correction factor is equal to 1, which is the same as theimproved energy index without considering the type of sag. In fact, the severity of the sagevent is affected by the type of sag to varying degrees, so it is reasonable to describe theseverity of the sag event with interval numbers.
Based on the results obtained in Table 4, the 24 voltage sag events at the monitoringnode are calculated according to the determination method of the order relationship ofthe measurement function established in Section 4.2. The severity ranking results of thesag events which consider the influence of user equipment tolerance characteristics andsag types are also obtained through this process. According to the energy index valuecalculated by Equation (1), the severity of the sag events before improvement is then sorted.Thus, a comparative analysis of the ranking results of the sag event severity before andafter the improvement of the energy index can be obtained, as shown in Figure 10.

Energies 2021, 14, 5065 18 of 21
Energies 2021, 14, 5065 20 of 22
10 100.00 1.77 22 36.25 1.09 11 100.00 1.54 23 0.00 0.17 12 100.00 1.57 24 4.67 0.39
The severity of MSDI and Se is sorted and compared with the improved energy in-dex ′′vsE after considering the type of sag, as shown in Figure 11.
5 10 15 20123456789
101112131415161718192021222324
1 2 3 4 6 7 8 9 11 12 13 14 16 17 18 19 21 22 23 24
MSDISe
E''vssort voltage sag event
sag event Figure 11. Comparison of severity ranking results under different evaluation indicators.
It can be seen from Figure 11 that the ranking results of the severity of the sag events obtained by the three evaluation indicators have similar trends, which indicates the fea-sibility of the indicators proposed in this paper. However, when comparing ′′vsE with MSDI, since the impact of sag type is considered in ′′vsE , over-evaluation of sag events 1, 3, 4, 6, 7, 8, 14, 15, 16, 19, 20, 21, 22 and 24 in the uncertain region is avoided by MSDI and is more in line with the actual situation. At the same time, the severity of the sag events in the normal operation region and the abnormal fault region can be quantified by ′′vsE , and the problem around the severity of MSDI sag events 2, 5, 13, 17, 18 and 23 in the normal operation region being 0 and the severity of MSDI sag events 9, 10, 11 and 12 in the ab-normal fault region being 1, leading to the same severity ranking in these two regions, is solved. This is because only the characteristic quantity of the sag amplitude is dependent on Se, which leads to the under-evaluation of the sag events 5, 7, 14 and 24 with a long duration and high sag amplitude and the over-evaluation of the sag events 3, 13, 15 and 22 with a short duration and low sag amplitude. This problem can be overcome by ′′vsE with a comprehensive consideration of the characteristics of the sag amplitude, duration and type of sag.
6. Conclusions Considering the influence of the user equipment voltage tolerance characteristics
and sag types on the evaluation results, this paper proposes a voltage sag severity eval-uation method for the system side which considers the influence of the voltage tolerance curve and sag type. The conclusions are as follows:
1. From the perspective of the evaluation of the grid system, the user’s comprehensive voltage tolerance curve is constructed, which avoids the problem of difficult access to user-side information, and indirectly reflects the severity of user equipment af-fected by the sag.
Figure 10. Severity ranking comparison before and after improvement based on energy index.
Figure 10 shows that the severity ranking curves of the sag events before and after theimprovement of the energy index are basically the same, which indicates that the improvedenergy index, considering the equipment tolerance characteristics and the type of sag, isreasonable for evaluating the sag event. Among them, sag events 9, 10, 11, 12 and 19 arealways in the front of the ranking, before and after the improvement of the energy index,and have a great impact on users and are equivalent to the fault abnormal region; sagevents 2, 4, 6, 13, 15, 17, 18 and 23 are always at the back of the ranking, before and afterthe improvement of the energy index, and have little impact on users and are equivalentto the normal operation region. In addition, there are situations in which the severityranking results of sag events change before and after the improvement of energy index: theranking results of the severity of the sag event 16 and the sag event 21, before and afterimprovement, are opposite. This is because when the sag types of the two sags are thesame, the influence factor of the sag amplitude is larger than that of the duration. Thatis, it is more realistic to consider the equipment tolerance characteristics. Similarly, theranking results of the severity of the sag event 3 and the sag event 14, before and afterimprovement, are also opposite. This is because sag event 14 is a two-phase sag eventoccurring in region D, while sag event 3 is a single-phase respite event occurring in regionC. In the same way, the change in the severity ranking results of sag event 7 and sag events8, 22, and the change in severity ranking results of sag event 5 and sag event 20, can beanalyzed, although this will not be repeated here.
5.3. Comparison of Different Evaluation Indicators
In order to further illustrate the superiority of the improved energy index evaluationmethod proposed in this paper, the index is compared with the comprehensive severityindex MSDI and the severity index Se. Since the severity indexes are usually characterizedby a single tolerance curve, the average curve in the tolerance curve can be used to representthe voltage tolerance curve with uncertain regions. Based on the sag event informationand voltage tolerance curve, the evaluation results of MSDI and Se of each sag event can beobtained, as shown in Table 5.
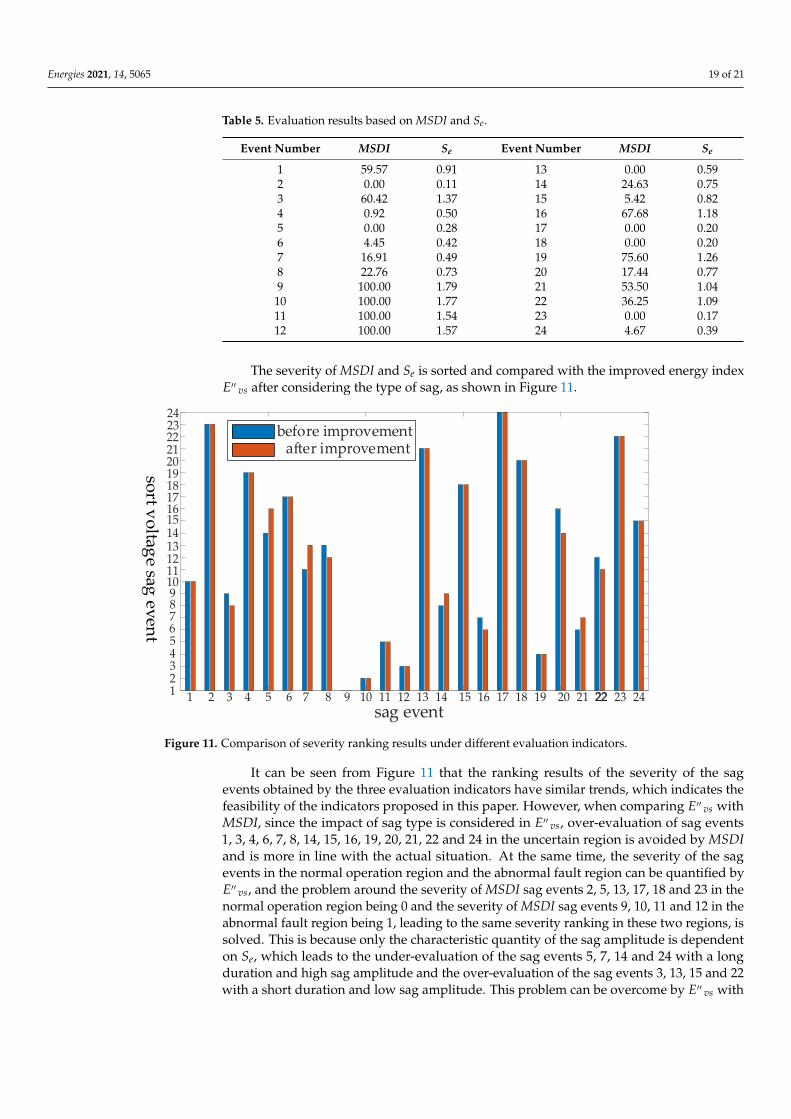
Energies 2021, 14, 5065 19 of 21
Table 5. Evaluation results based on MSDI and Se.
Event Number MSDI Se Event Number MSDI Se
1 59.57 0.91 13 0.00 0.592 0.00 0.11 14 24.63 0.753 60.42 1.37 15 5.42 0.824 0.92 0.50 16 67.68 1.185 0.00 0.28 17 0.00 0.206 4.45 0.42 18 0.00 0.207 16.91 0.49 19 75.60 1.268 22.76 0.73 20 17.44 0.779 100.00 1.79 21 53.50 1.04
10 100.00 1.77 22 36.25 1.0911 100.00 1.54 23 0.00 0.1712 100.00 1.57 24 4.67 0.39
The severity of MSDI and Se is sorted and compared with the improved energy indexE′′ vs after considering the type of sag, as shown in Figure 11.
Energies 2021, 14, 5065 19 of 22
region; sag events 2, 4, 6, 13, 15, 17, 18 and 23 are always at the back of the ranking, be-fore and after the improvement of the energy index, and have little impact on users and are equivalent to the normal operation region. In addition, there are situations in which the severity ranking results of sag events change before and after the improvement of energy index: the ranking results of the severity of the sag event 16 and the sag event 21, before and after improvement, are opposite. This is because when the sag types of the two sags are the same, the influence factor of the sag amplitude is larger than that of the duration. That is, it is more realistic to consider the equipment tolerance characteristics. Similarly, the ranking results of the severity of the sag event 3 and the sag event 14, be-fore and after improvement, are also opposite. This is because sag event 14 is a two-phase sag event occurring in region D, while sag event 3 is a single-phase respite event occurring in region C. In the same way, the change in the severity ranking results of sag event 7 and sag events 8, 22, and the change in severity ranking results of sag event 5 and sag event 20, can be analyzed, although this will not be repeated here.
Figure 10. Severity ranking comparison before and after improvement based on energy index.
5.3. Comparison of Different Evaluation Indicators In order to further illustrate the superiority of the improved energy index evalua-
tion method proposed in this paper, the index is compared with the comprehensive se-verity index MSDI and the severity index Se. Since the severity indexes are usually char-acterized by a single tolerance curve, the average curve in the tolerance curve can be used to represent the voltage tolerance curve with uncertain regions. Based on the sag event information and voltage tolerance curve, the evaluation results of MSDI and Se of each sag event can be obtained, as shown in Table 5.
Table 5. Evaluation results based on MSDI and Se.
Event Number MSDI Se Event Number MSDI Se 1 59.57 0.91 13 0.00 0.59 2 0.00 0.11 14 24.63 0.75 3 60.42 1.37 15 5.42 0.82 4 0.92 0.50 16 67.68 1.18 5 0.00 0.28 17 0.00 0.20 6 4.45 0.42 18 0.00 0.20 7 16.91 0.49 19 75.60 1.26 8 22.76 0.73 20 17.44 0.77 9 100.00 1.79 21 53.50 1.04
2324
22212019181716151413121110987654321 1 2 3 4 5 6 7 8 9 10 11 12 13 14 15 16 17 18 19 20 21 2222 23 24
after improvementbefore improvement
sag event
sort voltage sag event
Figure 11. Comparison of severity ranking results under different evaluation indicators.
It can be seen from Figure 11 that the ranking results of the severity of the sagevents obtained by the three evaluation indicators have similar trends, which indicates thefeasibility of the indicators proposed in this paper. However, when comparing E′′ vs withMSDI, since the impact of sag type is considered in E′′ vs, over-evaluation of sag events1, 3, 4, 6, 7, 8, 14, 15, 16, 19, 20, 21, 22 and 24 in the uncertain region is avoided by MSDIand is more in line with the actual situation. At the same time, the severity of the sagevents in the normal operation region and the abnormal fault region can be quantified byE′′ vs, and the problem around the severity of MSDI sag events 2, 5, 13, 17, 18 and 23 in thenormal operation region being 0 and the severity of MSDI sag events 9, 10, 11 and 12 in theabnormal fault region being 1, leading to the same severity ranking in these two regions, issolved. This is because only the characteristic quantity of the sag amplitude is dependenton Se, which leads to the under-evaluation of the sag events 5, 7, 14 and 24 with a longduration and high sag amplitude and the over-evaluation of the sag events 3, 13, 15 and 22with a short duration and low sag amplitude. This problem can be overcome by E′′ vs with

Energies 2021, 14, 5065 20 of 21
a comprehensive consideration of the characteristics of the sag amplitude, duration andtype of sag.
6. Conclusions
Considering the influence of the user equipment voltage tolerance characteristics andsag types on the evaluation results, this paper proposes a voltage sag severity evaluationmethod for the system side which considers the influence of the voltage tolerance curveand sag type. The conclusions are as follows:
1. From the perspective of the evaluation of the grid system, the user’s comprehensivevoltage tolerance curve is constructed, which avoids the problem of difficult access touser-side information, and indirectly reflects the severity of user equipment affectedby the sag.
2. Based on the voltage tolerance curve’s ability to reasonably select the comparisonreference value of the energy index, the severity of the sag event located in the normalarea and the abnormal area can be quickly evaluated and the problem of the energyindex not being able to evaluate the severity of a single sag event is solved, althoughit remains impossible to assess the severity of the sag event in the uncertain area.
3. Combining the voltage tolerance curve and energy index, through interval division,interval weight calculation and other operations, and considering the requirements ofuser governance expectations, the establishment of the severity level of voltage sagevents in the uncertain area has achieved the purpose of grading evaluation. This canguide the control of the sag and has practical engineering significance.
4. By comprehensively considering the influence of the type of sag type on the voltagetolerance curve and user equipment, the energy index correction factor is constructed,and the measurement function is used to calculate the voltage sag severity ranking inorder to achieve the purpose of interval evaluation and to make the evaluation resultmore in line with the actual situation.
5. Based on the measurement function, the severity results of the multiple sag eventsof a single node or multiple nodes can be sorted, and the weak nodes of the powergrid can be obtained, which can provide a guiding plan for the access of sensitiveequipment to the power grid nodes in the future.
6. In future research, it is possible to further analyze issues, such as the tolerance curveof the general equipment on the system side and the mixed load in the user equipmentin order to make the evaluation results more realistic.
Author Contributions: Conceptualization, Y.X. and X.F.; methodology, Y.X. and X.F.; software, X.F.and S.D.; validation, Y.X., C.N. and X.F.; formal analysis, C.N. and X.F.; investigation, Y.X. and X.F.;resources, Y.X. and S.D.; data curation, Y.X. and S.D.; writing—original draft preparation, Y.X. andX.F.; writing—review and editing, Y.X. and X.F. All authors have read and agreed to the publishedversion of the manuscript.
Funding: This research received no external funding.
Institutional Review Board Statement: Not applicable.
Informed Consent Statement: Not applicable.
Data Availability Statement: Not applicable.
Acknowledgments: This work is supported in part by the Natural Science Foundation of Beijing(3172036), and in part by the State Grid Tianjin Electric Power Company Science and TechnologyProject (KJ20-1-11).
Conflicts of Interest: The authors declare no conflict of interest.
References1. He, H.; Zhang, W.; Wang, Y.; Xiao, X. A Sensitive Industrial Process Model for Financial Losses Assessment Due to Voltage Sag
and Short Interruptions. IEEE Trans. Power Deliv. 2020, 36, 1293–1301. [CrossRef]

Energies 2021, 14, 5065 21 of 21
2. Yang, D.; Gao, X.; Ma, Z.; Cui, E.; Zhang, H. Novel Voltage Sag Protection Topology of Contactors for Uninterrupted SwitchingCapability. IEEE Trans. Ind. Appl. 2018, 54, 3170–3178. [CrossRef]
3. Liu, Y.; Xiao, X.; Zhang, X.; Wang, Y. Multi-Objective Optimal STATCOM Allocation for Voltage Sag Mitigation. IEEE Trans. PowerDeliv. 2020, 35, 1410–1422. [CrossRef]
4. Wang, Y.; Yang, Y.; Xiao, X. Configuration strategy of shared mitigation equipment for voltage sag considering the demands ofusers. IET Gener. Transm. Distrib. 2020, 14, 6338–6347. [CrossRef]
5. Motoki, E.; Filho, J.; da Silveira, P.; Pereira, N.; de Souza, P. Cost of Industrial Process Shutdowns Due to Voltage Sag and ShortInterruption. Energies 2021, 14, 2874. [CrossRef]
6. IEEE Guide for Voltage Sag Indices; IEEE Std. 1564-2014; IEEE: Piscataway, NJ, USA, 2014; pp. 1–59.7. Prajjwal, G.; Prasanna, P.; Rajesh, K. Development and Integration of Momentary Event Models in Active Distribution System
Reliability Assessment. IEEE Trans. Power Syst. 2020, 35, 3236–3246.8. Liao, H.; Abdelrahman, S.; Guo, Y.; Milanovic, J. Identification of Weak Areas of Power Network Based on Exposure to Voltage
Sags—Part I: Development of Sag Severity Index for Single-Event Characterization. IEEE Trans. Power Deliv. 2015, 30, 2392–2400.[CrossRef]
9. Rajender, K.; Manish, K.; Anand, N.; Basit, Q.; Akanksha, A. A Critical Analysis of Methodologies for Detection and Classificationof Power Quality Events in Smart Grid. IEEE Access 2021, 9, 83507–83534.
10. Amir, S.; Mahmud, F.; Matti, L. A General Framework for Voltage Sag Performance Analysis of Distribution Networks. Energies2019, 12, 2824.
11. Wu, G.; Zhong, Q.; He, Q.; Xu, Z. Evaluation Method and Probabilistic Index of Voltage Sag Severity Considering Point-on-wave.J. Mod. Power Syst. Clean Energy 2021, 9, 633–638. [CrossRef]
12. Jiang, H.; Xu, Y.; Liu, Z.; Ma, N.; Lu, W. A BPSO-Based Method for Optimal Voltage Sag Monitor Placement ConsideringUncertainties of Transition Resistance. IEEE Access 2020, 8, 80382–80394. [CrossRef]
13. Vijaya, H.; Nita, P.; Junghare, A. Computation of Energy Loss in an Induction Motor during Unsymmetrical Voltage Sags—AGraphical Method. IEEE Trans. Ind. Inf. 2018, 14, 2023–2030.
14. Rodney, H.G.T.; Vigna, K.R. Voltage Sag Acceptability Assessment Using Multiple Magnitude-Duration Function. IEEE Trans.Power Deliv. 2012, 27, 1984–1990.
15. Mo, W.; Xu, Z.; Ma, Z.; Li, C.; Lu, W. Estimation of single-event voltage sags using a novel classification method. In Proceedingsof the Industrial Electronics Society IECON 2017-43rd Annual Conference of the IEEE, Beijing, China, 29 October–1 November2017; pp. 233–238.
16. Lv, J.; Liu, Y.; Fan, X.; Deng, S.; Wu, Y.; Ye, X. Node Voltage Sag Severity Evaluation Based on Improved Energy Index. InProceedings of the 2020 10th International Conference on Power and Energy Systems (ICPES), Chengdu, China, 25–27 December2020; pp. 38–43.
17. Chang, H.Y.P.; Gilsoo, J. Systematic Method to Identify an Area of Vulnerability to Voltage Sags. IEEE Trans. Power Deliv. 2017, 32,1583–1591.
18. Behera, C.; Reddy, G.; Chakrapani, P.; Goswami, A.; Gupta, C.; Singh, G. Assessment of Equipment Trip Probability Due toVoltage Sags Based on Fuzzy Possibility Distribution Function. IEEE Access 2018, 6, 76889–76899. [CrossRef]
19. Cebrian, J.; Kagan, N.; Milanovic, J. Probabilistic Estimation of Distribution Network Performance with Respect to Voltage Sagsand Interruptions Considering Network Protection Setting—Part I: The Methodology. IEEE Trans. Power Deliv. 2018, 33, 42–51.[CrossRef]
20. Xiao, X.; He, H.; Wang, Y. Analytical model of AC contactors for studying response mechanism to multi-dimensional voltage sagcharacteristics and its novel applications. IET Gener. Transm. Distrib. 2019, 13, 3910–3920. [CrossRef]
21. Xu, Y.; Wu, Y.; Zhang, M.; Xu, S. Sensitivity of Programmable Logic Controllers to Voltage Sags. IEEE Trans. Power Deliv. 2019, 34,2–10. [CrossRef]
22. Anthony, J.; Christe, S.; Philip, M. Design Implementation and Evaluation of Open Power Quality. Energies 2020, 13, 4032.23. Cigre/Cired/Uie Joint Working Group C4.110 Voltage Dip Immunity of Equipment and Installations; Cigre Technical Brochure 412;
CIGRE: Paris, France, 2010.24. Xu, Y.; Li, C.; Wang, K. Compatibility between low voltage variable-frequency drives and voltage sags in distribution systems.
Trans. China Electrotech. Soc. 2019, 34, 2216–2229.25. Mallek, M.; Rodney, H. Evaluation of power quality experience in UCSI University North Wing Campus. In Proceedings of the
2017 2nd International Conference Sustainable and Renewable Energy Engineering (ICSREE), Hiroshima, Japan, 10–12 May 2017;pp. 129–133.
26. Alan, C. A Cement Plant’s Experience in Investigating Power Sags Leads to a Reduction in Kiln Outages by Utilizing PowerHardening Methods. IEEE Trans. Ind. Appl. 2016, 52, 4435–4441.
27. Somrak, T.; Tayjasanant, T. Minimized Financial Losses Due to Interruptions and Voltage Sags with Consideration of InvestmentCost. In Proceedings of the 2019 IEEE PES GTD Grand International Conference and Exposition Asia (GTD Asia), Bangkok,Thailand, 19–23 March 2019; pp. 29–34.
28. Li, Y.; Wei, G.; Li, G. Research on optimization of power supply route of active distribution network considering DG. Proc. CSEE2018, 38, 1971–1979.


![[side] THEORY BASE OF ACCOUNTING](https://static.fdokumen.com/doc/165x107/6316e2fb1e5d335f8d0a2c0c/side-theory-base-of-accounting.jpg)