Validation and Psychometric Properties of the Brazilian Version of the Subjective Happiness Scale
Upload
khangminh22Category
view
0download
0
Andersen et al. BMC Medical Education 2014, 14:214http://www.biomedcentral.com/1472-6920/14/214
RESEARCH ARTICLE Open Access
A validation study of the psychometric propertiesof the Groningen Reflection Ability ScaleNina Bjerre Andersen1, Lotte O’Neill1, Lise Kirstine Gormsen1, Line Hvidberg2 and Anne Mette Morcke1*
Abstract
Background: Reflection, the ability to examine critically one’s own learning and functioning, is consideredimportant for ‘the good doctor’. The Groningen Reflection Ability Scale (GRAS) is an instrument measuring studentreflection, which has not yet been validated beyond the original Dutch study. The aim of this study was to adaptGRAS for use in a Danish setting and to investigate the psychometric properties of GRAS-DK.
Methods: We performed a cross-cultural adaptation of GRAS from Dutch to Danish. Next, we collected primary dataonline, performed a retest, analysed data descriptively, estimated measurement error, performed an exploratory anda confirmatory factor analysis to test the proposed three-factor structure.
Results: 361 (69%) of 523 invited students completed GRAS-DK. Their mean score was 88 (SD = 11.42; scalemaximum 115). Scores were approximately normally distributed. Measurement error and test-retest score differenceswere acceptable, apart from a few extreme outliers. However, the confirmatory factor analysis did not replicate theoriginal three-factor model and neither could a one-dimensional structure be confirmed.
Conclusions: GRAS is already in use, however we advise that use of GRAS-DK for effect measurements and groupcomparison awaits further review and validation studies. Our negative finding might be explained by a weakconceptualisation of personal reflection.
Keywords: Assessment, Instrument, Reflection, Undergraduate medical education, Validation
BackgroundThe ability to reflect is frequently referred to in the me-dical education literature and regarded as important inpre- and postgraduate medical curricula [1]. For exam-ple, it is held to be of importance in personal learningplans [2], self-critique [3], technology-mediated teaching[4], case-solving [5], clinical reasoning [6], professiona-lism [7], and patient safety [8]. The attempts to imple-ment reflection and reflective practice as educationaltools have been followed by a focus on assessing reflec-tion over the last decade [9-11]. The general assumptionis that students do not adopt reflective learning habitsspontaneously [3], and it is often a quite difficult activityto elicit [12-15]. Furthermore, with this assessmentfocus, comes the need to measure reflection with thenecessary degree of reliability and validity [12,16-18]. In
* Correspondence: [email protected] for Medical Education, Aarhus University, Aarhus, DenmarkFull list of author information is available at the end of the article
© 2014 Andersen et al.; licensee BioMed CentCommons Attribution License (http://creativecreproduction in any medium, provided the orDedication waiver (http://creativecommons.orunless otherwise stated.
conclusion, reflection is important, but it can prove adifficult concept to both operationalise and measure.In order to assess reflection, researchers need a clear
concept of what reflection is. Reflection is a metacogni-tive process which allows the individual to learn frompast experiences [19], but what does this indicate? Oneresearcher, who has worked intensively with the differentmeanings of reflection in medical education, is Aukes[20]. He proposed that there are three types of reflec-tion in the context of medical education: clinical reason-ing, scientific reflection, and personal reflection. Clinicalreasoning is defined as a “problem and patient-orientedunderstanding, judgment, and decision, with the key func-tion of problem solving”. It is a cognitive-logical form ofreflection, which starts from an individual case. Aukesreferred to scientific reflection as “the critical appraisal ofliterature and own practice”, which rises above the levelof an individual case. Personal reflection differs fromthe first two in being cognitive-emotional, defined byAukes as “reflective attention to the process of sense-
ral Ltd. This is an Open Access article distributed under the terms of the Creativeommons.org/licenses/by/4.0), which permits unrestricted use, distribution, andiginal work is properly credited. The Creative Commons Public Domaing/publicdomain/zero/1.0/) applies to the data made available in this article,
Andersen et al. BMC Medical Education 2014, 14:214 Page 2 of 8http://www.biomedcentral.com/1472-6920/14/214
making in medical practice, and to the dynamics of ra-tional and irrational thoughts and emotions, assump-tions, and beliefs in that process”. He concluded thatthe three types of reflection should co-exist in medicaleducation, and that personal reflection should create abasis for professional functioning.To enable the investigation and measurement of per-
sonal reflection, Aukes and colleagues developed theDutch Groningen Reflection Ability Scale (GRAS), aninstrument measuring the self-reported personal reflec-tion ability of medical students [21]. Personal reflectionwas reported to consist of three underlying factors:self-reflection, empathic reflection, and reflective com-munication. GRAS has been used to measure the effectof an experiential learning programme and it is referredto as a scale that measures student reflection [22,23].To the best of our knowledge, it has not been validatedsince it was originally developed. Validation is a very im-portant, but often overlooked step when using a scale in anew research setting [24].The aim of this paper was to adapt GRAS for use in a
Danish setting and to investigate the psychometric prop-erties of GRAS-DK.
MethodsEthics, context, and participantsThe Danish Research Ethics Committee System does notapprove or disapprove educational survey research bylaw. Aarhus University, Faculty of Health Sciences, ap-proved the protocol. Data was collected, analysed, andstored according to the Danish Data Protecting Agencyrecommendation. Participants cannot be identified fromthe material. Participation was voluntary.The research was conducted among medical students
at Aarhus University. The 6-year undergraduate medicalprogram admits students direct from secondary school.The programme is divided into a 3-year pre-clinical part(bachelor’s degree) and 3-year clinical part (master’s de-gree). Reflection as an educational tool within the cur-riculum is currently being implemented in the clinicalyears as portfolio assignments, but reflection was not ex-plicitly taught at the time of the study.The study administration at Aarhus University routinely
allocates medical students into groups of approximately25 students, who take lessons together during each se-mester. We sampled students in clusters based on thesegroups and compiled complete student lists of two ran-domly selected groups from each of the 12 semesters.All students in these sampled groups were invited forinclusion in the study. In other words, we followed thecluster sampling method as described by Babbie [25].The sampling resulted in 523 students in the sample,representing all semesters, apart from two. Eighth andtenth semester students were excluded, because scheduled
clinical placements made them inaccessible to the re-searchers. We chose to cluster sample for two reasons.Firstly, to make it feasible to compile exhaustive lists ofthe students in the sample, and secondly, to sample thestudents in existing groups, so that all included studentscould be visited for oral information on the study.
InstrumentGRAS consists of 23 items measured on 5-point Likertscales with scores ranging from totally disagree (1) to to-tally agree (5) [21]. Individual item scores can be summedup to a total GRAS score ranging from 23 – 115. Fiveitems (items 3, 4, 12, 17, and 21) are differently worded ornegated, so that they should be reversed when scored.GRAS is administered on a single page with a set of in-structions. The information, which cues participants to re-spond, is limited to ‘how you learn and function inpractice?’ The instrument says “Learning and functioningas a medical student” and the word “reflect” or “reflection”is not mentioned.
Cross cultural adaptationGRAS exists in Dutch and an English translation [21].Using the Dutch version, we followed the process oftranslation and adaption suggested by Beaton and col-leagues [26] (Figure 1). In stage 1, one expert translatedthe Dutch version into Danish. Two other independentexperts and one author also translated the English versioninto Danish. In stage 2, we compared the four translationsand synthesised a single Danish version of GRAS, solvingdiscrepancies by consensus.After stage 2 (Figure 1), we conducted semi-structured
pilot test interviews with three medical students, chosenby gender (two females, one male) and program year (one7th semester, 8th semester, and 12th semester student) onwording, translation, relevance, understanding, and timeconsumption. The results from the pilot test interviewswere used to modify the existing version and produce apre-final Danish version of GRAS. In stages 3 and 4, aback translation from the pre-final Danish version toDutch tested its comparability against the original ver-sion, which did not lead to any alterations.In stage 5 (Figure 1), we pilot tested the pre-final Danish
version on two randomly selected groups of medical stu-dents (n = 35) to ensure that the electronic distribution,administration, and reminder procedure functioned well,and that the data output was usable. The final version wasnamed GRAS-DK.
Additional background variables and an open endedcomment boxAs we intended to explore arguments for validity, weadded a number of background variables to the begin-ning of the questionnaire. The following variables could
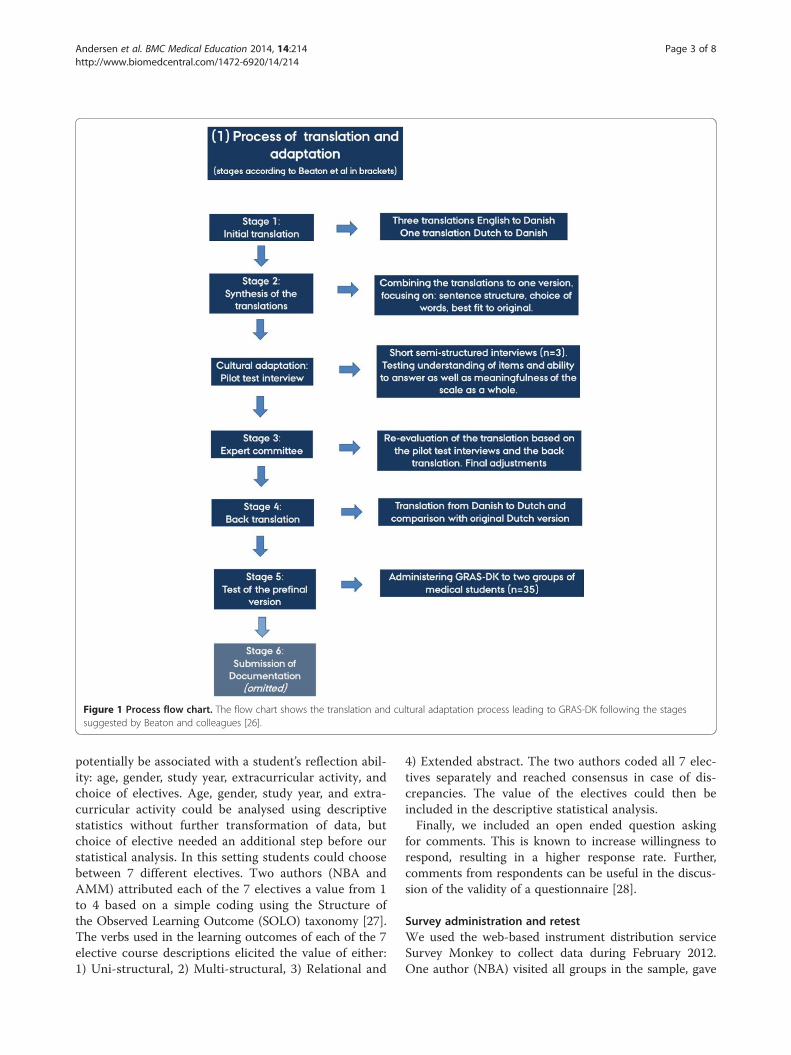
Figure 1 Process flow chart. The flow chart shows the translation and cultural adaptation process leading to GRAS-DK following the stagessuggested by Beaton and colleagues [26].
Andersen et al. BMC Medical Education 2014, 14:214 Page 3 of 8http://www.biomedcentral.com/1472-6920/14/214
potentially be associated with a student’s reflection abil-ity: age, gender, study year, extracurricular activity, andchoice of electives. Age, gender, study year, and extra-curricular activity could be analysed using descriptivestatistics without further transformation of data, butchoice of elective needed an additional step before ourstatistical analysis. In this setting students could choosebetween 7 different electives. Two authors (NBA andAMM) attributed each of the 7 electives a value from 1to 4 based on a simple coding using the Structure ofthe Observed Learning Outcome (SOLO) taxonomy [27].The verbs used in the learning outcomes of each of the 7elective course descriptions elicited the value of either:1) Uni-structural, 2) Multi-structural, 3) Relational and
4) Extended abstract. The two authors coded all 7 elec-tives separately and reached consensus in case of dis-crepancies. The value of the electives could then beincluded in the descriptive statistical analysis.Finally, we included an open ended question asking
for comments. This is known to increase willingness torespond, resulting in a higher response rate. Further,comments from respondents can be useful in the discus-sion of the validity of a questionnaire [28].
Survey administration and retestWe used the web-based instrument distribution serviceSurvey Monkey to collect data during February 2012.One author (NBA) visited all groups in the sample, gave
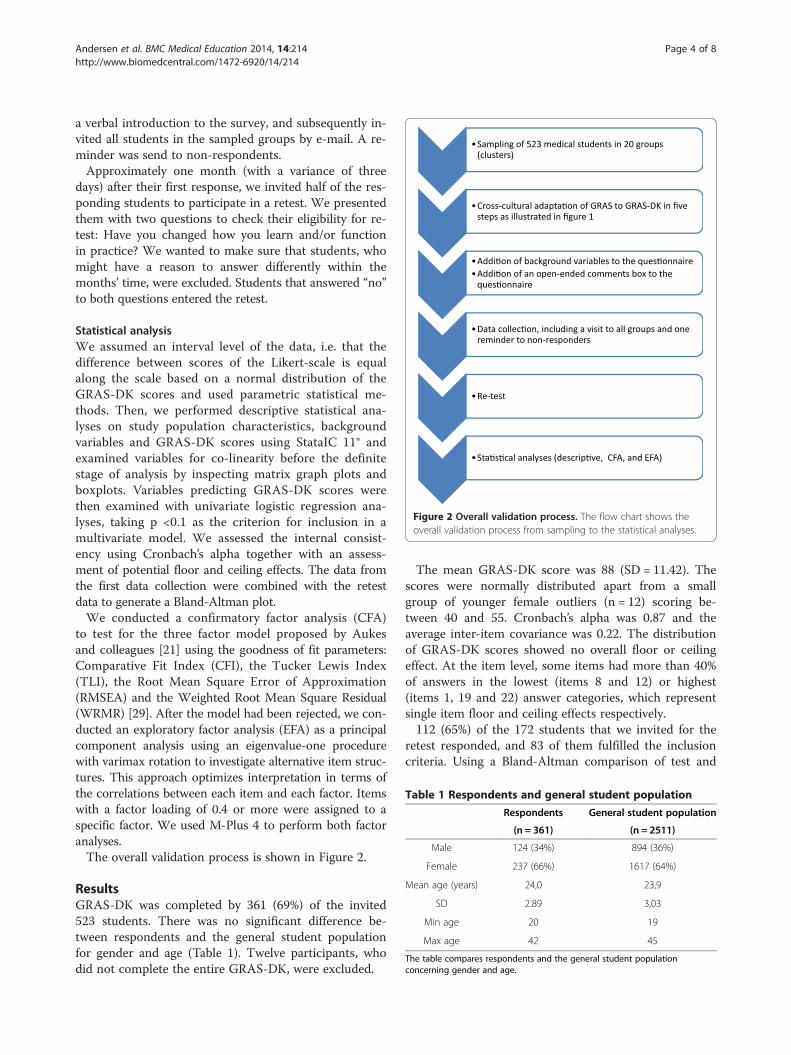
Figure 2 Overall validation process. The flow chart shows theoverall validation process from sampling to the statistical analyses.
Table 1 Respondents and general student population
Respondents General student population
(n = 361) (n = 2511)
Male 124 (34%) 894 (36%)
Female 237 (66%) 1617 (64%)
Mean age (years) 24,0 23,9
SD 2.89 3,03
Min age 20 19
Max age 42 45
The table compares respondents and the general student populationconcerning gender and age.
Andersen et al. BMC Medical Education 2014, 14:214 Page 4 of 8http://www.biomedcentral.com/1472-6920/14/214
a verbal introduction to the survey, and subsequently in-vited all students in the sampled groups by e-mail. A re-minder was send to non-respondents.Approximately one month (with a variance of three
days) after their first response, we invited half of the res-ponding students to participate in a retest. We presentedthem with two questions to check their eligibility for re-test: Have you changed how you learn and/or functionin practice? We wanted to make sure that students, whomight have a reason to answer differently within themonths’ time, were excluded. Students that answered “no”to both questions entered the retest.
Statistical analysisWe assumed an interval level of the data, i.e. that thedifference between scores of the Likert-scale is equalalong the scale based on a normal distribution of theGRAS-DK scores and used parametric statistical me-thods. Then, we performed descriptive statistical ana-lyses on study population characteristics, backgroundvariables and GRAS-DK scores using StataIC 11® andexamined variables for co-linearity before the definitestage of analysis by inspecting matrix graph plots andboxplots. Variables predicting GRAS-DK scores werethen examined with univariate logistic regression ana-lyses, taking p <0.1 as the criterion for inclusion in amultivariate model. We assessed the internal consist-ency using Cronbach’s alpha together with an assess-ment of potential floor and ceiling effects. The data fromthe first data collection were combined with the retestdata to generate a Bland-Altman plot.We conducted a confirmatory factor analysis (CFA)
to test for the three factor model proposed by Aukesand colleagues [21] using the goodness of fit parameters:Comparative Fit Index (CFI), the Tucker Lewis Index(TLI), the Root Mean Square Error of Approximation(RMSEA) and the Weighted Root Mean Square Residual(WRMR) [29]. After the model had been rejected, we con-ducted an exploratory factor analysis (EFA) as a principalcomponent analysis using an eigenvalue-one procedurewith varimax rotation to investigate alternative item struc-tures. This approach optimizes interpretation in terms ofthe correlations between each item and each factor. Itemswith a factor loading of 0.4 or more were assigned to aspecific factor. We used M-Plus 4 to perform both factoranalyses.The overall validation process is shown in Figure 2.
ResultsGRAS-DK was completed by 361 (69%) of the invited523 students. There was no significant difference be-tween respondents and the general student populationfor gender and age (Table 1). Twelve participants, whodid not complete the entire GRAS-DK, were excluded.
The mean GRAS-DK score was 88 (SD = 11.42). Thescores were normally distributed apart from a smallgroup of younger female outliers (n = 12) scoring be-tween 40 and 55. Cronbach’s alpha was 0.87 and theaverage inter-item covariance was 0.22. The distributionof GRAS-DK scores showed no overall floor or ceilingeffect. At the item level, some items had more than 40%of answers in the lowest (items 8 and 12) or highest(items 1, 19 and 22) answer categories, which representsingle item floor and ceiling effects respectively.112 (65%) of the 172 students that we invited for the
retest responded, and 83 of them fulfilled the inclusioncriteria. Using a Bland-Altman comparison of test and
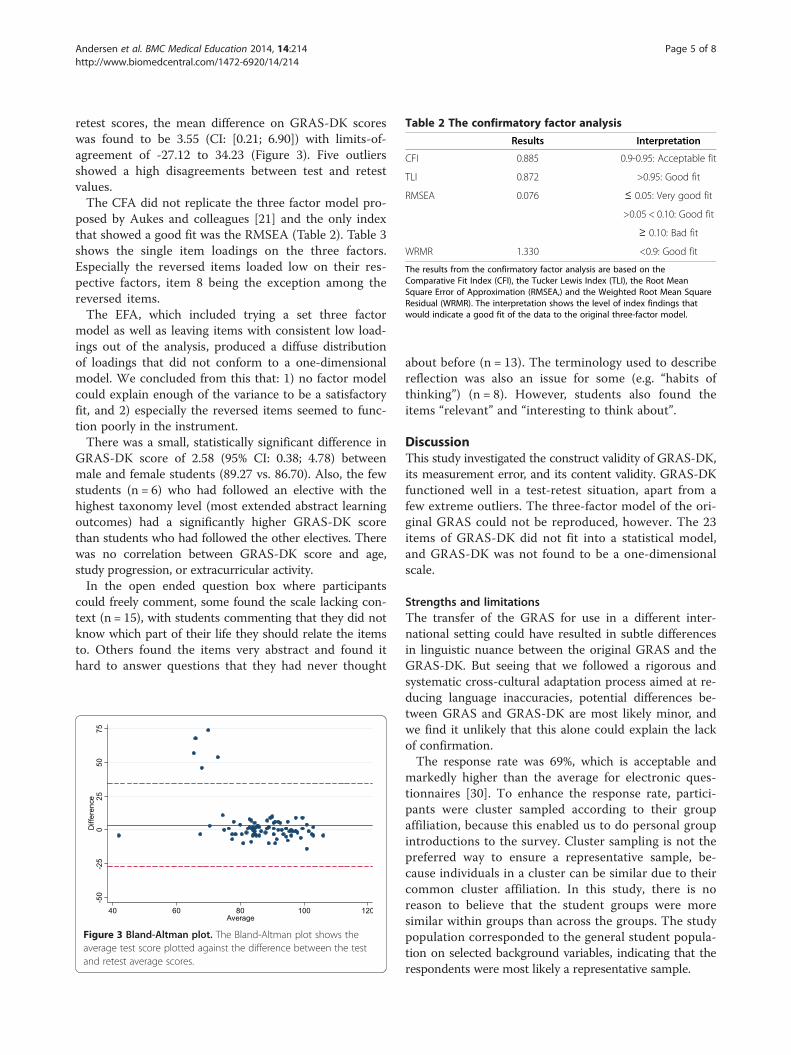
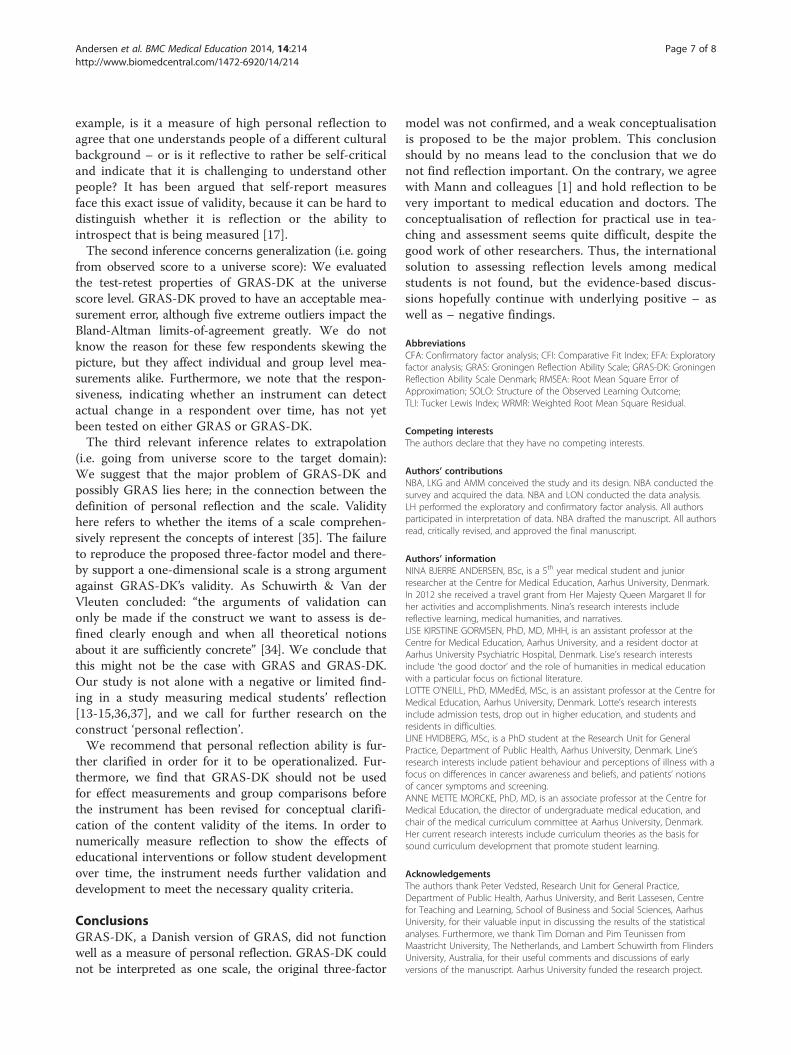
Table 2 The confirmatory factor analysis
Results Interpretation
CFI 0.885 0.9-0.95: Acceptable fit
TLI 0.872 >0.95: Good fit
RMSEA 0.076 ≤ 0.05: Very good fit
>0.05 < 0.10: Good fit
≥ 0.10: Bad fit
WRMR 1.330 <0.9: Good fit
The results from the confirmatory factor analysis are based on theComparative Fit Index (CFI), the Tucker Lewis Index (TLI), the Root MeanSquare Error of Approximation (RMSEA,) and the Weighted Root Mean SquareResidual (WRMR). The interpretation shows the level of index findings thatwould indicate a good fit of the data to the original three-factor model.
Andersen et al. BMC Medical Education 2014, 14:214 Page 5 of 8http://www.biomedcentral.com/1472-6920/14/214
retest scores, the mean difference on GRAS-DK scoreswas found to be 3.55 (CI: [0.21; 6.90]) with limits-of-agreement of -27.12 to 34.23 (Figure 3). Five outliersshowed a high disagreements between test and retestvalues.The CFA did not replicate the three factor model pro-
posed by Aukes and colleagues [21] and the only indexthat showed a good fit was the RMSEA (Table 2). Table 3shows the single item loadings on the three factors.Especially the reversed items loaded low on their res-pective factors, item 8 being the exception among thereversed items.The EFA, which included trying a set three factor
model as well as leaving items with consistent low load-ings out of the analysis, produced a diffuse distributionof loadings that did not conform to a one-dimensionalmodel. We concluded from this that: 1) no factor modelcould explain enough of the variance to be a satisfactoryfit, and 2) especially the reversed items seemed to func-tion poorly in the instrument.There was a small, statistically significant difference in
GRAS-DK score of 2.58 (95% CI: 0.38; 4.78) betweenmale and female students (89.27 vs. 86.70). Also, the fewstudents (n = 6) who had followed an elective with thehighest taxonomy level (most extended abstract learningoutcomes) had a significantly higher GRAS-DK scorethan students who had followed the other electives. Therewas no correlation between GRAS-DK score and age,study progression, or extracurricular activity.In the open ended question box where participants
could freely comment, some found the scale lacking con-text (n = 15), with students commenting that they did notknow which part of their life they should relate the itemsto. Others found the items very abstract and found ithard to answer questions that they had never thought
Figure 3 Bland-Altman plot. The Bland-Altman plot shows theaverage test score plotted against the difference between the testand retest average scores.
about before (n = 13). The terminology used to describereflection was also an issue for some (e.g. “habits ofthinking”) (n = 8). However, students also found theitems “relevant” and “interesting to think about”.
DiscussionThis study investigated the construct validity of GRAS-DK,its measurement error, and its content validity. GRAS-DKfunctioned well in a test-retest situation, apart from afew extreme outliers. The three-factor model of the ori-ginal GRAS could not be reproduced, however. The 23items of GRAS-DK did not fit into a statistical model,and GRAS-DK was not found to be a one-dimensionalscale.
Strengths and limitationsThe transfer of the GRAS for use in a different inter-national setting could have resulted in subtle differencesin linguistic nuance between the original GRAS and theGRAS-DK. But seeing that we followed a rigorous andsystematic cross-cultural adaptation process aimed at re-ducing language inaccuracies, potential differences be-tween GRAS and GRAS-DK are most likely minor, andwe find it unlikely that this alone could explain the lackof confirmation.The response rate was 69%, which is acceptable and
markedly higher than the average for electronic ques-tionnaires [30]. To enhance the response rate, partici-pants were cluster sampled according to their groupaffiliation, because this enabled us to do personal groupintroductions to the survey. Cluster sampling is not thepreferred way to ensure a representative sample, be-cause individuals in a cluster can be similar due to theircommon cluster affiliation. In this study, there is noreason to believe that the student groups were moresimilar within groups than across the groups. The studypopulation corresponded to the general student popula-tion on selected background variables, indicating that therespondents were most likely a representative sample.

Table 3 The factors loadings of the 23 GRAS –DK items
FACTOR 1 FACTOR 2 FACTOR 3
1. I want to know why I do what I do 0.542
2. I am aware of the emotions that influence my behaviour 0.639
3. I do not like to have my standpoints discussed 0.466
4. I do not welcome remarks about my personal functioning 0.374
5. I take a closer look at my own habits of thinking 0.491
6. I am able to view my own behaviour from a distance 0.553
7. I test my own judgments against those of others 0.384
8. Sometimes others say that I do overestimate myself 0.418
9. I find it important to know what certain rules and guidelines are based on 0.398
10. I am able to understand people with a different cultural/religious background 0.639
11. I am accountable for what I say 0.863
12. I reject different ways of thinking 0.612
13. I can see an experience from different standpoints 0.739
14. I take responsibility for what I say 0.810
15. I am open to discussion about my opinions 0.749
16. I am aware of my own limitations 0.472
17. I sometimes find myself having difficulty in illustrating an ethical standpoint 0.157
18. I am aware of the cultural influences on my opinions 0.559
19. I want to understand myself 0.677
20. I am aware of the possible emotional impact of information on others 0.727
21. I sometimes find myself having difficulty in thinking of alternative solutions 0.203
22. I can empathize with someone else’s situation 0.727
23. I am aware of the emotions that influence my thinking 0.733
The table lists the confirmatory factor analysis factor loadings of the 23 GRAS-DK items.
Andersen et al. BMC Medical Education 2014, 14:214 Page 6 of 8http://www.biomedcentral.com/1472-6920/14/214
ValidityAccording to the latest (1999) Standards for Educationaland Psychological Testing, validity refers to the degreeto which evidence and theory support the interpretationsof test scores entailed by the proposed uses of tests.Thus the process of validation involves accumulating evi-dence to provide a sound scientific basis for the proposedscore interpretation [31]. Since the old trinitarian modelhas been replaced with a unified validity framework, thediscourse in modern validity theory has moved fromexamining types of validity (content, criterion, construct)to examining sources of validity evidence (including evi-dence of consequences of test interpretation and use),which are all seen as counting towards construct validity[31,32]. In other words, although there may be differentsources and mixes of validity evidence for supporting theadequacy and appropriateness of interpretations of scoresin different situations, validity is seen a unitary concept inmodern validity theory [33].Validity should be tested through solid, logical argu-
ments to support that an instrument actually measureswhat it purports to measure [34]. Kane described howvalidation involves an interpretative argument, i.e. a
specification of the proposed test interpretation anduse, and a validity argument which provides an evalu-ation of the interpretative argument [32]. Interpretativearguments typically include major inferences relatingto: scoring, generalization, extrapolation, theory basedinterpretation (for theoretical constructs), and decisions/implications. In the following, we shall go through rele-vant inferences that relate to our findings and discuss thevalidity of GRAS-DK based on these inferences.The first inference relates to the scoring process:
GRAS-DK is a self-report measure scored on a 5-pointLikert scale and the difficulty for the respondents toanswer some items hints that not all items may corres-pond to a meaningful score. We suggest that a reasonfor this could be that the items are not grounded in acontext where respondents know what they shouldrefer to when answering. Also, we suggest that someitems in the instrument could be too vaguely formu-lated (“I want to know why I do what I do”) and sometoo concrete (“Sometimes others say that I do overesti-mate myself”) in order for students to understand howthey should be scored. Furthermore, we wonder, whe-ther a high score indicates a high level of reflection. For
Andersen et al. BMC Medical Education 2014, 14:214 Page 7 of 8http://www.biomedcentral.com/1472-6920/14/214
example, is it a measure of high personal reflection toagree that one understands people of a different culturalbackground – or is it reflective to rather be self-criticaland indicate that it is challenging to understand otherpeople? It has been argued that self-report measuresface this exact issue of validity, because it can be hard todistinguish whether it is reflection or the ability tointrospect that is being measured [17].The second inference concerns generalization (i.e. going
from observed score to a universe score): We evaluatedthe test-retest properties of GRAS-DK at the universescore level. GRAS-DK proved to have an acceptable mea-surement error, although five extreme outliers impact theBland-Altman limits-of-agreement greatly. We do notknow the reason for these few respondents skewing thepicture, but they affect individual and group level mea-surements alike. Furthermore, we note that the respon-siveness, indicating whether an instrument can detectactual change in a respondent over time, has not yetbeen tested on either GRAS or GRAS-DK.The third relevant inference relates to extrapolation
(i.e. going from universe score to the target domain):We suggest that the major problem of GRAS-DK andpossibly GRAS lies here; in the connection between thedefinition of personal reflection and the scale. Validityhere refers to whether the items of a scale comprehen-sively represent the concepts of interest [35]. The failureto reproduce the proposed three-factor model and there-by support a one-dimensional scale is a strong argumentagainst GRAS-DK’s validity. As Schuwirth & Van derVleuten concluded: “the arguments of validation canonly be made if the construct we want to assess is de-fined clearly enough and when all theoretical notionsabout it are sufficiently concrete” [34]. We conclude thatthis might not be the case with GRAS and GRAS-DK.Our study is not alone with a negative or limited find-ing in a study measuring medical students’ reflection[13-15,36,37], and we call for further research on theconstruct ‘personal reflection’.We recommend that personal reflection ability is fur-
ther clarified in order for it to be operationalized. Fur-thermore, we find that GRAS-DK should not be usedfor effect measurements and group comparisons beforethe instrument has been revised for conceptual clarifi-cation of the content validity of the items. In order tonumerically measure reflection to show the effects ofeducational interventions or follow student developmentover time, the instrument needs further validation anddevelopment to meet the necessary quality criteria.
ConclusionsGRAS-DK, a Danish version of GRAS, did not functionwell as a measure of personal reflection. GRAS-DK couldnot be interpreted as one scale, the original three-factor
model was not confirmed, and a weak conceptualisationis proposed to be the major problem. This conclusionshould by no means lead to the conclusion that we donot find reflection important. On the contrary, we agreewith Mann and colleagues [1] and hold reflection to bevery important to medical education and doctors. Theconceptualisation of reflection for practical use in tea-ching and assessment seems quite difficult, despite thegood work of other researchers. Thus, the internationalsolution to assessing reflection levels among medicalstudents is not found, but the evidence-based discus-sions hopefully continue with underlying positive – aswell as – negative findings.
AbbreviationsCFA: Confirmatory factor analysis; CFI: Comparative Fit Index; EFA: Exploratoryfactor analysis; GRAS: Groningen Reflection Ability Scale; GRAS-DK: GroningenReflection Ability Scale Denmark; RMSEA: Root Mean Square Error ofApproximation; SOLO: Structure of the Observed Learning Outcome;TLI: Tucker Lewis Index; WRMR: Weighted Root Mean Square Residual.
Competing interestsThe authors declare that they have no competing interests.
Authors’ contributionsNBA, LKG and AMM conceived the study and its design. NBA conducted thesurvey and acquired the data. NBA and LON conducted the data analysis.LH performed the exploratory and confirmatory factor analysis. All authorsparticipated in interpretation of data. NBA drafted the manuscript. All authorsread, critically revised, and approved the final manuscript.
Authors’ informationNINA BJERRE ANDERSEN, BSc, is a 5th year medical student and juniorresearcher at the Centre for Medical Education, Aarhus University, Denmark.In 2012 she received a travel grant from Her Majesty Queen Margaret II forher activities and accomplishments. Nina’s research interests includereflective learning, medical humanities, and narratives.LISE KIRSTINE GORMSEN, PhD, MD, MHH, is an assistant professor at theCentre for Medical Education, Aarhus University, and a resident doctor atAarhus University Psychiatric Hospital, Denmark. Lise’s research interestsinclude ‘the good doctor’ and the role of humanities in medical educationwith a particular focus on fictional literature.LOTTE O’NEILL, PhD, MMedEd, MSc, is an assistant professor at the Centre forMedical Education, Aarhus University, Denmark. Lotte’s research interestsinclude admission tests, drop out in higher education, and students andresidents in difficulties.LINE HVIDBERG, MSc, is a PhD student at the Research Unit for GeneralPractice, Department of Public Health, Aarhus University, Denmark. Line’sresearch interests include patient behaviour and perceptions of illness with afocus on differences in cancer awareness and beliefs, and patients’ notionsof cancer symptoms and screening.ANNE METTE MORCKE, PhD, MD, is an associate professor at the Centre forMedical Education, the director of undergraduate medical education, andchair of the medical curriculum committee at Aarhus University, Denmark.Her current research interests include curriculum theories as the basis forsound curriculum development that promote student learning.
AcknowledgementsThe authors thank Peter Vedsted, Research Unit for General Practice,Department of Public Health, Aarhus University, and Berit Lassesen, Centrefor Teaching and Learning, School of Business and Social Sciences, AarhusUniversity, for their valuable input in discussing the results of the statisticalanalyses. Furthermore, we thank Tim Dornan and Pim Teunissen fromMaastricht University, The Netherlands, and Lambert Schuwirth from FlindersUniversity, Australia, for their useful comments and discussions of earlyversions of the manuscript. Aarhus University funded the research project.
Andersen et al. BMC Medical Education 2014, 14:214 Page 8 of 8http://www.biomedcentral.com/1472-6920/14/214
Author details1Centre for Medical Education, Aarhus University, Aarhus, Denmark. 2TheResearch Unit for General Practice, Department of Public Health, AarhusUniversity, Aarhus, Denmark.
Received: 2 May 2014 Accepted: 6 October 2014Published: 10 October 2014
References1. Mann K, Gordon J, MacLeod A: Reflection and reflective practice in health
professions education: a systematic review. Adv Health Sci Educ 2009,14:595–621.
2. Challis M: AMEE Medical Education Guide No. 19: Personal learningplans. Med Teach 2000, 22:225–236.
3. Driessen E, van Tartwijk J, Dornan T: The self-critical doctor: helpingstudents become more reflective. BMJ 2008, 336:827–830.
4. Rowe M, Frantz J, Bozalek V: Beyond knowledge and skills: the use of aDelphi study to develop a technology-mediated teaching strategy.BMC Med Educ 2013, 13:51.
5. Koole S, Dornan T, Aper L, Scherpbier A, Valcke M, Cohen-Schotanus J,Derese A: Does reflection have an effect upon case-solving abilities ofundergraduate medical students? BMC Med Educ 2012, 12:75.
6. Sibbald M, de Bruin AB: Feasibility of self-reflection as a tool to balanceclinical reasoning strategies. Adv Health Sci Educ 2012, 17:419–429.
7. Korthagen F, Vasalos A: Levels in reflection: Core reflection as a means toenhance professional growth. Teach Theory Pract 2005, 11:47–71.
8. Ambrose LJ, Ker JS: Levels of reflective thinking and patient safety: aninvestigation of the mechanisms that impact on student learning in asingle cohort over a 5 year curriculum. Adv Health Sci Educ 2013.Epub ahead of print.
9. Aronson L, Niehaus B, Lindow J, Robertson PA, O’Sullivan PS: Developmentand pilot testing of a reflective learning guide for medical education.Med Teach 2011, 33:e515–e521.
10. Dannefer EF, Henson LC: The portfolio approach to competency-basedassessment at the Cleveland Clinic Lerner College of Medicine. Acad Med2007, 82:493–502.
11. Wald HS, Borkan JM, Taylor JS, Anthony D, Reis SP: Fostering andevaluating reflective capacity in medical education: developing theREFLECT rubric for assessing reflective writing. Acad Med 2012, 87:41–50.
12. van der Vleuten CPM, Schuwirth LWT, Driessen EW, Dijkstra J, Tigelaar D,Baartman LKJ, van Tartwijk J: A model for programmatic assessment fit forpurpose. Med Teach 2012, 34:205–214.
13. Jenkins L, Mash B, Derese A: The national portfolio of learning forpostgraduate family medicine training in South Africa: experiences ofregistrars and supervisors in clinical practice. BMC Med Educ 2013, 13:149.
14. Sánchez Gómez S, Ostos EM, Solano JM, Salado TF: An electronic portfoliofor quantitative assessment of surgical skills in undergraduate medicaleducation. BMC Med Educ 2013, 13:65.
15. Hudson JN, Rienits H, Corrin L, Olmos M: An innovative OSCE clinical logstation: a quantitative study of its influence on Log use by medicalstudents. BMC Med Educ 2012, 12:111.
16. Boenink A, Oderwald AK, De Jonge P, Van Tilburg W, Smal JA: Assessingstudent reflection in medical practice. The development of anobserver-rated instrument: reliability, validity, and initial experiences.Med Educ 2004, 38:368–377.
17. Koole S, Dornan T, Aper L, Scherpier A, Valcke M, Cohen-Schotanus J,Derese A: Factors confounding the assessment of reflection: a criticalreview. BMC Med Educ 2011, 11:104.
18. Koole S, Dornan T, Aper L, De Wever B, Scherpbier A, Valcke M,Cohen-Schotanus J, Derese A: Using video-cases to assess studentreflection: development and validation of an instrument. BMC Med Educ2012, 12:22.
19. Sandars J: The use of reflection in medical education: AMEE Guide No.44. Med Teach 2009, 31:685–695.
20. Aukes LC: Personal reflection in medical education, PhD thesis. TheNetherlands: University of Groningen; 2008.
21. Aukes LC, Geertsma J, Cohen-Schotanus J, Zwierstra RP, Slaets JP: Thedevelopment of a scale to measure personal reflection in medicalpractice and education. Med Teach 2007, 29:177–182.
22. Aukes LC, Geertsma J, Cohen-Schotanus J, Zwierstra RP, Slaets JP: Theeffect of enhanced experiential learning on the personal reflection ofundergraduate medical students. Med Educ Online 2008, 13:15.
23. Buchanan AO, Stallworth J, Christy C, Garfunkel LC, Hanson JL:Professionalism in practice: strategies for assessment, remediation, andpromotion. Pediatrics 2012, 129:407–409.
24. Terwee CB, Mokkink LB: Measurement in medicine: A practical guide.Cambridge, UK: Cambridge University Press; 2011.
25. Babbie E: Survey Research Methods. USA: Wadsworth Publishing Company;1998.
26. Beaton DE, Bombardier C, Guillemin F, Ferraz MB: Guidelines for theprocess of cross-cultural adaptation of self-report measures. Spine 2000,25:3186–3191.
27. Biggs J, Tang C: Teaching for quality learning at university. UK: OpenUniversity Press; 2007.
28. McColl E, Jacoby A, Thomas L, Soutter J, Bamford C, Steen N, Thomas R,Harvey E, Garratt A, Bond J: Design and use of questionnaires: a review ofbest practice applicable to surveys of health service staff and patients.Health Technol Assess 2001, 5:1–256.
29. Brown TA: Confirmatory factor analysis for applied research. New York, USA:The Guilford Press; 2006.
30. Cook C, Heath F, Thompson R: A meta-analysis of response rates in web- orinternet-based surveys. Educ and Psych Measurement 2000, 60:821–836.
31. American Educational Research Association, American PsychologicalAssociation, & National Council on Measurement in Education: Standards foreducational and psychological testing. American Educational ResearchAssociation: Washington, DC; 1999.
32. Kane MT: Validation. In Educational Measurement. Edited by Brennan RL.Westport, CT: ACE/Praeger; 2006.
33. Messick S: Validity of test interpretation and use. Princeton, NJ: EducationalTesting Service; 1990.
34. Schuwirth LWT, van der Vleuten CPM: Programmatic assessment andKane’s validity perspective. Med Educ 2012, 46:38–48.
35. Terwee CB, Bot SD, de Boer MR, van der Windt DA, Knol DL, Dekker J,Bouter LM, de Vet HC: Quality criteria were proposed for measurementproperties of health status questionnaires. J Clin Epidemiol 2007, 60:34–42.
36. Kamp RJ, Van Berkel HJ, Popeijus HE, Leppink J, Schmidt HG, Dolmans DH:Midterm peer feedback in problem-based learning groups: the effect onindividual contributions and achievement. Adv Health Sci Educ 2014,19:53–69.
37. Lew MD, Schmidt HG: Self-reflection and academic performance: is therea relationship? Acad Med 2011, 16:529–545.
doi:10.1186/1472-6920-14-214Cite this article as: Andersen et al.: A validation study of thepsychometric properties of the Groningen Reflection Ability Scale. BMCMedical Education 2014 14:214.
Submit your next manuscript to BioMed Centraland take full advantage of:
• Convenient online submission
• Thorough peer review
• No space constraints or color figure charges
• Immediate publication on acceptance
• Inclusion in PubMed, CAS, Scopus and Google Scholar
• Research which is freely available for redistribution
Submit your manuscript at www.biomedcentral.com/submit
Copyright © 2022 FDOKUMEN