A Usability Model for Software Development Processes and ...
229
A Usability Model for Software Development Processes and Practices Author: Diego Fontdevila Director: Dr. Marcela Genero Bocco Codirector: Dr. Gustavo Rossi Scientific Advisor: Lic. Alejandro Oliveros Thesis submitted towards obtaining the degree of Doctor in Information Sciences Facultad de Informática - Universidad Nacional de La Plata November 2020
-
Upload
khangminh22 -
Category
Documents
-
view
1 -
download
0
Transcript of A Usability Model for Software Development Processes and ...

A Usability Model for Software Development Processes and Practices
Author: Diego Fontdevila
Director: Dr. Marcela Genero Bocco
Codirector: Dr. Gustavo Rossi
Scientific Advisor: Lic. Alejandro Oliveros
Thesis submitted towards obtaining the degree of Doctor in Information Sciences
Facultad de Informática - Universidad Nacional de La Plata
November 2020

2

3
Table of Contents Chapter 1. Introduction ....................................................................................... 14
1.1. Motivation........................................................................................................ 14 1.2. Problem Statement .......................................................................................... 16 1.3. Objective of the Thesis ..................................................................................... 17 1.4. Research Strategy ............................................................................................ 18
1.4.1. Explicate Problem .......................................................................................... 20 1.4.2. Define Objective and Requirements ............................................................. 21 1.4.3. Design and Develop Artifact .......................................................................... 21 1.4.4. Demonstrate Artifact..................................................................................... 22 1.4.5. Evaluate Artifact ............................................................................................ 22
1.5. Research Context ............................................................................................. 23 1.6. Thesis Outline................................................................................................... 23
Chapter 2. State of the Art .................................................................................. 26 2.1. SMS on Process and Practice Usability ............................................................ 26
2.1.1. SMS Planning ................................................................................................. 27 2.1.1.1. SMS Objective and Research Questions ................................................... 27 2.1.1.2. Search Strategy ......................................................................................... 28 2.1.1.3. Inclusion and Exclusion Criteria ................................................................ 30 2.1.1.4. Selection Procedure .................................................................................. 30 2.1.1.5. Data Extraction Strategy ........................................................................... 30 2.1.1.6. Data Synthesis Strategy ............................................................................ 31
2.1.2. SMS Execution ............................................................................................... 32 2.1.3. SMS Results ................................................................................................... 35
2.2. Conclusions ...................................................................................................... 39
Chapter 3. Initial UMP Construction .................................................................... 40 3.1. Selection of Sources ......................................................................................... 40 3.2. Model Construction ......................................................................................... 42
3.2.1. Define Initial Usability Characteristics ........................................................... 42 3.2.2. Decompose Characteristics ........................................................................... 47 3.2.3. Define metrics ............................................................................................... 48
Chapter 4. UMP Structure Definition ................................................................... 51 4.1. UMP Summary ................................................................................................. 51 4.2. UMP Detailed Description ............................................................................... 55
4.2.1. Self-evident purpose ..................................................................................... 56 4.2.1.1. Appropriateness of name metric .............................................................. 56 4.2.1.2. Recognized purpose metric ...................................................................... 58
4.2.2. Learnability .................................................................................................... 59 4.2.2.1. Time required to learn to perform metric ................................................ 60 4.2.2.2. Standard introductory course duration metric ......................................... 60 4.2.2.3. Number of new concepts metric .............................................................. 61
4.2.3. Understandability .......................................................................................... 62 4.2.3.1. Conceptual model correspondence metric .............................................. 63 4.2.3.2. Conceptual model complexity metric ....................................................... 65
4.2.4. Safety ............................................................................................................. 65 4.2.4.1. Cost of incorrect adoption metric ............................................................. 66 4.2.4.2. Reduction in cost of error metric .............................................................. 67 4.2.4.3. Safety perception metric .......................................................................... 68

4
4.2.4.4. Use of restraining functions metric .......................................................... 69 4.2.5. Feedback ....................................................................................................... 69
4.2.5.1. Timeliness of feedback metric .................................................................. 70 4.2.5.2. Feedback richness metric.......................................................................... 72 4.2.5.3. People feedback metric ............................................................................ 72 4.2.5.4. Automatic feedback metric....................................................................... 73
4.2.6. Visibility ......................................................................................................... 74 4.2.6.1. Defines indicators metric .......................................................................... 75
4.2.7. Controllability ................................................................................................ 75 4.2.7.1. Defines checkpoints metric ....................................................................... 76 4.2.7.2. Explicit outcomes metric ........................................................................... 77 4.2.7.3. Level of autonomy metric ......................................................................... 78
4.2.8. Adaptability ................................................................................................... 79 4.2.8.1. Defines adaptation points metric ............................................................. 80 4.2.8.2. Ratio of roles allowed to adapt metric ..................................................... 80
4.2.9. Attractiveness ................................................................................................ 81 4.2.9.1. User attractiveness rating metric ............................................................. 81
4.2.10. User satisfaction ............................................................................................ 82 4.2.11. User satisfaction rating metric ...................................................................... 82
4.3. UMP Evaluation Process .................................................................................. 83 4.3.1. Example Evaluation of Continuous Integration ............................................. 85 4.3.2. UMP Metric Categorization ........................................................................... 87
4.4. UMP Usage Modes ........................................................................................... 89 4.5. UMP Usage Scenarios ...................................................................................... 91
Chapter 5. UMP Applications .............................................................................. 94 5.1. Feasibility Study ............................................................................................... 94
5.1.1. Feasibility Study Planning .............................................................................. 94 5.1.1.1. Study preparation ..................................................................................... 95 5.1.1.2. Participant Selection ................................................................................. 95
5.1.2. Feasibility Study Execution ............................................................................ 95 5.1.3. Feasibility Study Results ................................................................................ 95 5.1.4. Threats to Validity ......................................................................................... 96
5.2. Usability Profiles for Evaluated Processes and Practices ................................. 97 5.3. Conclusions ...................................................................................................... 99
Chapter 6. UMP Iterative Refinement ................................................................ 101 6.1. Focus Group Study ......................................................................................... 102
6.1.1. Focus Group Planning and Design ............................................................... 102 6.1.2. Focus Group Session.................................................................................... 104 6.1.3. Focus Group Data Analysis .......................................................................... 104
6.1.3.1. Data Analysis of UMP Characteristics ..................................................... 104 6.1.3.2. Data Analysis of UMP Metrics ................................................................. 107
6.1.4. Summary of UMP Changes in Version 3.0 after Focus Group ..................... 111 6.1.5. Threats to Validity ....................................................................................... 112
6.2. Conclusions .................................................................................................... 112
Chapter 7. UMP Reliability Evaluation ............................................................... 113 7.1. Inter-rater Reliability and Inter-rater Agreement .......................................... 113 7.2. Scrum Study ................................................................................................... 115
7.2.1. Study Design and Statistic Selection ........................................................... 115 7.2.1.1. Context Selection .................................................................................... 115 7.2.1.2. Subjects ................................................................................................... 115

5
7.2.1.3. Statistic and Variable Selection ............................................................... 116 7.2.1.4. Planning................................................................................................... 116
7.2.2. Study Execution ........................................................................................... 116 7.2.3. Data Analysis ............................................................................................... 117 7.2.4. Results and Conclusions .............................................................................. 118 7.2.5. Threats to Validity ....................................................................................... 119
7.3. TDD-BDD Study .............................................................................................. 120 7.3.1. Study Design and Statistic Selection ........................................................... 120
7.3.1.1. Context Selection .................................................................................... 121 7.3.1.2. Subjects ................................................................................................... 121 7.3.1.3. Statistic and Variable Selection ............................................................... 122 7.3.1.4. Planning................................................................................................... 123
7.3.2. Study Execution ........................................................................................... 124 7.3.3. Data Analysis ............................................................................................... 124 7.3.4. Results and Conclusions .............................................................................. 126 7.3.5. Threats to validity ........................................................................................ 128
7.4. Conclusions .................................................................................................... 129
Chapter 8. UMP Utility Evaluation ..................................................................... 130 8.1. VMP Study ...................................................................................................... 132
8.1.1. An Introduction to the VMP ........................................................................ 132 8.1.2. Case Study Design ....................................................................................... 132
8.1.2.1. Context Selection .................................................................................... 133 8.1.2.2. Participants ............................................................................................. 133 8.1.2.3. Design ...................................................................................................... 133
8.1.3. Case Study Execution .................................................................................. 134 8.1.4. Data Analysis ............................................................................................... 137 8.1.5. Results and Conclusions .............................................................................. 137 8.1.6. Threats to validity ........................................................................................ 138
8.2. BDD Study ...................................................................................................... 139 8.2.1. An Introduction to BDD ............................................................................... 139 8.2.2. Field Quasi-experiment Planning ................................................................ 140
8.2.2.1. Context Selection .................................................................................... 141 8.2.2.2. Subjects ................................................................................................... 144 8.2.2.3. Variable Selection ................................................................................... 147 8.2.2.4. Hypothesis Formulation .......................................................................... 148 8.2.2.5. Design ...................................................................................................... 148 8.2.2.6. Procedure, Materials and Tasks .............................................................. 149 8.2.2.7. Analysis Procedure .................................................................................. 150
8.2.3. Field Quasi-experiment Execution .............................................................. 151 8.2.4. Data Analysis ............................................................................................... 152
8.2.4.1. Descriptive Statistics ............................................................................... 152 8.2.4.2. Hypothesis Testing .................................................................................. 154 8.2.4.3. Qualitative Data Analysis ........................................................................ 157
8.2.5. Results and Conclusions .............................................................................. 161 8.2.6. Threats to Validity ....................................................................................... 162
8.3. Conclusions .................................................................................................... 164
Chapter 9. Conclusions and Future Work ........................................................... 165 9.1. Thesis Contributions ...................................................................................... 165 9.2. Achievement of the Thesis Objective ............................................................ 168
9.2.1. Additional Emergent Results ....................................................................... 171

6
9.3. Future Research Lines .................................................................................... 172 9.4. Dissemination of Results ................................................................................ 173
9.4.1. Thesis Publications ...................................................................................... 173 9.4.2. Thesis Publications in Progress ................................................................... 174 9.4.3. Other Related Publications.......................................................................... 175
9.4.3.1. HELENA Global Survey on Hybrid Methods ............................................ 175 9.4.3.2. State of Agile Practice ............................................................................. 176 9.4.3.3. Using Feedback to Improve Student Practice ......................................... 176
Appendixes ........................................................................................................ 177 Appendix A. Research Methods ........................................................................................ 177
A.1. Systematic Mapping Studies ....................................................................... 177 A.2. Focus Group ................................................................................................ 180 A.3. Case Studies................................................................................................. 181 A.4. Quasi-experiments ...................................................................................... 183
Appendix B. Details on Statistics ...................................................................................... 187 B.1. R Code for Inter-rater Reliability Assessment Calculations ......................... 187 B.2. Binomial Probability Distribution for Hypothesis Testing ........................... 187
Appendix C. Example Raw Data ........................................................................................ 189 C.1. Feasibility Study Data .................................................................................. 189 C.2. Focus Group Study Qualitative Data ........................................................... 193
Appendix D. TDD Evaluation Questionnaire ..................................................................... 203 Appendix E. Details on UMP Version Changes ................................................................. 217
E.1. UMP Version 2.0 .......................................................................................... 217 E.2. UMP Version 3.0 .......................................................................................... 217 E.3. UMP Version 3.1 .......................................................................................... 218 E.4. UMP Version 3.2 .......................................................................................... 219
Bibliography ...................................................................................................... 221

7
List of Figures Figure 1. Research strategy overview 19
Figure 2. UMP development and evaluation iterative cycle 20
Figure 3. Search string for Scopus 29
Figure 4. Overview of SMS selection procedure 33
Figure 5. Distribution of studies by type of object under study 38
Figure 6. Distribution of studies by type of research 38
Figure 7. Distribution of studies by study context 39
Figure 8. UMP evaluation process 83
Figure 9. UMP version evolution 101
Figure 10. Example questions from the focus group questionnaire 104
Figure 11. BDD flow 139
Figure 12. Responses to: How much of your work do you do with BDD? 143
Figure 13. Responses to: How much of your work has acceptance tests? 144
Figure 14. Responses to: How much of your work has a priori acceptance tests? 144
Figure 15. BDD study subjects’ years of experience in software development 145
Figure 16. Distribution of places where subjects learned BDD 145
Figure 17. Results on subjects’ prior experience with BDD 146
Figure 18. Responses to Had you practiced BDD with other technologies? 146
Figure 19. Subjects participating in the field quasi-experiment 151
Figure 20. BDD study post-it wall from brainstorming 152
Figure 21. Overview of research studies conducted 167
Figure 22. UMP structure 170
Figure 23. SMS process activities 178
Figure 24. SMS review protocol components 179
Figure 25 Quasi-experiment process activities 185
Figure 26. R script for kappa-like inter-rater reliability assessment 187
Figure 27. Example Linux command-line for executing R script 187
Figure 28. Formula for the probability of obtaining the sample given p 188
Figure 29. Formula for the probability of obtaining the sample given p <= a 188

8
List of Tables Table 1. Summary of research studies conducted in this Thesis ................................................ 23
Table 2. Papers related to process usability referenced by experts .......................................... 26
Table 3. SMS research questions .............................................................................................................. 27
Table 4. SMS search terms .......................................................................................................................... 28
Table 5. SMS excluded terms ..................................................................................................................... 28
Table 6. List of studies selected in the SMS .......................................................................................... 33
Table 7. Data extracted from selected studies .................................................................................... 35
Table 8. Distribution of papers by usability related attribute ..................................................... 37
Table 9. Rationale for source selection .................................................................................................. 41
Table 10. Methodology for UMP construction .................................................................................... 42
Table 11. Candidate usability characteristics by source ................................................................ 43
Table 12. Candidate usability characteristics ..................................................................................... 43
Table 13. Rationale for naming characteristics .................................................................................. 45
Table 14. Rationale for including and excluding characteristics ................................................ 46
Table 15. Rationale for decomposition into new characteristics ............................................... 47
Table 16. Goal, questions and metrics for each characteristic ..................................................... 48
Table 17. UMP characteristics overview ............................................................................................... 52
Table 18. UMP metrics overview ............................................................................................................. 52
Table 19. ISO 25040 quality evaluation activities ............................................................................. 83
Table 20. Mapping of ISO 25040 to UMP concepts ........................................................................... 84
Table 21. UMP evaluation process activities ....................................................................................... 84
Table 22. Example usability profile for Continuous Integration ................................................. 86
Table 23. UMP metrics category structure........................................................................................... 88
Table 24. UMP metrics categorization ................................................................................................... 88
Table 25. UMP usage scenarios ................................................................................................................. 91
Table 26. Usability profiles for all processes and practices evaluated ..................................... 97
Table 27. Focus group participant's profile ...................................................................................... 103
Table 28. Overview of focus group questionnaire questions .................................................... 103
Table 29. Summary focus group feedback and changes on characteristics ........................ 105
Table 30. Quantitative data on characteristic clarity .................................................................... 105
Table 31. Quantitative data on characteristic relevance ............................................................. 106
Table 32. Quantitative data on metric clarity .................................................................................. 107
Table 33. Quantitative data on metric relevance............................................................................ 109
Table 34. Rationale for metric changes after focus group .......................................................... 110
Table 35. Distribution of roles among Scrum experts .................................................................. 116

9
Table 36. Inter-rater agreement for Scrum evaluation metrics ............................................... 117
Table 37. Distribution of roles among TDD experts ...................................................................... 122
Table 38. Example inter-rater reliability evaluation data structure ...................................... 125
Table 39. Inter-rater reliability results for the TDD-BDD study .............................................. 125
Table 40. Summary of reliability levels for the interpretation of statistics’ values ......... 126
Table 41. Overview of utility evaluation studies ............................................................................ 131
Table 42. VMP usability profile .............................................................................................................. 134
Table 43. Rationale for UMP mode selection in the BDD study ................................................ 141
Table 44. State of BDD practice questionnaire ................................................................................ 143
Table 45. BDD study items used to measure variables ................................................................ 147
Table 46. Cronbach's Alpha for BDD study trial data ................................................................... 148
Table 47. Materials used in the BDD study ....................................................................................... 150
Table 48. BDD study activities and retrospective stages ............................................................ 150
Table 49. Criteria for answering BDD study research questions ............................................. 150
Table 50. Cronbach's Alpha for BDD study data ............................................................................. 153
Table 51. Descriptive statistics for BDD feedback questionnaire ........................................... 153
Table 52. P-values for BDD study questions .................................................................................... 155
Table 53. BDD study inferential statistics ......................................................................................... 156
Table 54. Challenges to BDD adoption identified in initial questionnaire ........................... 158
Table 55. Text data from post-it notes produced in brainstorming ....................................... 159
Table 56. Content analysis pre-test/post-test frequencies for labels .................................... 160
Table 57. Feasibility study data from evaluator #1....................................................................... 189
Table 58. Feasibility study data from evaluator #2....................................................................... 191
Table 59. Focus group comments on characteristic clarity ....................................................... 193
Table 60. Focus group comments on characteristic relevance ................................................. 194
Table 61. Focus group comments on metric clarity ...................................................................... 195
Table 62. Focus group comments on metric relevance ............................................................... 199
Table 63 Overview of UMP version details ....................................................................................... 217
Table 64. Rationale for metric changes in version 3.1 ................................................................. 218
Table 65. Rationale for metric changes in version 3.2 ................................................................. 219

10
Acknowledgments I specially appreciate and thank:
Fátima, Mati and Santi for all the time and patience they gave me as a present during this process. My parents, Pimpi and Pablo, and my siblings Eva and Pablo, for lending me their ears and their support. My aunt Elisa Colombo, for her sage advice and for being there for me.
Alejandro Oliveros, who was always by my side and helped turn the idea of process and practice usability into research. Marcela Genero, who as supervisor has advised me in the research process of this Thesis to conduct a rigorous investigation applying the appropriate research methods. Gustavo Rossi, who had faith in me from the beginning and whose support made this possible. Nico Paez, who together with Alejandro Oliveros formed our research group and shared this and other research interests.
David Garlan, who mentored me while writing my first essay on this subject, had the generosity to allow me to explore it together, taught me a lot about learning and writing, and showed me how the wise might converse benevolently with their apprentices.
Eduardo Miranda, for the collaboration shared, for his interest, advice and valuable references.
Mario Piattini, for his advice and useful references. Alistair Cockburn, who helped me from the beginning and marked the difference between feedback and visibility. Laurie Williams, for nudging me to turn my ideas into a Thesis. Dietmar Pfahl, Michael Felderer, Nestor Barraza, Silvia Abrahao and Esperanza Manso, for their clear guidance on specific issues of this Thesis. Alejandra Garrido, for her advice. Andrés Diaz-Pace, for his reviews and insights.
My partners and colleagues at Grupo Esfera, Sergio Romano, Claudio Figuerola, Mariano Tugnarelli, Ignacio Raguet, Lina Prato, Marcelo Gore, Sebastián Ismael, Santiago Risaro, Nayla Portas, Joaquín Moreno Fernández, Virginia Gonzalez, Sebastián Konikoff, Damián Spizzirri, Victoria Vasquez, Matías Mannarino, Guido Rombola and Diego Cañizares, who contributed their time to help me in this work. Maxi Cruz, who lent his experience and perspective.
Juan Gabardini, who helped me think on this from the beginning and was the first to tell me that this was useful to him and worth the trouble. Alan Cyment, who listened and put forth his thoughts and his time to help me improve the UMP. Marcelo Talamona, who sacrificed important things to participate and brought his complementary perspective. Ignacio Raguet and Mariano Tugnarelli who participated in a thousand conversations when I needed them to.
All the friends and colleagues that put in their time to share their knowledge: Hiroshi Hiromoto, for the long conversations; Martín Salías, for his always prompt participation; Xavier Quesada-Allué, for his input; Hernán Wilkinson for his participation and for inviting evaluators; Hernán Mariño for always being there, Alvaro Ruiz de Mendarozqueta for his generous help; Angel Nuñez, Yamit Cárdenas, Andrés Joaquín, Angel López and all the others for their contributions.

11
Mary and Tom Poppendieck, who gave their time when this was just starting up. Brian Marick, who listened and provided confirmation, and taught me where the term affordance came from. Tobias Mayer, who taught me that Scrum is a restraining function. John Cutler, who gave me the gift of confirmation because he was thinking along the same lines and was generous enough to share a conversation with me on the UMP.
Alicia Mon, Andrés Dmitruk, Sergio Hardaman, who helped to make this possible more than ten years ago.
Alejandra Pizarro, for her kind support and guidance in the administrative aspects of the PhD process.
María José Compalati, for the beautiful cover illustration.
12
Summary Software processes and practices have a leading role in software development and in the last few decades a wide variety of processes and practices have emerged to face the challenges arising in the software industry. The success of adopting these processes and practices will depend on the experience and satisfaction perceived by the people who use them. Therefore, improving software development processes and practices usability might promote their adoption and make those adopted processes and practices more sustainable.
Until now, research on usability has been almost exclusively focused on software products. Software process and practice usability is a novel concept that has been less explored. Thus in this Thesis the usability of software processes and practices is defined as “How easy it is to follow a process or practice, including the effort needed to learn, the probability of making mistakes, the cost of such mistakes and the overall satisfaction and motivation promoted by following the process or practice ”. And to support that definition it is necessary to provide an instrument to help software practitioners to evaluate and improve the usability of software processes and practices. Therefore the main objective of this Thesis is “Define and evaluate a usability model for software development processes and practices, with the aim of enhancing their usability, in order to improve the work experience of software developers and the overall effectiveness of process and practice improvement and adoption initiatives”. The Usability Model for Software Development Processes and Practices (UMP) has been created, refined, and evaluated, following the Design Science Research framework.
The UMP will help practitioners and coaches to identify and deal with the challenges of process and practice adoption, process improvement specialists to better plan improvement initiatives, methodologists to better design new ways of working, teachers and mentors to improve how they facilitate learning, and researchers working on processes or practices. Adoption initiatives might increase their probability of success by adapting processes and practices to make them more usable, or at least by refining adoption strategies to take usability challenges into account. It will also help make processes and practices sustainable so that they are not easily abandoned.
To evaluate the UMP several empirical studies were conducted: an initial expert evaluation to assess its feasibility; a focus group for gathering feedback on the UMP characteristics and metrics; two reliability studies, an inter-rater agreement study on Scrum and an inter-rater reliability study on TDD-BDD; and two studies to evaluate UMP utility, a case study on the application of the UMP to the VMP method, and a field quasi-experiment in which an industry development team applied the UMP to improving their BDD practice. The results of the utility studies show that users consider the UMP useful, and 37 independent evaluations have been effectively conducted on real life processes and practices.
This Thesis contributions include: the UMP itself with its characteristics and metrics, the UMP evaluation process, the knowledge created about the reliability and utility of the UMP through the empirical studies, and the usability profiles characterizing currently mainstream processes and practices like Scrum,

13
Continuous Integration, TDD and BDD, obtained through the application of the UMP.

14
Chapter 1. Introduction
This chapter presents the motivation for this Thesis, the problem it aims to solve, its main objective, the research strategy followed to achieve it, the context in which its research was conducted, and the structure of this document. It is organized as follows: Section 1.1 presents the motivation for this Thesis, how process and practice usability might provide support for the modern needs of innovative processes and practices; Section 1.2 presents the problem statement describing the current challenges in process and practice adoption, and how the usability model for software development processes and practices (UMP) might help, by treating people as process and practice users, whose needs have to be taken into account; Section 1.3 presents the Thesis objective; Section 1.4 details the research strategy followed to achieve the formulated objective based on the Design Science Research framework; Section 1.5 presents the context in which this research was conducted; and finally, Section 1.6 outlines the structure of this Thesis.
1.1. Motivation
Process is central to software development, and it has changed in the last few decades, from views inspired in manufacturing to more innovative approaches, like Agile and DevOps. These new approaches are more people and practice focused, complementing the process perspective, and they include continuous improvement activities. Adoption is a popular form of improvement initiative and internal evolution is also very common. These new approaches do not explicitly consider usability of processes or practices, although they are people-centric. Processes and practices are tools, and given that people want usable artifacts, usability might improve process and practice adoption. There is little research focused on process and practice usability. This is the motivation for this Thesis, which is described in detail below.
Process is central to our modern view of work, from production to business settings, and across domains, from factories to artistic endeavors. There is also wide consensus on its impact on the results of that work, be it in effectiveness, product quality, business efficiency and even people’s satisfaction (Austin & Devin, 2003; Humphrey, 2001). At the same time, the notion of process has

15
changed profoundly over time, from Taylor’s “scientific management”, bent on mechanizing the behavior of people to increase efficiency, to design thinking and other creative processes in which people are agents expected to collaborate and create new ideas (Austin & Devin, 2003; T. Brown, 2008). This change is not accidental; it follows a shift in society from mass-production based on standard replication (cars could be any color if that color was black, according to the quote attributed to Henry Ford) to more subtle, innovative and flexible ways of production, from the Toyota Production System through agile software development (Poppendieck & Poppendieck, 2007) to theatre production (Austin & Devin, 2003).
Traditional views of the software development process, inspired in manufacturing, considered it to be simple work, but today it is more and more understood as a complex endeavor (Stacey, 2002). For complex work, organizations are realizing, it is necessary to apply iterative and adaptive processes such as those proposed by agile methods. These processes are heavily reliant on people, who are expected to collaborate and even adapt the process to fit the changing environment (Austin & Devin, 2003).
Although processes are a very important aspect of software development, they are not enough to describe how it is performed. Process describes the flow of work, work products and information that allows the coordination of activities between multiple stakeholders, towards the production of value. On the other hand, practice describes the shared everyday activities and experience of work (J. S. Brown & Duguid, 2000). Jacobson et al. propose that practices are better than processes for developer adoption because of their granularity, the fact that they are more usable and better support learning and adaptation (Jacobson et al., 2007).
Following Brown & Duguid and Jacobson, in this Thesis we focus on both software processes and practices, which are the actual techniques applied to perform the work (J. S. Brown & Duguid, 2000; Jacobson et al., 2007). For instance, software testing is a process, and exploratory testing is a practice for performing parts of the software testing process.
Processes and practices need to be continually improved to sustain quality, this is one of the core tenets of the quality movement in the 20th century, of which Shewhart, Deming, Juran and Crosby were the main representatives. Also, the continuously changing environment and the increasingly fast pace of those changes make improvement necessary to maintain effectiveness (Austin & Devin, 2003). Scrum, for example, is an iterative process framework that explicitly defines that both the product and the process are to be evolved by the team (Schwaber & Sutherland, 2017).
Much of process and practice improvement today takes the form of adoption initiatives, in which organizations try to learn to do things the way they are done somewhere else. The processes and practices that organizations try to adopt are usually packaged in some specific way, named and popularized in certain circles or communities of practice by specific individuals or organizations. Examples include agile methods like Scrum, XP and Crystal, CMMI, Six Sigma, Peer Reviews and many others. Popularity and fads also have a significant amount of influence in adoption initiatives (J. S. Brown & Duguid, 2000). One alternative to adoption is

16
evolving processes and practices inside the organization. This is a more organic approach, and many organizations use it, but it requires maturity and ability, and does not exclude adopting existing processes and practices.
Software processes and practices are tools that people use to perform their work effectively (Cockburn, 2004; Pfleeger, 1999), and there is evidence that the interactions between users and their methods are alike to their interactions with their tools (Riemenschneider et al., 2002).
Given that usability characterizes artifacts that users want to use, improving process and practice usability might promote adoption, and also make those adopted processes and practices more sustainable. This is a common goal of improvement initiatives (as an example, CMMI defines level 1 as a stage in which processes and practices are easily abandoned). Usability is about learning and understanding, it is also about dealing effectively with errors and exploration, and it is about visibility and the ability of users to exert control. Finally, it has significant impact on the user experience, promoting motivation and satisfaction.
Therefore, applying usability principles and heuristics to software development processes and practices might help adoption initiatives and improve the experience of the people involved.
There are few examples of software development process research that consider people as users of their processes and explicitly focus on usability. Kroeger et al. have defined a process quality model from the users´ perspective which includes usability as one of four quality attributes (Kroeger et al., 2014). Culver-Lozo and Mahrin have studied the usability of process descriptions, but not of process enactment (Culver-Lozo, 1995; Mahrin et al., 2008). Polgar proposes applying usability techniques to software process improvement (Polgár & Biró, 2011). Also, there is no standard to evaluate process quality (as there is for product quality (International Organization for Standardization, 2011)), and there are only some proposals for process quality models such as those described in (Feiler & Humphrey, 1992; Guceglioglu & Demirors, 2005; Kroeger et al., 2014). Moreover, there is little evidence of their usefulness or impact in software development practice. There is also no consensus on what characteristics of the software processes should be evaluated or what measures to use to evaluate these characteristics. Finally, there is no process quality model focused on the evaluation and improvement of usability aspects of software development processes and practices.
1.2. Problem Statement
Software process and practice adoption is a critical success factor for projects (Chow & Cao, 2008; Overhage et al., 2011; Van Kelle et al., 2015). Also, there is evidence that high business performance might be related to high software delivery performance, which requires adopting Lean, Agile and DevOps practices (Forsgren et al., 2018). There is also evidence that adoption success depends on the interactions between people as users of the process or practice and the process or practice itself (J. S. Brown & Duguid, 2000). Riemenschneider et al. found that one of the factors affecting acceptance of methodologies was acceptance by coworkers (Riemenschneider et al., 2002). Van Kelle et al. conducted a study on social success factors for agile projects, their results suggest

17
that congruence in values and goals, agile practices adoption and transformational leadership are good predictors of success (Van Kelle et al., 2015). Modern research on process quality is looking at process from the people’s perspective (Kroeger et al., 2014) and at process evolution as a key factor for success (Kuhrmann et al., 2016).
Although Agile and DevOps are very popular sources of processes and practices, real-world teams and organizations struggle to adopt their practices and embrace their mindsets. Many agile transformation initiatives struggle to accomplish their objectives (Dikert et al., 2016) and practice adoption levels are not what might be expected given the popularity of agile methods (Kuhrmann et al., 2019; Paez et al., 2018). This produces negative impact on process improvement initiatives and negatively affects costs and motivation. Also, many improvement initiatives are planned and conducted in top-down fashion without involving the people affected or even considering them (J. S. Brown & Duguid, 2000). Process and practice improvement through adoption is hard, even for effective organizations. These challenges are made more difficult by the lack of clear and concrete guidance.
Since usability characterizes good interactions between users and their tools (International Organization for Standardization, 2011), applying usability concepts to process and practice might increase the probability of success for process and practice improvement and adoption initiatives, as in Agile transformations or DevOps implementations. As an example, feedback is a basic usability principle, and it is applied in iterative processes, allowing teams to gather information about the product they are building and the processes and practices they are applying, in order to improve.
Given that process and practice usability is a novel concept, the purpose of this Thesis is to introduce it into Software Engineering. This Thesis defines process and practice usability (following the usability definition in (International Organization for Standardization, 2011)) as:
How easy it is to follow a process or practice, including the effort needed to learn, the probability of making mistakes, the cost of such
mistakes and the overall satisfaction and motivation promoted by following the process or practice.
In order to improve a process or practice, we need to evaluate it to understand its current state and characteristics. To address the problems with process and practice adoption described in this section, this Thesis presents the Usability Model for Software Development Process and Practice (UMP) and defines its objective in the next section.
1.3. Objective of the Thesis
Based on the analysis in the previous sections, the main objective of this Thesis is formulated as follows:
Define and evaluate a usability model for software development processes and practices, with the aim of enhancing their usability, in
order to improve the work experience of software developers and the overall effectiveness of process and practice improvement and
adoption initiatives.

18
The main contribution of this Thesis is to provide a Usability Model for Software Development Process and Practice (UMP) to promote a wider perspective on process and practice quality, one that addresses the modern concerns of the information age, like employee turnover and knowledge retention, motivation and job satisfaction, quality and the growth of teams and individuals as yet another result of the process, beyond the products.
The UMP will help practitioners and coaches to identify and deal with the challenges of process and practice adoption, process improvement specialists to better plan improvement initiatives, methodologists to better design new ways of working, teachers and mentors to improve how they facilitate learning, and researchers working on processes or practices. Adoption initiatives might increase their probability of success by adapting processes and practices to make them more usable, or at least by refining adoption strategies to take usability challenges into account. It will also help make processes and practices sustainable so that they are not easily abandoned.
In order to properly evaluate the ability of the UMP to solve the stated problem, it has been evaluated with actual practitioners and experts to provide more significant evidence about its impact in actual practice.
1.4. Research Strategy
To achieve the formulated objective the research strategy on this Thesis was organized following the Design Science Research framework. Although there are several available references on the Design Science Research framework (Hevner & Chatterjee, 2010; Johannesson & Perjons, 2014; Wieringa, 2014), the book by Johannesson and Perjons was used as reference (Johannesson & Perjons, 2014), since it presents a very concrete and accessible perspective to be applied on a Thesis.
Design Science is an innovative approach to the creation and validation of novel artifacts that provide solutions or seize improvement opportunities. In design research, the researchers do not only try to “describe, explain and predict“ (Johannesson & Perjons, 2014) as is the case with empirical research, but also to change the world in order to improve it.
In Design Science Research, the results produced are twofold, the artifact created, and the knowledge generated about it. This knowledge goes beyond the artifact itself and describes how it affects its environment. This is the main difference between Design and Design Science, from a design perspective it might be enough to create a novel artifact that provides a solution or improvement for a single person in a unique context, whereas from a Design Science perspective the results include the generation of knowledge that must be applicable to a broader, more general set of contexts.
As Johannesson and Perjons state (Johannesson & Perjons, 2014):
“In Design Science, researchers take an intentional stance in the sense that they view an artefact as something that should support
people in a practice. The researchers are not disinterested

19
observers but take on the role of designers that create useful objects”.
Given that the objective was the construction of an artifact (in this Thesis the artifact is the UMP) to improve a specific area of practice (software development) and to generate scientific knowledge about UMP and its application, the Design Science Research framework presented itself as a perfect fit for this Thesis.
Figure 1 summarizes the research strategy of this Thesis. For each activity of the Design Science Research framework, it presents the tasks performed and the chapter or section of this Thesis that describes them between parentheses.
Figure 1. Research strategy overview
Figure 1 shows the top-level research activities but not the flow of work. Although the Design Science Research framework may look sequential, it is performed iteratively, going back to any of the previous activities when feedback from the current activity provides useful input for it (Johannesson & Perjons, 2014). The focus during iteration was on design, development, and evaluation. As defined in (Johannesson & Perjons, 2014), the research conducted for this Thesis can be characterized as a “Design Science research project with focus on development and evaluation”.
At this point it is important to clarify so as not to create confusion that in this Thesis the term “evaluation” is used for two different purposes. On the one hand, in the context of the Design Science Research framework, evaluation refers to assessing the ability of the UMP to fulfill its utility and reliability requirements, addressed in Chapter 7 and Chapter 8 respectively. On the other hand, when using the UMP to evaluate a specific process or practice, it refers to applying the UMP evaluation process to assess the usability of that process or practice (see Section 4.3).
Explicate problem
State the problem and
audience(Sections 1.2,1.3)
Establish the state of the art
(Section 2.2)
Define objective and requirements
Define objective
(Section 1.3)
Define artifact structure
(Section 1.2)
Define requirements
and usage scenarios
(Section 5.2)
Design and develop artifact
Construct initial UMP
version(Chapters 3,4)
Define evaluation
process(Section 5.3)
Iteratively refine the
UMP(Chapter 6)
Demonstrate artifact
Conduct feasibility
study(Section 5.5)
Evaluate artifact
Conduct reliability
evaluations(Chapter 7)
Conduct utility evaluations
(Chapter 8)

20
Figure 2 shows the complete iterative process that produced the UMP, including initial design and development, and subsequent evaluations and refinements. It provides a historical overview of the process, from initial construction (in the center) to the last evaluation study (the TDD-BDD study at the top left).
Figure 2. UMP development and evaluation iterative cycle
The following sections briefly describe how each activity of the Design Science Research framework and its tasks were conducted in this Thesis.
1.4.1. Explicate Problem
This activity has the purpose of defining a practical problem and identifying the significance of that problem for a specific practice.
The first task in this activity was to analyze the problem and define it precisely enough so that it could be tackled, including the audience affected. The problem was defined in terms of the limitations in current process and practice usability research, and the needs of organizations to improve and adopt processes and practices, and retain people, in order to succeed. The UMP potential audience or users were defined as practitioners, coaches, consultants, teachers and researchers (see Section 1.3).
The second task was to establish the state of the art, in order to define the knowledge base for the research. To establish the state of the art on process and practice literature a Systematic Mapping Study (SMS) was conducted following the
Focus Group Study
Feasibility
Study
Initial Construction
v1.0
Refinement UMP 2.0
Refinement UMP 3.0
Refinement UMP 3.1
VMP Study
Scrum
Study
Refinement
UMP 3.2
BDD
Study
TDD
BDD
Study
Design and development Devlopment
Evaluation studies

21
guidelines proposed in (Kitchenham & Charters, 2007; Petersen et al., 2015) (see Chapter 2).
1.4.2. Define Objective and Requirements
This activity has the purpose of explicitly defining the objective and requirements for the artifact to be developed. The objective defines the purpose of the artifact, its reason to exist. The requirements define an abstract solution to the problem defined in current practice, it might take the form of a set of artifact characteristics, but they can also be about structure and environment.
The first task in this activity was to define the objective. It was defined as constructing and evaluating the UMP with the aim of enhancing the usability of processes and practices, in order to improve the work experience of software developers and the effectiveness of improvement and adoption initiatives.
The second task was to define the artifact structure. It was defined that the UMP take the form of a quality model, since it made it easier to present to practitioners and researchers alike. It was also decided that it was necessary to define an evaluation process to facilitate model use and promote consistent model applications.
Finally, the third task was to define the requirements for the UMP. The first requirement was that it be useful for its audience, and this was specified through a set of usage scenarios (see Section 4.5). These scenarios described how the UMP was supposed to be used in the real world, who would use it, and what they would use it for. This provided guidance for the definition of the utility evaluation studies which are presented in Chapter 8. The second requirement was that the UMP be reliable, so that different users would obtain consistent results from its applications. Reliability evaluations are presented in Chapter 7.
1.4.3. Design and Develop Artifact
This is the creative part of the framework, here an artifact is designed and developed that fulfills the requirements to address the explicated problem.
The development of UMP follows an iterative process as it is shown in Figure 2. The first task in this activity was to construct the initial version of UMP, which consisted of defining a set of usability characteristics and corresponding metrics (see Chapter 3).
The second task was to define an evaluation process to facilitate the application of the UMP (see Section 4.3).
The third task in this activity was to refine the model. A focus group (Kontio et al., 2008) with expert practitioners was conducted in order to gather feedback on the clarity, understandability, precision, and relevance of model characteristics and metrics (see Section 6.1). Then, the UMP was modified to address the improvement opportunities identified in the focus group.
The UMP was also modified according to internal feedback from the research group and external feedback received on publications and through participation in conferences and workshops, as the research progressed.

22
Finally, the UMP was refined according to the results of the Scrum study described in Section 7.2.
1.4.4. Demonstrate Artifact
The Demonstrate Artefact activity uses the developed artefact in an illustrative or real-life case, sometimes called a “proof of concept”, thereby proving the feasibility of the artefact. The demonstration will show that the artefact actually can solve an instance of the problem.
For this purpose a feasibility study was conducted by applying the UMP to Scrum (see Section 5.1).
1.4.5. Evaluate Artifact
This activity has the purpose of evaluating to what extent the artifact fulfills its stated requirements and addresses the practical problem that motivated the creation of the artifact.
The first task in this activity was to evaluate UMP reliability. Towards this goal, two reliability assessment studies were conducted, consisting of experts applying the model. The first study was based on the UMP application to Scrum (see Section 7.2), and the second one to Test Driven Development (TDD) and Behavior Driven Development (BDD) (see Section 7.3).
The second task in this activity was to evaluate UMP utility. Towards this goal, two empirical studies were conducted. A preliminary case study was conducted through the application of UMP to the Visual Milestone Planning method (VMP), a participatory and visual method for planning software development projects (Miranda, 2019) (see Section 8.1). The second study was a field quasi-experiment on the application of the UMP to the implementation of BDD by a development team working in a small software development company for a financial industry client (see Section 8.2). The preliminary case study on the VMP was based on interviews and documentation review, and was designed following the guidelines provided in (Runeson & Höst, 2008). Both studies followed a naturalistic approach (Johannesson & Perjons, 2014), that is, they were conducted in a real-world environment, to provide more significant evidence about its ability to affect real-world practice.
Quasi-experiments (Privitera & Lynn, 2018) were selected as the research method for the BDD study because they support measuring response to a treatment, have high external validity (the case is more representative than a laboratory setting), support single-case experimental designs, and do not require randomization/control groups, controlling all factors or having an independent variable. Quasi-experiments can take advantage of the existing factors in the context, such as the fact that the subject team was facing challenges in their BDD adoption. In a naturalistic utility study such as this, it is very hard to control the variables or factors affecting the study. On the other hand, such a context is selected because of the perceived applicability of the treatment, as in this case, in which the identified adoption challenges pointed towards usability issues (e.g. feedback). The downside is that quasi-experiments cannot establish causal relationships (a more through discussion on this is presented in Appendix A).

23
Summarizing, the research studies developed as part of the research strategy followed in this Thesis are shown in Table 1. For each study it shows the name, the research method used to conduct the study, and the section of this document in which the study is described.
Table 1. Summary of research studies conducted in this Thesis
Study name Research Method Section
SMS SMS 2.1
Feasibility study Expert evaluation 5.1
Focus group study Focus group 6.1
Scrum study Inter-rater agreement assessment 7.2
TDD-BDD study Inter-rater reliability assessment 7.3
VMP study Case study 8.1
BDD study Field quasi-experiment 8.2
1.5. Research Context
This Thesis was developed mainly in the context of the Usability of Process and Practice research project at Universidad Nacional de Tres de Febrero, Caseros, Argentina, from September 2016 to September 2020. The development of this Thesis was supported by:
• The “Milstein” scholarship within the “Programa Raíces”, financed by “Ministerio de Ciencia y Tecnología” in Argentina.
• The financial contribution from Universidad Nacional de Tres de Febrero enabling travelling for the initial visit from Marcela Genero.
This project included the collaboration with the Alarcos Research Group from the University of Castilla-La Mancha in Spain (https://alarcos.esi.uclm.es/). Two other related projects that supported the development of this Thesis were the following:
• The GEMA project (SBPLY/17/180501/000293), financed by the “Conse-jería de Educación, Cultura y Deporte de la Dirección General de Universi-dades, Investigación e Innovación de la JCCM” in Spain (2018-2021).
• The ECLIPSE project (RTI2018-094283-B-C31), financed by the “Minis-terio de Ciencia, Innovación y Universidades, y FEDER” in Spain (2019-2021).
1.6. Thesis Outline
This Thesis is organized as follows:
Chapter 1. Introduction: this chapter presents the motivation for this Thesis, the problem statement, the Thesis objective, the research strategy organized following the Design Science Research framework, the context in which the research for this Thesis was conducted, and the Thesis structure.

24
Chapter 2. State of the Art: this chapter details the SMS conducted to establish the state of the art on process and practice usability.
Chapter 3. Initial UMP Construction: this chapter describes how the initial version of the UMP was constructed from the selected sources. The construction process is described emphasizing the rationale behind each of the decisions made.
Chapter 4. UMP Structure Definition: this chapter presents the definitions of UMP characteristics and metrics, accompanied by several examples of their application to real-life software processes and practices. It also presents the UMP evaluation process, usage modes and scenarios. The UMP evaluation process describes the procedure for applying the model successfully; the UMP usage modes describe the different ways in which the model can be used; the UMP usage scenarios describe the real world contexts for which the model has been designed, including who are its intended users, the context in which they might find it useful, and the recommended usage modes for that scenario.
Chapter 5. UMP Applications: this chapter presents the UMP applications, in particular, the feasibility study initially conducted to demonstrate the UMP. UMP applications also include the definition of the usability profiles for Scrum, Continuous Integration, the VMP, TDD and BDD, produced throughout the research studies for this Thesis.
Chapter 6. UMP Iterative Refinement: this chapter details the iterative refinement of the UMP, which includes the description of the focus group study conducted, the analysis of the obtained data and the rationale applied in the refinement process.
Chapter 7. UMP Reliability Evaluation: this chapter describes the two assessment studies conducted to evaluate UMP reliability, in which experts evaluated Scrum, TDD and BDD.
Chapter 8. UMP Utility Evaluation: this chapter details the evaluation of UMP utility through two studies on its application in real-life scenarios; the first is a preliminary case study on the VMP, and the second a field quasi-experiment on a team’s implementation of BDD.
Chapter 9. Conclusions and Future Work: this chapter concludes this Thesis, presenting the main contributions, how the Thesis objectives were achieved, the list of publications produced as part of the research conducted for this Thesis and the future lines of work.
Appendix A. Research Methods: this appendix presents a brief description of the research methods applied in this Thesis.
Appendix B. Details on Statistics: this appendix presents additional details on the statistics applied during the studies conducted for this Thesis.
Appendix C. Example Raw Data: this appendix presents raw data obtained in some of the studies conducted for this Thesis.
Appendix D. TDD Evaluation Questionnaire: this appendix presents as an example the TDD evaluation questionnaire used in the TDD-BDD study.

25
Appendix E. Details on UMP Version Changes: this appendix details the evolution of UMP versions, including a summary of changes in each version and the rationale for each change.
Bibliography: This chapter lists the bibliographical references used in this Thesis.

26
Chapter 2. State of the Art
This chapter describes the state of the art on software process and practice usability, established by performing a Systematic Mapping Study (SMS) (Kitchenham et al., 2011; Petersen et al., 2015) (see details on the SMS method in Appendix A).
The rest of this chapter is organized as follows: Section 2.1 presents how the SMS was performed and Section 2.2 presents the SMS conclusions.
2.1. SMS on Process and Practice Usability
To determine the state of the art on software process and practice usability an informal preliminary search was conducted on Google Scholar and Scopus, obtaining very limited search results. Then, experts on software process were contacted, who provided references to literature in two groups, research papers and what is called grey literature, that is, literature that is not from conferences or journals (Kitchenham & Charters, 2007). Table 2 shows the references provided.
Table 2. Papers related to process usability referenced by experts
# Title Authors Publication Year
1 Software process from the de-veloper's perspective: A case study on improving process usa-bility
Culver-Lozo, Kathleen
Proceedings of the International Software Process Workshop, pp. 67-69
1995
2 A perspective-based model of quality for software engineering processes
Kroeger, T., Davidson, N.
Proceedings of the Australian Software Engineering Conference, ASWEC, 5076637, pp. 152-161
2009
3 Understanding the characteristics of quality for software engineering processes: A Grounded Theory investigation
Kroeger, T.A., Davidson, N.J., Cook, S.C.
Information and Software Technology, 56(2), pp. 252-271
2014

27
# Title Authors Publication Year
4 Software Process Development and Enactment: Concepts and Definitions
Feiler, P., Humphrey, W.
Software Engineering Institute TECHNICAL REPORT CMU/SEI-92-TR-004
1992
In addition, an SMS was conducted to get the relevant literature on software process and practice usability in a rigorous and systematic way. For performing and reporting the SMS the guidelines proposed in (Kitchenham & Charters, 2007; Petersen et al., 2015) were followed.
The next sections describe the SMS planning, execution, and results.
2.1.1. SMS Planning
SMS planning includes the definition of the protocol which specifies the methods that will be used to undertake the systematic mapping study, to reduce the probability of researcher bias. The SMS protocol includes the following elements:
The SMS protocol includes the following elements:
• Research questions.
• Search strategy. Includes search string, search scope, sources to be searched and the search period.
• Inclusion and exclusion criteria. Used to determine which studies are included in, or excluded from, a systematic review.
• Selection procedure. Defines how the selection criteria will be applied, e.g. how many assessors will evaluate each prospective primary study, and how will assessors resolve their disagreements.
• Data extraction strategy. Defines how the information required from each primary study will be obtained.
• Data synthesis strategy. Defines how the data will be processed to answer the research questions.
2.1.1.1. SMS Objective and Research Questions
The objective of the SMS was to:
Systematically define the state of the art on software development process and practice usability.
To achieve this objective, the research questions shown in
Table 3 were formulated.
Table 3. SMS research questions
Id Research question Rationale Classification
RQ1 Which quality attributes of software development processes and practices related to usability are of interest to researchers?
To discover which are the usability related attributes investigated.
Usability, Understandability, Learnability

28
Id Research question Rationale Classification
RQ2 Which types of objects under study are the focus of software process and practice usability research?
To assess the applications of process and practice usability studies.
Process, Practice, Method/Methodology, Framework
RQ3 Which type of research do the studies on software process and practice usability belong to?
To describe the research approaches applied and characterize their level of advancement.
Proposal of solution, Evaluation research, Validation research
RQ4 In which context was the study conducted?
To discover whether or not the studies conducted on process and practice usability have been applied into real world contexts.
Industrial, Academic
2.1.1.2. Search Strategy
This section describes the search strategy defined for the SMS, consisting of search string, search scope and period, and search sources.
Search String
The search string is composed of major and alternative search terms, which are required to be found in the search, and the excluded terms, which are not to be found in the search. The major and alternative terms are shown in Table 4.
Table 4. SMS search terms
Major term Alternative term Rationale
usability understandability OR learnability
The quality attribute under study, alternative terms were chosen in context.
The word quality was not used because it was too generic and produced many unrelated results.
process practice The type of object of study whose usability is under consideration.
software - Processes and practices under study are restricted to software development.
The search string is also composed of excluded terms, which help filter studies that are not in the scope of this SMS but are commonly associated with the major or alternative terms. These are shown in Table 5.
Table 5. SMS excluded terms
Major term Alternative term Rationale
apps “end user” OR “software user” OR web OR mobile OR cloud OR “Open Source” OR prototype OR interface OR
Excludes studies focused on the usability of software products instead of processes.

29
Major term Alternative term Rationale
programming OR analytics OR code OR SaaS
The word product was not used because it appears in expressions like “work product” that relate explicitly to process.
health medical Excludes a wide range of unrelated studies.
The term quality was tried as an alternative term for usability but caused trial searches to include too many unrelated results, since it is too generic. The same was attempted for excluded terms; for example, product produced the exclusion of potentially viable studies as described in Table 5.
Using these terms and based on the source specific syntax and limitations, the final search string was assembled for each source. Figure 3 shows the search string for the Scopus repository as an example:
TITLE-ABS-KEY ( ( ( process OR practice ) AND ( usability OR understandability OR learnability ) AND software AND NOT ( "end user" OR "software user" OR web OR mobile OR apps OR cloud OR "open source" OR prototype OR interface OR programming OR analytics OR code OR SaaS OR
health OR medical ) ) ) AND PUBYEAR < 2017 AND ( LIMIT-TO ( SUBJAREA , "COMP" ) )
Figure 3. Search string for Scopus
The search string was proofed by checking that it included sample studies, which were the first three studies in Table 2 (the fourth study was not used because it was considered grey literature, being a technical report). Given that process studies range across decades, one particular consequence is that studies originated in the 1980’s and 1990’s tend to relate programming terminology to process terminology, making the selection of terms used to exclude studies on product usability more limited. For example, Kathleen Culver-Lozo’s study on process usability includes the word programming among its keywords (Culver-Lozo, 1995).
Search Scope and Period
The searches were limited to the Computer Science field and the string was applied to the Title, Abstract and Keywords. In cases in which the source did not allow this exact search configuration, a wider search was performed and then results were filtered manually.
The search period was limited to studies published up to December 2016.
Search Sources
The searches were performed on the following sources, which are usually used in Software Engineering:
• SCOPUS database
• Wiley InterScience
• IEEE Digital Library

30
• ACM Digital Library
2.1.1.3. Inclusion and Exclusion Criteria
Inclusion and Exclusion criteria were defined to filter studies during SMS execution.
The inclusion criteria are the following:
• Papers related to software development process usability.
• Papers must be research papers from conferences, journals, or workshops.
• Papers must be written in English.
The exclusion criteria are the following:
• Papers related to product usability.
• Papers that present lessons learned.
2.1.1.4. Selection Procedure
The selection procedure consists of the following steps, which were mainly performed by the Thesis author:
• Perform the searches in the selected sources.
• Remove duplicates.
• Apply the inclusion/exclusion criteria to title and abstract.
• In cases in which the title and abstract do not provide sufficient information the inclusion/exclusion criteria must be applied to the full text.
• When all studies are marked for inclusion/exclusion, extract data for all included studies.
• To ensure consistent data extraction a fellow researcher reviews random sample of studies.
• Disagreements between Thesis author and fellow researcher are resolved by joint review and consensus.
2.1.1.5. Data Extraction Strategy
To facilitate data extraction for each research question, a classification scheme was defined.
The classification scheme contains the following dimensions and categories:
• Usability related attribute
o Usability: related to how easy it is to follow a process or practice, including the effort needed to learn, the probability of making mistakes, the cost of such mistakes and the overall satisfaction and motivation promoted by using the practice or process.
o Understandability: related to how easy it is to apprehend how the underlying principles, structure and dynamics make the process or practice work to achieve the desired results.

31
o Learnability: related to how easy it is to learn to use the process or practice.
• Type of object under study
o Process: a definition of the flow of work, including activities, roles, and the inputs/outputs of each activity.
o Practice: a technique for performing a specific task.
o Method/Methodology: a set of steps that provide guidance towards the accomplishment of an objective (methodology is used interchangeably in most Software Engineering contexts, although it has a different connotation related to the study of methods).
o Framework: a generic set of conceptual guidelines that must be instantiated to fulfill its purpose.
• Type of research defined in (Wieringa et al., 2006) matching inclusion criteria
o Proposal of solution: which is about presenting a solution to a problem and arguing its relevance without full validation.
o Evaluation research: which is about the investigation of a problem or solution implementation in practice.
o Validation research: which is about investigating the properties of a solution proposal.
• Study context
o Industrial: performed in an industrial setting or with industry practitioners.
o Academic: performed in an academic context with students or professors.
The data extraction form contains the following fields:
General study data:
Title, authors, publication, year.
Research questions data:
RQ1: Usability related attribute
RQ2: Type of object under study
RQ3: Type of research
RQ4: Study context
2.1.1.6. Data Synthesis Strategy
To answer the research questions, the following indicators were defined to be calculated from the extracted data:
• RQ1: Which quality attributes of software development processes and practices related to usability are of interest to researchers?

32
o Count of process usability studies for each usability related attribute.
o Total count of process usability studies.
• RQ2: Which types of objects under study are the focus of software process and practice usability research?
o Histogram of types of object under study
• RQ3: Which type of research do the studies on software process and practice usability belong to?
o Histogram of types of research.
• RQ4: In which context was the study conducted?
o Histogram of study contexts.
2.1.2. SMS Execution
The SMS was executed following the protocol defined during planning. Figure 4 shows an overview of the selection procedure results.
The search produced a consolidated 1493 initial results from all sources. From that data set, 167 duplicates were eliminated, yielding a total of 1326 results. For each of these studies, the Thesis author reviewed title and abstract, applying inclusion and exclusion criteria. During this activity, studies emerged which were not related to process or practice usability (and thus were not included) but neither were they specifically related to product usability. For example, usability of modeling languages, usability of process algebra, and usability of process models. Approximately 16 of the studies excluded were in this category. Another emergent trait among the studies excluded was the use of the term use-able, with a hyphen, to describe that some object was applicable in some context, but this concept was related to viability or applicability and not usability as it is understood in this Thesis.

33
Figure 4. Overview of SMS selection procedure
This yielded a set of 32 studies that were candidates for final inclusion. For each of these studies, the full paper was reviewed to make the final inclusion/exclusion decision. For the selected studies, the data was extracted into a spreadsheet. Extraction was also performed by a fellow researcher on a random sample of the studies to ensure consistent data extraction. As shown in Figure 4 , 16 studies were finally selected to be analyzed. The list of these 16 studies is shown in Table 6.
Table 6. List of studies selected in the SMS
Id Title Authors Publication Year
P1 Software Process Development and Enactment: Concepts and Definitions
Feiler, P., Humphrey, W.
Software Engineering Institute TECHNICAL REPORT CMU/SEI-92-TR-004
1992
Scopus IEEE
Explore
ACM Digital Library
Wiley
16 selected results
0 results 177 results
424 results
888 results
1493 initial results
1326 non-duplicate results
Experts
4 results

34
Id Title Authors Publication Year
P2 Software process from the developer's perspective: A case study on improving process usability
Culver-Lozo Kathleen
Proceedings of the International Software Process Workshop, pp. 67-69
1995
P3 Practitioners' views on the use of formal methods: An industrial survey by structured interview
Snook C., Harrison R.
Information and Software Technology, 43(4), pp. 275-283
2001
P4 Evaluation of a scenario-based reading technique for analysing process components
Tortorella M., Visaggio G.
Journal of Software Maintenance and Evolution, 13(3), pp. 149-166
2001
P5 A definition of software process quality based on statistical process control
Li Z., Gong B., He X., Yu Z.
Proceedings of the 11th Joint International Computer Conference, JICC 2005, pp. 814-817
2005
P6
About the Complexity of Teamwork and Collaboration Processes
Cardoso, J. 2005 Symposium on Applications and the Internet Workshops (SAINT 2005 Workshops), pp. 218-221
2005
P7 Assessing the Quality of Collaborative Processes
den Hengst, M., Dean, D. L., Kolfschoten, G., Chakrapani, A.
Proceedings of the 39th Annual Hawaii International Conference on System Sciences (HICSS'06)
2006
P8 Towards validating prediction systems for process understandability: Measuring process understandability
Melcher J., Seese D.
Proceedings of the 2008 10th International Symposium on Symbolic and Numeric Algorithms for Scientific Computing, SYNASC 2008
2008
P9 Investigating factors affecting the usability of software process descriptions
Mahrin M.N., Carrington D., Strooper P.
Lecture Notes in Computer Science (including subseries Lecture Notes in Artificial Intelligence and Lecture Notes in Bioinformatics), 5007 LNCS, pp. 222-233
2008
P10 A perspective-based model of quality for Software Engineering processes
Kroeger T., Davidson N.
Proceedings of the Australian Software Engineering Conference, ASWEC, 5076637, pp. 152-161
2009
P11 Synthetic experiment in evaluating the usability factor of the requirement change propagation process model
Ibrahim N., W. Kadir W.M.N., Abd Halim S., Deris S., Aziz M.A.
Communications in Computer and Information Science, 251 CCIS, Part 1, pp. 477-491
2011

35
Id Title Authors Publication Year
P12 The usability approach in Software Process Improvement
Polgár P.B., Biró M.
Communications in Computer and Information Science, 172, pp. 113-142
2011
P13 OPI model: A methodology for development metric based on outcome oriented
Thammarak, K., Intakosum, S.
2011 Eighth International Joint Conference on Computer Science and Software Engineering (JCSSE), pp.337-342
2011
P14 Understanding the characteristics of quality for Software Engineering processes: A Grounded Theory investigation
Kroeger T.A., Davidson N.J., Cook S.C.
Information and Software Technology, 56(2), pp. 252-271
2014
P15 Keep improving MAS method fragments: A Medee-based case study for MOISE+
Casare S., Brandao A.A.F., Sichman J.
Lecture Notes in Computer Science (including subseries Lecture Notes in Artificial Intelligence and Lecture Notes in Bioinformatics), 8758, pp. 146-162
2014
P16 Using the cognitive walkthrough method in software process improvement
Polgár P.B. E-Informatica Software Engineering Journal, 9(1), pp. 79-85
2015
2.1.3. SMS Results
This section presents the answers to each of the research questions formulated (see
Table 3). The data extracted to answer the research questions is shown in Table 7.
Table 7. Data extracted from selected studies
Id Title Usability related at-tribute
Type of object under study
Type of re-search
Context
P1 Software Process Development and Enactment: Concepts and Definitions
Usability Process Proposal of solution
Academic
P2 Software process from the developer's perspective: A case study on improving process usability
Usability Process Evaluation research
Industrial
P3 Practitioners' views on the use of formal methods: An industrial
Understandability
Method Evaluation research
Industrial

36
Id Title Usability related at-tribute
Type of object under study
Type of re-search
Context
survey by structured interview
P4 Evaluation of a scenario-based reading technique for analysing process components
Usability Framework Validation research
Academic
P5 A definition of software process quality based on statistical process control
Understandability
Process Proposal of solution
Academic
P6 About the Complexity of Teamwork and Collaboration Processes
Usability Process Proposal of solution
Academic
P7 Assessing the Quality of Collaborative Processes
Usability Process Proposal of solution
Academic
P8 Towards validating prediction systems for process understandability: Measuring process understandability
Understandability
Process Validation research
Academic
P9 Investigating factors affecting the usability of software process descriptions
Usability Process Evaluation research
Industrial
P10 A perspective-based model of quality for Software Engineering processes
Usability Process Evaluation research
Industrial
P11 Synthetic experiment in evaluating the usability factor of the requirement change propagation process model
Usability Process Validation research
Academic
P12 The usability approach in Software Process Improvement
Usability Method Proposal of solution
Academic
P13 OPI model: A methodology for development metric based on outcome oriented
Usability Methodology
Proposal of solution
Academic
P14 Understanding the characteristics of quality for Software Engineering
Usability Process Evaluation research
Industrial

37
Id Title Usability related at-tribute
Type of object under study
Type of re-search
Context
processes: A Grounded Theory investigation
P15 Keep improving MAS method fragments: A Medee-based case study for MOISE+
Understandability
Method Proposal of solution
Academic
P16 Using the cognitive walkthrough method in software process improvement
Usability Method Proposal of solution
Academic
Hereafter the results for each research question are presented.
RQ1: Which quality attributes of software development processes and practices related to usability are of interest to researchers?
Table 8 shows the distribution of papers by usability related quality attribute. It is interesting to note that usability is clearly the most frequent quality attribute considered and that learnability was not present at all (it did appear in some of the excluded studies).
Table 8. Distribution of papers by usability related attribute
# Usability related quality attrib-ute
Number of studies
Relative frequency
1 Usability 12 0.75
2 Understandability 4 0.25
3 Learnability 0 0.00
Total 16
RQ2: Which types of object under study are the focus of process and practice usability research?
Figure 5 shows the histogram with the distribution of the types of object under study which are the focus of process and practice usability research.

38
Figure 5. Distribution of studies by type of object under study
The results show a prevalence of process focused studies, which is consistent with historical focus on process as described in Section 1.1. The second most frequent object under study is Method/Methodology, which is also as expected. It is interesting to note that there is only one of type framework, which is the most modern concept, and that there are no studies focusing on practices. Overall, if ordered by frequency, the results show a clearly historical progression, from the oldest concept (process) to the newest concept (practice).
RQ3: Which type of research do the studies on software process and practice usability belong to?
Figure 6 shows the histogram with the distribution of types of research following the classification by (Wieringa et al., 2006). It clearly shows a prevalence of preliminary research in which problems are evaluated and solutions are proposed over validation research. This is consistent with the fact that it is a very novel area of research.
Figure 6. Distribution of studies by type of research
RQ4: In which context was the study conducted?
Figure 7 shows the histogram with the distribution of selected studies by study context. There is a clear prevalence of academic settings, which
10
5
10
0
2
4
6
8
10
12
8
5
3
0
1
2
3
4
5
6
7
8
9
Proposal of solution Evaluation research Validacion research

39
shows that there is ample opportunity for empirical research and practical solutions that can be used in industrial contexts.
Figure 7. Distribution of studies by study context
Overall, the SMS results confirm that very little research has been conducted on software process and practice usability. Five studies focus on specific rather than generic objects under study, and these are not mainstream. Also, most are specific methods proposed by the authors and with no apparent practitioner base (except in the case of formal methods). The specific objects under study include: a method for composing method fragments from a repository, for developing multi agent systems [P15]; a perspective based methodology for software development metric creation [P13]; a requirements change propagation process [P11]; a scenario-based reading technique for improving the usability of a method for analysis of process components [P3]; formal methods in software development and the factors that affect it, including usability [P2].
The studies on generic process and practice usability include two main categories, those focusing on usability as a process or practice quality attribute (this includes most of the studies in this group) and those studies applying usability techniques to software process improvement [P12][P16]. The studies focusing on usability as a process or practice quality attribute include: a process quality model with four main attributes (suitability, usability, manageability, evolvability) by Kroeger et al. [P10][P14]; studies focusing in the usability of process descriptions (e.g. manuals) for their users [P2][P9]; a study focused on measuring process understandability, particularly of its descriptions [P8]; two studies on usability of collaborative processes by different authors[P6][P7], in one of them the focus is a hybrid of process/tool usability [P7]; and a definition of software process quality based on statistical process control [P5].
2.2. Conclusions
This chapter presented the SMS conducted to define the state of the art on software process and practice usability.
The results obtained make evident the very limited existing research on the usability of software development processes and practices, which highlights the need to build the UMP model, which is the main contribution of this Thesis. The studies selected in this SMS were used as candidate sources for the UMP construction as described in Chapter 3.
5
11
0
2
4
6
8
10
12
Industrial Academic

40
Chapter 3. Initial UMP Construction
This chapter details the UMP construction process, which consists of the following steps and tasks:
1. Selection of sources
2. Model construction
a. Identify candidate usability characteristics from sources.
b. Decompose usability characteristics.
c. Define metrics to measure specific aspects of the characteristics.
While describing the UMP construction process, significant effort has been put into encoding and conveying the design rationale (Clements et al., 2002; Dutoit & Paech, 2001), to make the design process visible, facilitate model critique and eventual modification, and also to promote better understanding of the UMP.
The rest of this chapter is organized as follows: Section 3.1 presents the process for selecting appropriate sources for the model and Section 3.2 presents the model construction process in detail, including how the usability characteristics emerged from the analysis of the selected sources and the rationale for their inclusion/exclusion.
3.1. Selection of Sources
Three source types were established:
• Peer-reviewed existing research literature on software process and practice usability, to include a research perspective.
• Well-known software product quality standards, to include an industry perspective.
• Classic product usability literature, to complement the other sources with rich content and deep insights on usability principles and heuristics.
To select the sources a set of initial candidates were chosen for each source type:

41
• For research on software process and practice usability, those studies from the SMS presented in Chapter 2 which included software process and practice quality models featuring usability were selected.
• For the standards source type, since there is no international standard on process quality (Kroeger et al., 2014), the ISO 25010 International Standard on Systems and software quality models was selected (International Organization for Standardization, 2011). Considering process to be like a software product is an analogy that other researchers have already used (Feiler & Humphrey, 1992; Osterweil, 1987).
• For the classic literature source type the works of Norman and Nielsen were selected (Nielsen, 1994; Norman, 1988). These books provided the initial inspiration for this research, in particular the resonance between the concepts of feedback and error tolerance as described in usability and Software Engineering literature.
For selecting the definitive sources from which the UMP would be constructed, the argumentative design rationale approach (Shum & Hammond, 1994) was followed. Table 9 shows the rationale for the selection of sources, including for each source its type, the arguments for inclusion/exclusion, and the final decision made.
Table 9. Rationale for source selection
Source Type
Source candidate
Arguments for inclusion Arguments for exclusion Decision
Process usability
(Kroeger et al., 2014)
Focuses on process quality and includes usability as a process characteristic.
- Include
Process usability
(Feiler & Humphrey, 1992)
Mentions process usability in the paper introduction.
Usability not included among process properties in the conceptual model.
Exclude
Quality Standard
(International Organization for Standardization, 2011)
A well-known international quality standard.
Lack of process quality standard.
It is composed of a set of quality models with sub-characteristics and metrics.
Product focus. Include
Product Usability
(Norman, 1988) Usability specific and rich terminology.
Classic reference on usability.
Product focus. Include
Product Usability
(Nielsen, 1994) Usability specific and rich terminology.
Classic reference on usability.
Product focus. Include

42
Summarizing, the selection process produced the following sources to be used in the construction of the UMP:
• The study by Kroeger et al. (Kroeger et al., 2014), which proposes a model of software development process quality.
• The ISO 25010 International Standard on System and software quality models (International Organization for Standardization, 2011).
• The books by Norman (Norman, 1988) and Nielsen (Nielsen, 1994).
3.2. Model Construction
The construction of the UMP consisted of defining the usability characteristics and the corresponding metrics that compose it. The construction process was based on an adaptation of the top-down methodology for building structured quality models (Franch & Carvallo, 2003), which proposes starting with the top-level elements (i.e. characteristics) and proceeding towards the lower level elements (i.e. metrics). Table 10 shows the adapted form of the methodology followed for the UMP construction.
Table 10. Methodology for UMP construction
Activity Description
1 Define initial usability characteristics
2 Decompose characteristics
3 Define metrics for all characteristics
3.2.1. Define Initial Usability Characteristics
For each of the four selected sources, those elements that were candidates to constitute a characteristic of usability in UMP were identified: sub-attributes in (Kroeger et al., 2014), sub-characteristics in (International Organization for Standardization, 2011), principles in (Norman, 1988), and heuristics in (Nielsen, 1994). Table 11 shows the characteristics and the element type for each source.

43
Table 11. Candidate usability characteristics by source
Source ISO 25000 (International
Organization for Standardization,
2011)
Kroeger et al. (Kroeger et al.,
2014)
Norman (Norman, 1988)
Nielsen (Nielsen, 1994)
Element type Sub-characteristic Sub-attribute Principle Heuristic
Characteristics Appropriateness recognizability
Learnability
Operability
User error protection
User interface aesthetics
Accessibility
Accessibility
Understandability
Learnability
Adaptability
Visibility
Feedback
Affordance
Matching conceptual models
Forcing function
Less is more
Tolerate mistakes
Avoid modes
Next, the elements from each source were added to an initial candidate list of characteristics. Candidates with similar names and/or meanings were listed together.
Table 12 shows the list of candidate usability characteristics from the selected sources specifying name and definition.
Table 12. Candidate usability characteristics
Characteristic Definition Source
Appropriateness recognizability
Degree to which users can recognize whether a product or system is appropriate for their needs.
(International Organization for Standardization, 2011)
Affordance (Natural mapping)
Things should by their outward nature expose what they are for (i.e. what their purpose is).
(Norman, 1988)
Learnability Degree to which a product or system can be used by specified users to achieve specified goals of learning to use the product or system with effectiveness, efficiency, freedom from risk and satisfaction in a specified context of use.
(International Organization for Standardization, 2011)
Ease with which a process user is able to learn how to perform the activities of a Software Engineering process.
(Kroeger et al., 2014)
Accessibility Degree to which a product or system can be used by people with the widest range of characteristics and capabilities to achieve a specified goal in a specified context of use.
(International Organization for Standardization, 2011)

44
Characteristic Definition Source
Ease with which a process user is able to find information about a Software Engineering process.
(Kroeger et al., 2014)
User interface aesthetics
Degree to which a user interface enables pleasing and satisfying interaction for the user.
(International Organization for Standardization, 2011)
Less is more A thing’s effectiveness or aesthetic appeal is increased by reducing its size or simplifying it.
(Nielsen, 1994)
Operability Degree to which a product or system has attributes that make it easy to operate and control.
NOTE Operability corresponds to controllability, (operator) error tolerance and conformity with user expectations as defined in ISO 9241-110.
(International Organization for Standardization, 2011)
Tolerate mistakes Things should allow us to make mistakes without incurring much rework or frustration.
(Nielsen, 1994)
User error protection Degree to which a system protects users against making errors.
(International Organization for Standardization, 2011)
Forcing function
Things should not allow us to make use of them if there is danger of grave consequences of that use.
(Norman, 1988)
Adaptability Ease with which a process user is able to adapt a Software Engineering process for use in different situations. Process adaptability may be further categorized into the three sub-types of tailorability, scalability and flexibility.
(Kroeger et al., 2014)
Matching conceptual models
Every artifact has an implicit mental model that should match that of the people doing the work.
(Norman, 1988)
Understandability The ease with which a process user is able to understand whether a Software Engineering process is relevant and how it can be used to achieve desired results.
(Kroeger et al., 2014)
Visibility Things need to be visible so that users can interact with them.
(Norman, 1988)
Feedback When we act upon the world, there is a reaction from the world that we can perceive.
(Norman, 1988)
Avoid modes Things being used should not change their behaviors according to modes.
(Nielsen, 1994)

45
A synthesis process was performed by grouping similar candidate characteristics and selecting a name and definition. Table 13 shows the resulting name for each candidate characteristic and the rationale for its selection.
Table 13. Rationale for naming characteristics
Selected name for each characteristic
Original name of the characteristics
Rationale
Self-evident purpose
Appropriateness recognizability
Affordance
The original names were hard to understand even by experts.
Learnability Learnability The original name was kept because it is widely used.
Understandability Understandability
Matching conceptual models
Understandability was considered the more generic term, while matching conceptual models is a significant aspect of understandability.
Safety Tolerate mistakes
User error protection
Forcing function
The name was chosen as a generalization to better apply to process and practice usability (the original name chosen was Error tolerance, and was renamed to Safety after the focus group study, see Section 6.1).
Visibility Visibility
Feedback
Although the similarity was partial, the original decision was to group these two characteristics and consider Visibility the more general (these two there separated later, see Section E.1).
Controllability Operability Controllability appears as an alias and sub-aspect of Operability in the source, and controllability applies better to process and practice usability.
Accessibility Accessibility The original name was kept because it is widely used.
Adaptability Adaptability The original name was kept because it is widely used.
Avoid modes Avoid modes The original name was kept because it is appropriate.
User satisfaction User interface aesthetics
Less is more
Choosing a more generic name that applies better to process and practice usability.
The final step for defining the initial list of usability characteristics was filtering the resulting list considering the applicability of each characteristic to software process and practice usability. The usability characteristics were selected applying specific arguments for inclusion/exclusion following the argumentative design rationale approach (Shum & Hammond, 1994).
Table 14 shows the rationale for inclusion and exclusion of characteristics.

46
Table 14. Rationale for including and excluding characteristics
Characteristic Arguments for inclusion Arguments for exclusion Decision
Self-evident purpose
Purpose is a key motivator for people.
Newcomers to a process or practice need to recognize its purpose to adopt it effectively.
It is a complex aspect to understand for model users.
Include
Learnability Difficulty to learn a new process or practice is a basic barrier for adoption.
Might be confused with Understandability.
Include
Understandability Understanding a process and practice helps with appropriate selection before adoption, and also support effective performance.
Might be confused with Learnability.
Include
Safety Lack of safety can block users from attempting new activities, and it also makes a process or practice hard to learn “on the job”. Frequent errors can make users feel ineffective.
- Include
Visibility Visibility allows users to know the status of a process or practice and take early corrective action when necessary. It also helps to set realistic expectations early on and promotes trust.
- Include
Controllability Controlling the process or practice allows users to make decisions to obtain the best possible results.
It might be hard to generalize to abstract processes and practices.
Include
Accessibility Accessibility might promote more widespread use of a process or practice.
The definitions in the sources have very different meanings.
Given the very immature state of process and practice usability, addressing the impact of different people characteristics in process and practice usability is extremely complicated and subtle.
Exclude
Adaptability Adapting a process or practice allows it to be used in different contexts and by different users. It also enables a better user experience and a higher usage rate.
It might be too hard to define what valid adaptations are for each processes and practice, and users might find it confusing.
Include
User satisfaction Satisfaction is a key element for positive feedback and impacts the creation of new habits.
Might be too fine grained compared to some other characteristics.
Include

47
Characteristic Arguments for inclusion Arguments for exclusion Decision
Avoid modes Modes affect usability negatively.
Considering modes in software development processes or practices seems too complicated.
Modes seem to be naturally avoided in software development processes and practices.
Exclude
Therefore, the selection process produced an initial set of 8 candidate usability characteristics. In the next activity the final set of characteristics was defined.
3.2.2. Decompose Characteristics
During this activity, the candidate list of characteristics was reviewed to determine if some of the characteristics had different aspects that might warrant becoming a separate characteristic. This activity was performed during the initial UMP construction (in which Attractiveness and User satisfaction were separated) and during UMP iterative refinement as well (in which Feedback and Visibility were separated, see Section E.1).
For each characteristic, the question was whether or not to decompose it into several characteristics. In the case of Visibility, the final decision was to decompose it into Visibility and Feedback, reversing the original decision to merge them. In fact, during the earliest analysis of the sources these two had been confused into one, and the difference had been highlighted by one of the experts reviewing the model during an informal interview.
Table 15 shows the set of characteristics that were decomposed and the rationale for the decision.
Table 15. Rationale for decomposition into new characteristics
New characteristic
Original characteristic
Rationale
Feedback Visibility The difference is that feedback requires user action and enables future action, while visibility informs but is independent of user action, as in the case of information radiators (Cockburn, 2006).
Feedback was also the one characteristic that appealed the most to some of the early reviewers, and it was missing in version 1.0 of the model, initially published along with the feasibility study (see Section 5.1).
Attractiveness User satisfaction The distinction between prospective and current users of a process and practice became significant when early considerations of model applications were made. In particular, the focus in process and practice adoption highlighted the need to distinguish them.

48
This task produced the final set of 10 UMP characteristics. Their definitions were adapted from the sources to fit process and practice usability and are shown in the UMP summary in Section 4.1.
3.2.3. Define metrics
The final activity in the model construction process was the definition of metrics. For each characteristic, a set of metrics was proposed, defined, and validated. As stated before, only the final version of the model metrics is presented in this chapter to avoid confusion, and a detailed discussion of the changes performed during refinement is included in Chapter 6 and Appendix E.
The Goal Question Metric (GQM) (Basili et al., 1994; Fenton & Bieman, 2014) paradigm was used for deriving the metrics from the characteristics, which were already defined with a process and practice perspective.
The GQM method starts with the definition of the goals that we want to achieve. Given that the objective of this work is to support the assessment and enhancement of usability aspects of process and practice, it is fitting that the usability characteristics themselves be considered as goals. For each goal, a set of questions was formulated, and metrics were defined for each question.
Table 16 shows the goal, questions and metrics for each usability characteristic.
Table 16. Goal, questions and metrics for each characteristic
Characteristic Goal Question Metric
Self-evident purpose
Recognizing the purpose of the process or practice by its name.
How appropriate is the name for helping people recognize the purpose?
Appropriateness of name
Recognized purpose
Learnability
Learning to perform the activities of the process or practice at novice level of ability (Dreyfus & Dreyfus, 1980).
How long does it take an adopter to learn enough to perform the activities independently at a novice level of ability?
Time required to learn to perform
Standard introductory course duration
How many new concepts are needed to learn to perform the process or practice?
Number of new concepts
Understandability Understanding how its underlying principles, structure and dynamics make it work to achieve the desired results.
Does the users’ conceptual model of the activity match that of the process or practice?
Conceptual model correspondence
How complex is the conceptual model of the process or practice?
Conceptual model complexity
Safety Maintaining a safe work environment.
How risky is it to incorrectly adopt the process or practice?
Cost of incorrect adoption
How much does applying the process or practice
Reduction in cost of error

49
Characteristic Goal Question Metric
provide safety for its users?
Safety perception
Does the process or practice provide hard restrictions or limitations to prevent the materialization of significant risks?
Use of restraining functions
Feedback Confirming the results of actions to enable consequent actions.
Is the feedback valuable? Timeliness of feedback
Feedback richness
How is the feedback generated?
People feedback
Automatic feedback
Visibility Making activities, status, obstacles and information flow visible.
Does the process or practice define standard indicators?
Defines indicators
Controllability Allowing users to check status and make decisions that affect the outcomes of the process or practice.
Is the process or practice defined so that it can be controlled?
Defines checkpoints
Explicit outcomes
Can a user make decisions independently to affect the execution of the process or practice?
Level of autonomy
Adaptability Adapting the process or practice to better suit different users and contexts.
Does the process or practice explicitly define how to adapt it?
Defines adaptation points
Are all user roles allowed to modify the process or practice according to their needs?
Ratio of roles allowed to adapt
Attractiveness Appealing to prospective users.
Does the process or practice appeal to prospective users?
User attractiveness rating
User satisfaction Satisfying users. Have users had a good experience using the process or practice?
User satisfaction rating
All the characteristics have between one and four metrics. It is interesting to note that Safety, the one characteristic with the most metrics was also the one that was the result of the synthesis of the biggest number of source elements (three). This might have to do with the fact that several aspects were merged into one characteristic, and this pattern is observable in several others, were original elements that form the characteristic appear as metrics. This is also consistent with how meaningful metrics became when applied, as described in Section 9.2.1.

50
To complete the definition of each metric, several meta-data were added, specifically type of scale (e.g. nominal, ordinal, etc.), scale (e.g. yes/no), unit of measurement (only for absolute scales), most positive value, type of measurement method and measurement method. The meta-data fields were selected based in the ISO 15939 Systems and Software Engineering – Measurement process Standard (International Organization for Standardization, 2007). Care was taken to maintain the model as simple as possible and to improve metric ease of use. Overall, metrics were changed significantly during model refinement and were simplified to enhance the experience of model users based on expert feedback from the focus group as described in Chapter 6. Metric relevance was another key driver for improvement when prioritizing changes.
The process described produced UMP version 1.0. Chapter 4 presents a detailed description of the UMP characteristics and metrics in their final version.

51
Chapter 4. UMP Structure Definition
This chapter presents the definition of the UMP, focusing on its final version to avoid confusion. Details on the modifications made throughout the iterative refinement process are available in Chapter 6 and Appendix E.
The UMP consists of several elements: The UMP itself, with its characteristics and metrics definitions, the UMP evaluation process, and the usability profile resulting from the evaluation of a specific process or practice, comprised of metric values and additional comments. It is important to clarify at this point that in this chapter, the term evaluation is used to describe the application of the UMP to the assessment of the usability of a specific process and practice, not the Design Science Research evaluation concept that focuses on evaluating the UMP model itself.
The rest of this chapter is organized as follows: Section 4.1 presents a UMP summary with an overview of its characteristics and metrics to provide a more concise first introduction to the model; Section 4.2 presents the details for each characteristic and its metrics, including examples for each one; Section 4.3 presents the UMP evaluation process; Section 4.4 presents the UMP usage modes, which support different contexts of use and particularly, different types of users; and Section 4.5 presents UMP application scenarios, which were specified to guide the design and evaluation of the UMP.
4.1. UMP Summary
In this section a short summary of the current version of the UMP is presented. Table 17 shows the final list of UMP characteristics, a complete description of each characteristic can be found in Section 4.2, along with several examples.

52
Table 17. UMP characteristics overview
Characteristic Definition
Self-evident purpose Ease with which users can recognize what a process or practice is for by its name.
Learnability Ease with which process or practice users are able to learn how to perform its activities at a novice level of ability (Dreyfus & Dreyfus, 1980).
Understandability Ease with which process or practice users are able to apprehend how the underlying principles, structure and dynamics make it work to achieve the desired results.
Safety Degree to which a process or practice is safe for its users, preventing errors or limiting their impact, including using the practice or process incorrectly.
Feedback Degree to which the use of a process or practice produces or promotes reactions or responses to actions performed.
Visibility Degree to which a process or practice helps make activities, status, obstacles and information inputs and outputs visible to people.
Controllability Degree to which a process or practice allows its users to check status and make decisions that affect the outcomes during process or practice execution.
Adaptability Ease with which process or practice users are able to adapt the process or practice for use in different contexts.
Attractiveness Degree to which users find a process or practice attractive or appealing by its form, structure or reported results.
User satisfaction Degree to which user needs are satisfied when using a process or practice.
Table 18 shows some details about each metric, specifying the characteristic that the metric is associated to, its definition and values (the most positive value is marked with an asterisk). A complete definition of each metric can be found in Section 4.2, along with several examples.
Table 18. UMP metrics overview
Characteristic Metric Description Values
Self-evident purpose
Appropriateness of name
Measures how appropriate the name is for describing the purpose of the process or practice (consider for example whether names are translations or used in a foreign language).
Not appropriate,
partially appropriate,
Highly appropriate*
Recognized purpose Measures whether the purpose of the process or practice is usually recognized by new adopters.
Yes*/No
Learnability Time required to learn to perform
Measures the time required to learn to perform process or practice activities on average complexity tasks independently, at a novice level of ability.
Number of hours (0*)

53
Characteristic Metric Description Values
Standard introductory course duration
Measures standard introductory course duration in hours, as defined by authoritative sources.
Number of hours (0*)
Number of new concepts
Measures how many new concepts make up the conceptual model of the process or practice (evaluators must specify the concepts considered).
Number of new concepts
(0*)
Understandability Conceptual model correspondence
Measures the correspondence between the conceptual model of the process or practice and the user’s own conceptual model for the same activity.
Low, Medium, High*
Conceptual model complexity
Measures the subjective complexity of the process or practice’s conceptual model.
Low*, Medium, High
Safety Cost of incorrect adoption
Measures the cost of adopting the process or practice incorrectly as overall impact. Errors include applying the process or practice inappropriately; failing to understand its purpose or dynamics, failure to perform its activities and to evaluate results correctly. For example, incorrect adoption might produce burnout, a high cost, or local inefficiencies, which might be medium costs.
Low*, Medium, High
Reduction in cost of error
Measures how applying the process or practice correctly reduces the overall cost of errors made in the work system. For example, iterative processes are designed to reduce the cost of errors by checking intermediate results early.
Low, Medium, High*
Safety perception Measures how the users perceive the process or practice in terms of safety for themselves and others. For example, if the by-products of executing the process or practice can be used against them, safety perception might be low.
Low, Medium, High*
Use of restraining functions
Measures whether the process or practice provides hard restrictions to prevent the materialization of significant risks.
Yes*/No
Feedback Timeliness of feedback
Measures the timeliness of the feedback as perceived by the actor, with respect to the action performed and the consequent
Immediate*, Prompt,

54
Characteristic Metric Description Values
actions that need to be performed.
Delayed, Non-existent
Feedback richness Measures the value of the information received in terms of significance, breadth, depth, or nuance.
Low, Medium, High*
People feedback Measures if the process or practice promotes feedback from people interactions.
Yes*/No
Automatic feedback Measures if the process or practice provides automatic feedback.
Yes*/No
Visibility Defines indicators Measures if the process or practice defines standard indicators.
Yes*/No
Controllability Defines checkpoints
Measures whether the process or practice defines specific checkpoints where users can make decisions that control the outcomes of the process or practice. For example, Scrum Reviews are specific checkpoints to evaluate the product and eventually decide whether to accept, reject or refine a product increment.
Yes*/No
Explicit outcomes Measures if the process or practice defines outcomes explicitly.
Yes*/No
Level of autonomy
Measures the level of autonomy users have in making decisions related to the execution of the process or practice. Examples include handling unexpected results or deciding whether to proceed or not at specific checkpoints.
Low, Medium, High*
Adaptability Defines adaptation points
Measures whether the process or practice defines adaptation points. Adaptation points are specific opportunities for variation described by the process or practice. For example, in Scrum the Retrospective is focused on process adaptation.
Yes*/No
Ratio of roles allowed to adapt
Measures how many roles among the process or practice users are allowed to modify the process or practice out of the total number of roles (evaluators must specify the roles considered, if no roles
0 to 1*

55
Characteristic Metric Description Values
are distinguishable, value should be non-applicable).
Attractiveness User attractiveness rating
Measures how attractive the process or practice is to prospective users (i.e. those lacking experience).
1 to 5*
User satisfaction User satisfaction rating
Measures the subjective experience of using the process or practice.
1 to 5*
4.2. UMP Detailed Description
This section describes the current version of the UMP, resulting from the construction process described in Chapter 3 and the iterative refinement described in Chapter 6 and Appendix E. The UMP is composed of 10 sub-characteristics and 23 metrics, and should help users to:
• Better understand usability issues with processes or practices.
• Evaluate the fitness of potential processes or practices to specific contexts (for example, mature teams might be better suited to hard to learn but potentially beneficial practices).
• Adapt processes or practices by highlighting specific concerns (e.g. particular characteristics or metrics with negative values) to enhance the adoption process.
• Support planning of improvement initiatives by providing specifics on usability related risks.
• Provide explanation for obstacles or challenges in past adoption initiatives.
The UMP has characteristics that apply to several aspects of the process and practice adoption lifecycle. For example:
• For process and practice adoption planning:
o Self-evident Purpose
o Understandability
o Learnability
o Adaptability
o Attractiveness
• For process and practice performance:
o Visibility, because it characterizes how transparent the status of a process and its intermediate products is to its stakeholders.
o Feedback, because it provides confirmation of past actions and enables future actions.
o Controllability, because it describes how easy it is for different stakeholders to control a process or practice during execution.

56
o Safety, because it describes the process or practice environment.
• For process and practice adoption evaluation:
o User satisfaction, which is a by-product of the experience of using the process or practice.
This does not mean that other characteristics might not support those activities too but highlights the fact that in different contexts different sets of characteristics might prove more significant.
Hereafter, the model characteristics and metrics are described in detail.
4.2.1. Self-evident purpose
Self-evident purpose is the name given to the convergence of the Affordance principle from (Norman, 1988) and the Appropriateness recognizability sub-characteristic (International Organization for Standardization, 2011). The intent was to increase characteristic clarity, since early discussions with expert practitioners showed the terms were hard to apprehend by those unfamiliar with usability terminology.
Characteristic Definition
The objective of this characteristic is that users would recognize the purpose of a process or practice by its name. Purpose is a key motivator (Pink, 2011), and users adopting a new process or practice will probably learn faster if the purpose matches their needs. They also need to know its purpose in order to apply it correctly. Users have been known to fake process execution, behavior known as ”processing” (J. S. Brown & Duguid, 2000), when there is a gap between the formal definition of the process and the actual context in which process is executed. Alignment of process definitions and correct process execution depends on purpose alignment, among other aspects including process or practice fitness to the context.
Examples of processes or practices with self-evident purpose include:
• Kick-off meeting, held at the beginning of the project to align the people involved with the project’s vision.
• Continuous integration, one of the core XP practices (Beck & Andres, 2004).
The following sections describe the Self-evident purpose metrics.
4.2.1.1. Appropriateness of name metric
Appropriate naming is a central usability issue (Norman, 1988). This metric is aimed at measuring how appropriate the name is. The focus on naming is particularly important in the context of process and practice because unlike material objects or software user interfaces, processes and practices are intellectual constructs and thus have no visible form to help with identification and sense making.
Ease with which users can recognize what a process or practice is for by its name.

57
One interesting aspect of this, particularly in technology specific areas like software development, is whether names are translations or used in a foreign language. In some knowledge areas translations are used throughout the community of practice and in some others, names are used in the original language (typically English in software development). This also varies depending on the country, in Argentina many technical names are used in English, while in Spain most names are translated. In some very specific areas, like the patterns community, names are even more sensitive, because they are explicitly aimed at articulating a pattern language (Gamma et al., 1994).
Metric Definition
Examples of highly appropriate names are:
• Continuous Integration, which is a practice of continually integrating the software product to a repository and verifying the result (Beck & Andres, 2004; Fowler, 2000); the name is literally composed of the key concepts of the practice. Still, some users confuse its focus, thinking that it is about running automated tests from a Continuous Integration tool when it really is about developers continually committing small changes to a shared repository, and then verifying the resulting integrated product (Fowler, 2000).
• Peer reviews, which is a practice of having peers review and provide feedback to the author on some work product. The name is very appropriate and has mostly replaced the original name Fagan Inspections, named after the original author (Fagan, 1974).
Examples of partially appropriate names are:
• Test Driven Development, which is a practice for designing code (Beck, 2002), while the name mentions tests.
• Standup Meeting is a popular, although non-official, name given to Scrum’s “Daily Scrum” which emphasizes a non-essential aspect of the meeting, standing up (to keep the meeting short) while hiding the “daily” aspect which is closer to the practice’s purpose, which is to review, plan and coordinate the work around 24hr cycles (Schwaber & Sutherland, 2017).
Type of scale: Ordinal
Scale: Not appropriate: the name does not help prospective users understand the purpose of the process or practice.
Partially appropriate: the name describes only a partial aspect of the purpose.
Measures how appropriate the name is for describing the purpose of the process or practice.

58
Highly appropriate: the name describes the purpose of the process or practice accurately, without confusion.
Most positive value: Highly appropriate
Type of measurement method:
Subjective
Measurement method: The evaluator assigns a value to the metric according to his/her experience of how prospective users tend to interpret the name of the process or practice.
4.2.1.2. Recognized purpose metric
This metric aims at measuring whether or not adopters tend to recognize the purpose of the process or practice. There are cases in which organizations or teams adopt a process or practice because it is popular but without properly recognizing its real purpose. This leads to conflictive misalignments, particularly for people in hierarchies who are below the level were the decisions were made (as discussed in Chapter 1).
Metric Definition
Examples of processes or practices with usually well-recognized purpose are:
• Build automation, the practice of automating the generation of a software package, whose purpose is to make the build fast, effortless and error free.
• Manual testing, the practice is aimed at finding defects (Pressman & Maxim, 2014).
Examples of processes or practices where purpose is usually not well recognized are:
• The Velocity metric in agile: "indication of the average amount of Product Backlog turned into an Increment of product during a Sprint by a Scrum Team, tracked by the Development Team for use within the Scrum Team” (Doshi, 2018). As the author states, “Agile Metrics are meant to serve certain purpose(s) and can be very useful if leveraged appropriately. […] metrics may be used, abused and effectively become focal point of failure of Agile adoption in an organization” (Doshi, 2018). One specific and very popular misuse of the velocity metric is confusing it with a productivity metric, and pressuring teams to increase their velocity. Another example is using velocity to compare teams when it is not a comparable measure.
• The Daily Scrum is a meeting "is a 15-minute time-boxed event for the Development Team […] At it, the Development Team plans work for the next 24 hours.” (Schwaber & Sutherland, 2017). Many people confuse the Daily Scrum with a status report meeting, when it actually is a tactical planning event. The definition states that “The Daily Scrum is an internal meeting for
Measures whether the purpose of the process or practice is usually recognized by new adopters.

59
the Development Team”, so it cannot be a status report if it is internal. In their early work on agile organizational patterns, Coplien and Harrison criticized the Daily Scrum because they considered it instilled a crisis mindset by promoting checks every day (Coplien & Harrison, 2004), but that again seems to match a management status report meeting rather than an internal planning meeting.
Type of scale: Nominal
Scale: Yes/No
Most positive value: Yes
Type of measurement method:
Subjective
Measurement method: The evaluator assigns a value to the metric according to his/her experience of whether prospective users tend to recognize the purpose of the process or practice by its name.
4.2.2. Learnability
Difficulty to learn a new process or practice is a basic barrier for adoption. The adoption process first requires learning to perform, and later commitment to perform. Processes and practices that are hard to learn and to perform, for example, formal specifications or Test Driven Development (selected by survey participants as the hardest agile practice to learn (Ambler, 2009)), also show comparatively low adoption rates (Paez et al., 2018).
Characteristic Definition
Difficulty to learn a new process or practice is a basic barrier for adoption. Improving learnability for a process or practice might increase its adoption rate.
Examples of learnability issues in process or practices are:
• Scrum is a product development framework, described in the Scrum Guide as "Simple to understand […] Difficult to master” (Schwaber & Sutherland, 2017).
• RUP, the Rational Unified Process, is a relatively complex to learn iterative process for software development (Jacobson et al., 1999).
Some of the metrics for learnability are simple in that they use time as the absolute scale to gauge how easy/hard it is to learn a new process or practice, but at the same time they do not include other important aspects of the learning process like: What kinds of activities are required to learn to perform the process or practice? Which kinds of support from teachers or peers are needed? What materials, resources and environment characteristics are required? All of these aspects
Ease with which process or practice users are able to learn how to perform its activities at a novice level of ability.

60
might also affect the learnability of a process or practice, but since they are heavily dependent upon the specifics of each process or practice, and the context of adoption, they are not included in the model.
The following sections describe the Learnability metrics.
4.2.2.1. Time required to learn to perform metric
How long does it take novice users to learn enough to perform the activities independently at a novice level of ability? The keyword here is “to perform”, because it deals with knowing how to do things, not knowing about things (J. S. Brown & Duguid, 2000). The metric considers the ability to perform tasks independently at a novice level (Dreyfus & Dreyfus, 1980), with the criteria that it will be the bare minimum to qualify novices as practitioners (and thus, the earliest).
Metric Definition
Example of time required for learning to perform:
• During our Scrum study (see Section 7.2) experts characterized Scrum with between 12 and 80 hours needed to learn to perform at a novice level of ability, which seems reasonably short for a process framework.
Type of scale: Absolute
Scale: Positive integer from zero to infinity
Unit: Hours
Most positive value: 0
Type of measurement method:
Subjective
Measurement method: The evaluator assigns a value to the metric according to his/her experience of how long novice users take to learn to perform the process or practice.
4.2.2.2. Standard introductory course duration metric
How long is an introductory course? Most established processes or practices have an ecosystem of training providers that offer introductory courses. Even for homegrown processes or practices organizations tend to have their own training courses. The criteria applied here is that the longer the course, the harder it is to learn the basics. It is reasonable to assume that longer introductory courses (for example, over 2 days) might make the learning experience less appealing, particularly for industry training provided to employees.
Measures the time required to learn to perform process or practice activities on average complexity tasks independently, at a novice level of
ability.

61
Metric Definition
The reference to authoritative sources helps identify valid references. For each process or practice the kind of authoritative source might vary, from the author of the process or practice to a respected training provider.
Examples of standard course duration are:
• The Scrum Alliance Certified Scrum Master introductory course is 16hs long (Scrum Alliance, 2020).
• The SEI’s Software Architecture Design and Analysis introductory course is 32hs long (SEI, 2020).
Type of scale: Absolute
Scale: Positive integer from zero to infinity
Unit: Hours
Most positive value: 0
Type of measurement method:
Objective
Measurement method: The evaluator takes the official duration of a course from an authoritative source.
4.2.2.3. Number of new concepts metric
How many new concepts make up the conceptual model of the process or practice? One interesting challenge in learning new ways of working is grasping the new concepts involved. Although not directly, failing to learn these new concepts might impact the ability to perform the process or practice.
Metric Definition
The metric serves to gauge the weight that these new concepts have on the learning process.
Examples of new concepts for processes and practices are:
• The concept of MVP (Minimum Viable Product) in the Lean Startup method (Ries, 2011).
• The concept of Artifact in RUP (Rational Unified Process).
Type of scale: Absolute
Scale: Positive integer from zero to infinity
Measures standard course duration in hours, as defined by authoritative sources.
Measures how many new concepts make up the conceptual model of the process or practice.

62
Unit: -
Most positive value: 0
Type of measurement method:
Subjective
Measurement method: The evaluator must specify the concepts considered and count them.
4.2.3. Understandability
Understanding a process or practice helps with appropriate selection before adoption, and also supports effective performance. Without clear understanding of the principles, structure and dynamics of a process or practice, users are at risk of performing activities in a way that takes effort but might not produce the expected results.
Characteristic Definition
The objective of this characteristic is to describe how easy it is for process or practice users to understand it in depth, beyond the basic ability to perform described by Learnability. Understandability is particularly significant for processes and practices with significantly different conceptual models or underlying principles, as is the case with many of the agile methods and practices for people with experience in more traditional ways of working. It has been widely discussed in the industry community that lean and agile bring with them a very different mindset from more traditional approaches, beyond the details of their methods and practices. Also, that to succeed in applying their methods and practices, it is necessary to understand their underlying principles.
Example errors in understanding might take many forms:
• Misunderstanding the purpose, thus performing actions that produce results in a different direction than the one originally intended. For example, the Test-first practice in XP (Beck & Andres, 2004) is aimed at guiding the development work, not finding bugs. The execution of those tests might help find bugs in the future during regression test. Confusing the purpose of the Test-first practice with that of traditional testing might produce very limited and even frustrating results in novice practitioners.
• Misunderstanding the structure, either the interactions between the parts, the parts themselves, or both. For example, an organization might confuse the concept of MVP in the Lean Startup Method (Ries, 2011) with that of a product release. An MVP is actually an experiment performed to obtain information about the fit of a product and its intended market; it might be a video of the product or a very limited (hence minimum) product version designed to test a hypothesis, but it is not necessarily a product release. Misuse of the term MVP leads to confusion and unsatisfied expectations,
Ease with which process or practice users are able to apprehend how the underlying principles, structure and dynamics make it work to achieve the
desired results.

63
and adequate comprehension is heavily dependent on understanding of the Lean Startup method as a whole.
• Misunderstanding the form or dynamics, thus performing inadequately, producing inefficient interactions or just plain disagreeable user experiences. This example is a true story from one of my clients in industry: the software development department of a company held a Daily Scrum meeting for the whole department, around 20 people; since the meeting became too long (it should last no more than 15min), they decided to make interventions optional, so anyone could choose not to speak. The meeting, thus modified, missed its point, which is to provide opportunity for tactical planning, and drastically reduced visibility of the work being done. The solution changed the form of the meeting and broke it. The root cause of the problem might have been that 20 people actually exceed the recommended size of an agile team (Schwaber & Sutherland, 2017), or that they actually did not share enough focus to plan tactically all together, or maybe something else, but breaking the form that says everyone participates (Schwaber & Sutherland, 2017) made the meeting ineffective.
The following sections describe the Understandability metrics.
4.2.3.1. Conceptual model correspondence metric
Does the users’ conceptual model of the activity match that of the process or practice? The issue is whether the conceptual model of the process or practice matches how the users conceive those activities. This is heavily dependent on the cultural context of users or prospective users, because it shapes their conceptual model of the activities to be performed. This cultural context might be made up of previous practices or processes applied, opinions of coworkers (Riemenschneider et al., 2002), formal education, industry training, etc. This metric assesses the conceptual affinity that prospective users might have with new processes or practices.
Metric Definition
An example of practice that matches the conceptual model of users is the Retrospective, a meeting in Scrum where a team reviews and reflects on its process and practices to define improvements (Schwaber & Sutherland, 2017). The conceptual model for the retrospective is that of a meeting (a very common element in the industry landscape for software development), and thus, although its purpose might be unusual for prospective users, its form tends to be very familiar. This might explain the very high rate of usage of retrospectives when compared to other examples in this section (Paez et al., 2018).
Examples of non-matching conceptual models include:
• As described above, a common mistake is to confuse the concept of an MVP (Minimum Marketable Product) in the Lean Startup method with a product release in any iterative method. In the Lean Startup method, an MVP is
Measures the correspondence between the conceptual model of the process or practice and the user’s own conceptual model for the same
activity.

64
actually an experiment designed to test a hypothesis, and thus not the same as a product increment, which makes sense to release into production in terms of the value that it will bring. Both might be used to describe the same milestone, but they do not mean the same. In the context of the Lean Startup method, the purpose of the MVP is to validate a hypothesis, thus producing information, not direct product value. If the MVP is understood as a generic incremental release, then the focus becomes releasing valuable product increments, rather than discovering (buying) validated information about product-market fit, and that defeats the purpose of the Lean Startup method (Ries, 2011).
• The use of tests to guide design in TDD (Beck, 2002). Traditional tests are considered to be useful to critique the product (or find its defects), and thus make sense after the product has been created. Many newcomers to Test Driven Development find it very hard to wrap their heads around the idea that the tests are written before the system under test exists. On the other hand, for Smalltalk developers, used to writing method invocations before the actual method is written, the practice of Test Driven Development probably makes more sense.
• Another example of conflicting conceptual models is the practice of pair programming, in which two people work together sharing a single computer (Beck & Andres, 2004). Since this practice changes the traditional structure of one developer per computer, it is highly challenging for many prospective users.
• Another example of this problem is described by De Marco and Lister in their classic book Peopleware (DeMarco & Lister, 1987): De Marco is sitting in his office writing in his computer and a co-worker is pondering a solution in the other desk. Their boss stops by and tells the co-worker “Get to work, like Tom”. The reflection is that the boss thinks that the work they do is typing, not solving problems. A similar mental model is proposed by Peter Naur in his classic article “Programming as Theory Building” (Naur, 1985).
Type of scale: Ordinal
Scale: Low, Medium, High
Most positive value: High
Type of measurement method:
Subjective
Measurement method: The evaluator must specify the level of correspondence according to his/her experience of how well users’ conceptual models of the activities to be performed match the conceptual model defined by the process or practice.

65
4.2.3.2. Conceptual model complexity metric
How complex is the overall conceptual model of the process or practice?
This metric aims to assess the complexity of the conceptual model for the process or practice. Complexity might depend on the number of conceptual elements, the number of relationships between the elements or the dynamic aspects of interactions between the elements.
Metric Definition
For example, a simple process framework like Scrum that consists of 3 roles, 6 ceremonies (meetings) and 3 artifacts, might have a low complexity index because it has a low count of conceptual entities, if compared to more complex processes like RUP.
Type of scale: Ordinal
Scale: Low, Medium, High
Most positive value: Low
Type of measurement method:
Subjective
Measurement method: The evaluator must specify the complexity index according to his/her evaluation of the process or practice. Optionally, evaluators might apply counting and then compare to other processes or practices to perform the measurement.
4.2.4. Safety
Safety in the work environment is a traditional concern in industrial settings, and a more modern aspect of safety that has gained popularity in software development is psychological safety (Edmondson, 1999). One recurring aspect of usability is limiting the occurrence or impact of errors to provide a safe experience (see Section 1.2).
Safety is also a prerequisite of learning and exploration, because people in risk-averse environments tend to be less innovative (Edmondson, 1999). Lack of safety can block users from attempting new activities, and it also makes a process or practice hard to learn “on the job”. Frequent errors can also make users feel ineffective and demotivated.
Characteristic Definition
Examples of safe processes or practices are:
Measures the subjective complexity of the process or practice conceptual model.
Degree to which a process or practice is safe for its users, preventing errors or limiting their impact, including using the practice or process
incorrectly.
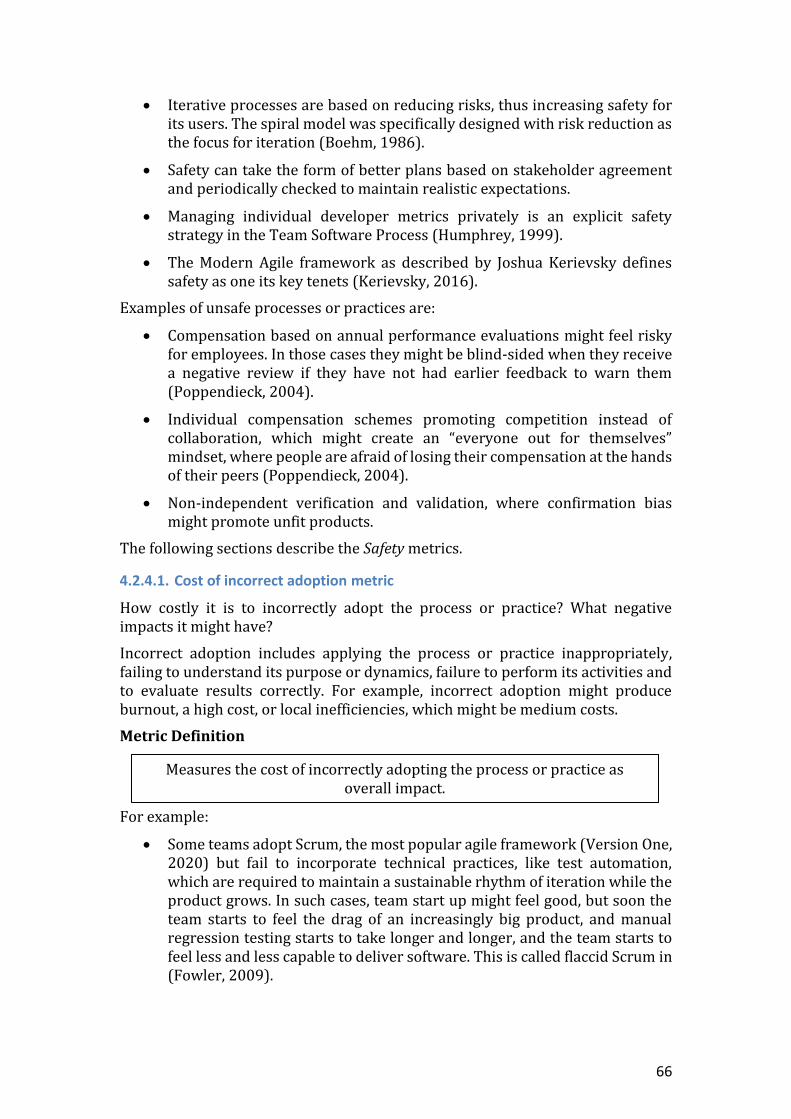
66
• Iterative processes are based on reducing risks, thus increasing safety for its users. The spiral model was specifically designed with risk reduction as the focus for iteration (Boehm, 1986).
• Safety can take the form of better plans based on stakeholder agreement and periodically checked to maintain realistic expectations.
• Managing individual developer metrics privately is an explicit safety strategy in the Team Software Process (Humphrey, 1999).
• The Modern Agile framework as described by Joshua Kerievsky defines safety as one its key tenets (Kerievsky, 2016).
Examples of unsafe processes or practices are:
• Compensation based on annual performance evaluations might feel risky for employees. In those cases they might be blind-sided when they receive a negative review if they have not had earlier feedback to warn them (Poppendieck, 2004).
• Individual compensation schemes promoting competition instead of collaboration, which might create an “everyone out for themselves” mindset, where people are afraid of losing their compensation at the hands of their peers (Poppendieck, 2004).
• Non-independent verification and validation, where confirmation bias might promote unfit products.
The following sections describe the Safety metrics.
4.2.4.1. Cost of incorrect adoption metric
How costly it is to incorrectly adopt the process or practice? What negative impacts it might have?
Incorrect adoption includes applying the process or practice inappropriately, failing to understand its purpose or dynamics, failure to perform its activities and to evaluate results correctly. For example, incorrect adoption might produce burnout, a high cost, or local inefficiencies, which might be medium costs.
Metric Definition
For example:
• Some teams adopt Scrum, the most popular agile framework (Version One, 2020) but fail to incorporate technical practices, like test automation, which are required to maintain a sustainable rhythm of iteration while the product grows. In such cases, team start up might feel good, but soon the team starts to feel the drag of an increasingly big product, and manual regression testing starts to take longer and longer, and the team starts to feel less and less capable to deliver software. This is called flaccid Scrum in (Fowler, 2009).
Measures the cost of incorrectly adopting the process or practice as overall impact.

67
• Scrum calls for fixed-length iterations (sprints) to promote rhythm, but some teams misunderstand this cadence, which should act as a Use of Restraining function (see Section 4.2.4.4), called forcing function in (Norman, 1988). In such cases, some teams feel pressured by the hard restriction that does not allow them to extend their sprints and work overtime to fulfill the expectations created by their initial sprint estimations. Working overtime is the opposite of a sustainable practice (see the Energized Work practice in XP (Beck & Andres, 2004)). Such teams might even abandon their attempt to practice agility, burned by their own folly. This kind of unhealthy behavior is one of the causes for the #NoEstimates movement in agile.
Type of scale: Ordinal
Scale: Low, Medium, High
Most positive value: Low
Type of measurement method:
Subjective
Measurement method: The evaluator must specify the value according to his/her evaluation of the process or practice. Evaluators might use comparisons to other processes or practices to perform the measurement.
4.2.4.2. Reduction in cost of error metric
How much will the cost of error will be reduced by adopting the process or practice?
Errors in this case include those made while applying the process or practice correctly. Such errors might include incorrect decisions, errors in information recording or communication and failure to include important aspects of an object of analysis.
Metric Definition
For example, iterative processes are designed to reduce the cost of errors by checking intermediate results early. As another example, the impact of incorrectly defined requirements in the software development process might be highly reduced if an iterative process is put in place. Or the number of defects introduced during the design activities might by highly reduced if some of the review practices are applied. On the other hand, end-of-project Postmortems might produce low reduction in the cost of errors, since improvement opportunities identified would not be helpful for the project itself.
Type of scale: Ordinal
Measures how applying the process or practice correctly reduces the overall cost of errors made in the work system.

68
Scale: Low, Medium, High
Most positive value: High
Type of measurement method:
Subjective
Measurement method: The evaluator must specify the value according to his/her evaluation of the process or practice. Evaluators might use comparisons to other processes or practices to perform the measurement.
4.2.4.3. Safety perception metric
Do users of the process or practice feel safe when applying it? This metric is aimed at assessing the perceived effect of applying the process or practice on user safety. For example, psychological safety is the “shared belief held by members of a team that the team is safe for interpersonal risk taking” (Edmondson, 1999). A high safety perception will enable innovation and foster collaboration, while lower values might severely restrict the contributions of workers or undermine the quality of such contributions.
Metric Definition
For example, if the by-products of executing the process or practice might be used against them, the safety perception might be low. Examples of high safety perception practices might be:
• Iterative processes, in which decisions might be reviewed and improved if proven incorrect before they have severe consequences. One typical parameter that affects this safety perception is the period between checkpoints, the longer the period, the higher the stakes if anyone makes a mistake.
Type of scale: Ordinal
Scale: Low, Medium, High
Most positive value: High
Type of measurement method:
Subjective
Measurement method: The evaluator must specify the value according to his/her evaluation of the process or practice. Evaluators might use comparisons to other processes or practices to perform the measurement.
Measures how the users perceive the process or practice in terms of safety for themselves and others.

69
4.2.4.4. Use of restraining functions metric
Restraining functions, also called forcing functions (Norman, 1988), are restrictions designed into a construct to prevent negative consequences. Everyday examples include: a car that does not allow the driver to remove the car keys until they have locked the transmission (to prevent the car shifting when the driver is not in the car and hurting someone), or when an alarm button is covered by a plastic casing so that it cannot by pushed by mistake (preventing false alarms that undermine the alarm system).
Metric Definition
Examples of restraining functions in process and practice are:
• Time-boxing, which means that an event “has a maximum duration” (Schwaber & Sutherland, 2017), the purpose being to limit risk and avoid waste. In the particular case of the Scrum Sprint (fixed-length iteration), the ”Sprints also limit risk to one calendar month of cost” (Schwaber & Sutherland, 2017) or less, when sprints are shorter (they can range from one to four weeks).
• Guardian role, when a role is tasked with a responsibility that no one else can exercise, for example, the Gate-Keeper role as defined in (Coplien & Harrison, 2004). This ensures that activities are coordinated by that role avoiding conflicts, for example, by keeping a single point of entry for new requirements.
• The 10’ Build practice in Extreme Programming constraints the duration of the automated build to prevent delaying the build feedback for too long (Beck & Andres, 2004). The practice limits the amount of potentially fragile progress that the developer might make while continuing to modify the code without confirmation that the previous modifications work.
Type of scale: Nominal
Scale: Yes/No
Most positive value: Yes
Type of measurement method:
Subjective
Measurement method: The evaluator must specify the value according to his/her evaluation of the process or practice. Evaluators might use comparisons to other processes or practices to perform the measurement.
4.2.5. Feedback
Feedback is the act of “sending back to the user information about what action has actually been done, what result has been accomplished”(Norman, 1988). Feedback
Measures whether the process or practice provides hard restrictions to prevent the materialization of significant risks.

70
confirms our actions and enables our future actions. It is one of the key usability principles and also a major component of iterative processes.
Characteristic Definition
Examples of feedback in processes or practices are:
• In continuous improvement activities, feedback is a necessary part of the process, since any improvement requires first comparing new results with previous results. One specific and very influential example is Shewhart's continuous improvement cycle Plan-Do-Check-Act, in which feedback permeates the whole process but is also specifically reviewed in the check activity.
• The Continuous Integration practice promotes the integration of changes from all team members into a single version of the product that can then be promptly checked by static analysis and automated tests to produce timely feedback about the health of the integrated product. In this practice, the resulting status of the build is fed back to the team and enables subsequent validation and eventually deployment through the build pipeline.
• The Review event in Scrum is aimed at checking the product increment and gathering feedback from stakeholders, as the Scrum Guide states: “the presentation of the Increment is intended to elicit feedback and foster collaboration” (Schwaber & Sutherland, 2017).
• Peer reviews are about explicitly and systematically asking peers to review a construct and provide feedback to the original authors (Wiegers, 2001).
• The Lean Startup principle of “build-measure-learn” is based on the concept of feedback loop (Ries, 2011).
The following sections describe the Feedback metrics.
4.2.5.1. Timeliness of feedback metric
One of the main characteristics of valuable feedback is timeliness. When feedback is timely, that is, when the time elapsed between the action taken and the reception of the information about the results is appropriately short, the user is able to easily make the connection between the two. When the feedback is delayed, it becomes increasingly hard to connect it to the action that caused it. As a casual example, if someone were to provide negative feedback about an event that is two years in the past, it would probably be harder to relate to, comprehend, and most of all, act upon, than if the feedback was about an event that had taken place a few hours ago. The limits for acceptable delays will depend on context; typically the delay for satisfactory feedback exchanged by people interacting might range from minutes to days, whereas the delay for people-technology satisfactory interactions might range from milliseconds to seconds (Norman, 1988).
Degree to which the use of a process or practice produces or promotes reactions or responses to actions performed.

71
Metric Definition
Examples of timely feedback in process and practice are:
• The 10’ Build is one of Extreme Programming’s core practices. It states that the automated process to generate an executable or deliverable version of the software product from its sources must take no more than 10 minutes. The build process includes the execution of multiples activities, including compilation for static languages and automated test execution, among others. The purpose of this restriction on build duration is to make sure that the gap between the action (modifying the code and running the build process) and the feedback (build process results) is not so long that the developer has completely switched context, in case he/she needs to fix anything if the build fails. The delay limit can also be viewed as a restraining function, as described in Section 4.2.4.4.
• In Continuous Integration, tool support typically allows for several alternatives to detect changes in the code repository, which must trigger the execution of the build job. When continuous integration tools are configured to periodically poll the code repository, the average delay before the build starts is the polling period times 2. Alternatively, some tool configurations allow for the code repository to notify the continuous integration tool of changes, thus avoiding such delays (at the cost of extra configuration). Since the feedback from the continuous integration build will always include the duration of the build itself, in many situations it might make sense to optimize code modification detection.
• Many organizations use yearly employee evaluations. If those opportunities are used to provide feedback to employees, it is probable that the feedback arrives too late to be acted upon efficiently. It might also imply that feedback arrives in large batches thus confounding multiple issues together. Reducing the evaluation period or even better practicing on demand interactions to exchange timely feedback might provide a better experience for the people involved and better overall results.
Type of scale: Ordinal
Scale: Immediate, Prompt, Delayed, Nonexistent
Most positive value: Immediate
Type of measurement method:
Subjective
Measurement method: The evaluator must specify the value according to his/her evaluation of the process or practice. Evaluators might use comparisons to other processes or practices to perform the measurement.
Measures the timeliness of the feedback as perceived by the actor with respect to the action performed and the consequent actions that need to
be performed.

72
4.2.5.2. Feedback richness metric
Another important aspect of valuable feedback is richness. The information received as feedback for our actions can be very rich and interesting or it can be very limited. The richer the information, the better we will be at understanding the results of our actions.
Metric Definition
Examples of rich feedback in process and practice are:
• In Continuous Integration a key indicator is defined, the build status. If the build status is positive (green or blue, or OK, or Pass, depending on the team and the tool), the team can assume that the latest contributed changes did not break the product, and that more modifications can be added. If the build breaks, the build status changes to negative (red , or broken, or failed, depending on the team and the tool), which means that the team must stop and fix the problem before proceeding. The build feedback is rich in meaning, although it might be a simple Boolean indicator. At the same time, failed builds should usually provide details on what went wrong, pointing to specific tests, for example, to support diagnostics.
• The Lean Startup method and the Continuous Delivery practice both promote releasing products into use by real users in order to obtain rich feedback from real life contexts (Humble & Farley, 2010; Ries, 2011).
Type of scale: Ordinal
Scale: Low, Medium, High
Most positive value: High
Type of measurement method:
Subjective
Measurement method: The evaluator must specify the value according to his/her evaluation of the process or practice. Evaluators might use comparisons to other processes or practices to perform the measurement.
4.2.5.3. People feedback metric
Feedback in process and practice can be categorized according to its source, people or automated. People feedback is the one provided to the practitioners by interactions with other people. People feedback tends to be more nuanced and dependent on context, it can provide interesting insights beyond the more standardized results from automated feedback. Some processes and practices promote or make space for people feedback.
Measures the value of the information received in terms of significance, breadth, depth, or nuance.

73
Metric Definition
Examples of processes or practices that promote people feedback are:
• The Sprint Review in Scrum promotes prompt feedback from stakeholders on the product increment resulting from that sprint (Schwaber & Sutherland, 2017), as described in the introduction to Section 4.2.5.
• Peer reviews are a systematic approach to providing people feedback on specific constructs, as described in the introduction to section 4.2.5.
• Exploratory testing provides feedback from people, typically beyond the behavior specified or even expected from the system.
Type of scale: Nominal
Scale: Yes/No
Most positive value: Yes
Type of measurement method:
Subjective
Measurement method: The evaluator must specify the value according to his/her evaluation of the process or practice. Evaluators might review authoritative documentation on the process or practice to determine if people feedback is promoted by it.
4.2.5.4. Automatic feedback metric
Feedback in process and practice can be categorized according to its source, people or automated. Automatic feedback is the one produced by tools according to criteria specified by practitioners. Automatic feedback tends to be faster and more standardized; it also tends to be less rich and sometimes more error prone (for example, a fragile automated test might fail for unexpected reasons, producing unclear feedback).
Metric Definition
Examples of processes or practices that provide automatic feedback are:
• The Continuous integration practice informs the team if any change to the source repository breaks the build (Beck & Andres, 2004; Fowler, 2000).
• Automated tests provide feedback on the behavior of a system (and might be part of the continuous integration build).
• Service monitoring can provide feedback on availability, performance and reliability of services (Forsgren et al., 2018).
Measures if the process or practice promotes feedback from people interactions.
Measures if the process or practice provides automatic feedback.

74
Type of scale: Nominal
Scale: Yes/No
Most positive value: Yes
Type of measurement method:
Subjective
Measurement method: The evaluator must specify the value according to his/her evaluation of the process or practice. Evaluators might review authoritative documentation on the process or practice to determine if automatic feedback is promoted by it.
4.2.6. Visibility
Visibility is about making the activities, status and results of processes and practices visible to the practitioners and others that might have a stake on them. It promotes responsibility and transparency, by making the actual reality closer to perceived reality, thus enabling more profound and effective actions. Norman states: ”make things visible” and describes the many usability problems that arise from black box interactions in which the user does not know what is going on (Norman, 1988). Visibility fosters transparency, aligning our actions with our intentions and helping to make us accountable.
Unlike feedback, which is about perceiving the results of one’s actions, visibility is about making it easier to perceive reality, irrespective of one’s actions. Also, visibility might require safety. If making something visible is liable to make the ones responsible suffer, it might promote unhealthy behavior, such as “hiding dirt under the rug”, as the saying goes. Tobias Mayer describes this problem clearly in his essay “Simple Scrum” (Mayer, 2009):
“The metrics should be used to measure truth — not to measure success or failure. Only measures of truth can be trusted not to
incite quick-fix behavior in a team.”
Characteristic Definition
Examples of visibility in processes or practices are:
• In Scrum, the “significant aspects of the process must be visible to those responsible for the outcome” (Schwaber & Sutherland, 2017).
• Information radiators, the term coined by Alistair Cockburn (Cockburn, 2006) to describe an element that “displays information in a place where passersby can see it“ (like Scrum and Kanban boards), thus conveying information without requiring the users to search for or even access the information. According to Cockburn, information must be dynamic to hold the interest of users, thus unchanging posters describing a process, for
Degree to which a process or practice helps make activities, status, obstacles and information inputs and outputs visible to people.

75
example, do not qualify. Information radiators are good examples of practices aimed at producing visibility (Forsgren et al., 2018).
The following section describes the Visibility metric.
4.2.6.1. Defines indicators metric
Indicators are graphical representations for displaying metric information. They act as bridges between the user’s perception and the plain information provided by the metric; thus helping users perceive reality more easily or attractively (e.g. a visually well designed and colorful indicator tends to attract our attention more than a grey one).
Metric Definition
Examples of processes or practices that define indicators are:
• Information radiators typically display some indicators for a process or practice, for example, current work in progress or a colorful display showing hours since the last system failure, are examples of information radiators.
• The Kanban method (Anderson, 2010) defines a board that represents the current execution status of an instance of the process, made visible by a card representing the status of flow of work.
• The Continuous Integration practice defines, at the very least, the Successful/Broken build indicator, typically as a semaphore.
Type of scale: Nominal
Scale: Yes/No
Most positive value: Yes
Type of measurement method:
Subjective
Measurement method: The evaluator must specify the value according to his/her evaluation of the process or practice. Evaluators might review authoritative documentation on the process or practice to determine if indicators are formally defined or just consider popular implementations that they are familiar with.
4.2.7. Controllability
Controllability is a key aspect of usability since it allows users to make timely decisions to improve the outcomes and impact of their work. Managing risk is also heavily dependent on timely interventions, and thus related to control issues. From a motivation perspective, users that feel they have no control tend to feel
Measures if the process or practice defines standard indicators.

76
helpless and generally less effective. Control is a key aspect of process management, in both the statistical and empirical perspective.
Characteristic Definition
Examples of controllability in processes or practices are:
• In Scrum, “decisions to optimize value and control risk are made based on the perceived state of the artifacts” (Schwaber & Sutherland, 2017).
• Hierarchical organizations are usually explicitly designed so that every tier is expected to exert control over lower tiers.
The following sections describe the Controllability metrics.
4.2.7.1. Defines checkpoints metric
Checkpoints are specific points in the flow of a process or activity in which certain metrics or other qualitative information are evaluated, according to specific criteria dependent on the context, to decide on future actions.
Metric Definition
Examples of processes or practices that define checkpoints are:
• Shewhart’s Plan-Do-Check-Act defines explicitly a Check activity to control the process and improve.
• In Scrum, Sprint Reviews are specific points to evaluate the product and eventually decide whether to accept, reject or refine a product increment.
• In Scrum, Sprint Retrospectives are specific points in which the process itself is reviewed and the team collaborates to determine whether the process or any of the practices should be changed to improve.
• Stage-gate processes are explicitly organized around checkpoints called gates, in which the decision to proceed or not to the next stage is explicitly defined (Cooper, 1986).
• In the Lean Startup method, the results of the “build-measure-learn” feedback loop are periodically checked to decide whether to persevere with the current strategy or to pivot away from it (Ries, 2011).
• The Continuous Integration practice defines each time that a developer contributes (integrates) a modification to the source repository as a checkpoint at which a build must be run to verify the whole product (Fowler, 2000).
• The Continuous Delivery practice (Humble & Farley, 2010) defines a delivery pipeline in which most activities are typically considered a
Degree to which a process or practice allows its users to check status and make decisions that affect the outcomes during process or practice
execution.
Measures whether the process or practice defines specific checkpoints where users can make decisions that control the outcomes of the process
or practice.

77
checkpoint, in which the decision to continue executing or stop the pipeline is made for every execution (Humble & Farley, 2010).
Type of scale: Nominal
Scale: Yes/No
Most positive value: Yes
Type of measurement method:
Subjective
Measurement method: The evaluator must specify the value according to his/her evaluation of the process or practice. Evaluators might review authoritative documentation on the process or practice to determine if checkpoints are formally defined or just consider popular implementations that they are familiar with.
4.2.7.2. Explicit outcomes metric
Outcomes define the expected results, objectives and impacts that a process or practice produces, in quantifiable terms, in order to manage them (as opposed to outputs, the very basic product of executing a process).
Explicit outcomes help people align process execution with the ultimate purpose and produce better results.
Metric Definition
Examples of processes or practices that define explicit outcomes are:
• In Artful Making (Austin & Devin, 2003), according to the quality called Play, an innovative process is explicitly expected to produce not only the products but also the improved team/organization capable of producing further value.
• The Continuous Integration practice is explicitly aimed at producing a consistently verified product that might eventually be promoted to the next verification stage with a specific level of quality.
• The Continuous Delivery practice is explicitly aimed at improving the delivery process and reducing the time it takes to effect software delivery, with the objective of improving quality, reducing time to market and maximizing the flow of value. Recent research has shown that indicators characterizing mature software delivery correlate highly with business performance (Forsgren et al., 2018).
• The Scrum Guide explicitly defines Scrum as: “A framework within which people can address complex adaptive problems, while productively and creatively delivering products of the highest possible value” (Schwaber & Sutherland, 2017).
Measures if the process or practice defines outcomes explicitly.

78
Type of scale: Nominal
Scale: Yes/No
Most positive value: Yes
Type of measurement method:
Subjective
Measurement method: The evaluator must specify the value according to his/her evaluation of the process or practice. Evaluators might review authoritative documentation on the process or practice to determine if explicit outcomes are formally defined.
4.2.7.3. Level of autonomy metric
Daniel Pink defines autonomy, the worker’s ability to govern their own work, as one of three key motivators; autonomy requires that people control some aspects of their work, as opposed to those being imposed from the outside (or above). As a concrete example, one of the principles in the Agile Manifesto states (Beck et al., 2001):
“The best architectures, requirements, and designs emerge from self-organizing teams”.
Autonomy allows people to make fast decisions related to the performance of a process or practice from the close perspective that involvement provides, as opposed to waiting for input or approval from supervisors or managers.
Metric Definition
Examples of processes or practices that promote high levels of autonomy are:
• The agile principle of Self-organization is about teams doing the best they can, given a set of constraints imposed by the outside world, by coordinating their work, defining their own processes and practices, and assigning themselves tasks, all of this with solidary responsibility for the work they share. As the Agile Manifesto states (Beck et al., 2001):
“Build projects around motivated individuals. Give them the environment and support they need, and trust them to get the job
done.”
• The Team Software Process (TSP) defines that teams create and own their development plans, which promotes higher levels of commitment and better ability to adjust in cases of need (Humphrey, 1999).
• In Artful Making (Austin & Devin, 2003), the concept of “Control by release” is defined as a balance between the autonomy of creative teams
Measures the level of autonomy users have in making decisions related to the execution of the process or practice.
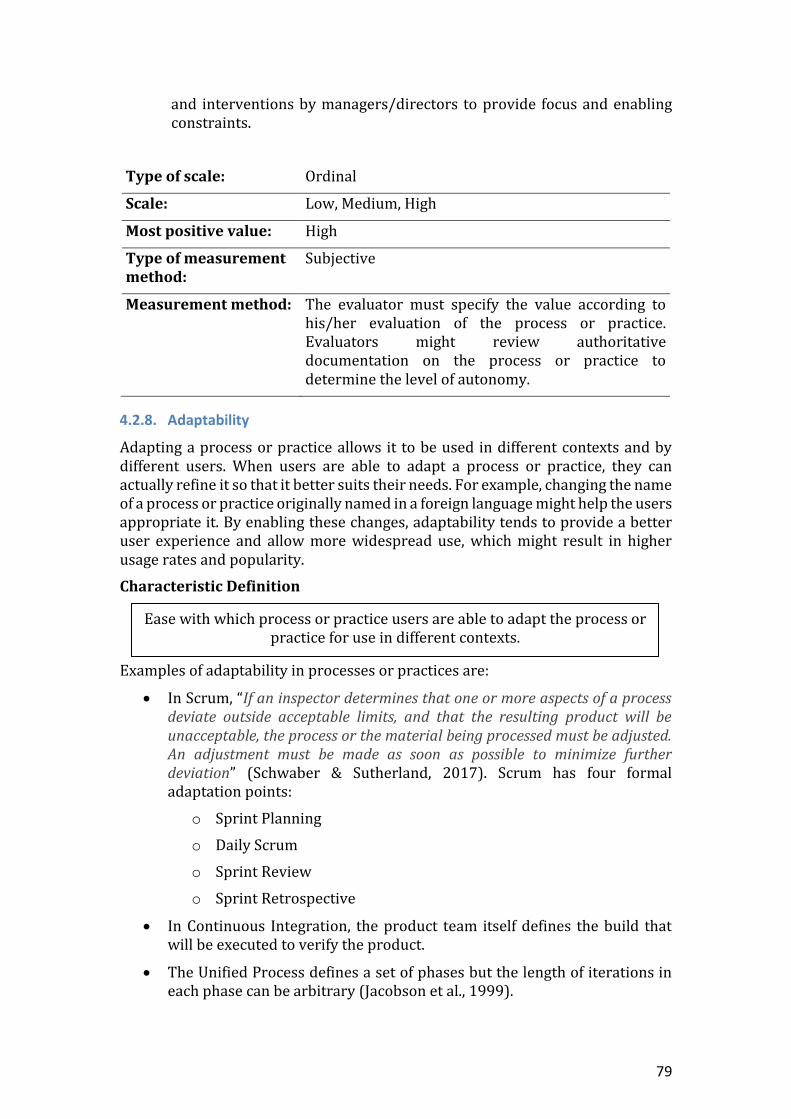
79
and interventions by managers/directors to provide focus and enabling constraints.
Type of scale: Ordinal
Scale: Low, Medium, High
Most positive value: High
Type of measurement method:
Subjective
Measurement method: The evaluator must specify the value according to his/her evaluation of the process or practice. Evaluators might review authoritative documentation on the process or practice to determine the level of autonomy.
4.2.8. Adaptability
Adapting a process or practice allows it to be used in different contexts and by different users. When users are able to adapt a process or practice, they can actually refine it so that it better suits their needs. For example, changing the name of a process or practice originally named in a foreign language might help the users appropriate it. By enabling these changes, adaptability tends to provide a better user experience and allow more widespread use, which might result in higher usage rates and popularity.
Characteristic Definition
Examples of adaptability in processes or practices are:
• In Scrum, “If an inspector determines that one or more aspects of a process deviate outside acceptable limits, and that the resulting product will be unacceptable, the process or the material being processed must be adjusted. An adjustment must be made as soon as possible to minimize further deviation” (Schwaber & Sutherland, 2017). Scrum has four formal adaptation points:
o Sprint Planning
o Daily Scrum
o Sprint Review
o Sprint Retrospective
• In Continuous Integration, the product team itself defines the build that will be executed to verify the product.
• The Unified Process defines a set of phases but the length of iterations in each phase can be arbitrary (Jacobson et al., 1999).
Ease with which process or practice users are able to adapt the process or practice for use in different contexts.

80
The following sections describe the Adaptability metrics.
4.2.8.1. Defines adaptation points metric
Adaptation points are specific points in the structure or flow of a process or activity in which modifications can be made to adjust the process or practice to make it better suited to a specific context.
Metric Definition
Examples of processes or practices that define adaptation points are:
• In Scrum, Sprint Retrospectives are specific points in which the process itself is reviewed and the team collaborates to determine whether the process or any of the practices should be changed to improve. So are the Sprint planning, Daily Scrum and Sprint review.
• In the Visual Milestone Planning method (Miranda, 2019), the Milestone dependency list is explicitly defined as optional.
Type of scale: Nominal
Scale: Yes/No
Most positive value: Yes
Type of measurement method:
Subjective
Measurement method: The evaluator must specify the value according to his/her evaluation of the process or practice. Evaluators might review authoritative documentation on the process or practice to determine if adaptation points are formally defined.
4.2.8.2. Ratio of roles allowed to adapt metric
Roles are abstractions that describe the expectations and the responsibilities of individuals performing activities. This metric assesses how widespread is the ability or authority to adapt a process or practice.
Metric Definition
Examples of ratio of roles allowed to adapt a process or practice are:
• Scrum defines three roles: Development Team, Product Owner and Scrum Master. They are all allowed to participate in adapting the process, thus the ratio is 1.
Measures whether the process or practice defines adaptation points. Adaptation points are specific opportunities for variation described by the
process or practice.
Measures how many roles among the process or practice users are allowed to modify the process or practice out of the total number of roles.
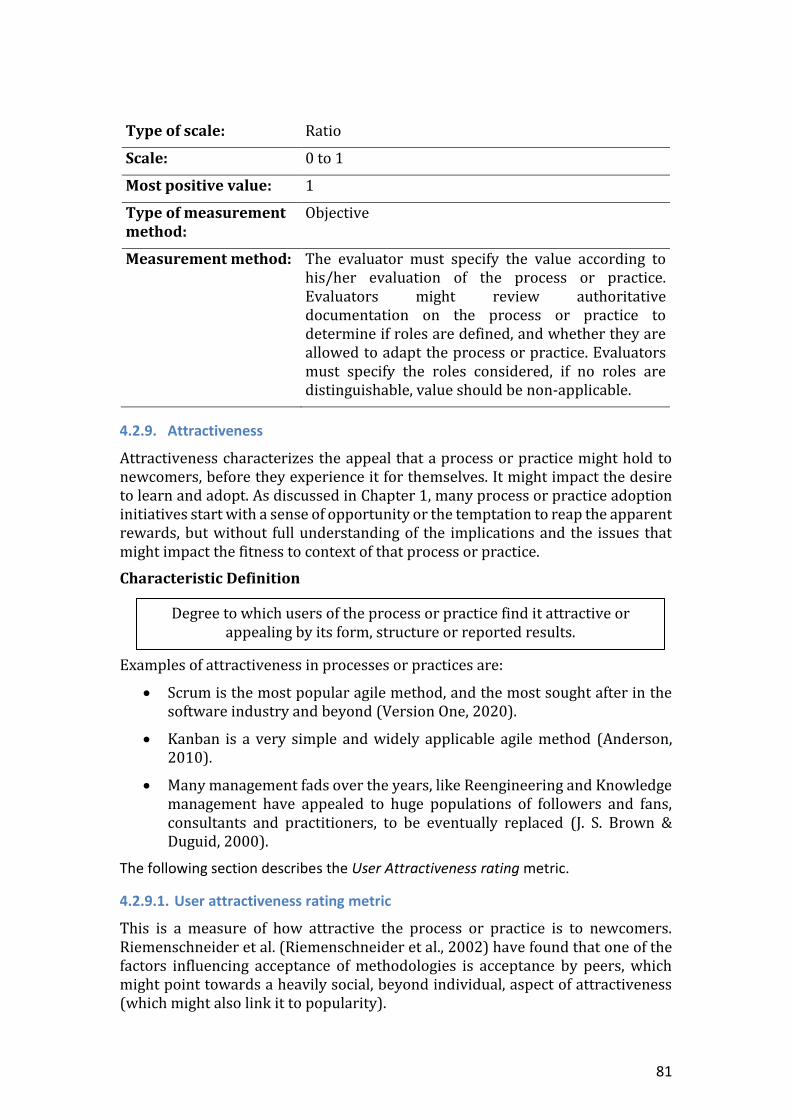
81
Type of scale: Ratio
Scale: 0 to 1
Most positive value: 1
Type of measurement method:
Objective
Measurement method: The evaluator must specify the value according to his/her evaluation of the process or practice. Evaluators might review authoritative documentation on the process or practice to determine if roles are defined, and whether they are allowed to adapt the process or practice. Evaluators must specify the roles considered, if no roles are distinguishable, value should be non-applicable.
4.2.9. Attractiveness
Attractiveness characterizes the appeal that a process or practice might hold to newcomers, before they experience it for themselves. It might impact the desire to learn and adopt. As discussed in Chapter 1, many process or practice adoption initiatives start with a sense of opportunity or the temptation to reap the apparent rewards, but without full understanding of the implications and the issues that might impact the fitness to context of that process or practice.
Characteristic Definition
Examples of attractiveness in processes or practices are:
• Scrum is the most popular agile method, and the most sought after in the software industry and beyond (Version One, 2020).
• Kanban is a very simple and widely applicable agile method (Anderson, 2010).
• Many management fads over the years, like Reengineering and Knowledge management have appealed to huge populations of followers and fans, consultants and practitioners, to be eventually replaced (J. S. Brown & Duguid, 2000).
The following section describes the User Attractiveness rating metric.
4.2.9.1. User attractiveness rating metric
This is a measure of how attractive the process or practice is to newcomers. Riemenschneider et al. (Riemenschneider et al., 2002) have found that one of the factors influencing acceptance of methodologies is acceptance by peers, which might point towards a heavily social, beyond individual, aspect of attractiveness (which might also link it to popularity).
Degree to which users of the process or practice find it attractive or appealing by its form, structure or reported results.

82
Metric Definition
Examples of processes or practices that might have high attractiveness ratings are:
• Scrum and Kanban, the Unified Process, the Lean Startup, Continuous Integration and Continuous Delivery are all examples of very attractive processes and practices in the modern history of software development.
Type of scale: Ordinal
Scale: 1 to 5
Most positive value: 5
Type of measurement method:
Subjective
Measurement method: The evaluator must specify the value according to his/her evaluation of how newcomers perceive the process or practice.
4.2.10. User satisfaction
User satisfaction characterizes the overall experience that practitioners have had with a process or practice. Users might be satisfied by perceived effectiveness, efficiency, reduced risk, increased reliability, positive feedback, challenging motivation, status, sense of growth, accomplishment, or belonging.
Characteristic Definition
Examples of user satisfaction in processes or practices are:
• There is evidence that using agile practices promotes increased job satisfaction (Kropp et al., 2018; Tripp et al., 2016).
• Scrum is the most popular agile method (Version One, 2020).
The following section describes the User satisfaction metric.
4.2.11. User satisfaction rating metric
This is a measure of how satisfying the process or practice has been to practitioners.
Metric Definition
Examples of processes or practices with good satisfaction ratings are:
• Continuous Delivery usage correlates with increased job satisfaction (Forsgren et al., 2018).
Measures how attractive the process or practice is to prospective users (i.e. those lacking experience).
Degree to which user needs are satisfied when using a process or practice.
Measures the subjective experience of using the process or practice.

83
Type of scale: Ordinal
Scale: 1 to 5
Most positive value: 5
Type of measurement method:
Subjective
Measurement method: The evaluator must specify the value according to his/her evaluation of how practitioners perceive their experience with the process or practice.
4.3. UMP Evaluation Process
The evaluation process describes the activities to be performed to apply the model to a specific process or practice and produce its usability profile. It was defined to improve model evaluation consistency and to make it easier to use.
Figure 8 describes the flow of the UMP evaluation process.
Figure 8. UMP evaluation process
The evaluation process was defined based on the ISO 25040 standard for quality model evaluation processes (International Organization for Standardization, 2011). Table 19 shows the activities defined by the standard.
Table 19. ISO 25040 quality evaluation activities
Activity Description
Establish evaluation purpose
Define the objectives, quality characteristic and scope of evaluation.
Evaluation specification Select the metrics to apply and establish objective criteria for the evaluation.
Evaluation design Plan and design evaluation activities.
Evaluation execution Perform the evaluation by applying evaluation criteria and determining metrics values.
Evaluation completion Review the results, assess the evaluation quality and elaborate report.
Evaluation Process
Usability profile for process or
practice
Process or Practice
reference sources
+ Evaluator
experience

84
The ISO 25040 describes a generic quality evaluation process defined for systems and software product evaluation. The following aspects were considered while adapting it to define the UMP evaluation process:
• Shift from Software product evaluation to process and practice evaluation: In most cases, no adaptations were required, but the mapping for certain key concepts is shown in Table 20.
Table 20. Mapping of ISO 25040 to UMP concepts
Aspect ISO 25040 UMP
Scope System parts Process or practice version or variant (e.g. by the book vs. standard practice)
Quality Attributes
Generic Restricted to usability
Evaluators Person using product Process and practice experts/trainers/coaches/practitioners
• Usability of the evaluation process itself: the focus was on maintaining a simple and usable evaluation process; for example, the first three activities were composed to form one.
The UMP evaluation process describes the activities to be performed to apply the UMP to a specific process or practice and produce the usability profile. Table 21 shows the model evaluation process activities.
Table 21. UMP evaluation process activities
Activity Description
Evaluation design
Define the objectives, scope, reference sources, characteristic and metric exclusions, and evaluators.
Evaluator training
Introduce the UMP concepts to evaluators.
Evaluation execution
Perform the evaluation process by analyzing the process or practice according to each characteristic. Determine values for all included metrics by completing the UMP evaluation questionnaire.
Evaluation process review
Review the evaluation results.
The evaluation process has four activities:
1. Evaluation design, in which objectives, scope (process or practice version or variant, e.g. by the book vs. standard practice) and reference sources are defined; characteristics and metrics are reviewed to decide if they are pertinent and applicable (Section 4.3.2 provides support for metric selection), and evaluators are defined. Reference sources are well-respected or official sources for information on the process or practice being evaluated. For example, in the case of Scrum, the Scrum Guide,

85
created and maintained by the creators of Scrum (Schwaber & Sutherland, 2017).
2. Evaluator training, in which the model is explained to the evaluator and the evaluator performs other activities to better understand the process or practice to be evaluated. These might include finding reference information, reading case studies, attending courses, trying processes and practices, and discussing with peers. To illustrate how the model is applied, examples of application must be provided to the evaluators in training (see the example evaluation for Continuous Integration in Section 4.3.1). A short video was created as material to support self-administered UMP evaluation questionnaires (see Appendix D).
3. Evaluation execution, in which the evaluator applies the UMP to the process and practice by filling the evaluation questionnaire, analyzing each characteristic and determining values for all the metrics included in the evaluation, and providing qualitative comments to support or expand on their evaluation. Metric value determination depends on their specific type: numeric values are evaluated by processing information from reference sources (e.g. selecting elements and then counting them), while nominal and ordinal variables are evaluated subjectively be evaluators by considering their previous experience with the process or practice and eventually comparing to other processes or practices. In all cases evaluators are asked to provide qualitative comments to promote understanding of evaluation rationale and support evaluation quality analysis. For example, in some cases evaluators provide very different values for a metric but their qualitative comments show that their perceptions are actually closely aligned; in these cases the comments help with interpretation of results and have been used to improve metric definitions. The evaluators can provide objective information from reference sources to support their subjective perspective on the object being evaluated, for example, quotes from the documentation. The subjective aspect of the information provided is particularly valuable since the goal is to assess the fit between people and the process or practice subject of the evaluation.
4. Evaluation process review, in which the results are reviewed.
The UMP evaluation process yields a usability profile with two kinds of information, quantitative values of metrics and qualitative comments on rationale and source information analysis.
4.3.1. Example Evaluation of Continuous Integration
This section describes how the Thesis author applied the UMP to the Continuous Integration practice (Beck & Andres, 2004; Fowler, 2000) by performing the evaluation process. Continuous Integration is one of Extreme Programming’s core practices and one that is considered hygienic in the DevOps movement (Humble & Farley, 2010).
Evaluation Design
• The standard version of the Continuous Integration practice is considered.

86
• The article by Martin Fowler was used as reference documentation (Fowler, 2000).
• All characteristics and metrics are included.
Evaluator Training
• Introductory training material consisting of a short video (7min) and a summary of the model including an example application to Continuous Integration was provided. The material describes the model and the evaluation process.
Evaluation execution
• For each model characteristic, the evaluator fills the evaluation questionnaire by assigning values to the model’s candidate metrics, and adding qualitative comments.
Evaluation process review
• The usability profile produced is reviewed.
Table 22 shows the Continuous Integration usability profile produced by the evaluation.
Table 22. Example usability profile for Continuous Integration
Metric Value Comments
Appropriateness of name
Highly appropriate
The name is explicit and concrete.
Recognized purpose Yes The purpose is usually recognized.
Time required to learn to perform
16hs It takes a few days practice to manage the basic versioning.
Standard introductory course duration
2hs This is part of a course, never a whole course.
Number of new concepts
1 Build CI status (broken, passing).
Conceptual model correspondence
High Everyone understands integration.
Conceptual model complexity
Low It is a basic practice, based on versioning and automated tests.
Cost of incorrect adoption
Medium If the practice is not well implemented, it might lead to fragility from a false sense of safety (e.g. poor test coverage).
Reduction in cost of error
High This reduces the cost of error by prompting early fixes.
Safety perception High The build helps the team trust the correctness of the product.
Use of restraining functions
Yes A failed build usually disables further deployment of the erroneous product version.
Timeliness of feedback
Prompt The CI server informs the team if the build status changes.

87
Metric Value Comments
Feedback richness High The CI server confirms if the product is correct and deployable.
People feedback Yes CI problems promote conversations to find root causes.
Automatic feedback Yes The CI server provides automatic feedback by executing the build (including tests).
Defines indicators Yes The passing/broken build indicator is a central feature.
Defines checkpoints Yes The execution of the CI build is a checkpoint, if the build breaks the team must prioritize fixing it over producing more changes.
Explicit outcomes Yes The build is either broken or passing, thus describing the quality of the product.
Level of autonomy High The development team should have full authority over the build process.
Defines adaptation points
Yes Build, tests, CI job. In these elements the practice users can change the CI behavior.
Ratio of roles allowed to adapt
Non-applicable
Although CI defines no roles, all development team members (analysts, developers, etc.) are allowed to adapt the build.
User attractiveness rating
4 Continuous integration is attractive because it creates constant status information.
User satisfaction rating
5 Continuous integration provides feedback on every change, creating a safety net for developers.
Evaluation results show that almost all metric values match the most positive value for that metric (see Table 18). This is consistent with Continuous Integration’s popularity, simplicity, tool support and its focus on visibility and risk mitigation.
4.3.2. UMP Metric Categorization
This section presents a categorization of metrics to support metric selection. This categorization was defined taking into account evaluator feedback throughout the research studies conducted, and particularly the results of the reliability evaluations described in Chapter 7.
This metric categorization was the latest addition to the UMP and emerged after the last UMP evaluation (see Section 7.3). The purpose of the categorization is to help UMP users to select appropriate metrics and to partially address the limited ease of use reported on the UMP (see Section 8.2.5) by presenting a subset of metrics that should be used in most cases, leaving aside potentially less important metrics and thus reducing evaluation time and complexity. The recommendations in this section plug into the UMP evaluation process which establishes that before evaluation, the set of included characteristics and metrics must be defined (see Section 4.3).
Table 23 shows the metrics’ category structure, including category name, description, and rationale for including metrics in each category.

88
Table 23. UMP metrics category structure
Category Description Rationale for metric categorization
Core Metrics that should always be included unless very strong evidence to the contrary can be provided.
Metrics that have shown to be applicable in all studied contexts and which experts have highlighted as most useful or significant.
Recommended Metrics that should always be considered for inclusion and excluded only if they do not seem pertinent.
Metrics that are more difficult to evaluate, have intermediate reliability or are partially context sensitive.
Complementary Metrics that might be included if they seem to provide value for the specific context of evaluation.
Metrics that are highly context sensitive and had lower reliability statistics.
Table 24 shows each of the UMP metrics, their inter-rater reliability coefficient from the TDD-BDD study (see Section 7.3), their inter-rater agreement coefficient from the Scrum study (see Section 7.2), and the category that was assigned to them (core, recommended or complementary).
Table 24. UMP metrics categorization
Characteristic Metric TDD-BDD reliability study
Gamma (Gwet)
Scrum reliability study
rWG(i)
(James)
Category
Self-evident purpose
Appropriateness of name -0.090 0.4579 Core
Understandability Conceptual model complexity 0.472 0.6026 Core
Safety Reduction in cost of error 0.796 0.7436 Core
Feedback Timeliness of feedback 0.703 0.8538 Core
Feedback Feedback richness 0.506 0.7308 Core
Feedback People feedback -0.059 0.8462 Core
Feedback Automatic feedback 0.876 0.8333 Core
Controllability Defines checkpoints 0.754 1.0000 Core
Controllability Explicit outcomes 0.876 0.6154 Core
User satisfaction User satisfaction rating 0.256 0.8667 Core
Self-evident purpose
Recognized purpose -0.051 0.4872 Recommended
Understandability Conceptual model correspondence
0.251 0.3077 Recommended
Safety Cost of incorrect adoption 0.033 0.4231 Recommended
Safety Safety perception 0.385 0.4231 Recommended

89
Characteristic Metric TDD-BDD reliability study
Gamma (Gwet)
Scrum reliability study
rWG(i)
(James)
Category
Safety Use of restraining functions 0.220 0.5385 Recommended
Visibility Defines indicators 0.594 0.4615 Recommended
Controllability Level of autonomy 0.505 0.9231 Recommended
Adaptability Defines adaptation points 0.264 0.5385 Recommended
Attractiveness User attractiveness rating 0.164 0.8974 Recommended
Learnability Number of new concepts 0.666 0.0250 Recommended
Learnability Time required to learn to perform
0.103 0.0815 Complementary
Learnability Standard introductory course duration
0.350 0.0421 Complementary
Adaptability Ratio of roles allowed to adapt - - Complementary
4.4. UMP Usage Modes
The UMP can be used in three modes, depending on the context (for example, according to the application scenario). These modes have been defined to enable different types of users to obtain value from the UMP and to improve the usability of the UMP itself. The UMP usage modes describe how the different UMP elements (the UMP itself, the evaluation process, and the resulting usability profile) should be used.
Evaluation: in this mode, the UMP is used to evaluate a specific process or practice, producing a usability profile and improvement opportunities. In this mode, the goal of the model user is to get insight into the process/practice under evaluation. The UMP itself and the evaluation process are used to produce the usability profile and identify improvement opportunities (see Section 4.3 for details on the UMP evaluation process).
The main advantages of this mode are:
• Usability evaluations, by their very nature, profit from user’s subjective perspective (Nielsen, 1994). UMP users that perform evaluations can thus include their very own and probably unique perspective on the process or practice, thus producing more nuanced and context specific evaluations.
• The act of evaluation is by itself an act of reflection on the process or practice, thus it might produce insights on the evaluator by prompting a new perspective, which might be valuable beyond the output produced (i.e. the usability profile for the process or practice).
The main disadvantages of this mode are:

90
• Evaluation might require a high level of expertise, experience using the process or practice and a certain awareness of how the process and practice affects users.
• Evaluations tend to be time consuming. For the UMP evaluations, experts have reported times ranging from 30 minutes to more than one hour.
Profile: in this mode, the UMP was previously used by a third-party to perform an evaluation and now the user applies the usability profile from that evaluation to a specific context (e.g. in scenario #4, Development team considering adoption of a process or practice, see Section 4.5). In this mode, the usability profile is the only artifact used. The advantages and disadvantages of this mode are the inverse of those described for the evaluation mode. The main advantages of this mode are:
• It does not require experience with the process or practice.
• It can be used immediately.
The main disadvantages of this mode are:
• It requires that a previous evaluation by a third-party be available.
• Reading the usability profile might not promote the same reflections as performing the evaluation.
Framework: in this mode, the UMP is used as a usability framework for process and practice improvement, acting as a checklist that provides potential risks/root causes that can assist in planning and assessing adoption/improvement initiatives. In this mode it also provides metrics that can be used to assess the improvement initiative.
The main advantages of this mode are:
• Ability to benefit from the model’s conceptual framework without the need to perform evaluations.
• Flexibility in using the model concepts partially, for example, using the model characteristics and metrics as areas of interest and recommendations, as opposed to quantitatively rating a process or practice. For example, several users have reported some characteristics like Self-evident purpose, and particularly, the Appropriateness of name metric as having significant impact on how they think about the importance of naming while helping teams adopt a process or practice.
The main disadvantage of this mode is:
• Using the UMP as a framework might not promote the same reflections as performing the evaluation.
Given that the model is rather complex (its 10 characteristics aimed at being complete), and that it tends to require significant effort to be able to perform evaluations, these modes might allow practitioners to benefit from third-party (and even reusable) expert evaluation results (in the profile mode) or to use only the model more easily in the framework mode.

91
One of the underlying assumptions on UMP usage is that newcomers to a process or practice are not well suited to reflecting about its usability, let alone evaluating its characteristics and metrics. For example, a newcomer might be able to assess the process or practice User attractiveness rating reasonably well but might be challenged to assess most of the other metrics, like User satisfaction rating, which requires experience, or Conceptual model correspondence, which requires deep understanding. Thus, the assumption is that model users, at least in evaluation mode, will generally be process and practice experts, trainers or coaches, or researchers; beginner practitioners are not excluded but would probably benefit from the support and guidance of others with more experience.
4.5. UMP Usage Scenarios
To drive evaluation, a set of application scenarios was defined to help determine applicability of the UMP in real-life. The UMP usage scenarios describe potential scenarios in which different actors might use it for specific purposes. These scenarios were aimed at describing the context in which the UMP would be used, by whom, and for which purpose.
The definition of each scenario includes what the model is used for, the suggested usage modes (see Section 4.4), and the model artifacts used. Table 25 shows a summary of the ten real-life UMP application scenarios originally defined.
Table 25. UMP usage scenarios
# Scenario UMP usage purpose Suggested usage modes
Artifact
1 Consultants/Improvement team plan transformation program
As a checklist for risk management
Framework Empty model
2 Consultants/Improvement team evaluate transformation program
Potential root causes for problems found
Framework Empty model
3 Consultants/Improvement team define metrics for process or practice adoption program
UMP as a source of metrics
Framework Empty model
4 Development team considering adoption of a process or practice
As a checklist for risk management
Framework/ Profile
Empty model/ Usability profile
5 Team Coach proposes/helps team with process or practice adoption
As a checklist for risk management
Evaluation/ Framework/ Profile
Empty model/ Usability profile
6 Team analyzes problem with a specific practice during a Retrospective
Potential root causes for problems found
Evaluation/ Framework/ Profile
Empty model/ Usability profile
7 Researcher builds process or practice quality model
Characteristics and metrics as candidate model elements
Framework Empty model
8 Researcher evaluates process or practice
Characterizing usability aspects
Evaluation/ Profile
Empty model/ Usability profile
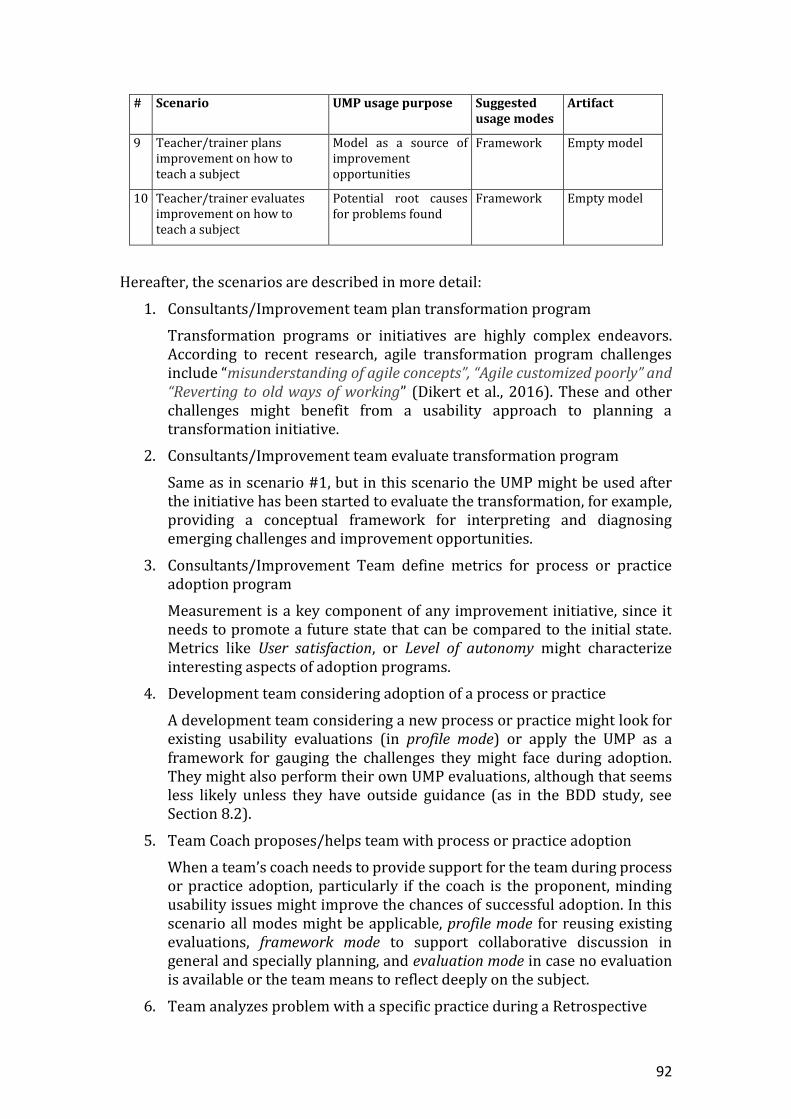
92
# Scenario UMP usage purpose Suggested usage modes
Artifact
9 Teacher/trainer plans improvement on how to teach a subject
Model as a source of improvement opportunities
Framework Empty model
10 Teacher/trainer evaluates improvement on how to teach a subject
Potential root causes for problems found
Framework Empty model
Hereafter, the scenarios are described in more detail:
1. Consultants/Improvement team plan transformation program
Transformation programs or initiatives are highly complex endeavors. According to recent research, agile transformation program challenges include “misunderstanding of agile concepts”, “Agile customized poorly” and “Reverting to old ways of working” (Dikert et al., 2016). These and other challenges might benefit from a usability approach to planning a transformation initiative.
2. Consultants/Improvement team evaluate transformation program
Same as in scenario #1, but in this scenario the UMP might be used after the initiative has been started to evaluate the transformation, for example, providing a conceptual framework for interpreting and diagnosing emerging challenges and improvement opportunities.
3. Consultants/Improvement Team define metrics for process or practice adoption program
Measurement is a key component of any improvement initiative, since it needs to promote a future state that can be compared to the initial state. Metrics like User satisfaction, or Level of autonomy might characterize interesting aspects of adoption programs.
4. Development team considering adoption of a process or practice
A development team considering a new process or practice might look for existing usability evaluations (in profile mode) or apply the UMP as a framework for gauging the challenges they might face during adoption. They might also perform their own UMP evaluations, although that seems less likely unless they have outside guidance (as in the BDD study, see Section 8.2).
5. Team Coach proposes/helps team with process or practice adoption
When a team’s coach needs to provide support for the team during process or practice adoption, particularly if the coach is the proponent, minding usability issues might improve the chances of successful adoption. In this scenario all modes might be applicable, profile mode for reusing existing evaluations, framework mode to support collaborative discussion in general and specially planning, and evaluation mode in case no evaluation is available or the team means to reflect deeply on the subject.
6. Team analyzes problem with a specific practice during a Retrospective

93
As in scenario #4, a team might use the UMP in framework mode to help make sense of challenges or problems encountered, in profile mode for the same purpose, or in evaluation mode in case no evaluation is available or the team means to reflect deeply on the subject (as in the BDD study, see Section 8.2).
7. Researcher builds process or practice quality model
A researcher building a process or practice quality model might use the UMP as a source.
8. Researcher evaluates process or practice
It describes an academic context in which a researcher wishes to perform an evaluation to assess the usability of a process or practice. It applies when a researcher is performing studies on one or more processes or practices, and also includes cases in which multiple quality models are applied to the evaluation of the same process or practice.
9. Teacher/trainer plans improvement on how to teach a subject
In this scenario, the teacher is trying to improve the learning process. This might focus on the following characteristics: self-evident purpose, learnability, understandability, visibility, attractiveness, and user satisfaction. The VMP, described in Chapter 8, is an example in which reification (giving abstract concepts a visual and material form) was used as a strategy for improving the learning experience (Miranda, 2019).
10. Teacher/trainer evaluates improvement on how to teach a subject
In this scenario, the same characteristics as in scenario #9 are applicable, but would be used after applying the improvement to assess or understand the results of the improvement effort.

94
Chapter 5. UMP Applications
This chapter describes UMP applications to real-life processes and practices. In particular, it describes the feasibility study used as initial demonstration of the UMP, and the usability profiles for Scrum, Continuous Integration, TDD, BDD, and the VMP produced throughout the research conducted for this Thesis.
The rest of this chapter is organized as follows: Section 5.1 presents the feasibility study conducted by having experts evaluate Scrum; Section 5.2 presents the usability profiles produced in the research studies for this Thesis for Scrum, Continuous Integration, TDD, BDD and the VMP; and Section 5.3 presents the chapter’s conclusions.
5.1. Feasibility Study
A feasibility study was conducted to provide initial confirmation that the UMP was applicable to a real-life process or practice. The study was conducted by having experts apply the initial version of the UMP to the evaluation of Scrum. Scrum is a product development framework created by Ken Schwaber and Jeff Sutherland; it is the most popular agile method (Version One, 2020) and a simple but hard to master approach to agility (Schwaber & Sutherland, 2017). Scrum was selected because of its popularity and relative simplicity. It was also attractive because being a process framework, it was not too small as some practices like Continuous Integration might be, nor as large as some heavier processes like the Unified Process. UMP version 1.0 was used in the feasibility study.
5.1.1. Feasibility Study Planning
The study was designed to answer two research questions:
RQ1: Is the UMP understandable and applicable to the evaluation of Scrum?
RQ2: Are the overall metric values for Scrum positive, neutral, or negative?
The answers to both research questions would be determined as follows:
RQ1: If the experts were able to produce values for all (or almost all) metrics, and comments consistent with the UMP definitions, the answer would be yes. Otherwise, the answer would be no.

95
RQ2: Each metric value from the collected data would be compared to the metric´s most positive value. Then metrics with positive and negative leaning values would be counted.
5.1.1.1. Study preparation
First, the Thesis author performed an internal evaluation of Scrum to provide basic confirmation of applicability. It was determined that the evaluation would be limited to standard Scrum implementations as described in the Scrum Guide (Schwaber & Sutherland, 2017).
The materials presented to evaluators were very limited, a single spreadsheet with the definitions of all the UMP characteristics and metrics, and a sheet in which evaluators were to complete the metric values and add comments for each metric and characteristic. The evaluators were also given a summary introduction to the UMP and the evaluation process in two individual preparatory interviews.
5.1.1.2. Participant Selection
Two external Scrum experts with more than 10 years of experience with Scrum were selected for the study. They were both practitioners with ample experience using and teaching Scrum.
5.1.2. Feasibility Study Execution
Evaluators performed the evaluations by assigning values for each metric and providing qualitative comments. Evaluators were allowed to ask questions should they require clarifications, and both did. They were given one week to complete the evaluation.
5.1.3. Feasibility Study Results
Although both evaluators needed a few clarifications during their evaluations, both were able to use the model effectively and provide values and comments for all metrics. This provided a positive answer to RQ1.
Evaluation results showed almost all metric values in the middle or positive spectrum for that metric (see details in Appendix C). This provided a positive response to RQ2. This is consistent with Scrum’s popularity and simplicity, and with its focus on visibility and risk mitigation.
Overall, the results of both evaluators were highly consistent (see details in Appendix C); even when there were differences in metric values, qualitative comments usually showed alignment.
After the evaluation, informal interviews were conducted to gather feedback from the external evaluators. This produced insights on issues related to:
• Granularity of the object of evaluation (Scrum vs. Scrum components, like the Retrospective).
• Differences between correct and incorrect implementations. One of the evaluators made a related distinction when evaluating Cost of error, about whether it meant Cost of error in correct applications of Scrum or Cost of applying it incorrectly; this distinction appeared again during the focus group session and was eventually incorporated into version 3.0.

96
• Distinguish standard from typical implementations. This emerged in the case of the Use of information radiators metric, which was eventually eliminated in version 3.0 after receiving further negative feedback during the focus group. From this feedback it was also decided to make explicit in the evaluation questionnaire which was the object of evaluation and which reference source was considered. For example, the evaluation questionnaire for TDD states: “TDD, as described by Kent Beck in his book Test Driven Development by Example“.
• Evaluation is context sensitive (the Safety perception metric yielded two different values but with coherent underlying explanations); there were definitions that needed to be improved.
Later on, the Scrum study was conducted on a more refined version of the UMP, to assess UMP inter-rater reliability, as described in Section 7.2.
5.1.4. Threats to Validity
This section presents the threats to validity of the feasibility study, following the categorization provided in (Wohlin et al., 2012):
• Threats to construct validity
Construct validity is about how well an instrument measures the construct it measures (Wohlin et al., 2012).
Although the evaluation results were formally collected, the interviews to obtain feedback from the evaluators were informal. More structured feedback mechanisms are needed and were constructed for the rest of the studies. On the positive side, experts with more than 10 years of experience were selected so that their feedback would be valuable and to the point.
• Threats to internal validity
Internal validity is about the ability of the study to establish cause and effect relationships (Wohlin et al., 2012).
Evaluators were trained only with informal material (verbal explanations from the author and model element definitions), this was improved in the rest of the studies providing video and written material.
• Threats to external validity
External validity is about the ability to generalize the study results to real world practice (Wohlin et al., 2012).
The study did not allow assessment of applicability to other processes or to specific practices.
• Threats to conclusion validity
Conclusion validity is about how reasonable it is to arrive at our conclusions given the data available (Wohlin et al., 2012).
This being a very preliminary study, it did not provide enough confirmation of theoretical saturation. Also, the sample of evaluations was very limited (only two external evaluations). This sample size was later increased as described in Section 7.2.

97
5.2. Usability Profiles for Evaluated Processes and Practices
This section presents the usability profiles for all the processes and practices evaluated during the research studies conducted for this Thesis. In some cases the evaluations were performed with different versions of the UMP; in those cases, values have been ported to the new scales for each metric (care was taken when making modifications to the UMP to ensure forward compatibility).
Table 26 shows the values for all model metrics (but no comments), and it also specifies the number of evaluations performed in the heading under the name of the process or practice. The evaluations are grouped according to whether they were performed internally by the research team or were performed by independent external evaluators. The metric values for each usability profile were composed from the individual expert evaluations using in each case a composition statistic according to the metric scale as described in Section 4.2: for ordinal and numerical variables, the median was used, for nominal variables the mode was used. Colors are used to highlight values related to particularly interesting aspects of each process or practice, as described below.
Table 26. Usability profiles for all processes and practices evaluated
Internal Evaluations Independent Evaluations
Metric Continuous Integration
(n=1)
VMP
(n=1)
Scrum
(n=13)
TDD
(n=17)
BDD
(n=7)
Appropriateness of name
Highly appropriate
Highly appropriate
Not appropriate
Highly appropriate
Partially appropriate
Recognized purpose Yes Yes No No Yes
Time required to learn to perform
30hs 4hs 31hs 4hs 24hs
Standard introductory course duration
2hs 8hs 16hs 8hs 8hs
Number of new concepts
1 13 12.5 3 2
Conceptual model correspondence
High High Low-Medium
Low-Medium
Medium
Conceptual model complexity
Low Medium Low Low Low
Cost of incorrect adoption
Medium Low Medium Medium Medium
Reduction in cost of error
High High Medium High High
Safety perception High High Medium High High
Use of restraining functions
Yes Yes Yes Yes Yes
Timeliness of feedback
Prompt Prompt Delayed Immediate Prompt
Feedback richness High Medium Medium High Medium

98
Internal Evaluations Independent Evaluations
Metric Continuous Integration
(n=1)
VMP
(n=1)
Scrum
(n=13)
TDD
(n=17)
BDD
(n=7)
People feedback Yes No Yes Yes Yes
Automatic feedback Yes No No Yes Yes
Defines indicators Yes Yes No Yes Yes
Defines checkpoints Yes No Yes Yes Yes
Explicit outcomes Yes Yes Yes Yes Yes
Level of autonomy High Medium High High Medium
Defines adaptation points
Yes Yes Yes No Yes
Ratio of roles allowed to adapt
1 Non-applicable
1 Non-applicable
Non-applicable
User attractiveness rating
4 4 5 3 3
User satisfaction rating
5 Not available
4 4 4
The cells colored in Table 26 highlight significant values that match generally known aspects of each process or practice, as described below:
• Appropriateness of name: this is one of the metrics that seem to resonate the most with UMP users. Both Scrum and BDD have non positive values, and in the case of TDD, although the median value of evaluations states a Highly appropriate, several evaluators stated that the reference to Test in Test Driven Development is confusing.
• Recognized purpose: both Scrum and TDD present negative values, which is consistent with their industry adoption; Scrum is attractive, popular and simple in appearance, but at the same time hard to perform effectively; TDD is one of the least popular of agile technical practices (Paez et al., 2018) and hard to perform, although it is loved by its practitioners, see User satisfaction rating below.
• Conceptual model correspondence: values are most positive for Continuous Integration and VMP; Continuous Integration matches naturally the perspective of most developers who have experience with integration problems; VMP provides a participatory and visual approach to planning, it uses very well established concepts like milestones, thus it does not clash with users’ mental models. None of them introduce conflictive elements, which is not the case with TDD. In TDD, the concept of test-first (the idea that tests are to be written before any code is implemented) is very alien to most developers (except maybe for Smalltalk developers). In the case of Scrum, although some aspects are very familiar, like the meetings, some issues like self-organization usually do not find a matching culture during adoption processes in hierarchical organizations.

99
• Conceptual model complexity: it is not surprising that all agile processes and practices have been evaluated as having low complexity, being designed by practitioners for practitioners.
• Use of restraining functions: all the processes and practices evaluated were rated yes.
• Timeliness of feedback: it is not surprising that Continuous Integration, TDD and BDD have very positive values for this metric, which is one of their core tenets.
• User attractiveness rating: The positive ratings for Continuous Integration and Scrum match their relative popularity (Paez et al., 2018; Version One, 2020). In the case of the VMP, this is readily explained by its visual and participatory aspects.
It is interesting to note how TDD and BDD show neutral values, which matches their relatively low popularity. TDD is characterized as the hardest agile practice to learn by (Ambler, 2009) and the one that is least used (Paez et al., 2018). Also, they both have low Conceptual Model Correspondence (see Table 26).
• User satisfaction rating: this metric shows very high values for all agile practices, which is consistent with the way practitioners value them. It is interesting to contrast this metric with User attractiveness, which shows TDD and BDD as challenging to newcomers but really valued by its practitioners.
It is must be noted that the evaluation of Continuous Integration produced almost all positive values, and this is one of the reasons why it was chosen as an example (see Section 4.3.1).
Finally, one emergent pattern in the research for this Thesis, which the author did not anticipate, was the conceptual significance that metrics would contribute towards explaining aspects of process and practice adoption in industry. In other words, the underlying hypothesis was that if a process or practice presented poor usability, which would emerge through poor values in many metrics, even all the metrics for several characteristics. What was found was that single negative values correlated with usability problems. For example, in the BDD Study People Feedback pointed to issues with customer collaboration that the team had not clearly realized they had, while Timeliness of feedback issues pointed to other, more technology oriented, problems (see Section 8.2). This pattern motivated the explanatory comments in this section relating metric values to other aspects of each process or practice adoption in industry.
5.3. Conclusions
This chapter presented the UMP’s feasibility study, conducted by having two external experts apply the UMP to Scrum. The study showed that the UMP was applicable and that evaluators could use it effectively and produce consistent results. It also presented the usability profiles for all of the processes and practices studied throughout this Thesis, generated from 37 independent practitioners and experts’ evaluations. This not only provides valuable information about the UMP but also contributes usability profiles for several processes and practices that are

100
currently used in industry, particularly Continuous Integration, Scrum, TDD and BDD.
Chapter 6 presents the UMP version history and the details on the focus group study performed to obtain feedback in order to refine the UMP.

101
Chapter 6. UMP Iterative Refinement
The UMP underwent several modifications throughout the research process of this Thesis. It was initially refined through the execution of a focus group study conducted for obtaining feedback about the UMP with the goal of improving it. It was also refined in response to information obtained in other empirical studies conducted throughout this Thesis. Figure 9 shows an overview of the evolution of UMP versions, and Appendix E provides more details on each version.
Figure 9. UMP version evolution
The rest of this chapter is organized as follows: Section 6.1 presents the focus group study performed to obtain qualitative feedback on UMP characteristics and metrics and the refinement performed based on that feedback; and Section 6.2 presents the chapter summary.
Version 1.0 Initial version from sources
Version 2.0 Separated Feedback from Visibility
Version 3.0 Major changes after focus group
Version 3.1 Minor metric changes
Version 3.2 Metric changes after Scrum study

102
6.1. Focus Group Study
Using UMP version 2.0, a focus group with expert practitioners was conducted to gather feedback on the UMP and identify improvement opportunities (see details on the focus group method in Appendix A).
The focus group is a cost-effective and fast empirical method used in Software Engineering to produce qualitative insights and feedback from practitioners (Kontio et al., 2008).
The following steps were performed:
• Planning the research, in which the research problem is defined.
• Designing the focus group, in which the participants are selected, the material for the session is prepared, and the session flow and moderation is defined.
• Conducting the focus groups session.
• Analyzing the data and reporting the results, in which the feedback from the experts was analyzed to identify and prioritize improvement opportunities for the model.
6.1.1. Focus Group Planning and Design
The focus group was planned to obtain expert feedback on model characteristics and metrics clarity and relevance, which would help to identify improvement opportunities and refine the UMP.
During the design step, expert software development practitioners with varied experience were invited to participate. The requirements for selecting the practitioners were:
• 10+ years of experience with software development.
• Experience with software process and practice improvement.
A total of 5 participants were selected for the focus group. As part of the participant selection process, care was taken to vary the composition of the group (Kontio et al., 2008), in terms of perspectives on the software development process. The perspectives considered were taken from (Kroeger et al., 2014), and the number of participants matching the profile is shown in parentheses:
• Software Developer (5)
• Software Development Manager (1)
• Software Development Process Engineer (2)
• Software Development Process Owner (4).
Table 27 shows an overview of the participants, their experience profile and process perspectives represented.

103
Table 27. Focus group participant's profile
Participant Experience Profile Process Perspective
P1 Software Developer, Software Development Manager
User, Manager
P2 Software Developer, Agile Coach, Professor User, Owner, Engineer
P3 Software Developer, Agile Coach User, Owner
P4 Software Developer, Agile Coach User, Owner
P5 Software Developer, Agile Coach, Professor User, Owner
The focus group questionnaire was designed to provide feedback on each model characteristic and metric. For each element, two closed questions were asked, one about clarity and one about relevance. The clarity questions were meant to provide input for modification, while the relevance questions were designed to decide whether to remove the characteristic or metric or not. Table 28 shows an overview of questionnaire questions.
Table 28. Overview of focus group questionnaire questions
Model Element
Question Question Type
Characteristic Is the characteristic well defined, understandable and precise? Closed
Comments Open
Is the characteristic relevant? Closed
Comments Open
Metric Is the metric well defined, understandable and precise? Closed
Comments Open
Is it relevant for evaluating <corresponding Characteristic>? Closed
Comments Open
Each of these questions was asked for all characteristics and metrics. Figure 10 shows a section of the questionnaire, where the questions for both a Characteristic (Learnability) and its first metric (Volume of information of introductory material, eventually removed in version 3.0) are displayed.

104
Figure 10. Example questions from the focus group questionnaire
6.1.2. Focus Group Session
During the focus group session, one fellow researcher performed the role of facilitator, and the Thesis author presented the model to the experts. These experts were presented with a set of slides that introduced them to the model, and were handed paper copies of the questionnaire including all model characteristics and their metrics, along with a part where their feedback on the overall UMP could be provided.
The session was organized around a walkthrough of the model, each question being used to prompt collaborative discussions among the experts. The session lasted 3 hours and was recorded, to provide reference material in case clarifications were needed during data analysis.
6.1.3. Focus Group Data Analysis
The analysis consisted of a summarization of quantitative and qualitative feedback to determine which characteristics and metrics to modify/remove (Table 30 and Table 31 show the quantitative data for characteristics and Table 32 and Table 33 for metrics). Qualitative comments were analyzed to determine how to improve the model elements (see the raw qualitative data in Appendix C). Modifications were prioritized by number of positive and negative responses to the closed questions and based on the qualitative comments and discussion during the session; and were performed by two researchers working collaboratively.
6.1.3.1. Data Analysis of UMP Characteristics
Table 29 shows a summary of the feedback on UMP characteristics, and the changes proposed after the analysis of the data.

105
Table 29. Summary focus group feedback and changes on characteristics
Characteristic Feedback Summary
Proposed Change
Self-evident purpose Unclear Fix: what would make it evident: name, description, form, structure?
Learnability Needs refinement Refine: state basic level of proficiency
Understandability Unclear Fix: Change to understanding how it works to obtain the desired results
Error tolerance (version 2.0)
Unclear Fix: Rename to safety. Clarify that it includes both misapplying and making further mistakes
Feedback Needs refinement Refine: Remove feedback from the def. Add next action.
Visibility Needs refinement Refine: rephrase to simplify, and remove the word stakeholders.
Controllability Needs refinement Refine: Remove control from the definition, make more explicit what is controlled.
Adaptability Clear -
Attractiveness Clear -
User satisfaction Clear -
The feedback summary field was calculated from the number of positive and negative responses to the closed question about clarity, understandability and precision in the questionnaire, and also from the qualitative comments (e.g. although Learnability was rated most positively in the closed questions, it needed refinement since during the discussion some feedback was made explicit about ambiguity in the definition, which led to adding a reference to what was meant by basic level of proficiency). Clear means it did not require modification, needs refinement means it required minor modifications, unclear means it required major modifications.
The first question about each characteristic dealt with its clarity. The question was:
Table 30 shows the raw quantitative data and summary on the questions on UMP characteristic clarity (see Appendix C for the raw qualitative comments).
Table 30. Quantitative data on characteristic clarity
Characteristic P1 P2 P3 P4 P5 # of Yes # of No
Self-evident purpose Yes Yes No - - 2 1
Learnability Yes Yes Yes Yes Yes 5 0
Understandability No No No Yes No 1 4
Error tolerance Yes No No No Yes 2 3
Feedback Yes Yes No Yes - 3 1
Is the characteristic well defined, understandable and precise?

106
Characteristic P1 P2 P3 P4 P5 # of Yes # of No
Visibility Yes - Yes Yes - 3 0
Controllability No No No - No 0 4
Adaptability Yes Yes Yes - Yes 4 0
Attractiveness No Yes Yes - Yes 3 1
User satisfaction Yes Yes Yes - Yes 4 0
Color-coding is based on conditional formatting:
For “# of Yes”
• Red: value <= 2
• Yellow: value = 3
• Green: value => 4
For “# of Not”
• Green: value <= 1
• Yellow: value = 2
• Red: value >= 3
Color-coding is biased towards improvement, since more than one negative response marks a characteristic as yellow, and only four or more positive responses mark one as green.
The question about relevance was key to determining if any of the characteristics might be removed from the UMP, but none of the characteristics received strongly negative relevance responses. The question was:
Table 31 shows the raw data and summary on the questions on UMP characteristic relevance (see Appendix C for the raw qualitative comments).
Table 31. Quantitative data on characteristic relevance
Characteristic P1 P2 P3 P4 P5 # of Very
# of Quite
# of Not
Self-evident purpose Very Very Very - Very 4 0 0
Learnability Very Very Very Very Very 5 0 0
Understandability Very Very Very Very Quite 4 1 0
Error tolerance Very Not Very Very Quite 3 1 1
Feedback Very Quite Very - - 2 1 0
Visibility Very Quite Very - Very 3 1 0
Controllability Quite Quite Quite - Not 0 3 1
Adaptability Very Very Very - Not 3 0 1
Is the characteristic relevant?

107
Characteristic P1 P2 P3 P4 P5 # of Very
# of Quite
# of Not
Attractiveness Quite Very Quite - Very 2 2 0
User satisfaction Very Quite Very - Very 3 1 0
Color-coding is based on conditional formatting:
For “# of Very “and # of Quite”, the sum of Very and Quite is considered.
• Red: value <= 2
• Yellow: value = 3
• Green: value => 4
For “# of Not”
• Green: value <= 1
• Yellow: value = 2
• Red: value >= 3
Again, color-coding is biased towards improvement, since more than one negative response marks a characteristic as yellow, and only four or more positive responses mark one as green.
6.1.3.2. Data Analysis of UMP Metrics
The first question about each metric dealt with its clarity. The question was:
Table 32 shows the raw data and summary of the responses to the question on UMP metric clarity (see Appendix C for the raw qualitative comments).
Table 32. Quantitative data on metric clarity
Characteristic Metric P1 P2 P3 P4 P5 # of Yes
# of No
Self-evident purpose
Appropriateness of name Yes Yes Yes - Yes 4 0
Self-evident purpose
Purpose alignment for stakeholders Yes No No No - 1 3
Learnability Volume of information of introductory material Yes Yes Yes Yes Yes 5 0
Learnability Standard introductory course duration Yes Yes Yes Yes Yes 5 0
Understandability # of elements Yes Yes No No No 2 3
Understandability Conceptual model correspondence No No Yes No No 1 4
Understandability Data model complexity index Not - Yes Yes Yes 3 0
Error tolerance Cost of error - Yes No Yes No 2 2
Is the metric well defined, understandable and precise?
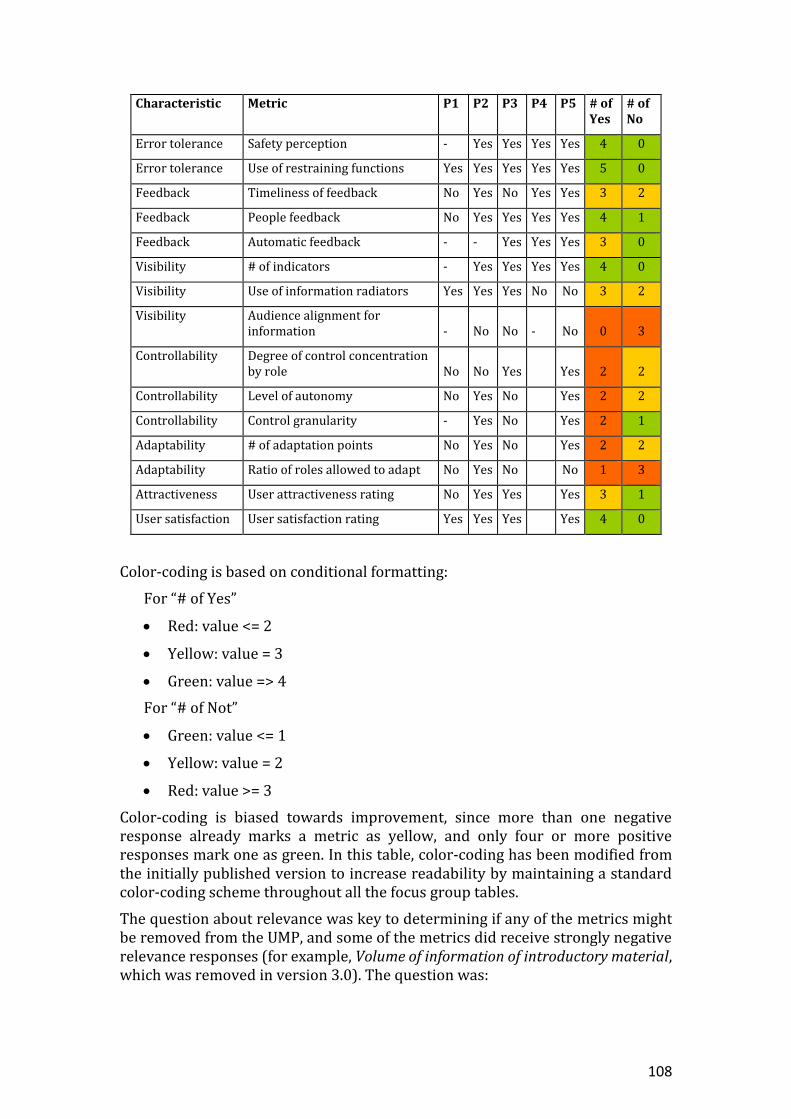
108
Characteristic Metric P1 P2 P3 P4 P5 # of Yes
# of No
Error tolerance Safety perception - Yes Yes Yes Yes 4 0
Error tolerance Use of restraining functions Yes Yes Yes Yes Yes 5 0
Feedback Timeliness of feedback No Yes No Yes Yes 3 2
Feedback People feedback No Yes Yes Yes Yes 4 1
Feedback Automatic feedback - - Yes Yes Yes 3 0
Visibility # of indicators - Yes Yes Yes Yes 4 0
Visibility Use of information radiators Yes Yes Yes No No 3 2
Visibility Audience alignment for information - No No - No 0 3
Controllability Degree of control concentration by role No No Yes Yes 2 2
Controllability Level of autonomy No Yes No Yes 2 2
Controllability Control granularity - Yes No Yes 2 1
Adaptability # of adaptation points No Yes No Yes 2 2
Adaptability Ratio of roles allowed to adapt No Yes No No 1 3
Attractiveness User attractiveness rating No Yes Yes Yes 3 1
User satisfaction User satisfaction rating Yes Yes Yes Yes 4 0
Color-coding is based on conditional formatting:
For “# of Yes”
• Red: value <= 2
• Yellow: value = 3
• Green: value => 4
For “# of Not”
• Green: value <= 1
• Yellow: value = 2
• Red: value >= 3
Color-coding is biased towards improvement, since more than one negative response already marks a metric as yellow, and only four or more positive responses mark one as green. In this table, color-coding has been modified from the initially published version to increase readability by maintaining a standard color-coding scheme throughout all the focus group tables.
The question about relevance was key to determining if any of the metrics might be removed from the UMP, and some of the metrics did receive strongly negative relevance responses (for example, Volume of information of introductory material, which was removed in version 3.0). The question was:

109
Table 33 shows the raw data and summary on the questions on UMP metric relevance (see Appendix C for the raw qualitative comments).
Table 33. Quantitative data on metric relevance
Characteristic Metric P1 P2 P3 P4 P5 # of Very
# of Quite
# of Not
Self-evident purpose
Appropriateness of name Very Very Very - - 3 0 0
Self-evident purpose
Purpose alignment for stakeholders Very Quite Very Very Very 4 1 0
Learnability Volume of information of introductory material Not Not Not Not Not 0 0 5
Learnability Standard introductory course duration Very Not Quite Very Quite 2 2 1
Understandability # of elements Not Quite Quite Very Very 2 2 1
Understandability Conceptual model correspondence Very Very Quite ? Quite 2 2 0
Understandability Data model complexity index Very Very Quite Very Quite 3 2 0
Error tolerance Cost of error - Very Quite Very Quite 2 2 0
Error tolerance Safety perception - Not Very Very Very 3 0 1
Error tolerance Use of restraining functions Very Very Very Very Very 5 0 0
Feedback Timeliness of feedback Very Very Very Very Quite 4 1 0
Feedback People feedback Quite Not Quite Quite Not 0 3 2
Feedback Automatic feedback - - Very - Very 2 0 0
Visibility # of indicators Very Not Quite Quite Very 2 2 1
Visibility Use of information radiators Very - Not Quite Not 1 1 2
Visibility Audience alignment for information - Quite Not Not Quite 0 2 2
Controllability Degree of control concentration by role Not Not Not Very 1 0 3
Controllability Level of autonomy Quite Quite Not Very 1 2 1
Controllability Control granularity Quite Quite Quite Quite 0 4 0
Is the metric relevant?

110
Characteristic Metric P1 P2 P3 P4 P5 # of Very
# of Quite
# of Not
Adaptability # of adaptation points Quite Very Not Quite 1 2 1
Adaptability Ratio of roles allowed to adapt Not Not Quite Very 1 1 2
Attractiveness User attractiveness rating Quite Very Quite Very 2 2 0
User satisfaction User satisfaction rating Quite Very Very Very 3 1 0
Color-coding is based on conditional formatting:
For “# of Very and # of Quite”, the sum of Very and Quite is considered:
• Red: value <= 2
• Yellow: value = 3
• Green: value => 4
For “# of Not”
• Green: value <= 1
• Yellow: value = 2
• Red: value >= 3
The color-coding is conservative leaning towards improvement.
Table 34 shows the rationale for the metric changes included in version 3.0.
Table 34. Rationale for metric changes after focus group
Characteristic Metric Change Rationale
Self-evident purpose
Purpose alignment for stakeholders
Removed Low clarity, hard to rate effectively.
Learnability Volume of information of introductory material
Removed Low relevance.
Learnability # of elements Changed from Understandability to Learnability
For clarification purposes.
Error tolerance
Cost of error Clarified Confused with Cost of incorrect adoption.
Error tolerance
Cost of incorrect adoption Added As a distinction that emerged with respect to Cost of error.
Feedback Feedback richness Added To describe the information provided as feedback.
Visibility Use of information radiators
Removed Too specific.

111
Characteristic Metric Change Rationale
Visibility Use of indicators Changed scale to Yes/No
Low clarity, hard to rate effectively.
Visibility Audience alignment for information
Changed to Information tailored to audience (eventually removed)
Low clarity, hard to rate effectively.
Controllability Degree of control concentration by role
Removed Low relevance.
Controllability Defines checkpoints Added It is a regular feature of effective processes.
Controllability Control granularity Removed Low clarity, very hard to rate effectively.
6.1.4. Summary of UMP Changes in Version 3.0 after Focus Group
• Modified characteristics (see details in Table 34)
o Renamed Error tolerance to Safety
o Refined definitions for
o Learnability
o Visibility
o Feedback
o Controllability
• Removed metrics
o Self-evident purpose / Purpose alignment for stakeholders
o Learnability / Volume of information of introductory material
o Visibility / Use of information radiators
o Controllability / Degree of control concentration by role
o Controllability / Control granularity
• Added metrics
o Feedback / Feedback richness
o Safety / Cost of incorrect adoption
o Controllability / Defines checkpoints
• Modified metrics
o # of elements was moved from Understandability to Learnability
o Several metrics were slightly modified, particularly Cost of error

112
6.1.5. Threats to Validity
This section presents the threats to validity of the focus group study, following the categorization provided in (Wohlin et al., 2012):
• Threats to construct validity
For this study, this validity may have been affected by the questionnaire design. Care was taken to make answering easy for the respondents, and three researchers reviewed and refined the questionnaire extensively.
• Threats to internal validity
In focus group studies, the value of the method is very sensitive to the experience and insight of the participants (Kontio et al., 2008); there is a risk that people with profiles that are too similar would bias the results. To prevent this, the selection of the candidates was careful to include people with different perspectives, including the following aspects: agile/traditional and developer/manager. Though the balance was tilted towards the process user and process owner perspective (Kroeger et al., 2014), this was by design, and is consistent with the focus in usability.
• Threats to external validity
In focus group studies, the bias introduced by the limited perspectives of participants might impact on the research. In this context, generalization was not a priority since the goal was to obtain qualitative feedback as input for further UMP improvement. Feedback did not need to be complete nor produce general knowledge about the UMP but rather provide refinement opportunities.
• Threats to conclusion validity
The conclusions were made by simple weighted analysis of the questionnaire questions, and their objective was to prioritize improvements; they were not aimed at producing knowledge about the UMP in context, and thus conclusion validity was not a primary concern.
6.2. Conclusions
The focus group study provided significant information which was used to create UMP version 3.0. The results showed that many characteristics required clarifications, and that many metrics needed to be modified, some removed, and some others added. It also provided insights on why some of the proposed concepts were not clear, thus guiding the improvements. The UMP was significantly modified, but the core structure and semantics remained.
The next chapter describes the UMP reliability evaluation studies.

113
Chapter 7. UMP Reliability Evaluation
This chapter presents the two reliability assessment studies conducted on the UMP, one on Scrum and the other on TDD and BDD.
UMP reliability is about the ability of the model to produce consistent results when used by different subjects on the same software process or practice (Hallgren, 2012). For example, if multiple experts evaluate a practice, metric evaluations should not display high dispersion or variance, otherwise, the model’s ability to describe the usability features of the practice would not be reliable. This type of reliability, in which the subjects rate the object of evaluation, can be assessed with two approaches, each with their own statistics: inter-rater reliability (Hallgren, 2012)(Gwet, 2014), and inter-rater agreement (James, 1982). Both were applied in this Thesis, inter rater agreement in the Scrum study (Section 7.2) and inter-rater reliability in the TDD-BDD study (Section 7.3).
This chapter is organized as follows: Section 7.1 explains inter-rater reliability and inter-rater agreement, highlighting the differences between these two reliability assessments and their statistics; Section 7.2 describes the Scrum study conducted for preliminary reliability evaluation of the UMP; Section 7.3 presents the TDD-BDD study performed to evaluate the reliability of the final version of the UMP; and Section 7.4 presents the chapter conclusions.
7.1. Inter-rater Reliability and Inter-rater Agreement
Both inter-rater reliability and inter-rater agreement are measures of association (Kitchenham et al., 1995). They are applicable in contexts in which raters (evaluators) measure some characteristic of an object (or subject) and it is important to assess the quality of those measurements. The field emerged in the context of psychometric and medical studies and has grown significantly (Hallgren, 2012)(Gwet, 2014). These approaches differ in their theoretical approach and the contexts in which they are applicable. The main difference between inter-rater agreement and inter-rater reliability is in how they conceptualize variance (Liao et al., 2010).
Inter-rater reliability follows classical psychometric test theory stating that observed values (X) are the sum of a true score (T) that would be the true value for

114
the characteristic of that object if there were no measurement error, and a measurement error (E) (Hallgren, 2012). Thus:
X = T + E
And, assuming that true scores and errors are uncorrelated:
Var(X) = Var(T) + Var(E)
In inter-rater agreement, instead, total variance is the sum of random measurement error (E) variance plus systematic variance, which is comprised of true (T) variance and variance that reflects bias (B) among raters (Liao et al., 2010). Thus:
Var(X) = Var(T) + Var(B) + Var(E)
As stated before, the difference between inter-rater agreement and inter-rater reliability is in how they conceptualize variance, and particular statistics provide support for different contexts. In this Thesis, the inter-rater agreement statistic is calculated following James et al. (James, 1982) as described in (Liao et al., 2010):
rWG = 1 – (Varobs/Varrand)
In the formula, r is the inter-rater agreement coefficient, Varobs is the observed variance in the sample, and Varrand is the variance if all ratings emerged from random measurement error only. Thus, variance in inter-rater agreement is defined in terms of how the sample variance relates to random measurement error variance (Liao et al., 2010). In other words, when the sample variance is close to random error r is close to 0 (low agreement), and when the sample variance is very small, r is close to 1 (high agreement).
Measurement errors can be due to “imprecision, inaccuracy, or poor scaling of the items within an instrument (i.e., issues of internal consistency); instability of the measuring instrument in measuring the same subject over time (i.e., issues of test-retest reliability); and instability of the measuring instrument when measurements are made between coders” (Hallgren, 2012). This last type of error is the one that affects inter-rater reliability and is the focus of this chapter. Issues with imprecision, inaccuracy and poor scaling of the items were evaluated and refined initially through the focus group as described in Section 6.1; issues with test-retest reliability were not considered an issue in this context, given the nature of the objects under evaluation and the already high complexity of evaluating processes and practices once.
In inter-rater reliability, statistics correct in varying ways for chance agreement (that is, when evaluators are uncertain and they assign a metric value at random among those they consider potentially appropriate), and are recommended for Software Engineering studies (Kitchenham et al., 1995). In terms of study design, inter-rater reliability studies require at least two objects of evaluation and multiple raters, although not all raters need to rate all objects (Hallgren, 2012). In the case of inter-rater agreement studies, study designs with multiple raters evaluating a single object are supported.
It must be noted that during the TDD-BDD study several limitations on standard inter-rater reliability statistics from the Kappa family were noticed, requiring

115
further study (Hallgren, 2012). The limitations were first described in (Byrt et al., 1993) and the study is described in Section 7.3.
Given these applicability restrictions and conceptual differences, a preliminary inter-rater agreement assessment was performed on Scrum using UMP version 3.1 (since at the time data was only available on that single object of study), and then, after refining the UMP and producing version 3.2, two evaluations were performed on TDD and BDD respectively, and with that data an inter-rater reliability assessment study was performed. The following sections present these studies, and Appendix B provides further information on the statistics used in this chapter.
7.2. Scrum Study
After the initial UMP feasibility study (see Section 5.1), in which Scrum was evaluated by two experts using the UMP, a new study was performed with a larger expert sample on Scrum, to assess UMP reliability and increase the sample size of Scrum evaluations. This study was conducted using UMP version 3.1, which was the current version at the time (see Section E.2).
7.2.1. Study Design and Statistic Selection
The study was designed to provide information on the reliability of the UMP by having experts evaluate Scrum.
As described in Section 7.1, inter-rater agreement was applicable in this context (in which there was only a single object of study, Scrum) and it was considered valuable as a preliminary means of assessing the reliability of the UMP as an evaluation instrument (Hallgren, 2012).
7.2.1.1. Context Selection
Scrum was selected to continue the research line of the feasibility study (see Section 5.1) and because of the following reasons:
• Scrum is a process framework, larger in size than most practices, but at the same time, simple enough for holistic evaluation.
• Scrum is the most popular agile framework (Version One, 2020).
• Some of Scrum’s stated values are well aligned with usability, for example, transparency is akin to visibility, one of UMP’s characteristics (Schwaber & Sutherland, 2017).
7.2.1.2. Subjects
The subjects in this study were selected by convenience. Initial study subjects were direct contacts of the Thesis author, they were invited and asked to recommend other candidates, using snowball sampling to increase the sample size (Mockus, 2008).
The total number of subjects in the study was 13. The following criteria was applied for selection:
• At least 5 years of experience with Scrum.

116
• Acceptable roles were practitioner, mentor, coach, teacher, consultant, manager/supervisor and researcher/academic.
The average experience of the subjects with Scrum was 10.38 years, which is considered high practical experience. Table 35 shows the distribution of roles in the sample (each subject could select more than one role).
Table 35. Distribution of roles among Scrum experts
Role Count
Practitioner 10
Coach 8
Consultant 8
Mentor 7
Teacher 6
Manager/supervisor 5
Researcher/academic 5
As shown in Table 35, most of the subjects in the sample were expert practitioners, with experience using Scrum, and also coaches/mentors, with experience in helping others adopt Scrum.
7.2.1.3. Statistic and Variable Selection
Following the statistic selection rationale described in Section 7.1, the statistic selected for assessing inter-rater agreement on each UMP metric was rWG. Thus, 24 variables were defined as rWGi, with i corresponding to each of the UMP metrics.
7.2.1.4. Planning
The study was designed so that experts could perform the evaluation through a self-administered questionnaire, given that it provided access to experts even when they were remotely located. The downside was that with self-administered questionnaires evaluator training conditions could not be strictly controlled.
This led to simplifying the material and performing improvements on the UMP evaluation questionnaire. One of the first improvements included converting the assessment form from an online spreadsheet to an online form. Then a fellow researcher performed a trial evaluation of Scrum and provided feedback and improvement opportunities. Moreover, a short 7-minute video was recorded to provide subjects with guidance on how to use the UMP. Finally, all subjects were offered help to clarify any issues (and some of them asked for it, as described in the next section).
7.2.2. Study Execution
The study was initiated by sending invitation emails to all subjects. After a few weeks, subjects with pending evaluations were contacted to inquire if they needed help. Two out of the 13 subjects required help to clarify some aspect of the questionnaire, and all completed it successfully.

117
7.2.3. Data Analysis
The UPM evaluation questionnaire was filled online and the data was exported to a spreadsheet. It was then reviewed and formatted for processing, including converting all the answers to numeric scales.
The first finding emerged even before the data could be analyzed: three metrics, Time required to learn to perform, Standard introductory course duration and Number of specific conceptual definitions allowed any positive number and thus, some had answers that spanned a very wide range (for example, Time required to learn to perform ranged from 9 to 320 hours). To perform the inter-rater agreement calculations, the range for Time required to learn to perform was divided in discrete sub-ranges to create an ordinal numerical scale. This follows the advice provided in (Hallgren, 2012) to evaluate the scales once they have been converted and not as raw data. This adapted scale is marked with an asterisk in Table 36, which shows the inter-rater agreement values for all UMP metrics.
Table 36. Inter-rater agreement for Scrum evaluation metrics
Metric Adjusted Numerical Scale
Median Variance rWGi
(agreement) Identified main causes
Appropriateness of name
1,2,3,4,5,6 1 0.6026 0.4579 Scale
Recognized purpose
1,2 1 1.8974 0.4872 Subtle metric semantics
Time required to learn to perform
1,2,3,4,5,6,7,8* 31 7331.5379 0.0815 Scale
Standard introductory course duration
Positive integer 16 112.2308 0.0421 Scale
Number of specific conceptual definitions
Positive integer 12.5 48.7500 0.0250 Scale
Conceptual model correspondence
1,2,3 2 0.6923 0.3077 Subtle metric semantics Context sensitivity
Conceptual model complexity
1,2,3 1 0.3974 0.6026 -
Cost of incorrect adoption
1,2,3 2 0.5769 0.4231 Context sensitivity
Reduction in cost of error
1,2,3 2 0.2564 0.7436 -
Safety perception 1,2,3 2 0.5769 0.4231 Context sensitivity
Use of restraining functions
1,2 2 0.2308 0.5385 Subtle metric semantics
Timeliness of feedback
1,2,3,4 3 0.2436 0.8538 -

118
Metric Adjusted Numerical Scale
Median Variance rWGi
(agreement) Identified main causes
Feedback richness 1,2,3 2 0.2692 0.7308 -
People feedback 1,2 2 0.0769 0.8462 -
Automatic feedback 1,2 1 0.0833 0.8333 -
Defines indicators 1,2 1 0.2692 0.4615 Context sensitivity
Information tailored to audience
1,2 1 0.4231 0.1538 Subtle metric semantics
Defines checkpoints
1,2 2 0.0000 1.0000 -
Explicit outcomes 1,2 2 0.1923 0.6154 -
Level of autonomy 1,2,3 3 0.0769 0.9231 -
Defines adaptation points
1,2 2 0.2308 0.5385 Subtle metric semantics
Ratio of roles allowed to adapt
1,2,3,4 0.65 0.2343 0.5314 Scale
User attractiveness rating
1-5 5 0.2564 0.8974 -
User satisfaction rating
1-5 4 0.3333 0.8667 -
Interpretation of the results is based on the guidelines by (Altman, 1991). Color-coding is based on conditional formatting:
• Red: 0 <= value < 0.2 (Poor)
• Orange: 0.2 <= value < 0.4 (Fair)
• Yellow: 0.4 <= value < 0.6 (Moderate)
• Light Green: 0.6 <= value <= 0.8 (Good)
• Dark Green: 0.8 <= value <= 1 (Very good)
7.2.4. Results and Conclusions
Only 11 out of 24 metrics show good inter-rater agreement; another 8 show moderate agreement and the remaining show fair or poor agreement. For each metric with moderate, fair or poor agreement a potential main cause was identified by following the guidelines proposed in (Hallgren, 2012), analyzing the comments for each metric and by reviewing the metrics themselves:
• Scale: long ordinal scales with associated specific labels produced very poor agreement. Examples include:
o Appropriateness of name scale: Deceiving, Ambiguous, Inappropriate, Partial, Appropriate and Precise. As can be noticed, the long, very specific set of labels might make this scale very

119
unreliable. Although definitions accompanied each label, this scale was clearly too complicated, making it difficult to discern the difference between one value and another.
o Time required to learn to perform: a positive integer scale allowed evaluators to choose from a very wide range producing values from 9 to 320. Although this scale was discretized as described above, the inter-rater agreement was still very low.
o Standard introductory course duration and Number of specific conceptual definitions: a positive integer scale allowed evaluators to choose from a very wide range of values.
• Subtle metric semantics: some metrics include evaluator assessment of subtle issues, for example whether newcomers to a process or practice usually perceive it in some specific way. Examples include:
o Recognized purpose: different evaluators focus on different aspects, whether the name is an issue, or whether people really understand the true changes that come with Scrum, or whether they just approach it because of its attractiveness.
o Conceptual model correspondence: some evaluators differ on the granularity they use to consider Scrum; some consider parts of Scrum in their comments (e.g. backlog refinement and self-organization are deemed hard) while others take a more holistic approach. There is also reference to the deceivingly simple nature of Scrum (Schwaber & Sutherland, 2017).
o Defines adaptation points: the concept of adaptation point is interpreted with a wide range of meanings. For example, the core concept of adapting the process appears correctly tied to the retrospective, and other examples point to operational parameters like sprint (iteration) length. This might explain why some evaluators considered Scrum has no adaptation points.
• Context sensitivity: evaluators also point to the fact that certain metrics, particularly those that belong to the Understandability characteristic, are highly dependent on context. For example, for very traditional command-and-control organizations some concepts like self-organization might seem very surprising while other concepts like planning meetings might seem very normal.
The overall results of the study pointed to some very easy to improve issues (e.g. poor scaling) and more difficult ones (e.g. subtle metric semantics). Several improvements were made to improve UMP metrics before further reliability evaluations were performed, thus producing UMP version 3.2 (see details in Section E.4).
7.2.5. Threats to Validity
This section presents the threats to validity of the Scrum reliability study, following the categorization provided in (Wohlin et al., 2012):
• Threats to construct validity

120
For this study, construct validity may have been affected by questionnaire design. Care was taken to make characteristic and metric definitions clear, and two researchers reviewed and refined the questionnaire. Although evaluators did not provide particularly negative feedback on the questionnaire, some of the clarifications required suggested improvements, which were applied after this study and used in the TDD-BDD study.
• Threats to internal validity
Given the simple nature of the statistics applied, and that the recommendations provided in (Hallgren, 2012) were followed in the design of the study, the results are considered valid.
The main reservation on inter-rater agreement is the lack of adjustment for chance agreement. Given that this was a preliminary evaluation, this was considered acceptable and appropriate given that it provided preliminary feedback on UMP reliability at a lower cost, offering improvement opportunities that were incorporated before the inter-rater reliability study described in Section 7.3.
• Threats to external validity
The main restriction to generalizability is the small sample size, but given that evaluations take about one hour, and required the participation of experts, this is considered a reasonable size. Care was taken to ensure a reasonable distribution of participant profiles (as shown in Table 35), while maintaining a predominance of experts that are close to actual users (e.g. practitioners and coaches). In addition, the ability to generalize from a single preliminary study is very limited, that is why the TDD-BDD study was designed to complement this study and increase generalizability.
• Threats to conclusion validity
The number of observations limits the conclusion validity in this study; that is one of the reasons why it was complemented with the inter-rater reliability study described in Section 7.3.
7.3. TDD-BDD Study
The second reliability study was performed on UMP version 3.2, which in turn was produced from the feedback obtained from the first reliability study. The second reliability study gathered evaluation data on TDD and reused evaluation data on BDD obtained from the BDD study described in Section 8.2.
This second study was an inter-rater reliability study, as described in Section 7.1, with several differences with the Scrum study in terms of design and statistic selection, as described in the following section.
7.3.1. Study Design and Statistic Selection
This study was designed according to the inter-rater reliability study recommendations provided in (Hallgren, 2012) and the statistics were initially selected according to the guidance by Kitchenham et al. (Kitchenham et al., 1995). Although the use of the Kappa family of statistics is widespread and recommended

121
for Software Engineering (Kitchenham et al., 1995), early tests with Fleiss’ Kappa showed surprisingly low values for the statistic, which were inconsistent with low sample variance. This prompted further research and the discovery that serious limitations of the Kappa family had been identified and proved by Byrt et al. (Byrt et al., 1993), and were affecting the study results. This fact led to the selection of Gwet’s Gamma and Bennet’s S statistics (Girard, 2016; Gwet, 2014).
7.3.1.1. Context Selection
Context selection in this study was restricted to selecting the objects of evaluation and the context in which those evaluations would be performed.
For the selection of objects of evaluation, and to increase the variety of available research data on UMP applications, these were the criteria considered and their corresponding rationale:
• Granularity of the object of evaluation: after the evaluation of Scrum, which is a process framework (Schwaber & Sutherland, 2017) and thus, of relatively medium granularity, a smaller (or more fine grained) object of evaluation was desired.
• Process and practice: since Scrum is a process framework, it was decided to focus on practices.
• Popularity and rate of usage: one of the reasons Scrum had been selected was its popularity (it is the most widely used agile method) (Version One, 2020) and relative simplicity (Schwaber & Sutherland, 2017). For this study, it was decided to choose a relatively less popular object of evaluation.
With these considerations in mind, TDD and BDD were selected; they are both practices with relatively low usage rates (Paez et al., 2018) and relatively more fine-grained than Scrum. In particular, TDD has the lowest usage rate of all agile practices in (Paez et al., 2018) and was identified as the hardest agile practice to learn (Ambler, 2009); and BDD was also a convenient object since its data could be obtained from the utility study described in Section 8.2. Given the case and subjects that we had available, a specific implementation of BDD was evaluated, not the general definition of the practice.
7.3.1.2. Subjects
Subjects for the TDD evaluations were selected by convenience. Initial study subjects were direct contacts of the Thesis author, they were invited and asked to recommend other candidates, using snowball sampling to increase the sample size (Mockus, 2008).
The total number of subjects that evaluated TDD was 17. The following criteria was applied for participant selection:
• At least 5 years of experience with TDD.
• Acceptable roles were practitioner, mentor, coach, teacher, consultant, manager/supervisor and researcher/academic.

122
The average experience of the subjects with TDD was 9.63 years, which is considered high practical experience. Table 37 shows the distribution of roles in the participant’s sample (each participant could select more than one role).
Table 37. Distribution of roles among TDD experts
Role Count
Practitioner 17
Mentor 13
Teacher 12
Coach 9
Consultant 8
Researcher/academic 4
Manager/supervisor 2
As shown in Table 37, all of the subjects in the sample were expert practitioners, with experience using TDD, and also mentors, with experience in helping others adopt TDD. It is interesting to note that TDD experts in the sample are all practitioners, unlike the experts in the Scrum sample (shown in Table 35). This might be due to Scrum’s popularity or the fact that TDD is one of the hardest agile practices to learn (Ambler, 2009).
Subjects for the BDD evaluations were selected by filtering those considered experts in the data from the BDD study described in Section 8.2. This was done to preserve the integrity of the reliability data sample, in which only experts had been included and given that the BDD study sample contained a few less experienced subjects.
The total number of BDD evaluations included was 7. The following criteria was applied for selection:
• At least 5 years of experience with BDD.
• Acceptable roles were practitioner, mentor, coach, teacher, consultant, manager/supervisor and researcher/academic.
7.3.1.3. Statistic and Variable Selection
The Kappa family of statistics includes the original Cohen’s Kappa, a 2x2 inter-rater reliability statistic, meaning it supports two raters and two objects of evaluation; and Fleiss’ Kappa, an extension to Cohen’s Kappa suited for more than two evaluators. These two statistics were designed for nominal variables (Hallgren, 2012). Other examples of inter-rater reliability statistics include Kendall Coefficient of Concordance W (Kitchenham et al., 1995) and ICC (Intra Class Correlations) for continuous variables (e.g. interval and ratio variables) (Hallgren, 2012; Kitchenham et al., 2017).
The main issue with Cohen’s Kappa is that it misrepresents the inter-rater reliability of a variable in the presence of prevalence or bias (Byrt et al., 1993; Hallgren, 2012). Prevalence means that one of the values has a much higher rate than the other values in the sample. This issue is caused by the fact that Cohen’s

123
Kappa over-adjusts for chance agreement in the presence of prevalence or bias. The reason for this is that it estimates the probability of chance agreement in a fashion that is dependent on the evaluators’ ratings being evenly distributed (fixed-marginal), which is almost always not the case in Software Engineering. This in turn was not a problem in the original application context it was designed for which was fixed-marginal studies related to patient treatment, with participant subjects selected specifically and distributed evenly among the variable values. Bias refers to the situation in which the marginal distributions of values vary significantly between evaluators. The same limitations for prevalence and bias apply to Fleiss’ Kappa. The alternative to fixed-marginal distributions are called free-marginal distributions (Hallgren, 2012).
Byrt et al. defined a Kappa variant called PABAK (Prevalence Adjusted Kappa) to correct the chance adjustment in the presence of prevalence (Byrt et al., 1993). PABAK is free-marginal but does not support more than two evaluators. Gwet mentions a KappaBP, for Brennan & Prediger, which is also a free-marginal kappa-like statistic and a generalized version of the PABAK kappa for multiple raters (Gwet, 2014). Girard in turn describes KappaBP as analogous to Bennet’s S, and chooses that name as identifying the original proponents (Girard, 2016). Girard implemented a version of Bennet’s S (Bennett et al., 1954), which is free-marginal and supports multiple raters and missing data, avoiding the prevalence issue (Girard, 2016, 2020). Gwet proposes a free-marginal Gamma statistic, also called AC1 and AC2 according to the type of scale (Gwet, 2014), which is very robust in the presence of prevalence and bias.
In summary, although initially the Fleiss’ Kappa statistic had been selected, because of prevalence issues, Gwet’s Gamma and Bennet’s S were selected as the main inter-rater reliability statistics for the study. For completeness reasons, and to illustrate the impact of prevalence, the Fleiss’ Kappa value is also presented for the study data.
Given the width and depth of the issues, the subtle variations in statistics and implementations, and the fact that Software Engineering studies are not usually fixed-marginal, these details are included to guide others pursuing similar research. Finally, because of the difficulty found in interpreting references to the various statistics during the research process, and following the recommendations by (Hallgren, 2012), the specific variations and implementations of the statistics applied are provided to ensure repeatability and appropriate interpretation of the results.
Again, as in the preliminary inter-rater agreement study described in Section 7.2, 22 variables were defined, one for each of the UMP metrics, and were calculated for each of the three statistics selected. There were 22 instead of 24 variables because Ratio of roles allowed to adapt was excluded because TDD and BDD do not define roles, and Information tailored to Audience had been removed after the Scrum study.
7.3.1.4. Planning
The TDD-BDD study plan was based on the guidelines for inter-rater reliability assessment studies and has the following characteristics (Hallgren, 2012):

124
• Design not fully crossed, that is, not all evaluators evaluate both practices (since not all participants are experts at both practices).
• Both practices are evaluated by multiple evaluators.
Hallgren also recommends that the evaluation protocol be reviewed, in particular metric scales and ranges (this had already been done after the Scrum study described in Section 7.2); and that evaluators perform practice evaluations as part of their training, but given the long duration of evaluations (around 1hr) this was considered unfeasible (although evaluators were provided with example values from Continuous Integration for every metric).
As defined in Section 4.3, the evaluation process includes the determination of values for all metrics included in the evaluation and adding qualitative comments. The evaluation procedure was described and guided by the questionnaire form. Evaluators received a link to the online questionnaire and were instructed to complete it. The questionnaire was designed for self-administration and trial evaluations were performed by two members of the research team to validate it.
The questionnaire form included the following material:
• Link to the video with the introduction to the UMP.
• Characteristic and metric definitions.
• Example evaluation of Continuous Integration.
Before this study, the UMP evaluation questionnaire was rewritten completely to improve ease of use, with particular care put into improving the evaluation experience and clarifying references to the practice under evaluation. Both the organization and presentation of characteristic and metric definitions were also improved; and example values and comments for all metrics from the evaluation of Continuous Integration were provided inside the questionnaire. The evaluation questionnaire for TDD is available as an example in Appendix D.
7.3.2. Study Execution
TDD evaluation was executed following the same guidelines provided in Section 7.2, evaluators received an email invitation to participate, including access to the evaluation form (which in turn included a link to the UMP introduction video). A few weeks later, participants who had not completed their evaluation were contacted.
During the evaluation of TDD there was no need for clarifications, which might be due to the improvements applied to the evaluation questionnaire form. Also, all invited participants completed the evaluation.
The evaluation data on the implementation of BDD were taken directly from the BDD study data as described in Section 7.3.1.2.
7.3.3. Data Analysis
First, the collected data was reviewed and all scales were normalized to numerical values. Then, data was organized in such a way that each metric had a pair of evaluation records, one for each experimental object, as shown in Table 38.

125
Table 38. Example inter-rater reliability evaluation data structure
Practice Evaluator1 Evaluator 2 Evaluator 3 Evaluator 4 Evaluator 5 Evaluator 6
TDD 1 2 1 2 1
BDD 1 1 1
Following the guidelines by Hallgren, each statistic is presented along with the specific version or variant applied, and also stating the implementation used to calculate its values (Hallgren, 2012). For calculating the inter-rater reliability statistics the agreement R package was used, which calculates multiple statistics. Unlike many other implementations assessed, it effectively supports not fully crossed designs, that is, with data missing in the structures due to the fact that not all evaluators evaluated both practices (as shown in Table 38) (Hallgren, 2012). Another advantage of the agreement R package (Girard, 2020) is that it supports nominal, ordinal and continuous scales. The last ones through ICC (Intra-class correlations) (Kitchenham et al., 2017), which were not applied in this study because the only metric with a continuous scale Ratio of roles allowed to adapt, was excluded because it did not apply. For each metric, the statistic variant was selected according to the metric scale: for nominal variables the standard Kappa-like statistic was used (Gwet’s Gamma, Bennet’s S and Fleiss Kappa) and for ordinal variables the linearly weighted version of the statistic was used (Girard, 2020). The R commands used for the calculations are detailed in Section B.1. The TDD-BDD inter-rater reliability assessment results are shown in Table 39, for each metric three statistics are shown, Gwet’s Gamma, Bennet’s S and Fleiss´s Kappa.
Table 39. Inter-rater reliability results for the TDD-BDD study
Metric Gamma (Gwet)
S (Bennet)
Kappa (Fleiss)
Interpretation for Gamma
(Altman, 1991)
Appropriateness of name -0.090 -0.101 -0.055 Poor
Recognized purpose -0.051 -0.057 -0.017 Poor
Time required to learn to perform 0.103 0.033 -0.001 Poor
Standard introductory course duration
0.350 0.209 -0.101 Fair
Number of new concepts 0.666 0.603 0.290 Good
Conceptual model correspondence 0.251 0.175 0.056 Fair
Conceptual model complexity 0.472 0.257 -0.164 Moderate
Cost of incorrect adoption 0.033 -0.003 -0.007 Poor
Reduction in cost of error 0.796 0.612 -0.941 Good
Safety perception 0.385 0.229 0.114 Fair
Use of restraining functions 0.220 0.083 -0.009 Fair
Timeliness of feedback 0.703 0.679 0.511 Good
Feedback richness 0.506 0.381 0.089 Moderate

126
Metric Gamma (Gwet)
S (Bennet)
Kappa (Fleiss)
Interpretation for Gamma
(Altman, 1991)
People feedback -0.059 -0.086 -0.096 Poor
Automatic feedback 0.876 0.779 0.363 Very good
Defines indicators 0.594 0.405 -0.065 Moderate
Defines checkpoints 0.754 0.597 -0.165 Good
Explicit outcomes 0.876 0.779 0.363 Very good
Level of autonomy 0.505 0.364 -0.008 Moderate
Defines adaptation points 0.264 0.185 0.206 Fair
User attractiveness rating 0.164 0.108 -0.001 Poor
User satisfaction rating 0.256 0.129 -0.342 Fair
Table 40 presents the detail for each reliability level, including the interval for each level and the count of metrics in that level.
Table 40. Summary of reliability levels for the interpretation of statistics’ values
Interpretation Color Minimum value
Maximum value
Count of metrics
Very good 0.81 1.00 2
Good 0.61 0.80 4
Moderate 0.41 0.60 4
Fair 0.21 0.40 6
Poor - 0.20 6
7.3.4. Results and Conclusions
The study produced positive results (moderate to very good) for 10 out of 22 metrics assessed. These results are not comparable with the results from the Scrum study, among other reasons because the statistics used in this study apply a compensation factor to discard coincidence among evaluators that might be due to chance, and are thus more demanding than the inter-rater agreement statistic used in the Scrum study in Section 7.2.
For each metric with poor or fair results potential causes for such lower reliability assessments were identified by analyzing the metrics and the qualitative comments provided by the evaluators. These are the potential causes identified:
• Intrinsic subjectivity:
Some metrics, like Recognized purpose, User attractiveness rating and User satisfaction rating are evidently subjective, their value depends heavily on the evaluator’s experience. In these cases, the dispersion in the sample might be due to differences in practical experience of evaluators.

127
• Subtle metric semantics:
Some metrics have subtle meaning, as in the case of Appropriateness of name, given that some evaluators seem to have considered literally only the name, others how well the name describes the purpose (it is in the context of Self-evident purpose), and some considered the perception of users in this regard, according to their experience. It is interesting to note that in the preliminary Scrum study, this metric also had a negative reliability assessment but at that point this was attributed to an extensive and complicated scale (which was improved and thus might not be the only cause).
This also seems to be the case with Time required to learn to perform, although a reference to the Dreyfus model is made explicit, it is not likely that all evaluators have a unified perspective about what it means to perform the practice at a basic level of ability.
In the case of Cost of incorrect adoption, for some evaluators it had to do with the product, for others with developer experience, for others with the difficulty to detect errors in adoption, and yet for others with the risk of frustration and practice abandonment.
Something very similar, in the wide spectrum of reasons offered, seems to have happened in the case of the Defines adaptation points metric.
• Scale:
There do not seem to be any significant remaining scale problems after the improvements applied in version 3.2, after the Scrum study. As an example, Number of specific conceptual definitions, which has a scale of positive integer values presents a good Gamma value. Nonetheless, there is not sufficient information to confirm that the scale improvements performed on the metrics have produced improvements on reliability (for example, Time required to learn to perform and Standard introductory course duration still present poor values on their inter-rater reliability statistics, although their scales were discretized).
The case of Safety perception is interesting, qualitative comments confirm ample agreement among evaluators but as the scale has three values, there is high dispersion among medium and high values (there are no low values in the sample). This could point to potential improvements on the scale.
• Context sensitivity:
In some cases, for example People feedback, there are clear references in the comments that point to context sensitivity.
In general, the results of the study show clear differences on the reliability of the different metrics. Some patterns are apparent: binomial scales tend to be more reliable (which was expected since the amount of values bears on the statistics’ compensations for agreement due to chance); subjective metrics tend to have lower values; and the same happens with the cases with high context sensitivity.
A less evident pattern is that, depending on the practice or process under study, certain metrics have high agreement, as is the case of Timeliness of feedback for

128
TDD, for which there is unanimous agreement on immediacy, and in general for all Feedback metrics for Scrum. This might also point to higher affinity with specific practices or process in some evaluators (for example, Feedback is one of the most popular usability characteristics among the participants of different studies and interviews conducted as part of the research for this Thesis).
Finally, there is converging evidence in both studies that inter-rater reliability statistics vary not only depending on metric scale and definition, but also according to the object under evaluation (Scrum, TDD, BDD). This seems to point at differences in the true value of the metrics perceived by each evaluator, that is, in the personal subjectivity beyond the features of the UMP and the questionnaires.
7.3.5. Threats to validity
This section presents the threats to validity in the TDD-BDD study following the categorization provided in (Wohlin et al., 2012):
• Threats to construct validity
For this study, construct validity may have been affected by questionnaire design. To assess and improve the clarity of the characteristic and metric definitions a focus group was conducted as described in Section 6.1. Also, internal reviews were conducted by two researchers and the questionnaire was adjusted accordingly. Finally, for this study improvements were applied to the structure and wording of the questionnaire according to evaluator feedback received in the Scrum study, and these latest changes were reviewed and tested by two researchers in the research team.
• Threats to internal validity
Given the relatively simple nature of the statistics applied, and that the study design complies with the guidelines from (Hallgren, 2012), the study is considered internally valid. In particular, recommended statistics that compensate for chance agreement and that deal appropriately with prevalence and bias problems in the sample were used.
The main remaining reservation is that the study results might be due to multiple causes, from differences in evaluation perception for intrinsically subjective metrics to context sensitivity, as described in Section 7.3.4.
• Threats to external validity:
The main restrictions for generalizability are the small sample size and the fact that although it was defined following specific criteria it cannot be considered representative (Kitchenham & Pfleeger, 2008). Given that the study required the participation of experts and that the evaluations take considerable time (around 1hr), this is considered reasonable. Care was taken to ensure that all participants fulfilled the criteria established for participation and a distribution of profiles aligned with the research objectives (as shown on Table 37), in which practitioners and coaches predominate because they are closest to how people use the practice.
This study complements the preliminary Scrum study and provides information from multiple objects of evaluation to assess the inter-rater

129
reliability of the UMP, although as the statistics from the Scrum study cannot be compared to those used in this study, the sample cannot be composed for integrated interpretation.
• Threats to conclusion validity:
The number of observations limits the conclusion validity in this study, and although the Scrum study and this study provide significant information on metric inter-rater reliability, there is not enough information to determine drastic modifications to the UMP (like metric removal). The conclusions from both inter-rater reliability studies have been considered valuable input for recommending metric selection, as described in Section 4.3.2.
7.4. Conclusions
This chapter presented the two reliability assessment studies, the Scrum study and the TDD-BDD study.
The Scrum study is based on the UMP evaluation of Scrum by 13 experts and the statistic used was James’ rWG inter-rater agreement coefficient (James, 1982). The study allowed the identification of basic metric scale problems, which were improved by simplifying and rationalizing scales, as described in detail in Section E.4. Almost half the metrics evaluated presented good or very good agreement coefficients, while 8 presented moderate agreement coefficients, and only 5 presented poor or fair agreement coefficients. The structure of the questionnaire, the clarity of descriptions and examples were also improved after the Scrum study.
In the second study, kappa-like inter-rater reliability statistics were applied, given that they provide more conservative assessment of reliability since they compensate for estimated chance agreement. This might explain the increase in the rate of poor or fair metric assessments (12 out of 22).
It is interesting to note that, although the statistics are not comparable between the two studies, certain contrasts can be observed for metrics on both studies that indicate that part of the differences observed might be due to improvements on the measuring instrument (the questionnaire) and others seem to be due to subjective variation on the perception of the evaluators on the different experimental objects evaluated (Scrum, TDD, BDD).
The consequences of these studies included the elimination after the Scrum study of a metric that was too hard to evaluate, multiple improvements on the evaluation instrument and a categorization of the metrics for helping users select those most appropriate to their context, as described in Section 4.3.2. One of the causes of low reliability detected, subtle metric definitions, might be improved through evaluator training.
Also, the data from the studies was used to create the usability profiles for Scrum, TDD and BDD presented in Section 5.2.

130
Chapter 8. UMP Utility Evaluation
This chapter describes the empirical studies performed to evaluate the utility of the UMP.
As stated in Section 1.3, the main objective of the UMP is to:
• Support the evaluation and enhancement of usability aspects of process and practice.
• Improve the work experience of software developers and the overall effectiveness of process and practice improvement and adoption initiatives.
The utility of the UMP can thus be evaluated in terms of whether the UMP is useful to its users for:
• Evaluating the usability of a process or practice.
• Understanding process and practice usability issues.
• Identifying usability improvement opportunities in processes and practices.
In this chapter, the term evaluation has two meanings, as described in Section 1.4. When referring to UMP utility evaluation, it means assessing how useful the UMP is for its users. When referring to UMP applications to the VMP and BDD, it means using the UMP evaluation process to assess the usability of the specific process or practice.
The main challenge for utility evaluation is the availability of study opportunities that can be representative to some degree of real-life scenarios. In the case of the UMP, this was particularly difficult given that, as has been shown in Chapter 2, it is not common for researchers nor practitioners to reflect on usability as an aspect of process or practice quality (this of course is also one of the reasons why this research is of interest). Also, appropriate UMP users were required to be practitioners or researchers, thus raising the bar for study candidates (for example, students were not considered to be representative users because of their
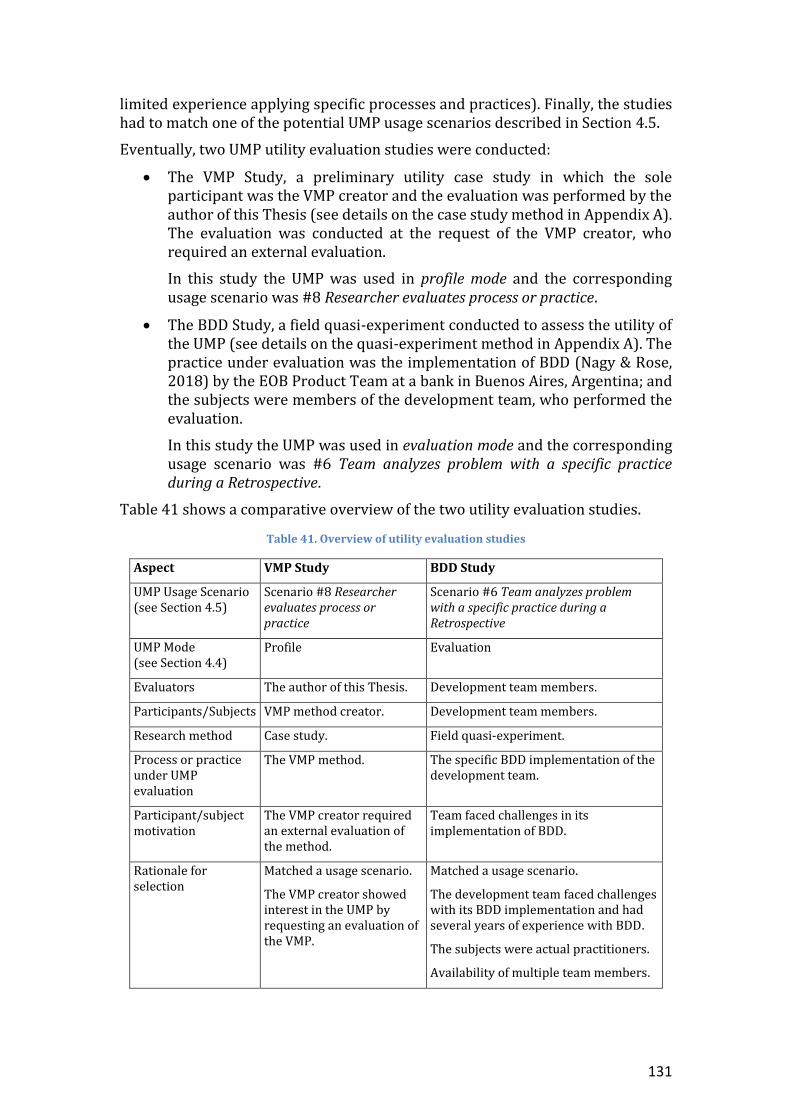
131
limited experience applying specific processes and practices). Finally, the studies had to match one of the potential UMP usage scenarios described in Section 4.5.
Eventually, two UMP utility evaluation studies were conducted:
• The VMP Study, a preliminary utility case study in which the sole participant was the VMP creator and the evaluation was performed by the author of this Thesis (see details on the case study method in Appendix A). The evaluation was conducted at the request of the VMP creator, who required an external evaluation.
In this study the UMP was used in profile mode and the corresponding usage scenario was #8 Researcher evaluates process or practice.
• The BDD Study, a field quasi-experiment conducted to assess the utility of the UMP (see details on the quasi-experiment method in Appendix A). The practice under evaluation was the implementation of BDD (Nagy & Rose, 2018) by the EOB Product Team at a bank in Buenos Aires, Argentina; and the subjects were members of the development team, who performed the evaluation.
In this study the UMP was used in evaluation mode and the corresponding usage scenario was #6 Team analyzes problem with a specific practice during a Retrospective.
Table 41 shows a comparative overview of the two utility evaluation studies.
Table 41. Overview of utility evaluation studies
Aspect VMP Study BDD Study
UMP Usage Scenario (see Section 4.5)
Scenario #8 Researcher evaluates process or practice
Scenario #6 Team analyzes problem with a specific practice during a Retrospective
UMP Mode (see Section 4.4)
Profile Evaluation
Evaluators The author of this Thesis. Development team members.
Participants/Subjects VMP method creator. Development team members.
Research method Case study. Field quasi-experiment.
Process or practice under UMP evaluation
The VMP method. The specific BDD implementation of the development team.
Participant/subject motivation
The VMP creator required an external evaluation of the method.
Team faced challenges in its implementation of BDD.
Rationale for selection
Matched a usage scenario.
The VMP creator showed interest in the UMP by requesting an evaluation of the VMP.
Matched a usage scenario.
The development team faced challenges with its BDD implementation and had several years of experience with BDD.
The subjects were actual practitioners.
Availability of multiple team members.

132
The rest of this chapter is organized as follows: Section 8.1 presents the preliminary case study on the application of the UMP to the VMP method; Section 8.2 presents the study on the application to the implementation of BDD by a development team; and Section 8.3 presents the conclusions of this chapter.
8.1. VMP Study
To evaluate the utility of the UMP a preliminary case study was conducted on the VMP method (Miranda, 2019).
This study was published as part of the research conducted for this Thesis (see Chapter 9) and the VMP, together with the UMP evaluation performed as part of this study, was published in (Miranda, 2019).
Miranda created the VMP at Carnegie Mellon University, where he is a professor in the Software Engineering Master programs. The opportunity for conducting the preliminary case study arose when the VMP method creator asked the Thesis author to perform an external usability evaluation on the VMP. The VMP creator also valued that the UMP was already published, allowing the UMP to be referenced. Given that the VMP method creator required an external evaluation to further his own research activities, the UMP usage by the VMP method creator was restricted to the profile mode (see Section 4.4).
8.1.1. An Introduction to the VMP
The VMP method (Miranda, 2019) was created on top of two existing planning methods, Milestone planning and Participatory planning. Its main contributions are (Miranda, 2019):
“The integration of the milestone planning and participatory planning approaches through a visual planning process.”
“A novel construct called the milestone planning matrix, that systematically and visually captures: 1) temporal dependencies
between milestones and 2) the allocation of work elements to the milestones they help realize.”
“The reification of work packages by means of sticky notes which must be physically accommodated on a resource and time-scaled milestone scheduling canvas to derive the milestones due dates”.
Student teams in the Master of Software Engineering Program at Carnegie Mellon University have successfully used the VMP for planning their capstone projects (Miranda, 2019), and it has also been taught in several industrial and governmental organizations.
8.1.2. Case Study Design
The case study design of the VMP study was based on the concept of model use or application, that is, the study participant had to make use of the UMP (in this case, in profile mode, using only the VMP usability profile) and the study had to produce data to answer the research questions formulated below.
The objective of the study was to:

133
Evaluate if the UMP is useful for the researcher to characterize the usability aspects of the VMP method under study.
The following research questions were formulated to guide the study:
RQ1: Is the UMP applicable to the evaluation of the VMP method?
RQ2: Are the UMP model evaluation results helpful in assessing the usability of the VMP method?
RQ3: Is the feedback produced from the UMP evaluation valuable and applicable from the point of view of the VMP creator?
8.1.2.1. Context Selection
The selection of the VMP case study was based on the following criteria:
• It matched one of the specified usage scenarios (Scenario #8 Researcher evaluates process or practice).
• The VMP presented certain aspects such as reification of work packages as post-it notes and the use of the scheduling canvas as a restraining function visually limiting how much work could be done in a given time unit. These design decisions matched certain usability heuristics such Forcing function (Nielsen, 1994), and thus made it a potentially good fit for usability evaluation.
• The researcher was interested in an external evaluation of the VMP.
• The researcher was the method creator and thus the ultimate VMP expert.
• The researcher was willing to participate in the study.
8.1.2.2. Participants
Two people were involved in the study, the VMP creator, who provided the information and would use the VMP usability profile, and the author of this Thesis, who applied the UMP to the evaluation of the VMP.
The only study participant was the VMP method creator, Eduardo Miranda.
8.1.2.3. Design
This case study is characterized as a descriptive-confirmatory study (Runeson & Höst, 2008), because its main objective is to validate the UMP’s use in real-life, but it is also an Improving study, since it produces actionable feedback on the
case in the form of improvement opportunities for the VMP method. In terms of structure, it is also a holistic case study since it is composed of a single unit of analysis (Runeson & Höst, 2008).
The two sources of information were the single study participant (Miranda) and the VMP description pre-print (Miranda, 2018). The case was the definition of the VMP method (VMP).
The study activities were designed as follow:
• Initial interactions to define the expectations of both parties.

134
• UMP evaluation on the VMP, conducted by the evaluator (Thesis author), using as input the VMP description pre-print (Miranda, 2018) and additional information provided by the VMP creator (for example, comments on VMP user satisfaction).
• Feedback provided by the evaluator to the VMP creator (an early version of
• Table 42) who in turn provided minor comments.
• Final interview in which the VMP creator responded questions from a short feedback questionnaire.
• Data analysis and reporting.
The criteria for answering the research questions were defined as follows: RQ1 would be answered by the feedback from the execution of the UMP Evaluation process by the evaluator. An affirmative answer to RQ1 would arise from an effective execution of the UMP evaluation process (i.e. an evaluation that produced a usability profile for the VMP); RQ2 and RQ3 would be answered through a short feedback questionnaire used during the final interview with the VMP creator. Affirmative answers to the questions in the questionnaire would confirm RQ2 and RQ3, negative answers would not.
8.1.3. Case Study Execution
The initial interactions were aimed at defining the expectations of both parties. Specifically, it was validated with the VMP creator that the evaluation feedback (VMP usability profile) would take the form of a table with metric values and comments, and that the documentation and interview time from the VMP creator would be available. All interactions were made remotely, since the Thesis author and VMP creator lived in different cities (Buenos Aires and Pittsburgh, respectively).
After the initial interactions, the evaluator studied the VMP documentation (Miranda, 2018), planned and executed the UMP evaluation process on the VMP (see Section 4.3). Given that the evaluator was the author of the UMP, the evaluator training activity was not necessary. During evaluation design all characteristics and metrics were included, although during evaluation some metric values were deemed non-applicable. The execution of the evaluation produced a usability profile with evaluation metrics and comments, presented as feedback to the VMP creator as recommended by (Runeson & Höst, 2008), who in turn provided confirmation and minor comments. The final VMP usability profile is shown in
Table 42.
Table 42. VMP usability profile
Characteristic Metric Comments Value
Self-evident purpose
Appropriateness of name
The name describes the essential aspects of the method, that it is visual (and reified), that it is milestone-based and that its purpose is planning.
Highly appropriate

135
Characteristic Metric Comments Value
Recognized purpose
From the experiences described by the VMP creator.
Yes
Learnability Time required to learn to perform
From the experiences described by the VMP creator.
4hs
Standard introductory course duration
Informed by the VMP creator. 8hs
Number of specific conceptual definitions
Outcomes, Dependencies, Milestone Planning Matrix, Milestone Sequence Diagram, Milestone Effort, Cross-cutting Effort, Milestone Dates, Soft Milestone, Hard Milestone. Milestone work package, Effort unit of time, Milestone scheduling canvas, Milestone list.
13
Understandability Conceptual model correspondence
It is a participatory planning activity, where the team is responsible for conducting the plan. The meaning of milestones and due dates is fairly straightforward, as is the rest of the conceptual model.
High
Conceptual model complexity
In general, the data model has low complexity, but specific elements like the pair-wise dependency matrix “roof”, the existence of two types of milestones and two types of effort make the overall data model less simple.
Medium
Safety Cost of incorrect adoption
It seems hard to use the method so badly that it would produce serious damage.
Low
Reduction in cost of error
The focus on milestone planning makes plans “much more stable and practical” than
task or activity-oriented plans (Miranda, 2018). The cost of modifying milestones is lower than that of modifying tasks. Making the plan and its elements visual also makes it easier to detect issues and gauge the impact of modifications.
High
Safety perception The team participates in planning its own work. That provides a safer environment for establishing commitments, since these are not imposed from the outside. Depending on the culture of the organization around the team, and the level of autonomy that the team has in planning and executing the plan, the cost of error may vary.
High
Use of restraining functions
Matching the scheduling canvas scale to the sticky notes size offers visible hard restrictions on milestone planning to avoid resource over-allocation and help validate milestone viability.
Yes

136
Characteristic Metric Comments Value
Feedback Timeliness of feedback
Creating the Milestones Planning Matrix and the Scheduling Canvas provides early feedback on the soundness of the plan.
Prompt
Feedback richness
The feedback confirms that the plan is sound but does not provide more details.
Medium
People feedback The method does not describe a specific stage to request feedback from others.
No
Automatic feedback
Not applicable. No
Visibility Defines indicators The Scheduling Canvas acts as an indicator of project duration.
Yes
Information tailored to audience
Not necessary, the information seems fairly general and without much detail.
No
Controllability Defines checkpoints
The method describes explicitly several checkpoints during planning.
Yes
Explicit outcomes The Milestone Planning Matrix and the Scheduling Canvas are produced by executing the VMP.
Yes
Level of autonomy
Teams have a say and are involved but are not necessarily self-organized.
Medium
Adaptability Defines adaptation points
Milestone sequence diagram is optional. Yes
Ratio of roles allowed to adapt
No roles are defined. Non-applicable
Attractiveness User attractiveness rating
Evaluator opinion after reading the documentation.
4
User satisfaction User satisfaction rating
The VMP creator reports anecdotal positive initial responses encountered in both classroom and industry settings. A more precise measurement of satisfaction might provide interesting insights.
Not available
Metrics marked as non-applicable were initially included in the evaluation but during the evaluation process the information obtained confirmed that they did not apply to the VMP (e.g. since the VMP defines no roles, Ratio of roles allowed to adapt was not applicable). Metrics marked not available mean that the data needed to assign a value was not available (e.g. in the case of User satisfaction rating).
After the final VMP usability profile was delivered, the Thesis author interviewed the VMP method creator to obtain answers to the questionnaire described in the next section. Also, the Thesis author produced improvement recommendations that were proposed to the VMP creator as described in Section 8.1.5.

137
8.1.4. Data Analysis
The fact that the evaluation was effective (because it was able to produce a usability profile for the VMP) confirmed applicability of the UMP (RQ1) and it also produced feedback that was presented to the VMP creator.
The short feedback questionnaire used during the final interview is shown below, along with the corresponding answers:
• Q1: Was the feedback from the evaluation clear and understandable?
Yes.
• Q2: Is the feedback useful and applicable in practice?
Yes. It was also valuable that the UMP model was already published, and that the UMP first author could act as an external evaluator.
• Q3: Is the feedback coherent with the adoption potential perceived in interactions with method users?
Yes. Students are usually very satisfied, and the feedback received is consistent with that positive experience.
• Q4: Are you satisfied with the results?
Yes.
• Q5: Why?
The evaluation touched upon all the main features of the method and highlighted the VMP’s contributions.
The analysis of data was very straightforward, given that there was a single data point and the information was aimed directly at evaluating the UMP model. No content analysis or other techniques were considered necessary.
The questionnaire responses provided confirmation that the evaluation results were applicable to the VMP (RQ1) and useful for its creator (Q2 for RQ2 and the rest for RQ3). This, together with the initial interest of the VMP creator to have the UMP evaluation performed, provided preliminary confirmation that the UMP was perceived as useful by the VMP creator.
8.1.5. Results and Conclusions
Although the VMP study was a preliminary case study, it provided initial confirmation that the VMP creator perceived the UMP as useful. It is also noteworthy that the VMP creator highlighted the fact that the UMP evaluation results touched upon all of the main features of the VMP, hinting that UMP sensitivity (i.e. ability to detect specific or subtle features of the process or practice under evaluation) to the VMP was appropriate. It was also valuable that the UMP evaluation eventually became published along with an introduction to the VMP (Miranda, 2019).
In terms of the evaluation results, it is interesting to note that several salient aspects of the VMP design, such as the reification of work packages as post-it notes and the use of the scheduling canvas as a time-scaled restraining function,

138
matched classical usability principles like affordance and forcing functions (Norman, 1988) and are thus positively highlighted in the evaluation.
The main recommendations provided to the VMP creator were to consider a simplified version of the method for simpler projects (this emerged from the medium value for the Conceptual model complexity metric and the qualitative comments for it, which marked opportunities for simplification) and to include some form of satisfaction evaluation in VMP trainings, to obtain more systematic feedback from VMP users (this was prompted by the lack of data to evaluate the User satisfaction rating metric).
8.1.6. Threats to validity
This section presents the threats to validity of the VMP study, following the categorization provided in (Wohlin et al., 2012):
• Threats to construct validity
For the VMP study, this validity may have been affected by questionnaire design. Care was taken to make answering easy for the respondent, and two researchers reviewed and refined the questionnaire.
• Threats to internal validity
In the VMP study only the VMP creator was interviewed; information about the actual experience of VMP method users is thus not directly available. A recommendation was made to the VMP creator to include direct measures of VMP user experience in future trainings.
Both the VMP creator and the Thesis author had interests at stake in the study, but the study was carefully designed to reduce bias. For the VMP creator, the interest at stake was having an external evaluation of the VMP (preferably a positive assessment), thus, his interest did not introduce bias in this study but rather suggests that the UMP evaluation results were applicable (because the VMP creator requested the assistance of the Thesis author, not the other way around).
Regarding RQ1 in this study, about UMP applicability to the VMP, the bias of the Thesis author is consistent with the stated interest of the Thesis, that is, to create an artifact that can help with actual practice. To offset this perspective, UMP evaluation by external practitioners has been studied and is presented in Chapter 7 and Section 8.2.
• Threats to external validity
To limit the bias towards accepting any available study contexts, the application scenarios for the UMP were defined beforehand and this study matched scenario #8 Researcher evaluates process or practice.
The bias introduced by limited access to study participants can have a significant impact on the VMP usability profile produced by this study, but not on the UMP utility evaluation.
The ability to generalize from a single preliminary study is very limited, that is why the BDD study was designed to complement this study and increase generalizability.

139
• Threats to conclusion validity
The number of observations limits the conclusion validity in this study; that is why it was complemented with the BDD study presented in Section 8.2.
8.2. BDD Study
To further evaluate the utility of the UMP, a second study was performed following the field quasi-experiment method, in which the corresponding usage scenario was #6 Team analyzes problem with a specific practice during a Retrospective (see Section 4.5 for details).
In this case, the study context was more specific than in the VMP Study, since the object of evaluation was the concrete implementation of BDD by the development team, rather than the generic practice of BDD (Nagy & Rose, 2018).
8.2.1. An Introduction to BDD
BDD is a second-generation Extreme Programming practice, in that it is an extension of TDD (Beck, 2002) that relies on tests specified in domain-specific terms and that are readable by all members of the product team (developers, business experts, analysts, testers, etc.). The BDD flow (Ferguson Smart, 2014; Keogh, n.d.; North, 2006) is similar to TDD (and actually includes it), but it also includes the interactions with business experts, analysts, testers and other non-technical team members. Figure 11 shows a representation of the BDD flow adapted from (Paez et al., 2014):
Figure 11. BDD flow
The practice of BDD has the following characteristics:
• Tests are specified first, before any related code is written.
• Tests are specified in domain-specific (i.e. non-technical) terms.
Technical tests
Acceptance tests
Production quality code
Acceptance criteria
Product Design
+ Customer

140
• Tests are usually automated using specific tools, like Cucumber (Hellesøy, 2008), RSpec (Astels et al., 2005), Fit (Cunningham, 2002) or Fitnesse (Martin & Martin, 2003).
• Tests aim at describing the behavior of the system as a whole, not of specific components.
• Tests can interact with the system under test through different interfaces: user interfaces, distributed services, internal/in-memory APIs, or data access technologies, among others.
• Quality attributes usually important for BDD tests include performance, reliability, readability, and significance (the value that the tests bring).
The practice of BDD has become mainstream in the last few years, it has had significant presence in conferences like the International Conference on Agile Software Development (XP Conference) and many books have been published on the subject (Ferguson Smart, 2014; Nagy & Rose, 2018; Wynne & Hellesøy, 2012). It has also become of interest to researchers (Solis & Wang, 2011).
8.2.2. Field Quasi-experiment Planning
The experimental design of the field quasi-experiment was based on the concept of model use or application, that is, the subjects had to make use of the UMP and the study had to produce data to answer the research questions.
The objective of the field quasi-experiment was to:
Evaluate if the UMP is useful for a software development team to identify BDD implementation challenges and improvement
opportunities, in order to increase internal adoption and improve developer experience.
The study was conducted in a real-life scenario to provide significant utility validation.
The following research questions were formulated to guide the study:
RQ1: Is the UMP perceived as useful to users for identifying improvement opportunities in the implementation of BDD?
RQ2: Do users intend to use the UMP in the future?
RQ3: Is the UMP perceived as easy to use?
RQ4: Does using the UMP affect the BDD challenges identified?
The scenario described the context as a retrospective and thus, the first design decision was to present the study to its subjects as a retrospective in which the researchers would act as facilitators (the fact that an empirical study was taking place was also made visible to the subjects). This provided two benefits:
1. Integrating the activity as one of the team’s regular activities, thus reducing participant stress and promoting more natural behavior.

141
2. Aligning the UMP’s overall objective of improving developer’s experience with the retrospectives’ purpose, which is for the team to reflect and improve their way of working.
The second decision was about which UMP mode to use, profile (as in the previous VMP study), evaluation (as in the reliability studies described in Chapter 7) or framework. The profile mode had the advantage of making it easier for the team members to analyze the usability of BDD by using its UMP profile (i.e. without having to perform the evaluation themselves), but it also had a main disadvantage, that the evaluation required to produce such a UMP profile for BDD would not be for the team’s specific context but a generic BDD profile. The evaluation mode (marked with an asterisk) was eventually selected, and Table 43 shows the rationale for the selection.
Table 43. Rationale for UMP mode selection in the BDD study
UMP Mode Advantages Disadvantages
Evaluation* The object of evaluation would be the team’s own implementation of BDD, not the generic practice.
The process of evaluation itself might create insights related to the usability of their BDD implementation in the team members.
Obtaining data from independent evaluations by non-expert practitioners.
The team had to dedicate 1hr to the evaluation.
Not all team members were experts, which had been the preferred evaluator type in previous studies.
Profile The team would not need to dedicate time to the evaluation but use the evaluation profile previously produced by a group of experts.
A group of BDD experts might be convened to produce a BDD profile through UMP evaluation.
The object of evaluation would be the generic BDD practice.
It would require additional subjects (i.e. the BDD experts) to create the BDD profile.
Framework The UMP checklist used in framework mode might be easier to use than the UMP model itself.
Constructing and validating the UMP checklist would require more preliminary work.
8.2.2.1. Context Selection
Several candidates were available for this study. The EOB team was selected because the object of evaluation was concrete and traceable to well-known a Software Engineering practice (BDD).
The EOB team complied with the following criteria:
• It matched one of the specified usage scenarios; specifically, scenario #6 Team analyzes problem with a specific practice during a Retrospective.
• The development team faced challenges with its BDD implementation and had several years of experience with BDD.

142
• The team was interested in external help on dealing with their BDD challenges.
• The members of the team were actual practitioners.
• The team was willing to participate in the study.
The EOB Product Team had started working on their product two and a half years before the study, implementing since the beginning the practice of BDD. The selection of this practice, along with several others like Continuous Integration, Automated Build, Automated Delivery Pipeline, TDD (Test Driven Development), Infrastructure as Code, and other organizational practices like Retrospectives, had been part of the original team charter and sponsored by the client (the IT management team at the bank). The team was a mix of developers and agile coaches from an agile software development firm and developers from the bank. Part of the team’s charter was to improve the quality of the software produced by implementing organizational and technical practices, by integrating domain and technical experience through the bank’s developers, testers and analysts, and agile technical and organizational practices from the agile software development firm.
The level of BDD experience on the team varied greatly, from junior to senior BDD practitioners with several years of experience.
Initial interest on usability of BDD arose from the growing challenges the team faced with obtaining feedback from the automated acceptance tests, since as the product grew larger and the number of tests increased, the total time required to run the complete test suite increased, becoming more and more frustrating for the developers. This problem was particularly acute since the team had selected a strategy of running full stack acceptance tests, that is, tests including all the architectural components of the system (i.e. web UI, business services, databases, etc.). The total build time had grown from 15 to close to 50 minutes. This had been addressed by the team in several ways as part of their standard continuous improvement initiatives, and the team had reduced the test execution times significantly (around 50%) by parallelizing test execution and optimizing test implementation, but still the developer’s experience was not satisfying. Also, there was varied discipline among the team members on the application of BDD. Although creating automated acceptance tests was a universally accepted practice among team members (and their acceptance test coverage was carefully evaluated by the team on a regular basis) some team members created their acceptance tests a posteriori, not following the BDD development flow (Nagy & Rose, 2018).
The team had grown during the past few years and eventually split into several sub-teams, all of which relied heavily on the agile technical practices of Continuous Integration and Test Automation, among others, to coordinate their work.
To confirm the state of BDD practice in the EOB Team, part of the initial questionnaire that the subjects responded included questions about this. Table 44 presents the items of the initial questionnaire on the state of BDD practice at the EOB team.

143
Table 44. State of BDD practice questionnaire
# Question
1 How many years of experience do you have in software development?
2 Where did you learn BDD?
3 Had you practiced BDD before joining the EOB team?
4 Have you practiced BDD with other technologies?
5 How much of your work you do with BDD
6 How much of your work has acceptance tests?
7 How much of your work has a priori acceptance tests?
8 How much of your work has a priori and automated acceptance tests?
9 Which difficulties or challenges do you find in practicing BDD in the EOB team?
The first question assessed their perception on how much of their development work they performed using BDD. Figure 12 shows the responses:
Figure 12. Responses to: How much of your work do you do with BDD?
As can be seen in Figure 12, only 5 out of 12 (0.42) team members state that they perform half or more of their work using BDD. It is also interesting to note that only one participant states that none of the work is done using BDD.
To further understand the state of their practice, subjects were asked about how much of their development work had acceptance test specifications. Here the positive results were much higher, 7 out of 12 (0.58) stated that approximately half or most of their work had acceptance tests specifications. This implies that some of the acceptance tests are specified a posteriori or in some other way that does not follow the BDD flow. This is consistent with the observations of some subjects stating that specifying tests a priori is challenging. Figure 13 shows the results:
None, 1, 8%
A small part, 6, 50%
Approximately half, 2, 17%
Most, 3, 25%
None A small part Approximately half Most

144
Figure 13. Responses to: How much of your work has acceptance tests?
To further describe the state of their practice, and to crosscheck their perceptions about their BDD practice, subjects were asked about how much of their development work had acceptance test specifications defined a priori (meaning, before implementing the behavior specified, this being the expected BDD flow). Here the results were that 5 out of 12 (0.42) stated that approximately half or most of their work had acceptance tests specified a priori. Figure 14 shows the results:
Figure 14. Responses to: How much of your work has a priori acceptance tests?
As shown, the EOB team had an established practice of BDD, which presented challenges and was not homogenously adopted, although almost everyone in the team (except one person) explicitly stated that they performed BDD.
8.2.2.2. Subjects
The study subjects were all members of the EOB Product Team, they were selected randomly by inviting them all and allowing voluntary participation. Of the 20 EOB
None, 1, 8%
A small part, 4, 34%
Approximately half, 3, 25%
Most, 4, 33%
None A small part Approximately half Most
None, 1, 8%
A small part, 5, 42%Approximately
half, 4, 33%
Most, 2, 17%
None A small part Approximately half Most

145
Product Team members, 12 accepted the invitation to participate in the study. Although in this Thesis the EOB subjects are described as part of one team, in reality the size of the group exceeded what is generally recommended for agile teams and they worked in several sub-teams operating independently and coordinating mostly by a shared code repository and practices like Continuous Integration, Feature Toggles and Continuous Delivery.
The following graphs show the demographics of the EOB team’s 12 subjects. The majority were senior team members with previous experience with BDD.
Figure 15 shows the participant’s years of experience with software development:
Figure 15. BDD study subjects’ years of experience in software development
As can be observed, although there is a wide range of experience, most of the subjects are senior developers and only two (out of 12) have less than 5 years of experience.
Figure 16 shows the results obtained in the second demographic question, regarding where they had learned the practice of BDD.
Figure 16. Distribution of places where subjects learned BDD
As can be clearly seen in Figure 16, most of the subjects learned the practice of BDD at their current job. It is worth noting that the question allowed multiple answers, given that it is reasonable to assume that learning a specific professional
1 1
3
1
2
1
2
1
0
0.5
1
1.5
2
2.5
3
3.5
2 4 5 7 9 13 14 16
Years
0 2 4 6 8 10 12
In college
In a course I took on my own
In my current job
In a previous job
Froom books, articles, conferences

146
practice is probably done partly in educational environments and partly as “on-the-job” training.
Figure 17 shows the responses to the following question, “Had you practiced BDD before working at the EOB team? “, aimed at confirming prior experience.
Figure 17. Results on subjects’ prior experience with BDD
As can be seen in Figure 17, half of subjects had had prior experience with BDD, although not necessarily with the same technologies as those used in the EOB team.
This leads to the next question: “Have you practiced BDD with other technologies?” for which Figure 18 shows the results obtained.
Figure 18. Responses to Had you practiced BDD with other technologies?
As can be seen in Figure 18, the portion of subjects that have practiced BDD with other technologies (5 out of 12) is one lower than the portion of the subjects that have practiced BDD before (6 out of 12), meaning than almost all BDD practitioners with previous experience also had been exposed to other technologies.
Yes, 6, 50%No, 6, 50%
Maybe, 0, 0%
Yes No Maybe
Yes, 5, 42%
No, 7, 58%
Maybe, 0, 0%
Yes No Maybe

147
All of these confirm the general EOB Team’s experience with BDD and software development in general.
8.2.2.3. Variable Selection
Given that the study was designed to evaluate UMP utility in a real-life scenario, the application of the UMP to the evaluation of f BDD by the EOB Team was the single treatment applied.
The independent variable was the UMP evaluation. The dependent variables for the study were selected by following the Technology Acceptance Model (TAM) (Davis, 1989). The TAM is widely used to evaluate the perceptions of people about a technology or construct, in this case, the UMP. The TAM defines three variables of interest: Perceived Usefulness (PU), Perceived Ease of Use (PEOU) and Intention to Use (ITU).
Given that the objective of this study was to evaluate the utility of the UMP, the main variable of concern was Perceived Usefulness (PU), but the other variables are also used to characterize how users perceive the UMP.
The definition for each of the variables is given below:
• Perceived Usefulness (PU): describes the degree to which a subject perceives the UMP as effective for them to accomplish their objectives.
• Perceived Ease of Use (PEOU): describes the degree to which a subject believes that learning to use and using the UMP will be easy.
• Intention to Use (ITU): describes the degree to which a subject intends to use the UMP in the future.
To operationalize the definition of the variables a questionnaire was designed following the recommendations described in (Davis, 1989). Following this approach, a set of questions was defined for each variable. Table 45 shows the set of questionnaire items (see the example questionnaire for TDD in Appendix D). The items were adapted from the questionnaire proposed by Moody (Moody, 2003), and were all structured with 5-point Likert scale. The items were also randomly ordered for each participant and were alternatively formulated as opposed questions to reduce bias.
Table 45. BDD study items used to measure variables
Id Question
PEOU1 The Usability model was simple
PEOU2 The UMP evaluation questionnaire was easy to follow
PEOU3 It was easy for me to use the UMP to evaluate BDD
PU1 The UMP was useful for me to understand the challenges in practicing BDD
PU2 The UMP was useful for me to understand the causes of the challenges in practicing
BDD
PU3 The UMP seemed to me to be useful to improve on the adoption of BDD
PU4 The UMP was useful to me to think and propose improvements to our BDD practice
PU5 The UMP may help in the adoption of processes and practices

148
Id Question
PU6 The UMP seemed to me to be useful to improve the adoption of difficult practices
ITU1 I would recommend the UMP
ITU2 If in the future we adopt a practice, I would use the UMP to evaluate it
ITU3` It would be easy for me to become skilled at using the UMP in the future
To evaluate the internal consistency and reliability of the questionnaire, that is, how well correlated the different questions for each variable were, the Cronbach’s Alpha statistic (Cronbach, 1951) was calculated during questionnaire design on trial data. One requirement for Cronbach’s Alpha is that all questions included in the calculation should be for the same variable, thus three Alpha values were used for the questionnaire, one for each group of questions related to each variable (PU, PEOU, ITU). The resulting Cronbach’s Alpha values for each variable on the trial data is presented in Table 46.
Table 46. Cronbach's Alpha for BDD study trial data
Study Variable Cronbach’s Alpha for test data
PU 0.8
PEOU -18
PTU 0.96
Values above 0.7 are considered good (Maxwell, 2002). The negative Alpha for PEOU was considered to be due to very different levels of experience with the UMP in the trial data (provided by the Thesis author and a fellow researcher), and this was confirmed by a very high Alpha value for PEOU in the study sample data.
The Cronbach’s Alpha values were calculated using the ltm R package by (Rizopoulos, n.d.), using its non-standardized variation. These details are presented here to foster reproducibility and appropriate interpretation following the guidelines proposed in (Hallgren, 2012).
8.2.2.4. Hypothesis Formulation
The field quasi-experiment’s null hypotheses were defined as follows:
• HPU0: UMP is perceived as not useful. HPU1 = HPU0
• HPEOU0: UMP is perceived as hard to use. HPEOU1 = HPEOU0
• HITU0: There is no intention to use the UMP in the future. HITU1 = HITU0
The field quasi-experiment’s objective was to find enough statistical evidence so as not to accept the null hypothesis and thus possibly accept the alternative hypotheses.
8.2.2.5. Design
The field quasi-experiment’s design was based on the objectives and driven by the null hypotheses. The object of study was the UMP. The experimental object was

149
the EOB team´s implementation of BDD. The experimental subjects were the members of the EOB Team.
The field quasi-experiment was designed as a pretest/posttest study (Privitera & Lynn, 2018), qualitative data was gathered before and after the UMP evaluation, although the perceived utility information could only be gathered after the UMP evaluation.
8.2.2.6. Procedure, Materials and Tasks
The field quasi-experiment was organized in the following four activities:
1. Introduction (20min)
In this activity, an introduction to the UMP, including examples, was presented to the subjects. The Thesis author used the same slides as those used in the video material provided to subjects in previous studies (the link is available in Appendix D).
The subjects filled an initial questionnaire on the state of BDD adoption at the EOB Team, including demographic information. Part of this information (item number 9 in Table 44) was used to provide pre-test data on BDD adoption challenges, which was later on compared to the post-test data on BDD adoption challenges produced from the brainstorming session using content analysis (see Section 8.2.4.3).
2. UMP Evaluation (1hr)
The subjects evaluated their BDD implementation by applying the UMP. They received a link to the UMP evaluation questionnaire (see an example questionnaire in Appendix D).
3. Brainstorming (30min)
After evaluating their BDD implementation using the UMP, a brainstorming session was facilitated so that the team could identify challenges and improvement opportunities in their implementation of BDD. From the point of view of the study, the purpose of this activity was to apply the UMP to the identification of improvement opportunities.
4. Feedback (10min)
The subjects filled a feedback questionnaire with the items described in Table 45. The purpose of this questionnaire was to evaluate the subjects’ perceptions regarding the UMP.
Table 47 shows a list of materials used in the field quasi-experiment, detailing in which activity they were used and referencing the table/appendix of this Thesis which provides further details about them.

150
Table 47. Materials used in the BDD study
Activity Experimental materials Detailed in
1 Introduction UMP Introductory slides.
State of BDD questionnaire.
Table 44
2 UMP Evaluation UMP Evaluation of BDD questionnaire.
As an example, a very similar questionnaire used in the TDD study is presented in Appendix D
3 Brainstorming Blank wall, post-its and markers. -
4 Feedback Feedback questionnaire. Table 45
The four activities of the field quasi-experiment were designed to be aligned with the typical structure of a retrospective (Derby & Larsen, 2005), see Section 8.2.2 for the rationale behind this decision. The mapping between the field quasi-experiment activities the retrospective stages is shown in Table 48.
Table 48. BDD study activities and retrospective stages
Study activity Retrospective stage
1 Introduction 1 Check-in
2 UMP Evaluation 2 Gather data
3 Brainstorming 3 Generate Insights
- - 4 Decide what to do
4 Feedback 5 Check-out
The only retrospective stage that was not addressed was stage number 5 of the retrospective, decide what to do, where the team usually commits to specific improvement actions to be conducted. This was so given that the motivation for the study and the primary driver for its timing was the research agenda and not the team’s own agenda, thus it was decided it was better not to press the team into committing to specific actions. It must be noted that although this study was conducted as a retrospective, it did not take place at the end of a sprint but in the middle, complementing but not replacing their standard retrospective.
8.2.2.7. Analysis Procedure
The procedure for answering the research questions is defined in Table 49.
Table 49. Criteria for answering BDD study research questions
Research Question Associated variable Criteria
RQ1 PU Hypothesis test P(PU=Yes < 0.7)
RQ2 ITU Hypothesis test P(ITU=Yes < 0.7)
RQ3 PEOU Hypothesis test P(PEOU=Yes < 0.7)

151
8.2.3. Field Quasi-experiment Execution
The session in which the field quasi-experiment was executed lasted 2hs and was conducted as a retrospective facilitated by the Thesis author and a fellow researcher, both with ample experience in retrospective facilitation and previously familiar with the EOB Team.
During the introduction, the Thesis author presented the UMP. During UMP evaluation of their BDD practice, the subjects could ask questions from the facilitators to obtain support in the use of the UMP. Figure 19 shows the subjects during the UMP evaluation:
Figure 19. Subjects participating in the field quasi-experiment
The brainstorming was performed using post-it notes and broad pointed markers that allowed subjects to read the post-its when they were posted on a wall. The objective was to identify challenges and improvement opportunities in their practice of BDD. The subjects were encouraged to discuss and were prompted to post their post-its as they wrote each one so that others could read them and participate in the collaborative process. The subjects were prompted to place one challenge or improvement opportunity they identified in each post-it. This then allowed the subjects to cluster the post-its by affinity, activity that was supported by the facilitators (this followed standard agile practice and thus was quite natural for the subjects). Then the facilitators prompted the subjects to write labels for the clusters, so that each cluster would have an explicit title, and to use the UMP concepts if that made sense to them, as title candidates. Figure 20 shows the post-its in the wall at the end of the brainstorming session:

152
Figure 20. BDD study post-it wall from brainstorming
Although the details of individual post-its notes is not easily readable, it might be easier to read the yellow post-its that represent labels added at the end to the clusters. In the next section the detailed content from the post-its is listed and analyzed along with the rest of the quantitative data.
After the brainstorming, the subjects filled the feedback questionnaire.
8.2.4. Data Analysis
The data analysis for the study was mainly centered on the quantitative data produced in the Feedback activity of the study in which the subjects filled the feedback questionnaire. There was also valuable insight in the analysis of qualitative data on the team’s challenges and improvement opportunities produced in the brainstorming, which is described in Section 8.2.4.3.
The quantitative data was initially processed to normalize all questions to positive scales (they had been alternatingly stated as opposed questions as described in Section 8.2.2.3).
The data gathered from the UMP evaluation of BDD was not analyzed in this study, but it was used to create the BDD profile described in Section 5.2.
8.2.4.1. Descriptive Statistics
The quantitative data was first analyzed through descriptive statistics to provide initial exploratory results. The first statistic evaluation performed was
determining the sample data Cronbach’s Alpha, which characterizes the questionnaire’s internal consistency, as described in Section 8.2.2.3. The values for Cronbach’s Alpha for each variable on the participant’s data are presented in Table 50.

153
Table 50. Cronbach's Alpha for BDD study data
Study Variable Cronbach’s Alpha
PU 0.693
PEOU 0.815
PTU 0.7
The Cronbach’s Alpha values were calculated as described in Section 8.2.2.3. Values above 0.7 are considered good (Maxwell, 2002). It is noticeable that as expected, the value of Cronbach’s Alpha for PEOU (0.815) is very good, although the trial value obtained during questionnaire design was negative. Cronbach’s Alpha for PU (0.693) is only marginally below 0.7 and thus considered good enough.
The descriptive statistics were evaluated for each question and then for each variable. Also, the 5-point Likert scale variables for each question and each study variable (PU, PEOU, PTU) were transformed into Yes/No nominal variables to help answer the research questions.
The transformation to Yes/No was performed as follows:
• 4 and 5 were evaluated as Yes.
• 3 was evaluated as Do not know/Will not answer (#? in Table 51)
• 1 and 2 were evaluated as No.
Table 51 shows the descriptive statistics for the questions in the feedback questionnaire.
Table 51. Descriptive statistics for BDD feedback questionnaire
Id Question Median Std.
Dev.
# Yes # No # ?
PEOU1 The Usability model was simple 3 0.94 4 3 5
PEOU2 The UMP evaluation questionnaire was easy to follow
3 0.82 2 5 5
PEOU3 It was easy for me to use the UMP to evaluate BDD
4 1.04 10 2 0
PU1 The UMP was useful for me to understand the challenges in practicing BDD
4 0.93 7 2 3
PU2 The UMP was useful for me to understand the causes of the challenges in practicing BDD
4 0.92 7 1 4
PU3 The UMP seemed to me to be useful to improve on the adoption of BDD
3 0.92 5 2 5
PU4 The UMP was useful to me to think and propose improvements to our BDD practice
4 1.21 8 3 1
PU5 The UMP may help in the adoption of processes and practices
4 0.82 6 1 5
PU6 The UMP seemed to me to be useful to improve the adoption of difficult practices
3 0.54 2 1 9
ITU1 I would recommend the UMP 3 0.82 6 1 5

154
Id Question Median Std.
Dev.
# Yes # No # ?
ITU2 If in the future we adopt a practice, I would use the UMP to evaluate it
3 0.79 6 2 4
ITU3 It would be easy for me to become skilled at using the UMP in the future
4 0.87 8 1 3
The color highlighting shows medians varying between 3 and 4. It is noticeable that two out of the three questions about PEOU and ITU have median 3, while only 2 out of 6 questions about PU have medians of 3.
Another noteworthy observation is the very high number (9 out of 12) of “Do not know/Will not answer” for question PU6, this seems related to the fact that the question asks generally about “difficult practices”, and this is consistent with feedback from UMP users in this study and in previous studies, that evaluating more concrete objects (like the BDD practice) seems to be easier than evaluating more abstract objects (like difficult practices in general).
There are 5 questions (a significant number) with 5 “Do not know/Will not answer” answers. This effectively reduced the sample size for answering the research questions. There is open controversy around the use of odd numbered Likert scales since they make these results possible, but at the same time enable respondents to answer so when they are not definite about the subject. This is also dependent not only on whether the scale is even or odd, but on the labels attached to each option. In the questionnaire, the middle value 3 was associated with the label “Neither agree nor disagree”, openly allowing this kind of answer.
8.2.4.2. Hypothesis Testing
In this section the inferential statistical analysis applied to the study sample data is presented.
Before testing the research study hypotheses defined in Section 8.2.2.4, a generic null and alternative hypothesis were defined for each question in the questionnaire:
HQ0: The response to question Q was not positive. HQ1 = HQ0
Then, a test was designed for HQ0 as follows:
HQ0: P (Yes/sample) < 0.7 with alpha = 0.05
The objective of the test was to check if there was enough available evidence from the sample to reject the null hypotheses HQ0. These hypothesis tests were later used to support interpretation of the study’s hypotheses.
This was stated under the assumption of 0.7 as a reasonable threshold for determining the population majority’s perception.
Given that the study sample was small, the distribution could not be considered approximately normal and thus the p-value was calculated using the standard binomial distribution probability (McClave et al., 2008) (see Appendix B for a discussion of how each p-value was calculated). Table 52 shows the p-values for each item.

155
Table 52. P-values for BDD study questions
Id Question p-value
PEOU1 The Usability model was simple 0.838
PEOU2 The UMP evaluation questionnaire was easy to follow 0.142
PEOU3 It was easy for me to use the UMP to evaluate BDD 0.021
PU1 The UMP was useful for me to understand the challenges in practicing BDD 0.051
PU2 The UMP was useful for me to understand the causes of the challenges in practicing BDD
0.032
PU3 The UMP seemed to me to be useful to improve on the adoption of BDD 0.069
PU4 The UMP was useful to me to think and propose improvements to our BDD practice
0.052
PU5 The UMP may help in the adoption of processes and practices 0.032
PU6 The UMP seemed to me to be useful to improve the adoption of difficult practices
0.163
ITU1 I would recommend the UMP 0.047
ITU2 If in the future we adopt a practice, I would use the UMP to evaluate it 0.069
ITU3` It would be easy for me to become skilled at using the UMP in the future 0.015
The p-values on Table 52 show the test significance for each question. P-values in green are below the alpha value 0.05, meaning the test found enough evidence to reject the null hypothesis HQ0 for that question, that is, that P (Yes) < 0.7. P-values in red are way above alpha, meaning the test did not find enough evidence to reject HQ0. That is the case of PEOU1, PEOU2 and PU6. P-values in yellow are close to but still above alpha, thus, with a significance level of 0.05 there is not enough evidence to reject HQ0 for them either.
To answer the study’s research questions, the values for each question group were aggregated to define the values for each study variable PU, PEOU and PTU. This is acceptable given that the Cronbach’s Alpha value for each of the three question groups, as presented in Table 50, were in the “good” range (Maxwell, 2002).
First, for each study variable a null hypothesis was defined
HPU0: UMP is not perceived as useful. HPU1 = HPU0
HPEOU0: UMP is not perceived as easy to use. HPEOU1 = HPEOU0
HITU0: There is no intention to use UMP. HITU1 = HITU0
Then, a test was designed for each of these hypotheses, as follows:
HPU0: P (Yes/sample) < 0.7 with alpha = 0.01
HPEOU0: P (Yes/sample) < 0.7 with alpha = 0.01
HITU0: P (Yes/sample) < 0.7 with alpha = 0.01
Also, given that question aggregation had increased the sample size for each variable, another type of test became viable and was performed. Since the variables are categorical (being binomial), Pearson’s 2 (Chi square) test of the one-way table variation was performed. The one-way table 2 test checks if the proportions of the categories match the expected values. The conditions for the

156
statistic were satisfied, particularly the sample size of 5 or more per category (McClave et al., 2008).
First, for each of the variables a null and alternative hypothesis were defined as follows:
HPUC0: PU response population proportion is as expected.
HPUC1 = HPUC0
HPEOUC0: PEOU response population proportion is as expected.
HPEOUC1 = HPEOUC0
HITUC0: HITU response population proportion is as expected.
HITUC1 = HITUC0
Then, a test was designed for each of these hypotheses, as follows:
HPUC0: Proportions are Yes = 0.8, No = 0.2.
HPEOUC0: Proportions are Yes = 0.8, No = 0.2.
HITUC0: Proportions are Yes = 0.8, No = 0.2.
The 0.8 proportion of Yes assessed in this test is not the same as the 0.7 threshold used in the previous test. The reason for this is that the Binomial probability test is based on an accumulated probability, and this one on the exact proportions.
A rejection region for the null hypothesis was defined in the test with alpha = 0.05. For this test, the rejection region was made larger since from the point of view of the BDD study, testing that the proportions were precisely 80-20 was less important (and less probable) than testing the accumulated probability of Yes being higher than a given threshold. This is so because the goal of the study if to evaluate UMP utility, not exact probabilities.
Table 53 presents the inferential statistics for each of the study’s dependent variables.
Table 53. BDD study inferential statistics
Variable Name
Binomial
p-value
(alpha=0.01)
2
p-value
(alpha=0.05)
# Yes # No # ?
PU Perceived Usefulness 0.0031 0.7094 35 10 27
ITU Intention to Use 0.0087 0.6831 20 4 12
PEOU Perceived Ease of Use 0.0312 0.0186 16 10 10
As shown in Table 53, the binomial probability test p-values for PU and ITU are below alpha, thus the test found enough evidence to reject the null hypothesis in those two cases, while for PEOU it did not. It must be noted that the significance level (p-value) for the binomial probability test is one order of magnitude better for PU and ITU over that of PEOU.

157
As for the Pearson’s 2 (Chi square) test of the yes/no proportions, Table 53 shows that there is enough evidence to reject HPEOUC0, but not enough to reject HPUC0 and HITUC0. Notice that for the Pearson’s 2 (Chi square) test the null hypotheses are not negative.
8.2.4.3. Qualitative Data Analysis
As described in the beginning of Section 8.2, the objective of the BDD study was to evaluate the utility of the UMP for identifying challenges and improvement opportunities in the team’s implementation of BDD. Qualitative data analysis was focused on the two data sources related to this issue:
• Pre-test data: an open question on the subject in the initial questionnaire filled at the beginning of the session (item number 9 in Table 44).
• Post-test data: the post-it notes produced during the brainstorming.
The technique applied is Content analysis, a systematic and simple technique for qualitative data analysis. Content analysis follows six steps, as described by (Johannesson & Perjons, 2014):
1. Choose text samples: as has already been explained, the texts were the answers to the open question in the initial questionnaire and the post-it notes from the brainstorming activity.
2. Break the texts down into units: the units of analysis selected were sentences.
3. Develop analysis categories: categories should be appropriate for the research questions being answered. Initially the analysis categories selected were the UMP characteristics, but after reviewing the collected data the UMP metrics were chosen because they provided more fine-grained categories and also better matched the emerging clusters in the brainstorming session (shown in Figure 20). The actual categories are then based on UMP metrics but specific categories were added as needed for each sample.
4. Code the units according to the categories: each unit was assigned to one or more categories.
5. Count the frequency of the units for each category: the number of units in each category was counted for both pre-test and post-test data.
6. Analyze the texts in terms of unit frequencies in each category: the number of units in each category was counted and compared as shown in Table 56.
Table 54 shows the sample of texts from pre-test data, describing challenges on BDD practice identified by team members in the initial questionnaire.

158
Table 54. Challenges to BDD adoption identified in initial questionnaire
Participant Responses to initial question on BDD challenges Category
P1 The time it takes to run is a great obstacle. Timeliness of feedback
P1 Most times I end up making the acceptance tests once the development of the production code is well under way.
Conceptual model correspondence
P2 It is very slow for me; It takes too long to test what I am doing.
Timeliness of feedback
P2 Most of my time is spent dealing with test problems, not with problems with the code I write.
Feedback richness Tooling*
P2 I was not effective for me that businesspeople write them, most of the time we had to rewrite completely what was written.
People feedback
P2 Several of the tests are very fragile and break without a real error.
Feedback richness
P3 Challenges, many, since the test specification may come associated with the difficulty of the business itself.
Business Complexity*
P3 Also, the process of transferring the practice to people that do not come from the industry is complex (for example, businesspeople at the bank).
Learnability
P4 Test execution is very slow, context configuration is complicated, step definition design is confusing, tests are coupled to the implementation, step reuse complicates refactoring, tests are hard to execute from the IDE (and debug), it is difficult to generate good test data.
Timeliness of Feedback Tooling*
P5 Not having a business representative with whom to write tests (might cause missing some scenario).
People feedback
P5 Difficulty debugging acceptance tests. Tooling*
P6 - using selenium to access page elements. Tooling*
P6 - long execution times and iteration between tests. Timeliness of Feedback
P7 Feedback delays, test fragility, specification redundancy.
Timeliness of Feedback Tooling*
P8 They don’t always have a good definition or it is not clear what they want to accomplish, from the business side.
People feedback
P9 The feedback cycle is very slow. Timeliness of Feedback
P10 Depending on the maturity of the organization, in certain cases it made it hard for subjects to understand.
Understandability
P10 It was hard to adopt that first you have to describe the behavior clearly and then implement it.
Conceptual model correspondence
P11 The time it takes to execute the tests (because of technological restrictions).
Timeliness of Feedback
P12 The feedback cycle for the technology is very slow. Timeliness of Feedback
P12 It is sometimes difficult to involve the businesspeople in building/validating the scenarios.
People feedback
Note: categories marked with an asterisk (*) are not UMP metrics nor characteristics
Table 55 shows the sample of texts from the post-test data. There is no participant information in this sample because it was not a feature of the typical collaborative agile practice for the team during retrospectives.

159
Table 55. Text data from post-it notes produced in brainstorming
Post-it notes produced during brainstorming Category
Agreement among teams (“standards”) People feedback
Lack of business involvement People feedback
More customer participation People feedback
Scenario validation with customers is not good People feedback
Business participation in writing People feedback
Enable cucumber access for the business People feedback
Improvement in execution times Timeliness of Feedback
Faster build Timeliness of Feedback
Feedback speed Timeliness of Feedback
Feedback Timeliness of Feedback
Local and Jenkins build time Timeliness of Feedback
Feedback time Timeliness of Feedback
Faster feedback Timeliness of Feedback
Delayed feedback. Execution time. Timeliness of Feedback
Slow test execution Timeliness of Feedback
Unstable acceptance tests that fail randomly Feedback richness
More stable build Feedback richness
Build instability (test fragility) Feedback richness
Test fragility (build) Feedback richness
Debug mode! Tooling*
Execution from the IDE Debug Tooling*
Work repetition in test implementation Tooling*
Context generation Tooling*
User creation (profiles) Tooling*
Ease of running a subset of tests Tooling*
Heavy environment Tooling*
Note: categories marked with an asterisk (*) are not UMP metrics or characteristics
Finally, Table 56 shows the comparison of frequencies from pre-test to post-test count.

160
Table 56. Content analysis pre-test/post-test frequencies for labels
Labels Initial
Frequency
Final
Frequency
Timeliness of Feedback 8 9
Tooling 5 7
People feedback 4 6
Feedback richness 2 4
Conceptual model correspondence 2 0
Learnability 1 0
Understandability 1 0
Business complexity 1 0
Total 24 26
The categories in rows highlighted in yellow in Table 56 are the only ones that appear in the brainstorming. The first pattern to notice is the high reduction in categories from the initial questionnaire (pre-test) to the brainstorming (post-test), only half of the categories remained. Also, no new categories were identified. This seems to indicate a narrowing of the subjects’ perspective produced during the session; this is not necessarily due to UMP use, since three of the disappearing categories are actually part of the UMP, but it might be due to bias towards action, which is a central aspect of the retrospective, which might focus subjects on the highest priority items for improvement action.
Another noticeable pattern is that the two categories with the highest frequencies have a more technical perspective in this case: Timeliness of Feedback issues are caused by long test execution times, and Tooling issues are obviously technology oriented. On the other hand, the two other categories remaining have a more organizational perspective: People Feedback items pointed to challenges with feedback provided by people interactions, and Feedback richness challenges, in this case, are related to mistrust in test results. For these last two categories, particularly People feedback, using the UMP seems to have increased awareness of those challenges (count increased from 4 to 6). At the end of the session itself, a couple of participants commented that they had not expected the People Feedback aspect to appear so prominently, and that it was an interesting result.
The highest frequency category, Timeliness of Feedback, saw little change, this means that the most painful challenge for the team was well identified before using the UMP, but at the same time, matched a UMP metric.
It must be remarked that Business Complexity is the only category not directly related to the UMP that was present in the analysis. It is also interesting to note that categories for more abstract issues (Learnability, Understandability, Business Complexity) do not appear in the final sample. This might imply that the UMP helped filter less concrete items, which might be less useful from an improvement perspective.

161
Finally, it can be noted how the constraints provided by post-it size and the fact that felt-tip pens are used to make them more readable result in shorter sentences in the final data from the brainstorming.
8.2.5. Results and Conclusions
The results of the data analysis provide the answers to the research questions:
• RQ1: Is the UMP perceived as useful to users for identifying improvement opportunities in the implementation of BDD?
The criterion for answering RQ1, as described in Table 49, was passing the hypothesis test on P(PU=Yes < 0.7). The test significance result (p-value) PU of 0.0031 is below the alpha=0.01 defined for the test, thus providing enough evidence to reject the null hypothesis P(PU=Yes < 0.7). Thus, the answer to RQ1 is affirmative.
• RQ2: Do users intend to use the UMP in the future?
The criterion for answering RQ2, as described in Table 49, was passing the hypothesis test on P(ITU=Yes < 0.7). The test significance result (p-value) ITU of 0.0036 is below the alpha=0.01 defined for the test, thus providing enough evidence to reject the null hypothesis P(ITU=Yes < 0.7). Thus, the answer to RQ2 is affirmative.
• RQ3: Is the UMP perceived as easy to use?
The criterion for answering RQ3, as described in Table 49, was passing the hypothesis test on P(PEOU=Yes < 0.7). The test significance result (p-value) PEOU of 0.0312 is above the alpha=0.01 defined for the test, thus not providing enough evidence to reject the null hypothesis P(PU=Yes < 0.7). Thus, the answer to RQ3 is negative.
• RQ4: Does using the UMP affect the BDD challenges identified?
The qualitative results shown in Section 8.2.5 show that after using the UMP only half the original content categories remained, this might be described as a focusing process, in which some issues were disregarded. Also, it is noticeable that the remaining categories were those with the highest initial frequencies, thus UMP use did not make any new categories appear, but it might have increased awareness of more organizational issues, like People feedback, since subjects emphasis had initially been on more technical issues like Timeliness of Feedback and Tooling.
This focusing effect might also be partly due to the structure and purpose of the retrospective, which is to identify improvement opportunities.
The answers to the research questions are consistent with the expected results. Regarding the main goal of the study, they confirm that UMP is perceived as useful, thus providing positive evidence of UMP perceived utility. In particular, low Perceived Ease of Use might be caused by UMP core design decisions including: UMP comprehensiveness, with all appropriate characteristics from the UMP sources included and UMP complexity, given that it is composed of 10 characteristics and 23 metrics. These decisions, added to the fact that it takes new users around 1 hour to perform an evaluation, make it reasonable and even

162
expected that Perceived Ease of Use would be low. To partially address this issue, a categorization of metrics was defined to aid in metric selection, see Section 4.3.2. Also, content analysis shows changes in the challenges/improvement opportunities identified, with a narrowing focus on the top challenges and increasing awareness of People Feedback issues, which was not initially perceived as a top issue by most of the subjects.
Beyond the answers to the research questions, the review of individual items in Table 51 and Table 52 shows that items that are more general in nature, like PEOU1, PEOU2, and PU6, have more negative results than those that are more specific, like PEOU3. This observation is also supported by the fact that although PEOU is perceived as much more negative than PU and ITU, PEOU3 is perceived as much more positive than PEOU1 and PEOU2. This is consistent with informal feedback received from evaluators that evaluated more than one object and stated that they felt more comfortable evaluating more concrete objects like the BDD implementation at the EOB team than the more generic Scrum framework.
Another interesting finding was provided by qualitative data analysis, which highlights a growth in awareness of usability factors after using the UMP, and also, a narrowing of that awareness (from 8 to 4 categories) towards more concrete issues like People Feedback and away from more generic issues like the UMP characteristics, Learnability and Understandability. This trend is somewhat similar to the one described in the previous paragraph about individual items in the questionnaire, since both show a tendency towards focusing on more concrete factors. This might be due to the fact that rating individual metrics is one of the more concrete actions during UMP evaluation, while UMP characteristics are only commented on. Thus UMP evaluation might act as a lens that focuses user attention onto its more prominent features, and abstracts away those that are less so. It is of particular interest that awareness of People Feedback challenges grew by a factor of 0.5, given that people interactions are at the core of the BDD practice. This might be due to the fact that most of the team members are technical developers, and thus might tend to focus on what is more familiar to them, like tooling and test execution challenges. Or it might stem from the fact that Timeliness of feedback issues produced more immediate pains on team members.
When comparing the study results with the subjects’ responses to the initial questionnaire about their BDD practice, it is worth mentioning that 7 out of 13 subjects stated they do half or more of their work using BDD and 8 out of 13 stated that they specify their acceptance tests before developing functionality. This is consistent with some responses provided in the initial questionnaire about this being a challenge. It is noteworthy that this concern does not show up in the brainstorming session post-it notes. This might imply that team members that do not specify acceptance tests before coding do not see this as something to improve, having naturalized working as they do. The fact that this challenge did not come up would also mean that other team members have also implicitly accepted this status quo.
8.2.6. Threats to Validity
In this section the threats to validity for the BDD study are presented, following the categorization provided in (Wohlin et al., 2012):

163
• Threats to construct validity:
For the BDD field quasi-experiment, care was taken to use variables based on widely used concepts: PU, PTU and PEOU were taken from the TAM (Davis, 1989).
Construct validity might also have been affected by questionnaire design. Care was taken to make answering easy for the respondents: initial and final questionnaires were kept short (no more than 10 questions), three researchers reviewed and refined the questionnaires extensively. To check questionnaire consistency in measuring each variable, Cronbach’s Alpha
was calculated for the questionnaire trial data and the actual subject’s data.
To avoid bias, research hypotheses and objectives were not informed to subjects, questions were stated in alternating positive and negative fashion, and question order was randomized.
• Threats to internal validity
Given that the study objective was to evaluate UMP utility, it was prioritized to conduct the study in a naturalistic context, in which controlling factors is very hard. A field quasi-experiment was selected as the study research method since the focus was on evaluating UMP utility in a real-life scenario in which there were actual adoption challenges. With such an approach, given that it is not possible to use a control group or randomize subjects or control certain factors, studies cannot establish cause and effect relationships (Privitera & Lynn, 2018). On the other hand, given that the UMP is a relatively novel artifact as described in Chapter 2, there was no alternative treatment to apply. Thus, it made no sense to use a control group or randomized subjects.
Also, since the subjects applied the UMP to their own challenges, it is considered reasonable that they acted as their own control group (Privitera & Lynn, 2018), given that only their perceptions before and after using the UMP are evaluated.
• Threats to external validity
As described in Section 8.2.2, the study was designed to be naturalistic (Johannesson & Perjons, 2014), conducted in a natural setting for the study subjects. It was also framed as a retrospective, so that it took the form and purpose of a standard practice for any agile team. This was by design, to favor representativeness while undermining internal validity.
Although the subjects were not randomized, a wide spectrum of participant seniority and specific experience with BDD was present in the sample, thus providing a more balanced sample in those respects. Regarding organizational maturity, the organization has 12 years of experience with agility, including retrospectives. Such length of experience might make it easier for subjects to reflect on their practice and not be representative of the experience of less mature teams. At the same time, this is consistent with UMP design objectives, as described in Section 1.3, since UMP aims at helping improve practitioners’ work experience.

164
Also, the fact that the team faced BDD adoption challenges and thus was intrinsically motivated to use the UMP might make the sample more representative than other subjects, for example, students. This preexisting need was a part of the criteria for context selection and is typical in quasi-experiments, in which such preexisting case factors are usually of interest and cannot be controlled.
• Threats to conclusion validity
The hypothesis tests used to answer the research questions were performed using standard binomial statistics, with very few applicability constraints and carefully avoiding assuming normality. Also, all of the requirements for applying Pearson’s 2 tests were met.
Qualitative data analysis also showed changes in challenge identification among subjects after using the UMP, although this is also consistent with the focus on concrete improvement associated with retrospectives.
8.3. Conclusions
This chapter presented two UMP utility evaluation studies. The evaluation in both studies was designed to be naturalistic (Johannesson & Perjons, 2014) to provide evidence about UMP utility obtained from actual practice instead of from laboratory studies. The VMP study provided preliminary confirmation that the UMP was useful. The BDD study results provided stronger confirmation of UMP utility, with a larger sample of subjects and allowing for more subtle qualitative and quantitative data analysis, including inferential statistics. In the BDD study, UMP perceived usefulness, intention to use and ease of use were evaluated following the variables defined in the TAM (Davis, 1989). The BDD study results confirm that the UMP was perceived as useful and that subjects intend to use it in the future, although it was not perceived as easy to use. This is the expected result given the size and complexity of the UMP, and it is also interesting to note that subjects in this and previous studies stated that UMP evaluations were simple when the object of evaluation was specific and concrete (e.g. their own BDD implementation for the EOB Team), and hard when the object of evaluation was more generic (e.g. Scrum).
Overall, these results provide valuable general confirmation on UMP utility along with information about the contexts in which it might be used more easily. It also highlights that there is space for improvement in UMP ease of use.

165
Chapter 9. Conclusions and Future Work
This chapter presents the conclusions obtained through the research developed in this Thesis and outlines future work. It is organized as follows: Section 9.1 presents the main contributions of this Thesis, Section 9.2 presents the justification of the achievement of the main objective of this Thesis, Section 9.3 outlines future research lines that emerge from the findings obtained in this Thesis and opportunities to transition its contributions towards development teams and organizations in industry, and Section 9.4 lists the publications produced to disseminate the results of this Thesis.
9.1. Thesis Contributions
As described in Chapter 1, the focus of Design Science Research is to produce artifacts that will improve some specific practice, and scientific knowledge about them. This Thesis undertook the creation and evaluation of the UMP, a usability model for software development processes and practices. Therefore, the main contributions of this Thesis are the UMP, the knowledge created by the empirical studies conducted for evaluating its reliability and utility (mainly with practitioners), and the usability profiles for processes and practices commonly used in the software development industry. These contributions are summarized as follows:
• A Usability Model for Software Development Process and Practice. The UMP establishes a definition and systematic way to evaluate, reflect on and improve software process and practice usability. The UMP was designed and evaluated to ensure that it was reliable and useful for both practitioners and researchers. It should help practitioners and coaches to identify and deal with the challenges of process and practice adoption, and organizations to plan and conduct improvement initiatives. Researchers can also benefit from a usability model if they are interested in expanding the limited research on the subject, or they can use it to evaluate their proposed solutions.
The UMP was constructed in a rigorous way and refined iteratively (see Figure 2) to produce its current version (see Chapter 4). It has been applied

166
internally by the research team to the evaluation of Continuous Integration (see Section 4.3.1) and the VMP (see Section 8.1), and by independent evaluators to the evaluation of Scrum (see Section 7.2), TDD (see Section 7.3) and BDD (see Section 8.2). The UMP includes the model itself, an evaluation process defined to promote consistent evaluations, and the evaluation profile produced by the evaluation process; usage modes were also defined to accommodate different contexts of use, and usage scenarios were specified to guide evaluations (see Chapter 4).
• Knowledge created through empirical studies.
Relevant knowledge was created through several empirical studies performed during this Thesis’ development (see Figure 21).
o An SMS was conducted to establish the state of the art on process and practice usability, confirming that very limited research on the matter existed (see Chapter 2).
o A focus group was conducted to obtain expert feedback on the clarity, understandability, precision, and relevance of UMP characteristics and metrics. This not only confirmed the relevance of all UMP characteristics but led to the improvement of UMP characteristic and metric definitions as well as the elimination of unclear or irrelevant metrics (see Chapter 6).
o Two UMP reliability assessments, the Scrum study and the TDD-BDD study (see Chapter 7), which produced information that led both to the improvement of UMP metrics (see Appendix E) and to producing suggestions on how to select metrics according to context (see Section 4.3.2).
o Two UMP utility studies, first the VMP study, a preliminary case study (see Section 8.1); and then the BDD study, a field quasi-experiment performed on the implementation of BDD by a development team at a small software development company working on a financial industry product (see Section 8.2). Both provided confirmation that the UMP was useful for its users for characterizing the usability of the VMP and the team’s BDD implementation; and identifying improvement opportunities. In the case of the VMP, the improvement opportunities identified were to define a simplified version with less elements for projects without milestone dependencies and to perform user experience measurement through participant surveys to confirm user satisfaction (see Section 8.1). In the case of the BDD implementation, the improvement opportunities identified were to improve test execution time, test reliability, customer collaboration by asking the customer for more direct involvement with writing and validating test scenarios, and test execution and debugging tools (see Section 8.2).
Figure 21 shows an overview of research studies conducted for this Thesis (the number of participants is shown in parentheses).

167
Figure 21. Overview of research studies conducted
• Usability profiles for processes and practices used in agile software development.
Usability profiles are the set of UMP metric values (and comments) produced during evaluations. They characterize the usability of a specific process or practice that was evaluated with the UMP.
The research conducted in this Thesis produced concrete usability profiles for several agile processes and practices and the VMP (see Table 26). All in all, 39 expert evaluations were performed: 37 external and 2 internal; one for Continuous Integration, one for the VMP, 13 for Scrum, 17 for TDD and 12 for BDD. Also, non-experts contributed 5 more external evaluations as part of the BDD study.
These usability profiles might help future users to identify potential issues and plan usability improvements or adoption tactics to work around those issues gracefully. The agile processes and practices evaluated have a solid practitioner base and thus their usability profiles have a wide target population of practitioners in industry, and researchers and students in academia.
These usability profiles were produced in specific contexts, and thus they are not necessarily representative of other contexts in which practitioners might make use of them. In some cases, particularly those like the TDD profile, in which 17 different experts provided their perspective through UMP evaluation, this might be more representative; on the other end of the spectrum, the BDD profile produced is specifically representative of the
Res
earc
h S
tud
ies
Study Objective Participants
SMSEstablish the state of the art
of software process and practice usability
Feasibility study Demonstrate viability Scrum experts (2)
Focus group studyObtain feedback on the
characteritics and metricsSoftware process and
practice experts (5)
Scrum studyAssess UMP inter-rater
agreementScrum experts (13)
TDD-BDD studyAssess UMP inter-rater
reliabilityTDD (17) and BDD (7)
experts
VMP study Evaluate UMP utility VMP creator (1)
BDD study Evaluate UMP utility BDD practitioners (12)

168
challenges of a single team, thus, its ability to provide representative value in other contexts might be limited.
9.2. Achievement of the Thesis Objective
The objective of this Thesis has been achieved through the execution of the Design Science Research activities, as follows:
• Explicate Problem
To achieve the main objective of this Thesis the following tasks were performed:
o The problem was stated and motivated in terms of failures that occur in software process and practice improvement conducted without thinking of people as users of their processes and practices. These failures could be the consequence of incorrect adoption or failed agile transformation initiatives. Since usability characterizes good interactions between users and tools that are appropriate and satisfactory to use (International Organization for Standardization, 2011), applying usability concepts to process and practice might improve the probability of success of those improvement initiatives (see Section 1.2).
o The first step towards achieving this objective was to establish the state of the art for software process and practice usability through a rigorous SMS. This SMS confirmed that no usability models existed for software development processes and practices, that existing research on the field was quite preliminary and that there was little evaluation or validation in industry contexts (see Chapter 2).
• Define Objective and Requirements
To define the main objective and requirements for this Thesis the following tasks were performed:
o The objective of this Thesis was defined as “Define and evaluate a usability model for software development processes and practices, with the aim of enhancing their usability, in order to improve the work experience of software developers and the overall effectiveness of process and practice improvement and adoption initiatives“ (see Section 1.3).
o The second task was to define the artifact structure. It was defined that the UMP take the form of a quality model with characteristics and metrics, and an evaluation process was defined to support consistent evaluation of processes and practices using UMP (see Section 4.3).
o The UMP was required to be useful and reliable; usage scenarios were specified to describe how the UMP was to be used by its users and guide UMP evaluation. The scenarios describe potential users (researchers, development teams, process improvement teams), their goals in using the UMP, and how they would use it (see Section

169
4.5). UMP reliability is about the ability of the model to produce consistent results when used by different subjects on the same software process or practice (see details in Chapter 7).
• Design and Develop Artifact
The UMP was initially constructed from three sources, Kroeger et al.’s process quality model (Kroeger et al., 2014), the International Standard on Software and Systems Quality ISO 25000 (International Organization for Standardization, 2011) and classic literature on product usability (Norman, 1988)(Nielsen, 1994) (see Chapter 3).
The UMP consists of several elements: The UMP itself, with its characteristics and metrics (Section 4.2), the UMP evaluation process (Section 4.3), and the usability profile resulting from the evaluation of a specific process or practice, comprised of metric values and additional comments (see an example in Section 4.3.1). UMP usage modes were added to support different contexts of use and particularly, different types of users (see Section 4.4).
The UMP was iteratively refined through several empirical studies, first a focus group to produce expert feedback (see Section 6.1) and then inter-rater reliability assessment studies (see Chapter 7). The UMP was refined according to the feedback produced in these studies. and through internal collaboration by the research team (see Chapter 6).
The current UMP version is composed of 10 characteristics and 23 metrics, its structure is shown in Figure 22.

170
Figure 22. UMP structure
• Demonstrate Artifact
The feasibility of the UMP was demonstrated initially through the evaluation of Scrum by two external experts (see Section 5.1). This initial evaluation confirmed viability of the UMP and provided initial feedback from experts to improve the UMP and the evaluation materials.
• Evaluate Artifact
As utility and reliability were the two UMP requirements defined (see Section 1.4.2), the UMP was evaluated from these two perspectives:
1) Inter-rater reliability, to assess the consistency of evaluations by different evaluators.
UM
P
Self-evident purposeAppropriateness of name
Recognized purpose
Learnability
Time required to learn to perform
Standard introductory course duration
# Of new conceptual definitions
UnderstandabilityConceptual model correspondence
Conceptual model complexity
Feedback
Timeliness of feedback
Feedback richness
People feedback
Automatic feedback
Visibility Defines indicators
Safety
Cost of incorrect adoption
Reduction in cost of error
Safety perception
Use of restraining functions
Controllability
Defines checkpoints
Explicit outcomes
Level of autonomy
AdaptabilityDefines adaptation points
Ratio of roles allowed to adapt
User attractiveness User attractiveness rating
User satisfaction User experience rating

171
2) Utility, to determine if it was considered useful by its users, mainly practitioners and one researcher.
The two inter-rater reliability assessment studies were the Scrum study (see Section 7.2) and the TDD-BDD study (see Section 7.3). The Scrum study produced preliminary feedback on UMP inter-rater reliability, from which metric scales and evaluation materials were improved. The TDD-BDD study provided stronger evidence on UMP metric reliability and prompted a categorization for metric selection, distinguishing core metrics (which seem valuable in all studied contexts), recommended metrics (which seem valuable in most contexts) and complementary metrics (which seem highly context sensitive and less valuable) (see Section 4.3.2).
For evaluating UMP utility two studies were conducted: the VMP study and the BDD study. The VMP study was conducted through a case study (see Section 8.1) and the BDD study through a field quasi-experiment (see Section 8.2). The results obtained from both empirical studies produced evidence that actual UMP users found it useful.
In the VMP study, the VMP creator (a researcher) used the VMP usability profile to characterize the usability of the method and received feedback from the Thesis author on improvement opportunities. In this study the VMP creator used the UMP in profile mode, and the study matched Scenario #8 Researcher evaluates process or practice (see Section 4.5).
In the BDD study, members of a software development team (practitioners) used the UMP to identify improvement opportunities and challenges that were limiting their adoption of BDD and causing a negative experience (e.g. delayed feedback from long test execution times and lack of effective customer feedback). In this study the team used the UMP in evaluation mode, and the study matched Scenario #6 Team analyzes problem with a specific practice during a Retrospective (see Section 4.5).
All in all, this Thesis has produced the UMP and empirical evidence that it is useful for evaluating software development processes and practices usability; and identifying usability related improvement opportunities. This evidence has been collected in real-life contexts (both industry and academic) in which the UMP was aligned with actual user needs. Moreover, evidence was obtained that points to positive intention of the practitioners to apply the UMP in the future. On the other hand, only two out of 10 usage scenarios have been evaluated, so that there is no evidence about UMP usage in those scenarios. Furthermore, the framework mode has not been evaluated. Finally, the usability profiles produced might be valuable, but their utility has not been assessed beyond the VMP study.
9.2.1. Additional Emergent Results
The following are additional results that emerged from the research conducted in this Thesis:
• Individual metrics highlight significant usability problems with software process or practices. For example, in the BDD study (see Section 8.2), many practitioners discovered problems they had not explicitly

172
noticed before when evaluating the People feedback metric, while most of them had already detected issues with Timeliness of Feedback.
The implicit hypothesis was that usability problems would relate directly to whole characteristics, and thus, all the related metrics would produce negative values for any given problem. What actually happened was that specific metrics highlighted usability issues. This not also makes metrics more valuable, because they point to specific usability issues, but it also confirms that they do not have much overlap.
• More concrete processes and practices seem to be easier to evaluate. For example, the BDD implementation by a team seemed to be easier to evaluate than more abstract ones, like Scrum as a generic framework. This has been indicated as formal and informal feedback by experts and junior practitioners, so it does not seem to be due to experience.
• UMP is not perceived as easy to use (in evaluation mode). Although the experimental materials were easy to follow, the overall perception of users is that the UMP is not easy to use. This seems to be due to long evaluation times (around 1hr) and the fact that some metrics are hard to evaluate. To improve this situation, one alternative already supported by the evaluation process is to select a reduced set of the proposed metrics. To support metric selection, a categorization has been proposed: core, recommended and complementary (see Section 4.3.2).
9.3. Future Research Lines
The research conducted throughout this Thesis has opened many lines of future work, from the research point of view as well as from the practical point of view, to enable the transfer of UMP towards practitioners in the software industry. The following are some potential future lines of work:
• Publish a web site on software process and practice usability targeting practitioners and researchers. Potential features of this site include:
o Publish existing usability profiles for popular or challenging processes and practices, from data already available and data obtained from future research.
o Quick UMP evaluation questionnaire with a reduced set of proposed metrics, to promote data collection and improve sample size.
o Provide generic guidelines for usability improvement based on the evidence gathered and expert recommendations. This could also be strengthened with examples from specific evaluations already conducted.
• Improve UMP ease of use. The UMP evaluation mode has proven (as expected) to be demanding on evaluators, not only because of the time it takes but because of the mental effort involved. In evaluation mode, UMP users evaluate a specific software process or practice by assigning values to each metric and adding qualitative comments. Therefore, the improvements might include:

173
o Generating and publishing usability profiles on the website for other processes and practices, so that practitioners can use them without performing the evaluations.
o Refine the metric selection step in the evaluation process and validate the proposed categorization (core, recommended and complementary, see Section 4.3.2) to ensure that it improves the UMP user experience in evaluation mode.
o Develop materials for and evaluate the proposed UMP framework mode, in which the UMP is used as a usability framework for process and practice improvement, acting as a checklist that provides potential risks/root causes that can assist in planning and assessing adoption/improvement initiatives (see Section 4.4).
• Continue research on software process and practice usability.
o Improve on the evidence generated about UMP utility, by applying the UMP in different modes to different scenarios, and replicating or refining the studies already conducted. Specifically, the framework mode has not been evaluated (see Section 4.4), and only scenarios #6 and #8 have been evaluated (see Section 4.5). More research is needed in order to make more general observations about the value provided by the UMP for practitioners and researchers.
o Further assess the relationship between usability and the state of current practice in industry through case studies or field experiments. For example, one of the underlying assumptions related to the objective of this Thesis is that low adoption rates for processes or practices might correlate well with usability issues, as in the case of TDD, which rates very well for Feedback metrics but poorly con Conceptual model correspondence (because test-first seems to make users uncomfortable, see Section 8.2) and Appropriateness of name (because its name mentions tests but it is a design technique).
9.4. Dissemination of Results
This section presents the publications produced during the development of this Thesis, some that present specific results of the Thesis and others that emerged along the way and that are related to the research conducted.
9.4.1. Thesis Publications
• Fontdevila, D., Genero, M., Oliveros, A., & Paez, N. (2019). Evaluating the Utility of the Usability Model for Software Development Process and Practice. In X. Franch, T. Männistö, & S. Martínez-Fernández (Eds.), Product-Focused Software Process Improvement (pp. 741–757). Springer International Publishing. https://doi.org/10.1007/978-3-030-35333-9_57
This paper presents the preliminary UMP utility evaluation through the VMP study, along with the latest version of the UMP. It provided initial confirmation that the UMP was useful for a real world researcher and the

174
VMP usability profile produced in the VMP study was also published in (Miranda, 2019).
• Fontdevila, D., Genero, M., & Oliveros, A. (2017). Towards a Usability Model for Software Development Process and Practice. In M. Felderer, D. Méndez Fernández, B. Turhan, M. Kalinowski, F. Sarro, & D. Winkler (Eds.), Product-Focused Software Process Improvement (pp. 137–145). Springer International Publishing. https://doi.org/10.1007/978-3-319-69926-4_11.
This paper presented the initial version of the UMP, along with its feasibility study in which Scrum was evaluated by two external experts. It also provided opportunity for obtaining valuable feedback from the research community on the UMP.
• Fontdevila, D. (2016). Usability of Process and Practice, 3rd ICSE 2017 PhD and Young Researchers Warm Up Symposium, Buenos Aires, Argentina. https://lafhis.dc.uba.ar/icsewp2016/
This ICSE warmup symposium poster allowed a very early version of the ideas in this Thesis to be reviewed and improved. After receiving advice from the mentor at the symposium, it was decided that the Thesis required a more structured form and it was determined that it would be structured around a usability model for software processes and practices.
• Fontdevila, D. (2014). A Tool Evaluation Framework based on Fitness to Process and Practice. A usability driven approach. ICSEA, International Conference on Software Engineering Advances, Nice, France, (pp. 15–21). https://www.thinkmind.org/index.php?view=article&articleid=icsea_2014_1_30_10155
This initial paper presented the idea of process and practice usability, and applied the concept to a very concrete problem, the selection of tools for supporting processes and practices. The proposed solution was a usability framework devised to help users find tools that matched their ways of working by checking accordance with usability principles rather than selecting tools based on traditional criteria for tool evaluation, like functionality and cost.
9.4.2. Thesis Publications in Progress
Most of the evaluations conducted in this Thesis, both inter-rater reliability assessment studies (see Chapter 7) and the BDD study (see Section 8.2) have not been published yet. The two following articles are undergoing preparation to be submitted to JCR indexed journals as soon as possible:
• Fontdevila, D., Genero, M., Oliveros, A., & Paez, N. Assessing Inter-rater Reliability for the Usability Model for Software Development Processes and Practices. Software Process and Practice Journal (John Wiley & Sons Ltd). Impact Factor (JCR): 1.78. Quartile: Q2.
This paper describes the inter-rater reliability evaluations performed on the UMP to assess consistency among metric values produced by different

175
evaluators. It presents two inter-rater reliability assessment studies, the Scrum study and the TDD-BDD study. The paper presents four inter-rater reliability statistics for the process and practices under study, a comparative analysis of their strengths and weaknesses, presents an analysis of the study results and their interpretation, and how the UMP was refined from the data gathered in the studies.
• Fontdevila, D., Genero, M., Oliveros, A., & Paez, N. A Field Quasi-experiment for Evaluating the Utility of the Usability Model for Software Development Processes and Practices. Journal of System and Software (Elsevier). Impact Factor (JCR): 2.450. Quartile: Q1.
This paper presents the field quasi-experiment conducted to evaluate UMP utility in a real industry project performed with a software development team from a small company working on a financial industry product . It presents the BDD study, describing how UMP utility was evaluated by conducting a single group pre-test/post-test study using quantitative and qualitative methods. In this study the team was experiencing actual BDD adoption challenges and used the TAM (Technology Acceptance Model) to measure perceived usefulness, perceived ease of use and intention to use in the future. Results from 12 team members show that they found the UMP useful, intend to use it in the future, but did not find it easy to use.
9.4.3. Other Related Publications
This section presents other publications on subjects related to this Thesis, they are organized in three groups: HELENA initiative (HELENA Group, n.d.), a global survey on hybrid development methods and practices; state of agile practice research initiative, results from a research project undertaken by the research group at Universidad Nacional de Tres Febrero, of which the Thesis author is a member; and one related publication on the application of feedback to practice improvement in higher education.
9.4.3.1. HELENA Global Survey on Hybrid Methods
• Kuhrmann, M., Tell, P., Hebig, R., Klünder, J., Münch, J., Linssen, O., Pfahl, D., Felderer, M., Prause, C. R., MacDonell, S. G., Nakatumba-Nabende, J., Raffo, D., Beecham, S., Tüzün, E., López, G., Paez, N., Fontdevila, D., Licorish, S. A., Küpper, S., Ruhe, G., Knauss, E., Özcan-Top, Ö., Clarke, P., McCaffery, F., Genero, M., Vizcaino, A., Piattini, M., Kalinowski, M., Conte, T., Prikladnicki, R., Krusche, S., Coşkunçay ̧ A., Scott, E., Calefato, F., Lanubile, F., Pimonova, S., Pfeiffer, R., Pagh Schultz, U., Heldal, R., Fazal-Baqaie, M., Anslow, C., Nayebi, M., Schneider, K., Meier, A., Sauer, S., Winkler, D., Biffl, S., Bastarrica, M. C. and Richardson, I., What Makes Agile Software Development Agile?, (submitted to IEEE Transactions on Software Engineering).
• Paez, N., Fontdevila, D., Oliveros A. (2017) HELENA Study: Initial Observations of Software Development Practices in Argentina. In: Felderer M., Méndez Fernández D., Turhan B., Kalinowski M., Sarro F., Winkler D. (eds) Product-Focused Software Process Improvement. PROFES 2017. Lecture Notes in Computer Science, vol 10611. Springer, Cham. https://doi.org/10.1007/978-3-319-69926-4_34

176
9.4.3.2. State of Agile Practice
• Paez, N., Oliveros, A., Fontdevila, D., Zangara, M. A., (2019), Introducing Agile Methods in Undergraduate Curricula, a Systematic Mapping Study, Congreso Argentino de Ciencias de la Computación CACIC 2019, Rio Cuarto, Argentina.
• Paez, N., Oliveros, A., Fontdevila, D. (2019) Initial Assessment of Agile Development in the Undergraduate Curricula. In: Meirelles P., Nelson M., Rocha C. (eds) Agile Methods. Workshop Brasileira em Métodos Agile WBMA 2019. Communications in Computer and Information Science, vol 1106. Springer, Cham. https://doi.org/10.1007/978-3-030-36701-5_6
• Paez, N., Oliveros, A., Fontdevila, D., (2019). Procesos y Prácticas Ágiles en el Desarrollo de Software, XXI Workshop de Investigadores en Ciencias de la Computación, San Juan, Argentina.
• Paez N., Fontdevila D., Gainey F., Oliveros A. (2018) Technical and Organizational Agile Practices: A Latin-American Survey. In: Garbajosa J., Wang X., Aguiar A. (eds) Agile Processes in Software Engineering and Extreme Programming. 19th International Conference on Agile Software Development XP 2018. Lecture Notes in Business Information Processing, vol 314. Springer, Cham. https://doi.org/10.1007/978-3-319-91602-6_10
• Paez N., Gainey, F., Oliveros A., Fontdevila D., (2017). An empirical study on the usage of technical and organizational practices in the Agile Community, Proceedings V Congreso Nacional de Ingeniería en Informática/Sistemas de Información CONAIISI 2017, Santa Fe, Argentina.
• Paez, N., Fontdevila, D., & Oliveros, A. (2016). Characterizing technical and organizational practices in the Agile Community. Proceedings IV Congreso Nacional de Ingeniería en Informática/Sistemas de Información CONAIISI, Salta, Argentina.
9.4.3.3. Using Feedback to Improve Student Practice
• Fontdevila, D., Tugnarelli, M., Ismael, S., & Videla, L. (2015). Promoción del ritmo de estudio por feedback colectivo de progreso en trabajos prácticos. Proceedings XXI Congreso Argentino de Ciencias de la Computación CACIC 2015, Junín, Argentina. http://sedici.unlp.edu.ar/handle/10915/50620

177
Appendixes
The following sections hold the appendixes for this Thesis, which provide additional information that expands on what was presented in the preceding chapters.
Appendix A. Research Methods
This appendix presents a brief description of the research methods used in this Thesis.
A.1. Systematic Mapping Studies
Systematic Mapping Studies (SMS) are used as secondary studies in Software Engineering, aiming at producing rigorous and unbiased results that include as many of the related literature as possible, including but not limited to empirical studies (Kitchenham & Charters, 2007; Petersen et al., 2015). They are used as scoping studies, to assess whether there is research evidence on a certain topic and to quantify the existing evidence. They are also appropriate to identify relevant literature for the related work section of other empirical research projects (Kitchenham et al., 2011). These studies are designed to improve the results of traditional (non-systematic) literature reviews by defining and executing a rigorous process to produce the search results. This process is also aimed at improving the auditability of these studies to enhance the performance of the research community as a whole (Kitchenham & Pfleeger, 2008). These types of studies have become more common during the first decade of the twenty-first century (Wohlin et al., 2012). Figure 23 shows the main activities of the SMS process (Kitchenham & Charters, 2007).

178
Figure 23. SMS process activities
SMS process is described as a sequence, although it is refined iteratively, particularly the definition of the review protocol, which needs to be validated and improved. This refinement includes the execution and testing of search strategies (Zhang et al., 2011).
The next sections describe SMS activities in detail.
Planning
The planning activities include the design and preparation of the SMS protocol to ensure that the process will be systematic and rigorous to reduce the probability of researcher bias. The tasks to be performed as part of this activity are:
• Determine the need for the SMS: the associated research context might require an SMS in cases in which researchers need to identify the relevant literature related to a software engineering subject or need to answer general questions about the subject that do not include an aggregation of the results of the primary studies.
• Define the research questions: the research questions for the SMS tend to be broad and more about the existence or quantity of research on a subject rather than about a very specific issue within the subject (where a Systematic Literature Review, SLR, might be more appropriate). They are also helpful for identifying areas where primary studies might be needed. The research questions will provide focus for the whole study, guiding the protocol definition from identifying the studies to extracting the appropriate data to finally producing the results.
• Develop a review protocol: the review protocol is developed beforehand to minimize the impact of researcher bias in the results. It describes how the review is going to be performed, including issues related to planning. Figure 24 shows the components of the review protocol.
Planning
•Determine the need for the SMS
•Define research questions
•Develop a review protocol
•Evaluate the review protocol
Conducting
•Identify research
•Select primary studies
•Evaluate study qualities
•Extract data
•Synthesize data
Reporting
•Formatting the report
•Evaluating the report

179
Figure 24. SMS review protocol components
• Evaluate the review protocol: the protocol needs to be reviewed to ensure its quality and reduce the cost of rework for errors found while conducting the review or even reporting. Researchers must agree on the protocol to also ensure uniformity while conducting the review. The evaluation must determine whether the protocol is internally sound (e.g. whether the search string is compatible with the search resources or whether the data extraction will be aligned with the research questions) and also if it is effective, for example in terms of sensitivity (i.e. the proportion of relevant studies identified) and precision (i.e. the proportion of retrieved studies that are relevant) (Zhang et al., 2011).
Conducting
The SMS must be conducted according to the protocol defined in the planning activity. The tasks to be performed as part of this activity are:
• Identify research: during this stage the search strategy defined during the planning activity is executed and refined iteratively. The review process benefits from running trial searches and checking their results against known studies, and also from interviewing experts in the field that can point to grey literature that can be used to check the search results and also eventually be included even if they do not appear in the searches (Kitchenham & Charters, 2007; Petersen et al., 2015).
• Select primary studies: the procedure of selecting the studies to be included must be executed according to the protocol, including inclusion and exclusion criteria, coordination between evaluators, resolution of disagreements, etc.
• Evaluate study qualities: evaluating study quality according to the instruments defined in the protocol provides information for (Kitchenham & Charters, 2007; Petersen et al., 2015):
Research questions The questions that the SMS needs to answer
Search strategy Includes the search terms, string and resources
Selection Criteria Criteria for inclusion and exclusion of studies
Selection procedures
Procedure for selection of studies
Data Extraction Strategy
Strategy for extracting information from each study
Schedule The review schedule

180
o Fine-grained inclusion/exclusion criteria.
o Investigating the relationship between quality differences and study results.
o Identifying opportunities for further research.
o Informing the interpretation of findings and determining the strength of inferences.
• Extract data: the data from the selected studies must be extracted in such a way that it can be reliably used in the following tasks. If possible, researchers must independently extract data, and disagreements must be resolved by consensus or arbitration depending on the context. If it is not feasible to have more than one researcher extract the data, specific papers might be extracted by more than one researcher to check that the extraction procedure is being executed correctly (Kitchenham & Charters, 2007; Petersen et al., 2015). The extraction form must be used uniformly to minimize extraction errors.
• Synthesize Data: the data extracted must be synthesized in order to answer the research questions. Available synthesis methods include descriptive (narrative) data synthesis and quantitative data synthesis (e.g. meta-analysis), but for SMS it usually is enough to create tabular representations and apply total counts and summarizations.
Reporting
The reporting activity is aimed at making the results accessible to potentially interested parties. The tasks to be performed as part of this activity are:
• Formatting the report: the report must be formatted according to how and where it is going to be published (i.e. the form of dissemination). For example, a Journal Paper might describe the SMS in far more detail than a conference paper. It might also be that the report is published in more than one form, for example, as part of a conference paper and a Ph.D. Thesis. The study might also be formatted as a Technical Report.
• Evaluating the report: depending on the form of dissemination, the evaluation of the report might be different. Except for technical reports, external peer reviews are the generally accepted way of evaluation.
A.2. Focus Group
The focus group is a cost-effective and fast empirical method used in software engineering to produce qualitative insights and feedback from practitioners (Kontio et al., 2008). A focus group requires careful consideration of participant and session flow dynamics to produce valuable results.
Conducting a focus group requires performing the following steps:
• Plan the focus group.
• Designing the focus group.
• Conduct the focus group sessions.
• Analyze the data and reporting the results.

181
The next sections describe these steps in detail.
Planning the research
In which the research problem is defined and the research objectives are stated. It is important to understand if the focus group is aimed at evaluating a phenomenon and producing conclusive and generalizable information about it or if the objective is limited to obtaining feedback on it.
Designing the focus group
During this step the participants are selected, the location and material for the sessions is prepared, and the session flow and moderation is defined.
Conducting the focus group sessions
Conducting the sessions includes making sure the participants attain, facilitating and moderating the sessions, collecting the data (questionnaires, recording of audio and video, etc.) and closing the sessions effectively. Managing session flow, including facilitating the effective participation of different participants is a key concern during this step (Kontio et al., 2008).
Analyzing the data and reporting the results
In this step the data obtained during the sessions is analyzed and the results are formatted according to how they are going to be used.
A.3. Case Studies
A case study is an empirical method aimed at studying contemporary phenomena in their context, especially when the boundary between the phenomenon and its context is unclear (Runeson & Höst, 2008). Runeson and Höst state: “Case studies offer an approach which does not need a strict boundary between the studied object and its environment; perhaps the key to understanding is in the interaction between the two?” (Runeson & Höst, 2008).
According to the authors, the case study methodology needs to be tailored for software engineering given that their study objects are usually:
• Organizations developing software rather than using it.
• Project oriented rather than function or line oriented.
• The work under study is advanced engineering performed by highly educated people.
This is also so because “the software engineering research community has a pragmatic and result-oriented view on research methodology, rather than a philosophical stand, as noticed by Seaman” (Runeson & Höst, 2008).
It is also important to consider the ethical ramifications of the case study, including the interests at stake from the perspectives of both subjects and researchers. In particular, inducements or other motivations to participate in the study must be explicitly stated so that their role in “threatening the validity of the study may also be analyzed” (Runeson & Höst, 2008). According to Runeson, key ethical factors include informed consent, confidentiality, inducements and feedback. Runeson and Höst state: “Giving feedback to the participants of a study is critical for the long-term trust and for the validity of the research. Firstly, transcript

182
of interviews and observations should be sent back to the participants to enable correction of raw data. Secondly, analyses should be presented to them in order to maintain their trust in the research. Participants must not necessarily agree in the outcome of the analysis, but feeding back the analysis results increases the validity of the study” (Runeson & Höst, 2008).
The steps for conducting case studies in Software Engineering are as follows (Runeson & Höst, 2008):
• Define objectives and plan the case study.
• Define protocol for data collection.
• Execute the case study and collect data.
• Analyze the data.
• Report.
This process is very similar to the one followed for other empirical studies, as Runeson and Höst note. The next sections describe these steps in detail.
Define objectives and plan the case study
The plan for a case study can be described in a case study protocol. It should define the objectives, the case under study and its units of analysis, the theory that frames the case, the research questions, the data collection methods and strategy, including which persons to interview, which documents to read, etc.
Define the protocol for data collection
Define the methods, strategy, procedures, instruments and requirements on data validity and completeness.
Data collection is a key aspect of case studies, methods include (Runeson & Höst, 2008):
• First degree: researchers perform data collection through direct interactions with the subjects, for example, through interviews, focus groups or “think aloud” protocol observations.
• Second degree: the researcher collects data without interacting with the subjects, through mediated means such as software tools.
• Third degree: the researchers access preexisting document or data previously collected.
Execute the case study and collect data
Case studies can belong to any of these four types, depending on their purpose (Runeson & Höst, 2008):
• Exploratory: exploring the state of a case as basis for further study.
• Descriptive: describing the phenomenon in its context.
• Explanatory: explaining a phenomenon, not necessarily its causes.
• Improving: seeking to produce positive change on a specific aspect of the phenomenon.

183
During case study execution, which can be iterative, researchers collect data and may participate much or very little in the activities involved. Researchers interactions with subjects may also vary from very high (e.g. researcher as observing participant) to very low (e.g. through video recordings) (Runeson & Höst, 2008).
Analyze the data
Case study data can be quantitative or qualitative, or a mix of both. For quantitative data, Runeson and Höst propose “analysis of descriptive statistics, correlation analysis, development of predictive models, and hypothesis testing” (Runeson & Höst, 2008).
For qualitative data, the focus must be on keeping a clear chain of evidence to support the conclusions that emerge from the data analysis. This is caused by the fact that case studies are flexible methods that allow the modification of the case study instruments (e.g. questionnaires) in response to preliminary results produced. Techniques can be grouped into hypothesis generating techniques (e.g. constant comparison and cross-case analysis) and hypothesis confirmation techniques (e.g. triangulation and replication) (Runeson & Höst, 2008).
Report
Case study reporting can take many forms, from articles in journals and conferences to whole books or monographs (Runeson & Höst, 2008). Reports should have the following characteristics according to (Robson, 2002):
• Present the case study.
• Describe the case under study.
• Tell the story of the research, with explicit references to who did what.
• Provide basic data that supports the conclusions.
• Present the conclusions in the context they contribute to.
A.4. Quasi-experiments
Quasi-experiments are a type of experimental study that is organized similarly to a controlled experiment, but which lacks some control. As Privitera and Ahlgrim-Delzell state (Privitera & Lynn, 2018):
“A quasi-experimental research design is the use of methods and procedures to make observations in a study that is structured
similar to an experiment, but the conditions and experiences of participants lack some control because the study lacks random assignment, includes a preexisting factor (i.e., a variable that is
not manipulated), or does not include a comparison/control group.”
A quasi-experiment is an empirical study structured close to a controlled experiment but one or both of the following conditions are true (unlike the case of experiments) (Privitera & Lynn, 2018):
• There is a quasi-independent variable.

184
• There is no appropriate comparison control group.
A quasi-independent variable is a variable that is not controlled but selected as a preexisting factor in the context of the study. For example, to study the impact of parent´s education on college students, a study could be conducted separating students in groups according whether one or both of their parents attended college, high-school or primary school. Their assignment to those groups could not be randomized nor controlled, but at the same time, that preexisting factor might provide the context required for the quasi-experiment.
On the other hand, quasi-experiments might have an independent variable but not have the ability to control their subjects to groups, and thus are not able to establish causal relationships (Privitera & Lynn, 2018).
There are several types of quasi-experiments (Privitera & Lynn, 2018):
• One-group post-test only designs, in which a treatment is administered and a dependent variable is measured. These are the most limited of quasi-experimental designs.
• One-group pre-test/post-test designs, in the dependent variable is measured before and after the treatment.
• Nonequivalent control group designs, in which both groups are not equivalent because subjects are not randomly assigned to groups but are selected according to preexisting factors, which could then impact the results of the study. These designs can also be post-test only or pre-test/post-test.
• Time-series designs, in which researchers observe subjects at several points in time, not just one time.
In single case designs, the individual case servers as its own control by comparing two different moments of time (Privitera & Lynn, 2018).
Quasi-experiments are reported very similarly to experiments (Jedlitschka et al., 2005), but the conditions and the context for participants tend to be different. Quasi-experiments can be structured according to the process shown in Figure 25, adapted from the definition provided in (Wohlin et al., 2012).

185
Figure 25 Quasi-experiment process activities
Quasi-experiment planning
For planning the quasi-experiment, researchers first need to define the goals and research questions for the study. Wohlin et al assign these activities to an earlier activity, scoping, which in this Thesis has been merged with planning (Wohlin et al., 2012).
Researchers must define the quasi-experiment context in detail, including the environment (e.g. if it will take place in an industrial setting). Then, the hypothesis must be stated formally, both null hypothesis and alternative hypothesis. The subjects must also be determined (Wohlin et al., 2012).
Next, the variables need to be defined, both the independent (or quasi-independent) variable and the dependent variable. The measurement scale for the variables needs to be defined and affects the analysis that can be performed later
Then, the experimental units need to be defined, including the population from which the sample will be drawn and how they are going to be grouped (if applicable)(Jedlitschka et al., 2005). The experimental materials need also to be prepared. Next, hypothesis, variables and parameters need to be defined.
To define the experimental design the quasi-experiment designs described above can be used as guidelines. The experimental procedure must be defined to guide the performance of the quasi-experiment (e.g. data collection). Tasks, tools and use of materials must also be explicitly defined during planning.
The validity of the results must be considered during planning, according to the four types of validity (internal, external, construct and conclusion) defined in (Wohlin et al., 2012).
Finally, the data analysis strategies must be determined.
Planning ExecutionAnalysis and
interpretationReporting

186
Quasi-experiment execution
The quasi-experiment execution includes initial preparation (including scheduling and training), conducting the experimental session, and data validation. Subjects must be informed and provide their consent, and they must confirm their participation.
Execution is structured according to the quasi-experimental design chosen, for example, single group pre-test/post-test designs must carefully align measurement activities before and after applying the treatment.
Finally, data validation is performed to confirm that the collected data corresponds to the activities conducted and can be used for analysis.
Quasi-experiment data analysis
Data analysis includes a first step in which descriptive statistics are applied to try to understand the data. They provide support for informal review and interpretation of the data.
Next, data must be reviewed to determine if any data points need to be excluded. Then, inferential statistics can be used to test the hypothesis.
Data analysis can also include qualitative methods like content analysis.
Quasi-experiment reporting
Quasi-experiment reporting can be conducted for publication or to support replication. Independently of the objective, it must be conducted thoroughly to support correct interpretation and further studies. It is recommended to follow the guidelines for reporting controlled experiments and quasi-experiments provided in (Jedlitschka et al., 2005).
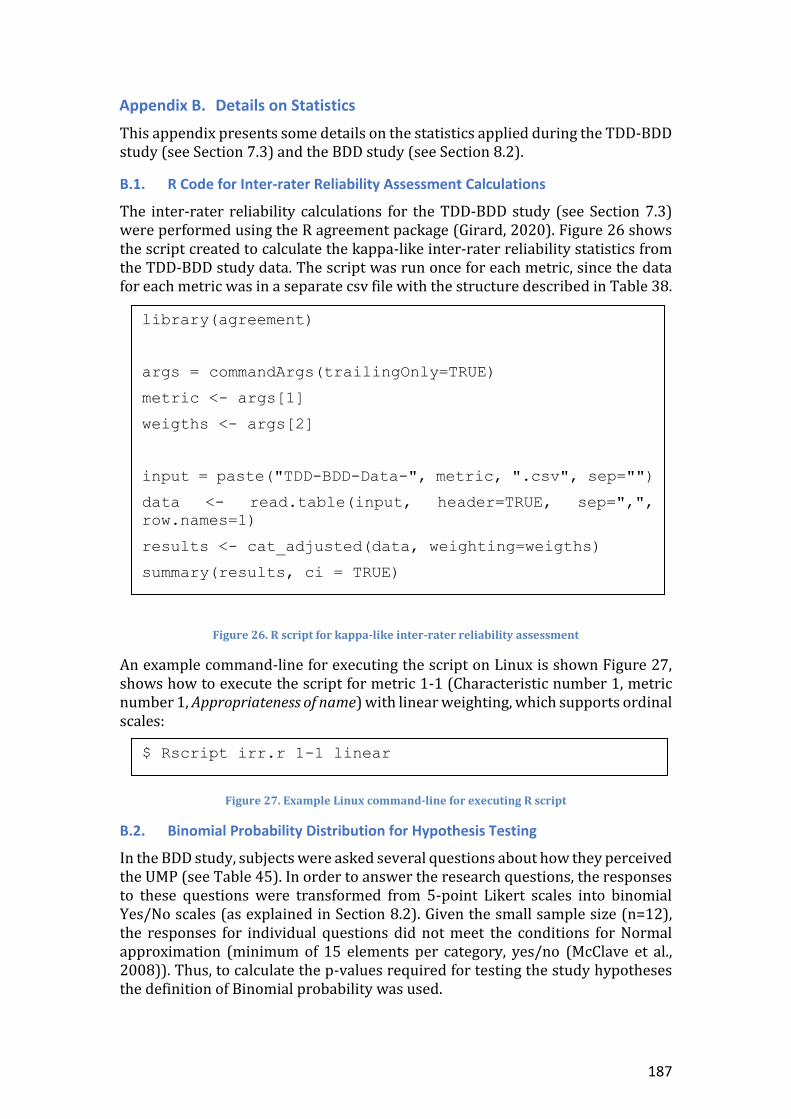
187
Appendix B. Details on Statistics
This appendix presents some details on the statistics applied during the TDD-BDD study (see Section 7.3) and the BDD study (see Section 8.2).
B.1. R Code for Inter-rater Reliability Assessment Calculations
The inter-rater reliability calculations for the TDD-BDD study (see Section 7.3) were performed using the R agreement package (Girard, 2020). Figure 26 shows the script created to calculate the kappa-like inter-rater reliability statistics from the TDD-BDD study data. The script was run once for each metric, since the data for each metric was in a separate csv file with the structure described in Table 38.
Figure 26. R script for kappa-like inter-rater reliability assessment
An example command-line for executing the script on Linux is shown Figure 27, shows how to execute the script for metric 1-1 (Characteristic number 1, metric number 1, Appropriateness of name) with linear weighting, which supports ordinal scales:
Figure 27. Example Linux command-line for executing R script
B.2. Binomial Probability Distribution for Hypothesis Testing
In the BDD study, subjects were asked several questions about how they perceived the UMP (see Table 45). In order to answer the research questions, the responses to these questions were transformed from 5-point Likert scales into binomial Yes/No scales (as explained in Section 8.2). Given the small sample size (n=12), the responses for individual questions did not meet the conditions for Normal approximation (minimum of 15 elements per category, yes/no (McClave et al., 2008)). Thus, to calculate the p-values required for testing the study hypotheses the definition of Binomial probability was used.
library(agreement)
args = commandArgs(trailingOnly=TRUE)
metric <- args[1]
weigths <- args[2]
input = paste("TDD-BDD-Data-", metric, ".csv", sep="")
data <- read.table(input, header=TRUE, sep=",",
row.names=1)
results <- cat_adjusted(data, weighting=weigths)
summary(results, ci = TRUE)
$ Rscript irr.r 1-1 linear

188
The probability of obtaining the sample (n total and x successes) given a p probability of success (for a binomial distribution) is defined by the formula shown in Figure 28:
𝑃(/𝑝) = (𝑛
𝑥) 𝑝𝑥(1 − 𝑝)𝑛−𝑥
Figure 28. Formula for the probability of obtaining the sample given p
Thus, assuming a uniform distribution for p, the probability of obtaining the sample given p <= a (which is the p-value sought in the BDD study hypothesis test) is given by the formula shown in Figure 29:
𝑃(/𝑝 ≤ 𝑎) = (𝑛
𝑥) ∫ 𝑝𝑥(1 − 𝑝)𝑛−𝑥
𝑎
0
Figure 29. Formula for the probability of obtaining the sample given p <= a
For each item in Table 45, the numbers x and n were defined (x was always 12). Thus, for each question and later for each composed variable in the study a probability formula was calculated by replacing the parameter values in Figure 29 and performing the symbolic integration. This was done manually for the items in Table 45, since the parameter values for composed variables were relatively small. Once the symbolic integrals were calculated producing polynomials, the polynomials were evaluated using Open Office Calc, yielding the p-values shown in Table 52 and Table 53. For larger parameter values (which was the case of the composed variables) the integrations were performed using the Maxima software (Schelter, 1982).

189
Appendix C. Example Raw Data
This appendix presents example raw data obtained in the Feasibility study (see Section 5.1) and the Focus group study (see Section 6.1).
C.1. Feasibility Study Data
This section presents raw data from the Feasibility study (see Section 5.1). Table 57 shows the raw data provided by evaluator #1, including comments for each characteristic and metric, and the values assigned to each metric.
Table 57. Feasibility study data from evaluator #1
Charac-teristic
Characteristic Analysis Com-ment
Candidate Metric
Met-ric Evalu-ation
Metric Comment
Self-evi-dent purpose
Scum -------- Roles: Dev Team, ScrumMaster, Product Owner, Scrum Team. Events: The Sprint, Sprint Plan-ning, Daily Scrum, Sprint Review, Sprint Retrospective.
Appropri-ateness of name
Am-bigu-ous ------ Am-bigu-ous
Scrum comes from Daily Scrum (metonymy). Most people that apply the Scrum framework don't know about Rugby (Scrum is a formation in this sport). Relationship between the name and the practice is obscure. ------ Dev team: not only software developers. ScrumMaster: master in which sense. Prod Owner: does not own the product.
Purpose alignment for stake-holders
High Planning has two purposes, one more relevant to the Product Owner and the other to the Scrum Team.
Learna-bility
Scrum Guide and training for each role Certified Scrum Master / Cer-tified Scrum Developer / Certified Scrum Product Owner.
Volume of infor-mation of introduc-tory mate-rial
5400 Scrum Guide (English).
Standard introduc-tory course du-ration
8 8hs common in Certified Scrum Master / Certified Scrum Developer / Certified Scrum Product Owner courses.
Under-standa-bility
From the Scrum Guide: - Values: commitment, courage, focus, openness and respect - Roles: Dev Team, ScrumMaster, Product Owner, Scrum Team - Artifacts: The Sprint, Product Backlog, Sprint Backlog, Incre-ment Definition of Done.
# of ele-ments
14
Conceptual model cor-respond-ence
Me-dium
Timebox (time vs feature con-strained increment) is coun-ter-intuitive. Plan-do-show is intuitive (al-beit not easy).
Data model complexity index
Low

190
Charac-teristic
Characteristic Analysis Com-ment
Candidate Metric
Met-ric Evalu-ation
Metric Comment
Error toler-ance
Errors: - unsatisfactory results of an iter-ation (i.e. Committing too much/few). - Internal/External communica-tion problems. - Team dynamics/ organization. - doing the product right (beyond the scope of Scrum) and the right product (on the Product Owner’s shoulders).
Cost of er-ror
Low Shorter iteration length, itera-tion product increment avail-able to real users conducive to lower costs.
Safety per-ception
Me-dium
Should be high but depends on org culture. Or the team should be a cultural island.
Use of re-straining functions
No Scrum provides visibility but no hard restriction. i.e. Prod-uct Owner could ask for prod-uct features that does not im-prove the product.
Visibility - Internal / external commit-ments. - work status. - improvements (aka kaizen board).
# of indica-tors
2 Product backlog (updated by the Product Owner at the Re-view) Sprint backlog (update by the Dev Team at the Daily Scrum).
Use of in-formation radiators
Yes
Audience alignment for infor-mation
Yes Information is public but could be summarized for stakeholders.
Contro-lability
Role cross control and inter-nal/external visibility.
Degree of control concentra-tion by role
Low Control through transpar-ency. ScrumMaster responsi-ble of transparency but not of control.
Level of autonomy
High Scrum is a framework. The Scrum team is expected to in-spect and adapt.
Control granularity
Me-dium
finer for internal (sprint back-log), coarser for external (product backlog)
Adapta-bility
There are some explicit adapta-tion points: sprint length, roles in-side the Dev Team, format of PBI, how to expand PBI into tasks, prod/sprint indicators, radiator. Additional adaptations: dev prac-tices with low cost of change, product discovery and planning practices, WIP limit.
# of adap-tation points
6 Explicit
Ratio of roles al-lowed to adapt
0.5 Most of dev team role and part of the Product Owner role. Scrum Master role is in-volved in the adaptations, but Scrum Master role is not adapted.
User sat-isfaction
Scrum adoption is in late major-ity. Most established companies (Banking/Financial) choose Scrum when going to agility. Scrum alone is not enough. After an initial success, a Scrum only adoption don't keep up to the ex-pectations.
User at-tractive-ness rating
4 It is the 'safe' option for late adopters.
User satis-faction rat-ing
4 Initial adoption shows a per-ceived doubled productivity improvement. Just focusing on working in fewer things at a time and having user satis-faction as a goal, make the dif-ference.

191
Table 58 shows the raw data provided by evaluator #2, including comments for each characteristic and metric, and the values assigned to each metric.
Table 58. Feasibility study data from evaluator #2
Charac-teristic
Characteristic Qualitative Analysis Comment
Candi-date Met-ric
Met-ric Eval-ua-tion
Metric Qualitative Comment
Self-evi-dent purpose
There are widespread miscon-ceptions around the purpose of Scrum, even among practition-ers.
Appropri-ateness of name
De-ceiv-ing
Many people think it's an acronym. Rugby is not known in many coun-tries. The scrum in rugby is not a good metaphor for neither the framework's philosophy nor prac-tices.
Purpose alignment for stake-holders
High One of the main goals of the frame-work is actually to help align stake-holders.
Learna-bility
Scrum is deceivingly simple to learn, which might partially ex-plain why it's so easily misun-derstood.
Volume of infor-mation of introduc-tory ma-terial
10k A lot of this material is focused on the mechanics of the framework. Sadly there is not much material on the philosophy behind it.
Standard introduc-tory course duration
16h Student will need coaching after training in order to really adopt the framework.
Under-standa-bility
Scrum's model is very easy to understand. This constitutes a double-edged sword when adopting the framework, as practitioners therefore under-estimate just how hard it is to switch to the paradigm that supports the new rules.
# of ele-ments
12 It's usually easy for students to re-member the elements after a bit of practice.
Concep-tual model corre-spond-ence
Low It's easy to think this should be rated High, as one can fool oneself into finding a correspondence with standard practice. This 1-to-1 cor-respondence is usually behind stu-dents not switching paradigms.
Data model complex-ity index
Sim-ple
Data model is quite simple.
Error toler-ance
Scrum implementations have safety valve (the ScrumMas-ter), which has very low corre-spondence and is therefore ill-implemented. This makes error tolerance quite low in most real-life implementations.
Cost of er-ror
Low When implemented according to its principles, error should have a low impact. Actually, lowering er-ror impact is one of the main tenets of Scrum.
Safety percep-tion
High Good Scrum implementations aim at creating a safe place to fail.
Use of re-straining functions
Yes These functions are so abstract in nature that actual risk prevention is highly dependent on implemen-tation.

192
Charac-teristic
Characteristic Qualitative Analysis Comment
Candi-date Met-ric
Met-ric Eval-ua-tion
Metric Qualitative Comment
Visibil-ity
All agile methods have a strong focus on visibility and Scrum is no exception.
# of indi-cators
3 Product Backlog/Sprint Back-log/Potentially Shippable Product Increment.
Use of in-formation radiators
No Not part of the definition of Scrum (although part of the culture, which makes it almost mandatory in most implementations).
Audience alignment for infor-mation
Yes Information is equally available to all stakeholders, although it is rec-ommended that some information be consumed by only some of them (e.g. Sprint Backlog shouldn't be of interest to outside stakeholders - it's usually a smell that microman-agement is taking place).
Contro-lability
Scrum is quite unique in its equal division of power among roles.
Degree of control concen-tration by role
Low Control is divided equally among the three roles.
Level of autonomy
High Scrum puts strong emphasis on having team develop its own pro-cess. Nevertheless, there is practi-cally no tolerance for changing Scrum's rules.
Control granular-ity
Fine Although Product Backlog is usu-ally like a pyramid in terms of size, which makes its bottom elements quite coarse-grained. On a side note, Scrum is quite fractal and can be used for coarse-grained aspects of the organization (e.g. Product Backlog is used for portfolio plan-ning, therefore items are whole projects).
Adapta-bility
Scrum has two sides to adapta-bility: the framework rules are supposed to be very rigid (at least until the user reaches a subjective point of "under-standing what's behind the rules"), but those rules are quite minimal and strongly point towards adapting con-stantly all other aspects of work.
# of adap-tation points
1 The retrospective is the one point where adaptation of the rest of the framework takes places. All as-pects of Scrum are partially adapt-able though.
Ratio of roles al-lowed to adapt
1 All roles are encouraged to take place in adapting the process.
User sat-isfaction
User at-tractive-ness rat-ing
4 Most prospective users find it at-tractive.
User sat-isfaction rating
4 Many users find the experience en-joyable, but this is highly context-dependent (e.g. who decided to use the process in the first place is

193
Charac-teristic
Characteristic Qualitative Analysis Comment
Candi-date Met-ric
Met-ric Eval-ua-tion
Metric Qualitative Comment
highly influential in its effective-ness and in subjective experience).
C.2. Focus Group Study Qualitative Data
This section presents raw data from the Focus group study (see Section 6.1). Table 59 shows the qualitative comments provided by participants on the clarity of each characteristic. Columns P1, P2, etc., correspond to focus group participants.
Table 59. Focus group comments on characteristic clarity
Characteristic P1 P2 P3 P4 P5
Self-evident purpose
Considering name and definition.
Not clear if it includes its place in a more general context.
The elements being evaluated are not identified.
- -
Learnability Level of learning.
Perform might be a little ambiguous.
- - -
Understandability
Overlap with self-evident purpose.
How it fits in the whole is missing.
Make more precise what is being measured.
- I think there are two questions: Is it relevant to me? Do I understand how to implement it?
Error tolerance Clarify relationship with purpose.
Suggests it is about what happens if I do not perform the practice well (which actually seems more interesting).
I interpret that it is about the practice, not about the results of applying it. Interesting to measure the other one.
Is it error tolerance o is it also making errors evident early?
-
Feedback Focus on action.
- Don't use "feedback" to define feedback.
Consider that is has the word feedback in the definition.
-
Visibility "+ easily" Again, I tend to confuse visibility of the practice vs guided by the practice.
- - -
Controllability The example does not
I get lost with the definition.
It is not clear what is being
- Remove the mention of

194
Characteristic P1 P2 P3 P4 P5
classify which decision related to control can be made.
It happens as with some other: the definition reads as meta and the example (and verbal clarifications) point to something concrete.
measured. It could be that the process or practice has ways of intervening to modify the results.
attributes. The rationale is not clear. It is unclear what controllability means from the user’s point of view. It sounded like Auditability. If that is the case, if I do have a lot of control over decision, it does affect usability.
Adaptability - - I would change "adapt" for "adjust" o "fit".
- -
Attractiveness I do not understand the applicability of the concept. The example does not help.
- I would not use the word "attractive" in the definition.
-
Table 60 shows the qualitative comments provided by participants on the relevance of each characteristic. Columns P1, P2, etc., correspond to focus group participants.
Table 60. Focus group comments on characteristic relevance
Characteristic P1 P2 P3 P4 P5
Self-evident purpose
- - - - -
Learnability - - - Maturity levels
-
Understandability
Focus. How does this practice lead to the purpose?
Look out, it overlaps the two previous ones.
- Depends on the complexity of the practice, which can lead to misunderstandings.
-
Error tolerance - My intuition tells me yes,
I find the concept relevant, but
- -

195
Characteristic P1 P2 P3 P4 P5
but I can't visualize it.
its name and definition are not clear.
Feedback - We might be evaluating with too much of an "agile" eye.
- - -
Visibility - Watch out for "agilization".
- - -
Controllability - I assume it is not meta. I cannot completely image why this would be super relevant.
- -
Adaptability - - - -
Attractiveness - - - -
Table 61 shows the qualitative comments provided by participants on the clarity of each metric. Columns P1, P2, etc., correspond to focus group participants.
Table 61. Focus group comments on metric clarity
Characteristic Metric P1 P2 P3 P4 P5
Self-evident purpose
Appropriateness of name
- - - - -
Self-evident purpose
Purpose alignment for stakeholders
stakeholders -> adopters.
- Stakeholders are too broad. I would use involved o practitioners.
- I think the word stakeholders...
Learnability Volume of information of introductory material
- Does not consider audio-visual material.
- - -
Learnability Standard introductory course duration
- - - What about practice? Is it needed besides books and courses for learning?
-

196
Characteristic Metric P1 P2 P3 P4 P5
Understandability
# of elements
Elements. - It is not specified what is a component to be measured. I think it can be defined clearly. I would try to measure complexity.
- Looks like "Volume of information of introductory material".
Understandability
Conceptual model correspondence
understandable? => hard
- It is precise but overly complex in its definition and understanding.
- -
Understandability
Data model complexity index
- I might clarify that it might be by comparison.
- - I think I would remove the word data.
Error tolerance Cost of error (Transcription comment: arrow points to Clarify relationship with purpose).
Watch out, it carries with it the ambiguity of the previous definition (for the sub-characteristic).
- - -
Error tolerance Safety perception
In the definition "safe it is" vs "safety perception".
- This would be more aligned with the risk of performing the practice badly.
- -
Error tolerance Use of restraining functions
- - - - -
Feedback Timeliness of feedback
focus on what comes next.
I would take out the part (that ends
Make it about what happens next.
- -

197
Characteristic Metric P1 P2 P3 P4 P5
in "by the actor").
Feedback People feedback
Promotes conversations.
- - Why make the "people" distinction if it is still feedback?
-
Feedback Automatic feedback
- - The word "feedback" is used too much.
- -
Visibility # of indicators
precise? => status, evolution
- Might change it to yes/no.
It must have indicators, no doubt. The # total by itself does not tell me anything.
-
Visibility Use of information radiators
- Watch out, the term might not be well understood outside agility.
- The word radiator is not clear to me.
-
Visibility Audience alignment for information
- - Name is unclear.
Consider consistency and not sameness exactly.
Is it understood the same way? Is it the same information?
Controllability Degree of control concentration by role
I do not know which roles it refers to. The example, beyond the value, should have a justification.
Again, I get lost with the example Does it mean the roles defined in CI (I think I does not define any)? Or the roles defined in a container (e.g. Scrum) in terms of CI?
- I am conflicted with which are the roles. Given the roles, the metric is easy.

198
Characteristic Metric P1 P2 P3 P4 P5
Controllability Level of autonomy
Explanatory example.
- It is not clear what is being measured. It could be whether the process or practice has a way to intervene to modify its results.
- -
Controllability Control granularity
Explained example. I consider goldilocks values better, like too fine, just right, too coarse.
I am not sure how a framework like Scrum would measure, since it has more than one level of granularity.
I would not use the same words "control granularity." to define it.
-
Adaptability # of adaptation points
Pre post steps?
- It is unclear to me what is an adaptation point. I do not understand why the ones enumerated in the example are the adaptation points for CI.
- -
Adaptability Ratio of roles allowed to adapt
I do not understand the roles; the example does not help.
- Does it mean adapting the whole process or practice or only the part pertaining to that role?
I think it means those who among the roles that perform the practice or process are allowed to adapt it, but I am not sure.

199
Characteristic Metric P1 P2 P3 P4 P5
Attractiveness User attractiveness rating
I do not understand, and it sounds somewhat subjective. I would use few qualitative values.
- - - -
User satisfaction
User satisfaction rating
- - - - -
Table 62 shows the qualitative comments provided by participants on the relevance of each characteristic. Columns P1, P2, etc., correspond to focus group participants.
Table 62. Focus group comments on metric relevance
Characteristic Metric P1 P2 P3 P4 P5
Self-evident purpose
Appropriateness of name
- The name is source of many misunderstandings in daily practice.
- - -
Self-evident purpose
Purpose alignment for stakeholders
- I just thought it relevant on second reflection. The metric itself might not be so evident itself.
- - -
Learnability Volume of information of introductory material
- - Not always are "official" texts used to learn.
- -
Learnability Standard introductory course duration
- It is less ugly than the previous one.
- - -
Understandability
# of elements
Relevance of elements interaction.
Might be a good "as birds fly" measure.
The relationships between the elements
- -

200
Characteristic Metric P1 P2 P3 P4 P5
are missing.
Understandability
Conceptual model correspondence
- - It would help to think about the alignment of the practice with the objective of the user in using/performing it.
- -
Understandability
Data model complexity index
- - - - -
Error tolerance Cost of error - - - - -
Error tolerance Safety perception
- Might lead to false sense of control (I made my plan, I believe I am safe, and the error is even higher), which combined might give the idea of fragility.
Because the practices perceived as safer are attempted more often.
- -
Error tolerance Use of restraining functions
- Although maybe all practices assert that.
- - Thinking about this as related to "safety".
Feedback Timeliness of feedback
- - - - -
Feedback People feedback
- - - - -
Feedback Automatic feedback
- - - - -
Visibility # of indicators
Check issue of # of metrics.
I don't see the relationship between number of indicators and
Relevance has to do with the range of indicators and their informatio
- Depends on what the indicator shows and not the number of indicators.

201
Characteristic Metric P1 P2 P3 P4 P5
promoted visibility (might just ask yes/no).
n, their richness.
Visibility Use of information radiators
- - Depends on having an indicator and building an information radiator.
It is a form of promoting actions (it is feedback).
-
Visibility Audience alignment for information
- Useful, but I cannot quite see it.
- The expectations and needs for information differ.
-
Controllability Degree of control concentration by role
I don’t understand the relevance.
I don’t see the correlation.
This metric does not allow me to determine if it is more controllable or not.
-
Controllability Level of autonomy
- It is very debatable whether something is less or more controllable when decentralized (which is the consequence of autonomy). There could be a centralized control role for the practice, for example.
I do not think controllability can be evaluated with this metric.
-
Controllability Control granularity
- - It is unclear to me if granularity improves the capacity to control.
-

202
Characteristic Metric P1 P2 P3 P4 P5
Adaptability # of adaptation points
Being adaptable seems relevant. The number of points is very debatable. It is not clear what is better.
- - -
Adaptability Ratio of roles allowed to adapt
- I don’t see the correlation (it is true that with more roles there are more perspectives, but it could also mean that they could break it all). Adaptation could be faster and smarter, but it also increases the risk of breaking it all up).
- -
Attractiveness User attractiveness rating
- - It is unclear to me how to measure this, because it is a subjective metric, but no of the evaluator, but of the potential user.
-
User satisfaction
User satisfaction rating
- - - - -

203
Appendix D. TDD Evaluation Questionnaire
In the Scrum study, TDD-BDD study, and BDD study UMP evaluation questionnaires were used, and they are all very similar and rather long. That is why this appendix presents the TDD evaluation questionnaire as an example that complements the data provided in the preceding chapters. This questionnaire was implemented online using Google Forms.
Introduction to the UMP Evaluation Questionnaire for the TDD Study
UMP Evaluation Questionnaire for the TDD
* Required
Personal Data
Full Name *
In case we need to contact you for clarification purposes
This evaluation is based in the Usability for Software Development Process and Practice model. The model is composed of 10 usability characteristics (self-evident purpose, visibility, feedback, etc.) and one or more metrics for each characteristic.
The purpose of this evaluation is to analyze the usability of TDD as a software development practice in order to help improve the experience of adoption for its users by identifying challenges and improvement opportunities.
This evaluation is based on the standard TDD based on programmer tests (as described in Test Driven Development by Example by Kent Beck).
The time estimated to complete this evaluation is 45 to 60 minutes.
You can answer the open questions in English or Spanish, according to your preference. Each form section corresponds to a usability characteristic in the Process and Practice Usability Model, and each characteristic has one or more metrics.
For each metric, an example evaluation applied to the "Continuous Integration" practice is provided.
To perform the evaluation:
1) For each characteristic, read the characteristic's description.
2) For each metric for that characteristic, read the metric's description, assign values and add comments with the rationale, analysis or other clarifications.
3) Optionally add comments about TDD as regards that characteristic.
This short 7min video http://bit.ly/processandpracticeusabilityvideo describes the model.

204
E-mail *
In case we need to contact you for clarification purposes
How many years of experience do you have with TDD?
Mark all the roles in which you have had contact with TDD
▢ Practitioner ▢ Mentor ▢ Coach ▢ Teacher ▢ Consultant ▢ Manager/Supervisor ▢ Researcher/Academic ▢ Creator
How confident are you in your knowledge of TDD?
1 - Self-evident Purpose characteristic
Ease with which users can recognize what a process or practice is for by its name, description, structure or form
1.1 - Self-evident Purpose metric / Appropriateness of Name
Measures how appropriate the name TDD (Test Driven Development) is for describing its purpose (consider for example whether names are translations or used in a foreign language).
Example: "Appropriateness of name" of Continuous Integration
1.1.1 - How appropriate is the name TDD (Test Driven Development)? *
◯ Not appropriate ◯ Partially appropriate ◯ Highly appropriate
1.1.2 - Observations on Appropriateness of the name TDD
Explain your rationale, analysis or just add comments
1 2 3 4 5
Not at all confident ◯ ◯ ◯ ◯ ◯ Highly confident

205
1.2 - Self-evident Purpose metric / Recognized Purpose
Measures whether the purpose of TDD is usually recognized by new adopters
Example: "Recognized Purpose" of Continuous Integration
1.2.1 - Is the purpose of TDD usually recognized by new adopters? *
◯ Yes ◯ No
1.2.2 - Observations on Recognized purpose
Explain your rationale, analysis or just add comments
1.3 - General observations on Self-evident Purpose of TDD
2 - Learnability characteristic
Ease with which a user new to TDD is able to learn how to perform its activities at a novice level of ability.
2.1 - Learnability metric / Time required to learn to perform
Measures the time required to learn to perform TDD's activities on average complexity tasks independently, at a novice level of ability
Example: "Time required to learn to perform" of Continuous Integration
2.1.1 - How much time does it take to learn to perform TDD at a novice (basic) level of ability [hours]? *
◯ 2 ◯ 4 ◯ 8 ◯ 16 ◯ 24 ◯ 32

206
◯ 40 ◯ +40
2.1.2 - Observations on Time required to learn to perform
Explain your rationale, analysis or just add comments
2.2 - Learnability metric / Standard introductory course duration
Example: "Standard introductory course duration" for Continuous Integration
2.2.1 - How many hours does a standard introductory course last? *
Measures standard course duration in hours, as defined by authoritative sources. Does not include homework time.
◯ 2 ◯ 4 ◯ 8 ◯ 16 ◯ 24 ◯ 32 ◯ 40 ◯ +40
2.2.2 - Observations on Standard introductory course duration
Explain your rationale, analysis or just add comments
2.3 - Learnability metric / # of new concepts
Measures how many new specific concepts TDD introduces (evaluators must specify the concepts considered in the Observations)
Example: "# of new concepts" for Continuous Integration
2.3.1 - How many new concepts does TDD introduce? *

207
2.3.2 - Observations on # of new concepts
Explain your rationale, analysis or just add comments
2.4 - General observations on Learnability of TDD
3 - Understandability
Ease with which a TDD user is able to apprehend how the underlying principles, structure and dynamics make it work to achieve the desired results. Understanding a process and practice helps with appropriate selection before adoption, and also support effective performance.
3.1 - Understandability metric / Conceptual model correspondence
Measures the correspondence between the conceptual model for software development that TDD offers and the user’s own preexisting conceptual model for the same activity.
Example: "Conceptual model correspondence" of Continuous Integration
3.1.1 - How good is the matching between TDD's conceptual model compared to the user's preexisting conceptual model of programming? *
◯ Low ◯ Medium ◯ High
3.1.2 - Observations on Conceptual model correspondence
Explain your rationale, analysis or just add comments
3.2 - Understandability metric / Conceptual model complexity
Measures the subjective complexity of TDD's conceptual model. Low means the user perceives the model as simple, with few entities and simple relationships. Medium means the user perceives the model complexity as noticeable, requiring

208
some effort to understand. High means the data model of the process or practice exceeds what the user can apprehend directly, requiring significant effort and study to understand.
Example: "Conceptual model complexity" of Continuous Integration
3.2.1 - How would you rate TDD's conceptual model complexity? *
◯ Low ◯ Medium ◯ High
3.2.2 - Observations on Conceptual model complexity
Explain your rationale, analysis or just add comments
3.3 - General observations on Understandability of TDD
4 - Safety
Degree to which TDD is safe for its users, preventing errors or limiting their impact, including using TDD incorrectly. Lack of safety can block users from attempting new activities, and it also makes a process or practice hard to learn “on the job”. Frequent errors can make users feel ineffective.
4.1 - Safety metric / Cost of incorrect adoption
Measures the cost of adopting TDD incorrectly. Incorrect adoption includes applying the process or practice inappropriately; failing to understand its purpose or dynamics, failure to perform its activities and to evaluate results correctly. For example, incorrect adoption might produce burnout, a high cost, or local inefficiencies, which might be medium costs.
Example: "Cost of incorrect adoption" of Continuous Integration
4.1.1 - How would you rate the cost of adopting/implementing TDD incorrectly? *

209
◯ Low ◯ Medium ◯ High
4.1.2 - Observations on Cost of incorrect adoption for TDD
Explain your rationale, analysis or just add comments
4.2 - Safety metric / Reduction in cost of error
Measures the overall reduction in cost of errors made in the work system through correct application of TDD. For example, continuous integration reduces the cost of errors by early checking an integrated version.
Example: "Reduction in cost of error" of Continuous Integration
4.2.1 - How would you rate the reduction in cost of error produced by adopting TDD? *
◯ Low
◯ Medium
◯ High
4.2.2 - Observations on Reduction in cost of error
Explain your rationale, analysis or just add comments
4.3 - Safety metric / Safety perception
Measures users' perception of TDD in terms of safety for themselves and others. For example, if the by-products of executing the process or practice can be used against them, the safety perception might be low
Example: "Safety perception" of Continuous Integration
4.3.1 - How do you rate TDD users' safety perception about the practice? *

210
◯ Low ◯ Medium ◯ High
4.3.2 - Observations on Safety perception
Explain your rationale, analysis or just add comments
4.4 - Safety metric / Use of restraining functions
Measures whether TDD provides hard restrictions to prevent the materialization of significant risks. For example, continuous deployment might not allow deploying a release if a required acceptance test fails.
Example: "Use of restraining functions" of Continuous Integration
4.4.1 - Does TDD make use of restraining functions *
◯ Yes ◯ No
4.4.2 - Observations on Use of restraining functions
Explain your rationale, analysis or just add comments
4.5 - General observations on Safety of TDD
5 - Feedback
Degree to which use of TDD produces or promotes reactions or responses to actions performed. Feedback is a key motivator, confirms progress enabling consequent action, and fosters reflection and improvement
5.1 - Feedback metric / Timeliness of Feedback
Measures the timeliness of the feedback as perceived by the actor with respect to the action performed and the consequent actions that need to be performed
Example: "Timeliness of Feedback" of Continuous Integration

211
5.1.1 - How would you rate the timeliness of feedback in TDD? *
◯ Immediate ◯ Prompt ◯ Delayed ◯ Nonexistent
5.1.2 - Observations on Timeliness of Feedback
Explain your rationale, analysis or just add comments
5.2 - Feedback metric / Feedback richness
Measures the value of the information received in terms of significance, breadth, depth or nuance.
Example: "Feedback richness" of Continuous Integration
5.2.1 How would you rate the richness of feedback information received in TDD? *
◯ Low ◯ Medium ◯ High
5.2.2 - Observations on Feedback richness
Explain your rationale, analysis or just add comments
5.3 - Feedback metric / People feedback
Measures if TDD promotes feedback from people interactions
Example: "People feedback" of Continuous Integration
5.3.1 - Does TDD promote feedback from interactions with people? *

212
◯ Yes ◯ No
5.3.2 - Observations on People feedback
Explain your rationale, analysis or just add comments
5.4 - Feedback metric / Automatic feedback
Measures if TDD provides automatic feedback
Example: "Automatic feedback" of Continuous Integration
5.4.1 - Does TDD provide automatic feedback? *
◯ Yes
◯ No
5.4.2 - Observations on Automatic feedback
Explain your rationale, analysis or just add comments
5.5 General observations on Feedback of TDD
6 - Visibility
Degree to which TDD helps make activities, status, obstacles and information inputs and outputs visible to people. Visibility allows users to know the status of a process or practice and take early corrective action when necessary. It also helps set realistic expectations early and promotes trust.
6.1 - Visibility metric / Defines indicators
Measures if TDD defines standard indicators
Example: "Defines indicators" of Continuous Integration

213
6.1.1 - Does TDD define indicators? *
◯ Yes ◯ No
6.1.2 - Observations on Defines indicators
Explain your rationale, analysis or just add comments
6.2 - General observations on Visibility of TDD
Measures if TDD defines standard indicators
7 - Controllability
Degree to which TDD allows its users to check status and make decisions that affect the outcomes during execution of the practice. Controlling the practice allows users to make decisions to obtain the best possible results
7.1 - Controllability metric / Defines checkpoints
Measures whether TDD defines specific checkpoints where users can make decisions that control the outcomes of the process or practice. For example, Scrum Reviews are specific points to evaluate the product and eventually decide whether to accept, reject or refine a product increment
Example: "Defines checkpoints" of Continuous Integration
7.1.1 - Does TDD define checkpoints? *
◯ Yes ◯ No
7.1.2 - Observations on Defines checkpoints
Explain your rationale, analysis or just add comments
7.2 - Controllability metric / Explicit outcomes

214
Measures if TDD defines outcomes explicitly
Example: "Explicit outcomes" of Continuous Integration
7.2.1 - Does TDD define explicit outcomes? *
◯ Yes ◯ No
7.2.2 - Observations on Explicit outcomes
Explain your rationale, analysis or just add comments
7.3 - Controllability metric / Level of autonomy
Measures the level of autonomy users have in making decisions related to the execution of the TDD practice. Examples include handling unexpected results, or deciding whether to proceed or not at specific checkpoints.
Example: "Level of autonomy" of Continuous Integration
7.3.1 - How would you rate TDD practitioners’ level of autonomy? *
◯ Low ◯ Medium ◯ High
7.3.2 - Observations on Level of autonomy
Explain your rationale, analysis or just add comments
7.4 - General observations on Controllability of TDD
8 - Adaptability

215
Ease with which a TDD user is able to adapt the practice for use in different contexts. Adapting a process or practice allows it to be used in different contexts and by different users. It also enables a better user experience and a higher usage rate.
8.1 - Adaptability metric / Defines adaptation points
Measures how many adaptation points TDD defines. Adaptation points are specific opportunities for variation described by the practice.
Example: "Defines adaptation points" of Continuous Integration
8.1.1 - Does TDD define adaptation points? *
◯ Yes ◯ No
8.1.2 - Comments on Defines adaptation points
Explain your rationale, analysis or just add comments
8.2 - General observations on Adaptability of TDD
9 - Attractiveness
Degree to which prospective users of TDD find it attractive or appealing by its form, structure or reported results. Attractiveness characterizes the appeal to newcomers. It might impact the desire to learn and adopt.
9.1 - Attractiveness metric / User attractiveness rating
Measures the attractiveness of TDD to prospective users (i.e. those lacking experience)
Example: "User attractiveness rating" of Continuous Integration
9.1.1 - How would you rate TDD attractiveness for newcomers? *

216
9.1.2 - Observations on User attractiveness rating
Explain your rationale, analysis or just add comments
9.2 - General observations on Attractiveness of TDD
10 - User satisfaction
Degree to which user needs are satisfied when using TDD. Satisfaction is a key element for positive feedback and impacts the creation of new habits
10.1 - User satisfaction metric / User satisfaction rating
Measures the subjective experience of using the process or practice.
Example: "User satisfaction rating" of Continuous Integration
10.1.1 - How would you rate TDD's users experience rating? *
Measures the subjective experience of using TDD
10.1.2 - Observations on User satisfaction rating
Explain your rationale, analysis or just add comments
10.2 - General observations on User satisfaction of TDD
1 2 3 4 5
Completely unattractive ◯ ◯ ◯ ◯ ◯ Highly attractive
1 2 3 4 5
Completely dissatisfied ◯ ◯ ◯ ◯ ◯ Highly satisfied

217
Appendix E. Details on UMP Version Changes
This appendix presents an overview of UMP versions and a summary of changes for each version, except version 3.0, created after the focus group study, which is described in Section 6.1.
Table 63 shows an overview of each UMP version, including version number, a short description, a short summary of the changes involved, and the source of input for the change (e.g. the empirical study or UMP development activity that produced it).
Table 63 Overview of UMP version details
Version Short description Changes Source of input
1.0 Initial version - Model sources
2.0 Added Feedback Separated Feedback from Visibility.
Expert review
3.0 Refinement from focus group feedback
Modified characteristics, removed, added and modified metrics.
Focus group study
3.1 Minor metric changes
Added Time required to learn to perform and explicit most positive value.
Research team
3.2 Metric changes Removed metric, changed metric names and scales significantly.
Reliability studies (Scrum study and TDD-BDD study)
E.1. UMP Version 2.0
In version 2.0 the Visibility and Feedback characteristics were finally separated (they had been merged in v1.0). The rationale for this decision is described in Section 3.2.
Summary of UMP Changes in Version 2.0
• Added Feedback as a characteristic.
• Added three metrics for the Feedback characteristic:
o Timeliness of feedback
o People feedback
o Automatic feedback
E.2. UMP Version 3.0
This version was created after the focus group study, and it is described in detail in Section 6.1.

218
E.3. UMP Version 3.1
Version 3.1 was created with minor adjustments to the UMP. It was prompted by internal collaboration between the research team members. Table 64 shows each metric along with its characteristic, a description of the change and the rationale for it.
Table 64. Rationale for metric changes in version 3.1
Characteristic Metric Change Rationale
Self-evident purpose
Recognizable purpose
Renamed to Recognized purpose.
For clarification purposes.
Learnability # of elements Renamed to Number of specific conceptual definitions.
Simplified to represent the number of specific elements introduced by the process or practice that have to be learned.
Learnability Time required to learn to perform
Metric added. The issue of learning to perform had emerged in the focus group but no metric had been identified that could assess this aspect in version 3.0.
Learnability Standard introductory training course duration
Renamed to Standard introductory course duration. Changed questionnaire values to discrete options instead of any positive number.
Removed the redundant “training” term.
The scale granularity was too high and produced very low reliability statistics.
Controllability Explicit outcomes Metric added. The issue of outcomes had emerged in the focus group but no metric had been identified that could assess this aspect in version 3.0
Summary of UMP Changes in Version 3.1
• Modified metrics
o Renamed Self-evident purpose / Recognizable purpose to Recognized purpose
o Renamed Learnability / # of elements to Number of specific conceptual definitions (eventually renamed # of new concepts in version 3.2)
• Added metrics
o Learnability / Time required to learn to perform
o Controllability / Explicit outcomes

219
E.4. UMP Version 3.2
Version 3.2 is the current version of the UMP. The modifications in this version were prompted mostly by the Scrum study described in 7.2.
No characteristics were modified in version 3.2, and metric modifications were mostly related to scales, including the removal of one metric because it was deemed too hard to evaluate appropriately.
Table 65. Rationale for metric changes in version 3.2
Characteristic Metric Change Rationale
Self-evident purpose
Appropriateness of name
Simplified scale. The ordered nominal scale was too complex and produced very low reliability statistics.
Learnability Number of specific conceptual definitions
Renamed to Number of new concepts.
For clarification purposes.
Learnability Time required to learn to perform
Changed questionnaire values to discrete options instead of any positive number.
The scale granularity was too high and produced very low reliability statistics.
Learnability Standard introductory training course duration
Renamed to Standard introductory course duration. Changed questionnaire values to discrete options instead of any positive number.
Removed the redundant “training” term.
The scale granularity was too high and produced very low reliability statistics.
Visibility Information tailored to audience
Metric removed. Too hard to rate, contradictory perceptions among raters on which value was the most positive.
Summary of UMP Changes in Version 3.2
• Modified metrics
o Modified the scale of Self-evident purpose / Appropriateness of name
o Modified the scale of Learnability / Time required to learn to perform to a discrete numerical scale.
o Renamed Learnability / Number of specific conceptual definitions to Number of new concepts and made its scale discrete.
o Renamed Learnability / Standard introductory training course duration to Standard introductory course duration and made its scale discrete.
• Removed metrics

220
o Visibility / Information tailored to audience.

221
Bibliography
Altman, D. G. (1991). Practical statistics for medical research. Chapman and Hall.
Ambler, S. (2009). Agile practices survey results. http://www.ambysoft.com/surveys/ practices2009.html.
Anderson, D. J. (2010). Kanban: Successful Evolutionary Change for Your Technology Business. Blue Hole Press.
Astels, D., Baker, S., Hellesøy, A., & Chelimsky, D. (2005). RSpec. https://rspec.info/
Austin, R., & Devin, L. (2003). Artful Making, What Managers Need to Know about How Artists Work. Finantial Times.
Basili, V. R., Caldiera, G., & Rombach, H. D. (1994). The Goal Question Metric Approach, Chapter in Encyclopedia of Software Engineering. In J. Marciniak (Ed.), Wiley.
Beck, K. (2002). Test Driven Development by Example. Addison-Wesley Professional.
Beck, K., & Andres, C. (2004). Extreme Programming Explained: Embrace Change. Addison-Wesley Professional.
Beck, K., Beedle, M., van Bennekum, A., Cockburn, A., Cunningham, W., Fowler, M., & Grenning, J. (2001). Agile Manifesto. http://agilemanifesto.org
Bennett, E. M., Alpert, R., & Goldstein, A. C. (1954). Communications Through Limited Response Questioning. Public Opinion Quarterly, 18(3), 303. https://doi.org/10.1086/266520
Boehm, B. (1986). A spiral model of software development and enhancement. ACM SIGSOFT Software Engineering Notes, 11(4), 14–24. https://doi.org/10.1145/12944.12948
Brown, J. S., & Duguid, P. (2000). The Social Life of Information. Harvard Business Press.
Brown, T. (2008, June 1). Design Thinking. Harvard Business Review, June 2008. https://hbr.org/2008/06/design-thinking
Byrt, T., Bishop, J., & Carlin, J. B. (1993). Bias, prevalence and kappa. Journal of Clinical Epidemiology, 46(5), 423–429. https://doi.org/10.1016/0895-4356(93)90018-V
Chow, T., & Cao, D.-B. (2008). A survey study of critical success factors in agile software projects. Journal of Systems and Software, 81(6), 961–971. https://doi.org/10.1016/j.jss.2007.08.020

222
Clements, P., Bachmann, F., Bass, L., Garlan, D., Ivers, J., Little, R., Merson, P., Nord, R., & Stafford, J. (2002). Documenting Software Architectures: Views and Beyond. Addison-Wesley Professional.
Cockburn, A. (2004). What the agile toolbox contains. Crosstalk Magazine, November.
Cockburn, A. (2006). Agile Software Development: The Cooperative Game. Pearson Education.
Cooper, R. G. (1986). Winning at New Products. Addison-Wesley.
Coplien, J. O., & Harrison, N. B. (2004). Organizational patterns of agile software development. Prentice-Hall.
Cronbach, L. J. (1951). Coefficient alpha and the internal structure of tests. Psychometrika, 16(3), 297–334. https://doi.org/10.1007/BF02310555
Culver-Lozo, K. (1995). The software process from the developer’s perspective: A case study on improving process usability. Proceedings. Ninth International Software Process Workshop, 67–69.
Cunningham, W. (2002). Fit Framework. http://fit.c2.com/
Davis, F. D. (1989). Perceived Usefulness, Perceived Ease of Use, and User Acceptance of Information Technology. MIS Quarterly, 13(3), 319. https://doi.org/10.2307/249008
DeMarco, T., & Lister, T. (1987). Peopleware: Productive Projects and Teams. Addison-Wesley.
Derby, E., & Larsen, D. (2005). Agile Retrospectives: Making Good Teams Great. The Pragmatic Programmer.
Dikert, K., Paasivaara, M., & Lassenius, C. (2016). Challenges and success factors for large-scale agile transformations: A systematic literature review. Journal of Systems and Software, 119, 87–108. https://doi.org/10.1016/j.jss.2016.06.013
Doshi, P. (2018). Agile Metrics: Velocity. Scrumg.Org. https://www.scrum.org/resources/blog/agile-metrics-velocity
Dreyfus, S. E., & Dreyfus, H. L. (1980). A five-stage model of the mental activities involved in directed skill acquisition. California Univ Berkeley Operations Research Center.
Dutoit, A. H., & Paech, B. (2001). Rationale Management in Software Engineering. In S. K. Chang (Ed.), Handbook of Software Engineering and Knowledge Engineering. World Scientific.

223
Edmondson, A. (1999). Psychological Safety and Learning Behavior in Work Teams. Administrative Science Quarterly, 44(2), 350–383. JSTOR. https://doi.org/10.2307/2666999
Fagan, M. E. (1974). Design and code inspections and process control in the development of programs (Technical Report TR 21.572). IBM Corporation.
Feiler, P. H., & Humphrey, W. S. (1992). Software process development and enactment: Concepts and definitions. Software Engineering Institute.
Fenton, N., & Bieman, J. (2014). Software metrics: A rigorous and practical approach. CRC press.
Ferguson Smart, J. (2014). BDD in Action: Behavior-driven development for the whole software lifecycle. Manning Publications.
Forsgren, N., Humble, J., & Kim, G. (2018). Accelerate: The Science of Lean Software and DevOps: Building and Scaling High Performing Technology Organizations. IT Revolution Press.
Fowler, M. (2000). Continuous Integration. Martinfowler.Com. https://martinfowler.com/articles/originalContinuousIntegration.html
Fowler, M. (2009). Flaccid Scrum. Martinfowler.Com. https://martinfowler.com/bliki/FlaccidScrum.html
Franch, X., & Carvallo, J. P. (2003). Using quality models in software package selection. IEEE Software, 20(1), 34–41.
Gamma, E., Helm, R., Johnson, R., Vlissides, J., & Booch, G. (1994). Design Patterns: Elements of Reusable Object-Oriented Software. Addison-Wesley Professional.
Girard, J. (2016). Free-marginal multirater/multicategories agreement indexes and the K categories PABAK. https://stats.stackexchange.com/questions/242631/free-marginal-multirater-multicategories-agreement-indexes-and-the-k-categories
Girard, J. (2020). R agreement package. https://github.com/jmgirard/agreement
Guceglioglu, A. S., & Demirors, O. (2005). A Process Based Model for Measuring Process Quality Attributes. In I. Richardson, P. Abrahamsson, & R. Messnarz (Eds.), Software Process Improvement (pp. 118–129). Springer Berlin Heidelberg.
Gwet, K. L. (2014). Handbook of Inter-Rater Reliability, 4th Edition: The Definitive Guide to Measuring the Extent of Agreement Among Raters. Advanced Analytics, LLC.
Hallgren, K. A. (2012). Computing Inter-Rater Reliability for Observational Data: An Overview and Tutorial. Tutorials in Quantitative Methods for Psychology, 8(1), 23–34. https://doi.org/10.20982/tqmp.08.1.p023
224
HELENA Group. (n.d.). HELENA Study—Hybrid dEveLopmENt Approaches in software systems development. HELENA Study. https://helenastudy.wordpress.com
Hellesøy, A. (2008). Cucumber. http://cucumber.io
Hevner, A., & Chatterjee, S. (2010). Design Research in Information Systems: Theory and Practice. Springer US. https://doi.org/10.1007/978-1-4419-5653-8
Humble, J., & Farley, D. (2010). Continuous Delivery: Reliable Software Releases through Build, Test, and Deployment Automation. Addison-Wesley Professional.
Humphrey, W. S. (1999). Introduction to the Team Software Process. Addison-Wesley Professional.
Humphrey, W. S. (2001). Winning with Software: An Executive Strategy. Addison-Wesley Professional.
International Organization for Standardization. (2007). ISO/IEC 15939 Systems and software engineering—Measurement process. International Organization for Standardization.
International Organization for Standardization. (2011). ISO/IEC 25010 Systems and Software Engineering—Systems and Software Quality Requirements and Evaluation (SQuaRE)—System and Software Quality Models.
Jacobson, I., Booch, G., & Rumbaugh, J. (1999). Unified Software Development Process. Addison-Wesley Professional.
Jacobson, I., Ng, P. W., & Spence, I. (2007). Enough of Processes—Lets do Practices. The Journal of Object Technology, 6(6), 41. https://doi.org/10.5381/jot.2007.6.6.c5
James, L. R. (1982). Aggregation bias in estimates of perceptual agreement. Journal of Applied Psychology, 67(2), 219.
Jedlitschka, A., Ciolkowski, M., & Pfahl, D. (2005). Reporting guidelines for controlled experiments in software engineering. 2005 International Symposium on Empirical Software Engineering, 2005., 10–pp. https://doi.org/10.1109/ISESE.2005.1541818
Johannesson, P., & Perjons, E. (2014). An Introduction to Design Science. Springer International Publishing. https://doi.org/10.1007/978-3-319-10632-8
Keogh, L. (n.d.). BDD Articles. Retrieved May 1, 2019, from https://lizkeogh.com/category/bdd/
Kerievsky, J. (2016). An Introduction to Modern Agile. Infoq.Com. https://www.infoq.com/articles/modern-agile-intro/
225
Kitchenham, B., Budgen, D., & Pearl Brereton, O. (2011). Using mapping studies as the basis for further research – A participant-observer case study. Information and Software Technology, 53(6), 638–651. https://doi.org/10.1016/j.infsof.2010.12.011
Kitchenham, B., & Charters, S. (2007). Guidelines for performing systematic literature reviews in software engineering. Citeseer.
Kitchenham, B., Madeyski, L., Budgen, D., Keung, J., Brereton, P., Charters, S., Gibbs, S., & Pohthong, A. (2017). Robust statistical methods for empirical software engineering. Empirical Software Engineering, 22(2), 579–630. https://doi.org/10.1007/s10664-016-9437-5
Kitchenham, B., & Pfleeger, S. L. (2008). Personal opinion surveys. In F. Shull, J. Singer, & D. I. K. Sjøberg (Eds.), Guide to Advanced Empirical Software Engineering (pp. 63–92). Springer. https://doi.org/10.1007/978-1-84800-044-5_7
Kitchenham, B., Pfleeger, S. L., & Fenton, N. (1995). Towards a framework for software measurement validation. IEEE Transactions on Software Engineering, 21(12), 929–944. https://doi.org/10.1109/32.489070
Kontio, J., Bragge, J., & Lehtola, L. (2008). The Focus Group Method as an Empirical Tool in Software Engineering. In F. Shull, J. Singer, & D. I. K. Sjøberg (Eds.), Guide to Advanced Empirical Software Engineering (pp. 185–200). Springer. https://doi.org/10.1007/978-1-84800-044-5_7
Kroeger, T. A., Davidson, N. J., & Cook, S. C. (2014). Understanding the characteristics of quality for software engineering processes: A Grounded Theory investigation. Information and Software Technology, 56(2), 252–271. https://doi.org/10.1016/j.infsof.2013.10.003
Kropp, M., Meier, A., Anslow, C., & Biddle, R. (2018). Satisfaction, Practices, and Influences in Agile Software Development. Proceedings of the 22nd International Conference on Evaluation and Assessment in Software Engineering 2018, 112–121. https://doi.org/10.1145/3210459.3210470
Kuhrmann, M., Diebold, P., Munch, J., Tell, P., Trektere, K., McCaffery, F., Garousi, V., Felderer, M., Linssen, O., Hanser, E., & Prause, C. R. (2019). Hybrid Software Development Approaches in Practice: A European Perspective. IEEE Software, 36(4), 20–31. https://doi.org/10.1109/MS.2018.110161245
Kuhrmann, M., Münch, J., Richardson, I., Rausch, A., & Zhang, H. (Eds.). (2016). Managing Software Process Evolution. Springer International Publishing. https://doi.org/10.1007/978-3-319-31545-4
Liao, S. C., Hunt, E. A., & Chen, W. (2010). Comparison between inter-rater reliability and inter-rater agreement in performance assessment. Annals Academy of Medicine Singapore, 39(8), 613.
Mahrin, M. N., Carrington, D., & Strooper, P. (2008). Investigating Factors Affecting the Usability of Software Process Descriptions. In Q. Wang, D. Pfahl, & D. M. Raffo

226
(Eds.), Making Globally Distributed Software Development a Success Story (pp. 222–233). Springer Berlin Heidelberg.
Martin, M., & Martin, R. C. (2003). Fitnesse Tool. http://docs.fitnesse.org/
Maxwell, K. (2002). Applied Statistics for Software Managers. Prentice Hall PTR.
Mayer, T. (2009). Simple Scrum. https://agileanarchy.wordpress.com/2009/09/20/simple-scrum/
McClave, J. T., Benson, P. G., & Sincich, T. T. (2008). Statistics for Business and Economics (10th ed.). Pearson Education.
Miranda, E. (2018). Milestone Planning: A Participative and Visual Approach, unpublished manuscript.
Miranda, E. (2019). Milestone Planning: A Participatory and Visual Approach. The Journal of Modern Project Management, 07(02), 46–66. https://doi.org/10.19255/JMPM02003
Mockus, A. (2008). Missing Data in Software Engineering. In F. Shull, J. Singer, & D. I. K. Sjøberg (Eds.), Guide to Advanced Empirical Software Engineering (pp. 185–200). Springer. https://doi.org/10.1007/978-1-84800-044-5_7
Moody, D. L. (2003). The method evaluation model: A theoretical model for validating information systems design methods. Proceedings of ECIS ’03, 1327–1336. https://doi.org/10.1.1.108.3682
Nagy, G., & Rose, S. (2018). Discovery, Explore behaviour using examples. LeanPub /CreateSpace.
Naur, P. (1985). Programming as theory building. Microprocessing and Microprogramming, 15(5), 253–261. https://doi.org/10.1016/0165-6074(85)90032-8
Nielsen, J. (1994). Usability Engineering. Elsevier.
Norman, D. A. (1988). The design of everyday things. Basic books.
North, D. (2006, March). Introducing BDD. https://dannorth.net/introducing-bdd/
Osterweil, L. (1987). Software processes are software too. Proc. of the 9th International Conference on Software Engineering, Los Alamitos, CA, USA.
Overhage, S., Schlauderer, S., Birkmeier, D., & Miller, J. (2011). What Makes IT Personnel Adopt Scrum? A Framework of Drivers and Inhibitors to Developer Acceptance. 2011 44th Hawaii International Conference on System Sciences, 1–10. https://doi.org/10.1109/HICSS.2011.493

227
Paez, N., Fontdevila, D., Gainey, F., & Oliveros, A. (2018). Technical and Organizational Agile Practices: A Latin-American Survey. In J. Garbajosa, X. Wang, & A. Aguiar (Eds.), Agile Processes in Software Engineering and Extreme Programming (Vol. 314, pp. 146–159). Springer International Publishing. https://doi.org/10.1007/978-3-319-91602-6_10
Paez, N., Fontdevila, D., Súarez, P., Fontela, C., Degiovannini, M., & Molinari, A. (2014). Construcción de software: Una mirada ágil. EDUNTREF.
Petersen, K., Vakkalanka, S., & Kuzniarz, L. (2015). Guidelines for conducting systematic mapping studies in software engineering: An update. Information and Software Technology, 64, 1–18. https://doi.org/10.1016/j.infsof.2015.03.007
Pfleeger, S. L. (1999). Understanding and improving technology transfer in software engineering. Journal of Systems and Software, 47(2–3), 111–124. https://doi.org/10.1016/S0164-1212(99)00031-X
Pink, D. H. (2011). Drive: The Surprising Truth About What Motivates Us. Riverhead Books.
Polgár, P. B., & Biró, M. (2011). The Usability Approach in Software Process Improvement. In R. V. O‘Connor, J. Pries-Heje, & R. Messnarz (Eds.), Systems, Software and Service Process Improvement (pp. 133–142). Springer Berlin Heidelberg.
Poppendieck, M. (2004). Unjust deserts. Better Software, 33–47.
Poppendieck, M., & Poppendieck, T. (2007). Lean Software Development, From Concept to Cash. Addison-Wesley.
Pressman, R. S., & Maxim, B. (2014). Software Engineering: A Practitioner’s Approach. McGraw Hill.
Privitera, G. J., & Lynn, A.-D. (2018). Research Methods for Education. Sage Publications. https://us.sagepub.com/en-us/nam/research-methods-for-education/book245749
Riemenschneider, C. K., Hardgrave, B. C., & Davis, F. D. (2002). Explaining software developer acceptance of methodologies: A comparison of five theoretical models. IEEE Transactions on Software Engineering, 28(12), 1135–1145. Scopus. https://doi.org/10.1109/TSE.2002.1158287
Ries, E. (2011). The Lean Startup. Penguin Books.
Rizopoulos, D. (n.d.). Ltm R package. https://www.rdocumentation.org/packages/ltm/versions/1.1-1/topics/cronbach.Alpha
Robson, C. (2002). Real world research: A resource for social scientists and practitioner-researchers (Vol. 2). Blackwell Oxford.

228
Runeson, P., & Höst, M. (2008). Guidelines for conducting and reporting case study research in software engineering. Empirical Software Engineering, 14(2), 131. https://doi.org/10.1007/s10664-008-9102-8
Schelter, W. (1982). Maxima, a computational algebra system. http://maxima.sourceforge.net
Schwaber, K., & Sutherland, J. (2017). Scrum Guide. http://www.scrumguides.org/scrum-guide.html
Scrum Alliance. (2020). Certified Scrum Master Course. Scrum Alliance Website. https://www.scrumalliance.org/get-certified/scrum-master-track/certified-scrummaster
SEI. (2020). Software Architecture Design and Analysis course. SEI. https://www.sei.cmu.edu/education-outreach/courses/course.cfm?courseCode=P34
Shum, S. B., & Hammond, N. (1994). Argumentation-based design rationale: What use at what cost? International Journal of Human-Computer Studies, 40(4), 603–652.
Solis, C., & Wang, X. (2011). A study of the characteristics of behaviour driven development. 2011 37th EUROMICRO Conference on Software Engineering and Advanced Applications, 383–387. https://doi.org/10.1109/SEAA.2011.76
Stacey, R. D. (2002). Strategic management and organisational dynamics: The challenge of complexity. Prentice Hall.
Tripp, J., Riemenschneider, C., & Thatcher, J. (2016). Job Satisfaction in Agile Development Teams: Agile Development as Work Redesign. Journal of the Association for Information Systems, 17(4). https://doi.org/10.17705/1jais.00426
Van Kelle, E., Visser, J., Plaat, A., & Van Der Wijst, P. (2015). An empirical study into social success factors for agile software development. Proceedings - 8th International Workshop on Cooperative and Human Aspects of Software Engineering, CHASE 2015, 77–80. https://doi.org/10.1109/CHASE.2015.24
Version One. (2020). State of Agile Report. Version One. https://stateofagile.com/
Wiegers, K. (2001). Peer Reviews in Software: A Practical Guide. Addison-Wesley.
Wieringa, R. (2014). Design Science Methodology for Information Systems and Software Engineering. Springer-Verlag. https://doi.org/10.1007/978-3-662-43839-8
Wieringa, R., Maiden, N., Mead, N., & Rolland, C. (2006). Requirements engineering paper classification and evaluation criteria: A proposal and a discussion. Requirements Engineering, 11(1), 102–107. https://doi.org/10.1007/s00766-005-0021-6

229
Wohlin, C., Runeson, P., Höst, M., Ohlsson, M. C., Regnell, B., & Wesslén, A. (2012). Experimentation in Software Engineering. Springer Berlin Heidelberg. https://doi.org/10.1007/978-3-642-29044-2
Wynne, M., & Hellesøy, A. (2012). The Cucumber Book: Behaviour-Driven Development for Testers and Developers. Pragmatic Bookshelf.
Zhang, H., Babar, M. A., & Tell, P. (2011). Identifying relevant studies in software engineering. Information and Software Technology, 53(6), 625–637. https://doi.org/10.1016/j.infsof.2010.12.010