A Two-Dimensional, Two-Phase, Multicomponent, Transient Model for the Cathode of a Proton Exchange...
12
A Two-Dimensional, Two-Phase, Multicomponent, Transient Model for the Cathode of a Proton Exchange Membrane Fuel Cell Using Conventional Gas Distributors Dilip Natarajan and Trung Van Nguyen* ,z Department of Chemical and Petroleum Engineering, University of Kansas, Lawrence, Kansas 66045, USA A two-dimensional, two-phase, multicomponent, transient model was developed for the cathode of the proton exchange membrane fuel cell. Gas transport was addressed by multicomponent diffusion equations while Darcy’s law was adapted to account for the capillary flow of liquid water in the porous gas diffusion layer. The model was validated with experimental results and qualitative information on the effects of various operating conditions and design parameters and the transient phenomena upon imposing a cathodic overpotential were obtained. The performance of the cathode was found to be dominated by the dynamics of liquid water, especially in the high current density range. Conditions that promote faster liquid water removal such as temperature, dryness of the inlet gas stream, reduced diffusion layer thickness, and higher porosity improved the performance of the cathode. There seems to be an optimum in the diffusion layer thickness at the low current density range. The model results showed that for a fixed electrode width, a greater number of channels and shorter shoulder widths are preferred. The transient profiles clearly showed that liquid water transport is the slowest mass-transfer phenomenon in the cathode and is primarily responsible for mass-transfer restrictions especially over the shoulder. © 2001 The Electrochemical Society. @DOI: 10.1149/1.1415032# All rights reserved. Manuscript submitted November 3, 2000; revised manuscript received July 12, 2001. Available electronically November 1, 2001. Proton exchange membranes ~PEM! fuel cells are considered to be one of the most promising energy conversion devices of the 21st century. 1 However, for this technology to be commercially viable, its performance needs to be further optimized, to be cost competitive with current energy conversion devices. 1-3 A cursory look at a typi- cal polarization curve of a PEM fuel cell shows that the loss in the cell potential occurs due to activation resistance, ohmic losses, and mass-transfer limitations. 1 The activation loss is a kinetic property and is determined by the quality, distribution, and the activity of the platinum/carbon catalyst. The ohmic losses are directly related to the protonic conductivity of the membrane and the electronic conduc- tivity of the current collectors. The mass-transfer limitations are caused by the inability of the reactants to keep up with the demands imposed by the electrochemical reaction. 1 It is a widely accepted fact that the cathode of the proton exchange membrane fuel cell is the performance-limiting component due to the slower kinetics of the oxygen reduction reaction 4,5 and the mass-transfer limitations caused by the nitrogen barrier layer effect and the liquid water gen- erated by the reaction and electro-osmotic drag, accumulating in the porous catalyst and gas diffusion layers. 4 Over the past decade, sig- nificant research effort has been focused by researchers all over the world on fuel cell designs that would alleviate the cathode-flooding problem caused by liquid water, the development of better catalysts, and catalyst dispersion on the supports for improving the kinetics of the reduction reaction and development of membranes with higher protonic conductivity. 1 Of these the mass-transport problems seem to have the greatest potential for improvement. 4 Comprehensive experimental investigations on PEM fuel cells have traditionally been difficult. While the cell voltage and the cur- rent densities are relatively easy to measure, the actual reactant and product concentration profiles in the catalyst and gas diffusion lay- ers, which would provide great insight into the actual mass-transport processes involved and hence guide one to better designs, are very difficult to measure due to their small geometry ~thickness are in the order of micrometers!. This has prompted researchers to develop mathematical models to provide qualitative insights into the pro- cesses involved in the fuel cells. Due to the importance of the cath- ode as the performance-limiting component, researchers have pre- dominantly focused their modeling efforts on the cathode. Initially due to the inherent difficulties associated with two-phase dynamics in porous media, most models dealt only with the gas phase and a single dimension, usually the dimension normal to the plane of the reactive catalyst surface. 4,6,7 The predictions of these models are not representative of ‘‘real life’’ situations. Over the past few years re- searchers have started looking into two-phase, multidimensional models to get a more realistic picture of the processes. 8-14 Gurau et al. 8 developed a two-dimensional, steady-state model for the entire fuel cell sandwich employing conventional flow fields. The dimension along the length of the channel and the one normal to the reactive surface were considered. Dutta et al. 10 included the third dimension in their model. In Gurau’s model, the liquid water domain includes only the catalyst layers and the membrane. The transport of liquid water across the membrane due to electro- osmotic drag and back diffusion is accounted for. Dutta et al. do not consider liquid water in any of their modeled domains. In a more recent publication, Shimpalee et al. 11 accounted for liquid water in their complete 3D model of the entire fuel cell sandwich. However, they treat the liquid water as a component of the gas mixture that is transported by convection by total gas pressure and diffusion by density gradients. Furthermore, the effect of liquid water and its distribution in the porous gas diffusion layer on the gas transport and the electrochemical reactions were not accounted for. The presence of liquid water was only included to account for the energy ex- change due to phase change. Though these are the only models currently available in the literature that account for the entire chan- nel and not just the channel-diffuser interface, they do not correctly account for the transport of liquid water by capillary forces and the presence of liquid water in the porous gas diffusion layer that is of great significance in light of mass-transport limitations imposed by restriction of gas diffusion pores and by the coverage of reactive sites as is shown in the later sections of this paper. Recently our research group came up with an interdigitated gas distributor design and one of the first two-phase models for the cathode of the PEM fuel cell using this design. 12,15 Other research groups have come up with complementary models to describe the processes in the cathode of a fuel cell using interdigitated gas distributors. 13 However, the conventional and the intermediate ser- pentine flow field designs are still widely being used by fuel cell researchers. Hence in this paper a two-phase, two-dimensional, iso- thermal transient model is developed for the cathode of the fuel cell using the conventional flow field. In this paper, a new and novel approach similar to that used by He et al. 12 and Wang et al. 13 is applied to liquid water transport in the porous gas diffusion layer. The liquid water and gaseous species governing equations are pri- marily coupled by an interfacial mass-transfer rate, similar to that of He et al.’s work. Various operating conditions and design param- * Electrochemical Society Active Member. z E-mail: [email protected] Journal of The Electrochemical Society, 148 ~12! A1324-A1335 ~2001! 0013-4651/2001/148~12!/A1324/12/$7.00 © The Electrochemical Society, Inc. A1324 ) unless CC License in place (see abstract). ecsdl.org/site/terms_use address. Redistribution subject to ECS terms of use (see 24.124.78.223 Downloaded on 2015-02-01 to IP
Transcript of A Two-Dimensional, Two-Phase, Multicomponent, Transient Model for the Cathode of a Proton Exchange...

Journal of The Electrochemical Society, 148 ~12! A1324-A1335~2001!0013-4651/2001/148~12!/A1324/12/$7.00 © The Electrochemical Society, Inc.
A1324
Dow
A Two-Dimensional, Two-Phase, Multicomponent, TransientModel for the Cathode of a Proton ExchangeMembrane Fuel Cell Using Conventional Gas DistributorsDilip Natarajan and Trung Van Nguyen* ,z
Department of Chemical and Petroleum Engineering, University of Kansas, Lawrence, Kansas 66045, USA
A two-dimensional, two-phase, multicomponent, transient model was developed for the cathode of the proton exchange membranefuel cell. Gas transport was addressed by multicomponent diffusion equations while Darcy’s law was adapted to account for thecapillary flow of liquid water in the porous gas diffusion layer. The model was validated with experimental results and qualitativeinformation on the effects of various operating conditions and design parameters and the transient phenomena upon imposing acathodic overpotential were obtained. The performance of the cathode was found to be dominated by the dynamics of liquid water,especially in the high current density range. Conditions that promote faster liquid water removal such as temperature, dryness ofthe inlet gas stream, reduced diffusion layer thickness, and higher porosity improved the performance of the cathode. There seemsto be an optimum in the diffusion layer thickness at the low current density range. The model results showed that for a fixedelectrode width, a greater number of channels and shorter shoulder widths are preferred. The transient profiles clearly showed thatliquid water transport is the slowest mass-transfer phenomenon in the cathode and is primarily responsible for mass-transferrestrictions especially over the shoulder.© 2001 The Electrochemical Society.@DOI: 10.1149/1.1415032# All rights reserved.
Manuscript submitted November 3, 2000; revised manuscript received July 12, 2001. Available electronically November 1, 2001.
21e,itiv
thean
ythe
thucrend
llo
senth
-r tingst
s ohe
em
ellur-t alaypov
loproathpllyic
nd
theotre-nal
dels.al to
erThetro-
re
er,t isbyits
andencex-
odelsan-ctlythe
ofby
tive
gasthe
thegaser-ell, iso-cellvel
er.pri-
t ofm-
Proton exchange membranes~PEM! fuel cells are considered tobe one of the most promising energy conversion devices of thecentury.1 However, for this technology to be commercially viablits performance needs to be further optimized, to be cost competwith current energy conversion devices.1-3 A cursory look at a typi-cal polarization curve of a PEM fuel cell shows that the loss incell potential occurs due to activation resistance, ohmic losses,mass-transfer limitations.1 The activation loss is a kinetic propertand is determined by the quality, distribution, and the activity ofplatinum/carbon catalyst. The ohmic losses are directly related toprotonic conductivity of the membrane and the electronic condtivity of the current collectors. The mass-transfer limitations acaused by the inability of the reactants to keep up with the demaimposed by the electrochemical reaction.1 It is a widely acceptedfact that the cathode of the proton exchange membrane fuel cethe performance-limiting component due to the slower kineticsthe oxygen reduction reaction4,5 and the mass-transfer limitationcaused by the nitrogen barrier layer effect and the liquid water gerated by the reaction and electro-osmotic drag, accumulating inporous catalyst and gas diffusion layers.4 Over the past decade, significant research effort has been focused by researchers all oveworld on fuel cell designs that would alleviate the cathode-floodproblem caused by liquid water, the development of better catalyand catalyst dispersion on the supports for improving the kineticthe reduction reaction and development of membranes with higprotonic conductivity.1 Of these the mass-transport problems seto have the greatest potential for improvement.4
Comprehensive experimental investigations on PEM fuel chave traditionally been difficult. While the cell voltage and the crent densities are relatively easy to measure, the actual reactanproduct concentration profiles in the catalyst and gas diffusioners, which would provide great insight into the actual mass-transprocesses involved and hence guide one to better designs, aredifficult to measure due to their small geometry~thickness are in theorder of micrometers!. This has prompted researchers to devemathematical models to provide qualitative insights into the pcesses involved in the fuel cells. Due to the importance of the code as the performance-limiting component, researchers havedominantly focused their modeling efforts on the cathode. Initiadue to the inherent difficulties associated with two-phase dynamin porous media, most models dealt only with the gas phase a
* Electrochemical Society Active Member.z E-mail: [email protected]
address. Redistribution subject to ECS te24.124.78.223nloaded on 2015-02-01 to IP
st
e
d
e-
s
isf
-e
he
s,fr
s
nd-rtery
--
re-
sa
single dimension, usually the dimension normal to the plane ofreactive catalyst surface.4,6,7The predictions of these models are nrepresentative of ‘‘real life’’ situations. Over the past few yearssearchers have started looking into two-phase, multidimensiomodels to get a more realistic picture of the processes.8-14
Gurau et al.8 developed a two-dimensional, steady-state mofor the entire fuel cell sandwich employing conventional flow fieldThe dimension along the length of the channel and the one normthe reactive surface were considered. Duttaet al.10 included thethird dimension in their model. In Gurau’s model, the liquid watdomain includes only the catalyst layers and the membrane.transport of liquid water across the membrane due to elecosmotic drag and back diffusion is accounted for. Duttaet al.do notconsider liquid water in any of their modeled domains. In a morecent publication, Shimpaleeet al.11 accounted for liquid water intheir complete 3D model of the entire fuel cell sandwich. Howevthey treat the liquid water as a component of the gas mixture thatransported by convection by total gas pressure and diffusiondensity gradients. Furthermore, the effect of liquid water anddistribution in the porous gas diffusion layer on the gas transportthe electrochemical reactions were not accounted for. The presof liquid water was only included to account for the energy echange due to phase change. Though these are the only mcurrently available in the literature that account for the entire chnel and not just the channel-diffuser interface, they do not correaccount for the transport of liquid water by capillary forces andpresence of liquid water in the porous gas diffusion layer that isgreat significance in light of mass-transport limitations imposedrestriction of gas diffusion pores and by the coverage of reacsites as is shown in the later sections of this paper.
Recently our research group came up with an interdigitateddistributor design and one of the first two-phase models forcathode of the PEM fuel cell using this design.12,15 Other researchgroups have come up with complementary models to describeprocesses in the cathode of a fuel cell using interdigitateddistributors.13 However, the conventional and the intermediate spentine flow field designs are still widely being used by fuel cresearchers. Hence in this paper a two-phase, two-dimensionalthermal transient model is developed for the cathode of the fuelusing the conventional flow field. In this paper, a new and noapproach similar to that used by Heet al.12 and Wanget al.13 isapplied to liquid water transport in the porous gas diffusion layThe liquid water and gaseous species governing equations aremarily coupled by an interfacial mass-transfer rate, similar to thaHe et al.’s work. Various operating conditions and design para
) unless CC License in place (see abstract). ecsdl.org/site/terms_userms of use (see
ssnddet
ldH
tepfuehicth
ultil
of
d
ul-idt
ryedeuld
fond
ora
sa
uue alityansma
eyanve
rob. Iui
ffute
en ismul-fileater
ionbythatthethe
sewn
aren isermll
to
ousthe
s inre
larcal
n-
cial
-itchde-ceater
Journal of The Electrochemical Society, 148 ~12! A1324-A1335~2001! A1325
Dow
eters are evaluated to provide qualitative insights into the procethat will help in the improvement and fine tuning of this model aunderstanding the experimental results. Moreover, in this momulticomponent gas transport equations are used to describemovement of gaseous reactant and product species. It shounoted that this paper is complementary to the work published byet al. on interdigitated flow field designs. This paper is the first sin developing a comprehensive model for a conventional PEMcell cathode that includes all dimensions and a catalyst layer, wis believed to be of great importance in accurately describingphenomena occurring in a fuel cell. Moreover, the model rescoupled with experimental investigations currently in progress wprovide excellent insight into the time-varying spatial distributionlocal current densities.
Model Development and Other Considerations
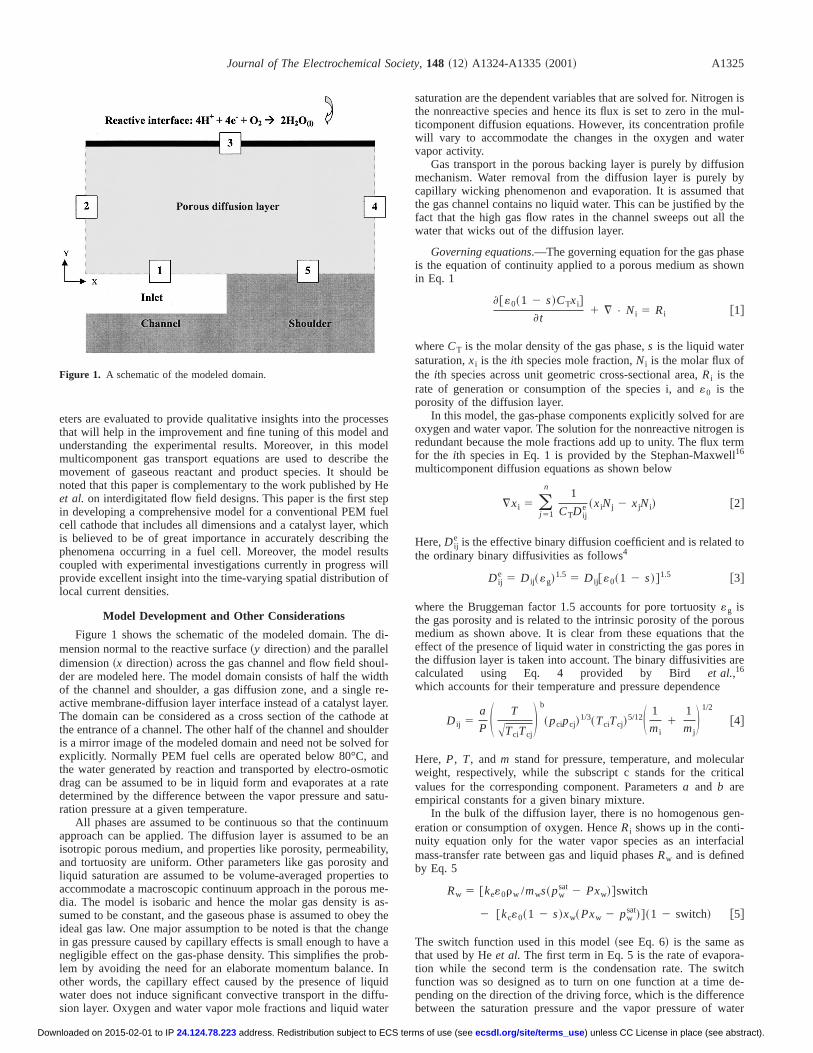
Figure 1 shows the schematic of the modeled domain. Themension normal to the reactive surface~y direction!and the paralleldimension~x direction!across the gas channel and flow field shoder are modeled here. The model domain consists of half the wof the channel and shoulder, a gas diffusion zone, and a singleactive membrane-diffusion layer interface instead of a catalyst laThe domain can be considered as a cross section of the cathothe entrance of a channel. The other half of the channel and shois a mirror image of the modeled domain and need not be solvedexplicitly. Normally PEM fuel cells are operated below 80°C, athe water generated by reaction and transported by electro-osmdrag can be assumed to be in liquid form and evaporates at adetermined by the difference between the vapor pressure andration pressure at a given temperature.
All phases are assumed to be continuous so that the continapproach can be applied. The diffusion layer is assumed to bisotropic porous medium, and properties like porosity, permeabiand tortuosity are uniform. Other parameters like gas porosityliquid saturation are assumed to be volume-averaged propertieaccommodate a macroscopic continuum approach in the porousdia. The model is isobaric and hence the molar gas density issumed to be constant, and the gaseous phase is assumed to obideal gas law. One major assumption to be noted is that the chin gas pressure caused by capillary effects is small enough to hanegligible effect on the gas-phase density. This simplifies the plem by avoiding the need for an elaborate momentum balanceother words, the capillary effect caused by the presence of liqwater does not induce significant convective transport in the dision layer. Oxygen and water vapor mole fractions and liquid wa
Figure 1. A schematic of the modeled domain.
address. Redistribution subject to ECS te24.124.78.223nloaded on 2015-02-01 to IP
es
lhebee
lhesl
i-
he-r.at
err
tictetu-
mn
,dtoe-s-the
gea
-nd-r
saturation are the dependent variables that are solved for. Nitrogthe nonreactive species and hence its flux is set to zero in theticomponent diffusion equations. However, its concentration prowill vary to accommodate the changes in the oxygen and wvapor activity.
Gas transport in the porous backing layer is purely by diffusmechanism. Water removal from the diffusion layer is purelycapillary wicking phenomenon and evaporation. It is assumedthe gas channel contains no liquid water. This can be justified byfact that the high gas flow rates in the channel sweeps out allwater that wicks out of the diffusion layer.
Governing equations.—The governing equation for the gas phais the equation of continuity applied to a porous medium as shoin Eq. 1
]@«0~1 2 s!CTxi#
]t1 ¹ • Ni 5 Ri @1#
whereCT is the molar density of the gas phase,s is the liquid watersaturation,xi is the ith species mole fraction,Ni is the molar flux ofthe ith species across unit geometric cross-sectional area,Ri is therate of generation or consumption of the species i, and«0 is theporosity of the diffusion layer.
In this model, the gas-phase components explicitly solved foroxygen and water vapor. The solution for the nonreactive nitrogeredundant because the mole fractions add up to unity. The flux tfor the ith species in Eq. 1 is provided by the Stephan-Maxwe16
multicomponent diffusion equations as shown below
¹xi 5 (j 51
n1
CTD ije ~xiNj 2 xjNi! @2#
Here,D ije is the effective binary diffusion coefficient and is related
the ordinary binary diffusivities as follows4
D ije 5 D ij~«g!
1.5 5 D ij@«0~1 2 s!#1.5 @3#
where the Bruggeman factor 1.5 accounts for pore tortuosity«g isthe gas porosity and is related to the intrinsic porosity of the pormedium as shown above. It is clear from these equations thateffect of the presence of liquid water in constricting the gas porethe diffusion layer is taken into account. The binary diffusivities acalculated using Eq. 4 provided by Bird et al.,16
which accounts for their temperature and pressure dependence
D ij 5a
P S T
ATciTcjD b
~pcipcj!1/3~TciTcj!
5/12S 1
mi1
1
mjD 1/2
@4#
Here, P, T, andm stand for pressure, temperature, and molecuweight, respectively, while the subscript c stands for the critivalues for the corresponding component. Parametersa and b areempirical constants for a given binary mixture.
In the bulk of the diffusion layer, there is no homogenous geeration or consumption of oxygen. HenceRi shows up in the conti-nuity equation only for the water vapor species as an interfamass-transfer rate between gas and liquid phasesRw and is definedby Eq. 5
Rw 5 @ke«0rw /mws~pwsat 2 Pxw!#switch
2 @kc«0~1 2 s!xw~Pxw 2 pwsat!#~1 2 switch! @5#
The switch function used in this model~see Eq. 6!is the same asthat used by Heet al. The first term in Eq. 5 is the rate of evaporation while the second term is the condensation rate. The swfunction was so designed as to turn on one function at a timepending on the direction of the driving force, which is the differenbetween the saturation pressure and the vapor pressure of w
) unless CC License in place (see abstract). ecsdl.org/site/terms_userms of use (see
or
s-ed.potionath
a-one
asein
of
hethpeve
icaatubeeshaenfludy
eanlikthdep
rehes eblofrs
nifi
atio
nandthe
d, asown
ereoul-ionh-ted
inicaliquidll.ter
the14.lytonso the
sed
Journal of The Electrochemical Society, 148 ~12! A1324-A1335~2001!A1326
Dow
vapor at a given temperature. The reason for having both evaption and a condensation term is explained in later sections
switch 51 1 upw
sat 2 Pxwu/~pwsat 2 Pxw!
2@6#
Equation 7 gives the governing equation for liquid water
«0
]s
]t1 ¹ • qw 5
2Mw • Rw
rw@7#
whereqw is the liquid water flux across the unit geometric crossectional area. The treatment of unsaturated flow in porous mfrom petroleum and hydrology literature17 is adopted in this paperBasically, Darcy’s law is adapted to define flow in unsaturatedrous media. In this adaptation, one assumes that the cross-secarea available for a particular phase to flow is directly proportioto the ratio of the pore volume occupied by that phase. Hencepermeability, which is a measure of the cross-sectional area~assum-ing continuity of phases! becomes a function of liquid water saturtion in this case. Moreover, in the cathode of a fuel cell using cventional distributors, the only driving force for liquid water is thcapillary pressure difference between the gas and the liquid phHence the driving force term in Darcy’s equation is expressedterms of capillary head, which in itself is a complex functionsaturation. Hence the flux expression for liquid water is
qw 52K~s!rwg~2¹c!
mw5
2K~s!rwg
mwS 2
]c
]s D¹s @8#
Here K(s) is the permeability and is a function of saturation. TtermdC/ds is the functionality that describes the dependence ofcapillary head on saturation. Equations 9 and 10 give the dedence of permeability and capillary head on saturation, respecti
f 5 $@e[ 2A(s 2 C)] 2 e[A(s 2 C)]# 1 B%D
]c
]s5 2A 3 D@e[ 2A(s 2 C)] 1 e[A(s 2 C)]# @9#
K~s! 5 K l,abskl,rel 5 K l,abs~s 1 0.01! @10#
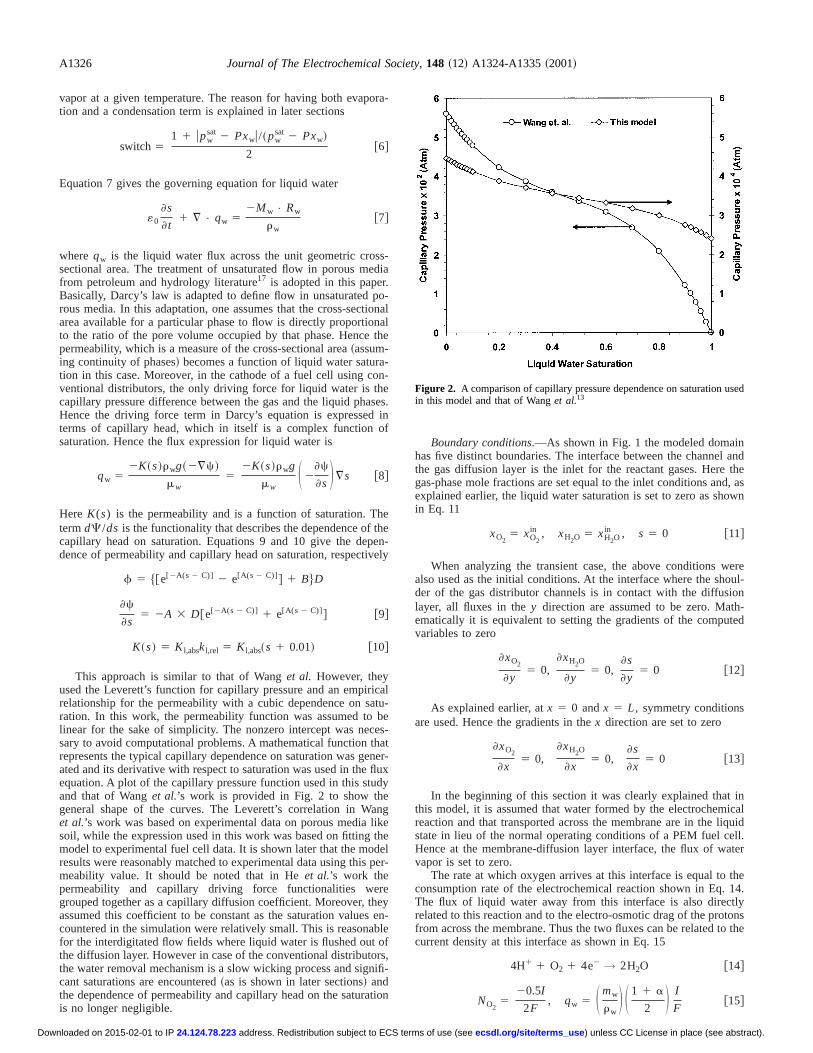
This approach is similar to that of Wanget al. However, theyused the Leverett’s function for capillary pressure and an empirrelationship for the permeability with a cubic dependence on sration. In this work, the permeability function was assumed tolinear for the sake of simplicity. The nonzero intercept was necsary to avoid computational problems. A mathematical function trepresents the typical capillary dependence on saturation was gated and its derivative with respect to saturation was used in theequation. A plot of the capillary pressure function used in this stuand that of Wanget al.’s work is provided in Fig. 2 to show thgeneral shape of the curves. The Leverett’s correlation in Wet al.’s work was based on experimental data on porous mediasoil, while the expression used in this work was based on fittingmodel to experimental fuel cell data. It is shown later that the moresults were reasonably matched to experimental data using thismeability value. It should be noted that in Heet al.’s work thepermeability and capillary driving force functionalities wegrouped together as a capillary diffusion coefficient. Moreover, tassumed this coefficient to be constant as the saturation valuecountered in the simulation were relatively small. This is reasonafor the interdigitated flow fields where liquid water is flushed outthe diffusion layer. However in case of the conventional distributothe water removal mechanism is a slow wicking process and sigcant saturations are encountered~as is shown in later sections! andthe dependence of permeability and capillary head on the saturis no longer negligible.
address. Redistribution subject to ECS te24.124.78.223nloaded on 2015-02-01 to IP
a-
ia
-nalle
-
s.
en-ly
l-
-ter-x
geel
er-
yn-
e
,-
n
Boundary conditions.—As shown in Fig. 1 the modeled domaihas five distinct boundaries. The interface between the channelthe gas diffusion layer is the inlet for the reactant gases. Heregas-phase mole fractions are set equal to the inlet conditions anexplained earlier, the liquid water saturation is set to zero as shin Eq. 11
xO25 xO2
in , xH2O 5 xH2Oin , s 5 0 @11#
When analyzing the transient case, the above conditions walso used as the initial conditions. At the interface where the shder of the gas distributor channels is in contact with the diffuslayer, all fluxes in they direction are assumed to be zero. Matematically it is equivalent to setting the gradients of the compuvariables to zero
]xO2
]y5 0,
]xH2O
]y5 0,
]s
]y5 0 @12#
As explained earlier, atx 5 0 andx 5 L, symmetry conditionsare used. Hence the gradients in thex direction are set to zero
]xO2
]x5 0,
]xH2O
]x5 0,
]s
]x5 0 @13#
In the beginning of this section it was clearly explained thatthis model, it is assumed that water formed by the electrochemreaction and that transported across the membrane are in the lstate in lieu of the normal operating conditions of a PEM fuel ceHence at the membrane-diffusion layer interface, the flux of wavapor is set to zero.
The rate at which oxygen arrives at this interface is equal toconsumption rate of the electrochemical reaction shown in Eq.The flux of liquid water away from this interface is also directrelated to this reaction and to the electro-osmotic drag of the profrom across the membrane. Thus the two fluxes can be related tcurrent density at this interface as shown in Eq. 15
4H1 1 O2 1 4e2 → 2H2O @14#
NO25
20.5I
2F, qw 5 S mw
rwD S 1 1 a
2 D I
F@15#
Figure 2. A comparison of capillary pressure dependence on saturation uin this model and that of Wanget al.13
) unless CC License in place (see abstract). ecsdl.org/site/terms_userms of use (see
Journal of The Electrochemical Society, 148 ~12! A1324-A1335~2001! A1327
Dow
Table I. Parameters used in the model for the base case.
Channel width~half! 0.05 cmShoulder width~half! 0.05 cmDiffusion layer thickness 0.015 cmPorosity of diffusion layer 0.6Inlet oxygen mole fraction 0.21Inlet water vapor mole fraction 0.0Inlet liquid water saturation 0.0System temperature 60°CSystem pressure 1 atmInlet stream relative humidity 0% ~dry!Condensation rate constant (kc)
12 mol/~atm-s-cm3!
Evaporation rate constant (ke)12 1/~atm-s!
Exchange current density at 273 Ka,22 1.243 1024 A/cm2
Transfer coefficient for oxygen reduction (ac)22 0.5
Electro-osmotic drag coefficient~a!22 0.5Cathode overpotential~h! 20.5Liquid water permeability at 100% saturation (K l,abs) based on Ref. 12 0.733 10210 cm2
Constants used in capillary head expression15
~A, B, C, and D in cm!3.7, 21, 0.494, and 0.0173respectively
Viscosity of liquid water at 60°C18 5.0 3 1023 g/cm sDensity of liquid water at 60°C18 0.9832 g/cm3
a Obtained from Ref. 22 and adjusted for temperature and active surface area.
t,e bribthafternsagt-Tin
t
ndetwe
thsusftiol
caantanturk-hoap
atiotraforsie
e theas
dedoutne.the
to be0%ra-mgersingdeted
ottlethe
andromnp-
tingtion
over-
ter
ystemons.d tocello befel
odeodendlopeloss
Here I is the local current density,F is the Faraday’s constananda is the net ratio of water transport rate across the membranelectro-osmotic drag per proton. Tafel kinetics is used to descthe oxygen reduction reaction, which is first order with respect tooxygen concentration at the interface. Equation 16 shows the Texpression for the current density. Liquid water formed at the inface can cover up the active reaction sites and impose mass-trarestrictions on the oxygen reactant. To account for this coverphenomenon the (12 s) term is included in this equation suggesing a linear decrease in the area with an increase in saturation.effect of temperature on the exchange current density is alsocluded in this expression
I 5 2I 0a02S T 2 27310 D~1 2 s!
xO2P
PrefexpS 2acFh
RT D @16#
Here h is the cathodic overpotential,I o is the exchange currendensity,T is the temperature,R is the universal gas constant,a is thereactive surface area, andac is the cathodic transfer coefficient.
The above described governing equations and boundary cotions were discretized using the finite difference method, and a snonlinear algebraic equations was obtained. These equationssolved using a banded solver described by Nguyen and White11 thatemployed an iterative Newton-Raphson procedure to arrive atfinal solutions. Even though no change in temperature and presis expected here, the general form of the interfacial mass-tranequation for water is used and furthermore using both evaporaand condensation terms prevent overshooting problems typicathe Newton-Raphson method.
Results and Discussion
Table I lists the important parameter values used as the baseThe model was used to evaluate various operating conditionsdesign parameters while maintaining all other parameters consThe operating conditions addressed in this model are temperaand relative humidity of the inlet gas stream. Diffusion layer thicness and porosity, channel to shoulder ratio, and channel and sder size are some of the design parameters considered in this pThe results are presented in the form of a steady-state polarizcurve with respect to the cathodic overpotential. Actual concention profiles and local current density profiles are provided onlythe base case for the sake of brevity. Furthermore, the tran
address. Redistribution subject to ECS te24.124.78.223nloaded on 2015-02-01 to IP
yeeel-fere
he-
i-ofre
ereern
of
se.dt.e,
ul-er.n-
nt
concentration profiles were also studied for the base case to givreader an idea of how oxygen and liquid water profiles developone approaches steady-state operation.
Experimental validation and the base case.—A special mem-brane and electrode assembly, fabricated in our laboratory, inclua built-in reference electrode. Nafion 112 with a thickness of ab50 mm obtained from Ion Power, Inc., was used as the membraTorray Carbon Paper obtained from E-TEK, Inc., was used asdiffusion layers. The manufacturers estimated the carbon paperabout 170mm thick and rated the porosity to be about 70% and 2wet-proofed with Teflon. A catalyst ink was prepared in our labotory and used to coat the diffusion layers to give a loading of 0.4of Pt/cm2. The polarization curve for this MEA was generated ovthe entire activation, ohmic, and mass-transport limited range ua single-cell assembly, with an interdigitated flow field for the anoand a conventional flow field for the cathode. The cell was operaat 60°C, and the anode stream was humidified with a sparging bheld at 85°C. The use of a built-in reference electrode enabledmeasurement of the individual half-cell potentials of the anodethe cathode. The potentiostat used in this experiments was fArbin Instruments, Inc. A stoichiometric flow rate of hydrogeequivalent to 1.6 A/cm2 was used for the anode, and air was suplied to the cathode at a stoichiometric flow rate of 1.2 A/cm2 toavoid any oxygen depletion effects along the channel. The operaconditions and design parameters used for experimental validawas also considered as the base case in this study. A cathodicpotential of20.5 V was used in the base case.
Liquid water viscosity, density, and saturation pressure for wavapor at 60°C were obtained from the literature.18 Other relevantparameters, such as channel and shoulder size and ratio and spressure, were so chosen to match with experimental conditiBased on the specifications provided by the manufacturer anaccount for dimensional changes due to compression duringassembly, porosity and diffusion layer thickness were assumed t60% and 150mm, respectively. Parameters involved in the Taexpression were selected from the literature.1,2,12
Figure 3 shows the experimental results in terms of the anand cathode half-cell overpotentials, and the model fit to the cathside. The anode half-cell overpotential, which includes kinetic aohmic losses, changes linearly with current density and has a sof about 290 mV per decade. When an activation overpotentialof 50 mV per decade as reported in the literature2 for hydrogen
) unless CC License in place (see abstract). ecsdl.org/site/terms_userms of use (see

af ththnen
erea
fu-lyateast iyso
ntedutepile as,
per aertheab,nd
owuntiesa
vere oFiatth
onepoionig
iffuhicere
er-tiveell
xy-of
long
ra-ac-tore itThe
apil-hereac-sionover
s theing
ofyerandode
ativethe
ceatertheileuldere oformdropthe
lf inac-adi-oul-tionygenint.
aterter
bycon-
atu-ctivethethanthease.stan-dif-tionughase
thisit isn-entlytheially
in
Journal of The Electrochemical Society, 148 ~12! A1324-A1335~2001!A1328
Dow
oxidation on platinum is subtracted from this value, it providesreasonable estimate of the ohmic losses in the anode half omembrane. Based on this value the cathode overpotentials werecorrected for the ohmic losses in the other half of the membraThe model results agree very well with experimental data as seeFig. 3.
The electrode active area and the liquid water permeability wthe parameters adjusted to fit experimental data. As explainedlier, in a conventional flow field design, gas transport in the difsion layer is strictly by diffusion and liquid water removal is soleattributed to capillary effects and evaporation and transport of wvapor. Hence parameters affecting the transport of these two phare of great significance in the model results. Liquid water presenthe cathode of a PEM fuel cell affects the performance in two waIts presence in the diffusion layer blocks the diffusive pathwaysthe reactants, and the presence of liquid water on the reactive iface covers up the active sites for the electrochemical oxygen retion reaction. In this light, at steady state, for a given rate of waproduction, the magnitude of the product of permeability and calary head functionalities is the deciding factor as far as the ratwhich water is removed from the diffusion layer or, in other wordcontrols the extent of accumulation in the diffusion layer.
So far the authors of this paper have not come across any exmental data for the permeability and capillary functionalities fodiffusion layer like carbon cloth or Torray carbon paper. Moreovthe scaling factor in a Tafel type of current density equation isproduct of the exchange current density and the ratio of the availreactive area~depending on saturation! to the actual geometric areai.e., aIo . Hence their product and the product of capillary head apermeability were the only parameters that were scaled up or dto match experimental data. It should be noted that the actual ftionalities were not adjusted. In other words the linear functionaliof the permeability and area coverage factor were not changedthe mathematical expression for capillary head similar to the Leett function was also held constant. Only the absolute magnitudthese functions at any given saturation was scaled up or down.ure 3 also includes a hypothetical case study where the liquid wremoval rate is increased by an order of magnitude by increasingpermeability or the capillary driving force. This curve in compariswith the actual fit shows clearly that it is the liquid water in thporous gas-diffusion layer that imposes significant mass-translimitations and covers up reactive sites leading to severe limitatin the fuel cell performance. This curve also shows that if onenores liquid water and its mass-transfer hindering effects, the dsive gas transport rates are more than enough to sustain verycurrent densities which are practically never achieved in a fuelwith any currently available type of cathode gas distributors. Mo
Figure 3. Comparison of model results after correction for ohmic lossesthe cathode half of the membrane to experimental data.
address. Redistribution subject to ECS te24.124.78.223nloaded on 2015-02-01 to IP
een.
in
er-
resn.fr-c-r-t
ri-
,
le
nc-
nd-f
g-ere
rts--ghll-
over, our research group has published experimental results19 thatclearly show that the use of other types of flow fields like the intdigitated design that enhances liquid water removal by convectransport significantly improves the performance of the fuel ccathode.
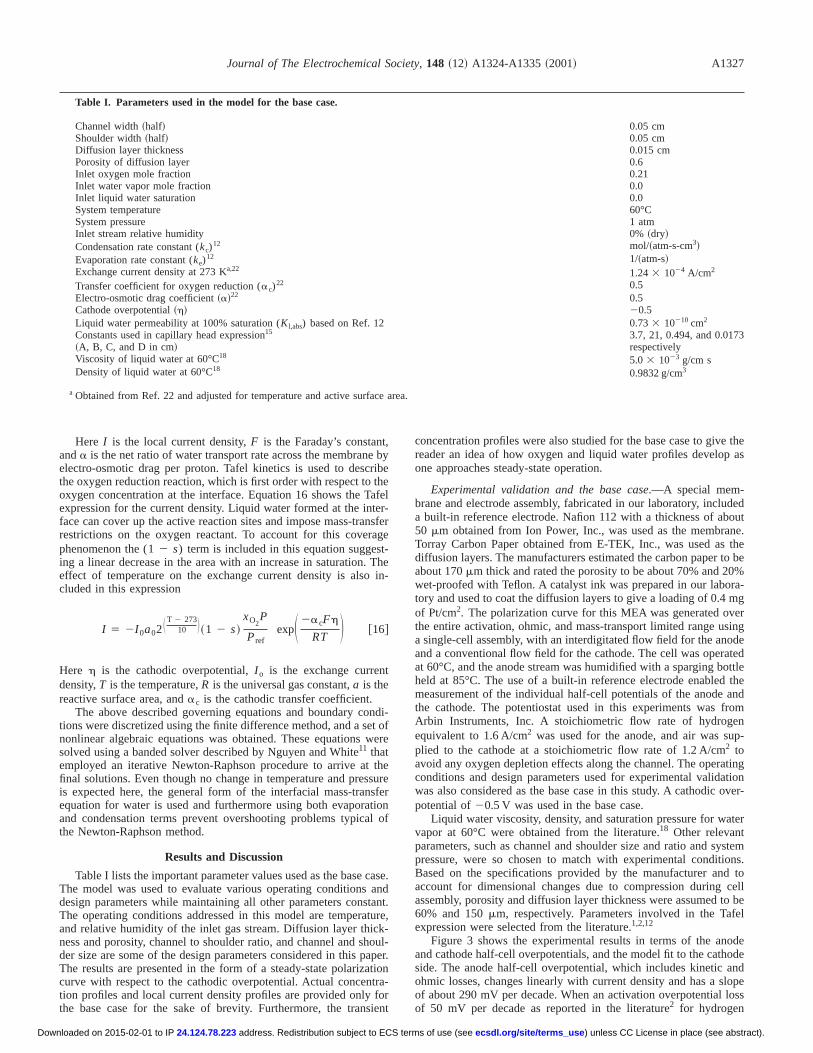
Figure 4 provides the steady-state concentration profiles of ogen, water vapor, and liquid water for the base case in the formsurface plots. Figure 5 shows the local current densities profile athe electrode width.
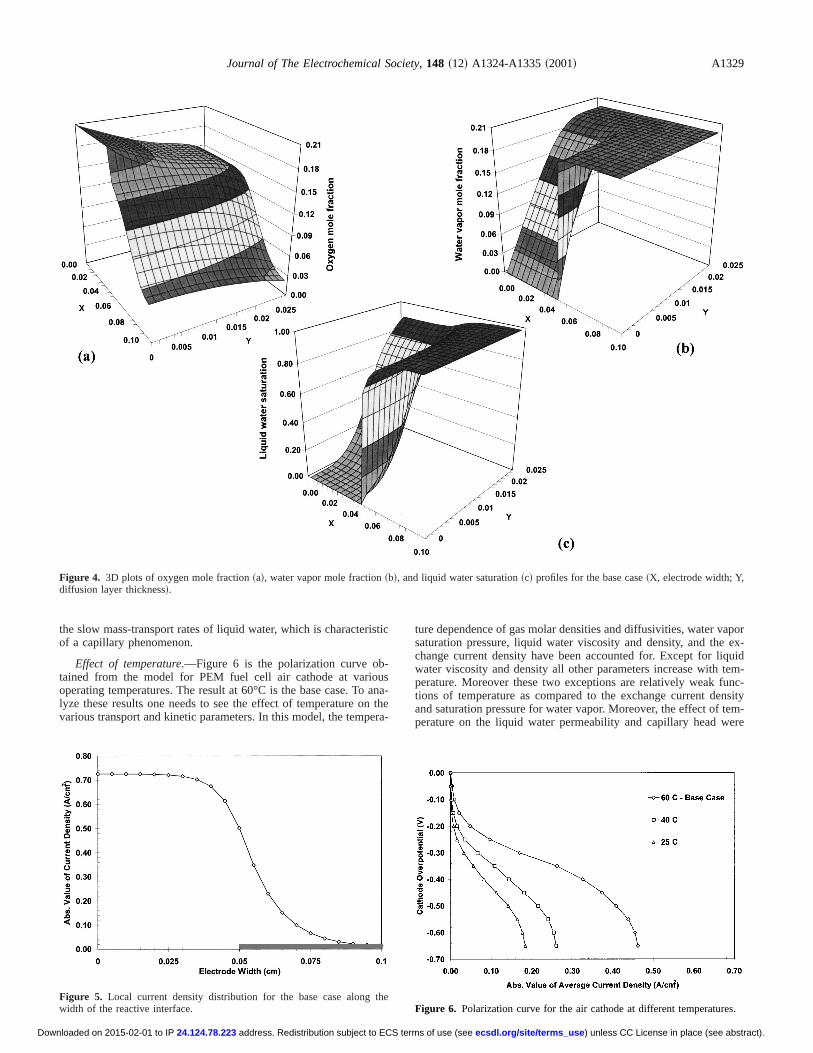
At the channel-diffusion layer interface, the oxygen concenttion is set to inlet boundary condition that translates to a mole frtion of 0.21 for oxygen in air. From this interface oxygen diffusesthe reactive surface through the porous gas-diffusion layer wheis consumed by the electrochemical reaction to produce water.water so produced is removed by two mechanisms, namely, clary flow and diffusion of vapor upon evaporation. In case of treactive region over the channel, mass transport is fast, as thetants and products need to cover only the thickness of the diffulayer. On the other hand, as one approaches the reactive regionthe shoulder, the reactants and products have to diffuse acrosthickness and width of the diffusion layer, the latter dimension besix times greater. Hence one would expect a lesser availabilityoxygen and a greater accumulation of water in the diffusion laover the shoulder as clearly seen in the surface plots of oxygenliquid water saturation. Since the current density along the electrlength is directly affected by the oxygen availability one seescurrent density profile that matches the oxygen profile at the reacinterface. However, one would expect higher water generation inregion of high current densities~above the channel!, which wouldoffset the effect of oxygen concentration in the form of the surfacoverage function. This is not the case because the liquid wgenerated over the channel is removed relatively quickly due toshorter diffusion distance along the diffusion layer thickness whthe water generated over the shoulder accumulates over the shoarea resulting in higher saturation values despite the lower ratwater generation. This phenomenon results in an almost unifwater saturation at the reactive interface. One does see a slightin the saturation at the reactive surface from the shoulder area tochannel area. This difference is not great enough to manifest itsethe current density profile. Thus in the direction normal to the retive surface we have much steeper oxygen and liquid water grents over the channel and relatively shallower slopes over the shder which acts as a dead end in that dimension. In the direcalong the width of the electrode, one sees a sharp gradient in oxand liquid water profiles around the channel-shoulder contact poThis region acts as a choke point for the accumulated liquid wtrying to flow out of the shoulder region. This accumulated waimposes severe mass-transport limitations on the oxygen profilerestricting the pore spaces causing a sharp drop in the oxygencentration.
The water vapor profile suggests that the air is completely srated above the shoulder region and everywhere near the reainterface and the vapor mole fractions drop off steeply nearchannel. This can be explained by the fact that there is moreenough liquid water available near the reactive surface andshoulder to allow evaporation to completely saturate the gas phMoreover this model assumes that the evaporation process is intaneous as compared to the relatively slower process of vaporfusion out of the backing layer. Hence one sees a concentragradient for vapor only near the channel where there is not enoliquid water available to allow complete saturation of the gas phwith water vapor.
The cathode overpotential for the base case is 0.5 V. Atoverpotential, mass-transfer effects are usually significant. Thusintuitively evident that when one operates in the kinetically cotrolled region, the oxygen and liquid water and hence the currdensity profiles along the width of the electrode will be relativeuniform. Thus it is evident that mass-transport effects causenonuniform current density profile seen for the base case espec
) unless CC License in place (see abstract). ecsdl.org/site/terms_userms of use (see
Journal of The Electrochemical Society, 148 ~12! A1324-A1335~2001! A1329
Dow
Figure 4. 3D plots of oxygen mole fraction~a!, water vapor mole fraction~b!, and liquid water saturation~c! profiles for the base case~X, electrode width; Y,diffusion layer thickness!.
isti
b-usa
ner
aporex-uid
em-nc-nsityem-ere
thes.
the slow mass-transport rates of liquid water, which is characterof a capillary phenomenon.
Effect of temperature.—Figure 6 is the polarization curve otained from the model for PEM fuel cell air cathode at variooperating temperatures. The result at 60°C is the base case. Tolyze these results one needs to see the effect of temperature ovarious transport and kinetic parameters. In this model, the temp
Figure 5. Local current density distribution for the base case alongwidth of the reactive interface.
address. Redistribution subject to ECS te24.124.78.223nloaded on 2015-02-01 to IP
c
na-thea-
ture dependence of gas molar densities and diffusivities, water vsaturation pressure, liquid water viscosity and density, and thechange current density have been accounted for. Except for liqwater viscosity and density all other parameters increase with tperature. Moreover these two exceptions are relatively weak futions of temperature as compared to the exchange current deand saturation pressure for water vapor. Moreover, the effect of tperature on the liquid water permeability and capillary head w
Figure 6. Polarization curve for the air cathode at different temperature
) unless CC License in place (see abstract). ecsdl.org/site/terms_userms of use (see

il-nly
apoted
aneheghththitie
e oess
dync
latinemugthi
prohuth
thd t
nct in
vertlatin-sinntthov
t isothpe
itiesy atallyside
thean
aterm isentthe
eau-ss,
abler theial,h thebe-
veig-h ofrpo--n in
theistri-s tol astheses
nnels dueulder
inhan-n-uidlatesonver
r andg to
air ity
Journal of The Electrochemical Society, 148 ~12! A1324-A1335~2001!A1330
Dow
not considered for the sake of simplicity. It is known that the caplary head decreases with an increase in temperature but has oweak dependence.
It is clear from Fig. 6 that an increase in temperature results inimprovement in current density over the entire spectrum of overtentials. The increase in the current density in the kinetically limiregion ~i.e., at low overpotentials!can be directly attributed to thehigher exchange current density. At overpotentials where kineticmass-transfer rates are comparable, the increase in temperaturresults in better performance. This is a combined effect of higexchange current density, higher transport coefficients, and a hirate of evaporation. This manifests itself as a gentler slope inpolarization curve at higher temperatures. Figure 6 also showsthe mass-transfer-limited region is pushed to higher current densat higher temperature. This can be attributed to a higher ratevaporation due to increased saturation pressure resulting in laccumulation of pore constricting liquid water.
Ticianelli et al.20 have conducted extensive experiments to stuthe effect of temperature and pressure on single-cell performausing hydrogen and oxygen. The Nafion 117 membrane with pnum loading of 0.1 mg/cm2 and 20% Pt on carbon were usedthese experiments. It is seen in their work that an increase in tperature results in an improvement in the current densities throout the entire range of the polarization curve as predicted bymodel. It should be noted that Ticianelliet al. sufficiently humidi-fied their anode and cathode gas streams to avoid dehydrationlems at high temperature. If the anode side is not sufficientlymidified, dehydration effects can manifest themselves offsettingeffect of higher temperatures. Other researchers21 have shown ex-perimental data that shows improvements in performance overentire spectrum of stacks. Here again, the researchers humidifiegas streams to avoid dehydration problems.
Effect of relative humidity of inlet stream.—Figure 7 shows theeffect of relative humidity of the inlet gas stream on the performaof the cathode. The relative humidity of the inlet gas has no effecthe region where reaction kinetics is the rate-limiting step. Howeas the overpotential is increased to values where mass-transpofects are significant, the current densities decrease as the rehumidity is increased. As the humidity of the gas stream iscreased, the rate of evaporation of liquid water is reduced caumore accumulation in the diffusion layer. Thus the limiting-curredensity values are lowered. It should be noted that loweringoperational temperature would mask this effect as the water remby evaporation becomes insignificant.
Despite the drop in performance predicted by this model, icommon practice among fuel cell experimentalists to humidify bthe anode and the cathode streams when operating at high tem
Figure 7. Effect of inlet stream humidification on the performance of thecathode.
address. Redistribution subject to ECS te24.124.78.223nloaded on 2015-02-01 to IP
a
n-
dstillrereatsfer
ei-
-hs
b--e
ehe
e
r,ef-ive
g
eal
ra-
tures. While anode humidification is essential at all current densto avoid dehydration effects, cathode humidification is necessarlow current densities and high stoichiometric flow rates especifor air, which can dry out the membrane even on the cathoderesulting in significant reduction in performance.
Effect of diffusion layer thickness and porosity.—Figure 8 showsthe effect of the diffusion layer thickness on the performance ofair cathode. Reduction in the diffusion layer thickness results inincrease in the current densities at overpotentials where liquid wdynamics assume significance. At overpotentials where the systenot transport limited and liquid water generation and subsequaccumulation has a negligible effect there exists an optimum indiffusion layer thickness as shown in Fig. 8.
In He et al.’s modeling work on interdigitated flow fields thauthors showed an optimum in diffusion layer thickness. Thethors suggested that up to a certain critical diffusion layer thickneincrease in the thickness resulted in an increase in the availcross-sectional area over the channel-shoulder contact point foconvective flow of gas. However at a given pressure differentbeyond a certain thickness value, the gas tends to bypass througshortest possible distance and diffusion transport mechanismcomes dominant.
In this work on conventional flow fields, there is no convectiflow, and transport is purely by diffusion and capillary effects. Fures 9a and b provide the current density profiles along the widtthe electrode at various diffusion layer thickness at cathode ovetentials of20.3 and20.5 V, respectively. At lower cathode overpotentials, the liquid water generation and subsequent accumulatiothe diffusion layer is low and hence does not significantly affectgas-mass-transport rates. In this context, the current density dbution over the width of the electrode is determined by its accesthe oxygen from the channel, which is greater over the channecompared to regions over the shoulder though the contribution oflatter is still significant. It is seen from Fig. 9a that as one decreathe diffusion-layer thickness, the current densities over the chaincreases while the current density over the shoulder decreaseto a reduction in the cross-sectional area over the channel-shointerface. Eventually at some diffusion layer thickness the losscurrent density over the shoulder out weighs the gain over the cnel leading to an optimum in diffusion-layer thickness. On the cotrary at higher current density ranges as shown in Fig. 9b, the liqwater generated by reaction and electro-osmotic drag accumusignificantly over the shoulder leading to drastically low reactirates and a negligible contribution from the electrode regions othe shoulder even at a base case diffusion layer thickness of 150mm.Thus, as one decreases the diffusion layer thickness, the wategas transport distances over the channel are reduced leadin
Figure 8. Effect of diffusion layer thickness on the average current dens~inset provides current densities at20.3 V!.
) unless CC License in place (see abstract). ecsdl.org/site/terms_userms of use (see
inth
eath
n-yee
e force inath-sfer
ves-re-
tionbe1:1.
andldersureand
andes in-
er
zes
d
de
Journal of The Electrochemical Society, 148 ~12! A1324-A1335~2001! A1331
Dow
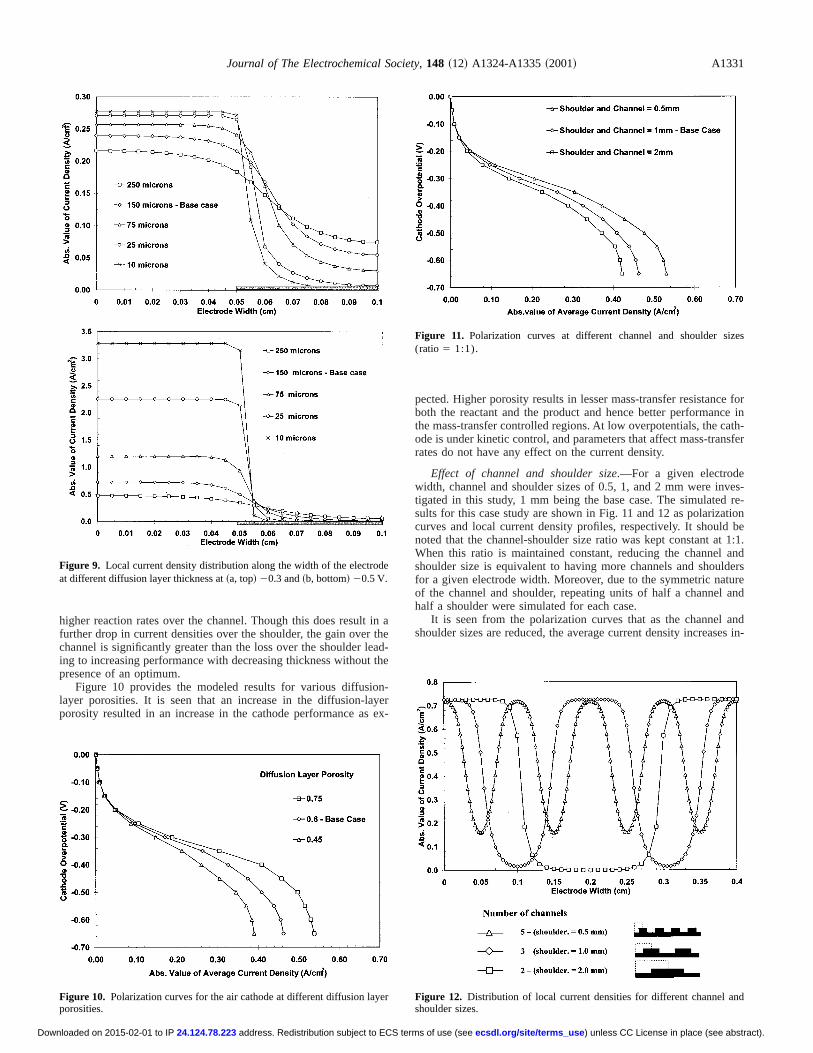
higher reaction rates over the channel. Though this does resultfurther drop in current densities over the shoulder, the gain overchannel is significantly greater than the loss over the shoulder ling to increasing performance with decreasing thickness withoutpresence of an optimum.
Figure 10 provides the modeled results for various diffusiolayer porosities. It is seen that an increase in the diffusion-laporosity resulted in an increase in the cathode performance as
Figure 10. Polarization curves for the air cathode at different diffusion layporosities.
Figure 9. Local current density distribution along the width of the electroat different diffusion layer thickness at~a, top!20.3 and~b, bottom!20.5 V.
address. Redistribution subject to ECS te24.124.78.223nloaded on 2015-02-01 to IP
aed-e
rx-
pected. Higher porosity results in lesser mass-transfer resistancboth the reactant and the product and hence better performanthe mass-transfer controlled regions. At low overpotentials, the code is under kinetic control, and parameters that affect mass-tranrates do not have any effect on the current density.
Effect of channel and shoulder size.—For a given electrodewidth, channel and shoulder sizes of 0.5, 1, and 2 mm were intigated in this study, 1 mm being the base case. The simulatedsults for this case study are shown in Fig. 11 and 12 as polarizacurves and local current density profiles, respectively. It shouldnoted that the channel-shoulder size ratio was kept constant atWhen this ratio is maintained constant, reducing the channelshoulder size is equivalent to having more channels and shoufor a given electrode width. Moreover, due to the symmetric natof the channel and shoulder, repeating units of half a channelhalf a shoulder were simulated for each case.
It is seen from the polarization curves that as the channelshoulder sizes are reduced, the average current density increas
Figure 11. Polarization curves at different channel and shoulder si(ratio 5 1:1).
Figure 12. Distribution of local current densities for different channel anshoulder sizes.
) unless CC License in place (see abstract). ecsdl.org/site/terms_userms of use (see

amk-neth
e dis-ed intion
l to -
Journal of The Electrochemical Society, 148 ~12! A1324-A1335~2001!A1332
Dow
the mass-transfer controlled region. This can be explained by exining the local current density profiles. While diffusion layer thicness is a measure of the normal diffusion distance, the chanshoulder size is a measure of one of the dimensions parallel to
Figure 13. Polarization curves for the air cathode at different channeshoulder ratios.
address. Redistribution subject to ECS te24.124.78.223nloaded on 2015-02-01 to IP
-
l-e
electrode. Thus, as one decreases the channel-shoulder size, thtance over which reactants and products need to be transportthe dimension parallel to the electrode is reduced. Hence utilizaof the reactive area over the shoulder is greatly enhanced.
Figure 14. Local current density distribution for different channel-toshoulder ratios.
Figure 15. Transient profiles of oxygen in the diffusion layer~X, electrode width and Y, diffuson layer thickness!.
) unless CC License in place (see abstract). ecsdl.org/site/terms_userms of use (see
Journal of The Electrochemical Society, 148 ~12! A1324-A1335~2001! A1333
Dow
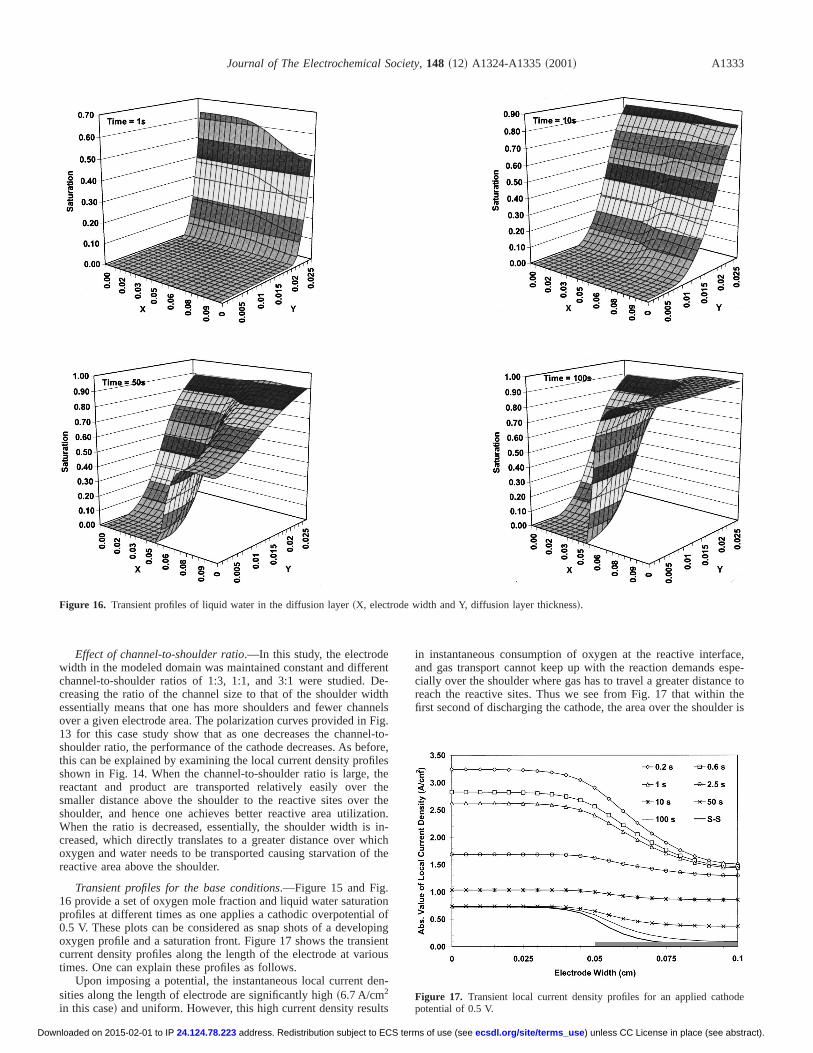
Figure 16. Transient profiles of liquid water in the diffusion layer~X, electrode width and Y, diffusion layer thickness!.
renDeidtnnFigel-fo
filethth
r ttioin
hicf t
tionl o
opien
iou
en
lts
ace,spe-
ce totheer is
de
Effect of channel-to-shoulder ratio.—In this study, the electrodewidth in the modeled domain was maintained constant and diffechannel-to-shoulder ratios of 1:3, 1:1, and 3:1 were studied.creasing the ratio of the channel size to that of the shoulder wessentially means that one has more shoulders and fewer chaover a given electrode area. The polarization curves provided in13 for this case study show that as one decreases the channshoulder ratio, the performance of the cathode decreases. As bethis can be explained by examining the local current density proshown in Fig. 14. When the channel-to-shoulder ratio is large,reactant and product are transported relatively easily oversmaller distance above the shoulder to the reactive sites oveshoulder, and hence one achieves better reactive area utilizaWhen the ratio is decreased, essentially, the shoulder width iscreased, which directly translates to a greater distance over woxygen and water needs to be transported causing starvation oreactive area above the shoulder.
Transient profiles for the base conditions.—Figure 15 and Fig.16 provide a set of oxygen mole fraction and liquid water saturaprofiles at different times as one applies a cathodic overpotentia0.5 V. These plots can be considered as snap shots of a develoxygen profile and a saturation front. Figure 17 shows the transcurrent density profiles along the length of the electrode at vartimes. One can explain these profiles as follows.
Upon imposing a potential, the instantaneous local current dsities along the length of electrode are significantly high~6.7 A/cm2
in this case!and uniform. However, this high current density resu
address. Redistribution subject to ECS te24.124.78.223nloaded on 2015-02-01 to IP
t-hels.
to-re,seehen.-h
he
fingt
s
-
in instantaneous consumption of oxygen at the reactive interfand gas transport cannot keep up with the reaction demands ecially over the shoulder where gas has to travel a greater distanreach the reactive sites. Thus we see from Fig. 17 that withinfirst second of discharging the cathode, the area over the should
Figure 17. Transient local current density profiles for an applied cathopotential of 0.5 V.
) unless CC License in place (see abstract). ecsdl.org/site/terms_userms of use (see

renr, tovinthienctiui
r is
ra
t orin
lonstadetivethatno
nseryhe
foign
isdevaiv
e ttinr rodntturthanifinifigh
posiolifethth
oweaiespr
nhin
tio
thi
ting
Journal of The Electrochemical Society, 148 ~12! A1324-A1335~2001!A1334
Dow
first starved of oxygen, and we see a significant drop in the curdensities as one goes from the channel to the shoulder. Howevegas mass transport cannot keep up with the current demandsthe channel despite the shorter distance, and one sees a dropcurrent density over the channel with time while the area overshoulder is about the same. Up to this point in time, the transcurrent densities are determined totally by gas transport and reasurface coverage by liquid water as one can see from the liqwater profile at 1 s that water accumulation in the diffusion layenot very significant.
However as time progresses~1 s to steady state!, liquid watetends to accumulate in the regions closer to the reactive surfacesignificantly over the shoulder. This hinders the mass transporoxygen, accumulates more water at the surface thereby covereactive sites, which results in a drop in the current densities athe length of the electrode. Moreover as one approaches steadya significant accumulation of liquid water is seen over the shoulwhich ultimately results in high water saturation near the reacsurface over the shoulder, despite the lower current densities inregion. During model simulations, it was seen that the gas was srated with water vapor in most cases and vapor profiles areprovided for the sake of brevity. It is evident that the oxygen traport ~and water vapor!is quite fast and reaches a steady state vquickly. It is the slower transport of liquid water that controls ttransient time period to reach a new steady state.
Conclusions
A transient two-phase, multicomponent model was developedthe cathode of a fuel cell using conventional gas distributor desIn a cathode with conventional gas distributors, where diffusionthe dominant transport process, the performance of the cathohighly influenced by the presence of liquid water and its remorate, especially at high overpotentials or current densities. Diffusgas transport in itself is quite fast and cannot be assumed to breason for the limitations in the cathode performance. Operaconditions and design parameters that increase the liquid watemoval rate were found to enhance the performance of the cath
The performance of the cathode can be enhanced over the espectrum of operating overpotentials by increasing the temperaIn the case of practical applications one needs to keep in minddehydration effect of higher temperature on the anode and its mfestations on the cell performance. The effect of inlet gas humidcation did reduce the performance of the cathode though not sigcantly enough to mitigate the advantages of humidification in liof dehydration of membrane at low operating current densities.
The performance of the cathode improved with increasingrosities. However, one needs a sufficient solid phase in the diffulayer to avoid ohmic losses in the electronic current in realapplications. Decreasing the diffusion layer thickness improvedperformance of the cathode. This model predicts an optimum fordiffusion layer thickness for conventional gas distributors at lcurrent density ranges while the performance continues to incrwith decreasing diffusion layer thickness at high current densitShorter shoulder widths and a greater number of channels aredicted to enhance the performance of the cathode. Optimizatiothis regard for real life applications need to account for the macing costs involved.
Acknowledgment
This work was supported by the National Science Foundaunder grant no. CTS-9910923.
University of Kansas assisted in meeting the publication costs ofarticle.
address. Redistribution subject to ECS te24.124.78.223nloaded on 2015-02-01 to IP
theertheet
ved
ndfggte,
r,
isu-t
-
r.
islehege-e.iree.ei---
t
-n
ee
se.e-in-
n
s
List of Symbols
a empirical constant in Eq. 4A empirical constant in Eq. 9, cm
a0 available reaction area, cm2
b empirical constant in Eq. 4B empirical constant in Eq. 9, cmC empirical constant in Eq. 9, cm
CT molar density, mol/cm3
D empirical constant in Eq. 9, cmD ij binary diffusion coefficient, cm2/sD ij
e effective binary diffusion coefficient, cm2/sF Faraday’s constant, 96,487 C/equivg acceleration due to gravity, cm/s2
I current density, A/cm2
I 0 exchange current density, A/cm2
K permeability, cm2
kc condensation rate constant mol/~atm-s-cm3!ke evaporation rate constant, 1/~atm-s!
K l,abs absolute permeability of liquid water, cm2
kl,rel relative permeability of liquid water, cm2
mi molecular weight of species i, g/molNi molar flux of species i, mol/cm2-sP pressure, atm
Pci critical pressure of species i, atmPref reference pressure, atmPw
sat saturation pressure for water vapor, atmqw liquid water flux, cm/sR universal gas constant, 82.06 cm3 atm/mol or 8.314 J/mol-KRi homogenous reaction rate for species i, mol/cm3-ss saturationT temperature, °Ct time, s
Tci critical temperature of species i, °Cx x dimension~normal to the electrode!y y dimension~parallel to electrode!xi mole fraction of species i
Greek
a net water transfer coefficient per protonac cathodic transfer coefficient«g gas porosity«0 porosity of electrodeh overpotential for oxygen reduction reaction, Vm viscosity of liquid water, g/cm-s
rw density of liquid water, g/cm3
c capillary head, cm
Subscripts and superscripts
c cathodee effectiveg gas
H2O water vapori species ij species j
w water
References
1. K. Kordesch and G. Simader,Fuel Cells and Their Applications, VCH, Weinheim~1996!.
2. A. J. Appleby and F. R. Foulkes,Fuel Cell Handbook, Van Nostrand Reinhold,New York ~1989!.
3. C. Berger,Handbook of Fuel Cell Technology, Prentice-Hall, Englewood Cliffs, NJ~1968!.
4. T. E. Springer, M. S. Wilson, and S. Gottesfeld,J. Electrochem. Soc.,140, 3513~1993!.
5. R. Mosdale and S. Srinivasan,Electrochim. Acta,40, 413~1995!.6. D. M. Bernardi and M. W. Verbrugge,J. Electrochem. Soc.,139, 2477~1992!.7. M. L. Perry, J. Newman, and E. J. Cairns,J. Electrochem. Soc.,145, 5 ~1998!.8. V. Gurau, H. Liu, and S. Kakac,AIChE J.,44, 2410~1998!.9. T. V. Nguyen and R. E. White,Comput. Chem. Eng.,11, 543 ~1987!.
10. S. Dutta, S. Shimpalee, and J. W. Van Zee,J. Appl. Electrochem.,30, 135~2000!.11. S. Shimpalee and S. Dutta,J. Numerical Heat Transfer, Part A,38, 111~2000!.12. W. He, J. S. Yi, and T. V. Nguyen,AIChE J.,46, 2053~2000!.13. Z. H. Wang and C. Y. Wang, Abstract 90, The Electrochemical Society Mee
Abstracts, Vol. 2000-1, Toronto, Ontario, Canada, May 14-18, 2000.14. A. C. West and T. F. Fuller,J. Appl. Electrochem.,26, 57 ~1996!.15. T. V. Nguyen,J. Electrochem. Soc.,143, L105~1996!.16. R. B. Bird, W. E. Stewart, and E. N. Lightfoot,Transport Phenomena, John Wiley
& Sons, New York~1960!.17. L. A. Richards,J. Phys.,1, 318~1931!.
) unless CC License in place (see abstract). ecsdl.org/site/terms_userms of use (see

23,
slec-
Journal of The Electrochemical Society, 148 ~12! A1324-A1335~2001! A1335
Dow
18. R. H. Perry and D. W. Green,Perry’s Chemical Engineering Handbook, McGraw-Hill, New York ~1997!.
19. D. L. Wood III, Masters Thesis, University of Kansas, Lawrence, KS~1998!.20. E. A. Ticianelli, V. A. Paganin, and E. R. Gonzalez, inProton Conducting Mem-
brane Fuel Cells I, S. Gottesfeld, G. Halpert, and A. Langrebe, Editors, PV 95-
address. Redistribution subject to ECS te24.124.78.223nloaded on 2015-02-01 to IP
p. 102, The Electrochemical Society Proceeding Series, Pennington, NJ~1995!.21. Y. W. Rho, W. I. Cho, and Y. T. Kho, inProton Conducting Membrane Fuel Cell
I, S. Gottesfeld, G. Halpert and A. Langrebe, Editors, PV 95-23, p. 82, The Etrochemical Society Proceeding Series, Pennington, NJ~1995!.
22. W.-k. Paik, T. E. Springer, and S. Srinivasan,J. Electrochem. Soc.,136, 644~1989!.
) unless CC License in place (see abstract). ecsdl.org/site/terms_userms of use (see