Personal Automobile: Cost Drivers, Pricing, and Public Policy
Upload
khangminh22Category
view
1download
0
HAL Id: tel-00805528https://tel.archives-ouvertes.fr/tel-00805528
Submitted on 28 Mar 2013
HAL is a multi-disciplinary open accessarchive for the deposit and dissemination of sci-entific research documents, whether they are pub-lished or not. The documents may come fromteaching and research institutions in France orabroad, or from public or private research centers.
L’archive ouverte pluridisciplinaire HAL, estdestinée au dépôt et à la diffusion de documentsscientifiques de niveau recherche, publiés ou non,émanant des établissements d’enseignement et derecherche français ou étrangers, des laboratoirespublics ou privés.
A transaction cost approach for environmental policyanalysis : the case of the Water Framework Directive in
the Scheldt International river basin districtMarion Laurenceau
To cite this version:Marion Laurenceau. A transaction cost approach for environmental policy analysis : the case of theWater Framework Directive in the Scheldt International river basin district. Economics and Finance.Université de Strasbourg, 2012. English. �NNT : 2012STRAB008�. �tel-00805528�


i
Abstract
Following our literature review, a better estimation of costs and constraints linked to policy
implementation can improve the assessment of policy efficiency. In this line, we show that the
transaction cost theory offers potential for policy analysis. In this research, we argue that the
concept of transaction costs can apply to the policy context, with the aim to better understand how
transaction costs affect decisions linked to policy implementation. Within the scope of this work, we
will focus on state intervention to regulate market failure, and most specifically environmental
policy.
Our review of empirical studies highlights that transaction costs do matter for policy analysis as they
affect the policy costs considered and the resulting policy choices (i.e. over a policy scenario).
However, transaction cost assessment is limited to administration costs, which do not allow for
grasping the influence of other dimensions of constraints. We are thus concerned with assessing the
impact of transaction costs on policy, including how policy actors respond to such constraints, with
the aim to take account of transaction costs in policy analysis.
Since the concept of transaction costs was developed in the context of contractual relationships and
private firms, existing theory requires adaptations so as better understand the determinants of
actors’ decisions over policy implementation. To this end, we developed a conceptual framework,
the ‘policy transaction’ framework, and a methodology to address the issue of transaction costs in
the context of policy implementation. The core of this work, as to say the methodology developed to
assess policy transaction costs and their impacts on policy decisions, is both based on existing
transaction cost typologies and on a case study. The ‘policy transaction’ at stake in the case study
consists in the early implementation phase (2004-2009) of the European Water Framework Directive
(WFD) in the Scheldt International River Basin District, which includes 3 countries (France, Belgium
and the Netherlands). This diversity of institutional contexts is helpful to investigate the incidence of
different institutional settings on transaction cost determinants and transaction cost coping
strategies.
The methodology developed is a step-by-step approach allowing to empirically describe the policy
decisions resulting from transaction costs (or so-called ‘arrangements’). On the basis of a first
analysis of countries’ interpretation and implementation the WFD objectives (within the frame of the

ii
policy transaction at stake), we drew up a preliminary assessment of transaction cost determinants
that have conditioned the WFD implementation in the various contexts. This provided a first
understanding of actors’ decisions to optimize time and resources as a result of transaction costs.
On that basis, we introduced a general typology of ‘policy transaction costs’ adapted to
environmental policy early implementation, namely: information search and collection costs,
negotiation costs and coordination costs. The determinants of ‘policy transaction costs’ are found to
stem from what we refer to as policy transaction specificities and consist in: policy interpretation, the
division of power and resources among actors, the link between policy planning and financial
resources, the division of power and resources between levels or sectors, as well as the state of the
environment and the pressures on the environment.
In a following step, we depict the ‘policy arrangements’ analyzed in the case study, as to say the
decisions of policy actors over the implementation of policy tasks as a result of ‘policy transaction
costs’. In light of these policy arrangements, we provide a first assessment of ‘policy transaction
costs’ (PTC) minimization strategies. We identified 3 main categories of PTC minimization strategies:
strategies either focusing on the information collected or produced, the coordination or operational
organization of tasks, and the decisions on human resources and tasks allocation.
By analyzing transaction costs linked to policies and how they condition the implementation of policy
tasks, this research sought to understand how policy decisions are taken. We argue that certain
decisions over policy implementation can be explained by the attempt to minimize ‘policy
transaction costs’ according to contextual determinants. In this research, we have focused on the
identification of stakeholders’ strategies to cope with ‘policy transaction costs’. This allows for
acknowledging the importance of ‘policy transaction costs’ in policy analysis and for better
anticipating these costs, but also for considering changing the determinants’ modes if necessary.
Policy analysis shall thus consider PTC linked to policy implementation, so as to anticipate (1) the
constraints actors will face when implementing a given policy and (2) how these actors are likely to
respond to such constraints. In addition, considering the general typologies presented, our findings
can apply to other policies.
iii
Acknowledgements
Je souhaite remercier toutes les personnes et institutions qui ont contribué à la réalisation de ce
travail et voyage initiatique dans le monde de la recherche : l’UMR GESTE et l’ENGEES pour leur
accueil, l’IRSTEA (ancien Cemagref) et l’UMR GESTE pour leurs financements, mes encadrants Anne
Rozan et François Destandau qui m’ont patiemment encouragée, toute l’équipe de GESTE qui a
rendu l’ambiance de travail joyeuse, instructive et « thought-provoking », les amis de GESTE pour nos
échanges et leur soutien (Nathalie, Carine, Agnès, Myriam, Jeanne, Julian, Youssef, et tous les
autres…), les amis de Strasbourg (Marthe, Elisa, …) qui ont rendu ces 4 années passées à Strasbourg
pleines de vie, sans oublier ma famille qui est au cœur de cette aventure.
Je remercie également le personnel des institutions qui m’ont accordé un entretien et partagé de
nombreuses informations, notamment les Agences de l’Eau Rhin-Meuse et Artois-Picardie ainsi que
les DREAL en France, la DGARNE en Wallonie, VMM, VITO, et A. Crabbé en Flandres, le RWS et la
province de Zélande aux Pays-Bas, mais aussi toutes les personnes ayant apporté une précieuse aide
ponctuelle (G. Bouleau, P. Strosser, C. Ménard, etc.).
Je suis également très reconnaissante à L. McCann, P. Leroy, P. Strosser et S. Thoyer d’avoir accepté
de faire partie du jury de thèse.

iv
Table of content
Introduction 1
Chapter I Theoretical background and conceptual framework 13
1. Transaction cost theory and policy analysis 13
1.1 Transaction cost theory and the policy context 13
1.1.1 Definitions and rationale . . . . . . . . . . . . . . . . . . . . . . . . . . . 13
1.1.2 Transaction cost theory applied to public action . . . . . . . . . . . . . . . . . 15
1.1.3 Transaction cost theory for policy analysis: adaptations are required . . . . . . . . 17
1.2 Adapting to policy characteristics 19
1.2.1 Inputs from policy analysis . . . . . . . . . . . . . . . . . . . . . . . . . . 19
1.2.2 Policy and transaction costs’ assessment . . . . . . . . . . . . . . . . . . . . 24
2. Applying transaction cost theory to policy analysis: conceptual framework 26
2.1 Theoretical basis 26
2.1.1 The role of institutions . . . . . . . . . . . . . . . . . . . . . . . . . . . 26
2.1.2 Transaction cost theory and the policy process . . . . . . . . . . . . . . . . . 30
2.1.3 Transaction cost theory and efficiency . . . . . . . . . . . . . . . . . . . . . 32
2.2 The policy transaction framework 34
2.2.1 Terminology and concepts . . . . . . . . . . . . . . . . . . . . . . . . . . 34
2.2.2 Policy transaction cost framework . . . . . . . . . . . . . . . . . . . . . . 36
2.2.3 The policy transaction . . . . . . . . . . . . . . . . . . . . . . . . . . . 39
Chapter II Case study 43
1. The Water Framework Directive (2000/60/EC) 46
1.1 Objectives, principles and policy implementation process 46
1.1.1 Objectives and principles . . . . . . . . . . . . . . . . . . . . . . . . . . 47
1.1.2 Coordination of the implementation process . . . . . . . . . . . . . . . . . . 52
1.1.3 Economics for evaluation . . . . . . . . . . . . . . . . . . . . . . . . . . 58
1.2 The WFD as policy transaction 68
2. Case study: the International Scheldt River Basin District (ISD) 72
2.1 Characteristics of the International Scheldt District 72
2.1.1 Presentation of the ISD. . . . . . . . . . . . . . . . . . . . . . . . . . . 73
2.1.2 Institutional contexts and water management . . . . . . . . . . . . . . . . . 79
2.2 Methodology developed to assess policy transaction costs and their impact 93

v
Chapter III Applying TCT to policy analysis: the analysis of the WFD implementation 100
1. Preliminary assessment of the WFD implementation in four institutional contexts 100
1.1 WFD implementation in practice 100
1.1.1 France. . . . . . . . . . . . . . . . . . . . . . . . . . . . . . . . . . 101
1.1.2 Belgium – Walloon region. . . . . . . . . . . . . . . . . . . . . . . . . . 108
1.1.3 Belgium – Flemish region. . . . . . . . . . . . . . . . . . . . . . . . . . 110
1.1.4 The Netherlands. . . . . . . . . . . . . . . . . . . . . . . . . . . . . . 114
1.2 Preliminary assessment of transaction costs’ origin 123
1.2.1 Outcomes of WFD tasks implementation . . . . . . . . . . . . . . . . . . . 124
1.2.2 Constraints underlying WFD tasks implementation . . . . . . . . . . . . . . . 133
2. Policy transaction cost typology and determinants 138
2.1 Policy transaction costs 138
2.2 Policy transaction cost determinants 149
Chapter IV From policy arrangements to policy transaction costs minimization strategies
154
1. Depicting WFD policy arrangements 154
1.1 France 154
1.1.1 Determinants’ modes . . . . . . . . . . . . . . . . . . . . . . . . . . . 154
1.1.2 Arrangements . . . . . . . . . . . . . . . . . . . . . . . . . . . . . . 159
1.2 Belgium – Walloon region 165
1.2.1 Determinants’ modes . . . . . . . . . . . . . . . . . . . . . . . . . . . 165
1.2.2 Arrangements . . . . . . . . . . . . . . . . . . . . . . . . . . . . . . 168
1.3 Belgium – Flemish region 172
1.3.1 Determinants’ modes . . . . . . . . . . . . . . . . . . . . . . . . . . . 172
1.3.2 Arrangements . . . . . . . . . . . . . . . . . . . . . . . . . . . . . . 174
1.4 The Netherlands 178
1.4.1 Determinants’ modes . . . . . . . . . . . . . . . . . . . . . . . . . . . 178
1.4.2 Arrangements . . . . . . . . . . . . . . . . . . . . . . . . . . . . . . 180
2. Policy transaction cost minimization strategies 186
2.1 From arrangements to PTC minization strategies 187
2.1.1 Research and information collection costs. . . . . . . . . . . . . . . . . . . 187
2.1.2 Coordination costs . . . . . . . . . . . . . . . . . . . . . . . . . . . . . 188
2.1.3 Negotiation costs . . . . . . . . . . . . . . . . . . . . . . . . . . . . . 191

vi
2.2 Categorization of policy transaction costs minimization strategies 197
Conclusion and discussion 201
REFERENCES 208
APPENDICES
Appendix A. Methodologies to quantify constraints 219
Appendix B. WFD implementation calendar 223
Appendix C. List of interviewees 224
Appendix D. Questionnaire 225
Appendix E. Empirical studies investigated 233
Appendix F. Description of arrangements 247
Appendix G. Arrangements by country or region 253

vii
List of tables
Table 1 . Empirical studies analyzed to investigate constraint estimates 7
Table 2. Constraints components identified 8
Table 3. Constraint estimates and assessment methods 10
Table 4. Differences between economics and politics of organization as identified by T. Moe 21
Table 5. Transaction cost assessment approaches 24
Table 6. Environmental objectives set by the WFD 49
Table 7. Steps required for implementing the WFD (CIS) 52
Table 8. First set of working groups of the CIS (from the CIS) 56
Table 9.Different approaches to economics of integrated river basin management 58
Table 10. Guidance provided for the economic analysis in the WATECO document 61
Table 11. Representation of the Scheldt District in each country 75
Table 12. Gross Domestic Product (GDP) for the Scheldt IRBD per region (2001) 77
Table 13. Main characteristics of the International Scheldt River Basin 78
Table 14. Main French water legislations 80
Table 15. Planning deadlines in France as a consequence of the WFD 82
Table 16. Structure and planning of the integrated water policy at different levels 85
Table 17. General institutional characteristics and possible impacts on transaction costs 93
Table 18. Organizations where interviews were carried out in 2009 and 2010 96
Table 19. Methodology developed to identify TC determinants and minimization strategies and
main outcomes 98
Table 20. Main categories of measures tackled by the French PoM 102
Table 21. Economic indicators of cost disproportion used in the Rhine-Meuse water agency 106
Table 22. Main categories of measures tackled by Wallonia’s PoM 108
Table 23. Main categories of measures tackled by the Flemish PoM 111
Table 24. Economic indicators and disproportionality thresholds in Flanders 113
Table 25. Estimated total costs and benefits of WFD implementation in the Netherlands 116
Table 26. Costs of the measures’ packages in the Netherlands(2008) 119
Table 27. Phasing of RBMP investments in the Netherlands 119
Table 28. Characteristics of the PoM implementation in the 4 institutional contexts of the ISD 122
Table 29. Number of water bodies in the International Scheldt District 124
Table 30. Number of water bodies in the International Scheldt District and other basins or regions 125
Table 31. Water body size in the ISD 127
Table 32. Types of surface water bodies in the Scheldt ISD 127
viii
Table 33. Proportion of Heavily Modified and Artificial Water Bodies in the ISD 128
Table 34. Objectives set for 2015 (source: PoMs and interviews) for surface water bodies 129
Table 35 Number of groundwater bodies and surface water bodies that can reach the ‘good status’ in
2015 and number of time exemptions proposed 130
Table 36. Number of groundwater bodies and surface water bodies that can reach the ‘good status’
in 2015 and number of time exemptions proposed 130
Table 37. Investment costs (million €) for the Dutch part of the Scheldt 2010-2015-2027 132
Table 38. The costs of PoMs in the ISD 132
Table 39. Preliminary assessment of transaction costs linked to the early WFD implementation
process in the ISD 135
Table 40. Tasks involved in preparing the WFD policy transaction and main outcomes 139
Table 41. Typology of transaction costs (adapted from Falconer and Whitby, 2001) 141
Table 42. Relevant TC categories for policy transaction 144
Table 43. Ex ante policy transaction costs 146
Table 44. Ex ante policy transaction costs applied to the WFD 147
Table 45.Impact of PTC determinants on policy transaction costs 186
Table 46. Arrangements and related strategies to minimize information costs 188
Table 47. Arrangements and related strategies to minimize coordination costs 190
Table 48. Arrangements and related strategies to minimize negotiation costs 192
Table 49.PTC minimization strategies involved in the WFD policy transaction 199

vi
List of figures
Figure 1. The policy cycle 22
Figure 2. Williamson’s 4 levels of social analysis. 29
Figure 3. The policy process as a hierarchy 30
Figure 4. Research framework 36
Figure 5. TCT applied to the policy implementation process 37
Figure 6. Policy transaction cost framework 38
Figure 7. The policy transaction 40
Figure 8. Policy implementation as a policy transaction and related production and transaction costs
41
Figure 9. Internationally agreed IWRM principles and WFD principles 49
Figure 10. Initial CIS organizational structure with 10 working groups 55
Figure 11. Organization of Common Implementation Strategy 2007-2009 57
Figure 12. The explicit economic functions of the economic analysis 60
Figure 13. The logic of the economic analysis 61
Figure 14. Flow-chart of the economic analysis 62
Figure 15. The WFD implementation as policy transaction and related production and transaction
costs 69
Figure 16. Water Framework Directive implementation as policy transaction 70
Figure 17. River basin districts in Europe 73
Figure 18. The international Scheldt River Basin 74
Figure 19. Levels of water governance in France 81
Figure 20. Levels of water governance in the Flemish region, Belgium 84
Figure 21. Levels of water governance in the Walloon region, Belgium 87
Figure 22. Levels of water governance in The Netherlands 90
Figure 23. A. Total surface water bodies in relation to total area of selected member states ; B. total
groundwater bodies in relation to total area of selected member states 125
Figure 24. A. Mean size of groundwater bodies in the Rhine district ; B. Mean size of surface water
bodies in the Moselle-Sarre district 126
Figure 25. Representation of the share of natural water bodies as compared to the share of heavily
modified and artificial water bodies in the ISD 128
Figure 26. Transaction costs associated with public policies 142

vii
Figure 27. Categories and types of TC and how they are experienced in the creation and use of
environmental policy 143
Figure 28. Environmental policy implementation specificities and policy transaction cost
determinants 152
Figure 29. Policy transaction costs related to environmental policy implementation 153

vii
Acronyms
AWB Artificial Water Body
CBA Cost-Benefit Analysis
CEA Cost-Efficiency Analysis
CIS Common Implementation Strategy
DGARNE Direction Générale de l’Agriculture des Ressources Naturelles et de l’Environnement
DREAL Direction Régionale de l’Environnement, de l’Agriculture et du Logement
EBITDA Earnings Before Interest, Tax, Depreciation and Amortization
EQR Ecological Quality Ratio
EU European Union
GES Good Ecological Status
GEP Good Ecological Potential
HMWB Heavily Modified Water Bodies
ISC International Scheldt Commission
ISD International Scheldt District
NWB Natural Water Body
PoM Program of Measures
PTC Policy Transaction Costs
RBD River Basin District
RBMP River Basin Management Plan
SAGE Schéma d’Aménagement et de Gestion des Eaux
SDAGE Schéma Directeur d’Aménagement et de Gestion des Eaux
SWB Surface Water Body
TC Transaction Costs
TCE Transaction Cost Economics
TCT Transaction Cost Theory
VMM Vlaamse Milieumaatschappij
WFD Water Framework Directive
WTP Willingness To Pay

1
Introduction
From a perfect planner acting for general interest to an inefficient administration failing to reduce
social costs of externalities, economic theory developed divergent perspectives on State
intervention. In the last decades, economists gradually questioned the legitimacy and efficiency of
public policies, along with the “benevolent, omnipotent and omniscient” nature of the State (Dixit,
1996, Schleich, 1999). Constraints to public intervention addressed by Public Choice economists,
Political Economics and New Institutional Economics are identified as factors leading to an under
optimal level of investment (see Lévêque, 2004 for a review). As a consequence, Laffont (2002)
highlights that “efforts to reintroduce political constraints in economic analysis” are a central issue
for Public Economics. Along with evidences of shortcomings to State intervention, economic
integration and globalization have enhanced legislation to control State intervention in the economy
(Ziller, 2002) and this trend is significant in the integration process of the European Union. The study
of constraints to public intervention is a strategic issue, especially in a context where European
Member States need to account for their policies, progress and results in implementing legally-
binding legislations. Not to mention the current monetary and budgetary restrictions in the Euro
zone, calling for finer and more adequate analysis to justify and assess public action. From the
1970’s, the legitimacy and efficiency of the welfare State are contested by Public Choice economists
and New Institutional Economics, referring to “government failures” for inefficient government
policies. In other words, a government failure occurs when the resulting allocation of goods and
resources is more inefficient than it would have been without the intervention. Wallis and Dollery
(2001) provided an understanding of government failures1 on the basis of various definitions and
typologies advanced by several authors (i.e. Bator, 1958; O’Dowd, 1978; Wolf, 1989;Weisbrod, 1978;
Dollery & Wallis, 1997). Winston (2006) questioned whether government policy has generated
significant net benefits in the process of reducing the social costs of externalities, and identifies cases
of market failure policies generating welfare costs. He holds that government failure may result in
1- First, allocative inefficiency may arise from the bias toward the excess provision of public goods characteristic of distributive politics in representative democracies, sometimes termed “constitutional failure” or “legislative failure.” Politicians, it is argued, pursue self-interested strategies designed to maximize their chances of re-election rather than policies aimed at improving the well-being of society at large.
- Second, even if socially beneficial policies are enacted, “bureaucratic failure” ensures that these policies will not be efficiently implemented.[...] inefficiency would still arise since agents appointed to implement public projects are unlikely to have sufficient incentives to carry out policies efficiently.
- Finally, state intervention almost invariably creates wealth transfers, which provide individuals and groups with strong incentives to engage in “rent-seeking” activities which generate social waste rather than social surplus.

2
“missed opportunities, wasted resources, and waning public support”. Le Grand (1991) argues that
the arguments concerning government failure to achieve either efficiency or equity vary according to
the type of government intervention involved. In the end, as highlighted by Le Grand (op cit),
“whether a particular form of government intervention creates more inefficiency or more inequity
than if that intervention had not taken place is ultimately an empirical question” . As introduced, the
government failure paradigm offers a framework to identify constraints and limits to State
intervention. With State intervention, we will focus on the prevention of environmental degradation
that results from market’s negative externalities. With the aim to establish corrections to attain a
social optimum (in environmental policy making), State intervention is subject to biases and
shortcomings that we hereby characterize as constraints to public intervention. We will see that
existing literature indicates there are many arguments and empirical works identifying constraints
that limit appropriate public intervention to correct market failures. In order to improve the
evaluation of public intervention, it is expedient to develop existing knowledge on these constraints
and reconsider the conditions under which public policy options are likely to be effective. This
implies having a clear overview and characterization of the constraints having an impact on policy
choice and effectiveness. With this aim, this introduction will review some theoretical contributions
on costs and constraints linked to policies, and investigate existing empirical evidences of constraints
linked to environmental policies.
Theoretical insights on costs and constraints of state intervention
On the basis of the literature review undertaken and the different approaches to costs and
constraints in economic theory, we could distinguish between (1) constraints associated with the
definition of the policy objective to be reached and (2) the constraints associated with reaching this
objective.
Constraints associated with the definition of the policy objective to be reached (« optimum »)
Economic theory sustains that State intervention shall lead to an allocation of financial and natural
resources that maximizes social welfare. We identified two conditions that can jeopardize this
mission: when this ideal allocation is difficult to define, or when the regulator does not seek to reach
this optimum. Regarding the allocation of resources, there are some difficulties to aggregate
individual preferences in Public Economics in general. Public decision rules face obstacles to ensure
general interest or coherent public choices (see Marchand, 1999). These obstacles are illustrated by
3
Arrow’s “impossibility theorem” (Arrow, 1951), showing that democratic decision rules based on a
voting system (majority or unanimity) cannot simultaneously ensure general interest and the
coherence of public choices. A constraining and rigorous rule (close to unanimity) reduces the risk of
a decision conflicting with individual interests, but implies important negotiation costs. In parallel, a
less constraining decision rule increases the risk of a non-favourable public decision. On the other
hand, there are obstacles to the elaboration of a cost-benefit analysis in Environmental Economics in
particular, as the regulator is not « omniscient ».In Environmental and Natural Resources Economics
the optimum is determined by a cost-benefit analysis assessing on one side the costs to preserve,
restore and improve a natural resources (or to reduce an ecological nuisance), and on the other side
the benefits in terms of social welfare generated by these actions. However, the estimation of both
costs and benefits is still an issue and an incorrect estimation of costs and/or social welfare would
induce a gap between the objective set and the optimum. As highlighted by Cropper and Oates
(1992), “problems of measurement and the breakdown of second-order conditions (…) constitute
formidable obstacles to the determination of truly first-best environmental policy”. Concerning
benefits, the difficulty stems from the choice over the impacts to take into account and the methods
to monetize these impacts. These methods are numerous and can be based either on avoided costs,
restoration costs, observed behaviours or hypothetical markets (Bonnieux and Desaigues 1998,
Hanley et al., 2007). However, the choice over the evaluation method significantly affects
environmental benefits estimation. Moreover, these evaluations imply important costs and are
strongly bound to the specific context where the study is undertaken which limits the transfer of
results (Brookshire et Neill, 1992, OCDE, 2006, Rozan, 2004). Regarding costs, literature mostly
develops the case where costs are decentralized, for instance when the regulator shall incite
polluters to reduce their effluents. In this case, information asymmetry occurs since it is in polluters’
interest to hide part of the information they hold on their costs (Kwerel, 1977, Siriex 2003). In order
to avoid this problem, the regulator can use an information disclosure strategy by proposing
contracts the acceptance or refusal of which reveals the hidden information (see incentives theory
literature, i.e. Laffont and Maskin [1982], Caillaud et al. [1988], Baron [1989], Laffont and Tirole
[1993] in : Brousseau, 2000). In return, this policy implies giving up an informational rent to polluters
(Laffont and Tirole, 1993).
Regarding regulator’s lack of motivation to reach the optimum, the Public Choice School and the
Political Economic theory question the hypothesis of regulator’s intention, considering that the
regulator is not “benevolent”.In their sense, State intervention is venal and composed of private
interests and repercussions on social welfare are thus to be expected. More precisely, policies are

4
developed by officials seeking to satisfy specific interests such as career promotions or the
maximization of their budget (Stigler, 1971, Buchanan and Tollison 1972, Tullock, 1978). In addition,
there is a rather low credibility of the regulator’s commitments in the future given the election cycle
(Marchand, 1999). Another constraint associated with the regulator’s lack of motivation to reach the
optimum is lobbying. When public spending is high and redistribution important as it is the case in
France, organized interest groups tend to invest in collective action in order to obtain benefits for
their sector (Olsen, 1982). These actions generate additional functioning costs for the public
authority (i.e. time to negotiate with interest groups, ensure security in case of demonstration, etc.)
that can outweigh the amount redistributed. Interest groups are incited to invest an amount
corresponding to the expected profit in case of a success. Oates and Portney (2001) describe two
types of lobbying actions: either candidates announce the measures they will implement if they are
elected and the interest groups decide which candidate to support, or interest groups offer certain
contributions and representatives choose policies that will favour their re-election. These actions
create a “political market” with an imperfect representation of interests. The policy elaboration
process and the institutional setting encourage interest groups to invest in lobbying activities, and
this political bargain overloads the decision-making process. Schleich (1999) notes that
environmental policies are particularly subject to be exploited by interest groups. In an article
analyzing the consequences of lobbying on environmental quality, he shows that the lobbying
activities of a polluting industry induce a level of environmental quality that is lower than the socially
optimal level, except if the marginal damage costs decrease very rapidly. He considers that lobbies
influence policies with financial contributions, and are incited to act in favour of less efficient
policies.
Constraints to reach the environmental objective
Once the environmental objective is set (corresponding or not to an economic optimum), the
implementation, monitoring and evaluation of policy tasks allowing to reach the objective are also
subject to costs or constraints for the regulator, for the regulated agents and for the rest of society
(especially tax payers). The costs borne by the regulator include administrative costs induced by
policies. Often referred to as transaction costs, they represent the costs to develop, implement
(execution, monitoring, control) and evaluate policies. Several studies (i.e. McCann, 2005, OECE,
2007) recommend to distinguish between fix transaction costs (that do not depend on the number of
agents/surface concerned/etc. and do not vary according to the volume of financial transfer) and
variable transaction costs (that increase according to the scope of the policy program). Dahlman
(1979 in : Rørstad et al., 2005) considers three elements of transaction costs : costs of information

5
gathering, contracting costs and costs of control. These transaction costs can be ex ante or ex post
(see Saussier and Yvrande-Billon, 2007 for a typology of contracting costs) but there is however no
theoretical consensus on their characterization and operationalization, which remains an empirical
issue (Wang, 2003). We can add that in 1969, Kolm had already described the discrimination costs of
a tax including costs of knowledge, judgement making, optimal rates calculations, users payments,
transmission of information, exclusion, etc. that can counterbalance the profitability of
discrimination. We also consider that the acceptability of policies is a factor that constitutes a cost
for the regulator. Agents can refuse to apply certain decisions, or deviate from initial objectives (i.e.
Salles, 2006, details the case of programs to reduce agricultural pollution). The same way, a low level
of participation in certain voluntary programs (i.e. agri-environmental schemes) that is not
anticipated can generate important costs given the organization in place. The potential costs
incurred include delays, legal expenses, strikes, demonstrations, re-negotiations. Ex ante policy
evaluation shall also consider constraints for regulated agents, which are often neglected. The
corresponding costs, considered as “private transaction costs” or “private costs of compliance”, can
counterbalance the total policy costs. In the literature, they include administrative expenses invested
to proceed to a transaction (i.e. tradable permits schemes), to participate in certain programs or
comply with programs’ objectives (i.e. organic agriculture certification costs). Policies induce another
category of constraints that affect the collective welfare. Kolm (1969) argues that fiscal distortions
due to tax collection imply a divergence between social costs of public and private funds, therefore a
cost of public funds. Beaud (2006) defines a social marginal cost of public funds as the cost borne by
the community through taxes collected by the State. Boyer and Porrini (2001) use a political
economy theoretical model on the choice of instrument in environmental policy, assuming a cost of
public funds that stems from distortions due to taxation. Morer (2000) shows that the inefficiency of
fiscal competition between local communities originates from the improper estimation of the
marginal cost of public funds by local representatives (due to externalities induced by the fiscal
competition between local communities). These authors have thus considered a non-negligible cost
of public funds affecting policies’ efficiency. Regarding other distortions, Buchanan and Tullock
(1962) recall that public authorities have the possibility to transfer to future generations the burden
of the debt without bearing the costs of this transfer, which corresponds to the “predation of
resources by the current generations”.
On the basis of this literature review, we have seen that costs and constraints linked to public
intervention were addressed by Political Economics, supporting that government intervention is
venal (since decisions are influenced by lobbying groups) and composed of private interests that may

6
be at the expense of social welfare. New Public Economics advanced that the State lacks information
(for instance on abatement costs) to define optimum policies, referring to information asymmetry
and moral hazard. New Institutional Economics argues that public intervention has a significant cost,
and should aim at minimizing transaction costs (Calabresi, 1968, Dahlman, 1979, Coase, 1988). In
order to appreciate the impacts of such costs and constraints, we will investigate how they are dealt
with in practice.
Costs and constraints of state intervention in practice
In the economic literature, constraints appear under different terminologies: ‘costs of public
intervention’, ‘transaction costs’, ‘marginal costs of public funds’, etc. and under different forms:
information asymmetry between the regulator and regulated agents, regulator’s lack of motivation
to maximize the collective welfare, administrative costs of policy implementation and monitoring,
distortions on other markets caused by taxes, etc. However, it is only more recently, in 1990s that
empirical studies aimed at assessing these constraints ex post. We hold that the study of constraints
to public intervention becomes a strategic issue, especially in the European Union where Member
States need to account for their policies and the results achieved to reach the European objectives
set. The European Union has become a “supra-regulator” of Member States, the latter being subject
to sanctions if the objectives are not reached. The context of budget restrictions and monetary crisis
in the Euro zone calls for a finer or more appropriate analysis to justify and assess public action. For
instance, the necessity to assess the costs linked to European policies has triggered the launch of a
program by the European Commission to reduce the administrative burdens by 25% from 2008 to
20122. These administrative burdens were assessed during the year 2008 (on the basis of the
Standard Cost Model) and correspond to the administrative costs of the European legislation for
businesses. In addition, the reduction of administrative burdens tends to be part of the ex ante
impact assessment of new EU policies.
With the aim to characterize constraints linked to public intervention that induce significant but ill-
defined costs, we considered 9 ex post empirical studies (table 1) where two main categories of
policies are at stake in line with our focus on policies dealing with natural resources and
environment:
2TheAction Programme for Reducing Administrative Burdens in the European Union presented by the European Commission in January 2007.

7
- Pollution abatement policies and agri-environmental policies
These policies aim at mitigating pollution through an arbitration between the economic profit (or
cost) and the environmental damage (of benefit). This way, setting an optimal pollution level
requires an assessment of pollution abatement costs and benefits. Regulation instruments
investigated are taxes on inputs or emissions, management measures, or voluntary programs
with compensatory payments.
- Markets for water rights and water provision services
These policies aim at best allocating water resources between the different users and the
different generations. In the case of markets for water rights, the regulator defines the maximum
water volume that can be extracted. In the case of drinking water supply, local public authorities
decide of a contractual arrangement for water provision.
Table 1. Empirical studies analyzed to investigate constraint estimates
Authors Year Title of the study
Beaud, M. 2006 Le coût social marginal des fonds publics
Challen, R. 2000 Institutions, transaction costs and environmental policy
Colby, B. 1990 Transaction costs and efficiency in Western water allocation
Falconer, K., Whitby, M. 1999 Transaction and administrative costs in countryside stewardship policies: an investigation for eight European member states
McCann, L., Colby, B., Easter, K., Kasterine, A., Kuperan, K.
2005 Transaction cost measurement for evaluating environmental policies
McCann, L. and Easter, K. 2000 Estimates of public sector transaction costs in NRCS programs
McCann, L. and Easter, K. 1999 Transaction costs of policies to reduce agricultural phosphorous pollution in the Minnesota River
Ménard, C. and Saussier, S. 2000 Contractual choice and performance: the case of water supply in France
Rorstad, P., Vatn, A. and Kvakkestad, V.
2005 Transaction costs and agricultural policy
Acknowledging that policy objectives tend to be second-order solutions based on a cost-efficiency
analysis (policies seeking for the lowest compliance costs for a given environmental objective), the
empirical studies considered actually assess constraints ‘to reach a given environmental objective’
(rather than constraints ‘to define an optimal environmental objective’). We will now provide an
overview of the constraints identified and the assessment methods used and to characterize
constraints.
8
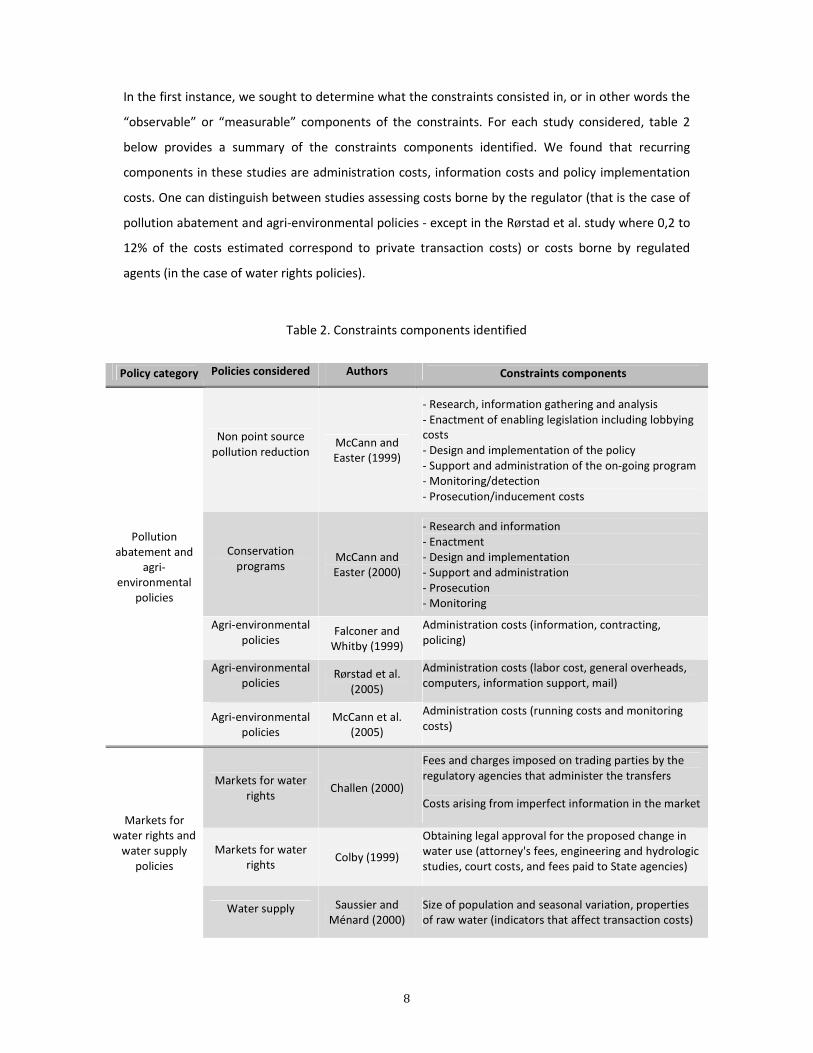
In the first instance, we sought to determine what the constraints consisted in, or in other words the
“observable” or “measurable” components of the constraints. For each study considered, table 2
below provides a summary of the constraints components identified. We found that recurring
components in these studies are administration costs, information costs and policy implementation
costs. One can distinguish between studies assessing costs borne by the regulator (that is the case of
pollution abatement and agri-environmental policies - except in the Rørstad et al. study where 0,2 to
12% of the costs estimated correspond to private transaction costs) or costs borne by regulated
agents (in the case of water rights policies).
Table 2. Constraints components identified
Policy category
Policies considered Authors Constraints components
Pollution abatement and
agri-environmental
policies
Non point source pollution reduction
McCann and Easter (1999)
- Research, information gathering and analysis - Enactment of enabling legislation including lobbying costs - Design and implementation of the policy - Support and administration of the on-going program - Monitoring/detection - Prosecution/inducement costs
Conservation programs
McCann and Easter (2000)
- Research and information - Enactment - Design and implementation - Support and administration - Prosecution - Monitoring
Agri-environmental policies
Falconer and Whitby (1999)
Administration costs (information, contracting, policing)
Agri-environmental policies
Rørstad et al. (2005)
Administration costs (labor cost, general overheads, computers, information support, mail)
Agri-environmental policies
McCann et al. (2005)
Administration costs (running costs and monitoring costs)
Markets for water rights and
water supply policies
Markets for water rights
Challen (2000)
Fees and charges imposed on trading parties by the regulatory agencies that administer the transfers
Costs arising from imperfect information in the market
Markets for water rights
Colby (1999)
Obtaining legal approval for the proposed change in water use (attorney's fees, engineering and hydrologic studies, court costs, and fees paid to State agencies)
Water supply Saussier and Ménard (2000)
Size of population and seasonal variation, properties of raw water (indicators that affect transaction costs)

9
From the 9 empirical studies analyzed, we identified three main types of methods to assess
constraints: management accounting, statistics and fiscal data, which highlights that there is no
standard methodology to assess the constraints at stake. We will summarize the description of these
methods but background information can be found in appendix A.The management accounting
method is the most commonly used. It corresponds to the monetization of working time dedicated
to administrate a policy program (which is assessed through interviews) supplemented with data on
administrative spending (financial data, administrative and legal expenses, etc.). Overall, the costs
estimated with the “management accounting” method consist mainly in administrative costs
associated with policy or program implementation. Another approach to assess constraints is found
in the of Saussier and Ménard study (2000) analyzing the determinants of the organizational mode
(‘arrangement’) chosen by local government authorities to provide (or outsource) a public service. In
this study, statistics allowed to analyze the correlations between constraints (characterized by
proxies) and the organizational mode chosen. The last approach to assess constraints is found in the
study of Beaud (2006) focusing on the hidden cost of public funds (through tax collected) resulting
from the economical distortions generated. He defines the cost for the community of taxes collected
by the State as Social Marginal Cost of Public Funds (SMCPF). Beaud argues that taking into account
the SMCPF in cost-benefit analysis of public policies should limit the number of public policies
currently chosen, especially projects with low financing capacities. He adds that the value of the
SMCPF has consequences on the size and composition of the public sector and is a core issue for the
debate on the production and provision of public utilities.
As illustrated in table 3 below, the costs assessed in the studies considered consist in transaction
costs, administrative costs and social costs of public funds. Their quantification does not follow a
standard methodology nor a cost typology. Indeed, costs are expressed in terms of different
parameters (absolute value, percentage of total costs of policy measures, percentage of a major
component of total cost, percentage of the amount invested or collected), which do not allow for
their comparison nor their impact assessment.

10
Table 1. Constraint estimates and assessment methods
Constraint Policy Constraint estimates Assessment
method
Transaction costs,
administration
costs
Markets for water rights
3-29% of average trade price Challen (2000)
Management accounting
6% of price paid by applicants to transfer their water rights Colby (1999)
Water supply
Statistically significant relationship between proxies (population size and variability, water quality) and the contractual arrangement chosen Saussier and Ménard (2000)
Statistical method
Pollution abatement and agri-environmental
policies
$ 0.9-9.4 million (for 4 policy scenarios with the same environmental objective); McCann and Easter (1999)
Management accounting
6-87% of compensatory payments provided by each scheme (or 1-100% of total cost of each scheme over a year) Falconer and Whitby (1999)
0.1-66% of payments to farmers or tax revenue Rorstad et al. (2005)
Nature conservation 38% of overall conservation costs McCann and Easter (2000)
Management accounting
Costs of public
funds Public policies
Social marginal costs of public funds = 1.2 (20% of the taxes collected) Beaud (2006)
Fiscal data
The 9 empirical studies analyzed indicate that the assessment of constraints and transaction costs
related to (agri-) environmental policies is recent, and that a better understanding of these costs and
constraints could improve policies’ efficiency. In most empirical studies assessing transaction and
administrative costs, estimates are found to be significant. For instance, in a study on pollution
abatement policies, McCann and Easter (1999) argue that taking account of transaction costs in the
analysis implies that “the optimal (pollution) abatement level will be lower [than without
consideration for transaction costs] because the total costs of achieving a given level of abatement
are much higher”. They also suggest that one should switch from practices and areas with high
transaction costs to other arrangements generating less transaction costs.

11
The potential of transaction costs for policy analysis
From the literature review carried out, we found that several constraints have been identified in line
with the government failure paradigm, but most empirical studies on the ex post estimation of these
constraints are rather recent. These estimations mostly relate to constraints associated with
‘reaching the policy objective’ and concern administration costs, while other costs are more difficult
to assess. According to the European and national contexts of policy reform where State
expenditures are expected to be reduced while policy efficiency is expected to improve, it is worth
considering the opportunity of a better estimation of constraints and transaction costs to improve
policies’ efficiency, as highlighted by the empirical literature. Although transaction costs are
considered useful to optimize policies’ efficiency, the empirical data on these constraints is however
hardly operational. One especially needs to better define and identify these costs (Wang, 2003,
McCann et al. 2005) to minimize them, and it is suited to “analyze how these transaction costs affect
public authorities’ decisions [which public authorities look for the most efficient option at the lowest
cost to reach a given objective]” (OECD, 2007). We are particularly interested in this last point, as to
say how transaction costs affect policy decisions. According to the literature survey undertaken,
transaction costs appear to be a relevant and innovative parameter to appreciate (quantitatively or
qualitatively) a wide range of constraints (and related costs) involved in the public sector and most
specifically in policy implementation. Recalling North (1996), “transaction costs are the most
observable dimension of the institutional framework that underlies the constraints in exchange”.
Ménard (2001) also highlighted that the mechanisms through which governance structures apply
rules and how these mechanisms contribute to the organization of transactions remains a field to be
further explored. On these bases, this research recognizes the potential of transaction costs to
analyze costs and constraints linked to State intervention via its policies. Within the scope of this
work, we will focus on public intervention to regulate market failure, and most specifically
environmental policy. Since transaction costs consist in a concept developed in the context of
contractual relationships and private firms, existing approaches will require adaptations to assess the
impact of transaction costs on policy. Our review of empirical studies highlighted that transaction
costs do matter for policy analysis as they affect the policy costs considered and the resulting policy
choices (i.e. over a policy scenario). However, transaction cost assessment is limited to
administration costs, which do not allow for grasping the influence of other (non quantifiable?)
dimensions of constraints. In this research, we are thus concerned with assessing the impact of
transaction costs on policy, including how actors respond to such constraints, so as to take account
of transaction costs in policy analysis. With this aim, we developed a conceptual framework and a

12
methodology to address the issue of transaction costs linked to policy implementation. The core of
this work, as to say the methodology developed to assess ‘policy transaction costs’ and their impacts
on policy decisions, is both based on existing transaction cost typologies and on a case study. The
methodology developed is a step-by-step approach allowing to empirically describe the policy
decisions resulting from transaction costs (so-called ‘arrangements’). Chapter 1 first addresses the
ins and outs of the transaction cost theory, especially regarding its relevance to policy. On that basis,
it introduces the ‘policy transaction framework’ developed to address the issue of transaction costs
in the context of policy implementation. Second, chapter 2 depicts the ‘policy transaction’ at stake in
the case study, as to say the Water Framework Directive (WFD) implementation in the International
Scheldt District involving three countries (France, Belgium and the Netherlands). It also provides an
overview of the main steps of the methodology to analyze ‘policy transaction costs’. On the basis of
countries’ interpretation and implementation of the WFD objectives (within the frame of the policy
transaction at stake), we drew up a preliminary assessment of transaction cost determinants that
have conditioned the WFD implementation in the various contexts, and introduced a general
typology of ‘policy transaction costs’ adapted to environmental policy early implementation (chapter
3). Chapter 4 then describes the ‘policy arrangements’ analyzed in the case study, as to say the
decisions of policy actors over the implementation of policy tasks as a result of ‘policy transaction
costs’. In light of these policy arrangements, we provide a first assessment of countries’ ‘policy
transaction costs’ (PTC) minimization strategies when implementing the WFD. Last, we conclude on
and discuss these findings.

13
Chapter I Theoretical background and conceptual framework
1. Transaction cost theory and policy analysis
For the purpose of this research, we have approached the concept of transaction costs from an
empirical standpoint, as an evidence of constraints or costs linked to public action. However, the
concept was initially developed in the context of private firms and contracts with a given purpose. In
this section, we will first present the main principles and definition of the transaction cost theory and
how they have been applied to the policy context (1.1). We will then develop why existing
approaches require further adaptations so as to assess the policy implementation process (1.2).
1.1 Transaction cost theory and the policy context
In light of the main concepts underlying the transaction cost theory, we will highlight what the
existence of transaction costs imply for policy analysis (1.1.1). We will then see how different authors
have assessed the relevance of TCT for policy analysis (1.1.2). On that basis, we show why further
adaptations are required in order to extend the concept of transaction costs to policy
implementation (1.1.3).
1.1.1 Definitions and rationale
Originally, a (market) transaction is considered to occur “when a good or service is transferred across
a technologically separable interface" (Williamson, 1996, p.379). In Coase’s (1937, 1961) original
formulation, transaction costs refer to “the cost of using the price mechanism” or “the cost of
carrying out a transaction by means of an exchange on the open market”. In practice, “to carry out a
market transaction it is necessary to discover who it is that one wishes to deal with, to inform people
that one wishes to deal and on what terms, to conduct negotiations leading up to a bargain, to draw
up the contract, to undertake the inspection needed to make sure that the terms of the contract are
being observed, and so on” (Coase, 1961, p. 15) and these tasks represent transaction costs. In other
words, Arrow (1969) defines transaction costs as “costs of running the economic system”.
More generally, New Institutional Economics consider that institutions, by setting rules and the
structure that guide behaviors, frame the economy and are key to economic development. North
(1990) holds that institutions are not efficient but do accomplish the role they were initially created

14
for. He argues that institutions are not created with a pure economic efficiency purpose, but they are
first a response to transaction costs and to uncertainty they attempt to limit by guiding behaviors.
Transaction cost economics thus provides an analytical framework to explain why inefficient
institutions persist. The objective here is not to provide an extensive review of the transaction cost
theory which has been done elsewhere by several scholars and researchers, but rather to underline
the main points and focus on the most relevant part for policy analysis as to say the perspective
developed by Williamson.
The transaction cost approach regards the transaction as the basic unit of analysis and holds that
understanding of transaction cost economizing is central to the study of organizations through
assessing how their governance structures serve to economize on these transaction costs
(Williamson, 1981). In the Williamson (i.e. 1998, 2000) research tradition, transaction costs provide
the key to understanding alternative forms of economic organization and contractual arrangement.
The concern is about the cost of conducting transactions in one organizational or contractual form
relative to the others. Therefore, what matters is not the absolute amount of transaction costs, but
the relative ranking of transaction costs associated with different organizational or contractual
choices. To Williamson (2000), transaction costs affect institutional arrangements relevant for
economic performance. Transaction cost analysis is thus “about the comparative costs of planning,
adapting, and monitoring task completion under alternative governance structures" (Williamson,
1981 p. 552).
A transaction cost approach accounts for indirect costs to organize and make exchanges, where
“anything that impedes the specification, monitoring, or enforcement of an economic transaction is a
transaction cost” (Dixit 1996). In practice, this concept is used to define various constraints, tasks or
costs among which administrative costs. Following Williamson (1995), analyzing transaction costs of
policy implementation could allow assessing how different modes of governance economize on these
costs. This would mean assuming that “all modes of governance operate as economizing
instruments—provided that they are used to manage transactions for which they are (comparatively)
well-suited”. In this line, the objective is not to calculate administrative costs but to understand the
different factors that underlie the policy decisions to minimize transaction costs. That is to say that
transaction costs are shaping policy arrangements. A major hypothesis we can draw from
Williamsonian transaction costs economics is that the performance of institutions’ organizational
modes stems from transaction costs and transaction costs optimization strategies: “we need
governance structures that keep transaction costs low and thereby optimize performance”.

15
As our focus is policy analysis, we assume that state intervention implies costs or constraints other
than the costs of policy measures. There is a cost to run the system, but how to isolate these
transaction costs? We will provide an overview of existing approaches to assess transaction costs
linked to public action.
1.1.2 Transaction cost theory applied to public action
Transaction cost theory has been mostly applied to private organizations and contractual
relationships but the public sector remains an interesting investigation field. Dixit (cited in Jobin,
2008, p.443) mentions that information impactedness, opportunism, and asset specificity (the more
specific the transaction, the more transaction costs) are the main transaction costs relevant to the
public sector. Jobin (2008) is perhaps one of the few to have explicitly reported the practical
application and usefulness of transaction costs theory to the public sector.
McCann and Easter (1999, 2000), Falconer and Whitby (1999), Ducos and Dupraz (2006), OECD
(2007), Vollet (2010) have quantitatively assessed administration costs of agricultural/environmental
policies implementation or clarified the conditions under which transaction cost assessment can
support policy evaluation. It results from these studies that the omission of “organizational costs”
(referring to administration costs) can lead either to sub-optimal policies (i.e. Falconer and Whitby,
1999), or a biased evaluation of economic efficiency of policies, or that state policies make transfers
less expensive than they should be (Colby, 1990, p.1189), or that the optimal abatement level will be
lower because the total costs of achieving a given level of abatement are much higher (when
considering transaction costs). Hahn and Hester (1989) suggested that a water-pollutant trading
program failed because high transaction costs in the form of administrative requirements ultimately
eradicated potential gains from trade (in Wang, 2003). These authors especially highlighted the
importance of balancing these costs with other policy costs (i.e. pollution abatement cost). According
to McCann et al. (2005, p.528), measuring transaction costs can: (1) improve preliminary comparison
and screening across alternative policy instruments, (2) enhance effective design and
implementation of policies to achieve particular objectives, (3) evaluate current policies in order to
improve their effectiveness, and (4) assess budgetary impacts of policies over their life cycle. The
measurement of such transaction costs associated with policies was possible using different
measurement methods: surveys or interviews, ex post results from other studies, government
reports, financial accounts, and proposed budgets.
16
A significant point of such applications of TCT to policies is that the quantification of transaction costs
required developing operational transaction costs typologies. Falconer and Whitby (1999) and the
OECD report (2007) developed quite specific typologies (relating to agri-environmental and
agricultural policies) whereas McCann et al. (2005), Coggan et al. (2010) have developed broader
transaction cost categories regarding environmental policies. Two key studies of the transaction
costs literature from McCann et al. (1999, 2000) have defined administrative costs (referred to as
transaction costs) as consisting in the following categories:
- Research and information
- Enactment of enabling legislation or litigation
- Design and implementation of the policy
- Support and administration of the program
- Contracting
- Monitoring/detection
- Prosecution/enforcement
Such categories follow the different policy steps, where each policy phase includes one or more of
these cost categories.
We can distinguish another approach of TCT applied to public action, in line with Williamson’s work,
where transaction costs are not directly measured. Certain proxies (such as uncertainty, transaction
frequency, asset specificity, opportunism) are considered to critically affect the cost of transactions.
The contractual arrangements (of production) chosen are justified by a statistically significant
relationship between the chosen proxy and organizational governance, which economize on
transaction costs. Such method allows for not involving the controversial issue of transaction cost
measurement.
With this approach, Saussier and Ménard (2000) define public service performance as linked to a
contractual arrangement (mode of governance) that depends on transaction costs (and transaction
characteristics). In their study, determinants of organizational modes chosen by local government
authorities to provide (or outsource) a public service have been assessed with statistical data. Using
data from water supplying units and an econometric model, they could show that transaction
characteristics (origin and quality of raw water, population affected and financial constraints) have a
significant impact on the organizational mode chosen. They pointed out that the organizational
mode considered by government authorities to supply water depends on the constraints involved by
its public or private nature of management (having impacts on overall costs, water prices and

17
quality). The authors have thus indirectly assessed the relative impact of these constraints for three
organizational modes, and showed that the comparative advantages of the organizational mode
depend on the characteristics of the transactions3. Some precautions are however necessary when
interpreting transaction costs. For instance, decreasing transaction costs is not synonymous of
efficiency gain.
According to Saussier and Yvrande-Billon (2007), the contractual arrangement determines
transaction costs, and transaction costs are to be related to the governance structure. Highlighting
the link between transaction costs and governance structures’ efficiency, the authors recall some
recent works focusing on the identification of the determinants of public officials choices’ (i.e.
decisions to internalize the production of a particular service) and on their confrontation with the
TCT principles, confirming the relevance of TCT to explain the organizational choices of public
decision-makers (Saussier and Yvrande-Billon, op cit, p.72).
On the basis of these two main approaches of TCT to public action, we come to the conclusion that
the first series of study (the quantification of transaction costs associated with policies) is rather
limited to the assessment of administrative costs and the second type of approach is so far limited to
contractual relationships. We argue that a different frame of analysis could account for a broader
definition of both policy and policy objective, and for a diversity of constraints linked to policy
implementation (i.e. institutional, political, cultural, etc.). With this perspective we can question the
possibility of using a qualitative approach for policy analysis. This raises the issue of what is
understood as policy and policy transaction costs, which is discussed in the next section.
The potential of using transaction cost theory for policy assessment obviously faces important
challenges such as the definition of a public transaction or limits in defining transaction costs. Given
other existing policy assessment methods focusing mostly on impact evaluation, a transaction cost
framework offers the opportunity of policy process evaluation with consideration to governance
structures.
1.1.3 Transaction cost theory for policy analysis: adaptations are required
Applying transaction cost theory to a public policy may appear somewhat a challenge for economists.
The same way, political scientists are likely to be hostile to the notion of efficiency as defined by
3Related to: investments, uncertainty and financial constraints.

18
transaction cost economics. As recalled by several authors, “the transfer of theory from one discipline
to another may lead to inappropriate or costly generalizations and predictions. This occurs because a
theory may be dependent on the tenets of a particular discipline or, more specifically, the theory may
be contingent on a specified set of parameters, boundaries and/or system states that are unavailable
in the existing theory of another discipline” (Dubin, 1978, cited in McWilliams and Smart, 1993, p.
63). In light of these considerations, we are concerned with public policy specificities we need to take
into account to apply a transaction cost approach. Although transaction cost theory has already been
applied to public policies, the analytical frameworks developed to day do not allow grasping policy
implementation as a non-contractual transaction, involving different scales, multiple tasks and
agents.
Transaction cost theory was mostly applied to private firms and contracts. As recalled by Muller
(1990), private firms and public administrations have different logics – and we can say different
focuses – as the main relationships between a firm and its environment lie in exchange, contract and
agreement of will whereas public administrations take up and distribute resources, while offering
allowance and services without compensation, they forbid and oblige to do, and more generally
regulate behaviors (Gibert, cited in Muller, 1990, p.21). Although public administrations are involved
in economic transactions in a similar way as firms (e.g. government contracts for public services, agri-
environmental schemes, etc.), we argue that depicting the policy implementation process as a
transaction requires the concept of transaction to be extended by taking account of the specific
characteristics of a public policy transaction.
To date, relatively few authors have addressed the policy issue within the framework of transaction
cost economics. Bromley (1989) stated that public policy “is about institutional transaction that
redefines the domain of volitional choice” and he distinguished four types of institutional transactions
at the macro-economic level4. Williamson (1999) speaks of six “public sector transactions”
(procurement, redistributional, regulatory, sovereign transaction, judiciary, infrastructure) and
elaborates on sovereign transaction5 in his paper. To this end, he introduced another important
transaction attribute: probity6which is seen as determining “the vertical relations of a public agency
with the political leadership, horizontal relations with counterpart agencies, and internal relations
within the agency” (Ruiter, 2005). North (1990) highlighted that political markets are very imperfect
4(1) Instances in which institutional change will improve the economy’s productive efficiency (2) instances in which the distribution of income is purposefully altered for whatever reason (3) institutional transaction that reallocate economic opportunity (4) institutional transaction that redistribute economic advantage. 5 Foreign affairs, military, foreign intelligence, managing the money supply, … 6Referring to the loyalty and rectitude with which certain public transactions are to be discharged (Jobin, 2008).

19
and prone to inefficiency since “high transaction cost issues gravitate to the polity”. Regarding the
applicability of transaction costs economics to the public sector, Ruiter (op. cit) claims that “the first
problem to be dealt with is that of the scope of the concept of public transaction”. Williamson (1999)
acknowledged that politics “is different” but that efficiency reasoning can and does apply to politics.
As a result, public bureaucracy for some transactions is the best feasible response. In the present
research, we are concerned with a different debate, as to say analyzing the policy implementation
process with a transaction cost approach. In this sense, we will not discuss the validity of public
bureau model of organization as compared to other alternative modes of organizations to create
environmental quality. Our focus still lies in the policy process efficiency but at a lower level.
Despite the fact that transaction cost theory was mostly applied to private firms and contracts, we
argue that this approach can be relevant to policy analysis, in the sense that public action involves
transaction costs. Although several papers dealt with the application of TCT to policy, we need a
different frame of analysis to account for a different definition of policy and policy objective than
those considered by neoinstitutional economists, and to account for a variety of constraints linked to
policy implementation which goes beyond the (difficult) quantification of administrative costs.
1.2 Adapting to policy characteristics
In this section, we will first set the ground for a ‘policy transaction’ by considering general policy
specificities (1.2.1). We will then review two main methodologies used to apply TCT to public action
and present the approach chosen in this research to assess transaction costs linked to policy
implementation, as to say a qualitative method (1.2.2).
1.2.1 Inputs from policy analysis
From the extended literature dealing with political sciences and policy analysis, we sought to identify
appropriate policy attributes to characterize a policy transaction. For an evaluation purpose, a public
policy can be defined as a “program of governmental action in a sector or geographical space” (Mény
and Thoenig, in Muller, 1990, p.22). As such, it can be considered as the output of a broader political
process where the role and means of the State, its political, juridical and administrative structure, as
well as historical and cultural considerations are at stake. In this sense, policy is the result of
constraints, compromises and conflicts within the political system. From another perspective, policy
20
can be the starting point of a series of subsequent empirical effects and focusing on policy impacts7,
as it will be the case in our research since we take as given the (environmental) policy objective. In
the European context, directives thus establish a legally-binding objective as well as general
implementation prescriptions so as to generate effects to solve (environmental) issues. However, a
policy objective is usually connected to a variety of issues (i.e. for water policy: navigation, electricity,
biodiversity, drinkable water provision and water sanitation, recreation, etc.) and affects other
policies (in the case of water policy: agriculture, transport, urban planning, energy, etc.). In other
words, “public agencies have multiple objectives, government programs have distributional effects
and considerations of equity and accountability are often important” and policy output is “complex
and controversial” (Wilson in Williamson, 1999).
Another distinctive characteristic of a public policy transaction is that a single mode of governance is
considered suited (given the nature and objective of the transaction), namely public agency, whereas
transaction cost theory recommends assessing which mode of governance is best suited for the
transaction at stake. More precisely, the public policy transaction deals with the implementation of
regulation: in our case study we will see that the European Union sets an environmental standard
and controls the different implementation steps and achievement of such standard. It is worth
noting that the implementation of environmental regulation involves different types of instruments,
among which market instruments, which is why we consider that the specificities of a public policy
transaction encompass the principles of bureaucracy as proposed by Hood (1976) – limited to rules,
authority and hierarchy.
Some interesting elements to compare private sector and public sector transactions were put
forward by Moe (1990), as detailed in Table 2. From that basis, when dealing with the public sector,
we cannot speak of a market, we cannot assess efficiency the same way as for the private sector, we
cannot describe a transaction according to private transaction attributes, but we argue here that we
can develop an extended definition of a transaction: a policy transaction.
7Robert L. Lineberry, American Public Policy: What Government Does And What Difference It Makes, New York:
Harper & Row, 1977 cited by Hayes, W. http://profwork.org/pp/study/cycle.html.

21
Table 2. Differences between economics and politics of organization as identified by T. Moe (1990)
Differences between economics and politics of organization
Private sector Public sector
The basic comparison between markets and
hierarchies in private sector transactions do not
apply to politics
There is no market for most goods and services supplied
by the government
Private sector actors can be presumed to structure
their relationships efficiently
Political actors are unable to sell their rights to exercise
public authority and the need for compromise in politics
give rise to expediency rather than efficiency in the
design of public bureaus
Mutual gains from trade accrue to voluntary
private sector agreements
Public authority is involuntary (coercive) therefore the
presumption of efficiency gains is jeopardized
Asset specificity is key to study many private
sector transactions This is not the case in the public sector
Policy implementation is a process in which a variety of decisions need to be constantly made, and
throughout which power, acceptance, information, capacity and other elements play a decisive role.
Policy implementers are actors with their own goals and ambitions, who are able to carry out or
oppose policy decisions, who may or may not possess the resources to do so, and so on (Crabbé and
Leroy, 2008, p. 15). Policy can be evaluated in terms of the degree to which it possesses the means of
facilitating or obstructing implementation, for instance by analyzing the interplay between
government bodies at different administrative levels. For policy analysts, the interaction between
numerous actors is a key factor in explaining successes and failures of policy processes. By
developing a policy transaction framework, we seek to analyze the conditions that constrain such
policy implementation process by using the concept of transaction costs. To this end, we will give a
simple definition of policy characteristics and set boundaries to what is considered as policy
implementation within our framework. Policy analysts Mény and Thoenig (in Muller, 1990) argue
that a public policy in practice:
− has a set of concrete measures
− consists of more or less authoritarian decisions
− is part of a larger frame of action
− has a “public” (target group whose situation is affected by the policy)
− sets an objective

22
Within the scope of this work, the focus lies on the last of these five policy characteristics, as to say
the policy objective. Indeed, the core of the policy transaction would correspond to policy
implementation, and in practice to the actions necessary to reach the (environmental) objective set.
At this point, we refer to the policy cycle model (Lasswell, 1948, 1956; Brewer, 1974; Brewer and
deLeon, 1983; deLeon 1988) to set boundaries for policy analysis as it defines policy stages as
chronological steps. Although the model shows limits by simplifying a complex process (i.e. the order
of steps can differ or be altered, certain steps cannot be easily identified) (Crabbé and Leroy, 2008), it
allows pointing out an implementation stage where key decisions are executed (fig.1).
Figure 1. The policy cycle (from Crabbé and Leroy, 2008, p. 3)
Referring to a public policy handbook, Hayes recalls that at the policy implementation stage, “the
authorized policy must be administered and enforced by an agency of government. The agency must
take instructions as stated in the policy, but will probably provide missing pieces and make judgments
as to intent, goals, timetables, program design, and reporting methods. The agency's mission may be
well defined or poorly understood, but the action has shifted”8. This is a major argument why this
research will seek to analyze the policy implementation phase of a European environmental directive
as government agencies make choices (resulting from interpretations, judgments, assumptions,
available information, constraints, etc.) to implement the EU objectives within a broader setting or
frame of reference. In the next chapters, we will further develop the extent to which these choices
are shaped by determinants and transaction costs. For the purpose of our analysis, the definition of
8Jones, C. An Introduction to the Study of Public Policy. Belmont, CA: Wadsworth, 1984, cited in http://profwork.org/pp/study/cycle.html.

23
public policy characteristics is thus restricted to the implementation process of a result-oriented
(environmental) policy.
So as to understand the policy implementation mechanisms, policy analysts underline the need to
focus on both structural determinants (or constraints) and stakeholders’ strategies (i.e. the policy
arrangement framework developed by Arts, van Tatenhove and Leroy (2000), which considers the
“rules of the game9” – what we refer to as structural determinants – along with policy discourses and
coalitions, power and resources – that depict stakeholder strategies). Understanding policy change
requires combining a structure approach and an actor approach, where (1) a structure is defined as a
“set of mechanisms whether historical, institutional, economical, social, cultural or cognitive that
frame in a stabilized way across time the initiatives that different actors seek to undertake10” (Muller,
1990, p.74) and (2) actors are “(individual or collective) agents identifiable insofar as they directly
participate to public action”. Considering these two dimensions of public policy allows pointing out
the mechanisms by which policy outcomes result both from structural constraints and actors’
behaviors. In our analysis, the structural constraints induced by the institutional environment will be
considered as stable for the purpose of comparative public policy, it being the study of “how, why,
and to what effect different governments pursue a particular course of action or inaction”
(Heidenheimer et al., 1990 in Parsons, 1995, p.40).
An institutionalist approach of comparative public policy addresses the role that state and social
institutions have in defining and shaping public policy (Parsons). Our case study will relate to the
comparison of a policy area or sector (more specifically water resources management) between a
selected number of comparable countries. We will thus focus on actors’ behaviors by assessing the
constraints they face to implement policy tasks. Now our approach to policy and policy analysis is
clarified, we will elaborate on the operationalization of a transaction approach to policy analysis.
9 « Rules of the game determine how policies and politics are played and which norms are legitimate. A distinction is often made between formal and informal rules. Formal rules are rules actors have formally agreed upon, while informal rules reflect the dominant political culture » (Van der Zouwen and Van den Top, 2000). 10 Ensemble des mécanismes d’ordre historique, institutionnel, économique, social, culturel ou cognitifs qui encadrent de manière stabilisée dans le temps les initiatives que les différents acteurs cherchent à entreprendre.

24
1.2.2 Policy and transaction costs’ assessment
As introduced earlier (1.1.2), we can distinguish between two main approaches to assess transaction
costs: a quantitative approach and a rather qualitative approach (Table 5). In the first case,
transaction costs are interpreted as measurable costs. Some authors conducted a direct quantitative
assessment of policy implementation transaction costs, which implies a categorization of transaction
costs (see McCann and Easter, 1999, McCann et al., 2000, McCann et al., 2005 for a transaction cost
typology). Other authors recognized the difficulty to define and measure transaction costs and used
the critical dimensions of transactions as proxies (i.e. Saussier and Ménard, 2000, Pérard 2008). Table
5 highlights the different focuses and purposes of two main types of TCT empirical applications.
Table 5.Transaction cost assessment approaches
Quantitative approach Qualitative approach
Authors McCann et al. , Falconer and Whitby Ménard and Saussier
Focus Transaction costs (of policy scenarios) Arrangements
Hypothesis
Policy costs equal the costs of
measures to implement plus
transaction costs
Public service provision and performance is
linked to the contractual arrangement chosen
(which corresponds to TC optimization choices)
Purpose of the
methodology Assess policy scenarios ex ante
Explain the arrangements observed by
transaction cost determinants
Methodology
Estimate time spent on tasks
supporting the implementation of
different policy scenarios through
interviews
Convert time into monetary estimates
according to staff salaries
Statistical analysis of the arrangement (A , B or
C) chosen according to 3 criteria representing
transaction characteristics:
Specificity: water initial quality
Uncertainty: population seasonal variation
Frequency : municipality population
Result
Estimates of administrative costs
associated with different policy
scenarios
Proxies explaining the arrangements chosen
Both approaches can be relevant decision support tools, but the second approach seems promising
to fulfil our research objective of analyzing transaction costs linked to policy implementation: with

25
the qualitative approach, transaction costs can be interpreted as constraints or determinants
conditioning policy choices. Although the quantitative approach was used in the case of public
policies and we are concerned with a policy transaction, the qualitative approach is more
appropriate for the issue under consideration. Recalling Challen (2000), the difficulty with transaction
costs empirical studies is that it is impossible to generalize results, which calls for more emphasis on
the functions and determinants of transaction costs. When a quantitative method is more
contextual, a quantitative approach has more explanatory power. We thus pitch on a qualitative
approach so as to account for a wide scope of constraints or transaction costs (i.e. political, cultural
factors), which is not possible with a qualitative approach that implies a more restricted definition of
transaction costs (i.e. administrative costs). The qualitative method is also considered best suited to
answer our research question since a policy transaction involves different scales, multiple tasks and
agents and non-contractual relationships. In this research, a qualitative approach does not seek to
explain the extent to which transaction costs impact policy implementation but rather to identify the
types of costs involved, their determinants and how they impact the policy implementation process.
In order to apply the TCT to a policy transaction, we will thus refer to the reasoning and methodology
developed by Ménard and Saussier (2000). However, some major differences will remain between
the units of analysis and the variables. In the Ménard and Saussier study, the sample is very large and
allows for a statistical analysis. Also, the description of arrangements is based on a few variables
(proxies of transaction characteristics), which values are easily observable from databases. As will be
developed in the next chapter, our sample would consist in few but complex units of analysis
(including Member States’ administrations in charge of implementing the environmental policy
under focus) and would not allow for a statistical test but rather a case study analysis.
At this stage, it is worth considering that political institutional analysis seeks to understand the role
of government and political institutions in policy formation, implementation, and economic
performance. With a transaction cost approach to policy analysis, we will not compare alternative
modes of governance but alternative modes of organization (‘arrangements’) to implement a public
policy. The next section presents the framework we developed so as to assess transaction costs
linked to policy implementation.

26
2. Applying transaction cost theory to policy analysis: conceptual framework
Before introducing the ‘policy transaction framework’ (2.2), we provide an understanding of where
we stand from specific theoretical insights (2.1).
2.1 Theoretical basis
In this section, we first develop the notion of institution at the basis of our theoretical framework
(2.1.1). Second, we will review the framework developed by Bromley (1989) as it considers the policy
process (2.1.2). Third, we will discuss the implications of a transaction cost approach for efficiency,
and how a transaction cost approach for policy analysis could help improving the analysis of policy
efficiency (2.1.3).
2.1.1 The role of institutions
According to Bromley (1989), there exists on the one hand, commodity transactions and on the other
hand, institutional transactions11 that are transactions over the “rules of the game”, as to say
transactions about the institutional structure that defines the economy as set of ordered relations.
Institutional transactions yield a particular structure of institutional arrangements that defines the
domain over which commodity transactions will occur and are thus foundations to markets. This
framework allows for an understanding or an interpretation of economic efficiency, where
institutions determine the cost of transactions.
From a policy analysis perspective, Parsons (1995) mentions three frameworks of institutional
analysis, namely sociological institutionalism (focusing on public institutions rather than firms),
political institutionalism, and economic institutionalism (with TCE and agency theory) which has
developed out of theories of the firm. He holds that although these approaches share the common
focus that institutions matter, “they share little else, including the definition of what the concept of
institution means”. There are thus different insights in how institutions shape the way in which
decision-making takes place and thus different interpretations of “how institutions ought to be
arranged so as to ensure that they function ‘efficiently’”.
11Bromley identifies 4 types of institutional transactions: (1) to increase productive efficiency, (2) redistribute income, (3) reallocate economic opportunity, (4) redistribute economic advantage.

27
Within the New Institutional Economics branch, institutions matter as they affect the cost of running
the economic system and its performance. The concept of institutions is approached by with two
behavioral assumptions: bounded rationality (limited ability of individuals to be perfectly rational in
the face of non-trivial information costs) and opportunism (seeking of self-interest with guile).
Williamson is primarily concerned with “the economic institutions of capitalism, with special
reference to firms, markets and relational contracting” (1985, p.16). Institutions are defined as rules
and conventions that elicit patterns of behavior of individuals and firms engaged in various
transactions, whether market transactions of hierarchical transactions. Firms just as markets are
considered as governance structure relying on rules and conventions. The structure of market and
hierarchies guides and sanctions certain behaviors, and that structure evolves to reduce transaction
costs (Bromley).
Most definitions converge on the fact that institutions are the rules of the game in a society or, more
formally, are the humanly devised constraints that shape human interaction (Jobin, 2008). In
consequence they structure incentives in human exchange, whether political, social, or economic.
North argues (1990) that institutions can be formal (such as rules that human beings devise) or
informal (such as convention and code of behavior). Institutions are thus defined as “routines,
procedures, conventions, roles, strategies, organizational forms and technologies around which policy
action is built” and “believes, paradigms, codes, cultures and knowledge which support and
contradict these roles and routines” (Jobin, op cit.). Whether referring to social relations, the political
sphere, legal system, culture or religion, an institution is a set of rules, conventions and norms that
sets a standard of behavior for the members of the society. From these rather broad definitions,
institutional economists define institutions as the rules of the game (distinct from the players) meant
to create the constraints and the space of actions for the players and thus to develop agents’
behavior. They are responsible for structuring the interactions among the actors and also determine
the cost of transactions (North, 1991). They have a role in defining the information and incentive
structure within which economic outcomes are determined. Since “actors of an economy invest
resources, skills, knowledge, energy and time to achieve their desired level of welfare, a rational,
wealth-maximizing actor will find it useful to cooperate with other actors in an institutional
framework for reducing the transaction costs which are an important factor of the economic
performance” (Bromley, 1989). Transaction costs are determined by institutions and constitute an
important factor in determining the economic performance.

28
Bromley argues that institutions define the nature of transactions at the operational level of an
economy, and what is a cost or a benefit and for whom these costs and benefits are pertinent. More
specifically, institutions can take the form of (1) convention (“social institutions that arise to
coordinate behaviors derived from shared preferences over outcomes but indifference over means”)
that brings order and predictability to human relationships (social convention) or (2) working rules
and entitlements (“social institutions that arise to regularize behaviors in the face of discordant
preferences over either social ends or means”) which induces regularities in human behaviors that
arise from a structured set of legal relations (i.e. enabling legislation, the constitution, the by-laws,
the charter, or the administrative rules of organizations). Within the scope of this research,
institutions will mostly refer to working rules and entitlements as they are considered prevailing in
structuring the arrangements involved to implement an environmental policy.
Regarding the nature and fundaments of these ‘rules of the game’ and their resulting relevance to
economic analysis, Bromley identifies two different views:
(1) The exogenous view: institutions are considered as rules exogenously pre-determined outside the
domain of economic transactions, such as legal rules and social norms, while economic
institutions such as contracts, organizations and hybrids are regarded as rational transaction-
cost-saving responses within those constraints (North, 1990; Williamson, 2000). Neo-
institutionalists like North identify institutions with formal rules such as constitutions, statutory
laws, and contracts, as well as informal rules such as social norms. They visualize a kind of
hierarchical ordering in which the political structure (and the social structure in the case of social
norms) formulates rules for the economic domain. This view separates the rule-making game and
the operational game.
(2) The endogenous view: institutionalized rules are treated as something spontaneously and/or
endogenously shaped and sustained in the repeated operational plays of the game itself. It is an
integrative approach (considering rule-making game and operational game together). An
institution thus conceptualized can appear to be an exogenous constraint to the agents. Such an
institution is “salient, self-sustaining features of social interactions, held as the common
knowledge of all the agents about ways in which they are to act/not act”. It can be regarded as
rules of the game endogenously constructed and self-sustaining.
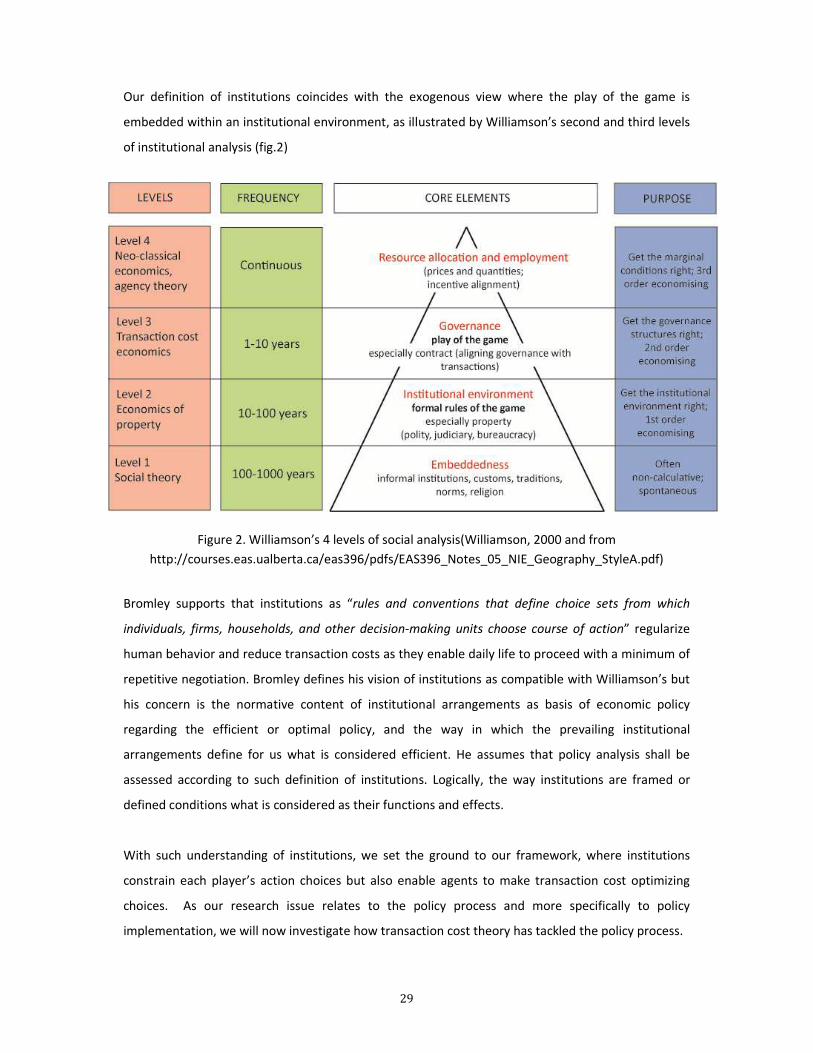
29
Our definition of institutions coincides with the exogenous view where the play of the game is
embedded within an institutional environment, as illustrated by Williamson’s second and third levels
of institutional analysis (fig.2)
Figure 2. Williamson’s 4 levels of social analysis(Williamson, 2000 and from
http://courses.eas.ualberta.ca/eas396/pdfs/EAS396_Notes_05_NIE_Geography_StyleA.pdf)
Bromley supports that institutions as “rules and conventions that define choice sets from which
individuals, firms, households, and other decision-making units choose course of action” regularize
human behavior and reduce transaction costs as they enable daily life to proceed with a minimum of
repetitive negotiation. Bromley defines his vision of institutions as compatible with Williamson’s but
his concern is the normative content of institutional arrangements as basis of economic policy
regarding the efficient or optimal policy, and the way in which the prevailing institutional
arrangements define for us what is considered efficient. He assumes that policy analysis shall be
assessed according to such definition of institutions. Logically, the way institutions are framed or
defined conditions what is considered as their functions and effects.
With such understanding of institutions, we set the ground to our framework, where institutions
constrain each player’s action choices but also enable agents to make transaction cost optimizing
choices. As our research issue relates to the policy process and more specifically to policy
implementation, we will now investigate how transaction cost theory has tackled the policy process.

30
2.1.2 Transaction cost theory and the policy process
To our knowledge, few authors have dealt with the theoretical implications of the TCT for the policy
process. In this line, Bromley (1989) has addressed the issue of transaction cost economics and public
policy from a theoretical standpoint to explain how policy should aim at institutional change. We will
consider the framework he developed where three important levels are considered to analyze the
policy process (fig.3):
a. A policy level (legislative and judicial branches)
b. An organizational level (executive branch)
c. An operational level
Figure 3. The policy process as a hierarchy (Bromley, 1989)
As illustrated in Figure 3, the three main levels connect through institutional arrangements. The
institutional arrangements sketched in the figure are defined as “arrangements between economic
units that governs the way in which these units can cooperate or compete”.
Influence to design new institutional arrangements
a. Policy level
Institutional arrangement
b. Organizational level
Institutional arrangements
c. Operational level
Patterns of interaction
Outcomes
Assessment

31
The institutional arrangement that links the policy (a) and the organizational (b) levels relates to rules
and laws that define “how organizations will operate but also what they will do a programmatic
sense”. The policy level (a) makes decisions regarding the boundary between the market and non-
market processes (i.e. tax policy determining the distribution of income among members of the
society), decisions regarding the allocation of net benefits from various economic activities, and
decisions regarding “conditions under which change is called for in the prior two types of collective
decisions”. The operational level (c) corresponds to the operating units in society (firms, households).
The range of choice open to actors at this level is defined by institutional arrangements both at policy
level (a) (i.e. detail of the income tax code) and organizational level (b) (i.e. administrative rules such
as work conditions). According to Bromley, the behaviors observed at operational level (c) (the
patterns of interaction) result in outcomes that will be regarded by citizenry as either good or bad.
Our analysis lies at the operational level (c) (see dotted line on Figure) where policy actors (operating
units) interact to implement environmental policies (patterns of interaction) which results in
outcomes (i.e. policy plans, or water quality). In our framework, Bromley’s policy and organizational
levels (a and b) are taken as given and define the range of choice open to policy actors. They
correspond to what we refer to as the institutional environment, defined by Bromley as “the
political, social, and legal ground rules that govern economic and political activity”.
To Bromley (1989), public policy is about two central concepts:
(1) Deciding socially acceptable institutional arrangements (entitlement structures) that both
constrain and liberate individual action at the operational level, where the concern is “what
sort of world we want to have, who will participate in that choice, and the weighting of the
preferences of the respective constituents”;
and
(2) Searching for the boundary between autonomous (market-like) and collective decision making,
where the concern is “the operating efficiency of alternative entitlement structures, and by the
possible costs of a mistake”
where States (as manifestations of the hopes and interests of their citizens) retain authority over
these two types of choices, which choices are culturally and situation specific.
Our focus lies on the first concept, where institutional arrangements condition the range of choices
open to policy actors at operational level, but our concern is what actually constrains individual
action at operational level. By applying a TCT approach to policy implementation, we actually seek to
investigate the impacts of such institutional arrangements: how they constrain choices

32
(implementation of policy tasks) based on policy transaction cost assessment. Our interpretation of
transaction lies at a lower level than the ‘rules of the game’: the ‘play of the game’ or policy
implementation level, where the purpose of transaction is to implement policy in a way that
minimizes transaction costs. We will now discuss the implications of a transaction cost approach for
(policy) efficiency.
2.1.3 Transaction cost theory and efficiency
The transaction cost theory frames a certain definition of performance through the efficiency of
organizations, where efficiency relies on aligning governance structure with transaction costs. New
Institutional Economics suggest that people develop and enforce institutions to prevent negative
externalities and free-riding, reduce costs of getting information and costs of bargaining and
exchange, and to improve efficiency in interactions by providing predictability (standards, contracts,
etc.). But we have in mind that “just because we form institutions and organizations for good
reasons, it does not mean that they are optimal”12.
Bromley puts the focus on efficiency into perspective when stating that “there remains a persistent
belief that adherence to efficiency, variously defined, constitutes the necessary condition for an
objective approach and value-free approach to policy science. This means, among other things, that
policy analysis that is not strictly efficiency driven runs the risks of being regarded as unworthy of
serious economic notice”. The present work is meant to understand arrangements and how they
respond to transaction costs. Efficiency is thus not so much about “getting the governance structure
right” (referring to the choice among different alternative modes of governance) but rather focused
on transaction costs minimization strategies. To this end, we will first analyze the situation on the
basis of empirical data and second, assess which transaction cost minimization strategies are induced
by which determinants.
About public policy and efficiency, Bromley argues that “neither the process nor the outcomes of
public policy seem to conform to the expectation that such serious business should be driven – indeed
dominated – by the quest for efficiency in actions to be pursued. Too often, or so it seems, the obvious
course of action is forsaken for one that promises to entail excessive costs, or to interfere with
volitional exchange among responsible and well-meaning agents, or to cater to the wishes of the
‘special interests’” (p.1). To him, efficiency calculations rest upon the current structure of
12http://courses.eas.ualberta.ca/eas396/pdfs/EAS396_Notes_05_NIE_Geography_StyleA.pdf.

33
institutional arrangements that determine what is a cost – and for whom. We join him on the point
that there is no single efficient policy choice but rather an efficient policy choice for every possible
presumed institutional set up. For neo-institutionalists like him, selecting one efficient outcome
means selecting one particular structure of institutional arrangement and its corresponding
distribution of income. The efficiency judgment is thus interconnected with the institutional
structure of an economy (which defines what is considered as efficient) and institution’s efficiency
must be assessed with respect to institution’s particular purpose of objective13. We acknowledge
that “efficiency is dependent upon the institutional structure that gives meaning to costs and benefits
and that determines the incidence of those costs and benefits” (Bromley). When considering a policy
transaction, we focus on arrangements as outcomes of complex transaction costs optimization
strategies, considering the multi-layer governance context and different time scales.
According to the TCT, efficiency rests in aligning governance structures with transaction costs. And if
so, what is observed is considered efficient. According to Williamsonian TCE, we need governance
structures that keep TC low and thereby optimize performance. This is why this study targets
transaction costs and we use a TC approach to assess the impacts of TC on (environmental) policy
implementation, and indirectly on policy efficiency. Policy outcomes are the results of stakeholders’
strategies to cope with transaction costs, as transaction costs influence stakeholders’ to implement
policy. TC thus influence the results and the costs of the policy process, and in the present research,
we are concerned with how TC condition policy implementation.
In the case of policies and in our analysis of a policy transaction, we will investigate the determinants
that shape governance structures (arrangements) and their dependence on transaction costs.
Efficiency gain in a policy transaction framework would lie in changing determinants so as to reduce
specific types of transaction costs related to the policy tasks considered and so over a certain time
frame. The New Institutional Economics approach argues that performance of institutions’
organizational modes relies on transaction costs and transaction costs minimizing strategies. The
identification of transaction costs determinants therefore allows for appreciating policy transaction
costs minimization.
We will not use the TCE framework to analyze different organizational forms but rather different
arrangements with the aim to improve the efficiency of public policy arrangements and thereby
13With reference to Bromley’s 4 types of institutional transactions: (1) to increase productive efficiency, (2) redistribute income, (3) reallocate economic opportunity, (4) redistribute economic advantage).

34
policy impact. In this context, we will now depict the policy transaction framework developed to
adapt the TCT to policy analysis.
2.2 The policy transaction framework
At this point, we have seen the main reasons for developing a policy transaction framework, and its
objectives when analyzing policy implementation. We will now introduce the main concepts tackled
by this framework (2.2.1), its logic and operational objectives (2.2.2), and the illustration of a ‘policy
transaction’ considered in this framework (2.2.3).
2.2.1 Terminology and concepts
A core issue in the analysis of a public policy transaction lies in the characterization of arrangements
as it represents our main unit of analysis. The term arrangement is mobilized in various contexts and
disciplines with different meanings. For the purpose of this research we will focus both on the
economic perspective of arrangement as put forward by the TCT, and on a more sociological
approach as developed by policy scientists (policy arrangement). The resulting concept of “policy
transaction arrangement” builds a bridge between the economic approach (study of economic
organization) and the sociological approach (policy analysis) with the aim to better fit to the
assessment of a public policy transaction.
New institutional economists such as North (1971) and Williamson (1990) distinguished the
institutional environment from the institutional arrangement where:
- the institutional environment is “the set of fundamental political, social, and legal ground rules
that establish the basis for production, exchange and distribution” (i.e. rules governing elections,
property rights, and the right of contract), and
- the institutional arrangement is “an arrangement between economic units that governs the ways
in which these units can cooperate and/or compete. It […] can provide a structure within which its
members can cooperate […] or it can provide a mechanism that can affect a change in laws or
property rights”.
From these theoretical bases, one can question what actually an arrangement is in practice and how
to describe it. In their study on contractual choice and performance, Ménard and Saussier (2000)
have identified three forms of contractual arrangements for water supply (public bureaus, lease and
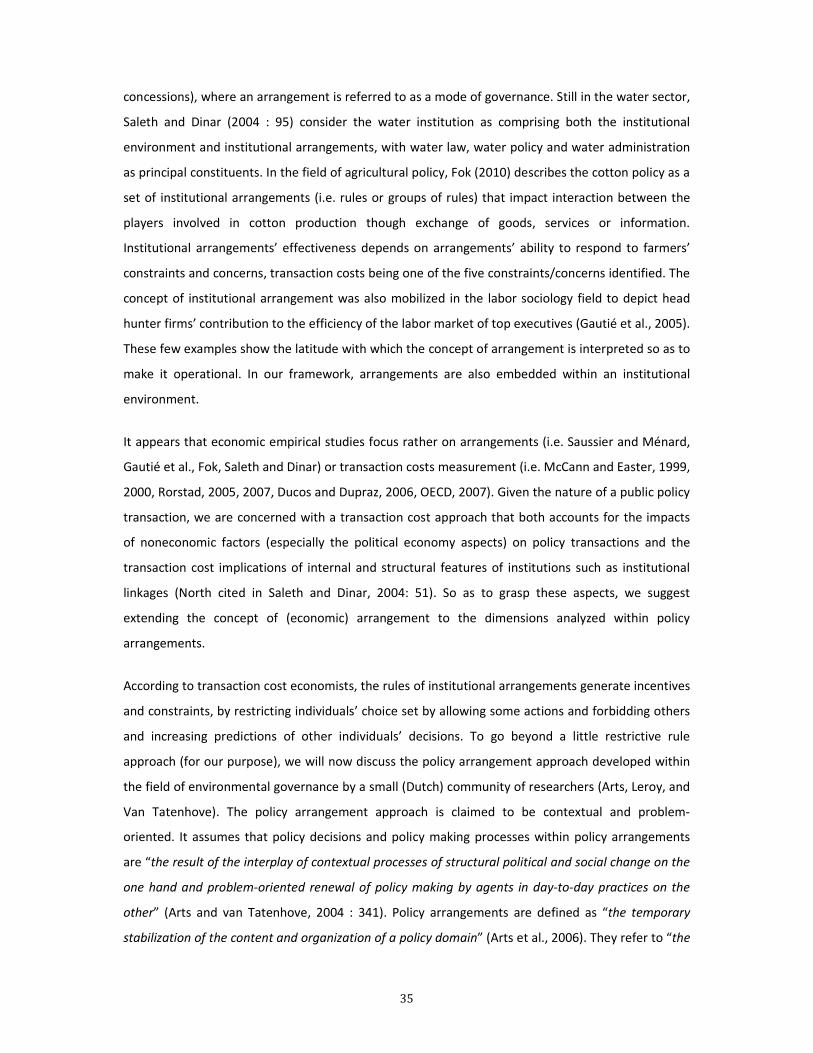
35
concessions), where an arrangement is referred to as a mode of governance. Still in the water sector,
Saleth and Dinar (2004 : 95) consider the water institution as comprising both the institutional
environment and institutional arrangements, with water law, water policy and water administration
as principal constituents. In the field of agricultural policy, Fok (2010) describes the cotton policy as a
set of institutional arrangements (i.e. rules or groups of rules) that impact interaction between the
players involved in cotton production though exchange of goods, services or information.
Institutional arrangements’ effectiveness depends on arrangements’ ability to respond to farmers’
constraints and concerns, transaction costs being one of the five constraints/concerns identified. The
concept of institutional arrangement was also mobilized in the labor sociology field to depict head
hunter firms’ contribution to the efficiency of the labor market of top executives (Gautié et al., 2005).
These few examples show the latitude with which the concept of arrangement is interpreted so as to
make it operational. In our framework, arrangements are also embedded within an institutional
environment.
It appears that economic empirical studies focus rather on arrangements (i.e. Saussier and Ménard,
Gautié et al., Fok, Saleth and Dinar) or transaction costs measurement (i.e. McCann and Easter, 1999,
2000, Rorstad, 2005, 2007, Ducos and Dupraz, 2006, OECD, 2007). Given the nature of a public policy
transaction, we are concerned with a transaction cost approach that both accounts for the impacts
of noneconomic factors (especially the political economy aspects) on policy transactions and the
transaction cost implications of internal and structural features of institutions such as institutional
linkages (North cited in Saleth and Dinar, 2004: 51). So as to grasp these aspects, we suggest
extending the concept of (economic) arrangement to the dimensions analyzed within policy
arrangements.
According to transaction cost economists, the rules of institutional arrangements generate incentives
and constraints, by restricting individuals’ choice set by allowing some actions and forbidding others
and increasing predictions of other individuals’ decisions. To go beyond a little restrictive rule
approach (for our purpose), we will now discuss the policy arrangement approach developed within
the field of environmental governance by a small (Dutch) community of researchers (Arts, Leroy, and
Van Tatenhove). The policy arrangement approach is claimed to be contextual and problem-
oriented. It assumes that policy decisions and policy making processes within policy arrangements
are “the result of the interplay of contextual processes of structural political and social change on the
one hand and problem-oriented renewal of policy making by agents in day-to-day practices on the
other” (Arts and van Tatenhove, 2004 : 341). Policy arrangements are defined as “the temporary
stabilization of the content and organization of a policy domain” (Arts et al., 2006). They refer to “the
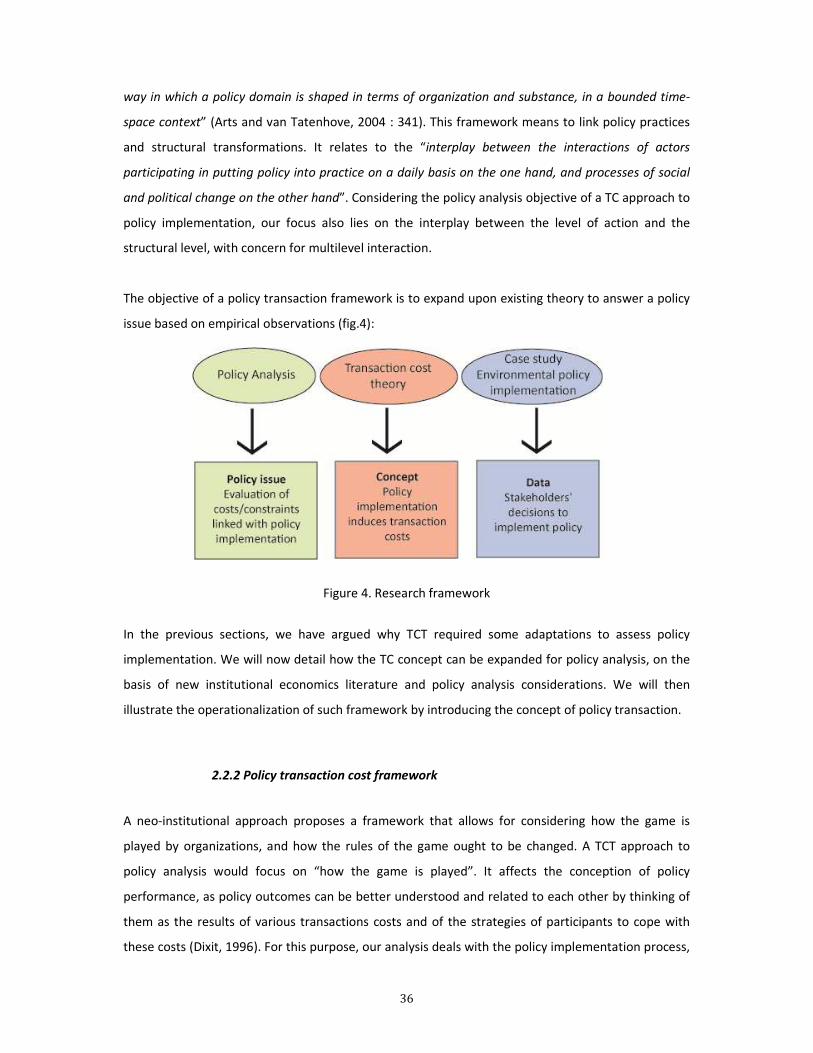
36
way in which a policy domain is shaped in terms of organization and substance, in a bounded time-
space context” (Arts and van Tatenhove, 2004 : 341). This framework means to link policy practices
and structural transformations. It relates to the “interplay between the interactions of actors
participating in putting policy into practice on a daily basis on the one hand, and processes of social
and political change on the other hand”. Considering the policy analysis objective of a TC approach to
policy implementation, our focus also lies on the interplay between the level of action and the
structural level, with concern for multilevel interaction.
The objective of a policy transaction framework is to expand upon existing theory to answer a policy
issue based on empirical observations (fig.4):
Figure 4. Research framework
In the previous sections, we have argued why TCT required some adaptations to assess policy
implementation. We will now detail how the TC concept can be expanded for policy analysis, on the
basis of new institutional economics literature and policy analysis considerations. We will then
illustrate the operationalization of such framework by introducing the concept of policy transaction.
2.2.2 Policy transaction cost framework
A neo-institutional approach proposes a framework that allows for considering how the game is
played by organizations, and how the rules of the game ought to be changed. A TCT approach to
policy analysis would focus on “how the game is played”. It affects the conception of policy
performance, as policy outcomes can be better understood and related to each other by thinking of
them as the results of various transactions costs and of the strategies of participants to cope with
these costs (Dixit, 1996). For this purpose, our analysis deals with the policy implementation process,

37
as to say policy actors’ strategies to cope with transaction costs when implementing policy tasks
(choices over environmental policy measures or tasks) which result in outcomes (the results of policy
measures). In this research, policy effects (i.e. water quality after the implementation of policy
measures) are not known yet. A TC approach to policy analysis means to answer two main questions:
(1) where do transaction costs come from ; and
(2) what are the arrangements to cope with these costs
To this end, figure 5 depicts how structural elements such as the institutional environment can
enable (facilitate) or constrain policy implementation. In the case of environmental policy, we will
consider in addition to the institutional environment, the state of the natural environment or natural
resources as a potential transaction cost determinant (Chapter 3, section 2.2). With a transaction
cost approach to policy analysis, we focus on the determinants that generate transaction costs (see
figure 6 next page) and therefore constrains policy implementation.
Figure 5. TCT applied to the policy implementation process
We will thus extend the concept of transaction costs developed by Williamson (1981: 1552–3) from
the “comparative costs of planning, adapting, and monitoring task completion under alternative
governing structures” to the ‘costs of planning, adapting, and monitoring policy task completion’
within different institutional environments. Considering the difficulty to carry out an exhaustive
measurement of such transaction costs, we will focus on proxies called determinants. That is to say
that the arrangements observed (strategies to cope with transaction costs) are shaped by transaction
cost determinants. As a result, arrangements allow for coping more or less efficiently with
transaction costs and so over a short or longer time frame. Relying on transaction cost determinants
(or proxies) implies that the assessment of transaction costs and arrangements is in the first place
qualitative.
Bromley (1989) argues that policy analysis must start with a clear understanding of the way in which
the status quo defines the metric against which alternative institutional arrangements can be judged.
Institutional
environment
Policy implementation - arrangements -
Outcomes
of tasks (i.e. number and type of
water sanitation measures)
Enables /
Constrains
Policy effects
(i.e. on water/air quality,
biodiversity, energy saving,
waste recycling, etc.)

38
Our aim is not to assess arrangements against a status quo situation. Within the scope of this work,
we will not analyze the performance of arrangements per se but their respective dependence on
transaction costs via determinants. We assume that arrangements are case-specific and are not
measured against a status quo situation. Our analysis is qualitative and only attempts to (1) assess
transaction cost determinants and the type of transaction costs involved in policy implementation
and (2) characterize arrangements (transaction costs coping strategies) within different institutional
environments.
To extend transaction cost theory to policy analysis, we consider the following assumptions:
• A policy transaction involves transaction costs
• The institutional environment and the state of natural environment induce transaction costs
• The arrangements chosen to implement policy are strategies to cope with transaction costs
(arrangements depend on TC)
• Transaction costs can be assessed via determinants (that shape arrangements)
The resulting conceptual framework allows for illustrating the linkages between the different
dimensions identified by the TCT (fig.6):
Figure 6. Policy transaction cost framework
The institutional environment influences arrangements via determinants, the latter inducing rather
high or low transaction costs. Actors make choices within an institutional environment that is
considered as given or static in the first instance. Arrangements are defined as actors’ decisions to
implement the tasks, which decisions result from transaction-cost related determinants. It is obvious
that the conceptual framework developed here cannot grasp the complexity of public policy
purposes, implementation and outcomes and is not meant so. It focuses on TC coping strategies
(arrangements) and the figure above illustrates the main causal relationships at stake.
Transaction cost theory offers a framework to identify transaction-cost-economizing behaviors. With
such lenses, economic performance can be attributed to institutional structures that keep their
transaction costs low (North, 1990). The same way, we are concerned with transaction-cost
Institutional
environnement
Transaction costs Arrangements
(TC coping strategies) Outcome
of tasks
Determinants
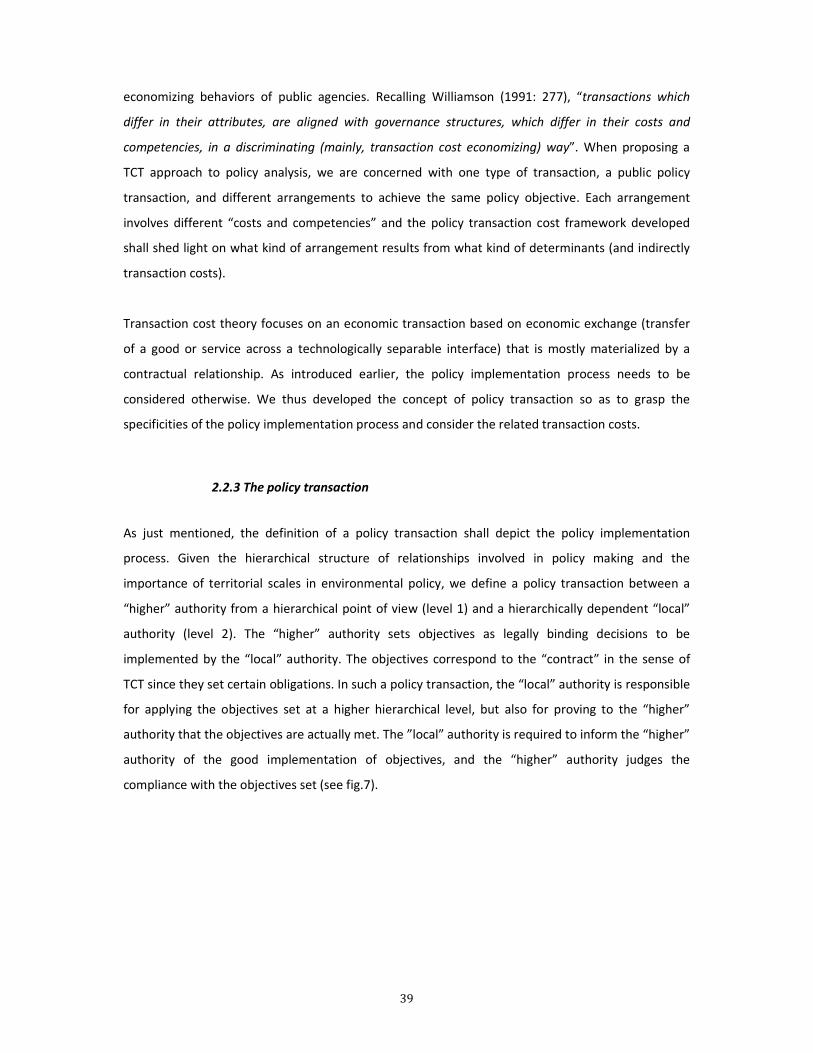
39
economizing behaviors of public agencies. Recalling Williamson (1991: 277), “transactions which
differ in their attributes, are aligned with governance structures, which differ in their costs and
competencies, in a discriminating (mainly, transaction cost economizing) way”. When proposing a
TCT approach to policy analysis, we are concerned with one type of transaction, a public policy
transaction, and different arrangements to achieve the same policy objective. Each arrangement
involves different “costs and competencies” and the policy transaction cost framework developed
shall shed light on what kind of arrangement results from what kind of determinants (and indirectly
transaction costs).
Transaction cost theory focuses on an economic transaction based on economic exchange (transfer
of a good or service across a technologically separable interface) that is mostly materialized by a
contractual relationship. As introduced earlier, the policy implementation process needs to be
considered otherwise. We thus developed the concept of policy transaction so as to grasp the
specificities of the policy implementation process and consider the related transaction costs.
2.2.3 The policy transaction
As just mentioned, the definition of a policy transaction shall depict the policy implementation
process. Given the hierarchical structure of relationships involved in policy making and the
importance of territorial scales in environmental policy, we define a policy transaction between a
“higher” authority from a hierarchical point of view (level 1) and a hierarchically dependent “local”
authority (level 2). The “higher” authority sets objectives as legally binding decisions to be
implemented by the “local” authority. The objectives correspond to the “contract” in the sense of
TCT since they set certain obligations. In such a policy transaction, the “local” authority is responsible
for applying the objectives set at a higher hierarchical level, but also for proving to the “higher”
authority that the objectives are actually met. The ”local” authority is required to inform the “higher”
authority of the good implementation of objectives, and the “higher” authority judges the
compliance with the objectives set (see fig.7).
40
Figure 7. The policy transaction
Our analysis aims at investigating how the execution of such policy transaction actually minimizes
transaction costs via arrangements, and which determinants (stemming from transaction’s
attributes) influence arrangements. Transaction costs correspond the costs involved to execute the
transaction, in other words “costs to prepare, negotiate and guarantee/secure an agreement”
defined as ex ante transaction costs in the TCT. These transaction costs are inevitable and
correspond to the organization to prepare the program of measures: execution of tasks (i.e. defining
management units, selection of policy measures, costs estimation, cost-efficiency analysis, analysis of
costs repercussion, cost-benefit analysis, cost disproportion analysis, select/check data for
reporting,…) but also strategic decisions to support the execution of tasks which involves
coordination, monitoring, etc. We assume that these costs cannot be avoided but can be minimized.
In this regard, the policy transaction framework does not tackle the issue of policy transaction costs
measurement but rather transaction costs minimization strategies (arrangements).
The different costs involved in a policy transaction are illustrated in figure 8. We distinguish 3 main
categories:
− ex ante transaction costs that are equivalent to the costs involved by the preparation of the
transaction, that is to say the organization of the local authority and decision-making over
‘how to apply the objective set by the higher authority’ (i.e. information search, planning,
etc.)
− production costs corresponding to the costs of policy measures selected to reach the
(environmental) policy objective . In this respect, transaction cost theorists assert that the
total cost incurred by a firm can be defined as transaction costs and production costs.
Transaction costs (also known as coordination costs) are the costs of "all the information
Higher authority
(level 1)
(1) Sets objectives
(2) Juges compliance with objectives
Local authority
(level 2)
(1) Applies objectives
(2) Reports on the implementation process

41
processing necessary to coordinate the work of people and machines that perform the
primary processes," whereas production costs include the costs incurred from "the physical
or other primary processes necessary to create and distribute the goods or services being
produced" (Malone et al., 1987, p.485). In the case of policy, we define ex ante TC as the
costs of information processing and coordination necessary to support policy objectives
appropriation, interpretation, negotiations over issues and identification of solutions, and
decision-making over policy measures.
− ex post transaction costs that are involved to support the implementation of policy
measures (monitoring, control, etc.) to reach the objective set by the higher authority
Figure 8. Policy implementation as a policy transaction and related production and transaction costs
As policy implementation is a continuum of decisions and interactions, we will decompose the
transaction in terms of tasks so as to facilitate the operationalization of such policy transaction. Tasks
are delegated from the higher authority to the lower authority (that dispose of information and
means to implement policy as opposed to the higher authority). The policy transaction objective thus
consists in implementing tasks in order to reach the policy objective (the environmental objective).
The implementation of tasks is expected to result in different organizational modes or arrangements
given the existence of various local authorities that may be part of different institutional
environments.
Within the scope of the conceptual framework introduced, our analysis of policy transaction cost
determinants and policy transaction costs minimization strategies is based on a case study: the
implementation of the European Water Framework Directive, that will be developed in the next
chapter.
Before the transaction
ex ante TC
After the transaction
Implementation of
measures
ex post TC
Policy measures
(production
costs)

42
Conclusion chapter 1
We have seen that public intervention has its own constraints, and can result in significant indirect
costs either for the regulator, for regulated agents, or for society. We have presented evidences of
constraints to public intervention and proposed to address this issue with a transaction cost
approach. Indeed, the concept of transaction cost offers an interesting framework to assess the
effects of constraints inherent to public intervention. To this end, the concept needs to be adapted
to policy characteristics and context. We referred to Bromley’s work (1989) to set the theoretical
basis of a transaction cost framework focusing on policy implementation, and introduced the
concept of policy transaction based on economic theory and policy analysis. We developed a policy
transaction framework that aims to (1) identify the source of transaction costs linked to policy
implementation, and (2) depict the arrangements to cope with these costs. Policy implementation
strategies (arrangements) are thus considered both as a result of transaction cost determinants and
as transaction cost coping strategies.

43
Chapter II Case study
In this chapter, we will progressively develop the policy transaction under focus, as to say the
implementation of a European environmental directive focusing on water quality: the Water
Framework Directive (WFD). We will first present its core objectives and principles, and focus on the
innovative economic analysis required for the implementation process. Such information is necessary
to understand the content of the transaction, the resulting challenges for Member States, and the
arrangements that will be depicted on the basis of policy tasks to carry out. Second, the policy
transaction is analyzed in the context of the International Scheldt District including 3 Member States
(case study). Last, we introduce the research methodology developed to analyze TC determinants
and TC minimizing strategies linked to the WFD implementation in the International Scheldt District
(ISD).
First of all, we will highlight some specific aspects of environmental policy and underline the WFD’s
European anchorage, as these will condition certain policy implementation characteristics and
challenges.
Environmental policy is defined as “any [course of] action deliberately taken [or not taken] to
manage human activities with a view to prevent, reduce, or mitigate harmful effects on nature and
natural resources, and ensuring that man-made changes to the environment do not have harmful
effects on humans” (McCormick, 2001, p.21). Having said that, considering the environment as a
policy problem is rather complex and requires taking into account five core characteristics identified
by environmental policy analysts (from Carter, 2001, p.162):
(1) Collective action and free-riding
Although there is a collective interest in preventing resource degradation, each individual (or
country) benefits from continuing to degrade a resource (Hardin, 1968). Also, since the whole
community benefits from action taken by some to prevent environmental harm, there is an incentive
to let others take costly action without taking action oneself (i.e. to free-ride on the actions of
others). Therefore, under these conditions, organizing collective action to prevent environmental
harm is a policy challenge.

44
(2) Complexity and interlinkages
It is widely acknowledged that linkages between human and natural systems remain complex and
incompletely understood. In addition, ecosystems are interconnected, which leads to “non-
reducible” environmental problems (i.e. those which cannot be addressed in isolation).
Environmental policy thus faces the challenge of preventing unanticipated consequences of policies
that address problems in isolation.
(3) Uncertainty and irreversibility
Environmental policy is also subject to uncertainty, as often not enough is known about the nature,
but also about the extent, causes and consequences of environmental harm. In addition,
environmental harm can be irreversible, putting more pressure on policy. Policy has thus to be made
under conditions of incomplete information and the underlying dilemma lies in waiting for more
information or taking precautionary measures.
(4) Temporal and spatial variability
Environmental damage can occur over the long term but it usually requires costly action in the
present. In addition, environmental improvements have long time-lags. Also, environmental harm is
unevenly distributed spatially and crosses national boundaries. Therefore, policy shall propose
solutions to complex environmental problems in the face of such temporal and spatial variability.
(5) Administrative fragmentation
Environmental problems are cross-sectoral in nature (i.e. addressing climate change requires
coordination across transport, energy, industrial production, forestry, and overall economic policy).
Although coordinated and cross-sectoral responses are needed, environmental policy-making usually
remains compartmentalized.
These five main characteristics underline why environment is a particularly challenging policy area,
and highlight the specificities of a policy transaction focusing on environmental issues. Barraqué
(2004) also underlines the complexity of environmental policy, arguing that the main characteristic of
environmental policies is the paradox between the need to control a distant but uncertain future
involving systemic causes, which calls for a specialized expertise, whereas civil society requires more
transparency, a more direct participation and immediate evaluations. Despite being a complex policy
area, the ‘environment’ cannot be avoided by governments and other stakeholders as it sustains
human life. As a consequence, environmental policy has evolved with growing concerns, bringing
new issues, actors and concepts into the environmental policy domain.
45
An OECD report on water governance in OECD countries (OECD, 2011) discusses the concept of
governance as means to manage the complexity in water policy-making, so as to deal with the
variety of interdependent stakes and strong territorial characteristics, the plurality of mutually
dependent actors, and the increasing mobilization of new actors at different levels. As recalled
during a related OECD workshop (OECD, 2010): “beyond the question of which water policies should
be designed [we refer here to the 5 characteristics afore mentioned], there is a need to think about
‘how’ they will be implemented and ‘by whom’”. In this regard, environmental policy is much subject
to an “implementation gap”, which calls for improvements in the understanding and the analysis of
the implementation process and its main obstacles. This is what we propose to do with a transaction
cost approach to policy implementation, as to say pointing out the governance challenges or
constraints and the related stakeholders’ responses.
Another aspect that conditions environmental policy implementation in Europe is the European
Union (EU) context. In France for instance, jurists and lawyers consider that about 80% of
environmental law now results from European Union directives. The European level thus establishes
a frame that defines conditions of State’s intervention since Member States recognized that certain
environmental problems can better be dealt with at the EU level given that the State is limited and
can lead to certain failures14. European institutions are influent and numerous interest groups are
represented in Brussels with a role of institutional lobbying to influence European environmental
policies. The Europeanization of environmental policy led to a change of global referential as the
European Union conveys a new vision of the world and expression of the international constraint.
The WFD establishes, among others, a European norm of water quality as well as new efficiency
requirements and rationalization of financial choices (i.e. through a specific economic analysis). In
short, the WFD establishes a « new » (and common) frame for water policy across Europe.
We found the WFD a particularly interesting environmental policy as it proposes a new frame to
solve water quality and water resources management issues in an integrated way. More specifically,
as a new generation of environmental policy, the WFD sets a legally-binding ambitious
environmental objective to all European Member States. However, according to the subsidiarity
principle, it leaves to the discretion of Member States the latitude to “translate” (interpret) this
objective and even derogate to this objective, and organize according to the local context and
specific constraints. As most environmental policies face an ‘implementation gap’ and given the quite
different institutional contexts among countries, we will investigate the implementation process (as
14In 1992, the Treaty of Maastricht included environmental policy within the objectives of the EU.

46
opposed to the impacts) and the constraints Member States face when implementing such
environmental policy. The WFD is a good example of a large scale policy transaction, involving
different administrative levels, numerous stakeholder categories and where the management unit is
based on natural boundaries. Such scope induces a large variety of constraints and transaction costs
to be analyzed. In addition, the time frame established to implement the WFD is more than 20 years
(2003-2027), which allows for constraints and transaction costs to evolve (increase or decrease)
throughout time (i.e. with learning effects, etc.), and allows for a better assessment of policy
impacts.
In order to analyze the sources of TC related to the implementation of the WFD, we will first
distinguish between the common rules set to all Members States (section 1) and the specific
institutional contexts in which these rules are applied (section 2.1), and then present the
methodology developed (section 2.2).
1. The Water Framework Directive (2000/60/EC)
This section will depict how the WFD responds to the environmental policy challenges just
introduced, focusing on water resources management. This consists in the WFD formal rules and
requirements (section 1.1) in the one hand, and how the WFD implementation process is framed in
terms of policy transaction in the second hand (section 1.2).
1.1 Objectives, principles and policy implementation process
The WFD can both be considered as an outcome of the evolution of water legislation in Europe as
well as a turning point in EU environmental policy. Two previous waves of water legislations have
paved the way to a more integrated approach of water issues. From public health concerns (1975-
1988) to pollution control and environmental management setting quality objectives (1988-1996),
European legislations have led to significant improvements of certain water quality components
(Page and Kaika, 2003). With hindsight, it became evident that these legislations in place (12 texts by
the year 2000 - Baudry, 2006) still lacked co-ordination, compliance, and scope to protect water
resources. A first proposal for a framework directive on ecological quality of freshwaters came out in

47
1993 (COM(93)680 in Bouleau, 2008a), but negotiations went on until the year 1999 and the WFD
final text was adopted and came into force in 2000 (2000/60/EC). Several authors (Kaika and Page,
2003, Bouleau, 2007) highlighted the unusual turn of the negotiation process that opposed Members
States defending national interests (represented through the Council of Ministers) to strong
environmentalist positions hold by the Commission and the Parliament. Thanks to the Parliament’s
strengthened role since the Amsterdam Treaty in 1997, the WFD was the first directive to be
adopted according to the co-decision process between the EU Parliament and Council (Bouleau, op
cit). It is widely recognized as an ambitious and innovative piece of legislation, promoting the
integration of water issues under a common regulatory framework. For the first time, ecological
objectives are addressed at the European level, and the WFD requires setting, justifying and reaching
restoration objectives for all waters. The main point under discussion during the negotiation process
consisted in the definition of the objective to be achieved (the ‘good status’) and its legally-binding
nature. It is true that the WFD reduces the room for manoeuvre of Member States in the water
sector. However, the text contains a number of vague terms, leaving the door open to different
interpretations but also to competing performances of Member States as a mean of coordination
(Bouleau, 2008a).
1.1.1 Objectives and principles
The WFD provides a framework for community action in the field of water policy to prevent further
deterioration, protect and enhance the state of water resources. It shall also promote a more
sustainable water use based on long-term protection of water resources. The WFD 3 main objectives
consist in:
- Reaching environmental objectives (article 4):
o preventing further deterioration of water resources
o reaching the ‘good ecological status’ (or potential) for all waters by 2015, namely
inland surface waters and groundwater, transitional (estuarial) and coastal waters
o reducing or suppressing priority substances in waters (there is to date a list of 41
substances that is evolving)
o reaching the environmental objectives by 2015 in the protected areas (i.e. drinking
water catchment zones, Natura 2000 sites, etc.)
- Protecting waters used for the abstraction of drinking water (article 7)
- Taking account of the principle of recovery of the costs of water services (article 9)

48
So as to ensure a decision-making process at the lowest appropriate level, but also precautionary
(and “preventive”) action, and to target in priority the causes of environmental degradations, the
WFD requires 4 conditions:
- a management at the watershed level (river basin district), knowing that a river basin is itself
subdivided in smaller management units: water bodies
Member states are responsible for characterizing river basin districts, delimiting water bodies as well
as assessing water body types within their territory (see below). Water bodies’ delimitation is done
according to a combination of criteria that usually respect natural characteristics and homogenous
anthropogenic pressures. It is clear that the water body delimitation process appears to be a
compromise with management or administrative concerns.
- an obligation of result (reach the ‘good ecological status’ by 2015)
The overall water quality status both includes an ecological and a chemical status. The ecological
status is qualified according to 5 categories: a bad, mediocre, medium, good, or a very good
ecological status. The chemical status can be either ‘good’ or ‘bad’ according to acceptable levels of
pollutants. Concerning groundwater bodies, both quantitative and chemical status can be either
‘good’ or ‘bad’ (see Table 6). The initial quality of water bodies establishes the distance to target for
Member States and related RBDs (where the target is the ‘good’ status), which is a rather strategic
data to report to the EU.
- an economic analysis so as to reach the environmental objectives at an acceptable cost
We will elaborate on this point later in this section.
- public information and participation
A water body consists in the unit at which the water status is assessed. Surface water bodies are
categorized according to 3 types that condition the water quality expected to be achieved (‘water
status’). We can distinguish between natural water body (NWB), heavily modified water body
(HMWB) or artificial water body (AWB). HMWB are “water bodies that, as a result of alterations by
human activity, are substantially changed in character and cannot, therefore, meet the ‘good
ecological status’ (GES)” (i.e. for purpose of irrigation, drinking water supply, power generation and
navigation, for instance a channeled river). AWB are water bodies that have been created by human
beings, for example reservoirs for water supply purposes or canals. The methodology to define
groundwater bodies is simpler than surface water bodies and there is no limitation in terms of size.
According to these water body types, different quality objectives are required, as illustrated in table
6.
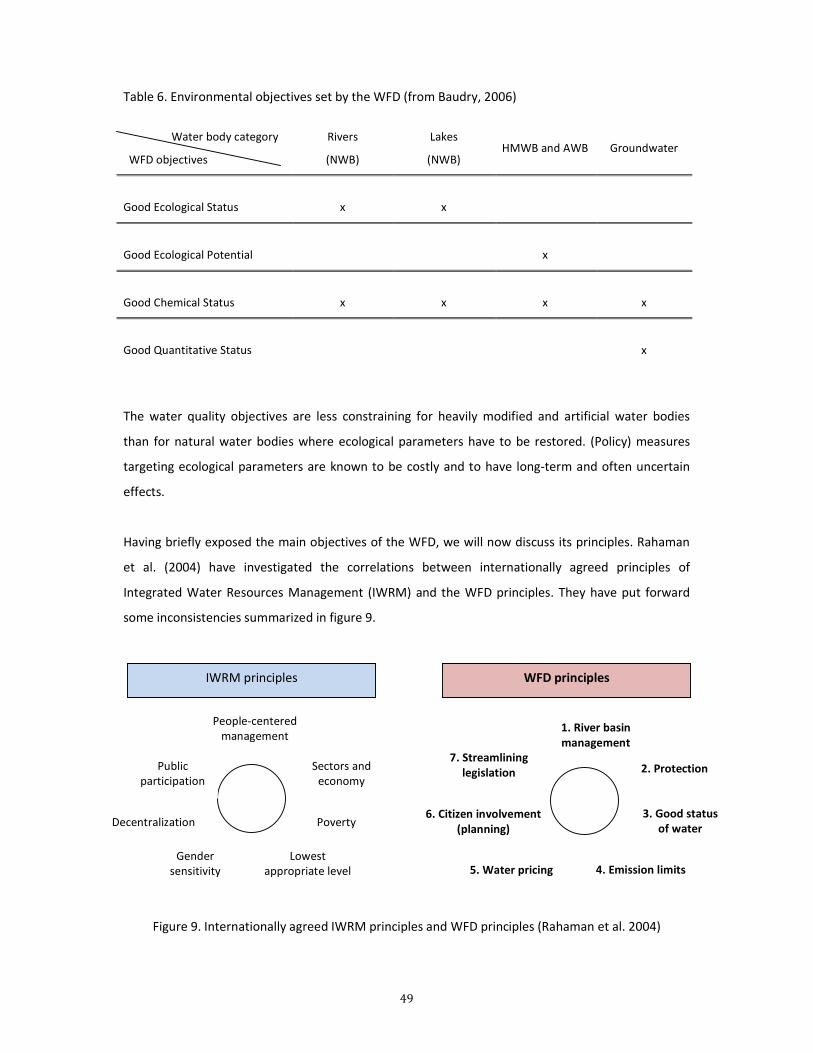
49
Table 6. Environmental objectives set by the WFD (from Baudry, 2006)
The water quality objectives are less constraining for heavily modified and artificial water bodies
than for natural water bodies where ecological parameters have to be restored. (Policy) measures
targeting ecological parameters are known to be costly and to have long-term and often uncertain
effects.
Having briefly exposed the main objectives of the WFD, we will now discuss its principles. Rahaman
et al. (2004) have investigated the correlations between internationally agreed principles of
Integrated Water Resources Management (IWRM) and the WFD principles. They have put forward
some inconsistencies summarized in figure 9.
Figure 9. Internationally agreed IWRM principles and WFD principles (Rahaman et al. 2004)
Water body category
WFD objectives
Rivers
(NWB)
Lakes
(NWB) HMWB and AWB Groundwater
Good Ecological Status
x
x
Good Ecological Potential
x
Good Chemical Status
x
x
x
x
Good Quantitative Status
x
People-centered management
Lowest appropriate level
Gender sensitivity
Decentralization Poverty
Public participation
Sectors and economy
2. Protection
4. Emission limits 5. Water pricing
6. Citizen involvement
(planning)
1. River basin
management
7. Streamlining
legislation
3. Good status
of water
IWRM principles WFD principles

50
The WFD principles established towards a more sustainable use of water resources can be further
explained as follows (Rahaman et al. 2004, Page and Kaika, 2003, www.ec.europa.eu):
1. River basin management
� Water management is based on hydrological boundaries: river basins (not political
administrative and national boundaries)
2. Water protection
� The scope of water protection is extended to all waters, surface waters and groundwater
3. Good status of water and 4. Emission limits
� A combined approach to pollution control is introduced by linking of emission limit values
and environmental quality standards
� The achievement of the ‘good status’ for all waters is expected by a set deadline
5. Water pricing
� It consists in getting the ‘right prices’ of water by introducing the costs of environmental
externalities into water pricing in order to encourage demand management
6. Citizen involvement
� Citizens should get more closely involved by increasing public participation in policy-making
in order to increase transparency and compliance
7. Streamlining legislation
� A streamlining legislation shall be developed as well as the co-ordination of policies that
previously addressed different water types separately, and co-ordination of water
management strategies
Integrated water resources management (IWRM) is a broad notion, defined as “a process which
promotes the co-ordinated development and management of water, land, and related resources in
order to maximize the resultant economic and social welfare in an equitable manner without
compromising the sustainability of vital ecosystem” (GWP, 2000, 2003 in Rahaman et al. 2004). The
inconsistencies between IWRM and WFD principles thus seem to lie on the means rather than the
goal. In the context of the WFD, the term integration is rather put forward and defined as a key
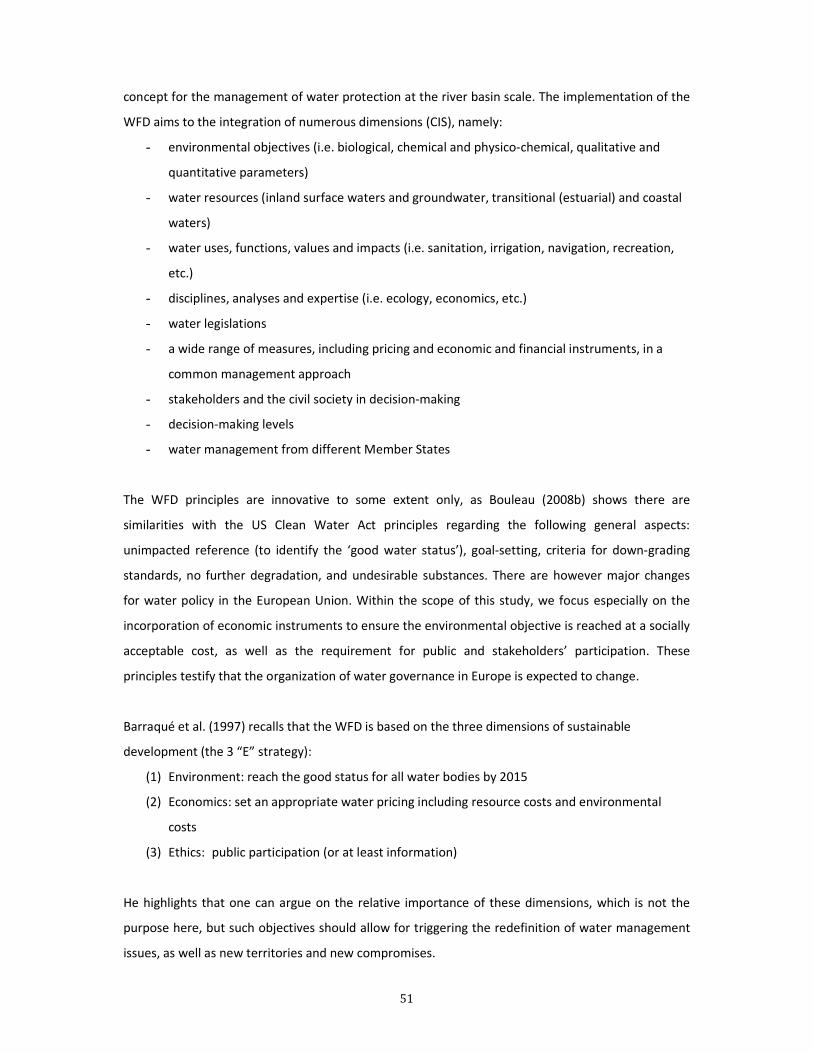
51
concept for the management of water protection at the river basin scale. The implementation of the
WFD aims to the integration of numerous dimensions (CIS), namely:
- environmental objectives (i.e. biological, chemical and physico-chemical, qualitative and
quantitative parameters)
- water resources (inland surface waters and groundwater, transitional (estuarial) and coastal
waters)
- water uses, functions, values and impacts (i.e. sanitation, irrigation, navigation, recreation,
etc.)
- disciplines, analyses and expertise (i.e. ecology, economics, etc.)
- water legislations
- a wide range of measures, including pricing and economic and financial instruments, in a
common management approach
- stakeholders and the civil society in decision-making
- decision-making levels
- water management from different Member States
The WFD principles are innovative to some extent only, as Bouleau (2008b) shows there are
similarities with the US Clean Water Act principles regarding the following general aspects:
unimpacted reference (to identify the ‘good water status’), goal-setting, criteria for down-grading
standards, no further degradation, and undesirable substances. There are however major changes
for water policy in the European Union. Within the scope of this study, we focus especially on the
incorporation of economic instruments to ensure the environmental objective is reached at a socially
acceptable cost, as well as the requirement for public and stakeholders’ participation. These
principles testify that the organization of water governance in Europe is expected to change.
Barraqué et al. (1997) recalls that the WFD is based on the three dimensions of sustainable
development (the 3 “E” strategy):
(1) Environment: reach the good status for all water bodies by 2015
(2) Economics: set an appropriate water pricing including resource costs and environmental
costs
(3) Ethics: public participation (or at least information)
He highlights that one can argue on the relative importance of these dimensions, which is not the
purpose here, but such objectives should allow for triggering the redefinition of water management
issues, as well as new territories and new compromises.

52
1.1.2 Coordination of the implementation process
The WFD is a complex framework, which raises the question of ‘how to implement such ambitious
goals and principles’. To this end, the directive sets a common implementation procedure, requiring
Member States to observe a number of specific steps detailed in table 7 below. It is important to
mention that this procedure adds on the existing organization of water management in the Member
States. We would like to point out two main phases in this common implementation procedure:
- A 6 year-period to establish a baseline scenario (analysis of water uses, pressures and
impacts on water resources) in each river basin district (RBD) and identify actions to reach
the ‘good ecological status or potential’ in a program of measures (PoM) (in blue on the
figure)
- A 6 year-period to make measures operational and implement measures to achieve
environmental objectives (in yellow and green)
Table 7. Steps required for implementing the WFD (CIS)
Deadline Steps Member States need to take to implement the WFD Where in the
directive
2003
Identify individual river basins lying within the national territory and assign
them to individual River Basin Districts (RBDs)
Identify competent authorities
Article 3,
Article 24
2004
Characterize RBDs in terms of pressures, impacts and economics of water
uses,
including a register of protected areas lying within the RBD
Article 5,
Article 6,
Annex II,
Annex III
2006 Carry out the inter-calibration of the ecological status classification systems Article 2,
Annex V
2006 Make operational the monitoring of water status Article 8
2008
Identify a program of measures (POM) to achieve the environmental
objectives of the WFD cost-effectively (based on sound monitoring and on
the analysis of the characteristics of the river basin) for consultation
Article 11, 14
Annex III
2009
Produce and publish River Basin Management Plans (RBMPs) for each RBD
(including the designation of heavily modified water bodies, setting
environmental objectives, finalizing PoMs to meet objectives, justifying
exemptions)
Article 13,
Article 4.3

53
3 years to achieve objectives
2010 Implement water pricing policies that enhance the sustainability of water
resources Article 9
2012 Make the measures of the PoMs operational Article 11
2015 Achieve environmental objectives specified in the first river basin
management plans Article 4
Legend
6 years to analyze issues and prepare the RBMPs
3 years to put POM in place
The general description of the policy context in which the WFD has emerged and its innovative
approach to tackle water quality issues help us understand this complex and multi-purpose process.
It is worth noting that the main actions required by the directive to implement such a process refer
to various subtasks that imply subtleties and nuances.
From the implementation calendar just introduced, water bodies’ initial quality (status) was assessed
during the 2003-2008 period. With this basis, the cleanup effort distribution - in other words, the
necessary measures to achieve the ecological objectives - was assessed in two stages. First, water
bodies at risk (which may not achieve the ‘good status’) are identified during the RBD
characterization (first deadline in 2004), as well as the main pollution sources and their relative
economic significance in the catchment’s area. Second, the elaboration of the River Basin
Management Plans (first deadline in 2009) describes the appropriate strategy required to achieve the
‘good status’. These plans are based on information provided during the RBD characterization in
order to identify the obstacles/impediments to the ‘good status’ and determine the best
combination of cost-effective measures to reach the ‘good status’. The purpose of the program of
measures (PoM) is thus to target the main pollution abatement sources in a cost-effectiveness
decreasing order. This means that priority is given to pollution abatement measures that achieve
either the lowest pollution level for equivalent cleanup costs, or the same pollution level at a
minimum cost.
54
Table 7 includes the first cycle of the implementation of PoMs (2010-2015), but the last deadline
considered by the WFD is the year 2027 (see Appendix B WFD implementation calendar). Indeed,
two similar 6-year implementation cycles are planned: 2016-2021 and 2022-2027, so as to spread
over time the costs and the implementation of the measures for feasibility purposes. At the same
time, the WFD requires that all water bodies of a RBD reach the good water status by 2015, but for
reasons of technical feasibility, disproportionate costs or natural conditions, Member States can plan
the implementation of certain measures over two other six-year cycles. The justifications of such
deferment or exemptions have to be made explicit in the RBMPs.
Since the identification of the necessary measures to achieve the ecological objectives will be
repeated over two 6-year cycles (see annex B), the non-compliance of certain water bodies to the
‘good status’ must be anticipated to allow appropriate cost-effective measures for the next
management plans.
Given the timing of this research, we have focused on the first stage of the first planning cycle and
most specifically on the elaboration of programs of measures (2003-2009). This first stage was very
challenging for Member States since a number of tasks were new and required to develop an
organization, identify issues, mobilize resources, collect data, etc. We will elaborate on this point in
section 2.1.2 when defining the WFD implementation as policy transaction.
The experience of the EU Commission with previous directives is that “Member States did little about
implementation until coercive legal manoeuvres forced them into action” (Page and Kaika, 2003). As
far as implementation is concerned, the WFD sets mandatory requirements regarding the result to
achieve or maintain and the process to follow (principles and implementation steps with deadlines).
In parallel, the directive provides a structure and related funding for a non-binding process to assist
Member States in the implementation: the Common Implementation Strategy. The Common
Implementation Strategy (CIS) is meant to facilitate and enhance the effectiveness of the
implementation process. Since 2001, thematic working groups are in place to assist and involve
Member States. Initially, 10 different working groups (Figure 10) were mandated to work on the
interpretation and the operational application of the main aspects of the WFD (i.e. defining the good
status, inter-calibration, economic analysis, etc.). As a main outcome, they produced non-binding
guidance documents. The participation of Member States’ representatives in the working groups is
necessarily strategic as they can influence the interpretations of the directive, the methodologies
developed, etc. This participation can also influence the degree of adoption of the recommendations
made by the working groups.

55
Figure 10. Initial CIS organizational structure with 10 working groups

56
Table 8. First set of working groups of the CIS (from the CIS)
N° Acronym Working group Lead
2.1 IMPRESS Analysis of pressures and impacts UK/Germany
2.2 HMWB Designation of heavily modified bodies of water UK/Germany
2.3 REFCOND Reference conditions in inland waters Sweden
2.4 COAST Typology, reference conditions and classification of
transitional and coastal waters UK/Spain/EEA
2.5 IC Inter-calibration Commission (JRC/EI)
2.6 WATECO Economic analysis in the context of the WFD France/ Commission
2.7 Monitoring Monitoring of surface and groundwater Italy/EEA
2.8 Groundwater
tools Tools for the assessment of groundwater trends Austria
2.9 PROCLAN Best practices in river basin planning Spain
3.1 Geographical Information System Commission (JRC/SAI)
Three work programs have been issued to report the progress of the CIS for the periods 2003-2004,
2005-2006, and 2007-2009. They include some learning experiences, and the adjustments made
according to the evolving capacity building needs. From the first set of working groups, five groups
remain in the last program (2007-2009) as illustrated in figure 11
Working group A on Ecological Status
Working group C on Groundwater
Working group D on Reporting
Working group E on Priority substances
Working group F on Floods
Working group B on Integrated River Basin Management is discontinued. The related issues will be
taken by other groups or tackled through ad-hoc workshops or information exchange activities.
The instance dealing with the guidance related to current issues stemming from the economic
analysis requirements became a ‘drafting group’ on “objectives/exemptions/economics” (circled in
red in figure 11).
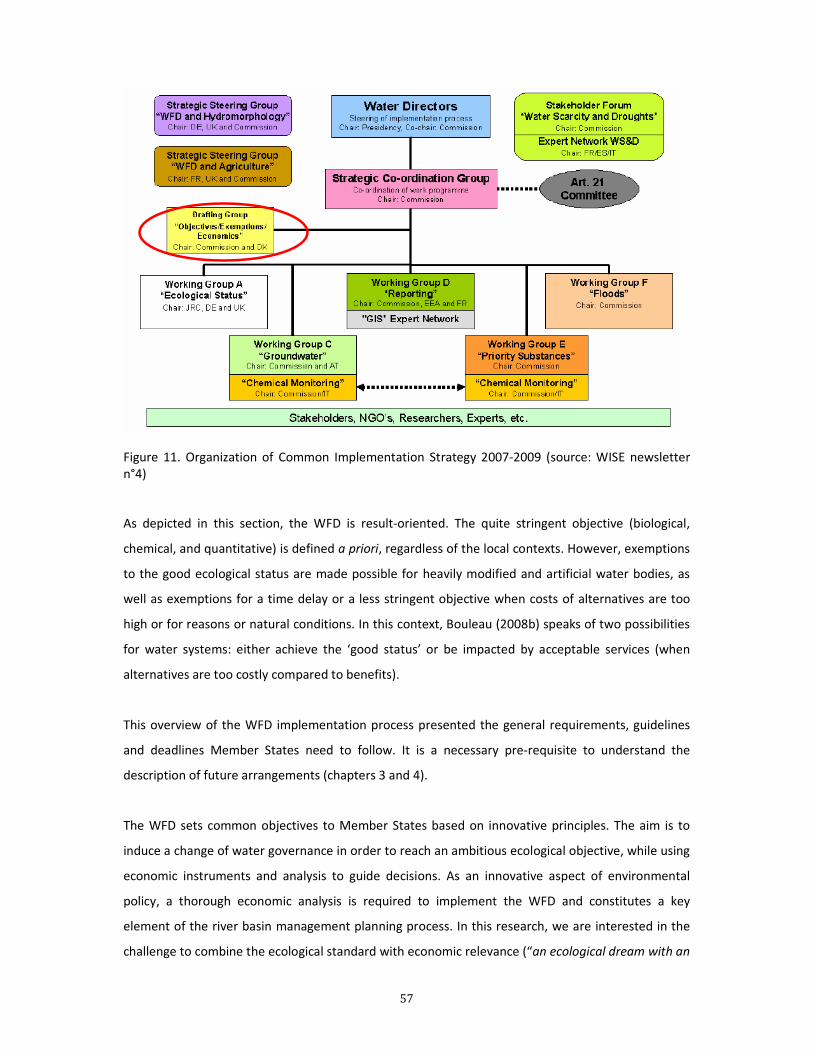
57
Figure 11. Organization of Common Implementation Strategy 2007-2009 (source: WISE newsletter n°4)
As depicted in this section, the WFD is result-oriented. The quite stringent objective (biological,
chemical, and quantitative) is defined a priori, regardless of the local contexts. However, exemptions
to the good ecological status are made possible for heavily modified and artificial water bodies, as
well as exemptions for a time delay or a less stringent objective when costs of alternatives are too
high or for reasons or natural conditions. In this context, Bouleau (2008b) speaks of two possibilities
for water systems: either achieve the ‘good status’ or be impacted by acceptable services (when
alternatives are too costly compared to benefits).
This overview of the WFD implementation process presented the general requirements, guidelines
and deadlines Member States need to follow. It is a necessary pre-requisite to understand the
description of future arrangements (chapters 3 and 4).
The WFD sets common objectives to Member States based on innovative principles. The aim is to
induce a change of water governance in order to reach an ambitious ecological objective, while using
economic instruments and analysis to guide decisions. As an innovative aspect of environmental
policy, a thorough economic analysis is required to implement the WFD and constitutes a key
element of the river basin management planning process. In this research, we are interested in the
challenge to combine the ecological standard with economic relevance (“an ecological dream with an

58
economic ideal” as called by Bouleau, 2008b). On that basis, the next section will further detail the
role and significance of the economic analysis required, particularly to design the cost-effective
programs of measures (PoMs).
1.1.3 Economics for evaluation
Along with other authors, Antona and Farolfi (2001) highlighted that the content of environmental
policy in general is progressively changing: economic instruments, their design and implementation
become a central element of debates on environmental issues. Indeed, it is now widely recognized
and emphasized in policies to meet environmental objectives in the most cost-effective way.
Advocates of the economic analysis recall that the WFD is the first EU environmental policy
legislation to explicitly include economic principles, tools and instruments (WATECO). However, they
also specify that “the economic analysis does not take the decision”. Each Member State and related
RBDs have to work out how this economic analysis will support decisions. And one should not forget
that this process requires building a common approach since “the economic approach of water
management is new” as highlighted by the working group on the economic analysis and illustrated in
table 9.
Table 9. Different approaches to economics of integrated river basin management
(CIRCA, 2003,“Economics in the WFD process“)
The WFD requires a prior assessment of costs and efficiency of alternative solutions to restore water
environments before planning measures. The EU Commission calls for an evaluation based on the
transparency of technical and economic data. It also recognizes that knowledge and diffusion of
economic data (i.e. costs of water uses, environmental damage costs, etc.) is a weak point in the
Novelty for water actors
(decision-makers, professionals, stakeholders) Novelty for economists
New concepts Cost recovery
Environment and resource costs
Elasticity, etc.
New concepts Water cycle
Water utilities
Integrated water management
Water treatment techniques, etc.
New methods Baseline scenario
Cost-effectiveness analysis
Cost-benefit analysis
New methods Public participation
Non-economic procedure, etc.
59
evaluation of water policy. We will see how the economic analysis is a key element of the river basin
management planning process.
The CIS guidance document n°1 (Economics and the Environment – The implementation challenge of
the WFD) commonly known as the WATECO guidance in reference to the name of the working group,
has identified the economic elements in the WFD. We will focus on the WFD Article 5 dedicated to
the characterization of the RBDs where ‘an economic analysis of water use’ is required by 2004 and
to be revised in 2013 and 2019. Annex III adds that this economic analysis should include sufficient
and detailed information to assess the recovery of costs of water services (according to article 9) as
well as the most efficient combination of measures at the least cost to include in the PoMs.
The WFD sets a common and rather thorough approach to water economics. As stated in the
WATECO guidance document, the economic analysis shall help understanding economic issues and
compromises at stake in the RBDs. One can distinguish four main objectives of the economic analysis.
First, it aims at clarifying the linkages between water uses, water quality and economic sectors.
Second, economics should also support (1) the identification of least cost measures for economic
sectors to reach the environmental objectives, and (2) the assessment of economic impacts of such
measures designed to improve water quality at the river basin scale. Third, the economic analysis will
also help identifying where (region or water body) the environmental objective should be revised in
order to take account of economic and social impacts. Fourth, it will deal with the development of
economic and financial instruments (i.e. water pricing, pollution taxes and fees) to reach the
environmental objectives. Overall, the discussion and negotiations on important issues of water
management at the river basin scale will involve information on the costs, who will pay, who are the
winners and losers of the current situation. However, the WATECO guidance document distinguishes
an explicit and an implicit function of the economic analysis. The explicit function refers to the
components that are specifically outlined in WFD Article 5 and Annex III, as illustrated in figure 12.
The implicit function refers to issues in other parts of the Directive that will also require an economic
analysis, namely the designation of Heavily Modified Water Bodies, the assessment of costs’
disproportion and the justification of economic exemptions based on cost-benefit analyses.

60
Figure 12. The explicit economic functions of the economic analysis (European Communities, 2003)
The European guidance documents are not legally binding but they are endorsed by all water
directors. The Commission will also assess the WFD implementation in the light of these documents.
The European reporting and benchmarking allows for comparisons between Member States and thus
stimulates new ideas as well as more efficient and competitive solutions.
The logical order of economic elements is represented in a cyclic process (fig.13). However, the
distinction between the different tasks and their chronological order is not so clear-cut and may take
different paths. For instance, the designation of HMWB (included in the ‘justify potential exemptions’

61
stage) necessitates a combination of data (environmental objectives, pressures and impacts,
measures to improve environmental quality). In practice, the process depicted in figure 13 is not that
segmented and rational. Several factors influence the interpretation and appropriation of these tasks
(i.e. politics, culture/history, geography, etc.).
Figure 13. The logic of the economic analysis (from European Communities, 2003)
Legend : CEA = Cost-efficiency analysis ; CBA = Cost-benefit analysis
The WATECO guidance document on the economic analysis was designed early in the WFD
implementation process as it was issued in 2003. It was meant to support Member States
implementing the following tasks (table 10) to prepare for the design of cost-effective programs or
measures (PoMs):
Table 10. Guidance provided for the economic analysis in the WATECO document
Carry out an economic analysis of water uses (with general indicators as output) Article 5
Investigate dynamics in the river basin: develop baseline scenario according to the forecast of
key economic drivers likely to influence pressures on water bodies (including changes in
general socio-economic variables, key sector policies that influence water use, economic
growth and planned investment)
Article 5,
Annex III
Assess current levels of cost-recovery of water services (the extent to which financial,
environmental and resource costs are recovered and the way in which key water uses
contribute to the cost of water services)
Annex III,
Article 9
Justify potential
exemptions
- CBA, cost
disproportion -
Identify
potential
measures
- CEA -
Cost-
effective
POMs
Assess water
uses, impacts,
pressures
Implement
POMs
Evaluate
impacts

62
Prepare for the cost-effectiveness analysis Annex III
Propose activities to enhance the information and knowledge base Annex III
The report suggests following a ‘3 steps approach’ (in blue on figure 14) corresponding to the
requirements of the WFD for the economic analysis:
(1) the characterization of the river basin in terms of economics of water uses, trends in water
supply and demand, current recovery of costs of water services
(2) the identification of gaps in water status or risks of failure to achieve to good status for given
water bodies or group of water bodies
(3) the development of the PoMs based on a cost-effectiveness analysis and the justification of
exemptions from an economic point of view
These steps are delineated in sub-steps (yellow boxes) and economic outputs (green boxes) by the
working group on the economic analysis, for a common understanding of their implementation
(fig.14).
Figure14. Flow-chart of the economic analysis
(CIRCA, 2003, “Where are economics in the WFD process”)
63
The elaboration of cost-effective programs of measures (PoMs) by 2009 as part of River Basin
Management Plans (RBMP) requires certain tasks that need further explanation. We will now provide
information on such tasks as they are involved in the design of cost-effective PoMs.
� Distinguish basic and supplementary measures
The economic analysis to elaborate PoMs requires distinguishing ‘basic’ from ‘supplementary’
measures. Basic measures are measures and already planned investments to comply with existing
water legislation (step 2 of the ‘3 step approach’). They can be sufficient to meet the WFD objective
(the ‘good status’) at the water body scale according to the water status foreseen by 2015. Their
impact on socio-economic sectors and cost recovery shall thus be assessed. If a gap still exists to
reach the ‘good status’ despite the consideration of basic measures, the related pressures should be
targeted by additional measures or options called supplementary measures (i.e. new investments,
sector policies, economic instruments). Similarly to basic measures, an analysis of their impacts on
socio-economic groups is needed to assess who bear the costs of the PoMs and whether these costs
are ‘disproportionate’.
� Undertake a cost-effectiveness analysis (CEA) of measures to achieve the ‘good water status’
The CEA is defined as a technique that provides a ranking of alternatives on the basis of their costs
and effectiveness (and where the most cost-effective has the highest ranking). It is used to find the
most cost-effective PoM to reach the ‘good status’ at the river basin scale, and it is a basis for the
analysis of costs disproportion.
As mentioned in the WATECO guidance document, there exists a range of possible policy measures15.
Attention is required regarding the scale of analysis to consider when designing measure packages
(the levels of decision and levels of implementation of measures). The procedure suggested to carry
out the CEA is as follow:
- define the scale of analysis (according to the most significant pressures causing failures)
- define time horizons (i.e. 2015)
- determine the effects of measures on water
- estimate the costs of proposed measures (direct costs – investment and running costs –and
environmental costs)
15i.e. requirements for water industry to implement measures to reduce abstraction, controls on other direct
discharge, controls on other abstractors, best practice controls on pollution and abstraction at farms, agri-environmental programs, economic instruments, morphological measures.
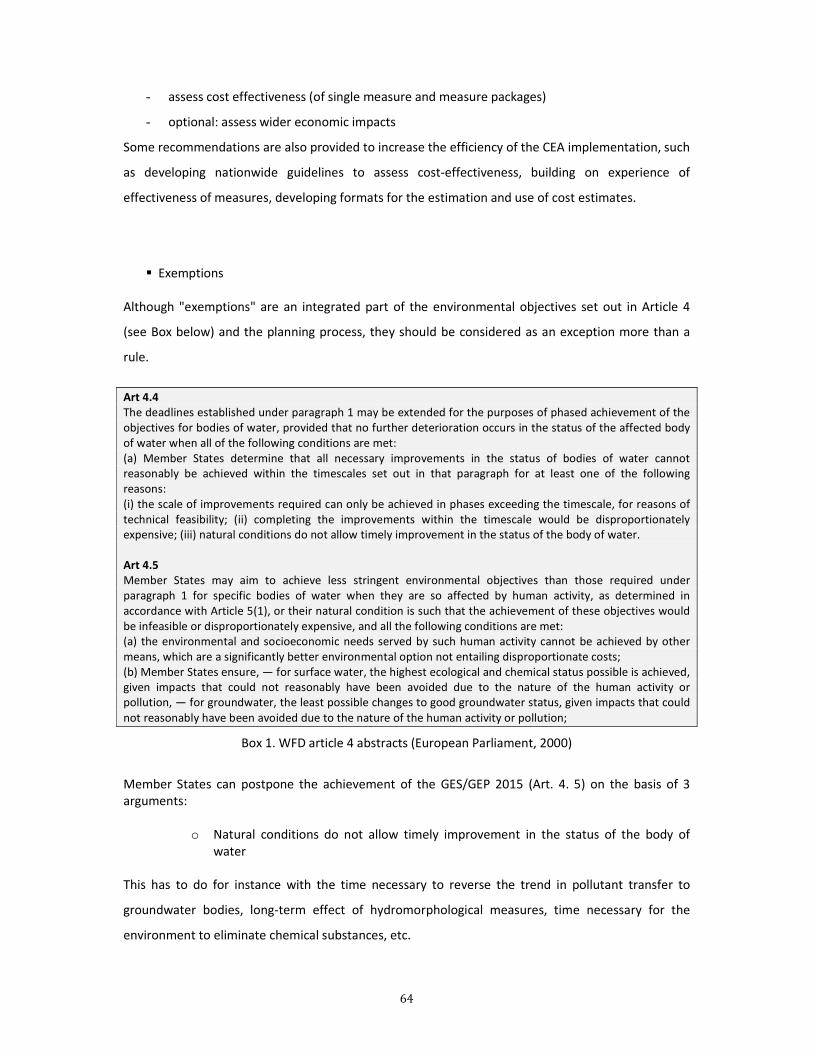
64
- assess cost effectiveness (of single measure and measure packages)
- optional: assess wider economic impacts
Some recommendations are also provided to increase the efficiency of the CEA implementation, such
as developing nationwide guidelines to assess cost-effectiveness, building on experience of
effectiveness of measures, developing formats for the estimation and use of cost estimates.
� Exemptions Although "exemptions" are an integrated part of the environmental objectives set out in Article 4
(see Box below) and the planning process, they should be considered as an exception more than a
rule.
Art 4.4
The deadlines established under paragraph 1 may be extended for the purposes of phased achievement of the objectives for bodies of water, provided that no further deterioration occurs in the status of the affected body of water when all of the following conditions are met: (a) Member States determine that all necessary improvements in the status of bodies of water cannot reasonably be achieved within the timescales set out in that paragraph for at least one of the following reasons: (i) the scale of improvements required can only be achieved in phases exceeding the timescale, for reasons of technical feasibility; (ii) completing the improvements within the timescale would be disproportionately expensive; (iii) natural conditions do not allow timely improvement in the status of the body of water.
Art 4.5
Member States may aim to achieve less stringent environmental objectives than those required under paragraph 1 for specific bodies of water when they are so affected by human activity, as determined in accordance with Article 5(1), or their natural condition is such that the achievement of these objectives would be infeasible or disproportionately expensive, and all the following conditions are met: (a) the environmental and socioeconomic needs served by such human activity cannot be achieved by other means, which are a significantly better environmental option not entailing disproportionate costs; (b) Member States ensure, — for surface water, the highest ecological and chemical status possible is achieved, given impacts that could not reasonably have been avoided due to the nature of the human activity or pollution, — for groundwater, the least possible changes to good groundwater status, given impacts that could not reasonably have been avoided due to the nature of the human activity or pollution;
Box 1. WFD article 4 abstracts (European Parliament, 2000)
Member States can postpone the achievement of the GES/GEP 2015 (Art. 4. 5) on the basis of 3 arguments:
o Natural conditions do not allow timely improvement in the status of the body of water
This has to do for instance with the time necessary to reverse the trend in pollutant transfer to
groundwater bodies, long-term effect of hydromorphological measures, time necessary for the
environment to eliminate chemical substances, etc.

65
o Technical reasons: the scale of improvements required can only be achieved in
phases exceeding the timescale, for reasons of technical feasibility
According to the 2009 CIS guidance document on exemptions (European Communities, 2009),
technical infeasibility is justified if:
- No technical solution is available
- It takes longer to fix the problem than there is time available
- There is no information on the cause of the problem; hence a solution cannot be identified
o Economics: disproportionately expensive costs: completing the improvements within
the timescale would be disproportionately expensive
Disproportionality refers to a political judgment that consists in the appreciation of the financial
impact of the costs of measures (on stakeholders’ categories or sectors), and the social benefits
linked to achieving the GES.
The WATECO guidance document highlighted that:
- Disproportionality should not begin at the point where measured costs simply exceed
quantifiable benefits;
- The assessment of costs and benefits will have to include qualitative costs and benefits as
well as quantitative;
- The margin by which costs exceed benefits should be appreciable and have a high level of
confidence;
- In the context of disproportionality the decision-maker may also want to take into
consideration the ability to pay of those affected by the measures and some information on
this may be required.
Besides an extension of delay, Member States may achieve less stringent objectives than those
required for specific water bodies when they are so affected by human activity, or their natural
condition is such that the achievement of these objectives would be infeasible or disproportionately
expensive (Art. 4. 5)
66
� Assess costs disproportion
The assessment of disproportionate costs consists in determining whether the costs of the POM are
‘disproportionately costly’ or ‘expensive’ regarding benefits, willingness to pay and affordability. If
so, this information is relevant to justify an exemption to the ‘good status’ (at the water body scale)
for economic reasons based on an assessment of costs (i.e. of measures) and benefits (i.e. of
achieving the GES).
As stated by the guidance document, the assessment of disproportionate costs is relevant to:
- designate Heavily Modified Water Body (HMWB) when “the beneficial objectives served by
the modified characteristics of the water body cannot, for reasons including disproportionate
costs, reasonably be achieved by other means (representing a better environmental option)”
- justify a time exemption when “reaching the ‘good status’ within the time scale would be
disproportionately expensive”
- require less stringent environmental objectives when “the achievement of these objectives
would be infeasible or disproportionately expensive and the environmental and socio-
economic needs served by such human activity cannot be achieved by other means which are
a significantly better environmental option not entailing disproportionate costs”
- justify the failure to achieve the ‘good status’ “as a result of new modifications to the water
body when the beneficial objectives served by those modifications cannot for reasons
including disproportionate costs be achieved by other means which are a ‘significantly better’
environmental option”
The guidance document distinguishes two types of disproportion. First, disproportionate costs refer
to other than present means to serve needs and beneficial objectives. They are relevant in to
designate HMWB, justify the failure to achieve the ‘good status’ as a result of new modifications, and
to require a less stringent objective. Second, disproportionately expensive costs relate to the
supplementary measures to improve water quality. They apply to the justification of a time
exemption and a less stringent objective. This means that extended time or less stringent objectives
can be justified with disproportionately expensive measures. For HMWB, new modifications and less
stringent objectives can be justified by current needs and socio-economic benefits from an activity
that cannot be achieved by other means with acceptable costs.
The assessment can be mostly qualitative in the first place (i.e. a list of costs and benefits but no
valuation yet). Cost disproportion shall be assessed gradually, to end up with data on financial,
economic, environmental and social costs and benefits. Also, marketable and non-marketable effects

67
are to be assessed quantitatively as far as possible and qualitatively where necessary. The guidance
document also stipulates that time exemption may only be based on financial (disproportionately
expensive costs) criteria whereas disproportionate costs require more robust quantitative data. In
the context of this research, our focus lies in the PoM design and thus the notion of
‘disproportionately expensive costs’. However, in practice, it is common to speak of cost
disproportion analysis.
The procedure to compare costs and benefits in the case of the WFD is expected to include the
following steps:
- define the scale of assessment (and thus who will be affected by the measures)
- identify the types of costs and benefits (quantitative, qualitative, or monetary)
- choose a methodology
- collect data
- assess costs and benefits
Overall, the social cost-benefit analysis to carry out in order to assess disproportionate costs or
disproportionately expensive costs needs to include qualitative but also quantitative costs and
benefits, and the definition of a margin by which costs exceed benefits. The guidance document adds
that Member States may take into account the ability to pay of stakeholders affected by the
measures in such assessment. However, some questions regarding how to consider stakeholders’
ability to pay remain open: by sector? At which administrative level? How to take account of state
and cross subsidies as well as the interaction with cost recovery?
According to Bouleau (2008b), the economic provisions of the WFD are meant to prevent
contradictory investments, promote most cost-effective measures and target incentive pricing. It is
worthwhile to highlight that in the context of the WFD, economics is both an element of the
decision-making process (economic significance of water uses and pressures, assessment of
disproportionate costs) as well as a tool to achieve environmental objectives (CEA). Thus, economics
has to be integrated within the design of actions to be taken and it is also part of an evaluation
process. The CEA will help to choose measures to be taken when the CBA will help defining
objectives according to their feasibility regarding socio-economic considerations.
It is also important to note that the working group which delivered the first guidance document on
the economic analysis was led by France. Other guidance documents on the economic analysis have
been developed and used by other countries. This is the case of the German handbook “Basic
principles for selecting the most cost-effective combinations of measures for inclusion in the

68
program of measures as described in Article 11 of the Water Framework Directive” as a result of a
research project for the German Federal Environmental Agency (Interwies et al., 2004).
The WATECO guidance document on the economic analysis provides general recommendations but it
can be argued that there is no detailed information on the methodologies to use. According to the
EU subsidiarity principle but also recognizing that one size does not fit all, Members States need to
develop the economic analysis building on their experience, existing data and resources to answer
their specific needs. Numerous working groups, workshops and research projects (whether national,
cross-border, or international) have been launched to share experiences, approaches and
methodologies related to the economic analysis. We will argue that the appropriation and
operationalization of the economic analysis requirements as well as the organization of Member
States to carry out the economic analysis partly respond to constraints or transaction costs. Not to
mention that the assessment of cost disproportion is qualified from the start as a “case by case
issue”, a “local judgment informed by economic information”, and ultimately as “a political decision”.
To ensure more transparency and to allow for comparisons, the WFD Common Implementation
Strategy requires a rather rational process to undertake the economic analysis and elaborate PoMs,
where rational policy-making assumes that it is possible to choose an optimal course of action based
on:
- knowledge of one’s preferences, which are assumed to be fixed and rankable;
- knowledge of the full range of available options for action;
- expectations about the outcomes of the various available options for action.
Our analysis of the WFD implementation process with a transaction cost approach shall account for
more complex decision making criteria influencing the choices made by Member States to realize a
transaction (arrangements). As introduced in chapter 1, we chose to adapt the concepts of
transaction and transaction costs so that they can apply to (environmental) policy implementation.
The next section applies our definition of policy transaction to the WFD context.
1.2 The WFD as policy transaction
The WFD establishes objectives for Member States at the EU level. We hold these correspond to the
content of a contract such as in an economic transaction. According to Williamsonian TCE, the
realization of such transaction at the river basin scale (scale at which objectives shall be applied)
implies arrangements that result from transaction costs. River basins’ organizational choices to
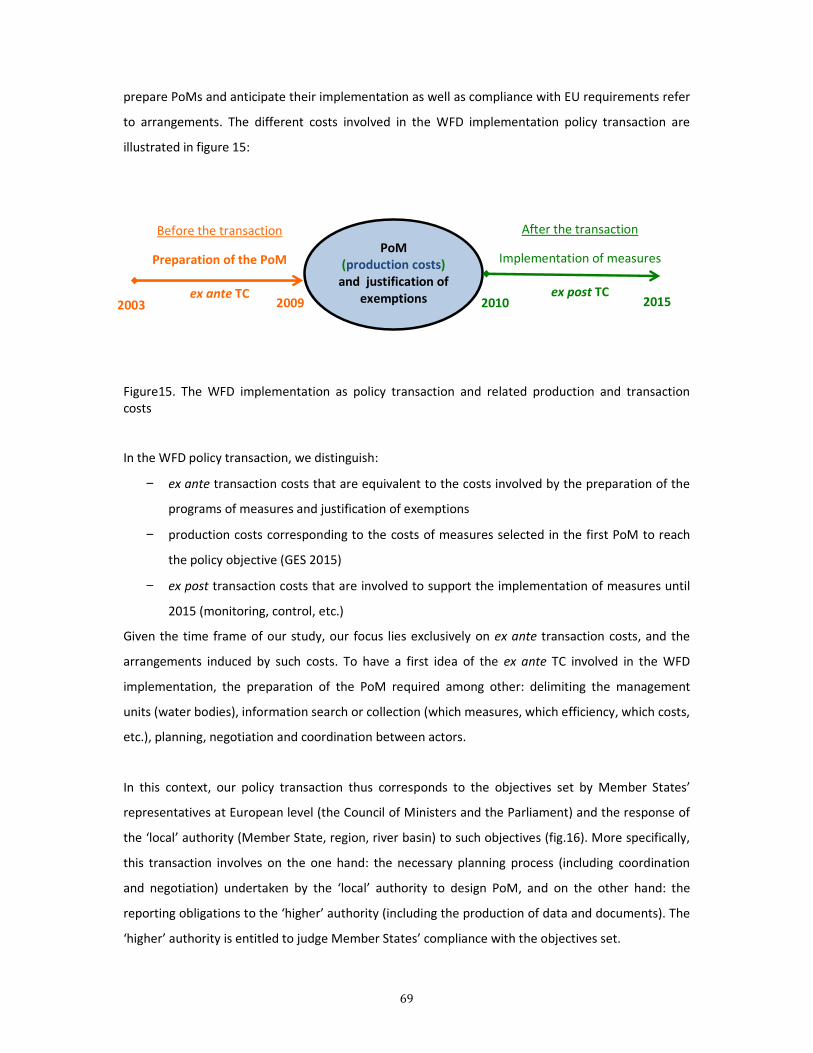
69
prepare PoMs and anticipate their implementation as well as compliance with EU requirements refer
to arrangements. The different costs involved in the WFD implementation policy transaction are
illustrated in figure 15:
Figure15. The WFD implementation as policy transaction and related production and transaction costs
In the WFD policy transaction, we distinguish:
− ex ante transaction costs that are equivalent to the costs involved by the preparation of the
programs of measures and justification of exemptions
− production costs corresponding to the costs of measures selected in the first PoM to reach
the policy objective (GES 2015)
− ex post transaction costs that are involved to support the implementation of measures until
2015 (monitoring, control, etc.)
Given the time frame of our study, our focus lies exclusively on ex ante transaction costs, and the
arrangements induced by such costs. To have a first idea of the ex ante TC involved in the WFD
implementation, the preparation of the PoM required among other: delimiting the management
units (water bodies), information search or collection (which measures, which efficiency, which costs,
etc.), planning, negotiation and coordination between actors.
In this context, our policy transaction thus corresponds to the objectives set by Member States’
representatives at European level (the Council of Ministers and the Parliament) and the response of
the ‘local’ authority (Member State, region, river basin) to such objectives (fig.16). More specifically,
this transaction involves on the one hand: the necessary planning process (including coordination
and negotiation) undertaken by the ‘local’ authority to design PoM, and on the other hand: the
reporting obligations to the ‘higher’ authority (including the production of data and documents). The
‘higher’ authority is entitled to judge Member States’ compliance with the objectives set.
PoM
(production costs)
and justification of
exemptions
Before the transaction
Preparation of the PoM
ex ante TC
After the transaction
Implementation of measures
ex post TC 2003 2009 2015 2010

70
Figure 16. Water Framework Directive implementation as policy transaction
On that basis, our analysis aims at investigating (1) how the execution of such policy transaction
actually cope with transaction costs (‘arrangements’), and (2) which determinants (stemming from
transaction’s specificities - attributes) influence arrangements. Transaction costs correspond the
costs involved to execute the transaction, in other words the “costs to prepare, negotiate and
guarantee/secure an agreement” defined as ex ante transaction costs by TC economists (Saussier
and Yvrande-Billon, 2007). These transaction costs are inevitable and correspond to the organization
to prepare the programs of measures: the execution of tasks (water body delimitation, selection of
measures, costs estimation, cost-efficiency analysis, analysis of costs repercussion, cost-benefit
analysis, cost disproportion analysis, justification of exemptions, select or check data for reporting,
etc.) but also strategic decisions to support the execution of tasks which involves coordination,
monitoring, etc. We assume that these costs cannot be avoided but can be minimized. In this regard,
the policy transaction framework does not tackle the issue of policy transaction costs measurement
but rather transaction costs coping strategies (arrangements).
In this line, a policy transaction arrangement corresponds to the choices made or decisions taken to
prepare and organize the transaction as a result of transaction costs. Such arrangement results from
determinants that stem from transaction’s specificities (attributes). In the WFD context, a policy
transaction arrangement relates to the choices and decisions of each Member State (of the
International Scheldt District) over the preparation of PoM and justification of exemptions. The
European Union – Commission
(‘higher’authority)
Member State/region (‘local’ authority)
River basin district level
Sets objectives
Finalize the PoM and justify exemptions
by the end of 2009
Judges compliance with objectives
Requires reporting documents
Sets evaluation criteria
�validation/approval or sanction of
Member State
Applies objectives
Selection of measures,
economic analysis, PoM design
Reports on implementation process
Regular reporting of Member States
to the EU Commission
�production of data and documents

71
choices made by the ‘local’ authority to prepare and organize the transaction have a double purpose:
(1) optimize the costs to prepare the PoM and (2) comply with the ‘higher’ authority’s (EU
Commission) expectations.
In the sense of TCE, determinants are the expression of transaction’s attributes. Within a WFD
implementation policy transaction framework, we argue that determinants condition the
arrangements since river basin authorities respond to determinants and the related transaction
costs. In the case of a policy transaction, determinants can be extended to the geographical and
institutional contexts as they also condition Member States decisions related to WFD objectives’
implementation. Indeed, applying Williamson’s scheme to the WFD implementation policy
transaction would imply that the institutional environment coincides with the Member State level.
The institutional environment constrains or enables the modes of organization (or arrangements) to
implement the WFD.
By analyzing ex ante policy transaction costs, we are both concerned with (1) a wide conception of
policy costs and (2) understanding how policy decisions are made. This second concern refers to
policy process evaluation rather than policy impact evaluation (the result of policy measures or
options selected). The underlying objective is to improve our understanding of public action’s
performance through the strategies to cope with transaction costs (constraints) linked to policy
implementation.
Now we have introduced the policy transaction framework applied to the WFD implementation, the
next section will depict the setting where such policy transaction is analyzed: the Scheldt
International River Basin District (referred to as ISD International Scheldt District), which spreads
over 3 European countries. We will investigate transaction costs linked to the WFD implementation
at the river basin district level (the management scale required by the WFD Art. 2), which
particularity is its transboundary nature.

72
2. Case study: the International Scheldt River Basin District (ISD)
We selected an international river basin district so as to investigate the incidence of different
institutional settings on transaction cost determinants and transaction cost minimization strategies.
Among the three countries that are part of the ISD, France shows a model of historical centralization.
Although its river basin organization allows for a rather decentralized water policy planning, the
French administrative tradition remains and river basin institutions (water agencies) do not have a
policing nor contracting authority role (Barraqué, 2004). In Belgium, the federal organization assigns
powers to the three regions (Walloon region, Flemish region, Brussels Capital Region) as regard to
water quality management. The regions function quite independently even within the same river
basin district. For the purpose of this research, we will not consider the particular case of Brussels
Capital Region, as it deals more with a city than a river basin. The Netherlands has a long and
important history of water management based on a decentralized model supporting subsidiarity
(Barraqué, op cit).
In the section 2.1, we will first provide insight on the socio-economic and natural environments of
the Scheldt International River Basin District. We will then review the specificities of water
management and planning in the four institutional contexts identified (France, the Walloon and
Flemish region, and the Netherlands), and how the WFD implementation is embedded within this
organization. Such overview of the ISD is meant to shed light on the context that influences
arrangements and therefore will constitute potential TC determinants. Section 2.2 is dedicated to the
research methodology developed to identify transaction costs minimization strategies involved in the
WFD implementation process in the ISD.
2.1 Characteristics of the International Scheldt District
A ‘river basin district’ constitutes the main unit for management of river basins as meant by the
European Water Framework Directive. It is defined as “the area of land and sea, made up of one or
more neighboring river basins together with their associated groundwaters and coastal waters”
(European Parliament and Council, 2000, Art.2). When a river basin district covers the territory of
several Member States, it is considered as an international river basin district where Member States
shall ensure the coordination of the PoM and collaborate to develop a single and common River
Basin Management Plan (RBMP).

73
2.1.1 Presentation of the ISD
The ISD (see map on figure 17) was demarcated by means of a decision taken by the governments of
the riverain states and regions making up the Scheldt river basin (France, the Kingdom of Belgium,
the Walloon Region, the Flemish Region, the Brussels Capital Region, the Netherlands), and its
demarcation has been integrated into the Scheldt Treaty signed in Ghent and dated 3rd December
2002 (Gilbert et al., 2007).
Figure 17. River basin districts in Europe (Source: European Environmental Agency)
The European international river basin districts have an average surface of about 100 000 km². Well
below this average, the International Scheldt River Basin District is one of the smallest IRBD in Europe
(36 000 km²) and it is located in a flat and densely populated area with intense economic and
industrial activity. It covers France upstream (50% of its total area), Belgium (43% shared between

74
Wallonia (10%) and Flanders (33 %)) and the Netherlands downstream (7%) (fig.18). The
international Scheldt district consists in the Scheldt, Somme, Authie, Canche basins, the Aa, IJzer and
Bruges Polder basins, along with the corresponding coastal waters.
Figure 18. The international Scheldt River Basin District (International Scheldt Commission, www.isc-cie.com)
In France, water management in the Scheldt district is dealt with at the scale of the Artois-Picardie
river basin, one of the 6th French river basins covered by the water agencies. There are 16 sub-basins
(“territoires”) in Artois-Picardie. In Wallonia (Belgium), the Scheldt is the second largest of 4 river
basins (the others being Meuse, Rhine and Seine) and counts 5 sub-basins. The Flemish Scheldt is the
largest of 2 river basins in Flanders and regroups 10 of the 12 Flemish sub-basins. In the Netherlands,
the Scheldt is dealt with at the Scheldt river basin scale with 3 hydrological sub-units: Zeeland
(province), West-Brabant (parts of provinces) and the national waters.

75
Table 11. Representation of the Scheldt District in each country
Number of basins Number of sub-basins
France 6 -
Scheldt District 1 16
Belgium – Wallonia 4 -
Scheldt District 1 5
Belgium – Flemish region 2 12
Scheldt District 1 10
The Netherlands 4 -
Scheldt District 1 3 (hydrological sub-units)
Regarding geography, the North of the Scheldt (Flemish and Dutch parts) is mainly flat, with areas
lying below sea level (up to 2 meters) in the Netherlands. The highest point (210 meters above sea
level) is to be found in the Walloon part. Due to this particularly flat relief, the Scheldt District’s rivers
are lowland waterways with broad valleys and slight water currents and drains. In the district,
lowlands alternate with low plateaus and hill areas. One of the typical reliefs is the polder area, to be
found in the French, the Flemish and the Dutch parts. Coastal polders and river polders are areas
reclaimed from the waters, respectively the sea and the river (Gilbert et al., 2007). The main
woodlands are located in the East, where the soil is poor and thus hardly suited for agriculture,
around a number of cities (Brussels, Louvain, Valenciennes) and in the Haine sub-basin.
The different characteristics of the ISC constitute pressures on the water systems and on water
quality. The Scheldt district is a highly urbanized area with a high construction rate. The Scheldt
district’s overall population amounts to 12.8 million inhabitants and the average population density
is 352 inhabitants/km², about three times as much as the average European population density (120
inh./km²). Six French and Belgian cities house 23% of the district’s inhabitants: the Lille conglomerate
(1,091,000 inh.), the Brussels Capital Region (959,318 inh.), Antwerp (445,000 inh.), Ghent (225,000
inh.), Amiens (136,224 inh.) and Bruges (115,000 inh.). As a consequence, providing sufficient and
clean drinking water and treating wastewaters are major issues. It appears that about half of the
population’s wastewater is taken to and treated in a public sewage plant (Gilbert et al., 2007, based
on data from the year 2000 or 2002 for the Flemish Region).

76
Agriculture is an important activity, which covers 61% of the district’s total surface (22,077 km² of
farmland). There are about 69 000 farms with an average surface of 32 hectares, which comes down
to about 2 farms per km². Agricultural activities (arable farming in the South and cattle breeding in
the Northern part) are very intensive, relying on a heavy use of pesticides and fertilizers and resulting
in a high production of manure, which lead to important non-point source pollution (nutriments and
pesticides) of surface and groundwater. The remaining open space in the district is strongly
fragmented (mainly in the North) and consequently under high pressure.
The Scheldt district is a place of important industrial activity since more than two centuries, with a
high industrialization rate. A number of important industrial centers are located near the harbors,
the canals and cities. The numerically strongest industrial sectors are the food and the metallurgical
industry, each with one third of the total number of companies. Other important sectors are the
chemical and the textile industry. Major industrial effluents occur in the downstream Scheldt and in
the Aa river. Despite major investments to improve industrial wastewater treatment in the last years,
industrial effluents still represent a significant pressure for surface waters.
In this context, it appears logical that the Scheldt district has one of Europe’s densest network of
traffic routes (railways, waterways and roads), which makes it easily accessible. In addition, a number
of important ports are to be found (Antwerp, Ghent, Zeebruges and Ostend in the Flemish Region,
the autonomous port of Brussels, the ports of Dunkerque, Calais, Boulogne-sur-Mer and Lille in
France, en Flushing and Terneuzen - together the Port of Zeeland - in the Netherlands). As Europe’s
second biggest port and also one of the largest in the world, the port of Antwerp is the most
important of the ISD, where more than 130 million tons of cargos are shipped there every year. In
this port, large quantities of chemicals are shipped, and the Antwerp port area is the world’s second
biggest petrochemical complex (after Houston, U.S.A.). The Scheldt district also counts 5 main
passenger airports: Zaventem (Brussels), Antwerp and Ostend in the Flemish Region, and Lille and Le
Touquet in France.
Regarding fishery, aquaculture is significant in the Dutch and French parts.
In the Dutch part, 6000 hectares of mussel beds are to be found and the French part has a number of
mussel farms. In France, offshore fishing is mainly based in the different ports (coastal fleet), but
most of all in the port of Boulogne-sur-Mer (traditional fleet and offshore fishing). Concerning
tourism, tourists enjoy the ISD’s entire coastal belt (about 340 km long), from Ault (France) up to the
Scheldt’s estuary near Breskens (the Netherlands).

77
The peninsular structure in the North of the Scheldt estuary (on Dutch territory) is a tourist
attraction. Also, the Scheldt estuary is unique from an ecological point of view, with a tidal range of
six meters and a 60-kilometre freshwater tidal area with associated flora and fauna. The Western
Scheldt is a spawning area for birds.
The Scheldt District shows a certain degree of heterogeneousness when it comes to the different
regions’ welfare level. The most commonly used socio-economic indicator is the Gross Domestic
Product (GDP), as illustrated in table 12. The Flemish region shows the highest GDP per capita before
France, the Walloon Region and the Netherlands.
Table 12. Gross Domestic Product (GDP) for the Scheldt IRBD per region (2001)(source: ISC brochure16)
GDP (in million euros) GDP per capita (in euros)
France 89,516 19,292 Walloon Region 21,003 17,357 Brussels Capital Region 46,974 48,982 Flemish Region 132,278 23,692 Netherlands 7,092 16,303
International Scheldt District 296,863 23,144
Along with the characteristics introduced, a major issue for water management in the ISD relies to
flood risk and climate change. Sea level rise and strong waves related to climate change are likely to
increase the flood risk in the Dutch part of the Scheldt but also further upstream in the Antwerp
region. In addition, seawater intrusion caused by climate change is expected to affect agriculture,
tourism and drinking water supplies.
Transboundary water management involves cross-country issues. As highlighted by Mostert (1998),
“problems occur in transboundary river basins. Implementing the hydrological model in such basins
requires a very high level of international cooperation. While desirable, this is also very difficult, if not
impossible. National sovereignty of the basin states over their territory would decrease as
competencies would shift to a supranational river basin authority. Moreover, coordination problems
would occur between the river basin authority and the national governments, who will always keep
competencies that are relevant for river basin management (agricultural policy, environmental
management, land-use planning, etc.)”. Formal cooperation initiatives attempt to improve
16http://carto1.wallonie.be/webgis_escaut_public_EN/Pdf/EN_DHI.pdf

78
negotiations and decision-making. In this regard, with the Scheldt Estuary Development Outline
2010, which addresses the future of the entire Scheldt region, Flanders and the Netherlands have
concluded agreements on issues such as the accessibility of the Scheldt (regarding the Antwerp
harbor area). There exist various treaties between the Netherlands and Flanders relating to shipping,
navigation and the deepening of the waterway. The Technical Scheldt Commission (TSC) is
responsible for their implementation. A Scheldt treaty has been concluded between France, Belgium
and the Netherlands regarding the protection of the water quality and the implementation of the
European Water Framework Directive. An International Scheldt Commission has been established
and is based in Antwerp to foster collaboration.
The main geographical and socio-economic features of the different parts of the Scheldt district (in
bold) are summarized in Table 12. Data are compared between administrative regions (BE) or other
river basins (FR, NL).
Table 13. Main characteristics of the International Scheldt River Basin
(source: river basin characterization reports, PoMs, ISD brochure)
ISD in France
(Artois-Picardie RB)
Seine-Normandy RB (France)
Walloon region (BE) ISD in Wallonia
Area 20 000 km²
(3,6% of France) 97 000 km² (18%) 16 900 km²
3 770 km² (22% of Wallonia)
Population 4,7 million (249 inhab/km²)
17 million (35 - 20 000 inhab/km²)
3,3 million (~220 inhab/km²)
1,2 million (316 inhab/km²)
Agriculture 1,4 million ha 9,7 million ha 760 000 ha (45%) 72% of land use
GDP GDP (2001) =
19 290 €/capita (6% national GDP)
NA 24% of national GDP GDP (2001) =
17 360 €/capita
Flemish region ISD in Flanders Rijn-Delta RB
(The Netherlands)
ISD in the Netherlands
Area 13 500 km² 10 500 km²
(78% of Flanders) 31 800 km²
3 200 km² (8% of Netherlands)
Population 6,2 million
(456 inhab/km²) 5,6 million
(468 inhab/km²) 7,3 millions
0,47 million (230 inhab/km²)
Agriculture 633 000 ha 556 000 ha
(46%) 60% NA
GDP 27 610 €/capita (2006)
56% national GDP GDP (2001) =
23 690 €/capita 30174 €/capita
(national GDP 2006) GDP (2001) =
16 300 €/capita

79
This overview of the ISD highlighted the main geographical features of the river basin, as well as the
main pressures on water systems since the Scheldt district is one of the most densely populated and
industrialized river basins in Europe. The three countries tend to have a certain experience to
collaborate and cooperate on certain issues (i.e. Scarwell and Laganier, 2003), which does not seem
to be the case for other international river basin districts such as the Rhine (i.e. for the economic
analysis - personal communication with the Rhine-Meuse Water Agency). This could partly be
explained by the small number of countries involved in the ISD (as opposed to the Rhine river basin
district), the common languages between France and Wallonia (French) as well as Flanders and the
Netherlands (Flemish and Dutch), and the geographical proximity with a dense and diversified
transportation network. However, for the purpose of a transaction cost analysis, a transboundary
river basin is a more complex case than a national river basin. It a priori involves more transaction
costs as negotiations and agreements are necessary to ensure the WFD implementation at this level,
but one can also argue that this process can trigger efficient solutions and a learning process (i.e.
through exchanges on respective methods and tools). In the sense of the WFD, the ISD is the
management scale to consider but in practice it involves several public intervention scales: the
European, the Member State, the regional and the river basin district levels. We could have analyzed
the WFD implementation process in France only, but the purpose of considering an international
river basin district as a scale of reference17 will allow for considering the influence of the respective
institutional contexts on TC minimization strategies. To this end, the next section will detail the
existing organization of water management in the respective institutional contexts and how these
frame the WFD implementation process. Such analysis constitutes a first step in the identification of
transaction cost determinants that condition the WFD implementation.
2.1.2 Institutional contexts and water management
The analysis of the institutional contexts that set the rules of the game and the organization of water
management in France, Belgium and The Netherlands will shed light on Member State specific
institutional characteristics that frame policy implementation and effectiveness. In Belgium, the
administrative scale (region) is prominent and the river basin scale is dealt with in the respective
regions. This is why the Walloon and the Flemish regions are considered separately since they
function independently.
17The river basin is (in theory) more adapted to natural resources management, at least certain issues.

80
France
A quick overview of the main legislations (table 14) allows pointing out the different steps in the
institutionalization of river basin management and planning in France. As highlighted by Mostert
(1998), there existed in France river basin institutions and river basin planning prior to the WFD. This
organization corresponds to what he refers to as a ‘hydrological model’ (management by river basin
authorities) as opposed to a ‘coordinated model’ (coordination at the river basin level) and an
administrative model (management not based on river basins at all).
Table 14. Main French water legislations
Date of
legislations
Changes (not exhaustive)
1964
Framework to regulate water pollution
Establishment of water agencies at the river basin level (Agences financières de bassin)
1992 Inclusion of the requirements of the Directive on Urban Waste Water (1991)
Introduction of two planning levels: SDAGE (basin level) et SAGE (sub-basin level)
2004 Adoption of the WFD in French legislation
Adaptation of existing planning system to new requirements of the WFD: the geographical scale
of the SDAGE, the calendar is adapted to a 6 year cycle, quality objectives are set, etc. Certain
themes of the SDAGE remain in the PoM (ex : flood, water provision, wetlands,…). A PoM is
considered as a “revised SDAGE”.
2006 Revision of the 1964 and 1992 regulatory frameworks (LEMA – Loi sur l’Eau et les Milieux
Aquatiques)
ONEMA (Office National de l’Eau et des Milieux Aquatiques) is in charge of the information
system on water resources, uses and pressures
More transparency to establish water charges
The composition of the river basin committees is changed
Three main levels of public intervention in water management are represented in figure 19: the state
central level (in white), the river basin (in blue), and local state authorities (in yellow and orange).

81
Figure 19. Levels of water governance in France
The State central level (the Water and Biodiversity Directorate within the Ministry of Ecology,
Sustainable Development, Transport and Housing) has a regulatory role. It plans and coordinates
national water policy. In the context of the WFD, Water Directors are key stakeholders. They
represent Member States to the Commission, and are members of the Strategic Coordination Group
to which CIS (Common Implementation Strategy) working groups are reporting. They coordinate the
WFD implementation and seek to harmonize WFD implementation practices at the national level, for
instance regarding methodologies to carry out the economic analysis or to establish common
(national) databases (i.e. case studies on costs and benefits assessment). The executive power of the
central State determines how the WFD should be implemented at all levels through guidelines,
decrees, etc. (i.e. organization of public participation).
At the river basin level, the 6 States representatives of each basin (“préfets coordonnateurs de
basin”) and the respective DREAL (Regional Environment Directorates) coordinate the actions of
state authorities regarding water issues (qualitative and quantitative monitoring of water status).
They approve the plans (SDAGE -“Schema d’Aménagement et de Gestion de l’Eau” or Water
Development and Management Master Plan) designed by the river basin committees (“comités de
basin”). Planning is thus the main responsibility of the river basin committees who elaborate the
plans (SDAGE), provide directions for the water agencies’ policy and advices on major development
plans. The river basin committee, also called “local water parliament”, is an assembly comprising
local government (40%), water users – including socio-professional groups and associations (40%)
and state (20%) representatives. The 6 water agencies (“Agences de l’Eau”) participate to develop
the SDAGE and ensure its implementation. As mentioned by Mostert (1998), the SDAGE balances the
MEDDTL Ministry of Ecology - Water and Biodiversity Directorate
Départements – Préfets, MISE
(control)
Water agencies
Municipalities
Regions - DREAL

82
plans and programs of the administration with the users' interests. It defines the main objectives
with respect to water quantitative and qualitative aspects and the instruments to reach these
objectives.
Water agencies also have a financial incitation role by collecting pollution charges and water intake
charges. They distribute these funds to pollution prevention, water resources management and
restoration projects from municipalities, farmers and industries. However, there used to be no
evaluation of the projects co-financed by water agencies. It is often claimed by analysts that the role
of water agencies is limited as they do not have regulatory powers (permitting, sanctioning, etc.) and
cannot build infrastructures.
Another layer of planning is the SAGE (“Schema d’Aménagement et de Gestion de l’Eau” or Water
Development and Management Plan). Such plans can be formulated for (groups of) sub-basins and
correspond to a detailed implementation of the SDAGE at the local level. Since the WFD, connections
between the (already existing) SDAGE and programs of measures (PoMs) need to be established. The
following calendar illustrates the existing planning milestones and includes the WFD requirements
related to the establishment of PoM (table 15). Given the obligation of Member States to implement
the WFD and the stringent objective to be reached, the role of river basin committees is thus
strengthened in designing and planning water policy at the river basin level.
Table 15. Planning deadlines in France as a consequence of the WFD
2002-2006 Water agencies’ 8th program
2006 Start of PoM design
2007 Start of the water agencies’ 9th program for the period 2007-2012
2009 Final version of the PoM and update of the 9th program
2010-2015 PoM implementation within 2 water agencies’ program (2007-2012 and 2013-2018)
The third level of the figure 19 represents the local implementation by regions, departments and
municipalities. Regions and departments offer technical and financial support to municipalities (along
with water agencies). There exist inter-municipal organizations or inter-governmental structures and
partnerships with policy instruments (SAGE, “contrats de milieux”,…). Municipalities are responsible
for drinkable water distribution, wastewater collection and treatment tasks. Local stakeholders
(industries, farmers) by their activities can be involved in policy planning and implementation.

83
The Artois-Picardie water agency is the river basin organization corresponding to the ISD territory in
France. It is a small water agency (along with the Rhine-Meuse water agency) as compared to the 4
other French water agencies. This implies that less administration levels are present on the territory
(the delegations are located within the water agency whereas they are geographically separated in
the larger river basins) and it is expected that decisions are easier or faster to implement regarding
the less numerous stakeholders and water bodies.
An analysis of the WFD implementation process by Uitenboogaart et al. (2009) highlights the
challenges to implement the WFD in five member states. In the case of France (Loire-Brittany river
basin), Bourblanc et al. (2010) refer mostly to the non-point source pollution (and we can add water
sanitation concerning the Artois Picardie river basin). The fact that river basin planning already
existed facilitated the adoption of a PoM (as it corresponds mostly to a SDAGE) but the
implementation of measures will be a great challenge; the interpretation of the WFD is France is
rather ambitious (such as the PoMs) and the obligation of results is required by law.
River basin management thus existed prior to the WFD in countries with a centralization tradition
(France, Spain, England) but has not been set up in countries with a tradition of more subsidiarity
(Germany, The Netherlands, Sweden, Finland) where local communities are stronger (Barraqué,
2004). When France is following a ‘hydrological model’, The Netherlands opted for a ‘coordinated
model’ (coordination at the river basin level) (Mostert, 1998), and Belgium shows a rather
administrative model, where water management is based on the regions although the WFD is
triggering a rather ‘coordinated model’.
Belgium
In the Kingdom of Belgium the federal structure is relatively recent, which explains why there is no
river basin organization but rather regional powers. Since 1993 (according to the 06/07/1993 law,
modifying the 08/08/1980 law), environmental policy is a regional responsibility (except for specific
issues – i.e. coastal waters management issues). Competencies regarding environmental and water
policy is thus delegated to the regional governments. The three regions work and report
independently on the WFD implementation process, even though they are part of a same river basin
(i.e. the Scheldt). Such regional political involvement implies that the political decision-makers
appreciate the implications of the PoM to be implemented and the necessary resources. Regarding

84
the Belgian context, the country is relatively poor in water resources, with a high population density
and a significant share of untreated domestic wastewater. Tensions between cultural and linguistic
communities (overlapping with economic regions) impact politics and governance. In Flanders, the
Antwerp harbor is dependent of the estuary dredging by the Dutch for the access to the sea.
The Flemish region
The Flemish region is competent for environmental policy through the Ministry of the Flemish
community (with different departments and divisions) (fig.20). The Flemish government is
responsible for determining the PoM. In theory, the basin executive approves the basin management
plans prepared by the basin secretariat and advise on the draft RBMP. The Flemish government
needs to adopt the RBMP, which is a kind of (political) supervision (Uitenboogaart et al., 2009).
Figure 20. Levels of water governance in the Flemish region, Belgium
(source : Wiering and Crabbé, 2006).
A framework decree on integrated water policy in the Flemish region (2003) transposes the WFD and
integrates existing water policy. It recognizes 3 river basin districts and 11 sub-basins sub-divided in
smaller catchment areas at local level. Integrated water management plans have to be elaborated at
the river basin level. To this end, the newly created CIW (Flemish co-ordination commission for
integrated water management) ensures the coordination between the different hydrographic levels.
Each sub-basin has its own sub-river basin committee with different competent authorities (UNEP,
2004).
Flemish Environment Agency(VMM)
Division W ENL& Water Management Administration
Waterways and Marine AffairsAdministration
Provinces
Waterboards Municipalities
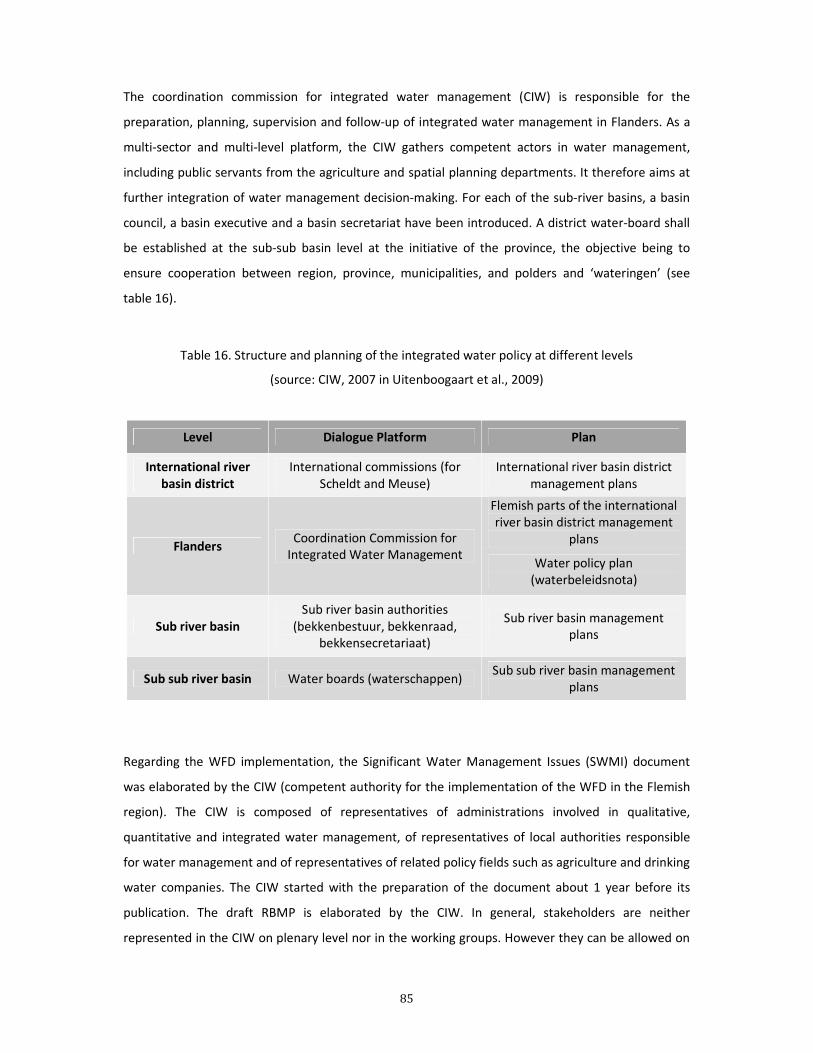
85
The coordination commission for integrated water management (CIW) is responsible for the
preparation, planning, supervision and follow-up of integrated water management in Flanders. As a
multi-sector and multi-level platform, the CIW gathers competent actors in water management,
including public servants from the agriculture and spatial planning departments. It therefore aims at
further integration of water management decision-making. For each of the sub-river basins, a basin
council, a basin executive and a basin secretariat have been introduced. A district water-board shall
be established at the sub-sub basin level at the initiative of the province, the objective being to
ensure cooperation between region, province, municipalities, and polders and ‘wateringen’ (see
table 16).
Table 16. Structure and planning of the integrated water policy at different levels
(source: CIW, 2007 in Uitenboogaart et al., 2009)
Level Dialogue Platform Plan
International river
basin district
International commissions (for Scheldt and Meuse)
International river basin district management plans
Flanders Coordination Commission for
Integrated Water Management
Flemish parts of the international river basin district management
plans
Water policy plan (waterbeleidsnota)
Sub river basin
Sub river basin authorities (bekkenbestuur, bekkenraad,
bekkensecretariaat)
Sub river basin management plans
Sub sub river basin Water boards (waterschappen) Sub sub river basin management
plans
Regarding the WFD implementation, the Significant Water Management Issues (SWMI) document
was elaborated by the CIW (competent authority for the implementation of the WFD in the Flemish
region). The CIW is composed of representatives of administrations involved in qualitative,
quantitative and integrated water management, of representatives of local authorities responsible
for water management and of representatives of related policy fields such as agriculture and drinking
water companies. The CIW started with the preparation of the document about 1 year before its
publication. The draft RBMP is elaborated by the CIW. In general, stakeholders are neither
represented in the CIW on plenary level nor in the working groups. However they can be allowed on

86
request (e.g. the nature and environment council and the socio-economic council are represented in
the working group on economic analysis). About half a year before the official start of the public
consultation procedure, a first draft of the program of measures was presented to the nature and
environment council and the socio-economic council, and ideas were exchanged with the members.
The Flemish Environment Agency (VMM) is the main organization in charge of the elaboration of the
PoMs, together with the CIW. In the context of the WFD implementation, the integration and
planning is in theory organized at the level of 11 sub-basins in the so-called ‘bekkenbeheersplannen’
(Crabbé, 2005). In practice, the PoM elaboration process relies on the regional level and especially
VMM, given the young experience in river basin coordination.
The main challenges identified to implement the WFD (Crabbé, op cit) are:
− bad water quality due to agriculture and waste waters – although significant efforts have
been made from the industrial sector ; hydromorphology ; river beds contamination ; flood
management ; disturbed groundwater systems
− fragmented competencies as an obstacle to the coordination of political actions, the
coordination between regions and cooperation with neighboring countries, and the lack of
experience of multi-stakeholder governance
− the need for a political effort to improve water quality
The Walloon region
Although the Walloon region has more water resources than the Flemish region (especially for
drinkable water), these resources are under pressure of (intensive) agriculture (covering 46% of the
total area), industrial and urban pollutions. Non-treated domestic wastewaters are an important
source of groundwater pollution.
In Wallonia, different administrations are in charge of surface waters according to their
characteristics (i.e. navigable or non-navigable waters). Administrative competencies of the ministry
of the Walloon region are spread in several directorates, among which the DGRNE (Direction
Générale des Ressources Naturelles et de l'Environnement) in charge of surface water bodies (non-
navigable waters and 1st category of navigable waters).

87
Figure 21. Levels of water governance in the Walloon region, Belgium
In Wallonia, water management falls into 5 categories of stakeholders (Walloon region
administration - http://mrw1.wallonie.be) (fig.21):
- The Ministry of Wallonia - Direction Générale des Ressources Naturelles et de l'Environnement
(MRW-DGRNE) and Direction des Cours d’Eau Non Naviguables (MRW-DCENN), who are in charge of
non-navigable rivers (1651 km of 1st category of non-navigable waters)
- The Ministry of Equipment and Transports - Direction Générale des Voies Hydrauliques (MET-
DGVH), who is in charge of navigable waters (460 km or navigable waters and 281 km of non-
navigable waters)
- Provinces (5950 km of 2nd category non navigable waters)
- Municipalities (5750 km of 3rd category non navigable waters)
- Landowners
Along with the public management of water courses, 4020 km of water courses are privately
managed, for a total of about 18 000 km of water course.
The Walloon Water Code (Art. D. 26 and D. 27, Art. D. 28) requires that the basin authority, the
Walloon Government, consult stakeholders on the WFD implementation timetable and work
program, Significant Water Management Issues, and the draft RBMPs. They include institutional
stakeholders such as AQUAWAL (union of public institutions producing drinking water and treating
wastewater), SPGE (public company financing wastewater treatment infrastructures), the different
advisory boards (consultative Commissions), the union of municipalities of Wallonia (UVCW), the
“Contrats de rivière”, etc. as well as stakeholders from the industry and agriculture sectors (Union
Wallonne des Entreprises, Fédération Wallonne de l'Agriculture) and environmental NGOs (Inter-
Environnement Wallonie, member of EEB). The advisory boards (such as the “Commission
SPW DGRNE Division de l’Eau
Provinces
Municipalities
Ministry of Equipment and Transports DGVH

88
consultative de l'eau”) and the “Contrats de rivière” were involved during all the process of
elaboration of the RBMPs and more specifically the elaboration of the programs of measures.
The “Commission consultative de l'Eau” is responsible for producing reports on regulatory texts to
implement two decrees on water resources. It is competent in the field of water protection and can
inform the Walloon Government on water policy issues within the scope of integrated water
resources management. The Commission is composed of 24 members organized in 3 groups
(Ministry of Environment - http://environnement.wallonie.be):
- 8 representatives of socio-economic groups (2 UWE, 2 EWCM, 2 FWA, 1 FGTB, 1 CSC)
- 8 representatives of environmental NGOs (2), fisheries organizations (1), recreation organizations
(1), consumers organizations (2), Union of municipalities of Wallonia (1), “contrats de rivière” (1)
- 8 AQUAWAL (6) and SPGE (2) representatives
This commission is called the « WFD Commission » since water legislation (Code de l’Eau) mentions it
should be consulted regarding all preparatory documents for the elaboration of RBMPs.
There exist 21 Walloon “contrats de rivière” with the main objective of participative water
management and awareness raising (communication) in the field of water. A “contrat de rivière”
gathers stakeholders of a same sub-basin in order to define (consensually) a program of actions for
the restoration of watercourses and surroundings, and for the protection of water resources in the
sub-basin. Various representatives (political, administrative, educational, socio-economic,
associative, scientific) are invited to participate in this approach. The area of competence of most
Walloon “contrats de rivière” corresponds to the borders of the 15 Walloon sub-basins. The impact
of their actions is principally local (municipal). Such planning process is not yet mature or functional
in most areas but the WFD is strengthening their legitimacy.
Considering challenges to implement the WFD, we can mention the important investments to be
realized in Belgium, especially in Wallonia, as a consequence of the 1991 directive on Urban Waste
Water (Barraqué, 1995). The implementation of this directive knew important delays due to the
scope of the actions to take and the related investments. Also, the institutional, administrative, and
political divisions do not allow for a global coordinated action and there is difficulty to establish a
river basin approach due to institutional and political constraints (Barraqué, 1995). Indeed, regional
policies are autonomous and pursue distinct interests. The political instability is quite strong in
Belgium and this is also true for Wallonia, where the improvement of water quality is not necessary a
political priority.

89
The Netherlands
The Netherlands are located downstream of several important rivers (Scheldt, Ems, Meuse, Rhine),
which implies that the country is dependent on neighboring countries regarding certain water
resources management issues and consequently its water policy is necessarily international. The
country being mostly flat, no territorial management entities were created for river basin
management18 (Barraqué, 1995). But water management is centuries old and powerful organizations
have a long experience with managing a very anthropized and somehow artificial ecosystem where
important constructions (dikes, ditches, canals, etc.) have allowed the country to develop and to
control the sea level. Barraqué (op cit) highlights the integrated management and the complex
planning process in place in the Netherlands, where multiple relationships are involved between
numerous actors with divergent interests.
This integrated management relies notably on sophisticated modeling of the physical environment,
the coordination of different territorial levels’ roles, and the development of mediation processes
between interests at stake. The Rijkswaterstaat (as part of the Ministry of Transport, Public Works
and Water Management) and its 10 regional branches, 12 provinces and 26 water boards (as
independent regional water management bodies) are the main actors in this integrated management
process – dealing simultaneously with qualitative and quantitative issues, taking into account various
water uses. Rijkswaterstaat and the provinces are not or partly based on river basins, and the water
boards are based on water management units (fig.22).
For the purpose of water management, surface waters are divided into “state waters” or national
waters (large rivers, canals, lakes and coastal water) and “non-state waters” or regional waters
(smaller regional waters). Both quantity and quality management of state waters are part of the
Rijkswaterstaat competency. It has 10 regional branches to support policy implementation and the
daily management of infrastructure and of state waters.
18Mostert (1998) adds that water management units in the southern and eastern parts of the Netherlands are one or more sub-basins. In the flat northern and western parts, no natural river basins can be distinguished, and these units are groups of polders.

90
Ministry of Transport, Public Works and Water Management
Figure 22. Levels of water governance in The Netherlands (source : Wiering and Crabbé, 2006)
The Rijkswaterstaat proposes policy for national waters and provides the framework for policy for
regional waters. The ministries of Housing, Physical Planning and the Environment (VROM) and of
Agriculture, Nature Conservation and Food Quality (LNV) are also responsible for national waters
planning and policy. Provinces translate and tailor national policy to strategies on the provincial level
and oversee municipalities and water boards. Their tasks consist in regulating large groundwater
abstractions, protection of environment, ensuring navigability of waterways (Mostert, 2008) and
regional waters’ policy implementation. In the ISD, three provinces (South Holland, Zeeland and
North Brabant) are involved and four water boards carry out management for regional waters
(Goeree Overflakkee, Zeeuwse Eilanden, Zeeuwse-Vlaanderen and Brabantse Delta). Water boards
are institutions to manage regional (non-state) waters and their competencies include safety against
flooding, water quantity management, sewerage treatment, and management of water quality and
ecology. To this end, they own and operate several types of infrastructures. They levy taxes for
specific tasks (i.e. waste water treatment, flood protection, surface water quantity and quality
management). In the Scheldt district, 17 municipalities translate water policy in their development
plans. They are also responsible for urban water management (waster and rain water collection and
groundwater management in urban areas) (Gilbert et al., 2007).
Planning has a central role at all government levels. Each level is responsible for certain categories of
water or territories. The State deals with dams and main rivers (upstream-downstream
management), provinces with groundwater, and water boards along with municipalities are
competent with water quality issues. Water boards are quite independent from the political powers,
and its board of direction is composed of representatives (more technical staff than politicians)
DG of Public Works and Water Management
Ministry of Housing,Spatial Planningand Environment
Provinces
Waterboards Municipalities

91
elected by inhabitants. They are traditionally composed of real-estate owners, but now include
inhabitants (Mostert, 1998, Notte, 2008). Water policy used to be centralized in the 19th century.
Since water quality issues in the 1970’s, more competencies in terms of qualitative water
management were given to water boards (Notte, op cit).
Water issues at national and provincial levels are considered along with strategic land-use plans and
environmental management plans. Land-use planning is often having a more prominent position
than water planning: “desired land use in an area determines water management” (Mostert, 1998).
Hydrological possibilities hardly influence land-use planning but is increasingly taken into account.
Along with these difficult trade-offs, coordination is also weak point of the system in place, as the
planning procedures differ and plans are adopted at different times. As introduced earlier, river basin
management is not performed by river basin authorities but there exist river basin commissions with
a coordination task (i.e. strategic river basin planning). Within these commissions, general goals can
be set but the choice and application of the measures to reach these goals are the responsibility of
different bodies that are not based on hydrological boundaries. The ‘coordination model’ is effective
in The Netherlands also because of cultural matters, as conflicts tend to be solved through
negotiations and compromises.
More specifically regarding the WFD implementation process, an “Implementation Act” (07/04/2005)
transferring the WFD into Dutch law modified existing acts (especially the Water Management Act
and the Environmental Protection Act) so as to comply with the WFD. The Ministry of Transport,
Public Works and Water management, provinces, water boards and municipalities (represented by
the Vereniging van Nederlandse Gemeenten) are designated as competent authorities. The 2009
Water Act covers all water management. The centralized state, Rijkwaterstaat, is responsible for the
delimitation of river basins. It coordinates the formulation of the strategic national water
management plan and prepares the operational management plan for “state waters” (e.g. the main
rivers). Provinces elaborate a strategic water management plan for all waters within their area
(regional or non-state waters), along with the operational management plan for groundwater
quantity. Water boards manage regional surface waters and make operational management plans
for their area. Each of these levels produces a segment of the river basin management plan (RBMP)
while Rikswaterstaat provides a model of RBMP (Notte, 2008). Provinces represent the local power.
They are in charge of the coordination of RBMP (and thus between the different territorial and
governance scales) and validate local plans produced by water boards. Even though three levels of
planning (national, province, water boards) participate in the elaboration of the RBMP and its PoM,
the Rijkwaterstaat makes the final decision on RBMP and PoM.

92
In the Netherlands, institutions thus adopted a model of coordination and cooperation between and
within government levels. The existing competent authorities keep their competencies and
cooperate in river basin commissions (without authority and competency) to implement the WFD on
river basin level. All different governmental levels and institutions draw up their own policy plans.
The frequency of renewing water policy plans has changed from 4 to 6 years to match the frequency
required in the WFD. A major specificity of water management is subsidiarity, since much operational
powers are delegated to local authorities, and each level has a competence of contracting authority,
ensures policing/control, and participates to the planning process (according to its role and
competencies). The drawback of such complex organization process is the difficulty to implement an
integrated management process, which is why there exist hierarchical relationships between RWS
and other levels, and local structures (water boards) tend to merge. Also, two main historical views
are now difficult to conciliate to implement the WFD. Indeed, an ‘environmentalist’ view is shared by
the VROM (environmental ministry) and most provinces, whereas a ‘civil engineering’ position is
defended by RWS and water boards. These views used to be somehow contradictory but now a
“good ecological status/potential” is at stake, both practices need to be integrated and this
represents a challenge, especially for water boards, since planning is centered at the provincial level.
The main challenges identified to implement the WFD (Wiering and Keessen, 2008) are:
− dangerous substances, eutrophication, sediments, and hydromorphology
− coordination for river basin management and public participation in planning
− administrative coordination (to this end, one water act was issued in 2009 to integrate
existing water policies)
− political involvement towards an obligation of results (i.e. water boards do not have the
power nor the responsibility to deal with diffuse pollution from the agricultural sector and
the national government is not taking – and partly not able to take – measures to further
address this issue, Uitenboogaart et al., 2009, chapter 3)
− upstream countries action
The institutional contexts and the organizational structures of water management depicted in this
section pointed out the main stakeholders involved in the policy transaction under focus, as well as
the challenges raised by the WFD in each of the 4 institutional contexts presented. This context
(summarized in table 17) will influence the steps to be performed and the decisions to implement
the WFD, and thus represent potential TC determinants.

93
Table 17. General institutional characteristics and possible impacts on transaction costs
Characteristics Possible impacts on TC or constraints to
implement WFD
France
Centralized system
Administrative layers (State, regions,
departments, numerous municipalities)
River basin organizations
Less contact between water managers
and water users
More bureaucracy
Gain of time and resources to set up
POM at RB level
Belgium
Federal State
3 independent regions
Lack of coordination
Possible trade-offs between regions are
limited
The Netherlands
Subsidiarity
No river basin organizations
Different levels with different
competencies
Need of coordination for river basin
management and planning
Now we have detailed the formal rules and requirements of the policy transaction at stake (section
2.1) as well as the specific institutional setting in which this policy transaction is investigated (section
2.2.1), we will introduce the methodology developed to analyze the WFD implementation process as
a policy transaction. This methodology is meant to qualify a less formal process, as to say the
organization and decisions made (arrangements) to cope with transaction costs when implementing
the WFD.
2.2 Methodology developed to assess policy transaction costs and their impact
As introduced in chapter 1, there is not much convergence on the issue of TC measurement. The
relatively few studies that propose a TC quantitative estimation developed a very context-specific
methodology (adapted to the transaction under focus) and relate to the assessment of

94
administrative costs. The research methodology we propose here results from a different approach,
where the issue is rather focused on how TC influence policy decisions than on the scope of TC linked
to a particular policy option or program. We thus conducted several steps so as to progressively
identify transaction cost coping strategies (arrangements), focusing on ex ante policy TC (as defined
in section 1.3.2) linked to the elaboration of the PoMs and justification of exemptions in the context
of the WFD implementation.
The main steps consist in
(1) Defining the policy transaction (the content of the transaction)
(2) Analyzing the institutional context
(3) Data collection on how countries organized to implement policy tasks so as to minimize their
constraints
(4) Data preliminary assessment to identify sources of policy TC
(5) Elaborating a policy TC typology
(6) Identifying policy TC determinants and the description of arrangements (TC coping
strategies)
(7) Categorizing TC minimization strategies
(1) Defining the policy transaction (section 2.1.2)
In chapter 1, we have set the theoretical basis for the definition of a policy transaction. Within this
framework, it is necessary to set boundaries to the transaction so as to identify: agents involved in
the policy transaction, the content of the policy transaction (policy tasks) that will be observable to
describe arrangements, and the categories of TC we are dealing with. In our case study, we analyze
the WFD implementation as policy transaction, with a focus on ex ante TC involved in the production
of PoMs and the justification of exemptions by Member States.
(2) Analysis of the institutional context (section 2.2.1)
This step allows for the identification of factors (potential TC determinants) that influence the
execution of policy tasks required in the transaction. It is especially relevant for a comparative
analysis where several institutional contexts are at stake (such as in the ISD), so as to investigate both
general policy transaction specificities and the context-specific TC sources.
Since steps 1 and 2 were detailed in the present chapter, we will now elaborate on data collection.

95
(3) Data collection (phase 1)
This step is meant to identify observable policy tasks in order to describe arrangements. At this stage,
data collection mostly consisted in grey literature on the WFD implementation (reports, studies,
policy documents, etc.) and phone interviews with stakeholders. Since the WFD was a recent and on-
going policy, this step was necessary to identify the stakeholders involved and key actors to
interview, the tasks undertaken in practice in each part of the ISD, how these tasks were undertaken,
the timing of tasks, and to get informed on existing documents and data.
(4) Data preliminary assessment
The overview of the WFD implementation practices in the 3 countries of the ISD (on the basis of
local/national/international policy documents and reports, conferences and exploratory interviews)
highlights certain strengths and weaknesses of the respective institutional contexts: certain aspects
favor whether others constrain the WFD implementation process. It also points out some practices
that clearly result from a minimization of constraints (i.e. choice over the water body size). Overall,
this step allows for targeting the information to focus on and to further investigate so as to describe
arrangements. It will be developed in section 1.1 of chapter 3.
(3) Data collection (phase 2)
So as to refine the definition of policy TC within the WFD policy transaction framework, 14 expert
face-to-face interviews (appendix C) were conducted in each of the three Member State of the ISD in
order to generate more precise information on how policy tasks were implemented and the
underlying motivations. Key staff in charge of the WFD implementation within different public
administrations (table 18) was interviewed on the basis of a questionnaire.The questionnaire was
tested beforehand in the French Rhine-Meuse river basin Agency for relevancy.

96
Table 18. Organizations where interviews were carried out in 2009 and 2010
France
Artois-Picardie Water Agency (Agence de l’Eau Artois-Picardie - river basin level)
Decentralized environmental administration (Direction Régionale de l’Environnement, de
l’Aménagement et du LogementNord-Pas-de-Calais- regional level)
Belgium
Walloon
region
Regional administration competent for agriculture, natural resources and environment DGARNE
(Direction Générale Opérationnelle de l'Agriculture, des Ressources Naturelles et de
l'Environnement – regional level)
Belgium
Flemish
region
Flemish Environment Agency (Vlaamse Milieumaatschappij) as government agency competent
environment (regional level)
Research organization VITO
Antwerp university
The
Netherlands
Province of Zeeland (local level)
Decentralized administration of the Ministry of Infrastructure and Environment
(Rijkswaterstaat) (national and regional level)
Phase 1 of data collection pointed out issues over which decision-making seemed to result from the
minimization of constraints. The questionnaire (see appendix D) was used as a basis for discussion
with the interviewees to further investigate such issues identified in the phase 1 of data collection
(related to the PoM design and justification of exemptions):
• Water bodies’ type, size and quality
• Designation of Heavily Modified Water Bodies
• Selection of measures
• Cost-efficiency analysis
• Cost-benefit analysis
• Capacity to pay analysis / Affordability study
• Exemptions
• Synergies
• Public consultations

97
The questionnaire was sent in advance to inform the interviewees on the information that would be
needed or that may be collected prior to the interview. It comprised both closed and open-ended
questions meant to (i) identify who was in charge of the different tasks, which actors participated
and to what extent, what where the choices made and why (on the different issues), what where
potential difficulties encountered, and (ii) prospect some possible measurable outcomes of tasks (i.e.
number of water bodies, number of studies undertaken, etc.).
(5) Policy TC typology (chapter 3)
This step consists in reviewing existing TC categories in light of the data collected. As a result, we
propose a TC typology adapted to policy early implementation, but also an understanding of
transaction cost minimization (section 2.1 of chapter 3).
(6) Policy TC determinants and description of arrangements (TC minimization strategies) (chapter 3
and 4)
The identification of policy TC sources is based on the analysis of the WFD implementation as policy
transaction and on the data collected (section 2.2 of chapter 3). The description of arrangements
results from the analysis of the linkages between observed TC determinants and the decisions made
by stakeholders to minimize TC when implementing policy tasks (section 1 of chapter 4).
(7) Categorizing TC minimization strategies (chapter 4)
As a last step, 3 general categories of arrangements (TC minimization strategies) can be identified
from the data analyzed (section 2 of chapter 4). This result can allow for a better analysis of policy
choices and decisions, and for anticipating the effects of TC.
The main steps of the methodology developed to identify TC determinants and minimization
strategies are summarized in the following table 19.

98
Table 19.Methodology developed to identify TC determinants and minimization strategies and main outcomes
Steps Outcomes
Defining the policy transaction
We analyze ex ante TC of WFD implementation
(elaboration of PoMs and justification of
exemptions)
Analysis of the institutional contexts
Factors that influence WFD implementation in the
4 institutional contexts
Data collection (phase 1)
Identification of observable policy tasks
Data preliminary assessment
Identification of constraints that influenced
decisions related to WFD implementation
(potential TC sources)
Data collection (phase 2)
Analysis of how tasks are performed
Elaboration of a policy transaction costs
typology
3 categories of policy TC
Identification of policy TC determinants
Description of arrangements
(TC minimization strategies)
5 types of determinants
Linkages between determinants and arrangements
Categorization of policy TC minimization
strategies
3 categories of policy TC minimization strategies

99
This 7 steps-methodology aims at analyzing/depicting policy arrangements so as to (1) characterize
transaction costs linked to policy implementation and (2) assess to what extent these arrangements
minimize transaction costs. The next chapter will present the operationalization of these two
objectives based on empirical data.
Conclusion chapter 2
Chapter 2 provided a definition of the policy transaction under focus and its content in terms of
policy tasks (the formal rules and requirements of the policy transaction at stake). Our analysis thus
targets the WFD early implementation phase, focusing on the design of programs of measures and
justification of exemptions, in the Scheldt International River Basin District. This phase is referred to
as the preparation of the policy transaction that induces ex ante policy transaction costs. We
depicted the institutional contexts that set the rules of the game and the organization of water
management in the International Scheldt District (France, Belgium and The Netherlands). On this
basis, we introduced the methodology developed to analyze the WFD implementation process as a
policy transaction. This methodology aims at qualifying the organization and the decisions made
(arrangements) by Member States to minimize transaction costs when implementing the WFD.
Chapter 3 will investigate the respective countries’ practices to implement the economic analysis to
design cost-effective programs of measures and to justify exemptions.

100
Chapter III Applying TCT to policy analysis: the analysis of the WFD
implementation
We have seen that the objectives set by the WFD will lead to strategic choices by Member States,
especially when considering the (financial) efforts required to reaching the GES. At this stage, our
objective is to identify constraints (transaction costs) that influenced the decisions to transpose and
implement the WFD, as a compromise between multiple actors. We are concerned with describing
arrangements, as to say the strategies and efforts to implement the WFD. Whether these efforts are
liable and the methods based on reliable rationales and data is beyond our observations and the
objectives pursued. In order to describe the policy arrangements (chapter 4), we have investigated
the TC factors that conditioned the WFD implementation process (section 1) and identified (1) a
policy transaction cost (PTC) typology and (2) categories of policy transaction cost (PTC)
determinants in light of the analysis of the PoM elaboration process (section 2).
1. Preliminary assessment of the WFD implementation in four institutional
contexts
PTC and PTC determinants are based on a preliminary analysis of the WFD implementation process.
To this end, section 1.1 will first depict Member States’ decisions to elaborate the PoMs according to
local specificities or constraints. Second, section 1.2 will analyze such trends so as to focus on the
specific decisions that consist in a response to constraints or potential TC determinants.
1.1 WFD implementation in practice
There is not yet much evidences to support the description of a policy arrangement in terms of which
dimensions show significant explanatory power with regard to transaction costs. For that reason, we
opted for an empirical analysis of the policy transaction’s determinants (phase 1 of the data
collection). This section will thus investigate the respective ISD countries’ practices to implement the
economic analysis to design cost-effective programs of measures and to justify exemptions. We refer
to step 3 of the methodology developed in chapter 2. Since the description of the whole
implementation process of the PoMs elaboration is beyond the scope of this work, we have chosen

101
to focus, among the data collected, on significant differences between contexts, practices and policy
decisions. It is worthwhile highlighting that data on this issue are sensitive (political, strategic, etc.)
and that public report on this process before any evaluation from the European Commission (i.e.
Interwies and Borowski, 2007) is necessarily partial (Interwies, personal communication). However,
despite this limitation, our concern lies in the main differences observed when developing the PoMs
and the underlying constraints.
As introduced in chapter 2, the WFD sets objectives to Member States, but Member States “work
these out” and assess their own objectives to pursue according to national priorities, accounting for
local communities and economic actors demands, and trying to ensure an acceptable cost for
taxpayers. Member States identify and select measures to reach the GES, anticipating their effect on
water bodies’ quality and justifying for any exemptions to the GES in 2015. The economic analysis to
carry out these tasks has a direct impact on the ambition of objectives pursued by Member States.
Among others, it has to do with choices on the possible options and the least cost way to reach the
WFD objectives, the distribution of the financial burden (through existing or future pricing policies),
the assessment of an “acceptable” cost (that is not “disproportionate”) although it is not possible to
analyze all costs and benefits in and economic way.
Since data on the WFD implementation is not homogenous among countries (i.e. in terms of
information available or shared), we will successively depict major trends for each country or region.
From now on, when we mention ‘France’, ‘the Walloon region’, ‘the Flemish region’ or ‘the
Netherlands’, we refer to the International Scheldt District, but data can be either specific to the ISD
or to the whole country/region.
1.1.1 France
Water body delimitation
In the Artois-Picardie river basin, 64 surface water bodies were delimited, with a mean size of 300
km2 (source: interview). There were negotiations between the water directorate (Ministry level) and
the Water Agency regarding water body size, since the Water Agency chose to delimitate large water
bodies (as compared to other French water agencies) so as to save on monitoring and other costs.
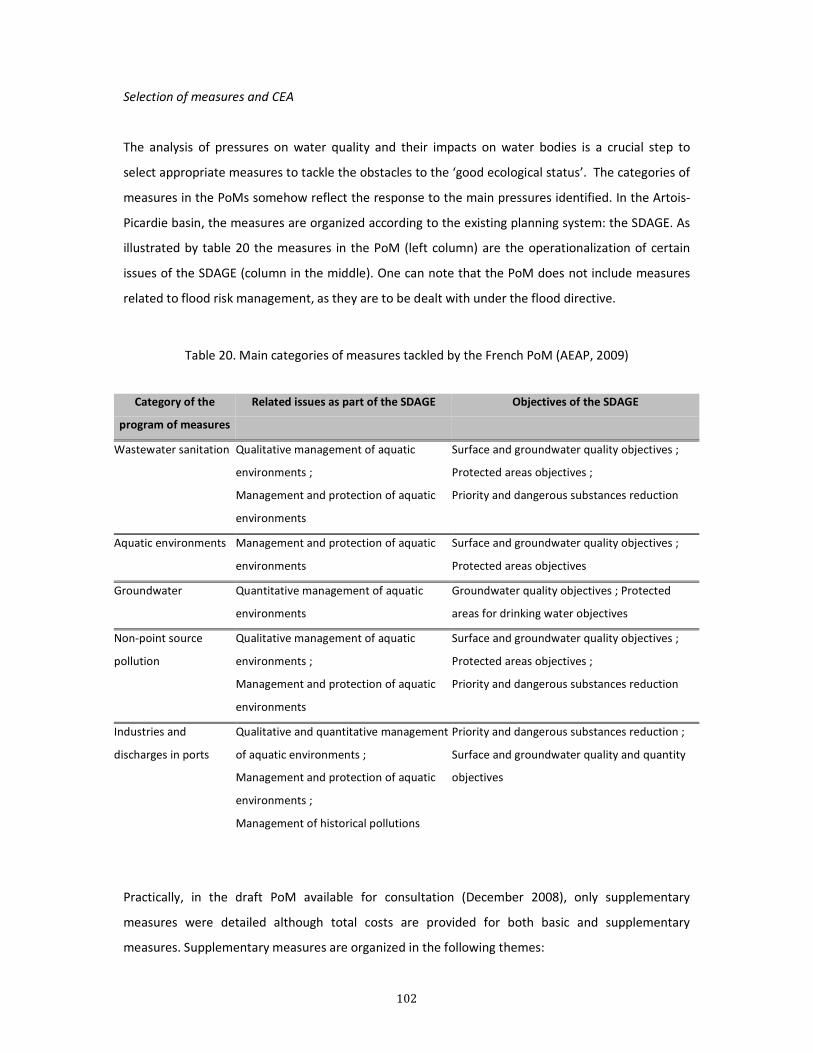
102
Selection of measures and CEA
The analysis of pressures on water quality and their impacts on water bodies is a crucial step to
select appropriate measures to tackle the obstacles to the ‘good ecological status’. The categories of
measures in the PoMs somehow reflect the response to the main pressures identified. In the Artois-
Picardie basin, the measures are organized according to the existing planning system: the SDAGE. As
illustrated by table 20 the measures in the PoM (left column) are the operationalization of certain
issues of the SDAGE (column in the middle). One can note that the PoM does not include measures
related to flood risk management, as they are to be dealt with under the flood directive.
Table 20. Main categories of measures tackled by the French PoM (AEAP, 2009)
Category of the
program of measures
Related issues as part of the SDAGE Objectives of the SDAGE
Wastewater sanitation Qualitative management of aquatic
environments ;
Management and protection of aquatic
environments
Surface and groundwater quality objectives ;
Protected areas objectives ;
Priority and dangerous substances reduction
Aquatic environments Management and protection of aquatic
environments
Surface and groundwater quality objectives ;
Protected areas objectives
Groundwater Quantitative management of aquatic
environments
Groundwater quality objectives ; Protected
areas for drinking water objectives
Non-point source
pollution
Qualitative management of aquatic
environments ;
Management and protection of aquatic
environments
Surface and groundwater quality objectives ;
Protected areas objectives ;
Priority and dangerous substances reduction
Industries and
discharges in ports
Qualitative and quantitative management
of aquatic environments ;
Management and protection of aquatic
environments ;
Management of historical pollutions
Priority and dangerous substances reduction ;
Surface and groundwater quality and quantity
objectives
Practically, in the draft PoM available for consultation (December 2008), only supplementary
measures were detailed although total costs are provided for both basic and supplementary
measures. Supplementary measures are organized in the following themes:
103
- Knowledge measures
- Habitat measures (effects on hydromorphology, etc.)
- Wastewater sanitation- Industry (effects on organic matter and phosphorous, etc.)
- Non point source pollution measures (effects on nitrates and phytosanitary products, etc.)
The Artois-Picardie PoM also includes the impacts of measures on the local water price.
In France, the selection of measures is carried out by water agencies and assisted by other
stakeholders (i.e. local or national administration representatives) with the support of DREAL (the
regional environmental authority). Guidance was provided by the Ministry through a regulatory
document (5/10/06 circular) about how to build a PoM, define objectives, content and priorities, and
trough information on the CEA and CBA. The selection of measures was thus led by the water agency
and carried out at the sub-basin scale (with data from sub-basin commissions: “commissions
géographiques”) or smaller units. An indicative list of measures was established for each type of issue
and provided to the water agency authority of each sub-basin. Local workshops with water agency’s
representatives, state representatives and thematic working groups were carried out to select the
most cost-effective measures for water bodies. Measures were identified within the 16 “territorial
committees” (comités de territoires), then discussed within the different river basin commissions
with stakeholders’ representatives (Commmission Industrie de Bassin and Commission Agriculture de
Bassin).
In the Artois-Picardie water agency, the individual effectiveness of measures is assessed by expert
judgment. Regarding the CEA, no general research program was carried out. The CEA evaluation
criteria used to select measures consisted in the application scale (i.e measure targeting the river
basin, a sub-basin or a water body), the direct and indirect effects, efficiency (a scale of 1 to 3 was
used) expressed in terms of emissions or loads reduction (not in terms of water quality), the
implementation difficulty (0 to 3 scale), the operational leader, and the financing source. This
analysis was thus mostly qualitative and the criteria go beyond the costs and efficiency given the
consideration for the conditions of feasibility (i.e. ease and rapidity to implement measures) (CIE,
2009, p.64).
CBA and affordability analysis
In France, water agencies undertook separately the CBA and the assessment of stakeholders’ ability
to pay, although the Ministry required combining both approaches (Cemagref, 2008). First, CEA is

104
undertaken to select the most (cost-)efficient measures. Then, CBAs were carried out for
supplementary measures with the aim to ensure economic legitimacy. General guidance was
provided by the Water Directorate of the Ministry of Environment.
A first screening of the costs of PoM was done based on a comparison between water agencies’ past
investments and investments currently needed to reach the good status. Economist at the Seine-
Normandy Water Agency,Laurans (2006 in Görlach and Pielen, 2007)proposed the screening
threshold of 20% of current water management costs, implying that if additional costs are lower that
20% no exemption should be required, if higher 20% look at costs and benefits. If the necessary
additional investments are too high, a CBA would be required according to a stepwise approach: a
qualitative assessment of potential impacts and consequences, and if not sufficient, benefits would
be assessed based on reference values (benefit transfer). A list of reference benefit values based on
60 existing studies has been set up at the central level by 2005 along with the assessment of their
quality or applicability to benefit transfer. The information is available to the public on the website
www.economie.eaufrance.fr. The issue to adapt these values to local income levels was raised, as to
say the elasticity of the willingness to pay and the willingness to pay estimations. To this end, 4
guidebooks were developed in 2005 with 4 benefits evaluation methods to be used for specific CBA
studies (www.economie.eaufrance.fr).
At the same time, specific indicators to assess affordability are defined at each sub-basin level in
cooperation with local stakeholders. If the necessary investments appear too important at the sub-
basin level, the local PoM is spread over time and if costs become “acceptable”, a time exemption is
foreseen. These local exemptions proposals are then checked at the basin level. Otherwise, a CBA is
carried out to check if costs are disproportionate in comparison to the benefits. However, local
stakeholders are reluctant to this approach and benefits were considered as negligible. The main
difficulties encountered for this analysis are stakeholders’ low acceptability of benefit assessment
but also the CBA, and the insufficient interpretation of the quality of the CBA due to the lack of
reference values and uncertainty about benefit transfer.
At the Artois-Picardie water agency, the economist Courtecuisse (2005) suggestedto look at the
effects on water supply costs in relation to household income, considering that the water bill should
not exceed 3% of disposable household income. This indicator considers the social dimension of
costs disproportion but disregards possible transfers between communities and the potential for a
socially adjusted water pricing based on households’ ability to pay. As highlighted by Brouwer (2008),

105
“in France, water managers seem to attach most importance to affordability type of arguments that
underline the importance of social factors in defining disproportionate costs”.
The main method to assess cost disproportion was proposed by the Ministry (Water Directorate) in
March 2008 (Croiset, 2009):
Step 1 Quantitative analysis to identify the need of an exemption due to disproportionate costs.
Step 2 Cost-benefit analysis. The Ministry developed a computer tool for water agencies to select
unit costs and willingness to pay within a list, and calculate costs and benefits ratios.
Step 3 Interpretation. A threshold for disproportionate costs was defined in May 2008 between the
Ministry and water agencies. The policy note (06/06/08) highlights that benefits are over estimated
since both basic and supplementary measures are considered by comparison to costs of
supplementary measures. If benefits are less than 80% of costs, costs are considered
disproportionate. This threshold can be revised according to the results of CBA studies. If benefits are
at least 80% of costs, the analysis of stakeholders’ ability to pay is undertaken to identify if they can
finance these measures. Such analysis shall also help determining when stakeholders’ contribution is
possible, so as to set potential delays in the financing of the PoM (spreading of costs over 2 or 3
cycles).
In the Artois-Picardie river basin, no exemptions for economic reasons were proposed when the draft
RBMP was issued in December 2008. Only exemptions for technical reasons and natural conditions
were detailed. In this river basin, it was acknowledged that the CBA faces significant acceptability
problems from local (elected) officials. In addition, the role of the CBA appears limited in cases where
costs are high and benefits low. In the end, the economic argument only came as an additional
argument to justify exemptions for particular water bodies. It was decided to undertake a CBA at the
river basin scale. A 6 months CBA study was commissioned to two consultancy firms (Ecowhat and
Ecodecision). The benefits of achieving the GES in the river basin were assessed on the basis of value
transfer (from existing studies and using the calculation tool developed by the Ministry known as
“D4E tool”) for a representative sample of water bodies. On this basis, the water agency focused on 7
types of water bodies so as to be able to identify benefits at the water body level.
Thresholds regarding cost disproportion were defined in May 2008 and this issue was dealt with by
the Ministry and the 6 water agencies. The ability to pay is interpreted as the one of stakeholders
who bear the costs of measures. Economic indicators were developed by water agencies to assess
costs disproportion and the weight of the PoM on economic sectors (see table 21 for the Rhine-
Meuse water agency). In the Artois-Picardie river basin, the issue of cost disproportion relates mostly

106
to water sanitation, and thus the impacts on households’ local water bill. A specific study was carried
out on the impact of sanitation measures on local water prices in the basin and the main results
appear in the RBMP. It allowed for considering the WFD effects on water supply cost in relation to
household income (water bill should not exceed 3%) but it ignores possible transfers among
categories of income. Regarding the capacity to pay, economic indicators are considered but given
the lack of data on this aspect, we will provide data from the Rhine-Meuse river agency, which
include similar economic indicators.
In the Rhine-Meuse river agency, the affordability analysis is done at the scale of a sector or groups
of water bodies. To assess stakeholders’ ability to pay, the costs of PoM are spread among sectors (to
apply the polluter pays principle): agriculture, households, industry, first without taking into account
subsidies. For households, the impact on water price is checked. Water price should not exceed 2-3%
of households’ total revenue. If so, disproportionate costs can be justified without the need to
consider alternative funding. In the case of agriculture, the costs of measures are assessed by farm
and expressed in percentage of the EBITDA (earnings before interest, tax, depreciation and
amortization). If higher than 2-3% of the EBITDA, costs are disproportionate without the need to
consider alternative funding. For the industrial sector, costs of measures are assessed by unit of
production and expressed in percentage of the EBITDA (earnings before interest, tax, depreciation
and amortization). Similarly, if higher than 2-3% of the EBITDA, costs are disproportionate without
the need to consider alternative funding.
Table 21. Economic indicators of cost disproportion used in the Rhine-Meuse water agency (AERM, 2009)
Field Economic indicators
Water sanitation Water price
Share of water bill in households revenue
Industry and artisans Added value
EBITDA (earnings before interest, tax, depreciation and amortization)
Internal financing capacity
Annual investment
Profitability rate
Artisans Revenue
Added value
Agriculture Added value
EBITDA (earnings before interest, tax, depreciation and amortization)
Net income
Internal financing capacity
Hydromorphology Local taxes (property tax, “habitation tax”)
107
If costs are found to be disproportionate, the consideration of alternative funding should contribute
to diminish the financial burden on local stakeholders and whether possible, subsidies can help
making costs proportional. If costs remain disproportionate despite possible subsidies19, one or two
consecutive time exemptions should be foreseen. If the spreading of costs (including subsidies) still
leads to disproportionate costs, less stringent objectives for the given water bodies should be
considered.
The Artois-Picardie water agency undertook the analysis of stakeholders’ ability to pay prior to the
CBA in order to target water bodies for which a (costly and time demanding) CBA would be required.
From this first analysis of the WFD implementation in the French part of the ISD, we can highlight the
existence of river basin institutions (water agency, river basin committee, to some extent DREAL) and
river basin planning (SDAGE, SAGE) prior to the WFD. These are likely to facilitate the elaboration of
the PoM at the river basin scale, in terms of data available and existing negotiation and coordination.
The Artois-Picardie is a small water agency along with the Rhine-Meuse water agency, as compared
to the other 4 French water agencies that deal with a larger territory. They are thus less actors and
stakeholders, and to some extent a more direct communication between the river basin agency and
the local level. This results in more work and decisions taken directly by the water agency and that
may allow the basin level for more responsiveness and adaptation capacity. In France, the role of the
water agencies is strong as compared to the national level (Ministry), partly given their financial
autonomy. In practice, this resulted in a gap between the two levels when implementing the WFD, in
the sense that water agencies seem to have been ahead in terms of implementation and technical
issues, when national guidance was sometimes delayed. Overall, the water policy planning is
organized at a territorial scale but somehow remains centralized. With regard to the PoM
elaboration, the water body was the privileged scale, which implies that detailed data was
researched for. The PoM was validated by the river basin committee. It is financed to a large extent
by water agencies (through water levies and taxes) and its costs will be spread equally over the three
(6-year) WFD cycles. A priority in this river basin was stakeholders’ capacity to pay, thus with a
concern for the incidence of a water price increase, leading to the first screening of measures.
19Households: water price should not exceed 2-3% of households’ total revenue (including subsidies).
Agriculture: if higher than 2-3% of the EBITDA (including subsidies), costs are disproportionate.
Industry: similarly, if higher than 2-3% of the EBITDA (including subsidies), costs are disproportionate.
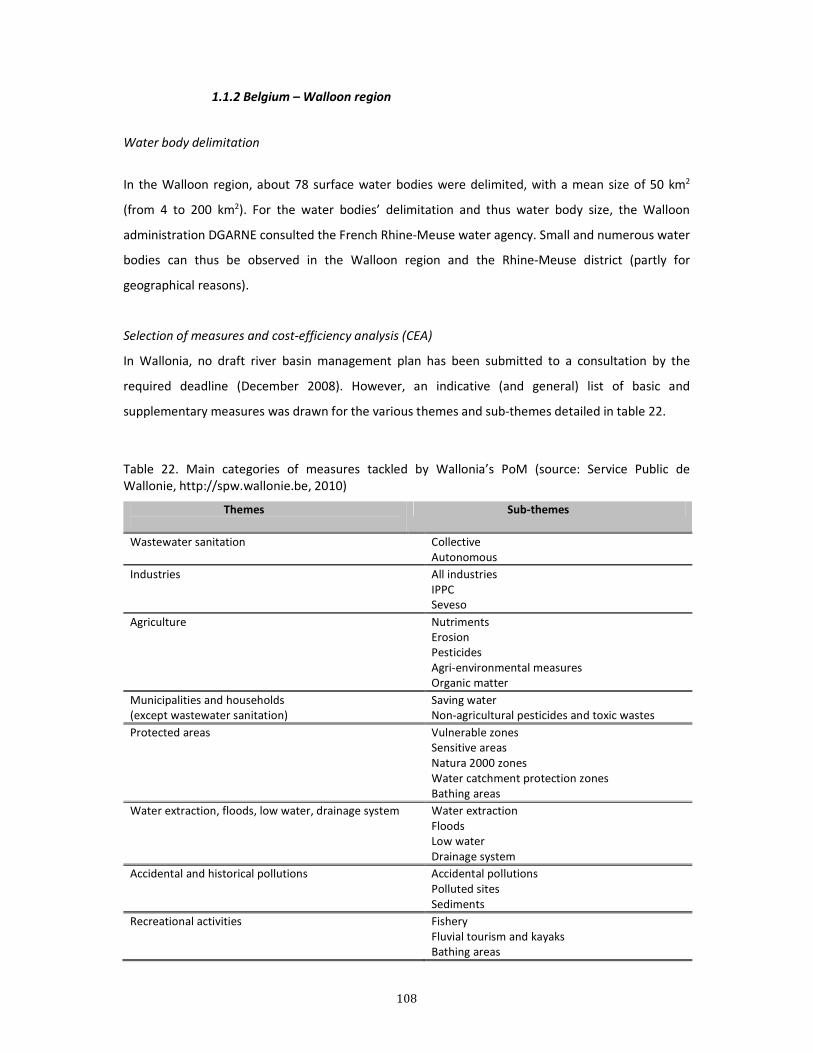
108
1.1.2 Belgium – Walloon region
Water body delimitation
In the Walloon region, about 78 surface water bodies were delimited, with a mean size of 50 km2
(from 4 to 200 km2). For the water bodies’ delimitation and thus water body size, the Walloon
administration DGARNE consulted the French Rhine-Meuse water agency. Small and numerous water
bodies can thus be observed in the Walloon region and the Rhine-Meuse district (partly for
geographical reasons).
Selection of measures and cost-efficiency analysis (CEA)
In Wallonia, no draft river basin management plan has been submitted to a consultation by the
required deadline (December 2008). However, an indicative (and general) list of basic and
supplementary measures was drawn for the various themes and sub-themes detailed in table 22.
Table 22. Main categories of measures tackled by Wallonia’s PoM (source: Service Public de Wallonie, http://spw.wallonie.be, 2010)
Themes
Sub-themes
Wastewater sanitation Collective Autonomous
Industries All industries IPPC Seveso
Agriculture Nutriments Erosion Pesticides Agri-environmental measures Organic matter
Municipalities and households (except wastewater sanitation)
Saving water Non-agricultural pesticides and toxic wastes
Protected areas Vulnerable zones Sensitive areas Natura 2000 zones Water catchment protection zones Bathing areas
Water extraction, floods, low water, drainage system Water extraction Floods Low water Drainage system
Accidental and historical pollutions Accidental pollutions Polluted sites Sediments
Recreational activities Fishery Fluvial tourism and kayaks Bathing areas

109
Hydromorphology Management and maintenance of rivers Hydro-electrical construction
Several experts have established a catalogue of basic and supplementary measures on the basis of an
existing list of measures called “Thesaurus” developed in Belgium. These measures were applied to
the water body scale or groups of water bodies. Political negotiations over the draft RBMP were
expected to leave out some of the most constraining measures.
The evaluation criteria used in the CEA to select measures consist in: the probability to reach the
objective, the ecological efficiency, and time required for measures to be efficient. The Pegase
model20 was used to assess the effects of measures on certain parameters (15 water quality
parameters, and micro-pollutants levels when possible) (CIE, 2009, p.64). The Pegase model allowed
for developing pollution reduction scenarios by objective (i.e. diminish nitrogen amount by 20%).
Considering the limits of existing models, experts have completed the analysis. If the risk of not
reaching the good status/potential related to biological parameters, a delay was systematically
requested (interview).
As part of the public consultation process, a document specifically dedicated to the economic
analysis of water uses and pressures was issued. However, it did not include information on CEA nor
CBA. In May 2009, the draft RBMP was not finalized. A public consultation on draft RBMP was
scheduled for fall 2009 (for 2 small sub-river basins) and January 2010 (2 other sub-river basins)
(interview). Regional elections in June 2009 can partly explain this delay. Like in Flanders, the
Parliament votes to approve the draft RBMP, after what it is submitted to public consultation and
again to the Parliament.
Regarding the economic analysis under way in 2010, Wallonia sought for data at the water body
scale, for instance of costs of measures, which implied information on the water body surface or
length. Since other administrations work at the scale of municipalities, these data had to be
transcribed.
20Planification et Gestion de l'Assainissement des Eaux (Smitz et al., 1997).

110
Affordability analysis and Cost-benefit analysis (CBA)
The impact of the cost of PoM was investigated for the different sectors. If stakeholder groups can
pay for the measures (the thresholds are not known), these measures will be implemented, if their
possible contribution is judged insufficient, a CBA is required. For the CBA, costs of PoM are
considered at the water body scale, and benefits are calculated at the scale of the sub-basin. A
thorough benefit estimation study was undertaken by the Free University of Brussels, the
consultancy ACTeon and Espace Environnement during 6 months. Several methods were used:
- Contingent evaluation to assess willingness to pay (WTP) (non-market benefits). A representative
sample (2000 people) of the population of the 15 sub-basins were consulted by phone
- Travel cost method: studies on-site to assess the value of recreational areas, according to
explanatory variables of the visits (i.e. water quality). Water quality did not seem to be a significant
criterion for visitors.
The time horizon for the CBA was still under discussion recently. In the study on WTP, the time
horizon was 20 years (in order to match the 2027 deadline). However, one can argue that if the time
horizon is smaller (i.e. 5 years), the WTP could be higher. The benefits estimated amount 600 million
€ for 20 years, whereas the costs of water sanitation for 4 years amount 800 million €.
In short, the context in Wallonia is similar to Flanders in the sense that the PoM elaboration process
is undertaken at the regional level and it is led by political actors. Wallonia consulted more
stakeholders (different administrations) than in Flanders from the start. More public administrations
were involved in the PoM elaboration and they changed and adapted the draft river basin
management plan according to the consultations undertaken. However, Wallonia was subject to a
significant political instability, implying limited mid-term or long-term political objectives and lack of
political consensus. In addition to the fluctuant political situation, bilateral coordination with the
Flemish region is not systematic and mostly effective only for transboundary water bodies.
1.1.3 Belgium – Flemish region
Water body delimitation
In the Flemish region, the application of the method by VMM to delimitate water bodies led to a very
large number of water bodies (about 800). The regional government asked for changes to reduce this

111
number to a more manageable amount of water bodies. After a several year process, the final
number of water bodies reached 182 with a mean size of 14 km. The minimum water bodies’
catchment size was increased from 10 km2 to 50 km2.
Selection of measures and cost-efficiency analysis (CEA)
The central administration is responsible for the final design of the River Basin Management Plan
(RBMP). Since the 2003 decree on integrated water policy, three councils (economic, agriculture,
environment) give advice on the draft RBMP. These consultations may take the form of lobbying and
trigger negotiations with the Ministry of Environment. The RBMP also has to be approved by the
Flemish government, which adds a strong political dimension.
In the Flemish draft river basin management plan, the scope of pressures on water bodies is
explained by the high demographic pressure, the intensive use of land, the economic activities and
the surface water quality originating from neighboring regions. The risk of not achieving the good
status is due to point and non-point source pollution as well as hydromorphological changes. In the
case of groundwater bodies, land occupation and related pollution as well as water extraction
constitute the main pressures that could jeopardize the achievement of the good status. The draft
PoM is based on 8 main themes illustrated in table 23.
Table 23.Main categories of measures tackled by the Flemish PoM (CIW, 2008)
Groups of
measures
Themes
1. European legislation 2. Cost recovery and polluter pays principles 3. Sustainable use of water 4A. Protected areas and wetlands – groundwater 4B. Protected areas and wetlands – surface water 5A. Groundwater quantity 5B. Surface water quantity 6. Floods 7A. Groundwater pollution 7B. Surface water pollution 8A. Hydromorphology 8B. Sediments
In the Flemish region, the selection of measures and the costs of measures are defined at the scale of
the region (and not at the water body scale). Three scenarios were developed: baseline (basic
measures), intermediate (cost-effective measures) and maximum (all measures required to achieve

112
the good status). Different thematic groups (composed of administrative agencies at the Flemish
level) produced templates with proposed measures and information on the costs and effects. For the
costs of measures, measures were linked to issues (i.e. Nitrogen reduction measures, water
pollution, water quantity, flood protection, etc.).
For the purpose of the economic analysis, the Flemish Environment Agency (VMM) hired one
economist (to work on cost recovery) and outsourced several studies (mostly to VITO). VMM used
the Pegase model for the Scheldt river basin only21, and the Environmental Costing Model (ECM or
Milieu-Kosten-Model – MKM – in Dutch) to support the CEA which tool was first tested in the Nete
sub-basin (Broekx et al. 2008) and then used for other sub-basins. The CEA was carried out in 2008 at
the regional scale by thematic working groups. The objective will be to refine this analysis to a
smaller scale for the next cycle and RBMP. The CEA was partly quantitative (with the use of ECM and
Pegase for some parameters related to the physico-chemical status of waters) and partly qualitative:
where no quantitative effects of measures were assessed, a ranking from 1 (“no impact”) to 7 (“high
impact”) was chosen. This resulted in the establishment of cost-effectiveness ratios to account for
the costs and effects of measures. No specific database on costs of measures was established before
the WFD, except for sanitation and sewage measures. So as to carry out the CEA, handbooks of other
countries (Germany, The Netherlands) were consulted, pilot projects on effectiveness of measures
were launched, and the TWOL research project allowed for an inventory of environmental cost
efficiency of measures targeting diffuse pollution.
Affordability analysis and Cost-Benefit Analysis (CBA)
In 2008, both of these analyses were undertaken simultaneously. The underlying issues consisted in
how costs of measures are spread and who pays for measures (considering 4 types of subsidies: EU,
federal, region, community) as well as who is responsible for the costs of pollution. Regarding
benefits estimation, the Aquamoney project22 was a trigger: in the Dender sub-basin, a study of
willingness-to-pay to improve water quality was undertaken. The assessment of benefits included
original valuation studies on flood protection (2008) and other studies, as well as benefit transfer (i.e.
choice experiment in one basin). Costs and benefits were assessed at the regional level (and not river
21This is due to the Scaldit project carried out by countries of the ISD in the early implementation phase of the WFD. It was agreed by parties to use a single model so as to have common references. 22Research project funded under the 6th EU Framework Programme. It aims at developing and testing practical guidelines for the assessment of environmental and resource costs and benefits in the WFD.

113
basin level). Benefits are estimated to range from 40 to 200 €/household/year or 100-500 million
€/year given the 2.6 million households in Flanders (interview), while the costs of the maximum
scenario (full implementation of the WFD by 2015) amount 1 900-2 300 million €/year and the cost-
effective scenario 1 000-1 300 million €/year (CIW 2009).
The disproportionality analysis was undertaken for the entire PoM at the scale of the Flemish region
by VITO in 2008. It was found that benefits were inferior or equal to costs. Similarly to France, the
financial impact of the PoM is investigated through the repartition of costs among stakeholder
groups, and thresholds of costs disproportion were established (see table 24).
Table 24. Economic indicators and disproportionality thresholds in Flanders (source: CIW 2009)
Stakeholder groups Economic indicators Thresholds
Acceptable To be discussed Not acceptable
Industry Revenue
Profit
Added value
Total investment
< 0.5%
< 10%
< 2%
< 10%
0.5-5%
10-100%
2-50%
10-100%
> 5%
> 100%
> 50%
> 100%
Agriculture Income
Added value
No fixed threshold (impact of costs of the 3 scenarios on
average income)
Basic: 1% ; Cost-effective scenario: 6-7% ; Maximum
scenario: 17-19%
Households Income
Costs of water service
Max. 2-5% of income (also for low income groups)
As highlighted by the thresholds of the economic indicators developed, there is room for negotiation
on what is considered as cost disproportion. The issue of who incurs and who bears the costs was
also still ongoing in 2010.
In Flanders, there existed a sub-basin level planning prior to the WFD, but sub-basin plans are not yet
in conformity with the WFD requirements (i.e. there is no economic analysis). Also, there is a 3 years
interval between the WFD deadlines for RBMP (2009, 2015, 2021) and the sub-basin planning (2006,
2012, 2018). More convergence between the Flemish water planning and the WFD requirements is
expected for the next cycle. Given these aspects and the new administrative set-up including river
basin management committees (with members from local municipalities, drinking water agencies,

114
environmental agencies, etc.), the analysis for the elaboration of the PoM was not very detailed in
the beginning. For instance, the first draft RBMP submitted for consultation did not include much
information on costs and effects. Another reason for this lies in the institutional context since in
Flanders, polders and “becken” are small territorial entities and they only work on water quantity
issues. Their responsibility is thus limited and their commitment is quite low, which induces that the
local level is not really involved (or informed - as questioned by our interviewee) in the WFD and the
selection of measures. In Belgium there is no “one single national scale” and the rather high number
of planning levels in Flanders makes it harder for lower levels to take decisions than in the
Netherlands (interview).
Although Flanders and the Netherlands have cooperated during the Scaldit project23 and exchanged
much information (i.e. through meetings to compare their ways of working), they have different
approaches and organization of water management.
1.1.4 The Netherlands
Water body delimitation
In the Dutch part of the ISD, 56 water small bodies were delimited, with a mean size of 22 km2.
Cost-benefit analysis (CBA), selection of measures and cost-efficiency analysis (CEA)
The CEA was actually part of a more general analysis. In 2005, the Dutch Parliament required a
strategic CBA to have an idea of expected costs and benefits of 3 different WFD implementation
levels, where the contribution of measures to GES was assessed qualitatively. An interdepartmental
working group on the CBA was set up to discuss methods and progress, reports to minister and
Parliament. Water managers were asked to provide information about the potential measures
necessary to achieve the good ecological status in their basin. Authorities (water boards, provinces,
central state for state-managed waters) have been asked to compile different lists of potential
measures based on cost-effectiveness considerations (decision of the Ministry of Transport and
23An Interreg IIIB NWE project aiming at the transnational characterization of the Scheldt International River Basin District, (Dieltjens and Van Den Langenbergh, 2005).

115
Waterworks and the Parliament, December 2005) in order to elaborate 5 measure packages
(Interwies and Borowski, 2007):
1. Measures already decided or current policy implementation: measures to be implemented within
the next year with a specific budget assigned
2. Basic measures required for the implementation of other EU directives: baseline scenario
3. Measures for a WFD implementation based on a limited effort
4. Measures for a WFD implementation based on a significant effort and that are still affordable
5. All theoretically possible measures to implement the WFD.
The decision whether measures were part of list 4 (still affordable) or 5 was based on budgetary
constraints at the regional level.
The strategic CBA provided costs estimates of current policies and potential additional measures to
implement the WFD, leaving aside the analysis of benefits (interview). The aim of a national CBA was
to get an idea of the potential impacts of measures and to support strategic choices on the types of
measures that should be part of the first RBMP and on what intensity.
A handbook on the selection of cost-effective measures for the WFD implementation has been
developed for the Netherlands. Expert judgment was also important to develop the different
measure packages. The assessment of cost-effective measures for the agricultural sectors
(nutriments and pesticides use and emission reduction, drought management) was carried out at the
national scale during the strategic CBA. It involved among others two projects. One relates to the
elaboration of a “best practices” national database (PPO - Praktijkonderzoek Plant & Omgeving or
Applied Plant Research organization - in collaboration with LTO - Land en Tuinbouw Organisatie or
Dutch Federation of Agriculture and Horticulture), comprising measures adapted to the different
sectors. The measures are organized according to the practical implementation degree (“good
practices”, “best practices”, “knowledge development”, “applicable measures under restrictions”)
and the cost-effectiveness ratio of measures is broad. In the second project (“Groslijst maatregelen
Kaderrichtlijn Water”), LTO-Nederland (Land en Tuinbouw Organisatie or Dutch Federation of
Agriculture and Horticulture) and the Unie van Waterschappen (Associationof Regional
Water Authorities) have elaborated a database of possible measures for the agricultural sectors,
including links with organizations and pilot projects. Results were published in 2007 (www.lltb.nl).
At the national level, a “national accounting matrix” including water accounts for river basin was
developed. This integrated river basin accounting supported the measurement of the water uses’
socio-economic significance by sector, which was useful to discuss costs disproportion. Strategic

116
discussions with specific sectors regarding their contributions to water problems and the possible
improvements were triggered at national level. Such negotiations allowed to target the necessity of a
strategic analysis for agriculture sector and to identify possibilities for the industrial sector to take
additional measures. It was argued that few options were possible at national level and that more
potential lies at local level (based on a study by the consultancy Ecorys).
The CEA evaluation criteria included the parties who execute measures, the target group, the time
period required for a measure’s implementation, the delay necessary before a measure is considered
efficient, risks (probability and factors of a successful implementation), and uncertainties. This
analysis was rather quantitative but efficiency was expressed in terms of emission reduction or loads
and not in terms of water quality (CIE, 2009, p.64).
The main difficulty encountered for the selection of measures rested on the integration of measures
that have impacts of different WFD objectives. Van der Veeren (2002, cited in Brower 2008)
proposed a theoretical solution that would imply increasing complexity (and thus decreasing
transparency). It is recognized that complex modeling approaches are too difficult to implement at a
practical level due to data requirements but also capacities at the regional level (very few
economists).
For the CBA, the Rijkswaterstaat considered three main WFD implementation scenarios: minimum,
intermediate, and maximum implementation. The contribution of each scenario to the
environmental objective was assessed in a qualitative way regarding the effect on water chemistry,
ecology and eutrophication. Estimated costs and benefits of each scenario are summarized in table
25.
Table 25. Estimated total costs and benefits of WFD implementation in the Netherlands (Brouwer,
2008)

117
Costs refer to the total direct costs of basic and supplementary measures needed to reach the WFD
objectives. The author specifies that the highest share of the total expected investment costs is
dedicated to investments in chemical water quality improvement (60-70% of total costs). The other
main source of expenses consists in the ecological restoration of water bodies. When these estimates
are compared to the total costs of water management in the Netherlands: 3.8 billion € (V&W, 2007),
the WFD is expected to induce an annual cost increase for 2010-2015 of 25 to 75% (depending on the
scenario chosen), and about 15% lower if measures can be spread over time after 2015 (Brouwer,
2008). However, the cost estimates are subject to overestimation (about 10%) and high uncertainty
(costs could be 25-50% higher or lower). If real costs are 50% lower, the annual increase of
expenditures for water quality management would be 12-40% (Brouwer, op cit). Supplementary
measures targeting polluting substances are not found to be cost-effective (since basic measures are
in most cases efficient) and measures targeting the improvement of hydromorphology are cost-
effective (V&W, 2008).
The market and non-market benefits of the WFD implementation was based on a rough benefit
transfer study carried out in 2006 (Witteveen en Bos, 2006 in Brouwer, 2008). The main components
identified were: improved water quality (40% of the total benefits), the economic value of nature
conservation (30%), recreation (15%) and biodiversity (15%). Market values (including expenditures
and cost estimates) were used as proxies for most benefits and a 4% discount rate was used. Benefits
are likely to be 20% higher or lower. They are found to be less than 25% of total costs (50% if costs
are lower than the estimates in table 25). The issue of cost disproportion is raised at this time and
scale. Brouwer mentions that in a December 2006 policy note, the Dutch government considered the
maximum scenario disproportionately costly based on table 25 information. When considering
willingness to pay (stated preferences), it is found that Dutch households are willing to pay 22% extra
(of taxes and charges on water – about 470€ in 2003) for the implementation of the WFD, or 0.4% of
the average household income (2003). When aggregated to cover the whole population and
discounted over the period 2009-2015, benefits amount 3,3 billion € which is lower than the benefits
estimated for the intermediate scenario (table 25). The author highlights the need to consider the
financial implications for other target groups (agriculture and industry). This analysis pointed out the
types of measures of specific interest (i.e. ecological measures) and types with high costs and limited
benefits. The results of the strategic CBA will contribute to the final development of lists of measures
at the local level to be included in the RBMP.
118
The results of the strategic CBA were discussed by the national Parliament in 2007 (V&W, 2009). A
follow-up (2007-2008) included the preliminary results on the lists of measures proposed by the
regional level based on scenario 4 “significant effort option” or intermediate scenario. On the basis
of these results, “regional processes” led by water boards were developed for each (sub-) basin. They
involved authorities, relevant sectors (especially agriculture) and NGOs. The design of regional
measure packages was considered at the sub-basin scale, and measures were prioritized according
to: cost estimation, feasibility, and the integration potential within the management and
implementation processes of the sectors concerned. The regional measure packages are designed as
a complement of national measures and programs. Regional administrators focused mainly on
development and management measures to restore hydromorphological conditions and reduce
nutriment emissions in surface waters. Supplementary measures targeting nutriments and pesticide
emissions are part of the general policy, such as the 4th Nitrates national action program 2010-2013.
In 2007, water managers started gathering regional information on measures and objectives in a
national database. Some of the difficulties encountered when carrying out the CBA relate to benefits’
assessment. A handbook on the estimation of benefit values has been developed at the national
level to develop “prize tags”, and includes benefit transfer approaches. The results of the
Aquamoney project (implemented in the years 2007-2010) could be useful for the next
implementation cycle.
Ex-ante evaluation of the WFD (2008)
From the information available on the national database, the Planbureau vor Leefomgeving (PBL) (or
Netherlands Environmental Assessment Agency) carried out a second CBA as an ex ante evaluation of
the WFD at the request of the Ministry of Transport, Public Works and Water Management. The
public report published entitled “Evaluation of the WFD in the NL; costs and benefits” reviews the
ambition levels of the measure packages to improve surface waters’ ecological quality. These
packages include measures for the large national water bodies developed by the national water
authority (RWS) and measures for the regional water bodies proposed by the regional water
authorities. It is recognized that the WFD measures may be difficult to distinguish since the PoM
contributes to WFD targets as well as other policy targets (i.e. the Dutch water Management in the
21st century – WB21, the Birds and Habitat directives, the Nitrate directive and the Bathing water
directive). Based on the PBL estimations (table 26), the extra costs of measures especially dedicated
to the WFD implementation amount 2.9 billion € for the whole country.

119
Table 26. Costs of the measures’ packages in the Netherlands, 2008 (source: PBL 2008)
Investments 2007-2027
(million €)
Estimated share of standing
(current/existing) policy
Regional water bodies 5 443 (30%) 3 578 (70%)
National water bodies 1 687 (60%) 663 (40%)
Total (million €) 7 130 (60%) 4 241 (40%)
The major share of investments (65-70%) is planned for the period 2010-2015 (table 27). The annual
cost to society would amount 390 million € until 2027, where 60% would be paid by the water
boards, 15% by municipalities and 15% by the national water authority (RWS). About 10% of these
are not yet allocated. As a result of such costs, the water board charges would increase yearly by
0.7% during the period 2010-2027.
Table 27. Phasing of RBMP investments in the Netherlands (source: PBL 2008)
2007-2009 2010-2015 2016-2027
Regional water bodies 0.8 2.7 1.9
National water bodies 0.25 0.9 0.5
Total (billion €) 1.05 3.6 2.4
An additional cost is considered in the PBL ex ante evaluation of the WFD implementation: regulation
costs. They include about 400 FTEs (full-time equivalent) per year (45 million €) corresponding to the
staff involved in the process of implementing the WFD, as well as 45 million € dedicated to research,
engineering, and development of technologies and tools. These costs amount 300-350 million €
(between 2000 and 2009), or 10-12% of the total investments in WFD-related measures. The results
of this ex-ante evaluation were presented and discussed at the national Parliament in June 2008. This
process has involved stakeholders’ meetings at the regional and national levels. It has led the final
design of regional PoMs. Measures and targeted objectives for each water body were included in the
national database, along with the respective costs of measures and the most profitable time of
execution.
This 2008 ex ante evaluation only considered the “the priority package” scenario to be in the draft
RBMP. It does not include monetary estimates of benefits, but ecological benefits presented as
quality ratios illustrated in the form of pictures.

120
Cost disproportion assessment
The Netherlands opted for “assessing proportionality at the national level”. In a 2005 report to the
Dutch Water Management Agency (RIZA), Brouwer suggested to distinguish the financial and the
economic impacts of the measures (Görlach and Pielen, 2007). He proposed several criteria to assess
disproportionality:
- the impact of measures on BSP level and growth (disaggregated for regions and sectors)
- the impact of measures on prices, taxes and charges, and consequently on available household
income
- the sectoral distribution of burdens between households, agriculture and industry
- for individual firms, the ability to pay could be assessed based on profit margins and liquidity.
This highlights that there is no clear-cut answer to assess what acceptable costs are. The willingness
to pay study is informative as it considers a 20% increase over the current expenditure for water
management. Brouwer argues that the approach of cost disproportion in the Netherlands is
somehow in between the French and the British, considering both affordability and welfare
economics (the balance between costs and benefits). The Netherlands also underlines the political
nature of the discussion on cost disproportion as the disproportion thresholds should be set by policy
makers. Van der Veeren (in: Interwies and Borowski, 2007) indicates that the assessment of costs
disproportion is closely linked to the different packages of measures, especially the decision whether
measures are part of scenario 4 (economically on the edge) or 5 (disproportionately costly). This
decision is partly linked to the existing budgetary constraints at the regional level. However, neither
specific methodology nor guidelines were developed at the national level to support the assessment
of disproportionate costs.
Given the existing water policy planning in the Netherlands, several territorial or administrative
levels (4) contributed to different plans constituting the RBMP, all plans being due the same year.
This organization allowed for a rather bottom-up process and the selection of more water body
specific measures than in the neighboring Flemish region. Indeed, the RBMP is a combination of local
information and works whereas in Flanders there are not yet clear linkages between the local and
regional level processes (interview). Despite the involvement of lower levels, the national guidance
and supervision is strong, which may facilitate the coordination of the planning process. A significant
share of measures relate to climate change and flooding issues (in comparison to water quality),
which correspond to national policy priorities.

121
The Dutch approach to elaborate the PoM on the basis of an economic analysis is claimed to be
‘strategic’, and appears to be focused on pragmatic considerations where decisions shall be relatively
easy to set in practice. In this line, the ‘strategic CBA’ at the national level allowed to identify
measures with high costs and limited benefits and to inform provinces and water boards on which
types of measures to leave out and which one to focus on (interview). Despite the benefit
assessment studies carried out, the ex ante evaluation of RBMP did not include benefit monetary
estimates as they are considered ‘too unsure’ and the disproportionate nature of costs is political.
The Dutch PoM does not propose an explicit affordability analysis, but local budgetary constraints
are much determined by water boards’ decisions on water charges’ increase (interview). Like in
France, the annual increase of expenditures for water quality management is considered in the
discussion on cost disproportion. There is a difference between the French and the Dutch ways to
spread the costs of PoM: in France, the costs are equally spread among the 3 cycles, whereas in the
Netherlands, the highest amount is allocated to the first cycle, where all possible measures are to be
taken (especially considering long terms effects of measures). It was observed by a Dutch policy
maker interviewed that France seemed to gather as much (detailed) data as possible before deciding
what is feasible with this knowledge to implement the WFD, whereas the Dutch had first a clear
position of “what information is needed” for a specific purpose (i.e. for the SCBA) and then focused
on the means to find it. Although we cannot judge this opinion, it refers to different approaches to
target a complex policy problem, the first one being time and resource consuming (and not
necessarily efficient in terms of results or outcomes) and the second likely to simplify issues.
-------
The information reported in this section contributes to describe what our policy transaction consist
in. Such an overview of the WFD implementation practices in 4 different institutional contexts allows
for drawing preliminary interpretations, before the analysis of constraints or TC underlying these
decisions in the next section (1.2). For the purpose of comparison, the main trends observed are
summarized in table 28. Overall, one can note similarities between the French and Walloon systems
as well as the Dutch and Flemish systems, possibly due to the cultural backgrounds inducing more
exchanges and cooperation, the neighboring geographical locations, similarities between the water
policy planning processes, etc. France was the only country relying on river basin planning process
(even though similar territorial approaches were developed in Wallonia at a smaller scale – ‘contrat
de rivière’) whereas Belgium and the Netherlands rely more on a coordination model. The specificity
of Belgium is that the administrative and the river basin scales do not coincide: the PoMs are

122
established at the (administrative) regional level and the river basin level is secondary. In Belgium,
the political involvement is important in the PoM elaboration process due to the regions’ leading
position. Such influence implies that things tend to get done more slowly but political actors are
inclined to think about the consequences of the WFD implementation (interview). Beyond the
national processes, it is worth noting that the participation of Member States in the European
working groups influenced countries’ responses to and interpretations of certain issues (i.e. France
had the lead in the WATECO working group) since leading positions were conferred to countries with
strong national positions (which is not the case of Belgium for instance). The main trends observed
in the four institutional contexts are depicted in the following table 28.
Table 28. Characteristics of the PoM implementation in the 4 institutional contexts of the ISD
France Few and large water bodies
Existing river basin planning (SDAGE, SAGE) � selection of measures at the river basin scale
(thematic working groups) but focused on water bodies or groups of water bodies
CBA is not given much importance (just an additional justification for exemptions);
assessment of C and B for specific water bodies (when cost disproportionate)
Cost disproportion: social impact is important
Walloon region Numerous and small water bodies
Extended stakeholders consultation to develop the PoM and PoM adapted as a result of
consultations
Connection with practices in France (getting knowledge of methodologies, reports,
contracting with a French consultancy,…) as well as Flemish practices (through exchanges
with VMM and by contracting with VITO)
Important delays due to the political agenda, policy priorities, policy choices (2
consultations on measures realized instead of 1 which postponed the economic analysis),
and 2 administrations (DGARNE and SPGE) with conflicting roles in the elaboration of the
PoM
Flemish region The number of water bodies was reduced for management purpose
No clear linkages between local and regional processes ; there is a whole new
administrative set-up � river basin management committees are not really operational
PoM established at regional scale (although there exists sub-basin management plans 2007)
CEA also carried out at regional scale
CBA and affordability analysis studies commissioned to VITO
Disproportion analysis is carried out for the whole PoM � the conclusion is that the
maximum scenario (reach the GES in 2015) is disproportionate
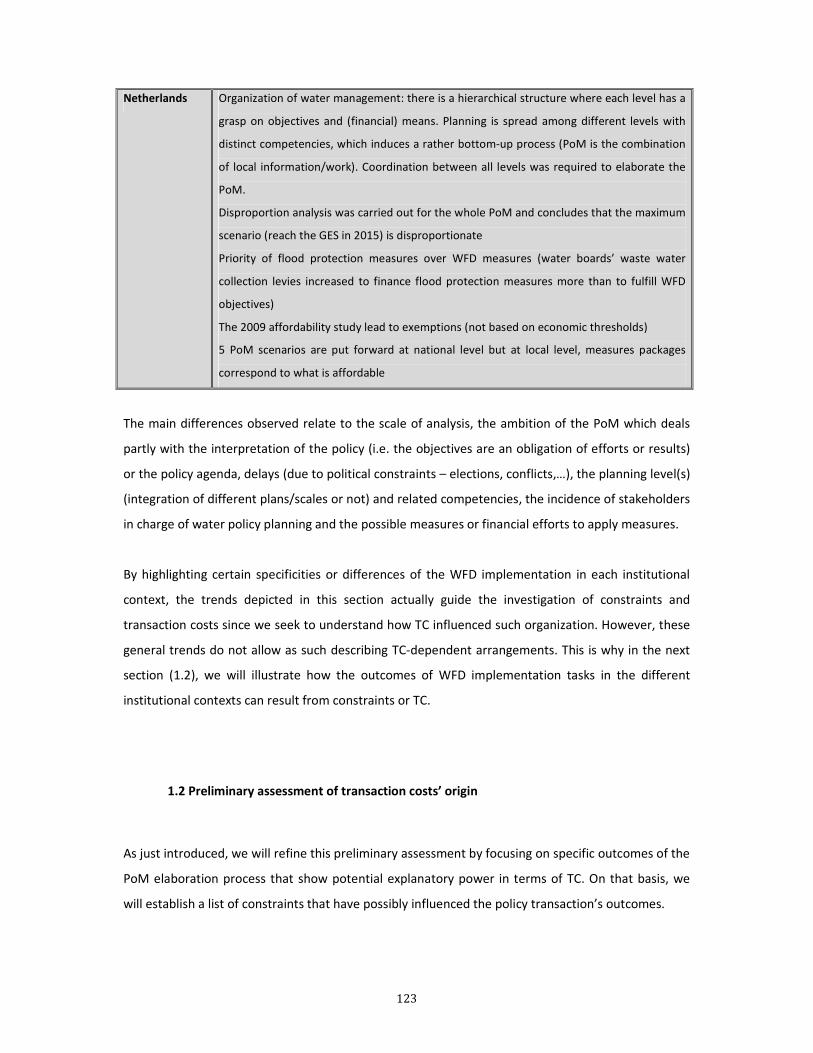
123
Netherlands Organization of water management: there is a hierarchical structure where each level has a
grasp on objectives and (financial) means. Planning is spread among different levels with
distinct competencies, which induces a rather bottom-up process (PoM is the combination
of local information/work). Coordination between all levels was required to elaborate the
PoM.
Disproportion analysis was carried out for the whole PoM and concludes that the maximum
scenario (reach the GES in 2015) is disproportionate
Priority of flood protection measures over WFD measures (water boards’ waste water
collection levies increased to finance flood protection measures more than to fulfill WFD
objectives)
The 2009 affordability study lead to exemptions (not based on economic thresholds)
5 PoM scenarios are put forward at national level but at local level, measures packages
correspond to what is affordable
The main differences observed relate to the scale of analysis, the ambition of the PoM which deals
partly with the interpretation of the policy (i.e. the objectives are an obligation of efforts or results)
or the policy agenda, delays (due to political constraints – elections, conflicts,…), the planning level(s)
(integration of different plans/scales or not) and related competencies, the incidence of stakeholders
in charge of water policy planning and the possible measures or financial efforts to apply measures.
By highlighting certain specificities or differences of the WFD implementation in each institutional
context, the trends depicted in this section actually guide the investigation of constraints and
transaction costs since we seek to understand how TC influenced such organization. However, these
general trends do not allow as such describing TC-dependent arrangements. This is why in the next
section (1.2), we will illustrate how the outcomes of WFD implementation tasks in the different
institutional contexts can result from constraints or TC.
1.2 Preliminary assessment of transaction costs’ origin
As just introduced, we will refine this preliminary assessment by focusing on specific outcomes of the
PoM elaboration process that show potential explanatory power in terms of TC. On that basis, we
will establish a list of constraints that have possibly influenced the policy transaction’s outcomes.

124
1.2.1 Outcomes of WFD tasks implementation
As far as outcomes of WFD implementation tasks are concerned, we focused on observable and
measurable data. This data represent indicators illustrating to some extent how the WFD tasks were
performed in the different institutional environments. Four indicators will be successively sketched:
- The number and size of water bodies
- Water body types
- The initial water quality status and water quality objectives
- The costs of PoMs
� Number and size of water bodies
In the characterization phase of the WFD implementation (2004), each member state delimited
water bodies as the relevant units to measure and achieve the WFD objectives (water status). The
number of water bodies should be based on natural criteria and homogenous pressures, but it is also
a compromise with politico-administrative considerations. Indeed, the number of water bodies
delimited in each part of the ISD (table 29) can affect the share of water bodies achieving or failing to
achieve the ‘good status’ since the water quality status is assessed at the water body level. The same
way, water body size matters since for instance, the delimitation of large size water bodies can limit
the number of studies to undertake as well as monitoring costs.
Table 29. Number of water bodies in the International Scheldt District (source: PoMs and interviews)
France Walloon
region
Flemish
region
The
Netherlands
Total
ISD
Number of surface water bodies 80 78 182 56 396
% of surface water bodies 20% 20% 46% 14% 100%
Number of groundwater bodies 18 10 32 5 65
% of groundwater bodies 28% 15% 49% 8% 100%
From table 29, we can note that the Flemish region has by far the highest share of the ISD water
bodies, followed by France (Artois-Picardie), Wallonia and the Netherlands. The Flemish and the
Dutch parts of the ISD have a relatively high density of water bodies.

125
Table 30. Number of water bodies in the International Scheldt District and other basins or regions (source: PoMs and interviews)
FR BE NL
Total
ISD
Rhine
Meuse
district
Artois-
Picardie
district
ISD
Seine-
Norma
ndy
district
Wa Wa
ISD Fl
Fl
ISD
ISD
Rhine
district
Number of
surface water
bodies 646 80 509 254 78 202 182 56 490 396
Number of
groundwater
bodies 30 18 60 34 10 42 32 5 11 65
In table 30, ISD specific data is highlighted in the grey columns. France counts nearly 4000 surface
water bodies and 500 groundwater bodies. The Artois-Picardie and Rhine-Meuse river basins show a
comparable size. However, there is a significant difference of total water bodies in the respective
basins (table 30), which is mostly due to the geographical characteristics (Artois-Picardie being a flat
area, and Rhine-Meuse hosting the Vosges mountain chain). Generally, there is a relatively low
number of water bodies in relation to the total area in France (fig.23, circled in red). In a study on the
typologies used to define the water status, Putot (2006) highlighted the deliberate limitation of
groundwater bodies’ number. Concerning surface water bodies, this can be due to the typology
chosen or the natural conditions.
Figure 23.A.Total surface water bodies in relation to total area of selected member states ; B. Total groundwater bodies in relation to total area of selected member states (Putot, 2006)
Figure 23 B. Total groundwater bodies in relation to total area of selected member states
Figure 23 A. Total surface water bodies in relation
to total area of selected member states

126
Longueur moyenne ME cours d'eau dans le district Moselle-Sarre (km)
0
5
10
15
20
25
30
Fra
nce
Bel
giqu
e
Luxe
mbo
urg
Sar
re
R
hn
an
ieP
alat
inat
R
hn
an
ie d
uN
ord
Wes
tpha
lie
Surface moyenne des M E souterraines dans le
district Rhin sup rieur (km_)
0
200
400
600
800
1000
1200
1400
1600
Fra
nce
Bad
e
Wur
tenb
erg
Hes
se
R
hn
an
ie
Pal
atin
at
The WFD designates natural boundaries, as to say RBDs, as central management units of water
resources. These are broken down in smaller units since watercourses in a type region are to be
divided into water bodies of catchment sizes varying between 10 and 2500 km² (Achleitner et al.,
2005). Achleitner and co-authors argue that the final sizes for the water bodies are “a compromise
between the required degree of differentiation regarding the ecological characteristics, and the
number of water bodies being manageable by a member state’s administration”. Water body size is
generally appreciated by its length (in km). The mean size is the ratio between the total length and
the number of surface water bodies (fig 24. A.). Groundwater bodies are measured in km², which is
the unit of the mean size (fig.24. B.).
Figure 24. A. Mean size of groundwater bodies in the Rhine district ; B. Mean size of surface water bodies in the Moselle-Sarre district (Putot, 2006)
Figure 24 shows that France chose to delimitate large groundwater bodies. France and Belgium do
not have significantly different surface water body sizes, which can however hide regional disparities.
The number of water bodies is strategic and depends among others on the number of ecological
types. The Netherlands had first defined 300 types and Belgium 336, which numbers were later
reviewed and led to regional differences (i.e. the Netherlands) (Putot, 2006). In the Netherlands, this
process could result from national decisions on water bodies’ classification and delimitation, where
the State had difficulties to coordinate and harmonize local level practices. The resulting regional
A. Mean size of groundwater bodies in
the Rhine district
B. Mean size of surface water bodies in
the Moselle-Sarre district

127
heterogeneity and high number of water bodies could not be handled as such and required
adjustments (Putot, 2006).
Table 31 depicts water bodies’ mean size based on data obtained during interviews. Data is not
homogenous since countries either dealt with a size in length (km) or catchment surface (km²).
However, we can see that that France (Artois Picardie river basin) has delimitated significantly large
water bodies.
Table 31. Water body size in the ISD (source: interviews)
France Walloon Region Flemish Region The Netherlands
Mean water body size 300 km2 50 km2 (4-200 km2) 14 km 22 km2
By deciding on water bodies’ number and size, Member States also anticipate the incidences of such
choices, especially the monitoring and management costs.
� Water body types
Water bodies are classified into Natural Water Bodies (NWB), Heavily Modified Water Bodies
(HMWB) or Artificial Water Bodies (AWB). We would like to highlight that natural water bodies
(NWB) do not involve the same target (GES) than heavily modified water bodies (HMWB) and
artificial water bodies (AWB), which require achieving a “good ecological potential” (GEP). Member
States’ decisions on water bodies’ classification can thus be influenced by such considerations,
especially the designation of surface water bodies into either natural water bodies or not. The share
of natural water bodies decreases from France upstream to the Netherlands downstream (table 32).
Table 32. Types of surface water bodies in the Scheldt ISD (source: river basin characterization reports, interviews)
FR BE Wallonia BE Flemish region NL
NWB 62 (77%) 38 (49%) 40 (22%) 2 (3%) HMWB
18 (23%) 28 (36%) 92 (50%) 19 (34%)
AWB 12 (15%) 50 (28%) 35 (63%) Total 80 78 182 56
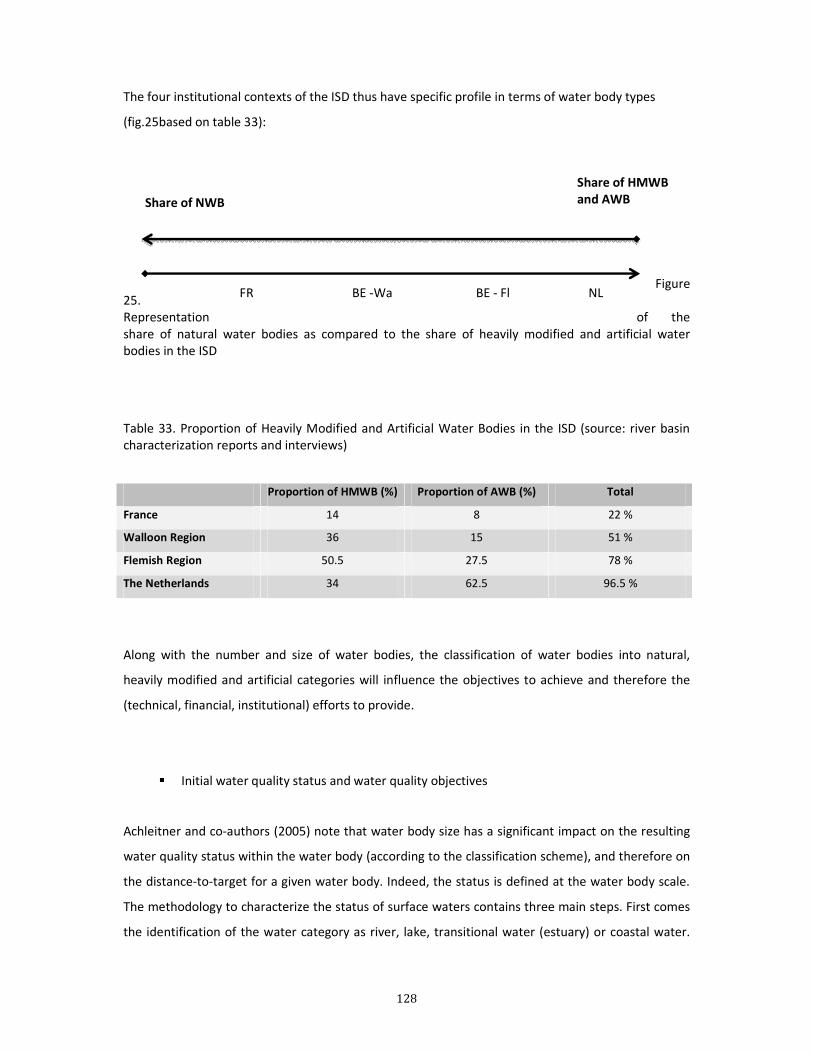
128
The four institutional contexts of the ISD thus have specific profile in terms of water body types
(fig.25based on table 33):
Figure 25. Representation of the share of natural water bodies as compared to the share of heavily modified and artificial water bodies in the ISD
Table 33. Proportion of Heavily Modified and Artificial Water Bodies in the ISD (source: river basin characterization reports and interviews)
Proportion of HMWB (%) Proportion of AWB (%) Total
France 14 8 22 %
Walloon Region 36 15 51 %
Flemish Region 50.5 27.5 78 %
The Netherlands 34 62.5 96.5 %
Along with the number and size of water bodies, the classification of water bodies into natural,
heavily modified and artificial categories will influence the objectives to achieve and therefore the
(technical, financial, institutional) efforts to provide.
� Initial water quality status and water quality objectives
Achleitner and co-authors (2005) note that water body size has a significant impact on the resulting
water quality status within the water body (according to the classification scheme), and therefore on
the distance-to-target for a given water body. Indeed, the status is defined at the water body scale.
The methodology to characterize the status of surface waters contains three main steps. First comes
the identification of the water category as river, lake, transitional water (estuary) or coastal water.
Share of NWB
BE - Fl FR BE -Wa NL
Share of HMWB
and AWB

129
Second, waters are classified according to ecological types. The type determines the conditions of
reference, as to say the conditions of a water body of a given type that is not impacted by human
activity. These reference conditions set what the “good ecological status” (GES) is for each type. Two
typologies can be used to identify the ecological types: typology A or B (WFD, annex II). Most
countries opted for a B typology (i.e. Belgium, France, Germany, Norway, Portugal, The Netherlands)
which is more flexible and leaves room to choose certain factors to describe ecoregions (Putot,
2006). The United Kingdom chose typology A, described as an a priori approach, where types are
defined according to physical criteria, which have an impact on biological communities. The typology
B also includes biological data from representative sites (observed biodiversity). After the
classification of water bodies, Member States thus assessed their initial quality, which allowed
setting the distance to target for 2015, 2021 or 2027. The initial water status, prior to the
implementation of the programs of measures (PoMs) is depicted in table 34.
Table 34. Objectives set for 2015 (source: PoMs and interviews) for surface water bodies
This table shows that a very little share of water bodies already achieve the good ecological status
required by the WFD. For most water bodies, this will require significant efforts to change the
current trend, according to the main pressures identified. In the Walloon report on the
characterization of RBD, the water status is assessed for different ecological or chemical parameters
but not in terms of one single criterion (ecological status). In the Flemish region, most rivers and
lakes have an intermediate or bad status.
GES/GEP 2008 GES/GEP 2015 Exemptions Total
France 20 40 40 80
Walloon Region 1 10 69 79
Flemish Region 0 5 177 182
The Netherlands 0 0 56 56

130
As indicated in tables 35 and 36, the proportion of water bodies not likely to achieve the GES by 2015
is high (over 50%). This is not only due to the WFD ambitious objectives. By announcing a low level of
compliance to the objectives, Member States also take account of the lack of data or the difficulty to
establish operational criteria to assess the water status24.
Table 35. Number of groundwater bodies and surface water bodies that can reach the ‘good status’ in 2015 and number of time exemptions proposed (source: PoMs and interviews)
Groundwater bodies Surface water bodies
GES 2015
(good chemical and quantitative status)
Exemption (delay)
GES 2015 (good chemical and ecological
status/potential)
Exemption (delay)
France 4 12 34 34
Walloon Region 4 6 1 78
Flemish Region 3 29 0 182
The Netherlands 3 2 6 50
Total ISD 17 51 42 346
Table 36. Number of groundwater bodies and surface water bodies that can reach the ‘good status’ in 2015 and number of time exemptions proposed (source: CIE, 2009, p.59)
Groundwater bodies Surface water bodies
GES 2015
(good chemical and quantitative status)
Exemption (delay)
GES 2015 (good chemical and ecological
status/potential)
Exemption (delay)
France 3 2 11 53
Walloon Region 3 5 10 69
Flemish Region 2 17 5 177
The Netherlands 3 1 0 56
Total ISD* 11 25 26 355
* without the Brussels Capital region
However, in Belgium and the Netherlands, few improvements of the water status are expected for
2015. France proposes the lowest proportion of exemptions to the GES for 2015 and we will see that
24WISE Newsletter, 2005
131
such ambition is supported by a political will. In France, the first Grenelle Law (Loi n°2009-967,
art.27) stipulates that 2/3 of water bodies should reach the GES by 2015, which implied modifications
in most of the 2008 RBMP (SDAGE), mainly regarding priority water pumping areas. In the end, this
objective was interpreted to be at the national scale so that small disparities among water agencies
could remain and about 50% of surface water bodies in the Artois-Picardie river basin are expected
to reach the GES by 2015.
� Costs of programs of measures (PoMs)
The costs of PoMs are only a partial indication of the ambition of the respective PoMs. These values
are the result of calculation methodologies, trade-offs, interpretations and assumptions that we do
not intend to judge here. The ambition of the PoM also depends on degree of implementation of
previous policies (which could somehow be assessed with the ratio of basic and supplementary
measures). We will simply expose the different costs as presented by Member States.
In France, the first PoM is expected to cost 2,8 billion Euros and a similar amount for the respective
two other cycles. In the first PoM 90% of the costs are dedicated to supplementary measures and
10% to basic measures.
In Belgium, the Flemish region assessed a cost of PoM of about 1,2 to 1,5 billion Euros. In the
Walloon region, no data on the costs of PoM was available at the time of this study, since the
economic analysis was delayed for several political and administrative reasons.
The Dutch PoM foresees a cost of about 50 million Euros for the first cycle (2010-2015) and a total
cost of 77 million Euros (table 37). This amount is about 5 times less than the French PoM which
could be linked to the small size of Dutch part of the ISD but also its “rural” characteristic (less
population density, few agricultural measures are considered under the WFD given the requirements
of the Common Agricultural Policy), and the higher importance of water quality issues in the other
Dutch river basins.

132
Table 37. Investment costs (million €) for the Dutch part of the Scheldt 2010-2015-2027
(V&W, 2008)
Type of measures 2010-2015 2016-2027 Total
Point sources 0,1 0,1
Non point sources 9,3 9,3
Water flow control and hydromorphology
25,4 22,2 47,7
Supplementary measures
11,1 4,7 15,8
Studies 4,7 4,7
Total 50,6 27,0 77,6
The measures forecasted for the period 2016-2027 are mostly regional measures (V&W, 2008).
Overall in the Netherlands, it is expected that water management costs will know a 25 to 75%
increase as compared to 2006 water management costs.
Table 38. The costs of PoMs in the ISD (source: PoMs and interviews)
District or region FR
BE
Wallonia
BE
Flanders
NL
Cost of POM
2010-2015
2,6 billion
(20% basic measures,
80% supplementary
measures)
0.500 billion
(basic measures) +
182 million
(supplementary
measures)
1,2-1,5 billion
630-830 million/yr
(basic measures) +
1170-1490 million/yr
(suppl. measures)
0.050-0.073 billion
(supplementary
measures)
Cost of POM
2016-2027 4.7 billion NA NA 0.027 billion
This data shall mostly witness the economic significance of PoMs and the scope of the financial
efforts required by the WFD implementation (table 38). This suggests that trade-offs and
negotiations occurred within Member States to decide who will bear these costs and to what extent.
The economic analysis carried out to establish the PoM is usually interpreted either as a decision-
making tool but also as an a posteriori justification of the choices made.
This section highlighted that the initial situation of river basins as well as their characterization (in the
context of the WFD) are likely to impact the implementation and the output of the economic analysis
based on:
133
- the number, size and classification of water bodies
- the initial quality of water bodies and the type of pressures on water bodies
- interpretations regarding data processing to assess the risks of not reaching the 2015 GES with or
without supplementary measures, such as assumptions regarding the trend scenario (there are
variables for which uncertainty is high), data aggregation methods, percentage of watercourse used
to define the good status, or identification of HMWB (interpretation of “heavy modifications” -
certain human impacts are not included) (Bouleau, 2011).
The next section aims at shedding light on such factors that influenced Member States’ response and
interpretations when elaborating the PoMs.
1.2.2 Constraints underlying WFD tasks implementation
Our literature review highlighted the difficulty to quantify transaction costs and therefore suggests
further exploring transaction costs determinants. These determinants mostly stem from transactions’
characteristics as defined by transaction costs theory: specificity, frequency and uncertainty (Saussier
and Yvrande-Billon, 2007). In practice, throughout the various empirical studies investigated (see
appendix E), we found that a diversity of factors can influence transaction costs:
- transaction’s characteristics or attributes
- number and diversity of agents
- frequency of transactions
- size of transaction (i.e. pollution abatement level) or investments
- transaction implementation stage
- available technology
- institutional environment
- potential for economies of scale
- easiness to understand measures to undertake
- uncertainties
- financial constraints
- discount rate
- learning effects
- coordination
- incentive system

134
- outsourcing/make-or-buy decisions
- decision rights allocation
- access to information
- trust
- level of flexibility
Tang and Lo (2009) recall two main theoretical approaches to explain organizational forms: TCE that
argues for a TC optimization choice of organizational form, whereas political economy and Public
Choice academics argue that arrangements are “seldom driven only by efficiency and effectiveness
reasons” – they rather consist in political compromises. They conclude that TC factors must include
political components and other structural reasons. As a result, TC factors help to understand but are
not deterministic. They hold that choices made by public organizations (actors) are chosen
“depending on how they assess various institutional constraints and transaction costs factors”.
Constraints to public intervention thus consist in political and institutional factors25as well as TC
concerns (probity, accountability, legitimacy, efficiency, reliability), which together consist in criteria
in deliberating institutional choices (Tang and Lo, 2009).
This list shall not be exhaustive but it gives an overview of some specific parameters we can consider
for our analysis. As our main concern here is public policy implementation, not all of these factors
may be of interest. However, we found particularly relevant to our issue the factors affecting
transaction costs linked to agricultural policies, as depicted in the OECD study (2007). They are
defined as:
- policy characteristics (i.e. the level of precision and definition of objectives affect the
implementation and monitoring costs)
- the institutional framework
- structural factors
- information / coordination systems
In a recent analysis of the WFD implementation, Notte (2008) identified 3 factors explaining the
respective organization of public participation in France and the Netherlands: (1) the nature et
importance of water related issues, (2) the scale of WFD implementation (i.e. in the Netherlands, the
country is small and densely populated which explains why water public agencies are numerous and
25Central/local relations, policy priorities, embedded social relationships, development of market economy and
civil society.

135
have a specific local anchorage), (3) the political and institutional organization (i.e. the national,
provincial and municipal political levels are significantly involved in the WFD implement in the
Netherlands, whereas in France the influence of the national level is still strong).
In light of these findings, table 39 provides an interpretation of our first observations in terms of TC
and constraints. The first column lists some selected points of the WFD implementation process that
appeared to generate constraints or TC. We thus deliberately leave out the factors that facilitated or
enabled the WFD implementation process. The second column of table 39 details the possible
impacts in terms of TC of the first column’s observations. The last column provides categories of
determinants that led to the observations made.
Table 39. Preliminary assessment of transaction costs linked to the early WFD implementation process in the ISD
Evidences / Observations
Effects (TC) Possible determinants
River basin characteristics (i.e. water body types, quality, RBD location upstream or downstream, etc.) Relative importance of the RBD at the national level Size of river basin (more reactivity, easier communication, less WB, less studies, etc.)
Distance to target (information costs, negotiation costs) Negotiation costs Coordination costs, information costs
Characteristics of the environment
Number and levels of governance involved in the PoM elaboration process (i.e: in the NL, several levels with different responsibilities; in Flanders, only the regional level) In FR, the WFD transposition was led by the central level whereas in the NL it was shared between 3 levels
Negotiation costs Coordination costs
Organization of water management
Local water policy plans not in accordance with
WFD requirements (i.e. timing, content) (Belgium)
Coordination costs
Organization of water management
Turn over of civil servants in charge of the WFD implementation (France)
Coordination costs
Existing organization/institutions
Low priority of the WFD as compared to other water or environmental policies (Belgium, the Netherlands)
Negotiation costs (efforts to mobilize resources)
Political agenda

136
Policy makers’ reticence to act (elections, delays),
consultation organized without sufficient data
(Walloon region)
Coordination costs Negotiation costs
Political agenda
NL: relatively long history in effective chemical policies leaves little room for additional cost-effective measures Belgium: delays regarding wastewater and sanitation measures (UWWS directive)
Negotiation costs Information costs (costs linked to previous policies implementation)
Degree of previous policy implementation
NL: publication of Aquarein study (2003) – ‘reaching the GES would imply reducing the agricultural area by 2/3’ FR: the Grenelle Law (2009) stipulates that ‘2/3 of water bodies shall reach the GES by 2015’
Negotiation costs (stakeholders reluctant to adopt measures, I-FIVE report) Information costs
Policy interpretation
NL: several levels involved in planning; the central level reviews measures and costs, harmonizes, simplifies and can cancel measures
Coordination costs
Coordination between levels of governance implied in the economic analysis
Scale of analysis or level of detail (i.e: costs of measures, CEA, CBA, considered at national, regional or local scale, per water body or per PoM, etc.) ; Wallonia and FR sought to work at water body scale. Wallonia has 4 PoM (1 per basin) whereas Flanders established 1 global PoM).
Information costs (when detailed or complex data is required) Monitoring costs Coordination costs
‘Scale of implementation’ Data collection and processing
Projects, studies undertaken
Research and information costs
Data collection
Methodologies and methods used (i.e. benefit transfer or benefit estimation studies carried out for the CBA)
Research and information costs (i.e. minimized if benefit transfer)
Data collection and processing
The observations depicted intable 39 constitute elements we think are significant to describe
arrangements and compare countries. They are not exhaustive but shall be informative enough to
develop a policy TC typology. Other (more quantitative) variables may be relevant (i.e. frequency of
meetings - internal meetings, national international) but at the scale of our analysis, data are difficult
if not practically impossible to collect.

137
Based on this preliminary analysis, the main determinants that can explain arrangements to establish
the PoMs are somehow in line with the elements highlighted by the OECD (2007) study and Notte
(2008), which appear below in brackets. In table 39, we can distinguish so far 6 dimensions:
- the characteristics of the environment (‘structural factors’)
- the organization of water management and existing institutions (‘institutional framework’)
- the political context (‘political and institutional organization’)
- policy interpretation (‘nature and importance of water related issues’)
- coordination between governance levels (‘information/coordination systems’)
- data collection and processing (‘the scale of policy implementation’)
The analysis of policy transaction costs (the second column in table 39) will be further investigated in
the next section, mostly in light of existing TC typologies. With this first understanding of actors’
decisions to optimize time and resources as a result of constraints (table 39), we can address the
issue of which transaction costs are actually minimized by these decisions and what are their causes.

138
2. Policy transaction cost typology and determinants
Although the existence of transaction costs is today well acknowledged, empirical evidences of
transaction costs remain a research issue. In this section, we will propose a specific policy transaction
cost typology (2.2), based on the analysis of the WFD policy tasks and a review of existing TC
typologies (2.1).
2.1 Policy transaction costs
Unlike formal contractual arrangements, the policy implementation process involves multiple tasks,
levels and agents. We thus consider policy arrangements as the strategic choices and decisions made
to implement the tasks involved in the public policy transaction to reach the policy objective. In this
study, policy TC are not defined a priori and their characterization is based both on the analysis of
policy tasks and existing TC typologies.
Description of policy tasks
Policy tasks refer to what is required by the EU Commission (the “higher authority” as labeled in the
policy transaction framework). The description of policy tasks is meant to give a first idea of the
possible time and/or resources needed to execute tasks. The main tasks are detailed in the articles of
the directive, and most tasks are further operationalized in the European Common Implementation
Strategy working groups. As introduced in chapter 2, these groups produced thematic guidance
documents (i.e. on the economic analysis) so as to detail how the policy tasks shall be implemented.
Such guidance is then worked out by Member States. The main policy tasks involved in the first
phase of the policy transaction to prepare the PoM and justify exemptions, in other words the
organization of the transaction, are labeled in table 40. It is worth noting that the chronology of tasks
and the possible synergy between tasks is specific to the country or region. The execution of these
tasks led to various outcomes supporting the decisions over the PoM and exemptions.

139
Table 40. Tasks involved in preparing the WFD policy transaction and main outcomes
Tasks Main outcomes
Water body (WB) delimitation Number of WB and WB size
Water body initial quality assessment Number/proportion of WB at the GES
Selection of measures List of measures or scenarios and proportion of basic/supplementary measures
Cost-efficiency analysis Prioritization of measures and objectives over time
Affordability analysis Economic indicators and financial impact of PoM on stakeholders
Cost-benefit analysis Assessment of benefits to reach the GES, cost-benefit ratio, disproportionate costs
Public consultation of the draft RBMP Public meetings, advices and suggestions for changes
We can argue that the execution of these tasks is likely to involve time and resources:
− to collect and produce information or data (i.e. on measures, on efficiency of measures, on
costs and benefits of measures, financing mechanisms, etc.)
− for consultations and bargaining over possible options (i.e. meetings with stakeholders to
identify and select measures, costs, decision-making over the description of problems and
solutions, etc.)
− to ensure coordination between actors at various levels (national, regional, river basin, local)
and from different organizations
We can thus expect that Member States would seek to minimize three or four categories of
transaction costs, namely:
(1) Research and information collection (i.e. on measures, costs, financial resources, contracting
authorities, etc.)
(2) Acceptance, consultations, negotiation (i.e. meetings with stakeholders to discuss measures,
costs, issues raised and potential solutions, etc.)
(3) Coordination between stakeholders (i.e. dissemination of information such as national guidance,
etc.) and
possibly (4) Administration costs (i.e. procedures, redoing tasks if inconclusive outcomes, etc.)

140
Existing typologies
We will now refer to existing TC typologies in order to get an overview first idea of transaction costs
categories and their potential relevance for policy implementation as framed in the policy
transaction framework. The typologies selected relate specifically to agricultural, agri-environmental
or environmental policies.
In the OECD report on the implementation costs of agricultural policies (OECD, 2007), transaction
costs linked to policy (TCLP) are defined as “resulting from the interactions within and between
governmental agencies, private organizations and program participants at each policy
implementation stage”. In the case of agricultural policies, it is relevant to distinguish fixed costs (not
affected by the size of transfer – they are in general occurred at an early implementation stage) and
variable costs (i.e. depending on the number of participants to the schemes or programs). Such TCLP
comprises labor costs (time spent by agents to communicate, fill out forms, travel, negotiate, launch
projects, etc.) and operating costs (equipment, services).
Falconer and Whitby (1999) have estimated transaction costs linked to various agri-environmental
schemes (AES) in the European Union. The typology they used was revisited by Van Huylenbroeck et
al. (2005) and includes 3 main TC categories: information, contracting and policing costs (table 41)
incurred either by state agency or participants to the AES.

141
Table 41. Typology of transaction costs (adapted from Falconer and Whitby, 2001), van Huylenbroeck et al. (2005)
Looking at the state agency costs, certain of the (sub-)categories identified corroborate the WFD
policy transaction costs envisaged, mostly: information and, negotiation (within the contracting
category). However, informing farmers on the policy scheme (i.e. participation to courses or
workshops) is included in the information category, when we consider the information cost category
rather linked to information search and collection.
In the case of agricultural policies, the extended OECD study (from 2007) considers 3 main sub-
categories of TC linked to payments to farmers based on the work of Mann (2000): initial and final
costs, implementation costs, and participation costs (OECD, 2007, p. 23). The study focuses on the
implementation costs, but among the “initial” costs appears: research, information, conception, and
consensus building (OECD, 2007, p. 24), which categories are of interest when targeting the WFD
early implementation costs.

142
With a wider approach to policy, McCann and co-authors (2005) proposed a typology of transaction
costs associated with public policies, including their occurrence during the policy process (fig. 26). Up
to the early implementation phase, the main TC categories are: (1) research, information gathering
and analysis associated with defining the problem; (2) enactment of enabling legislation, including
lobbying and public participation costs, or, alternatively, the costs of changing laws through the
courts or modifying existing regulations; (3) design and implementation of the policy, which may
include costs of regulatory delay; (4) support and administration of the ongoing program; (5)
contracting costs, which may include additional information costs, bargaining costs, and decision
costs, which are relevant when a market has been set up for a pollutant, or natural resource. The
authors provided as well a categorization of TC according to the actors whom incur these costs.
Figure 26. Transaction costs associated with public policies (McCann et al., 2005)
More recently, in the same line, Coggan and co-authors (2010) compiled 7 studies to propose a TC
typology that is specific to environmental policy(fig.27). It is also organized by phase of the policy
process (time period).

143
Figure 27. Categories and types of TC and how they are experienced in the creation and use of environmental policy (Coggan et al., 2010)

144
This typology is the most relevant for our case study as it goes more in detail regarding the
operational definition of transaction costs. Given the policy transaction framework developed, we
are interested in the TC experienced by policy administrators or public actors. Table 42highlights the
elements of the first 5 activity categories as developed by Coggan et al. (2010), which constitute
relevant categories for the WFD policy transaction:
Table 42. Relevant TC categories for policy transaction (from Coggan et al., 2010)
Activity category How TC are experienced
Research, information gathering
and analysis, policy design
Time and resources associated with (i) investigating the problem
and the benefits and costs of alternate solutions, (ii) refining
policy design such as trials, public consultation, training,
development of procedures, investment in monitoring and
auditing infrastructure
Enactment Time and resources invested in policy briefing and policy
change, preparing background documentation for legislation
changes
Establishment Time and resources in hiring and training staff, advertising
Implementation Time and resources invested in implementing policy
Support and administration Time and resources invested in assessing applications, auditing
processes, keeping records, interpreting policy
We can highlight that three main types of policy administration costs (transaction costs) are typically
considered:
– Search and information costs
– Bargaining and contracting costs
– Policing and enforcement costs
However, the issue of what type of costs we are talking about in practice and the related terminology
is still discussed. Not to mention the difficulties to separate out transaction costs themselves, or
transaction costs from policy implementation. Still, these existing TC typologies constitute a major
basis to identify policy transaction costs categories. It is rather intuitive that implementing policy
(and more specifically WFD) tasks requires collecting/searching for/producing information, setting a
methodology, organizing, planning and distributing tasks, or negotiating. It however remains a
145
challenge to set boundaries to transaction costs and to identify criteria to assess them. In this study,
we do not hold an analytical accounting perspective to characterize the magnitude of TC but we seek
to understand to what extent TC can condition policy implementation. We will now attempt to
elaborate a TC typology that is specific to a policy transaction and to environmental policy
implementation. To this end, we will both refer to our first analysis of the WFD implementation tasks
and the existing typologies reviewed.
Policy transaction cost typology
According to the preliminary assessment of transaction costs linked to the early WFD
implementation process (table 39) and preliminary data collected (which is quite heterogeneous
between countries/regions), we argue that the preparation of the program of measures required:
(1) Research/collect of information (i.e. to define the units of analysis as to say water bodies, to
identify potential measures, to assess their costs and efficiency, to analyze the impact and
repercussion of costs, etc…). In practice, this has to do for instance with the creation of
databases, the studies undertaken or commissioned, information search and processing, the
design of methodologies to collect appropriate information/data, the elaboration of
guidance documents, etc.
(2) Negotiation between stakeholders to adopt common or collective decisions (i.e. on water
bodies size and number, on the choice of measures, negotiations over the economic and
financial impact of the PoM, presentation and discussions over measures with local
stakeholders, etc.). This category has to do with interactions between actors at various policy
levels (national, regional, river basin, local) or from various sectors.
(3) Coordination between stakeholders and tasks (i.e. change of organization or communication
tools). The existing planning process can more or less favor the coordination or synergy
between tasks and actors.
(4) Unforeseen expenses in terms of time and resources (i.e. due to delays, information
collected but not used in the decision-making process, change of goals, political instability,
etc.).

146
With this basis, we identified 3 main categories of ex ante policy transaction cost, as detailed in the
following table 43. Unforeseen expenses figure in each of the three categories since they are
considered to be part of each PTC category.
Table 43. Ex ante policy transaction costs
Label PTC category References in the literature Definition / Examples
R Research and
collection of
information
Dahlman (1979), Thompson 1999, McCann et al. (2005),
OCDE (2007),…
Time and resources dedicated to analyze a problem, costs and benefits associated to
alternative solutions, collection of data/information,…
Thompson 1999 (« support and administration »), McCann et al. (2005),…
Unforeseen expenses (i.e. time spent to redo or review tasks, delays, etc…)
N Negotiation
Dahlman (1979), Bromley, 1991, OCDE (2007),…
Efforts or to ensure stakeholders’ support to propositions/decisions with the aim to ensure
acceptability Thompson 1999 (« support
and administration »), McCann et al. (2005),…
Unforeseen expenses (i.e. time spent to redo or review tasks, delays, etc…)
C Coordination
Costs to manage interdependencies between
activities (Malone & Crowston, 2001)
Transmission of information, guidance, etc. to make tasks/actors at various levels coherent and
operational
Thompson 1999 (« support and administration »), McCann et al. (2005),…
Unforeseen expenses (i.e. time spent to redo or review tasks, delays, etc…)
This typology is specific to policies’ early implementation phase and refers most specifically to ex
ante policy transaction costs (PTC) as defined in the WFD policy transaction framework, as to say the
time and resources implied to elaborate the PoMs. In order to set a clear boundary to these ex ante
PTC, we consider that when preparing the PoMs, agents seek to minimize 3 types of costs:
� ex ante PTC (in other words, organization costs) which are time and resources dedicated to
studies undertaken, meetings organized to share information, etc.
� « production » costs which refer to the costs of the PoMs: these are the results of the
economic analysis (mostly via cost-efficiency, cost-benefit, capacity to pay and cost
disproportion analyses)

147
� ex post PTC that consist in measures or decisions taken to anticipate the acceptability of
measures as well as their successful implementation to reach the objectives set in the first
PoM or the WFD objectives (GES/GEP for all water bodies). One can note that certain
decisions at the preparation phase of the PoMs can be explained by the anticipation of ex
post PTC, such as PTC linked to a potential non-compliance with the objectives set in the
PoMs.
Although our analysis targets decisions allowing for minimizing ex ante PTC, these decisions are also
meant to minimize other costs. When the minimization of ex post PTC was made explicit in the
interviews, such information was not considered for the present analysis of ex ante PTC.
With the aim to make PTC a concrete and operational concept, PTC categories are hereby applied to
the WFD in table 44, keeping in mind that the PTC typology originated from the combination of
existing TC typologies and the analysis on the WFD implementation. For an indicative purpose,
possible indicators of certain PTC components (in the context of the WFD implementation) appear in
brackets.
Table 44.Ex ante policy transaction costs applied to the WFD
PTC categories Definition Application to the WFD
Research and collection of
information
Time and resources dedicated to
analyze a problem, costs and benefits
associated to alternative solutions,
collection of data/information
Studies – within the organization or
outsourced (costs, number of persons and
time spent) Data production/collection (number of
persons and time spent) Development and use of models/tools
Unforeseen expenses ; Constraints beyond control
i.e. Late instructions for stakeholders to proceed with tasks, or additional instructions
that question the work done
Negotiation (actors)
Efforts or to ensure stakeholders’
support to propositions/decisions with
the aim to ensure acceptability
Stakeholders’ meetings - i.e. on the choice
of WB size, to decide on methods, to
promote measures, etc. (number of persons and time spent)
Unforeseen expenses ; Constraints beyond control
i.e. Extra meetings to reach an agreement

148
Coordination (levels/sectors)
Transmission of information, guidance,
etc. to make tasks or actors at various
levels coherent and operational
Stakeholders’ meetings (number of persons
and time spent) Data production and diffusion of
information i.e. for national guidance -
developing methodological guides, for
harmonizing practices, monitoring, control
Unforeseen expenses ; Constraints beyond control
i.e. Staff turn-over
Table 44 illustrates the main PTC identified that actors seek to minimize through arrangements, on
the basis on a qualitative analysis of the WFD implementation. In order to investigate such PTC
minimization strategies (chapter 4), we will first provide an understanding of what PTC minimization
means in practice.
Ex ante PTC minimization
So as to depict Members States’ actions, choices and organization to elaborate PoM and their
interpretation in terms of which TC are minimized, we will provide un understanding of PTC
minimization. Within the WFD policy transaction framework, the PTC minimization linked to the
preparation of the transaction (the elaboration of the PoM and the justification of exemptions)
would correspond to certain decisions undertaken by the representatives of the “local authority” as
described below.
Research and information collection PTC
Minimization : Decisions/choices to limit time and resources dedicated to the research and
information collection necessary to elaborate the PoM/justify exemptions
Negotiation PTC
Minimization : Decisions/choices to facilitate the adoption of common/collective decisions (we refer
here to the role of information in decision-making) and limit the costs of possible conflicts or
agreements
Coordination PTC
Minimization : Decisions/choices to limit costs due to exchanges between (levels of) actors

149
Unforeseen/unplanned expenses
Minimization : Decisions/choices to anticipate or to mitigate the time and resources still necessary
to prepare the transaction (elaborate the PoM) after unexpected constraints or constraints beyond
control
In the context of public policy, the early implementation phase (corresponding here to the
preparation of the PoM) is important in terms of which and how resources are mobilized to respond
to the policy objective constrained by transaction costs, especially given the scope (all surface,
groundwater and coastal water bodies at river basin level), the ambition (GES/GEP by 2015) and the
costs of the program of measures (from 73 million to 2.6 billion Euros for 2010-2015 in the ISD). In
the case of the WFD, this early implementation phase seems significant in terms of PTC linked to the
organization of a new and large scope process, involving actors of the river basins, important
information search and transmission (in terms of guidance, methodology, models but also field data).
With the identification of PTC implied in policy implementation as a main step to assess PTC
minimization strategies (arrangements), the next section will shed light on the determinants that
induce the PTC.
2.2 Policy transaction cost determinants
Given the broad PTC categories identified, the development of operational PTC indicators related to
the WFD implementation would have required extensive work beyond available means. Such
indicators could consist in number of meetings held and nature of participants, costs of studies
undertaken, etc. We are hereby trying to answer a different question, as to say the causes of PTC
referred to as determinants.
According to Williamsonian TC theorists, the mode of governance (arrangement) chosen depends on
TC and transaction’s attributes (specificity, frequency, uncertainty). In the Ménard and Saussier study
(2000), the TC “determinants” (proxies) identified were operational indicators of transaction’s
attributes and correlated with the level of investments26. The authors argued that according to
transaction’s attributes (specificity, frequency, uncertainty), agents chose a TC minimizing
contractual arrangement.
26The proxies identified are: properties of raw water, origin of water and population affected.

150
Policy transaction’s specificities
Few authors have extended the key transaction attributes as defined by TCE in order to increase
their application to the public sector. Within the public agency mode of governance, we sought to
identify specific public policy characteristics (and more specifically environmental policy) so as to
define equivalents of public policy transaction attributes. As recalled by Liefferink et al. (2011), ‘new
generation’ directives tend towards multi-level, multi-actor and multi-sector governance which are
general characteristics of new modes of environmental governance. Indeed, river basin management
as required by the WFD involves numerous actors and planning levels, and implies the integration of
problems and solutions, negotiation among stakeholders, etc. In line with public policies specificities
(chap.1), our definition of the policy implementation process (chap.1) and the analysis of the WFD
(chap.2), we propose to consider 4 policy transaction specificities (equivalent to attributes) of ‘new
generation’ environmental policies/directives:
1. No obligation of means (but obligation of results) while uncertainties to assess the causes of
issues and effects of actions
2. Multi-stakeholder process
3. Multi-levels and sectors process
4. Characteristics of the natural environment
Determinants
We argue that these specificities (transaction characteristics) induce PTC determinants. As observed
in the WFD implementation process (see fig.28 below):
1. There is room for Member States to organize according to their local context (existing laws,
institutions, programs, data, experience, etc.) so as to reach the WFD objectives. As a
consequence, policy interpretation differs from one country to the next, and it appeared
that the implementation of policy tasks can reveal either high or limited ambition. We argue
that a quite demanding policy interpretation implies mostly ‘research and collection of
information’ PTC due to ambitious goals, need for a fine or detailed analysis, specific studies
carried out, etc. A limited ambition can correspond to a low WFD priority of the objective in
the policy agenda (i.e. by comparison to flood prevention measures), lack of political
involvement, etc. which induces ‘negotiation’ PTC since efforts are required to convince and
involve stakeholders to take actions.
151
2. There are two main aspects of interest that follow from a multi-stakeholder process:
a. the way power and resources are distributed among actors (actors and decisions
can be compartmentalized which induces ‘coordination’ PTC, or more integrated
where ‘negotiation’ PTC prevail) and
b. the nature of connection between the planning process and financial resources: it
can be weak – requiring coordination and negotiation - or high.
3. The multi-level/sector process induces a division of power and resources between
levels/sectors that can be rather fragmented (inducing coordination) or integrated for the
purpose of the WFD objectives.
4. The characteristics of the environment condition the state of the environment and existing
pressures at the origin of such conditions. There can either be an information gap on the
state of environment (need of information), or scattered information on the state of
environment (need of coordination), or need to make specific decisions regarding the driving
forces of certain parameters of the state of environment (need of negotiation).
Figure 28 depicts such PTC determinants we found that stem from the policy specificities introduced.
It also illustrates the different “modes” (referred to as ‘options’ in fig.28) PTC can take on the basis of
the data collected on the PoM elaboration process. The last column describes the effects of PTC for
the WFD implementation process. The PTC determinants and the related environmental policy
specificities show a certain gradient, from the most anchored (at the bottom) to the less anchored
elements (at the top).Background information on figure 28 is available in appendix F.

152
Fig. 28.Environmental policy transaction specificities and policy transaction cost determinants
As a consequence of PTC determinants, countries or regions made decisions to minimize PTC, as
illustrated in figure 29.
In light of the data analysis presented in this chapter, chapter 4 will now further describe the PTC
minimization strategies (or arrangements) in each of the institutional contexts analyzed.
Policy transaction
specificities
Modes

153
Determinants Policy transaction costs
Figure 29. Policy transaction costs related to environmental policy implementation
Conclusion chapter 3
So as to assess how Member States interpreted and implemented the WFD objectives (within the
frame of the policy transaction at stake), we depicted some general trends regarding the PoM
elaboration process in the respective 4 institutional contexts as well a certain observable outcomes.
On that basis, we drew up a preliminary assessment of TC determinants that have conditioned the
WFD implementation in the various contexts. This provided a first understanding of actors’ decisions
to optimize time and resources as a result of TC. To address the issue of which transaction costs are
actually minimized by these decisions, we have both considered existing TC categories and the data
collected. As a result, we proposed a general TC typology adapted to environmental policy early
implementation, with an understanding of TC minimization. The 3 policy TC categories presented are
information search and collection, negotiation and coordination costs. PTC determinants are based
on the analysis of the PoM elaboration process in the different institutional contexts investigated.
They are found to stem from what we refer to as policy transaction specificities: respectively 4
environmental policy implementation specificities and 5 related determinants are identified.
Actors’ decisions to
minimize PTC
� Policy interpretation
� Institutional context
(division of power and resources among actors and between sectors/levels, connection between planning and financial resources)
� Characteristics of the
environment
Research and information
collection PTC
Negotiation PTC
Coordination PTC

154
Chapter IV From policy arrangements to policy transaction costs
minimization strategies
According to the PTC typology developed and the PTC determinants identified, we can refine and
consolidate the description of organizational arrangements of each country/region on the basis of
data collected and expert interviews. Section 1 will provide data and empirical evidences supporting
the identification of PTC determinants in each institutional context, as well as Member States’
strategies to cope with such determinants. Section 2 details how the WFD policy arrangements feed
in the assessment of PTC minimization strategies.
1. Depicting WFD policy arrangements
The assessment of policy implementation tasks in light of PTC and PTC determinants rests on the
assumption that PTC influence the way policy tasks are implemented. So as to depict in what specific
way PTC have conditioned the WFD implementation, the description of arrangements will focus on
the specific tasks that follow from PTC determinants. In the present section, such description is
organized country by country (see appendix G) and not task by task, since some tasks are carried out
in a different order or are given a different focus depending on the country. For each institutional
context, we will first detail the PTC determinants modes identified based on data collected. Second,
we will depict the arrangements observed as a result of such PTC determinants. The elements
developed in chapter 2, such as the characteristics of the institutional contexts or the organization of
water management, will be useful to understand the arrangements.
1.1 France
1.1.1 Determinants’ modes
For each of the 4 institutional contexts investigated, the PTC determinants correspond to the policy
transaction’s specificities that appear to most condition the WFD implementation by inducing PTC.
We will now develop 6 PTC determinants observed in the French context and their respective modes.

155
The determinants’ modes are illustrated by the data collected that witness of significant PTC
induced.
Policy transaction determinant Mode
Policy interpretation High ambition (demanding)
In France, the WFD objectives were considered as an obligation of result (by opposition to an
obligation of efforts), both in the formal policy documents (decrees) and by policy makers. As a
consequence, quite ambitious goals were sought along with detailed data and analyses. Given the
already existing river basin planning, the draft SDAGE and PoM were established quite early (2007) as
compared to the European agenda, when certain requirements (on dangerous and chemical
substances) where not yet issued. France had set an ambitious calendar to prepare the 2008
consultation, with detailed measures to reach the GES. During a local meeting27, policy official
A.Strebelle highlighted that the translation of the WFD into French law was more demanding than
the WFD and the PoM. He argued that this was most likely to keep a link with the existing plan
(SDAGE).
« Globalement, la transcription dans le droit français de la Directive cadre est allée plus loin que la Directive cadre sur l’eau et le plan de gestion : les orientations et les dispositions sont franco-françaises. Elles ont été conservées probablement pour garder le lien avec le premier SDAGE, mais il va falloir « faire le ménage » du point de vue juridique afin de ne garder que la valeur ajoutée. Ce qui est important, ce sont les objectifs affichés et les actions qui vont permettre de les atteindre ». M. Alain STREBELLE, Artois-Picardie Water Agency Director, Commission Géographique de la Somme (AEAP, 2006).
The Grenelle Law adopted in 2008 also testifies the political ambition to reach the GES. It stipulates
that 2/3 of the water bodies shall attain the GES by 2015.
Dans le domaine de l'eau, le premier objectif est d'atteindre ou de conserver d'ici à 2015 le bon état écologique ou le bon potentiel, au sens de l'article 2 de la directive 2000/60/CE du Parlement européen et du Conseil du 23 octobre 2000 établissant un cadre pour une politique communautaire dans le domaine de l'eau, de l'ensemble des masses d'eau, tant continentales que marines. L'Etat se fixe l'objectif de ne pas recourir aux reports de délais, autorisés par cette directive, pour plus d'un tiers des masses d'eau. (LOI n° 2009-967 du 3 août 2009 de programmation relative à la mise en œuvre du Grenelle de l'environnement (1), article 27).
27In one of the 6 local committees (« commissions géographiques ») regrouping local stakeholders of the Artois-Picardie River Basin District.

156
Initially, the SDAGEs in France were designed so that about 50% of water bodies reach the GES by
2015, corresponding to a 12% increase of water bodies at the GES (Simonnet, 2008). In autumn 2007,
the Grenelle de l’Environnement strengthened this ambition to the level of 66% of water bodies
(2/3). As a consequence, the SDAGEs were revised and new measures were added, mostly targeting
agricultural pollution (with drinking water catchment protection, buffer stripes, etc.).
In a recent study on the WFD implementation, Bouleau (2011) highlights that according to case study
analyses on France and other European countries, it appears that France is a country with relatively
good water status (1/3 of the water bodies) that has however set a high restoration ambition. She
adds that existing international comparisons of WFD implementation (Moss 2008; Keessen et al.
2010; Scheuer and Naus 2010) show that other countries had set more pragmatic objectives. With
the lowest share of HMWB and AWB in the ISD, France has higher quality standards to reach in terms
of ecological objectives (which does not mean that water quality restoration is easier in the other ISD
countries).
France’s rather clear ambition to reach the GES is coupled with the anticipation (up to the explicit
fear) of sanctions from the European level. According to certain interviewees, the Ministry in charge
of Environment (Water and Biodiversity Directorate) conveyed the message to water agencies that
the threat of sanctions for not achieving the GES was real (considering the blames France received
for implementation failures to other directives) and that the efforts to reach the WFD objectives
would have to be significant. The Ministry also put pressure to carry out timely and thorough public
consultations. This can most likely be explained by the uncertainties faced by Member States
regarding the compliance to WFD objectives. For instance, measures of the first PoM are expected to
be operational by 2012, but Brussels’ assessment criteria are not known and could be as vast as the
efforts realized, the existence of contractors to implement measures, the budget effectively
allocated to measures, etc.
Policy transaction determinant Mode
Division of power and competencies among actors Integrated (synergy)
Despite the existing administrative set-up (2 regions, 5 departments) and the 16 sub-basins
(‘territoires’) in the Artois-Picardie RBD, river basin planning was organized around six geographical
committees (‘commissions géographiques’) to build the new SDAGE and PoM, with stakeholders’
representatives of the water sector. These committees aimed mostly at examining the objectives
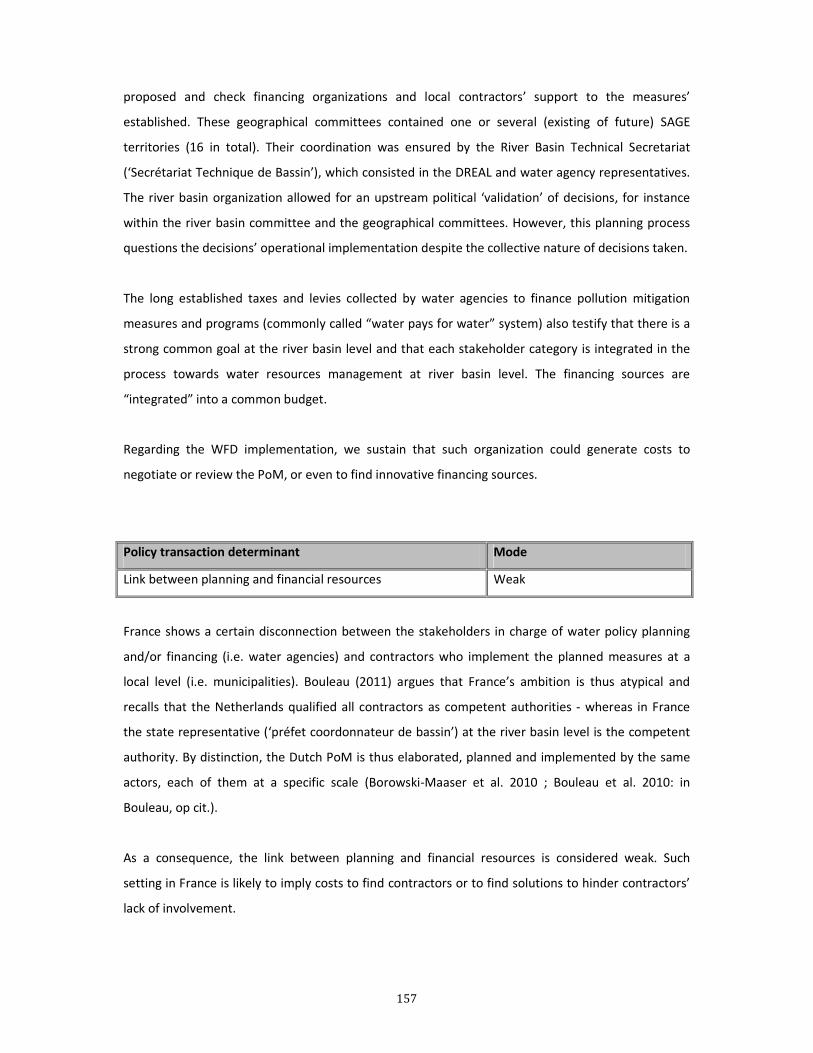
157
proposed and check financing organizations and local contractors’ support to the measures’
established. These geographical committees contained one or several (existing of future) SAGE
territories (16 in total). Their coordination was ensured by the River Basin Technical Secretariat
(‘Secrétariat Technique de Bassin’), which consisted in the DREAL and water agency representatives.
The river basin organization allowed for an upstream political ‘validation’ of decisions, for instance
within the river basin committee and the geographical committees. However, this planning process
questions the decisions’ operational implementation despite the collective nature of decisions taken.
The long established taxes and levies collected by water agencies to finance pollution mitigation
measures and programs (commonly called “water pays for water” system) also testify that there is a
strong common goal at the river basin level and that each stakeholder category is integrated in the
process towards water resources management at river basin level. The financing sources are
“integrated” into a common budget.
Regarding the WFD implementation, we sustain that such organization could generate costs to
negotiate or review the PoM, or even to find innovative financing sources.
Policy transaction determinant Mode
Link between planning and financial resources Weak
France shows a certain disconnection between the stakeholders in charge of water policy planning
and/or financing (i.e. water agencies) and contractors who implement the planned measures at a
local level (i.e. municipalities). Bouleau (2011) argues that France’s ambition is thus atypical and
recalls that the Netherlands qualified all contractors as competent authorities - whereas in France
the state representative (‘préfet coordonnateur de bassin’) at the river basin level is the competent
authority. By distinction, the Dutch PoM is thus elaborated, planned and implemented by the same
actors, each of them at a specific scale (Borowski-Maaser et al. 2010 ; Bouleau et al. 2010: in
Bouleau, op cit.).
As a consequence, the link between planning and financial resources is considered weak. Such
setting in France is likely to imply costs to find contractors or to find solutions to hinder contractors’
lack of involvement.

158
Policy transaction determinant Mode
Division of power and competencies between sectors/levels Fragmented
Considering the rather limited role of the national level regarding water policy planning (and
financing), we qualified the division of power and competencies between levels as fragmented.
Indeed, water agencies are quite independent from the Ministry (Water and Biodiversity
Directorate), especially given their financial autonomy but also other resources (human, technical,
etc.). Water agencies – and more generally the river basin level - have an important technical role
and ensure guidance.
On that basis, we expect costs for the national level to coordinate water agencies’ practices, to
collect and process information from water agencies but also to diffuse information to water
agencies.
Another point of interest is the staff turn-over within central administrations (at the Ministry Water
and Biodiversity Directorate and DREAL), especially during the crucial phase of the early WFD
implementation. It appeared that trained staff changed location or position after getting acquainted
with the complex WFD process. This may be due to the structure of the civil servants career
evolution’s rules, where staff needs to change mission, location or administration to be offered
career prospects.
It however generates costs to collect and spread information between levels since there exists
evidences of a lack of memory (i.e. no track of why certain decisions have been made) in this early
WFD implementation process.
Policy transaction determinant Mode
State of the environment and pressures Information gap
Given water bodies’ quality and the existing pressures affecting such quality, there is an information
gap to collect and process data to elaborate the PoM. Much data and information are required so as
to select appropriate measures, to identify their costs and effectiveness as well as implementation
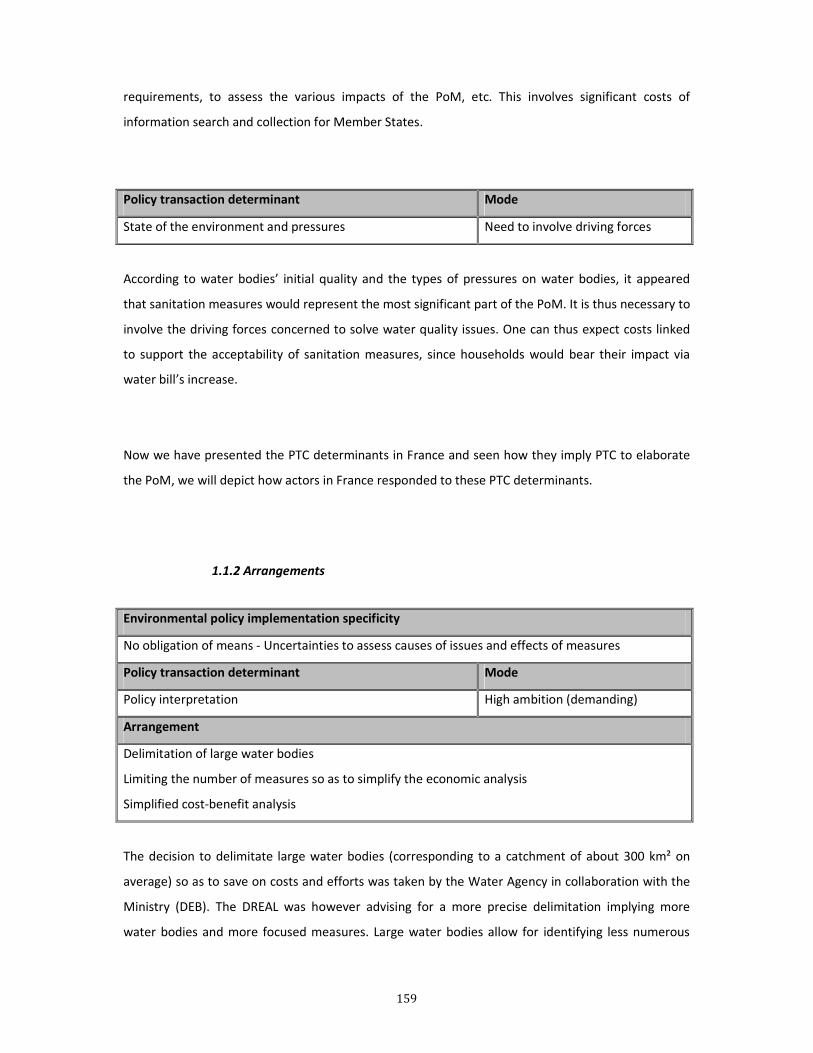
159
requirements, to assess the various impacts of the PoM, etc. This involves significant costs of
information search and collection for Member States.
Policy transaction determinant Mode
State of the environment and pressures Need to involve driving forces
According to water bodies’ initial quality and the types of pressures on water bodies, it appeared
that sanitation measures would represent the most significant part of the PoM. It is thus necessary to
involve the driving forces concerned to solve water quality issues. One can thus expect costs linked
to support the acceptability of sanitation measures, since households would bear their impact via
water bill’s increase.
Now we have presented the PTC determinants in France and seen how they imply PTC to elaborate
the PoM, we will depict how actors in France responded to these PTC determinants.
1.1.2 Arrangements
Environmental policy implementation specificity
No obligation of means - Uncertainties to assess causes of issues and effects of measures
Policy transaction determinant Mode
Policy interpretation High ambition (demanding)
Arrangement
Delimitation of large water bodies
Limiting the number of measures so as to simplify the economic analysis
Simplified cost-benefit analysis
The decision to delimitate large water bodies (corresponding to a catchment of about 300 km² on
average) so as to save on costs and efforts was taken by the Water Agency in collaboration with the
Ministry (DEB). The DREAL was however advising for a more precise delimitation implying more
water bodies and more focused measures. Large water bodies allow for identifying less numerous

160
and less detailed measures, which we assume is less constraining in terms of data collection and
processing. It also allows having one monitoring point per water body, which limits difficulties to
assess the water status as compared to having one monitoring point for several water bodies. The
incidence of large water bodies was made clear by D. Martin (Artois-Picardie water agency) in one of
the river basin meetings in 2007:
« Cet arrêté ne sera pas vu par Bruxelles, il nous permettra de continuer de travailler sur
le terrain mais sans risquer de contentieux puisque nous n’aurons pas de rapportage à
faire sur tous les petits cours d’eau. Derrière cette question, il faut considérer les coûts :
plus on présente de masses d’eau, plus nombreux sont les points de surveillance, les
outils de calcul pour faire ce rapportage, et plus on risque d’avoir des remontrances de la
part de l’Europe ». D. Martin, Planning and Evaluation Service Director, Commission
Géographique de la Somme (AEAP, 2006).
In addition to having defined large water bodies (especially by comparison to other French water
agencies), the total number of measures was restricted to a manageable amount. This is to save on
data collection and processing efforts since each of measure shall be analyzed in terms of costs,
effectiveness, and impact.
As regard to the CBA, a six-month study was delegated to 2 consultancy firms (Ecowhat and
Ecodecision) to assess the benefits of reaching the GES at the basin level, based on a representative
sample of water bodies. This study did not involve field interviews and its results were extrapolated
to the water body scale when benefit values were required at the water body level to consider an
exemption for economic reason. Indeed, a detailed CBA for each water body was considered a low
priority as it would have involved extensive work. A focus was given at the water body scale when
costs appeared particularly significant.
Last, the Artois-Picardie water agency presented in the SDAGE a short analysis of (costs of)
alternative uses to justify of the HMWB. Such analysis is meant to ensure compliance with European
requirements while having uncertainties on the European assessment criteria to judge the WFD
implementation process.
As a result of a demanding policy interpretation, extensive data search and processing is required.
We hereby highlighted the decisions taken in the French part of the ISD so as to mitigate research
and information costs.
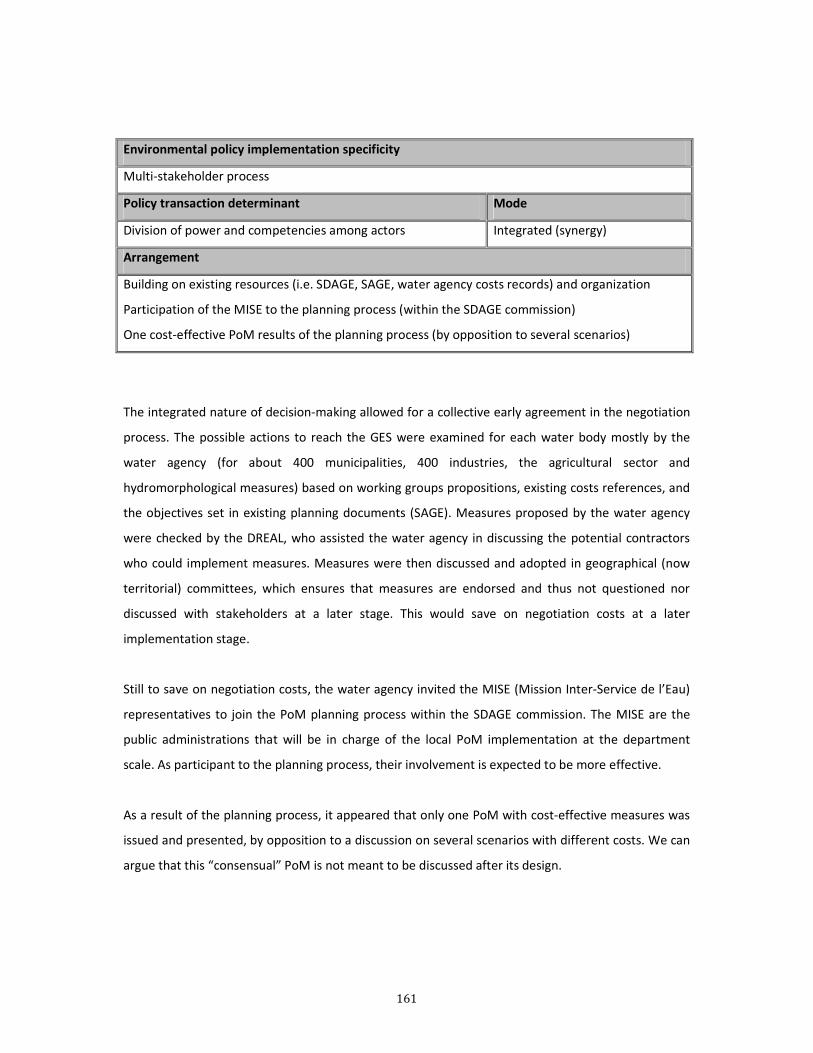
161
Environmental policy implementation specificity
Multi-stakeholder process
Policy transaction determinant Mode
Division of power and competencies among actors Integrated (synergy)
Arrangement
Building on existing resources (i.e. SDAGE, SAGE, water agency costs records) and organization
Participation of the MISE to the planning process (within the SDAGE commission)
One cost-effective PoM results of the planning process (by opposition to several scenarios)
The integrated nature of decision-making allowed for a collective early agreement in the negotiation
process. The possible actions to reach the GES were examined for each water body mostly by the
water agency (for about 400 municipalities, 400 industries, the agricultural sector and
hydromorphological measures) based on working groups propositions, existing costs references, and
the objectives set in existing planning documents (SAGE). Measures proposed by the water agency
were checked by the DREAL, who assisted the water agency in discussing the potential contractors
who could implement measures. Measures were then discussed and adopted in geographical (now
territorial) committees, which ensures that measures are endorsed and thus not questioned nor
discussed with stakeholders at a later stage. This would save on negotiation costs at a later
implementation stage.
Still to save on negotiation costs, the water agency invited the MISE (Mission Inter-Service de l’Eau)
representatives to join the PoM planning process within the SDAGE commission. The MISE are the
public administrations that will be in charge of the local PoM implementation at the department
scale. As participant to the planning process, their involvement is expected to be more effective.
As a result of the planning process, it appeared that only one PoM with cost-effective measures was
issued and presented, by opposition to a discussion on several scenarios with different costs. We can
argue that this “consensual” PoM is not meant to be discussed after its design.
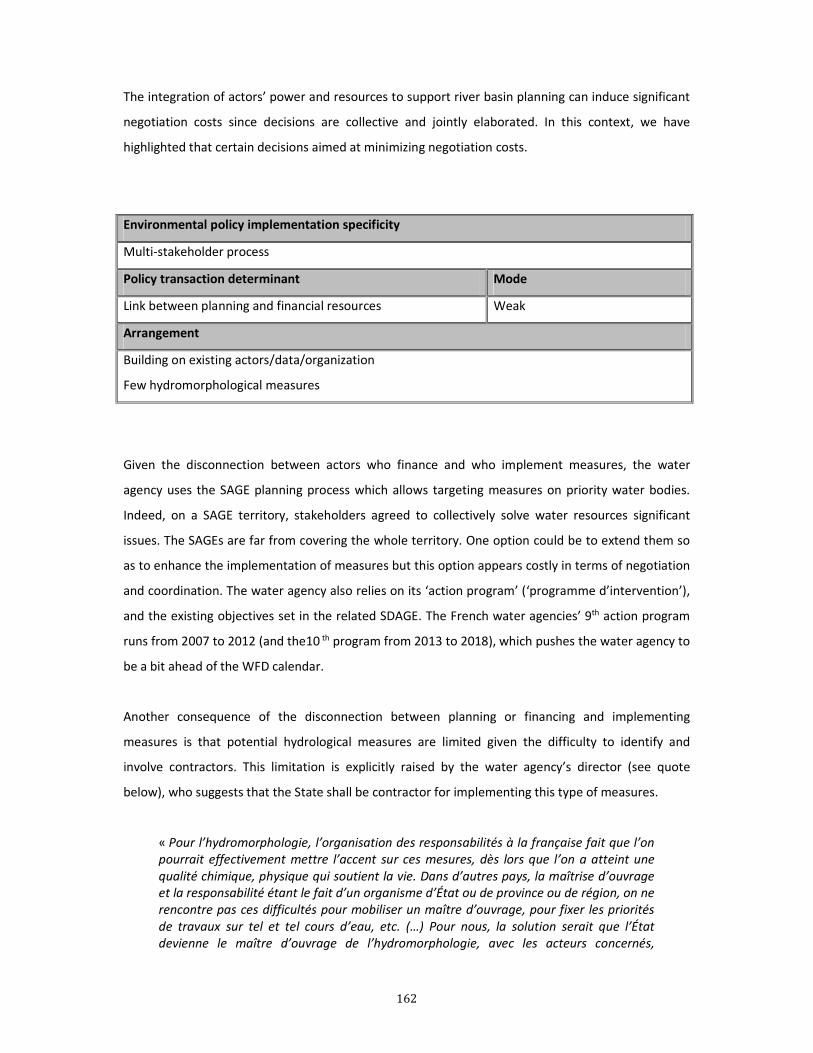
162
The integration of actors’ power and resources to support river basin planning can induce significant
negotiation costs since decisions are collective and jointly elaborated. In this context, we have
highlighted that certain decisions aimed at minimizing negotiation costs.
Environmental policy implementation specificity
Multi-stakeholder process
Policy transaction determinant Mode
Link between planning and financial resources Weak
Arrangement
Building on existing actors/data/organization
Few hydromorphological measures
Given the disconnection between actors who finance and who implement measures, the water
agency uses the SAGE planning process which allows targeting measures on priority water bodies.
Indeed, on a SAGE territory, stakeholders agreed to collectively solve water resources significant
issues. The SAGEs are far from covering the whole territory. One option could be to extend them so
as to enhance the implementation of measures but this option appears costly in terms of negotiation
and coordination. The water agency also relies on its ‘action program’ (‘programme d’intervention’),
and the existing objectives set in the related SDAGE. The French water agencies’ 9th action program
runs from 2007 to 2012 (and the10 th program from 2013 to 2018), which pushes the water agency to
be a bit ahead of the WFD calendar.
Another consequence of the disconnection between planning or financing and implementing
measures is that potential hydrological measures are limited given the difficulty to identify and
involve contractors. This limitation is explicitly raised by the water agency’s director (see quote
below), who suggests that the State shall be contractor for implementing this type of measures.
« Pour l’hydromorphologie, l’organisation des responsabilités à la française fait que l’on pourrait effectivement mettre l’accent sur ces mesures, dès lors que l’on a atteint une qualité chimique, physique qui soutient la vie. Dans d’autres pays, la maîtrise d’ouvrage et la responsabilité étant le fait d’un organisme d’État ou de province ou de région, on ne rencontre pas ces difficultés pour mobiliser un maître d’ouvrage, pour fixer les priorités de travaux sur tel et tel cours d’eau, etc. (…) Pour nous, la solution serait que l’État devienne le maître d’ouvrage de l’hydromorphologie, avec les acteurs concernés,
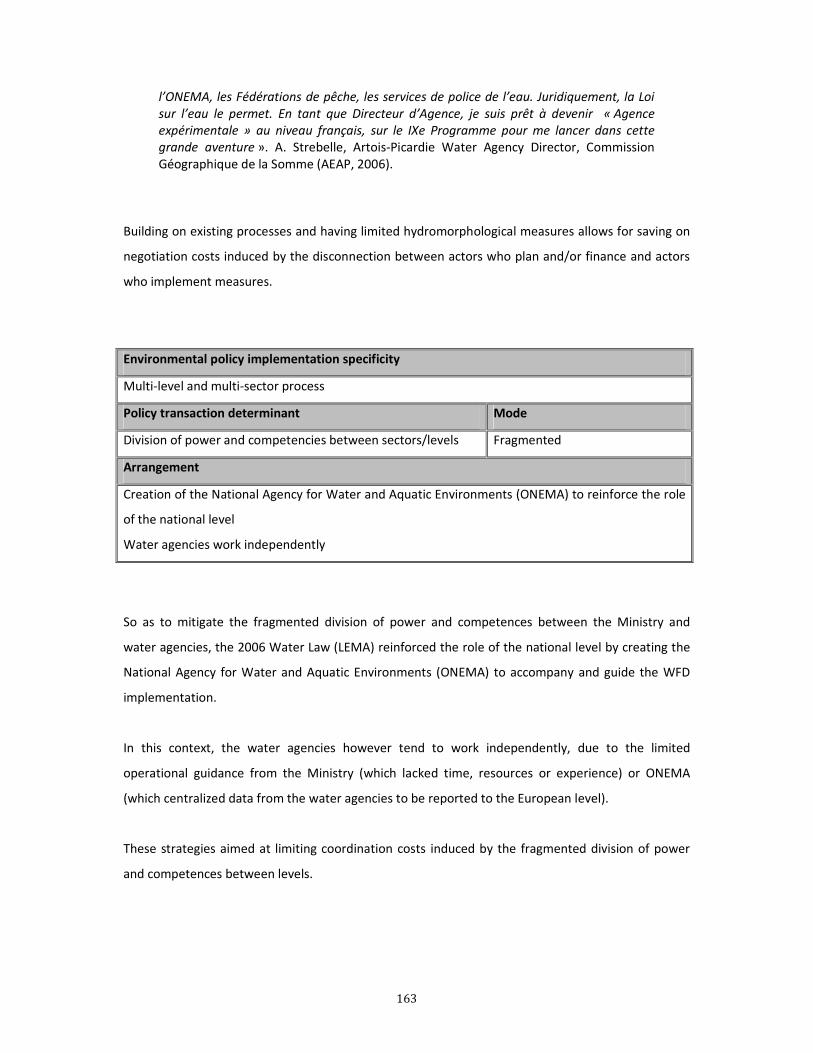
163
l’ONEMA, les Fédérations de pêche, les services de police de l’eau. Juridiquement, la Loi sur l’eau le permet. En tant que Directeur d’Agence, je suis prêt à devenir « Agence expérimentale » au niveau français, sur le IXe Programme pour me lancer dans cette grande aventure ». A. Strebelle, Artois-Picardie Water Agency Director, Commission Géographique de la Somme (AEAP, 2006).
Building on existing processes and having limited hydromorphological measures allows for saving on
negotiation costs induced by the disconnection between actors who plan and/or finance and actors
who implement measures.
Environmental policy implementation specificity
Multi-level and multi-sector process
Policy transaction determinant Mode
Division of power and competencies between sectors/levels Fragmented
Arrangement
Creation of the National Agency for Water and Aquatic Environments (ONEMA) to reinforce the role
of the national level
Water agencies work independently
So as to mitigate the fragmented division of power and competences between the Ministry and
water agencies, the 2006 Water Law (LEMA) reinforced the role of the national level by creating the
National Agency for Water and Aquatic Environments (ONEMA) to accompany and guide the WFD
implementation.
In this context, the water agencies however tend to work independently, due to the limited
operational guidance from the Ministry (which lacked time, resources or experience) or ONEMA
(which centralized data from the water agencies to be reported to the European level).
These strategies aimed at limiting coordination costs induced by the fragmented division of power
and competences between levels.

164
Environmental policy implementation specificity
Characteristics of the environment
Policy transaction determinant Mode
State of the environment and pressures Information gap
Arrangement
Choice of a limited number of water bodies
Each water agency undertake its economic analysis
Building on existing information and data
Restricting the number of water bodies by delimiting large water bodies reduces the amount of
information to collect and process so as to elaborate the PoM (i.e. less data on water body status, on
costs, effectiveness, on benefits of reaching the GES, less data for reporting, etc.).
Since water agencies gather most of the data necessary to design the PoM, it is logical they are in
charge of undertaking the economic analysis as opposed to the central level. In Artois-Picardie, the
river basin scale has been chosen to assess benefits of reaching the GES along with a simplified
methodology (benefit transfer – see for instance Rozan, 2004) so as to limit the data to be collected
and processed and the related costs.
For about 40 years, water agencies collected extensive data on pollutant discharge and levels (as a
basis to set taxes), as well as technical and information on costs since they have been financing
works and projects aiming at water pollution mitigation. They have experience in designing
measures, assessing works, setting financial limits (ceiling costs), and adjusting subsidies. The PoM is
much based on this experience and data.
The decisions to elaborate the PoM on these bases shall clearly contribute to minimizing information
search and collection.

165
Environmental policy implementation specificity
Characteristics of the environment
Policy transaction determinant Mode
State of the environment and pressures Need to involve driving forces
Arrangement
Interpretation of basic and supplementary measures
Detailed analysis on the impact of the PoM on the water bill
The definition of basic and supplementary measures may be strategic. Indeed, basic measures are
not negotiated and not subject to CEA or CBA since they are supposed to stem from previous
legislations or programs in place. The interpretation of the 1991 UWWD (Urban Waste Water
Directive) into French law allowed for limiting the share of basic measures in Artois-Picardie. As
mentioned earlier, sanitation measures represent the most significant share of the PoM in terms of
costs. However, they only represent a small share of basic measures. Many small municipalities need
sanitation measures but these are not considered under the UWWD (only municipalities with more
than 2000 equivalent inhabitants are concerned). Such interpretation allows for considering
supplementary measures for disproportionate costs and exemptions, which can contribute to favor
the acceptability of the PoM.
Given the significance of sanitation measures required to reach the GES and the sensitivity of its
incidence on households’ financial contribution, the water agency undertook a specific analysis on
the impact of measures on households (water price and water bill’s share of households’ budget).
Indeed, the issue of disproportionate costs rests mostly on sanitation measures and has thus a direct
impact on households’ contribution. The spreading of measures over time is very dependent on the
water price’s increase. According to the socio-economic context in the North of France, it appeared
crucial that such study shall contribute to improve stakeholders’ acceptance of sanitation measures
and the related water price increase.
Through these decisions, the actors in charge of the WFD implementation expect to minimize
negotiation costs and thus facilitate the adoption of the PoM.

166
1.2 Belgium – Walloon region
1.2.1 Determinants’ modes
For the Walloon region, we have identified 5 determinants and 6 related values, each one inducing a
main type of PTC.
Regarding the ‘policy interpretation’ determinant, we have highlighted a double trend based on the
interviews carried out: some policy actors are determined to implement the WFD with a high
ambition while other influent actors have other priorities.
Policy transaction determinant Mode
Policy interpretation High ambition (demanding)
The WFD demanding interpretation concerns the administration in charge of the environment: the
DGARNE. Despite its relatively scarce human and financial resources across the territory (mostly
given the size of the region), the DGARNE staff seemed determined to comply with the WFD
objectives and to follow the European guidelines, as testified by the small and numerous water
bodies delimited, the choice to undertake analyses at the water body scale, and the thorough benefit
assessment study commissioned (to carry out the CBA). A demanding policy implementation requires
a significant amount and detailed data, as well as efforts to collect and process information.
Policy transaction determinant Mode
Policy interpretation Low ambition
At the ministry level (Cabinet), the WFD was less a priority as shown by the preoccupation for the
2009 regional elections and the significant delays to implement the WFD. In preparation of the
elections, the Cabinet required in 2008 to prepare two management plans (as pilot project) but these
plans concerned the Rhine and the Seine districts, which constitute 5% of water bodies in Wallonia
and represented few measures. In the Walloon region, political instability is significant. It seemed
there was no clear mid and long-term political objectives are regard to the WFD implementation. As
a consequence, we can notice there is limited continuity between tasks, important delays to
elaborate the PoM, or the interruption of ongoing tasks (i.e. the economic analysis carried out by the
DGARNE). An additional public consultation had to be launched since the first one was held too early
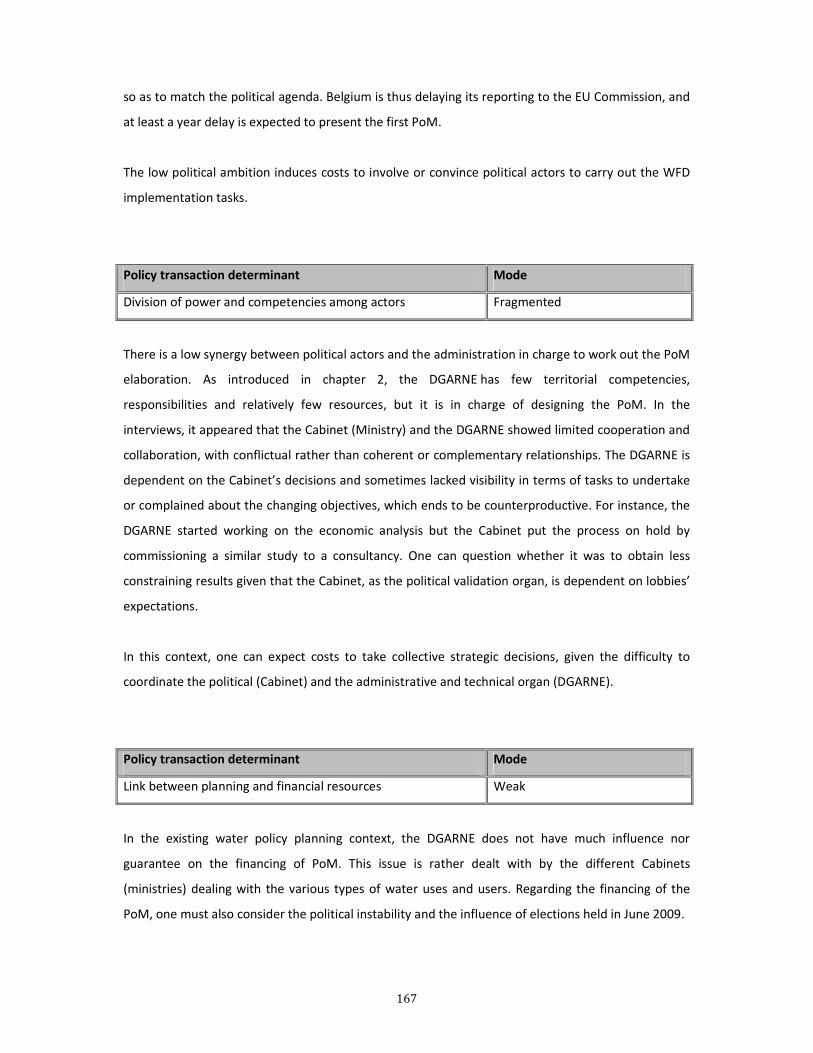
167
so as to match the political agenda. Belgium is thus delaying its reporting to the EU Commission, and
at least a year delay is expected to present the first PoM.
The low political ambition induces costs to involve or convince political actors to carry out the WFD
implementation tasks.
Policy transaction determinant Mode
Division of power and competencies among actors Fragmented
There is a low synergy between political actors and the administration in charge to work out the PoM
elaboration. As introduced in chapter 2, the DGARNE has few territorial competencies,
responsibilities and relatively few resources, but it is in charge of designing the PoM. In the
interviews, it appeared that the Cabinet (Ministry) and the DGARNE showed limited cooperation and
collaboration, with conflictual rather than coherent or complementary relationships. The DGARNE is
dependent on the Cabinet’s decisions and sometimes lacked visibility in terms of tasks to undertake
or complained about the changing objectives, which ends to be counterproductive. For instance, the
DGARNE started working on the economic analysis but the Cabinet put the process on hold by
commissioning a similar study to a consultancy. One can question whether it was to obtain less
constraining results given that the Cabinet, as the political validation organ, is dependent on lobbies’
expectations.
In this context, one can expect costs to take collective strategic decisions, given the difficulty to
coordinate the political (Cabinet) and the administrative and technical organ (DGARNE).
Policy transaction determinant Mode
Link between planning and financial resources Weak
In the existing water policy planning context, the DGARNE does not have much influence nor
guarantee on the financing of PoM. This issue is rather dealt with by the different Cabinets
(ministries) dealing with the various types of water uses and users. Regarding the financing of the
PoM, one must also consider the political instability and the influence of elections held in June 2009.
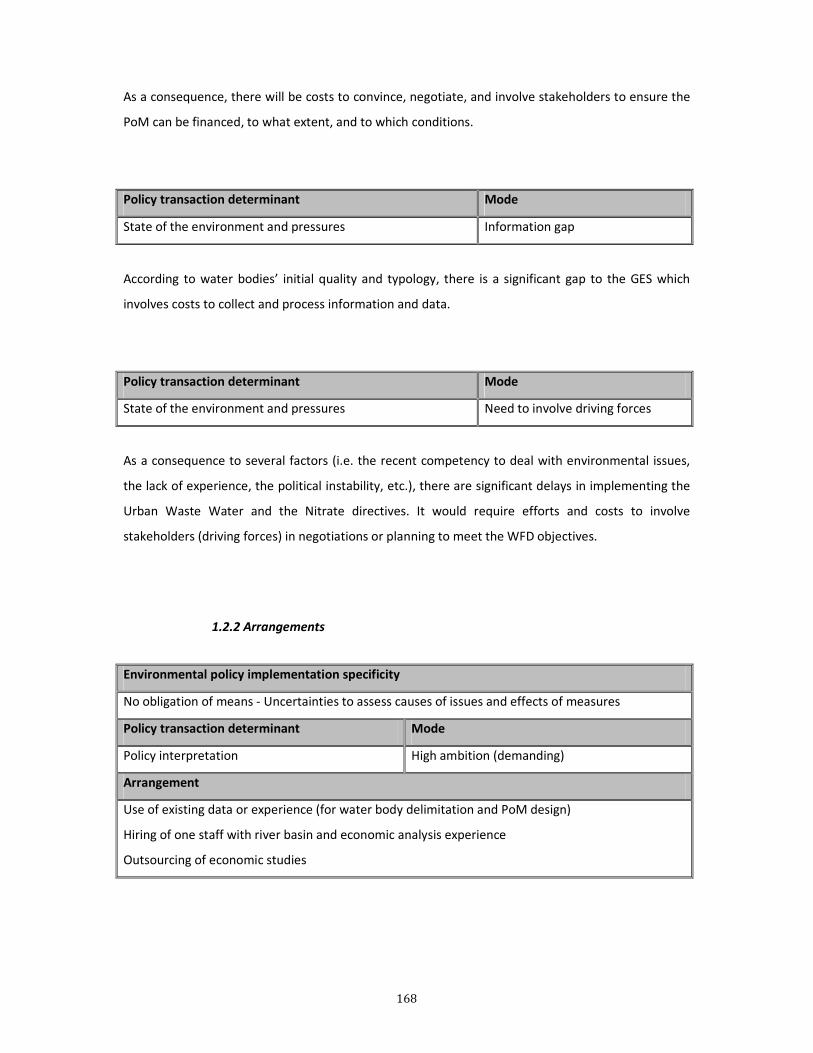
168
As a consequence, there will be costs to convince, negotiate, and involve stakeholders to ensure the
PoM can be financed, to what extent, and to which conditions.
Policy transaction determinant Mode
State of the environment and pressures Information gap
According to water bodies’ initial quality and typology, there is a significant gap to the GES which
involves costs to collect and process information and data.
Policy transaction determinant Mode
State of the environment and pressures Need to involve driving forces
As a consequence to several factors (i.e. the recent competency to deal with environmental issues,
the lack of experience, the political instability, etc.), there are significant delays in implementing the
Urban Waste Water and the Nitrate directives. It would require efforts and costs to involve
stakeholders (driving forces) in negotiations or planning to meet the WFD objectives.
1.2.2 Arrangements
Environmental policy implementation specificity
No obligation of means - Uncertainties to assess causes of issues and effects of measures
Policy transaction determinant Mode
Policy interpretation High ambition (demanding)
Arrangement
Use of existing data or experience (for water body delimitation and PoM design)
Hiring of one staff with river basin and economic analysis experience
Outsourcing of economic studies
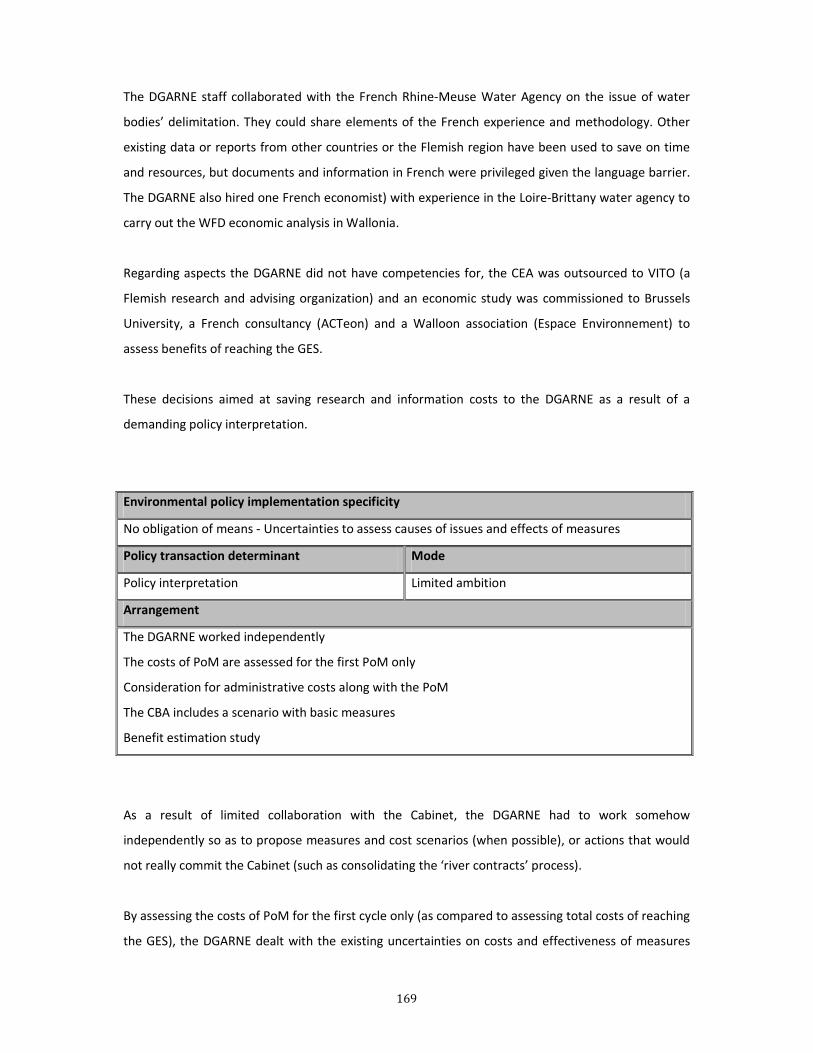
169
The DGARNE staff collaborated with the French Rhine-Meuse Water Agency on the issue of water
bodies’ delimitation. They could share elements of the French experience and methodology. Other
existing data or reports from other countries or the Flemish region have been used to save on time
and resources, but documents and information in French were privileged given the language barrier.
The DGARNE also hired one French economist) with experience in the Loire-Brittany water agency to
carry out the WFD economic analysis in Wallonia.
Regarding aspects the DGARNE did not have competencies for, the CEA was outsourced to VITO (a
Flemish research and advising organization) and an economic study was commissioned to Brussels
University, a French consultancy (ACTeon) and a Walloon association (Espace Environnement) to
assess benefits of reaching the GES.
These decisions aimed at saving research and information costs to the DGARNE as a result of a
demanding policy interpretation.
Environmental policy implementation specificity
No obligation of means - Uncertainties to assess causes of issues and effects of measures
Policy transaction determinant Mode
Policy interpretation Limited ambition
Arrangement
The DGARNE worked independently
The costs of PoM are assessed for the first PoM only
Consideration for administrative costs along with the PoM
The CBA includes a scenario with basic measures
Benefit estimation study
As a result of limited collaboration with the Cabinet, the DGARNE had to work somehow
independently so as to propose measures and cost scenarios (when possible), or actions that would
not really commit the Cabinet (such as consolidating the ‘river contracts’ process).
By assessing the costs of PoM for the first cycle only (as compared to assessing total costs of reaching
the GES), the DGARNE dealt with the existing uncertainties on costs and effectiveness of measures

170
but also with uncertainties regarding the political validation of costs and measures which allows for
possible readjustments according to the political involvement.
In a report on the economic analysis, the DGARNE included an estimation of administrative costs so
as to inform political actors on the possible costs associated to the PoM. Also, the CBA includes a
scenario with basic measures (instead of supplementary measures only) because if only
supplementary measures are considered in the CBA, the costs of PoM would be too important to be
considered by decision-makers. One can also argue that the benefit estimation study shall provide
objective arguments to plead for measures proposed by DGARNE so as to convince political actors.
With these strategies to provide detailed information so as to induce an informed decision-making
process by policy actors, the DGARNE sought to limit negotiation costs in implementing the WFD.
Environmental policy implementation specificity
Multi-stakeholder process
Policy transaction determinant Mode
Division of power and competencies among actors Fragmented
Arrangement
Few actors are involved in the planning process
Existing planning processes (‘river contracts’) are further developed
Given the fragmented division of power and competencies among actors, relatively few actors are
involved in the PoM planning process and measures are thus defined within the DGARNE to minimize
coordination costs.
So as to foster actors’ involvement and cooperation with the aim to ensure an effective
implementation of measures, the DGARNE also extended the ‘river contacts’ to the whole territory.
They will be local intermediaries for the DGARNE (i.e. to carry out the consultations, etc.).
With these decisions, the DGARNE attempted to minimize coordination costs.
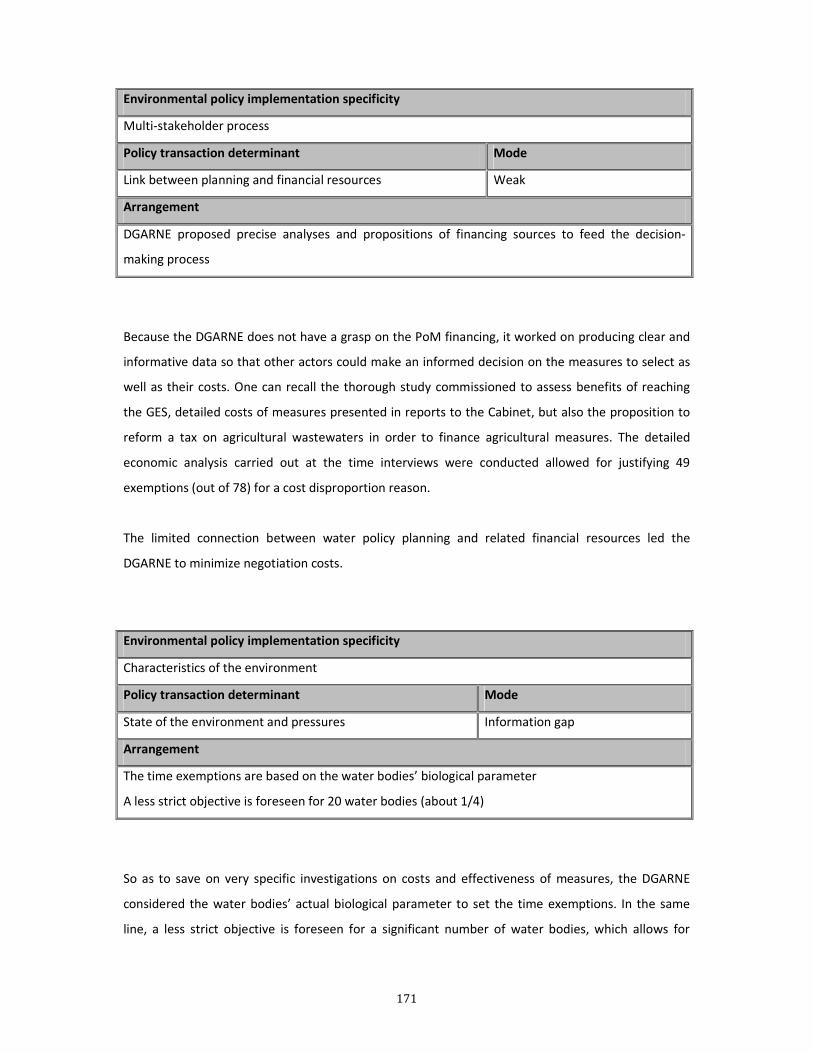
171
Environmental policy implementation specificity
Multi-stakeholder process
Policy transaction determinant Mode
Link between planning and financial resources Weak
Arrangement
DGARNE proposed precise analyses and propositions of financing sources to feed the decision-
making process
Because the DGARNE does not have a grasp on the PoM financing, it worked on producing clear and
informative data so that other actors could make an informed decision on the measures to select as
well as their costs. One can recall the thorough study commissioned to assess benefits of reaching
the GES, detailed costs of measures presented in reports to the Cabinet, but also the proposition to
reform a tax on agricultural wastewaters in order to finance agricultural measures. The detailed
economic analysis carried out at the time interviews were conducted allowed for justifying 49
exemptions (out of 78) for a cost disproportion reason.
The limited connection between water policy planning and related financial resources led the
DGARNE to minimize negotiation costs.
Environmental policy implementation specificity
Characteristics of the environment
Policy transaction determinant Mode
State of the environment and pressures Information gap
Arrangement
The time exemptions are based on the water bodies’ biological parameter
A less strict objective is foreseen for 20 water bodies (about 1/4)
So as to save on very specific investigations on costs and effectiveness of measures, the DGARNE
considered the water bodies’ actual biological parameter to set the time exemptions. In the same
line, a less strict objective is foreseen for a significant number of water bodies, which allows for

172
dealing with actual uncertainties about possible measures, their costs and effectiveness, and for
anticipating likely changes without compromising the quality objectives expected.
The DGARNE also outsourced (economic) studies, collaborated with neighboring countries, used data
produced by other countries, or analyzed the impact of the costs of PoM at the water body scale only
when necessary (if not, at the regional level) so as to save information collection costs.
Environmental policy implementation specificity
Characteristics of the environment
Policy transaction determinant Mode
State of the environment and pressures Need to involve driving forces
Arrangement
Some competencies (especially relating to the WFD economic analysis and sanitation measures)
were transferred to the SPGE due to its experience and mandate regarding water sanitation
Unlike in the ‘water pays for water’ system in France, measures are financed via different sources.
Sanitation measures are financed through the water price whereas other types of measures require
other financial sources (European funding, taxes, etc.). At a late stage of the first economic analysis,
the Cabinet considered transferring competencies to the SPGE (created in 2000) due to its
experience on water sanitation, which allowed for involving the sanitation sector to facilitate
agreements on objectives, means and costs. This decision would help saving on negotiation costs to
involve key stakeholders to reach the WFD objectives.
1.3 Belgium – Flemish region
1.3.1 Determinants’ modes
In the context of the Flemish region, we identified 4 determinants and 4 related modes.

173
Policy transaction determinant Mode
Division of power and competencies among actors Fragmented
The fragmented division of power and competencies is linked to the numerous actors and
competencies involved in water management and the historical fragmentation of competencies
(interview). The rather recent mandate of the Belgian regions regarding environmental (and thus
water quality) policy could also explain a limited experience of horizontal collaboration among
actors. In this context, one can expect costs to coordinate actors and actions towards the WFD
objectives.
Policy transaction determinant Mode
Link between planning and financial resources Weak
Such as in the Walloon region, there is no “water pays for water” system in place, and the PoM is
financed via different financial sources. Taxes collected for water sanitation are used for water
sanitation, but for measures regarding industries and other stakeholders, the so-called MINA fund is
raised and used to finance “environmental measures”. The administration in charge of designing
measures (VMM) does not have a grasp on the financing of measures. This induces costs to negotiate
with or convince actors to finance WFD measures.
Policy transaction determinant Mode
Division of power and competencies between sectors/levels Fragmented
The division of power and competencies between levels is considered fragmented first of all given
the existing different planning levels and the lack of experience in multilevel governance. There are 3
main planning levels:
- The river basin level (2 river basins on the Flemish territory)
- The sub-basin level (there are 11 sub-basins, about 2 per province). At this level, there exists
a council with stakeholders’ representatives since about 2005.
- The sub-sub-basin level, corresponding to smaller territories based on hydrological
boundaries (52 sub-sub-basins in Flanders and about 45 in the Scheldt District)
The main political validation of measures however remains at the regional level.

174
Second, it is difficult for the local level to take decisions as compared to the Netherlands. There is no
“one” national level in Belgium, since provinces operate independently. The local level (polders and
‘becken’) is hardly involved in the WFD measures selection process, also possibly because it is poorly
informed. Polders are very small entities that only deal with water quantitative management, which
limits their responsibility (interview).
We expect such determinant to induce costs to coordinate actors and actions across levels.
Policy transaction determinant Mode
State of the environment and pressures Information gap
According to water body types and initial quality, there is a significant gap to reach the GES, which
necessarily generate costs to collect, process information and data to build a cost-effective PoM to
meet the WFD objectives.
1.3.2 Arrangements
Environmental policy implementation specificity
Multi-stakeholder process
Policy transaction determinant Mode
Division of power and competencies among actors Fragmented
Arrangement
Creation of a coordination platform (CIW) for a river basin scale management (2003 decree)
The PoM is designed at the regional (and not water body) scale and only one PoM is established for
the Flemish region (it combines the 2 river basin districts)
The Flemish PoM was ready by the deadline set (unlike the Walloon region)
VMM is an active and involved stakeholder (i.e. as being the lead partner in the ScaldWIN project)

175
The PoM is designed at the regional (and not water body) scale. This way, it gives priority to the most
important surface water systems. More precise measures are expected in the local management
plans for the 2nd WFD implementation cycle.
Scaldit and ScaldWIN are two successive European Interreg (IIIB and IVB) cross-border cooperation
projects launched in 2003 and 2008. Scaldit was meant to test the guidance documents at the ISD
scale for the execution of the WFD. The ScaldWIN project dealt with cooperation between 8 partners
on technical WFD implementation issues.
We argue that these decisions allow for limiting coordination costs, as they simplify exchanges
between actors to elaborate the PoM or reinforce the role of a key stakeholder (VMM).
Environmental policy implementation specificity
Multi-stakeholder process
Policy transaction determinant Mode
Link between planning and financial resources Weak
Arrangement
Economic analysis commissioned to VITO
Several PoM scenarios were presented to the Ministry
Regarding the economic analysis, VMM outsourced the CBA and affordability analysis to VITO, for an
18 months period (April 08 – October 09). VITO also undertook a study to support the CEA based on
the Environmental Cost Model. Costs disproportion was assessed for the entire PoM and not at
water body scale. The costs and benefits considered in the CBA were the costs of the maximum
scenario and the benefits of reaching the GES at the regional scale. To assess benefits, VITO used the
results of the Aquamoney case study, and the Dender case study based on the willingness to pay
(WTP) method. Two approaches were considered for the CBA: a “bottom-up” approach (where each
category of benefits was assessed, and data from other countries used to make calculations) and
“top-down” approach (with the WTP study, all benefits were assumed), leading to similar results.
Costs appeared to be two times higher than benefits. As a result, no cost disproportion threshold
was used and the maximum scenario was considered disproportionate (especially for agricultural
measures) on the basis of costs being significantly higher than benefits. This analysis led to exclude
the measures of the maximum scenario based on cost disproportion. The affordability analysis
(stakeholders’ capacity to pay for measures) was undertaken for each scenario.

176
The capacity to pay analysis carried out by VITO for the intermediate scenario was considered “to be
discussed”. It was presented to the Ministry who decided whether costs were acceptable or should
be lowered. The intermediate scenario first proposed by VITO implied that the different
stakeholders’ categories contributed to a certain share of the costs of PoM (and its financial burden):
Costs: households 13-16%; industry 25-35%; agriculture 7-8%; government 45-51%
Financial burden: households 9-11%; industry 24-34%; agriculture 5%; government 52-60%
The government bears the most significant share since it is responsible for non-navigable waterways
and thus hydromorphological measures.
The stakeholder categories shall contribute to the PoM in different ways:
- households through water price (and other investment)
- the agricultural sector through a tax on groundwater (only if more than a certain amount is
withdrawn) aiming at induce a change of practice
- industries through improved sanitation and measures for sustainable water use
- government with river restoration measures, studies, campaigns
Since VMM does not have a grasp on the financing of the PoM, it required a thorough economic
analysis to present to the Ministry. Such analysis presented several scenarios, the ins and the outs of
the PoM and arguments to support the intermediate scenario. With such approach, costs of
negotiations with the Ministry and stakeholders’ representatives are expected to be limited (as
compared to on-going discussions with actors to analyze their possible financial involvement) since
the political actor at regional level eventually makes the decision.
Environmental policy implementation specificity
Multi-level and multi-sector process
Policy transaction determinant Mode
Division of power and competencies between sectors/levels Fragmented
Arrangement
Creation of a coordination platform (CIW) for a river basin scale management (2003 decree)
The PoM is designed at the regional (and not water body) scale and only one PoM is established
More synergy is sought between the different management plans
VMM is an active and involved stakeholder, taking a lead in the coordination of the Scaldit and
Scaldwin projects

177
The coordination platform (CIW) gathers stakeholder representatives of the different sectors and
thus helps centralizing the decision-making for a river basin planning.
The PoM being designed at the regional level, limited information was gathered from the lower
levels and the PoM consists mainly of general measures focusing on the most important surface
water systems. More precise measures are expected in the local management plans for the 2nd WFD
implementation cycle. The coordination between levels was not sought at this stage to select
measures as it may have prevented the PoM elaboration in time. Only one PoM is presented for the
Flemish region, which allows for centralizing the information and reaffirms the importance of the
regional administrative level over the river basin level.
More synergy is sought between the different management plans to increase their coherence and
coordination so that sub-basin and sub-sub management plans could feed the river basin plan (PoM).
Sub-basin planning exists since 2007 and sub-basin authorities (sectors’ representatives supervised
by the governor of the the province, administration and the river basin council) are part of the CIW.
There exists today different planning cycles between the sub-basin plans and the PoM: both have 6
year cycles but at 3 years interval. For the second WFD implementation cycle, the objective is to
match these respective planning cycles and their content (selection of measures, analysis of
exemptions, economic analysis for local measures, etc.) so that sub-basin plans can be an input for
the PoM, but also to improve the implementation and monitoring of measures.
The strategies depicted aim at minimizing coordination costs between the different levels.
Environmental policy implementation specificity
Characteristics of the environment
Policy transaction determinant Mode
State of the environment and pressures Information gap
Arrangement
The number of water bodies was lowered
Exemptions are based on biological criteria
The PoM is designed at the regional (and not water body) scale
Consultation of the PoM undertaken without much data
Cost disproportion was assessed for the whole PoM
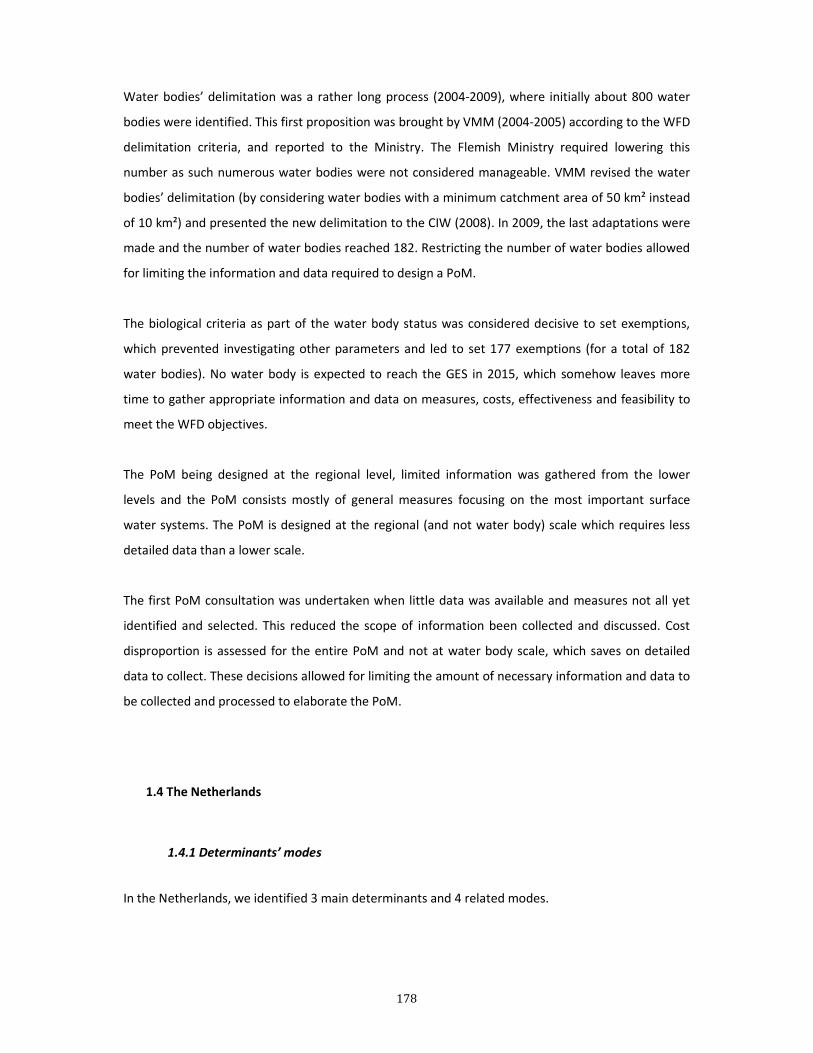
178
Water bodies’ delimitation was a rather long process (2004-2009), where initially about 800 water
bodies were identified. This first proposition was brought by VMM (2004-2005) according to the WFD
delimitation criteria, and reported to the Ministry. The Flemish Ministry required lowering this
number as such numerous water bodies were not considered manageable. VMM revised the water
bodies’ delimitation (by considering water bodies with a minimum catchment area of 50 km² instead
of 10 km²) and presented the new delimitation to the CIW (2008). In 2009, the last adaptations were
made and the number of water bodies reached 182. Restricting the number of water bodies allowed
for limiting the information and data required to design a PoM.
The biological criteria as part of the water body status was considered decisive to set exemptions,
which prevented investigating other parameters and led to set 177 exemptions (for a total of 182
water bodies). No water body is expected to reach the GES in 2015, which somehow leaves more
time to gather appropriate information and data on measures, costs, effectiveness and feasibility to
meet the WFD objectives.
The PoM being designed at the regional level, limited information was gathered from the lower
levels and the PoM consists mostly of general measures focusing on the most important surface
water systems. The PoM is designed at the regional (and not water body) scale which requires less
detailed data than a lower scale.
The first PoM consultation was undertaken when little data was available and measures not all yet
identified and selected. This reduced the scope of information been collected and discussed. Cost
disproportion is assessed for the entire PoM and not at water body scale, which saves on detailed
data to collect. These decisions allowed for limiting the amount of necessary information and data to
be collected and processed to elaborate the PoM.
1.4 The Netherlands
1.4.1 Determinants’ modes
In the Netherlands, we identified 3 main determinants and 4 related modes.

179
Policy transaction determinant Mode
Policy interpretation Limited ambition
The WFD translation into Dutch law does not consider there is an obligation of results, but rather an
obligation of efforts (“best effort”) to restore water quality towards the GES. According to Bouleau
(2011), this interpretation stems from the English version of the WFD, mentioning that Member
States shall protect, improve and restore water status « with the aim to achieve …» the objectives
set.
It also appeared that in the political agenda, priority is given to flood protection issues and the WFD
has thus a relative importance in the arena of water resources management. Indeed, basic measures
for the PoM are measures comprised in existing programs, especially “make space for the rivers” and
“prevention of flooding”.
Regarding local policy makers, water boards are elected so their ambition can be considered as
subjective. The PoM is established mostly according to regional budgetary constraints: the water
boards decided by what amount the taxes would be raised. Since a raise of taxes is sensitive in most
sub-basins, water boards were reluctant to increase taxes as a result of the WFD. As a consequence,
the number of measures was reduced in most river basins but less significantly in the Scheldt river
basin.
Policy transaction determinant Mode
Division of power and competencies between sectors/levels Fragmented
The Netherlands is a small country counting however 4 important river basins and numerous
planning levels, each of them having a distinct and specific role in planning. Two main categories of
water are distinguished: the national waters under the responsibility of the Rijkswaterstaat, and
regional waters dealt with by provinces and water boards (waterschappen). A specificity of the
Netherlands is that the local level is much implied in decision-making. Such complex organization of
planning and water management implies that the division of power and competencies between
levels is considered fragmented.

180
Policy transaction determinant Mode
State of the environment and pressures Information gap
Similarly to the other countries of the ISD, there is a significant gap between today’s water quality
and the GES, involving an information gap due to necessary data to collect and process so as to
elaborate a cost-effective PoM aiming at reaching the GES.
Policy transaction determinant Mode
State of the environment and pressures Need to involve driving forces
The poor water quality due to existing pressures requires involving the driving forces so as to change
practices. Pollution from agriculture being significant, it can be a challenge to deal with this issue.
1.4.2 Arrangements
Environmental policy implementation specificity
No obligation of means - Uncertainties to assess causes of issues and effects of measures
Policy transaction determinant Mode
Policy interpretation Limited ambition
Arrangement
Designation of HMWB and AWB
WFD not a policy priority
Local budgetary constraints led to not too ambitious measures
Measures designed at sub-basin scale in the PoM
It can be argued that the identification of almost all water bodies as heavily modified (HMWB) or
artificial (AWB) might be influenced by the aim of having a less constraining water quality objective.

181
Regarding the issue of water boards’ taxes raise, flood prevention measures (mostly via the existing
program “prevention of flooding”) had priority over WFD measures. In fact, when water boards had
to identify WFD measures for the PoM, costs were already allocated and the budget set.
It was agreed that water boards would increase levies (for agriculture, industries and households) by
0.7% per year until 2027 (or 13% accumulative) to finance regional measures. Given the existing
relatively long term water policy planning in the Netherlands, the Dutch tend to have
institutionalized measures already identified which implies a rather “business as usual” approach
that an ambitious program. The PoM is partly built according to local budgetary constraints, but
regarding national measures, the Rijkswaterstaat (RWS) considers trade-offs between the different
river basins. Given the past investments and the existing programs, most of the measures considered
for the ISD are supplementary measures except for measures related to the Nitrate Directive
(nitrogen reduction measures). The Nitrate Directive implementation is a difficult issue and the
discussion was open between the Netherlands and the EU Commission and between the national
government and the agricultural sector to find an agreement.
In the RBMP (PoM), measures are designed at sub-basin scale (and not water body scale) so as to
deal with the uncertainty on the effectiveness or implementation of measures. However, there exists
more detailed or specific information in the water boards’ water management plans (i.e. measures to
improve fish migration are foreseen but their exact location is not known yet).
We consider that these strategies help minimizing negotiation costs by pursuing a “reasonable” or
pragmatic objective, and by defining broad measures (avoiding specific discussions on clear quality
objectives or the effects of local measures to improve water quality).
Environmental policy implementation specificity
Multi-level and multi-sector process
Policy transaction determinant Mode
Division of power and competencies between sectors/levels Fragmented
Arrangement
Strong guidance from the RWS and centralization of the economic analysis at national level
CEA and CBA combined (SCBA) and analysis at national scale
On the basis of the SCBA, templates were proposed by the RWS to facilitate the selection of
measures

182
Change of planning cycles to match the WFD
Numerous working groups and coordination meetings
Discussion with sectors at the province level
Given the fragmented division and power between levels, the Rijkswaterstaat (RWS) had a strong
role in coordinating the WFD implementation. Among others, it was responsible for the economic
analysis, the centralization and harmonization of measures, and issued the final versions of the
PoMs. Indeed, local authorities (Regionaal Bestuurlijk Overleg Schelde) elaborated a report in 2008
(Overwegingen bij het Stroomgebiedbeheerplan Schelde) expecting it would have a grasp on the
RBMP but the government decided the RBMP should be issued by the Ministry.
Regarding the economic analysis, an early CBA was carried out at national scale by the RWS
waterdienst (water management head office) as required by the Parliament: the “Strategic CBA”
(SCBA) mobilized about 3 or 4 persons in 2006-2007. The aim was to have a first idea of the potential
costs by the WFD implementation and the PoM. To this end, a first investigation of possible
measures was undertaken at local level (2005-2006) and then revised in 2007 at national level. Each
decision-making level chose measures according to their competencies and territory, and the
efficiency of measures was analyzed at national level (RWS waterdienst) after the harmonization of
about 1500 types of measures proposed by the 27 water boards. Along with the assessment of costs
of measures, benefits of reaching the GES were monetized for different groups. A second CBA was
carried out in 2008 by a third party: PBL (Netherlands Environmental Assessment Agency). In this ex
ante evaluation of WFD implementation, benefits were not monetized and expressed in terms of
increase of Ecological Quality Ratio (PBL,2008, p. 160).
In the SCBA process, the CEA and CBA were combined and served as indication for local water
authorities to identify and leave out the most costly or the less efficient measures. The 2006 SCBA
(used as CEA) thus allowed the RWS to give instructions to water boards such as to focus on
ecological measures since they are more cost-effective and bring more benefits. The templates
proposed included all cost categories to be described (investment, annual costs, NPV).
The different water management plans (national, provincial, local - waterboards) were designed
every 4 years but it was changed to 6 years to fit with the WFD. The first common deadline was 2009.

183
Each water authority selected measures for its territory. Measures were reconciled in district
meetings. In the Scheldt district, 4 water boards, 3 provinces, RWS and a representative of the
municipalities met. At a national level representatives of the associations of provinces, water boards,
municipalities and the related departments met with the minister of public works and water
management. The national meetings outlined the standards and framework for districts’ RBMPs. The
whole process took about 5 years until approval of the official RBMP. In this period, every 3 months
meetings at the administrative level were scheduled. New collaboration systems were put in place,
such as a weekly gathering between key stakeholders: one day a week the representative for the
Scheldt (A. van der Straat) working at the Province of Zeeland (in Middelburg) spent a day in Utrecht
for 2 years (2008 and 2009) to work with ministry representatives.
One can also note that consultations with sectors’ representatives occurred upstream (national,
provincial levels) and early in the WFD planning process so as to discuss possible sectors’
contributions and efforts towards the WFD objectives. In the Scheldt district, a ‘project bureau’ (staff
from local RWS Zeeland and province of Zeeland) coordinated the work of the various working
groups and organized the meetings with sectors’ representatives to highlight problems and identify
potential solutions. For instance, regarding navigation, it was agreed that companies working with
ships could reduce chemical leach. It was also identified that agricultural measures could be
considered regarding fruit production, cattle and arable lands.
These decisions and strategies contributed to minimize the coordination costs to implement the
WFD.
Environmental policy implementation specificity
Characteristics of the environment
Policy transaction determinant Mode
State of the environment and pressures Information gap
Arrangement
The great majority of water bodies are defined as HMWB or AWB
The first PoM requires 100% of exemptions
Measures are defined at the sub-basin scale in the PoM

184
As introduced in chapter 3, the great majority of water bodies are defined as HMWB or AWB. After a
meeting held in Prague on WFD implementation issues28, the WFD Common Implementation
Strategy (CIS) experts recognized the so-called “Prague-matic” method, considering the GEP of
HMWB as the water status reached “once all feasible and efficient measures are applied” (Bouleau,
2011). It was argued that such considerations left room for Member States’ interpretation of what is
“feasible”(Keessen et al., 2010 ; Scheuer and Naus, 2010). Such definition of the GEP led several
countries to review water bodies’ characterization: in the Netherlands, 99% of surface water bodies
are heavily modified or artificial (Borowski-Maaser et al., 2010 ; Scheuer and Naus, 2010).
The Dutch PoM does not provide clear objectives in terms of expected global water bodies’ status as
the result of the first PoM (but rather objectives for specific parameters). No water bodies are
expected to reach the GES before 2027 and the first PoM thus considers exemptions for all surface
water bodies, based on an affordability analysis (as part of the CBA) but not according to cost
disproportion threshold. Such position may save on efforts but also on information to collect and
process so as to design appropriate measures and analyze their impact.
In the RBMP, measures are given at sub-basin scale (and not water body scale) because it is argued
there is too much uncertainty about the implementation of measures. However, there is more
specific information in the water boards’ water management plans (i.e. measures to improve fish
migration but do not know where exactly it would be possible).
The focus on already planned measures (for the national CBA) allowed saving on extensive
information collection and processing. The SCBA was also a starting point to guide the PoM design
with the maximum complementarity between the tasks carried out.
At first, the national level considered 5 scenarios for the PoM, but to avoid extensive data search and
processing, the sub-basin level only focused on selecting most cost-effective measures according to
local budgetary constraints. One can also highlight that in the Netherlands, the monetization of
benefits and the elaboration of cost disproportion thresholds was not considered a necessity as they
are meant to feed decisions consisting in a “political judgment”.
28 Workshop “WFD & Hydromorphology”, 17-19 October 2005, Prague

185
Based on these observations, we argue that information collection and processing costs are
minimized, mostly via pragmatic objectives, and the simplification or reduction of information to be
collected.
Environmental policy implementation specificity
Characteristics of the environment
Policy transaction determinant Mode
State of the environment and pressures Need to involve driving forces
Arrangement
One specific study was carried out for the CEA on the impact of agricultural measures
Benefits not monetized to support decision-making
The Province of Zeeland launched pilot projects with the water boards and LTO (an agriculture
organization) to investigate certain measures (i.e. biological control or no use of pesticides). This
allowed for involving the agricultural sector and anticipating negotiations on measures.
In the CBA, it was chosen not to consider benefits in economic terms so as to support decision-
making, but rather to use an Ecological Quality Ratio (EQR) to assess the impact of measures on
water status.
Last, water boards decided on their level of taxes and as an elected body, few negotiations were
carried out on this matter since it was politically sensitive.
On this basis, the choices made allowed for limiting negotiation costs by working with the specific
sectors to be involved or by focusing on information that speak to stakeholders.
For each institutional context, we have depicted the arrangements that follow from the PTC
determinants identified, and highlighted the effects of such arrangements on PTC. Arrangements
aiming at minimizing PTC require further investigation as there is no clear trend reflecting the
linkages between a particular institutional context, the PTC determinants and resulting
arrangements. Indeed, on the basis of this first description, it is difficult to compare countries to
analyze the influence of the institutional context on arrangements. The next section will thus develop
the policy arrangements as general PTC minimization strategies.

186
2. Policy transaction cost minimization strategies
Although the description of the WFD policy arrangements was undertaken according to the
institutional contexts, the analysis of policy arrangements is bound to PTC determinants. In this
capacity and given the limited influence of institutional contexts on the arrangements (as compared
to the policy transaction determinants), we will now detail how WFD policy arrangements
correspond to general PTC minimization strategies. In this line, section 1 provided explanations on
the PTC minimized as a result of each PTC determinant’s mode. This information is summarized in
table 45 where “RI” stands for research and information collection costs, “N” for negotiation costs,
and “C” for coordination costs.
Table 45. Impact of PTC determinants on policy transaction costs
Environmental policy
transaction specificities
Policy transaction
determinants Modes
PTC
minimized
No obligation of means
Uncertainties to assess causes and effects
Policy interpretation (level of ambition)
High ambition (demanding) RI
Limited ambition (i.e. ‘business as usual’, low political will)
N
Multi-stakeholders
Division of power and resources between
actors
Fragmented (low synergy between political and administrative actors)
C
Integrated (synergy)
N
Link between planning and financial resources
Weak C
High -
Multi-levels and sectors
Division of power and resources between
levels/sectors
Fragmented between levels/sectors C
Integrated -
Characteristics of the environment
State of the environment and pressures
Information gap RI
Scattered information C
Need to involve the driving forces N
The impact of determinants on PTC is necessarily simplified so as to overcome the complexity of such
qualitative policy analysis in order to focus on the main causal relationships and identify general
trends. As a consequence, each PTC category attached to a determinant’s mode (last column in table
45) corresponds to the principal PTC minimized through the arrangements observed.

187
On this basis, we will analyze the arrangements observed for each PTC category and provide an
understanding in terms of PTC minimization strategies (section 2.1). In section 2.2 we propose a
typology of PTC minimization strategies that is transferable to other environmental policies.
2.1 From arrangements to PTC minimization strategies
So as to characterize PTC minimization strategies, we first listed the arrangements (presented in
section 1 of this chapter) by PTC category: research and information collection costs (RI), negotiation
costs (N), and coordination costs (C). Second, we developed a generic terminology to define these
arrangements in terms of general PTC minimization strategies.
2.1.1 Research and information collection costs
Based on the arrangements depicted, we identified 3 main PTC minimization strategies Member
States/regions opted for to mitigate research and information collection costs (see table 46 below).
They correspond to the decisions and choices made to limit time and resources dedicated to the
necessary information search, collection and processing required to elaborating the PoM and
justifying exemptions:
- Limiting the quality/quantity of data to produce or collect, for instance through decisions on
the number or size of water bodies, the number or type of measures, the scale at which
measures are defined or the scale at which the economic analysis is carried out. Reducing the
objective to achieve also allows for limiting the quality/quantity of data to produce or collect.
- Building on existing information/data or experience
- Outsourcing studies to competent organizations (when internal resources are lacking and it is
thus judged too costly to generate information)
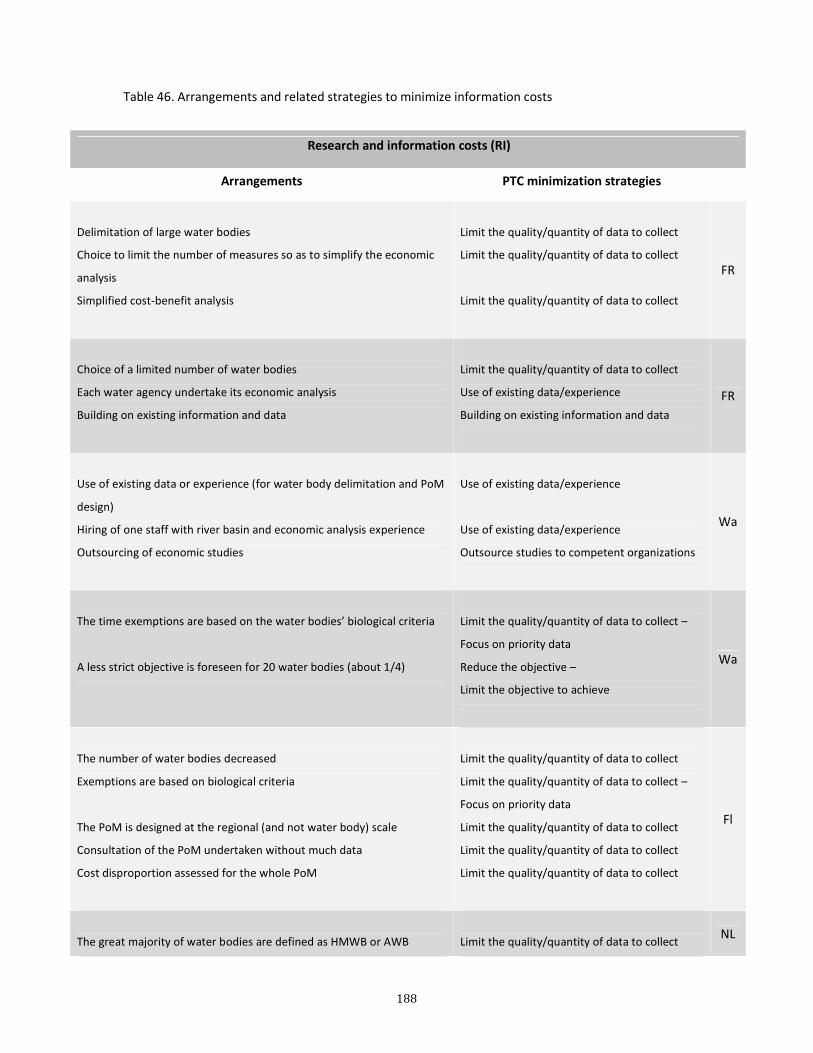
188
Table 46. Arrangements and related strategies to minimize information costs
Research and information costs (RI)
Arrangements PTC minimization strategies
Delimitation of large water bodies
Choice to limit the number of measures so as to simplify the economic
analysis
Simplified cost-benefit analysis
Limit the quality/quantity of data to collect
Limit the quality/quantity of data to collect
Limit the quality/quantity of data to collect
FR
Choice of a limited number of water bodies
Each water agency undertake its economic analysis
Building on existing information and data
Limit the quality/quantity of data to collect
Use of existing data/experience
Building on existing information and data
FR
Use of existing data or experience (for water body delimitation and PoM
design)
Hiring of one staff with river basin and economic analysis experience
Outsourcing of economic studies
Use of existing data/experience
Use of existing data/experience
Outsource studies to competent organizations
Wa
The time exemptions are based on the water bodies’ biological criteria
A less strict objective is foreseen for 20 water bodies (about 1/4)
Limit the quality/quantity of data to collect –
Focus on priority data
Reduce the objective –
Limit the objective to achieve
Wa
The number of water bodies decreased
Exemptions are based on biological criteria
The PoM is designed at the regional (and not water body) scale
Consultation of the PoM undertaken without much data
Cost disproportion assessed for the whole PoM
Limit the quality/quantity of data to collect
Limit the quality/quantity of data to collect –
Focus on priority data
Limit the quality/quantity of data to collect
Limit the quality/quantity of data to collect
Limit the quality/quantity of data to collect
Fl
The great majority of water bodies are defined as HMWB or AWB
Limit the quality/quantity of data to collect NL

189
The first PoM considers 100% of exemptions
Measures are defined at the sub-basin scale in the PoM
Reduce the objective –
Limit the objective to achieve
Limit the quality/quantity of data to
collect/process
2.1.2 Coordination costs
By analyzing the arrangements (see table 47 below), we found that Member States/regions
developed 9 types of PTC minimization strategies to mitigate coordination costs. They refer to
decisions and choices made to limit the costs associated with exchanges between levels of actors:
- National guidance to facilitate exchanges between different levels of actors (i.e. through
centralizing or harmonizing information, giving strategic orientations, developing tools and
methods within a frame of action, etc.)
- Creating synergy between tasks to increase efficiency of the decision making process and the
implementation of tasks (i.e. the Dutch SCBA at national level was the main frame and
included the CEA)
- Building on existing processes to facilitate exchanges
- Coordinating management plans
- Creation of an exchange platform or meeting to optimize exchanges
- Upstream agreement between sectors
- Limiting the number of levels in planning (when it is judged counter-productive or to require
too much time or resources) restricts the exchanges to coordinate
- Limiting the scope of the tasks and the number of actors involved
- Reinforcing competencies to enhance the complementarity between levels

190
Table 47. Arrangements and related strategies to minimize coordination costs
Coordination costs (C)
Arrangements PTC minimization strategies
Creation of the National Agency for Water and Aquatic
Environments(ONEMA) to reinforce the role of the national level
Water agencies work independently
National guidance
Limit the number of levels in planning –
Limit the scope of the tasks and the number of
actors involved
FR
Few actors are involved in the planning process
Existing planning processes (‘river contracts’) are further developed
Limit the number of levels in planning
Building on existing processes
Wa
Creation of a coordination platform (CIW) for a river basin scale
management (2003 decree)
The PoM is designed at the regional (and not water body) scale and only
one PoM is established for the whole region
VMM is an active and involved stakeholder (i.e. as being the main
partner in the Scaldit and Scaldwin projects)
Creation of an exchange platform
Limit the scope of the tasks and the number of
actors involved
Reinforce competencies
Fl
More synergy is sought between the different management plans
Coordinate management plans
Fl
Strong guidance from the RWS and centralization of the economic
analysis at national level
CEA and CBA combined (SCBA) and analysis at national scale
On the basis of the SCBA, templates were proposed by the RWS to
facilitate the selection of measures
Change of planning cycles to match the WFD
Numerous working groups and coordination meetings
Discussion with sectors at the province level
National guidance
Synergy between tasks and national guidance
National guidance
Coordinate management plans - Synergy
between tasks
Coordinate management plans
Creation of an exchange platform –
Agreement between sectors upstream
NL
191
2.1.3 Negotiation costs
From the arrangements presented (see table 48), it appears that Member States/regions used about
11 types of strategies to minimize negotiation costs. They correspond to choices and decision made
to facilitate the adoption of collective or joint decisions (we refer here to the link between
information and decision) and limit the costs of agreements or potential conflicts:
- Building on existing resources and organization to rely on ‘routine’ negotiation processes
- Actors’ participation / consultation upstream or decision taken upstream
- Choice of information to be shared or discussed so as to select the points to be negotiated
- Simplify measures to limit the scope of negotiations
- Interpretation of information to facilitate the adoption of an agreement
- Limit interfaces when negotiations are not possible or bound to fail
- Propose solutions with means to facilitate the adoption of an agreement
- Provide actors with (new) competencies
- Limit the objective to facilitate the adoption of an agreement
- Specific study to negotiate with and convince stakeholders – Target priority data
- Simplify information to create a common discourse (i.e. with the EQR)
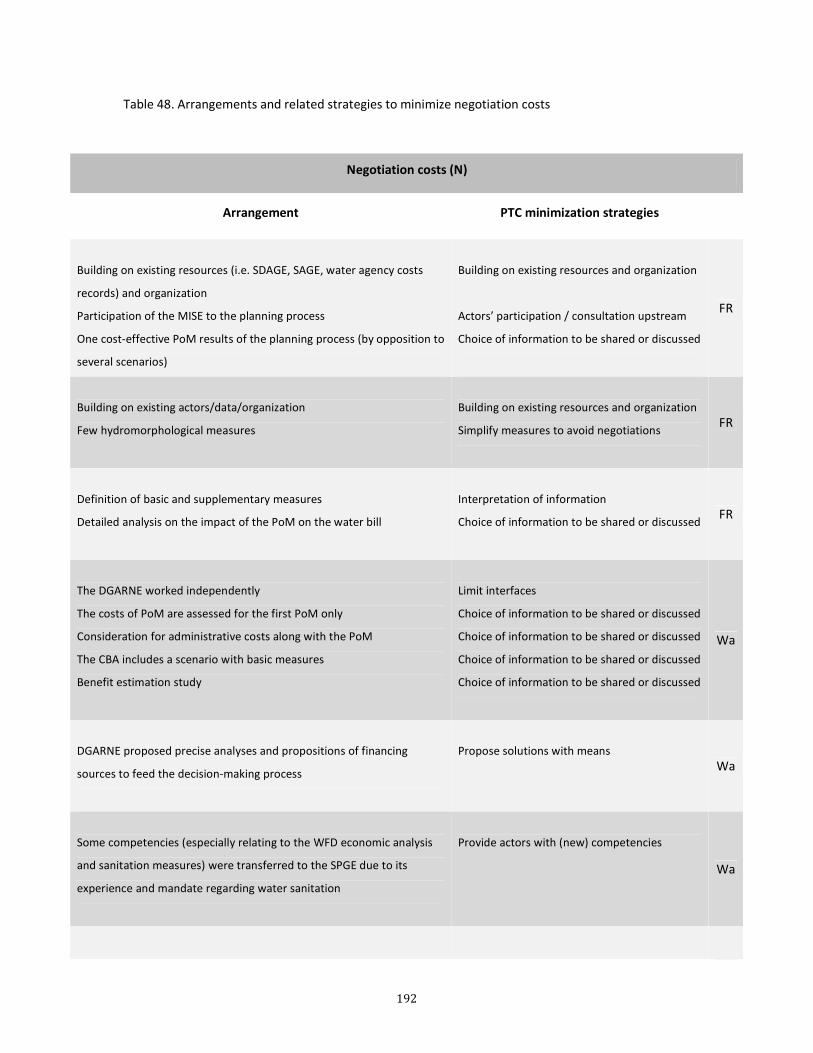
192
Table 48. Arrangements and related strategies to minimize negotiation costs
Negotiation costs (N)
Arrangement PTC minimization strategies
Building on existing resources (i.e. SDAGE, SAGE, water agency costs
records) and organization
Participation of the MISE to the planning process
One cost-effective PoM results of the planning process (by opposition to
several scenarios)
Building on existing resources and organization
Actors’ participation / consultation upstream
Choice of information to be shared or discussed
FR
Building on existing actors/data/organization
Few hydromorphological measures
Building on existing resources and organization
Simplify measures to avoid negotiations
FR
Definition of basic and supplementary measures
Detailed analysis on the impact of the PoM on the water bill
Interpretation of information
Choice of information to be shared or discussed
FR
The DGARNE worked independently
The costs of PoM are assessed for the first PoM only
Consideration for administrative costs along with the PoM
The CBA includes a scenario with basic measures
Benefit estimation study
Limit interfaces
Choice of information to be shared or discussed
Choice of information to be shared or discussed
Choice of information to be shared or discussed
Choice of information to be shared or discussed
Wa
DGARNE proposed precise analyses and propositions of financing
sources to feed the decision-making process
Propose solutions with means
Wa
Some competencies (especially relating to the WFD economic analysis
and sanitation measures) were transferred to the SPGE due to its
experience and mandate regarding water sanitation
Provide actors with (new) competencies
Wa

193
Economic analysis commissioned to VITO
Several PoM scenarios were presented to the Ministry: VMM had to
lower the costs of PoM
Choice of information to be shared or discussed
Decision on/Choice of information to be shared
or discussed
Fl
Designation of HMWB and AWB
WFD not a policy priority
Local budgetary constraints led to not too ambitious measures
Measures designed at sub-basin scale in the PoM
Limit the objective
Limit the objective
Decision taken upstream - Limit the objective
Choice of information to be shared or discussed
NL
One specific study was carried out for the CEA on the impact of
agricultural measures
Benefits not monetized to support decision-making
Specific study to negotiation with stakeholders
– Target priority data
Simplify information to create a common
discourse
NL
These lists of PTC minimization strategies (summarized below) are based on the analysis of policy
arrangements related to the WFD early implementation process. Consequently, they are not
considered exhaustive to analyze all environmental policies, but they consist in a first typology of PTC
minimization strategies linked to environmental policy early implementation.

194
Research and information collection PTC
(implied by the environmental objective and the policy’s obligation of results)
Minimization : Decisions to limit time and resources dedicated to the research and information
collection necessary to elaborate the PoM/justify exemptions
Minimization strategies observed
- Limiting the quality/quantity of data to produce/collect (i.e. water body size/number,
number/type of measures, scale at which measures are defined – water body or basin, scale
of CBA - water body or basin, typology of water bodies) ; targeting priority data (i.e. impact
of sanitation measures) ; reducing the temporal scale (i.e. by estimating costs only for the
first PoM) or reducing/limiting the objective (i.e. no water body at the GES for 2015)
- Extrapolating existing data ; using existing work/expertise
- Statistics undertaken from a sample to limit measurements
- Delegating studies to competent organizations (i.e. when few data available on costs of
measures)

195
Negotiation PTC
(implied by the multi-stakeholder process)
Minimization : Decisions to facilitate the adoption of common or collective decisions (we refer here
to the role of information in decision-making) and limit the costs of possible conflicts or agreements
Minimization strategies observed
- Meetings organized to mobilize or convince stakeholders (and present data)
- Interpretation of information (i.e. basic and supplementary measures)
- Choice over information to disseminate/communicate (i.e. proposing several scenarios,
objective of 100% exemptions, estimating costs for the first PoM, type of de costs included
in the economic analysis)
- Stakeholders consultation/participation upstream (i.e. within the “geographical
commissions”, involvement of new actors - MISE)
- Decisions taken upstream (i.e. water boards’ 2% of tax increase)
- Giving competences to specific actors (i.e. SPGE in Belgium)
- Proposing financial sources

196
Coordination PTC
(implied by the multi-level/sector process)
Minimization : Decisions to limit costs due to exchanges between (levels of) actors
Minimization strategies observed
- Limiting the number of management plans (or extend/adjust their duration)
- Creating an exchange platform (i.e. CIW ; change of working place in the Netherlands) or
building on existing processes to optimize exchanges (i.e. “contrat de rivière” in Wallonia)
- Limiting the levels of actors in the planning/decision process
- National guidance (i.e. the central level harmonizes work/information and gives main trends
- i.e. LEMA and role of ONEMA ; measures’ efficiency assessed at the national level in the
Netherlands)
- Strengthening of competences (i.e. Scaldit/Scaldwin projects)
- Synergy between tasks (i.e. CBA served as a CEA in the Netherlands)
- Coordinating management plans (i.e. each level of actors propose measures for a specific
issue)
- Simplifying information to create common discourses (i.e. EQR ratio)

197
Now we have identified PTC minimization strategies on the basis of the arrangements observed, we
will go a step further and consolidate the frame around PTC minimization strategies by building a
typology.
2.2 Categorization of policy transaction costs minimization strategies
The elaboration of a typology of PTC minimization strategies aims at a more general characterization
of PTC minimization strategies, allowing for comparing countries on the basis of common grounds
and extending the analysis to other policies. In light of the specific WFD implementation stage at
stake in this research, this typology focuses on policy planning and implementation.
One can distinguish three main categories of PTC minimization strategies:
1) Strategies targeting the information collected or produced to prepare the transaction
(elaborate the PoM and justifying exemptions)
� Simplify information to create a common discourse
� Limit/restrict quality or quantity of data to be collected or produced
� Target priority data or reduce temporal scale or lower objective
� Extrapolate existing data ; use existing work or expertise
� Propose solutions with means (financing mechanisms)
� Policy interpretation (i.e. basic and supplementary measures)
� Select specific information to be diffused
2) Strategies dealing with the coordination or operational organization of tasks to prepare the
transaction. They focus on the operational aspects of the implementation of tasks as part of
the transaction. We could refer here to Williamson’s term “the play of the game”, although it
has to do with the policy game.
� Limit/restrict the number of management plans (or extend their duration)
� Create synergy between tasks

198
� Coordinate management plans (increase their synergy, coherence and complementarity)
� Outsource studies to other organizations
� Meetings organized to mobilize or convince stakeholders
� Create a coordination platform or build on existing organization to optimize exchanges
3) Strategies based on the decisions on human resources and tasks allocation to prepare the
transaction. They refer to rather strategic decisions on the distribution of tasks and the
division of roles or competencies of actors in charge of implementing the transaction. We
refer here to the decisions on the “rules” of the policy game.
� Limit/restrict the number of stakeholder levels in the planning/decision process
� Consultation with stakeholders ; participation of stakeholders upstream
� Decisions taken at an early stage of the process
� Transfer competences to stakeholders ; provide stakeholders with certain competences
� National guidance
� Strengthen competences
The categorization of PTC minimization strategies proposed here thus consists in three main levels:
- the inputs at stake in the transaction, as to say the information collected or produced that
serves as a basis for decision-making (“what information”),
- the mechanisms to effectively coordinate and implement tasks as part of the transaction
(“how to collect, process and transmit this information”),
- the strategic decisions on the allocation of human resources and tasks so as to create
favorable conditions to carry out the transaction (“what information shall be produced and
to what purpose”).
We have applied this typology to our WFD case study, as depicted in table 49 next page.

199
Table 49. PTC minimization strategies involved in the WFD policy transaction

200
Table 49 illustrates that the minimization of information costs often relies on one type of strategy
(information collected/processed). Also, one or two types of strategies are used to minimize
negotiation costs, whereas the minimization of coordination costs required a more diverse choice of
strategies (two or three types). These trends are not meant to be generalized, but from this example,
the more complex the PTC category, the more diverse the strategies to minimize those.
Conclusion chapter 4
Building on the PTC typology and the PTC determinants developed in chapter 3, we provided detailed
information to illustrate which specific determinants were relevant in the WFD implementation
contexts, and what were the resulting decisions and strategies of Member States/regions. On this
basis, we could draw conclusions regarding the impact of such decisions on specific PTC categories,
and thus make a link between PTC determinants, Member Sates/regions’ coping strategies and the
types of PTC minimized. In light of these findings, we could identify PTC minimization strategies for
each PTC category, and develop a first typology of PTC minimization strategies that consists in 3 main
categories: strategies either focusing on the information collected or produced, the coordination or
operational organization of tasks, or the decisions on human resources and tasks allocation.

201
Conclusion
Acknowledging that the costs of environmental policy (and most specifically policy implementation)
do not correspond exclusively to the costs of policy measures to reach a given policy objective, this
research proposes an approach to account for costs and constraints linked to policy implementation
in light of the transaction cost theory (TCT). As policy evaluation practices mostly focus on policy
effectiveness and policy impact, the consideration for transaction costs linked to policy
implementation can be helpful for policy analysis when global policy efficiency is at stake.
In this context, we have seen in the first chapter that public intervention has its own constraints and
can result in significant indirect costs. We showed that the concept of transaction cost offers an
interesting framework to assess the effects of constraints linked to policy implementation. In order
to adapt transaction costs to the policy context, we introduced the concept of ‘policy transaction’
based on economic theory and policy analysis, and developed a ‘policy transaction framework’ that
aims to (1) identify the source of transaction costs linked to policy implementation, and (2) depict the
policy implementation strategies (‘arrangements’) to cope with these costs. In this framework,
‘arrangements’ are a result of transaction cost determinants and consist in transaction cost coping
strategies.
Our analysis focuses on environmental policies as they are prone to significant policy transaction
costs. From the case study depicted in chapter 2, we provided a definition of the ‘policy transaction’
under focus, that is to say the Water Framework Directive (WFD) implementation in the International
Scheldt District. On this basis, we introduced the methodology developed to analyze the WFD
implementation process and most specifically the organization of Member States (‘arrangements’) to
cope with policy transaction costs (PTC).
In chapter 3, we drew up a preliminary assessment of PTC determinants that have conditioned the
WFD implementation in the 4 institutional contexts identified in the International Scheldt District.
This provided us with a first understanding of policy actors’ decisions to optimize time and resources
(when implementing the WFD) as a result of PTC. To address the issue of which transaction costs are
actually minimized by these decisions, we proposed a general PTC typology adapted to
environmental policy early implementation and an understanding of PTC minimization. Three
categories of transaction costs linked to policy implementation are presented: information search
and collection costs (to gather necessary data to make a decision), negotiation costs (to facilitate

202
either the adoption of collective decisions or actors’ support) and coordination costs (to coordinate
tasks between actors or levels). PTC determinants are found to stem from what we refer to as policy
transaction specificities. In our context of environmental policy implementation, the transaction
specificities consist in: (1) the latitude of policy actors to reach the target set while high uncertainties
exist to assess the causes of issues and the effects of policy actions, (2) the multi-stakeholder
process, (3) the multi-levels and sectors process, and (4) the characteristics of the natural
environment. The related PTC determinants identified are: policy interpretation resulting from (1),
the way power and resources are distributed among actors and the nature of the connection
between the planning process and financial resources resulting from (2), the division of power and
resources between levels/sectors resulting from (3), and the state of the environment and existing
pressures resulting from (4).
Building on the PTC typology and the PTC determinants developed in chapter 3, chapter 4 explained
why such determinants were identified in the WFD implementation contexts, and the resulting
Member States/regions’ decisions and strategies. On this basis, we could make a link between the
PTC determinants, Member Sates/regions’ coping strategies and the nature of PTC minimized. In
light of these findings, we could identify PTC minimization strategies that can be generalized and
used to assess other policies. They are assessed by PTC category, namely:
- The research and information collection costs minimization strategies, consisting for instance in
limiting the quality/quantity of data to produce or collect (i.e. through decisions on the number or
size of water bodies, the number or type of measures), the scale at which measures are defined (i.e.
river basin, region or water body) or the scale at which policy tasks are carried out (i.e. the economic
analysis).
- The negotiation costs minimization strategies, referring for instance to building on existing
resources and organization to rely on ‘routine’ negotiation processes (i.e. river basin planning in
France), actors’ participation or consultation upstream (i.e. involvement of the MISE in France) or
decision taken upstream (i.e.by the water boards for the level of the tax increase in the Netherlands),
choosing the information to be shared or discussed so as to select the points to be negotiated (i.e.
proposing several PoM scenarios in Flanders or the Netherlands, assessing the costs for the first PoM
only), or simplifying information to create a common discourse (i.e. with the EQR ratio used as a
qualitative indicator to assess benefits in the CBA in the Netherlands).
203
- Coordination costs minimization strategies, including for instance the national guidance to facilitate
exchanges between different levels of actors (i.e. through centralizing or harmonizing information
with the economic analysis carried out at the national level in the Netherlands), the creation of
synergy between tasks to increase the efficiency of the decision making process and the
implementation of tasks (i.e. the Dutch SCBA at national level was the main frame and included the
CEA), the coordination of management plans (i.e. in the Netherlands, each level of actors proposed
measures for the PoM), the creation of an exchange platform or meeting to optimize exchanges (i.e.
CIW in Flanders).
With the same data on countries’ ‘arrangements’, we proposed a more general typology of PTC
minimization strategies, that is to say strategies either focusing on (1) the information collected or
produced, (2) the coordination or operational organization of tasks, or (3) the decisions on human
resources and tasks allocation.
- Strategies targeting the information collected or produced to prepare the transaction or
“what information is needed”.
They refer to the simplification of the information to create a common discourse, the
limitation/restriction of the quality or quantity of data to be collected/produced, targeting priority
data or reducing the temporal scale or the objective, extrapolating existing data or using existing
work or expertise, proposing solutions with means (financing mechanisms), policy interpretation, the
selection of specific information to be diffused.
- Strategies dealing with the coordination or operational organization of tasks to prepare
the transaction or “how to collect, process and transmit this information”.
They can consist in limiting/restricting the number of management plans (or extend their
duration), creating synergy between tasks, coordinating management plans (to increase their
synergy, coherence and complementarity), outsourcing studies to other organizations, organizing
meetings to mobilize/convince stakeholders, creating a coordination platform or building on the
existing organization to optimize exchanges.
- Strategies based on the decisions on human resources and tasks allocation to prepare
the transaction or “decisions over what information shall be produced and to what
purpose”.
They deal with the limitation/restriction of the number of stakeholder levels in the
planning/decision-making process, the consultation of stakeholders or participation of stakeholders

204
upstream, decisions taken at an early stage of the process, the transfer of competencies to key
stakeholders, the (national) guidance provided, the strengthening of competences.
In short, we argue that the transaction cost theory offers an analytical framework to explain policy
choices and policy implementation strategies. Consequently, we can analyze policy implementation
in terms of arrangements that minimize PTC, where PTC minimization strategies rely on
determinants stemming from the specificities of environmental policy implementation, and where
determinants’ modes are specific to each institutional context. This research testifies that certain
policy implementation decisions can be explained by the search for PTC minimization.
Discussion
Given the challenge to characterize and isolate a ‘policy transaction’ (as opposed to an economic
transaction), the step-by-step approach developed to empirically describe ‘arrangements’ required
choices to be made. We necessarily simplified the policy implementation process so as to identify the
main policy tasks corresponding to the content of the transaction, but also to focus on the impact of
PTC and their determinants on the implementation of tasks.
Also, the ‘arrangements’ depicted are based partly on the analysis of the policy implementation
process (via policy documents, reports, etc.) but mostly on the expert interviews carried out. These
elements are thus to be considered with caution since they reflect personal (partial) views and
interpretations, and correspond to the information interviewees wish to share or consider important
within the limits of their knowledge of the policy implementation process. Acknowledging that this
data is partial or not exhaustive, our concern is that it can reflect some major constraints faced by
stakeholders to implement the WFD.
In order to depict the impact of determinants, we chose to consider only one type of PTC minimized
for each determinant’s mode. Although an ‘arrangement’ could minimize several types of PTC as a
result of one determinant’s mode, we only mentioned the main PTC minimized for each mode. The
analysis could thus be considered as caricatural but it is meant to highlight the main trends in the
first instance and develop a PTC minimization strategies typology.
Another difficulty faced in this research was the scale of analysis, that is to say the contexts in several
countries. This large scope somehow prevents the collection of detailed data (i.e. the number, types
205
and frequency of meetings carried out, number, type and role of stakeholders involved in the
decision-making process, etc.) that could provide a more quantitative dimension to the analysis (the
first step to assess the relative impacts of PTC). Also, the data collected was often not homogenous,
given the different approaches and interpretations of the Member States/regions. Despite this
limitation, the investigation of different countries’ policy implementation processes allowed for
identifying PTC determinants that apply in different institutional contexts, and for considering a more
important variety of PTC minimization strategies to build a typology.
Regarding the approach developed in this thesis, the ‘policy transaction cost’ framework allows to
overcome certain shortcomings of existing quantitative assessments of costs and constraints linked
to policy, since it accounts for a diversity of constraints in a qualitative way. It can also provide an
understanding of stakeholders’ response to such constraints. By analyzing transaction costs linked to
policies and how they condition the implementation of policy tasks, this research sought to
understand how policy decisions are taken. We showed that certain decisions can be explained by
the attempt to minimize PTC according to contextual determinants. However, PTC minimization
strategies do not mean that such a process is efficient, but that it is conditioned by determinants.
One should consider for instance that PTC will evolve over the policy implementation process.
Indeed, the decisions taken at the early WFD implementation stage have incidence on the later
stages, which is why we have considered other costs in our framework: ex post PTC and production
costs.
We have focused on the identification of stakeholders’ strategies to cope with these PTC. This allows
for acknowledging the importance of PTC in policy analysis and thus for better anticipating these
costs, but also for considering changing determinants’ modes if necessary. As highlighted by Jobin
(2008), TCE allows for addressing a governance dimension (of a transaction) by considering both
formal (financial and non-financial resources, results management, compliance with rules and
regulations) and informal (social capital: reputation, trust, personal values, culture, etc.) elements.
This is particularly important when considering policy transactions. With the policy transaction
framework, we thus aimed to develop a broader conception of policy costs, which is not without
impact on the conception of policy performance and cost-effectiveness. As suggested by certain TC
analysts (i.e. Mc Cann et al., Falconer and Whitby, Rorstad et al.), transaction costs linked to policies
can change the conception of performance and efficiency.
206
We argue that Member States/regions aim at minimizing their PTC according to the specificities of
the policy transaction. We cannot conclude that policy implementation is necessarily efficient if PTC
are minimized. We hold that ex ante PTC minimization impacts the amount of production costs
(given the choices made regarding the economic analysis) and ex post PTC. Minimizing short term
PTC could induce high PTC at a later policy stage. In the same way, efforts to reduce PTC could be
important at an early stage and decrease with time (i.e. organizing a participatory process in an early
phase could save on negotiation and litigation costs in a later phase, etc.).
Seeking to increase public action’s performance by minimizing ex ante PTC would imply improving
determinants’ modes so as to reduce their impact in terms of PTC, which implies further
investigation to analyze such impacts. This requires, however, paying attention to the linkages
between determinants: if one does change, (how) do the others change? (i.e. tending for more
synergy between actors when roles and competencies are initially fragmented). Increasing public
performance could also be sought through improving the PTC minimization strategies (induced by
determinants) to effectively deal with PTC in an integrated way. An analysis of policy performance
would necessitate taking account of the other costs (production costs and ex post PTC) and the
evolution of PTC throughout time.
Within the timing of this research, we could not analyze the link between the transaction (the
elaboration of PoMs) and the policy impact (water quality reached as the result of the PoM and the
exemptions approved or not by the European level). Also, we do not have elements to assess
whether the PTC minimization strategies are efficient: for instance in Flanders, one cannot yet assess
the effects of the decisions and actions taken to increase synergy between the management plans.
Acknowledging that policy transaction costs represent only a decision factor among several costs and
advantages, they both are part of and impact policy implementation costs. The policy transaction
framework and the PTC minimization strategies identified in this research are meant to improve
policy analysis, and especially the performance evaluation of the global policy implementation
process. Policy analysis shall thus consider PTC linked to policy implementation, so as to anticipate
the constraints actors will face to implement policy and how these actors are likely to respond to
such constraints.

207
The policy transaction framework allows for considering a wider scope of policy implementation
costs, and thus broadens the frame to define policy performance. In order to consolidate such
framework, it would be opportune to assess the scope of PTC according to the particular
determinants’ modes linked to a policy transaction, and the extent to which policy arrangements
minimize these PTC. Targeting the main constraints linked to a policy transaction would require
investigating which determinants have more impact on the arrangements observed. Consequently,
one can also identify the possible actions to limit the impact of PTC determinants.

208
REFERENCES
(2009). Loi n°2009-967 du 3 août 2009 de programmation relative à la mise en œuvre du Grenelle de
l'Environnement (1) (Grenelle Law). France, JORF n°0179 du 5 août 2009.
Abdelmalki, L. and Mundler, P. (1997). Economie de l'environnement. Paris, Hachette.
Achleitner, S., De Toffol, S., Engelhard, C. and Rauch, W. (2005). “The European Water Framework Directive: Water Quality Classification and Implications to Engineering Planning”. Environmental Management35(4): 517-525.
Agence de l’Eau Artois Picardie (2006). Compte-rendu synthétique. Commission Géographique de la Somme, 26 Octobre 2006, Amiens, Agence de l'Eau Artois-Picardie.
Agence de l’Eau Artois Picardie (2008). Programme de mesures (projet) - Bassin Artois-Picardie, 107p.
Agence de l’Eau Artois Picardie (2009). Programme de mesures 2010-2015 - Bassin Artois-Picardie,
99p.
Agence de l’Eau Rhin Meuse (2009). Le programme de mesures du district Rhin 2010-2015
Anthon, S., Garcia, S. and Stenger, A. (2007). “Incentive contracts for Natura 2000 implementation in forest areas”. Environmental and Resource Economics, 46(3): 281-302.
Antona Martine, Farolfi Stefano (2001). Décision et négociation des politiques environnementales : l’application de la fiscalité dans les pays du nord et du sud. Actes de la Conférence internationale PIREE « Les instruments des politiques environnementales », Nice (Sophia Antipolis), 5-6 Avril 2001.
Aoki, M. (2006). Mechanisms of endogenous Institutional Change.SIEPR Discussion Paper No. 05-13Stanford, Stanford Institute for Economic Policy Research, 40 p.
Aoki, M. (2007). “Endogenizing institutions and institutional changes”. Journal of Institutional Economics,3(1): 1-31.
Arrow, K. (1951). Social choice and individual values. New York, Wiley.
Arrow, K. (1969). The Organisation of Economic Activity: Issues Pertinent to the Choice of market versus non-market allocation in “The Analysis of and Evaluation of Public Expenditure.The PPB System”. U.S. Government Printing Office: 59-73.
Arts, B., Leroy, P. and van Tatenhove, J. (2006). “Political Modernisation and Policy Arrangements: A Framework for Understanding Environmental Policy Change”. Public Organization Review, 6: 93-106
Arts, B. and Leroy, P. (Eds) (2006). Institutional Dynamics in Environmental Governance. Springer.
Arts, B. and van Tatenhove, J. (2004). “Policy and power: a conceptual framework between the ‘old’ and ‘new’ policy idioms”. Policy Sciences,37: 339-356.
Barnett, V. and O’Hagan, A. (1997). Setting environmental standards: the statistical approach to handling uncertainty and variation, Chapman & Hall/CRC: New York.
Barraqué, B. (1995). "Les politiques de l'eau en Europe". Revue française de sciences politiques,45(3): 420-453.
Barraqué, B. (1995). Les politiques de l'eau en Europe. Paris, La Découverte.
Barraqué, B., Johannes, B. and De Gouvello, B. (1997). Phase 2 report on France: Sustainability of the water service industry, chapter II on Amiens. DG Research.

209
Barraqué, B. (2004). Aspects institutionnels de la gestion durable de l’eau en Europe. Séminaire de recherche du GDR Rés-Eau-Ville (CNRS 2524) « L'eau à la rencontre des territoires » Montpellier, France, 27-28 et 29 mai 2004.
Batabyal, A. (2000). “A renewal theoretic approach to environmental standard setting”. Applied Mathematics Letters, 13: 115-119.
Baudry, F. (2006). La DCE et les SDAGE - Origine, portée juridique, logique et méthodes de mise en œuvre. Presented at ENGEES, Strasbourg, France, on 25 September 2006. Agence de l'Eau Rhin-Meuse.
Baumol, W. and Oates, W. (1971). “The use of standards and prices for protection of the environment”. Swedish Journal of Economics,73: 42-54.
Beaud, M. (2006). Le coût social marginal des fonds publics. UFR des Sciences, Juridiques, Economiques, Politiques et de Gestion. PhD thesis in Economics, Université de Franche-Comté, Besançon, 249 p.
Beaud M. (2008). “The Social Marginal Cost of Public Funds in France”. Annals of Economics and Statistics, 90: 215-232.
Bental, B., Deffains, B. and Demougin, D. (2007). Organizational structure: monitoring vs credibility. 28 August 2007, 20p.
Bertrand, E. and Destais, C. (2002). “Le «théorème de Coase », une réflexion sur les fondements microéconomiques de l’intervention publique”. Reflets et perspectives de la vie économique, tome XLI(2): 111-124.
Bonnieux, F. and Desaigues, B. (1998). Economie et politiques de l'environnement. Paris, Dalloz.
Borowski-Maaser, I., Mostert, E., Junier, S., Interwies, E., Ridder, D., Bouleau, G., Bots, P., Maurel, P., Richard, A., Abrami, G., Cernesson, F. and Richard, S. (2010). Research Report No 3&4. I-FIVE Innovative instruments and institutions in implementing the water framework directive. Lessons learnt for the second implementation cycle of the WFD. Case Study Cross Comparison & the QuickScan method. OIEau. Limoges, 93p.
Bouleau, G. (2007). La gestion française des rivières et ses indicateurs à l’épreuve de la directive cadre. PhD thesis in Environmental Sciences. AgroParisTech - ENGREF. Paris,457p.
Bouleau, G. (2008a). “L'épreuve de la directive cadre européenne sur l'eau”. Responsabilités et Environnement, 49: 84-93.
Bouleau, G. (2008b). “The WFD dreams: between ecology and economics”. Water and Environment Journal, 22: 235–240.
Bouleau, G. (2011). Retour d’expérience sur la construction du scénario tendanciel pour l’élaboration des programmes de mesure. Rapport final Cemagref - Onema Cemagref, Février 2011.
Bourblanc, M. (2010). The European Union and global environmental governance in: “The European Union and global governance”, A. Heyes (ed.), London, Routledge: 249-279.
Boyer, M. and Porrini, D. (2000). Law versus regulation: a political economy model of instrument choice in environmental policy. CIRANO, Scientific series, November 2000, 41 p.
Boyer, M. and Porrini, D. (2001). Law versus regulation: a Political economy model of instrument choice in environmental policy in: “The Law and Economics of the Environment”, Wunderlich J. and Bailey D.(Eds), Edward Elgar: 131-139.
Brewer, G. (1974). “The Policy Sciences Emerge: To Nurture and Structure a Discipline”. Policy Sciences, 5(3): 239-244.
Brewer, G. and deLeon, P. (1983). The Foundations of Policy Analysis. Monterey, CA, Brooks/Cole.

210
Broekx, S., Meynaerts, E., Vercaemst, P. and Beheydt, D. (2008). Selecting cost-effective abatement measures to achieve good water status with the Environmental Costing Model. Working paper. VITO.
Bromley, D. (1989). Economic interests and institutions: the conceptual foundations of public policy. New York, USA, Oxford, UK, Basil Blackwell.
Bromley, D. (1991). Environment and Economy: Property Rights and Public Policy. Oxford, Blackwell.
Brookshire, D. and Neill, H. (1992). “Benefit transfers: Conceptual and empirical issues”. Water Resources Research,28(3): 651-655.
Brousseau, E. (1995). “Les apports de l'analyse économique des contrats à la mise en œuvre des politiques industrielles". Revue d’Économie Industrielle,71(71): 181-198.
Brouwer, R. (2008). "The potential role of stated preference methods in the Water Framework Directive to assess disproportionate costs". Journal of Environmental Planning and Management,51(5): 597-614.
Brun, A. (2003). Les politiques territoriales de l'eau en France - Le cas des contrats de rivière dans le bassin versant de la Saône. Institut National Agronomique Paris-Grignon, France, 376p.
Buchanan, J. and Tullock, G. (1962). The calculus of consent. Logical foundations of constitutional democracy. A Harbour (ed), The University of Michigan Press, 361 p.
Buchanan, J. and Tollison, R. (1972). Theory of Public Choice: political application of economics. Ann Harbour, University of Michigan Press.
Calabresi, G. (1968). "Transaction costs, resource allocation and liability rules, a comment". Journal of Law and Economics, 11: 67-74.
Carter, N. (2001). The politics of the environment. Ideas, activism, policy, Cambridge.
Cavagnac, M. (2003). "Environmental standard setting by a supra-regional authority: customisation or convergence?" European Review of Agricultural Economics,30(4): 415-437.
Cemagref (2008). Bilan des agences de l'eau en matière d'analyse économique. Montpellier, UMR G-EAU.
Challen, R. (2000). Institutions, transaction costs and environmental policy. Cheltenham, UK - Northampton, USA, Edward Elgar Publishing.
CIE (2009). Partie faîtière du plan de gestion du district hydrographique international de l'Escaut. Commission Internationale de l’Escaut, 93 p.
CIRCA (2003) Economic training products. Presentations on the economic issues of the water Framework Directive implementation. Available at http://circa.europa.eu
CIW (2008). Projet de plan de gestion de l'Escaut. Ce document est une traduction du document «Ontwerp stroomgebiedbeheerplan voor de Schelde», Coördinatiecommissie Integraak Waterbeleid, 61 p.
CIW (2009). Maatregelenprogramma voor Vlaanderen. SGD Schelde en Maas. Coördinatiecommissie Integraal Waterbeleid. 203 p.
Coase, R. (1937). "The Nature of the Firm." Economica,4(16): 386-405.
Coase, R. (1961). "The problem of social cost." Journal of Law and Economics,3: 1-44.
Coase, R. (1988). The firm, the market and the law. The University of Chicago Press.
Coggan, A., Whitten, S. and Bennett, J. (2010). "Influences of transaction costs in environmental policy". Ecological Economics, 69: 1777-1784.

211
Colby, B. (1990). "Transaction costs and efficiency in western water allocation". American Journal of Agricultural Economics, 72: pp. 1184-1192.
Courtecuisse, A. (2005).Water prices and households’ available Income: fey indicators for the assessment of potential disproportionate costs - Illustration from the Artois-Picardie Basin (France). International Work Session on Water Statistics, Vienna, 20-22 June 2005
Crabbé, A. (2005). Quick Scan WFD implementation in Belgium - focusing on Flanders. Utrecht University, Utrecht, The Netherlands.
Crabbé, A. and Leroy, P. (2008). The handbook of policy evaluation. London, UK, Earthscan.
Croiset, N. (2009). La justification des coûts disproportionnés pour l’atteinte du bon état écologique Synthèse technique OIEau, ENGREF.
Cropper, M. and Oates, W. (1992). "Environmental Economics: A Survey." Journal of Economic Literature, 30: 675-740.
Dahlman, C. (1979). "The Problem of Externality." Journal of Law and Economics, 22: 141-162.
De Leon, P. (1988). Advice and Consent: The Development of the Policy Sciences. New York, Russell Sage Foundation.
Derycke, P.-H. and Gilbert, G. (1988). Economie publique locale. Paris, Economica.
Dieltjens, I. and van den Langenbergh, V. (2005). "The SCALDIT project: An Interreg IIIB NWE project aiming at the transnational characterisation of the Scheldt International River Basin District." Environmental Science & Policy,8(3): 239-243.
Dixit, A. K. (1996). The Making of Economic Policy: A Transaction-Cost Politics Approach. Cambridge, Massachusetts.
Ducos, G. (2007). « Efficacité et coûts de transaction des contrats agri-environnementaux ». PhD thesis in Economics. Université de Rennes 1, Rennes.
Ducos, G. and Dupraz, P. (2006). Private provision of environmental services and transaction costs: Agro-environmental contracts in France. “3rd World Congress of Environmental and Resource Economists”, Kyoto, Japan.
European Communities (2003). Guidance document No. 1, Economics and the environment - The implementation challenge of the Water Framework Directive. Common Implementation Strategy for the Water Framework Directive (2000/60/EC). Brussels, European Commission.
European Communities (2009). Guidance document No. 20, Guidance document on exemptions to the environmental objectives. Common Implementation Strategy for the Water Framework Directive (2000/60/EC). Brussels, European Commission.
European Parliament and Council (2000). Directive 2000/60/EC establishing a framework for Community action in the field of water policy, Official Journal L 327 of 22 December 2000: 1-73.
Falconer, K. and Whitby, M. (1999). Transactions and administrative costs in countryside stewardship policies: an investigation for eight European member states. Newcastle, Centre for Rural Economy (CRE), Department of Agricultural Economics and Food Marketing, University of Newcastle upon Tyne: 149p.
Fok, M. (2010). "Facteurs d'efficacité des arrangements institutionnels en politique cotonnière africaine." Cahiers Agricultures, 19(1): 68-74.

212
Furberg, D. (2006). The New European Water Management Geography: An Indicator-based Analysis of the River Basins Districts. Master’s thesis in Environmental Engineering and Sustainable Infrastructure. KTH, Stockholm, Sweden, June 2006.
Gautié, J., Godechot, O. and Sorignet, P.-E. (2005). "Arrangement institutionnel et fonctionnement du marché du travail. Le cas de la chasse de tête." Sociologie du travail, 47: 383-404.
Gilbert, A., Schaafsma, M., De Nocker, L., Liekens, I. and Broekx, S. (2007). Case study report Scheldt. Aquamoney. Flemish Institute for Technological Research (VITO), Belgium Institute for Environmental Studies (IVM), Netherlands. May 2007. 23p.
Görlach, B. and Pielen, B. (2007). Disproportionate Costs in the EC Water Framework Directive – The Concept and its Practical Implementation. “ENECON 2007 Applied Environmental Economics Conference”. London, 23 March 2007.
Hahn, R. and Hester, G. (1989). "Where Did All the Markets Go? An Analysis of EPA's Emissions Trading Program." Yale Journal on Regulation,6(1): 109-53.
Hardin, G. (1968). "The tragedy of the commons." Science, 162: 1243-1248.
Hood, C. (1976). The limits of administration. London and New York, Wiley.
Interwies, E., Kraemer, A., Kranz, N., Goerlach, B., Dworak, T., Borchardt, D., Richter, S., and Willecke, J. (2004). Basic principles for selecting the most cost-effective combinations of measures for inclusion in the programme of measures as described in Article 11 of the Water Framework Directive Handbook. Federal Environmental Agency, Berlin (Germany), 245 p.
Interwies, E. and. Borowski, I. (2007). Current use of economic methods and models for the
implementation of the WFD in selected EU-Member States: the role of European research. Background note for the 4th Harmoni-CA/WP5 Policy Workshop, June 14-15, 2007, Berlin, Germany.
Jobin, D. (2008). "A transaction cost-based approach to partnership performance evaluation." Evaluation,14(4): pp. 437– 465.
Joshi, S., Krishnan, R. and Lave, L. (2001). "Estimating the hidden costs of environmental regulation." The Accounting Review, 76(2): 171-198.
Kaika, M. and Page, B. (2003). "The EU Water Framework Directive: Part1 European Policy Making and the Changing Topography of Lobbying." European Environment13: 314-327.
Kampas, A. and White, B. (2004). "Administrative costs and instrument choice for stochastic non-point source pollutants." Environmental and Resource Economics,27: 119-133.
Keessen, A. M., van Kempen, J. J. H., van Rijswick, M., Robbe, J. and Backes, C. W. (2010). "European River Basin Districts: Are They Swimming in the Same Implementation Pool?" Journal of Environmental Law, 22(2): 197-221.
Kim, S. H. (2007). "Evaluation of negative environmental impacts of electricity generation: neoclassical and institutional approaches." Energy Policy, 35(1): 413-423.
Kolm, S.-C. (1969). Prix publics optimaux. Paris, CNRS.
Kwerel, E. (1977). "To tell the truth: imperfect information and optimal pollution control." Review of Economic Studies,44(3): 595-601.
Lacroix, A., Bel, F., Mollard, A. and Sauboua, E. (2006). "La territorialisation des politiques environnementales. Le cas de la pollution nitrique de l'eau par l'agriculture." Développement durable et territoire, Dossier 6, 17 p.

213
Laffont, J.-J. (2002). "Public economics yesterday, today and tomorrow." Journal of Public Economics,86(3): 327-334.
Laffont, J.-J. and Tirole, J. (1993). A Theory of Incentives in Regulation and Procurement. Cambridge, MIT Press.
Landry, R. (1984). "La nouvelle analyse institutionnelle." Politique,6: 5-32.
Lasswell, H. (1936). Who gets what, when, and how? New York, McGraw Hill.
Lasswell, H. (1948). Power and Personality. New Brunswick, NJ, Transaction Press.
Lasswell, H. (1956). The Decision Process. College Park, University of Maryland Press.
Laurans, Y. (2006). Implementing cost-effectiveness analysis: Perspectives based on recent French pilot studies. Report for Messe Wasser Berlin, 5 April 2006
Le Grand, J. (1991). "The theory of government failure." British Journal of Political Science,21(4): 423-442.
Lévêque, F. (2004). Economie de la réglementation. Paris.
Lévêque, O. (2007). L'économie de la Directive Cadre sur l'Eau. Master’s thesis in Droit de l'économie et de la régulation. Université Robert Schuman,Strasbourg, 120 p.
Liefferink, D., Wiering, M. and Uitenboogaart, Y. (2011). "The EU Water Framework Directive : a multi-dimensional analysis of implementation and domestic impact. " Land Use Policy, 28(4): 712-722.
Lotter, F. (1995). "Coûts de transaction et fondements de l'intervention publique." Revue d'économie industrielle, 71: 163-180.
Luken, R. and Clark, L. (1991). "How efficient are national environmental standards? A benefit-cost analysis of the United States experience" Environmental and Resource Economics, 1: 385-413.
Malone, T., Yates, J. and Benjamin, R. (1987). "Electronic markets and electronic hierarchies." ACM Computing Surveys, 30(6): 484-497.
Malone, T. and Crowston, K. (1994). "The Interdisciplinary Study of Coordination." ACM Computing Surveys,26(1): 87-119.
Marchand, C. (1999). Economie des interventions de l'Etat. Paris, Presses Universitaires de France.
McCann, L., Colby, B., Easter, K.W., Kasterine, A. and Kuperan K.V. (2005). "Transaction cost measurement for evaluating environmental policies." Ecological Economics,52(4): 527-542.
McCann, L. and Easter, K.W. (1999). "Transaction costs of policies to reduce agricultural phosphorous pollution in the Minnesota River" Land Economics,75(3): 402-414.
McCann, L. and Easter., K.W. (2000). "Estimates of public sector transaction costs in NRCS programs." Journal of Agricultural and Applied Economics, 32(3): 555-563.
McCormick, J. (2001). Environmental policy in the European Union. The European Series, Palgrave Macmillan. 347 p.
McWilliams, A. and Smart, D. (1993). "Efficiency v. Structure-Conduct-Performance: implications for strategy research and practice." Journal of Management, 19(1): 63-78.
Ménard, C. (2001). "Methodological issues in New Institutional Economics." Journal of Economic Methodology, 8(1): 85-92.
214
Ménard, C. and Saussier, S. (2000). "Contractual choice and performance: the case of water supply in France." Revue d'économie industrielle, 92: 385-404.
Milliman, J. (1982). "Can water pollution policy be efficient?" Cato Journal,2(1): 165-204.
Moe, T. (1990). "Political institutions: the neglected side of the story." Journal of Law, Economics & Organization, 6: 213-253.
Moreau, F. (2006). State and economic system regulation in: Evolutionary microeconomics, Lesourne J., Orléan A. et B. Walliser (eds), Springer Verlag, 23 p.
Morer, M. (2000). Marginal cost of public funds and tax competition inefficiency between local government: a literature analysis. Report n° 2000-40. Thema, Paris X – Nanterre University,
17 p.
Moss, B. (2008). "The Water Framework Directive: Total environment or political compromise?" Science of the Total Environment, 400 (1-3): 32-41.
Mostert, E. (1998). River basin management and planning. “4th National Congress on Water Resources - Portuguese Water Resources Association” Lisbon, 27 March 1998.
Muller, P. (1990). Les politiques publiques. Paris, Presses Universitaires de France.
North, D. (1971). "Institutional change and economic growth." The Journal of Economic History, 31(1): 118-125.
North, D. (1990). Institutions, Institutional Change and Economic Performance. Cambridge University Press.
North, D. (1991). "Institutions." The Journal of Economic Perspectives, 5(1): 97-112.
North, D. (1996). Where have we been and where are we going? Working paper. EconWPA Series Economic History. St Louis, Washington University.
Notte, O. (2008). Transposer la Directive Cadre sur l'Eau dans son bassin. La participation du public le long des trajectoires institutionnelles françaises et néerlandaises. XVIIIe congrès AISLF, Approches intégrées de l’environnement, Istanbul, 7-11 July 20089, 15 p.
Oates, W. and Portney, P. (2001). The political economy of environmental policy. Discussion paper 01-55, November 2001, Resources for the Future, Washington, 35 p.
OECD (2010). Water Institutions and Information Challenges: a Preliminary OECD Overview. OECD Workshop: Improving the information base to better guide water resource management decision making, Zaragoza, Spain, 4-7 May 2010.
OECD (2007). The implementation costs of agricultural policies. 196 p.
OECD (2011). Water Governance in OECD Countries: A Multi-level Approach. 236 p.
Olsen, M. (1982). The rise and decline of nations. New Haven, Yale University Press.
Page, B. and Kaika, M. (2003). "The EU Water Framework Directive: Part2 Policy innovation and the shifting choregraphy of governance." European Environment, 13: 328-343.
Parsons, W. (1995). Public Policy: an introduction to the theory and practice of policy analysis. Cheltenham, UK, Northampton, USA, Edward Elgar.
PBL (2008). Evaluation of the Water Framework Directive in the Netherlands; costs and benefits.
Netherlands Environmental Assessment Agency (PBL), Bilthoven, September 2008 40 p.
Pérard, E. (2008). "Water policy: public or private? An approach based on cost of funds, transaction costs, efficiency and political costs." Policy and society, 27(4): 193-219.
Perret, B. (2001). L'évaluation des politiques publiques. Paris.

215
Putot, O. (2006). Typologie des masses d'eau de la DCE. Modalités dans quelques pays Européens. ENGREF.
Rahaman, M., Varis, O. and Kajander, T. (2004). "EU Water Framework Directive vs. Integrated Water Resources Management: the seven mismatches." Water Resources Development, 20(4): 565-575.
Revesz, R. and Stavins, R. (2004). “Environmental Law and Policy”. KSG Faculty Research Working Paper Series Cambridge, MA, Harvard University
Rørstad, P. K., Vatn, A. and Kvakkestad, V. (2005). Transaction costs and agricultural policy. Discussion paper, Norwegian university of Life Sciences, 19 April 2005.
Rørstad, P. K., Vatn, A. and Kvakkestad, V. (2007). "Why do transaction costs of agricultural policies vary?" Agricultural Economics, 36: 1-11.
Rozan, A. (2004). "Benefit transfer: a comparison of WTP for air quality between France and Germany." Environmental and Resource Economics,29: 295-306.
Ruiter, D. (2005). "Is Transaction Cost Economics Applicable to Public Governance?" European Journal of Law and Economics, 20: 287-303.
Saleth, R. M. and Dinar, A. (eds). (2004). The institutional economics of water: a cross-country analysis of institutions and performance. Cheltenham, UK.
Salles, D. (2006). Les défis de l'environnement - Démocratie et efficacité. Paris, Syllepse.
Salles, D. (2009). "Environnement : la gouvernance par la responsabilité ?" VertigO - la revue électronique en sciences de l'environnement, Hors série n°6.
Saussier, S. and Yvrande-Billon, A. (2007). Economie des coûts de transaction. Paris.
Scarwell, H.-J. and Laganier, R. (2003) "Les recompositions de l’action publique en contexte transfrontalier. Dossier 2 : Gouvernance locale et Développement Durable. Développement durable et territoires (http://developpementdurable.revues.org/1077).
Scheuer, S. and N., J. (2010). 10 years of the Water Framework Directive: A toothless tiger? A snapshot assessment of EU environmental ambitions. EEB, Brussels, July 2010, 20 p.
Schleich, J. (1999). "Environmental quality with endogenous domestic and trade policies." EuropeanJournal of Political Economy, 15: 53-71.
Seroa da Motta, R., Thomas, A., Saade Hazin, L., Feres, J., Nauges, C. and Saade Hazin, A (2004). Economic instruments for water management - The cases of France, Mexico and Brasil. Cheltenham, UK ; Northampton MA, USA.
Serverin, E. and Berthoud, A. (eds) (2000). La production des normes entre état et société civile. Paris, L'Harmattan.
Shirley, M. (ed) (2002). Thirsting for water. Oxford, UK, Elsevier Science.
Simonnet, R.-M. (2008). D'un bassin l'autre. Journ'eau - La lettre des acteurs de l'eau, 644, 19 May 2008, 8 p.
Siriex, A. (2003). Le paysage agricole: un essai d'évaluation. PhD thesis in Law and Economical Sciences. Limoges University, Limoges, France.
Smitz, J., Everbecq, E., Deliege, J.F., Descy, J.P., Wollast, R. and Vanderborght, J.P. (1997). "Pégase, une méthodologie et un outil de simulation prévisionnelle pour la gestion de la qualité des eaux de surface." La Tribune de l'Eau, 588:73-82.
Stavins, R. (2004). Environmental Economics. KSG Working Paper No. RWP04-051, Harvard Kennedy School, Harvard University, December 2004, 19 p.

216
Stigler, G. (1971). "The theory of economic regulation." Bell Journal of Economic and Management Science, 2(1): 3-21.
Tang, S.-Y. and Lo, C. W.-H. (2009). "The political economy of service organization reform in China: an institutional choice analysis." Journal of Public Administration Research and Theory, 19 (4 ): 731-767.
Van Tatenhove, J., Arts, B. and Leroy, P. (2000). Political Modernisation and the Environment; The Renewal of Environmental Policy Arrangements. Dordrecht, Kluwer Academic Publishers.
Thompson, D. (1998). “The Institutional-Transaction-Cost Framework for Public Policy Analysis”. Washington University Working Paper n°OLIN-97-19 (http://ssrn.com/abstract=80308).
Thompson, D. (1999). "Beyond Benefit-Cost Analysis: Institutional transaction costs and the regulation of water quality." Natural Resources Journal, 39(5): 17-41.
Tietenberg, T. (1998). "Disclosure strategies for pollution control." Environmental and Resource Economics, 11(3-4): 587-602.
Van Der Top, M. and Van Der Zouwen, M. (2000). "Europees natuurbeleid in Nederland: een pionier die zichzelf in de weg loopt [European nature conservation policies in the Netherlands: a pioneer unable to implement its own ambitions]." Landschap, 17(2): 81-96.
Tullock, G. (1978). Le marché politique. Analyse économique des processus politiques. Paris, Economica.
Uitenboogaart, Y., van Kempen, J., Wiering, M. and van Rijswick, H. (eds) (2009). Dealing with complexity and policy discretion. A comparison of the implementation process of the European Water Framework Directive in five member states. Den Haag, Sdu Uitgevers
UNEP (2004). Belgian best practices/innovative approaches water and sanitation. 8th special session of the Governing Council/Global Ministerial Environment Forum. Jeju, Republic of Korea, 29-31 March 2004.
V&W (2008). Plan de gestion de bassin hydrographique de l'Escaut. Ontwerp CDL versie, Ministerie van Verkeer en Waterstaat, 200p.
V&W (2009). 2009 - 2015 Stroomgebiedbeheerplan Schelde. Ministerie van Verkeer en Waterstaat, Ministerie van Volkshuisvesting, Ruimtelijke Ordening en Milieubeheer, Ministerie van Landbouw, Natuur en Voedselkwaliteit. 22 Dedember 2009, 216 p.
Van Huylenbroeck, G., D’Haese, M. and Verspecht A. (2005). Methodology for analysing private transaction costs. WP6 deliverable. Document n° ITAES WP6 P3 D5, Ghent University, Belgium, September 2005, 31 p.
Vollet, D., Callois, J.-M., Aznar, O. and Yelkouni, M. (2010). "Coûts de transaction et politiques agri-environnementales." The Canadian Journal of Program Evaluation, 24(2): 103-130.
Wallis, J. and Dollery, B. (2001). "Government Failure, Social Capital and the Appropriateness of the New Zealand Model for Public Sector Reform in Developing Countries." World Development, 29(2): 245-263.
Wang, N. (2003). Measuring Transaction Costs: An Incomplete Survey, Ronald Coase Institute.
Wiering, M. and Keessen, A. (2008). Quick Scan WFD implementation in the Netherlands. Utrecht, Utrecht University, The Netherlands.
Wiering, M. and Crabbé, A. (2006). The institutional dynamics of water management in low counties, in: Institutional dynamics in environmental governance. B. Leroy and Arts, P. (eds), Dordrecht: Springer Verlag: 93-114.

217
Williamson, O. (1981). "The Economics of Organization: The Transaction Cost Approach." American Journal of Sociology, 87: 548-577.
Williamson, O. (1990). "A comparison of alternative approaches to economic organization." Journal of Institutional and Theoretical Economics, 146: pp. 61-71.
Williamson, O. (1996). The mechanisms of governance. Oxford, Oxford University Press.
Williamson, O. (1998). "Transaction cost economics: how it worlds; where it is headed." The Economist,146(1): 23-58.
Williamson, O. (1999). "Public and private bureaucracies: a transaction cost economics perspective." The Journal of Law, Economics and Organization, 15(1): 37.
Williamson, O. (2000). "The New Institutional Economics: taking stock, looking ahead." Journal of Economic Literature, 38: 595-613.
Williamson, O. (1995). Public and Private Bureaus. Working paper. Berkeley Program in Law and Economics, Working Paper Series, 30 April 1995
Winston, C. (2006). Government Failure versus Market Failure. Washington, D.C., Brookings Institution Press.
Ziller, J. (2002). "Mondialisation et interventions publiques dans le marché." Revue internationale de droit économique, 16(2-3): 313 à 328.

218
APPENDICES
Appendix A. Methodology to quantify constraints 219
Appendix B. WFD implementation calendar 223
Appendix C. List of interviewees 224
Appendix D. Questionnaire 225
Appendix E. Empirical studies investigated 233
Appendix F. Description of arrangements 247
Appendix G. Arrangements by country or region 253

219
Appendix A. Methodologies to quantify constraints
• Management accounting method
It appeared that most empirical studies focus on evaluating the share of certain cost components
(commonly referred to as transaction costs) of environmental policy’s overall costs. The authors
support that the estimation of transaction costs can improve the comparison of policy alternatives ex
ante, and support a more effective design, implementation and evaluation of policies. Although
sometimes referred to as transaction costs, we will refer to “administration costs” for all costs
involved in the administration of a policy (design, implementation, monitoring). They exclude
abatement costs and compensatory payments. As for the assessment and the scope of transaction
costs, each empirical study consists in an interpretation (in the sense of application) of the
transaction cost theory. We will hereby provide a short review of such assessments in order to have a
better idea of the transaction costs components considered and their evaluation methods. Challen
(2000) has estimated the costs occurring in the trade of water entitlements. He finds that they range
from 3 to 29% of the average trade price for water entitlement and consist in (i) administrative costs
(namely fees and charges imposed on trading parties by the regulatory agencies that administer the
transfers) accounting for 3 to 12% of average price, and (ii) information costs arising from imperfect
information in the market (and estimated with price dispersion). Colby (1990) analyzed costs
incurred by parties seeking to obtain State approval to transfer a water right to a new place and
purpose of use in several U.S. states. These administrative costs borne by transferors consist in
obtaining legal approval for the proposed change in water use (attorney’s fees, engineering and
hydrologic studies, court costs, and fees paid to State agencies). These costs exclude the price paid
for water right and costs of implementing a transfer once it has been approved. Colby found that
these costs average 6% of the price paid by the applicant to transfer water for all states studied, and
12% for the state of Colorado. Falconer and Whitby (1999) quantified the administration costs of
agri-environmental policies in 8 European countries. Cost estimations consist in staff time inputs to
carry out the necessary activities of the policy process translated into monetary terms.
Administration costs elements can be generalized as: (i) information cost (surveying of designated
area, designation of area and management prescriptions, re-notification/re-design of prescription),
(ii) contracting costs (promotion of scheme to farmers, negotiation between organization and
farmer, administration of contract), and (iii) policing costs (monitoring and scheme evaluation,
enforcement of farmer compliance). These administration costs are estimated in: percentage of the
compensatory payments provided by each scheme (they range from 6 to 87%) and percentage of the

220
total costs of each scheme over a year (from 1-3% to 100%). While giving an idea on the scope of
administration costs, there are limits to compare and interpret these results. The authors recall that
it is impossible to make conclusions on relative efficiencies of different administrations in the
absence of environmental benefit data.
McCann et al. (1999, 2000, 2005) showed that administration costs were a significant part (38%) of
overall conservation policies costs, and have estimated the magnitude of administrative costs
associated with four policies to reduce agricultural phosphorous pollution by 40% in the Minnesota
River. They also propose a typology of administration costs (referred to as transaction costs) and
suggest using different methods according to the types of cost to be measured and their
characteristics. First, McCann and Easter (1999) estimated the magnitude of administrative costs
associated with four policy scenarios to reduce agricultural phosphorous pollution by 40% in the
Minnesota River. In-depth interviews with staff from governmental agencies were conducted. Results
indicate that the tax on phosphate fertilizers had the lowest administrative costs ($0.94 million),
followed by educational programs on best management practices ($3.11 million), the requirement
for conservation tillage on all cropped land ($7.85 million) and expansion of a permanent
conservation easement program ($9.37 million). Second, McCann and Easter (2000) showed that
administration costs were a significant portion (38%) of overall conservation policies costs. The data
collected by the Natural Resource Conservation Service (NRCS) include the costs of planning,
application and support of 60 conservation practices, as well as non-NRCS costs. The authors specify
that this analysis does not examine the relationship between pollution abatement levels and
administration costs of conservation practices (achieved abatement level or productivity increase are
not known). Administration costs do not explain the frequency of the different practices, but they do
vary according to the type of practice being applied and the region. They also increase with the level
of abatement costs. Considering that administration costs imply higher costs of achieving a given
level of abatement, policies would have to define lower values of optimal abatement level. Third,
McCann et al. (2005) suggested using different methods (surveys or interviews of government
personnel and stakeholders; ex post results from other studies; government reports; financial
accounts; proposed budgets) according to the type of costs to be measured and their characteristics
(ex ante/ex post or implicit/explicit). They also pointed out the need to consider other factors such as
who incurs the costs (legislature/courts, agencies, or stakeholders), when these costs occur in the
policy process, and when they should be measured.
Rorstad et al. (2005) have assessed administrative costs (referred to as transaction costs) for 12 agri-
environmental policies. Administrative cost estimates range from 0.1 to 66.3% of payments to

221
farmers or tax revenue (depending on the policy considered). Only running-costs were estimated
through interviews with representatives of public administrations, market actors and farmers (labor
costs, general overhead, computer costs, costs related to information material and postage); set-up
costs were not taken into account. Data show that there are differences in administrative costs
between the different policy schemes. They are lower for polices applied to commodities than other
point of application, and they increase as asset specificity increases and/or frequency decreases.
• Statistics
In the Saussier and Ménard (2000) study, three main forms of water supply can be distinguished: a
direct management by local public authorities, an associate governance structure (partial delegation
to a private operator), or a delegation to a private operator. Each of these arrangements involves
constraints related to the public or private nature of management. The authors have indirectly
assessed the relative impact of these constraints through a comparative analysis of transaction
characteristics29 to explain the arrangement chosen. Using data from water supplying units covering
75% of the French population and an econometric model, they could show that transaction
characteristics (origin and quality of raw water, population affected and financial constraints) have a
significant impact on the arrangement chosen. This means that based on the constraints of
organizational modes and their consequences on overall costs, water prices and quality, the
comparative advantages of the organizational mode depend on the characteristics of the
transactions.
• Fiscal concerns
The study of Beaud (2006) focuses on the hidden cost of public funds (through tax collected)
resulting from the economical distortions generated. Beaud defines the cost for the community of
taxes collected by the State as Social Marginal Cost of Public Funds (SMCPF). It corresponds to the
ratio of the households welfare loss (in absolute value) caused by a fiscal reform and the public funds
collected with this reform. This ratio is superior to 1 when the fiscal reform generates a welfare loss
higher than the public funds collected. This ratio is calculated based on data concerning household
revenues and spending30, parameters of the fiscal context, public spending, elasticity of households’
demand for goods and work supply. Laffont (1998) gave and estimation of this ratio between 1.3 and
29Namely:origin and quality of raw water, population affected and financial constraints as proxies of specificity, size and frequency. 30In the case of France: the survey “Budget des familles 2001” carried out by INSEE (National Institute for Statistics and Economic Studies) and the “Code Général des Impôts”.

222
1.5, corresponding to the major estimations obtained for the United States [Browning (1987), Stuart
(1984), Ballard et al. (1985)]. Bernard and Vielle (2003) found a value of 1.13 for France with a model
aiming at defining optimal environmental policies. In the case of France, Beaud found values ranging
from 0.98 to 1.788 depending on the fiscal reform, giving a mean value of 1.2. In general, a policy
would be accepted if its benefits are equal or superior to its costs of implementation multiplied by
the SMCPF. Considering the value of 1.2, it implies that public spending should be 20% more
productive than private spending.

223
Appendix B. WFD implementation calendar
In order to prepare for the second and third cycles, the following steps are required:
2012 Report progress in implementing the first RBMPs
2013 Review progress of the first RBMP cycle
2015 Review and update the first RBMPs
2021 Are the main environmental objectives specified in the second RBMPs met?
Review and update the second RBMPs
2027 Are the main environmental objectives specified in the third RBMPs met?

224
Appendix C. List of interviewees
Country /Region Institution Name of
interviewee
Position Date of
interview
Location
France Agence de l’Eau
Artois-Picardie -
Direction
Planification et
Evaluation
D. Martin
H. El Yousfi
Director of the
Planning and
Evaluation department
Chargé d'études
économiques
18/02/10
Douai
DREAL bassin Nord
Pas de Calais
C. Dalle-Fratte
E. Salles
Agence de l’Eau
Rhin-Meuse
S.Nicolaï
K. Schmitzberger
G.Demortier
Economist
Policy officer
Policy officer
15/02/10
Moulin-Lès-
Metz
DREAL Lorraine V. Duchene
Belgium - Flanders VMM W. Gabriels
I.Dieltjens
Bio-ingenieur
Policy officer
02/03/10
Aalst
VITO S. Broekx Economist 26/02/10
Antwerp
Antwerp University A. Crabbé Researcher 03/03/10
Belgium - Wallonia SPW Service Public
de Wallonie -
DGARNE (Direction
Générale de
l’Agriculture, des
Ressources
Naturelles et de
l’Environnement)
P.-N. Libert
N. Fermin
Attaché
Economist
22/02/10
Namur
The Netherlands Ministry of Public
Works and Water
Management
N. Vlaanderen Advisor 16/03/10
Den Haag
RWS waterdienst M. Peerdeman
R.van der Veeren
Economists
Senior advisor
18/03/10
Lelystad
Province of Zeeland A. van der Straat Projectbureau KRW
Schelde
17/03/10
Middelburg

225
Appendix D. Questionnaire
Questionnaire WFD implementation in the Scheldt and Rhine
Superior international river basin districts. Year 2010
Scheldt district
Introduction Why this questionnaire ? This questionnaire is part of an independent PhD research. It is designed for managers of the Scheldt and Rhine Superior districts. Its aim is to characterise organisational modes (scale of action, tools chosen, etc…) to implement the WFD locally. The objective is to identify specific constraints of regions/states. What for feed-back ? A first synthesis of the questionnaire results will be carried out by district and sent to interviewees for consultation and comments.
For further information :
Marion Laurenceau UMR Cemagref-ENGEES Gestion des Services Publics 1, Quai Koch – BP 61 039 67 070 Strasbourg cedex France Tel : 03.88.24.82.32 E-mail : [email protected]

226
Part 1. Water body (WB) types, size, quality and monitoring network
► How many water body types exist in the district ?....................................... ► Are there reference stations for each type in the district ?............................. ► How many monitoring stations are there in the district (in total and per WB)? ..................................................................................................... ► What is the mean water body size (median and variance) ?............................. ……………………………………………………………………………………………………………………………………. ► Which criteria determined water body size ? (i.e. size of hydrosystem/river, level of
detail chosen for typologie B, localisation/number of pressures, etc…)
► Which stakeholders participated in water bodies delimitation ? ► What is WB initial quality in terms of good status ?
► What is the number of WB at the good status scheduled for 2015, 2021, 2027 ?
Part 2. Heavily Modified Water bodies (HMWB) characterization
► Which stakeholders took part in HMWB characterization ?
(number of people and organisations/institutions, roles)
► When did this process start and for how long did it last ? ……………………………………………………………………………………………………………………………………. ► How many meetings were held ? ► Did costs of alternatives solutions were considered ?...................................... ► Is the characterization of HMWB rather qualitative or quantitative ? ………………..

227
Part 3. Selection of measures
► How is the selection of measures organized ?
(i.e. by territory ? by issue ? by theme ? by objective ?)
► At which scale are potential measures considered ?
(national ? régional ? river basin ? municipality ?)
► Could another scale have been more efficient ? For what kind of measures ? ……………………………………………………………………………………………………………………………………. ► Were there several scenarios considered or one single (cost-effective) program of Measures (POM )? .………………………………………………………………………………………………………. ► According to which criteria were scenarios/POM established ?
(i.e. objectives, capacity to pay, budgetary constraints, etc…)
……………………………………………………………………………………………………………………………………. ……………………………………………………………………………………………………………………………………. ► Were costs of measures assessed at the same time of measures or afterwards ? ……………………………………………………………………………………………………………………………………. ► Were measures and costs assessed by the same persons ? (how manny) ……………………………………………………………………………………………………………………………………. ► Which stakeholders and organisations are in charge of the selection of measures ?
(number ; level – national/regional/basin/local ; participation in decision making ;
number of meetings ; duration of the process)
► Who participated to negotiations over measures/scenarios chosen ?
Were specific meetings held ? (number ; level - international/national/regional/
basin/local ; participation in decision making ; results/effects of negotiation)
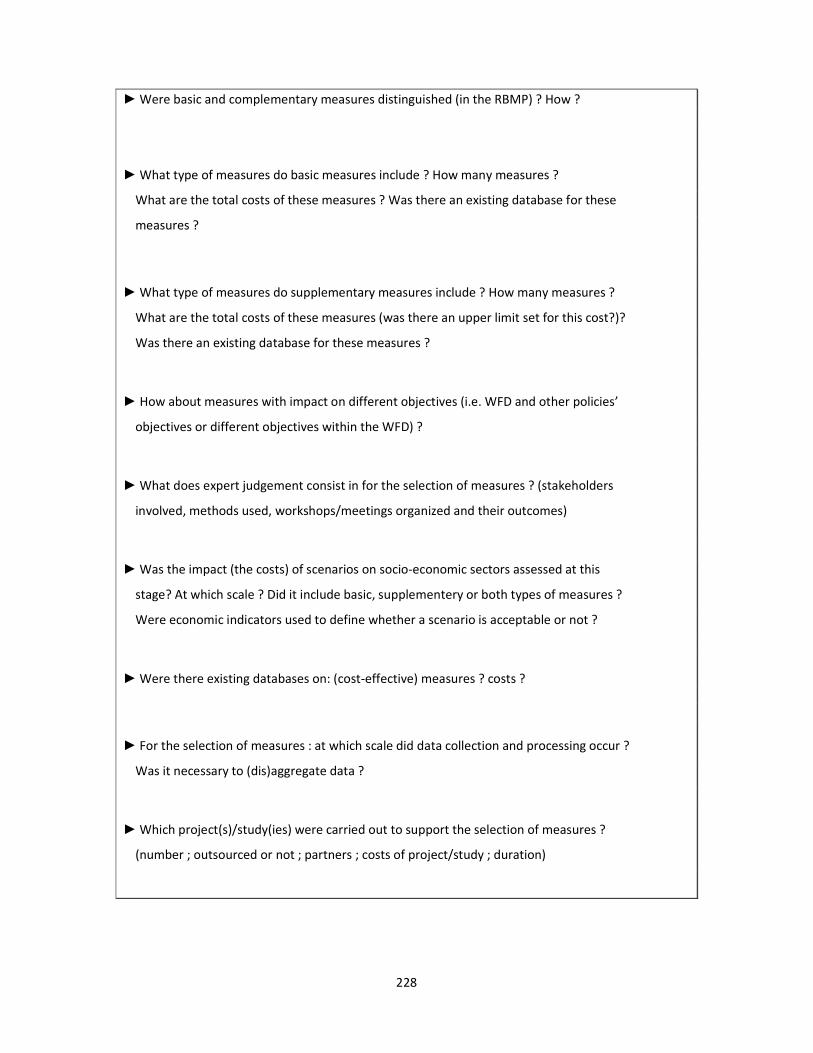
228
► Were basic and complementary measures distinguished (in the RBMP) ? How ?
► What type of measures do basic measures include ? How many measures ?
What are the total costs of these measures ? Was there an existing database for these
measures ?
► What type of measures do supplementary measures include ? How many measures ?
What are the total costs of these measures (was there an upper limit set for this cost?)?
Was there an existing database for these measures ?
► How about measures with impact on different objectives (i.e. WFD and other policies’
objectives or different objectives within the WFD) ?
► What does expert judgement consist in for the selection of measures ? (stakeholders
involved, methods used, workshops/meetings organized and their outcomes)
► Was the impact (the costs) of scenarios on socio-economic sectors assessed at this
stage? At which scale ? Did it include basic, supplementery or both types of measures ?
Were economic indicators used to define whether a scenario is acceptable or not ?
► Were there existing databases on: (cost-effective) measures ? costs ? ► For the selection of measures : at which scale did data collection and processing occur ?
Was it necessary to (dis)aggregate data ?
► Which project(s)/study(ies) were carried out to support the selection of measures ?
(number ; outsourced or not ; partners ; costs of project/study ; duration)

229
Part 4. Cost-effectiveness analysis (CEA)
► Which stakeholders and organisations were in charge of the CEA ?
(number ; level – national/regional/basin/local ; participation in decision-making ;
number of meetings held ; duration of the process)
► Who participated in negotiations on the CEA ?
Were there specific meetings held ?
► For what type of measures was cost-efficiency assessed ?
(basic or supplementary measures) ………………………………………………
► Which project(s)/study(ies) were carried out to support the CEA ?
(number ; outsourced or not ; partners ; costs of project/study ; duration)
► At which scale was the CEA conducted ? (national ? regional ? water body ?) ……………………………………………………………………………………………………………………………………. ► Were guidelines available to assist implementing the CEA ? (scale ? precision ?) ► Were model(s) used to carry out the CEA ? (i.e. Pegase) ……………………………………………………………………………………………………………………………………. ► Was the CEA qualitative, quantitative, or both ? (scale ?) ► Which cost components are considered for the CEA ? (i.e. investment, running costs,
administrative costs,…)
……………………………………………………………………………………………………………………………………. ► Which cost-efficiency indicators were used ? ► What does expert judgement consist in to assess cost-efficiency of measures ? (stakeholders
involved, methods used, workshops/meetings organized and their outcomes)

230
Part 5. Cost-benefit analysis (CBA)
► Which stakeholders and organisations are in charge of the CBA ?
(number ; level – national/regional/basin/local ; participation in decision making ;
number of meetings ; duration of the process)
► Who participated in negotiations on the CBA ?
Were there specific meetings held (number; level – international/national/regional/
basin/local ; participation in decision-making ; results/effects of negotiations)
► What was the scale of analysis of the CBA ? (cf. who is affected by measures) ? (i.e. basin ? region ? water body ?) ► Which methods were used for the CBA ? ► Was the CBA qualitative, quantitative, or both ? ► What type of costs were considered for the CBA? (POM or supplementary measures) What is the total amount of costs (Scheldt river basin district) ? ► Were the benefits considered qualitative ? quantitative ? Which method(s) were used to assess these benefits ? What is the estimated (monetary) value of benefits ? ► Were benefit analysis studies undertaken ? (number, type, organisation(s) in charge, duration, costs of studies) ► Was benefit transfer used ? In which case ? From which data/study ? ► What are the discount rate and time horizon considered ? ► Which guidelines (scale, precision) and models were available to carry out the CBA ? ► What is/are the C / B ratio(s) considered ? ► How is the CBA interpreted ? (conclusions, impact on decisions,…) ► What is/are the cost disproportion threshold(s) used ?

231
Part 6. Capacity to pay analysis
► Which stakeholders and organisations are in charge of the capacity to pay analysis ?
(number ; level – national/regional/basin/local ; participation in decision making ;
number of meetings ; duration of the process)
► What are the costs considered when spreading of costs of POM among socio-economic
groups?
► Does the analysis take into account subsidies ? What kind ? ► Which stakeholder groups will bear the costs of the POM ? In which proportion? ► How is the impact of costs assessed ? (i.e. by sector ? Water body ? Municipality ?) ► Is cost transfer possible from one entity (i.e. water body, municipality) to another ? how ► How are costs of the POM spread over the three 6-year cycles ? ► Is the polluter-pay principle applied (when spreading costs of POM) ? ► When was the capacity to pay analysis carried out ? ► Which capacity to pay thresholds were considered ? (on what basis? By which actors?) ► Were there interactions between the capacity to pay and cost recovery analyses ?
Part 7. Exemptions
► What are (1) the measures, (2) the water body types, (3) the types of pressures concerned for each type of exemption (natural condition, technical reasons or disproportionate costs) ? ► What were the main reasons or particular criteria to consider a time delay ?

232
Part 8. Synergies
► Were certain tasks undertaken simultaneously ? (i.e. selection of measures and CEA) ► How? (i.e. tasks are carried out by the same persons or using the same data/results)
Part 9. Public consultation
► When did the consultation occur for: - the RB characterisation ?
- the draft RBMP ? ► When is the final RBMP available to the public ?
Thank you

233
Appendix E. Empirical studies investigated
Auteurs Mode de gestion
/politique concerné(e)
Contraintes IP Problème Solution(s) proposées
Coûts pris en compte
Résultats (évaluation des
contraintes)
Déterminants des CT
(Anthon et al., 2007)
Contrat de gestion Natura 2000 (zones forestières)
- France et Danemark -
Aléa moral Asymétrie d’information (sur-compensation, sous-performance)
Contrats incitatifs non adéquats ; les paiements compensatoires ne prennent pas en compte aléa moral et variabilité des zones naturelles ; les paiements sont indépendants des résultats
Différencier les agents (high/low probability) et offrir 2 types de contrats (faibles/importants investissements, non basé/basé sur résultats écologiques)
Voir modèle. (manque ds modèle : aspects temporels, termes du contrat - ex. conditional payment)
Modèle théorique
(Challen, 2000)
Marché de droits de l’eau (trade of water entitlements)
- Australie -
(Effets de la distribution des) CT
Manque de procédures et techniques pour mesurer et quantifier les CT (“estimation of direct costs to traders in water rights due to regulatory approvals process for proposed transfers of rights. No consideration for TC incurred in negotiating trade contracts and with uncertainty of trading outcomes”.
Evaluation de la performance des institutions doit considérer plusieurs alternatives, et l’allocation des pouvoirs de prise de décision au travers des niveaux de hiérarchie
- CT statiques - CT dynamiques (coûts de la prise de décision et mise en œuvre + coûts pour de futurs CT/ flexibilité pour répondre à ne nouveaux changements – cf. valeurs de quasi-option) - Coûts de transition31
CT statiques = 3-29% du prix d’échange moyen CT dynamiques
Hétérogénéité des produits (si taxe de réhabilitation, ou si intervention d’un agent médiateur, etc..) Coût administratif du transfert Asymétrie d’information
31 research and institutional design / negotiation, bargaining and decision making / political repercussions to decision makers / institutional creation - including the drafting of legislation, policies, regulations, etc… / implementation – including establishing regulatory organisations and programmes and conducting education activities / redundancy of organisations and human capital associated with pre-existing institutional structure / social displacement of individuals and firms affected by institutional change / compensation payments to persons of firms disadvantaged by institutional change / costs associated with lobbying and rent-seeking behaviour of interest groups / increased perceptions of sovereign risk and policy uncertainty
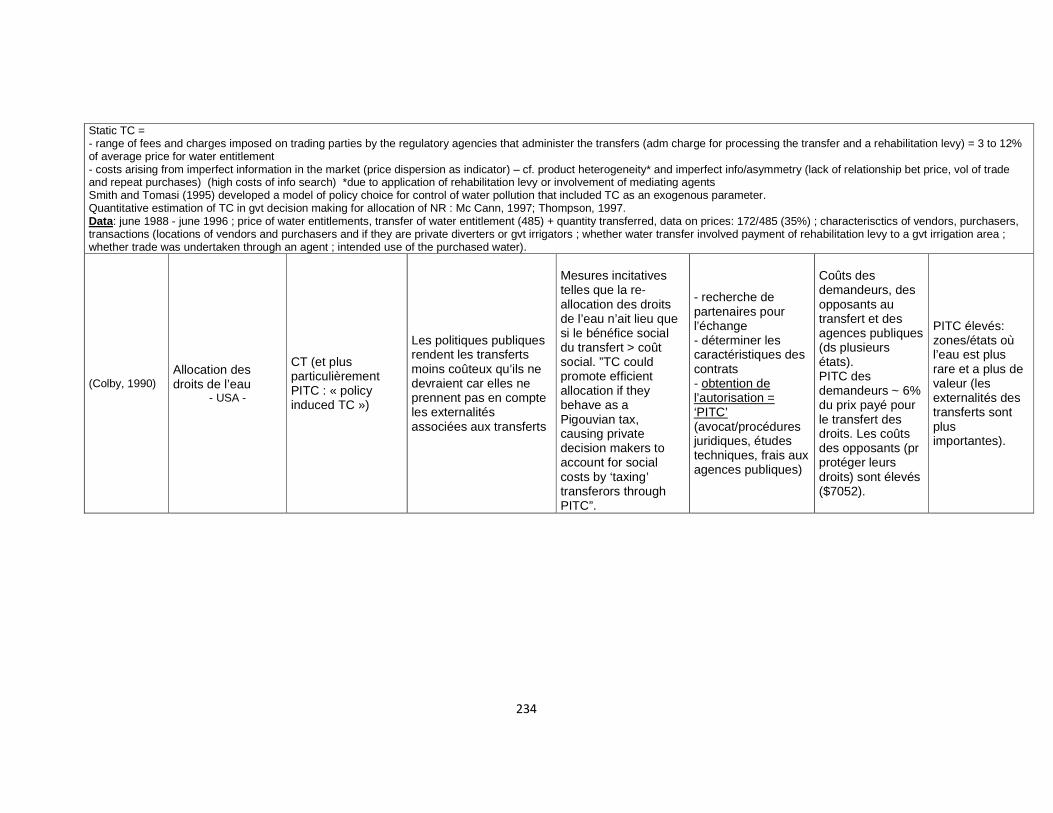
234
Static TC = - range of fees and charges imposed on trading parties by the regulatory agencies that administer the transfers (adm charge for processing the transfer and a rehabilitation levy) = 3 to 12% of average price for water entitlement - costs arising from imperfect information in the market (price dispersion as indicator) – cf. product heterogeneity* and imperfect info/asymmetry (lack of relationship bet price, vol of trade and repeat purchases) (high costs of info search) *due to application of rehabilitation levy or involvement of mediating agents Smith and Tomasi (1995) developed a model of policy choice for control of water pollution that included TC as an exogenous parameter. Quantitative estimation of TC in gvt decision making for allocation of NR : Mc Cann, 1997; Thompson, 1997. Data: june 1988 - june 1996 ; price of water entitlements, transfer of water entitlement (485) + quantity transferred, data on prices: 172/485 (35%) ; characterisctics of vendors, purchasers, transactions (locations of vendors and purchasers and if they are private diverters or gvt irrigators ; whether water transfer involved payment of rehabilitation levy to a gvt irrigation area ; whether trade was undertaken through an agent ; intended use of the purchased water).
(Colby, 1990) Allocation des droits de l’eau
- USA -
CT (et plus particulièrement PITC : « policy induced TC »)
Les politiques publiques rendent les transferts moins coûteux qu’ils ne devraient car elles ne prennent pas en compte les externalités associées aux transferts
Mesures incitatives telles que la re-allocation des droits de l’eau n’ait lieu que si le bénéfice social du transfert > coût social. ”TC could promote efficient allocation if they behave as a Pigouvian tax, causing private decision makers to account for social costs by ‘taxing’ transferors through PITC”.
- recherche de partenaires pour l’échange - déterminer les caractéristiques des contrats - obtention de l’autorisation = ‘PITC’ (avocat/procédures juridiques, études techniques, frais aux agences publiques)
Coûts des demandeurs, des opposants au transfert et des agences publiques (ds plusieurs états). PITC des demandeurs ~ 6% du prix payé pour le transfert des droits. Les coûts des opposants (pr protéger leurs droits) sont élevés ($7052).
PITC élevés: zones/états où l’eau est plus rare et a plus de valeur (les externalités des transferts sont plus importantes).

235
TC are incurred in: - searching for trading partners - ascertaining the characterisitic of water commodities - negotiating price and other terms of transfer
- obtaining legal approval for the proposed change in water use = policy induced TC (TC that this paper addresses) - attorney's fees, engineering and hydrologic studies, court costs, and fees paid to state agencies; exclude: price paid for water right and costs of implementing a transfer once it has been approved.
Colby et al. analyzed applicant, protestant, and state agency costs for water transfers in several states with active water markets (sample not necessarily representative - voluntary participation) --> applicants' PITC averaged $91 per acre-foot of water transferred with considerable variation among states. Another measure of PITC involves the opportunity costs to transfer applicants of time delays while waiting for state agency approval of a transfer proposal. This period is measured in months from the time a transfer application is filed to the date of the state agency decision (29 months in Colorado, 4.3 in New Mexico, and 5 in Utah). Applicant costs per acre-foot averaged 6% of the price paid by the applicant for water rights to transfer (it varies with the market value of water). average cost per protest filed of $7,052, indicating that parties protesting a transfer to protect their own water rights can incur significant costs. PITC are higher in areas where water is more scarce and more valuable, transfers are more controversial, and the externalities of water transfers are more likely to be significant. Policy implications: One goal of policy changes should be to generate information on the externalities that accompany water transfers in a least-cost manner ; judicial proceedings should not be the first forum for evaluating a transfer proposal as in Colorado ; data developed for previous transfers should be publicly available and used to build up a cumulative information base for evaluating transfer impacts, with the goal of reducing information costs.

236
(Falconer et Whitby, 1999)
Politiques agri-environnementales - 8 pays européens -
CT (ou coûts d’organisation) des agences publiques Asymétrie d’information ------------------- administration costs = non-trivial policy-related TC (cf. heterogeneity of producers; asymmetry of info) TC = organisational costs. Policy-related TC = in public and private sector. Public TC = administrative TC
L’omission des coûts d’organisation peuvent engendrer des politiques sous-optimales "Ratio of administration expenditure to scheme compensation payments in each year indicates by how much typically the public exchequer costs of schemes are being under-reported, for example, in government policy evaluation documents" (p.72)
La contribution de personnel peut être plus flexible et basé sur la demande Set-up cost could be omitted from consideration (compare only operating costs) Cibler (targeting is thought to be extremely important to the environmental effectiveness of schemes)
Composants des coûts d’administration (ou CT publics) = � information (diagnostic des zones, évaluation des prescriptions), � établissement des contrats (promotion, négociation, administration), � gestion (suivi, évaluation, exécution des termes du contrat)
Méthodes ; détails des CT (tab. 9 p.45) Dépenses administratives en % des paiements compensatoires (6-87%) – France le plus élevé, et en % du coût total de chaque mesure par an (1-3% à 100%) 2 stages: (1) assessment of scheme administration (and other organisational) costs at the level of member state (2) assessment of the costs and variations in these at the european level of analysis. adm costs/ha entered into a scheme and the adm costs/mgmt agreement made = basis for exploration of how adm res use varies over schemes. Quantitative measures: financial administrative costs (ex: ECU/ha entered under a given scheme) ; resource usage in terms of time
- Hétérogénéité agriculteurs -Transparence, compréhension des mesures -‘Observabilité’ de conformité avec objectifs établis - Nombre d’agences impliquées ds adm des mesures - Régularité des interactions entre agences et participants - Potentiel pour économies d’échelle -Temps depuis mise en oeuvre - Technologie disponible - Attitude et compréhension des agriculteurs - Structure et culture administratives - Possible régionalisme (+ de flexibilité)

237
Estimation of the size of public agency TC (administration costs) in the provision of environmental public goods in EU Methods: qualitative data on policy structure ; interviews ( full-time staff equivalent) ; official administrati ve resource use data from public agencies ; evaluation in terms of labour inputs for each stage of the processes involved in implementing, monitor ing and controlling ; (un)published official data o n administrative expenditures . history of events relating to each scheme's dvpt and operation --> estimation of the total time per year needed to carry out the necessary activities (standard labour cost per hour - blunt method of estimation). Components: see table 9. p.45 Countries included different components in their administrative costs estimations. - - -> STAFF TIME INPUTS Administrative costs were estimated by multiplying the time required by typical staff wage rates, using a constant wage level for the entire period of the study (no need for indexation for cross-year comparisons). Annual time inputs for scheme = estimated: (1) directly through interview or (2) calculated from the total cost estimates using typical staff salary rates. Typically, most schemes had time usage of ~ < 20 hrs/ha and < 200 hrs/agreement made Compensatory payments: actual amounts paid. Rise with time. 2 quantitative indicators (do not represent scheme efficacy): administrative costs as a % of the compensation cos ts incurred under the scheme and adm costs as a % of total scheme costs. Table 16: weighted average annual administrative costs for case-study agri-environmental schemes in each member state (9-75 ecu/ha ; 140-2446 ecu/participant) Adm expenditures as a proportion of scheme compensa tion costs = 6-87% (lower = Austria, Germany, Italy, Sweden ; higher = France (extensive and deeply entrenched administrative infrastructure), Belgium (small agri environmental sector), UK (monitoring costs)) Economies of scale occur (but diff to separate out scale-economy from other factors). Relative imp of adm costs to overall scheme costs i n each year = 1-3% up to 100% (chart 5) . If low participation level --> high ratios. Large proportion of the adm costs = fixed costs relating to policy monitoring and evaluation. What explains data variations: Relative shares of =/= adm cost components (information, monitoring, and general administration such as processing payments) also vary accross time, country and measures. Annual administrative costs were estimated for the case-studies over different time-scales with the implication that some costs should be indexed/annuitised for meaningful comparative use. !!!! to quality of administrative time inputs (more detailed work is needed on the structure of policy-implementing organisations and their context). - time-profile of adm costs - scheme scale (table 18&19) - scheme participation (charts 7&8) Adm costs comprise significant BUT GENERALLY HIDDEN components of public expenditure in the agri-environmental sphere. · Time since scheme implementation is imp to the size of administrative costs · Relative share of adm costs of total scheme expenditure depend on stage reached in scheme life-cycle · Key factors = changes in administrative function over time and differences in costs/unit associated with functions executed · High costs for set-up decrease maintenance activities. · As pption increase, potential for economies of scale · monitoring and running costs become quite significant in absolute terms, but imp to overall gross scheme expenditure is dwarfed by the increasing expenditure on payments to farmers · The set-up costs and life-span of the asset: agreements should be maintained for a period long enough to gain the benefits from the costs of setting them up · Trade-offs between short term and long term TC and the length of mgmt agreements · There may be important trade-offs between TC and LT environmental benefits: instruments leading to payments to provide environmental benefits over a long period are more diff to establish · Experience factor · Policy evolution, policy framework can explain some costs · Discontinuities in adm costs (ex: renewal stage)

238
Auteurs Mode de gestion
/politique concerné(e)
Contraintes IP Problème Solution(s) proposées
Coûts pris en compte
Résultats (évaluation des
contraintes)
Déterminants CT
(Lacroix et al., 2006)
Politiques environnementales: cas de la pollution nitrique de l’eau par l’agriculture
- France -
Coûts de la territorialisation (coût élevé de mise en œuvre, de contrôle et de surveillance)
Niveau spatial optimal devrait au minimum atteindre un compromis entre l'économie réalisée grâce à une modulation adaptée aux conditions locales et les sur-coûts dus à la décentralisation des solutions mises en œuvre.
Schéma optimal : discrimine spatialement le taux de taxe. Différencier les espaces : selon les objectifs à atteindre et selon les moyens à mettre en œuvre (réduire pollution là où plus efficace et moins coûteux)
Evaluation, via modélisation intégrée (STICS couplé à modèle économique)32, l'impact environnemental et économique de différents scénarios de pratiques culturales sous contrainte environnementale (50 mg/L au moindre coût).
Coûts varient de 1 à 7 pr 1kg de N abattu. CT des politiques territorialisées pas forcément différents des politiques uniformes lorsque liés à nature des instruments de régulation/contrôle mis en œuvre. Prise en compte diversité spatiale pèse sur coûts d’information.
- Degré d’hétérogénéité pris en compte - Finesse de représentation de cette hétérogénéité - La population cible des politiques publiques - Technique à mettre en œuvre
32 prend en compte l’incertitude de rendement et la variabilité pédo-climatique

239
Influence de la variabilité du milieu ; Influence des pratiques culturales ; réduction de la fertilisation, gestion de l’interculture par la mise en place de cultures pièges à nitrates et gel des terres. Ces différents scénarios prennent en compte les coûts directs supportés par les agriculteurs du fait de la modification de leurs pratiques culturales. La réduction de fertilisation se traduit par des pertes de recettes dues à la baisse des rendements, déduction faite des économies réalisées avec la réduction de consommation d'azote minéral. Dans le cas d'implantation d'une culture intermédiaire, les coûts pris en compte sont ceux des semences, du matériel et du travail liés à cette implantation. Ces différentes solutions ont été étudiées à la fois sur le site de la plaine de Bièvre-Liers et sur le bassin versant de Bruyères-Montbérault. Notre méthode a consisté à évaluer, via une modélisation intégrée (STICS couplé à un modèle économique), l'impact environnemental et économique de différents scénarios de pratiques culturales sous contrainte environnementale. Ce modèle prend en compte l'incertitude de rendement et la variabilité pédo-climatique, en vue de déterminer un scénario optimal (forte probabilité d'atteindre la norme de 50 mg/l au moindre coût). 6 scénarios de pratiques culturales ont été simulés et comparés aux pratiques habituelles des agriculteurs de la région étudiée (scénario Conv). Résultats attendus à long terme (variables: espérance de coûts de chacun des scénarios calculés à l'échelle de l'ensemble du bassin, espérance de concentration de NO3, probabilité d'atteindre la norme européenne). les coûts de mise en œuvre de ces solutions sont très hétérogènes (Bel et al., 2001) ; les CT des politiques territorialisées, ne sont pas forcément très différents de ceux des politiques uniformes lorsqu'ils sont liés à la nature des instruments de régulation et de contrôle mis en œuvre ; la prise en compte de la diversité spatiale pèse sur les coûts d’information ; les résultats présentés ci-dessus montrent que ces coûts varient en fonction des techniques à mettre en oeuvre ; L’analyse des résultats permet d’expliciter l’ampleur des réductions de coûts, qui dépend : - du degré d’hétérogénéité pris en compte - de la finesse de représentation de cette hétérogénéité - de la population cible des politiques publiques En moyenne, le coût est de 1,50€ par kilogramme ; moins de 10% des exploitations ont un coût inférieur à 1€ par kilogramme ; 1/3 d’entre elles dépassent 1,70€. Cette variabilité inter-exploitation est fonction du contexte dans lequel les agriculteurs produisent et, notamment, de la combinaison des différentes cultures qu’ils opèrent. fonder la différenciation des politiques sur l’information spatiale la plus importante pour décrire la pollution. En raisonnant pour un type d’instrument donné (un accord contractuel pour de meilleures pratiques agricoles), Carpentier et alii (1998) montrent qu’en ciblant précisément les exploitations contractualisées, la population cible est restreinte et les CT significativement réduits, notamment du fait de coûts de contrôle quatre fois moindres. A travers une étude de sensibilité, ils montrent même que le choix entre politique uniforme et politique ciblée dépend bien plus de la comparaison du montant des coûts d’abattement que de celle des CT CT des politiques territorialisées, ne sont pas forcément très différents de ceux des politiques uniformes lorsqu'ils sont liés à la nature des instruments de régulation et de contrôle mis en œuvre. Par contre, la prise en compte de la diversité spatiale pèse sur les coûts d’information (recherche de données plus fines, collecte et analyse). La question primordiale devient alors de savoir si cet accroissement des coûts d’information peut être compensé par une précision accrue de la politique envisagée et par la diminution de la population-cible. Répondre à cette question impliquerait de détailler beaucoup plus le contenu de l'information et les échelles pertinentes. Une autre manière de poser le problème consisterait, ainsi que le fait Tietenberg (1974), à rechercher des modifications dans le design des politiques territorialisées, modifications qui permettent de diminuer les informations requises tout en maintenant le maximum des propriétés de ce type de politiques.

240
(Lotter, 1995) Politiques publiques CT Possibilité de meilleure
efficacité de l’IP
CT les + faibles ds les cas de : - marché pr faible spécificité des actifs - hybride pr spécificité des actifs moyenne - hiérarchie pr actifs fortement spécifiques
Attributs des structures de gouvernance et des transactions
(McCann et Easter, 1999)
Politiques environnementales: cas de la pollution des eaux par le phosphore d’origine agricole
- USA -
CT
Pour un objectif environnemental à atteindre donné, quelle politique choisir qui économise au maximum les CT ? tax on phosphate fertilizer, educational programs, conservation tillage, permanent conservation easement program
Estimation des CT pour 4 politiques de réduction de la pollution au phosphore par 40% (2 scénarios hypothétiques et 2 réels) Total cost of policy = fixed costs + variable cost related to discounted marginal abatement costs + variable cost related to discounted marginal TC
CT (dont coûts adm.) = - recherche, récolte et analyse d’info - mise en vigueur de la législation (dont coûts de lobbying) - conception et mise en oeuvre de la politique - assistance et administration du programme en route - suivi / détection - dépenses de poursuite/incitation
TC : tax on phosphate fertilizers ($0.94 million), educational programs on best management practices ($3.11 million), conservation tillage on all cropped land ($7.85 million), expansion of a permanent conservation easement program ($9.37 million). Taxes, thus, may have advantages with respect to TC and abatement costs
- the number and diversity of agents - available technology - policy under consideration - the amount of abatement OR size of the transaction - institutional environment

241
Total cost of policy = fixed costs + variable cost related to discounted marginal abatement costs + variable cost related to discounted marginal TC. Abatement costs. in-depth interviews with gvtal agency personnel (to obtain ex ante estimates of TC that would be borne by the implementing agencies) --> perceived costs Aspects of the contingent valuation method. magnitude of TC associated with policies to reduce agricultural nonpoint source pollution. Interviews with staff from governmental agencies were conducted to estimate TC associated with four policies to reduce agricultural phosphorous pollution in the Minnesota River. The tax on phosphate fertilizers had the lowest TC ($0.94 million), followed by educational programs on best management practices ($3.11 million), the requirement for conservation tillage on all cropped land ($7.85 million), and expansion of a permanent conservation easement program ($9.37 million). Taxes, thus, may have advantages with respect to TC and abatement costs The magnitude of TC involved with eliminating externalities = affected by: - the number and diversity of agents - available technology - policy under consideration - the amount of abatement OR size of the transaction - institutional environment Colby (1990): policy-induced TC in western water markets and found that TC ~ 6% of the price paid by the applicant to transfer water Howit (1994): overhead costs incurred by State Dpt of Water Res for the California Water Bank ~ 8% of the water purchase costs Hearne and Easter (1995): TC involved with water transfers in Chile = 2-11% of transaction price McCann (1997): TC = 38% of total conservation cost (cf. cost share and technical assistance data) TC Calculations The time requirements are translated into monetary terms in Table 2. Recurring costs for administration, monitoring, and enforcement were discounted at a rate of 5% over a 10-year period. In the case of RIM, the implementation costs were discounted over the 10-year period since parcels would be enrolled over this period. The 1996 Minnesota Salary Survey was used to obtain salary information. Salaries for a range of positions including compliance officers, public administration. The annual cost was calculated assuming 40-hour weeks and 52 weeks per year. Fringe benefits were added at a rate of 28% for a total cost per FTE of $53,000. The fertilizer tax was the least expensive policy in terms of total TC at less than a million dollars (Table 2). The next least costly policy was the extension program at over $3 million, followed by the conservation tillage requirement at almost $8 million. The most costly policy was the permanent easement program (RIM) at over $9 million (highest design and implementation costs, while the conservation tillage requirement had the highest administration, monitoring, and prosecution costs). When the time horizon assumption was increased to 20 years, the conservation tillage requirement became the most expensive of the four policies. Changing the discount rate to 10% had no effect on the ordering of the policies.

242
(McCann et Easter, 2000)
Politiques environnementales: cas de programmes de conservation des ressources naturelles
- USA -
CT (”When evaluating the economic efficiency of policies to reduce nonpoint source pollution, administrative or TC are usually not taken into account”)
The optimal abatement level will be lower because the total costs of achieving a given level of abatement are much higher. There should be practices and areas with high TC --> to ones with lower TC
Examine relationship between costs of installing and maintaining practices to achieve an (unknown) abatement or productivity objective vs TC involved with achieving the same objective. (instead of examining relationship between pollution abatement levels and TC)
from this data, we do not know the abatement level or productivity increase that was achieved, only the costs. This data is used to examine relationship between costs of installing and maintaining practices to achieve an (unknown) abatement or productivity objective vs TC involved with achieving the same objective. (instead of examining relationship between pollution abatement levels and TC) Total conservation costs/acre33 CT (ou coûts adm.) : 1. research and information, 2. enactment, 3. design and implementation, 4. support and administration, 5. prosecution, 6. monitoring. TC include technical support provided by other agencies.
TC = significant portion (38%) of overall conservation costs. From the data, we do not know the abatement level or productivity increase that was achieved, only the costs. TC do not explain the frequency of the different practices (related to the on-site and off-site benefits - not included in this data set - as well as the abatement costs and TC). TC increase with level of abatement costs and vary acc. to region and conservation practice.
- number and diversity of agent - technology, policy under consideration, - level of uncertainty, - asset specificity, - institutional environment, - amount of abatement/size of transaction (Oates, North, Coase, Stavins, Williamson) Abatement costs are a small but significant determinant of TC. Support costs have a fixed component. TC do vary according to the type of practice being applied --> further research...
33Total conservation costs/acre = abatement costs (financial assistance + private cost/acre) + TC (total NRCS: planning*, application*, support* costs/acre + non NRCS costs/acre). *salary rate of conservationist = used for planning component; technician for application component. * support costs=calculated with NRCS overhead

243
public costs include planning of the system, application/implementation of the system, support or overhead costs, and cost-sharing by NRCS and other agencies. abatement costs (= private farmer costs + gvt cost-sharing amount) included operating and maintenance costs. Total conservation costs/acre = abatement costs (financial assistance + private cost/acre) + TC (total NRCS: planning*, application*, support* costs/acre + non NRCS costs/acre). *salary rate of conservationist = used for planning component; technician for application component. * support costs=calculated with NRCS overhead. TC = significant portion (38%) of overall conservation costs. This provides strong support for including these costs in economic evaluations of alternative policy instruments. Abatement costs (within systems and regions) are a small but significant determinant of TC. Support costs have a fixed component. 60 conservation systems: structural and management practices. TC do not explain the frequency of the different practices (related to the on-site and off-site benefits - not included in this data set - as well as the abatement costs and TC). TC do vary according to the type of practice being applied --> further research... (practices have other objectives than reducing environmental degradation). Need to investigate if the per-acre costs of these practices are justified by the benefits obtained. --> practice with clear res cons obj and measure expected poll abatement. TC increase with the level of abatement costs and vary according to region and conservation practice. Magnitude of TC involved with eliminating externalities is affected by the number and diversity of agents, technology, policy under consideration, level of uncertainty, asset specificity, institutional environment, an amount of abatement/size of transaction (Oates, North, Coase, Stavins, Williamson) !!! some planning and application costs may be thought of as abatement costs. Inclusion of TC in the total cost of this technical assistance and cost-sharing program greatly increases the estimated cost to society and has important ramifications for envtal policy. The optimal abatement level will be lower because the total costs of achieving a given level of abatement are much higher. There should be practices and areas with high TC --> to ones with lower TC. this data set does not relate the practices to abatement levels of benefits of abatement (need of marginal abatement costs + marginal benefits of abatement + marginal TC --> Identify optimal abatement level)

244
(McCann et al., 2005)
Politiques environnementales
- USA - CT
TC ne sont pas bien définis ni mesurés Measuring CT can: - improve preliminary comparison and screening across alternative policy instruments - enhance effective design and implementation of policies to achieve particular objectives - evaluate current policies in order to improve their effectiveness - assess budgetary impacts of policies over their life cycle
TC must first be measured to be included in the evaluation of alternative environmental or natural resource policies. Methods used for nonmarket valuation of environmental goods may have potential for the measurement of TC
TC = the resources used to define, establish, maintain, and transfer property rights. Voir typologie. TC incurred by: (1) market transactions, (2) dvpt of market , enabling institutions, (3) changes in the institutional envt , legal system. There are unresolved boundary issues.
Typologie et chronologie des CT. Méthodologies de mesure recommandée pour chaque type de CT.
Effect of time on TC (ex ante/ex post, life cylcle of a program, pre-existing policies, time period and discount rate --> tradeoffs among costs over time)
Effect of time on TC (ex ante/ex post, life cylcle of a program, pre-existing policies, time period and discount rate --> tradeoffs among costs over time) ; methods used for nonmarket valuation of environmental goods may have potential for the measurement of TC. In this paper, TC = the resources used to define, establish, maintain, and transfer property rights. Boundary issues relating to TC: (1) market transactions, (2) dvpt of market , enabling institutions, (3) changes in the institutional envt , legal system. There are also unresolved boundary issues. Implicit vs explicit costs

245
(Ménard et Saussier, 2000)
Politiques publiques: cas de la distribution d’eau
- France -
La performance des SP = liée à arrangement contractuel/forme de gouvernance qui dépendent des CT (et caractéristiques des transactions)
Les avantages comparatifs dépendent des caractéristiques des transactions
Economie des transactions appliquée à la décision qu’un gouvernement doit prendre entre fournir un service, ou le déléguer. Comparative analysis of performance for different contractual arrangements in the provision of public utilities - water sector
Dependent variables: - Mode d’organisation - Performance (cf. standards before distribution or not) Investment variables: - properties of raw water - origin of water - population affected - Financial constraints: size of pop and seasonal variation. Control variables Uncertainty: cf. basins - geographic urban/economic dvpt Econometric analysis � determinants of contractual choice
WSU under lease or concession perform better than public bureaus only when the latter do not correspond to what the theory suggests to be the most adapted form with regard to the characteristics of the transactions (areas in which important investments are required and in which quality is a real problem). � comparative advantage of lease and concessions disappears
Caractéristiques des transactions. (cf. investissements, incertitude, contraintes financières).

246
Comparative analysis of performance for different contractual arrangements in the provision of public utilities - water sector ; Info relevant to characteristics of the transactions: investments, uncertainty, financial constraints. Dependent variables: - Mode of organization - Performance: value 1 for WSU that has been identified as producing water NOT meeting the standards before distribution (at least once within a year for 1 parameter), 0 otherwise. Investment variables: - properties of raw water (the worse the quality, the greater the investments) - origin of water (underground water à more investment) - population affected (the larger, the more rapid amortization can be) - Financial constraints: size of pop and seasonal variation. Control variables Uncertainty: cf. basins - natural geographic areas (climate) and specific urban/economic development Econometric analysis => determinants of contractual choice WSU under lease or concession perform better than public bureaus only when the latter do not correspond to what the theory suggests to be the most adapted form with regard to the characteristics of the transactions (areas in which important investments are required and in which quality is a real problem).
� comparative advantage of lease and concessions disappears
(Rorstad et al., 2005)
Politiques agricoles et agri-environnementales
CT
Comparer le montant des CT pour plusieurs politiques Analyser les cause des différences de montant
CT : quantifiés à l’aide d’interviews Running-costs (set-up costs not taken into account) (labor costs, general overhead, computer costs, costs related to information material and postage).
CT les plus faibles pour les politiques appliquées à des biens (commodities) CT augmentent qd la spécificité des actifs augmente et/ou la fréquence décroît.
- Point of policy application - Spécificité des actifs - Fréquence
data presented in this paper clearly show that there are differences in TC between different policy schemes, both at the national level and for farmers. support the hypothesis that these differences at the national level are due to differences in point of policy application, asset specificity and frequency. TCs are lower for polices that are applied to commodities than other point of application, and they increase as asset specificity increases and/or frequency decreases. For policies where farmers are actors, differences in farm level TCs are mainly due to differences in asset specificity. TCs increase as asset specificity increases. For many polices applied to commodities there are no TCs at farm level. This means that the point of policy application also affects the farm level TCs. We have used data from Norway, but the hypotheses tested were posed in rather general terms. Therefore, we believe that our conclusions apply to agricultural polices in general, at least in Europe

247
Appendix F. Description of arrangements
SPECIFICITE MISE EN
ŒUVRE POLITIQUE
ENVIRONNEMENTALE
DETERMINANTS DE
LA TRANSACTION
POLITIQUE
MODALITÉ PAYS STRATÉGIES D’OPTIMISATION DES CT
IMPACT
OBSERVÉ
SUR CT
Obligation de
résultats
Interprétation de
la politique
(niveau
d’ambition)
Exigeante/
ambitieuse
FR
Grandes ME --> peu de mesures
Choix de limiter les mesures pour l'analyse économique RI (N)
Wa
Petites ME ; Analyse économique précise
Délégation étude éco (Université Bruxelles et BE français), découpage ME en
concertation avec AERM, utilisation données existantes autres pays, définition
des coûts DCE (mesures complémentaires et mesures de base "spécifiques DCE")
Délégation étude éco (Université Bruxelles et BE français), découpage ME en
concertation avec AERM, utilisation données existantes autres pays, définition
des coûts DCE (mesures complémentaires et mesures de base "spécifiques DCE")
RI
Peu exigeante /
peu de volonté
politique
Wa
DGARNE travaille de façon indépendante (propose mesures et scénarios de
coûts), avance là où il y a de la marge de manœuvre (consolidation contrats de
rivières)
Coûts du PDM estimés pour le 1er cycle seulement (permet réajustements)
Inclusion des coûts administratifs dans rapport analyse économique; ACB inclut
un scénario avec mesures de base (si uniquement coûts mesures
complémentaires dans ACB: coûts PDM très élevé)
A, N
NL pour ce qui est de l’augmentation des taxes des water boards, les mesures N

248
inondations sont prioritaires par rapport à la DCE. Quand les water boards ont
identifié les mesures, les coûts étaient déjà affectés. Cf. mresures base (existantes
ou prévues) - il existait un programme "prevention of flooding"
Multi-acteurs
Division des
compétences
entre acteurs
Fragmentées
entre acteurs
Peu de synergie
pol – adm
Wa
Peu de niveaux de décision impliqués dans planification (élaboration mesures en
interne à la DGARNE) ; Extension l'existant (les contrats de rivière) sur tout le
territoire
C
Fl
Création plateforme de coordination pour gestion à l'échelle bassin (CIW)
Objectif de synergie entre plans de gestion
PDM à l'échelle région (et non ME) -infos plus précises seront dans plans de
gestion locaux pour 2nd cycle - PDM priorise les systèmes d'eau de surface
importants. 1 PDM pour Flandres. Respect délais de la Commission pour PDM
VMM acteur impliqué: partenaire principal dans les projets Scaldit et Scaldwin
Interprétation des mesures de base (mesures en cours, déjà existantes). PDM =
50% mesures base et 50% complémentaires. Plusieurs scénarios de PDM
présentés au Ministère pour avis (suite à quoi VMM à dû diminuer les coûts)
C
Peu
fragmentées/
intégrées
Synergie pol –
adm
FR
Validation mesures/PDM en commissions géographiques/territoriales
(propositions AE-DREAL) pour ne pas revenir dessus après. Participation des MISE
en commission SDAGE N
Lien planification Faible FR Bâtir sur acteurs/données/dispositifs existants (ex: SAGE permet de cibler C

249
- financement mesures sur ME prioritaires); Peu de mesures hydromorpho (difficultés pour
engager maitres ouvrages)
Wa
DGARNE a commandé une étude approfondie d'estimation des bénéfices liés à
l'atteinte du bon état, a proposé de réformer taxe sur déversement eaux usées
agricoles, et travaille de façon indépendante (propose scénarios de coûts)
Analyse économique précise (notamment analyse des bénéfices ce qui permet de
justifier 49/78 dérogations pour motif de coûts disproportionnés)
Suite à réalisation analyse éco par DGARNE, Cabinet à mandaté une autre étude à
un BE (pour avoir résultats qui passent politiquement?)
C, N
Fl
Analysé économique déléguée à VITO.
Plusieurs scénarios de PDM présentés au Ministère pour avis (suite à quoi VMM à
dû diminuer les coûts)
RI ?
N ?
Fort
Multi-niveaux et
secteurs
Division des
compétences
entre
niveaux/secteurs
Fragmentées
entre niveaux ou
secteurs
FR
LEMA (2006) --> rôle échelon national renforcé (création ONEMA) pour
accompagner et cadrer la mise en œuvre de la DCE. Bâtir sur existant:
planification à l'échelle bassin. Les AE fonctionnent de façon autonome
(collectent directement des redevances) - cadrage DEB/ONEMA limité.
C
Fl
Création plateforme de coordination pour gestion à l'échelle bassin (CIW)
Objectif de synergie entre plans de gestion
PDM à l'échelle région (et non ME) -infos plus précises seront dans plans de
gestion locaux pour 2nd cycle - PDM priorise les systèmes d'eau de surface
C

250
importants. 1 PDM pour Flandres. Respect délais de la Commission pour PDM
VMM acteur impliqué: partenaire principal dans les projets Scaldit et Scaldwin
NL
Cadrage du RWS, réalisation analyse économique et élaboration finale du PDM au
niveau national
5 scénarios considérés pour le PDM (niveau national) mais niveau sous-bassin :
mesures ‘coûts-efficaces’ sélectionnées
Changement planification de 4 à 6 ans. RWS a décidé que PDM final serait produit
par le niveau national (en se basant plus ou moins sur plans sous-bassins)
Réunions au niveau district (water boards, provinces, communes, RWS)
Escaut : 1 fois/semaine le représentant du district Escaut travaillait à Utrecht
(pendant 2 ans) avec les représentants du ministère
capacité à payer (water boards : choix augmentation taxe de 2%) à PDM construit
selon contrainte budgétaire niveau local (régional) - Quand les water boards ont
identifié les mesures, les coûts étaient déjà affectés.
ACE et ACB ont été combinées (SCBA a servi d’ACE)
ACB nationale (demandée par le Parlement) : pr avoir une 1ère idée des coûts du
PDM à 2005-2006 : 1er état des lieux mesures au niveau sous-bassin à revu en
2007
Chaque niveau de décision a choisi mesures (en fonction de son domaine de
compétences/territoire attribué), puis l’efficacité des mesures a été analysée au
niveau national RWS waterdienst (harmonisation 1500 mesures, 27 water boards)
lors SCBA en 2006 (cf. EQR – PBL report p.160) à modèle/guide pour les autorités
C

251
locales (quelles mesures sont les plus coûteuses/moins efficaces)
1ère ACB : bénéfices monétarisés pour groupes
2e ACB par organisation PBL/NEAA : bénéfices non monétarisés (EQR ratio)
ACB : échelle nationale à Ratio plutôt qu’ACB à la masse d’eau (faciliter
acceptabilité)
ACB comprend l’analyse de la capacité à payer
Peu
fragmentées/
intégrées
Caractéristiques
du milieu naturel
/ des ressources
naturelles
Ecart à l’objectif
environnemental
Ecart significatif
� beaucoup
d’informations
nécessaires
FR
Limiter nombre ME.
Chaque AE réalise son analyse économique: en AEAP c'est à l'échelle bassin pour
diminuer coûts de recherche/collecte d'informations
Redevances rassemblées dans un pot commun destinées au financement du
SDAGE/PDM (« l’eau paye l’eau » --> acceptabilité des mesures assainissement) --
> Etude approfondie sur impact du PDM sur les ménages (prix eau et part du
budget)
RI (N)
Wa 20 ME (environ 1/4) en objectif moins strict ; état écologique déterminant pour
fixer durée reports RI
Fl
Limiter nombre ME - Délimitation des ME (2004-2009) : 800 ME à 182 ME (VMM,
Ministère, CIW)
Critère biologie --> reports (177/182 ME). Pas de ME au BE pour 2015
RI (N)

252
PDM à l'échelle région (et non ME) -infos plus précises seront dans plans de
gestion locaux pour 2nd cycle - PDM priorise les systèmes d'eau de surface
importants. 1 PDM pour Flandres.
Capacité à payer estimée pour chacun des scénarios et pour différents types de
revenus des ménages (impact socio-économique)
NL
PDM : 100% dérogations ? (pas vraiment d’objectifs clairs en termes de qualité
pour 2015). Bcp MEA et MEFM
Mesures à l'échelle bassin dans PDM (car incertitudes)
RI (N)
Informations
« éparses » -
Besoin
d’impliquer les
secteurs
concernés
(pressions)
FR
Définition des mesures de base et complémentaires (interprétation de la DERU) à
limiter nombre mesures de base à droit aux reports et à la justification des coûts
disproportionnés à diminuer coûts d’acceptabilité (car affecte coûts du 1er PDM)
N
Wa Transferts compétences (analyse économique) à SPGE (créée en 2000) dû à
expérience en assainissement N
NL
ACE : 1 étude réalisée (la Province a lancé projets pilotes avec water boards et
organisation agricole (LTO) pour avoir informations sur certaines mesures
agricoles). Etude spécifique sur impact mesures agriculture
(RI) N

253
Appendix G. Arrangements by country or region
France
SPECIFICITE MISE EN ŒUVRE
POLITIQUE
ENVIRONNEMENTALE
DETERMINANTS DE LA
TRANSACTION POLITIQUE MODALITÉ STRATÉGIES D’OPTIMISATION DES CT
IMPACT
OBSERVÉ
SUR CT
Obligation de résultats
Interprétation de la
politique (niveau
d’ambition)
Exigeante/
ambitieuse
Grandes ME --> peu de mesures
Choix de limiter les mesures pour l'analyse économique RI (N)
Multi-acteurs
Division des
compétences entre
acteurs
Peu fragmentées/
intégrées
Synergie pol -adm
Validation mesures/PDM en commissions géographiques/territoriales
(propositions AE-DREAL) pour ne pas revenir dessus après. Participation des MISE
en commission SDAGE
N
Lien planification -
financement Faible
Bâtir sur acteurs/données/dispositifs existants (ex: SAGE permet de cibler mesures
sur ME prioritaires); Peu de mesures hydromorpho (difficultés pour engager
maitres ouvrages)
C
Multi-niveaux et
secteurs
Division des
compétences entre
niveaux/secteurs
Fragmentées
entre niveaux ou
secteurs
LEMA (2006) --> rôle échelon national renforcé (création ONEMA) pour
accompagner et cadrer la mise en œuvre de la DCE. Bâtir sur existant: planification
à l'échelle bassin. Les AE fonctionnent de façon autonome (collectent directement
des redevances) - cadrage DEB/ONEMA limité.
C

254
Caractéristiques du
milieu naturel / des
ressources naturelles
Ecart à l’objectif
environnemental
Ecart significatif
� beaucoup
d’informations
nécessaires
Limiter nombre ME.
Chaque AE réalise son analyse économique: en AEAP c'est à l'échelle bassin pour
diminuer coûts de recherche/collecte d'informations
Redevances rassemblées dans un pot commun destinées au financement du
SDAGE/PDM (« l’eau paye l’eau » --> acceptabilité des mesures assainissement) -->
Etude approfondie sur impact du PDM sur les ménages (prix eau et part du budget)
RI (N)
Besoin
d’impliquer les
secteurs
concernés
(pressions)
Définition des mesures de base et complémentaires (interprétation de la DERU) à
limiter nombre mesures de base à droit aux reports et à la justification des coûts
disproportionnés à diminuer coûts d’acceptabilité (car affecte coûts du 1er PDM) N

255
Belgium - Wallon region
SPECIFICITE MISE EN <ŒUVRE
POLITIQUE
ENVIRONNEMENTALE
DETERMINANTS DE LA
TRANSACTION POLITIQUE MODALITÉ STRATÉGIES D’OPTIMISATION DES CT
IMPACT
OBSERVÉ
SUR CT
Obligation de résultats
Interprétation de la
politique (niveau
d’ambition)
Exigeante/
ambitieuse
Petites ME ; Analyse économique précise
Délégation étude éco (Université Bruxelles et BE français), découpage ME en
concertation avec AERM, utilisation données existantes autres pays, définition des
coûts DCE (mesures complémentaires et mesures de base "spécifiques DCE")
Délégation étude éco (Université Bruxelles et BE français), découpage ME en
concertation avec AERM, utilisation données existantes autres pays, définition des
coûts DCE (mesures complémentaires et mesures de base "spécifiques DCE")
RI
Peu exigeante /
peu de volonté
politique
DGARNE travaille de façon indépendante (propose mesures et scénarios de coûts),
avance là où il y a de la marge de manœuvre (consolidation contrats de rivières)
Coûts du PDM estimés pour le 1er cycle seulement (permet réajustements)
Inclusion des coûts administratifs dans rapport analyse économique; ACB inclut un
scénario avec mesures de base (si uniquement coûts mesures complémentaires
dans ACB: coûts PDM très élevé)
A, N

256
Multi-acteurs
Division des
compétences entre
acteurs
Fragmentées
entre acteurs
Peu de synergie
pol - adm
Peu de niveaux de décision impliqués dans planification (élaboration mesures en
interne à la DGARNE) ; Extension l'existant (les contrats de rivière) sur tout le
territoire C
Lien planification -
financement Faible
DGARNE a commandé une étude approfondie d'estimation des bénéfices liés à
l'atteinte du bon état, a proposé de réformer taxe sur déversement eaux usées
agricoles, et travaille de façon indépendante (propose scénarios de coûts)
Analyse économique précise (notamment analyse des bénéfices ce qui permet de
justifier 49/78 dérogations pour motif de coûts disproportionnés)
Suite à réalisation analyse éco par DGARNE, Cabinet à mandaté une autre étude à
un BE (pour avoir résultats qui passent politiquement?)
C, N
Caractéristiques du
milieu naturel / des
ressources naturelles
Ecart à l’objectif
environnemental
Ecart significatif
� beaucoup
d’informations
nécessaires
20 ME (environ 1/4) en objectif moins strict ; état écologique déterminant pour
fixer durée reports RI
Besoin
d’impliquer les
secteurs
concernés
(pressions)
Transferts compétences (analyse économique) à SPGE (créée en 2000) dû à
expérience en assainissement
N
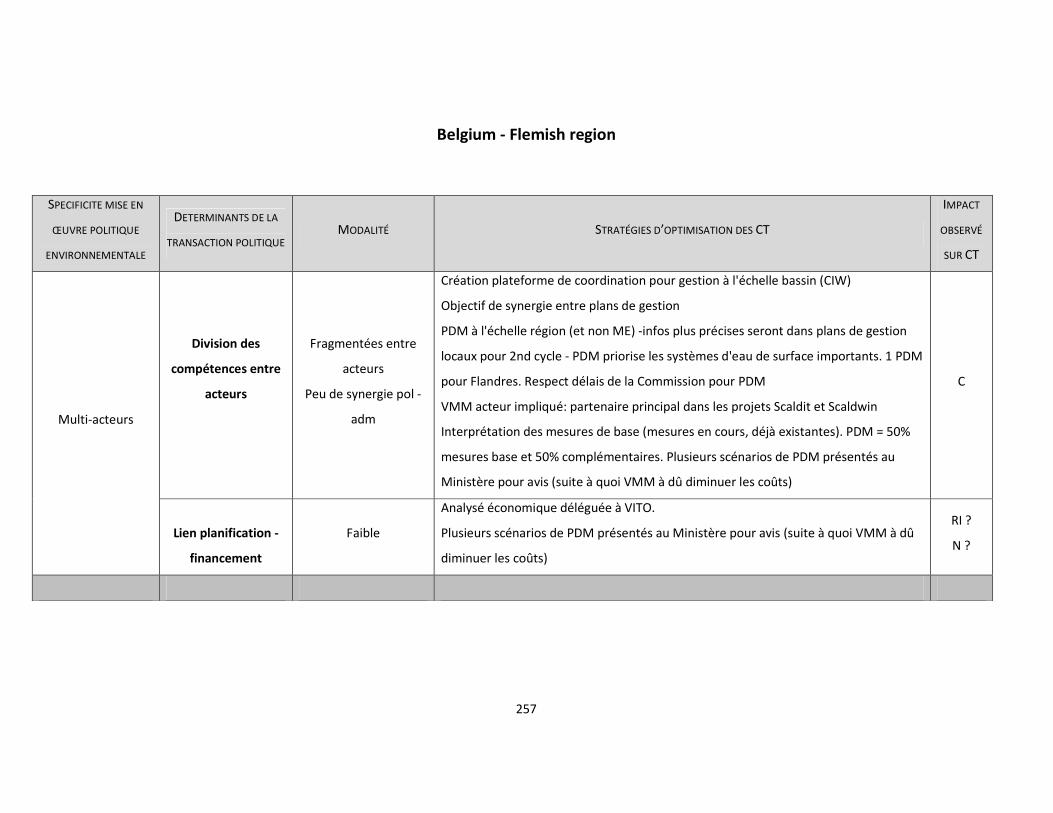
257
Belgium - Flemish region
SPECIFICITE MISE EN
ŒUVRE POLITIQUE
ENVIRONNEMENTALE
DETERMINANTS DE LA
TRANSACTION POLITIQUE MODALITÉ STRATÉGIES D’OPTIMISATION DES CT
IMPACT
OBSERVÉ
SUR CT
Multi-acteurs
Division des
compétences entre
acteurs
Fragmentées entre
acteurs
Peu de synergie pol -
adm
Création plateforme de coordination pour gestion à l'échelle bassin (CIW)
Objectif de synergie entre plans de gestion
PDM à l'échelle région (et non ME) -infos plus précises seront dans plans de gestion
locaux pour 2nd cycle - PDM priorise les systèmes d'eau de surface importants. 1 PDM
pour Flandres. Respect délais de la Commission pour PDM
VMM acteur impliqué: partenaire principal dans les projets Scaldit et Scaldwin
Interprétation des mesures de base (mesures en cours, déjà existantes). PDM = 50%
mesures base et 50% complémentaires. Plusieurs scénarios de PDM présentés au
Ministère pour avis (suite à quoi VMM à dû diminuer les coûts)
C
Lien planification -
financement
Faible
Analysé économique déléguée à VITO.
Plusieurs scénarios de PDM présentés au Ministère pour avis (suite à quoi VMM à dû
diminuer les coûts)
RI ?
N ?

258
Multi-niveaux et
secteurs
Division des
compétences entre
niveaux/secteurs
Fragmentées entre
niveaux ou secteurs
Création plateforme de coordination pour gestion à l'échelle bassin (CIW)
Objectif de synergie entre plans de gestion
PDM à l'échelle région (et non ME) -infos plus précises seront dans plans de gestion
locaux pour 2nd cycle - PDM priorise les systèmes d'eau de surface importants. 1 PDM
pour Flandres. Respect délais de la Commission pour PDM
VMM acteur impliqué: partenaire principal dans les projets Scaldit et Scaldwin
C
Caractéristiques du
milieu naturel / des
ressources
naturelles
Ecart à l’objectif
environnemental
Ecart significatif �
beaucoup
d’informations
nécessaires
Limiter nombre ME - Délimitation des ME (2004-2009) : 800 ME à 182 ME (VMM,
Ministère, CIW)
Critère biologie --> reports (177/182 ME). Pas de ME au BE pour 2015
PDM à l'échelle région (et non ME) -infos plus précises seront dans plans de gestion
locaux pour 2nd cycle - PDM priorise les systèmes d'eau de surface importants. 1 PDM
pour Flandres.
Capacité à payer estimée pour chacun des scénarios et pour différents types de
revenus des ménages (impact socio-économique)
RI (N)
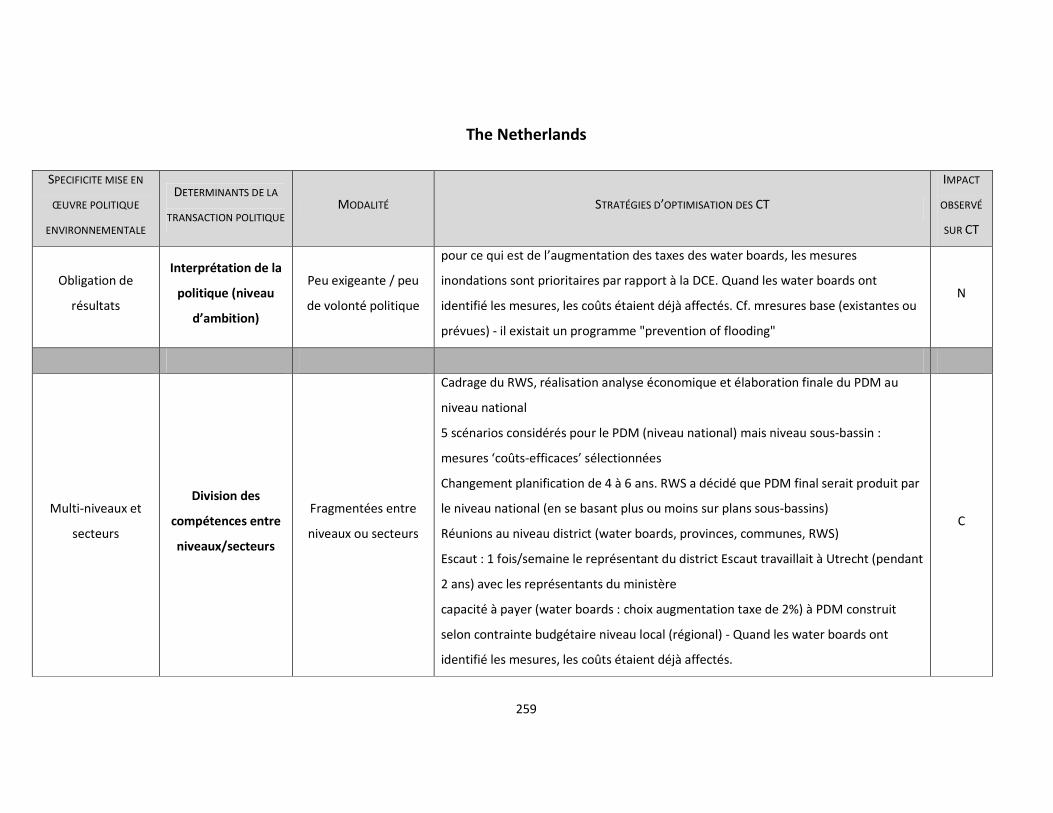
259
The Netherlands
SPECIFICITE MISE EN
ŒUVRE POLITIQUE
ENVIRONNEMENTALE
DETERMINANTS DE LA
TRANSACTION POLITIQUE MODALITÉ STRATÉGIES D’OPTIMISATION DES CT
IMPACT
OBSERVÉ
SUR CT
Obligation de
résultats
Interprétation de la
politique (niveau
d’ambition)
Peu exigeante / peu
de volonté politique
pour ce qui est de l’augmentation des taxes des water boards, les mesures
inondations sont prioritaires par rapport à la DCE. Quand les water boards ont
identifié les mesures, les coûts étaient déjà affectés. Cf. mresures base (existantes ou
prévues) - il existait un programme "prevention of flooding"
N
Multi-niveaux et
secteurs
Division des
compétences entre
niveaux/secteurs
Fragmentées entre
niveaux ou secteurs
Cadrage du RWS, réalisation analyse économique et élaboration finale du PDM au
niveau national
5 scénarios considérés pour le PDM (niveau national) mais niveau sous-bassin :
mesures ‘coûts-efficaces’ sélectionnées
Changement planification de 4 à 6 ans. RWS a décidé que PDM final serait produit par
le niveau national (en se basant plus ou moins sur plans sous-bassins)
Réunions au niveau district (water boards, provinces, communes, RWS)
Escaut : 1 fois/semaine le représentant du district Escaut travaillait à Utrecht (pendant
2 ans) avec les représentants du ministère
capacité à payer (water boards : choix augmentation taxe de 2%) à PDM construit
selon contrainte budgétaire niveau local (régional) - Quand les water boards ont
identifié les mesures, les coûts étaient déjà affectés.
C

260
ACE et ACB ont été combinées (SCBA a servi d’ACE)
ACB nationale (demandée par le Parlement) : pr avoir une 1ère idée des coûts du
PDM à 2005-2006 : 1er état des lieux mesures au niveau sous-bassin à revu en 2007
Chaque niveau de décision a choisi mesures (en fonction de son domaine de
compétences/territoire attribué), puis l’efficacité des mesures a été analysée au
niveau national RWS waterdienst (harmonisation 1500 mesures, 27 water boards) lors
SCBA en 2006 (cf. EQR – PBL report p.160) à modèle/guide pour les autorités locales
(quelles mesures sont les plus coûteuses/moins efficaces)
1ère ACB : bénéfices monétarisés pour groupes
2e ACB par organisation PBL/NEAA : bénéfices non monétarisés (EQR ratio)
ACB : échelle nationale à Ratio plutôt qu’ACB à la masse d’eau (faciliter acceptabilité)
ACB comprend l’analyse de la capacité à payer
Caractéristiques du
milieu naturel / des
ressources
naturelles
Ecart à l’objectif
environnemental
Ecart significatif �
beaucoup
d’informations
nécessaires
PDM : 100% dérogations ? (pas vraiment d’objectifs clairs en termes de qualité pour
2015). Bcp MEA et MEFM
Mesures à l'échelle bassin dans PDM (car incertitudes) RI (N)
Besoin d’impliquer les
secteurs concernés
(pressions)
ACE : 1 étude réalisée (la Province a lancé projets pilotes avec water boards et
organisation agricole (LTO) pour avoir informations sur certaines mesures agricoles).
Etude spécifique sur impact mesures agriculture
(RI) N
Copyright © 2022 FDOKUMEN