A Tornado Hazard Analysis for Indiana and An Evaluation of the Emergency Management Needs of the...
137
A TORNADO HAZARD ANALYSIS FOR INDIANA AND AN EVALUATION OF THE EMERGENCY MANAGEMENT NEEDS OF THE AMISH COMMUNITY A THESIS SUBMITTED TO THE GRADUATE SCHOOL IN PARTIAL FULFILLMENT OF THE REQUIREMENTS FOR THE DEGREE MASTER OF SCIENCE BY AMY M. LINDSEY J. ERIC DIETZ, ADVISOR BALL STATE UNIVERSITY MUNCIE, INDIANA MAY 2009
Transcript of A Tornado Hazard Analysis for Indiana and An Evaluation of the Emergency Management Needs of the...
A TORNADO HAZARD ANALYSIS FOR INDIANA AND AN EVALUATION OF THE EMERGENCY MANAGEMENT NEEDS
OF THE AMISH COMMUNITY
A THESIS SUBMITTED TO THE GRADUATE SCHOOL IN PARTIAL FULFILLMENT OF THE REQUIREMENTS
FOR THE DEGREE MASTER OF SCIENCE
BY
AMY M. LINDSEY
J. ERIC DIETZ, ADVISOR
BALL STATE UNIVERSITY MUNCIE, INDIANA
MAY 2009
ACKNOWLEDGEMENTS
Many thanks to my family, friends, and colleagues for nagging me all these years
to get this project done. Lori Peek at Colorado State University- thanks for your
encouragement and proofreading. Thanks to my advisory committee- Eric Dietz
(Purdue University) and David Call and Jill Coleman (Ball State University)- for
steering me in the right direction. Finally, to Dr. David L. Arnold whose love of
severe weather, especially tornadoes, got me started down this path. Your
enthusiasm is contagious! I’m glad I decided to go storm chasing that first season
and stick it out through 10 days of clear, blue skies! A few dozen tornadoes later
and here I am!
~Amy~
iii
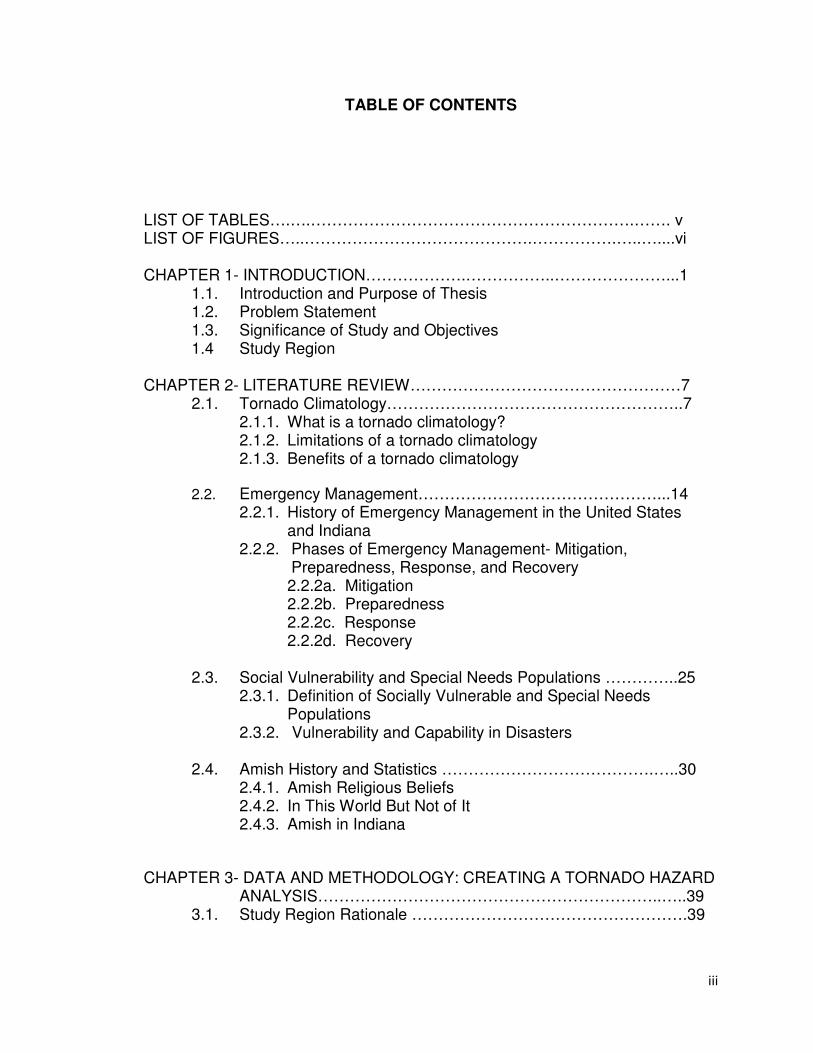
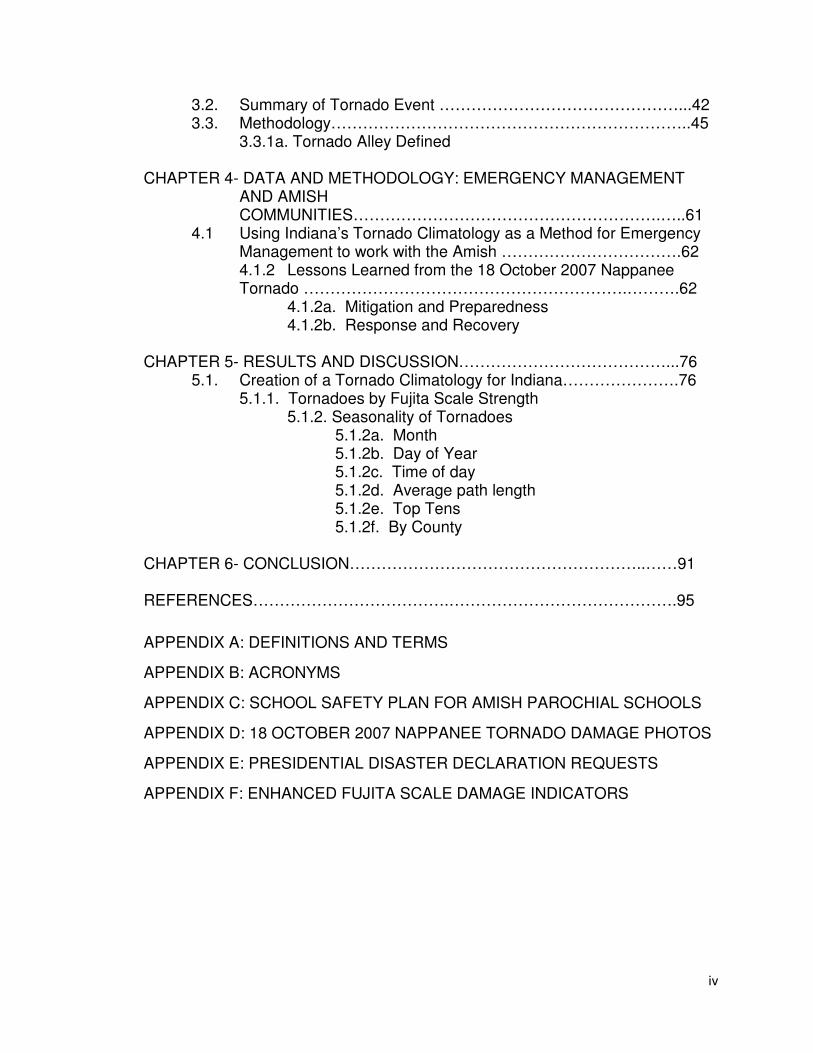
TABLE OF CONTENTS
LIST OF TABLES….….…………………………………………………….……. v LIST OF FIGURES…..…………………………………….…………….…..…....vi CHAPTER 1- INTRODUCTION……………….……………..…………………...1
1.1. Introduction and Purpose of Thesis 1.2. Problem Statement 1.3. Significance of Study and Objectives 1.4 Study Region
CHAPTER 2- LITERATURE REVIEW……………………………………………7
2.1. Tornado Climatology………………………………………………..7 2.1.1. What is a tornado climatology? 2.1.2. Limitations of a tornado climatology 2.1.3. Benefits of a tornado climatology
2.2. Emergency Management………………………………………...14
2.2.1. History of Emergency Management in the United States and Indiana
2.2.2. Phases of Emergency Management- Mitigation, Preparedness, Response, and Recovery 2.2.2a. Mitigation 2.2.2b. Preparedness 2.2.2c. Response 2.2.2d. Recovery
2.3. Social Vulnerability and Special Needs Populations …………..25
2.3.1. Definition of Socially Vulnerable and Special Needs Populations
2.3.2. Vulnerability and Capability in Disasters 2.4. Amish History and Statistics ………………………………….…..30
2.4.1. Amish Religious Beliefs 2.4.2. In This World But Not of It 2.4.3. Amish in Indiana
CHAPTER 3- DATA AND METHODOLOGY: CREATING A TORNADO HAZARD
ANALYSIS………………………………………………………..…..39 3.1. Study Region Rationale …………………………………………….39
iv
3.2. Summary of Tornado Event ………………………………………...42 3.3. Methodology…………………………………………………………..45
3.3.1a. Tornado Alley Defined CHAPTER 4- DATA AND METHODOLOGY: EMERGENCY MANAGEMENT
AND AMISH COMMUNITIES………………………………………………….…..61
4.1 Using Indiana’s Tornado Climatology as a Method for Emergency Management to work with the Amish …………………………….62 4.1.2 Lessons Learned from the 18 October 2007 Nappanee Tornado …………………………………………………….……….62
4.1.2a. Mitigation and Preparedness 4.1.2b. Response and Recovery
CHAPTER 5- RESULTS AND DISCUSSION…………………………………...76
5.1. Creation of a Tornado Climatology for Indiana………………….76 5.1.1. Tornadoes by Fujita Scale Strength
5.1.2. Seasonality of Tornadoes 5.1.2a. Month 5.1.2b. Day of Year 5.1.2c. Time of day 5.1.2d. Average path length 5.1.2e. Top Tens 5.1.2f. By County
CHAPTER 6- CONCLUSION………………………………………………..……91 REFERENCES……………………………….…………………………………….95
APPENDIX A: DEFINITIONS AND TERMS
APPENDIX B: ACRONYMS
APPENDIX C: SCHOOL SAFETY PLAN FOR AMISH PAROCHIAL SCHOOLS
APPENDIX D: 18 OCTOBER 2007 NAPPANEE TORNADO DAMAGE PHOTOS
APPENDIX E: PRESIDENTIAL DISASTER DECLARATION REQUESTS
APPENDIX F: ENHANCED FUJITA SCALE DAMAGE INDICATORS
v
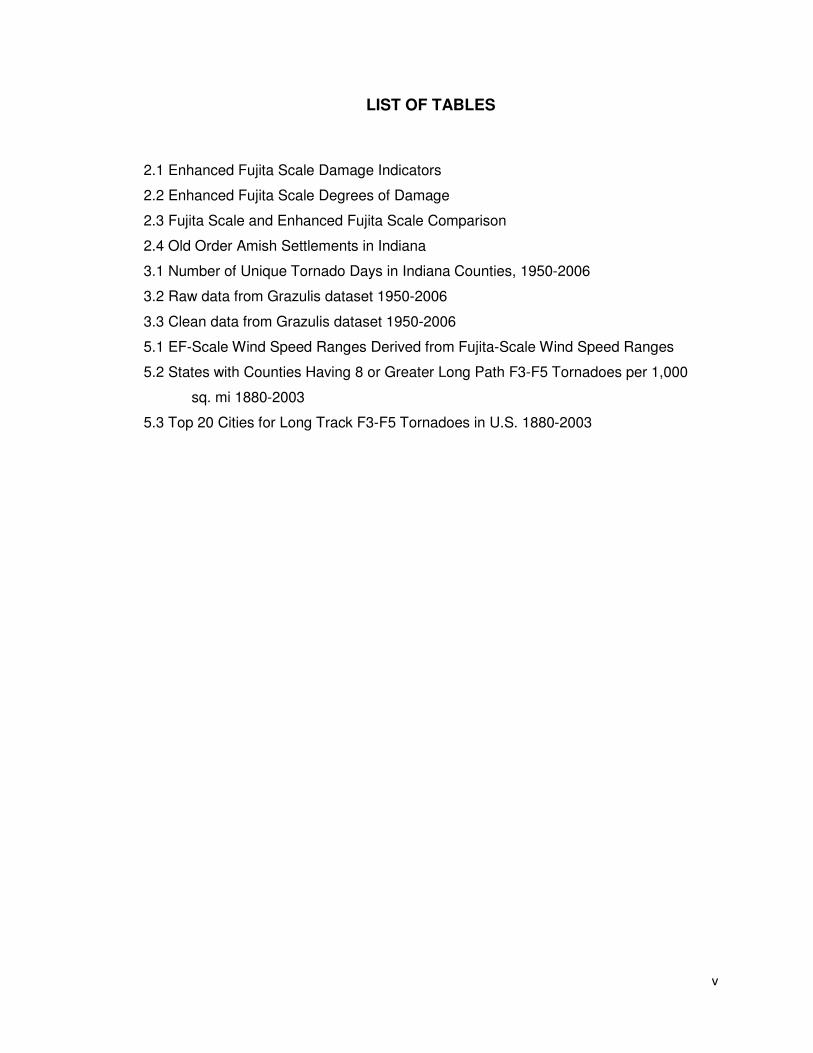
LIST OF TABLES
2.1 Enhanced Fujita Scale Damage Indicators
2.2 Enhanced Fujita Scale Degrees of Damage
2.3 Fujita Scale and Enhanced Fujita Scale Comparison
2.4 Old Order Amish Settlements in Indiana
3.1 Number of Unique Tornado Days in Indiana Counties, 1950-2006
3.2 Raw data from Grazulis dataset 1950-2006
3.3 Clean data from Grazulis dataset 1950-2006
5.1 EF-Scale Wind Speed Ranges Derived from Fujita-Scale Wind Speed Ranges
5.2 States with Counties Having 8 or Greater Long Path F3-F5 Tornadoes per 1,000
sq. mi 1880-2003
5.3 Top 20 Cities for Long Track F3-F5 Tornadoes in U.S. 1880-2003
vi
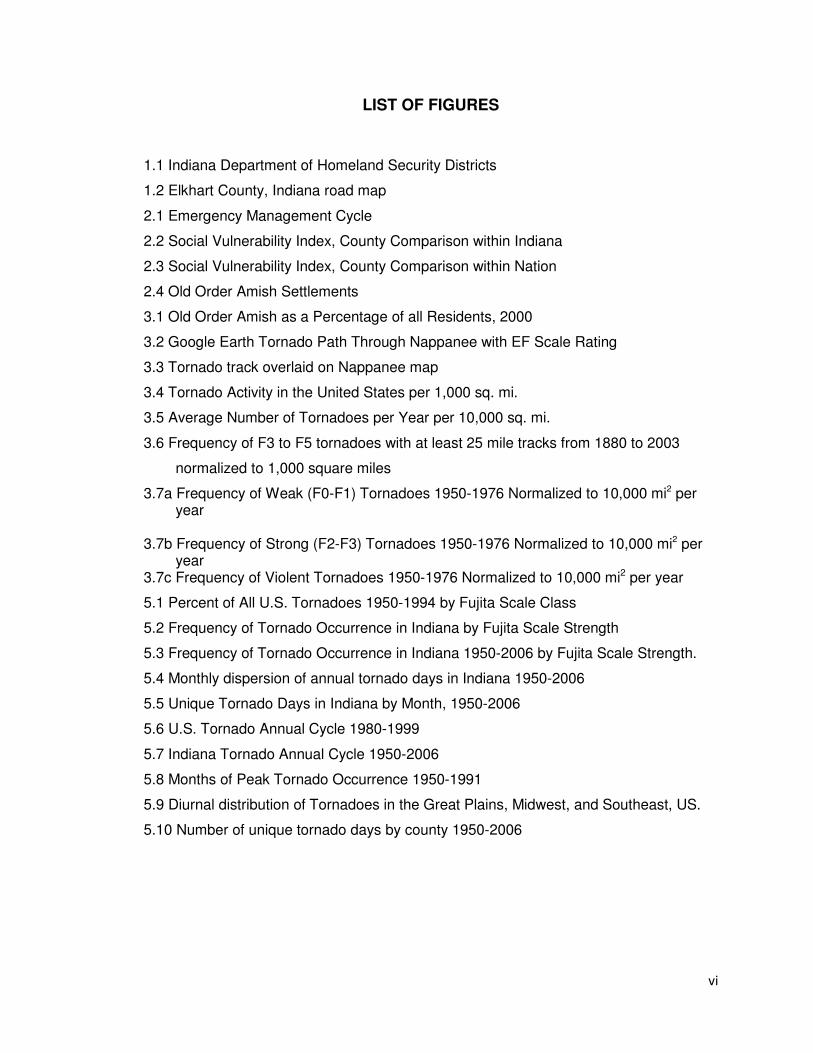
LIST OF FIGURES
1.1 Indiana Department of Homeland Security Districts
1.2 Elkhart County, Indiana road map
2.1 Emergency Management Cycle
2.2 Social Vulnerability Index, County Comparison within Indiana
2.3 Social Vulnerability Index, County Comparison within Nation
2.4 Old Order Amish Settlements
3.1 Old Order Amish as a Percentage of all Residents, 2000
3.2 Google Earth Tornado Path Through Nappanee with EF Scale Rating
3.3 Tornado track overlaid on Nappanee map
3.4 Tornado Activity in the United States per 1,000 sq. mi.
3.5 Average Number of Tornadoes per Year per 10,000 sq. mi.
3.6 Frequency of F3 to F5 tornadoes with at least 25 mile tracks from 1880 to 2003
normalized to 1,000 square miles
3.7a Frequency of Weak (F0-F1) Tornadoes 1950-1976 Normalized to 10,000 mi2 per year
3.7b Frequency of Strong (F2-F3) Tornadoes 1950-1976 Normalized to 10,000 mi2 per
year 3.7c Frequency of Violent Tornadoes 1950-1976 Normalized to 10,000 mi2 per year
5.1 Percent of All U.S. Tornadoes 1950-1994 by Fujita Scale Class
5.2 Frequency of Tornado Occurrence in Indiana by Fujita Scale Strength
5.3 Frequency of Tornado Occurrence in Indiana 1950-2006 by Fujita Scale Strength.
5.4 Monthly dispersion of annual tornado days in Indiana 1950-2006
5.5 Unique Tornado Days in Indiana by Month, 1950-2006
5.6 U.S. Tornado Annual Cycle 1980-1999
5.7 Indiana Tornado Annual Cycle 1950-2006
5.8 Months of Peak Tornado Occurrence 1950-1991
5.9 Diurnal distribution of Tornadoes in the Great Plains, Midwest, and Southeast, US.
5.10 Number of unique tornado days by county 1950-2006
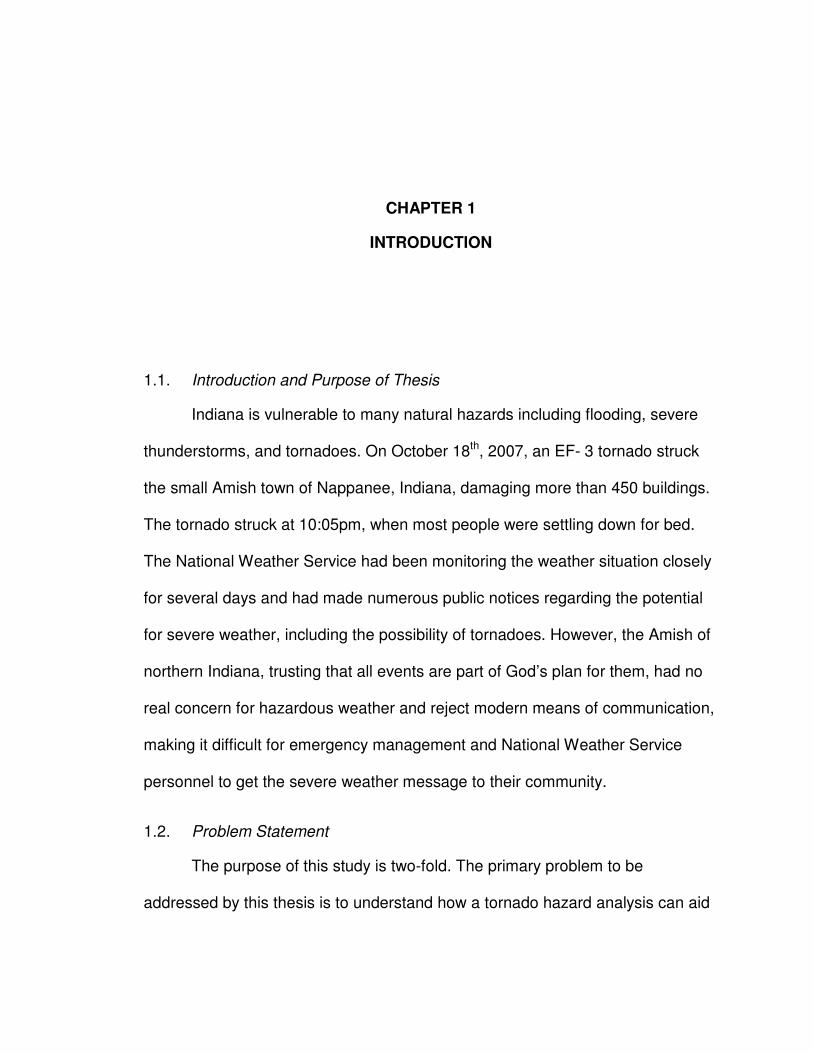
CHAPTER 1
INTRODUCTION
1.1. Introduction and Purpose of Thesis
Indiana is vulnerable to many natural hazards including flooding, severe
thunderstorms, and tornadoes. On October 18th, 2007, an EF- 3 tornado struck
the small Amish town of Nappanee, Indiana, damaging more than 450 buildings.
The tornado struck at 10:05pm, when most people were settling down for bed.
The National Weather Service had been monitoring the weather situation closely
for several days and had made numerous public notices regarding the potential
for severe weather, including the possibility of tornadoes. However, the Amish of
northern Indiana, trusting that all events are part of God’s plan for them, had no
real concern for hazardous weather and reject modern means of communication,
making it difficult for emergency management and National Weather Service
personnel to get the severe weather message to their community.
1.2. Problem Statement
The purpose of this study is two-fold. The primary problem to be
addressed by this thesis is to understand how a tornado hazard analysis can aid
2
local emergency managers in the development of a comprehensive hazard
mitigation plan. To this end a tornado climatology for Indiana was created for use
by emergency managers as part of a comprehensive, local hazard analysis. The
secondary objective of this thesis was to examine the unique needs of the Amish
community in terms of the emergency management phases and formulate
suggestions for tailoring mitigation activities of local emergency management
programs to this diverse community. An overview of the 18 October 2007
Nappanee tornado in Elkhart County is presented as a basis for discussion into
the mitigation, preparedness, prevention, response, and recovery needed by a
socially vulnerable community from a tornado.
1.3. Significance of Study and Objectives
This thesis examined tornado hazards in Indiana in order to create a
statewide, comprehensive tornado hazard analysis which may then be used as
part of local emergency management mitigation plans. Critical to the discussion
of an effective mitigation program is a discussion of the local community. This
thesis examined a unique community within northern Indiana and reviewed the
actions of that community to a real-life natural disaster in order to provide
suggestions for tailoring a mitigation program to that community. It was the intent
of this thesis to develop suggestions for local emergency managers with a similar
community to use as part of their mitigation planning. The real-life event
concentrated on issues related to mitigation and recovery of the Old Order Amish
community through a case study of a tornado in Elkhart County, Indiana, on 18
October 2007. A discussion of the disaster recovery process of Amish and non-
3
Amish households and businesses in northern Indiana enabled local emergency
managers to gain a better understanding of disaster recovery needs for
specialized populations. A statewide tornado hazard analysis identifying the
frequency, severity, and geographic dispersion of tornadic events over the period
from 1950-2006 provided a closer look at Indiana’s seasonal distribution of
tornadoes, allowing emergency management personnel to mitigate against and
prepare for a tornadic event and to tailor these efforts to a non-traditional
community.
The significance of this research was the creation of a tornado climatology
not only for Indiana, but allowing that climatology to assist in hazard planning for
an area with a unique community population. The overall goal of this study was
to provide emergency managers with a quick glance of Indiana’s tornado
climatology to enable them to prepare for the hazard. A secondary goal of this
research was to examine the recovery from a tornado in Indiana Homeland
Security District 2 looking at both the Amish and non-Amish communities.
With limited staff and time and numerous anti-terrorism projects that fund
not only the emergency management agency but other public safety agencies in
the county, a hazard analysis, though vital to the community and success of an
emergency management program, may not be given its due process. This thesis
aimed to provide a detailed tornado hazard analysis for Indiana communities,
particularly Elkhart County. With this information, Indiana’s Emergency Managers
4
can better plan for tornadic events through all phases of emergency
management- mitigation, preparedness, response, and recovery.
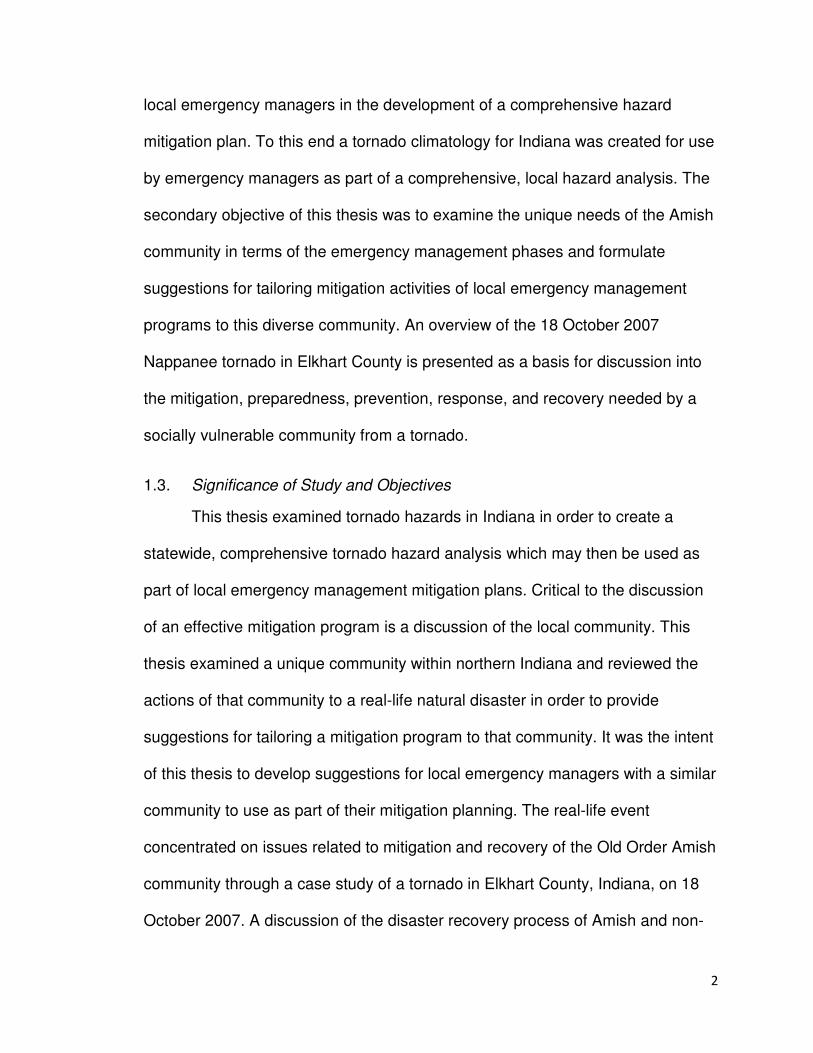
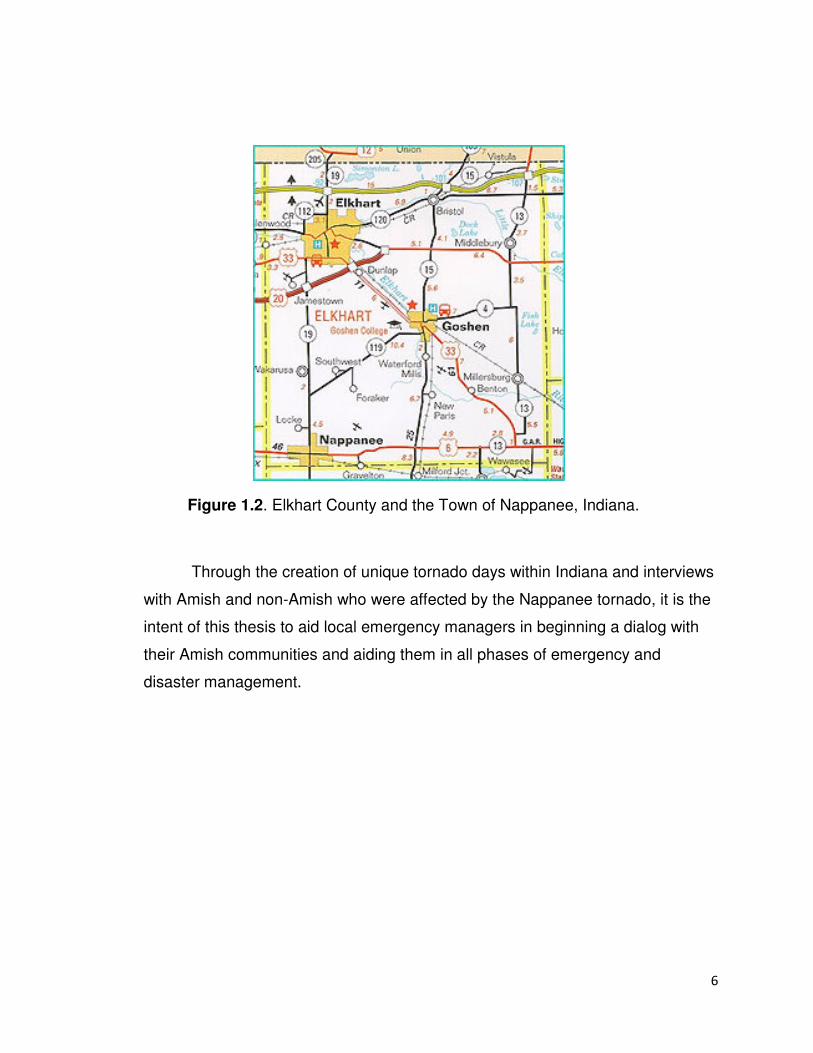
1.4. Study Region
The primary study region for this project was Indiana Department of
Homeland Security District 2 (Figure 1.1) in north central Indiana along the
Michigan border, particularly the town of Nappanee (Figure 1.2), located in
southwest Elkhart County. Elkhart County was chosen as the study area due to
its relatively high population of Amish residents and the rarity of a tornado
occurrence in a primarily Amish community.
5
Figure 1.1. Indiana Department of Homeland Security Districts (Indiana Department of Homeland Security, www.in.gov/dhs).
6
Figure 1.2. Elkhart County and the Town of Nappanee, Indiana.
Through the creation of unique tornado days within Indiana and interviews
with Amish and non-Amish who were affected by the Nappanee tornado, it is the
intent of this thesis to aid local emergency managers in beginning a dialog with
their Amish communities and aiding them in all phases of emergency and
disaster management.
CHAPTER 2
LITERATURE REVIEW
There are many ways to develop a tornado climatology. The climatology
developed for this thesis is unique because it focuses on the creation of a
catalogue of unique tornado days, rather than reports of individual tornadoes,
tornadoes by strength, killer tornadoes, or long track tornadoes which have all
been created by other researchers. This climatology will enable emergency
managers to implement a tornado component to their county hazard analysis.
Emergency managers may use the climatology to illustrate the risk to their local
communities, including Amish populations, who have unique concerns when it
comes to disaster preparedness and response.
2.1. Tornado Climatology
2.1.1. What is a tornado climatology?
A climatology involves collecting data over a given period to analyze trends or
patterns. Schaefer et al. (1993) examined various decadal periods of tornadic
events and found that a more accurate picture of a tornado climatology should
8
include a minimum of thirty-five years of data. When comparing events across a
five or ten-year period, United States tornado frequencies show large
discrepancies in tornado maximas and minimas. A more accurate picture can be
gauged with a longer climatology. Prior to cross-referencing by Kelly et al (1978),
tornado data from 1950-1976 was considered heavily biased. Kelly et al
examined more than 17,000 tornado reports from 1950-1976 to obtain a
consistent and clean tornado climatology. Therefore, tornado data can be
considered relatively accurate from 1950 to the present. For the purpose of this
project, a fifty-seven year climatology was used (1950-2006).
Although a graphical climatology of U.S. tornadoes (including data prior to the
early 1950s) would show a dramatic increase in tornadic activity around 1952, it
is not the frequency of tornadoes that has increased, but the frequency in the
reporting of tornadoes that has increased. This reporting increase comes from
greater public awareness of severe thunderstorms and tornadoes due to National
Severe Storms Forecast Center (NSSFC) public severe weather statements
beginning in 1952.
2.1.2. Limitations of a tornado climatology
Numerous limitations in the various tornado databases have been
highlighted in meteorological publications. One of the primary limitations with
tornado climatologies exists in F-scale classifications. Prior to 1972, no scale
existed to classify tornadoes. In 1971, Dr. Tetsuya “Ted” Fujita of the University
of Chicago developed the Fujita Scale to provide a method to rate the intensity of
9
tornadoes (by estimated wind speeds) based on damage caused to various
structures. There was a need to be able to rate tornadoes in the historical
database as well as future tornadoes as they occur. Doswell (2007) includes
small sample size in his list of data quality issues. Kelly et al (1978) showed the
inconsistencies of the tornado database from 1950-1976. Doswell and Burgess
(1988) discussed F-scale rating and very long path tornadoes in their article On
Some Issues of United States Tornado Climatology.
The National Weather Service (NWS) applies the Fujita Scale in rating
tornadoes. Although the Fujita Scale has been in use for several decades, there
are several limitations, primarily a lack of damage indicators, no account of
construction quality and variability and no definitive correlation between damage
and wind speed. These limitations have led to inconsistent rating of tornadoes.
Fujita scale ratings are subject not only to structural integrity, but to the
experience of the damage assessor as well. Damage ratings may be subject to
the assessor’s knowledge, experience, and personal biases. Lack of adequate
training for damage assessors may lead to default Fujita scale ratings, such as
the National Weather Service’s guideline of assigning F2 ratings in borderline
F1/F2 damage. Wind speeds estimated by spotters or chasers may also be used
in assigning F-scale ratings when structural damage is lacking (the tornado hits
in an open field or hits a decrepit barn). Lack of qualified NWS damage
assessors may negate the need for damage assessment to be done by
unqualified local officials.
10
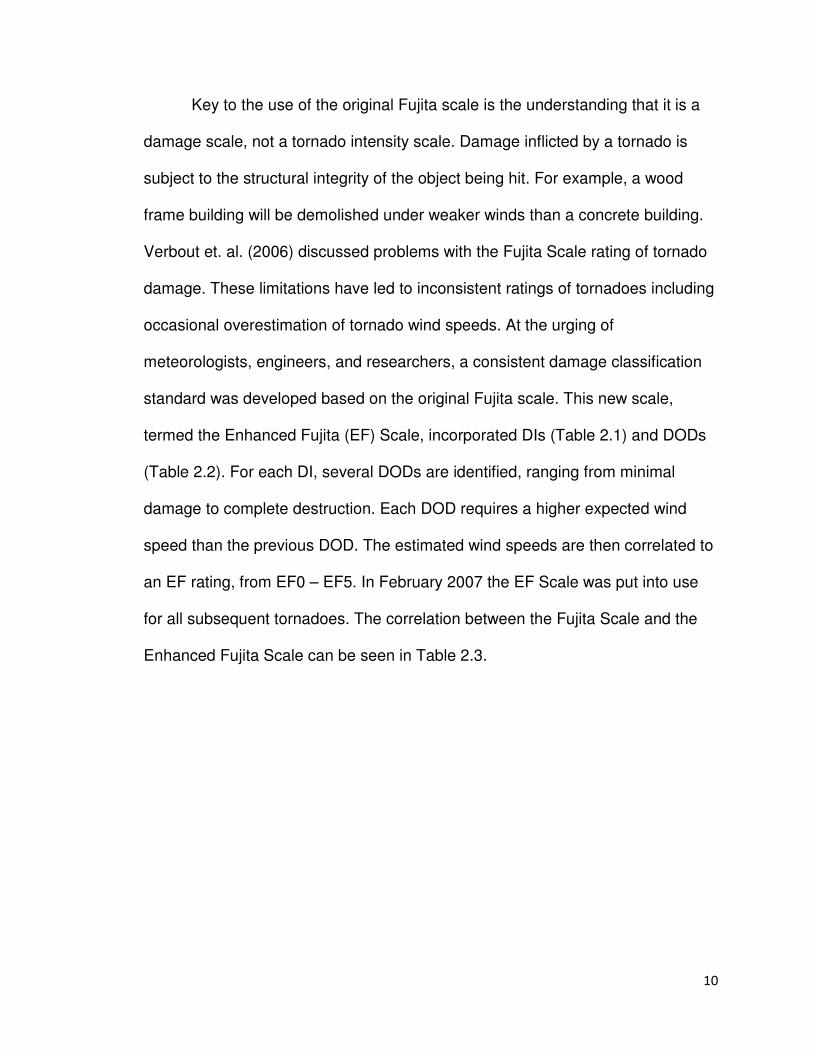
Key to the use of the original Fujita scale is the understanding that it is a
damage scale, not a tornado intensity scale. Damage inflicted by a tornado is
subject to the structural integrity of the object being hit. For example, a wood
frame building will be demolished under weaker winds than a concrete building.
Verbout et. al. (2006) discussed problems with the Fujita Scale rating of tornado
damage. These limitations have led to inconsistent ratings of tornadoes including
occasional overestimation of tornado wind speeds. At the urging of
meteorologists, engineers, and researchers, a consistent damage classification
standard was developed based on the original Fujita scale. This new scale,
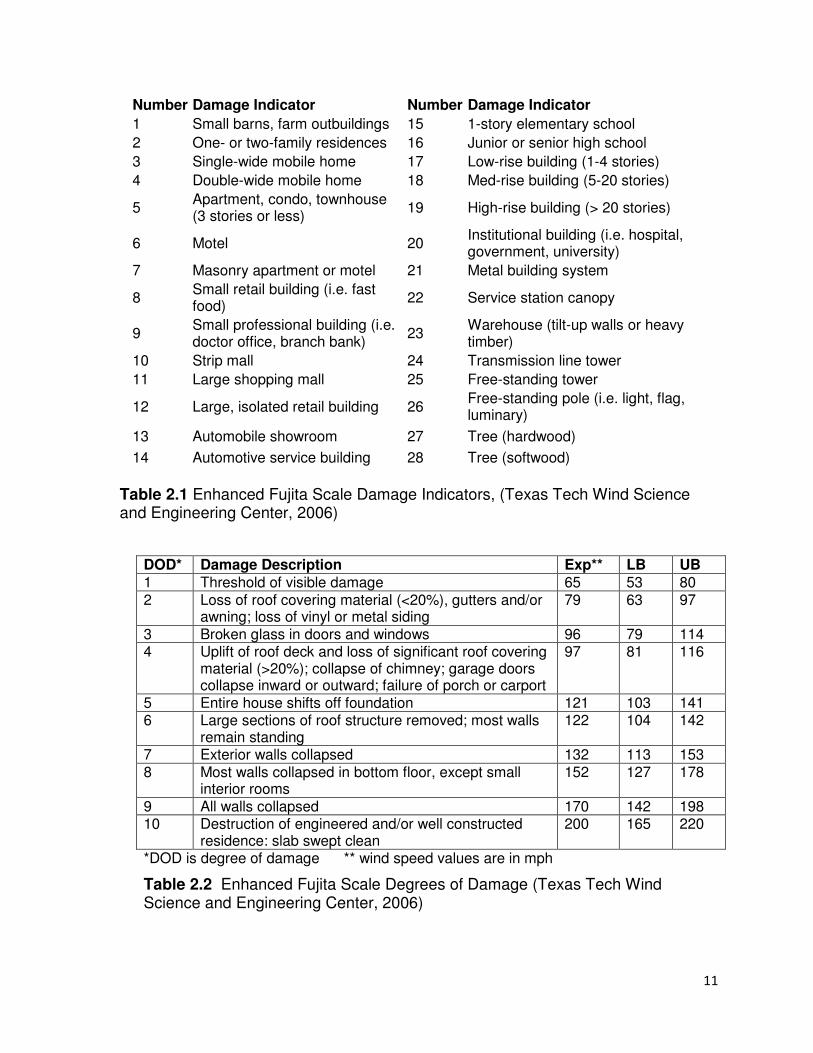
termed the Enhanced Fujita (EF) Scale, incorporated DIs (Table 2.1) and DODs
(Table 2.2). For each DI, several DODs are identified, ranging from minimal
damage to complete destruction. Each DOD requires a higher expected wind
speed than the previous DOD. The estimated wind speeds are then correlated to
an EF rating, from EF0 – EF5. In February 2007 the EF Scale was put into use
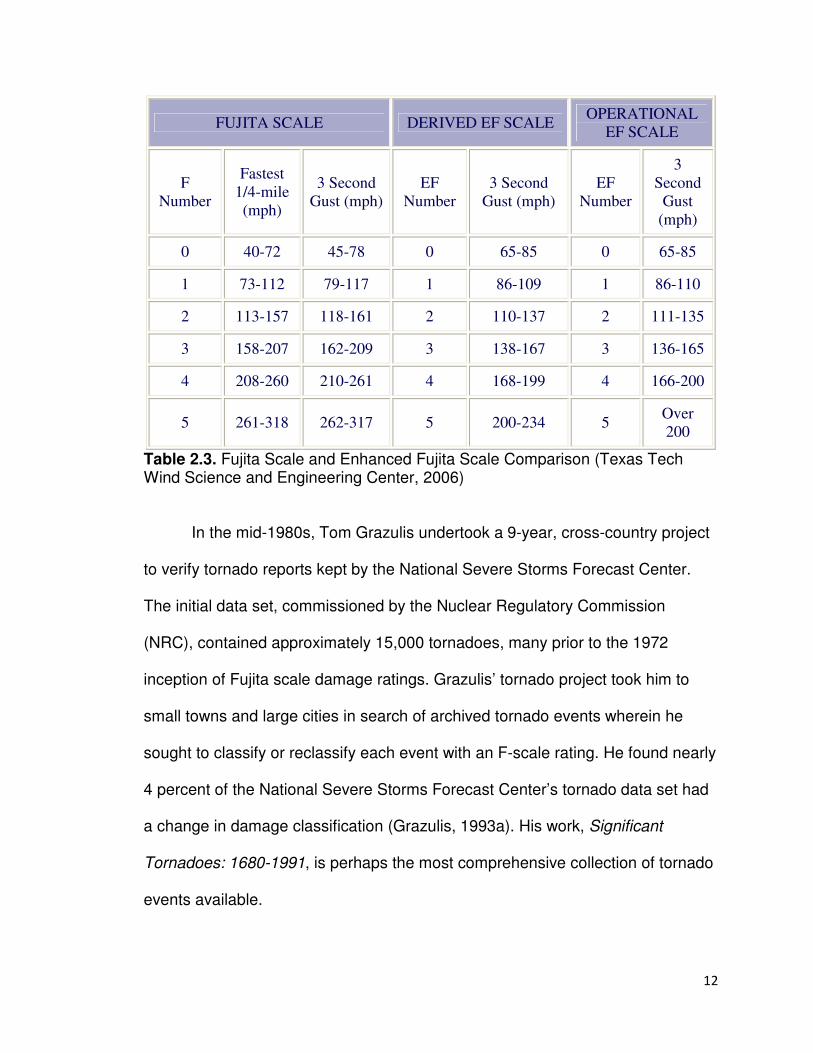
for all subsequent tornadoes. The correlation between the Fujita Scale and the
Enhanced Fujita Scale can be seen in Table 2.3.
11
Number Damage Indicator Number Damage Indicator
1 Small barns, farm outbuildings 15 1-story elementary school
2 One- or two-family residences 16 Junior or senior high school
3 Single-wide mobile home 17 Low-rise building (1-4 stories)
4 Double-wide mobile home 18 Med-rise building (5-20 stories)
5 Apartment, condo, townhouse (3 stories or less)
19 High-rise building (> 20 stories)
6 Motel 20 Institutional building (i.e. hospital, government, university)
7 Masonry apartment or motel 21 Metal building system
8 Small retail building (i.e. fast food)
22 Service station canopy
9 Small professional building (i.e. doctor office, branch bank)
23 Warehouse (tilt-up walls or heavy timber)
10 Strip mall 24 Transmission line tower
11 Large shopping mall 25 Free-standing tower
12 Large, isolated retail building 26 Free-standing pole (i.e. light, flag, luminary)
13 Automobile showroom 27 Tree (hardwood)
14 Automotive service building 28 Tree (softwood)
Table 2.1 Enhanced Fujita Scale Damage Indicators, (Texas Tech Wind Science and Engineering Center, 2006)
DOD* Damage Description Exp** LB UB
1 Threshold of visible damage 65 53 80 2 Loss of roof covering material (<20%), gutters and/or
awning; loss of vinyl or metal siding 79 63 97
3 Broken glass in doors and windows 96 79 114 4 Uplift of roof deck and loss of significant roof covering
material (>20%); collapse of chimney; garage doors collapse inward or outward; failure of porch or carport
97 81 116
5 Entire house shifts off foundation 121 103 141 6 Large sections of roof structure removed; most walls
remain standing 122 104 142
7 Exterior walls collapsed 132 113 153 8 Most walls collapsed in bottom floor, except small
interior rooms 152 127 178
9 All walls collapsed 170 142 198 10 Destruction of engineered and/or well constructed
residence: slab swept clean 200 165 220
*DOD is degree of damage ** wind speed values are in mph
Table 2.2 Enhanced Fujita Scale Degrees of Damage (Texas Tech Wind Science and Engineering Center, 2006)
12
FUJITA SCALE DERIVED EF SCALE OPERATIONAL
EF SCALE
F
Number
Fastest
1/4-mile
(mph)
3 Second
Gust (mph)
EF
Number
3 Second
Gust (mph)
EF
Number
3
Second
Gust
(mph)
0 40-72 45-78 0 65-85 0 65-85
1 73-112 79-117 1 86-109 1 86-110
2 113-157 118-161 2 110-137 2 111-135
3 158-207 162-209 3 138-167 3 136-165
4 208-260 210-261 4 168-199 4 166-200
5 261-318 262-317 5 200-234 5 Over
200
Table 2.3. Fujita Scale and Enhanced Fujita Scale Comparison (Texas Tech Wind Science and Engineering Center, 2006)
In the mid-1980s, Tom Grazulis undertook a 9-year, cross-country project
to verify tornado reports kept by the National Severe Storms Forecast Center.
The initial data set, commissioned by the Nuclear Regulatory Commission
(NRC), contained approximately 15,000 tornadoes, many prior to the 1972
inception of Fujita scale damage ratings. Grazulis’ tornado project took him to
small towns and large cities in search of archived tornado events wherein he
sought to classify or reclassify each event with an F-scale rating. He found nearly
4 percent of the National Severe Storms Forecast Center’s tornado data set had
a change in damage classification (Grazulis, 1993a). His work, Significant
Tornadoes: 1680-1991, is perhaps the most comprehensive collection of tornado
events available.
13
2.1.3. Benefits of a tornado climatology
As the number of years in a tornado data set increase, tornado-maxima
and minima areas may become more defined. Such maximas may aid in alerting
the public to the increased risk associated with the high frequency of events in
their area. A hazard analysis may allow insurers to use this climatology to set
rates based on increased risk or to offer reduced rates based on the mitigative
efforts of a community or homeowner. Researchers use such a climatology to do
in-depth studies as to why various areas have such maximas and minimas (land-
cover boundaries, greater concentration of a certain storm type, etc.). Similarly,
emergency management benefits from a hazard analysis of their area and could
better mitigate against (and otherwise plan for) the consequences of tornadoes.
The National Weather Service, Storm Prediction Center, universities, emergency
managers, and other researchers can use tornado climatologies to study radar
signatures, upper-air features, or local topographic features associated with
tornado days, locations, season, times, intensities, or parent thunderstorm type.
A tornado climatology using individual days tornadoes are likely to occur allows
users a quick glance at the probability of a tornado occurrence affecting their
community, but may not account for extreme events such as an tornado
outbreak, which are only counted as a single tornado day (or perhaps an event
spreading across two days).
2.2. Emergency Management
14
2.2.1. History of Emergency Management in the United States and Indiana
Emergency management is the managerial function charged with creating
the framework within which communities reduce vulnerability to hazards and
cope with disasters (see Appendix A for definitions). Its vision is to promote safer,
less vulnerable communities with the capacity to cope with hazards and
disasters. Emergency managers are asked to meet this vision by protecting
communities through coordination and integration of all activities necessary to
build, sustain, and improve the capability to mitigate against, prepare for, protect
against, respond to, and recover from threatened or actual natural disasters, acts
of terrorism, or other man-made disasters.
Emergency preparedness had its beginnings early in the turn of the last
century with the advent of World War I. In 1916, the United States established
the Council of National Defense, having the direct responsibility of “coordinating
resources and industries for national defense” and “stimulating civilian morale”
(United States Department of Homeland Security, 2006). In turn, the federal
government asked that state and local governments also establish their own
councils, but much of what was completed related very closely to supporting the
war effort, and not for the general protection of the civilian population.
By 1941 the United States, as well as much of the rest of the Northern
Hemisphere, was involved in another far-reaching conflict. In response to
requests made by states and local governments for the protection of their
citizens, President Roosevelt created the Office of Civilian Defense (OCD). The
15
OCD was charged with “civilian protection to include morale maintenance,
promotion of volunteer involvement, and nutrition and physical education” (United
States Department of Homeland Security, 2006). Much like the Council of
National Defense that came before the OCD, state and local governments were
again asked to organize their own councils. After World War II however,
emergency protection and preparedness efforts lost their appeal at the federal
level.
With the rise of the Soviet Union and their first successful test of a nuclear
weapon in 1949, the federal government moved toward a new effort in protecting
the civilian population as well as sustaining government functions. Spear-headed
by President Truman, Congress enacted the Federal Civil Defense Act of 1950,
which placed most of the civil defense burden on the States and created the
Federal Civil Defense Administration (FCDA). In 1951, Indiana passed the Civil
Defense Act, which created the Indiana Department of Civil Defense.
Although the perceived threat of a nuclear attack weighed heavily on the
minds of many leaders during the 1950s, it was not widely discussed until the
Kennedy administration. On July 20, 1961, President Kennedy issued Executive
Order 10952, that effectively created the Office of Emergency Planning (OEP)
and the Office of Civil Defense (OCD). The responsibilities of these offices were
quite different from what their names suggested; OEP was an executive level
organization reporting directly to the President, charged with non-military
emergency preparedness programs, whereas the OCD considered the defense
of the “homeland” and reported to the Secretary of Defense.
16
During the first few years of this decade, Americans were witness to a
building and funding boom for fall-out shelters all across the country. The
stockpiling of equipment, supplies, and food was also encouraged, which held to
President Kennedy’s belief that these civil defense measures acted as “insurance
we trust will never be needed – but insurance which we could never forgive
ourselves for foregoing in the event of catastrophe” (United States Department of
Homeland Security, 2006).
Under the leadership of President Johnson, however, civil defense efforts
that were specific to nuclear attack began to subside. One of the primary reasons
was the significant and catastrophic events that took place later in the 1960s.
These incidents included hurricanes Hilda and Betsy which devastated the
southeast, and an Alaskan earthquake that caused a damaging tidal wave in
California. There was also a lethal tornado outbreak that swept through the
Midwest, including Indiana, on Palm Sunday 1965. This one incident still remains
the most devastating tornado outbreak in Indiana history, taking the lives of 137
people.
As a consequence of these events, Indiana’s own Senator Birch Bayh
(father of former Governor Evan Bayh), sponsored a piece of legislation which
would grant emergency federal loan assistance to disaster victims. This bill
passed in 1966, allowing for additional funding for those citizens impacted by
disaster events. Over the next decade, nuclear attack shared the spotlight with,
and in some instances took a backseat to, the need to prepare for natural
disasters.

17
Interestingly, only under President Richard Nixon did the U.S. see the true
merging of the national priorities of nuclear attack and natural disasters,
replacing the OCD with the Defense Civil Preparedness Agency (DCPA). It was
the first time since civil defense was established that federal funds previously
allocated for the preparation of military attacks would be shared with state and
local governments for natural disaster preparedness.
Later in the Nixon Administration, the Disaster Relief Act of 1974 (known
today as the Stafford Act) was passed and with it came a stronger emphasis on
involving state and local governments in preparing communities for natural
disasters. It was with the passing of this law that the federal government provided
funds to state and local governments for emergency preparedness activities. To
this end, Indiana passed the Civil Defense and Disaster Law of 1975, [IC 10-4-1-
2], promoting the concepts that would later be called emergency management.
At the end of the decade in 1979, President Carter issued Executive Order
12148, establishing the Federal Emergency Management Agency (FEMA) as the
lead agency for coordinating federal disaster relief efforts. At that time, the
creation of FEMA represented the single largest consolidation of civil defense
efforts in U.S. history, bringing together a large number of federal agencies,
departments, and organizations.
Consequently, Indiana also made changes to the Civil Defense Disaster
Law, eliminating the Indiana Department of Civil Defense and replacing it with the
Indiana State Emergency Management Agency (SEMA). Like FEMA at the
federal level, SEMA was comprised of multiple organizations, which included the
18
State Fire Marshal’s Office, State EMS Commission, and the Public Safety
Training Institute.
Over the next two decades, from the administrations of Reagan to Clinton,
the nation bore the brunt of a significant number of natural disasters, to include
devastating hurricanes, tornadoes, flooding, and wildfires. Additionally,
technological events like those of the Three Mile Island nuclear power plant
incident continued to shape how emergency preparedness activities were
addressed.
A new threat however, came to the forefront toward the end of the 1990s.
This threat was the recurring incidents of both domestic and international
terrorism. It was during this period the phrase “weapons of mass destruction” or
more commonly, WMDs, came to the forefront of emergency preparedness.
Events such as the 1993 bombing of the World Trade Center, the 1994 bombing
of the Alfred P. Murrah Federal Building in Oklahoma City, and the bombing of
the Khobar Tower in Saudi Arabia, an American military facility, all played a
significant role in the next concept of emergency preparedness- homeland
security. This new focus on terrorism would be the beginning of what many still
see as negligence toward natural hazards and disasters.
The greatest catalyst for the expansion of homeland security came on the
morning of September 11, 2001 when nineteen Islamic terrorists hijacked
commercial airliners and flew them into the World Trade Center Tower and the
Pentagon. A total of 2,974 people died in the carefully planned attacks. The
majority of the fatalities were civilians, representing over 90 countries. As a
19
result, the United States, under the administration of President George W. Bush,
launched the War on Terrorism, invading the country of Afghanistan to depose
the Taliban, who harbored al-Qaeda, the masterminds of the 9/11 attacks.
The terrorist attacks on the United States in 2001 brought about yet
another shift in the focus of government response to disasters. In January 2003,
the U.S. Department of Homeland Security was created and was the largest
reorganization of a government agency since WWII, incorporating 26 federal
agencies and over 200,000 employees. Its primary purpose is to prevent and
protect the United States against acts of terrorism, absorbing such agencies as
the United State Immigration and Custom Enforcement, the United State Coast
Guard, United States Secret Service, and FEMA. Massive amounts of federal
funding were passed down to the states and counties to work on anti-terrorism
projects, including planning, training, and exercising. Local emergency
management agencies were overwhelmed with hundreds of thousands of dollars
in grants for each county and no additional staff to help manage these funds
(same at the state level, but with millions in funding). Prior to 2001, SEMA doled
out about $2M a year in funding to the counties. By the end of 2002, SEMA had
$60M in homeland security / anti-terrorism money to dole out, shifting its focus
from natural disasters to terrorism.
The 2001 terrorist attacks not only brought about changes at the federal
level, but the states were affected as well. Indiana, following the lead of the
federal government, established the Indiana Department of Homeland Security in
20
April 2005. This new department took over the responsibilities and functions of
SEMA, absorbing such groups as the Counter-Terrorism and Security Council
(C-TASC), the Office of the State Fire Marshal, the State Building Commission,
State EMS Commission, and creating the Indiana Intelligence Fusion Center
(IIFC). The new Indiana Emergency Management and Disaster Law, IC 10-14-3,
provided language that supported both responsibilities and obligations to
homeland security and emergency management. As a result, many county and
municipal emergency management agencies, took on the additional title of
“homeland security”.
As homeland security and emergency management lines begin to cross
and areas of public safety responsibilities are shared, the real challenge will be to
continue to prepare for, respond to, and recovery from emergencies and
disasters in a timely and effective manner.
2.2.3. Phases of Emergency Management- Mitigation, Preparedness, Response, and Recovery
According to McLoughlin (1985), an effective emergency management
program “must identify its potential hazards and determine the probable impact
that each can have on people and property” (p. 168). The importance of a hazard
analysis is underscored by Blanchard et al (2007) in Principles of Emergency
Management. Throughout this document the vitality of a hazard analysis is
discussed- “Emergency management is the managerial function charged with
creating the framework within which communities reduce vulnerability to hazards
21
and cope with disasters” (p. 4), and promotes safer communities that can cope
with hazards and disasters. The basis of the emergency management position is
to account for all possible hazards and determine risks and vulnerabilities, thus
building safer, mort resilient communities. This includes mitigative efforts aimed
at reducing the potential for future disasters, preparing for those disasters which
cannot be mitigated against, responding to disaster situations in a timely and
cost-effective manner, and providing recovery coordination after a disaster.
Finally “emergency managers value a science and knowledge-based
approach…” (p. 4).
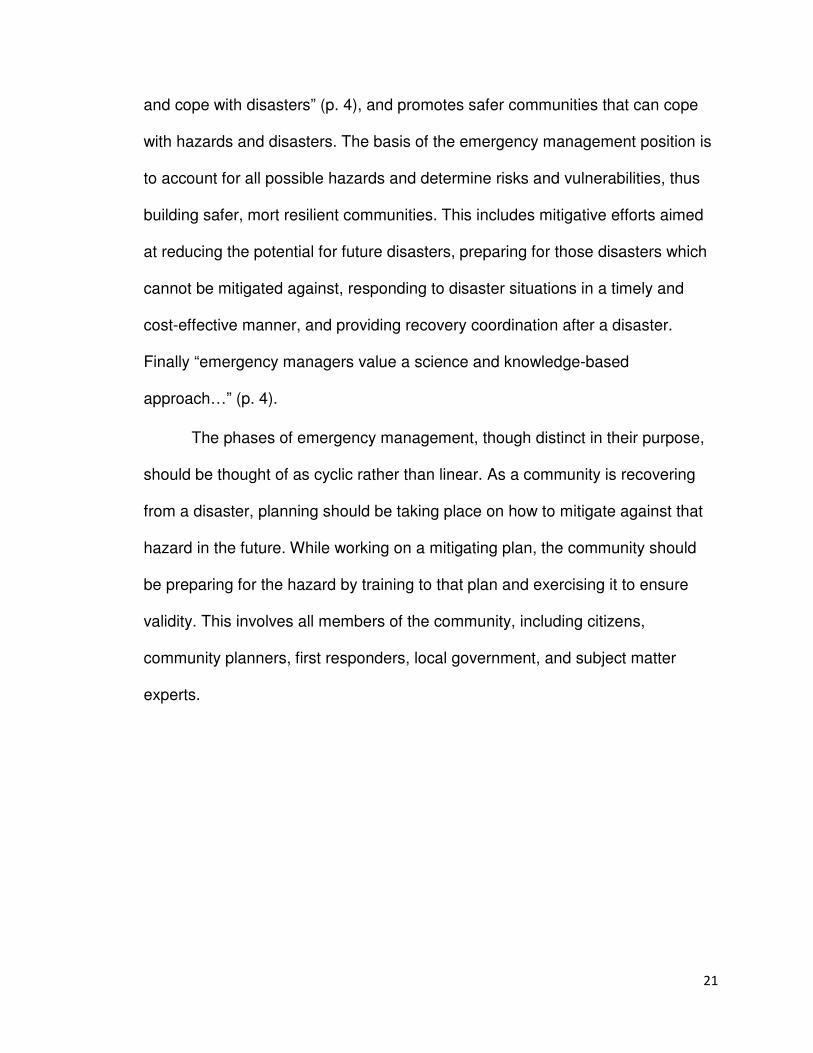
The phases of emergency management, though distinct in their purpose,
should be thought of as cyclic rather than linear. As a community is recovering
from a disaster, planning should be taking place on how to mitigate against that
hazard in the future. While working on a mitigating plan, the community should
be preparing for the hazard by training to that plan and exercising it to ensure
validity. This involves all members of the community, including citizens,
community planners, first responders, local government, and subject matter
experts.
22
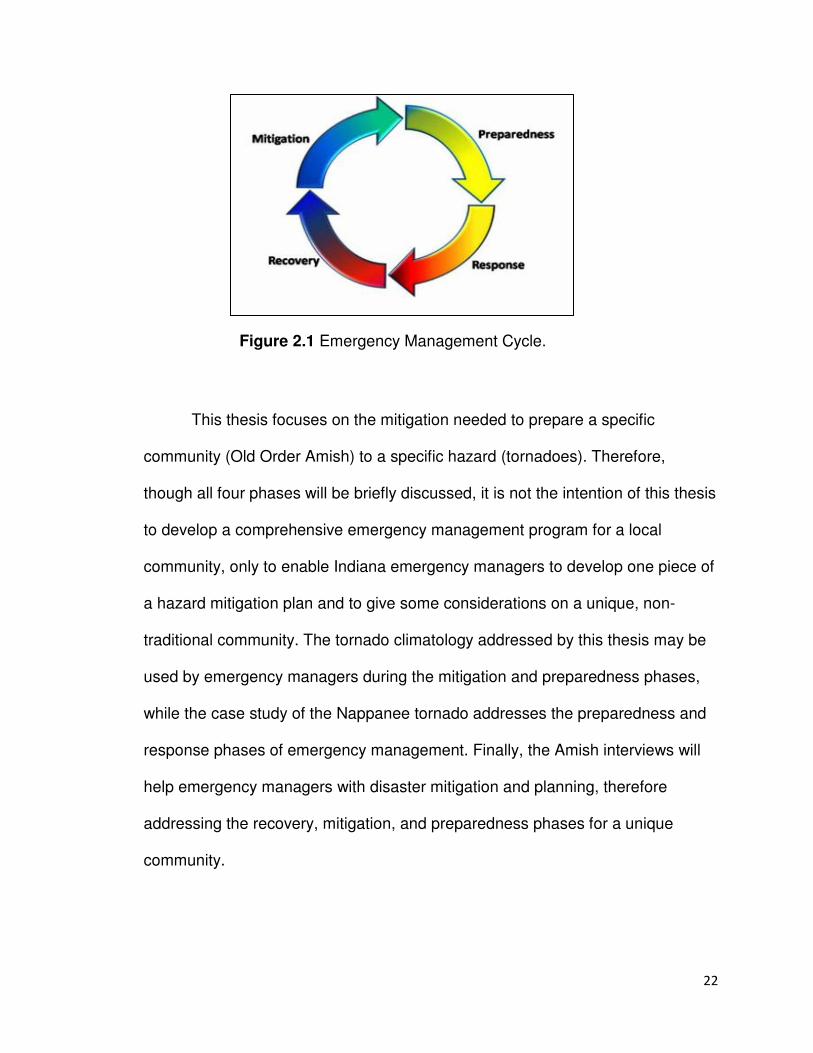
Figure 2.1 Emergency Management Cycle.
This thesis focuses on the mitigation needed to prepare a specific
community (Old Order Amish) to a specific hazard (tornadoes). Therefore,
though all four phases will be briefly discussed, it is not the intention of this thesis
to develop a comprehensive emergency management program for a local
community, only to enable Indiana emergency managers to develop one piece of
a hazard mitigation plan and to give some considerations on a unique, non-
traditional community. The tornado climatology addressed by this thesis may be
used by emergency managers during the mitigation and preparedness phases,
while the case study of the Nappanee tornado addresses the preparedness and
response phases of emergency management. Finally, the Amish interviews will
help emergency managers with disaster mitigation and planning, therefore
addressing the recovery, mitigation, and preparedness phases for a unique
community.
23
2.2.2a. Mitigation
An effective mitigation program involves preparing a community for
hazardous events. In order to do this, a hazard analysis must be conducted. This
involves identifying potential threats to a community, whether natural or human-
caused. Through identification of potential events that could affect a community,
efforts can be directed towards mitigation activities and developing effective
incident response plans.
According to the Environmental Protection Agency (EPA), a hazards
analysis is a three step process: hazard identification, vulnerability analysis, and
risk analysis (Blanchard, p. 534). These steps involve conducting an extensive
review of the hazardous events that have historically and could potentially affect
a community, analyzing the vulnerability of the community to those hazardous
based on a variety of factors from land use to population statistics to
infrastructure, and determining the risk of that community to the given hazards.
This thesis undertook the first two steps in the hazard analysis for Indiana. Local
communities will need to pursue a risk analysis, using the tornado hazard
analysis, to complete a comprehensive mitigation plan for tornadoes.
In terms of a hazard analysis, determinations of hazard probability,
intensity, and location can be made on the basis of historical data collection,
scientific research, or community perception of the risk of an event. FEMA
(Blanchard, 2008, p. 535) concludes,
When the data for each hazard are combined, a community can determine its relative vulnerability to each hazard. This will allow assignment of priorities for emergency management needs.
24
Conducting a hazard analysis should be part of an on-going hazard
mitigation plan (HMP) that focuses on taking proactive steps in advance of a
hazardous event to decrease or eliminate its impact on the community. The HMP
involves the coordination of activities aimed at reducing the injuries, deaths,
property damage and loss, environmental hardships, and economic losses due to
natural or human-caused events and should focus on the long-term benefits to
the community of reducing such hazards (Blanchard, 2008).
2.2.2b. Preparedness
Because not all hazards can be mitigated against/ prevented, emergency
managers must conduct preparedness activities to get their communities ready
for such events. This involves planning for the event, training to the plan, and
exercising the plan to ensure it works as anticipated. Preparedness can be
thought of as a state of readiness for hazardous events. Barring any chance of
mitigation, the best way to protect against the effects of hazards is to be
prepared for them. Preparedness and mitigation are key to reducing the impacts
of disasters (Blanchard, 2008).
2.2.2c. Response
Perhaps the most visible and well-known phase of emergency
management, the response phase is where the mitigation and preparedness
phases are tested in a real-life event. This phase involves the use of resources,
25
both personnel and equipment, to save lives, protect property and the
environment, and meet the basic survival needs of a community. The response
phase may include the use of emergency declarations, ordinances, or other
authorities at a local, state, and/ or federal level to enable a community to
support short- and long-term actions. Such actions may include enacting a
curfew, providing for emergency equipment procurement, providing emergency
food, water, shelter, and medical attention, performing search and
rescue/recovery operations, and/or declaring a local disaster.
The declaration of a local disaster is critical to having any hope of
receiving state or federal aid, including resources or monetary assistance for
recovery. Without a local disaster declaration, outside assistance may not be
provided. In Indiana, declaring a disaster effectively enacts the local disaster plan
as a form of law which must be followed not only by the citizens it aims to protect,
but by the supporting agencies included in the disaster response plan.
2.2.2d. Recovery
After initial actions are taken to assist the community with life-, property-,
and environment-saving, a community begins to transition to a state of recovery.
This is the phase where the community begins to return to a pre-disaster state,
including restoration of utilities, rebuilding critical infrastructure such as
roadways, bridges, schools, and government facilities, and individual recovery.
During the recover phase disaster expenses may be recouped and emergency
personnel transition from short-term (hours and days) response/ operations to

26
long-term (weeks, months, and perhaps even years) recovery. It is also within
this phase that emergency management (in the community-wide sense) must
look at ways to prevent a future occurrence of the hazard through mitigative
efforts.
2.3. Social Vulnerability and Special Needs Populations
2.3.1. Definition of Socially Vulnerable and Special Needs Populations
One of the most widely accepted versions of social vulnerability defines it
as traits of a person or group and their lifestyle or living situation that influence
their capacity to anticipate, cope with, resist and recover from the impact of a
natural hazard (Wisner et al, 2003). Cutter (2007) also includes in this definition
qualifications such as special needs populations (children, elderly, poor health,
mental/physical handicaps, transients), gender (women), race and ethnicity (non-
white, non-Anglo), socioeconomic status (poor), head of household type (single
parents, female head of household), family and social networks, and immigration
status which can determine how much of an effect a disaster has on a person. In
addition to the immediate impact a disaster may have on an individual or
household, vulnerability can also apply to a person’s ability to recover from a
disaster or from future disasters. According to Wisner et al (2003),
Vulnerable groups are also those that also find it hardest to reconstruct their livelihoods following disaster, and this in turn makes them more vulnerable to the effects of subsequent hazard events.
27
This includes infants/children; frail/elderly; economically disadvantaged;
intellectually, psychologically, and physically disabled; single-parent families; new
immigrant and visitors; socially/physically isolated; seriously ill; poorly sheltered
social groups (p. 337). A comparison of Indiana counties (Figure 2.2) shows
Elkhart County to be in the middle group of vulnerability. In a comparison with the
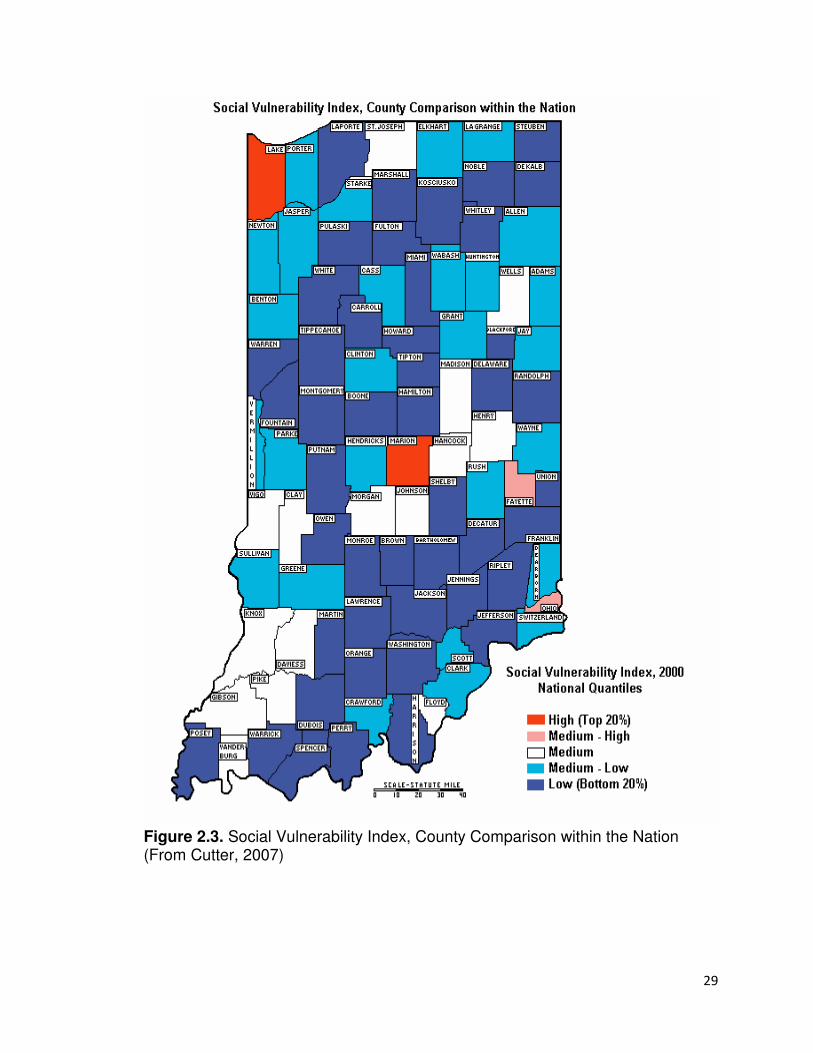
nation (Figure 2.3), Elkhart County rates in the middle – low classification.
Special needs populations are described by the United States Department
of Homeland Security’s National Response Framework (NRF) as populations
whose members may have additional needs before, during, and after an incident
in functional areas, including but not limited to maintaining independence,
communication, transportation, supervision, and medical care (p. 4).
In Elkhart County, these definitions would include the Amish who may
have difficulty with communication, transportation, and medical care. In some
areas they may also be physically or socially isolated, have large numbers of
children, or could be vulnerable to illness or injury with no rapid access to
medical care. When emergency management considers special needs or socially
vulnerable populations in disaster planning, the community is able to recover
from disasters more effectively.

28
Figure 2.2. Social Vulnerability Index, County Comparison within Indiana (From Cutter, 2007)
29
Figure 2.3. Social Vulnerability Index, County Comparison within the Nation (From Cutter, 2007)

30
2.4. Amish History and Statistics
2.4.1. Amish Religious Beliefs
In the Amish community, church is a crucial part of everyday life. The
Ordnung, a prescribed set of guidelines for living, dictates everything from dress
code to use of technology and requires letting go of one’s own identity to create a
stronger community identity. This includes a submission to the authority of the
church and its bishops. The Amish are perplexed when outsiders inquire whether
one can be a non-church going Amish, as their religion dictates their everyday
life. Church and the Amish way of life cannot be separated.
Membership in the Amish church requires submission to an authority
beyond oneself. Their belief in gelassenheit, submission to God, to others, and to
the church, allows the Amish to lose themselves and find a stronger identity in
their collective community of faith (Meyers and Nolt, 2005). Gelassenheit
involves giving up one’s own identity to strengthen that of the group. The Amish
believe the identity of the community is greater than the identity of the individual.
To stand out in the Amish community is frowned upon. Gelassenheit calls for a
humble demeanor, in dress, speech, and all acts of daily life. Amish are soft-
spoken, defer to the opinions of others, and are hesitant to identify themselves
publicly, including through signatures and photographs. Even church bishops beg
forgiveness for incorrectness in sermons and ask others to correct what he has
said.
31
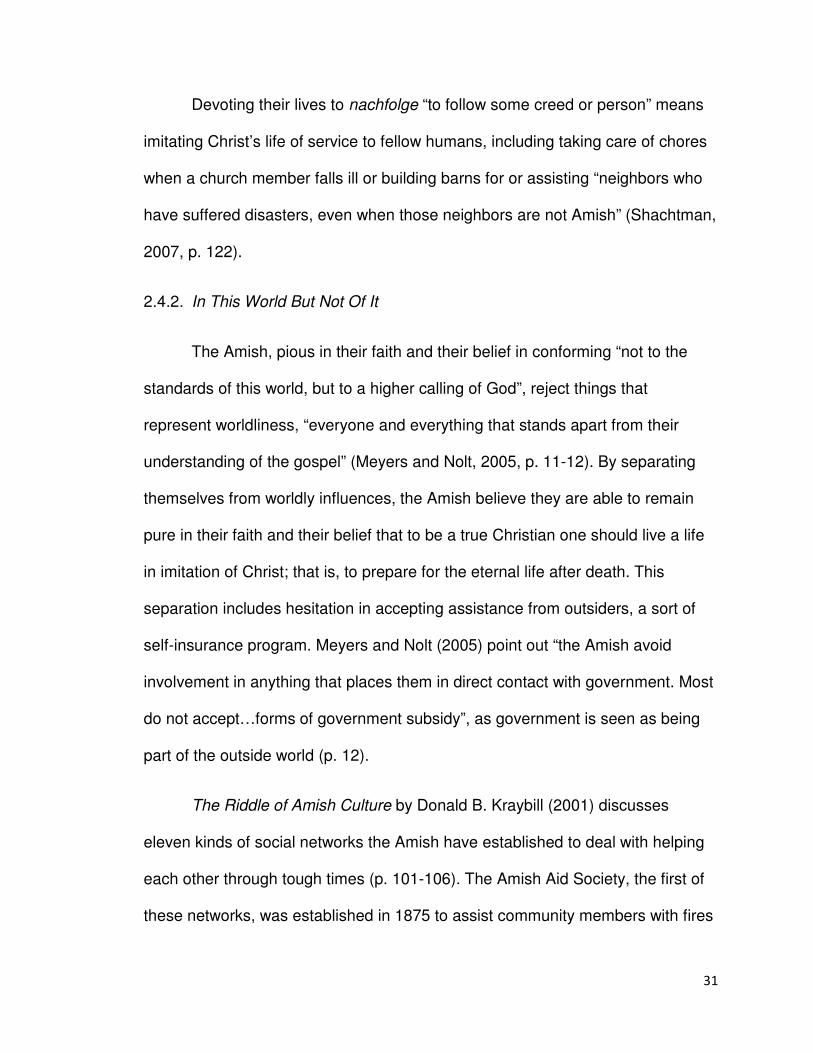
Devoting their lives to nachfolge “to follow some creed or person” means
imitating Christ’s life of service to fellow humans, including taking care of chores
when a church member falls ill or building barns for or assisting “neighbors who
have suffered disasters, even when those neighbors are not Amish” (Shachtman,
2007, p. 122).
2.4.2. In This World But Not Of It
The Amish, pious in their faith and their belief in conforming “not to the
standards of this world, but to a higher calling of God”, reject things that
represent worldliness, “everyone and everything that stands apart from their
understanding of the gospel” (Meyers and Nolt, 2005, p. 11-12). By separating
themselves from worldly influences, the Amish believe they are able to remain
pure in their faith and their belief that to be a true Christian one should live a life
in imitation of Christ; that is, to prepare for the eternal life after death. This
separation includes hesitation in accepting assistance from outsiders, a sort of
self-insurance program. Meyers and Nolt (2005) point out “the Amish avoid
involvement in anything that places them in direct contact with government. Most
do not accept…forms of government subsidy”, as government is seen as being
part of the outside world (p. 12).
The Riddle of Amish Culture by Donald B. Kraybill (2001) discusses
eleven kinds of social networks the Amish have established to deal with helping
each other through tough times (p. 101-106). The Amish Aid Society, the first of
these networks, was established in 1875 to assist community members with fires

32
and storm damage. Disaster Aid, founded in 1969 in response to Hurricane
Camille, has since become a subcommittee of the Mennonite Disaster Service.
Mennonite Disaster Service, an Anabaptist organization focused on helping
victims of tornadoes, hurricanes, fires, and other disasters through mutual aid,
was formed in 1950 in response to the desire of Amish, Mennonites, and
Brethrens, all Anabaptist groups, to help their communities in everyday service.
The Amish differ from non-Amish (what they call “English”) in their
attentiveness to their religion. The degree to which they practice their religion
sets the Amish apart from mainstream Christians. They believe Christians should
conform to biblical teachings and God’s higher calling, rebuffing the standards of
the world. They follow the Bible through their every move, denying worldy
pleasures to live simply so that they may revere God through their lifestyle. To
the Amish, “‘worldliness’ is a sign that the boundary is breaking down; giving in to
the habits of the world is, in a real sense, giving in to evil. Many elements of
Amish culture…help make the boundaries between the Amish and non-Amish
worlds unmistakably clear” (Meyers and Nolt, 2005, p. 10). Take, for example,
David Wagler’s thoughts on television. Wagler, a columnist for the Amish weekly
The Budget, says,
‘When the world is invited into our homes, it accepts the invitation and proceeds to take over… This monster will demand complete submission to its own set of values… We admit it would be convenient to have television sets in our homes to get the news, the markets, and the weather report. But we don’t think we can afford it. The price is too high…We don’t think it is fair to ourselves or to our children to be constantly exposed to the example and teachings of those who do not have the knowledge of the

33
true God. We will not invite the false gods that personify the goals of this world to enter our homes’ (Shachtman, 2007, p. 80).
In An Amish Patchwork, Meyers and Nolt (2005) describe the idea of
mutual aid in the Amish community (p. 14):
The other side of church discipline is accountability and commitment. Members know and support one another and live by an ethic of mutual aid. The church is not an abstraction but a living, breathing social body. It is a group of people that an Old Order individual knows he or she can depend on in a time of need and to which each person expects to contribute some form of assistance. If a fire destroys a house or barn, the grieving family can count on an outpouring of financial and emotional support from the community while recovering from the loss and rebuilding the structure. The vast majority of the Amish do not purchase commercial health insurance because they believe that the sick should depend on the church rather than on a worldly institution in times of need.
2.4.3. Amish in Indiana In their book An Amish Patchwork (2005) noted scholars Meyers and Nolt
conducted extensive research on Indiana’s Amish communities. Movement is a
way of life for Amish and Indiana’s 19 settlements come from a variety of
backgrounds. Several distinct waves of Amish came to Indiana between 1730
and the mid nineteenth century. The first group arrived from Germany between
1730 and 1770, calling Pennsylvania home until 1840 when a small group
ventured west into Indiana, eventually settling along the St. Joseph River in
northern Indiana. This group is now known as the Elkhart-LaGrange settlement
and is the largest Amish settlement in Indiana. The second wave of Amish from
Europe headed straight for the Midwest in the period from 1815 to 1860. This
group settled in Allen, Adams, and Howard Counties (Figure 2.4). Many of the
immigrants from this era were of Swiss heritage and though they shared the
34
same faith as their brothers and sisters in the Elkhart-LaGrange settlement, they
bore closer ties to their European heritage than did the settlement that had been
living on North American soil for more than a century. Lancaster, PA has lent to
the patchwork of Amish communities in the southern and eastern parts of
Indiana. Settlements in Daviess and Wayne Counties descended from there in
the early 1990s.
Since the Amish are divided into church districts rather than towns
dictated by political boundaries, the Nappanee Old Order Amish community is
spread across Marshall, Kosciusko, St. Joseph, and Elkhart Counties, including
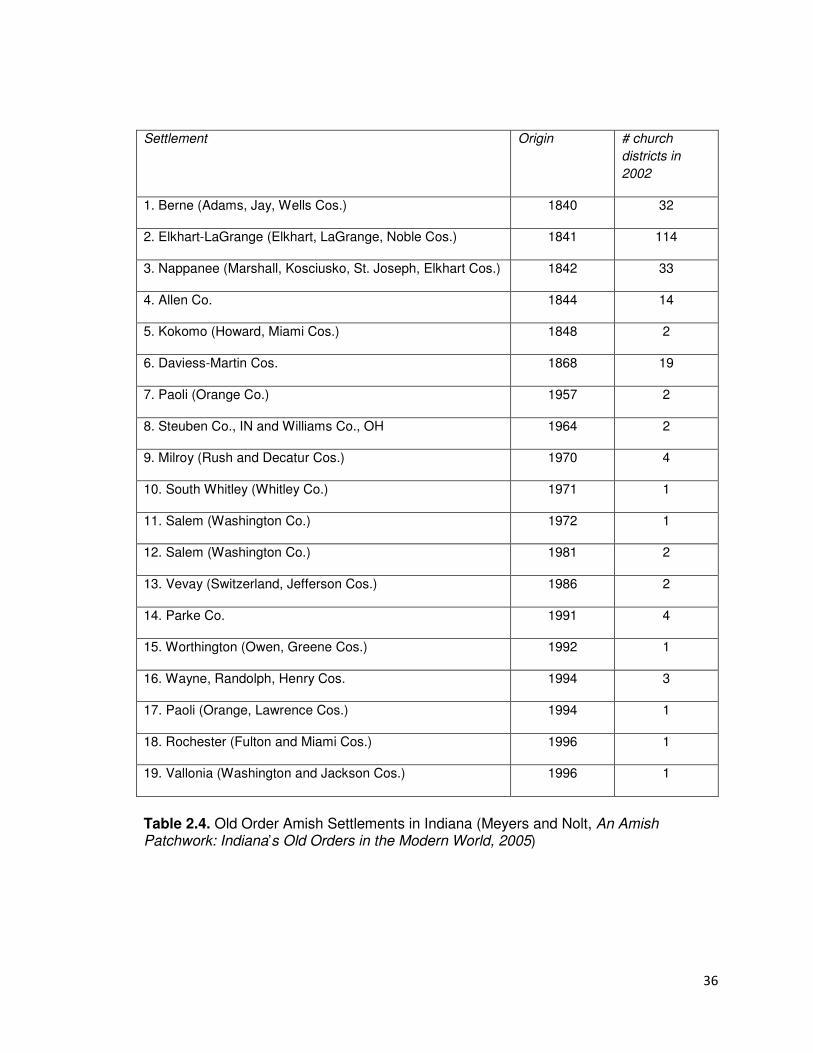
the town of Nappanee in southwest Elkhart County (Table 2.4). The community is
made up of 33 church districts and dates back to 1842. Of the six oldest Amish
settlements in Indiana, the average church district holds 40 households,
however, the Nappanee district has 27 households in its district. Once a church
district gets too large, a new church district is formed (Meyers and Nolt, 2005).

35
Figure 2.4. Old Order Amish Settlements by Linda Eberly. (Meyers and Nolt, An
Amish Patchwork: Indiana’s Old Orders in the Modern World, 2005)
36
Settlement Origin # church
districts in
2002
1. Berne (Adams, Jay, Wells Cos.) 1840 32
2. Elkhart-LaGrange (Elkhart, LaGrange, Noble Cos.) 1841 114
3. Nappanee (Marshall, Kosciusko, St. Joseph, Elkhart Cos.) 1842 33
4. Allen Co. 1844 14
5. Kokomo (Howard, Miami Cos.) 1848 2
6. Daviess-Martin Cos. 1868 19
7. Paoli (Orange Co.) 1957 2
8. Steuben Co., IN and Williams Co., OH 1964 2
9. Milroy (Rush and Decatur Cos.) 1970 4
10. South Whitley (Whitley Co.) 1971 1
11. Salem (Washington Co.) 1972 1
12. Salem (Washington Co.) 1981 2
13. Vevay (Switzerland, Jefferson Cos.) 1986 2
14. Parke Co. 1991 4
15. Worthington (Owen, Greene Cos.) 1992 1
16. Wayne, Randolph, Henry Cos. 1994 3
17. Paoli (Orange, Lawrence Cos.) 1994 1
18. Rochester (Fulton and Miami Cos.) 1996 1
19. Vallonia (Washington and Jackson Cos.) 1996 1
Table 2.4. Old Order Amish Settlements in Indiana (Meyers and Nolt, An Amish Patchwork: Indiana’s Old Orders in the Modern World, 2005)

37
Indiana has two distinct ethnic groups of Amish, Pennsylvania Dutch and
Swiss Amish (Meyers and Nolt, 2005). A large group of Amish arrived in the
United States in the 1700s and became known as the Pennsylvania German
(known today as the Pennsylvania Dutch). These immigrants later made their way
to Indiana after 1840 and settled first in the northern parts of the state, including
Nappanee. Those Amish who arrived in Indiana at the end of the 20th century also
share Pennsylvania roots with the early arrivals. The Swiss Amish descend from
Switzerland and made their way into the United States from the 1830s-1850s.
They later settled in Allen and Adams Counties, Indiana.
Some Amish districts are more strict than others, preferring the tradition of
the old ways to untested modern ways. “Convention is valued more than
innovation because it has endured through time and is not as susceptible to the
whims of popular culture” (Meyers and Nolt, 2005, p. 15). Change is possible
within the Amish community, but is a slow process and must be shown to be of
value to the community before it will be instituted.
While the Amish may differ from non-Amish in numerous ways,
emergency management must work with a variety of diverse populations.
Working with the Amish involves working directly with the bishops. The bishops,
believed to be chosen by God, are the voice of the church and the community
and guide their congregation in decision making (Meyers and Nolt, 2005).
Instituting change in the Amish community means working directly with local
bishops.

38
An examination of tornado climatologies created by previous researchers
led to the creation of an Indiana-specific tornado climatology based on unique
tornado days. This climatology can then be used by local emergency managers
to help prepare their communities for a tornado event. In preparing their
communities, planning must be done to incorporate all sectors, including special
needs or socially vulnerable populations. This particular thesis focuses on the
Amish as a special needs population and will suggest ways to incorporate this
community into all phase of emergencies and disasters.
CHAPTER 3
DATA AND METHODOLOGY
CREATING A TORNADO HAZARD ANALYSIS
3.1. Study Region Rationale
The unique population of Amish in Elkhart County, coupled with the
tornado event which struck their community, provided a rare opportunity to
examine the effects of a tornado on this unique community and learn how
emergency management can work with the Amish in disaster mitigation,
preparedness, response, and recovery.
Indiana Homeland Security District 2 encompasses St. Joseph, Elkhart,
Starke, Marshall, Kosciusko, Pulaski, and Fulton counties. While the latter five
counties are mostly rural with relatively small populations and large agricultural
bases, St. Joseph and Elkhart counties include the cities of South Bend, home to
the University of Notre Dame and a large student population, and Elkhart, a
diverse community with a relatively large Amish population, respectively.
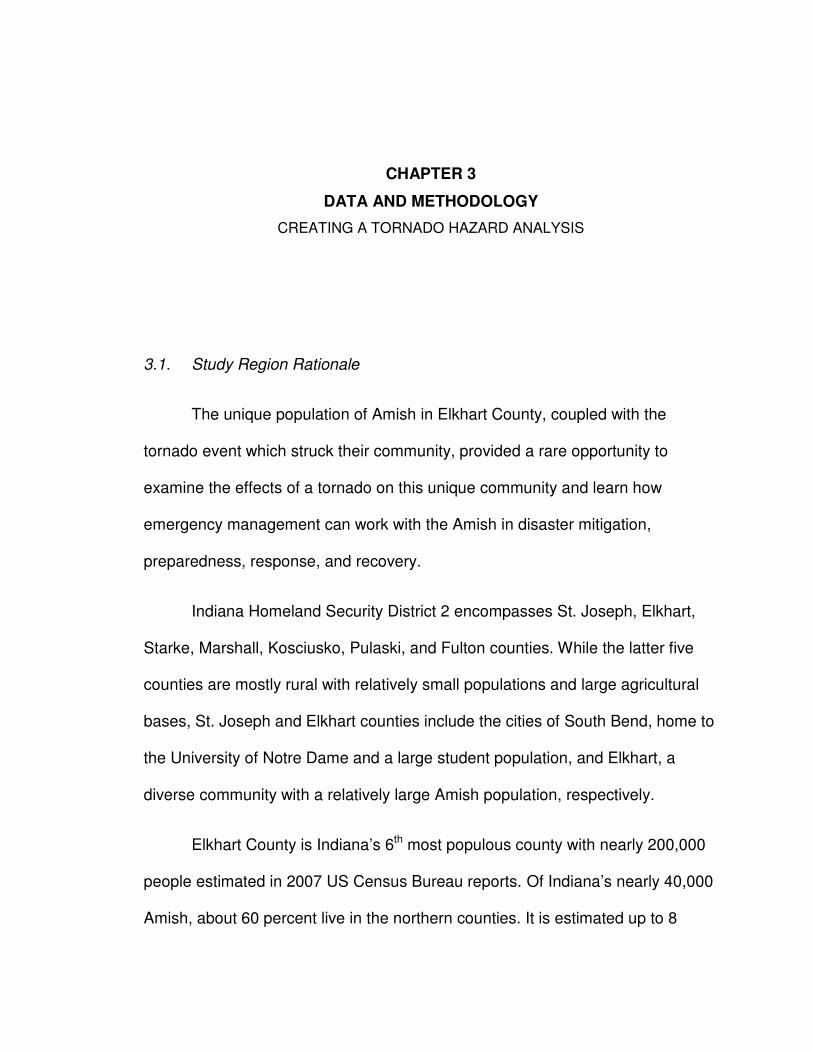
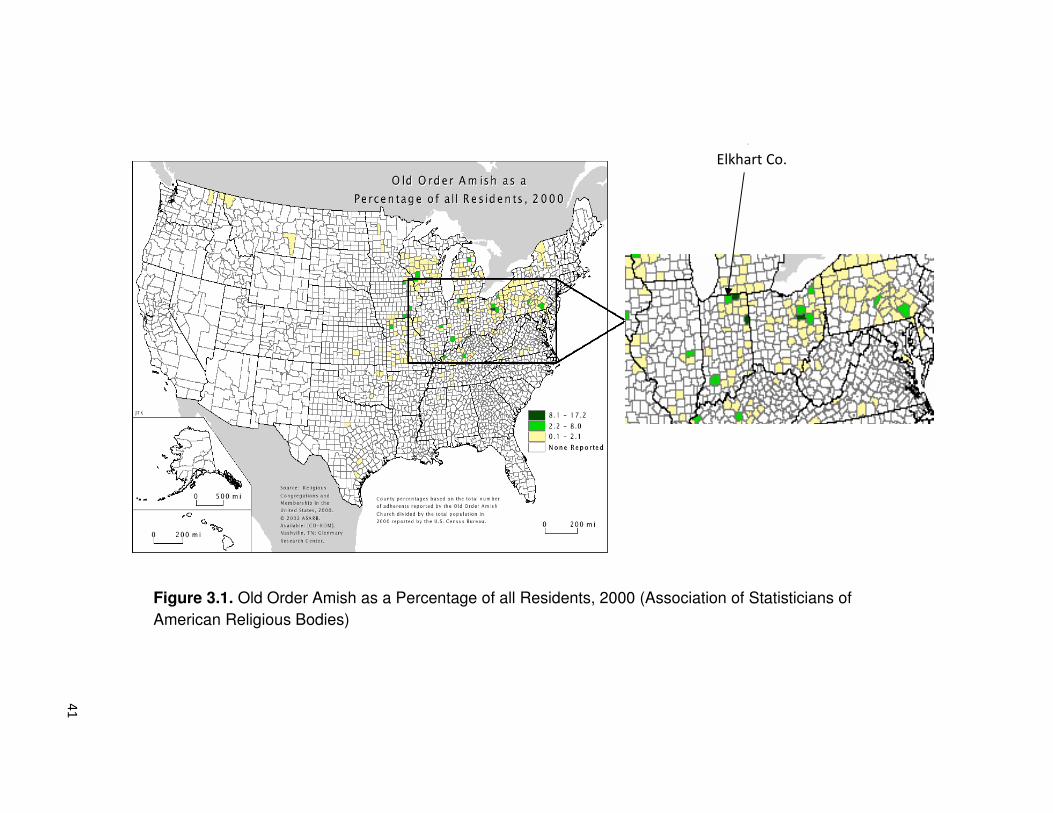
Elkhart County is Indiana’s 6th most populous county with nearly 200,000
people estimated in 2007 US Census Bureau reports. Of Indiana’s nearly 40,000
Amish, about 60 percent live in the northern counties. It is estimated up to 8
40
percent of the population of Elkhart County is Amish (Figure 3.1). This
percentage is among the highest percentage in the country. The Nappanee
Amish number approximately 4,750 and are spread across Kosciusko, Marshall,
Elkhart, and St. Joseph Counties (Nolt, pers. comm.). Since Amish live in church
districts with no political boundary such as county lines, church districts whose
members live in two or more counties are assigned to a county where the
majority of their members live. Very few of the Nappanee Amish live in the
politically defined town boundaries.
41
Elkhart Co.
Figure 3.1. Old Order Amish as a Percentage of all Residents, 2000 (Association of Statisticians of
American Religious Bodies)
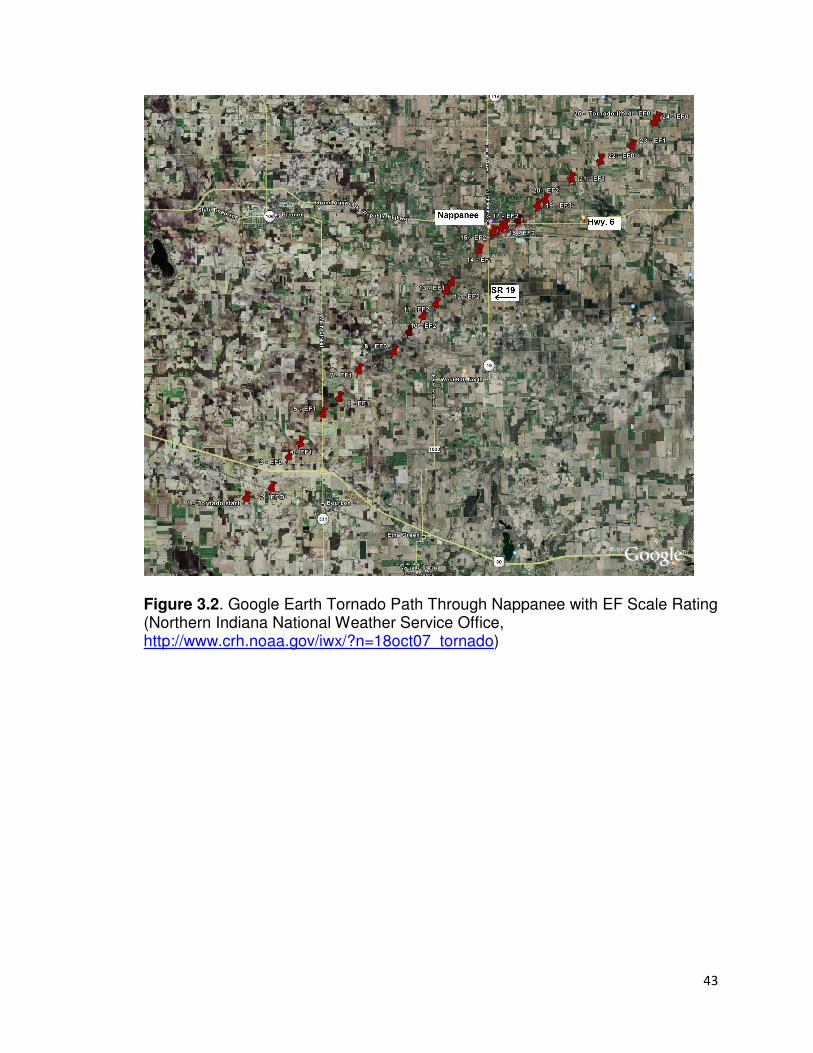
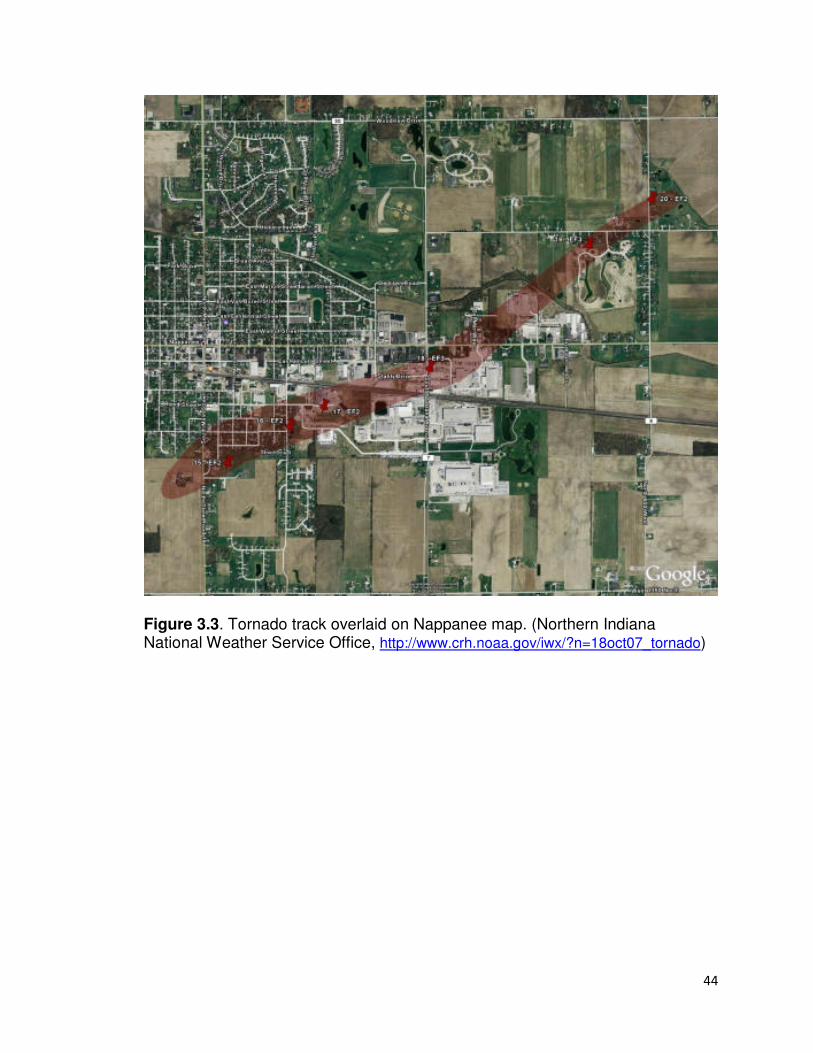
3.2 Summary of Tornado Event
On 18 October 2007, a 20 mile long, ¼ mile wide, tornado struck the small
Amish community of Nappanee, Indiana, damaging more than 450 buildings. The
tornado struck at 10:05pm, when most people were settling down for bed.
Although the tornado path covered 20 miles and was, at its widest, ½ mile
(Figure 3.2 and 3.3), no deaths or serious injuries occurred (National Weather
Service, http://www.crh.noaa.gov/iwx/?n=18oct07_tornado), A study of US
tornadoes 1950-1994 shows 74 percent of all U.S. tornadoes are “weak” with
winds less than 110mph (Grazulis, 2008a) and life spans of less than 10 minutes
(Storm Prediction Center, http://www.spc.noaa.gov/faq/tornado/), the Nappanee
tornado was among the 25 percent of all U.S. tornadoes considered “strong”,
with winds estimated 110-205 mph (Grazulis, 2008a). The Nappanee tornado,
rated an EF-3 on the Enhanced Fujita (EF) Scale, had winds estimated at 138-
165 mph.
The National Weather Service had been monitoring the weather situation
closely for several days and had made numerous public notices regarding the
potential for severe weather, including the possibility of tornadoes. However, the
Amish of northern Indiana reject traditional means communication, making it
difficult for Emergency Management and National Weather Service personnel to
get the severe weather message to their community.
43
Figure 3.2. Google Earth Tornado Path Through Nappanee with EF Scale Rating (Northern Indiana National Weather Service Office, http://www.crh.noaa.gov/iwx/?n=18oct07_tornado)
44
Figure 3.3. Tornado track overlaid on Nappanee map. (Northern Indiana National Weather Service Office, http://www.crh.noaa.gov/iwx/?n=18oct07_tornado)
45
3.3. Methodology Elkhart County has a history of tornadoes, including several experienced
during the Palm Sunday outbreak of 1965 (National Weather Service). Creation
of a graphic was essential to providing emergency managers a quick glance at a
county’s tornado history. This thesis created a tornado vulnerability map for
Indiana using unique tornado days as the indicator of vulnerability. Research has
indicated a strong bias when taking into account individual tornado reports.
According to McCarthy and Schaefer, “Dr. Stanley Changnon has long
advocated the use of “event days” because of its mitigation of the impact of
reporting biases (Changnon and Schnickedanz, 1969). When tornado days are
plotted against year, the rapid inflation that is apparent in the numbers of
reported tornadoes is no longer present” (McCarthy and Schaefer, 2004).
For the purpose of this thesis, unique tornado days were characterized as
having one or more tornado events within Indiana in a twenty-four hour period.
For example, tornadoes occurring in Noble, LaGrange, and Kosciusko counties
at 1200, 1245, and 1726 on May 23rd, 1978 were classified as 1 unique tornado
day (5/23/78). A tornado occurring at 1200 on June 12, 1954 in St. Joseph
County and a tornado occurring in Marion and Jasper Counties on June 14, 1954
at 1700 would be considered a two unique tornado days. Because tornadoes
often contain multiple segments or cross county/state lines and be counted
separately, individual tornadoes were not used in this project. Instead, a dataset
of tornado days was created. Each twenty-four hour period was considered a
unique tornado day. The tornado datasets were broken down by date (d/m/y),
46
time (CST), county, and Fujita Scale (original version) ranking. If a tornado
affected multiple counties during the 24-hour period, each county received credit
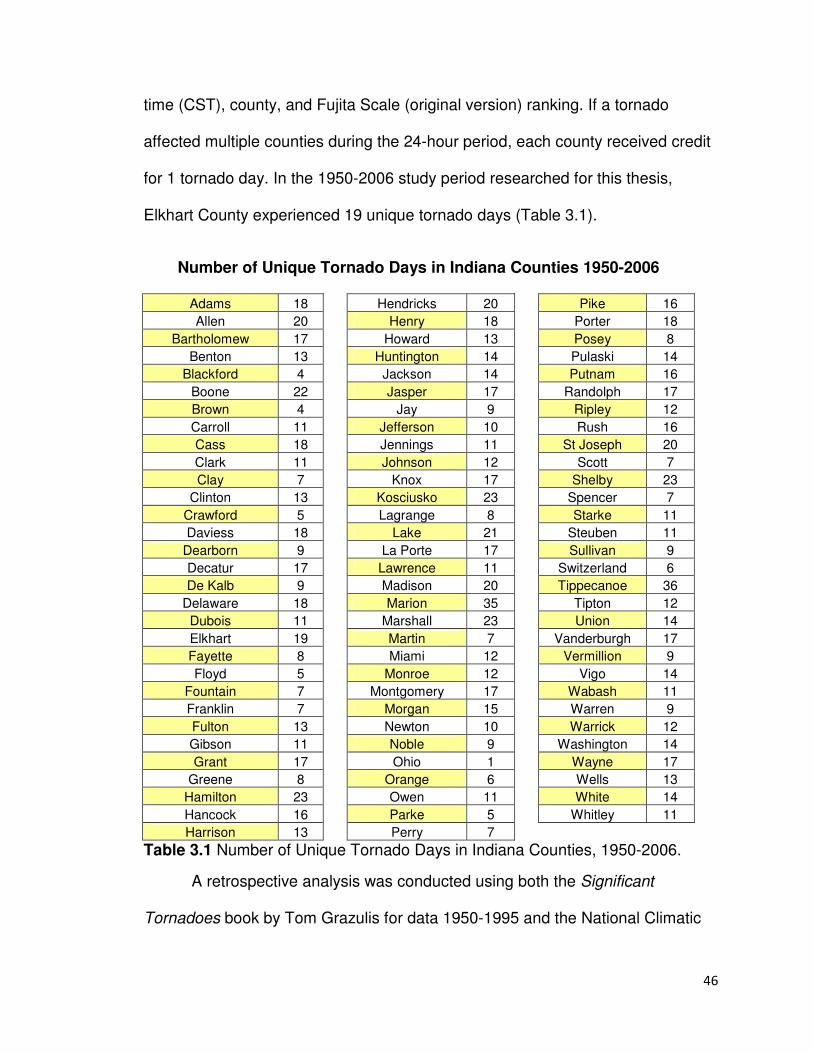
for 1 tornado day. In the 1950-2006 study period researched for this thesis,
Elkhart County experienced 19 unique tornado days (Table 3.1).
Number of Unique Tornado Days in Indiana Counties 1950-2006
Adams 18 Hendricks 20 Pike 16
Allen 20 Henry 18 Porter 18
Bartholomew 17 Howard 13 Posey 8
Benton 13 Huntington 14 Pulaski 14
Blackford 4 Jackson 14 Putnam 16
Boone 22 Jasper 17 Randolph 17
Brown 4 Jay 9 Ripley 12
Carroll 11 Jefferson 10 Rush 16
Cass 18 Jennings 11 St Joseph 20
Clark 11 Johnson 12 Scott 7
Clay 7 Knox 17 Shelby 23
Clinton 13 Kosciusko 23 Spencer 7
Crawford 5 Lagrange 8 Starke 11
Daviess 18 Lake 21 Steuben 11
Dearborn 9 La Porte 17 Sullivan 9
Decatur 17 Lawrence 11 Switzerland 6
De Kalb 9 Madison 20 Tippecanoe 36
Delaware 18 Marion 35 Tipton 12
Dubois 11 Marshall 23 Union 14
Elkhart 19 Martin 7 Vanderburgh 17
Fayette 8 Miami 12 Vermillion 9
Floyd 5 Monroe 12 Vigo 14
Fountain 7 Montgomery 17 Wabash 11
Franklin 7 Morgan 15 Warren 9
Fulton 13 Newton 10 Warrick 12
Gibson 11 Noble 9 Washington 14
Grant 17 Ohio 1 Wayne 17
Greene 8 Orange 6 Wells 13
Hamilton 23 Owen 11 White 14
Hancock 16 Parke 5 Whitley 11
Harrison 13 Perry 7
Table 3.1 Number of Unique Tornado Days in Indiana Counties, 1950-2006.
A retrospective analysis was conducted using both the Significant
Tornadoes book by Tom Grazulis for data 1950-1995 and the National Climatic
47
Data Center (NCDC)’s Storm Data database of tornadoes from 1996-2006 for
Indiana to determine monthly, diurnal, and day of year distribution of tornadoes.
The start of this dataset was chosen as 1950 because consistent tornado reports
have been available only since the early 1950s (Verbout et al, 2006). The end of
the dataset was chosen as 2006 because it was the last full year the original
Fujita scale was in use, thus allowing for consistency in tornado ratings. An
analysis was also conducted to determine Fujita Scale strength for Indiana
tornadoes compared to national averages. Tornado reports from NCDC were
placed into a spreadsheet and sorted the same way as the Grazulis data. With
NCDC data, reports are generally given by nearest town or city, rather than by
county. Each of the 300 tornado reports for the 1996-2006 period had to be
sorted by county and time (UTC) to be consistent with Grazulis data.
Indiana’s tornado history includes tornadoes during all seasons, months,
and times of day. From January 1, 1950 to December 31, 2006, there were
approximately 482 unique tornado days in Indiana. Using the Grazulis and NCDC
records, nearly 1400 tornado reports were recorded in Indiana in the period
1950-2006. This data was further broken down into the number of tornado days
occurring in each Indiana county during the study period.
There are several problems with the Grazulis and NCDC data sets:
1) Numerous reports are given for events that may be either a single
tornado or multiple tornadoes, making it difficult to determine and

48
strenuous to the researcher to differentiate between unique tornadoes and
multiple reports of the same tornado,
2) A tornado that hit multiple counties was reported multiple times so that
a single tornado that hit five counties would be reported at least five times,
3) In some cases data is skewed toward counties that have higher
population densities, ie. more people to observe and report tornadoes,
and more structures for the tornado to affect, increasing the probability the
tornado will cause damage and that damage will a) be observed b) be
rated by National Weather Service personnel and c) damage intensity may
increase due to compactness of urban areas and tendency for swirling
debris to cause subsequent damage to nearby structures.
4) Counties with geographic features that might obstruct the reporting of a
tornado (ie. hills, open fields where damage cannot be observed, etc.)
tended to have fewer reports of tornadoes.
For the purpose of this thesis, only the first two problems were resolved.
The primary problem with this data is that it contains numerous reports of
a single event. For example, if a tornado occurred in Jackson County on March
3, 1995, it might be reported as several events due to reports of the event
coming from numerous sources (local law enforcement, local citizens, National
Weather Service personnel, etc.) so that it would appear as if several tornadoes
actually occurred in Jackson County. This challenge was overcome by creating a

49
database of unique tornado days rather than events. For the purpose of this
thesis, a unique tornado day is characterized as having one or more tornado
events within Indiana in a 24 hour period from the time of the first reported
tornado. For example, multiple tornadoes occurring in Noble, LaGrange, and
Kosciusko counties at 1200, 1245, and 1726 on May 23rd, 1978 are classified as
1 unique tornado day (5/23/78). A tornado occurring at 1200 on June 12, 1954 in
St. Joseph County and a tornado occurring in Marion and Jasper Counties on
June 14, 1954 at 1700 were considered two unique tornado days. Tornadoes
occurring more than 24 hours apart were assigned separate days.
After figuring out unique days for each year, data was cleaned further into
unique days across all years, regardless of year of tornado occurrence. This
allowed for a look at the seasonality over the 57-year collection period.
50
Month Day Year Hour Dead Inj. F scale County
MAY 31 1958 2020 0 0 F2 La Porte
MAY 31 1958 1950 0 2 F2 La Porte
JUN 8 1958 2100 0 0 F2 Henry
JUN 8 1958 1730 0 0 F1 Jasper
JUN 8 1958 2100 0 0 F2 Jasper
JUN 8 1958 0530 0 0 F1 Porter
JUN 8 1958 2324 0 1 F2 Tipton
JUN 9 1958 2125 0 0 F1 Madison
JUN 13 1958 0040 0 0 F2 Cass
JUN 13 1958 0028 0 0 F2 Cass
JUN 13 1958 0230 0 1 F2 Madison
JUN 13 1958 1600 0 0 F1 Monroe
JUN 13 1958 1630 0 0 F1 Monroe
JUN 13 1958 1400 0 0 F2 Montgomery
JUN 13 1958 0040 0 0 F2 White
JUN 24 1958 1726 0 0 F2 Elkhart
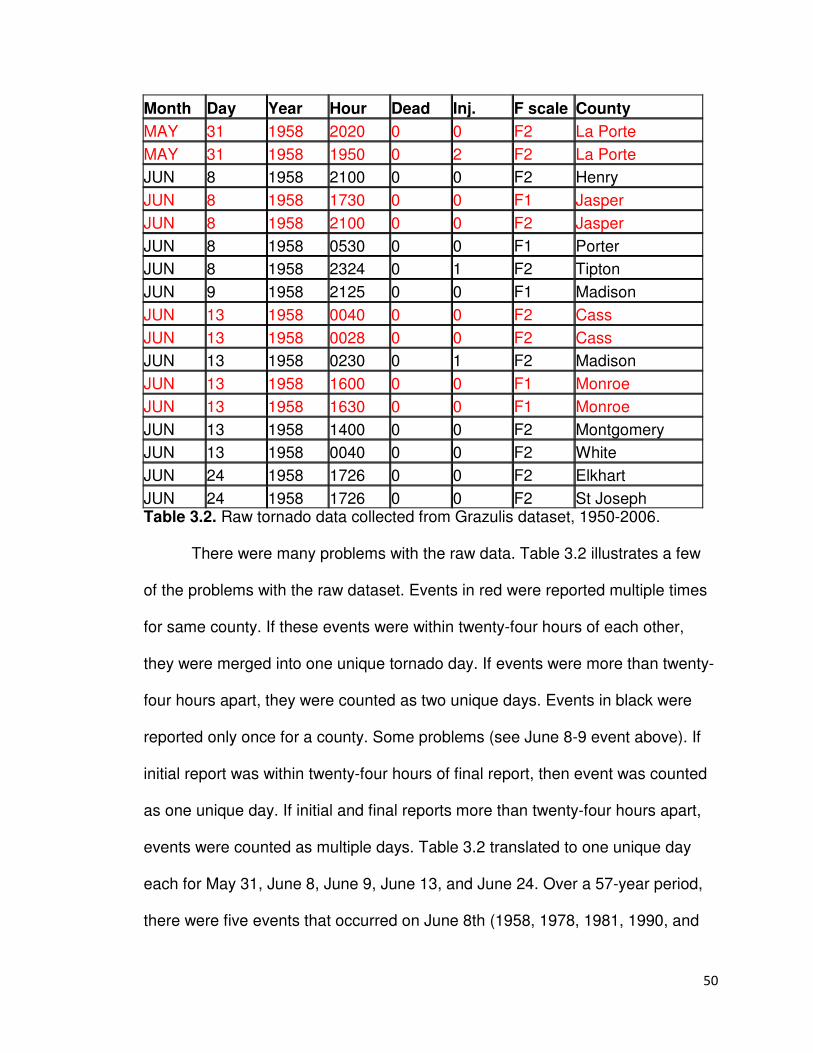
JUN 24 1958 1726 0 0 F2 St Joseph Table 3.2. Raw tornado data collected from Grazulis dataset, 1950-2006. There were many problems with the raw data. Table 3.2 illustrates a few
of the problems with the raw dataset. Events in red were reported multiple times
for same county. If these events were within twenty-four hours of each other,
they were merged into one unique tornado day. If events were more than twenty-
four hours apart, they were counted as two unique days. Events in black were
reported only once for a county. Some problems (see June 8-9 event above). If
initial report was within twenty-four hours of final report, then event was counted
as one unique day. If initial and final reports more than twenty-four hours apart,
events were counted as multiple days. Table 3.2 translated to one unique day
each for May 31, June 8, June 9, June 13, and June 24. Over a 57-year period,
there were five events that occurred on June 8th (1958, 1978, 1981, 1990, and
51
1993). Therefore, in a 57-year period, June 8th would have a total of five unique
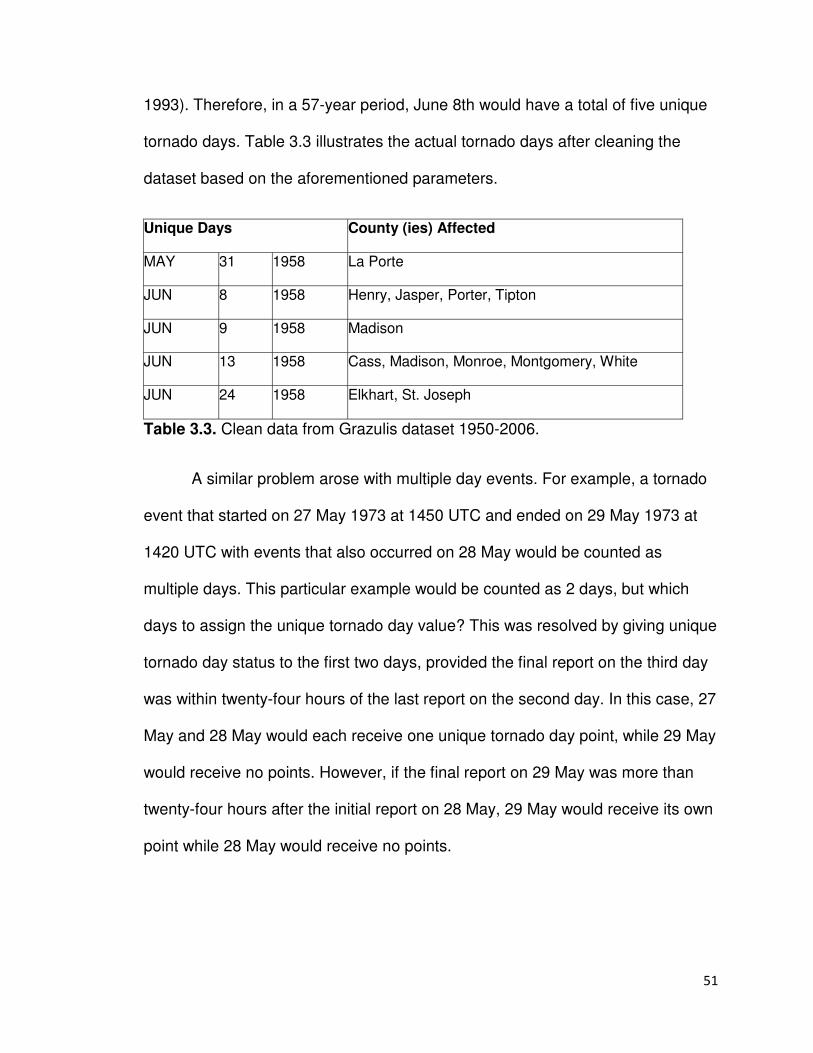
tornado days. Table 3.3 illustrates the actual tornado days after cleaning the
dataset based on the aforementioned parameters.
Unique Days County (ies) Affected
MAY 31 1958 La Porte
JUN 8 1958 Henry, Jasper, Porter, Tipton
JUN 9 1958 Madison
JUN 13 1958 Cass, Madison, Monroe, Montgomery, White
JUN 24 1958 Elkhart, St. Joseph
Table 3.3. Clean data from Grazulis dataset 1950-2006.
A similar problem arose with multiple day events. For example, a tornado
event that started on 27 May 1973 at 1450 UTC and ended on 29 May 1973 at
1420 UTC with events that also occurred on 28 May would be counted as
multiple days. This particular example would be counted as 2 days, but which
days to assign the unique tornado day value? This was resolved by giving unique
tornado day status to the first two days, provided the final report on the third day
was within twenty-four hours of the last report on the second day. In this case, 27
May and 28 May would each receive one unique tornado day point, while 29 May
would receive no points. However, if the final report on 29 May was more than
twenty-four hours after the initial report on 28 May, 29 May would receive its own
point while 28 May would receive no points.
52
After all tornadoes from 1950-2006 were entered into a database and
sorted by county, date (d/m/yy), time (CST), and Fujita Scale ranking, each day
of the year was assigned a value based on the number of tornadoes it had
experienced during that 57-year period. For example, April 14th had 4 unique
tornado days in the years 1950-2006. Therefore, April 14th was assigned the
value of 4. This value was then calculated into a percentage to analyze the
probability of tornado occurrence on April 14th (# years of tornado occurrence on
April 14th / years in study period= % probability). On any given April 14th between
1950 and 2006, there was a 0.07 percent probability of a tornado occurring
somewhere in Indiana. Each day of the year was assigned a percentage of
probability, which led to a probability of tornado occurrence (%) by day of the
year. Further, this value led to a tornado seasonality for Indiana, allowing for a
quick glance at the probability of tornado occurrence both by day of the year and
by month. A comparison of Indiana’s trend and the national trend shows
similarities in tornado increases around days 140 through 195 with late fall mini
peaks in the national trend and early fall mini peaks in the Indiana trend. These
results will be discussed further in Chapter 5- Results and Discussion.
3.3.1a. Tornado Alley Defined
Tornadoes, no matter their size or duration, can wreak havoc on any
community. Basic life support systems such as power and communications can
be severed, leaving a community susceptible to disarray and chaos. Resources
53
may be severely limited or unavailable, potentially leading to loss of life. The
economic impact from a tornado event can range from minor- businesses being
closed for a few hours or days to clean up- to devastating- entire towns wiped out
including businesses, homes, and schools.
A nickname with no official boundary, “Tornado Alley” is often thought of
as Oklahoma, Kansas, and Texas. A tornado climatology and subsequent
Tornado Alley can be constructed using a variety of methods, mostly based on
what the individual researcher wants to define as his/her focal point. Based on a
history of significant (rated F2 or stronger) tornadoes (Concannon et al, 2000),
Broyles and Crosbie (2004) defined small scale Tornado Alleys across the U.S.
as having received long-track (25+ miles) F3-F5 tornadoes during a period from
1880-2003 (including 6 areas in Indiana). Tornado Alleys can also be created
using outbreaks as the foundation, as in Schneider, et al’s work Tornado
Outbreak Days: An Updated and Expanded Climatology 1875-2003. A map of
tornado events created using SeverePlot software, a geographical database of
severe thunderstorm and tornado occurrences showing all tornado reports
across the U.S. from 1950-2006, illustrates the dispersion of tornado events and
further highlights the inconsistency in defining a true Tornado Alley.
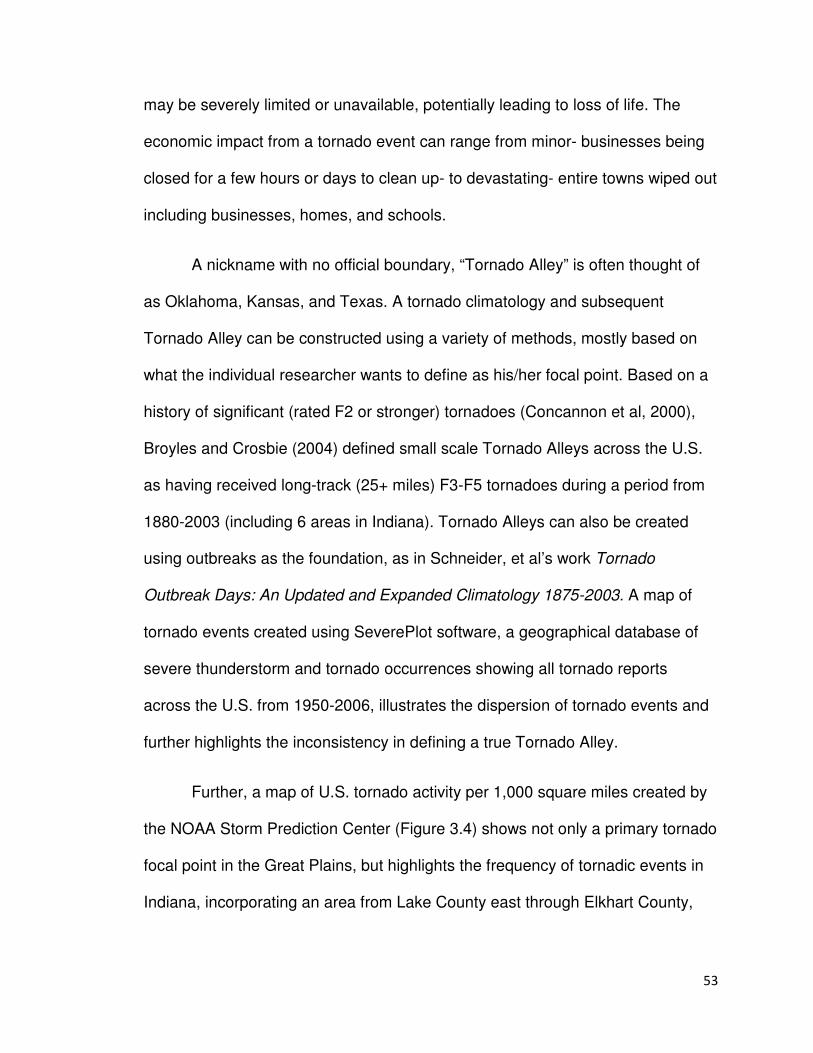
Further, a map of U.S. tornado activity per 1,000 square miles created by
the NOAA Storm Prediction Center (Figure 3.4) shows not only a primary tornado
focal point in the Great Plains, but highlights the frequency of tornadic events in
Indiana, incorporating an area from Lake County east through Elkhart County,
54
due south to Monroe County, west to Owen County, and due north to Lake
County. For the purpose of this thesis, a tornado climatology for Indiana was
created using the both the Grazulis tornado database for events 1950-1995
(1993a) and National Climactic Data Center’s Storm Data database for events
1996-2006. Using this data, a map of unique tornado days was created for
Indiana counties to enable a quick glance of a tornado climatology. Schaefer et al
(1993) suggest tornado days be used as a more accurate picture of tornado
activity rather than actual tornadoes due to the apparent inflation of reported
tornadoes (p. 460).
Figure 3.4. Tornado Activity in the United States per 1,000 sq. mi. (Storm
Prediction Center, www.spc.noaa.gov)
55
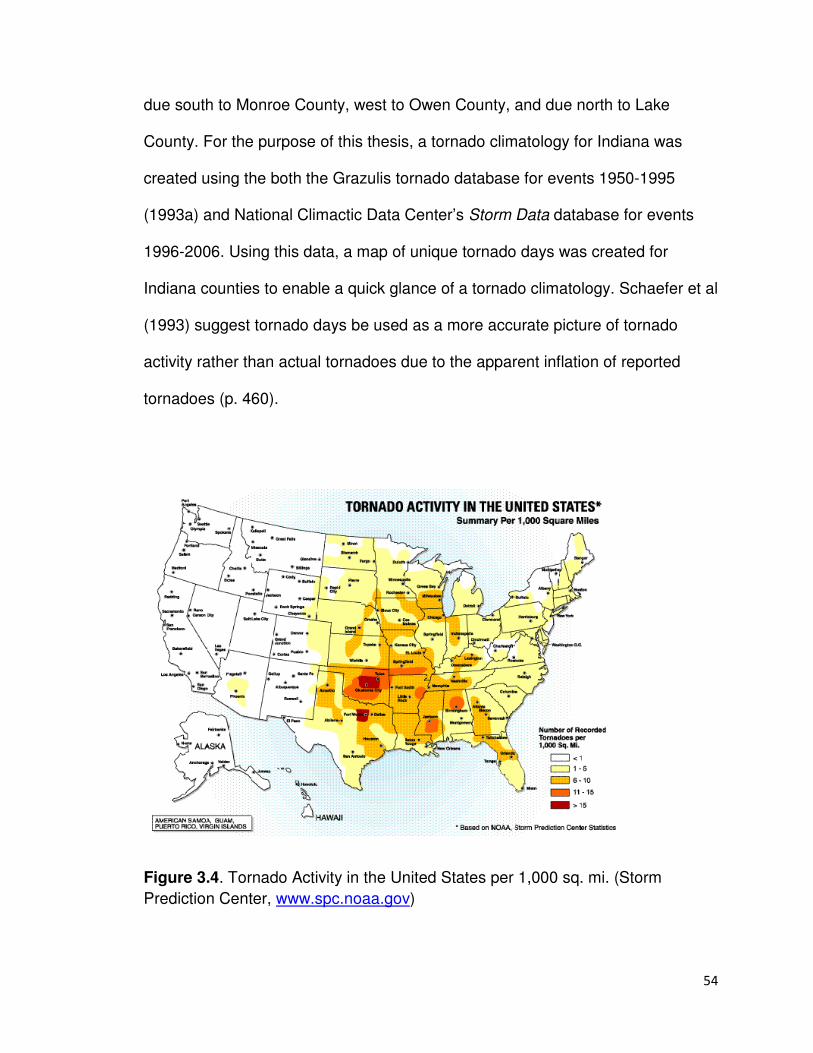
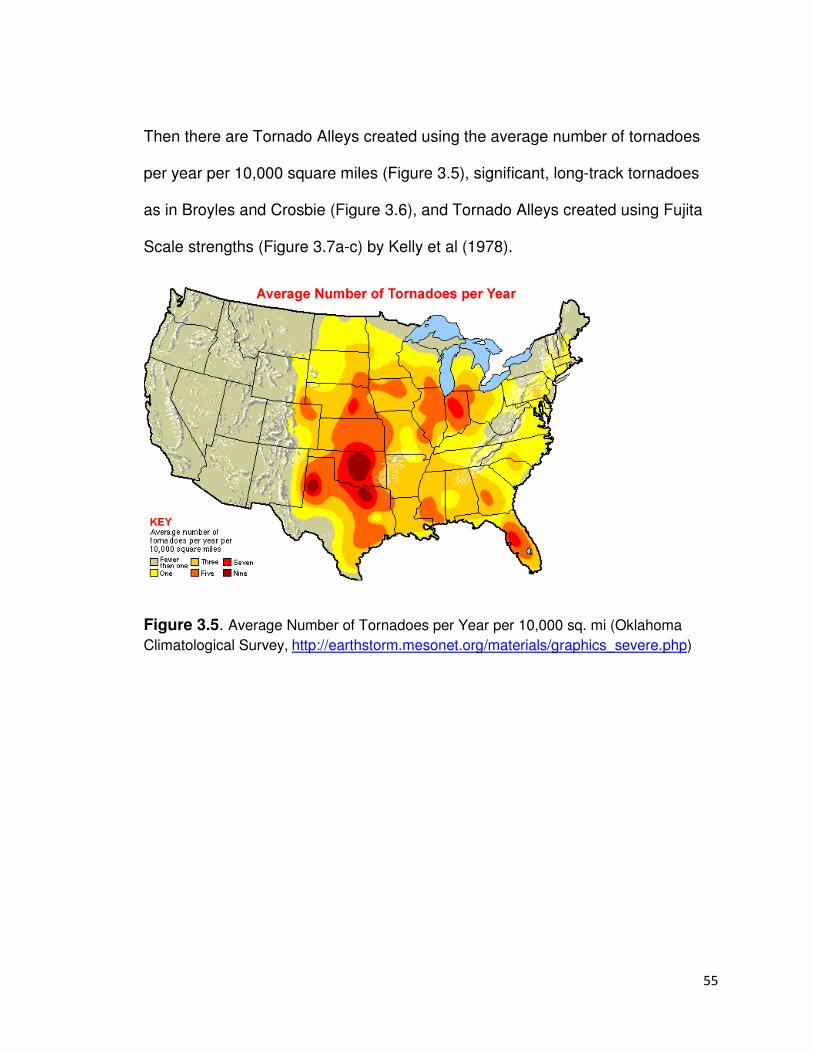
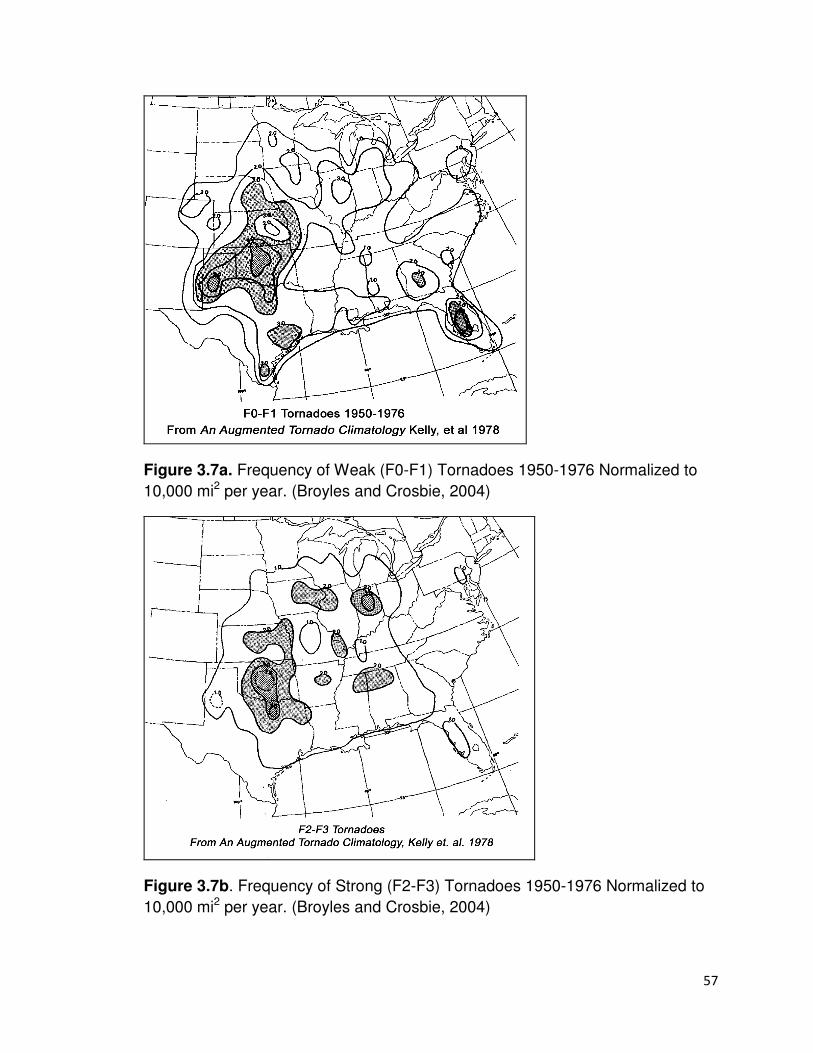
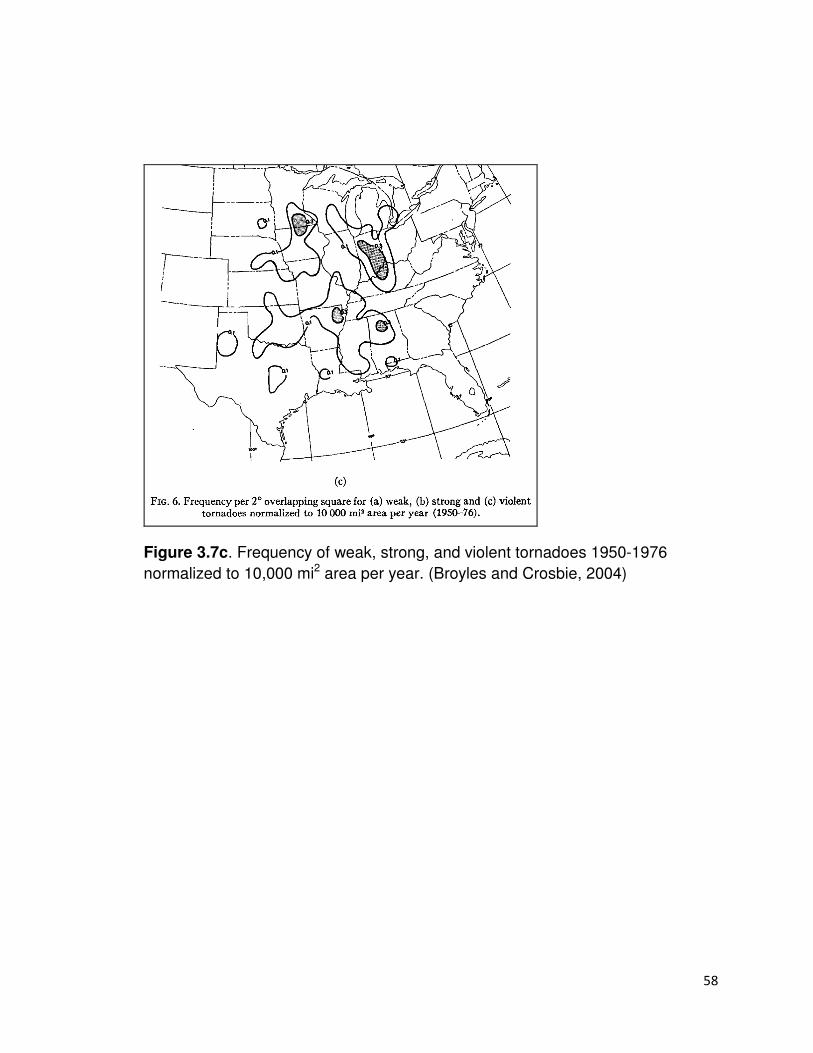
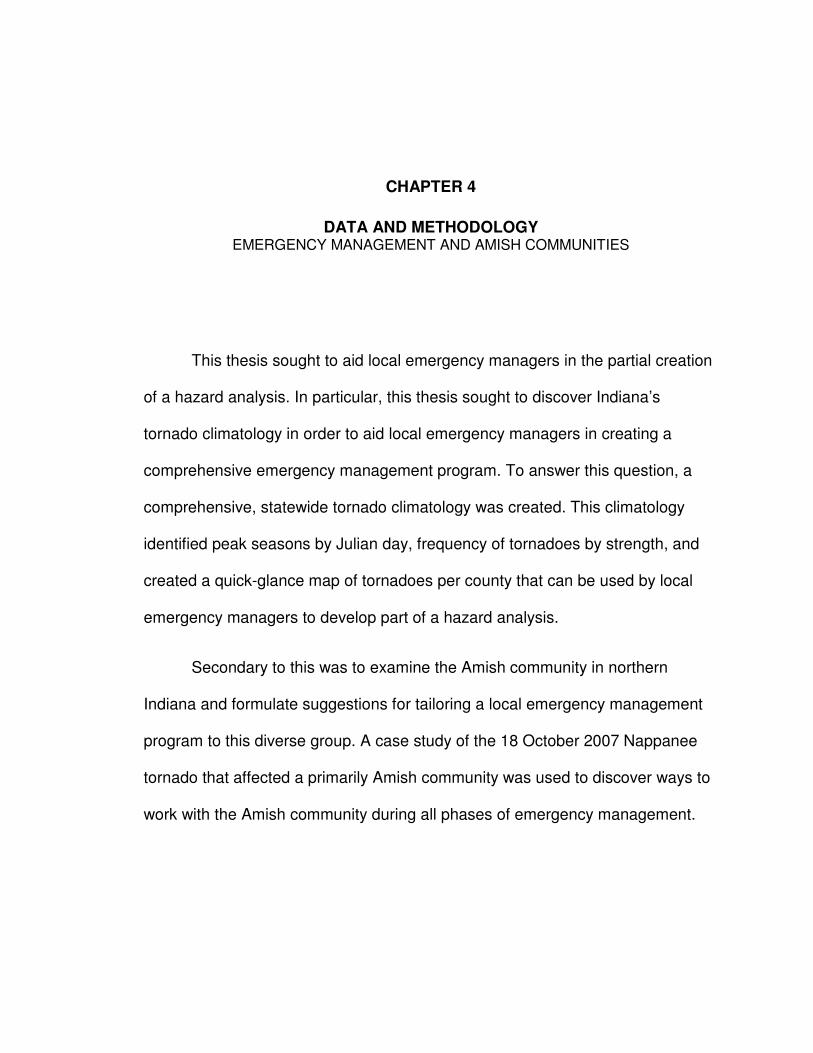
Then there are Tornado Alleys created using the average number of tornadoes
per year per 10,000 square miles (Figure 3.5), significant, long-track tornadoes
as in Broyles and Crosbie (Figure 3.6), and Tornado Alleys created using Fujita
Scale strengths (Figure 3.7a-c) by Kelly et al (1978).
Figure 3.5. Average Number of Tornadoes per Year per 10,000 sq. mi (Oklahoma
Climatological Survey, http://earthstorm.mesonet.org/materials/graphics_severe.php)
56
Figure 3.6. Frequency of F3 to F5 tornadoes with at least 25 mile tracks from
1880 to 2003 normalized to 1,000 square miles. (Broyles and Crosbie, 2004)
57
Figure 3.7a. Frequency of Weak (F0-F1) Tornadoes 1950-1976 Normalized to
10,000 mi2 per year. (Broyles and Crosbie, 2004)
Figure 3.7b. Frequency of Strong (F2-F3) Tornadoes 1950-1976 Normalized to
10,000 mi2 per year. (Broyles and Crosbie, 2004)
58
Figure 3.7c. Frequency of weak, strong, and violent tornadoes 1950-1976
normalized to 10,000 mi2 area per year. (Broyles and Crosbie, 2004)
CHAPTER 4
DATA AND METHODOLOGY EMERGENCY MANAGEMENT AND AMISH COMMUNITIES
This thesis sought to aid local emergency managers in the partial creation
of a hazard analysis. In particular, this thesis sought to discover Indiana’s
tornado climatology in order to aid local emergency managers in creating a
comprehensive emergency management program. To answer this question, a
comprehensive, statewide tornado climatology was created. This climatology
identified peak seasons by Julian day, frequency of tornadoes by strength, and
created a quick-glance map of tornadoes per county that can be used by local
emergency managers to develop part of a hazard analysis.
Secondary to this was to examine the Amish community in northern
Indiana and formulate suggestions for tailoring a local emergency management
program to this diverse group. A case study of the 18 October 2007 Nappanee
tornado that affected a primarily Amish community was used to discover ways to
work with the Amish community during all phases of emergency management.
60
4.1. Using Indiana’s Tornado Climatology as a Method for Emergency
Management to Work with the Amish
4.1.2 Lessons Learned from the 18 October 2007 Nappanee Tornado
4.1.2a. Mitigation and Preparedness
To develop a better understanding of the Amish perspectives of disasters
and preparedness, interviews were conducted with three members of the Amish
community; Howard Chupp, a bishop in the Nappanee area and a type of
superintendent of Amish parochial schools for the northern Indiana area; Nick
Raber, a medical responder in Daviess County who grew up in the Amish faith
but has since left the church; and a church member and farmer who requested
his identity remain anonymous. For the purpose of this project, he will be known
as Samuel. Interviews were also conducted with members of the English
community with extensive experience in working with the Amish. It is apparent
many Amish communities are willing to focus on natural disasters such as floods,
fires, winter storms, and tornadoes, but may be unwilling to concern themselves
with human-caused events such as shootings and acts of domestic terrorism.
The Amish trust their faith in God, that He will do what is right for them and teach
them through emergency events. They want to be aware of potentially dangerous
situations, but trust God to take care of them.
Prevention of disasters may be a foreign concept to a group who believes
that hazardous events are part of God’s will and it is not up to them to circumvent
His will. Therefore they see no need to be warned of an event that is in God’s
plan for them. According to Steve Eddy (pers. comm.), a National Weather
61
Service Meteorologist who worked extensively within Amish communities during
his years at the northern Indiana NWS office,
The problems range from no electricity, multimedia devices or
phones in their houses, they are rural and live far apart, and they have a
very old and traditional culture that is slow to change to our fast changing
world. They honestly don't really see a big need to be warned of any
hazardous event. Their folklore, wives tales, and word of mouth take care
of that from their view point.
You are dealing with a culture (Amish) that thinks electronics are
only a luxury and an opposing culture that believes electronics are almost
a God (you and me). You have a training/awareness problem and the
church that operates in small communities that are not really governed by
a higher body (other than tradition and God). So there is no "head council"
to go and sell the emergency preparedness message to...therefore you
have to go to each of the bishops (1 every 2 square miles or so, thus
probably 75 in Elkhart County alone). And if you could get to all the
churches, you have to correctly enter their culture. For example, they have
council church once every 6 months or so. Council church is when they
decide what "new" technology they allow into the community and under
what conditions. Thus someone would have to get with each Bishop, then
show up at each of the churches’ council session to demonstrate the
warning alert method you wish to present. The problem is most of the
churches have council church around the same time of year, so now you
need about 75 well trained advocates to be available on any given Sunday
(maybe anytime in the day when they get to your topic), etc. etc.
Of the 60 municipalities in Lancaster County Pennsylvania, home to an
estimated 18,000 Amish in 964 square miles, no tornado warning sirens exist
(Randy Gockley, pers. comm.). The only sirens that do exist for mass notification
of hazards are the sirens on the nuclear power plants which are within 10 miles
of 20 percent of the county. Those sirens may be used for all-hazards warning
62
notification, but when the siren is sounded the Amish must find out what the siren
is warning, a task made difficult by their complacency when it comes to
hazardous events. Gockley, Emergency Management Coordinator for Lancaster
County, manages to get warnings to the Amish through a sort of Pony Express
method. When he spoke with the church bishops about the need for warnings for
hazards, including rapid onset events such as tornadoes, the bishops indicated
communication should come from the local emergency manager through the
volunteer fire departments in Amish areas, and to the bishops who would then
disseminate the warning to the community. It is clear that this method of
communication is not only time-consuming, but may risk lives by the stagnant
pace at which the message must travel.
Jennifer Tobey, Emergency Management Director for Elkhart County,
Indiana, works through the bishops to promote weather safety, but it has taken
her years to make progress and to be accepted into the Amish community (pers.
comm.). As a single female, Tobey feels it has been difficult to get male bishops
to accept her as a person of authority and with great responsibility within the
English community. Her offers of free, battery-powered weather radios for the
Amish communities have been repeatedly turned down. Tobey believes it is in
part because the technology represents “worldly” technology in a community
where separation from the outside world is crucial (Jennifer Tobey, pers. comm.).
A glimmer of hope for emergency managers working to dispense
emergency warnings within Amish communities may have been inadvertently
63
caused by the tragic school shooting in Nickel Mines, Pennsylvania in 2006.
Gockley notes,
In the aftermath of the Nickel Mines School shooting, the
Amish seem to be willing to take a more proactive attitude with
public safety. For example, there are over 200+ Amish Schools in
the County. Many, as did the Nickel Mines School, not have a
street address. Since the shooting, many church elders have come
forward and request actual street addresses for the schools in case
of emergency.
Working with Amish communities before an event teaches them to
recognize warning signs. Tobey has a list of addresses for most Amish in her
community which she uses to send flyers and informational brochures about
various community hazards. Tobey also uses the local Amish newspaper to
spread information on various hazards and how to plan and prepared for them.
Tobey believes using communication and technology that are within their beliefs
aids in the willingness of the Amish to work with outsiders.
Some preparedness efforts may be accepted by the Amish provided it
stays within the confines of their faith and lifestyle. In 2008, Tobey began working
with the Amish in her community to create an Amish version of the Community
Emergency Response Team (CERT) program which aims to teach citizens how
to help themselves and their neighbors in the event of a disaster. The first Amish
CERT in Indiana, perhaps the country, Tobey is working with the local bishops to
bring together local first responders (Amish and English alike) and the Amish
community to enhance preparedness efforts one step at a time.
64
How can an emergency manager engage the Amish in emergency
management and disaster preparedness without challenging their belief system?
The first place to start in working with the Amish is to learn about the Amish
community and work through local connections. Rather than pushing hazard and
disaster information on them, ask them if you can talk to them rather than forcing
them to accept your presence. New emergency management directors should
contact experienced emergency management directors who also have an Amish
population, as neighboring Amish communities can point to other community
leaders. To get issues into Amish community, public safety must show the Amish
there is a need for addressing that issue and how the issue affects them
personally. According to Nick Raber (per. comm.) who grew up Amish and
currently works in the medical community, if the outside world can make an issue
relevant to the Amish way of life or livelihood, they will prepare for it. They do not
prepare for what could happen, but what has happened and may happen again.
Many in the Amish community believe preparedness is showing you have no
faith in God and you are showing Him you do not believe in His will if you prepare
for things He has planned for you. According to Howard Chupp, getting the
Amish engaged in disaster preparedness or concern over events outside their
control is not an easy task. The Amish do not feel the need to concern
themselves with events outside their control and realize they cannot prepare for
all potentially dangerous events. They prefer to keep their faith in God, trusting
that He will use a disaster event to teach them to become better people through
aid for others and becoming more sensitive to the needs of others. Even with
65
human-caused events, the Amish believe God has allowed that event to occur in
order to teach them something, be it compassion, forgiveness, empathy, learning
not to place blame, or another trait.
The Amish are not a community who prepares for the sake of staving off
potential trouble. Rather, they are willing to prevent future occurrences of an
event based on past occurrences. For example, an infectious disease struck the
equine population in Daviess County, Indiana in 2005. Prior to then, preventing
this type of problem was not an issue to the Amish community. When the Amish
lost many of their horses, a staple in their way of life, prevention of future
outbreaks was discussed and plans were implemented with the assistance of the
local veterinarians. The Nickel Mines, Pennsylvania shooting of 10 girls at an
Amish schoolhouse in 2006 also prompted the Amish to take a look at the safety
of their schools. Many Amish communities in Ohio and Indiana have developed
safety manuals for their schools. Some schools have gone as far as installing
doors that lock from the inside so intruders cannot enter. However, the decision
to include such precautions rests with the three man school board and the
teacher. A change which has come about since the shootings is the inclusion of
all Amish school addresses in local public safety directories. Many schools in the
north central Indiana area have a phone booth outside the school in case of an
emergency and the older school children are taught how to call 911. A third
example is the current tornado drills conducted in Nappanee and Daviess County
66
schools. Both areas have experienced tornadoes in recent years and have
incorporated tornado safety in school drills and safety manuals.
The subject of safety for their community is coming to the attention of
many, says Samuel. Recent events such as the tornado, animal illness in
southern Indiana, and the Nickel Mines shootings have caused some Amish
elders to reconsider disaster preparedness. While the Amish would be open to
safety information developed by public officials, preferably with the input of the
Amish community so as to adhere to their beliefs, they would be more concerned
with natural events than human-caused events. In northern Indiana, Bishop
Chupp worked with members of the various school boards and the Northern
Indiana Safety Association to develop a school safety manual for Amish
parochial schools (Appendix C). The manual focuses on first aid, fire drills and
prevention, road safety for pedestrians and buggies, tornadoes, and playground
safety.
Disaster education can be taught to adults as well as children, but it
should only be taught in a schoolhouse, not at a church session. Church
sessions are reserved for spiritual devotion and topics of an unrelated nature
should not be entered into discussion. With the exception of the American Red
Cross first aid course, formal disaster preparedness training is traditionally not
available to teachers unless the English community conducts it. Amish are willing
to accept presentations for schoolchildren by members of the public safety
community or the National Weather Service, but these are not typically part of the
67
curriculum. Knowledge of weather and emergency events is passed down among
the generations.
Although the Amish do not have an organized warning system for
emergencies or rapid-onset events such as tornadoes, they use word of mouth to
spread warnings about potentially severe weather events. Prior to the Nappanee
tornado, word of mouth had spread notification of pending severe weather
throughout the community. They are also keenly aware of weather patterns,
having learned it from their parents and grandparents. While the Amish may
occasionally have access to technology in the outside world (outside their homes
and businesses) such as a television, battery-powered radios are not permitted in
the Nappanee Amish community, as they do not want to be exposed to such
technology if at all possible. Bishop Chupp feels television and phones are only a
generation away from being accepted by the Amish community and he believes it
is preferable to keep the younger generation exposed to technology as little as
possible. According to Nick Raber, word of mouth is an unbelievably rapid
method of communication for the Amish community. At a farm accident in
Daviess County, Indiana, Raber estimates 500-700 Amish arrived on scene
within 15 minutes. However, with no formal medical training, most of them were
unable to help the victim. Raber has since been pushing for first aid training in
the schools and in Spring 2009 held his first course with 26 of 42 Daviess County
Amish school teachers in attendance.
68
4.1.2b. Response and Recovery
Who would think being able to clean up quickly after a disaster would be a
problem? In true Amish style, most homes affected by the tornado were repaired
or replaced within a week of the event. According to Tobey, by the time FEMA
damage assessors had a chance to survey the 20 percent of Nappanee that
incurred damage, new homes had been built directly in the center of the tornado
path. Assessors would read on their maps that a home had received major
damaged, only to find a brand new one in its place 5 days after the event. Non-
Amish homes, on the other hand, were still in various states of disrepair because
owners were waiting on insurance companies to conduct evaluations of repair
costs or were awaiting FEMA assessments for insurance purposes. While the
Amish got on with life, the non-Amish were not able to move as quickly. It
certainly did not help matters when FEMA denied Indiana’s two requests
(Appendix F) for disaster assistance which would have helped cover losses of
property for the disaster (Indiana Department of Homeland Security Press
Release, 11/21/07). FEMA stated there was not enough loss from the private
sector to warrant a federal disaster declaration. Considering many homes were
repaired within a week of the tornado event, it is clear this had an effect on the
lack of private damage losses and thus a federal disaster declaration. Eventually
the U.S. Small Business Administration was able to provide assistance to those
residents affected by the tornado (Indiana Department of Homeland Security
Press Release, 1/18/08).
69
As local Emergency Management Director, Tobey worked directly with the
Amish in the weeks following tornado. Even though funds were offered to them
on several occasions from a variety of non-Amish sources, some as far away as
Asia, the Amish community fund, supported by contributions of church members
and used for emergency purposes, was used by the Amish to purchase supplies
to rebuild their homes and businesses. The Amish politely refused outside
assistance, wanting to maintain their independence and separation from worldly
entities. After several weeks of negotiation and repeated offers of assistance, the
Amish bishops were reluctantly willing to accept outside monetary assistance
because their fund was depleted. The bishops would not set a dollar amount they
were willing to accept. Instead, the Northern Indiana Tornado Recovery
Operation (NITRO) offered them various amounts until NITRO felt they had made
a fair offer that the Amish would accept. In the end, $50,000 worth of support was
provided to the Amish to replace funds depleted from their internal emergency
fund, an estimated $1.2 million worth of damage. Although Nappanee did not
qualify for public assistance funding through FEMA, Governor Mitch Daniels gave
Nappanee nearly $200,000 from the state disaster relief fund to assist with
losses (Rosemary Petersen, IDHS Public Assistance, per. comm.). Zhe Chi, a
Buddhist organization from Taiwan, donated gift cards in the amount of $300-500
to homes and businesses that had major damage or were destroyed to help meet
immediate needs of residents.
70
The data gathered from the Nappanee tornado suggests the Amish will
ultimately take care of their own in a disaster response, but may be open to
outside assistance if the assistance is offered through their bishops. One of the
biggest lessons learned by Tobey after working with the Amish during disaster
recovery was they did not expect any help and were quite content working within
their churches to recover. Tobey states, “People think of them as outsiders, but
Amish are willing to work with outsiders like family members. They should not be
treated any differently. You don’t have to do anything extra for Amish in disaster.
Don’t forget about them, but they will take care of themselves.” According to
Tobey, the Amish did not ask for help, it was offered. They did not see
themselves as victims of a disaster; rather, they saw the event as a chance to
help others.
The best way to prepare a community for a hazard is to help that
community understand its risk to the hazard. Indiana’s peak tornado season
begins in April and last through early July, indicating that, while Indiana is
vulnerable to tornadoes during all months, tornado preparedness efforts should
peak before severe storm season (spring) and continue into the off season (late
fall) in an effort to maximize citizen readiness. In Indiana a typical tornadic event
has a major impact on most communities. Residents typically need short- and
long-term assistance in terms of recovery (housing, utilities, goods and services).
Preplanning for these needs is crucial to helping a community recover from a
devastating event. In the Amish community, religious beliefs will dictate what they
71
will and will not allow in terms of mitigation, preparedness, response, and
recovery. While some communities may only allow emergency contact through
bishops or local fire departments with Amish members, others may use a phone
tree, if phones are permissible or if a business phone can be used for emergency
purposes. Most Amish communities in Indiana, including the Nappanee
community, allow outside phones for any church member who desires one.
An analysis of the Nappanee tornado event can aid emergency managers
with high Amish populations anticipate the needs of this unique community.
When it comes to developing comprehensive emergency management plans,
emergency managers must get to know the local community and the needs
within. Emergency management should work with local Amish leaders (bishops)
to institute change, including preparedness training and warning communication,
but must be prepared to explain why change is needed and also face rejection.
Persistence may pay off, but progress is slow in this community.
In order to promote effective mitigation of hazards within a community,
emergency managers must understand the culture that envelopes the
community. This is exceedingly difficult within the Amish community, whose lives
are lived according to the principles of finding individual meaning only through a
community of believers; a clear and visible distinction between the Amish church
community and the rest of the world; relying primarily on one another and not
outside agencies or government for support in difficult times; and the wisdom of
tradition is usually a better guide for living life than are the uncertainties found
72
with innovation and progress. If Emergency Managers can understand and
appreciate the Amish way of life, they can begin to work with them to implement
preparedness measures that would be acceptable to the Amish. Emergency
managers should strive to work within the systems the Amish trust (bishops and
church) and be patient, as progress is sometimes a four-letter word to the Amish.
The Amish may change, but it will be slow and carefully debated to ensure
progress adheres to their beliefs.
Getting to know the local community is key to gaining their support for
public safety programs. Each Amish community is different in what it will and will
not accept when it comes to support and technology. Nappanee Amish refuse to
use battery-powered or hand-crank weather radios on the principle that
technology is part of the outside world and does not belong in the Amish
community. Elkhart County Emergency Manager Jennifer Tobey (per. comm.)
recommends working through the bishops first and selling the product or concept
to the decision makers. Once the bishops buy in to a concept or product they
have the power to influence the entire community. To get greater buy in to an
emergency preparedness program one might work through the local Amish
newsletter, the national newsletter The Budget, visiting them on their turf, and
establishing a relationship with the bishops. In the Nappanee community, Amish
are willing to accept weather training, handouts, use of a phone tree to contact
bishops, and hands-on Community Emergency Response Team (CERT) and first
aid training. Tobey has found if the reasons behind a product or concept are
73
explained, the Amish are generally willing to accept some form of change. A
bishop Tobey worked with during the 18 October 2007 tornado called from his
outdoor phone two days before the one-year anniversary of the tornado. He was
having some concerns another tornado might occur. After acknowledging his
concern and issuing comfort, the bishop told Tobey he was grateful for her help
during the tornado and said he knew she would be around to help if anything
happened in the future.
One of the key areas emergency managers will have to deal with after a
disaster is the recovery process. While many in the English world employee
homeowner, rental, or auto insurance, Amish employ an emergency fund called
the Amish Aid Plan. The money is not kept in an account, does not accrue
interest, nor is anyone paid to care for the fund. The Amish believe if the funds
were to be kept in advance of a disaster it would be a type of insurance program
and would be placing doubt in God and His will for them. Once an emergency or
disaster occurs, monetary aid is gathered from all church members and sent to
victims. Each church member contributes a base amount to the fund and those
who can contribute more. The amount each member contributes is based on
several factors including property or businesses owned, income, and recent
hardships. For example, if a disaster were to hit a nearby community, each
member would make a contribution to the church district designee who would
then distribute this aid to affected families. Assistance following a disaster is a
quick process. As with physical aid, there is relatively no waiting for families to
74
receive money once a disaster hits, unlike with traditional insurance for the
English community, which may take months or even years to recover disaster
costs.
One of the questions posed to the Amish interviewees was how public
safety could help them following a disaster. Aid such as debris removal, site
security, or transportation to the hospital were acceptable methods of assistance,
however, monetary aid, particularly from government or non-local charities,
would typically not be accepted. Because the Amish want separation from “the
world” and government is considered the world, they do not wish to accept aid. It
is looked at as a sort of welfare. The Amish perspective is that disasters are a
way to help others and if they were to accept monetary aid to pay for recovery
costs they would undermine God’s purpose for them. When Daviess County,
Indiana received federal disaster assistance from FEMA following a tornado in
November 2005 that affected many Amish families, the Amish were offered
money to help them rebuild. The Amish asked that the money instead be used to
repair local roads, therefore benefiting the entire county.
By getting to know a local Amish community in advance of a disaster,
emergency managers will be more sensitive to the uniqueness and needs of this
diverse group. Emergency officials must be prepared for the Amish to take care
of themselves, but they should not be forgotten. Post-disaster assistance should
be offered, but not forced upon them. Preferred assistance may include debris

75
removal, transportation, or medical care, but will likely not include physical labor
or monetary support.
CHAPTER 5
RESULTS AND DISCUSSION
5.1. Creation of a Tornado Climatology for Indiana 5.1.1. Tornadoes by Fujita Scale Strength
This thesis used the traditional Fujita scale, rather than the Enhanced
Fujita scale, to define tornadoes because all tornadoes in the study, with the
exception of the 2007 Nappanee tornado, were classified during the era of the
Fujita scale. Tornado classification using the Enhanced Fujita scale did not begin
until February 2007. The Nappanee tornado rated an EF-3, with 3-second wind
gusts estimated at 138-167 mph. This is comparable to a strong F2 or weak F3
(Table 5.1).

77
Table 5.1. EF-Scale Wind Speed Ranges Derived from Fujita-Scale Wind Speed
Ranges (Texas Tech University Wind Science and Engineering Center, 2006)
In the United States, 99 percent of tornadoes are classified as being weak
(F0-F1) or strong (F2-F3). Only 1 percent of tornadoes are classified as being
violent (F4-F5). Historically, most U.S. tornado deaths (67 percent) occur during
violent tornadoes, while 29 percent of deaths occur with the strong tornadoes,
and only 4 percent occur with weak tornadoes (Grazulis, 2008b).
Of the nearly 1400 recorded tornadoes in Indiana’s 57 year history, more
than 60 percent were considered “weak” having F scale ratings of F0 or F1 and
estimated wind speeds of 40-112 mph. Approximately 32 percent of Indiana
tornadoes during that time frame fell into the “strong” category, with estimated
wind speeds at 113-207 mph and the remaining nearly 7 percent were
considered “violent” tornadoes, with wind speeds estimated at 208-318 mph.
National statistics for the period 1950-1994 are 74 percent, 25 percent, and 1
Fujita Scale EF Scale
Fujita
Scale
Fastest 1/4/-mile
Wind Speeds
3-Second Gust
Speed, mph
EF
Scale
3-Second Gust
Speed, mph
F0 40-72 45-78 EF0 65-85
F1 73-112 79-117 EF1 86-109
F2 113-157 118-161 EF2 110-137
F3 158-207 162-209 EF3 138-167
F4 208-260 210-261 EF4 168-199
F5 261-318 262-317 EF5 200-234
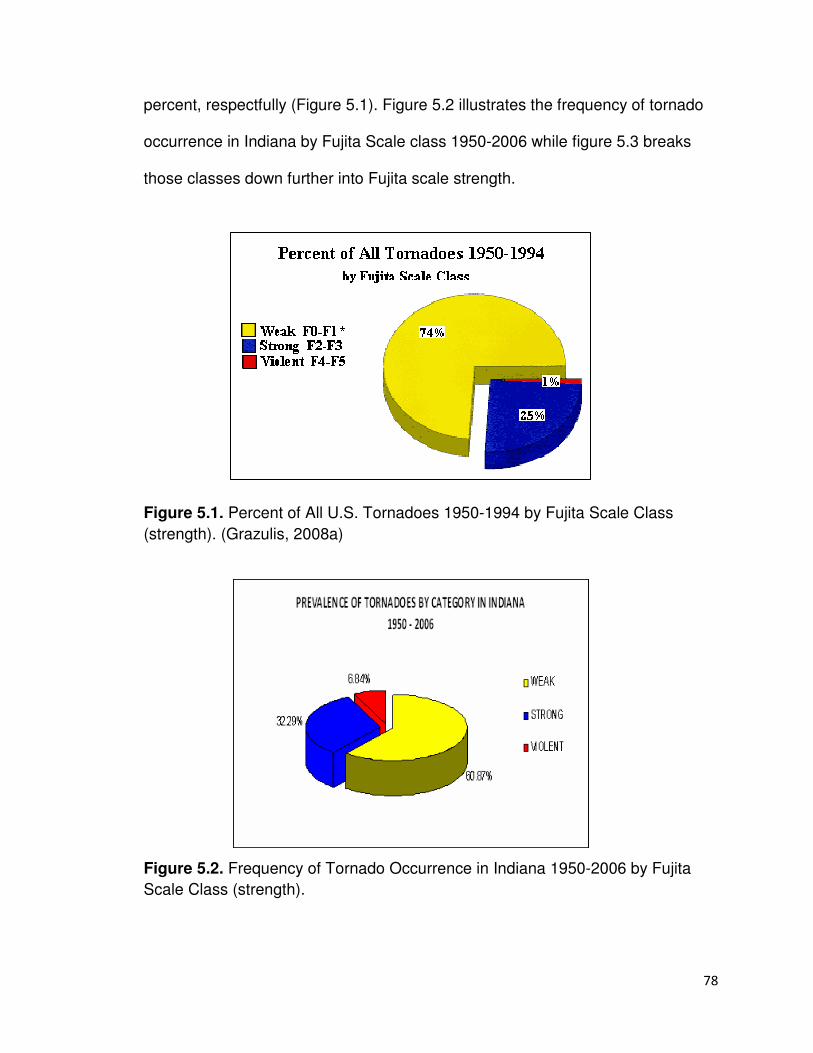
78
percent, respectfully (Figure 5.1). Figure 5.2 illustrates the frequency of tornado
occurrence in Indiana by Fujita Scale class 1950-2006 while figure 5.3 breaks
those classes down further into Fujita scale strength.
Figure 5.1. Percent of All U.S. Tornadoes 1950-1994 by Fujita Scale Class
(strength). (Grazulis, 2008a)
Figure 5.2. Frequency of Tornado Occurrence in Indiana 1950-2006 by Fujita
Scale Class (strength).

79
Figure 5.3. Frequency of Tornado Occurrence in Indiana 1950-2006 by
individual Fujita Scale Strength.
The differences in percentages can be attributed to multiple factors, not
the least of which is population density. Since the Fujita Scale estimates a
tornado’s wind speed (and thus the strength of the tornado) by the damage it
does, a tornado in an open space will not be able to create as much damage to
structures as would a tornado in an urban or suburban area. When there is little
to no damage, there is little evidence on which to rate the tornado and estimate
its wind speeds. Other factors include mesoscale thermodynamics / kinematics.
Those factors may best be left to future research. Mesoscale thermodynamic and
kinematic issues have been covered in numerous studies, including Edwards and
25.82%
35.05%
23.27%
9.02%
6.25% 0.58%
F0
F1
F2
F3
F4
F5
FREQUENCY OF TORNADO OCCURRENCE IN INDIANA
BY FUJITA SCALE STRENGTH
1950- 2006
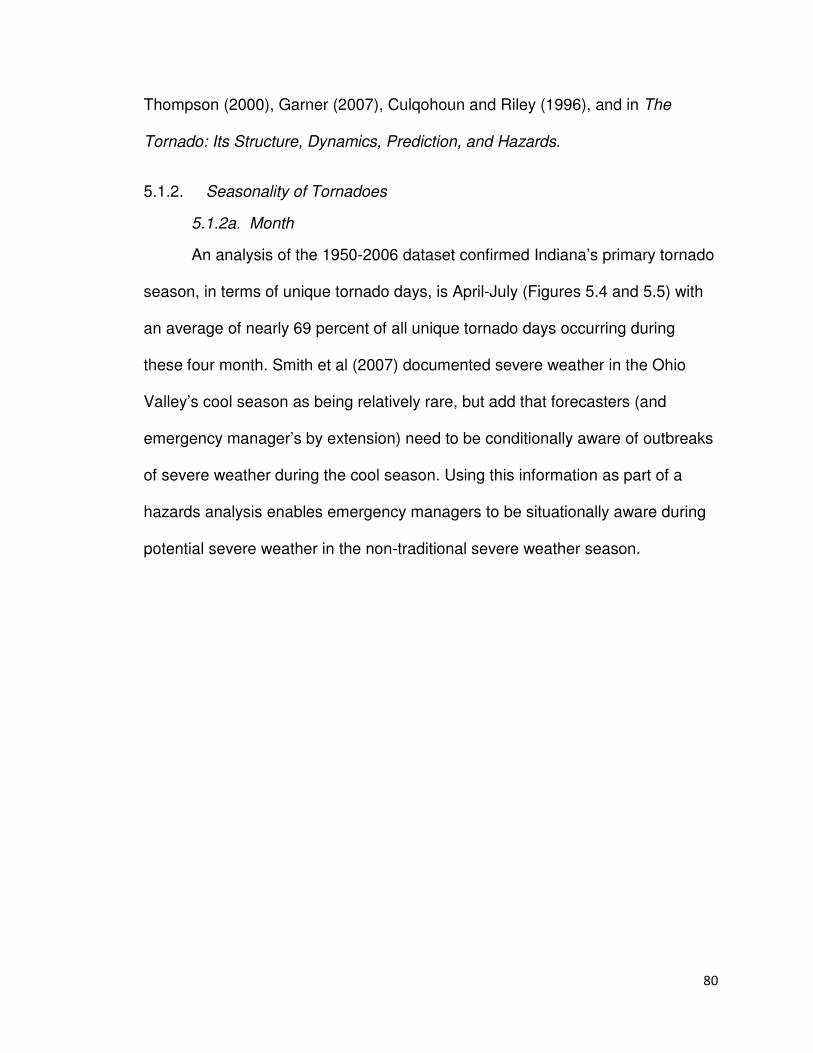
80
Thompson (2000), Garner (2007), Culqohoun and Riley (1996), and in The
Tornado: Its Structure, Dynamics, Prediction, and Hazards.
5.1.2. Seasonality of Tornadoes
5.1.2a. Month
An analysis of the 1950-2006 dataset confirmed Indiana’s primary tornado
season, in terms of unique tornado days, is April-July (Figures 5.4 and 5.5) with
an average of nearly 69 percent of all unique tornado days occurring during
these four month. Smith et al (2007) documented severe weather in the Ohio
Valley’s cool season as being relatively rare, but add that forecasters (and
emergency manager’s by extension) need to be conditionally aware of outbreaks
of severe weather during the cool season. Using this information as part of a
hazards analysis enables emergency managers to be situationally aware during
potential severe weather in the non-traditional severe weather season.
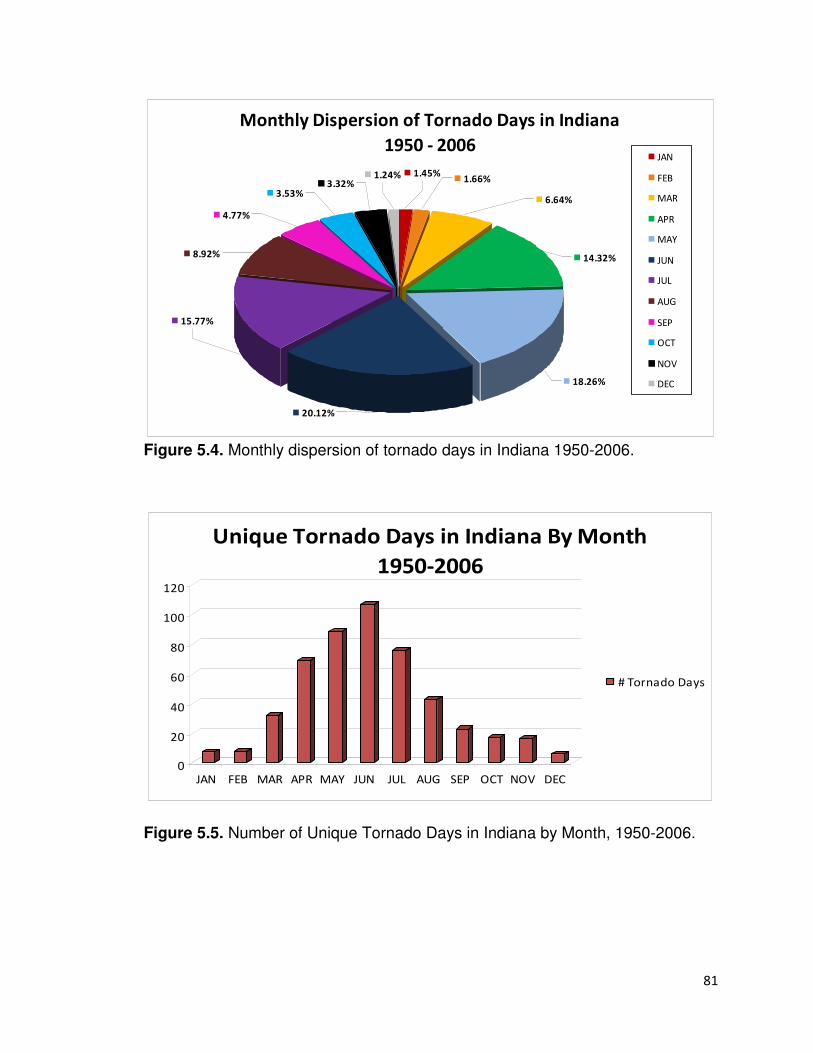
81
Figure 5.4. Monthly dispersion of tornado days in Indiana 1950-2006.
Figure 5.5. Number of Unique Tornado Days in Indiana by Month, 1950-2006.
0
20
40
60
80
100
120
JAN FEB MAR APR MAY JUN JUL AUG SEP OCT NOV DEC
Unique Tornado Days in Indiana By Month
1950-2006
# Tornado Days
Monthly Dispersion of Tornado Days in Indiana
1950 - 2006
1.45%1.66%1.24%
3.32%3.53%
4.77%
8.92%
15.77%
20.12%
18.26%
14.32%
6.64%
JAN
FEB
MAR
APR
MAY
JUN
JUL
AUG
SEP
OCT
NOV
DEC
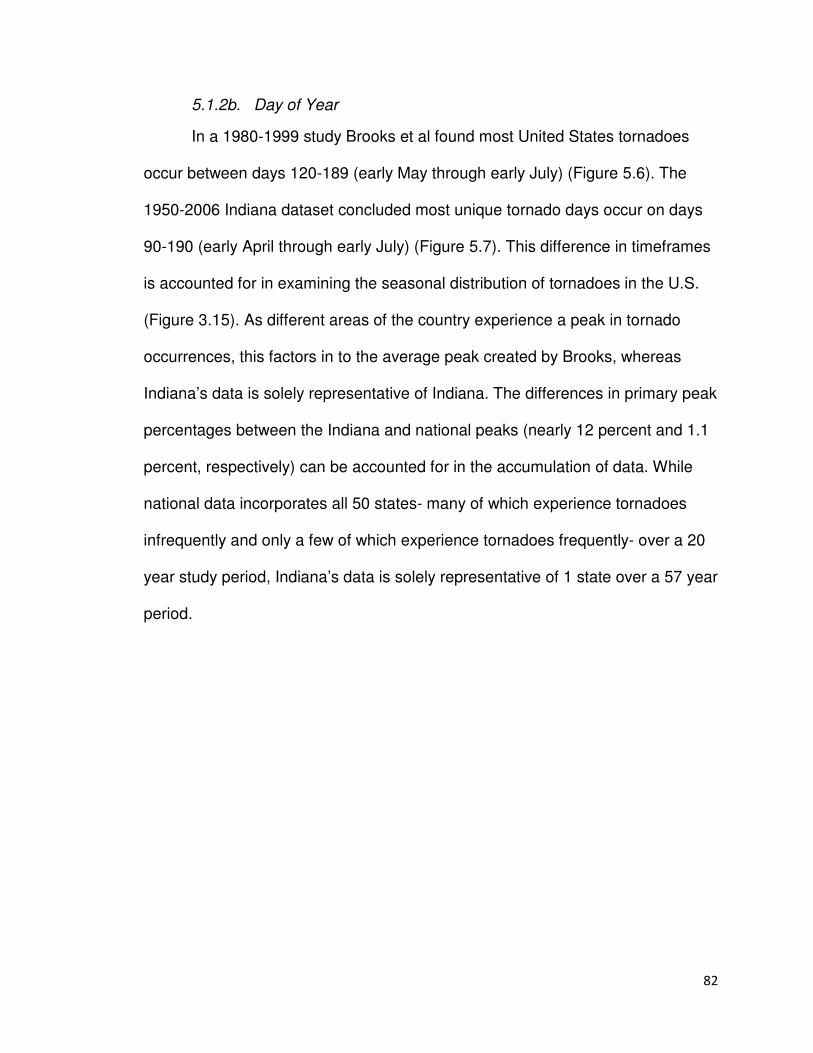
82
5.1.2b. Day of Year
In a 1980-1999 study Brooks et al found most United States tornadoes
occur between days 120-189 (early May through early July) (Figure 5.6). The
1950-2006 Indiana dataset concluded most unique tornado days occur on days
90-190 (early April through early July) (Figure 5.7). This difference in timeframes
is accounted for in examining the seasonal distribution of tornadoes in the U.S.
(Figure 3.15). As different areas of the country experience a peak in tornado
occurrences, this factors in to the average peak created by Brooks, whereas
Indiana’s data is solely representative of Indiana. The differences in primary peak
percentages between the Indiana and national peaks (nearly 12 percent and 1.1
percent, respectively) can be accounted for in the accumulation of data. While
national data incorporates all 50 states- many of which experience tornadoes
infrequently and only a few of which experience tornadoes frequently- over a 20
year study period, Indiana’s data is solely representative of 1 state over a 57 year
period.
83
Figure 5.6. U.S. Tornado Annual Cycle 1980-1999 (Brooks et al,
http://www.nssl.noaa.gov/hazard/loops.html)
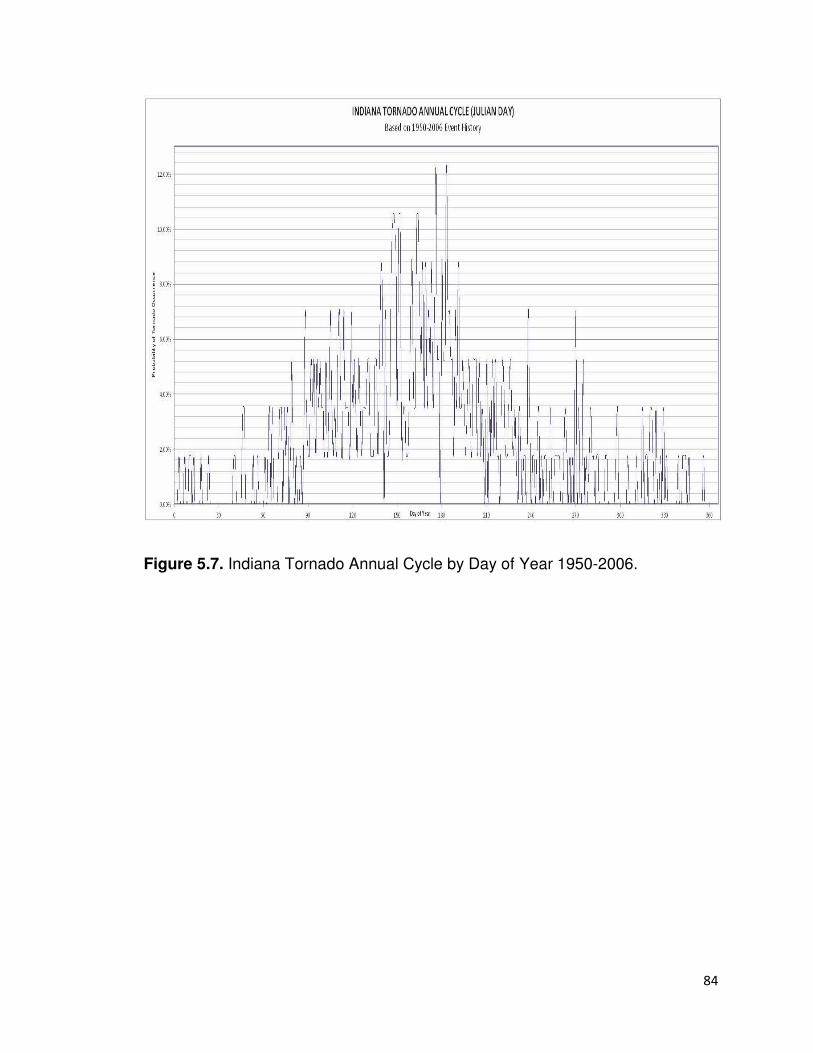
84
Figure 5.7. Indiana Tornado Annual Cycle by Day of Year 1950-2006.
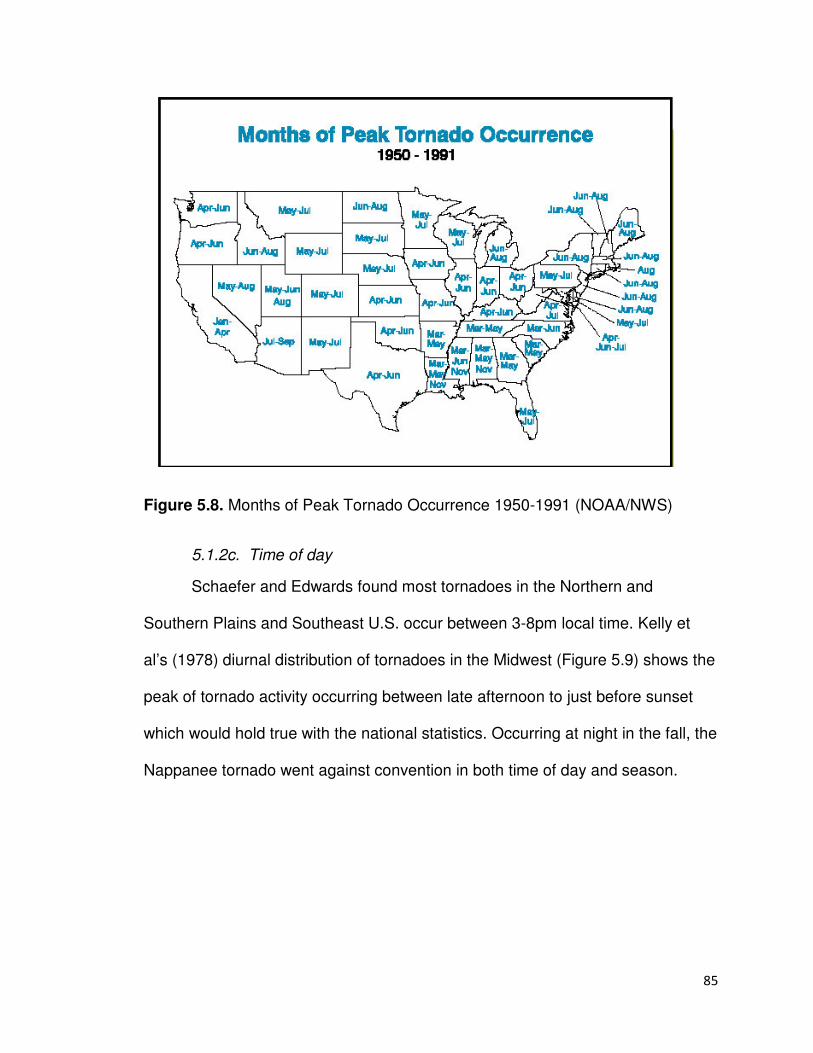
85
Figure 5.8. Months of Peak Tornado Occurrence 1950-1991 (NOAA/NWS)
5.1.2c. Time of day
Schaefer and Edwards found most tornadoes in the Northern and
Southern Plains and Southeast U.S. occur between 3-8pm local time. Kelly et
al’s (1978) diurnal distribution of tornadoes in the Midwest (Figure 5.9) shows the
peak of tornado activity occurring between late afternoon to just before sunset
which would hold true with the national statistics. Occurring at night in the fall, the
Nappanee tornado went against convention in both time of day and season.
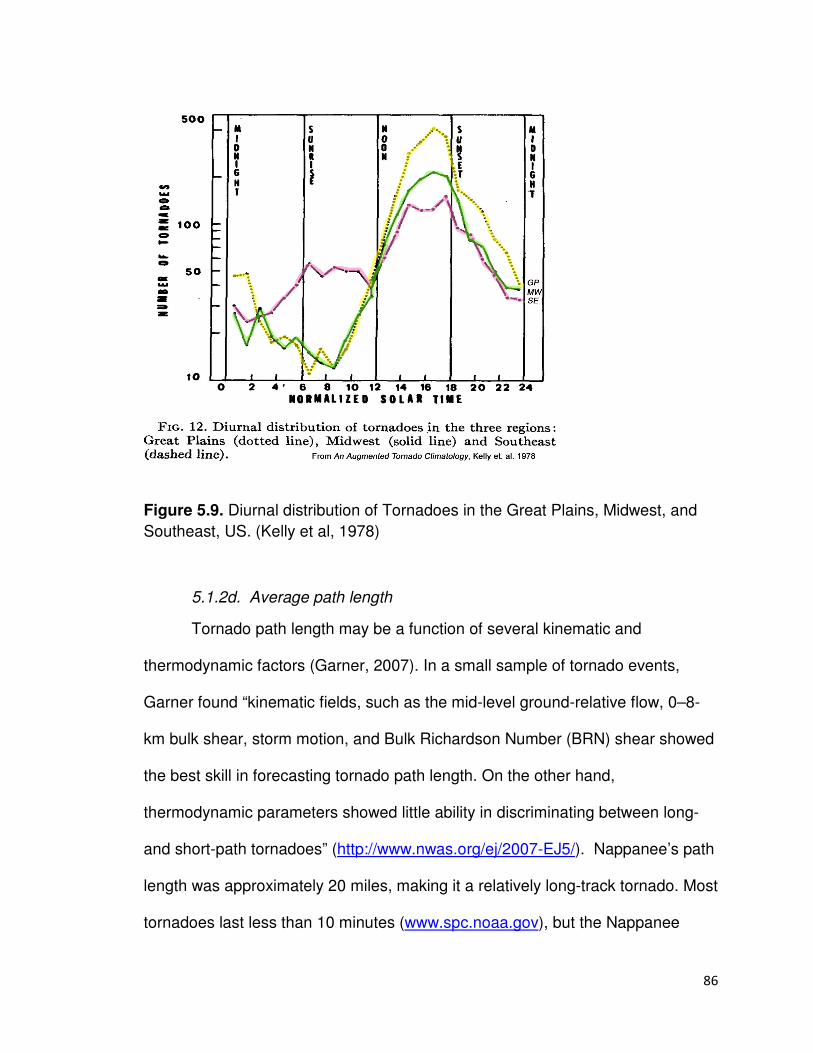
86
Figure 5.9. Diurnal distribution of Tornadoes in the Great Plains, Midwest, and
Southeast, US. (Kelly et al, 1978)
5.1.2d. Average path length
Tornado path length may be a function of several kinematic and
thermodynamic factors (Garner, 2007). In a small sample of tornado events,
Garner found “kinematic fields, such as the mid-level ground-relative flow, 0–8-
km bulk shear, storm motion, and Bulk Richardson Number (BRN) shear showed
the best skill in forecasting tornado path length. On the other hand,
thermodynamic parameters showed little ability in discriminating between long-
and short-path tornadoes” (http://www.nwas.org/ej/2007-EJ5/). Nappanee’s path
length was approximately 20 miles, making it a relatively long-track tornado. Most
tornadoes last less than 10 minutes (www.spc.noaa.gov), but the Nappanee
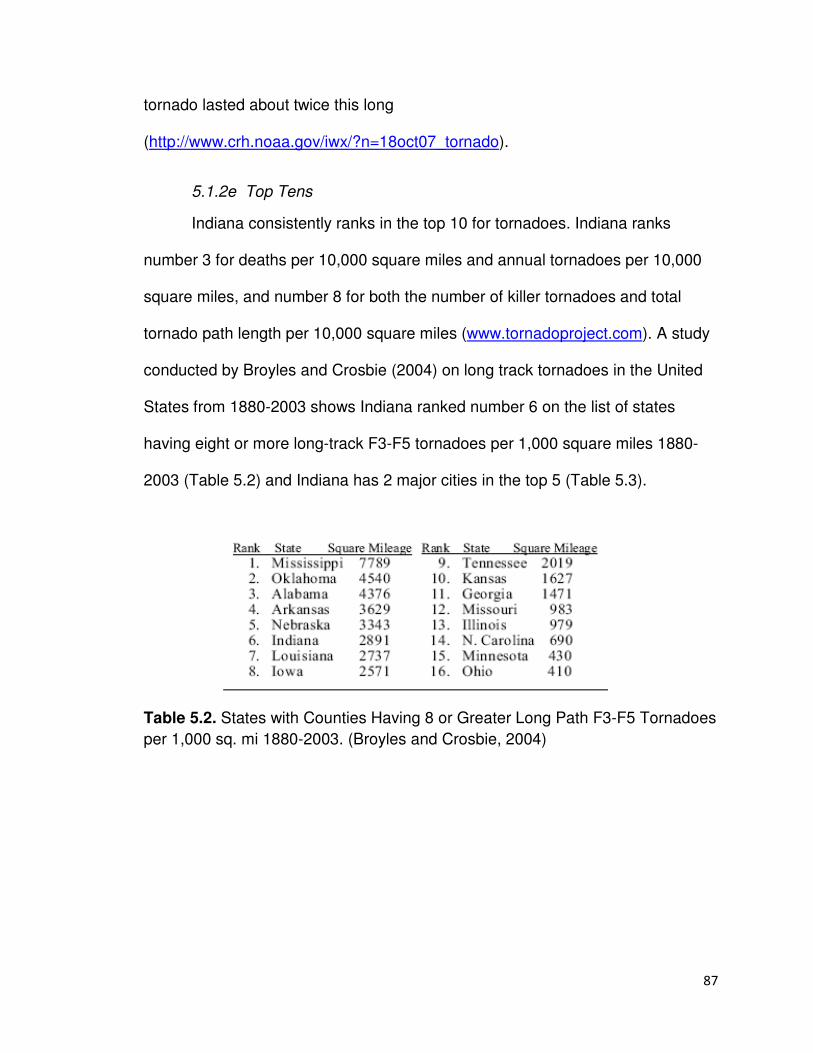
87
tornado lasted about twice this long
(http://www.crh.noaa.gov/iwx/?n=18oct07_tornado).
5.1.2e Top Tens
Indiana consistently ranks in the top 10 for tornadoes. Indiana ranks
number 3 for deaths per 10,000 square miles and annual tornadoes per 10,000
square miles, and number 8 for both the number of killer tornadoes and total
tornado path length per 10,000 square miles (www.tornadoproject.com). A study
conducted by Broyles and Crosbie (2004) on long track tornadoes in the United
States from 1880-2003 shows Indiana ranked number 6 on the list of states
having eight or more long-track F3-F5 tornadoes per 1,000 square miles 1880-
2003 (Table 5.2) and Indiana has 2 major cities in the top 5 (Table 5.3).
Table 5.2. States with Counties Having 8 or Greater Long Path F3-F5 Tornadoes
per 1,000 sq. mi 1880-2003. (Broyles and Crosbie, 2004)
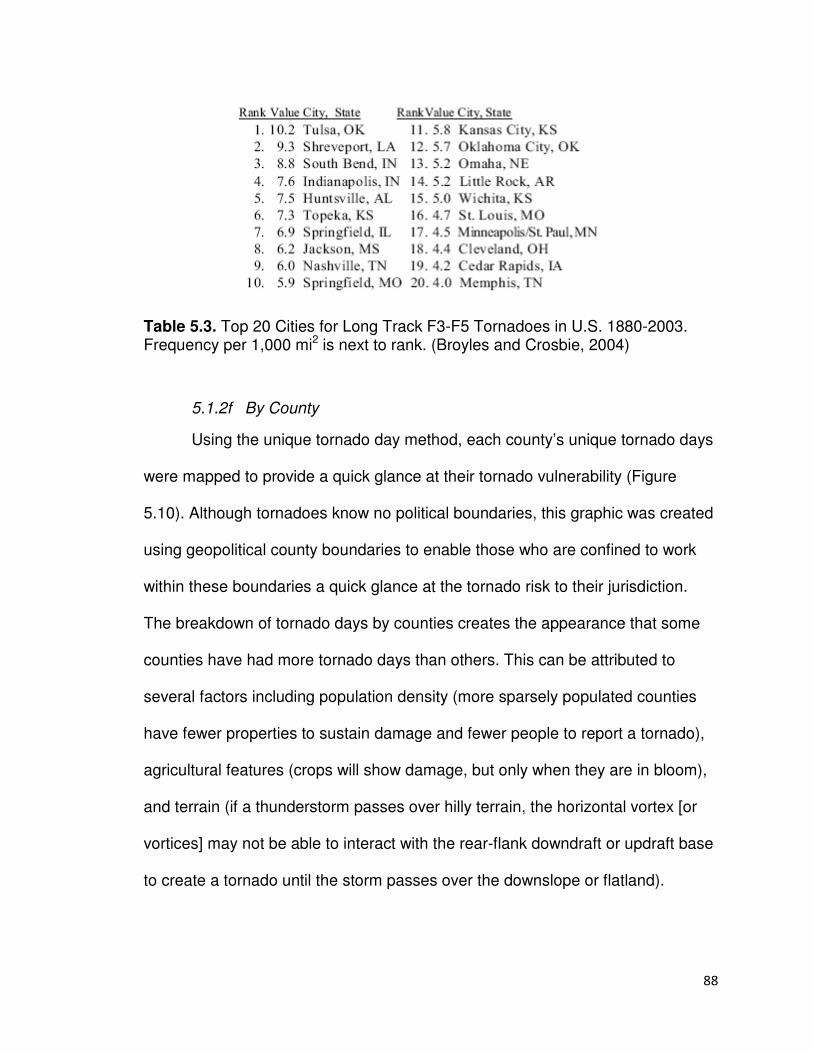
88
Table 5.3. Top 20 Cities for Long Track F3-F5 Tornadoes in U.S. 1880-2003. Frequency per 1,000 mi2 is next to rank. (Broyles and Crosbie, 2004)
5.1.2f By County
Using the unique tornado day method, each county’s unique tornado days
were mapped to provide a quick glance at their tornado vulnerability (Figure
5.10). Although tornadoes know no political boundaries, this graphic was created
using geopolitical county boundaries to enable those who are confined to work
within these boundaries a quick glance at the tornado risk to their jurisdiction.
The breakdown of tornado days by counties creates the appearance that some
counties have had more tornado days than others. This can be attributed to
several factors including population density (more sparsely populated counties
have fewer properties to sustain damage and fewer people to report a tornado),
agricultural features (crops will show damage, but only when they are in bloom),
and terrain (if a thunderstorm passes over hilly terrain, the horizontal vortex [or
vortices] may not be able to interact with the rear-flank downdraft or updraft base
to create a tornado until the storm passes over the downslope or flatland).
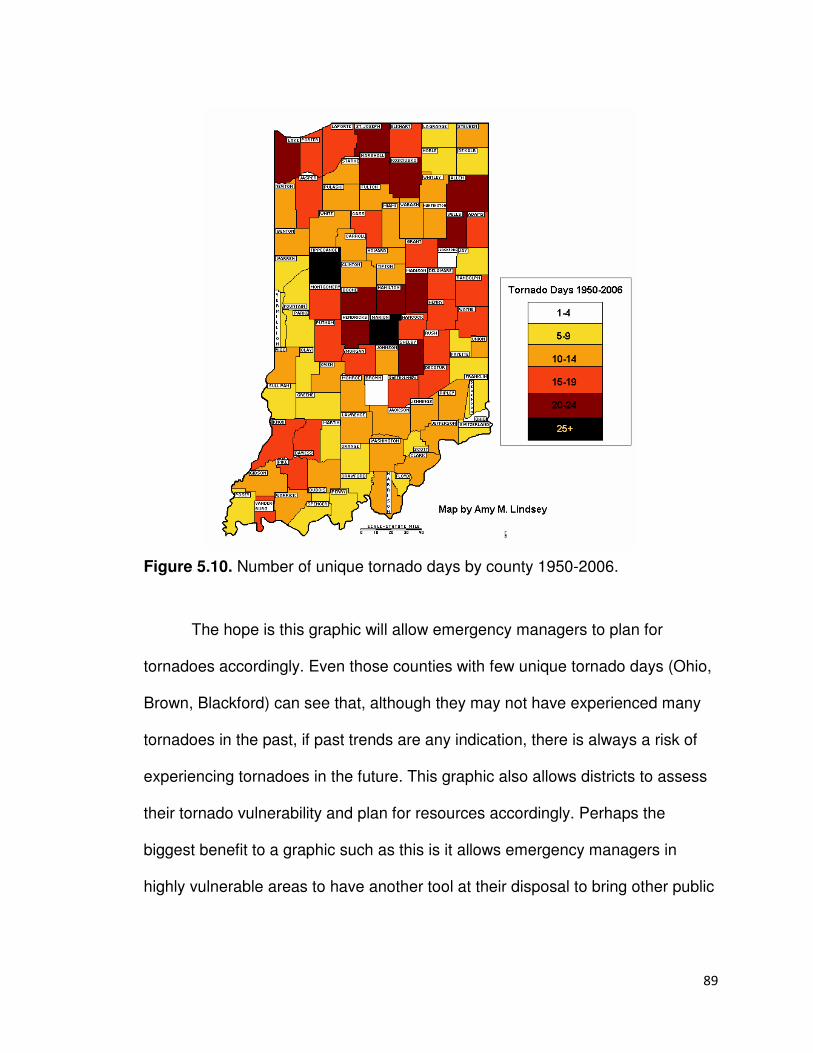
89
Figure 5.10. Number of unique tornado days by county 1950-2006.
The hope is this graphic will allow emergency managers to plan for
tornadoes accordingly. Even those counties with few unique tornado days (Ohio,
Brown, Blackford) can see that, although they may not have experienced many
tornadoes in the past, if past trends are any indication, there is always a risk of
experiencing tornadoes in the future. This graphic also allows districts to assess
their tornado vulnerability and plan for resources accordingly. Perhaps the
biggest benefit to a graphic such as this is it allows emergency managers in
highly vulnerable areas to have another tool at their disposal to bring other public
90
safety personnel into the community disaster planning fold by visually illustrating
the tornado risk to their county.
Using two sets of tornado databases, a comprehensive tornado catalog
was established for Indiana. From this, a retrospective analysis was conducted
and graphics were created by the author illustrating tornado seasonality in
Indiana by month, day of year, and county. These graphics allow a quick glance
at Indiana’s historical tornado occurrences and may be used as part of a
comprehensive hazard analysis for local emergency managers.
CHAPTER 6
CONCLUSION
This thesis aimed to understand how a tornado hazard analysis can aid
local emergency managers in the development of a comprehensive hazard
mitigation plan. A tornado climatology for Indiana was created for use by
emergency managers as part of a comprehensive, local hazard analysis. The
unique needs of the Amish community in terms of the emergency management
phases and formulate suggestions for tailoring mitigation activities of local
emergency management programs to this diverse community were explored
through an overview of the 18 October 2007 Nappanee tornado in Elkhart County
and interviews with members of the Amish church.
Indiana’s tornado climatology illustrates the importance of tornado
preparedness in Indiana. A statewide tornado climatology can be used by
emergency management to develop part of an effective hazard mitigation
program. It allows a quick glance at the tornadic events affecting not only their
community, but the larger community within the state. Information from the
hazard analysis allows emergency management to review critical infrastructures
92
such as businesses and public utilities. An effective hazard analysis also allows
the emergency manager to develop a vulnerability assessment for his/her
community and provides for situational awareness of the hazard threats.
Delimitations of this thesis included…
1. Limiting the tornado hazard analysis to Indiana and
2. Focus on a particular tornado event occurring in Elkhart County in north
central Indiana.
3. Study focused on how emergency managers could help the Amish community
throughout the four phases of emergency management.
Natural hazards have happened throughout Indiana, but by focusing on
the aforementioned delimitations, the thesis focuses on a specific natural hazard
(tornado) in a unique community (Amish) and allows public safety officials,
particularly emergency management, to structure preparedness programs to this
unique audience.
Limitations included…
1. The National Climatic Data Center (NCDC)’s tornado dataset is known to have
errors in tornado intensities,
2. Interviews with a select group of Amish and non-Amish participants affected
by the October 18, 2007 Nappanee, Indiana tornado, thus getting both an inside
perspective of how the tornado affected the Amish community and the English
perspective of the tornado and it’s after effects,
93
3. The study area was primarily limited to Indiana Homeland Security District 2,
particularly Elkhart County, and the Town of Nappanee
4. The Elkhart County Emergency Manager was on the job for less than 1 year,
limiting her ability to effectively cater to a unique community such as the Amish.
Although many lessons were learned about working with the Amish during and
after the disaster, Jennifer Tobey’s short time on the job gave her little time to
work with the Amish to preplan for disasters. An emergency management
director with more experience may have had a response and recovery plan
prepared to assist the Amish. An experienced emergency management director
also would likely have high-level contacts within the Amish community who could
have let the director know what the needs of the Amish community were instead
of having assistance forced on them as was the case in the Nappanee event.
Assumption
1. All tornado events for Indiana listed in the Grazulis and National Climatic Data
Center (NCDC)’s Storm Data during the study period were real, accurate, and
complete.
Final Thoughts on Working with the Amish
A final thought on working with Amish would be inclusion of a section on
special needs populations or non-traditional communities in the comprehensive
emergency management plan for the jurisdiction. The Amish may not ask for
specific help, but they may be willing to accept it if offered and, because Amish
94
are part of their local community, emergency managers need to be able to
provide assistance.
1. Get to know the local Amish community before a disaster strikes. Know their
strengths and what assistance they are willing to accept.
2. Be persistent but respectful. Change is a slow process for a community
steeped in tradition. Work with the local bishops to institute change, but be
prepared for it to take months or even years.
3. Ask what the Amish need following a disaster rather than forcing assistance
on them. Physical labor is generally not needed, but assistance with debris
removal may be.
4. Make preparedness relate to them and show how disasters can affect their
community. Use examples they can relate to such as natural disasters or
animal health issues that have occurred in recent memory.
Future Research
Other research may fuse lessons learned from the Amish with needs of
rural communities. A full hazard analysis for an Amish or other vulnerable
community could benefit local emergency management if it were to provide
suggestions on incorporating that community into all phases of emergency
management.
95
References
1. Association of Statisticians of American Religious Bodies. http://www.asarb.org/
http://www.valpo.edu/geomet/pics/geo200/religion/amish.gif (accessed September
29, 2008)
2. Blanchard, Wayne, 2008. Guide to emergency management and related terms,
definitions, concepts, acronyms, organizations, programs, guidance, executive
orders, & legislation: A tutorial on emergency management, broadly defined, past
and present.
3. Blanchard, B. W., Canton, L.G., Cwiak, C.L., Goss, K. C., McEntire, D.A., Newsome,
L., Selves, M.D., Sorchik, E.A., Stenson, K., Turner III, J.E., Waugh, Jr., W.L., and D.
West. Principles of Emergency Management. Emergency Management Roundtable,
September 11, 2007.
4. Bluestein, H. B., 1999: Tornado Alley: Monster Storms of the Great Plains. Oxford
Univ. Press, 180 pp.
5. Brooks, H., Zaras, D., Blais, N., and B. Flickinger. Time Series of Annual Cycle of
Tornado, Wind, and Hail Probability.
http://www.nssl.noaa.gov/hazard/hazardmap.html. (accessed January 5, 2008)
6. Broyles, J. C., and K. C. Crosbie, 2004: Evidence of smaller tornado alleys across
the United States based on a long track F3 to F5 tornado climatology study from
1880 to 2003. Preprints, 22nd Conf. Severe Local Storms, Hyannis, MA. Amer.
Meteor. Soc., http://www.spc.noaa.gov/publications/broyles/longtrak.pdf. (accessed
March 21, 2008)
7. Concannon, P.R., H.E. Brooks, and C.A. Doswell III, 2000: Climatological risk of
strong and violent tornadoes in the United States. Preprints, 2nd Conf. Environ.
Applications, Long Beach, CA. Amer. Meteor. Soc.
8. Crisis Point Response, Relief, Recovery. www.cpr3.org (accessed July 21, 2008)
9. Colquhoun, J. R., and P. A. Riley. 1996. Relationships between tornado intensity and
various wind and thermodynamic variables. Wea. Forecasting, 11, 360-371.
10. Cutter, Susan L. 2007. Estimating Disaster Resilience: The Social Vulnerability Index
of the United States (SoVI). http://www.emforum.org/vforum/lc070613.htm
(accessed October 4, 2008)
96
11. Doswell, C. A., III, and D. W. Burgess, 1988: On some issues of United States
tornado climatology. Mon. Wea. Rev. 116, 495-501.
12. Eddy, Steven. National Weather Service Forecast Office, Lincoln, Nebraska.
Personal Communication (May 17, 2008).
13. Edwards, R., and R. L. Thompson, 2000: RUC-2 supercell proximity soundings, part
ii: an independent assessment of supercell forecast parameters. Adapted from
Preprints, 20th AMS Conference on Severe Local Storms, Orlando, FL. Amer.
Meteor. Soc.
14. Environmental Protection Agency, Technical Guidance for Hazards Analysis, 1987.
15. Federal Emergency Management Agency. Strategic Plan for Fiscal Years 2008-
2013. FEMA P-422. January 2008. 64 pp.
http://www.fema.gov/pdf/about/fy08_fema_sp_bookmarked.pdf (accessed November
10, 2008)
16. Federal Emergency Management Agency and DHS Office for Civil Rights and Civil
Liberties. Interim Emergency Management Planning Guide for Special Needs
Populations. Comprehensive Preparedness Guide 301.
http://www.fema.gov/pdf/media/2008/301.pdf (accessed November 17, 2008)
17. Garner, Jonathan, 2007. A Preliminary Study on Environmental Parameters Related
to Tornado Path Length. http://www.nwas.org/ej/2007-EJ5 (accessed October 1,
2008)
18. Global Anabaptist Mennonite Encyclopedia Online (GAMEO). www.gameo.org
(accessed July 10, 2008)
19. Grazulis, T.P., 1993a: Significant Tornadoes: 1680-1991. Environmental Films, 1340
pp.
20. ________. 1993b. A 110-year perspective of significant tornadoes. The Tornado: Its
Structure, Dynamics, Prediction, and Hazards. Geophysical Monograph, No. 79.
American Geophysical Union, 467-474.
21. ________, 2008a. Percentage of All Tornadoes 1950-1994.
www.TornadoProject.com (accessed June 6, 2008)
22. ________, 2008b. Percentage of Tornado Related Deaths 1950-1994.
www.TornadoProject.com (accessed June 6, 2008)
23. Gockley, Randy. Lancaster County, Pennsylvania Emergency Management Director.
Personal Communication. (May 22, 2008)
97
24. Hart, John. SeverePlot v2.5 http://www.spc.noaa.gov/software/svrplot2/
25. Indiana State Climate Office. http://www.agry.purdue.edu/climate/ (accessed June 7,
2008)
26. Kelly, D.L., J.T. Schaefer, R.P. McNulty, C.A. Doswell III, and R.F. Abbey, Jr., 1978:
An augmented tornado climatology. Mon. Wea. Rev. 106, 1171-1183.
27. Kraybill, D.B., 2001: The Riddle of Amish Culture. Johns Hopkins University Press.
424 pp.
28. Kraybill, D.B. and S.M. Nolt, 2004: Amish Enterprise: From Plows to Profits. 2nd ed.
Johns Hopkins University Press, 304 pp.
29. Kraybill, D.B., S.M. Nolt, and D.L. Weaver-Zercher, 2007: Amish Grace: How
Forgiveness Transcended Tragedy. John Wiley & Sons Publishing, 237 pp.
30. McCarthy, D.W., and J.T. Schaefer, 2004: Tornado Trends over the Past 30 Years.
Preprints, 14th Conf. Applied Climatology, Seattle WA.
31. McEntire, David. 2007. The historical challenges facing emergency management and
homeland security. J. Emer. Mgt. 5(4), 17-21.
32. McLoughlin, D., 1985: A framework for integrated emergency management. Public
Admin. Rev. 45, 165-172.
33. Meyers, T. J., 1994: Old Order Amish: To remain in the faith or to leave. Mennonite
Qrtly. Rev. 68, 380, 392-94.
34. Meyers, T.J., and S.M. Nolt, 2005: An Amish Patchwork: Indiana’s Old Orders in the
Modern World. Indiana University Press/Quarry Books, 191 pp.
35. National Climatic Data Center. Storm Data. http://www4.ncdc.noaa.gov/cgi-
win/wwcgi.dll?wwEvent~Storms (accessed December 20, 2007)
36. National Weather Service Office of Northern Indiana. EF3 Tornado confirmed from
October 18th Storms. http://www.crh.noaa.gov/iwx/?n=18oct07_tornado (accessed
May 3, 2008)
37. Schaefer, J.T., R.L. Livingston, F.P. Ostby, and P.W. Leftwich, 1993: The stability of
climatological tornado data. The Tornado: Its Structure, Dynamics, Prediction, and
Hazards. Geophysical Monograph, No. 79. American Geophysical Union, 459-466.
38. Schaefer, J. T., and R. Edwards, 1999: The SPC tornado/severe thunderstorm
database. Preprints, 11th Conf. Applied Climatology, Dallas, TX.
http://www.spc.noaa.gov/publications/
98
39. Schneider, R. S., J. T. Schaefer, and H. E. Brooks, 2004: Tornado outbreak days:
An updated and expanded climatology 1875-2003. Preprints, 22nd Conf. on Severe
Local Storms, Hyannis, MA. Amer. Meteor. Soc.
http://www.spc.noaa.gov/publications/
40. Shachtman, T., 2007: Rumspringa: To Be or Not To Be Amish. North Point Press,
283 pp.
41. Smith, Bryan T., Chad Omitt, and Jared L. Guyer, 2007. Characteristics of cool
season severe environments in the Ohio Valley 1995-2006.
http://www.crh.noaa.gov/images/ind/cool_season.pdf (accessed September 6, 2008)
42. Storm Prediction Center. www.spc.noaa.gov (accessed March 14, 2008)
43. Texas Tech University Wind Science and Engineering Center, 2006. A
Recommendation for an Enhanced Fujita Scale. http://www.wind.ttu.edu/EFScale.pdf
(accessed August 18, 2008)
44. Tobey, Jennifer. Elkhart County, Indiana Emergency Management Director, Personal
Communication. (November 2007)
45. United States Census. www.census.gov (accessed July 18, 2008)
46. United States Department of Agriculture. www.usda.gov (accessed September 6,
2008)
47. United States Department of Homeland Security, 2006. Civil Defense and Homeland
Security: A Short History of National Preparedness Efforts.
http://www.training.fema.gov/EMIWeb/edu/highpapers.asp (accessed February 6,
2008).
48. Verbout, S.M., H.E. Brooks, L.M. Leslie, and D.M. Schultz, 2006: Evolution of the
U.S. tornado database: 1954-2003. Wea. Forecasting, 21, 86-93.
49. Vogeler, Ingolf. Technology use in various Amish communities.
http://www.uwec.edu/geography/Ivogeler/w188/utopian/amish-communities-
technology.jpg. (accessed September 24, 2008)
50. Wisner, B., P.M. Blaikie, T. Cannon, and I. Davis, 2003: At risk: Natural Hazards,
People’s Vulnerability, and Disasters. 2nd edition. Routledge, 464 pp.
51. Young Center for Anabaptist and Pietist Studies at Elizabethtown College.
www2.etown.edu/amishstudies (accessed May 4, 2008)

APPENDIX A
DEFINITIONS AND TERMS
100
Definitions and Terms
1. Affiliation: Amish church districts that recognize one another’s discipline.
Also known as being “in fellowship” with another church district (Meyers, T.J.,
and S.M. Nolt, 2005: An Amish Patchwork: Indiana’s Old Orders in the Modern
World, p.19).
2. Disaster: An event that requires resources beyond the capability of a
community and requires and multiple agency response (Blanchard, Wayne,
2008. Guide to emergency management and related terms, definitions,
concepts, acronyms, organizations, programs, guidance, executive orders, &
legislation: A tutorial on emergency management, broadly defined, past and
present, p. 274)
3. District: Local Amish churches, also known as church districts (Meyers, T.J.,
and S.M. Nolt, 2005: An Amish Patchwork: Indiana’s Old Orders in the Modern
World, p.17)
4. Emergency management phases: Mitigation, preparedness, protection,
response, and recovery. The phases are cyclic with no clear ending or
beginning. Mitigation can be ongoing while recovery from an event is
happening. Federal Emergency Management Agency Strategic Plan for
Fiscal Years 2008-2013. FEMA P-422, January 2008. 64 pp.
- Mitigation: Provides a critical foundation in the effort to reduce the loss of
life and property from natural and/or man-made disasters by avoiding or
lessening the impact of a disaster and providing value to the public by
101
creating safer communities. Mitigation seeks to fix the cycle of disaster
damage, reconstruction, and repeated damage. These activities or
actions, in most cases, will have a long-term sustained effect (p. 50).
- Preparedness: Continuous cycle of planning, organizing, training,
equipping, exercising, evaluating, and improving in an effort to ensure
effective coordination during incident response (p. 51).
- Prevention: Actions to avoid an incident or to intervene to stop an incident
from occurring. Prevention involves actions taken to protect lives and
property (p. 51).
- Response: Activities that address the short-term, direct effects of an
incident. Response includes immediate actions to save lives, protect
property, and meet basic human needs. Response also includes the
execution of emergency operations plans and of mitigation activities
designed to limit the loss of life, personal injury, property damage, and
other unfavorable outcomes (p. 52).
- Recovery: The development, coordination, and execution of service and
site restoration plans; the reconstitution of government operations and
services; individual, private-sector, non-governmental, and public
assistance programs to provide housing and promote restoration; long-
term care and treatment of affected persons; additional measures for
social, political, environmental, and economic restoration (p. 52).
5. Hazard: An event or physical condition that has the potential to cause
fatalities, injuries, property damage, infrastructure damage, agricultural loss,
damage to the environment, interruption of business, or other types of harm
or loss. Hazards are both naturally occurring (tornadoes, floods, blizzards,
etc.) and human-caused (terrorism, cyber failures, power plant accidents,
etc.). (Blanchard, Wayne, 2008. Guide to emergency management and
related terms, definitions, concepts, acronyms, organizations, programs,

102
guidance, executive orders, & legislation: A tutorial on emergency
management, broadly defined, past and present, pg. 528)
6. Hazard analysis: The basis for development of the emergency management
program. It evaluates what could happen, the likelihood of this event
occurring and the magnitude of problems created because of a given event.
By identifying potential events that could occur, efforts can be directed
towards mitigation activities and developing needed response plans. Although
this is not a complex task it does require a comprehensive review of the
natural and technological (man-made) hazards of the region. Consideration
must be given to the possibility of damage or failure of facilities, loss of basic
utilities, and multiple casualty events, to name a few. The organization must
also consider the effect of a loss of trust from the community as well as legal
ramifications, if it fails to respond properly. Consulting with local emergency
planners, public health, fire, police, public works, and utility company officials
is essential to this process in identifying current hazards and historical events
that have occurred in the region. Examples of this would be obtaining
information on the region’s 100-year flood plain record, hurricane or severe
storm experience, earthquake potential, utility outage records and hazardous
materials concerns in the area. (Blanchard, Wayne, 2008. Guide to
emergency management and related terms, definitions, concepts, acronyms,
organizations, programs, guidance, executive orders, & legislation: A tutorial
on emergency management, broadly defined, past and present, pg. 534)
103
7. Old Order Amish: Those churches whose members use horse and buggy
transportation on the road (Meyers, T.J., and S.M. Nolt, 2005: An Amish
Patchwork: Indiana’s Old Orders in the Modern World, p. 5).
8. Settlement: A group of Amish church districts in a given geographic area that
also share a common history. Eg. Elkhart-Lagrange settlement or Nappanee
settlement. Geographically adjacent settlements without a shared history and
origin are considered distinct settlements (Meyers, T.J., and S.M. Nolt, 2005: An
Amish Patchwork: Indiana’s Old Orders in the Modern World, p. 19)
9. Tornado climatology: For the purpose of this thesis, a study of the tornado
events affecting Indiana over a study period of 57 years.
10. Unique tornado day: a day characterized as having one or more tornado
events within Indiana in a 24 hour period. For example, tornadoes occurring
in Noble, LaGrange, and Kosciusko counties at 1200, 1245, and 1726 on May
23rd, 1978 are classified as 1 unique tornado day (5/23/78). A tornado
occurring at 1200 on June 12, 1954 in St. Joseph County and a tornado
occurring in Marion and Jasper Counties on June 14, 1954 at 1700 would be
considered a two unique tornado days. Because tornadoes often contain
multiple segments or cross county/state lines and be counted separately,
individual tornadoes were not used in this project. Instead, a dataset of
tornado days was created. Each 24-hour period was considered a unique
tornado day.

APPENDIX B
ACRONYMS
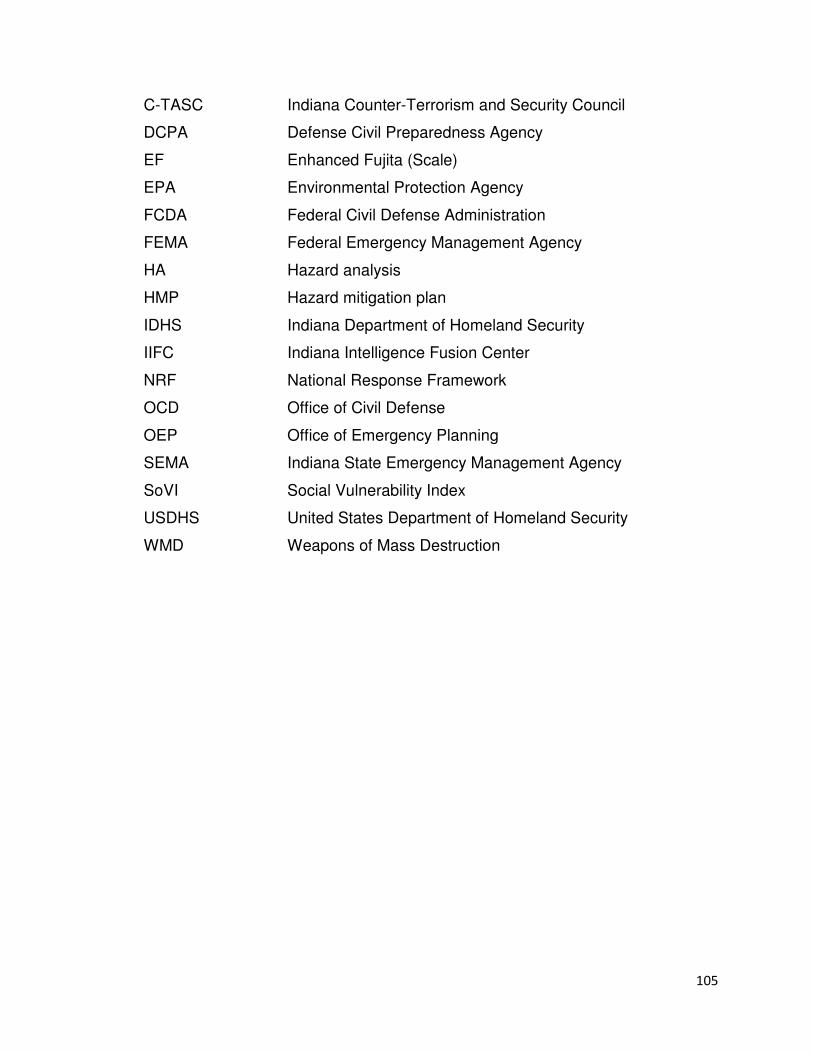
105
C-TASC Indiana Counter-Terrorism and Security Council
DCPA Defense Civil Preparedness Agency
EF Enhanced Fujita (Scale)
EPA Environmental Protection Agency
FCDA Federal Civil Defense Administration
FEMA Federal Emergency Management Agency
HA Hazard analysis
HMP Hazard mitigation plan
IDHS Indiana Department of Homeland Security
IIFC Indiana Intelligence Fusion Center
NRF National Response Framework
OCD Office of Civil Defense
OEP Office of Emergency Planning
SEMA Indiana State Emergency Management Agency
SoVI Social Vulnerability Index
USDHS United States Department of Homeland Security
WMD Weapons of Mass Destruction

APPENDIX C
SCHOOL SAFETY PLAN FOR AMISH PAROCHIAL SCHOOLS

107

108
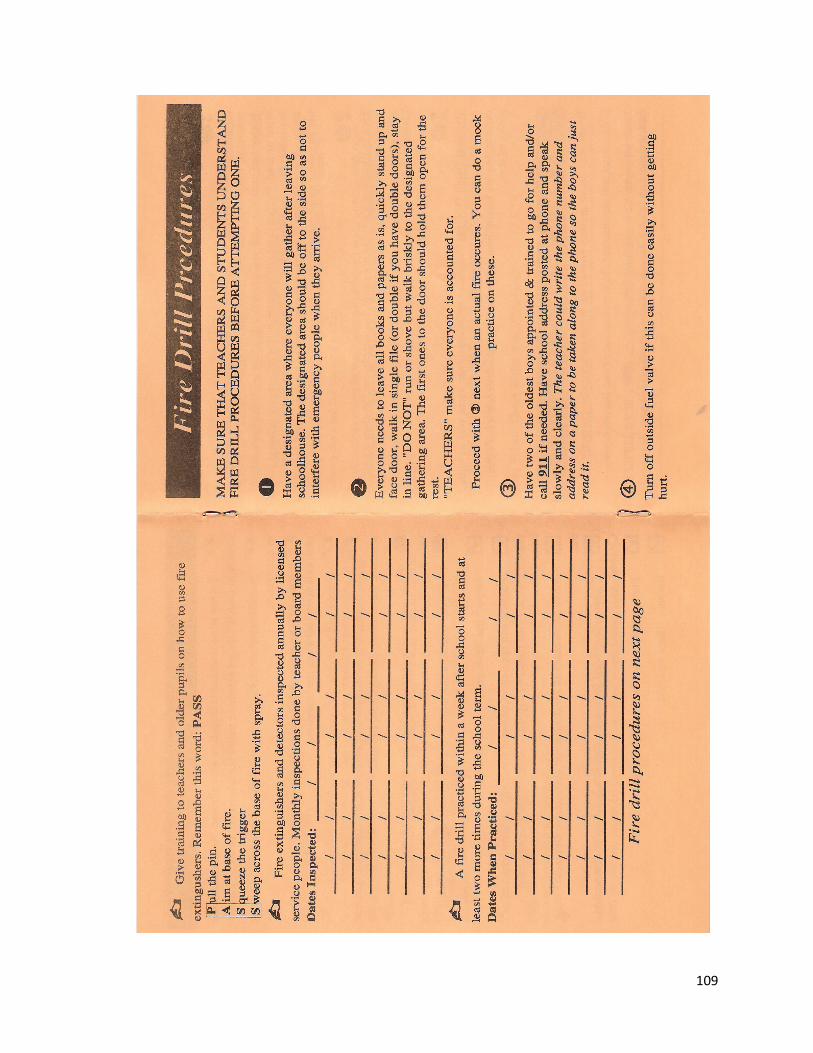
109
110
111
112

APPENDIX D
18 OCTOBER 2008 NAPPANEE, INDIANA DAMAGE PHOTOS
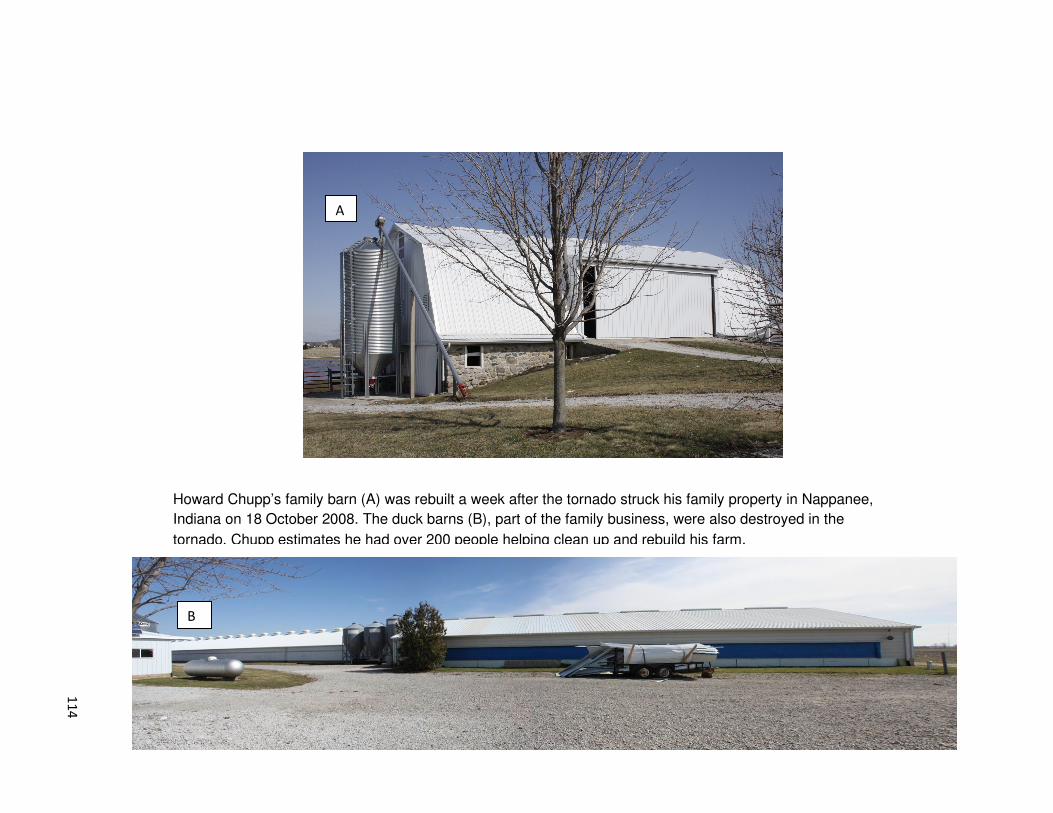
11
4
A
B
Howard Chupp’s family barn (A) was rebuilt a week after the tornado struck his family property in Nappanee,
Indiana on 18 October 2008. The duck barns (B), part of the family business, were also destroyed in the
tornado. Chupp estimates he had over 200 people helping clean up and rebuild his farm.
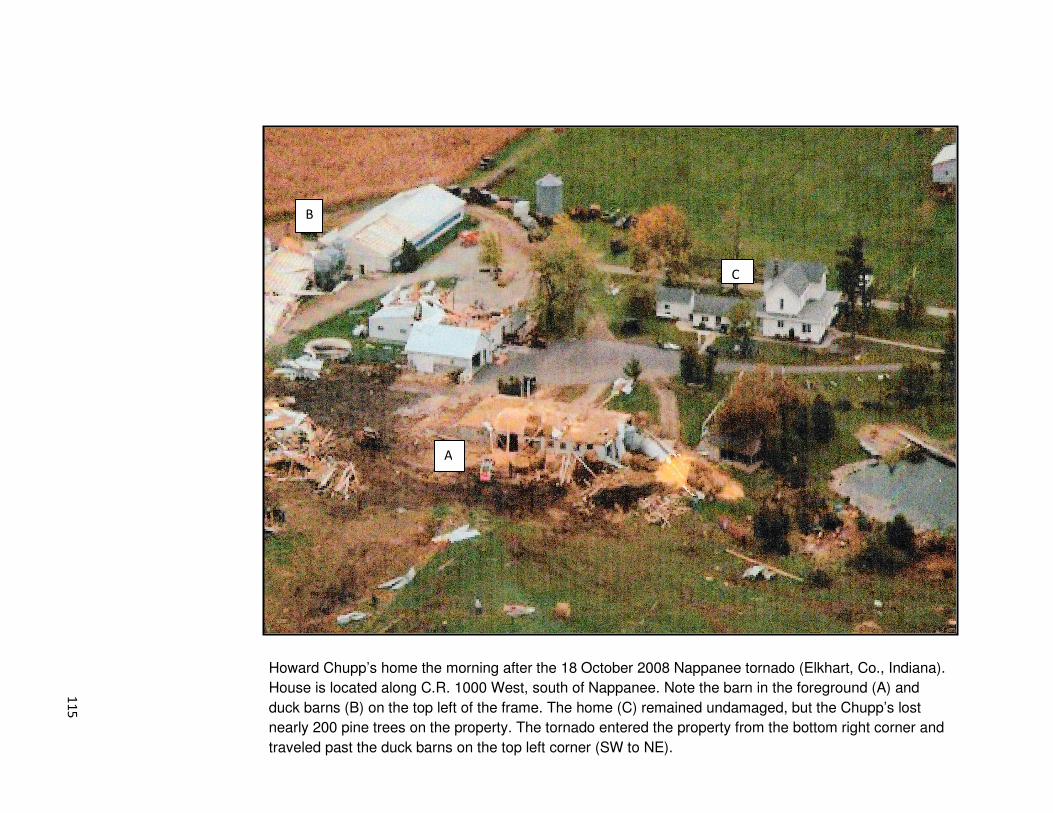
11
5
Howard Chupp’s home the morning after the 18 October 2008 Nappanee tornado (Elkhart, Co., Indiana).
House is located along C.R. 1000 West, south of Nappanee. Note the barn in the foreground (A) and
duck barns (B) on the top left of the frame. The home (C) remained undamaged, but the Chupp’s lost
nearly 200 pine trees on the property. The tornado entered the property from the bottom right corner and
traveled past the duck barns on the top left corner (SW to NE).
A
B
C
APPENDIX E
PRESIDENTIAL DISASTER DECLARATION REQUESTS
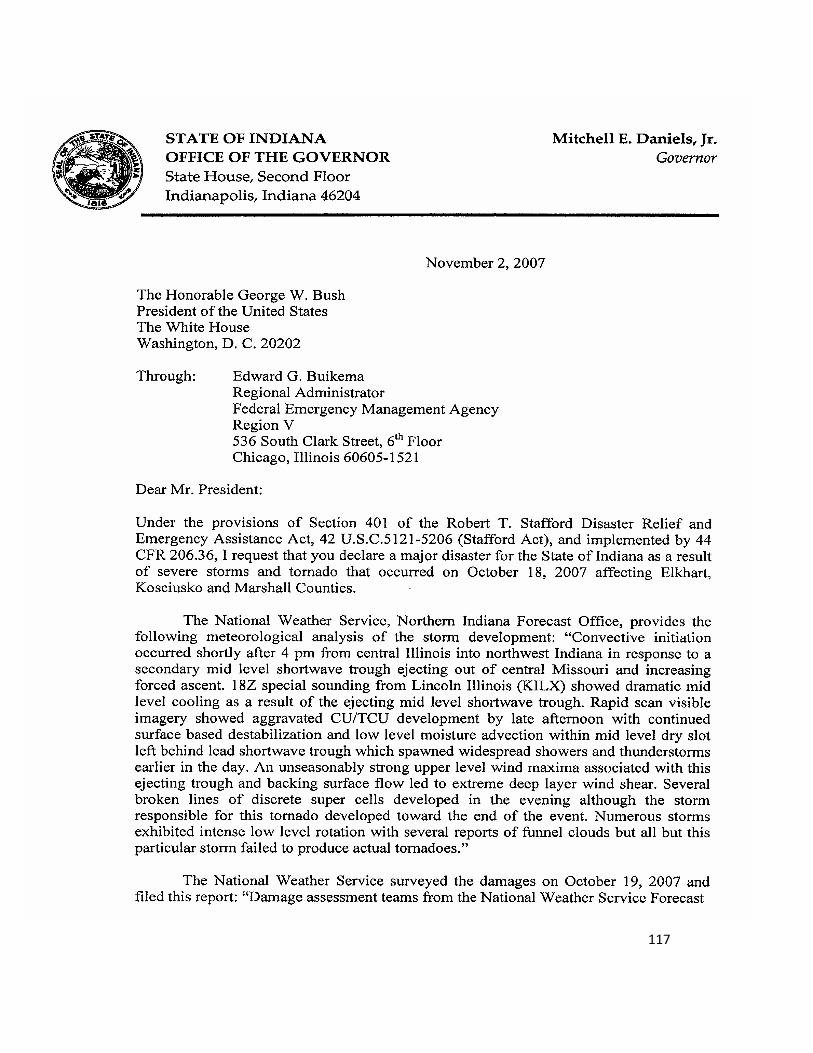
117
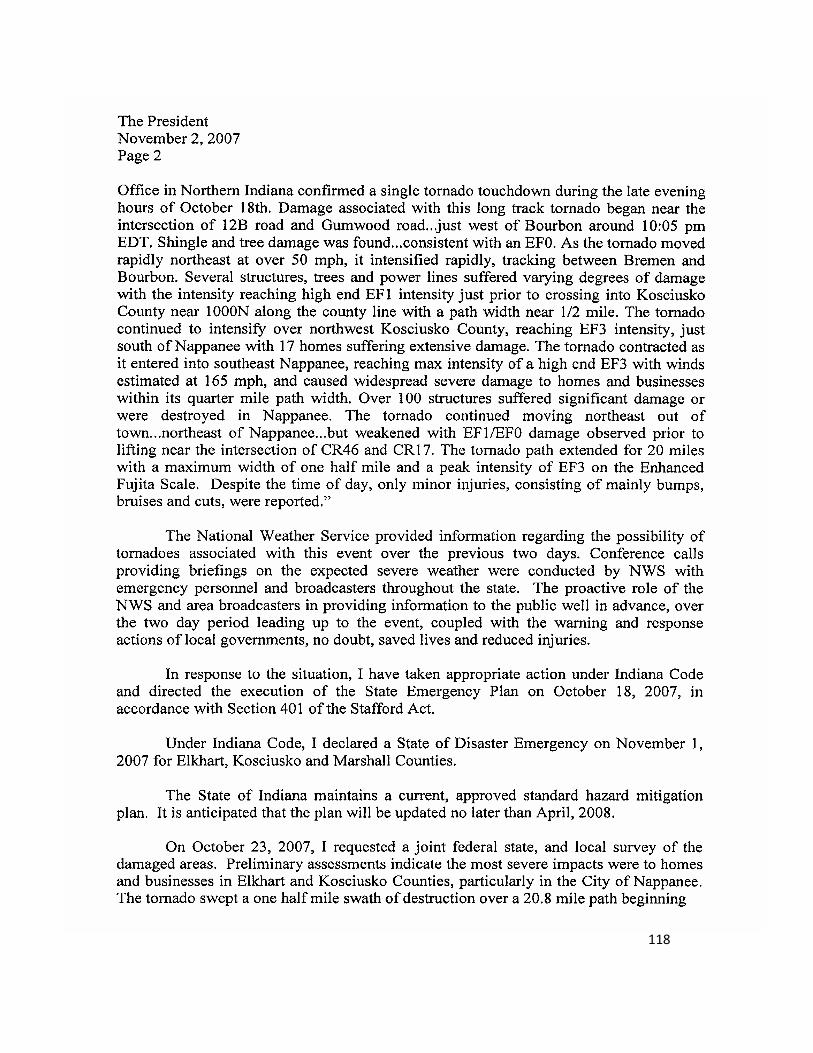
118
119
120
121
122
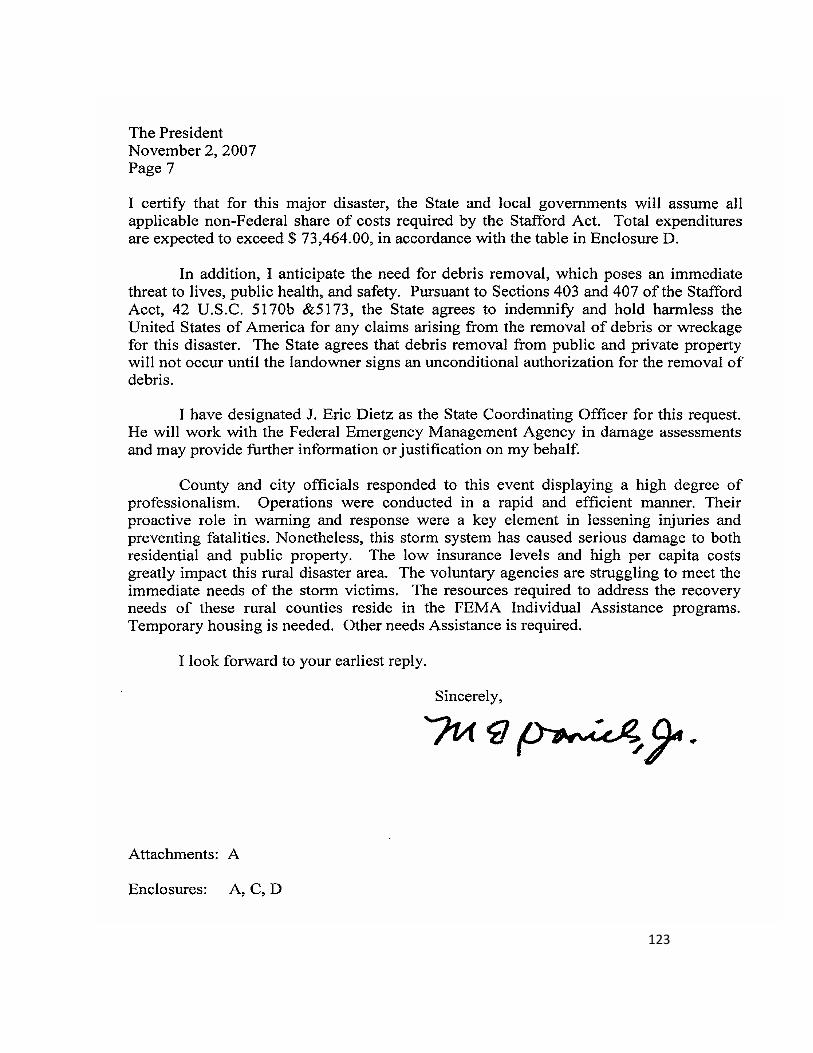
123
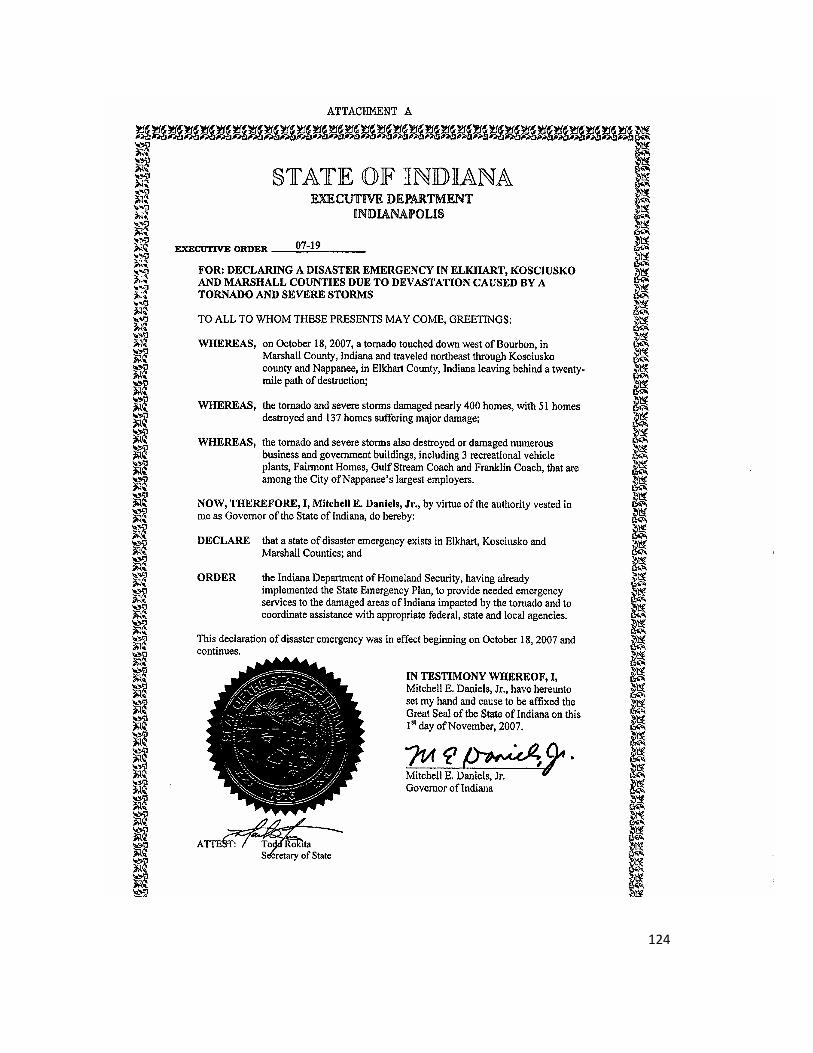
124
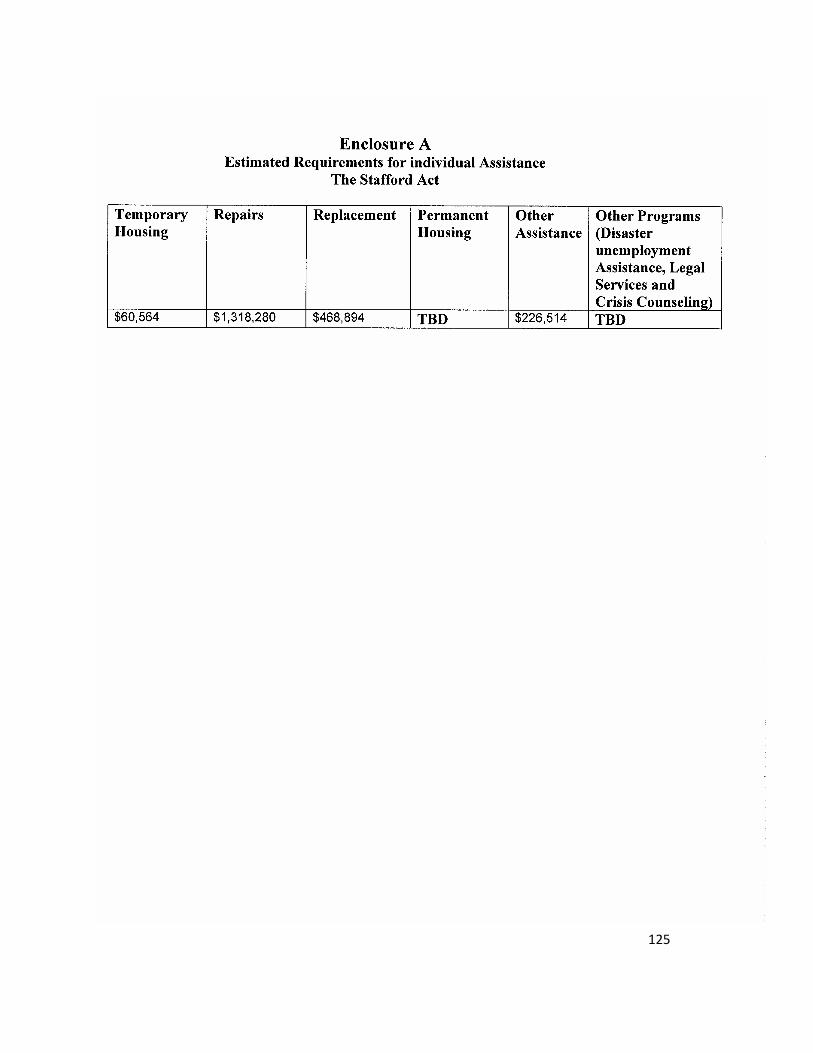
125
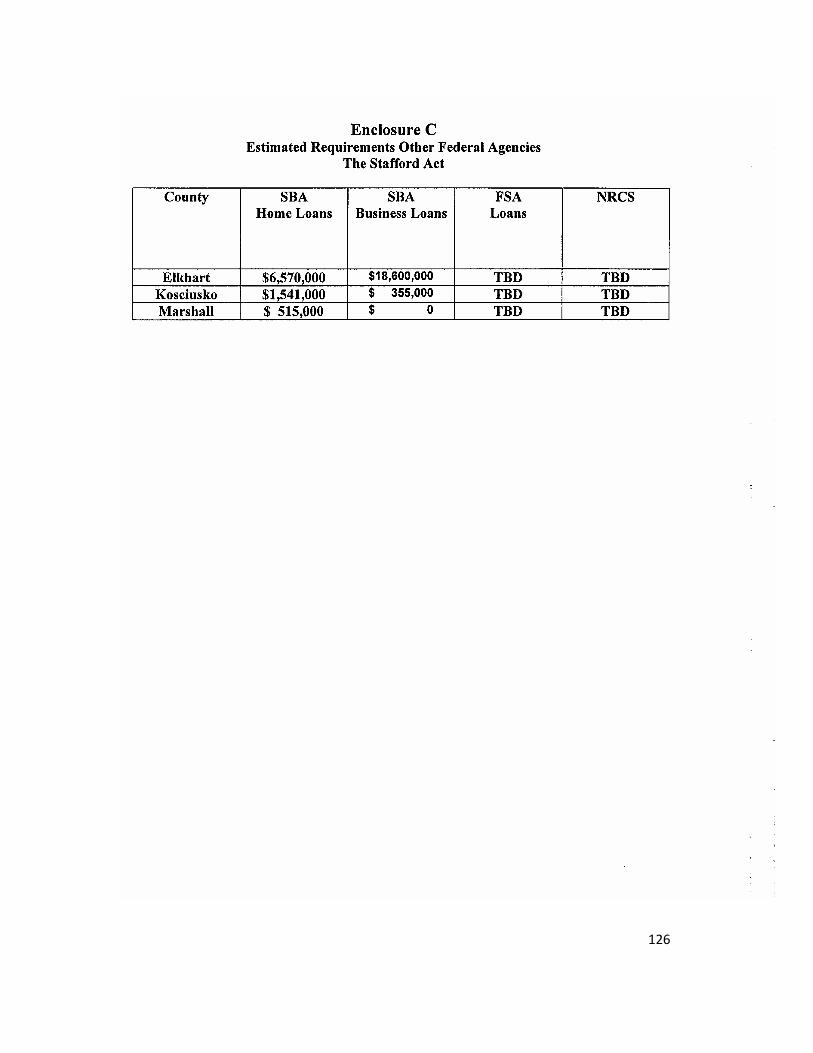
126
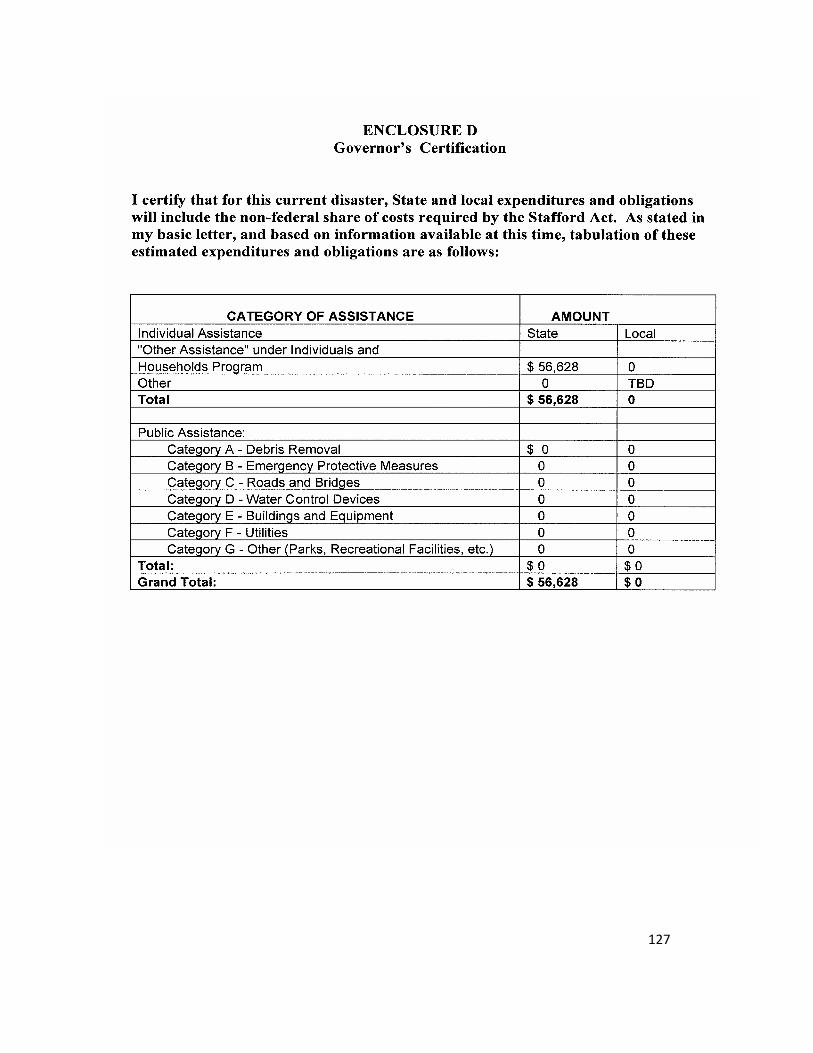
127

APPENDIX F
ENHANCED FUJITA SCALE DAMAGE INDICATORS

129
Enhanced Fujita Scale Damage Indicators
NUMBER DAMAGE INDICATOR ABBREVIATION
1 Small barns, farm outbuildings SBO
2 One- or two-family residences FR12
3 Single-wide mobile home (MHSW) MHSW
4 Double-wide mobile home MHDW
5 Apt, condo, townhouse (3 stories or less) ACT
6 Motel M
7 Masonry apt. or motel MAM
8 Small retail bldg. (fast food) SRB
9 Small professional (doctor office, branch bank) SPB
10 Strip mall SM
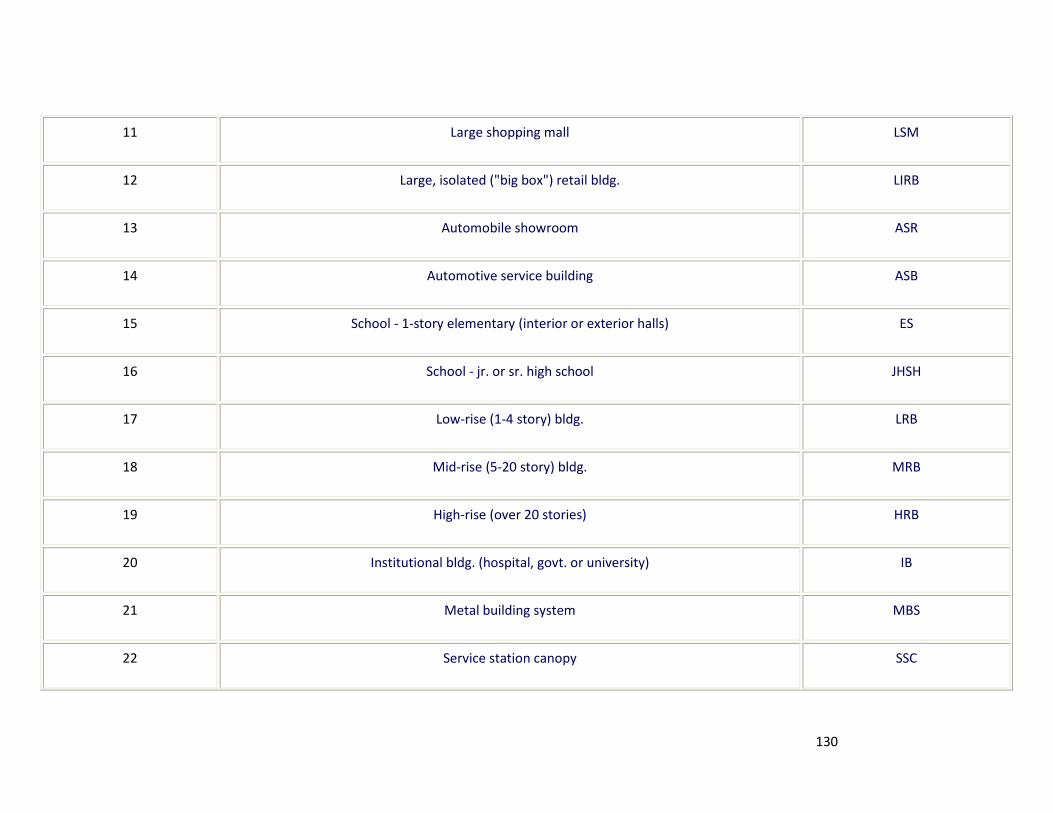
130
11 Large shopping mall LSM
12 Large, isolated ("big box") retail bldg. LIRB
13 Automobile showroom ASR
14 Automotive service building ASB
15 School - 1-story elementary (interior or exterior halls) ES
16 School - jr. or sr. high school JHSH
17 Low-rise (1-4 story) bldg. LRB
18 Mid-rise (5-20 story) bldg. MRB
19 High-rise (over 20 stories) HRB
20 Institutional bldg. (hospital, govt. or university) IB
21 Metal building system MBS
22 Service station canopy SSC
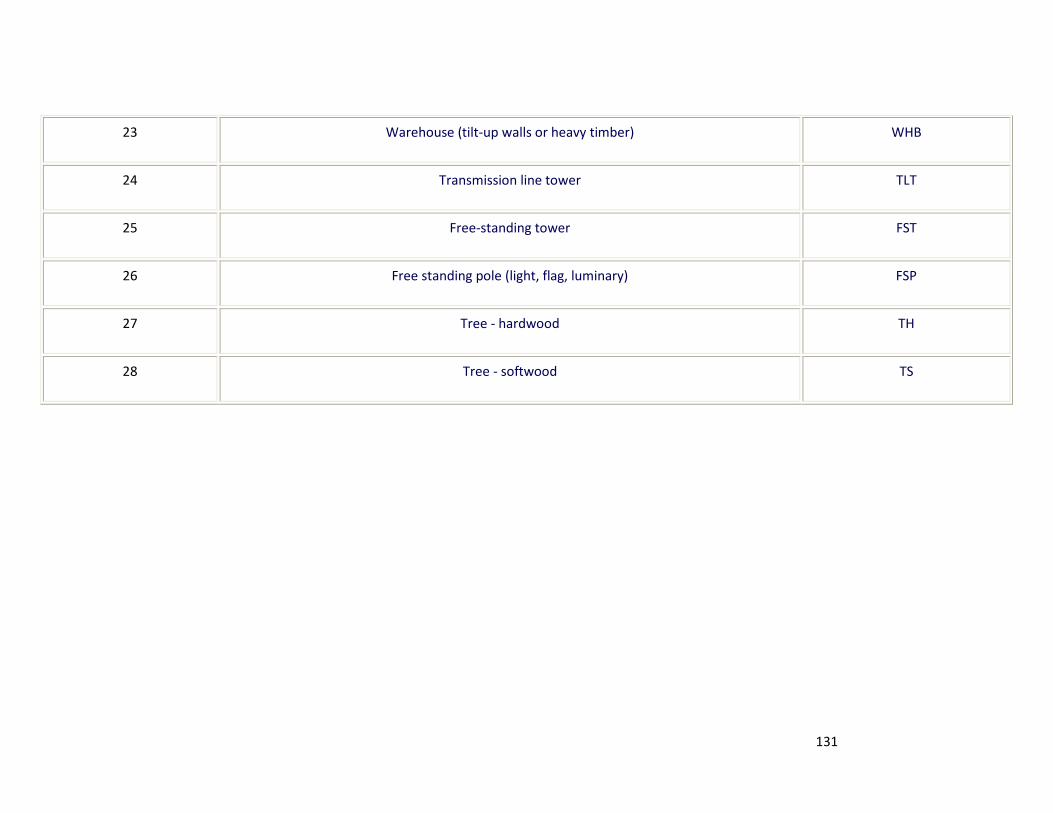
131
23 Warehouse (tilt-up walls or heavy timber) WHB
24 Transmission line tower TLT
25 Free-standing tower FST
26 Free standing pole (light, flag, luminary) FSP
27 Tree - hardwood TH
28 Tree - softwood TS