A thesis submitted to Anglo-American University for the ...
67
REPORTING OF GOOD VERSUS BAD NEWS IN THE PHARMACEUTICAL INDUSTRY A thesis submitted to Anglo-American University for the degree of M.A. in Business and Law in International Markets Spring 2019 MIHAELA STRATULAT PETER BOLCHA, PH.D. SCHOOL OF BUSINESS ADMINISTRATION
-
Upload
khangminh22 -
Category
Documents
-
view
0 -
download
0
Transcript of A thesis submitted to Anglo-American University for the ...

REPORTING OF GOOD VERSUS BAD NEWS IN THE
PHARMACEUTICAL INDUSTRY
A thesis submitted to Anglo-American University for the
degree of
M.A. in Business and Law in International Markets
Spring 2019
MIHAELA STRATULAT
PETER BOLCHA, PH.D.
SCHOOL OF BUSINESS ADMINISTRATION

i
DECLARATION
I hereby declare that no portion of the work referred to in this thesis has been submitted
in support of an application for another degree, or qualification thereof, or for any other
university or institute of learning.
I declare that this thesis is my independent work. All sources and literature are cited
and included.
I also hereby consent to my thesis being made publicly available via online open access
and for circulation in the Anglo-American University Library.
Mihaela Stratulat

ii
Table of Contents
1. INTRODUCTION ............................................................................................. 1
2. LITERATURE REVIEW .................................................................................. 2
3. INDUSTRY OVERVIEW ................................................................................. 7
A. KEY PLAYERS & RECENT NEWS ...................................................................... 7 B. INDUSTRY’S BAD REPUTATION ....................................................................... 9
4. DATA AND RESEARCH METHODOLOGY ................................................ 11
A. DATA COLLECTED ........................................................................................ 11 B. RESEARCH METHODOLOGY ........................................................................... 13
5. ANALYSIS OF BAYER ................................................................................. 17
A. COMPANY OVERVIEW ................................................................................... 17 B. FINANCIAL ANALYSIS ................................................................................... 17 C. CONTENT ANALYSIS ..................................................................................... 19 D. IMPRESSION MANAGEMENT ANALYSIS .......................................................... 24
6. ANALYSIS OF GLAXOSMITHKLINE ......................................................... 27
A. COMPANY OVERVIEW ................................................................................... 27 B. FINANCIAL ANALYSIS ................................................................................... 27 C. CONTENT ANALYSIS ..................................................................................... 29 D. IMPRESSION MANAGEMENT ANALYSIS .......................................................... 33
7. ANALYSIS OF NOVARTIS ........................................................................... 37
A. COMPANY OVERVIEW ................................................................................... 37 B. FINANCIAL ANALYSIS ................................................................................... 37 C. CONTENT ANALYSIS ..................................................................................... 39 D. IMPRESSION MANAGEMENT ANALYSIS .......................................................... 44
8. DISCUSSION ................................................................................................. 48
A. COMPARISON OF THE THREE COMPANIES ...................................................... 48 B. OTHER IMPRESSION MANAGEMENT TECHNIQUES........................................... 50
9. CONCLUSION ............................................................................................... 53
BIBLIOGRAPHY ...................................................................................................... I APPENDICES ........................................................................................................ VI
APPENDIX A: FINANCIAL FIGURES OF THE COMPANIES .......................................... VI APPENDIX B: DETAILED RESULTS OF THE CONTENT ANALYSES ...........................VIII

iii
List of Tables
Table 1: Financial Analysis of Bayer ....................................................................... 17
Table 2: Number of good & bad codings for Bayer .................................................. 19
Table 3: Word count analysis of Bayer's statements ................................................. 21
Table 4: Financial Analysis of GlaxoSmithKline...................................................... 27
Table 5: Number of good & bad codings for GlaxoSmithKline ................................ 29
Table 6: Word count analysis of GlaxoSmithKline's statements ............................... 30
Table 7: Financial Analysis of Novartis ................................................................... 37
Table 8: Number of good & bad codings for Novartis .............................................. 39
Table 9: Word count analysis of Novartis' statements .............................................. 41
Table 10: Word count comparison of all three companies........................................ 48
Table 11: Financial figures of Bayer ........................................................................VI
Table 12: Financial figures of GlaxoSmithKline ..................................................... VII
Table 13: Financial figures of Novartis .................................................................. VII
Table 14: Results of analysis of Bayer's statements ................................................ VIII
Table 15: Results of analysis of GlaxoSmithKline's statements .................................IX
Table 16: Results of analysis of Novartis' statements ................................................. X
List of Figures
Figure 1: Market Share in the Pharmaceutical Industry ............................................ 8
Figure 2: Profit after Tax vs. Good & Bad News in Bayer ....................................... 20
Figure 3: Profit after Tax vs. Good & Bad News in GlaxoSmithKline ...................... 30
Figure 4: Profit after Tax vs. Good & Bad News in Novartis ................................... 40

1
1. INTRODUCTION
Besides reporting the company’s financial statements, accompanying those with a
corporate or accounting narrative has also become a standard practice. Corporate
narratives now play a crucial role in the company’s annual reporting, being a good
source of information for shareholders to track the company’s performance. These
narratives, however, are not regulated and are often an opportunity for companies to
employ impression management techniques.
The concept of impression management was first introduced by Goffman (1959),
who discussed the self-presentation techniques individuals use to manage others’
impressions of them. This book was later used as a basis for numerous studies applying
the concept to a corporate level. Hooghiemstra (2000) defined impression management
as a field of study dealing with the way individuals present themselves to be favorably
perceived by others. Companies, just like individuals, use impression management
techniques in their narratives in an attempt to manage stakeholders’ perceptions of
them.
Reporting of good and bad news regarding the companies’ performances has also
become a subject of interest for various researchers. The aim of such research is to
determine whether companies focus mainly on the positive aspects, or address the
negative ones as well, and whether they take responsibility for the bad news.
The purpose of this research is, thus, to investigate the different disclosure
strategies that organizations undertake, specifically regarding good aspects of their
performance versus bad ones. The aim is to answer the research question – “What
impression management tactics are companies using when reporting good vs bad
news?”. Using a case study approach, the subject of this research is the European
pharmaceutical industry, specifically three of the top companies – Bayer,
GlaxoSmithKline, and Novartis.
The pharmaceutical industry is often largely scrutinized by the public, its
questionable ethicality severely damaging its reputation and leading to stakeholders
losing trust in the companies (Parker, 2007). Thus, the industry’s bad reputation among
stakeholders and close link to human welfare are the main roots of the importance and
interest in studying it. The chosen three companies are big and well-known entities,

2
part of the industry’s top, therefore, researching them will shed more light on the
impression management tactics used in the industry.
The rest of the thesis is organized as follows: the next section provides a review of
existing literature and discusses the value that this research brings. Chapter 3 brings a
discussion about the pharmaceutical industry, its reputation, and an overview of the key
players. Chapter 4 discusses the collected data, the chosen research methodology, and
describes the coding rationale. Chapters 5, 6 and 7 provide the results of the analyses
of Bayer, GSK, and Novartis, respectively, including financial, content and impression
management analyses. Chapter 8 brings a discussion of the findings, with a comparison
of the three analyzed companies, and other impression management tactics that were
used. The conclusion, limitations of the research, and future research opportunities are
provided in Chapter 9.
2. LITERATURE REVIEW
When introducing the concept of impression management in his book titled “The
Presentation of Self in Everyday Life”, Goffman (1959) also makes a dramaturgical
analogy. He explains that, in a similar manner that characters are portrayed by actors to
an audience, so do people present themselves in social interactions, employing different
techniques to manage the impressions they make.
While having its roots in literature on social psychology, impression management
later expanded into the corporate field. Brennan, Guillamon-Saorin & Pierce (2009)
write that, in the corporate context, this concept appears when the stakeholders’
perception of the company’s performance is twisted due to the manner in which it
presents selected information1. The authors further discuss other studies conducted in
this field, stating that most of them name self-attribution of a company’s results as the
main motivation for managers2. The main hypotheses are usually centered around the
proposition that management wants to conceal the inadequate results, resorting to
obfuscation of the failures and emphasis of the successes3. The most commonly used
method when researching impression management techniques is content analysis, the
1 The authors refer to the works of Neu (1991) and Neu et al. (1998) 2 Ibid. 3 The authors refer to Adelberg (1979)

3
authors also summarizing the main approaches of this method that were used by
previous researchers (ibid.).
Wang (2016) provided a literature review of impression management in corporate
information disclosure. The author states that companies generally use it as a tool to
bridge the gap between their actual status and their desired one (p.727). The research
done on financial information mainly concerns itself with the way companies may
control the descriptions featured in their financial reports to enhance their image.
Studies have also been conducted into the readability of reports, finding that managers
may use graphs or different narratives to influence it (ibid.). This tactic is further
discussed below, as well as throughout this thesis.
There are numerous researchers that analyzed companies’ disclosure strategies in
annual reports from the perspective of impression management. The previously
mentioned authors, Brennan, Guillamon-Saorin & Pierce (2009), also set out to
measure impression management by developing a score system for both qualitative and
quantitative data in corporate narratives. The researchers analyzed the use of four
impression management tactics – thematic manipulation, selectivity, presentation
effects, and performance comparisons, using examples from press releases of UK firms.
Findings conclude that such techniques are prevalent in financial communications, with
positive news being exaggerated, while negative aspects downplayed.
Seeking to provide a better understanding of impression management in the
corporate context, Merkl-Davies & Brennan (2011) designed a conceptual framework
using theories from behavioral finance, sociology, and critical accounting. Employing
a social psychology approach, another paper by Merkl-Davies, Brennan & McLeay
(2011) analyzed UK chairmen’s statements. Results suggest that building impressions
involves providing an accurate view of the company and its performance, i.e. consistent
with the overall tone of the report, but still favorable.
Jones (2011) emphasizes the susceptibility of accounting narratives to impression
management, as these are not audited and offer a good opportunity for companies to
manage their presentations. Moreover, evaluations of financial performance by
managers can be considered inherently subjective (p.98). The author discusses the
impression management techniques that companies employ in their reporting, through
the use of narratives, graphs, and photographs. The author argues that these are used
for ‘presentational enhancement’. The paper presents a synthesis of various existing
studies, the results of which are used as a basis for discussion of four main impression
4
management techniques. These include stressing the positive, downplaying the
negative; baffling the readers, by using difficult-to-read language; using differential
reporting; and using attribution.
The first impression management technique is quite self-explanatory, implying
reporting more positive news and omitting the negative ones. This tactic prevails in
most of the research done on impression management in annual reports (ibid., p.99).
Deegan & Gordon (1996) researched the environmental accounting of Australian
companies, finding that their reports are generally abounding in self-praise, with little
to no negative remarks. Similarly, Clatworthy & Jones (2003) discovered that even
poorly performing companies still report more positive than negative news.
Baffling the readers with technical language is another impression management
technique, whereby negative news is reported in a less transparent manner than positive
news. Poor performers have been found to report their results in a less readable manner,
thus, a strong correlation has been observed between failed performance and more
difficult-to-read language4 (Jones, 2011, pp.100-101). Another study looking into the
readability of reports, revealed that negative performance is generally reported with the
use of technical terms, while positive news is disclosed more clearly, in a cause-and-
effect manner (Aerts, 1994).
The next tactic is differential reporting, meaning that companies with successful
results may report them differently from companies with poor results, focusing on
different things. Poor performers tend to focus on the environment and employ more
emotion in their reports, as opposed to specific performance indicators5 (Jones, 2011,
p.101). Moreover, Clatworthy & Jones (2003) revealed that unprofitable companies do
not focus on the past, but rather emphasize the future, whereas profitable companies
clearly disclose their past results.
Finally, attribution is the last tactic, it implies management taking credit for good
news, and blaming the bad news on the environment (p.101). Staw, McKechnie &
Puffer (1983) researched 49 reports of US companies and analyzed the attribution of
the reported news, classifying those into ‘internal credit’ and ‘external blame’.
Clatworthy & Jones (2003), once again, reached the same conclusion, finding that both
4 The author specifically refers to Smith & Taffler (1992) 5 The author specifically refers to Clarke (1997)

5
good and bad performers tended to attribute positive news to themselves, and bad news
to external factors.
Melloni, Caglio & Perego (2016), drawing on studies of impression management,
discuss the disclosure conciseness, completeness, and balance that should be prevalent
in integrated reports. Their findings reveal that reports tend to be longer and more
optimistic, thus less concise and less balanced, when companies have a poor financial
performance. The researchers identified reading ease manipulation and manipulation
of the content and verbal tone as impression management tactics that firms may use.
A study on financial reporting of good and bad news was done by Clatworthy &
Jones (2003), analyzing the chairman’s narratives of top 50 and bottom 50 UK firms.
The purpose of the paper was to observe whether companies with improving
performances report good/bad news differently from those with a declining
performance. The researchers concluded that both types of firms focus on their positive
aspects. Moreover, a pattern was revealed, whereby companies blame the external
environment for bad news and attribute the good news to themselves.
Other researchers have set a similar research objective, employing different
approaches and perspectives. Aly, El-Halaby & Hussainey (2018) researched whether,
and to what extent, financial performance determines the tone disclosure in annual
reports of Egyptian companies. Performing a content analysis of 105 firms over a three-
year period, the researchers found that firms tend to disclose more good news than bad
ones, this disclosure being positively associated to financial performance. There are
also, however, various factors that affect the relationship between tone disclosure and
financial performance, such as profitability, leverage, firm growth, etc.
Beekes, Pope & Young (2004) examined the relationship between earning
timeliness and conservatism, and the board of directors’ composition in UK firms.
Accounting conservatism implies a prompt recognition of negative share returns.
Findings revealed that a higher percentage of outside board members leads to a timely
recognition of bad news in earnings. The paper, thus, contributes to existing literature
by suggesting a correlation between board composition and firms’ reporting quality, in
terms of timely admittance of bad news.
Another study, by Kothari, Shu & Wysocki (2009), was conducted to determine
whether managers tend to delay bad news as compared to good news. The reasoning
behind the study was that if bad news is withheld, while good news is immediately
disclosed to investors, the reaction of the negative stock price would be of a higher

6
magnitude than the positive stock price. Findings reveal that, on average, managers do
delay releasing the bad news to investors, until the point when it becomes unavoidable.
This paper sets to research good and bad news disclosure in a similar way to
Clatworthy & Jones (2003) and Aly, El-Halaby & Hussainey (2018), while combining
that with the qualitative analysis of impression management techniques discussed
previously by Hooghiemstra (2000), Merkl-Davies & Brennan (2011), Jones (2011),
and others. This research is set to contribute to prior literature by providing an insight
into the pharmaceutical companies, and the impression management methods that these
might use.
The main expectations are that the chosen companies do indeed disclose more of
their positive news rather than negative, and that the news are reported using the main
impression management techniques discussed above. The main expected difficulty to
be encountered during the research process stems from the chosen methodology, and
the definition of the rationale behind it. This is further discussed in the Research
Method section, in Chapter 4.
7
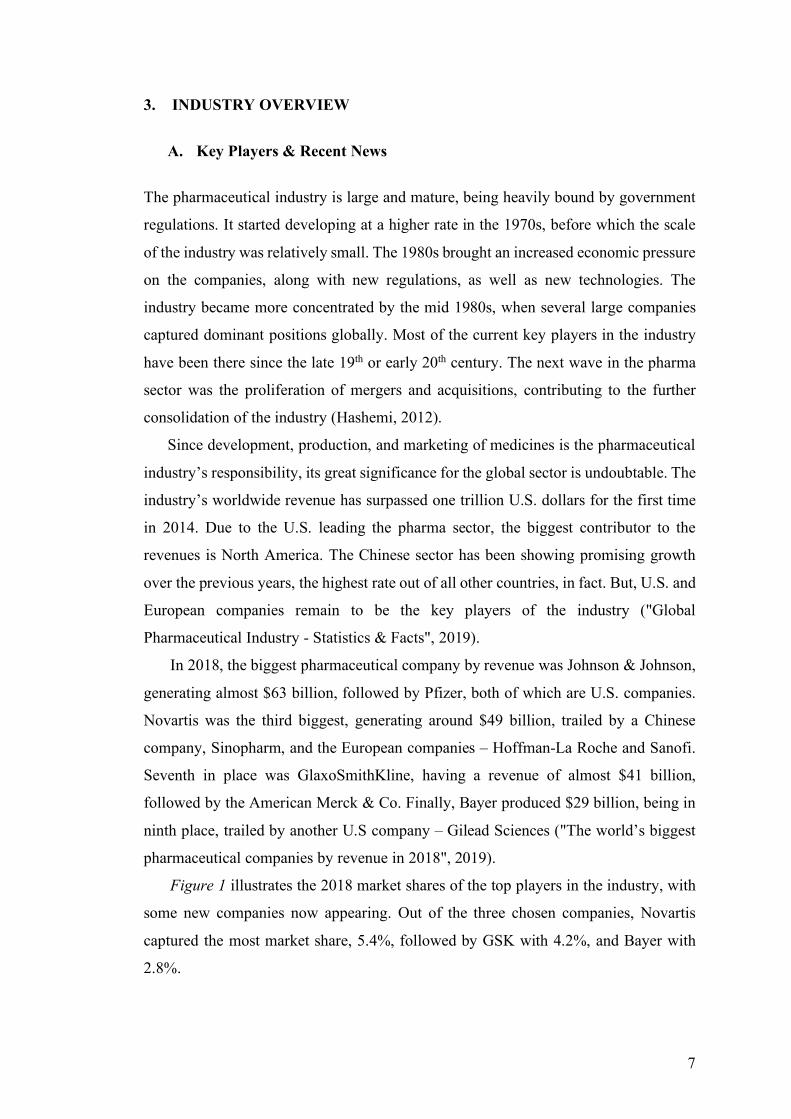
3. INDUSTRY OVERVIEW
A. Key Players & Recent News
The pharmaceutical industry is large and mature, being heavily bound by government
regulations. It started developing at a higher rate in the 1970s, before which the scale
of the industry was relatively small. The 1980s brought an increased economic pressure
on the companies, along with new regulations, as well as new technologies. The
industry became more concentrated by the mid 1980s, when several large companies
captured dominant positions globally. Most of the current key players in the industry
have been there since the late 19th or early 20th century. The next wave in the pharma
sector was the proliferation of mergers and acquisitions, contributing to the further
consolidation of the industry (Hashemi, 2012).
Since development, production, and marketing of medicines is the pharmaceutical
industry’s responsibility, its great significance for the global sector is undoubtable. The
industry’s worldwide revenue has surpassed one trillion U.S. dollars for the first time
in 2014. Due to the U.S. leading the pharma sector, the biggest contributor to the
revenues is North America. The Chinese sector has been showing promising growth
over the previous years, the highest rate out of all other countries, in fact. But, U.S. and
European companies remain to be the key players of the industry ("Global
Pharmaceutical Industry - Statistics & Facts", 2019).
In 2018, the biggest pharmaceutical company by revenue was Johnson & Johnson,
generating almost $63 billion, followed by Pfizer, both of which are U.S. companies.
Novartis was the third biggest, generating around $49 billion, trailed by a Chinese
company, Sinopharm, and the European companies – Hoffman-La Roche and Sanofi.
Seventh in place was GlaxoSmithKline, having a revenue of almost $41 billion,
followed by the American Merck & Co. Finally, Bayer produced $29 billion, being in
ninth place, trailed by another U.S company – Gilead Sciences ("The world’s biggest
pharmaceutical companies by revenue in 2018", 2019).
Figure 1 illustrates the 2018 market shares of the top players in the industry, with
some new companies now appearing. Out of the three chosen companies, Novartis
captured the most market share, 5.4%, followed by GSK with 4.2%, and Bayer with
2.8%.

8
Figure 1: Market Share in the Pharmaceutical Industry
Source: Researcher’s own work using data from “The top ten …” (2019)
In 2013, the average net profit margin in the pharmaceutical sector was around
18%, with the highest figure being 42%, made by Pfizer. Four other companies, one of
which was GSK, also achieved a profit margin of over 20% (Anderson, 2014).
However, a more recent report by Ernst & Young states that the margins of the world’s
21 largest pharma companies are declining. The companies are still able to grow due to
their blockbuster and cancer drugs, this, however, also shows their high dependency on
them. EY states that for the companies to increase their margins, new approaches must
be taken, such as more innovations and development of new ecosystems (Ernst &
Young, 2018).
Other main news related to the companies chosen for this research include GSK’s
acquisition of its joint venture with Novartis. The consumer health joint venture
between GSK and Novartis was created in 2015, but, in 2018, Novartis received an
attractive offer of $13 billion for its 36.5% stake in the venture (“Novartis sells stake in
joint venture…”, 2018).
5,60%5,44%
4,69%
4,44%
4,27%
4,19%
4,11%
3,43%
2,84%2,57%
58,42%
Market Share in Pharma in 2018
Pfizer Inc.
Novartis
F Hoffman-La Roche Ltd
Merck & Co Inc.
Johnson & Johnson
GlaxoSmithKline Plc
Sanofi
AbbVie Inc.
Bayer AG
Eli Lilly and Co
Other

9
Another major event was Bayer’s acquisition of Monsanto in 2016. The deal
spurred a lot of controversy, becoming a detrimental case for Bayer, who lost the
confidence vote of shareholders. The main controversy stemmed from Monsanto’s
glyphosate scandal, an allegedly carcinogenic substance of which the farmers were not
warned, resulting in legal cases. After the acquisition, Bayer now needs to deal with the
several thousands of legal claims regarding the chemical (“Bayer’s merger failure…”,
2019).
B. Industry’s Bad Reputation
As previously mentioned, the pharmaceutical industry is characterized by a very
tarnished reputation and lack of trust from the stakeholders. In an attempt to determine
the reasons behind a once respected industry losing its prestige, Kessel (2014) discusses
the several factors that have contributed to it. First of all, one of the reasons was the
need to adjust the business model of the pharmaceutical companies, many of which are
multinational corporations. The adjustment was necessary due to the decrease in price
margins, resulting from price and cost pressures, public policies, and expiration of
patents which significantly increased generic competition. The author states that this,
along with the pressure for companies to monitor their stock performances, shifted the
importance away from customers’ needs to increasing returns on investment (p.984).
Questionable marketing practices are another contributor to the industry’s bad
reputation. The promotional activities that were used spurred a lot of controversy, due
to them impacting the prescription practices of doctors. One of the main ones was
promoting the drugs during face-to-face meetings with the doctors, usually in
restaurants, while also providing them with promotional gifts. Other activities included
advertisements emphasizing a drug’s benefits, but omitting its risks; biased promotional
mailings again pointing out the benefits discovered during company-sponsored drug
trials; and many more (ibid., p.986).
The prices of drugs and their accessibility represent another problem. The industry
has been massively criticized for its excessive pricing, with the high drug costs being
ultimately passed from the healthcare systems on to the consumers. Low accessibility
of the drugs, especially among the poorer nations, has also caused censure among the
public. Finally, the numerous counts of malpractice in the industry is another

10
contributing factor to its damaged reputation, with many consumers believing that the
industry is not regulated enough (pp.997-988).
A recent poll conducted by an analytics company on the public’s view of the main
U.S. business sectors ranked the pharmaceutical industry as the second-worst sector,
only above the federal government ("Business and Industry Sector Ratings", 2018).
Another study of the industry’s trustworthiness revealed that consumers are becoming
more mistrustful of its intentions and commitment to human welfare (Kim & Ball,
2013).
A UK-based research and consultancy group, PatientView, conducts annual surveys
on the corporate reputation of the pharmaceutical industry from the patients’
perspectives. The study is international in scope, the 2018-2019 survey involving 1,500
respondent patient groups, from 78 countries. The findings revealed that 41% of the
participants believed that pharma had an “excellent” or “good” reputation, slightly
lower from 2017’s result of 43%. 53% believed it was “excellent” or “good” at
producing high-quality products, again lower than 2017’s result of 57%, but, only 9%
of respondents stated that the pricing policies are fair in the industry as a whole
(PatientView, 2019).

11
4. DATA AND RESEARCH METHODOLOGY
A. Data Collected
The data chosen to answer the stated research question are the companies’ annual
reports. Releasing an annual report is a legal requirement for any public company, its
content being governed by legislation, accounting principles, and regulations of a stock
exchange (Stittle, 2003). However, Stittle believes that these reports are more than a
formality for companies, and should be used as a tool for portraying the corporate
identity and transmitting the main corporate message. A crucial part of any annual
report is the company’s financial statements, but it also includes a narrative part,
reporting on all the trading activities performed during the previous one-year period
(p.3).
The importance of annual reports for investment decisions has long been confirmed
by various studies. Chang, Most & Brain (1983) conducted a survey among individual
and institutional investors, and financial analysts, the findings revealing a strong belief
in the usefulness of the financial statements for making investment decisions. A more
recent study has also reached the same conclusion, the results of its survey naming the
balance sheet, the auditor’s report, and the income statement, among others, as the most
important sections (Alattar & Al-Khater, 2008). However, annual reports are not
important merely because they disclose a company’s financials, they also provide the
stakeholders with a crucial source of more in-depth information about these figures
(Stittle, 2003, p.4).
The ten latest annual reports of each of the three pharmaceutical companies were
chosen for this research, from the years 2009 to 20186. These reports include sections
discussing some fundamental information about the organizations, such as strategies,
culture, values, etc., corporate governance, the remuneration report, and financial
statements, among others. Containing such a variety of information about the
company’s business activities, these reports are quite lengthy, ranging from around 200
to 350 pages. Due to the excess information provided in these reports, only one specific
section of them was chosen for the purpose of this thesis – the letters to shareholders.
According to Jones (2011), accounting narratives have become increasingly more
important over the last two decades, with the Chairman’s statements and President’s
6 The links to all the companies’ annual reports are listed in the Bibliography

12
letters being very influential. These allow managers to tell the company’s yearly story
to the shareholders, and have been known to shape investors’ decisions (pp.97-98).
The chairman’s statement typically discloses important information regarding the
company’s future financial position (Smith & Taffler, 2000). In fact, Bartlett &
Chandler (1997) found that the narrative sections of the annual reports have a larger
readership, the most thoroughly read part by private investors being the chairman’s
statement. The authors’ findings suggest that shareholders would rather read an
overview of the company’s performance than just plain financial data. Hooghiemstra
(2010) states that, since the letters to shareholders are unregulated, they may be used
by the CEOs to manage shareholders’ impressions of the company.
Thus, because of their crucial importance and susceptibility to impression
management, the main focus areas for this research will be the Chairman’s and CEO’s
letters to shareholders. These usually discuss the company’s performance in the
previous year, substantiate its achievements and failures, disclose any major changes
in the firm, and talk about the future outlook.
The Annual Reports of Bayer only have letters from the Chairman and no CEO’s
statements. GlaxoSmithKline has both statements from the Chairman and the CEO, but
in the years 2009-2010 these are combined into one letter. For Novartis, letters to
shareholders from the CEO were introduced in 2013, before which there were only
letters from the Chairman. The reports from the years 2010-2012 have sections
dedicated to interviews with the CEO, but these lack the typical structure of the letters
to shareholders, and, thus, were not considered for this research. These bring the total
number of collected letters or statements to 44. Even though there is a different number
of statements for each company, the content analysis results are provided in percentages
to ensure comparability.

13
B. Research Methodology
For the purpose of this research, both quantitative and qualitative methods were chosen.
Before analyzing the actual corporate statements, however, the companies’ income
statements and balance sheets were evaluated to ascertain their financial situation. The
aim was to observe whether the company experienced a growth or decline in
performance. The chosen indicators were the ones most likely to be addressed by the
Chairmen and/or CEOs in their statements: revenue, profit after tax, and earnings per
share.
The percentage change from previous years was calculated in order to establish a
preliminary set of expectations regarding what the Chairmen / CEOs’ statements might
include. In case the financial analysis showed a negative percentage change, i.e. a
decline in performance, the goal was then to observe whether, and in what light, this
was addressed in the accounting narratives. This, of course, does not represent a
complete picture of what the letters to shareholders may include, seeing as there are
various other aspects of a company’s performance. But, it provides a basic idea of
whether the businesses had an overall successful year, or not, in terms of financial
performance.
In order to assess whether a company had a good or a poor year, both relative and
absolute values of the mentioned indicators were considered. The percentages represent
relative changes, showing the year-on-year dynamics, which helped reveal the extent
of the growth or decline in results. But, these were sometimes quite volatile, and a sharp
increase in an indicator in one year (above 100%) was, most likely, followed by a
negative percentage change in the next year. This, however, did not necessarily mean
that the company had a poor performance, the negative percentages just reflecting the
comparison with the unusually high figures of the previous year. Thus, an analysis of
the absolute values of figures was necessary for a more accurate assessment of the
companies’ performance.
To answer the posed research question, manual content analysis was chosen as the
research method. Content analysis is a “research technique for making replicable and
valid inferences from texts (or other meaningful matter) to the contexts of their use”
(Krippendorff, 2018, p.24). While having journalistic roots, this technique has
expanded into an array of other fields, such as sociology, psychology, politics,
communication studies, and many others. Content analysis has developed into a wide

14
range of possible methods that can be employed to draw inferences from a variety of
data. The use of this technique has skyrocketed since its first mention, and still
continues to increase rapidly, especially due to the large amount of data available
electronically and the extensive use of computers for text analysis and processing (ibid.,
pp.23-24).
It is a scientific tool that can be used to gain insights and a better understanding of
certain phenomena. It involves a specific process, also called the research design, and
its steps are guided by the design’s logic. The two qualities that this logic should possess
are efficiency and impartiality, so that the researchers can justify how the analysis was
conducted. Essentially, the description of this logic should also represent a set of clear
instructions, which can make the research replicable (ibid., p.87).
Krippendorff (2018) also describes the process of content analysis with its six
components: unitizing, sampling, coding, reducing, inferring, and narrating. The first
step implies establishing a unit of analysis, while sampling involves selecting a
manageable but representative set of units (data) to be analyzed. Representing these
units, such as text or images, in an analyzable form is known as coding. Reducing the
data means aggregating the findings into efficient representations that omit
redundancies. The two final steps involve making inferences from the findings and
narrating these in a manner that is understandable to others (pp.88-89).
Brennan, Guillamon-Saorin & Pierce (2009) discuss various methods or
approaches of content analysis that are used for researching accounting narratives in
terms of impression management. Studies on syntactical manipulation focus on
analyzing the language used in these narratives. These mainly aim at measuring the
readability of the text and how this relates to the company’s performance. A similar
approach is analyzing rhetorical manipulation, which focuses on the linguistic choices
that managers make with the aim of influencing the meaning of the narratives. Different
from the syntactical approach is thematic research, divided into meaning-oriented and
form-oriented. The former examines how the companies attribute their outcomes,
whether it is to internal or external factors. The latter is directed towards observing the
positive and negative themes used by the management, measuring the frequency of
words and sentences (pp.794-796). This thesis is mainly based on thematic research,
both meaning and form-oriented, with certain references to the rhetorical manipulation
approach. The logic behind the coding process that was used for this research is
described below.

15
Mimicking the research conducted by Clatworthy and Jones (2003), the accounting
narratives were analyzed for specific statements of good or bad news regarding the
company’s financial performance. Sentences were coded as positive or negative when
their connotations implied good or bad news for the company or its environment (p.
175). One coding represents one such statement, and a sentence can have multiple
codings, if it includes more than one good or bad news, or both good and bad ones.
Examples of good and bad codings are given below:
Good news: “Sales grew 5% in constant currencies (cc) to USD 49.4 billion, in our continuing operations” (Novartis, 2016, p.4).
Bad news: “However, 2017 was still a difficult year operationally” (Bayer, 2018, p.4)
Good and bad news: “Performance in our Consumer Healthcare business was impacted … with sales for the year falling 1%, but increasing 2% in the last quarter following progress in remediation of these issues (GlaxoSmithKline, 2015, p.4).
The first example represents one good news coding, the second one is one bad news
coding, while the last one was coded as one good and one bad statement.
General statements praising the company, its competences and abilities, or
discussing its business model, strategy, plans (etc.) were not coded, since the focus of
this research is limited to news regarding the company’s performance. The statements
that were considered, for the purpose of this research, were specific and explicit,
relating to performance in a given year or within a certain period. Statements reporting
news or certain financial figures without providing substantiation or any context (e.g.
percentage change, or a comment about the figures) were considered to be neutral
statements and, therefore, not coded. Similarly, any estimations, potential future sales,
and any other outlooks for the future were disregarded, since these are not really
representative of the company’s actual performance, and also fall outside the purpose
of this paper.
Several letters to shareholders included general narratives about the state of the
environment in which the company operates, especially on the macroeconomic level.
Such statements were not considered, as these are out of the companies’ control.
However, the statements about the environment that are related to specific performance
aspects of the companies were indeed coded. An example of such a statement would
be: “net sales were down 2% cc due to fierce price competition in the US” (Novartis,

16
2018, p.4). These statements were also further analyzed to determine the attribution of
the good / bad news, e.g. whether the companies took credit for the good news, and
blamed the environment for the bad news.
To introduce a quantitative representation of the good and bad news in the corporate
statements, the number of words was counted for each of the codings. To put it into
perspective and allow comparison between the companies and over the selected period
of time, the number of words in the codings was also calculated as percentage of the
total word count in the letters to shareholders. In an attempt to have more accurate
results, the word count was taken from the actual statement / coding, as opposed to the
sentence as a whole, seeing as some sentences are much longer, while others are concise
and straight to the point. This meant that, occasionally, information that was not
relevant to the point made in the good / bad news (e.g. description of the pharmaceutical
products or product line) was not counted.
For the second part of the research, the codings were carefully read and analyzed
to determine whether any impression management techniques were present. The main
focus was on the tactics discussed by Jones (2011) – stressing the positive, downplaying
the negative; baffling the readers; differential reporting; and attribution. However, other
impression management strategies were also sought for, to provide a bigger picture of
the tactics that were most prevalent and make conclusions on the potential reasoning
behind companies using them.

17
5. ANALYSIS OF BAYER
A. Company Overview
Bayer AG is a multinational pharmaceutical company headquartered in Leverkusen,
Germany. It is a Life Science company managing three separate divisions,
Pharmaceuticals, Consumer Health, and Crop Science, and a business unit – Animal
Health. The Pharmaceuticals division is concerned with prescription drugs, while the
Consumer Health division mainly focuses on nonprescription products. Crop Science
is an agriculture enterprise operating in crop protection, and the Animal Health unit
markets products for treating diseases in farm animals. In 2018, Bayer was comprised
of 420 consolidated companies across 90 countries, employing approximately 117,000
people ("Names, Facts & Figures about Bayer", 2019).
The previously mentioned study on Corporate Reputation of Pharma, conducted by
PatientView, also researched performance of 46 companies. In 2018, Bayer was ranked
18th among patient groups that were familiar with the company, an improvement from
the previous year’s 19th rank. Among the three analyzed companies, Bayer is scored the
lowest in terms of reputation (PatientView, 2019). The next sections provide the results
of Bayer’s analyses.
B. Financial Analysis
Table 1: Financial Analysis of Bayer
Financial Indicators 2009 2010 2011 2012 2013 2014 2015 2016 2017 2018
Revenue -5.3% 12.6% 4.1% 8.8% 1.0% 5.2% 9.7% 1.0% -25.1% 13.1% Profit after tax -21.2% -3.6% 88.7% 1.0% 27.6% 8.1% 19.0% 17.8% 67.7% -78.9%
Profit after tax (cont. op.)
-21.2% -3.6% 88.7% 1.0% 27.6% 8.1% 16.7% 13.4% -28.7% -47.3%
Earnings per share -23.4% -7.6% 90.4% -1.0% 30.4% 7.3% 20.0% 9.5% 54.6% -78.6%
Source: Researcher’s own calculations with data from company’s Annual Reports
18
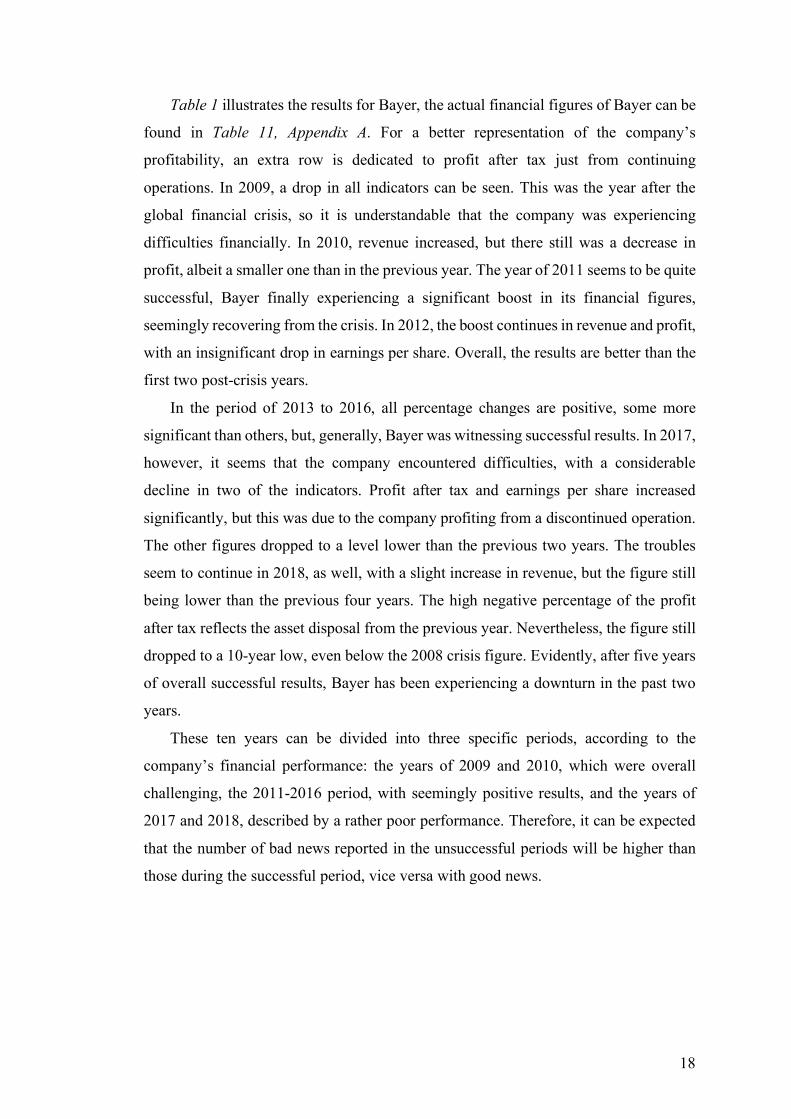
Table 1 illustrates the results for Bayer, the actual financial figures of Bayer can be
found in Table 11, Appendix A. For a better representation of the company’s
profitability, an extra row is dedicated to profit after tax just from continuing
operations. In 2009, a drop in all indicators can be seen. This was the year after the
global financial crisis, so it is understandable that the company was experiencing
difficulties financially. In 2010, revenue increased, but there still was a decrease in
profit, albeit a smaller one than in the previous year. The year of 2011 seems to be quite
successful, Bayer finally experiencing a significant boost in its financial figures,
seemingly recovering from the crisis. In 2012, the boost continues in revenue and profit,
with an insignificant drop in earnings per share. Overall, the results are better than the
first two post-crisis years.
In the period of 2013 to 2016, all percentage changes are positive, some more
significant than others, but, generally, Bayer was witnessing successful results. In 2017,
however, it seems that the company encountered difficulties, with a considerable
decline in two of the indicators. Profit after tax and earnings per share increased
significantly, but this was due to the company profiting from a discontinued operation.
The other figures dropped to a level lower than the previous two years. The troubles
seem to continue in 2018, as well, with a slight increase in revenue, but the figure still
being lower than the previous four years. The high negative percentage of the profit
after tax reflects the asset disposal from the previous year. Nevertheless, the figure still
dropped to a 10-year low, even below the 2008 crisis figure. Evidently, after five years
of overall successful results, Bayer has been experiencing a downturn in the past two
years.
These ten years can be divided into three specific periods, according to the
company’s financial performance: the years of 2009 and 2010, which were overall
challenging, the 2011-2016 period, with seemingly positive results, and the years of
2017 and 2018, described by a rather poor performance. Therefore, it can be expected
that the number of bad news reported in the unsuccessful periods will be higher than
those during the successful period, vice versa with good news.

19
C. Content Analysis
Table 2: Number of good & bad codings for Bayer
2009 2010 2011 2012 2013 2014 2015 2016 2017 2018
Good 17 7 22 32 21 17 19 17 14 11
Bad 6 6 5 4 4 0 0 0 11 5
Year poor poor good good good good good good poor poor Source: Researcher’s own findings from company’s Annual Reports
Table 2 illustrates the number of good and bad codings found in 10 letters from
Bayer’s Chairmen. The last row of the table labels the years as either good or poor,
reflecting the results of the Financial Analysis. The first observation is that the
predictions made at the end of the previous section came true for the most part. It seems
that there are indeed more codings for bad news in the unsuccessful periods, as
compared to the successful years. The opposite is true for good codings, except for the
first year, where the value is on par with some of the years in the successful period. A
possible explanation for that could be that the company wanted to draw the
shareholders’ attention to more positive aspects, in the context of the recent crisis. A
significant drop in good news can be seen in 2010, as the company was still struggling
to recover from the economic depression. The 2011-2016 period, described as more
successful, has more positive and less negative news, with the last three years having
no bad news whatsoever. The number of codings for bad news skyrocketed in 2017,
which wasn’t a great year for the company, financially. The good news decreased in
2017, and dropped further in 2018.
In order to observe the relationship between Bayer’s financial performance and
reporting of good versus bad news, the results were depicted in a graph, presented in
Figure 2. The financial indicator chosen was profit after tax from continuing
operations, since it is the best representative of the company’s profitability. The other
two data sets plotted on the graph are the codings for good and bad news from Table 2.

20
Figure 2: Profit after Tax vs. Good & Bad News in Bayer
Looking closely at the ‘profit’ and ‘good news’ curves, it can be noted that, at
certain times, these are trailing each other, revealing a positive relationship. It is,
however, quite weak, and especially not evident for the 2013-2014 period. But, in the
first and last four years, there is a level of association between the two. An increase in
profit is accompanied by an increase in good news and a drop in one is followed by a
drop in the other. Observing the ‘profit’ and ‘bad news’ curves, a more evident negative
relationship can be noted, especially in the first nine years. The bad codings start to
drop in 2010, as the profit is continuously rising, and significantly increase in 2017, as
the profit plummets.
Table 3 displays the word count analysis of the Chairmen’s statements, including
the percentage of the total number of words that each coding represents. This table will
be referred to in the further in-depth discussion of each letter to shareholders. An
overview of all of the content analysis results for Bayer can be found in Table 14,
Appendix B.
0
5
10
15
20
25
30
35
-
500,0
1000,0
1500,0
2000,0
2500,0
3000,0
3500,0
4000,0
4500,0
5000,0
2009 2010 2011 2012 2013 2014 2015 2016 2017 2018
Profit after Tax versus Good & Bad News
Profit after tax (cont.op) Good News Bad News

21
Table 3: Word count analysis of Bayer's statements
2009 2010 2011 2012 2013 2014 2015 2016 2017 2018 G
ood
# of words 241 134 346 564 282 243 305 255 237 165
% of Total 19.8% 10.2% 22.8% 34.4% 20.4% 19.6% 22.8% 18.0% 12.9% 12.7%
Bad
# of words 64 88 74 74 49 0 0 0 183 83
% of Total 5.3% 6.7% 4.9% 4.5% 3.5% 0.0% 0.0% 0.0% 9.9% 6.4%
Total # of words 1,215 1,316 1,520 1,641 1,384 1,240 1,339 1,418 1,843 1,300
Year poor poor good good good good good good poor poor
Source: Researcher’s own findings from company’s Annual Reports
In 2009, Bayer was struggling with the effects of the crisis, the Chairman addressing
that in his letter, and, in fact, even starting his narrative with the bad news:
“2009 was an especially challenging year. Despite our best efforts, we too were unable to prevent a decline in sales and earnings” (Bayer, 2010, p.4).
The overall tone of the letter, however, is rather optimistic, having a relatively high
amount of good news, representing 20% of the total text. As previously mentioned, this
could be explained by the Chairman wanting to spotlight more of the company’s
positive aspects to reassure the stockholders of its competence. Another interesting
observation made was the way in which some of the news is framed:
“we limited the drop in earnings to 6.6 percent”
“The subgroup initiated a rapid, broad response to the sharp drop in demand with measures such as temporary plant shutdowns, production cutbacks …” (Bayer, 2010, p. 4).
These negative aspects are portrayed in a positive light. Admittedly, under those critical
circumstances, a decrease in earnings that is not too significant does sound like good
news. But, the word choice in those statements – “limited the drop”, “rapid, broad
response to the sharp drop” – still is aimed at emphasizing Bayer’s good problem-
solving capabilities.
In 2010, an overall challenging year for Bayer, the number of codings for good
news substantially drops. These now make up only 10% of the total text, while the bad
news codings increase to 7%. This was also the year when a new Chairman was

22
assigned, which might have contributed to the change in disclosed news, due to a
different style of reporting. In light of the unimproved performance, the new Chairman
discusses the list of difficulties encountered by the company, and is no longer putting
too much emphasis on the positive aspects of performance. A bigger portion of the
letter focuses on the company’s plans and future prospects. This seems to be an attempt
to restore shareholders’ confidence in the company.
As the company saw major improvement in 2011, this was also reflected in the
amount of good news being reported, the Chairman himself calling it “a very successful
year for [the] company” (Bayer, 2012, p.1). Good news accounts for 23% of the total,
and bad news drops to 5%. With further success in 2012, there is another spike in good
news, and no major change in bad news. Among the few negative aspects addressed
were stagnant earnings resulting from legal disputes, and unfavorable effects of the
external environment:
“For Bayer HealthCare, the situation in Europe remained difficult, particularly in view of the health system reforms in a number of countries” (Bayer, 2013, p.2).
While the level of bad news generally matched the previous year’s, it was largely
overshadowed by the amount of good news reported. The 2012 statement is by far the
most positive one, with good news representing 34% of the total. The whole letter is
also a bit longer than the previous ones, perhaps on account of the Chairman wanting
to fit in more of the company’s successes for that year.
In the next four years, there is a steady increase across all financial indicators, as
discussed in the Financial Analysis. The good news in 2013 accounts for 20% of the
overall statement, less than in 2012, but still rather positive. There is also a drop in the
bad news, to 3.5%. The 2014 to 2016 statements lack bad news altogether, as the
company continues to improve its financial performance. There is another slight decline
in the good news coded for 2014. This could be explained by the Chairman taking more
time to discuss Bayer’s decision to demerge one of its divisions, thus, not reporting too
in-depth on all of the company’s financial performance aspects. In 2015, however, there
is a noticeable spike in the word count for good news, as the Chairman gives a more
detailed overview of each segment and the overall financial figures.
In 2016, Bayer’s profit from continuing operations reached its peak. Bad news is
still null, and good news is at around 18% of the total statement. This year also saw
another change in the Chairman/CEO position. A bigger part of the letter is dedicated
23
to discussing the planned acquisition of Monsanto, and some other investments and
joint ventures of Bayer. Thus, the good news reported is slightly less than in the
previous year.
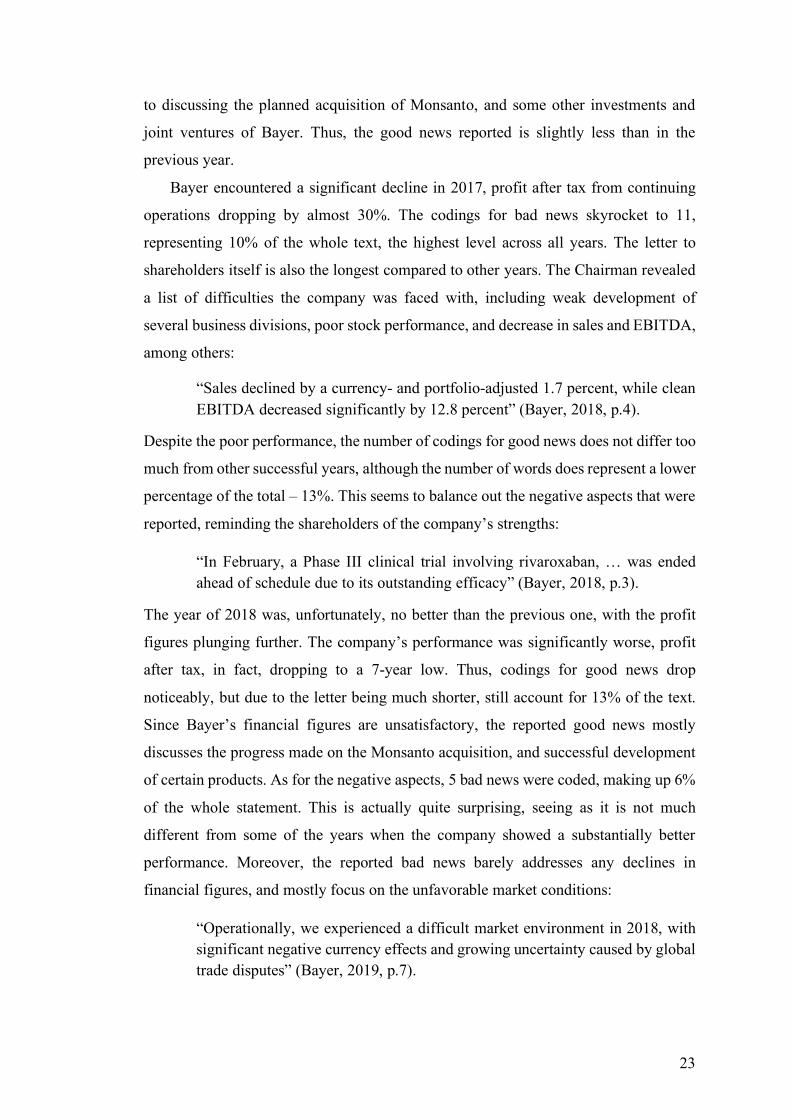
Bayer encountered a significant decline in 2017, profit after tax from continuing
operations dropping by almost 30%. The codings for bad news skyrocket to 11,
representing 10% of the whole text, the highest level across all years. The letter to
shareholders itself is also the longest compared to other years. The Chairman revealed
a list of difficulties the company was faced with, including weak development of
several business divisions, poor stock performance, and decrease in sales and EBITDA,
among others:
“Sales declined by a currency- and portfolio-adjusted 1.7 percent, while clean EBITDA decreased significantly by 12.8 percent” (Bayer, 2018, p.4).
Despite the poor performance, the number of codings for good news does not differ too
much from other successful years, although the number of words does represent a lower
percentage of the total – 13%. This seems to balance out the negative aspects that were
reported, reminding the shareholders of the company’s strengths:
“In February, a Phase III clinical trial involving rivaroxaban, … was ended ahead of schedule due to its outstanding efficacy” (Bayer, 2018, p.3).
The year of 2018 was, unfortunately, no better than the previous one, with the profit
figures plunging further. The company’s performance was significantly worse, profit
after tax, in fact, dropping to a 7-year low. Thus, codings for good news drop
noticeably, but due to the letter being much shorter, still account for 13% of the text.
Since Bayer’s financial figures are unsatisfactory, the reported good news mostly
discusses the progress made on the Monsanto acquisition, and successful development
of certain products. As for the negative aspects, 5 bad news were coded, making up 6%
of the whole statement. This is actually quite surprising, seeing as it is not much
different from some of the years when the company showed a substantially better
performance. Moreover, the reported bad news barely addresses any declines in
financial figures, and mostly focus on the unfavorable market conditions:
“Operationally, we experienced a difficult market environment in 2018, with significant negative currency effects and growing uncertainty caused by global trade disputes” (Bayer, 2019, p.7).

24
D. Impression Management Analysis
As can be seen from the Content Analysis, the tactic of stressing the positive and
downplaying the negative is certainly present in Bayer’s reports. This can be noticed
right from the first year analyzed, where the Chairman’s statement reports quite a high
number of good news, despite the financial performance being rather unsatisfactory.
Bayer does report a decrease in sales, but does not address the decline in all of the other
chosen financial indicators, mostly emphasizing increase in cash flow, growth in its
specific divisions, and progress in other performance aspects. Moreover, as discussed
in the previous chapter, some of Bayer’s negative news was framed as positive, making
the tone of the letter more optimistic.
In the rest of the years, there is always more good news than bad news, with three
years even lacking bad news altogether. Although, in some of those years, the company
had a successful performance, which explains the positive tone. In 2018, however, there
is a significant decline in financials, but bad news remains on par with some years that
saw a better performance. Moreover, the bad news does not address the decrease in
financial indicators, thus downplaying the negative aspects again.
The tactic of baffling readers is actually not prevalent in Bayer’s reports. Some
technical language is indeed present, but it is used when reporting both good and bad
news. But, even when technical terms are present, e.g. EBITDA, the overall message
of those negative aspects is rather clear. Overall, it seems that the language used to
report bad news is not different from that used with good news. An example of both is
displayed below:
“Sales declined by a currency- and portfolio-adjusted 1.7 percent, while clean EBITDA decreased significantly by 12.8 percent” (Bayer, 2018, p.4).
“Operationally, sales of Pharmaceuticals increased by a currency- and portfolio-adjusted 4.3 percent in 2017. Clean EBITDA rose by 8.8 percent” (ibid., p.3).
This actually ties into the next impression management tactic – differential reporting.
One example of this tactic could be companies using more ‘hard numbers’ to back up
their positive performance and not the negative one. The example above actually shows
the opposite. It seems that, in the 2017 report, several of Bayer’s bad performance
aspects are also reported with the use of clear numbers and percentage changes, even
though it is unfavorable for the company. However, this is only the case for the 2017

25
report, while the other statements have either just one or no numbers substantiating the
negative aspects, mostly focusing on the environment. An example is the 2010
Chairman’s statement, where the entire paragraph discussing good news includes
numerous figures and percentage changes, while the next paragraph that discusses bad
news has no numbers whatsoever:
“Adjusted for currency and portfolio effects, sales advanced by 8.0 percent. EBITDA before special items came in at €7.1 billion, which means we improved our operating performance by 9.7 percent” (Bayer, 2011, p. 4).
“However, the performance of the CropScience and HealthCare subgroups did not meet our expectations. In HealthCare, generic competition had a very noticeable effect. A particularly negative factor is the pressure on Yaz® / Yasmin®, …” (ibid., p. 5).
Another characteristic of this impression management technique is placing emphasis
on the future or the environment, in case of unsuccessful performance. This can again
be noticed in the 2010 letter, the year that Bayer saw a further decrease in profit, with
less good news reported. As discussed in the Content Analysis, a big part of that letter
is devoted to discussing the company’s future plans and prospects, rather than talking
about its past performance.
The last impression management tactic under question is attribution. Instances with
internal credit and external blame can indeed be noticed in Bayer’s letters to
shareholders. There are, however, quite a lot of cases when the company is merely
reporting its results, either good or bad, without explicitly attributing these to internal
or external factors (as can be seen in the example above, from Bayer, 2018).
There are also quite a few instances of external credit, the company naming the
environment as one of the reasons behind successful results. On more rare occasions,
the company may also take responsibility for the negative news – internal blame:
“Sales advanced substantially, helped by positive market conditions” (Bayer, 2014, p.4).
“…we were unable to fully exploit our growth potential because of production bottlenecks in the Pharmaceuticals Division and structural problems at Consumer Health” (Bayer, 2019, p.7).
These, however, are not as common, there being more cases of attribution. When
discussing negative aspects, the statements tend to blame external factors for them, thus
focusing mostly on the environment. This is also a sign of differential reporting,

26
discussed earlier. When disclosing good news, the Chairmen do attribute these to the
company’s efforts. Interestingly, with good news, the Chairmen also tend to use more
of the personal pronoun “we”, thus emphasizing the company’s competence in
delivering the successful results. Examples of internal credit and external blame are
provided below:
Internal Credit:
“Yet thanks to our strategic alignment, we navigated the economic downturn with comparative success” (Bayer, 2010, p.4).
“Our refocused sales and marketing activities as well as our streamlined product range were key to our success” (Bayer, 2013, p.4).
External Blame:
“In terms of earnings, CropScience was unable to match the record level of 2008 due to higher raw material costs and negative currency effects” (Bayer, 2010, p.4).
“… difficult situation in Brazil, where several factors led to unexpectedly high inventories of crop protection products” (Bayer, 2018, p.4)

27
6. ANALYSIS OF GLAXOSMITHKLINE
A. Company Overview
GlaxoSmithKline plc (GSK) is a multinational pharmaceutical company headquartered
in Brentford, United Kingdom. There are three global businesses under the GSK
umbrella – Pharmaceuticals, Vaccines, and Consumer Healthcare. From the wide range
of products brought by the Pharmaceuticals business, medicines for respiratory diseases
and HIV are the commercial leaders. Through its Vaccines business, GSK provides
vaccines to people of all ages across 160 countries. Pain relief, Respiratory, Digestive,
Oral, and Skin Health are some of the categories of medicine provided through its
Consumer Healthcare business ("About us | GSK", 2019). In 2018, the number of
employees of GSK was around 95,500 (GSK, 2019, p.28).
The survey by PatientView ranked GSK 13th in terms of corporate reputation
among patient groups familiar with the company. This is a decline from its previous
11th position, but still higher than Bayer (PatientView, 2019).
B. Financial Analysis
Table 4: Financial Analysis of GlaxoSmithKline
Financial Indicators 2009 2010 2011 2012 2013 2014 2015 2016 2017 2018
Revenue 16.5% 0.1% -3.5% -3.5% 0.3% -13.2% 4.0% 16.6% 8.2% 2.1%
Profit after tax 20.3% -67.3% 194.5% -13.1% 18.6% -49.7% 195.7% -87.3% 104.2% 86.5%
Profit after tax (w/o other inc.)
8.7% -70.0% 258.2% -28.4% 29.1% -21.6% -81.4% 579.9% -7.5% 36.3%
Earnings per share 23.1% -70.6% 225.9% -11.2% 21.1% -49.1% 204.2% -89.2% 67.0% 134.7%
Source: Researcher’s own calculations with data from company’s Annual Reports

28
Table 4 showcases the percentage change in the figures of GlaxoSmithKline, while
its financial figures are depicted in Table 12, Appendix A. The company seems to have
recovered from the 2008 crisis, there is an increase in all indicators in 2009. The year
of 2010, however, reflects a rather poor performance, with a decline in all indicators,
except revenue, which had barely any growth. While revenue had a slight decline in the
next year, all other indicators show a significant improvement, offsetting the decrease
in 2010. In 2012, there is another decrease in all figures. Granted, the percentage
changes are negative mostly due to comparison with the significant increase of 2011,
although the figures still dropped below the 2009 ones, indicating a not so successful
performance. The next year witnesses a recovery from this downturn, but, in 2014, GSK
again experiences a decline in all indicators.
The percentage changes for 2015 are quite high, seemingly pointing towards an
improvement in performance. However, the significant increase in profit is mostly due
to a disposal of an asset, without which GSK actually saw another decline. Thus, the
serious drop in the 2016 figures reflects the contrast with the unusually high figures of
2015. Similarly, the massive increase in the ‘profit without other income’ figure reflects
the comparison with the unusually low profit from previous year. Overall, the profit
figure of 2016 is still lower than in the previous year. The figures for 2017 seem to be
promising, with profit after tax slightly dropping, due to the comparison with the spike
in 2016. Lastly, 2018 appears to be a successful year for GSK financially.
The percentage changes of GSK’s financial indicators are quite erratic, it is, thus,
not as easy to divide the years into just a few periods according to performance, as done
with Bayer. Other income / loss, such as the asset disposal in 2015, was excluded in an
attempt to get more stable results, but these remain just as volatile, with every other
year showing a decline in performance. The good and bad codings for GSK can, thus,
be expected to show similar erratic change year-on-year.
In order to accurately label the years as either good or bad, the actual financial
figures of the company had to be observed and compared to previous years. Overall,
the years 2009, 2011, 2013, and 2018 can certainly be labeled as good, while 2010,
2012, and 2014 – bad. The years 2015 and 2016 were labeled as mixed, due to the
ambiguous percentage changes, while the year of 2017 was labeled as good, since the
decrease in profit after tax (without other income) was insignificant, with the other
indicators seeing a significant improvement.

29
C. Content Analysis
Table 5: Number of good & bad codings for GlaxoSmithKline
2009 2010 2011 2012 2013 2014 2015 2016 2017 2018
Good 6 6 13 12 23 15 11 14 12 19
Bad 0 3 2 6 1 6 2 2 1 0
Year good poor good poor good poor mixed mixed good good Source: Researcher’s own findings from company’s Annual Reports
As expected, the number of good and bad news reported each year is quite erratic.
2009, being an overall successful year for GSK, has no bad news, and with the
performance deteriorating in 2010, the bad news increase, while good news seems to
be on par with last year. In 2011, the company recovered from the downturn, and a
spike in good news can be seen. In the next years, GSK’s performance has again
followed that pattern, worsening in one year and improving in the next one. Thus, in
2012, codings for bad news significantly increased, with no major change in good news.
Perhaps, this was again done in order to keep the report more balanced. A substantial
change can be seen in both numbers for the year of 2013, with quite a high number of
reported good news, and barely any bad ones. The situation has reversed again in 2014,
after which the bad news seems to have plateaued for the next three years, while good
news changed slightly. Finally, with an improved performance in 2018, bad news is
again null and good news increased. The word count analysis and discussion provided
later in this section will help bring more context to these numbers.
To depict the relationship between the company’s profitability and the reporting of
good and bad news more clearly, the figures were plotted on a graph presented in Figure
3, the profit figure again not accounting for other income.
The relationship between the three data sets is a lot more prominent than in the case
of Bayer. The ‘good news’ curve trails the ‘profit after tax’ curve, an increase in one
corresponding to an increase in the other. A negative relationship between profit and
bad news is also evident, but more so in the first six years. Overall, however, it does
seem that the company’s financial situation impacts the type of news that are reported
in a more predictable way.

30
Figure 3: Profit after Tax vs. Good & Bad News in GlaxoSmithKline
Table 6 displays the word count analysis Chairmen’s and CEO’s statements of
GSK, including the percentage of the total number of words that each coding represents.
Table 15 in Appendix B presents more detailed results of GSK’s content analysis.
Table 6: Word count analysis of GlaxoSmithKline's statements
2009 2010 2011 2012 2013 2014 2015 2016 2017 2018
Goo
d
# of words 87 77 156 161 399 281 164 207 203 274
% of Total 11.9% 6.0% 8.5% 8.3% 17.3% 10.1% 12.8% 15.2% 10.5% 15.1%
Bad
# of words 0 73 23 99 8 106 21 45 16 0
% of Total 0.0% 5.7% 1.2% 5.1% 0.3% 3.8% 1.6% 3.3% 0.8% 0.0%
Total # of words 733 1,276 1,843 1,940 2,309 2,771 1,284 1,365 1,931 1,813
Year good poor good poor good poor mixed mixed good good
Source: Researcher’s own findings from company’s Annual Reports
0
5
10
15
20
25
-
1000,0
2000,0
3000,0
4000,0
5000,0
6000,0
2009 2010 2011 2012 2013 2014 2015 2016 2017 2018
Profit after Tax versus Good & Bad News
Profit after tax (w/o other inc) Good News Bad News

31
In 2009, the Chairman’s and CEO’s statements were combined into one, which was
rather short, the shortest out of all statements, in fact. The company had a rather good
financial performance, the good news reported, thus, making up 12% of the text, with
negative news omitted altogether. 2010 saw a substantial decrease in profit, above 65%
in both figures, which is reflected in the news disclosed in the statement. Some bad
news now appears, and while codings for good news remain at 6, their percentage of
the whole text decreased. Bad news represents 6% of the text, the highest percentage
out of all of the years, mostly on account of the letter being one of the shortest. Despite
that, there are only 3 codings, which barely address the company’s financial
performance. The statement mentions the decline in sales and earnings, but focuses
mostly on the external environment:
“Reported sales, for example, were impacted by generic competition to Valtrex, and reduced sales from Avarda and pandemic related products” (GlaxoSmithKline, 2011, p.4).
A spike in profit in 2011 was followed by a spike in good news – 13 codings, making
up around 8% of the text. Bad news significantly drops, there being only two codings,
accounting for just 1% of the statement. But, even those bad codings are immediately
followed by good aspects, thus, both statements are overall very positive:
“Reported sales were down 3% in the year – down 6% in the first half but up 1% in the second half” (GlaxoSmithKline, 2012, p.11).
2012 saw another decline in financials, although not as severe as in 2010. Despite that,
there isn’t much difference in the reporting of good news, which still makes up around
8% of the two letters. The CEO does disclose more negative aspects than in the previous
year, now at 5% of the whole. However, half of the bad codings are again followed by
good news, and the other half addresses the challenging European market, which
generated unsatisfactory sales. The company states “government austerity measures”
as the main reason behind that (GlaxoSmithKline, 2013, p.3).
The slight recovery from this downturn resulted in another optimistic narrative
from the Chairman and the CEO, in 2013. Both of the statements are also lengthier than
the previous ones, and have the most amount of good news – 17% of the whole text.
There is barely any bad news in either of the letters, the only negative aspect is
addressed in passing when mentioning a successful result achieved by GSK:

32
“We achieved this trading result despite some unexpected challenges, including significantly reduced sales in our Chinese business” (GlaxoSmithKline, 2014, p.4)
In 2014, the company experienced yet another decline in performance, the profits
decreasing substantially. Bad news noticeably increases, but still only making up 4%
of the text. Good news does not decrease significantly, representing 10% of the whole,
which is still higher than other unsuccessful years. Most of the positive aspects of
performance include progress made in areas other than financials, such as R&D or
specific product lines.
The percentage changes in GSK’s financial indicators for 2015 seem to show
growth in the figures. However, that is mostly due to a disposal of an asset, which
skyrocketed the company’s profits. Not counting other income into the profit figures, a
drastic drop can be noted. This is not addressed in the statements, the 2 bad news
codings making up barely 2%. Good news decreases in terms of codings, but since the
letters are much shorter than the few previous ones, these almost reach 13% of the
whole. There also now seems to be a pattern for how the company reports bad news, as
both of the codings are again accompanied by positive comments:
“New product sales are now more than offsetting the declines in Seretide/Advair; sales of which are now around 30% below their peak in 2013” (GlaxoSmithKline, 2015, p.7).
In 2016, revenue improved, but profit plummeted, mostly due to the comparison with
2015 figures that include the sale of an asset. Excluding that, profit after tax actually
significantly improved, and an increase in good news can also be noted, now at 15% of
the whole. Bad news remains at 2 codings, although a slightly bigger percentage – 3%.
One of the bad news addressed the substantial decline in financial performance and, as
expected, attributed it to the asset disposal:
“Total earnings per share was 18.8p (down 89% at actual rates, 99% CER), primarily reflecting comparisons with the £9.2 billion profit in 2015 from the disposal of the marketed Oncology assets” (GlaxoSmithKline, 2017, p.5).
In 2017, the overall performance improved, the company slowly recovering. The
statements only have one bad news coding, making up barely 1%, stating that the
company’s dividends exceed its cash flow generation, this news is also present in 2016.
Other than that, the narratives are positive, especially the CEO’s statement, which,
despite being almost twice as long as the 2016 one, does not explicitly state any

33
negative performance aspects for the year. This is the first year that the CEO’s
statement has no bad news, since 2009, when the Chairman and CEO letters were
combined into one. This could be explained by the fact that a new CEO was appointed,
who may have wanted to stress all of the positive aspects of the company in her first
statement as the CEO, and not shed light on the negative ones. The only thing
acknowledged in that statement was that “there are several areas of the company that
need to be strengthened” (GlaxoSmithKline, 2018, p.5).
GSK experienced continued improvement in 2018, with an increase across all
financial indicators. Bad news is again null, making it the second year in a row that the
CEO letter contains only good news. While in both of the years GSK did witness an
overall positive financial performance, it still seems that the new CEO has an overly
positive reporting style. There is another spike in good news, the 19 codings
representing 15% of the whole, one of the highest percentages of the 10-year period.
The opening sentence of the Chairman’s statement provides a summary of the
company’s success:
“I am pleased to report that 2018 was a year of good financial performance for GSK with improvements in sales, earnings and, particularly, cash flow generation” (GlaxoSmithKline, 2019, p.2).
A nice contrast can be seen between the last part of the good news stated above and the
bad news present in the previous two years. The company has finally, for the first time
in a while, generated enough cash flow to cover the dividend payments (ibid.).
D. Impression Management Analysis
The tactic of emphasizing the positive and minimizing the negative is also evident in
GlaxoSmithKline. The company has a couple of letters to shareholders that do not
report any bad news. But, similar to Bayer, in those years the company had successful
results, which might justify the optimism. However, there are some statements that have
very little bad news, barely addressing the company’s financials, despite it witnessing
a decline in performance. The 2010 Chairman and CEO summary, for example, does
not address the almost 70% drop in profit. Moreover, while there is a decrease in all
financial indicators, the managers still state that “GSK remains financially very strong”
(GlaxoSmithKline, 2011, p.4).

34
During the content analysis of GSK’s statements, a clear pattern was detected
regarding the company’s reporting of bad news. In the majority of the letters to
shareholders that do have negative news, some are immediately followed (or sometimes
preceded) by good news, usually in the same sentence. It seems that the managers prefer
to always finish on an optimistic note when disclosing negative results, thus
emphasizing the positive aspects:
“reflecting the impact of the Cervarix vaccine sales for the catch up programme in the prior year. Excluding Cervarix, sales grew 5%” (GlaxoSmithKline, 2013, p.3).
The tactic of confusing the readers with technical language seems to be, again, not
prevalent in GSK’s statements. There is, of course, some technical terms and corporate
legalese present, but these are used with both good and bad news. It, thus, does not
seem that the negative news is buried under difficult-to-read language.
As for differential reporting, GSK’s letters to shareholders do seem to include ‘hard
numbers’ when disclosing bad news, as well as good news. The majority of the bad
codings actually have clear numbers and percentage changes, which might be a bit
surprising since it is not advantageous for the company:
“Reported sales were down 3% in the year” (GlaxoSmithKline, 2012, p.11).
“… sales for the year declining 3% CER* to £23 billion and core earnings per share down 1% CER to 95.4p” (GlaxoSmithKline, 2015, p.4)
However, this does not mean that GSK’s reports are really transparent, seeing as a lot
of the statements have barely any negative news even when the company’s performance
has been poor. Seven out of the ten analyzed letters only have between 0 and 2 bad
codings, which is a lot less than in Bayer’s case. Moreover, in the so-called
unsuccessful years, when addressing the negative aspects, the company does focus
mainly on the environment, which is another characteristic of differential reporting.
One such year is 2014, with a decline in all financial indicators. The Chairman and the
CEO both preface the bad news with statements about the challenging environment:
“we also recognise the fundamental changes in the trading environment … and how that has impacted performance in 2014” (GlaxoSmithKline, 2015, p.2).
The tactic of attribution was not used as predominantly in GSK when disclosing good
news. It seems that quite a few of them are reported in a more impartial manner, simply
stating the results. However, in some of the letters to shareholders, the internal

35
attribution seems to be more implicit than explicit. The managers do not always
explicitly state that the positive performance is due to a company’s specific capability.
But, similarly to Bayer, some positive aspects are presented using the pronoun “we”
and active verbs, such as “we were able to” or “we grew”. This again emphasizes the
company’s abilities and competence to deliver successful results. There are also no
good news statements that attribute the success, at least partially, to the external factors
at play.
“We have made good progress…”; “… we were able to maintain core earnings per share…” (GlaxoSmithKline, 2013, p.3)
“We grew sales and earnings in line with guidance …” (GlaxoSmithKline, 2014, p.4)
As for the bad news, some of the statements were reported neutrally, but the majority
were, in fact, attributed to the external environment. This is especially evident in the
three reports that have more than just one or two bad codings. In the 2010 letter,
negative performance was blamed on generic competition; in 2012, the company
mentioned the adverse impact of government measures; and in 2014, as mentioned
above, the letters again blame the challenging environment. There seems to be only one
instance of a negative aspect being attributed to an internal problem. But, staying true
to the previously discussed pattern of reporting bad news, the CEO again ends it with
good news:
“Performance in our Consumer Healthcare business was impacted by some supply issues with sales for the year falling 1%, but increasing 2% in the last quarter following progress in remediation of these issues” (GlaxoSmithKline, 2015, p.4).
An interesting contrast can be observed in some of the letters to shareholders. As
illustrated above with examples from the 2012 and 2013 reports, some good news is
disclosed using the plural first person pronoun, as opposed to the more common “sales
grew” or “earnings increased”, for example. The opposite can be noticed with bad news
attributed to the environment, which is disclosed in a cause-and-effect manner, thus
making a clear link between the external factors and the unsuccessful performance.
Examples of this are displayed below, along with a couple more instances of self-
serving attribution:

36
Internal Credit:
“a focus on cost and financial efficiencies has allowed the Board to set a dividend of 80p per share for 2014, an increase of 3%” (GlaxoSmithKline, 2015, p.2).
“Group Adjusted operating margin improved, reflecting effective management of costs …” (GlaxoSmithKline, 2018, p.5)
External Blame:
“Trading conditions continue to be challenging, particularly in the US primary care market. This led to sales for the year declining 3% …” (GlaxoSmithKline, 2015, p.3).
“Here, government austerity measures adversely impacted growth by approximately 6 percentage points during the year” (GlaxoSmithKline, 2013, p.3).

37
7. ANALYSIS OF NOVARTIS
A. Company Overview
Novartis International AG is a multinational pharmaceutical company headquartered in
Basel, Switzerland. It operates through its two core divisions – Innovative Medicine
and Sandoz. Innovative Medicine is comprised of two business units, Novartis
Pharmaceuticals and Novartis Oncology, commercializing patented medicines for
Respiratory, Neuroscience, Immunology, and others. Sandoz is the company’s division
delivering generic pharmaceutical and biosimilar products. Novartis also has an
Institute for BioMedical Research, with a few campuses across the world, dedicated to
discovering new drugs (“Our Company | Novartis”, 2019). In 2018, Novartis employed
around 125,150 people (Novartis, 2019a, p.201).
As part of the PatientView survey, among the patient groups familiar with the
company, Novartis ranked 4th, same position as in the previous year (PatientView,
2019). Novartis seems to have the best reputation out of the three analyzed companies.
B. Financial Analysis
Table 7: Financial Analysis of Novartis
Financial Indicators 2009 2010 2011 2012 2013 2014 2015 2016 2017 2018
Revenue 6.8% 14.4% 15.7% -3.2% 2.2% -9.5% -5.7% -1.9% 1.2% 5.7% Profit after tax 2.7% 17.9% -7.3% 4.0% -3.4% 10.6% 73.1% -62.4% 15.0% 63.8%
Profit after tax (cont. op.)
3.6% 17.9% -7.3% 4.0% -3.4% 15.4% -34.5% -4.7% 15.0% 63.8%
Earnings per share 2.2% 15.7% -10.5% 2.6% -4.3% 16.8% -33.5% -3.4% 16.3% 65.9%
Source: Researcher’s own calculations with data from company’s Annual Reports

38
The results for Novartis are presented in Table 7, and its financial figures in Table
13, Appendix A. There is a modest increase in all indicators after the crisis, signaling a
promising recovery. The year of 2010 shows growth in all figures, as well. With
revenue continuing to increase in 2011, profit and earnings per share, unfortunately,
dropped. In 2012, these figures recover, but revenue decreased very slightly. In 2013,
there is another modest decrease in profit and earnings per share, and a modest recovery
in revenue.
The company witnessed a more improved performance in 2014, with increase in
the profit figures, although revenue again decreased. In this year, profit after tax have
actually reached a 6-year high (within the period chosen for analysis). 2015 does not
show the same promising results, the percentage change being negative for all figures,
except profit after tax, which includes profit from discontinued operations. Profit from
continuing operations decreased by almost 35%. The financial figures further decline
in 2016, profit after tax dropping even below the 2008 level. Novartis finally
experienced growth in 2017, which further intensified in 2018, the indicators
demonstrating significant improvement. The profit figure (excluding discontinued
operations), in fact, reached its 10-year peak.
The results of this financial analysis reveal a lot of ambiguous years, with
percentages being positive for one indicator and negative for the others, and vice versa.
To avoid having most years defined as ‘mixed’, the labeling is done based on the profit
from continuing operations, since also the changes in these ambiguous years are not
that significant. Thus, the years 2009, 2010, 2012, 2014, 2017 and 2018 are considered
to be overall successful for the company, while the others being labeled as having a
poor performance. It can be expected that the bad news will intensify in the
unsuccessful years.

39
C. Content Analysis
Table 8: Number of good & bad codings for Novartis
2009 2010 2011 2012 2013 2014 2015 2016 2017 2018
Good 31 35 20 13 36 11 14 5 18 10
Bad 7 1 5 6 0 0 0 5 1 0
Year good good poor good poor good poor poor good good Source: Researcher’s own findings from company’s Annual Reports
The number of codings for Novartis is even more erratic than for GSK. The change
in numbers for good news codings is quite drastic, ranging from 5 to 36. In the financial
analysis section, it was concluded that the years 2011, 2013, 2015, and 2016 were
overall unsatisfactory for Novartis, in terms of financial performance. However, only
in two out of those years an increase in bad news can be seen. There are quite a few
years with no bad codings, although this is not dissimilar to Bayer and GSK. After two
successful years, 2009 and 2010, with high numbers of good news, a decrease can be
seen in 2011. However, a further decrease in good news can be noted in 2012, even
though it was an overall good year for the company. Moreover, in 2013, the good news
skyrocketed, despite some figures slightly dropping. In 2014, another good year for the
company, good news again decreases counterintuitively, but increases in 2015, an
unsuccessful year for Novartis. Thus, there doesn’t seem to be a pattern with reporting
of good news, as was, more or less, visible in the other companies. Even though there
are other factors that may contribute to the disclosure of good and bad news, besides
just financial performance, it is still evident that Novartis has a different approach to
reporting, especially compared to the other two companies.
Figure 4 illustrates the relationship between the company’s profitability and the
good and bad news reported in its statements. The profit after tax figure plotted on the
graph excludes discontinued operations.

40
Figure 4: Profit after Tax vs. Good & Bad News in Novartis
As would be expected from the initial analysis of Table 8 earlier, the good news
curve does not trail the profit after tax curve. Good news seems to be quite
unpredictable, with no direct relationship to the company’s profitability for the year. A
further analysis of the content of the Chairmen’s and CEO’s statements will help shed
some light on the possible reasons behind that. As for the bad news, a weak negative
relationship can be noted with the profit after tax curve, more prominent in the first and
last three years. Similarly, in the first five and last three years, good and bad news have
a weak negative relationship, a decrease in one corresponding to an increase in the
other. Table 9 provides the word count analysis of the company’s statements, followed
by a more in-depth analysis of their content. All of Novartis’ content analysis results
are presented in Table 16, Appendix B.
0
5
10
15
20
25
30
35
40
-
2000,0
4000,0
6000,0
8000,0
10000,0
12000,0
14000,0
2009 2010 2011 2012 2013 2014 2015 2016 2017 2018
Profit after Tax versus Good & Bad News
Profit after tax (cont.op) Good News Bad News
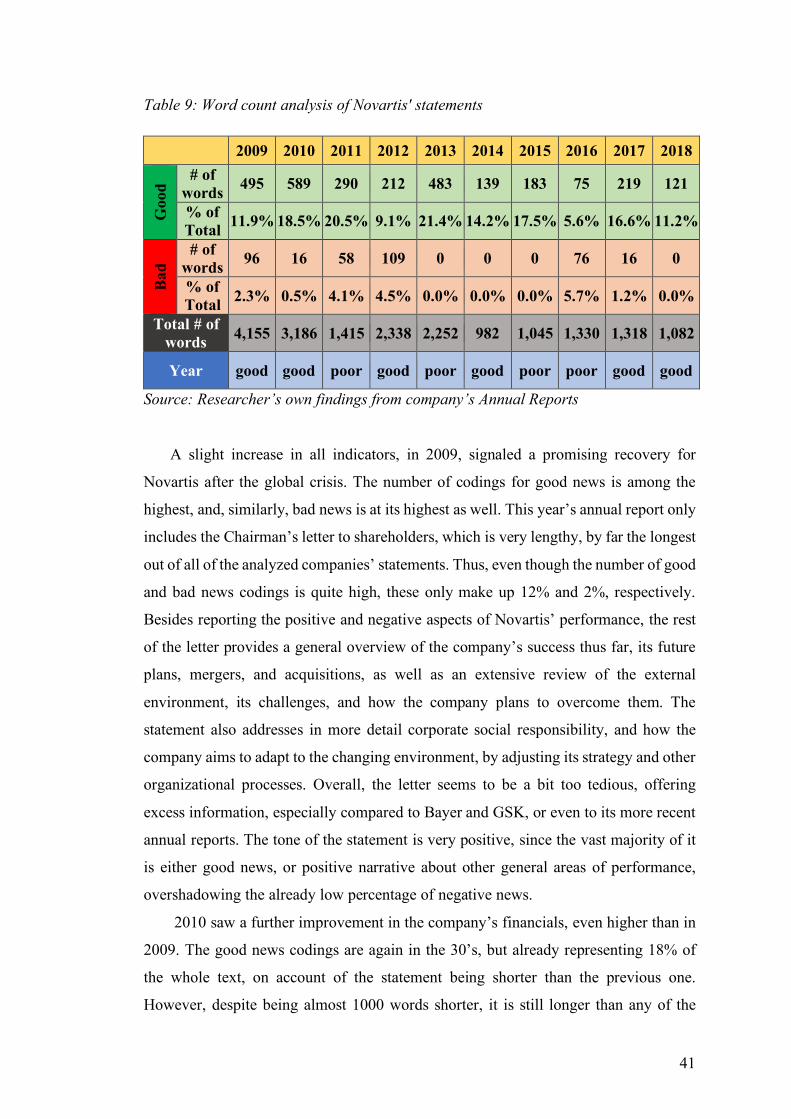
41
Table 9: Word count analysis of Novartis' statements
2009 2010 2011 2012 2013 2014 2015 2016 2017 2018 G
ood
# of words 495 589 290 212 483 139 183 75 219 121
% of Total 11.9% 18.5% 20.5% 9.1% 21.4% 14.2% 17.5% 5.6% 16.6% 11.2%
Bad
# of words 96 16 58 109 0 0 0 76 16 0
% of Total 2.3% 0.5% 4.1% 4.5% 0.0% 0.0% 0.0% 5.7% 1.2% 0.0%
Total # of words 4,155 3,186 1,415 2,338 2,252 982 1,045 1,330 1,318 1,082
Year good good poor good poor good poor poor good good
Source: Researcher’s own findings from company’s Annual Reports
A slight increase in all indicators, in 2009, signaled a promising recovery for
Novartis after the global crisis. The number of codings for good news is among the
highest, and, similarly, bad news is at its highest as well. This year’s annual report only
includes the Chairman’s letter to shareholders, which is very lengthy, by far the longest
out of all of the analyzed companies’ statements. Thus, even though the number of good
and bad news codings is quite high, these only make up 12% and 2%, respectively.
Besides reporting the positive and negative aspects of Novartis’ performance, the rest
of the letter provides a general overview of the company’s success thus far, its future
plans, mergers, and acquisitions, as well as an extensive review of the external
environment, its challenges, and how the company plans to overcome them. The
statement also addresses in more detail corporate social responsibility, and how the
company aims to adapt to the changing environment, by adjusting its strategy and other
organizational processes. Overall, the letter seems to be a bit too tedious, offering
excess information, especially compared to Bayer and GSK, or even to its more recent
annual reports. The tone of the statement is very positive, since the vast majority of it
is either good news, or positive narrative about other general areas of performance,
overshadowing the already low percentage of negative news.
2010 saw a further improvement in the company’s financials, even higher than in
2009. The good news codings are again in the 30’s, but already representing 18% of
the whole text, on account of the statement being shorter than the previous one.
However, despite being almost 1000 words shorter, it is still longer than any of the
42
statements of the other companies. The Chairman continues his narrative about the
industry, the external environment with its challenges, and other topics. Among positive
aspects, the letter reports increase in net sales, operating income, net income, and free
cash flow, as well as advances in various separate divisions. There is only one bad news
coding, which is rather general, and relating more to the external than the internal
environment:
“The past year was shaped by repercussions from the global financial crisis and considerable currency turbulence” (Novartis, 2011, p.7).
The 2011 letter to shareholders is, finally, much shorter, less than half of the size of the
previous one. The Chairman abandons the usual thorough description of the
environment, mostly focusing on the company’s performance. While revenue increased
in 2011, all the other profit figures slightly dropped. Good news decreased to 20
codings, but since the letter is shorter, these represent 20% of the whole text, the
second-highest percentage across all years. There are 5 bad news codings, making up
4%, although none of them address the decrease in profits. These mostly talk about
other performance aspects, such as delays of product approvals, site closures, and
others.
Interestingly, the 2012 statement again includes the Chairman’s descriptive
narrative of the external circumstances, albeit not as long-winded as the previous ones.
This year, an opposite result to the one in 2011 can be seen, revenue decreasing, while
other figures slightly increasing. Good news decreased to 13 codings, representing 9%
of the text. Among the positive aspects is progress in specific divisions, as well as
product approvals. Although bad news only increased from 5 to 6 codings, there is a
spike in terms of word count (around 100 words), but these still make up around 4% of
the whole. The bad news finally addresses the decline in growth, reporting some
specific figures, rather than just general statements regarding the environment:
“Production bottlenecks also affected Vaccines and Diagnostics (USD 1.9 billion, –4% in constant currencies)” (Novartis, 2013, p.6).
In 2013, there is a change in the Chairman position, and an official letter to shareholders
from the CEO is introduced. The CEO letter is now longer than the Chairman’s,
although the two of them combined are still shorter than some of the previous
Chairman’s letters. The number of good news codings is the highest of all years, and

43
makes up 21%. Neither of the statements includes any negative news, despite there
being a slight decrease in profit.
Further changes in the company’s reporting can be noted in 2014. Starting with this
year, all of the statements are a lot more concise, especially compared to the previous
years. The 2014 ones, in fact, being the shortest out of them all. In terms of financial
performance, Novartis saw a slight growth in its profit. Bad news is non-existent, while
good news understandably dropped to 11 codings, due to the shorter size of the letters,
representing 14% of the whole. Besides addressing the financial progress, other positive
performance aspects were also reported:
“We gained 13 major approvals in key markets in 2014 and advanced our pipeline” (Novartis, 2015, p.4).
In 2015, the company experienced another decline, more substantial than in the
previous years, profit after tax from continuing operations decreasing by 34%.
Surprisingly, neither of the statements reports this, bad news again being null, while
good news even slightly increasing. Even though Novartis considerably profited from
its discontinued operations, making the overall profit figure the highest across all years,
all other indicators declined. It is, thus, quite unexpected to read such overly positive
statements from the Chairman and CEO.
2016 was another rough year for Novartis, with a downturn in its financials. Good
news notably drops to only 5 codings, representing 5% of the text, the lowest number
across all years. Bad news increases to 5 codings, making up 5%, which is quite the
contrast against the previous years with no negative news whatsoever. This year’s
statements have a more prominent negative undertone than others, although still
outweighed by the optimistic narrative about the company’s plans and competences in
general.
Novartis witnessed growth in its figures in 2017, good news escalating to 18
codings, accounting for 17% of the text, and bad news dropping again to 1%. The only
negative aspect of performance is related to the Sandoz division, whose sales declined
by 2%. Good news mostly includes strong financial results, specifically related to the
company’s divisions. A nice parallel can be noted in this year’s letters to shareholders
compared to the previous ones. One of the negative aspects, in 2016, was related to the
Alcon division, which was not yielding a positive growth rate. In 2017, the narratives
now reveal progress in that division:

44
“One area where we fell short in 2016 was Alcon” (Novartis, 2017, p.5).
“Alcon made significant progress on its turnaround, returning to growth and building momentum toward the end of the year” (Novartis, 2018, p.4).
Finally, in 2018, Novartis experienced substantial growth in its profit indicators, with
a 64% increase in profit after tax. There is a slight decline in good news, now at 11%
of the statements, and, unsurprisingly, again no bad news is reported. However, this
year saw a change in the CEO position, there thus being a change in the reporting style
as well. The new CEO’s letter does not report a lot of the company’s positive financial
performance, mostly focusing on describing the cultural transformation that has started
in Novartis, the changes undertaken to improve efficiency, and any other future plans.
Among the good news was the company’s progress in making their medicine more
accessible:
“Our systematic approach helped us rise to No. 2 in the 2018 Access to Medicine Index” (Novartis, 2019b, p.3).
D. Impression Management Analysis
Novartis is not an exception when it comes to employing the tactic of stressing the
positive and downplaying the negative. More than half of the annual reports have either
just one bad news coding, or none at all. While most of those years saw some financial
growth, there are a couple during which Novartis witnessed decline in performance. In
2013, for example, despite a slight decrease in profit figures, both letters to shareholders
only report positive results. Even more unexpected are the 2015 statements, which
again do not mention any bad news despite the even more considerable decrease in
figures. The reports that have more than just one bad news coding, however, are still
overshadowed by the good news. Thus, there definitely is an emphasis on the positive,
especially in the first half of the analyzed letters.
Just as the other two companies, Novartis does not seem to use difficult-to-read
language in order to baffle the readers when disclosing negative news. Technical terms
are again present throughout all reports, with both good and bad news. Overall, the
company does not appear to be using a different language when talking about poor
performance. However, this is again not a sign of transparency, seeing as the company

45
barely discloses bad news, especially in some statements where there is merely one
sentence or none at all.
Instances of differential reporting can be detected in the letters to shareholders.
Indeed, when addressing positive aspects, the company often uses hard numbers to
illustrate the extent of its growth, while the few negative statements do not report as
many percentage changes. This is especially noticeable in the first three Chairman’s
statements. In the 2009 and 2010 letters, the company’s main financial results are
presented in bullet point form, illustrating the positive change in several figures. Below
are excerpts of two out of the five bullet points from both years:
“– Net sales rose by 11% …”; “– Operating income grew 11% …” (Novartis, 2010, p.7)
“– Net sales grew 14% …”; “– Operating income rose by 15% …” (Novartis, 2011, p.4)
However, in 2011, the first year with a decrease in profit, the usual bullet points are
now absent. Granted, this is also the year when the letter to shareholders is significantly
shorter than the previous ones, so it might be due to a change in the reporting style. But,
the letter still does not address any of the negative percentage changes in the profit
figures. Out of all of the bad news codings, there are only a couple that discuss the
declines in figures, depicting those in percentages. But, these are all attributed to the
environment, which is further discussed in the next impression management tactic.
An interesting observation can be made for the 2012 Chairman’s statement. While
some of the bad news do technically disclose unfavorable numbers for the company,
these are only included in parentheses, avoiding the use of words ‘decrease’, ‘decline’,
etc. There are also a couple of good codings that just include the percentage change in
brackets, but these are followed by further positive news, and other good codings use
words like ‘increase’ and ‘growth’.
“The Group’s net sales reached USD 56.7 billion (–3% …), while net income increased by 4% …”
“Sandoz (USD 8.7 billion, -4%, …) succeeded in compensating for the competition-driven price decline of enoxaparin, …” (Novartis, 2013, p.5).

46
In the first example, despite net sales decreasing by 3%, the Chairman uses the word
‘reached’, which has a positive connotation. Thus, even the bad news is delivered with
a generally positive tone, and is immediately followed by optimistic statements,
similarly to GSK:
“Production bottlenecks also affected Vaccines and Diagnostics (USD 1.9 billion, –4% in constant currencies). On an encouraging note, the division received EU approval …” (ibid., p.6).
Several instances of attribution can be encountered in the letters to shareholders. When
it comes to good news, however, there aren’t as many explicit ones, with most of them
not directly attributed to the company’s competence. Some are disclosed neutrally,
while some do appear to include implicit internal attribution. This is done in a similar
way to GSK, using phrases like “we increase”, “we delivered”, “we were able to”, etc.
Overall, most of the good news were just presented in a self-laudatory manner:
“In 2013, we increased net sales by 4% in constant currencies to USD 57.9 billion” (Novartis, 2014, p.8).
“In 2013, we delivered a total shareholder return of 32.3%, outpacing the average return in the pharmaceuticals industry” (ibid., p.9).
On very rare occasions, the positive statements give credit to some external factors that
benefitted the company:
“Sandoz benefited from strong growth in generics and biosimilars in Europe and emerging markets” (ibid., p.8).
Equally rare are also statements where the company is taking responsibility for poor
results. An example of internal blame is depicted below. There are also several bad
news codings that seemingly point towards an internal problem, e.g. quality issues or
production bottlenecks. However, these are not formulated in a way that portrays a clear
link between the internal problems and the negative results, and thus, do not really
present a case of attribution:
“One area where we fell short in 2016 was Alcon” (Novartis, 2017, p.5).
“The performance of OTC and Animal Health … was hurt by quality issues at a US production site …” (Novartis, 2013, p.6).
Most of the bad news in the letters to shareholders, however, still focus on the
environment. Not all of them explicitly blame the external factors for the negative

47
results, but a couple of the examples that were detected are presented below, along with
an example of internal credit:
Internal Credit:
“The generics division Sandoz achieved solid underlying growth … in key markets thanks to new product launches and increased marketing initiatives” (Novartis, 2010, p.7).
External Blame:
“However, Sandoz net sales were down 2% cc due to fierce price competition in the US” (Novartis, 2018, p.4).
“Our core operating income of USD 13.0 billion declined 2% (cc), as we expected, reflecting generic competition and growth investments” (Novartis, 2017, p.5).

48
8. DISCUSSION
A. Comparison of the Three Companies
All three companies reported more good news than bad, all of them also having several
reports that lacked bad news altogether. This is not surprising and is consistent with the
findings of various studies on corporate reporting, some of which were mentioned in
the Literature Review. In terms of the relationship between the profit and the number
of good news reported, there is some level of association present in Bayer and GSK,
but not evident in the case of Novartis. The reason behind that might be the frequent
changes in the reporting style of Novartis’ statements. But, some association between
profit and bad news could be observed in all three companies. These relationships were
not detected in all years and are, of course, not precise, since the positive and negative
news also included aspects beyond just the financial performance.
Each company had a different number of statements or letters to shareholders in
the chosen 10-year period, but Table 10 presents their word count analysis using
percentages to ensure comparability. Since Bayer’s reports only include a letter from
the Chairman, the number of words is lower than the other two companies’, although
not as significant as might be expected. Despite the shorter statements, however, the
reported good news represents 19.5% of all of Bayer’s statements, the highest number
out of the companies. But, equally, the reported bad news also represents the highest
percentage – 4.3%, while the other companies’ figures are around 2%. It appears that
the gap between the positive and negative codings is the smallest in Bayer’s case, and
the biggest in Novartis. It, thus, seems that Bayer has slightly more balanced reports.
However, this does not necessarily mean that it is more transparent, since the way in
which the negative news is presented is important.
Table 10: Word count comparison of all three companies
Total # of Words
# of words in good news
% of Total
# of words in bad news
% of Total
Bayer 14,216 2,772 19.5% 615 4.3% GSK 17,265 2,009 11.6% 391 2.3% Novartis 19,103 2,806 14.7% 368 1.9%
Source: Researcher’s own findings from company’s Annual Reports

49
Overall, however, the statements of GSK and Novartis did seem more positive.
More than half of their letters, 7 out of 10 for GSK, and 6 out of 10 for Novartis, had 0
to 2 bad news codings, while only 3 out of 10 Bayer’s letters had 0 negative news
reported, the others having at least over 4 codings. But, the tactic of stressing the
positive and downplaying the negative was still observed in all three companies, to a
lesser degree in Bayer though. It was especially evident in those years with a relatively
poor performance that had barely any bad news reported, or none at all.
This ties with the impression management tactic of differential reporting, which
was again present in all companies. In the case of Novartis, the company often used
clear numbers when reporting good news, but not when reporting bad news. The few
codings that did include some figures were still more focused on the environment. In
GSK’s case, majority of the bad news were actually reported using clear numbers, but
these were often attributed to the environment. As for Bayer, only one of its reports
included clear financial figures when discussing poor performance, the other letters
having more generalized bad statements or, again, ones focused on the environment.
Thus, even though Bayer’s statements have more bad news than the other two
companies, it does not indicate an increased level of transparency.
Overall, the tactic of attribution was not used as blatantly as might be expected. A
good portion of the news was disclosed in an impartial manner, merely stating the
results. Moreover, there were some cases of internal blame, the company conceding its
responsibility for bad news, and external credit, giving credit to the environmental
factors for positive results. These, however, were not as common, and could be
observed more in Bayer’s statements, but not as much in Novartis, and not at all in
GSK.
But, some instances of attribution could still be observed in all companies. An
interesting remark was made regarding the self-attribution of good news, which was
often more implicit rather than explicit, especially in GSK and Novartis. This was done
with the frequent use of the pronoun “we”, which helped emphasize that it was the
companies’ own merits for achieving the good results. In the cases with external blame
for the negative results, a clear link between the environment and the bad news was
often made, using cause-and-effect terminology.
The technique of baffling the readers with difficult-to-read language when
reporting bad news could not be detected in the analyzed reports. While some technical
terms and corporate language were indeed present, these were used when discussing

50
both good and bad news. Overall, it did not seem that any of the companies were
burying the negative results under complicated language. However, a lot of the reports
had barely any bad statements, so it could be that the companies prefer to omit them
altogether rather than confuse the readers when disclosing them. Although it is a
subjective interpretation, the language used in the reports seemed to be fitting to their
intended audience, which is at least somewhat familiar with the field. But, further
research, especially with the help of tools for assessing the readability of the text, can
shed some more light on this matter.
B. Other Impression Management Techniques
Besides the four impression management tactics from Jones (2011), there are other
techniques that were pervasive in the companies’ annual reports. One of them involves
the companies immediately accompanying the good news with bad news, thus creating
a contrast that highlights their accomplishments.
Stratulat (2019) analyzed the annual reports of Volkswagen, also detecting this
technique of juxtaposing the company’s progress against challenging external factors,
thus enhancing its corporate image. This could be put under the umbrella of an
impression management tactic discussed by Tierney and Webb (1995), called
competence enhancement, which was used by Exxon during the oil spill crisis. The
authors explained this tactic as highlighting a company’s fitness to overcome an
emergency.
Even though crisis events are outside the scope of this research, this technique
could also be observed when the companies were reporting their good and bad news.
Previously in the Content and Impression Management Analyses of GSK, its pattern of
stating the good news right after disclosing some negative aspects was discussed. The
tactic of competence enhancement, however, is a bit different. In GSK’s case, it almost
seemed as if the managers always wanted to finish on an optimistic note, bringing a
positive aspect to any statement. But, competence enhancement involves disclosing the
adverse effects of certain factors with the aim of emphasizing the company’s ability to
overcome them:
“Despite navigating the final year of the Gleevec/Glivec patent expiration, we grew Group net sales by 2% in constant currencies” (Novartis, 2018, p.4).

51
“Group sales rose 17% at actual rates, 6% CER (5% pro-forma) to £27.9 billion, despite the uncertainty and volatility experienced globally in 2016” (GlaxoSmithKline, 2017, p.5)
The examples above show the presence of this tactic within a single sentence. This is
quite common in some of the reports, several good news statements being preceded or
followed by short remarks of some bad news. In other cases, this technique can be
noticed within bigger sections of the letters. Sometimes, the managers describe the bad
news over several sentences, following that with a comment on how remarkable it is
for the company to achieve its positive results given the circumstances. In some of
Novartis’ first letters to shareholders, the Chairman even starts his narrative with a few
paragraphs of describing the challenging environment, and then starts discussing the
company’s achievements. Again, this contrast helps illustrate the company’s
competence to perform successfully even during difficult times:
“As in the previous year, the Pharmaceuticals segment was hampered by the efforts of many countries to reduce health system costs. Intense competition from generic products also presented an ongoing challenge. That makes it all the more positive that our cost management was successful and that our Consumer Health segment outperformed the market” (Bayer, 2012, p.2).
“The economic and debt crisis has cast a shadow over Europe and the United States for more than four years, and it significantly affected 2012, as well. Despite major concerted efforts, the end of this troubling period is not yet in sight. […] Despite this ominous backdrop, Novartis once again posted strong results in 2012” (Novartis, 2013, p.5).
Another tactic present in the analyzed reports was ingratiation, described by Allen &
Caillouet (1994) as companies trying to persuade stakeholders of their legitimacy. It
involves organizations portraying an image of compliance to the environment’s rules,
so to speak, expressing their values, beliefs, positive qualities and intentions, all in an
attempt to gain likeability and approval from the audience. In the case of the three
analyzed companies, this was evident in the discussion about their stance on corporate
social responsibility, as well as their overall corporate values:
“It is also important to us that economic growth be achieved in harmony with environmental and social responsibility. We adhere to the fundamentals of sustainable development and the ten principles of the Global Compact of the United Nations” (Bayer, 2016 p.6).

52
“Our ambition is to drive a high-performance culture, putting science at the heart of GSK, remaining true to our values and our purpose: to help people do more, feel better, live longer” (GlaxoSmithKline, 2018, p.6).
“Innovation, performance and quality are values embedded in the DNA of our company, and we are renewing emphasis on the values of courage, collaboration and integrity” (Novartis, 2015, p.4).
The other tactic observed was the use of emotion in the letters to shareholders. It is
understandable for pharmaceutical companies to evoke emotion, due to the industry’s
link with human welfare, especially when it comes to biggest societal challenges in
terms of healthcare or terminal illnesses. In several of the analyzed reports, emotional
narratives, however, were used with a self-laudatory aim, the companies enhancing
their importance for the industry and society.
In the case of Novartis, the best example of this tactic can be observed in the 2016
and 2017 reports. The CEO starts his statements with stories about seriously-ill patients,
only to then express his pride in the company and its great success in changing people’s
lives. In some of Bayer’s statements, it was evident during the discussions of the many
plans that the company aims to achieve, put into perspective by mentioning the benefits
these bring or will bring to society. In a much similar fashion, so does the CEO of GSK
emphasize the company’s ability to fight some of the biggest global health challenges,
stressing its value-based culture:
“Emily Whitehead was once a little girl close to death. […] Our ability to deliver new breakthrough treatments like Kymriah is one of the many reasons I am proud of our company …” (Novartis, 2018, p.4)
“All of these questions are part of a challenge for humankind that farmers around the world will have to tackle in the years ahead. As a partner to farmers – both large companies as well as smallholders – Bayer wants to contribute to the solution for this challenge” (Bayer, 2018, p.4).
While the tactics of ingratiation and use of emotion do not necessarily pertain to the
reporting of good and bad news, their discussion contributes to the understanding of
the overall tone of the companies’ disclosures. The tone of the letters is largely positive,
and sometimes overly-positive when negative aspects are omitted. But, even when
these are reported, they are often overshadowed by the discussion of the positive
aspects, and the narratives praising the companies.

53
9. CONCLUSION
As expected, the findings reveal that companies do focus more on reporting their good
news in the Chairmen’s and CEO’s statements. On average, the good news represented
around 15% of all statements taken together, while bad news around 3%. The reported
bad news was especially scarce in GSK and Novartis, with majority of their statements
having either a couple of codings, which is barely anything, or no codings at all.
When observing the relationship between the companies’ profitability and
reporting of good and bad news, some level of association could be observed. This was,
however, more evident in the cases of Bayer and GSK, the companies’ financial
situation impacting the type of news reported in a more predictable way than in
Novartis’ case.
The main impression management tactics detected when the companies reported
their good and bad news were stressing the positive and downplaying the negative,
differential reporting, attribution, and competence enhancement. Baffling the readers
was the one technique that could not be observed in the chosen companies, but further
research into the readability of the statements might reveal a different conclusion. The
additional impression management tactics that were identified include ingratiation and
the use of emotion. Although not pertaining to the good and bad news reporting, their
discussion helps provide more insight into the rhetorical manipulation used in the letters
to shareholders.
This thesis contributes to the existing research on impression management
techniques used in corporate statements. It brings value through its study of the letters
to shareholders, one of the most important sections of the annual report, and sheds light
on the impression management tactics used in the pharmaceutical industry. The
implications drawn from this research are that the shareholders, and stakeholders in
general, need to be vigilant when reading the corporate narratives, to discern when the
meaning of text is somehow manipulated to manage their impressions of the companies.
The main limitation of this research stems from the chosen methodology, as the
findings might be contingent upon the researcher’s subjective interpretations. Areas for
potential future research could be: finding ways to further eliminate possible
subjectivity, looking into the companies during scandals or crisis events to observe the
changes in reporting, or extending the sample of companies to include more of the
industry’s top players.

I
BIBLIOGRAPHY
About us | GSK. (2019). Retrieved from https://www.gsk.com/en-gb/about-us/ Adelberg, A. (1979). Narrative Disclosures Contained in Financial Reports: Means of
Communication or Manipulation?. Accounting and Business Research, 9(35), 179-190. doi: 10.1080/00014788.1979.9729157
Aerts, W. (1994). On the use of accounting logic as an explanatory category in narrative accounting disclosures. Accounting, Organizations And Society, 19(4-5), 337-353. doi: 10.1016/0361-3682(94)90001-9
Alattar, J., & Al-Khater, K. (2008). An empirical investigation of users' views on corporate annual reports in Qatar. International Journal Of Commerce And Management, 17(4), 312-325. doi: 10.1108/10569210710844381
Allen, M., & Caillouet, R. (1994). Legitimation Endeavors: Impression Management Strategies Used by an Organization in Crisis. Communication Monographs, 61, 44-62.
Aly, D., El-Halaby, S., & Hussainey, K. (2018). Tone disclosure and financial performance: evidence from Egypt. Accounting Research Journal, 31(1), 63-74. doi: 10.1108/arj-09-2016-0123
Anderson, R. (2014). Pharma industry gets high on profits. Retrieved from https://www.bbc.com/news/business-28212223
Bartlett, S., & Chandler, R. (1997). The Corporate Report and the Private Shareholder: Lee and Tweedie Twenty Years On. The British Accounting Review, 29(3), 245-261. doi: 10.1006/bare.1996.0044
Bayer. (2010). Annual Report 2009. Retrieved from https://www.investor.bayer.de/en/reports/archive/
Bayer. (2011). Annual Report 2010. Retrieved from https://www.investor.bayer.de/en/reports/archive/
Bayer. (2012). Annual Report 2011. Retrieved from https://www.investor.bayer.de/en/reports/archive/
Bayer. (2013). Annual Report 2012. Retrieved from https://www.investor.bayer.de/en/reports/archive/
Bayer. (2014). Annual Report 2013. Retrieved from https://www.investor.bayer.de/en/reports/archive/
Bayer. (2015). Annual Report 2014. Retrieved from https://www.investor.bayer.de/en/reports/archive/
Bayer. (2016). Annual Report 2015. Retrieved from https://www.investor.bayer.de/en/reports/archive/
Bayer. (2017). Annual Report 2016. Retrieved from https://www.investor.bayer.de/en/reports/archive/
Bayer. (2018). Annual Report 2017. Retrieved from https://www.investor.bayer.de/en/reports/archive/
Bayer. (2019). Annual Report 2018. Retrieved from https://www.investor.bayer.de/en/reports/archive/

II
Bayer’s merger failure is a lesson for other buyers. (2019). Retrieved from https://www.ft.com/content/b5c48f46-6d93-11e9-a9a5-351eeaef6d84
Beekes, W., Pope, P., & Young, S. (2004). The Link Between Earnings Timeliness, Earnings Conservatism and Board Composition: evidence from the UK. Corporate Governance, 12(1), 47-59. doi: 10.1111/j.1467-8683.2004.00342.x
Brennan, N., Guillamon-Saorin, E., & Pierce, A. (2009). Methodological Insights. Accounting, Auditing & Accountability Journal, 22(5), 789-832. doi: 10.1108/09513570910966379
Business and Industry Sector Ratings. (2018). Retrieved from https://news.gallup.com/poll/12748/business-industry-sector-ratings.aspx
Chang, L., Most, K., & Brain, C. (1983). The Utility of Annual Reports: An International Study. Journal Of International Business Studies, 14(1), 63-84. doi: 10.1057/palgrave.jibs.8490507
Clarke, G. (1997). Messages from CEOs: a content analysis approach. Corporate Communications: An International Journal, 2(1), 31-39. doi: 10.1108/eb046532
Clatworthy, M., & Jones, M. (2003). Financial reporting of good news and bad news: evidence from accounting narratives. Accounting And Business Research, 33(3), 171-185. doi: 10.1080/00014788.2003.9729645
Deegan, C., & Gordon, B. (1996). A Study of the Environmental Disclosure Practices of Australian Corporations. Accounting And Business Research, 26(3), 187-199. doi: 10.1080/00014788.1996.9729510
Ernst & Young. (2018). Margins of pharmaceutical companies are continuing to decline – the future lies in new ecosystems.
GlaxoSmithKline. (2010). Annual Report 2009. Retrieved from https://www.gsk.com/media/2688/annual-report-2009.pdf
GlaxoSmithKline. (2011). Annual Report 2010. Retrieved from https://www.gsk.com/media/2691/annual-report-2010.pdf
GlaxoSmithKline. (2012). Annual Report 2011. Retrieved from https://www.gsk.com/media/2696/annual-report-2011.pdf
GlaxoSmithKline. (2013). Annual Report 2012. Retrieved from https://www.gsk.com/media/2694/annual-report-2012.pdf
GlaxoSmithKline. (2014). Annual Report 2013. Retrieved from https://www.gsk.com/media/2701/annual-report-2013-interactive.pdf
GlaxoSmithKline. (2015). Annual Report 2014. Retrieved from https://www.gsk.com/media/2710/gsk-annual-report-2014-interactive.pdf
GlaxoSmithKline. (2016). Annual Report 2015. Retrieved from https://www.gsk.com/media/4697/gsk-annual-report-2015.pdf
GlaxoSmithKline. (2017). Annual Report 2016. Retrieved from https://www.gsk.com/media/3609/annual-report-2016.pdf
GlaxoSmithKline. (2018). Annual Report 2017. Retrieved from https://www.gsk.com/media/4751/annual-report.pdf
GlaxoSmithKline. (2019). Annual Report 2018. Retrieved from https://www.gsk.com/media/5349/annual-report-2018.pdf

III
Global Pharmaceutical Industry - Statistics & Facts. (2019). Retrieved from https://www.statista.com/topics/1764/global-pharmaceutical-industry/
Goffman, E. (1959). The presentation of self in everyday life. Garden City, N.Y.: Doubleday.
Hashemi, F. (2012). Industry Dynamics in Pharmaceuticals. Pharmacology & Pharmacy, 3(1), 1-6. doi: 10.4236/pp.2012.31001
Hooghiemstra, R. (2000). Corporate Communication and Impression Management - New Perspectives Why Companies Engage in Corporate Social Reporting. Journal of Business Ethics, 27(1/2), 55-68. doi: 10.1023/a:1006400707757
Hooghiemstra, R. (2010). Letters to the shareholders: A content analysis comparison of letters written by CEOs in the United States and Japan. The International Journal Of Accounting, 45(3), 275-300. doi: 10.1016/j.intacc.2010.06.006
Jones, M. (2011). Impression Management. In M. Jones, Creative Accounting, Fraud and International Accounting Scandals (pp. 97-113). Chichester, West Sussex, England: John Wiley & Sons.
Kessel, M. (2014). Restoring the pharmaceutical industry's reputation. Nature Biotechnology, 32(10), 983-990. doi: 10.1038/nbt.3036
Kim, H., & Ball, J. (2013). Multiple Levels Of Influence In Pharmaceutical Branding: An Examination Of Industry Trust, Corporate Credibility, And Brand Credibility. Lubbock: American Academy of Advertising. Retrieved from https://search-proquest-com.ezproxy.lib.cas.cz/docview/1440183699?accountid=159230
Kothari, S., Shu, S., & Wysocki, P. (2009). Do Managers Withhold Bad News?. Journal of Accounting Research, 47(1), 241-276. doi: 10.1111/j.1475-679x.2008.00318.x
Krippendorff, K. (2018). Content Analysis: An Introduction to Its Methodology (4th ed.). Los Angeles: SAGE.
Melloni, G., Caglio, A., & Perego, P. (2016). Saying More with Less? Disclosure Conciseness and Completeness in Integrated Reports. SSRN Electronic Journal. doi: 10.2139/ssrn.2861056
Merkl-Davies, D., & Brennan, N. (2011). A conceptual framework of impression management: new insights from psychology, sociology and critical perspectives. Accounting and Business Research, 41(5), 415-437. doi: 10.1080/00014788.2011.574222
Merkl-Davies, D., Brennan, N., & McLeay, S. (2011). Impression management and retrospective sense-making in corporate narratives. Accounting, Auditing & Accountability Journal, 24(3), 315-344. doi: 10.1108/09513571111124036
Names, Facts & Figures about Bayer. (2019). Retrieved from https://www.bayer.com/en/profile-and-organization.aspx
Neu, D. (1991). Trust, impression management and the public accounting profession. Critical Perspectives on Accounting, 2(3), 295-313. doi: 10.1016/1045-2354(91)90015-6

IV
Neu, D., Warsame, H., & Pedwell, K. (1998). Managing Public Impressions: Environmental Disclosures in Annual Reports. Accounting, Organizations and Society, 23(3), 265-282. doi: 10.1016/s0361-3682(97)00008-1
Novartis sells stake in joint venture to GSK for $13bn. (2018). Retrieved from https://www.ft.com/content/7e25ed88-317f-11e8-b5bf-23cb17fd1498
Novartis. (2010). Annual Report 2009. Retrieved from https://www.novartis.com/investors/novartis-annual-reporting-suite/annual-report-and-20-f-archive
Novartis. (2011). Annual Report 2010. Retrieved from https://www.novartis.com/investors/novartis-annual-reporting-suite/annual-report-and-20-f-archive
Novartis. (2012). Annual Report 2011. Retrieved from https://www.novartis.com/investors/novartis-annual-reporting-suite/annual-report-and-20-f-archive
Novartis. (2013). Annual Report 2012. Retrieved from https://www.novartis.com/investors/novartis-annual-reporting-suite/annual-report-and-20-f-archive
Novartis. (2014). Annual Report 2013. Retrieved from https://www.novartis.com/investors/novartis-annual-reporting-suite/annual-report-and-20-f-archive
Novartis. (2015). Annual Report 2014. Retrieved from https://www.novartis.com/investors/novartis-annual-reporting-suite/annual-report-and-20-f-archive
Novartis. (2016). Annual Report 2015. Retrieved from https://www.novartis.com/investors/novartis-annual-reporting-suite/annual-report-and-20-f-archive
Novartis. (2017). Annual Report 2016. Retrieved from https://www.novartis.com/investors/novartis-annual-reporting-suite/annual-report-and-20-f-archive
Novartis. (2018). Annual Report 2017. Retrieved from https://www.novartis.com/investors/novartis-annual-reporting-suite/annual-report-and-20-f-archive
Novartis. (2019a). Annual Report 2018. Retrieved from https://www.novartis.com/investors/novartis-annual-reporting-suite
Novartis. (2019b). Annual Review 2018. Retrieved from https://www.novartis.com/investors/novartis-annual-reporting-suite
Our Company | Novartis. (2019). Retrieved from https://www.novartis.com/our-company
Parker, J. (2007). The reputation, image and influence of the pharmaceutical industry: Regaining credibility. Journal Of Medical Marketing, 7(4), 309-313. doi: 10.1057/palgrave.jmm.5050098
PatientView. (2019). Corporate Reputation of Pharma in 2018 - the Patient Perspective. London. Retrieved from http://www.patient-view.com/corporate-reputation-reports-published-in-2019.html

V
Smith, M., & Taffler, R. (1992). The Chairman's Statement and Corporate Financial Performance. Accounting & Finance, 32(2), 75-90. doi: 10.1111/j.1467-629x.1992.tb00187.x
Smith, M., & Taffler, R. (2000). The chairman’s statement. A content analysis of discretionary narrative disclosures. Accounting, Auditing & Accountability Journal, 13(5), 624-647. doi: 10.1108/09513570010353738
Staw, B., McKechnie, P., & Puffer, S. (1983). The Justification of Organizational Performance. Administrative Science Quarterly, 28(4), 582-600. doi: 10.2307/2393010
Stittle, J. (2003). Annual reports. Burlington, VT: Gower. Stratulat, M. (2019). Impression Management During a Crisis Event. Logforum,
15(1), 119-128. doi: 10.17270/j.log.2019.320 The top ten pharmaceutical companies by market share in 2018. (2019). Retrieved
from https://www.pharmaceutical-technology.com/features/top-pharmaceutical-companies/
The world’s biggest pharmaceutical companies by revenue in 2018. (2019). Retrieved from https://www.pharmaceutical-technology.com/features/worlds-biggest-pharmaceutical-companies-2018/
Tierney, K., & Webb, G. (1995). Managing Organizational Impressions in Crisis Situations: Exxon Corporation and the Exxon Valdez Oil Spill. University of Delaware Disaster Research Center, Preliminary Paper #235.
Wang, J. (2016). Literature Review on the Impression Management in Corporate Information Disclosure. Modern Economy, 07(06), 725-731. doi: 10.4236/me.2016.76076

VI
APPENDICES
Appendix A: Financial Figures of the Companies
Table 11: Financial figures of Bayer
Bayer 2008 2009 2010 2011 2012 2013 2014 2015 2016 2017 2018 Revenue 32,918 31,168 35,088 36,528 39,760 40,157 42,239 46,324 46,769 35,015 39,586 Profit after tax 1,724 1,359 1,310 2,472 2,496 3,186 3,443 4,098 4,826 8,094 1,711 Profit after tax (continuing operations) 1,720 1,359 1,310 2,472 2,496 3,186 3,443 4,018 4,558 3,248 1,711
Earnings per share 2.22 1.70 1.57 2.99 2.96 3.86 4.14 4.97 5.44 8.41 1.80 Source: Figures taken from company’s Annual Reports

VII
Table 12: Financial figures of GlaxoSmithKline
Source: Figures taken from company’s Annual Reports
Table 13: Financial figures of Novartis
Novartis 2008 2009 2010 2011 2012 2013 2014 2015 2016 2017 2018 Revenue 41,459 44,267 50,624 58,566 56,673 57,920 52,429 49,440 48,518 49,109 51,900 Profit after tax 8,233 8,454 9,969 9,245 9,618 9,292 10,280 17,794 6,698 7,703 12,614 Profit after tax (continuing operations) 8,163 8,454 9,969 9,245 9,618 9,292 10,727 7,028 6,698 7,703 12,614
Earnings per share 3.62 3.70 4.28 3.83 3.93 3.76 4.39 2.92 2.82 3.28 5.44 Source: Figures taken from company’s Annual Reports
GlaxoSmithKline 2008 2009 2010 2011 2012 2013 2014 2015 2016 2017 2018 Revenue 24,352 28,368 28,392 27,387 26,431 26,505 23,006 23,923 27,889 30,186 30,821 Profit after tax 4,712 5,669 1,853 5,458 4,744 5,628 2,831 8,372 1,062 2,169 4,046 Profit after tax (without other income) 4,171 4,534 1,360 4,871 3,488 4,504 3,531 657 4,467 4,134 5,634
Earnings per share 88.60 109.10 32.10 104.60 92.90 112.50 57.30 174.30 18.80 31.40 73.70
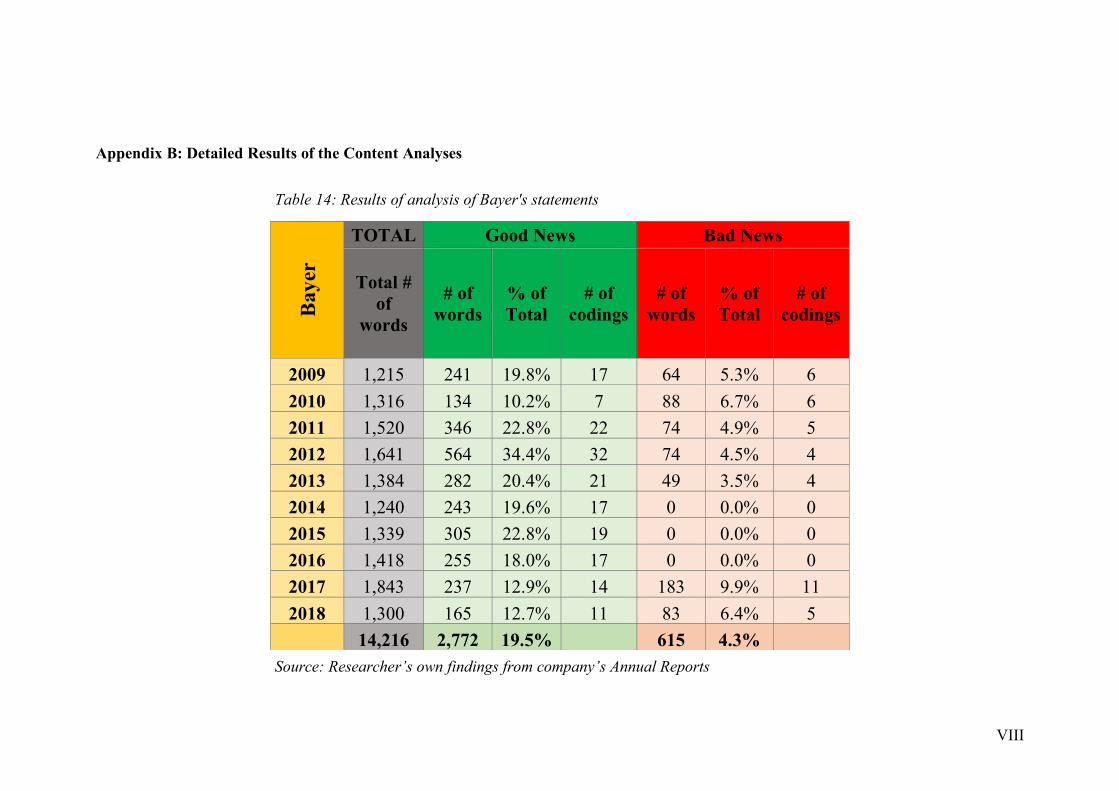
VIII
Appendix B: Detailed Results of the Content Analyses
Table 14: Results of analysis of Bayer's statements
Source: Researcher’s own findings from company’s Annual Reports
Bay
er
TOTAL Good News Bad News
Total # of
words
# of words
% of Total
# of codings
# of words
% of Total
# of codings
2009 1,215 241 19.8% 17 64 5.3% 6 2010 1,316 134 10.2% 7 88 6.7% 6 2011 1,520 346 22.8% 22 74 4.9% 5 2012 1,641 564 34.4% 32 74 4.5% 4 2013 1,384 282 20.4% 21 49 3.5% 4 2014 1,240 243 19.6% 17 0 0.0% 0 2015 1,339 305 22.8% 19 0 0.0% 0 2016 1,418 255 18.0% 17 0 0.0% 0 2017 1,843 237 12.9% 14 183 9.9% 11 2018 1,300 165 12.7% 11 83 6.4% 5
14,216 2,772 19.5% 615 4.3%

IX
Table 15: Results of analysis of GlaxoSmithKline's statements
Source: Researcher’s own findings from company’s Annual Reports
GSK
TOTAL Good News Bad News
# of words # of words # of codings # of words # of codings
Cha
ir
CE
O
Tot
al
Cha
ir
CE
O
Tot
al
% o
f T
otal
Cha
ir
CE
O
Tot
al
Cha
ir
CE
O
Tot
al
% o
f T
otal
Cha
ir
CE
O
Tot
al
2009 733 733 87 87 11.9% 6 6 0 0 0.0% 0 0 2010 1,276 1,276 77 77 6.0% 6 6 73 73 5.7% 3 3 2011 628 1,215 1,843 49 107 156 8.5% 3 10 13 0 23 23 1.2% 0 2 2 2012 614 1,326 1,940 36 125 161 8.3% 2 10 12 0 99 99 5.1% 0 6 6 2013 856 1,453 2,309 60 339 399 17.3% 3 20 23 0 8 8 0.3% 0 1 1 2014 1,163 1,608 2,771 56 225 281 10.1% 3 12 15 29 77 106 3.8% 1 5 6 2015 669 615 1,284 30 134 164 12.8% 2 9 11 0 21 21 1.6% 0 2 2 2016 728 637 1,365 60 147 207 15.2% 5 9 14 14 31 45 3.3% 1 1 2 2017 833 1,098 1,931 42 161 203 10.5% 2 10 12 16 0 16 0.8% 1 0 1 2018 807 1,006 1,813 69 205 274 15.1% 4 14 18 0 0 0 0.0% 0 0 0
17,265 2,009 11.6% 391 2.3%

X
Table 16: Results of analysis of Novartis' statements
Source: Researcher’s own findings from company’s Annual Reports
Nov
artis
TOTAL Good News Bad News
# of words # of words # of codings # of words # of codings
Cha
ir
CE
O
Tot
al
Cha
ir
CE
O
Tot
al
% o
f T
otal
Cha
ir
CE
O
Tot
al
Cha
ir
CE
O
Tot
al
% o
f T
otal
Cha
ir
CE
O
Tot
al
2009 4,155 -- 4,155 495 -- 495 11.9% 31 -- 31 96 -- 96 2.3% 7 -- 7 2010 3,186 -- 3,186 589 -- 589 18.5% 35 -- 35 16 -- 16 0.5% 1 -- 1 2011 1,415 -- 1,415 290 -- 290 20.5% 20 -- 20 58 -- 58 4.1% 5 -- 5 2012 2,338 -- 2,338 212 -- 212 9.1% 13 -- 13 106 -- 106 4.5% 6 -- 6 2013 839 1,413 2,252 156 327 483 21.4% 10 26 36 0 0 0 0.0% 0 0 0 2014 515 467 982 22 117 139 14.2% 1 10 11 0 0 0 0.0% 0 0 0 2015 477 568 1,045 69 114 183 17.5% 5 9 14 0 0 0 0.0% 0 0 0 2016 508 822 1,330 49 26 75 5.6% 3 2 5 26 50 76 5.7% 2 3 5 2017 564 754 1,318 120 99 219 16.6% 11 7 18 0 16 16 1.2% 0 1 1 2018 428 654 1,082 42 79 121 11.2% 2 8 10 0 0 0 0.0% 0 0 0
19,103 2,806 14.7% 368 1.9%