This thesis has been submitted in fulfilment of the ... - CORE
Upload
khangminh22Category
view
0download
0
ENERGY FROM BIOFUEL Thesis submitted to the Department of Chemical and Process Engineering, University of
Sheffield, for the Degree of Doctor of Philosophy (PhD)
by
Adela KHOR I Ling, BEng (Hons)
Department of Chemical and Process Engineering
University of Sheffield
August 2006
SUMMARY
Coal energized the 19"' century while oil worked for the 20"' century. The question that
remains pending is the future energy source. With the expanding population and growing demands from industrialization of countries such as India and China, total reliance on fossil
fuel is not sustainable. The urgent need for a green and sustainable fuel prompted research into energy crops as an alternative to fossil fuels. There is a need to identify a suitable biomass species, which can provide high-energy outputs in order to replace conventional fossil fuel. The type of biomass used would then depend on the energy conversion process
and the form in which the energy is required. Theoretical and experimental studies are also
required to investigate the relevant parameters for future process optimisation.
In response to this demand, the first part of this PhD study focuses on examining the
parameters affecting the behaviour of solid bed combustion in a fixed bed reactor. Extensive
experimental investigation aimed at studying the behaviour of various biomass materials in fixed bed combustion was successfully completed. The parameters investigated in this
experimental programme were the influence of primary air flow rates and particle sizes. Complementary conversion technology studied in this PhD is the solid bed gasification in a counter-current fixed bed reactor. The proposed gasifier is part of a two-stage integrated unit that ultimately aims to utilise biomass fuel such as wood chips and fuel pellets derived from
agricultural waste. Experimental work was carried out to increase the understanding of the
underlying principle of the gasification process. Parameters studied were the steam/air ratio, reactor temperature and particle size.
The results obtained from the combustion tests showed that the burning rate, ignition velocity and flue gas composition were governed by the primary air flow. Single stage combustion occurred at higher air flow rates. It was also observed that the ignition front speed was inversely proportional to the bulk density. Larger particles have a lower ignition front speed and burning rate. The average burning rates of herbaceous fuels were 3-4 times slower compared to other biomass materials such as willow wood, miscanthus pellets and RDF waste. Channelling occurred around the side wall of the reactor for small miscanthus pellets and at several locations in the bed for larger particles (35mm cube). However, the observed channelling effect is severe in the test cases for uncut straw. The study of the gasification process showed that the hydrogen yield is influenced by the steam/air ratio, total flow rate of reactants, reactor temperature and particle size. The production of methane was negligible and no higher hydrocarbons were detected.
A computational code known as the Fluid Dynamics of Incinerator Combustion code (FLIC) was used to interpret the experimental data. In this model, the initial solid waste undergoes step changes in the volume of its components consisting of moisture, volatile, fixed carbon, ash and internal pore space. The code was adapted to incorporate the steam-char reactions and gas phase reactions for the modelling of the gasification process. Comparison between the experimental results and model predictions showed good agreement. The combustion and gasification characteristics such as the burning rate, ignition rate, temperature profiles and gaseous emissions showed similar trends.
i
ACKNOWLEDGEMENTS
I would like to express my gratitude to my supervisors Professor Vida Nasserzadeh Sharifi and Professor Jim Swithenbank for their help, guidance and support throughout the duration of this
research
I am also very grateful to Dr Changkook Ryu and Dr Yao Bin Yang for their invaluable help and
suggestions on the research project.
I would also like to thank CPS Civic Ltd for the supplies of biomass material that made the
experimental work possible. I am also thankful to Nicola Yates from Plant and Invertebrate
Ecology Division (JACR Romthamsted) for the supply of Miscanthus. I would also like to
acknowledge the financial support from EPSRC Supergen who funded this project.
I would like to thank the technical and secretarial staff at the Chemical and Process Engineering
Department, University of Sheffield: Mike O'Meara, Mr Oz McFarlane, Mr Mike Wilde for the
technical assistance with the experimental work and analytical assistance, and Ms Maria Soto for
her secretarial support. Special thanks to Chris Wright who helped in the construction of the test
rig and helped me run the experiments, worked with me from the very early stages of the
research. I am also very appreciative to Mr Graham Glossop from the Department of Materials
Engineering and Miss Jane Stanbra from the Department of Chemistry for their laboratory help.
I would like to offer my deepest gratitude to my family and friends for their constant support,
guidance, inspiration and encouragement that have helped me through times of difficulty.
`At times our own light goes out and is rekindled by a spark from another person. Each
of us has cause to think with deep gratitude of those who have lighted the flame within
us. "[Albert Schweitzer]
11
TABLE OF CONTENTS
SUMMARY i
ACKNOWLEDGEMENT ii
TABLE OF CONTENTS iii
LIST OF FIGURES viii
LIST OF TABLES xiv
NOMENCLATURE xvi
ACRONYMS xx
Chapter 1 INTRODUCTION 1
1.1 Background 1
1.1.1 Energy Crops 1
1.1.2 Waste 2
1.1.3 Current Situation 2
1.1.4 Key Benefits of Energy from Biofuel 3
1.1.5 Gasification Background 4
1.2 Objective of Research 5
1.3 Layout of thesis 5
Chapter 2 LITERATURE REVIEW 7
2.1 Biofuel 7
2.1.1 Background 7
2.1.1.1 Miscanthus & Switchgrass 9
2.1.1.2 Willow wood 10 2.1.1.3 Straw 11
2.1.2 Current Situation 11
2.1.3 Waste 12
2.1.4 Legislation 15
2.1.4.1 Agricultural Policy 15
2.1.42 Environmental Policy 16
2.1.4.3 Energy Policy 17 2.2 Thermo-Chemical Conversion of Biomass 18
2.2.1 Combustion 18
2.2.1.1 Moving Grate 19 2.2.1.2 Incinerator Chamber 22
iii

2.2.1.3 Fluid Bed Incinerator 24
2.2.1.4 Rotary-Kiln Incineration Systems 25
2.2.2 Gasification 25
22.2.1 Gasification System 25
22.2.2 Types of Gasifier 27
2.2.2.3 Pre-treatment of Gas 31
22.2.4 Energy Recovery System 32
2.3 Summary 36
Chapter 3 THEORETICAL BACKGROUND 37
3.1 Combustion in the Bed Region 37
3.1.1 Fixed Bed Combustion Regime 39
3.2 Development in the Fixed Bed Combustion Model 40
3.2.1 Numerical and Mathematical Model of Fixed Bed Combustion 43
3.3 Gasification 50
3.3.1 Gasification Reactions 51
3.3.2 Reaction Kinetics 54
3.4 Development in Gasification Modelling 55
3.5 Catalyzed Gasification 58
3.5.1 Catalyst Application 60
3.6 Summary 61
Chapter 4 FIXED BED COMBUSTION 63
4.1 Experimental Work 64
4.1.1 Experimental Setup 64
4.1.1.1 Combustion Chamber 65
4.1.1.2 Grate 65
4.1.1.3 Sampling Positions for Temperature and Gas Analysers 66
4.1.1.4 Gas Burner 67
4.1.1.5 Weighing Beams 67
4.1.1.6 Combustion Air 67
4.1.1.7 Gas Analyser 68
4.1.1.8 Data Logging System 68
4.1.2 Measurement Accuracy 69
4.1.2.1 Temperature Measurement 69
4.1.2.2 Combustion Gas Measurement 70
4.1.2.3 Air Flow Measurement 70
iv
4.1.2.4 Weight Measurement 71
4.2 Biomass Samples 72
4.2.1 Preparation of Samples 72
4.2.2 Pelletisation 77
4.3 Operating Conditions 78
4.4 Experimental Procedures 79
4.4.1 Start Up Procedure 80
4.4.2 Shut Down Procedure 81
4.5 Experimental Results and Discussion 82
4.5.1 Temperature, Gas Composition and Mass Loss 82
4.5.2 Ignition Front Speed and Burning Rate 84
4.5.3 Influence of Air Flow Rate 85
4.5.4 Fuel Size Effect on Pine Wood Combustion 90
4.5.5 Channelling and Non-Uniform Temperature Distribution 96
4.5.6 Fuel Types 98 4.5.7 Straw Combustion 99
4.5.8 Ash Characterisation 111
4.5.9 Repeatability 115
4.6 Summary 117
Chapter 5 COUNTER-CURRENT GASIFICATION 119
5.1 Gasifier Design and Construction 119
5.1.1 Introduction 119 5.1.2 Experimental Setup 121
5.1.2.1 Gasification Chamber 123
5.1.2.2 Grate 126
5.1.2.3 Heating Elements 126
5.1.2.4 Temperature Controller 127 5.1.2.5 Sampling Position for Temperature 127
5.1.2.6 Gas Burner and Window 128
5.1.2.7 Reactant Supply System 129
5.1.2.8 Rotameter & Flowmeter 129
5.1.2.9 Air Preheater 129 5.1.2.10 Flow Meter 130 5.1.2.11 Steam Supply Line 130
5.1.2.12 Steam Orifice Plate 131 5.1.2.13 Design Equations 132
V

5.1.2.14 Condenser and Cooler 135
5.1.2.15 Weighing Beams 137
5.1.2.16 ABB Gas Chromatogn ph 137
5.1.2.17 MGA 3000 Multi-gas Analyser 139
5.1.3 Experiment Measurement Accuracy 139
5.2 Charcoal Samples 140
5.2.1 Preparation of Charcoal Samples 140
5 2.2.1 Composition of Charcoal samples 140
5.3 Experimental Procedure 142
5.3.1 Start-Up Procedure 143
5.3.1 Shut- Down Procedure 144
5.4 Operating Conditions 145
5.5 Heating Up of Charcoal 146
5.6 Experimental Results and Discussion 152
5.6.1 Steady Gasification Characteristics 152
5.6.2 Effect of Reactant (Steam/Air) Gasification of Char 155
5.6.2.1 Temperature 155
5.6.2.2 Carbon Conversion 160
5.6.2.3 Flue Gas Composition 161
5.6.2.4 Effect of Freeboard Temperature 165
5.6.2.5 Water Gas- Shift, Kp 166
5.6.3 Gasification of Pyrolysed Wood Chip 167
5.7 Summary 171
Chapter 6 MATHEMATICAL MODELLING 172
6.1 Introduction 172
6.1.1 Mathematical Description of the Fixed Bed 174
6.1.2 Background: Bed Model (FLIC) 175
6.1.3 Mathematical Model for the Bed 178
6.1.3.1 Process Rate Equations 182
6.1.3.2 Transport Equations for Gas and Solid Phases 185
6.1.3.3 Radiation Heat Transfer in the Bed 187
6.1.3.4 Solving the Mathematical Equations 188
6.2 Fuel Size Effect on Pine Wood Combustion in a Packed Bed 188
6.2.1 Input Conditions 188
6.2.2 Numerical Model Prediction 189
62.2.1 Temperature Profile in the Bed 189
vi
6.2.2.2 Moisture Evaporation 190
6.2.2.3 Volatile Matter in the Solid 192
6.2.2.4 Fixed Carbon in the Bed 194
6.2.3 Individual Process Rates 195
62.4 Comparison with Experimental Results (Mass Loss Rate, 196
Flue Gas Emission and Flame Temperature)
63 Modelling of Fixed Bed Gasification 200
6.3.1 Chemical Equilibrium Modelling 201
6.3.1.1 Gasification Reactions 201
6.3.1.2 Gas Compositions for Individual Reaction 202
6.3.1.3 Gasification Modelling Results and Discussion (CEA) 204
6.3.1.4 Cases: Al 10-S30, Al 10-S35, A110-S40 205
6.3.2 Detailed Mathematical Modelling: FLIC Code 209
6.3.2.1 Kinetic Rates 211
6.3.2.2 Calculation Results and Discussions 215 6.3.2.3 Modelling Results and Comparison with Experiments 216
6.4 Summary 221
Chapter 7 OVERALL DISCUSSION on 'ENERGY from BIOFUEL' 223
Chapter 8 CONCLUSION AND SUGGESTIONS FOR FUTURE WORK 226
8.1 Conclusion 226
8.2 Future Work 228
REFERENCES 230
Appendix A EXPERIMENTAL RIG (GASIFICATION)
A. 1 Gasification Controller System 239 A. 2 Elemental Analysis Service for CHN and S 240
A. 3 Thermal Expansion of the Pipe Lines 241
A. 4 Gasification Mass Balance 242
Appendix B MATHEMATICAL MODEL
B. 1 Chemical Equilibrium 244 B. 1 Calculation of Adiabatic Temperature 248
LIST OF PUBLICATIONS 249
vii
LIST OF FIGURES
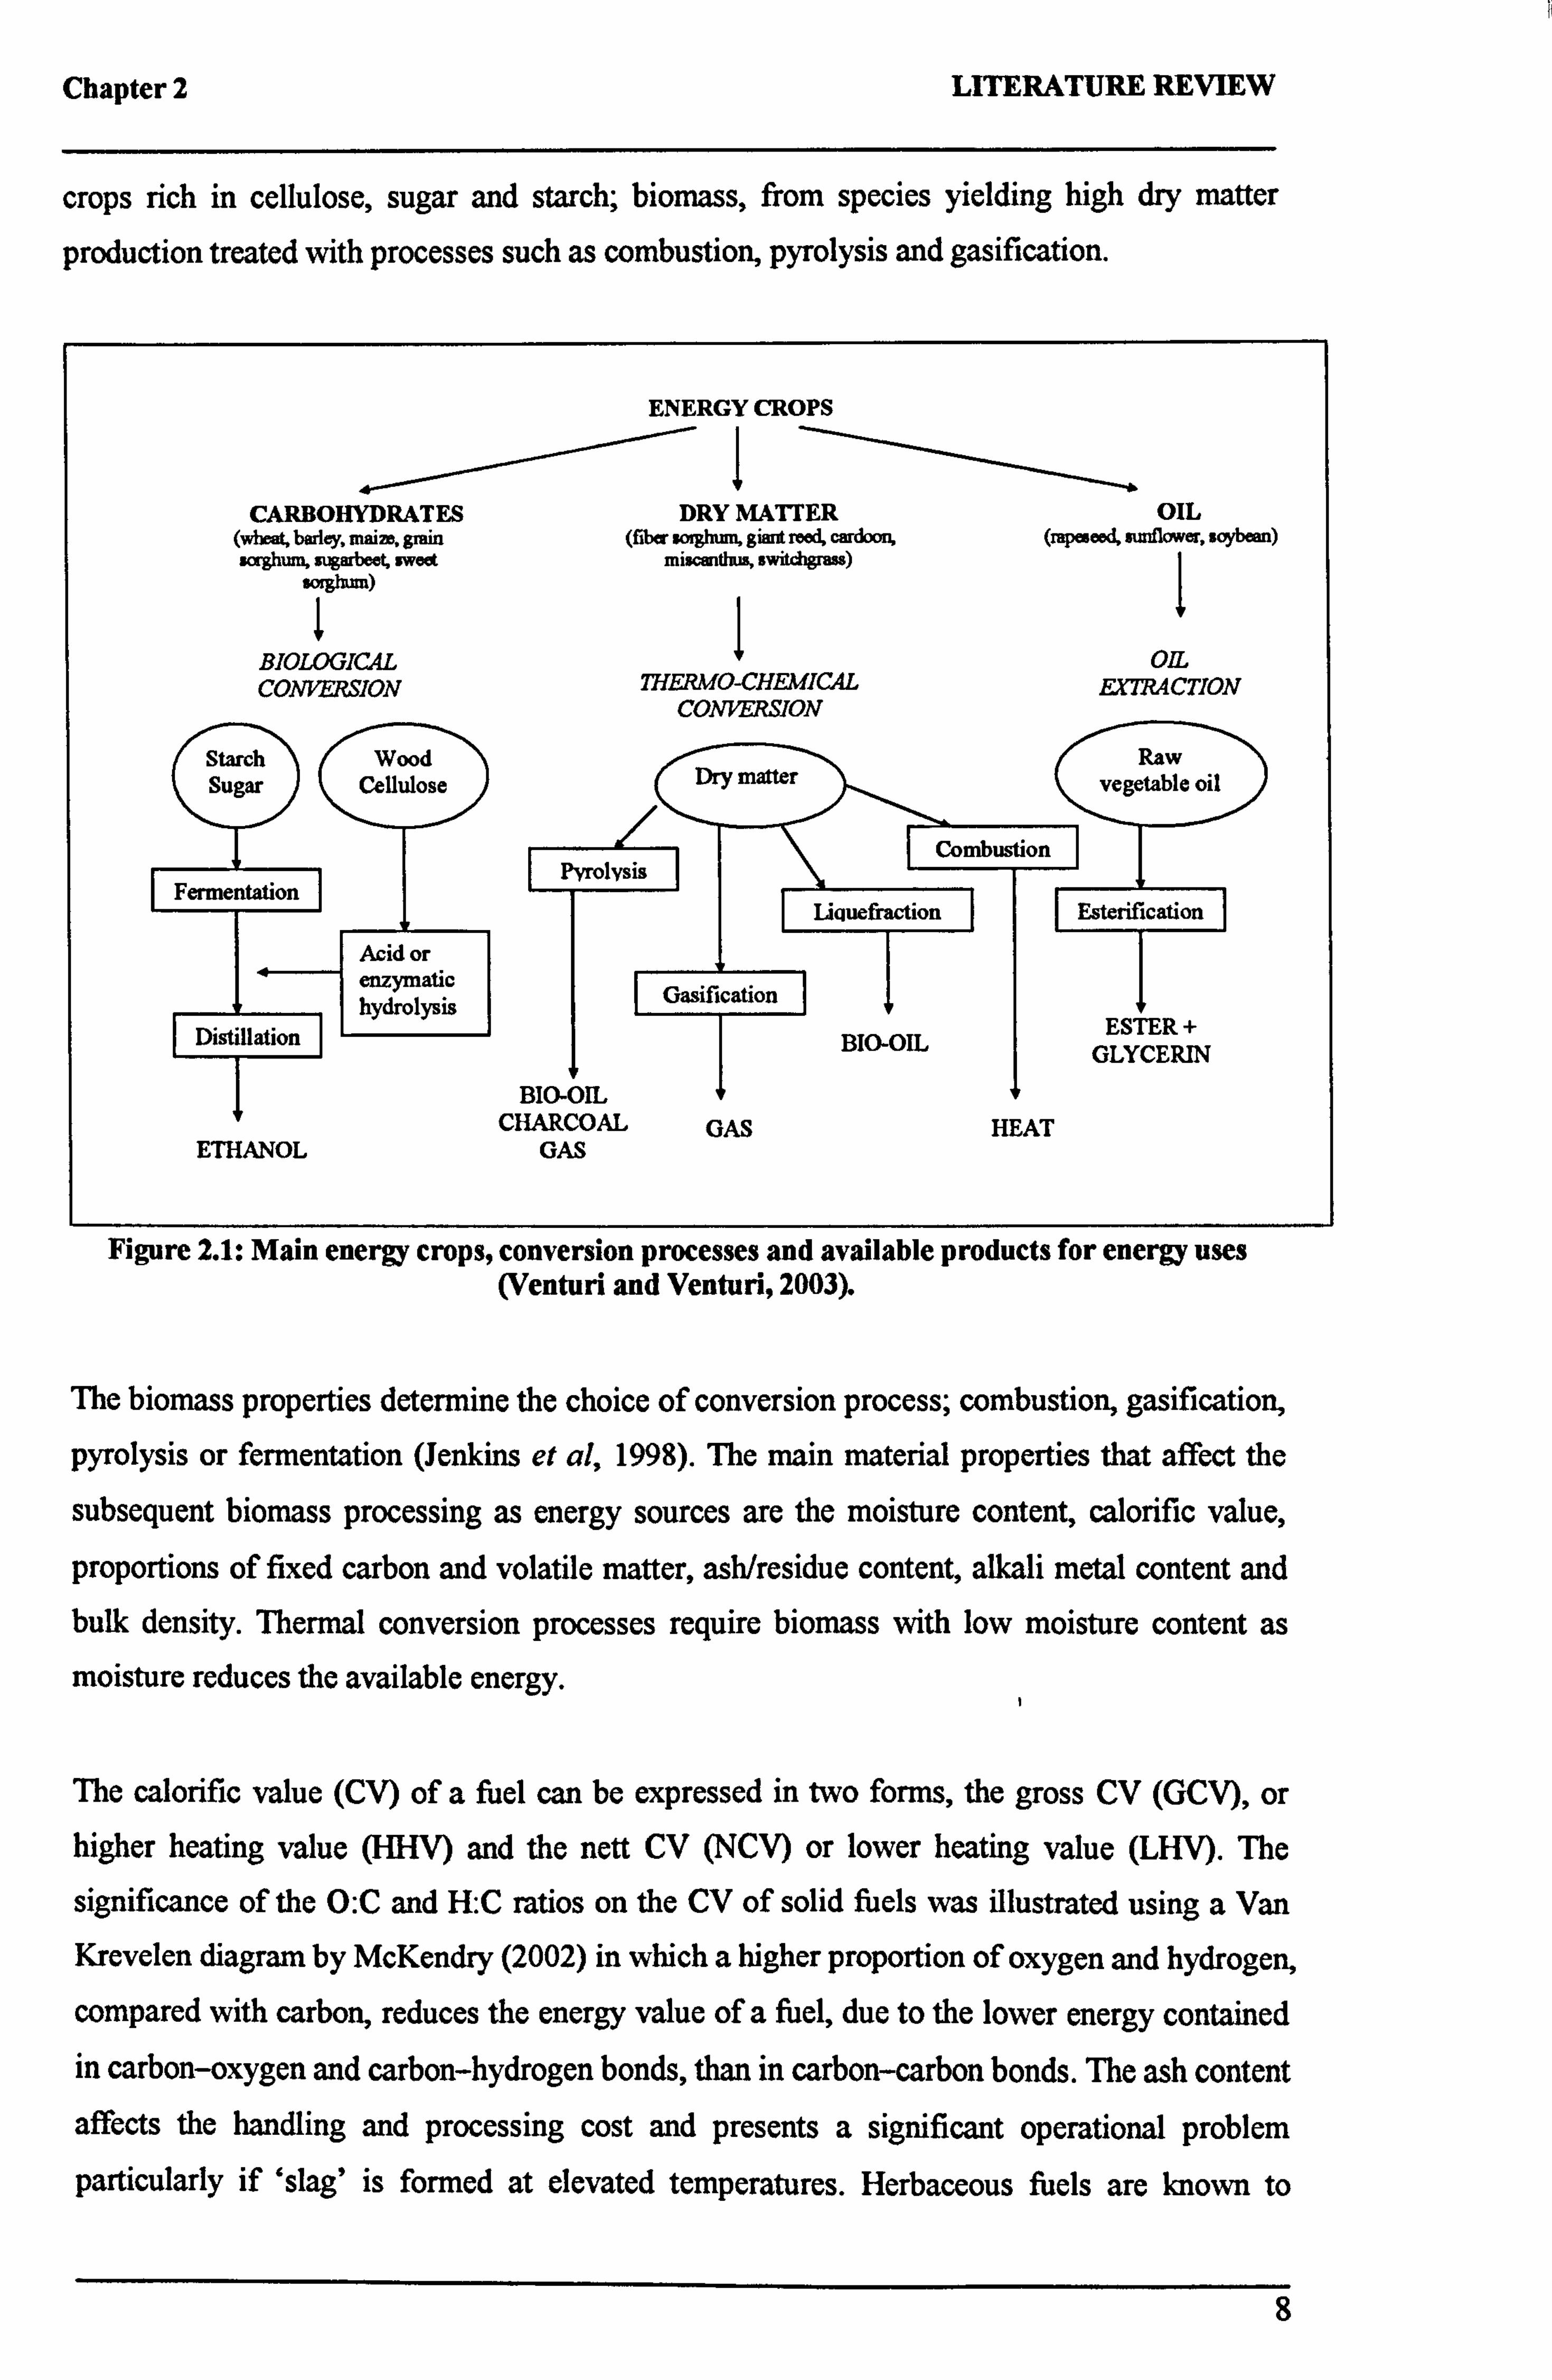
Figure 2.1 Main energy crops, conversion processes and available products for 8 energy uses (Venturi and Venturi, 2003).
Figure 2.2 Stages of RDF processing (Eduljee, 2003). 13
Figure 2.3 Main processes, intermediate energy carriers and final energy products 18 from the thermo-chemical conversion of biomass (McKendry, 2002).
Figure 2.4 Travelling grate ((Tillman, 1991). 19
Figure 2.5 ARR Widmer and Enst System Double Motion Overthrust 20 Grate (Umwelttechnick, 1995).
Figure 2.6 Reciprocating grate (Williams, 1998). 20
Figure 2.7 Reverse acting reciprocating grate (Williams, 1998). 21
Figure 2.8 Rocking grate (Williams, 1998). 21
Figure 2.9 Roller (Dusseldorf) grate (Williams, 1998). 22
Figure 2.10 Types of incineration chamber (Clayton, 1991; Hisaki, 2003). 23
Figure 2.11 Fluidized bed (Brunner, 1993). 24
Figure 2.12 Schematic of updraft gasifier (McKendry, 2002). 28
Figure 2.13 Schematic of downdraft gasifier (McKendry, 2002). 29
Figure 2.14 Fluidised bed gasifiers (Belgiomo; De Feo et al, 2003). 30
Figure 2.15 TPS gasification plant in Greve in Chianti (Italy) (Belgiome, 2003; 33 De Feo, 2000).
Figure 2.16 Foster Wheeler gasification plant in Lahti (Finland) 34 (Belgiomo, 2003; Nieminen, 1999).
Figure 2.17 TPS/ ARBRE gasification plant in Eggborought (UK) 34 (Belgiomo, 2003; Faiij et al, 1997).
Figure 3.1 Schematic view of solid fuel bed combustion (Shin and Choi, 2000). 38
Figure 3.2 Effects of air supply rate on the combustion of a bed 40 (Shin and Choi, 2000).
Figure 3.3 The waste-bed combustion zone (Kuo, 1970). 44
Figure 3.4 A fixed bed model for waste bed. 45
Figure 3.5 Numerical modelling concept of the solid and gas phases. 47
Figure 3.6 Radiation absorption by the bed particle. 47
viii
Figure 3.7 Simplified reaction scheme. Direct coal reactions during initial 51 gasification regime.
Figure 3.8 Equilibrium characteristics for C-H-O system 54 (hydrogen: oxygen=1 g-atom/g-atom) (Johnson, 1979).
Figure 4.1 Schematic of fixed bed reactor. 64
Figure 4.2 Fixed bed reactors' layout from the front view. 64
Figure 4.3 Fixed bed reactors' layout from the side view. 65
Figure 4.4 Grate used in the fixed bed reactor. 66
Figure 4.5 Weighing Beams. 67
Figure 4.6 MGA 3000 gas analyser and glass wool filter. 68
Figure 4.7 Input channel data logger. 69
Figure 4.8 Biomass samples used in this experiment. 73
Figure 4.9 Breakdown of materials used in the RDF production. 77
Figure 4.10 Flow diagram of the experimental setup. 79
Figure 4.11 Temperature history at the bed top for Case P-20. 82
Figure 4.12 Gas composition in the flue gases out the bed top vs. reaction time 82 for Case P-20.
Figure 4.13 Volatile emission during the pyrolysis stage. 83
Figure 4.14 Percentage mass left on the bed representing the different stages of 84 combustion.
Figure 4.15 Effect of air flow rates on burning rates. 86
Figure 4.16 Calculated burning zone thickness and the maximum temperature 88 at the flame front for the combustion of willow wood.
Figure 4.17 Temperature history at the bed top for a) Case W120, b) Case W160 90 and c) Case W200.
Figure 4.18 Mass loss curve for pine wood. 91
Figure 4.19 Effect of particle size on ignition front speed and burning rate and 92 mass loss during the ignition propagation period.
Figure 4.20 Transient and spatial temperature gradients at the ignition front. 93
Figure 4.21 Temperature history at different bed heights above the grate for 94 pine wood combustion with different particle sizes.
ix

Figure 4.22 Char oxidation period for different particle sizes of pinewood. 95
Figure 4.23 C02 concentrations for pinewood samples for pinewood combustion 95 with different particle sizes.
Figure 4.24 Schematic drawing of the non-uniform air distribution caused by the 96 channelling.
Figure 4.25 Case M200 during ignition propagation. 97
Figure 4.26 Photo of fuel bed for Case P-35.97
Figure 4.27 Effect of bulk density on ignition front speed and burning rate during 98 ignition propagation.
Figure 4.28 Mass loss history as a function of reaction time. 100
Figure 4.29 Bed temperature profile for Case ST1. 100
Figure 4.30 Gas composition measured at the bed top for Case ST1. 102
Figure 4.31 Bed temperature profile for Case ST5. 102
Figure 4.32 Gas composition measured at the bed top for Case ST5. 103
Figure 4.33 Effect of air flow rate on the burning rate, ignition rate and mass loss 105 during the ignition propagation stage.
Figure 4.34 Experimental results of CO/CO2 ratio as a function of primary air 107 flow rate.
Figure 4.35 Bed temperature profile for Case STU1. 108
Figure 4.36 Burning of uncut straw in a glass tube at 280kg/mzhr, (a) t=20sec 109 (b) t=106sec (c) t=194sec (d) t=207sec.
Figure 4.37 Gas composition measured at the bed top for Case STU1. 110
Figure 4.38 Ash residues obtained from the combustion of RDF, willow and 111 pinewood.
Figure 4.39 Sintered agglomerates of the bottom ash from miscanthus. 111
Figure 4.40 Elemental composition of the bottom ashes. 112
Figure 4.41 Major composition for miscanthus and glass. 112
Figure 4.42 Elemental analysis of bottom ash for switchgrass, reed canary grass 113 and straw.
Figure 4.43 Alkali index and sulphur concentration of the bottom ashes. 115
Figure 4.44 Mass loss as a function of reaction time for Case RI and R3. 116
Figure 4.45 Bed temperature profile for Case RI, Case R2 and Case R3. 117
X
Figure 5.1
Figure 5.2
Figure 5.3
Figure 5.4
Figure 5.5
Figure 5.6
Figure 5.7
Figure 5.8
Figure 5.9
Figure 5.10
Figure 5.11
Figure 5.12
Figure 5.13
Figure 5.14
Figure 5.15
Figure 5.16
Figure 5.17
Figure 5.18
Figure 5.19
Figure 5.20
Figure 5.21
Figure 5.22
Figure 5.23
Figure 5.24
Figure 5.25
Schematic of fixed bed gasifier.
FB gasifier.
Reactant (steam, air and nitrogen) pipelines.
Gasifier before assembling; top section of the furnace (before insulation) from the front view (i), bottom Section of the furnace from the front view (ii) and the Top View (iii).
Mechanical drawing of the combustion chamber.
Grate used in the gasifier.
Ceramic ribbon heaters (Ultra-high temperature, helically wound).
Block diagram of the temperature controller.
L-Shape Stainless Steel Tube and Reactant Outlet.
The set-up of air heaters with in-built temperature control.
Schematic diagram of steam pipelines to the fixed bed gasifier.
Sketch of steam orifice plate.
Experimental data for steam orifice plate calibration.
Mechanical drawing of the condensers.
Charcoal samples used for the gasification experiments.
Flow diagram of the fixed bed gasifier.
Temperature history within the bed during the heating up of charcoal (Case Si).
Dry flue gas composition vs the reaction time (Case S 1).
121
122
122
124
125
126
126
127
129
130
131
132
135
136
140
143
148
149
Dry flue gas composition as a function of bed temperature at T8 and Ti 149 (Case Si).
Dry flue gas composition vs. reaction time (Case S2). 150
Dry flue gas composition as a function of bed temperature at Ti and T8.151
Temperature and dry flue gas composition as a function of reaction time 152 (Case A100-S40 (S2)).
Methane concentration as a function of reaction time. 154
Mass left on the bed vs. reaction time (Case A100-S40 (S2)). 155
Distance from the grate vs. temperature for 10,20 and 30 minutes after 157 the steady phase was reached (Case A 100-S25 (S 1)).
xi
Figure 5.26 Distance from the grate vs. temperature for 10,20 and 30 minutes after 157 the steady phase was reached (Case A100-S40 (Si)).
Figure 5.27 Distance from the grate vs. temperature for 10,20 and 30 minutes after 158 the steady phase was reached (Case A100-S25 (S2)).
Figure 5.28 Distance from the grate vs. temperature for 10,20 and 30 minutes after 158 the steady phase was reached (Case A100-S40 (S2)).
Figure 5.29 Distance from the grate vs. temperature for five cases with 40%wt steam. 159
Figure 5.30 Effect of steam on the conversion of char at various air flow rates 160 (heating rate=S 1).
Figure 5.31 Effect of steam on the conversion of char at various air flow rates 161 (heating rate = S2).
Figure 5.32 Dry product gas composition for Case A100-S30(S1), A100-S40(S1), 166 A100-S25(S2), A100-S40(S2).
Figure 5.33 Thermodynamic equilibrium constant of the water gas shift versus 167 temperature.
Figure 5.34 Pyrolysed wood chips. 168
Figure 5.35 Distance from the grate vs. temperature for 10,20 and 30 minutes after 169 the steady phase was reached (Case WA 100-S40 (S2)).
Figure 5.36 Distance from the grate vs. temperature for 10,20 and 30 minutes after 170 the steady phase was reached (Case A100-S40 (S2)).
Figure 6.1 Processes that occur during incineration. 173
Figure 6.2 Processes in a fixed bed (Goh, 1998). 175
Figure 6.3 Step change model for the fixed bed combustion 175 (Goh, 1998).
Figure 6.4 Volume change of material due to process front movement. 179
Figure 6.5 Predicted solid bed temperature distribution in the fixed bed. 190 (a) Case P-10 (10mm); (b) Case P-35 (35mm).
Figure 6.6 Predicted solid bed residual water distribution in the fixed bed. 192 (a) Case P-10 (10mm); (b) Case P-35 (35mm).
Figure 6.7 Predicted solid bed residual volatile distribution in the fixed bed. 193 (a) Case P-10 (10mm); (b) Case P-35 (35mm).
Figure 6.8 Predicted solid bed fixed carbon distribution in the fixed bed. 194 (a) Case P-10 (10mm); (b) Case P-35 (35mm).
Figure 6.9 Bed-height process rates vs. reaction time. (a) 10mm fuel; 196 (b) 35mm fuel.
X11
Figure 6.10 Measured and calculated mass loss history as a function of reaction time. 197
Figure 6.11 Ignition velocity vs. fuel size. 197
Figure 6.12 Measured (a) and calculated (b) solid bed temperature for fuel size 199 35mm.
Figure 6.13 Calculated solid bed temperature for fuel size 5mm. 199
Figure 6.14 CO percentage in the out-of bed flue gases vs. fuel size. 200
Figure 6.15 Main components of the producer gas calculated for individual reactions 203 using CEA2.
Figure 6.16 Calculated and measured wet flue gas composition for Case A110-S30.206
Figure 6.17 Calculated and measure wet flue gas composition for Case A110-S35.206
Figure 6.18 Calculated and measured wet flue gas composition for Case A110-S40.207
Figure 6.19 Comparison between the experimental data and calculations showing 208 the influence of steam cases with primary air flow rate of 1001/min.
Figure 6.20 Comparison between the experimental data and calculations showing the 208 influence of steam cases with primary air flow rate of 1101/min.
Figure 6.21 Char oxidation rates of coal, wood and cellulosic paper from different 213 sources for particle sizes of up to 30mm as function of temperature.
Figure 6.22 Char-C02 rates of coal and wood from different sources for particle 213 sizes of up to 30mm as function of temperature.
Figure 6.23 Char-H20 rates of coal and wood from different sources for particle 214 sizes of up to 30mm as function of temperature.
Figure 6.24 Calculated solid bed temperature vs. distance above the grate for 215 Case Al 10-S30.
Figure 6.25 Calculated flue gas composition vs. distance above the grate for 216 Case Al10-S30.
Figure 6.26 Calculated and measured temperature along the bed. (a) Case A 218 (reference data: Hobbs, 1992); (b) Case B (reference data: Groeneveld, 1980 and Kashiwagi, 1992).
Figure 6.27 Calculated and measured wet flue gas composition vs. percentage 219 of steam for Case A (reference data: Hobbs, 1992).
Figure 6.28 Calculated and measured wet flue gas composition vs. percentage 220 of steam. (a) Case A (reference data: Hobbs, 1992); (b) Case B (reference data: Groeneveld, 1980 and Kashiwagi, 1992).
Figure 8.1 Proposed two stage gasifier unit. 229
X111
LIST OF TABLES
Table 1.1 Amount of municipal solid waste in some selected countries 2 (Bontoux, 1999).
Table 2.1 Energy yield from selected biomass (McKendry, 2002). 10
Table 2.2 Household and commercial waste content (Eduljee, 2003). 14
Table 2.3 Renewable energies, white paper goal for 2010 (Mtoe) (Aebiom, 1999). 17
Table 2.4 Fuel gas contaminants: problems and clean-up processes 32 (Belgiomo, De Feo et al, 2003).
Table 2.5 Gas quality requirements for power generators (Hasler and 32 _ Nussbaumer, 1999).
Table 3.1 Gasification reactions. 52
Table 4.1 Position of thermocouples on the combustion chamber. 66
Table 4.2 Specification of the MGA 3000 gas analyser. 68
Table 4.3 Reading errors for the maximum and minimum rotameter scale ranges. 71
Table 4.4 Properties of willow wood samples. 74
Table 4.5 Properties of pine wood samples. 74
Table 4.6 Properties of pelletised Miscanthus samples. 75
Table 4.7 Properties of Switchgrass samples. 75
Table 4.8 Properties of straw samples. 76
Table 4.9 Properties of Reed Canary Grass samples. 76
Table 4.10 Properties of Refused-Derived Fuel samples. 77
Table 4.11 Test cases and process conditions for each sample. 78
Table 4.12 Key parameters of combustion characteristics for the biomass samples. 87
Table 4.13 Key parameters of combustion characteristics for the biomass samples. 106
Table 4.14 Key parameters of combustion characteristics for uncut straw. 110
Table 4.15 Experimental conditions for the repeated tests. 115
Table 5.1 Specification of the semi-cylindrical helically wound ribbon heaters. 127
Table 5.2 Position of thermocouples on the gasification chamber. 128
xiv

Table 5.3 Calculated pressure head for various orifice diameters and steam 134 flow rate.
Table 5.4 Components measured and the respective span calibration for the gas 138 chromatograph (PGC2000).
Table 5.5 Accuracy of equipment used. 139
Table 5.6 Composition of the commercial lumpwood charcoal. 141
Table 5.7 Composition of the charcoal after gasification. 141
Table 5.8 Test cases and process conditions. 146
Table 5.9 Results on the equivalence ratio, dry product gas composition, 162 heating value, and H2/CO ratio obtained during steam gasification of char at various steam and air flow rates.
Table 5.10 The conversion ratios of hydrogen produced to char converted 165
Table 5.11 Molar concentration ratio [H2][C02]/[CO][H20]. 167
Table 5.12 Composition of wood chip. 168
Table 5.13 Results on the equivalence ratio, dry product gas composition, 170 heating value, and H2/CO ratio obtained during steam gasification of char from lumpwood and wood chips.
Table 5.14 The conversion ratios of char to hydrogen gas for char from lumpwood 171 and wood chips.
Table 6.1 Volume fraction of components in the fuel. 177
Table 6.2 Differential equations for the volume changes in fuel A, B, C and D. 182
Table 6.3 Bed properties for charcoal samples as input condition in the FLIC 210 calculations.
Table 6.4 Air feed rate, steam feed rate and the percentage of air to steam ratio. 210
Table 6.5 Reaction kinetics from different sources for coal and wood gasification. 212
Table 6.6 Oxidation and gasification kinetic rate constants. 217
xv
NOMENCLATURE
Upper Case Symbols
A Pre-exponential factor [s']
C Discharge coefficient, Concentration [-], [kg/m']
CC Carbon conversion [kg/mzhr]
Cp Specific heat capacity [Jkg''K"']
D Bed diameter, Pipe Diameter, Molecular [m], [m], [m2/s]
diffusivity
D, g Fluid dispersion coefficient of species ig [m2/s]
E Activation energy [J/mol]
E° Effective diffusion coefficient [m2s"1]
Eb Blackbody radiation intensity [Wm Z tm'] F Fractional increase of internal pore space [-]
h Enthalpy [J/kg]
° H Standard enthalpy of reaction [kJ/mol] 8
I, r, r Radiation intensity [Wm Zµm']
M. Molecular weight [kg/mol]
P Mean Pressure [Pa]
Q., Heat adsorbed by the solids [W/el
Qsh Thermal source term for solid phase [W/el
R. Process rate, Universal gas constant [kgmis''], [Jmol-'K'']
(8.314 Jmol"'K7')
S Stoichiometric coefficient, Source term [-], [-]
S. Surface area of solid particles m2 T Temperature [K]
V Volume, Velocity [m3], [m/s]
Y Mass fraction [-]
Lower Case Symbols
a, Area of pipe [m2]
a2 Orifice area [m2]
xvi
d Particle diameter, Diameter orifice bore, [m], [m]
g Gravitational acceleration (9.81ms"1), Gibbs [ms"2], [id/kg]
energy
h Enthalpy [kJ/kmol] h, Convective mass transfer coefficient between [m/s]
solid and gas
hs' Convective heat transfer coefficient between solid [Wm 2K'']
and gas k Rate constant [s'']
k, Radiation absorption coefficient [m']
k, Radiation scattering coefficient [m']
m Mass flow rate, mass combusted [kg/s], [kg/mzhr]
n Number of moles [kmol]
q, Radiative heat flux [Wm 2]
t Time [s]
U Flow velocity [m/s]
v Remaining yield of volatile [-]
V. Ultimate yield of volatile [-]
w Volume fraction [-]
Greek Symbols
Ratio of orifice bore to pipe diameter (ß=d/D) [-]
Emissivity, void fraction [-]
., System emissivity [-] Thermal dispersion coefficient, Equivalence Ratio [W/mK], [-]
Viscosity, chemical potential [Ns/m2], [kJ/kmol]
p Density [kg/m']
ab Boltzmann radiation constant, 5.86 x 10' [W/m2K°]
x Mole fraction [kmol/kmol]
(b Parameter to be solved [-]
0 Bed Porosity [-]
Wit
Dimensionless Numbers
Nu Nu =
hL
(Nusselt) kf
(L = characteristic length, kf= thermal conductivity of the "fluid" and h= convection heat transfer coefficient)
Pr V Pr =- (Prandtl) k
(v = kinematic viscosity and k= thermal diffusivity)
Re Re _
puL (Reynolds) P
(p = fluid density, u= fluid velocity, d= characteristic length, p= fluid viscosity)
Sc Sc=v
(Schmidt) -
(v = kinematic viscosity, D= mass diffusivity)
Sh Sh _
KýL
(Sherwood) D
(K,, = overall mass transfer coefficient, L= characteristic length and D= diffusion
coefficient)
Subscripts
2 Moisture
3 Volatile Matter
4 Ash
5 Fixed Carbon
A Dried, pyrolsed and gasified fuel
B Initial fuel
C Dried fuel
C Char
D Dried and pyrolysed waste d Diffusion
xviii

env environment
evp evaporation
g Gas
ig Component identifier in the gas phase
mix mixing
p particle
r Chemical kinetics
s Solid
sg Conversion from solid to gas phase
v devolatilisation
w Moisture
xix
ACRONYMS
Aebiom European Biomass Association
ASTM American Society of Testing Material
BFB Bubbling Fluidised Bed
CAP Common Agricultural Policy
CCGT Gas Turbine Combined Cycle
CCT Clean Coal Technology
CEA Chemical Equilibrium with Application
CFB Circulating Fluidised Bed
CFD Computational Fluid Dynamics CFM Cubic Feet per Minute
CGCU Cold Gas Clean-Up
CHP Combined Heat and Power
CV Calorific Value DEFRA Department of Environment, Food and Rural Affair
DPM Discrete Particle Model
DTI Department of Trade and Industry
ECS Energy Crop Scheme
EECI European Energy Crops Intemetwork EECO European Energy Crops Overview
EIA European Information Administration
EU European Union
EUR European Currency Unit
FB Fixed Bed
FC Fixed Carbon
FLIC Fluid Dynamics Incineration Code
FSD Full Scale Deflection
FSR Full Scale Reading
GCV Gross Calorific Value
GHG Greenhouse Gases
HGCU Hot Gas Clean-Up HHV Higher Heating Value
HMSO Her Majesty's Stationery Office
HTT Heat Treatment Temperatures
IC Internal Combustion
ID Induced Draft
xx
IEC International Electrotechnical Commission
IGCC Integrated Gasification Combined Cycle
IGFC Integrated Gasification Fuel Cell
LCV Low Calorific Value MAFF Ministry of Agriculture Fisheries and Food
MGA Multi-Gas Analyser
MSW Municipal Solid Waste
NASA National Aeronautics and Space Administration
NCV Nett Calorific Value
NFFO Non Fossil Fuel Obligation
NTDF New Technologies Demonstrator Programme
PAH Polyaromatic Hydrocarbons
PCDD/F Polychlorinated Dibenzodioxin and Dibenzofuran
PE Polyethylene
PGC Process Gas Chromatograph
PID Proportional Integral-Derivative
PRG Perennial Rhizomatous Grasses
PSIG Pound(s) per Square Inch Gauge
RCEP Royal Commission on Environmental Pollution
RCG Reed Canary Grass
RDF Refused Derived-Fuel
RIGES Renewable Intensive Global Energy Scenario
RO Renewables Obligation
SEE Standard Estimate of Error
SRC Short Rotation Crop
SUWIC Sheffield University Waste Incineration Centre
TCD Thermal Conductivity Detector
TPS/ARBRE Termiska Processor Arable Biomass Renewable Energy System
VM Volatile Matter
xxi
Chapter 1 INTRODUCTION
CHAPTER I
INTRODUCTION
The interest in energy from biomass has expanded dramatically over the last few years. In this
chapter, an overview of the main biomass sources, current energy crop application and the
potential of energy crops as an alternative to fossil fuel are presented.
1.1 BACKGROUND
1.1.1 Energy crops
Worldwide, biomass is the fourth largest energy resources after coal, oil and natural gas,
estimated to be about 14% of the global primary energy. Biomass is a potential source of
renewable energy as the conversion of plant material into a suitable form of energy can be
achieved using different routes.
Biomass energy comes from both primary and secondary sources. The primary sources are
energy crops that have the sole purpose of energy production. Such crops include woody
plants, sugar beet and rape-seed oil. Secondary sources include sugar cane fibre, rice husks
and wood waste from forestry, waste liquors from the pulp and paper industry, and manure from animal farming. More than 30 potential energy crop species have been investigated in
Europe but only a few have achieved commercial status. The introduction of energy crops in
agriculture is relatively easy for well-known agricultural crops such as rape and grain crops. However, new crops are hampered by technical and non-technical barriers (Venendaal et al, 1997).
An example of a large-scale commercial energy crop in European agriculture is the
production of willow for heat and power in Sweden. The crops investigated are suited to different climatic conditions throughout Europe. Crops like Cynara, sorghum and Eucalyptus
are grown in most southern parts of Europe. Reed canary grass is adapted to the cold climate
of Finland and northern Sweden while willow and rape are grown in northern Europe.
Miscanthus is grown in the more central parts of Europe covering regions as far apart as Denmark and Sicily.
1
Chapter 1 INTRODUCTION
1.1.2 Waste
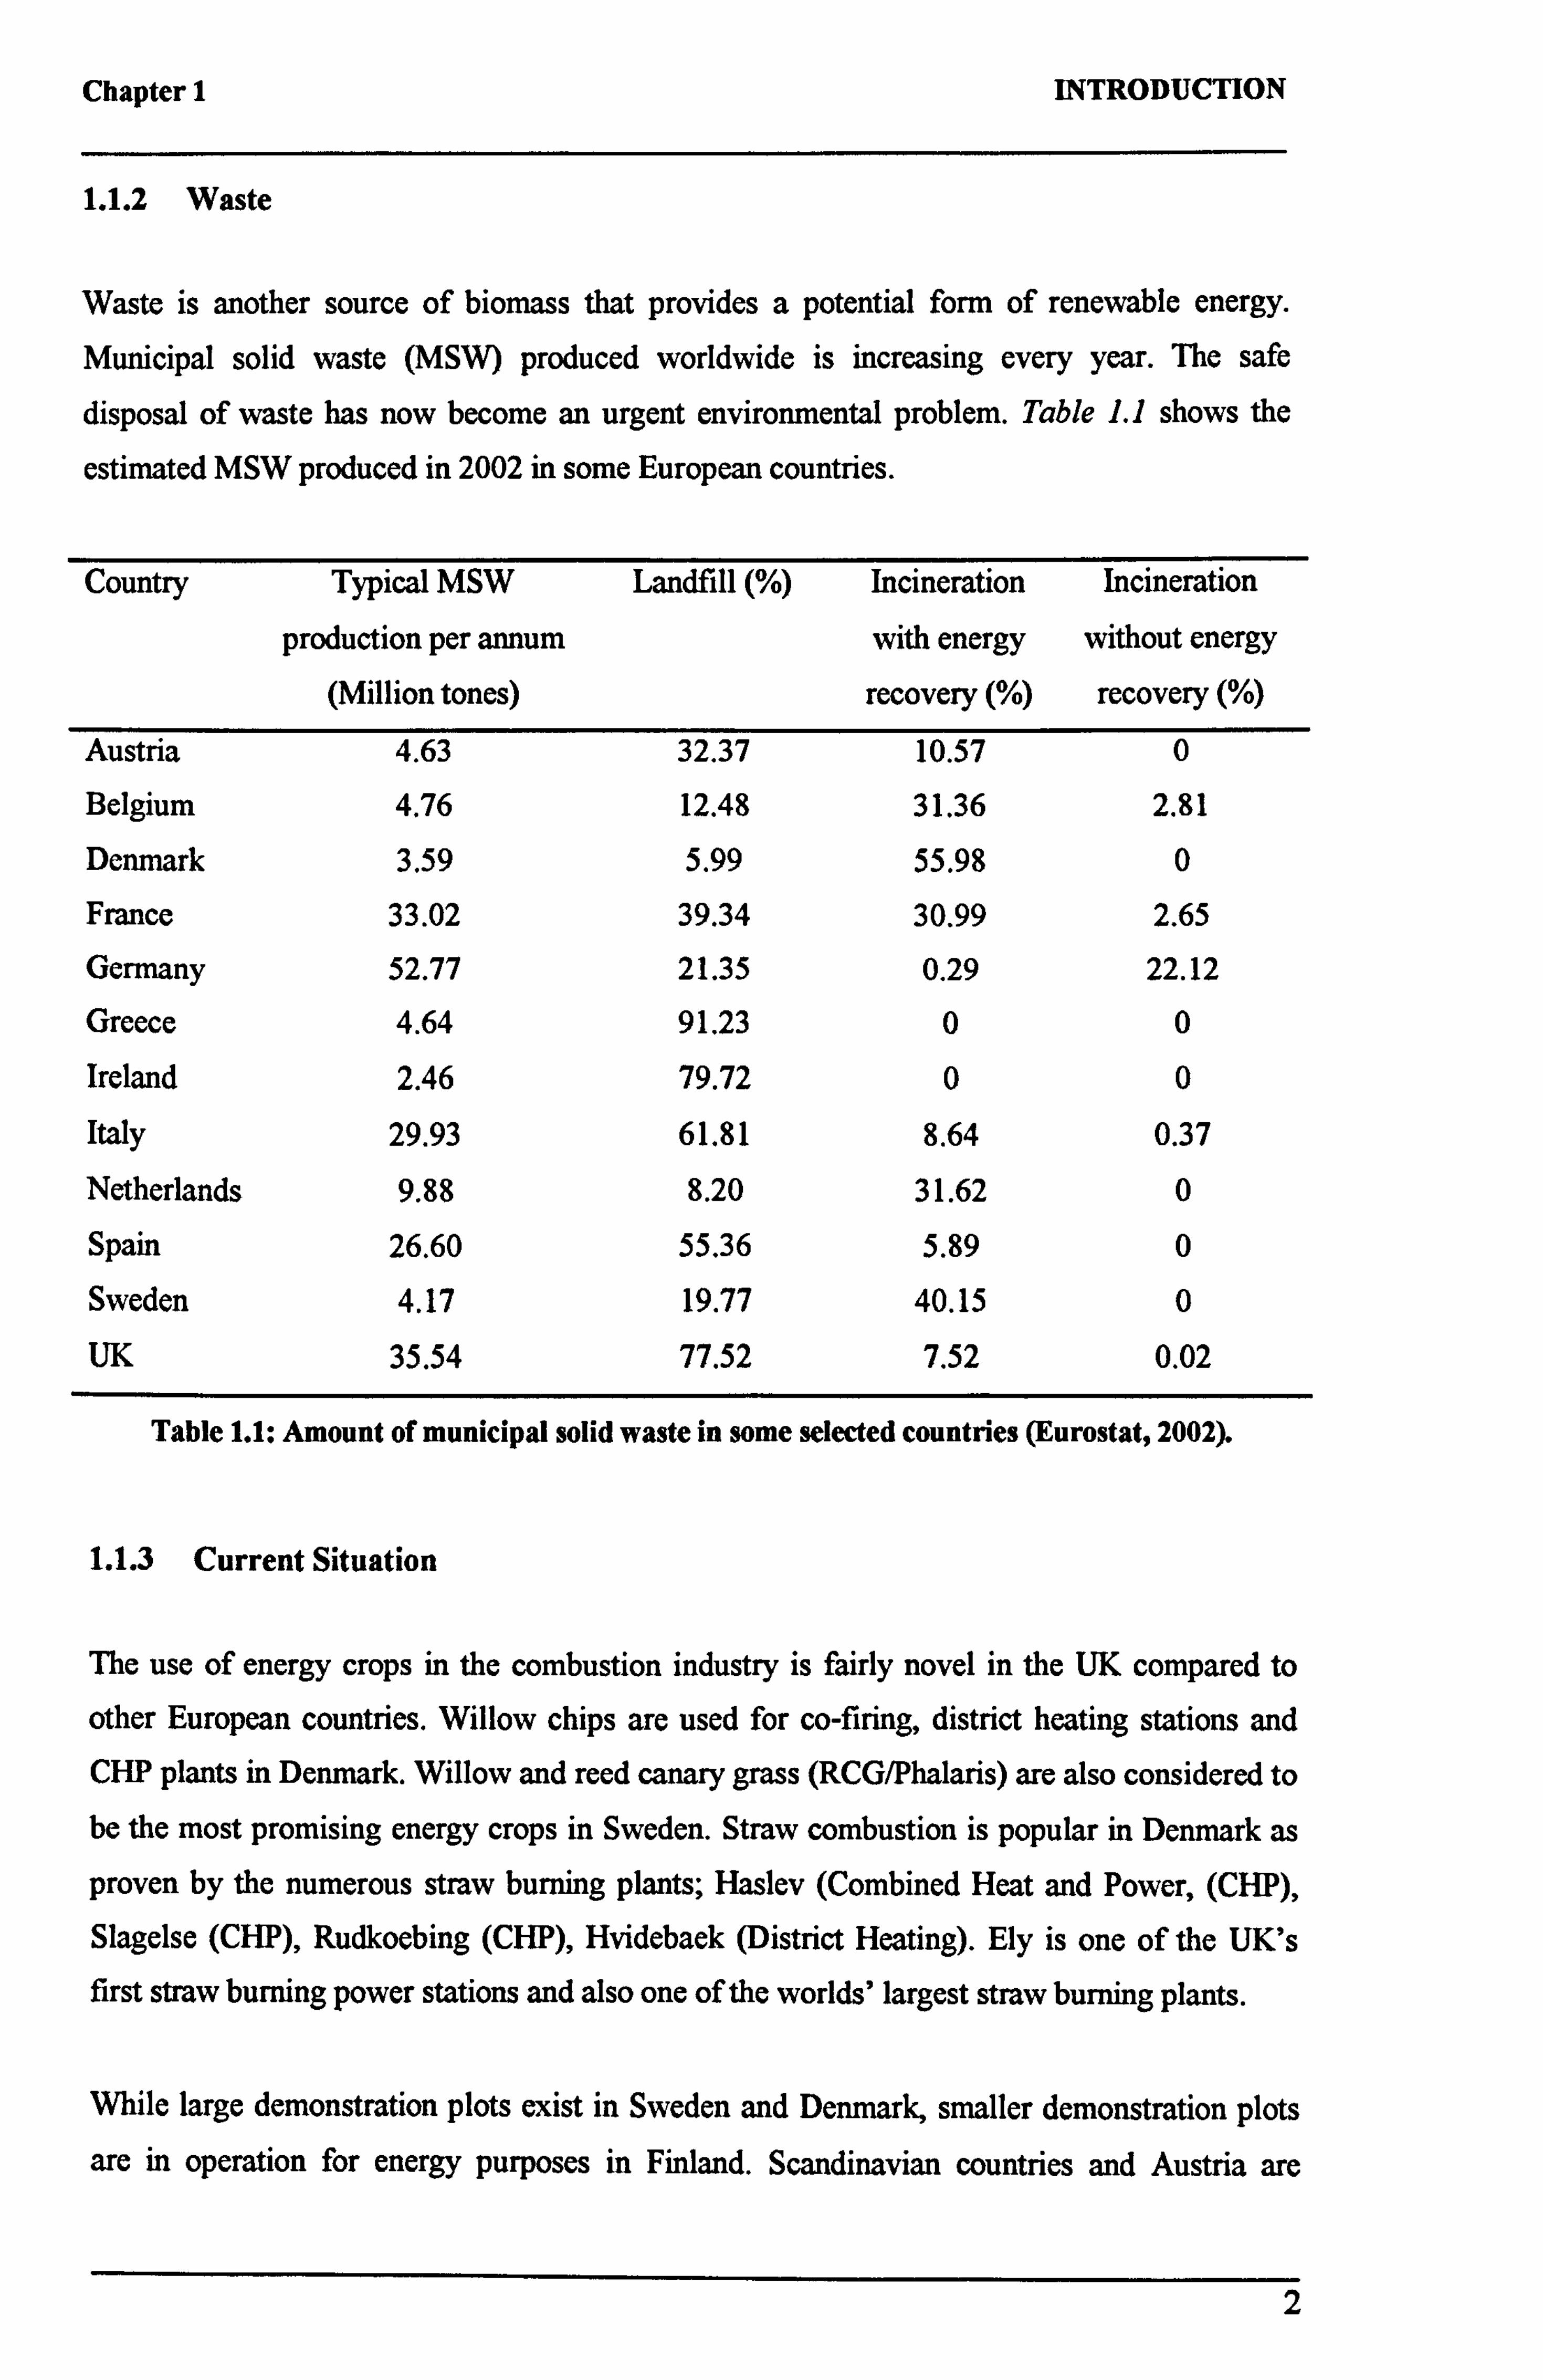
Waste is another source of biomass that provides a potential form of renewable energy.
Municipal solid waste (MSW) produced worldwide is increasing every year. The safe
disposal of waste has now become an urgent environmental problem. Table 1.1 shows the
estimated MSW produced in 2002 in some European countries.
Country Typical MSW
production per annum (Million tones)
Landfill (%) Incineration
with energy
recovery (%)
Incineration
without energy
recovery (%)
Austria 4.63 32.37 10.57 0
Belgium 4.76 12.48 31.36 2.81
Denmark 3.59 5.99 55.98 0
France 33.02 39.34 30.99 2.65
Germany 52.77 21.35 0.29 22.12 Greece 4.64 91.23 0 0
Ireland 2.46 79.72 0 0
Italy 29.93 61.81 8.64 0.37
Netherlands 9.88 8.20 31.62 0
Spain 26.60 55.36 5.89 0
Sweden 4.17 19.77 40.15 0
UK 35.54 77.52 7.52 0.02
Table 1.1: Amount of municipal solid waste in some selected countries (Eurostat, 2002).
1.1.3 Current Situation
The use of energy crops in the combustion industry is fairly novel in the UK compared to
other European countries. Willow chips are used for co-firing, district heating stations and CHP plants in Denmark. Willow and reed canary grass (RCG/Phalaris) are also considered to be the most promising energy crops in Sweden. Straw combustion is popular in Denmark as
proven by the numerous straw burning plants; Haslev (Combined Heat and Power, (CHP),
Slagelse (CHP), Rudkoebing (CHP), Hvidebaek (District Heating). Ely is one of the UK's first straw burning power stations and also one of the worlds' largest straw burning plants.
While large demonstration plots exist in Sweden and Denmark, smaller demonstration plots are in operation for energy purposes in Finland. Scandinavian countries and Austria are
2
Chapter 1 INTRODUCTION
successful in developing the energy crop industry. Miscanthus, RCG and willow/poplar
coppice are novel crops and thus there are barriers of agriculture acceptance. Other crops such
as Triticale, sorghum, rape seed oil and hemp do not have the same problem as they are
currently grown for non-energy purposes. Nevertheless, policy support from the government is crucial for the successful application of the energy crops. The most advanced countries in
the use of solid biofuels based on energy crops are Sweden and Denmark because of the
heavy taxation on fossil fuels. The countries that use liquid biofuels are France, Germany and Austria. However, work on the combustion of dedicated energy crops are still at a premature
stage compared to wood, coal and waste.
1.1.4 Key benefits of energy from biofuels
Greenhouse gas (GHG) emissions are soaring towards a crucial level leading to serious calls both nationally and locally for the highest possible reduction. The Kyoto Protocol imposes
emission targets under which the UK agreed to keep annual greenhouse emission during the
period of 2008-2012 to 12.5% below 1990 levels (DEFRA, 2005). The UK government set a higher target of 20%. Biomass is an ideal source of sustainable energy as it reduces
greenhouse emissions. The carbon given off in combustion is compensated for by that
sequestered in growing the biomass.
Other benefits include job-creation as the production and harvesting and transportation of biomass require labour. Biomass is estimated to take up 4 to 5 times more labour compared to fossil fuels. In the German state of Bavaria alone, the use of biomass as a major source of energy has resulted in creation of about 18 000 jobs (Fujita, 1999). A change in emphasis from food production to energy producing crops will provide a more varied agricultural landscape and increase the biodiversity of farmland.
Development of the conversion technologies promises the application of biomass at lower
cost and higher conversion efficiency. When low cost biomass residues are used for fuel, the
cost of electricity is often competitive with fossil-fuel powered generation.
Thermal treatment of energy crops yielding biofuel provides for indigenous energy
production and security of a sustainable national supply of fuel. Energy crops are easier to
predict and control compared to wind or solar power. There is a greater flexibility of supply
as the production can be adapted to the national requirements. The EU considers biomass
energy as the most important renewable resource. In the Rio United Nations Conference
3
Chapter 1 INTRODUCTION
(RIGES), 1992, half of the worlds' current primary energy consumption, 400EJ/yr is set to be
met by biomass while 60% of the worlds' electricity market will be supplied by renewable
sources (McKendry, 2002). There is further support from the Non-Fossil Fuel Obligation
(NFFO) scheme obliging companies to purchase a fixed amount of power from non-fossil
power production (Aebiom, 1999). Biomass is available on a renewable basis, either through
natural processes, or it can be made available as a by-product of human activities i. e organic
waste. The potential of biomass energy derived from forest and agricultural residues world-
wide is estimated at 30EJ/yr, compared to an annual world-wide energy demand of over
400EJ. If biomass is to contribute to a larger extend to the worlds' energy supply, then the
cultivation of dedicated crops for energy purposes will be required. When energy crops are
considered as a source of biomass, the total energy potential of biomass for energy production
may be considerably larger than the energy potential of biomass residues.
1.1.5 Gasification background
Gasification technology dates back to the late 19`h and early 20th centuries. In the 1850 period,
gas was initially used for cooking, power generation, city and home lighting as referred to in
Dickens novels as "gaslight". Coke for steel making was a useful by-product. Gasifiers were
then successfully used with engines for power generation in 1878 making the gasifier-engine
systems very popular in the period of 1901-1920. During World War II, Germany converted
existing vehicles to producer gas due to national security and independence. Gasification
technology remained dormant after that as plentiful gasoline and diesel were available. The
rise in natural gas prices in the 1970s, revived gasification technology as Shell, Texaco and Dow Chemicals initiated research projects and built coal gasification plants.
Recently, the addition of ten Accession Countries in the EU in May 2004 boosted the EU coal
reserves by over 40%. Of the 25 states that now comprise the enlarged EU, 24 rely on coal to
meet their primary energy requirement despite competition from other fuels. Coal's major
market lies in power generation although national industrial sectors will continue to consume
a significant amount. The integrated gasification combined cycles (IGCC), IGCC-fuel cells
and hybrid gasification/combustion systems are some of the technologies highlighted for the
clean coal technologies (CCT) and near-zero emissions technologies.
The demand for conversion of renewable to hydrogen may increase due to the amount of hydrogen needed in refineries and its possible utilization as a fuel. The shift towards a low
CO2 emission regime has stimulated research into the methods of hydrogen and synthesis gas
4

Chapter 1 INTRODUCTION
production from common catalytic reforming of natural gas towards the production of hydrogen from water electrolysis or thermal conversion processes. The current energy and
environmental situation has led to many major companies such as Toyota, Daimler-Benz and General Motors investing in hydrogen-powered vehicle technology.
1.2 OBJECTIVE OF RESEARCH
This PhD research aimed at investigating and comparing two thermal conversion processes;
combustion and gasification. The combustion characteristics of a broad spectrum of biomass;
Salix (i. e willow), pine wood, Miscanthus and RDF (Refused Derived Fuel) was studied. The
use of wood and biomass resources in electricity generation had grown in the recent years. However, improvements in efficiency and burning profile needed establishing before the biomass could be exploited for future development. As the combustion and gasification of biomass is a relatively new field, there is limited data available.
The PhD work was divided into two phases. The first stage involved the combustion of different biomass materials in a fixed bed reactor. The influences of parameters such as the
particle size and primary air flow rate on the combustion behaviour were examined. Manipulation of the combustion parameters is important in achieving good combustion
efficiency and reduction of pollutant emission. The second stage of this PhD focussed on the design and manufacture of a high temperature steam/air gasifier as part of a novel integrated
two-stage unit. Extensive experimental work is needed to increase the understanding of the
underlying principle of the gasification process that will hopefully lead to the application of these new technologies, overcoming present barriers. In support of this, a mathematical model
was developed and applied to the fixed bed combustion and gasification to further understand the process behaviour thus enabling optimisation of future design work and operation.
1.3 LAYOUT OF THESIS
This PhD thesis presents the research work carried over a period of three years. It consists of
eight chapters. These are as follows:
Chapter one introduces the purpose of this research by giving the background of the current biomass applications and the benefit of biomass as an ideal source of sustainable energy. A brief background to gasification is also presented. This section outlines the aim of this PhD
research.
5
Chapter 1 INTRODUCTION
Chapter two gives an overview of the biomass energy crops focussing on the origins,
availability and properties of the different sources of energy. Discussion includes the
legislation covering the agricultural policy, environmental policy and energy policy. This
chapter also presents the technological development of two processes; combustion and
gasification.
Chapter three presents the fundaments of solid fuel combustion and gasification in a fixed
bed reactor. The aim was to show the current progress of research in this field. This section
reviews the experimental and numerical research work previously carried out.
Chapter four gives a description of the experimental setup, results and some discussion of the fixed bed combustion. This includes temperature measurement along the bed height, flue gas
composition and key results such as the burning rate.
Chapter five concentrates on the experimental setup, results and some discussion of the high
temperature steam/air gasification process. The experimental work investigates the carbon
conversion of char under varying reactor and reactant conditions.
Chapter six covers the theoretical foundation used in the comprehensive mathematical model. This section presents the conditions and sub-models applied in the mathematical model that
was used to simulate the fixed bed combustion and gasification. The discussion of the
computational modelling results includes comparison with experimental values.
Chapter seven compares the energy production from biofuel through two thermal conversion
processes; fixed-bed combustion and gasification. The limitations of these two processes,
affecting the subsequent energy recovery systems and application in `real' plants are discussed.
Chapter eight lists the conclusion derived from this study as well as suggestions for future
work in the next stage of this research programme.
6
Chapter 2 LITERATURE REVIEW
CHAPTER 2
LITERATURE REVIEW
In the last few years, interest in energy from biofuel has expanded dramatically as the urgent
need for a sustainable, renewable green energy deepens. The energy recovery techniques
divide crudely into thermal processes and low temperature processes. The latter are generally based on bioreactors. This chapter reviews the thermal conversion technologies, focussing in
detail on the combustion and gasification process. It begins with an overview of the main biomass sources, the current energy situation in the UK and proceeds to discuss the
technological development in these two fields. The chapter concludes with the suitability of biofuel as a high-energy output fuel to replace or supplement conventional fossil fuel.
2.1 BIOMASS, BIOFUEL & ENERGY CROPS
2.1.1 Background
The term biomass refers to organic matter available on a renewable basis. Biomass can be
obtained , from residues or purpose grown crops. Biomass can be divided into four primary
classes: 1) wood and woody materials, 2) herbaceous and other annual growth materials such as straw, grasses, leaves
3) agricultural by-products and residues 4) refuse-derived fuels (RDF) and waste or non-recyclable papers often mixed with
plastics.
According to the Wikipedia dictionary, `biofuel' comprises of any fuel derived from biomass.
On the other hand, energy crops are a form of biomass grown specifically for their fuel value. Energy crops can be classified in three groups according to the raw materials from which
energy is obtained as shown in Figure 2.1. The main energy chains are: biodiesel, based on
oilseed crops through oil extraction and esterification; ethanol, derived by fermentation from
7
Chapter 2 LITERATURE REVIEW
crops rich in cellulose, sugar and starch; biomass, from species yielding high dry matter
production treated with processes such as combustion, pyrolysis and gasification.
ENERGY CROPS
CARBOHYDRATES DRY MATTER OIL (wheat, barley, maue, gram (fiber sorghum giert read, cardoon, (rapeseed, sunflower, soybean) sorghum, sugarbeet, 'wed miscsn hus, switdhgass)
uIgtwm) 1
BIOLOGICAL OIL CONVERSION THE-MO-CHEMICAL EXTRACTION
CONVERSION
Starch Wood Raw Sugar Cellulose matter vegetable oil
Combustion Pyrolysis
Fermentation Liquefraction Esterification
Acid or enzymatic hydrolysis Gasification
Distillation BIO-OIL ESTER +
GLYCERIN
BIO-OIL CHARCOAL GAS HEAT
ETHANOL GAS
Figure 2.1: Main energy crops, conversion processes and available products for energy uses (Venturi and Venturi, 2003).
The biomass properties determine the choice of conversion process; combustion, gasification,
pyrolysis or fermentation (Jenkins et a!, 1998). The main material properties that affect the
subsequent biomass processing as energy sources are the moisture content, calorific value,
proportions of fixed carbon and volatile matter, ash/residue content, alkali metal content and bulk density. Thermal conversion processes require biomass with low moisture content as
moisture reduces the available energy.
The calorific value (CV) of a fuel can be expressed in two forms, the gross CV (GCV), or higher heating value (HHV) and the nett CV (NCV) or lower heating value (LHV). The
significance of the O: C and H: C ratios on the CV of solid fuels was illustrated using a Van
Krevelen diagram by McKendry (2002) in which a higher proportion of oxygen and hydrogen,
compared with carbon, reduces the energy value of a fuel, due to the lower energy contained in carbon-oxygen and carbon-hydrogen bonds, than in carbon-carbon bonds. The ash content
affects the handling and processing cost and presents a significant operational problem
particularly if `slag' is formed at elevated temperatures. Herbaceous fuels are known to
8
Chapter 2 LITERATURE REVIEW
contain silicon and potassium as their principle ash-forming constituents making them difficult for application as they cause severe ash deposition problems.
The low bulk density of herbaceous fuels impacts the transport, storage and thermo-chemical
processing cost causing a concomitant increase in cost for it to be competitive on the same
energy density basis. Biomass implementation in agriculture requires time because decisions
have to be made regarding innovation of biomass. Conventional crops are easier to develop
compared to new crops. The high risk and investment puts a limit to biomass implementation
as farmers are not keen to undertake this.
In Europe, 20 perennial grasses have been tested and four perennial rhizomatous grasses (PRG); miscanthus, reed canary grass (RCG), giant reed and switchgrass were chosen for
extensive research. Some of the grasses and woody materials investigated in this research
work are the miscathus, switchgrass, reed canary grass, straw and willow wood. The following part briefly discusses the yield potential, characteristics and limitation of these four
grasses and the willow wood as the feasiblity of new crops will depend largely on production
costs, cost of conversion of biomass to usable energy and cost of competing fuels.
2.1.1.1 Miscanthus & Switchgrass
Miscanthus and switchgrass are C-4 perennial plants that reduce the atmospheric CO2 by
using a supplementary method of CO2 uptake which forms 4-carbon molecule instead of 3-
carbon molecules. As these C-4 grasses require temperate and warm regions, the productivity is limited to central and southern Europe where the temperature is higher. Miscanthus
provides a high dry-matter yield of 8-15t/ha (Scurlock, 1998) while the second year yield of switchgrass is about 8-10tdm. ha (Wageningen, 2003). The annual cropping cycle provides biomass supply throughout the year. The chemical composition of miscanthus and switchgrass is largely similar and is favourable for combustion. The composition of miscanthus on the average comprises of 50% carbon, 43% oxygen and 6% hydrogen with 1%
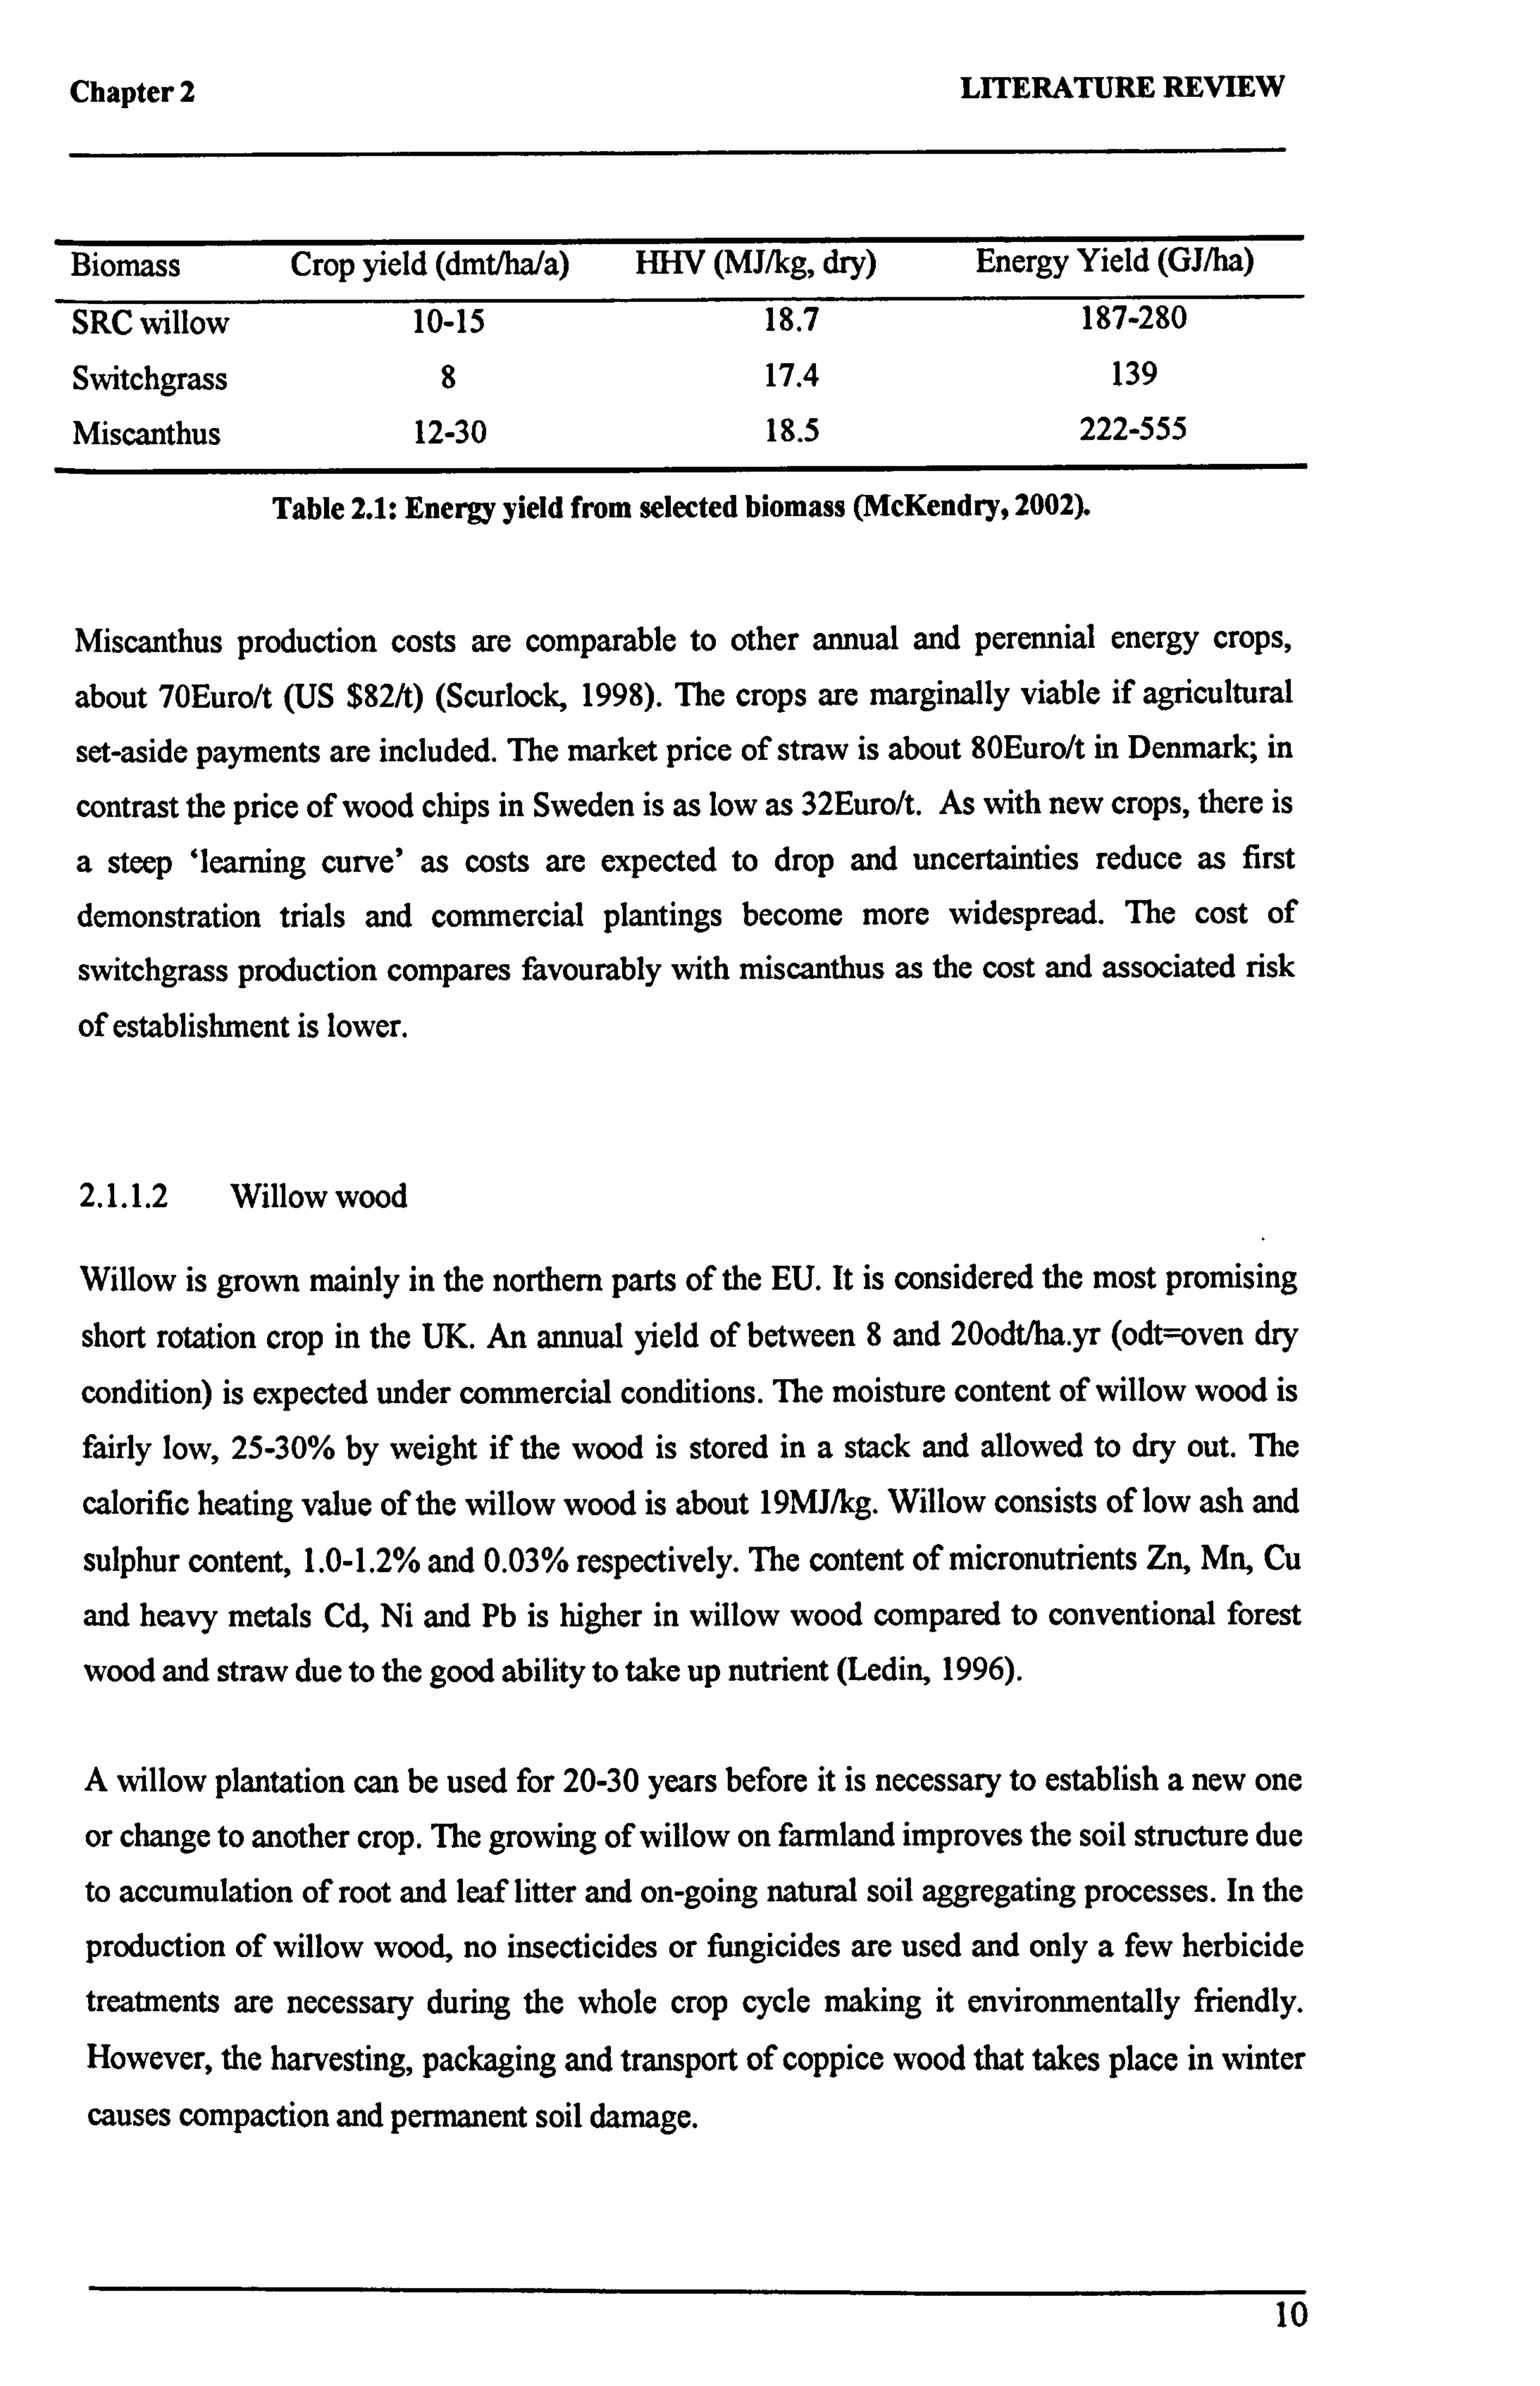
ash (Lewandowski et al, 2000) on a dry mass basis. The characteristics vary considerably from year to year between different locations. The mineral content is low compared to wheat straw but higher compared to willow/poplar coppice. The main problem of combustion of these two perennial plants are the low ash melting point showing clear sintering tendensies at temperatures as low as 600°C. Miscanthus has an equivalent CV to SRC willow but a greater crop yield. This reduces the necessary land-take requirement as shown in Table 2.1.
9
Chapter 2 LITERATURE REVIEW
Biomass Crop yield (dmt/ha/a) HHV (MJ/kg, dry) Energy Yield (GJ/ha)
SRC willow 10-15 18.7 187-280
Switchgrass 8 17.4 139
Miscanthus 12-30 18.5 222-555
Table 2.1: Energy yield from selected biomass (McKendry, 2002).
Miscanthus production costs are comparable to other annual and perennial energy crops,
about 70Euro/t (US $82/t) (Scurlock, 1998). The crops are marginally viable if agricultural
set-aside payments are included. The market price of straw is about 80Euro/t in Denmark; in
contrast the price of wood chips in Sweden is as low as 32Euro/t. As with new crops, there is
a steep ̀ learning curve' as costs are expected to drop and uncertainties reduce as first
demonstration trials and commercial plantings become more widespread. The cost of
switchgrass production compares favourably with miscanthus as the cost and associated risk
of establishment is lower.
2.1.1.2 Willow wood
Willow is grown mainly in the northern parts of the EU. It is considered the most promising
short rotation crop in the UK. An annual yield of between 8 and 20odt/ha. yr (odt=oven dry
condition) is expected under commercial conditions. The moisture content of willow wood is
fairly low, 25-30% by weight if the wood is stored in a stack and allowed to dry out. The
calorific heating value of the willow wood is about 19MJ/kg. Willow consists of low ash and
sulphur content, 1.0-1.2% and 0.03% respectively. The content of micronutrients Zn, Mn, Cu
and heavy metals Cd, Ni and Pb is higher in willow wood compared to conventional forest
wood and straw due to the good ability to take up nutrient (Ledin, 1996).
A willow plantation can be used for 20-30 years before it is necessary to establish a new one
or change to another crop. The growing of willow on farmland improves the soil structure due
to accumulation of root and leaf litter and on-going natural soil aggregating processes. In the
production of willow wood, no insecticides or fungicides are used and only a few herbicide
treatments are necessary during the whole crop cycle making it environmentally friendly.
However, the harvesting, packaging and transport of coppice wood that takes place in winter
causes compaction and permanent soil damage.
10
Chapter 2 LITERATURE REVIEW
2.1.1.3 Straw
The UK produces an estimated 14 million tonnes of straw annually from Eastern England and
parts of Central and Southern England (DTI, 1999). Half of the produced straw is used for
animal feed and bedding while the rest was previously disposed of by in-field burning but this
is now forbidden. The alternative method of straw removal leads to increase transportation
and baling costs as well as a penalty in reduction of subsequent crop yield due to the removal
of nutrients.
Straw has a low gross calorific value (15GJ/tonne) approximately the same as seasoned wood,
one half that of coal, and one-third that of oil (Martindale, 1985). Loose straw has a bulk
density of 30kg/m', which can be increased to 100-150kg/m' by baling. However, this would incur an additional cost of £18/tonne to the farmer for the baling, handling, storage and transportation if straw was to be used in power stations. Delivery cost over 10km would
increase the cost to £22/tonne (DTI, 1999). Further fuel processing such as compression to
briquettes or pellets increases the bulk density 5-10 fold to 450-650 kg/m3 (Wilen, 1987).
2.1.2 Current Situation
In the European Energy Crops Overview (EECO), it was found that both liquid and solid
biofuel can be economically feasible only with financial incentives, like tax exemptions (as in
France and Austria for liquid biofuels), heavier taxes on fossil fuels (like in Denmark and
Sweden in the order of magnitude of 5-6EUR/GJ for non-industrial users) and grants for
farmers who cultivate energy crops grown on set-aside land. Although the crop has become
highly technically developed, farmers' perception of the crop is still a major barrier to
increasing the cropped area. The lack of long-term legislation and risk of increase in pest
problems are among the barriers. The technical barriers and institutional barriers for liquid
biofuels are much smaller than for solid biofuels since the liquid biofuels use traditional and
well-known crops. In Austria renewable energy sources supply 27% of the country's total
energy consumption and biomass provides half of this. Waste and by-product of the forest
industry represent the major biomass input in Sweden and Finland. District heating systems
are based on forest and agricultural residues, wastes and peat (Coombs, 1996).
The use of energy crops in the combustion industry is fairly novel in the UK compared to
other European countries. Willow chips are used for co-firing, district heating stations and CHP plants in Denmark. Willow and reed canary grass (RCG/Phalaris) are considered the two
11
Chapter 2 LITERATURE REVIEW
most promising energy crops in Sweden. Straw combustion is popular in Denmark as proven by the numerous straw burning plants; Haslev (CHP), Slagelse (CHP), Rudkoebing (CHP)
and Hvidebaek (District Heating). Ely is the UK's first straw burning power station and also
one of the worlds' largest straw burning plants. However, work on the combustion of energy
crops are still at a premature stage compared to wood, coal and waste.
2.1.3 Waste
Waste represents a source of biomass that could be utilized to produce energy to reduce
reliance on fossil fuel. Previously, landfill was the major waste disposal method. However,
landfill contributes to greenhouse gas emissions and squanders energy equivalent to 25% of the current coal consumption. The total amount of UK municipal waste material is 30 million tones per year, which could provide 10 000MW of power. An electricity generation efficiency
of 20% provides 2000MW plus about 6000MW of district heating representing 10% of power
and heat consumption (Swithenbank et al, 2003).
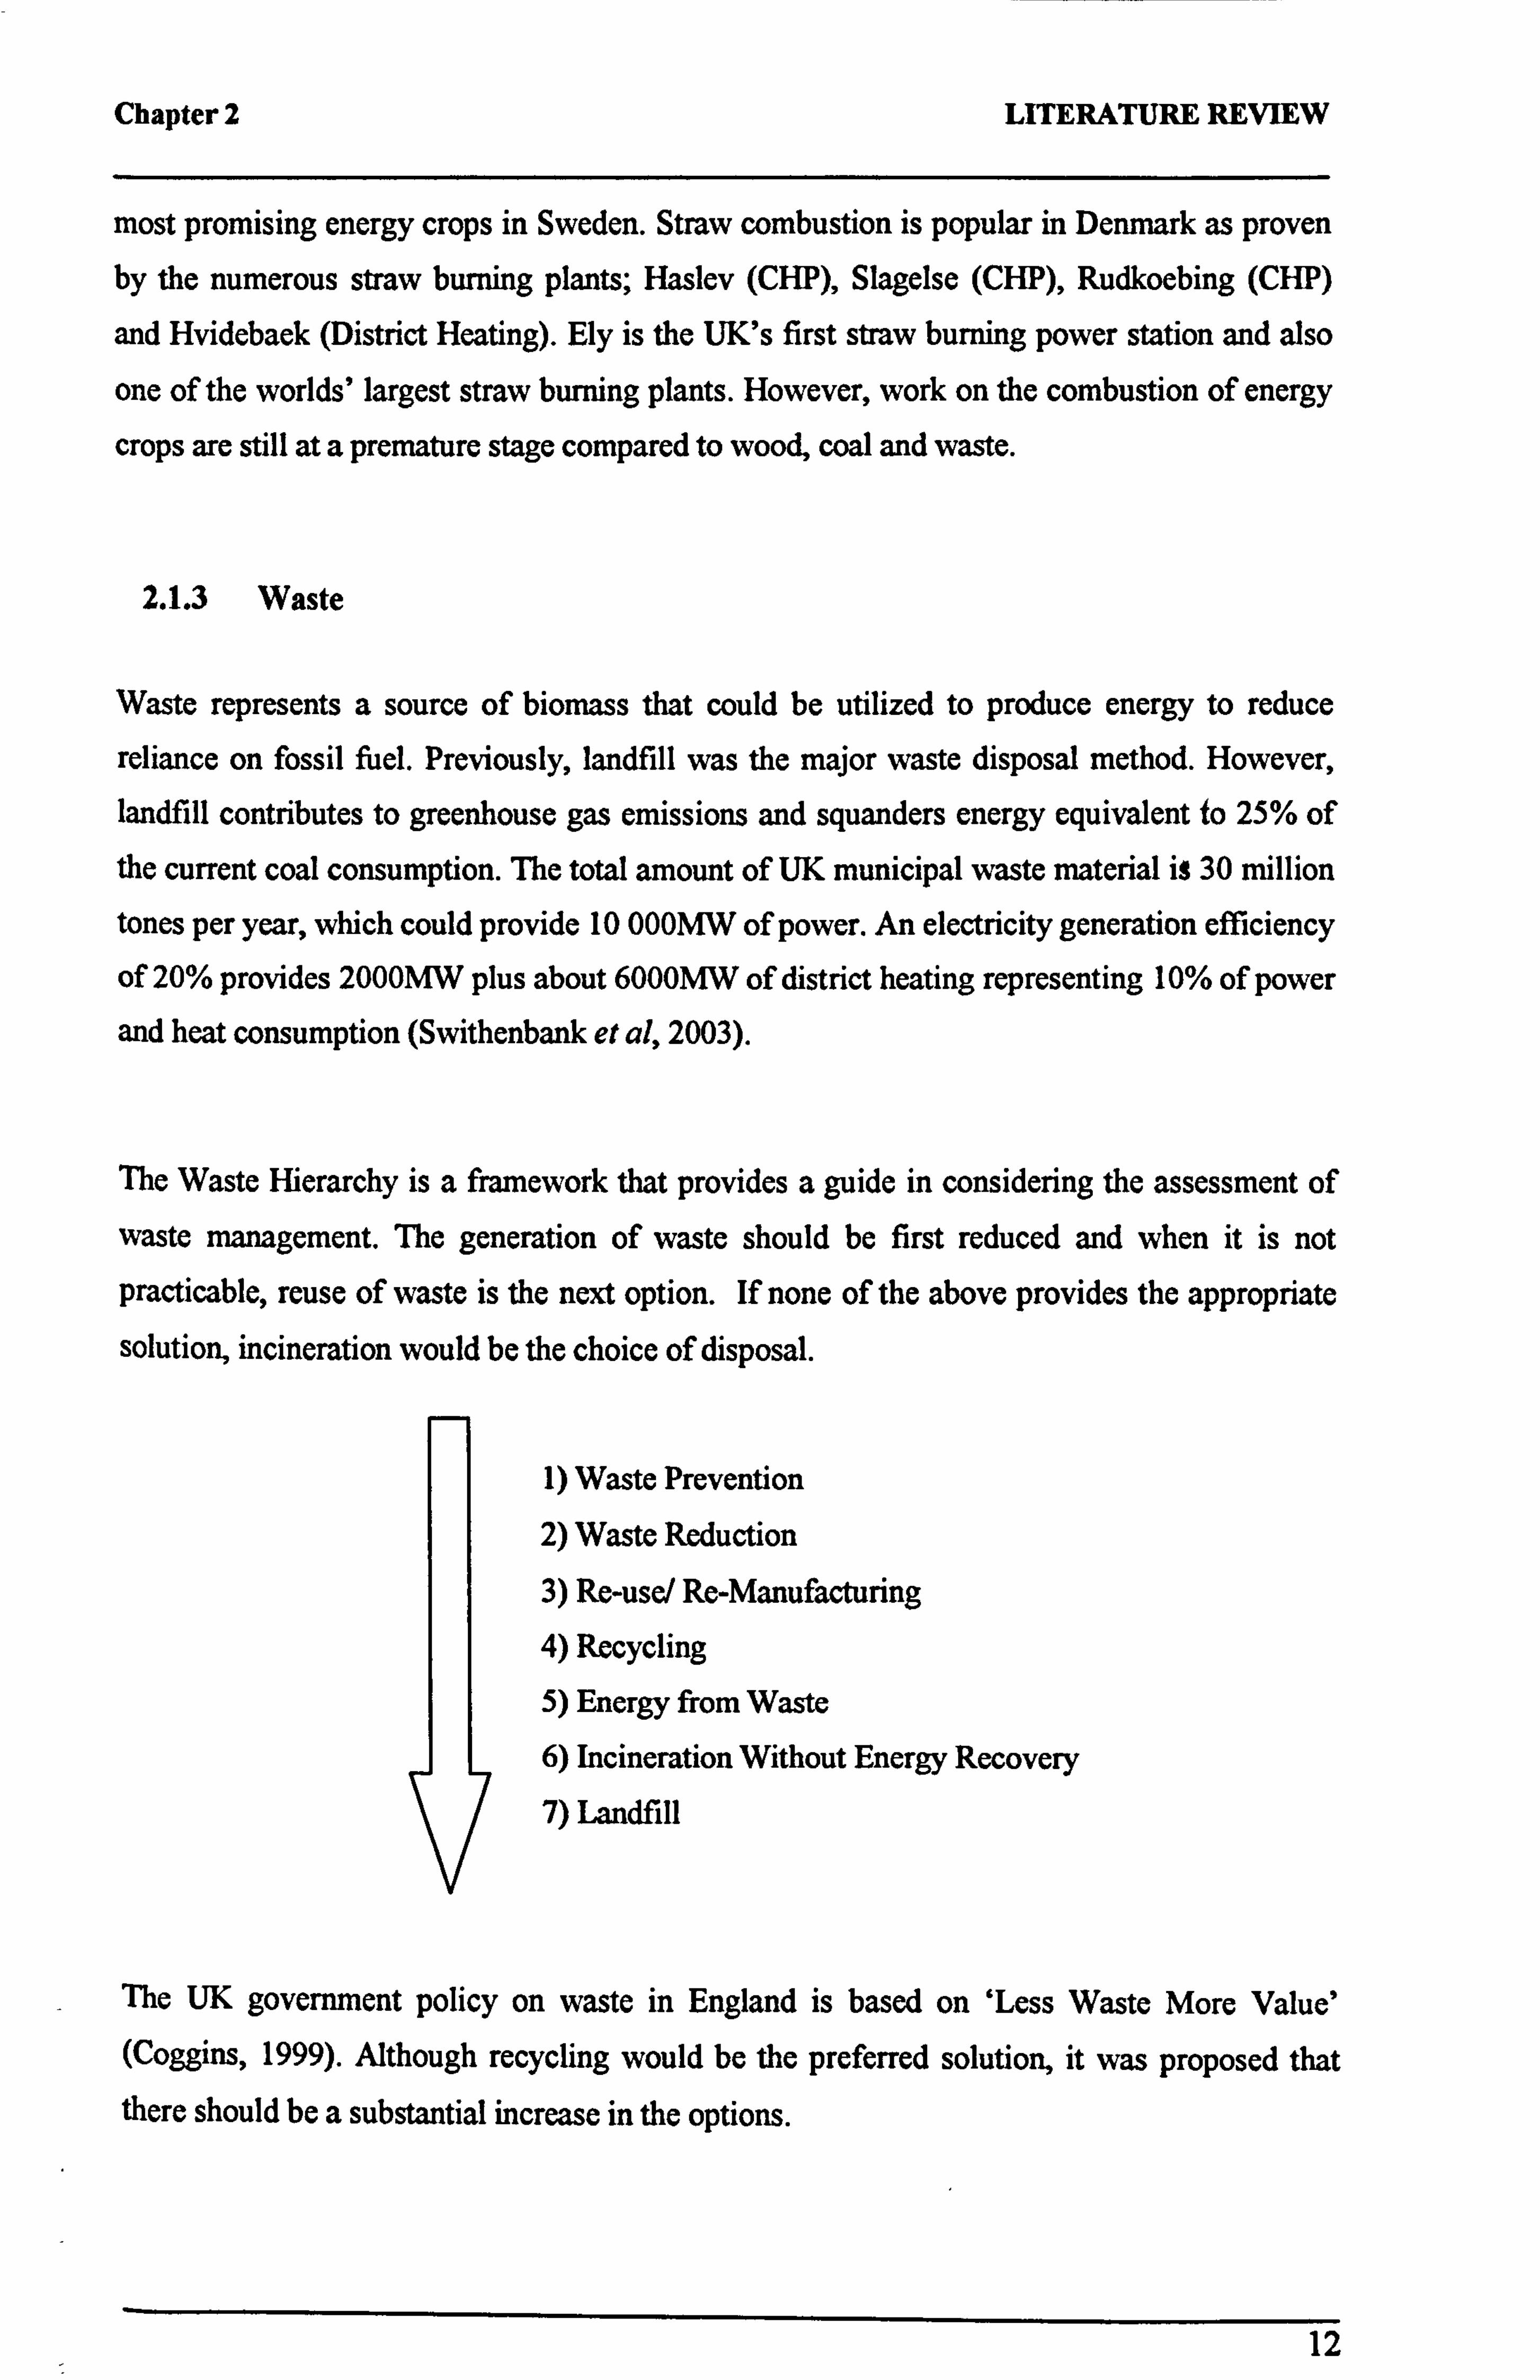
The Waste Hierarchy is a framework that provides a guide in considering the assessment of waste management. The generation of waste should be first reduced and when it is not practicable, reuse of waste is the next option. If none of the above provides the appropriate
solution, incineration would be the choice of disposal.
1) Waste Prevention
2) Waste Reduction
3) Re-use/ Re-Manufacturing
4) Recycling
5) Energy from Waste
6) Incineration Without Energy Recovery
7) Landfill
The UK government policy on waste in England is based on `Less Waste More Value' (Coggins, 1999). Although recycling would be the preferred solution, it was proposed that there should be a substantial increase in the options.
12
Chapter 2 LITERATURE REVIEW
The recovery of energy from waste is important to achieve sustainable waste management
especially for the fraction of waste that cannot be economically reused or recycled. The UK
has a maximum electricity capacity from waste processing of 3%. Therefore, part of this
research sets out to investigate the combustion characteristics of processed waste (refused-
derived waste) which focuses on both the emissions and ash composition.
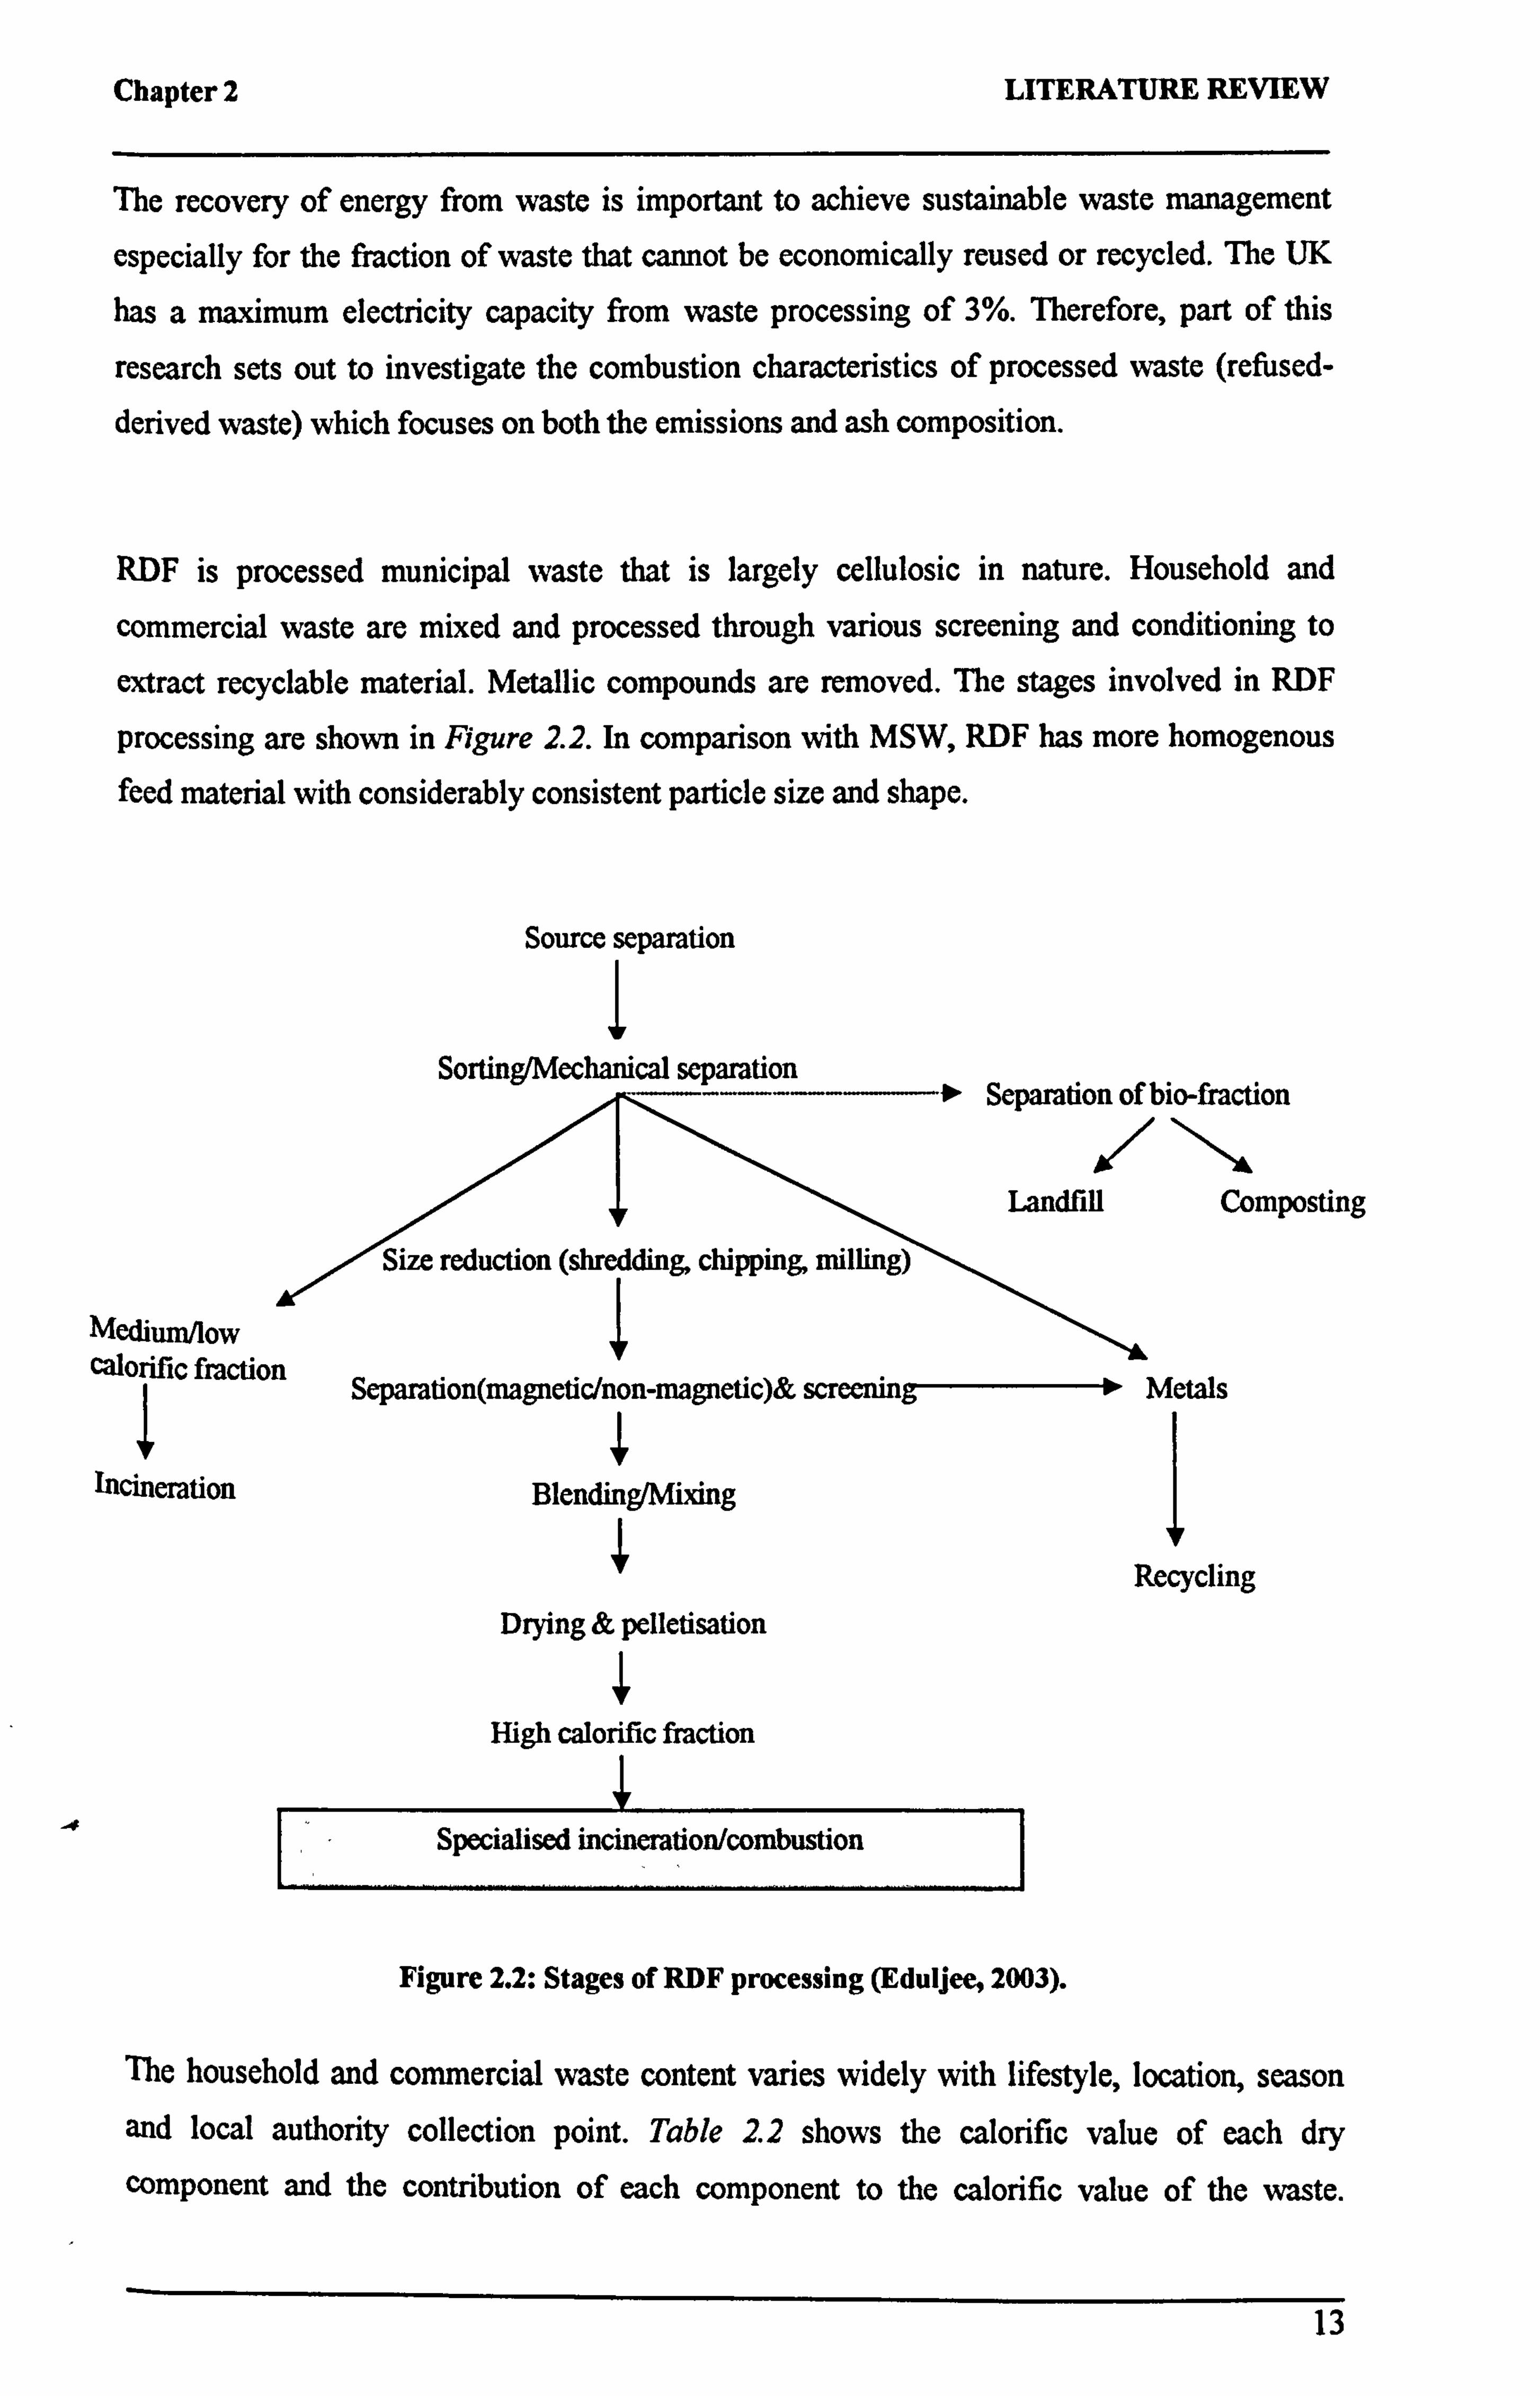
RDF is processed municipal waste that is largely cellulosic in nature. Household and
commercial waste are mixed and processed through various screening and conditioning to
extract recyclable material. Metallic compounds are removed. The stages involved in RDF
processing are shown in Figure 2.2. In comparison with MSW, RDF has more homogenous
feed material with considerably consistent particle size and shape.
Source separation
1 Sorting/Mechanical separation
Separation of bio-fraction
Landfill Composting
Size reduction (shredding, chipping, milling)
Medium/low 1
calorific fraction Separation(magnetic/non-magnetic)& screening Metals
Izºcineration Blending/Mixing
Recycling Drying & pelletisation
High calorific fraction
Specialised incineration/combustion
Figure 2.2: Stages of RDF processing (Eduijee, 2003).
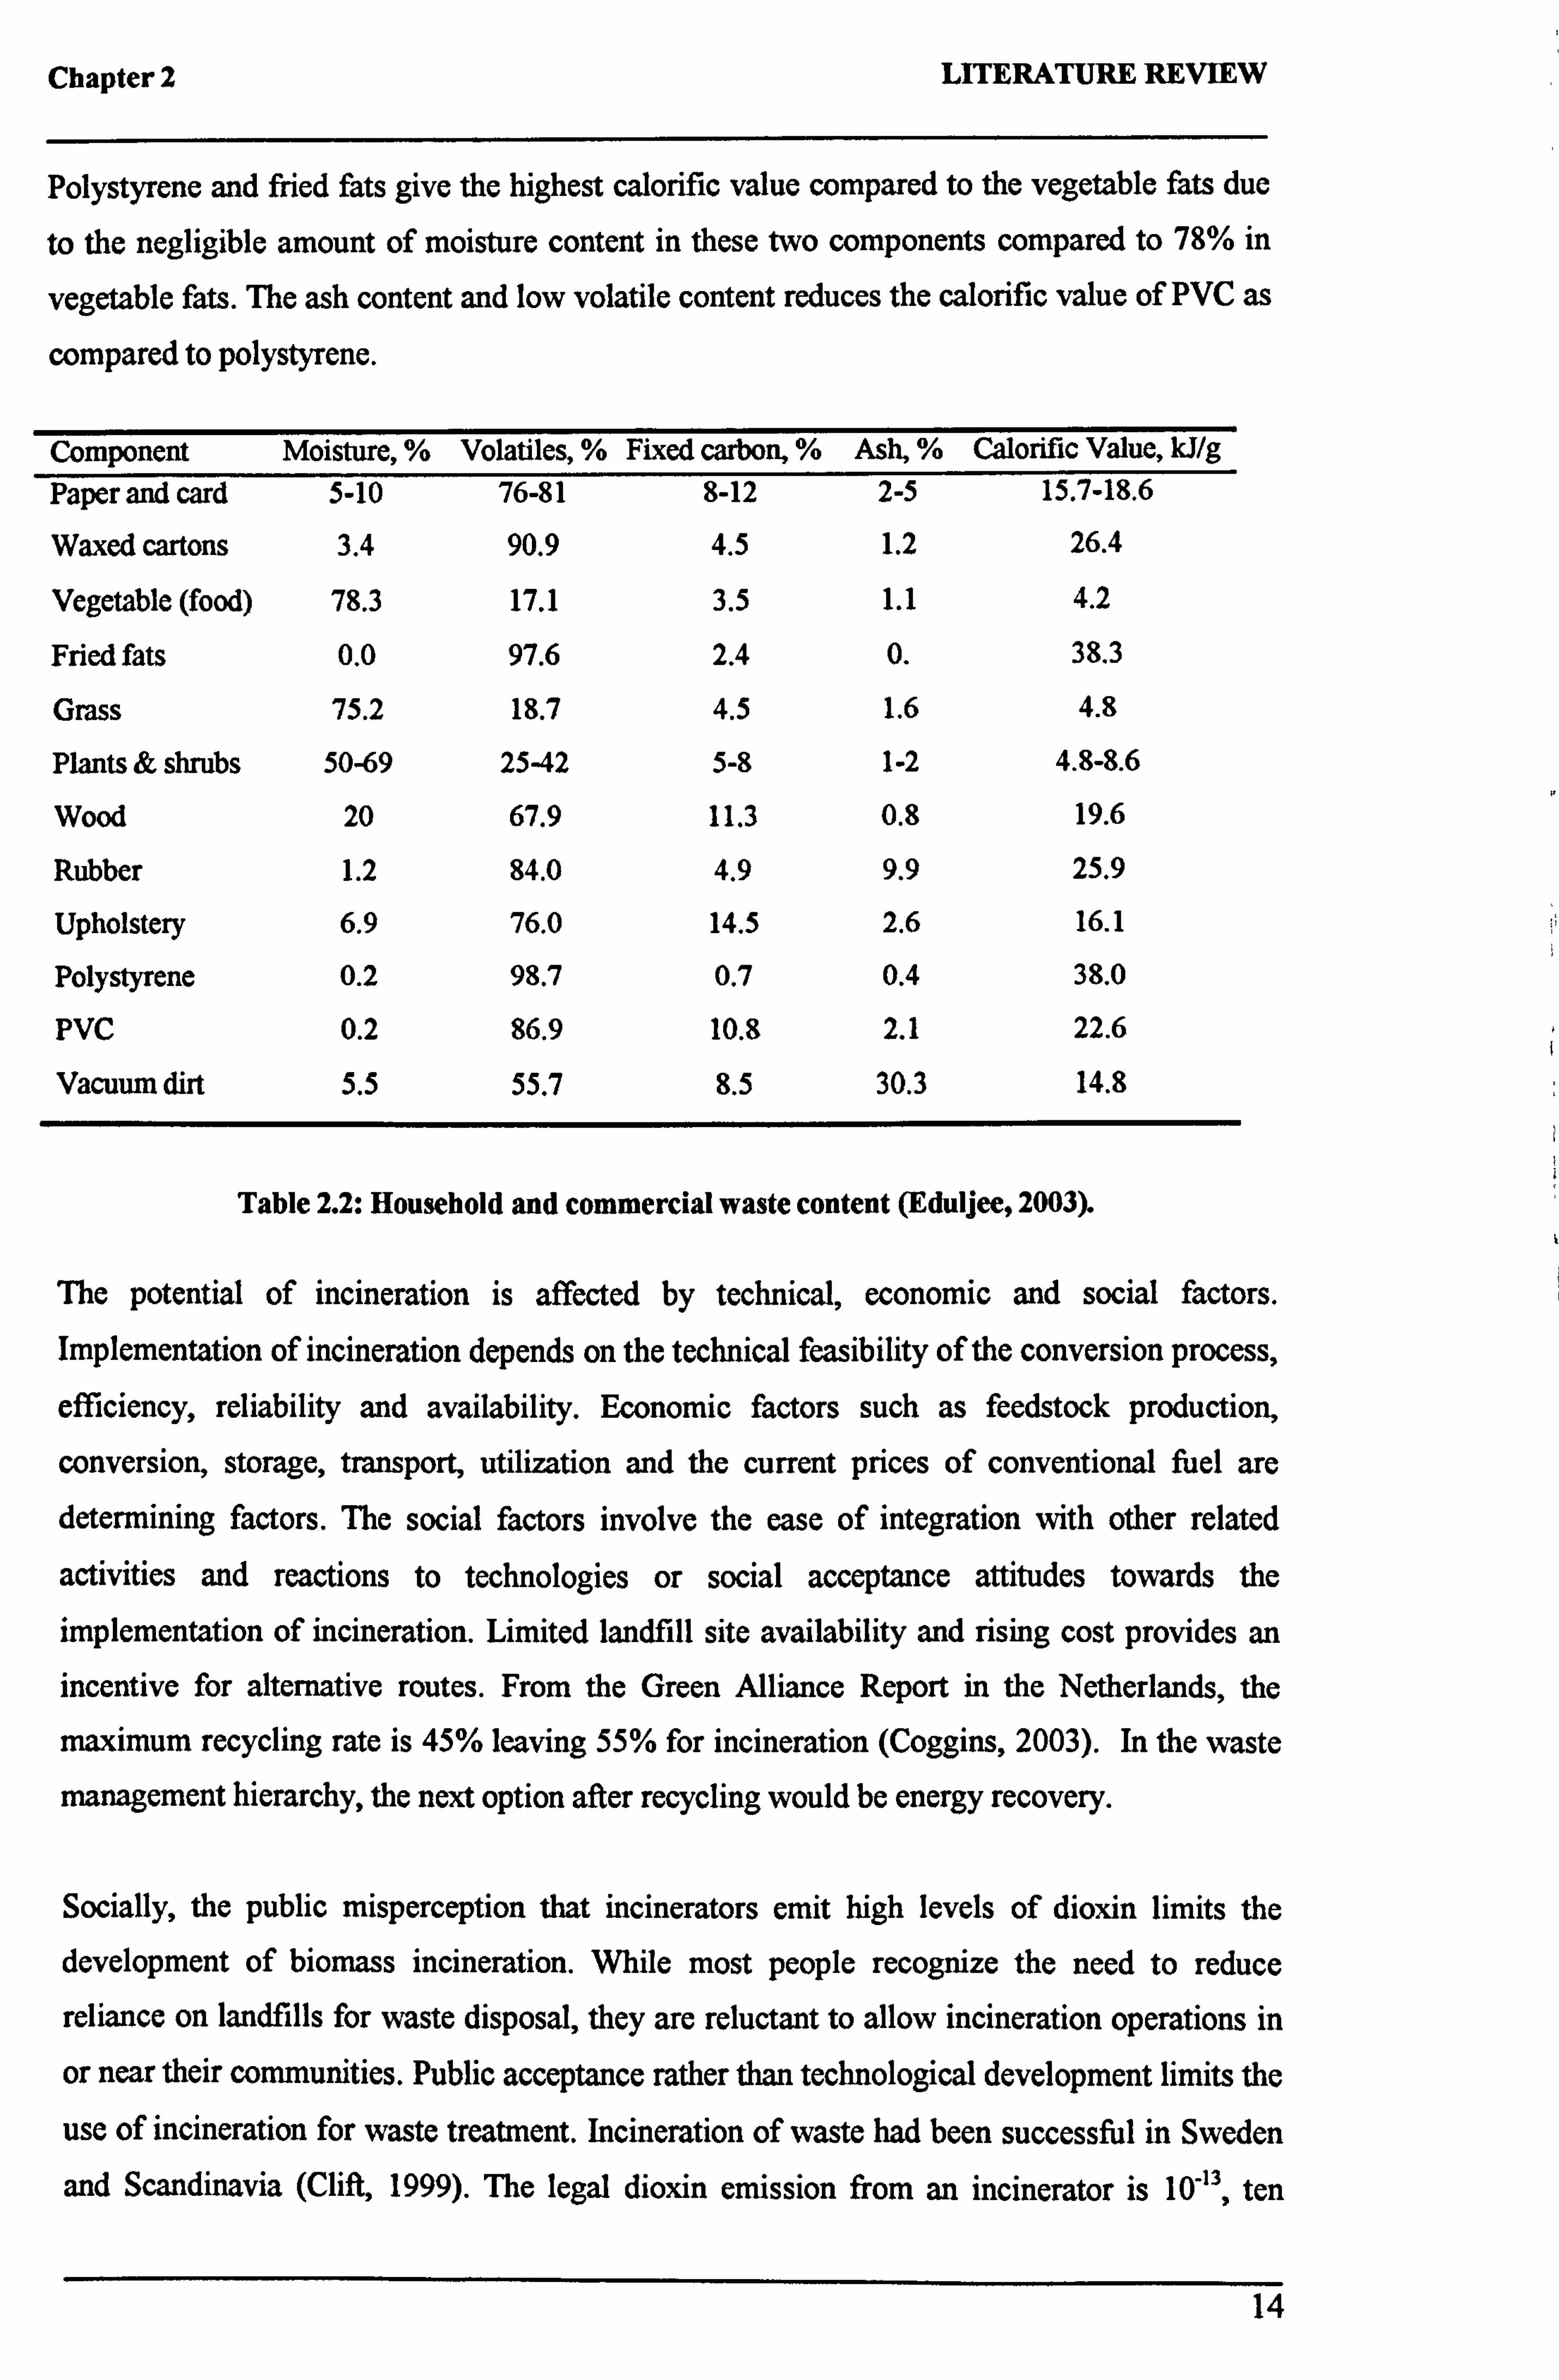
The household and commercial waste content varies widely with lifestyle, location, season and local authority collection point. Table 22 shows the calorific value of each dry
component and the contribution of each component to the calorific value of the waste.
13
Chapter 2 LITERATURE REVIEW
Polystyrene and fried fats give the highest calorific value compared to the vegetable fats due
to the negligible amount of moisture content in these two components compared to 78% in
vegetable fats. The ash content and low volatile content reduces the calorific value of PVC as
compared to polystyrene.
Component Moisture, % Volatiles, % Fixed carbon, % Ash, % Calorific Value, kJ/g Paper and card 5-10 76-81 8-12 2-5 15.7-18.6
Waxed cartons 3.4 90.9 4.5 1.2 26.4
Vegetable (food) 78.3 17.1 3.5 1.1 4.2
Fried fats 0.0 97.6 2.4 0. 38.3
Grass 75.2 18.7 4.5 1.6 4.8
Plants & shrubs 50-69 25-42 5-8 1-2 4.8-8.6
Wood 20 67.9 11.3 0.8 19.6
Rubber 1.2 84.0 4.9 9.9 25.9
Upholstery 6.9 76.0 14.5 2.6 16.1
Polystyrene 0.2 98.7 0.7 0.4 38.0
PVC 0.2 86.9 10.8 2.1 22.6
Vacuum dirt 5.5 55.7 8.5 30.3 14.8
Table 2.2: Household and commercial waste content (Eduljee, 2003).
The potential of incineration is affected by technical, economic and social factors.
Implementation of incineration depends on the technical feasibility of the conversion process,
efficiency, reliability and availability. Economic factors such as feedstock production,
conversion, storage, transport, utilization and the current prices of conventional fuel are determining factors. The social factors involve the ease of integration with other related
activities and reactions to technologies or social acceptance attitudes towards the implementation of incineration. Limited landfill site availability and rising cost provides an incentive for alternative routes. From the Green Alliance Report in the Netherlands, the
maximum recycling rate is 45% leaving 55% for incineration (Coggins, 2003). In the waste
management hierarchy, the next option after recycling would be energy recovery.
Socially, the public misperception that incinerators emit high levels of dioxin limits the development of biomass incineration. While most people recognize the need to reduce
reliance on landfills for waste disposal, they are reluctant to allow incineration operations in
or near their communities. Public acceptance rather than technological development limits the
use of incineration for waste treatment. Incineration of waste had been successful in Sweden
and Scandinavia (Cliff, 1999). The legal dioxin emission from an incinerator is 10-", ten
14
Chapter 2 LITERATURE REVIEW
thousand times less contaminant allowed compared to the manufacturing of microchips. The
emission of dioxins from incinerators contributes only 3% of the total UK dioxin emission (Swithenbank et al, 2003). More 'appealing' architecture of incinerator plants and public
accessible information sources could improve the situation (Schmidt, 1999).
2.1.4 Legislations
Government policy and legislation plays a vital role in the implementation of the new technology as a tax system on energy and new regulation on the power market help to make biofuel competitive with other conventional energy resources. However, the production of
energy crops depends just as much on agricultural policy as on the planning of future land use otherwise they cannot present as high a return compared to subsidised arable or livestock
production. This section reviews the agricultural, environmental and energy policy that push
towards the application of renewable resource or biomass in the energy industry.
2.1.4.1 Agricultural Policy
The attractiveness of new energy crops to farmers depends on the profitability of the land in
the alternative uses, which in turn depends on the terms of agricultural support schemes.
" Set-Aside Rules: Set-aside land in Ireland may be used for growing crops for
manufacture of products not intended for human or animal consumption (EECI, 1999).
" Finance Bill: Tax relief is introduced for corporate equity investment in wind energy
or biomass projects which are approved by the Minister for Public Enterprise (EECI,
1999).
" Woodland Grant Scheme: Provides grant aid for the establishment of short rotation
coppice (EECI, 1999).
" Regulation 1257/99 ("the Rural Development Regulation"): Provides establishment
grants for approved energy crops such as willow, poplar and miscanthus, if the crops
are used for heat, combined heat and power and power generation (Defra, 2003).
" Government strategy for alternative crops: The Ministry of Agriculture Fisheries and Food (MAFF), is working to encourage new developments of industrial and energy crops. MAFF will allocate £30 million to support the growing of energy crops (RCEP).
15
Chapter 2 LITERATURE REVIEW
" Energy Crop Scheme (ESC): Offers establishment grants covering 40-50% of the cost
of establishing energy crops. The EU Objective areas are Cornwall (including the Isles
of Scilly), Merseyside and South Yorkshire (Defra, 2003).
" Energy Crop Regulation 2000: Financial aid will be given to projects involving the
establishment of miscanthus and short rotation coppice that will be used in equipment
or a plant that produces energy through the use of such crops (HMSO).
" Common Agricultural Policy (CAP): Energy crops are allowed to grow on land for
which they receive set-aside payment to keep it out of food production. It is estimated
that there is a global area of 800 million hectares available for growing of energy crops (RCEP).
2.1.4.2 Environmental Policy
Greenhouse gas (GHG) emission is heading towards a critical level, leading to a serious call
nationally and locally for the highest possible reduction. `Dangerous' climate change with increasing damage is projected if global temperature increases about 1 to 3°C above current levels. Probability analysis estimated that concentration of CO2 levels below 400ppm is
required to avoid warming of 2°C (International Scientific Committee, 2005). The UK
accounts for 2.5% of the total world energy consumption and is responsible for 2.3% of the
total world carbon emissions. The Kyoto Protocol to the United Nations Framework
Convention on Climate Change imposes emission targets under which the UK has agreed to
the reduction of carbon emission by 12.5% of the 1990 level, by 2010 (EIA, 2003). The
commitment of the government to the development of a bioenergy industry is seen in the increasing investment in the renewable energy sources. Under the New Technologies
Demonstrator Programme (NTDP) a total of over £30 million funding was allocated to the innovation of new technologies with gasification and pyrolysis being two technologies
supported under the development scheme (Defra, 2004).
The Climate Change Levy that came into effect in 2001 imposes a tax on industrial and
commercial energy used. This causes industries to look towards alternative energy as a `clean' source of energy. Most combined heat and power (CHP), as well as solar and wind-
powered plants are exempted under the Climate Change Levy (EIA, 2003).
16
Chapter 2 LITERATURE REVIEW
2.1.4.3 Energy Policy
The EU considers biomass energy as the most important renewable source. Energy targets
were set at doubling the share of renewable in the overall energy production, rising from 6%
in 1997 to 12% in 2010, and renewable electricity from the current 14.5% to 23.5% in 2010
overall in the EU. The UK targets 10% electricity from renewables by 2010 with the current
level less than 3% (DTI, 1999). Below is some of the energy policies set out to encourage
commercial electricity generation from biomass technologies:
" Non Fossil Fuel Obligation (NFFO): Electricity supply companies have an obligation
to secure specified amounts of new generating capacity from non-fossil sources using
renewable generators at premium rates. The difference between the premium price paid to "green" electricity suppliers and the market prices is finance by the Fossil Fuel Levy
(DTI, 2001).
" Renewables Obligation (RO): Aims to supply 10% of the total energy from
renewables by 2010. From 2006,25% of co-fired biomass must come from energy
crops making energy crops an important source of energy for the UK (RCEP).
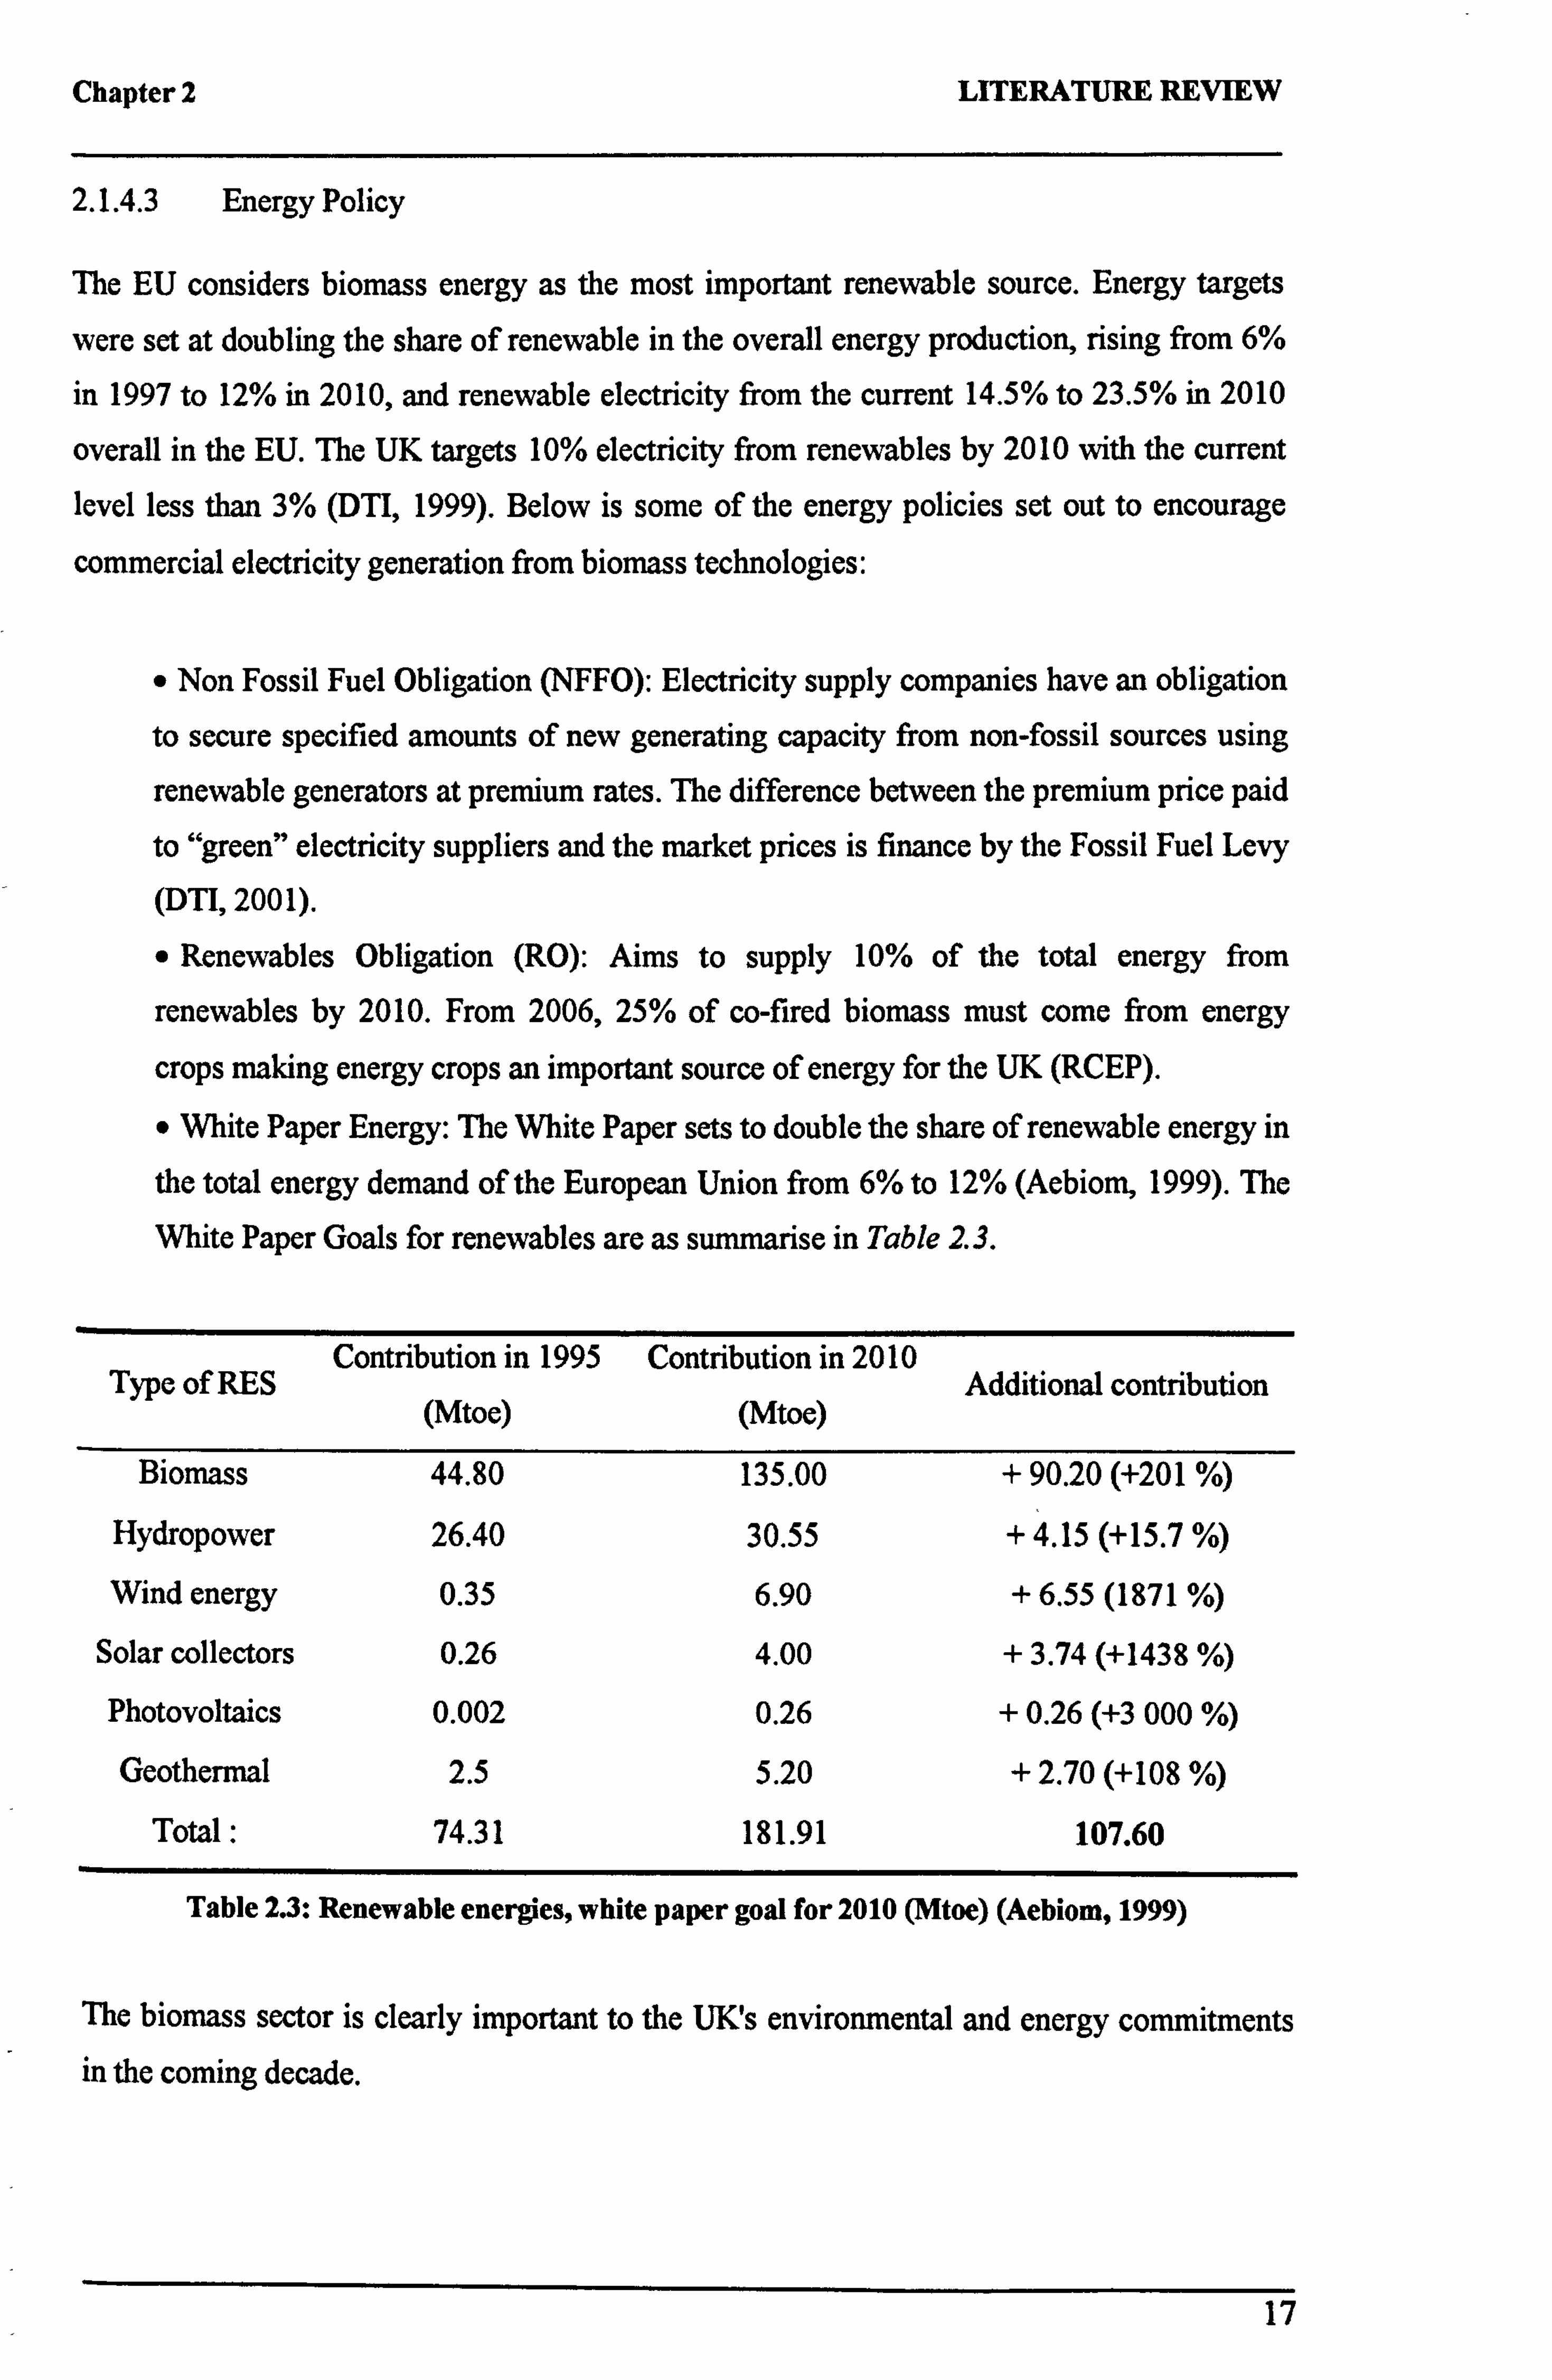
" White Paper Energy: The White Paper sets to double the share of renewable energy in
the total energy demand of the European Union from 6% to 12% (Aebiom, 1999). The
White Paper Goals for renewables are as summarise in Table 2.3.
Type of RES Contribution in 1995
(Mtoe)
Contribution in 2010
(Mtoe) Additional contribution
Biomass 44.80 135.00 + 90.20 (+201 %)
Hydropower 26.40 30.55 + 4.15 (+15.7 %)
Wind energy 0.35 6.90 + 6.55 (1871 %)
Solar collectors 0.26 4.00 + 3.74 (+1438 %)
Photovoltaics 0.002 0.26 + 0.26 (+3 000 %)
Geothermal 2.5 5.20 + 2.70 (+108 %)
Total : 74.31 181.91 107.60
Table 2.3: Renewable energies, white paper goal for 2010 (Mtoe) (Aebiom, 1999)
The biomass sector is clearly important to the UK's environmental and energy commitments in the coming decade.
17
Chapter 2 LITERATURE REVIEW
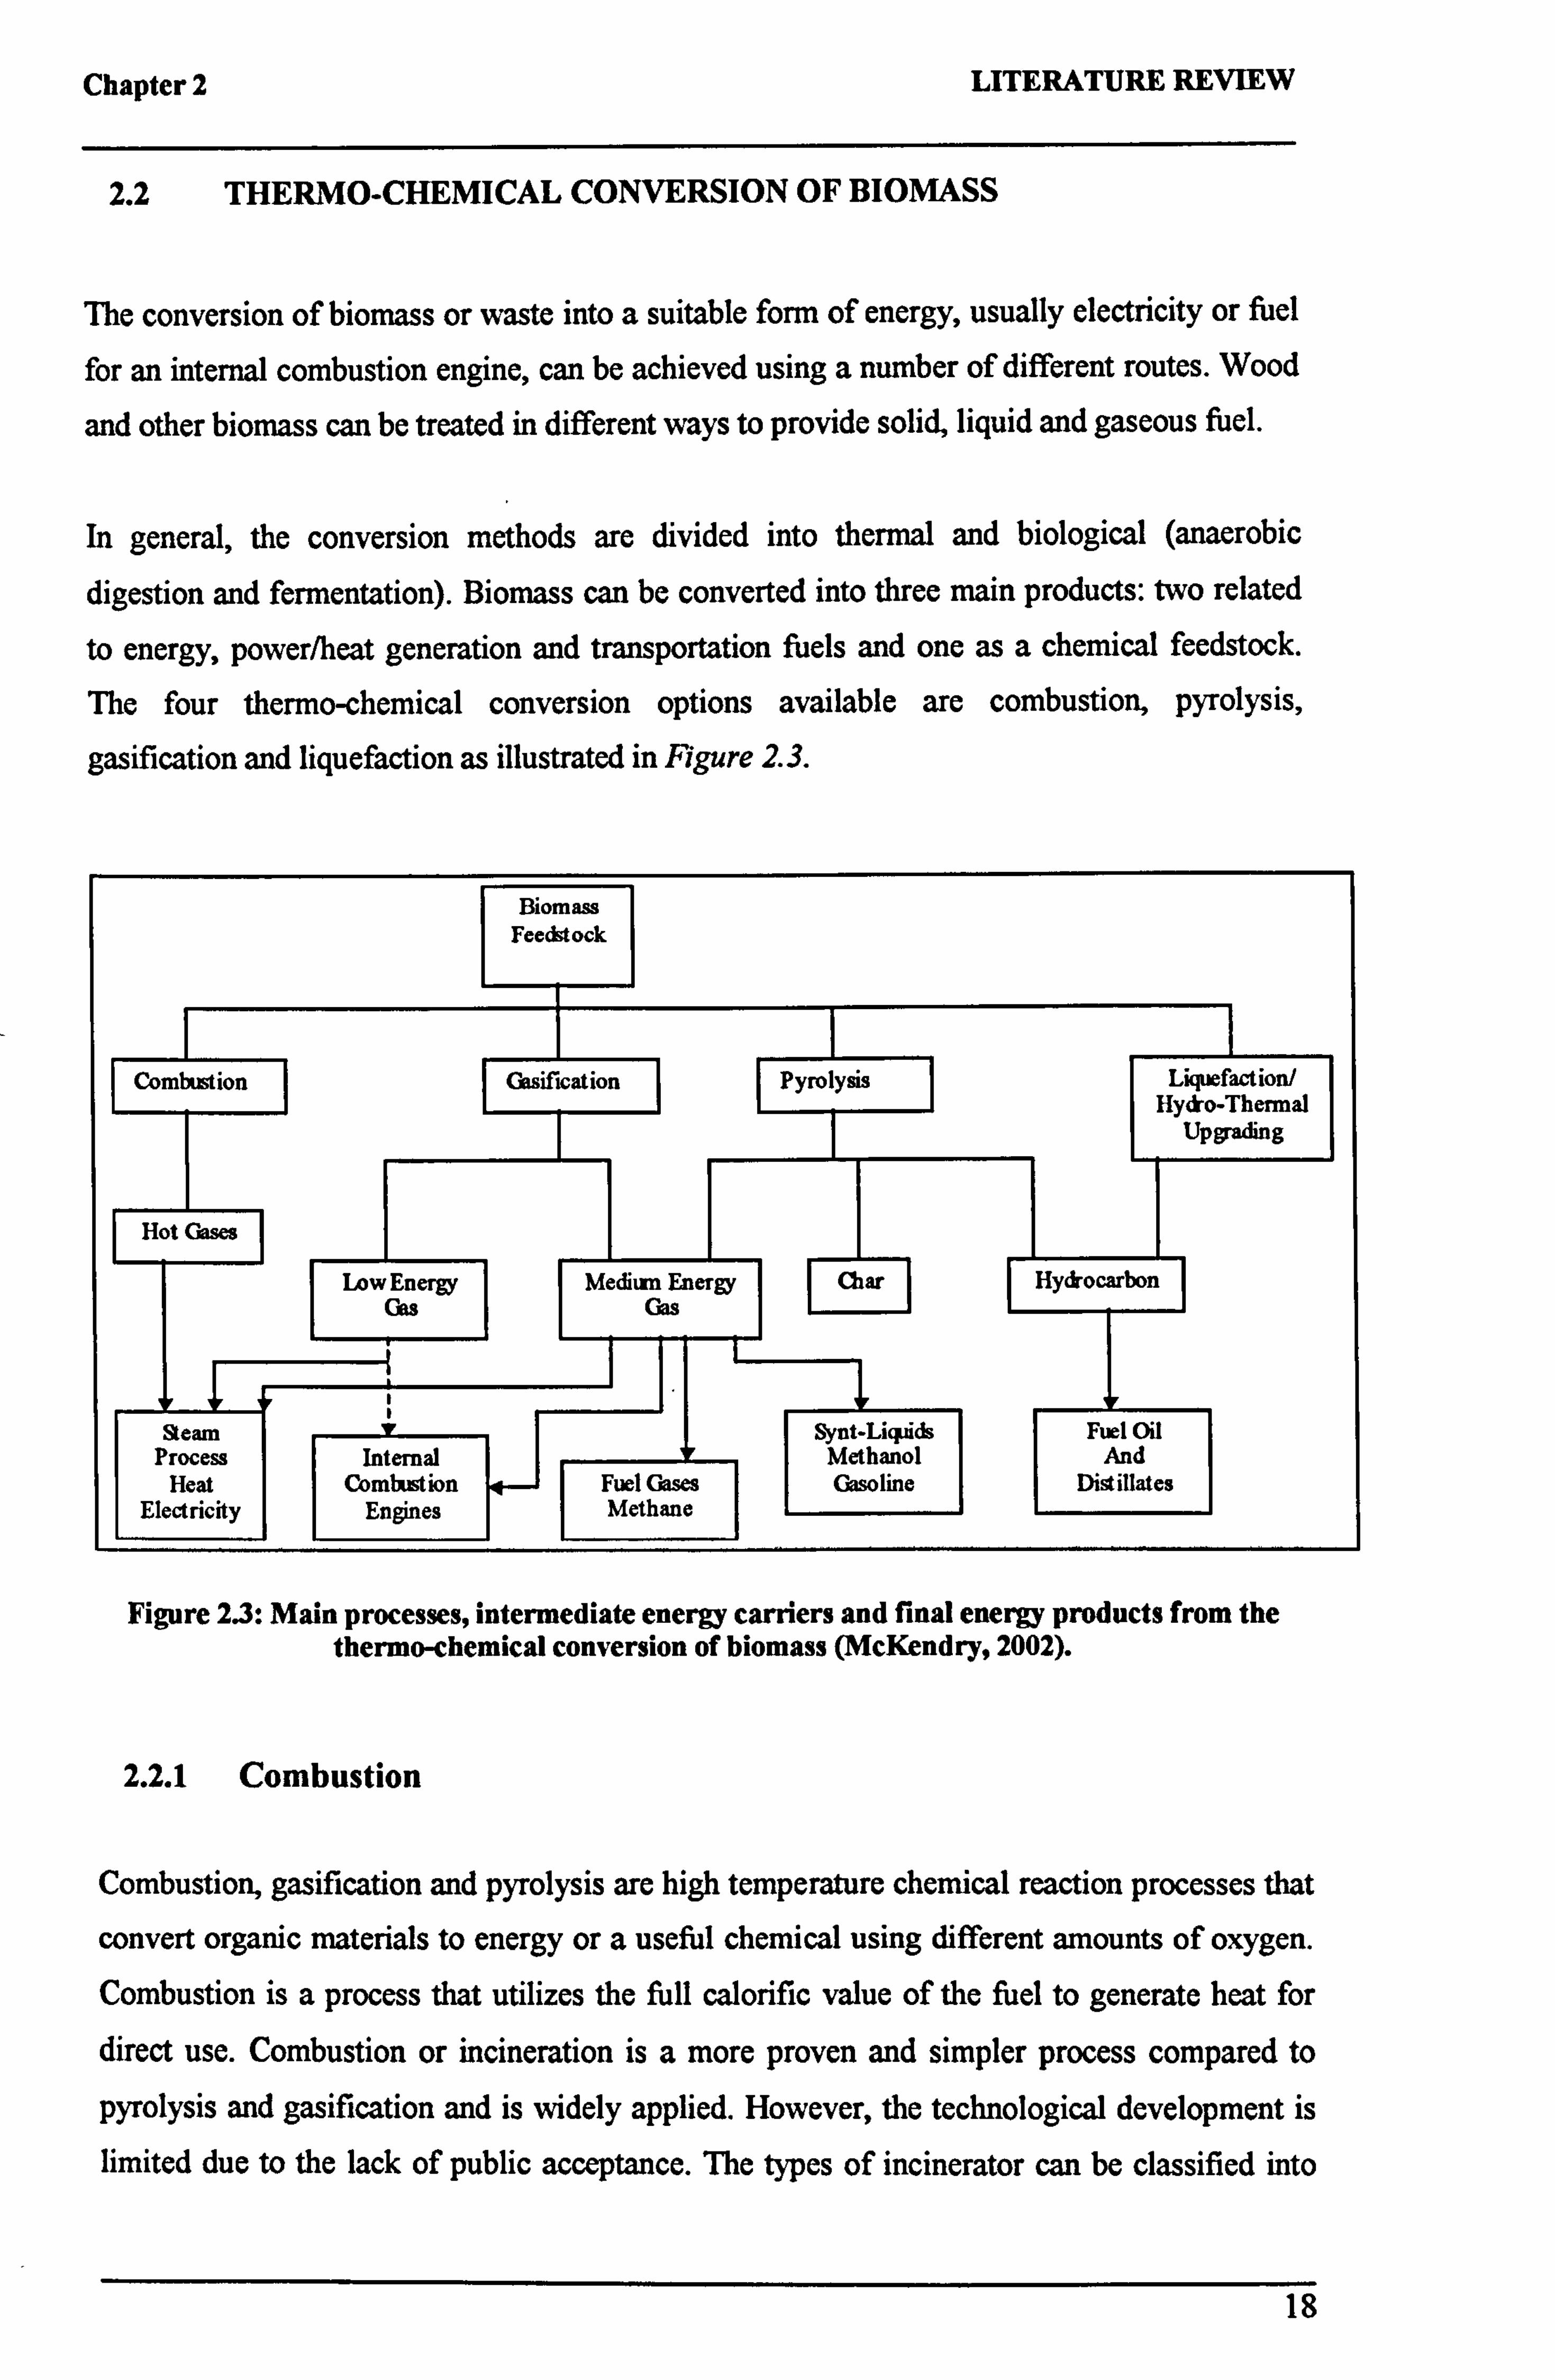
2.2 THERMO-CHEMICAL CONVERSION OF BIOMASS
The conversion of biomass or waste into a suitable form of energy, usually electricity or fuel
for an internal combustion engine, can be achieved using a number of different routes. Wood
and other biomass can be treated in different ways to provide solid, liquid and gaseous fuel.
In general, the conversion methods are divided into thermal and biological (anaerobic
digestion and fermentation). Biomass can be converted into three main products: two related
to energy, power/heat generation and transportation fuels and one as a chemical feedstock.
The four thermo-chemical conversion options available are combustion, pyrolysis,
gasification and liquefaction as illustrated in Figure 2.3.
Biomass Feedstock
Combustion Gasification Pyrolysis Liquefaction/ Hydro-Thermal
Upgrading
Hot Cases
Low Energy Medium Energy Char Hydrocarbon Gas Cos
Sleaze Synt-Liquids Fuel Oil Process Internal Methanol And
Heat Comb stion Fuel Grases Gasoline Distillates Electricity Engines Methane
Figure 2.3: Main processes, intermediate energy carriers and final energy products from the thermo-chemical conversion of biomass (McKendry, 2002).
2.2.1 Combustion
Combustion, gasification and pyrolysis are high temperature chemical reaction processes that
convert organic materials to energy or a useful chemical using different amounts of oxygen. Combustion is a process that utilizes the full calorific value of the fuel to generate heat for
direct use. Combustion or incineration is a more proven and simpler process compared to
pyrolysis and gasification and is widely applied. However, the technological development is
limited due to the lack of public acceptance. The types of incinerator can be classified into
18
Chapter 2 LITERATURE REVIEW
four groups: moving grate, incinerator chamber, fluidized bed and rotary-kiln, depending on the way in which the fuel and oxidant flow are supplied.
2.2.1.1 Moving Grate
Moving grate furnaces have been a popular system for municipal waste incineration to allow
mixing of waste with an appropriate excess of air. There are a few types of moving grate furnaces: travelling grate, ARR Widmer, Ernst System Double Motion Overthrust grate,
reciprocating grate, reverse acting reciprocating grate, rocking grate and the roller grate.
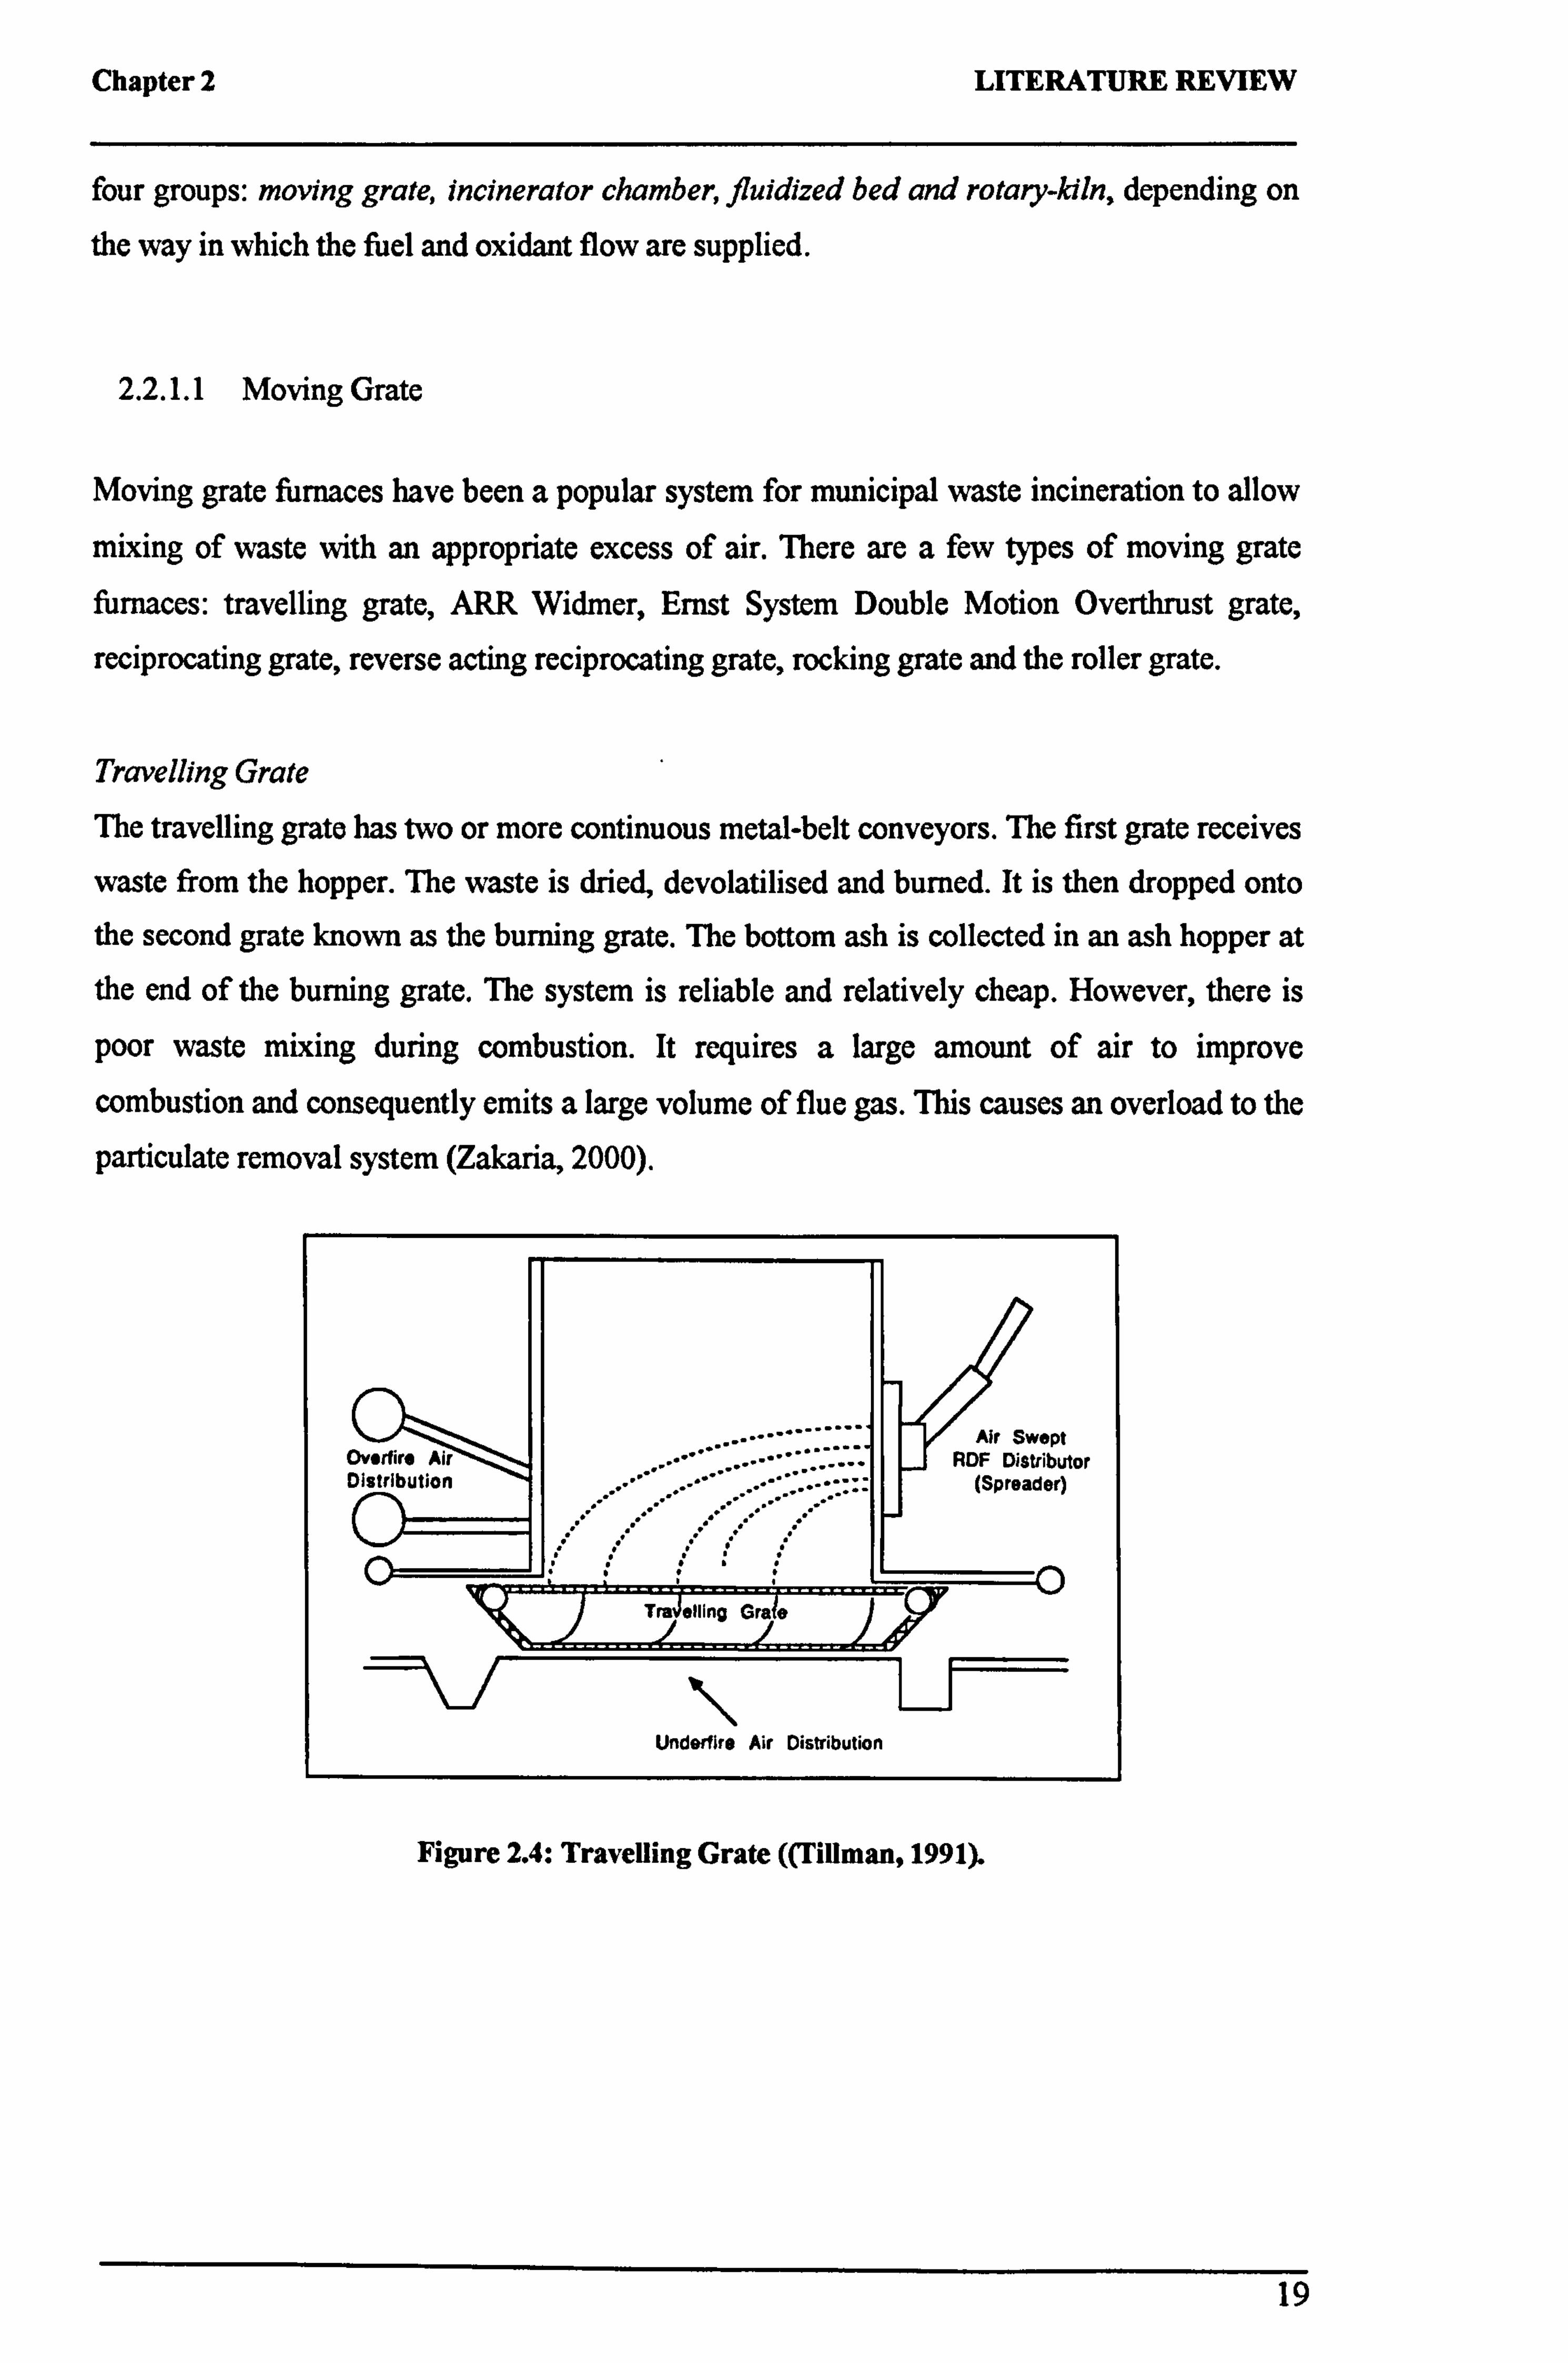
Travelling Grate
The travelling grate has two or more continuous metal-belt conveyors. The first grate receives
waste from the hopper. The waste is dried, devolatilised and burned. It is then dropped onto
the second grate known as the burning grate. The bottom ash is collected in an ash hopper at
the end of the burning grate. The system is reliable and relatively cheap. However, there is
poor waste mixing during combustion. It requires a large amount of air to improve
combustion and consequently emits a large volume of flue gas. This causes an overload to the
particulate removal system (Zakaria, 2000).
Figure 2.4: Travelling Grate ((Tillman, 1991).
19
Chapter 2 LITERATURE REVIEW
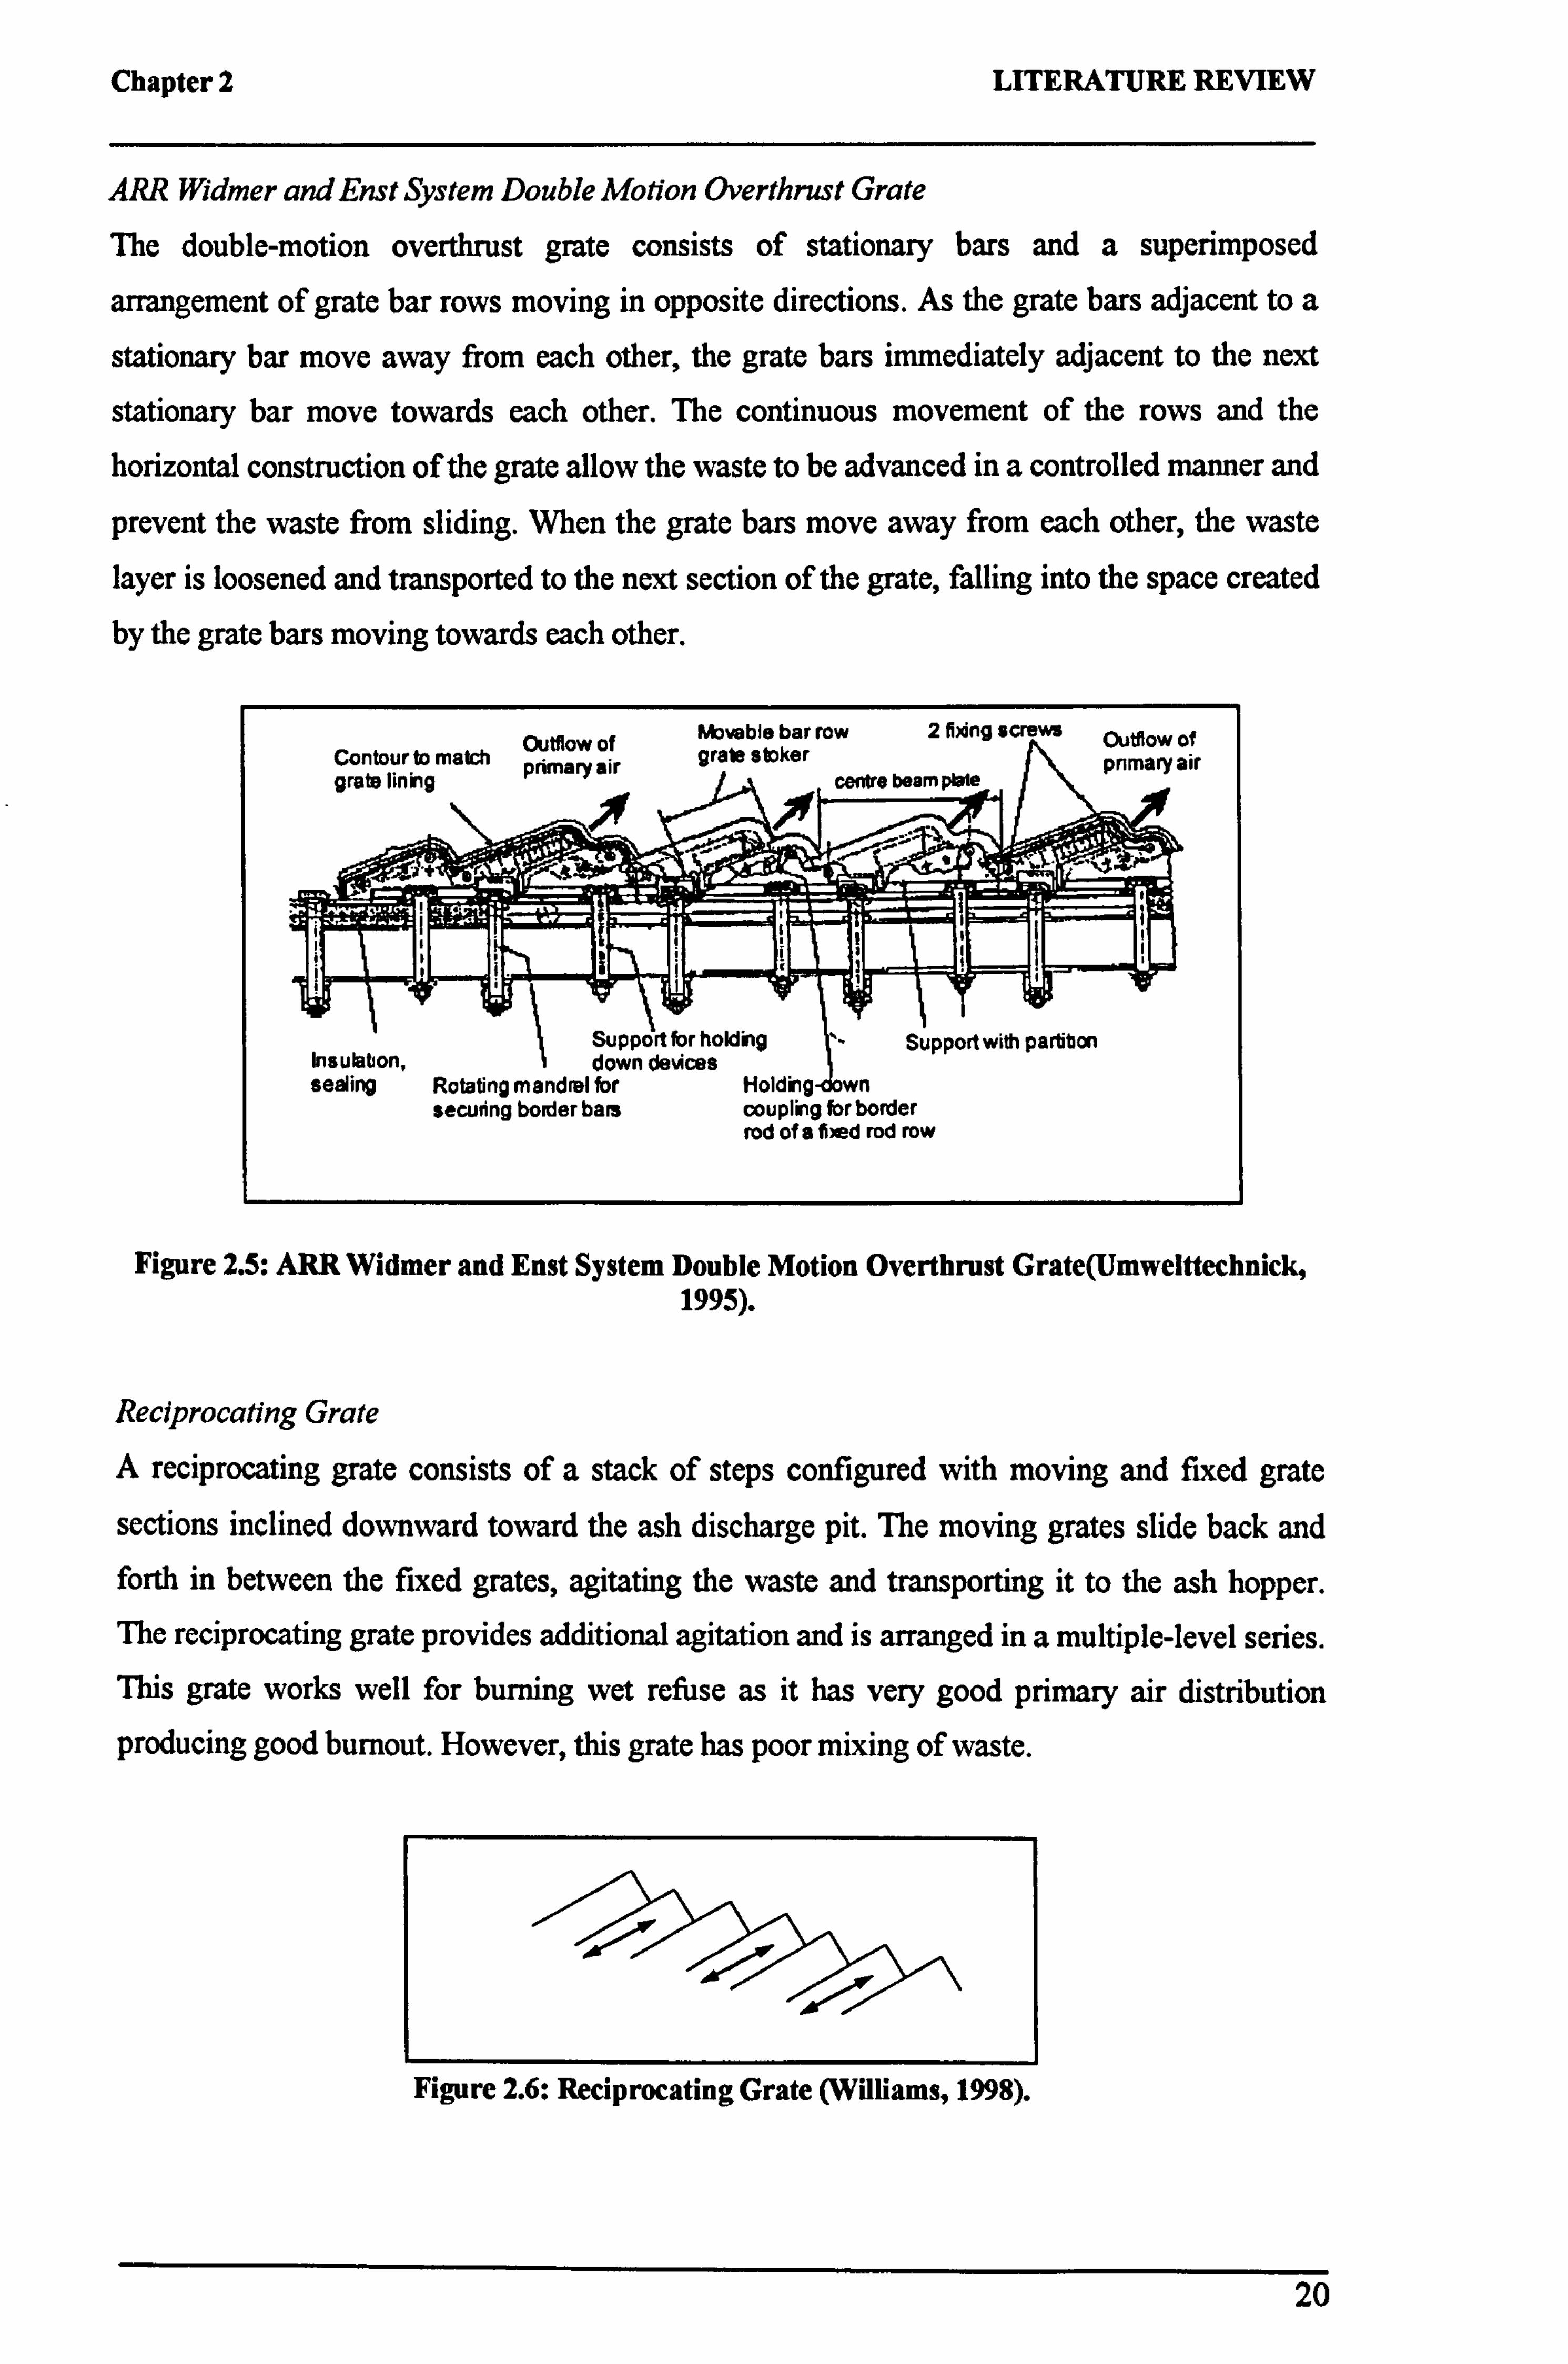
ARR Widmer and Enst System Double Motion Overthrust Grate
The double-motion overthrust grate consists of stationary bars and a superimposed
arrangement of grate bar rows moving in opposite directions. As the grate bars adjacent to a
stationary bar move away from each other, the grate bars immediately adjacent to the next
stationary bar move towards each other. The continuous movement of the rows and the
horizontal construction of the grate allow the waste to be advanced in a controlled manner and
prevent the waste from sliding. When the grate bars move away from each other, the waste layer is loosened and transported to the next section of the grate, falling into the space created by the grate bars moving towards each other.
Outflow of Wvable bar row 2 fing screws Outflow of
Contour to match primary air grate stoker pnmaryair
grata lining centre beamplale
i. i
t Support forholdiing Support with partition Insulation, iii down devices sealing Rotating mandrel for Holding wn
securing border bars coupling for border rod of a fixed rod row
Figure 2.5: ARR Widmer and Enst System Double Motion Overthrust Grate(Umwelttechnick, 1995).
Reciprocating Grate A reciprocating grate consists of a stack of steps configured with moving and fixed grate
sections inclined downward toward the ash discharge pit. The moving grates slide back and forth in between the fixed grates, agitating the waste and transporting it to the ash hopper.
The reciprocating grate provides additional agitation and is arranged in a multiple-level series. This grate works well for burning wet refuse as it has very good primary air distribution
producing good burnout. However, this grate has poor mixing of waste.
r r. r Figure 2.6: Reciprocating Grate (Williams, 1998).
20
Chapter 2 LITERATURE REVIEW
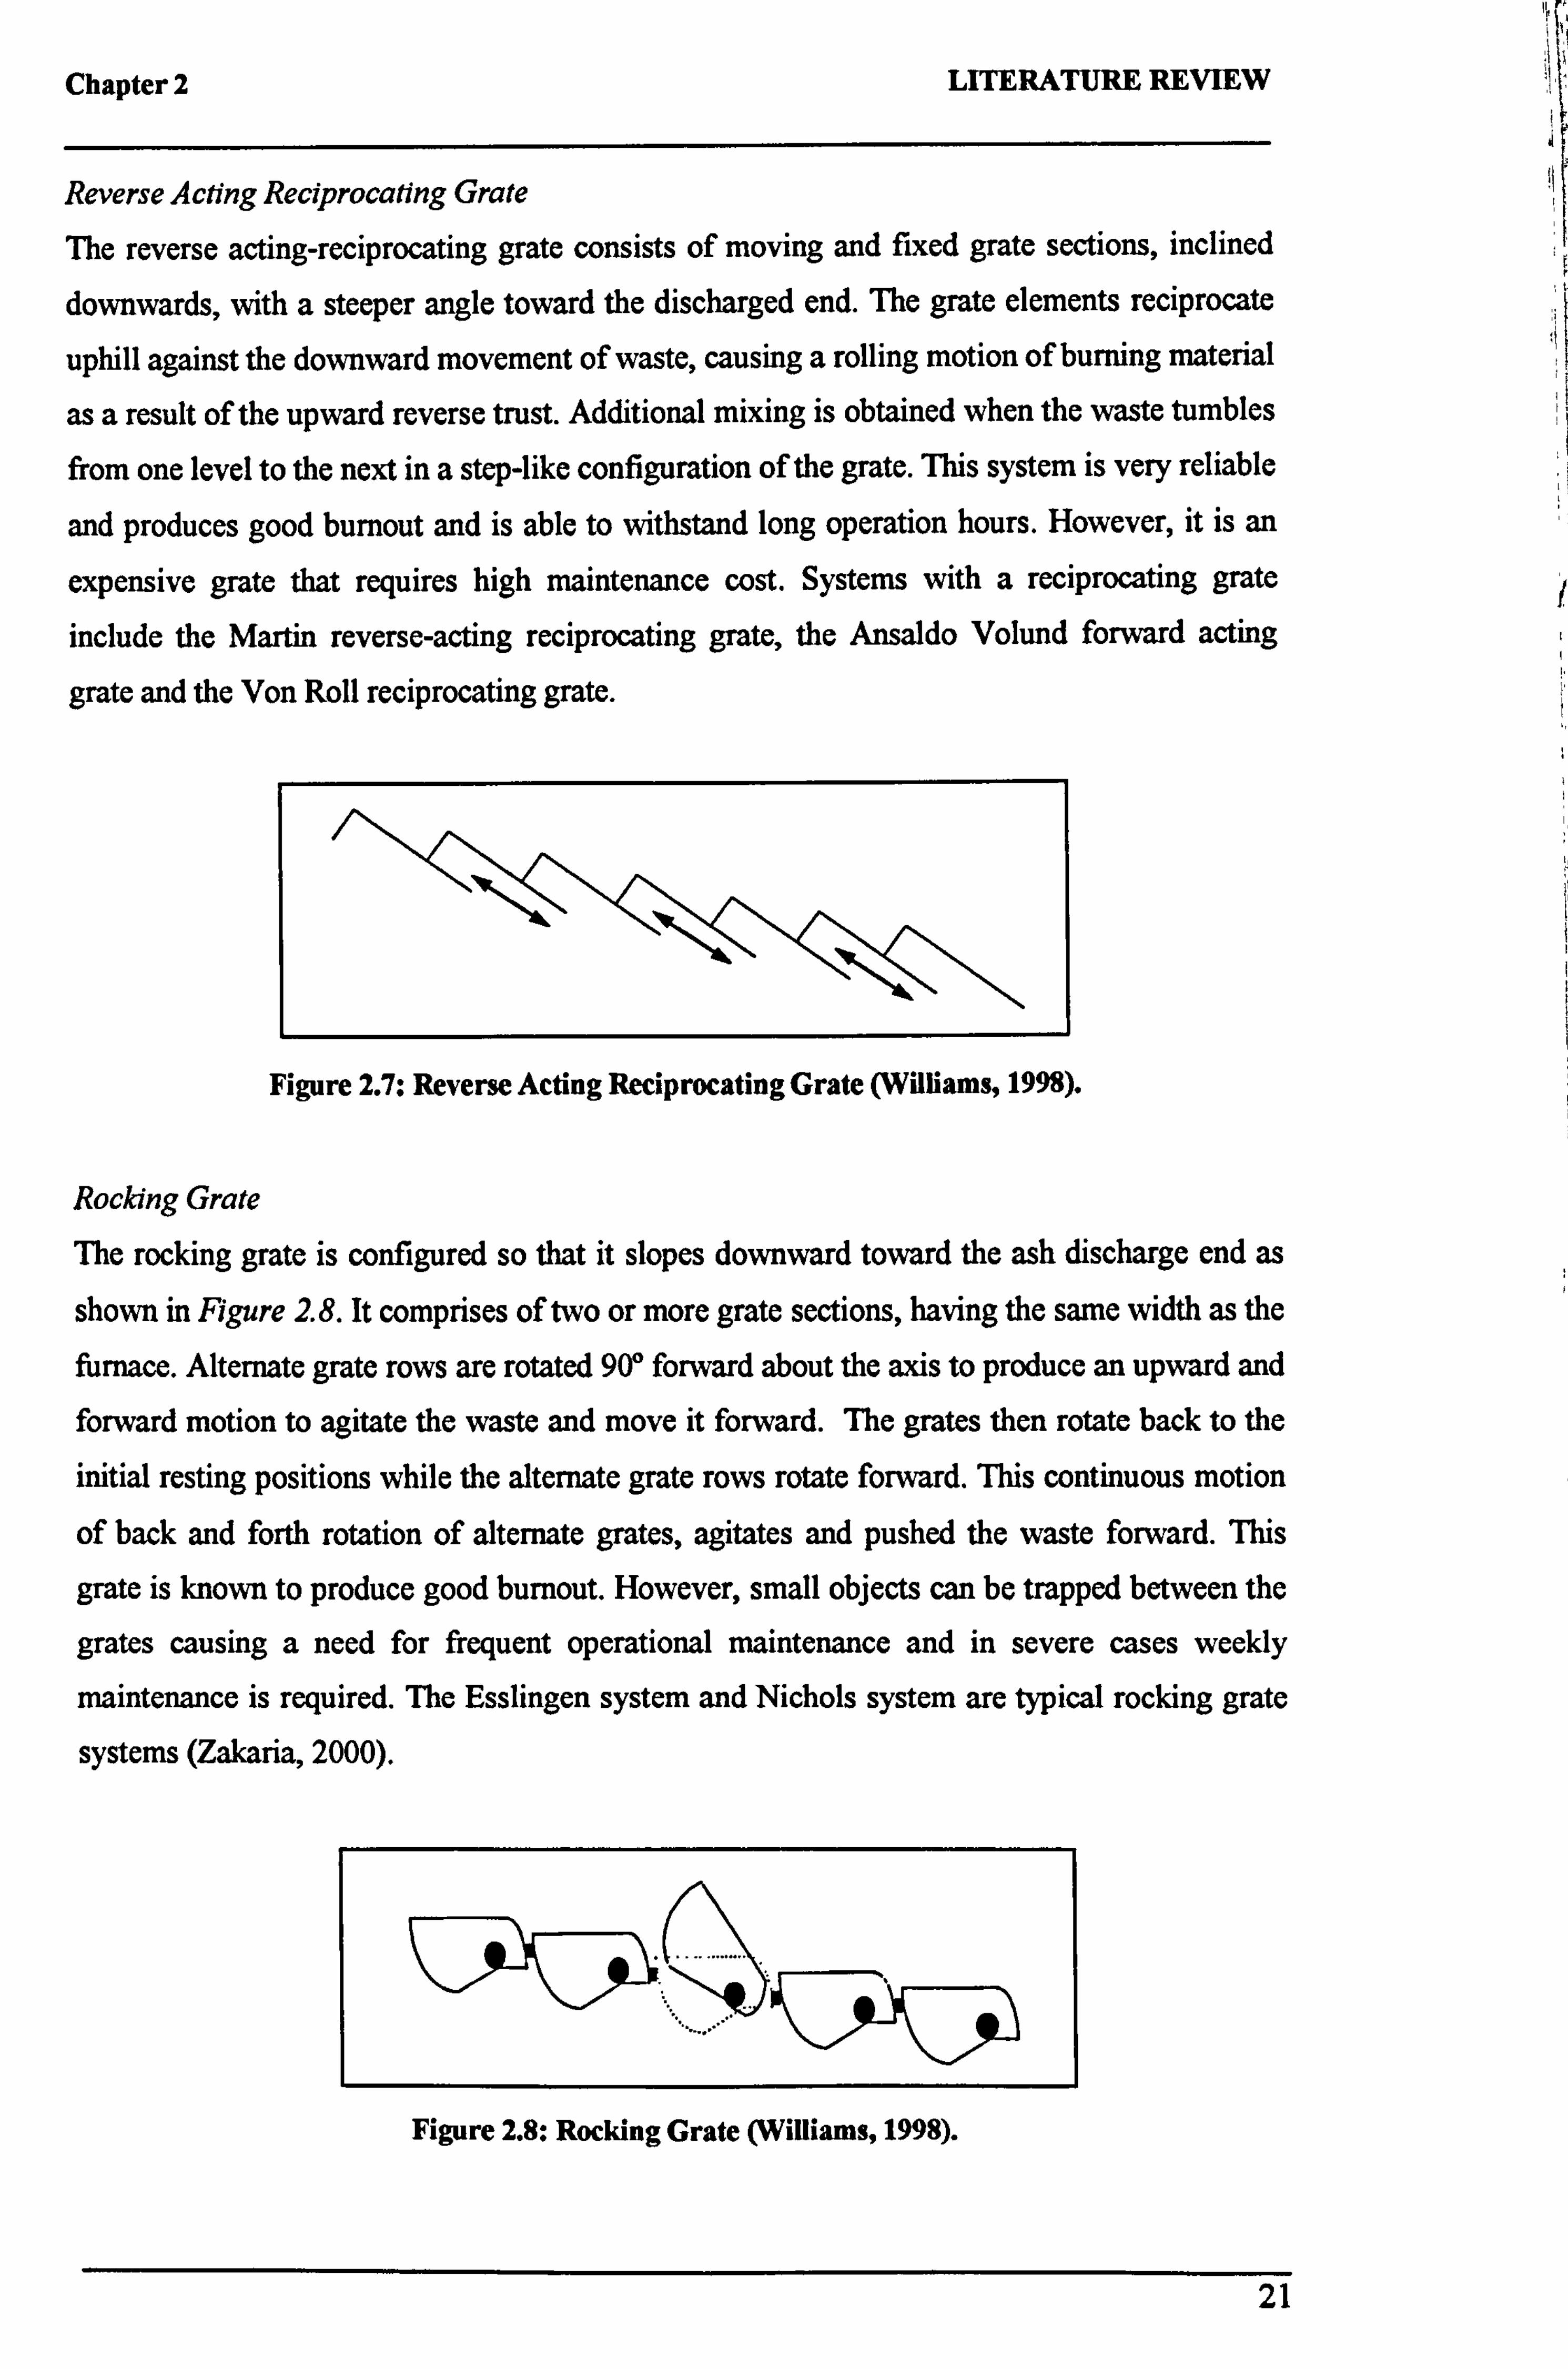
Reverse Acting Reciprocating Grate
The reverse acting-reciprocating grate consists of moving and fixed grate sections, inclined
downwards, with a steeper angle toward the discharged end. The grate elements reciprocate
uphill against the downward movement of waste, causing a rolling motion of burning material
as a result of the upward reverse trust. Additional mixing is obtained when the waste tumbles
from one level to the next in a step-like configuration of the grate. This system is very reliable
and produces good burnout and is able to withstand long operation hours. However, it is an
expensive grate that requires high maintenance cost. Systems with a reciprocating grate
include the Martin reverse-acting reciprocating grate, the Ansaldo Volund forward acting
grate and the Von Roll reciprocating grate.
ýý
Figure 2.7: Reverse Acting Reciprocating Grate (Williams, 1998).
Rocking Grate
The rocking grate is configured so that it slopes downward toward the ash discharge end as
shown in Figure 2.8. It comprises of two or more grate sections, having the same width as the furnace. Alternate grate rows are rotated 900 forward about the axis to produce an upward and
forward motion to agitate the waste and move it forward. The grates then rotate back to the
initial resting positions while the alternate grate rows rotate forward. This continuous motion
of back and forth rotation of alternate grates, agitates and pushed the waste forward. This
grate is known to produce good burnout. However, small objects can be trapped between the
grates causing a need for frequent operational maintenance and in severe cases weekly
maintenance is required. The Esslingen system and Nichols system are typical rocking grate
systems (Zakaria, 2000).
.... .......... ... Figure 2.8: Rocking Grate (Williams, 1998).
21
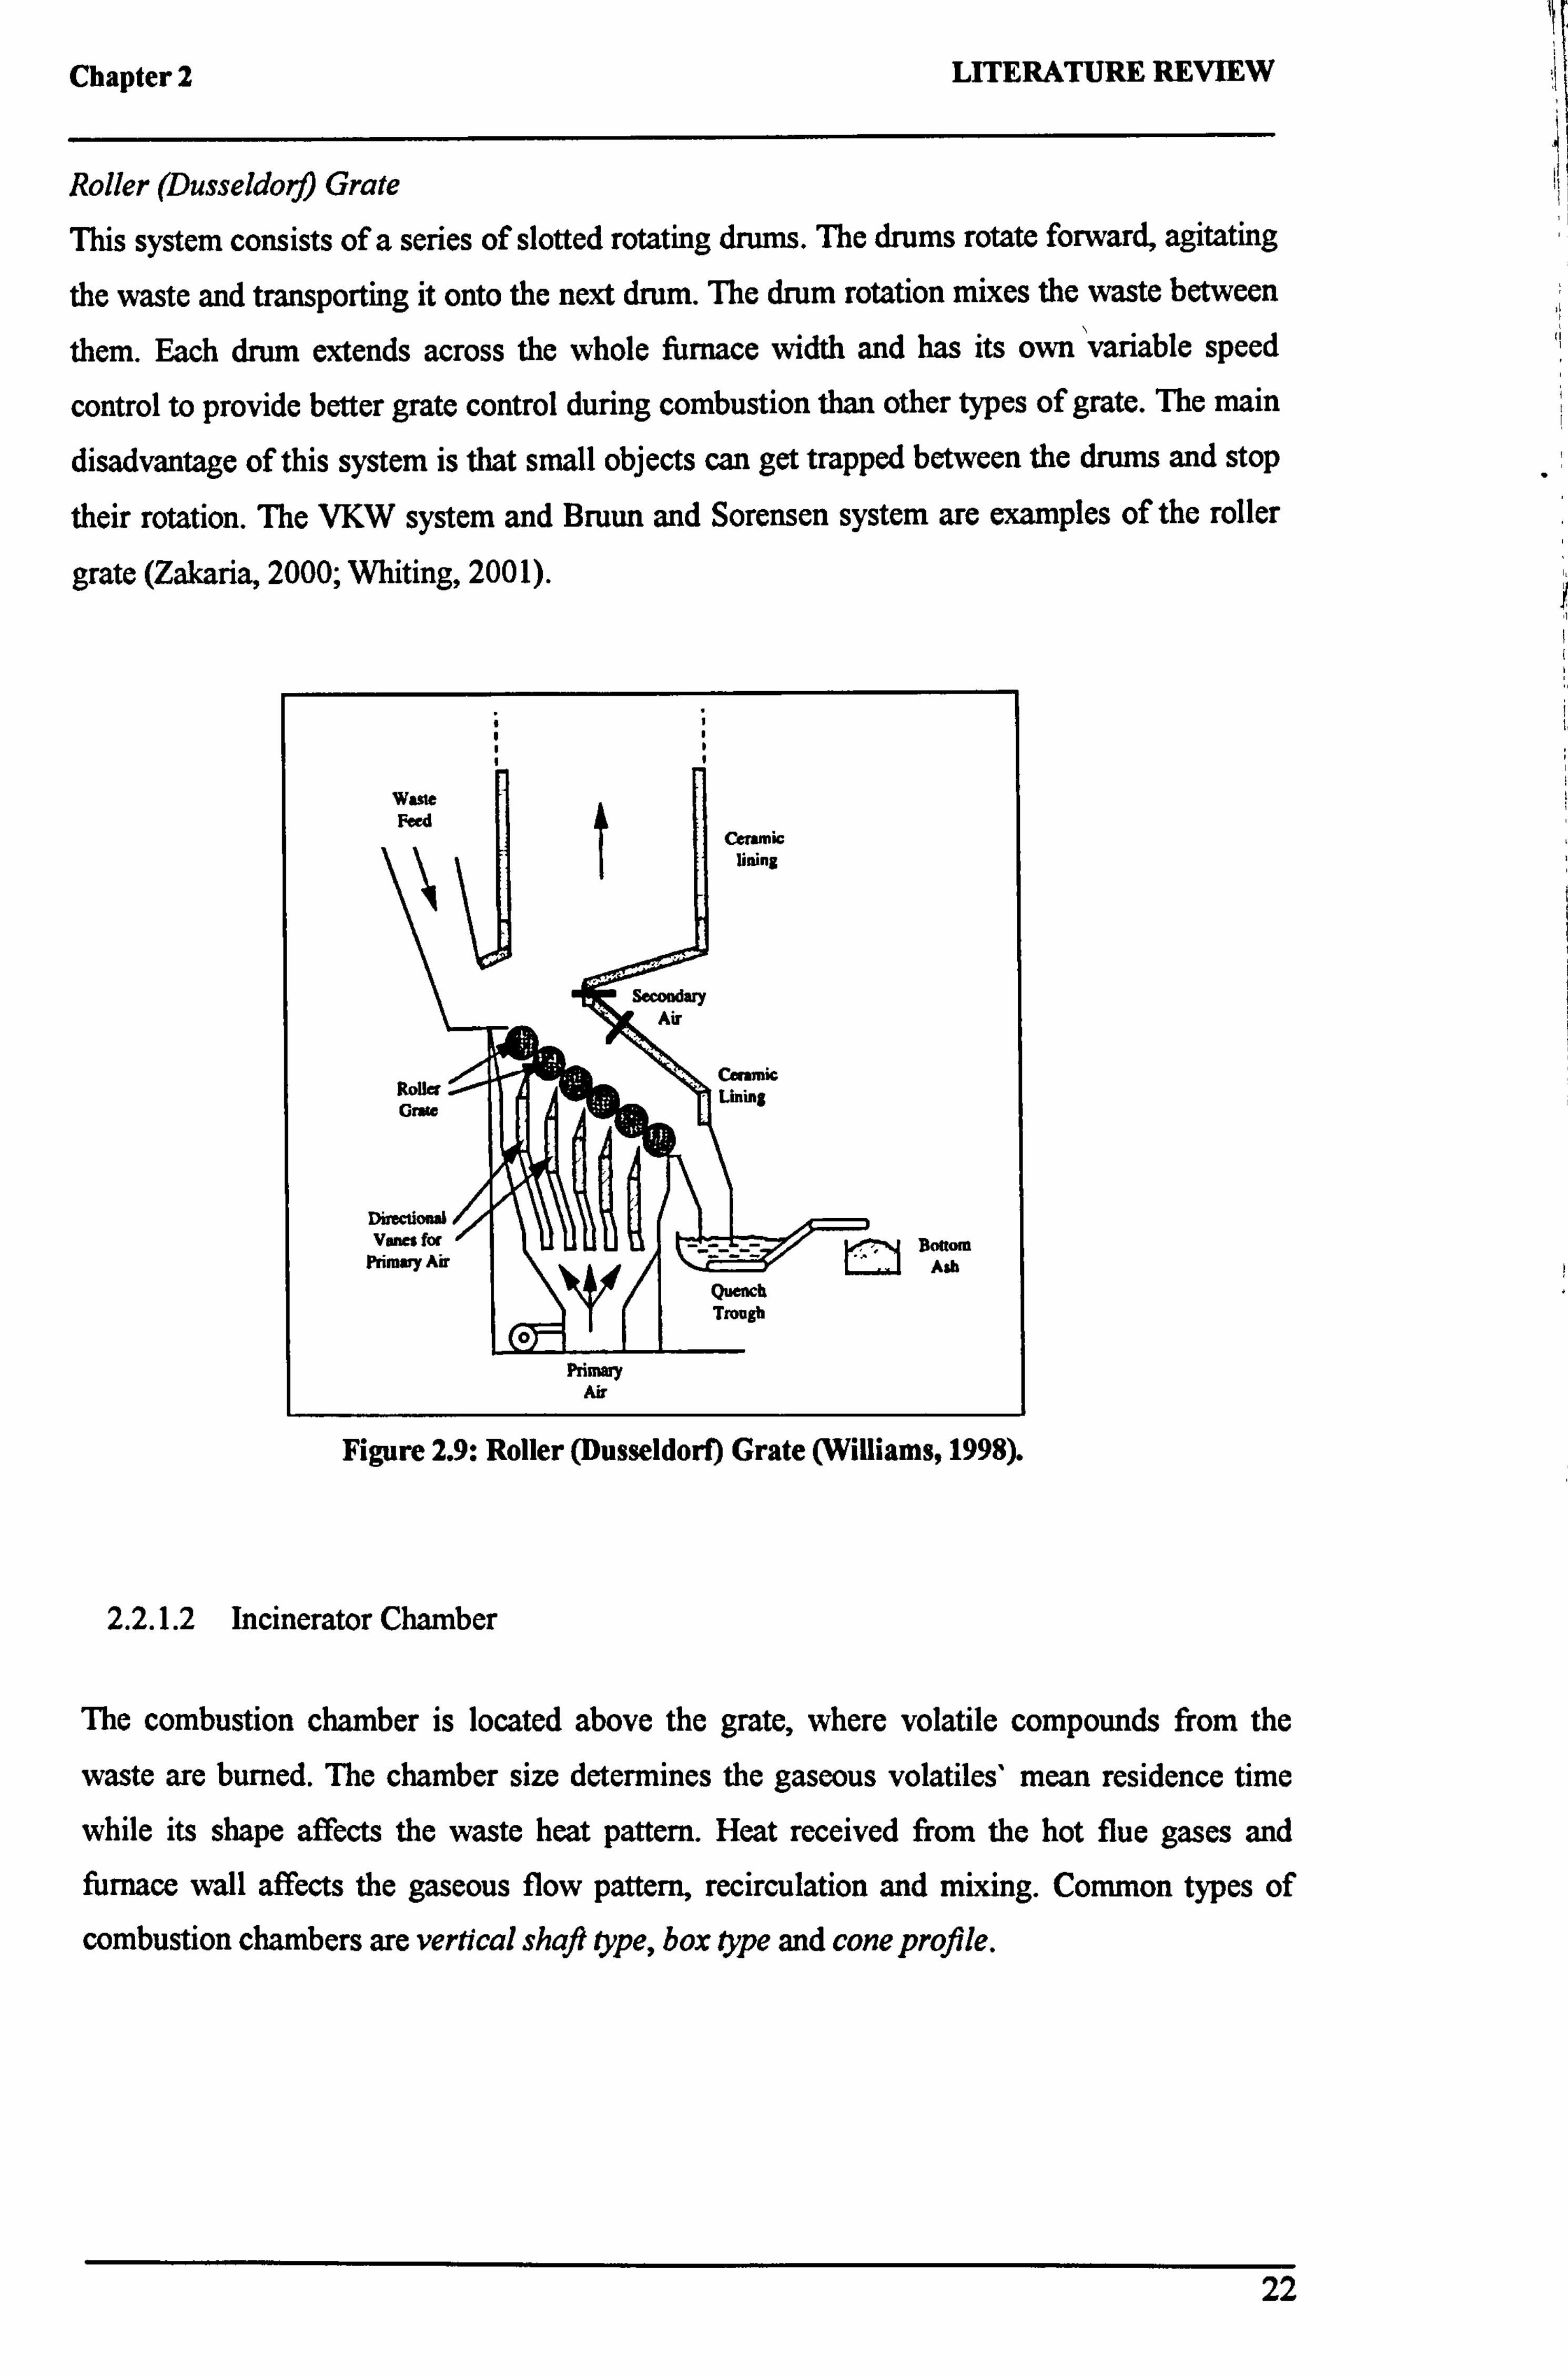
Chapter 2 LITERATURE REVIEW
Roller (Dusseldorf) Grate
This system consists of a series of slotted rotating drums. The drums rotate forward, agitating
the waste and transporting it onto the next drum. The drum rotation mixes the waste between
them. Each drum extends across the whole furnace width and has its own 'variable speed
control to provide better grate control during combustion than other types of grate. The main
disadvantage of this system is that small objects can get trapped between the drums and stop
their rotation. The VKW system and Bruun and Sorensen system are examples of the roller
grate (Zakaria, 2000; Whiting, 2001).
warne Feed
ceramic lining
Secondary Av
cond
Cenmk Roller Lining Grate
Directional Vanes for
--- Bottom Primary Air
. -_ -= Ash
Quench Trough
0
Primary Air
Figure 2.9: Roller (Dusseldorf) Grate (Williams, 1998).
2.2.1.2 Incinerator Chamber
The combustion chamber is located above the grate, where volatile compounds from the
waste are burned. The chamber size determines the gaseous volatiles' mean residence time
while its shape affects the waste heat pattern. Heat received from the hot flue gases and furnace wall affects the gaseous flow pattern, recirculation and mixing. Common types of
combustion chambers are vertical shaft type, box type and cone profile.
22
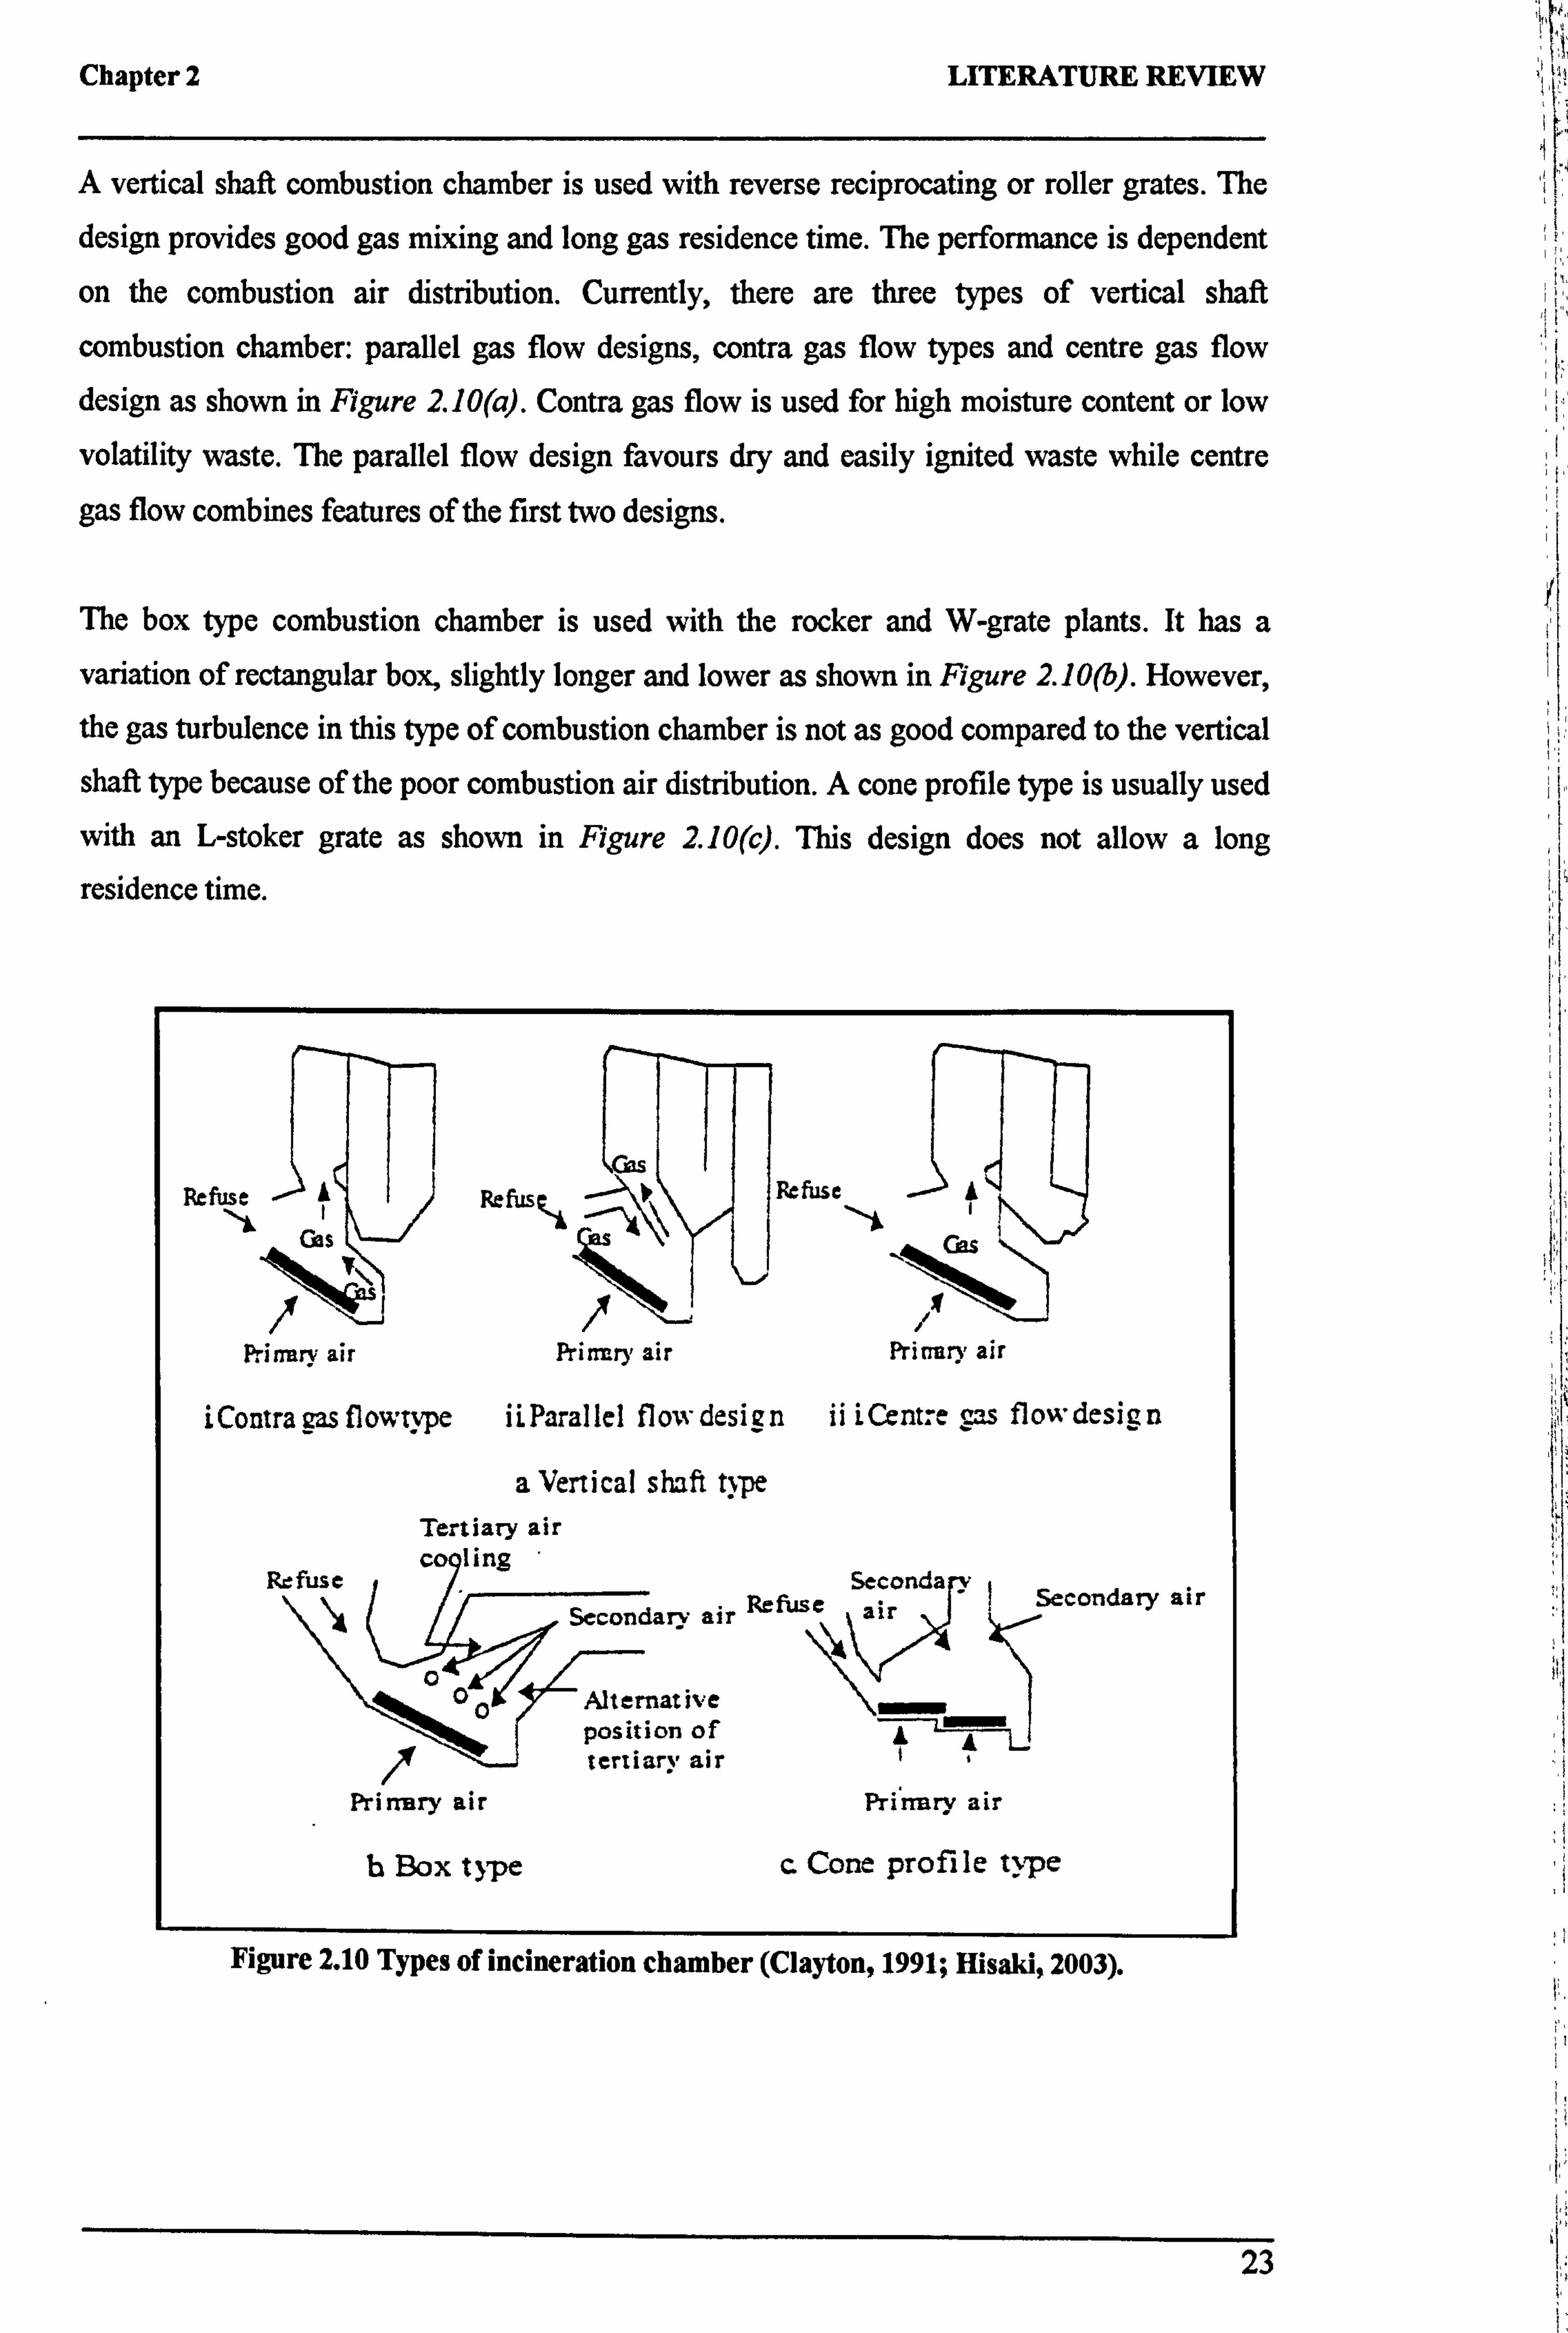
Chapter 2 LITERATURE REVIEW
A vertical shaft combustion chamber is used with reverse reciprocating or roller grates. The
design provides good gas mixing and long gas residence time. The performance is dependent
on the combustion air distribution. Currently, there are three types of vertical shaft
combustion chamber: parallel gas flow designs, contra gas flow types and centre gas flow
design as shown in Figure 2.10(a). Contra gas flow is used for high moisture content or low
volatility waste. The parallel flow design favours dry and easily ignited waste while centre
gas flow combines features of the first two designs.
The box type combustion chamber is used with the rocker and W-grate plants. It has a
variation of rectangular box, slightly longer and lower as shown in Figure 2.10(b). However,
the gas turbulence in this type of combustion chamber is not as good compared to the vertical
shaft type because of the poor combustion air distribution. A cone profile type is usually used
with an L-stoker grate as shown in Figure 2.10(c). This design does not allow a long
residence time.
ýyý ýýý ýº Refuse y1
Gas Gas
Pria ry air Priory air Prinury air
iContra gasfl ow"type iiParallel flow design ii iCent. e gas flowdesign
a Vertical shaft type Tertiary air co ling
Refuse Seconda _
air Secondary air
Secondary air
O Alternative position of tertiary air
Primary air Pri"nary air
b Box type c Cone profile type
Figure 2.10 Types of incineration chamber (Clayton, 1991; Hisaki, 2003).
23
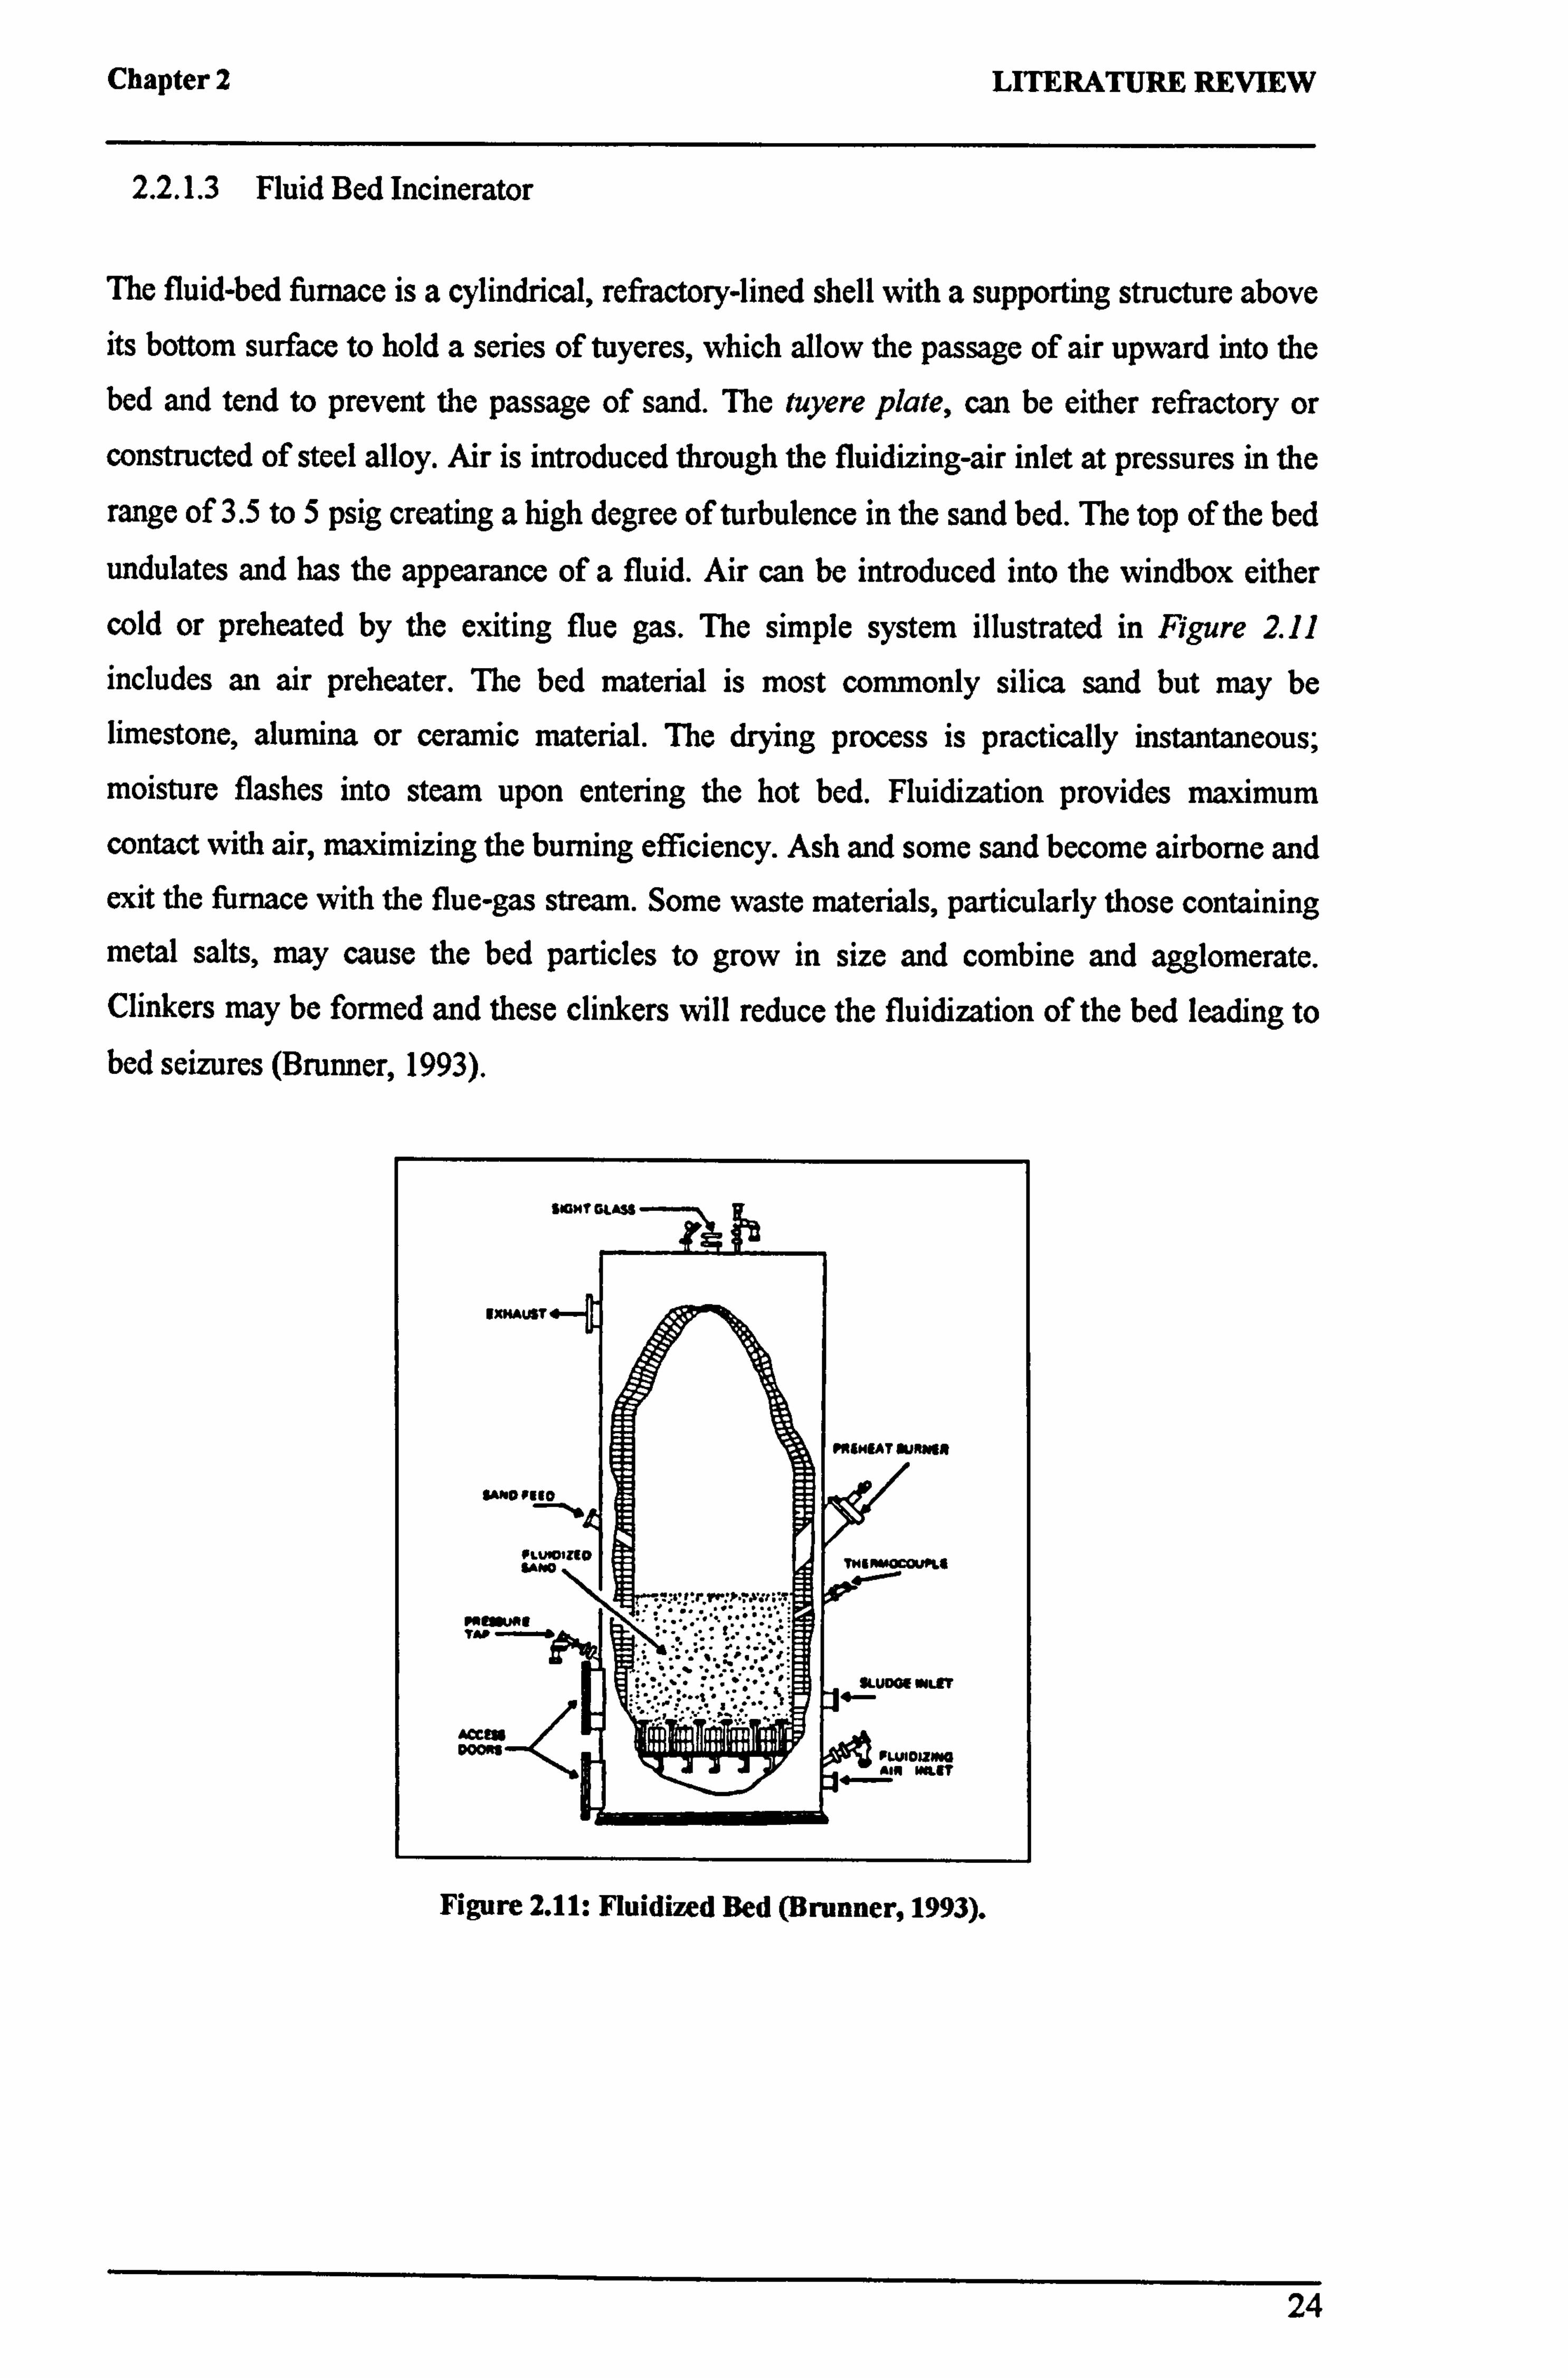
Chapter 2 LITERATURE REVIEW
2.2.1.3 Fluid Bed Incinerator
The fluid-bed furnace is a cylindrical, refractory-lined shell with a supporting structure above its bottom surface to hold a series of tuyeres, which allow the passage of air upward into the bed and tend to prevent the passage of sand. The tuyere plate, can be either refractory or constructed of steel alloy. Air is introduced through the fluidizing-air inlet at pressures in the
range of 3.5 to 5 psig creating a high degree of turbulence in the sand bed. The top of the bed
undulates and has the appearance of a fluid. Air can be introduced into the windbox either cold or preheated by the exiting flue gas. The simple system illustrated in Figure 2.11 includes an air preheater. The bed material is most commonly silica sand but may be limestone, alumina or ceramic material. The drying process is practically instantaneous;
moisture flashes into steam upon entering the hot bed. Fluidization provides maximum contact with air, maximizing the burning efficiency. Ash and some sand become airborne and exit the furnace with the flue-gas stream. Some waste materials, particularly those containing metal salts, may cause the bed particles to grow in size and combine and agglomerate. Clinkers may be formed and these clinkers will reduce the fluidization of the bed leading to bed seizures (Brunner, 1993).
SIGHT CLASS
IXHA ST
. [MUT SURNIN
1"O polo
SAW0 O no
4N Mf11MOCWrLf
MtfMMý ' ýt
SLUDGE MLR
ACC[! ýý ý"ý sunoura
mer
Figure 2.11: Fluidized Bed (Brunner, 1993).
24
Chapter 2 LITERATURE REVIEW
2.2.1.4 Rotary-Kiln Incineration Systems
The rotary-kiln incinerator can handle solid, liquid, gaseous and sludge wastes. It has
provisions for waste feed, air injection, the kiln itself, an afterburner and ash collection. The
gas discharge from the afterburner is directed to an air emissions control system. An induced
draft (ID) fan is provided within the control system to draw gases from the kiln through the
equipment line and discharge them through a stack to the atmosphere. The conventional
rotary kiln is a horizontal cylinder, lined with refractory, which turns about its longitudinal
axis. Waste is deposited in the kiln at one end and waste burns out to an ash by the time it
reaches the other end. Kiln rotation speed varies in the range of' to 4 revolutions per minute. A source of heat is required to bring the kiln up to operating temperature and to maintain its
temperature during incineration of the waste feed.
2.2.2 Gasification
The work on gasification processes can be dated back to as early as the 16th century. Some of
the first generation gasifiers developed are the Winkler Fluidised Bed Process (1926), the
Lurgi Moving Bed Pressurised Gasification Process (1931), the Koppers-Totzek Entrained
Flow Process (1940) and the Wellman Fixed Bed.
Gasification provides an option for inertisation and reduction of waste weight and volume,
offering considerable potential for highly efficient destruction of hazardous waste. It prevents
corrosion and emissions by retaining alkali and heavy metals (except mercury and cadmium),
sulphur and chlorine within the process residues preventing PCDD/F formation and reducing
thermal NOX formation due to the lower temperature and reducing condition (Phillips et al, 2001). Additional merit of gasification would be the production of large volumes of valuable hydrogen, carbon monoxide and methane compared to the production of carbon dioxide and
water from the conventional incineration processes.
2.2.2.1 Gasification System
Gasification involves the thermochemical conversion of solid carbon-based material (biomass) to combustible gaseous products by the supply of oxygen. The major gasification
outputs are the gases; C02, CO, H2, CH4, H20, liquid fraction; tars and oils and chars, which
consist of pure carbon plus inert material originally present in the feedstock. There are three
25
Chapter 2 LITERATURE REVIEW
alternative gasification processes with different main reactants resulting in product gases with different calorific values and composition:
" Direct Gasification: An oxidant gasification agent is used to partially oxidize the
feedstock. The oxidation reactions supply the energy required to sustain the process.
" Indirect Gasification: No oxidizing agent is required. Steam is used as it increases the
hydrogen content of the combustible gas.
9 Oxygen gasification: Produces 'synthesis gas'
The calorific values of the product gas are low for air gasification, about 4-7MJ/Nm3, and
medium, about 10-12MJ/Nm3 for oxygen gasification. Steam gasification produces a fuel gas
with calorific value of 15-20MJ/Nm3 (Belgiomo et al, 2003).
A wide variety of gasifier designs have been developed depending on the end-use of the
gasification products and the type of feedstock. The gasification processes can be
characterised in terms of the four main design parameters; temperature, pressure, reactant
gases and the method of contacting (Merrick, 1984).
The gasification operating temperatures are higher compared to pyrolysis, being about 800-
1100°C with air gasification and 1000-1400°C with oxygen. In general, a higher temperature increases the rate of the gasification reaction. However, operation at very high temperatures
could risk the possibility of ash forming molten slag.
Gasification operation at high pressure discourages the decomposition of carbon dioxide and
steam, reducing the formation of carbon monoxide and hydrogen. However, operation at elevated pressure is useful for a gas turbine power generation cycle that operates at high
pressure as it reduces the need for additional compression energy needed for the large volume of product gas.
The three basic reactants for the gasification processes are oxygen, steam and hydrogen. The
choice of reactants depends on the applications and properties of the required product gas as pure reactant or a mixture of reactants could be used in the gasification reactions. The use of air instead of oxygen in the system is usually accompanied by a lower volume of steam as sensible heat is required to heat the air. Steam gasification produces a nitrogen-free gas at the
expense of the requirement for an external source of heat. Gasification systems with hydrogen
as a reactant are commonly used when methane is the required product.
26
Chapter 2 LITERATURE REVIEW
A gasification system is made up of the three major fundamental elements (Belgiorno et al, 2003): gasifier, gas cleanup system and energy recovery system.
2.2.2.2 Types of Gasifier
Gasifiers fall into four groups: fixed bed gasifier, fluidised bed gasifier, entrained flow and indirect gasifier. Two types of gasification systems are available, the single-stage processes
and the two-stage processes. Single-stage processes employ a single
carbonisation/gasification bed. In the two-stage processes the carbonisation and gasification
zones are separated. Air and steam are supplied to the bottom of the lower stage in which the
gasification reactions take place. At the top of this stage part of the gas is removed to provide
a tar-free product gas. The remaining gas passes into the upper carbonisation stage to which it
supplies sensible heat. A product gas containing tar is obtained from a second gas of take at the top of this stage. This result in an extended, low-temperature carbonisation zone and minimises the soot and pitch in the product gas (Merrick, 1984).
Fixed-Bed Gasifier
This system is employed in the commercial Lurgi gasifier. Fixed bed gasifiers can be
classified as updraft, downdraft or cross-flow depending on the airflow.
Updraft Gasifier
The updraft gasifier is a counter-current flow reactor where fuel is introduced from the top by
a lockhopper/rotary valve and flows downward through the reactor to a grate where ash is
removed. The gasifying medium is supplied at the bottom of the unit via a grate and flows
upwards through the reactor. The gasification process could be divided to four different stages taking place along the height of the gasifier as shown in Figure 2.12.
27
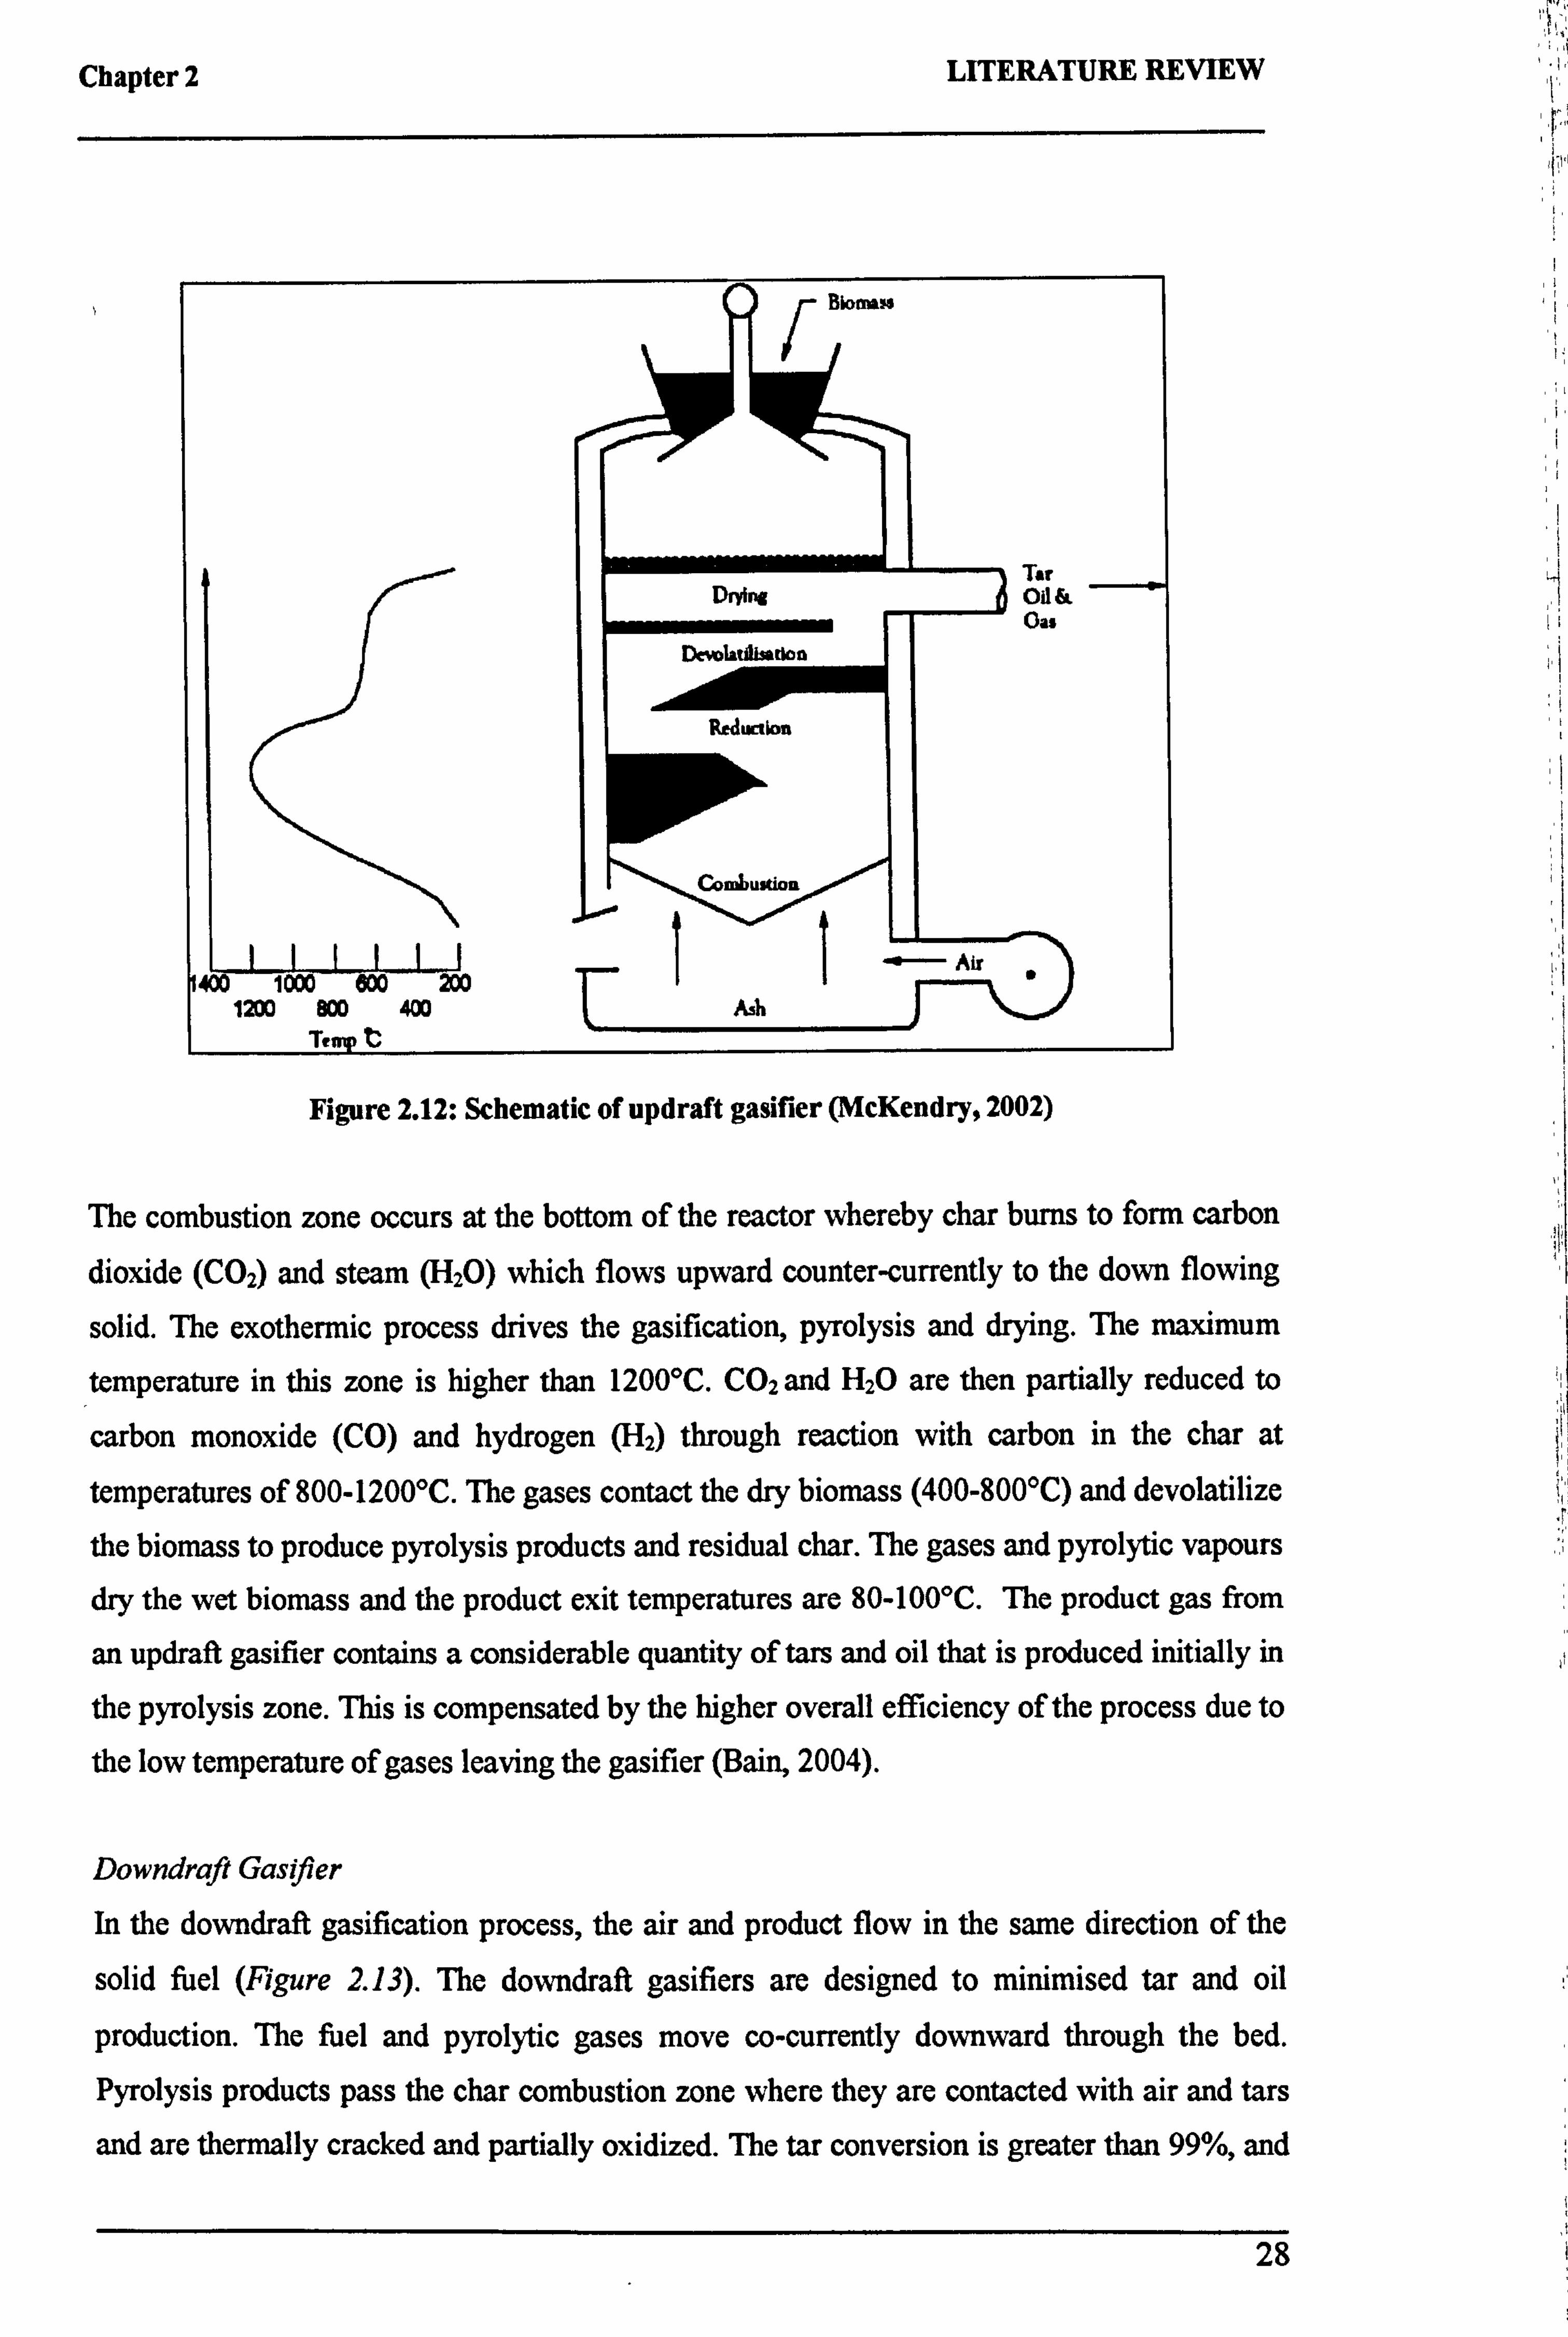
3ýý'ý
Chapter 2 LITERATURE REVIEW
r Bbma: s
Tar Drying Od &
Oas
Devolatdlsatlon
Rrducnbn
Combustion
400 1000 GDO
200 11 Air 1200 800 400 /ih
Temp t
Figure 2.12: Schematic of updraft gasifier (McKendry, 2002)
The combustion zone occurs at the bottom of the reactor whereby char burns to form carbon
dioxide (CO2) and steam (H20) which flows upward counter-currently to the down flowing
solid. The exothermic process drives the gasification, pyrolysis and drying. The maximum
temperature in this zone is higher than 1200°C. CO2 and H2O are then partially reduced to
carbon monoxide (CO) and hydrogen (H2) through reaction with carbon in the char at
temperatures of 800-1200°C. The gases contact the dry biomass (400-800°C) and devolatilize
the biomass to produce pyrolysis products and residual char. The gases and pyrolytic vapours dry the wet biomass and the product exit temperatures are 80-100°C. The product gas from
an updraft gasifier contains a considerable quantity of tars and oil that is produced initially in
the pyrolysis zone. This is compensated by the higher overall efficiency of the process due to
the low temperature of gases leaving the gasifier (Bain, 2004).
Downdraft Gasifier
In the downdraft gasification process, the air and product flow in the same direction of the
solid fuel (Figure 2.13). The downdraft gasifiers are designed to minimised tar and oil
production. The fuel and pyrolytic gases move co-currently downward through the bed.
Pyrolysis products pass the char combustion zone where they are contacted with air and tars
and are thermally cracked and partially oxidized. The tar conversion is greater than 99%, and
28
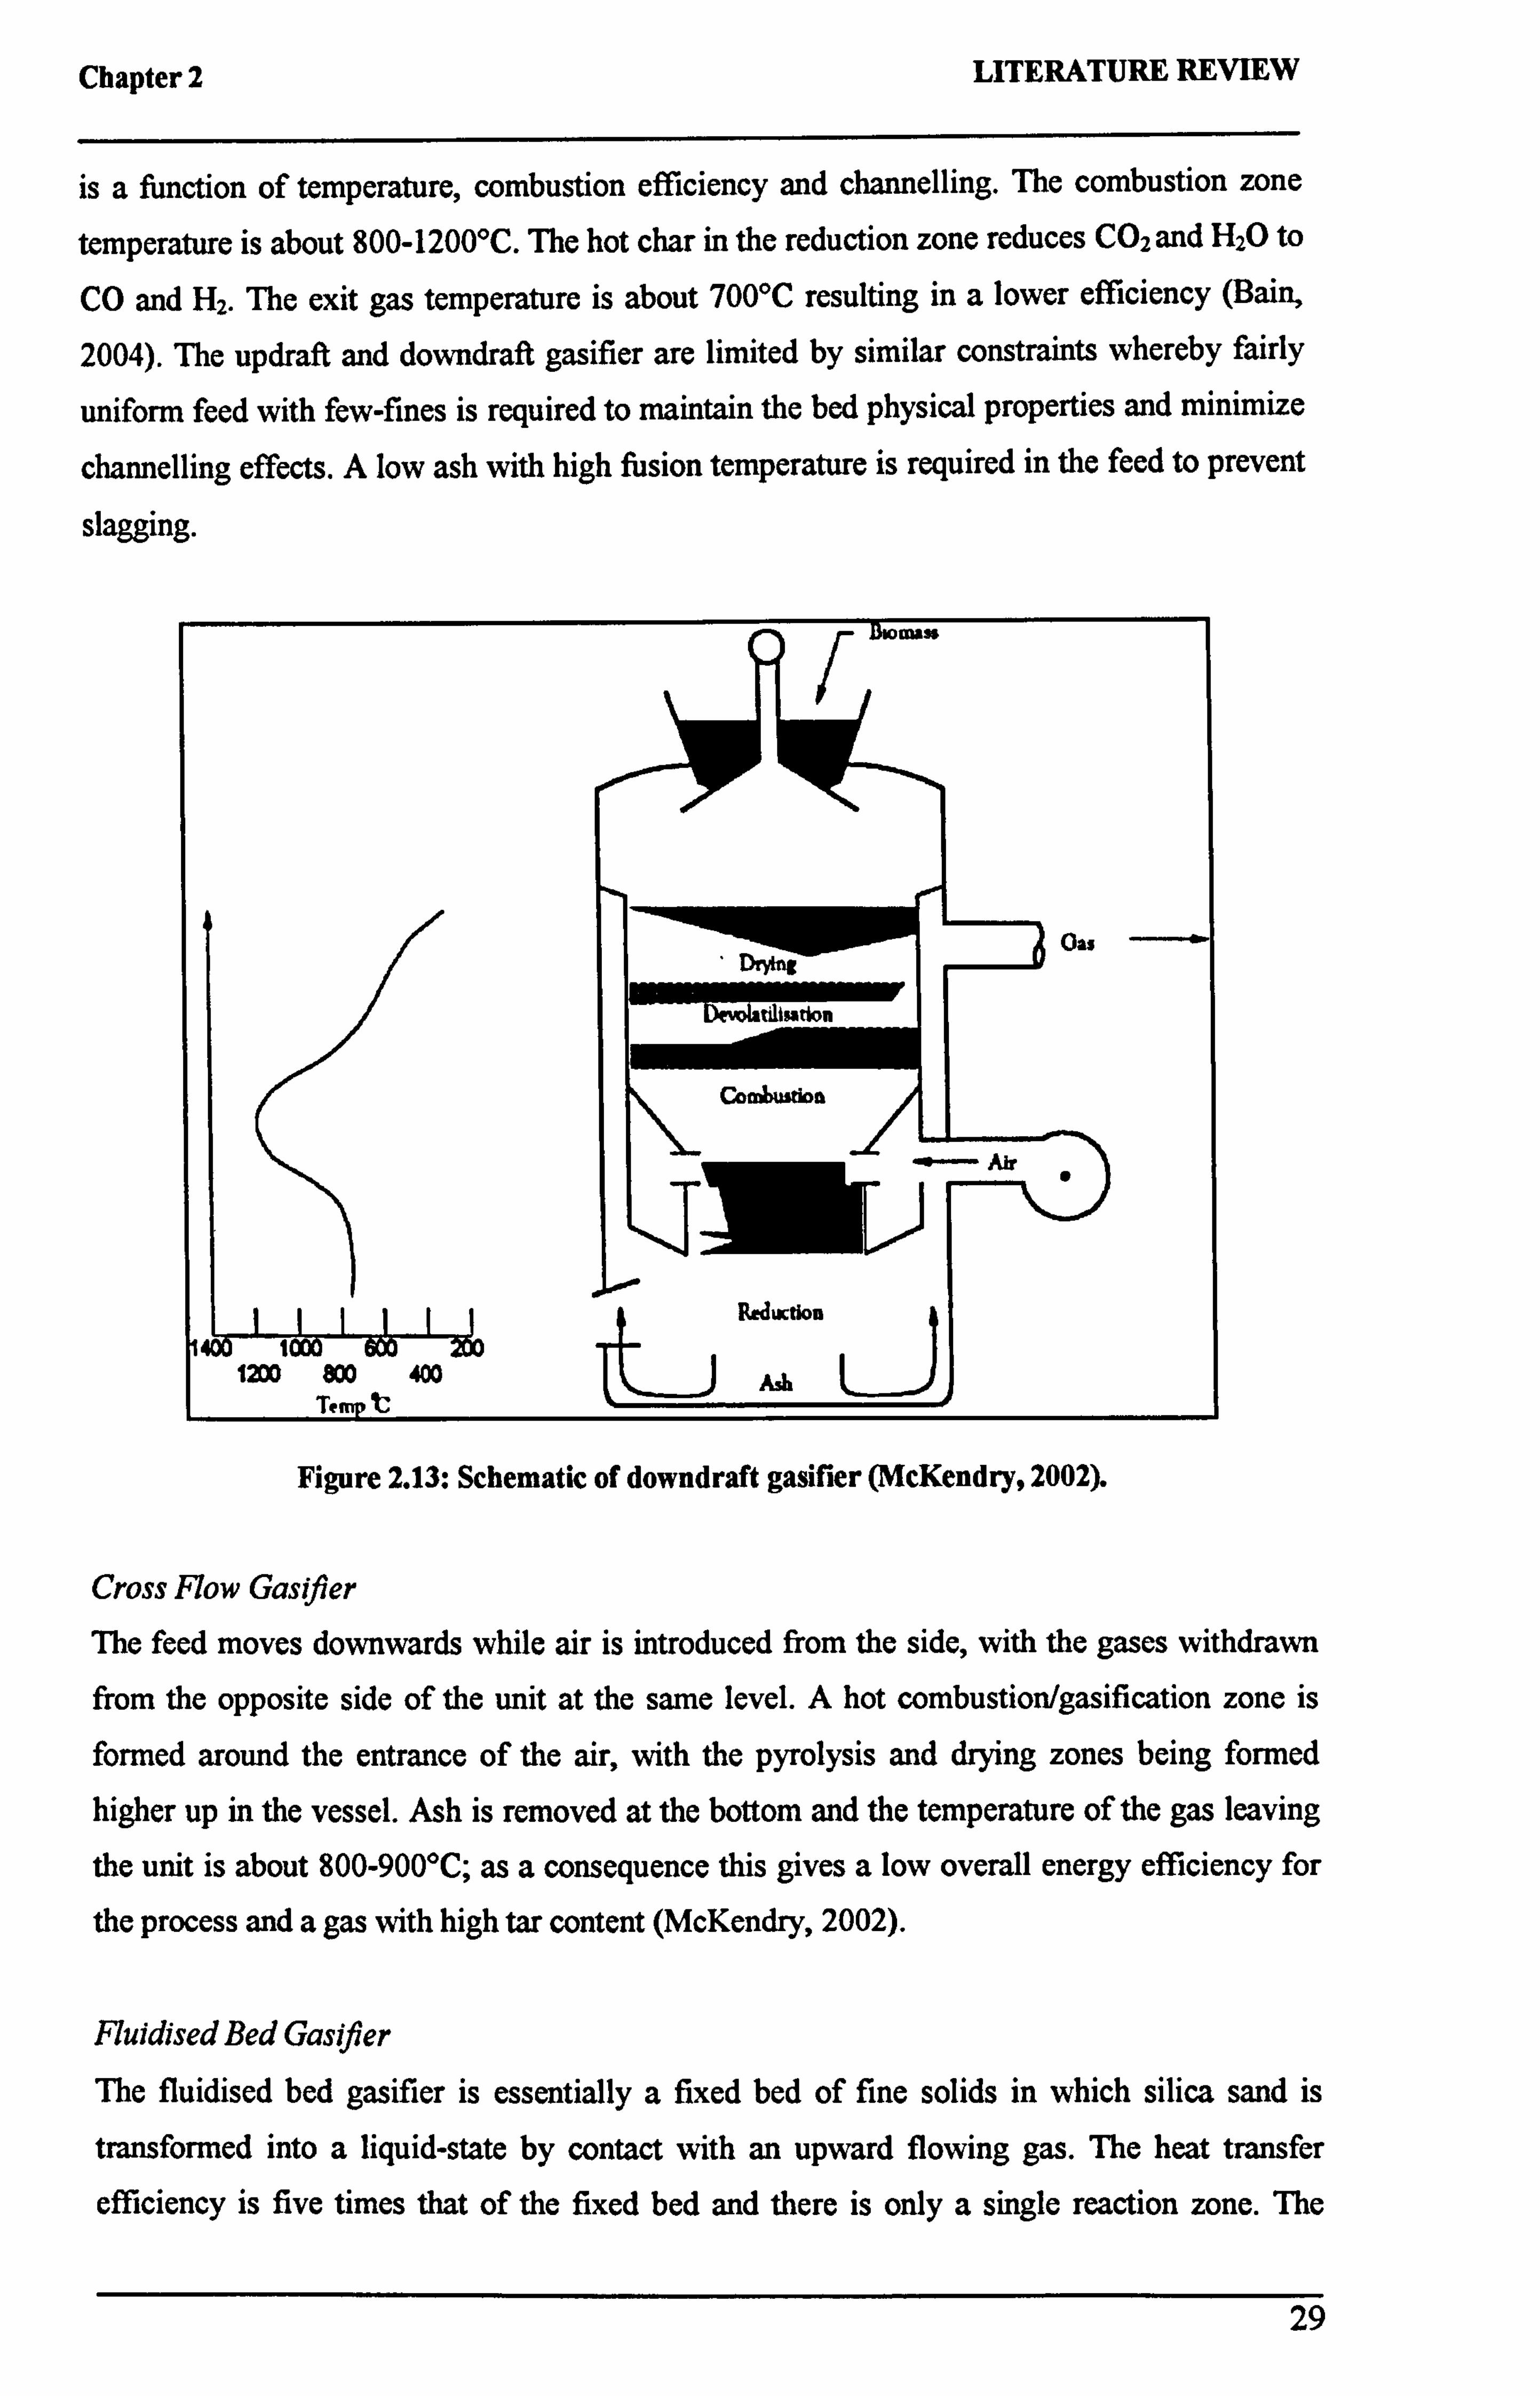
Chapter 2 LITERATURE REVIEW
is a function of temperature, combustion efficiency and channelling. The combustion zone
temperature is about 800-1200°C. The hot char in the reduction zone reduces CO2 and H2O to
CO and H2. The exit gas temperature is about 700°C resulting in a lower efficiency (Bain,
2004). The updraft and downdraft gasifier are limited by similar constraints whereby fairly
uniform feed with few-fines is required to maintain the bed physical properties and minimize
channelling effects. A low ash with high fusion temperature is required in the feed to prevent
slagging.
Ikowass
Gas
tilisadon
Combuldon
'+- Air "
Reduction
1200 800 400 j Ash
L-J
Temp t
Figure 2.13: Schematic of downdraft gasifier (McKendry, 2002).
Cross Flow Gasifier
The feed moves downwards while air is introduced from the side, with the gases withdrawn from the opposite side of the unit at the same level. A hot combustion/gasification zone is
formed around the entrance of the air, with the pyrolysis and drying zones being formed
higher up in the vessel. Ash is removed at the bottom and the temperature of the gas leaving
the unit is about 800-900°C; as a consequence this gives a low overall energy efficiency for
the process and a gas with high tar content (McKendry, 2002).
Fluidised Bed Gasifier
The fluidised bed gasifier is essentially a fixed bed of fine solids in which silica sand is
transformed into a liquid-state by contact with an upward flowing gas. The heat transfer
efficiency is five times that of the fixed bed and there is only a single reaction zone. The
29
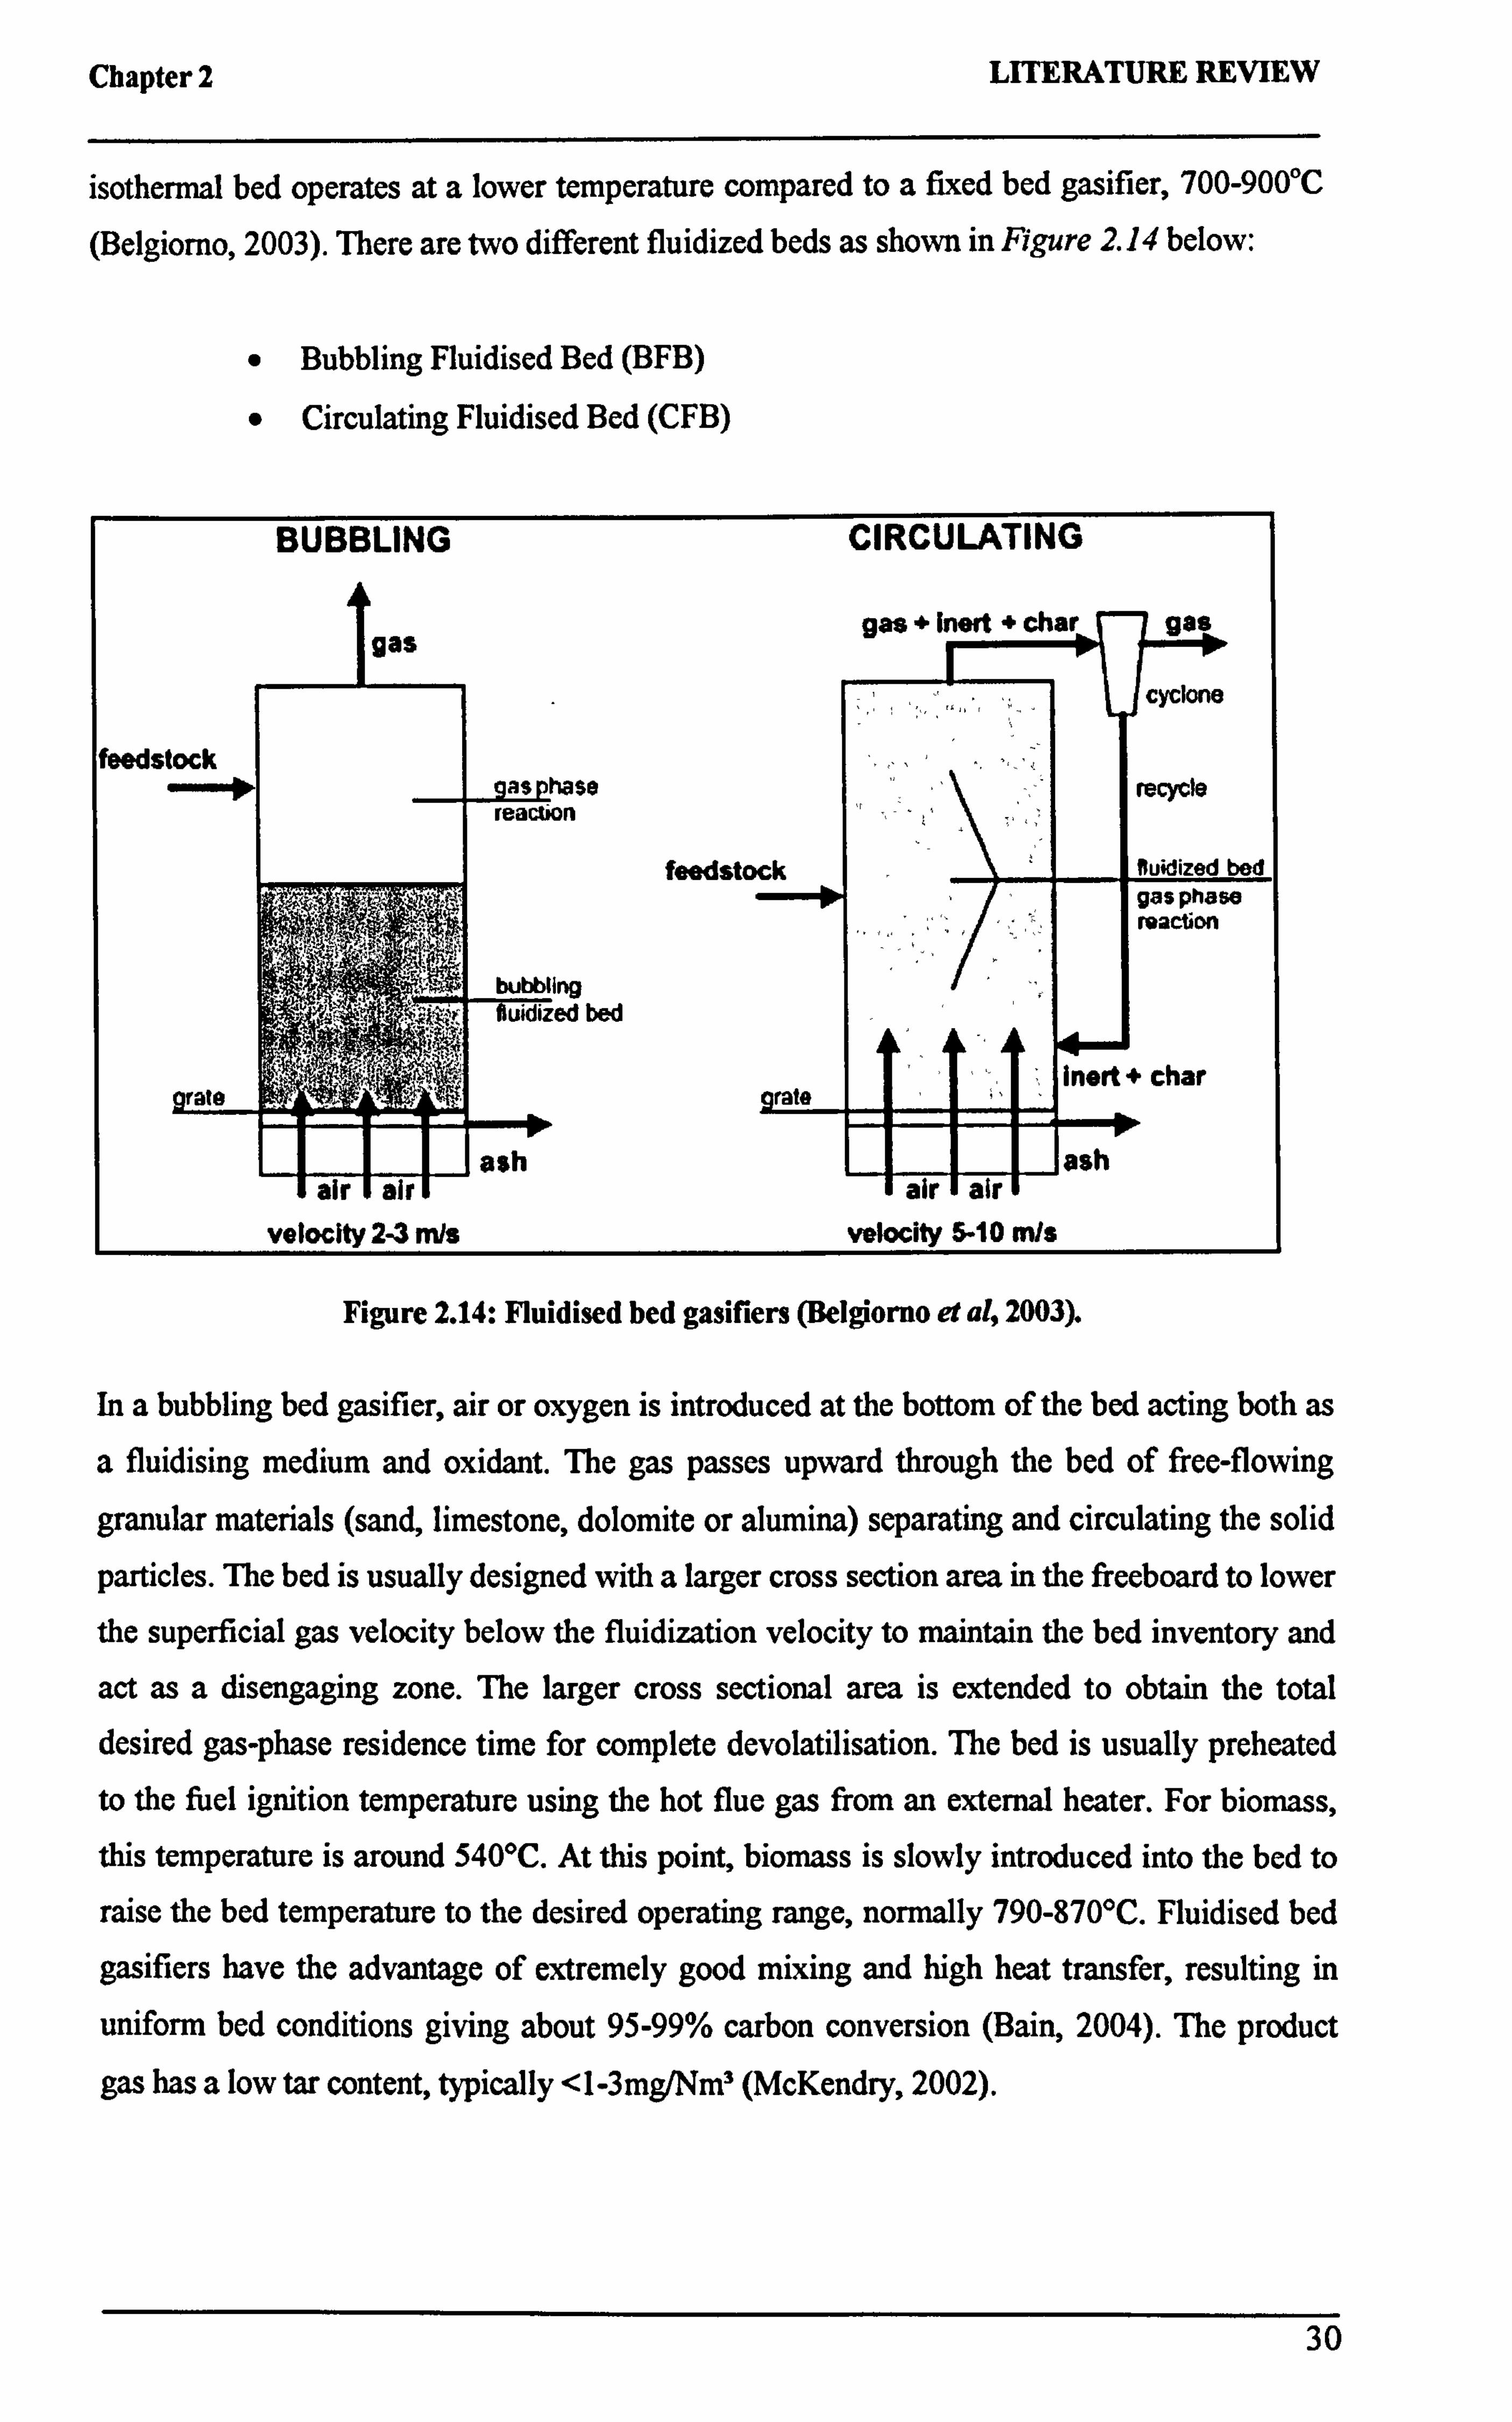
Chapter 2 LITERATURE REVIEW
isothermal bed operates at a lower temperature compared to a fixed bed gasifier, 700-900°C
(Belgiorno, 2003). There are two different fluidized beds as shown in Figure 2.14 below:
" Bubbling Fluidised Bed (BFB)
9 Circulating Fluidised Bed (CFB)
BUBBLING CIRCULATING
gas + Inert 4 char char gas gas
cyclone
feedstock as hale recycle
reaction
feedstock tluýdized bed gas phase maction f ý}
bubbling 1" , 'h;, fluidized bed
inert + char rate grate
ash ash air air air air
velocity 2-3 mis velocity 5-10 MIS
Figure 2.14: Fluidised bed gasifiers (Belgiorno et al, 2003).
In a bubbling bed gasifier, air or oxygen is introduced at the bottom of the bed acting both as
a fluidising medium and oxidant. The gas passes upward through the bed of free-flowing
granular materials (sand, limestone, dolomite or alumina) separating and circulating the solid
particles. The bed is usually designed with a larger cross section area in the freeboard to lower
the superficial gas velocity below the fluidization velocity to maintain the bed inventory and
act as a disengaging zone. The larger cross sectional area is extended to obtain the total desired gas-phase residence time for complete devolatilisation. The bed is usually preheated to the fuel ignition temperature using the hot flue gas from an external heater. For biomass,
this temperature is around 540°C. At this point, biomass is slowly introduced into the bed to
raise the bed temperature to the desired operating range, normally 790-870°C. Fluidised bed
gasifiers have the advantage of extremely good mixing and high heat transfer, resulting in
uniform bed conditions giving about 95-99% carbon conversion (Bain, 2004). The product
gas has a low tar content, typically <1-3mg/Nm3 (McKendry, 2002).
30
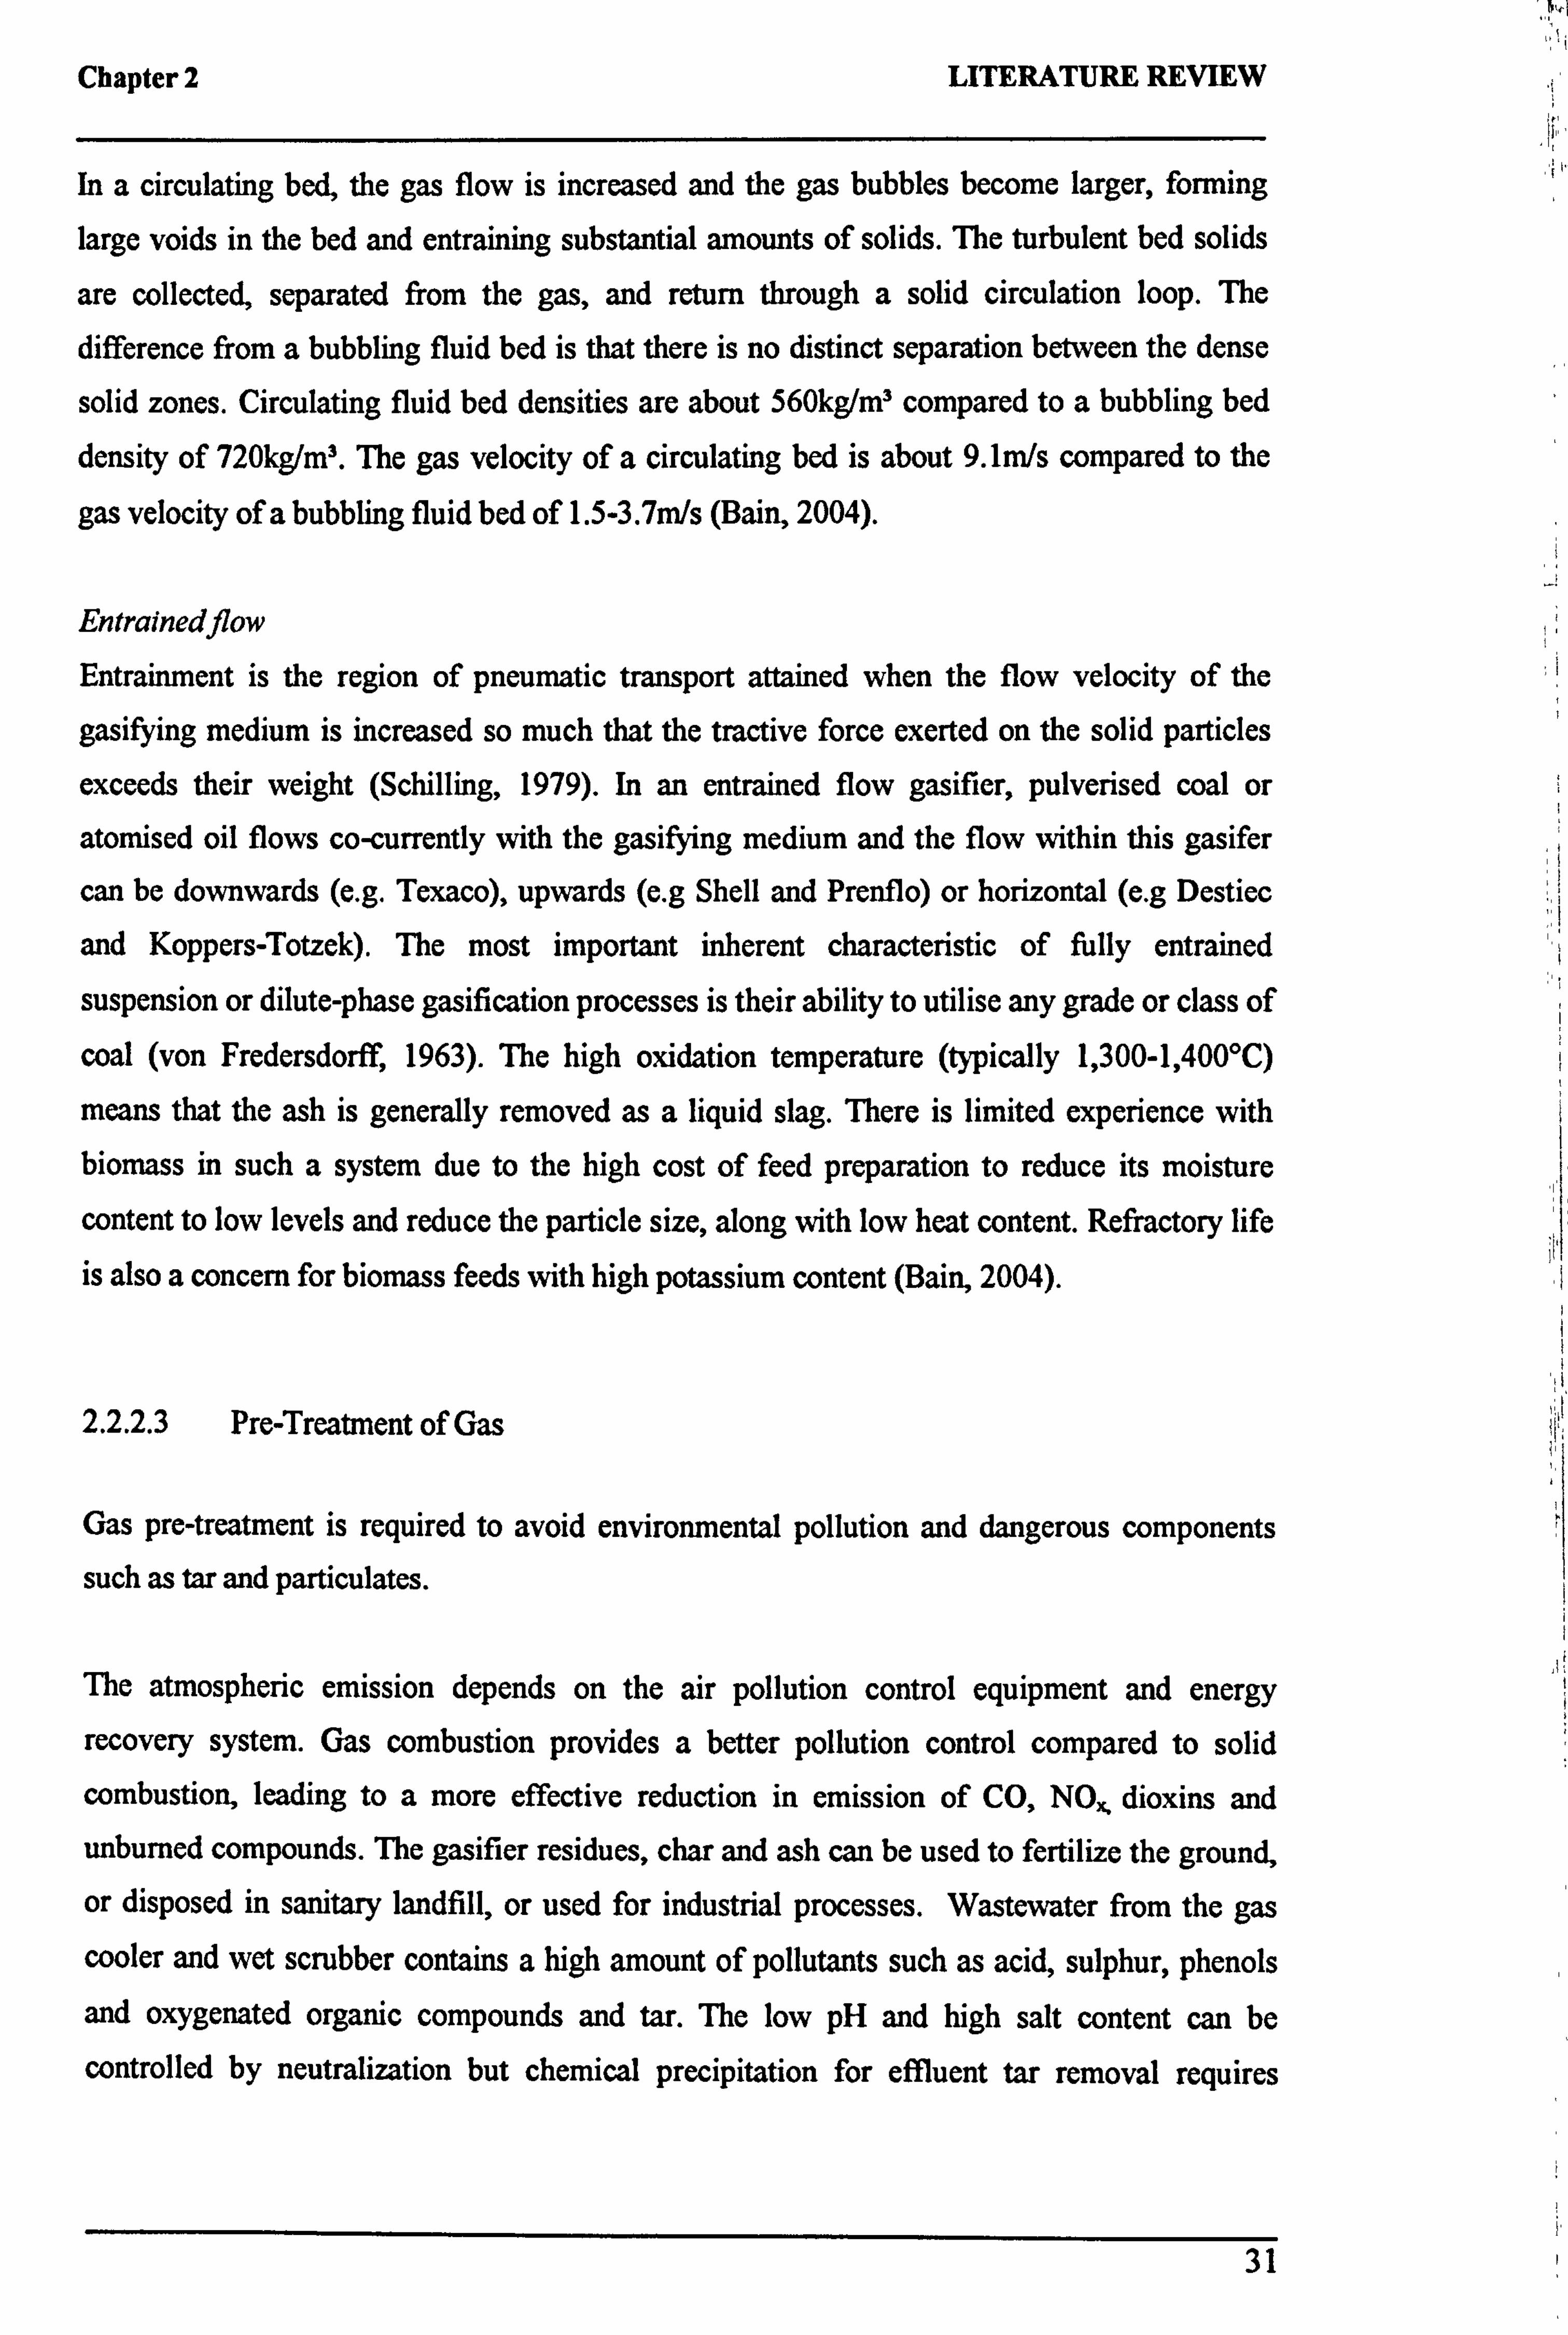
Chapter 2 LITERATURE REVIEW
In a circulating bed, the gas flow is increased and the gas bubbles become larger, forming
large voids in the bed and entraining substantial amounts of solids. The turbulent bed solids
are collected, separated from the gas, and return through a solid circulation loop. The
difference from a bubbling fluid bed is that there is no distinct separation between the dense
solid zones. Circulating fluid bed densities are about 560kg/m' compared to a bubbling bed
density of 720kg/m3. The gas velocity of a circulating bed is about 9. lm/s compared to the
gas velocity of a bubbling fluid bed of 1.5-3.7m/s (Bain, 2004).
Entrained flow
Entrainment is the region of pneumatic transport attained when the flow velocity of the
gasifying medium is increased so much that the tractive force exerted on the solid particles
exceeds their weight (Schilling, 1979). In an entrained flow gasifier, pulverised coal or
atomised oil flows co-currently with the gasifying medium and the flow within this gasifer
can be downwards (e. g. Texaco), upwards (e. g Shell and Prenflo) or horizontal (e. g Destiec
and Koppers-Totzek). The most important inherent characteristic of fully entrained
suspension or dilute-phase gasification processes is their ability to utilise any grade or class of
coal (von Fredersdorff, 1963). The high oxidation temperature (typically 1,300-1,400°C)
means that the ash is generally removed as a liquid slag. There is limited experience with biomass in such a system due to the high cost of feed preparation to reduce its moisture
content to low levels and reduce the particle size, along with low heat content. Refractory life
is also a concern for biomass feeds with high potassium content (Bain, 2004).
2.2.2.3 Pre-Treatment of Gas
Gas pre-treatment is required to avoid environmental pollution and dangerous components
such as tar and particulates.
The atmospheric emission depends on the air pollution control equipment and energy
recovery system. Gas combustion provides a better pollution control compared to solid combustion, leading to a more effective reduction in emission of CO, NO, dioxins and unburned compounds. The gasifier residues, char and ash can be used to fertilize the ground, or disposed in sanitary landfill, or used for industrial processes. Wastewater from the gas cooler and wet scrubber contains a high amount of pollutants such as acid, sulphur, phenols and oxygenated organic compounds and tar. The low pH and high salt content can be
controlled by neutralization but chemical precipitation for effluent tar removal requires
31
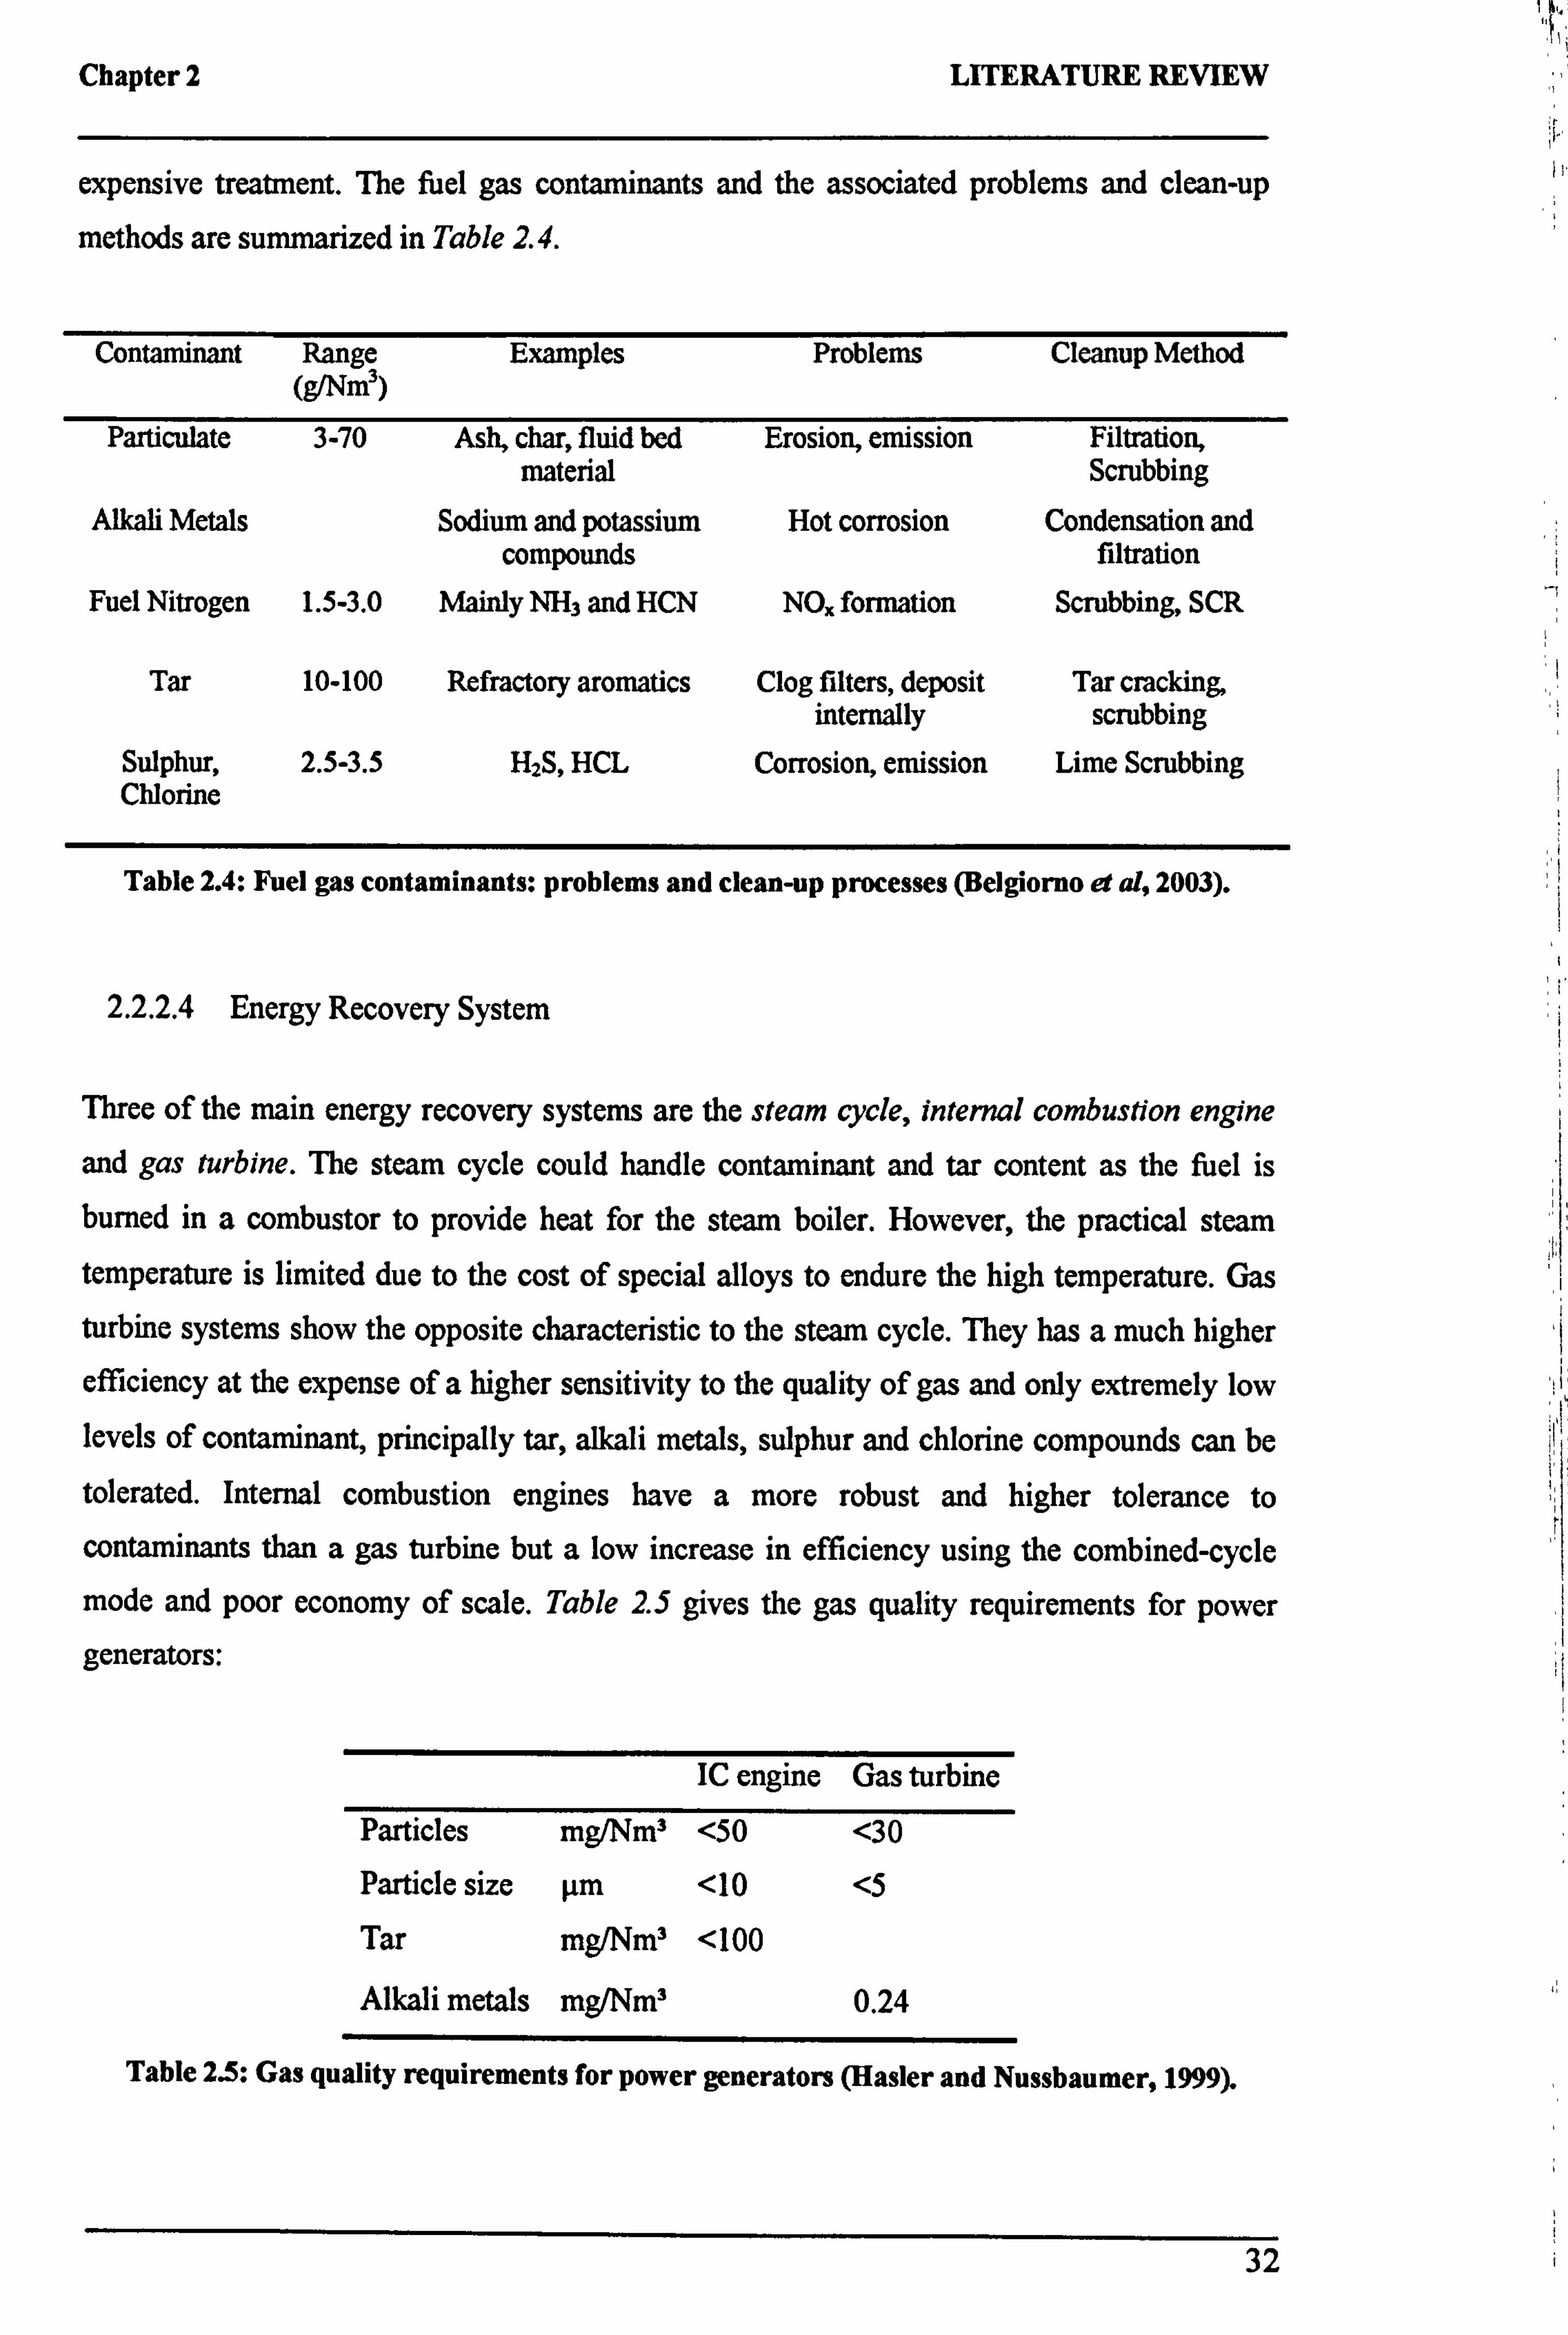
Chapter 2 LITERATURE REVIEW
expensive treatment. The fuel gas contaminants and the associated problems and clean-up
methods are summarized in Table 2.4.
Contaminant Range Examples Problems Cleanup Method (ßm)
Particulate 3-70 Ash, char, fluid bed Erosion, emission Filtration, material Scrubbing
Alkali Metals
Fuel Nitrogen 1.5-3.0
Sodium and potassium compounds
Mainly NH3 and HCN
Hot corrosion Condensation and filtration
Tar 10-100 Refractory aromatics
Sulphur, 2.5-3.5 H2S, HCL Chlorine
NO. formation
Clog filters, deposit internally
Corrosion, emission
Scrubbing, SCR
Tar cracking, scrubbing
Lime Scrubbing
Table 2.4: Fuel gas contaminants: problems and clean-up processes (Belgiorno et al, 2003).
2.2.2.4 Energy Recovery System
Three of the main energy recovery systems are the steam cycle, internal combustion engine
and gas turbine. The steam cycle could handle contaminant and tar content as the fuel is
burned in a combustor to provide heat for the steam boiler. However, the practical steam temperature is limited due to the cost of special alloys to endure the high temperature. Gas
turbine systems show the opposite characteristic to the steam cycle. They has a much higher
efficiency at the expense of a higher sensitivity to the quality of gas and only extremely low levels of contaminant, principally tar, alkali metals, sulphur and chlorine compounds can be
tolerated. Internal combustion engines have a more robust and higher tolerance to
contaminants than a gas turbine but a low increase in efficiency using the combined-cycle
mode and poor economy of scale. Table 2.5 gives the gas quality requirements for power generators:
IC engine Gas turbine
Particles mg/Nm3 <50 <30 Particle size µm <10 <5 Tar mg/Nm3 <100
Alkali metals mg/Nm3 0.24
Table 2.5: Gas quality requirements for power generators (Hasler and Nussbaumer, 1999).
32
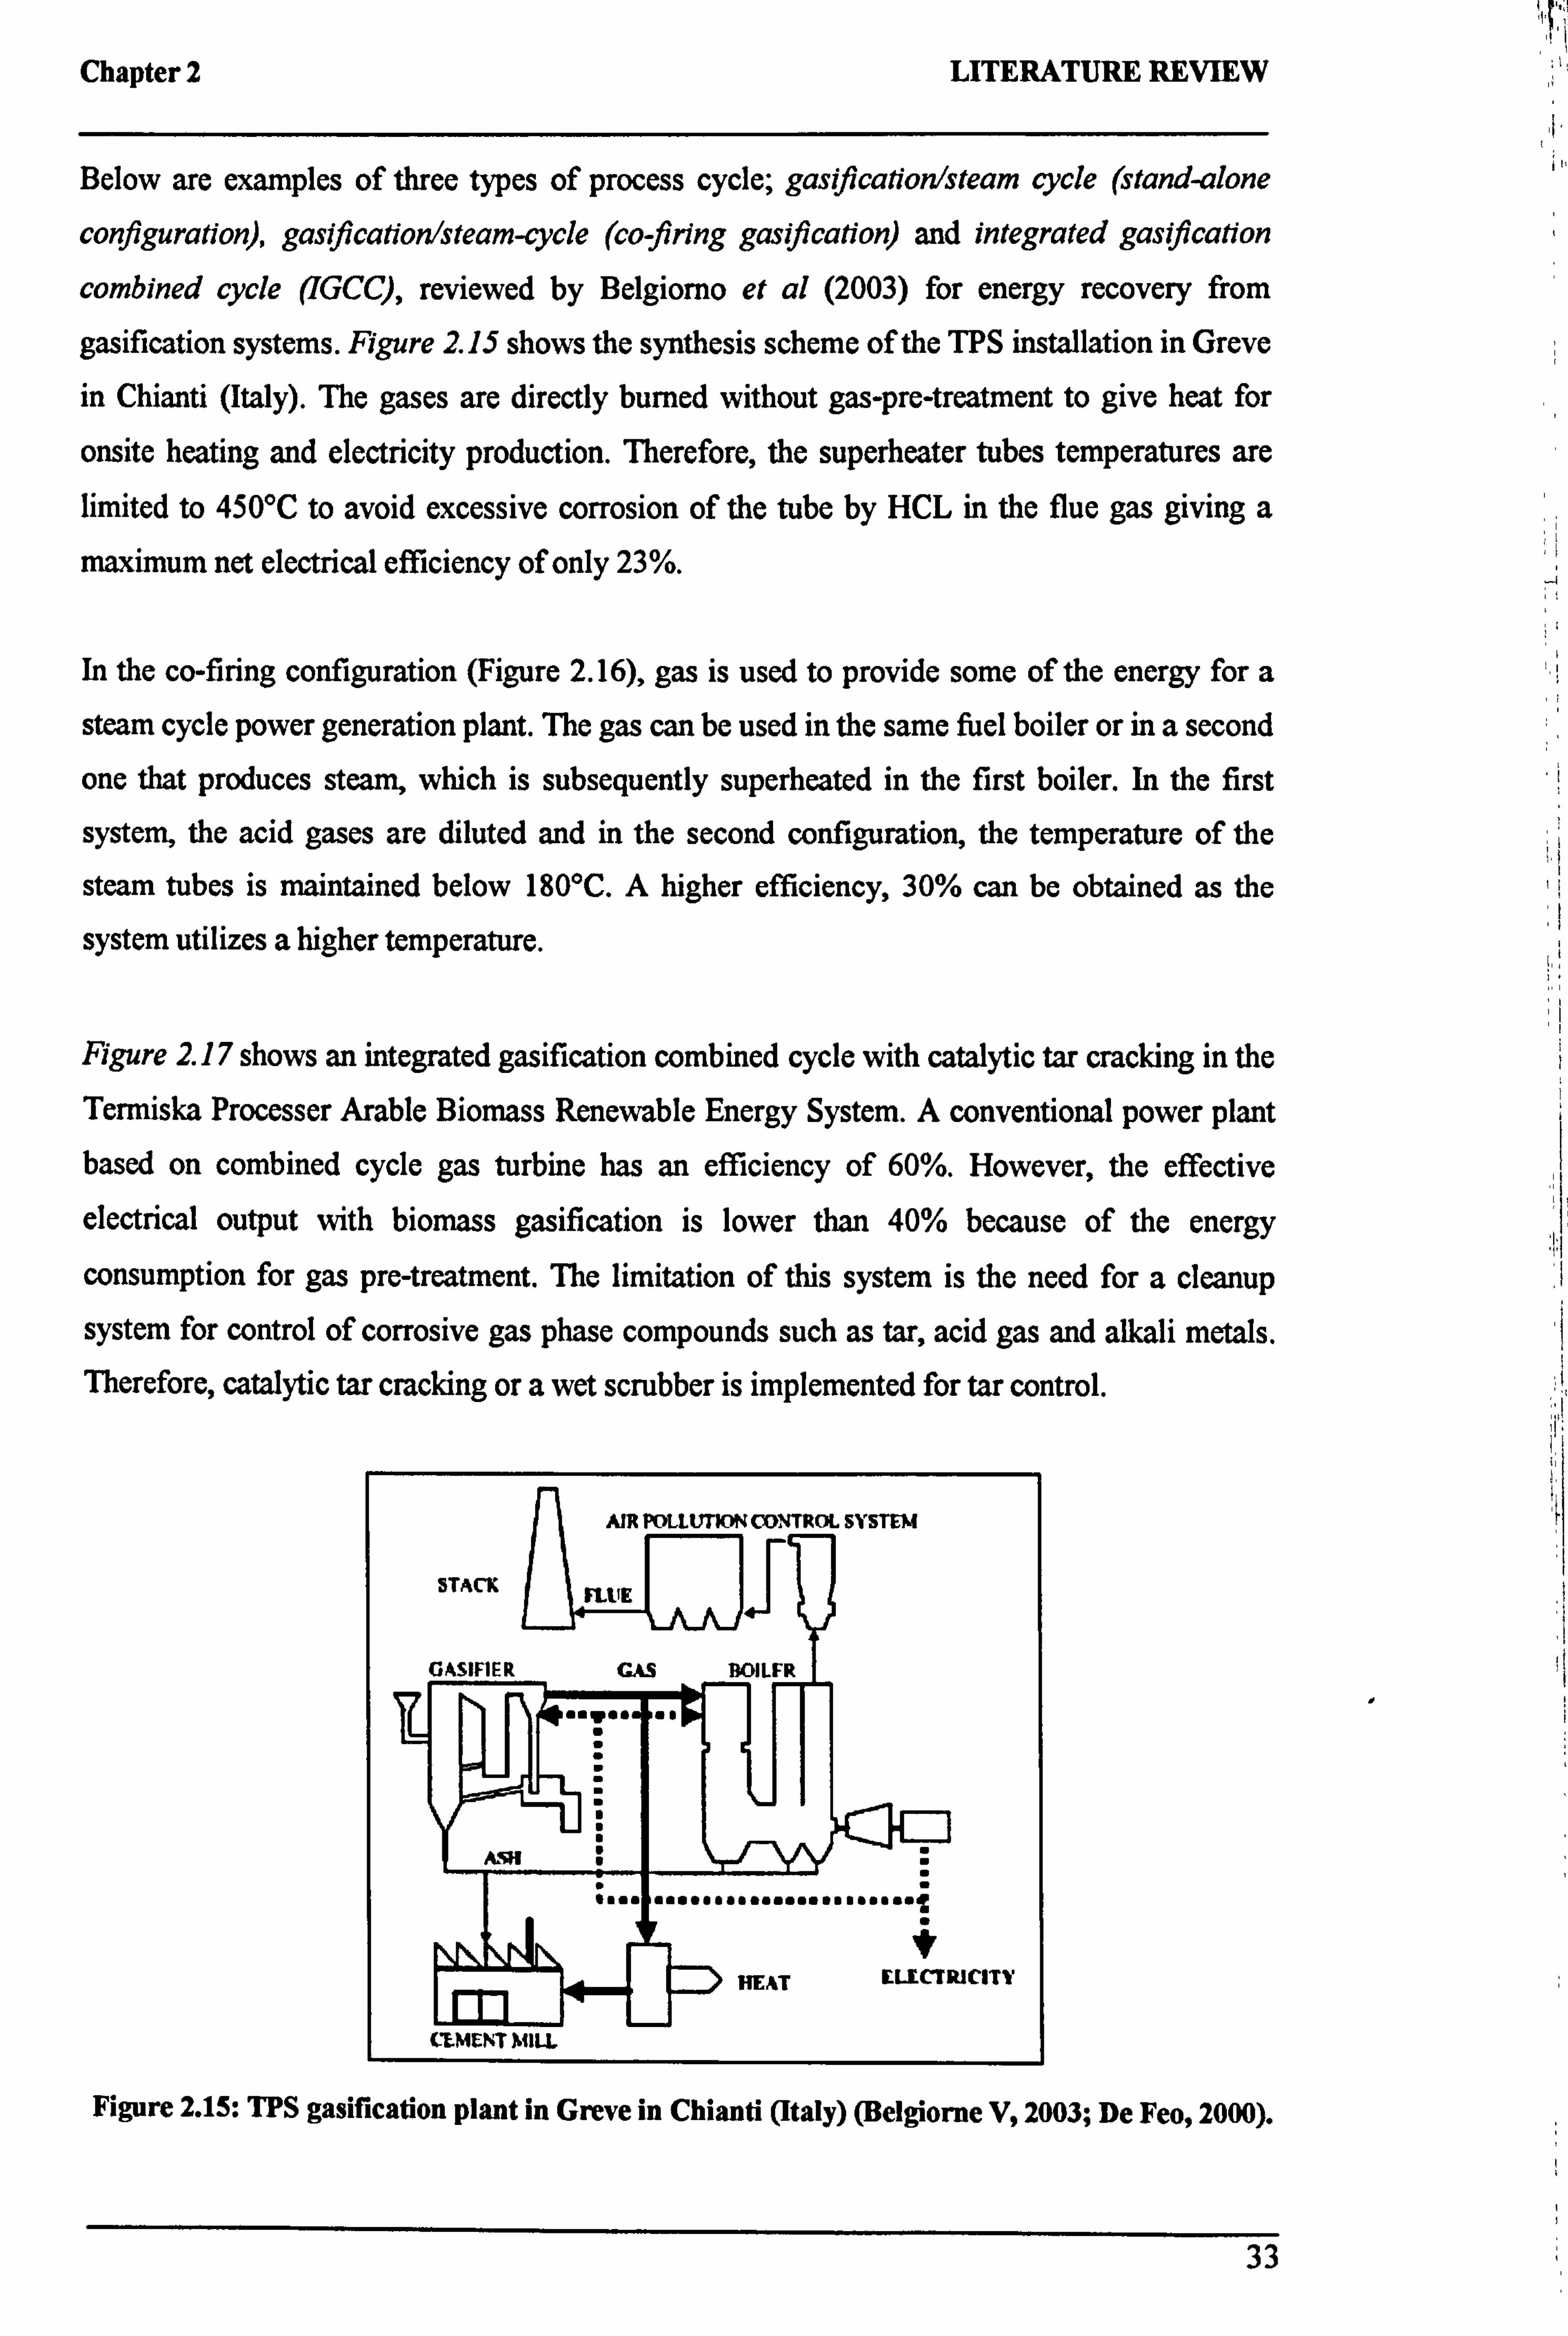
Chapter 2 LITERATURE REVIEW
Below are examples of three types of process cycle; gasifrcationlsteam cycle (stand-alone
configuration), gasification/steam-cycle (co firing gasification) and integrated gasification
combined cycle (IGCC), reviewed by Belgiorno et al (2003) for energy recovery from
gasification systems. Figure 2.15 shows the synthesis scheme of the TPS installation in Greve
in Chianti (Italy). The gases are directly burned without gas-pre-treatment to give heat for
onsite heating and electricity production. Therefore, the superheater tubes temperatures are limited to 450°C to avoid excessive corrosion of the tube by HCL in the flue gas giving a
maximum net electrical efficiency of only 23%.
In the co-firing configuration (Figure 2.16), gas is used to provide some of the energy for a
steam cycle power generation plant. The gas can be used in the same fuel boiler or in a second
one that produces steam, which is subsequently superheated in the first boiler. In the first
system, the acid gases are diluted and in the second configuration, the temperature of the
steam tubes is maintained below 180°C. A higher efficiency, 30% can be obtained as the
system utilizes a higher temperature.
Figure 2.17 shows an integrated gasification combined cycle with catalytic tar cracking in the Termiska Processer Arable Biomass Renewable Energy System. A conventional power plant based on combined cycle gas turbine has an efficiency of 60%. However, the effective
electrical output with biomass gasification is lower than 40% because of the energy
consumption for gas pre-treatment. The limitation of this system is the need for a cleanup
system for control of corrosive gas phase compounds such as tar, acid gas and alkali metals. Therefore, catalytic tar cracking or a wet scrubber is implemented for tar control.
AIR POLLUTION CONTROL SYSTEM
STACK II FLUE
GASIFIER GAS
... .. pl.
HEAT LLCC! RICITT
CLME. T MILL
Figure 2.15: TPS gasification plant in Greve in Chianti (Italy) (Belgiorne V, 2003; De Feo, 2000).
33
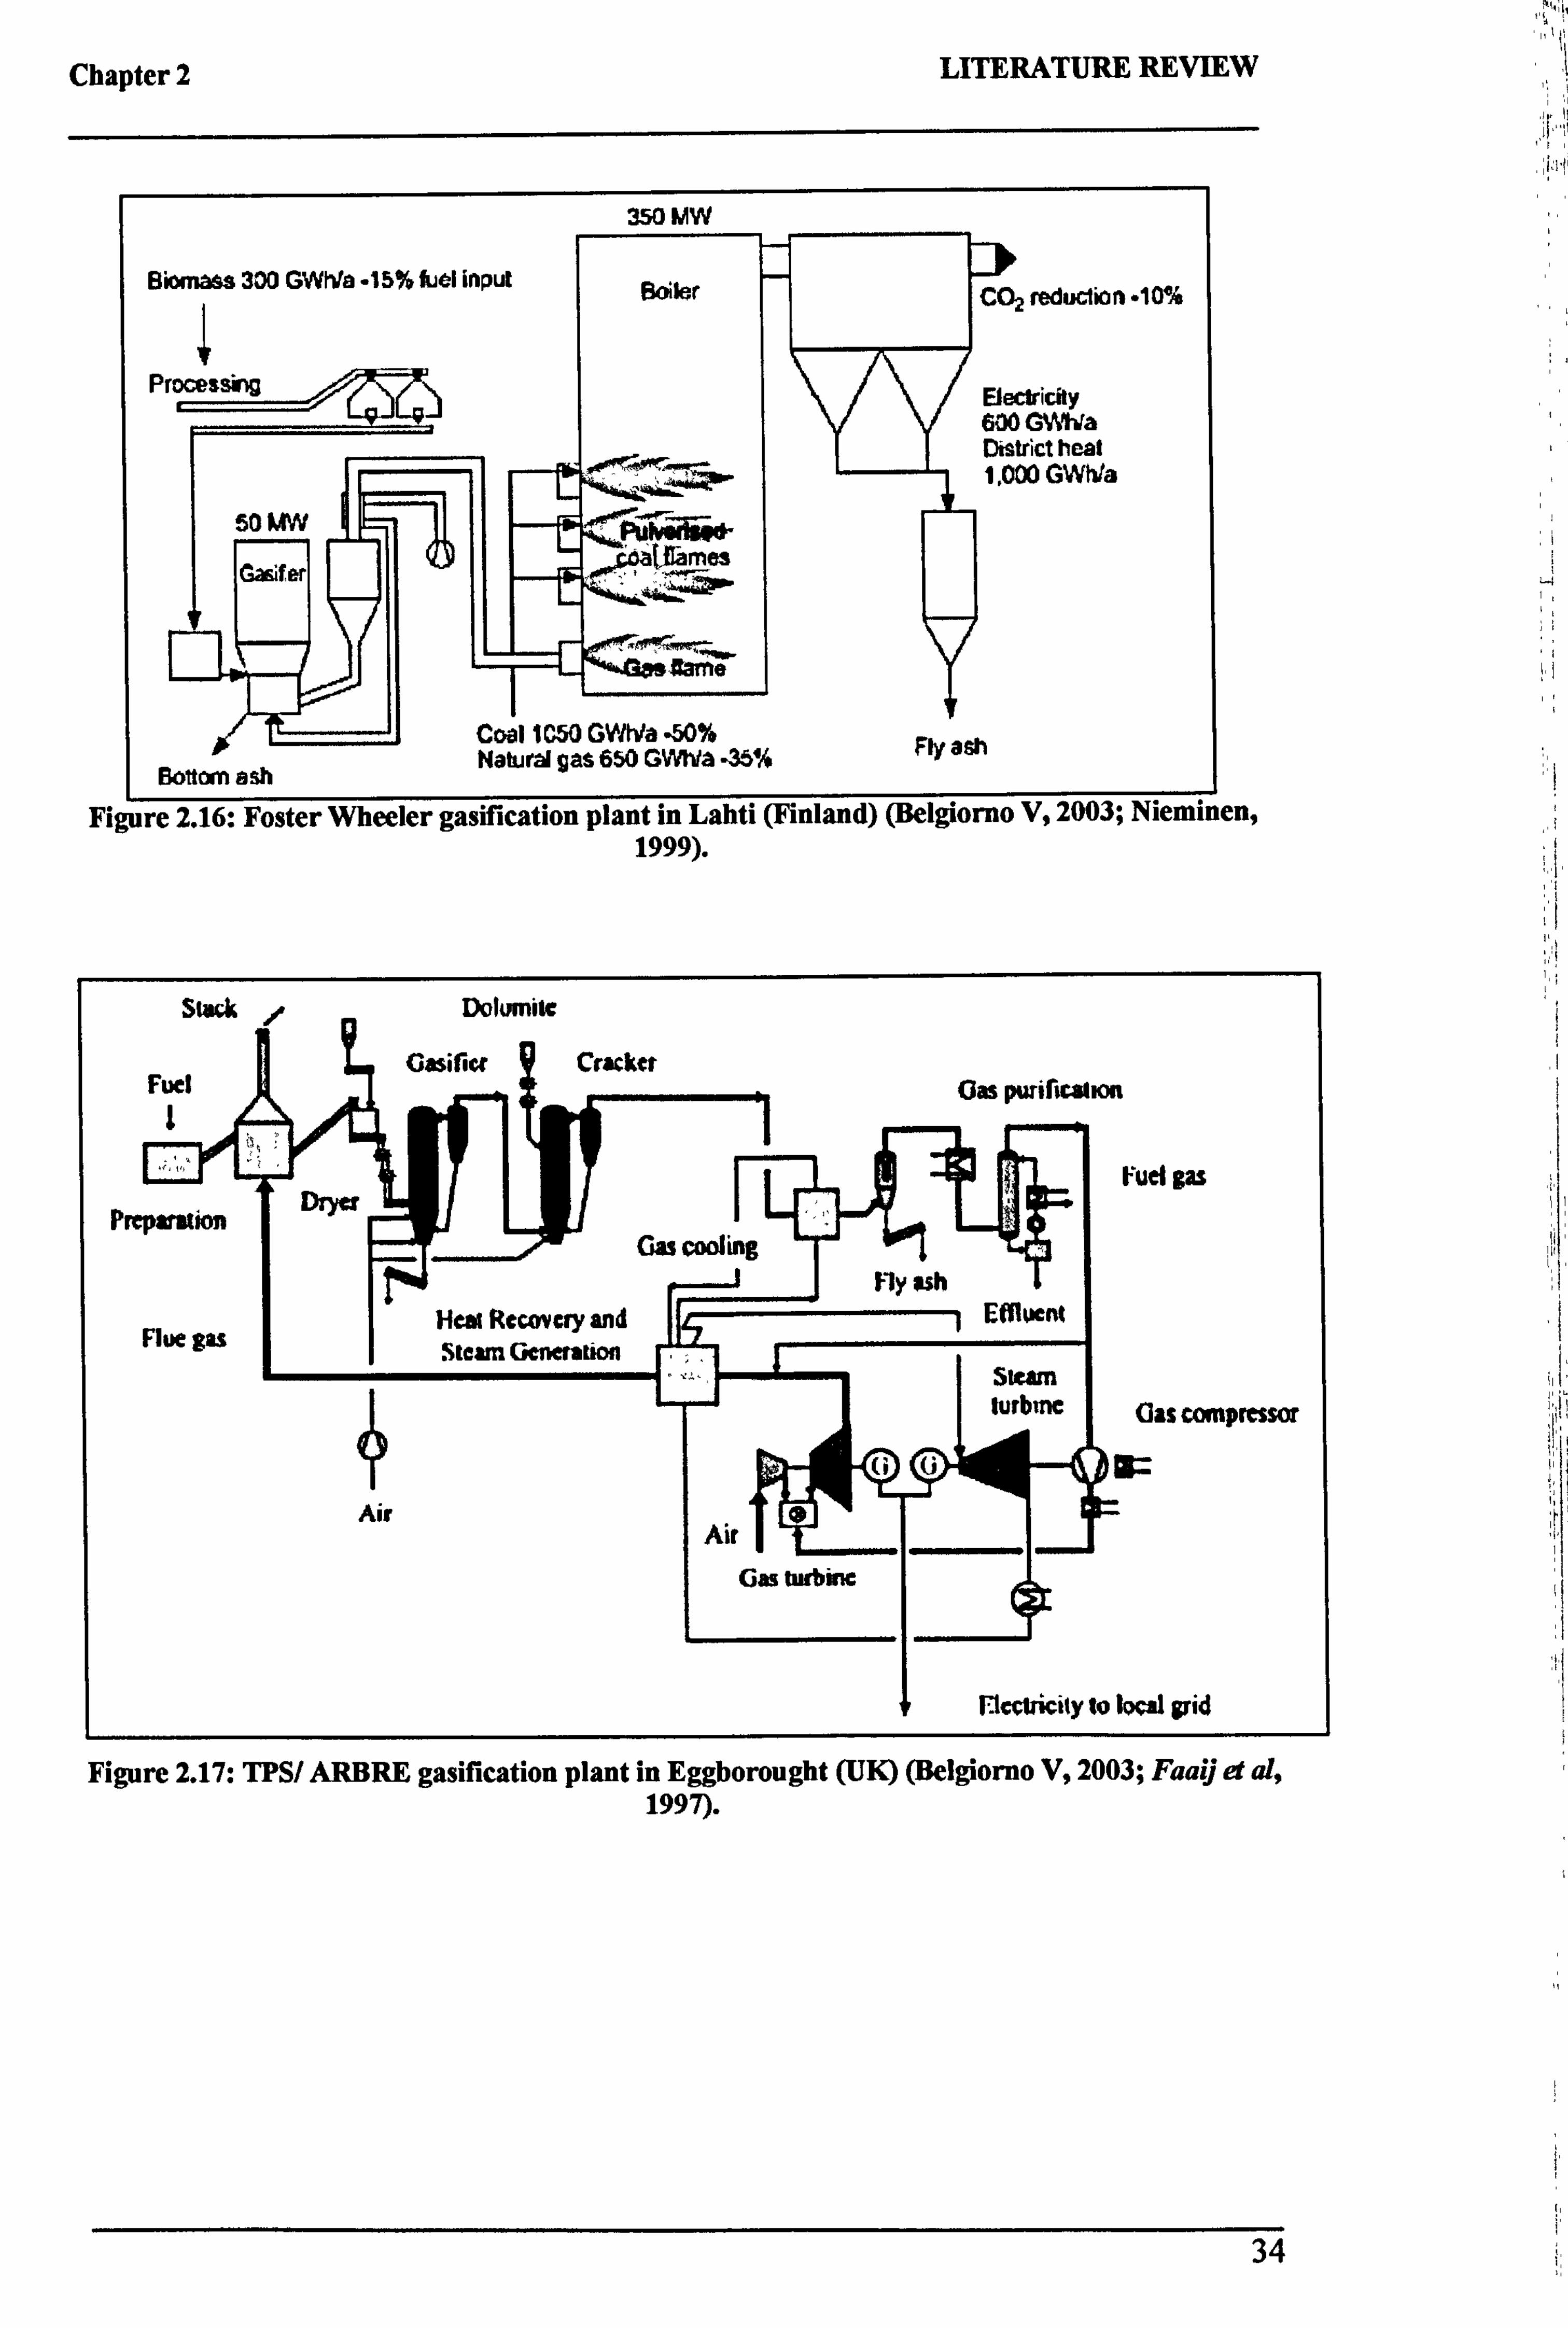
Chapter 2 LITERATURE REVIEW
350 MW
Biomass 300 GWh to 45% fuel input Viler C02 reduction "10"A
Processing Electricity 600 GV !a
ý AR
District heat 1.000 GWhta
50 W III
PV'I Coal 1 050 GWWa -50% Bottom ash
Natural gas 650 GWtVa . 35% Fly ash
Figure 2.16: Foster Wheeler gasification plant in Lahti (Finland) (Belgiorno V, 2003; 1999).
34
rigure h. 1 i: iraý rianrcr. gasuicauvu pýauý iu r uuiuugua ýua. ý ý�cýg. u. uv . ýwýý a uuy .. y 1997).
Chapter 2 LITERATURE REVIEW
Combined Heat and Power
The combined cycle power plant utilizes the coupling of a gas turbine and steam turbine
through a heat recovery steam generator. The high temperature exhaust gases of the gas
turbine are discharged into a heat-recovery boiler that provides steam for the steam turbine.
Heat is converted to power at a higher temperature than in a simple steam turbine cycle thus
giving higher efficiency. The energy saving of a small scale CHP is 30% when its power
generation replaces a conventional power plant, and 15% compared to a natural gas-fired
combined cycle (Hendriks and Blok, 1996). The electricity generated can be transported to
other users through the grid although back-up is required for periods that the CHP unit is not
operational. Heat is the most important energy needed in the EU as 46% of electricity is used
for heating. The efficiency of current system to transform chemical energy using fossil fuels
averages below 40-50%. Therefore, it is a waste of primary energy to produce electricity in
power stations without cogenerating electricity for heating (Aebiom, 1999).
CHP capacity increased by over 80% between 1991 and 1999. In 1999, it provided 6% of the
overall UK electricity generating capacity. The UK target is 10,000MWe of CHP capacity by
2010. The proportion of electricity generated from renewable has risen from 1.7% in 1989 to
2.8% in 1999. The UK targets an increase in the amount of electricity from renewable sources from 5% in 2003 to 10% in 2010 (DTI, 2001). The amount of combusted waste is also
expected to increase and CHP is predicted to increase. The waste used in combined power
and heat plants will increase from 31Mtons in 1990 to about 56Mtons because of the increase
in generated waste and decrease of landfill waste (Carlsson, 1999).
Capacity
Currently, biomass supplies 12% of the world energy supply. A large power plant (200MW)
has relatively efficient energy conversion compared to a smaller biomass-fired steam turbine
system. A large scale combined gas and steam turbine has -58% efficiency, while for small
sizes (5-20MW) efficiency is over 40% (Jurado et al, 2003). In Europe, small scale CHP
provides 1kWe-5MWe by mini-grids (Morris and Waldheim, 1998). While it is feasible to
build larger scale plant at a size of 25 to 30MWe in more amble parts of the UK, smaller plant is more suitable in farming areas. There is a demand for small-scale distributor power at sizes
of a hundred or less kilowatts (Barker, 1996). The waste fuelled district-heating scheme in
Sheffield has 150MW of heat load connected and a similar system operates in Nottingham
(Swithenbank et al, 1999).
35
Chapter 2 LITERATURE REVIEW
2.3 SUMMARY
Coal, oil and gas have been the main fuels generating electricity but this will not last as they
contribute to climate change. The urgent need for green and sustainable fuel prompted this
research into energy crops as an alternative to fossil fuel. The review of the literature reveals that the use of energy crops for the combustion industry is fairly novel in the UK compared to
other European countries. The application of energy crops as a source of fuel is hindered by
the lack of experience, economic viability and environmental cost, plus the relatively low
density of the fuel (compared to solid and liquid fossil fuels) imply that it cannot be
transported for long distances.
The implementation of incineration technology is hindered by social acceptance creating a need for an alternative route. The gasification process has been identified as the most favourable thermo-chemical biomass conversion process due to its higher thermal efficiency compared to combustion. The gasification of char produces synthesis gas that can also be
used as feedstock for chemical synthesis, production of liquid fuel via Fisher-Tropsch
technology, electric power in fuel cells or combustion in a gas turbine combined cycle (CCGT). Although work on gasification can be dated back to the 164' century, there has been little technological progress since then, leaving an urgent demand for this research work especially with the current state of diminishing fossil fuel. The review showed that there are many types of gasification processes with a broad range of reactor types and operating conditions. The end use of the product and economic factors are the primary factors that
govern the selection of a particular type of gasification process. The high level of contaminants and tar has traditionally ruled out the use of the up-draft or counter-current
gasification especially in the case of a gas-turbine cycle although the overall efficiency of the
process is higher compared to the co-current gasification. The three main parameters in the
operation of a gasifier are the pressure, temperature and reactants. High calorific value syngas can be achieved if there is no dilution by nitrogen. The review showed that the efficiency of the fixed bed gasification process can be further enhanced by manipulating the reactants and temperature and further study is needed to understand and optimize the system. There is also a need to tackle the problem of high tar content in the flue gas as this limits its application in
an energy recovery system and increases plant cost for gas clean-up.
36

Chapter 3 THEORETICAL BACKGROUND
CHAPTER 3
THEORETICAL BACKGROUND
This chapter aims to put the research on fixed bed combustion and gasification into context. Both fixed bed combustion and gasification processes are discussed, beginning with the background theory, and proceeding to review the experimental and modelling work that has
been carried out previously. The purpose is to show the current progress of research in this field. The gasification section includes a review on the use of catalysts in gasification to
enhance the decomposition of tarry constituents in fuel gas or to increase carbon conversion. This chapter concludes with the identification of the need for further characterisation of energy crops and waste in fixed bed combustion. It also highlights the urgent need for a deeper understanding of the gasification process and particularly a gasification system
yielding low tar producer gas.
3.1 COMBUSTION IN THE BED REGION
The combustion of a fuel batch in a pot furnace has traditionally been used to study the
combustion on a travelling grate. The combustion time for a fuel batch in a pot furnace
corresponds to a certain transport distance on a reciprocating grate where progress of combustion is comparable to that of a fuel batch in the pot furnace. The concept of a travelling pot furnace is a conventional approach, which is deemed suitable when the horizontal velocity of the bed along the grate is faster than the vertical velocity of the
propagating reaction front inside the bed, making the two-dimensional effects negligible (Thunman and Leckner, 2001).
The combustion in an incinerator occurs in two distinctive regions: the solid-bed region, where the combustion process occurs within the bed on top of the grate and in the freeboard
region. Waste incineration is a complex process as inhomogeneous waste composition and arbitrary physical characteristics cause difficulty in predicting the combustion behaviour. During incineration, the fuel undergoes complicated processes involving drying, pyrolysis, solid-phase and gas-phase combustion with conductive, convective and radiative heat transfer, mass transfer and gas flowing through randomly packed beds of various material size, shape
37
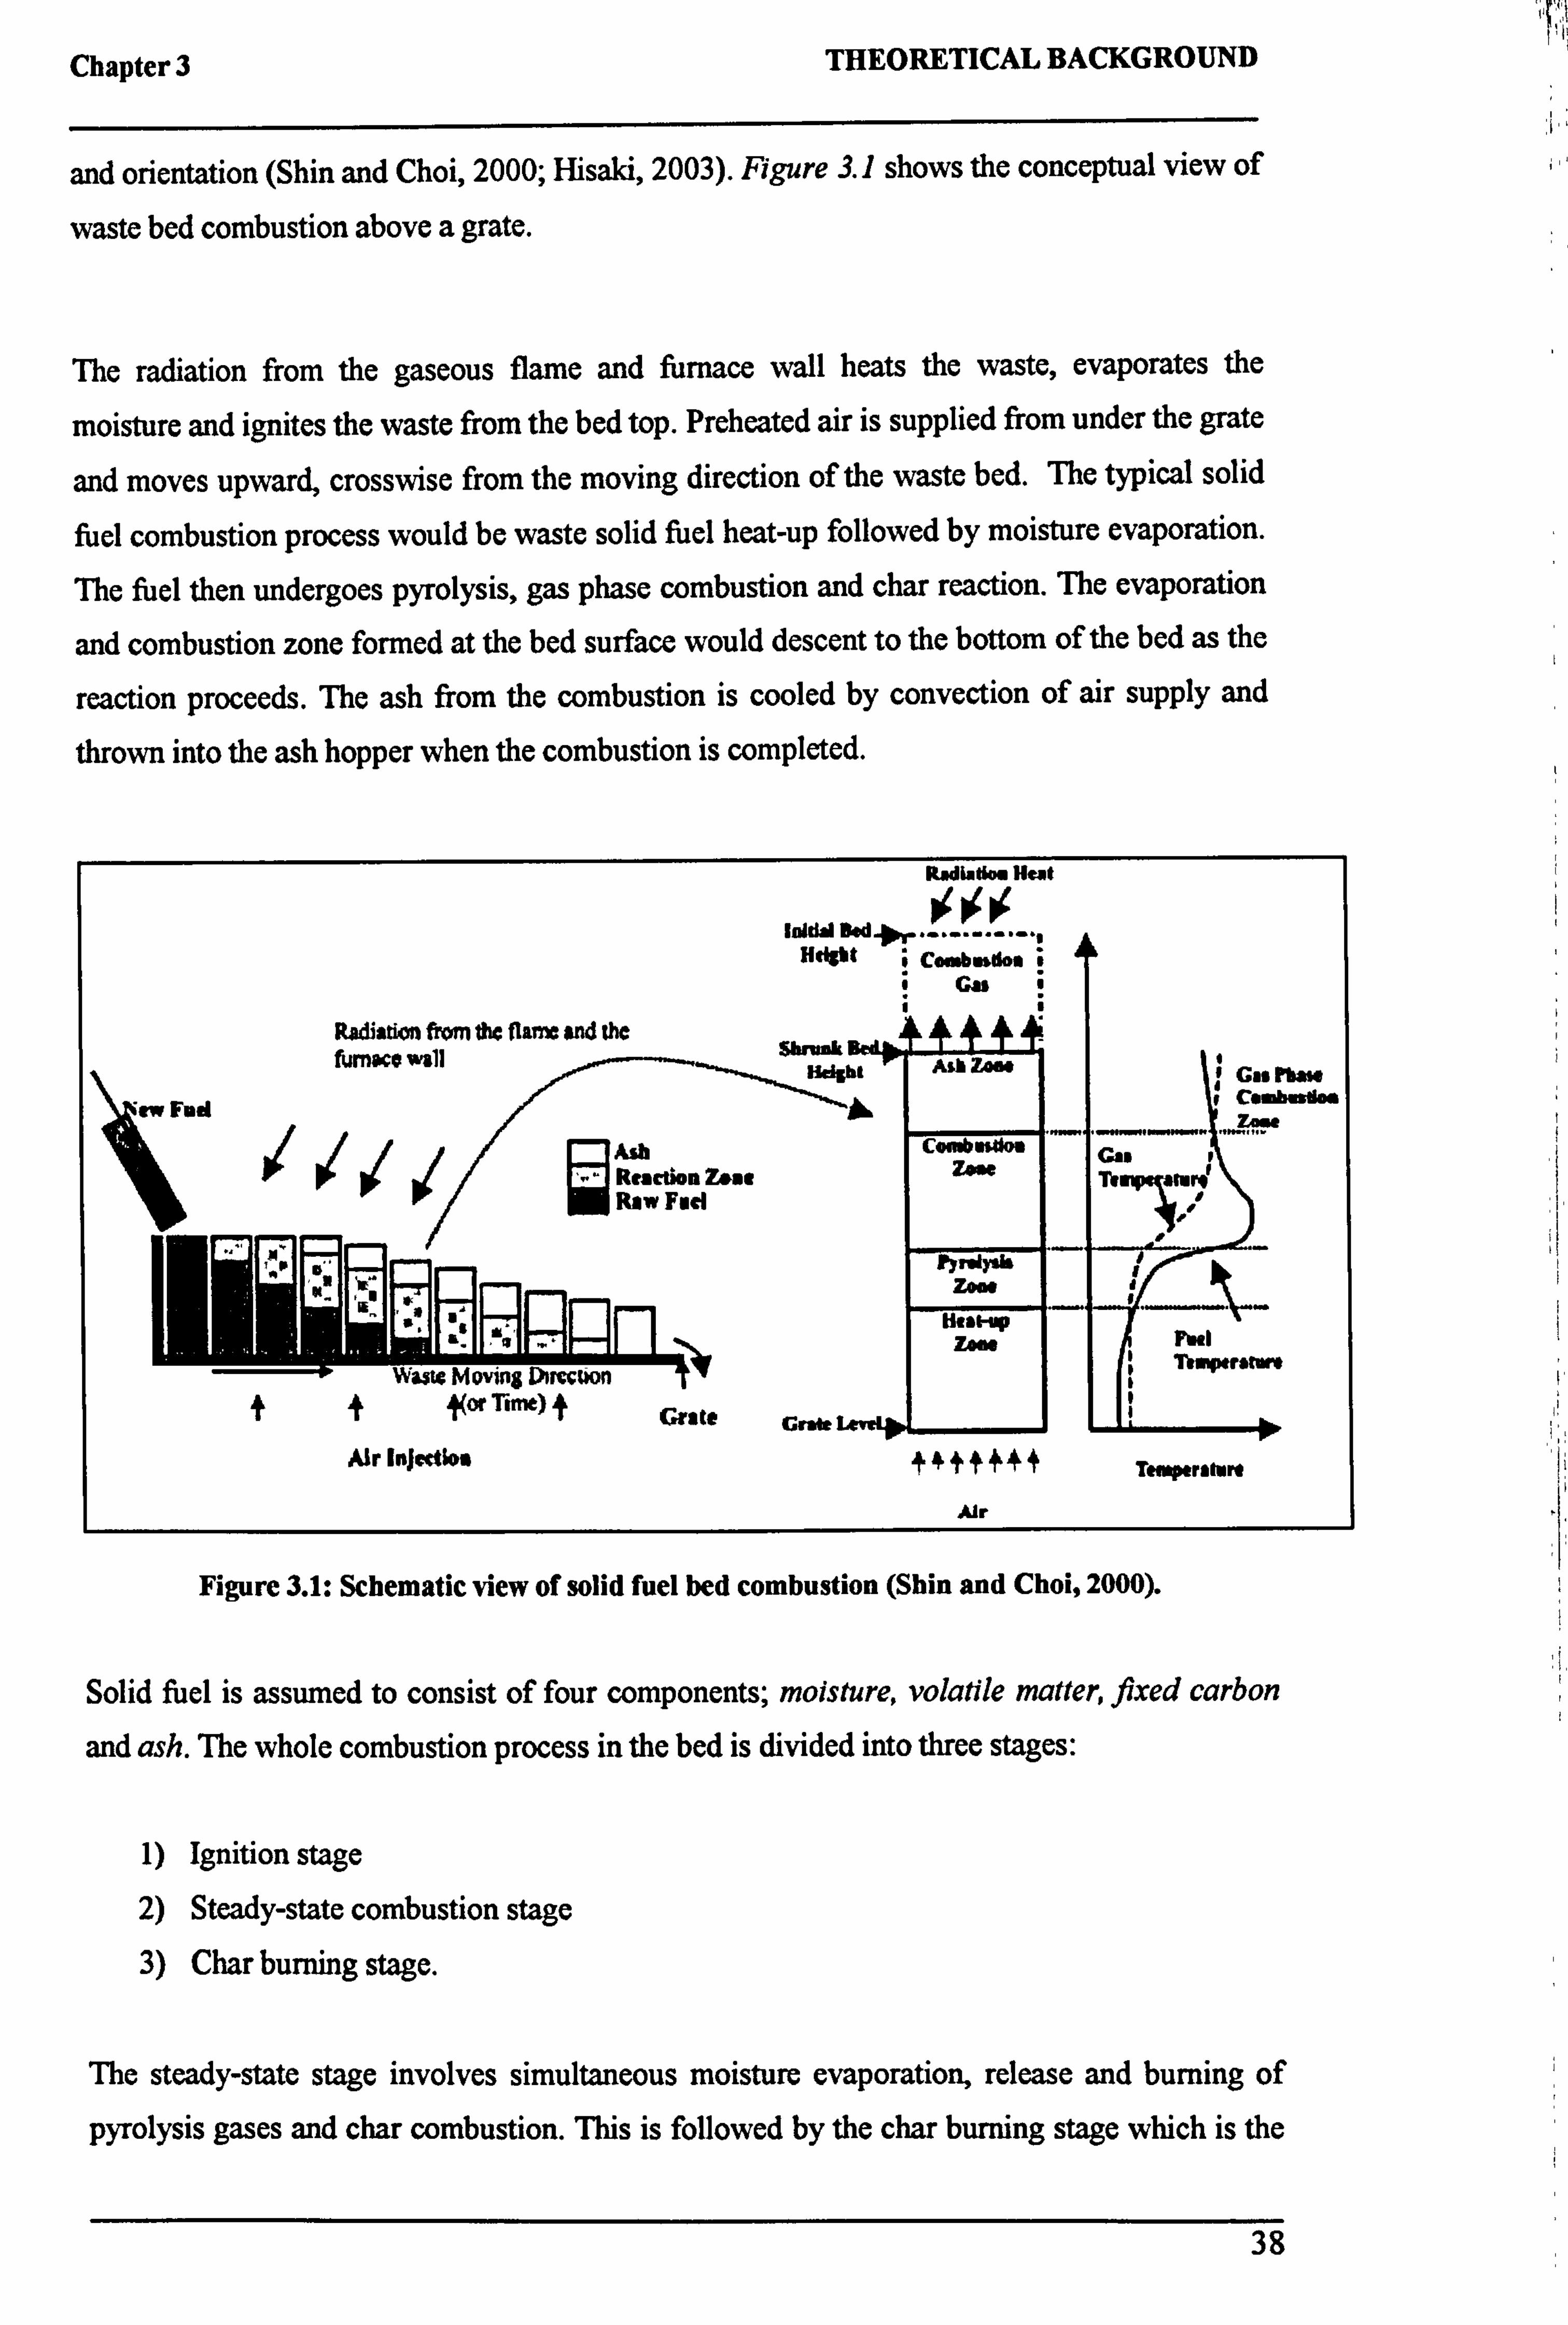
Chapter 3 THEORETICAL BACKGROUND
and orientation (Shin and Choi, 2000; Hisaki, 2003). Figure 3.1 shows the conceptual view of
waste bed combustion above a grate.
The radiation from the gaseous flame and furnace wall heats the waste, evaporates the
moisture and ignites the waste from the bed top. Preheated air is supplied from under the grate
and moves upward, crosswise from the moving direction of the waste bed. The typical solid
fuel combustion process would be waste solid fuel heat-up followed by moisture evaporation.
The fuel then undergoes pyrolysis, gas phase combustion and char reaction. The evaporation
and combustion zone formed at the bed surface would descent to the bottom of the bed as the
reaction proceeds. The ash from the combustion is cooled by convection of air supply and
thrown into the ash hopper when the combustion is completed.
Radiation Heat
Initial DW Htdgbt Coebodoa
i GL i
Radiation from the Harne and the furnace wall Alh Zane to Co lbaw
had i Co b d. 4
/ Ash Combngoa ý" Coe r Zone
Coro AIL Reaction Zoal Ti Raw Fed
er; OWN.;
1_r Ir--ý_ nZoa. k
ý.
IIII Tnp,
II np. ts.
tI for Time, f Grate Grob L me L. J. i_ Air Injection t44 f' Tenpcnhn
Air
Figure 3.1: Schematic view of solid fuel bed combustion (Shin and Choi, 2000).
Solid fuel is assumed to consist of four components; moisture, volatile matter, fixed carbon
and ash. The whole combustion process in the bed is divided into three stages:
1) Ignition stage
2) Steady-state combustion stage 3) Char burning stage.
The steady-state stage involves simultaneous moisture evaporation, release and burning of
pyrolysis gases and char combustion. This is followed by the char burning stage which is the
38

Chapter 3 THEORETICAL BACKGROUND
final stage where all the moisture and volatile matter have left the bed and only the char
reaction proceeds (Yang et al, 2003).
Solid fuels are first heated up by over-bed radiation when they enter the incinerator and
moisture is released as evaporation proceeds. Moisture can also be driven out by mass
exchange between the wet solids and the drier airflow from under the grate. Volatile matter in
MSW could range from 10% to as high as 70% of the original mass and the gases released are
composed mainly of hydrocarbon (CmH. ), CO, CO2 H2,02 and other trace compounds:
Waste Volatile (CmH�), CO, CO2 H2,02, etc. ) + char
The release of volatile gases from the solid is proportional to the bed temperature and the
remaining volatiles in the solid. Volatile hydrocarbon, CHnOt is oxidized to produce CO and H2. The CO is then burned by further oxidation to form CO2 and H2 to form H20.
CmH�Oi +(% - 12)O2
-*mCO+YH2
CO + 12 O2 -ý CO2
H2 + 12 O2 -* H2O
Gaseous fuels released from the devolatilisation process have to mix first with the
surrounding air before the combustion takes place. The burning of volatile hydrocarbon is limited by the reaction kinetics and the mixing-rate of the gaseous fuel with the under-fire air. Char is formed as the volatiles escape from the particles. The primary products of char combustion are CO and CO2. The moisture level in the fuel affects the percentage of char burned in the final stage.
3.1.1 Fixed Bed Combustion Regime
Gort (1995) and Shin and Choi (2000) proposed three modes of combustion in the bed, depending on the air supply rate; oxygen limited combustion, reaction-limited combustion and extinction by convection. The combustion in the bed region was characterized by the stoichiometry between fuel and oxygen as shown in Figure 3.2.
39
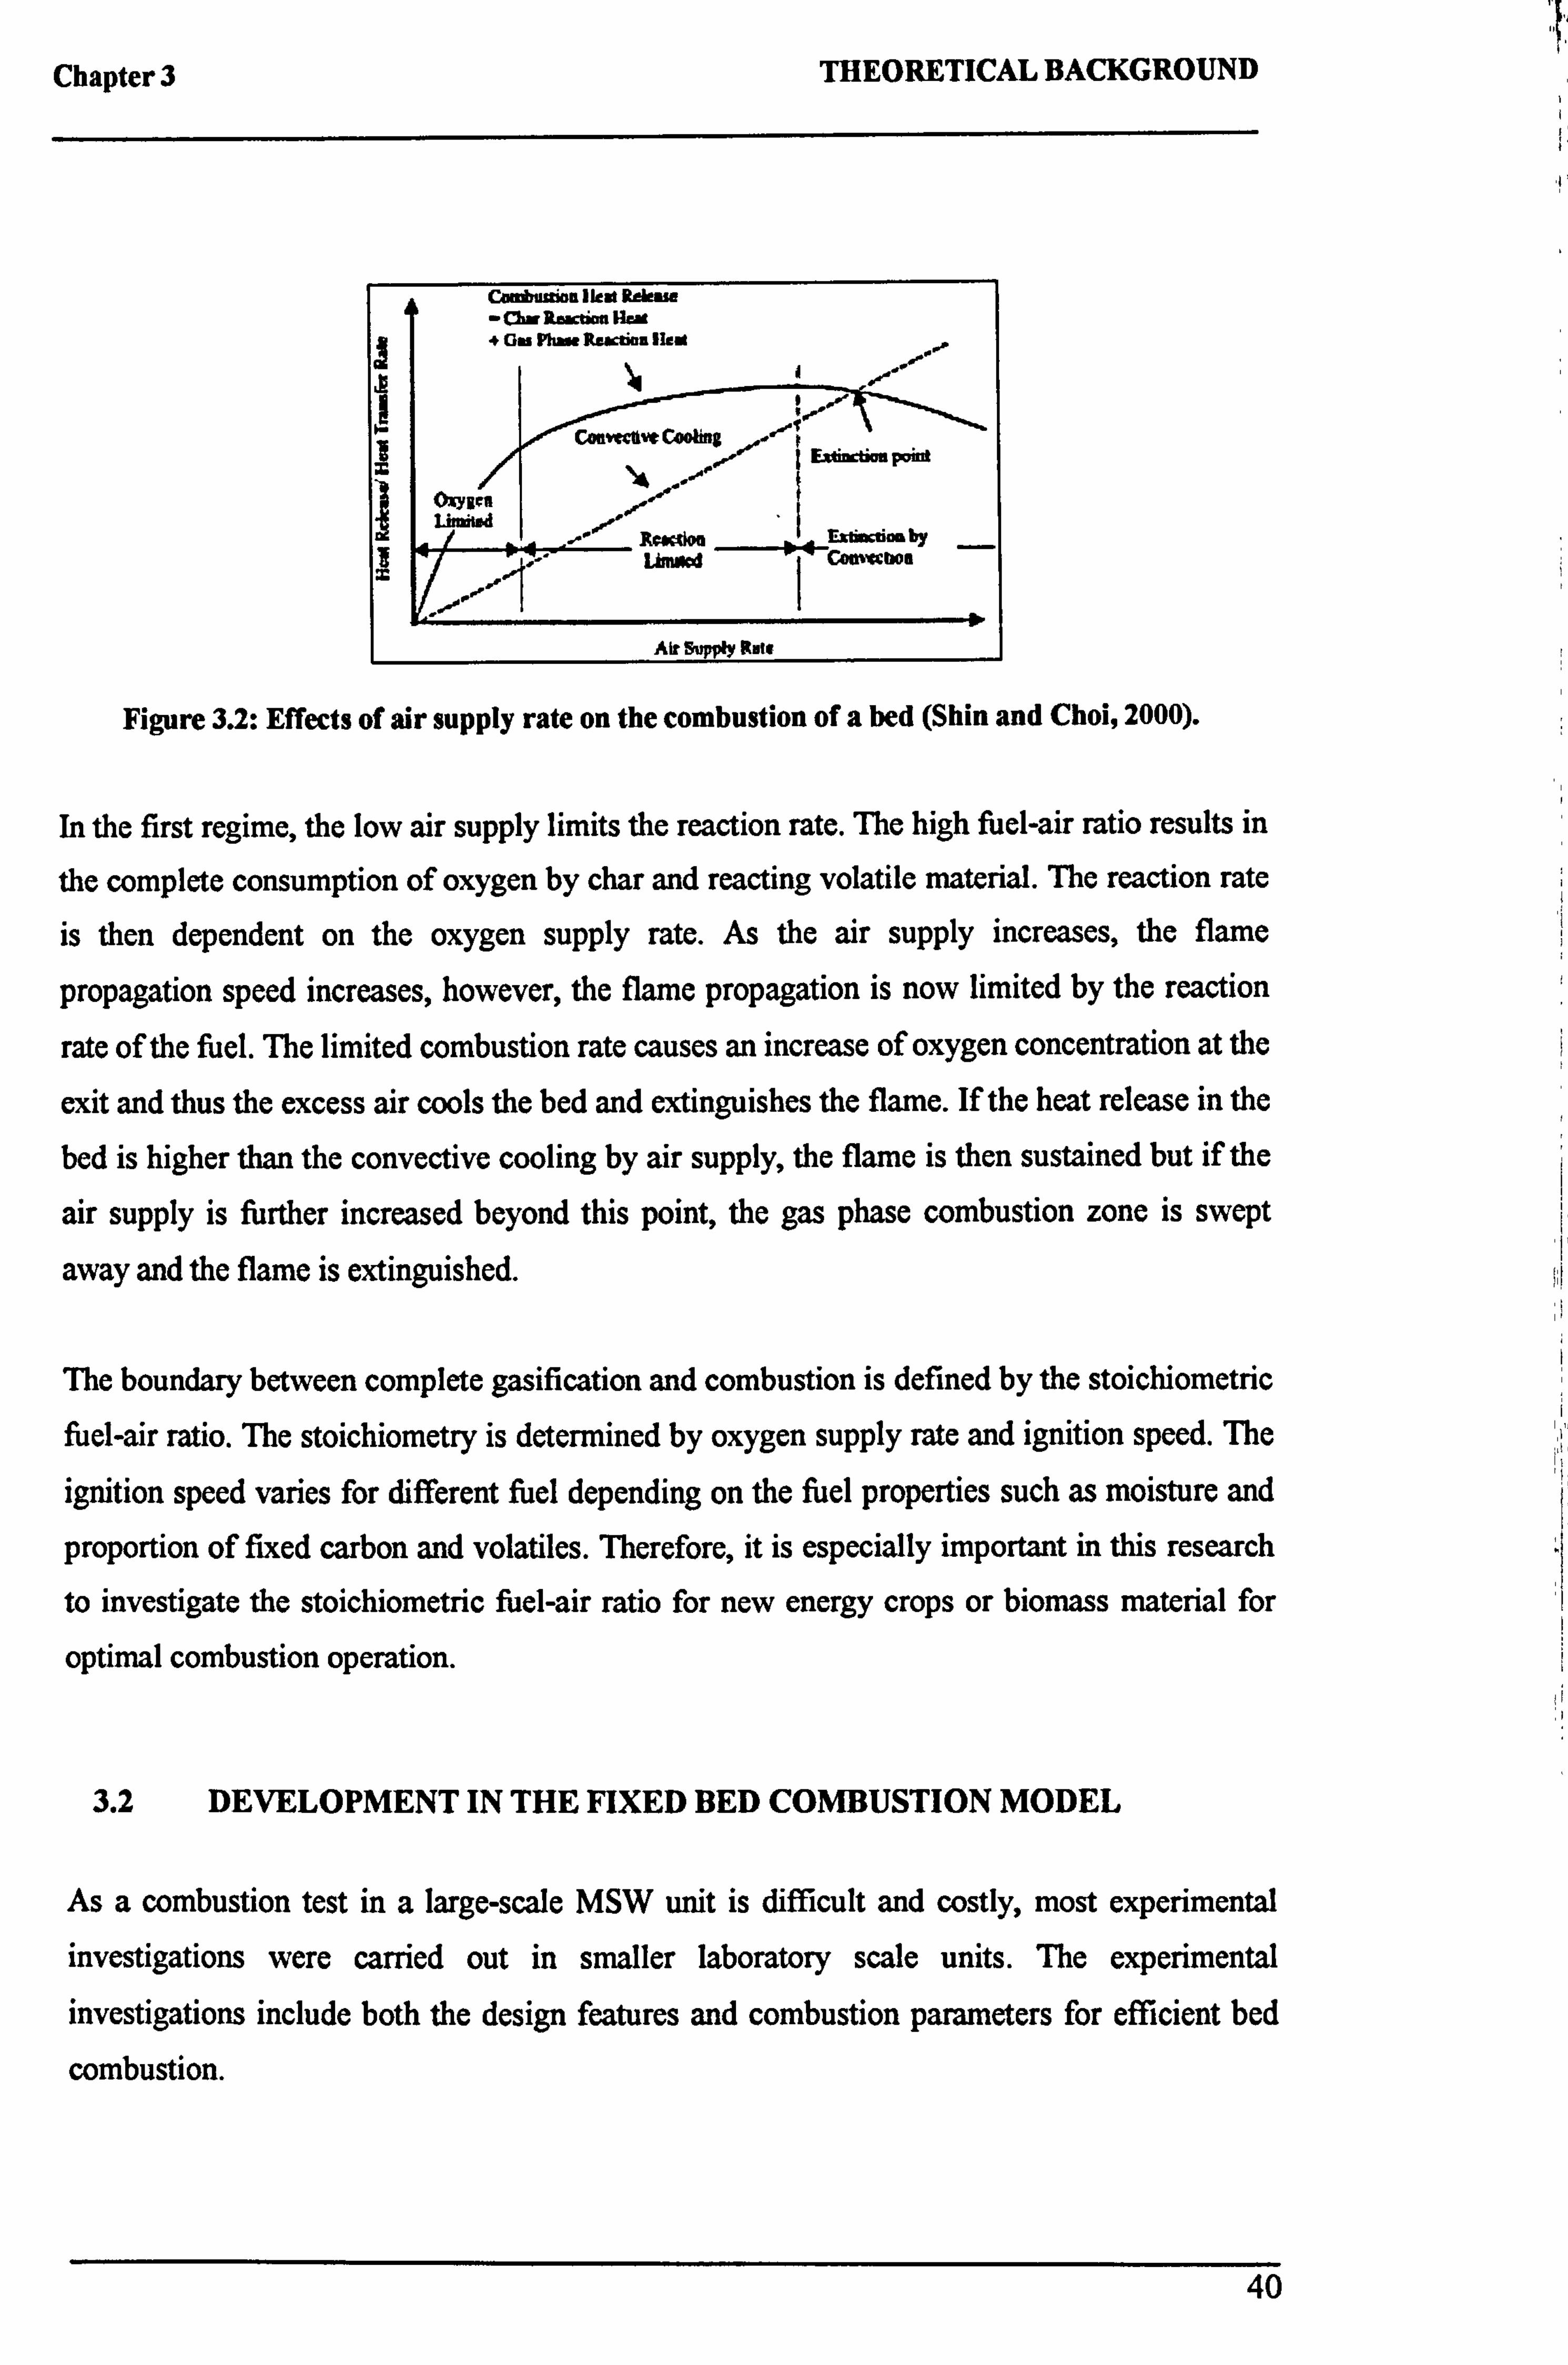
Chapter 3 THEORETICAL BACKGROUND
Cambumon Ilene ßdensn (fir auction Hen
f 6N PFuie Ruction flue
Cön y Cooling ,,.
ý 4 EVimfiampoid
app _Ext
cnao by LbRow C MMbOe
Aft Supply Rate
Figure 3.2: Effects of air supply rate on the combustion of a bed (Shin and Choi, 2000).
In the first regime, the low air supply limits the reaction rate. The high fuel-air ratio results in
the complete consumption of oxygen by char and reacting volatile material. The reaction rate is then dependent on the oxygen supply rate. As the air supply increases, the flame
propagation speed increases, however, the flame propagation is now limited by the reaction
rate of the fuel. The limited combustion rate causes an increase of oxygen concentration at the
exit and thus the excess air cools the bed and extinguishes the flame. If the heat release in the
bed is higher than the convective cooling by air supply, the flame is then sustained but if the
air supply is further increased beyond this point, the gas phase combustion zone is swept
away and the flame is extinguished.
The boundary between complete gasification and combustion is defined by the stoichiometric fuel-air ratio. The stoichiometry is determined by oxygen supply rate and ignition speed. The
ignition speed varies for different fuel depending on the fuel properties such as moisture and
proportion of fixed carbon and volatiles. Therefore, it is especially important in this research to investigate the stoichiometric fuel-air ratio for new energy crops or biomass material for
optimal combustion operation.
3.2 DEVELOPMENT IN THE FIXED BED COMBUSTION MODEL
As a combustion test in a large-scale MSW unit is difficult and costly, most experimental investigations were carried out in smaller laboratory scale units. The experimental investigations include both the design features and combustion parameters for efficient bed
combustion.
40
Chapter 3 THEORETICAL BACKGROUND
As explained in Section 3.1.1, the ignition propagation speed increases almost linearly with
air supply in the oxygen limited mode. The slope in Figure 3.2 decreases in the reaction-
limited mode and ceases in flame extinction zone due to convection from the air. Yang et al
(2002) found that the burning rate with large scale MSW is less sensitive to variation in air
flow rate although the flammability range becomes much wider. For low under-grate air (low UýýIVERSITY
OF SHBrFIELD
air to fuel ratio), the supply of oxygen to the reaction layer is insufficient and a large amount LIBRARY
of volatile gases escape without burning. This was found to lower the bed temperature and
inhibit the devolatilization process. Rogaume et al (2002) studied the effect of air flow rate
on the formation of pollutants during waste incineration including the yield of carbon
monoxide and nitrogen oxide. Primary air flow rate below the stoichiometric requirement leads to an oxygen deficient combustion region. This regime is characterized by low reaction
temperatures, favouring endothermic pyrolysis and enhances CO yield. The influence of
primary air flow rate was also reported by Swithenbank et al (1999), in which they explained
that CO was produced at low air flow rate due to the combustion and gasification of char. For
higher air flow rates, sufficient oxygen was available to ensure that the char burn-out occurred
as rapidly as ignition.
In her research using a pot burner, Goh et al (1999) described that a large volume of excess
air is required for a good burnout but this advantage is set off by problems caused in gas
phase combustion; overloading of electrostatic precipitators and scrubbers and high
particulate emissions. In her work, Goh monitored the behaviour of NO,, during the pyrolysis
stage, whereby, the NO,, concentration increased to a maximum value of 150ppm before
reducing to 100ppm. The increase in NO,, is due to the devolatilisation of waste while a
decrease in NO,, occurs when the CO and NO,, in the char layer reacts to form CO2 and N2
using carbon in the char as a catalyst. The effect of reduced NO. emission with a reduction in
air flow rate was also reported by Klasen and Gorner (1999) and colleagues. They suggested
an additional source of combustion air; using both primary and secondary air. The mixing of
the secondary air in the furnace was found to promote uniform oxygen, temperature and
velocity distribution. Jorgensen and Madsen (1999) and Rogaume et al (2002) described
similar benefits from using secondary air flow to promote mixing but highlighted the effect of fuel dilution leading to reduction in temperature in the case of high secondary air flow rate.
Recent work on particle emission was carried out by Gomez et al (2003). Their work focussed on the particle emission generated during different stages of pyrolysis/incineration
of refused derived fuel at a pilot scale incinerator. As RDF incineration is not a stationary
process, the aerosol properties are a function of the process stage and charge of the furnace.
The incinerator design and operation influences the particles formation. The mass
41
Chapter 3 THEORETICAL BACKGROUND
concentration of particles emitted increases during the pyrolysis phase, reaching the
maximum during transition between pyrolysis and combustion and then decreases during the
char combustion phase. Research on the formation and decomposition behaviour of a critical
pollutant, dioxin was carried out by Tagashira et al (1999). They investigated the combustion
characteristic of different materials; municipal waste, waste plastic and refuse derived fuel
(RDF). Dioxin control was found possible by sustaining a stable combustion temperature with longer gas residence time.
Saastamoinen et al (2000) carried out extensive research on the influence of combustion
parameters; airflow rate, moisture content, particle size, bed density and wood type on fixed
bed combustion. Their investigation showed that moisture above 30% was found to
significantly lower the ignition speed because of a decrease in temperature of the ignited
region. This was due to dilution and the increased energy needed to heat particles to the ignition temperature. Particle size proved to have no effect on ignition front speed but larger
particle sizes were associated with an increase in maximum bed temperature. The front
velocity was found to be inversely proportional to fuel bed density and the specific heat of
wood. The influence of primary air flow rate and particle properties on the ignition front,
temperature and gas composition were also studied by Ronnback (2000). Thermally thin fuel
was found to have a higher devolatilisation rate, leading to a sub-stoichiometric regime with full oxygen consumption sustained at high air flow. The resistance towards heat flow into the
particles increases with diameter, and more of the heat produced is transported to new layers
of fresh fuels and not towards the centre of the fuel particles. The larger particles are thermally thicker and the devolatilization rate is lower. Therefore, the sub-stoichiometric
regime with complete consumption starts at a higher airflow for larger diameter fuel. In 1972,
Rogers (1972) reported that the ignition velocity decreases with increasing bulk density. It
was explained by Hisaki (2003) that there is a slower heat transfer from the ignition part to the unburnt fuel with increasing bulk density. The more open packing in lower bulk density fuel allows the ignited particles to radiate further into unbumt fuel increasing the radiation heat transfer.
Zakaria (2000) extended the investigation of the primary and secondary air flow rate on wood and simulated waste consisting of wood, cardboard, paper and vegetable matter with 48%
moisture content. His findings supported Saastamoinens' work whereby the combustion rate varied linearly with primary air flow rates. Zakaria (2000) concluded that the temperature of the primary air has little effect on waste combustion because heat transfer within the bed was mainly by radiation and very little by convection and conduction. In the modelling work conducted by van der Lans et al (2000), a high air inlet temperature was found to increase the
42
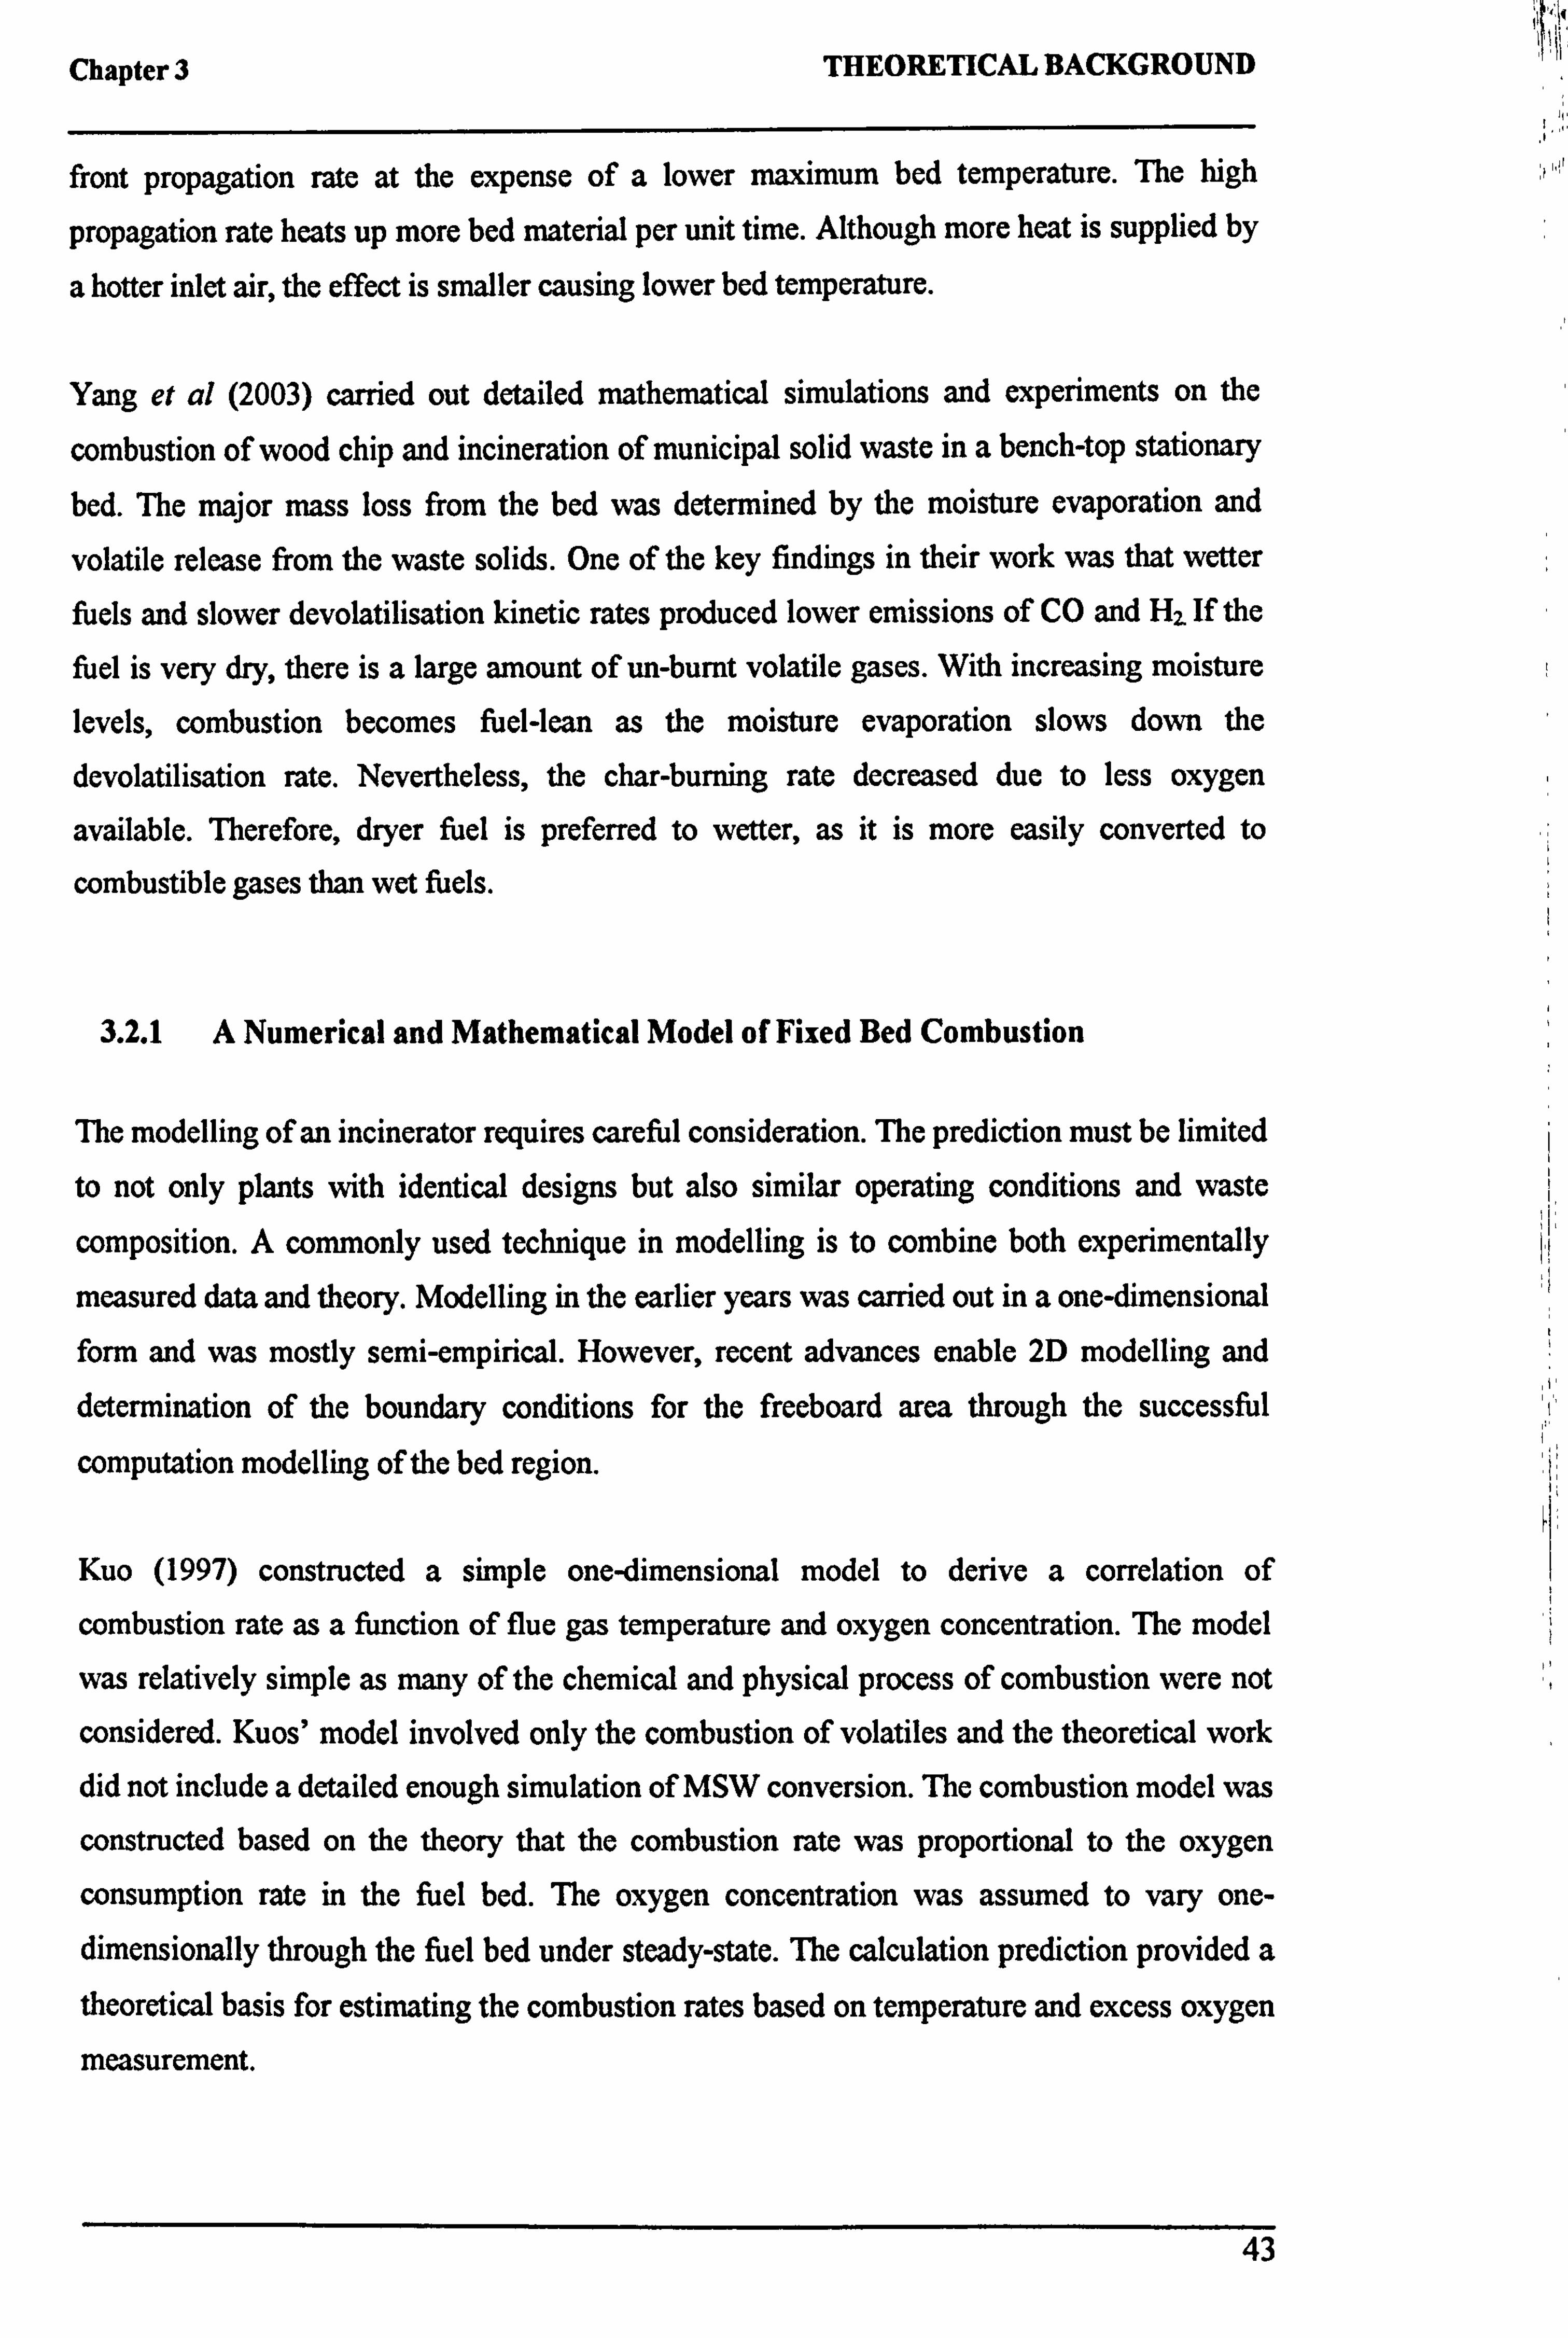
Chapter 3 THEORETICAL BACKGROUND
front propagation rate at the expense of a lower maximum bed temperature. The high
propagation rate heats up more bed material per unit time. Although more heat is supplied by
a hotter inlet air, the effect is smaller causing lower bed temperature.
Yang et al (2003) carried out detailed mathematical simulations and experiments on the
combustion of wood chip and incineration of municipal solid waste in a bench-top stationary
bed. The major mass loss from the bed was determined by the moisture evaporation and
volatile release from the waste solids. One of the key findings in their work was that wetter fuels and slower devolatilisation kinetic rates produced lower emissions of CO and Hz. If the
fuel is very dry, there is a large amount of un-burnt volatile gases. With increasing moisture levels, combustion becomes fuel-lean as the moisture evaporation slows down the
devolatilisation rate. Nevertheless, the char-burning rate decreased due to less oxygen
available. Therefore, dryer fuel is preferred to wetter, as it is more easily converted to
combustible gases than wet fuels.
3.2.1 A Numerical and Mathematical Model of Fixed Bed Combustion
The modelling of an incinerator requires careful consideration. The prediction must be limited
to not only plants with identical designs but also similar operating conditions and waste
composition. A commonly used technique in modelling is to combine both experimentally
measured data and theory. Modelling in the earlier years was carried out in a one-dimensional form and was mostly semi-empirical. However, recent advances enable 2D modelling and determination of the boundary conditions for the freeboard area through the successful
computation modelling of the bed region.
Kuo (1997) constructed a simple one-dimensional model to derive a correlation of
combustion rate as a function of flue gas temperature and oxygen concentration. The model
was relatively simple as many of the chemical and physical process of combustion were not
considered. Kuos' model involved only the combustion of volatiles and the theoretical work did not include a detailed enough simulation of MSW conversion. The combustion model was
constructed based on the theory that the combustion rate was proportional to the oxygen
consumption rate in the fuel bed. The oxygen concentration was assumed to vary one-
dimensionally through the fuel bed under steady-state. The calculation prediction provided a
theoretical basis for estimating the combustion rates based on temperature and excess oxygen
measurement.
43

Chapter 3 THEORETICAL BACKGROUND
Goh et al (1998) improved on Kuos' work to provide a more accurate representation of the
combustion process. Goh referred to Kuo (1970) illustration on how the various processes of
combustion propagates as waves through the waste bed as shown in Figure 3.3. This forms
the basis on which the mathematical model for solid phases was built. Goh developed the
model based on different zones for virgin, dried and pyrolysed fuel and ash to calculate the
boundary conditions for a CFD code. The model included the processes within a burning
refuse bed such drying, pyrolysis, solid-phase and gas-phase combustion, conduction,
convection and radiative heat-transfer, mass transfer and gas flowing through randomly
packed beds of material.
ý 4 CHANGE- L. --- OVER-FEED -º1. UNDER-FEED -º
BURNING OVER BURNING 1 RF(; TON
i i
EVOLUTION OF -º COMBUSTI3LE
FUEL CHAR "" SURFACE
FORMATION & GASIFICA ION
" "" / T "
DRYING "" "" CHAR
,. '
PYROLY IS " " '
IG ON ý " " CHAR ` " bN " . LIASIFICATJ
RAW ZERO % " "ýý CHAR ASH REFUSE FREE ". ; OXIDATI
------------ 0
ACTIVE FEED BURNING UNDERFIRE AIR CHAR END
Figure 3.3: The waste-bed combustion zone (Kuo, 1970)
One of the main assumptions made in the model was that there was no heat transfer within the bed material parallel to the direction of the grate movement. The steady-state moving bed was
modelled as an unsteady-state static bed in which heat was only transferred normal to the
grate. The variation with respect to time t, using the unsteady-state static bed model can be
employed to predict variation with distance x from the point of refuse input in the steady-state
moving bed model using x= vxt whereby vx represents the steady velocity of material
caused by the grate movement. The use of an unsteady-state bed model is as shown in Figure
3.4.
44
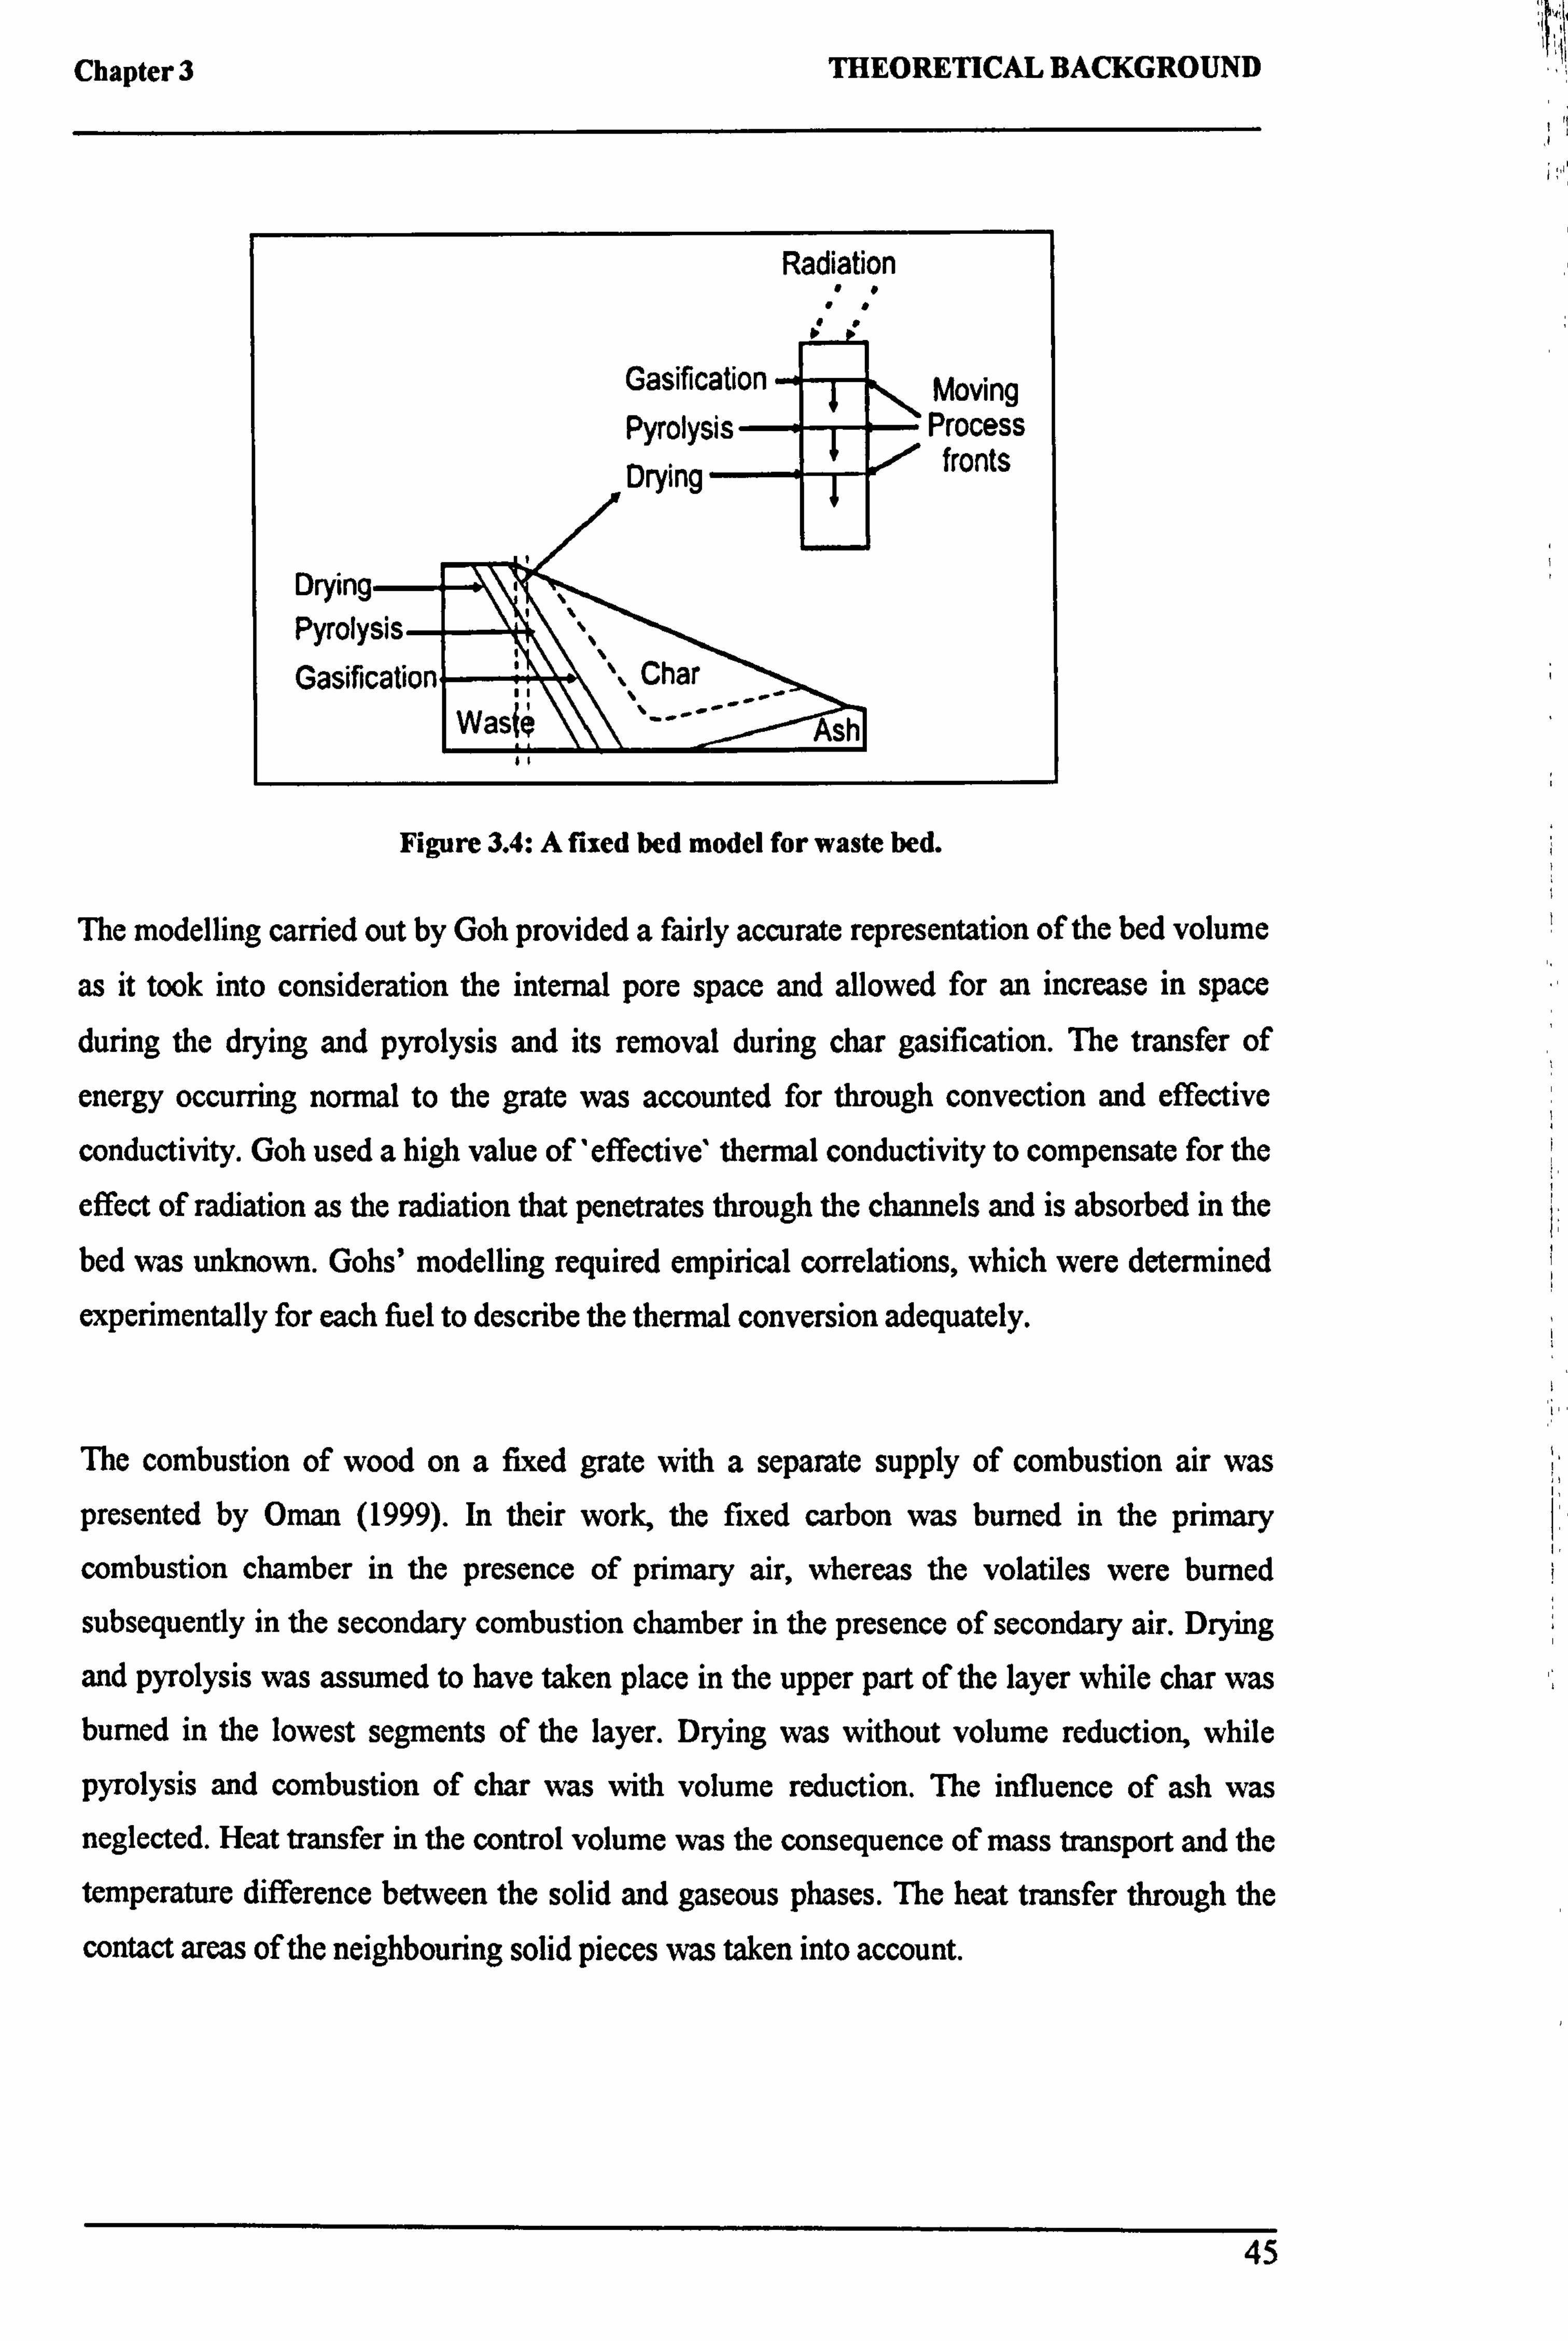
Chapter 3 THEORETICAL BACKGROUND
Figure 3.4: A fixed bed model for waste bed.
The modelling carried out by Goh provided a fairly accurate representation of the bed volume
as it took into consideration the internal pore space and allowed for an increase in space during the drying and pyrolysis and its removal during char gasification. The transfer of
energy occurring normal to the grate was accounted for through convection and effective
conductivity. Goh used a high value of 'effective' thermal conductivity to compensate for the
effect of radiation as the radiation that penetrates through the channels and is absorbed in the
bed was unknown. Gohs' modelling required empirical correlations, which were determined
experimentally for each fuel to describe the thermal conversion adequately.
The combustion of wood on a fixed grate with a separate supply of combustion air was
presented by Oman (1999). In their work, the fixed carbon was burned in the primary
combustion chamber in the presence of primary air, whereas the volatiles were burned
subsequently in the secondary combustion chamber in the presence of secondary air. Drying
and pyrolysis was assumed to have taken place in the upper part of the layer while char was burned in the lowest segments of the layer. Drying was without volume reduction, while
pyrolysis and combustion of char was with volume reduction. The influence of ash was neglected. Heat transfer in the control volume was the consequence of mass transport and the temperature difference between the solid and gaseous phases. The heat transfer through the
contact areas of the neighbouring solid pieces was taken into account.
45
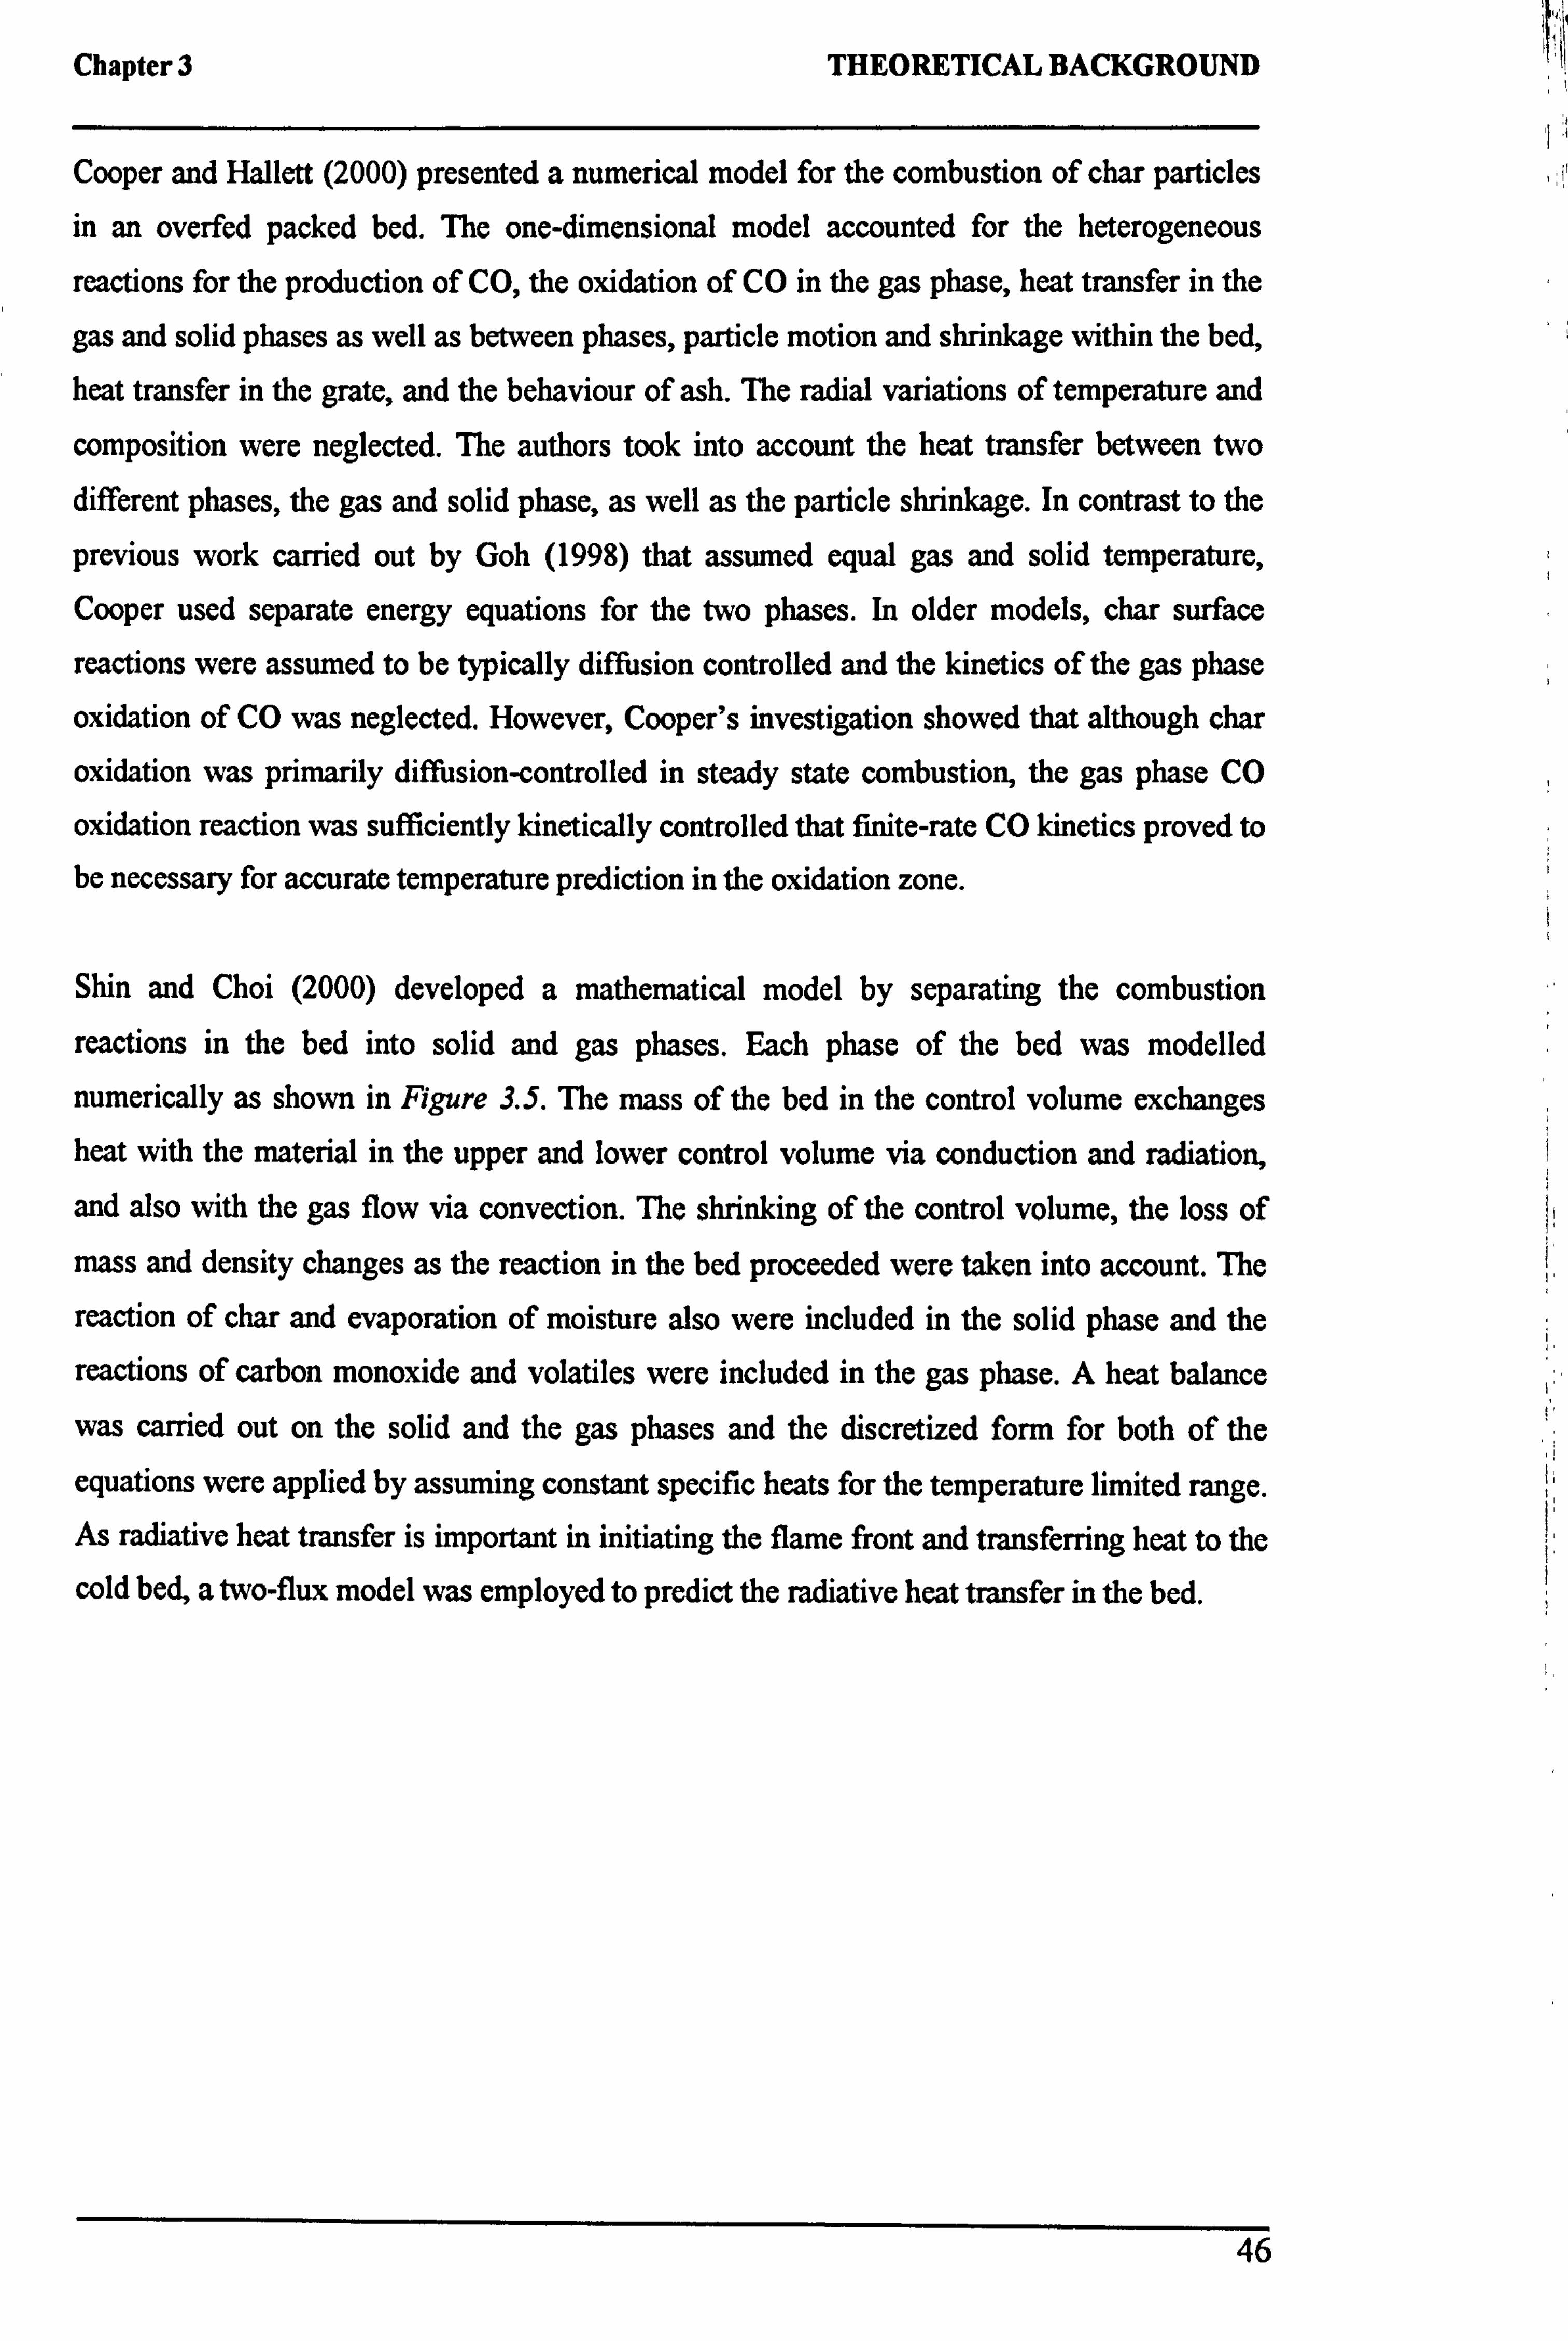
Chapter 3 THEORETICAL BACKGROUND
Cooper and Hallett (2000) presented a numerical model for the combustion of char particles in an overfed packed bed. The one-dimensional model accounted for the heterogeneous
reactions for the production of CO, the oxidation of CO in the gas phase, heat transfer in the
gas and solid phases as well as between phases, particle motion and shrinkage within the bed,
heat transfer in the grate, and the behaviour of ash. The radial variations of temperature and
composition were neglected. The authors took into account the heat transfer between two
different phases, the gas and solid phase, as well as the particle shrinkage. In contrast to the
previous work carried out by Goh (1998) that assumed equal gas and solid temperature, Cooper used separate energy equations for the two phases. In older models, char surface
reactions were assumed to be typically diffusion controlled and the kinetics of the gas phase
oxidation of CO was neglected. However, Cooper's investigation showed that although char
oxidation was primarily diffusion-controlled in steady state combustion, the gas phase CO
oxidation reaction was sufficiently kinetically controlled that finite-rate CO kinetics proved to be necessary for accurate temperature prediction in the oxidation zone.
Shin and Choi (2000) developed a mathematical model by separating the combustion
reactions in the bed into solid and gas phases. Each phase of the bed was modelled
numerically as shown in Figure 3.5. The mass of the bed in the control volume exchanges heat with the material in the upper and lower control volume via conduction and radiation,
and also with the gas flow via convection. The shrinking of the control volume, the loss of
mass and density changes as the reaction in the bed proceeded were taken into account. The
reaction of char and evaporation of moisture also were included in the solid phase and the
reactions of carbon monoxide and volatiles were included in the gas phase. A heat balance
was carried out on the solid and the gas phases and the discretized form for both of the
equations were applied by assuming constant specific heats for the temperature limited range. As radiative heat transfer is important in initiating the flame front and transferring heat to the
cold bed, a two-flux model was employed to predict the radiative heat transfer in the bed.
46
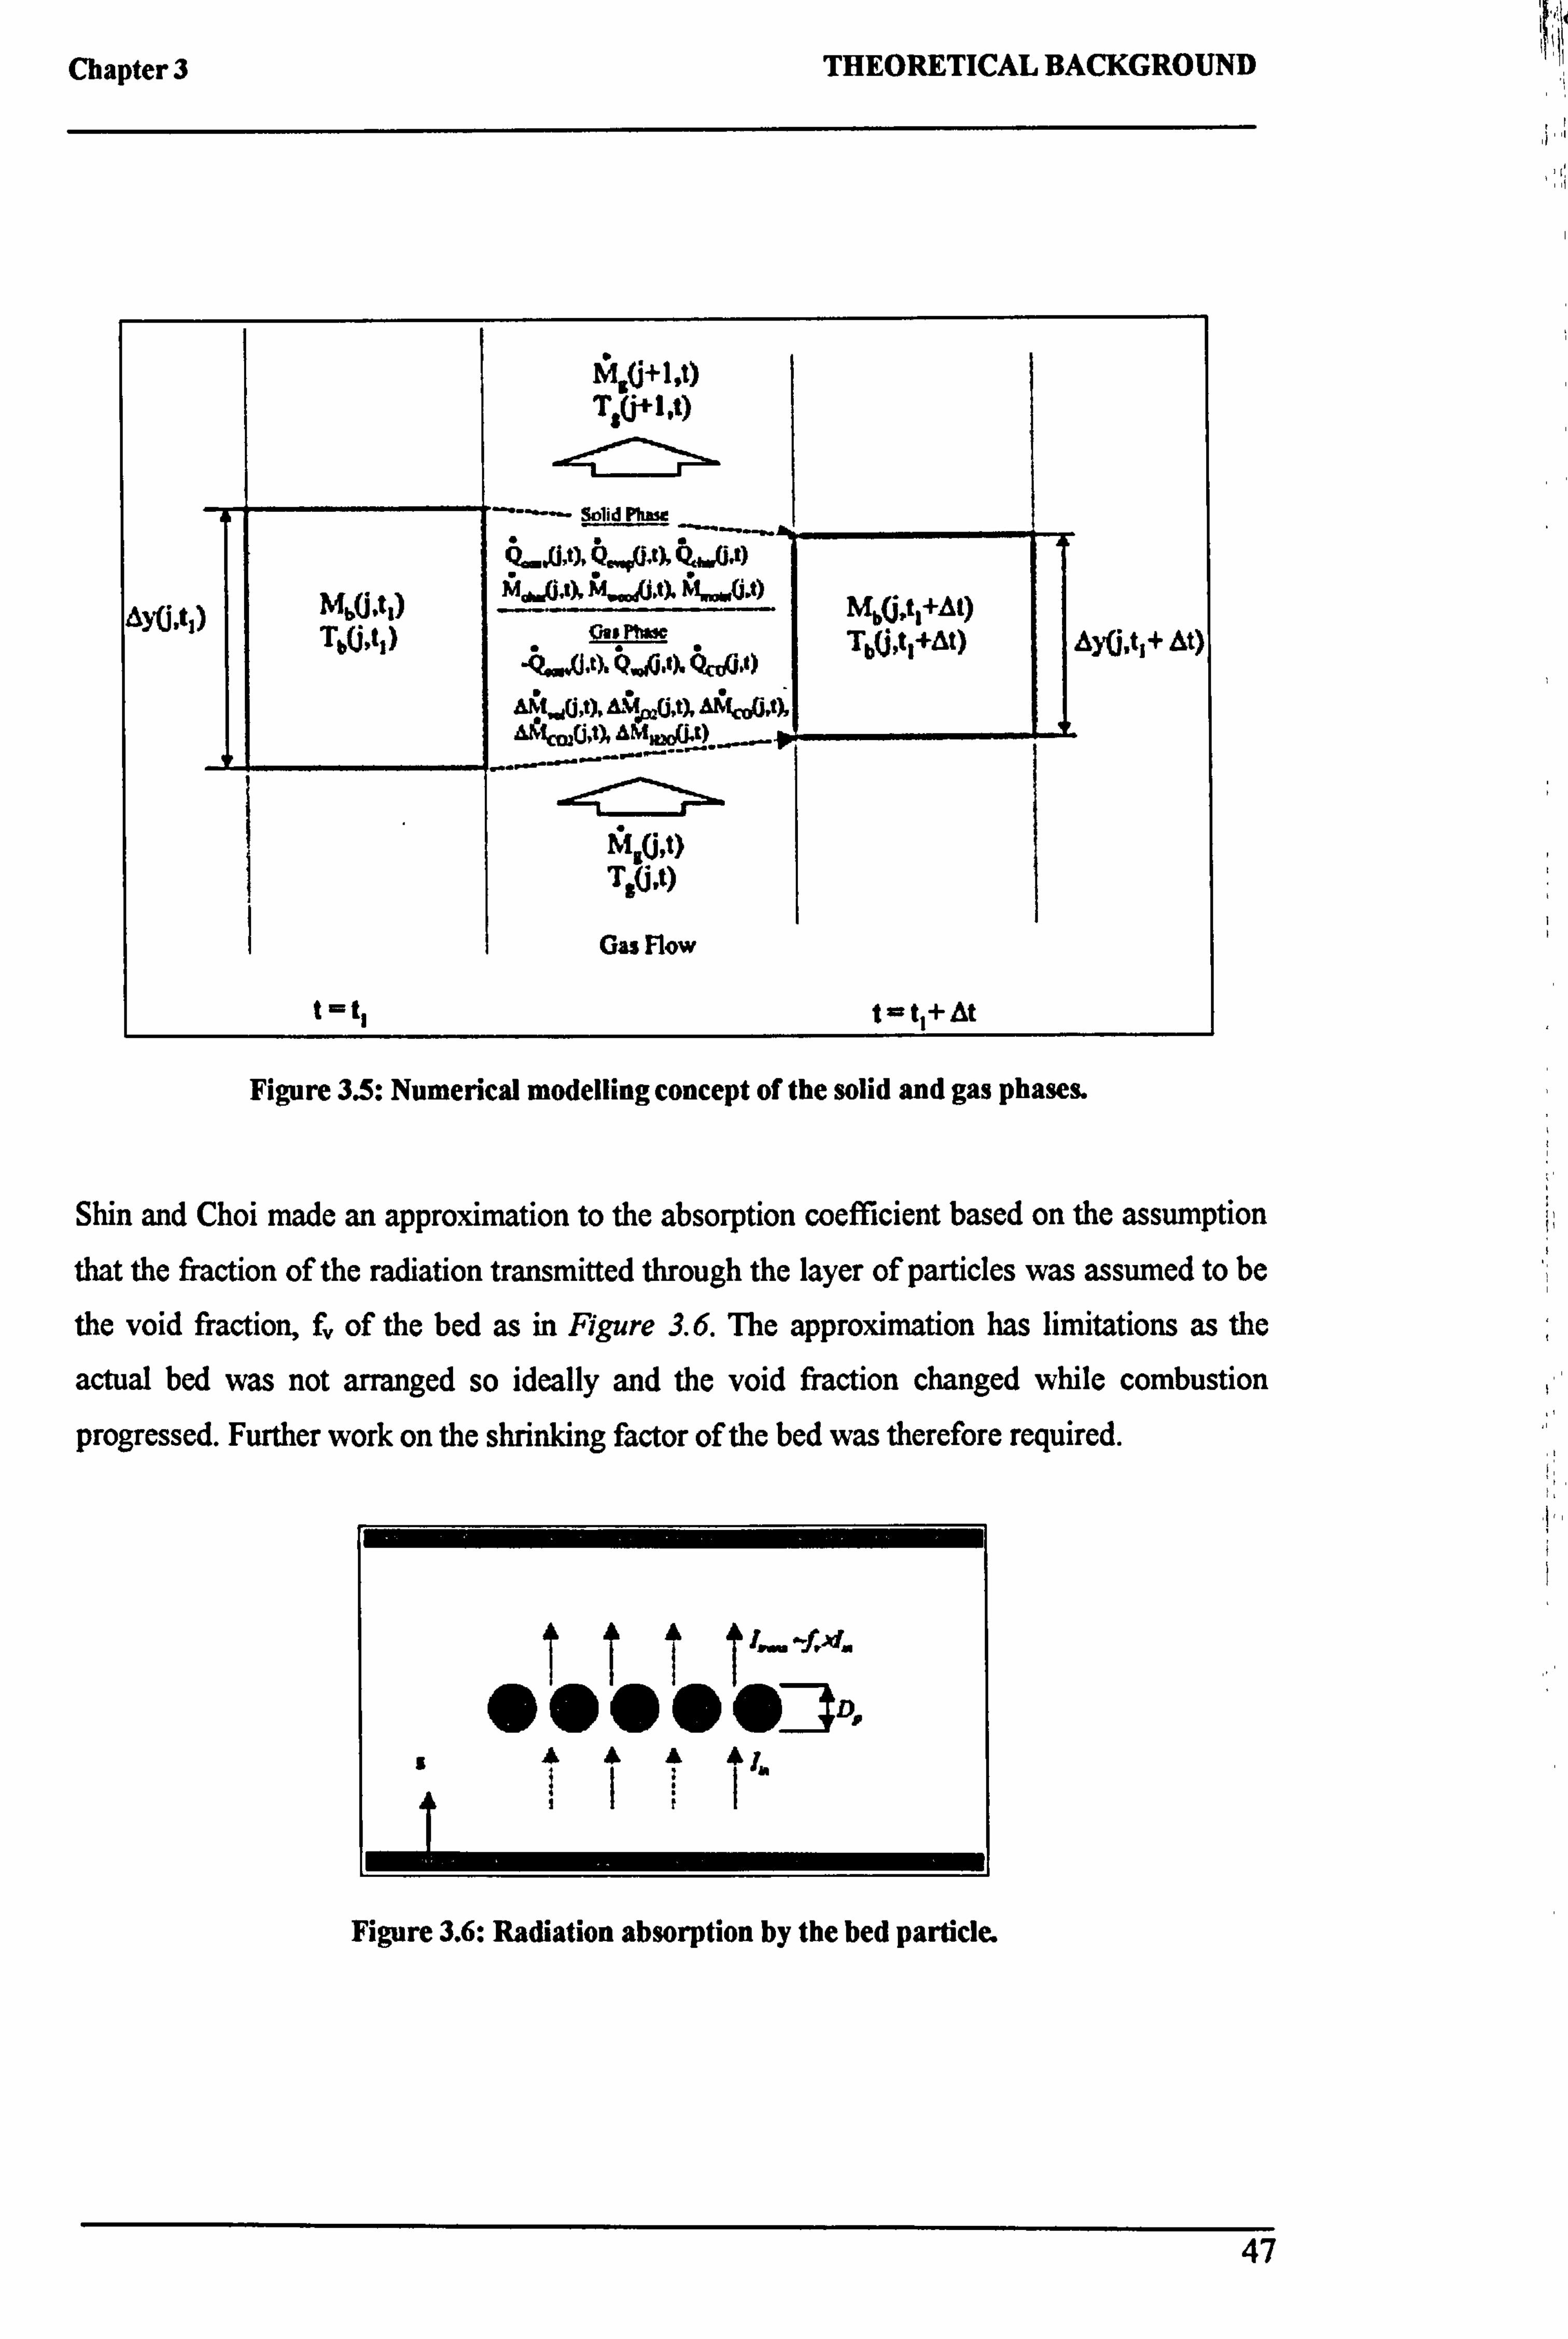
Chapter 3 THEORETICAL BACKGROUND
? sü+t, t) TT(j+l, t)
---- solid Phase
p ,t Mb(, tl)
Ma. U"`ý M. ýti tý A. G. t) Mbu}tI+At) TbG, tl) cairn Tb(i, tt+At) py(j, tl+ At)
1gG, t) T1(j, t)
Gas Flow
t= tI tats+ At
Figure 3.5: Numerical modelling concept of the solid and gas phases.
Shin and Choi made an approximation to the absorption coefficient based on the assumption
that the fraction of the radiation transmitted through the layer of particles was assumed to be
the void fraction, f� of the bed as in Figure 3.6. The approximation has limitations as the
actual bed was not arranged so ideally and the void fraction changed while combustion
progressed. Further work on the shrinking factor of the bed was therefore required.
1I ýiw Jiidw
"""""JD,
s! £44,
. ICI
Figure 3.6: Radiation absorption by the bed particle.
47
Chapter 3 THEORETICAL BACKGROUND
Peters (1995) has summarised the general governing equations for both the gas and solid
phases in a moving bed. For a stationary bed, the source term in gas and solid continuity
equations accounts for the conversion rate from solid to gas due to moisture evaporation, devolatilisation and char combustion.
Yang (2002) extended the numerical calculation in a stationary bed of solid waste material
carried out initially by Goh (1998). The governing equations for mass, momentum and heat
transfer for both solid and gaseous phases in a moving packed bed of waste solids were described. A 2-D interactive computer program was developed to solve all the concerned
equations numerically. The work carried out by Yang provided more spatial details of the incineration processes within bed as most of the previous work was on the empirical side. In
his model, the individual process rates such as moisture evaporation, volatile devolatilization
and char burning can be monitored and analysed. The incineration process of solid waste was divided into four successive sub-processes: evaporation of moisture from the solids, volatile
release/char formation, burning of the hydrocarbon volatiles in the gaseous space, and the
gasification of char particles. These processes may overlap to some extent. In the calculation,
the burning of volatile hydrocarbon gases was limited not only by the reaction kinetics but
also by the mixing-rate of gaseous fuel with the under-fire air. The bed radiation was
simulated by a four-flux model. The cell-averaged mixing in the freeboard area was
correlated to a number of parameters including local void fraction, gas velocity and length
scale comparable to particle size or size of the void space. The work carried out by Yang
forms the basis for the FLIC calculation used in this research work.
A homogeneous two-dimensional mathematical model was developed for combustion of
straw in a cross-current moving bed by van der Lans (2000). The model was used to predict the ignition front temperature and front propagation rate. In the model, Lans (2000) assumed that only the reaction of 02 with char took place in the bed. The particle shrinkage was not taken into account as he assumed that the outer surface area of the char corresponds to that of straw before reaction. As the theoretical prediction of C02/CO ratio was incorrect, the ratio was then fixed in the model. Further development in the gas-phase chemistry was required as
van der Lans work lacks other reactions in the char oxidation period such as the formation of carbon monoxide and the reverse reaction to account for the dissociation of carbon dioxide at high temperature.
Previous modelling had mostly been based on the transient, one-dimensional model as a representation of the two-dimensional steady-state model. Heat was assumed to be absorbed symmetrically on the surfaces of the particle. All the studies-mentioned above only access the
48
Chapter 3 THEORETICAL BACKGROUND
ideal case of surface reactions on a particle without temperature and species profiles inside
the particles. The models could not predict thermal conversion very accurately and required
several empirical correlations to compensate.
Thunman and Leckner (2003) developed a model to investigate the conversion of thermally
large wood particles in a fixed fuel bed on a grate. The model is formulated in a general way
and can be applied for co-current and counter-current combustion of any solid fuel. The bed
voidage was assumed to be constant and the absorption of radiation in the gas is negligible. In
contrast to other models previously developed, the derivation in this case includes irregularly
shaped, shrinking, thermally large particles, elutriation of solids, solids mixing in the bed
expressed as dispersion, and heat transport by diffusion of gas species or by dispersion of
solids. A shrinkage factor was determined empirically from experiment. In the mathematical
modelling of solid waste, Yang (2003) compensated for non-isothermal behaviour of a single
particle by reducing the cell size to a size-scale much smaller than the fuel particle.
For the past years, there has been very little research on the channelling phenomenon. The
current theory adopted by most researchers was to assume a uniform bed where combustion
and incineration of municipal solid waste occurs. Yang (2003) worked on the experimental
observations of channelling in the burning bed of municipal solid waste incinerator. A
detailed numerical simulation of the growth of an individual burning channel was carried out. Yang discussed the formation of channels by 'push' and 'loose' circles of the bed induced by
the grate movement. Channelling was found to present a chaotic and three-dimensional
pattern. The temperature profile was not orderly and the flame front reaches the bed bottom
much earlier while a significant part of the bed is still to be ignited. The detailed mathematical
simulation showed that the bulk of the oxidation processes took place inside the channel
where local temperature was 100-200°C higher than the bed temperature in the neighbouring
areas. The flame front was found to travel faster inside the channel and a hollow formed in
the bed centre grew deeper and bigger as the burning process proceeded
The approach taken by Peters (2002) was slightly different from the rest of the numerical modelling carried out previously. The packed bed was considered to be composed of a finite
number of individual particles with different sizes and properties. Each of the particles undergoes a sequence of processes such as heat-up, drying, pyrolysis or gasification and oxidation. The sum of these processes represents the conversion of a packed bed. A single particle model was developed and applied to each particle in the bed to present the entire
49
Chapter 3 THEORETICAL BACKGROUND
conversion of a packed bed in the Discrete Particle Model (DPM). The single particle model
is based on a system of one-dimensional transient conservation equations for mass and energy
to predict major properties such as temperature and distribution of species inside a particle.
The numerical model for the packed bed was carried out in two parts; the conversion of a
single particle and the model of the void space of a packed bed. The particles are coupled to
the surrounding gaseous phase by heat and mass transfer.
A similar modelling approach was taken by Bruch (2003). The packed bed was taken to
consist of a finite number of particles where an individual particle undergoes a thermal
conversion process, described by a one-dimensional and transient model. Brunch aimed at
developing a general model to cover the entire conversion process of biomass fuels, from
drying to char conversion, which can be used to determine limiting rate. A compromise is
required between the computational time and accuracy of description, therefore a general
approach was taken to which the chemical reactions; pyrolysis, char conversion and the
homogeneous reactions within a particle were neglected. Such application of a single particle
to an entire packed bed requires some form of simplification as more detailed models would
exceed the acceptable numerical effort. The bed mesh is filled up with solid particles by
assuming a constant porosity and a certain number of neighbouring particles. The position of
the solid particles may change and is recomputed during the conversion process, due to the
depletion of solid and shrinkage of the particles.
3.3 GASIFICATION
Gasification involves many chemical reactions, the two main types being; (1) the transition of biomass to char and (2) the subsequent gasification of the char itself.
The overall reactions that can occur during the initial gasification stages for coal are given in
Figure 3.7 (Johnson, 1979). The devolatilization reactions represented were similar to a
pyrolysis model. Primary devolatilization in an inert atmosphere illustrated by reactions I-
VIII involves the evolution of coal oxygen as carbon oxides and water, in addition to the formation of other gaseous hydrocarbons, heavy oils, tar, and some gaseous hydrogen. The
solid product of this reaction stage is semichar. Secondary devolatilization is illustrated by
reaction IX, in which semichar is converted to char through the evolution of hydrogen.
Methane formation from the direct reaction of gaseous hydrogen and coal is indicated by
reaction II, which occurs concurrently with primary devolatilization reactions. Reaction VIII,
illustrates another path for the formation of methane in hydrogen, which results from the
50
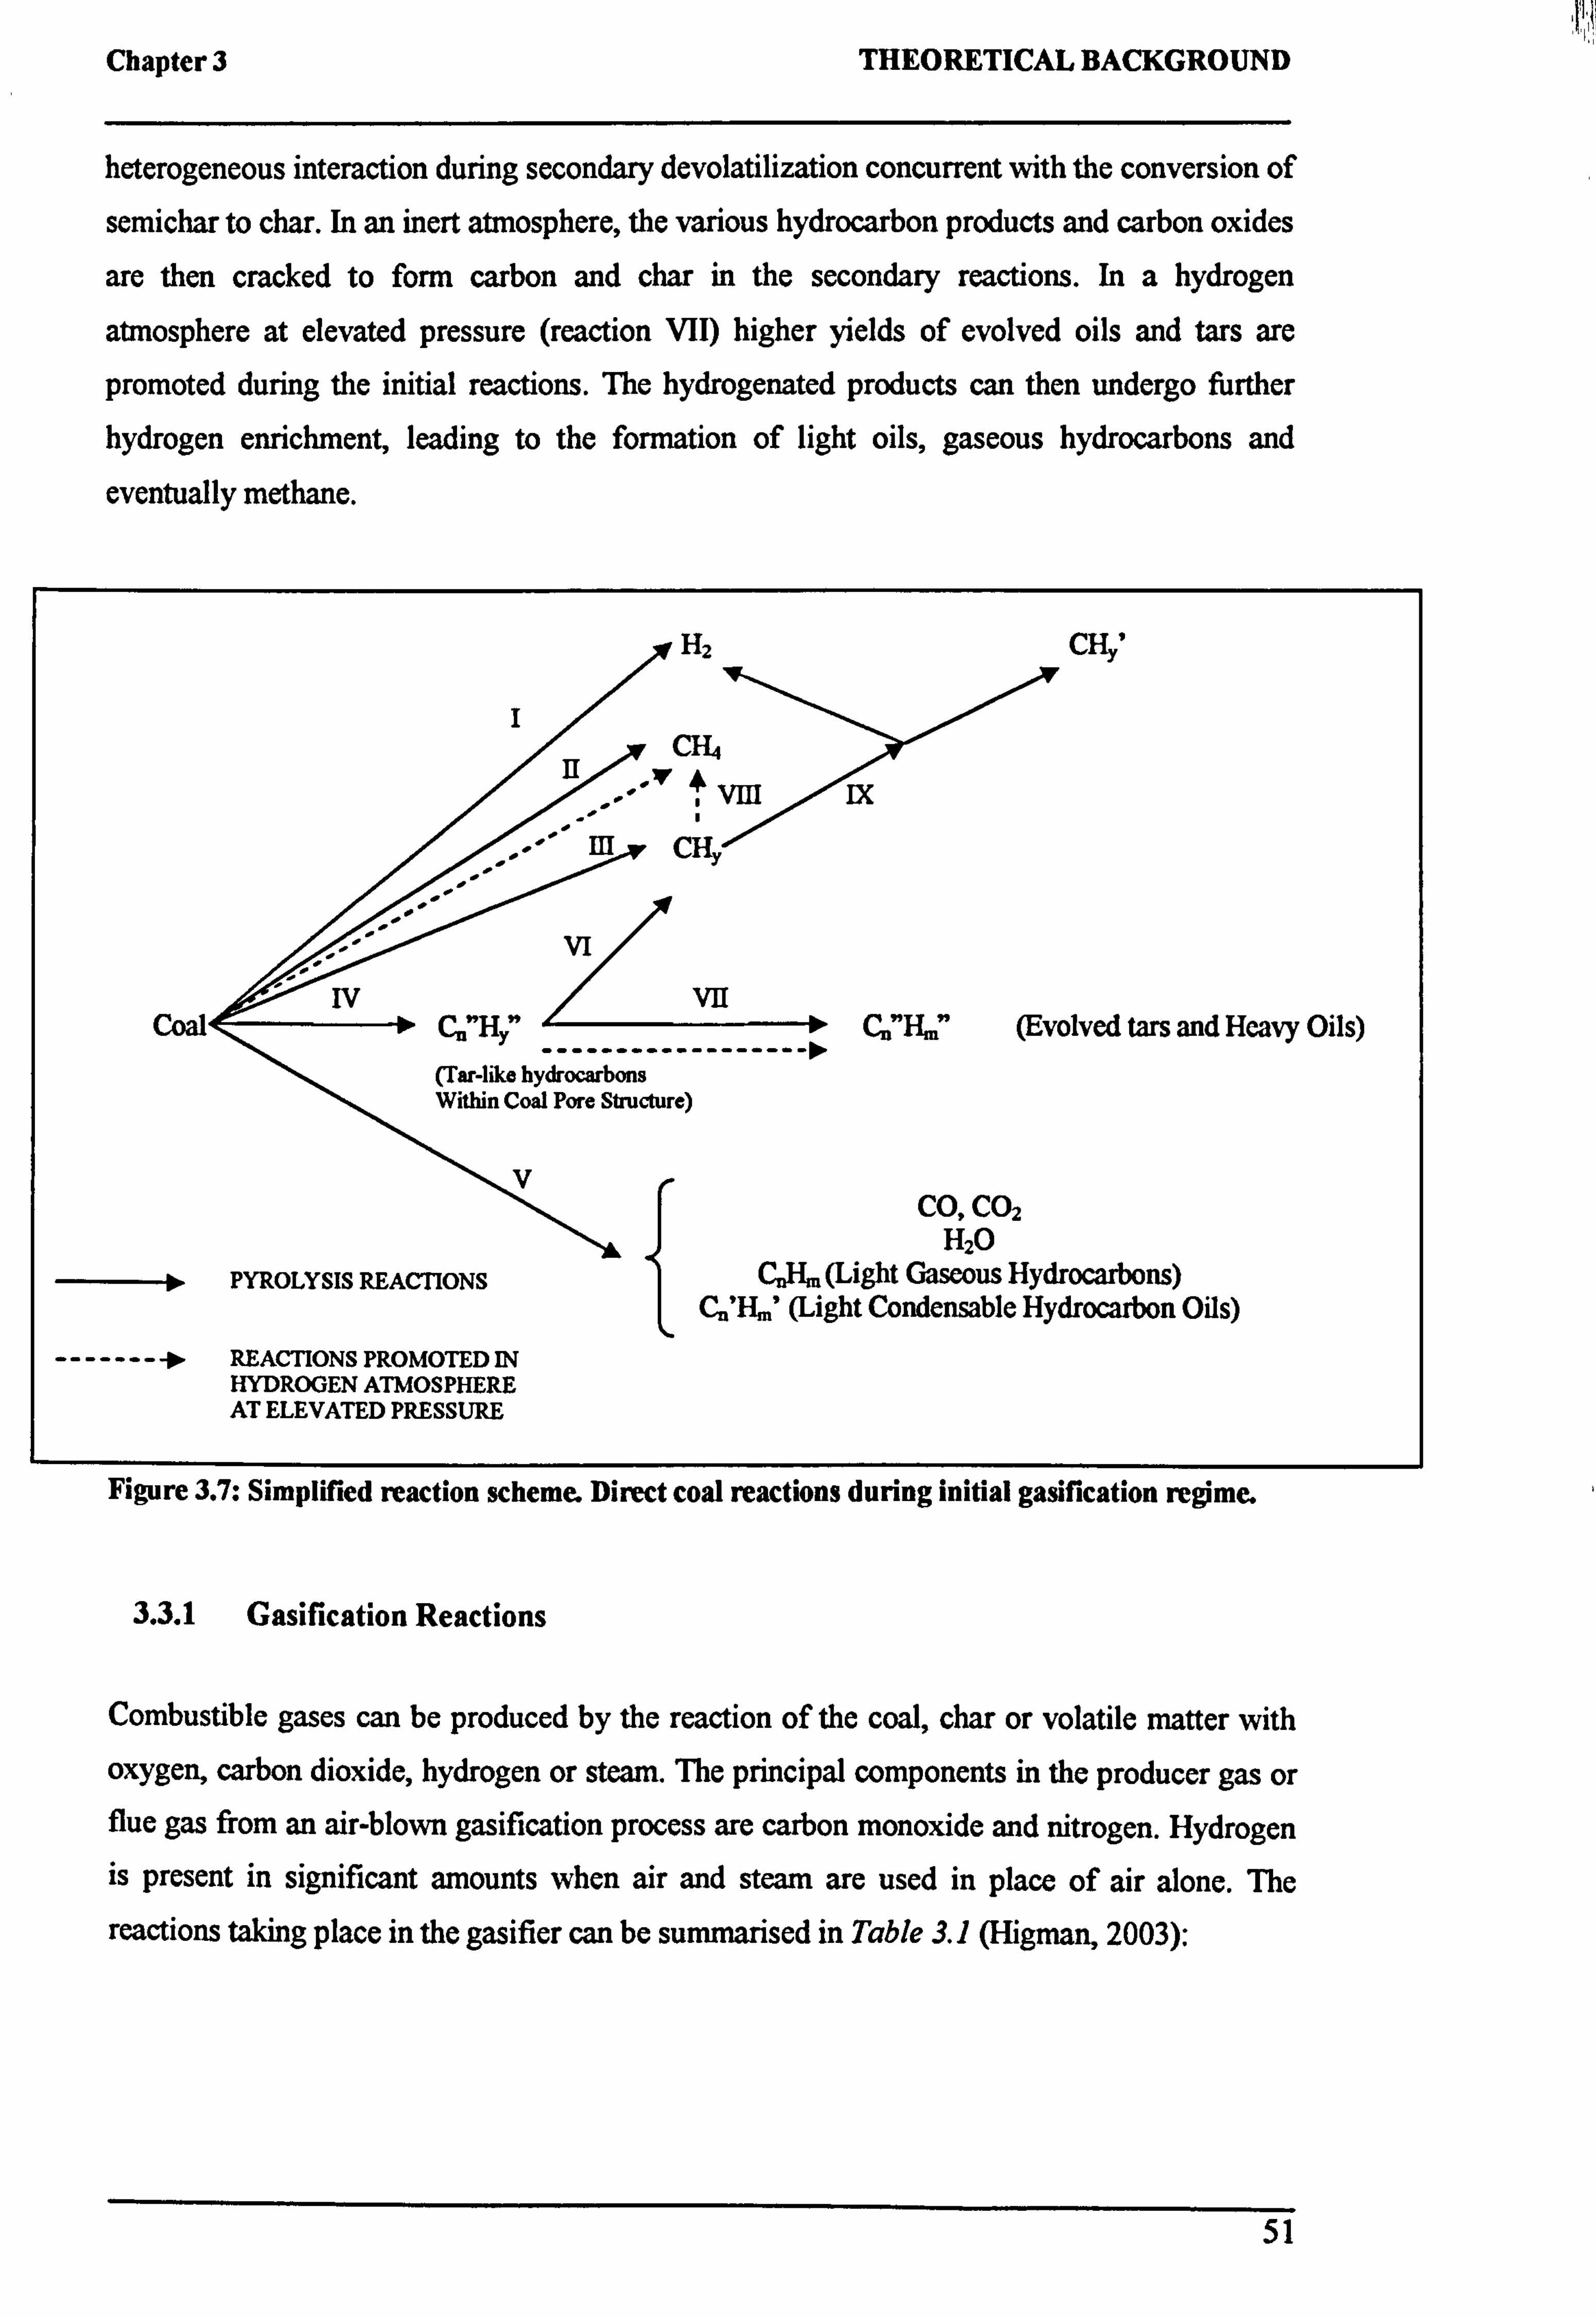
Chapter 3 THEORETICAL BACKGROUND
heterogeneous interaction during secondary devolatilization concurrent with the conversion of
semichar to char. In an inert atmosphere, the various hydrocarbon products and carbon oxides
are then cracked to form carbon and char in the secondary reactions. In a hydrogen
atmosphere at elevated pressure (reaction VII) higher yields of evolved oils and tars are
promoted during the initial reactions. The hydrogenated products can then undergo further
hydrogen enrichment, leading to the formation of light oils, gaseous hydrocarbons and
eventually methane.
Coal
HZ
1, -V * VIII IX
"ý CH,
n"H" - No.
(Tar-like hydrocarbons Within Coal Pore Structure)
º PYROLYSIS REACTIONS
-------f REACTIONS PROMOTED IN HYDROGEN ATMOSPHERE AT ELEVATED PRESSURE
CHy'
CA"Hm" (Evolved tars and Heavy Oils)
CO, CO2 H2O
CAHm (Light Gaseous Hydrocarbons) Ca'Hm' (Light Condensable Hydrocarbon Oils)
Figure 3.7: Simplified reaction scheme. Direct coal reactions during initial gasification regime.
3.3.1 Gasification Reactions
Combustible gases can be produced by the reaction of the coal, char or volatile matter with oxygen, carbon dioxide, hydrogen or steam. The principal components in the producer gas or flue gas from an air-blown gasification process are carbon monoxide and nitrogen. Hydrogen is present in significant amounts when air and steam are used in place of air alone. The
reactions taking place in the gasifier can be summarised in Table 3.1 (Higman, 2003):
51

Chapter 3 THEORETICAL BACKGROUND
Heterogeneous reaction Partial combustion C+ %O2
- CO -111 MJ/kmol
Boudouard reaction C+ CO2 H 2CO +266 MJ/kmol
Water gas reaction C+ H2O H CO + H2 +131 MJ/kmol
Hydro-gasification reaction C+ 2H2 H CH4 -75 MJ/lanol
Homogenous Reaction
Oxidation reaction CO + 12 O2 = CO2 -283 MJ/kmol
Oxidation reaction H2 + 12 O2 = H2O -242 MJ/kmol
Methanation reaction CO + 3H2 t-> CH4 + H2O -75 MJ/kmol
Water gas shift reaction CO + H20'4-> CO2 + H2 -41 MJ/lanol
Table 3.1: Gasification reactions.
The arrows indicate that the reactions are in equilibrium and can proceed in either direction,
depending on the temperature, pressure and concentration of the reaction species. All the
reactions above are exothermic except the Boudouard and water-gas shift reaction.
Three product gas qualities with different calorific value can be produced by varying the
gasifying agent, method of operation and process operating condition (McKendry, 2002):
Low CV 4-6 MJ/Nm3 Using air and steam/air Medium CV 12-18 MJ/Nm3 Using oxygen and steam High CV 40 MJ/Nm3 Using hydrogen and hydrogenation
The principal reactions in an air-blown gasifier are the partial combustion, oxidation and Boudouard reactions. Carbon dioxide formed in the presence of excess oxygen is reduced into
carbon monoxide by the Boudouard reaction. This reaction is the most important reaction controlling the process. Its equilibrium constant greatly increases with a rise in temperature but reduces with increase in pressure. The type of carbon does not disturb the equilibrium content of carbon monoxide but influences the kinetics of the reaction. Producer gas is favoured by a high fuel bed temperature, reactive fuel and adequate time of contact (thick fuel bed) (Sarkar, 1990).
52
Chapter 3 THEORETICAL BACKGROUND ! I!
The demerits of an air-blown gasification can be overcome by the addition of steam to the
blast of air. This increases the two reactions between the carbon and steam:
C+ H2O H CO + H2. MH = +28,440kcal Reaction 3.1
C+2H20HCO2 +HZ......... _... MI = +18,600kcal fiction 3.2
The water gas reaction is active at and above 1,000°C while the shift reaction predominates between 500-600°C (Table 3.1). Both reactions are endothermic and convert the sensible heat
liberated by carbon in the bed into potential heat in combustible form, namely CO and H2.
The formation of carbon dioxide (Reaction 3.2) can be suppressed by maintaining a high bed
temperature. Similar to the Boudouard reaction, Reaction 3.1 is inhibited at high pressure.
In addition to the above reactions, there is also methane formation or methanation reaction between carbon and hydrogen. It has been reported that 80% of the methane formed appears
as result of hydrocracking of primary tar and only 20% from hydrogasification of char (Merrick, 1984). The hydrogasification reaction is an exothermic reaction and is largely
suppressed by high temperature conditions in the bed but is favoured at high pressure.
Carbon-steam and carbon-CO2 reactions compete at temperatures above the transition range
of 700-1200°C, wherein the rates become about the same. Below the transition range, the
carbon-steam reaction is much faster. The addition of oxygen to the steam-carbon reaction (to
supply endothermic heat) will yield less H2 and thus give lower H2/C ratios. Sulphur in a
gaseous phase tends to appear as H2S in a reducing atmosphere whereas in an oxidizing
atmosphere, sulphur will appear as SO2 (Hoffman, 1978).
Therefore, it can be summarised that the formation of methane, steam and carbon dioxide in
the product gas is favoured by low temperatures and high pressures whereas the presence of hydrogen and carbon monoxide points towards a high temperature and low pressure operation.
Figure 3.8 gives an example of the equilibrium trend in a C-H-O gasification system for a hydrogen-oxygen ratio of 1. Thermodynamic consideration related to gasification is important
to evaluate the limiting performance and, also for the practical design of experimental and commercial reactor systems.
53
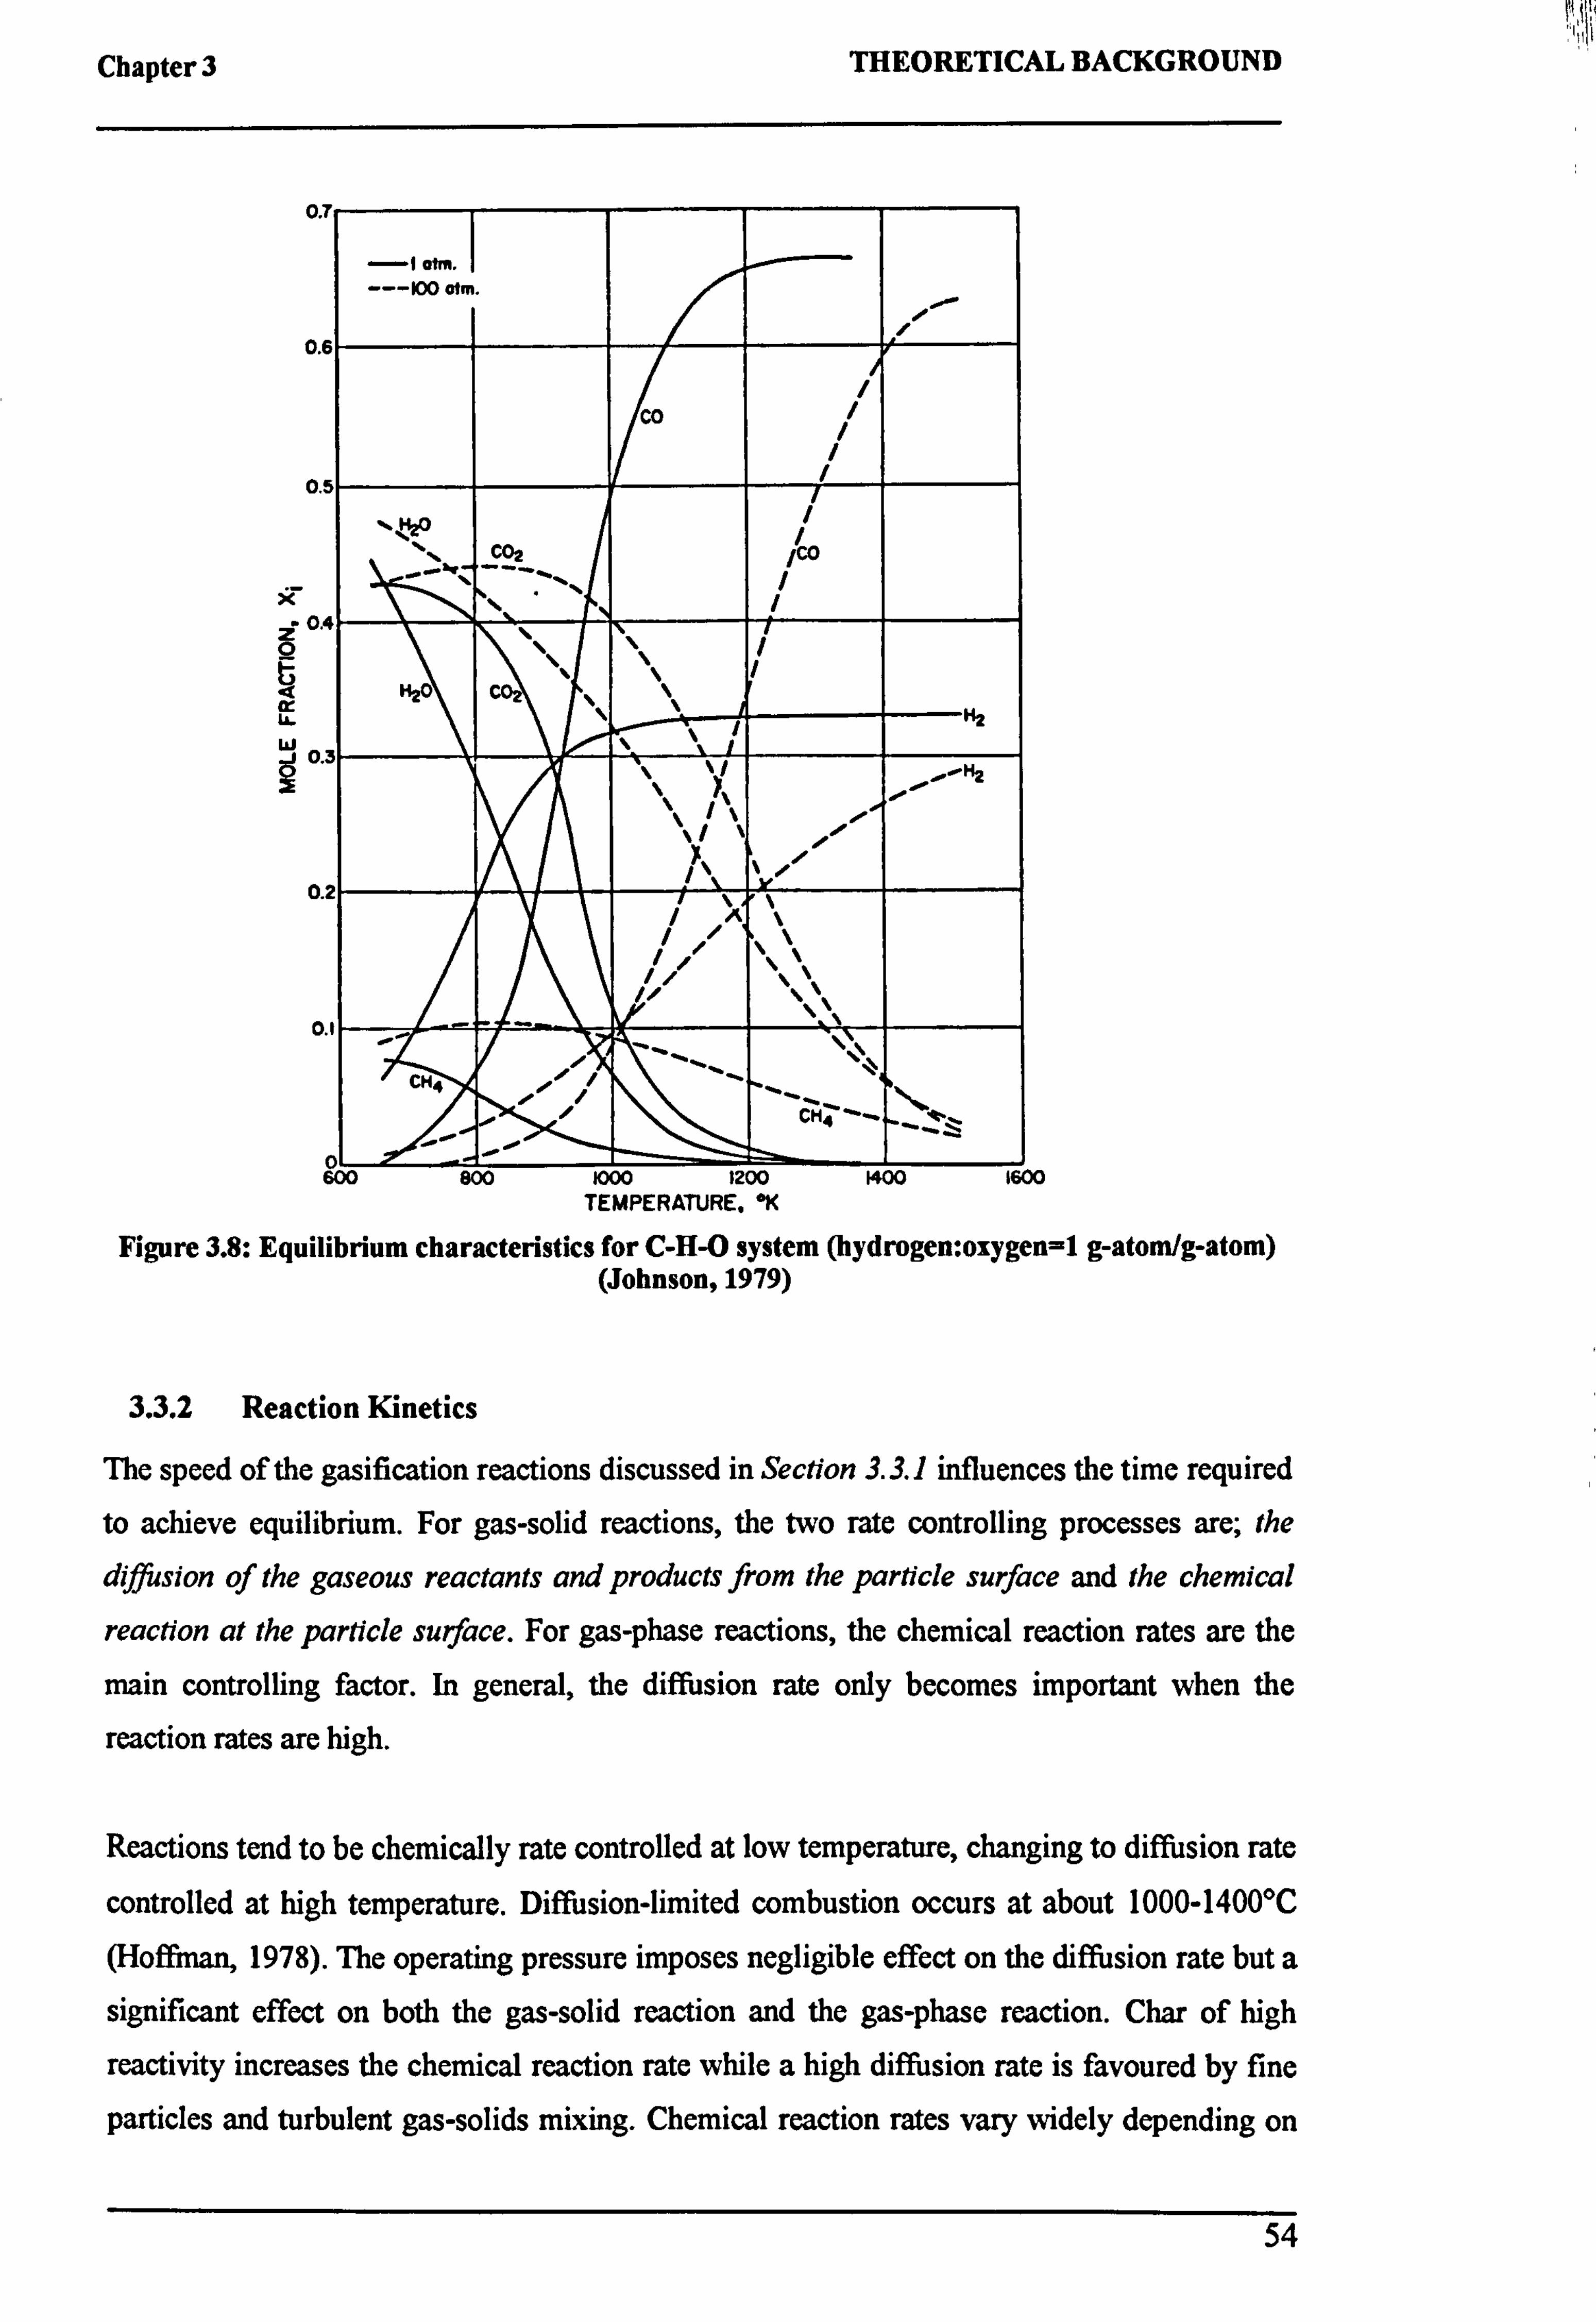
Chapter 3 THEORETICAL BACKGROUND
C
0
C
X
2C O_ ýi Q K
ýc
T
100 atm .
CO /
/ 5
ltýo C02 /CO
4
H2O \ \\
H2
3 \ \/
10,
2
/, \\
CH4
CM4 ' `ý-
n 600 800 1000 1200 1400 1600
TEMPERATURE. °K
Figure 3.8: Equilibrium characteristics for C-H-0 system (hydrogen: oaygen=1 g-atom/g-atom) (Johnson, 1979)
3.3.2 Reaction Kinetics
The speed of the gasification reactions discussed in Section 3.3.1 influences the time required to achieve equilibrium. For gas-solid reactions, the two rate controlling processes are; the diffusion of the gaseous reactants and products from the particle surface and the chemical
reaction at the particle surface. For gas-phase reactions, the chemical reaction rates are the
main controlling factor. In general, the diffusion rate only becomes important when the
reaction rates are high.
Reactions tend to be chemically rate controlled at low temperature, changing to diffusion rate
controlled at high temperature. Diffusion-limited combustion occurs at about 1000-1400°C
(Hoffman, 1978). The operating pressure imposes negligible effect on the diffusion rate but a
significant effect on both the gas-solid reaction and the gas-phase reaction. Char of high
reactivity increases the chemical reaction rate while a high diffusion rate is favoured by fine
particles and turbulent gas-solids mixing. Chemical reaction rates vary widely depending on
54
Chapter 3 THEORETICAL BACKGROUND
the type of reactants as combustion and pyrolysis reactions are extremely quick, compared to
the water-gas and shift reactions. For air gasification, the high combustion rate causes the
process to shift towards a diffusion controlled reaction, however, the other reactions such as
the Boudouard, hydrogasification, water-gas, shift and methanation are generally chemical
reaction controlled at non-slagging temperature (<1200°C) (Merrick, 1984).
3.4 DEVELOPMENTS IN GASIFICATION MODELLING
Goetz et al (1983) carried out gasification tests on four commercial types of coals ranking from bituminous coal to lignite in a drop tube furnace system, to determine the kinetic
parameters of these coals. Some of the main conclusions drawn from their findings are that
temperature and CO2partial pressure play important roles during the gasification of coal. Char
combustion and gasification could be assumed to proceed by a "shrinking core" mechanism. The reaction rate was found to exhibit near first order dependency on carbon dioxide partial
pressure. Tancredi et al (1996) investigated the reactivity of chars from Eucalyptus sawdust
prepared under different carbonisation temperatures. Char prepared at a low carbonisation
temperature showed higher reactivity. The gasification of the lower carbonisation char seems
to start at lower temperature. The reactivity of char increases with conversion, which, at low
and intermediate conversion can be attributed to the increase in surface area as the
gasification proceeds. At high conversion levels, a steeper increase in reactivity was observed due to the increasing catalytic effect of the metallic constituents (mainly Na and K) of the
inorganic matter present in char. The influence of the treatment condition during pyrolysis on
the reactivity of char was further investigated by Chen et al (1997) using a tubular reactor. A
rapid heating of char from biomass gave high reactivity in reaction with both CO2 and steam
compared to char formed under slow heating. The reactivity of chars from rapid pyrolysis is
2.4-3.3 times the value of the rate constant from slow pyrolysis.
Fushimi et al (2003) carried out work on the effect of heating rate on the final conversion and
reaction rate of char. The steam gasification was carried out using biomass materials (cellulose, lignin and bagasse) in a thermobalance reactor. In the rapid pyrolysis experiments
conducted, the evolution of low molecular weight gases such as H2, CO, CO2 and CH4
occurred at about the same time. One important finding in their study was the decrease of tar
and increased yield of carbon in the gas with rapid heating due to enhanced decomposition of tar. The importance of the water-gas shift reaction in affecting the overall gas composition
was highlighted as rapid heating or high temperatures were seen to encourage the evolution of CO.
55

Chapter 3 THEORETICAL BACKGROUND
de Jong et al (2003) studied the characteristics of two biomass fuels (pelletised Miscanthus
Giganteus and wood) at three heating rates (10,30,100°C/min) using thermogravimetric
analysis with a final temperature of 900°C. Contradicting the results obtained by Fushimi
(2003), Jong found that the tar yields increase at the expense of lighter gaseous species
(mostly, CO, COz, and acetaldehyde) as the heating rate increases. It was explained that at
high heating rates, there is insufficient time for the evolution of light species, and thus, tar
fragments leaving the biomass carry with them precursor material that could result in light gas
compound formation. The pyrolysis of miscanthus was found to produce higher yields of char
and lower yields of volatile matter compared to wood due to the difference in biochemical
composition.
Na et al (2003) studied the oxygen-blown fixed bed gasification of waste pellets ((=2-3cm)
in the temperature range of 1100-1450°C. A higher methane concentration was produced by
PE (plastic) gasification compared to the mixed-waste gasification due to the increased
cracking. His experimental study showed that the product gas composition was sensitive to
the 02/waste ratio. The CO concentration in the product gas was found to increase to a
maximum at an 02/waste ratio of 0.35-0.45 and then decreases. For an O? /waste ratio above
0.45, the concentration of H2, CH4 and CO decreased while CO2 increased.
Di Blasi (1993) reviewed the thermal degradation processes of charring and non-charring
materials. Cellulosic material pyrolysis was said to occur under two different regimes: (1) the
chemical regime, and (2) the heat transfer regime. The pyrolysis of wood and biomass
materials was described in two stages, primary reactions of virgin solid degradation and
secondary reactions of evolved degradation products. Blasi outlined the three main classes of
pyrolysis kinetic studies:
1) one step global models, when a one-step reaction is used to describe degradation of
solid fuel by means of experimentally measured rates of weight loss:
SOLID -! -> FOLA TILES + CHAR
2) One-stage, multi-reaction models, used to correlate reaction product distribution.
These are one-stage simplified kinetic models, made of several reactions, describing
the degradation of the solid to char and several gaseous species. The proposed models
56
Chapter 3 THEORETICAL BACKGROUND
assume that the virgin solid fuel decomposes directly to each reaction product i,
except tar, by a single independent reaction according to:
VIRGINFUEL --! -)PRODUCT,
The kinetics is modelled through a unimolar-first order reactions rate which was
expressed as:
dVj =A' . exp(- E, /RTXV, ̀ -V; dt
Where V; is the yield of the product i, and A; and E; are the pre-exponential factor and
apparent activation energy, respectively.
3) Two-stage, semi-global model, when the kinetic mechanism of solid degradation
includes both primary and secondary reactions. Below is an example of the first semi-
global models proposed for the degradation of cellulose:
CELL ULOSE -k-> ANHYDROCELL ULOSE
CELLULOSE--L--*TAR
ANHYDROCELLULOSE-21ý GAS +CHAR
Di Blasi (1999) employed counter-current air blown fixed-bed gasification to compare the
gasification characteristics of several biomass materials (beechwood, nutshells, olive husks
and grape residues). The gas-heating values of the product gas were reported to be in the
range of 5-5.5 MJ/Nm3 with 28-30%CO, 5-7% CO2,6-8% H2,1-2% CH4 and small amounts
of C2-hydrocarbons (apart from nitrogen). High density fuel (olive husks) led to poor flow
distribution with high amplitudes in the temperature oscillations. The non-uniform bed
properties of the grape residues caused the formation of bridges and large voids. The
experimental results also showed that the rate of fuel consumption increased with air flow rate. A higher amount of fuel consumed led to a higher bed temperature and higher rate of heat
transfer to the fuel, promoting further char gasification, pyrolysis and drying process. Findings indicated that the optimum gasification condition for grape and olive residues are
established at a higher air flow rate compared to wood.
57

Chapter 3 THEORETICAL BACKGROUND
3.5 CATALYZED GASIFICATION
Catalysts have been increasingly used in gasification processes to enhance desired reactions
and to upgrade primary products to higher quality fuels. One important effect of the catalyst is
that it permits a lowering of reaction temperature. Catalysts are used in two major reactions in
gasification processes:
" Carbon-Steam Reaction
In this case, the catalyst is used to improve the quality of the product gas in terms of
composition to make the synthesis of a higher value product, more efficient and cost effective. For example, the increased production of syngas that serves as an intermediate fuel. It could also be used to change the ratio of carbon monoxide to hydrogen for
methanol synthesis.
" Tar Breakdown
The gasification of biomass is proposed to be the future technology in gaining access to
electricity or other fuels while simultaneously maintaining the environmental quality. However, the formation of tar in the gasification processes, particularly with updraft
gasifiers greatly affects the practical application of the process. The high tar content in the
synthesis gas or biomass-derived fuel is a barrier to the application of these fuels in
engines, turbines or compressors. Higher thermal value of dry gas is obtained from the
catalytic reforming of tar as it decomposes to hydrogen and intermediate carbon compounds, which in turn will react with water, forming carbon monoxide, carbon dioxide
and hydrogen. Conventional methods of filtration are inadequate to complete the
separation of tar. Physical tar removal by water scrubbing creates more problems through
generation of dirty water requiring extensive biological or thermal treatment.
Catalytic substances such as lime or caustic soda, hydrates or carbonates, chlorides, sulphates, sulphides, silicates, metallic oxides, alkalis and metallic couples such as copper-ion have been
used to lower the carbon-steam reaction temperature. Taylor (1921) found potassium and sodium carbonates to be the best materials, particularly potassium carbonate. In the
experimental work conducted by Li and Cheng (1995) on the catalytic gasification of gas-coal char in C02, it was also found that potassium carbonate proved to be superior compared to sodium carbonate. The alkali metals in the ashes of many biomass species and some waste could act as a natural form of catalyst.
58
Chapter 3 THEORETICAL BACKGROUND
Ferric oxide was found to be only about one-tenth as effective as alkali carbonates for the
steam-carbon reaction although it was found to be very effective for the CO-shift (Hoffman,
1978). Ponder and Richards (1994) carried out an experimental study on the oxygen and CO2
gasification of chars from wood treated with iron (II) and iron (III) sulfates. Samples of
cottonwood and sapwood were sorbed with iron sulphate salt solutions. In this research, the
char samples were prepared at different heat treatment temperatures (HT F). Results showed that sorbed ferrous and ferric sulphates are only superior to indigenous inorganic in
cottonwood as catalysts in 02 gasification, only in the case of low-HHT chars. The opposite
situation was seen with CO2 where the iron sulphates are superior to the indigenous species. For both type of gasification, ferric sulphate appears to be superior to the ferrous sulphate as a catalyst.
In the review carried out by Hoffman, he pointed out several research studies that indicated
use of alkali carbonates as catalysts for carbon-oxygen steam reactions. Li and Cheng (1995)
investigated the catalytic effect of both Na2CO3 and K2CO3 in gas-coal char CO2 gasification
using a fixed-bed reactor at 790°C-1020°C and 0.2MPa. The catalytic effect of K2C03 was
proven to be greater than that of Na2C03. The reaction rate increased with loading above 9
wt% Na2C03 and 5 wt% K2C03 and starts to decrease above 25 wt% Na2C03 and 20 wt% K2C03 indicating a saturation effect. The catalytic steam gasification of Illinois No. 6 coal was carried out using binary Na2CO3 - K2C03 (NK) and ternary Li2CO3-Na2CO3 - K2C03 (LNK) eutectic salt mixtures in a fixed bed reactor by Godavarty and Agarwal (2000). The
catalyst was physically mixed in different amounts of 5 wt%, 10 wt% and 15wt% of the raw coal. Experimental findings showed that for both LNK and NK catalysts, 10 wt% is the
optimum amount of catalyst as any further increase beyond this point showed negligible increase of carbon conversion because the coal was physically saturated with catalyst. The
gasified char particles having NK catalyst coalesce indicated liquid-phase sintering whereas the ternary catalyst showed highly porous and crystalline morphology.
Asadullah (2004) investigated the effectiveness of a newly developed catalyst Rh/0002/SiO2 in both a single and dual-bed gasifier system. The Rh/Ce02/Si02 catalyst proved to exhibit a higher performance compared to the commercial steam-reforming catalyse G91 (14mass% Ni, 65-70mass% A1203,10-14 mass%CaO, and 1.4-1.8 mass%K20).
Cobalt compounds have been used in the Fischer-Tropsch reaction between CO and H2 to produce hydrocarbons. It was found that cobalt oxide reduced in hydrogen would catalyse the CO-shift, even at very low temperature. The effect of cobalt catalysts on the carbon dioxide
gasification of wood chars is also discussed by DeGroot and Richards (1988). Their work
59

Chapter 3 THEORETICAL BACKGROUND
placed a strong emphasis on the effect of heat treatment temperature (HTT) on the rate of
gasification. The chars were prepared from wood treated at and beyond the ion exchange
capacity with cobalt and compared with those prepared using calcium and potassium. Cobalt-
exchanged woods enable gasification at lower temperature whereas chars prepared from
calcium and potassium-exchanged wood was completely unreactive at this temperature. The
most reactive chars were those prepared and gasified at 600°C.
Carbonate rocks such as limestone and dolomite have been known to decompose tar
efficiently in gasification processes. Simell (1992) compared the tar decomposing activity of
potential low cost materials suitable for bulk use in gasification processes. The catalyst increases both the tar decomposing and gas reactions such as the water-gas shift and water-
gas reactions. The tested materials were divided according to their hydrocarbon decomposing
activity:
" High activity: ankerite and dolomite
" Intermediate activity: limestone, calcitic dolomite and dolomite limestone
" Low activity: sinter and pellet
The amounts of the most problematic tar compounds, polyaromatic hydrocarbons (PAH) and
monocyclic compounds, such as phenol, were reduced significantly even by the low activity
material. The effect of ankerite and dolomite were found to be comparable to that of
commercial nickel catalyst. The formation of CO was high with high activity materials and limestone. Nickel-catalyst and iron-containing materials (ankerite, sinter, pellets) decomposed
ammonia and hydrogen cyanide efficiently. Carbonate rocks decomposed hydrogen cyanide to some extent, but increased the content of ammonia. The tar composition changes were
similar with all the tested materials. The ferrous materials were not as reactive but the content
of most problematic tar fraction decreased significantly. Gases were apparently formed in the
tar decomposition reactions, the water-gas shift reaction and water-gas reaction.
3.5.1 Catalyst Application
The use of catalyst could be applied in a single bed or dual-bed gasifier system. Catalysts tend
to deactivate due to the deposition of coke and ash on the catalyst surface. This decreases the
catalyst activity as large amount of ash powder interacts with the catalyst surface and cover the active sites on the catalyst. Therefore, it is necessary to separate the catalyst from ash in
the gasification of biomass with high ash content. The dual bed gasifier has two separate
60
Chapter 3 THEORETICAL BACKGROUND
reactors for the secondary-bed reforming of tar and an ash separator used between the
reactors. The advantage of increased catalyst activity is offset by higher complexity in the
system. For biomass containing low amount of ash such as wood, the single-bed gasifier
system could be used.
Catalysts are usually used with promoters and carriers to enhance the activity of the given
catalyst. Alkali or alkali carbonates are effective promoters. Other carriers used include silica
gel, alumina, silica and dolomite. The catalysts may be prepared by impregnation from
solution, by binding agents or even physically mixed with the bed materials. Catalyst can also be sprayed on surfaces (e. g, Raney nickel) and are produced by spray drying. The process or
preparation affects the interstitial pores and the activity. The effect of the different methods of
catalyst application was studied by Mudge (1979). Two methods for wood catalyst contacting
were used here: dry mixing of wood and solid catalyst and impregnation of wood with
catalyst. The catalysts used in his study were potassium carbonate, sodium carbonate, trona
and borax, in order of their effectiveness at all temperature. Impregnation produced about 10% more gas than dry mixing with a slight increase in rate of gas production although both
contacting methods significantly increase the total gas production.
3.6 SUMMARY
The combustion on the travelling grate in a biomass plant is simulated using a laboratory
scale pot furnace to abate high cost and complex design. The literature shows that extensive experiments have been carried out using wood as a fuel source to investigate the influence of combustion parameters such as; airflow rate, moisture content, particle size and bed density
on fixed bed combustion. The behaviour of new energy crops and processed waste should be investigated experimentally before their use in commercial applications as the physical and chemical properties of the fuel source significantly affects the combustion efficiency. The
review showed that the use of numerical modelling helped to further understand the
mechanism of the combustion process. The bed calculation was based on a transient, one- dimensional model as a representation of the two-dimensional steady-state model. One of the
main assumptions made in the model was to assume negligible radiation variation with temperature and composition, limiting the model to small particles. The Discrete Particle Model (DPM) on the other hand, accounts for all processes in a single particle but the application of the model to an entire bed of particles is limited by computational time and requires some form of simplification.
61
Chapter 3 THEORETICAL BACKGROUND
The interest in gasification is driven by the fact that it yields an intermediate fuel that could be
used in an energy recovery system. The use of steam in gasification was found favourable as it leads to a higher yield of hydrogen. Nevertheless, the requirement for additional heat input
into the process has previously rendered this system economically unviable. The literature
reveals concerns regarding the problematic tar content in the synthesis gas barring its direct
application in gas turbines. Catalytic gasification has been proven useful in tackling tarry fuel
gas but at the expense of a more complicated system and higher cost. A lot of the gasification
research was carried out in a drop-tube furnace and focussed on the heating-up of the biomass.
The temperature and heating up rate of biomass materials prior to the gasification was found
to significantly affect the reactivity of the char during the gasification. The product gas
composition from the gasification was to found to be sensitive to the air/fuel ratio. From the literature, the gasification reactions were found to be chemically controlled at low
temperatures but diffusion limiting at high temperatures (>1000-1400°C) rendering the use of kinetic models appropriate in gasification calculations.
62
Chapter 4 FIXED BED COMBUSTION
CHAPTER 4
FIXED BED COMBUSTION
This chapter presents the experimental programme, results and discussions of the fixed bed
combustion of 3 main types of biomass materials (herbaceous plants, woody plants and
waste) under fuel-rich gasification conditions. The experimental setup, measurement accuracy
and experimental procedures carried out in this study are presented in detail.
The experimental results are reported in different sections corresponding to the characteristic investigated (air flow rate, fuel type and particle size). The primary air flow rate was varied in
the range of 281-468kg/m2hr to compare the performance of the fixed bed combustion under
varying conditions. This effect was tested with willow wood (woody plants), refused-derived fuel (RDF) and pelletised miscanthus (herbaceous plants). In the investigation of the effect of
particle size, all experimental conditions for the 4 cases except for the size of wood cubes (5mm, 10mm, 20mm and 35mm) were similar. A series of combustion tests was also carried out for three herbaceous crops (straw, switchgrass and reed canary grass) at different air flow
rates (237-1170kg/mzhr). The combustion experiments for straw were repeated with different
straw length to investigate the influence of bed packing on the combustion profile.
The temperature along the bed height, flue gas composition and mass loss were measured as the combustion progressed and the key results on the ignition front speed, burning rate, percentage mass loss, equivalence ratio and temperature gradient were evaluated.
63
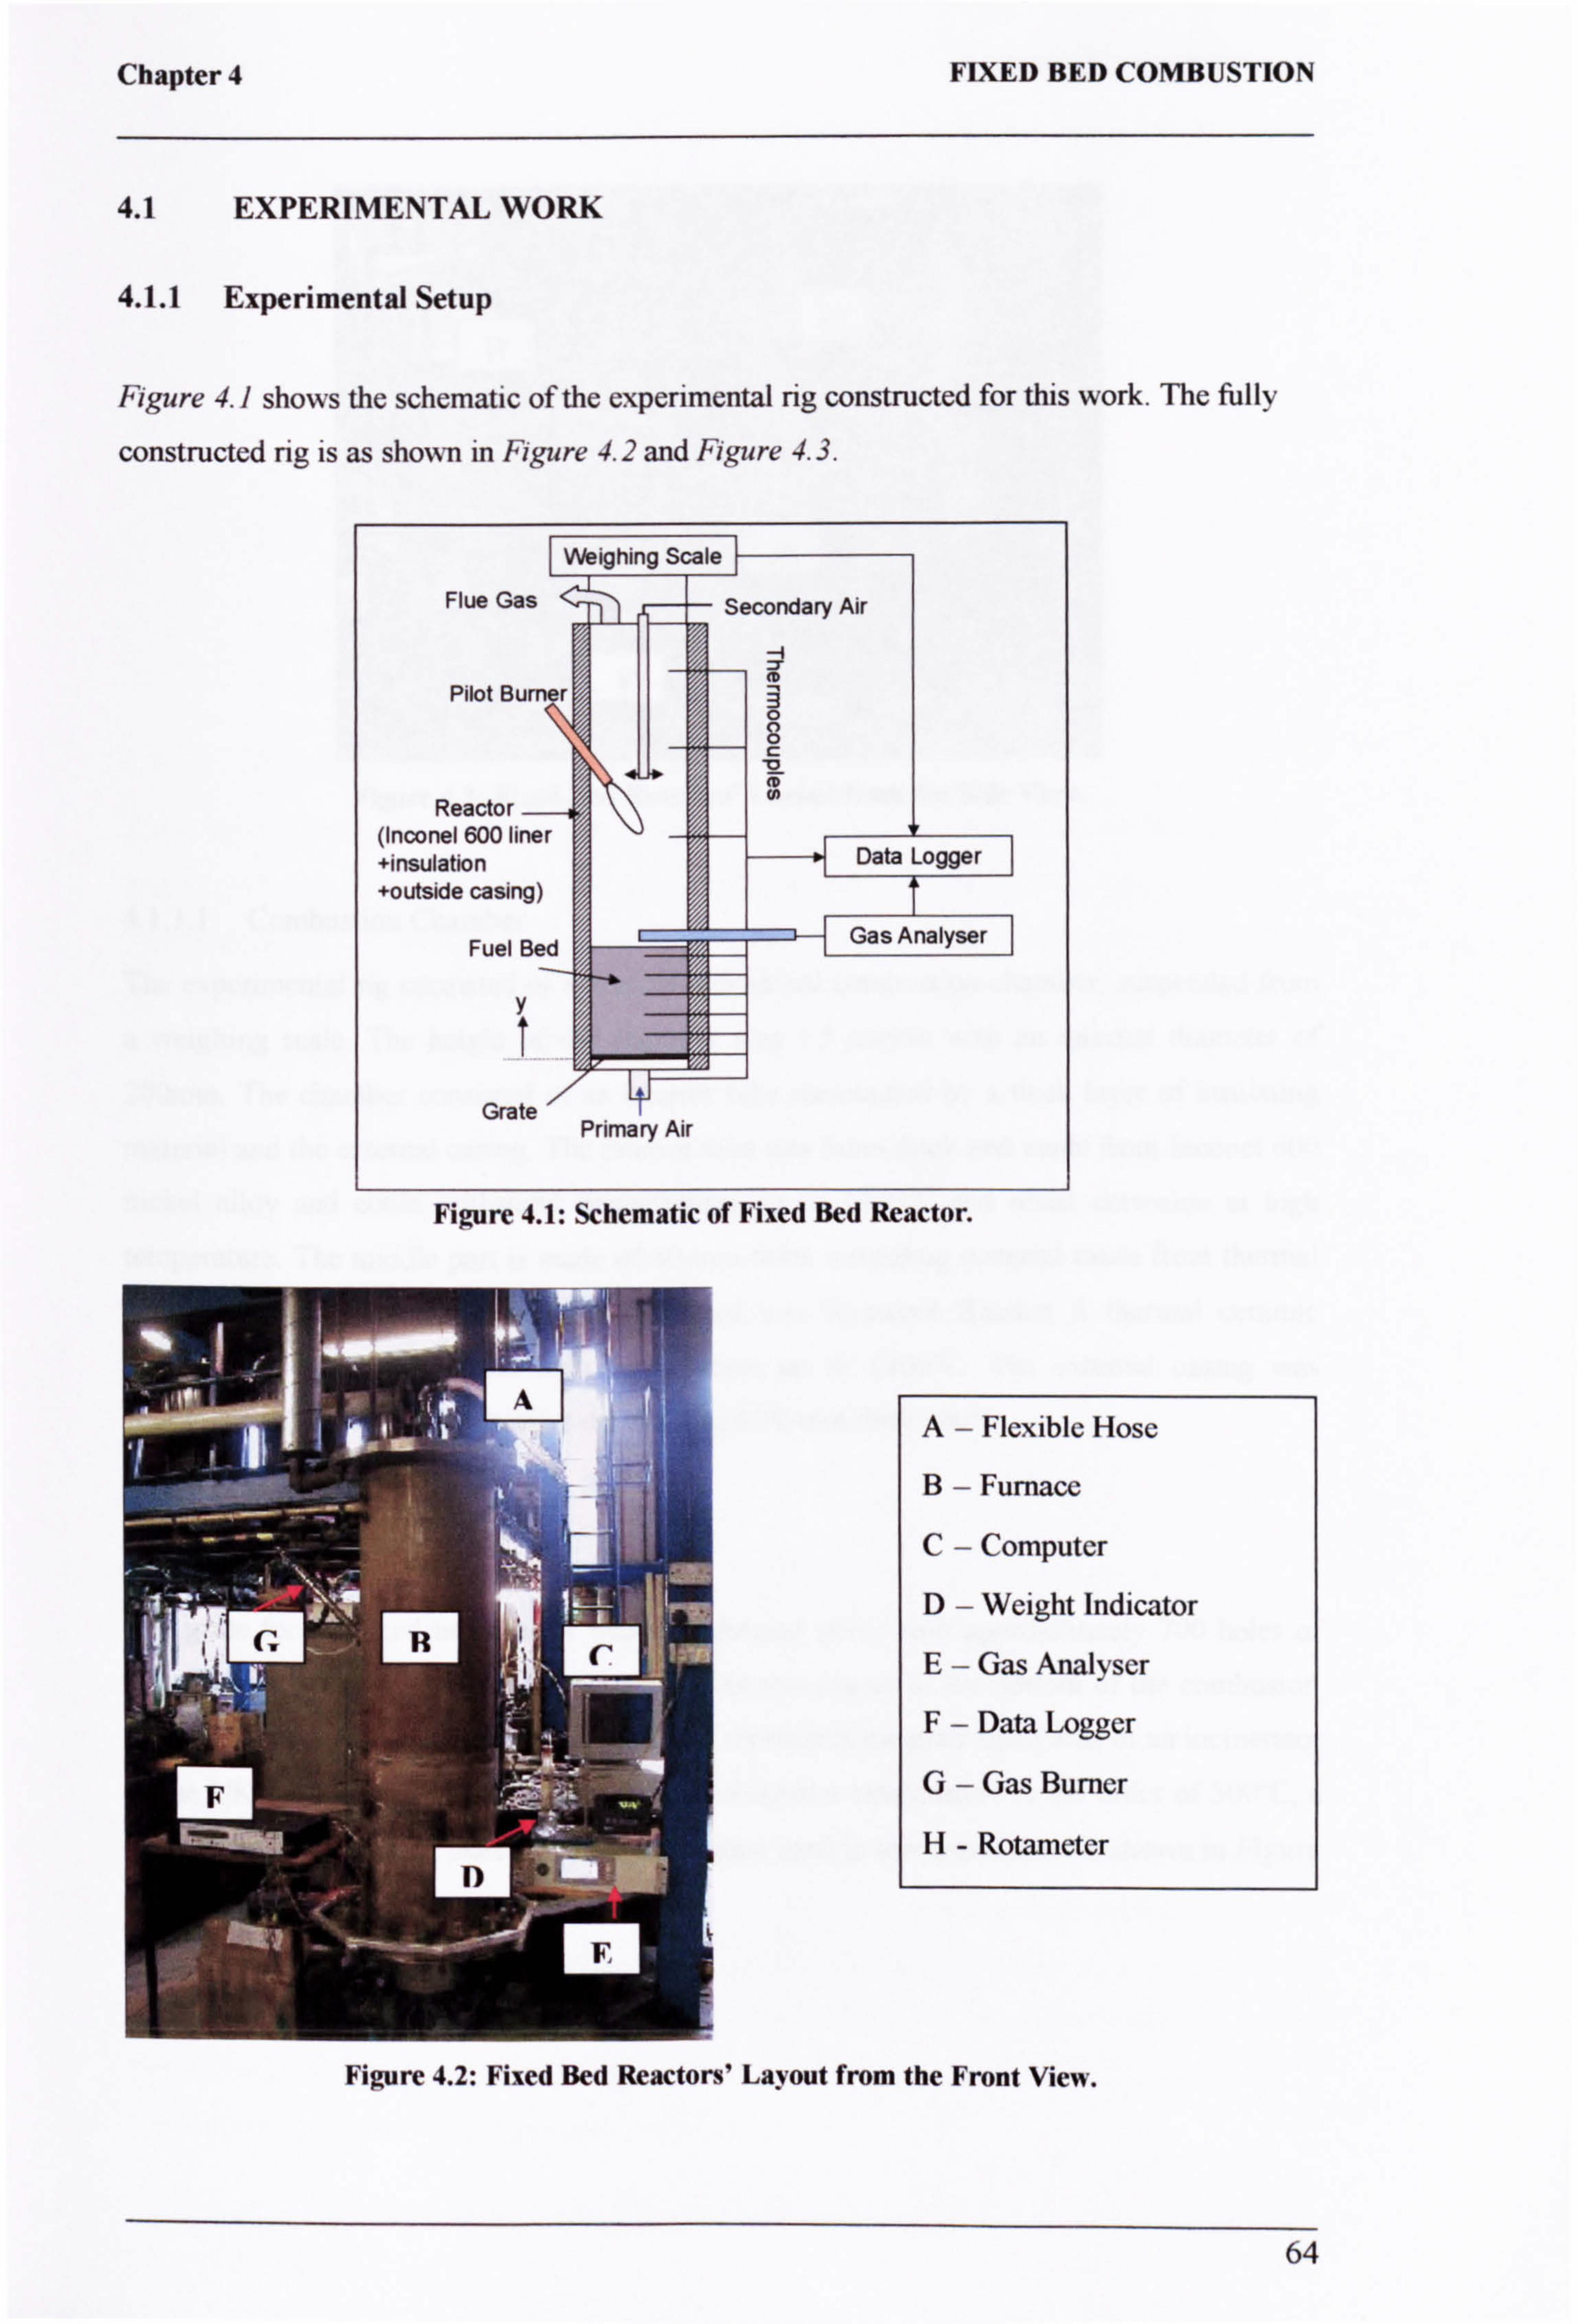
Chapter 4
4.1 EXPERIMENTAL WORK
4.1.1 Experimental Setup
FIXED BED COMBUSTION
Figure 4.1 shows the schematic of the experimental rig constructed for this work. The fully
constructed rig is as shown in Figure 4.2 and Figure 4.3.
A- Flexible Hose
B- Furnace
C- Computer
D- Weight Indicator
E- Gas Analyser
F- Data Logger
G- Gas Burner
H- Rotameter
Figure 4.2: Fixed Bed Reactors' Layout from the Front View.
64
rigure 4.1: acnematic of rixcu nea iwactor.

Chapter 4 FIXED BED COMBUSTION
4.1.1.1 Combustion Chamber
The experimental rig consisted of a vertical cylindrical combustion chamber, suspended from
a weighing scale. The height of the chamber was 1.5 metres with an internal diameter of
200mm. The chamber consisted of an interior tube surrounded by a thick layer of insulating
material and the external casing. The interior tube was 8mm thick and made from Inconel 600
nickel alloy and could withstand temperatures up to 1200°C and resist corrosion at high
temperature. The middle part is made of 80-mm-thick insulating material made from thermal
ceramic blanket. The insulating material used was Kaowool Blanket S thermal ceramic blanket, which can withstand high temperature up to 1260°C. The external casing was
stainless steel with 420-mm outside diameter and 30-mm thick wall.
4.1.1.2 Grate
The grate for the fixed bed reactor was a perforated plate, with approximately 700 holes of 2mm diameter, representing 7% open area. This was placed at the bottom of the combustor. The open area was taken as 7% open area as it represents the grate open area of an incinerator
in the UK (Nasserzadeh, 1990). In order to withstand a temperature in the order of 500°C, a
stainless steel perforated plate was used. The grate used in this experiment is shown in Figure
4.4.
65
Figure 4.3: Fixed Bed Reactors' Layout from the Side View.
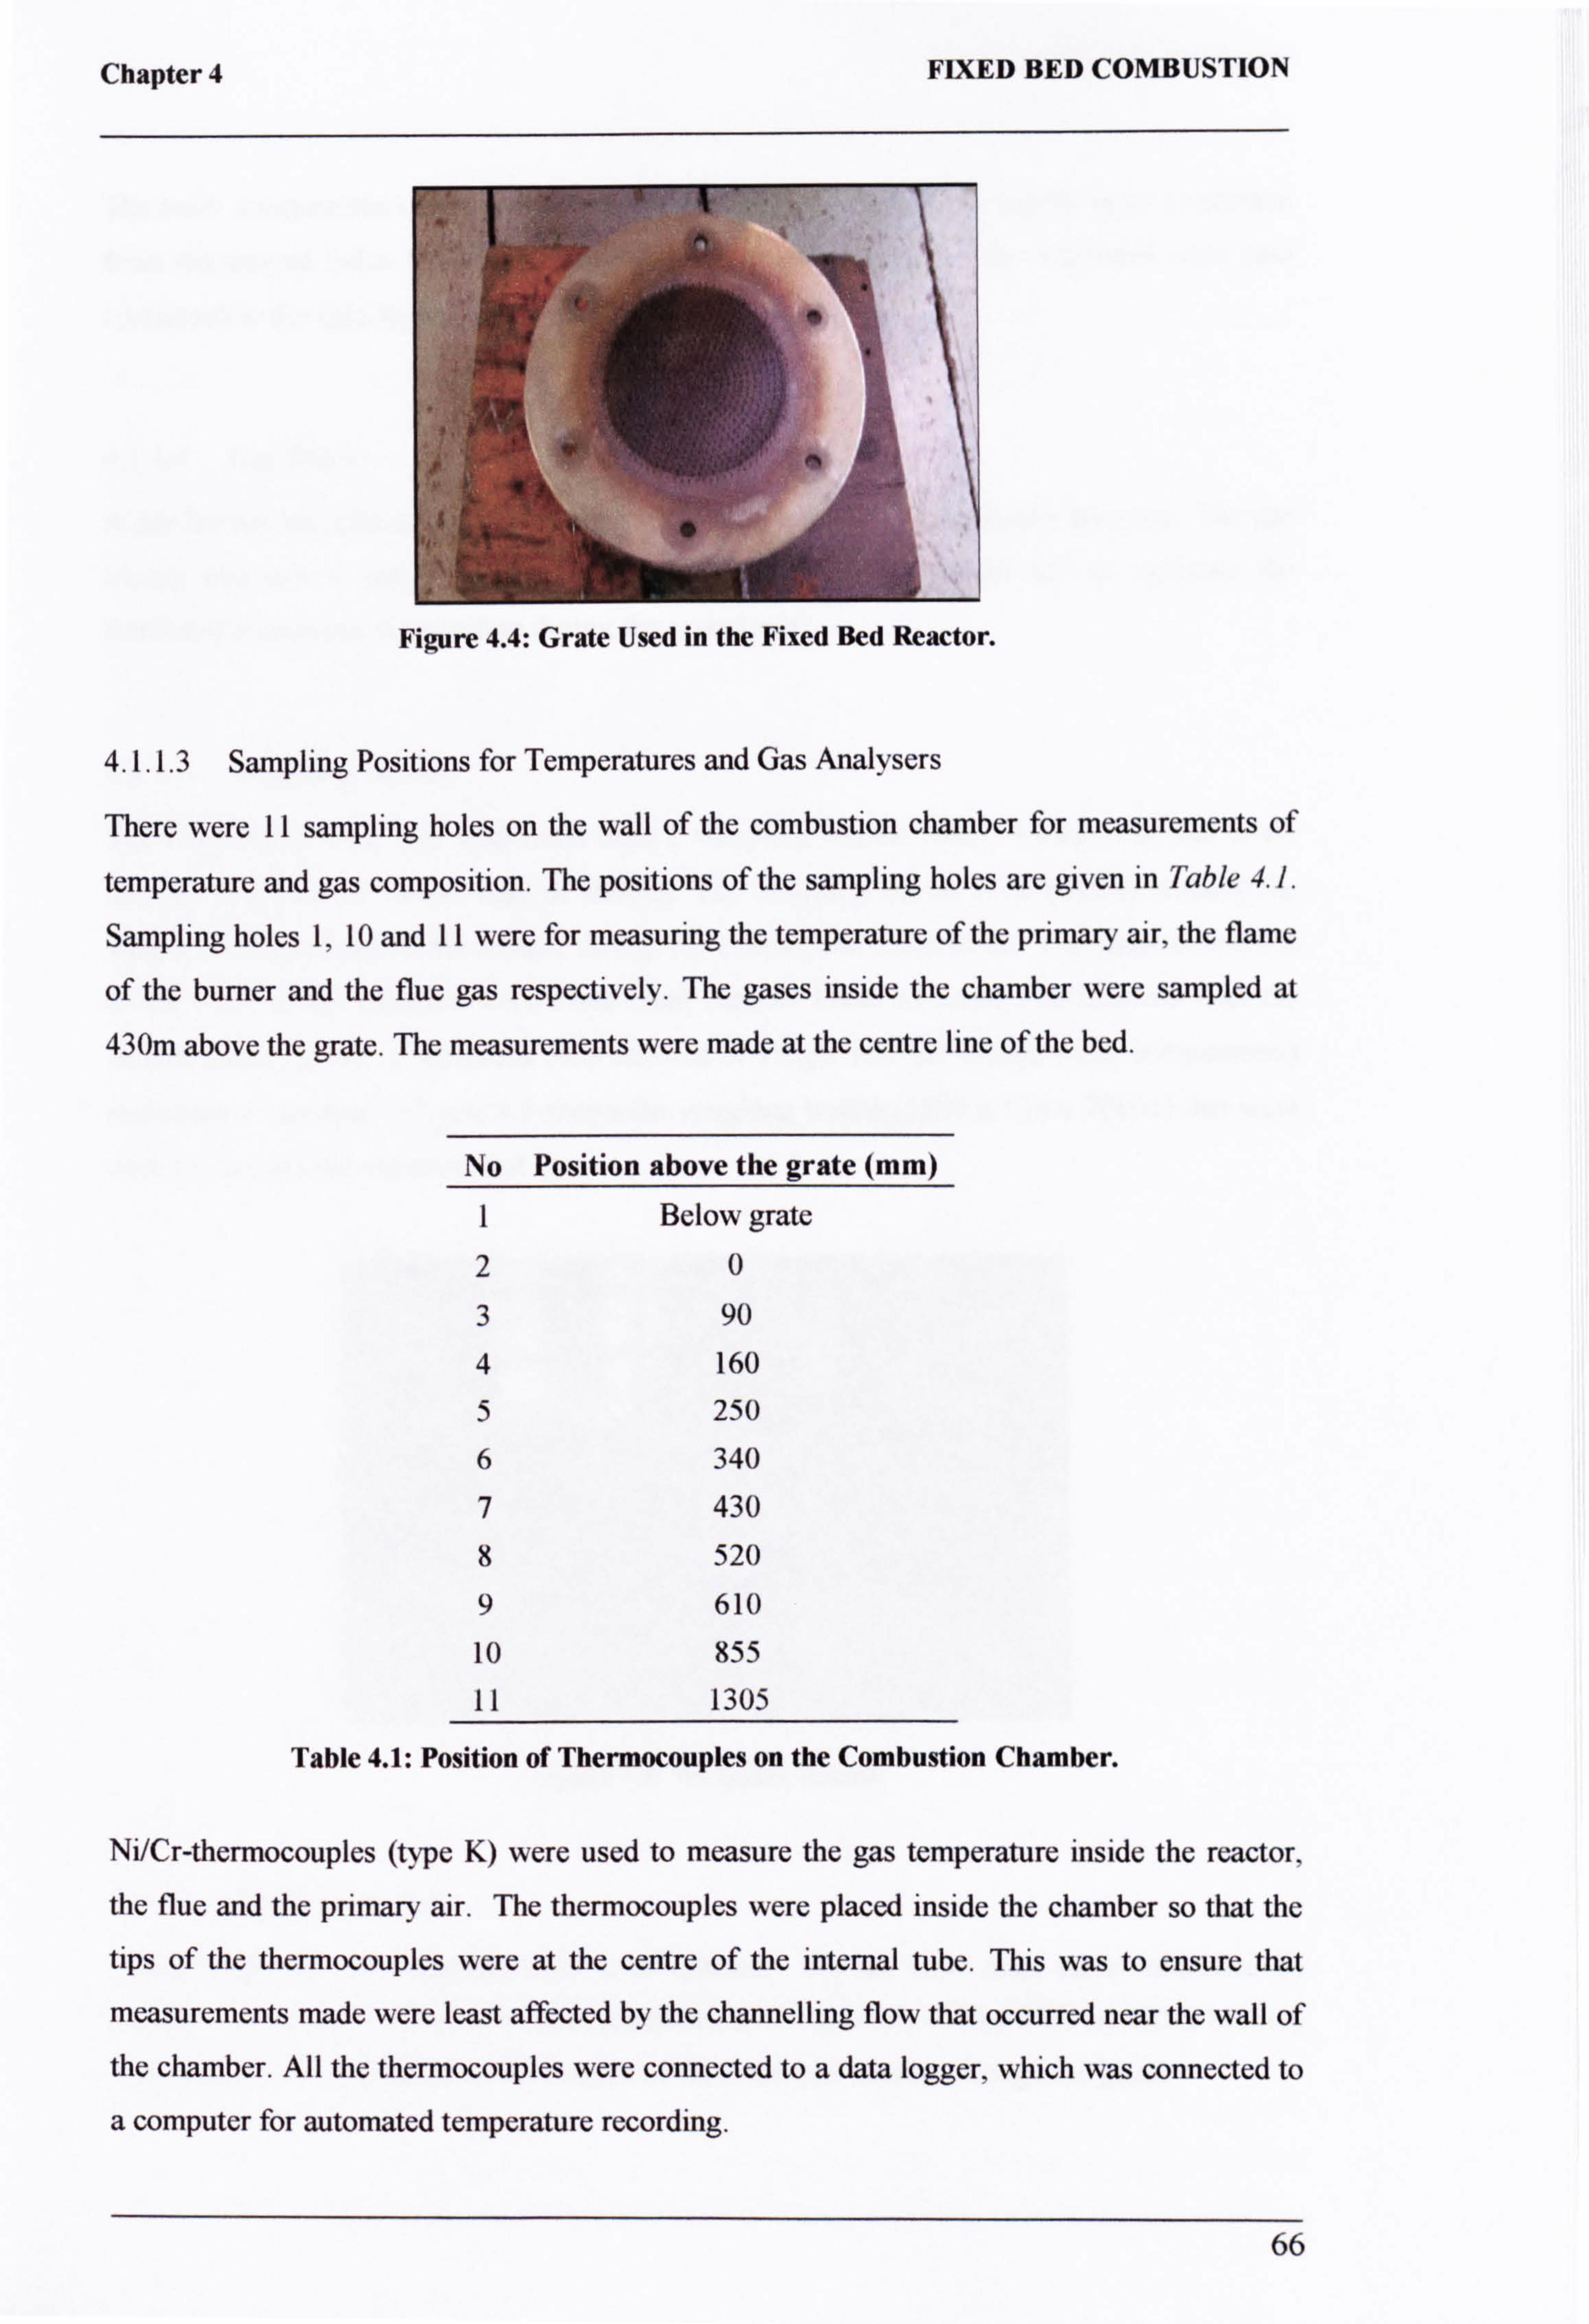
Chapter 4 FIXED BED COMBUSTION
0 ldýý
Figure 4.4: Grate Used in the Fixed Bed Reactor.
4.1.1.3 Sampling Positions for Temperatures and Gas Analysers
There were 11 sampling holes on the wall of the combustion chamber for measurements of
temperature and gas composition. The positions of the sampling holes are given in Table 4.1.
Sampling holes 1,10 and I1 were for measuring the temperature of the primary air, the flame
of the burner and the flue gas respectively. The gases inside the chamber were sampled at
430m above the grate. The measurements were made at the centre line of the bed.
No Position above the grate (mm)
1 Below grate 20
3 90
4 160
5 250
6 340
7 430
8 520
9 610
10 855
11 1305
Table 4.1: Position of Thermocouples on the Combustion Chamber.
Ni/Cr-thermocouples (type K) were used to measure the gas temperature inside the reactor,
the flue and the primary air. The thermocouples were placed inside the chamber so that the
tips of the thermocouples were at the centre of the internal tube. This was to ensure that
measurements made were least affected by the channelling flow that occurred near the wall of
the chamber. All the thermocouples were connected to a data logger, which was connected to
a computer for automated temperature recording.
66
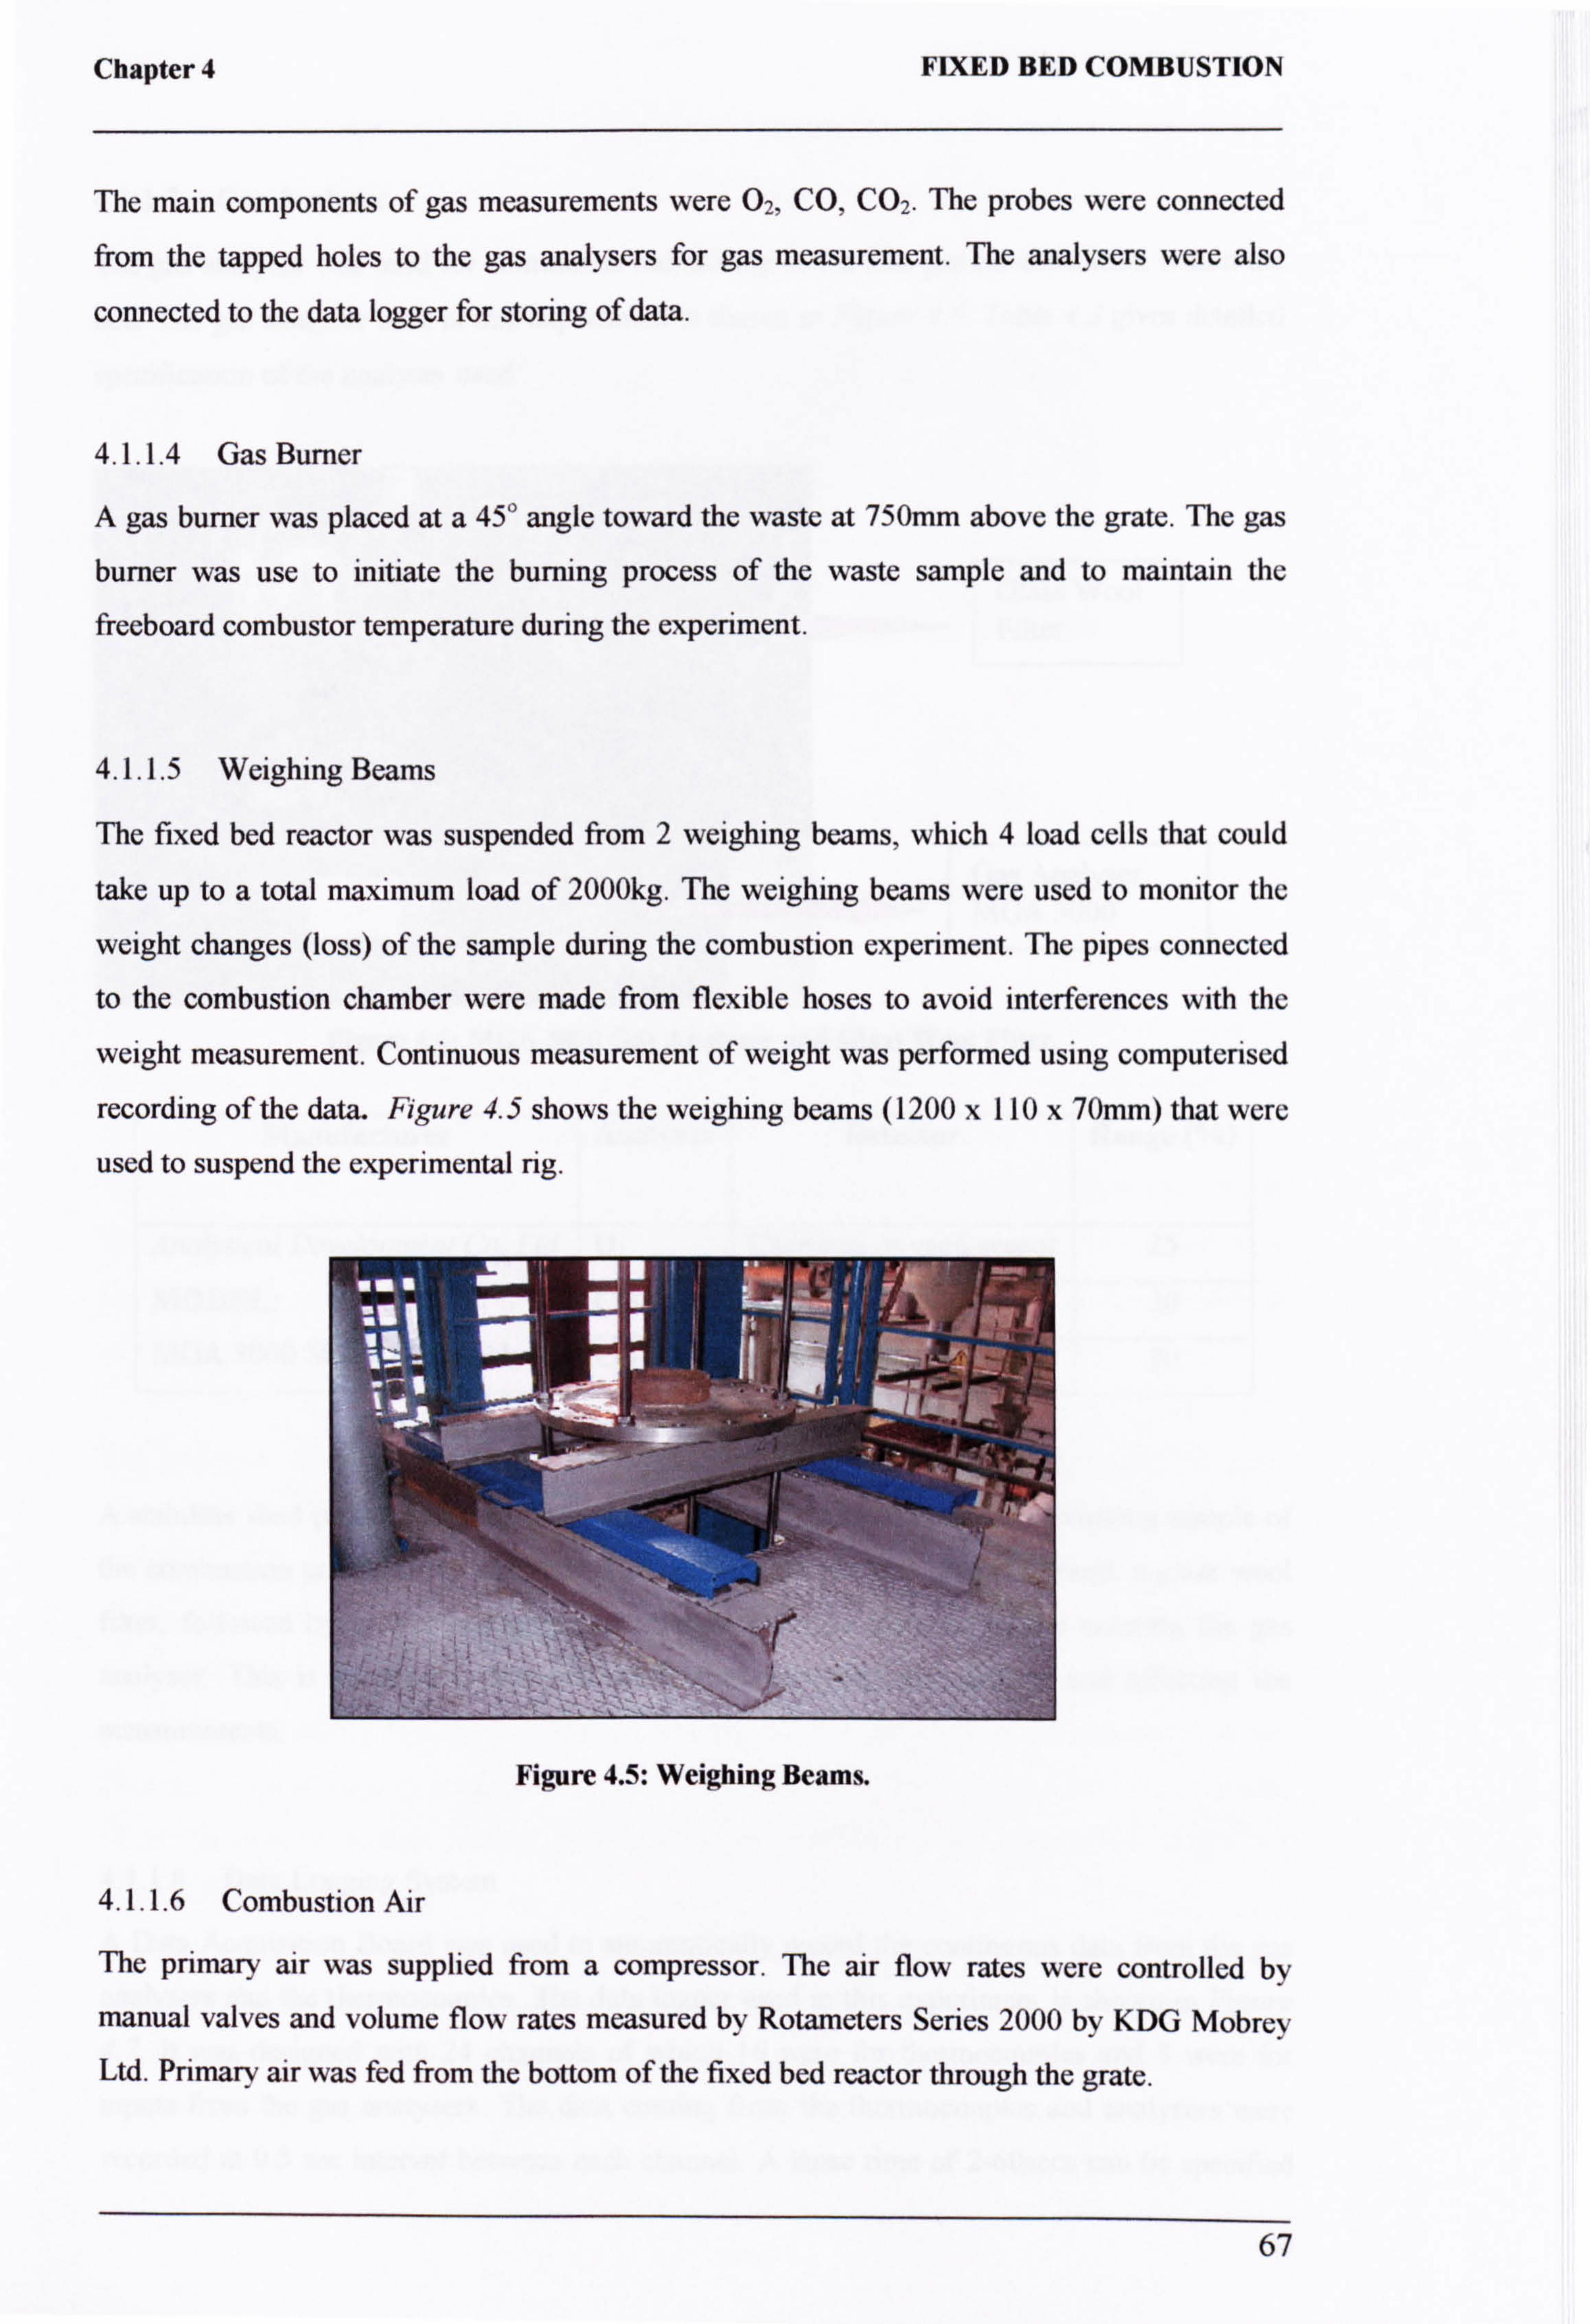
Chapter 4 FIXED BED COMBUSTION
The main components of gas measurements were 02, CO, CO2. The probes were connected
from the tapped holes to the gas analysers for gas measurement. The analysers were also
connected to the data logger for storing of data.
4.1.1.4 Gas Burner
A gas burner was placed at a 45° angle toward the waste at 750mm above the grate. The gas
burner was use to initiate the burning process of the waste sample and to maintain the
freeboard combustor temperature during the experiment.
4.1.1.5 Weighing Beams
The fixed bed reactor was suspended from 2 weighing beams, which 4 load cells that could
take up to a total maximum load of 2000kg. The weighing beams were used to monitor the
weight changes (loss) of the sample during the combustion experiment. The pipes connected
to the combustion chamber were made from flexible hoses to avoid interferences with the
weight measurement. Continuous measurement of weight was performed using computerised
recording of the data. Figure 4.5 shows the weighing beams (1200 x 110 x 70mm) that were
used to suspend the experimental rig.
Figure 4.5: Weighing Beams.
4.1.1.6 Combustion Air
The primary air was supplied from a compressor. The air flow rates were controlled by
manual valves and volume flow rates measured by Rotameters Series 2000 by KDG Mobrey
Ltd. Primary air was fed from the bottom of the fixed bed reactor through the grate.
67
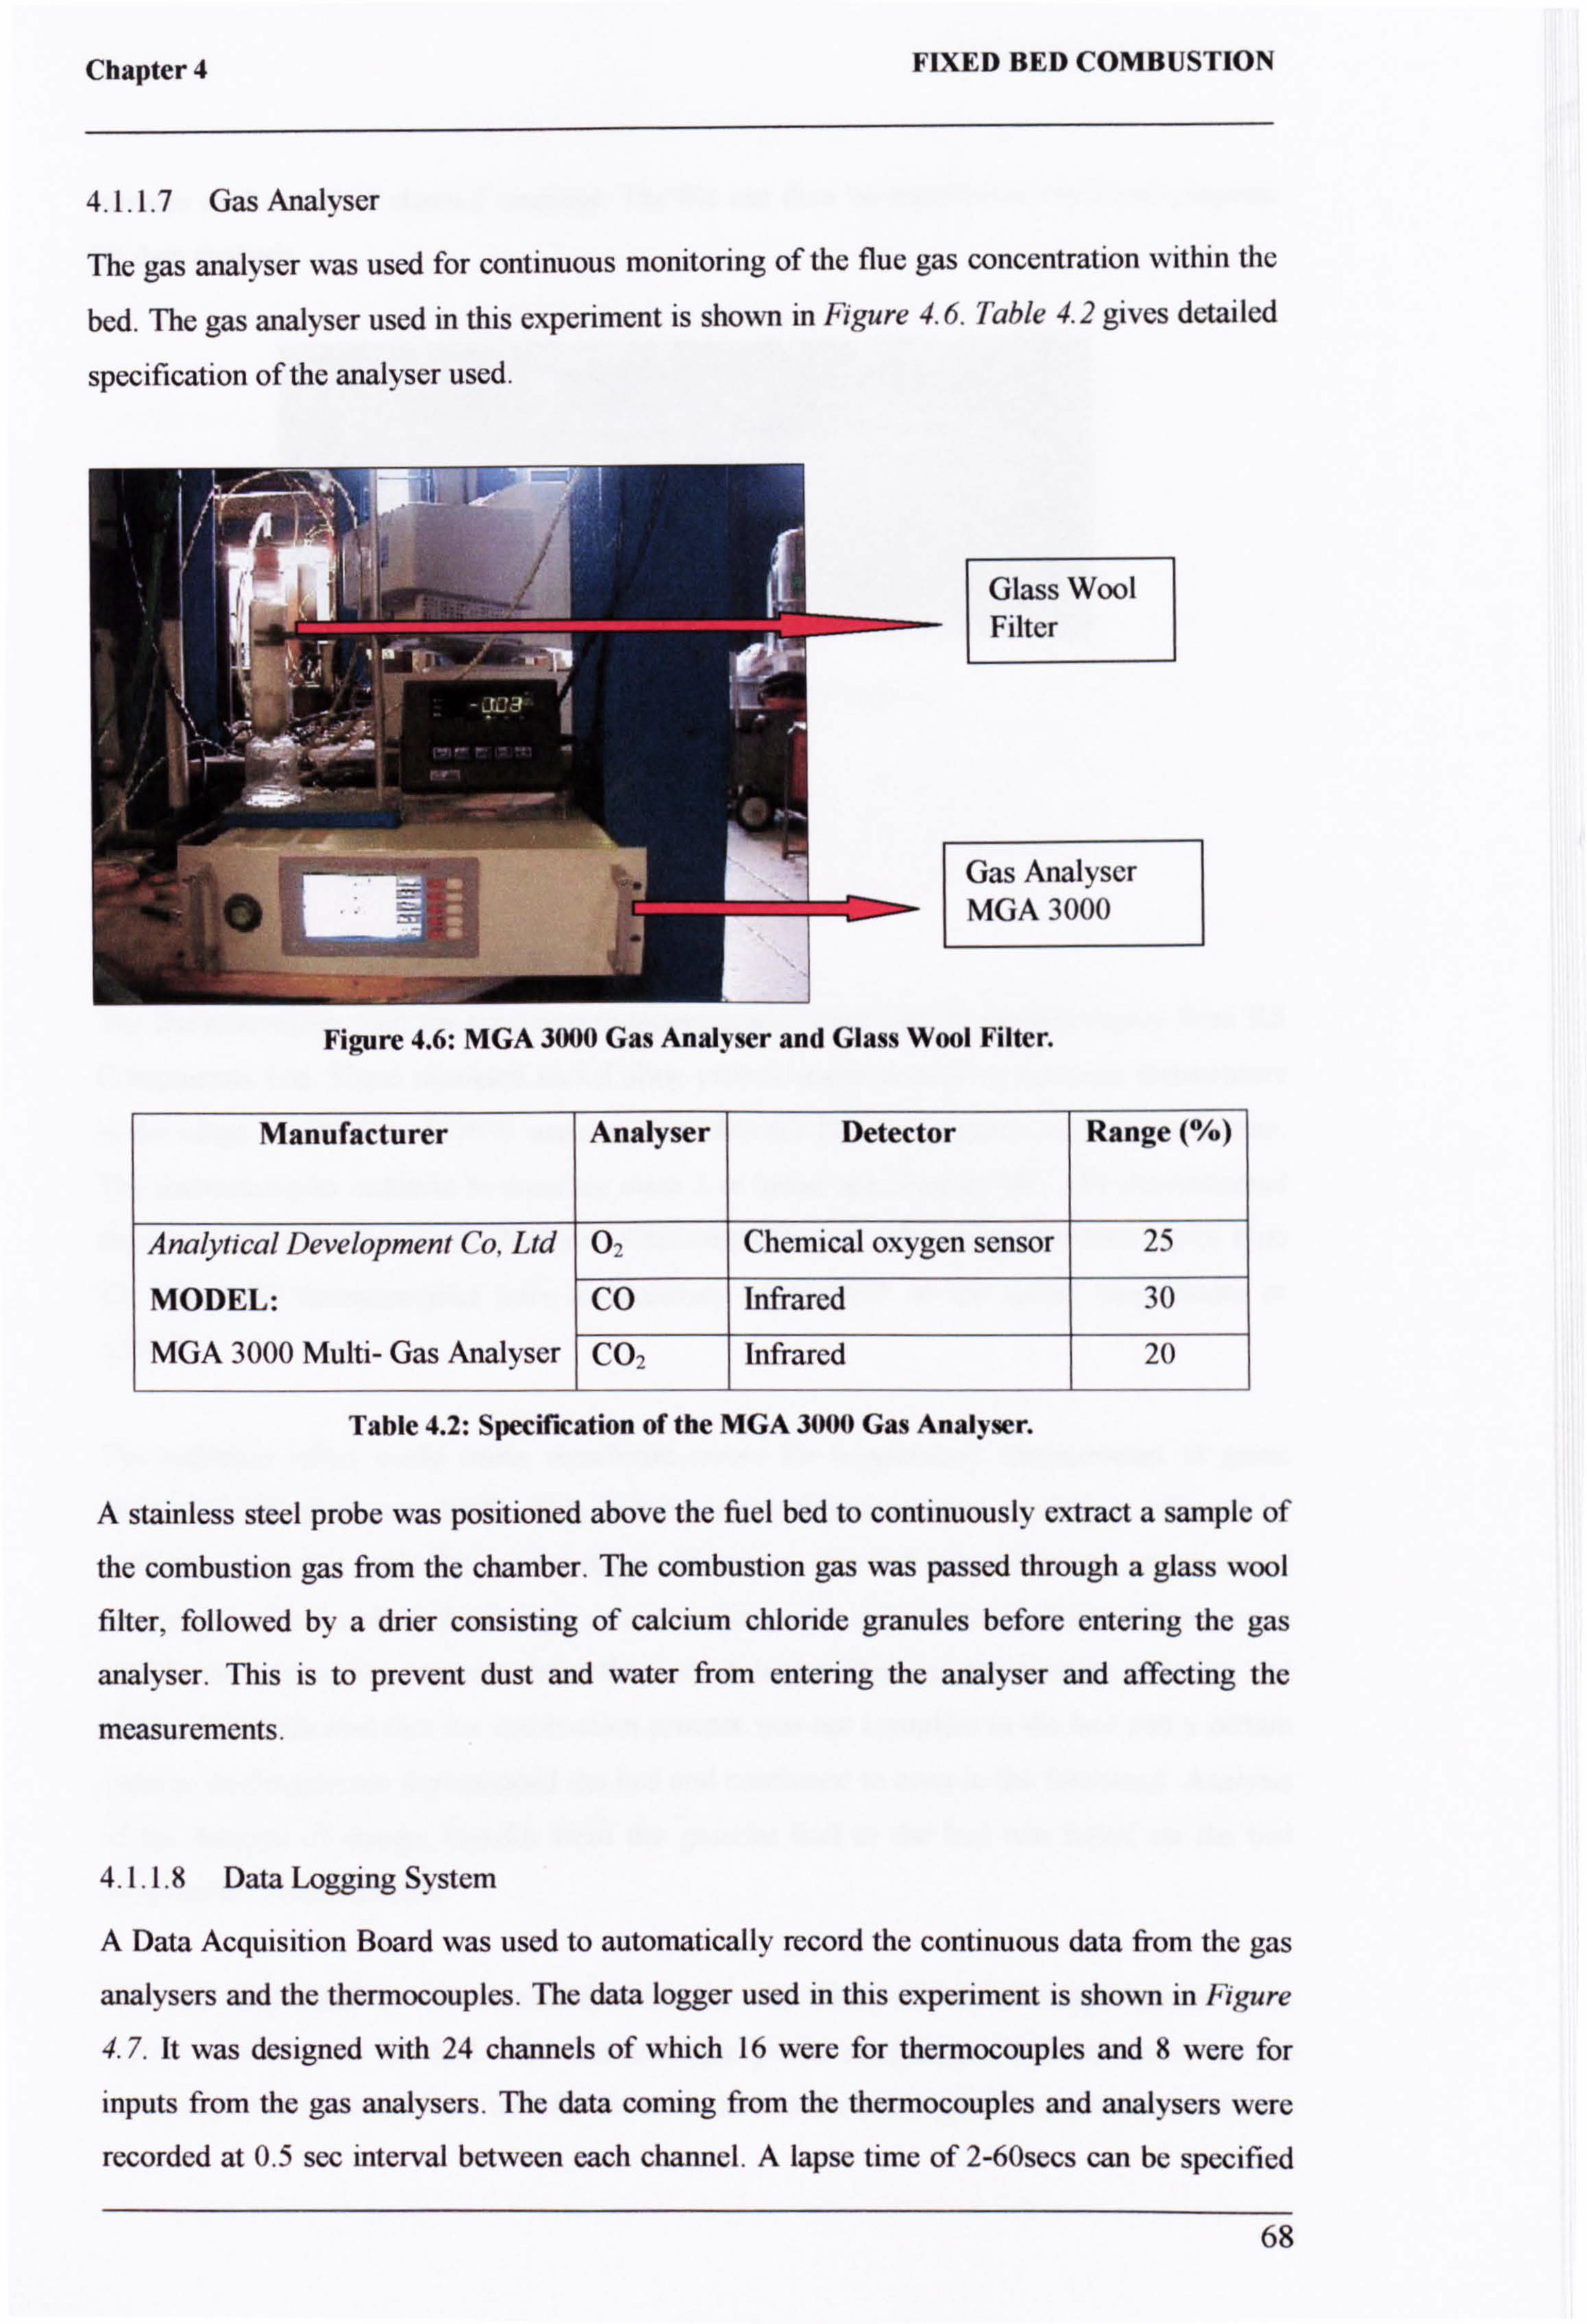
Chapter 4 FIXED BED COMBUSTION
4.1.1.7 Gas Analyser
The gas analyser was used for continuous monitoring of the flue gas concentration within the
bed. The gas analyser used in this experiment is shown in Figure 4.6. Table 4.2 gives detailed
specification of the analyser used.
Glass Wool Filter
Gas Analyser MGA 3000
Figure 4.6: MGA 3000 Gas Analyser and Glass Wool Filter.
Manufacturer Analyser Detector Range (%)
Analytical Development Co. Ltd 02 Chemical oxygen sensor 25
MODEL: CO Infrared 30
MGA 3000 Multi- Gas Analyser CO, Infrared 20
Table 4.2: Specification of the MGA 3000 Gas Analyser.
A stainless steel probe was positioned above the fuel bed to continuously extract a sample of
the combustion gas from the chamber. The combustion gas was passed through a glass wool
filter, followed by a drier consisting of calcium chloride granules before entering the gas
analyser. This is to prevent dust and water from entering the analyser and affecting the
measurements.
4.1.1.8 Data Logging System
A Data Acquisition Board was used to automatically record the continuous data from the gas
analysers and the thermocouples. The data logger used in this experiment is shown in Figure
4.7. It was designed with 24 channels of which 16 were for thermocouples and 8 were for
inputs from the gas analysers. The data coming from the thermocouples and analysers were
recorded at 0.5 sec interval between each channel. A lapse time of 2-60secs can be specified
68
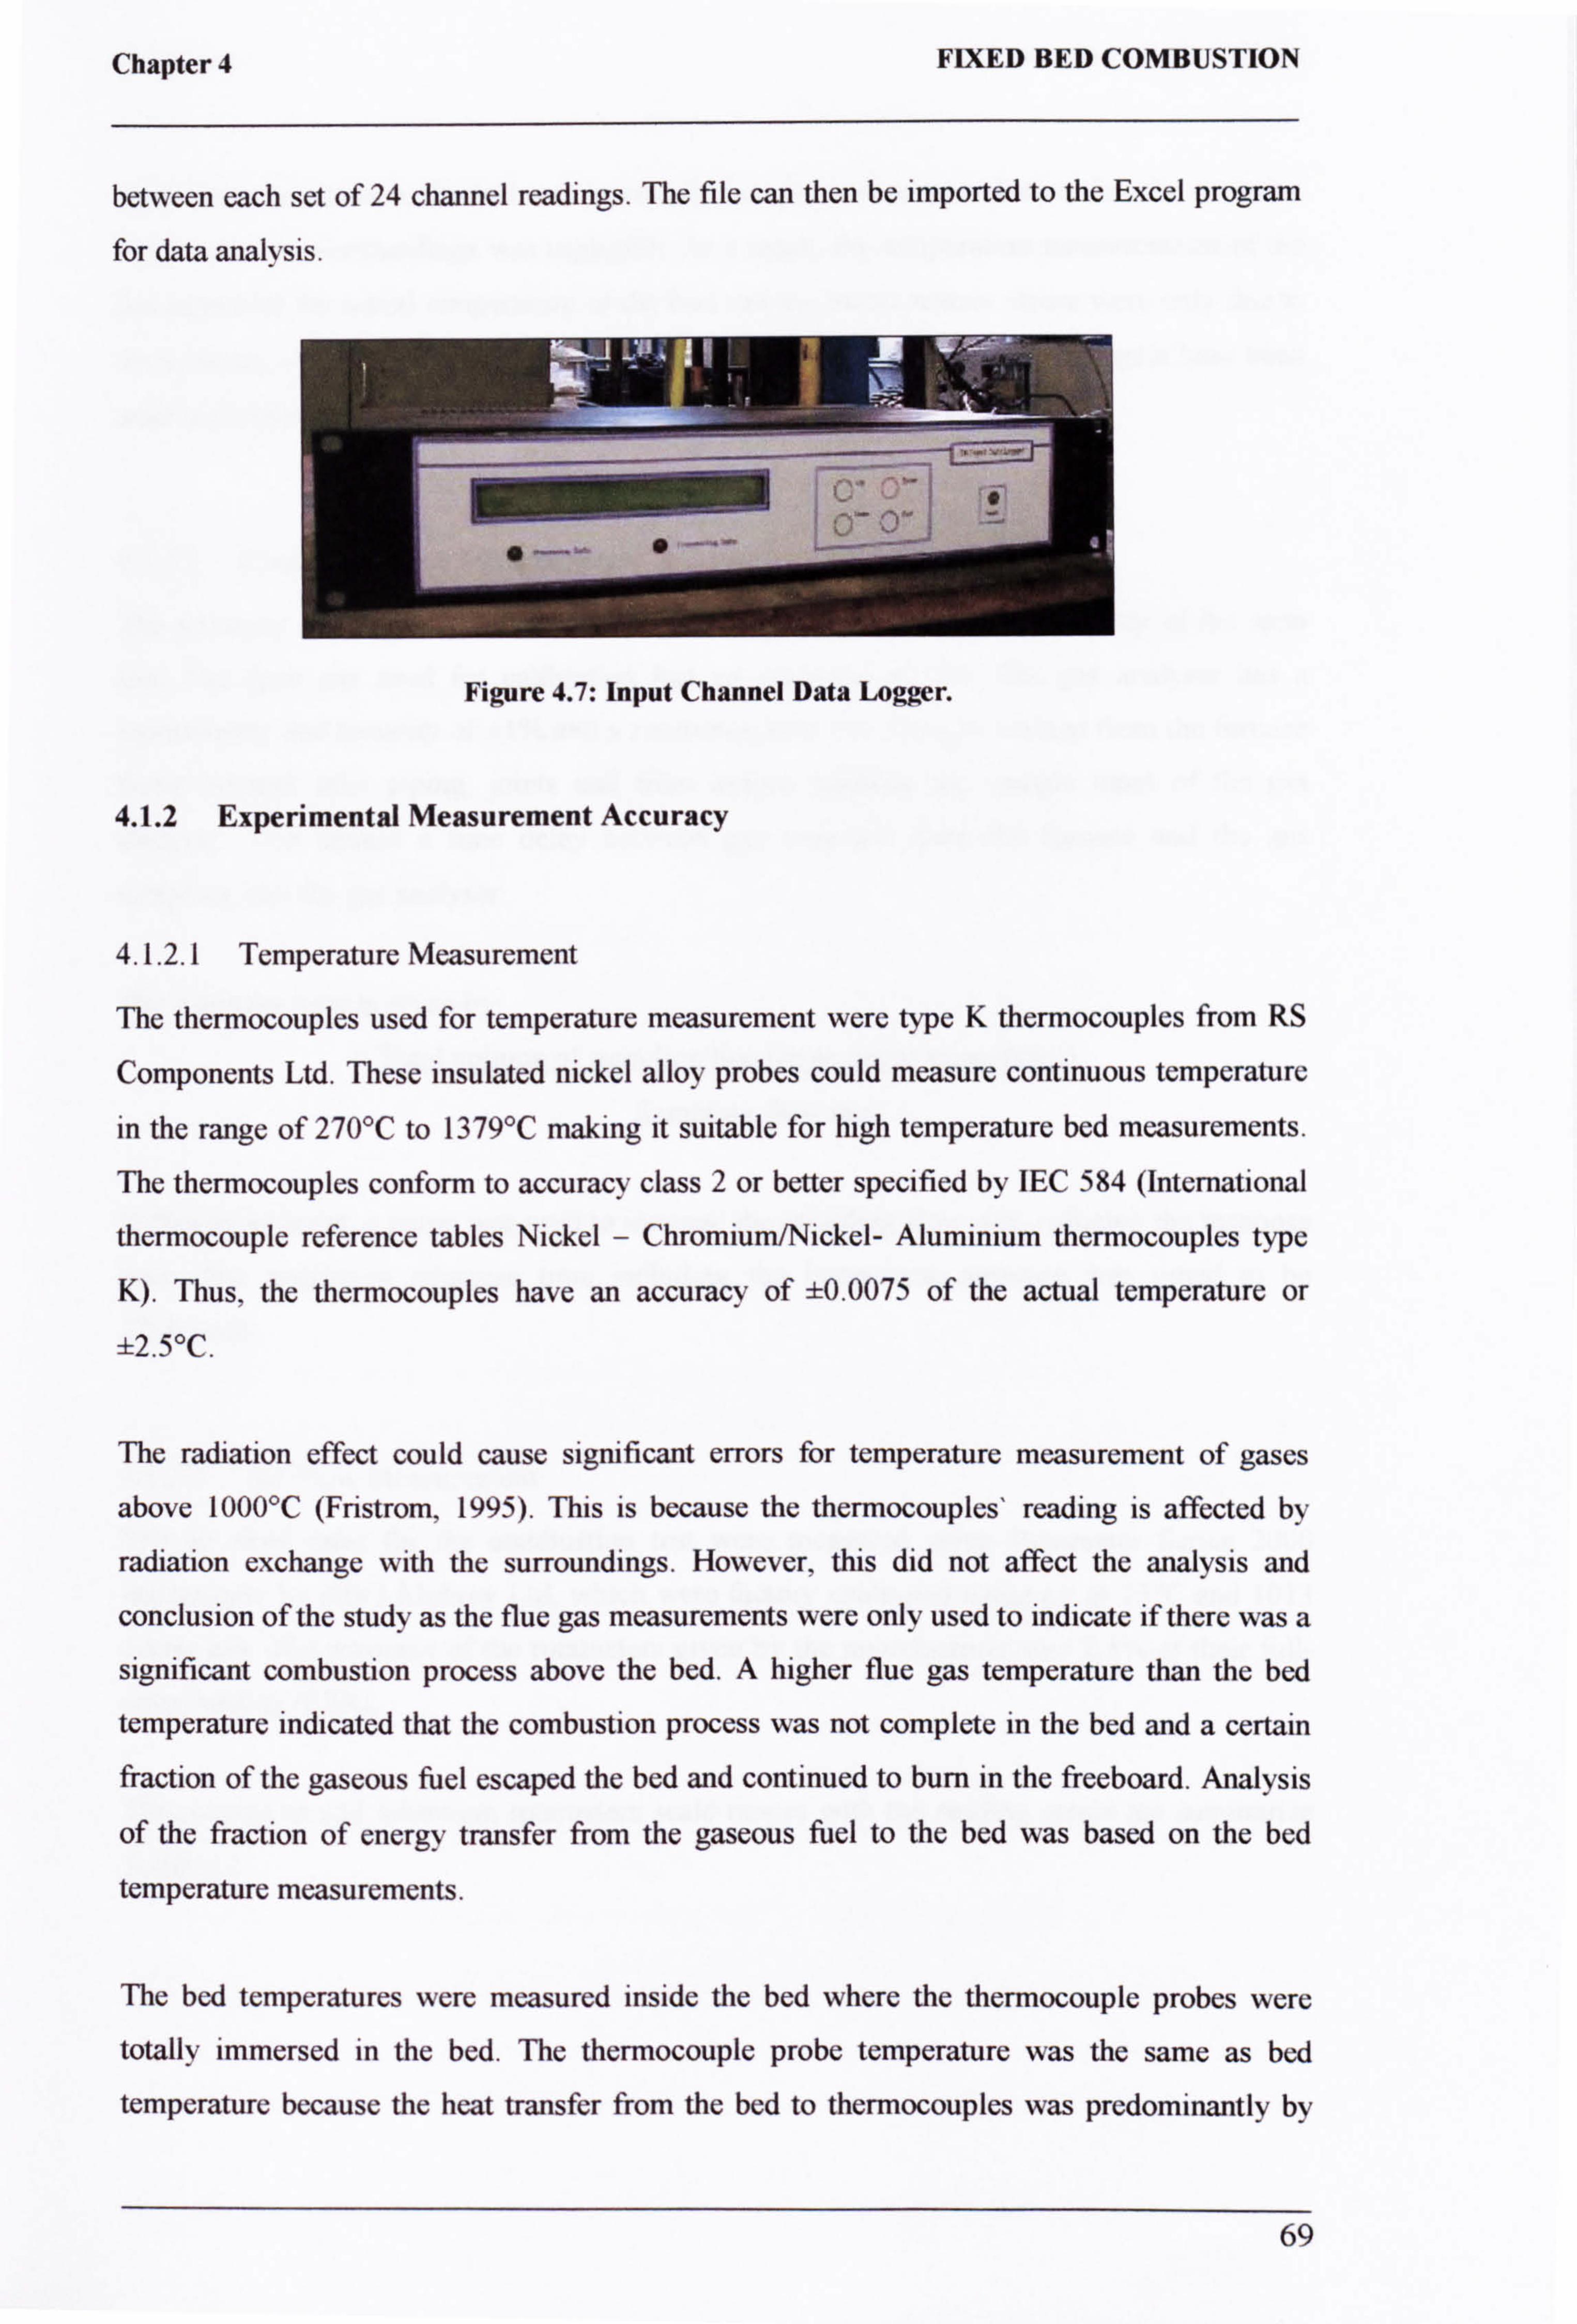
Chapter 4 FIXED BED COMBUSTION
between each set of 24 channel readings. The file can then be imported to the Excel program
for data analysis.
"
"o __
Figure 4.7: Input Channel Data Logger.
4.1.2 Experimental Measurement Accuracy
4.1.2.1 Temperature Measurement
The thermocouples used for temperature measurement were type K thermocouples from RS
Components Ltd. These insulated nickel alloy probes could measure continuous temperature
in the range of 270°C to 1379°C making it suitable for high temperature bed measurements.
The thermocouples conform to accuracy class 2 or better specified by IEC 584 (International
thermocouple reference tables Nickel - Chromium/Nickel- Aluminium thermocouples type
K). Thus, the thermocouples have an accuracy of ±0.0075 of the actual temperature or
±2.5°C.
The radiation effect could cause significant errors for temperature measurement of gases
above 1000°C (Fristrom, 1995). This is because the thermocouples' reading is affected by
radiation exchange with the surroundings. However, this did not affect the analysis and
conclusion of the study as the flue gas measurements were only used to indicate if there was a
significant combustion process above the bed. A higher flue gas temperature than the bed
temperature indicated that the combustion process was not complete in the bed and a certain fraction of the gaseous fuel escaped the bed and continued to bum in the freeboard. Analysis
of the fraction of energy transfer from the gaseous fuel to the bed was based on the bed
temperature measurements.
The bed temperatures were measured inside the bed where the thermocouple probes were
totally immersed in the bed. The thermocouple probe temperature was the same as bed
temperature because the heat transfer from the bed to thermocouples was predominantly by
69
Chapter 4 FIXED BED COMBUSTION
conduction. In addition, the bed was practically opaque to thermal radiation thus the radiation heat loss to the surroundings was negligible As a result, the temperature measurements of the bed represent the actual temperature of the bed and the measurement errors were only due to
the accuracy of the thermocouples as has been discussed above. The thermocouples have been
used in previous fixed bed combustion studies (Zakaria, 2000).
4.1.2.2 Combustion Gas Measurement
The accuracy of the gas analyser, MGA3000 (ADC) depended on the accuracy of the span
gas. The span gas used for calibration had an accuracy of 2%. The gas analyser has a
repeatability and linearity of ±1% and a resolution of 0.1%. The gas emitted from the furnace
flows through tube piping, joints and filter before reaching the sample input of the gas
analyser. This caused a time delay between gas emission from the furnace and the gas
sampling into the gas analyser.
The response time is given by:
= Total volume of samplin line ine (from probe to analyser) Sampling flow rate
In this experiment, a pump was used to increase the sampling flow rate, reducing the response time. The maximum response time including the instrument response was timed to be
37seconds.
4.1.2.3 Air Flow Measurement
The air flow rates for the combustion test were measured using Rotameter Series 2000
instruments by KDG Mobrey Ltd, which were factory calibrated using air at 15°C and 1013
mbars abs. The accuracy of the rotameters given by the manufacturer was 2.5% of their full-
scale reading (FSR).
The maximum and minimum rotameters scale ranges with the reading errors are summarize Table 4.3.
70
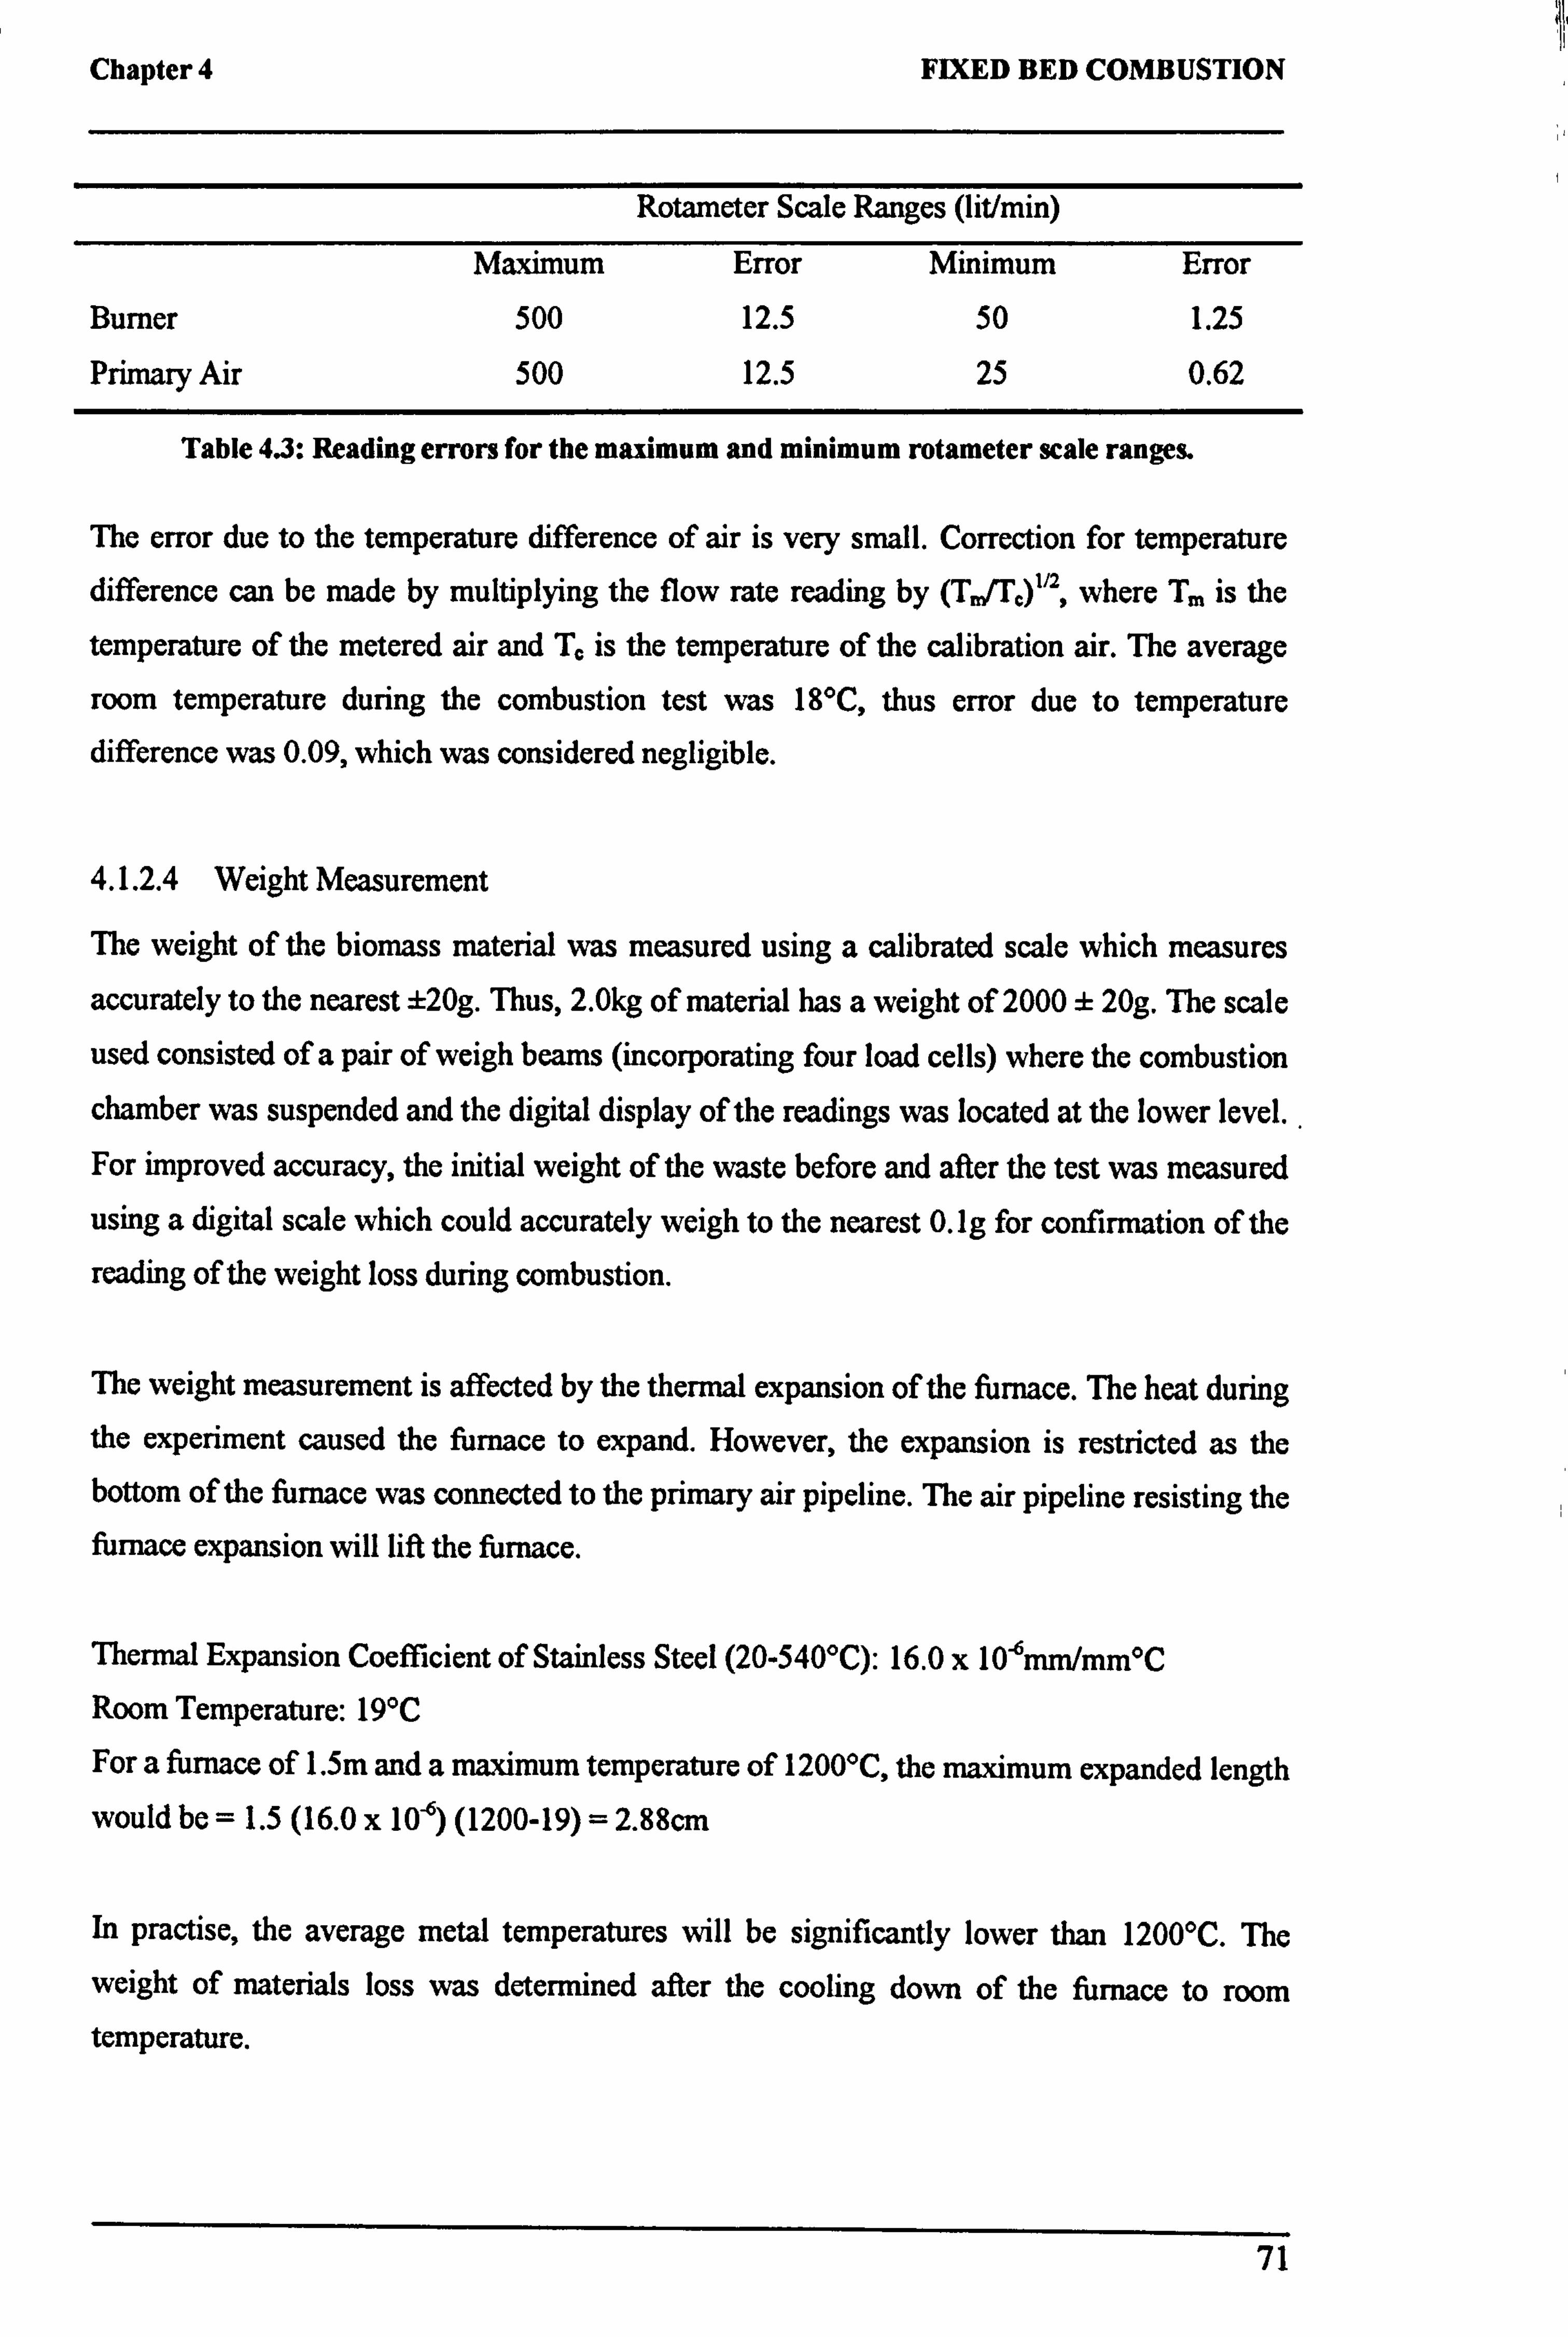
Chapter 4 FIXED BED COMBUSTION
Rotameter Scale Ranges (lit/min)
Maximum Error Minimum Error
Burner 500 12.5 50 1.25
Primary Air 500 12.5 25 0.62
Table 4.3: Reading errors for the maximum and minimum rotameter scale ranges.
The error due to the temperature difference of air is very small. Correction for temperature difference can be made by multiplying the flow rate reading by (TJT, )''2, where Tm is the
temperature of the metered air and T,. is the temperature of the calibration air. The average
room temperature during the combustion test was 18°C, thus error due to temperature difference was 0.09, which was considered negligible.
4.1.2.4 Weight Measurement
The weight of the biomass material was measured using a calibrated scale which measures
accurately to the nearest ±20g. Thus, 2.0kg of material has a weight of 2000 ± 20g. The scale
used consisted of a pair of weigh beams (incorporating four load cells) where the combustion
chamber was suspended and the digital display of the readings was located at the lower level.
For improved accuracy, the initial weight of the waste before and after the test was measured
using a digital scale which could accurately weigh to the nearest 0.1g for confirmation of the
reading of the weight loss during combustion.
The weight measurement is affected by the thermal expansion of the furnace. The heat during
the experiment caused the furnace to expand. However, the expansion is restricted as the bottom of the furnace was connected to the primary air pipeline. The air pipeline resisting the furnace expansion will lift the furnace.
Thermal Expansion Coefficient of Stainless Steel (20-540°C): 16.0 x 10⁻⁶mm/mm°C Room Temperature: 19°C
For a furnace of 1.5m and a maximum temperature of 1200°C, the maximum expanded length
would be = 1.5 (16.0 x 10⁻⁶) (1200-19) = 2.88cm
In practise, the average metal temperatures will be significantly lower than 1200°C. The
weight of materials loss was determined after the cooling down of the furnace to room temperature.
71

Chapter 4 FIXED BED COMBUSTION
4.2 BIOMASS SAMPLES
4.2.1 Preparation of Samples
The materials selected for the tests are from three primary classes of biomass fuels including
one sample from a segregated waste having a large fraction of cellulosic materials. Figure 4.8
illustrates the biomass samples used for the combustion experiments.
Woody Plants
4rr 0' -
Straw
72
Herbaceous /'/ants
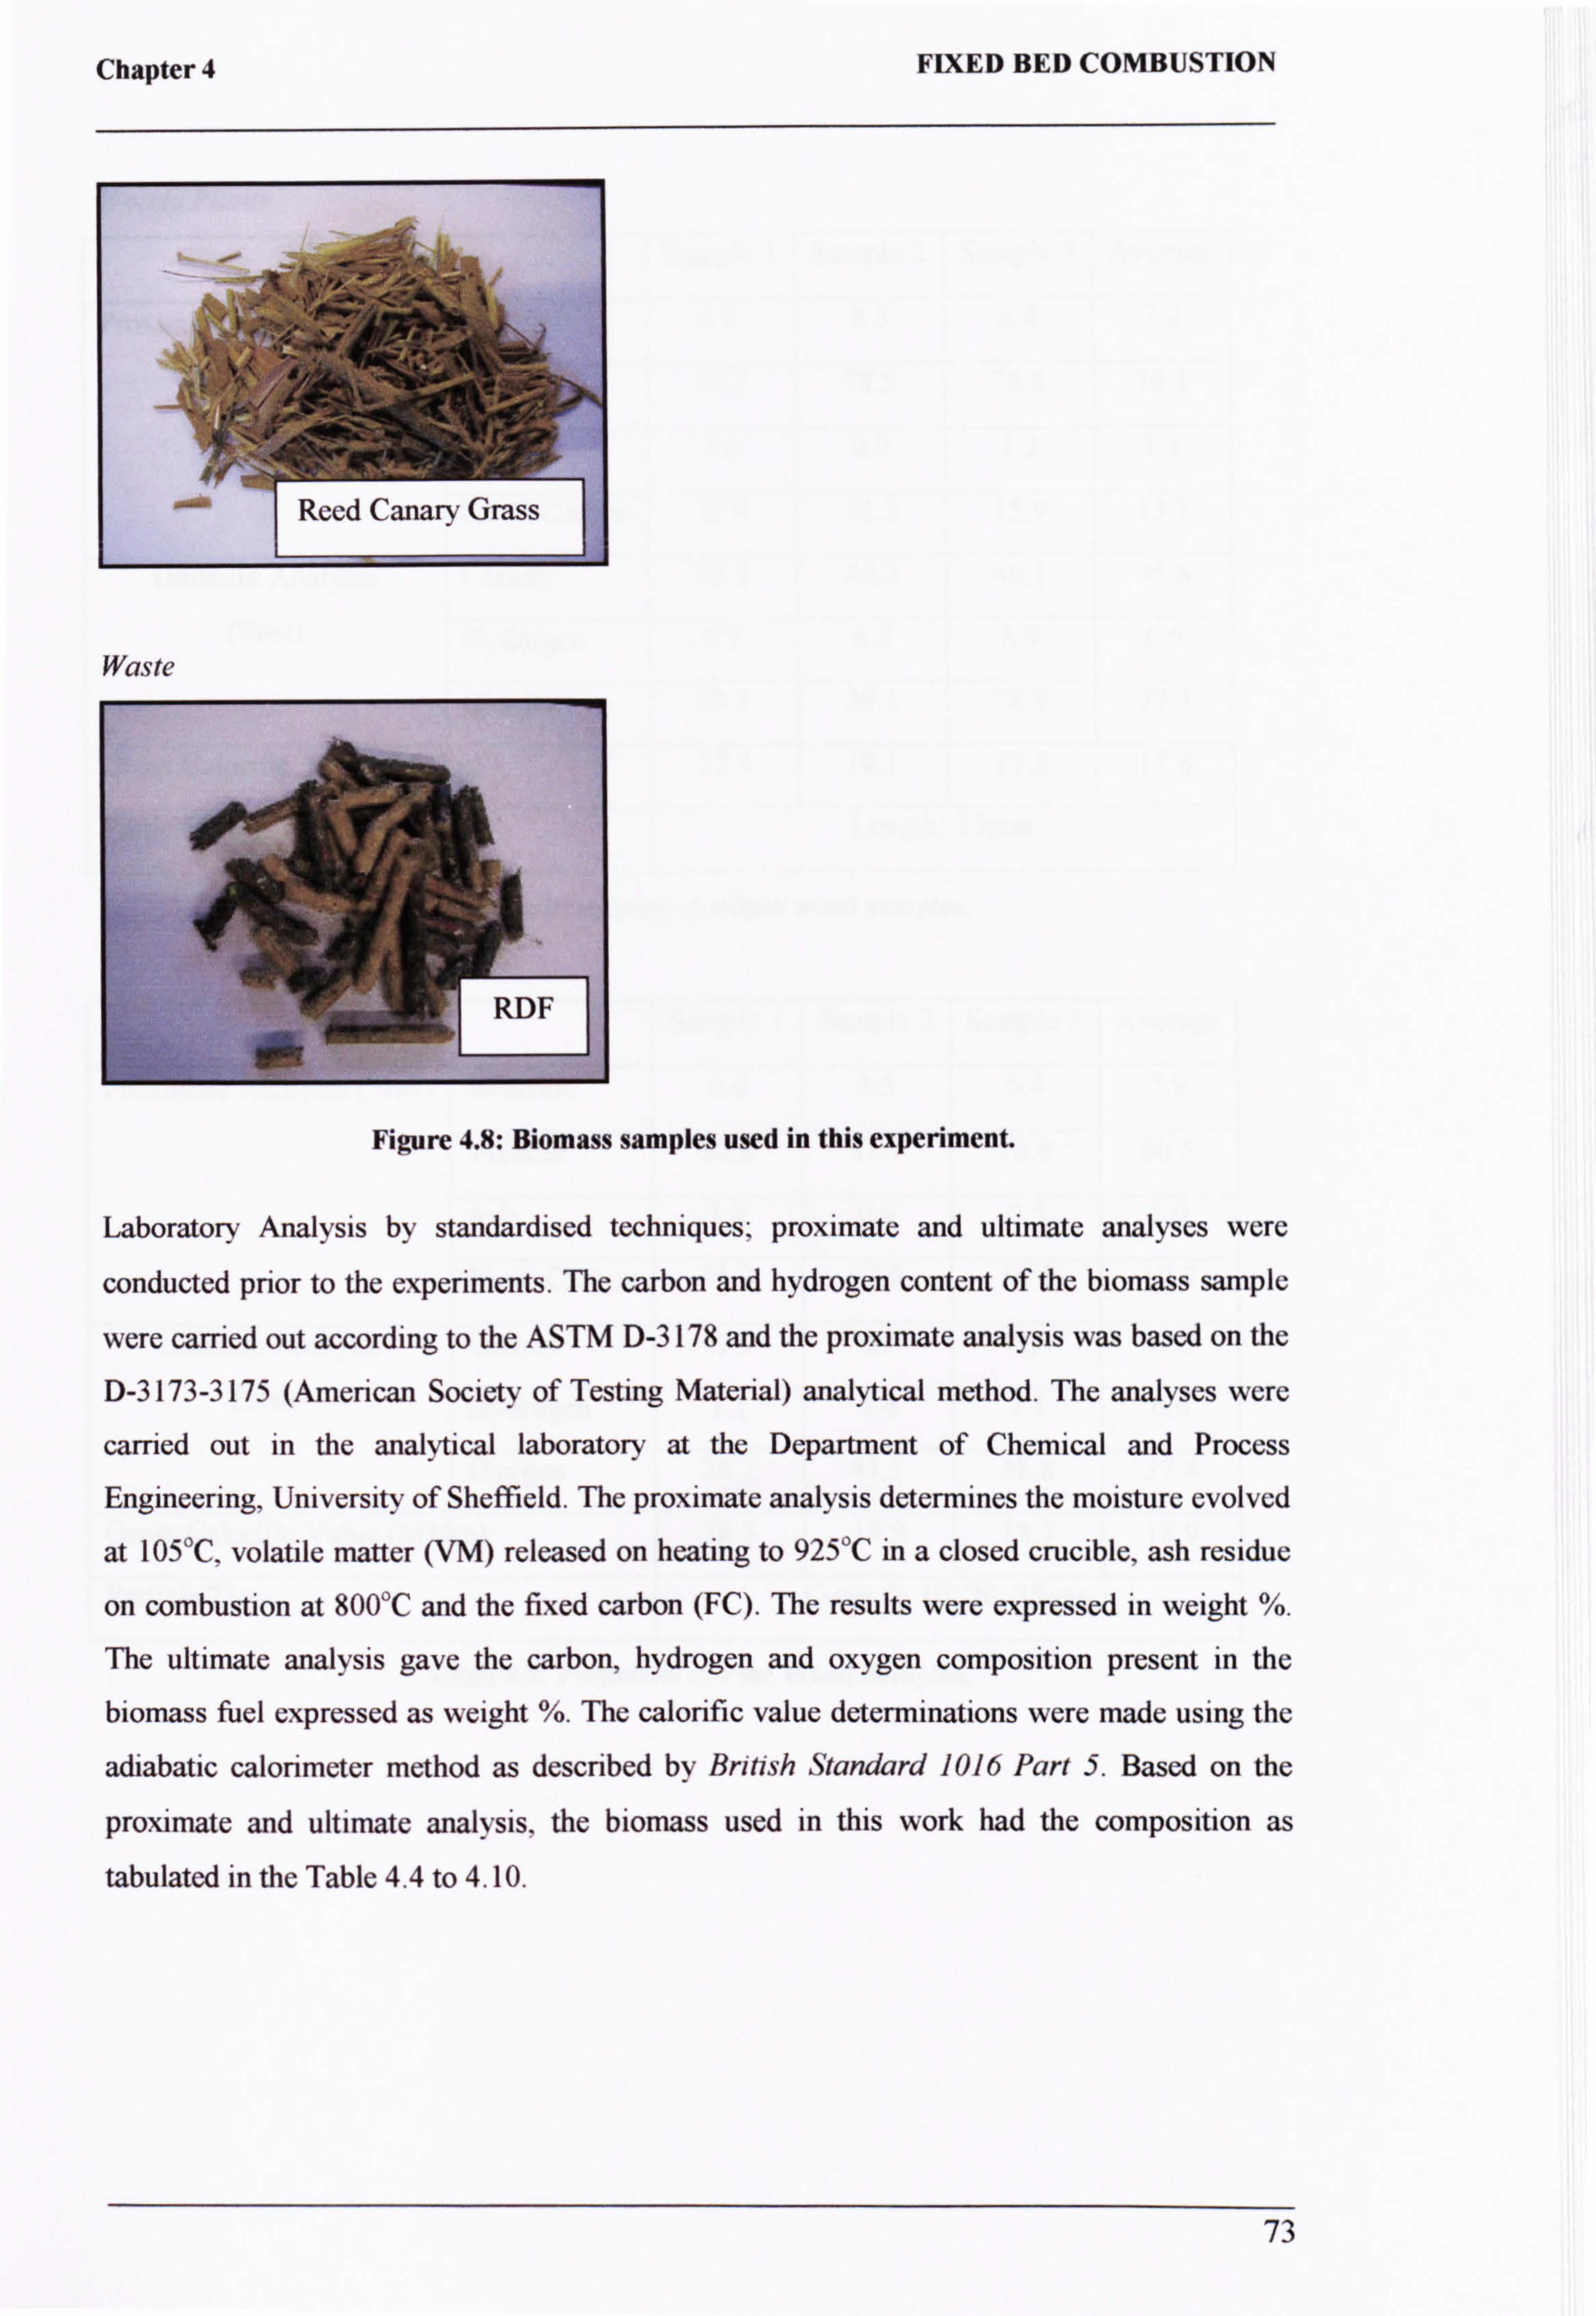
Chapter 4
. Ij 'yam! /i . ý, "
L1tkhv% O vas,, ý
Waste
RDF
FIXED BED COMBUSTION
Figure 4.8: Biomass samples used in this experiment.
Laboratory Analysis by standardised techniques; proximate and ultimate analyses were
conducted prior to the experiments. The carbon and hydrogen content of the biomass sample
were carried out according to the ASTM D-3178 and the proximate analysis was based on the
D-3173-3175 (American Society of Testing Material) analytical method. The analyses were
carried out in the analytical laboratory at the Department of Chemical and Process
Engineering, University of Sheffield. The proximate analysis determines the moisture evolved
at 105°C, volatile matter (VM) released on heating to 925°C in a closed crucible, ash residue
on combustion at NOT and the fixed carbon (FC). The results were expressed in weight %.
The ultimate analysis gave the carbon, hydrogen and oxygen composition present in the
biomass fuel expressed as weight %. The calorific value determinations were made using the
adiabatic calorimeter method as described by British Standard 1016 Part . 5. Based on the
proximate and ultimate analysis, the biomass used in this work had the composition as
tabulated in the Table 4.4 to 4.10.
73
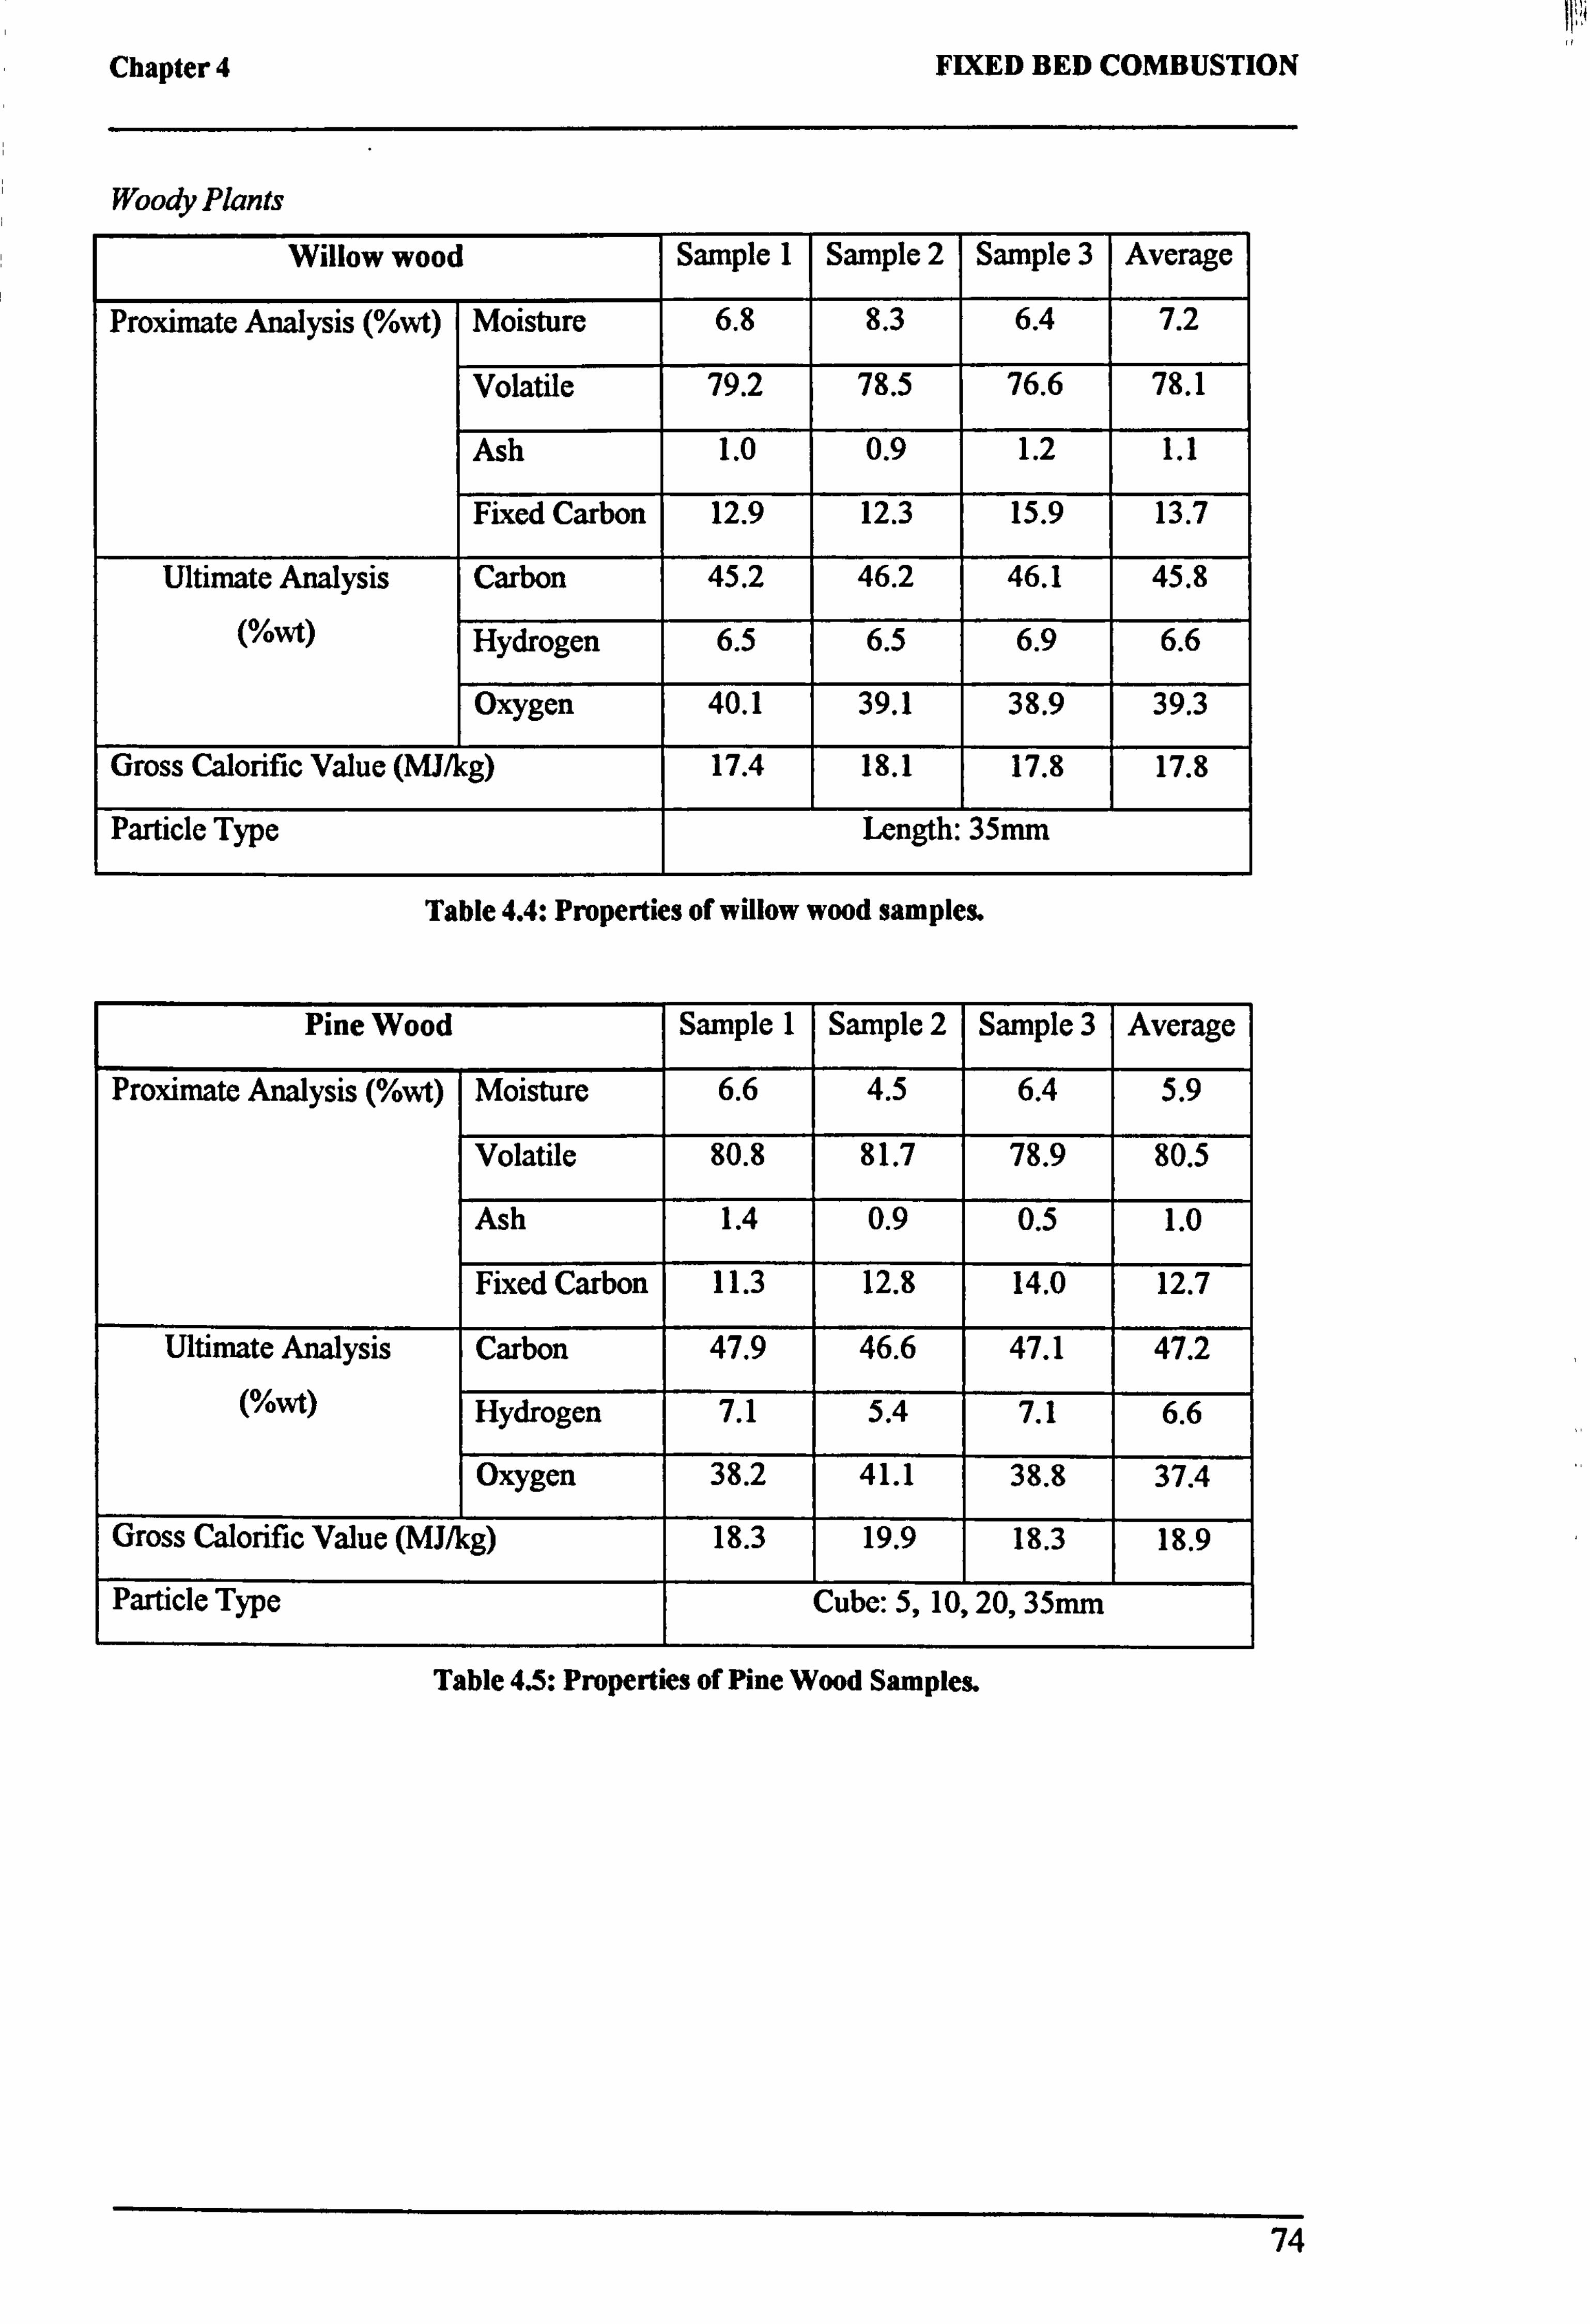
Chapter 4 FIXED BED COMBUSTION
Woody Plants
Willow wood Sample 1 Sample 2 Sample 3 Average
Proximate Analysis (%wt) Moisture 6.8 8.3 6.4 7.2
Volatile 79.2 78.5 76.6 78.1
Ash 1.0 0.9 1.2 1.1
Fixed Carbon 12.9 12.3 15.9 13.7
Ultimate Analysis Carbon 45.2 46.2 46.1 45.8
(%wt) Hydrogen 6.5 6.5 6.9 6.6
Oxygen 40.1 39.1 38.9 39.3
Gross Calorific Value (MJ/kg) 17.4 18.1 17.8 17.8
Particle Type Length: 35mm
Table 4.4: Properties of willow wood samples.
Pine Wood Sample 1 Sample 2 Sample 3 Average
Proximate Analysis (%wt) Moisture 6.6 4.5 6.4 5.9
Volatile 80.8 81.7 78.9 80.5
Ash 1.4 0.9 0.5 1.0
Fixed Carbon 11.3 12.8 14.0 12.7
Ultimate Analysis Carbon 47.9 46.6 47.1 47.2
(%") Hydrogen 7.1 5.4 7.1 6.6
Oxygen 38.2 41.1 38.8 37.4
Gross Calorific Value (MJ/kg) 18.3 19.9 18.3 18.9
Particle Type Cube: 5,10,20,35mm
Table 4.5: Properties of Pine Wood Samples.
74
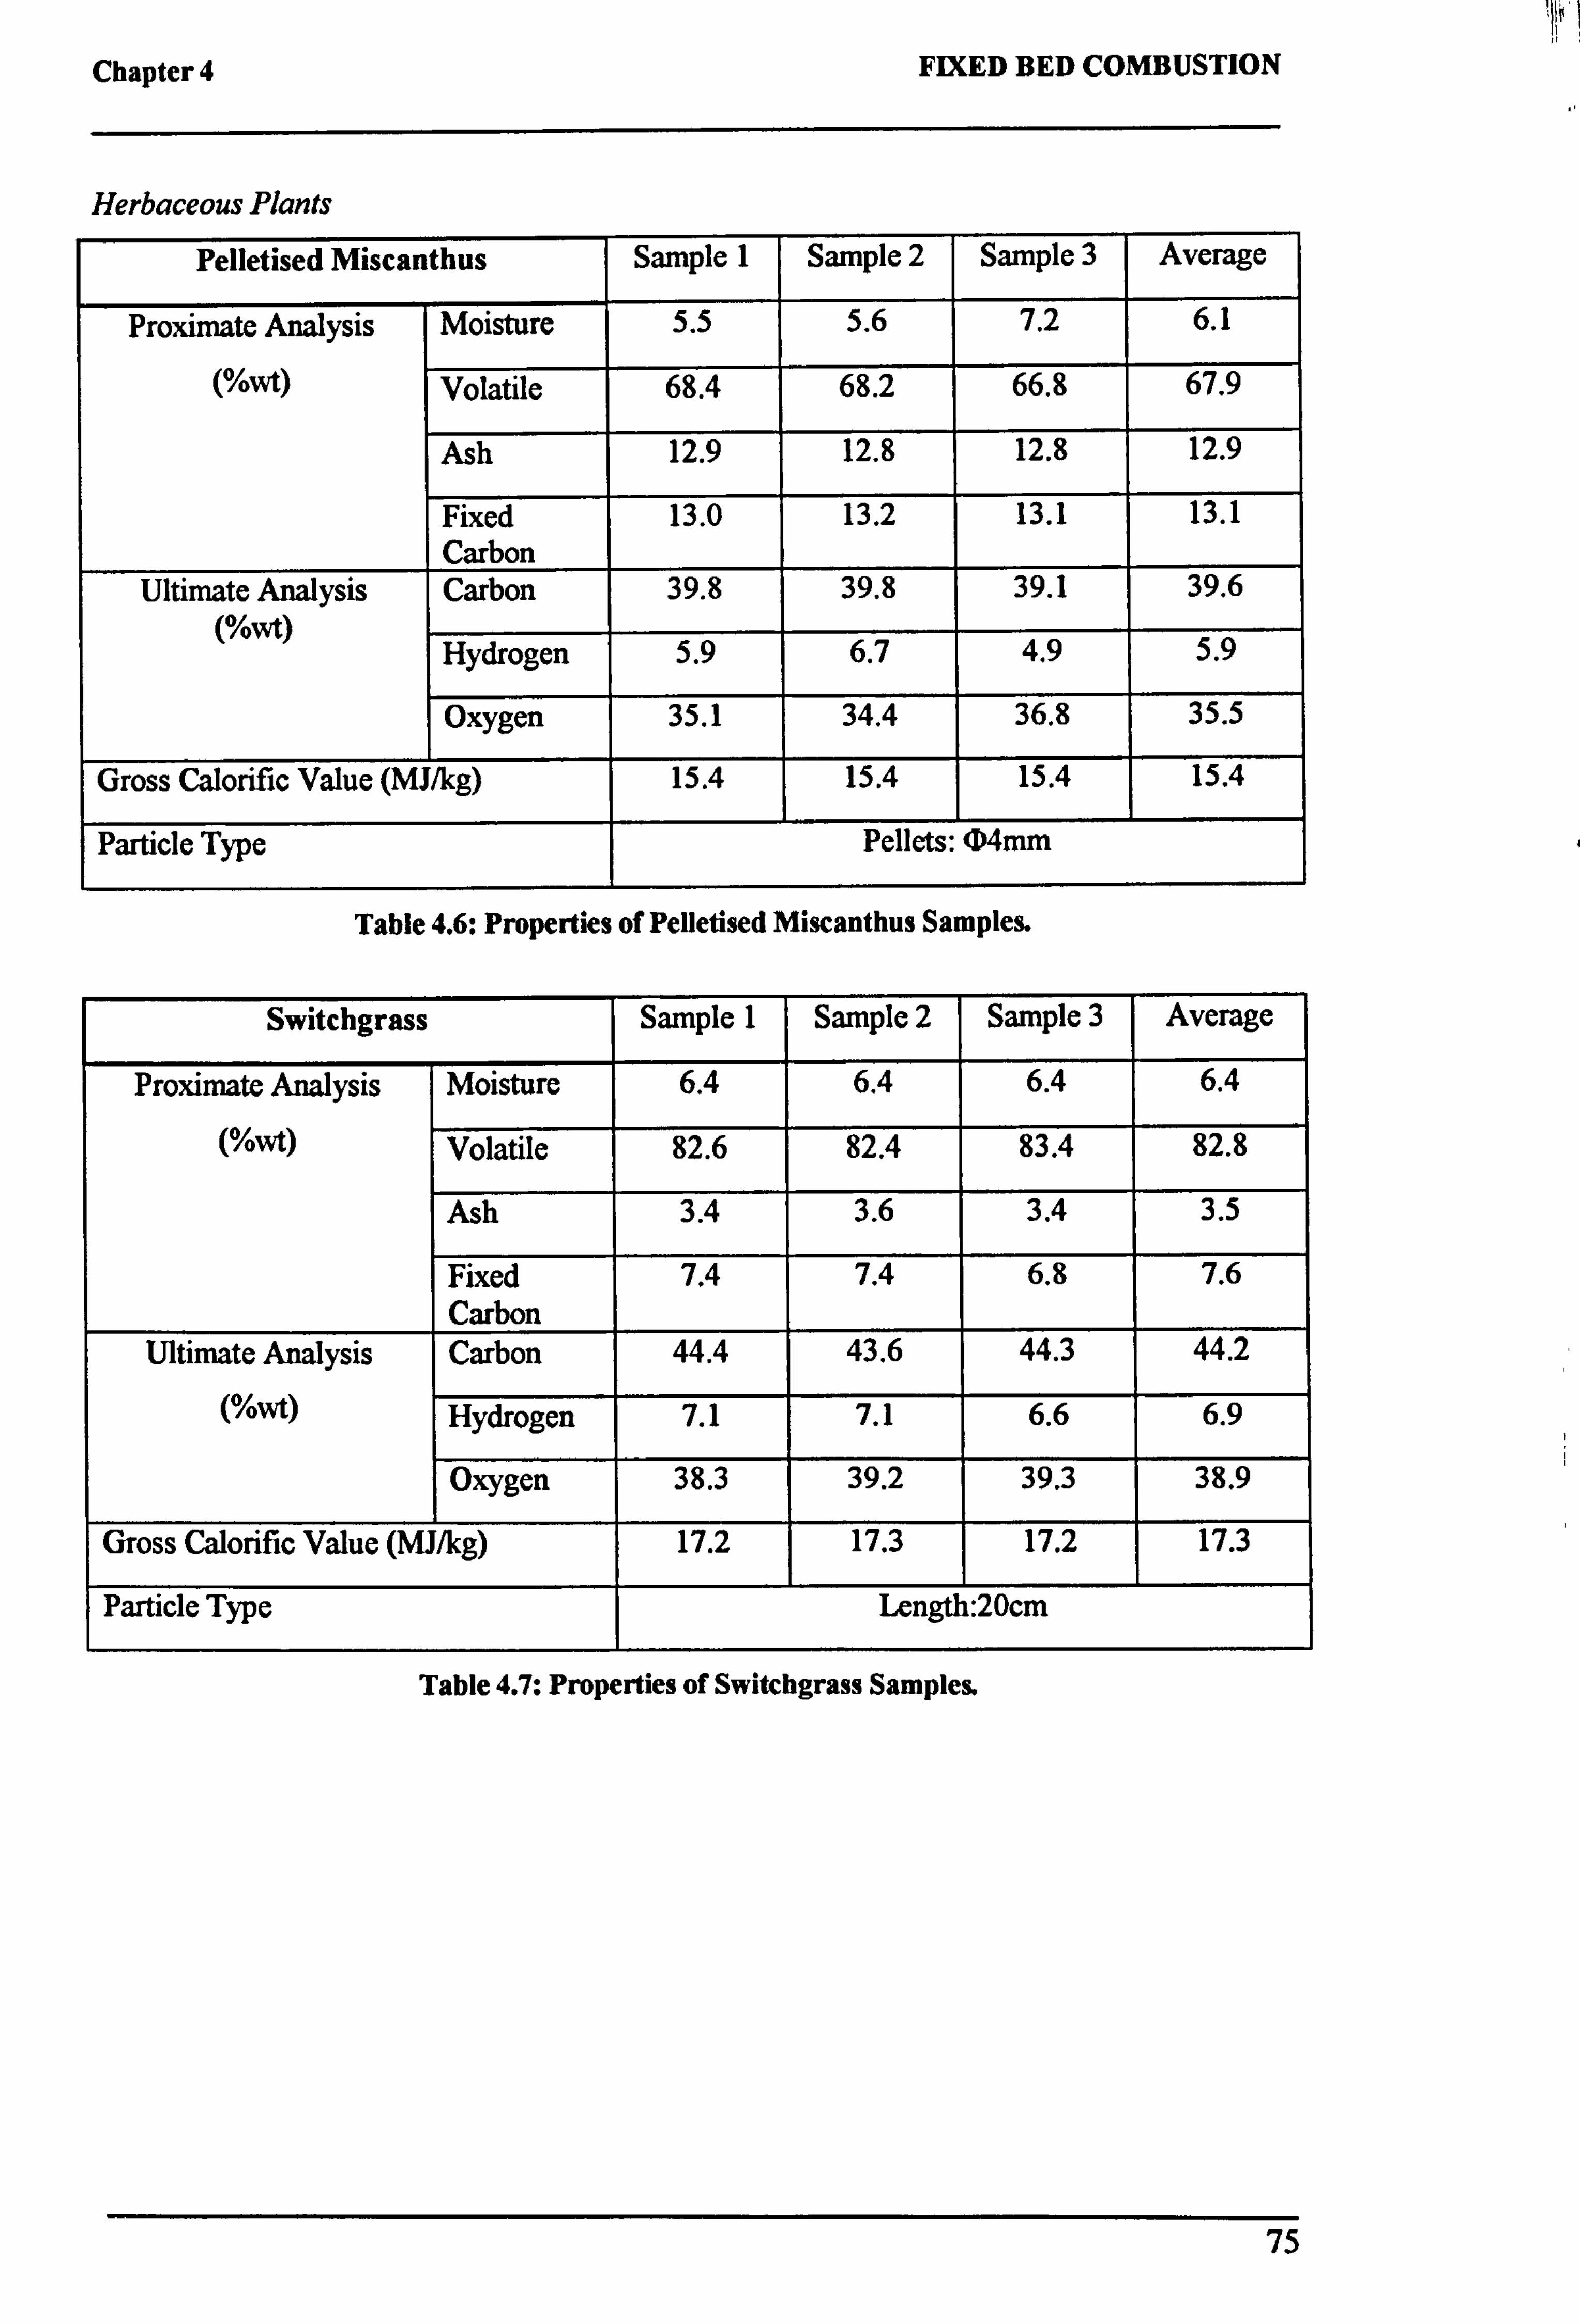
Chapter 4 FIXED BED COMBUSTION
Herbaceous Plants
Pelletised Miscanthus Sample 1 Sample 2 Sample 3 Average
Proximate Analysis Moisture 5.5 5.6 7.2 6.1
(%wt) Volatile 68.4 68.2 66.8 67.9
Ash 12.9 12.8 12.8 12.9
Fixed Carbon
13.0 13.2 13.1 13.1
Ultimate Analysis (%wt)
Carbon 39.8 39.8 39.1 39.6
Hydrogen 5.9 6.7 4.9 5.9
Oxygen 35.1 34.4 36.8 35.5
Gross Calorific Value (MJ/kg) 15.4 15.4 15.4 15.4
Particle Type Pellets: (4mm
Table 4.6: Properties of Pelletised Miscanthus Samples.
Switchgrass Sample 1 Sample 2 Sample 3 Average
Proximate Analysis Moisture 6.4 6.4 6.4 6.4
(%') Volatile 82.6 82.4 83.4 82.8
Ash 3.4 3.6 3.4 3.5
Fixed Carbon
7.4 7.4 6.8 7.6
Ultimate Analysis Carbon 44.4 43.6 44.3 44.2
(°") Hydrogen 7.1 7.1 6.6 6.9
Oxygen 38.3 39.2 39.3 38.9
Gross Calorific Value (MJ/kg) 17.2 17.3 17.2 17.3
Particle Type Length: 20cm.
Table 4.7: Properties of Switcbgrass Samples.
75
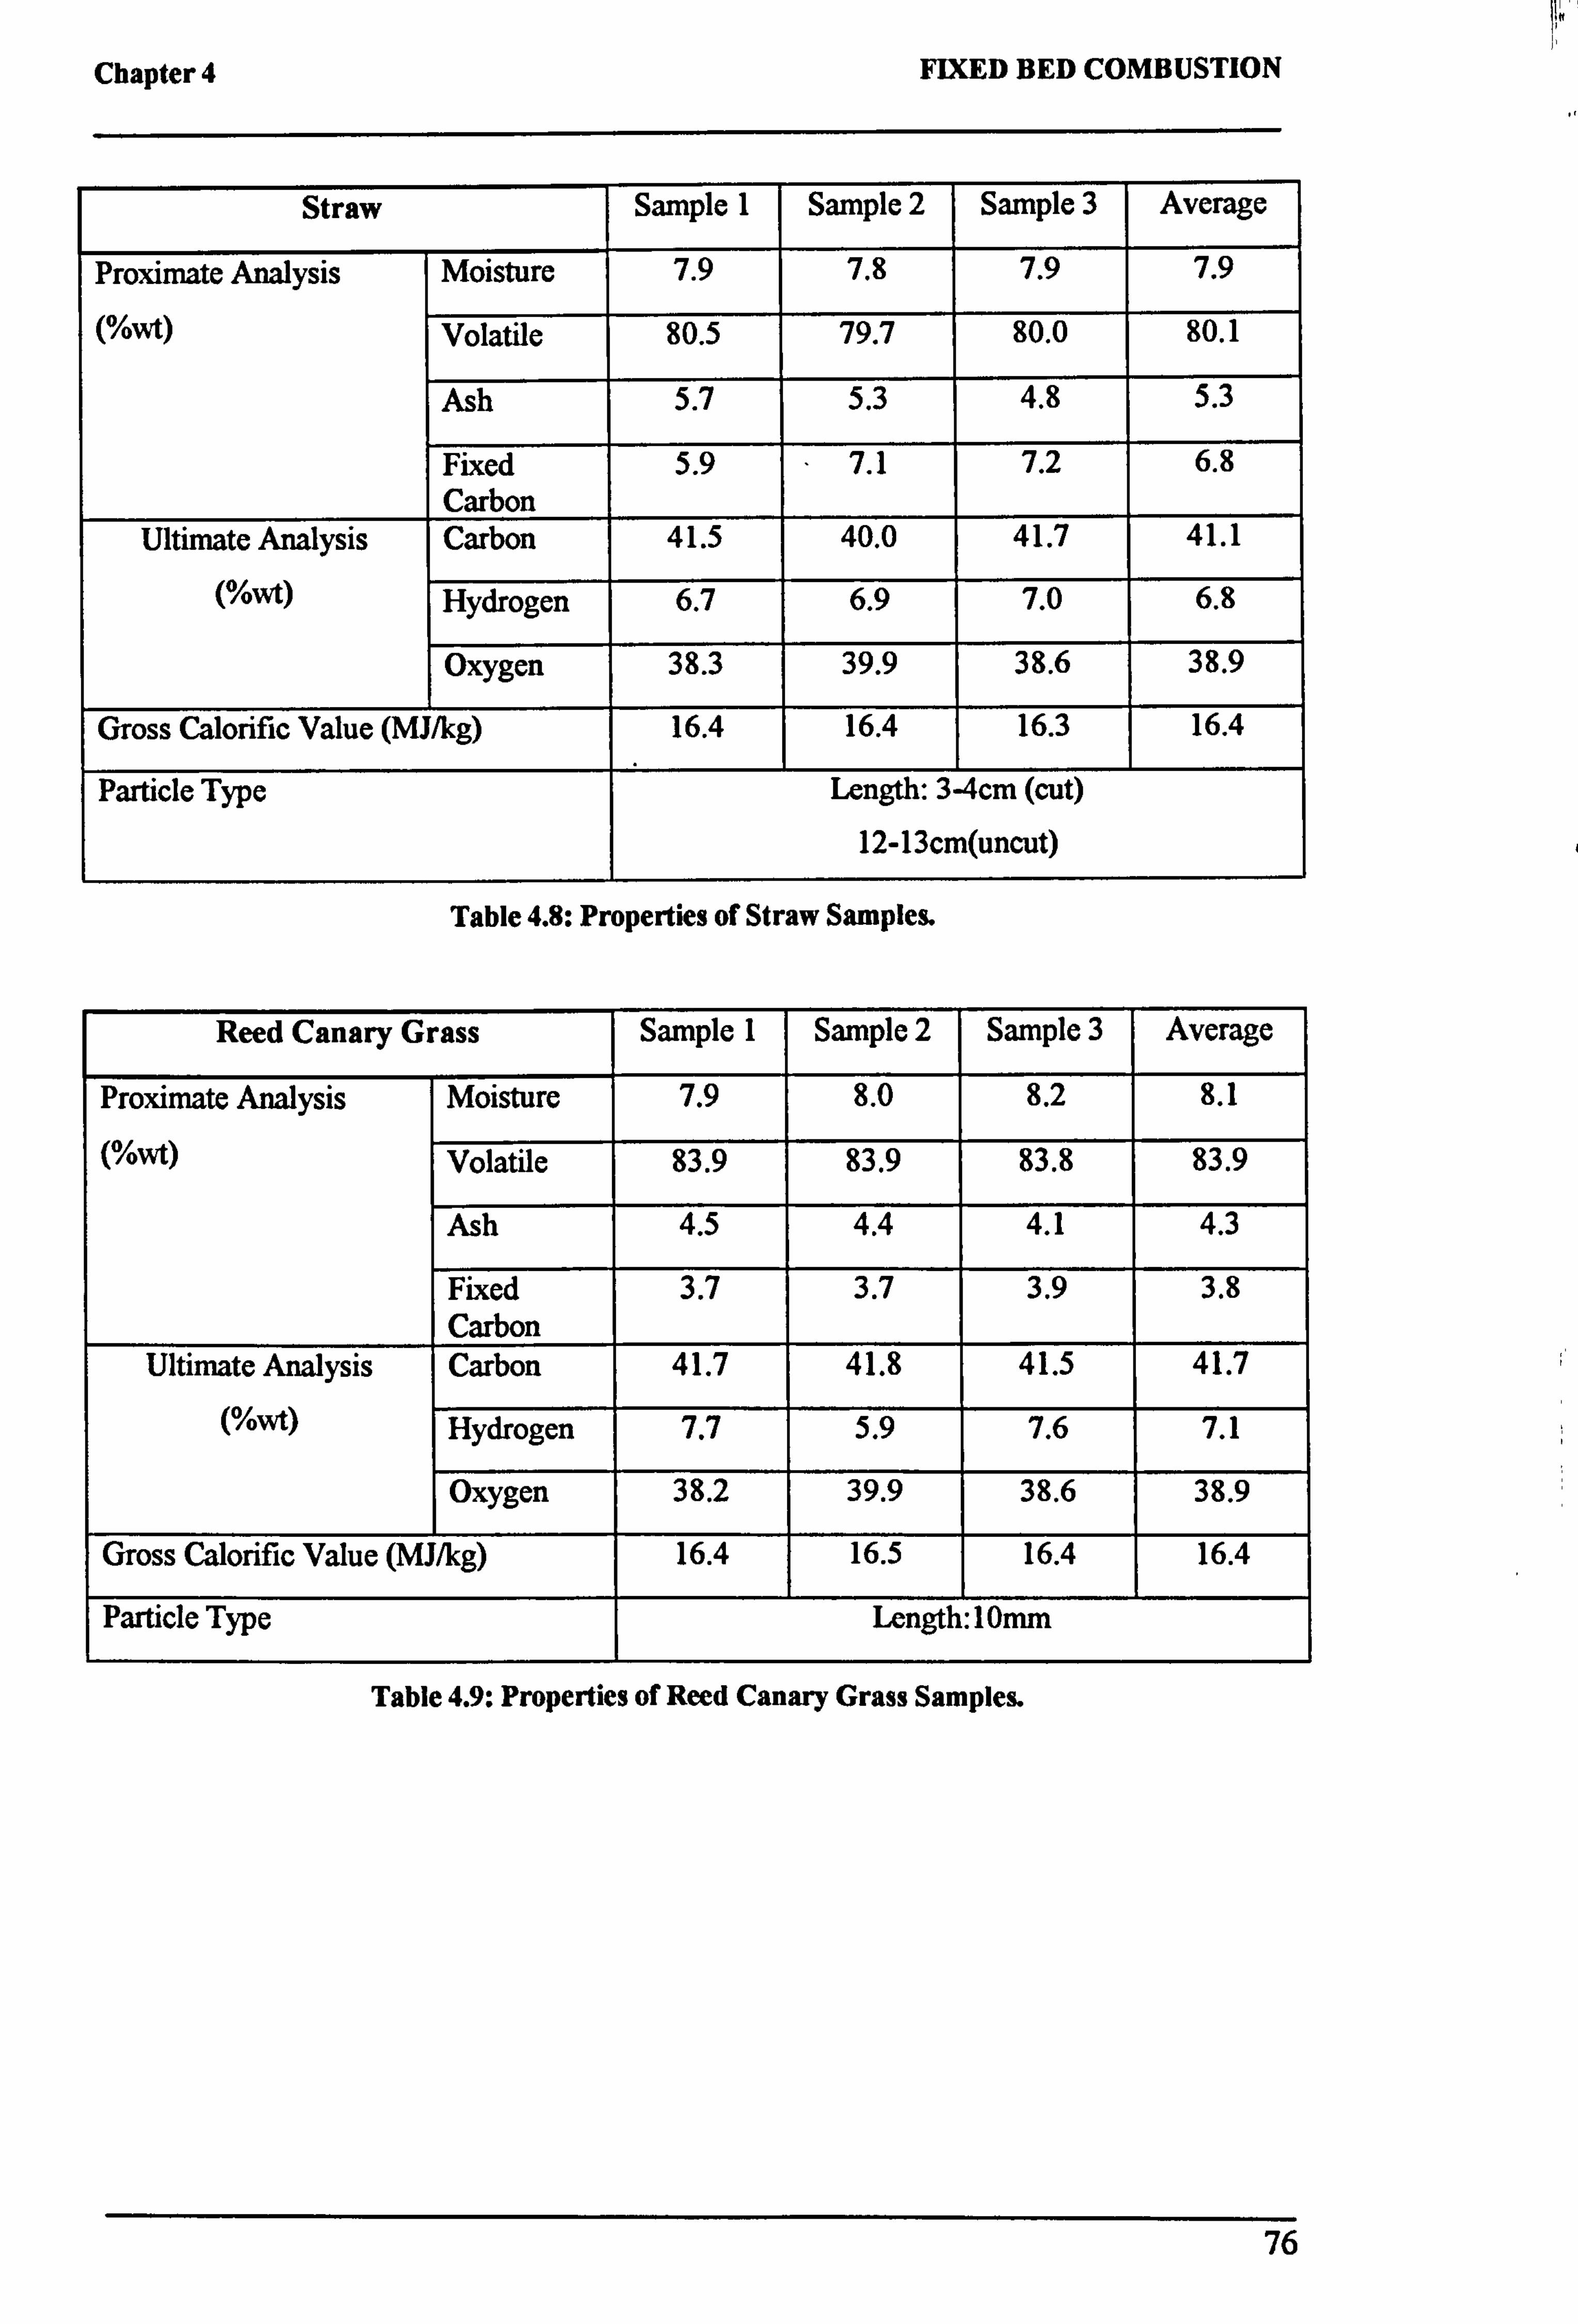
Chapter 4 FIXED BED COMBUSTION
Straw Sample 1 Sample 2 Sample 3 Average
Proximate Analysis Moisture 7.9 7.8 7.9 7.9
(%wt) Volatile 80.5 79.7 80.0 80.1
Ash 5.7 5.3 4.8 5.3
Fixed Carbon
5.9 7.1 7.2 6.8
Ultimate Analysis Carbon 41.5 40.0 41.7 41.1
(%') Hydrogen 6.7 6.9 7.0 6.8
Oxygen 38.3 39.9 38.6 38.9
Gross Calorific Value (MJ/kg) 16.4 16.4 16.3 16.4
Particle Type Length: 3-4cm (cut)
12-13cm(uncut)
Table 4.8: Properties of Straw Samples.
Reed Canary Grass Sample 1 Sample 2 Sample 3 Average
Proximate Analysis Moisture 7.9 8.0 8.2 8.1
(%wt) Volatile 83.9 83.9 83.8 83.9
Ash 4.5 4.4 4.1 4.3
Fixed Carbon
3.7 3.7 3.9 3.8
Ultimate Analysis Carbon 41.7 41.8 41.5 41.7
(0/. Wt) Hydrogen 7.7 5.9 7.6 7.1
Oxygen 38.2 39.9 38.6 38.9
Gross Calorific Value (MJ/kg) 16.4 16.5 16.4 16.4
Particle Type Length: IOmm
Table 4.9: Properties of Reed Canary Grass Samples.
76
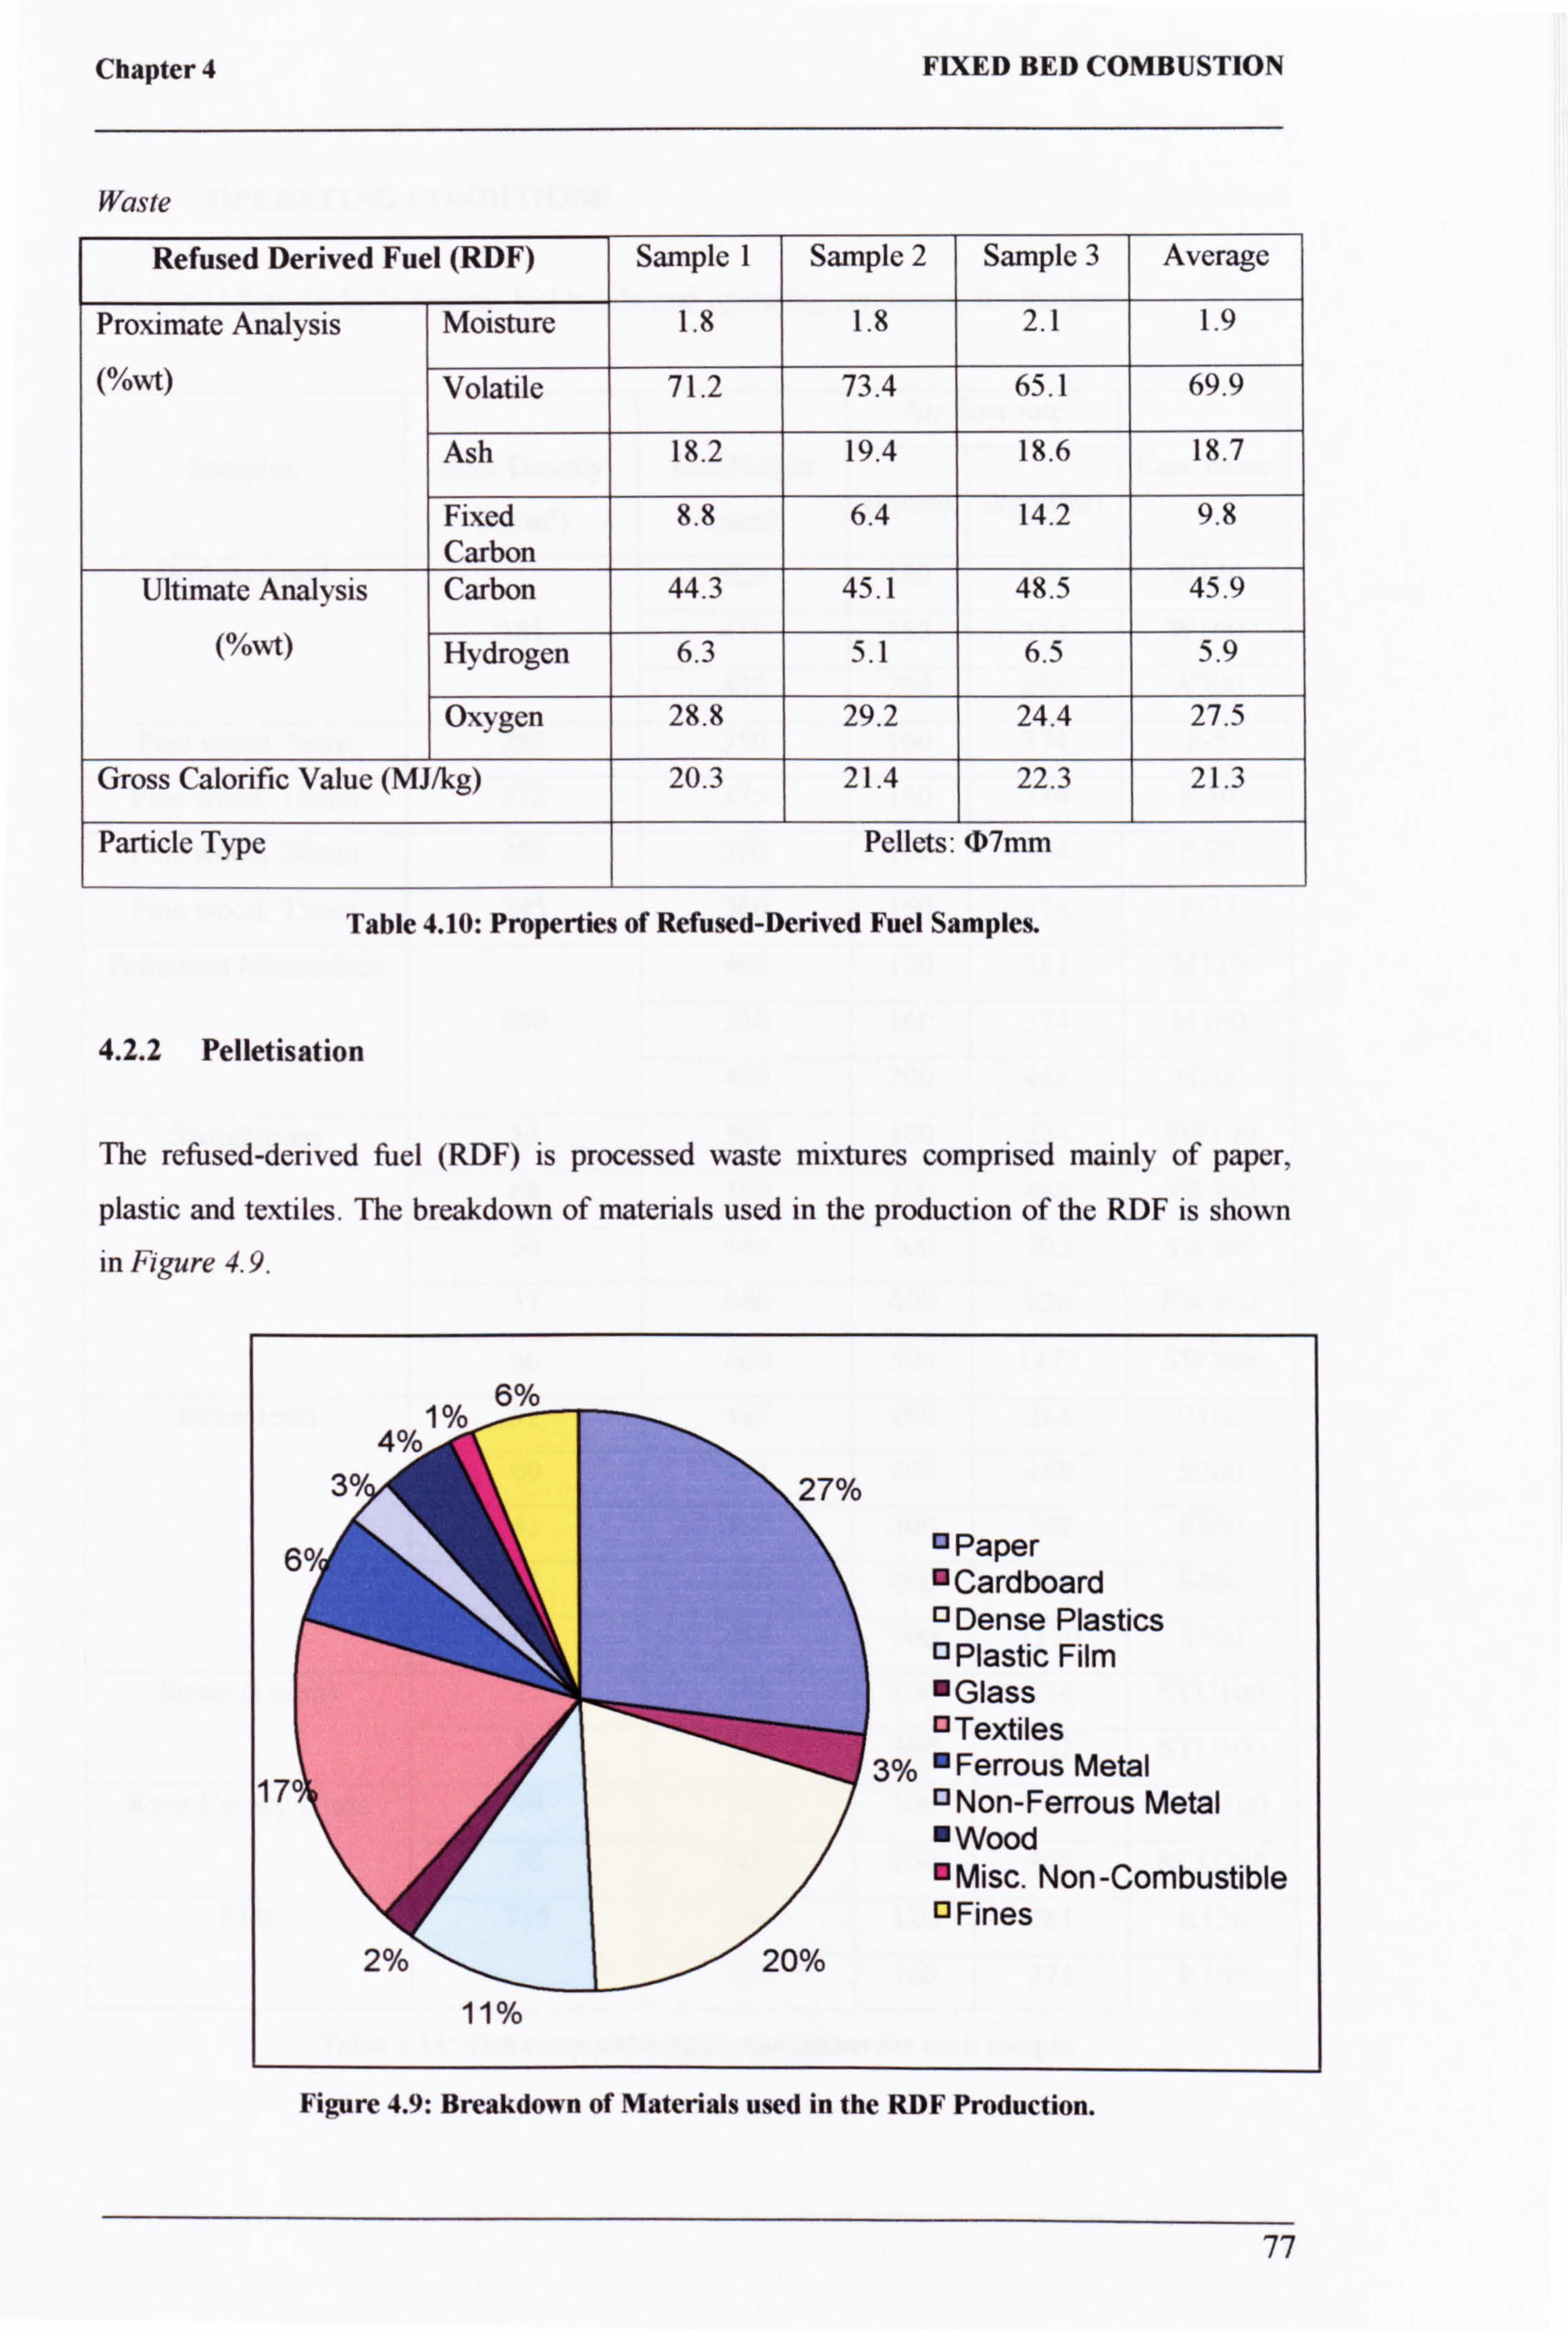
Chapter 4
Waste
FIXED BED COMBUSTION
Refused Derived Fuel (RDF) Sample 1 Sample 2 Sample 3 Average
Proximate Analysis Moisture 1.8 1.8 2.1 1.9
(%') Volatile 71.2 73.4 65.1 69.9
Ash 18.2 19.4 18.6 18.7
Fixed Carbon
8.8 6.4 14.2 9.8
Ultimate Analysis Carbon 44.3 45.1 48.5 45.9
(%') Hydrogen 6.3 5.1 6.5 5.9
Oxygen 28.8 29.2 24.4 27.5
Gross Calorific Value (MJ/kg) 20.3 21.4 22.3 21.3
Particle Type Pellets: (D7mm
Table 4.10: Properties of Refused-Derived Fuel Samples.
4.2.2 Pelletisation
The refused-derived fuel (RDF) is processed waste mixtures comprised mainly of paper,
plastic and textiles. The breakdown of materials used in the production of the RDF is shown in Figure 4.9.
6%
11%
13 Paper "Cardboard 13 Dense Plastics ° Plastic Film Glass 0 Textiles
3% Ferrous Metal °Non-Ferrous Metal " Wood "Misc. Non-Combustible 13 Fines
Figure 4.9: Breakdown of Materials used in the RDF Production.
77
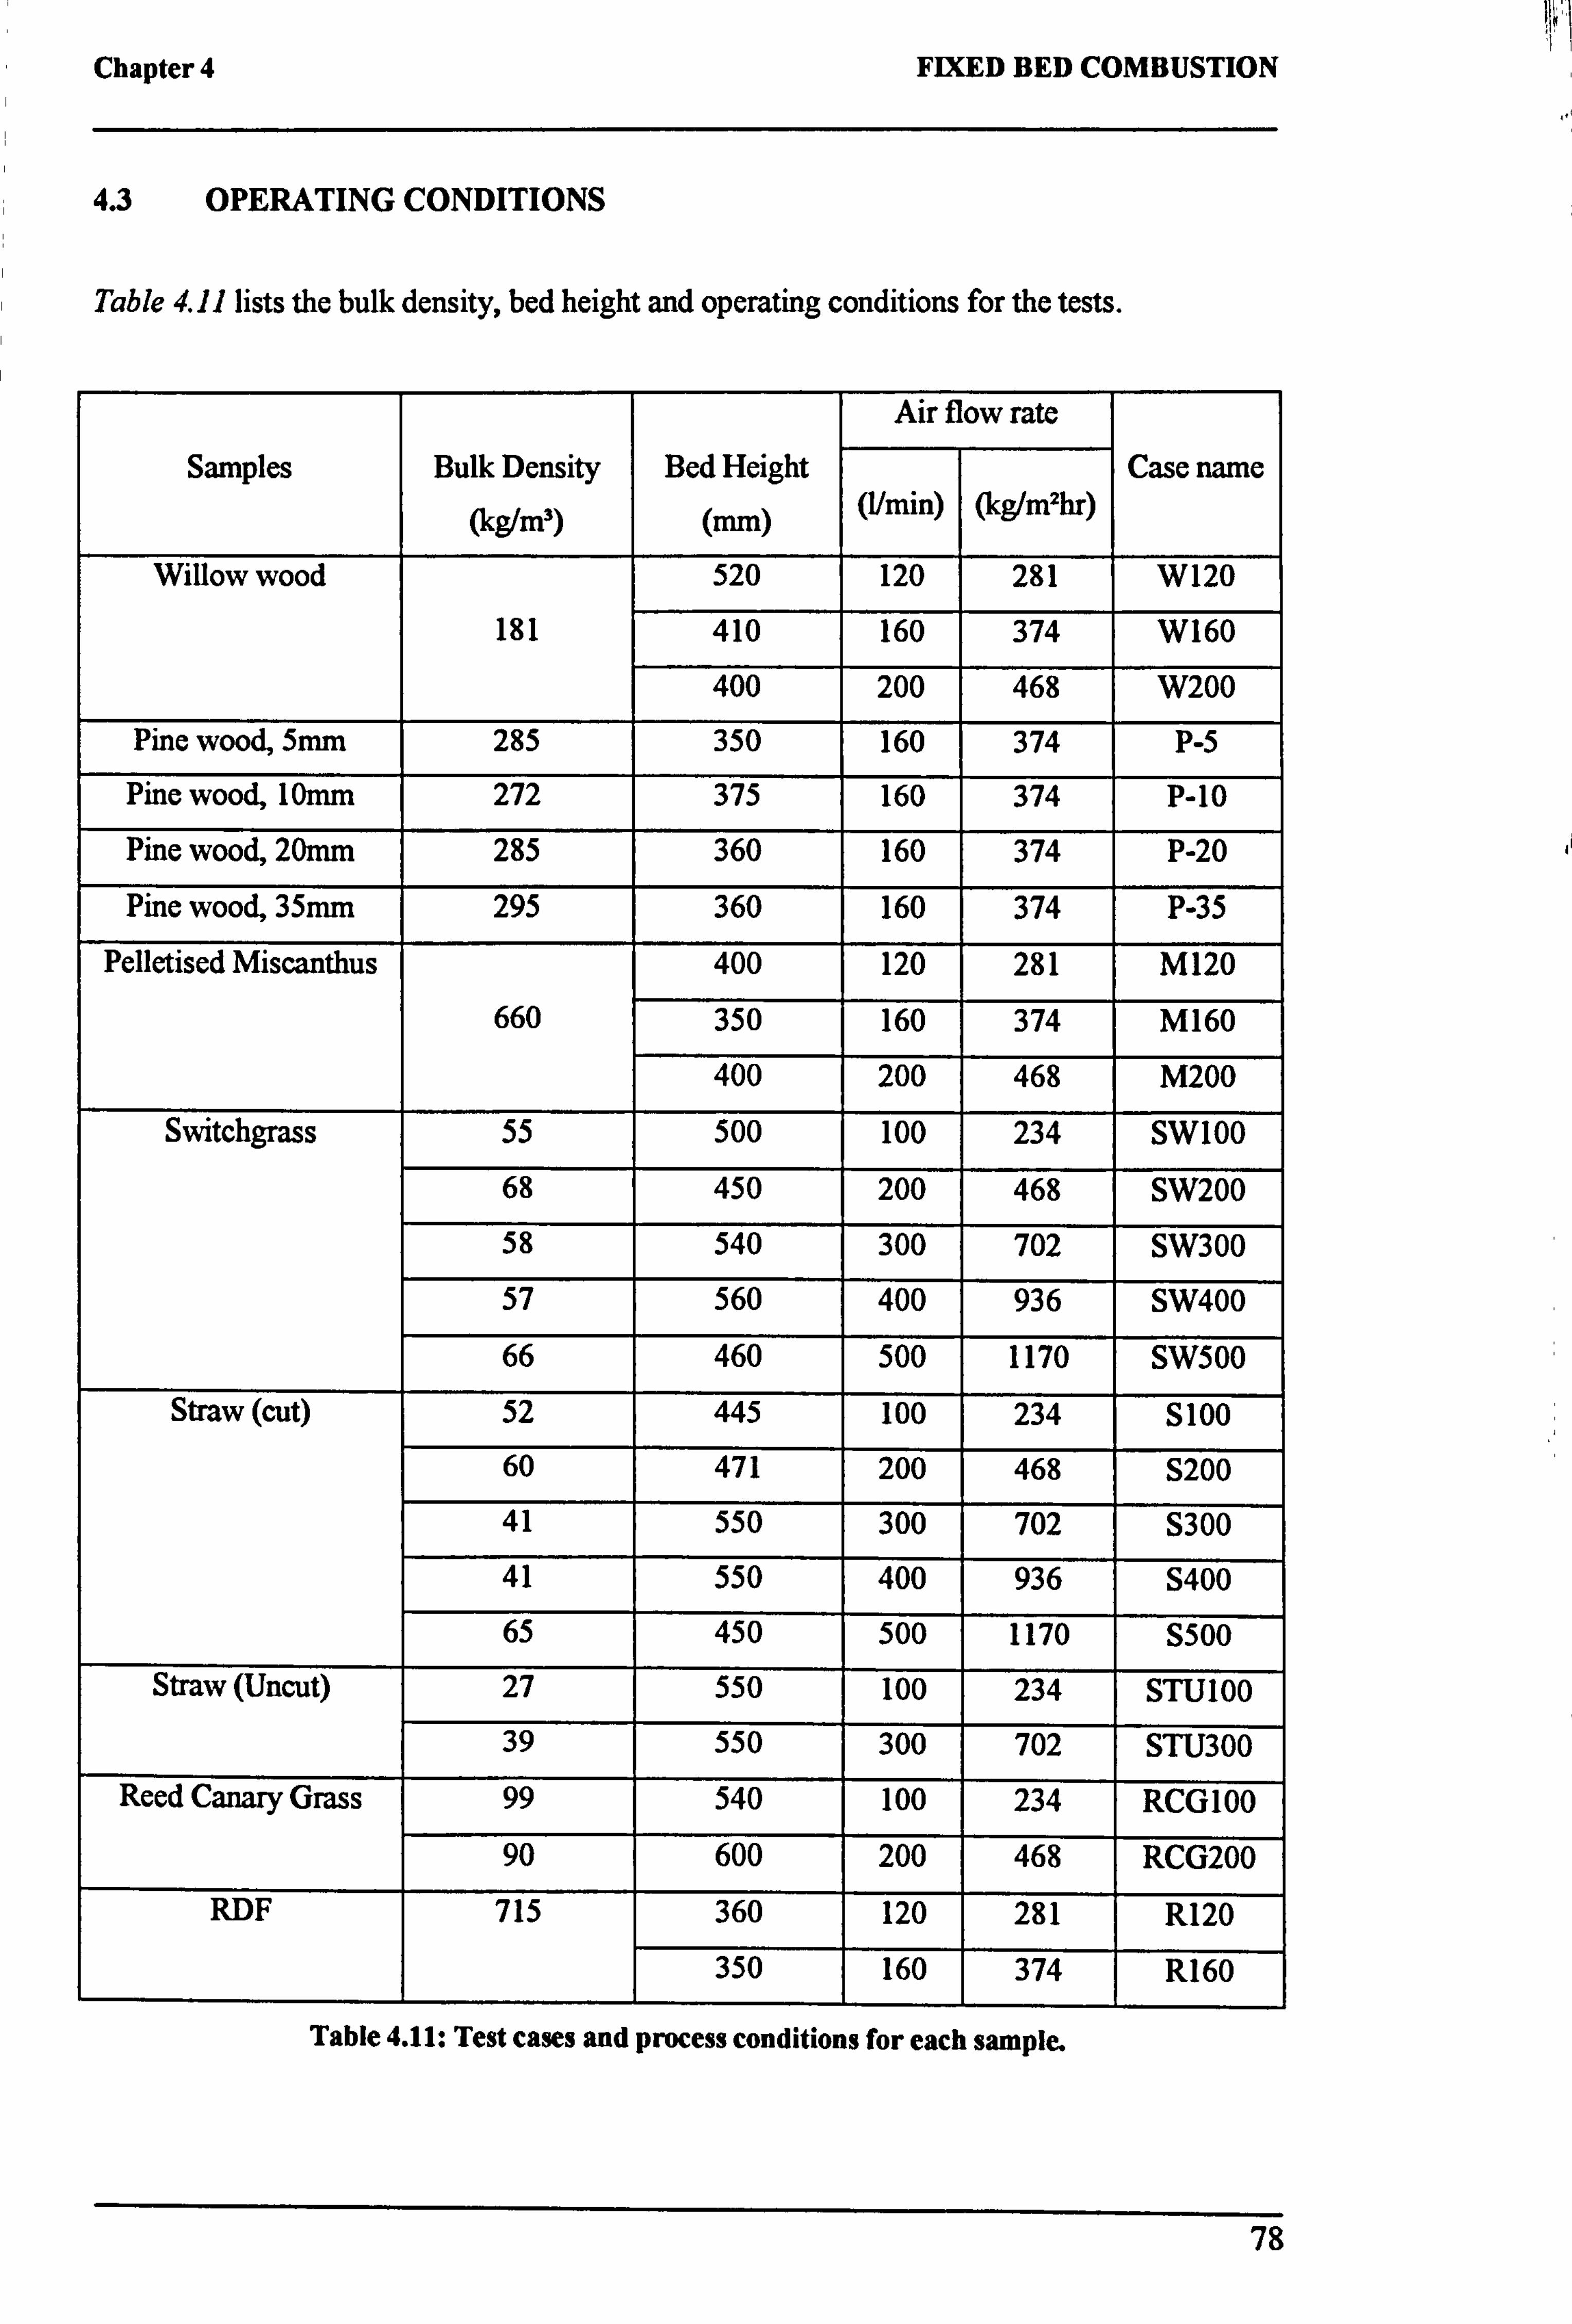
Chapter 4
4.3 OPERATING CONDITIONS
FIXED BED COMBUSTION
Table 4.11 lists the bulk density, bed height and operating conditions for the tests.
Air flow rate Samples Bulk Density
(kg/m')
Bed Height
(mm) (1/min) (kg/m2hr) Case name
Willow wood 520 120 281 W 120
181 410 160 374 W160
400 200 468 W200
Pine wood, 5mm 285 350 160 374 P-5
Pine wood, 10mm 272 375 160 374 P-10
Pine wood, 20mm 285 360 160 374 P-20
Pine wood, 35mm 295 360 160 374 P-35
Pelletised Miscanthus 400 120 281 M120
660 350 160 374 M160
400 200 468 M200
Switchgrass 55 500 100 234 SW100
68 450 200 468 SW200
58 540 300 702 SW300
57 560 400 936 SW400
66 460 500 1170 SW500
Straw (cut) 52 445 100 234 S100
60 471 200 468 S200
41 550 300 702 S300
41 550 400 936 S400
65 450 500 1170 S500 Straw (Uncut) 27 550 100 234 STU100
39 550 300 702 STU300
Reed Canary Grass 99 540 100 234 RCG100
90 600 200 468 RCG200
RDF 715 360 120 281 R120
350 160 374 R160
Table 4.11: Test cases and process conditions for each sample.
78
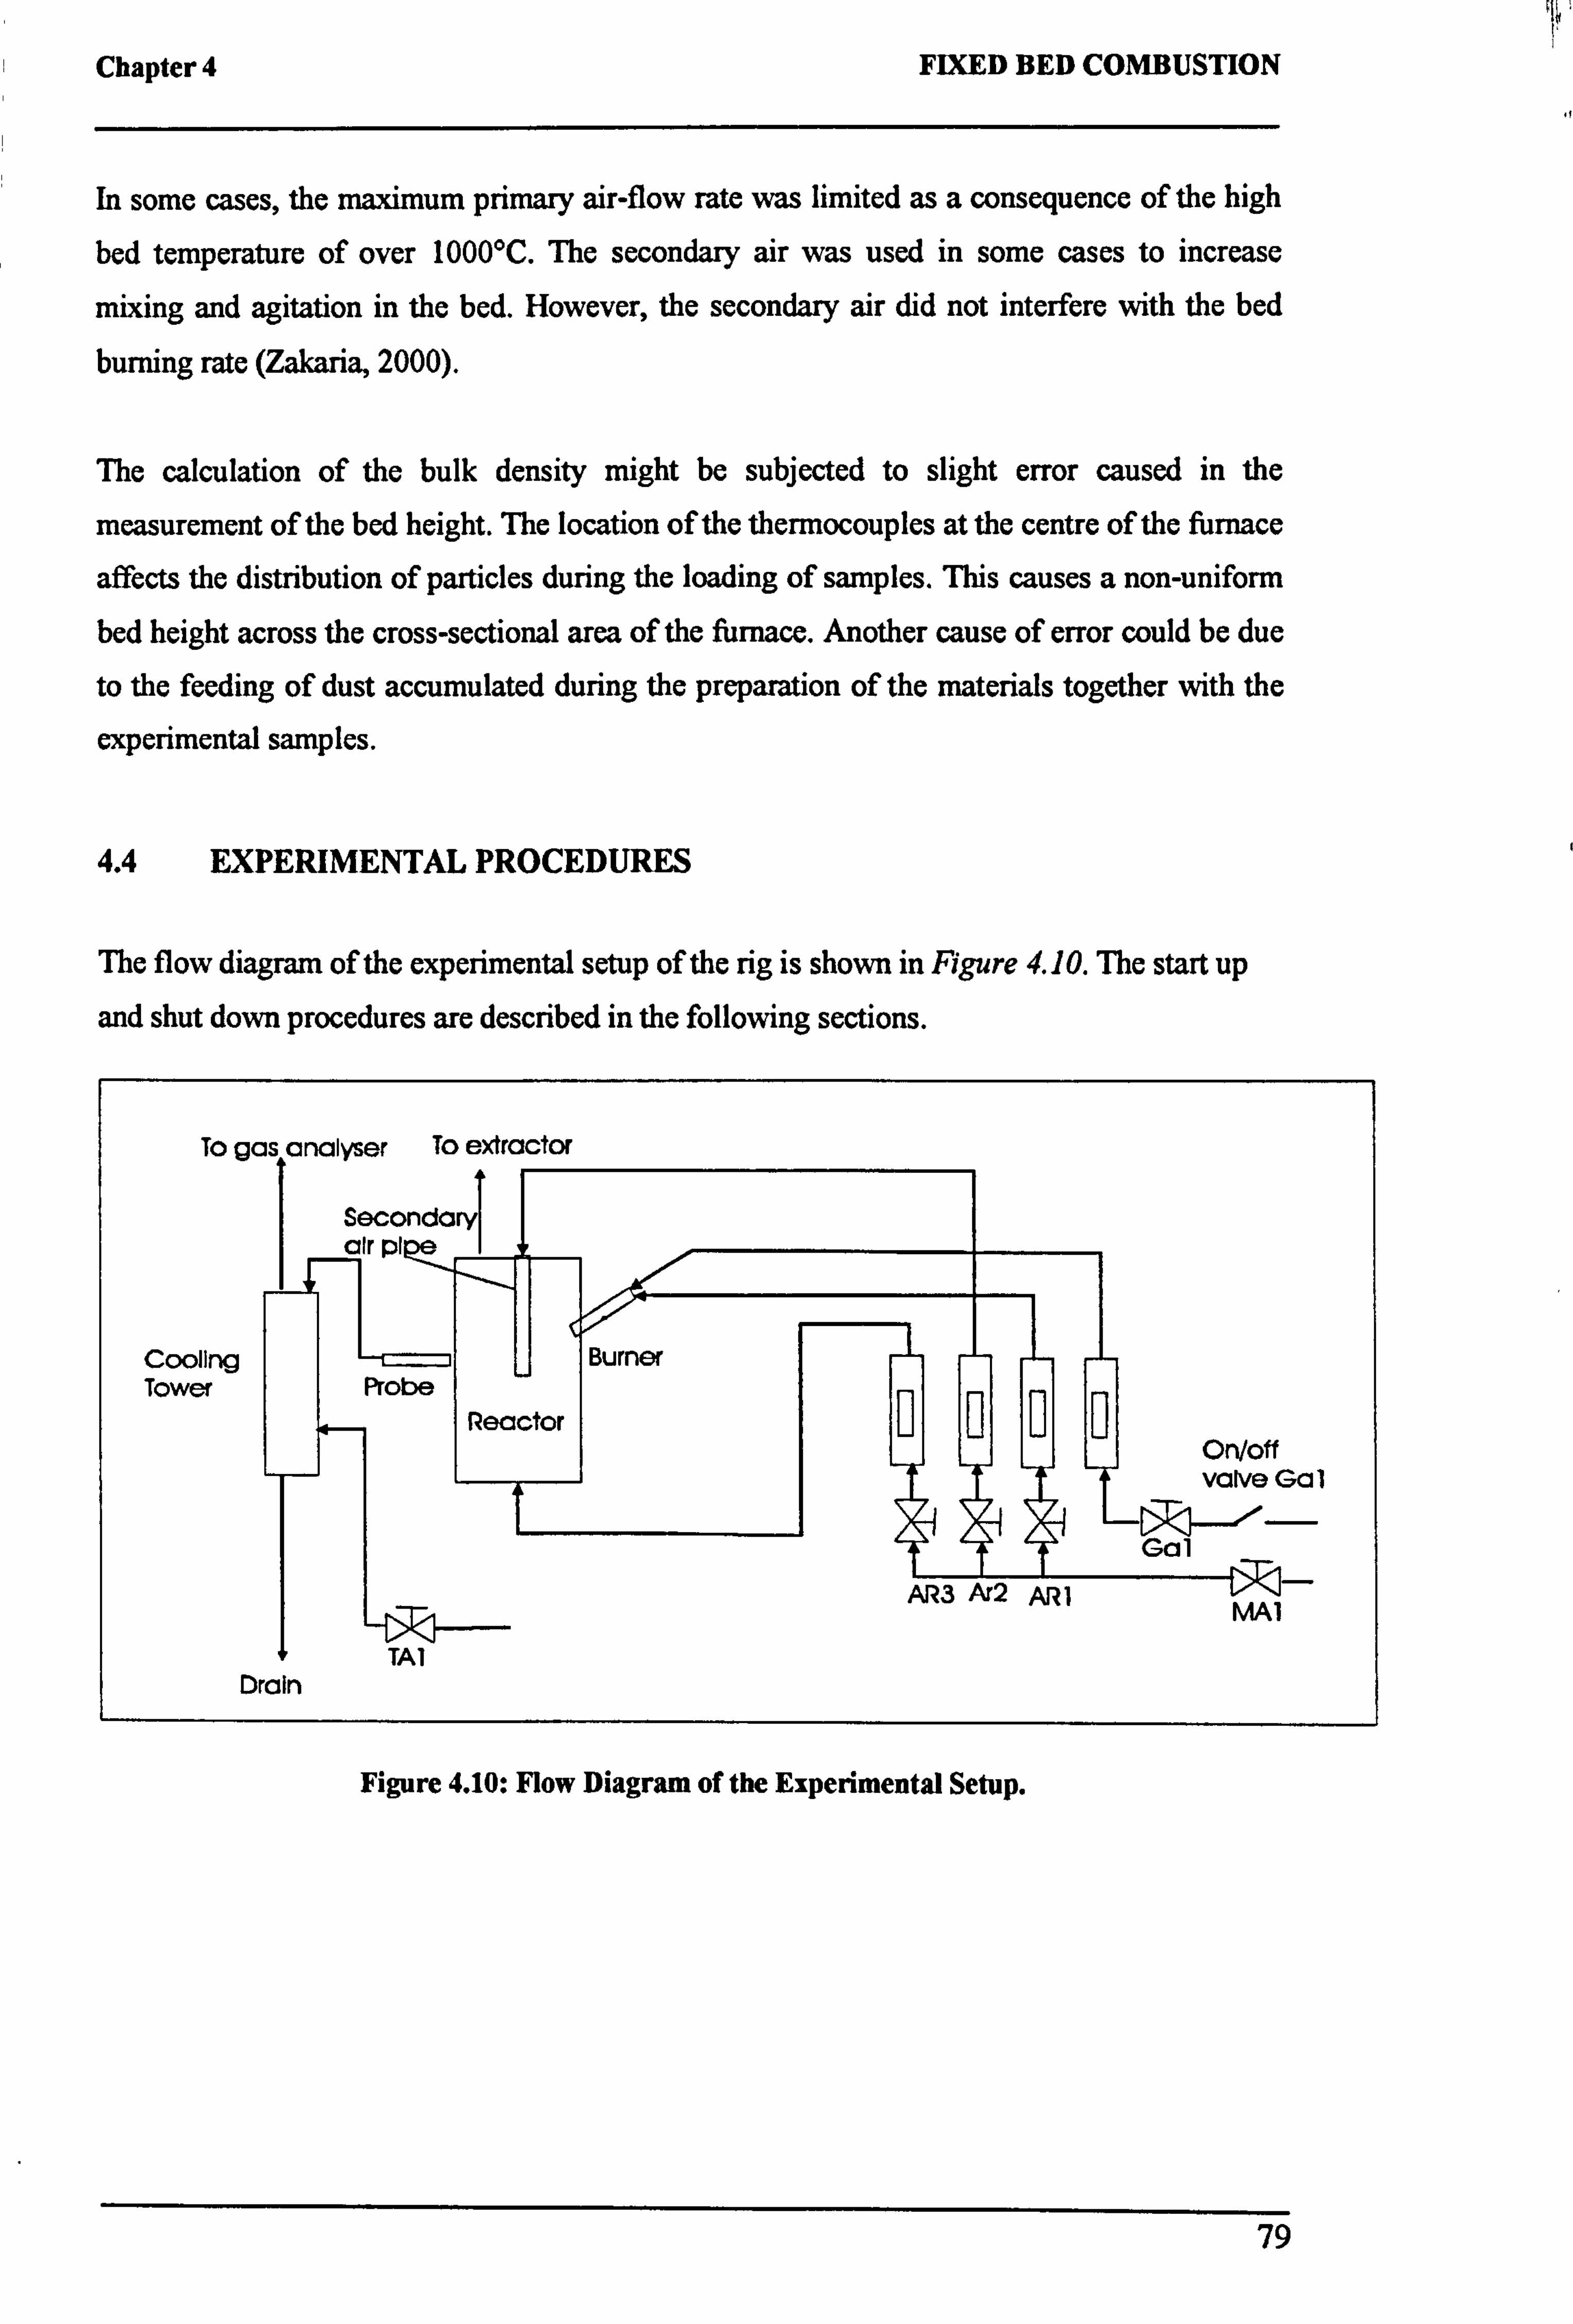
Chapter 4 FIXED BED COMBUSTION
In some cases, the maximum primary air-flow rate was limited as a consequence of the high
bed temperature of over 1000°C. The secondary air was used in some cases to increase
mixing and agitation in the bed. However, the secondary air did not interfere with the bed
burning rate (Zakaria, 2000).
The calculation of the bulk density might be subjected to slight error caused in the
measurement of the bed height. The location of the thermocouples at the centre of the furnace
affects the distribution of particles during the loading of samples. This causes a non-uniform bed height across the cross-sectional area of the furnace. Another cause of error could be due
to the feeding of dust accumulated during the preparation of the materials together with the
experimental samples.
4.4 EXPERIMENTAL PROCEDURES
The flow diagram of the experimental setup of the rig is shown in Figure 4.10. The start up
and shut down procedures are described in the following sections.
To gas analyser To extractor
Secondary) air pl
Cooling Burner Tower Probe
Reactor On/off valve Ga 1
Gal
AR3 Art AR 1 MAl
TAI Drain
Figure 4.10: Flow Diagram of the Experimental Setup.
79
Chapter 4
4.4.1 Start Up Procedure
FIXED BED COMBUSTION
1. The analysers and pumps were switched on and left to warm up for an hour.
2. The tap water (valve TAI) to the cooling tower was turned on. 3. The scale indicator was switched on and set to zero. 4. A known weight of pre-prepared biomass sample was fed into the combustor through
the waste inlet point on the top of the combustor. The lid was screwed on tightly. 5. The weight shown on the indicator was checked to ensure that the increase was the
same as the sample weight. 6. All measuring ports were checked to ensure that they were air tight. 7. The data logger was switched on and the thermocouple readings were checked by
manually going through the channels to ensure that all the thermocouples gave
correct readings. The thermocouples were then connected to a temperature indicator
to check that the readings from the data logger were correct. 8. When all the analysers were warmed up, they were calibrated with calibration gas
according to the instruction given by manufacturers. The readings of the analysers
were then compared with the calibration gas as well as with the readings logged from
the data logger.
9. The data logger was then switched off. This is to avoid the shock from the high
current when the burner is ignited.
10. The exhaust extraction fan was then switched on. 11. All the valves to the rotameters were checked to ensure that they were shut. The main
compressed air valve, MAI was first opened followed by valves for primary air (AR3).
12. The valve for air to the burner (AR 1) was turned to let 2501it/min air pass through. 13. The power supply to the burner ignitor was switched on (SW1), and the valve for gas
to the burner (GA2) was fully opened. While the ignitor was fired, the on/off valve (GA! ) was open and the flame was checked. (this requires two persons)
14. As soon as the ignitor was fired off, the weight logging was started. The data logger for the temperature and gas was switched on. Each channel on the data logger was recorded at every 0.5secs and the time elapse between each set of readings (24channels) was set according to the length of the experiment. A longer time elapsed
was chosen if the experiment were to be carried out for a longer period of time. This is to avoid over-flooding of the data loggers' memory ram.
15. The readings of the temperatures in the freeboard were checked to ensure that the thermocouple was working.
80
Chapter 4 FIXED BED COMBUSTION
4.4.2 Shut Down Procedure
1. The valves supplying gas to the burner (GAl and GA2) were shut off followed by the
valve supplying air to the burner (AR! ).
2. The power was switched off (SW2)
3. The valves for primary air (AR3) and secondary air (AR2) were shut off, followed by
the valve for main air supply (MAI).
4. The logging of weight, temperature and gas were stopped. 5. The analysers' connections were disconnected from the combustion port. 6. The analyser was left to flush out all the gas in it before switching off, usually for half
an hour or so. 7. The exhaust extraction fan was switched off followed by the tap water (valve TAI) to
the cooling tower.
81
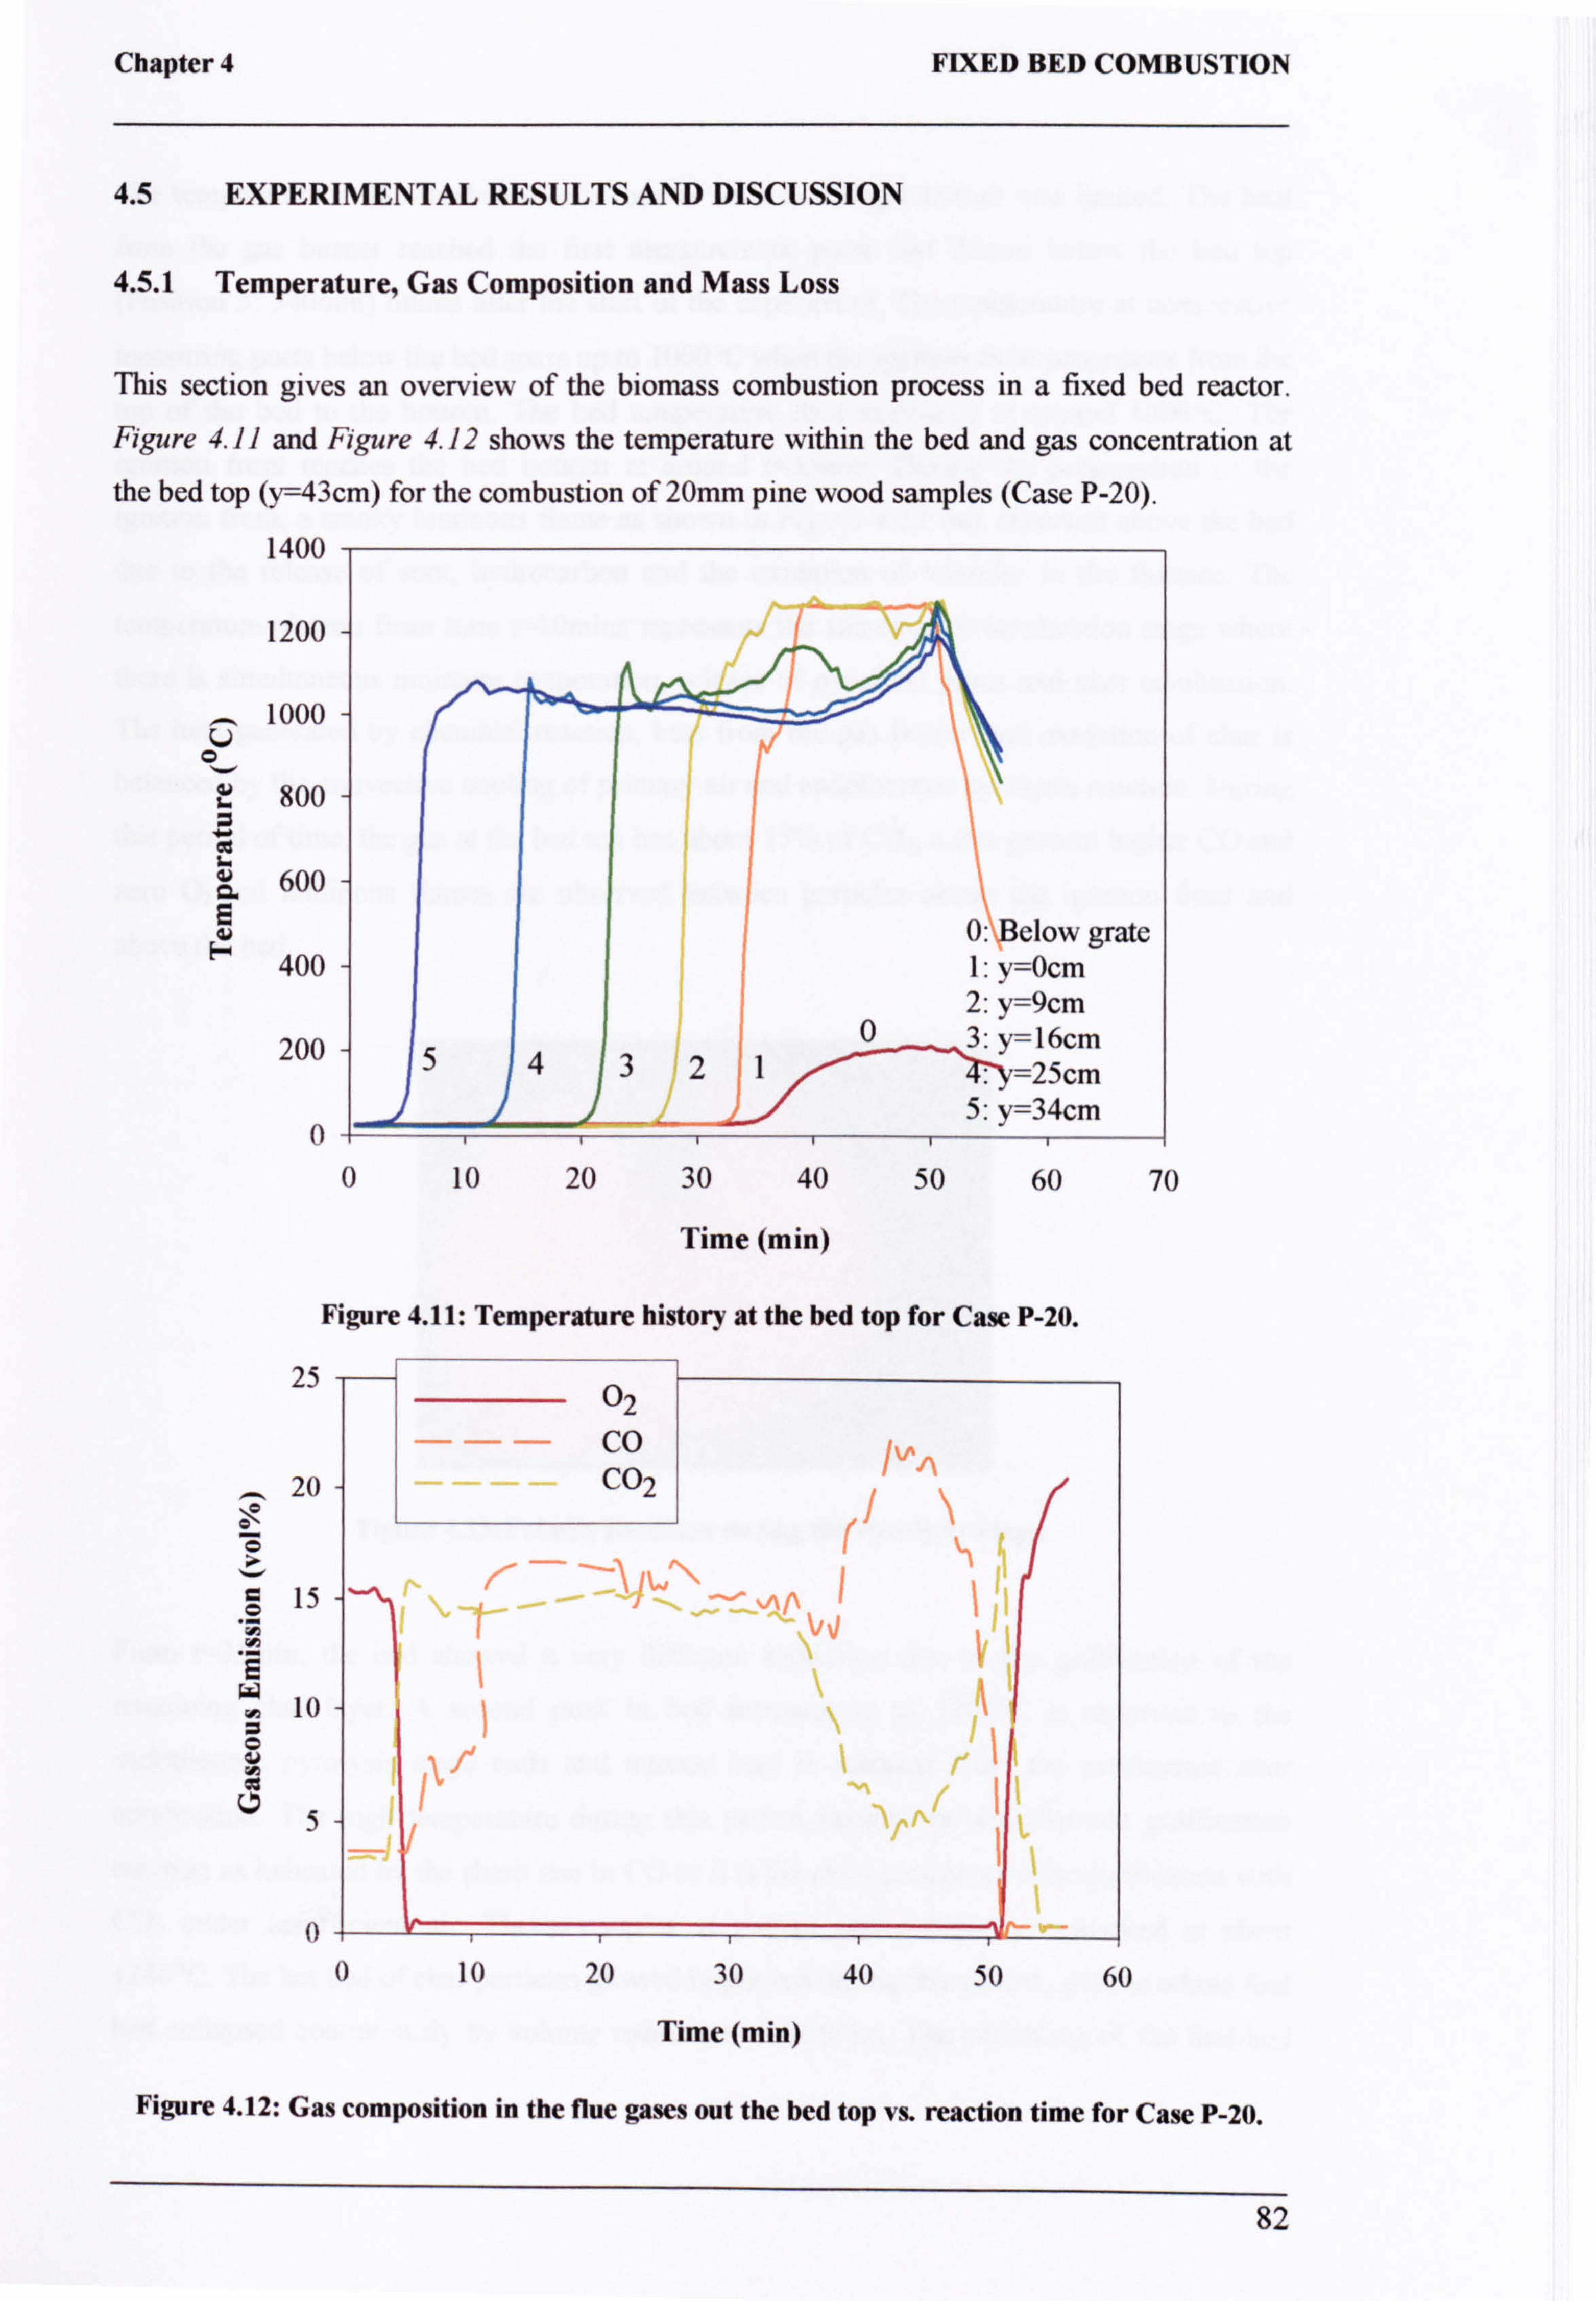
Chapter 4 FIXED BED COMBUSTION
4.5 EXPERIMENTAL RESULTS AND DISCUSSION
4.5.1 Temperature, Gas Composition and Mass Loss
This section gives an overview of the biomass combustion process in a fixed bed reactor.
Figure 4.11 and Figure 4.12 shows the temperature within the bed and gas concentration at
the bed top (v=43cm) for the combustion of 20mm pine wood samples (Case P-20). I Ann
i'vv
1200
1000 U
0 800
0
CL 600 8 F 400
200
\° 0
0: Below grate 1: y=Ocm 2: y=9cm 3: y=16cm y=25cm 5: y=34cm
0 10 20 30 40 50 60
Time (min)
Figure 4.11: Temperature history at the bed top for Case P-20.
25 , -ý
0
20
15
E
10 0
u5
70
0 0 10 20 30 40 50 60
Time (min)
Figure 4.12: Gas composition in the flue gases out the bed top vs. reaction time for Case P-20.
82
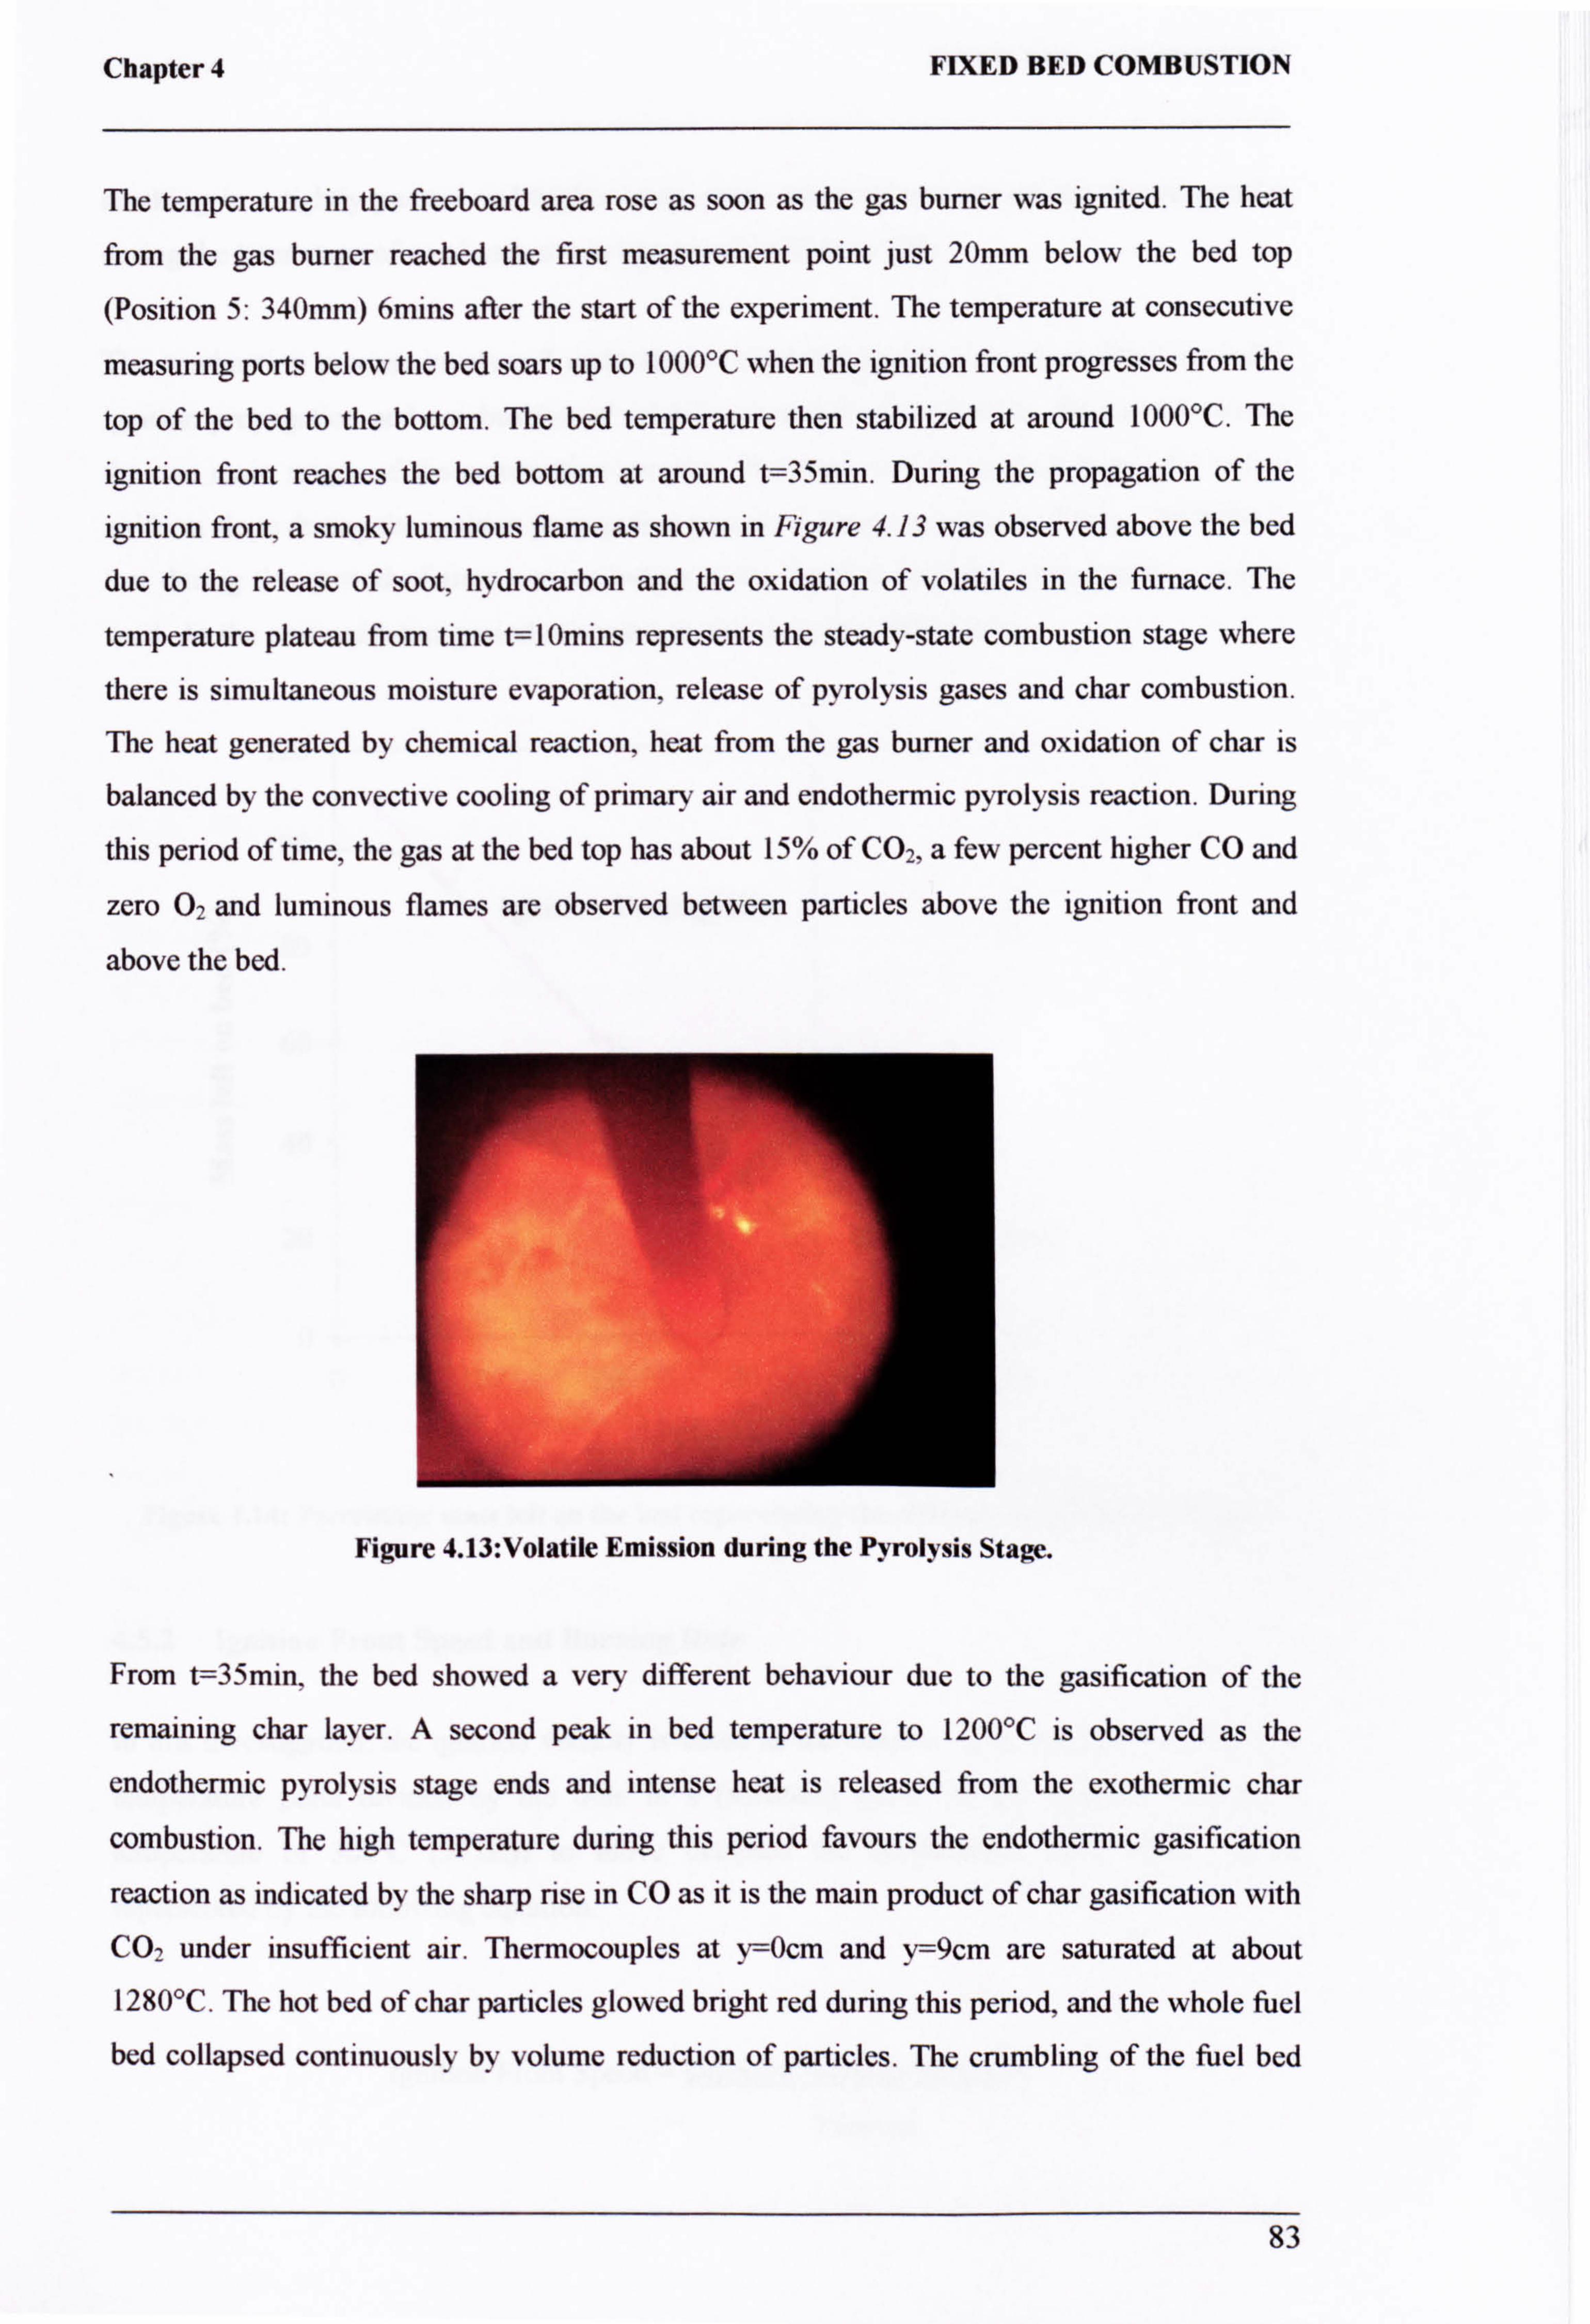
Chapter 4 FIXED BED COMBUSTION
The temperature in the freeboard area rose as soon as the gas burner was ignited. The heat
from the gas burner reached the first measurement point just 20mm below the bed top
(Position 5: 340mm) 6mins after the start of the experiment. The temperature at consecutive
measuring ports below the bed soars up to 1000°C when the ignition front progresses from the
top of the bed to the bottom. The bed temperature then stabilized at around 1000°C. The
ignition front reaches the bed bottom at around t=35min. During the propagation of the
ignition front, a smoky luminous flame as shown in Figure 4.13 was observed above the bed
due to the release of soot, hydrocarbon and the oxidation of volatiles in the furnace. The
temperature plateau from time t=10mins represents the steady-state combustion stage where
there is simultaneous moisture evaporation, release of pyrolysis gases and char combustion.
The heat generated by chemical reaction, heat from the gas burner and oxidation of char is
balanced by the convective cooling of primary air and endothermic pyrolysis reaction. During
this period of time, the gas at the bed top has about 15% of C02, a few percent higher CO and
zero 02 and luminous flames are observed between particles above the ignition front and
above the bed.
Figure 4.13: Volatile Emission during the Pyrolysis Stage.
From t=35min, the bed showed a very different behaviour due to the gasification of the
remaining char layer. A second peak in bed temperature to 1200°C is observed as the
endothermic pyrolysis stage ends and intense heat is released from the exothermic char
combustion. The high temperature during this period favours the endothermic gasification
reaction as indicated by the sharp rise in CO as it is the main product of char gasification with
CO2 under insufficient air. Thermocouples at y=Ocm and y=9cm are saturated at about 1280°C. The hot bed of char particles glowed bright red during this period, and the whole fuel
bed collapsed continuously by volume reduction of particles. The crumbling of the fuel bed
83
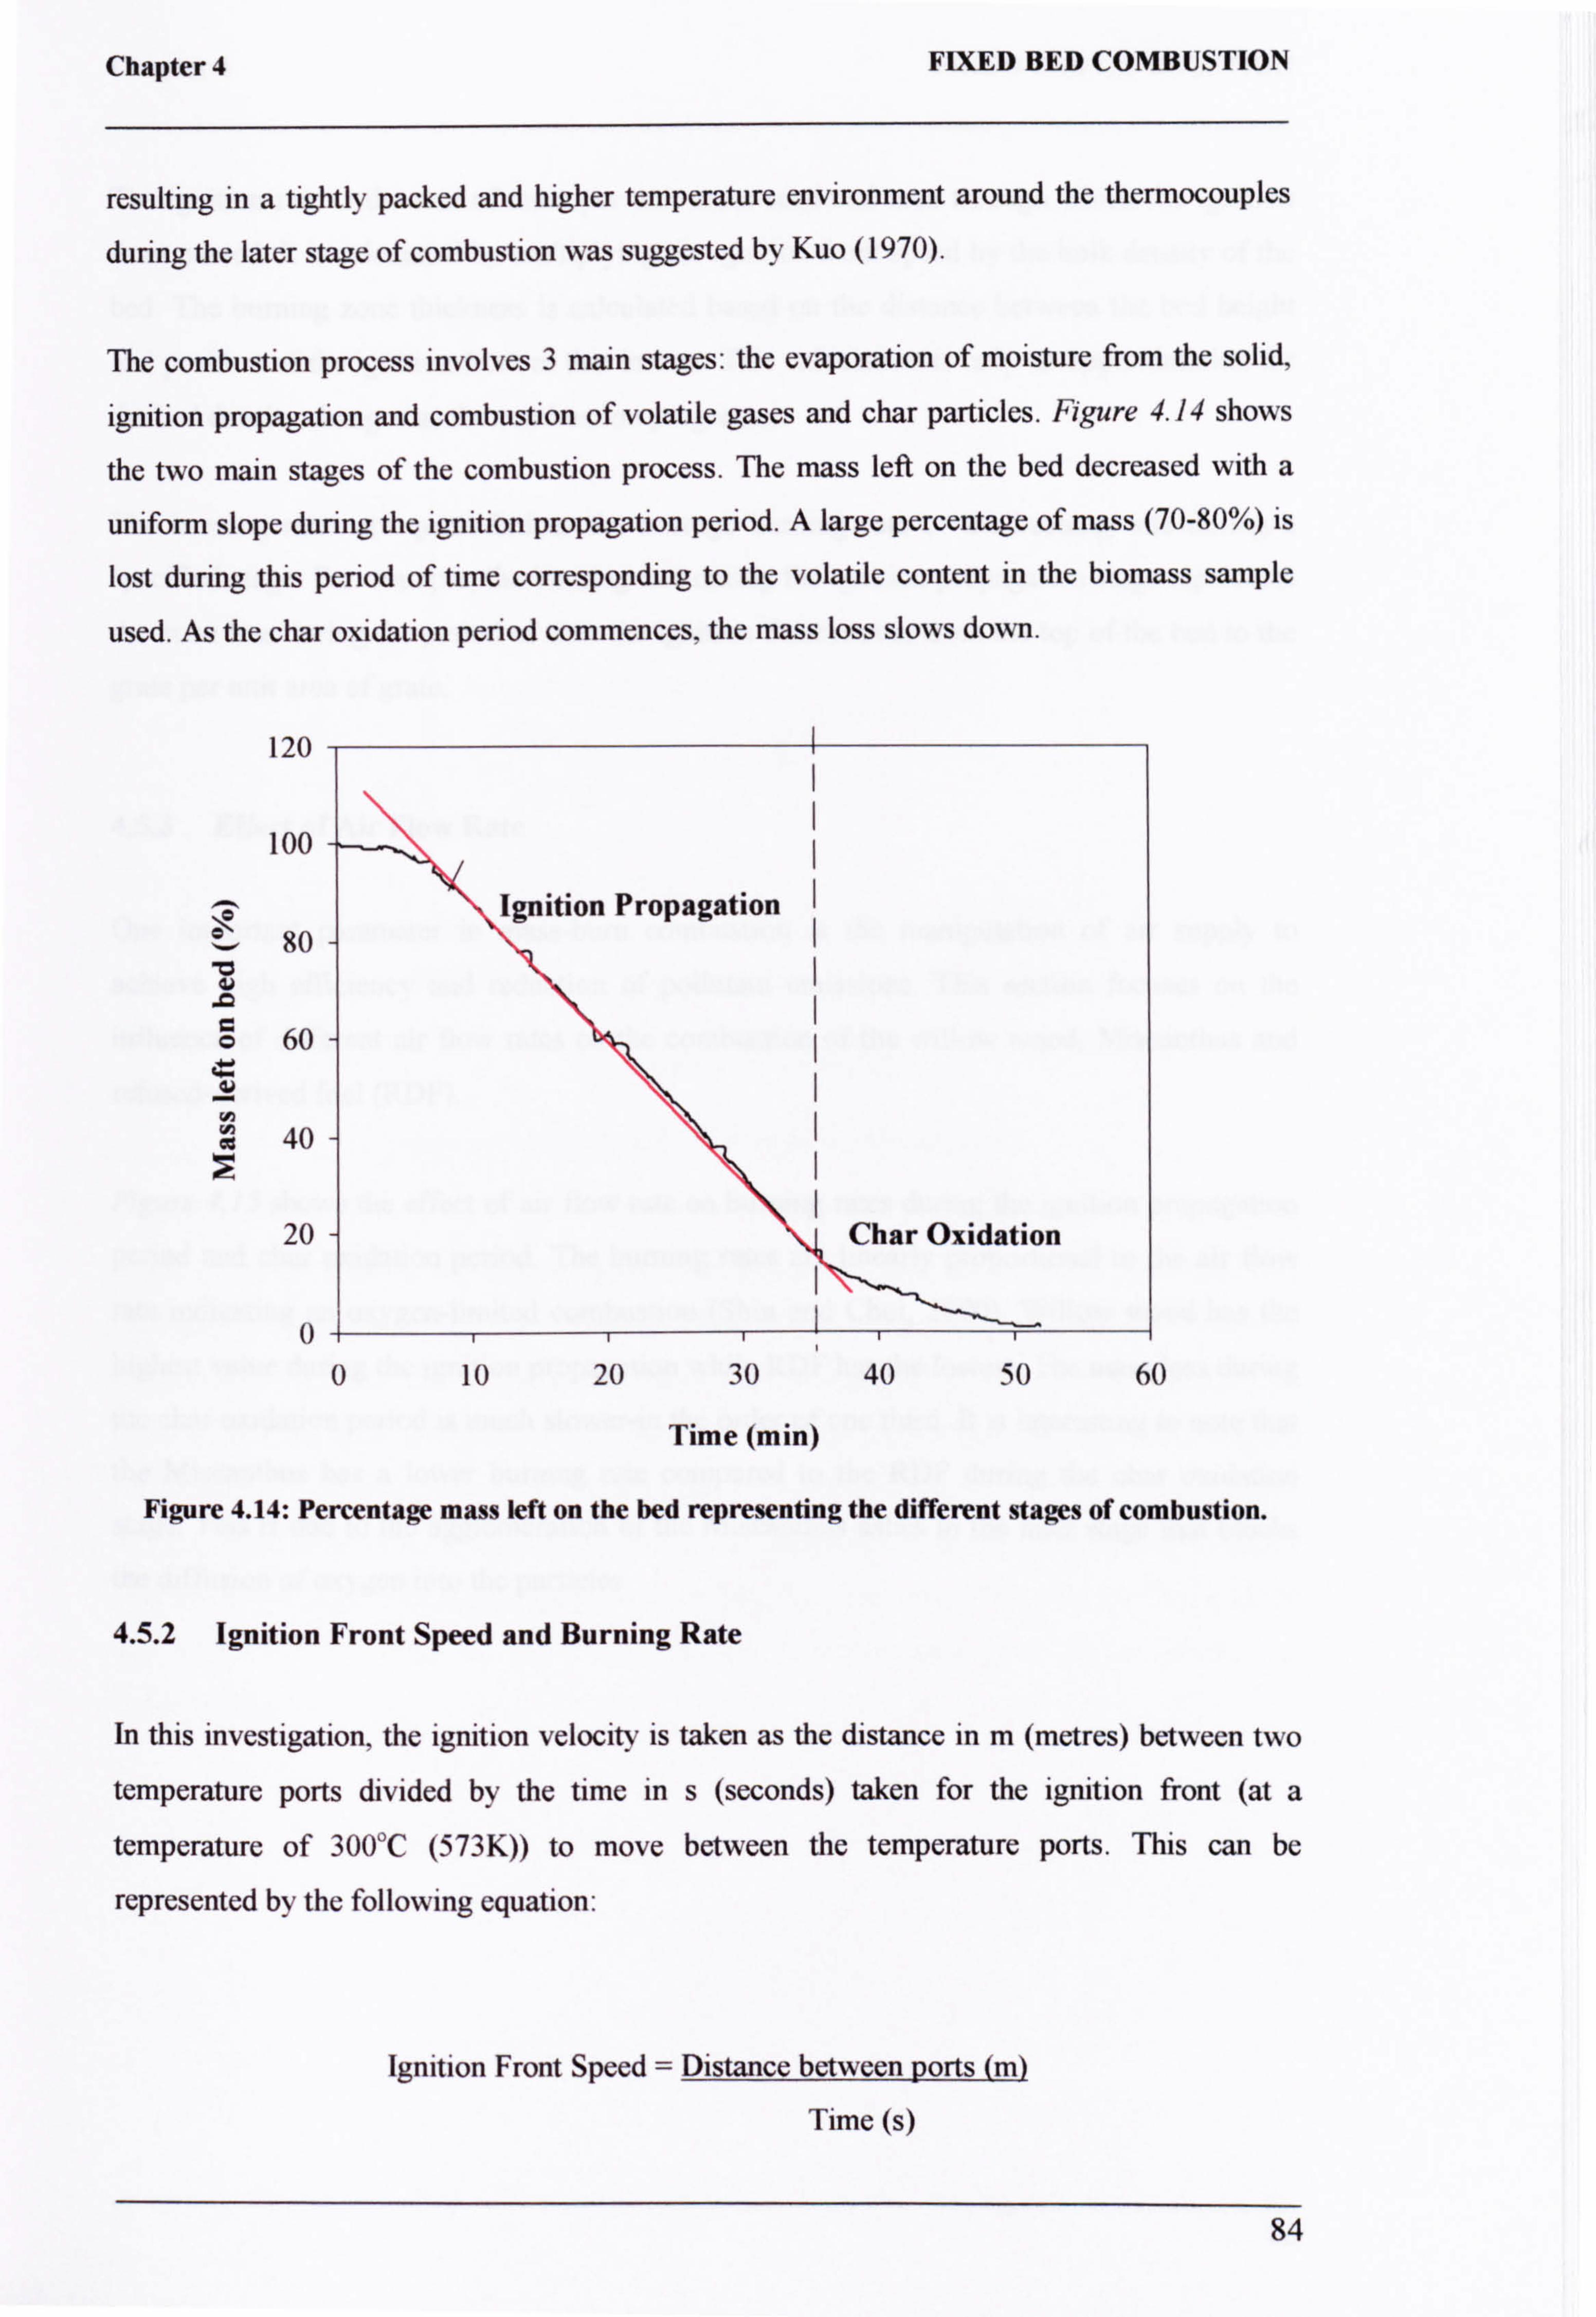
Chapter 4 FIXED BED COMBUSTION
resulting in a tightly packed and higher temperature environment around the thermocouples
during the later stage of combustion was suggested by Kuo (1970).
The combustion process involves 3 main stages: the evaporation of moisture from the solid,
ignition propagation and combustion of volatile gases and char particles. Figure 4.14 shows
the two main stages of the combustion process. The mass left on the bed decreased with a
uniform slope during the ignition propagation period. A large percentage of mass (70-80%) is
lost during this period of time corresponding to the volatile content in the biomass sample
used. As the char oxidation period commences, the mass loss slows down.
120
°. 80
100
Ignition Propagation
ö 60 V
Cd 40
0
20
0 10 20 30 40 50 60
Char Oxidation
Time (min)
Figure 4.14: Percentage mass left on the bed representing the different stages of combustion.
4.5.2 Ignition Front Speed and Burning Rate
In this investigation, the ignition velocity is taken as the distance in m (metres) between two
temperature ports divided by the time in s (seconds) taken for the ignition front (at a
temperature of NOT (573K)) to move between the temperature ports. This can be
represented by the following equation:
Ignition Front Speed = Distance between ports (m)
Time (s)
84
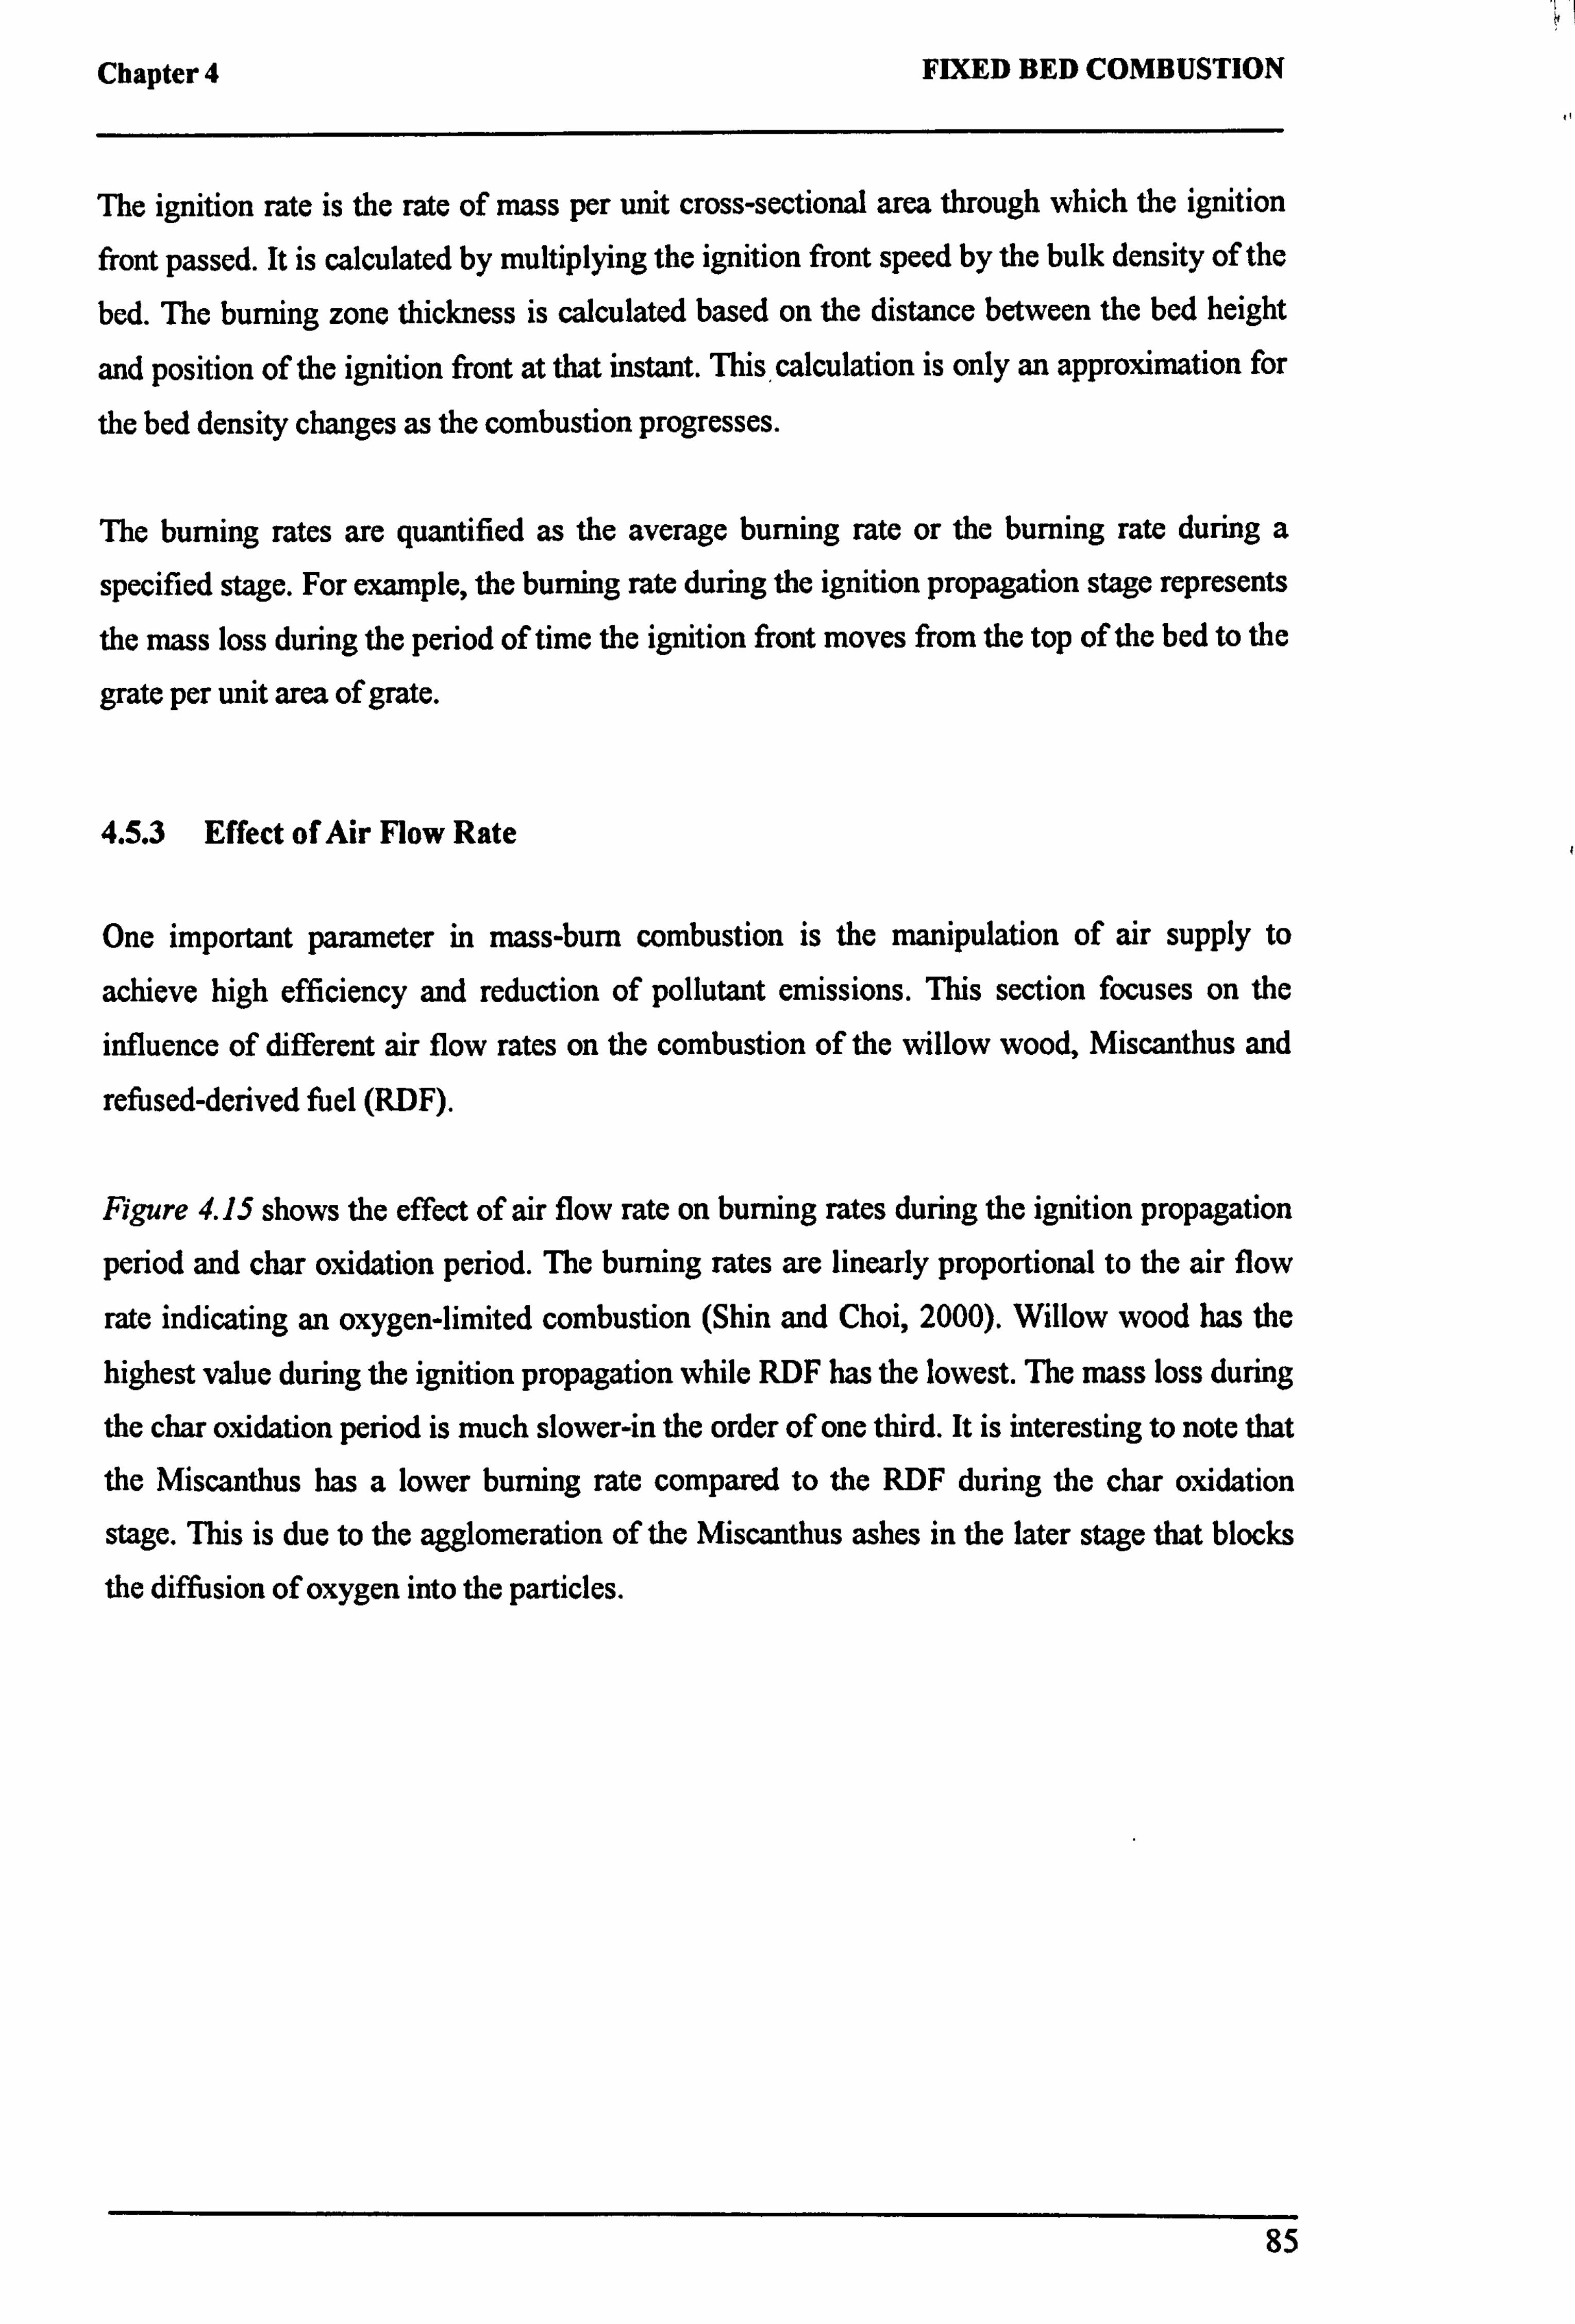
Chapter 4 FIXED BED COMBUSTION
The ignition rate is the rate of mass per unit cross-sectional area through which the ignition
front passed. It is calculated by multiplying the ignition front speed by the bulk density of the
bed. The burning zone thickness is calculated based on the distance between the bed height
and position of the ignition front at that instant. This calculation is only an approximation for
the bed density changes as the combustion progresses.
The burning rates are quantified as the average burning rate or the burning rate during a
specified stage. For example, the burning rate during the ignition propagation stage represents
the mass loss during the period of time the ignition front moves from the top of the bed to the
grate per unit area of grate.
4.5.3 Effect of Air Flow Rate
One important parameter in mass-bum combustion is the manipulation of air supply to
achieve high efficiency and reduction of pollutant emissions. This section focuses on the
influence of different air flow rates on the combustion of the willow wood, Miscanthus and
refused-derived fuel (RDF).
Figure 4.15 shows the effect of air flow rate on burning rates during the ignition propagation
period and char oxidation period. The burning rates are linearly proportional to the air flow
rate indicating an oxygen-limited combustion (Shin and Choi, 2000). Willow wood has the
highest value during the ignition propagation while RDF has the lowest. The mass loss during
the char oxidation period is much slower-in the order of one third. It is interesting to note that
the Miscanthus has a lower burning rate compared to the RDF during the char oxidation
stage. This is due to the agglomeration of the Miscanthus ashes in the later stage that blocks
the diffusion of oxygen into the particles.
85

Chapter 4 FIXED BED COMBUSTION
250
200
150
V
OC c 100
50
0
Ignition Propagation Period
w .v Mv.......
Char Oxidation Period
W
R f--'ý
200 250 300 350 400 450 500
Air flow rate (kg/m2hr)
Figure 4.15: Effect of air flow rates on burning rates.
Table 4.12 lists some of the key results of combustion characteristics for the test cases. The
equivalence ratio is a quantitative indication of whether the fuel oxidizer mixture is rich, lean
or stoichiometric. For fuel-rich mixtures, d» 1, and for fuel-lean mixtures, 1. The average
burning rate and equivalence ratio are based on the mass loss of the whole periods. All the
test cases are in fuel-rich conditions with average equivalence ratios of 1.9-4.1. The available
oxygen in the primary air is insufficient to achieve complete combustion. Therefore, reactions
proceed in the oxygen-limited region, controlled by the air supply. The value for Cases M 120
and M160 are not given as the thermocouples were damaged or erratic at severe bed
temperatures.
86
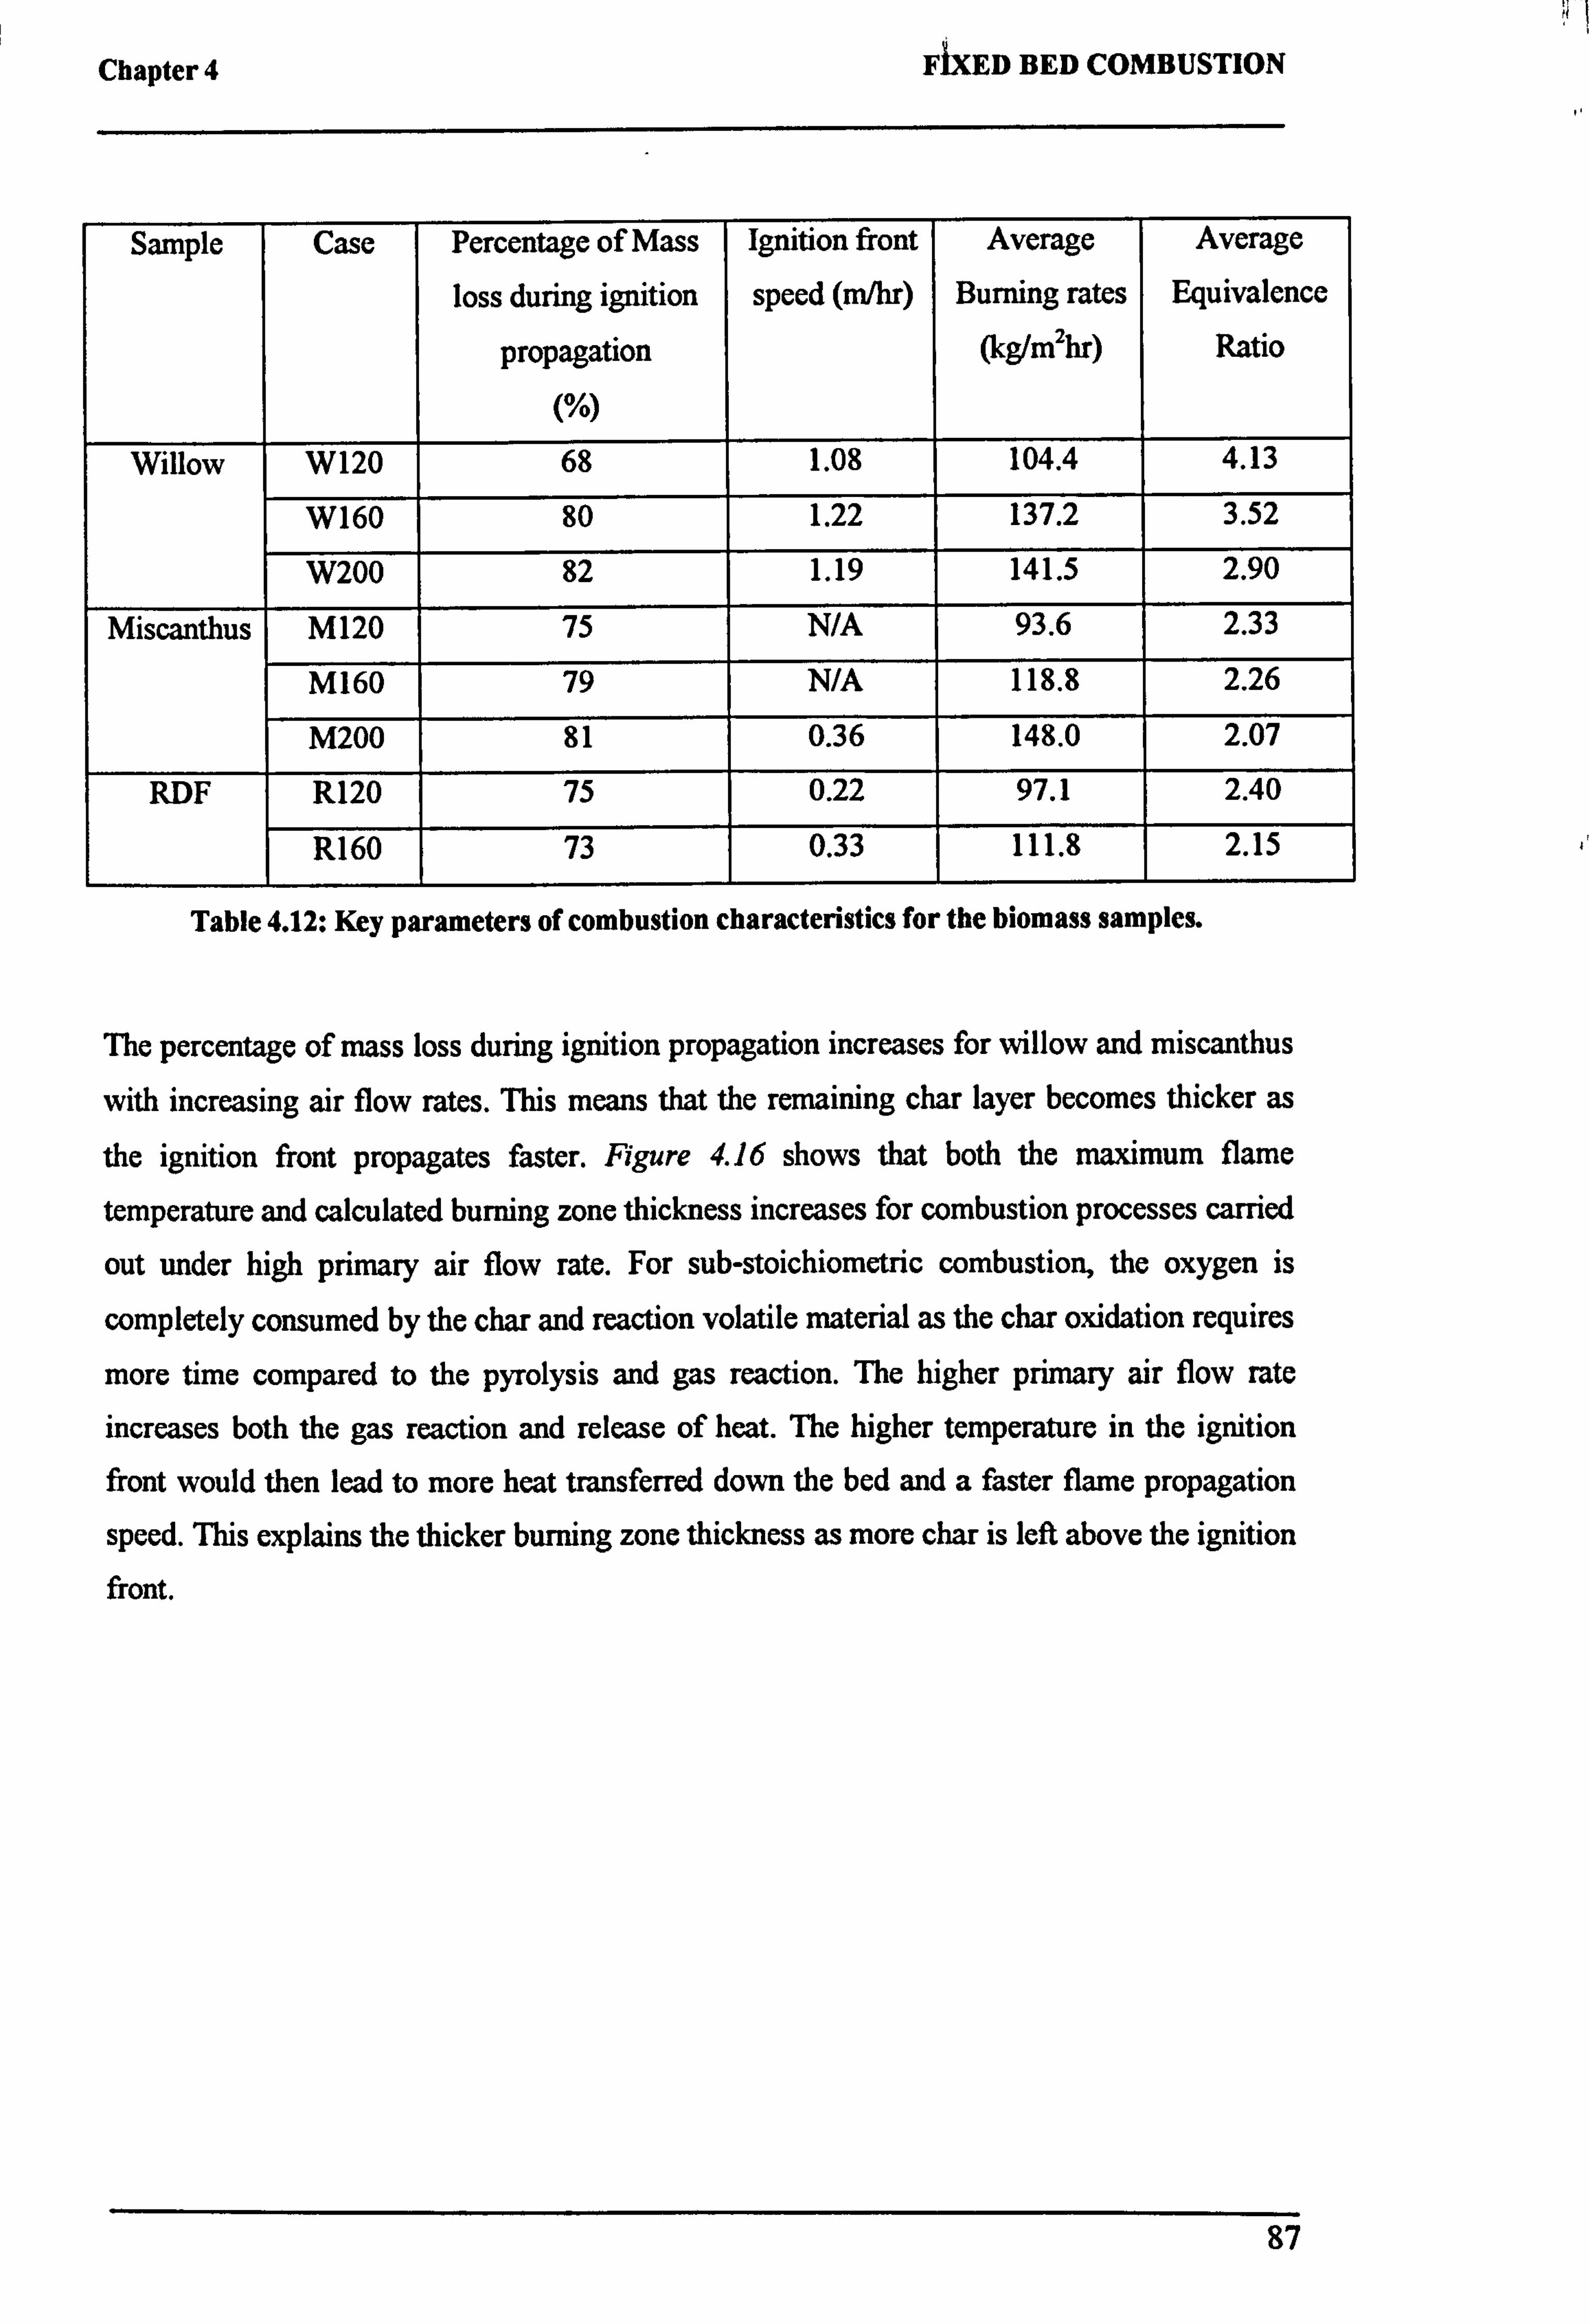
Chapter 4 FIXED BED COMBUSTION
Sample Case Percentage of Mass
loss during ignition
propagation
(%)
Ignition front
speed (m/hr)
Average
Burning rates
(kg/m2hr)
Average
Equivalence
Ratio
Willow W120 68 1.08 104.4 4.13
W160 80 1.22 137.2 3.52
W200 82 1.19 141.5 2.90
Miscanthus M120 75 N/A 93.6 2.33
M160 79 N/A 118.8 2.26
M200 81 0.36 148.0 2.07
RDF R120 75 0.22 97.1 2.40
R160 73 0.33 111.8 2.15
Table 4.12: Key parameters of combustion characteristics for the biomass samples.
The percentage of mass loss during ignition propagation increases for willow and miscanthus
with increasing air flow rates. This means that the remaining char layer becomes thicker as
the ignition front propagates faster. Figure 4.16 shows that both the maximum flame
temperature and calculated burning zone thickness increases for combustion processes carried
out under high primary air flow rate. For sub-stoichiometric combustion, the oxygen is
completely consumed by the char and reaction volatile material as the char oxidation requires
more time compared to the pyrolysis and gas reaction. The higher primary air flow rate increases both the gas reaction and release of heat. The higher temperature in the ignition
front would then lead to more heat transferred down the bed and a faster flame propagation
speed. This explains the thicker burning zone thickness as more char is left above the ignition
front.
87
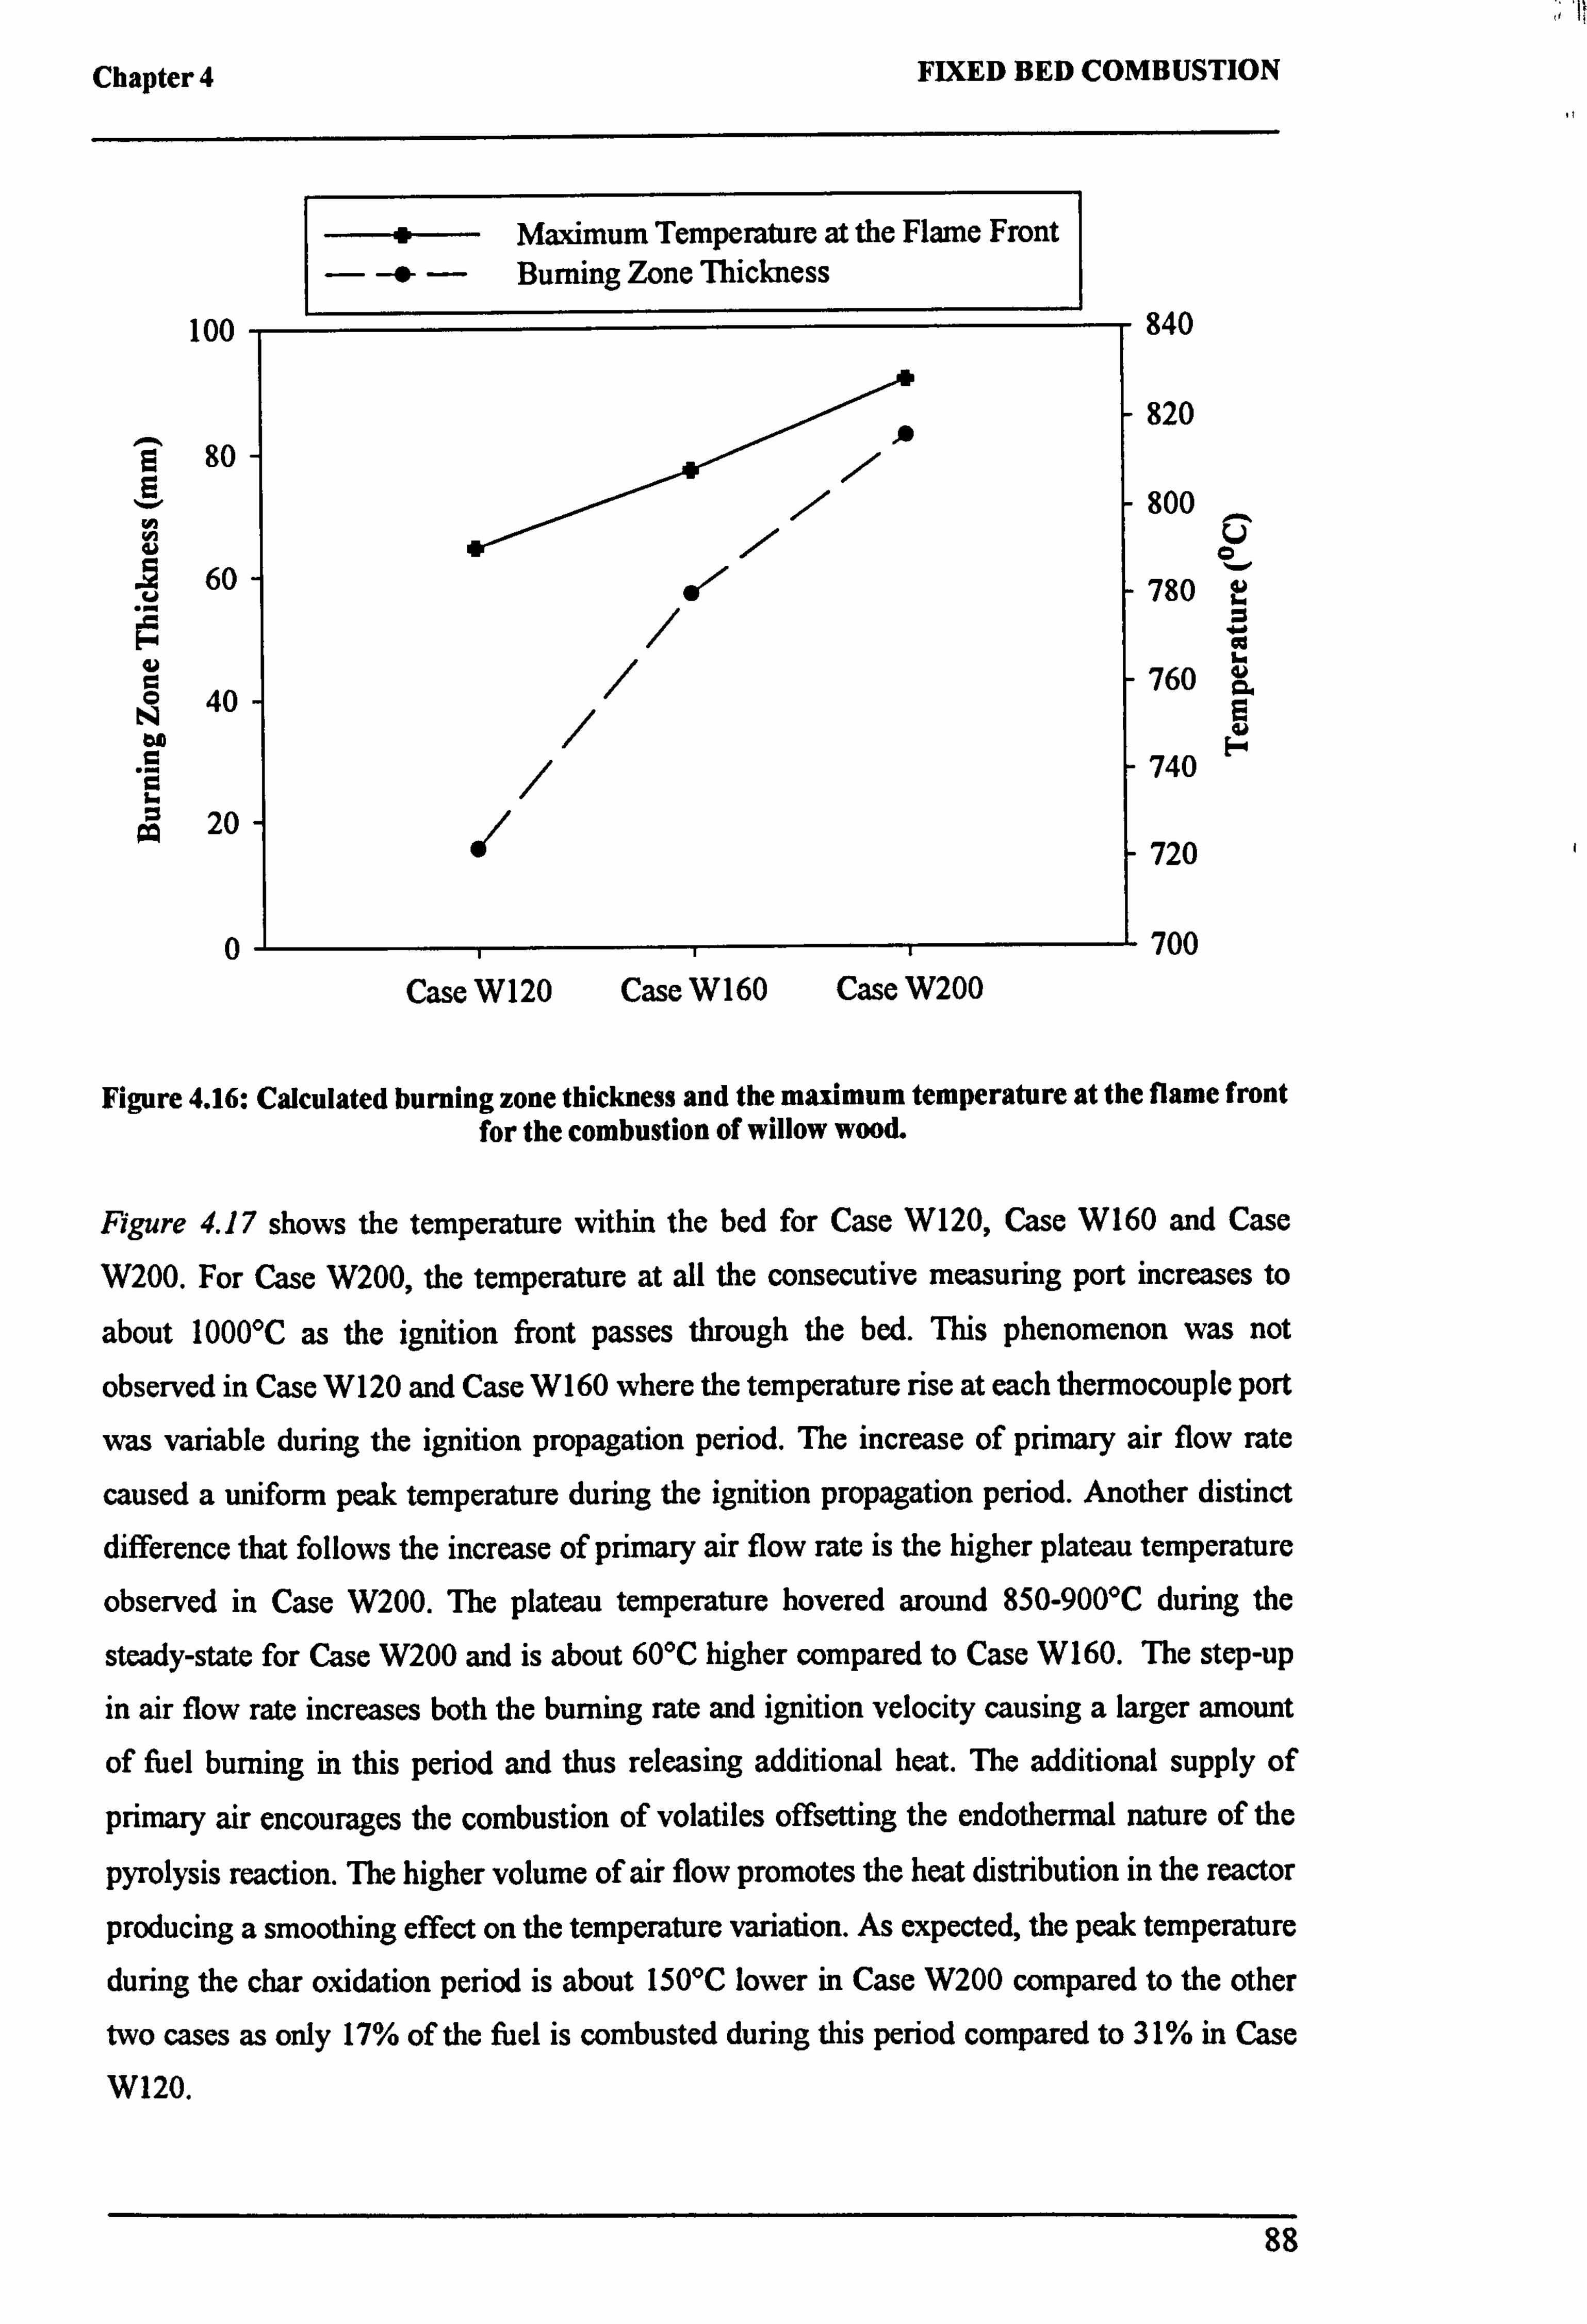
Chapter 4 FIXED BED COMBUSTION
100
E E y H 6)
u I
80
60
40
20
0
t Maximum Temperature at the Flame Front
- -f - Burning Zone Thickness
r
r
2
Case W120 Case W 160 Case W200
840
820
800
0 780
760
740
720
700
Figure 4.16: Calculated burning zone thickness and the maximum temperature at the flame front for the combustion of willow wood.
Figure 4.17 shows the temperature within the bed for Case W120, Case W160 and Case
W200. For Case W200, the temperature at all the consecutive measuring port increases to
about 1000°C as the ignition front passes through the bed. This phenomenon was not
observed in Case W120 and Case W160 where the temperature rise at each thermocouple port
was variable during the ignition propagation period. The increase of primary air flow rate
caused a uniform peak temperature during the ignition propagation period. Another distinct
difference that follows the increase of primary air flow rate is the higher plateau temperature
observed in Case W200. The plateau temperature hovered around 850-900°C during the
steady-state for Case W200 and is about 60°C higher compared to Case W160. The step-up
in air flow rate increases both the burning rate and ignition velocity causing a larger amount
of fuel burning in this period and thus releasing additional heat. The additional supply of
primary air encourages the combustion of volatiles offsetting the endothermal nature of the
pyrolysis reaction. The higher volume of air flow promotes the heat distribution in the reactor
producing a smoothing effect on the temperature variation. As expected, the peak temperature
during the char oxidation period is about 150°C lower in Case W200 compared to the other
two cases as only 17% of the fuel is combusted during this period compared to 31% in Case
W120.
88
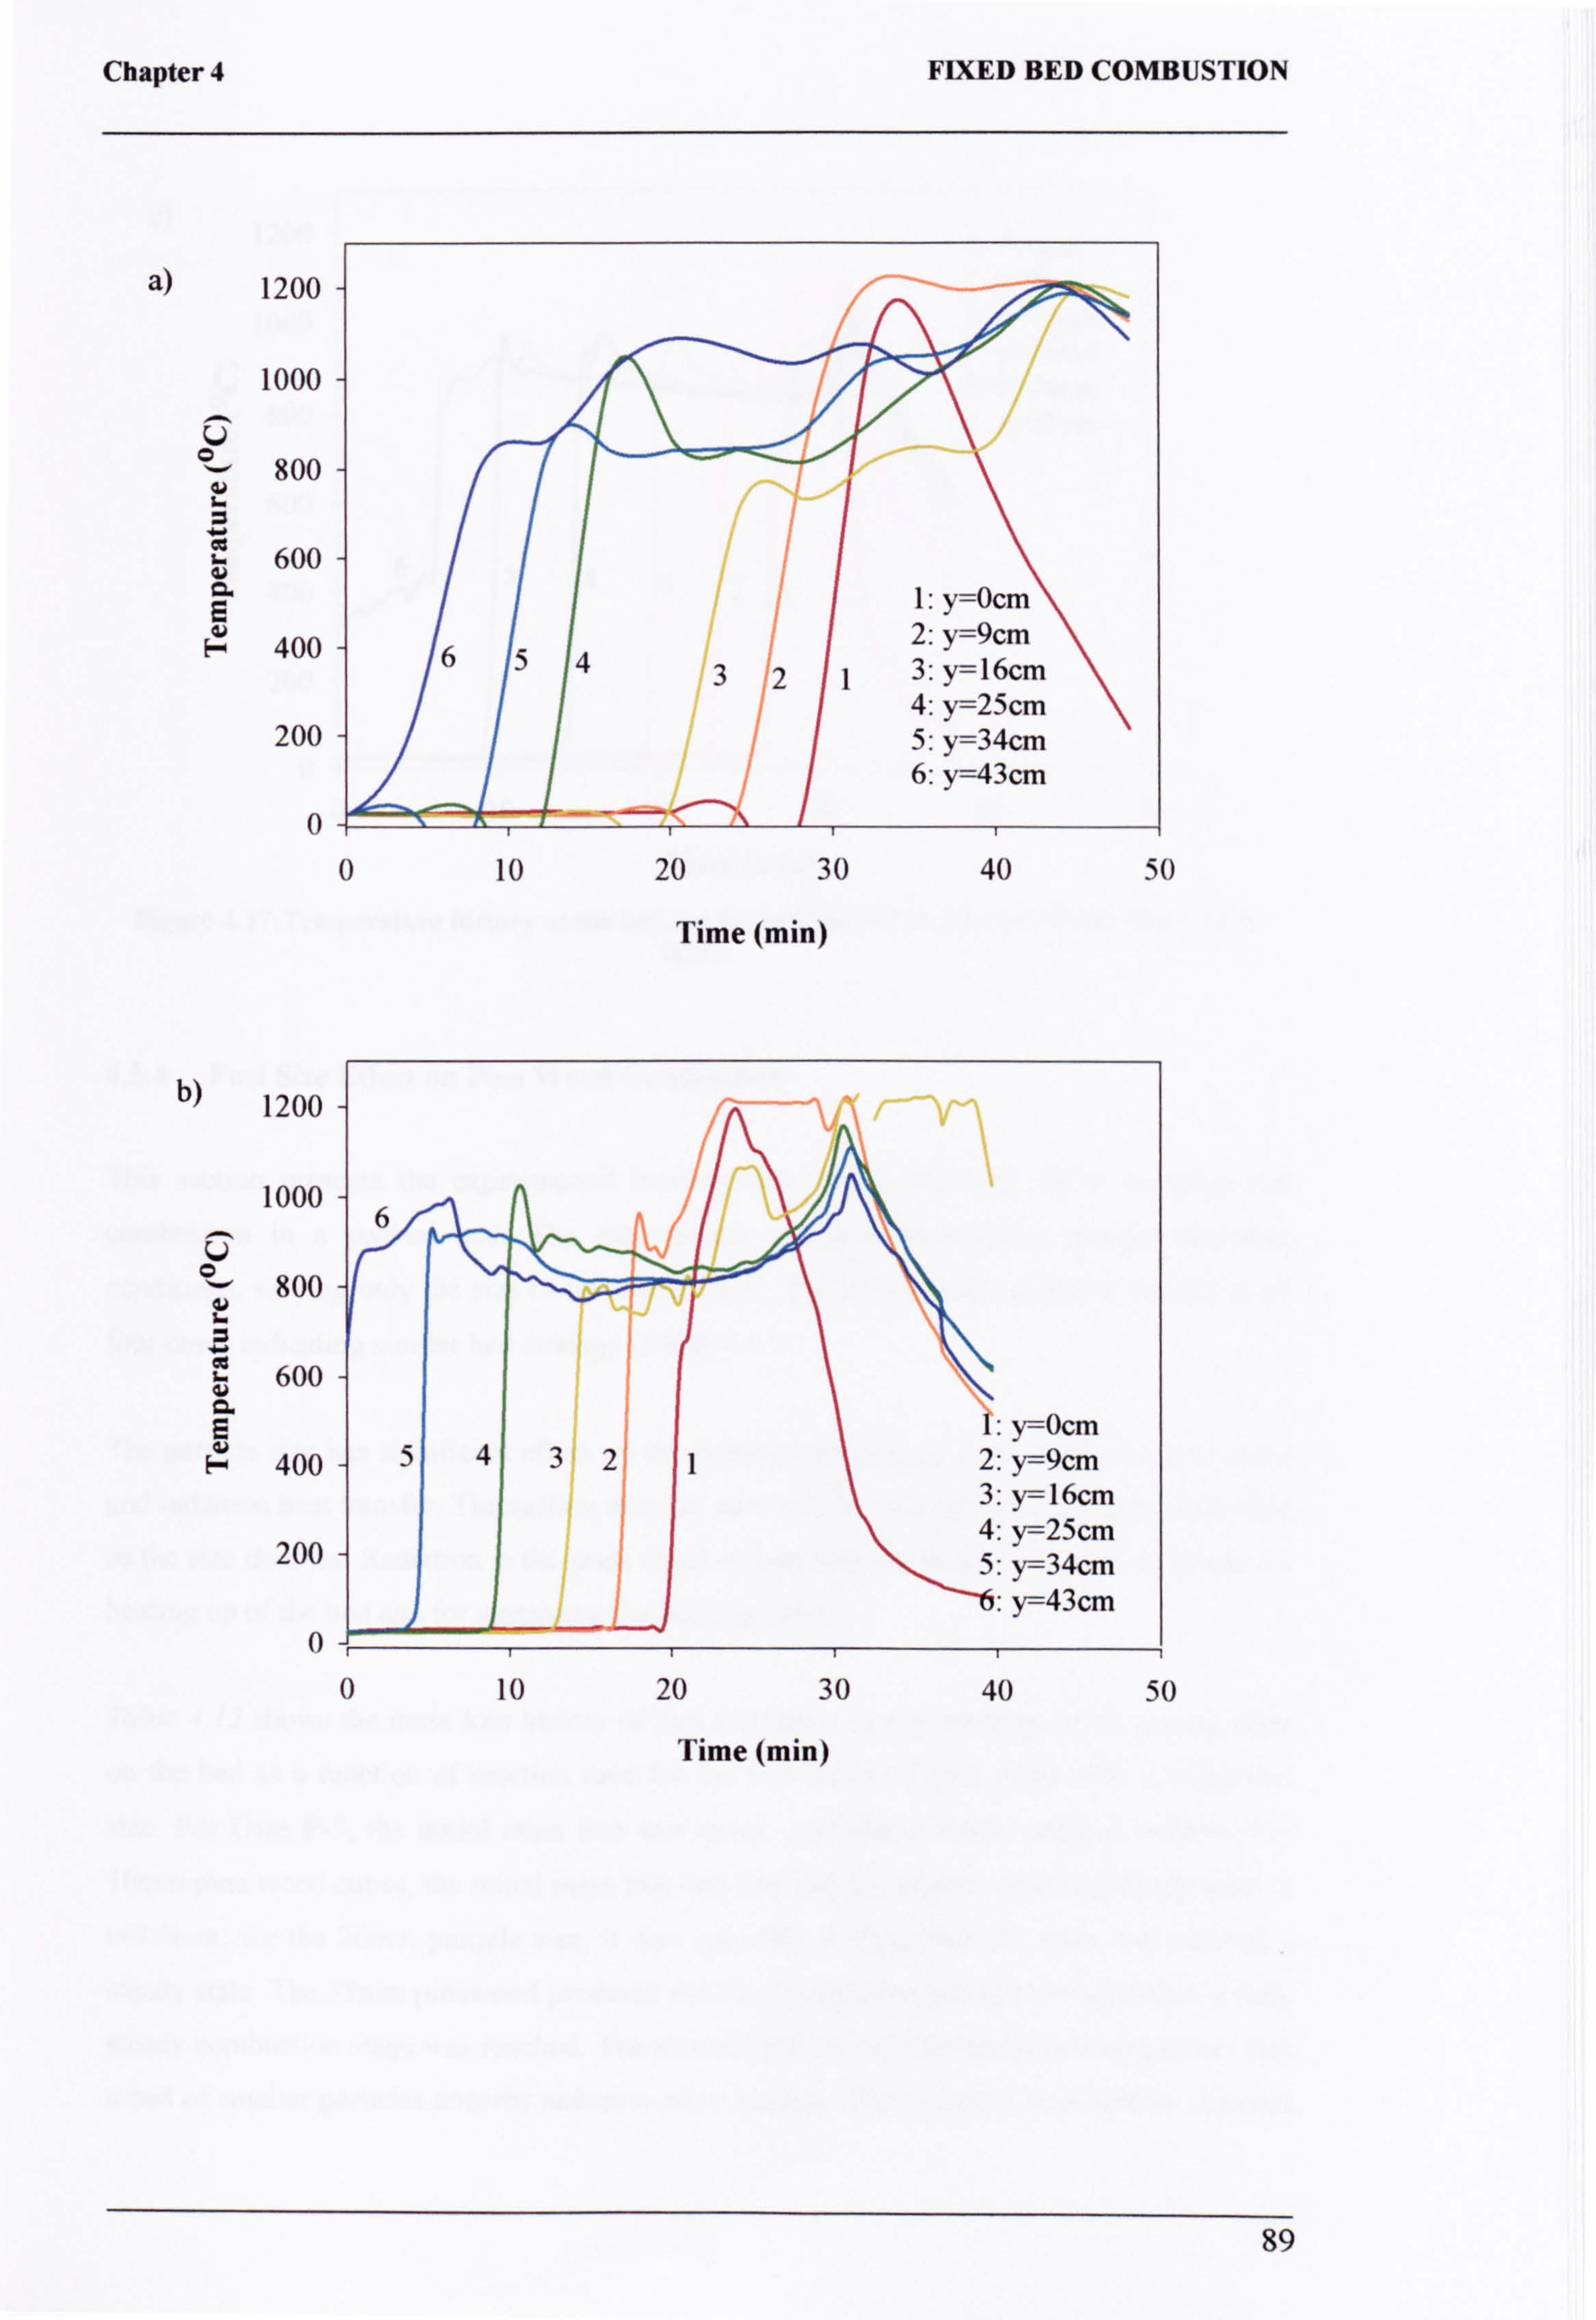
Chapter 4
a) 1200
1000
U °-' 800
600 a E Fý 400
200
0
1: y=0cm 2: y=9cm 6543213:
y=16cm 4: y=25cm 5: y=34cm 6: y=43cm
U 10
bý 1200
1000
U 800
600
400
200
0
20 30
Time (min)
FIXED BED COMBUSTION
40 50
6 n,
t
1: y=0cm 543212: y=9cm
3: y=16cm 4: y=25cm 5: y=34cm
y=43cm
0 10 20 30
Time (min)
40 50
89
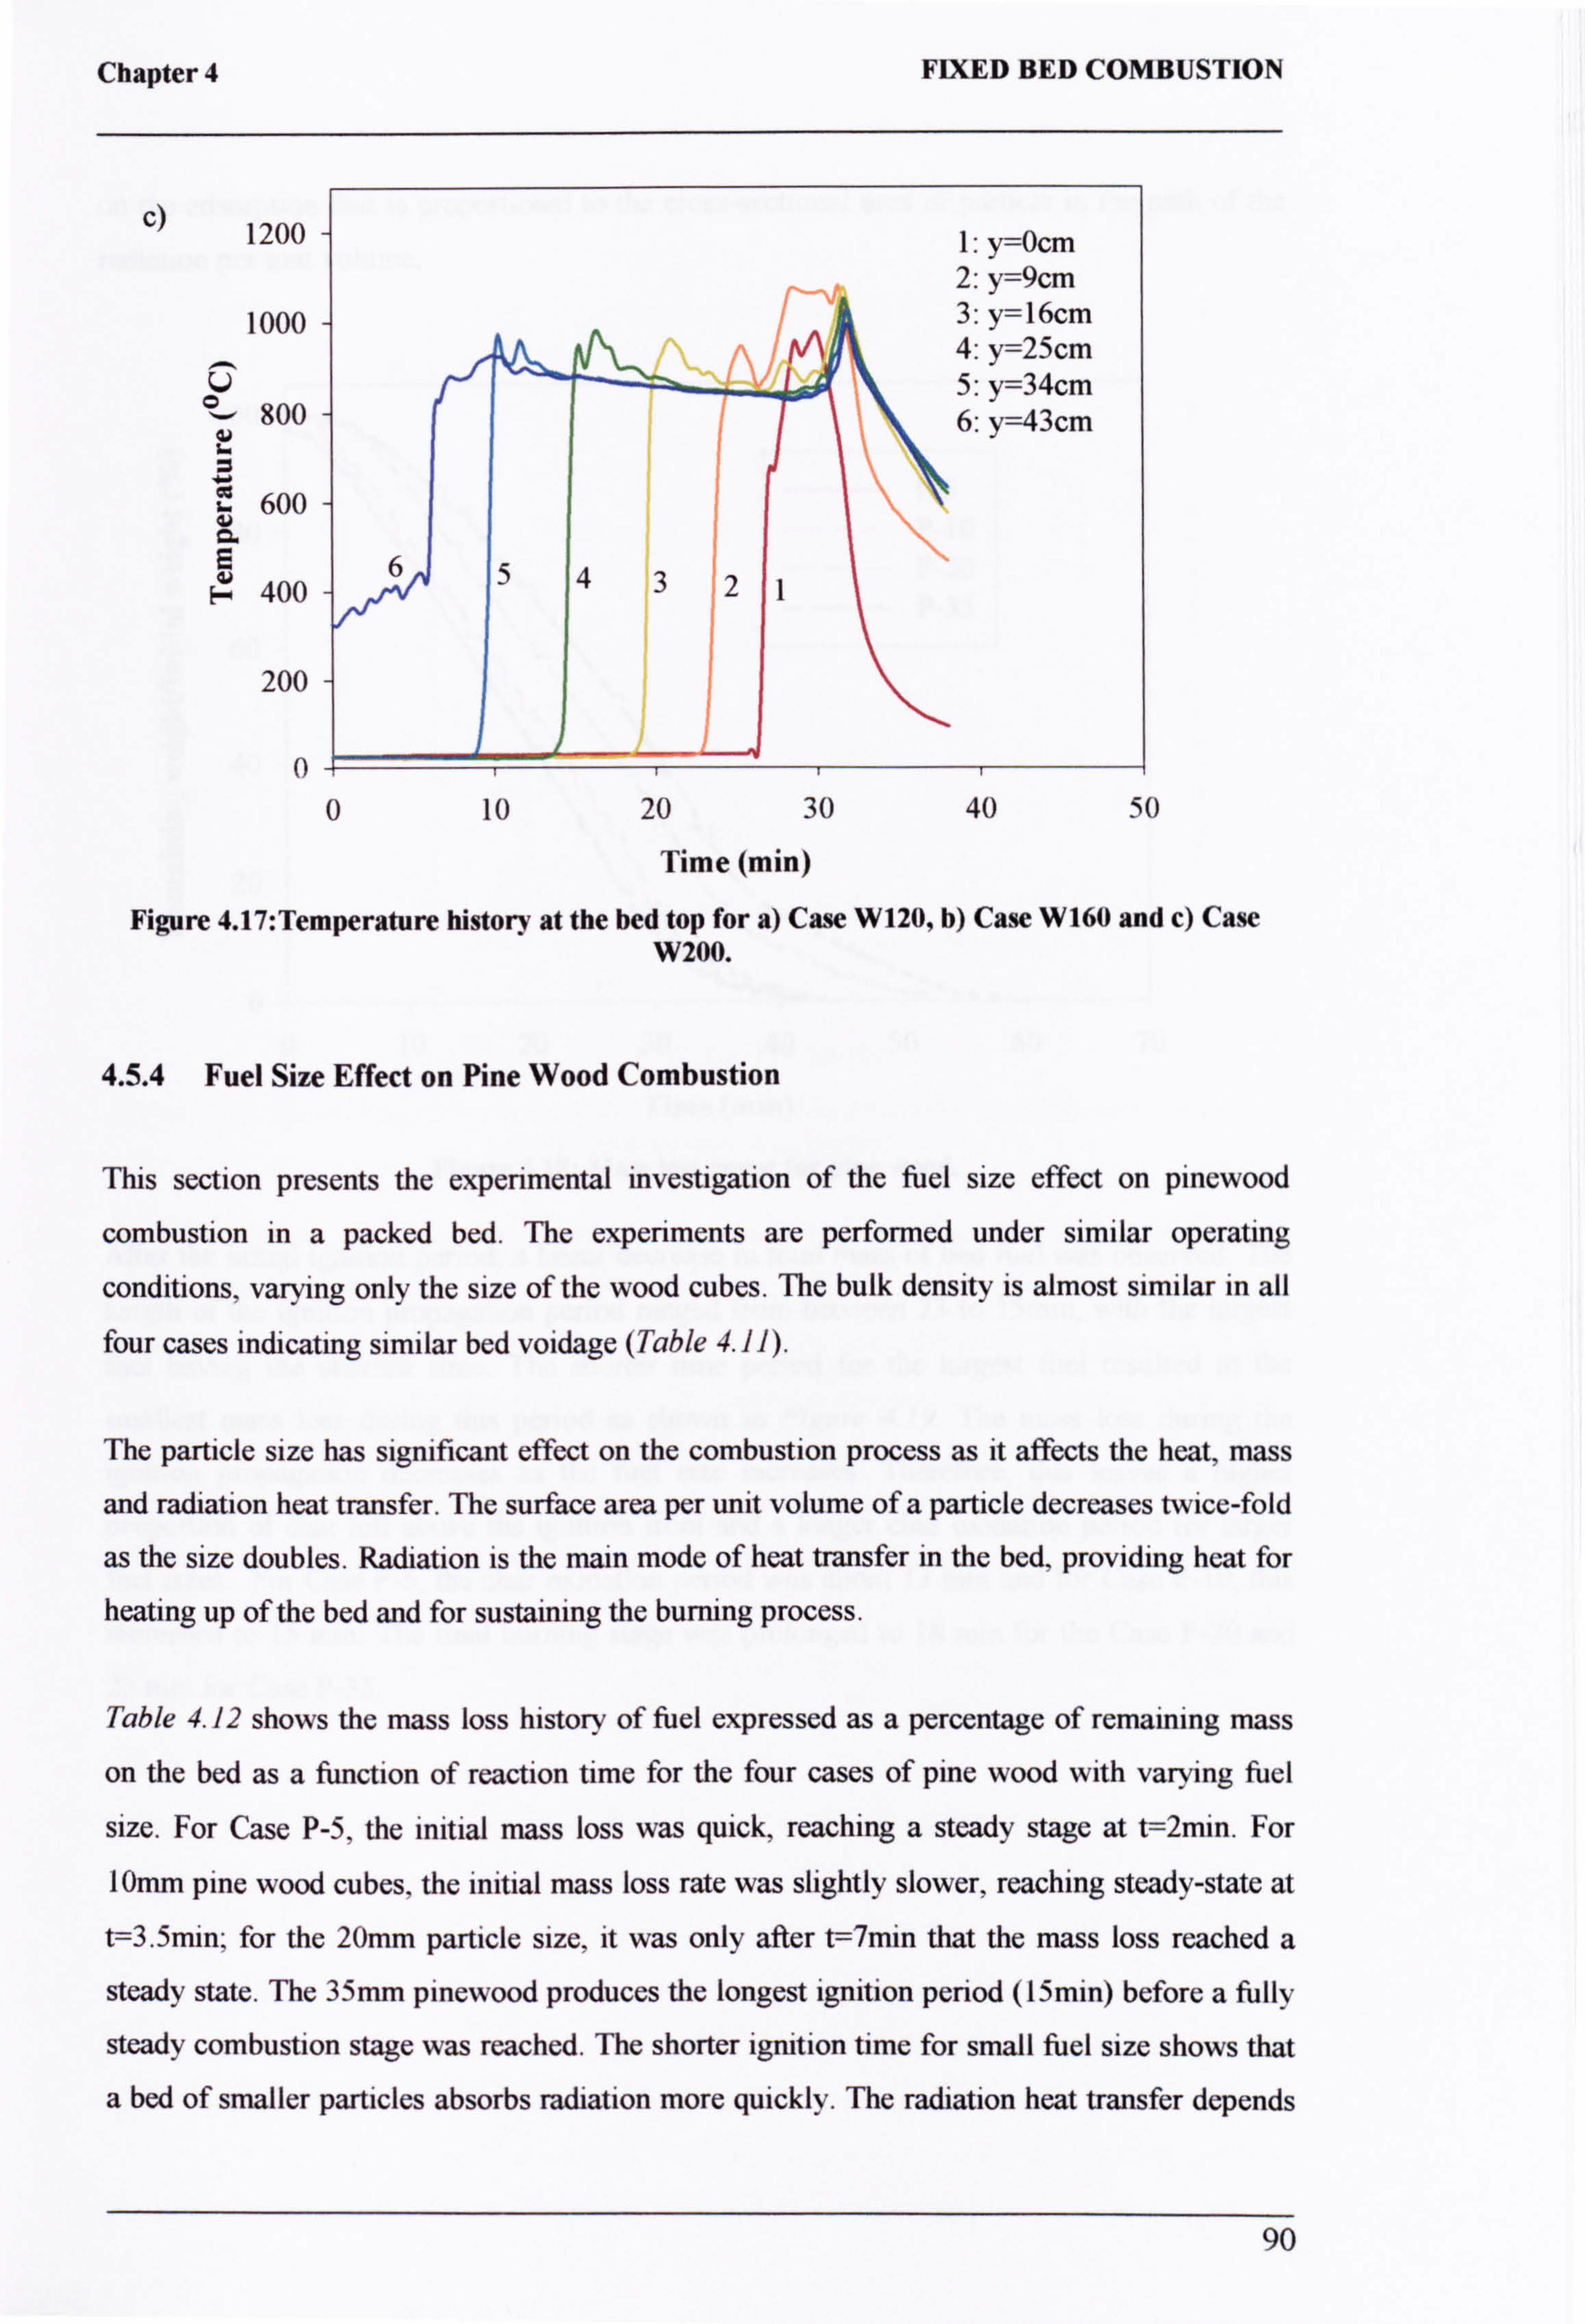
Chapter 4 FIXED BED COMBUSTION
ýý 1200
1000
U 800
r. +
600 CL E
400
200
0
1: y=Ocm 2: y=9cm 3: y=16cm 4: y=25cm 5: y=34cm 6: y=43cm
654321
0 10 20 30 40 50
Time (min)
Figure 4.17: Temperature history at the bed top for a) Case W120, b) Case W160 and c) Case W200.
4.5.4 Fuel Size Effect on Pine Wood Combustion
This section presents the experimental investigation of the fuel size effect on pinewood
combustion in a packed bed. The experiments are performed under similar operating
conditions, varying only the size of the wood cubes. The bulk density is almost similar in all
four cases indicating similar bed voidage (Table 4.11).
The particle size has significant effect on the combustion process as it affects the heat, mass
and radiation heat transfer. The surface area per unit volume of a particle decreases twice-fold
as the size doubles. Radiation is the main mode of heat transfer in the bed, providing heat for
heating up of the bed and for sustaining the burning process.
Table 4.12 shows the mass loss history of fuel expressed as a percentage of remaining mass
on the bed as a function of reaction time for the four cases of pine wood with varying fuel
size. For Case P-5, the initial mass loss was quick, reaching a steady stage at t=2min. For
10mm pine wood cubes, the initial mass loss rate was slightly slower, reaching steady-state at
t=3.5min; for the 20mm particle size, it was only after t=7min that the mass loss reached a
steady state. The 35mm pinewood produces the longest ignition period (15min) before a fully
steady combustion stage was reached. The shorter ignition time for small fuel size shows that
a bed of smaller particles absorbs radiation more quickly. The radiation heat transfer depends
90
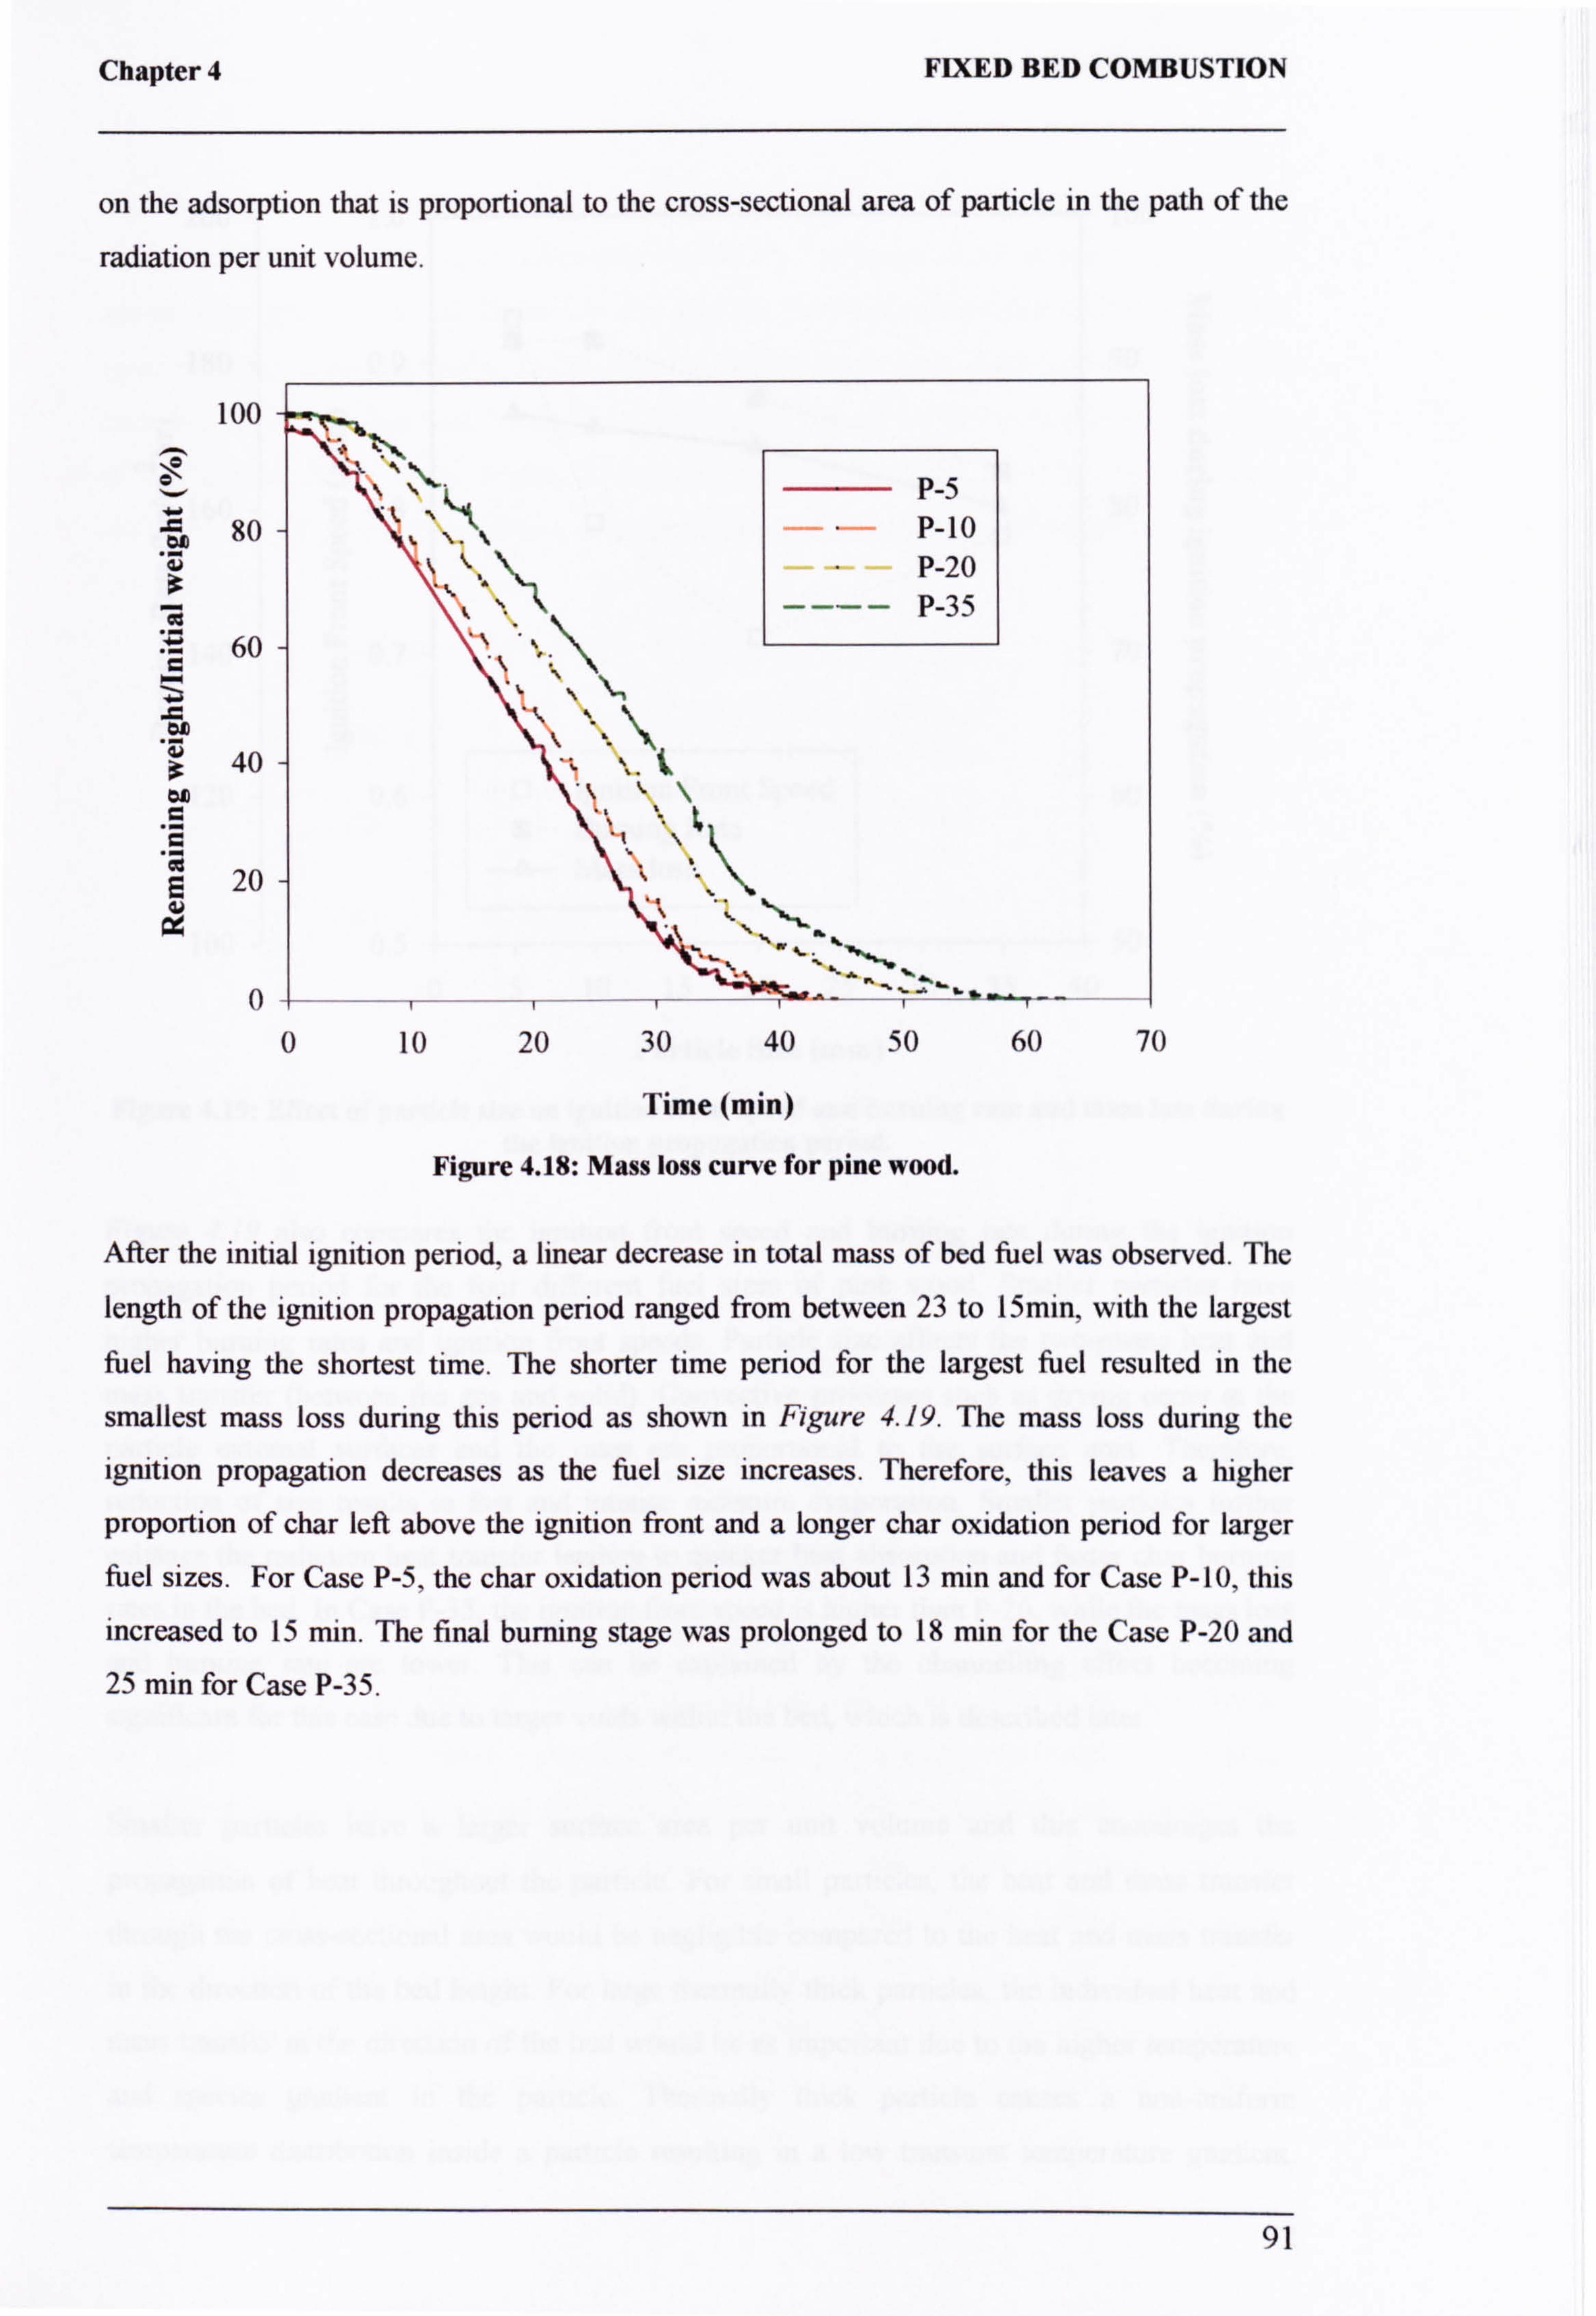
Chapter 4 FIXED BED COMBUSTION
on the adsorption that is proportional to the cross-sectional area of particle in the path of the
radiation per unit volume.
100
IN 't
, P-5
80 X. \ P-10 I k %,. \
4 P-20
' ---- P-35
c 60 X
3 40 `..
; .
20 `
a 4
0 10 20 30 40 50 60
Time (min)
Figure 4.18: Mass loss curve for pine wood.
70
After the initial ignition period, a linear decrease in total mass of bed fuel was observed. The
length of the ignition propagation period ranged from between 23 to 15min, with the largest
fuel having the shortest time. The shorter time period for the largest fuel resulted in the
smallest mass loss during this period as shown in Figure 4.19. The mass loss during the
ignition propagation decreases as the fuel size increases. Therefore, this leaves a higher
proportion of char left above the ignition front and a longer char oxidation period for larger
fuel sizes. For Case P-5, the char oxidation period was about 13 min and for Case P-10, this
increased to 15 min. The final burning stage was prolonged to 18 min for the Case P-20 and 25 min for Case P-35.
91
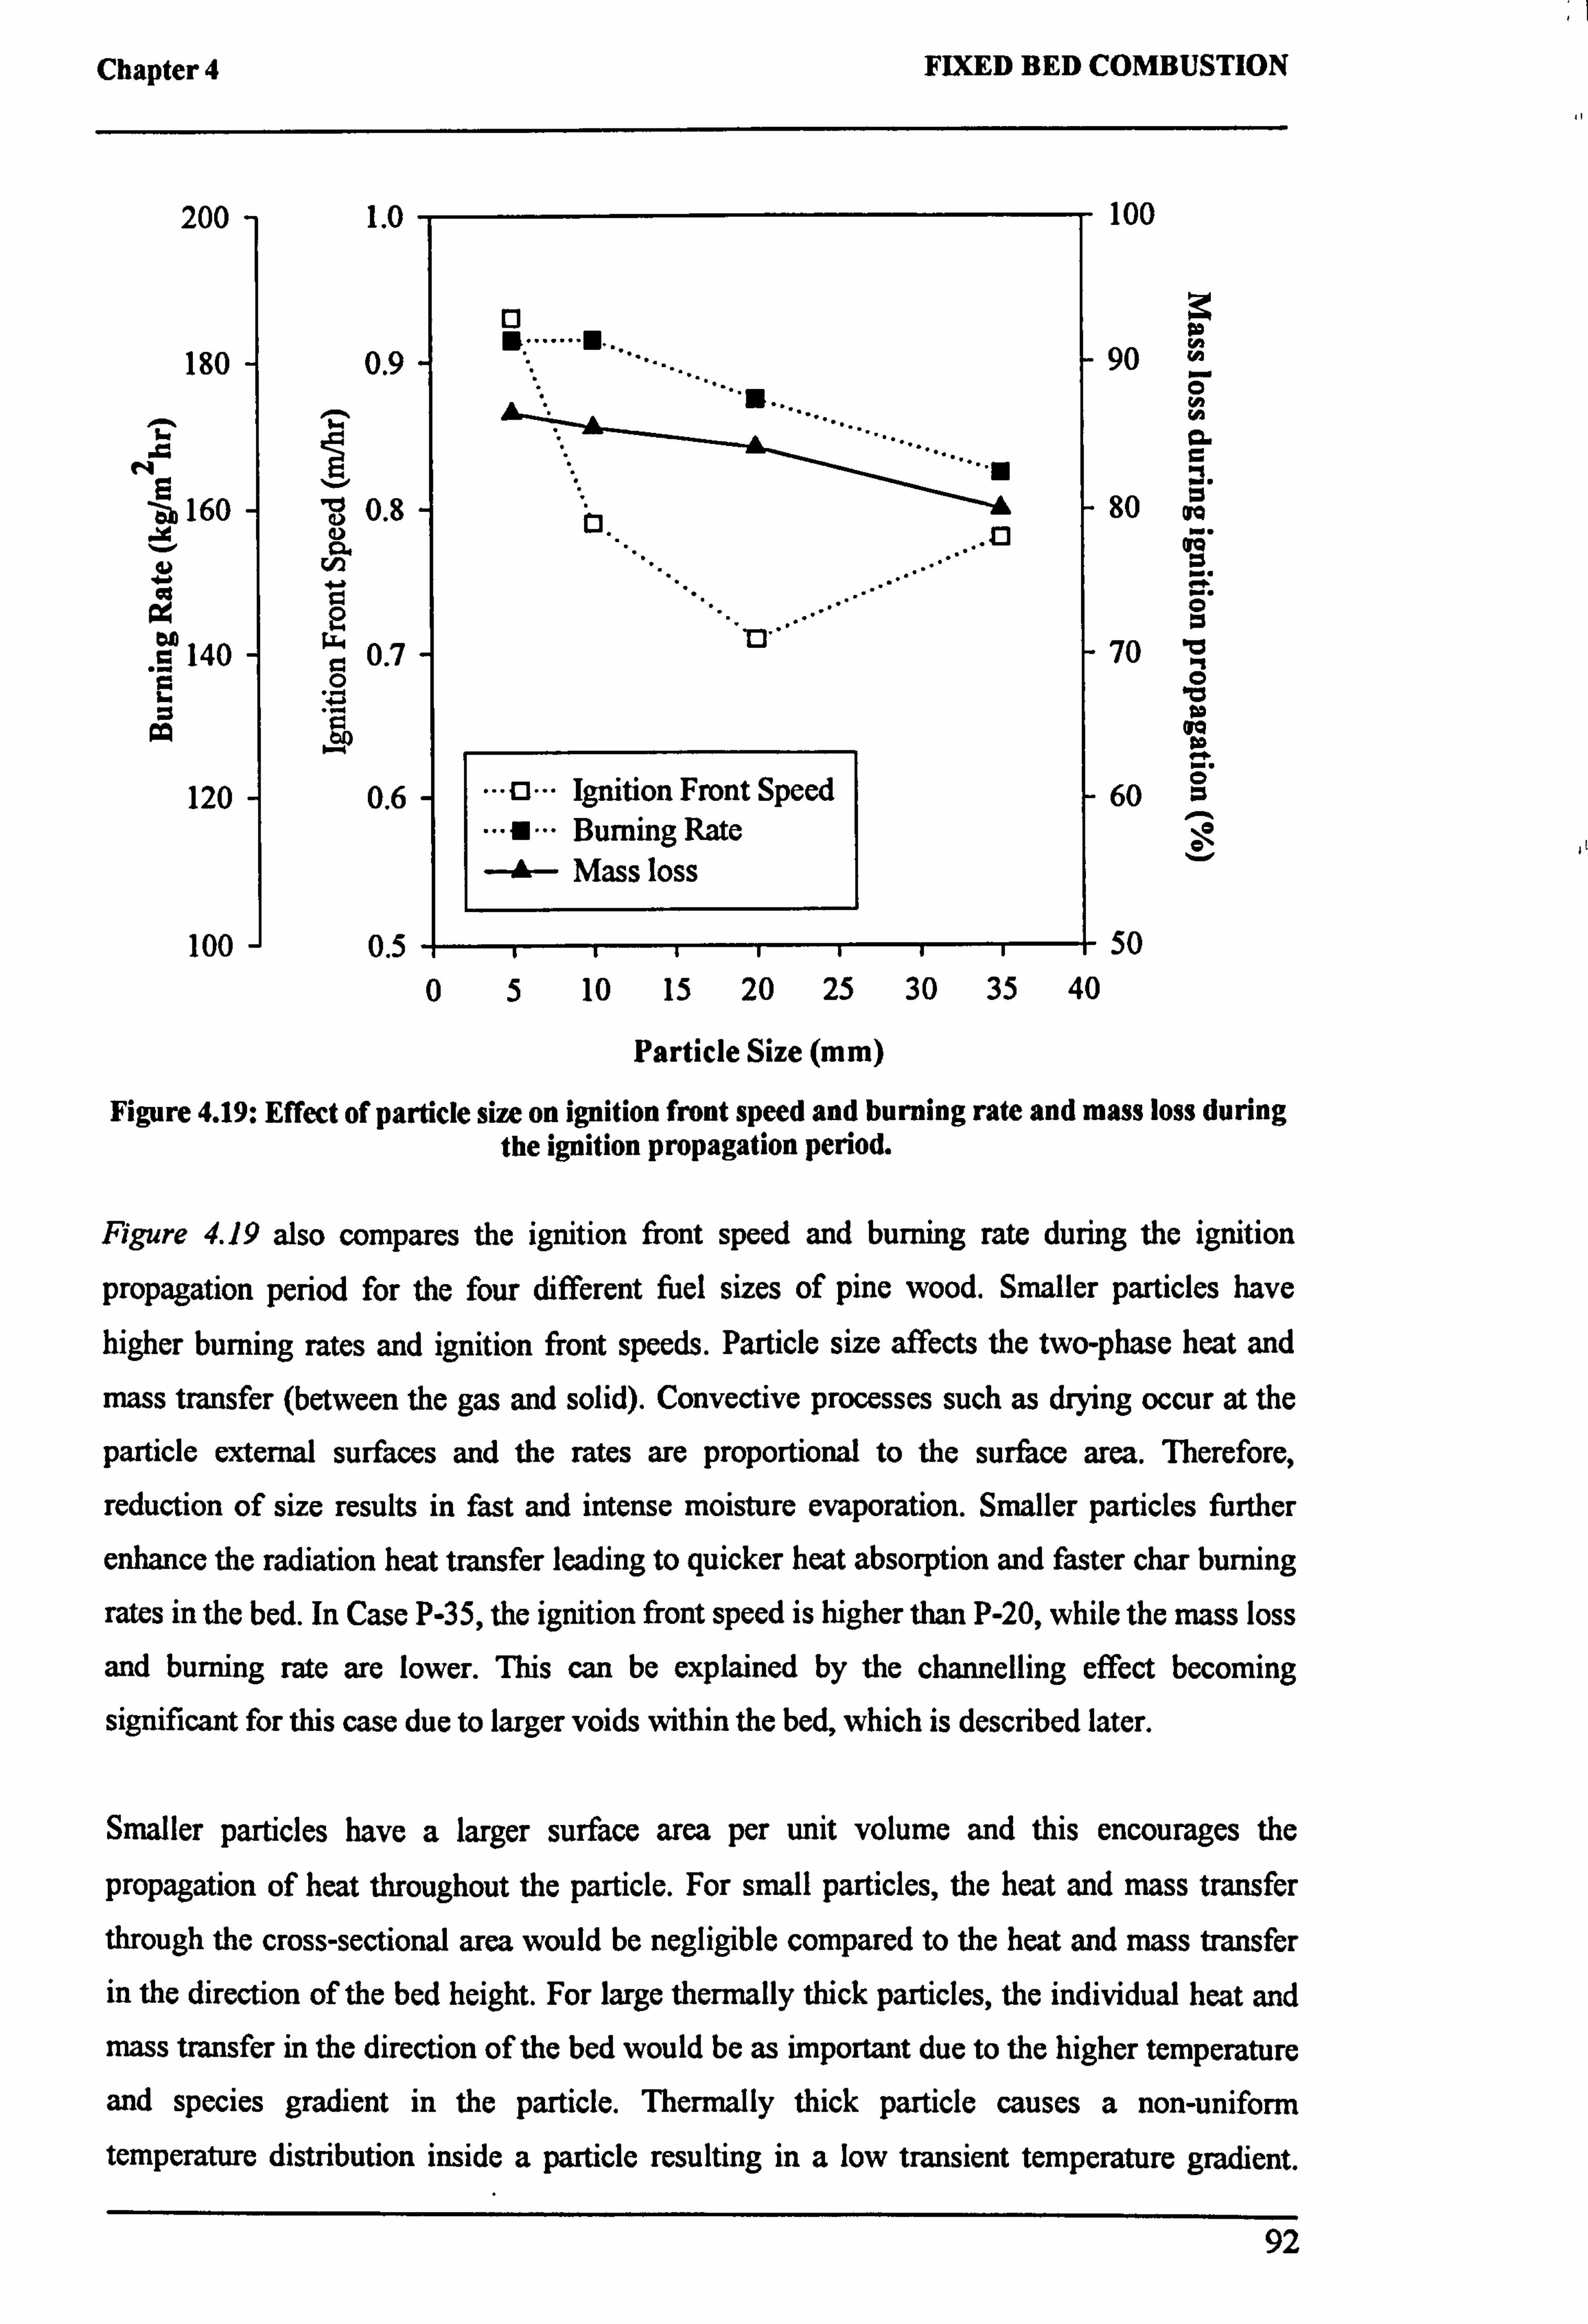
Chapter 4 FIXED BED COMBUSTION
200 1.0
180 0.9
X160
aý w a
140
Z w 1
0.8 N
2 0.7
0 45 r. won
120 0.6
100 0.5
0
's.
°"
fl Ignition Front Speed a""" Burning Rate A Mass loss
100
90
80
70
60
r m H
O
h
ara
ö'
10 O
wo to r. O
a° 0
50 05 10 15 20 25 30 35 40
Particle Size (mm)
Figure 4.19: Effect of particle size on ignition front speed and burning rate and mass loss during the ignition propagation period.
Figure 4.19 also compares the ignition front speed and burning rate during the ignition
propagation period for the four different fuel sizes of pine wood. Smaller particles have
higher burning rates and ignition front speeds. Particle size affects the two-phase heat and
mass transfer (between the gas and solid). Convective processes such as drying occur at the
particle external surfaces and the rates are proportional to the surface area. Therefore,
reduction of size results in fast and intense moisture evaporation. Smaller particles further
enhance the radiation heat transfer leading to quicker heat absorption and faster char burning
rates in the bed. In Case P-35, the ignition front speed is higher than P-20, while the mass loss
and burning rate are lower. This can be explained by the channelling effect becoming
significant for this case due to larger voids within the bed, which is described later.
Smaller particles have a larger surface area per unit volume and this encourages the
propagation of heat throughout the particle. For small particles, the heat and mass transfer
through the cross-sectional area would be negligible compared to the heat and mass transfer
in the direction of the bed height. For large thermally thick particles, the individual heat and
mass transfer in the direction of the bed would be as important due to the higher temperature
and species gradient in the particle. Thermally thick particle causes a non-uniform
temperature distribution inside a particle resulting in a low transient temperature gradient.
92
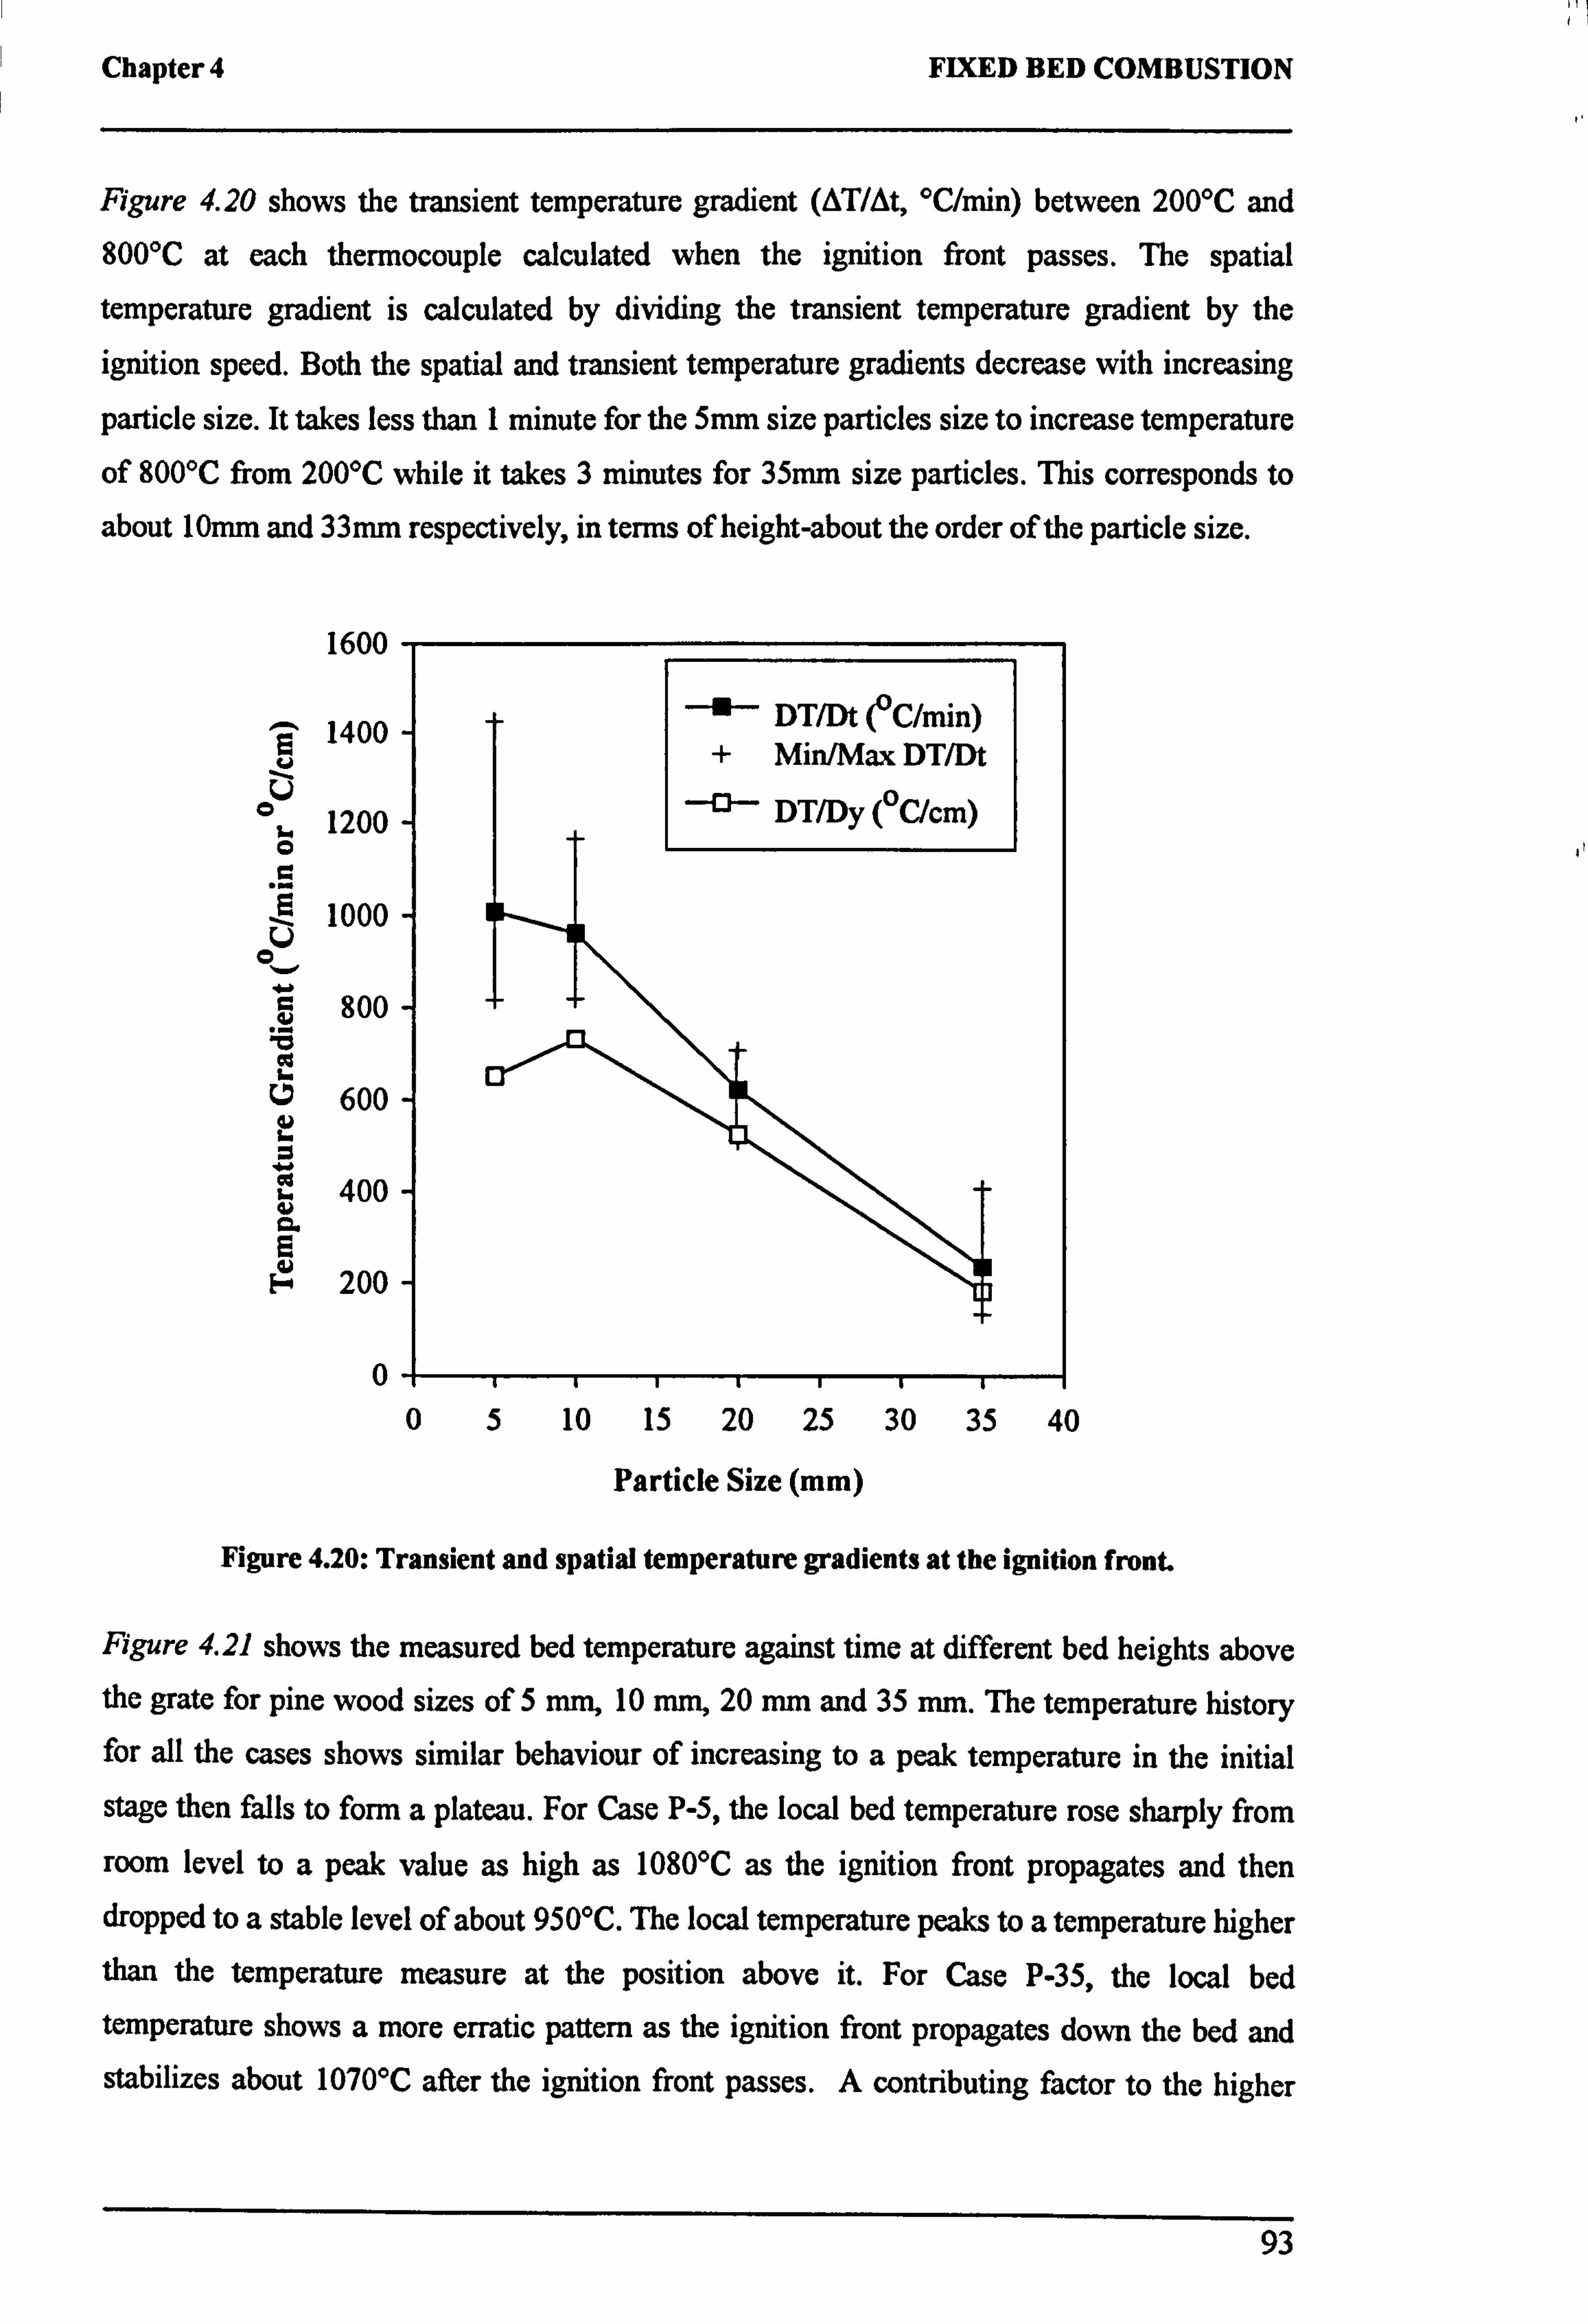
Chapter 4 FIXED BED COMBUSTION
Figure 4.20 shows the transient temperature gradient (AT/At, °C/min) between 200°C and NOT at each thermocouple calculated when the ignition front passes. The spatial
temperature gradient is calculated by dividing the transient temperature gradient by the
ignition speed. Both the spatial and transient temperature gradients decrease with increasing
particle size. It takes less than 1 minute for the 5mm size particles size to increase temperature
of NOT from 200°C while it takes 3 minutes for 35mm size particles. This corresponds to
about 10mm and 33mm respectively, in terms of height-about the order of the particle size.
1600
1400
1200 0
1000
800
° U 600
400 as
200
0
" DT/Dt (°C/min) + Min/Max DT/Dt
DT/Dy (°C/cm)
05 10 15 20 25 30 35 40
Particle Size (mm)
Figure 4.20: Transient and spatial temperature gradients at the ignition front.
Figure 4.21 shows the measured bed temperature against time at different bed heights above the grate for pine wood sizes of 5 mm, 10 mm, 20 mm and 35 mm. The temperature history for all the cases shows similar behaviour of increasing to a peak temperature in the initial
stage then falls to form a plateau. For Case P-5, the local bed temperature rose sharply from
room level to a peak value as high as 1080°C as the ignition front propagates and then dropped to a stable level of about 950°C. The local temperature peaks to a temperature higher
than the temperature measure at the position above it. For Case P-35, the local bed
temperature shows a more erratic pattern as the ignition front propagates down the bed and stabilizes about 1070°C after the ignition front passes. A contributing factor to the higher
93
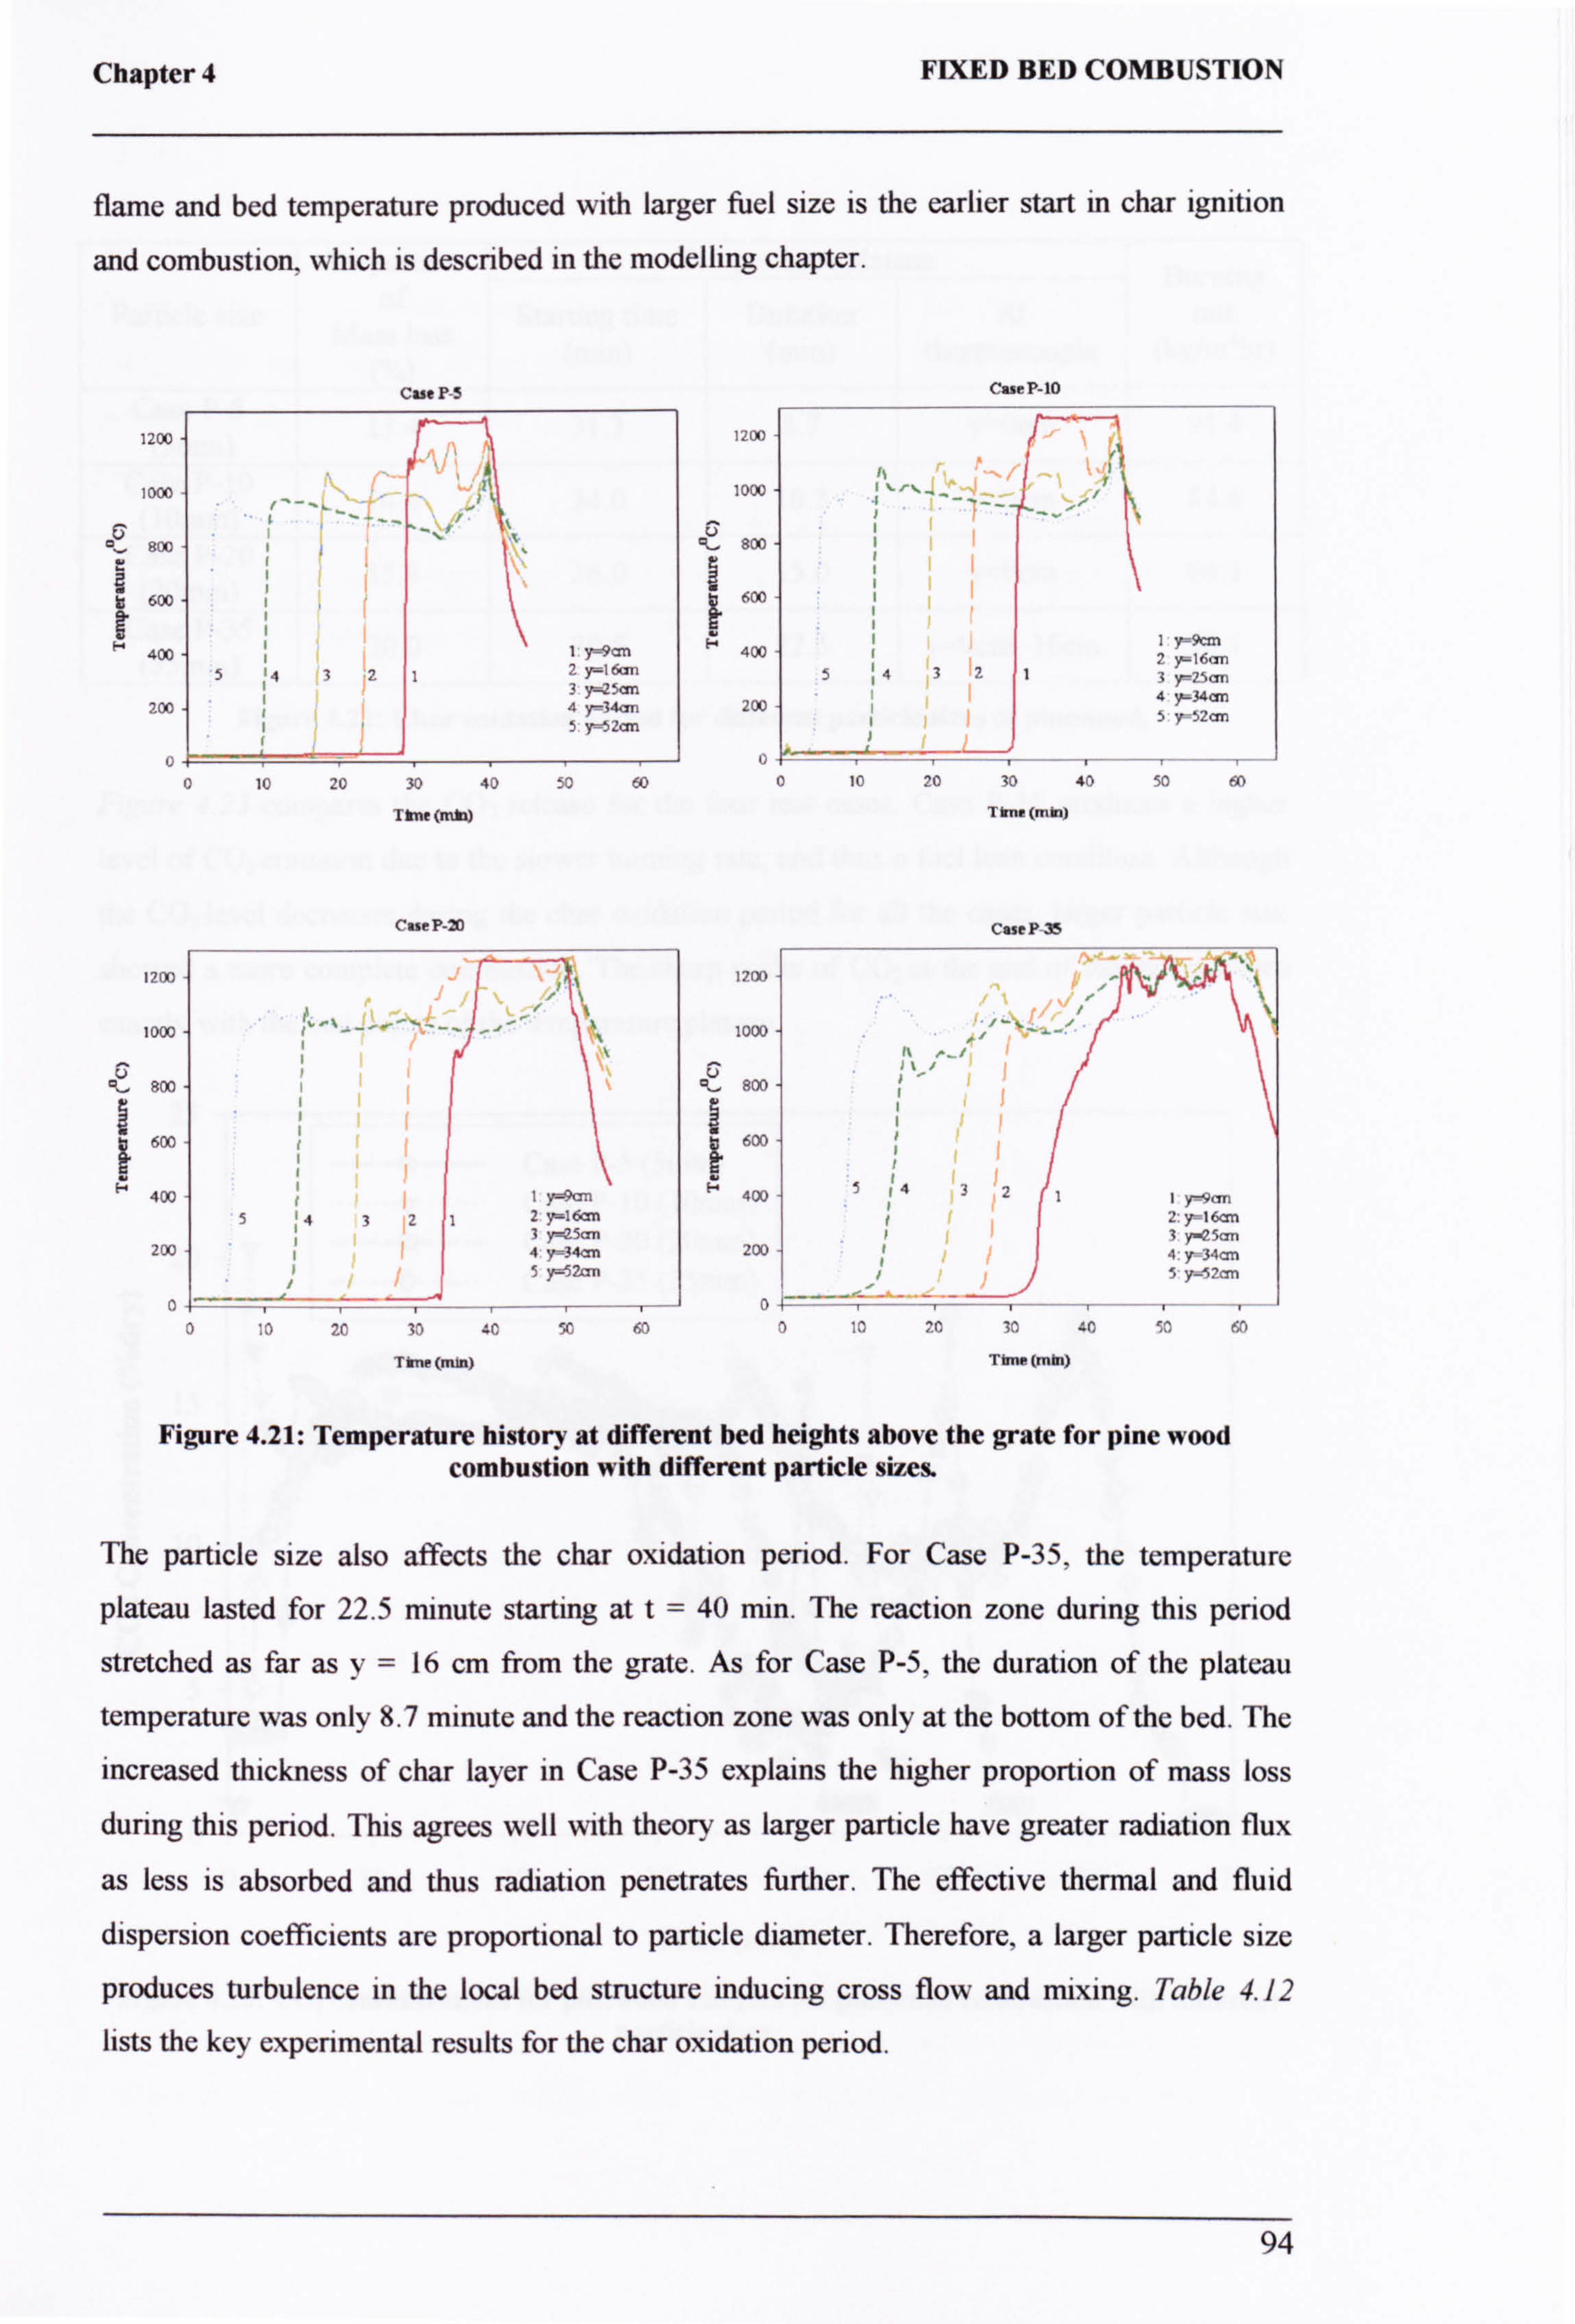
Chapter 4 FIXED BED COMBUSTION
flame and bed temperature produced with larger fuel size is the earlier start in char ignition
and combustion, which is described in the modelling chapter.
Cue P-5
1200
000
goo 600
F 4010
200
0
5e321 1 y-9 an
2 erica 3 7y25an 4 y--34<m 5 y-52an
0 10 20 30 40 50 00
Tine(mt)
1200
1000
Case P-20
/1
53212 yc16ao 3 y5= 4y 34an 5 y=52an
600
600
Fg 400
200
0 o .o zo 30 40 50 60
Time (min)
CueP-10
1200 i
r ý1. 1
1000 q
cu 800
I
lj 600
400 1 y=9cm
54321 2 ý16a 3'25M
200 4 5p34= 5 r52an
0 10 20 30 40 50 60
Ti.. (min)
Case P-J5
1200
1ooo
ü R, 800
i 600
400
200
0 7
I\ ýJ, IV
5143211 Y--9m
2: }r-l6an 3 y-e5=
ff 4: y--34a 5 y= 32m
;o 20 30 40 f'1
Time (man)
Figure 4.21: Temperature history at different bed heights above the grate for pine wood combustion with different particle sizes.
The particle size also affects the char oxidation period. For Case P-35, the temperature
plateau lasted for 22.5 minute starting at t= 40 min. The reaction zone during this period
stretched as far as y= 16 cm from the grate. As for Case P-5, the duration of the plateau
temperature was only 8.7 minute and the reaction zone was only at the bottom of the bed. The
increased thickness of char layer in Case P-35 explains the higher proportion of mass loss
during this period. This agrees well with theory as larger particle have greater radiation flux
as less is absorbed and thus radiation penetrates further. The effective thermal and fluid
dispersion coefficients are proportional to particle diameter. Therefore, a larger particle size
produces turbulence in the local bed structure inducing cross flow and mixing. Table 4.12
lists the key experimental results for the char oxidation period.
94
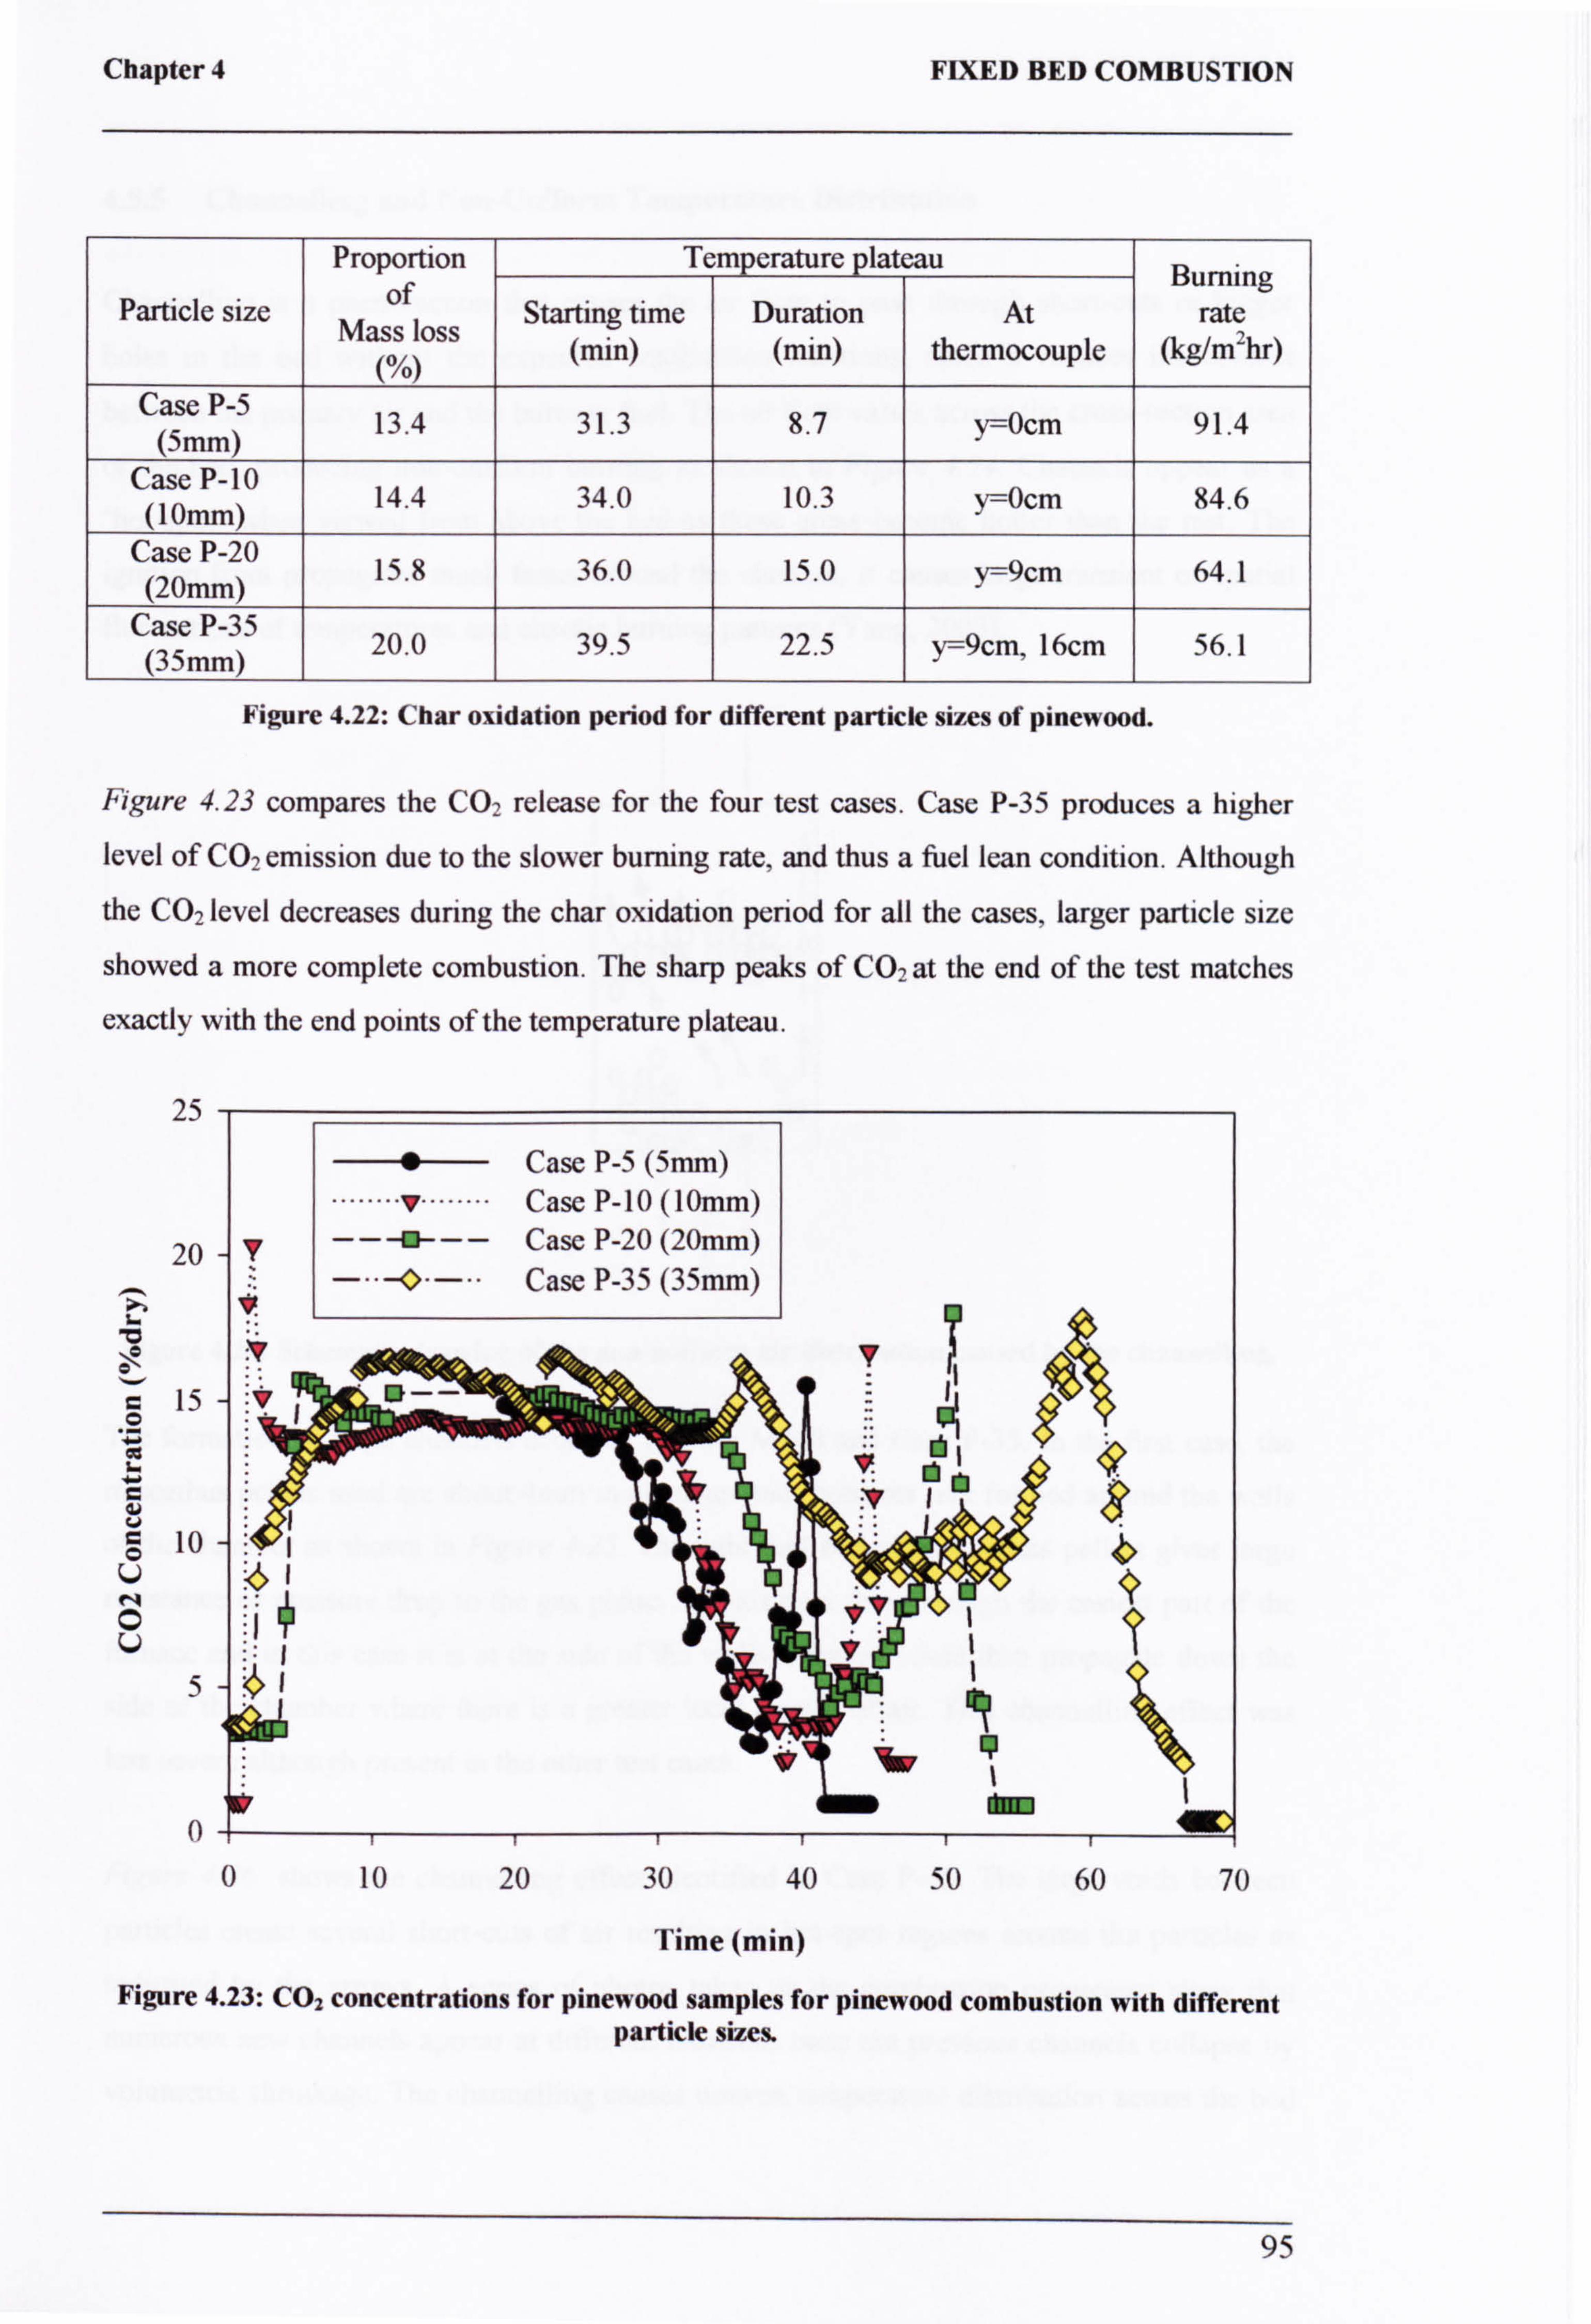
Chapter 4 FIXED BED COMBUSTION
Proportion Temperature plateau B i of urn ng
Particle size Mass loss Starting time Duration At rate
N (min) (min) thermocouple (kg/m2hr)
Case P-5 (5mm) 13.4 31.3 8.7 y=0cm 91.4
Case P-10 (10mm) 14.4 34.0 10.3 y=0cm 84.6
Case P-20 (20mm) 15.8 36.0 15.0 y=9cm 64.1
Case P-35 (35mm) 20.0 39.5 22.5 y=9cm, 16cm 56.1
Figure 4.22: Char oxidation period for different particle sizes of pinewood.
Figure 4.23 compares the CO2 release for the four test cases. Case P-35 produces a higher
level of CO-2 emission due to the slower burning rate, and thus a fuel lean condition. Although
the CO2level decreases during the char oxidation period for all the cases, larger particle size
showed a more complete combustion. The sharp peaks of CO2 at the end of the test matches
exactly with the end points of the temperature plateau.
25
20
L
15 O
it
L r. +
1
10 U N
C U 5
0
0 Case P-5 (5mm) Case P-10 (10mm)
T --f-- Case P-20 (20mm)
-ý - Case P-35 (35mm)
T
0 10 20 30 40 50 60 70
Time (min)
Figure 4.23: CO2 concentrations for pinewood samples for pinewood combustion with different particle sizes.
95
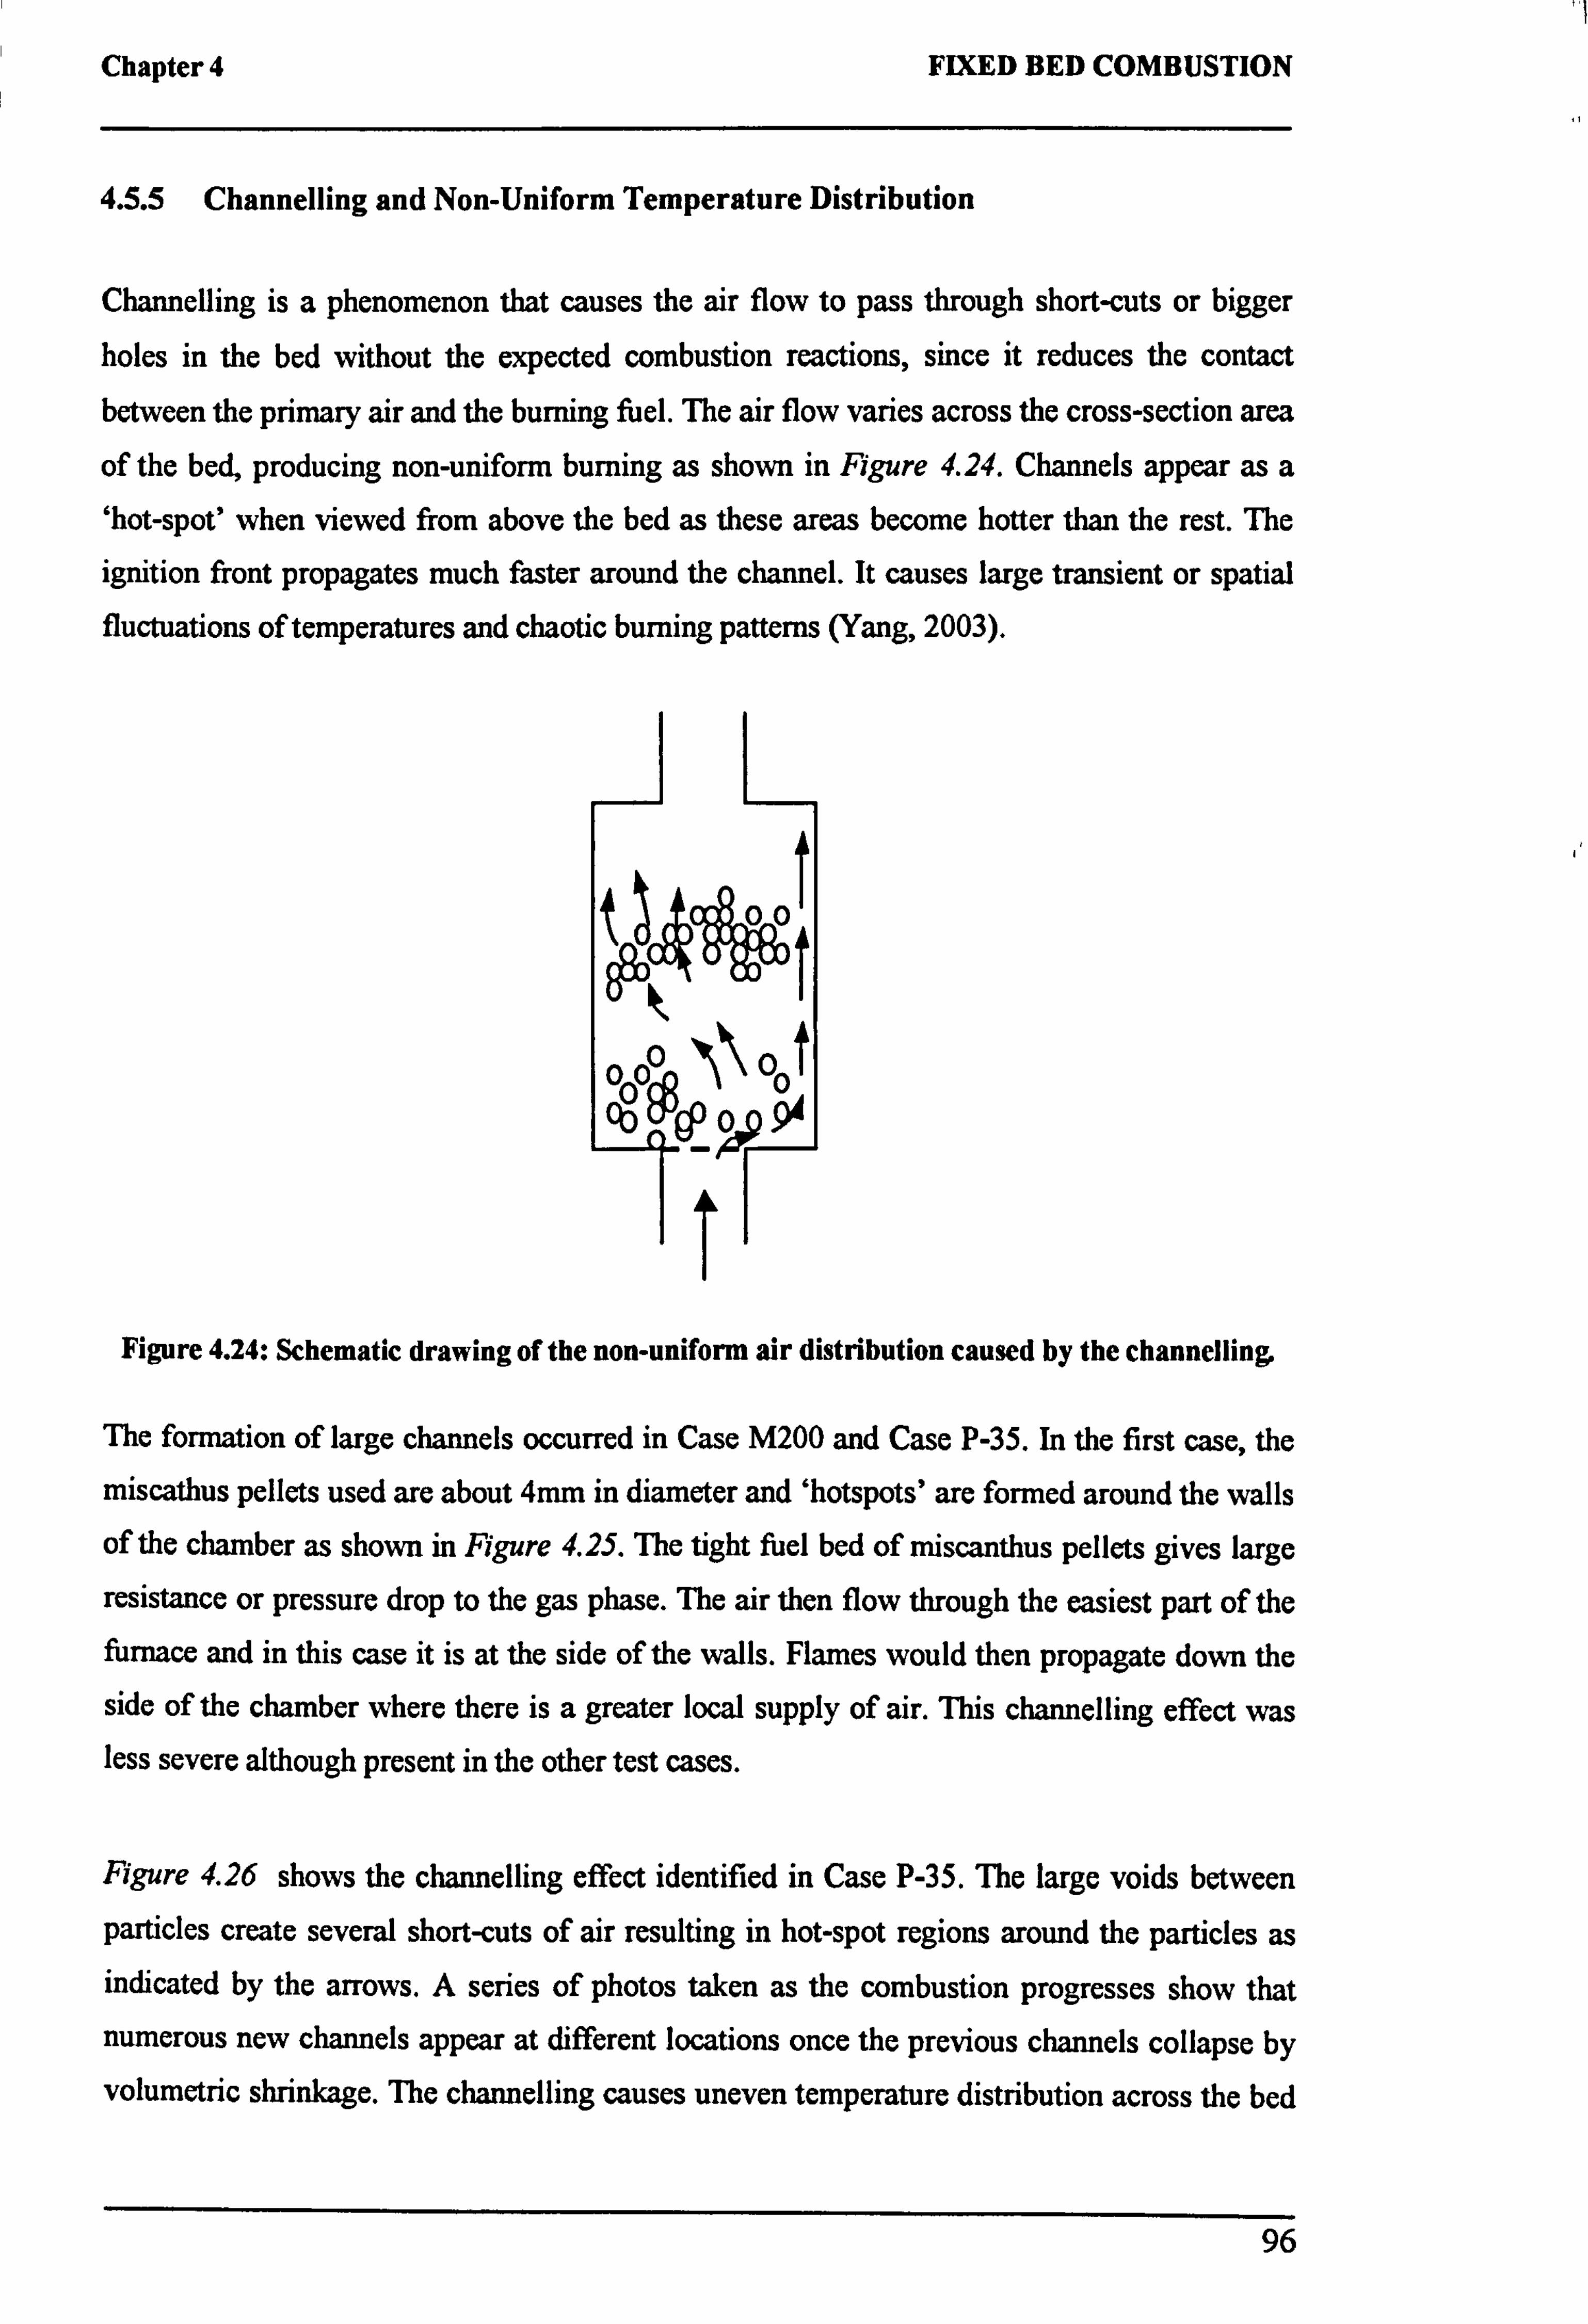
Chapter 4 FIXED BED COMBUSTION
4.5.5 Channelling and Non-Uniform Temperature Distribution
Channelling is a phenomenon that causes the air flow to pass through short-cuts or bigger
holes in the bed without the expected combustion reactions, since it reduces the contact between the primary air and the burning fuel. The air flow varies across the cross-section area
of the bed, producing non-uniform burning as shown in Figure 4.24. Channels appear as a `hot-spot' when viewed from above the bed as these areas become hotter than the rest. The
ignition front propagates much faster around the channel. It causes large transient or spatial fluctuations of temperatures and chaotic burning patterns (Yang, 2003).
00
0000 ý\ 00
t
Y-2!
Figure 4.24: Schematic drawing of the non-uniform air distribution caused by the channelling.
The formation of large channels occurred in Case M200 and Case P-35. In the first case, the
miscathus pellets used are about 4mm in diameter and ̀ hotspots' are formed around the walls of the chamber as shown in Figure 4.25. The tight fuel bed of miscanthus pellets gives large
resistance or pressure drop to the gas phase. The air then flow through the easiest part of the furnace and in this case it is at the side of the walls. Flames would then propagate down the
side of the chamber where there is a greater local supply of air. This channelling effect was less severe although present in the other test cases.
Figure 4.26 shows the channelling effect identified in Case P-35. The large voids between
particles create several short-cuts of air resulting in hot-spot regions around the particles as indicated by the arrows. A series of photos taken as the combustion progresses show that
numerous new channels appear at different locations once the previous channels collapse by
volumetric shrinkage. The channelling causes uneven temperature distribution across the bed
96
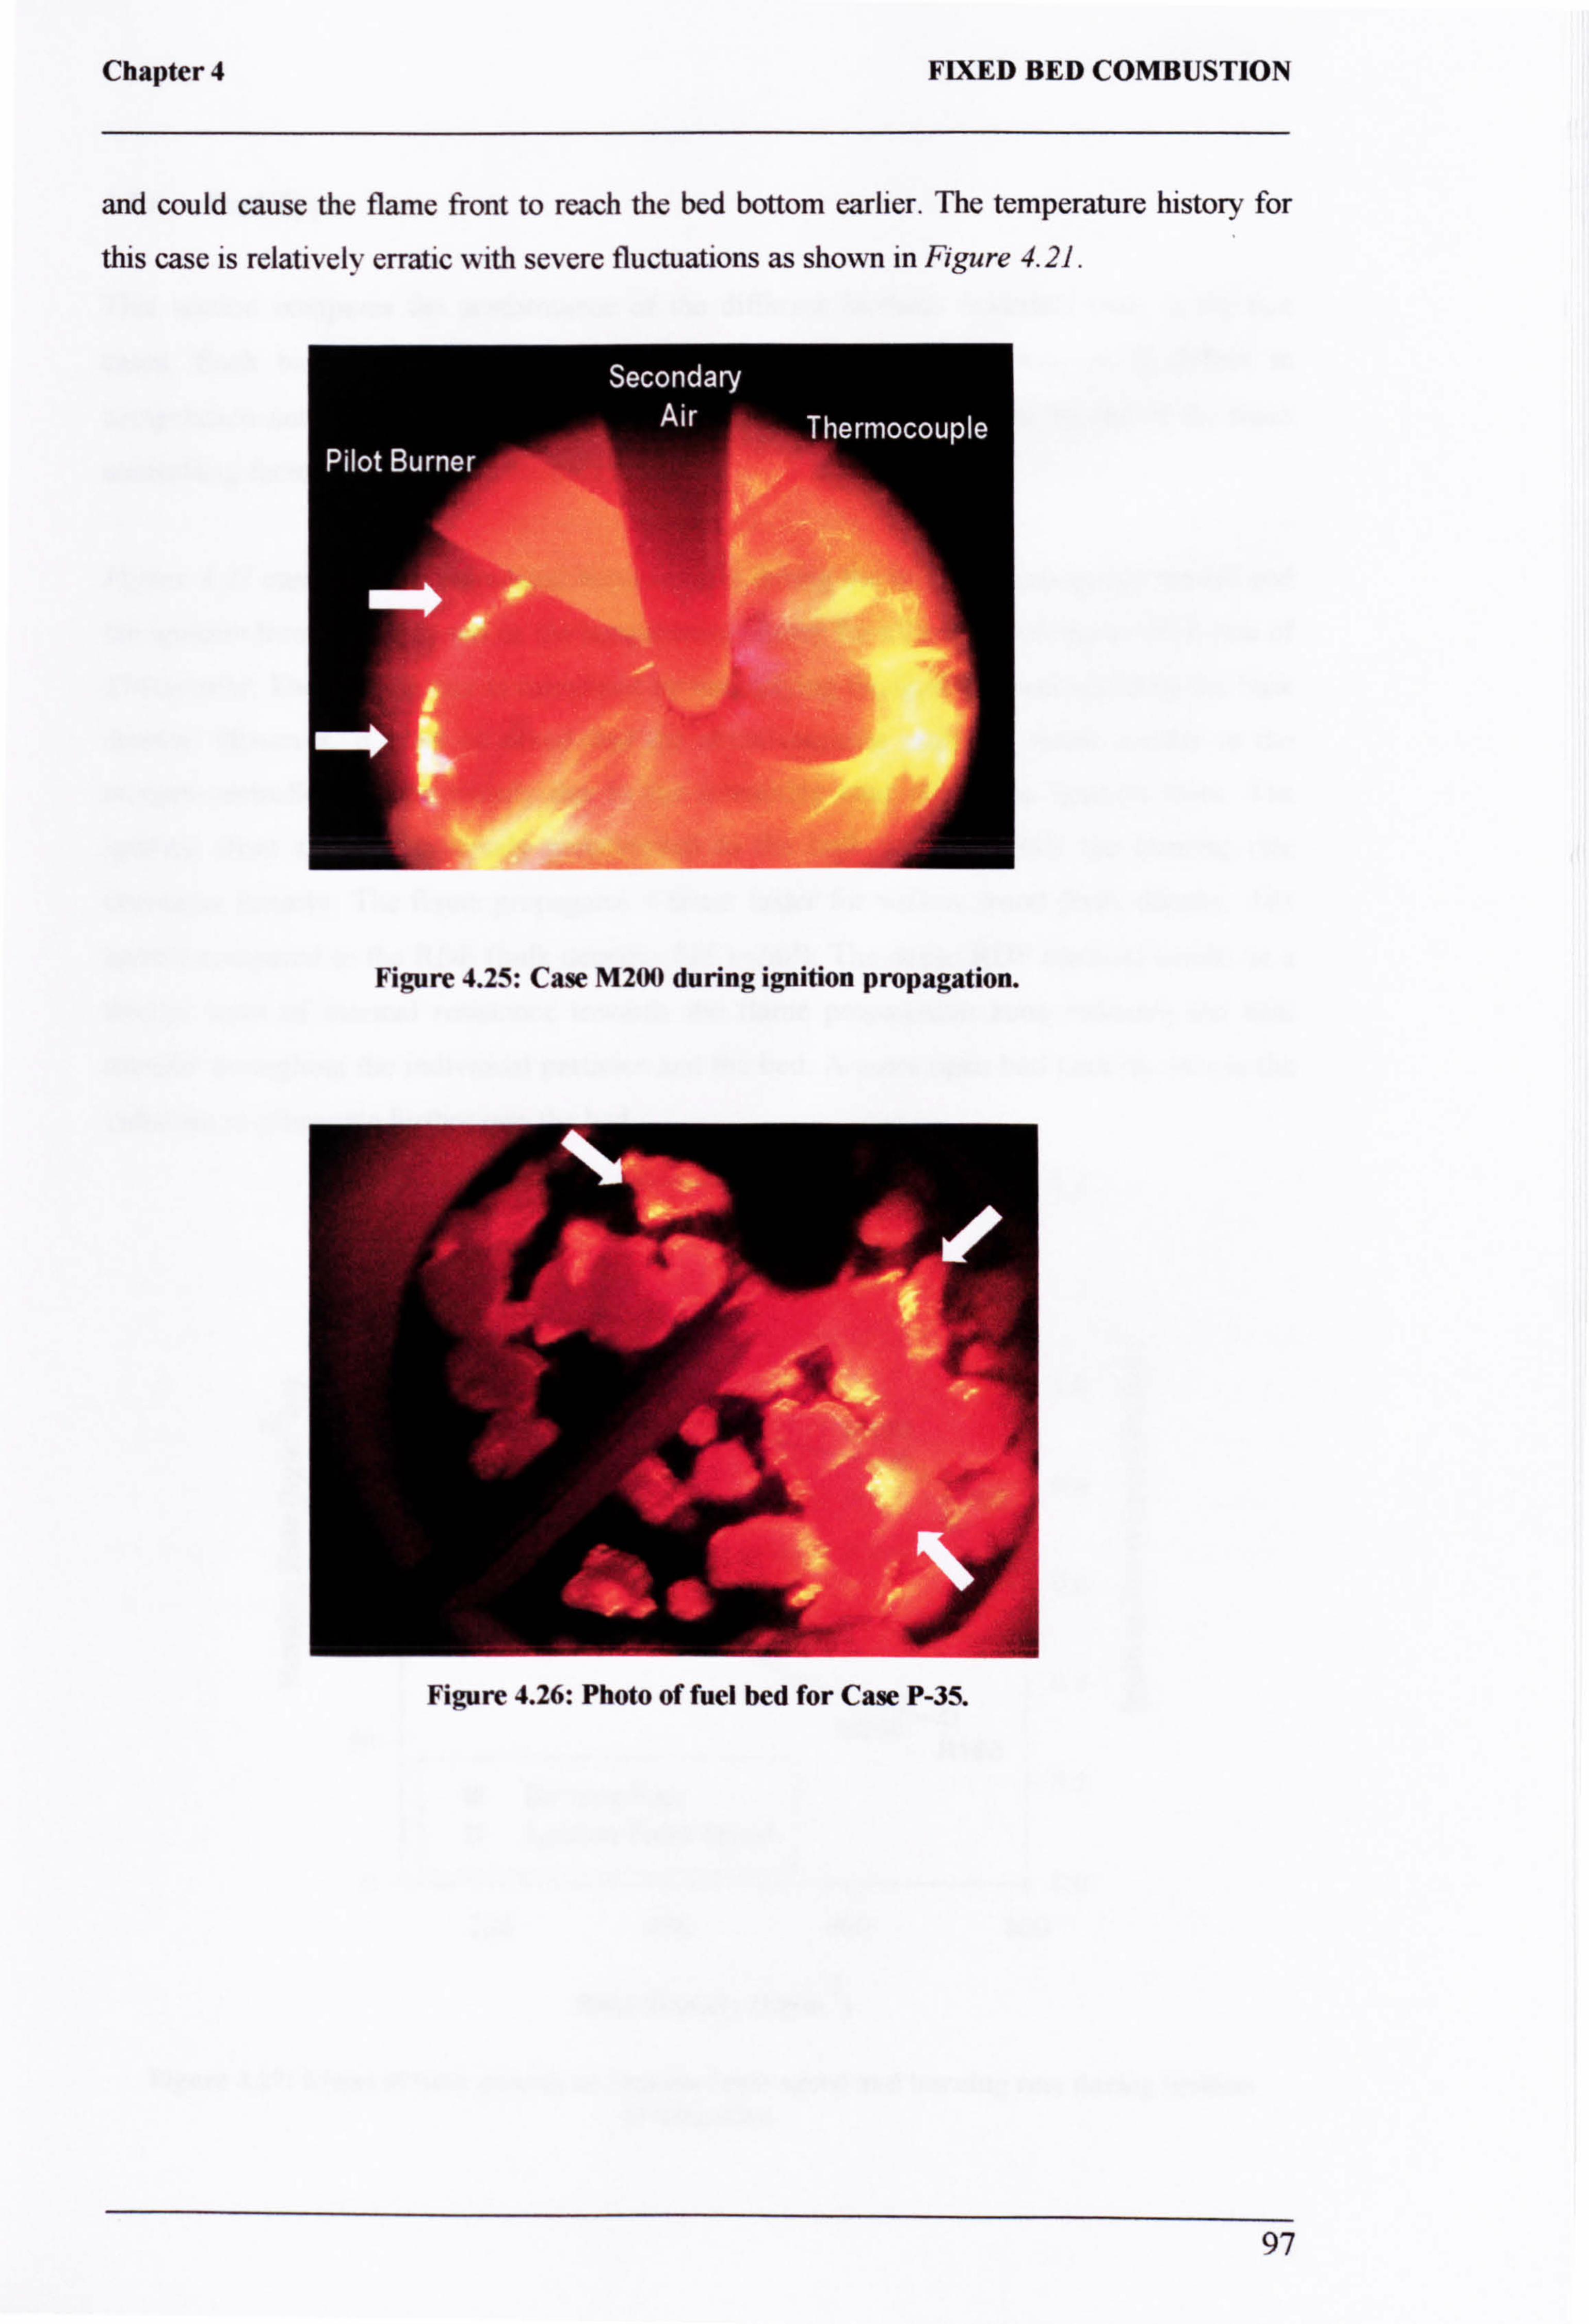
Chapter 4 FIXED BED COMBUSTION
and could cause the flame front to reach the bed bottom earlier. The temperature history for
this case is relatively erratic with severe fluctuations as shown in Figure 4.21.
Figure 4.25: Case M200 during ignition propagation.
97
Figure 4.26: Photo of fuel bed for Case P-35.
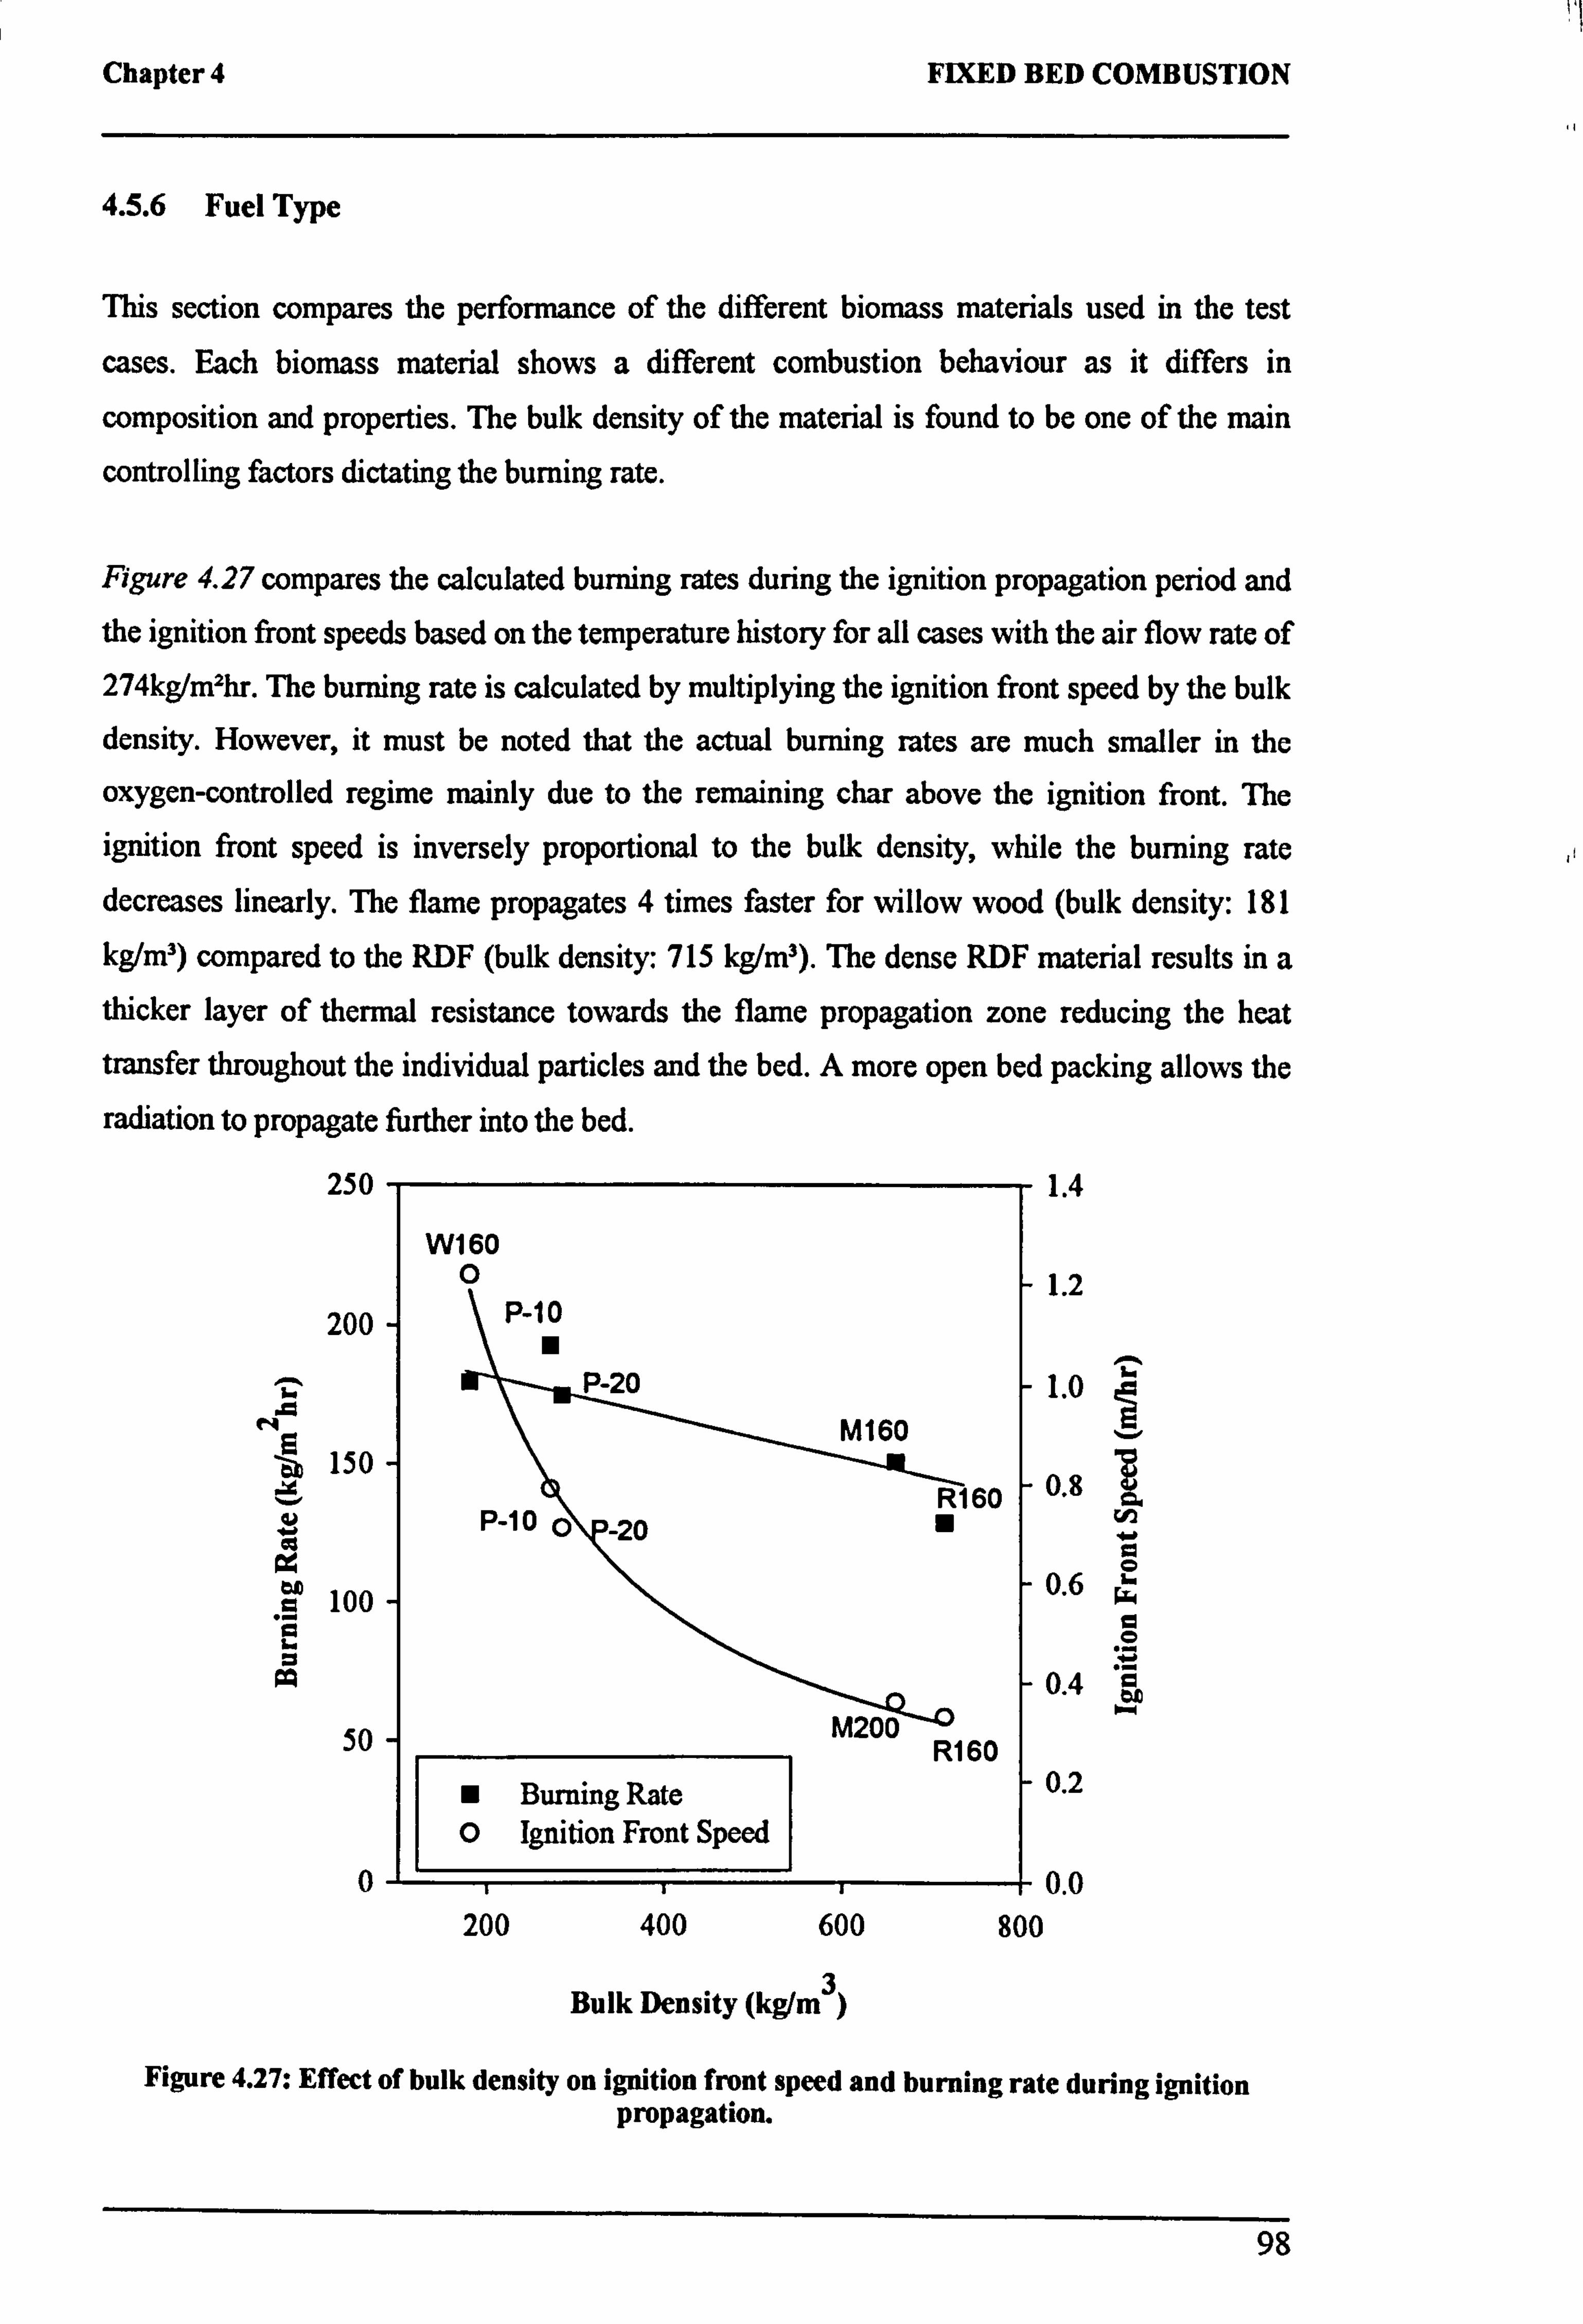
Chapter 4 FIXED BED COMBUSTION
4.5.6 Fuel Type
This section compares the performance of the different biomass materials used in the test
cases. Each biomass material shows a different combustion behaviour as it differs in
composition and properties. The bulk density of the material is found to be one of the main
controlling factors dictating the burning rate.
Figure 4.27 compares the calculated burning rates during the ignition propagation period and
the ignition front speeds based on the temperature history for all cases with the air flow rate of 274kg/m2hr. The burning rate is calculated by multiplying the ignition front speed by the bulk
density. However, it must be noted that the actual burning rates are much smaller in the
oxygen-controlled regime mainly due to the remaining char above the ignition front. The
ignition front speed is inversely proportional to the bulk density, while the burning rate decreases linearly. The flame propagates 4 times faster for willow wood (bulk density: 181
kg/m') compared to the RDF (bulk density: 715 kg/m'). The dense RDF material results in a
thicker layer of thermal resistance towards the flame propagation zone reducing the heat
transfer throughout the individual particles and the bed. A more open bed packing allows the
radiation to propagate further into the bed.
250
W160 0
200
150
P.
100
50
0
Burning Rate O Ignition Front Speed
1.4
1.2
1.0
60 0.8
.r a 0 0.6 w a 0 w
0.4
R160 0.2
0.0 200 400 600 800
Bulk Density (kg/m3)
Figure 4.27: Effect of bulk density on ignition front speed and burning rate during ignition propagation.
98
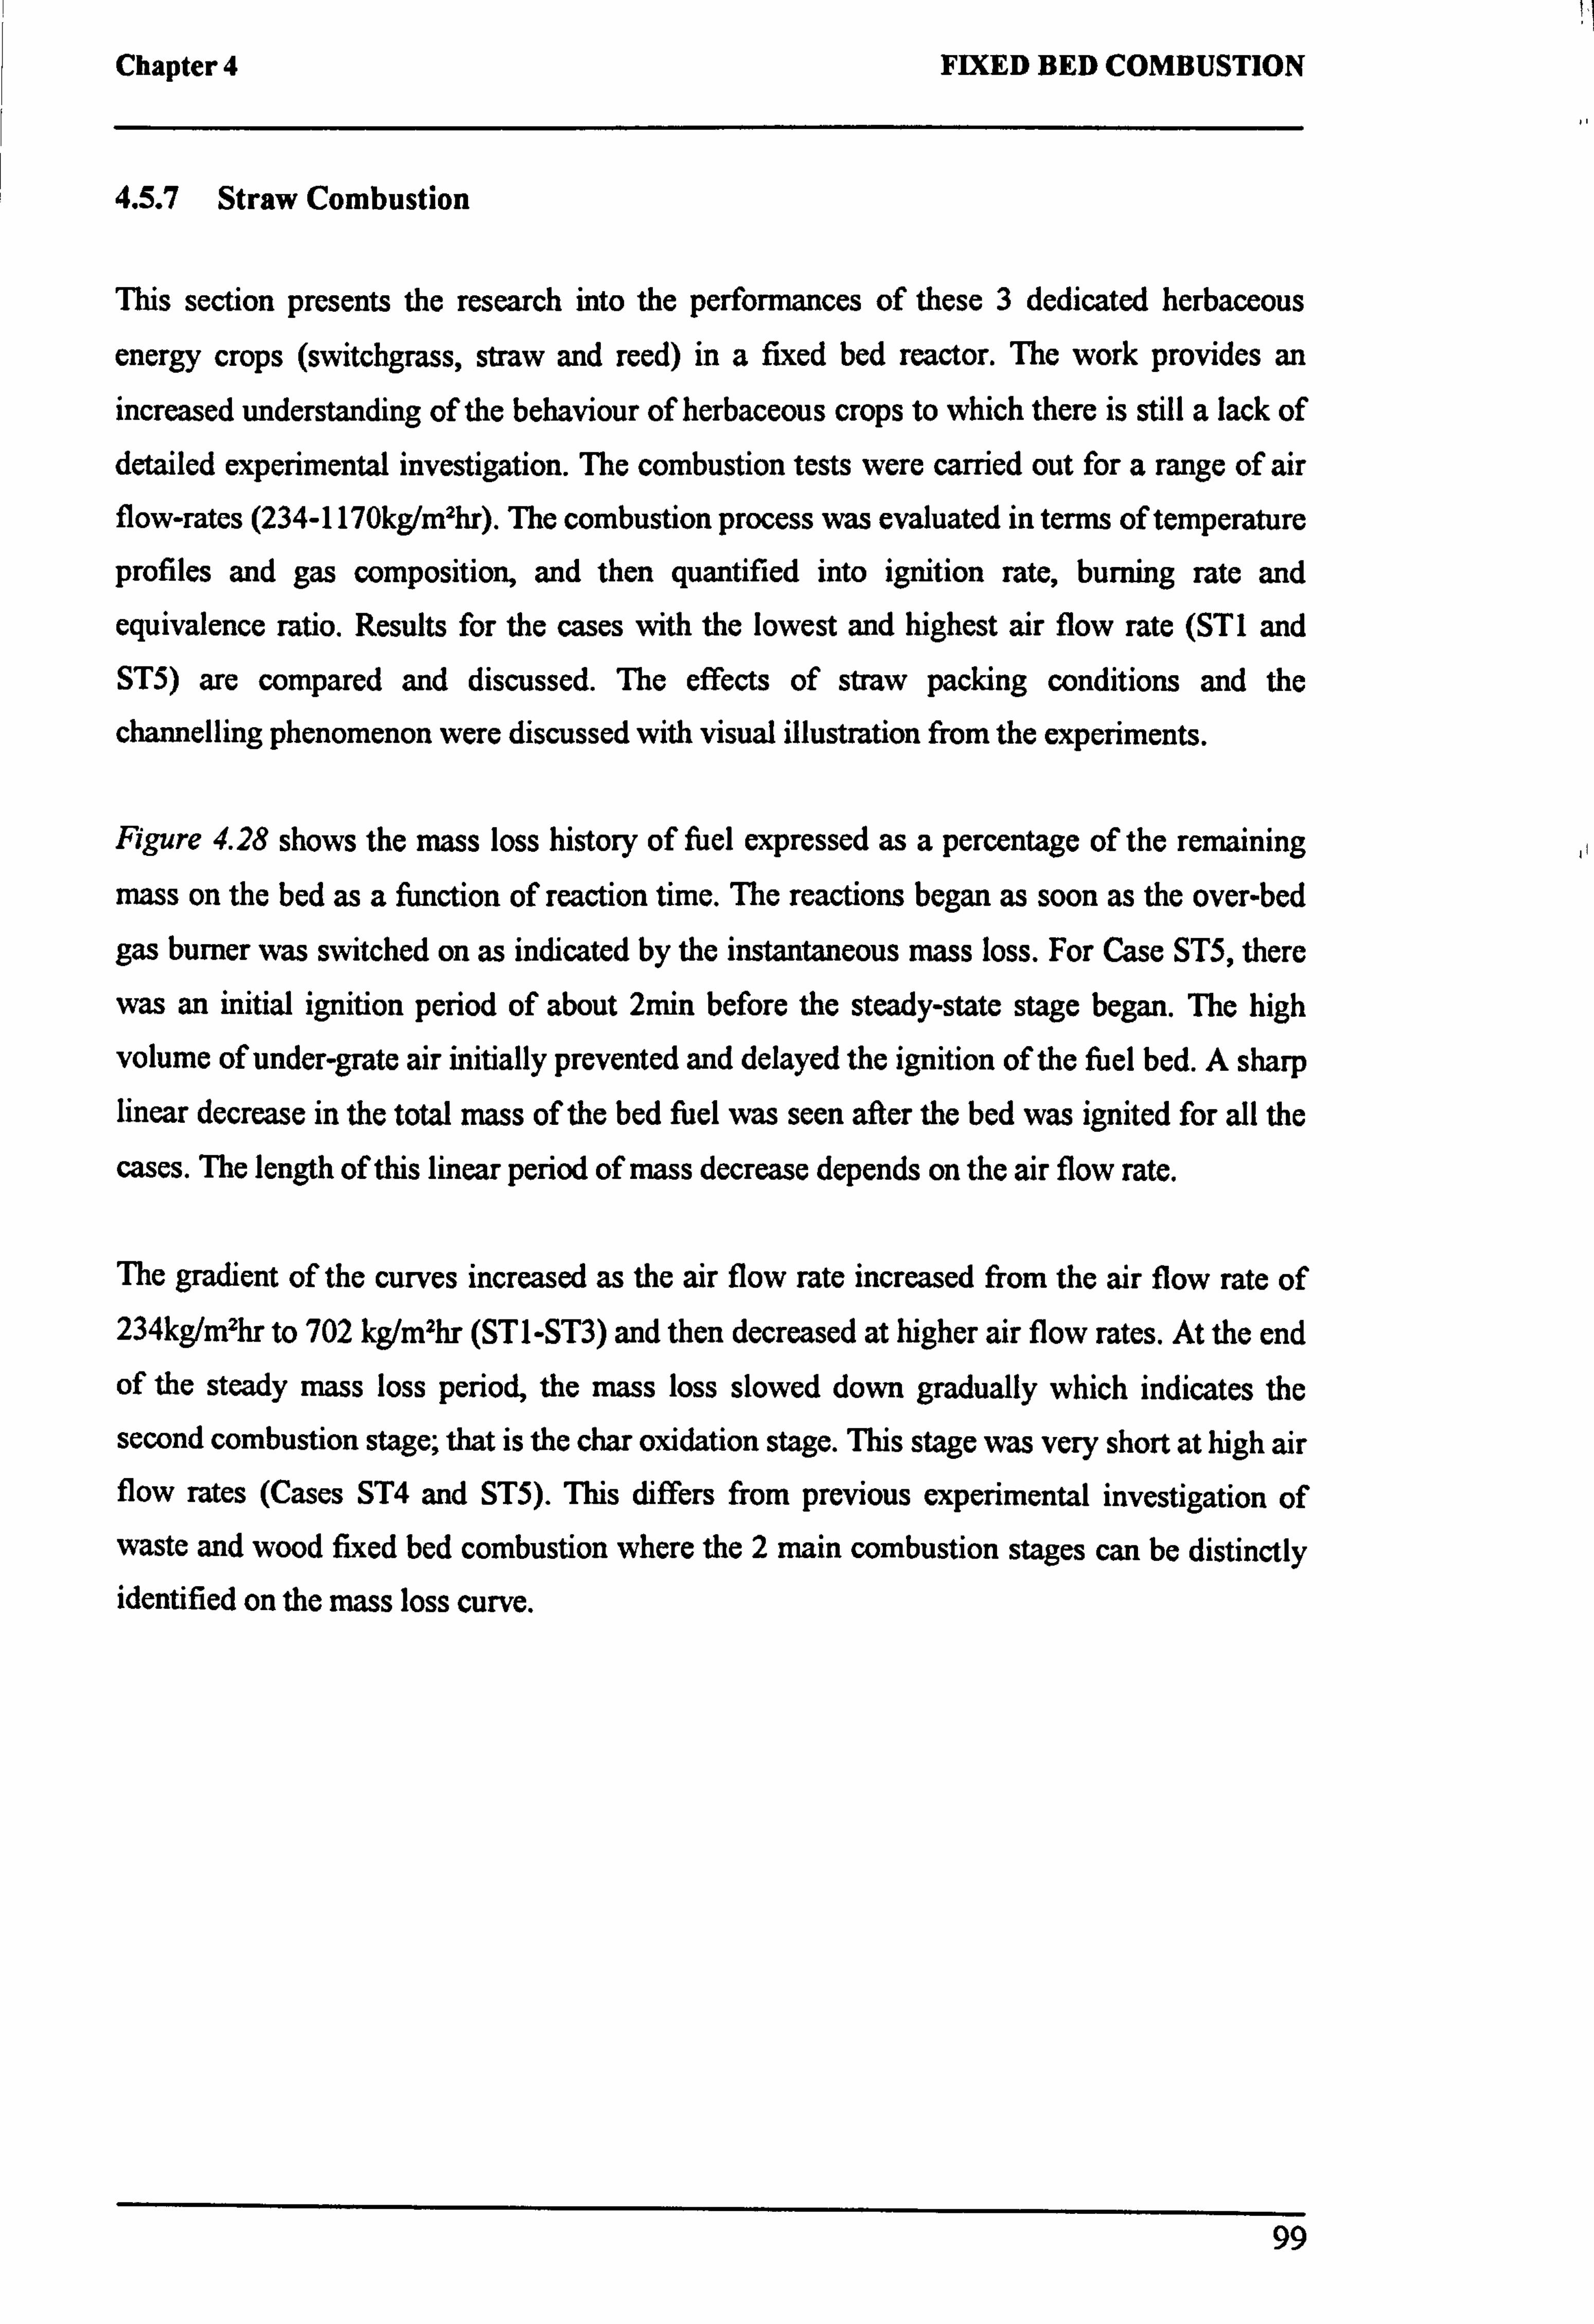
Chapter 4 FIXED BED COMBUSTION
4.5.7 Straw Combustion
This section presents the research into the performances of these 3 dedicated herbaceous
energy crops (switchgrass, straw and reed) in a fixed bed reactor. The work provides an
increased understanding of the behaviour of herbaceous crops to which there is still a lack of
detailed experimental investigation. The combustion tests were carried out for a range of air flow-rates (234-1170kg/mzhr). The combustion process was evaluated in terms of temperature
profiles and gas composition, and then quantified into ignition rate, burning rate and
equivalence ratio. Results for the cases with the lowest and highest air flow rate (ST1 and ST5) are compared and discussed. The effects of straw packing conditions and the
channelling phenomenon were discussed with visual illustration from the experiments.
Figure 4.28 shows the mass loss history of fuel expressed as a percentage of the remaining
mass on the bed as a function of reaction time. The reactions began as soon as the over-bed
gas burner was switched on as indicated by the instantaneous mass loss. For Case ST5, there
was an initial ignition period of about 2min before the steady-state stage began. The high
volume of under-grate air initially prevented and delayed the ignition of the fuel bed. A sharp linear decrease in the total mass of the bed fuel was seen after the bed was ignited for all the
cases. The length of this linear period of mass decrease depends on the air flow rate.
The gradient of the curves increased as the air flow rate increased from the air flow rate of 234kg/mzhr to 702 kg/m2hr (ST1-ST3) and then decreased at higher air flow rates. At the end
of the steady mass loss period, the mass loss slowed down gradually which indicates the
second combustion stage; that is the char oxidation stage. This stage was very short at high air flow rates (Cases ST4 and ST5). This differs from previous experimental investigation of waste and wood fixed bed combustion where the 2 main combustion stages can be distinctly identified on the mass loss curve.
99
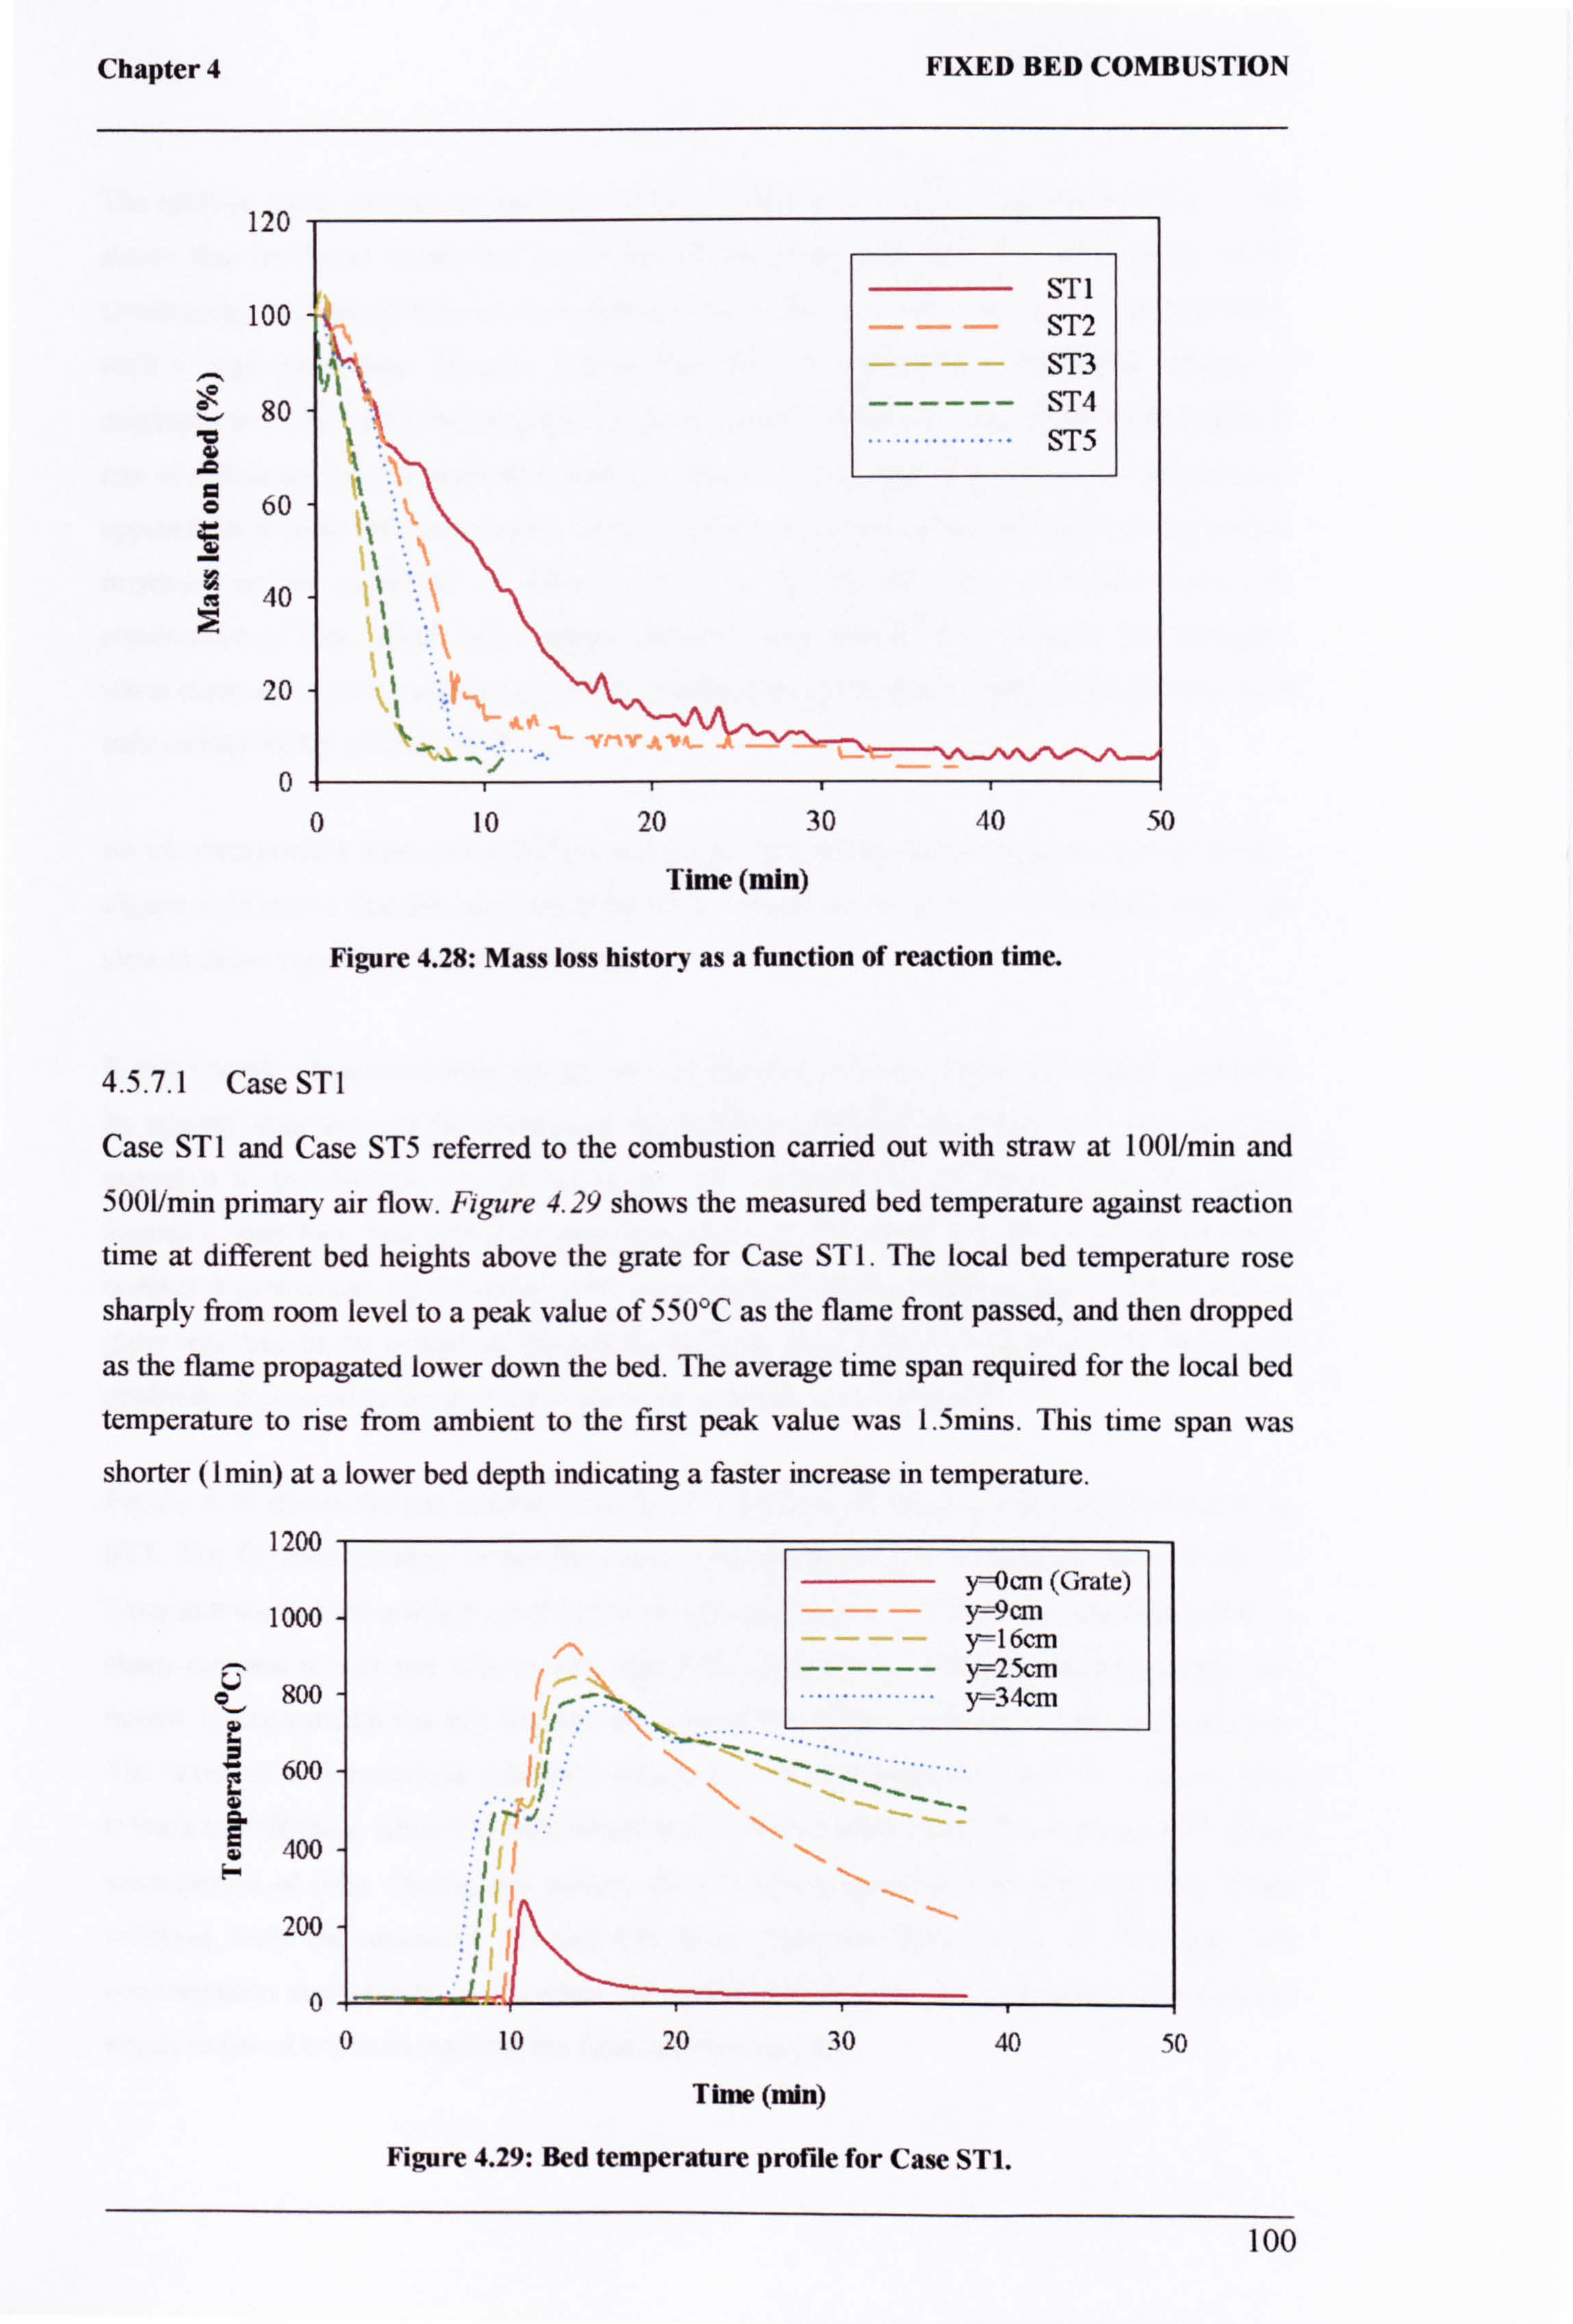
Chapter 4
120
100
FIXED BED COMBUSTION
80
ö 60 w as ß
40
20
0
S t. t1 1 '. 1 ý ý: l
,, i ýý. ý. ., ý ý, 1
1.
f'
lýý.
ST1 ST2 ST3
------ ST4 ST5
0 10 20 30 40 50
Time (min)
Figure 4.28: Mass loss history as a function of reaction time.
4.5.7.1 Case ST I
Case ST1 and Case ST5 referred to the combustion carried out with straw at 1001/min and
5001/min primary air flow. Figure 4.2 shows the measured bed temperature against reaction
time at different bed heights above the grate for Case ST 1. The local bed temperature rose
sharply from room level to a peak value of 550°C as the flame front passed, and then dropped
as the flame propagated lower down the bed. The average time span required for the local bed
temperature to rise from ambient to the first peak value was 1.5mins. This time span was
shorter (I min) at a lower bed depth indicating a faster increase in temperature.
1200
1000 y Ocm (Grate) Y--9cm y-16cm
------ y--25cm ............... y-34cm
r rý
ö 800
600 as
400 N
200
0 0 10 20 30 40 50
Time (min)
Figure 4.29: Bed temperature profile for Case STI.
100
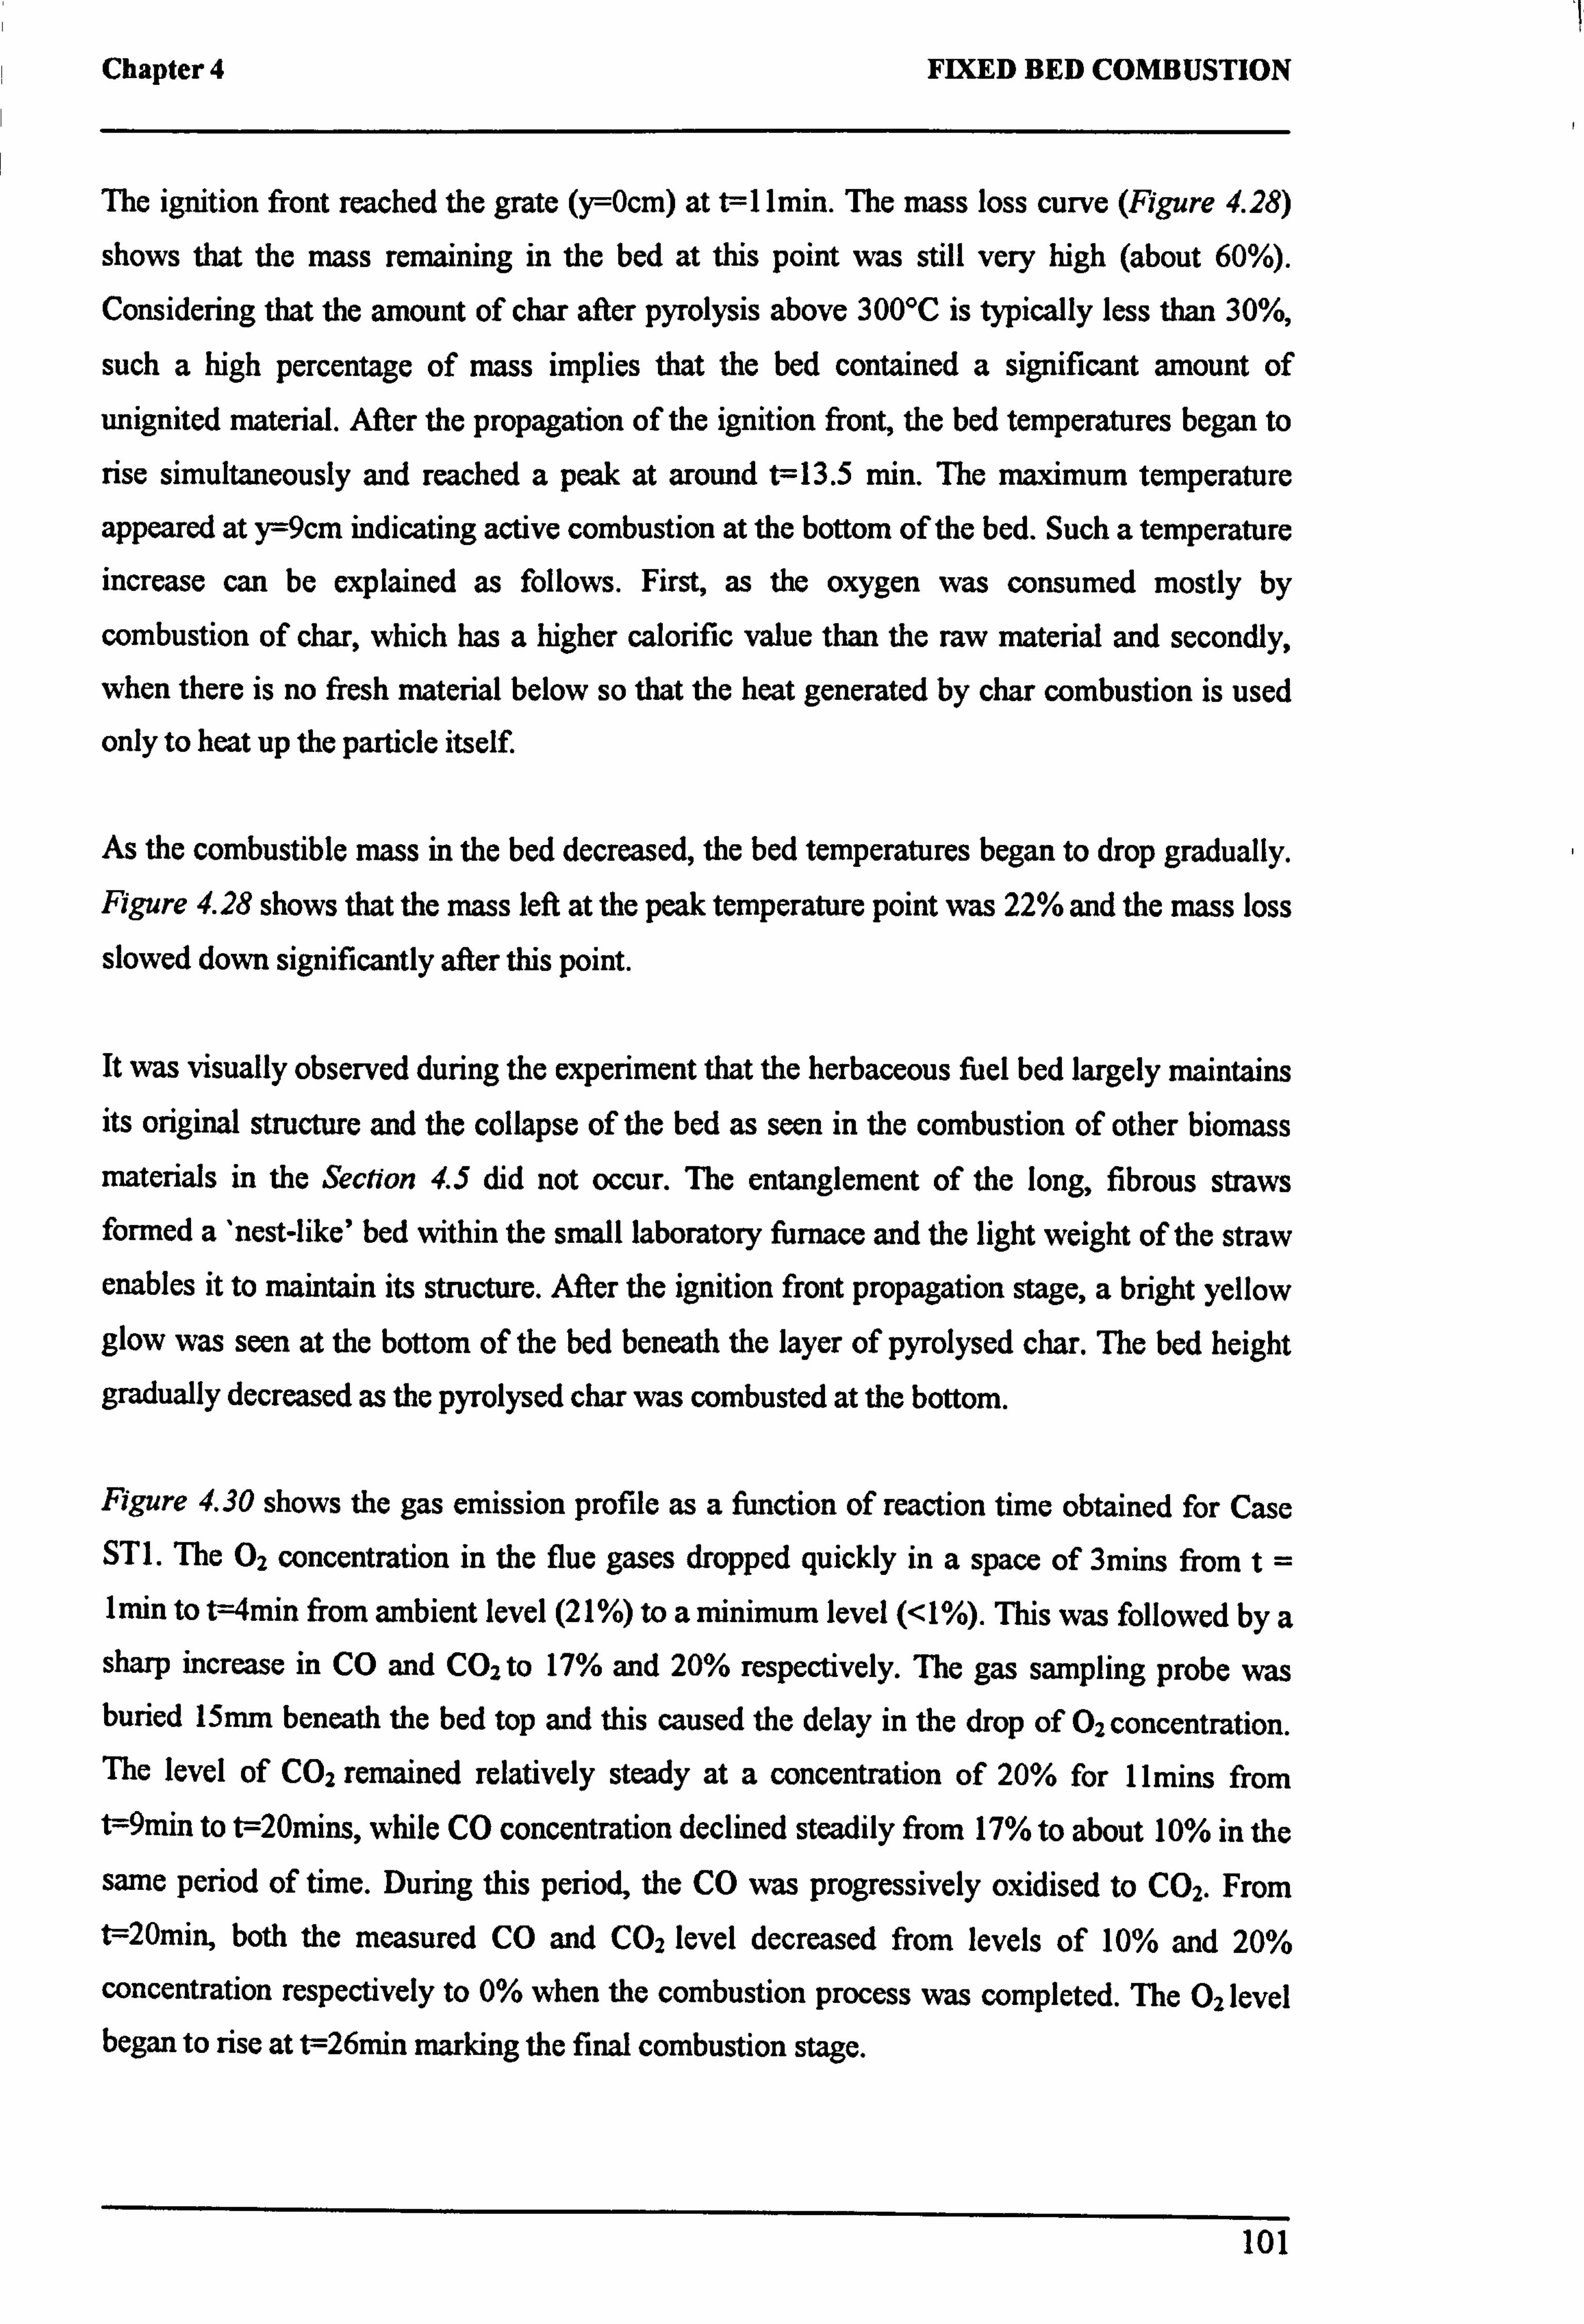
Chapter 4 FIXED BED COMBUSTION
The ignition front reached the grate (y=Ocm) at t=11min. The mass loss curve (Figure 4.28)
shows that the mass remaining in the bed at this point was still very high (about 60%).
Considering that the amount of char after pyrolysis above 300°C is typically less than 30%,
such a high percentage of mass implies that the bed contained a significant amount of
unignited material. After the propagation of the ignition front, the bed temperatures began to
rise simultaneously and reached a peak at around t=13.5 min. The maximum temperature
appeared at y=9cm indicating active combustion at the bottom of the bed. Such a temperature increase can be explained as follows. First, as the oxygen was consumed mostly by
combustion of char, which has a higher calorific value than the raw material and secondly,
when there is no fresh material below so that the heat generated by char combustion is used only to heat up the particle itself.
As the combustible mass in the bed decreased, the bed temperatures began to drop gradually. Figure 4.28 shows that the mass left at the peak temperature point was 22% and the mass loss
slowed down significantly after this point.
It was visually observed during the experiment that the herbaceous fuel bed largely maintains its original structure and the collapse of the bed as seen in the combustion of other biomass
materials in the Section 4.5 did not occur. The entanglement of the long, fibrous straws formed a 'nest-like' bed within the small laboratory furnace and the light weight of the straw enables it to maintain its structure. After the ignition front propagation stage, a bright yellow glow was seen at the bottom of the bed beneath the layer of pyrolysed char. The bed height
gradually decreased as the pyrolysed char was combusted at the bottom.
Figure 4.30 shows the gas emission profile as a function of reaction time obtained for Case ST1. The 02 concentration in the flue gases dropped quickly in a space of 3mins from t= lmin to t=4min from ambient level (21%) to a minimum level (<1%). This was followed by a sharp increase in CO and CO2 to 17% and 20% respectively. The gas sampling probe was buried 15mm beneath the bed top and this caused the delay in the drop of 02 concentration. The level of CO2 remained relatively steady at a concentration of 20% for 1lmins from t=9min to t=20mins, while CO concentration declined steadily from 17% to about 10% in the
same period of time. During this period, the CO was progressively oxidised to CO2. From
t=20min, both the measured CO and CO2 level decreased from levels of 10% and 20% concentration respectively to 0% when the combustion process was completed. The 02level began to rise at t=26min marking the final combustion stage.
101
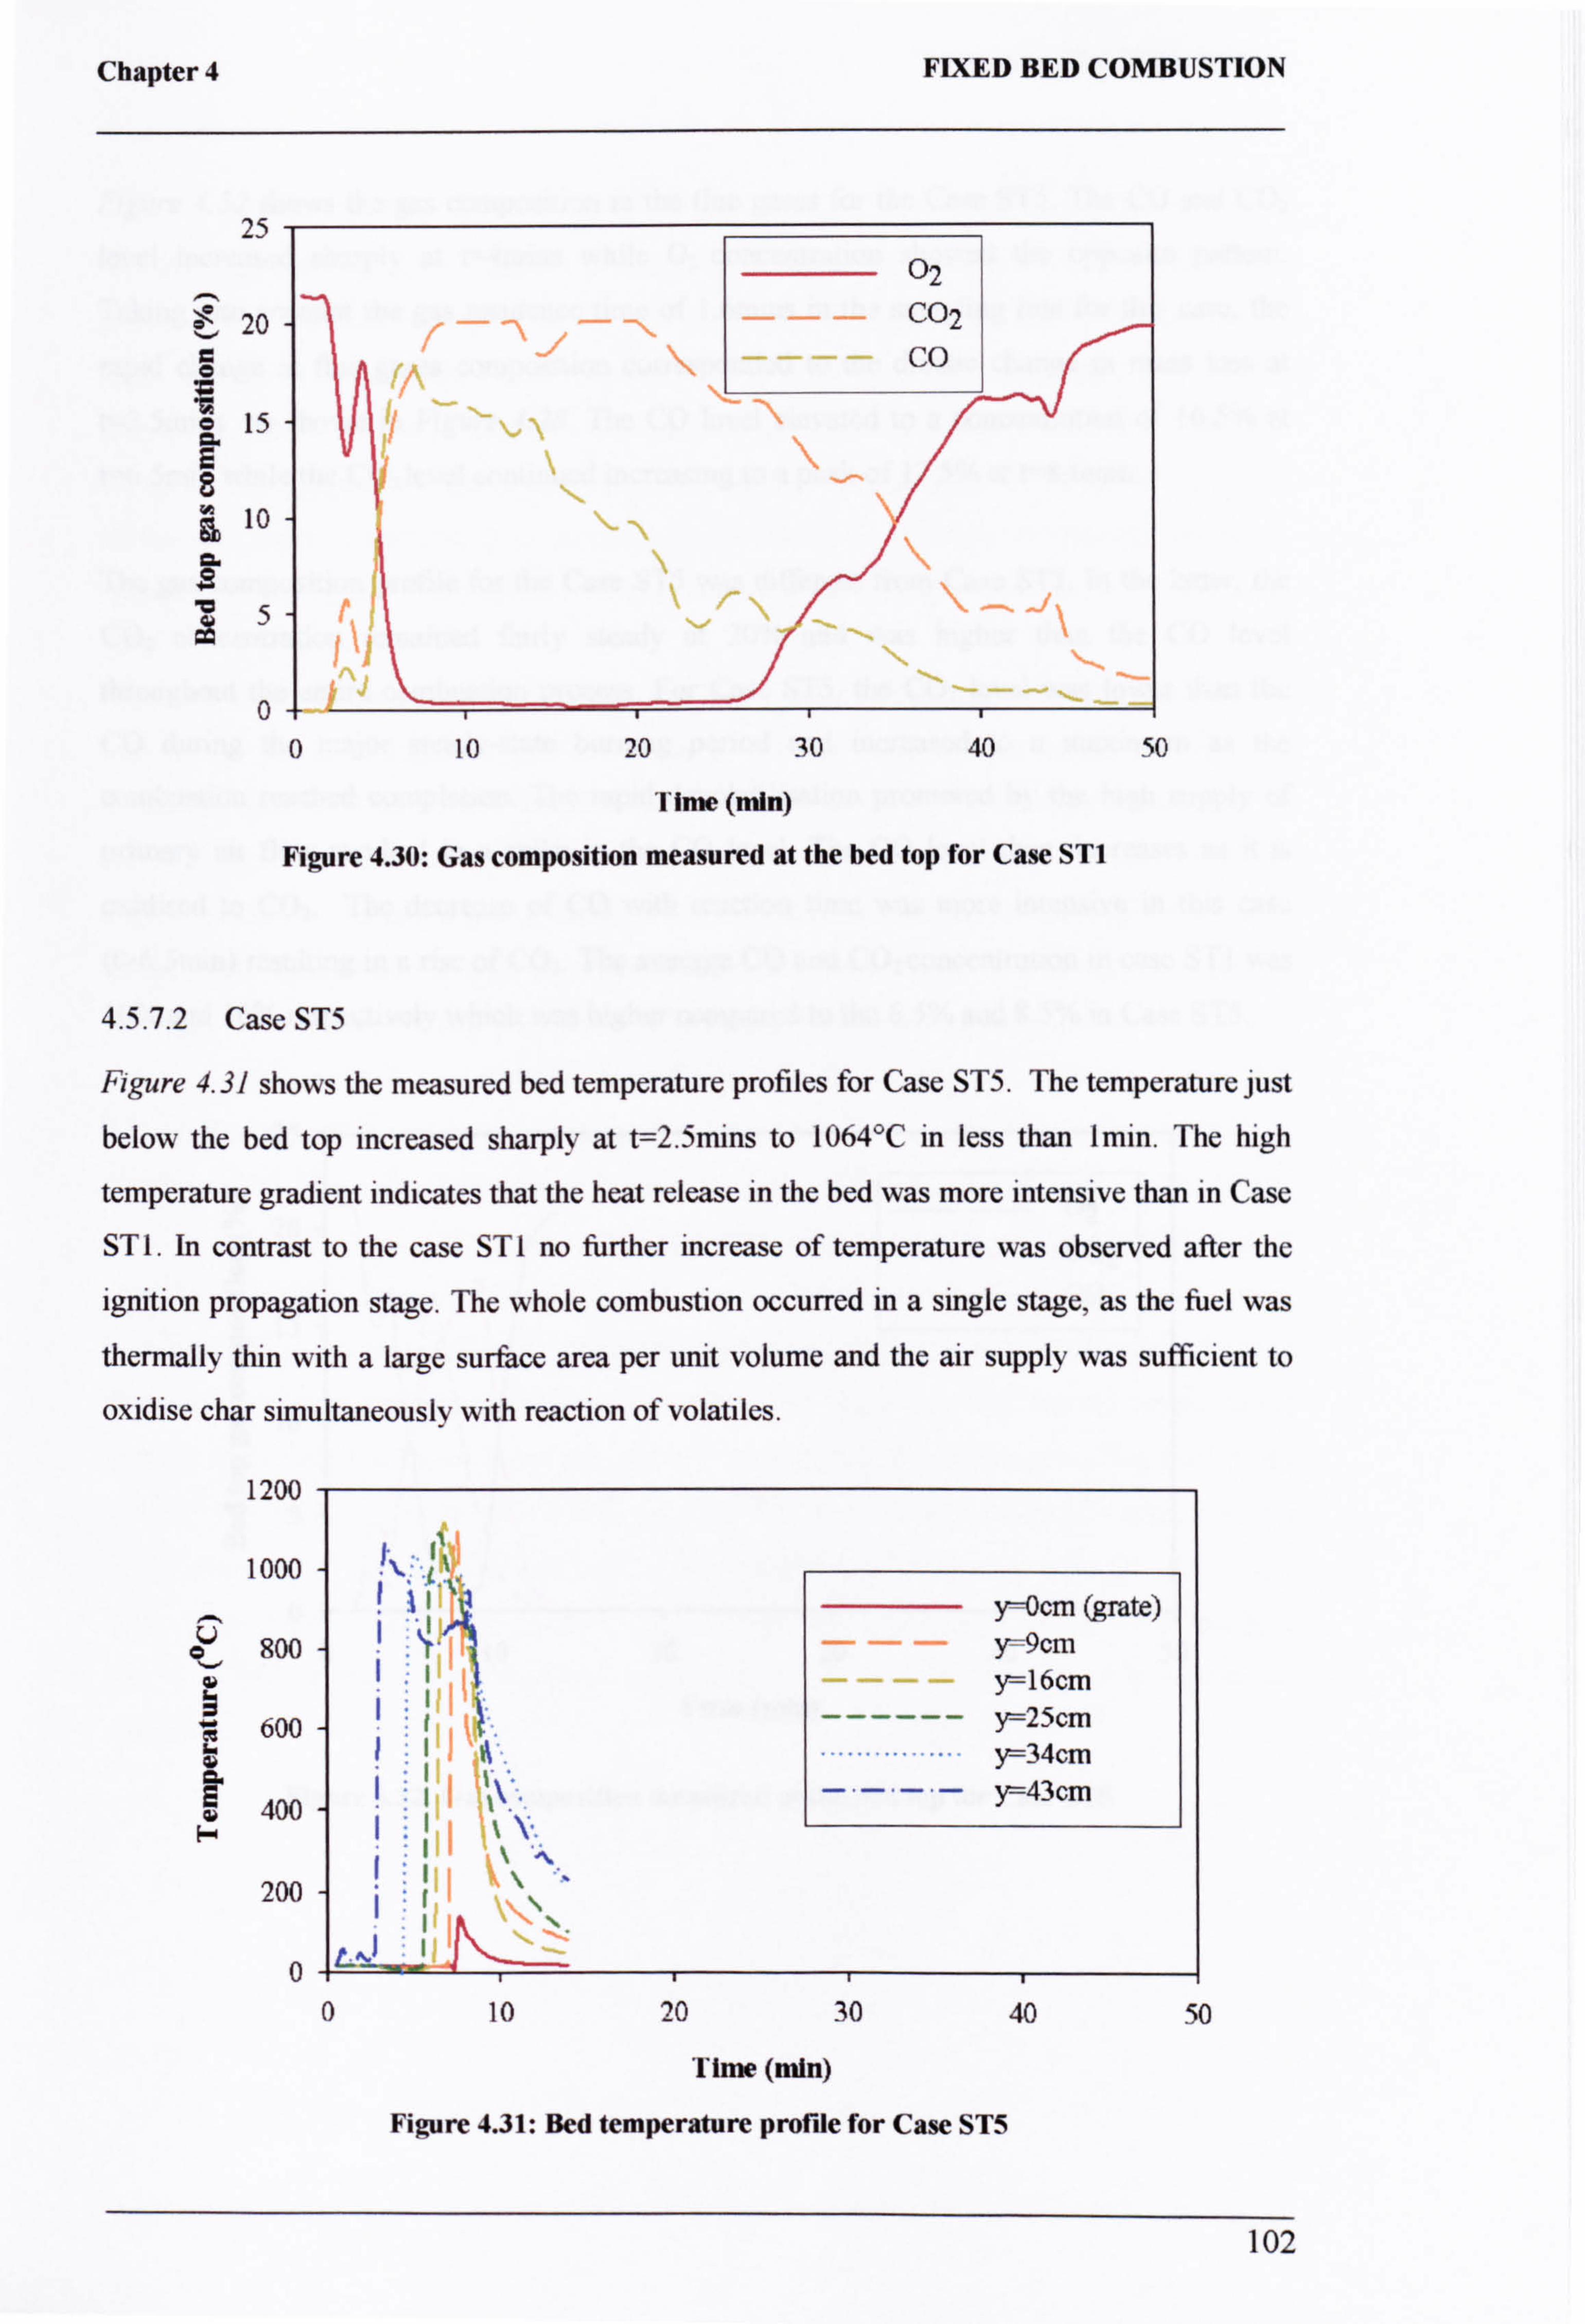
Chapter 4 FIXED BED COMBUSTION
25
20
ä 15
8 10
C6
5 aö
0
02
1ý ýl
0 10 20 30 40 50
Time (min)
Figure 4.30: Gas composition measured at the bed top for Case STI
4.5.7.2 Case ST5
Figure 4.31 shows the measured bed temperature profiles for Case ST5. The temperature just
below the bed top increased sharply at t=2.5mins to 1064°C in less than I min. The high
temperature gradient indicates that the heat release in the bed was more intensive than in Case
ST 1. In contrast to the case ST I no further increase of temperature was observed after the
ignition propagation stage. The whole combustion occurred in a single stage, as the fuel was
thermally thin with a large surface area per unit volume and the air supply was sufficient to
oxidise char simultaneously with reaction of volatiles.
IZUU
1000
Ö 800
ß 600 as
400 i-
200
0 0 10 20 30 40 50
Time (min)
Figure 4.31: Bed temperature profile for Case STS
102
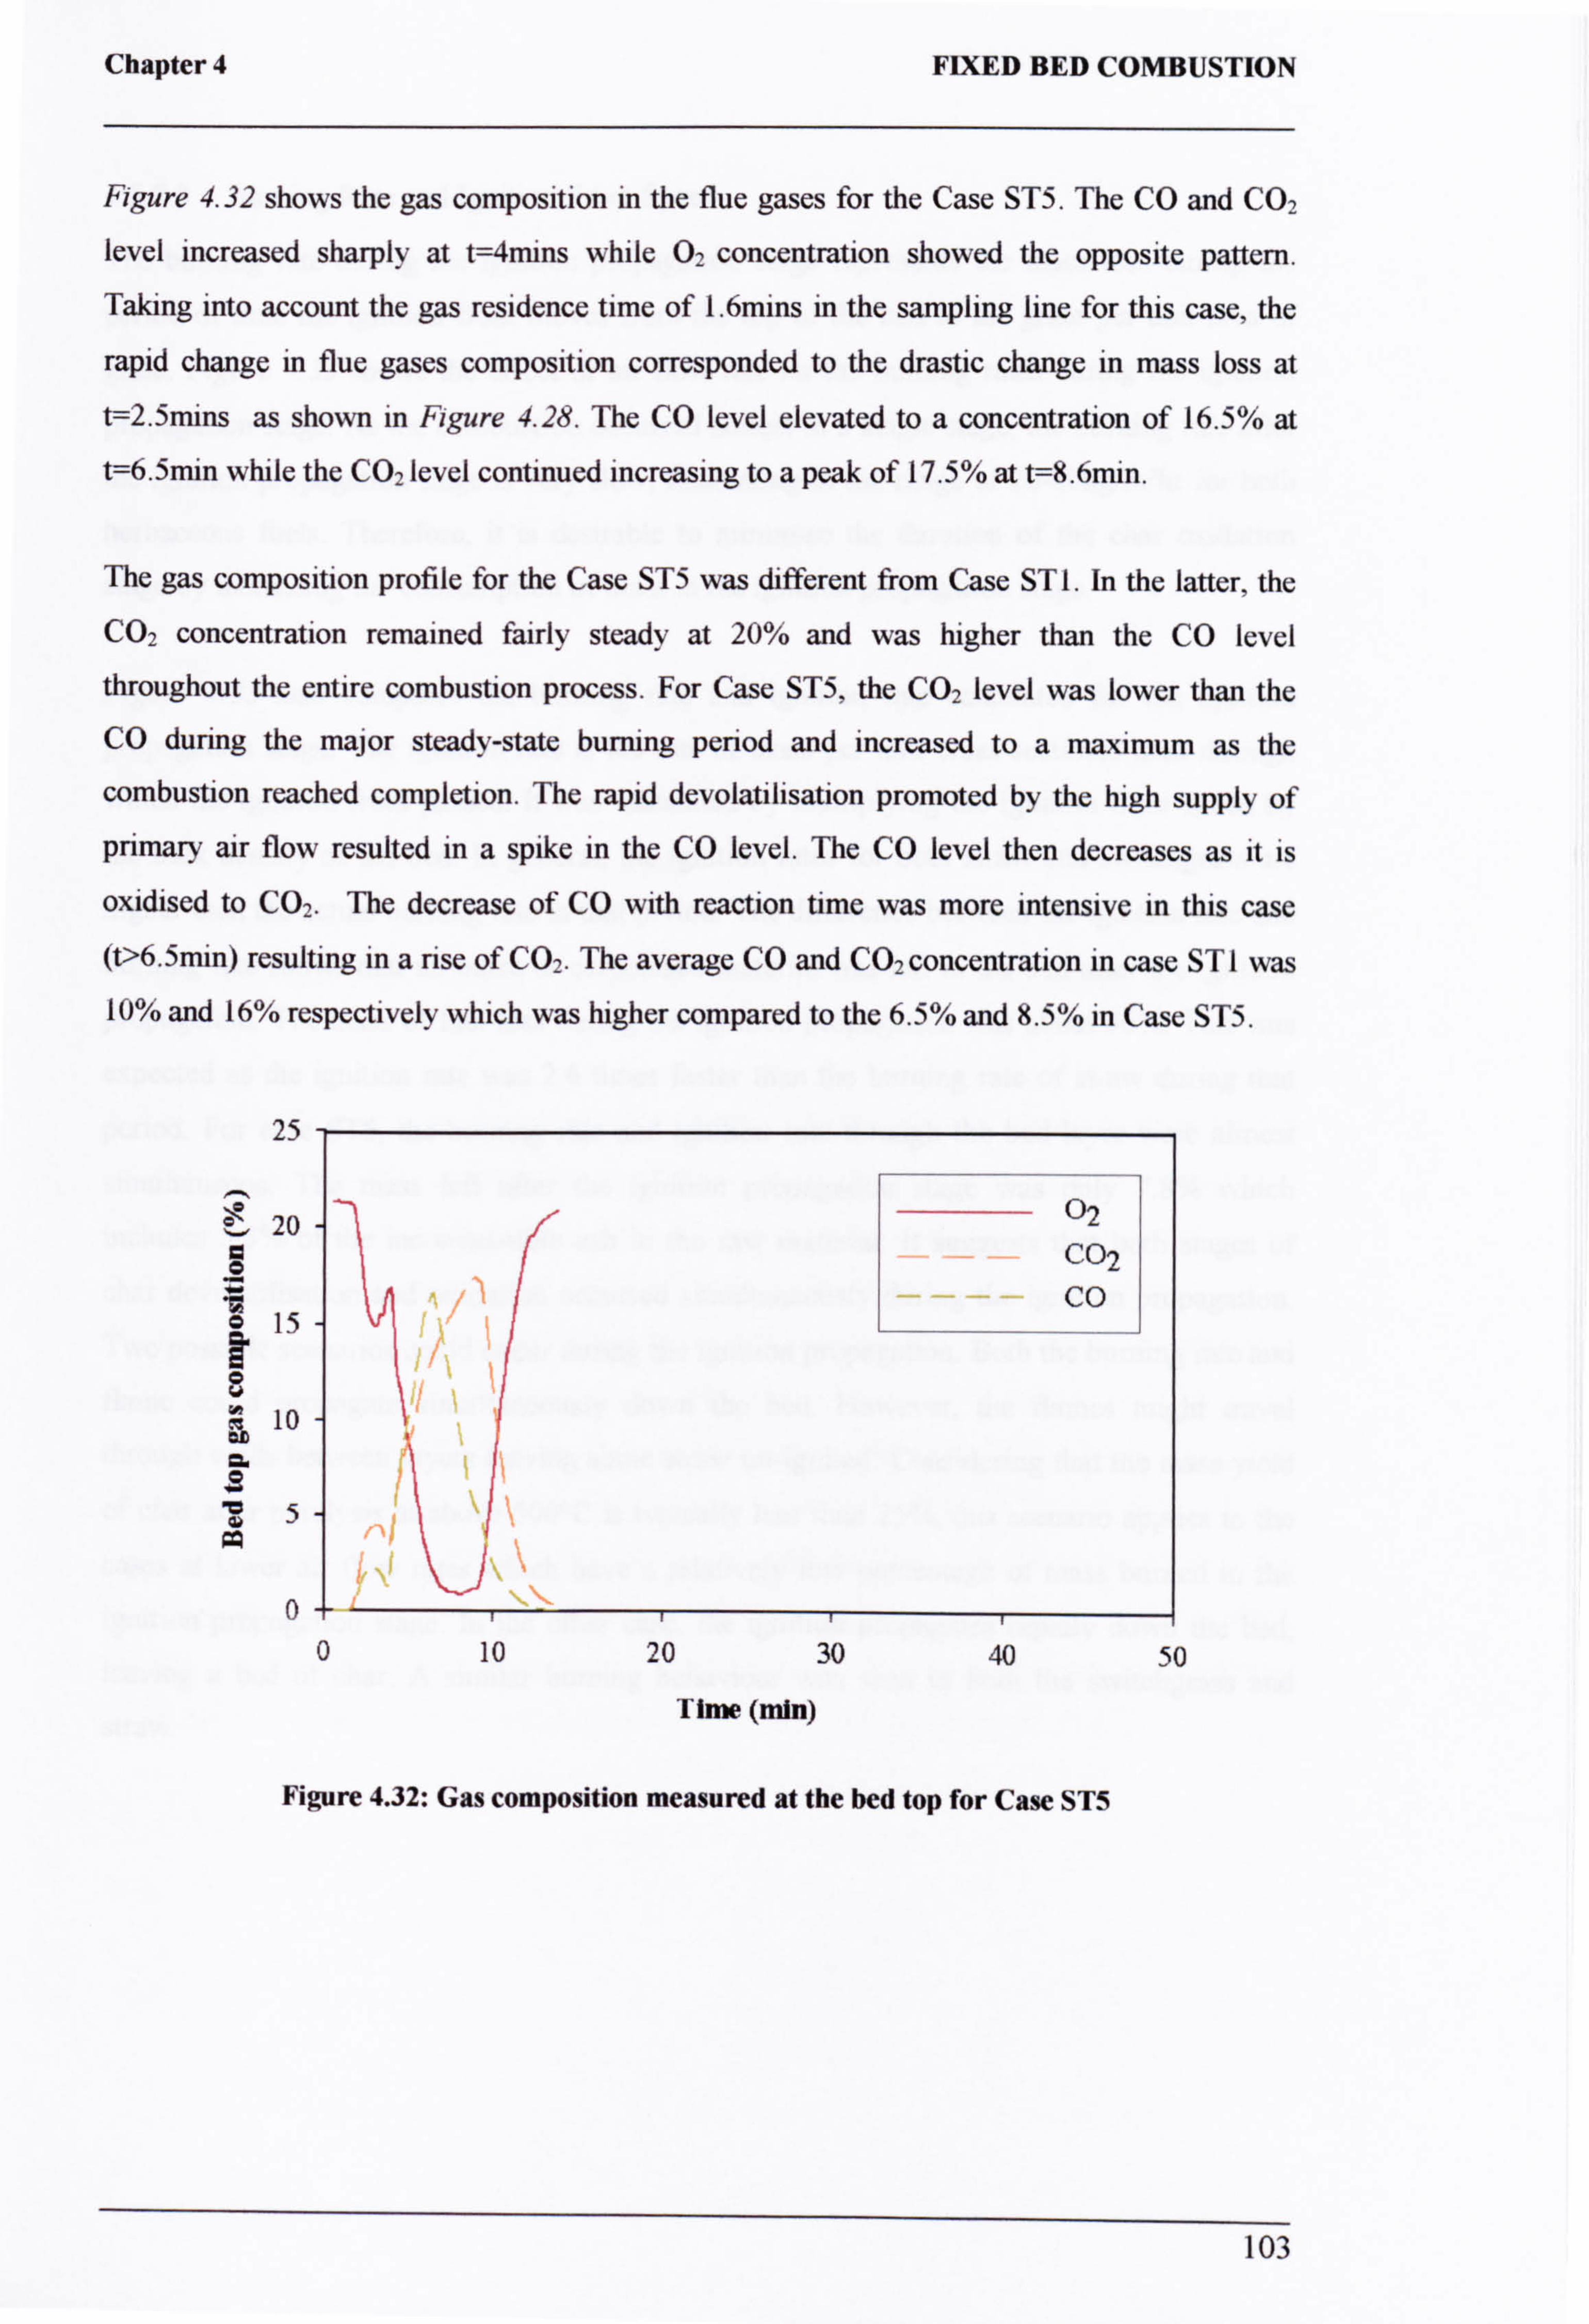
Chapter 4 FIXED BED COMBUSTION
Figure 4.32 shows the gas composition in the flue gases for the Case ST5. The CO and CO2
level increased sharply at t=4mins while 02 concentration showed the opposite pattern. Taking into account the gas residence time of 1.6mins in the sampling line for this case, the
rapid change in flue gases composition corresponded to the drastic change in mass loss at
t=2.5mins as shown in Figure 4.28. The CO level elevated to a concentration of 16.5% at
t=6.5min while the CO2 level continued increasing to a peak of 17.5% at t=8.6min.
The gas composition profile for the Case ST5 was different from Case ST 1. In the latter, the CO2 concentration remained fairly steady at 20% and was higher than the CO level
throughout the entire combustion process. For Case ST5, the CO2 level was lower than the CO during the major steady-state burning period and increased to a maximum as the
combustion reached completion. The rapid devolatilisation promoted by the high supply of
primary air flow resulted in a spike in the CO level. The CO level then decreases as it is
oxidised to CO2. The decrease of CO with reaction time was more intensive in this case (t>6.5min) resulting in a rise of CO2. The average CO and CO2 concentration in case ST I was 10% and 16% respectively which was higher compared to the 6.5% and 8.5% in Case ST5.
25
20
15 90
10
o. S
5
02 C02
Co
0+ 0 10 20 30 40 50
Time (min)
Figure 4.32: Gas composition measured at the bed top for Case ST5
1
103
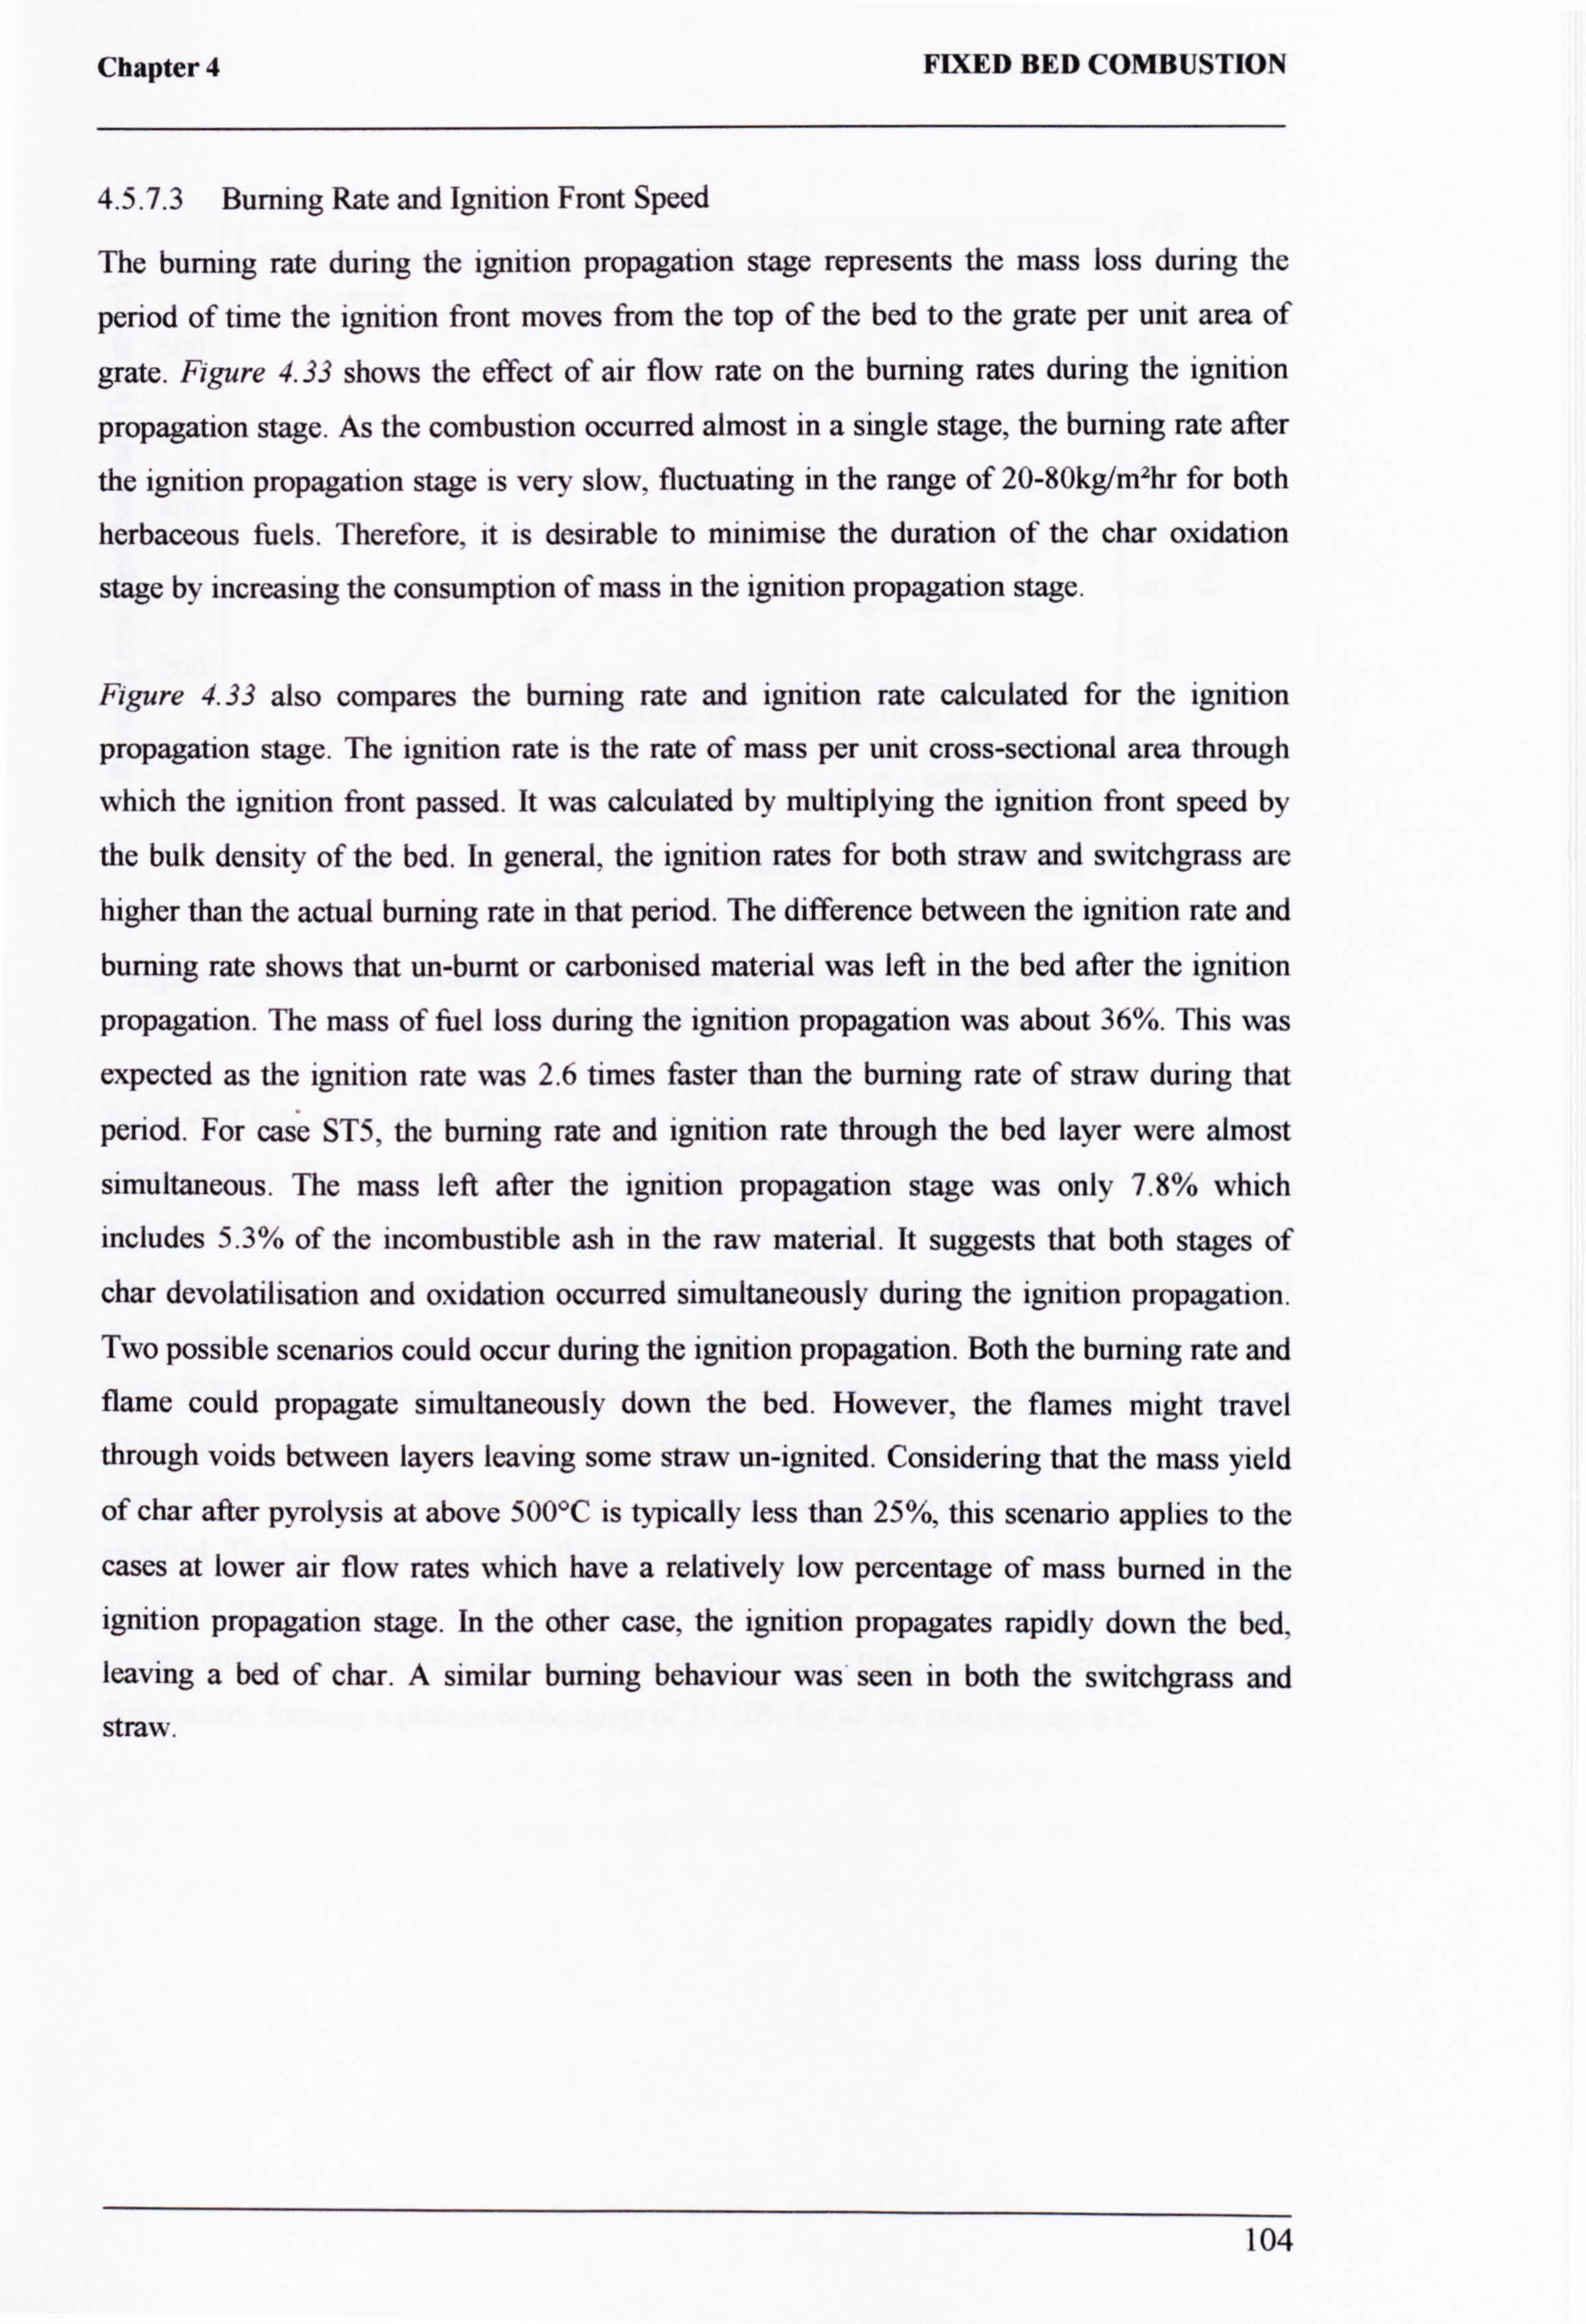
Chapter 4 FIXED BED COMBUSTION
4.5.7.3 Burning Rate and Ignition Front Speed
The burning rate during the ignition propagation stage represents the mass loss during the
period of time the ignition front moves from the top of the bed to the grate per unit area of
grate. Figure 4.33 shows the effect of air flow rate on the burning rates during the ignition
propagation stage. As the combustion occurred almost in a single stage, the burning rate after
the ignition propagation stage is very slow, fluctuating in the range of 20-80kg/m2hr for both
herbaceous fuels. Therefore, it is desirable to minimise the duration of the char oxidation
stage by increasing the consumption of mass in the ignition propagation stage.
Figure 4.33 also compares the burning rate and ignition rate calculated for the ignition
propagation stage. The ignition rate is the rate of mass per unit cross-sectional area through
which the ignition front passed. It was calculated by multiplying the ignition front speed by
the bulk density of the bed. In general, the ignition rates for both straw and switchgrass are
higher than the actual burning rate in that period. The difference between the ignition rate and
burning rate shows that un-burnt or carbonised material was left in the bed after the ignition
propagation. The mass of fuel loss during the ignition propagation was about 36%. This was
expected as the ignition rate was 2.6 times faster than the burning rate of straw during that
period. For case ST5, the burning rate and ignition rate through the bed layer were almost
simultaneous. The mass left after the ignition propagation stage was only 7.8% which includes 5.3% of the incombustible ash in the raw material. It suggests that both stages of
char devolatilisation and oxidation occurred simultaneously during the ignition propagation. Two possible scenarios could occur during the ignition propagation. Both the burning rate and flame could propagate simultaneously down the bed. However, the flames might travel
through voids between layers leaving some straw un-ignited. Considering that the mass yield
of char after pyrolysis at above 500°C is typically less than 25%, this scenario applies to the
cases at lower air flow rates which have a relatively low percentage of mass burned in the ignition propagation stage. In the other case, the ignition propagates rapidly down the bed,
leaving a bed of char. A similar burning behaviour was seen in both the switchgrass and
straw.
104
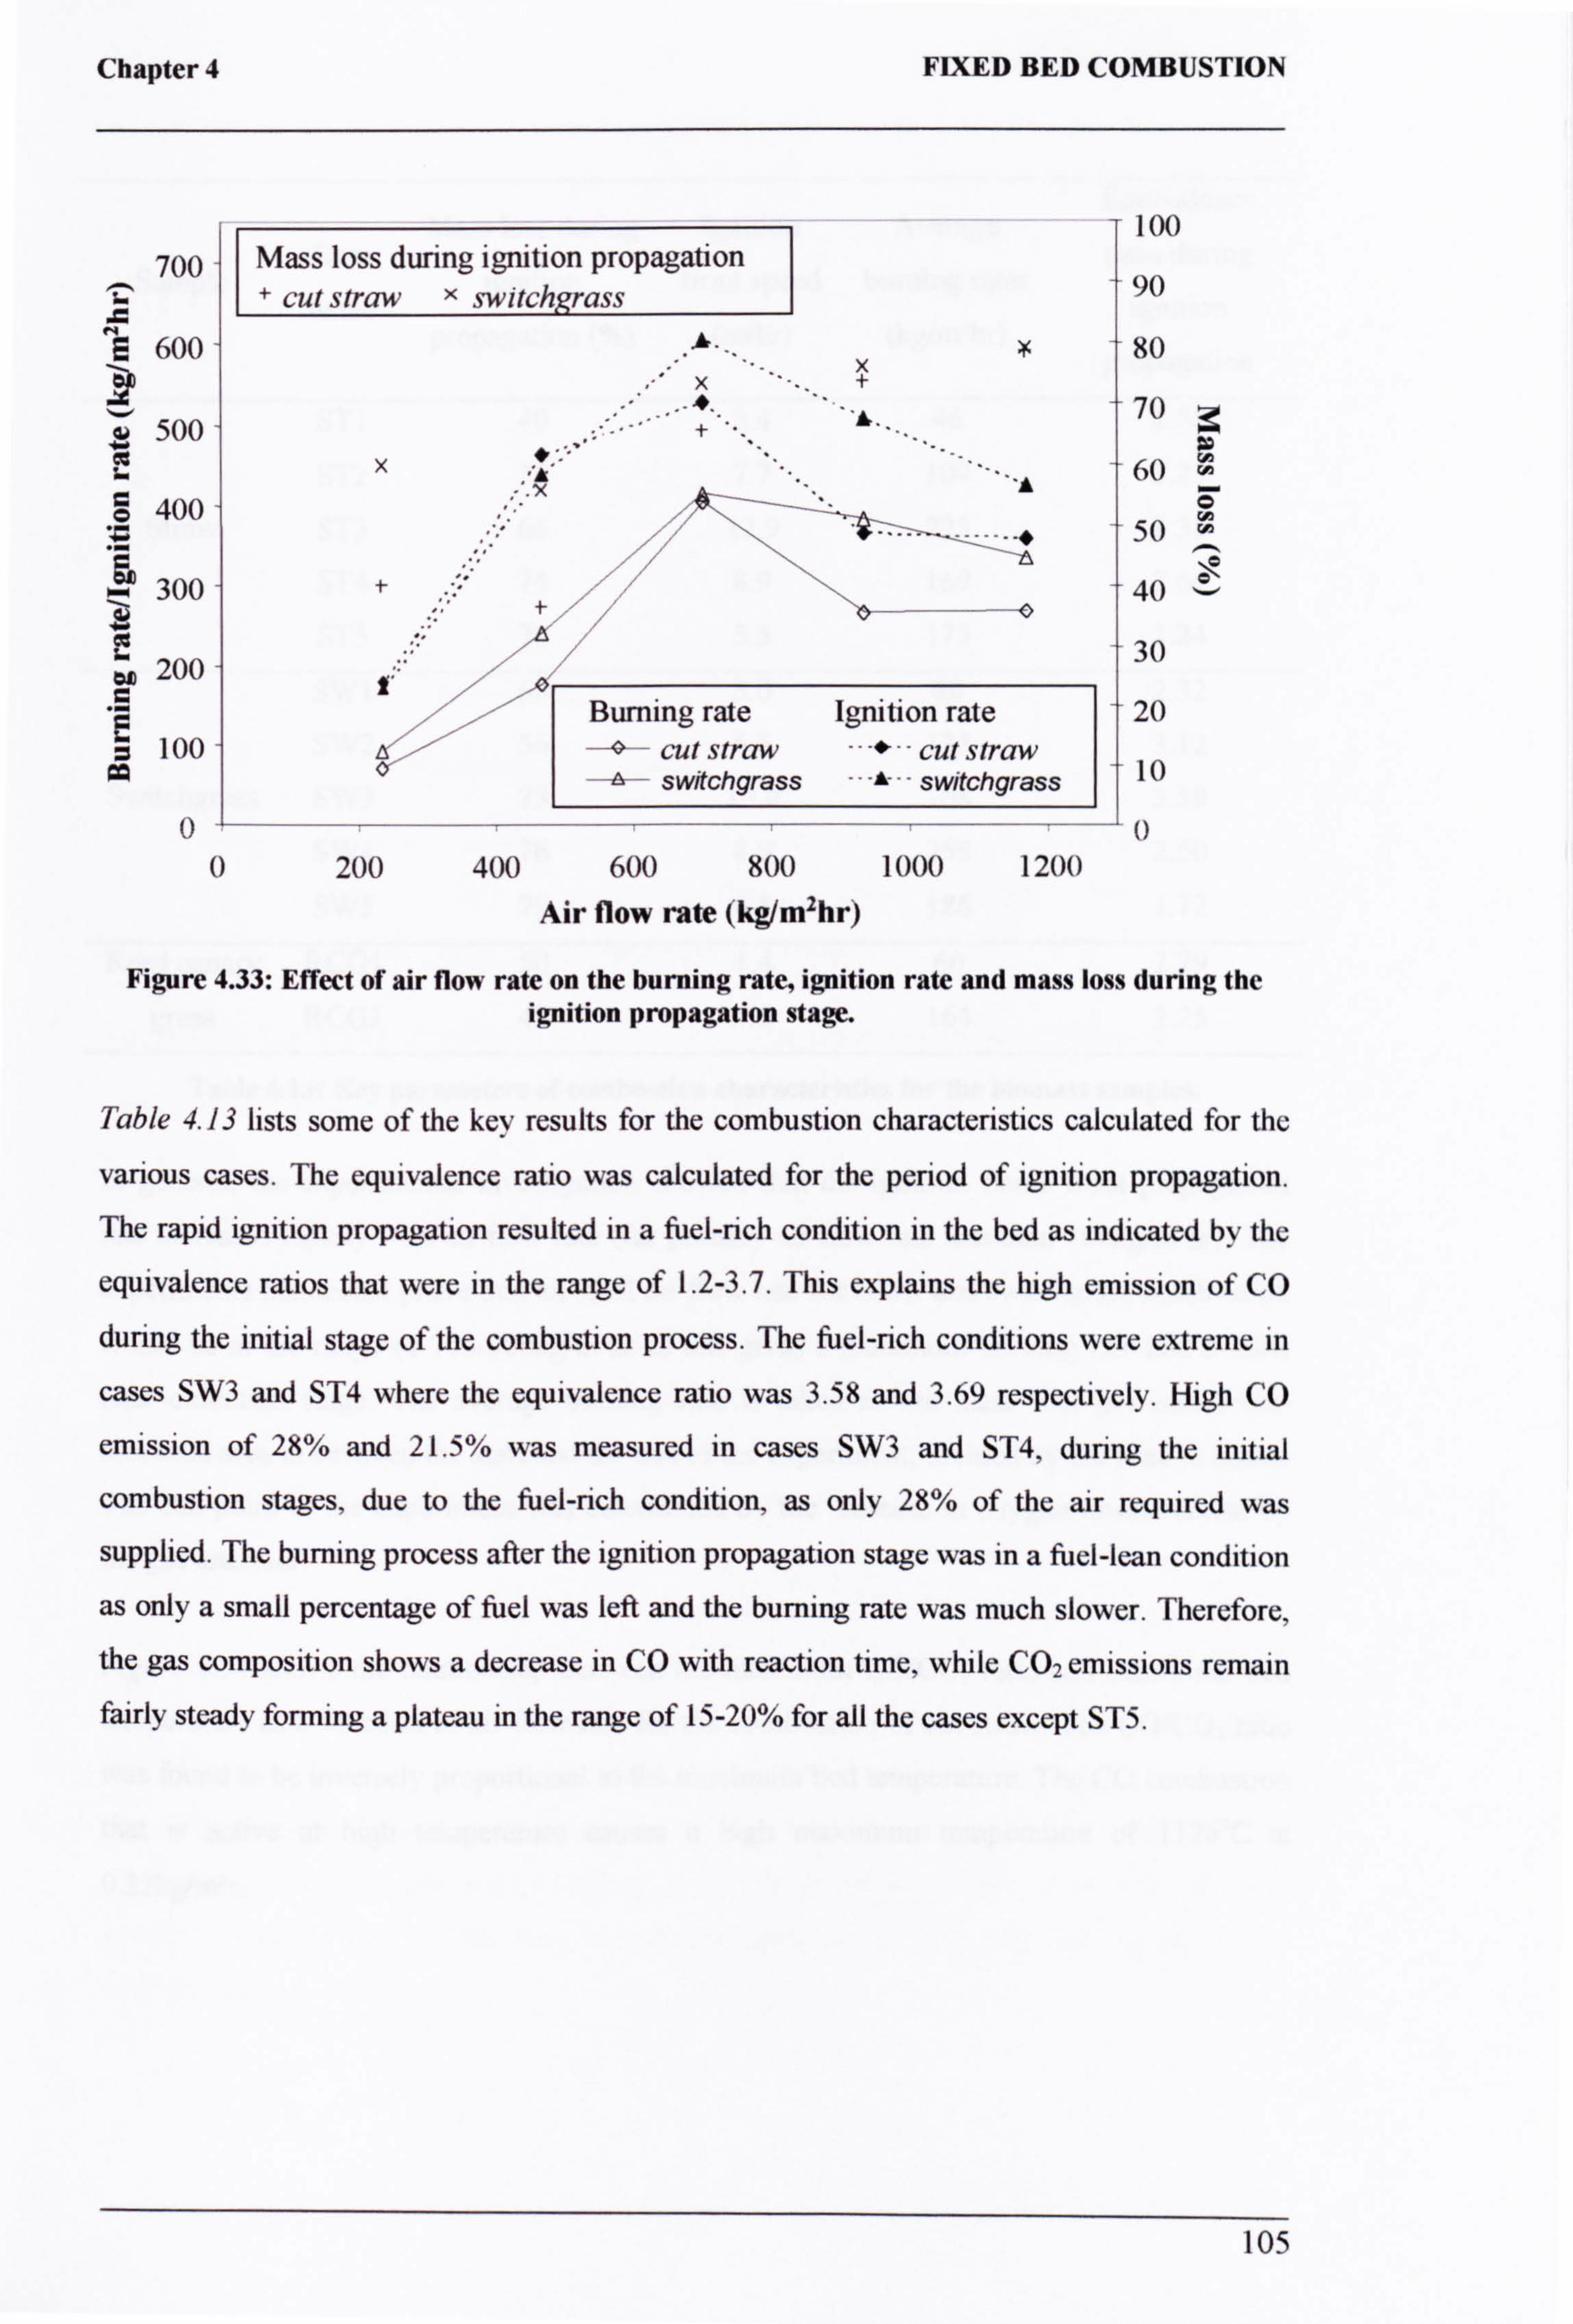
Chapter 4 FIXED BED COMBUSTION
100 700 Mass loss during ignition propagation
+ cut straw x switch grass 90
600 80 '- x
x +
ar 500 + 70
z xt A
60
400 ,. x y 50
300 t-' 40
200 30
Burning rate Ignition rate 20 z 100 -4-- cut straw -- -*-- - cut straw
switch grass - -A- -- switchgrass 10
0 0 0 200 400 600 800 1000 1200
Air flow rate (kgim2hr
Figure 4.33: Effect of air flow rate on the burning rate, ignition rate and mass loss during the ignition propagation stage.
Table 4.13 lists some of the key results for the combustion characteristics calculated for the
various cases. The equivalence ratio was calculated for the period of ignition propagation. The rapid ignition propagation resulted in a fuel-rich condition in the bed as indicated by the
equivalence ratios that were in the range of 1.2-3.7. This explains the high emission of CO
during the initial stage of the combustion process. The fuel-rich conditions were extreme in
cases SW3 and ST4 where the equivalence ratio was 3.58 and 3.69 respectively. High CO
emission of 28% and 21.5% was measured in cases SW3 and ST4, during the initial
combustion stages, due to the fuel-rich condition, as only 28% of the air required was
supplied. The burning process after the ignition propagation stage was in a fuel-lean condition
as only a small percentage of fuel was left and the burning rate was much slower. Therefore,
the gas composition shows a decrease in CO with reaction time, while CO2 emissions remain fairly steady forming a plateau in the range of 15-20% for all the cases except ST5.
105
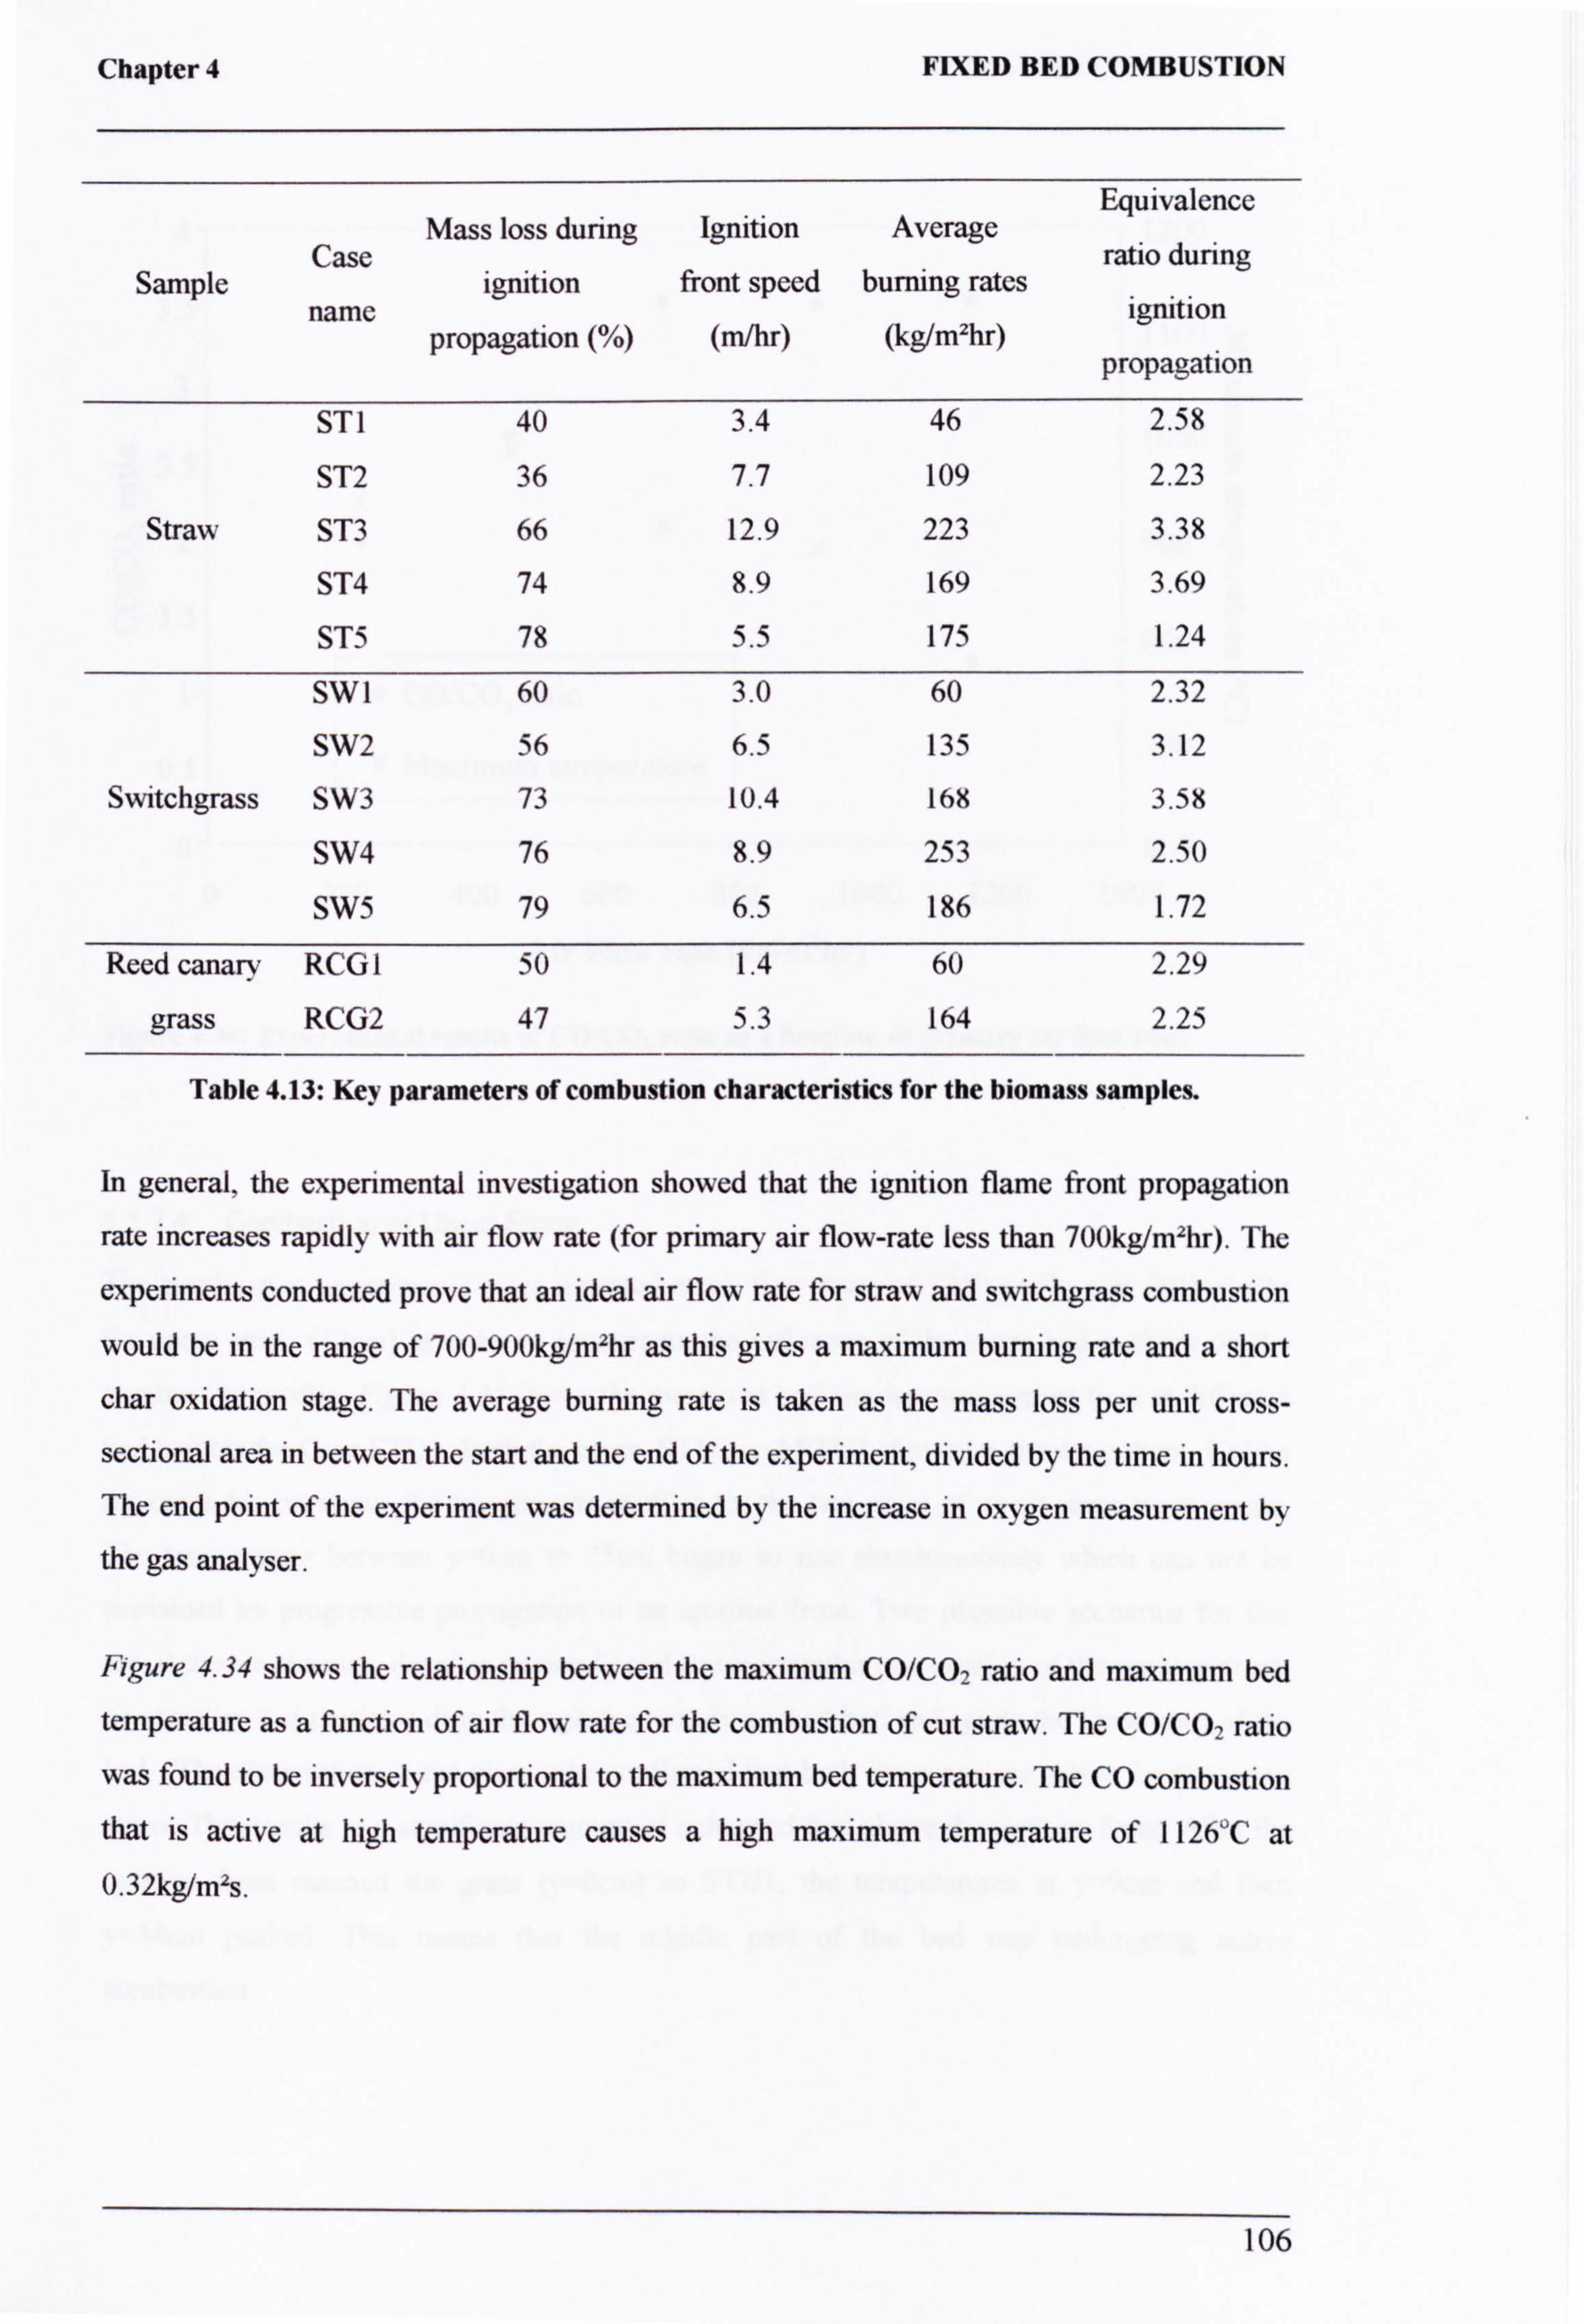
Chapter 4 FIXED BED COMBUSTION
Equivalence Mass loss during Ignition Average
Case ratio during Sample ignition front speed burning rates
name ignition propagation (%) (m/hr) (kg/mzhr)
propagation
ST1 40 3.4 46 2.58
ST2 36 7.7 109 2.23
Straw ST3 66 12.9 223 3.38
ST4 74 8.9 169 3.69
ST5 78 5.5 175 1.24
SW I 60 3.0 60 2.32
SW2 56 6.5 135 3.12
Switchgrass SW3 73 10.4 168 3.58
SW4 76 8.9 253 2.50
SW5 79 6.5 186 1.72
Reed canary RCGI 50 1.4 60 2.29
grass RCG2 47 5.3 164 2.25
Table 4.13: Key parameters of combustion characteristics for the biomass samples.
In general, the experimental investigation showed that the ignition flame front propagation
rate increases rapidly with air flow rate (for primary air flow-rate less than 700kg/m2hr). The
experiments conducted prove that an ideal air flow rate for straw and switchgrass combustion
would be in the range of 700-900kg/m2hr as this gives a maximum burning rate and a short
char oxidation stage. The average burning rate is taken as the mass loss per unit cross-
sectional area in between the start and the end of the experiment, divided by the time in hours.
The end point of the experiment was determined by the increase in oxygen measurement by
the gas analyser.
Figure 4.34 shows the relationship between the maximum CO/CO2 ratio and maximum bed
temperature as a function of air flow rate for the combustion of cut straw. The CO/CO2 ratio
was found to be inversely proportional to the maximum bed temperature. The CO combustion
that is active at high temperature causes a high maximum temperature of 1126°C at 0.32kg/mzs.
106
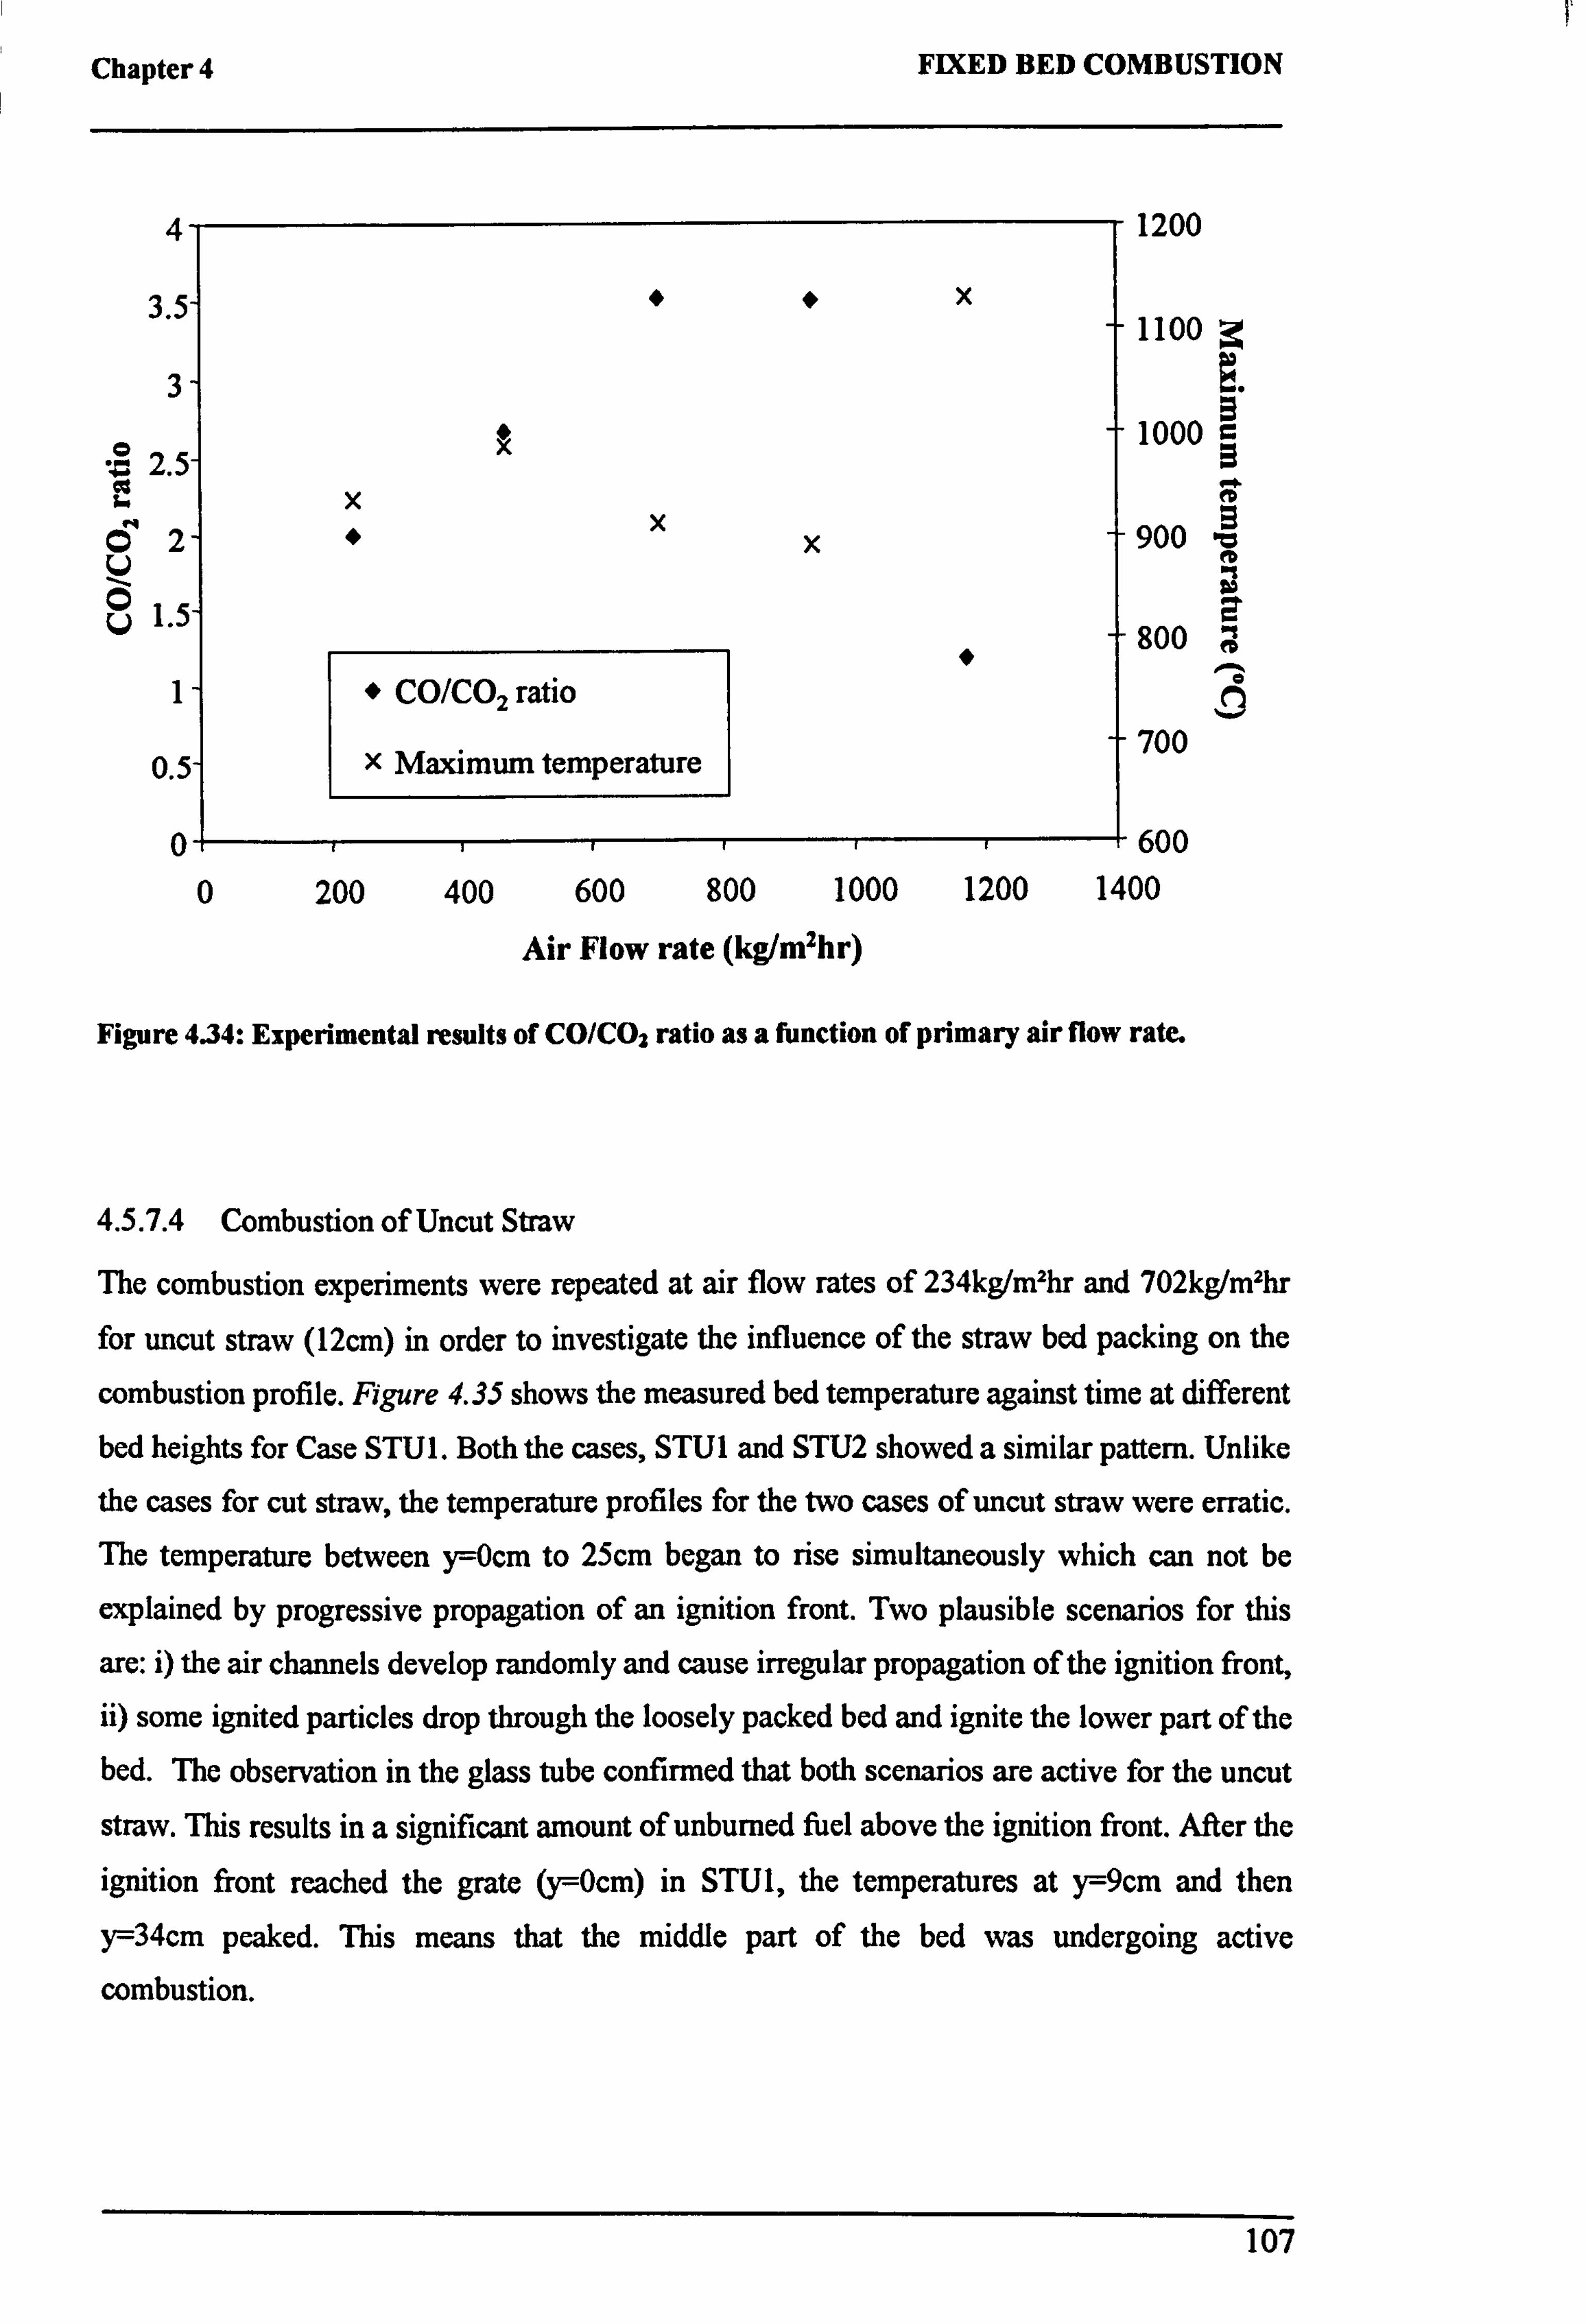
Chapter 4 FIXED BED COMBUSTION
4
3
3
2.5 x
Ö 2-
1.51
X
X
x
x
1" CO/CO2 ratio
.5X Maximum temperature
0 0 200 400 600 800 1000 1200
Air Flow rate (kg/mzhr)
1200
1100 4
1000 1
900 -0
E 800
e 10
700
-+600 1400
Figure 4.34: Experimental results of CO/CO2 ratio as a function of primary air flow rate.
4.5.7.4 Combustion of Uncut Straw
The combustion experiments were repeated at air flow rates of 234kg/mzhr and 702kg/m2hr
for uncut straw (12cm) in order to investigate the influence of the straw bed packing on the
combustion profile. Figure 4.35 shows the measured bed temperature against time at different
bed heights for Case STU1. Both the cases, STU1 and STU2 showed a similar pattern. Unlike
the cases for cut straw, the temperature profiles for the two cases of uncut straw were erratic. The temperature between y=Ocm to 25cm began to rise simultaneously which can not be
explained by progressive propagation of an ignition front. Two plausible scenarios for this
are: i) the air channels develop randomly and cause irregular propagation of the ignition front,
ii) some ignited particles drop through the loosely packed bed and ignite the lower part of the bed. The observation in the glass tube confirmed that both scenarios are active for the uncut
straw. This results in a significant amount of unburned fuel above the ignition front. After the ignition front reached the grate (y=Ocm) in STU1, the temperatures at y=9cm and then
y=34cm peaked. This means that the middle part of the bed was undergoing active
combustion.
107
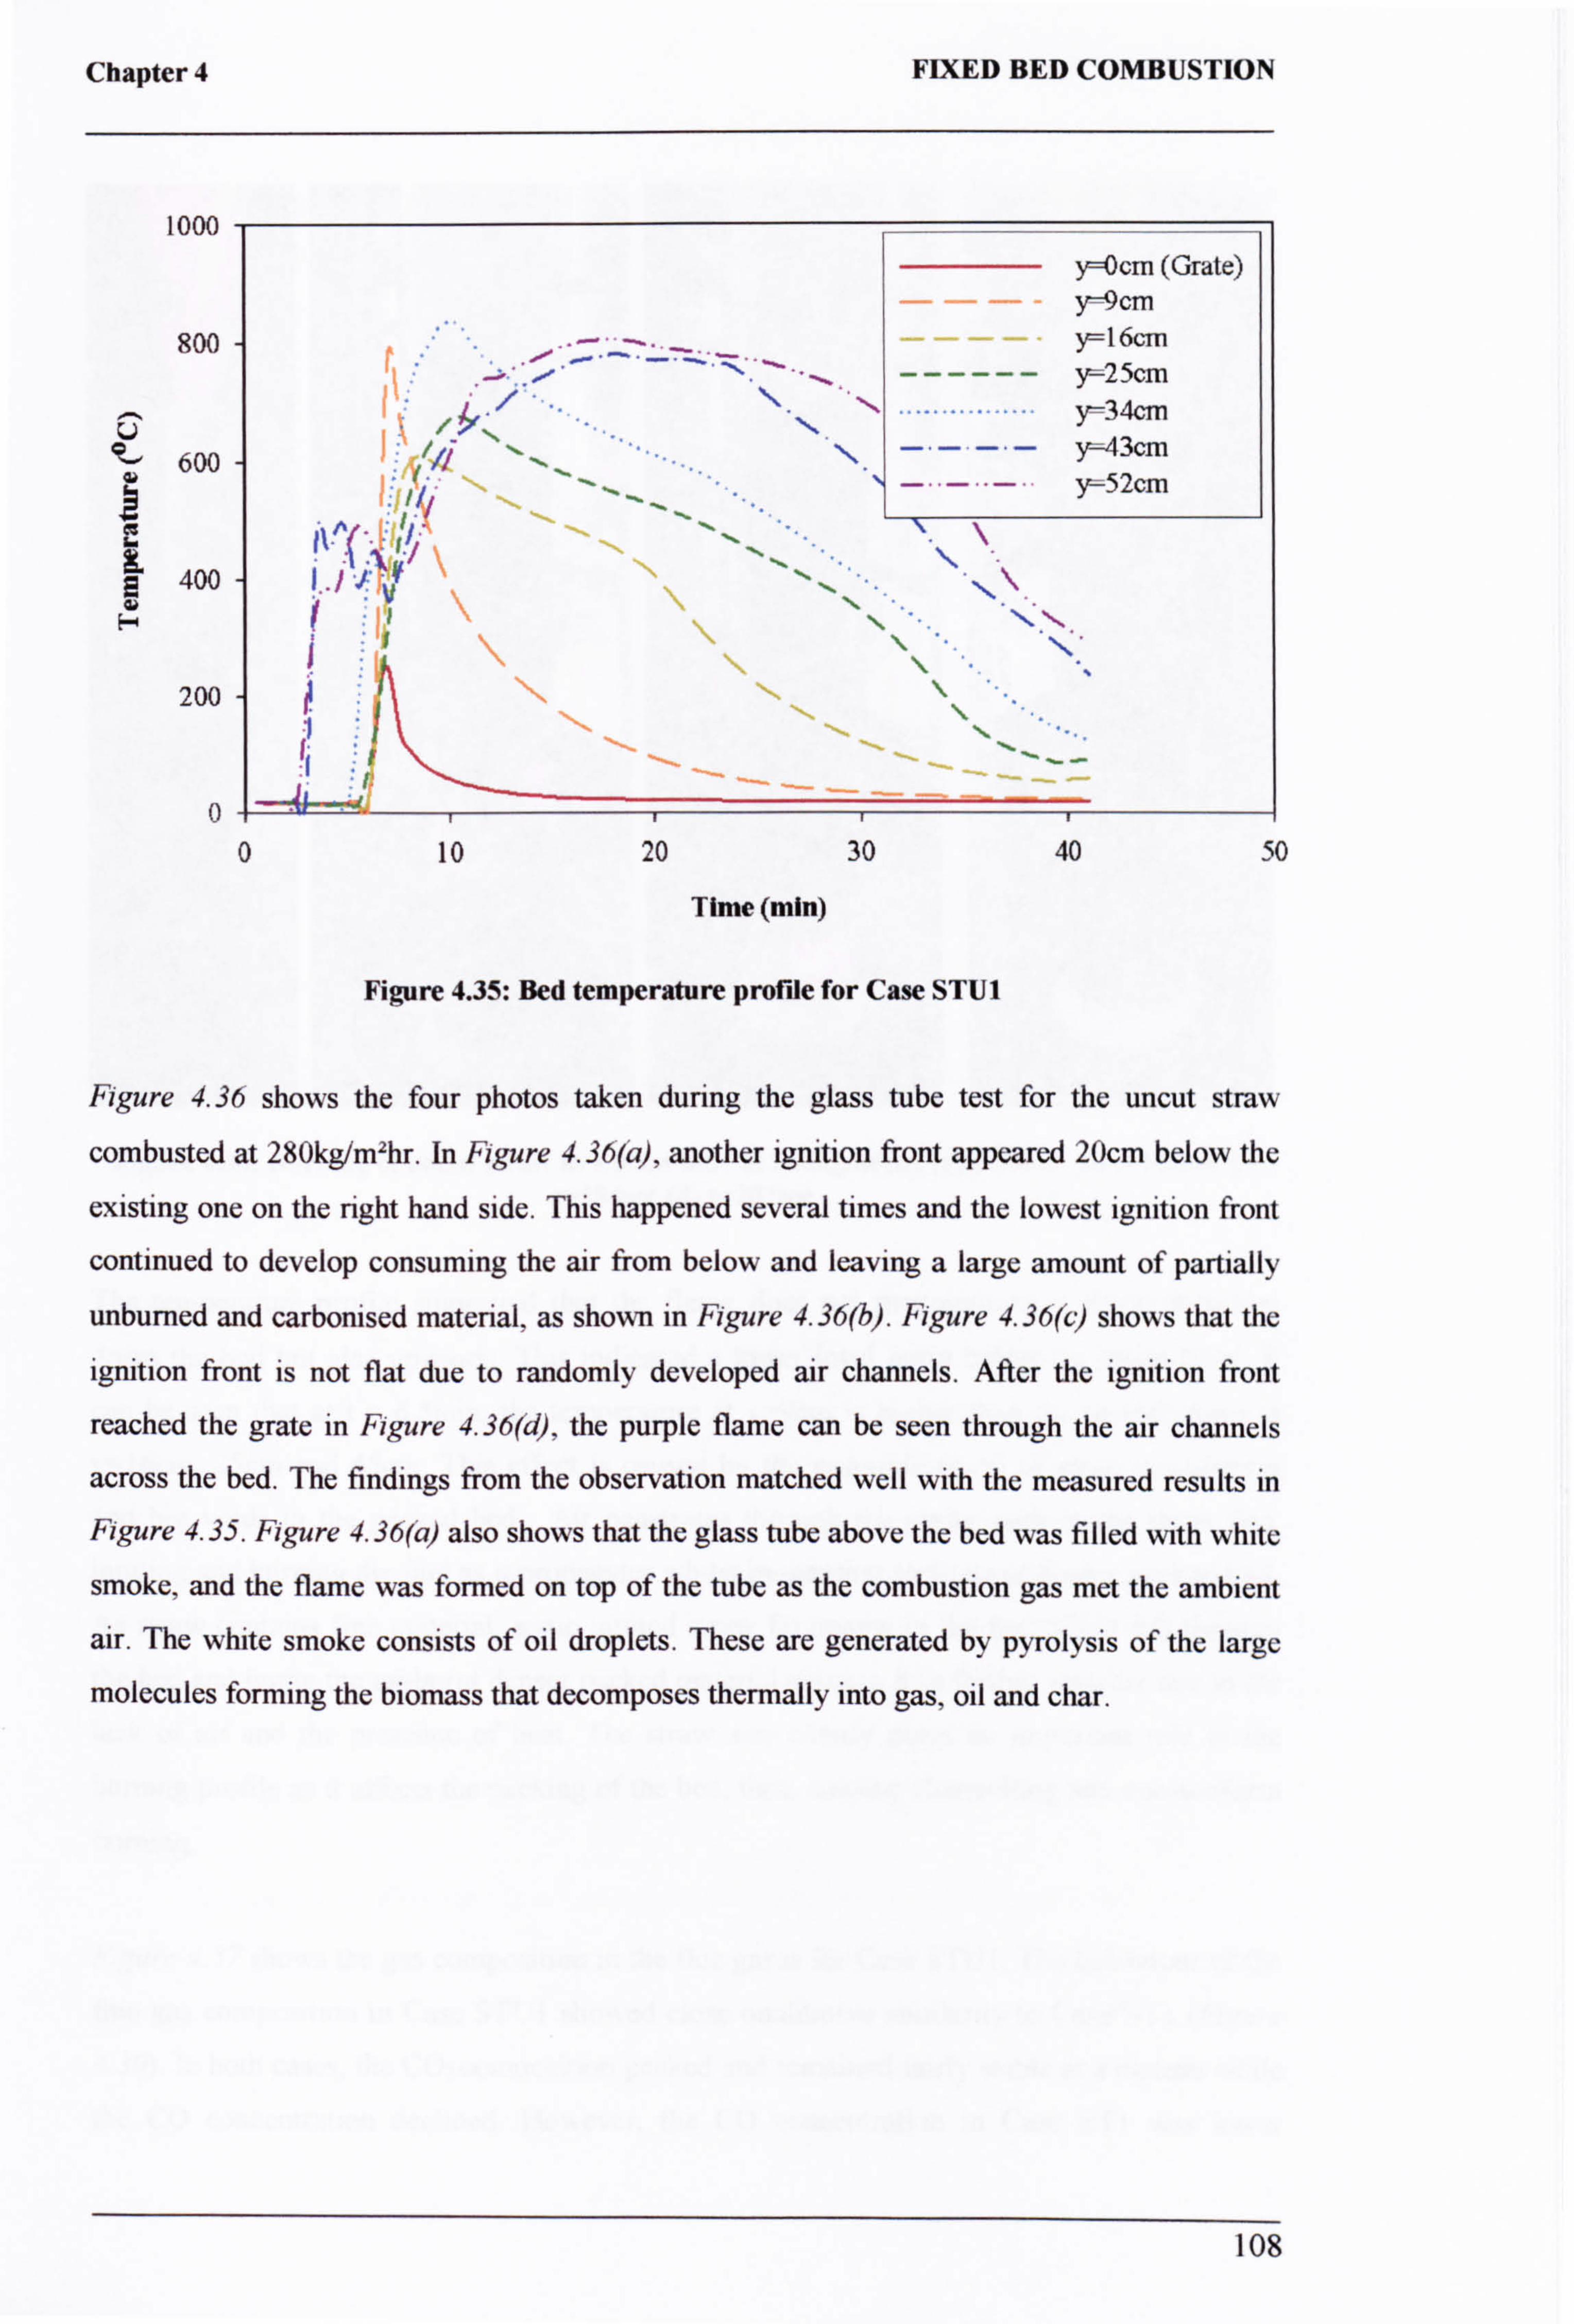
Chapter 4 FIXED BED COMBUSTION
1000
800
U ems' 600
400
F
200
0
0 10 20 30 40 50
Time (min)
Figure 4.35: Bed temperature profile for Case STU1
Figure 4.36 shows the four photos taken during the glass tube test for the uncut straw
combusted at 280kg/mzhr. In Figure 4.36(a), another ignition front appeared 20cm below the
existing one on the right hand side. This happened several times and the lowest ignition front
continued to develop consuming the air from below and leaving a large amount of partially
unburned and carbonised material, as shown in Figure 4.36(b). Figure 4.36(c) shows that the
ignition front is not flat due to randomly developed air channels. After the ignition front
reached the grate in Figure 4.36(d), the purple flame can be seen through the air channels
across the bed. The findings from the observation matched well with the measured results in
Figure 4.3.5. Figure 4.36(6) also shows that the glass tube above the bed was filled with white
smoke, and the flame was formed on top of the tube as the combustion gas met the ambient
air. The white smoke consists of oil droplets. These are generated by pyrolysis of the large
molecules forming the biomass that decomposes thermally into gas, oil and char.
7. N
il^/.: '1: ý `ýý
}=Ocm (Grate)
y--9cm
- ý16cm ------ y--2 5cm
............. r34cm
---- y-43cm --- }=52cm
L. 1
\N
108
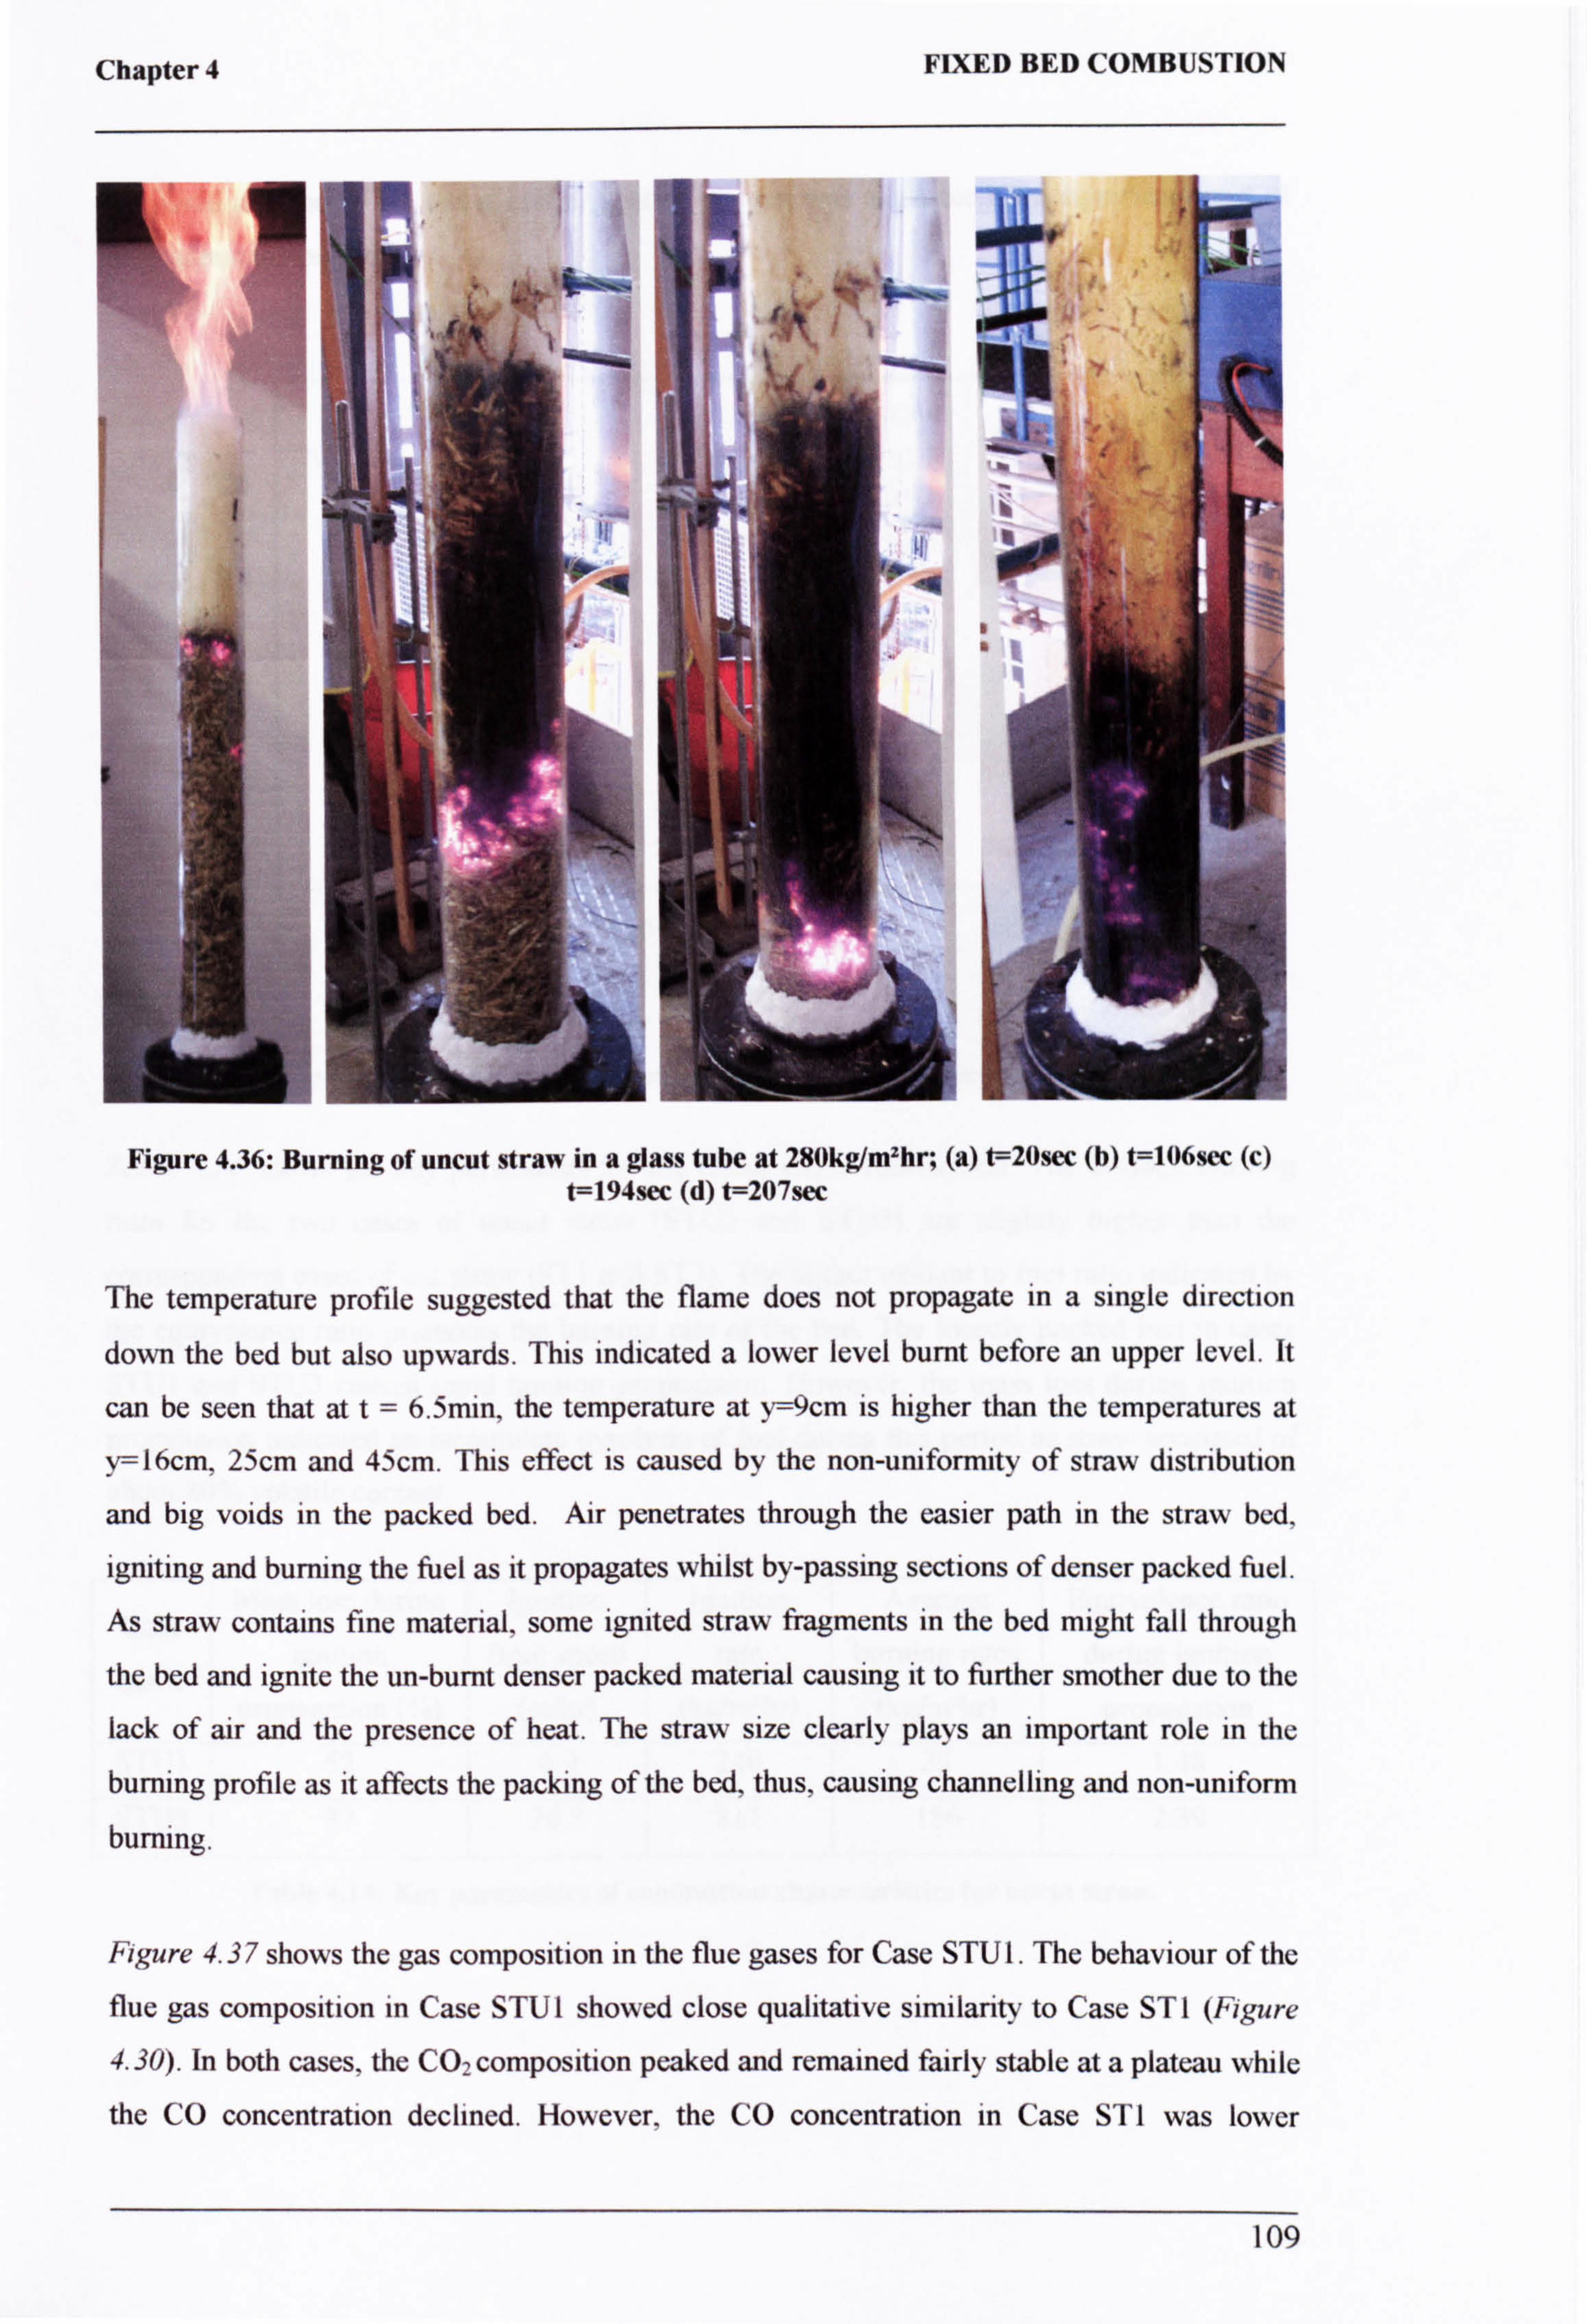
Chapter 4 FIXED BED COMBUSTION
I ! 4"14
Figure 4.36: Burning of uncut straw in a glass tube at 280kg/mzhr; (a) t=20sec (b) t=106sec (c) t=194sec (d) t=207sec
The temperature profile suggested that the flame does not propagate in a single direction
down the bed but also upwards. This indicated a lower level burnt before an upper level. It
can be seen that at t=6.5min, the temperature at v=9cm is higher than the temperatures at
v=16cm, 25cm and 45cm. This effect is caused by the non-uniformity of straw distribution
and big voids in the packed bed. Air penetrates through the easier path in the straw bed,
igniting and burning the fuel as it propagates whilst by-passing sections of denser packed fuel.
As straw contains fine material, some ignited straw fragments in the bed might fall through
the bed and ignite the un-burnt denser packed material causing it to further smother due to the
lack of air and the presence of heat. The straw size clearly plays an important role in the
burning profile as it affects the packing of the bed, thus, causing channelling and non-uniform
burning.
Figure 4.37 shows the gas composition in the flue gases for Case STU 1. The behaviour of the
flue gas composition in Case STU I showed close qualitative similarity to Case ST I (Figure
4.30). In both cases, the CO2 composition peaked and remained fairly stable at a plateau while
the CO concentration declined. However, the CO concentration in Case STI was lower
109
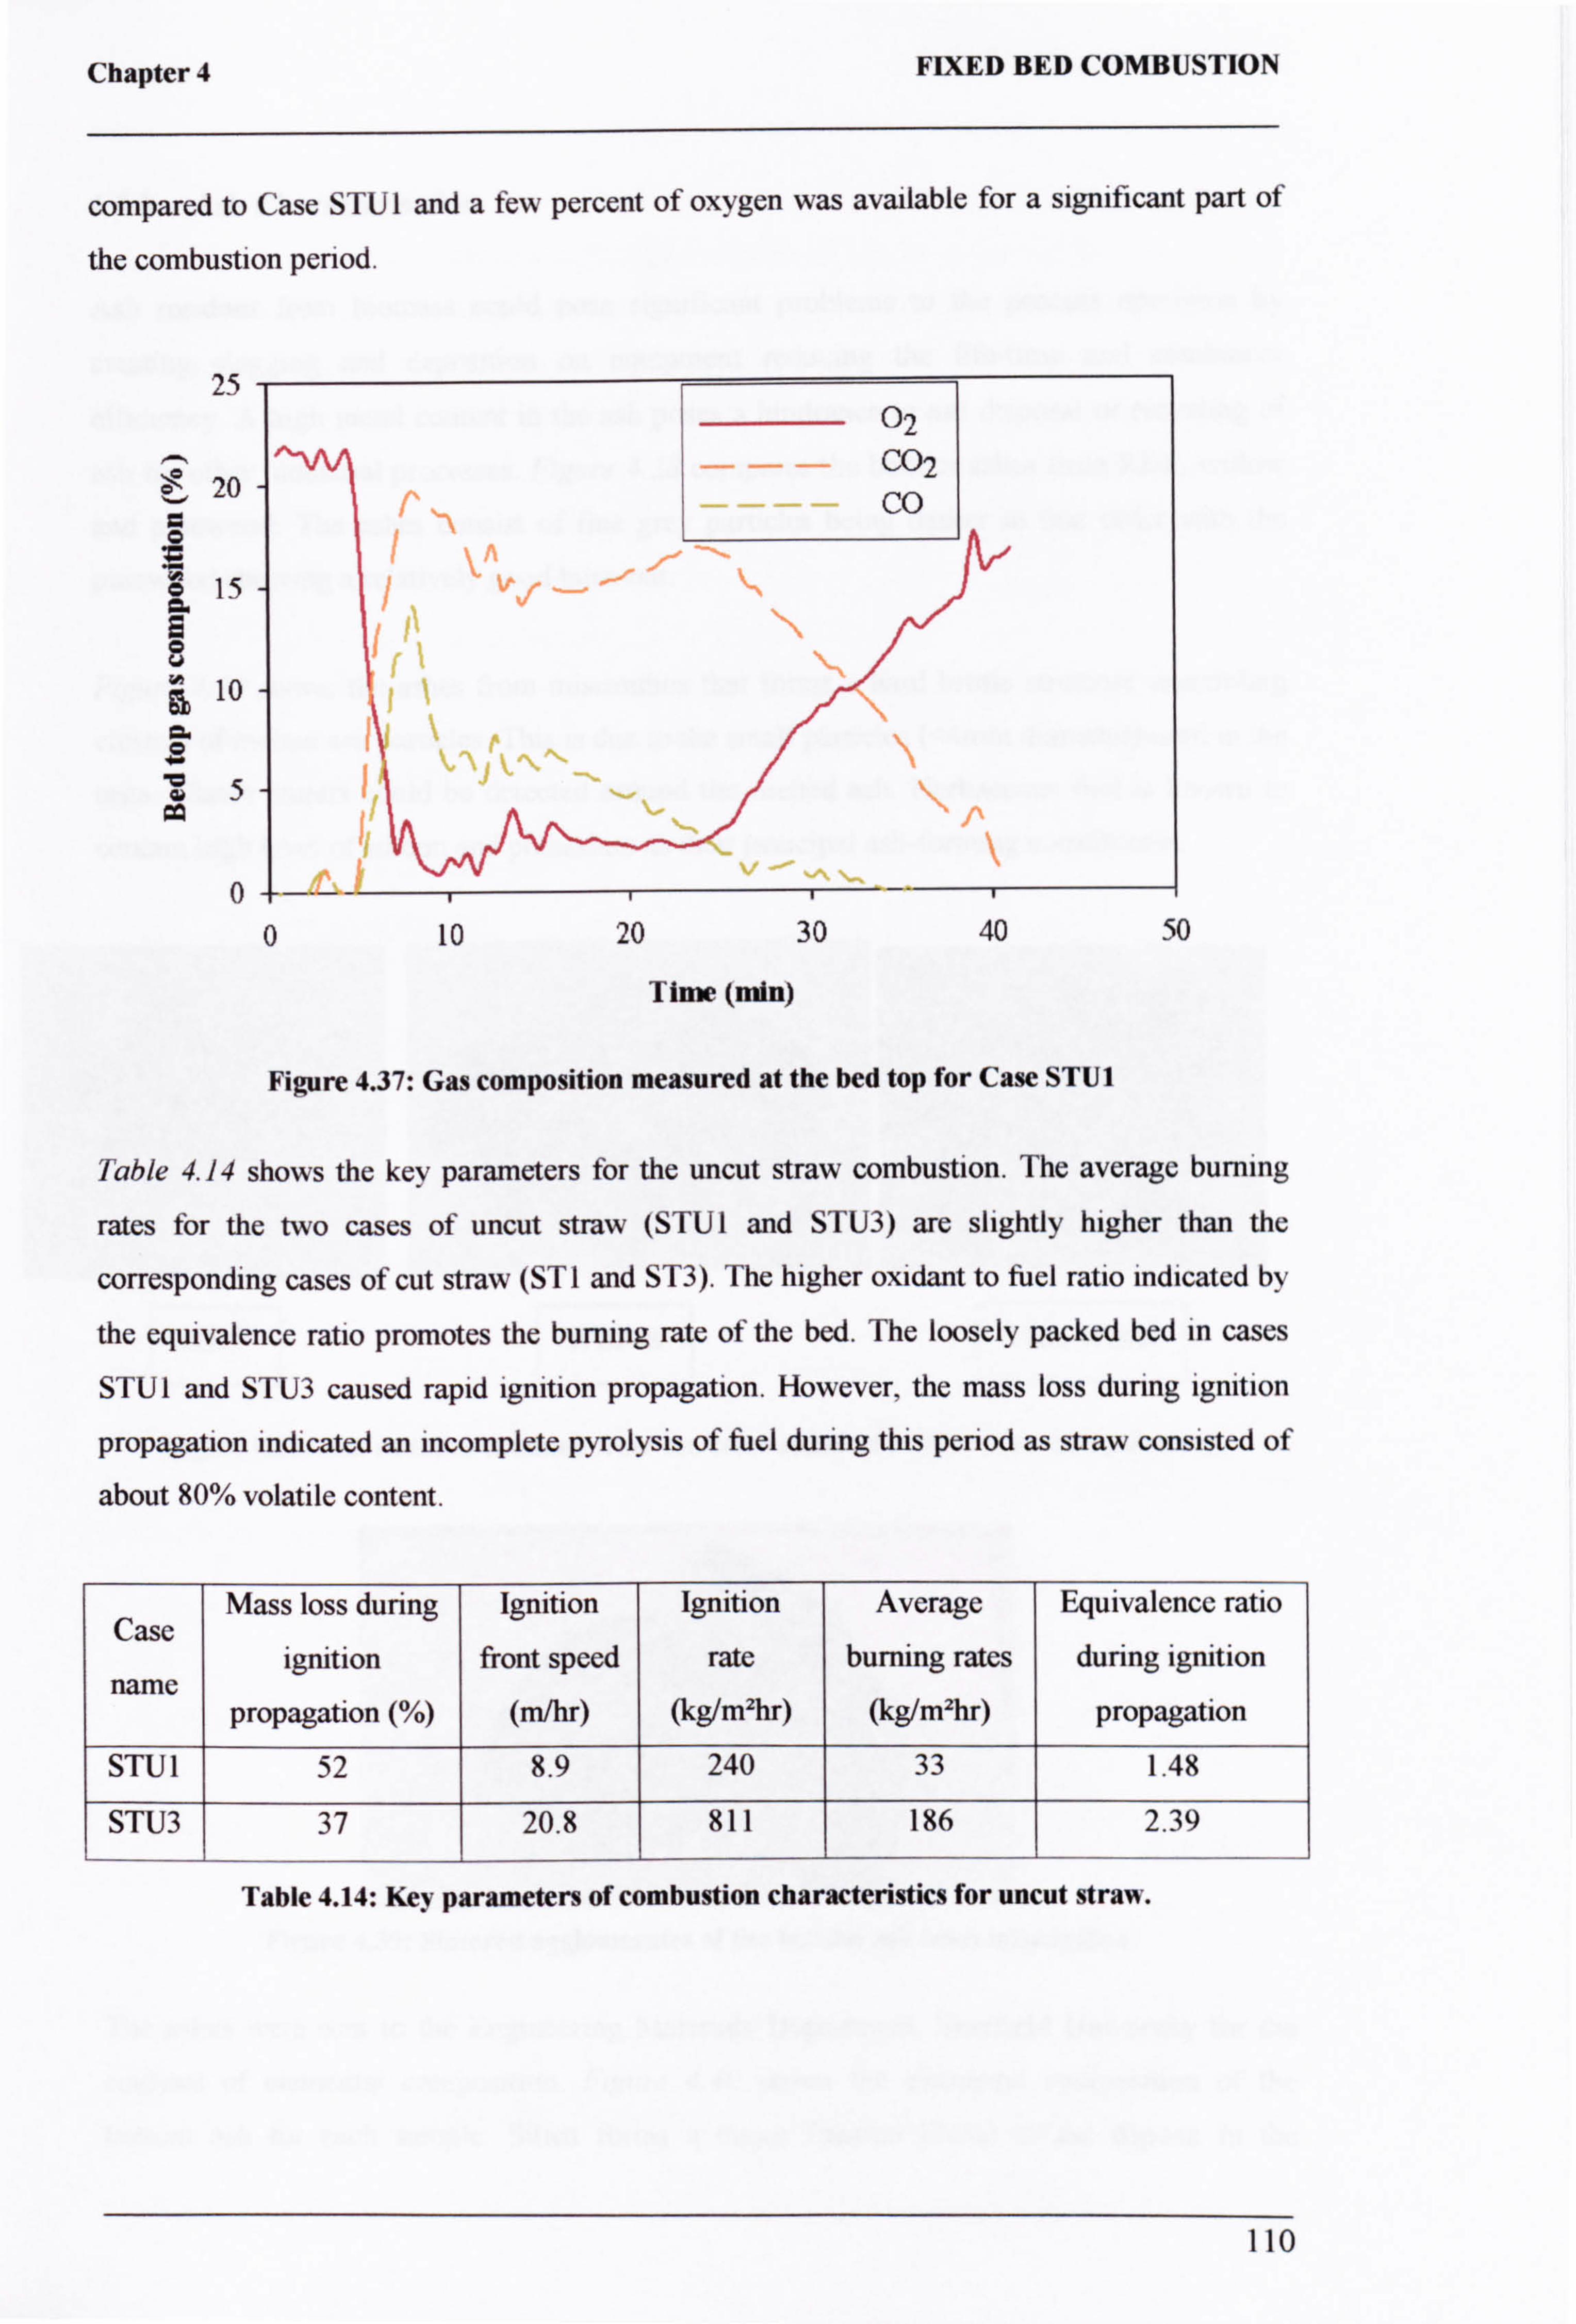
Chapter 4 FIXED BED COMBUSTION
compared to Case STU 1 and a few percent of oxygen was available for a significant part of
the combustion period.
25
20
15
10
5 po
0
02
--- C02 CO
It I
1`
0 10 20 30 40 50
Time (min)
Figure 4.37: Gas composition measured at the bed top for Case STU1
Table 4.14 shows the key parameters for the uncut straw combustion. The average burning
rates for the two cases of uncut straw (STUI and STU3) are slightly higher than the
corresponding cases of cut straw (ST1 and ST3). The higher oxidant to fuel ratio indicated by
the equivalence ratio promotes the burning rate of the bed. The loosely packed bed in cases
STU 1 and STU3 caused rapid ignition propagation. However, the mass loss during ignition
propagation indicated an incomplete pyrolysis of fuel during this period as straw consisted of
about 80% volatile content.
Mass loss during Ignition Ignition Average Equivalence ratio Case
ignition front speed rate burning rates during ignition name
propagation (%) (m/hr) (kg/mzhr) (kg/mzhr) propagation
STU 1 52 8.9 240 33 1.48
STU3 37 20.8 811 186 2.39
Table 4.14: Key parameters of combustion characteristics for uncut straw.
110
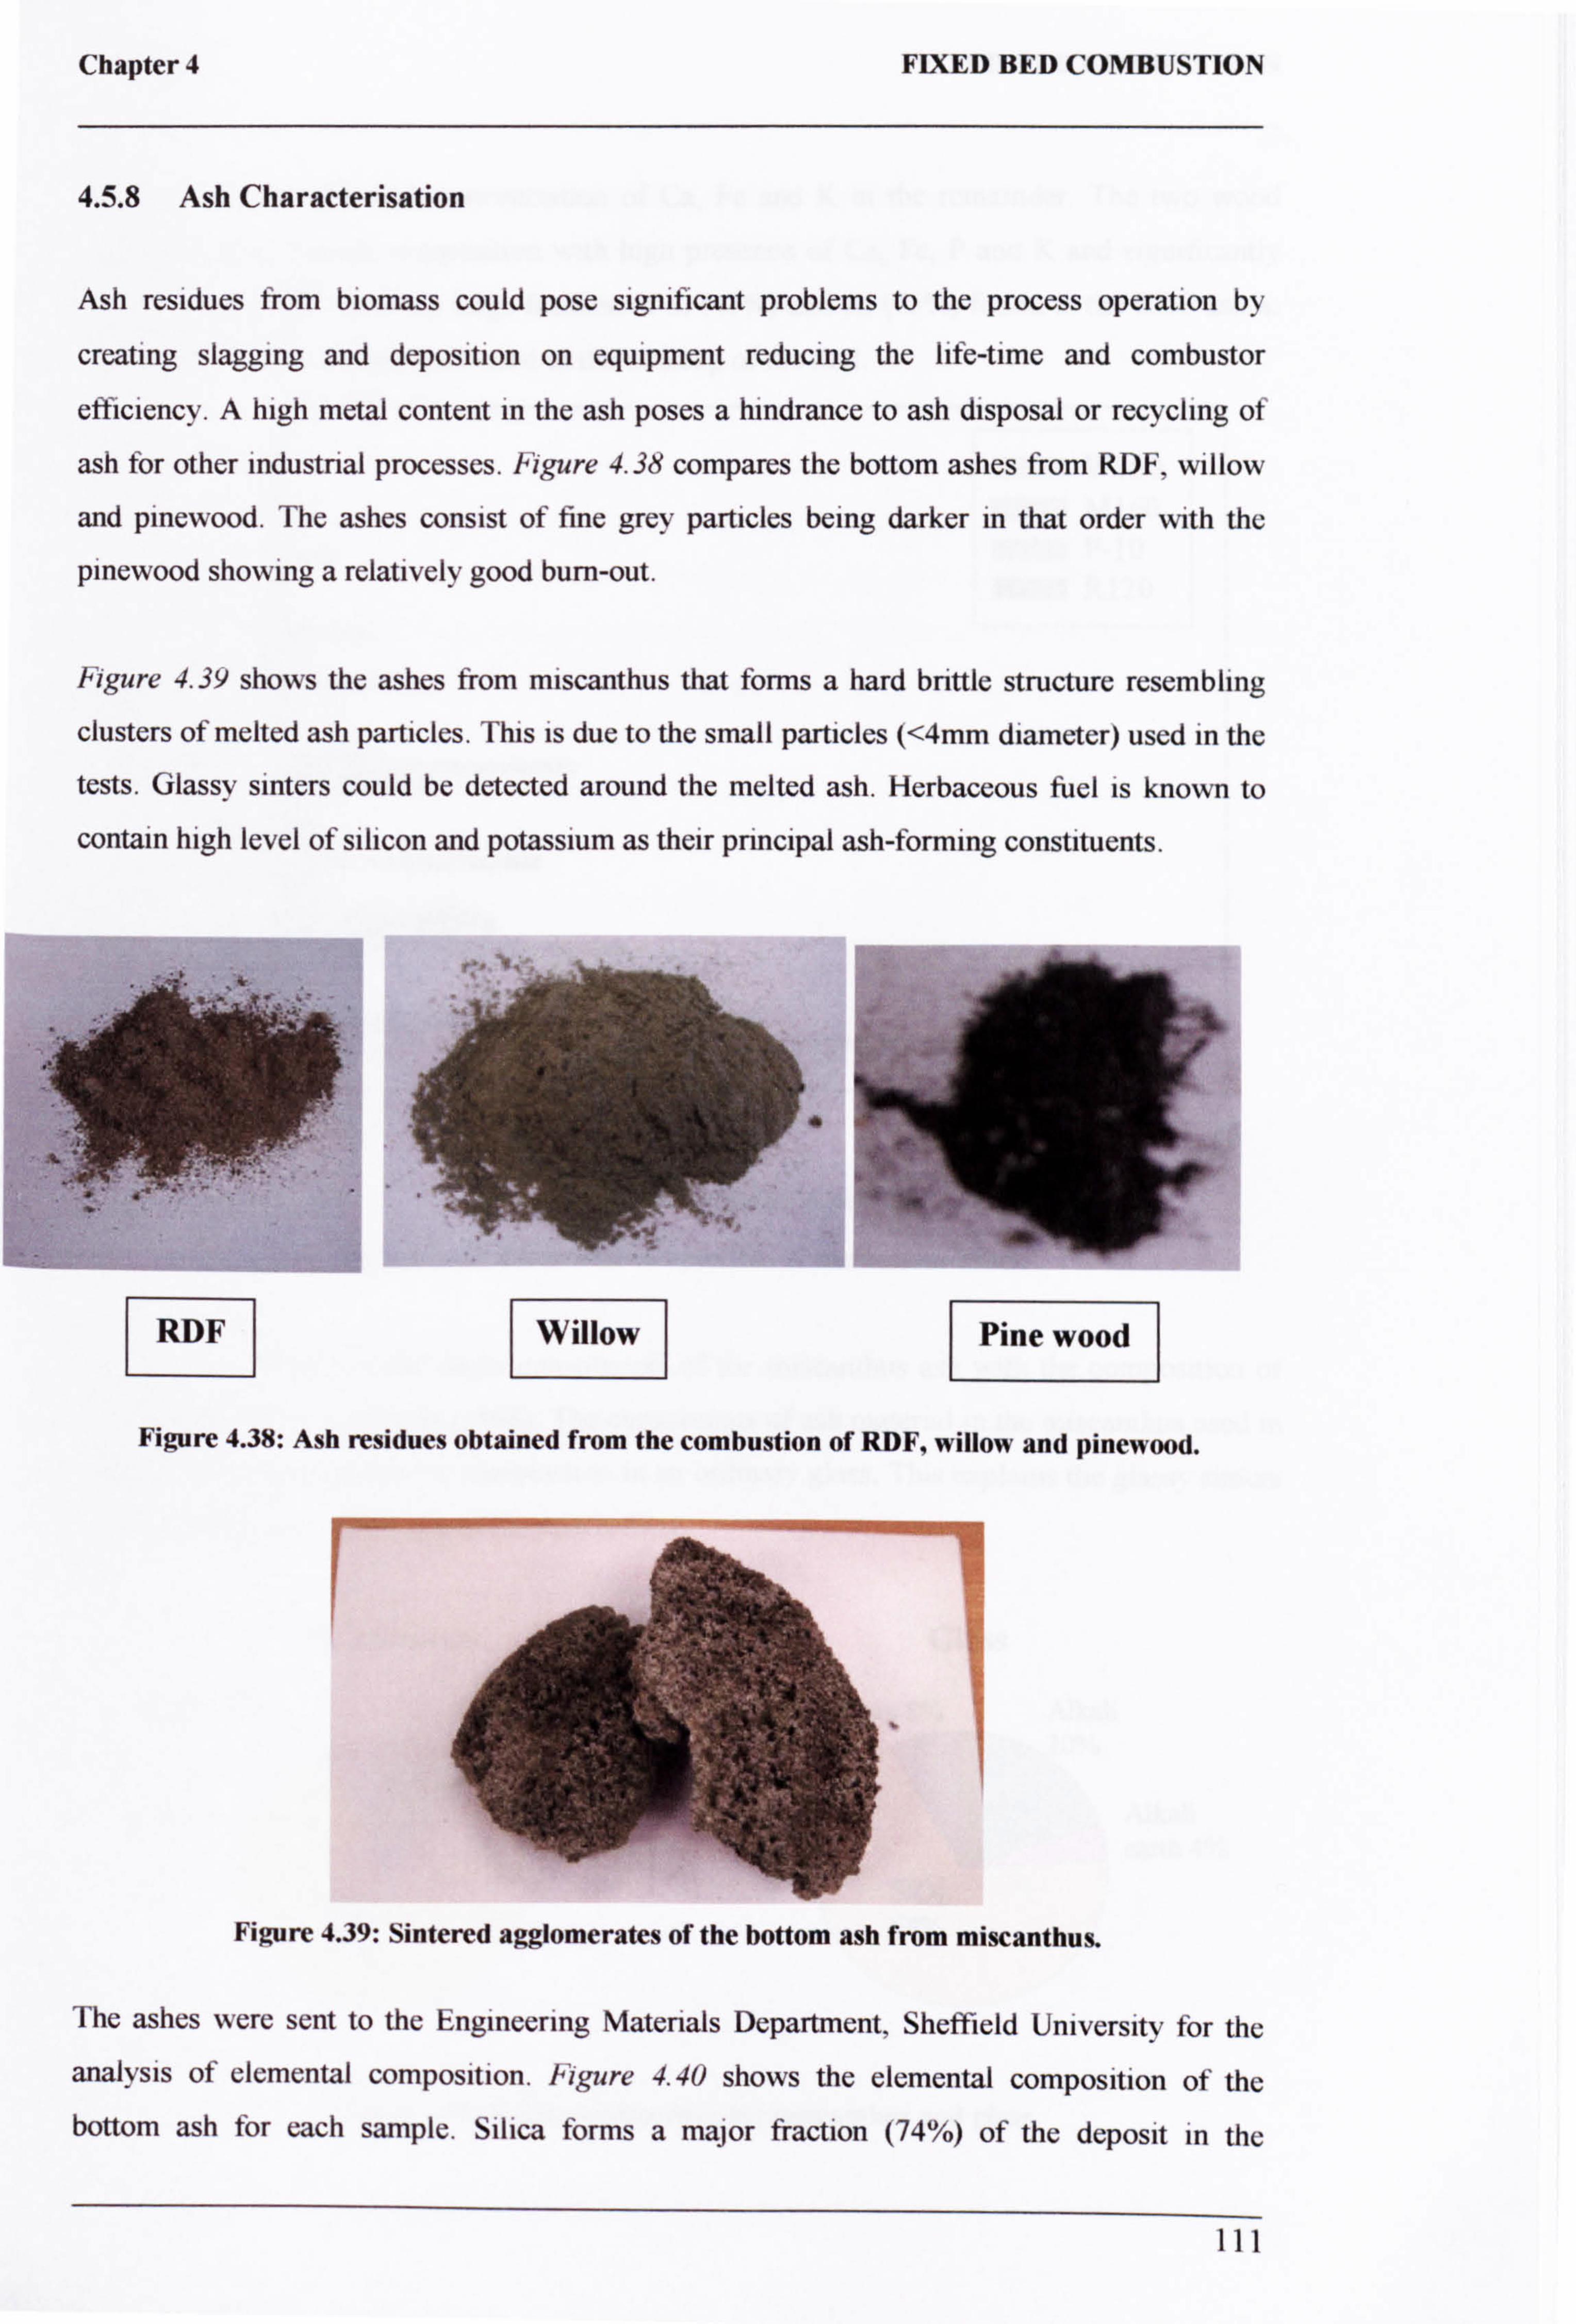
Chapter 4 FIXED BED COMBUSTION
4.5.8 Ash Characterisation
Ash residues from biomass could pose significant problems to the process operation by
creating slagging and deposition on equipment reducing the life-time and combustor
efficiency. A high metal content in the ash poses a hindrance to ash disposal or recycling of
ash for other industrial processes. Figure 4.38 compares the bottom ashes from RDF, willow
and pinewood. The ashes consist of fine grey particles being darker in that order with the
pinewood showing a relatively good bum-out.
Figure 4.39 shows the ashes from miscanthus that forms a hard brittle structure resembling
clusters of melted ash particles. This is due to the small particles (<4mm diameter) used in the
tests. Glassy sinters could be detected around the melted ash. Herbaceous fuel is known to
contain high level of silicon and potassium as their principal ash-forming constituents.
RDF
i
Figure 4.38: Ash residues obtained from the combustion of RDF, willow and pinewood.
-: ý3rý .
Figure 4.39: Sintered agglomerates of the bottom ash from miscanthus.
The ashes were sent to the Engineering Materials Department, Sheffield University for the
analysis of elemental composition. Figure 4.40 shows the elemental composition of the bottom ash for each sample. Silica forms a major fraction (74%) of the deposit in the
111
Willow Pine wood
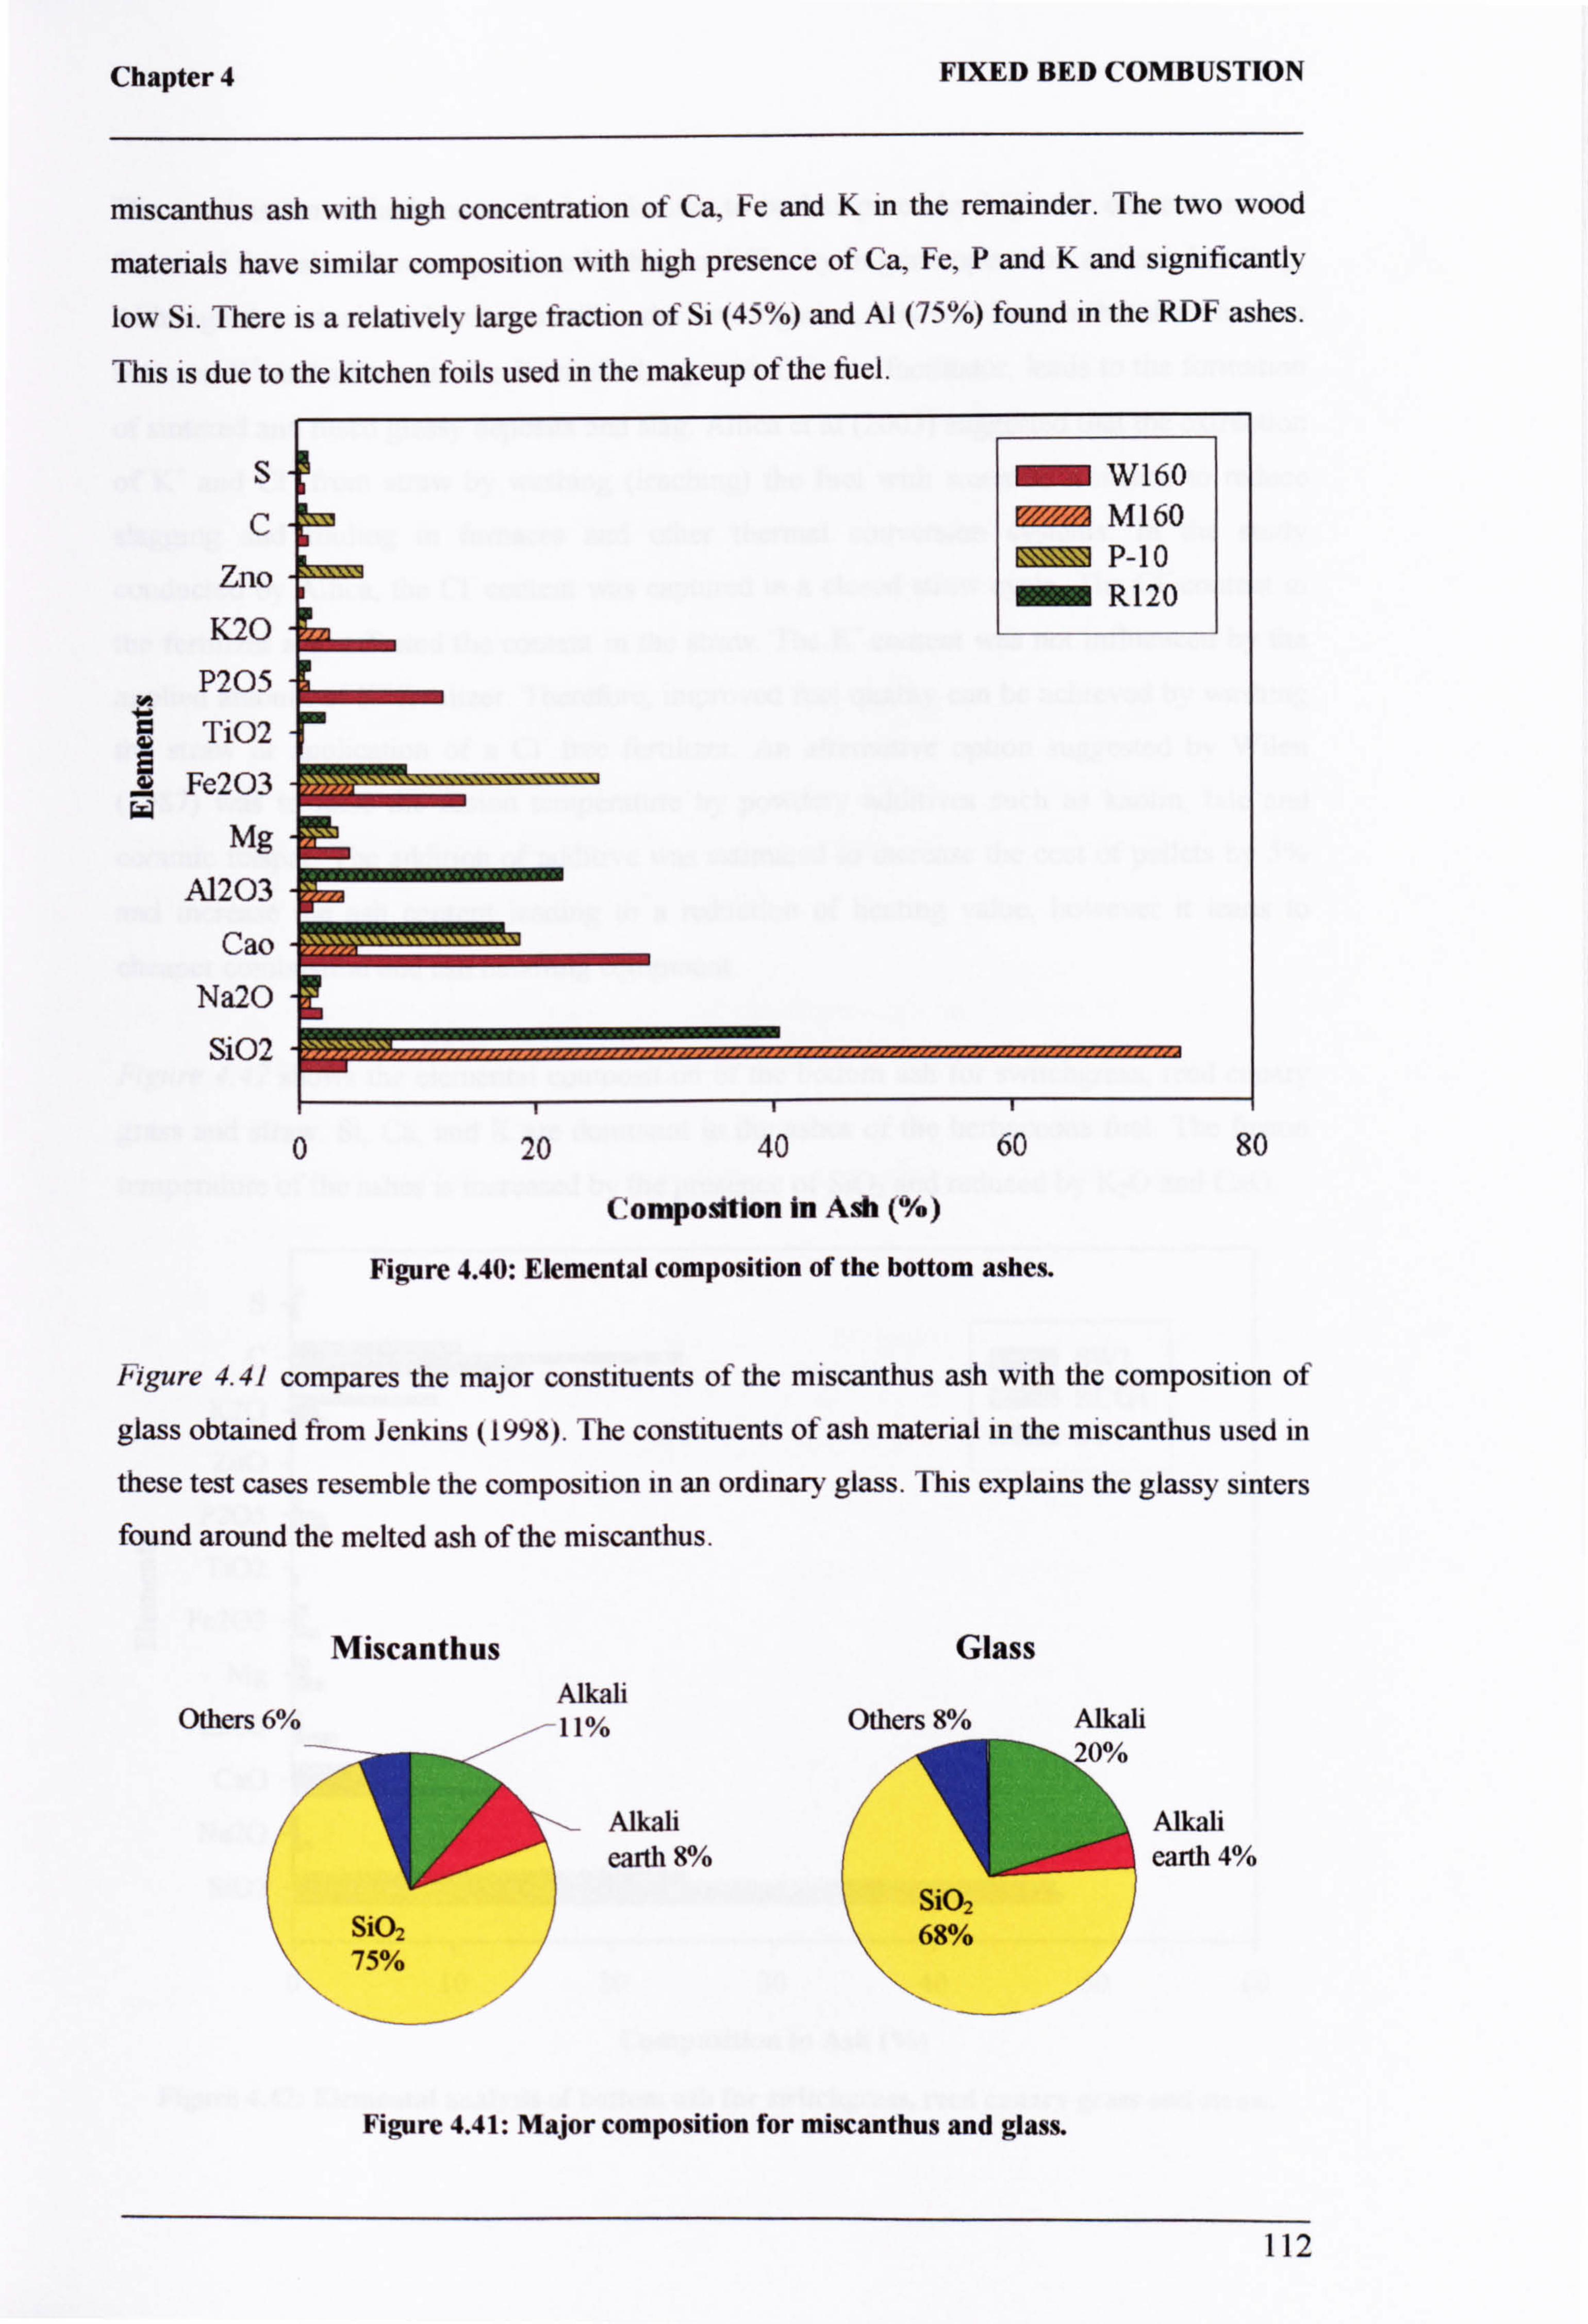
Chapter 4 FIXED BED COMBUSTION
miscanthus ash with high concentration of Ca. Fe and K in the remainder. The two wood
materials have similar composition with high presence of Ca, Fe, P and K and significantly
low Si. There is a relatively large fraction of Si (45%) and Al (75%) found in the RDF ashes.
This is due to the kitchen foils used in the makeup of the fuel.
S
C
Zno
K20
P205
Ti02
Fe203
Mg
A1203
Cao
Na20
Si02
W160 ® M160
I® P-10 R120
0 20 40 60 80
Composition in Ash (%)
Figure 4.40: Elemental composition of the bottom ashes.
Figure 4.41 compares the major constituents of the miscanthus ash with the composition of
glass obtained from Jenkins (1998). The constituents of ash material in the miscanthus used in
these test cases resemble the composition in an ordinary glass. This explains the glassy sinters found around the melted ash of the miscanthus.
Miscanthus Alkali
Others 6% ----Il
%
Alkali earth 8%
SiO2 68%
Figure 4.41: Major composition for miscanthus and glass.
Glass
Others 9% Alkali
Alkali
earth 4%
112
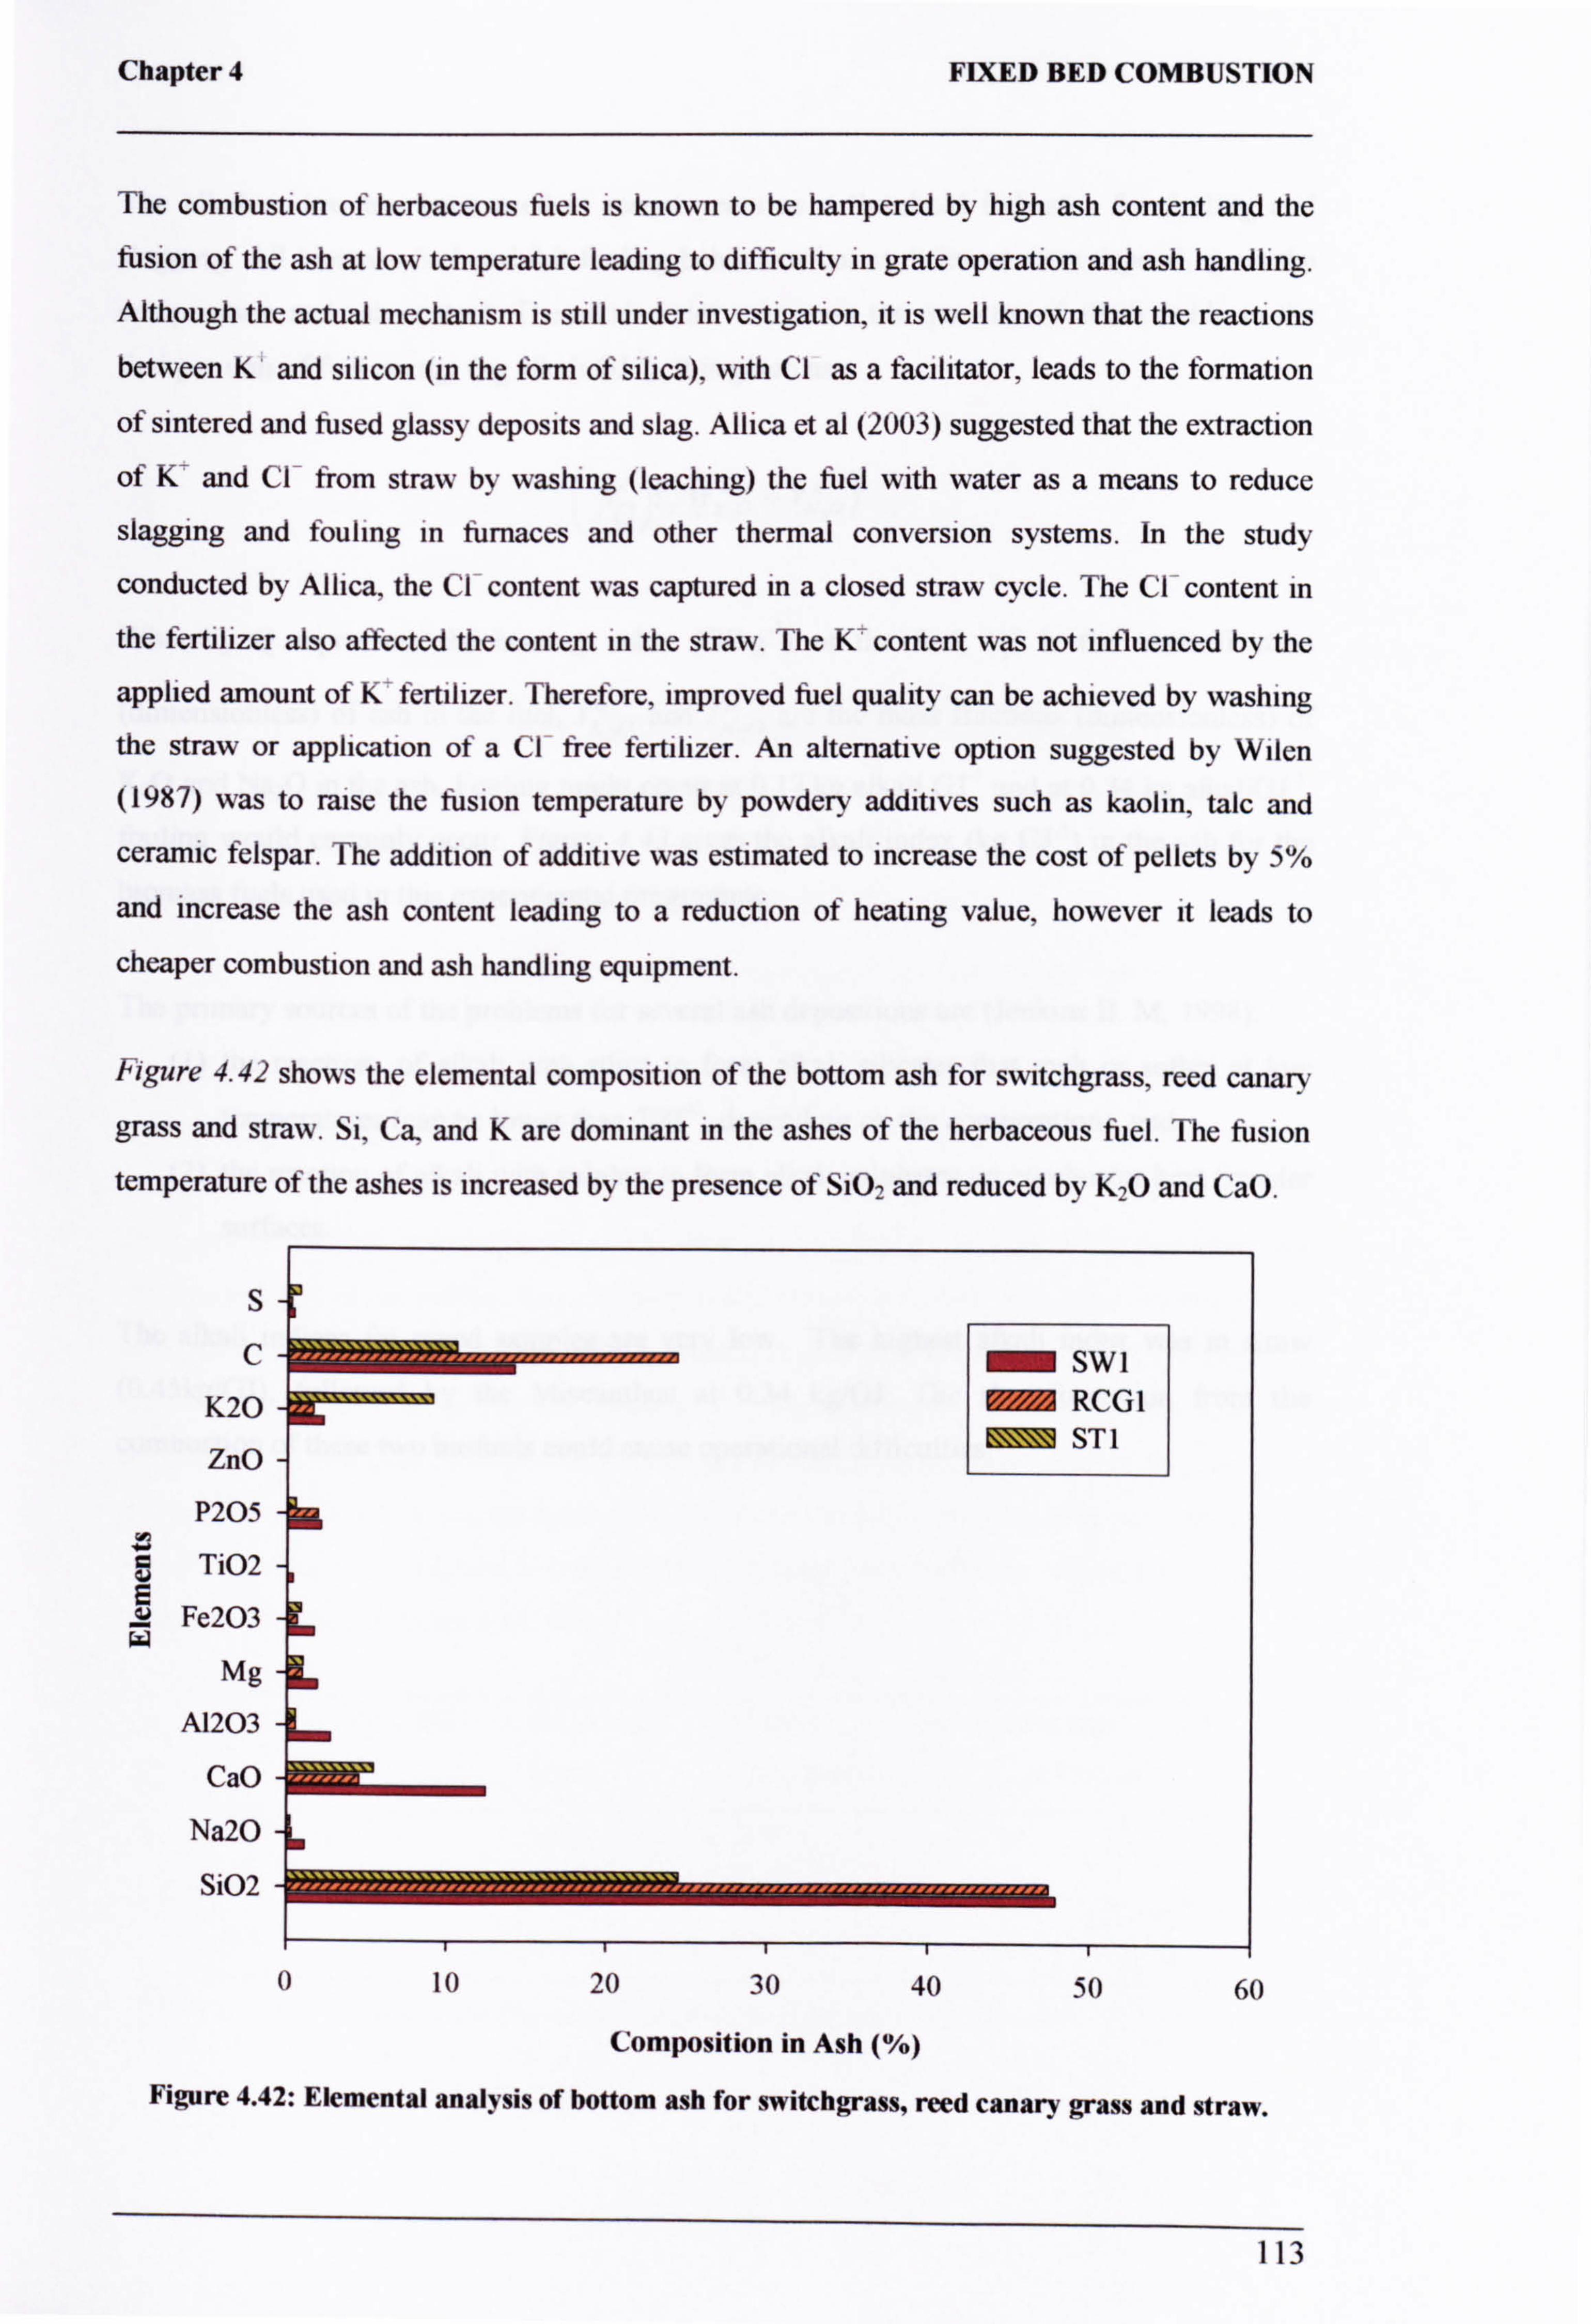
Chapter 4 FIXED BED COMBUSTION
The combustion of herbaceous fuels is known to be hampered by high ash content and the
fusion of the ash at low temperature leading to difficulty in grate operation and ash handling.
Although the actual mechanism is still under investigation, it is well known that the reactions between K and silicon (in the form of silica), with CI as a facilitator, leads to the formation
of sintered and fused glassy deposits and slag. Allica et at (2003) suggested that the extraction
of K- and Cl- from straw by washing (leaching) the fuel with water as a means to reduce
slagging and fouling in furnaces and other thermal conversion systems. In the study
conducted by Allica, the Cl content was captured in a closed straw cycle. The Cl content in
the fertilizer also affected the content in the straw. The K- content was not influenced by the
applied amount of K- fertilizer. Therefore, improved fuel quality can be achieved by washing the straw or application of a Cl free fertilizer. An alternative option suggested by Wilen
(1987) was to raise the fusion temperature by powdery additives such as kaolin, talc and
ceramic felspar. The addition of additive was estimated to increase the cost of pellets by 5%
and increase the ash content leading to a reduction of heating value, however it leads to
cheaper combustion and ash handling equipment.
Figure 4.42 shows the elemental composition of the bottom ash for switchgrass, reed canary
grass and straw. Si, Ca, and K are dominant in the ashes of the herbaceous fuel. The fusion
temperature of the ashes is increased by the presence of Si02 and reduced by K20 and CaO.
s c
K20
ZnO
P205
Ti02
Fe203 W
Mg
A1203
CaO
Na20
Si02
SW1 ® RCG1
ST1
0 10 20 30 40 50 60
Composition in Ash (%)
Figure 4.42: Elemental analysis of bottom ash for switchgrass, reed canary grass and straw.
113
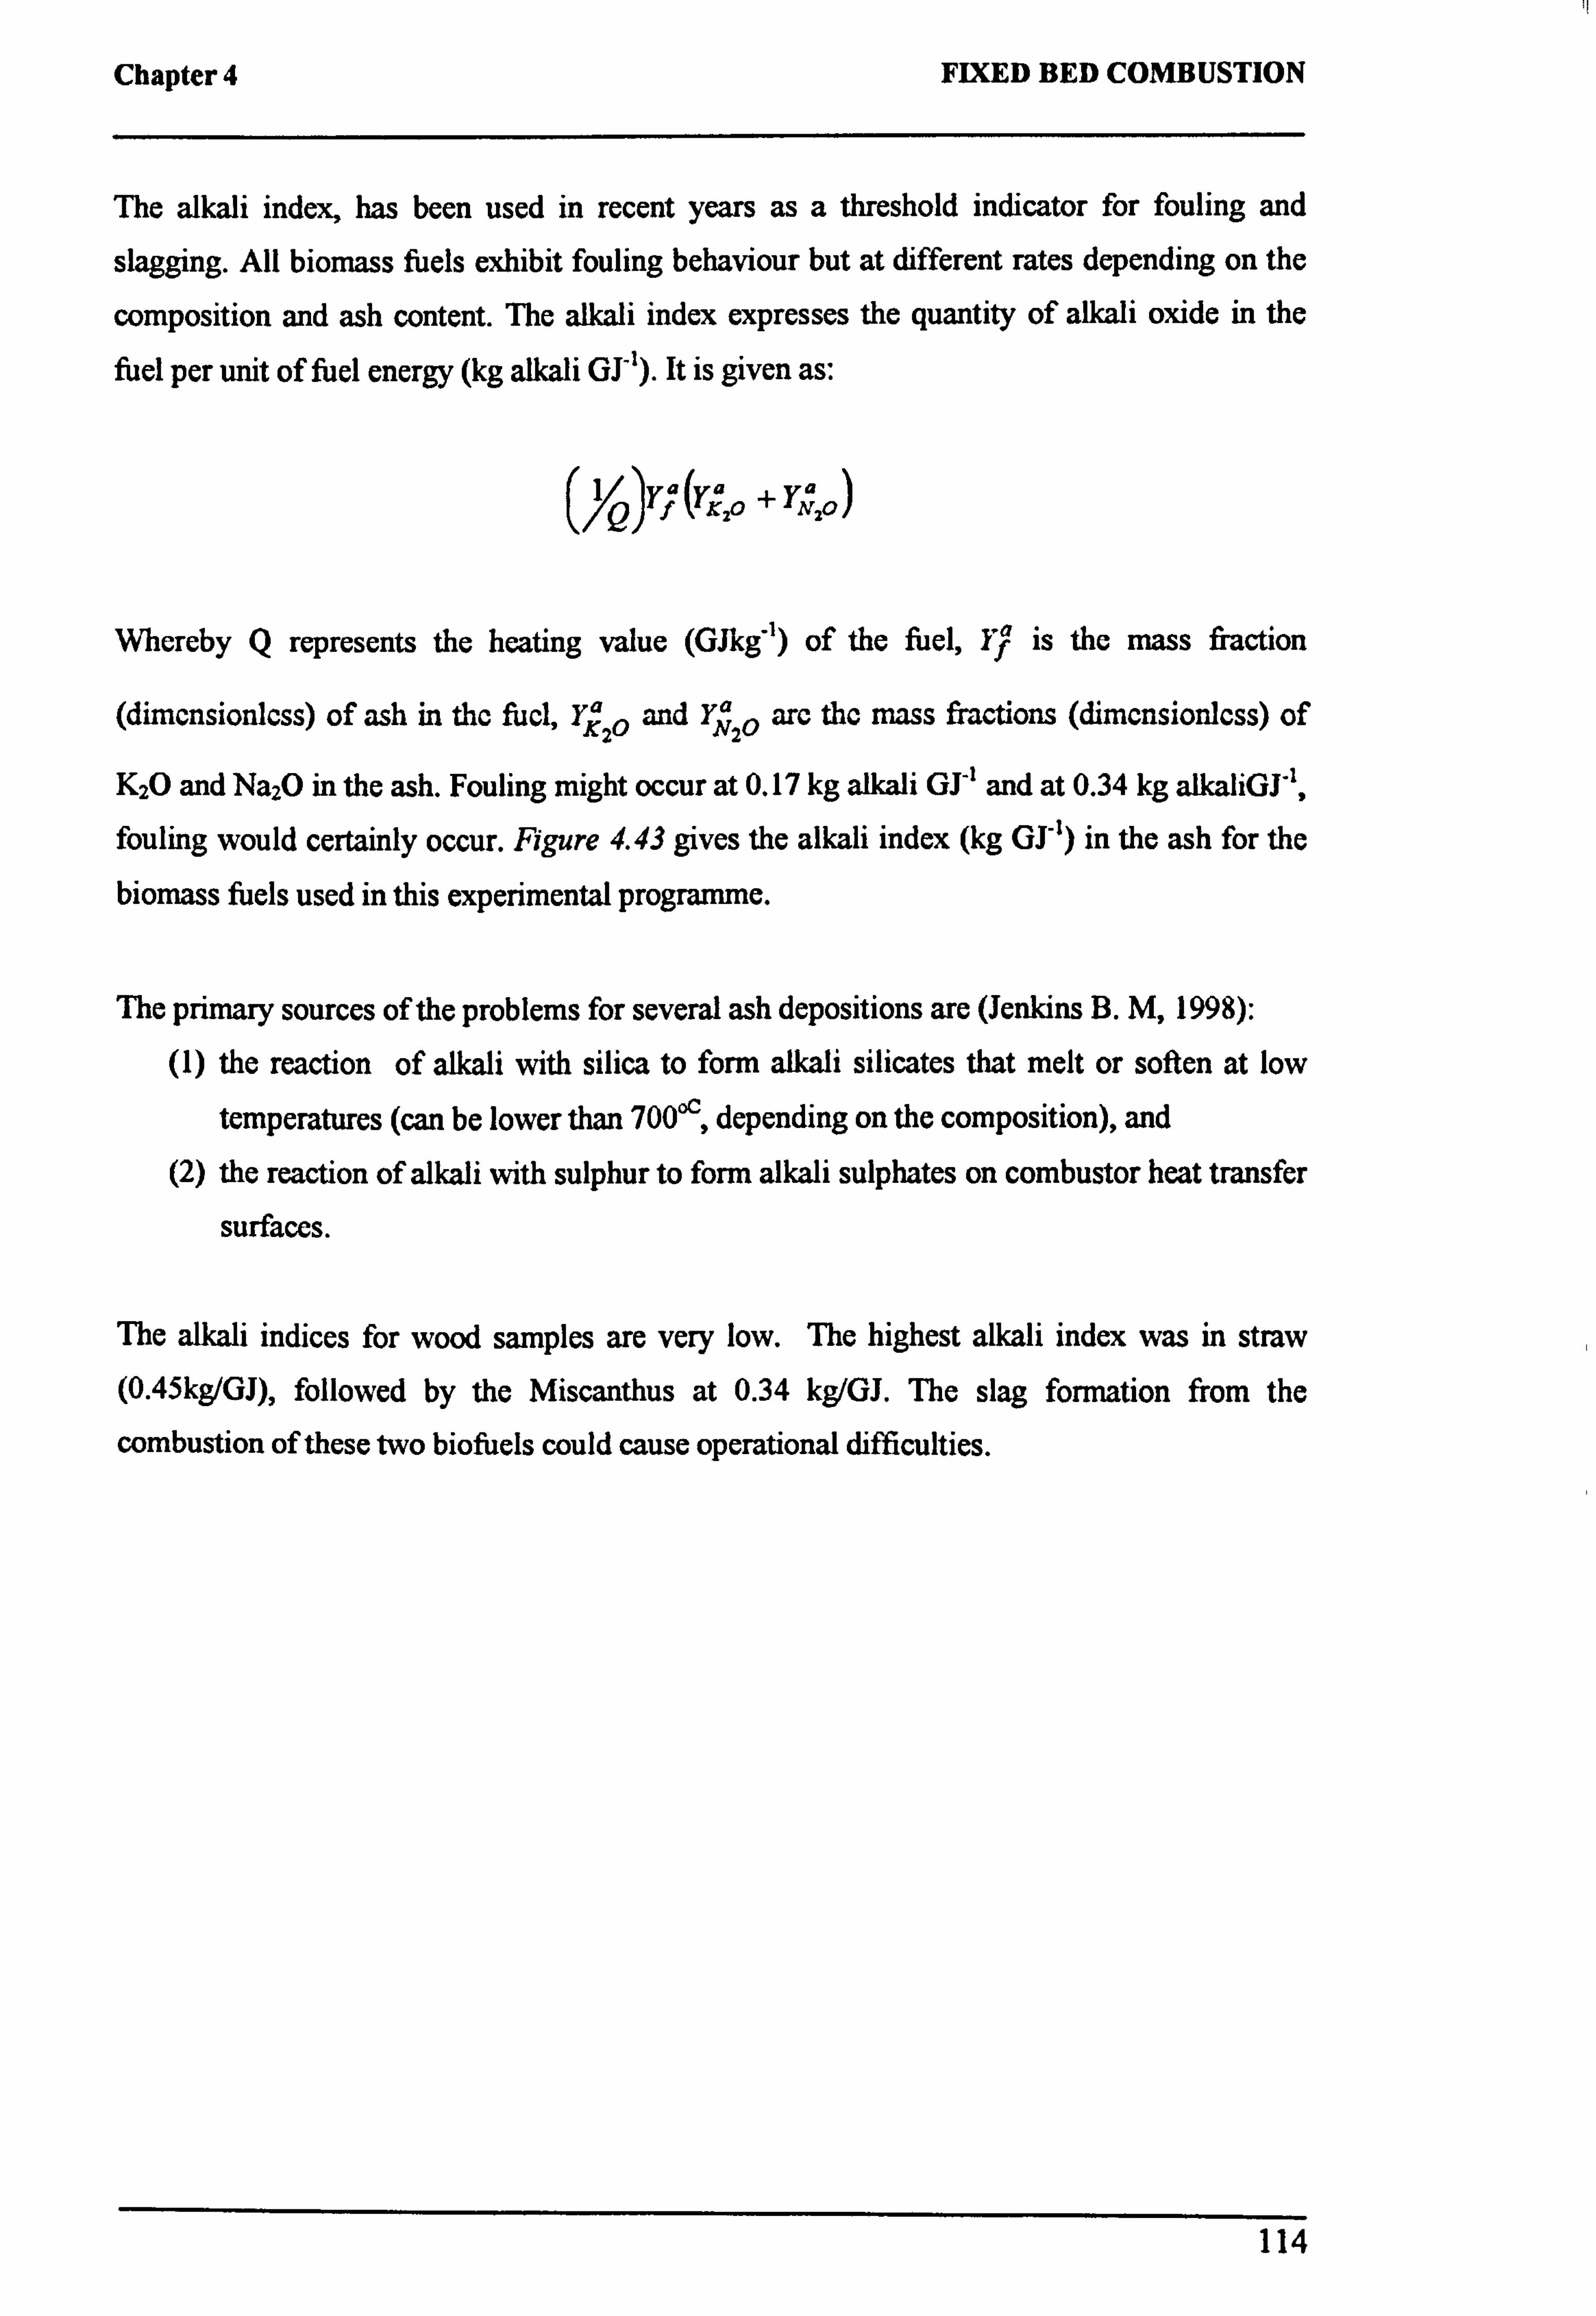
Chapter 4 FIXED BED COMBUSTION
The alkali index, has been used in recent years as a threshold indicator for fouling and
slagging. All biomass fuels exhibit fouling behaviour but at different rates depending on the
composition and ash content. The alkali index expresses the quantity of alkali oxide in the
fuel per unit of fuel energy (kg alkali GJ-1). It is given as:
(�/Q)Y; (r; O + y;, )
Whereby Q represents the heating value (GJkg) of the fuel, Yj is the mass fraction
(dimensionless) of ash in the fuel, YK20 and Y' are the mass fractions (dimensionless) of
K20 and Na2O in the ash. Fouling might occur at 0.17 kg alkali GJ'1 and at 0.34 kg alkaliGJ-1, fouling would certainly occur. Figure 4.43 gives the alkali index (kg GJ-) in the ash for the
biomass fuels used in this experimental programme.
The primary sources of the problems for several ash depositions are (Jenkins B. M, 1998):
(1) the reaction of alkali with silica to form alkali silicates that melt or soften at low
temperatures (can be lower than 700°c, depending on the composition), and (2) the reaction of alkali with sulphur to form alkali sulphates on combustor heat transfer
surfaces.
The alkali indices for wood samples are very low. The highest alkali index was in straw (0.45kg/GJ), followed by the Miscanthus at 0.34 kg/GJ. The slag formation from the
combustion of these two biofuels could cause operational difficulties.
114
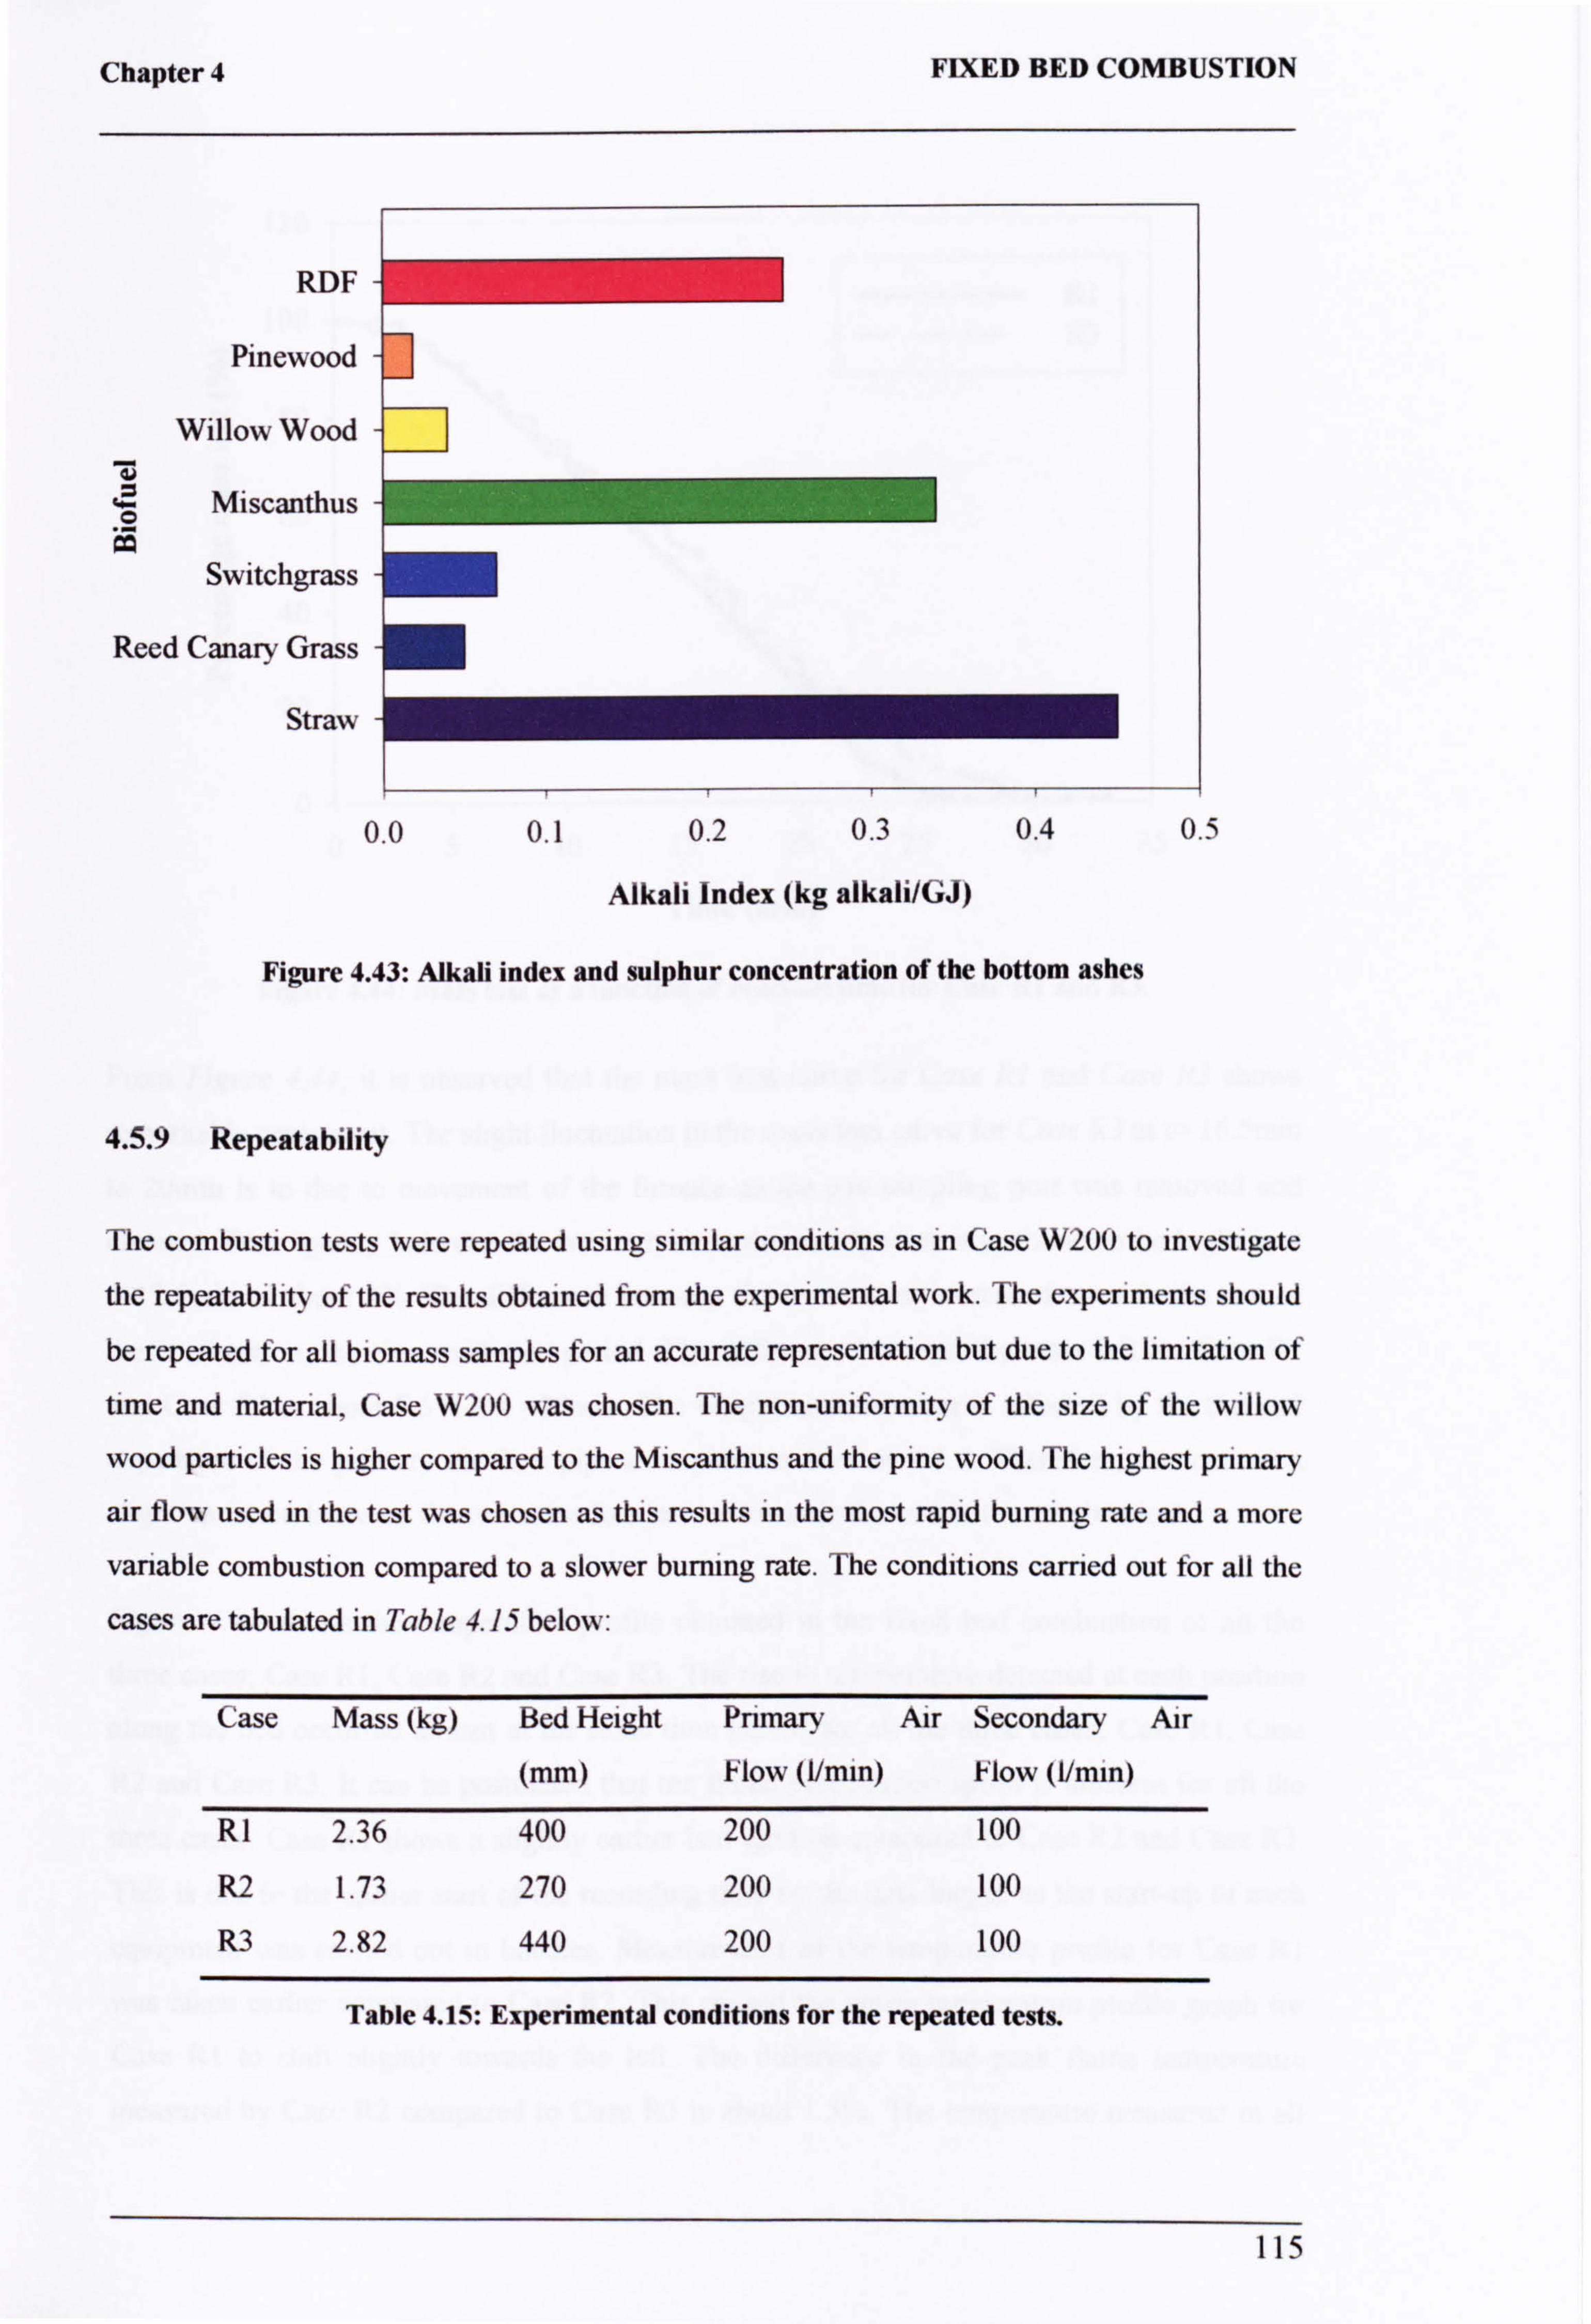
Chapter 4 FIXED BED COMBUSTION
RDF
Pinewood
Willow Wood äZ
Miscanthus
Switchgrass
Reed Canary Grass
Straw
Alkali Index (kg alkali/GJ)
Figure 4.43: Alkali index and sulphur concentration of the bottom ashes
4.5.9 Repeatability
The combustion tests were repeated using similar conditions as in Case W200 to investigate
the repeatability of the results obtained from the experimental work. The experiments should
be repeated for all biomass samples for an accurate representation but due to the limitation of
time and material, Case W200 was chosen. The non-uniformity of the size of the willow
wood particles is higher compared to the Miscanthus and the pine wood. The highest primary
air flow used in the test was chosen as this results in the most rapid burning rate and a more
variable combustion compared to a slower burning rate. The conditions carried out for all the
cases are tabulated in Table 4.15 below:
Case Mass (kg) Bed Height Primary Air Secondary Air
(mm) Flow (Umm) Flow (1/mm)
R1 2.36 400 200 100
R2 1.73 270 200 100
R3 2.82 440 200 100
Table 4.15: Experimental conditions for the repeated tests.
115
0.0 0.1 0.2 0.3 0.4 0.5

Chapter 4 FIXED BED COMBUSTION
120
100 e
80
E 60 d
40
20
0
R1 --- R3
Z-1
L-1
05 10 15 20 25 30 35
Time (min)
Figure 4.44: Mass loss as a function of reaction time for Case Rl and R3.
From Figure 4.44, it is observed that the mass loss curve for Case RI and Case R3 shows
remarkable agreement. The slight fluctuation in the mass loss curve for Case R3 at t= 16.5min
to 20min is to due to movement of the furnace as the gas sampling port was removed and cleaned. Discrepancy between the two curves at the steady-state was found to be highest at t=12.5min of about 3%. The difference between the two curves increased towards the end of the combustion; the char oxidation period. The difference between the mass left for Case R1
and Case R3 is about 7.6% at t =25min. The weight measurement is affected by the thermal
expansion of the primary air flow pipe as explain in Section 4.1.2. Therefore, this caused a slight variation between the two mass loss curves towards the end of the combustion.
Figure 4.45 shows the temperature profile obtained in the fixed bed combustion of all the three cases; Case R1, Case R2 and Case R3. The rise in temperature detected at each position along the bed occurred almost at the same time period for all the three cases; Case R1, Case R2 and Case R3. It can be postulated that the flame propagation speed is uniform for all the three cases. Case RI shows a slightly earlier bed ignition compared to Case R2 and Case R3. This is due to the earlier start of the recording time by the data logger as the start-up of each equipment was carried out in batches. Measurement of the temperature profile for Case RI
was taken earlier compared to Case R2. This caused the entire temperature profile graph for Case RI to shift slightly towards the left. The difference in the peak flame temperature measured by Case R2 compared to Case R3 is about 1.5%. The temperature measured in all
116
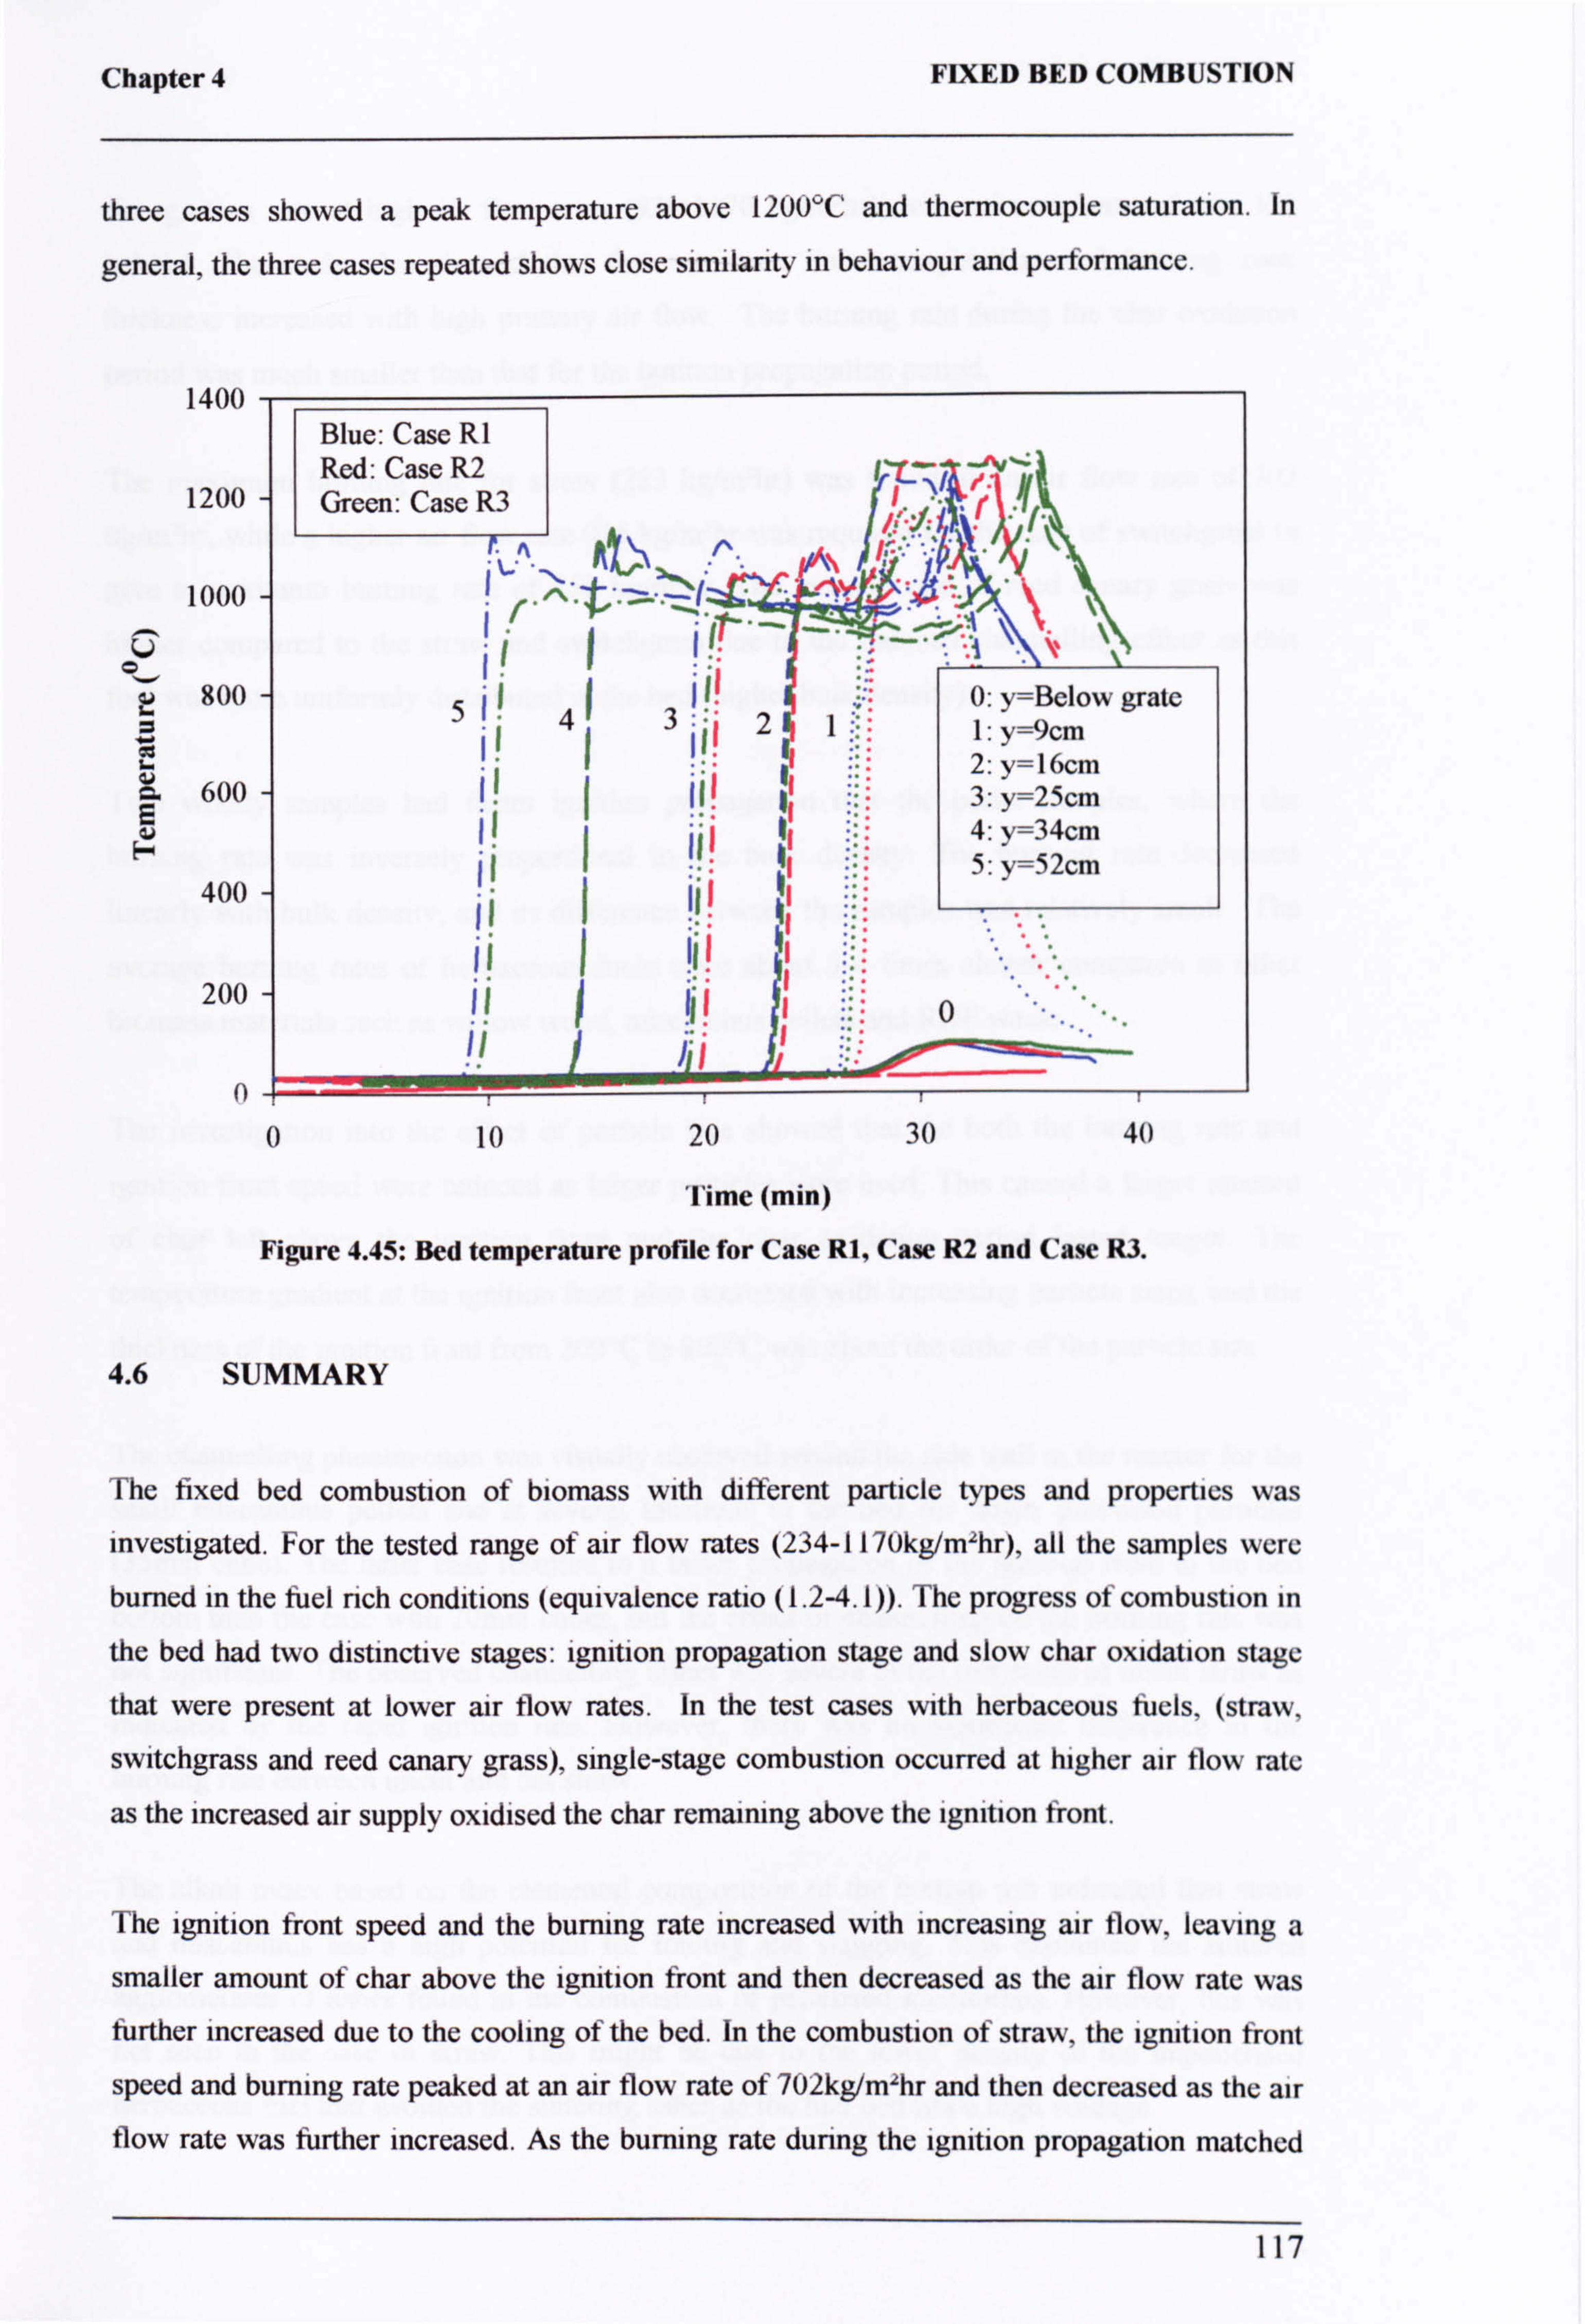
Chapter 4 FIXED BED COMBUSTION
three cases showed a peak temperature above 1200°C and thermocouple saturation. In
general, the three cases repeated shows close similarity in behaviour and performance.
1400
1200
1000
L 800 0
ä 600 E V
400
200
0
Blue: Case R1 Red: Case R2 Green: Case R3 ý. : .7
543 II 0: y=Below grate
2 1: y=9cm 2: y=1 firm 3: y=25cm 4: y=34cm 5: y=52cm
ii ii '0
0 10 20 30 40
Time (min)
4.6
Figure 4.45: Bed temperature profile for Case RI, Case R2 and Caw R3.
SUMMARY
The fixed bed combustion of biomass with different particle types and properties was investigated. For the tested range of air flow rates (234-117ukg/m2hr), all the samples were
burned in the fuel rich conditions (equivalence ratio (1.2-4.1)). The progress of combustion in
the bed had two distinctive stages: ignition propagation stage and slow char oxidation stage
that were present at lower air flow rates. In the test cases with herbaceous fuels, (straw,
switchgrass and reed canary grass), single-stage combustion occurred at higher air flow rate
as the increased air supply oxidised the char remaining above the ignition front.
The ignition front speed and the burning rate increased with increasing air flow, leaving a
smaller amount of char above the ignition front and then decreased as the air flow rate was further increased due to the cooling of the bed. In the combustion of straw, the ignition front
speed and burning rate peaked at an air flow rate of 702kg/m2hr and then decreased as the air flow rate was further increased. As the burning rate during the ignition propagation matched
117
Chapter 4 FIXED BED COMBUSTION
the ignition rate at high air flow rates (936-1170 kg/m2hr), less unbumt material was left
behind. The study also showed that the maximum flame temperature and burning zone
thickness increased with high primary air flow. The burning rate during the char oxidation
period was much smaller than that for the ignition propagation period.
The maximum burning rate for straw (223 kg/mzhr) was found at an air flow rate of 702
kg/mzhr, while q higher air flow rate 936 kg/m2hr was required for the case of switchgrass to
give a maximum burning rate of 253 kg/m2hr. The burning rate of reed canary grass was higher compared to the straw and switchgrass due to the reduced channelling effect as this
fuel was more uniformly distributed in the bed (higher bulk density).
Two woody samples had faster ignition propagation that the pellet samples, where the burning rate was inversely proportional to the bulk density. The burning rate decreased
linearly with bulk density, and its difference between the samples was relatively small. The
average burning rates of herbaceous fuels were about 3-4 times slower compared to other biomass materials such as willow wood, miscanthus pellets and RDF waste.
The investigation into the effect of particle size showed that the both the burning rate and ignition front speed were reduced as larger particles were used. This caused a larger amount
of char left above the ignition front and the char oxidation period lasted longer. The
temperature gradient at the ignition front also decreased with increasing particle sizes, and the
thickness of the ignition front from 200°C to NOT was about the order of the particle size.
The channelling phenomenon was visually observed around the side wall in the reactor for the
small miscanthus pellets and at several locations in the bed for larger pinewood particles (35mm cube). The latter case resulted in a faster propagation of the ignition front to the bed
bottom than the case with 20mm cubes, but the effect of channelling on the burning rate was
not significant. The observed channelling effect was severe in the test cases of uncut straw as indicated by the rapid ignition rate. However, there was no significant difference in the burning rate between uncut and cut straw.
The alkali index based on the elemental composition of the bottom ash indicated that straw
and miscanthus has a high potential for fouling and slagging. This explained the sintered agglomerates of ashes found in the combustion of pelletised miscanthus. However, this was not seen in the case of straw. This might be due to the lower density of the unpelletised herbaceous fuel that avoided the sintering ashes as the fuel bed has a high voidage.
118
Chapter 5 COUNTER-CURRENT GASIFICATION
CHAPTER 5
COUNTER-CURRENT GASIFICATION
This chapter presents the gasifier design, experimental setup, results and discussion of the fixed bed gasification of commercial charcoal. The experimental work involves the
gasification of char in a counter-current gasifier under varying mass flow rates of steam and
air. The percentage of steam in the total reactants was in the range of 30-55%wt. As known
from literature, gasification can be carried out using either air and/or steam as a reactant. The
use of steam increases the hydrogen content of the combustible gases at the expense of a lower operation temperature. Therefore, a heated furnace was used to increase or maintain the bed temperature to encourage crucial gasification reactions as the gasification process
comprises of both endothermic and exothermic reactions. The temperature at different
locations, gas composition and mass of charcoal were measured as the gasification progressed.
5.1 GASIFIER DESIGN AND CONSTRUCTION
5.1.1 Introduction
This section presents the design and construction of the novel gasifier used in this
experimental work. The fundamental designs and problems associated with conventional gasifiers are highlighted in the chapter on literature review. As commonly known, producer gas from biomass gasification contains particulate and organic contaminants (tars) which limits the end use of the product gas and causes operational problems. The performance as well as the investment and operational cost of gas cleaning systems are determined by the gasifier performance and the gas cleaning systems (Hasler, 1999). The design of the updraft gasifier successfully tackles the conventional challenges faced by traditional gasifiers:
I. Countercurrent gasifiers are not considered as an option for IC engine application due
to the high tar content >100mg/Nm3. If tar cleaning is carried out, valuable energy is lost when tar is taken from the gas. The newly designed gasifier differs from
conventional updraft and downdraft gasifier and produces practically tar-free gas. The high operating temperature of this gasifier (about 800°) is one of the unique and important features as this acts as a catalyst to pyrolyse tar to carbon and gas.
119

Chapter 5 COUNTER-CURRENT GASIFICATION
2. The newly developed gasifier provides the opportunity to combine thermal
gasification with a Stirling engine for use in small combined heat and power plants based on biomass. The high temperature gas has the advantage of improving the
overall electricity generation efficiency. Under normal operating conditions of
existing updraft gasifiers the temperature of the producer gas is low.
The design of this gasifier is part of an integrated two-stage unit. This PhD project focuses on this novel design and developing an understanding of the operation of the gasification
chamber that will be directly coupled to a pyrolysis chamber.
The steam and preheated air flow rate are operating parameters that are of interest in this
investigation. The application of steam requires prudent design to maintain its' temperature
above 100°C in all parts of the furnace and pipelines to avoid steam condensation. As the
gasifying steam and air were introduced into the bed at the same inlet location, it was
important to ensure that condensation did not occur as this would flood the pipelines leading
to a stop in the experiments. The small scale experiment would also require an accurate steam
measurement method for low steam flow rate (<10kg/hr). This proves challenging as the
standard commercial steam flow meter is mainly designed for steam flow rates of <100kg/hr.
The high operating temperature (=1000°C) gives rise to two engineering difficulties. One is
the selection of a suitable material of construction that will withstand the high temperature
encountered with the appropriate heaters to provide the heating power demanded. Another
feature that is necessary in the gasifier for efficient operation is a continuous or batch ash discharge system. The quantity of ash produced in this experiment using commercial char is
low but the quantities may become significant for other biomass residues as observed by Di
Blasi (1999). The gasifier design and auxiliary equipments are discussed in detail in the following sections.
120
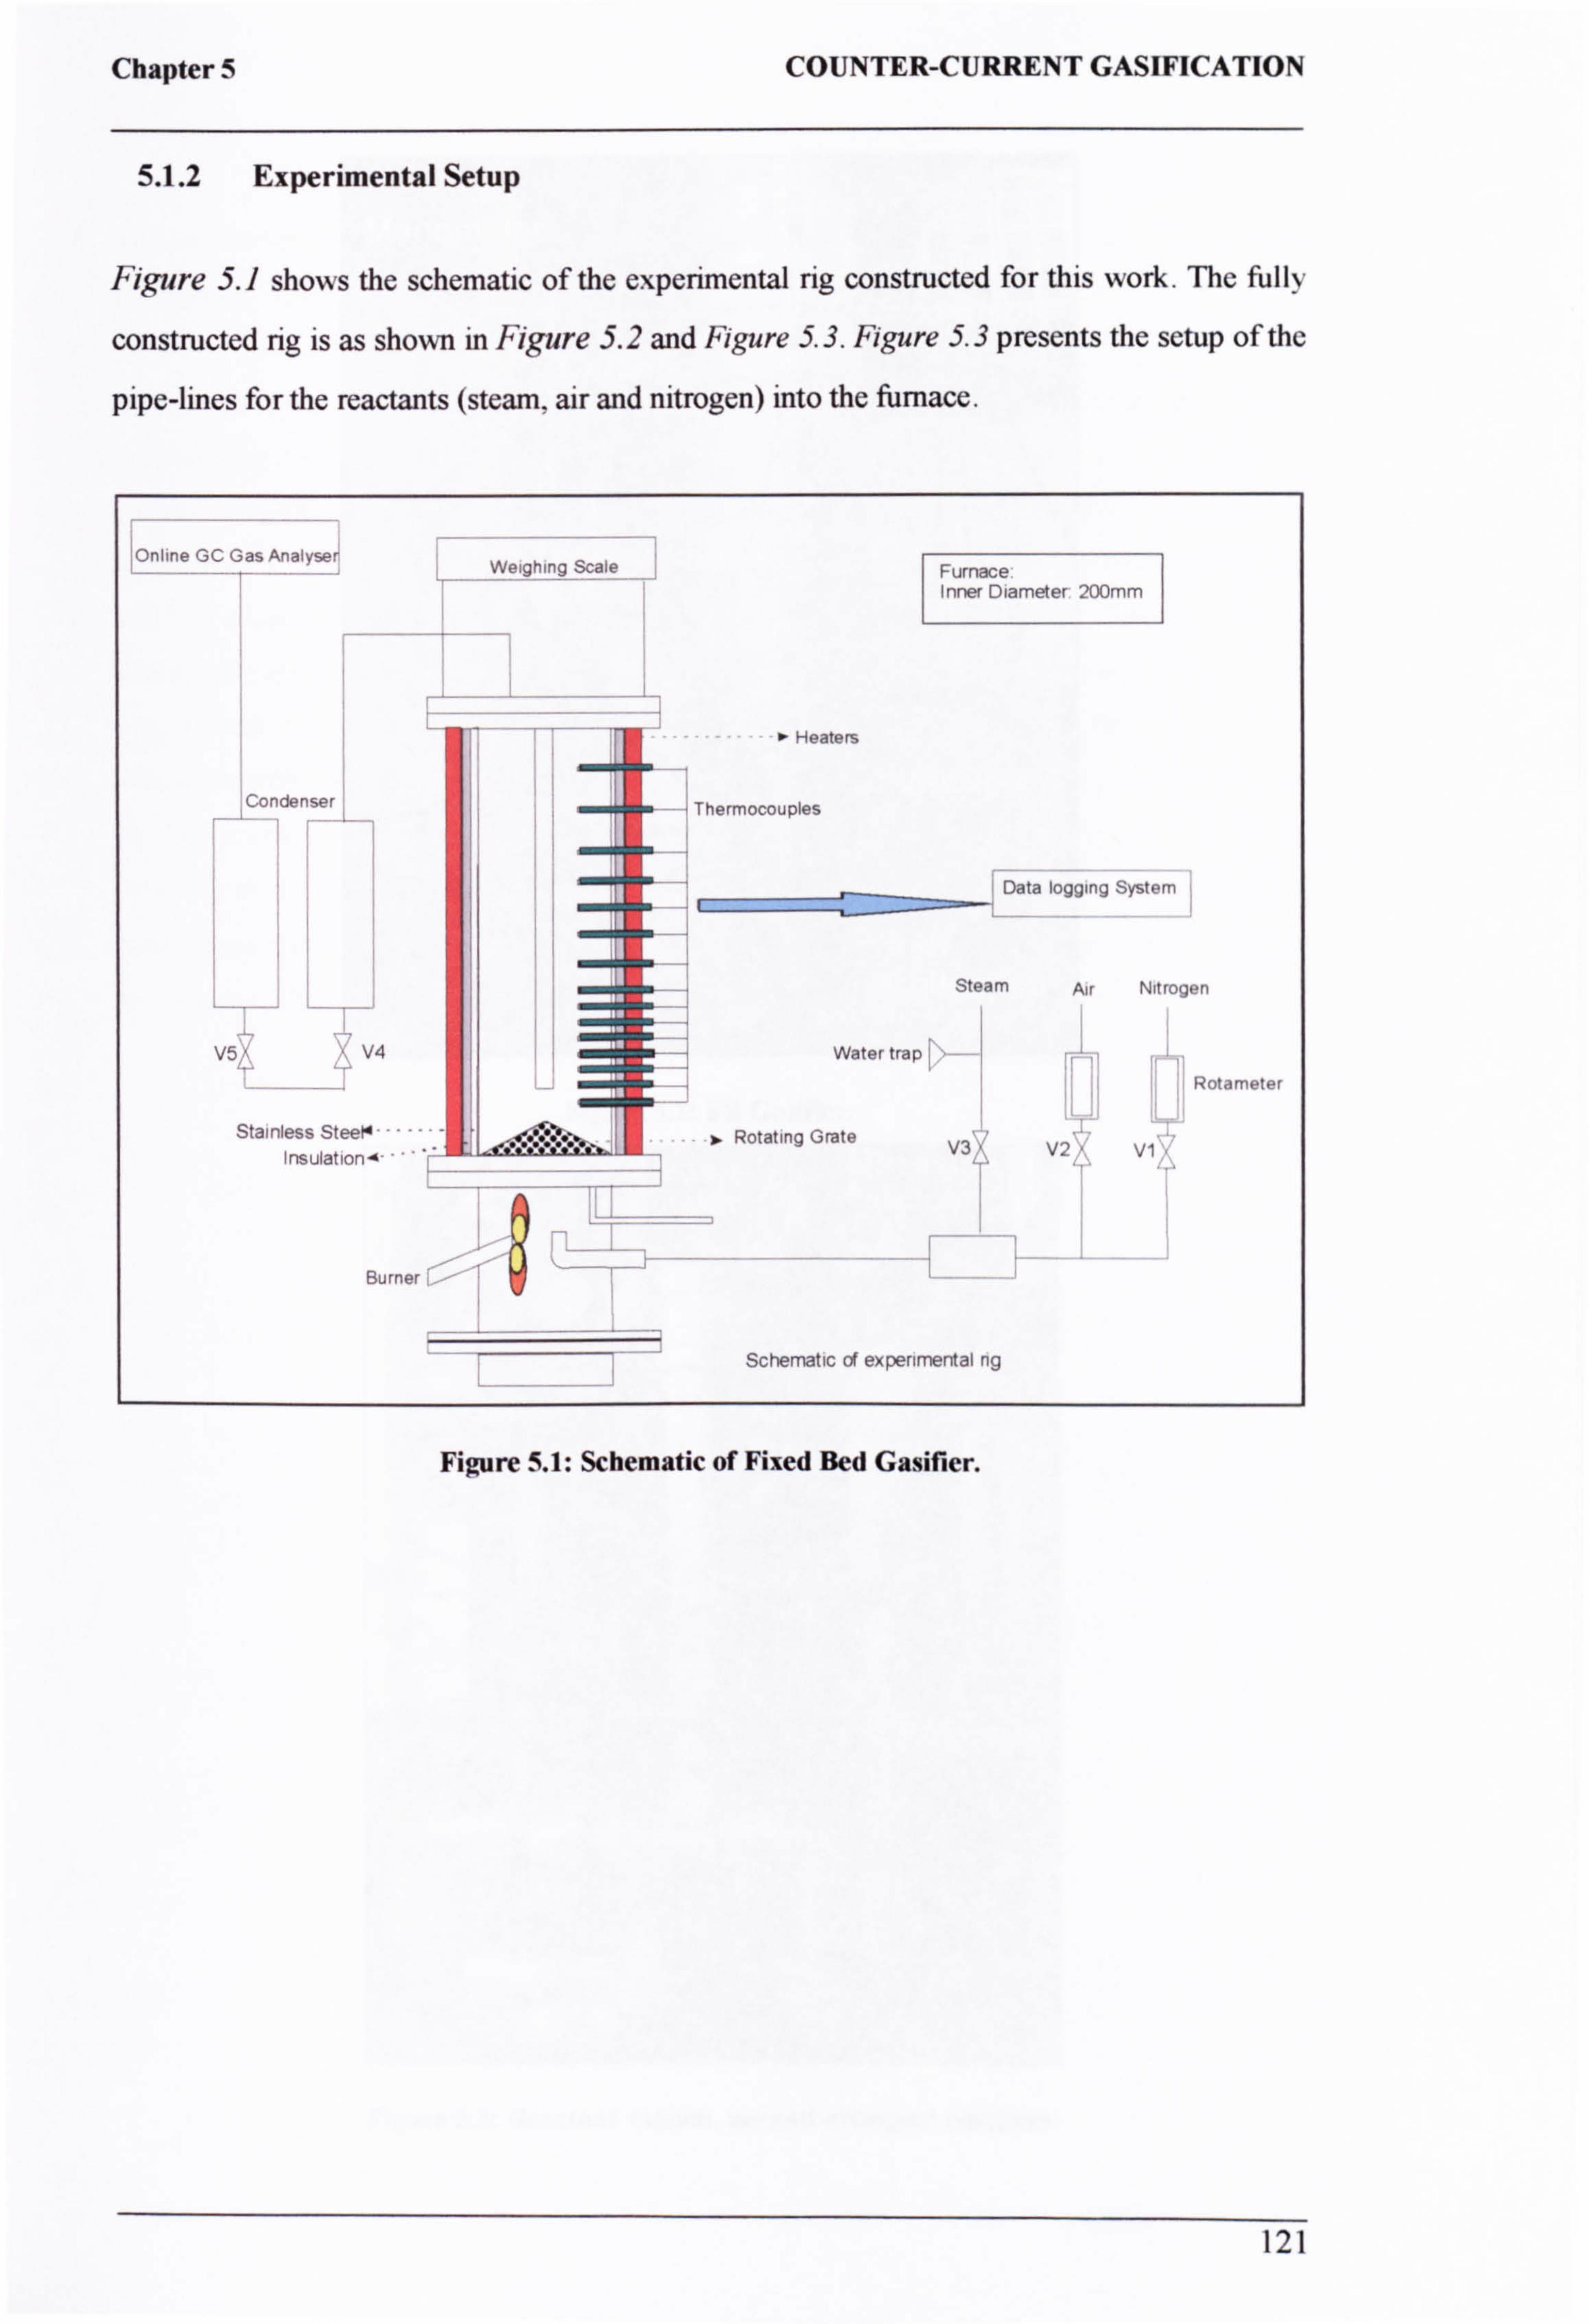
Chapter 5 COUNTER-CURRENT GASIFICATION
5.1.2 Experimental Setup
Figure 5.1 shows the schematic of the experimental rig constructed for this work. The fully
constructed rig is as shown in Figure 5.2 and Figure 5.3. Figure 5.3 presents the setup of the
pipe-lines for the reactants (steam, air and nitrogen) into the furnace.
Online GC Gas Analyser Weighing Scale Furnace
Inner Diameter 200mm
__ -___-T- -º Heaters i
tCondenser --- Thermocouples
Data logging System
iI Steam Air Nitrogen
J, I V54 x V4 Water trap ý?
--
.. _..: Rotameter
Stainless SteeN ----- - Rotating Grate V3 V2 j Vi nsulationA
Burner
Schematic of experimental ng
Figure 5.1: Schematic of Fixed Bed Gasifier.
121
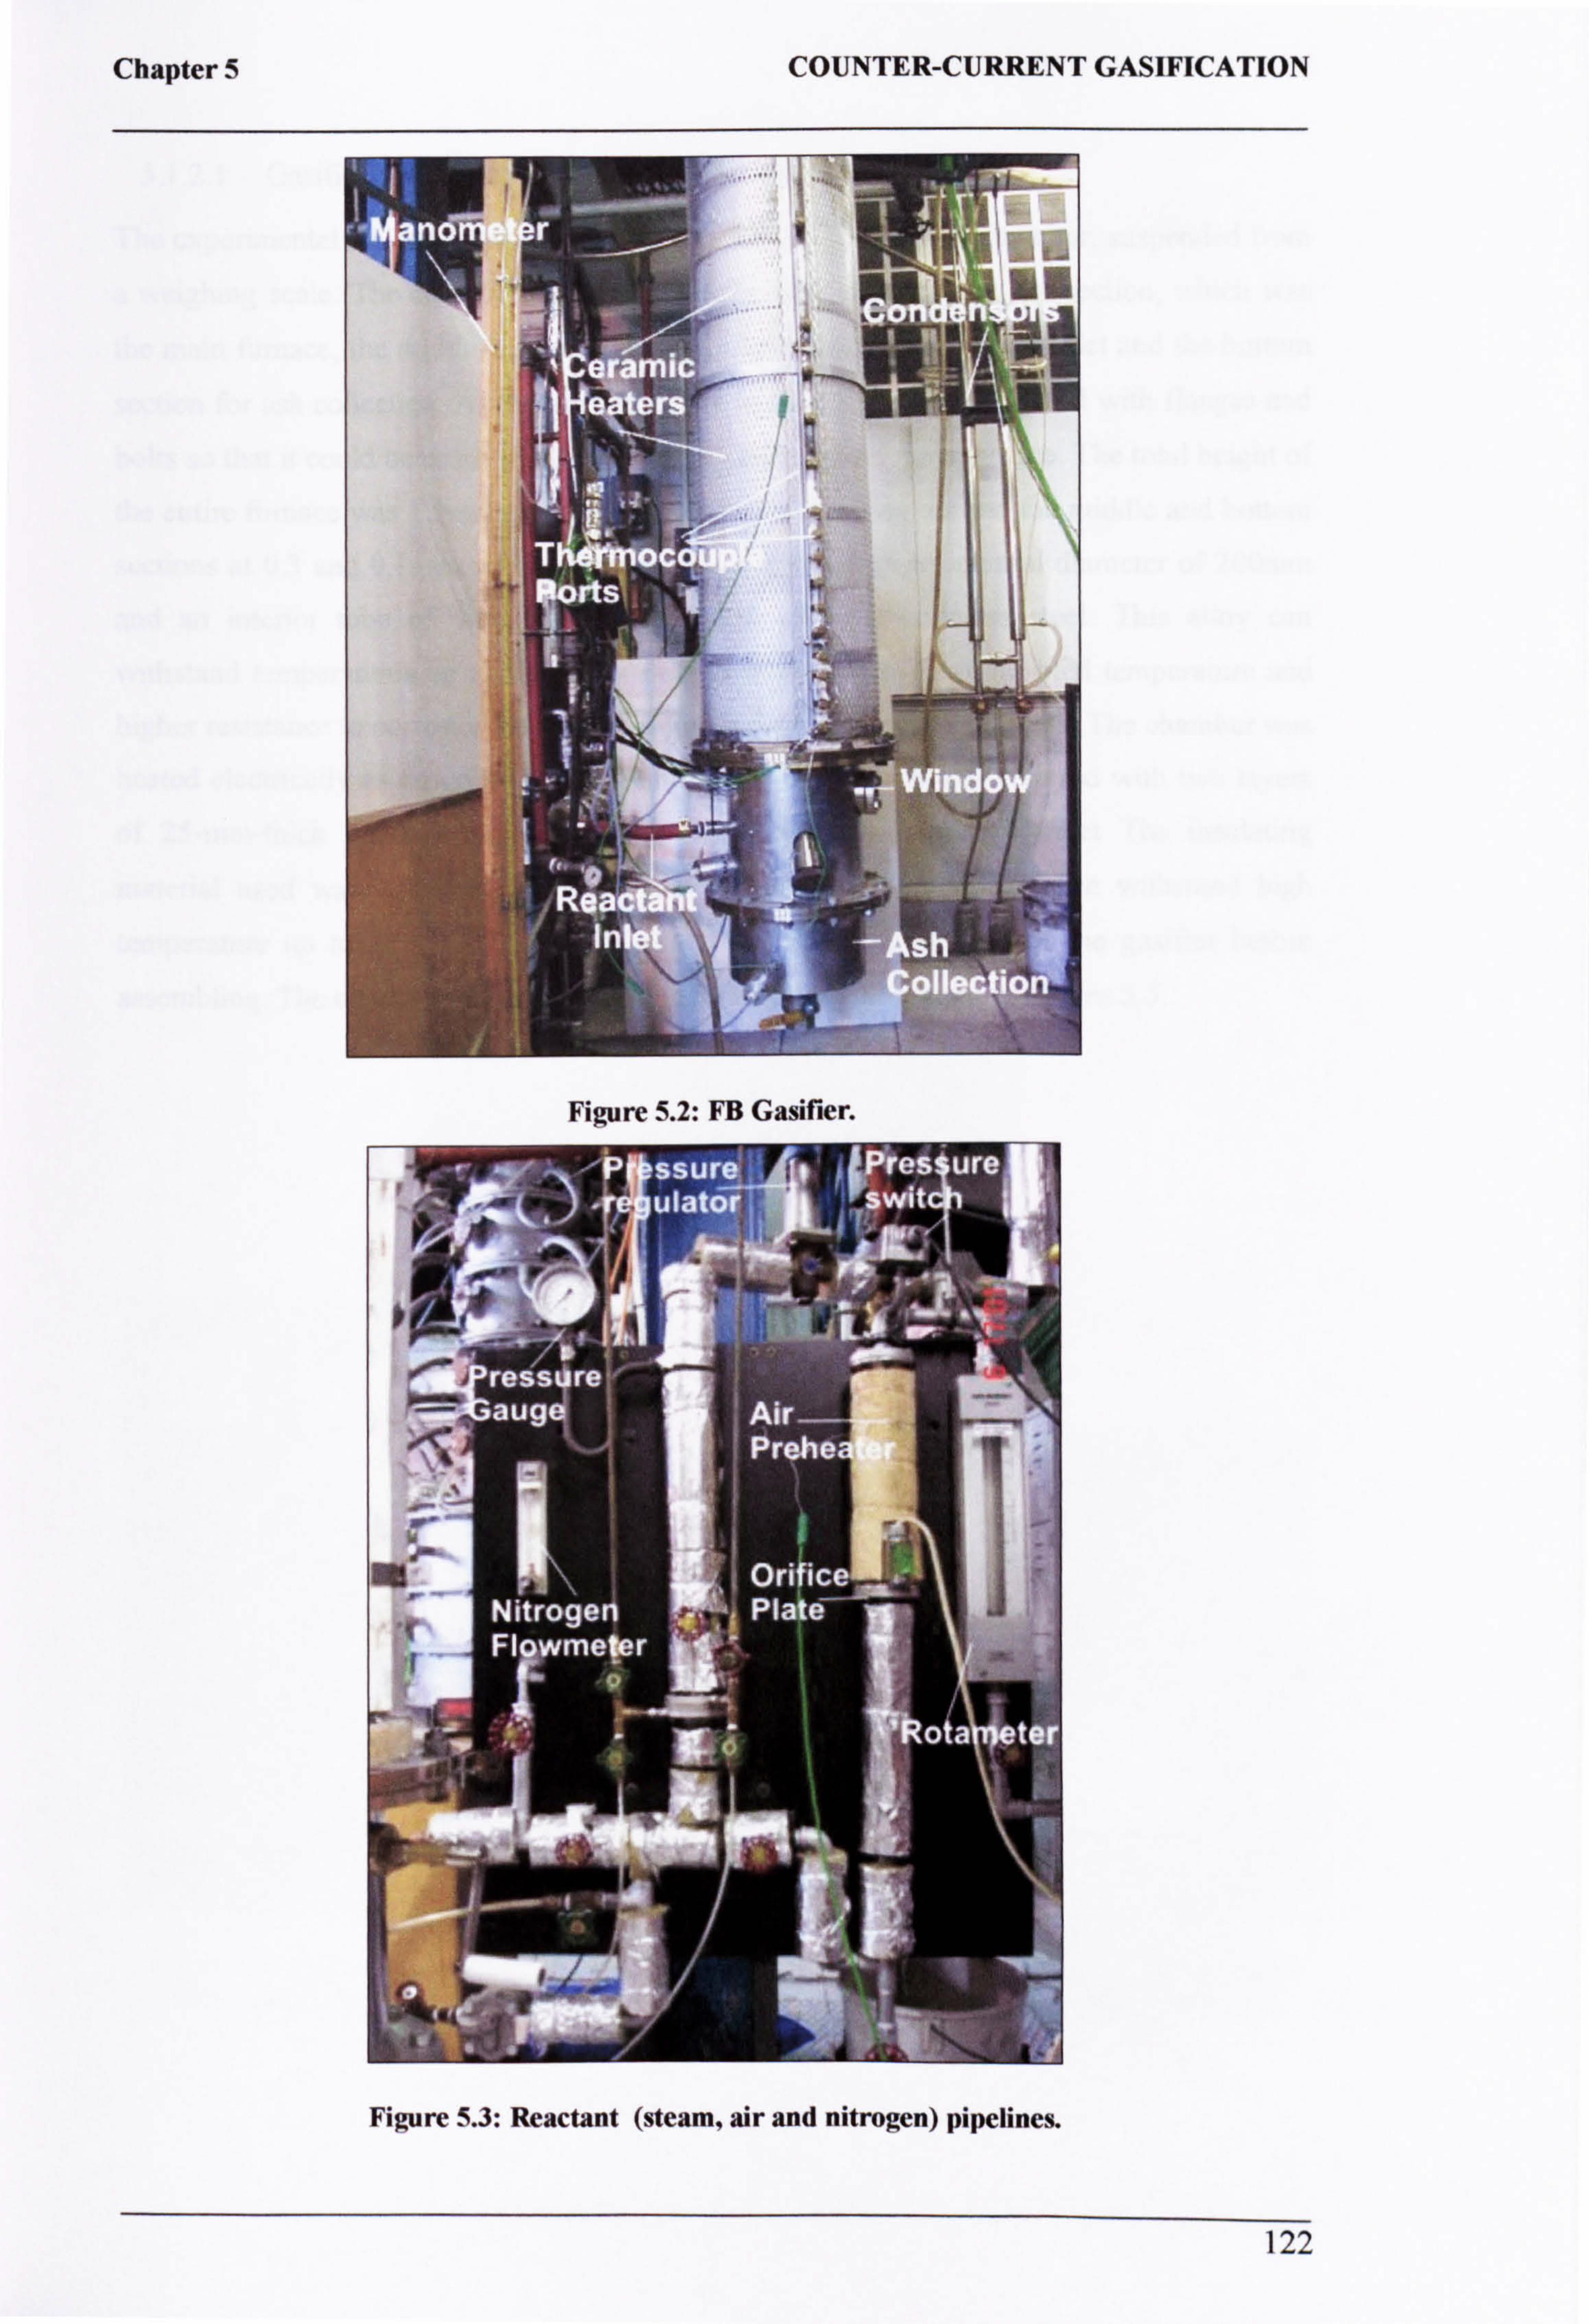
Chapter 5 COUNTER-CURRENT GASIFICATION
Figure 5.3: Reactant (steam, air and nitrogen) pipelines.
122
Figure 5.2: FB Gasifier.
Chapter 5 COUNTER-CURRENT GASIFICATION
5.1.2.1 Gasification Chamber
The experimental rig consisted of a vertical cylindrical gasification chamber, suspended from
a weighing scale. The chamber divided into three main sections; the top section, which was
the main furnace, the middle section containing the reactants and burner inlet and the bottom
section for ash collection. All the sections were secured together and sealed with flanges and bolts so that it could be easily disassembled for cleaning and maintenance. The total height of the entire furnace was 1.9metres with the top section at 1.5metres and the middle and bottom
sections at 0.3 and 0. lmetres respectively. The chamber had an internal diameter of 200mm
and an interior tube of 4mm thick constructed with 316-stainless steel. This alloy can
withstand temperatures up to 1200°C with high tensile strength at elevated temperature and higher resistance to corrosion compared to the conventional stainless steels. The chamber was heated electrically as described in Section 5.1.2.3. The furnace was covered with two layers
of 25-mm-thick insulating material made from thermal ceramic blanket The insulating
material used was Kaowool Blanket S thermal ceramic blanket that can withstand high
temperature up to 1260°C. Figure 5.4 shows the different sections of the gasifier before
assembling. The exact dimensions of the experimental rig are shown in Figure S. S.
123
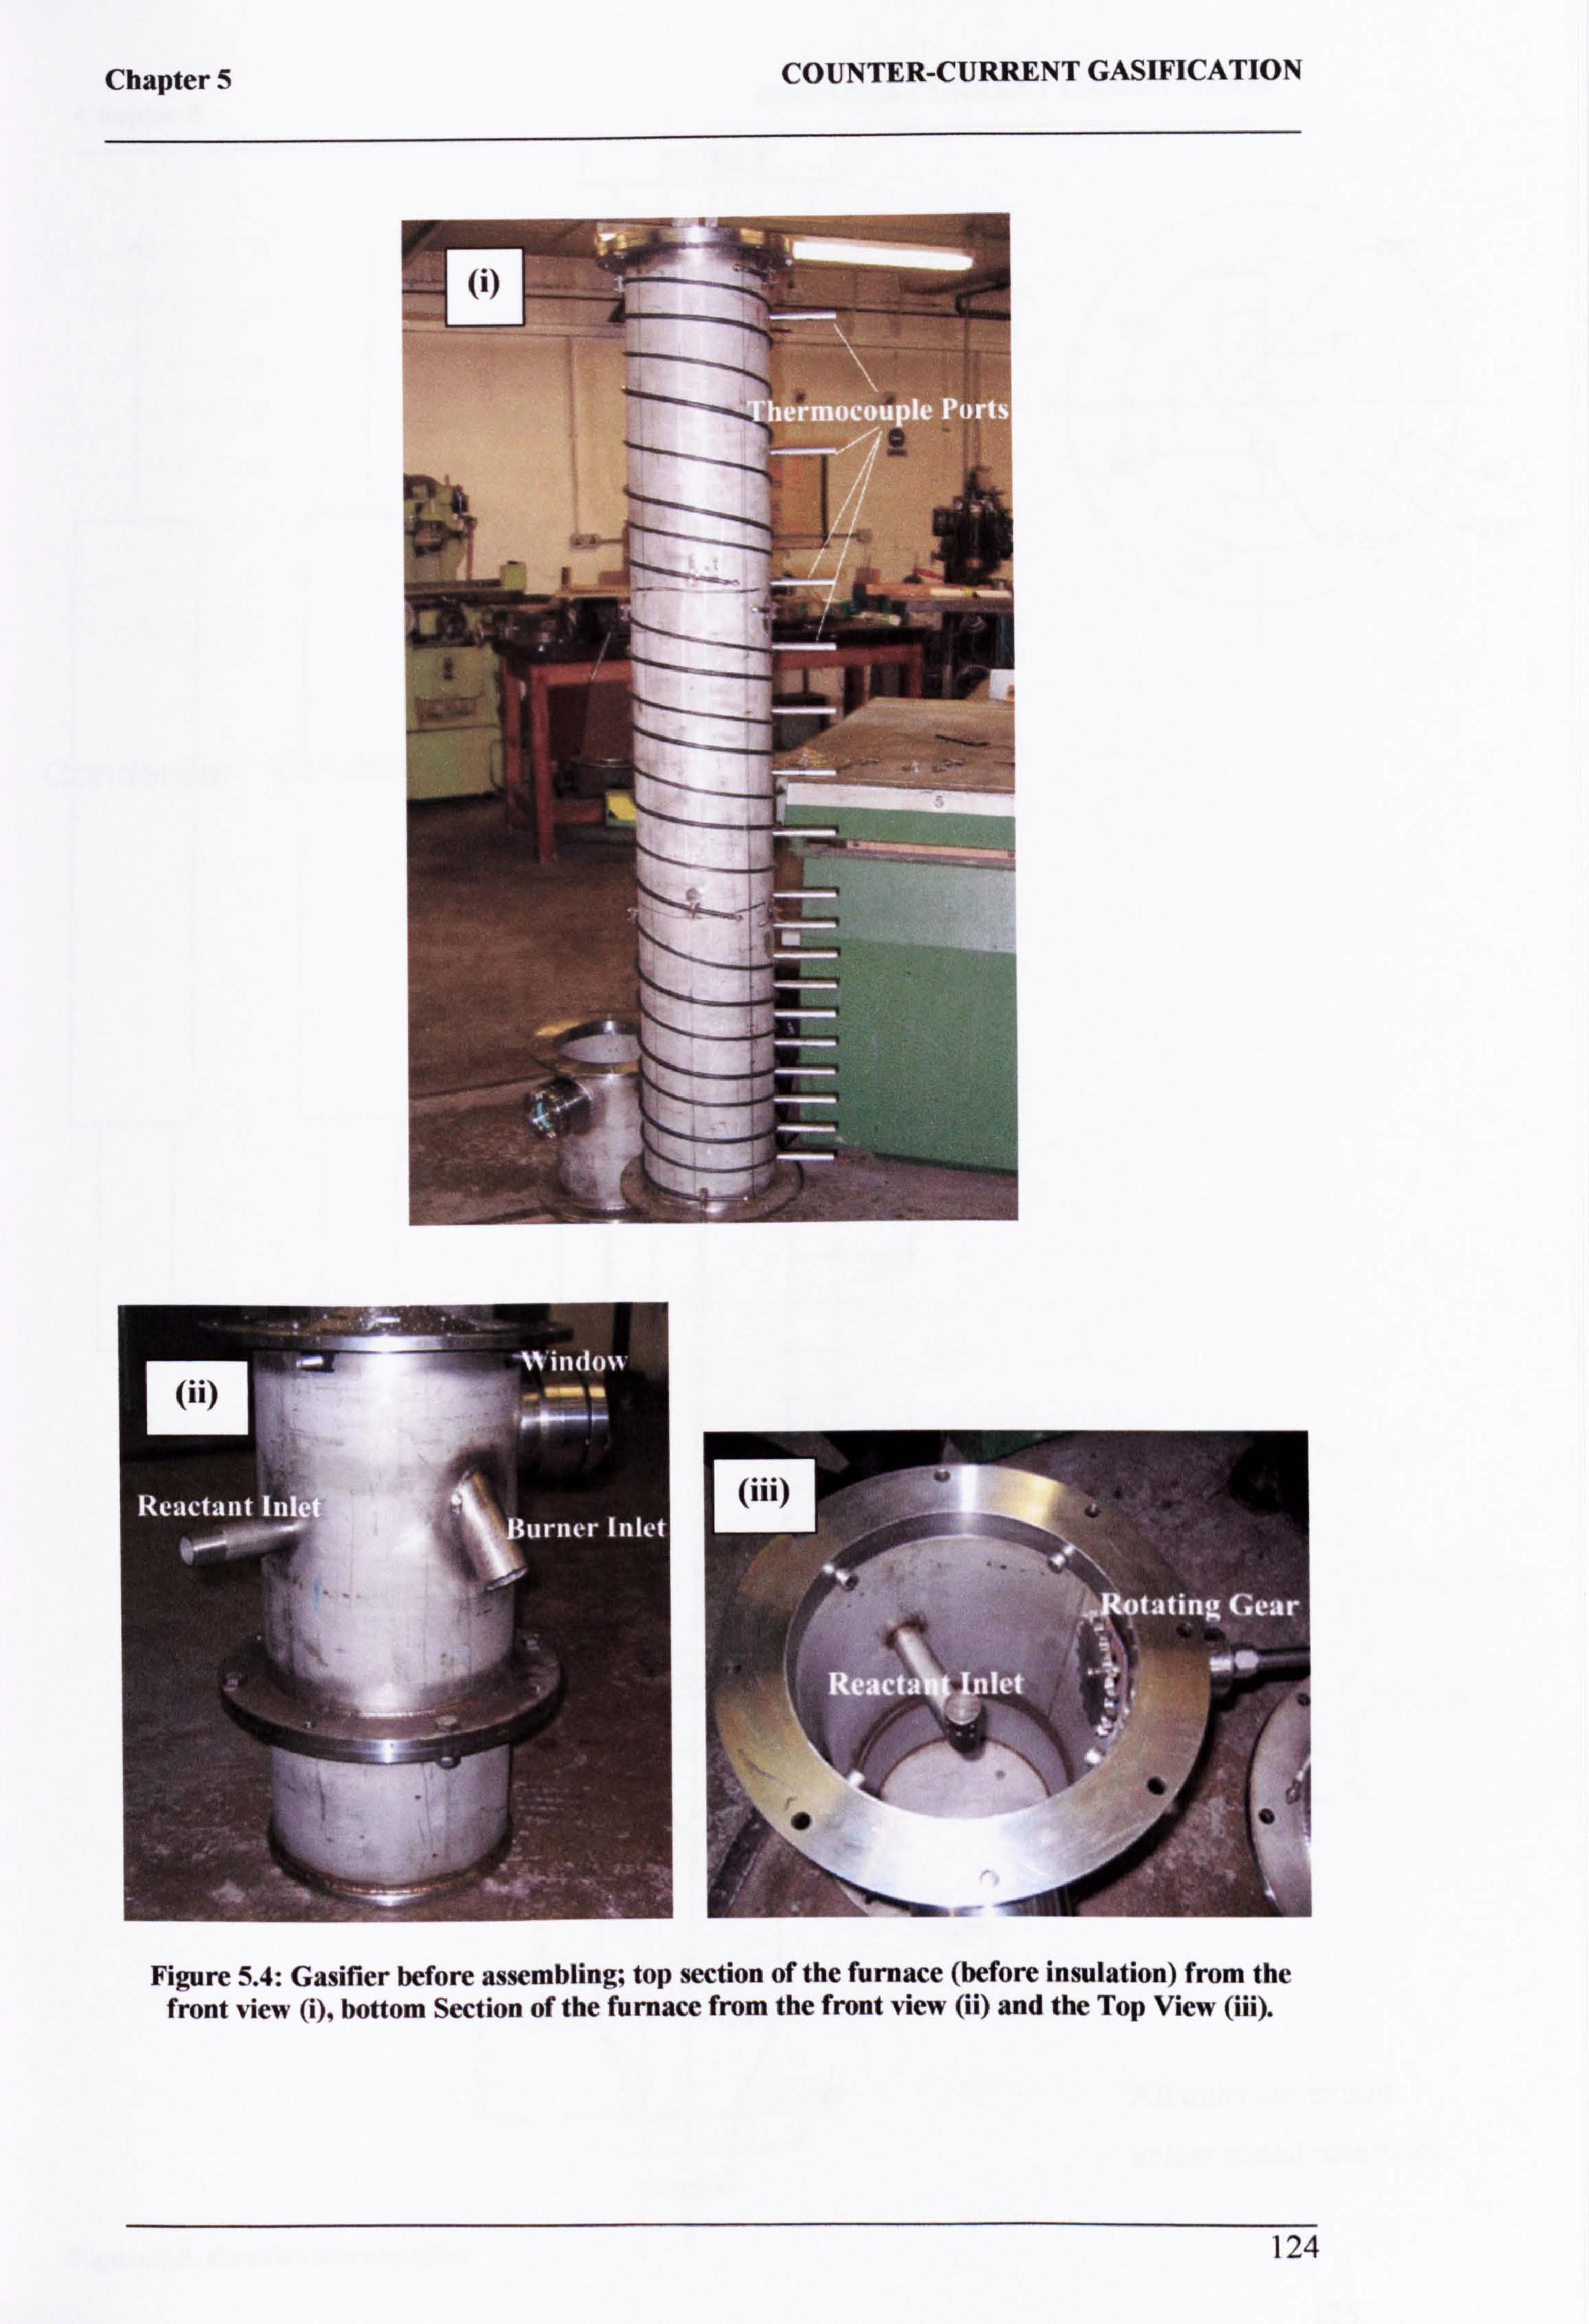
Chapter 5 COUNTER-CURRENT GASIFICATION
Figure 5.4: Gasifier before assembling; top section of the furnace (before insulation) from the front view (i), bottom Section of the furnace from the front view (ii) and the Top View (iii).
124

Chapter 5
S
0
COUNTER-CURRENT GASIFICATION
E
1
i
dender denser
Steam Air Nitrogen
50 Flowmeter
5 Valve
rn ti
All units are in mm
unless stated otherwise.
_ : Figure 5.5: Gasification chamber
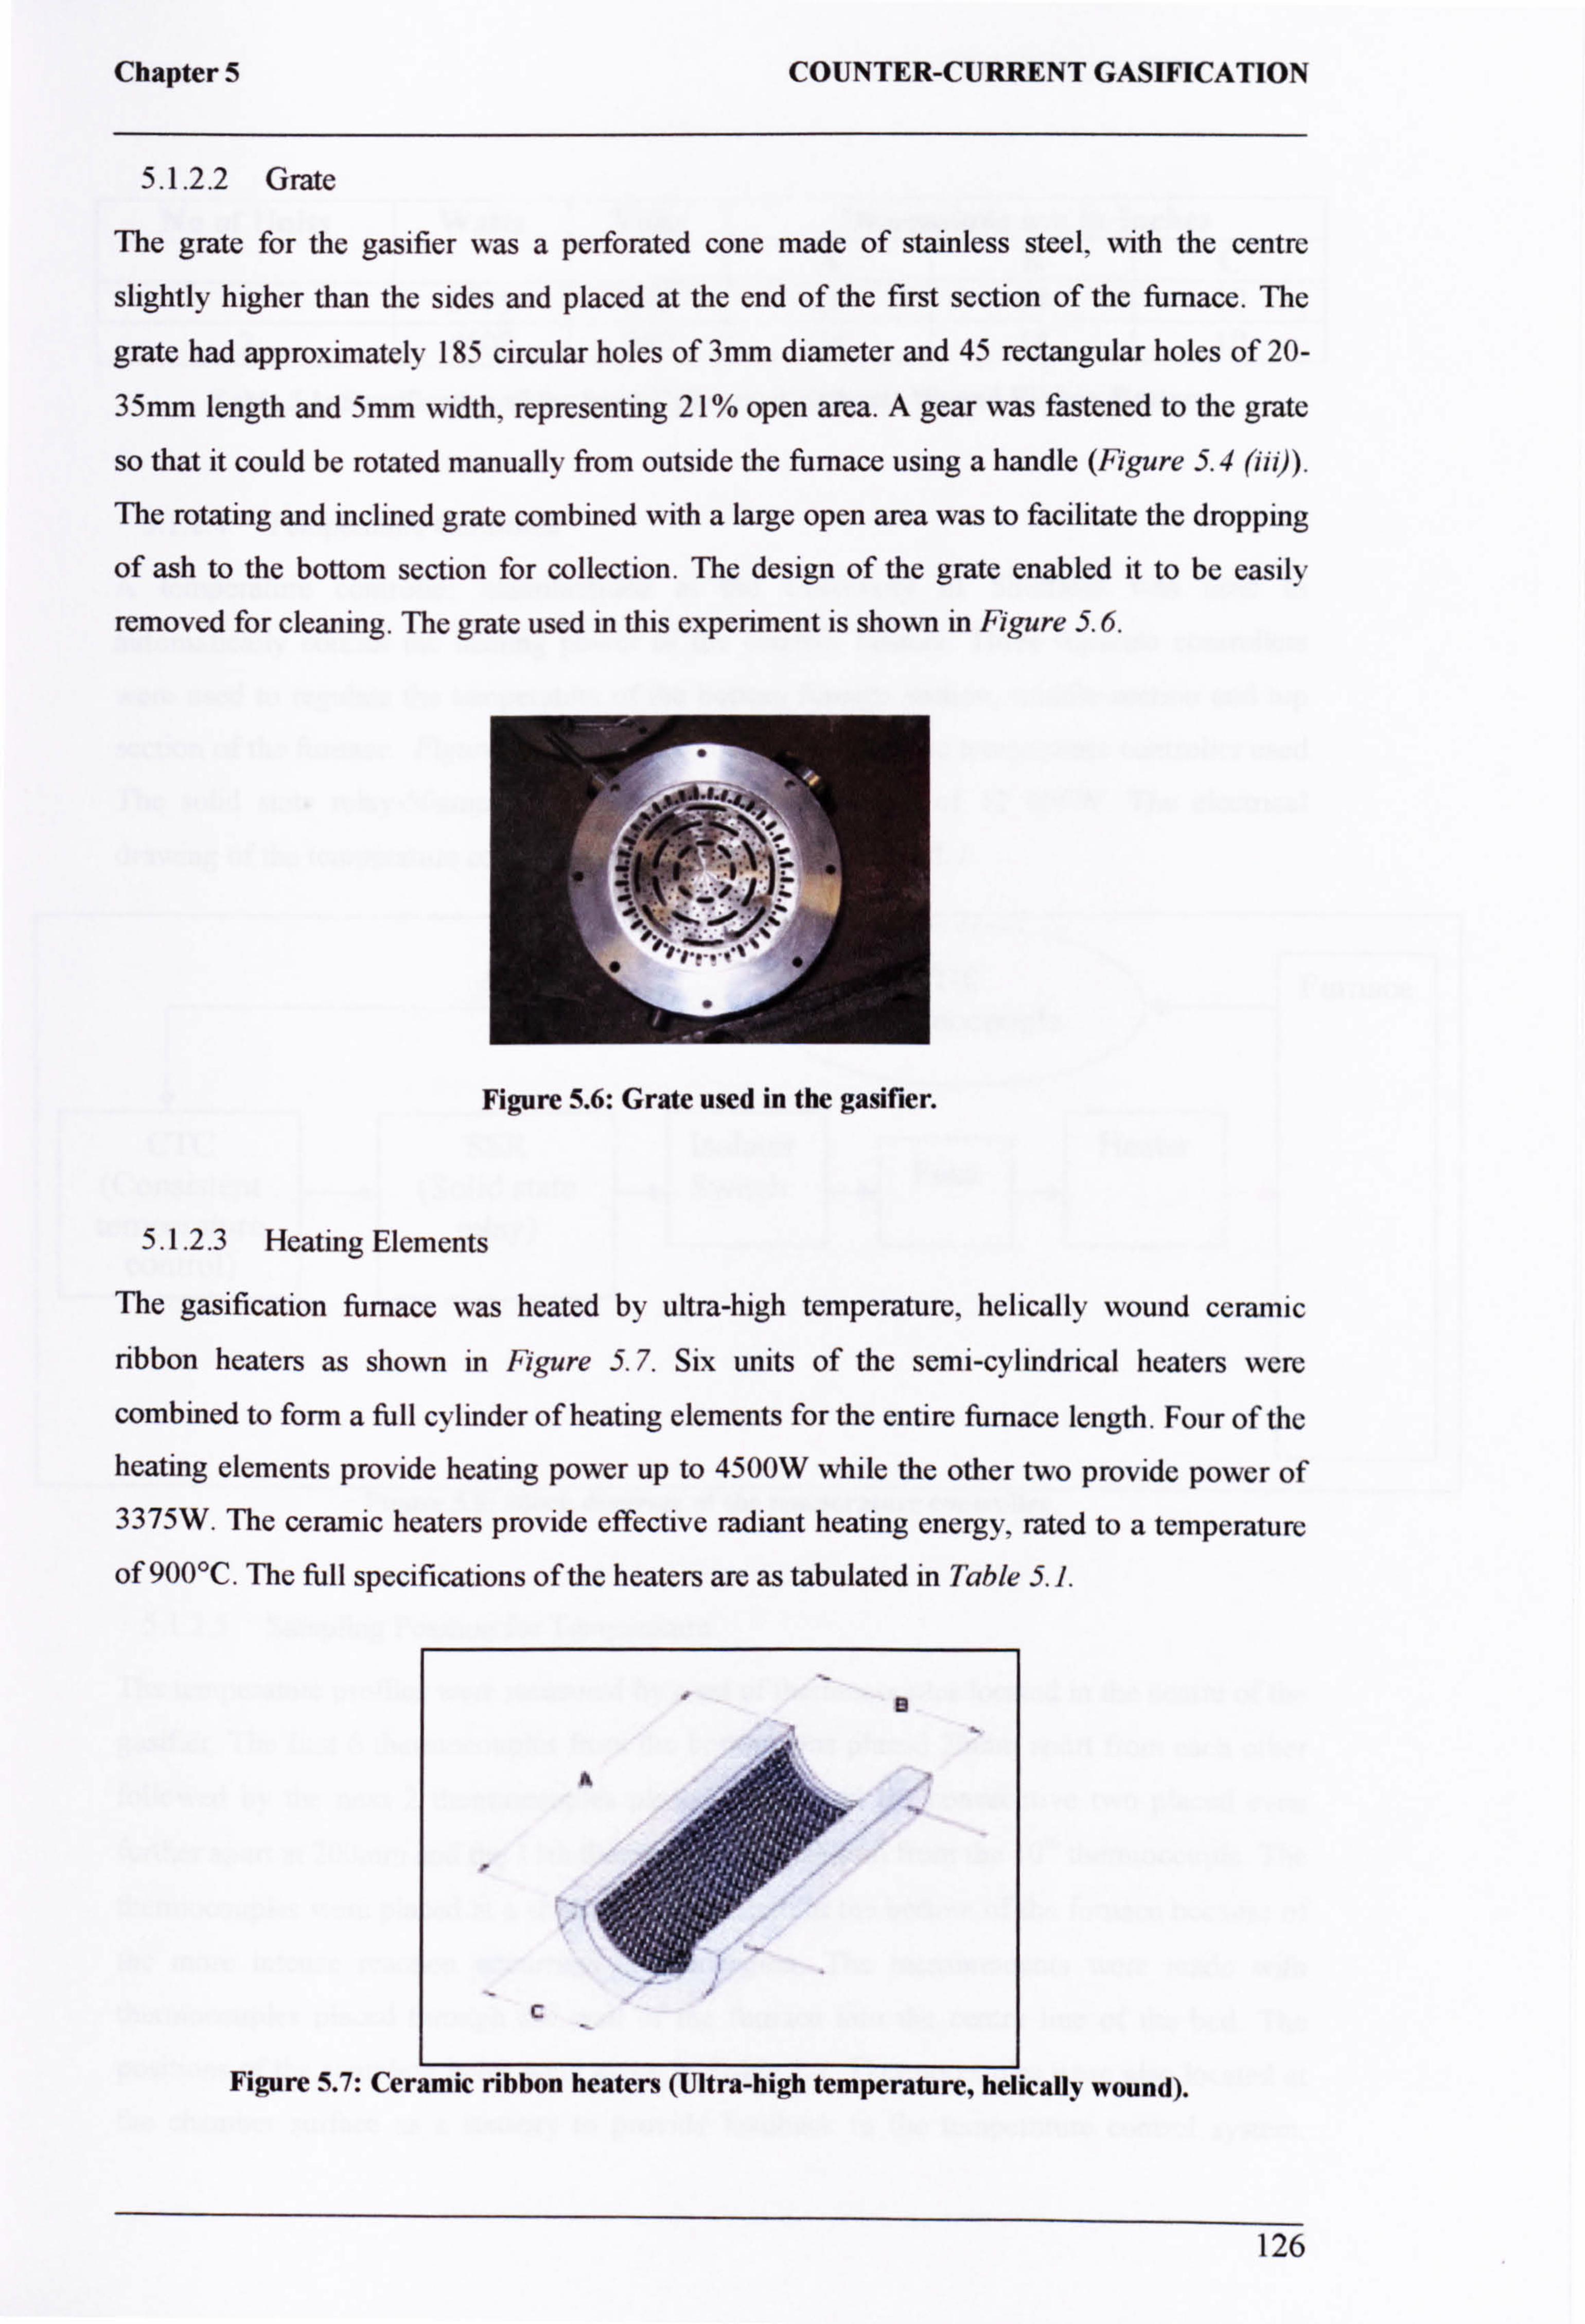
Chapter 5 COUNTER-CURRENT GASIFICATION
5.1.2.2 Grate
The grate for the gasifier was a perforated cone made of stainless steel, with the centre
slightly higher than the sides and placed at the end of the first section of the furnace. The
grate had approximately 185 circular holes of 3mm diameter and 45 rectangular holes of 20-
35mm length and 5mm width, representing 21% open area. A gear was fastened to the grate
so that it could be rotated manually from outside the furnace using a handle (Figure 5.4 (iii)).
The rotating and inclined grate combined with a large open area was to facilitate the dropping
of ash to the bottom section for collection. The design of the grate enabled it to be easily
removed for cleaning. The grate used in this experiment is shown in Figure 5.6.
Figure 5.6: Grate used in the gasifier.
5.1.2.3 Heating Elements
The gasification furnace was heated by ultra-high temperature, helically wound ceramic
ribbon heaters as shown in Figure 5.7. Six units of the semi-cylindrical heaters were
combined to form a full cylinder of heating elements for the entire furnace length. Four of the heating elements provide heating power up to 4500W while the other two provide power of 3375W. The ceramic heaters provide effective radiant heating energy, rated to a temperature
of 900°C. The full specifications of the heaters are as tabulated in Table 5.1.
B
C
Figure 5.7: Ceramic ribbon heaters (Ultra-high temperature, helically wound).
126
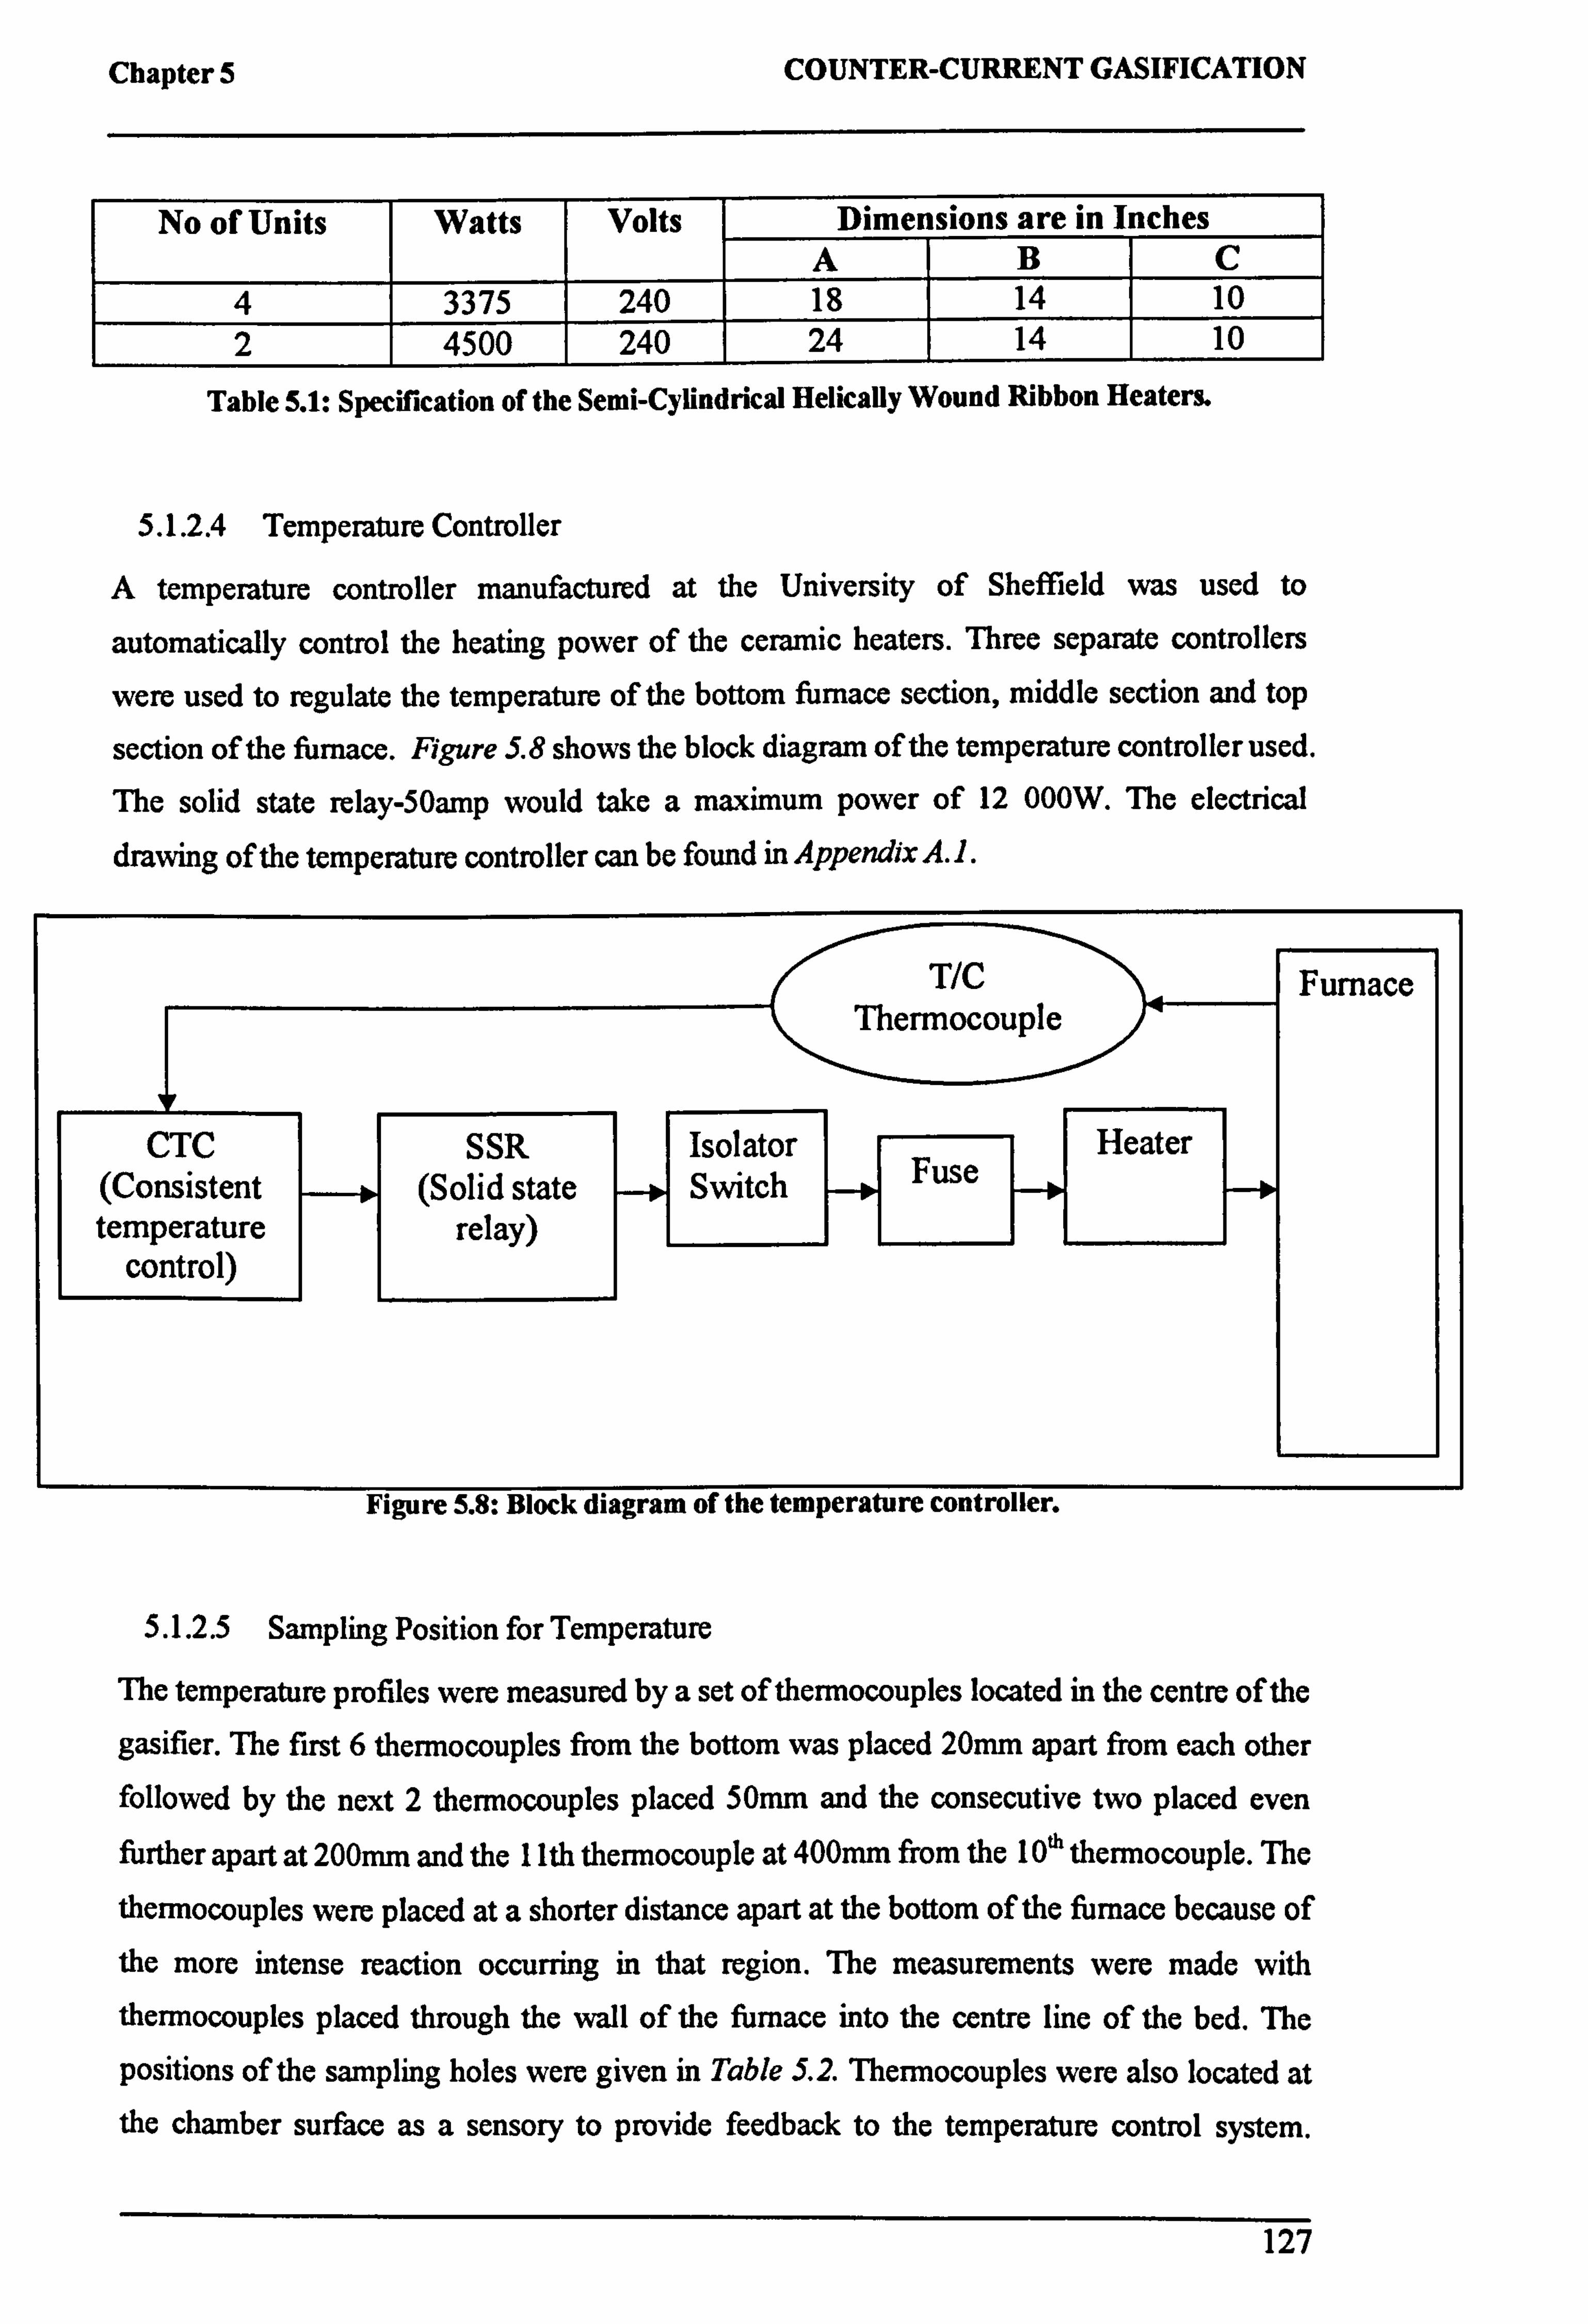
Chapter 5 COUNTER-CURRENT GASIFICATION
No of Units Watts Volts Dimensions are in Inches A B C
4 3375 240 18 14 10 2 4500 240 24 14 10
Table 5.1: Specification of the Semi-Cylindrical Helically Wound Ribbon Heaters.
5.1.2.4 Temperature Controller
A temperature controller manufactured at the University of Sheffield was used to
automatically control the heating power of the ceramic heaters. Three separate controllers
were used to regulate the temperature of the bottom furnace section, middle section and top
section of the furnace. Figure 5.8 shows the block diagram of the temperature controller used. The solid state relay-50amp would take a maximum power of 12 000W. The electrical
5.1.2.5 Sampling Position for Temperature
The temperature profiles were measured by a set of thermocouples located in the centre of the
gasifier. The first 6 thermocouples from the bottom was placed 20mm apart from each other followed by the next 2 thermocouples placed 50mm and the consecutive two placed even further apart at 200mm and the 1 lth thermocouple at 400mm from the 10`h thermocouple. The
thermocouples were placed at a shorter distance apart at the bottom of the furnace because of the more intense reaction occurring in that region. The measurements were made with thermocouples placed through the wall of the furnace into the centre line of the bed. The
positions of the sampling holes were given in Table 5.2. Thermocouples were also located at the chamber surface as a sensory to provide feedback to the temperature control system.
127
drawing of the temperature controller can be found in Appendix A. 1.
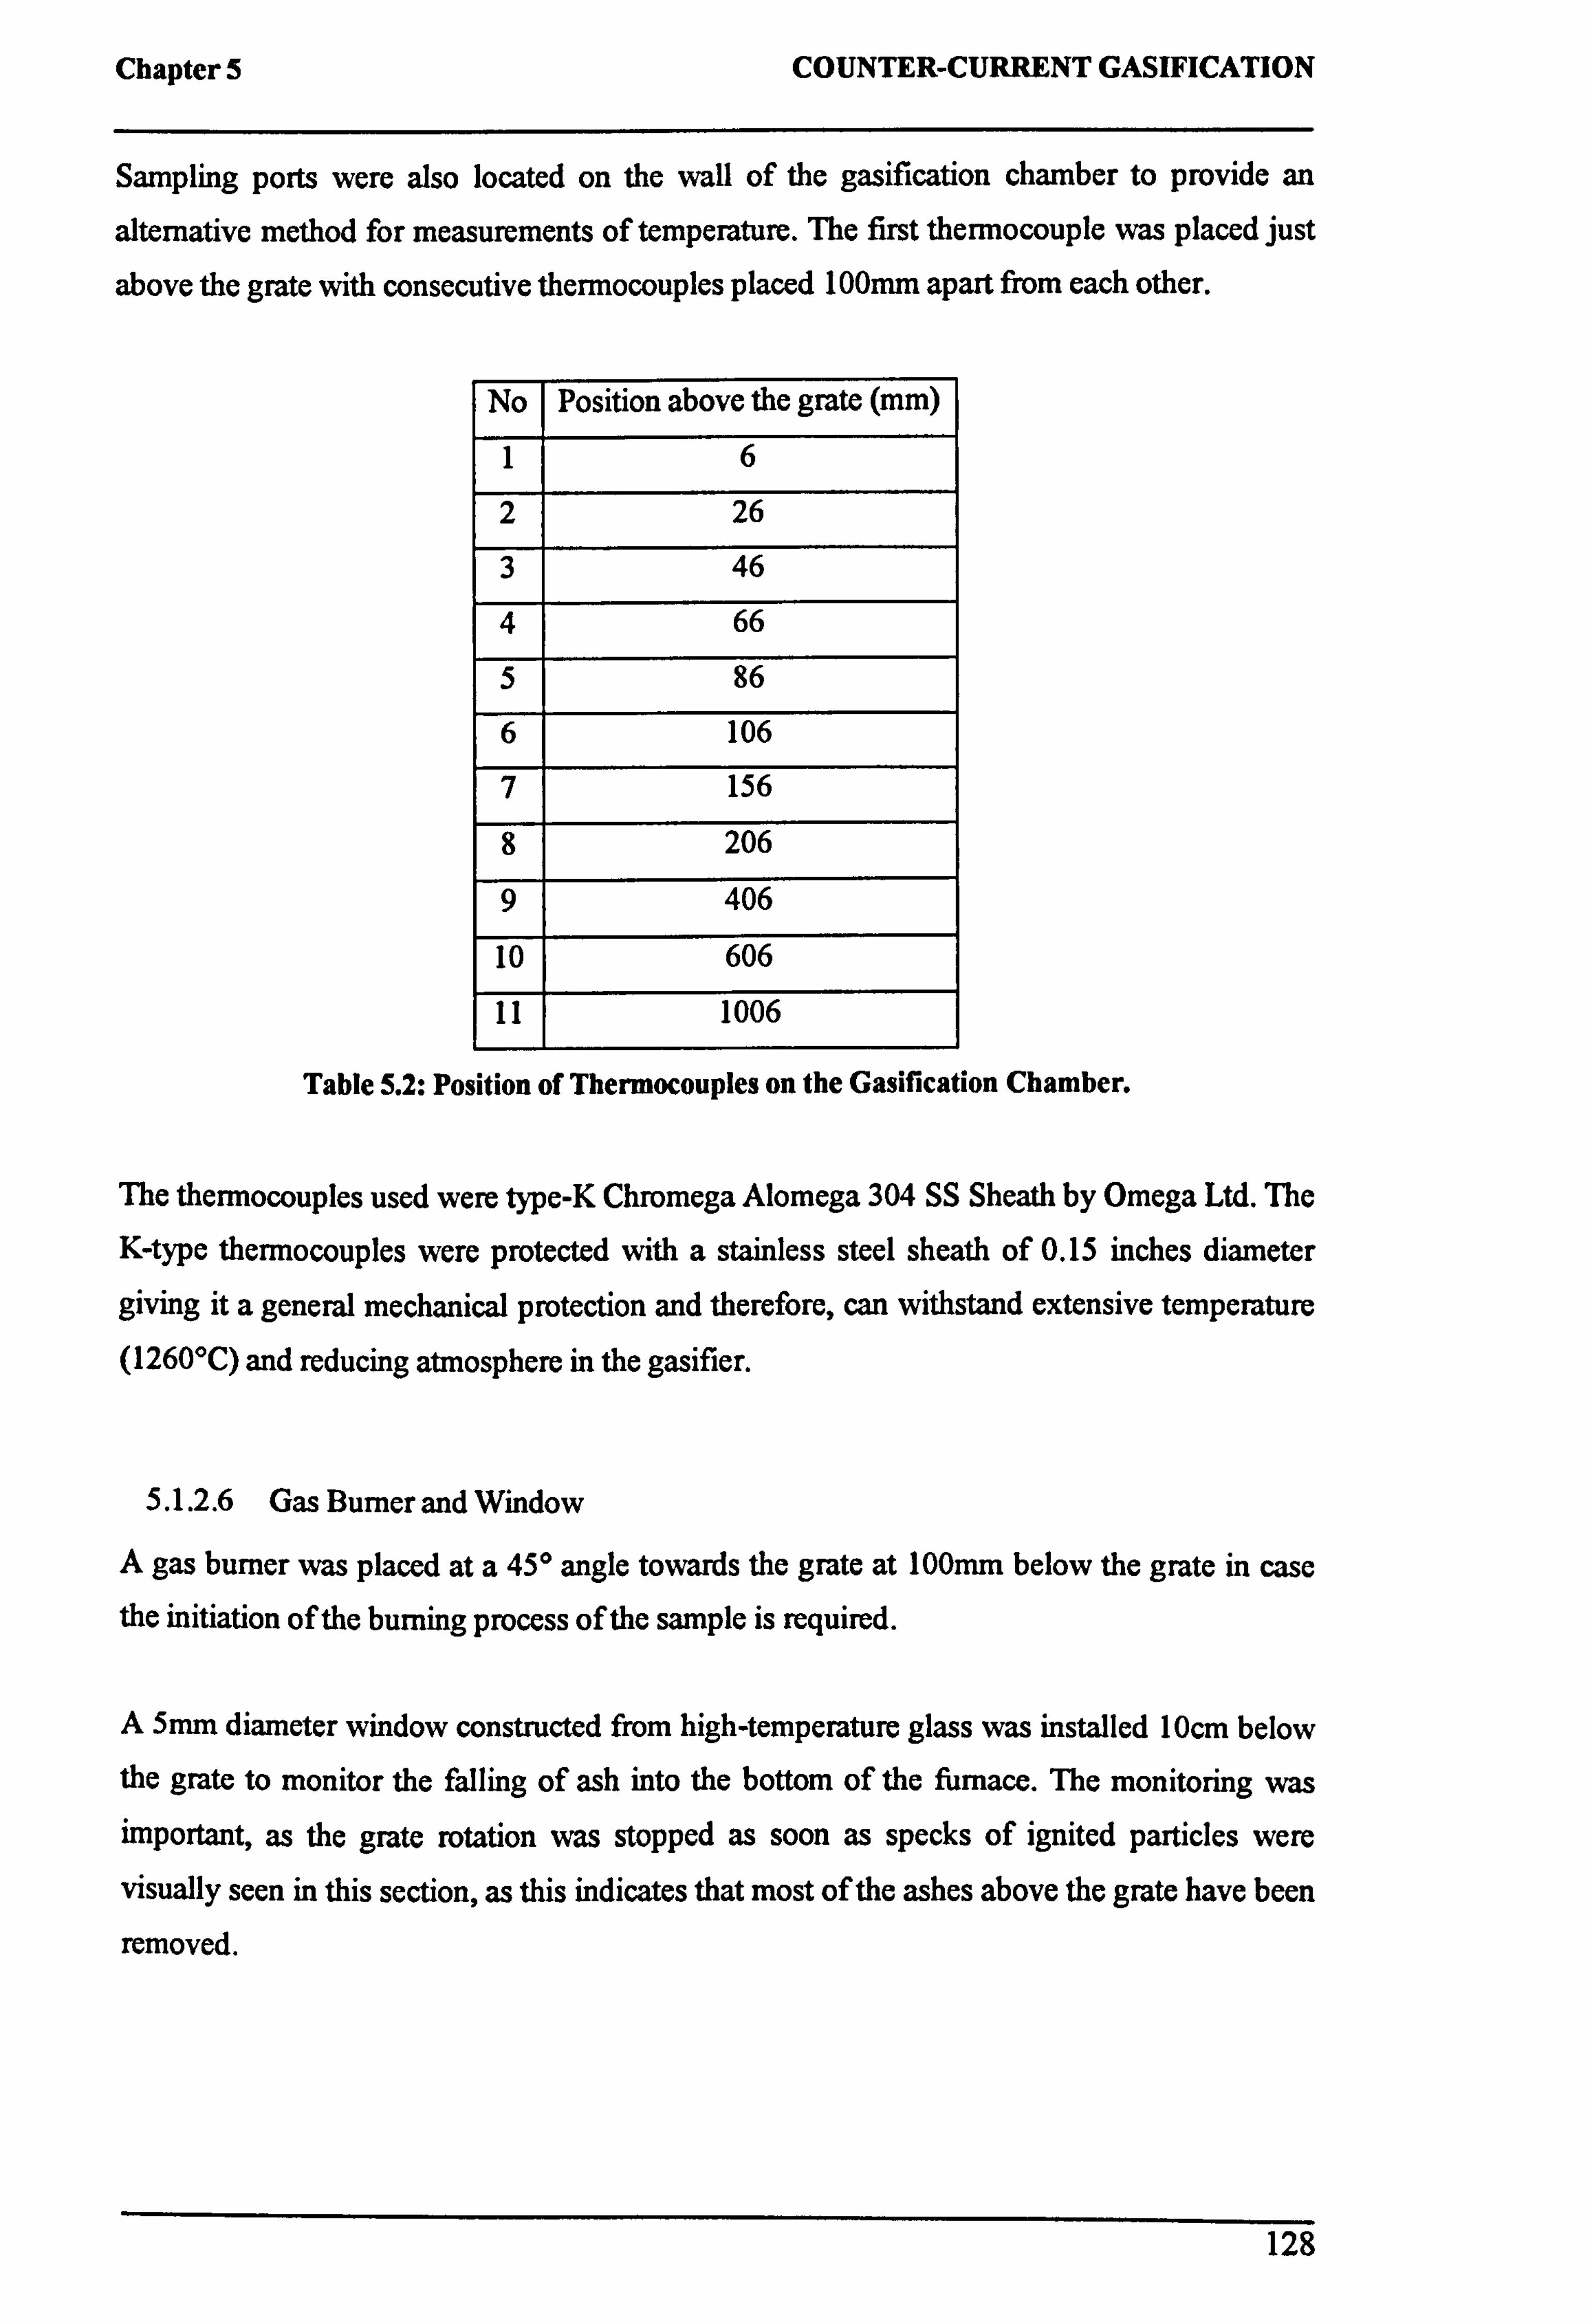
Chapter 5 COUNTER-CURRENT GASIFICATION
Sampling ports were also located on the wall of the gasification chamber to provide an
alternative method for measurements of temperature. The first thermocouple was placed just
above the grate with consecutive thermocouples placed 100mm apart from each other.
No Position above the grate (mm)
1 6
2 26
3 46
4 66
5 86
6 106
7 156
8 206
9 406
10 606
11 1006
Table 5.2: Position of Thermocouples on the Gasification Chamber.
The thermocouples used were type-K Chromega Alomega 304 SS Sheath by Omega Ltd. The
K-type thermocouples were protected with a stainless steel sheath of 0.15 inches diameter
giving it a general mechanical protection and therefore, can withstand extensive temperature (1260°C) and reducing atmosphere in the gasifier.
5.1.2.6 Gas Burner and Window
A gas burner was placed at a 450 angle towards the grate at 100mm below the grate in case the initiation of the burning process of the sample is required.
A 5mm diameter window constructed from high-temperature glass was installed 10cm below
the grate to monitor the falling of ash into the bottom of the furnace. The monitoring was important, as the grate rotation was stopped as soon as specks of ignited particles were
visually seen in this section, as this indicates that most of the ashes above the grate have been
removed.
128
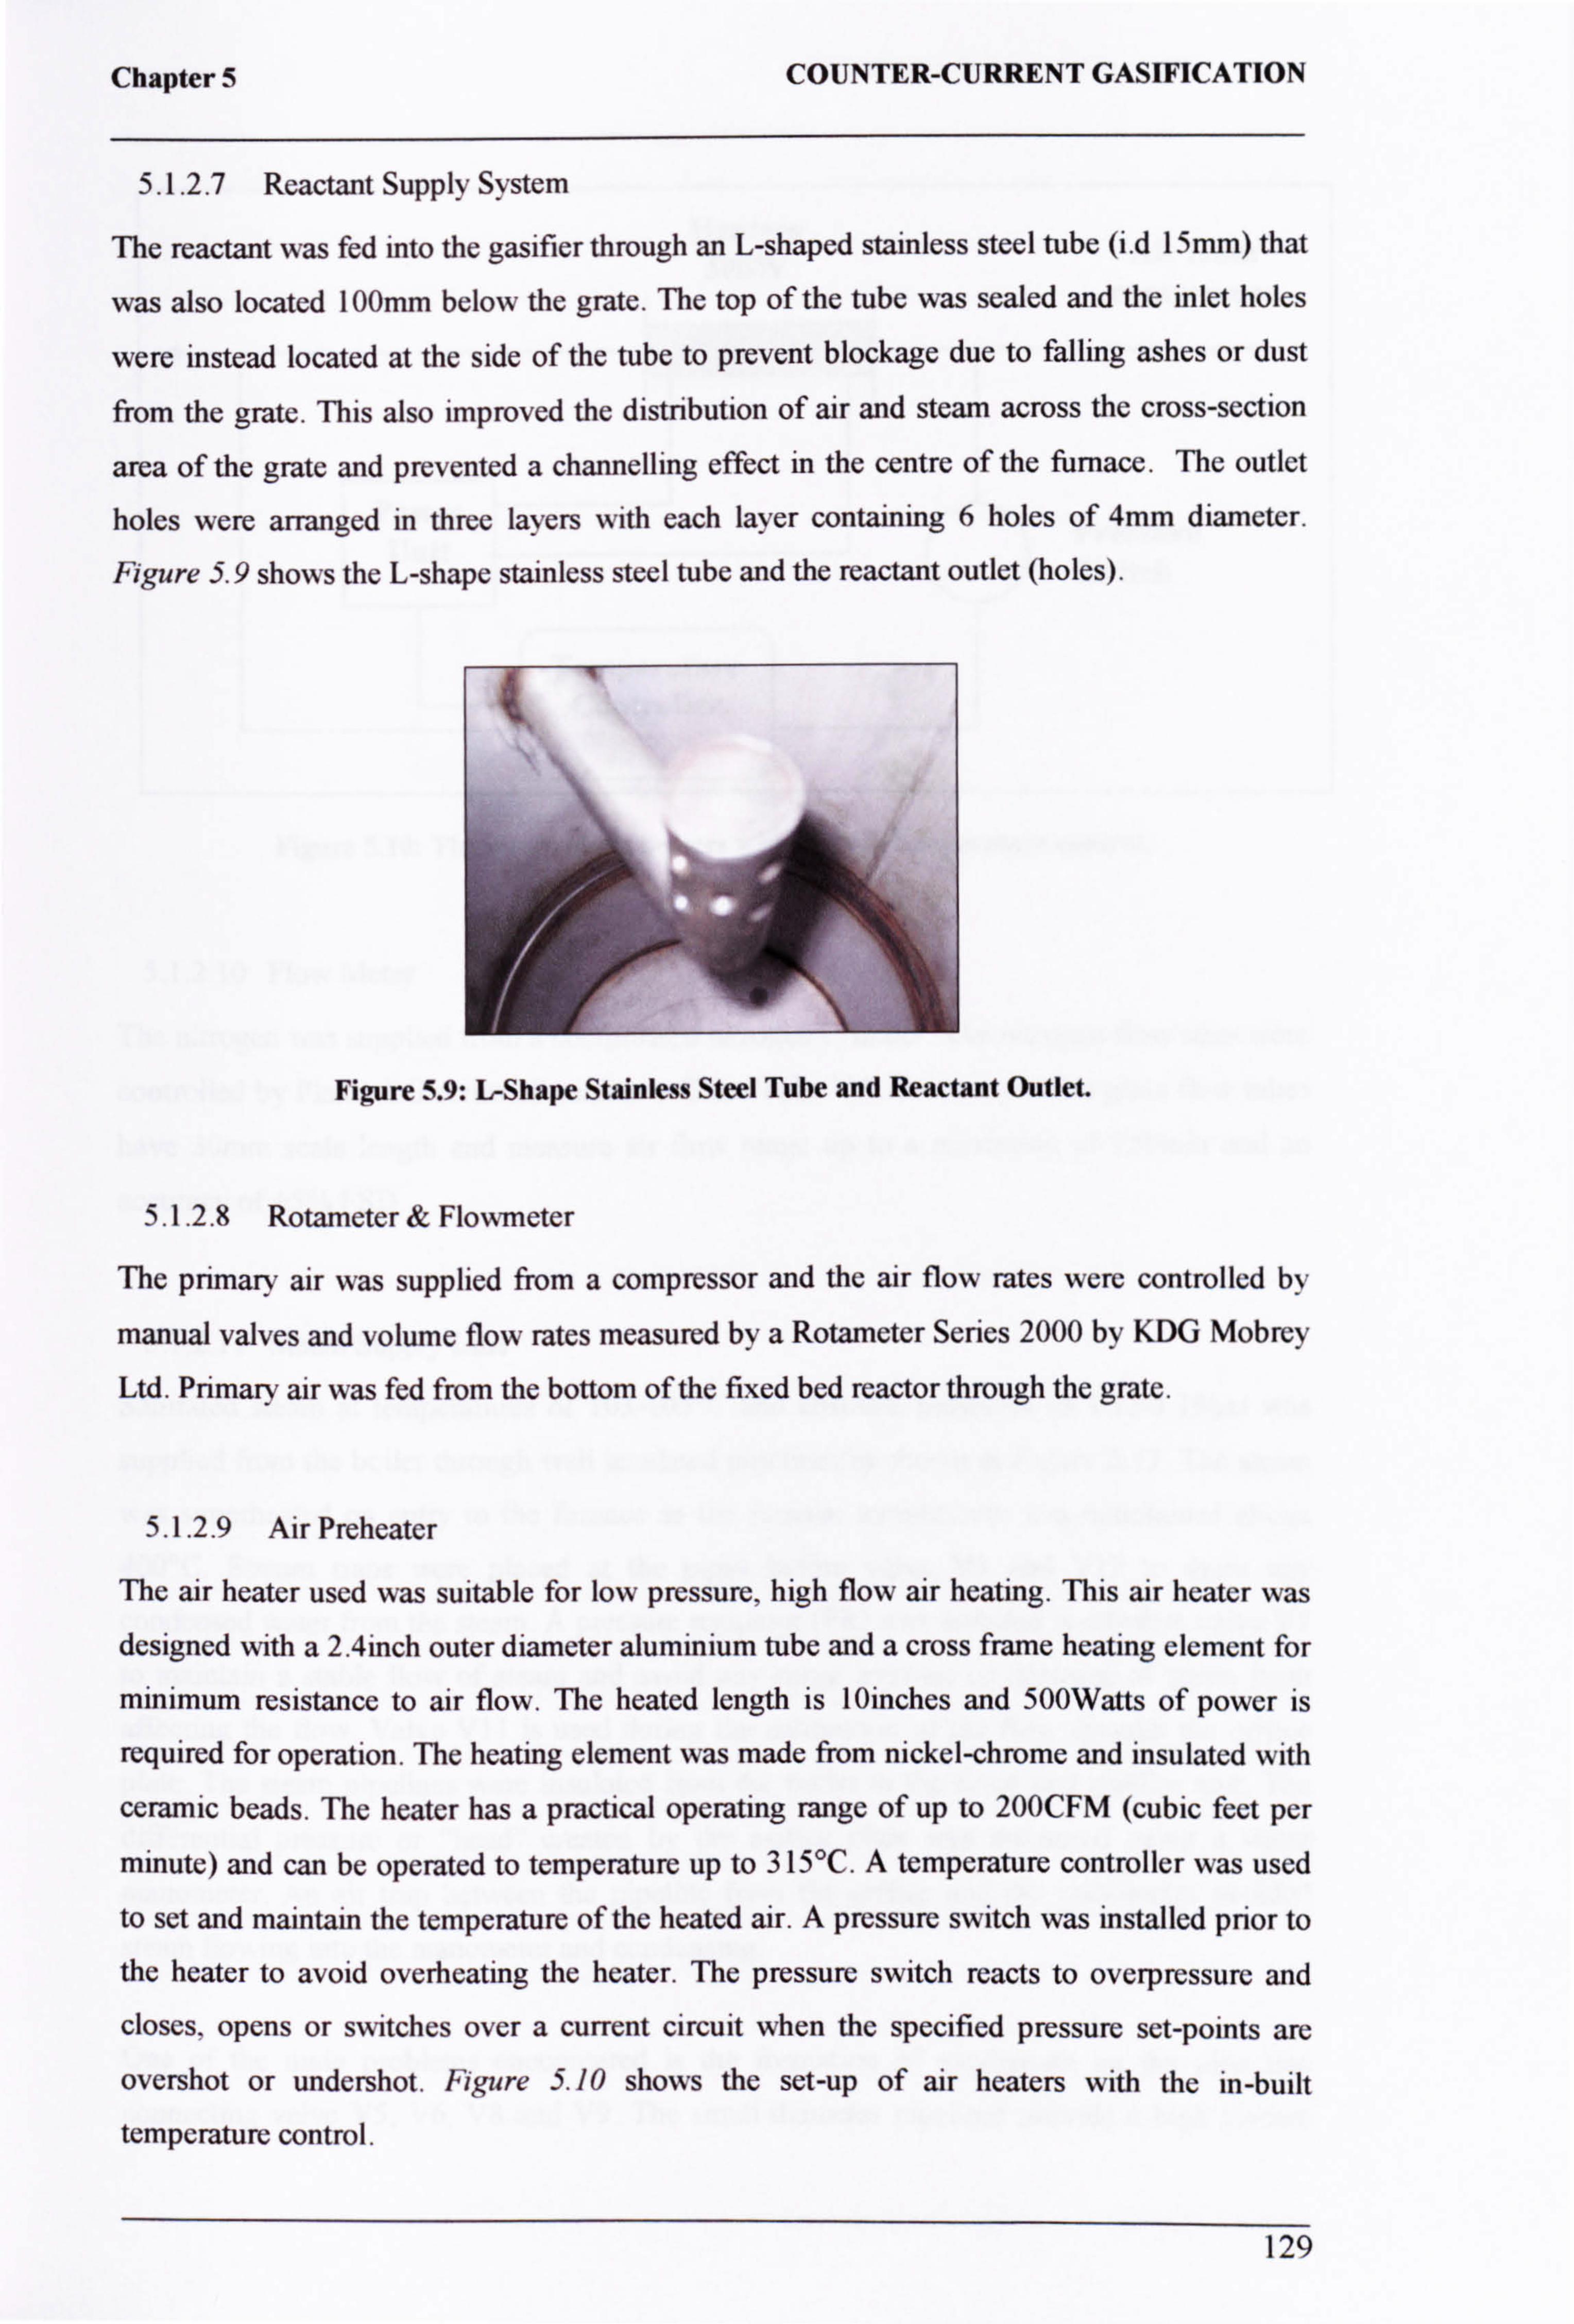
Chapter 5 COUNTER-CURRENT GASIFICATION
5.1.2.7 Reactant Supply System
The reactant was fed into the gasifier through an L-shaped stainless steel tube (i. d 15mm) that
was also located 100mm below the grate. The top of the tube was sealed and the inlet holes
were instead located at the side of the tube to prevent blockage due to falling ashes or dust
from the grate. This also improved the distribution of air and steam across the cross-section
area of the grate and prevented a channelling effect in the centre of the furnace. The outlet
holes were arranged in three layers with each layer containing 6 holes of 4mm diameter.
Figure 5.9 shows the L-shape stainless steel tube and the reactant outlet (holes).
Figure 5.9: L-Shape Stainless Steel Tube and Reactant Outlet.
5.1.2.8 Rotameter & Flowmeter
The primary air was supplied from a compressor and the air flow rates were controlled by
manual valves and volume flow rates measured by a Rotameter Series 2000 by KDG Mobrey
Ltd. Primary air was fed from the bottom of the fixed bed reactor through the grate.
5.1.2.9 Air Preheater
The air heater used was suitable for low pressure, high flow air heating. This air heater was designed with a 2.4inch outer diameter aluminium tube and a cross frame heating element for
minimum resistance to air flow. The heated length is Winches and 500Watts of power is
required for operation. The heating element was made from nickel-chrome and insulated with
ceramic beads. The heater has a practical operating range of up to 200CFM (cubic feet per
minute) and can be operated to temperature up to 315°C. A temperature controller was used
to set and maintain the temperature of the heated air. A pressure switch was installed prior to
the heater to avoid overheating the heater. The pressure switch reacts to overpressure and
closes, opens or switches over a current circuit when the specified pressure set-points are
overshot or undershot. Figure 5.10 shows the set-up of air heaters with the in-built
temperature control.
129
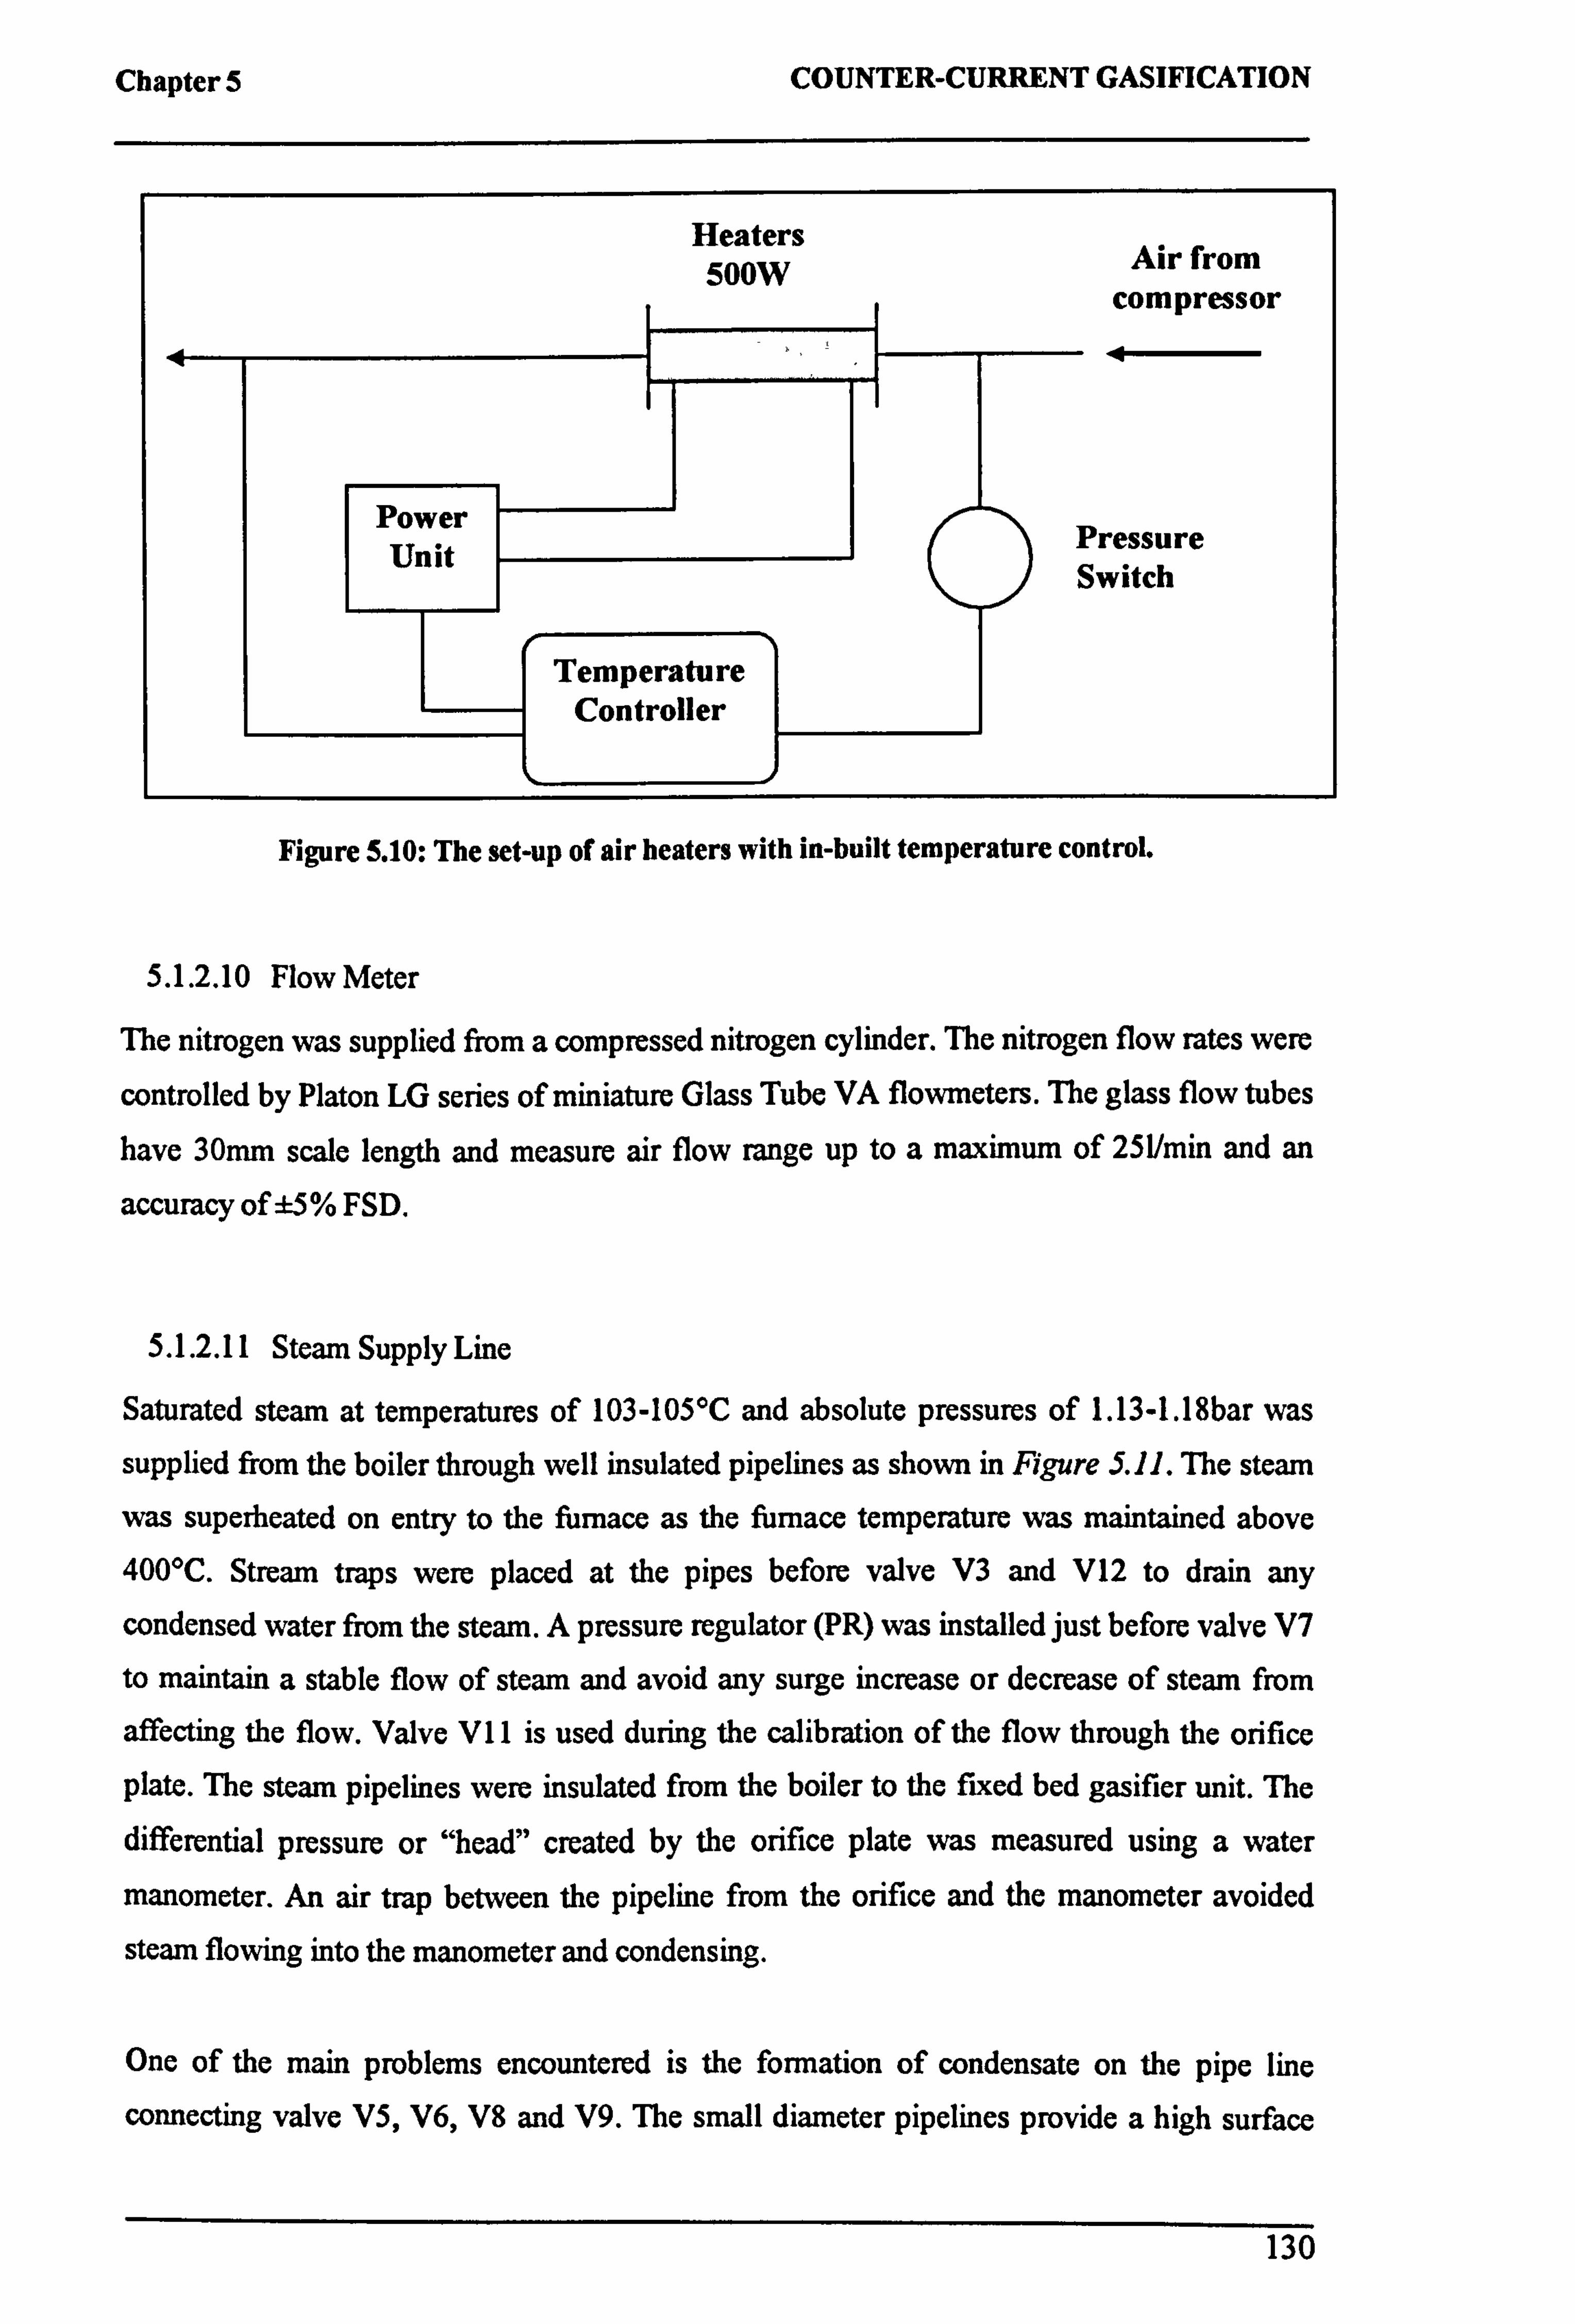
Chapter 5 COUNTER-CURRENT GASIFICATION
Figure 5.10: The set-up of air heaters with in-built temperature control.
5.1.2.10 Flow Meter
The nitrogen was supplied from a compressed nitrogen cylinder. The nitrogen flow rates were
controlled by Platon LG series of miniature Glass Tube VA flowmeters. The glass flow tubes
have 30mm scale length and measure air flow range up to a maximum of 251/min and an
accuracy of ±5% FSD.
5.1.2.11 Steam Supply Line
Saturated steam at temperatures of 103-105°C and absolute pressures of 1.13-1.18bar was
supplied from the boiler through well insulated pipelines as shown in Figure S. 11. The steam
was superheated on entry to the furnace as the furnace temperature was maintained above 400°C. Stream traps were placed at the pipes before valve V3 and V12 to drain any
condensed water from the steam. A pressure regulator (PR) was installed just before valve V7
to maintain a stable flow of steam and avoid any surge increase or decrease of steam from
affecting the flow. Valve VI I is used during the calibration of the flow through the orifice plate. The steam pipelines were insulated from the boiler to the fixed bed gasifier unit. The
differential pressure or "head" created by the orifice plate was measured using a water
manometer. An air trap between the pipeline from the orifice and the manometer avoided
steam flowing into the manometer and condensing.
One of the main problems encountered is the formation of condensate on the pipe line
connecting valve V5, V6, V8 and V9. The small diameter pipelines provide a high surface
130

Chapter 5 COUNTER-CURRENT GASIFICATION
tension in the condensed water droplets, causing a blockage in the pipelines. This affects the
reading of the manometer. Therefore, valves V6 and V9 were installed to flush or drain any
condensate formed before manometer measurements were taken.
Figure 5.11: Schematic diagram of steam pipelines to the fixed bed gasifier.
5.1.2.12 Steam Orifice Plate
For simplicity in design and economic reasons, an orifice plate was used to create a differential pressure that is measured using a water manometer. The differential pressure
across the restriction created by the orifice plate was calibrated to the fluid flow rate. One of
the important tasks during the design was to select the appropriate orifice plate and size. Due
to the small flow rate of steam (<O. 15m'/min), the quadrant orifice was chosen. Calculations
were carried out to determine the appropriate orifice size. An orifice size that is too large in
diameter will result in too small a differential pressure to be measured accurately and vice
versa. Figure 5.12 shows a sketch of the dimensions of the steam orifice plate. The steam
orifice plate was inserted into a pipe of 19.05mm in diameter and the pipe was clear of bends
and tees to avoid any disruption to the flow.
131
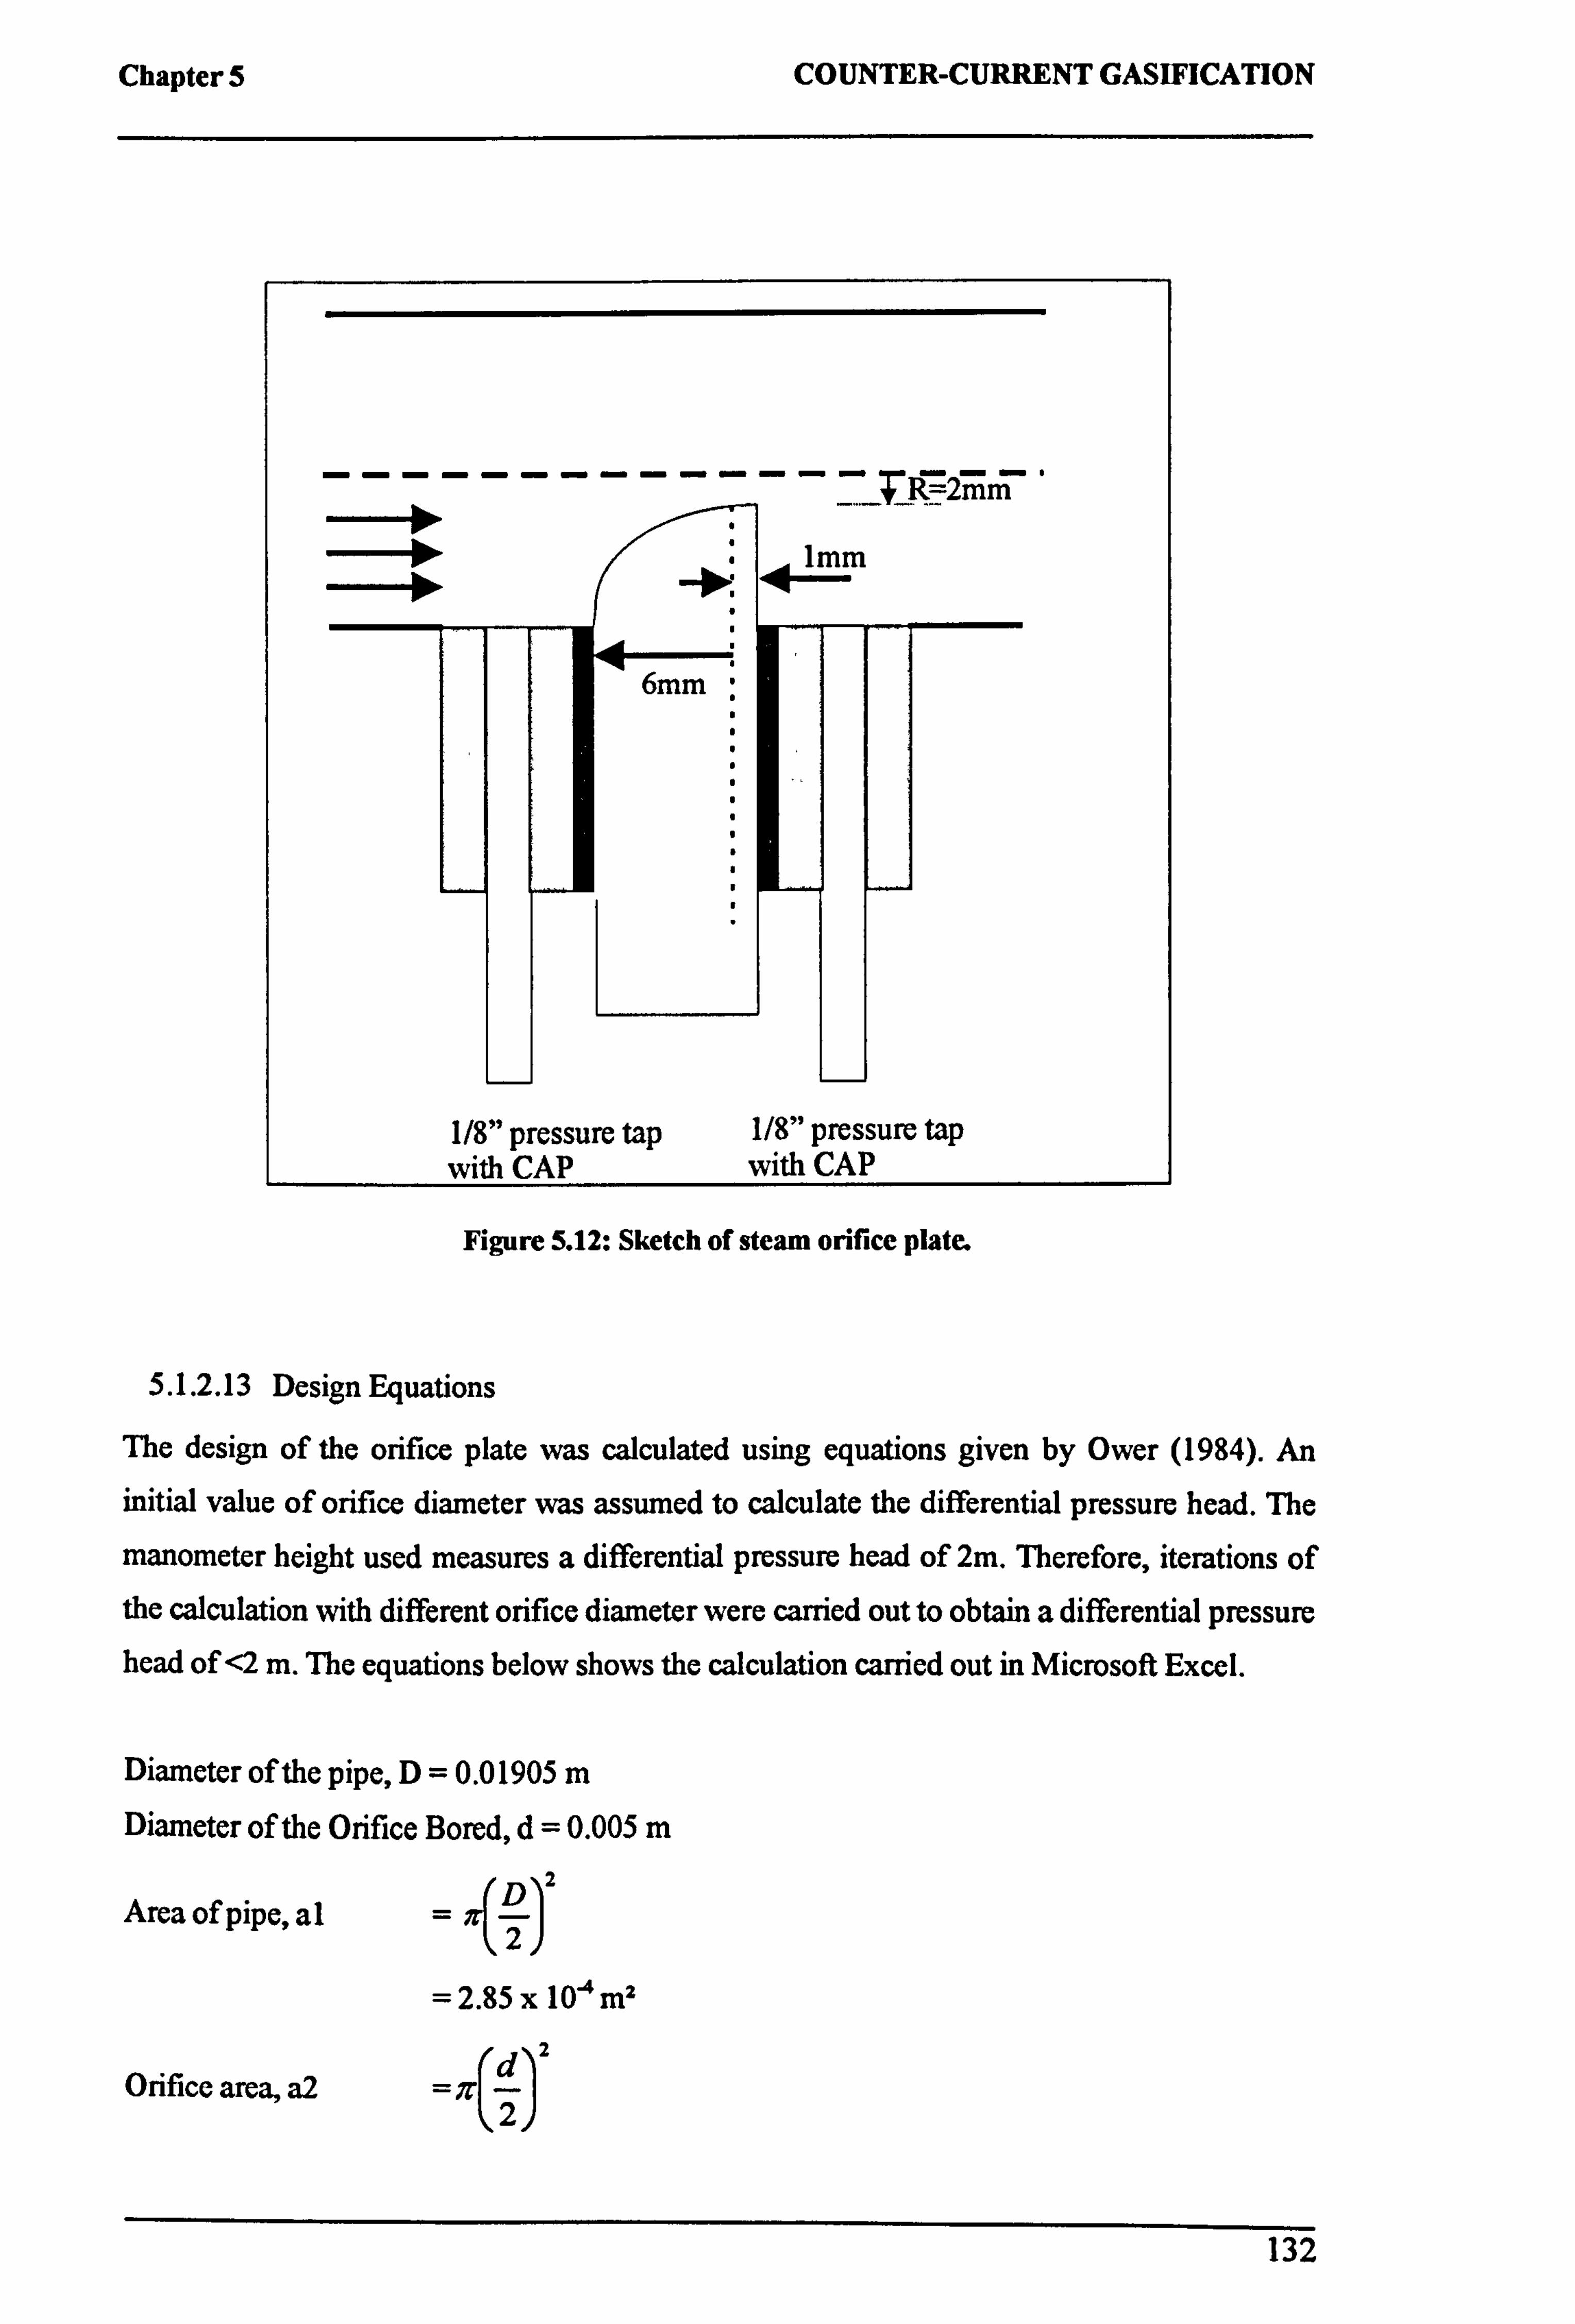
Chapter 5 COUNTER-CURRENT GASIFICATION
--------------=R=-2mm
Figure 5.12: Sketch of steam orifice plate.
5.1.2.13 Design Equations
The design of the orifice plate was calculated using equations given by Ower (1984). An initial value of orifice diameter was assumed to calculate the differential pressure head. The
manometer height used measures a differential pressure head of 2m. Therefore, iterations of the calculation with different orifice diameter were carried out to obtain a differential pressure head of <2 in. The equations below shows the calculation carried out in Microsoft Excel.
Diameter of the pipe, D=0.0 1905 m Diameter of the Orifice Bored, d=0.005 m
r l2 Area of pipe, al =ßr1 2
11
= 2.85 x 10⁻⁴ m2
Orifice area, a2 =; r(d)2 2
132
1/8" pressure tap 1/8" pressure tap with CAP with CAP
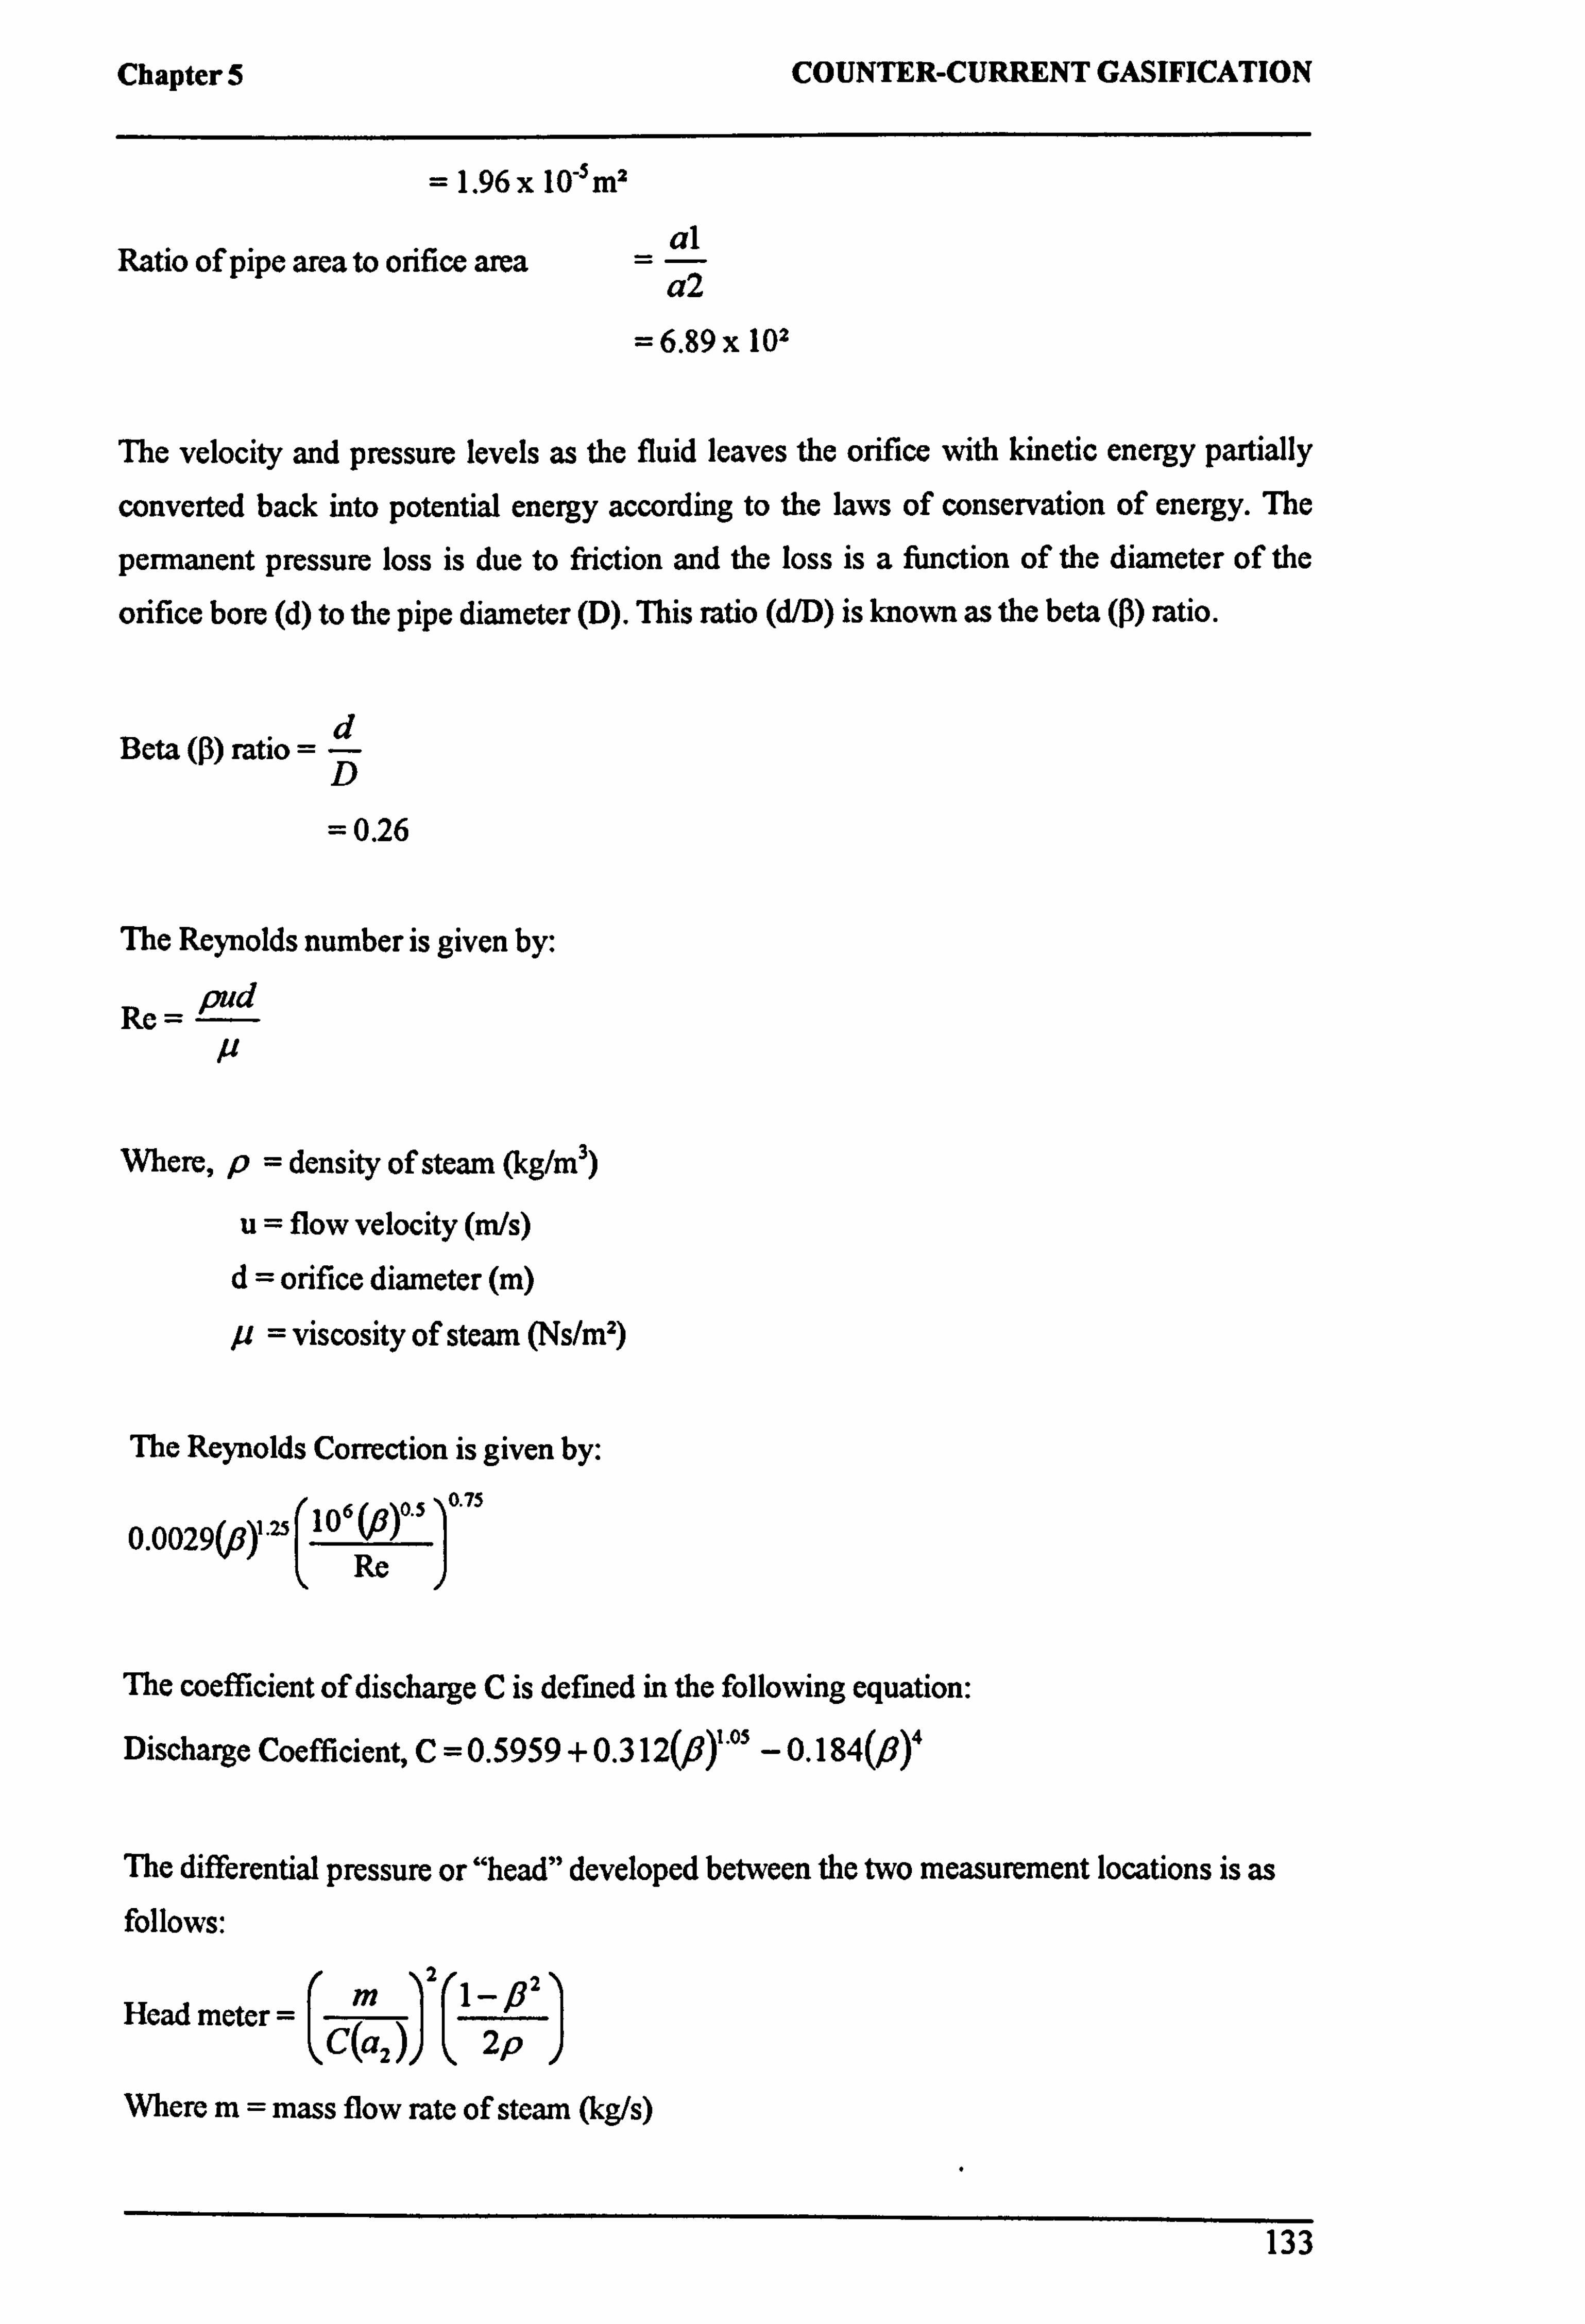
Chapter 5
=1.96x10⁻⁵m2
al Ratio of pipe area to orifice area = a2 2
= 6.89 x 10²
COUNTER-CURRENT GASIFICATION
The velocity and pressure levels as the fluid leaves the orifice with kinetic energy partially
converted back into potential energy according to the laws of conservation of energy. The
permanent pressure loss is due to friction and the loss is a function of the diameter of the
orifice bore (d) to the pipe diameter (D). This ratio (d/D) is known as the beta (ß) ratio.
Beta (R) ratio =
= 0.26
The Reynolds number is given by:
Re = pud
p
Where, p= density of steam (kg/m3)
u= flow velocity (m/s)
d= orifice diameter (m)
p= viscosity of steam (Ns/mz)
The Reynolds Correction is given by:
0.0029(ß)'. 106 (P) 0.5 ]O. 75
Re
The coefficient of discharge C is defined in the following equation:
Discharge Coefficient, C=0.5959 + 0.312(ß)1.0s - 0.184(ß)4
The differential pressure or "head" developed between the two measurement locations is as follows:
i2 Head meter = C(a2 )1 2p
Where m= mass flow rate of steam (kg/s)
133
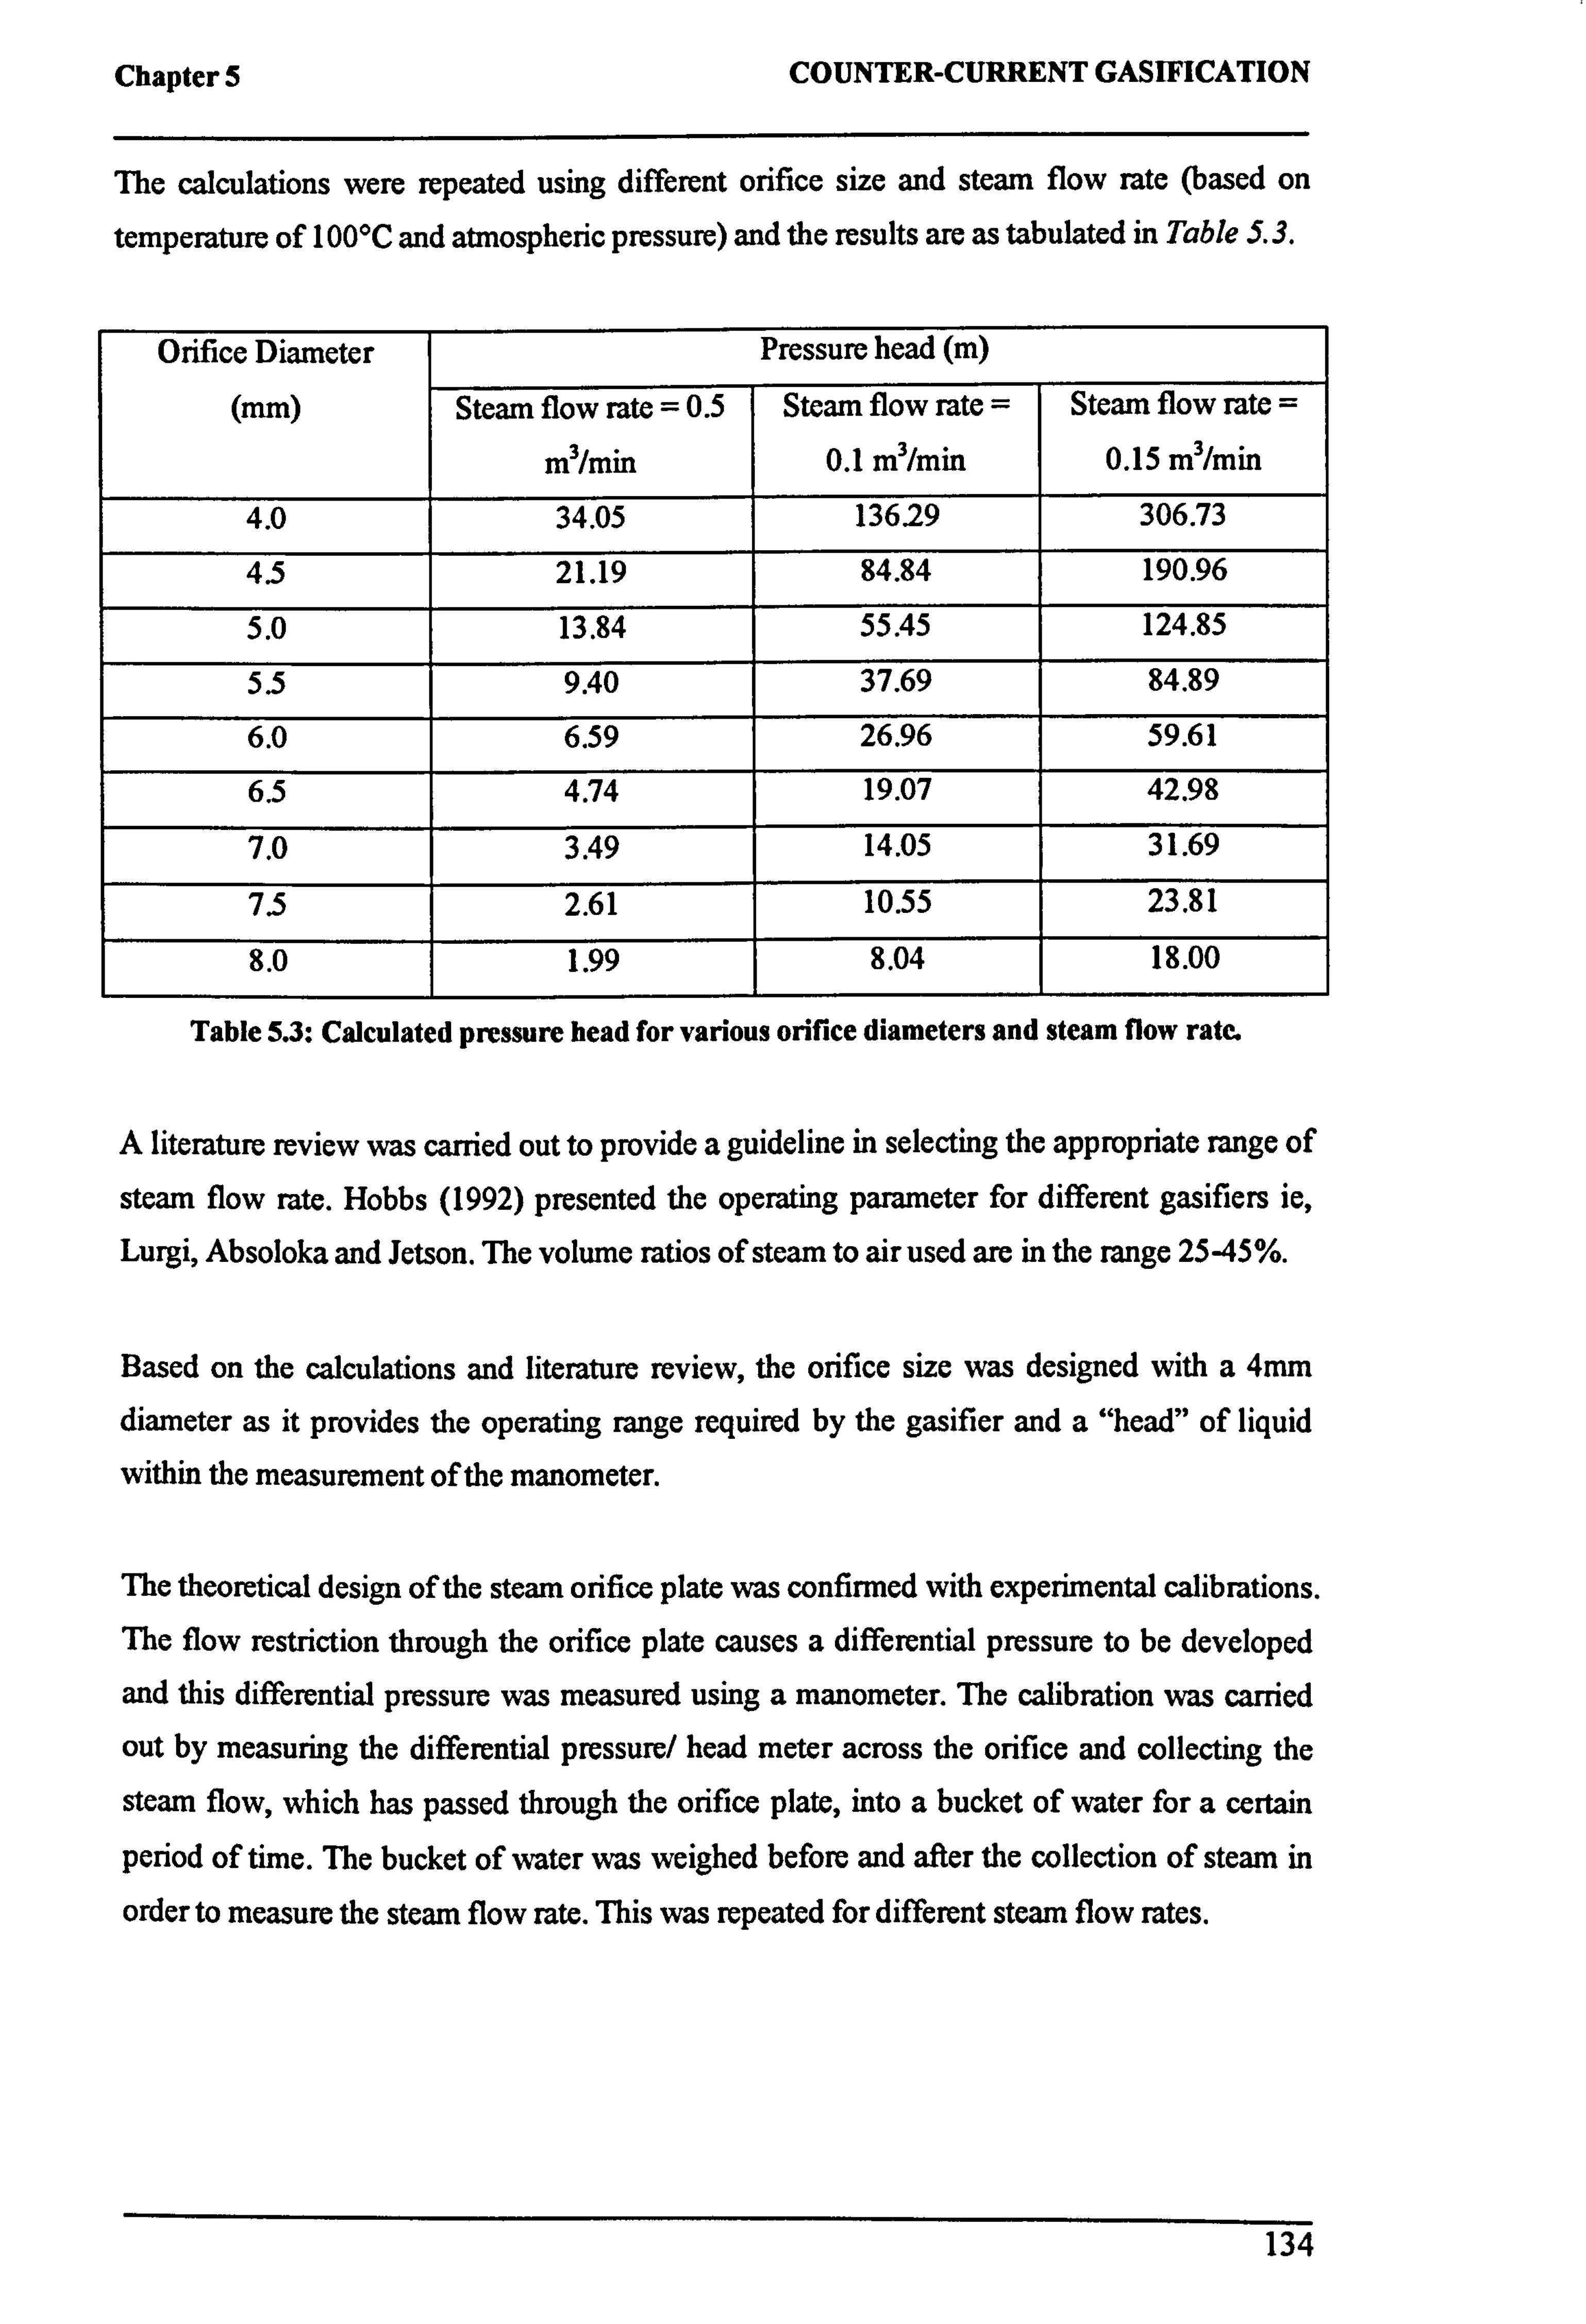
Chapter 5 COUNTER-CURRENT GASIFICATION
The calculations were repeated using different orifice size and steam flow rate (based on
temperature of 100°C and atmospheric pressure) and the results are as tabulated in Table S. 3.
Orifice Diameter Pressure head (m)
(mm) Steam flow rate = 0.5
m3/min
Steam flow rate = 0.1 m3/min
Steam flow rate = 0.15 m3/min
4.0 34.05 13629 306.73
4.5 21.19 84.84 190.96
5.0 13.84 55.45 124.85
5.5 9.40 37.69 84.89
6.0 6.59 26.96 59.61
6.5 4.74 19.07 42.98
7.0 3.49 14.05 31.69
7.5 2.61 10.55 23.81
8.0 1.99 8.04 18.00
Table 5.3: Calculated pressure head for various orifice diameters and steam flow rate.
A literature review was carried out to provide a guideline in selecting the appropriate range of
steam flow rate. Hobbs (1992) presented the operating parameter for different gasifiers ie,
Lurgi, Absoloka and Jetson. The volume ratios of steam to air used are in the range 25-45%.
Based on the calculations and literature review, the orifice size was designed with a 4mm
diameter as it provides the operating range required by the gasifier and a "head" of liquid
within the measurement of the manometer.
The theoretical design of the steam orifice plate was confirmed with experimental calibrations. The flow restriction through the orifice plate causes a differential pressure to be developed
and this differential pressure was measured using a manometer. The calibration was carried
out by measuring the differential pressure/ head meter across the orifice and collecting the
steam flow, which has passed through the orifice plate, into a bucket of water for a certain
period of time. The bucket of water was weighed before and after the collection of steam in
order to measure the steam flow rate. This was repeated for different steam flow rates.
134
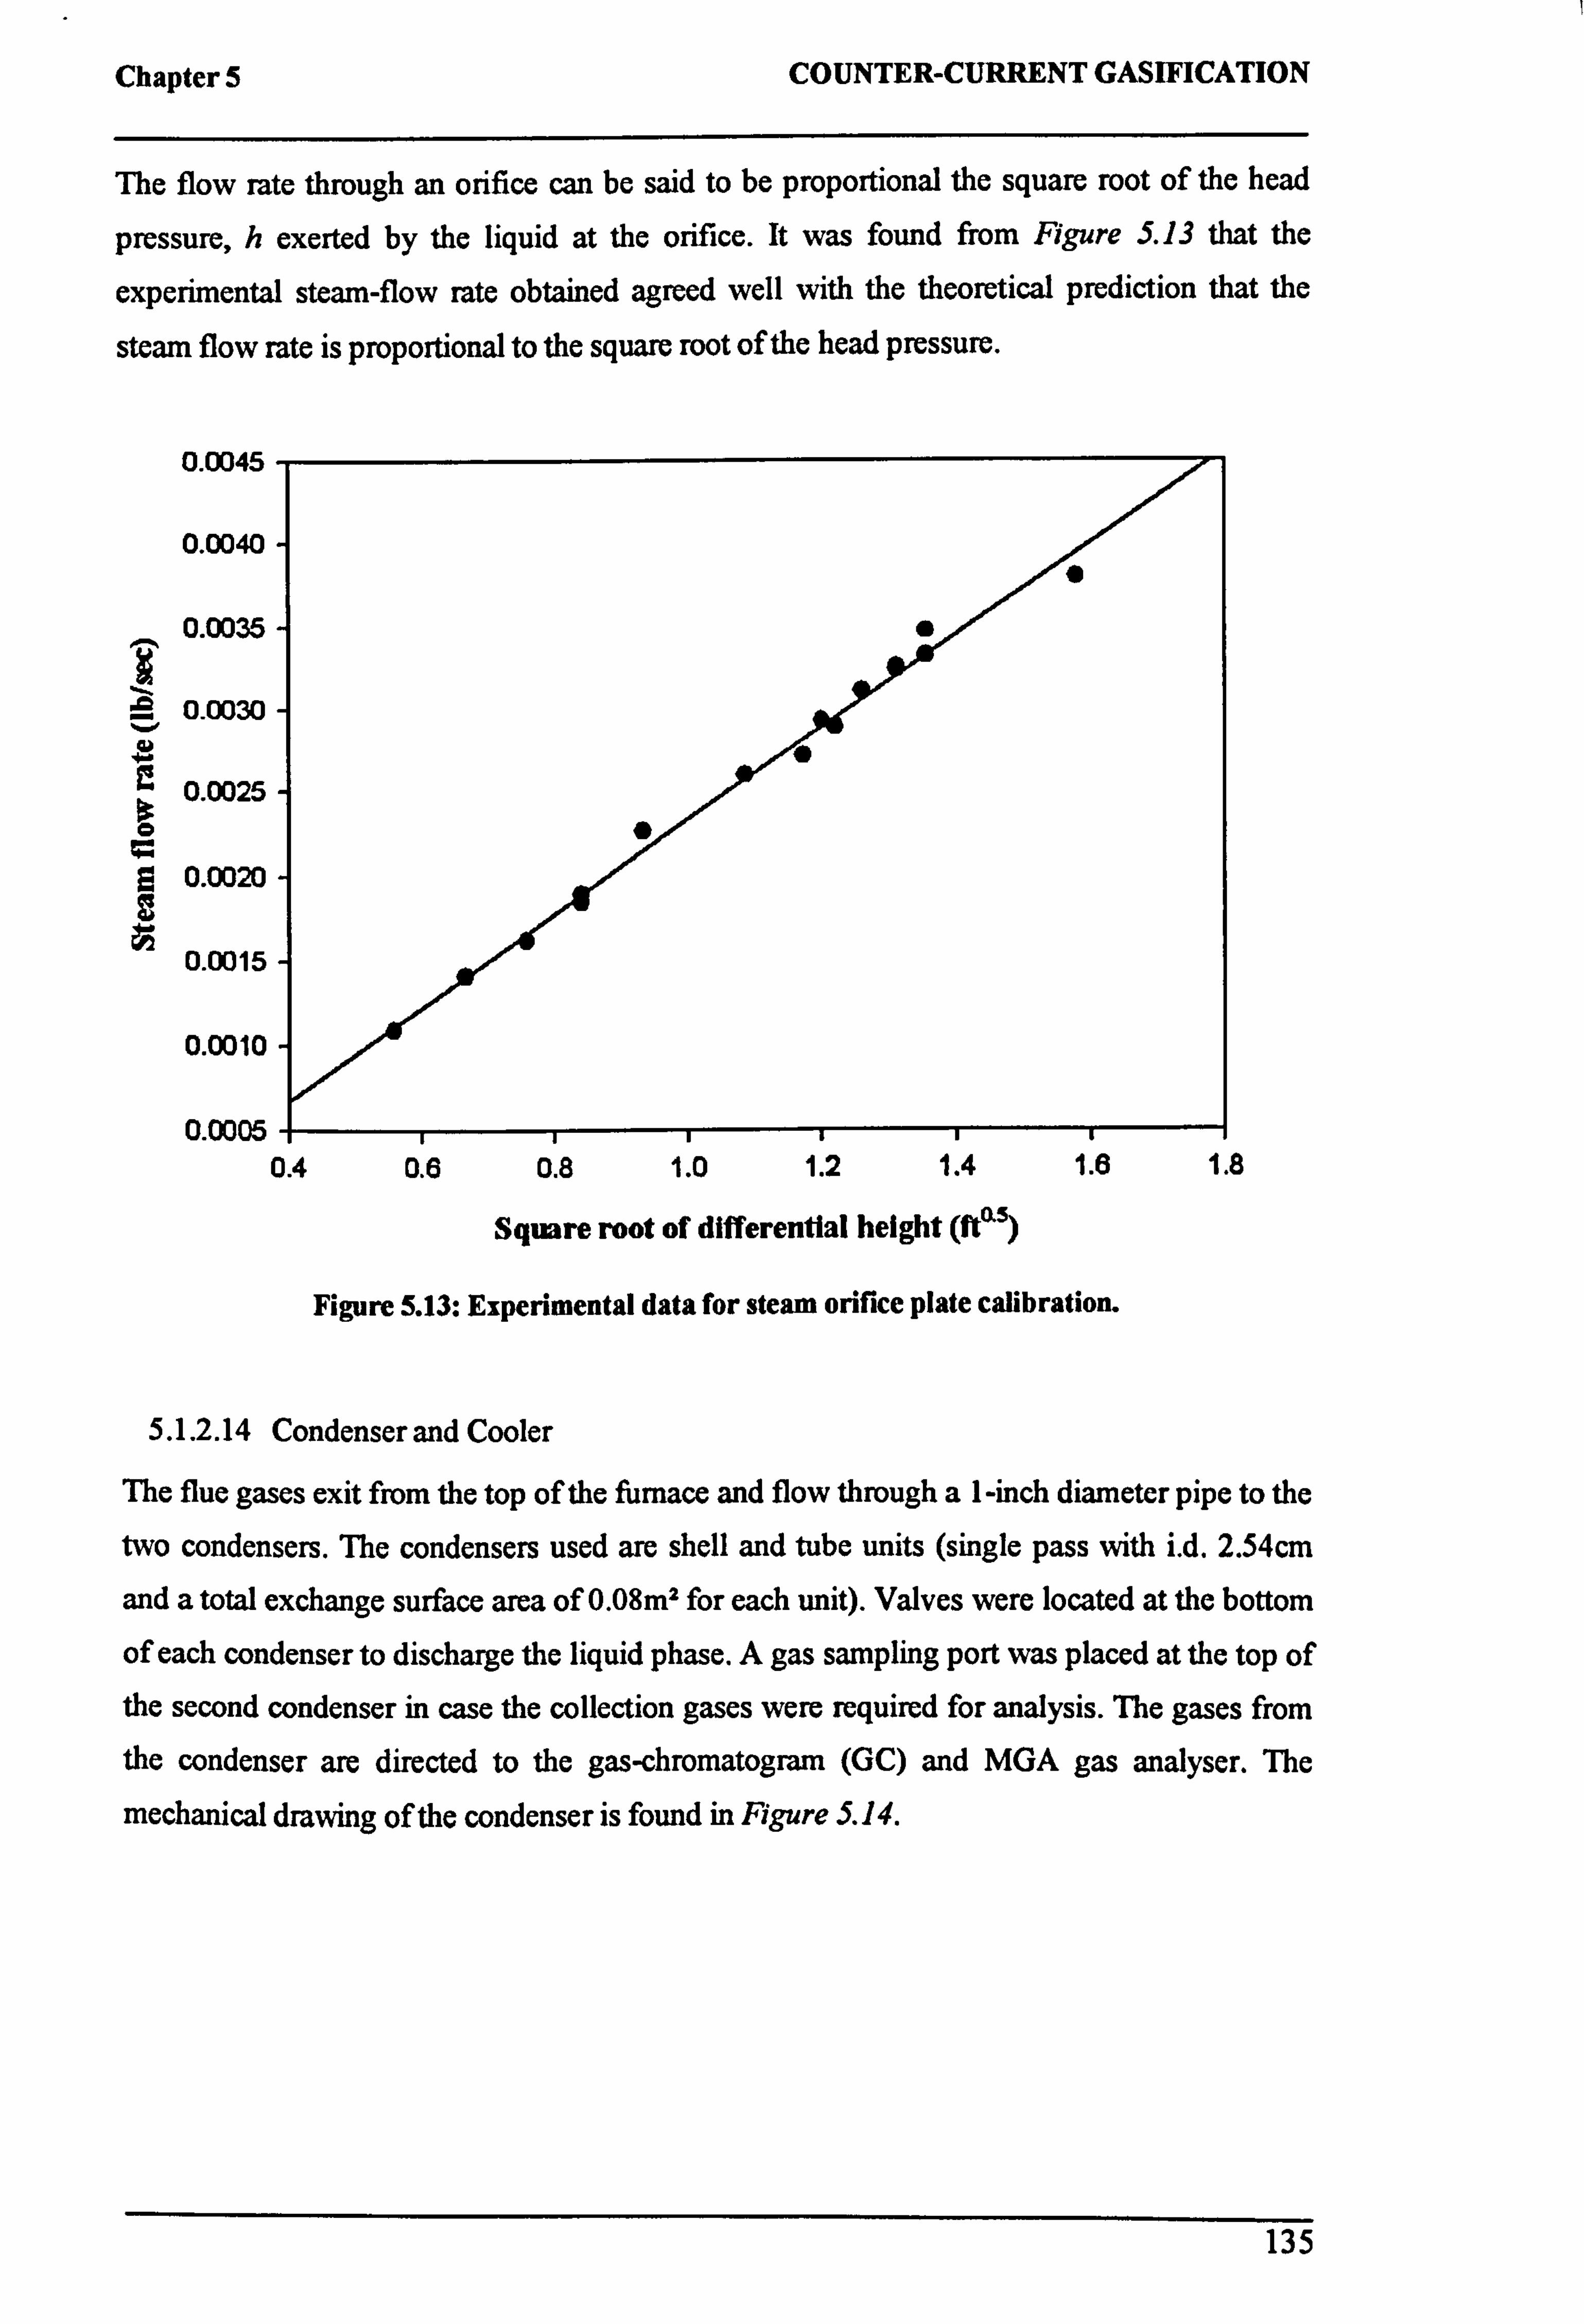
Chapter 5 COUNTER-CURRENT GASIFICATION
The flow rate through an orifice can be said to be proportional the square root of the head
pressure, h exerted by the liquid at the orifice. It was found from Figure 5.13 that the
experimental steam-flow rate obtained agreed well with the theoretical prediction that the
steam flow rate is proportional to the square root of the head pressure.
0.0045
0.0040
_ 0.0035 I
0.0030
0.0025
0.0020
0.0015
0.0010
0.0005
0
t
0.4 0.6 0.8 1.0 1.2 1.4 1.6 1.8
Square root of differential height (fta)
Figure 5.13: Experimental data for steam orifice plate calibration.
5.1.2.14 Condenser and Cooler
The flue gases exit from the top of the furnace and flow through a 1-inch diameter pipe to the
two condensers. The condensers used are shell and tube units (single pass with i. d. 2.54cm
and a total exchange surface area of 0.08m2 for each unit). Valves were located at the bottom
of each condenser to discharge the liquid phase. A gas sampling port was placed at the top of the second condenser in case the collection gases were required for analysis. The gases from
the condenser are directed to the gas-chromatogram (GC) and MGA gas analyser. The
mechanical drawing of the condenser is found in Figure 5.14.
135

Figure 5.14: Condensors nt nnec table
All unl±s are Jr) Cri. xi1nend
Chapter 5 COUNTER-CURRENT GASIFICATION
5.1.2.15 Weighing Beams
The gasifer was suspended from 2 weighing beams, which incorporated 2x 100kg capacity
load cells per beam giving a total maximum load of 400kg. The weighing beams were used to
monitor the weight changes (loss) during the gasification process. The pipes connecting the
air supply to the gasification chamber were made from flexible hoses to prevent the thermal
expansion of the furnace from interfering with the weighing equipment. Continuous
measurements of weight were performed with computerised recording of data. The weight
was also shown on an indicator and monitored throughout the experiment.
5.1.2.16 ABB Gas Chromatograph
An online process gas chromatograph (PGC2000) by ABB was used for continuous
monitoring of the flue gas concentration. The gas chromatograph separates and measures the
individual components of gas samples. Two types of thermal conductivity detector (TCD) are
used in this analyser, a filament TCD and a thermistor TCD.
The filament TCD works on the principle that a heated body loses heat dependent on the
composition of the surrounding gas. Filaments sense the rate of heat loss so that any change in
filament current results in a bridge output proportional to the change. The TCD contains a
reference filament and a measurement filament. When the reference carrier gas flows across both filaments, the two filaments have the same filament temperature and the bridge has a
zero output. During a measurement cycle a sample flows past the measurement filament,
changing thermal conductivity and the filament temperature, thereby, causing a corresponding
change in electrical resistance. The bridge senses this change in current and increases or decreases current flow through the bridge to compensate for the temperature change. The
change in current flow sensed by the bridge is proportional to the component concentration in
the sample being measured.
Hydrogen, nitrogen and helium were used as carrier gases to purge the columns and cell prior to introducing a sample, to sweep the sample into the detector cell, and to backflush the backflush column. The gas chromatograph has 10 columns and each column has one of the
four types of coating, Hayesep Q 60/80,5A Sieves 40/60, Chromosorb 103 (KOH washed
tubing) orHayesep T, 60/80 and 0.3% Carbowax 20M/0.1% H3P04 Carbopack C, 60/80. The
carrier gas pressures were set to 49.5PSIG for nitrogen, 57.5PSIG for hydrogen and 46.5 and 88 PSIG for helium while air supply was set to a pressure of 60PSIG.
137
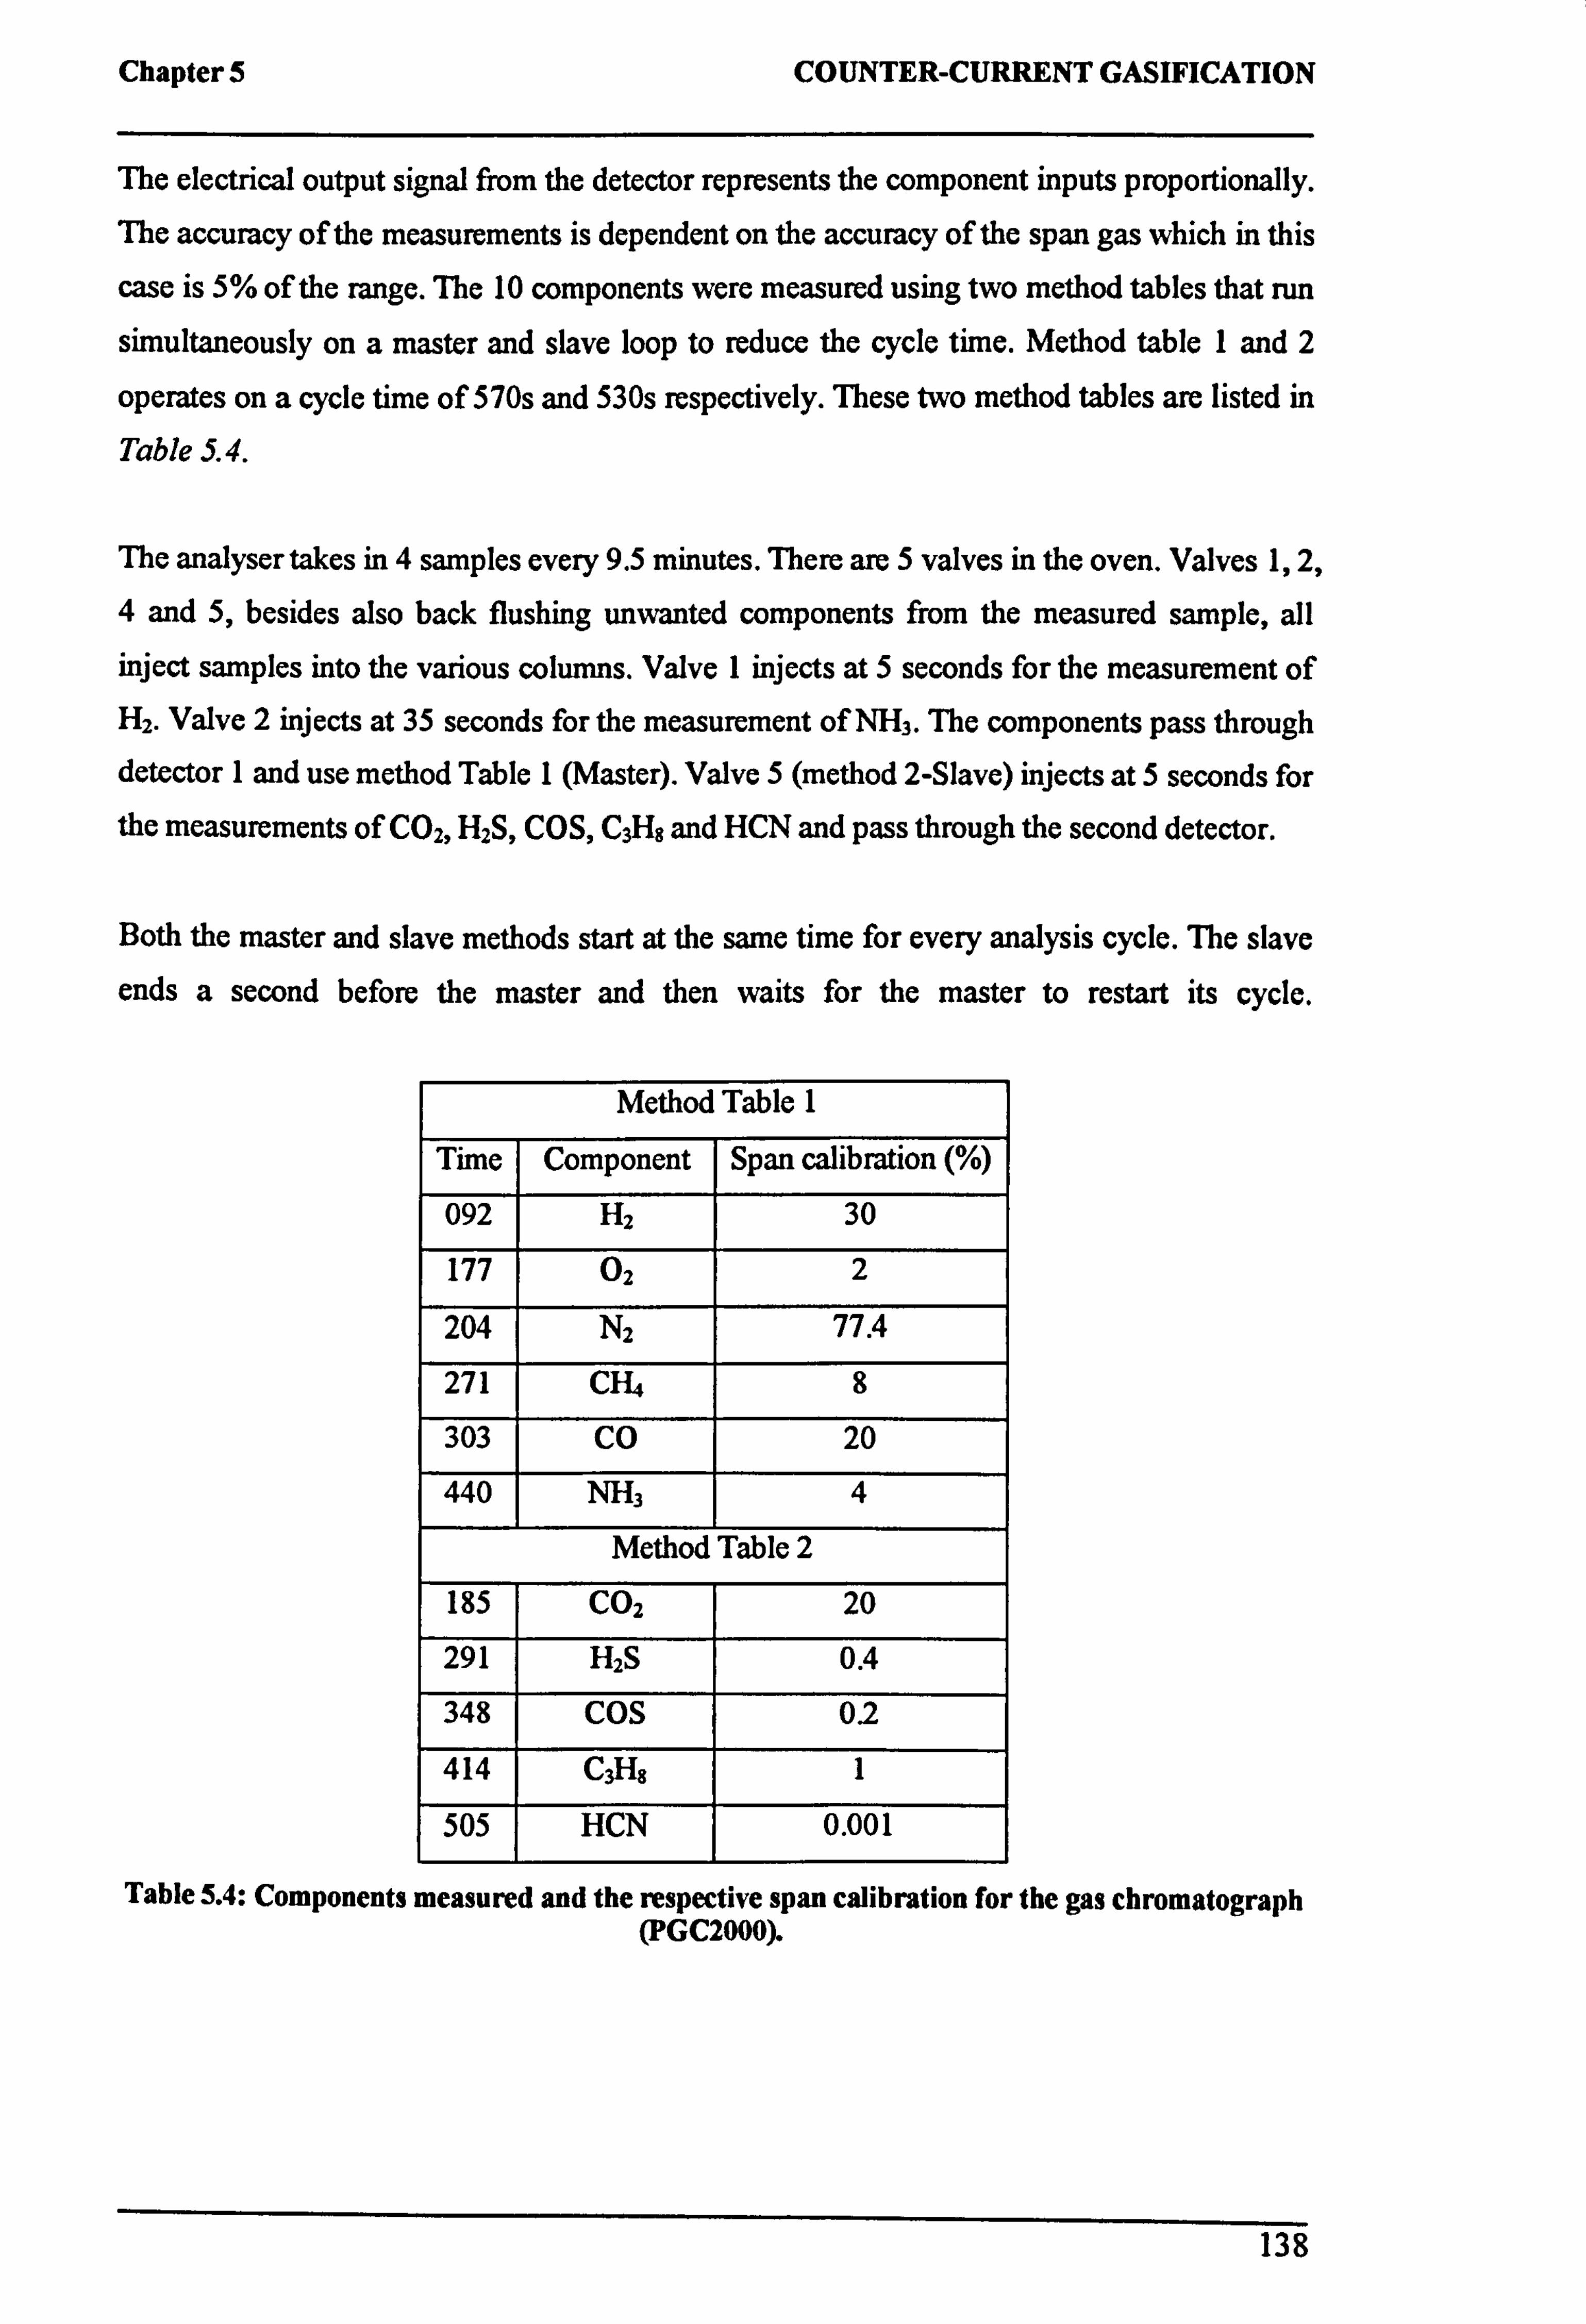
Chapter 5 COUNTER-CURRENT GASIFICATION
The electrical output signal from the detector represents the component inputs proportionally. The accuracy of the measurements is dependent on the accuracy of the span gas which in this
case is 5% of the range. The 10 components were measured using two method tables that run
simultaneously on a master and slave loop to reduce the cycle time. Method table 1 and 2
operates on a cycle time of 570s and 530s respectively. These two method tables are listed in
Table 5.4.
The analyser takes in 4 samples every 9.5 minutes. There are 5 valves in the oven. Valves 1,2,
4 and 5, besides also back flushing unwanted components from the measured sample, all inject samples into the various columns. Valve 1 injects at 5 seconds for the measurement of H2. Valve 2 injects at 35 seconds for the measurement of NH3. The components pass through detector 1 and use method Table 1 (Master). Valve 5 (method 2-Slave) injects at 5 seconds for
the measurements of C02, H2S, COS, C3Hg and HCN and pass through the second detector.
Both the master and slave methods start at the same time for every analysis cycle. The slave
ends a second before the master and then waits for the master to restart its cycle.
Method Table 1
Time Component Span calibration (%)
092 H2 30
177 02 2
204 N2 77.4
271 CH4 8
303 CO 20
440 NH3 4
Method Table 2
185 CO2 20
291 H2S 0.4
348 COS 02
414 C3H8 1
505 HCN 0.001
Table 5.4: Components measured and the respective span calibration for the gas chromatograph (PGC2000).
138
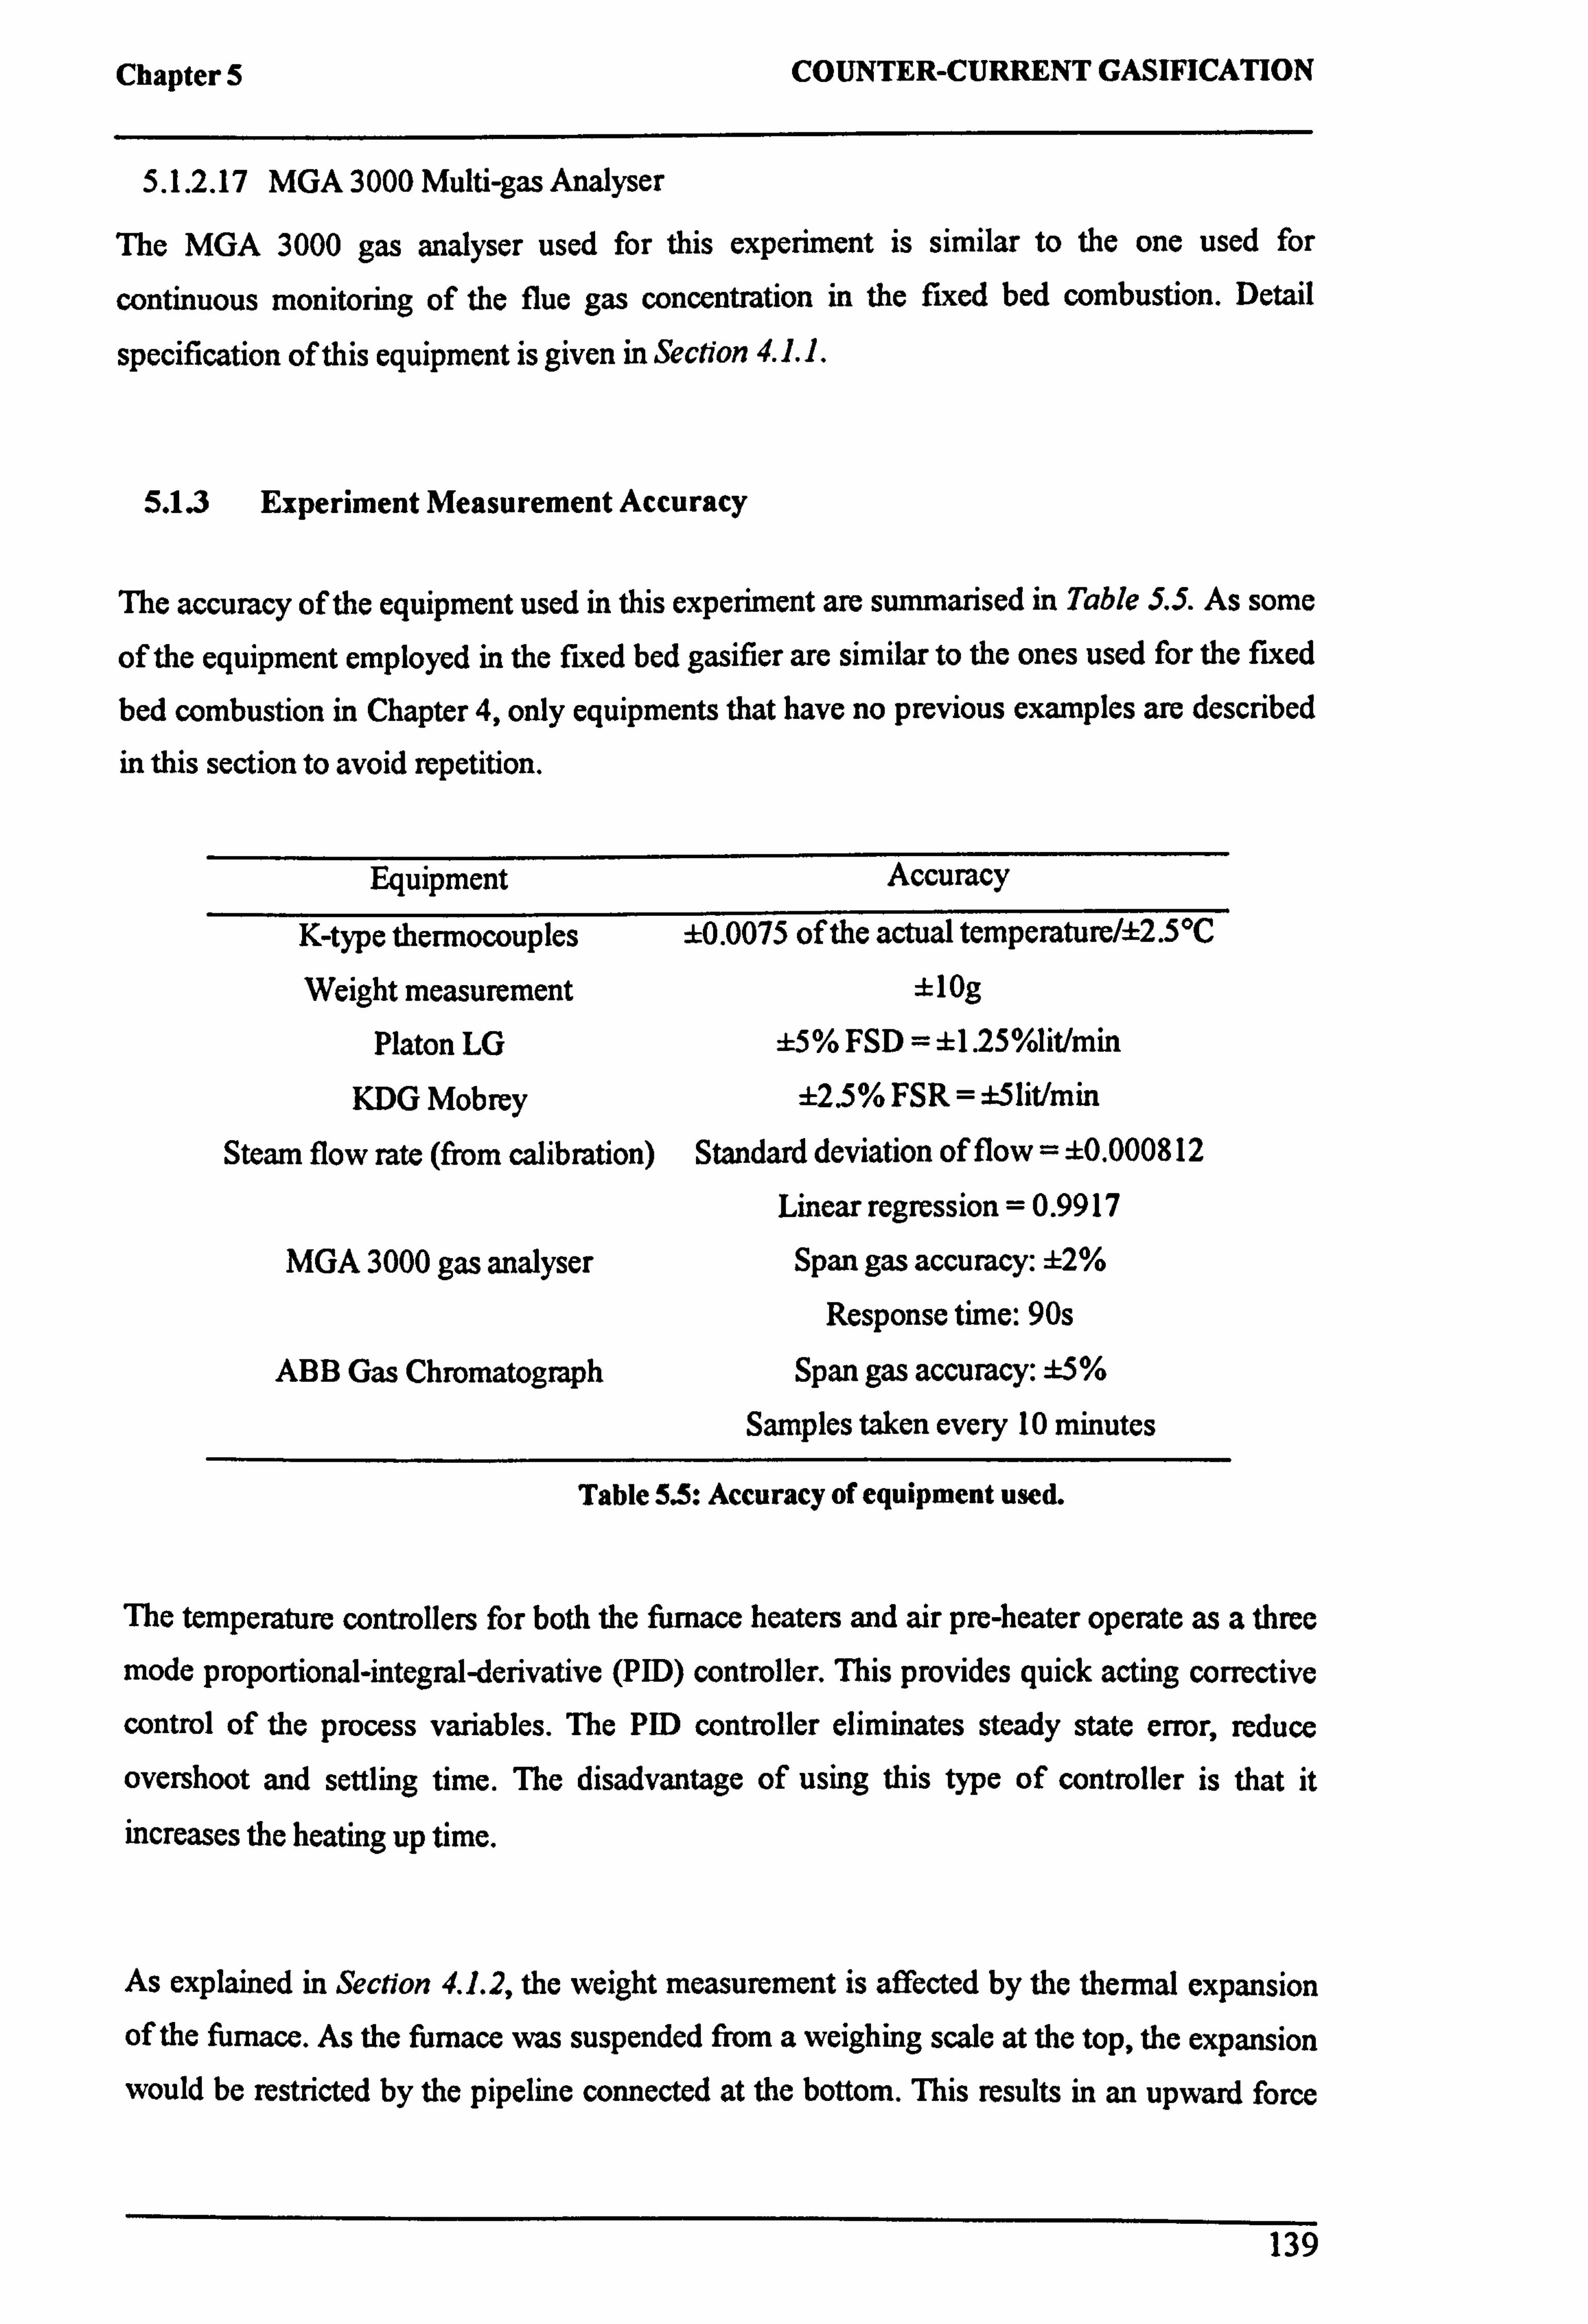
Chapter 5 COUNTER-CURRENT GASIFICATION
5.1.2.17 MGA 3000 Multi-gas Analyser
The MGA 3000 gas analyser used for this experiment is similar to the one used for
continuous monitoring of the flue gas concentration in the fixed bed combustion. Detail
specification of this equipment is given in Section 4.1.1.
5.1.3 Experiment Measurement Accuracy
The accuracy of the equipment used in this experiment are summarised in Table S. S. As some
of the equipment employed in the fixed bed gasifier are similar to the ones used for the fixed
bed combustion in Chapter 4, only equipments that have no previous examples are described
in this section to avoid repetition.
Equipment Accuracy
K-type thermocouples Weight measurement
Platon LG
KDG Mobrey
Steam flow rate (from calibration)
±0.0075 of the actual temperature/±2.5°C
flog
±5% FSD =±1.25%lidmin ±2.5%FSR=±51it/min
Standard deviation of flow = ±0.000812
Linear regression = 0.9917
MGA 3000 gas analyser Span gas accuracy: ±2%
Response time: 90s
ABB Gas Chromatograph Span gas accuracy: ±5%
Samples taken every 10 minutes
Table 5.5: Accuracy of equipment used.
The temperature controllers for both the furnace heaters and air pre-heater operate as a three
mode proportional-integral-derivative (PID) controller. This provides quick acting corrective
control of the process variables. The PID controller eliminates steady state error, reduce
overshoot and settling time. The disadvantage of using this type of controller is that it
increases the heating up time.
As explained in Section 4.1.2, the weight measurement is affected by the thermal expansion of the furnace. As the furnace was suspended from a weighing scale at the top, the expansion would be restricted by the pipeline connected at the bottom. This results in an upward force
139
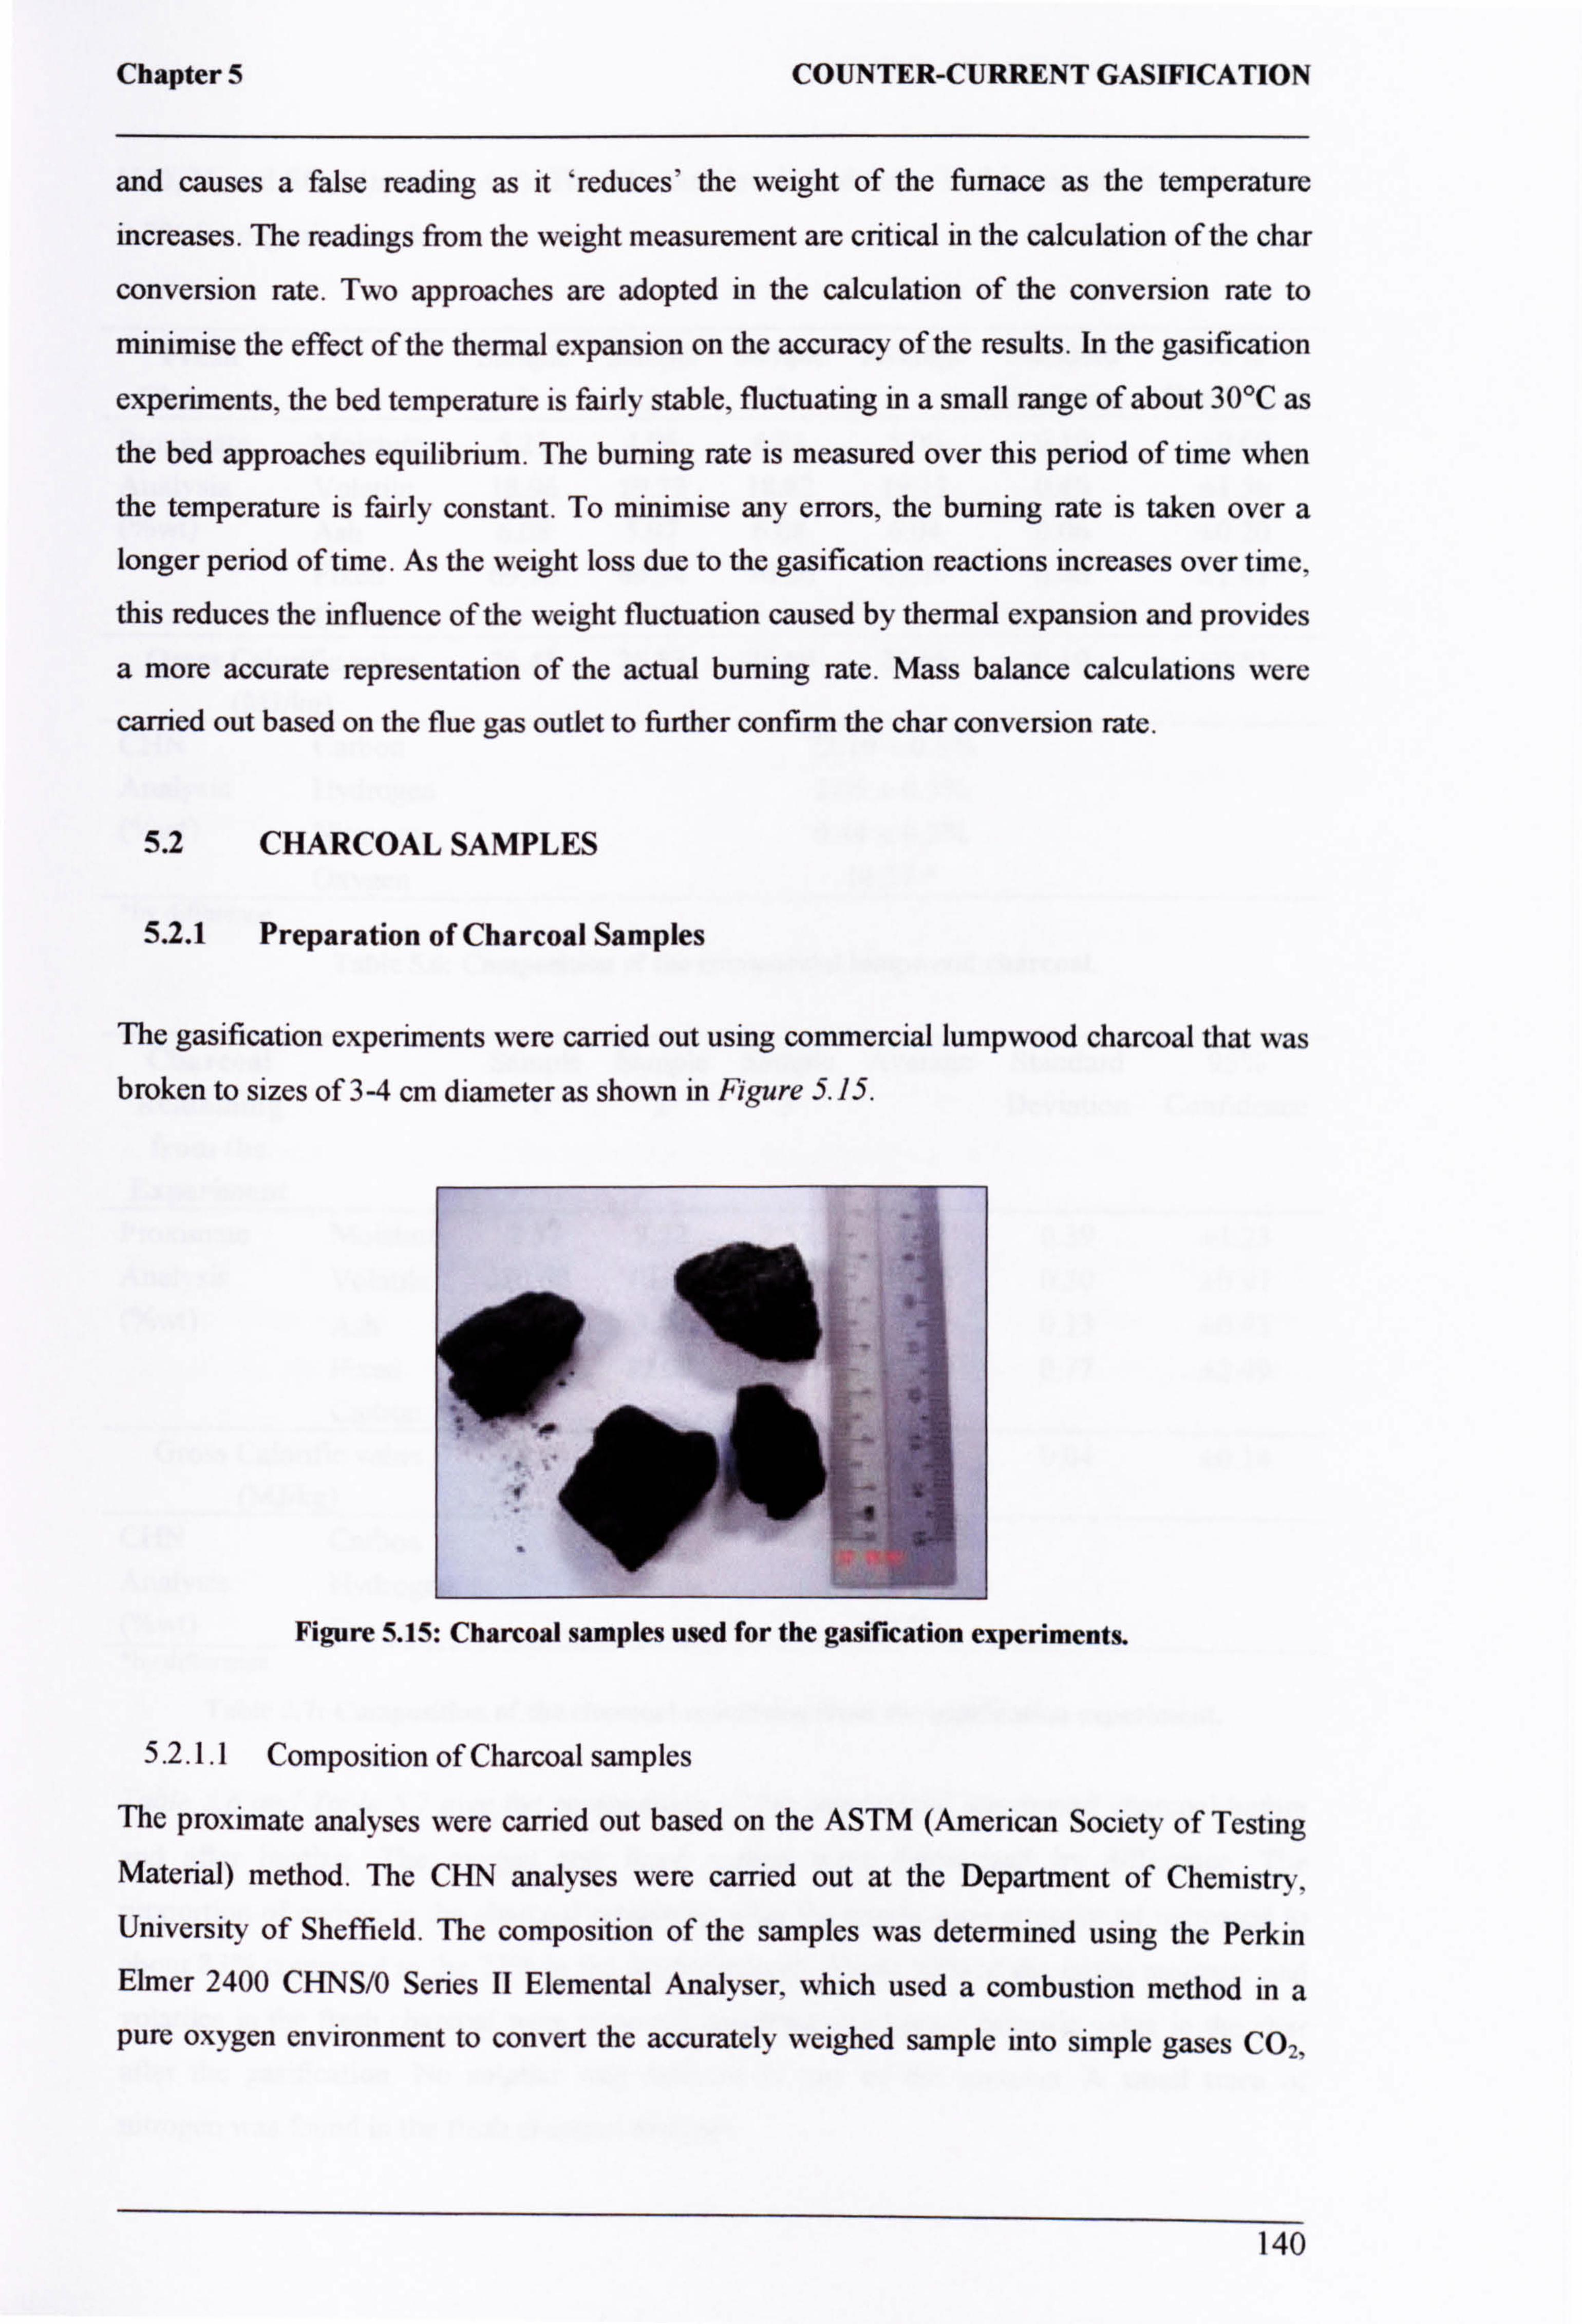
Chapter 5 COUNTER-CURRENT GASIFICATION
and causes a false reading as it 'reduces' the weight of the furnace as the temperature
increases. The readings from the weight measurement are critical in the calculation of the char
conversion rate. Two approaches are adopted in the calculation of the conversion rate to
minimise the effect of the thermal expansion on the accuracy of the results. In the gasification
experiments, the bed temperature is fairly stable, fluctuating in a small range of about 30°C as
the bed approaches equilibrium. The burning rate is measured over this period of time when
the temperature is fairly constant. To minimise any errors, the burning rate is taken over a longer period of time. As the weight loss due to the gasification reactions increases over time,
this reduces the influence of the weight fluctuation caused by thermal expansion and provides
a more accurate representation of the actual burning rate. Mass balance calculations were
carried out based on the flue gas outlet to further confirm the char conversion rate.
5.2 CHARCOAL SAMPLES
5.2.1 Preparation of Charcoal Samples
The gasification experiments were carried out using commercial lumpwood charcoal that was broken to sizes of 3-4 cm diameter as shown in Figure 5.15.
Figure 5.15: Charcoal samples used for the gasification experiments.
5.2.1.1 Composition of Charcoal samples
The proximate analyses were carried out based on the ASTM (American Society of Testing
Material) method. The CHN analyses were carried out at the Department of Chemistry.
University of Sheffield. The composition of the samples was determined using the Perkin
Elmer 2400 CHNS/0 Series II Elemental Analyser, which used a combustion method in a pure oxygen environment to convert the accurately weighed sample into simple gases C02,
140
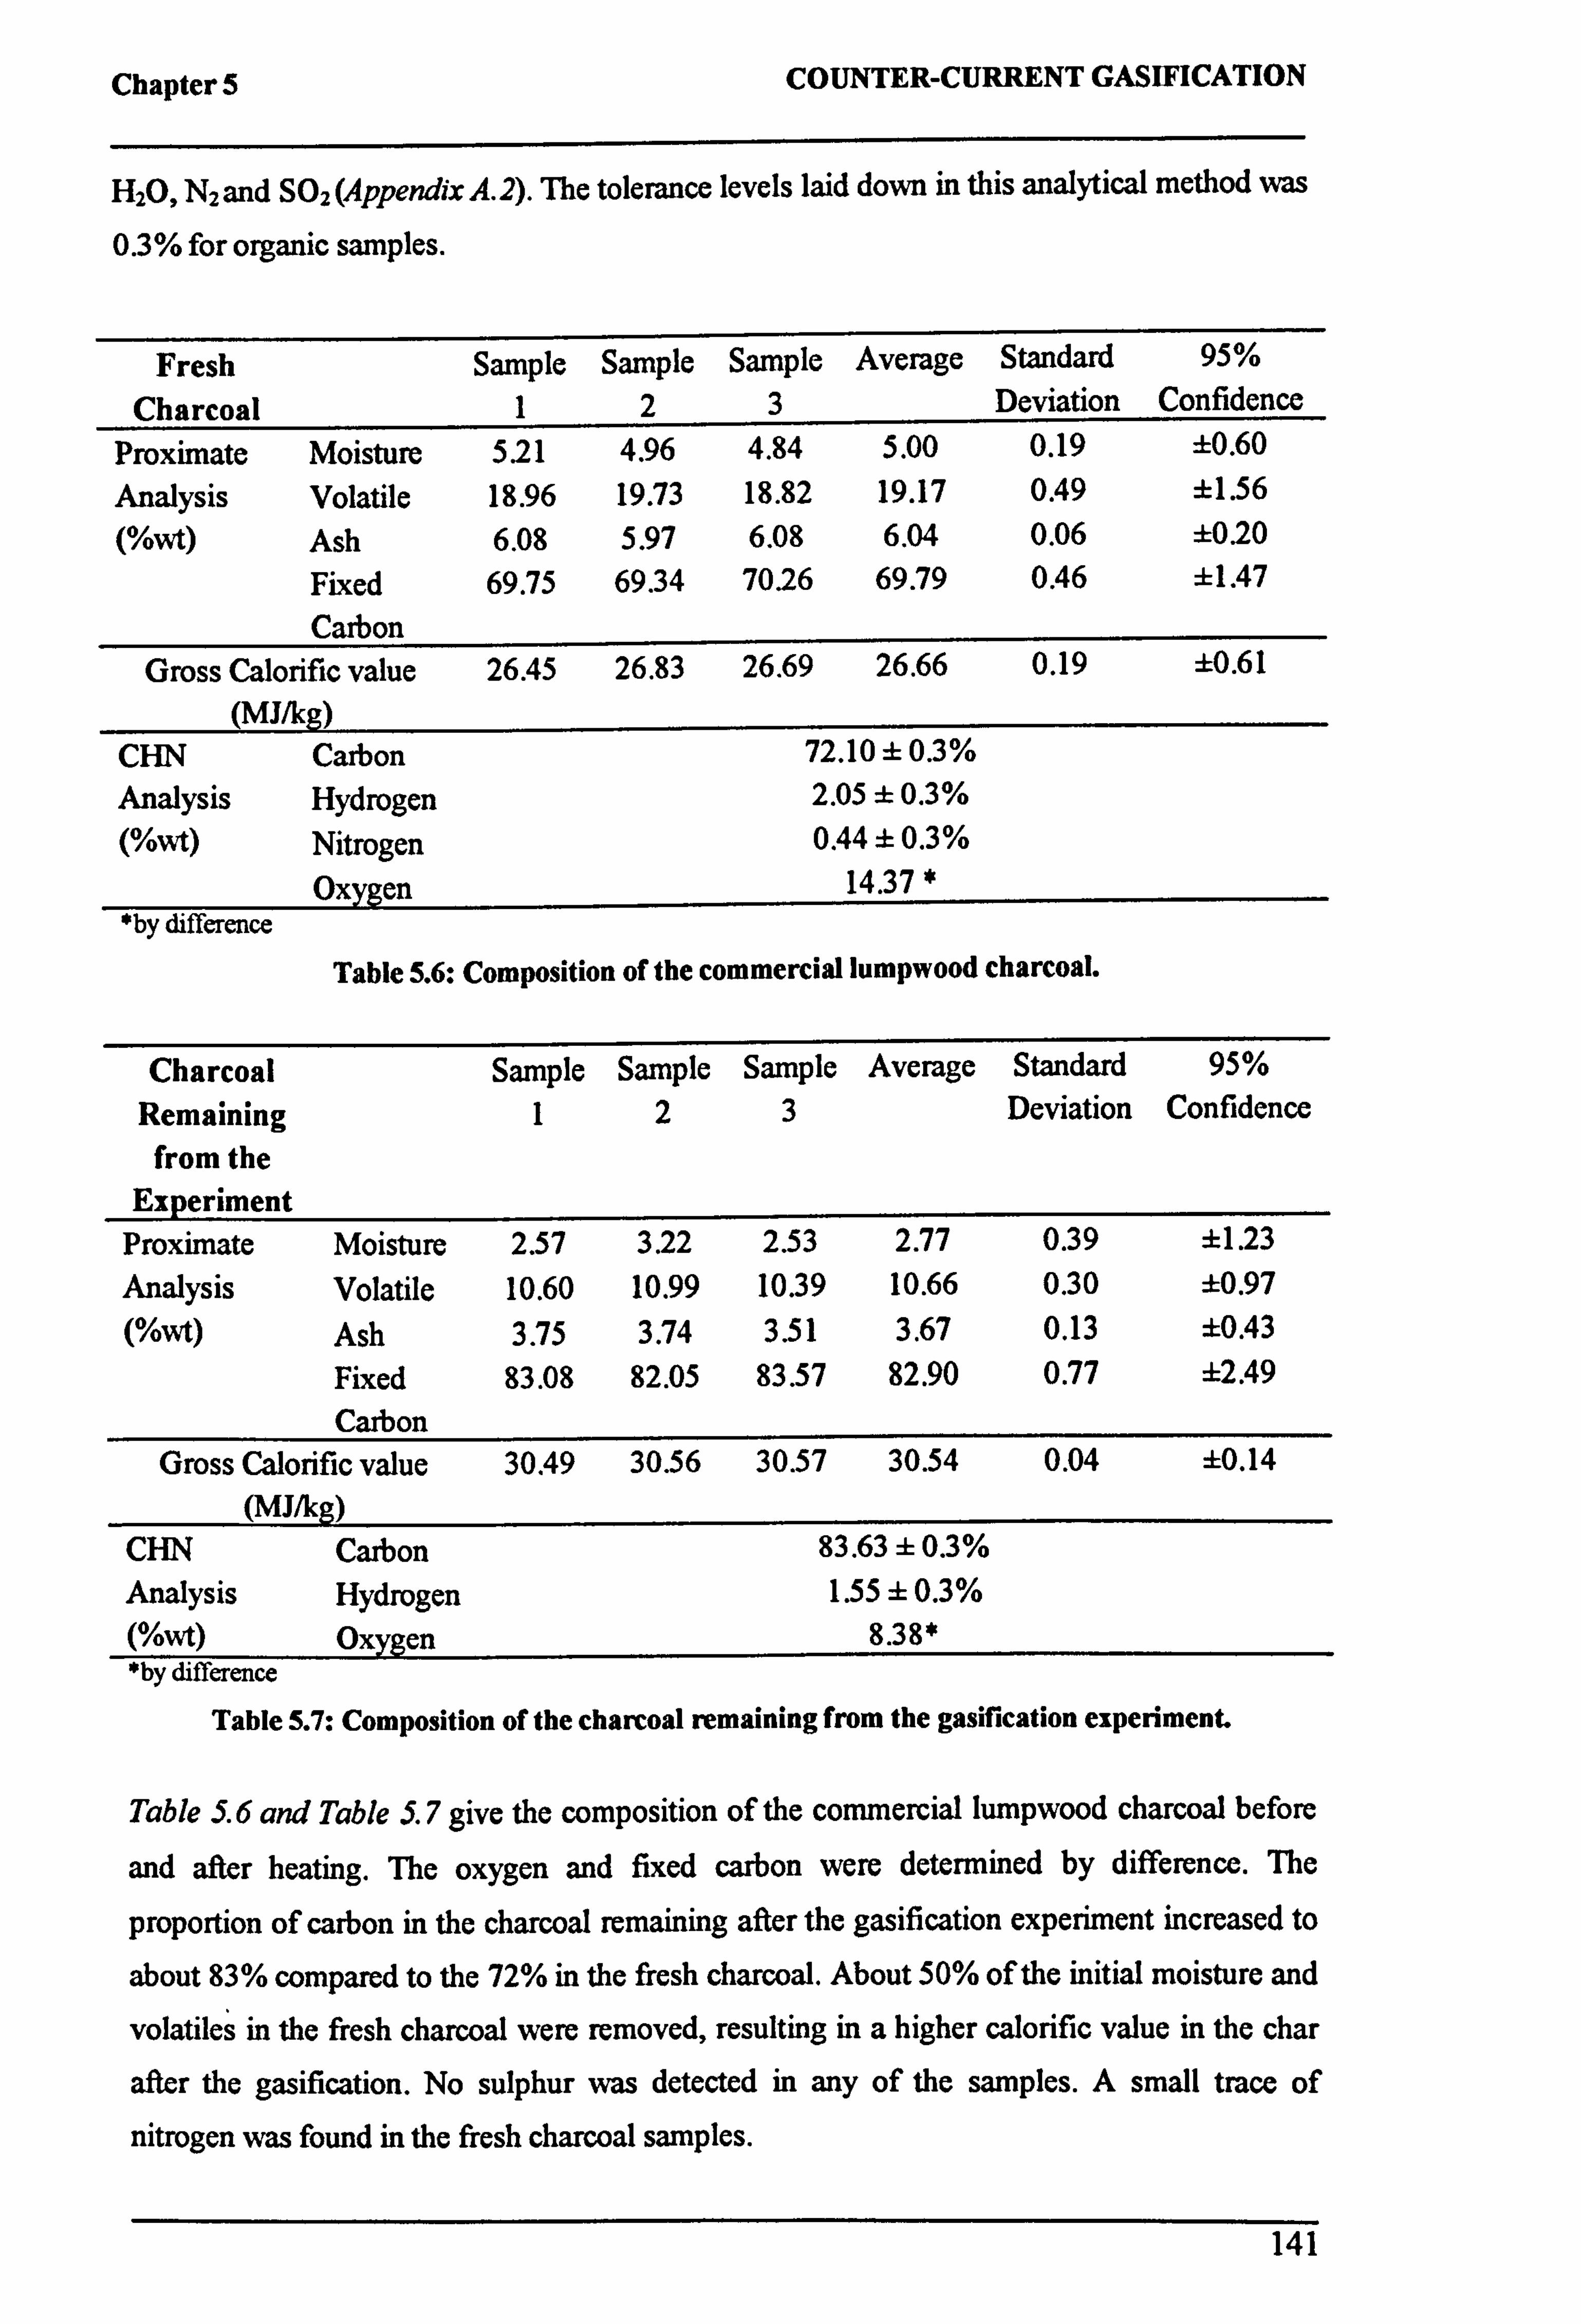
Chapter 5 COUNTER-CURRENT GASIFICATION
H20, N2 and S02 (Appendix A. 2). The tolerance levels laid down in this analytical method was
0.3 % for organic samples.
Fresh Sample Sample Sample Average Standard 95%
Charcoal 123 Deviation Confidence
Proximate Moisture 521 4.96 4.84 5.00 0.19 ±0.60 Analysis Volatile 18.96 19.73 18.82 19.17 0.49 ±1.56 (%wt) Ash 6.08 5.97 6.08 6.04 0.06 ±020
Fixed 69.75 69.34 70.26 69.79 0.46 ±1.47 Carbon
Gross Calorific value 26.45 26.83 26.69 26.66 0.19 ±0.61 (MJ/kg)
CHN Carbon 72.10 ± 0.3% Analysis Hydrogen 2.05 ± 0.3% (%wt) Nitrogen 0.44. +0.3%
Oxveen 14.37 * by difference
Table 5.6: Composition of the commercial lumpwood charcoal.
Charcoal Sample Sample Sample Average Standard 95%
Remaining 1 2 3 Deviation Confidence
from the Experiment
Proximate Moisture 2.57 3.22 2.53 2.77 0.39 ±1.23 Analysis Volatile 10.60 10.99 10.39 10.66 0.30 ±0.97 (%wt) Ash 3.75 3.74 3.51 3.67 0.13 ±0.43
Fixed 83.08 82.05 83.57 82.90 0.77 ±2.49 Carbon
Gross Calorific value 30.49 30.56 30.57 30.54 0.04 ±0.14 (MJ/kg)
CHN Carbon 83.63 f 0.3%
Analysis Hydrogen 1.55 f 0.3% ( owt) Oxvaen 8.38* *by difference
Table 5.7: Composition of the charcoal remaining from the gasification experiment.
Table 5.6 and Table 5.7 give the composition of the commercial lumpwood charcoal before
and after heating. The oxygen and fixed carbon were determined by difference. The
proportion of carbon in the charcoal remaining after the gasification experiment increased to
about 83% compared to the 72% in the fresh charcoal. About 50% of the initial moisture and
volatiles in the fresh charcoal were removed, resulting in a higher calorific value in the char
after the gasification. No sulphur was detected in any of the samples. A small trace of
nitrogen was found in the fresh charcoal samples.
141
Chapter 5 COUNTER-CURRENT GASIFICATION
5.3 EXPERIMENTAL PROCEDURE
Figure 5.16 shows the flow diagram of the experimental setup of the rig. The start up and shut down procedures are described in the following section.
Due to the complex characteristics of this fixed bed gasifier, several trial runs were carried
out before determining a start-up procedure. One of the main problems was the formation of
condensation in the pipe line connecting valves V5, V6, V8 and V9. Before any measurement
of steam was carried out using the manometer, any condensate was flushed/drained out of the
pipeline by opening valves, V3, V6, V7, V9 and V11 and shutting valves V5, V8 and V10.
Valves V6 and V9 are then shut while valves V5 and V8 are opened to measure the differential "head" developed due to the flow restriction by the orifice plate using the
manometer.
Complications were also encountered due to the time limit of the experimental work. For
safety reasons, the experimental work could not be conducted out of the normal working hours. Therefore, each experiment was constrained to an 8 hour run. The gasification is a
relative slow process compared to combustion or pyrolysis and requires a long period of time
to achieve a stable condition. The initial start up period (purging of reactor and heating up of the charcoal bed) requires about 5 hours. However, the bed temperature after this time is only about 500°C and is not high enough for most of the crucial gasification reactions such as the
water-gas reaction and water-shift reactions. Therefore, to shorten the preheating time and increase the bed temperature during the start-up, preheated air (175°C) was blown into the
reactor for about 20mins to raise the bottom bed temperature to about 700°C.
142
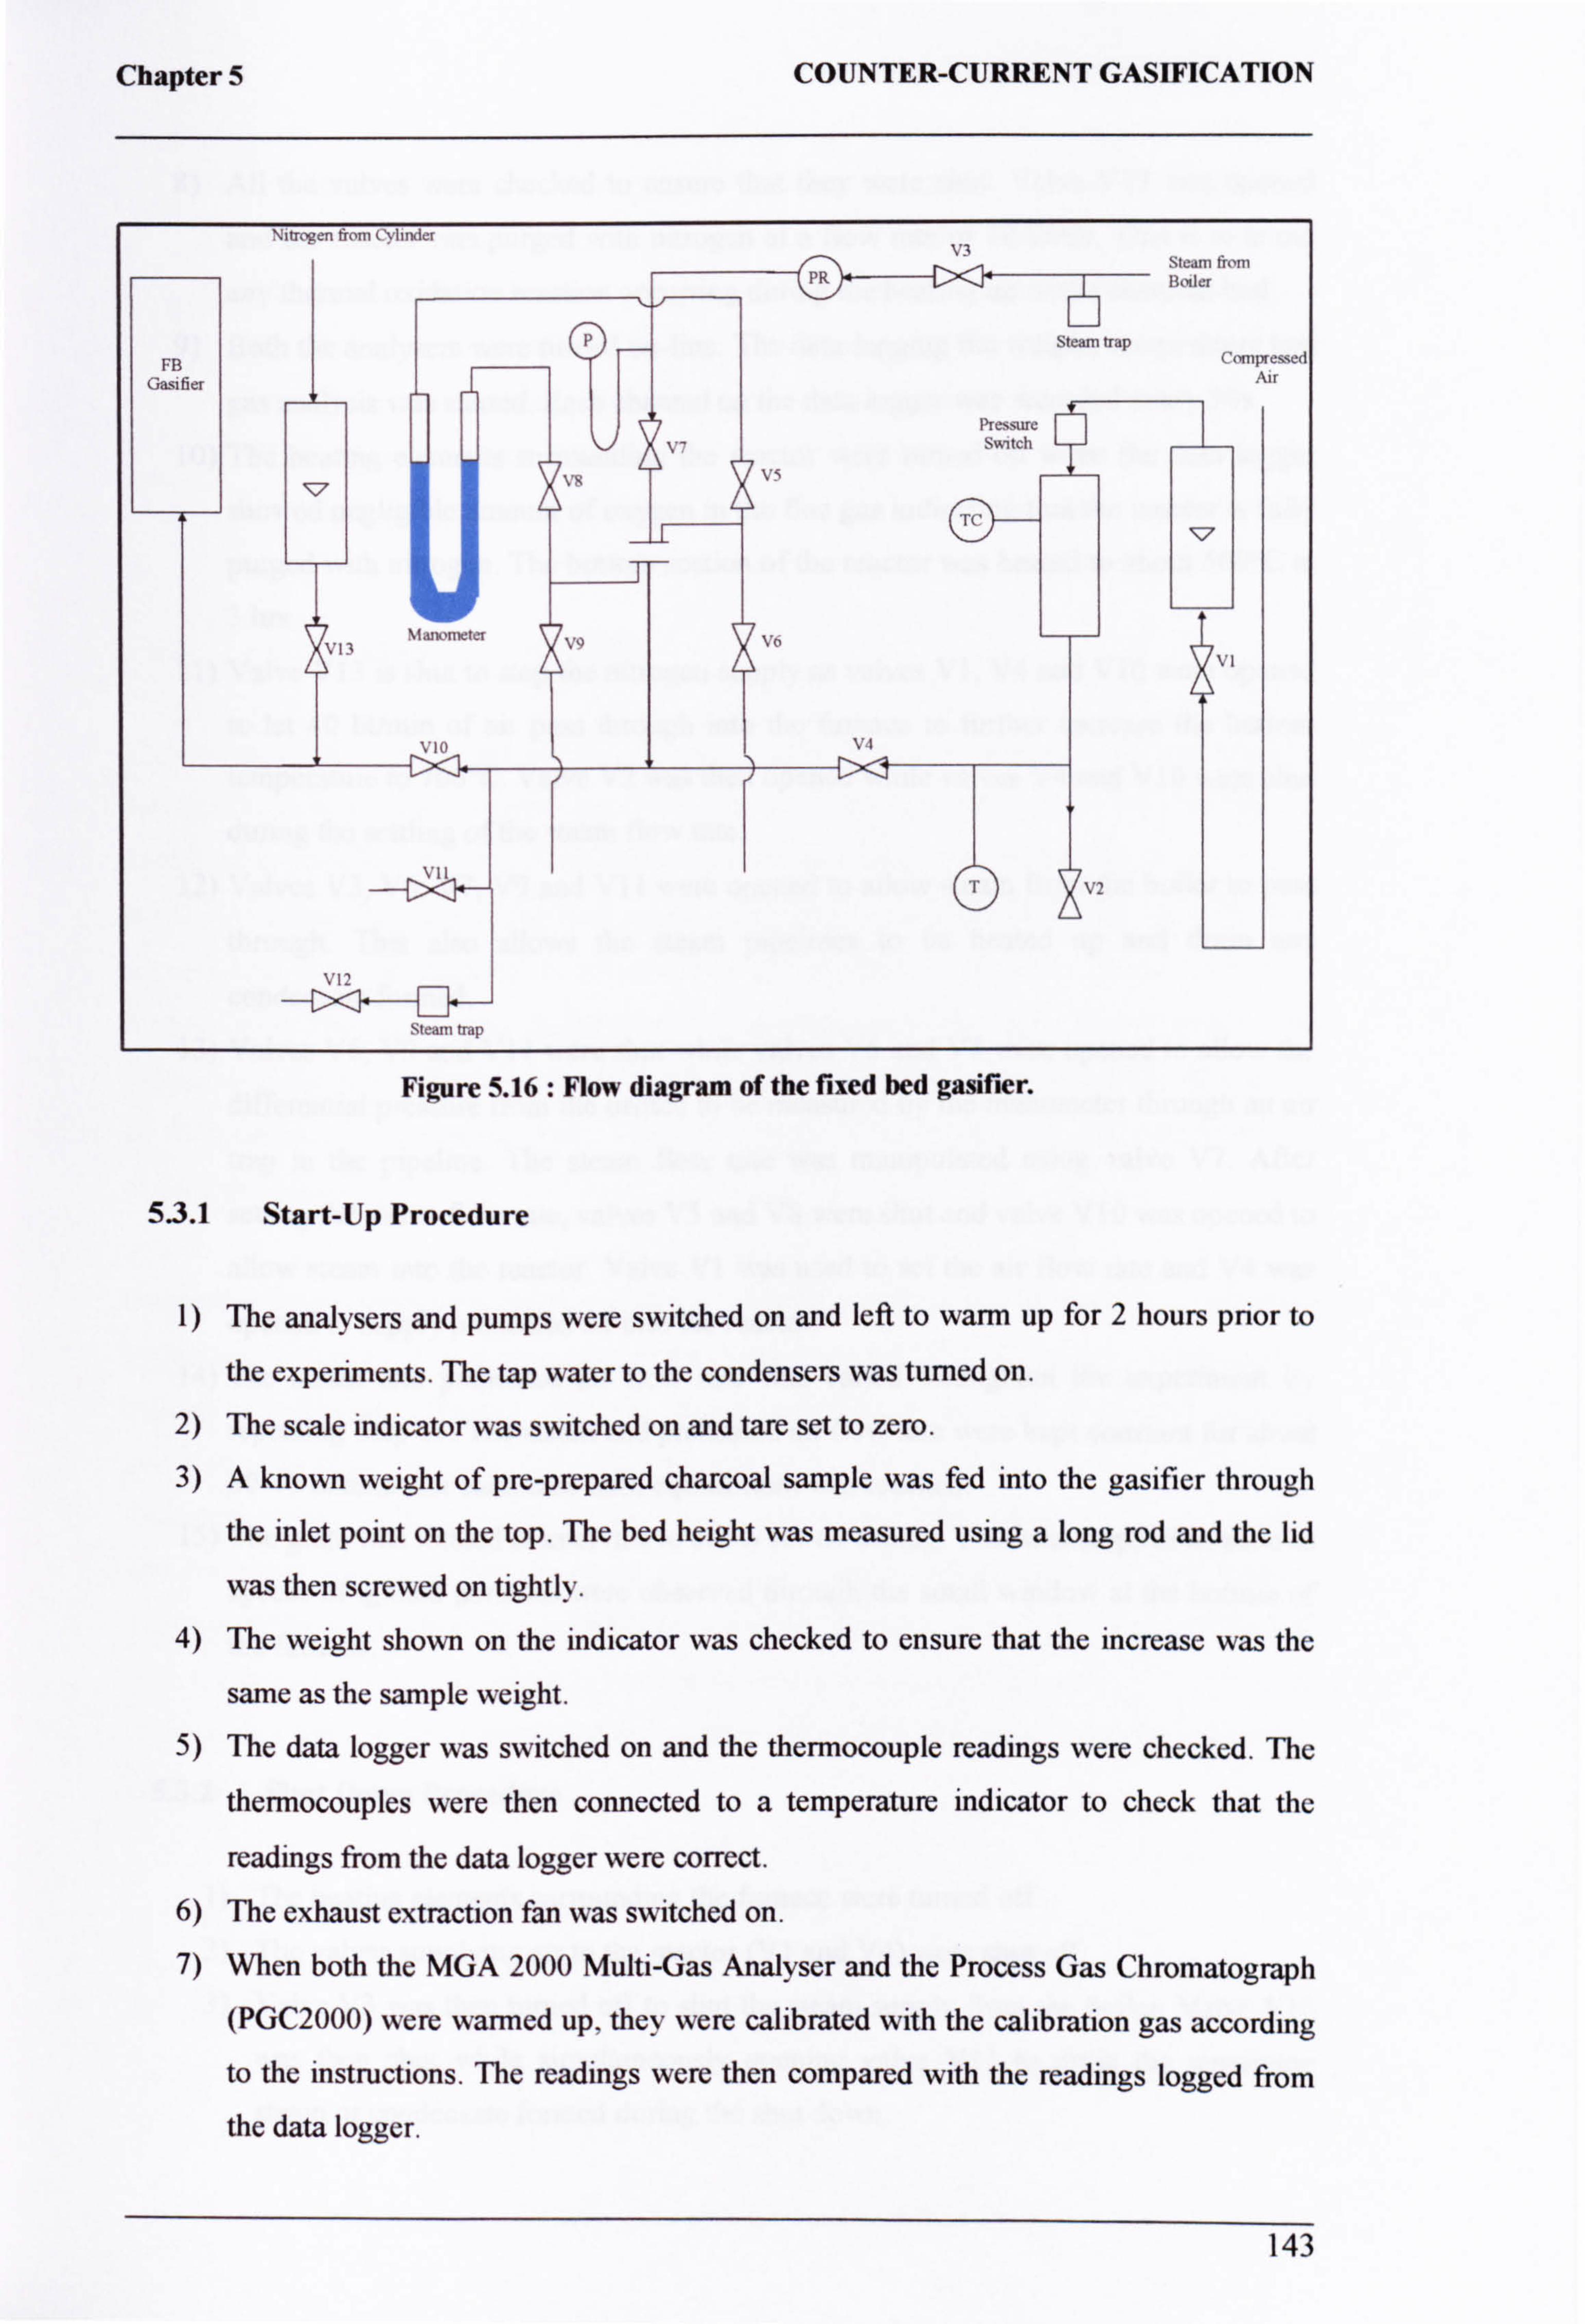
Chapter 5 COUNTER-CURRENT GASIFICATION
5.3.1 Start-Up Procedure
1) The analysers and pumps were switched on and left to warm up for 2 hours prior to
the experiments. The tap water to the condensers was turned on.
2) The scale indicator was switched on and tare set to zero. 3) A known weight of pre-prepared charcoal sample was fed into the gasifier through
the inlet point on the top. The bed height was measured using a long rod and the lid
was then screwed on tightly.
4) The weight shown on the indicator was checked to ensure that the increase was the
same as the sample weight. 5) The data logger was switched on and the thermocouple readings were checked. The
thermocouples were then connected to a temperature indicator to check that the
readings from the data logger were correct.
6) The exhaust extraction fan was switched on.
7) When both the MGA 2000 Multi-Gas Analyser and the Process Gas Chromatograph
(PGC2000) were warned up, they were calibrated with the calibration gas according
to the instructions. The readings were then compared with the readings logged from
the data logger.
143
Figure 5.16: Flow diagram of the fixed bed gasifier.
Chapter 5 COUNTER-CURRENT GASIFICATION
8) All the valves were checked to ensure that they were shut. Valve V13 was opened
and the reactor was purged with nitrogen at a flow rate of 10 Vmin. This is to avoid
any thermal oxidation reaction occurring during the heating up of the charcoal bed.
9) Both the analysers were turned on-line. The data logging the weight, temperature and
gas analysis was started. Each channel on the data logger was recorded every 30s.
10) The heating elements surrounding the reactor were turned on when the data logger
showed negligible amount of oxygen in the flue gas indicating that the reactor is fully
purged with nitrogen. The bottom section of the reactor was heated to about 500°C in
3 hrs.
11) Valve V 13 is shut to stop the nitrogen supply as valves V 1, V4 and V 10 were opened to let 40 lit/min of air pass through into the furnace to further increase the bottom
temperature to 700°C. Valve V2 was then opened while valves V4 and V 10 were shut during the settling of the steam flow rate.
12) Valves V3, V6, V7, V9 and V 11 were opened to allow steam from the boiler to pass
through. This also allows the steam pipelines to be heated up and drain any
condensate formed.
13) Valves V6, V9 and V11 were shut while valves V5 and V8 were opened to allow the differential pressure from the orifice to be measured by the manometer through an air
trap in the pipeline. The steam flow rate was manipulated using valve V7. After
setting the steam flow rate, valves V5 and V8 were shut and valve V 10 was opened to
allow steam into the reactor. Valve VI was used to set the air flow rate and V4 was
opened to supply preheated air into the reactor. 14) The steam and preheated air flow rate was varied throughout the experiment by
repeating Step 13. The steam and preheated air flow rate were kept constant for about 30-40 minutes for each case until equilibrium was reached.
15) The grate was rotated at intervals to allow for de-ashing. This was stopped as soon as specks of ignited particles were observed through the small window at the bottom of the furnace.
53.2 Shut Down Procedure
1) The heating elements surrounding the furnace were turned off. 2) The valves supplying air to the reactor (VI and V4) were shut off. 3) Valve V3 was then turned off to shut the steam supply from the boiler. Valve V 10
was then shut while simultaneously opening valve V11 to drain the remaining steam or condensate formed during the shut down.
144
Chapter 5 COUNTER-CURRENT GASIFICATION
4) The logging of weight, temperature and gas were stopped. 5) The analyser's connections were disconnected from the combustion port. 6) The MGA 2000 Multi-Gas Analyser was left for half an hour to flush out all the gas
in it before switching off. The Process Gas Chromatograph (PGC2000) was turn off
and left to cool down with a small purge of carrier gases. 7) The exhaust extraction fan was switched off followed by the tap water to the
cooling towers.
5.4 OPERATING CONDITION
The experiments were carried out with approximately 4kg of fresh charcoal samples and a bed height of 30cm. Two or three cases with varying air or steam flow rates were carried out during each run. The bed height decreased when the experiment progressed, this led to a lower bed height for some of the later cases. According to Encinar (2001), the reaction rates
are constant until the charcoal is exhausted as the reactions only occur on the surface in
contact with the steam and that surface is approximately constant. Consequently, the
influence of the bed height is relatively small as long as the bed depth was sufficient to allow
all the gasification reactions to occur. The approximate bulk density of the bed was measured
to be about 420kg/m3.
Detailed measurements were made during the series of gasification experiments at varied air
and steam flow rates. The air temperature was heated up to 175°C and steam was supplied at
atmospheric pressure. The test runs are named according to the volume of each reactant
supplied. For example, the "A40-S45" run refers to the gasification using 401it/min of
preheated air and with steam making up 45%wt of the total input reactants (air and steam). The furnace temperatures throughout the experiments were kept constant by external heaters.
Two sets of experiments were conducted with different heating rates. 'Si' refers to the cases
with the higher heating rate and a furnace temperature of about 850°C while `S2' represents
cases with a lower heating rate and furnace temperature of 650°C. The operating conditions for the cases are as shown in Table 5.8.
145
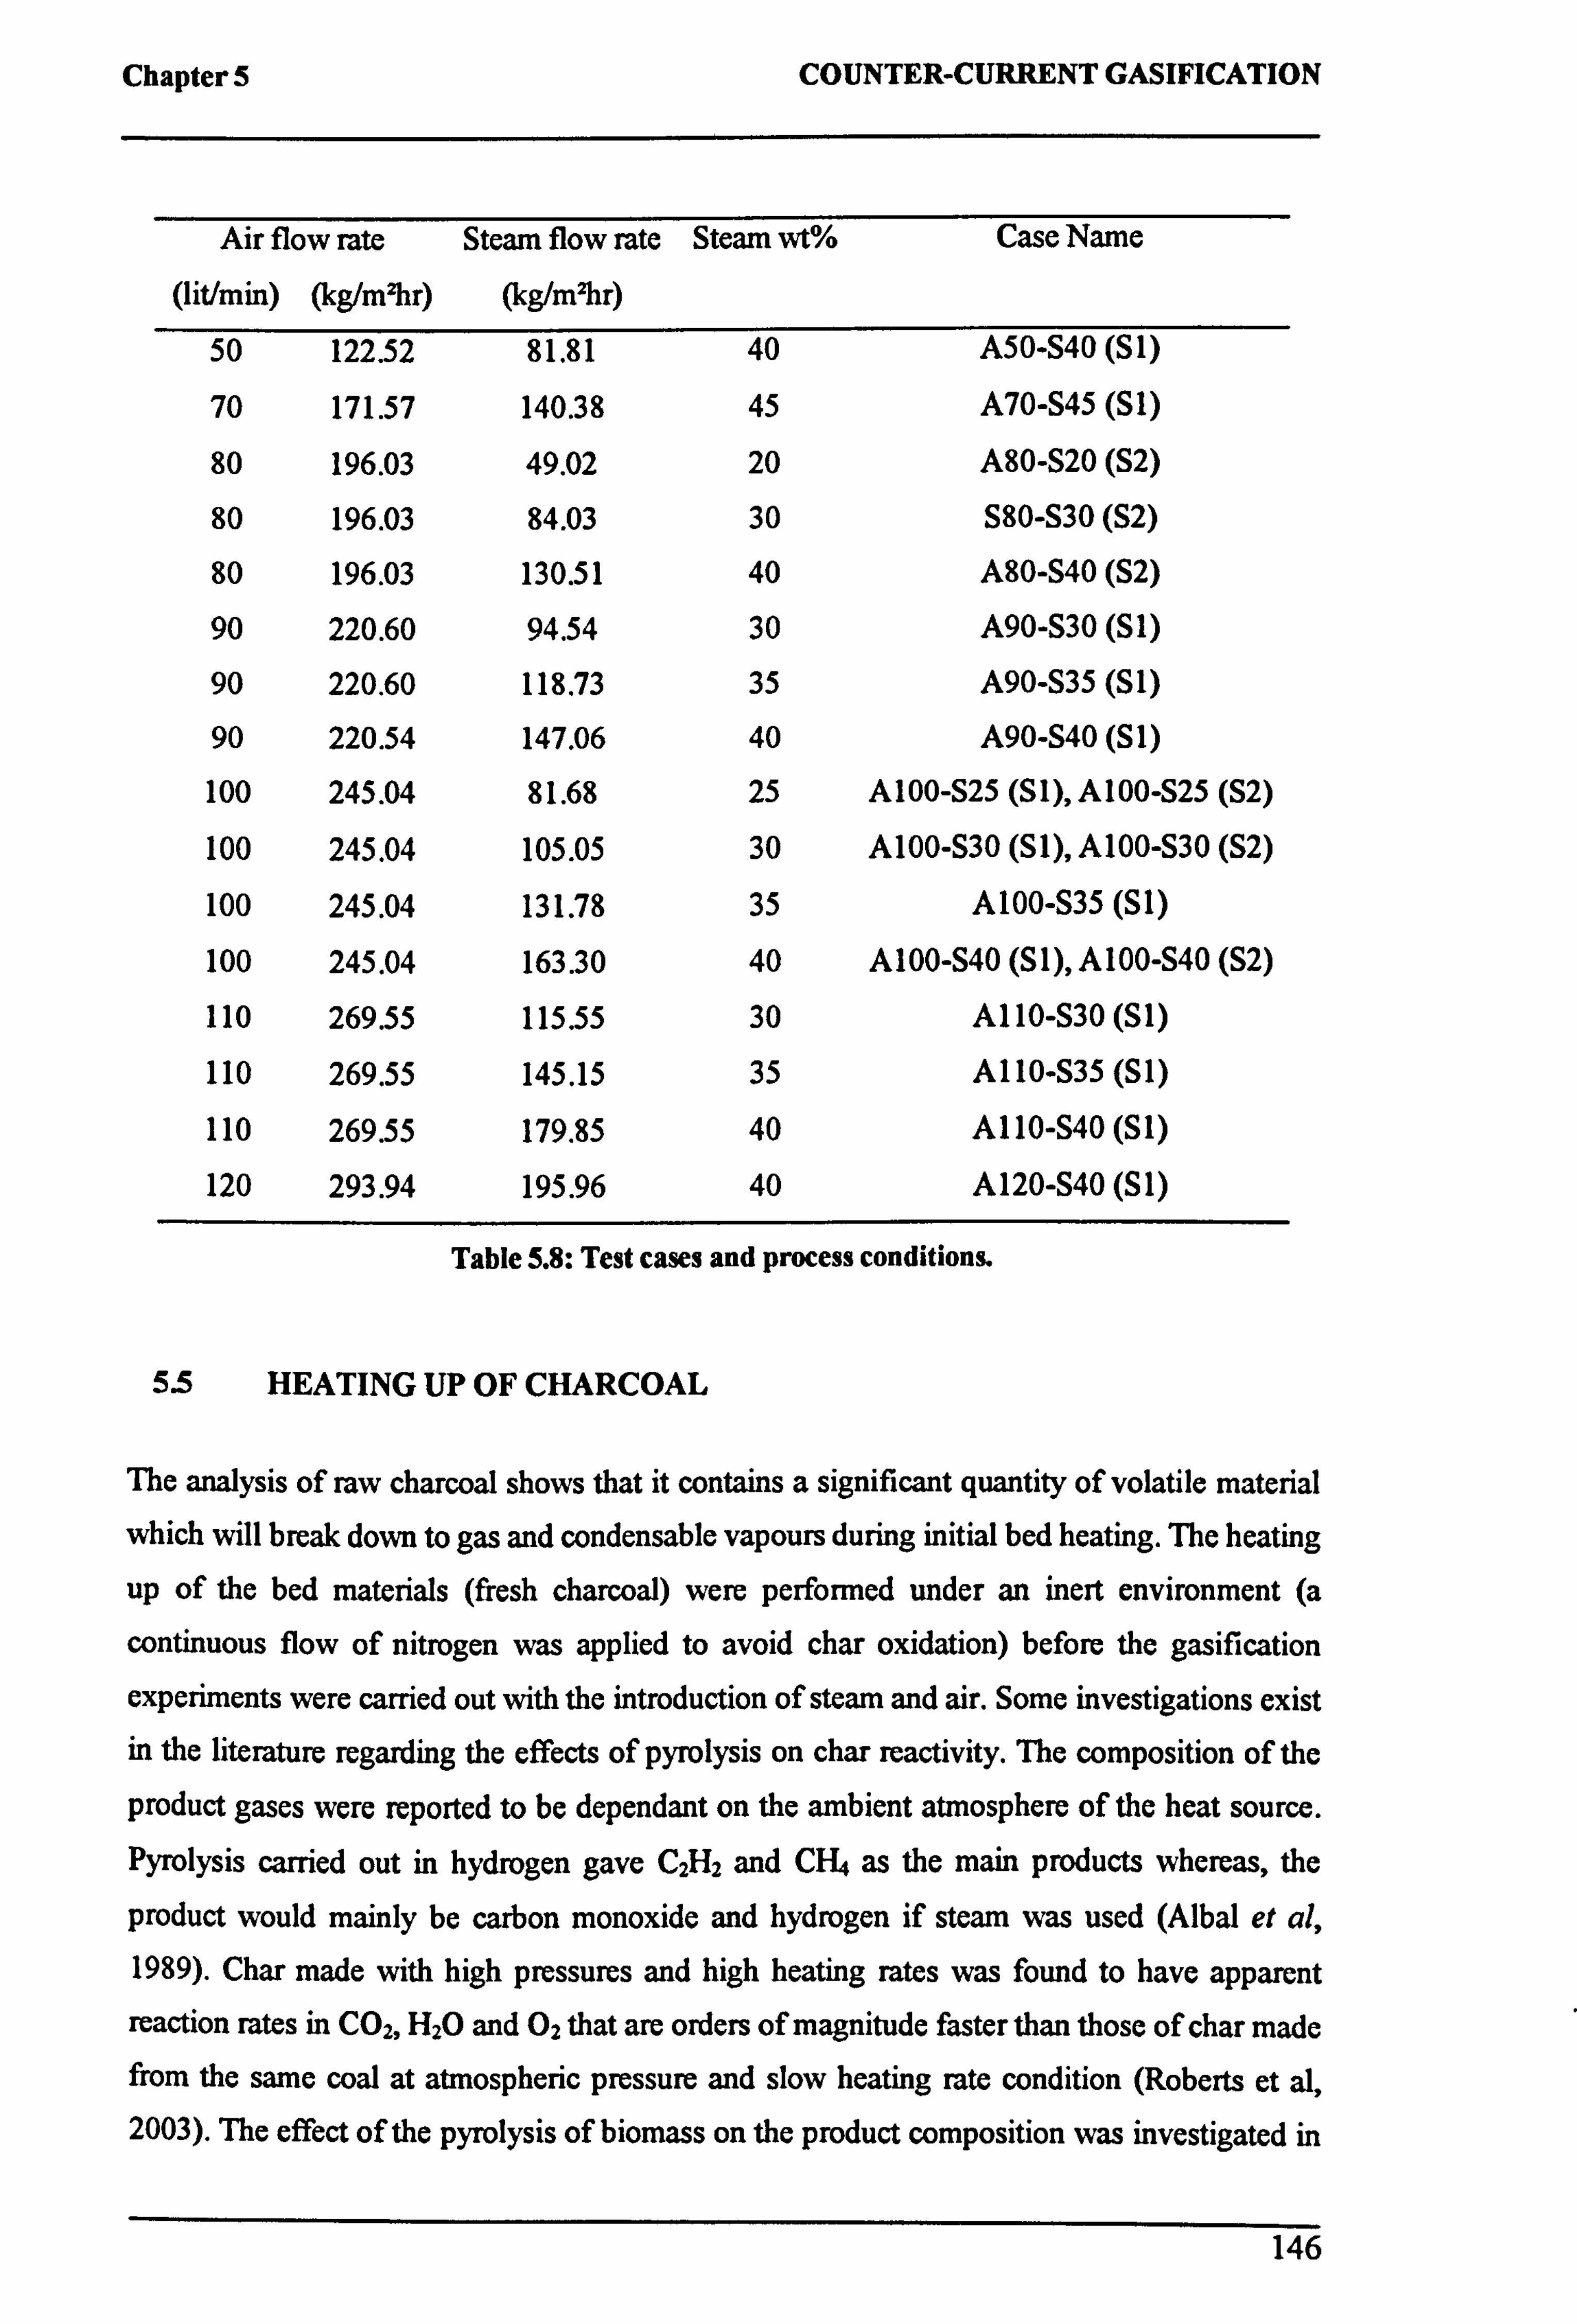
Chapter 5 COUNTER-CURRENT GASIFICATION
Air flow rate (lit/min) (kg/m2hr)
Steam flow rate (kg/m2hr)
Steam wt% Case Name
50 122.52 81.81 40 A50-S40 (S1)
70 171.57 140.38 45 A70-S45 (S1)
80 196.03 49.02 20 A80-S20 (S2)
80 196.03 84.03 30 S80-S30 (S2)
80 196.03 130.51 40 A80-S40 (S2)
90 220.60 94.54 30 A90-S30 (Si)
90 220.60 118.73 35 A90-S35 (Si)
90 220.54 147.06 40 A90-S40 (Si)
100 245.04 81.68 25 A100-S25 (S1), A100-S25 (S2)
100 245.04 105.05 30 A100-S30 (Si), A100-S30 (S2)
100 245.04 131.78 35 A 100-S35 (S 1)
100 245.04 163.30 40 A 100-S40 (S 1), A 100-S40 (S2)
110 269.55 115.55 30 A110-S30 (S1)
110 269.55 145.15 35 A110-S35 (S1)
110 269.55 179.85 40 A 110-S40 (S 1)
120 293.94 195.96 40 A 120-S40 (S 1)
Table 5.8: Test cases and process conditions.
5.5 HEATING UP OF CHARCOAL
The analysis of raw charcoal shows that it contains a significant quantity of volatile material
which will break down to gas and condensable vapours during initial bed heating. The heating
up of the bed materials (fresh charcoal) were performed under an inert environment (a
continuous flow of nitrogen was applied to avoid char oxidation) before the gasification
experiments were carried out with the introduction of steam and air. Some investigations exist in the literature regarding the effects of pyrolysis on char reactivity. The composition of the
product gases were reported to be dependant on the ambient atmosphere of the heat source. Pyrolysis carried out in hydrogen gave C2H2 and C1-14 as the main products whereas, the
product would mainly be carbon monoxide and hydrogen if steam was used (Albal et al, 1989). Char made with high pressures and high heating rates was found to have apparent reaction rates in CO2. H2O and 02 that are orders of magnitude faster than those of char made from the same coal at atmospheric pressure and slow heating rate condition (Roberts et al, 2003). The effect of the pyrolysis of biomass on the product composition was investigated in
146
Chapter 5 COUNTER-CURRENT GASIFICATION
detail by Shafizadeh (1985). Pyrolysis at lower temperatures (below 300°C) favours the
production of char, water, CO2 and CO. Whereas heating at higher temperatures (300-500°C) favours the formation of tar that interacts with water and carbon dioxide formed previously to
provide a mixture of low-molecular weight gaseous or volatile products. There is also a
possibility of the conversion of char directly to low-molecular weight gases. The reaction
products are lumped into three main classes (liquids, char and gas) whose relative amounts and composition are strongly dependant on the heating rate, reaction temperatures and also the conversion unit (Di Blasi, 1993; Chen et al, 1997).
Figure 5.17 shows an example of the temperature history within the bed during the heating up
of fresh charcoal prior to the gasification for cases (S 1). The average heating up rate of 5 tests
measured at position T8 in the centreline of the bed (y=206mm) is 10.74±2.16°C/min. This
rate was about 4 times faster compared to the heating up rate at Ti (y=6mm) of 2.59±0.98°C/min. A slow rise in temperature was observed at the bottom of the bed. This is
due to the lack of insulation in the ash discharge section beneath the bed and also the required
sensible heat to heat up the thick layer of charcoal materials at the bottom of the furnace. The
heating up rates in this experiment are slow compared to 1000°C/s used in flash pyrolysis
processes. Slow heating rates achieved by thick wood maximises the production of char and
this is desirable especially for the gasification process (Di Blasi et al, 2001). Chars obtained from rapid pyrolysis possessed higher reactivity in the reaction with carbon dioxide and steam
compared with chars obtained from slow pyrolysis (Chen et al, 1997). However, the primary degradation is only weakly affected by external heating condition given the intrabed
temperature gradients (Scott et al, 1988). The temperature across the bed (Ti to T8) fell in the
range of 500-900°C at t= 220min and this temperature was high enough to cause biomass degradation.
147
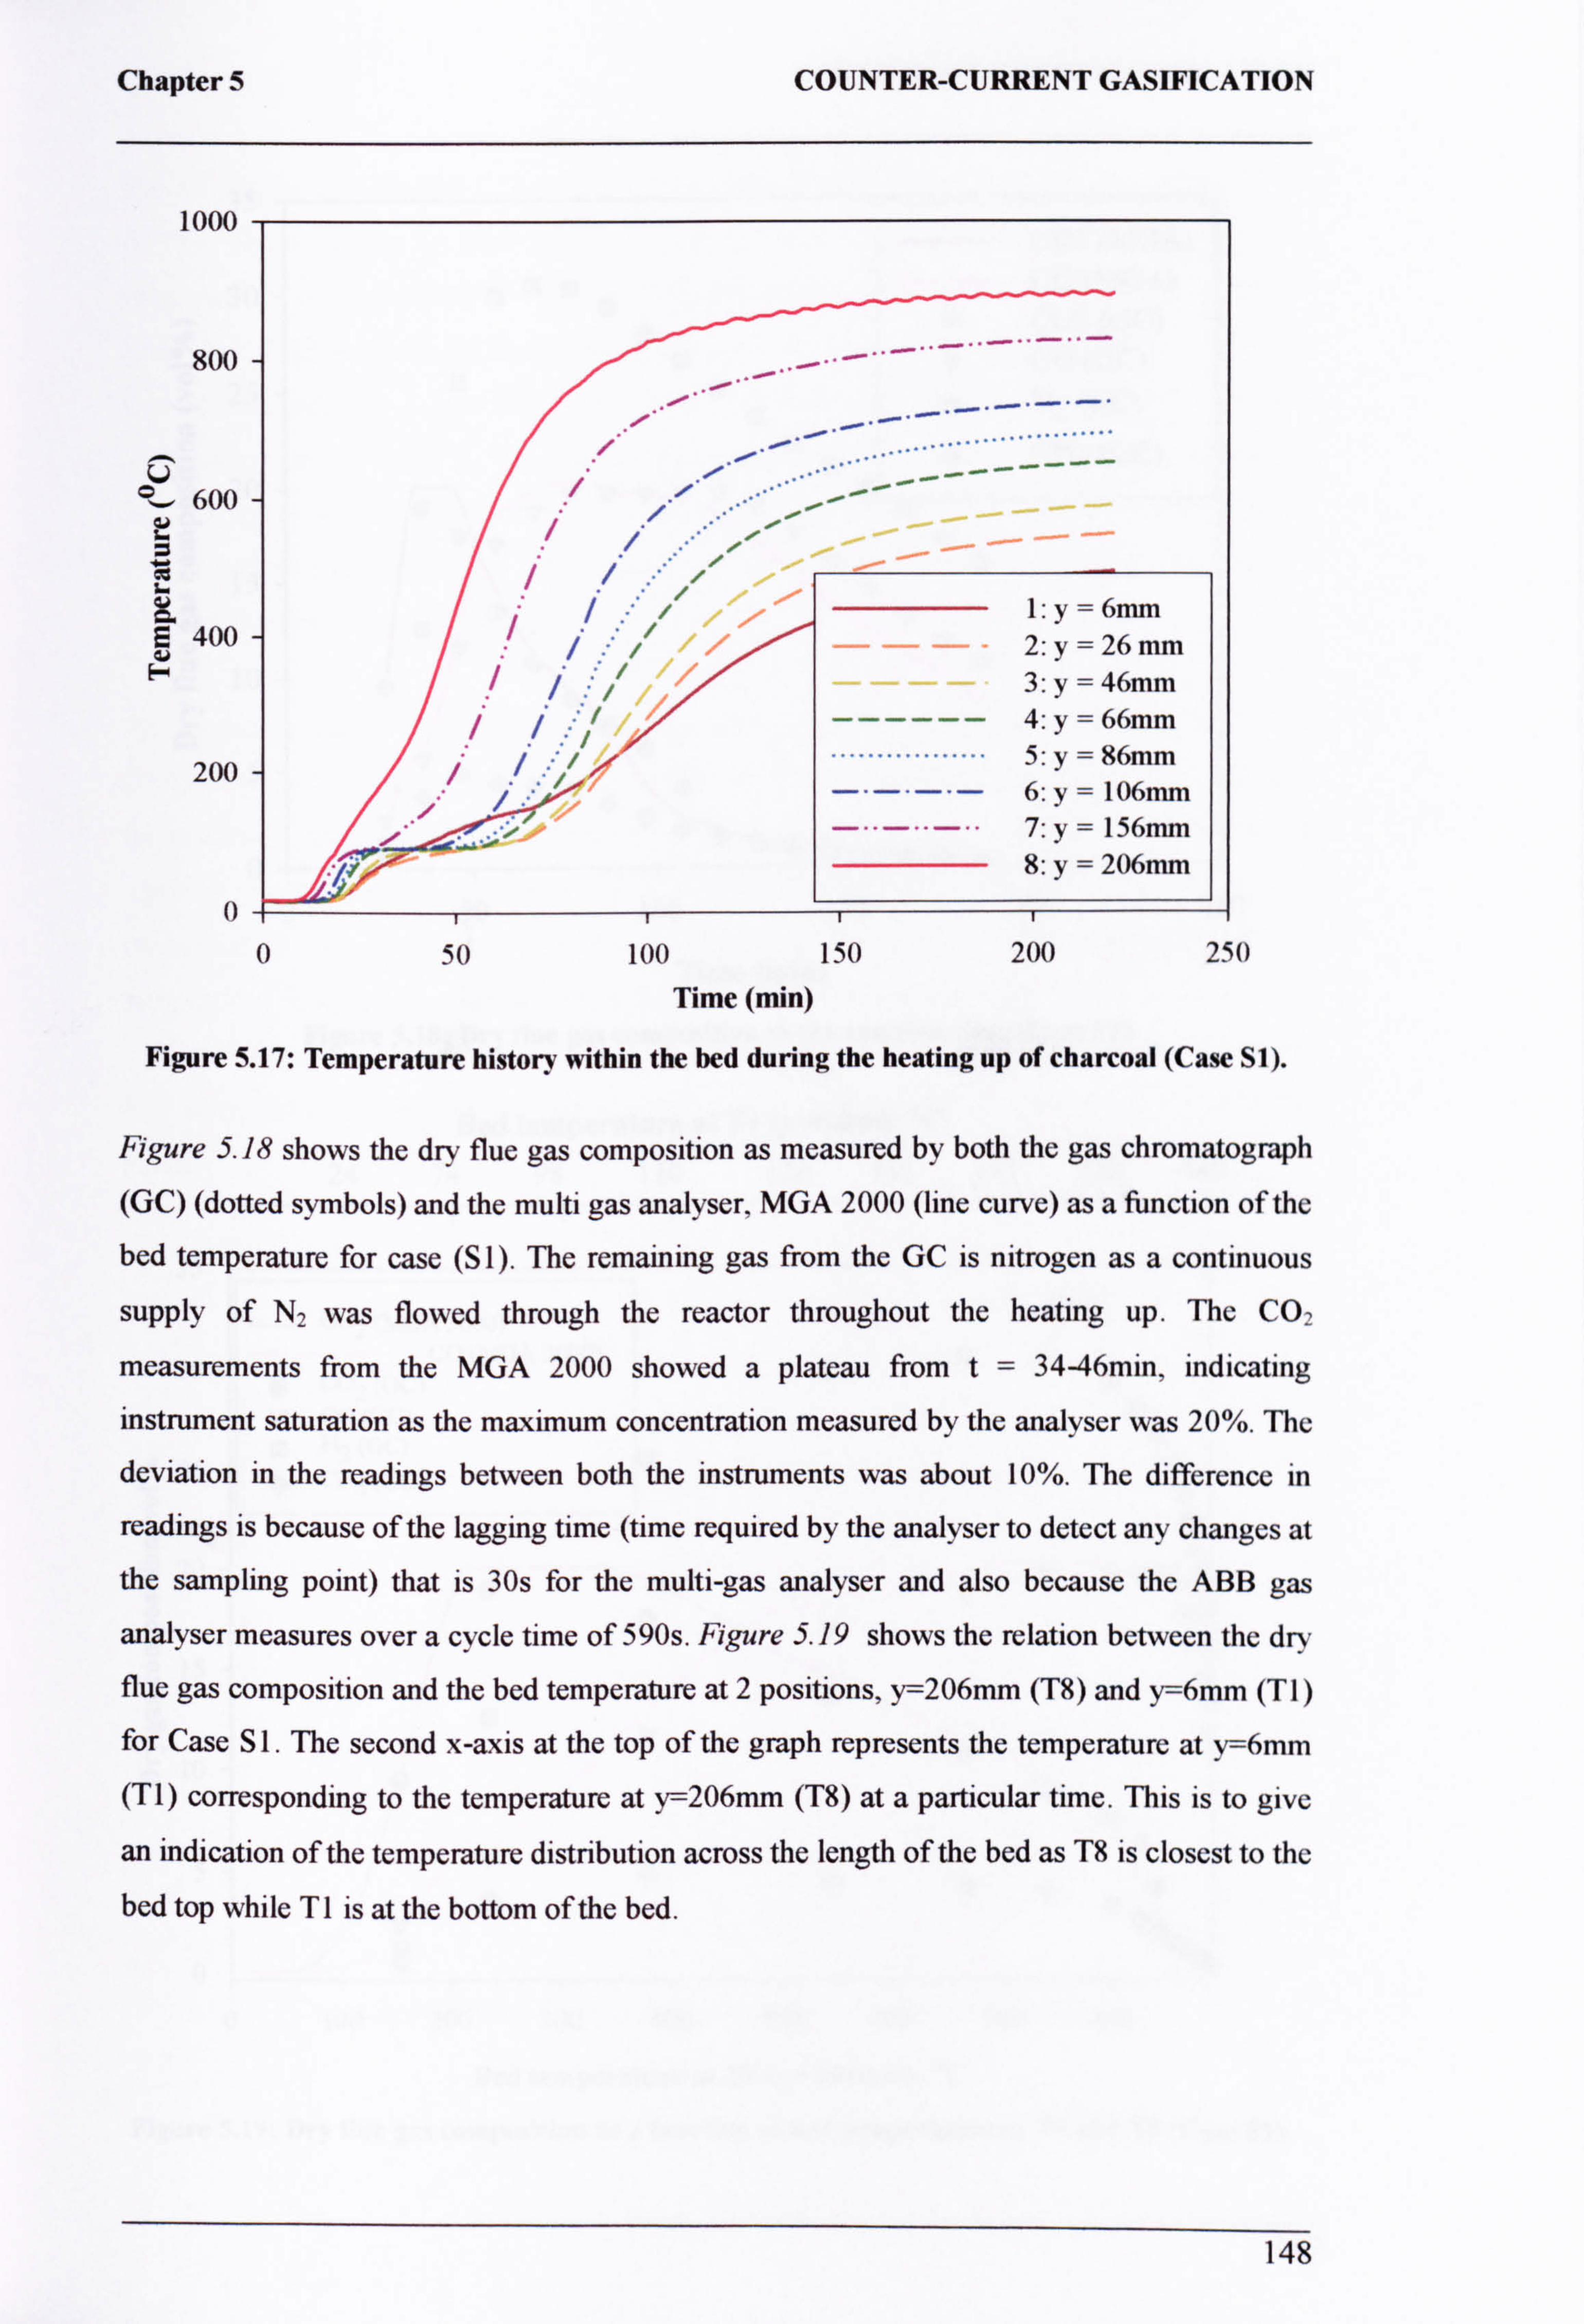
Chapter 5
1000
800
U 600
400
200
0
COUNTER-CURRENT GASIFICATION
1: y6mm / :" /ý 2: y=26mm
3: y= 46mm
------ 4: y= 66mm
................. 5: y=86mm
ýý.. 7: y=156mm 8: y=2o6mm
0 50 100 150 200 250
Time (min)
Figure 5.17: Temperature history within the bed during the heating up of charcoal (Case SI).
Figure 5.18 shows the dry flue gas composition as measured by both the gas chromatograph
(GC) (dotted symbols) and the multi gas analyser, MGA 2000 (line curve) as a function of the
bed temperature for case (S 1). The remaining gas from the GC is nitrogen as a continuous
supply of N2 was flowed through the reactor throughout the heating up. The CO,
measurements from the MGA 2000 showed a plateau from t= 34-46min, indicating
instrument saturation as the maximum concentration measured by the analyser was 20%. The
deviation in the readings between both the instruments was about 10%. The difference in
readings is because of the lagging time (time required by the analyser to detect any changes at
the sampling point) that is 30s for the multi-gas analyser and also because the ABB gas
analyser measures over a cycle time of 590s. Figure 5.19 shows the relation between the dry
flue gas composition and the bed temperature at 2 positions, y=206mm (T8) and y=6mm (TI)
for Case S 1. The second x-axis at the top of the graph represents the temperature at y=6mm (Ti) corresponding to the temperature at y=206mm (T8) at a particular time. This is to give
an indication of the temperature distribution across the length of the bed as T8 is closest to the
bed top while Ti is at the bottom of the bed.
148
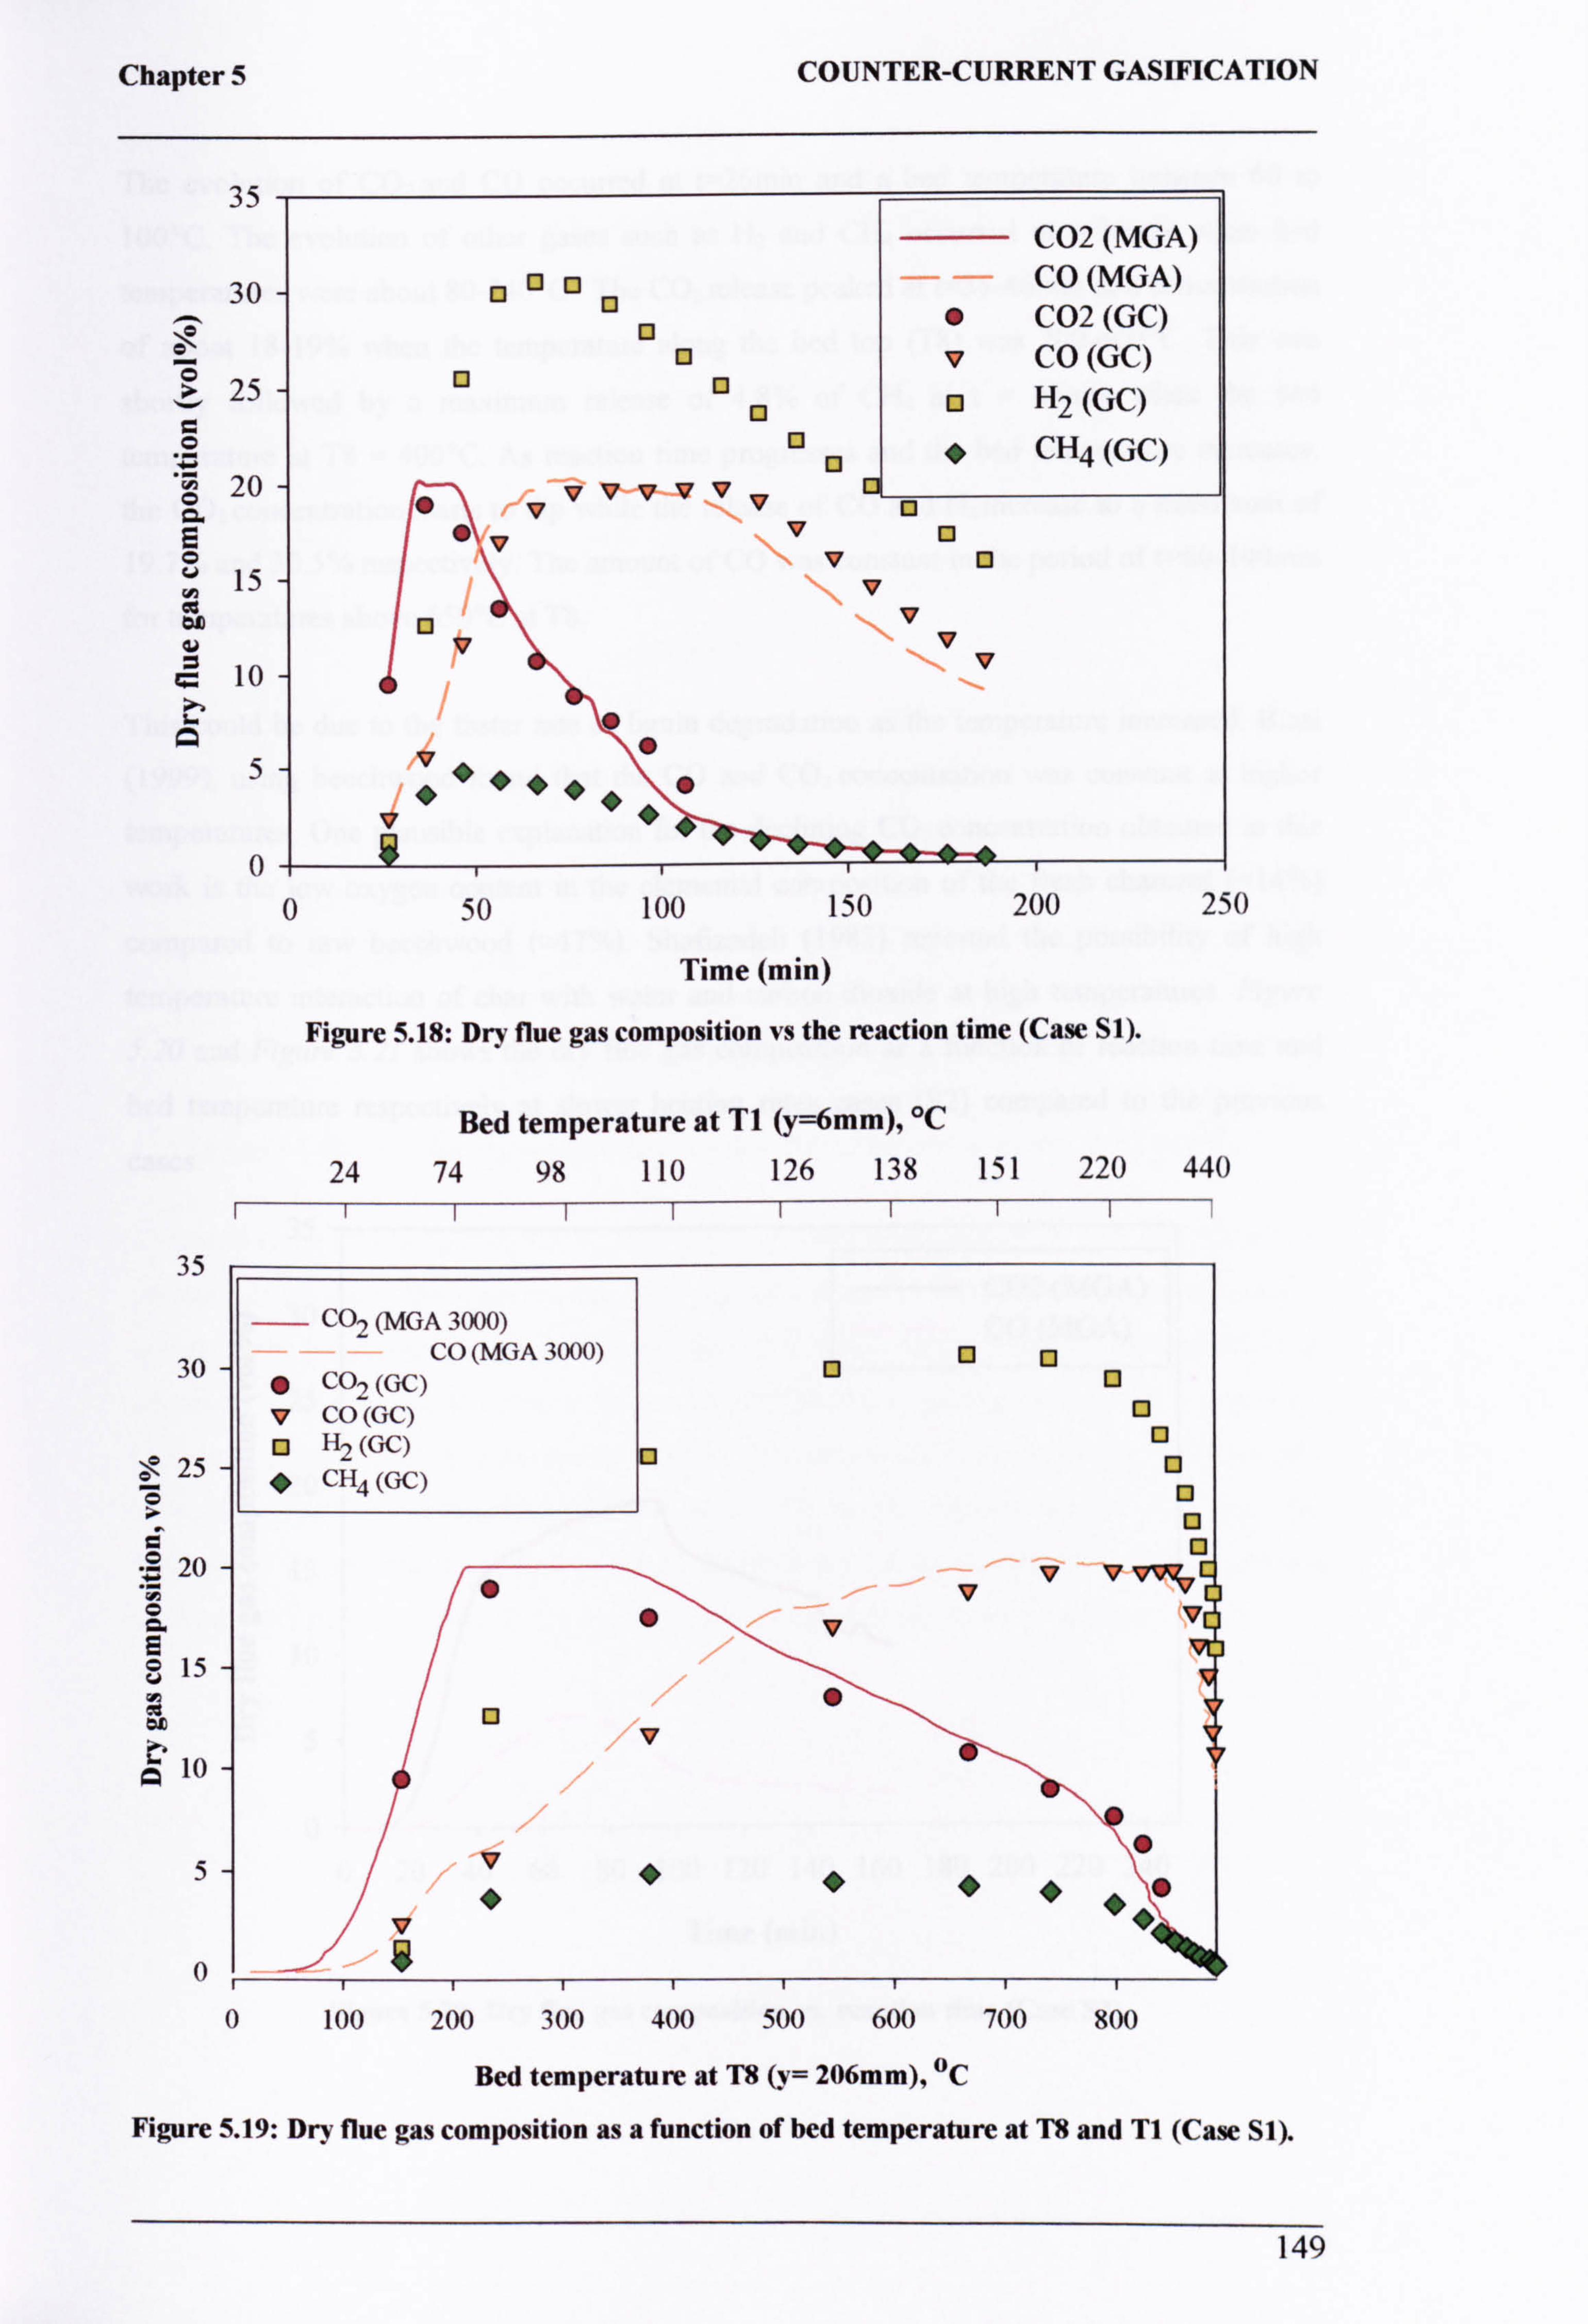
Chapter 5
35
30
25
0 20
15
ao
l0
ý, O
C02 (MGA)
QQQ° CO (MGA)
" C02 (GC) 0Qv CO (GC)
13 QQQ H2 (GC) Q°" CH4 (GC)
vvvvvvv° "0vQ
vo v
°v 0V
v
v"
v let 5
0
0
35
30
25 0 a ä
20
0 8 0 15
ao 10
5
0
50 100 150 200 250
Time (min)
Figure 5.18: Dry flue gas composition vs the reaction time (Case S1).
Bed temperature at Ti (y=6mm), °C
24 74 98 110 126 138 151 220 440
COUNTER-CURRENT GASIFICATION
CO2 (MGA 3000) CO (MGA 3000)
0 COZ (GC) V CO (GC) O H2 (GC)
CH4 (GC)
0
E3
QQQ0
0 13
13 0 0
vv vcq v
"vv
" v
/v
v
i 0 100 200 300 400 500 600 700 800
Bed temperature at T8 (y= 206mm), °C
Figure 5.19: Dry flue gas composition as a function of bed temperature at T8 and Tl (Case S1).
149

Chapter 5 COUNTER-CURRENT GASIFICATION
The evolution of CO2 and CO occurred at t=26min and a bed temperature between 60 to
100°C. The evolution of other gases such as H2 and CH4 occurred at t=36min when bed
temperatures were about 80-240°C. The CO2 release peaked at t=36-46min at a concentration
of about 18-19% when the temperature along the bed top (T8) was 200-400°C. This was
shortly followed by a maximum release of 4.8% of CH4 at t= 46min when the bed
temperature at T8 = 400°C. As reaction time progresses and the bed temperature increases,
the CO2 concentration starts to dip while the release of CO and H2 increase to a maximum of
19.7% and 30.5% respectively. The amount of CO was constant in the period of t=60-100min
for temperatures above 650°C at T8.
This could be due to the faster rate of lignin degradation as the temperature increased. Blasi
(1999), using beechwood found that the CO and CO2 concentration was constant at higher
temperatures. One plausible explanation for the declining CO2 concentration obtained in this
work is the low oxygen content in the elemental composition of the fresh charcoal (Z14%)
compared to raw beechwood (z47%). Shafizadeh (1982) reported the possibility of high
temperature interaction of char with water and carbon dioxide at high temperatures. Figure
5.20 and Figure 5.21 shows the dry flue gas composition as a function of reaction time and bed temperature respectively at slower heating rates cases (S2) compared to the previous
cases.
35
ö 30 C02 (MGA) CO (MGA)
25
20
15 OD
10
A5
0 0 20 40 60 80 100 120 140 160 180 200 220 240
Time (min)
Figure 5.20: Dry flue gas composition vs. reaction time (Case S2).
150
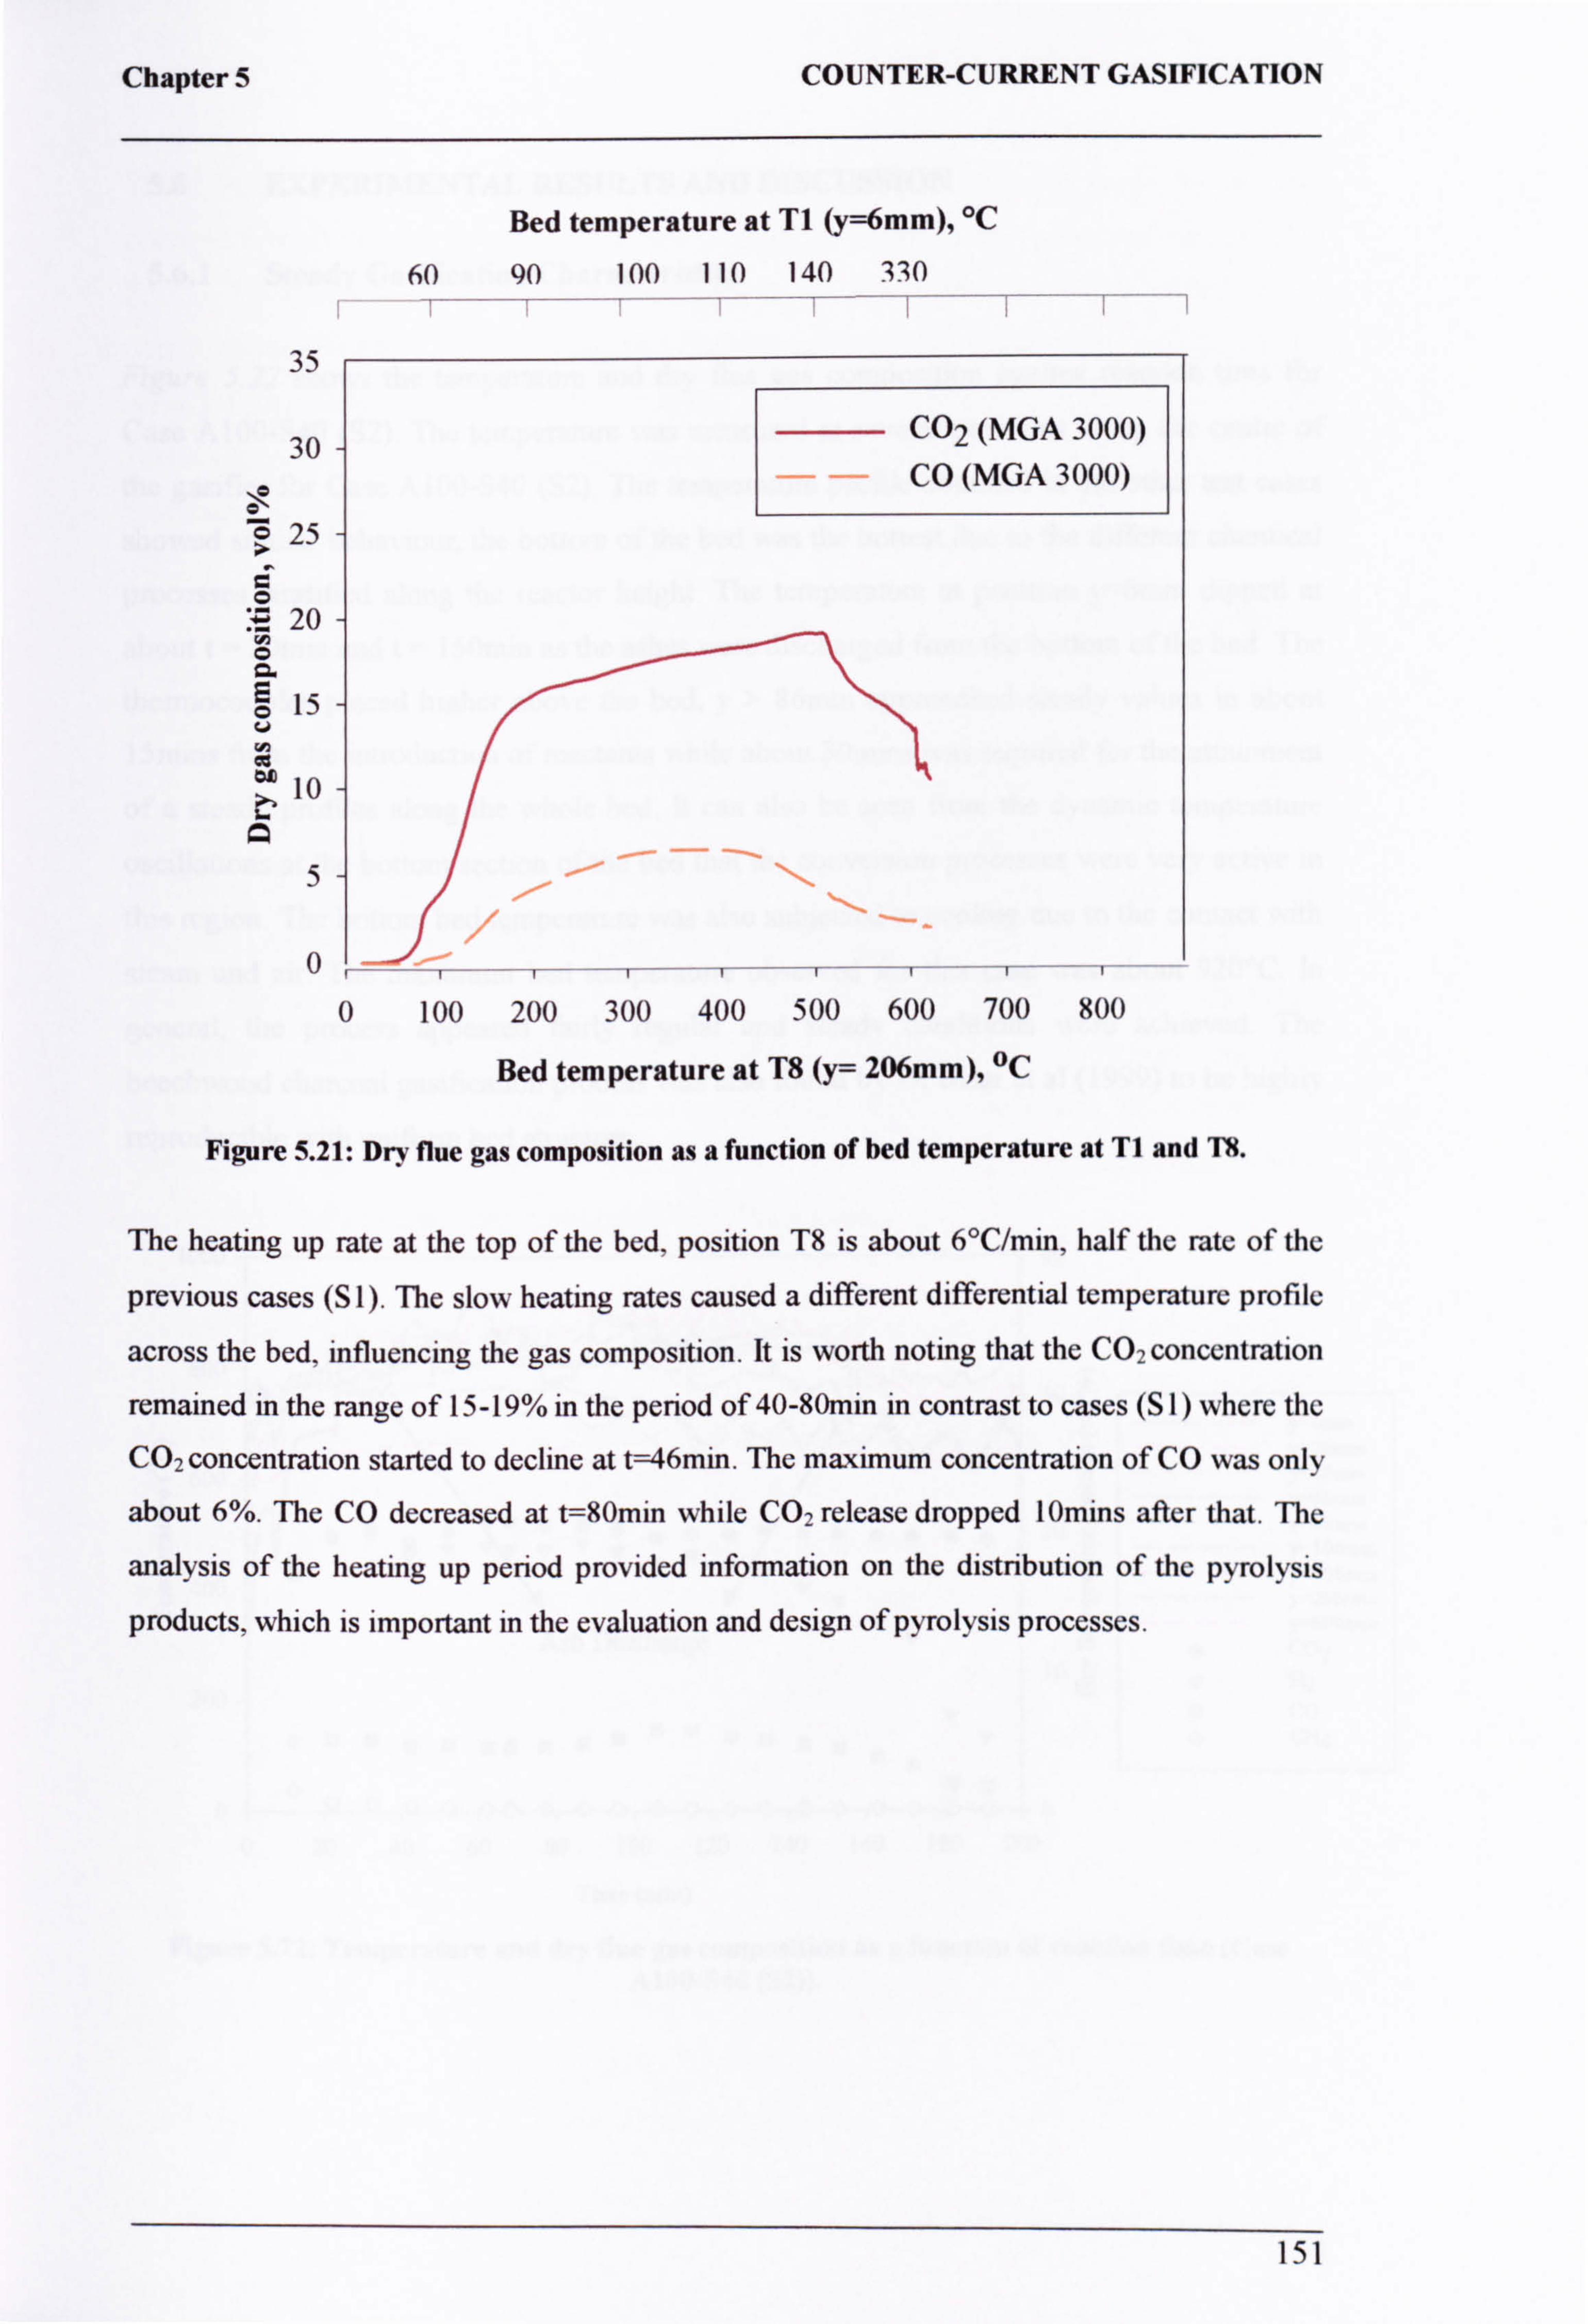
Chapter 5 COUNTER-CURRENT GASIFICATION
Bed temperature at Ti (y=6mm), °C
60 90 100 110 140 330
35
30
\° 0 25
20 C
ö15
10
5
0
Bed temperature at T8 (y= 206mm), °C
Figure 5.21: Dry flue gas composition as a function of bed temperature at TI and T8.
The heating up rate at the top of the bed, position T8 is about 6°C/min, half the rate of the
previous cases (S 1). The slow heating rates caused a different differential temperature profile
across the bed, influencing the gas composition. It is worth noting that the CO2 concentration
remained in the range of 15-19% in the period of 40-80min in contrast to cases (S 1) where the
CO2concentration started to decline at t=46min. The maximum concentration of CO was only
about 6%. The CO decreased at t=80min while CO2 release dropped 1 Omins after that. The
analysis of the heating up period provided information on the distribution of the pyrolysis
products, which is important in the evaluation and design of pyrolysis processes.
151
0 100 200 300 400 500 600 700 800
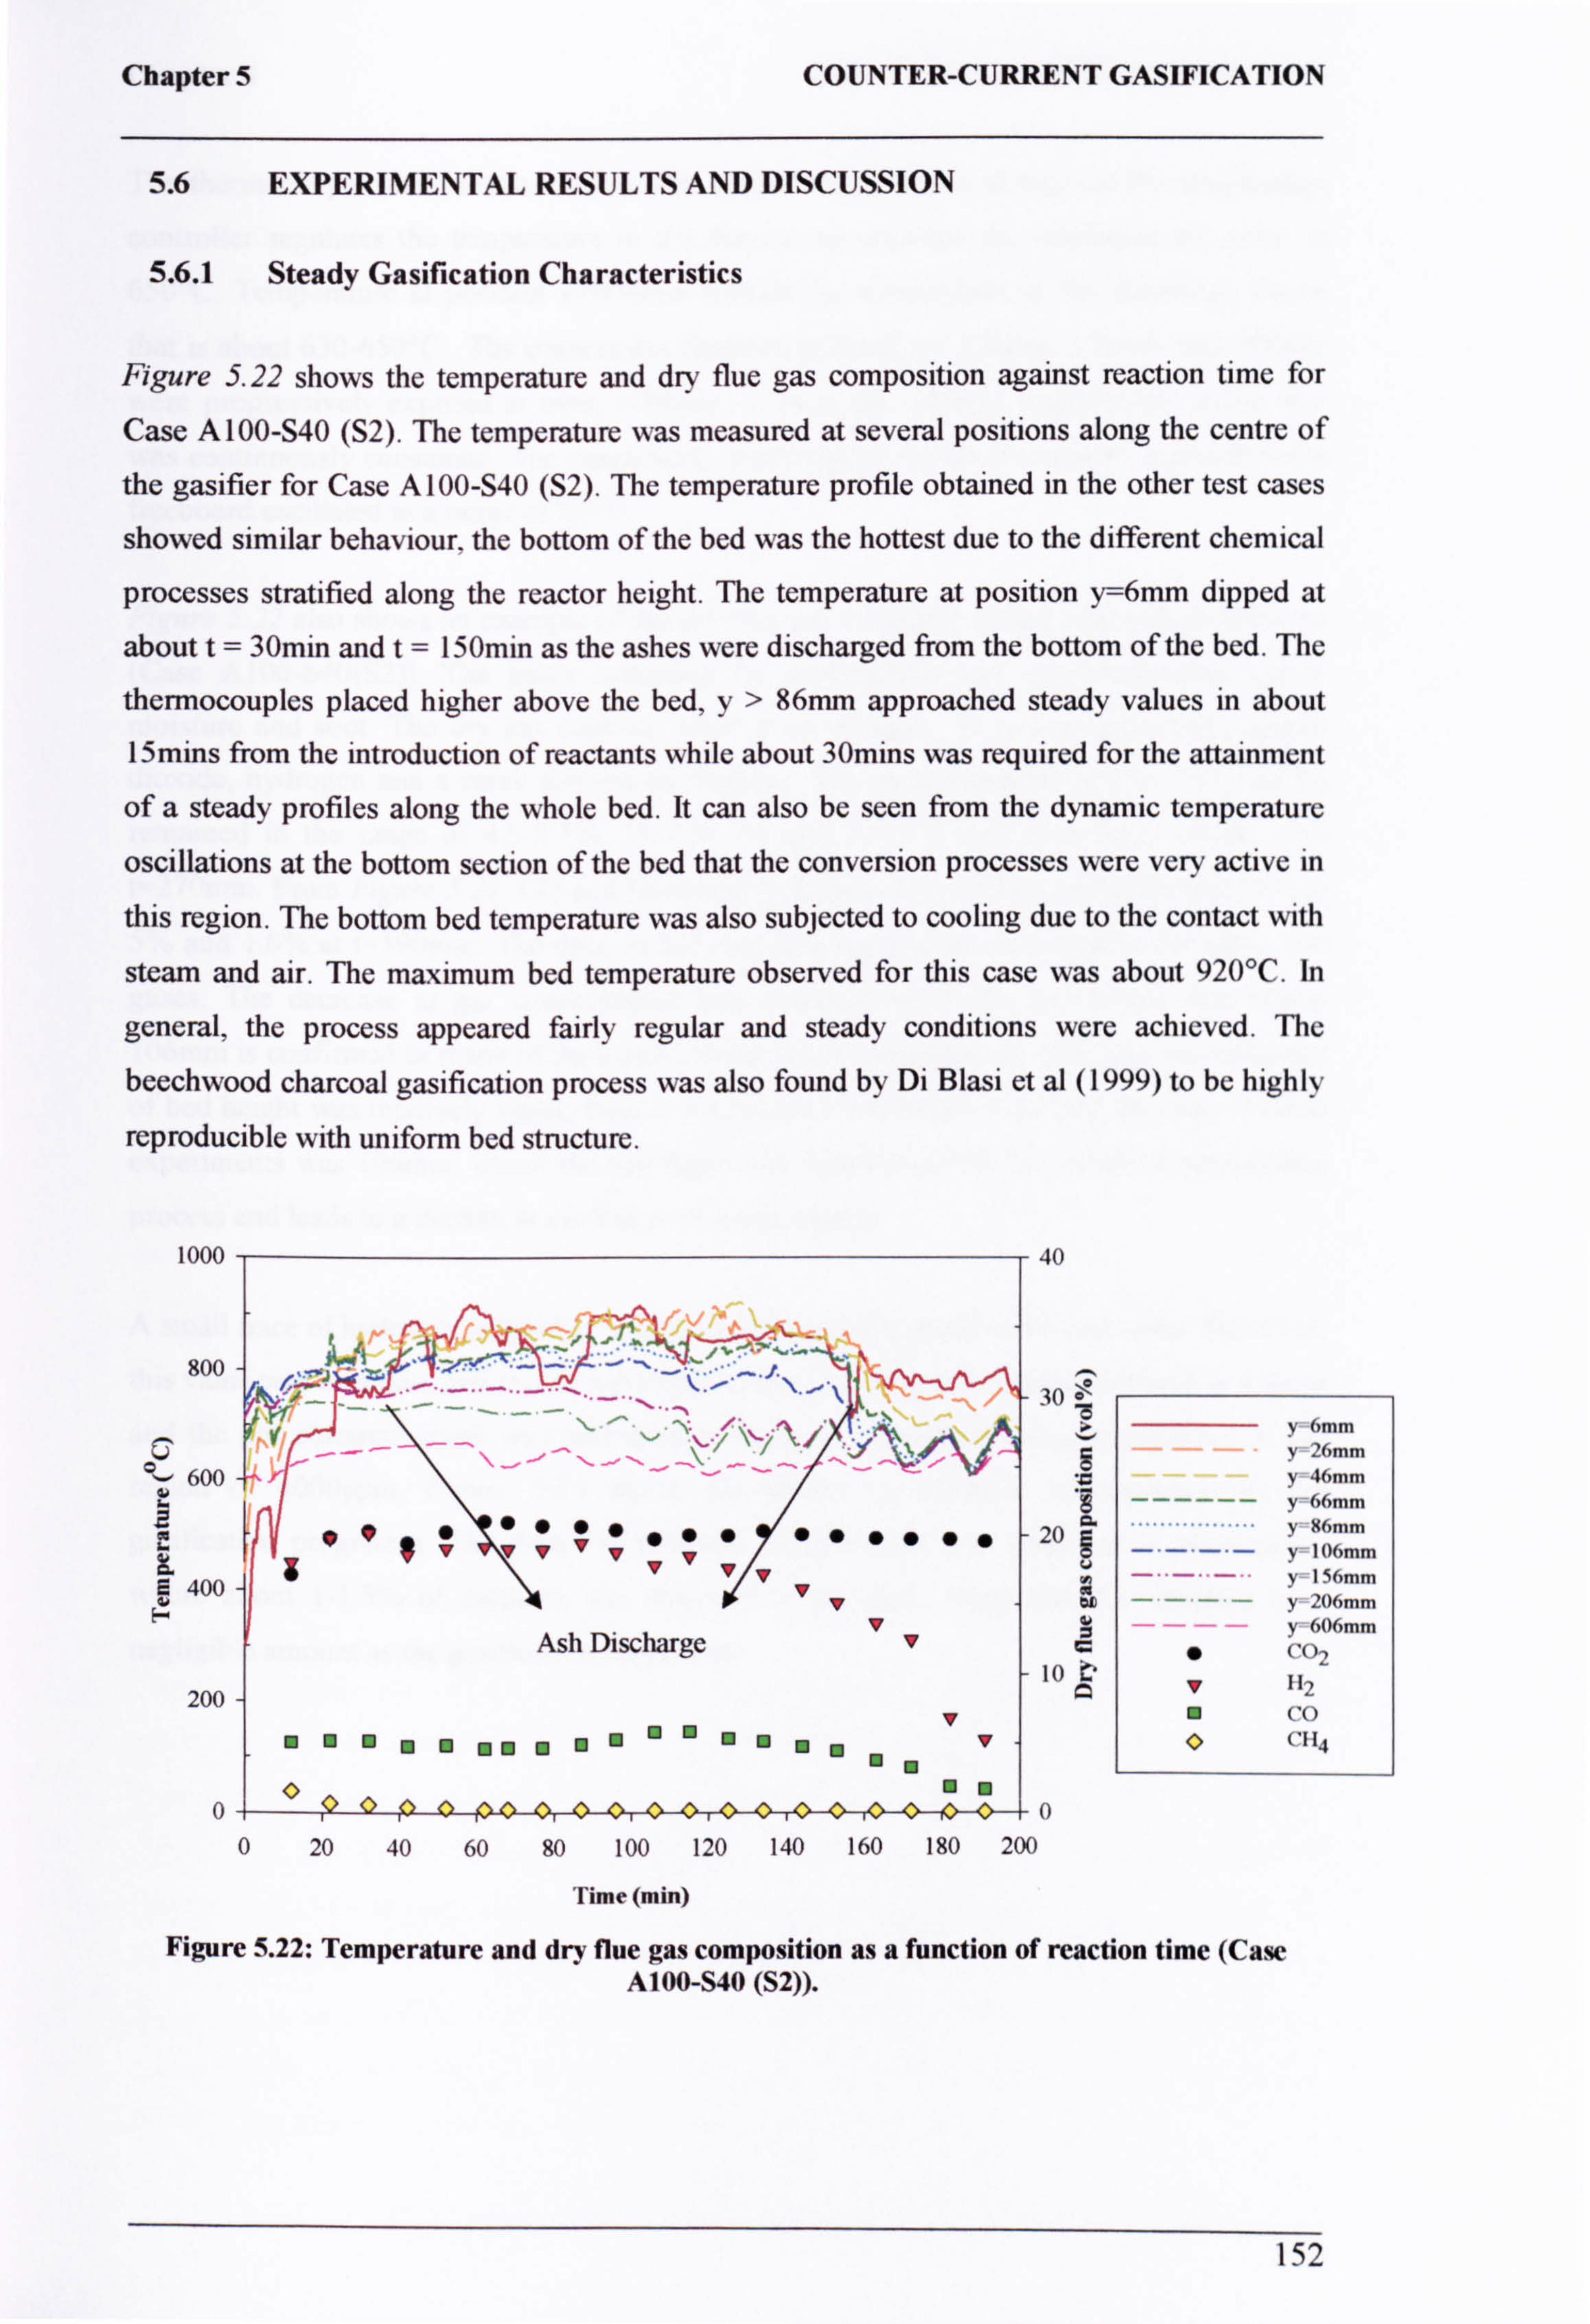
Chapter 5 COUNTER-CURRENT GASIFICATION
5.6 EXPERIMENTAL RESULTS AND DISCUSSION
5.6.1 Steady Gasification Characteristics
Figure 5.22 shows the temperature and dry flue gas composition against reaction time for
Case A100-S40 (S2). The temperature was measured at several positions along the centre of
the gasifier for Case A 100-S40 (S2). The temperature profile obtained in the other test cases
showed similar behaviour, the bottom of the bed was the hottest due to the different chemical
processes stratified along the reactor height. The temperature at position y=6mm dipped at
about t= 30min and t= 150min as the ashes were discharged from the bottom of the bed. The
thermocouples placed higher above the bed, y> 86mm approached steady values in about
15mins from the introduction of reactants while about 30mins was required for the attainment
of a steady profiles along the whole bed. It can also be seen from the dynamic temperature
oscillations at the bottom section of the bed that the conversion processes were very active in
this region. The bottom bed temperature was also subjected to cooling due to the contact with
steam and air. The maximum bed temperature observed for this case was about 920°C. In
general, the process appeared fairly regular and steady conditions were achieved. The
beechwood charcoal gasification process was also found by Di Blasi et al (1999) to be highly
reproducible with uniform bed structure.
1000 40
800 3 0
600 L
I
"g
20
2L = fff E
400 f f
Ash Discharge f c' 10 Ä
200
f
O " 0 0
0 20 40 60 80 100 120 140 160 180 20 0
Time (min)
v6mm y 26mm y 46mm
------ y 66mm
................. y 86mm
-'-'- -v 106mm
---y 156mm
-y 206mm
y 606mm " cot
112
CO ('114
Figure 5.22: Temperature and dry flue gas composition as a function of reaction time (Case A100-S40 (S2)).
152
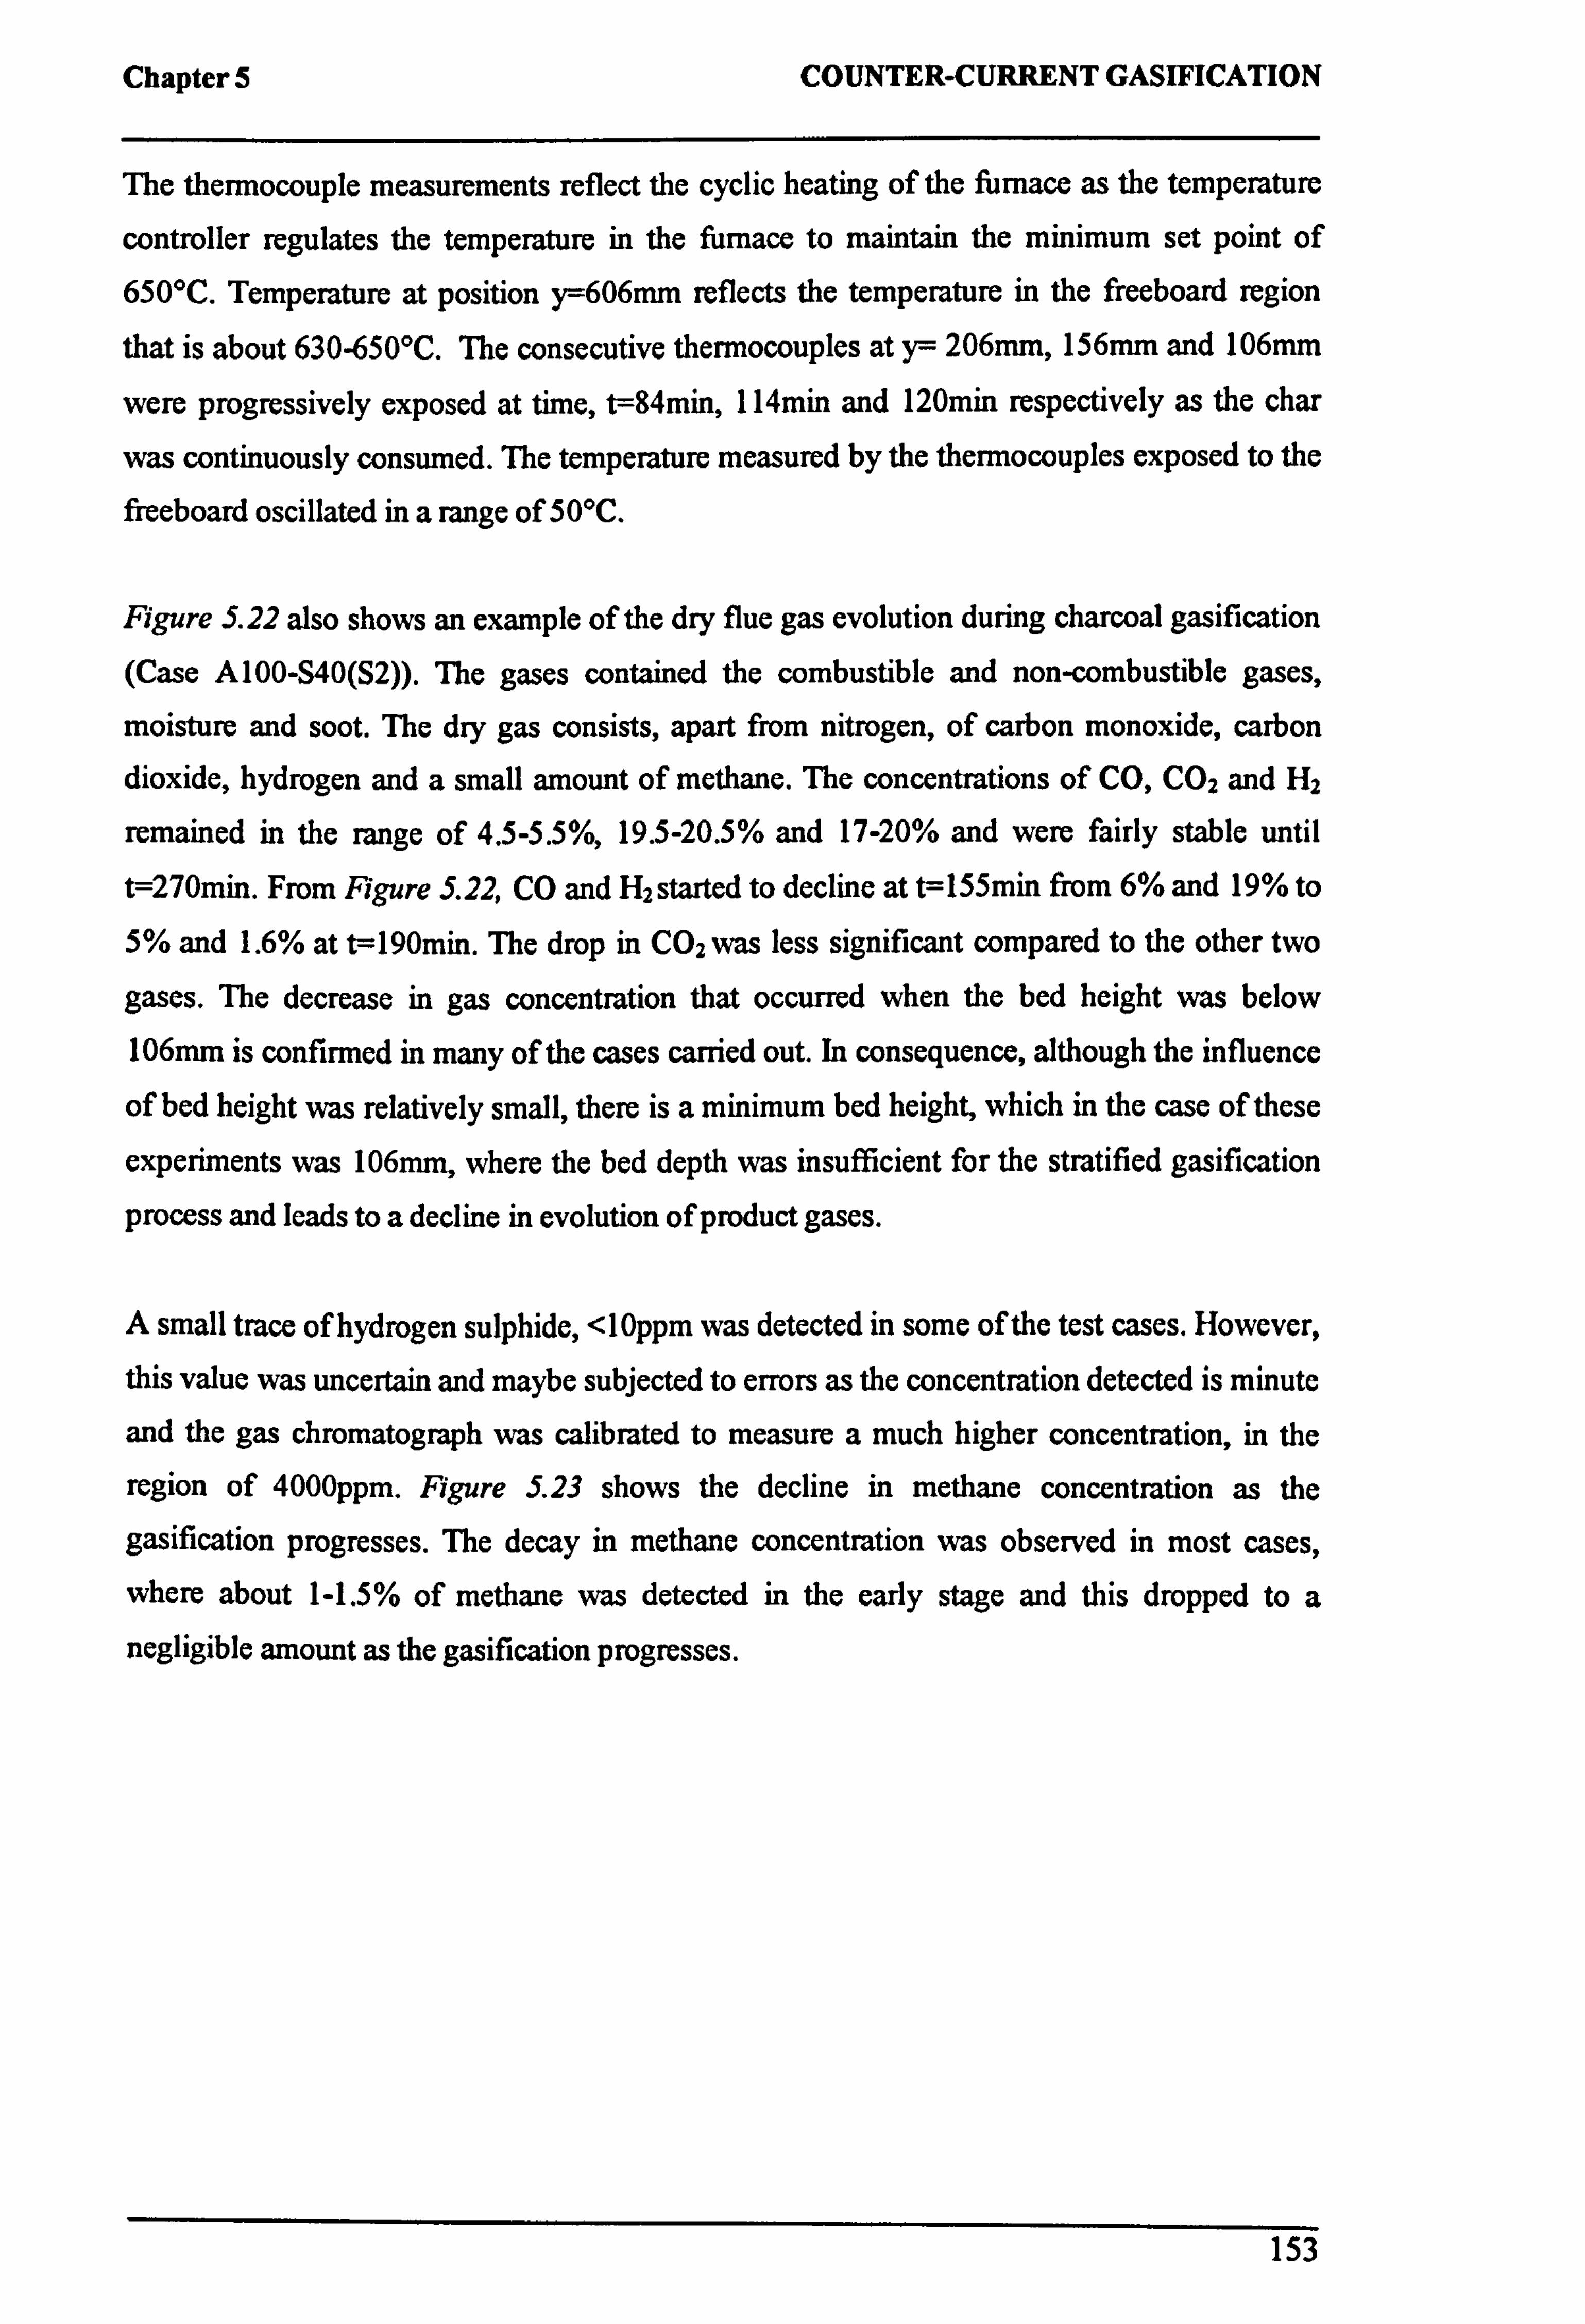
Chapter 5 COUNTER-CURRENT GASIFICATION
The thermocouple measurements reflect the cyclic heating of the furnace as the temperature
controller regulates the temperature in the furnace to maintain the minimum set point of 650°C. Temperature at position y=606mm reflects the temperature in the freeboard region
that is about 630-650°C. The consecutive thermocouples at y= 206mm, 156mm and 106mm
were progressively exposed at time, t=84min, 114min and 120min respectively as the char
was continuously consumed. The temperature measured by the thermocouples exposed to the
freeboard oscillated in a range of 50°C.
Figure 5.22 also shows an example of the dry flue gas evolution during charcoal gasification
(Case A100-S40(S2)). The gases contained the combustible and non-combustible gases,
moisture and soot. The dry gas consists, apart from nitrogen, of carbon monoxide, carbon dioxide, hydrogen and a small amount of methane. The concentrations of CO, CO2 and H2
remained in the range of 4.5-5.5%, 19.5-20.5% and 17-20% and were fairly stable until
t=270min. From Figure 5.22, CO and H2 started to decline at t=155min from 6% and 19% to
5% and 1.6% at t=190min. The drop in CO2 was less significant compared to the other two
gases. The decrease in gas concentration that occurred when the bed height was below
106mm is confirmed in many of the cases carried out. In consequence, although the influence
of bed height was relatively small, there is a minimum bed height, which in the case of these
experiments was 106mm, where the bed depth was insufficient for the stratified gasification
process and leads to a decline in evolution of product gases.
A small trace of hydrogen sulphide, <10ppm was detected in some of the test cases. However,
this value was uncertain and maybe subjected to errors as the concentration detected is minute
and the gas chromatograph was calibrated to measure a much higher concentration, in the
region of 4000ppm. Figure 5.23 shows the decline in methane concentration as the
gasification progresses. The decay in methane concentration was observed in most cases,
where about 1-1.5% of methane was detected in the early stage and this dropped to a
negligible amount as the gasification progresses.
153
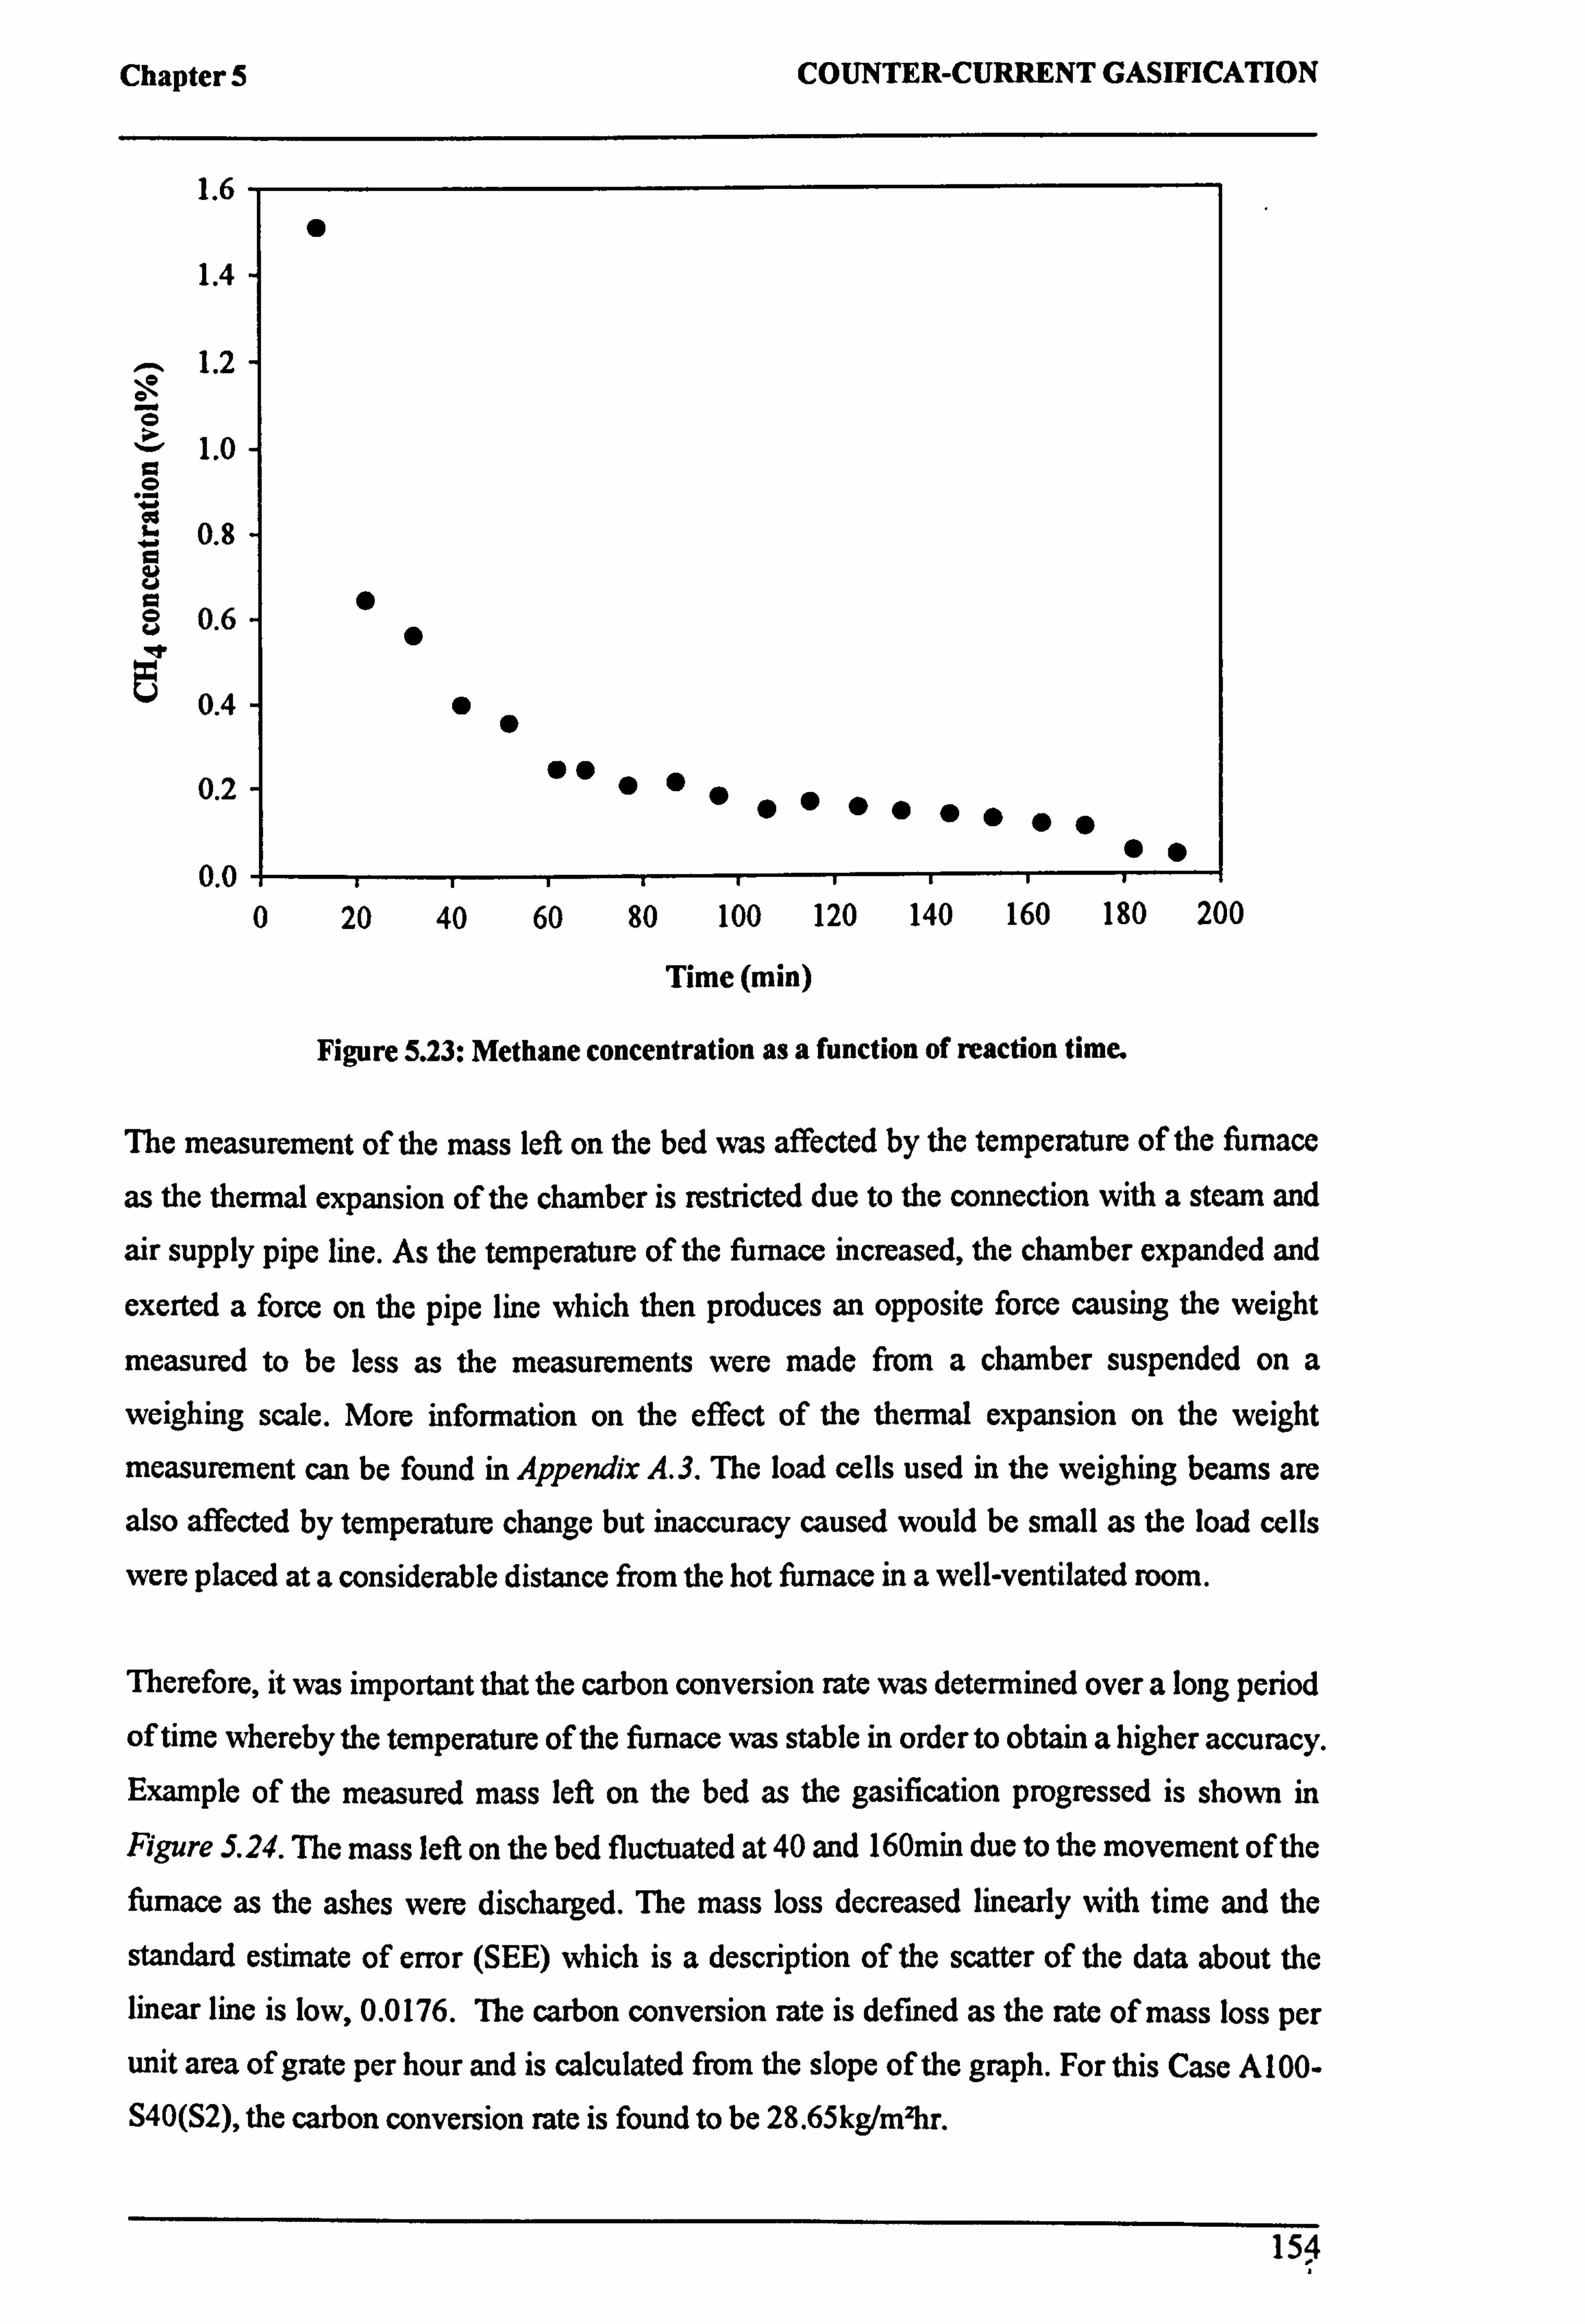
Chapter 5 COUNTER-CURRENT GASIFICATION
1.6
1.4
1.2 O
1.0 O
0.8
C 0.6
0.4
0.2
0.0
"
" "
" " "" """
"""""""" ""
0 20 40 60 80 100 120 140 160 180 200
Time (min)
Figure 5.23: Methane concentration as a function of reaction time.
The measurement of the mass left on the bed was affected by the temperature of the furnace
as the thermal expansion of the chamber is restricted due to the connection with a steam and
air supply pipe line. As the temperature of the furnace increased, the chamber expanded and
exerted a force on the pipe line which then produces an opposite force causing the weight
measured to be less as the measurements were made from a chamber suspended on a
weighing scale. More information on the effect of the thermal expansion on the weight
measurement can be found in Appendix A. 3. The load cells used in the weighing beams are
also affected by temperature change but inaccuracy caused would be small as the load cells
were placed at a considerable distance from the hot furnace in a well-ventilated room.
Therefore, it was important that the carbon conversion rate was determined over a long period
of time whereby the temperature of the furnace was stable in order to obtain a higher accuracy. Example of the measured mass left on the bed as the gasification progressed is shown in
Figure 5.24. The mass left on the bed fluctuated at 40 and 160min due to the movement of the furnace as the ashes were discharged. The mass loss decreased linearly with time and the
standard estimate of error (SEE) which is a description of the scatter of the data about the linear line is low, 0.0176. The carbon conversion rate is defined as the rate of mass loss per unit area of grate per hour and is calculated from the slope of the graph. For this Case A 100- S40(S2), the carbon conversion rate is found to be 28.65kg/m2hr.
154

Chapter 5 COUNTER-CURRENT GASIFICATION
3.0
2.8
,x2.6
2.4
0 2.2
y y
2.0
1.8
1.6
Time (min)
Figure 5.24: Mass left on the bed vs. reaction time (Case A100-S40 (S2)).
5.6.2 Effect of Reactants (steamlair) Flow on Gasification of Chars
5.6.2.1 Temperature
Figure 5.25 and Figure 5.26 show the measured temperature across the bed height for Case
A 100-S25 (S 1) and A 100-S40 (S 1) while Figure 5.27 and Figure 5.28 show the measured
temperature during the gasification test at similar reactant flow rates but a lower heating rate (S2). The temperature profiles were given for time t=10,20 and 30minutes after a steady
condition was reached. The air flow rate was kept constant at 1001/min (245kg/m2hr) for all
the four cases but the steam flow rate was increased from 25%wt (81kg/mzhr) to 40%wt
(163kg/m2hr) at two different heating temperatures (Si) and (S2). As explained in Section 5.4,
the heating temperature for (Si) is about 850°C and 650°C for (S2). The temperature profile
above 200mm was not extrapolated as there was another data point at a distance of 606mm.
With reference to Figure S. 2S, the hottest temperature was measured at the bottom of the bed,
y=6mm in the range of 830-940°C. The temperature fell as the distance from the grate increased to about 150mm above the grate. However, further along the bed >150mm, the temperature started to escalate as it approached the bed top due to the heat from the freeboard.
The temperature above the bed >300m varied in a close range for time t=10,20 and 3 0min as
155
60 80 100 120 140
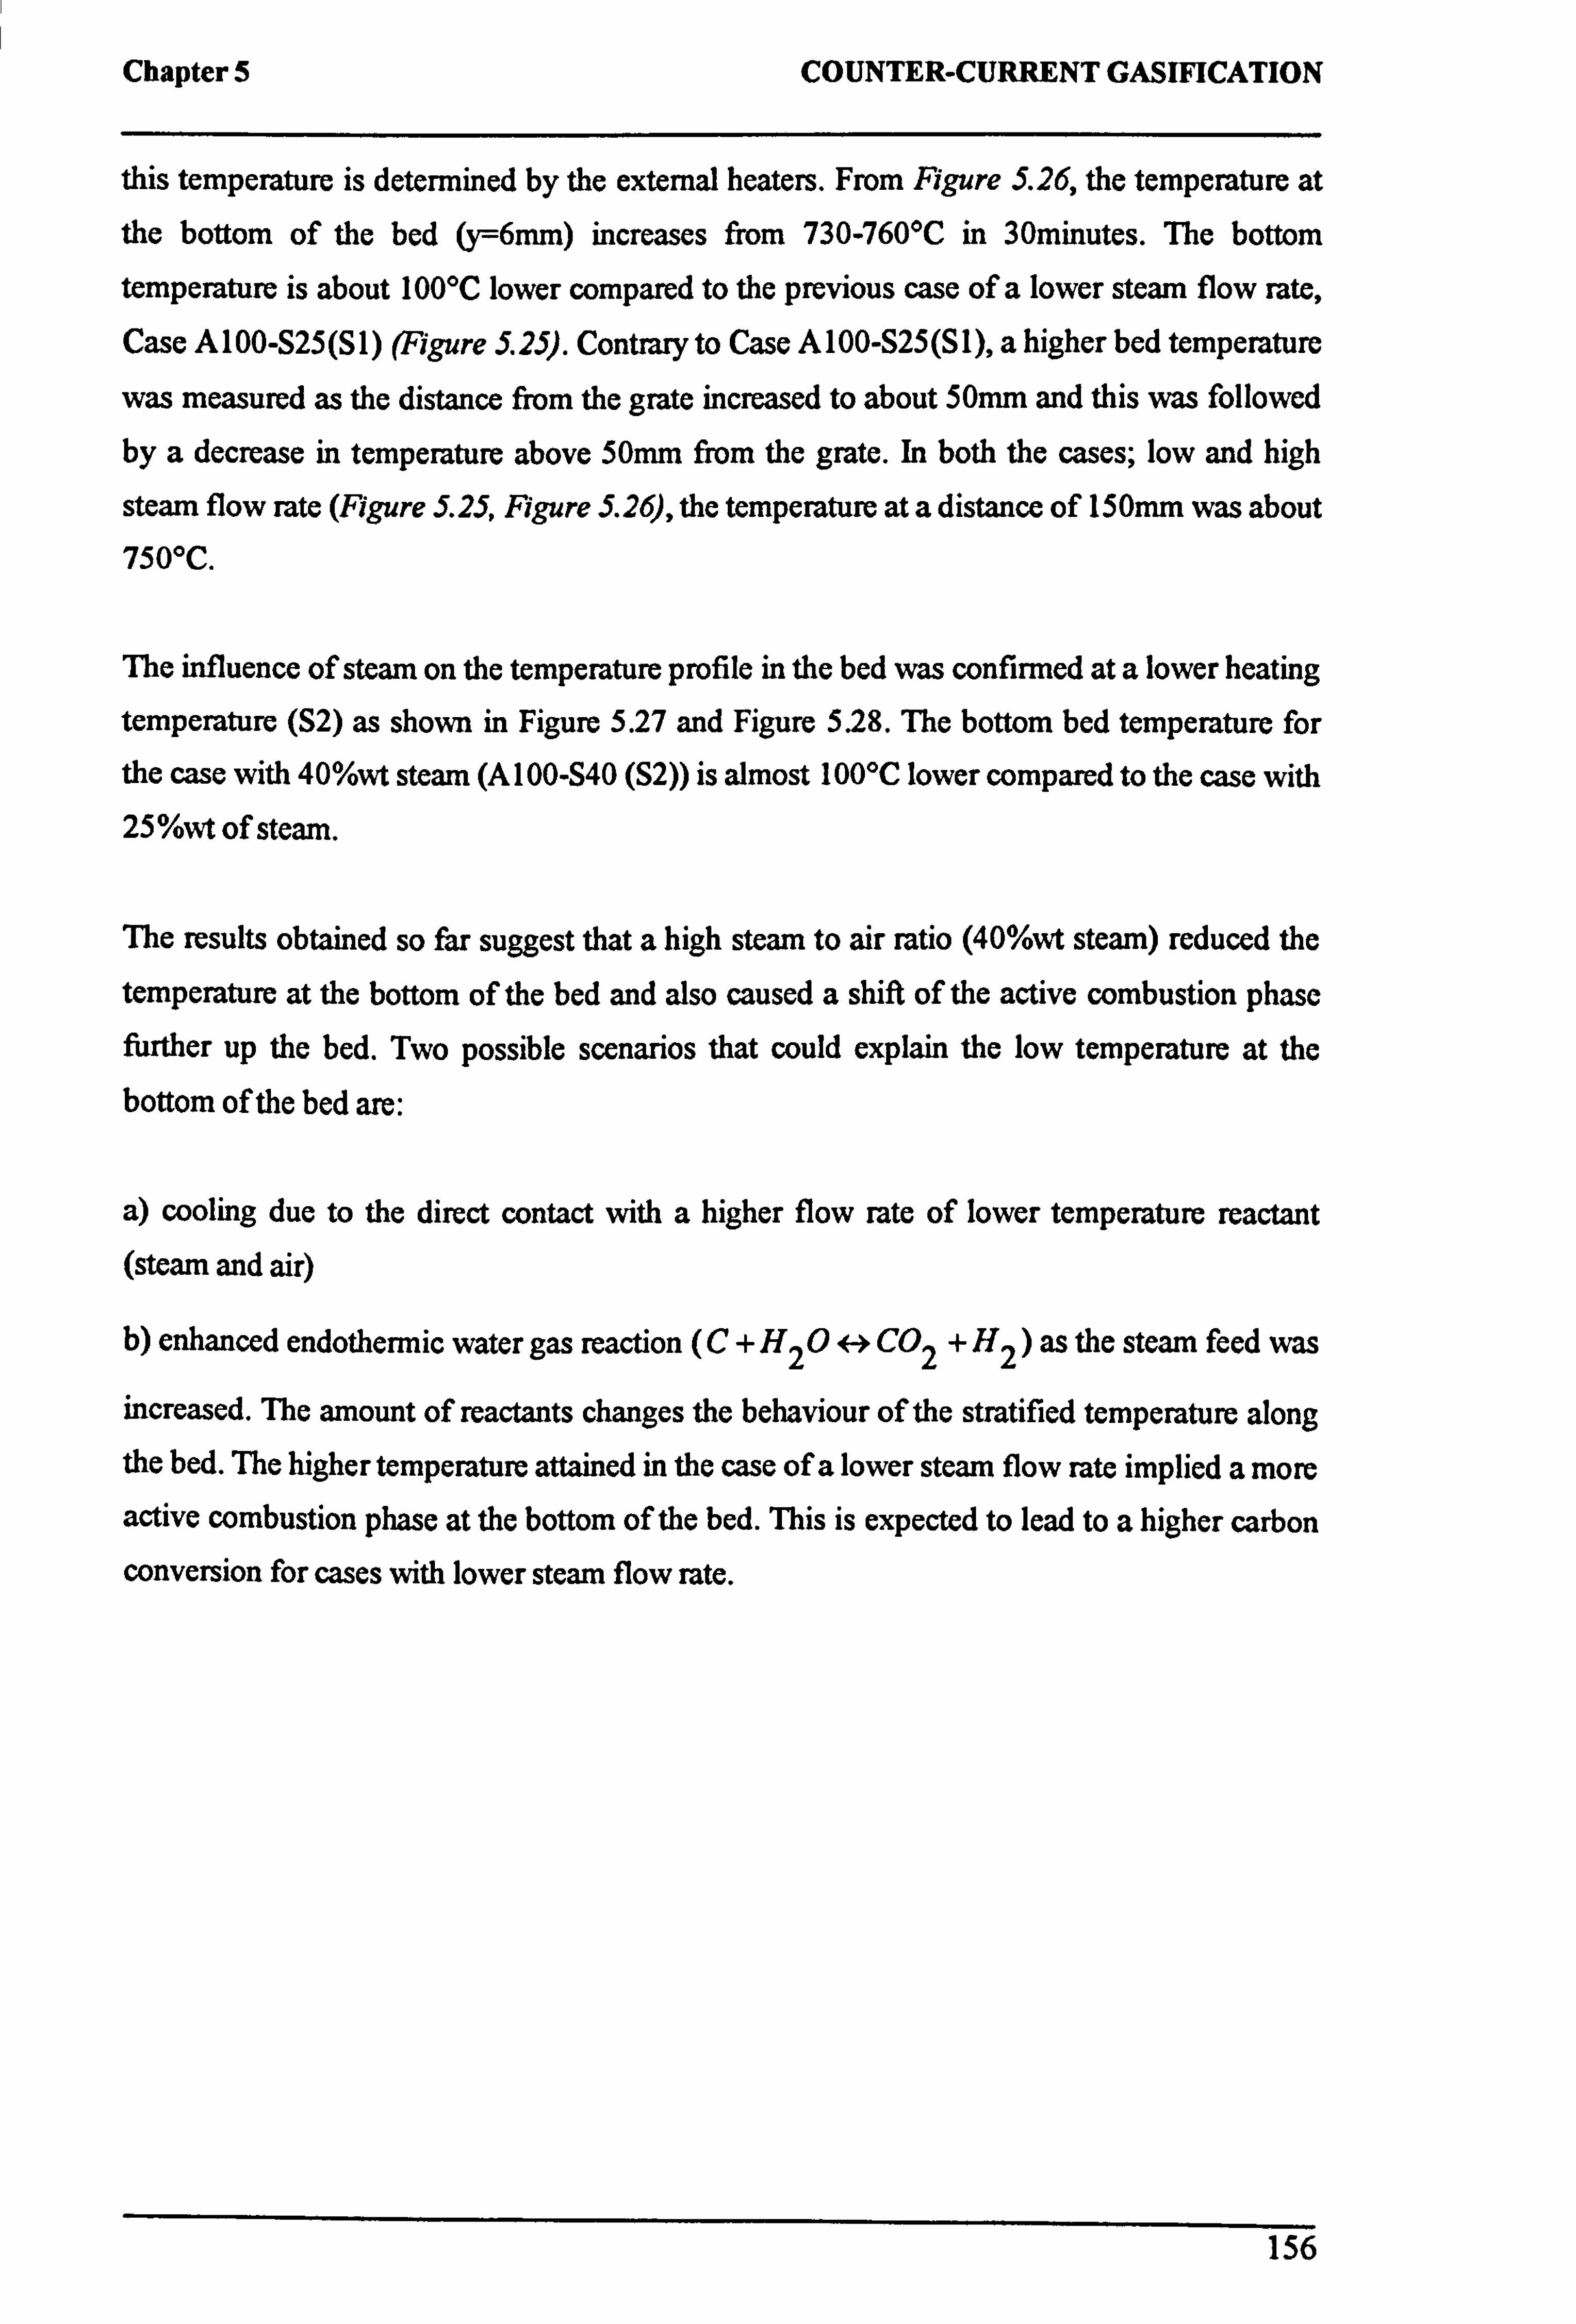
Chapter 5 COUNTER-CURRENT GASIFICATION
this temperature is determined by the external heaters. From Figure 5.26, the temperature at the bottom of the bed (y=6mm) increases from 730-760°C in 30minutes. The bottom
temperature is about 100°C lower compared to the previous case of a lower steam flow rate, Case A 100-S25 (S 1) (Figure 5.25). Contrary to Case A 100-S25 (S 1), a higher bed temperature
was measured as the distance from the grate increased to about 50mm and this was followed
by a decrease in temperature above 50mm from the grate. In both the cases; low and high
steam flow rate (Figure 5.25, Figure 5.26), the temperature at a distance of 150mm was about 750°C.
The influence of steam on the temperature profile in the bed was confirmed at a lower heating
temperature (S2) as shown in Figure 5.27 and Figure 5.28. The bottom bed temperature for
the case with 40%wt steam (A 100-S40 (S2)) is almost 100°C lower compared to the case with 25 %wt of steam.
The results obtained so far suggest that a high steam to air ratio (40%wt steam) reduced the
temperature at the bottom of the bed and also caused a shift of the active combustion phase further up the bed. Two possible scenarios that could explain the low temperature at the bottom of the bed are:
a) cooling due to the direct contact with a higher flow rate of lower temperature reactant (steam and air)
b) enhanced endothermic water gas reaction (C + H2 0 t-> CO2 + H2) as the steam feed was
increased. The amount of reactants changes the behaviour of the stratified temperature along the bed. The higher temperature attained in the case of a lower steam flow rate implied a more active combustion phase at the bottom of the bed. This is expected to lead to a higher carbon conversion for cases with lower steam flow rate.
156
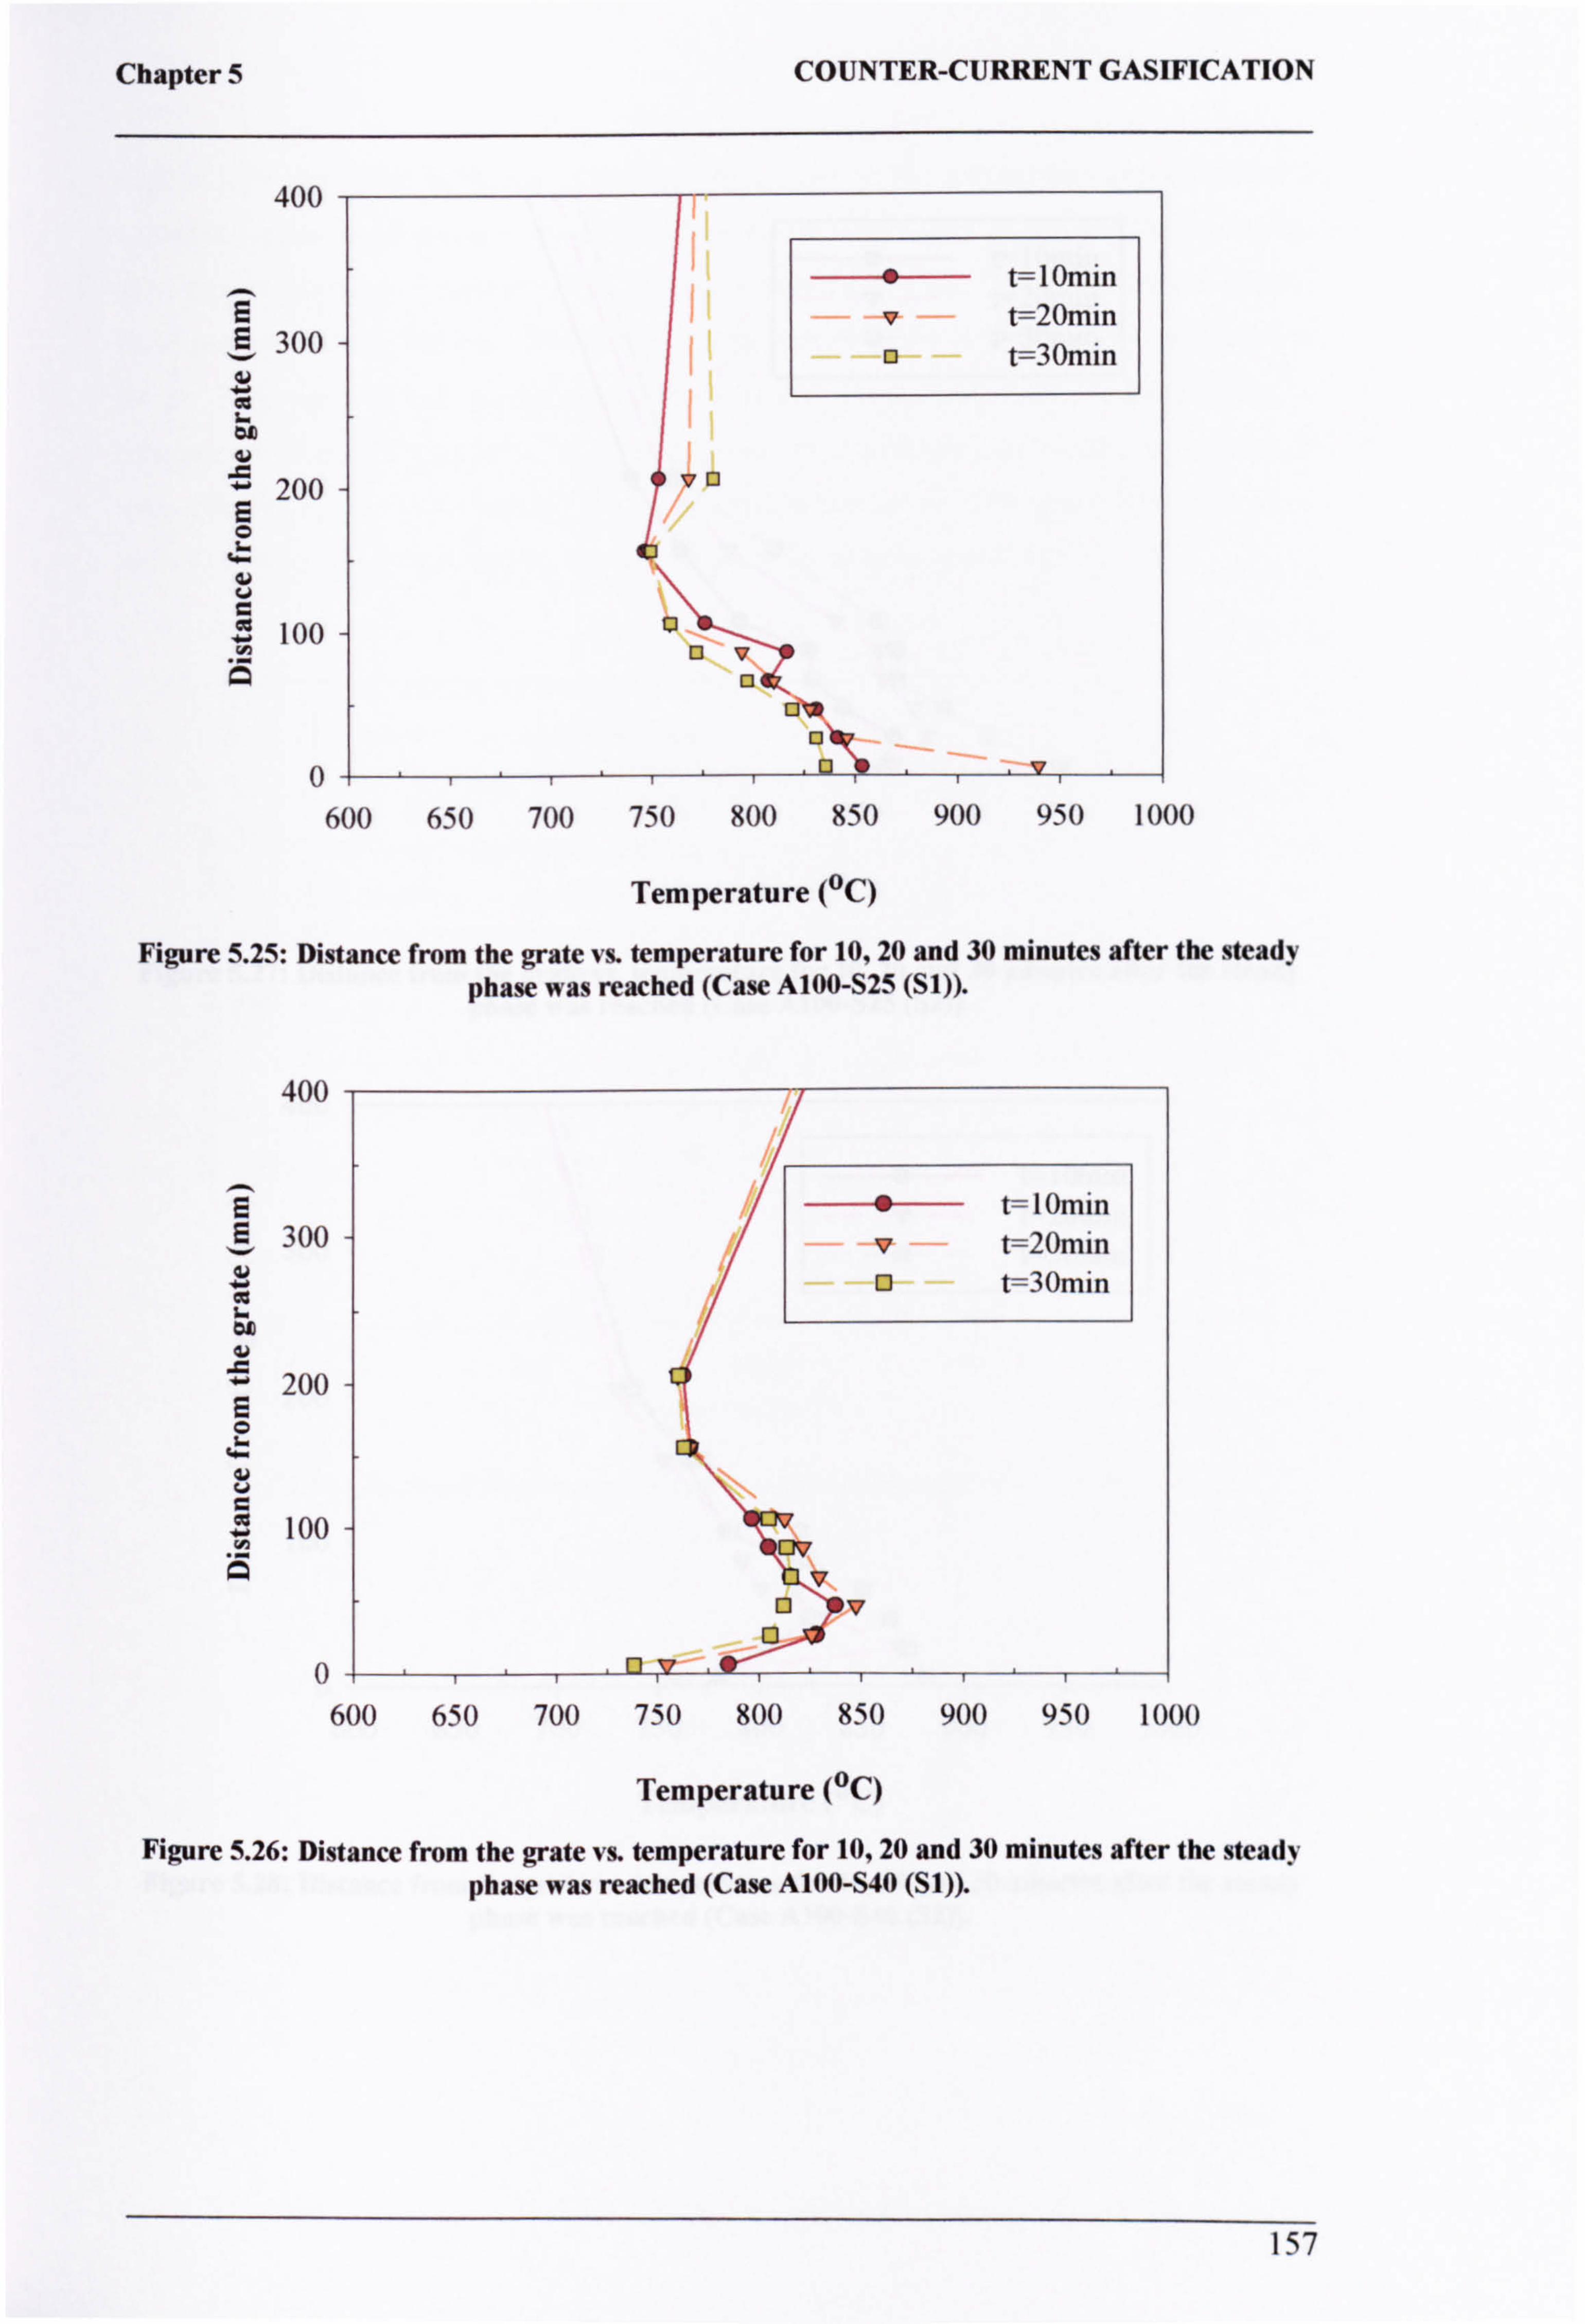
Chapter 5 COUNTER-CURRENT GASIFICATION
400
E 300
OL
200 8
6. ) V r-
100 G
" t= I Omin
V t=20min o t=30min
0 vo
600 650 700 750 800 850 900 950 1000
Temperature (°C)
Figure 5.25: Distance from the grate vs. temperature for 10,20 and 30 minutes after the steady phase was reached (Case A100-S25 (S1)).
400
8 300
" t=l0min
e t=20min D t=30min
L Cs
200 E O
100 4
. OF 0iuv rý I 600 650 700 750 800 850 900 950 1000
Temperature (°C)
Figure 5.26: Distance from the grate vs. temperature for 10,20 and 30 minutes after the steady phase was reached (Case A100-S40 (S1)).
157
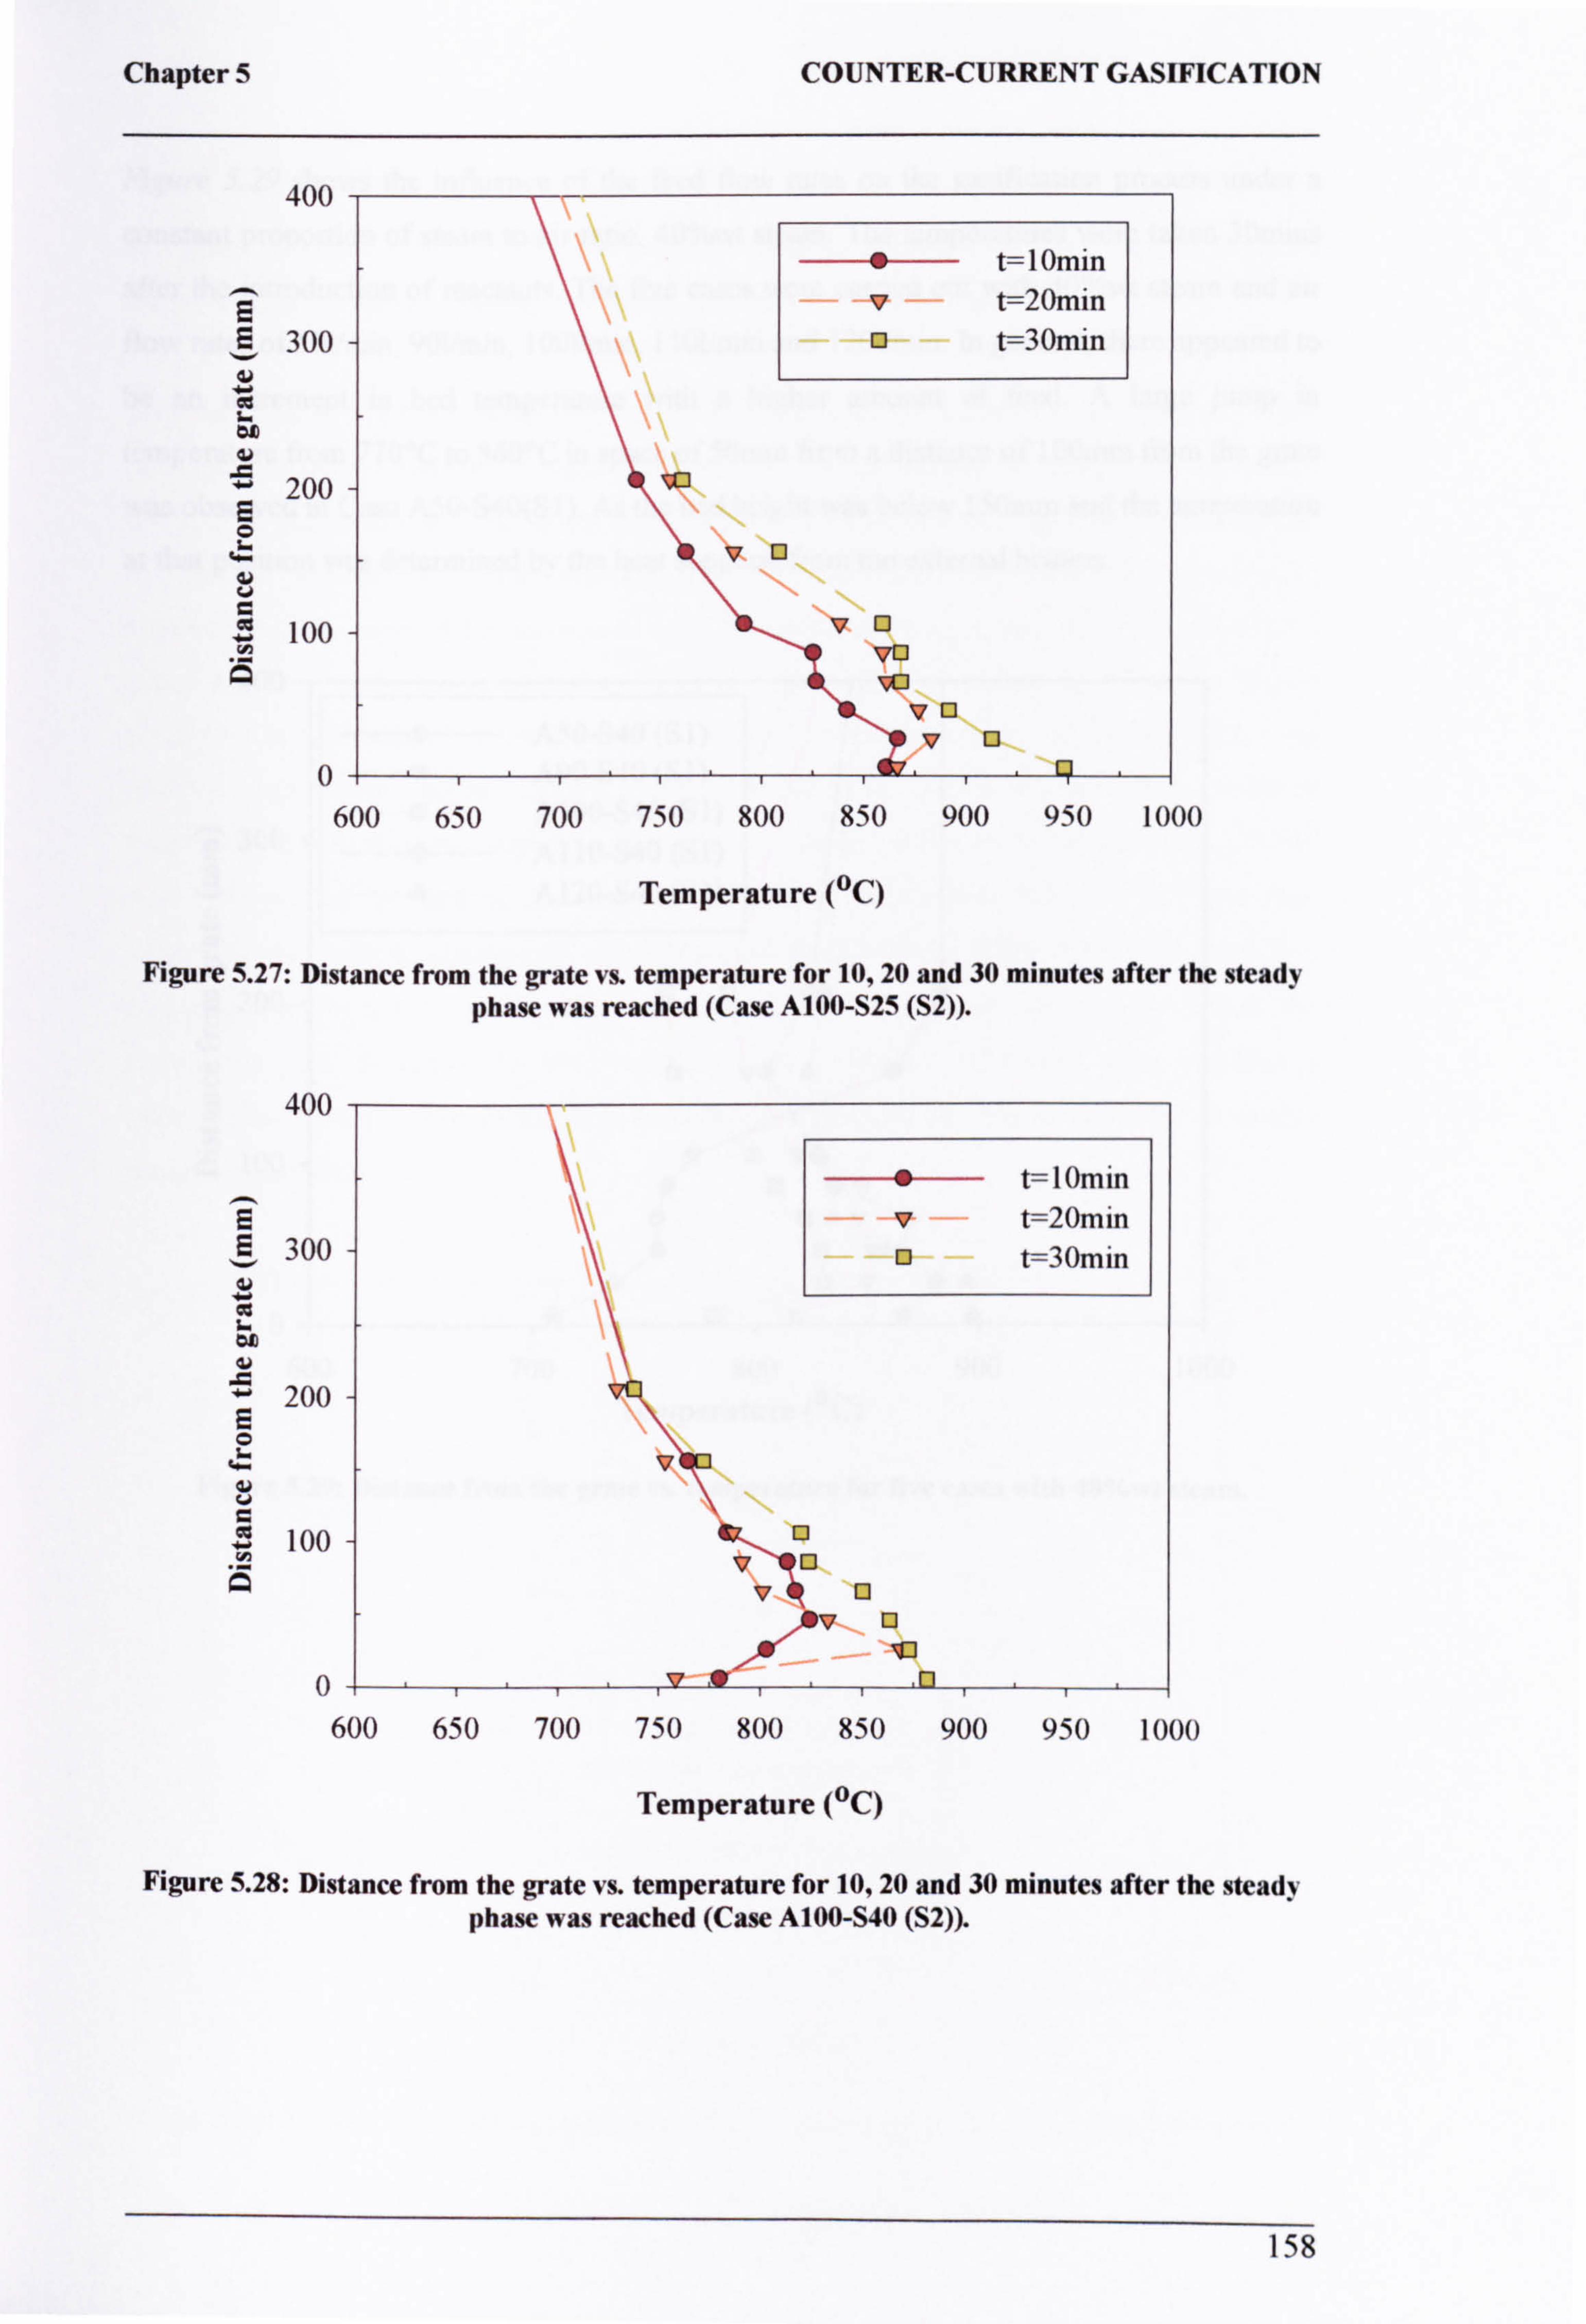
Chapter 5
400
300
b0
200 E
4..
u
100 4
0
COUNTER-CURRENT GASIFICATION
" t=l0min v t=20min Q t=30min
vQ
vQ vQ
V0 vQ
600 650 700 750 800 850 900 950 1000
Temperature (°C)
Figure 5.27: Distance from the grate vs. temperature for 10,20 and 30 minutes after the steady phase was reached (Case A100-S25 (S2)).
400
E 300
200 E
V..
w 100
A
0
" t=l0min v t=20min Q t=30min
vQ vQ
ýv Q m
600 650 700 750 800 850 900 950 1000
Temperature (°C)
Figure 5.28: Distance from the grate vs. temperature for 10,20 and 30 minutes after the steady phase was reached (Case A100-S40 (S2)).
158
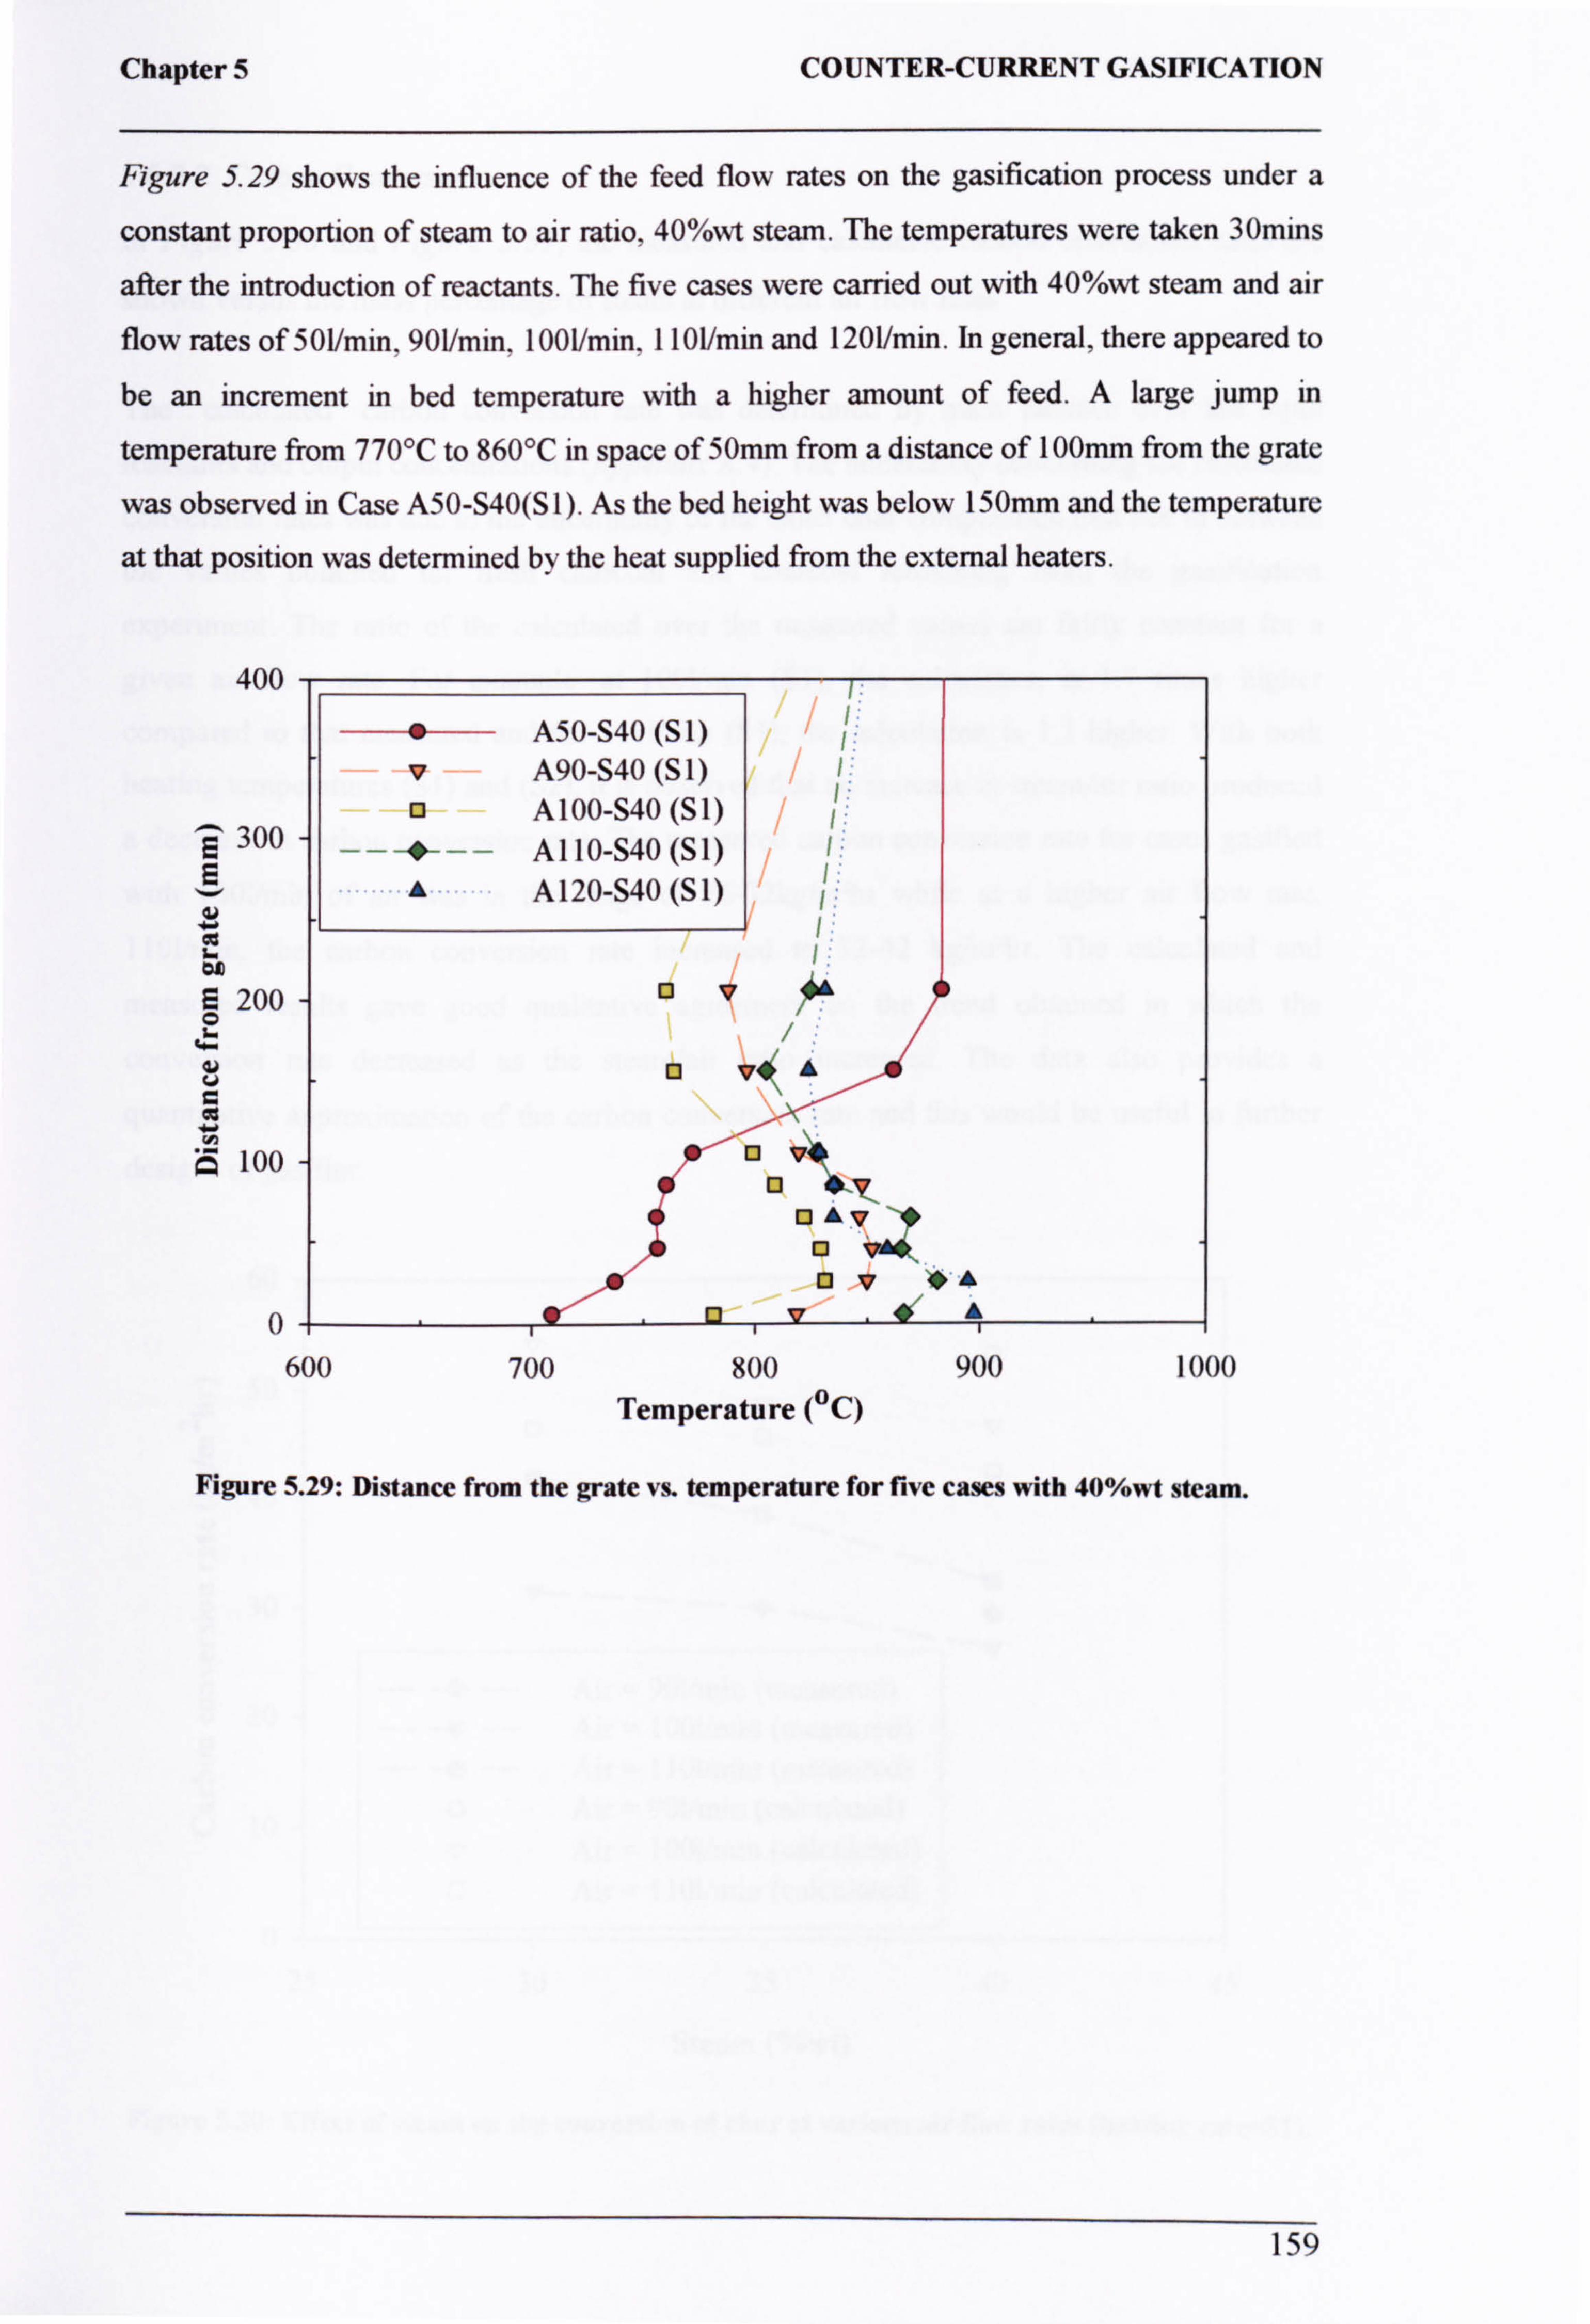
Chapter 5 COUNTER-CURRENT GASIFICATION
Figure 5.29 shows the influence of the feed flow rates on the gasification process under a
constant proportion of steam to air ratio, 40%wt steam. The temperatures were taken 30mins
after the introduction of reactants. The five cases were carried out with 40%wt steam and air
flow rates of 501/min, 901/min, 1001/min. 110Umin and 1201/min. In general, there appeared to
be an increment in bed temperature with a higher amount of feed. A large jump in
temperature from 770°C to 860°C in space of 50mm from a distance of 100mm from the grate
was observed in Case A50-S40(S 1). As the bed height was below 150mm and the temperature
at that position was determined by the heat supplied from the external heaters.
400
300 E
on S 200
to Ä 100
0
" A50-S40 (S 1) v A90-S40 (S 1) QA 100-S40 (S 1)
--+-- A110-S40 (S1) AA 120-S40 (S 1)
Qv f+
a vý A
Q vý 13
13 AV a Qv aºý
"
600 700 800 900 1000 Temperature (°C)
Figure 5.29: Distance from the grate vs. temperature for five cases with 40%wt steam.
159

Chapter 5 COUNTER-CURRENT GASIFICATION
5.6.2.2 Carbon Conversion
In Figure 5.30 and Figure 5.31, the measured and calculated carbon conversion rates are
shown versus the mass percentage of steam at different air flow rates.
The "calculated" carbon conversion rate was determined by mass balance over the input
reactants and output concentrations (Appendix A. 4). The uncertainty concerning the calculated
conversion rates was due to the uncertainty of the exact char composition that lies in between
the values obtained for fresh charcoal and charcoal remaining from the gasification
experiment. The ratio of the calculated over the measured values are fairly constant for a
given air flow rate. For example: at 1001/min (S 1), the calculation is 1.7 times higher
compared to that measured and for 1101/min (S 1), the calculation is 1.1 higher. With both
heating temperatures (S 1) and (S2), it is observed that an increase in steam/air ratio produced
a decrease in carbon conversion rate. The measured carbon conversion rate for cases gasified
with 1001/min of air was in the range of 26-32kg/m2hr while at a higher air flow rate, 1101/min, the carbon conversion rate increased to 32-42 kg/m2hr. The calculated and
measured results gave good qualitative agreement on the trend obtained in which the
conversion rate decreased as the steam/air ratio increased. The data also provides a
quantitative approximation of the carbon conversion rate and this would be useful in further
designs of gasifier.
60
N
SOD
O . 27 V
O
O AD L. cc U
50
40
30
20
10
v 0
v QQ v
Q 1+\
VL_
- - Air = 901/min (measured)
- - Air = 1001/min (measured)
- - Air = 1101/min (measured) 0 Air = 901/min (calculated)
v Air = 1001/min (calculated) Q Air = 1101/min (calculated)
25 30 35 40 45
Steam (%wt)
0
Figure 5.30: Effect of steam on the conversion of char at various air flow rates (heating rate=S1).
160
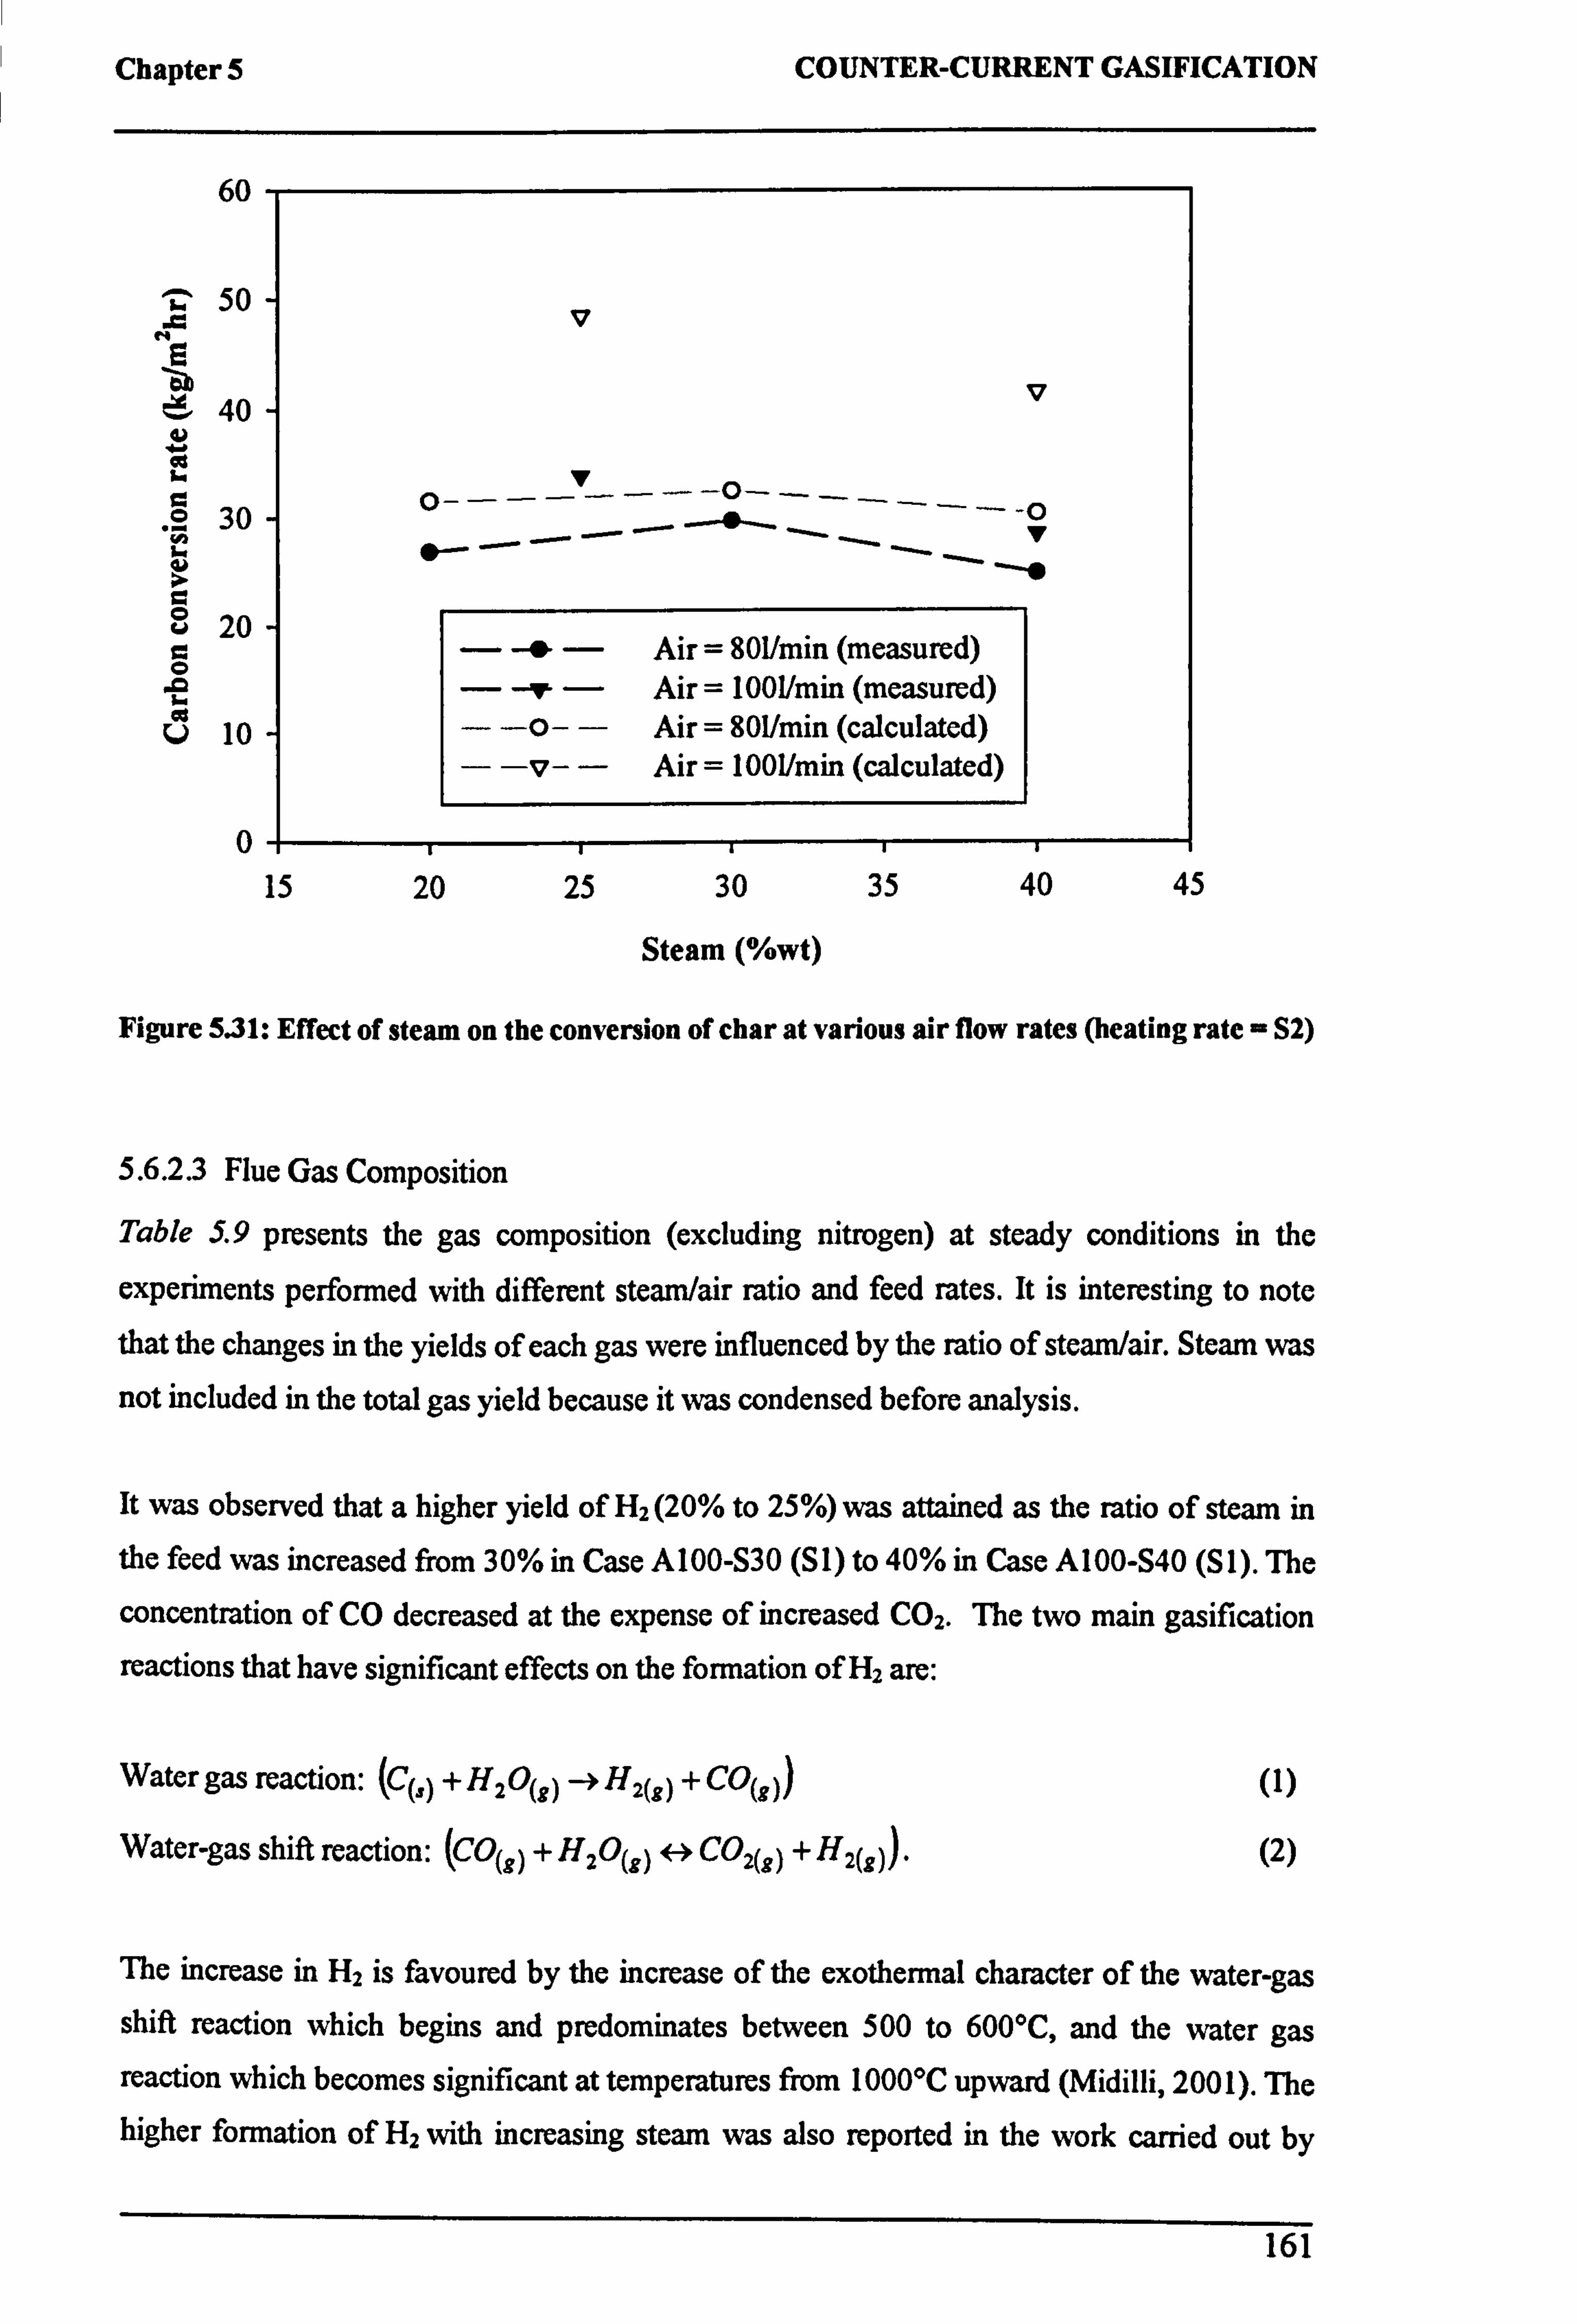
Chapter 5 COUNTER-CURRENT GASIFICATION
60
V
cis
iý ri
C "y
i. r
C
0
U
50
40
30
20
10
0
v
v
-- V
- -+ - Air = 801/min (measured)
- -ý - Air= 100Umin (measured)
- -o- - Air = 801/min (calculated)
- -v- - Air= I 001/min (calculated)
15 20 25 30 35 40 45
Steam (%wt)
Figure 5.31: Effect of steam on the conversion of char at various air flow rates (heating rate - S2)
5.6.2.3 Flue Gas Composition
Table S. 9 presents the gas composition (excluding nitrogen) at steady conditions in the
experiments performed with different steam/air ratio and feed rates. It is interesting to note that the changes in the yields of each gas were influenced by the ratio of steam/air. Steam was
not included in the total gas yield because it was condensed before analysis.
It was observed that a higher yield of H2 (20% to 25%) was attained as the ratio of steam in
the feed was increased from 30% in Case A100-S30 (Si) to 40% in Case A 100-S40 (S 1). The
concentration of CO decreased at the expense of increased CO2. The two main gasification reactions that have significant effects on the formation of H2 are:
Water gas reaction: (C(, ) +HZO(g) -4H2(g)+CO(9)) (1)
Water-gas shift reaction: (CO(, ) +HZO(g) H C02(g) +H2(g)). (2)
The increase in H2 is favoured by the increase of the exothermal character of the water-gas shift reaction which begins and predominates between 500 to 600°C, and the water gas reaction which becomes significant at temperatures from 1000°C upward (Midilli, 2001). The higher formation of H2 with increasing steam was also reported in the work carried out by
161
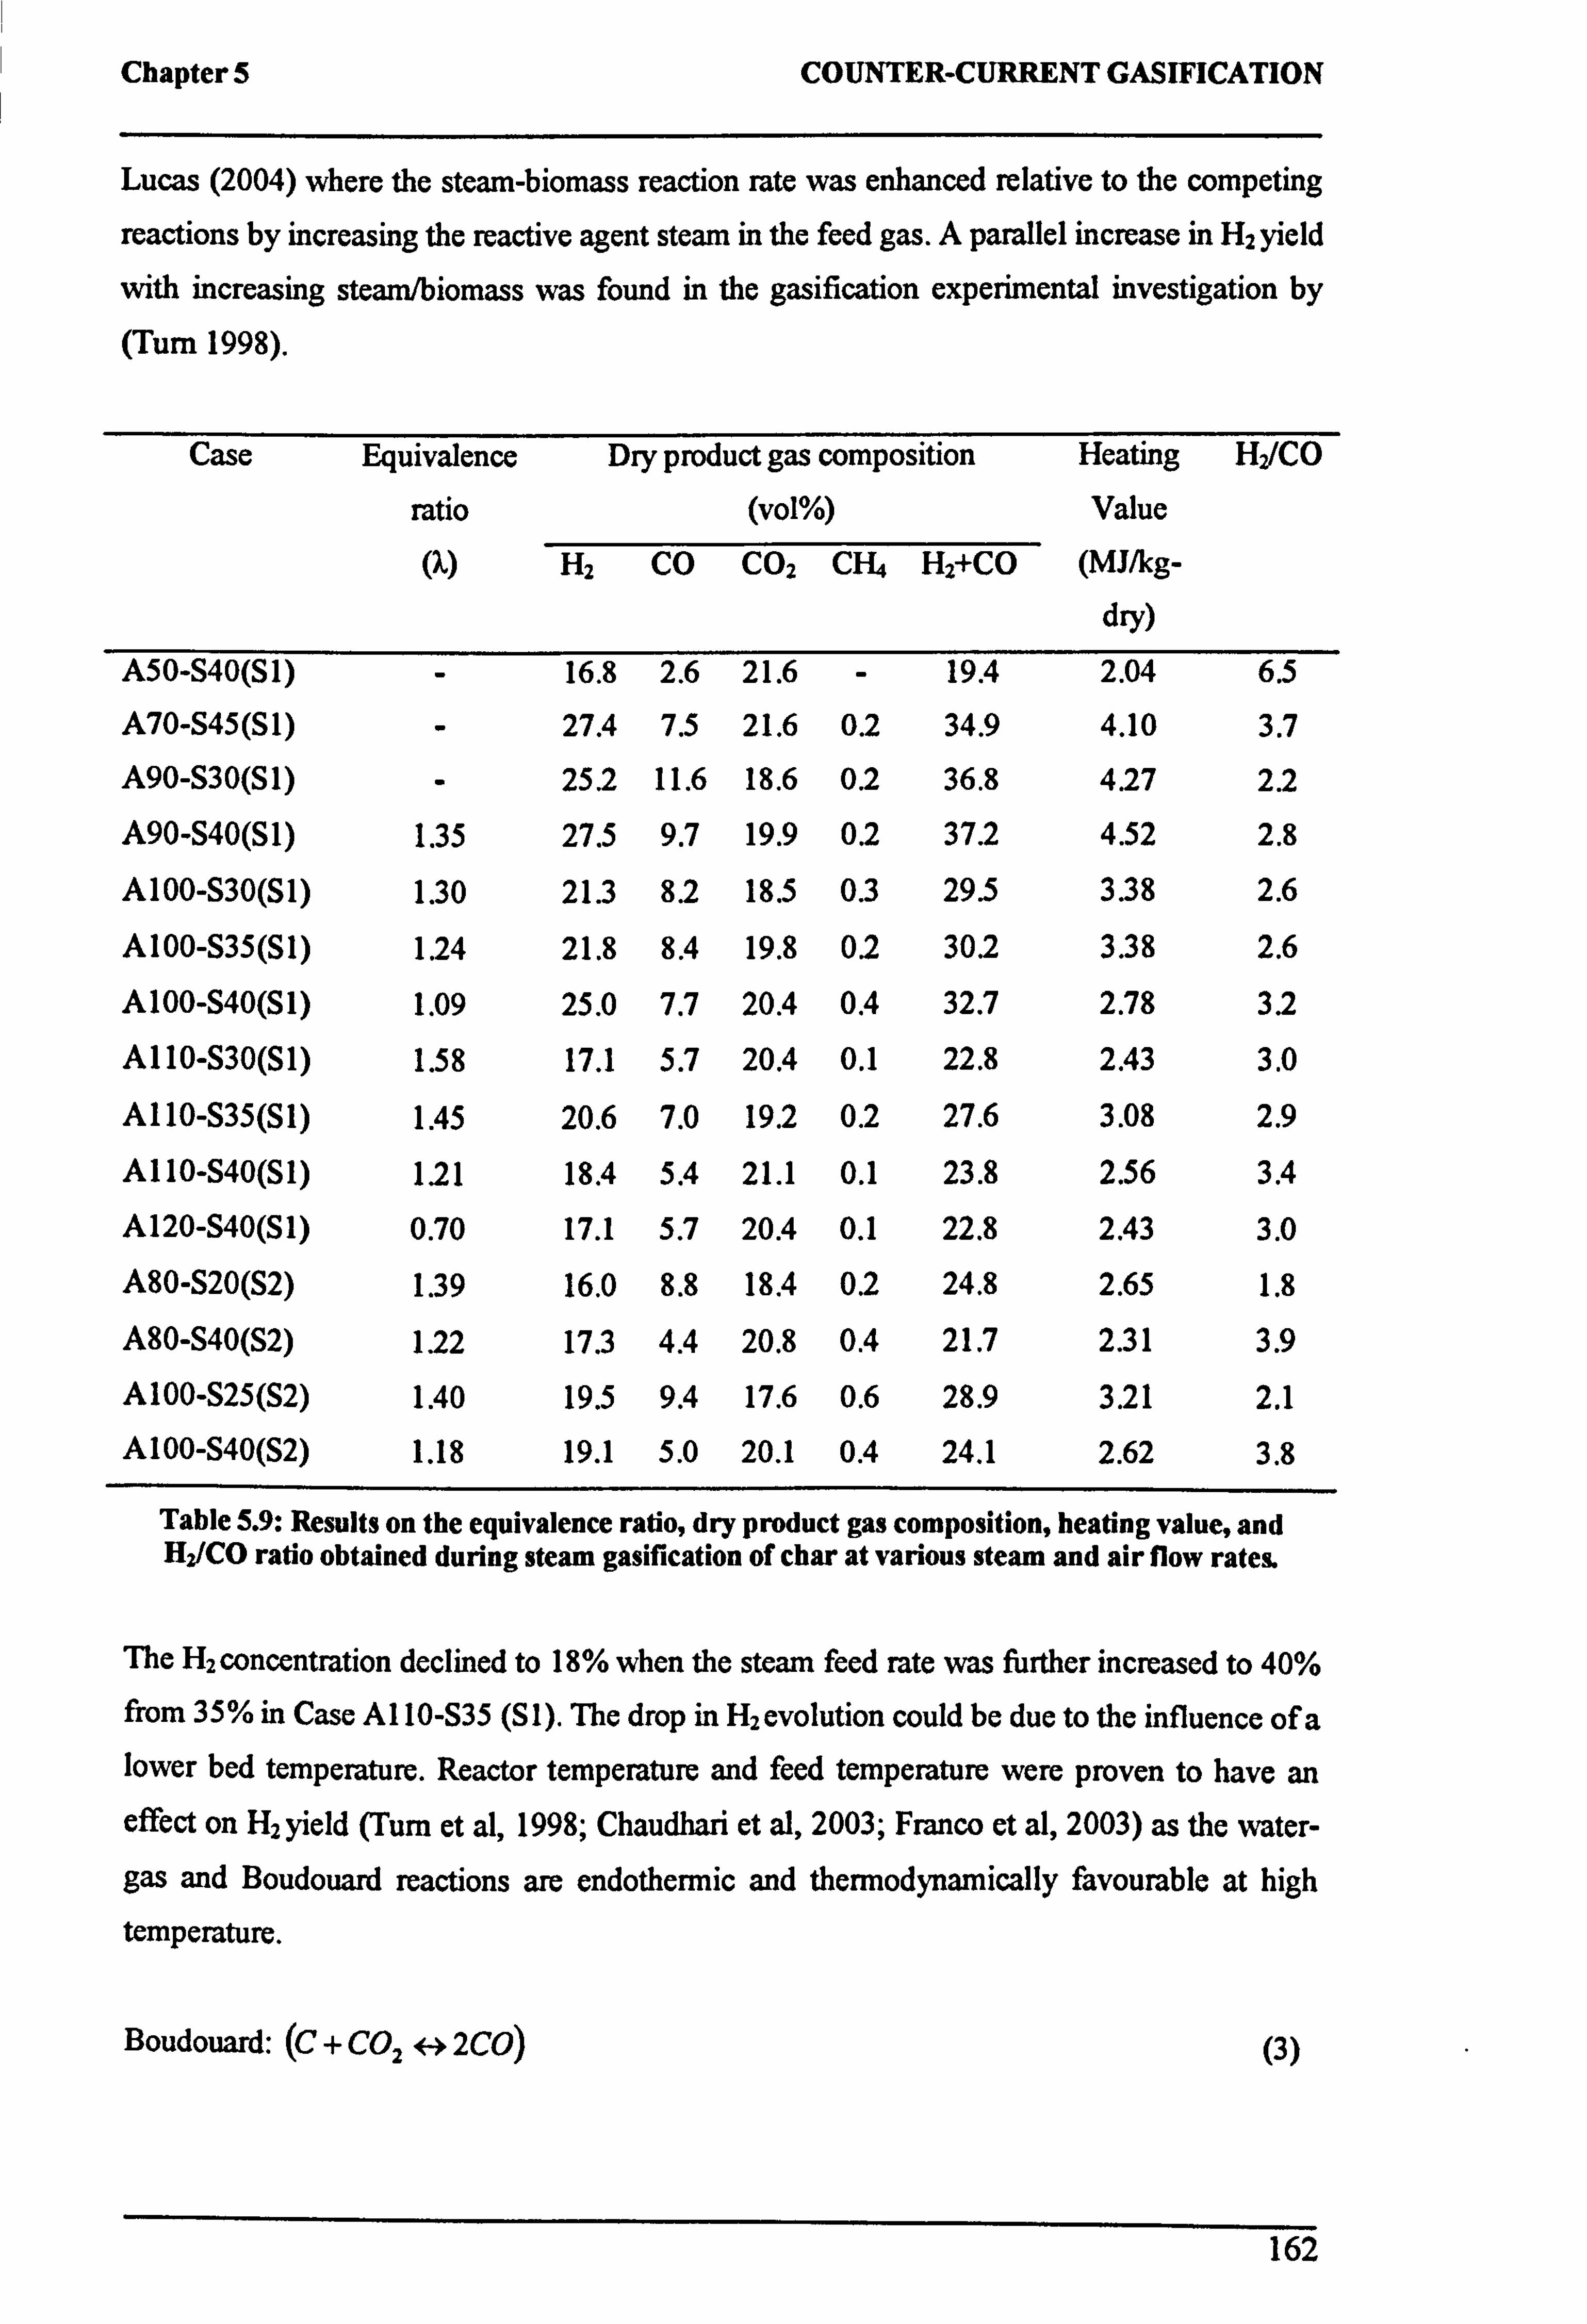
Chapter 5 COUNTER-CURRENT GASIFICATION
Lucas (2004) where the steam-biomass reaction rate was enhanced relative to the competing
reactions by increasing the reactive agent steam in the feed gas. A parallel increase in H2 yield
with increasing steam/biomass was found in the gasification experimental investigation by
(Turn 1998).
Case Equivalence Dry product gas composition Heating H1/CO
ratio (vo1%) Value
(ý) H2 CO CO2 CH4 H2+CO (MJ/kg-
dry) A50-S40(S1) - 16.8 2.6 21.6 - 19.4 2.04 6.5
A70-S45(S1) - 27.4 7.5 21.6 0.2 34.9 4.10 3.7
A90-S30(S1) - 25.2 11.6 18.6 0.2 36.8 4.27 2.2
A90-S40(S1) 1.35 27.5 9.7 19.9 0.2 37.2 4.52 2.8
A100-S30(S1) 1.30 21.3 8.2 18.5 0.3 29.5 3.38 2.6
A100-S35(S1) 1.24 21.8 8.4 19.8 0.2 30.2 3.38 2.6
A100-S40(S1) 1.09 25.0 7.7 20.4 0.4 32.7 2.78 3.2
A110-S30(S1) 1.58 17.1 5.7 20.4 0.1 22.8 2.43 3.0
A110-S35(S1) 1.45 20.6 7.0 19.2 0.2 27.6 3.08 2.9
A110-S40(S1) 121 18.4 5.4 21.1 0.1 23.8 2.56 3.4
A120-S40(S1) 0.70 17.1 5.7 20.4 0.1 22.8 2.43 3.0
A80-S20(S2) 1.39 16.0 8.8 18.4 0.2 24.8 2.65 1.8
A80-S40(S2) 1.22 17.3 4.4 20.8 0.4 21.7 2.31 3.9
A100-S25(S2) 1.40 19.5 9.4 17.6 0.6 28.9 3.21 2.1
A100-S40(S2) 1.18 19.1 5.0 20.1 0.4 24.1 2.62 3.8
Table 5.9: Results on the equivalence ratio, dry product gas composition, heating value, and H2/CO ratio obtained during steam gasification of char at various steam and air flow rates.
The H2 concentration declined to 18% when the steam feed rate was further increased to 40%
from 35% in Case Al 10-S35 (Si). The drop in H2evolution could be due to the influence of a lower bed temperature. Reactor temperature and feed temperature were proven to have an
effect on H2 yield (Turn et al, 1998; Chaudhari et al, 2003; Franco et al, 2003) as the water-
gas and Boudouard reactions are endothermic and thermodynamically favourable at high
temperature.
Boudouard: (C + CO2 H 2C0) (3)
162
Chapter 5 COUNTER-CURRENT GASIFICATION
The lowering of bed temperature due to the addition of steam as in Case Al 10-S40 could
possibly have reduce the influence of either rea ions (1) or (3) resulting in a slower char
conversion rate and lower H2 and CO evolution. similar trend was reported by Franco et al (2003) whereby the H2 formation reached a maximum with increasing steam/biomass ratio
and then declined as the ratio was further increased. In his work, the CO was found to
decrease significantly while no significant change was observed for CO2.
The equivalence ratio (k) is a quantitative indication of whether the fuel-oxidizer mixture is
rich, lean or stoichiometric. For fuel-rich mixtures, )>1, and for fuel lean mixtures, X<1.
Therefore, the equivalence ratio (X) is defined as the ratio of the actual fuel-oxidant ratio (F/O) to the ratio for a stoichiometric condition (F/O),. It was calculated from the air flow
rate (mw, kg/mzhr), the carbon conversion rate (CC, kg/mzhr) and the fuel elemental
composition combusted (w(H20). C,, H,, Oj.
A=(F/O)/(FIO)st -mahlst /main
m,; r�, =[32(x+y14- z/2)CC]/0.233(18w+12x+y+16z)
In the calculations, the portion of mass combusted was assumed to take the composition of the gasified material as given in Table 5.7 (w=0.16, x=7.24, y=1.61, zß. 54). However, in
practise there is slightly less C in the composition and more H and 0. Hence, the actual
equivalence ratio is marginally lower than in Table 5.9. All the experiments except A 120-
S40(S1) were in fuel-rich mixtures in an ER range of 1-1.58. The equivalence ratio reduced from 1.30 to 1.09 as the ratio of steam with 1001/min of air was increased from 30% to 40%.
The steam gasification reaction (2) becomes important as the steam content increased. This
explains the result that the content of CO decreases and CO2 increases. The lower bed
temperature associated with a higher steam input reduces the influence of endothermic reaction (1). Therefore, the lower carbon conversion rate gave the impression of a fuel lean
condition. The total concentration of H2 and CO (22-27%) in the product gas obtained in the
cases gasified with 110Umin of air was lower compared to the 29-33% obtained in the cases run with 1001/min of air. The 10% addition in air supplied was accompanied by a higher
amount of nitrogen entering the gasifier leading to a dilution in the product gas and a lowering of heating value. A possible reason why the addition of steam in cases run with 1101/min did not result in a higher percentage of H2 is that the equilibrium consideration for
reaction (2) suggests that it proceeds in the opposite direction at high temperatures (Merrick, 1984).
163
Chapter 5 COUNTER-CURRENT GASIFICATION
The total production of H2 and CO was highest in Case A90-S40 (S 1) whereby the product
gas contained 28% H2 and 10% CO. Comparing cases with 40% steam ratio [A90-S40 (S 1),
A 100-S40 (S 1), and A 120-S40 (S2)], the production of H2 and CO declined as the total flow
rate of reactant increased. Figure 5.29 showed that the bed temperature increased with a higher input of reactants. It can be postulated that the decrease in H2 and CO arises from more
air entering the reactor resulting in the exothermic burning of these two gases in the oxidation
zone, thus, contributing to the increase in bed temperature. The results obtained in this study
agrees with the observations made by Midilli (2001) in their experiment with an air-blow downdraft gasifier where the flow rate of hydrogen gas and temperatures at the oxidation
zone decreased from more air entering the reactor bed. Thus, combustion was said to occur in
the reactor bed rather than gasification. The heating value of the product gas decreased from 4.27MJ/kg to 2.43 MJ/kg as the air flow rate increased from 901/min (220kg/m2hr) in Case A90-S40 (S 1) to 1201/min (294kg/ m2hr) in Case A 120-S40 (S 1). The evolution of H2 and CO
was very low for Case A50-S40 (S1) due to the limited amount of reactant supplied. It can be
concluded that control of the air flow rate is crucial in the operation of air-steam gasification. A low air flow rate will lower the reaction temperature, which is not favourable while an air flow rate that is too high promotes the combustion of the product gas, lowering the heating
value.
The H2/CO ratio for steam-air gasification of commercial char ranges up to 3.7 (excluding Case A50-S40 (Si)). The results in Table 5.9 showed that the H2/CO ratio increased as the
proportion of steam in the feed was increased. The increase in H2/CO is mainly due to the decrease in CO with increasing ratio of steam in the feed. Therefore, the H2/CO ratio in the
synthesis gas can be adjusted to suit different application by manipulating the steam input.
The heating values were calculated based on the heat of combustion values (kcal/kmol) given by Sarkar (1990) (carbon: 97000kcal/kmol, hydrogen: 68317kcaIkmol, carbon monoxide: 67636kcaJkmol, methane: 212798kca1kmol). The presented heating values were calculated in units of MJ/kg by division of the total heat of combustion by the molecular weight of the dry product gas.
Table 5.10 presents the conversion ratios of hydrogen gas from char gasification. The flow
rate of H2 and combustible gas from char was calculated from the mass balance of the input
reactants and product gas concentration. The production ratio of the gases was based on the mass of gases produced per mass of char converted. In Case A90-S40, the combustible gas production ratio was over 100% as steam contributed to the H2 formed. The average production ratio of H2 is 0.12 (kg H2 /kg char). The average production ratio of hydrogen
164
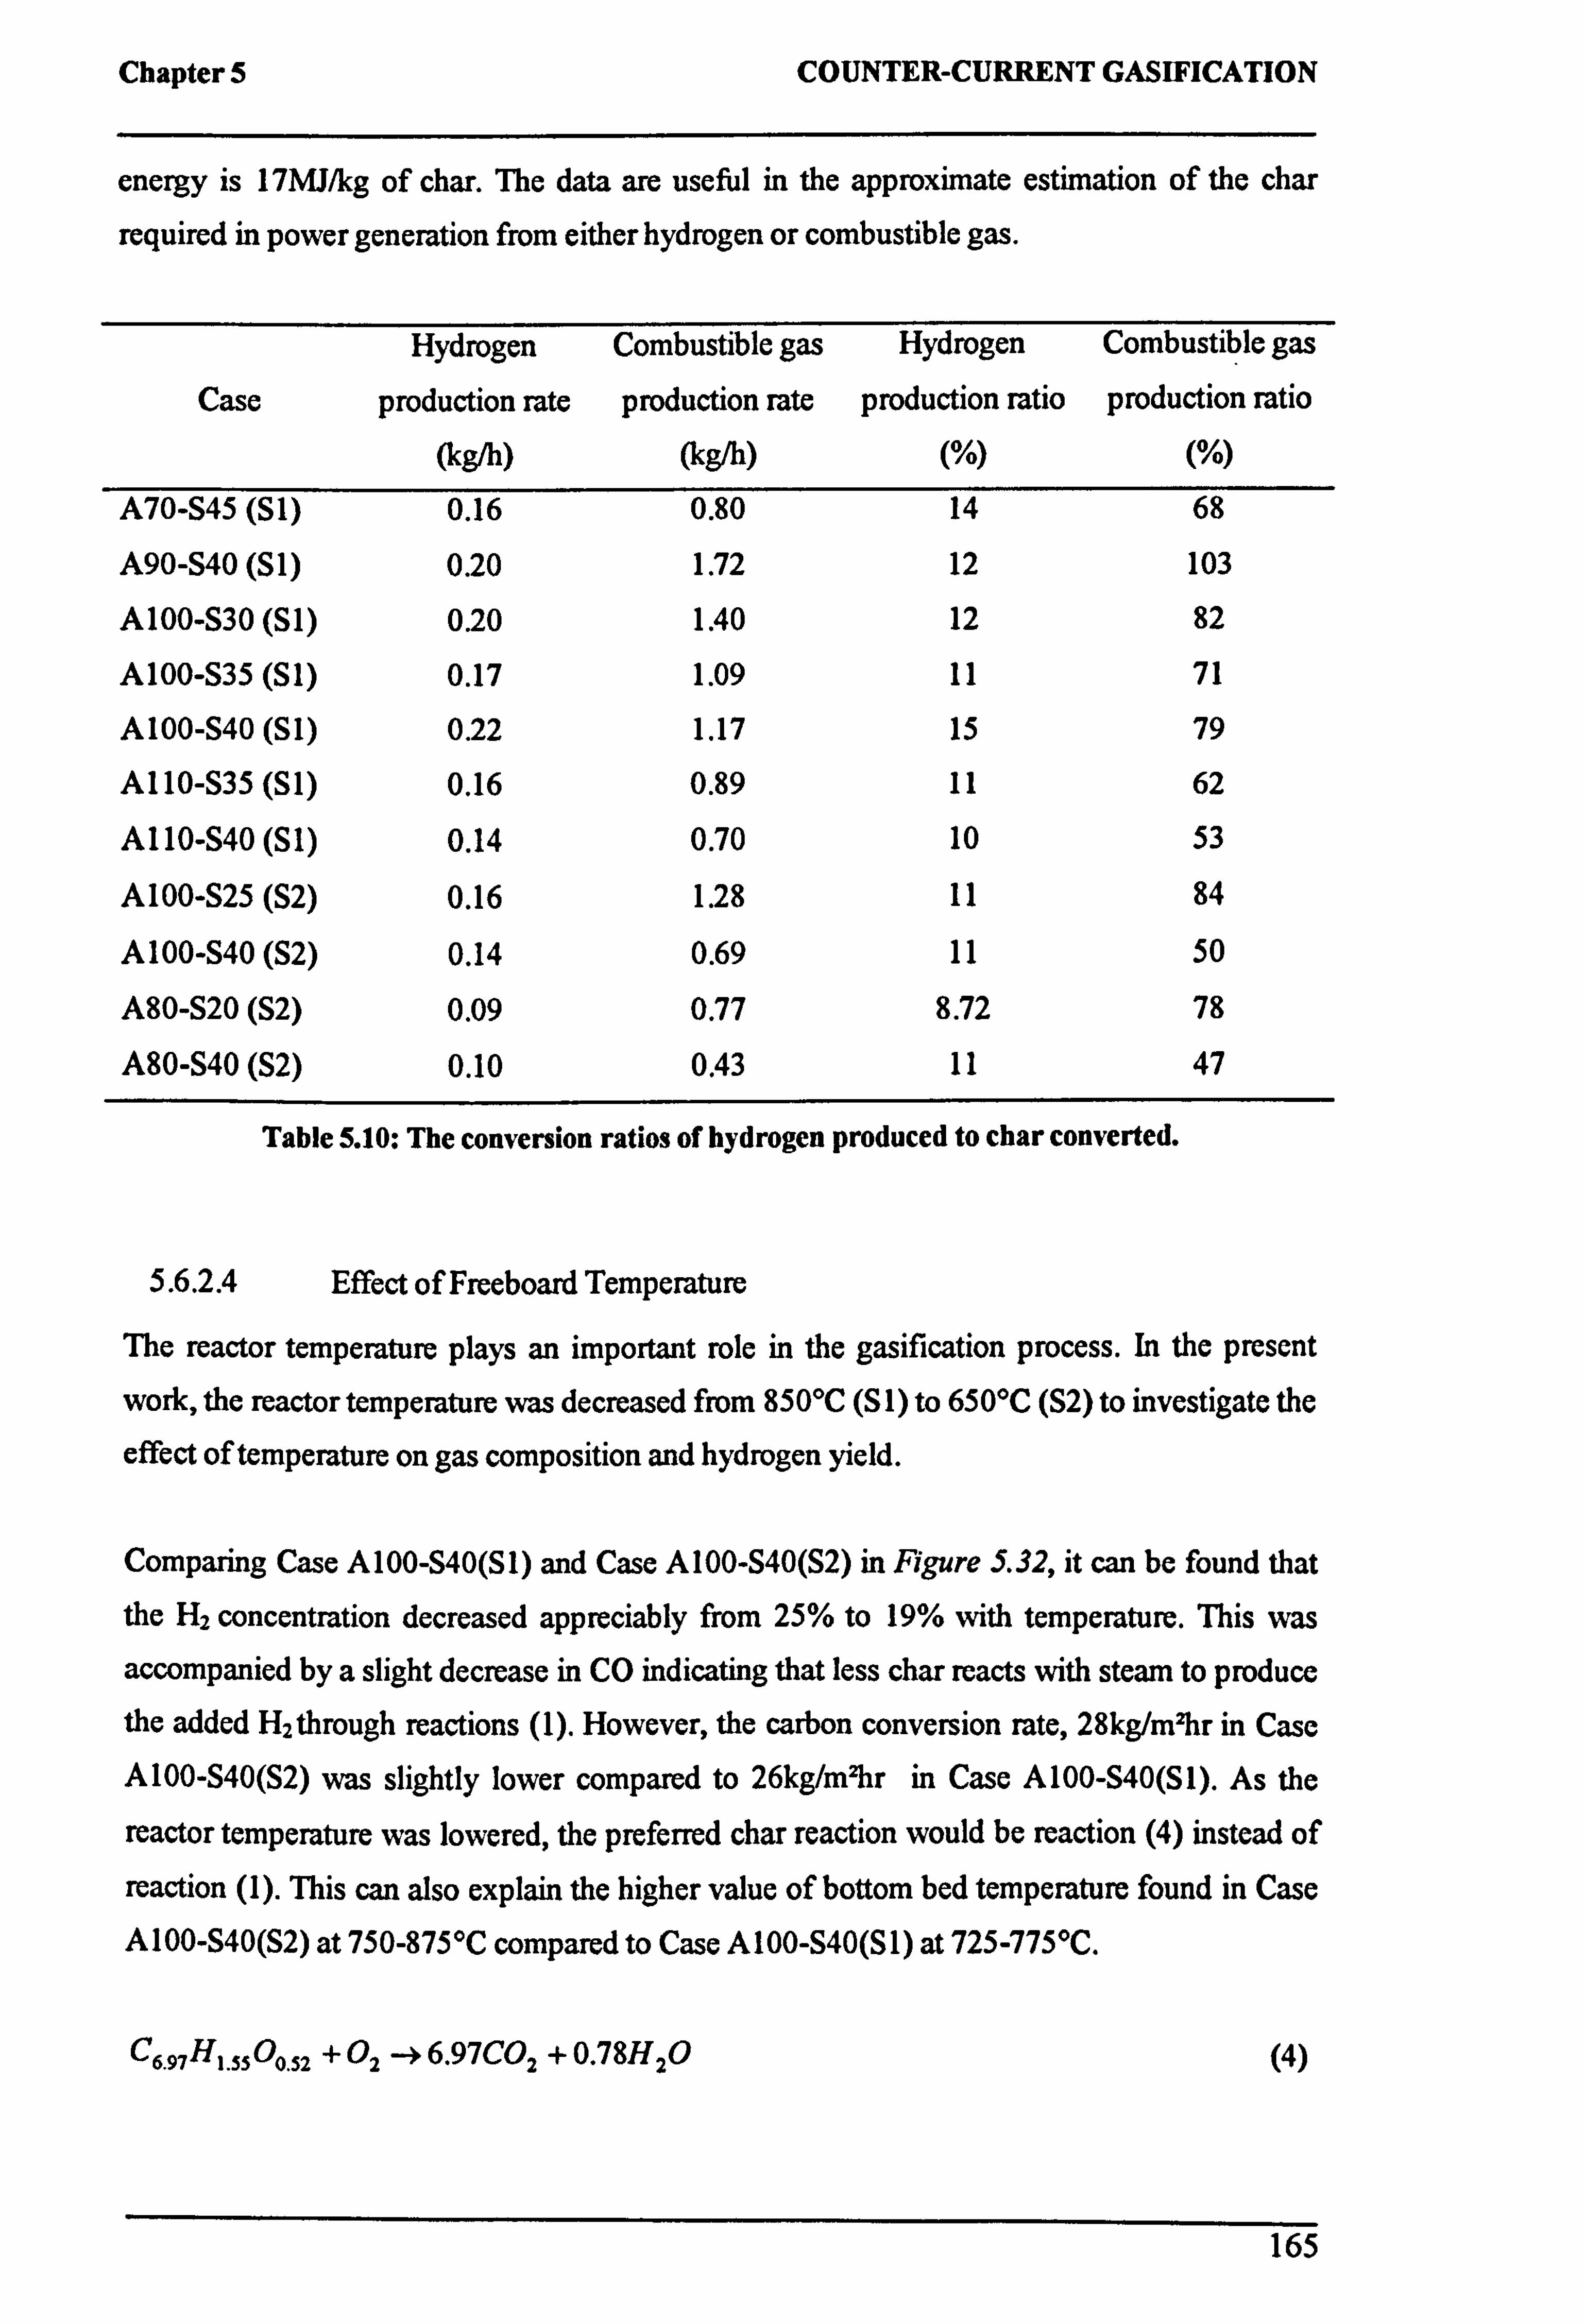
Chapter 5 COUNTER-CURRENT GASIFICATION
energy is 17MJ/kg of char. The data are useful in the approximate estimation of the char
required in power generation from either hydrogen or combustible gas.
Case
Hydrogen
production rate
(kg/h)
Combustible gas
production rate
(g h)
Hydrogen
production ratio
(%)
Combustible gas
production ratio
(%)
A70-S45 (Si) 0.16 0.80 14 68
A90-S40 (S 1) 0.20 1.72 12 103
A100-S30 (S1) 0.20 1.40 12 82
A 100-S35 (S 1) 0.17 1.09 11 71
A 100-S40 (S 1) 0.22 1.17 15 79
A110-S35 (S1) 0.16 0.89 11 62
A110-S40 (S1) 0.14 0.70 10 53
A100-S25 (S2) 0.16 1.28 11 84
A100-S40 (S2) 0.14 0.69 11 50
A80-S20 (S2) 0.09 0.77 8.72 78
A80-S40 (S2) 0.10 0.43 11 47
Table 5.10: The conversion ratios of hydrogen produced to char converted.
5.6.2.4 Effect of Freeboard Temperature
The reactor temperature plays an important role in the gasification process. In the present
work, the reactor temperature was decreased from 850°C (S 1) to 650°C (S2) to investigate the
effect of temperature on gas composition and hydrogen yield.
Comparing Case A100-S40(S1) and Case A100-S40(S2) in Figure 5.32, it can be found that
the H2 concentration decreased appreciably from 25% to 19% with temperature. This was
accompanied by a slight decrease in CO indicating that less char reacts with steam to produce the added H2 through reactions (1). However, the carbon conversion rate, 28kg/m2hr in Case A100-S40(S2) was slightly lower compared to 26kg/m2hr in Case A100-S40(S1). As the
reactor temperature was lowered, the preferred char reaction would be reaction (4) instead of
reaction (1). This can also explain the higher value of bottom bed temperature found in Case
A100-S40(S2) at 750-875°C compared to Case A100-S40(S1) at 725-775°C.
C6.97H,. 5300.52 + OZ -ý 6.97C02 + 0.78H20 (4)
165
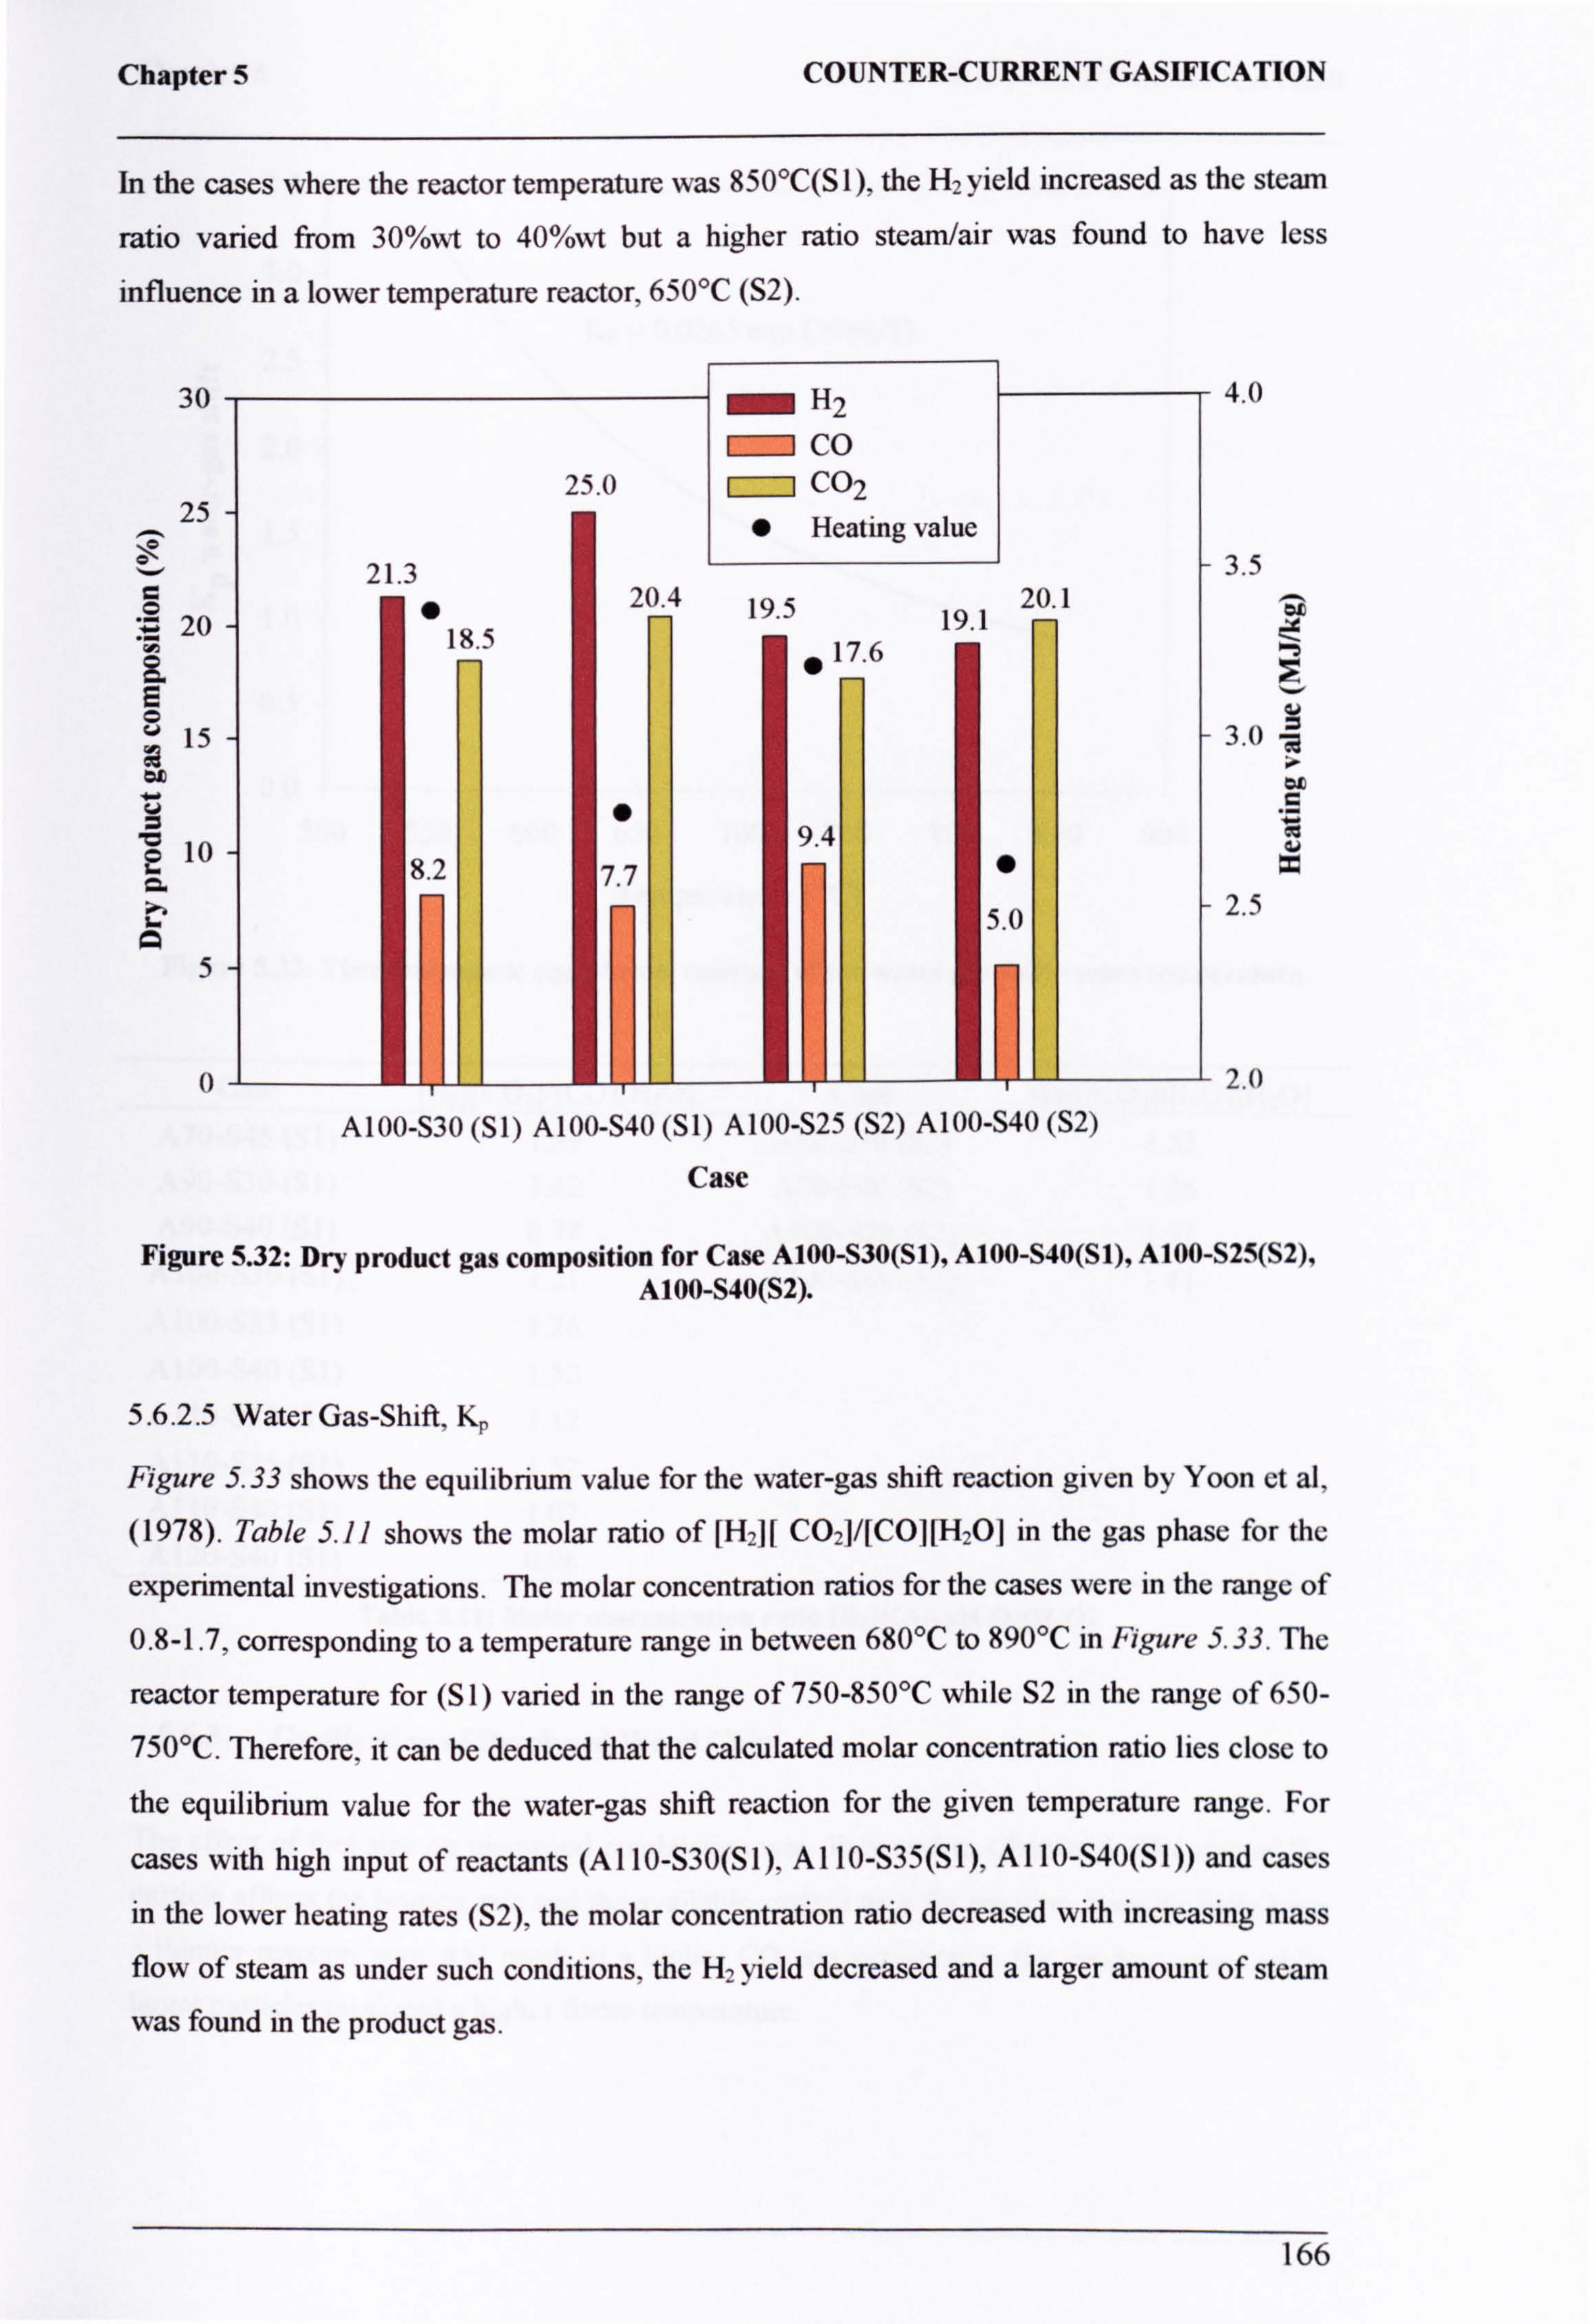
Chapter 5 COUNTER-CURRENT GASIFICATION
In the cases where the reactor temperature was 850°C(S 1), the H2 yield increased as the steam
ratio varied from 30%wt to 40%wt but a higher ratio steam/air was found to have less
influence in a lower temperature reactor, 650°C (S2).
30 H2 4.0
D CO 25.0 I CO2
25 " Heating value
21.3 3.5
w 20 " 20.4 19.5 20.1 19.1
-
$ 18.5 17.6 " E
15 3.0
ao ý v " 5 1 ° 10 E
9.4 8 2 " ý
. 7.7 S ý 2.5 n ý
5 II
01 01,111 Midi I Mi ii i =uu 20
A100-S30 (Si) A100-S40 (Si) A100-S25 (S2) A100-S40 (S2)
Case
Figure 5.32: Dry product gas composition for Case A100-S30(S1), A100-S40(S1), A100-S25(S2), A100-S40(S2).
5.6.2.5 Water Gas-Shift, K.
Figure 5.33 shows the equilibrium value for the water-gas shift reaction given by Yoon et al,
(1978). Table 5.11 shows the molar ratio of [H2][ C021/[CO][H201 in the gas phase for the
experimental investigations. The molar concentration ratios for the cases were in the range of
0.8-1.7, corresponding to a temperature range in between 680°C to 890°C in Figure 5.33. The
reactor temperature for (S 1) varied in the range of 750-850°C while S2 in the range of 650-
750°C. Therefore, it can be deduced that the calculated molar concentration ratio lies close to
the equilibrium value for the water-gas shift reaction for the given temperature range. For
cases with high input of reactants (A 110-S30(S 1), A 110-S35 (S 1), A 110-S40(S 1)) and cases
in the lower heating rates (S2), the molar concentration ratio decreased with increasing mass
flow of steam as under such conditions, the H2 yield decreased and a larger amount of steam
was found in the product gas.
166
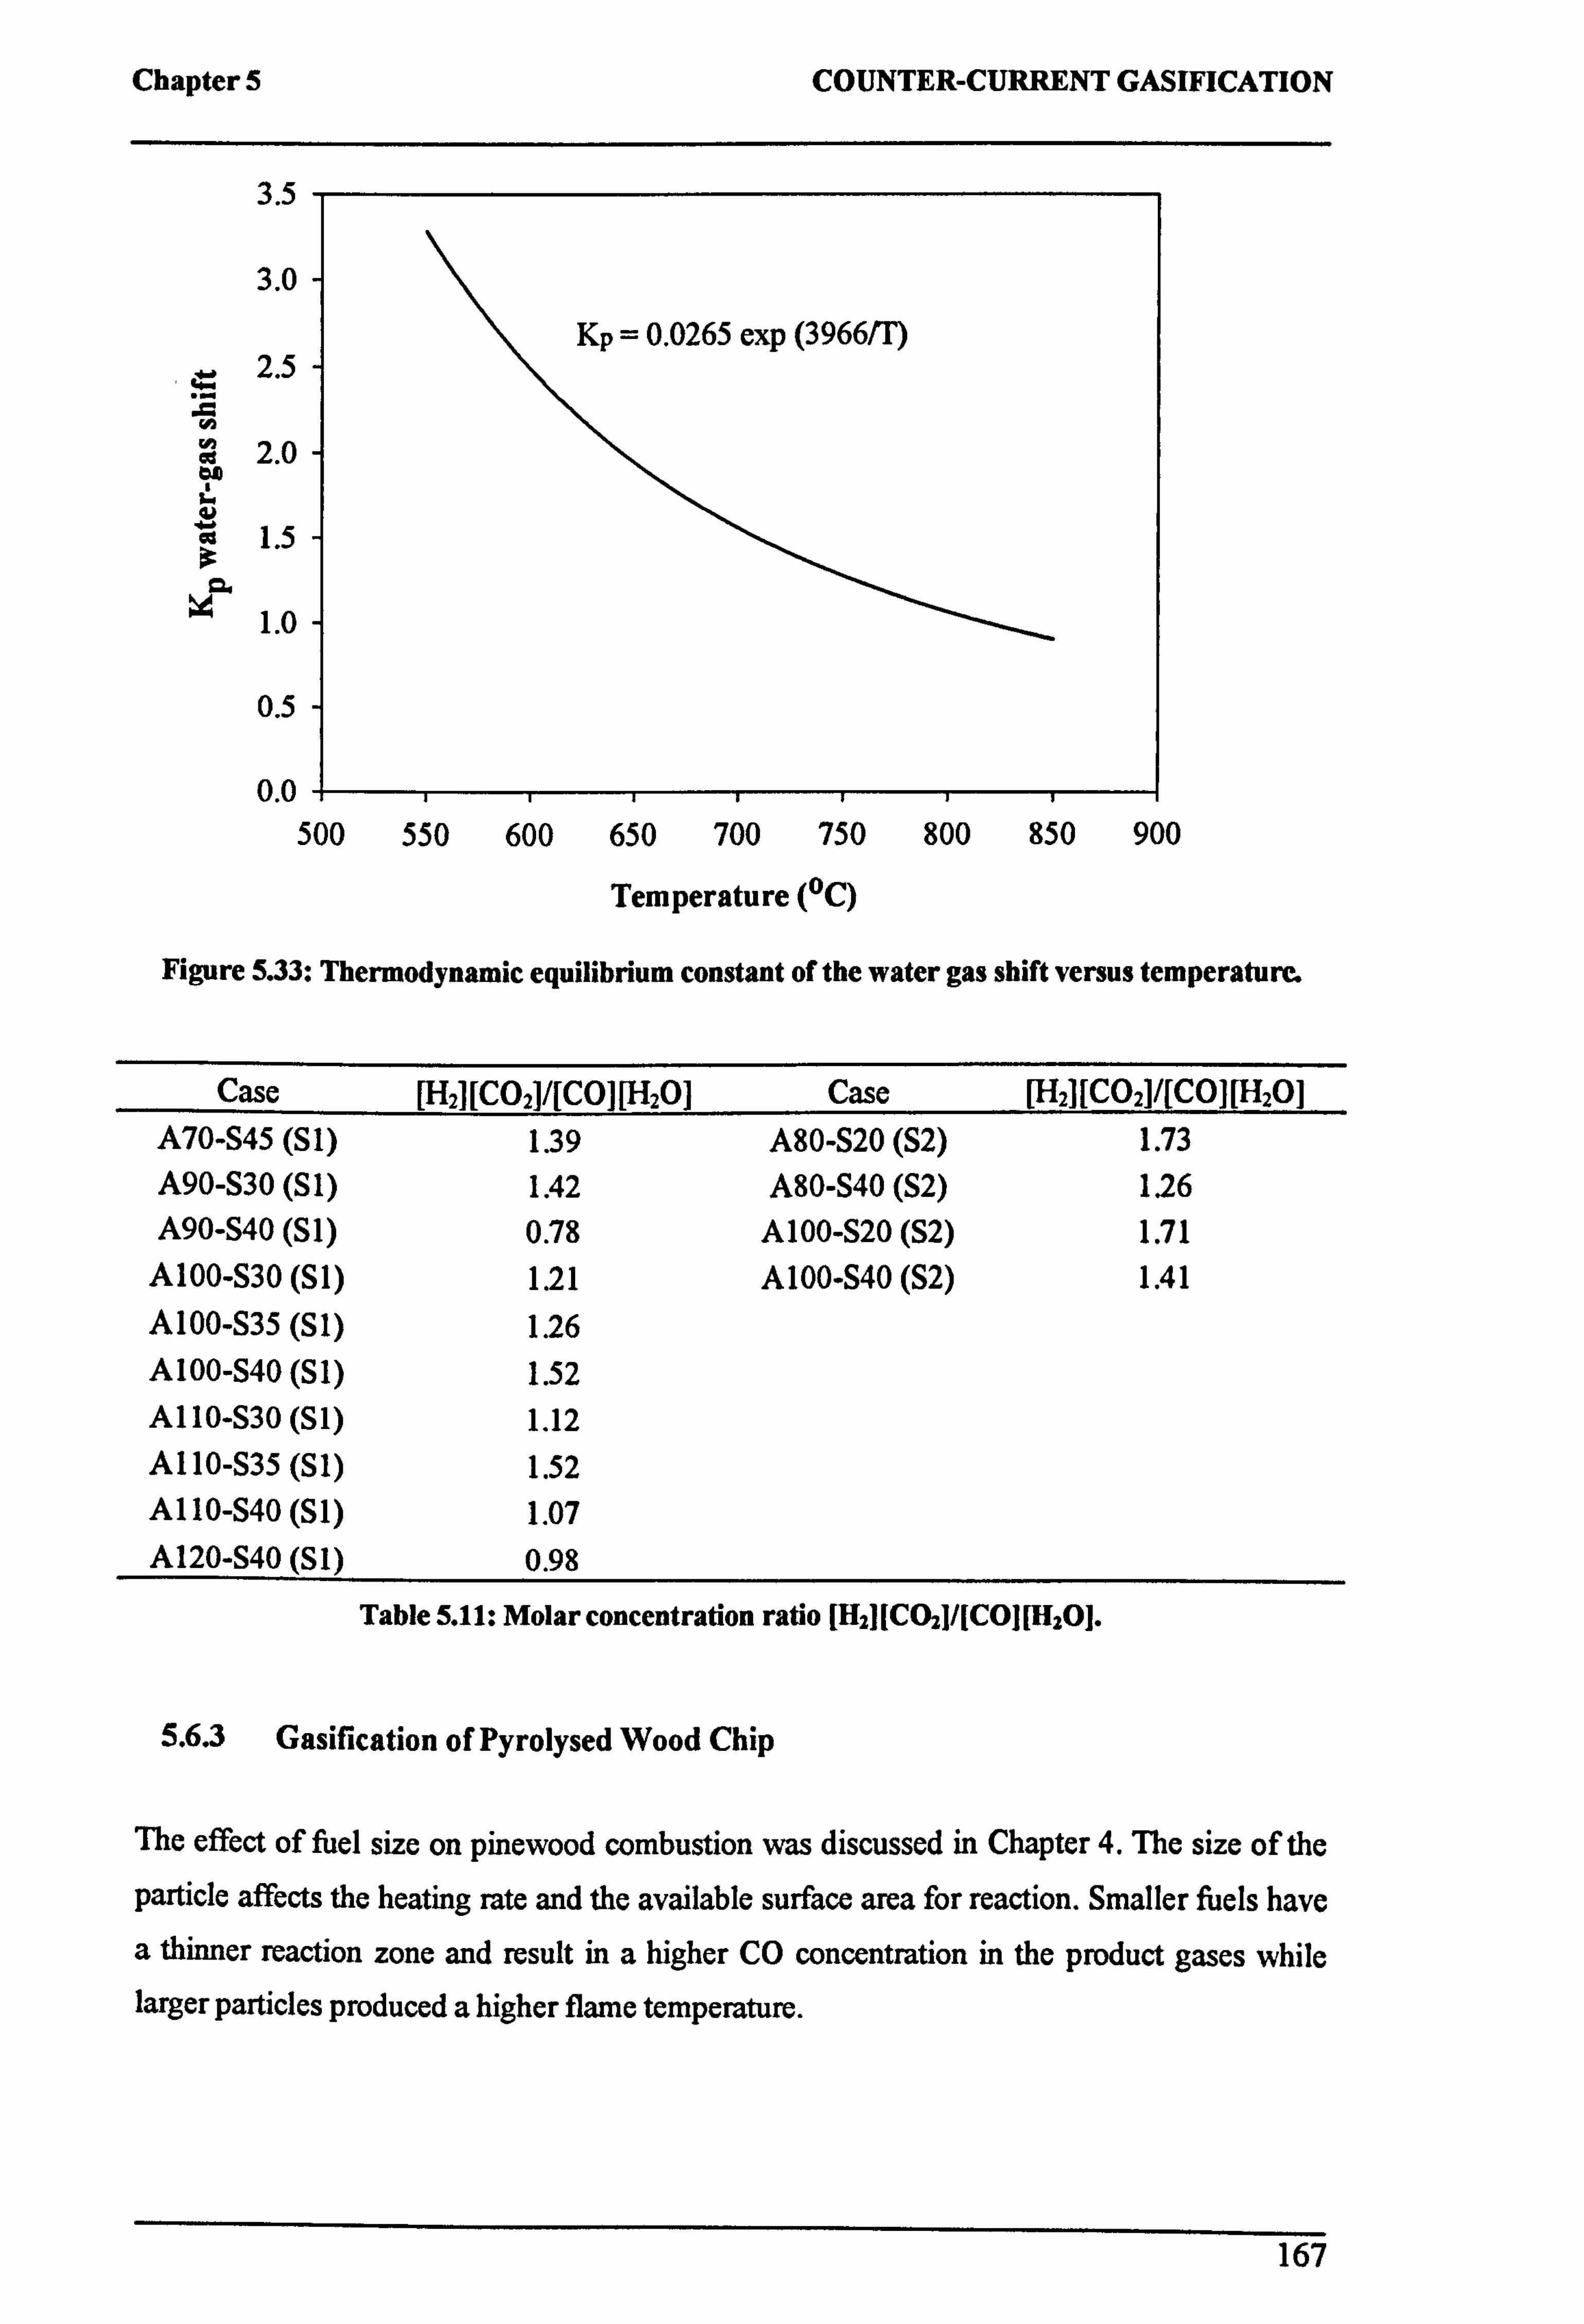
Chapter 5 COUNTER-CURRENT GASIFICATION
3.5
3.0
2.5
ä 2.0 ao
1.5
1.0
0.5
0.0 500 550 600 650 700 750 800 850 900
Temperature (°C)
Figure 5.33: Thermodynamic equilibrium constant of the water gas shift versus temperature.
Case [H2][CO2]/[CO][H201 Case [H2][CO2]/[CO][H201 A70-S45 (Si) 1.39 A80-S20 (S2) 1.73 A90-S30 (Si) 1.42 A80-S40 (S2) 1.26 A90-S40 (S 1) 0.78 A 100-S20 (S2) 1.71
A100-S30 (S1) 1.21 A100-S40 (S2) 1.41 A100-S35 (S1) 1.26 A 100-S40 (S 1) 1.52 A110-S30 (S1) 1.12 A110-S35 (S1) 1.52 A110-S40 (S1) 1.07 A120-S40 (Si) 0.98
Table 5.11: Molar concentration ratio [H21[CO21/[C01[H201.
5.6.3 Gasification of Pyrolysed Wood Chip
The effect of fuel size on pinewood combustion was discussed in Chapter 4. The size of the
particle affects the heating rate and the available surface area for reaction. Smaller fuels have
a thinner reaction zone and result in a higher CO concentration in the product gases while larger particles produced a higher flame temperature.
167
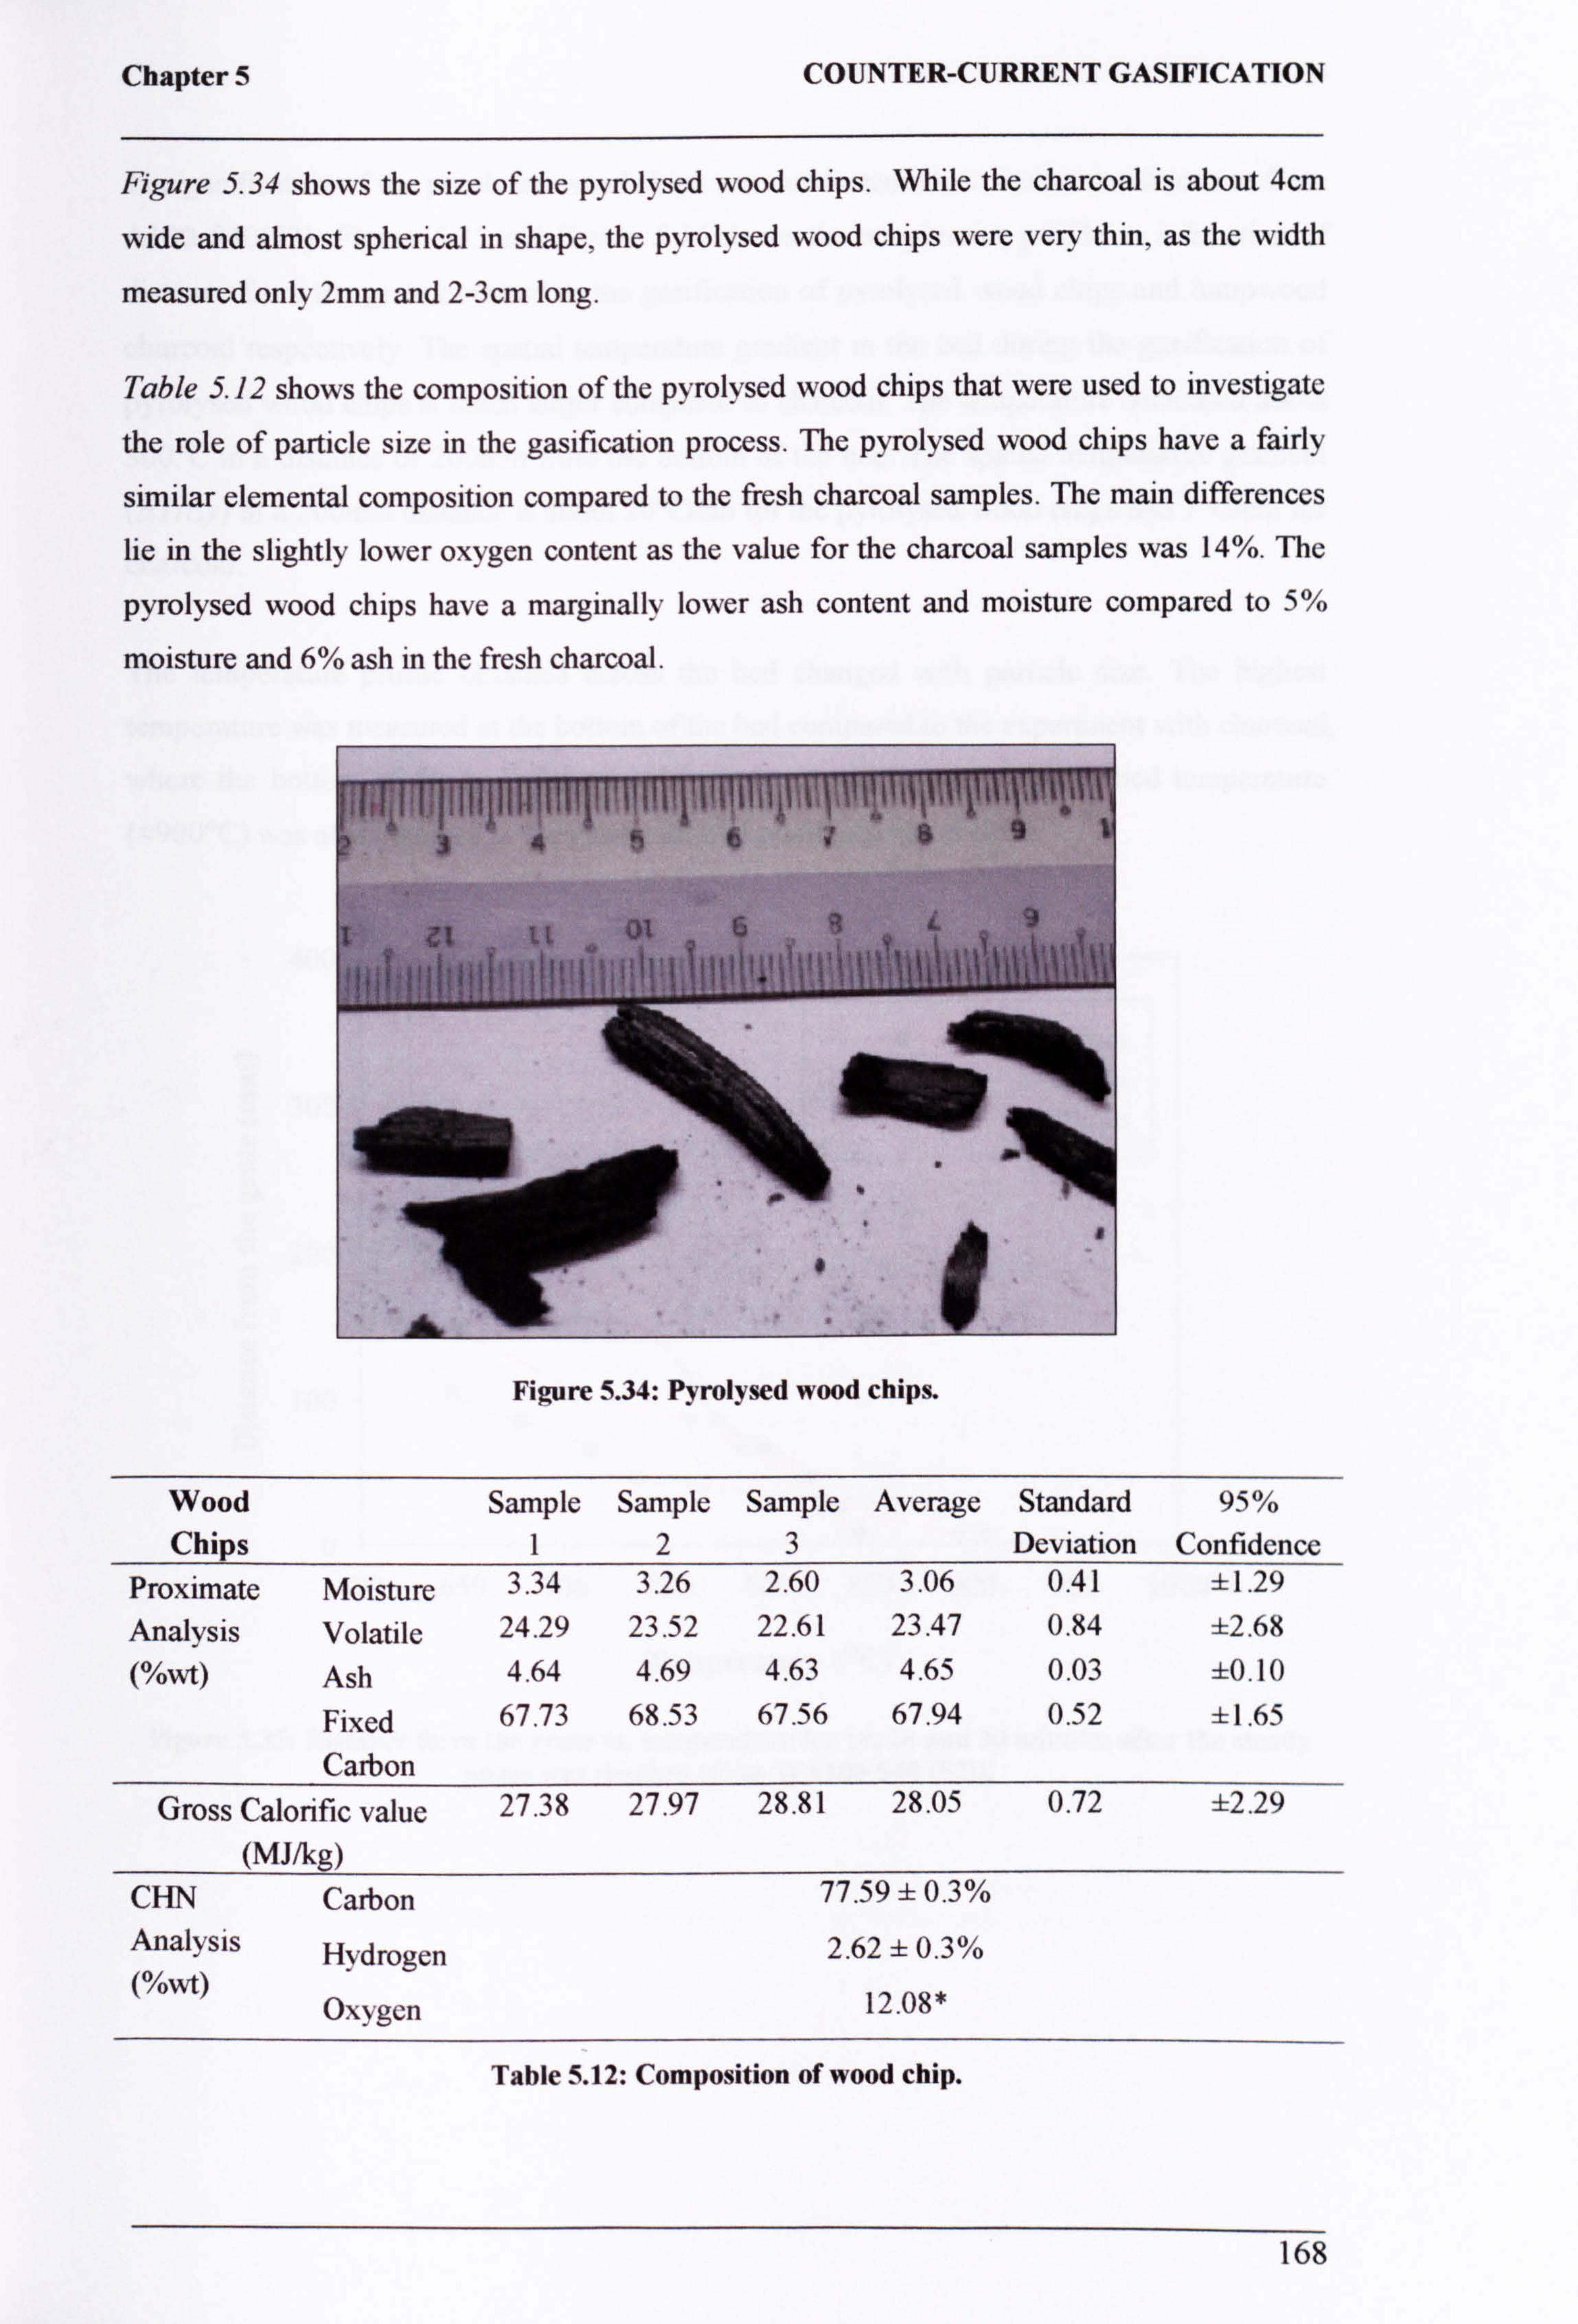
Chapter 5 COUNTER-CURRENT GASIFICATION
Figure 5.34 shows the size of the pyrolysed wood chips. While the charcoal is about 4cm
wide and almost spherical in shape, the pyrolysed wood chips were very thin, as the width
measured only 2mm and 2-3cm long.
Table 5.12 shows the composition of the pyrolysed wood chips that were used to investigate
the role of particle size in the gasification process. The pyrolysed wood chips have a fairly
similar elemental composition compared to the fresh charcoal samples. The main differences
lie in the slightly lower oxygen content as the value for the charcoal samples was 14%. The
pyrolysed wood chips have a marginally lower ash content and moisture compared to 5%
moisture and 6% ash in the fresh charcoal.
Figure 5.34: Pyrolysed wood chips.
Wood Sample Sample Sample Average Standard 95% Chips 1 2 3 Deviation Confidence
Proximate Moisture 3.34 3.26 2.60 3.06 0.41 ±1.29 Analysis Volatile 24.29 23.52 22.61 23.47 0.84 ±2.68 (%wt) Ash 4.64 4.69 4.63 4.65 0.03 ±0.10
Fixed 67.73 68.53 67.56 67.94 0.52 ±1.65
Carbon Gross Calorific value 27.38 27.97 28.81 28.05 0.72 ±2.29
(MJ/kg) CHN Carbon 77
. 59 f 0.3%
Analysis Hydrogen 2.62 f 0.3% (%wt)
Oxygen 12.08*
Table 5.12: Composition of wood chip.
168
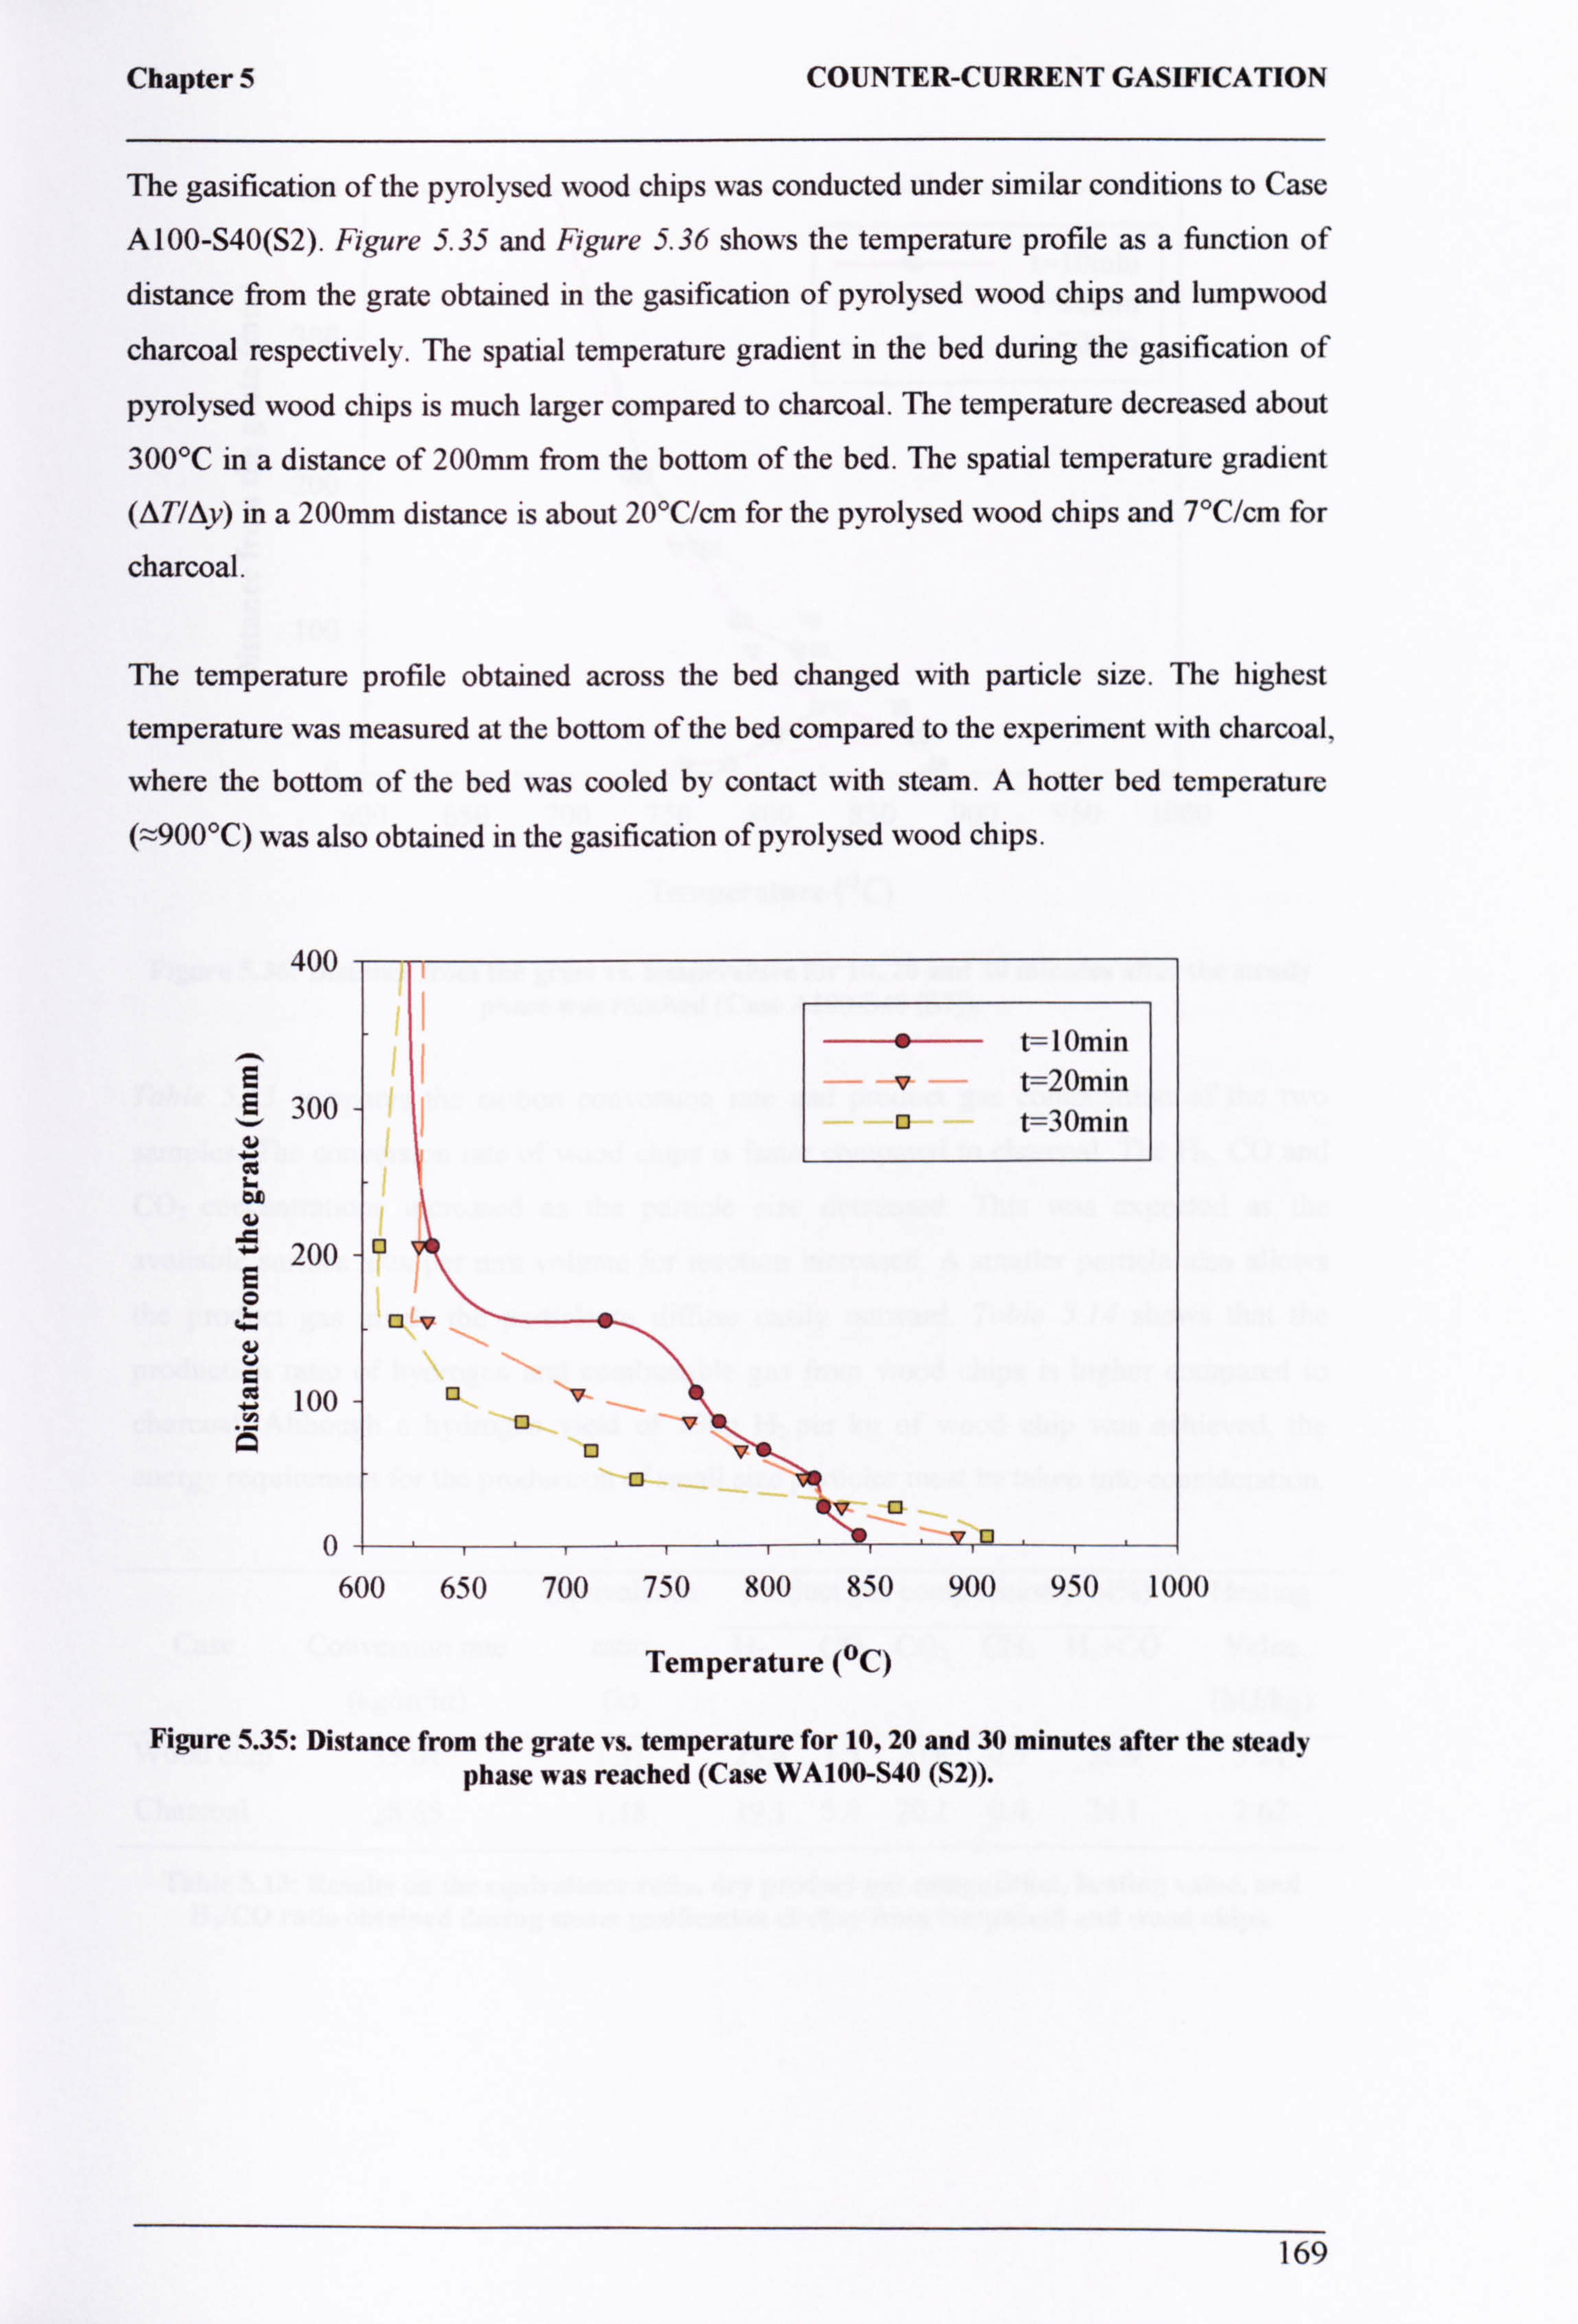
Chapter 5 COUNTER-CURRENT GASIFICATION
The gasification of the pyrolysed wood chips was conducted under similar conditions to Case
A100-S40(S2). Figure 5.35 and Figure 5.36 shows the temperature profile as a function of
distance from the grate obtained in the gasification of pyrolysed wood chips and lumpwood
charcoal respectively. The spatial temperature gradient in the bed during the gasification of
pyrolysed wood chips is much larger compared to charcoal. The temperature decreased about
NOT in a distance of 200mm from the bottom of the bed. The spatial temperature gradient
(OT/Ay) in a 200mm distance is about 20°C/cm for the pyrolysed wood chips and 7°C/cm for
charcoal.
The temperature profile obtained across the bed changed with particle size. The highest
temperature was measured at the bottom of the bed compared to the experiment with charcoal,
where the bottom of the bed was cooled by contact with steam. A hotter bed temperature
(2900°C) was also obtained in the gasification of pyrolysed wood chips.
400
300
ono
200 8
100 Ä
" t= I Omin
V t=20min Q t=30min
113 Qv ý---ý
Qv Q
13 Q
0 E3
0- 600 650 700 750 800 850 900 950 1000
Temperature (°C)
Figure 5.35: Distance from the grate vs. temperature for 10,20 and 30 minutes after the steady phase was reached (Case WA100-S40 (S2)).
169
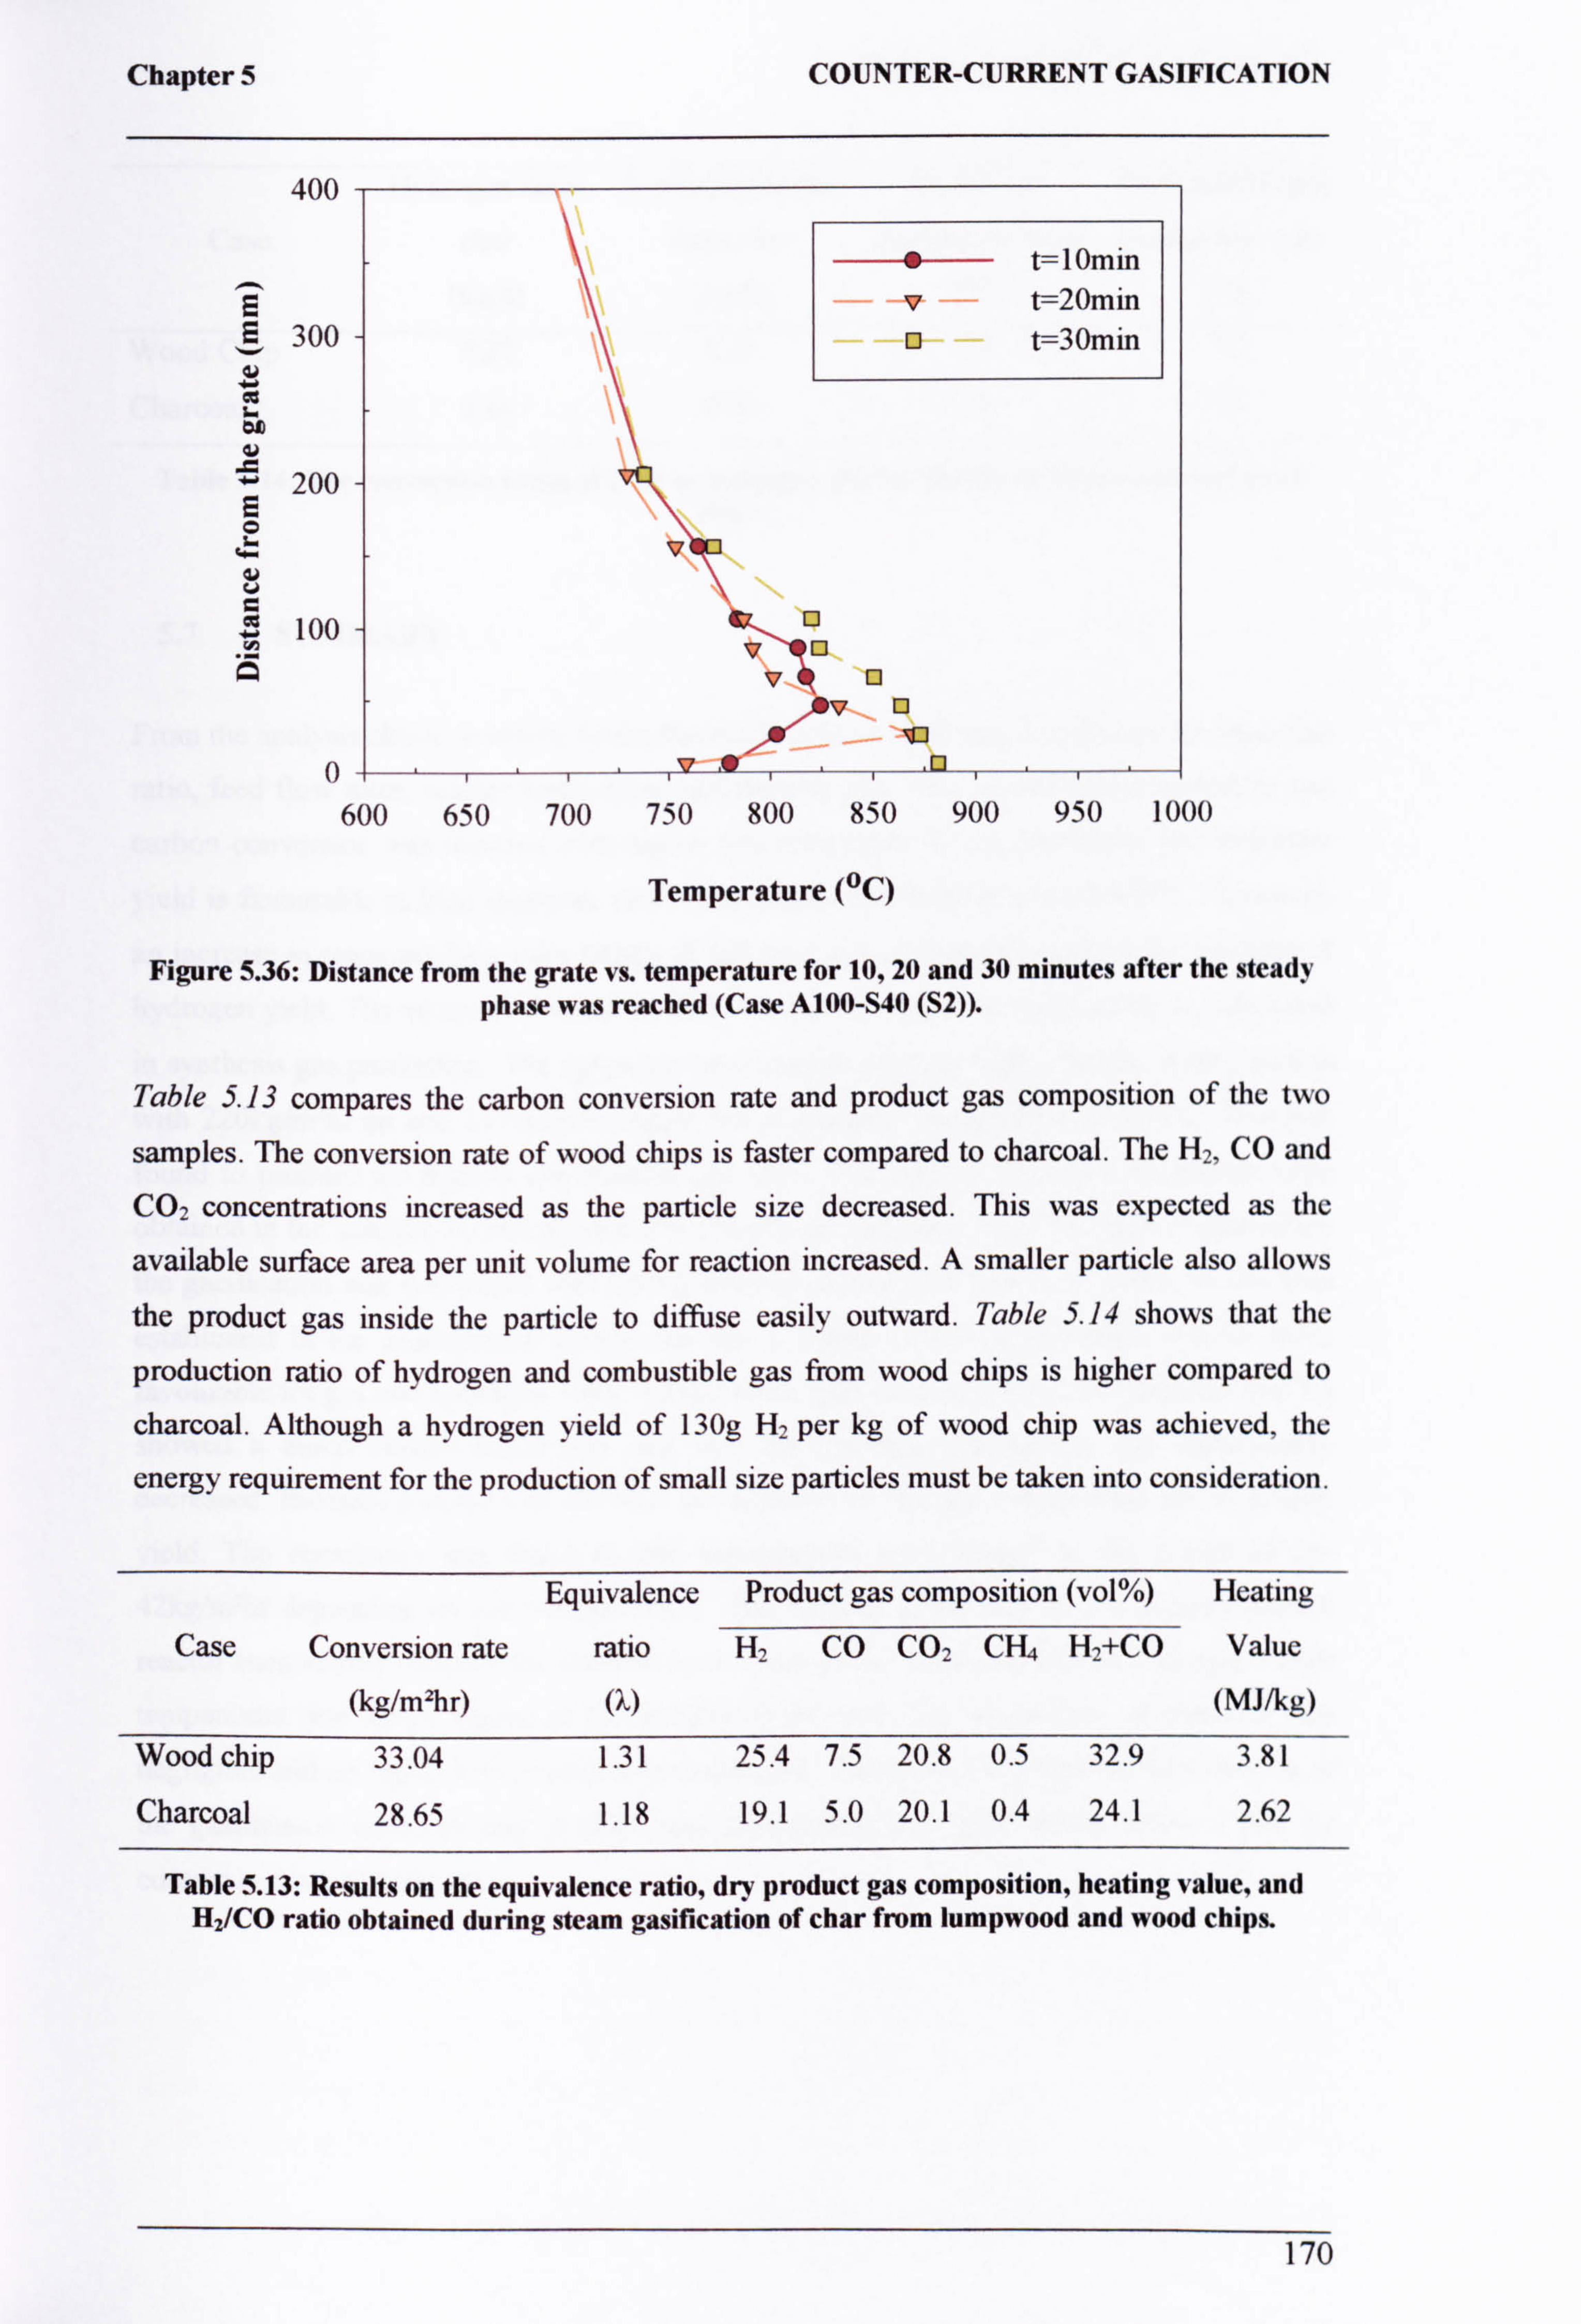
Chapter 5
400
E E 300
w L CD
200 8
100 y
A
COUNTER-CURRENT GASIFICATION
" t=l0min v t=20min Q t=30min
v..
vQ Q
, 0--*v Q 13
0- 600 650 700 750 800 850 900 950 1000
Temperature (°C)
Figure 5.36: Distance from the grate vs. temperature for 10,20 and 30 minutes after the steady phase was reached (Case A100-S40 (S2)).
Table 5.13 compares the carbon conversion rate and product gas composition of the two
samples. The conversion rate of wood chips is faster compared to charcoal. The H2, CO and
CO2 concentrations increased as the particle size decreased. This was expected as the
available surface area per unit volume for reaction increased. A smaller particle also allows
the product gas inside the particle to diffuse easily outward. Table 5.14 shows that the
production ratio of hydrogen and combustible gas from wood chips is higher compared to
charcoal. Although a hydrogen yield of 130g H2 per kg of wood chip was achieved, the
energy requirement for the production of small size particles must be taken into consideration.
Equivalence Product gas composition (vol%) Heating
Case Conversion rate ratio H, CO CO2 CH. H2+CO Value
(kg/m2hr) (? ) (MJ/kg)
Wood chip 33.04 1.31 25.4 7.5 20.8 0.5 32.9 3.81
Charcoal 28.65 1.18 19.1 5.0 20.1 0.4 24.1 2.62
Table 5.13: Results on the equivalence ratio, dry product gas composition, heating value, and H2/CO ratio obtained during steam gasification of char from lumpwood and wood chips.
170
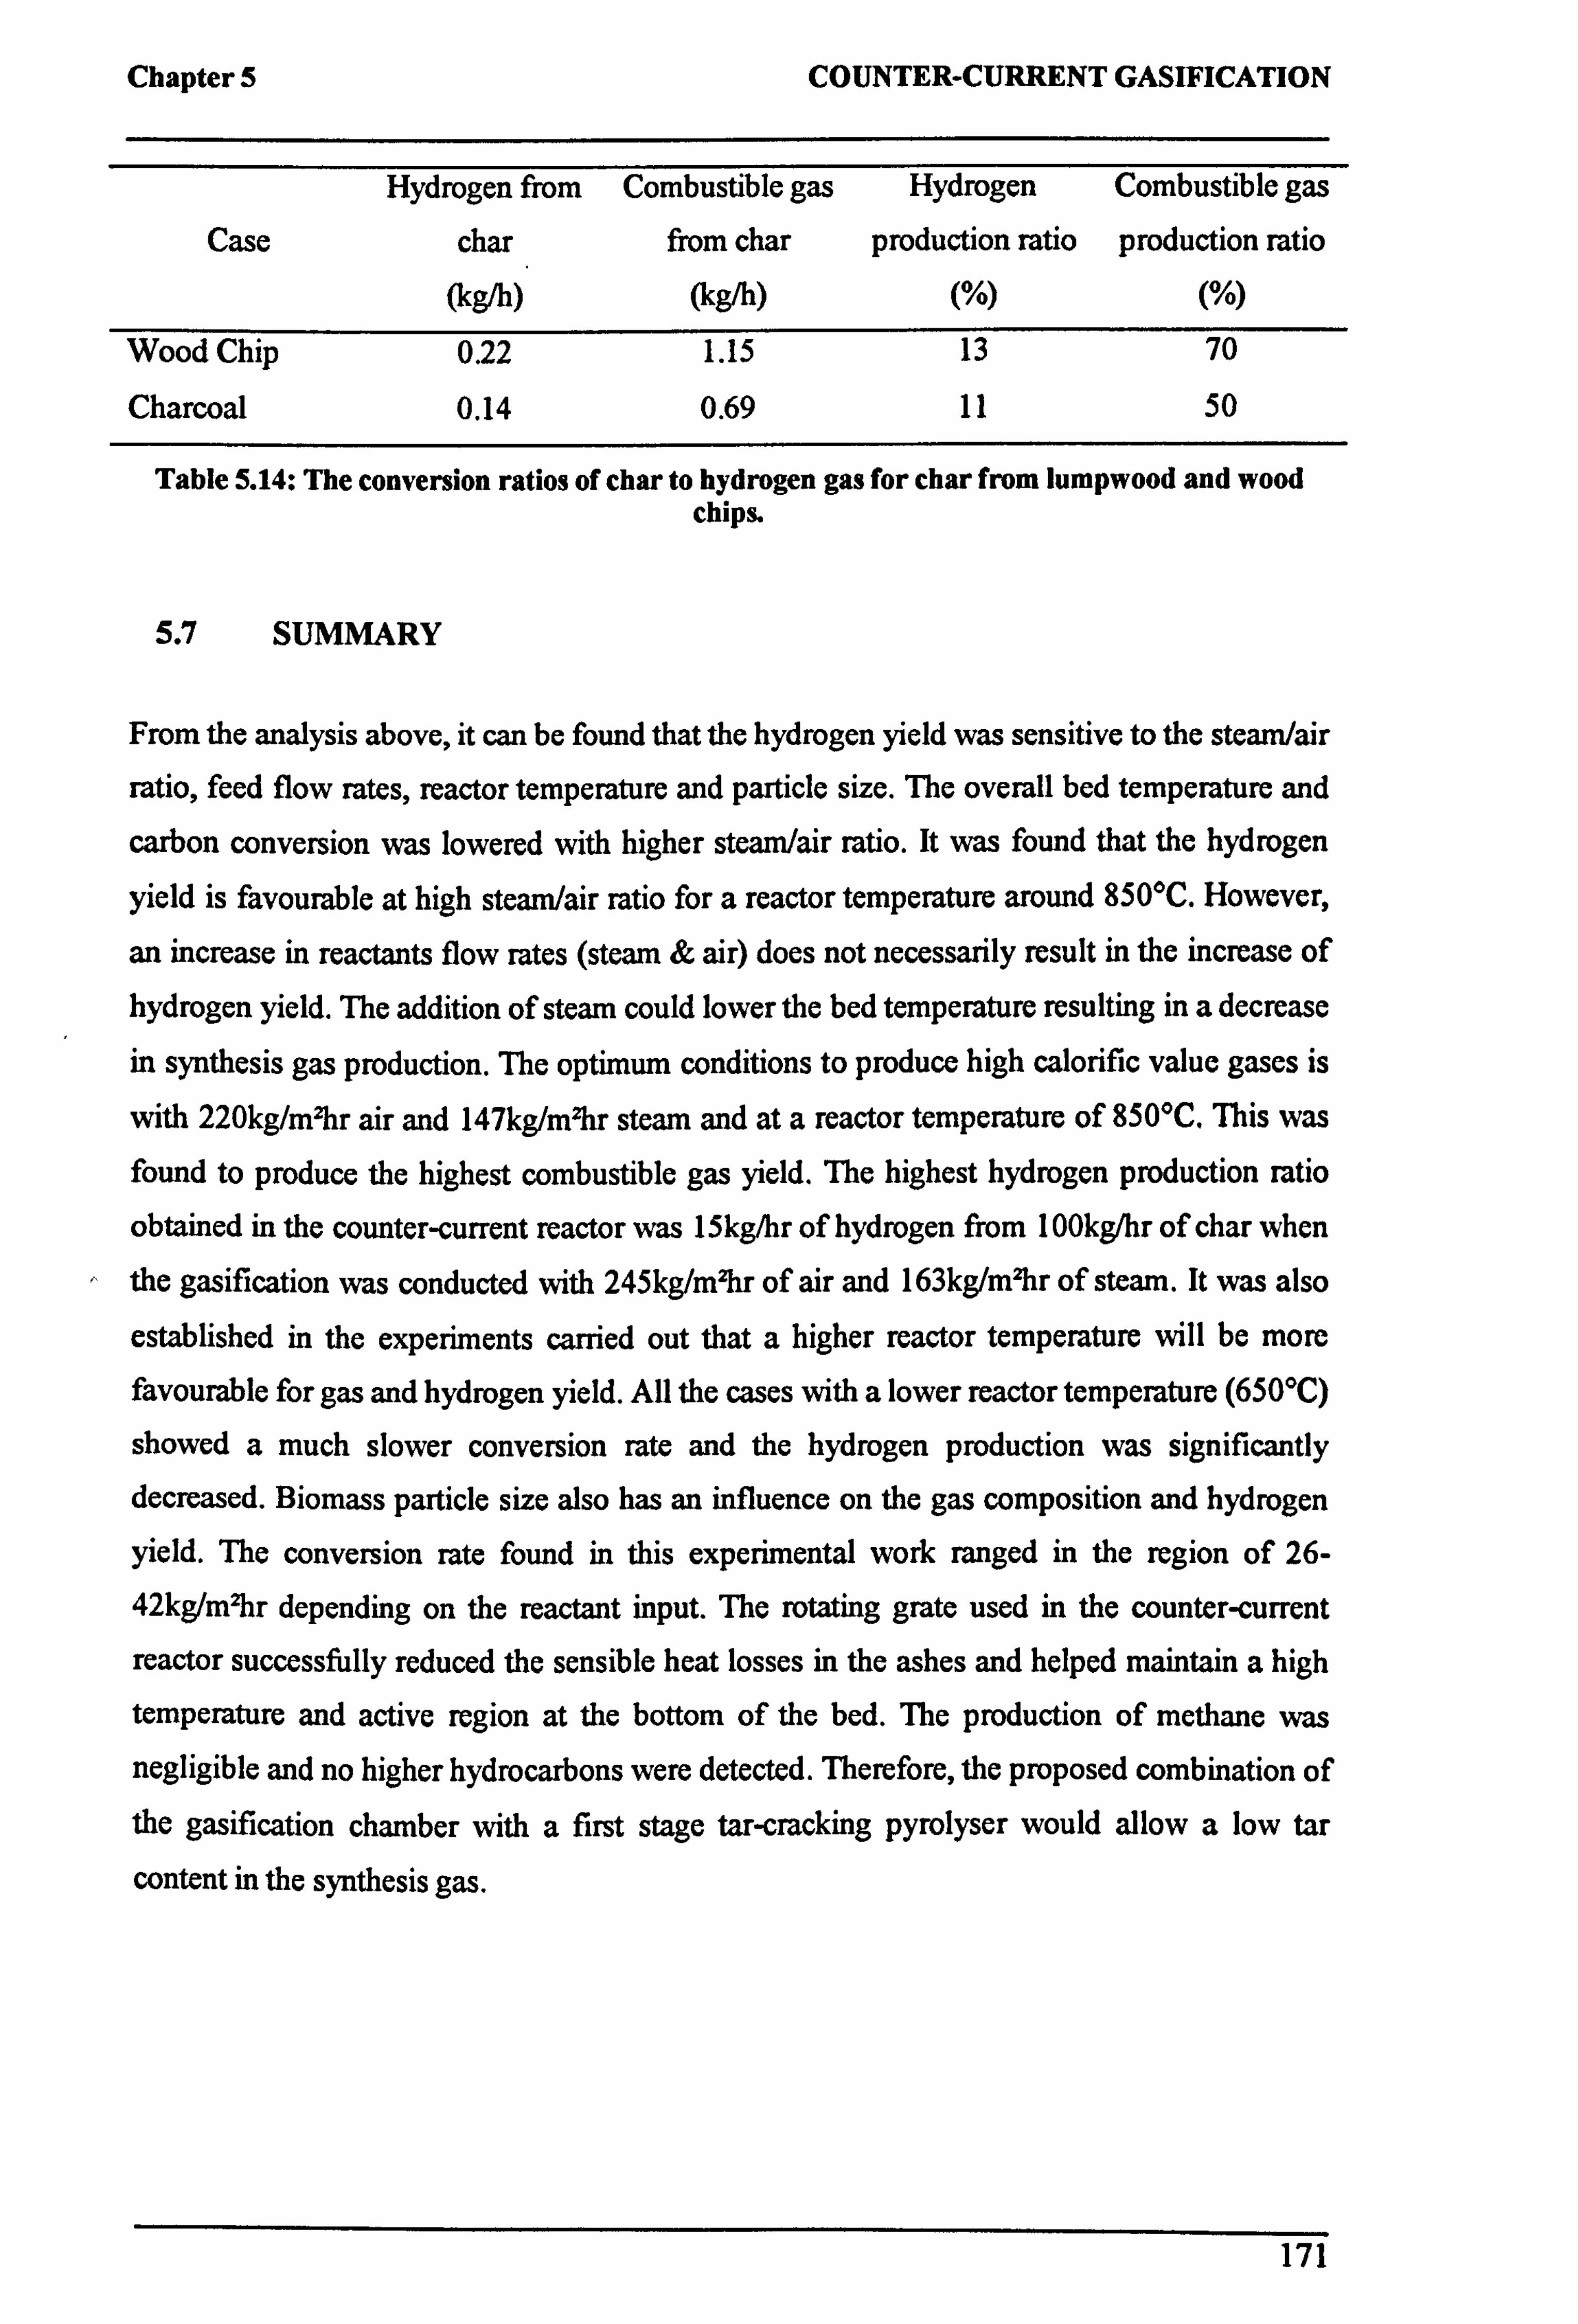
Chapter 5 COUNTER-CURRENT GASIFICATION
Hydrogen from Combustible gas Hydrogen Combustible gas Case char
(kg/h)
from char production ratio production ratio (kg"') (%) (°/U)
Wood Chip 0.22 1.15 13 70
Charcoal 0.14 0.69 11 50
Table 5.14: The conversion ratios of char to hydrogen gas for char from lumpwood and wood chips.
5.7 SUMMARY
From the analysis above, it can be found that the hydrogen yield was sensitive to the steam/air
ratio, feed flow rates, reactor temperature and particle size. The overall bed temperature and
carbon conversion was lowered with higher steam/air ratio. It was found that the hydrogen
yield is favourable at high steam/air ratio for a reactor temperature around 850°C. However,
an increase in reactants flow rates (steam & air) does not necessarily result in the increase of hydrogen yield. The addition of steam could lower the bed temperature resulting in a decrease
in synthesis gas production. The optimum conditions to produce high calorific value gases is
with 220kg/m2hr air and 147kg/m2hr steam and at a reactor temperature of 850°C, This was found to produce the highest combustible gas yield. The highest hydrogen production ratio
obtained in the counter-current reactor was 15kg/hr of hydrogen from 100kg/hr of char when the gasification was conducted with 245kg/m2hr of air and 163kg/m2hr of steam. It was also
established in the experiments carried out that a higher reactor temperature will be more favourable for gas and hydrogen yield. All the cases with a lower reactor temperature (650°C)
showed a much slower conversion rate and the hydrogen production was significantly decreased. Biomass particle size also has an influence on the gas composition and hydrogen
yield. The conversion rate found in this experimental work ranged in the region of 26-
42kg/mzhr depending on the reactant input. The rotating grate used in the counter-current
reactor successfully reduced the sensible heat losses in the ashes and helped maintain a high
temperature and active region at the bottom of the bed. The production of methane was negligible and no higher hydrocarbons were detected. Therefore, the proposed combination of the gasification chamber with a first stage tar-cracking pyrolyser would allow a low tar
content in the synthesis gas.
171
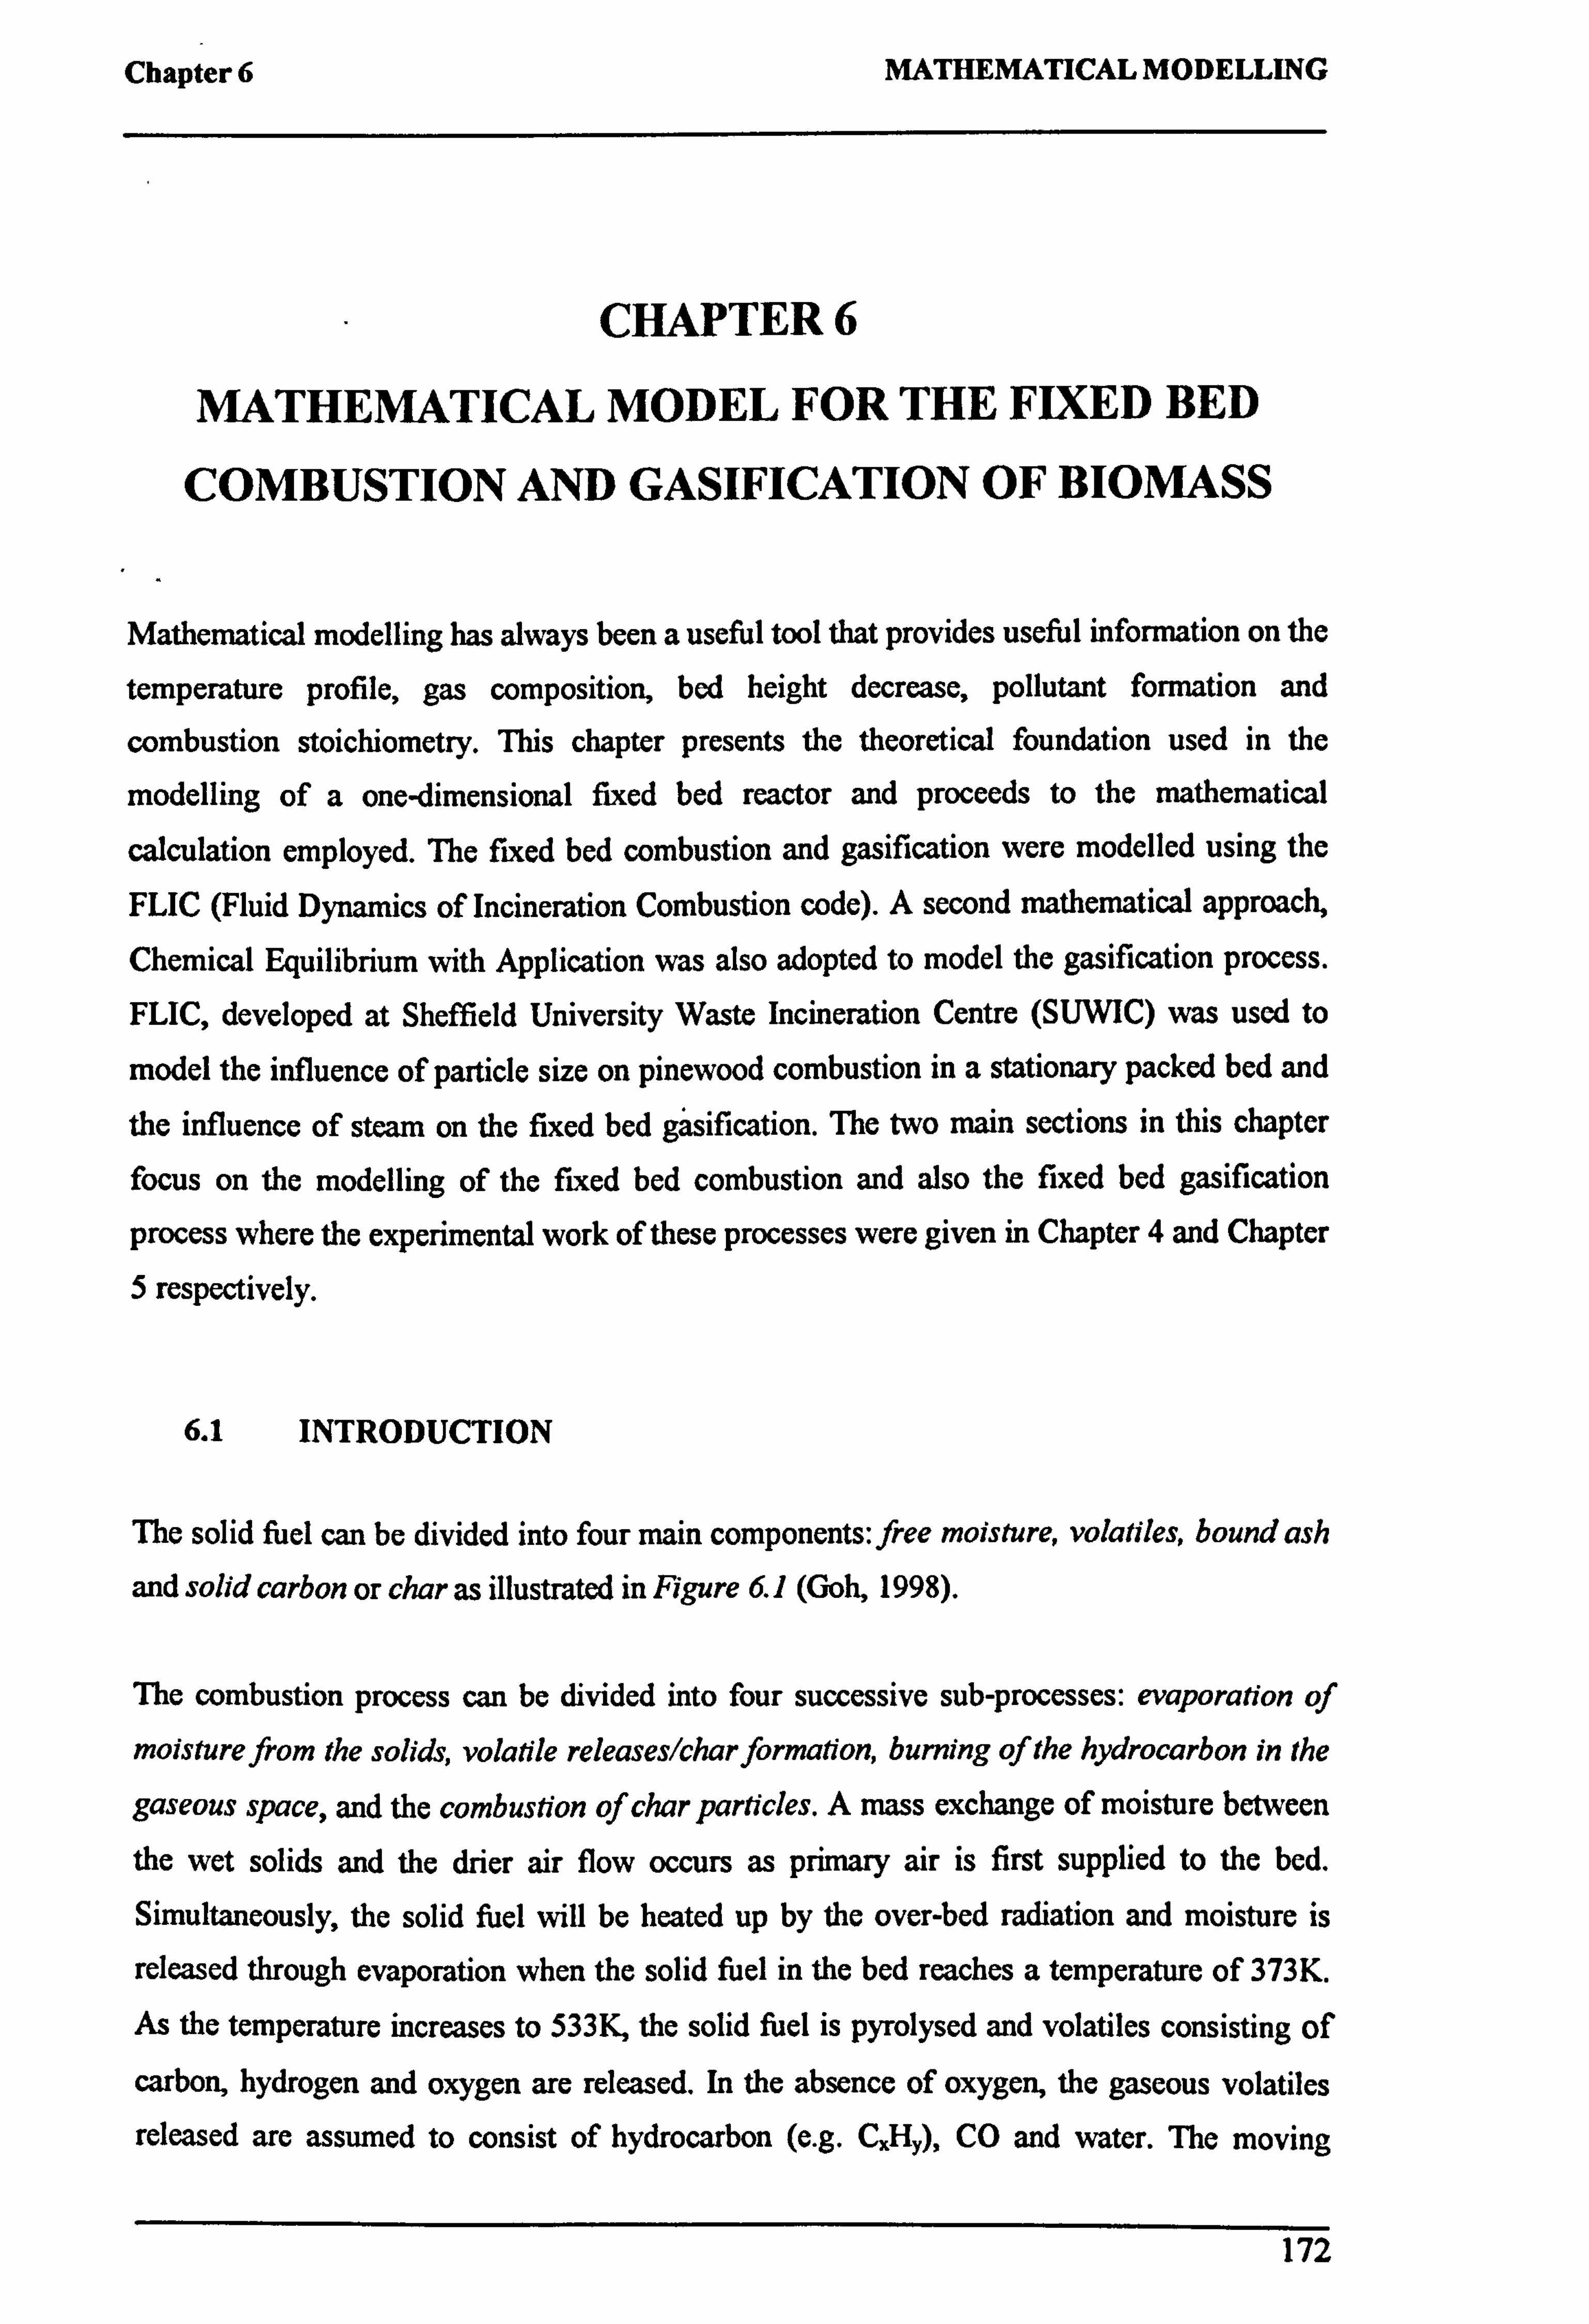
Chapter 6 MATHEMATICAL MODELLING
CHAPTER 6
MATHEMATICAL MODEL FOR THE FIXED BED
COMBUSTION AND GASIFICATION OF BIOMASS
Mathematical modelling has always been a useful tool that provides useful information on the
temperature profile, gas composition, bed height decrease, pollutant formation and
combustion stoichiometry. This chapter presents the theoretical foundation used in the
modelling of a one-dimensional fixed bed reactor and proceeds to the mathematical
calculation employed. The fixed bed combustion and gasification were modelled using the
FLIC (Fluid Dynamics of Incineration Combustion code). A second mathematical approach,
Chemical Equilibrium with Application was also adopted to model the gasification process.
FLIC, developed at Sheffield University Waste Incineration Centre (SUWIC) was used to
model the influence of particle size on pinewood combustion in a stationary packed bed and
the influence of steam on the fixed bed gasification. The two main sections in this chapter focus on the modelling of the fixed bed combustion and also the fixed bed gasification
process where the experimental work of these processes were given in Chapter 4 and Chapter
5 respectively.
6.1 INTRODUCTION
The solid fuel can be divided into four main components: free moisture, volatiles, bound ash
and solid carbon or char as illustrated in Figure 61 (Goh, 1998).
The combustion process can be divided into four successive sub-processes: evaporation of
moisture from the solids, volatile releases/char formation, burning of the hydrocarbon in the
gaseous space, and the combustion of char particles. A mass exchange of moisture between
the wet solids and the drier air flow occurs as primary air is first supplied to the bed.
Simultaneously, the solid fuel will be heated up by the over-bed radiation and moisture is
released through evaporation when the solid fuel in the bed reaches a temperature of 373K.
As the temperature increases to 533K, the solid fuel is pyrolysed and volatiles consisting of
carbon, hydrogen and oxygen are released. In the absence of oxygen, the gaseous volatiles
released are assumed to consist of hydrocarbon (e. g. CXHy), CO and water. The moving
172
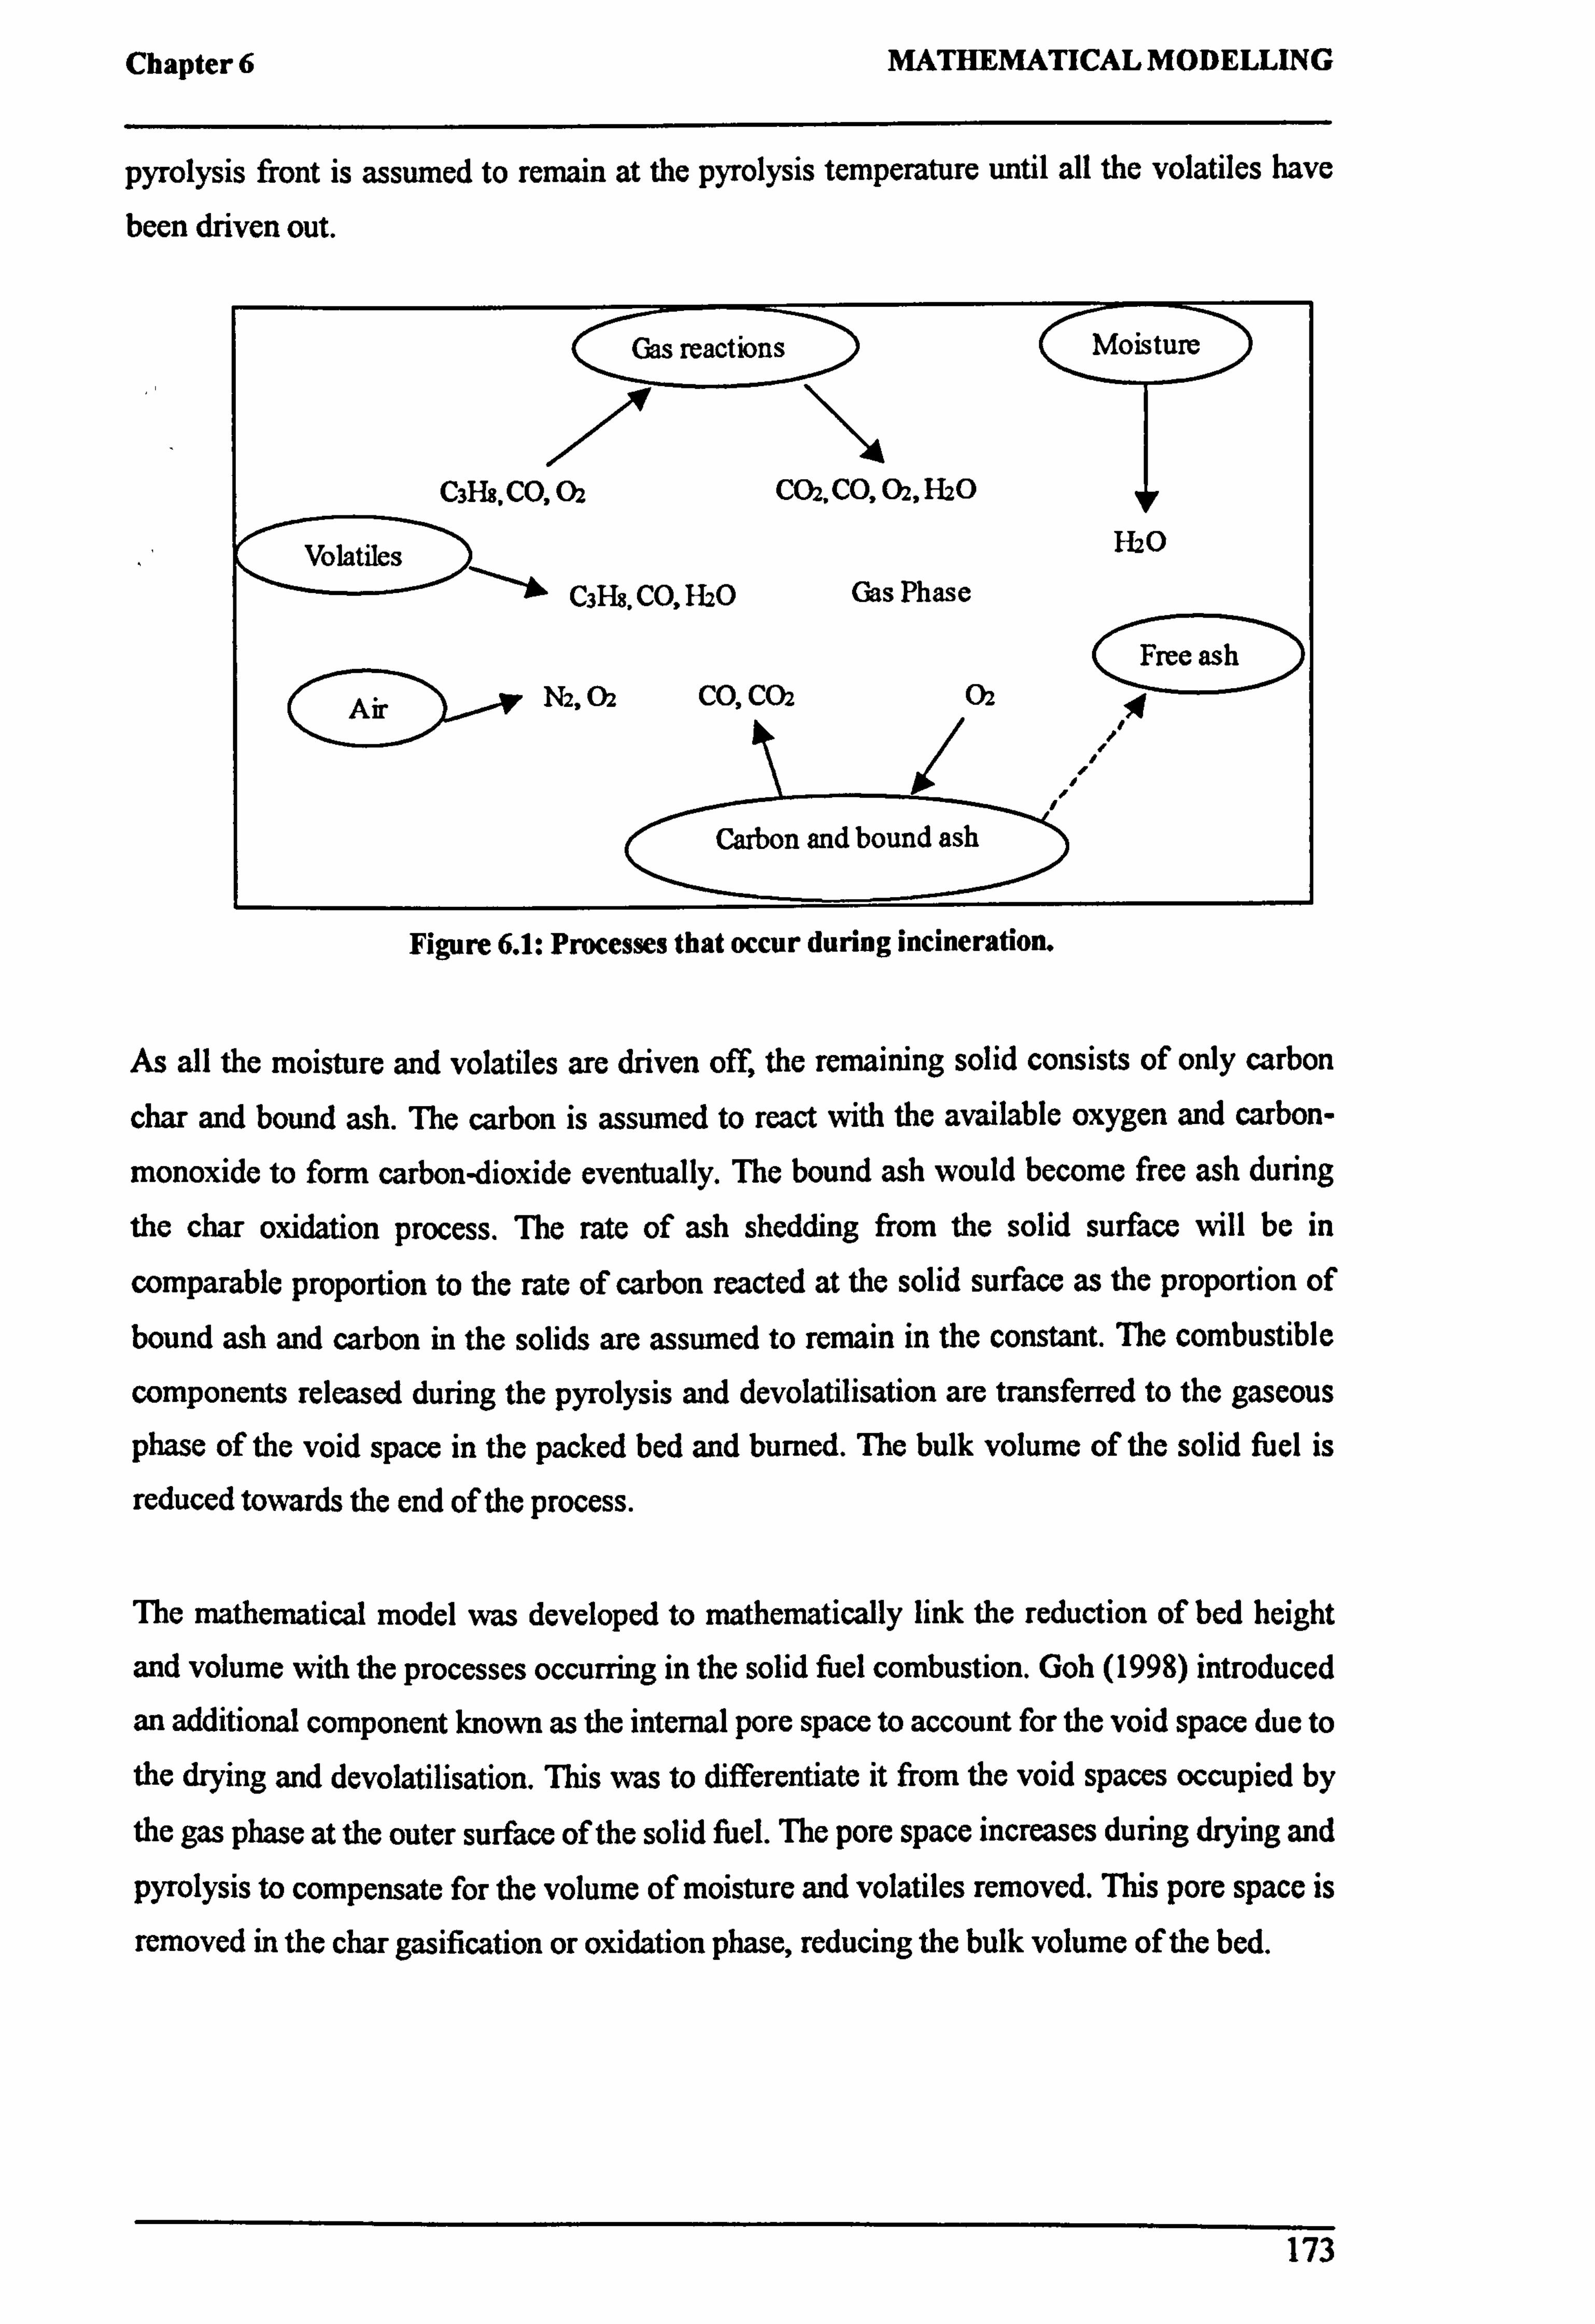
Chapter 6 MATHEMATICAL MODELLING
pyrolysis front is assumed to remain at the pyrolysis temperature until all the volatiles have
been driven out.
Gas Cl actions Moisture
a C3Hs, CO, 02 C02, CO, 02,1120
V112ý C3148, CO, H2O Gas Phase
Free ash N2,02 CO, C02 02
Carbon and bound ash
Figure 6.1: Processes that occur during incineration.
As all the moisture and volatiles are driven off, the remaining solid consists of only carbon
char and bound ash. The carbon is assumed to react with the available oxygen and carbon-
monoxide to form carbon-dioxide eventually. The bound ash would become free ash during
the char oxidation process. The rate of ash shedding from the solid surface will be in
comparable proportion to the rate of carbon reacted at the solid surface as the proportion of bound ash and carbon in the solids are assumed to remain in the constant. The combustible
components released during the pyrolysis and devolatilisation are transferred to the gaseous
phase of the void space in the packed bed and burned. The bulk volume of the solid fuel is
reduced towards the end of the process.
The mathematical model was developed to mathematically link the reduction of bed height
and volume with the processes occurring in the solid fuel combustion. Goh (1998) introduced
an additional component known as the internal pore space to account for the void space due to
the drying and devolatilisation. This was to differentiate it from the void spaces occupied by
the gas phase at the outer surface of the solid fuel. The pore space increases during drying and
pyrolysis to compensate for the volume of moisture and volatiles removed. This pore space is
removed in the char gasification or oxidation phase, reducing the bulk volume of the bed.
173

Chapter 6 MATHEMATICAL MODELLING
6.1.1 Mathematical Description of the Fixed Bed
The mathematical model was developed based on different zones for the initial state of the
fuel, dried and pyrolysed fuel and layer of ash free. The results of this mathematical model
could be use to provide the calculated boundary conditions for a CFD (Computational Fluid
Dynamic Code).
The packed bed consist of an assembly of individual particles where the combustion reactions
can be separated into the solid and gas phases. As the theoretical calculation of an entire
packed bed is challenging without some form of simplification, a few assumptions were
made:
" The temperature of gas and solid phases inside the bed, gas composition and solid
compositions can be described one dimensionally as functions of bed height.
" The temperature and concentration gradients of chemical species in the direction
across the cross sectional areas of the bed are negligible compared to those in the direction of
gas flow.
" The bed is treated as a porous medium where mass and heat transfer takes place between the solid and gas phases.
" The four successive sub-processes: evaporation of moisture from the solids, volatile
releasetchar formation, burning of the hydrocarbon volatiles in the gaseous space, and the
combustion of char particles occurs layer by layer from the bed top to the bottom.
Therefore, the whole bed is divided into many thin layers along the bed height (the thickness
of each layer much smaller than the particle size) and inside each layer, the major bed
parameters are assumed uniform.
Figure 6.2 shows the representation of the four succesive sub-processes taking place in four
subsequent layers of the bed. Layer B represents the fuel in its initial state, layer C consists of the dried materials, layer D is the dried and pyrolysed material and layer A is the layer of the free ash. The drying front lies between layer B and C, the pryolysis front between C and D
and the gasification front between D and A. The bed is heated from the top by radiation and
under-grate air supplied at the bottom. The processes occur layer by layer down the bed. If no reaction occurs within each layer, each process condition can be considered the boundary
condition for the layers immediately next to the process.
174
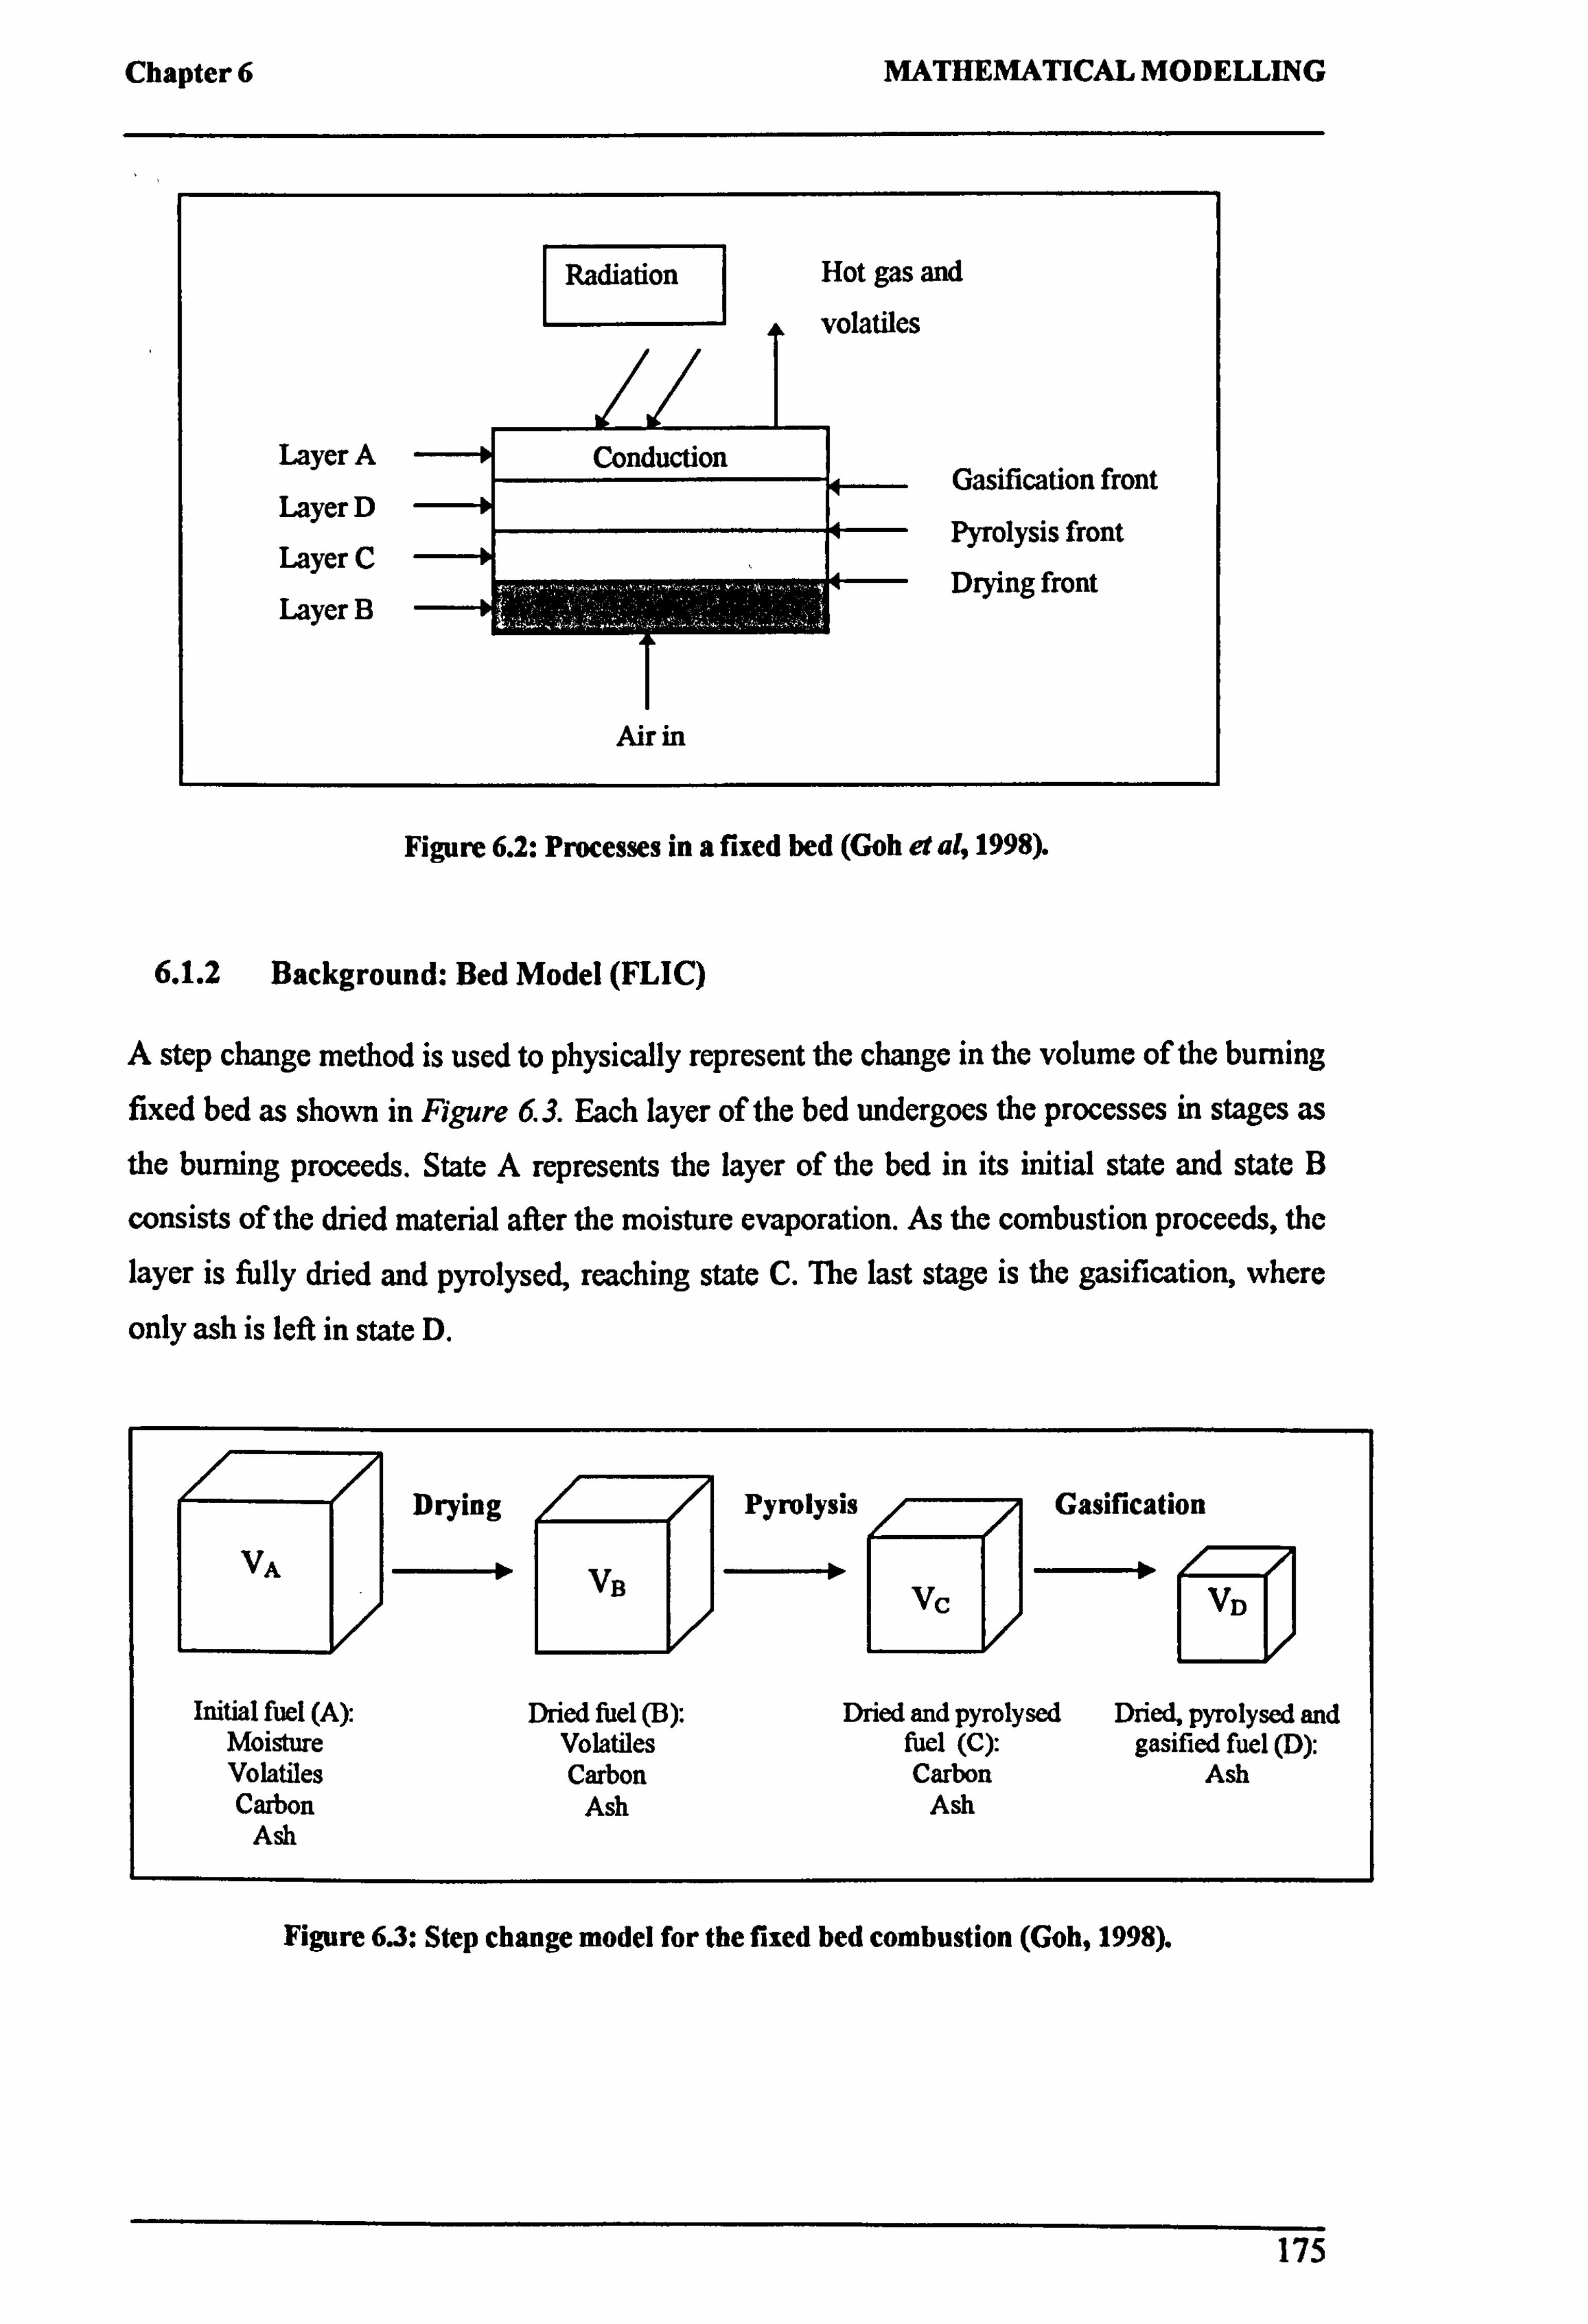
Chapter 6 MATHEMATICAL MODELLING
Radiation Hot gas and
volatiles
Layer A Conduction Gasification front
Layer D Pyrolysis front
Layer C 4- Drying front
Layer B- º
Air in
Figure 6.2: Processes in a fixed bed (Goh et a41998).
6.1.2 Background: Bed Model (FLIC)
A step change method is used to physically represent the change in the volume of the burning
fixed bed as shown in Figure 6.3. Each layer of the bed undergoes the processes in stages as
the burning proceeds. State A represents the layer of the bed in its initial state and state B
consists of the dried material after the moisture evaporation. As the combustion proceeds, the layer is fully dried and pyrolysed, reaching state C. The last stage is the gasification, where
only ash is left in state D.
Drying Pyrolysis Gasification
VA VB º -º Vc Vn
Initial fuel (A): Dried fuel (B): Dried and pyrolysed Dried, pyrolysed and Moisture Volatiles fuel (C): gasified fuel (D): Volatiles Carbon Carbon Ash Carbon Ash Ash
Ash
Figure 6.3: Step change model for the fixed bed combustion (Goh, 1998).
175
Chapter 6 MATHEMATICAL MODELLING
The initial volume of fuel A is given by:
= (1- CA)VA Equation 6.1
The volume of moisture in fuel A:
_ (l - c)VAWZA Equation 6.2
When the fuel A is fully dried, the remaining fuel has a volume of VB. For each unit volume
of moisture removed from VA, the interior pore space increased by F2. Therefore, the solid
volume would decrease by (1-F2)wzA. F2 would have a value between 0 and 1.
For the two extreme cases, where F2 equals to 0, there would be no increase of pore space during drying or in the other cases where F2 is equal to 1, the increase in pore space is equal to
the moisture removed. When the moisture in fuel A is fully evaporated, it would form the
dried fuel B which volume is given by:
Initial volume of fuel A- volume of moisture in fuel A+ volume of pores formed: (1-EA)VA
-(1-EA)VAW2A +(1-EA)VaF2WZA
_0-EA )V A
K'- F2 )W 2, A
J Equation 6.3
Therefore VA is related to VB by:
VB -(1-sa)[l -
(1- F2 )wZ Equation 6.4 VA (1-sB
Whereby, 6A and 6B represents the void fraction in the fuel in state A and B respectively and
wZA represents the volume fraction of moisture in fuel A. The volume fraction of moisture
(wZA ), volatile matter (w3, A ), carbon ( w4,, ß) and ash (W5, A) can be estimated from the
proximate and ultimate analysis. The volume fraction of the each individual component in the initial fuel can be calculated using the following equation:
Wn, A - PAX�
Pn 1- E, ý Equation 6.5
Whereby, n=2,3,4,5 for the moisture, volatile matter, fixed carbon and ash respectively.
pA is the bulk density of the solid fuel and X represents the mass fraction of each individual
176

Chapter 6 MATHEMATICAL MODELLING
component. The volume fraction of the volatile component in the initial fuel can be found by
difference as the sum of the volume fraction is equal to 1.
Table 6.1 shows the equation relating the volume fraction of each component in the fuel at
state B, C and D to the volume fraction in A.
Component FUEL A FUEL B FUEL C FUEL D W (VB) (VC (VD)
Gas VIA = BAVA V, B=EV
Vic = ECVC VID = EDVD Moisture V2A = W2A 1- CA A V2B =0 V2C =0 VvD =0 Volatile V3A= w3A 1- CAA (I V=0 V3D =0 Carbon V4A = W4A 1- CA )VA V4A = V4B = w4B (1- CB )VB V4B = V4C = w4C 1- CC C V4D =0
Ash V5A= w5A 1- -FA )VA V5A=V5B= W5B 1- 6BB V5B = V5C = W5C 1- CC TC V5C = V5D
=W5D(1-EDVD Internal V6A=0 V6B = W6B 1--OB1'"B V6C = W6C 1-CC C V6D =0
pore space V6B =V6A+F2w2A(1-eA)VA V6C =V6B+F3W3B(1-CB)VB
V6B = F2w2A(1-cA)VA V6C = F3w3B(I-EB B
Table 6.1: Volume fraction of components in the fuel.
The volume of fuel C is related to fuel B in the same way fuel B is related to A. For each
volatile matter removed from the dried fuel (B), the interior pore space is increased by F3 and the solid volume is decreased by (1- F3)w3, B. The relationship between VB and Vc is given by:
vc _
(1-eB) 1 [I-(1-F3)W3BJ
VB 1-Sý Equation 6.6
As the volume of volatile matter in fuel B is equal to fuel A, the volume fraction of both fuel
are related by the following equation: w3A(1-£A)VA
W3B = (_ Equation 6.7 1 £a a
Substituting Equation 6.7 into Equation 6.6 gives:
V )w3A(1 -CA
)VA Equation 6.8 c
(1_ýB) 1-(1F3
8( c) (1
- -a)s
From Equation 6.4, VA Va is substituted in Equation 6 8:
VC 1-[(1-f''2»A +(1-F3)3AJ
-ý- Equation 6.9 VB (1-ccý [1-(1-1 )w2A
177
Chapter 6 MATHEMATICAL MODELLING
Similarly, the volume fraction of ash in D is related to C:
VD =
(1- sc) 1wsc Equation 6.10 VC tl-cD) wsn
As wsD = 1, therefore:
VD -
(1-CA) (wsA ý Equation 6.11
VA (1-CD)
Multiplying Equations 6.9 and Equation 6.4, VI VA is given by the following equation:
VC Q-sA) (I-[(l-F2}VA +(l-F3)w3AD Equation 6.12
VA 1-se)
VD is then related to Vcusing Equation 6.11 and Equation 6.12:
V° EC) W5D Equation 6.13 VC (1-8°) 1- (1-F2)w, +(I-F3 3A
6.1.3 Mathematical Model for the Bed
The step change model in which the bed is divided into 4 layers (Section 6.1.2) is applied to
the entire fixed bed reactor by dividing the whole bed into many thin layers along the bed
height with the thickness of each layer much smaller than the size of a particle. Figure 6.4
shows the layer L of the bed under a regressing front.
A generalised equation used to represent the volume distribution of each component in the
thin layer, L:
£y +(1-£L)Z7 N_Z
WN L =1 Equation 6.14
Where IN_2WN L is the sum of the volume fractions of the solid components and internal
pore space in the solid volume within each layer, and has a value of unity. It should be noted
that if component N does not exist in the layer, WN becomes zero. For example, in layer B,
WZB is zero, and in layer C, wZc and w3, c are zero.
178

Chapter 6 MATHEMATICAL MODELLING
Moving process front
Volume of material L Layer
to be removed L+1
Volume of material AVL(-) in At, ----------------- L+1 formed AVL(+)
------------------ in Ar,
Layer L
Time t Time t+ At
Figure 6.4: Volume change of material due to process front movement.
If the process front above layer L moves a distance AYE in time At as shown in Figure 6.4,
the volume of layer L per unit surface area of bed is decreased by OVL(_). The volume of
solid and pores removed due to movement of the process front is given by: AVL(-Is =
(i - 6L
)VL(-) Equation 6.15
The volume of component N removed in the process can be expressed as: OVN,
s =WN, L1VL(-IS Equation 6.16
Over the same time step At, the volume of layer L+1 increases due to addition of material from layer L. The addition of volume due to movement of the process front can be given by
the volume of solids added plus the volume of internal pore space generated by the process: AVLi+ls - (1- WL, NI AVL(_). s + FN AVL(_
,N Equation 6.17
Where FN is the volume fraction of component N which leaves internal pore spaces as N is
being removed from the solid. FN has a value, which lies between 0 and 1 as previously
mentioned. Therefore, the total volume added due to movement of the process front becomes:
i =AVL(+Js Equation 6.18
1' ýL+i
The net reduction in bed volume due to movement of the process front is given by
AVL(-) - OVL(, ).
179
Chapter 6 MATHEMATICAL MODELLING
For fuel A, Equation 6.15 can be written as:
OVA(-IS - 1- sLEVd(-) Equation 6.19
The volume of moisture removed from fuel A is given by:
AV2, A(_) = W2 OVA(_)S Equation 6.20
The mass of moisture removed can be calculated from the rate and time of evaporation:
m24 _ (R)z At Equation 6 21
Therefore, the volume of moisture removed and the volume change of fuel A as drying took
place can be written as:
OV2. ak-) - (R)2 At
=W2ALVA(-), s Equation 6.22 2P
AVA(_IS = (R)2 At
Equation 6.23 P2W2A
Substituting Equation 619 into Equation 6 23 gives the volume change of fuel A as the
drying took place:
_ (R)2 At OVAý_ý
- P2W 2A
(1 - 6A ) Equation 6 24
Fuel B is then formed from each unit volume of A dried. The rate of change of fuel B is the difference between the rates of formation of B from fuel A during drying and the volume of B
removed during pyrolysis.
The rate of B formed is taken from Equation 6.4 as:
EVR(+)_evA (i-z)Wz, aý (i-ýB
Equation 6.25
Similarly, the volume of fuel B removed as the pryolysis takes place can be obtained by
rewriting Equation 6.24 ((R)3 is the rate volatilisation or pyrolysis).
(x)3 At Ps 3w3Bý B)
Equation 6 26
180
Chapter 6 MATHEMATICAL MODELLING
Therefore,
Rate change of volume B= Rate of formation of fuel B- Rate of removal of fuel B:
AVB =AVA (1-LA )[1-(1-Fz)ºvz,
4]- (R)3&
Equation 6.27 (1-eß) P3w3B 1-sit)
As fuel B is formed from each unit volume of fuel A removed, Equation 6.27 can be rewritten
using Equation 6 24:
OVB = (R)2 ýl
-(I - F2 )W2, A
]- (R)3 lýt Equation 6.28
P2W2A(1-CB) P3W3B(1-EB/
The rate of change of fuel C could be represented in the same way.
DYo = (R)3 Ei
- (1- F3 )w3,
B] - (R)4
At Equation 6.29 P3w38(l-sc) AW4C(l-sc)
The volume of fuel D formed during gasification is given by Equation 6.10:
AVDý+ý -AV e (1- sc) w5c (1-
ED) ;
5D
Equation 6.30
As there is no reaction in the ash (fuel D), the volume reduction of fuel D is zero. Therefore,
the rate of change of volume D would be equal to the rate of formation of fuel D from the
gasification of fuel C. Thus,
AVD = (R)4 wsc At Equation 6.31
P4W 4c 1- En 5D
As WSD = 1, Equation 6.33 can be rewritten as:
KYD = (R)4
(i 5 1t Equation 6.32 p4 4C lD/
181
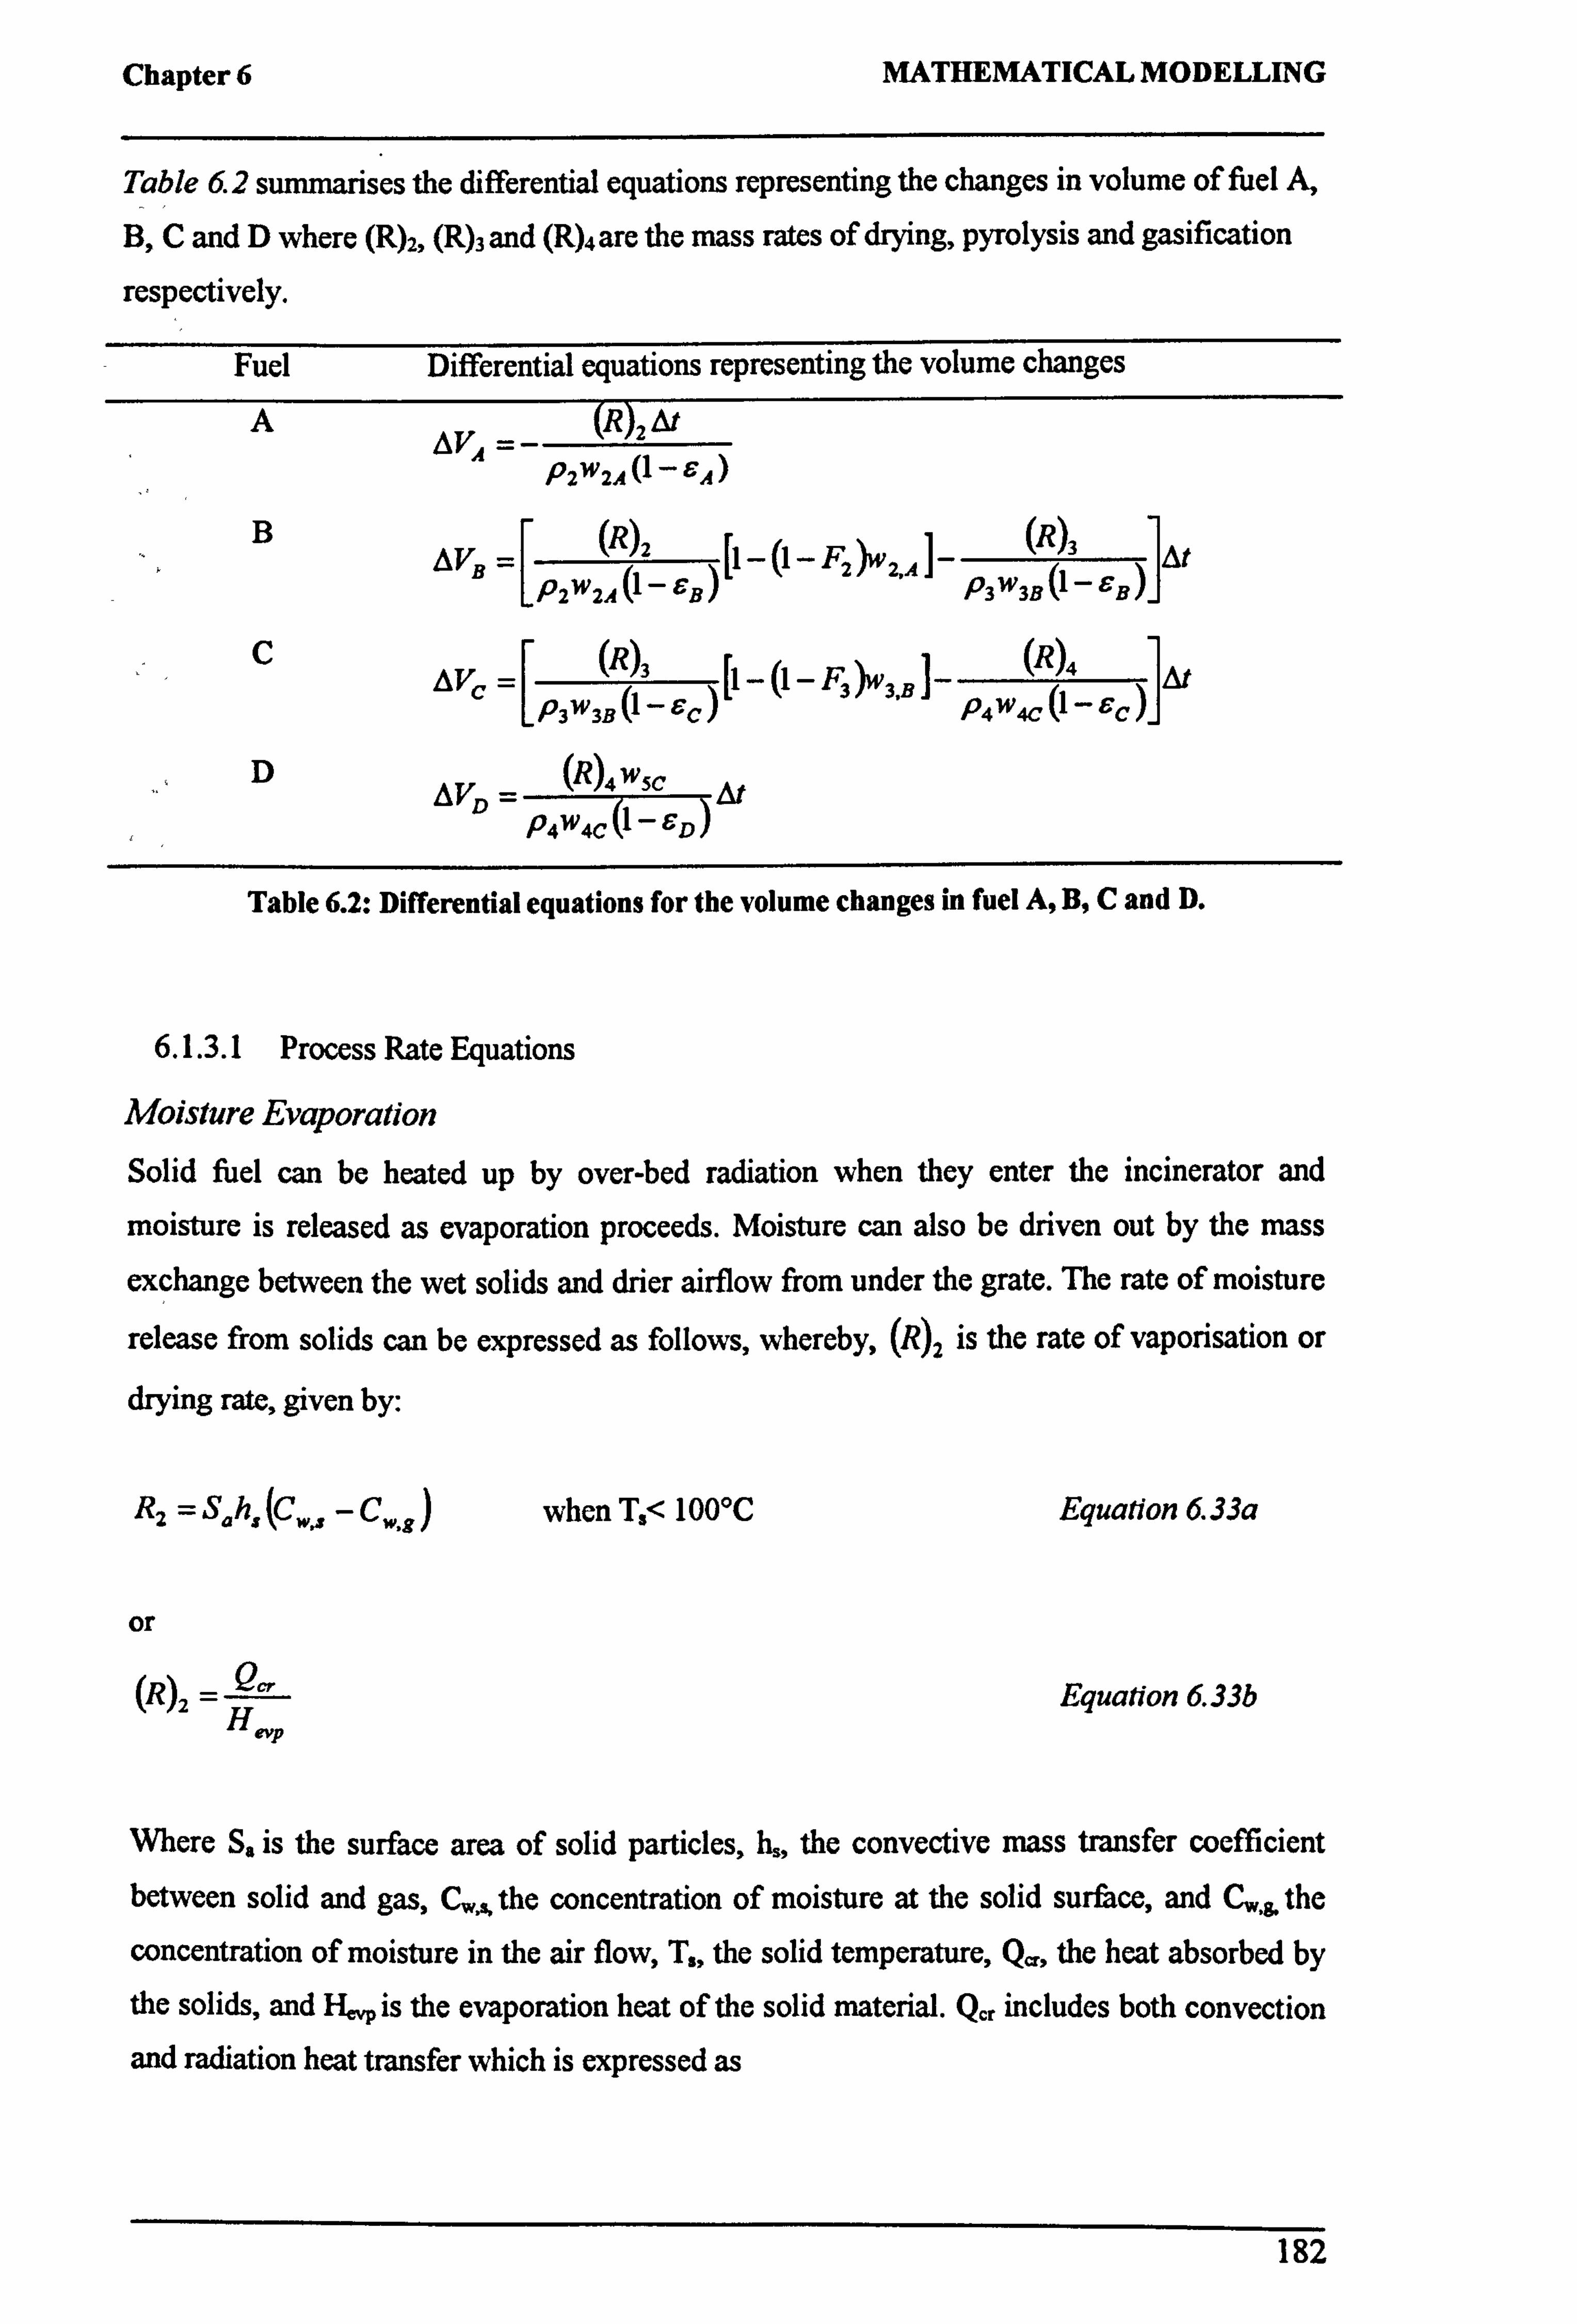
Chapter 6 MATHEMATICAL MODELLING
Table 6.2 summarises the differential equations representing the changes in volume of fuel A,
B, C and D where (R)2, (R)3 and (R)4 are the mass rates of drying, pyrolysis and gasification
respectively.
Fuel Differential equations representing the volume changes
A QVA _
(R)2 At P2W 2A (1- sA )
B AVB =
(R)2 ýl - (1- F2'2. A
I (R( 31 At
P2w2Al1-£B) P3w3Bl1-£B/
Cl OVC =
(R)3 [- (1- F3 )3,
B J
(R)4
l At Lp3w3Bý-6C) P4w4 C11-£C/
D AVD
(R)4 wsc At P4W4C 1-£D
Table 6.2: Differential equations for the volume changes in fuel A, B, C and D.
6.1.3.1 Process Rate Equations
Moisture Evaporation
Solid fuel can be heated up by over-bed radiation when they enter the incinerator and
moisture is released as evaporation proceeds. Moisture can also be driven out by the mass
exchange between the wet solids and drier airflow from under the grate. The rate of moisture
release from solids can be expressed as follows, whereby, (R)2 is the rate of vaporisation or
drying rate, given by:
R2 = Sah,: (Cw, - Cw.
8 when T, < 100°C Equation 6.33a
or
(R)2 =Hp Equation 6.33b
Where S, is the surface area of solid particles, h,, the convective mass transfer coefficient between solid and gas, Cw 3, the concentration of moisture at the solid surface, and C,,,. the
concentration of moisture in the air flow, T,, the solid temperature, QT, the heat absorbed by
the solids, and His the evaporation heat of the solid material. Qcr includes both convection
and radiation heat transfer which is expressed as
182

Chapter 6
Qmm, =sp(hs(Tg -T, )+ESQb(r
-T4))
MATHEMATICAL MODELLING
Equation 6 34
where h, represents the convective heat transfer coefficient between solid and gas, T8, the
gas temperature, e3 , the system emissivity, ab , the Boltmann radiation constant, and TQ/N is
the environmental temperature (Yang, 2003). The Nusselt number for heat transfer and Sherwood number for mass transfer between the solid and gas phases are calculated as
Nu =2+1.1 Pr'/3 Re 0-6 and Sh=2+1.1Sc'13Re0.6 (Wakao, 1982).
Solid Devolatilisation
As the devolatilisation of solid fuel yields a wide range of different gaseous fuels, the one- step global model was applied due to its simplicity. The gases are taken to compose mainly of hydrocarbon (CmH�). CO, H2, C02,02 (Smoot, 1979).
Waste -+ Volatile(CmH,,, CO, H2, COZ, O2, etc. )+char
The releasing rate of volatile gases from the solid is proportional to the remaining volatiles in
the solid and the temperature
R3 = k,, v. -v) '
Where
k,; = A,, exp(- E,, / RT,
Equation 6.35a
Equation 6.35b
For simplification, the volatile hydrocarbons are assumed to consist of a single product, C OQ, which is oxidised to produce CO and H2:
CmH�Ol +(m/2-1/202 --+mCO+YH2
CO is then burned by further oxidation to form CO2
CO +1 O2 -3 CO2
and H2to form H2O
H2 +2 O2 -> H2O
Equation 6 36
Equation 6.37
Equation 6.38
183

Chapter 6 MATHEMATICAL MODELLING
The temperature-dependent burning rates or kinetic rates, Rc. Hpo, is assumed to be the same
as proposed by Siminski (1972) for CmHn.
Rc11H. O, = 59.8TgP0"3 exp( 12,200 /Tg ). 11
p1 co, Equation 6.39
The kinetic rate for CO, Rco and H2, R., is as given by Howard (1973) and Haubnan (1981)
respectively.
Rco =1.3x10" exp( 62,700/Tgýoo CHs Co= Equation 6.40
g. Co x= CO, 2 CO, C-cý, xo.
se�o, Equation 6 41 Rtr2 = 3.9x10¹⁷ exP(- 20,5001T
The original Cc=, 1 was replaced with Cc�x o, as an approximation. C0, Cx, o , Co, . CC. H. o, represent the species concentrations, and P the pressure (taken as atmospheric for the
packed-bed combustion).
Mixing
The volatile products release from the particle surface during the devolatilisation process has
to first mix with the surrounding air before combustion could occur. Gas combustion takes
place in voids spaces that resemble long inter-connected channels with widths comparable to
particle diameters in the bed. The burning of volatiles hydrocarbon gases is limited by both
the reaction kinetics (temperature dependent) and the mixing-rate of the gaseous fuel with
primary air. The mixing rate inside the bed is assumed proportional to energy loss (pressure
drop) through the bed and by recalling Ergun equations (Hunt, 1988; Vafai, 1990) can be
correlated as:
D 1-s ' Rm
r= Cnux pg 150 8( +1.75
V(1- C)y mini
Cf1 e,
,
CO, Equation 6.42
d p2 pc
dpE Sf -, l
So=
where C. is an empirical constant, De, the molecular diffusivity of the combustion air, V.
the air velocity, d1,, the particle diameter, e, the local void fraction of the bed, C, the mass fraction of the gaseous reactants, and S is the stoichiometric coefficients in the reaction.
184
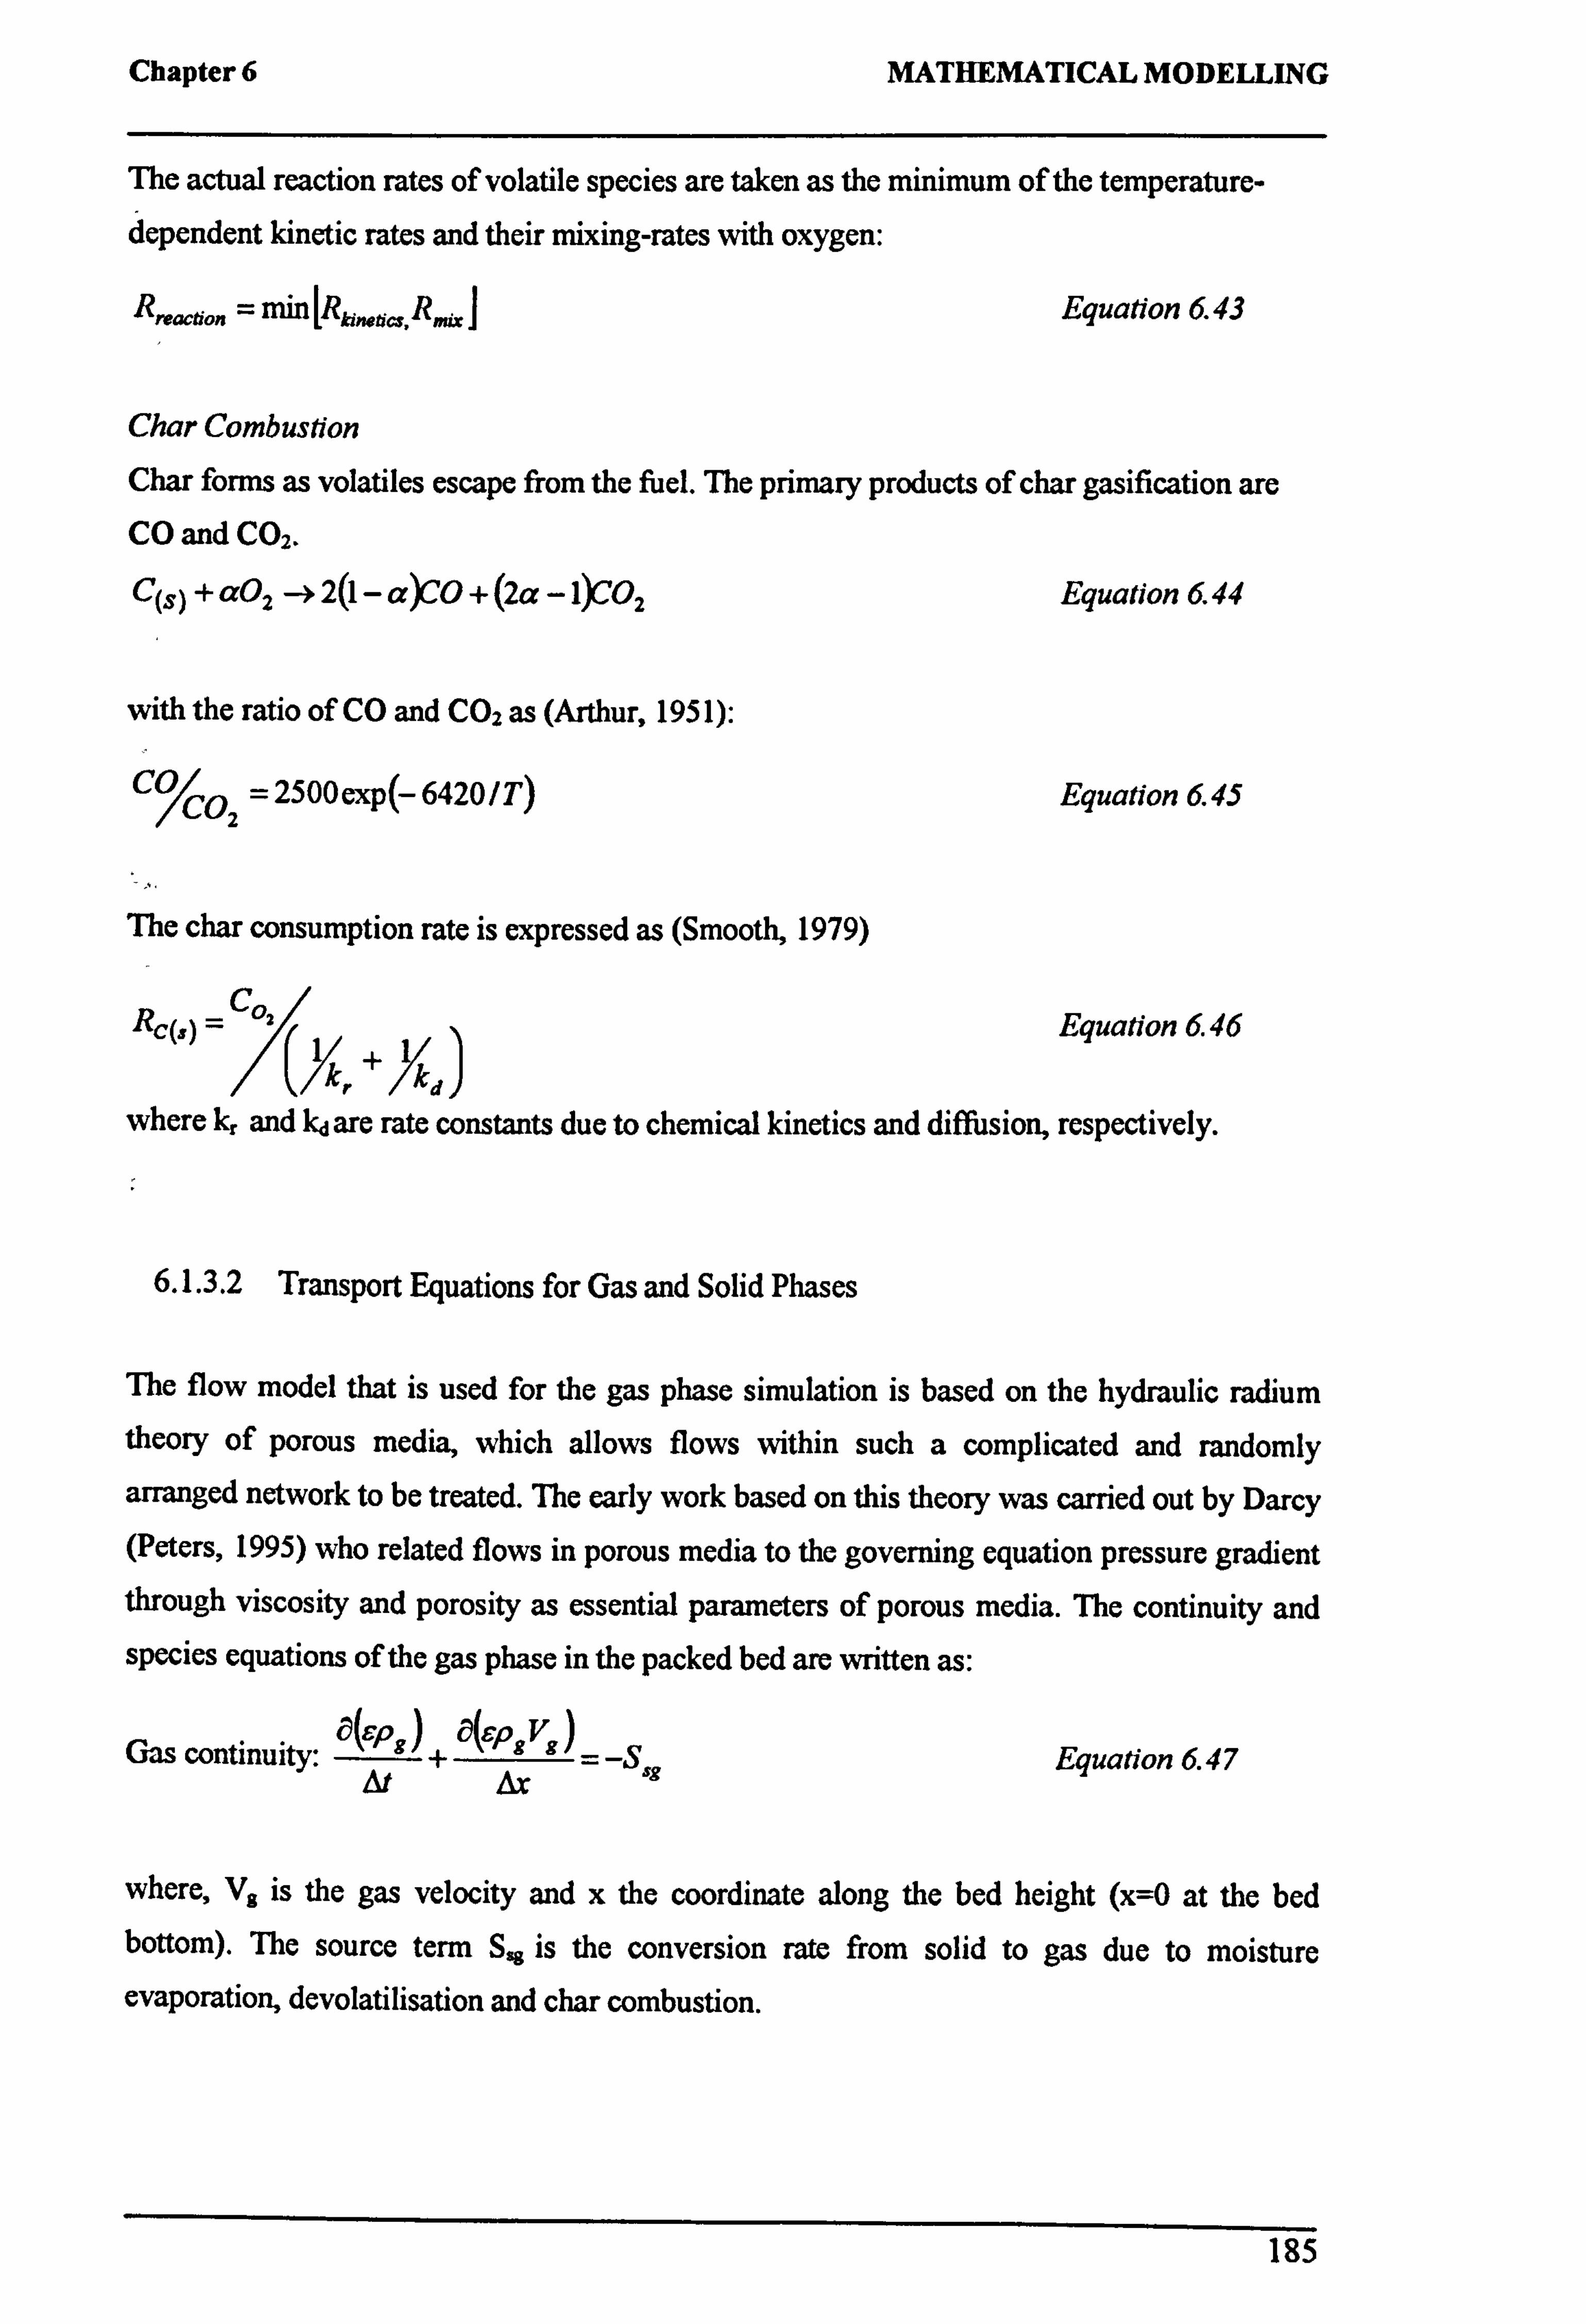
Chapter 6 MATHEMATICAL MODELLING
The actual reaction rates of volatile species are taken as the minimum of the temperature- dependent kinetic rates and their mixing-rates with oxygen:
Rreaction = min [Rkinetics. Riz ]
Char Combustion
Equation 6.43
Char forms as volatiles escape from the fuel. The primary products of char gasification are CO and CO2.
C(s) + a02 -+ 2(1- a)CO + (2a -1)CO2 Equation 6 44
with the ratio of CO and CO2 as (Arthur, 1951):
COI =2500exp( 6420/T) Equation 6.45
The char consumption rate is expressed as (Smooth, 1979)
Rc(, ) = C02/
Equation 6.46
/^d/ /(/ +
where kr and kd are rate constants due to chemical kinetics and diffusion, respectively.
6.1.3.2 Transport Equations for Gas and Solid Phases
The flow model that is used for the gas phase simulation is based on the hydraulic radium theory of porous media, which allows flows within such a complicated and randomly arranged network to be treated. The early work based on this theory was carried out by Darcy (Peters, 1995) who related flows in porous media to the governing equation pressure gradient through viscosity and porosity as essential parameters of porous media. The continuity and species equations of the gas phase in the packed bed are written as:
Gas continuity: a`
sJ+ a`ep
x)= _Ssg Equation 6.47
where, V. is the gas velocity and x the coordinate along the bed height (x=0 at the bed bottom). The source term Sg is the conversion rate from solid to gas due to moisture evaporation, devolatilisation and char combustion.
185

Chapter 6 MATHEMATICAL MODELLING
a(sPsYg) aa ___
) Gas species transport:
-+ (sPgY,
gv. ) _
(Dig + Sp ig Equation 6.48
where Yis is the mass fraction of species 'ig' in the gas (such as02, H2, H20, CO, C02, CmHn,
etc. ). The source term STa accounts for mass added to the fluid due to evaporation,
devolatilization and combustion.
The fluid dispersion coefficient D, g is considered to consist of diffusion and turbulent
contributions and is given by the following equation (Wakao, 1982). E° is the effective diffusion coefficient.
Dig = E° + 0.5d pVg Equation 6.49
Gas-phase energy conservation
OTg J+sah; (1v - Tg)+ Qh Equation 6.50 (E
at Ox Er är
where, H8 represents gas enthalpy, A.., the thermal dispersion coefficient, Qh, the heat gain of
the gas phase due to combustion. The thermal dispersion coefficient A. consists of diffusion
and turbulent contributions in a similar way as species dispersion, and can be express as (Wakao and Kaguei, 1982):
A8 =2° +0.5dpVgpgCpg
where 20 denotes the effective thermal diffusion coefficient.
Solid Phase
The continuity equation is given by:
Solid continuity: aýýl
Atýp'ý +
0((' V° -Ss
Equation 6 51
Equation 6.52
where p, is the particle density and V, is the solid velocity due to the downward movement
of the bed caused by mass loss.
186
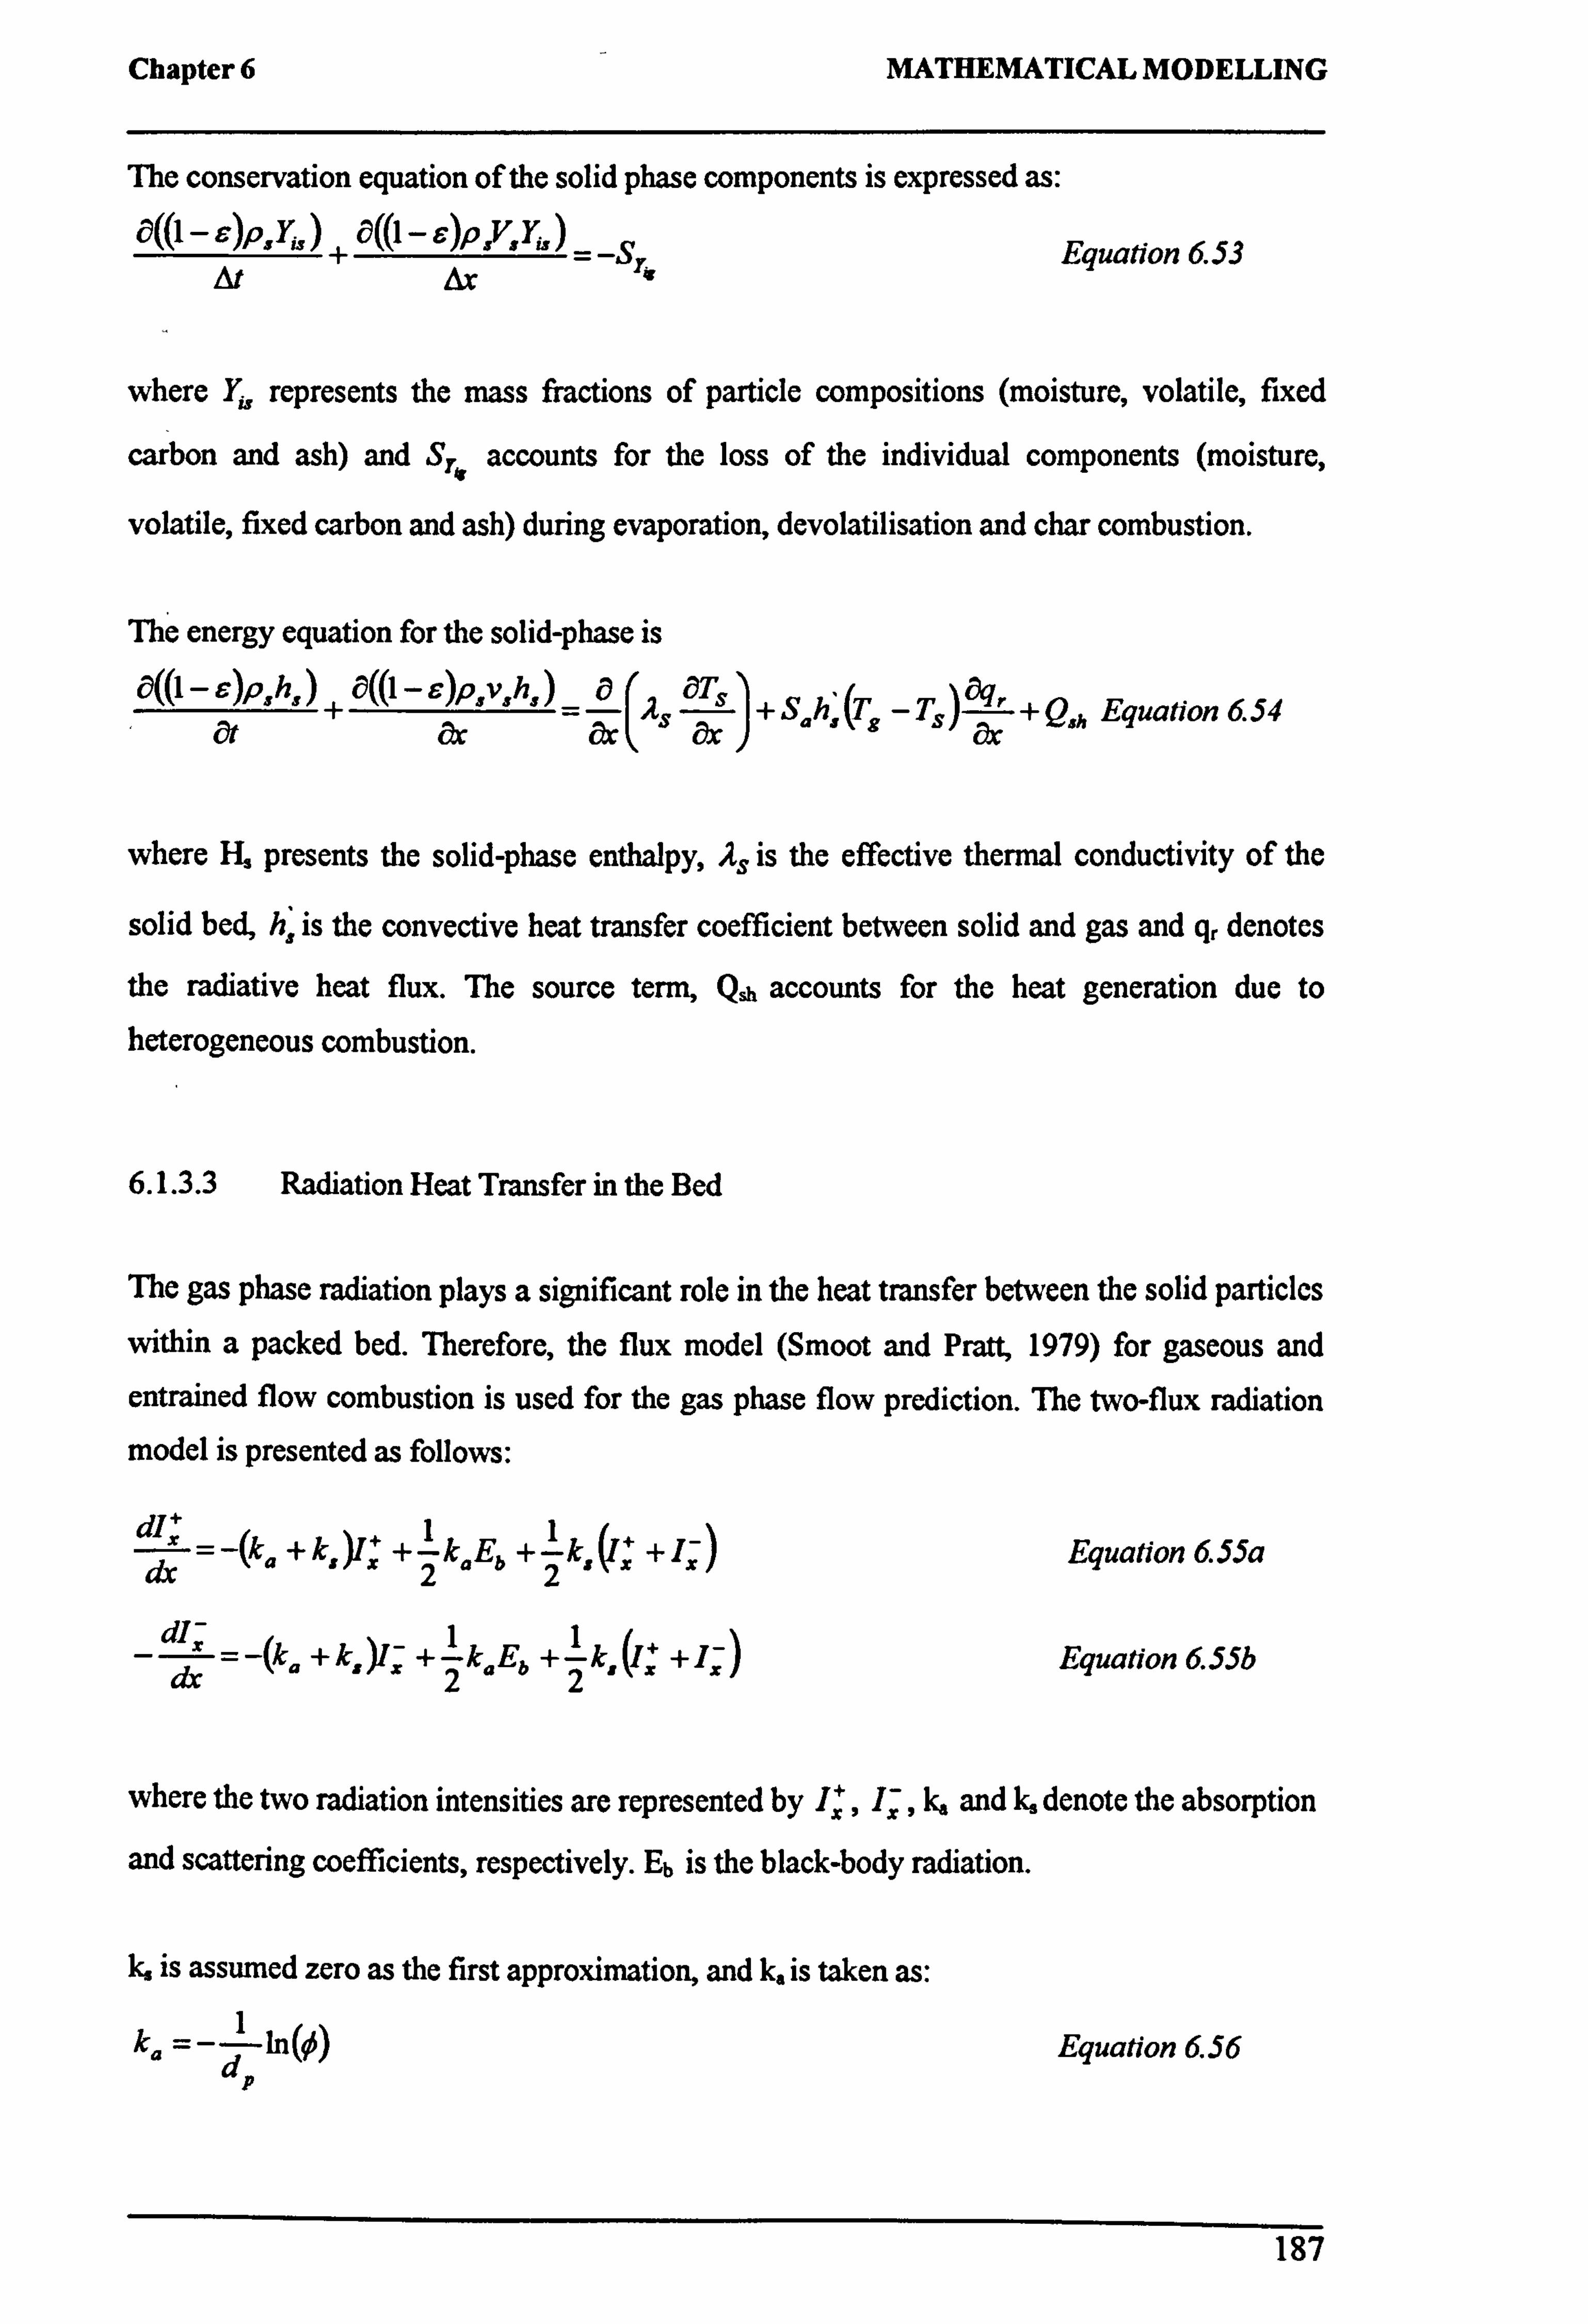
Chapter 6 MATHEMATICAL MODELLING
The conservation equation of the solid phase components is expressed as: ö((1- s)P, Y;
8) + ö((1- --)PV. Yý)
- -Sla Equation 6.53
where Y; s represents the mass fractions of particle compositions (moisture, volatile, fixed
carbon and ash) and Sr,. accounts for the loss of the individual components (moisture,
volatile, fixed carbon and ash) during evaporation, devolatilisation and char combustion.
The energy equation for the solid-phase is
ä((1- P, hs )+ ä((i -s Pavdhs ) (AS )+ Sah; (Ts
- Ts) "+ Q3h Equation 6 54
where H, presents the solid-phase enthalpy, AS is the effective thermal conductivity of the
solid bed, h, is the convective heat transfer coefficient between solid and gas and qr denotes
the radiative heat flux. The source term, Qt, accounts for the heat generation due to heterogeneous combustion.
6.1.3.3 Radiation Heat Transfer in the Bed
The gas phase radiation plays a significant role in the heat transfer between the solid particles
within a packed bed. Therefore, the flux model (Smoot and Pratt, 1979) for gaseous and
entrained flow combustion is used for the gas phase flow prediction. The two-flux radiation model is presented as follows:
W+ = -(ka + kf)Ix +2 kaEb + 3k ,
(iz + Iz) Equation 6.55a
-d= -(k, 4 k )i +2 ka Eb +2k, (1;
+1x-) Equation 6.55b
where the two radiation intensities are represented by Iz ,
Ix , k, and k, denote the absorption
and scattering coefficients, respectively. Eb is the black-body radiation.
k, is assumed zero as the first approximation, and k, is taken as:
ka =-d In P
Equation 6 56
187
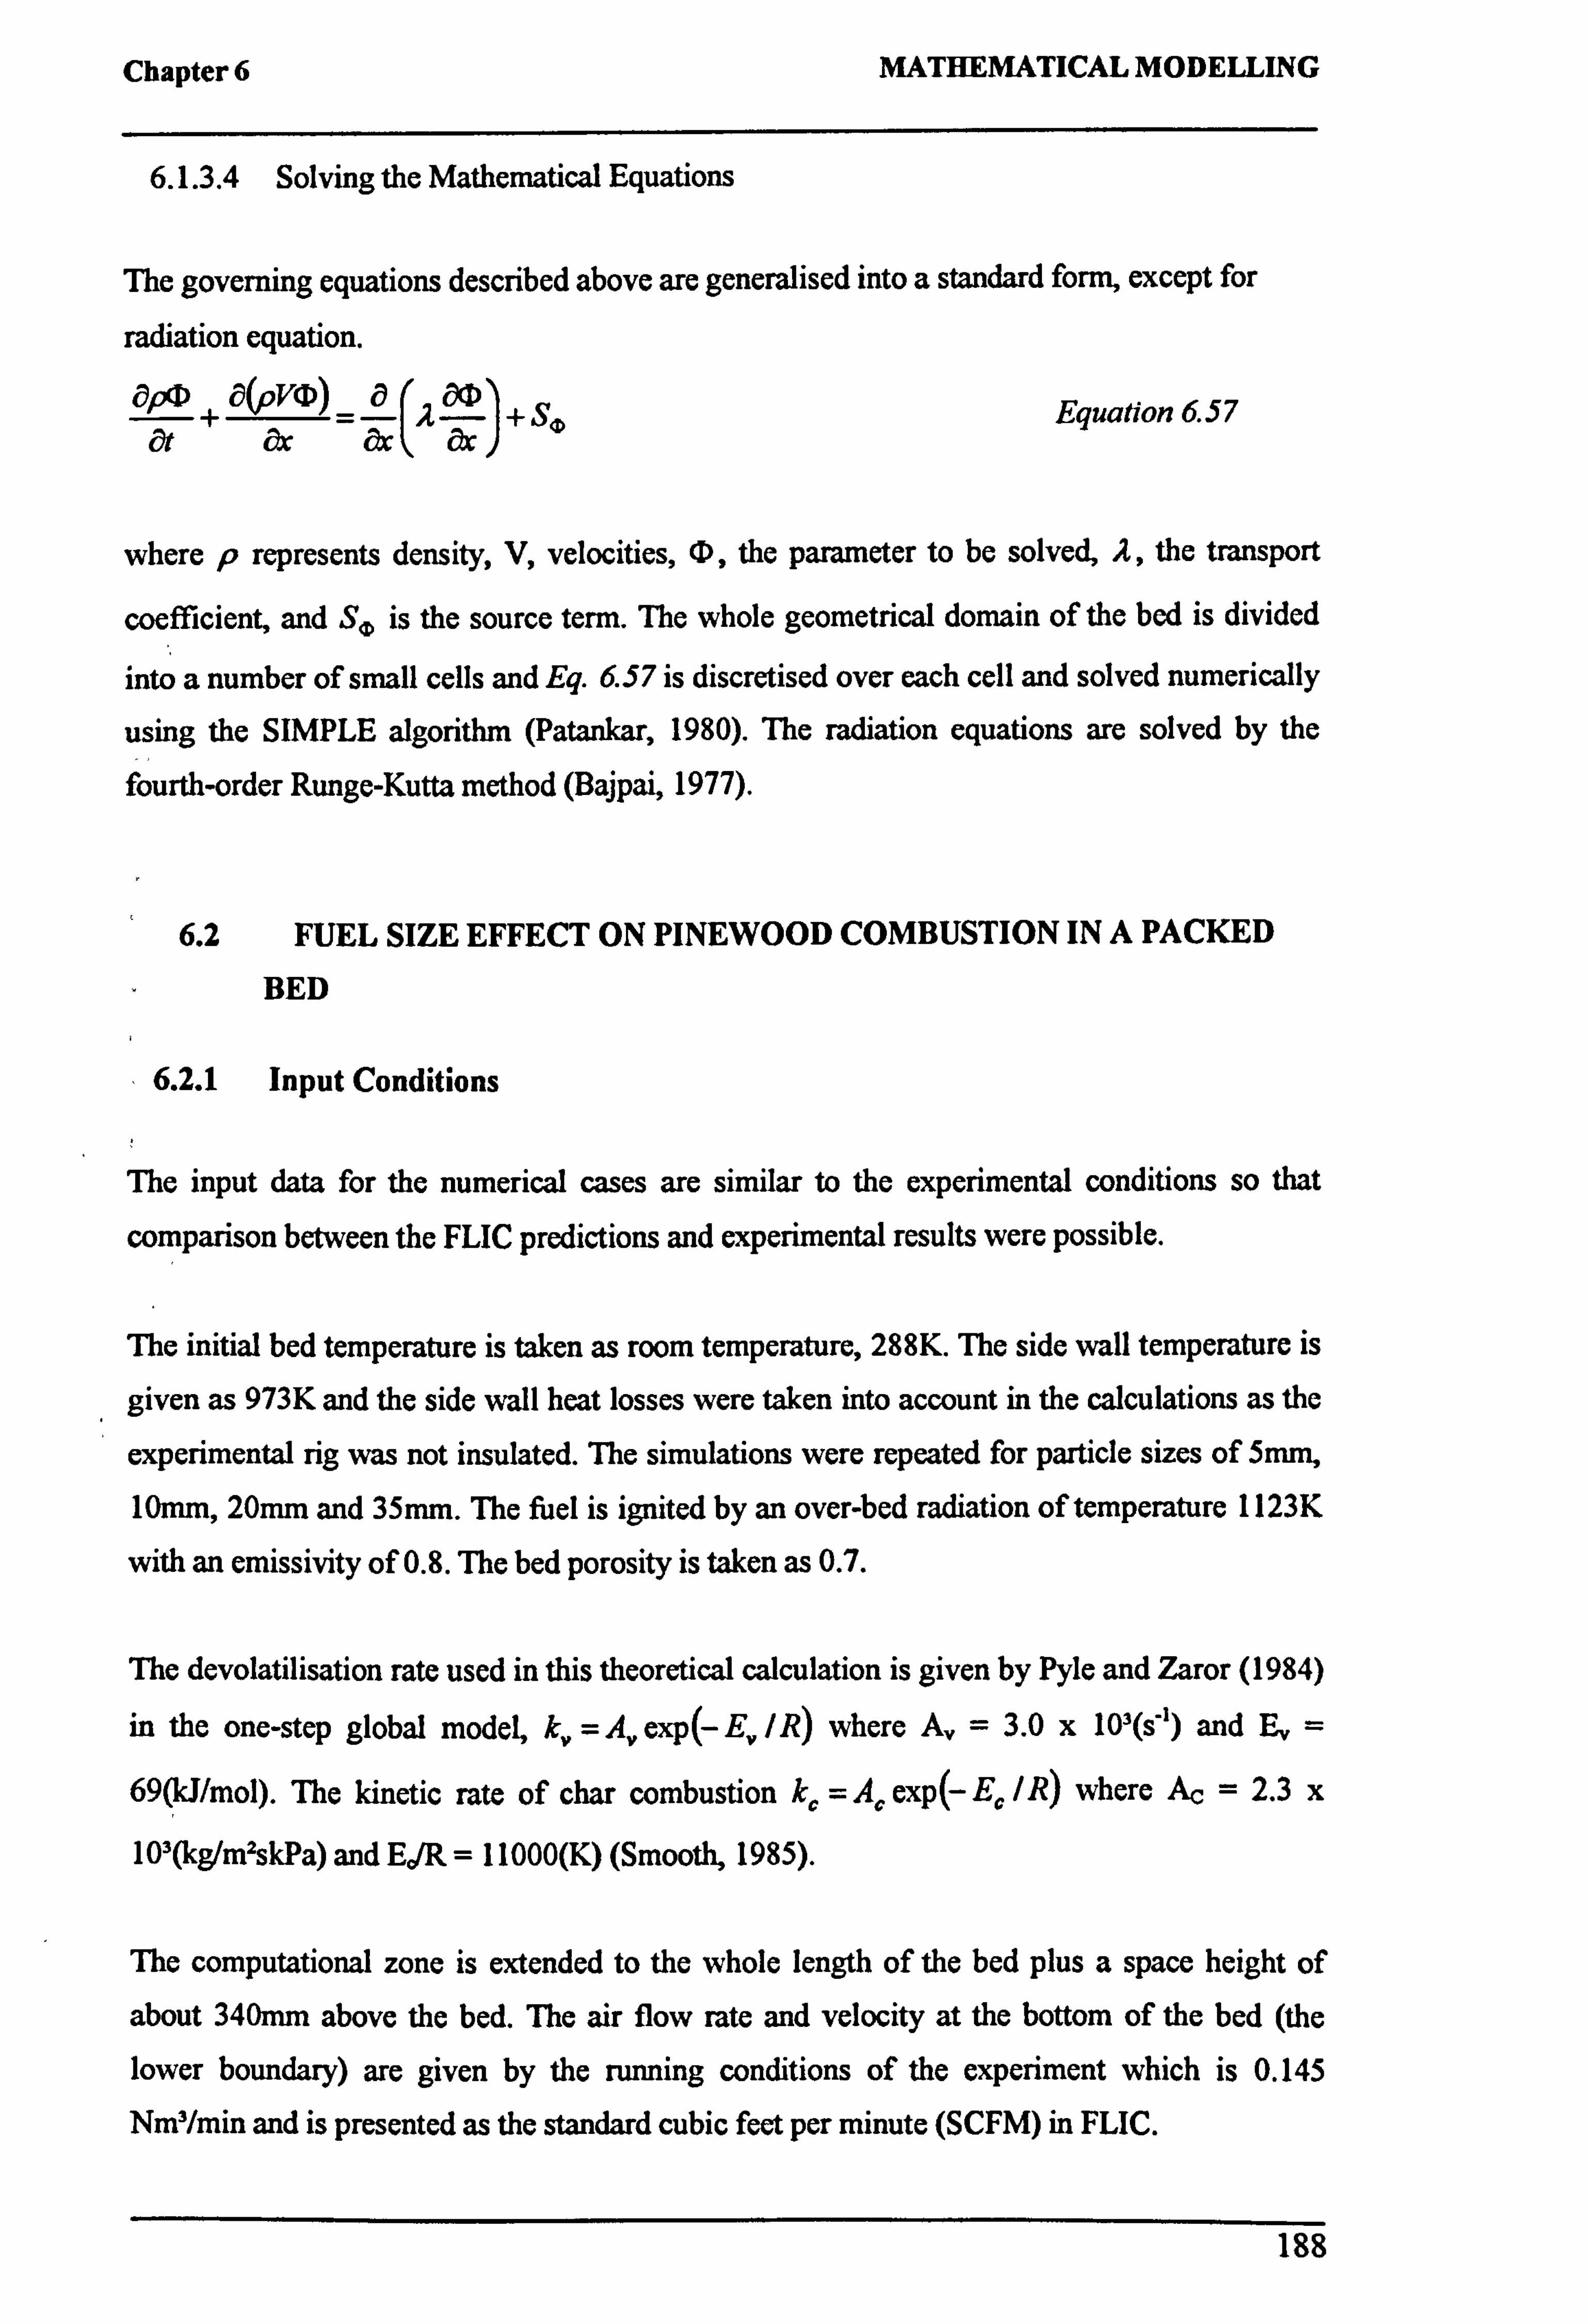
Chapter 6 MATHEMATICAL MODELLING
6.1.3.4 Solving the Mathematical Equations
The governing equations described above are generalised into a standard form, except for
radiation equation.
SZ at & ac ac
Equation 6.57
where p represents density, V, velocities, D, the parameter to be solved, A, the transport
coefficient, and S. is the source term. The whole geometrical domain of the bed is divided
into a number of small cells and Eq. 6.57 is discretised over each cell and solved numerically
using the SIMPLE algorithm (Patankar, 1980). The radiation equations are solved by the
fourth-order Runge-Kutta method (Bajpai, 1977).
6.2 FUEL SIZE EFFECT ON PINEWOOD COMBUSTION IN A PACKED
BED
6.2.1 Input Conditions
The input data for the numerical cases are similar to the experimental conditions so that
comparison between the FLIC predictions and experimental results were possible.
The initial bed temperature is taken as room temperature, 288K. The side wall temperature is
given as 973K and the side wall heat losses were taken into account in the calculations as the
experimental rig was not insulated. The simulations were repeated for particle sizes of 5mm,
10mm, 20mm and 35mm. The fuel is ignited by an over-bed radiation of temperature 1123K
with an emissivity of 0.8. The bed porosity is taken as 0.7.
The devolatilisation rate used in this theoretical calculation is given by Pyle and Zaror (1984)
in the one-step global model, k,, =A� exp( E,, /R) where A� = 3.0 x 10³(s-') and E� _
69(kJ/mol). The kinetic rate of char combustion k, = A, exp(- E0 IR) where Ac = 2.3 x
103(kg/m2skPa) and Eo1R = 11000(K) (Smooth, 1985).
The computational zone is extended to the whole length of the bed plus a space height of
about 340mm above the bed. The air flow rate and velocity at the bottom of the bed (the
lower boundary) are given by the running conditions of the experiment which is 0.145
Nm'/min and is presented as the standard cubic feet per minute (SCFM) in FLIC.
188
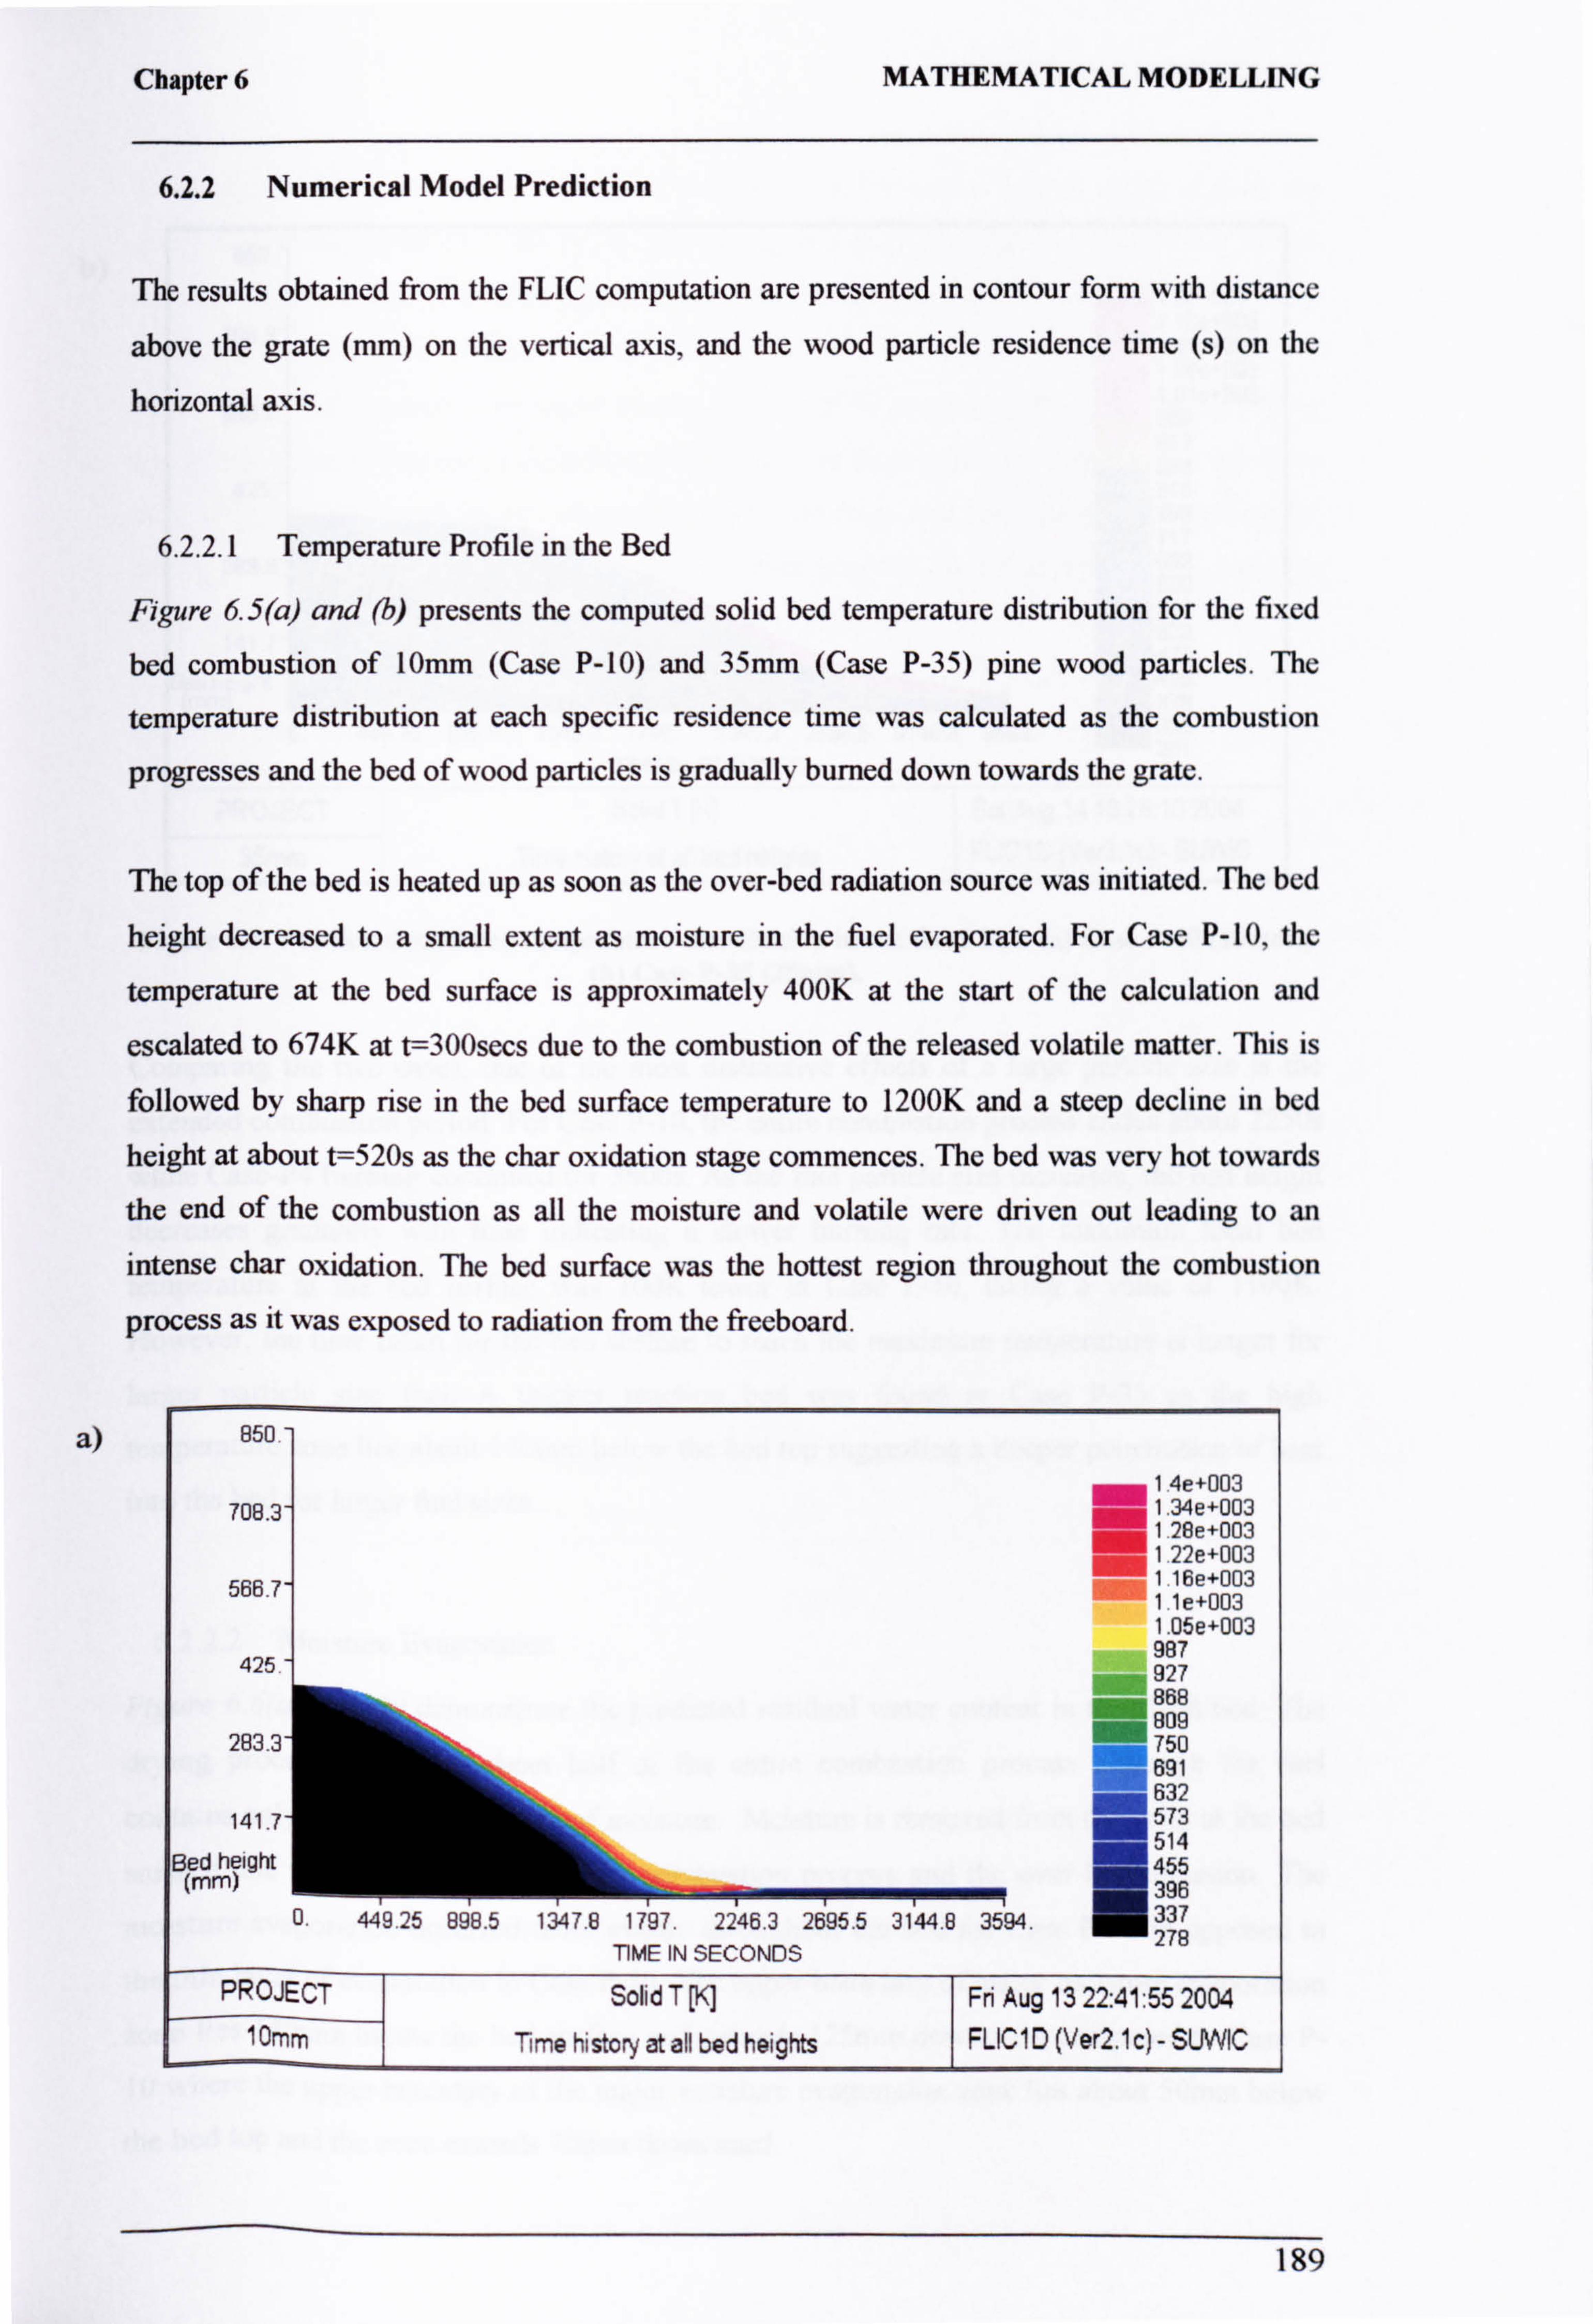
Chapter 6 MATHEMATICAL MODELLING
6.2.2 Numerical Model Prediction
The results obtained from the FLIC computation are presented in contour form with distance
above the grate (mm) on the vertical axis, and the wood particle residence time (s) on the
horizontal axis.
6.2.2.1 Temperature Profile in the Bed
Figure 6.5(a) and (b) presents the computed solid bed temperature distribution for the fixed
bed combustion of 10mm (Case P-10) and 35mm (Case P-35) pine wood particles. The
temperature distribution at each specific residence time was calculated as the combustion
progresses and the bed of wood particles is gradually burned down towards the grate.
The top of the bed is heated up as soon as the over-bed radiation source was initiated. The bed
height decreased to a small extent as moisture in the fuel evaporated. For Case P-10, the
temperature at the bed surface is approximately 400K at the start of the calculation and
escalated to 674K at t=300secs due to the combustion of the released volatile matter. This is
followed by sharp rise in the bed surface temperature to 1200K and a steep decline in bed
height at about t=520s as the char oxidation stage commences. The bed was very hot towards
the end of the combustion as all the moisture and volatile were driven out leading to an
intense char oxidation. The bed surface was the hottest region throughout the combustion
process as it was exposed to radiation from the freeboard.
a) B50. -
1.4e+003 708.3 _ 1.34e+003
128e+003 =1 22e+003 566 7 116e+003
. 11e+003 1.05e+003
425. 987 927 868 609
283 ' 750 = 691 632
141 573 514
Bed B height 455 396
1
1 _+'ý-ý '14'L : 197.2246.3 2695.5 3144.8 3594.337 TIME IN SECONDS
278
PROJECT Solid T Fri Aug 13 22: 41: 55 2004 10mm Time history at all bed heights FLICI D (Ver2.1 c) - SL WIC
189
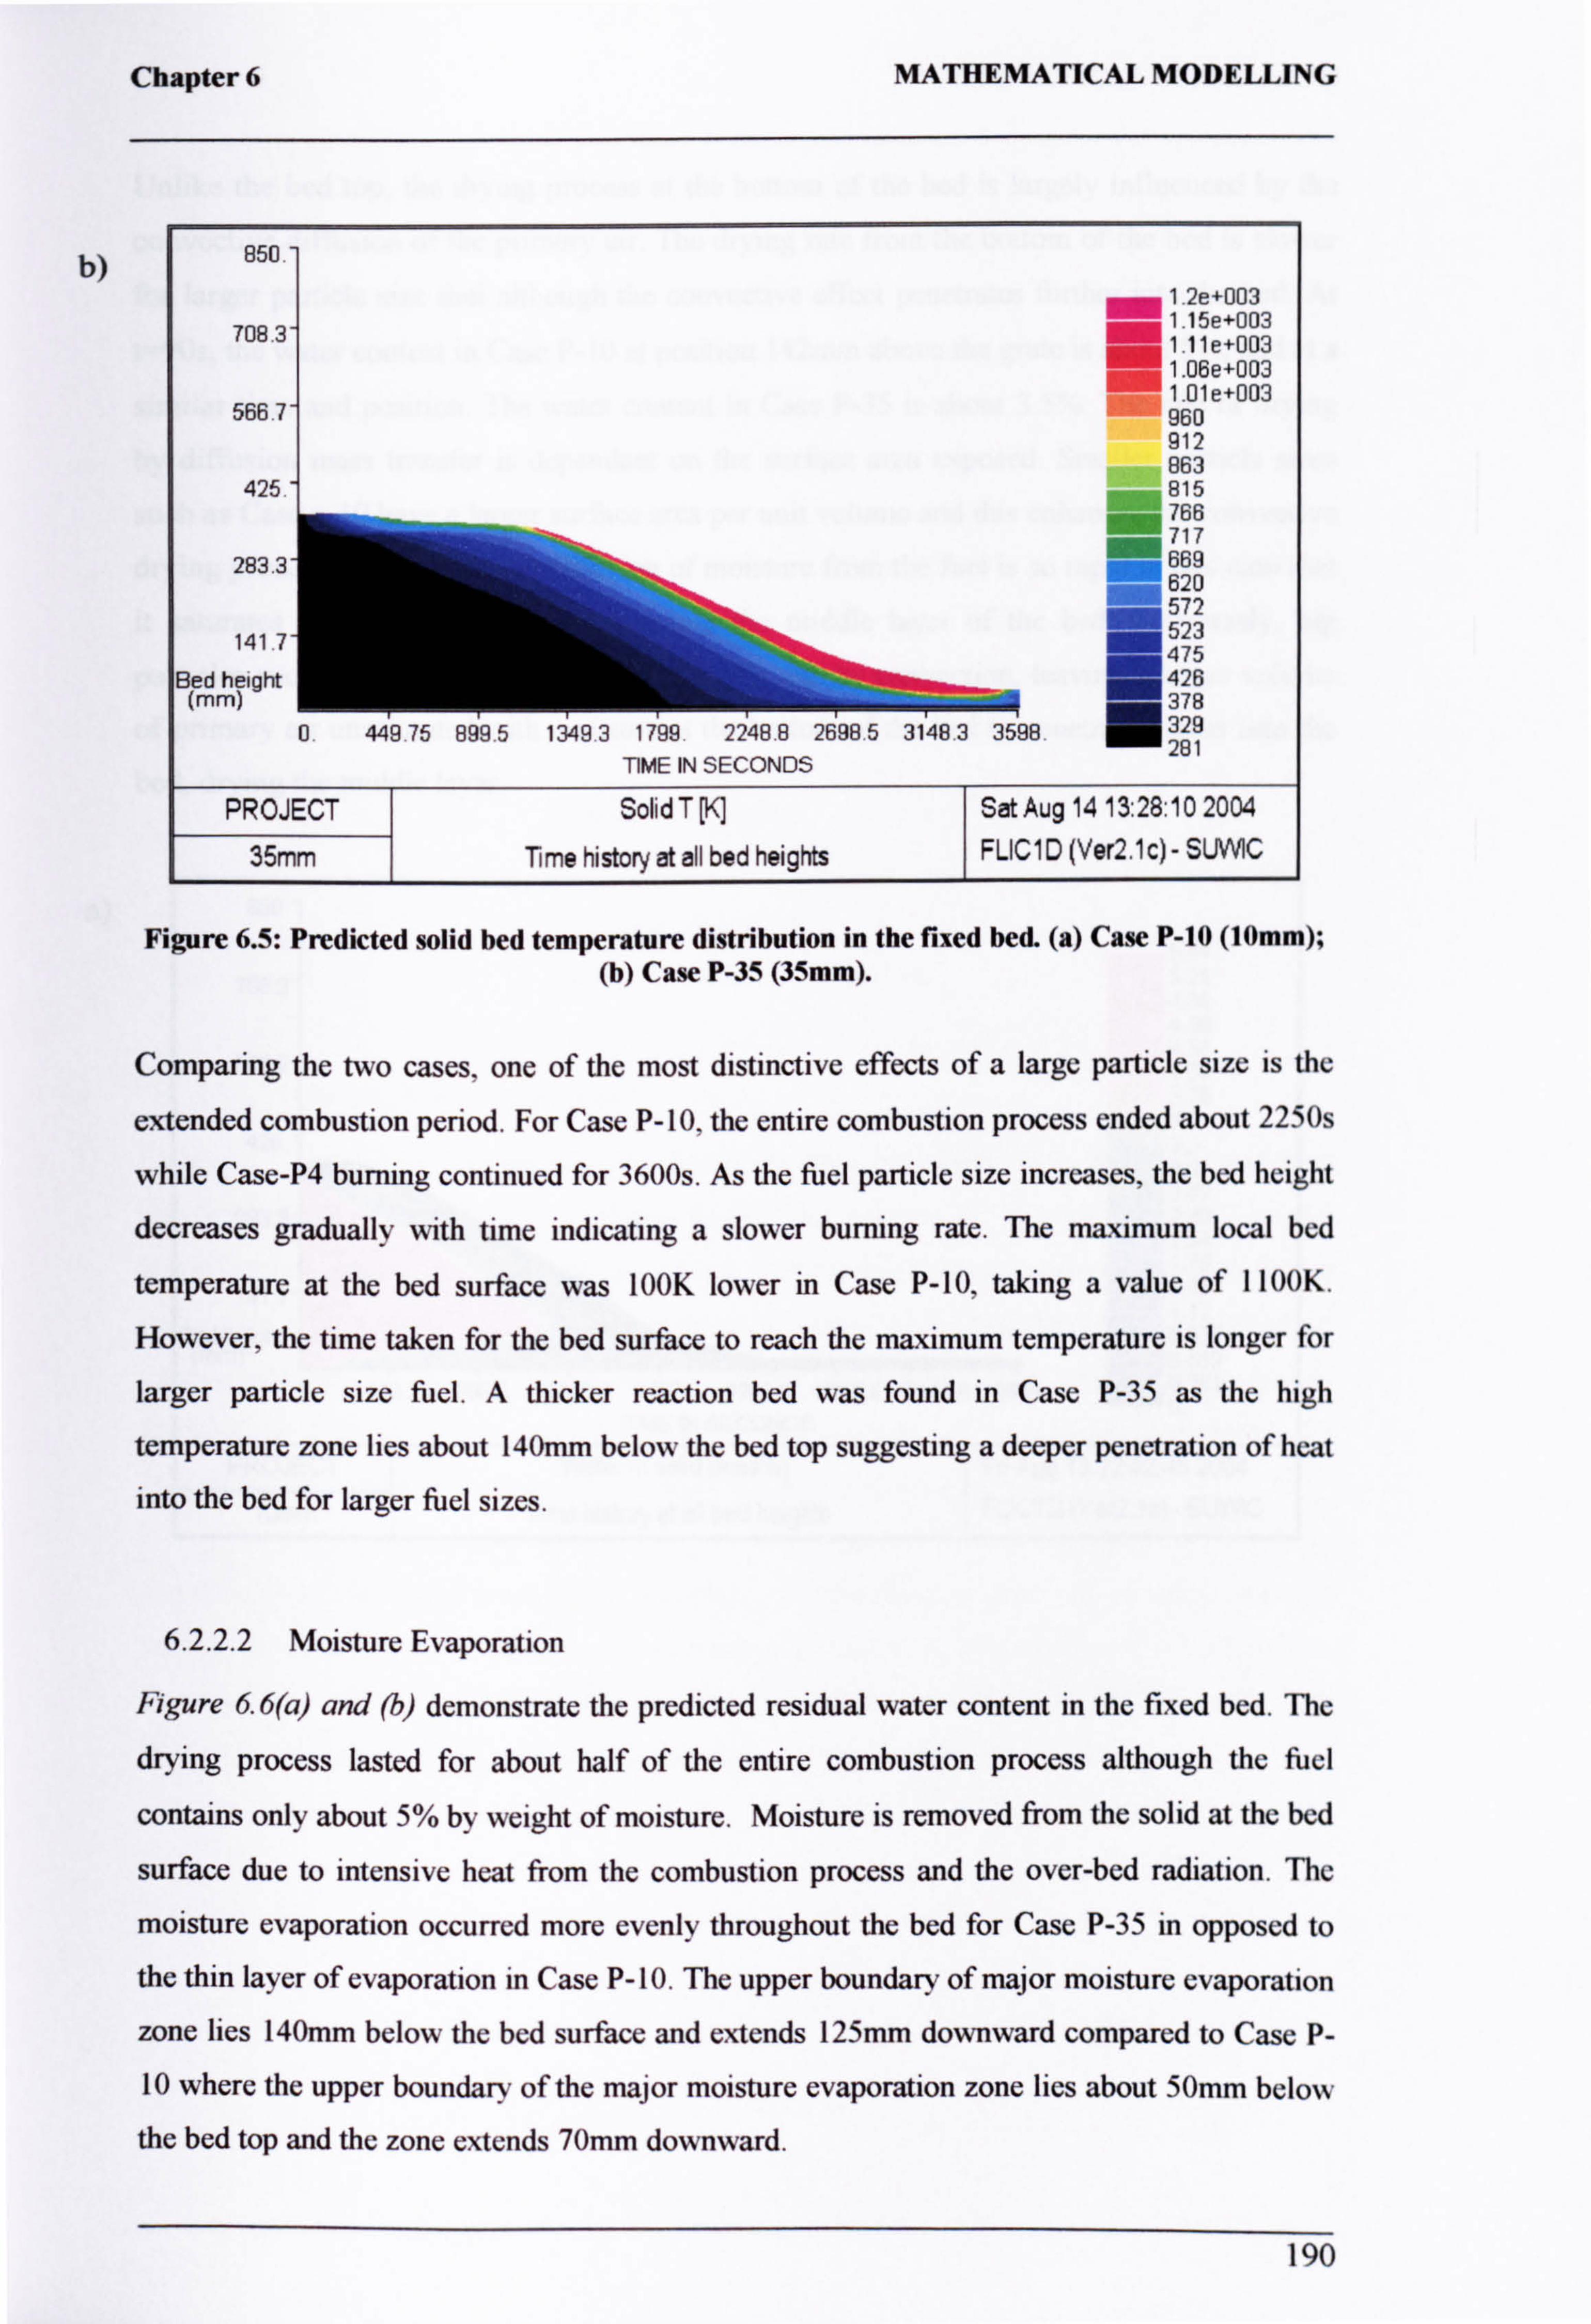
Chapter 6 MATHEMATICAL MODELLING
b) 850. -
1.2e+003
708.3 1.15e+003 1 11e+003 . 1.06e+003
1.01e+003 566.7 960
912 863
425 815 = 766 717 M
283 669 M 620 M
I
572 141 7
nho
523 475
Bed height
kk
'a 426 (mm) ib
' 378
m="
0 449 75 899 5 1349 3 1799 2248 8 26965 3148.3 3598 329 0
281 TIME IN SECONDS
PROJECT Solid T [K] Sat Aug 14 13: 28: 10 2004
35mm Time history at all bed heights FLIC1 D (Ver2.1 c) - SUW1C
Figure 6.5: Predicted solid bed temperature distribution in the fixed bed. (a) Case P-10 (10mm); (b) Case P-35 (35mm).
Comparing the two cases, one of the most distinctive effects of a large particle size is the
extended combustion period. For Case P- 10, the entire combustion process ended about 2250s
while Case-P4 burning continued for 3600s. As the fuel particle size increases, the bed height
decreases gradually with time indicating a slower burning rate. The maximum local bed
temperature at the bed surface was LOOK lower in Case P-10, taking a value of I100K.
However, the time taken for the bed surface to reach the maximum temperature is longer for
larger particle size fuel. A thicker reaction bed was found in Case P-35 as the high
temperature zone lies about 140mm below the bed top suggesting a deeper penetration of heat
into the bed for larger fuel sizes.
6.2.2.2 Moisture Evaporation
Figure 6.6(a) and (b) demonstrate the predicted residual water content in the fixed bed. The
drying process lasted for about half of the entire combustion process although the fuel
contains only about 5% by weight of moisture. Moisture is removed from the solid at the bed
surface due to intensive heat from the combustion process and the over-bed radiation. The
moisture evaporation occurred more evenly throughout the bed for Case P-35 in opposed to
the thin layer of evaporation in Case P-10. The upper boundary of major moisture evaporation
zone lies 140mm below the bed surface and extends 125mm downward compared to Case P-
10 where the upper boundary of the major moisture evaporation zone lies about 50mm below
the bed top and the zone extends 70mm downward.
190
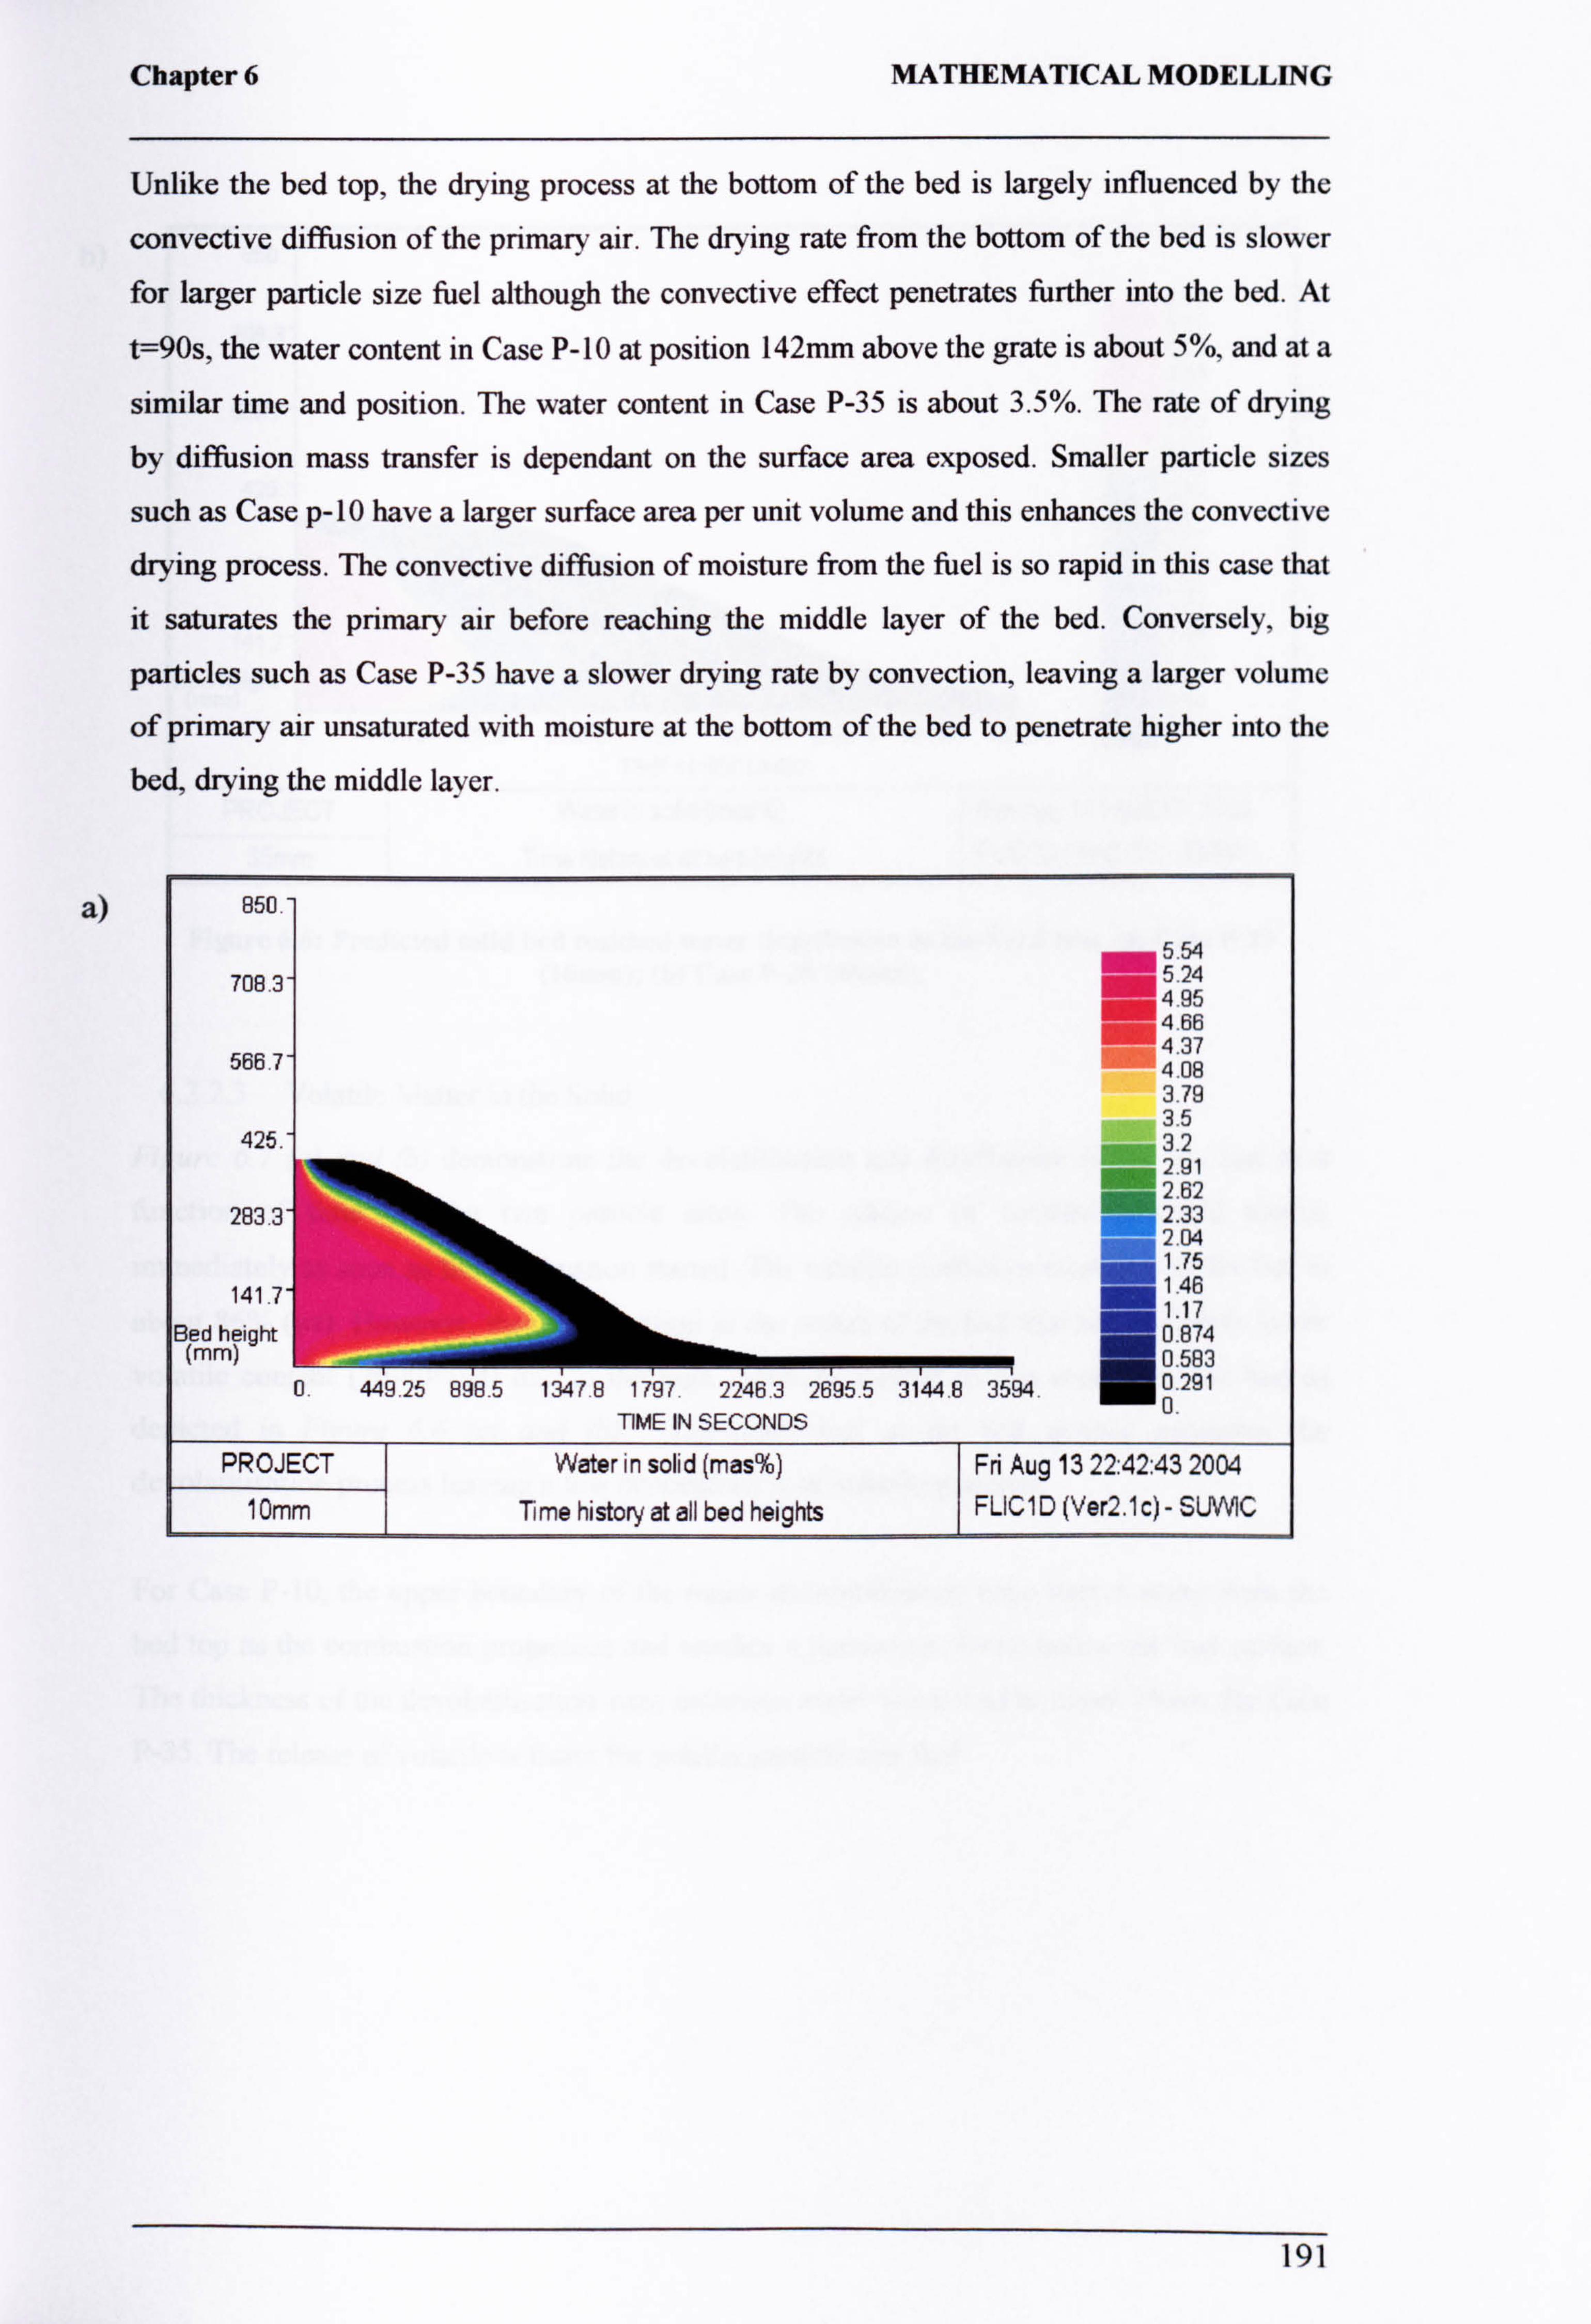
Chapter 6 MATHEMATICAL MODELLING
Unlike the bed top, the drying process at the bottom of the bed is largely influenced by the
convective diffusion of the primary air. The drying rate from the bottom of the bed is slower
for larger particle size fuel although the convective effect penetrates further into the bed. At
t=90s, the water content in Case P-10 at position 142mm above the grate is about 5%, and at a
similar time and position. The water content in Case P-35 is about 3.5%. The rate of drying
by diffusion mass transfer is dependant on the surface area exposed. Smaller particle sizes
such as Case p-10 have a larger surface area per unit volume and this enhances the convective
drying process. The convective diffusion of moisture from the fuel is so rapid in this case that
it saturates the primary air before reaching the middle layer of the bed. Conversely, big
particles such as Case P-35 have a slower drying rate by convection, leaving a larger volume
of primary air unsaturated with moisture at the bottom of the bed to penetrate higher into the
bed, drying the middle laver.
a) 850.
5.54 708.3 5.24 = 4.95
4.66 ®
566.7 4.37 4.08 3.79 3.5
425. 3.2 "MM 2.91
283.3
Ii
1.75 141.7
= 1.46 1.17
Bed height 0.874 (mm) 0.583
N
0. 449.25 898.5 1347 8 1797.2246.3 2695.5 3144.8 3594.0.291 TIME IN SECONDS
o
PROJECT Water in solid (mas%) Fri Aug 13 22: 42: 43 2004 10mm Time history at all bed heights FLIC1 D (Ver2.1 c) - SU1MC
191

b)
Chapter 6 MATHEMATICAL MODELLING
850.
5.51 708.3- 5-22 = 4.93
4.64 M 566.7
4.35 4.06 3.77 3.48
425 3.19 2.9 2.61
283.3 2.32 2.03 1.74 M
141.7 1.45 1 16
Bed height . 0.87 IN
(mm) '000,058
0 449 75 3148.3 3598 S 0.29
0. TIME IN SECONDS
PROJECT Water in solid (mas%) Sat Aug 1413: 29: 07 2004
35mm Time history at all bed heights FLIC1 D (Ver2.1 c) - SUW1C
Figure 6.6: Predicted solid bed residual water distribution in the fixed bed. (a) Case P-10 (10mm); (b) Case P-35 (35mm).
6.2.2.3 Volatile Matter in the Solid
Figure 67 (a) and (b) demonstrate the devolatilisation rate distribution inside the bed as a
function of time for the two particle sizes. The release of volatile occurred almost
immediately as soon as the combustion started. The volatile content in most part of the bed is
about 86% (wt). However, there is a portion in the centre of the bed that has a slightly lower
volatile content (70-80%wt) due to the high moisture content in this section of the bed as depicted in Figure 6.6 (a) and (b). The dried fuel at the bed surface promotes the
devolatilisation process leaving a low concentration of volatile material.
For Case P-10, the upper boundary of the major devolatilisation zone moves away from the
bed top as the combustion progresses and reaches a maximum 40mm below the bed surface. The thickness of the devolatilisation zone increases about twice-fold to about 75mm for Case
P-35. The release of volatile is faster for smaller particle size fuel.
192
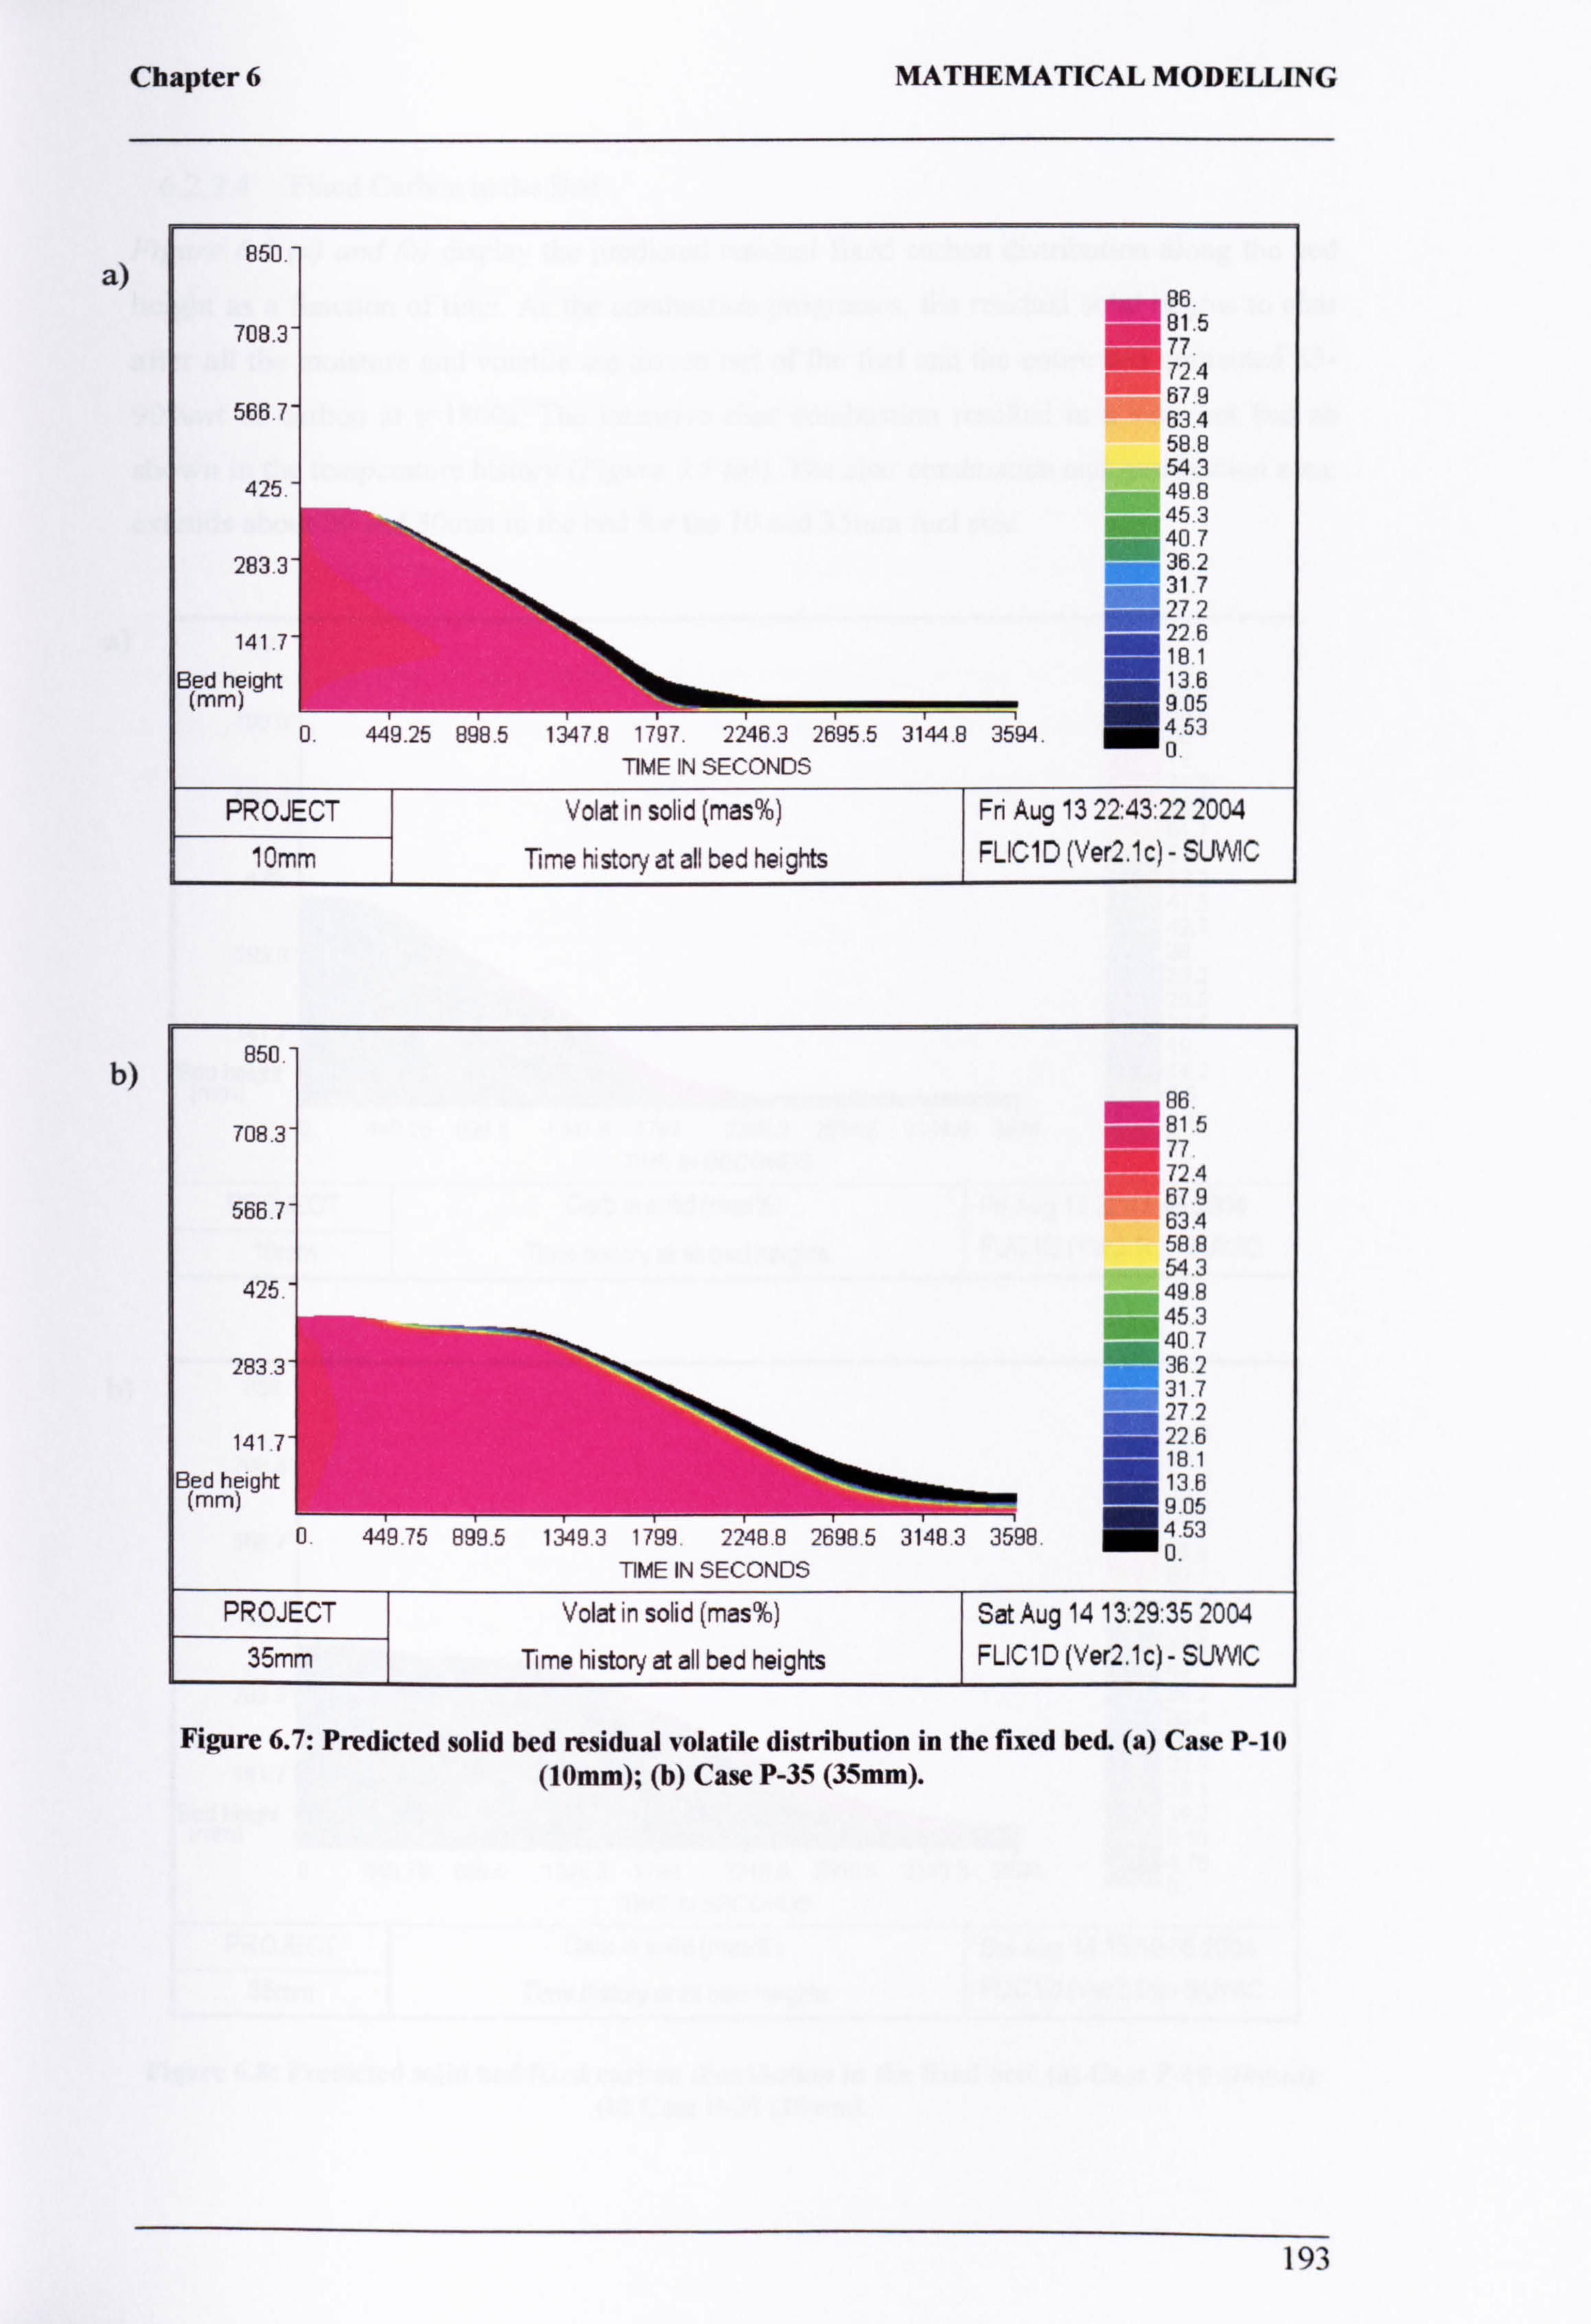
Chapter 6 MATHEMATICAL MODELLING
a) 850. -
B& 708.3
- 87.5
72 4 M 566.7
67 9 634 58.8 54.3
425. 49 B 453 = 40 7
283.3 . _ 36.2
31 7 . = 27 2 . 22 6 141.7 .
Bed height 18.1 13.6
(mm) 9 05 0. 449.25 898.5 1347.8 1797.2246.3 2695.5 3144.8 3594.4 53
0 TIME IN SECONDS
PROJECT Volat in solid (mas%) Fri Aug 13 22: 43: 22 2004
10mm Time history at all bed heights FLIC1D (Ver2.1c) - SUWC
b) 850.
86 708.3 81.5
77 4 72 . M679
566.7 63.4 588 543
425. 498 453
283 3 40 7 362
. 31 7 . 27 2 . 22 6 141. . M181
Bed height (mm)
M 13.6 M9
05
U 449.75 899.5 1349 3 1799 2248 8 2698 5 3148.3 3598 4 53
0. TIME IN SECONDS
PROJECT Volat in solid (mas%) Sat Aug 14 13: 29: 35 2004 35mm Time history at all bed heights FLIC1D (Ver2.1c) - SUWIC
Figure 6.7: Predicted solid bed residual volatile distribution in the fixed bed. (a) Case P-10 (10mm); (b) Case P-35 (35mm).
193
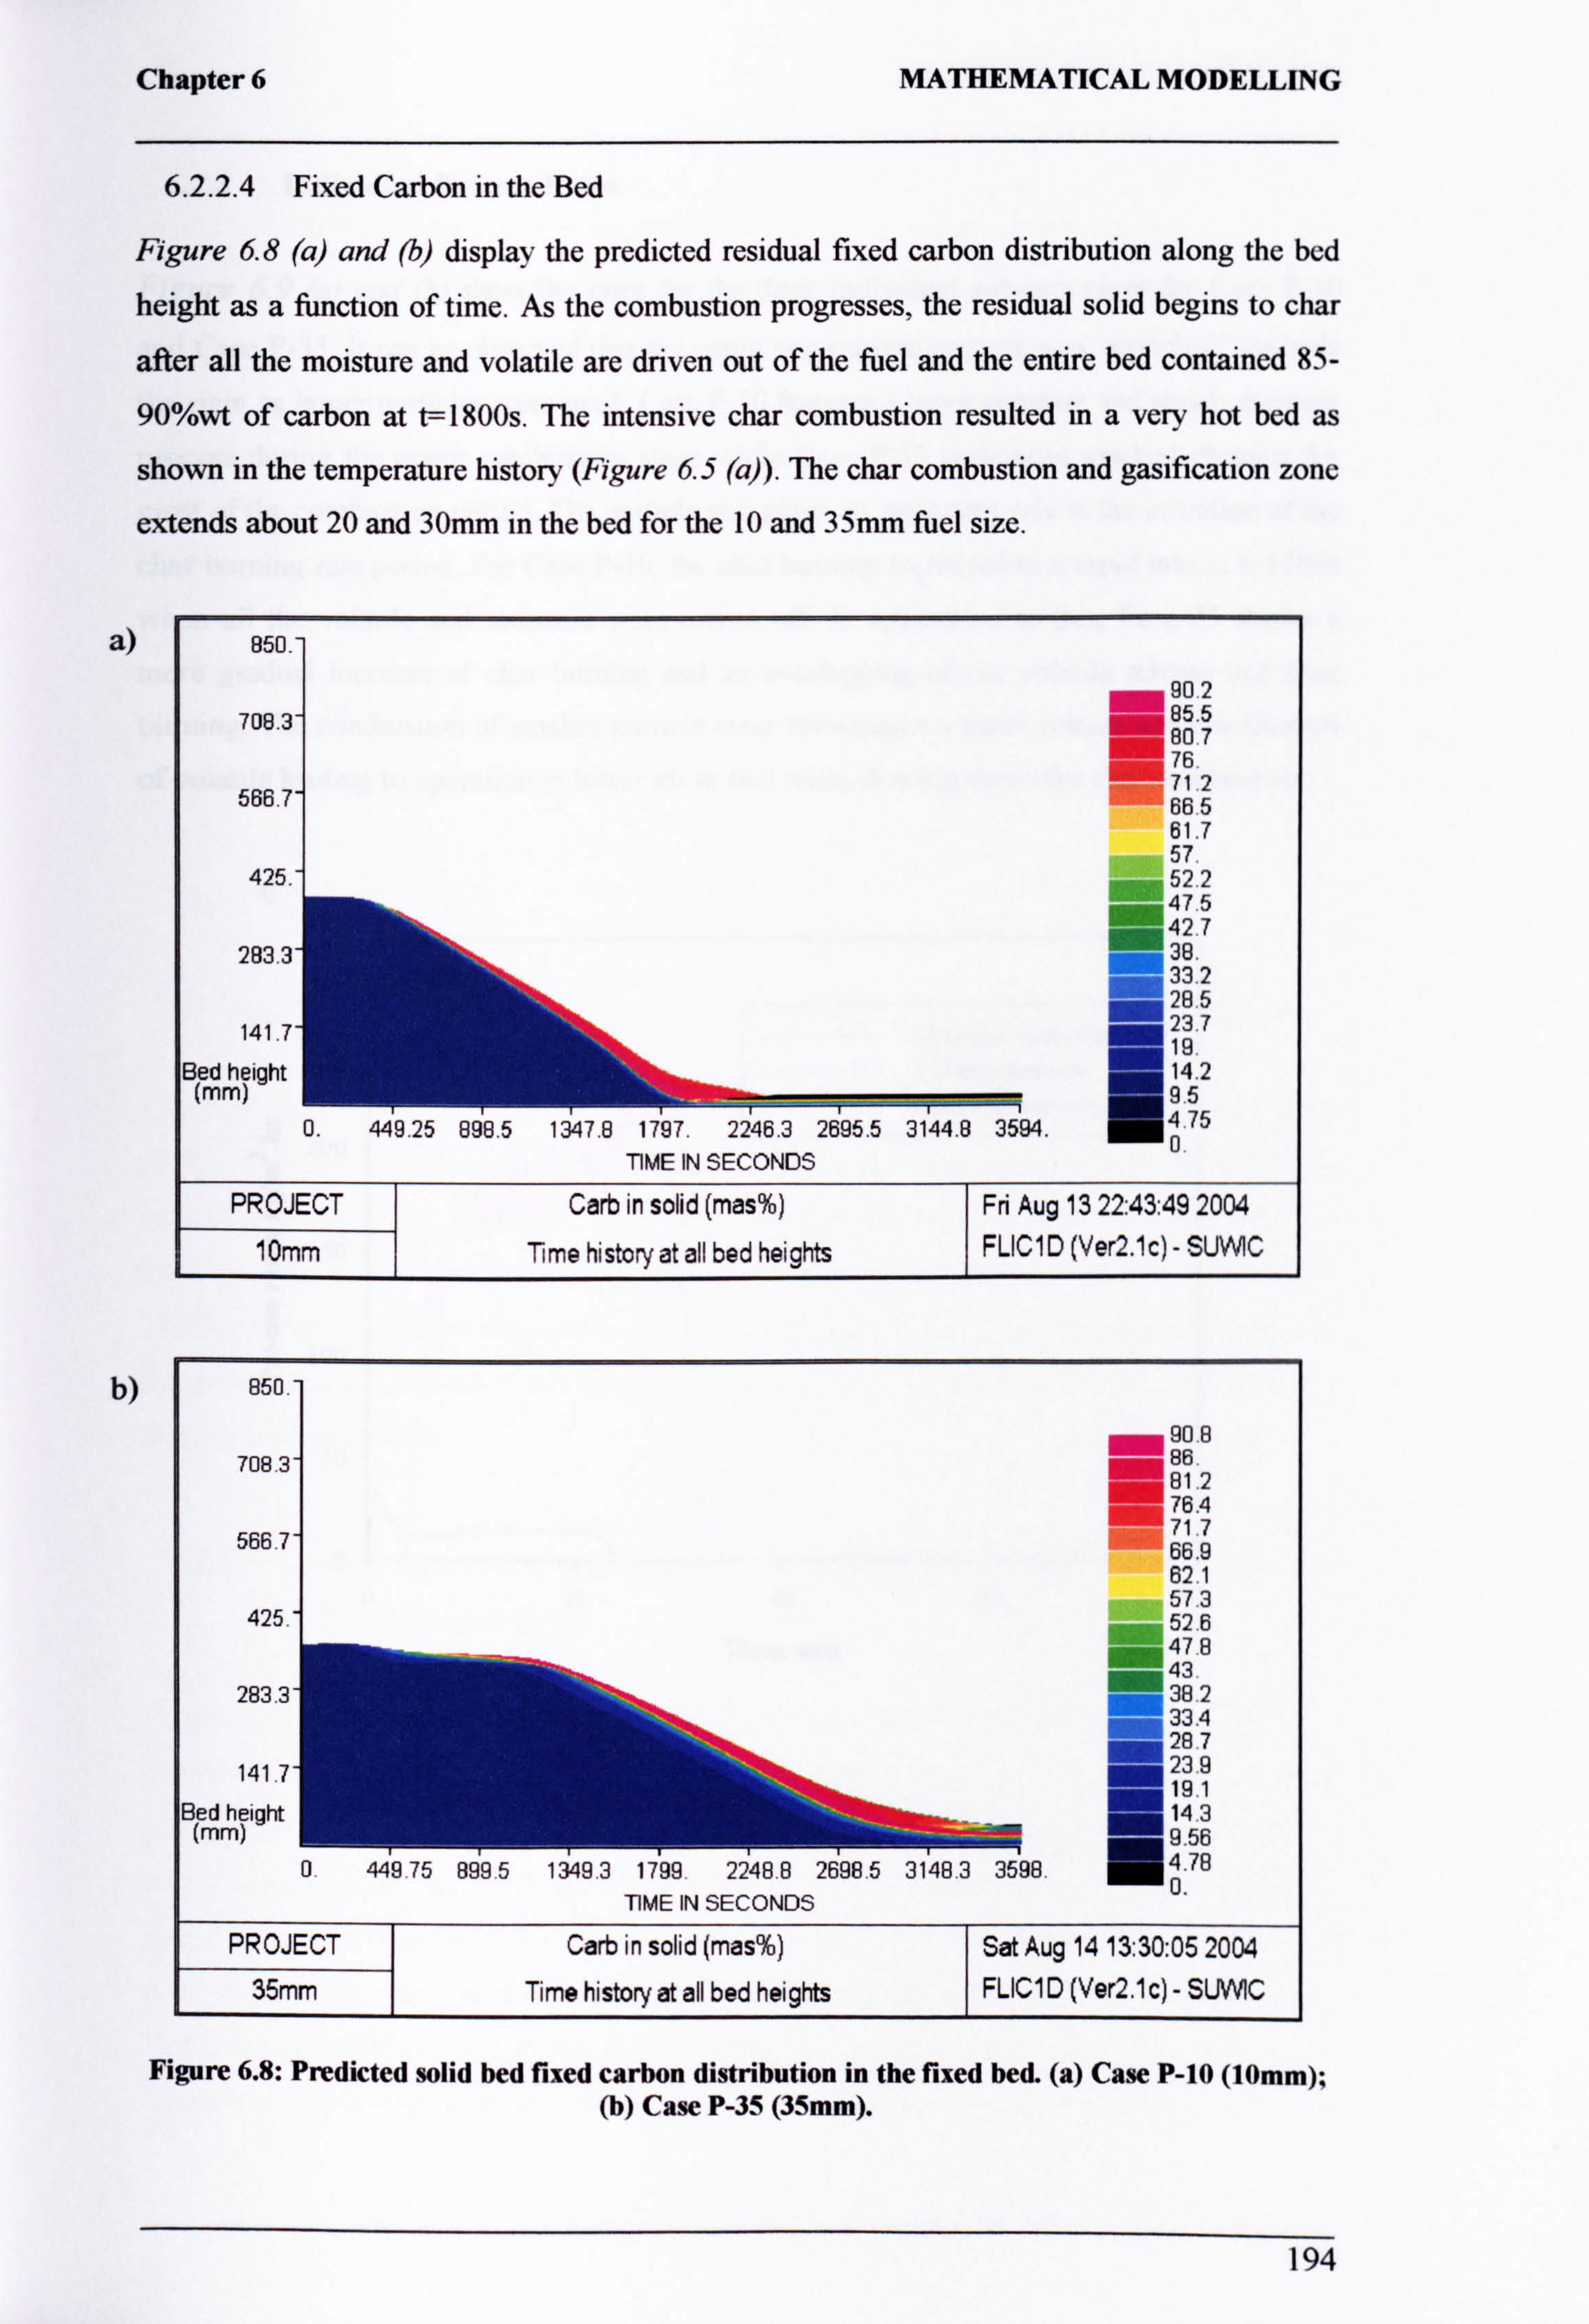
Chapter 6 MATHEMATICAL MODELLING
6.2.2.4 Fixed Carbon in the Bed
Figure 6.8 (a) and (b) display the predicted residual fixed carbon distribution along the bed
height as a function of time. As the combustion progresses, the residual solid begins to char
after all the moisture and volatile are driven out of the fuel and the entire bed contained 85-
90%wt of carbon at t=1800s. The intensive char combustion resulted in a very hot bed as
shown in the temperature history (Figure 6.5 (a)). The char combustion and gasification zone
extends about 20 and 30mm in the bed for the 10 and 35mm fuel size.
a) 850-
902 708.3
= 85.5 80.7 76.
566.7 71.2 66.5 61.7 57
425. 522 475 42.7
283.3 38. 33.2
1 1
28.5 141 7
6
23.7 19
Bed height 14.2 (mm) - 95
0. 449.25 898.5 1347.8 1797.2246.3 2695.5 3144.8 3594.4 75 0
TIME IN SECONDS
PROJECT Carb in solid (mas%) Fri Aug 13 22: 43: 49 2004
10mm Time history at all bed heights FLIC ID (Ver2.1c) - SUWIC
b) 850.
_ 90.8 708.3 86. E81.2
76.4 566.7 71.7
6 6.9 62.1 57.3
425. 52.6 = 47.8 43.
283 3 = 38.2 _ 33.4
a
28.7 23 9 141 7 . 19.1
Bed height 14.3 (mm)
' I mill" 9.56
0 449 r5 899 5 6493 1799 22 4H S 2686 3148.3 3598.
4.78 0
TIME IN SECONDS
PROJECT Carb in solid (mas%) Sat Aug 14 13: 30: 05 2004 35mm Time history at all bed heights FLIC1 D (Ver2.1 c) - SLJW1C
Figure 6.8: Predicted solid bed fixed carbon distribution in the fixed bed. (a) Case P-10 (10mm); (b) Case P-35 (35mm).
194
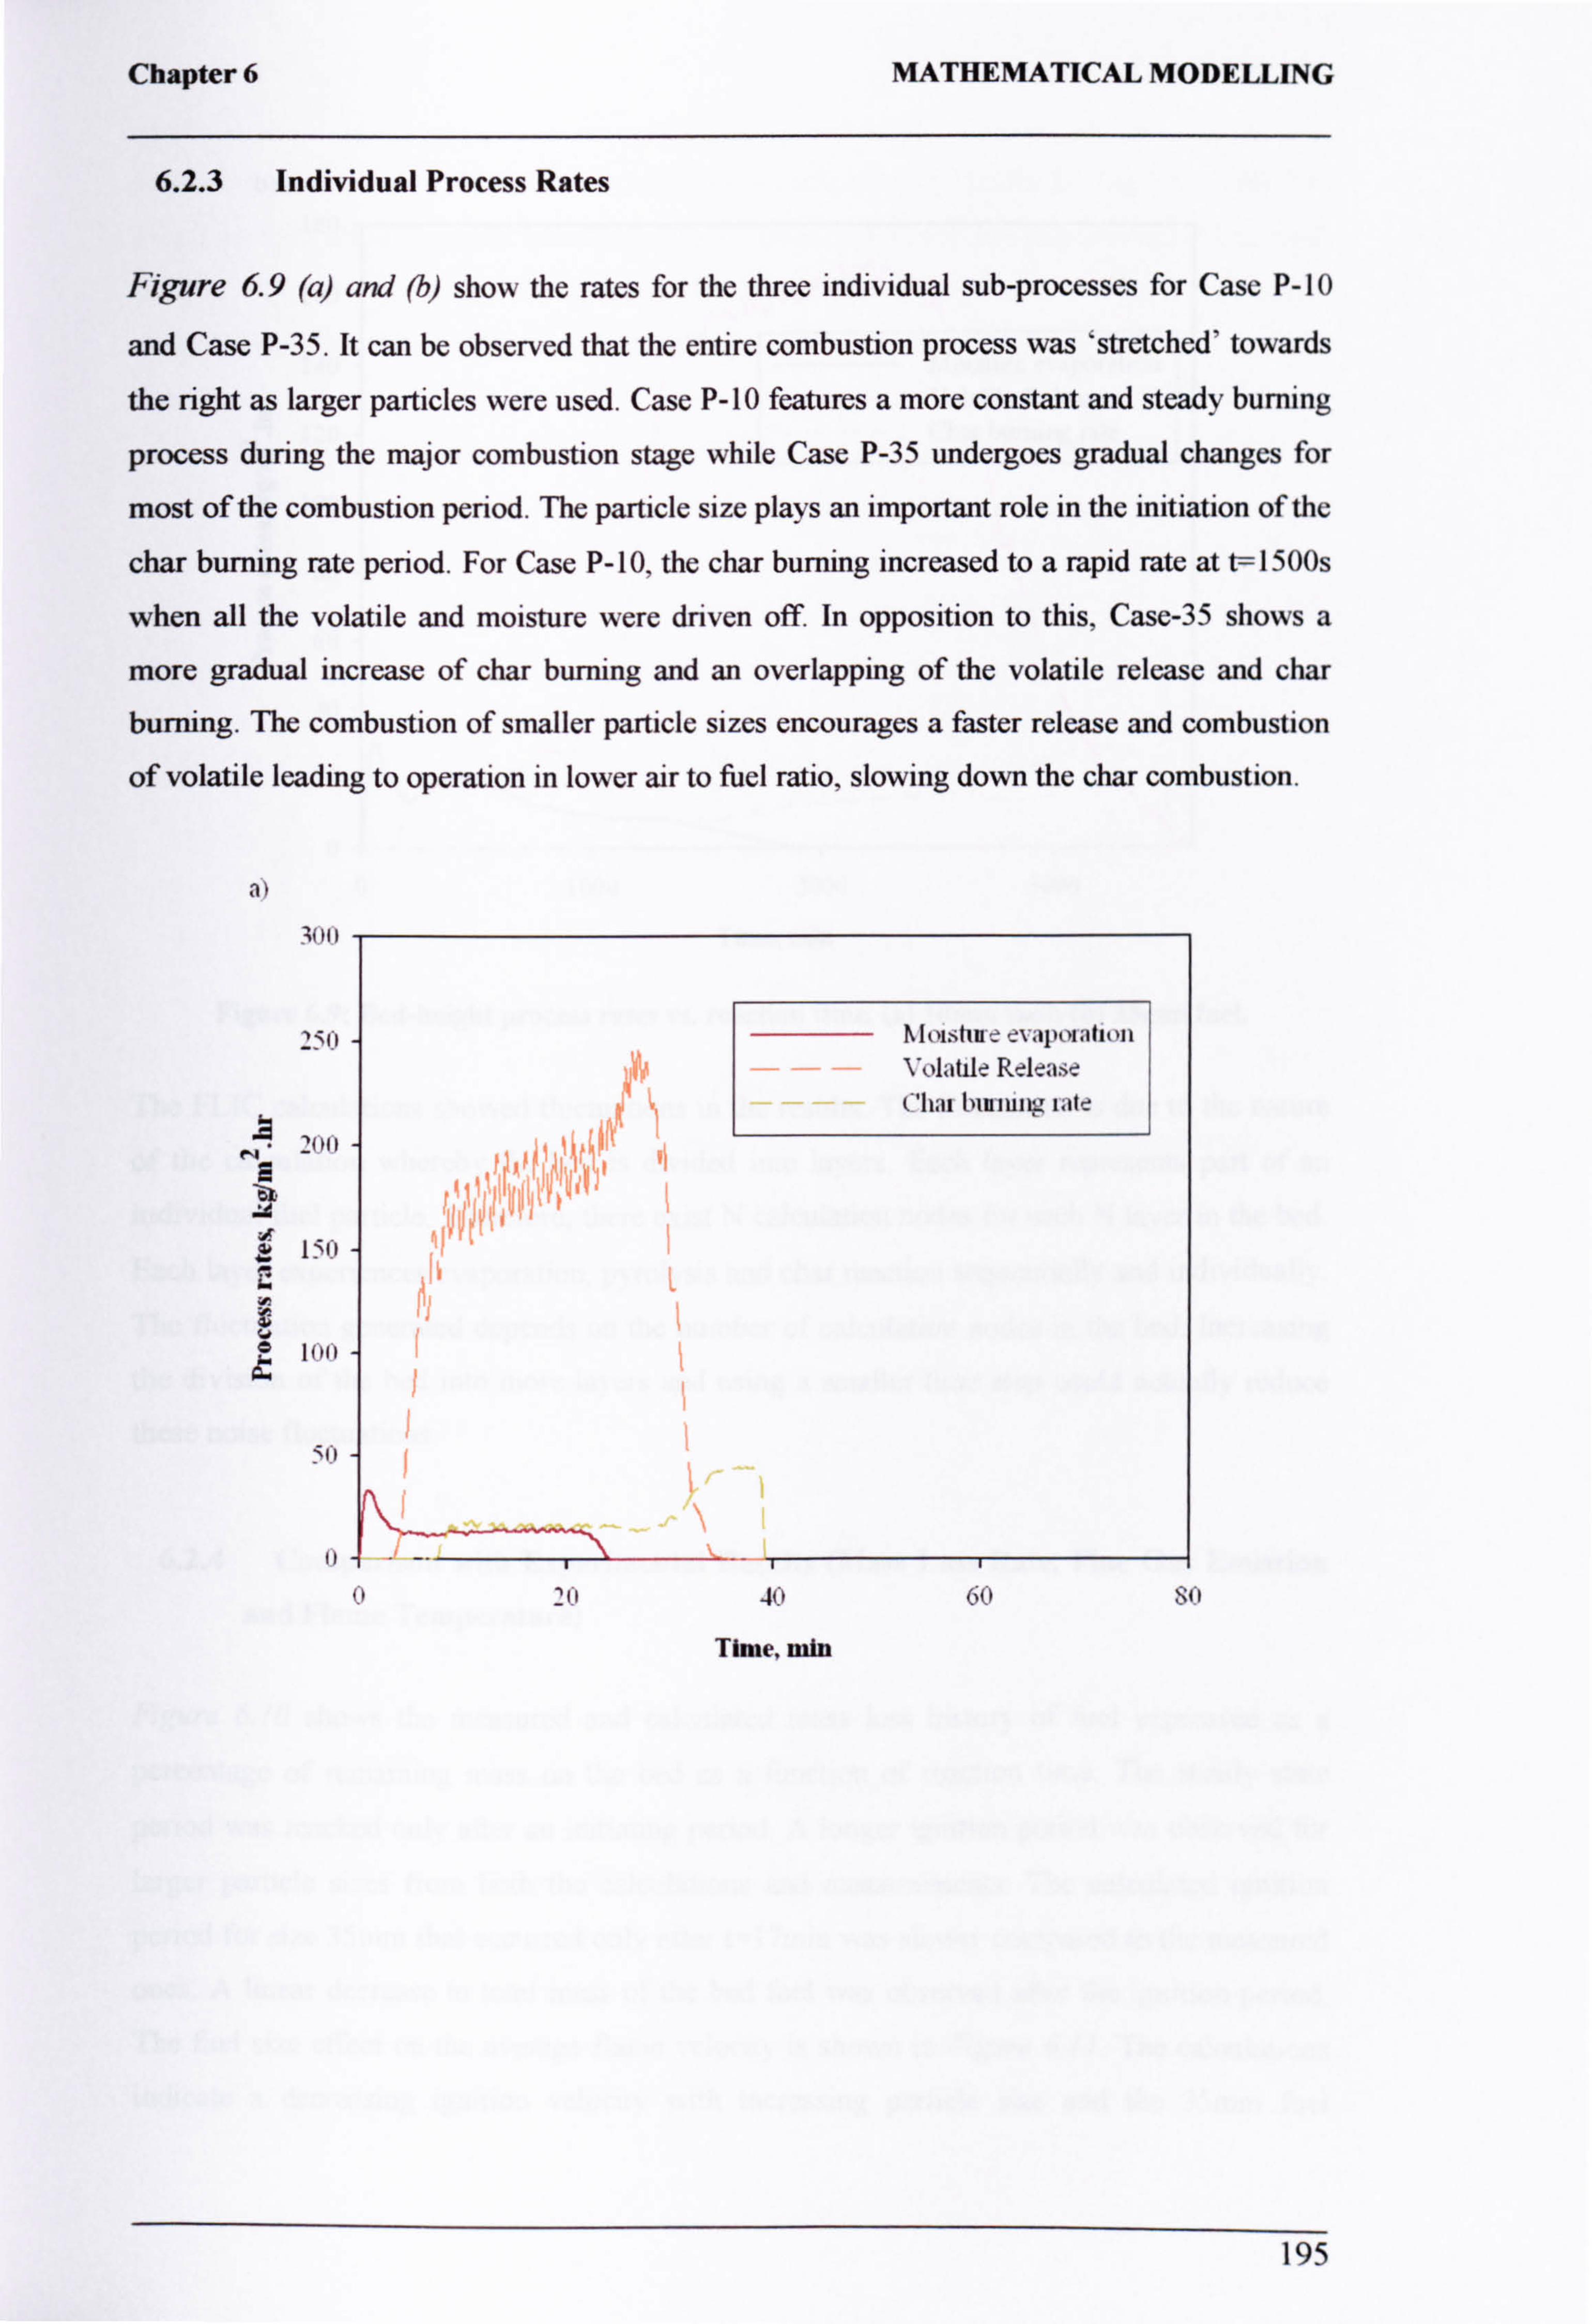
Chapter 6
6.2.3 Individual Process Rates
MATHEMATICAL MODELLING
Figure 6.9 (a) and (b) show the rates for the three individual sub-processes for Case P-10
and Case P-35. It can be observed that the entire combustion process was stretched' towards
the right as larger particles were used. Case P-10 features a more constant and steady burning
process during the major combustion stage while Case P-35 undergoes gradual changes for
most of the combustion period. The particle size plays an important role in the initiation of the
char burning rate period. For Case P-10, the char burning increased to a rapid rate at t=1500s
when all the volatile and moisture were driven off. In opposition to this, Case-35 shows a
more gradual increase of char burning and an overlapping of the volatile release and char
burning. The combustion of smaller particle sizes encourages a faster release and combustion
of volatile leading to operation in lower air to fuel ratio, slowing down the char combustion.
e) 3011
251)
N _'1N)
E
10))
SO
I'IOtshnz. e\: lpolahun Volatile Release ('hai btniung ratz
Sii i iii 40 60
Time, min
195
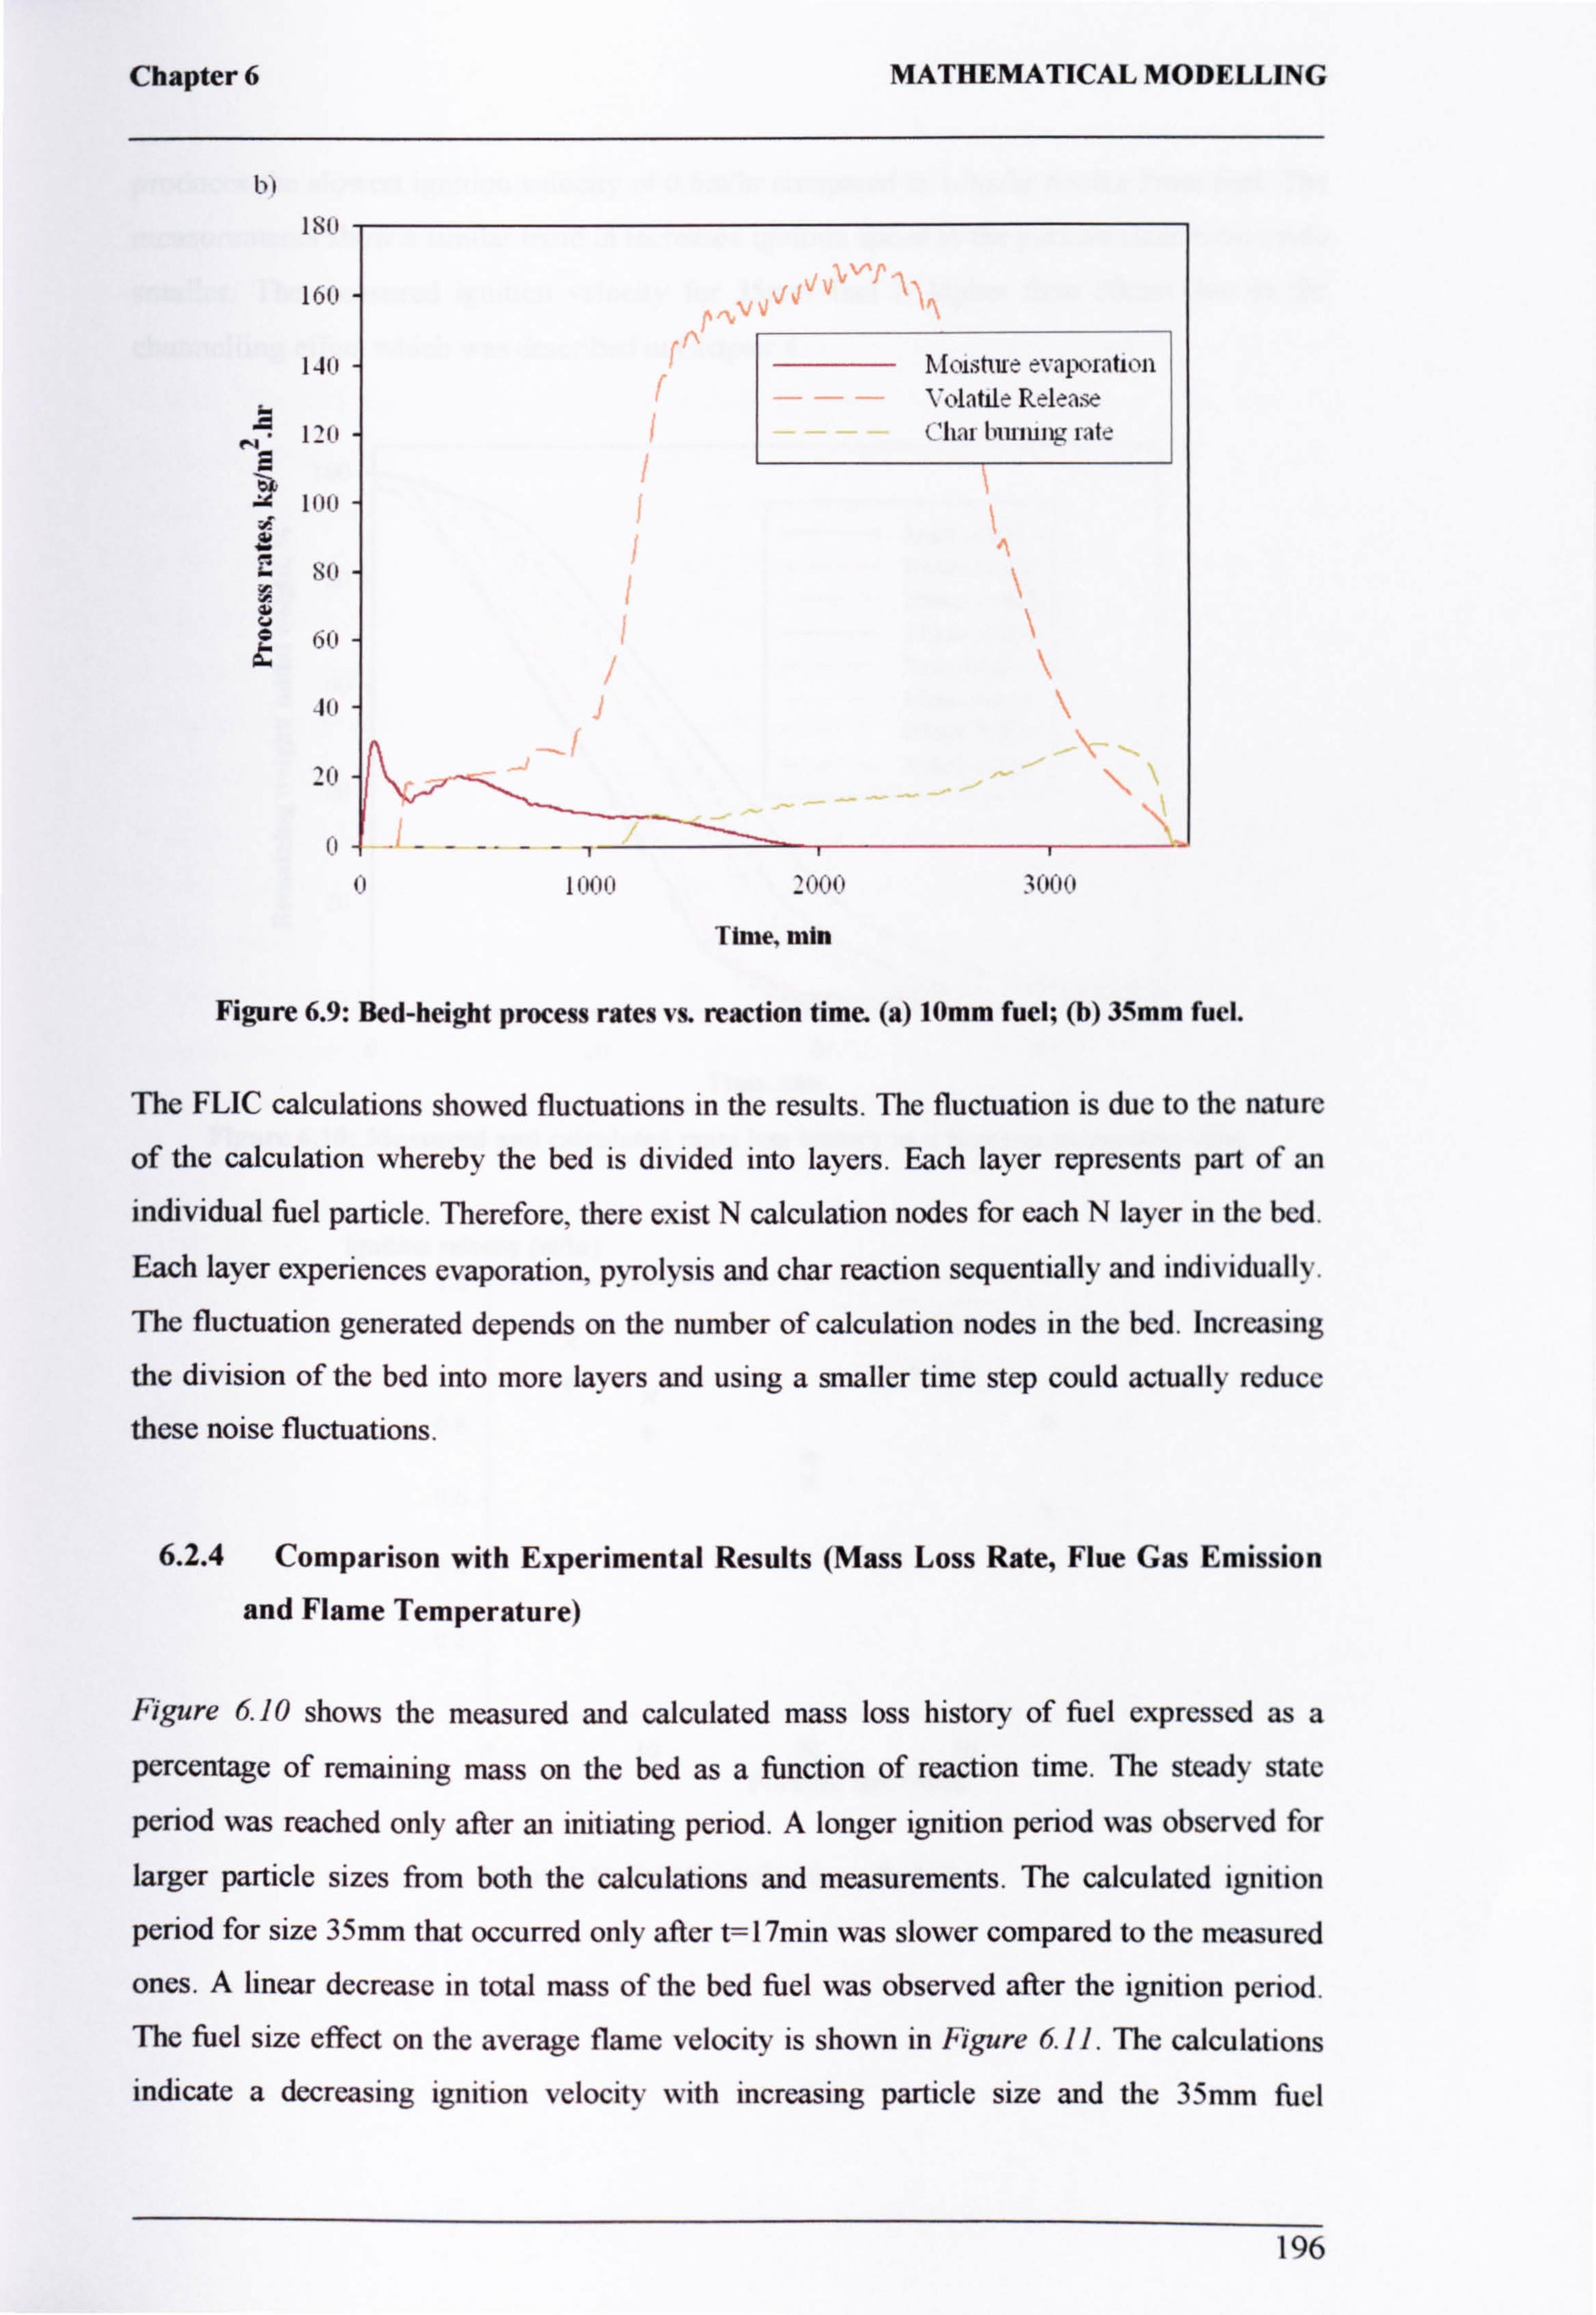
Chapter 6 MATHEMATICAL MODELLING
b 1811
161)
1-W
1211 4.4
8
u 60
Time, min
Figure 6.9: Bed-height process rates vs. reaction time. (a) 10mm fuel; (b) 35mm fuel.
The FLIC calculations showed fluctuations in the results. The fluctuation is due to the nature
of the calculation whereby the bed is divided into layers. Each layer represents part of an
individual fuel particle. Therefore, there exist N calculation nodes for each N layer in the bed.
Each layer experiences evaporation, pyrolysis and char reaction sequentially and individually.
The fluctuation generated depends on the number of calculation nodes in the bed. Increasing
the division of the bed into more layers and using a smaller time step could actually reduce
these noise fluctuations.
6.2.4 Comparison with Experimental Results (Mass Loss Rate, Flue Gas Emission
and Flame Temperature)
Figure 6.10 shows the measured and calculated mass loss history of fuel expressed as a
percentage of remaining mass on the bed as a function of reaction time. The steady state
period was reached only after an initiating period. A longer ignition period was observed for
larger particle sizes from both the calculations and measurements. The calculated ignition
period for size 35mm that occurred only after t=l7min was slower compared to the measured
ones. A linear decrease in total mass of the bed fuel was observed after the ignition period. The fuel size effect on the average flame velocity is shown in Figure 6.11. The calculations indicate a decreasing ignition velocity with increasing particle size and the 35mm fuel
20
Dfoishue eýalxýration Volatile Release C7ºa, biuiung rate
0 fill-11.1 2000 2(1(i(i
196
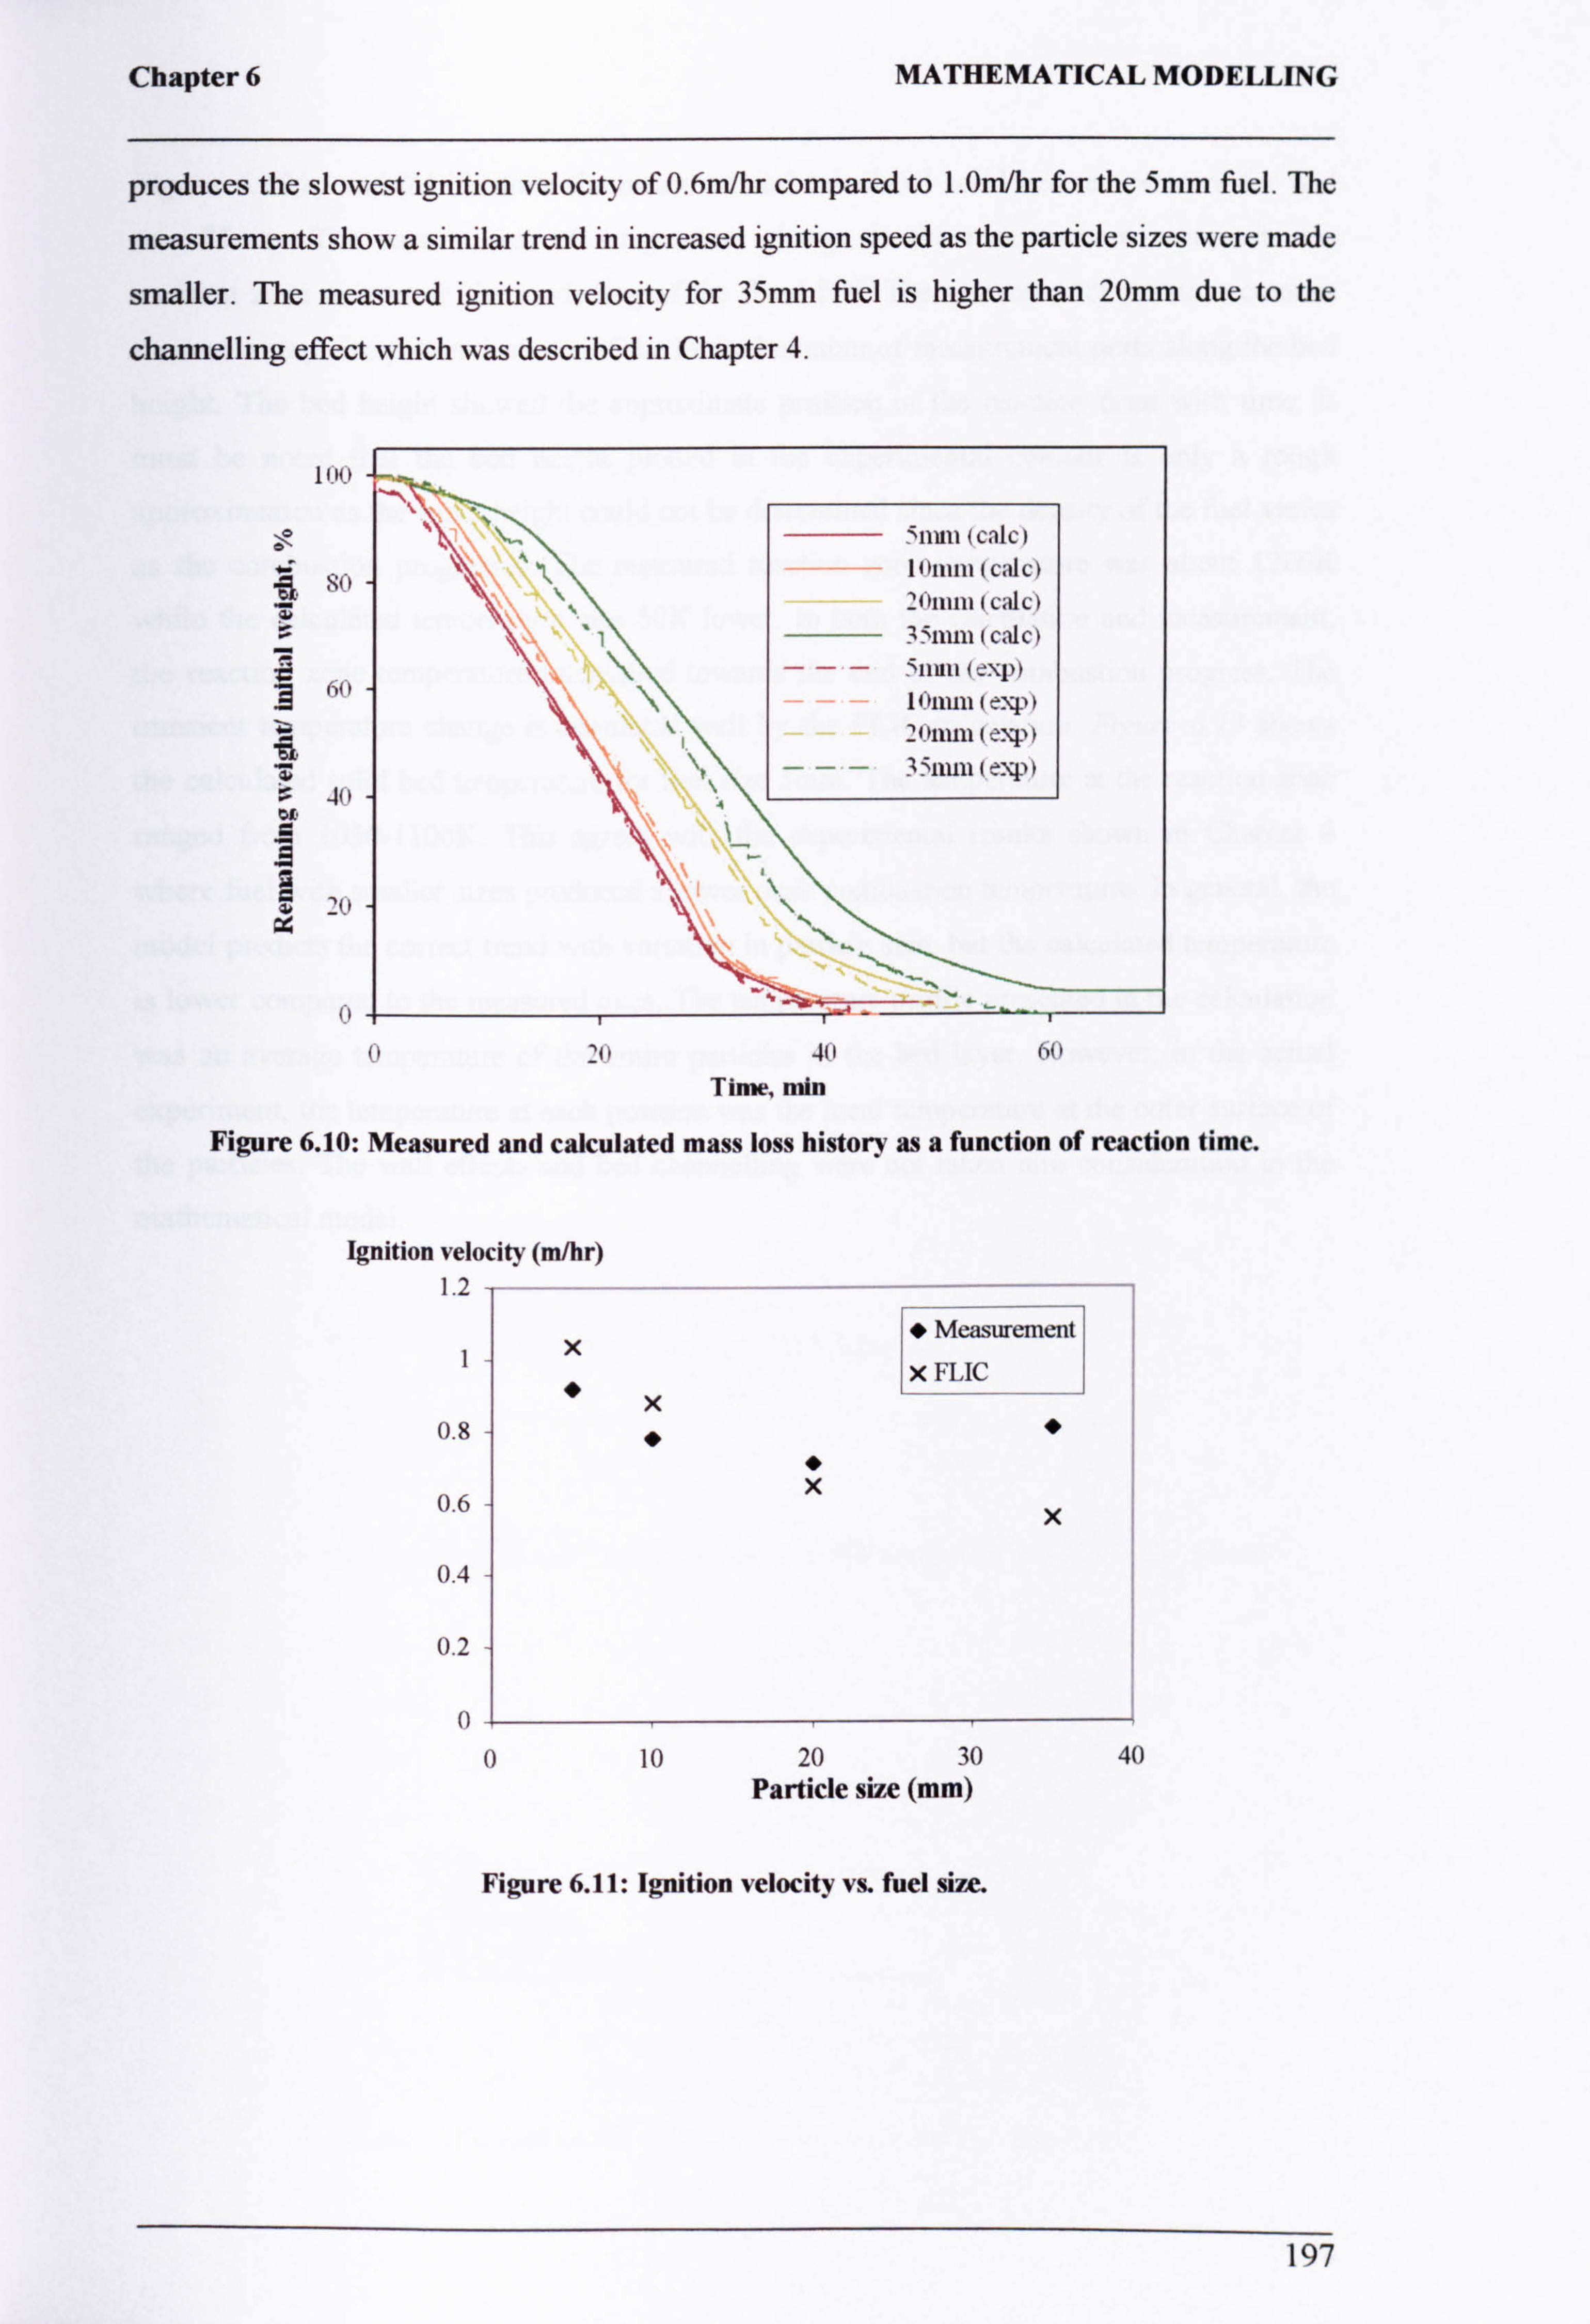
Chapter 6 MATHEMATICAL MODELLING
produces the slowest ignition velocity of 0.6m/hr compared to l. Om/hr for the 5mm fuel. The
measurements show a similar trend in increased ignition speed as the particle sizes were made
smaller. The measured ignition velocity for 35mm fuel is higher than 20mm due to the
channelling effect which was described in Chapter 4.
1(14)
e
w
. gk, ti() T
öL äý
oca
y 'll OG
5uuu ( calc 1l)uuu(cac) 'Omlu (caic) 3l uu (calc )
--- 5uuu(exp) l"nulllexpl 2 "lum l ex,
--- 35llllll(exp)
`ý, \ `ý
,ý ti
.ý
.. ý\
40 64) Time, min
Figure 6.10: Measured and calculated mass loss history as a function of reaction time.
Ignition velocity (m/hr) 1.2
" Measurement 1x
x FLIC x
0.8
X 0.6 x
0.4
0.2
0
0 10 20 30 40
Particle size (mm)
Figure 6.11: Ignition velocity vs. fuel size.
197
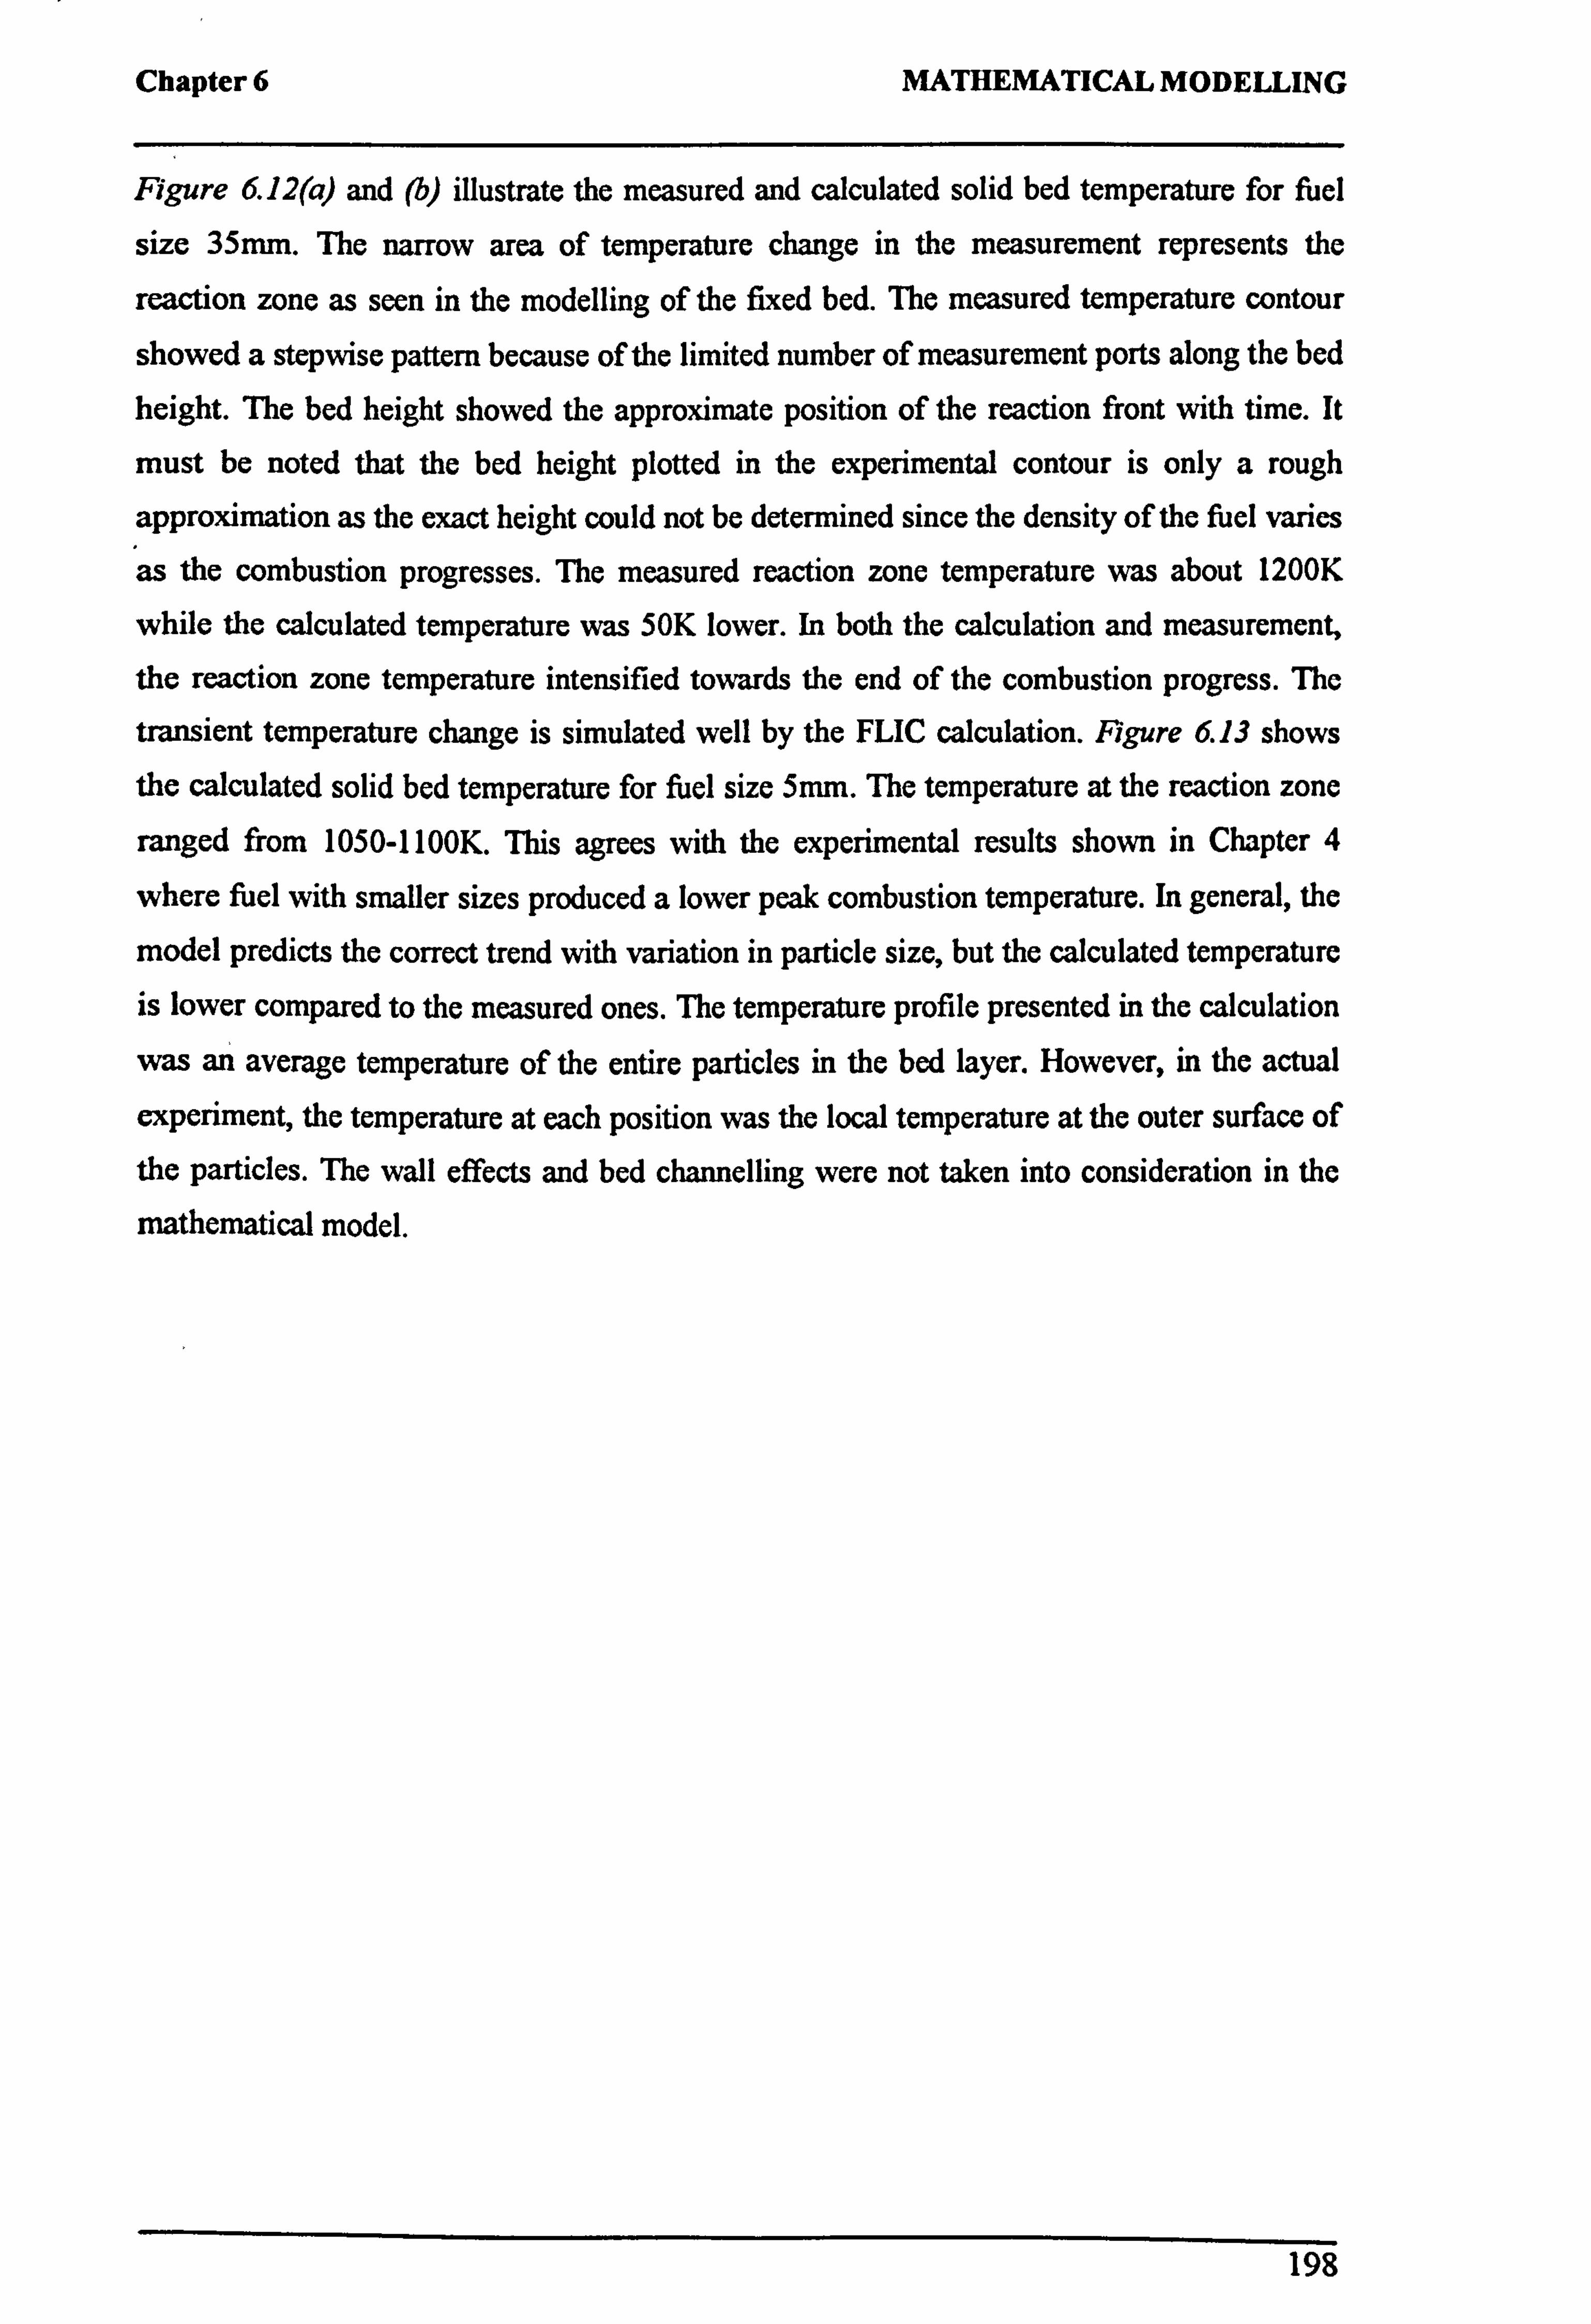
Chapter 6 MATHEMATICAL MODELLING
Figure 6.12(a) and (b) illustrate the measured and calculated solid bed temperature for fuel
size 35mm. The narrow area of temperature change in the measurement represents the
reaction zone as seen in the modelling of the fixed bed. The measured temperature contour
showed a stepwise pattern because of the limited number of measurement ports along the bed
height. The bed height showed the approximate position of the reaction front with time. It
must be noted that the bed height plotted in the experimental contour is only a rough
approximation as the exact height could not be determined since the density of the fuel varies
as the combustion progresses. The measured reaction zone temperature was about 1200K
while the calculated temperature was 50K lower. In both the calculation and measurement, the reaction zone temperature intensified towards the end of the combustion progress. The
transient temperature change is simulated well by the FLIC calculation. Figure 6.13 shows the calculated solid bed temperature for fuel size 5mm. The temperature at the reaction zone
ranged from 1050-1100K. This agrees with the experimental results shown in Chapter 4
where fuel with smaller sizes produced a lower peak combustion temperature. In general, the
model predicts the correct trend with variation in particle size, but the calculated temperature is lower compared to the measured ones. The temperature profile presented in the calculation
was an average temperature of the entire particles in the bed layer. However, in the actual
experiment, the temperature at each position was the local temperature at the outer surface of the particles. The wall effects and bed channelling were not taken into consideration in the
mathematical model.
198
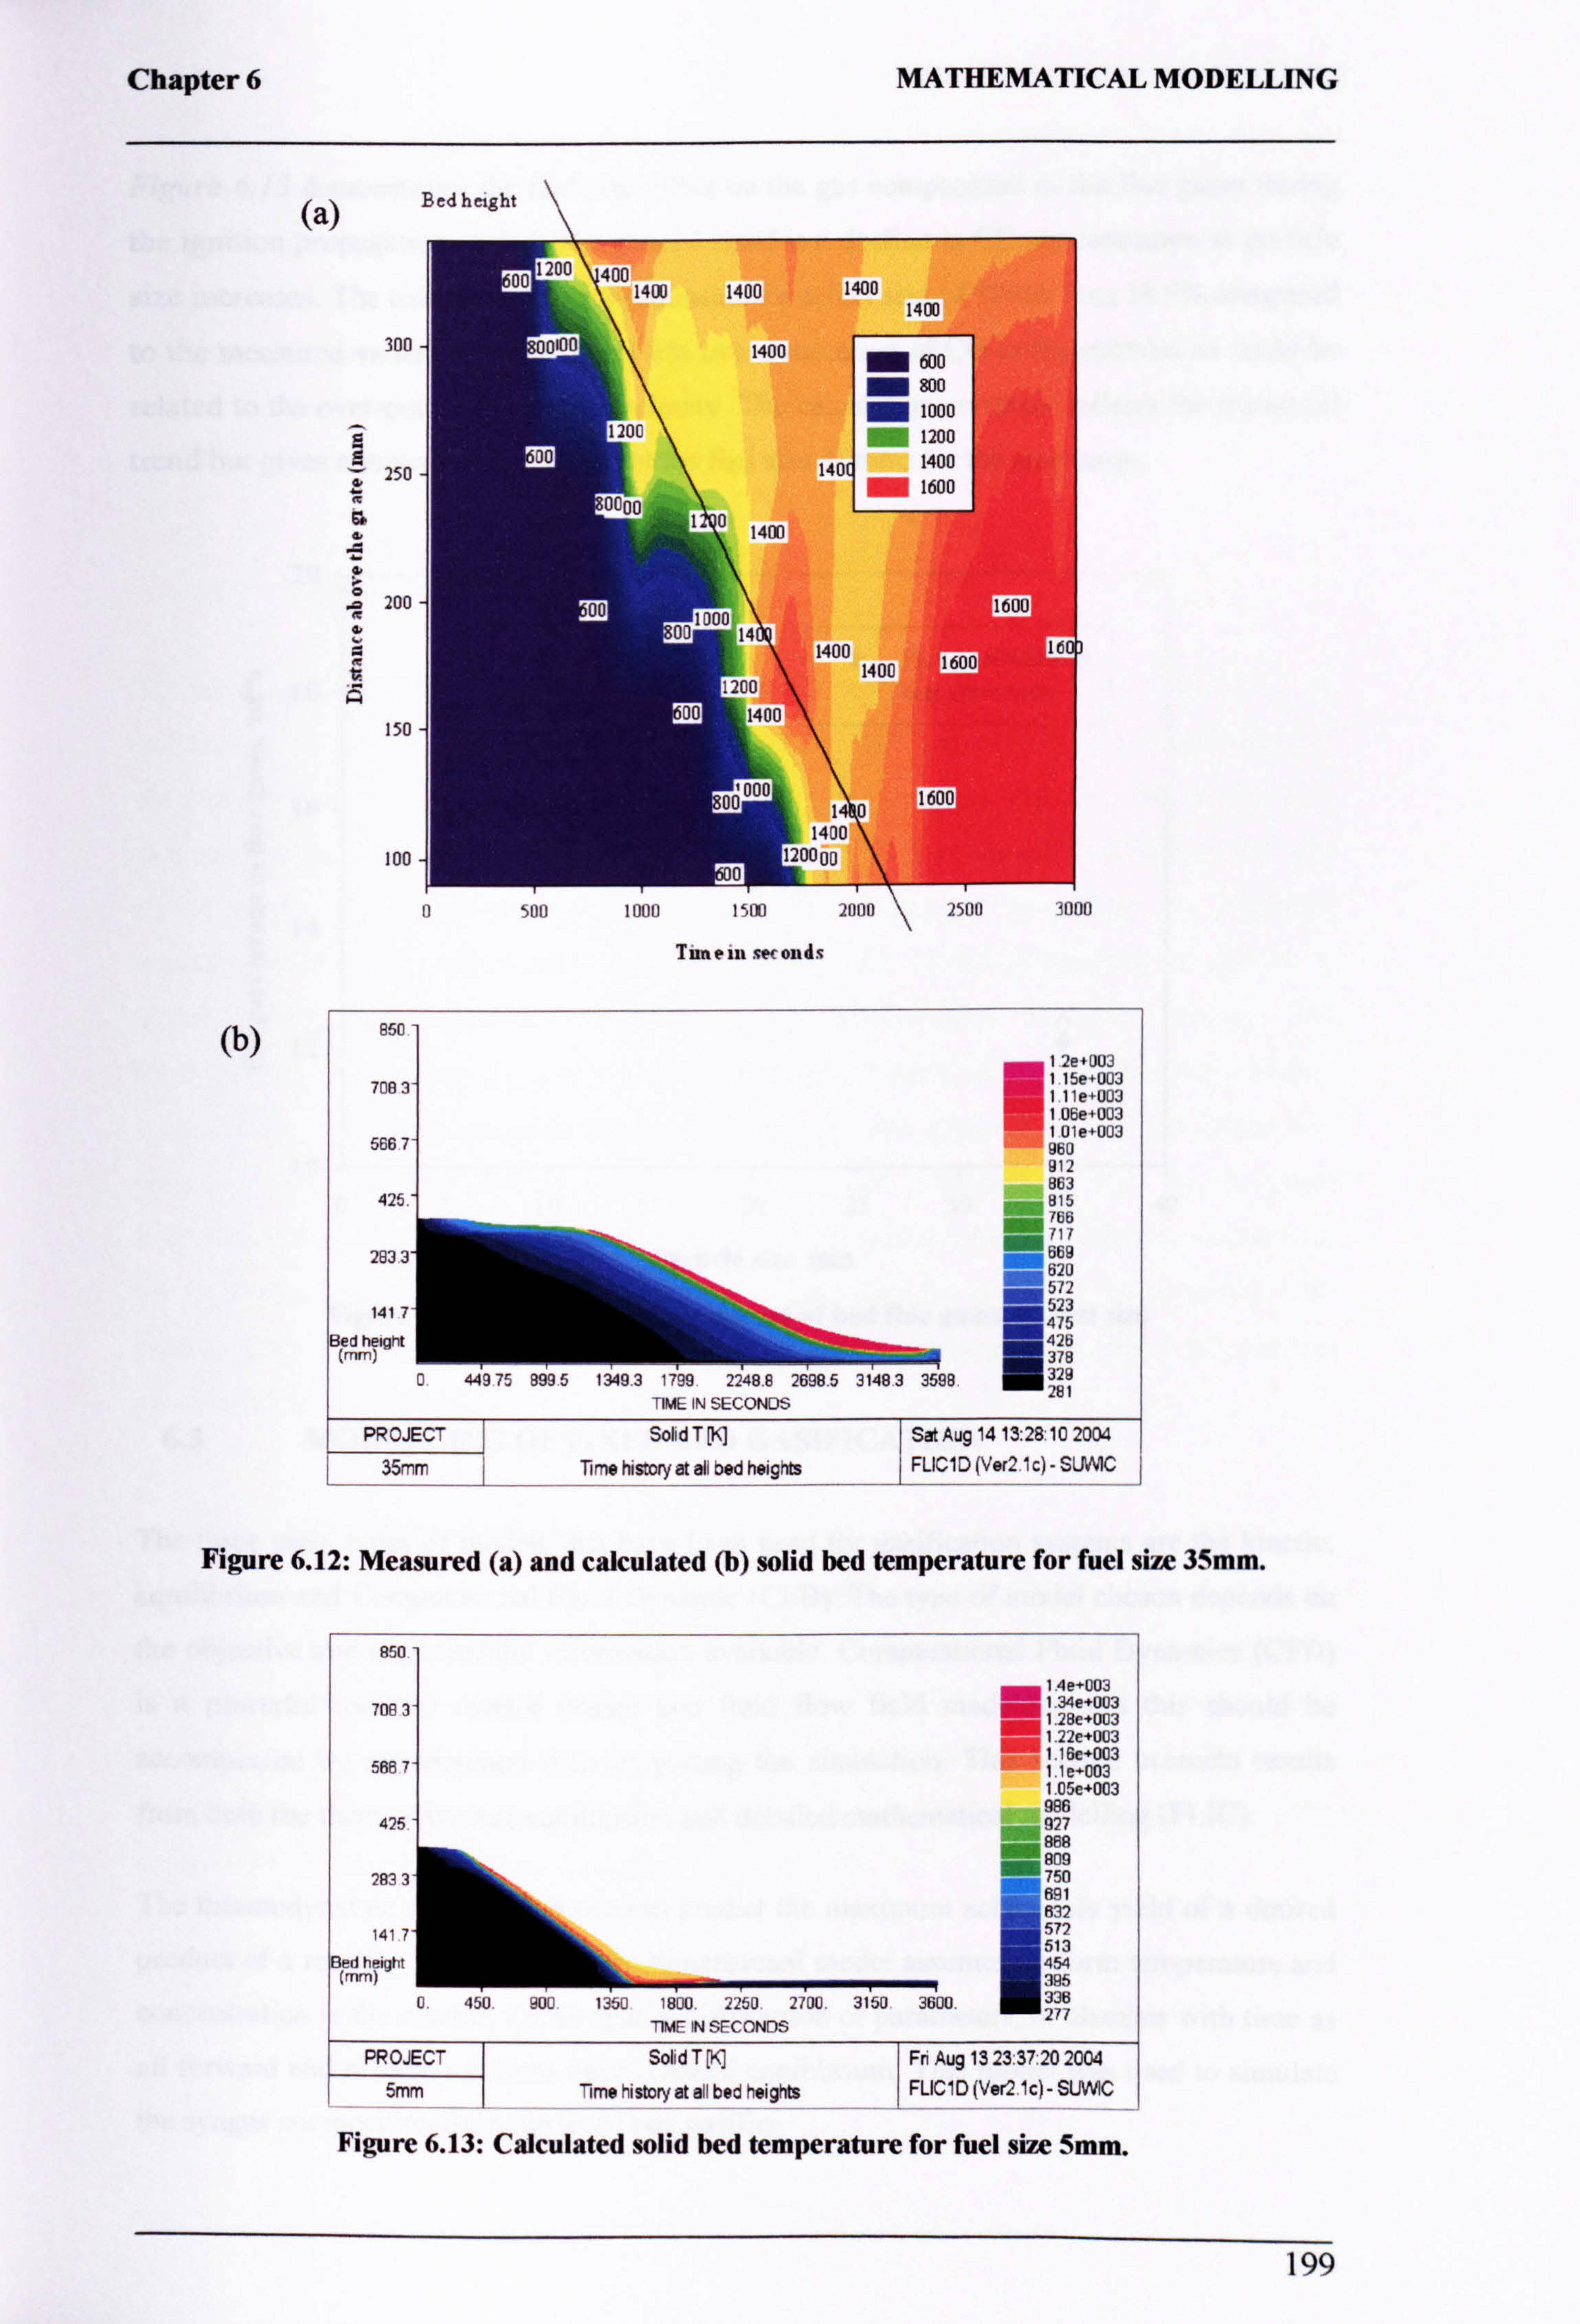
Chapter 6 MATHEMATICAL MODELLING
(a) Bed height
6c
300
250
6º d d p 200 R d
t
150
100
ION Tsai
Tunein rnonds
(b)
Figure 6.12: Measured (a) and calculated (b) solid bed temperature for fuel size 35mm.
951
1.4e*003
700 3 1.34e+003 1.2Be+003 1.22e+003
5867 1.16e+003 1.1 e+003 1.05e+003 986
425 927 989 = 809
281 750 M 1 691 832
141 7 6 572 513
3ed height (mm) hoi,
454 395
1
L iSu dU'_ 1_b- 1800.2250.2700. 3150 3600.330 277
71ME IN SECONDS
PROJECT Solid T [K] Fn Aug 13 23 37,20 2004
5mm Time history at all bed heights FLIC1 D (Ver2 1c) - SUWIC
Figure 6.13: Calculated solid bed temperature for fuel size 5mm.
199
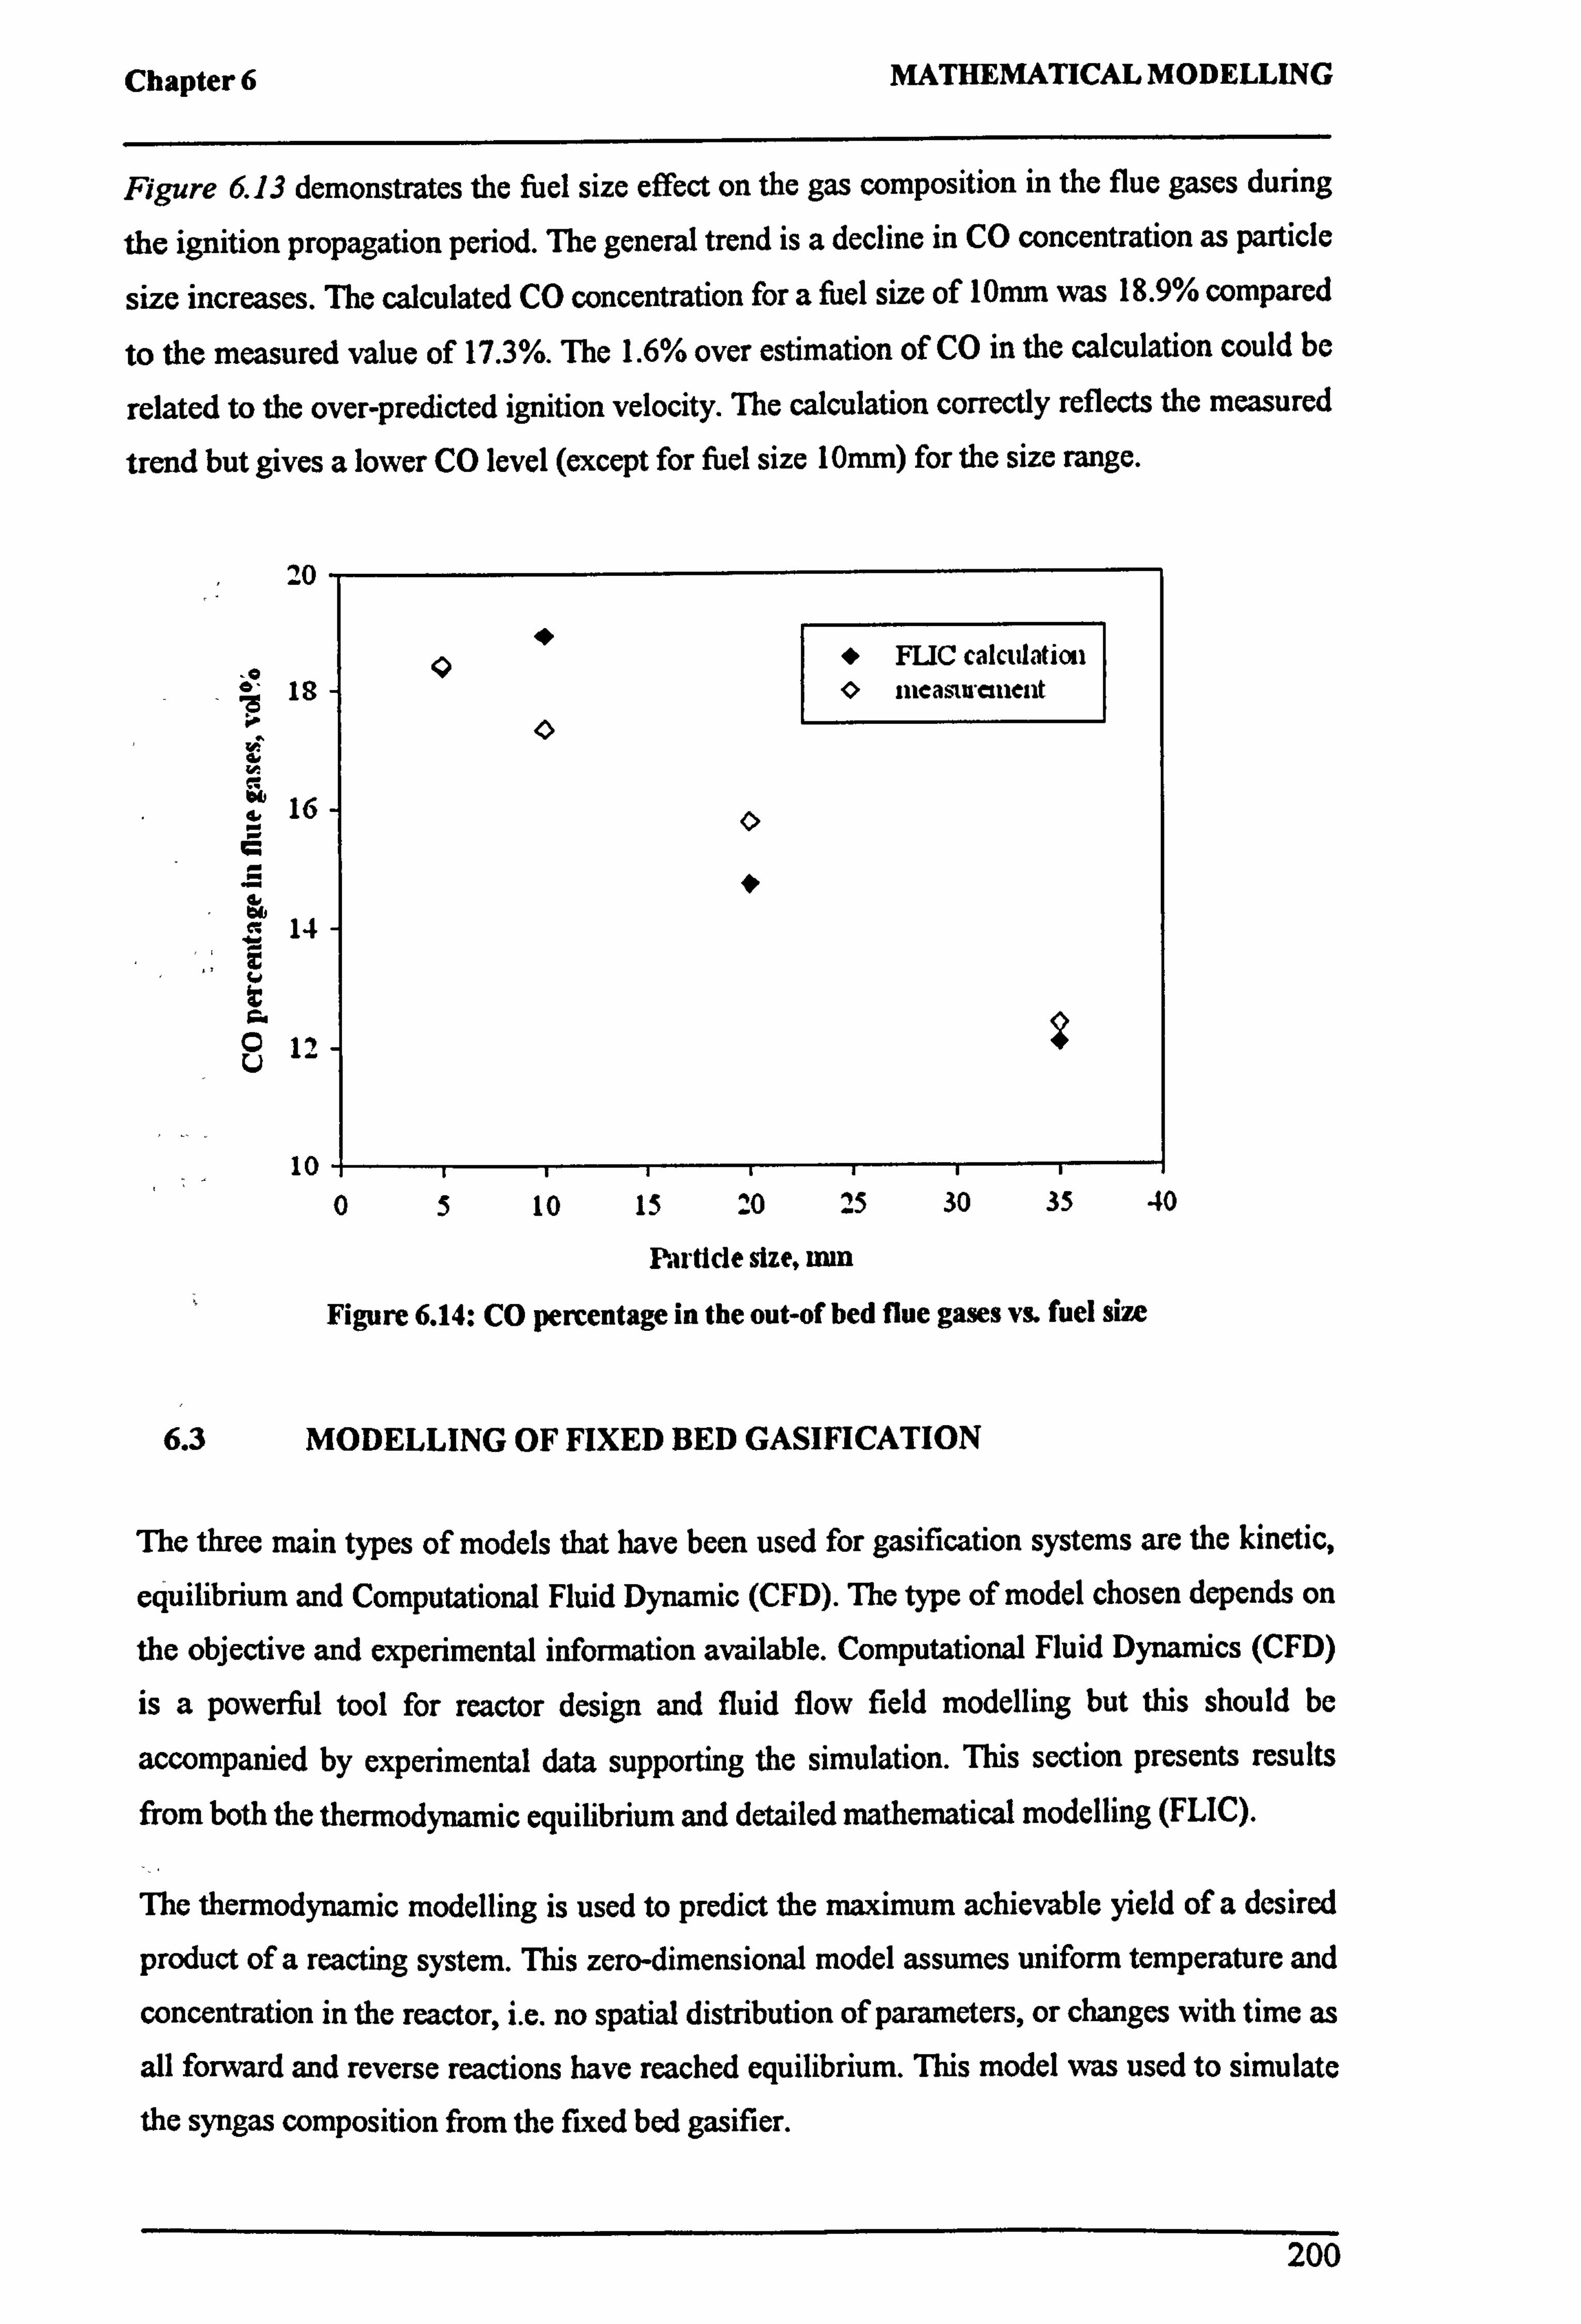
Chapter 6 MATHEMATICAL MODELLING
Figure 6.13 demonstrates the fuel size effect on the gas composition in the flue gases during
the ignition propagation period. The general trend is a decline in CO concentration as particle
size increases. The calculated CO concentration for a fuel size of 10mm was 18.9% compared
to the measured value of 17.3%. The 1.6% over estimation of CO in the calculation could be
related to the over-predicted ignition velocity. The calculation correctly reflects the measured
trend but gives a lower CO level (except for fuel size 10mm) for the size range.
20
18
d 16
c 14 t
V 12
10
0f FLIC calculation O nuaslaauent
O
05 10 15 20 25 30 35 40
Partide size, mm
Figure 6.14: CO percentage in the out-of bed flue gases vs. fuel size
6.3 MODELLING OF FIXED BED GASIFICATION
The three main types of models that have been used for gasification systems are the kinetic,
equilibrium and Computational Fluid Dynamic (CFD). The type of model chosen depends on
the objective and experimental information available. Computational Fluid Dynamics (CFD)
is a powerful tool for reactor design and fluid flow field modelling but this should be
accompanied by experimental data supporting the simulation. This section presents results
from both the thermodynamic equilibrium and detailed mathematical modelling (FLIC).
The thermodynamic modelling is used to predict the maximum achievable yield of a desired
product of a reacting system. This zero-dimensional model assumes uniform temperature and
concentration in the reactor, i. e. no spatial distribution of parameters, or changes with time as
all forward and reverse reactions have reached equilibrium. This model was used to simulate
the syngas composition from the fixed bed gasifier.
200
Chapter 6 MATHEMATICAL MODELLING
The detailed mathematical modelling was carried out using the Fluid Dynamics of Incineration Combustion code (FLIC). The mathematical calculation assumes that the major bed properties, i. e. temperatures of gas and solid phases inside the bed, gas composition and
solid composition can be described one dimensionally as functions of bed height. FLIC was
used to provide information on the reactor temperature, product composition at different
positions along the reactor and carbon conversion rate.
6.3.1 Chemical Equilibrium Modelling
The chemical equilibrium for a system is most stable when the entropy of the system is
maximized, while the Gibbs free energy is minimized. Two approaches have been developed
for equilibrium modelling: stoichiometric and non stoichiometric. The chemical equilibrium
calculations were carried out using version 2 of NASA Glenn's computer program Chemical
Equilibrium with Application (CEA) [2002]. The equations describing the chemical
equilibrium and the mathematical solutions used in the CEA2 programme is outline in
Appendix B. I. The equations are based on the minimisation of Gibbs' energy. The
information given is from the user's manual (Gordon, 1994). CEA uses a non-stoichiometric formulation to calculate reaction equilibrium based on the minimisation of the Gibbs free
energy. The program obtains chemical equilibrium composition for the assigned thermodynamic state such as temperature and pressure. In the non-stoichiometric calculation,
no particular reaction mechanism or species needs to be specified as required with
equilibrium constants. This method is suitable for gasification reactions where the reaction mechanism is still unclear.
6.3.1.1 Gasification Reactions
The CEA model was used for the equilibrium calculations of some of the main gasification
reactions highlighted by Burgt (2003). A minus sign indicates that heat is generated in the
reaction, a positive sign that the reaction requires heat. The individual reactions were
modelled at various temperatures using the CEA program to determine the equilibrium gas
composition. This allows postulation of the prevailing reactions on the product gas
composition at the experimental gasification temperature.
201
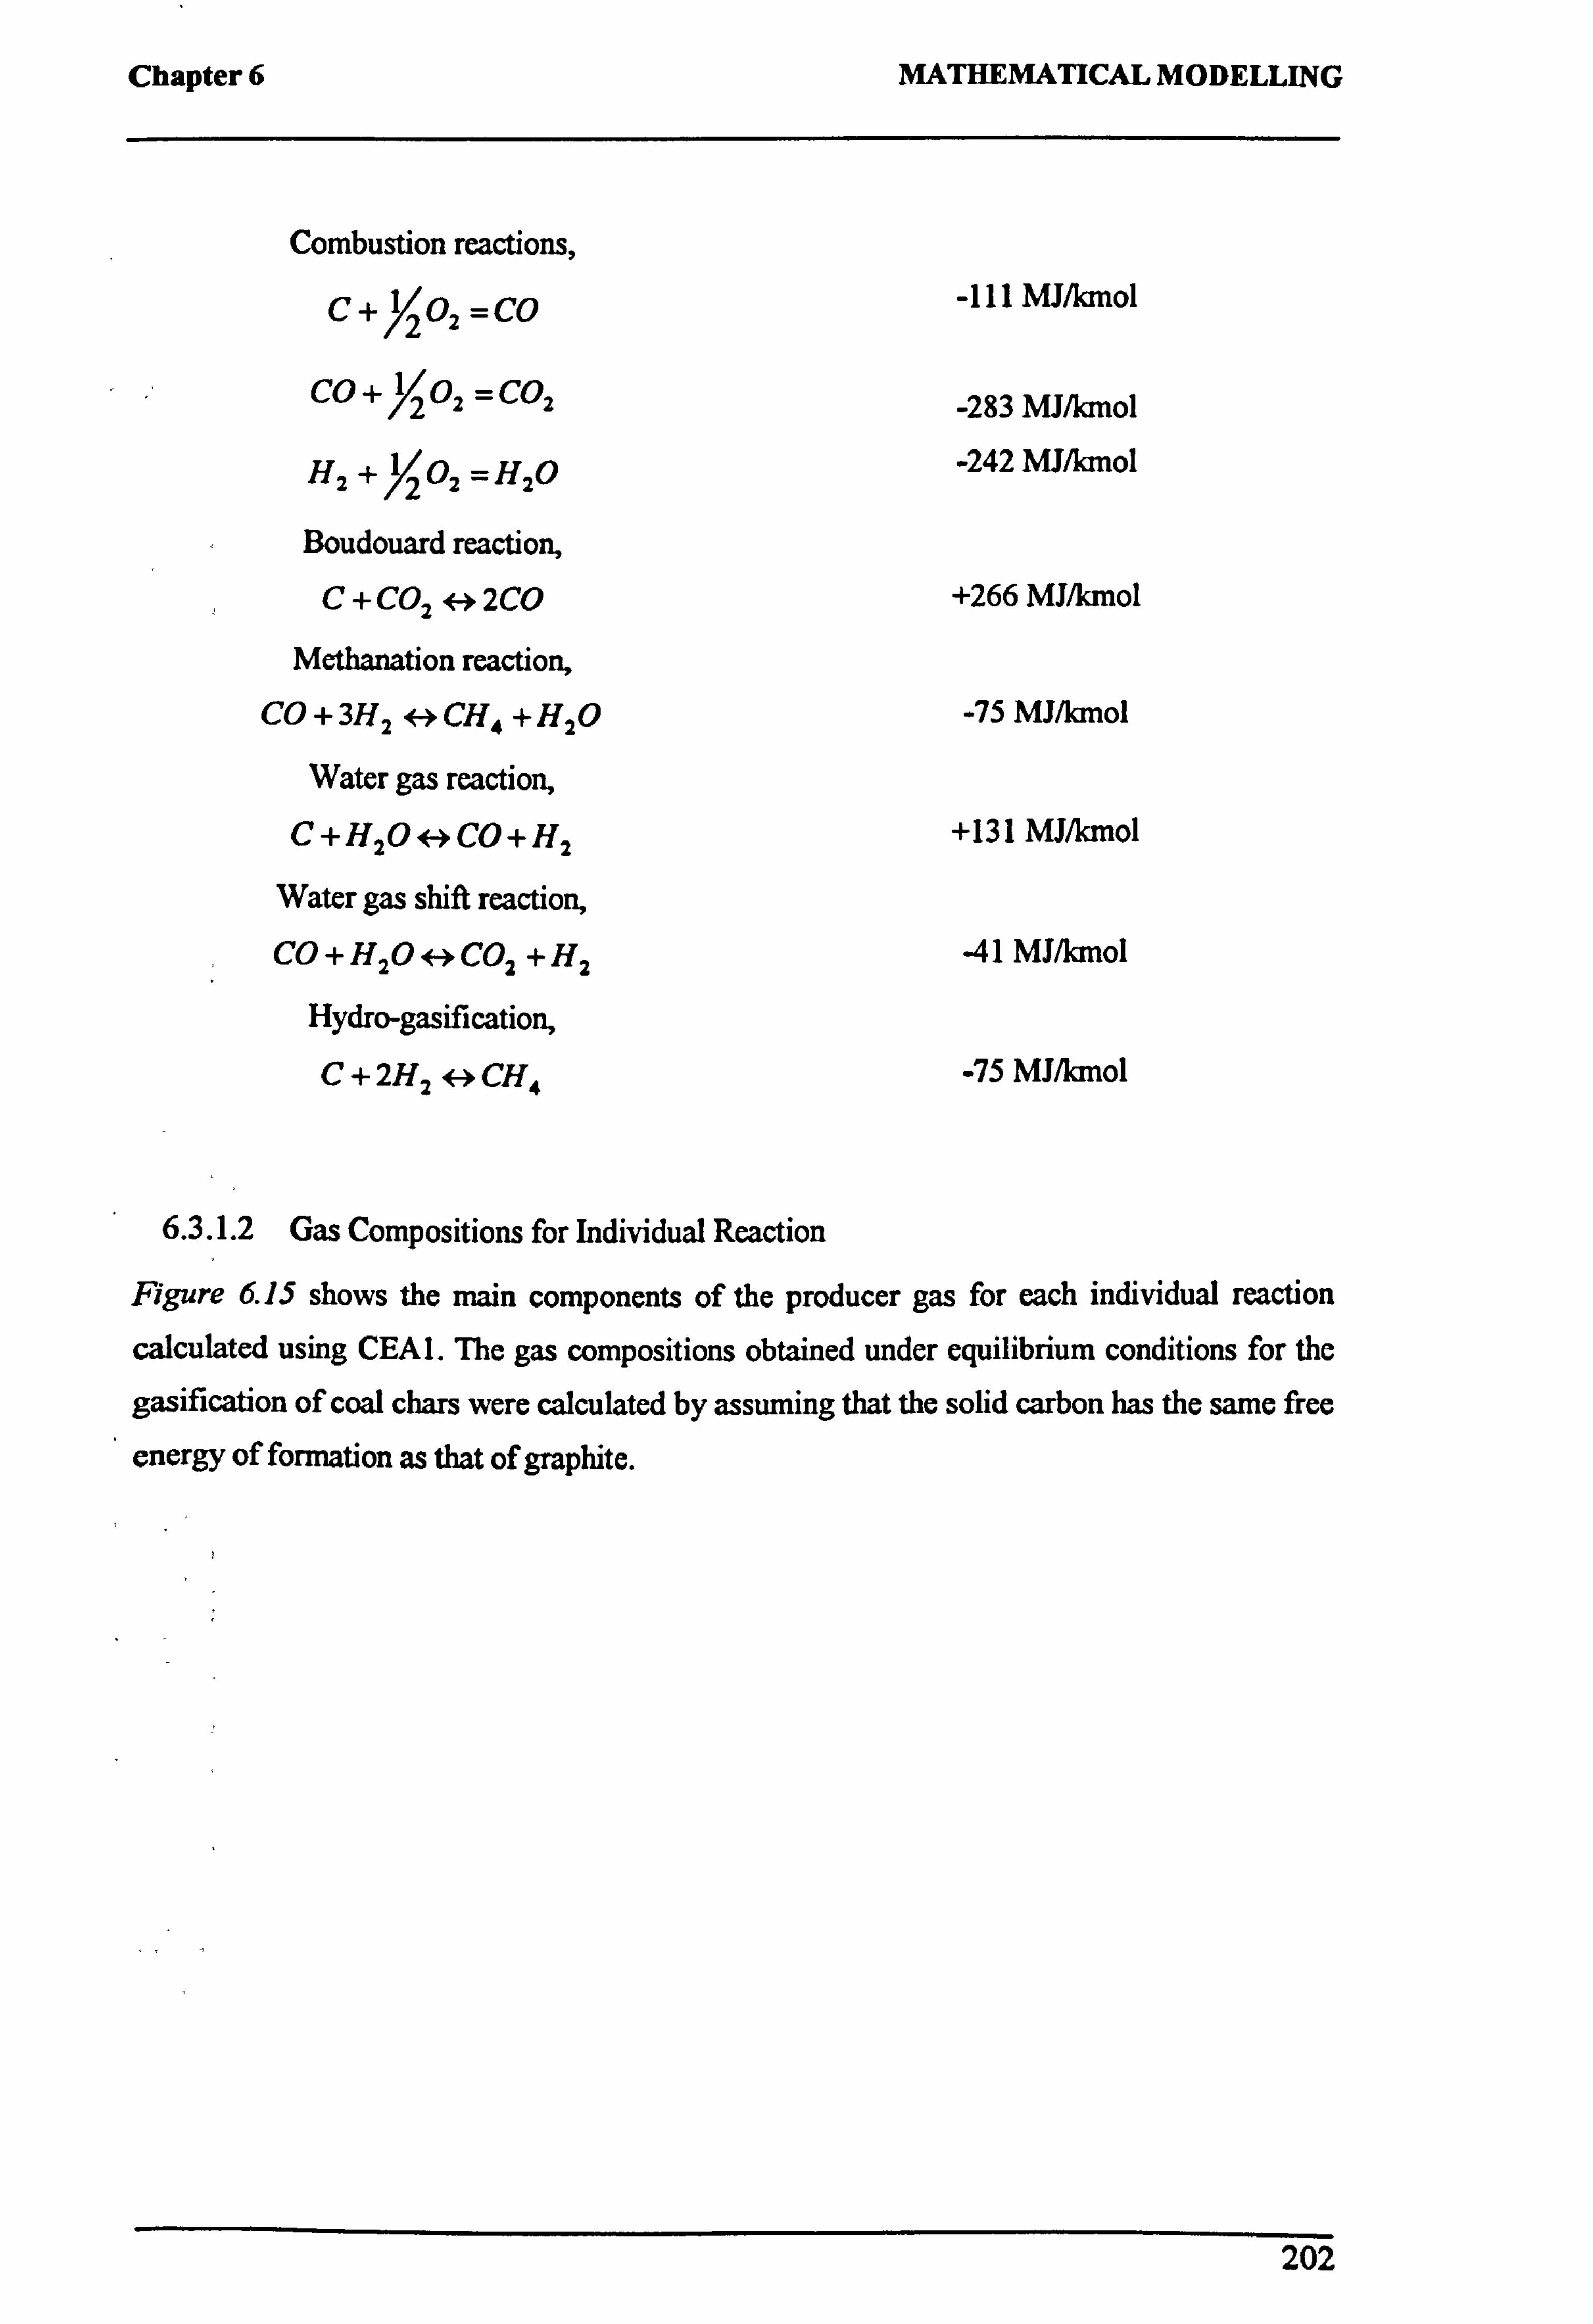
Chapter 6 MATHEMATICAL MODELLING
Combustion reactions,
C+ 12 02 = CO -111 MJ/lanol
CO + 12 02 = C02 -283 MJ/kmol
H2 + 12 02 =H20 -242 MJ/lanol
Boudouard reaction, C+ CO2 H 2CO +266 MJ/kmol
Methanation reaction, CO + 3H2 H CH4 + H2O -75 MJ/lanol
Water gas reaction, C+H2OHCO+H2 +131 MJ/kmol
Water gas shift reaction, CO + H2O H C02 + H2 -41 MJ/kmol
Hydro-gasification,
C+ 2H2 H CH4 -75 MJ/kmol
6.3.1.2 Gas Compositions for Individual Reaction
Figure 6.15 shows the main components of the producer gas for each individual reaction
calculated using CEA1. The gas compositions obtained under equilibrium conditions for the
gasification of coal chars were calculated by assuming that the solid carbon has the same free
energy of formation as that of graphite.
202
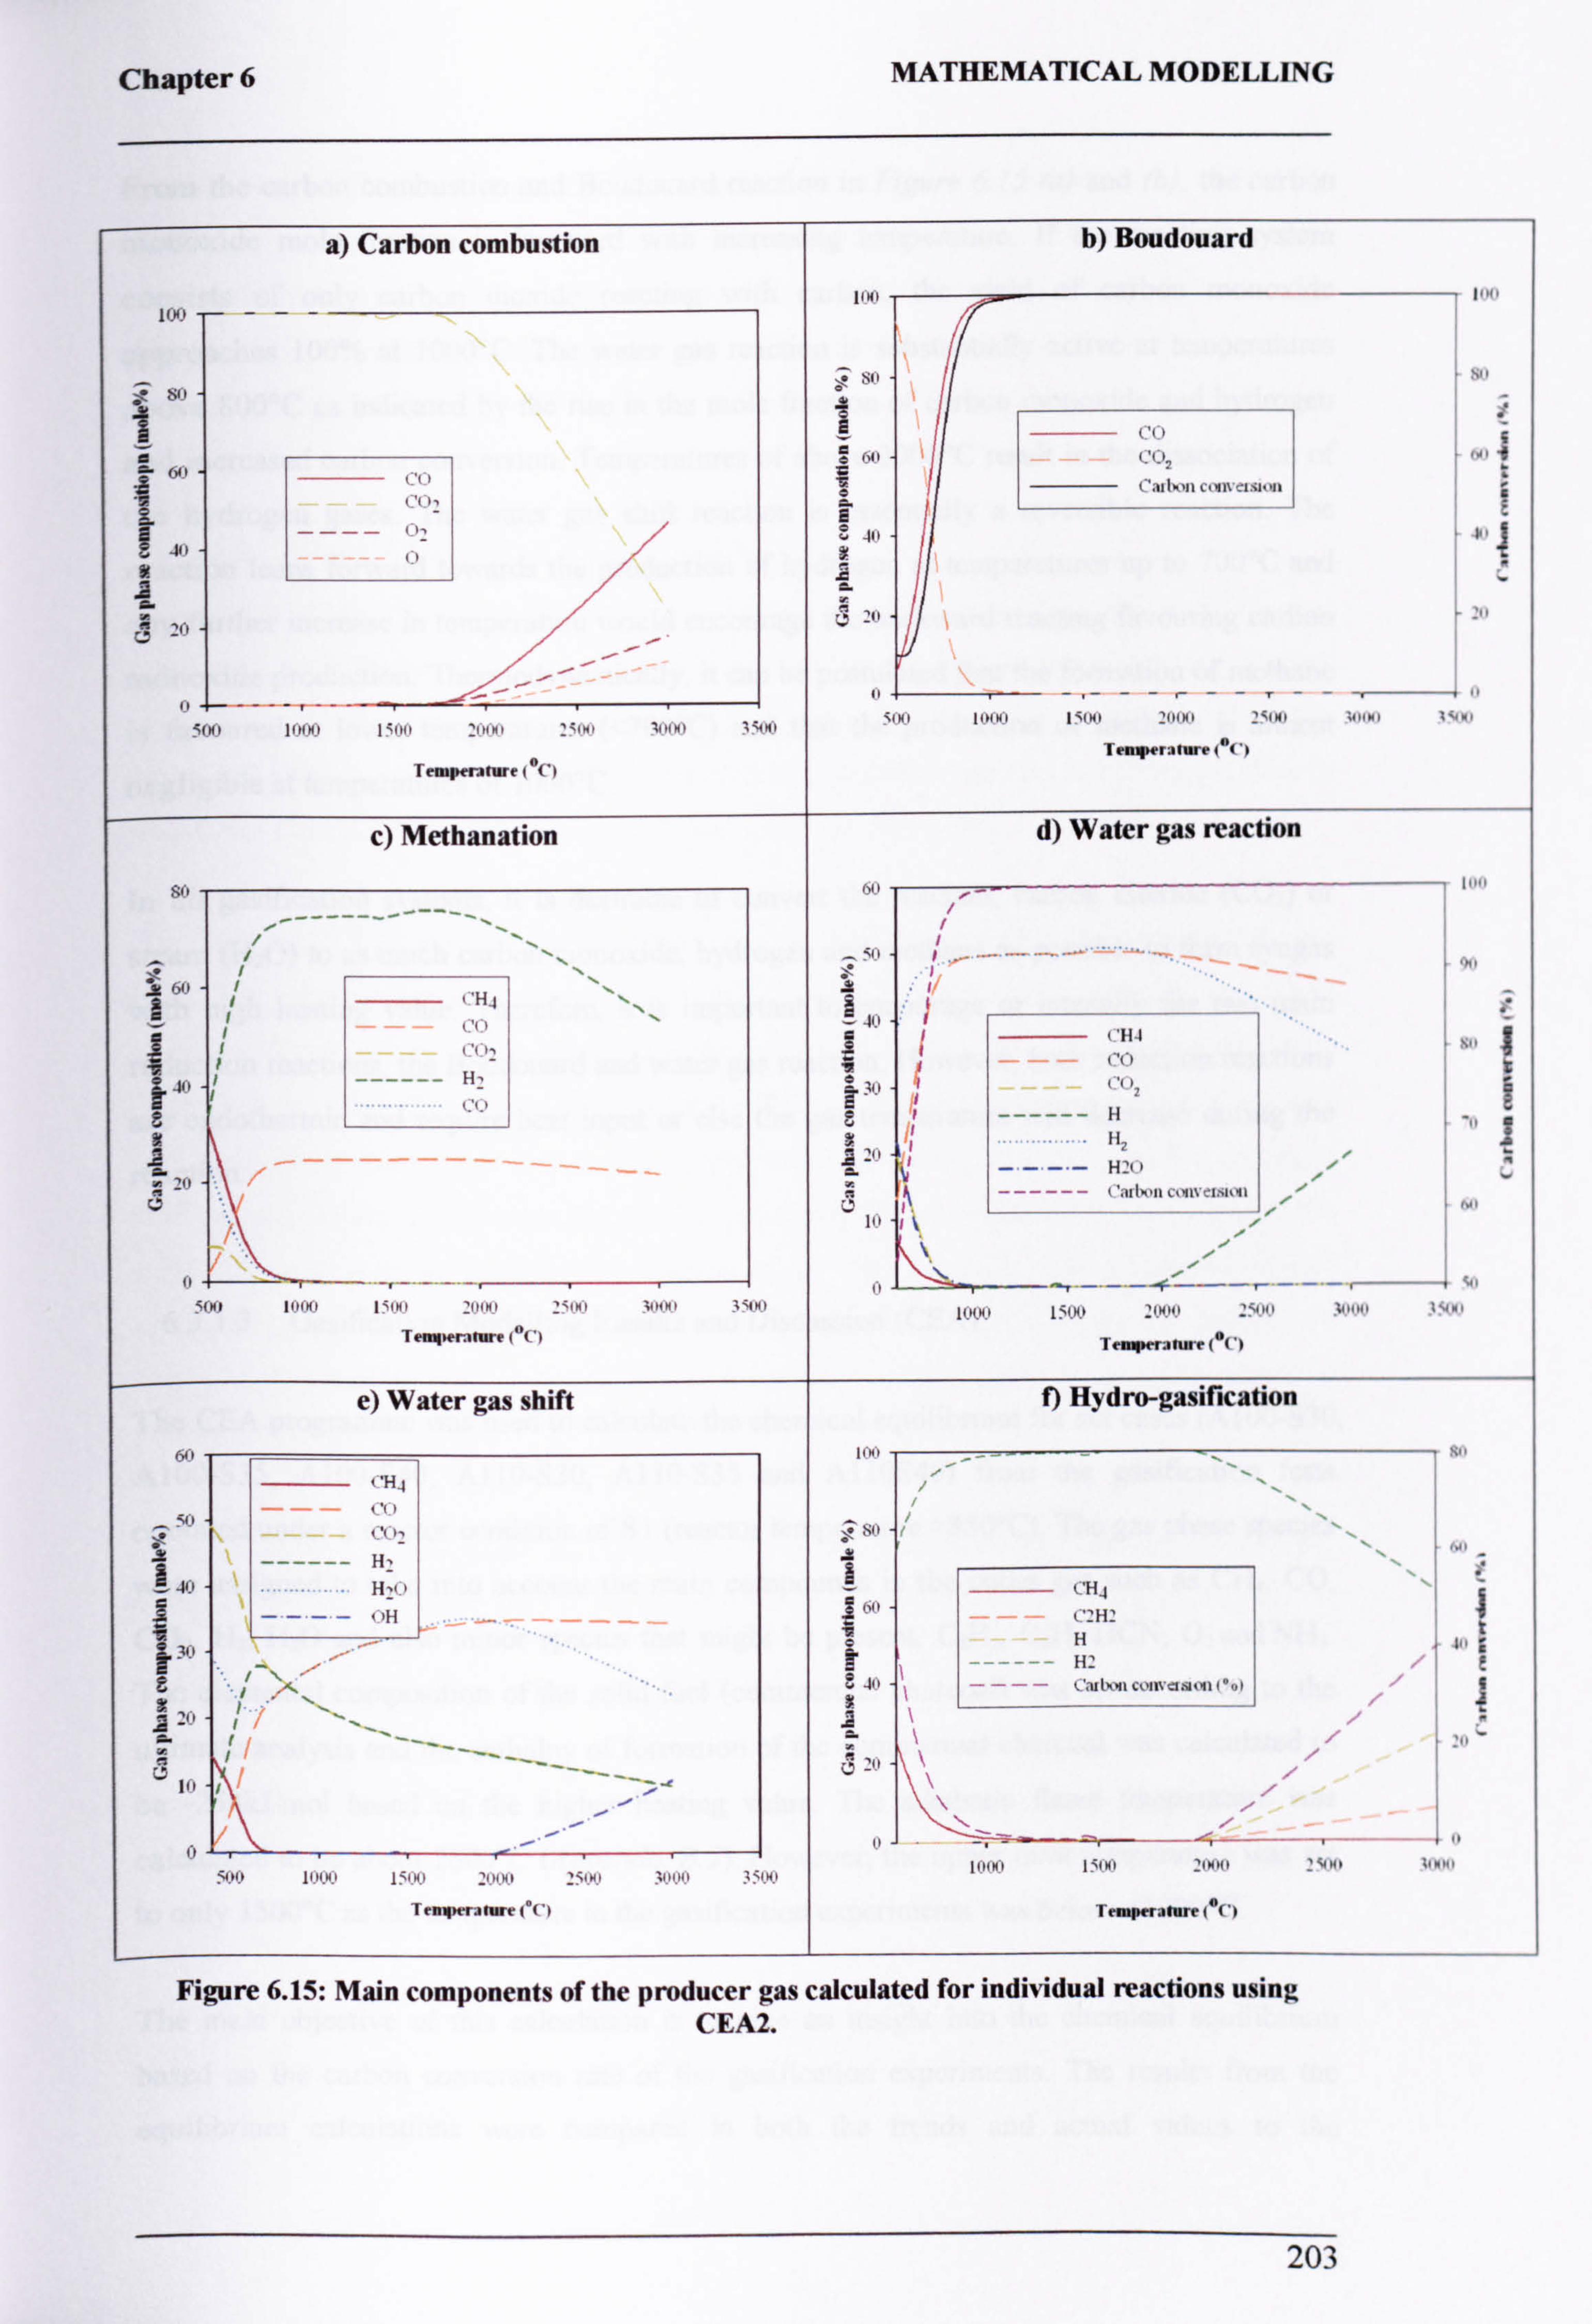
Chapter 6 MATHEMATICAL MODELLING
a) Carbon combustion b) Boudouard
___. -__- IINI
1(X. 1 -- 11 NI
e \11 \11
O
ý'' ccl
p (J11 (0, nll
g "91 CO
"MIX, n hylcalslým L , ,
u c° an 4t -0' 11
ý f
a
Cý - =11
11 - ý- ----r-- r--ý u
5(NI 1111X1 (11111 ýI. IIMI +ýIN1 ýI IINI i ? INI i1 Nl (III Ni (: INI ? 111X1 2i1N1 bbliNI 74M1
Temperature 1 °C) Tempera tare 1°(' 1
c) Methanation d) Water gas reaction O 1,11 , 1111 S
-- _
---------- ----
64) g 'r `'H4
_ (10 r
q
--111 r ''
Q1 C'HJ , 11
jo ------ H_+
3/1 I l'1 I1 1
Y
ßr) E vH i
,
y ýn - V Cý rý ------ Cal km CIMlltI.; 11M1
V I. / MI
441 50 (1 IIIINI 1.0(1 +111X1 -'MI 1,11M1 11
- -- - N1 -
- (111X1 j: INI 2INlll : +1111 UIINI l 04Yl
Temperature 1°() Temperature (O(')
e) Water gas shift f) Hydro-gasification
11 11X1 -_ }(Il 6
" --1.11
Ch SO
_
1
H MI
_ i
40 H 1 CH ...... , 1- (1 Fit
4 (., H,
L a
Ill r ý-ý
to 5(u) 11I(NI 151, X) _I IINI 251X1 : 111111 35 1 N1
151X1 Jim 21N51 254 NI 11X 111
Temperarwe (°(') Temperalare 1°0'1
Figure 6.15: Main components of the producer gas calculated for individual reactions using CEA2.
203
Chapter 6 MATHEMATICAL MODELLING
From the carbon combustion and Boudouard reaction in Figure 6.15 (a) and (b), the carbon
monoxide mole fraction is favoured with increasing temperature. If the reacting system
consists of only carbon dioxide reacting with carbon, the yield of carbon monoxide
approaches 100% at 1000°C. The water gas reaction is substantially active at temperatures
above 800°C as indicated by the rise in the mole fraction of carbon monoxide and hydrogen
and increased carbon conversion. Temperatures of above 2000°C result in the dissociation of
the hydrogen gases. The water gas shift reaction is essentially a reversible reaction. The
reaction leans forward towards the production of hydrogen at temperatures up to 700°C and
any further increase in temperature would encourage the backward reacting favouring carbon
monoxide production. Thermodynamically, it can be postulated that the formation of methane is favoured at lower temperatures (<700°C) and that the production of methane is almost
negligible at temperatures of 1000°C.
In all gasification systems, it is desirable to convert the reactant, carbon dioxide (C02) or
steam (H20) to as much carbon monoxide, hydrogen and methane as possible to form syngas
with high heating value. Therefore, it is important to encourage or intensify the two main
reduction reactions, the Boudouard and water gas reaction. However, both reduction reactions
are endothermic and require heat input or else the gas temperature will decrease during the
reaction.
6.3.1.3 Gasification Modelling Results and Discussion (CEA)
The CEA programme was used to calculate the chemical equilibrium for six cases (AlOO-S30, A100-S35, AlOO-S40, AllO-S30, AllO-S35 and AllOS40) from the gasification tests
operated under a reactor condition of S1 (reactor temperature 850°C). The gas phase species
were assigned to take into account the main compounds in the outlet gas such as CH4, CO, CO2, H2, H2O and also minor species that might be present, C2H5, CA, HCN, 02 and NH3. The elemental composition of the solid fuel (commercial charcoal) was set according to the
ultimate analysis and the enthalpy of formation of the commercial charcoal was calculated to be -254kJ/mol based on the higher heating value. The adiabatic flame temperature was
calculated to be about 2600°C (Appendix B. 2). However, the upper limit temperature was set to only 1500°C as the temperature in the gasification experiments was below <1000°C.
The main objective of this calculation is to give an insight into the chemical equilibrium based on the carbon conversion rate of the gasification experiments. The results from the
equilibrium calculations were compared in both the trends and actual values to the
204
Chapter 6 MATHEMATICAL MODELLING
measurements. The experimental gasifier operates at temperature ranging from 750-950°C
depending on the flow rate of reactant input (steam and preheated air). Therefore, comparison
was made based on the average temperature in the gasifier. The composition of the wet flue
gas was calculated through mass balance as experimental measurements were conducted on a dry flue gas basis.
6.3.1.4 Cases: Al 1O-S30, Al1O-S35, A11O-S40
Figure 6.16, Figure 6.17 and Figure 6.18 compares the calculated and measured wet flue gas
composition for Cases Al 10-S30, Al 10-S35 and Al 10-S40. The experimental tests showed
close agreement between the calculated CO, C02, H2 and H2O and the measured value. The
measured syngas composition fits the calculated equilibrium composition at a temperature of 850°C for Case Al 10-S30 and Case Al 10-S35 and Case Al 10-S40.
For Case A110-S30, a slight deviation was seen in the measured H2 concentration that was
about 13% compared to the calculated value of 11%. The H2 concentration fits the equilibrium
at about 700°C. As for Case A110-S35, the measured H2 (12.3%) and CO2 (14.6%) were
slightly higher than the calculated value of 10.4% and 13% while the measured CO (4.1%)
and H2O (28.3) were lower than the calculated value of 4.5% and 33.6%. As the water-gas shift reaction is one of the main gasification reactions, the relationship between H2 and CO2
with CO and H2O is significantly influenced by that reaction. The measured syngas
composition fits the calculated equilibrium composition at a much lower temperature of 700°C as forward the shift water-gas reaction was more active in the temperature region of 500-700°C (Figure 6.15).
Case -A11O-S45 shows good agreement between the measured and calculated flue gas composition with deviation only in the measured H2 concentration that was slightly higher.
205
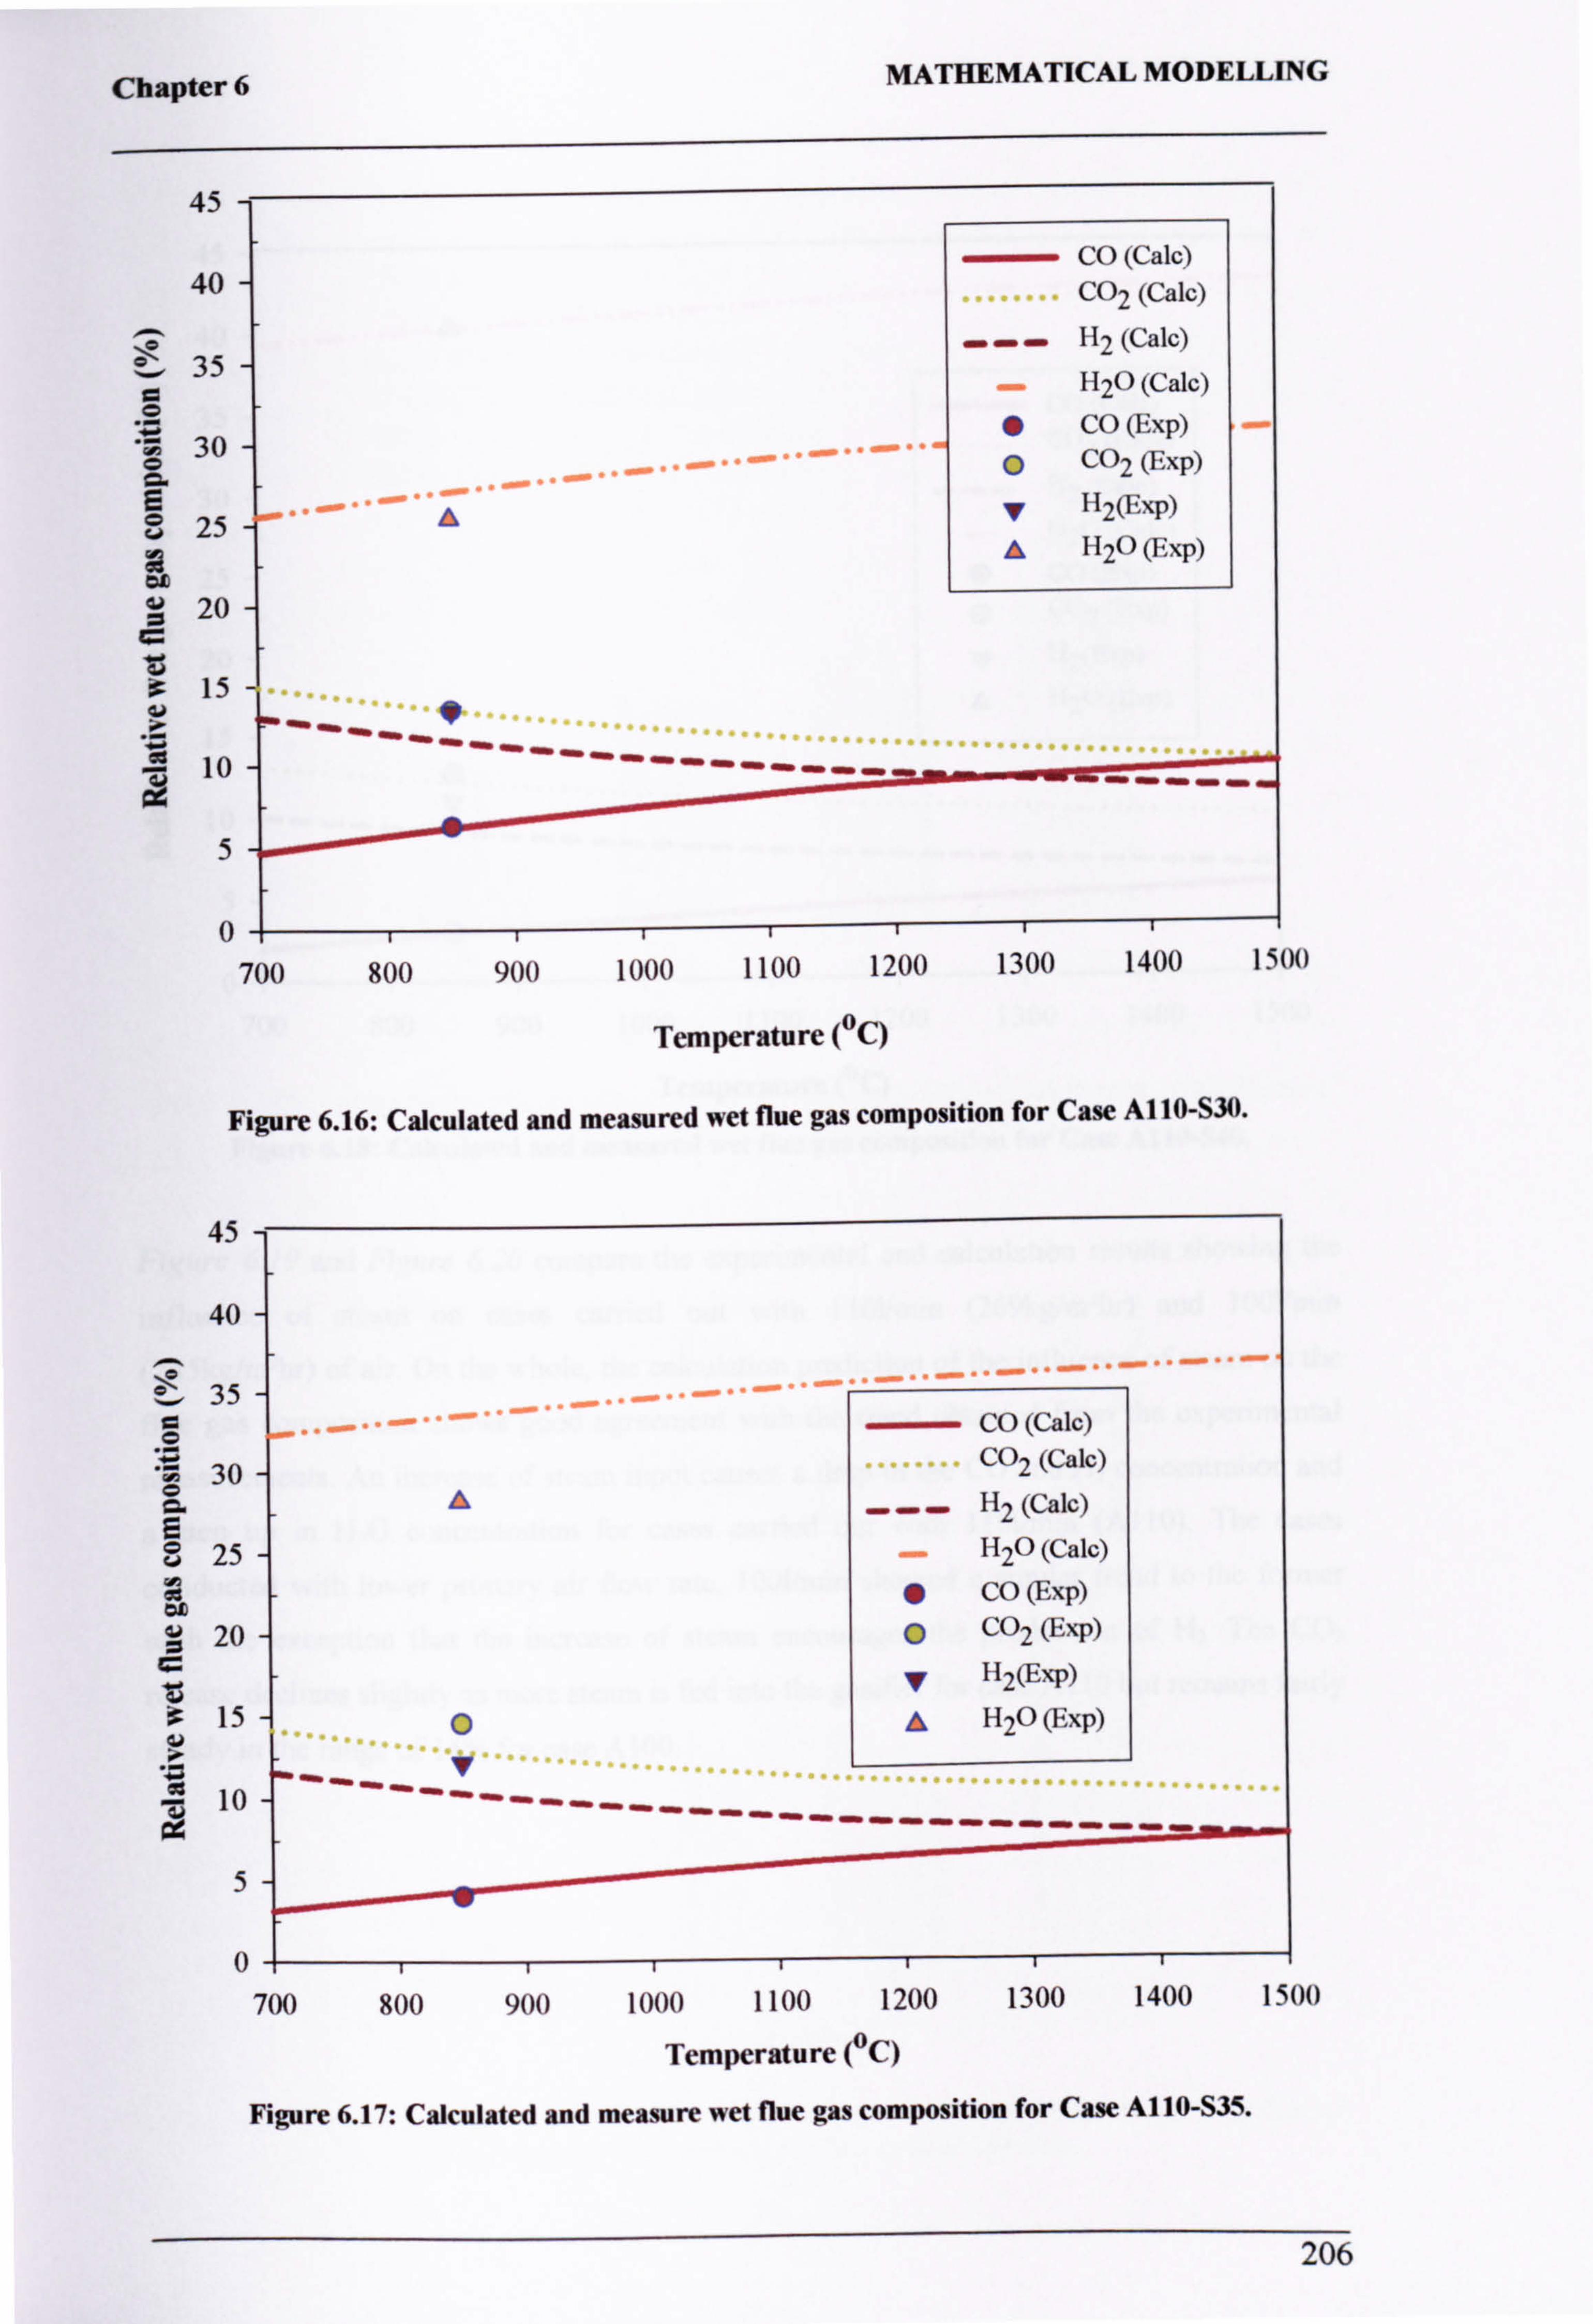
Chapter 6
45
40
35
ö 30 C6
co 25
20
15
10
5
0
MATHEMATICAL MODELLING
A
aa aaaaaaa
a_a aa
CO (Calc) CO2 (Calc)
... H2 (Calc)
H2O (Calc)
0 CO (Exp)
p CO2 (Exp)
v H2(ExP)
A H2O (Exp)
-a p-----
700 800 900 1000 1100 1200 1300 1400 1500
Temperature (°C)
Figure 6.16: Calculated and measured wet flue gas composition for Case Al 10-S30.
45
40
35
'ö 30
25
20
3 15
. 10
5
0
A
1oe ri2U (1'-XP)
`' `'ý----------------------
700 800 900 1000 1100 1200 1300 1400 15011
Temperature (°C)
Figure 6.17: Calculated and measure wet flue gas composition for Case A110-S35.
--- CO (Calc) CO2 (Calc)
H2 (Calc)
H2O (Calc)
0 CO (Exp)
O C02 (Exp)
H2(Exp)
206
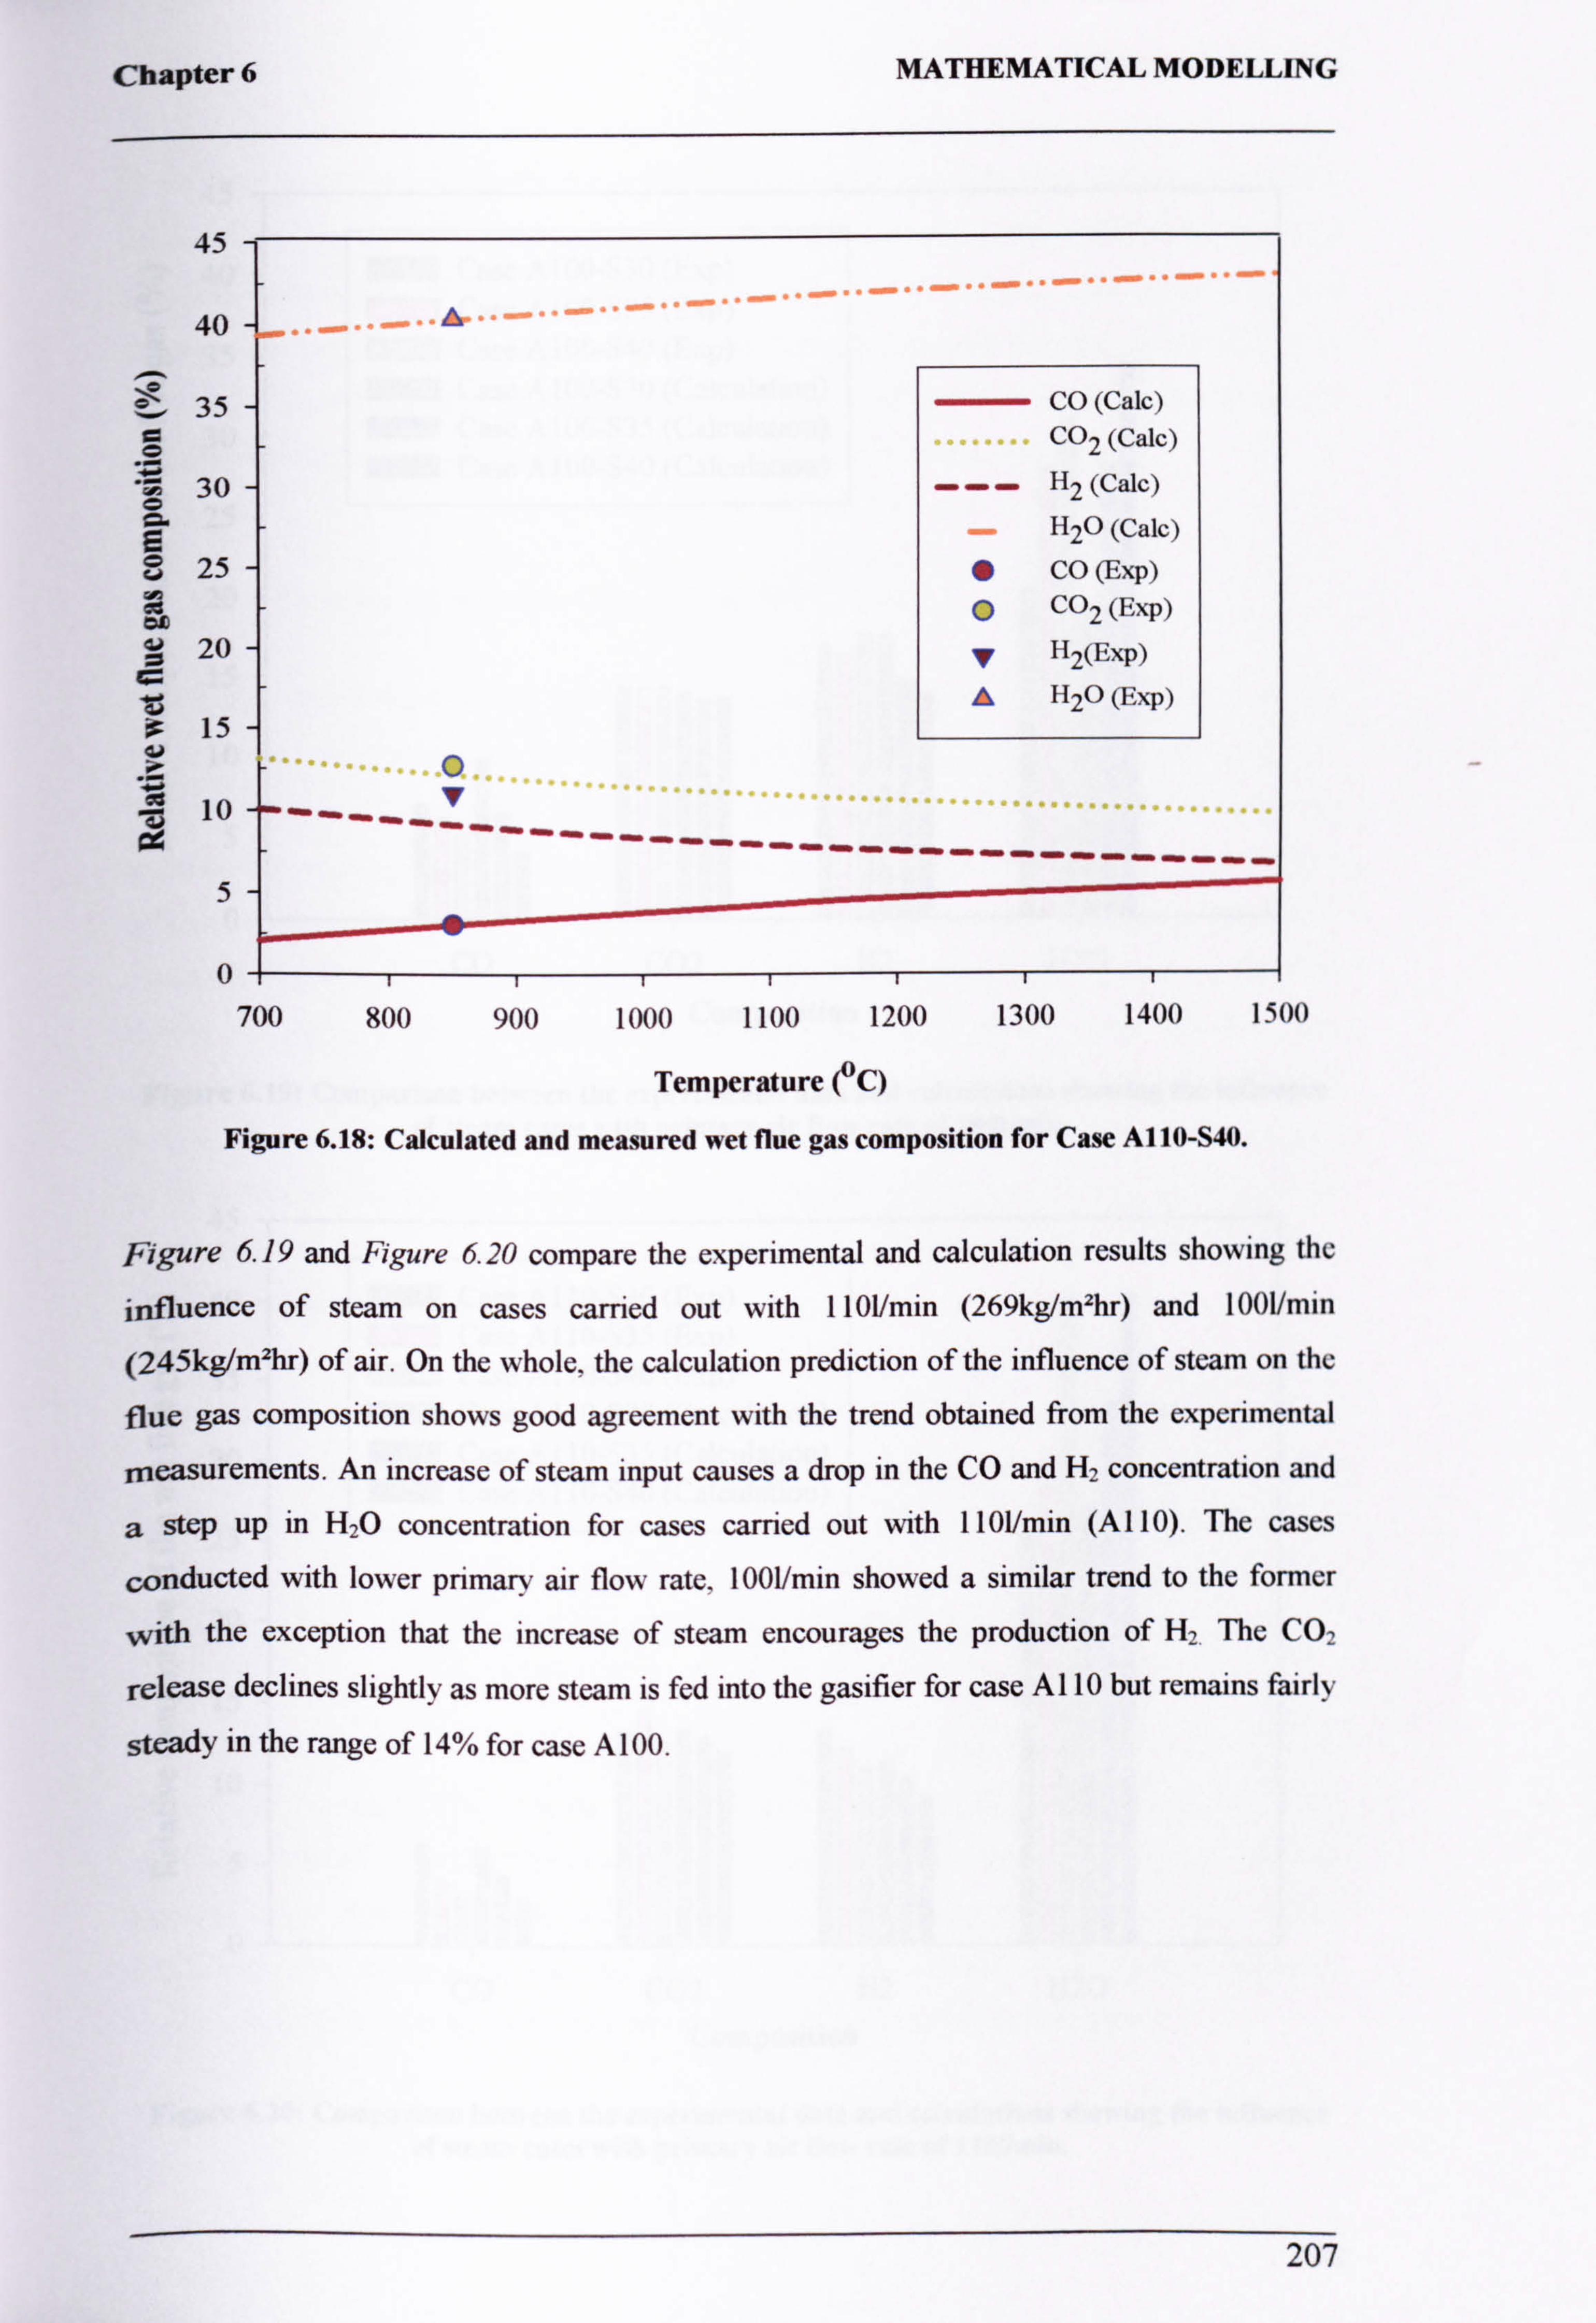
Chapter 6
45
MATHEMATICAL MODELLING
40
35 0
30
E v 25
ao 20
15
10 a
0
A I
CO (Cale) CO2 (Cale)
... H2 (Cale)
H2O (Cale)
" CO (Exp)
p CO2 (Exp)
y H2(Exp)
© H2O (Exp)
0 V --------------------------------
5
700 800 900 1000 1100 1200 1300 1400 1500
Temperature (°C)
Figure 6.18: Calculated and measured wet flue gas composition for Case A110-S40.
Figure 6.19 and Figure 6.20 compare the experimental and calculation results showing the
influence of steam on cases carried out with 1101/min (269kg/m2hr) and 1001/min
(245kg/m2hr) of air. On the whole, the calculation prediction of the influence of steam on the
flue gas composition shows good agreement with the trend obtained from the experimental
measurements. An increase of steam input causes a drop in the CO and H2 concentration and
a step up in H2O concentration for cases carried out with 1101/min (A 110). The cases
conducted with lower primary air flow rate, 1001/min showed a similar trend to the former
with the exception that the increase of steam encourages the production of H, The CO2
release declines slightly as more steam is fed into the gasifier for case Al 10 but remains fairly
steady in the range of 14% for case A 100.
207
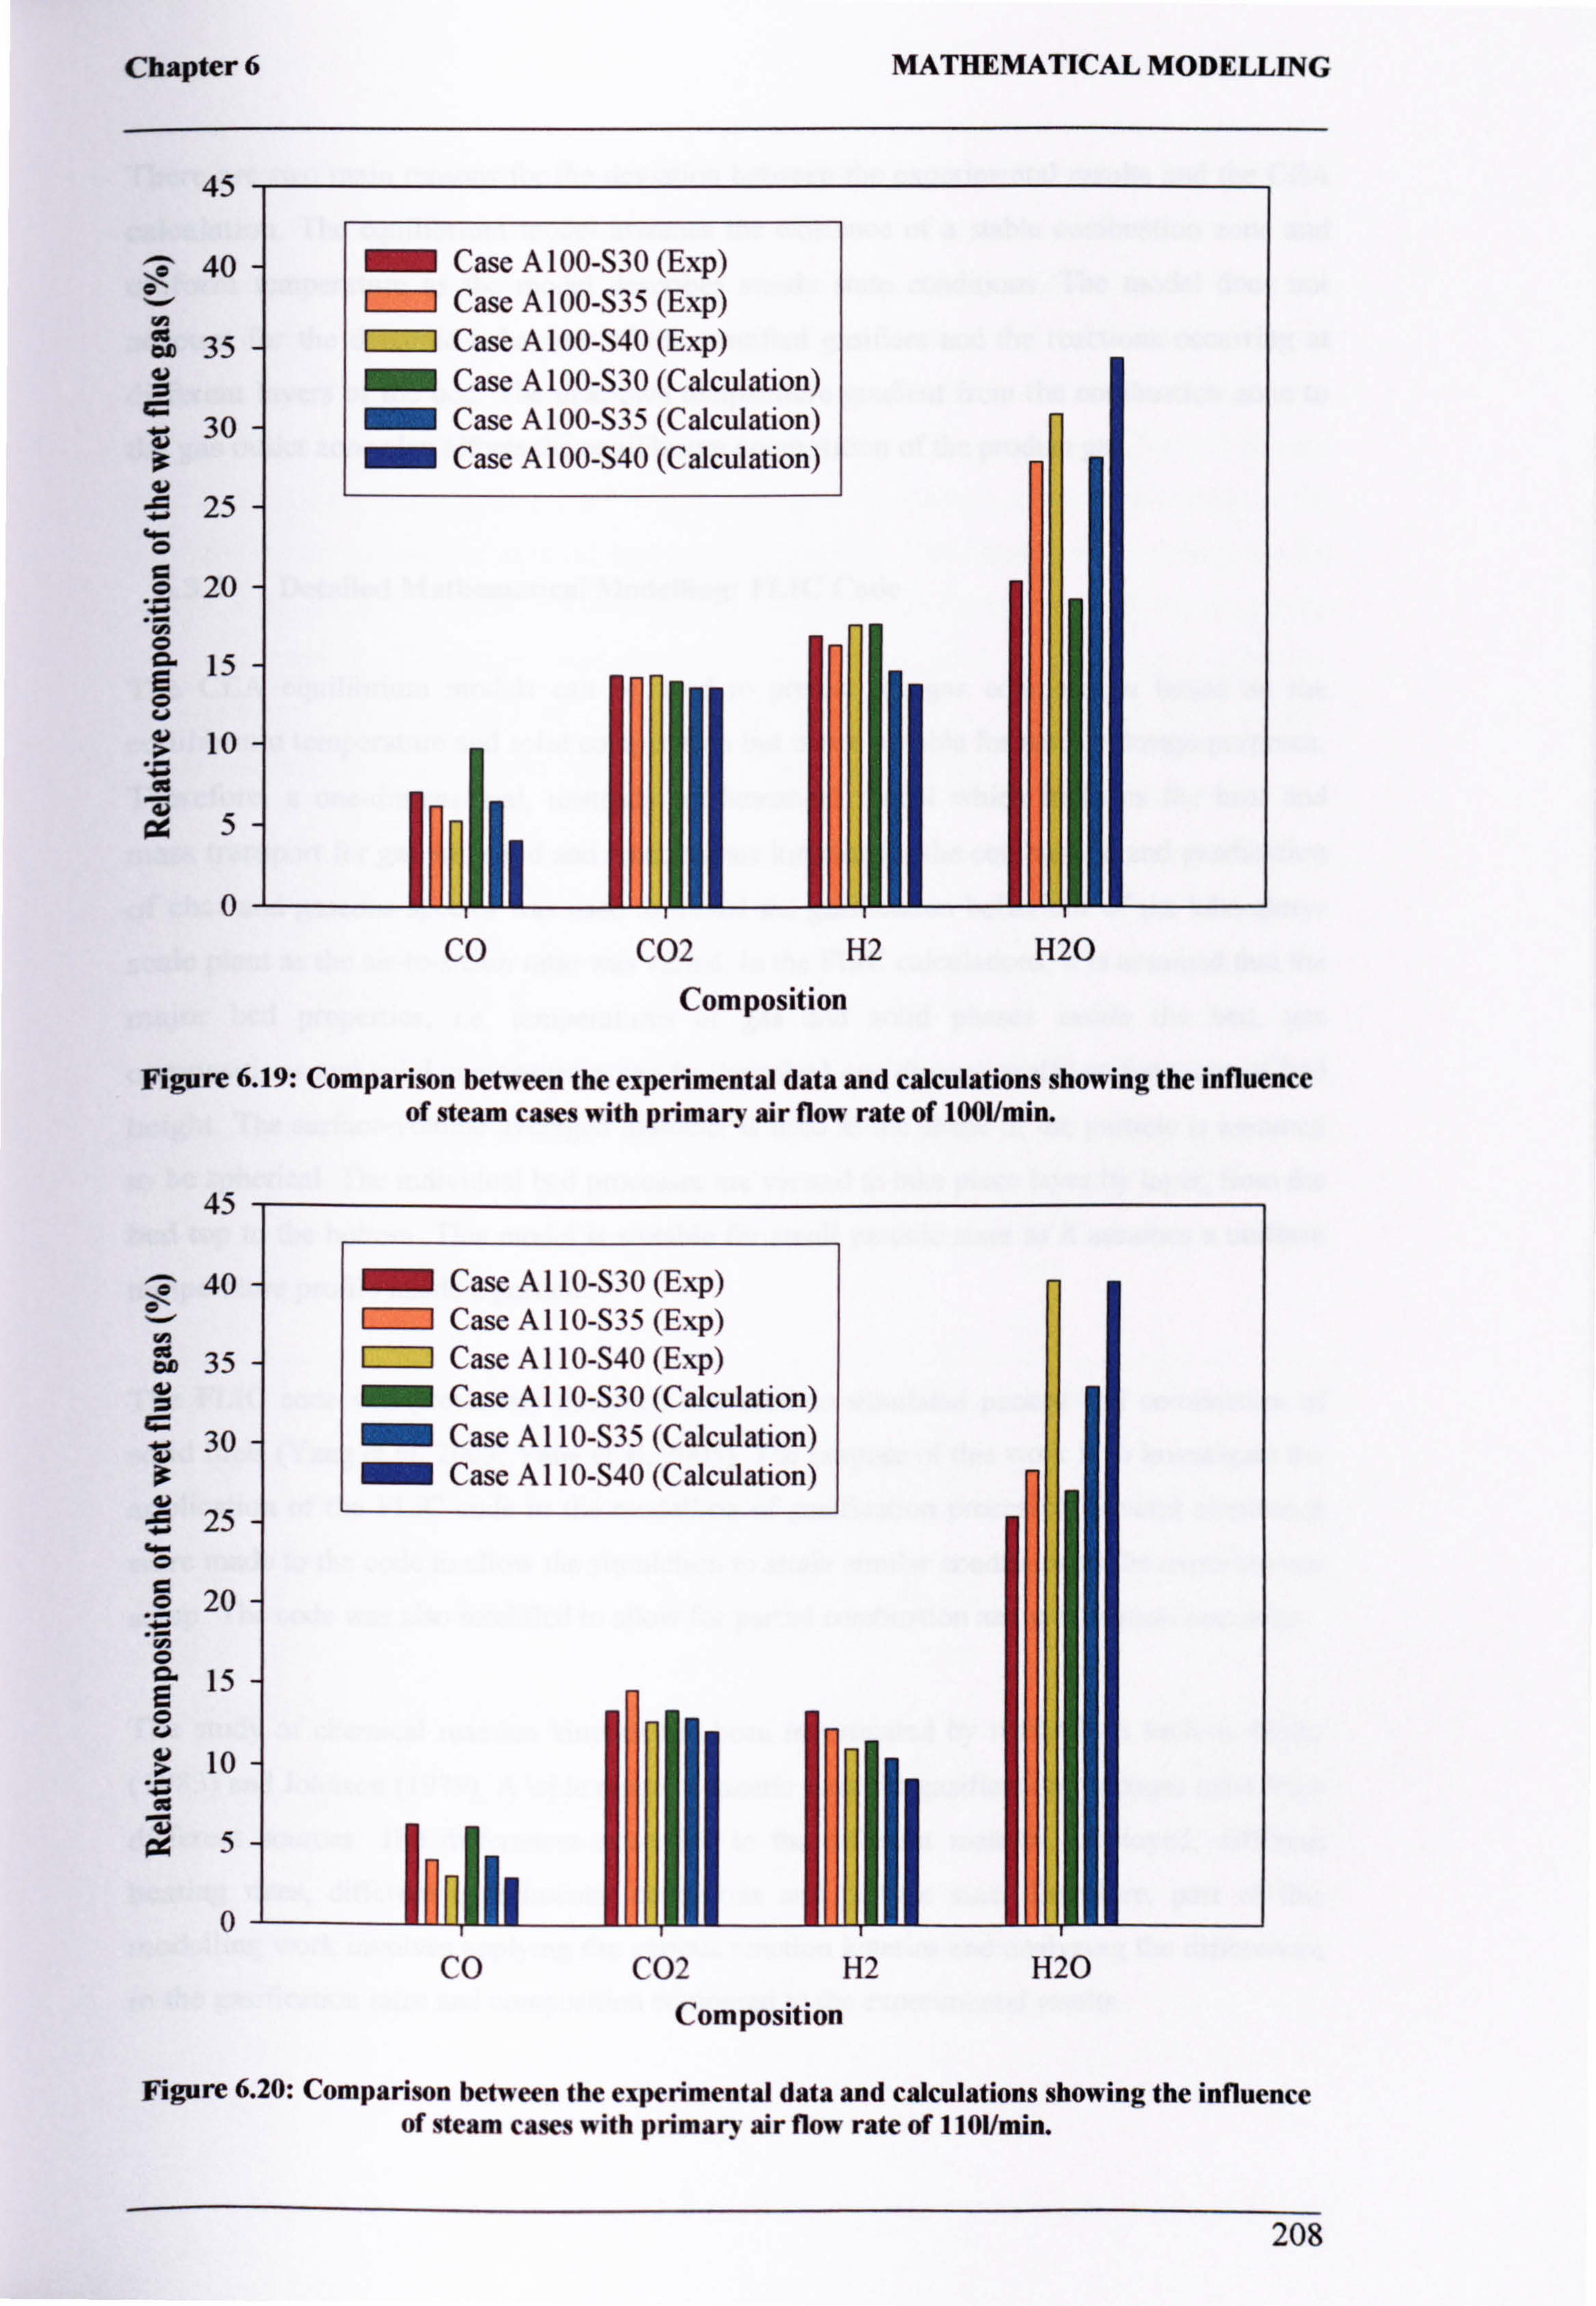
Chapter 6
45
40 0
MATHEMATICAL MODELLING
Case A 100-S30 (Exp) D Case A 100-S35 (Exp) O Case A 100-S40 (Exp)
Case A100-S30 (Calculation) Case A100-S35 (Calculation) Case A 100-S40 (Calculation)
H
cis 35
30
25
0
.o 20
y
0
15
10
5
0 CO C02 H2 H2O
Composition
Figure 6.19: Comparison between the experimental data and calculations showing the influence of steam cases with primary air flow rate of 1001/min.
45
40
ago 35
0 30
a? 25 I- 0 ö 20
C
15 G
10
p4 5
0
Case A 110-S30 (Exp) D Case A 110-S35 (Exp) D Case A 110-S40 (Exp)
Case A 110-S30 (Calculation) Case Al 10-S35 (Calculation) Case A 110-S40 (Calculation)
CO C02 H2 H2O
Composition
Figure 6.20: Comparison between the experimental data and calculations showing the influence of steam cases with primary air flow rate of 1101/min.
208
Chapter 6 MATHEMATICAL MODELLING
There are two main reasons for the deviation between the experimental results and the CEA
calculation. The equilibrium model assumes the existence of a stable combustion zone and
uniform temperature as the model describes steady state conditions. The model does not
account for the dynamic behaviour of the stratified gasifiers and the reactions occurring at
different layers of the bed. The unknown temperature gradient from the combustion zone to
the gas outlet zone also affects the equilibrium composition of the product gas.
6.3.2 Detailed Mathematical Modelling: FLIC Code
The CEA equilibrium models can be used to predict the gas composition based on the
equilibrium temperature and solid composition but is not suitable for reactor design purposes.
Therefore, a one-dimensional, unsteady mathematical model which includes the heat and
mass transport for gas and solid and reaction rate kinetics for the combustion and gasification
of char and gaseous species was used to model the gasification behaviour of the laboratory-
scale plant as the air-to-steam ratio was varied. In the FLIC calculations, it is assumed that the
major bed properties, i. e. temperatures of gas and solid phases inside the bed, gas
compositions and solid compositions can be described one dimensionally as functions of bed
height. The surface-volume averaged diameter is used as the shape of the particle is assumed
to be spherical. The individual bed processes are viewed to take place layer by laver, from the
bed top to the bottom. This model is suitable for small particle sizes as it assumes a uniform
temperature profile inside a particle.
The FLIC code was previously designed and used to simulated packed bed combustion of
solid fuels (Yang et al, 2003; Yang et al, 2005). The purpose of this work is to investigate the
application of the FLIC code in the modelling of gasification processes. Several alterations
were made to the code to allow the simulation to attain similar conditions to the experimental
setup. The code was also modified to allow for partial combustion and gasification reactions.
The study of chemical reaction kinetics has been investigated by researchers such as Goetz
(1983) and Johnson (1979). A wide range of kinetic rates for gasification reactions exist from
different sources. The differences arise due to the different material employed, different
heating rates, different experimental conditions and particle size. Therefore, part of this
modelling work involves applying the various reaction kinetics and analyzing the differences
in the gasification rates and composition compared to the experimental results.
209
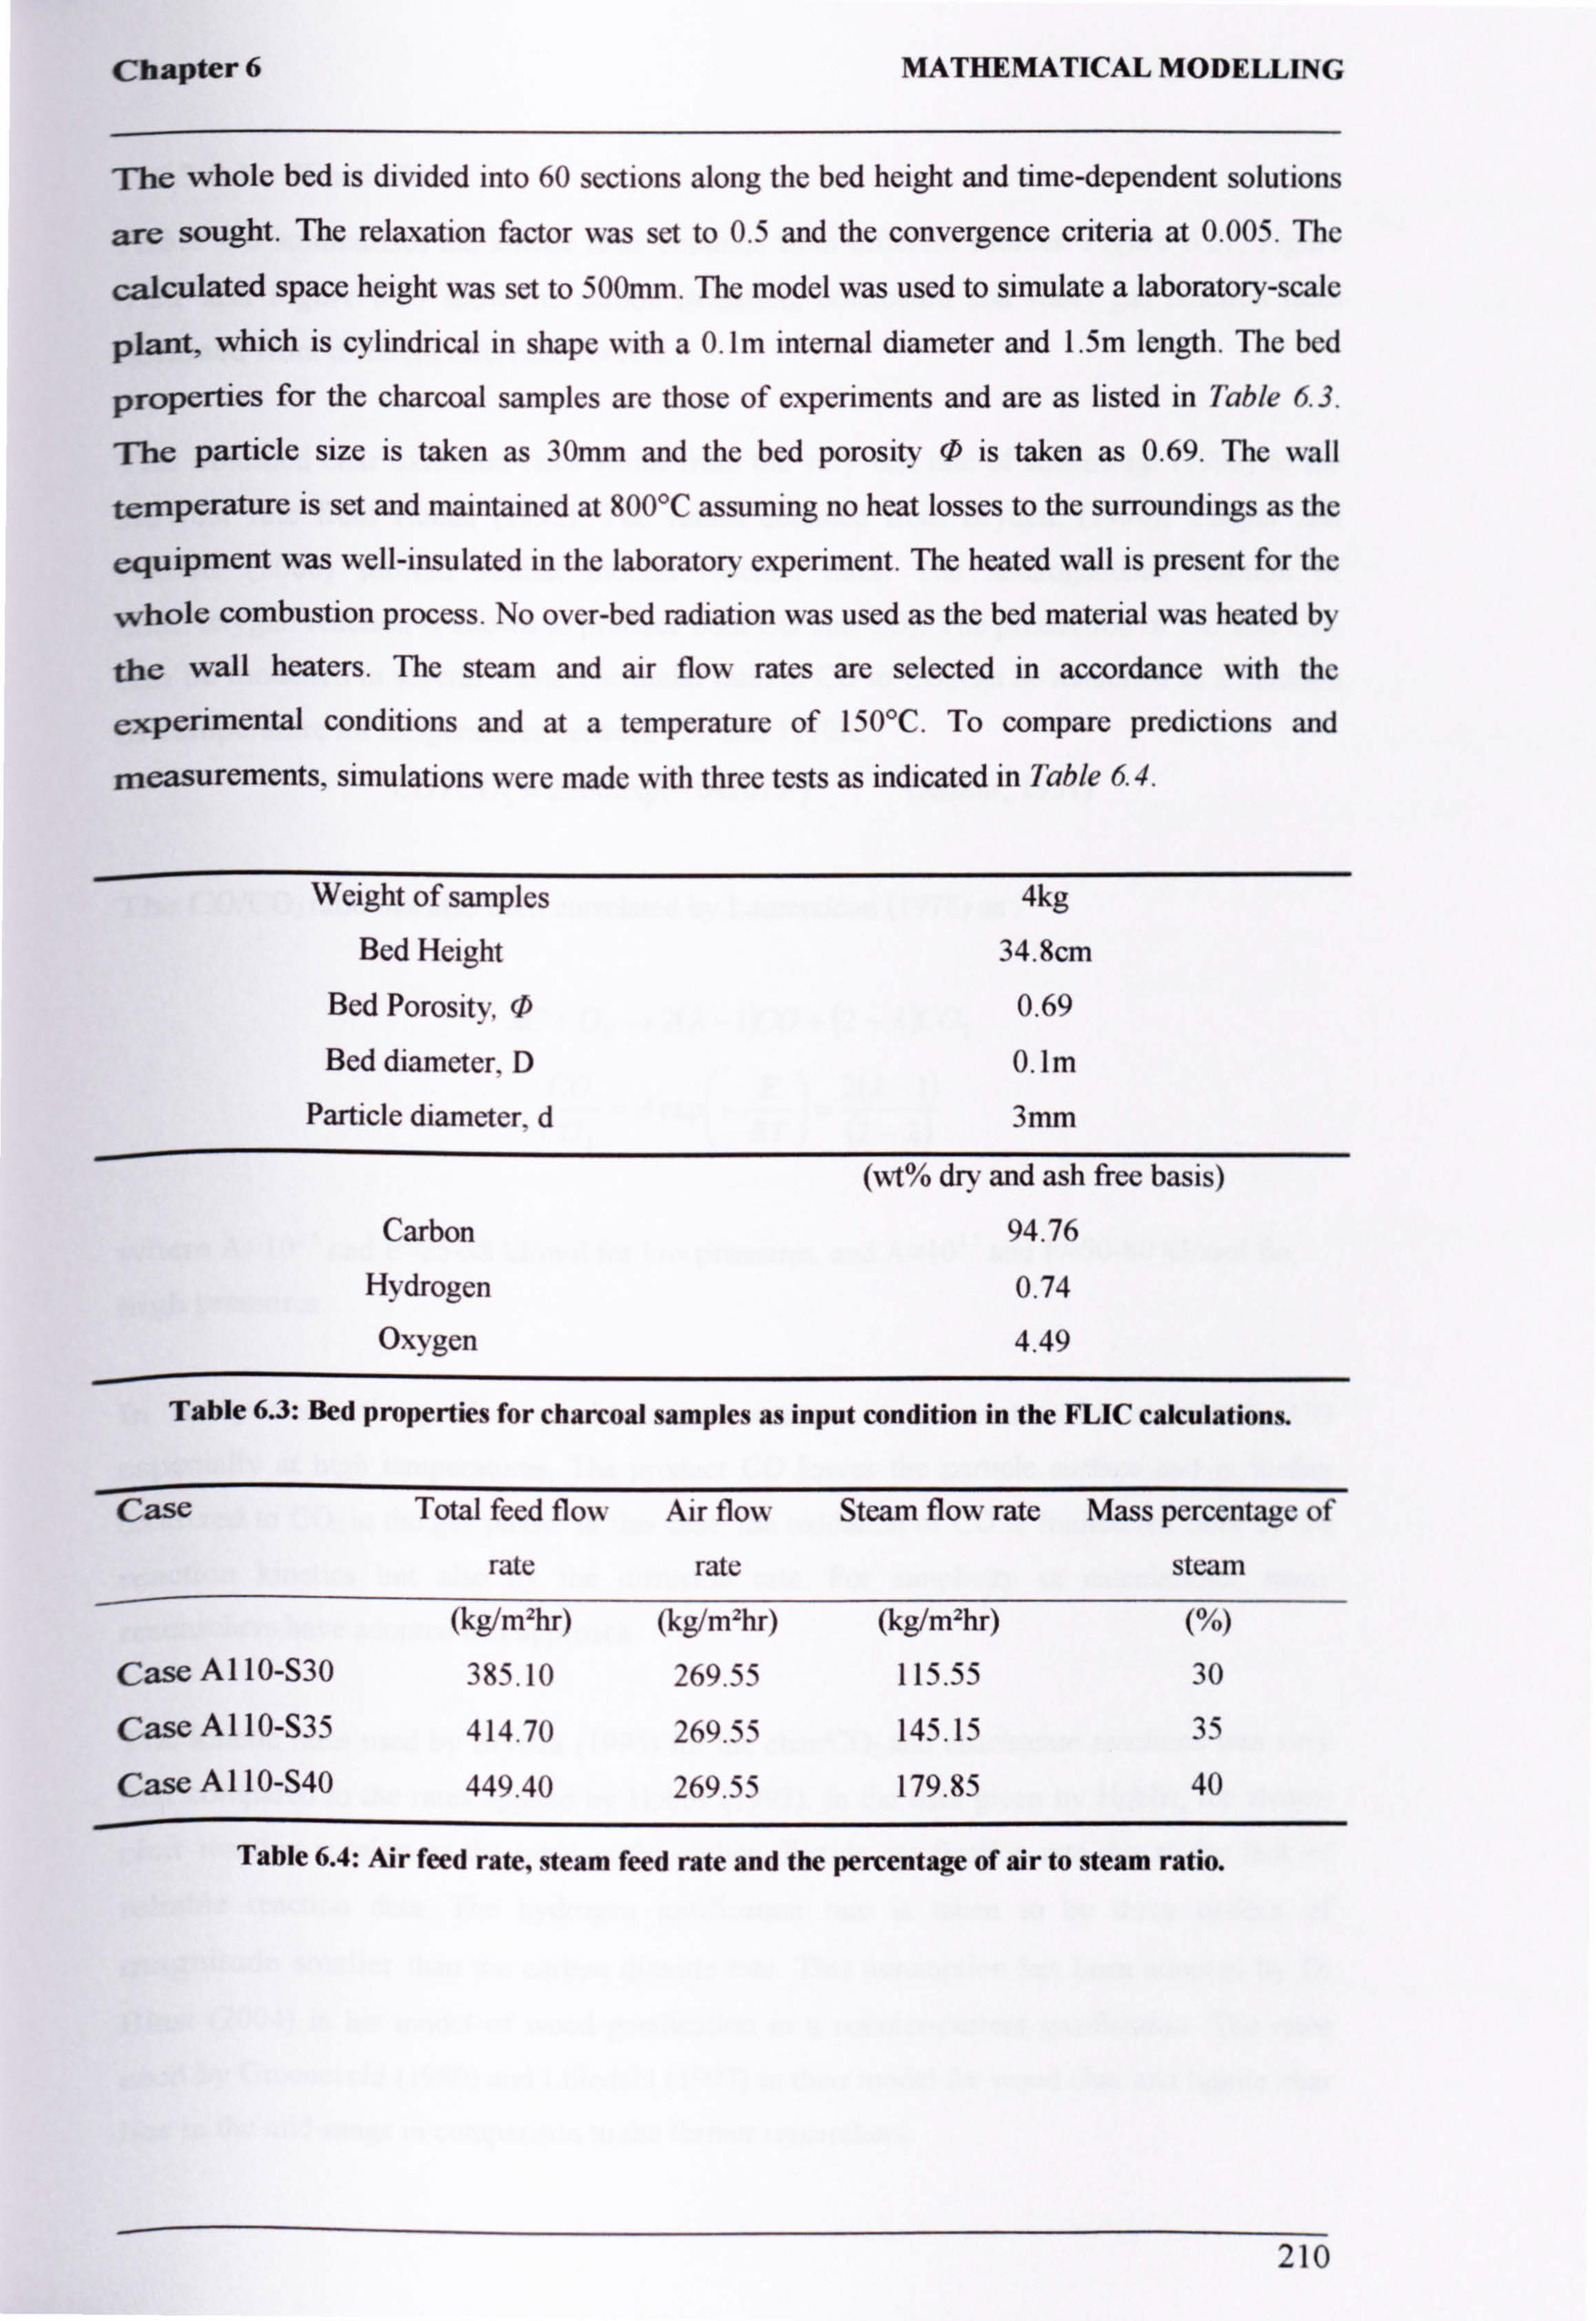
Chapter 6 MATHEMATICAL MODELLING
The whole bed is divided into 60 sections along the bed height and time-dependent solutions
are sought. The relaxation factor was set to 0.5 and the convergence criteria at 0.005. The
calculated space height was set to 500mm. The model was used to simulate a laboratory-scale
plant, which is cylindrical in shape with a 0. Im internal diameter and 1.5m length. The bed
properties for the charcoal samples are those of experiments and are as listed in Table 6.3.
The particle size is taken as 30mm and the bed porosity 0 is taken as 0.69. The wall
temperature is set and maintained at 800°C assuming no heat losses to the surroundings as the
equipment was well-insulated in the laboratory experiment. The heated wall is present for the
whole combustion process. No over-bed radiation was used as the bed material was heated by
the wall heaters. The steam and air flow rates are selected in accordance with the
experimental conditions and at a temperature of 150°C. To compare predictions and
measurements, simulations were made with three tests as indicated in Table 6.4.
Weight of samples 4kg
Bed Height 34.8cm
Bed Porosity. 0 0.69
Bed diameter, D 0.1 m Particle diameter. d 3mm
(wt% dry and ash free basis)
Carbon 94.76 Hydrogen 0.74
Oxygen 4.49
Table 6.3: Bed properties for charcoal samples as input condition in the FLIC calculations.
Case Total feed flow Air flow Steam flow rate Mass percentage of
rate rate steam
(kg/mzhr) (kg/mzhr) (kg/m2hr) (%)
Case Al 10-S30 385.10 269.55 115.55 30
Case A 110-S35 414.70 269.55 145.15 35
Case A 110-S40 449.40 269.5 S 179.85 40
Table 6.4: Air feed rate, steam feed rate and the percentage of air to steam ratio.
210
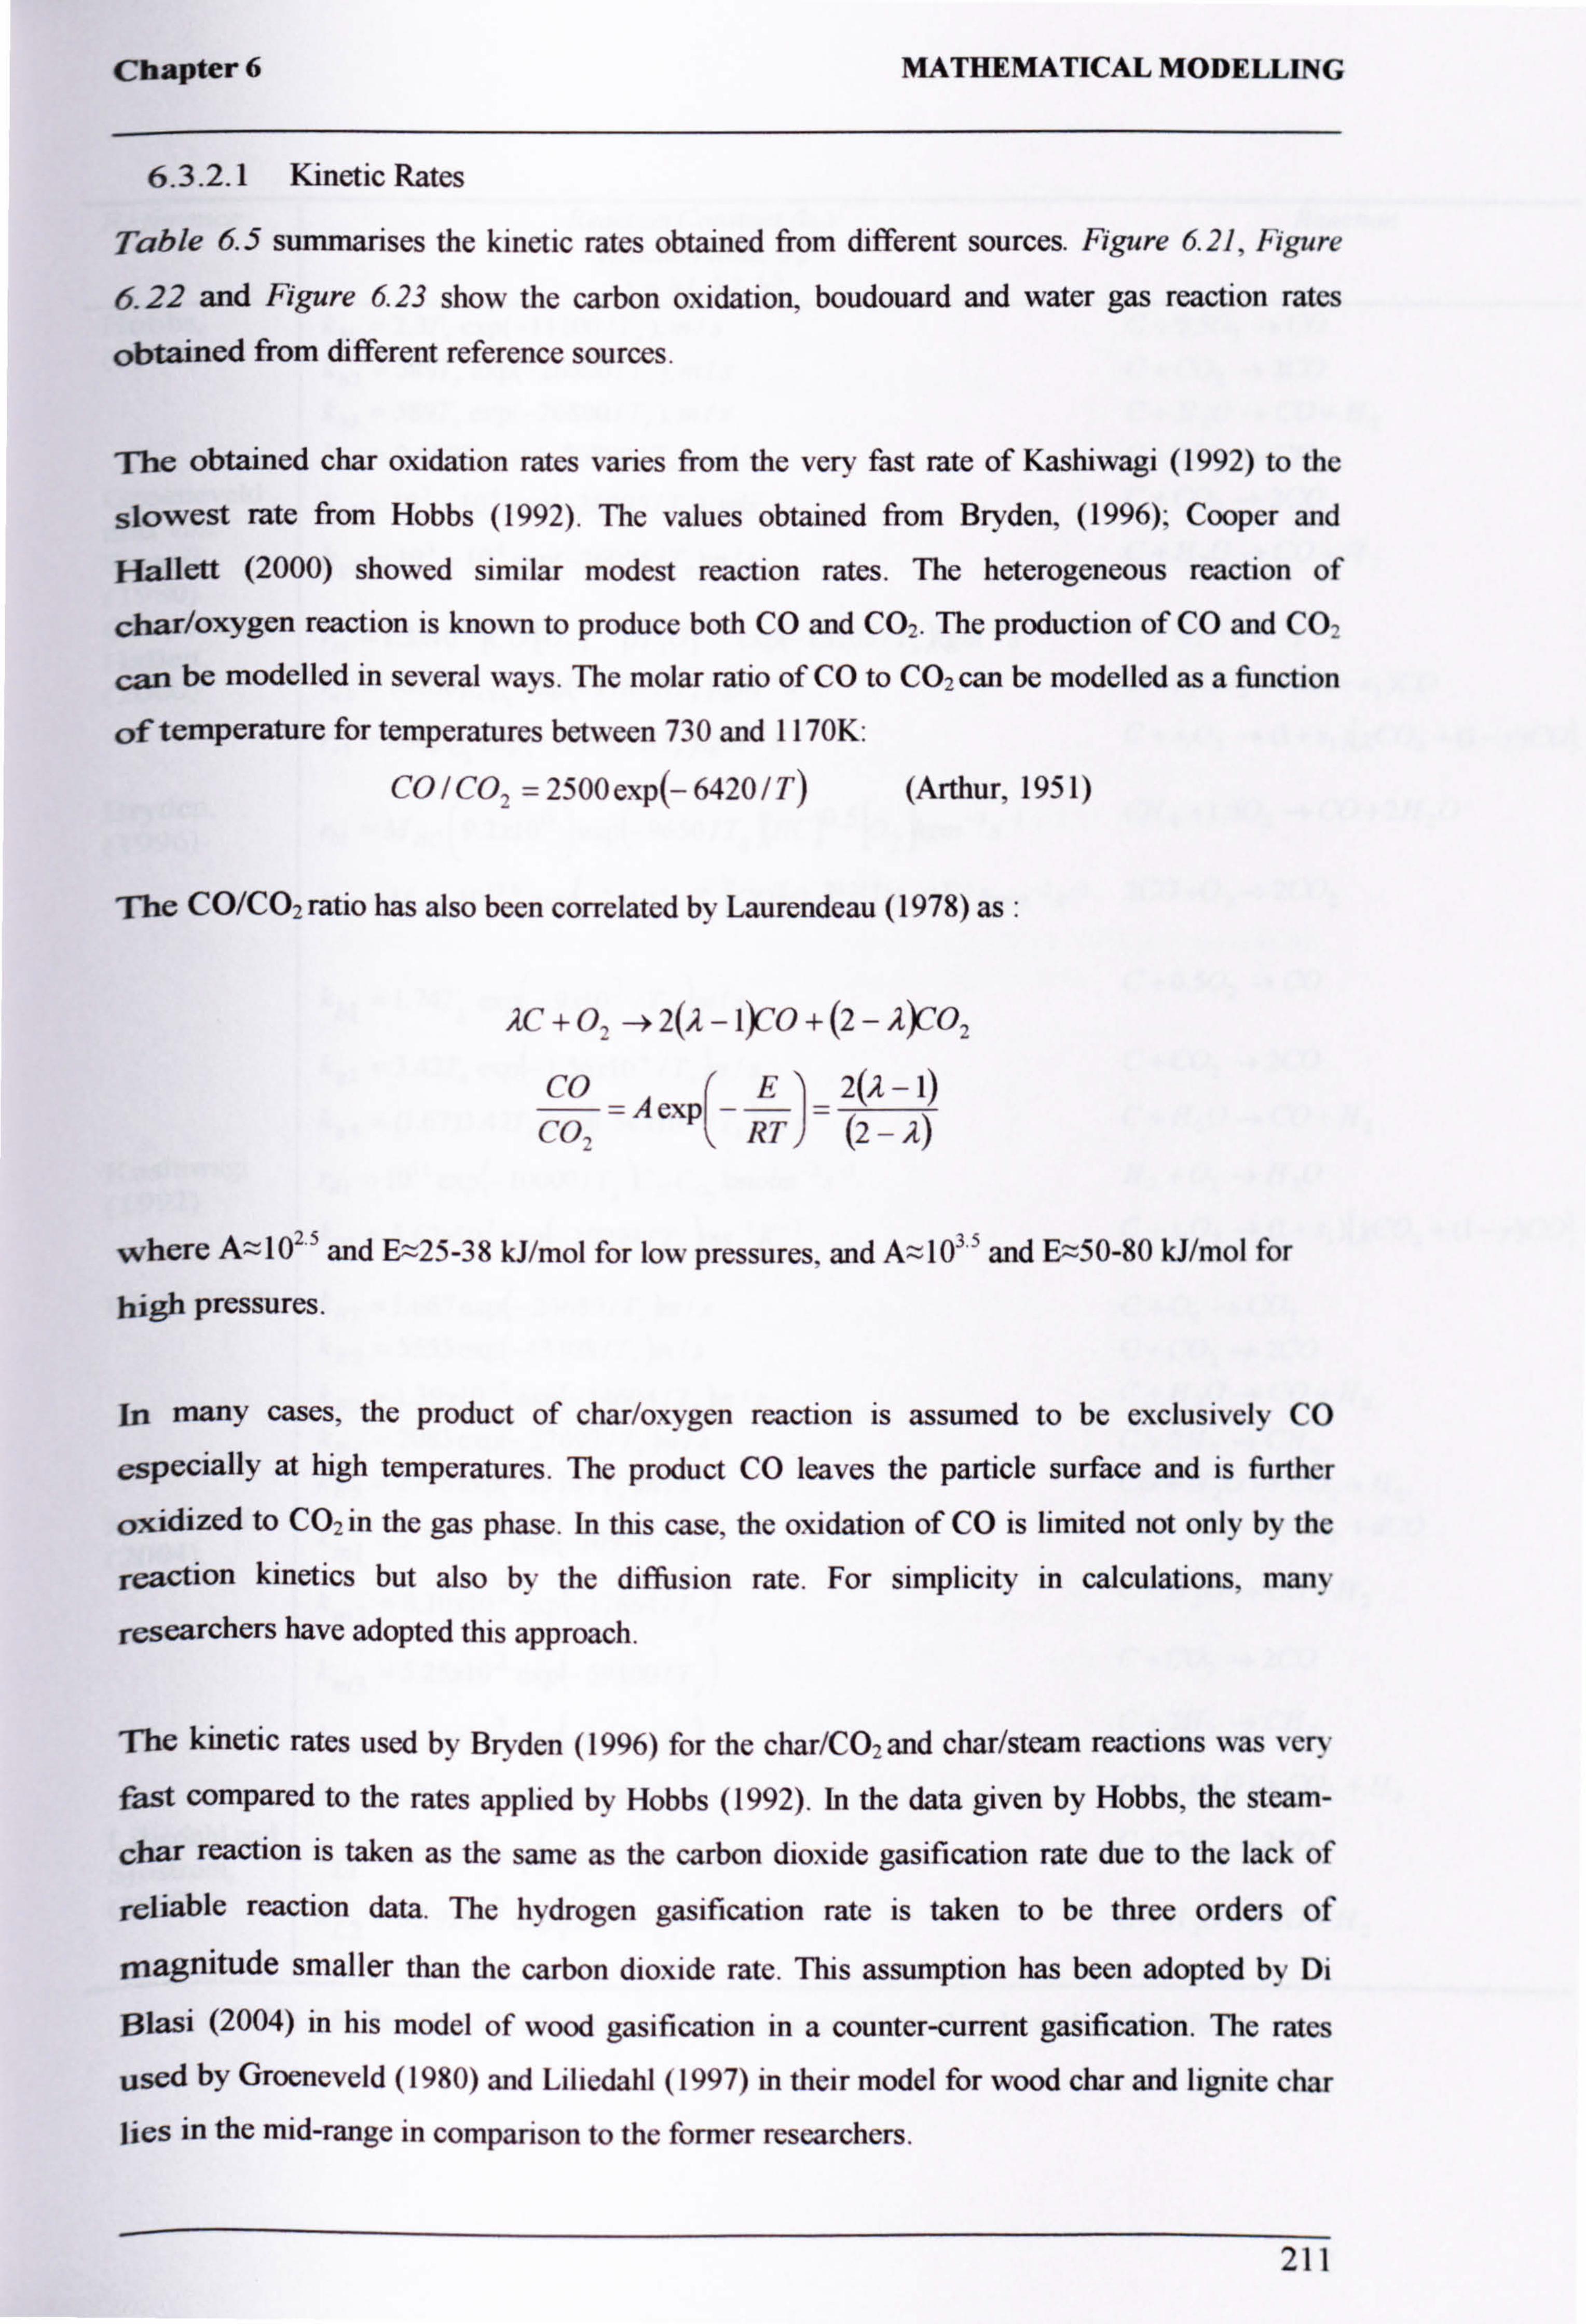
Chapter 6 MATHEMATICAL MODELLING
6.3.2.1 Kinetic Rates
Table 6.5 summarises the kinetic rates obtained from different sources. Figure 6.21, Figure
6.22 and Figure 6.23 show the carbon oxidation, boudouard and water gas reaction rates
obtained from different reference sources.
The obtained char oxidation rates varies from the very fast rate of Kashiwagi (1992) to the
slowest rate from Hobbs (1992). The values obtained from Bryden, (1996); Cooper and
Hallett (2000) showed similar modest reaction rates. The heterogeneous reaction of
char/oxygen reaction is known to produce both CO and CO,. The production of CO and CO2
can be modelled in several ways. The molar ratio of CO to CO2 can be modelled as a function
of temperature for temperatures between 730 and 1170K:
CO / CO, = 2500 exp(- 6420 / T) (Arthur, 1951)
The CO/CO2 ratio has also been correlated by Laurendeau (1978) as :
AC+o, -2(2-l)Co+(2-a, )Co,
CO -Aexp(- ET)- (2- 2)
where A; zý 102 5 and Ez 25-38 kJ/mol for low pressures, and Az 103 5 and Ez50-80 kJ/mol for
high pressures.
In many cases, the product of char/oxygen reaction is assumed to be exclusively CO
especially at high temperatures. The product CO leaves the particle surface and is further
oxidized to CO2 in the gas phase. In this case, the oxidation of CO is limited not only by the
reaction kinetics but also by the diffusion rate. For simplicity in calculations, many
researchers have adopted this approach.
The kinetic rates used by Brvden (1996) for the char/C02 and char/steam reactions was very
fast compared to the rates applied by Hobbs (1992). In the data given by Hobbs, the steam-
char reaction is taken as the same as the carbon dioxide gasification rate due to the lack of
reliable reaction data. The hydrogen gasification rate is taken to be three orders of
magnitude smaller than the carbon dioxide rate. This assumption has been adopted by Di
$lasi (2004) in his model of wood gasification in a counter-current gasification. The rates
used by Groeneveld (1980) and Liliedahl (1997) in their model for wood char and lignite char lies in the mid-range in comparison to the former researchers.
211
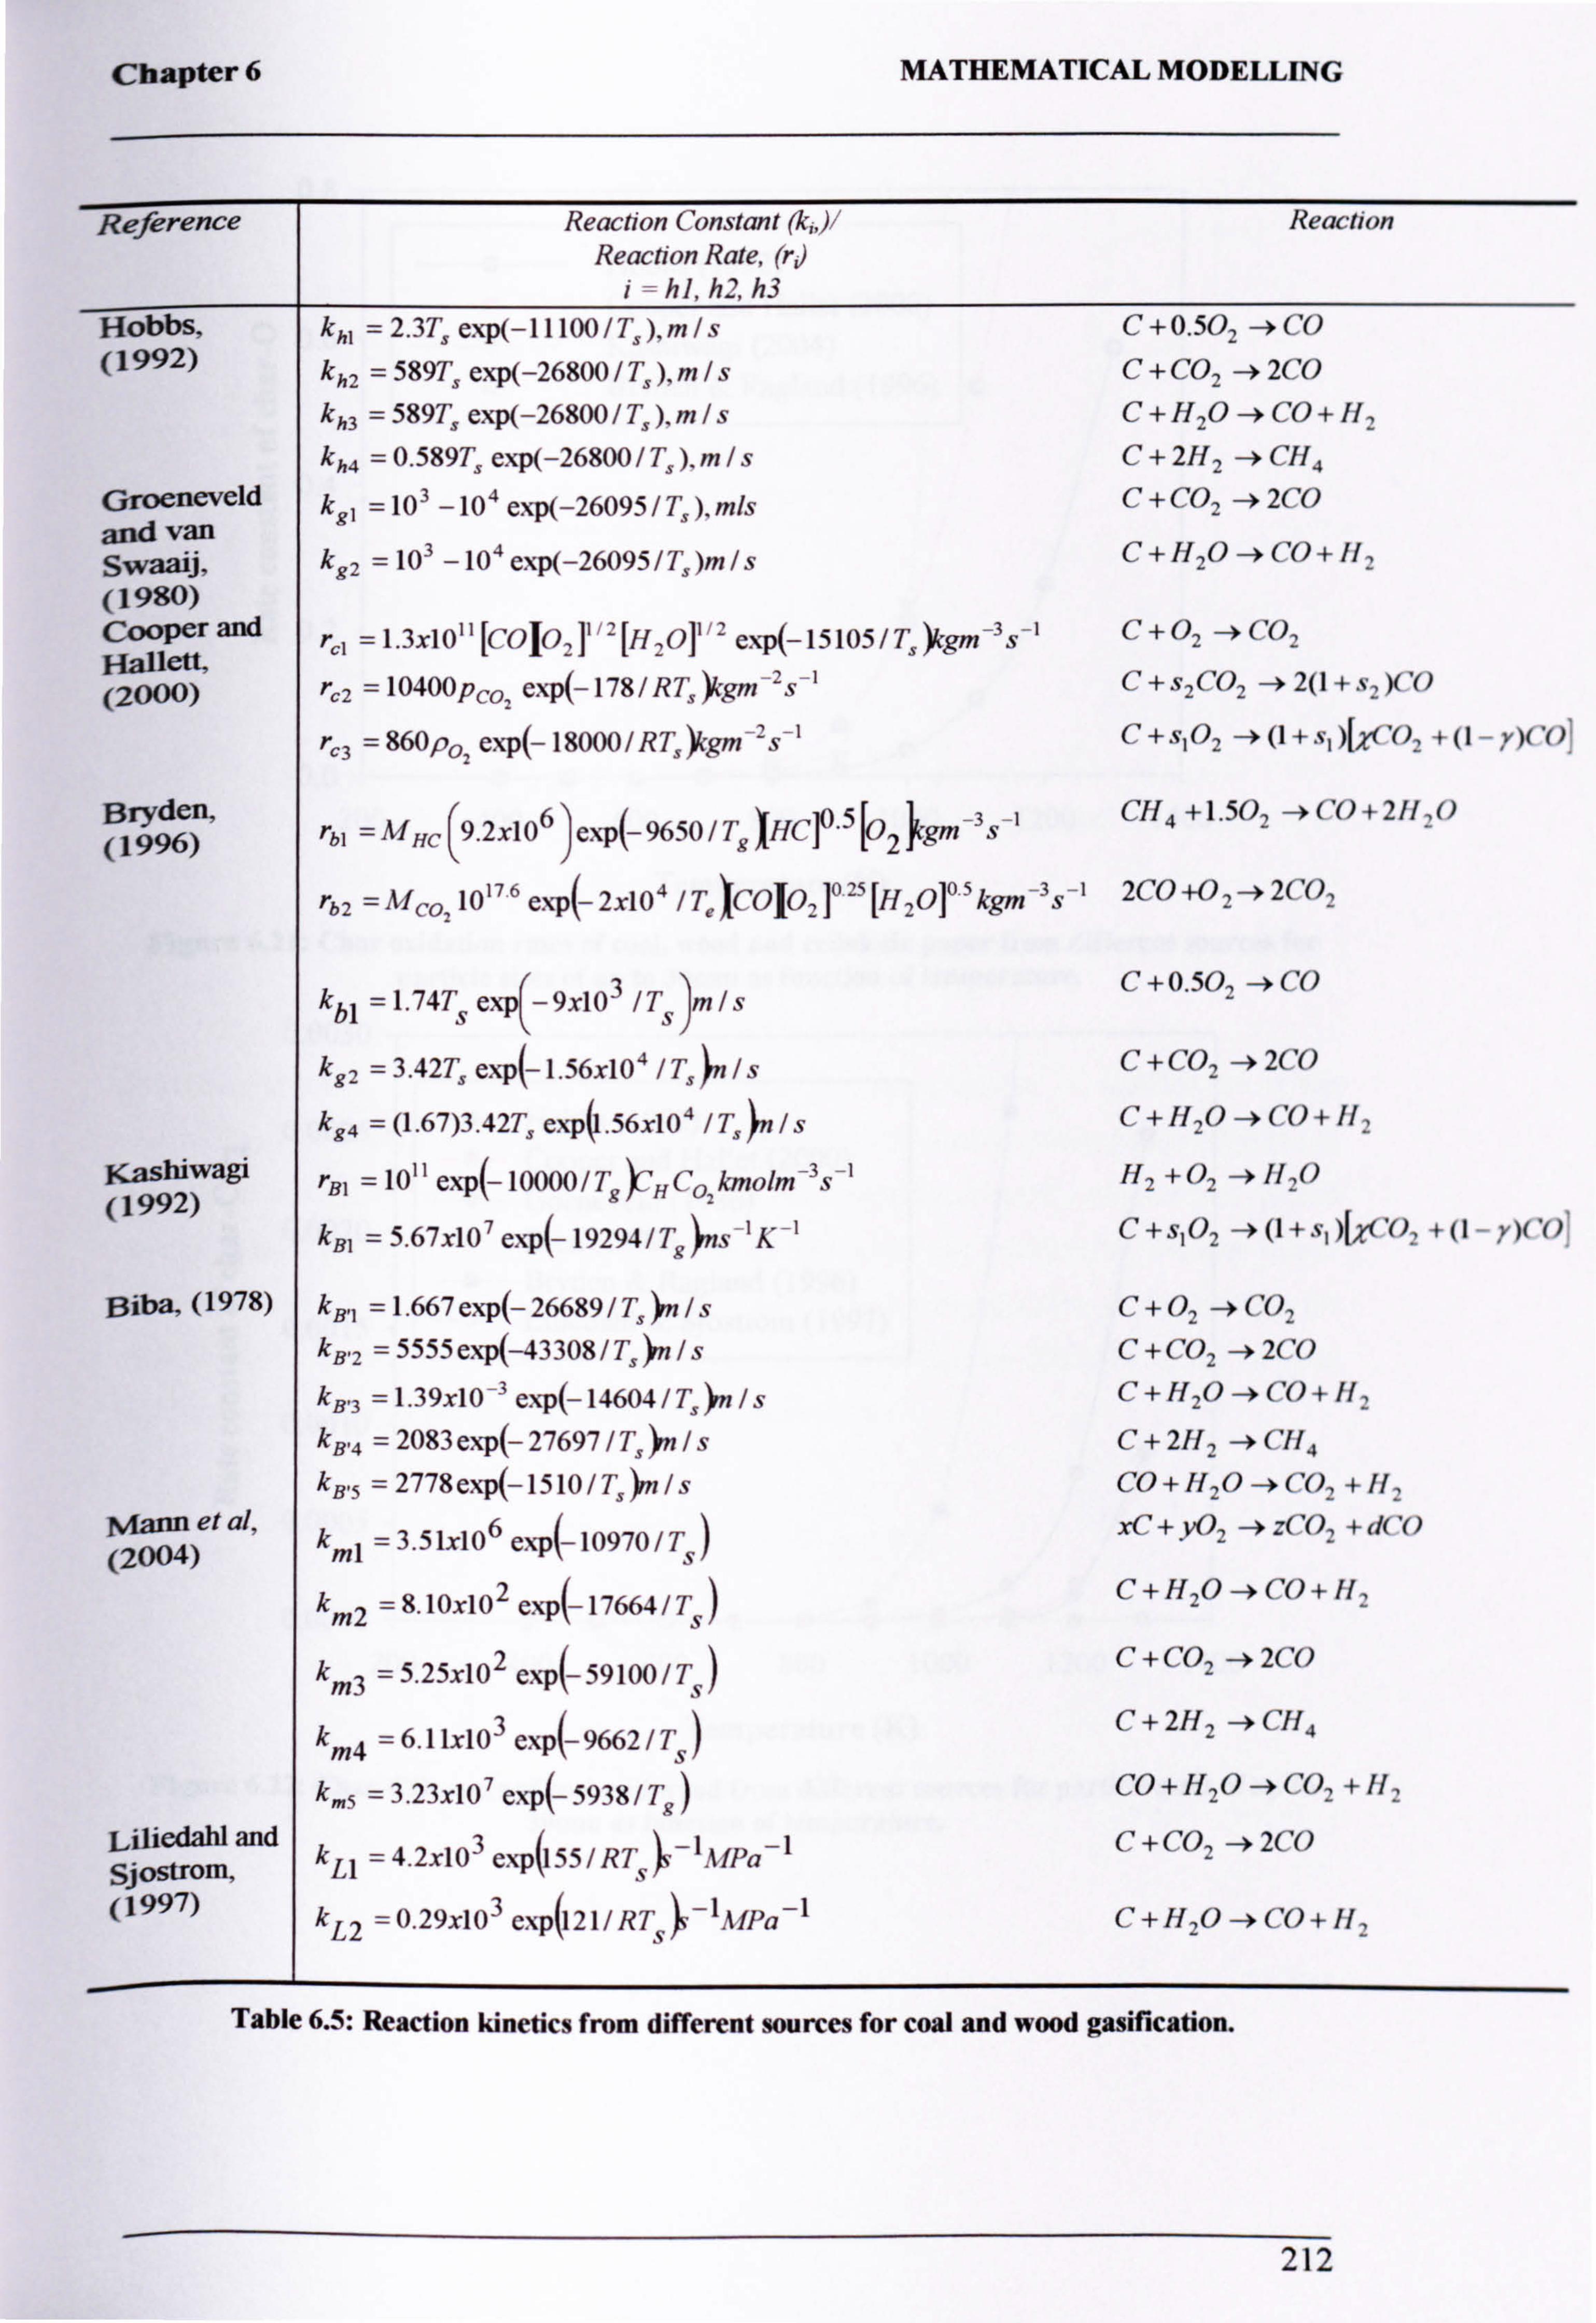
Chapter 6 MATHEMATICAL MODELLING
Reaction Constant (k;, )/ Reaction Rate, (r)
i=hl, h2, h3
(1992)
Groeneveld and van Swaaij, (1980) Cooper and Hallett, (2000)
Bryden, (1996)
K. ashiwagi (1992)
Biba, (1978)
Mann eta!, (2004)
Liliedahl and Sjostrom, (1997)
khl = 2.3T3 exp(-11100/TS), m/s kh2 = 589T5 exp(-26800 / TS ), m/s kh3 = 589Ts exp(-26800 / T, ), m/s kh4 = 0.589TS exp(-26800 / Ts), m/s kgi =103 -104 exp(-26095 /T5 ), m/s
kg2 = 103 -104 exp(-26095 /T,. )m ls
rr1 =1.3x101 [COIO, ]1'2[H, O]l'2 exp(-15105/Tsýgm-3s-'
rc2 =10400Pco, exp(-178/ RT, )Sm-zs-'
rr3 = 860po2 exp(- 18000 / RTj gm-zs-1
C+0.502 ->Co C +C02 - 2C0
C+H20-. CO+H,
C+ 2H2 - CH4
C+ C02 -ý 2C0
C+H2O-3CO+//,
C+ O2 CO2
C+s2CO2 -+2(1+s, )'O
C+s102 - (1 +s) )[, y('O, +(I - r)('()]
rbl = MHC (9.2x10⁶ )exp_965o/TgHc]05o2cgm_3s1 CH4+1.502 --ºCO +2H, 0
rb2 =MC0 1017 6 exp( 2x10⁴ /TQICOI021 O25LH201°5kgm-3S-1 2CO+O2-->2('O2
kbl =1.74s exp(-9x10³ /Ts )M/S
kg2 = 3.42Ts exp( 1.56x10⁴ ITS yn /s
kg4 = (1.67)3.42T5 exp(1.56x10 ° ITS )n /s
rB, =1011exp( 10000/TgýHCoekmolm-3s-1
kB, = 5.67x10⁷ exp( 19294/Tg )ns-1 K-1
kB'l =1.667 exp(- 26689 / TS }n /s kB, 2 = 5555 exp(-43308 / Ts yn /s
kB. 3 =1.39x10 -3 exp(-14604 / Ts }n is kB. 4 = 2083 exp(- 27697 / Ts )n /s k35 = 2778 exp(- 15 10 / Ts )n /s
kml = 3.51x10⁶ exp(- 10970 /s
km2 = 8.10x10² exp(- 17664 / Tc
km3 = 5.25x10² exp( 59100 / Tc
km4 = 6.11x10³ exp(- 9662 /s
km5 =3.23x10⁷exp(5938/Tg)
kLl = 4.2x10³ exp(155/RT S -1MPa-1
kL2 =0.29x10³ exp(121/RTcý-1A1Pa-1
C+0.50, ->CO
C +CO, -* 2C0
C+H20-3CO+H,
H2 +0,11,0
C+s, O2 -gy0 +s1)I; r( (), +(i - yX C0
C+02 -CO, C +C02 2C0
C+H20ý('O+H,
C+ 2112 - ('114
CO+1120 CO, +/I,
xC + y02 -* z('O, + d('0
C+H2O-CO+H,
C+ CO, --* 2C0
C+2H2 -ºCH4
CO+H2O -CO, +H,
C +CO, -> 2CO
('+/!, O -*CO+H,
Table 6.5: Reaction kinetics from different sources for coal and wood gasification.
212
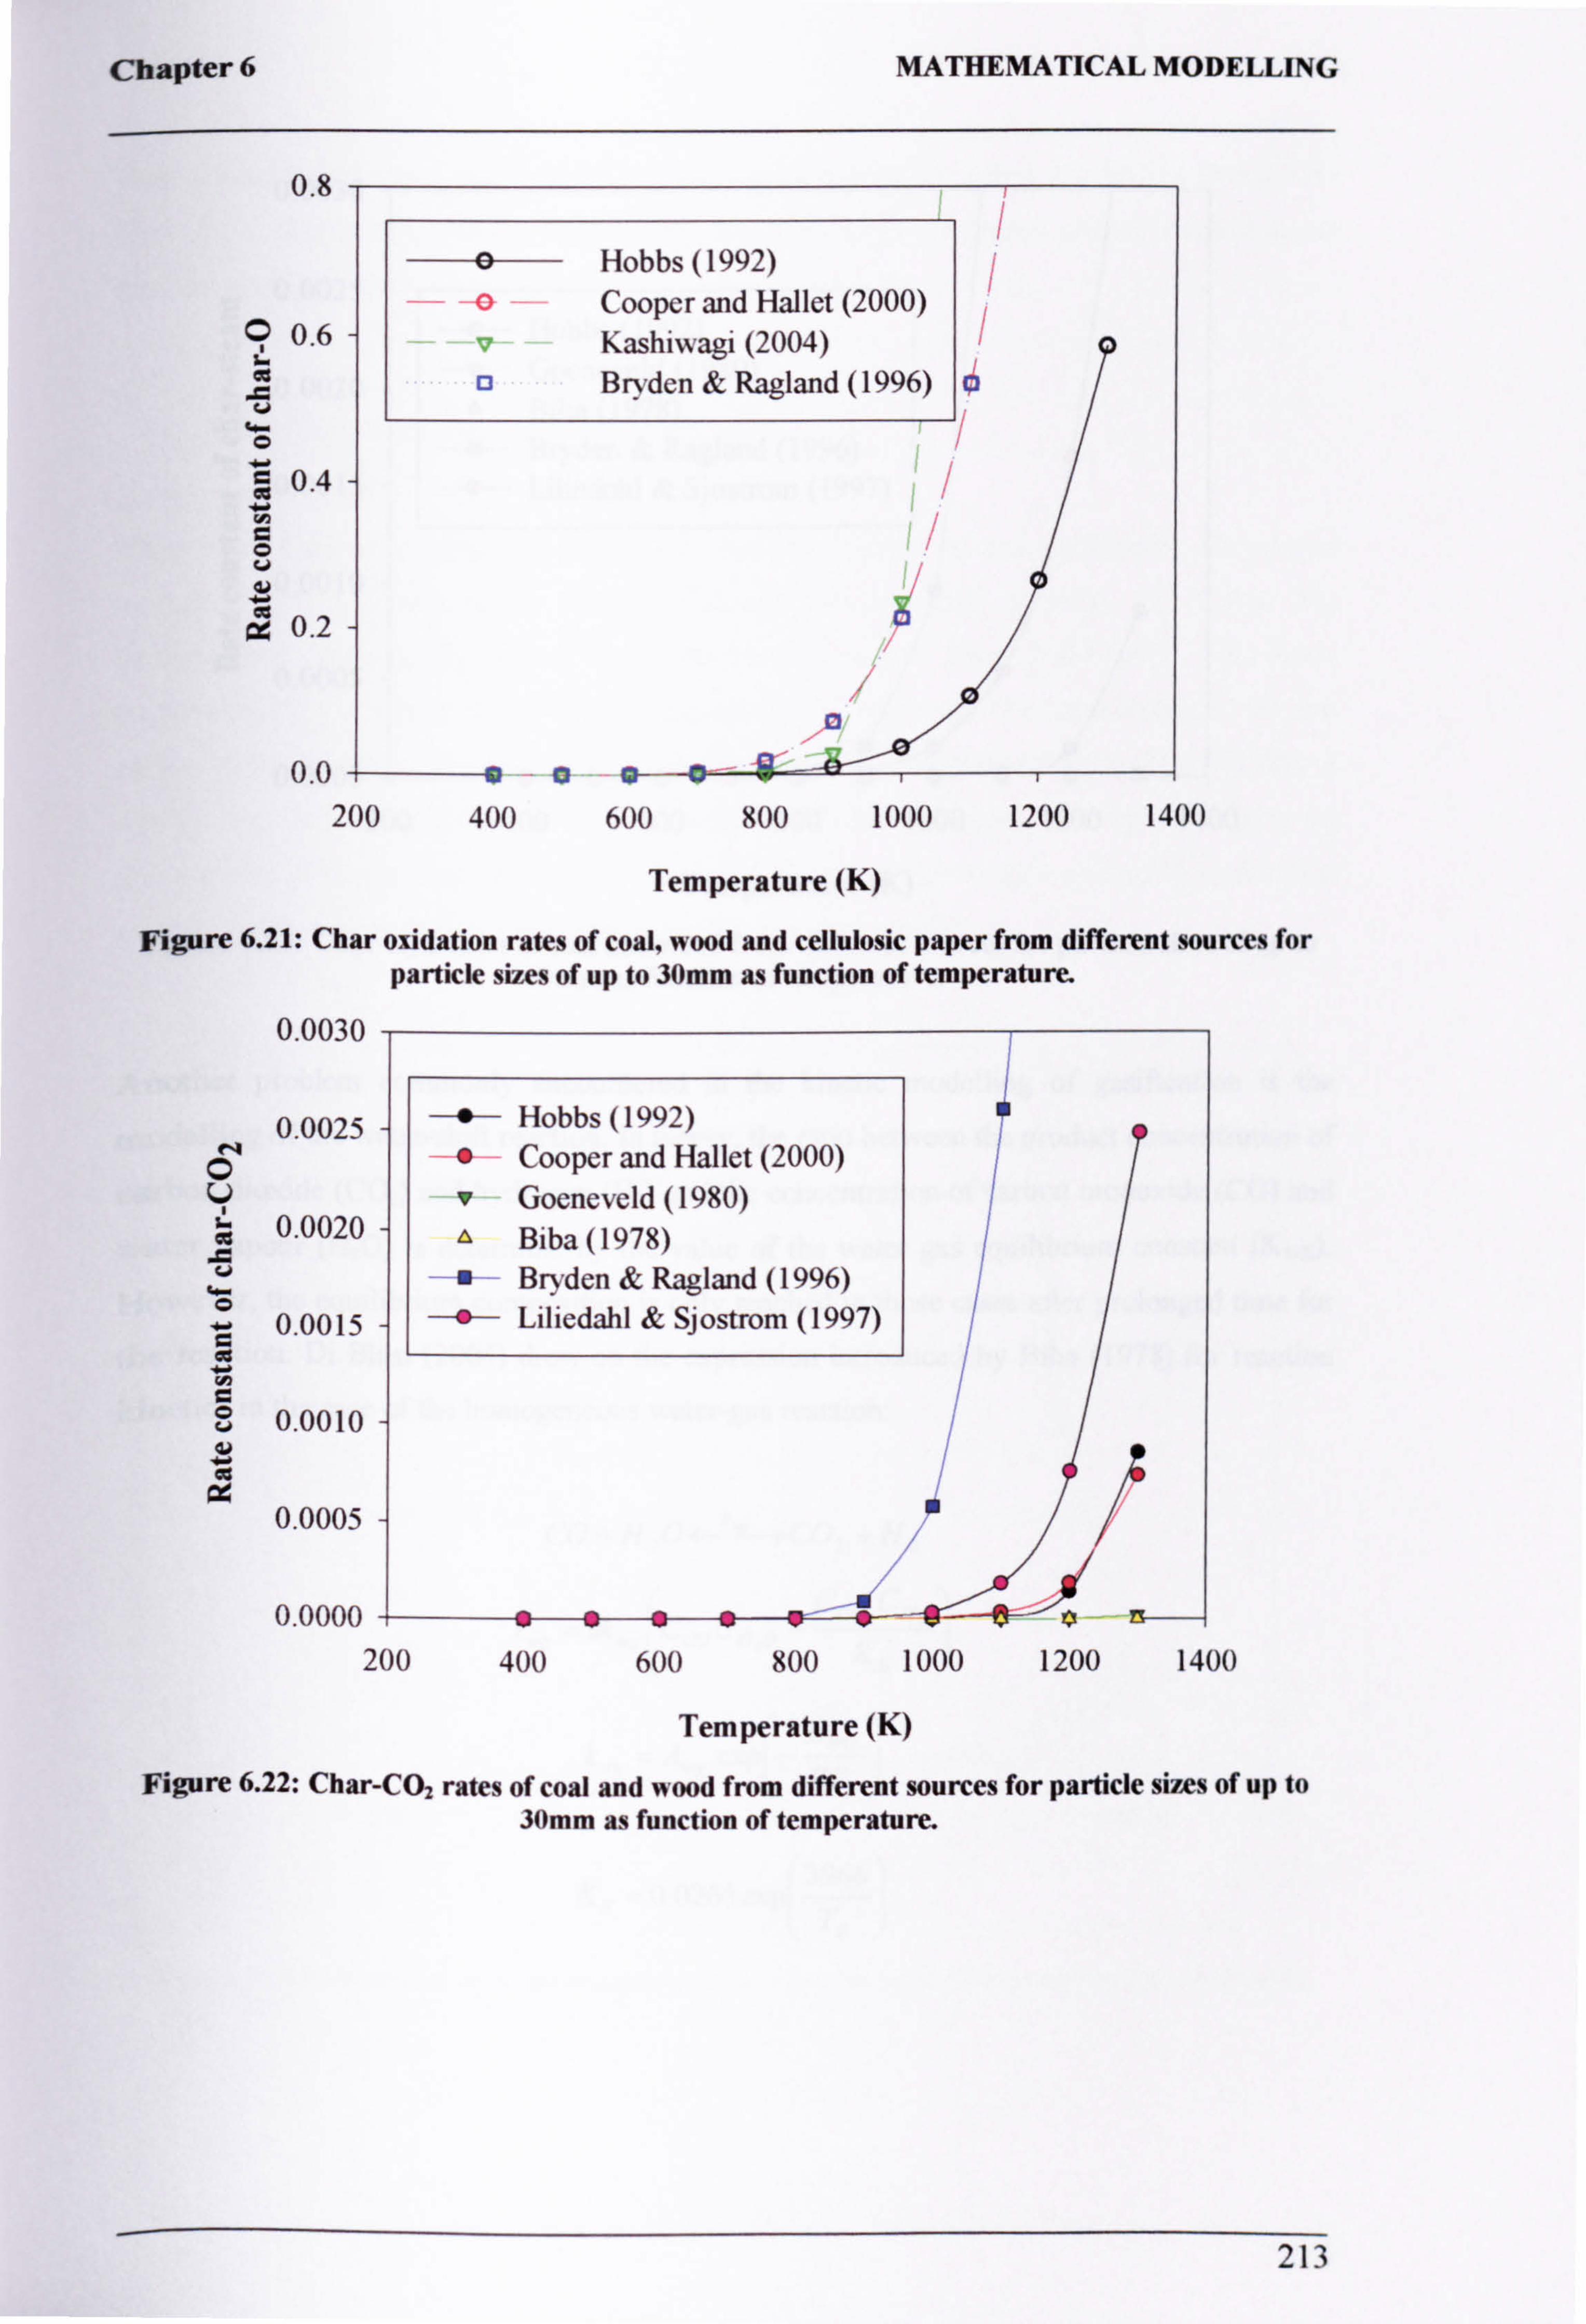
Chapter 6
0.8
90.6
0.4
0.2
MATHEMATICAL MODELLING
0 Hobbs (1992) Cooper and Hallet (2000)
V Kashiwagi (2004) o Brvden & Ragland (1996)
/
a
0.0 ; ---o--- o -- o- a 4. a- 200 400 600 800 1000 1200 1400
Temperature (K)
Figure 6.21: Char oxidation rates of coal, wood and cellulosic paper from different sources for particle sizes of up to 30mm as function of temperature.
0.0030
0.0025 N
G
0.0020
0.0015 0
0.0010
- f- Hobbs (1992) " Cooper and Hallet (2000)
" Goeneveld (1980) Biba(1978) Bryden & Ragland (1996)
-ý- Liliedahl & Sjostrom (1997)
0.0005
0.0000 ;0" is 200 400 600 800 1000 1200 1400
Temperature (K)
Figure 6.22: Char-C02 rates of coal and wood from different sources for particle sizes of up to 30mm as function of temperature.
213
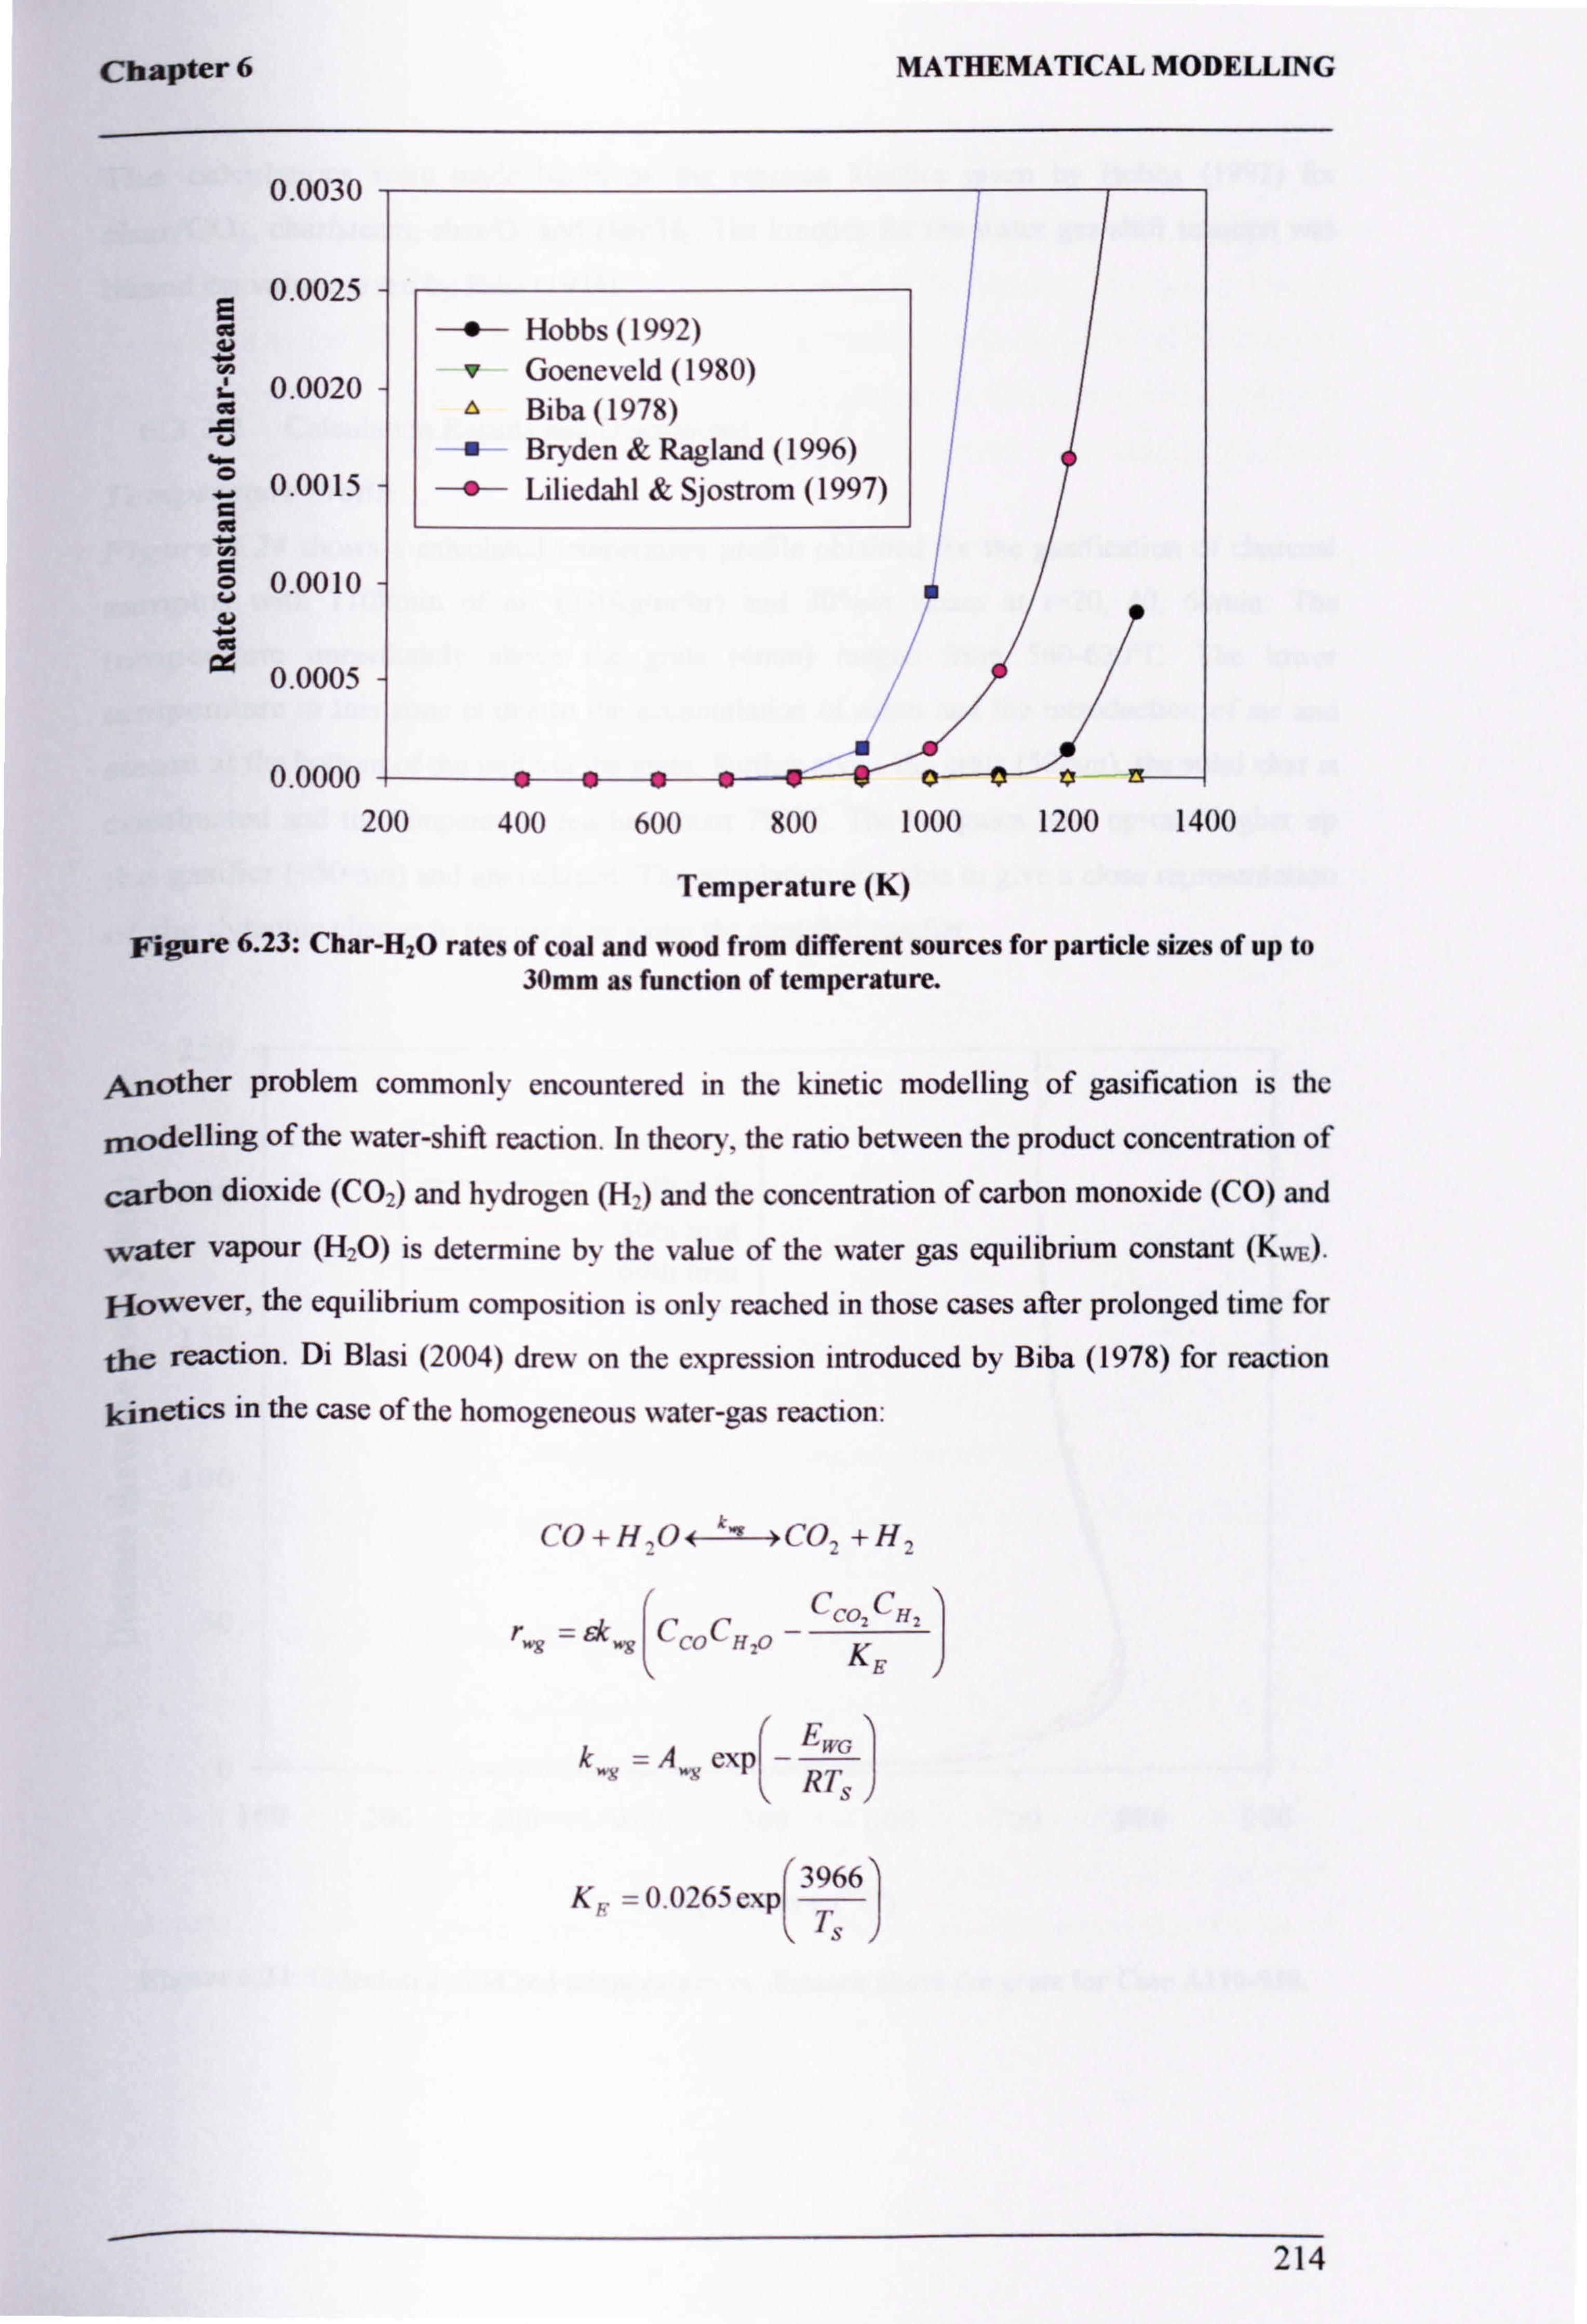
Chapter 6
0.0030
0 0025 rz . H
L 0.0020
0.0015 a
0.0010
0.0005
0.0000
MATHEMATICAL MODELLING
" Hobbs (1992)
" Goeneveld (1980) Biba(1978) Bryden & Ragland (1996)
-+- Liliedahl & Sjostrom (1997)
i a i
200 400 600 800 1000 1200 1400
Temperature (K)
Figure 6.23: Char-H20 rates of coal and wood from different sources for particle sizes of up to 30mm as function of temperature.
Another problem commonly encountered in the kinetic modelling of gasification is the
modelling of the water-shift reaction. In theory, the ratio between the product concentration of
carbon dioxide (C02) and hydrogen (H, ) and the concentration of carbon monoxide (CO) and
water vapour (H20) is determine by the value of the water gas equilibrium constant (KW I).
However, the equilibrium composition is only reached in those cases after prolonged time for
the reaction. Di Blasi (2004) drew on the expression introduced by Biba (1978) for reaction
kinetics in the case of the homogeneous water-gas reaction:
CO+H, OFk>CO, +H, CC0 CH
-2
ýE
kn = A,, x exp -
Ewc
RTS
K. =0.0265expý T3966) ,J
214
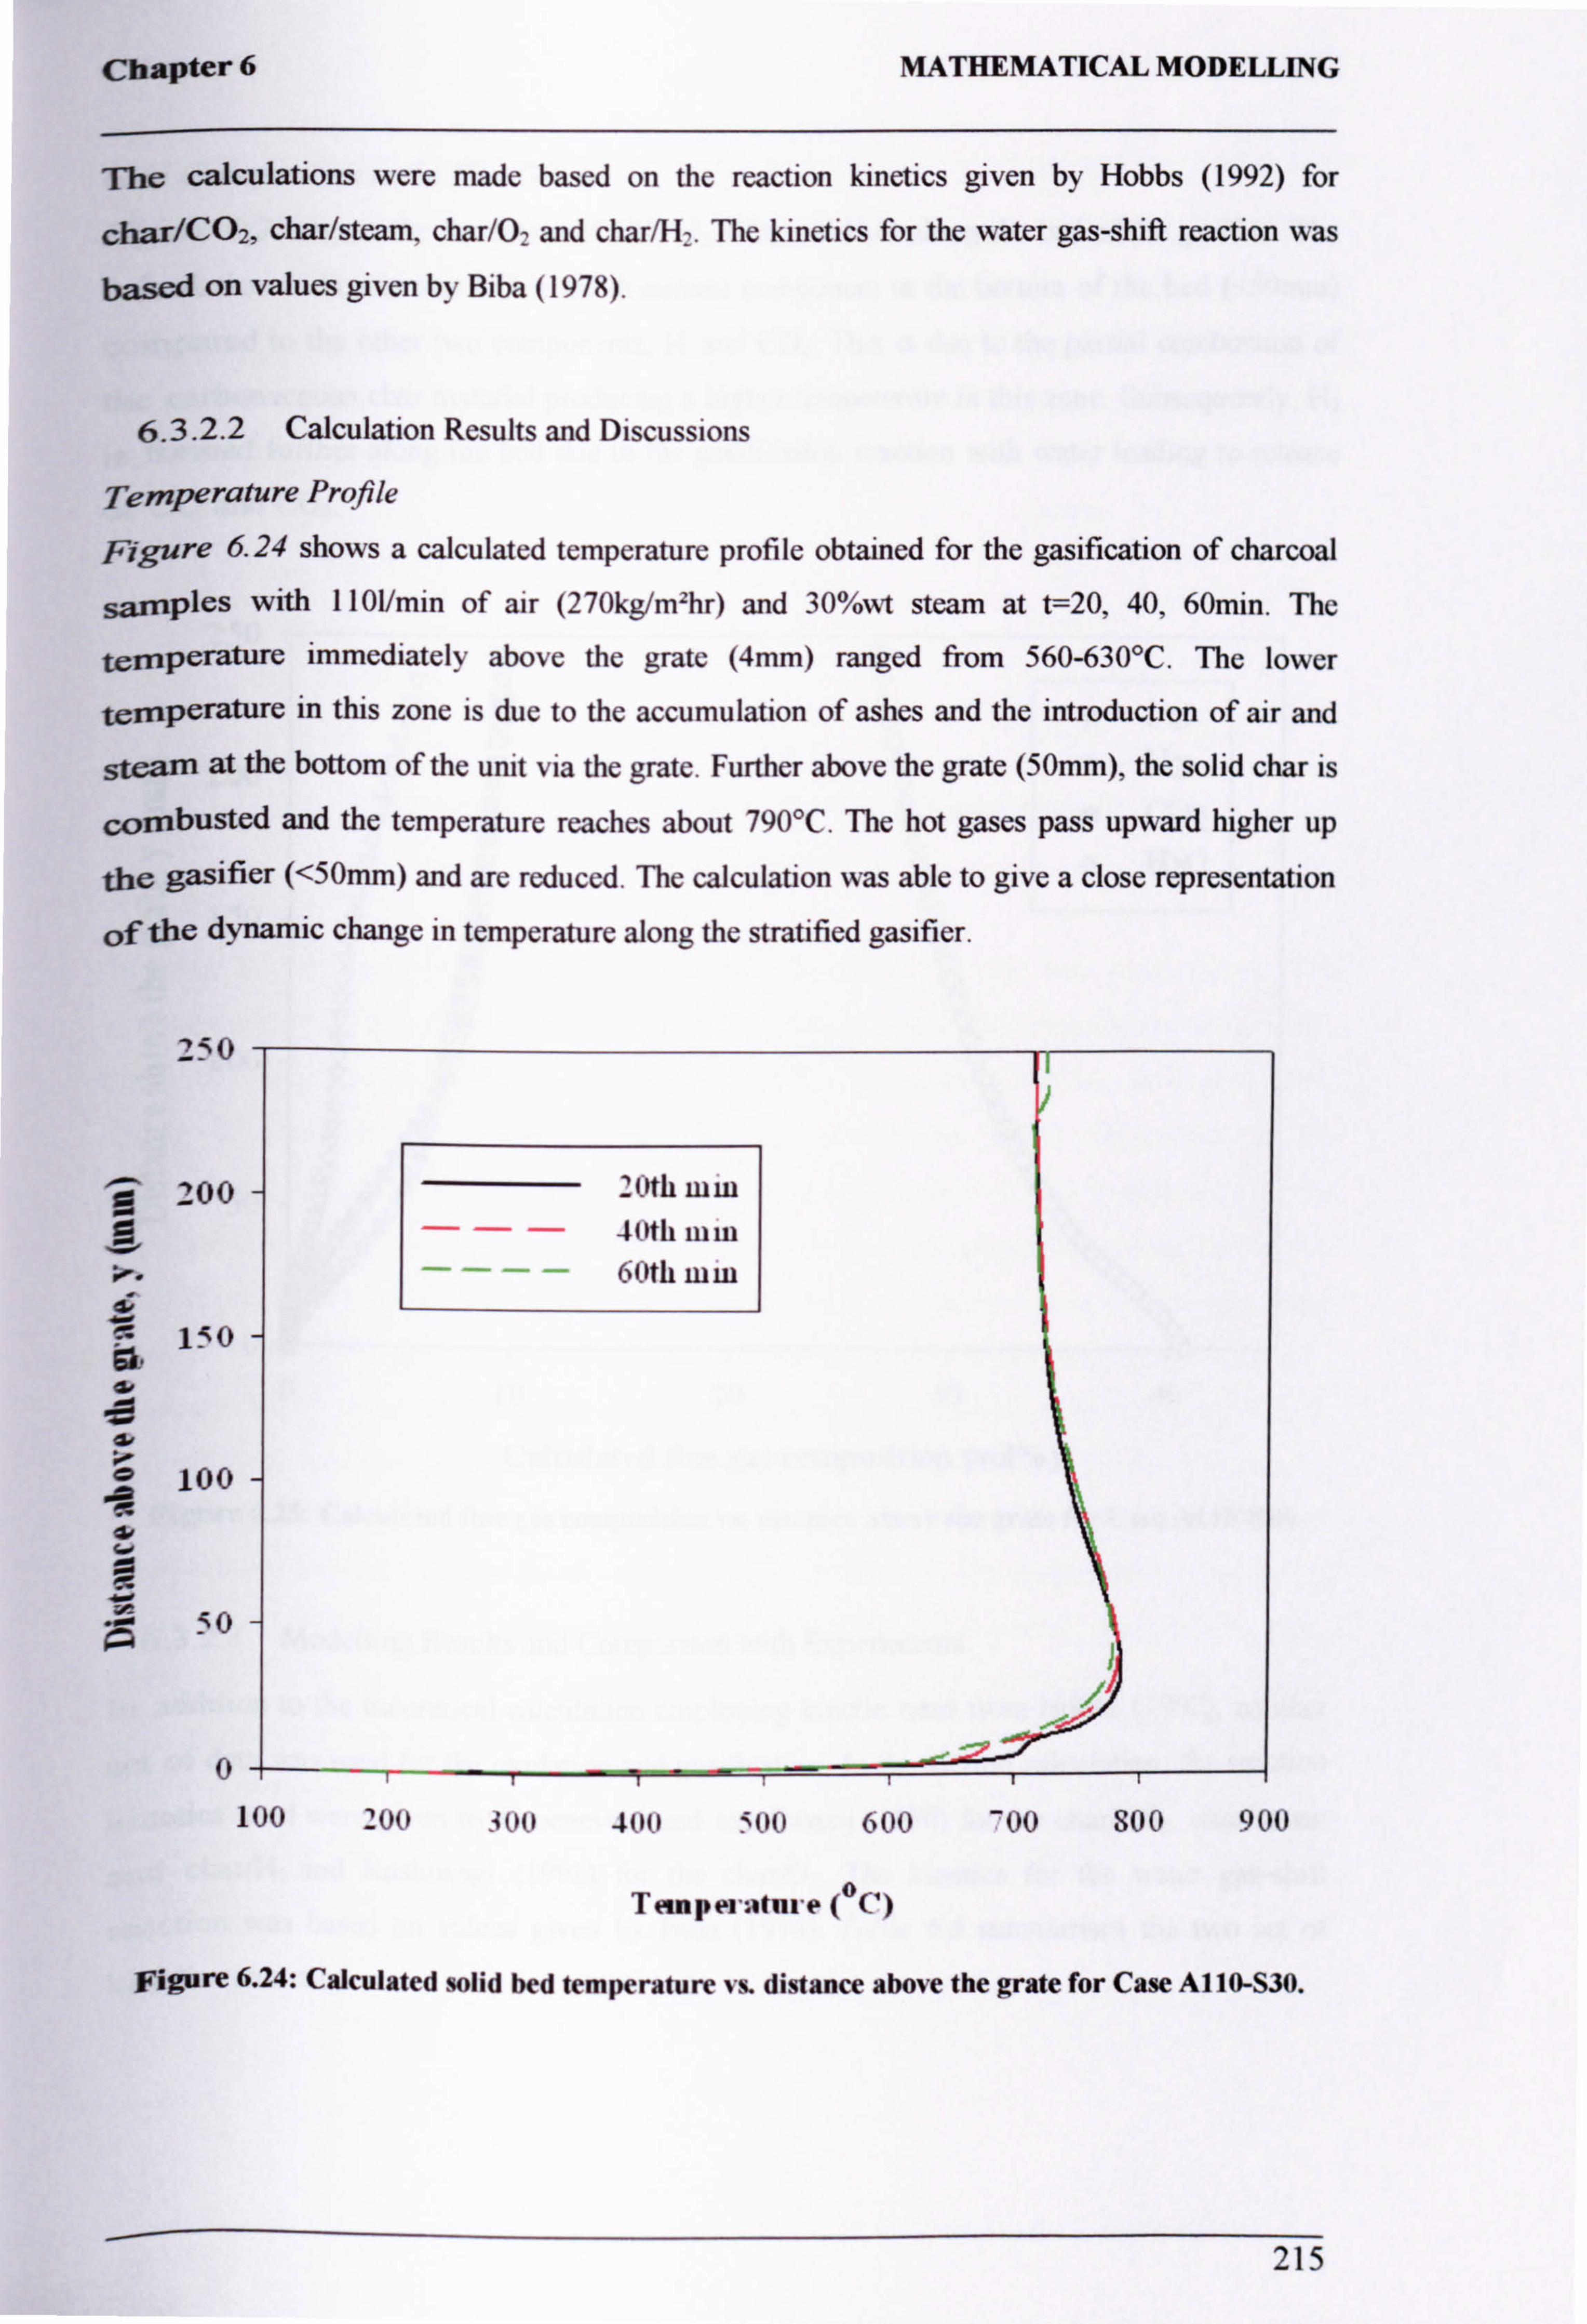
Chapter 6 MATHEMATICAL MODELLING
The calculations were made based on the reaction kinetics given by Hobbs (1992) for
char/CO2, char/steam, char/O, and char/H,. The kinetics for the water gas-shift reaction was
based on values given by Biba (1978).
6.3.2.2 Calculation Results and Discussions
Temperature Profile
Figure 6.24 shows a calculated temperature profile obtained for the gasification of charcoal
samples with 1101/min of air (270kg/mzhr) and 30%wt steam at t=20,40,60min. The
temperature immediately above the grate (4mm) ranged from 560-630°C. The lower
temperature in this zone is due to the accumulation of ashes and the introduction of air and
steam at the bottom of the unit via the grate. Further above the grate (50mm), the solid char is
combusted and the temperature reaches about 790°C. The hot gases pass upward higher up
the gasifier (<50mm) and are reduced. The calculation was able to give a close representation
of the dynamic change in temperature along the stratified gasifier.
2O
I
i.
200
40 r
ar
a-
a+ C. 0 eg G--
.ý A
20th law --- 40th in in
---- 60th mm
150
100
50
0 100 200 301) 400 500 600 -00 300 900
Tetnper: 4tare (°C)
Figure 6.24: Calculated solid bed temperature vs. distance above the grate for Case A110-S30.
215
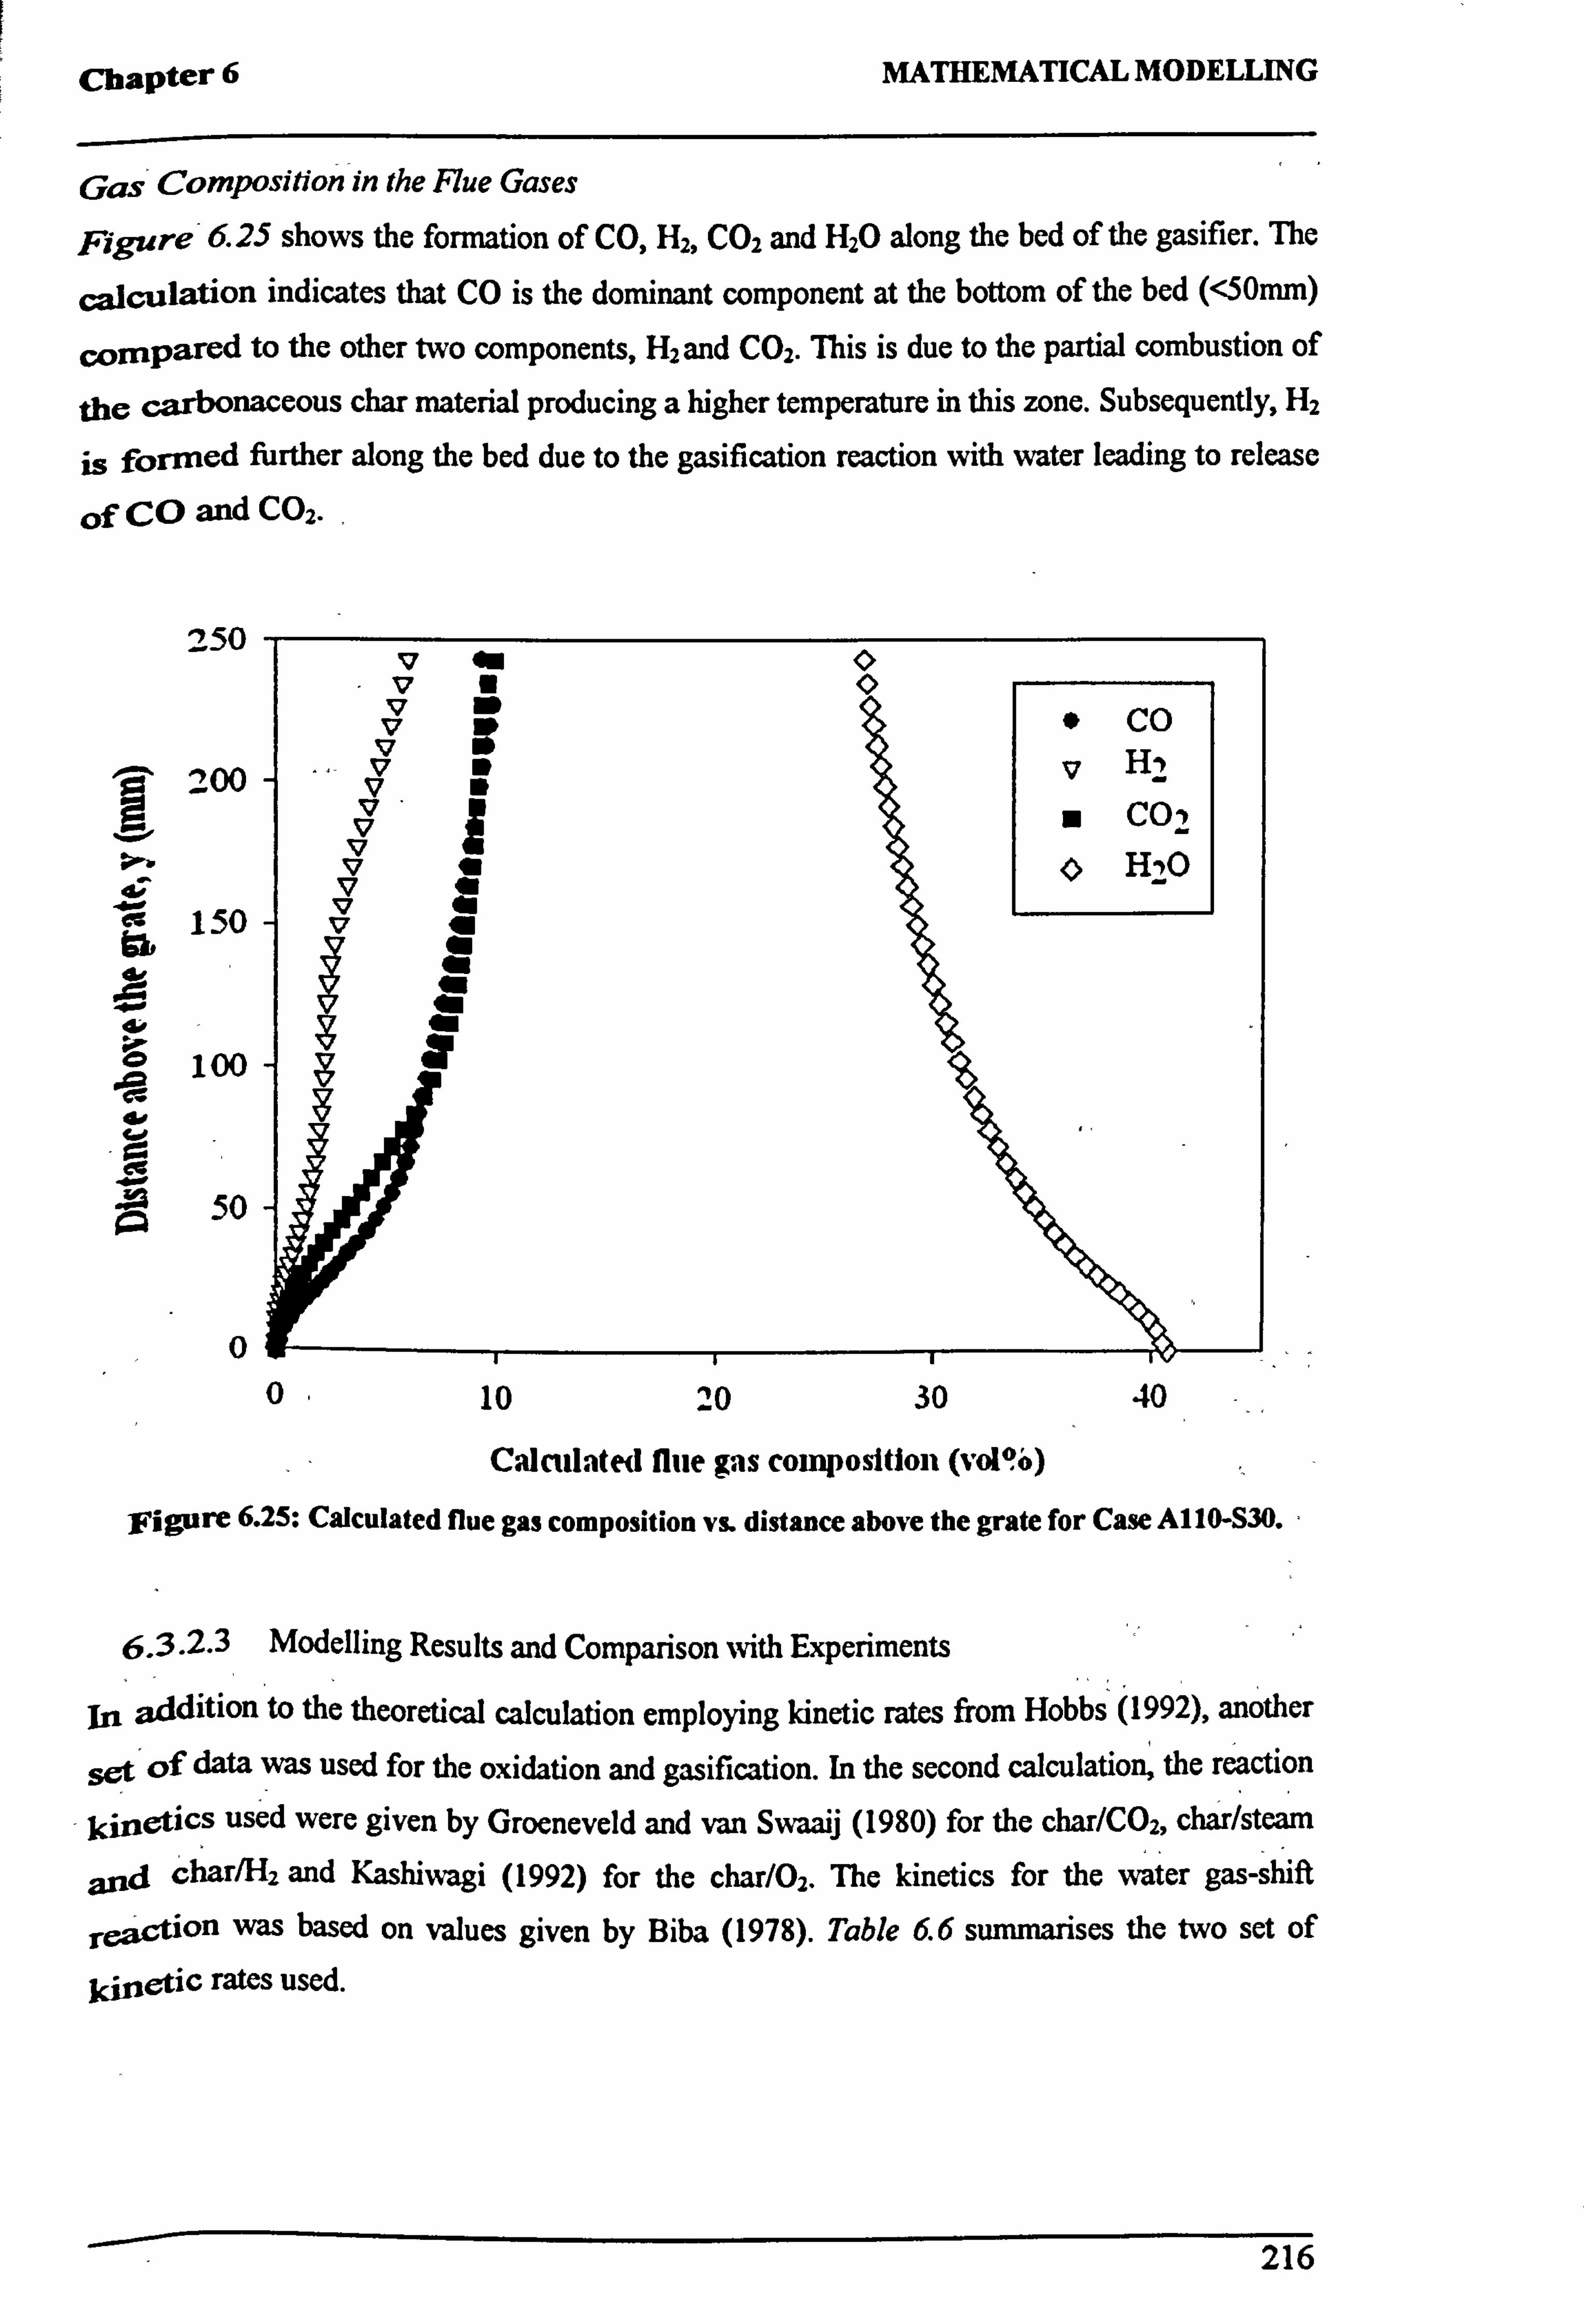
Chapter 6 MATHEMATICAL MODELLING
Gas Composition in the Flue Gases
Figure 6.25 shows the formation of CO, H2, CO2 and H2O along the bed of the gasifier. The
calculation indicates that CO is the dominant component at the bottom of the bed (<50mm)
compared to the other two components, H2 and CO2. This is due to the partial combustion of
the carbonaceous char material producing a higher temperature in this zone. Subsequently, H2
is formed further along the bed due to the gasification reaction with water leading to release
, of CO and CO2.
250
I
y. d ... R
200
150
... a:
09 490
100
G R ja A 50
0
i Ö v ö= " CO
°s v H, v ° V CO')
°r O H2O v
ý g $ g
a 10 20 30 40
Calculated flue gas composition (vol%)
Figure 6.25: Calculated flue gas composition vs. distance above the grate for Case A110-S30.
6.3.2.3 Modelling Results and Comparison with Experiments
In addition to the theoretical calculation employing kinetic rates from Hobbs (1992), another
't of data was used for the oxidation and gasification. In the second calculation, the reaction
kinetics used were given by Groeneveld and van Swaaij (1980) for the char/CO2, char/steam
and char/HZ and Kashiwagi (1992) for the char/02. The kinetics for the water gas-shift
reaction was based on values given by Biba (1978). Table 6.6 summarises the two set of
kinetic rates used.
216
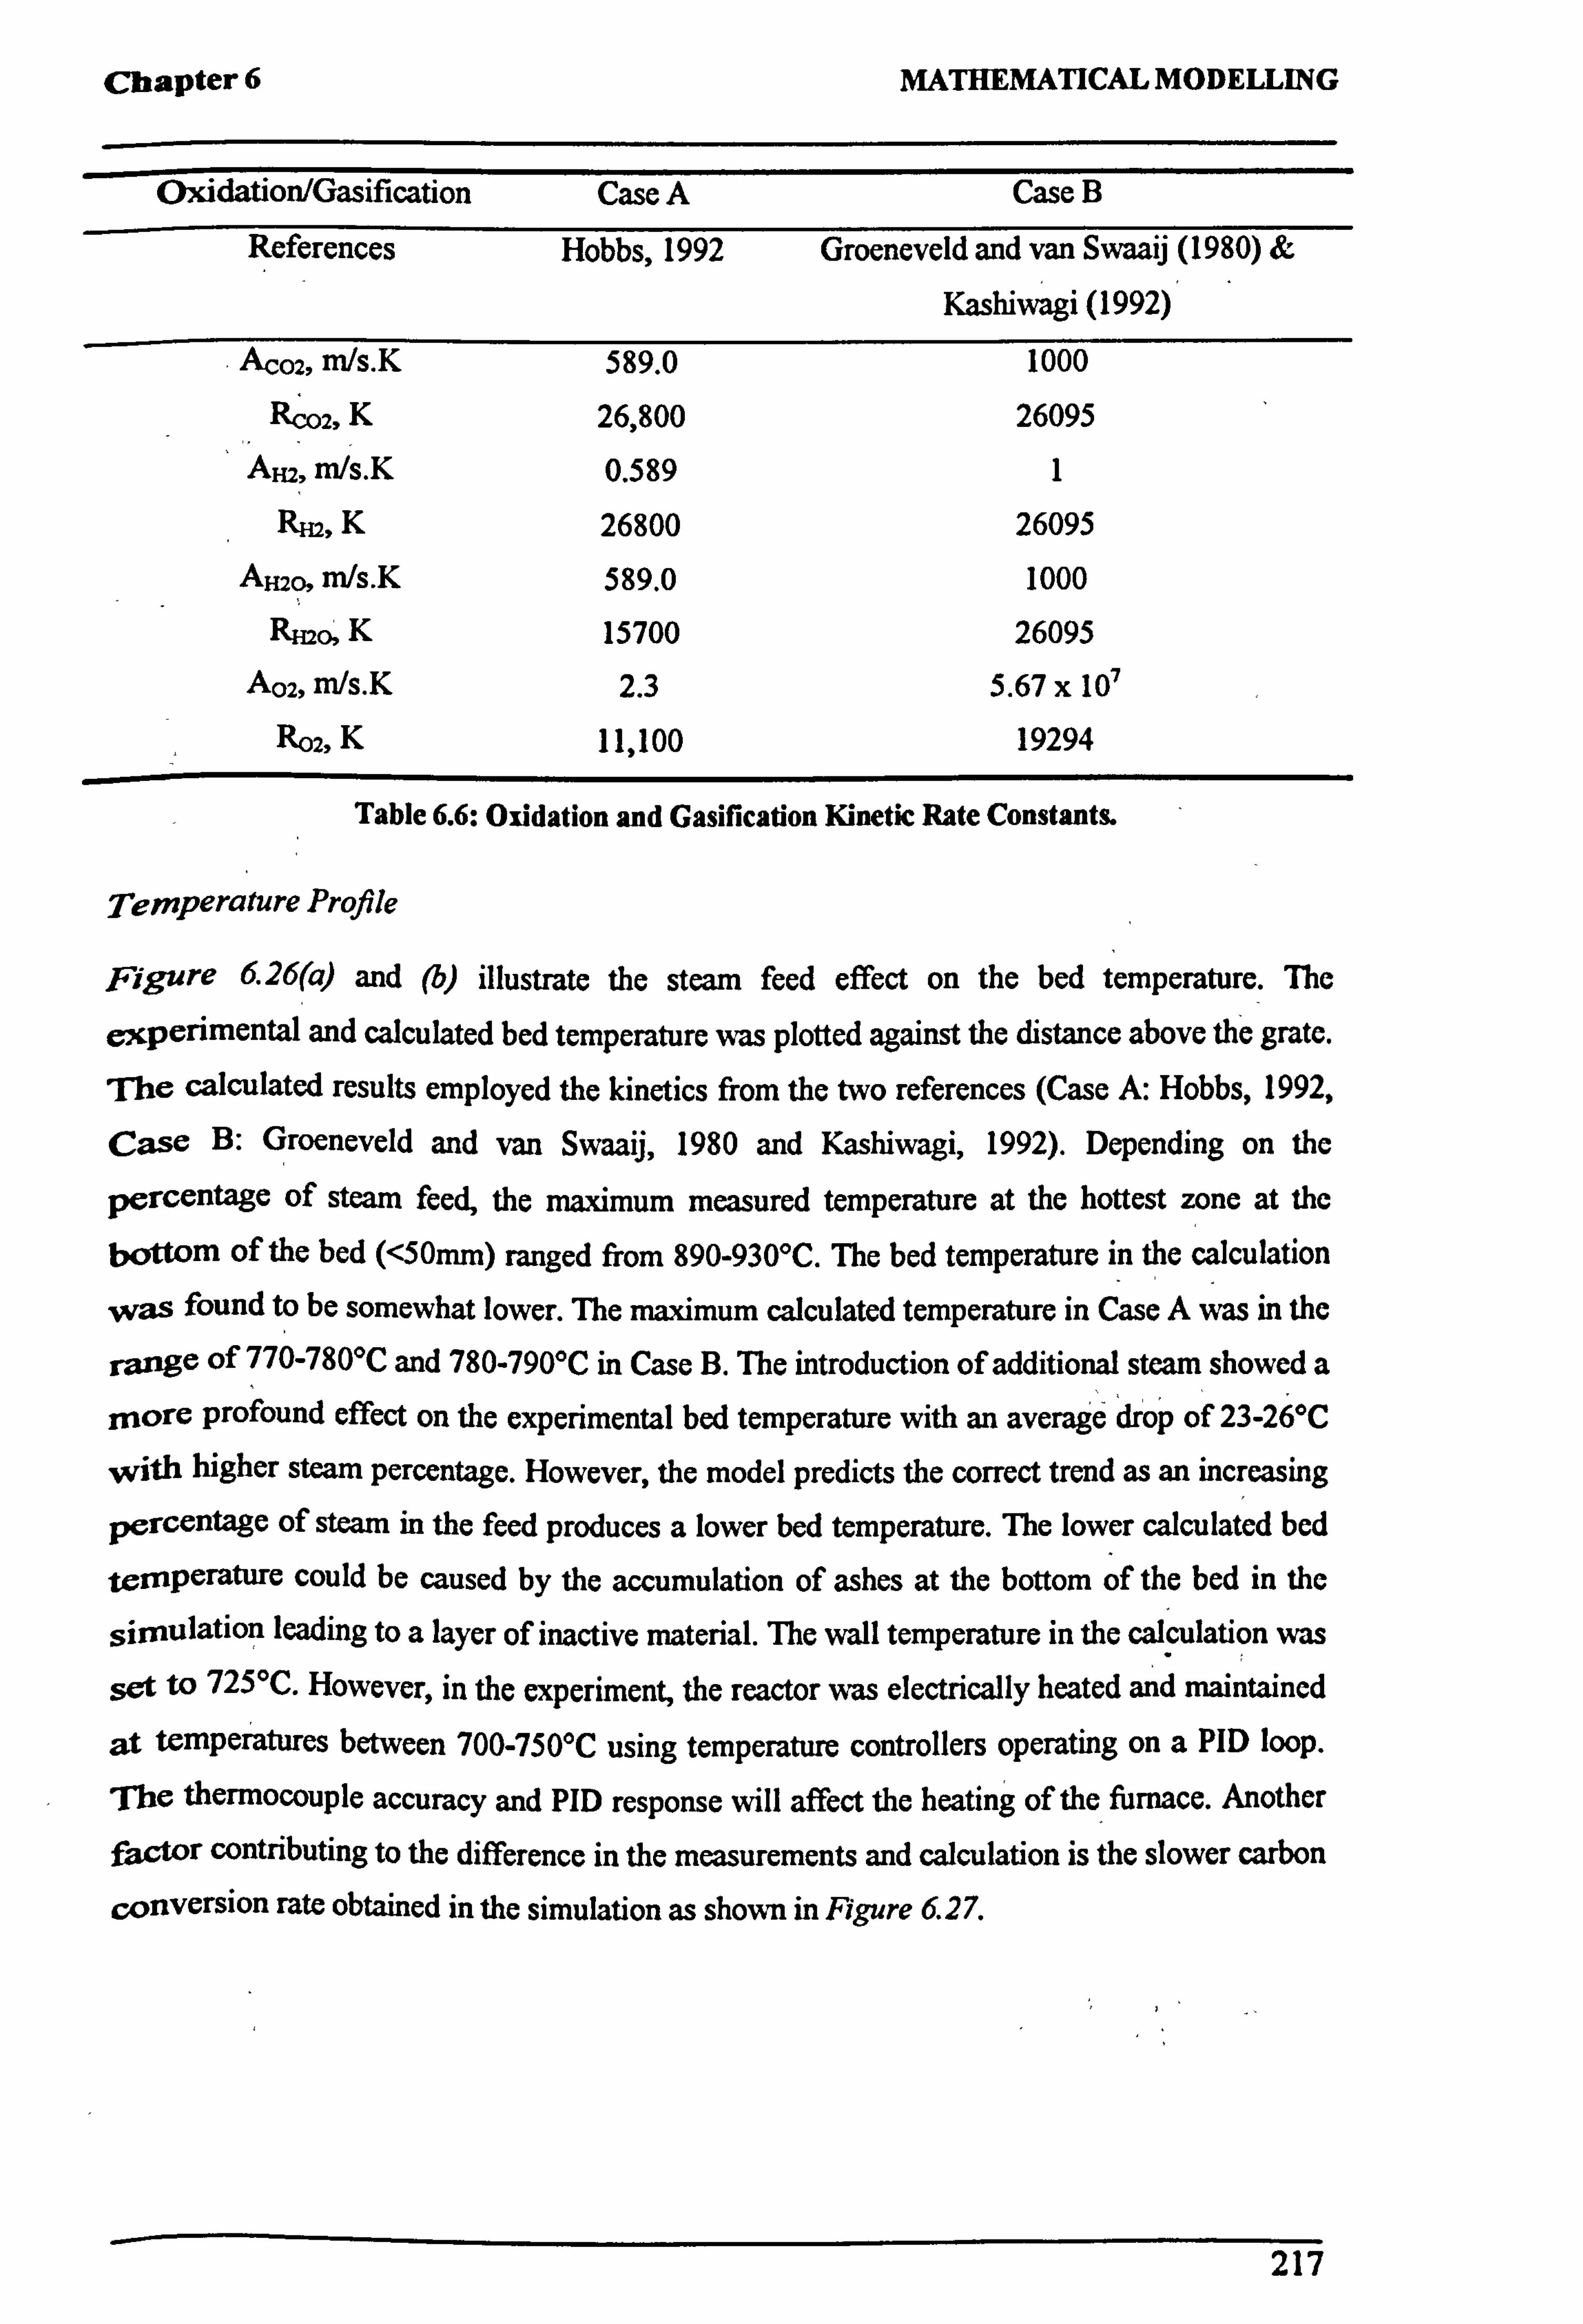
Chapter 6 MATHEMATICAL MODELLING
Oxidation/Gasification Case A Case B
References Hobbs, 1992 Groeneveld and van Swaaij (1980) &
Kashiwagi (1992)
A 02, m/s. K 589.0 1000
Rý02i K 26,800 26095
AH2, m/s. K 0.589 1
Rn, K 26800 26095
AH2o, m/s. K 589.0 1000
R2O, K 15700 26095 A02, m/s. K 2.3 5.67 x 10⁷
Roe, K 11,100 19294
Table 6.6: Oxidation and Gasification Kinetic Rate Constants.
Temperature Profile
Figure 6.26(a) and (b) illustrate the steam feed effect on the bed temperature. The
experimental and calculated bed temperature was plotted against the distance above the grate. The calculated results employed the kinetics from the two references (Case A: Hobbs, 1992,
Case B: Groeneveld and van Swaaij, 1980 and Kashiwagi, 1992). Depending on the
percentage of steam feed, the maximum measured temperature at the hottest zone at the
bottom of the bed (<50mm) ranged from 890-930°C. The bed temperature in the calculation
, vas found to be somewhat lower. The maximum calculated temperature in Case A was in the
range of 770-780°C and 780-790°C in Case B. The introduction of additional steam showed a
more profound effect on the experimental bed temperature with an average drop of 23-26°C
, With higher steam percentage. However, the model predicts the correct trend as an increasing
percentage of steam in the feed produces a lower bed temperature. The lower calculated bed
temperature could be caused by the accumulation of ashes at the bottom of the bed in the
simulation leading to a layer of inactive material. The wall temperature in the calculation was
set to 725°C. However, in the experiment, the reactor was electrically heated and maintained
at temperatures between 700-750°C using temperature controllers operating on a PID loop.
The thermocouple accuracy and PID response will affect the heating of the furnace. Another
actor contributing to the difference in the measurements and calculation is the slower carbon
conversion rate obtained in the simulation as shown in Figure 6.27.
217
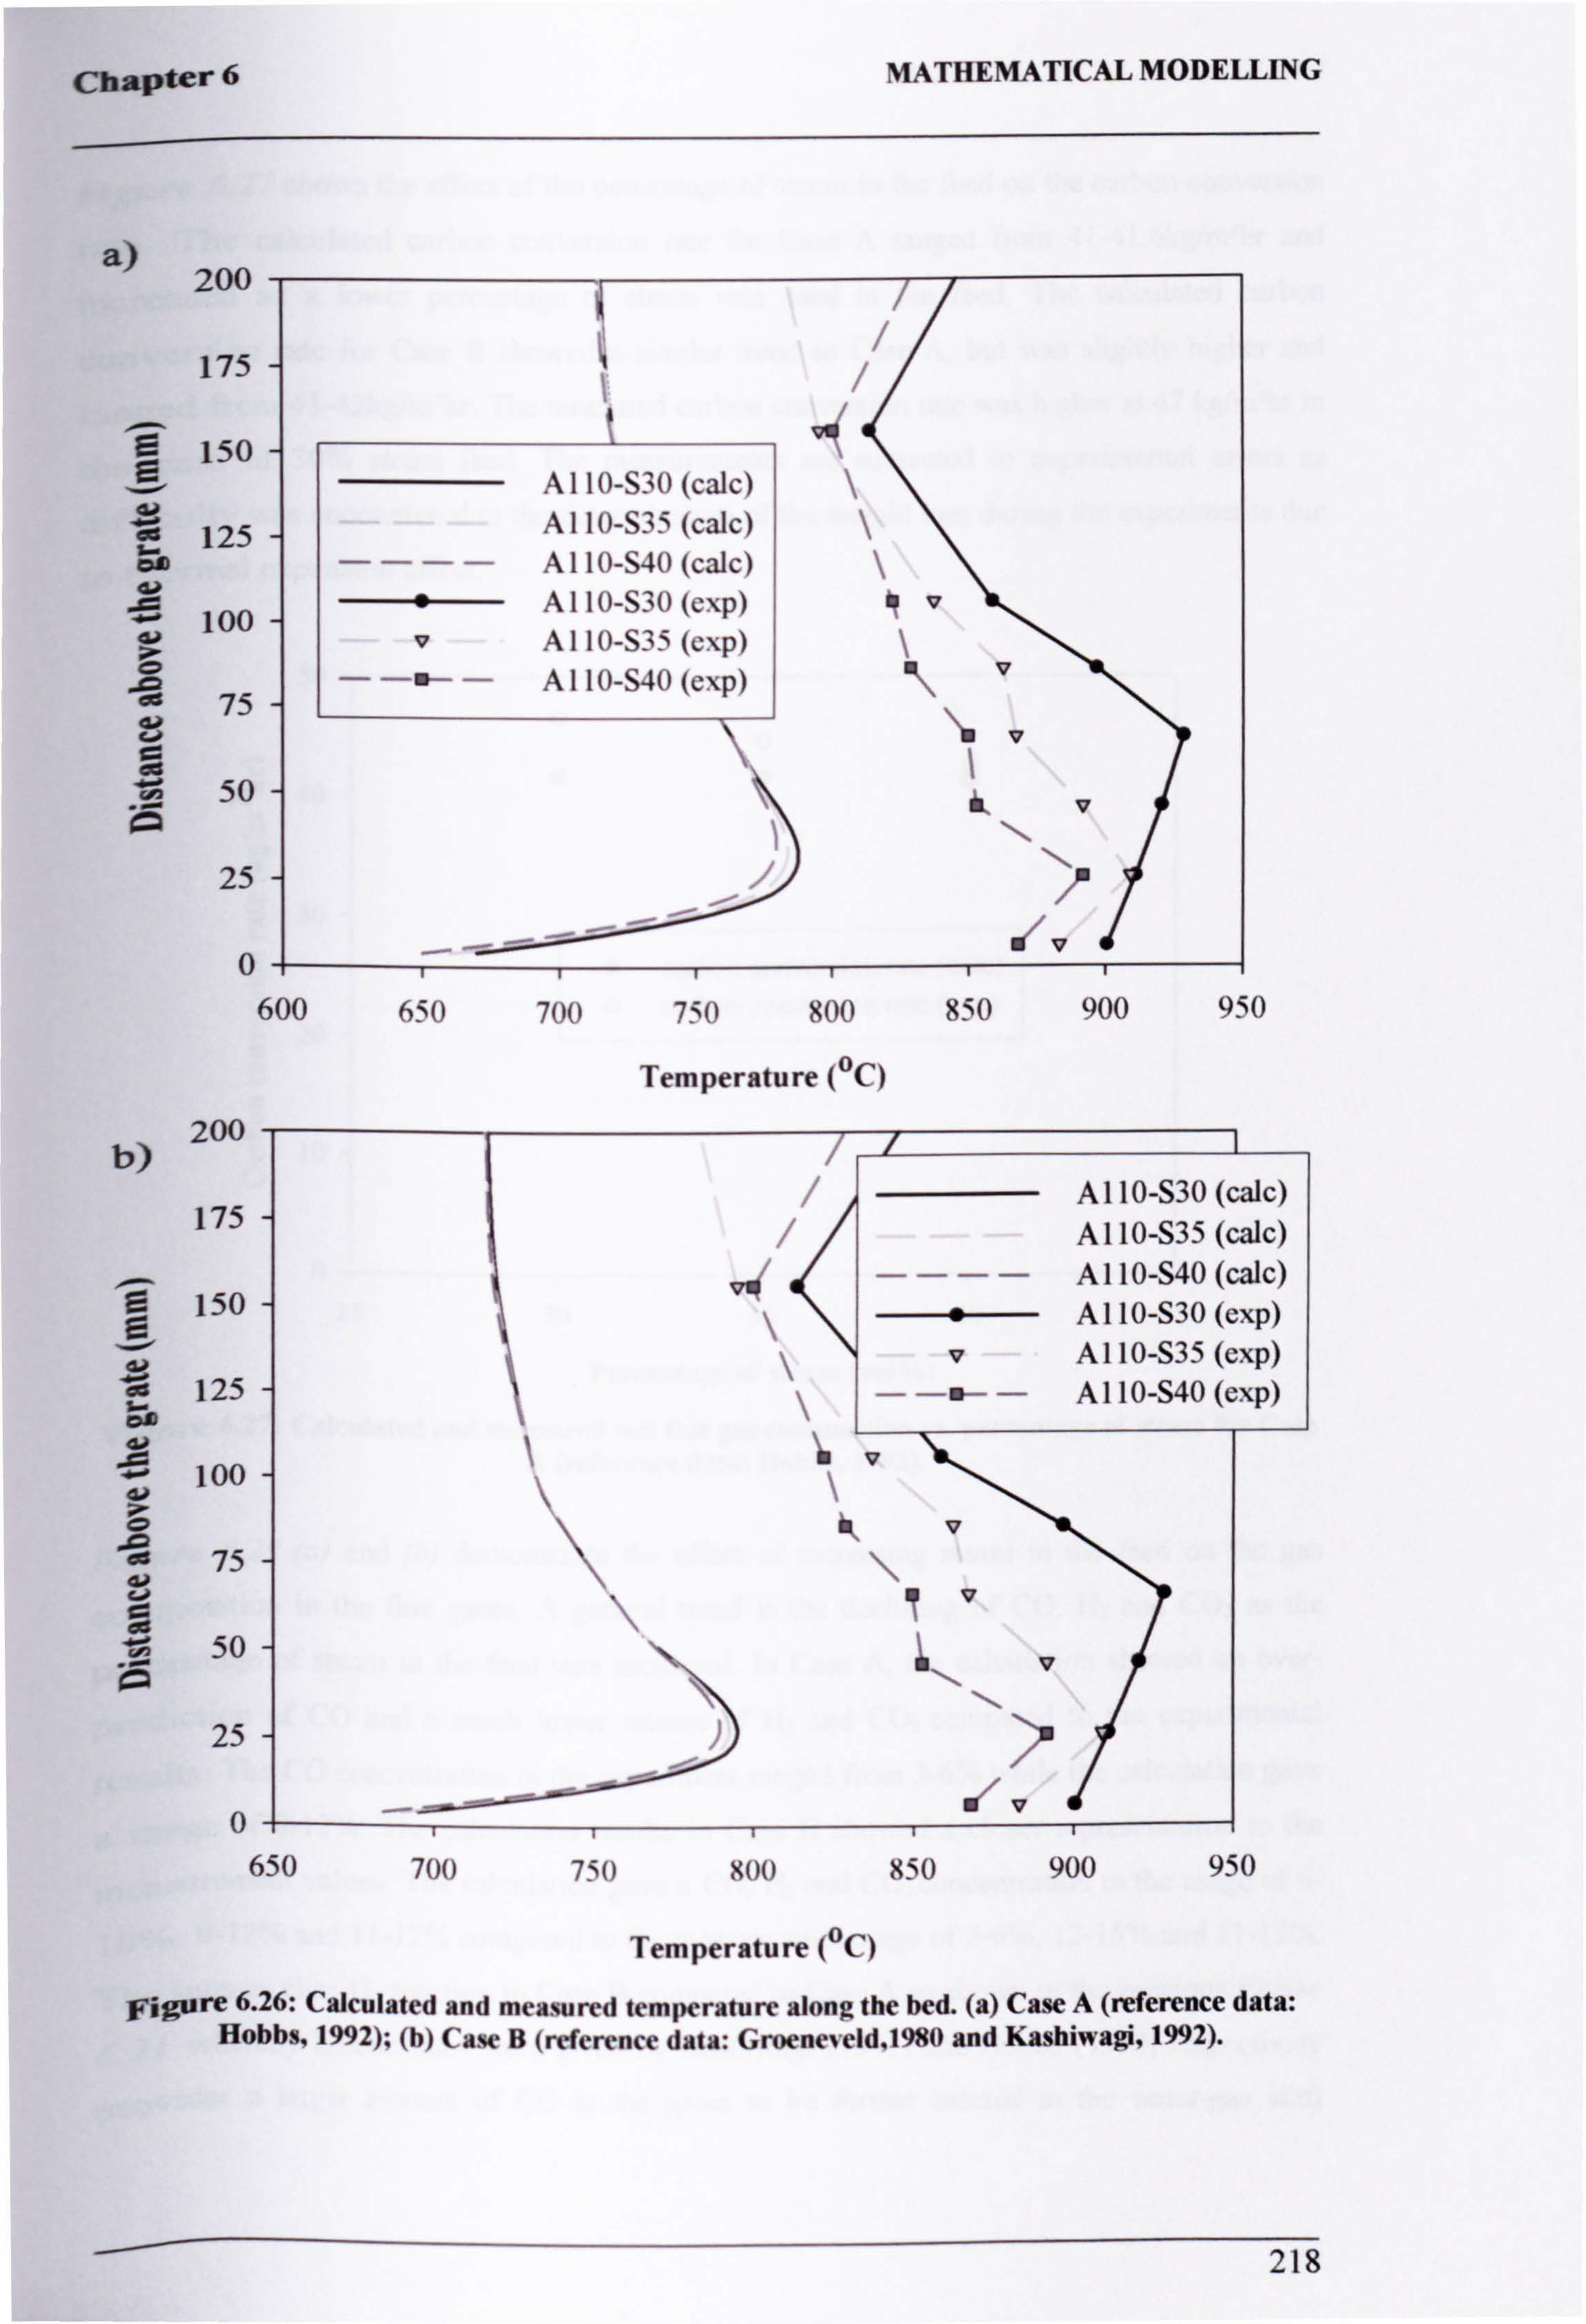
z5
0- I'll
650 700 750 800 850 900 950
Temperature (°C)
i
/A 110-S30 (talc) /A 110-S35 (calc)
----A 110-S40 (calc)
---ý-- A 110-S30 (exp)
vA 110-S35 (exp)
- -s- -A 110-S40 (exp)
v
v
v
v
wf v
bOU 700 750 800 850 9UU 91U
Temperature (°C)
e 6.26: Calculated and measured temperature along the bed. (a) Case A (reference data: Hobbs, 1992); (b) Case B (reference data: Groeneveld, 1980 and Kashiwagi, 1992).
218
Chapter 6
a) 200
175
a 150
C60 125
00
100
75 u ad
50
25
MATHEMATICAL MODELLING
0- 600
b) 200
175
150
125
100
75 ai
50
1
/.
/ý
4ý v
v
ýv
ýv
A 110-S30 (calc) A 110-S35 (calc)
----A 110-S40 (calc) Al 10-S30 (exp)
oA 110-S35 (exp)
- -f- -A 110-S40 (exp)
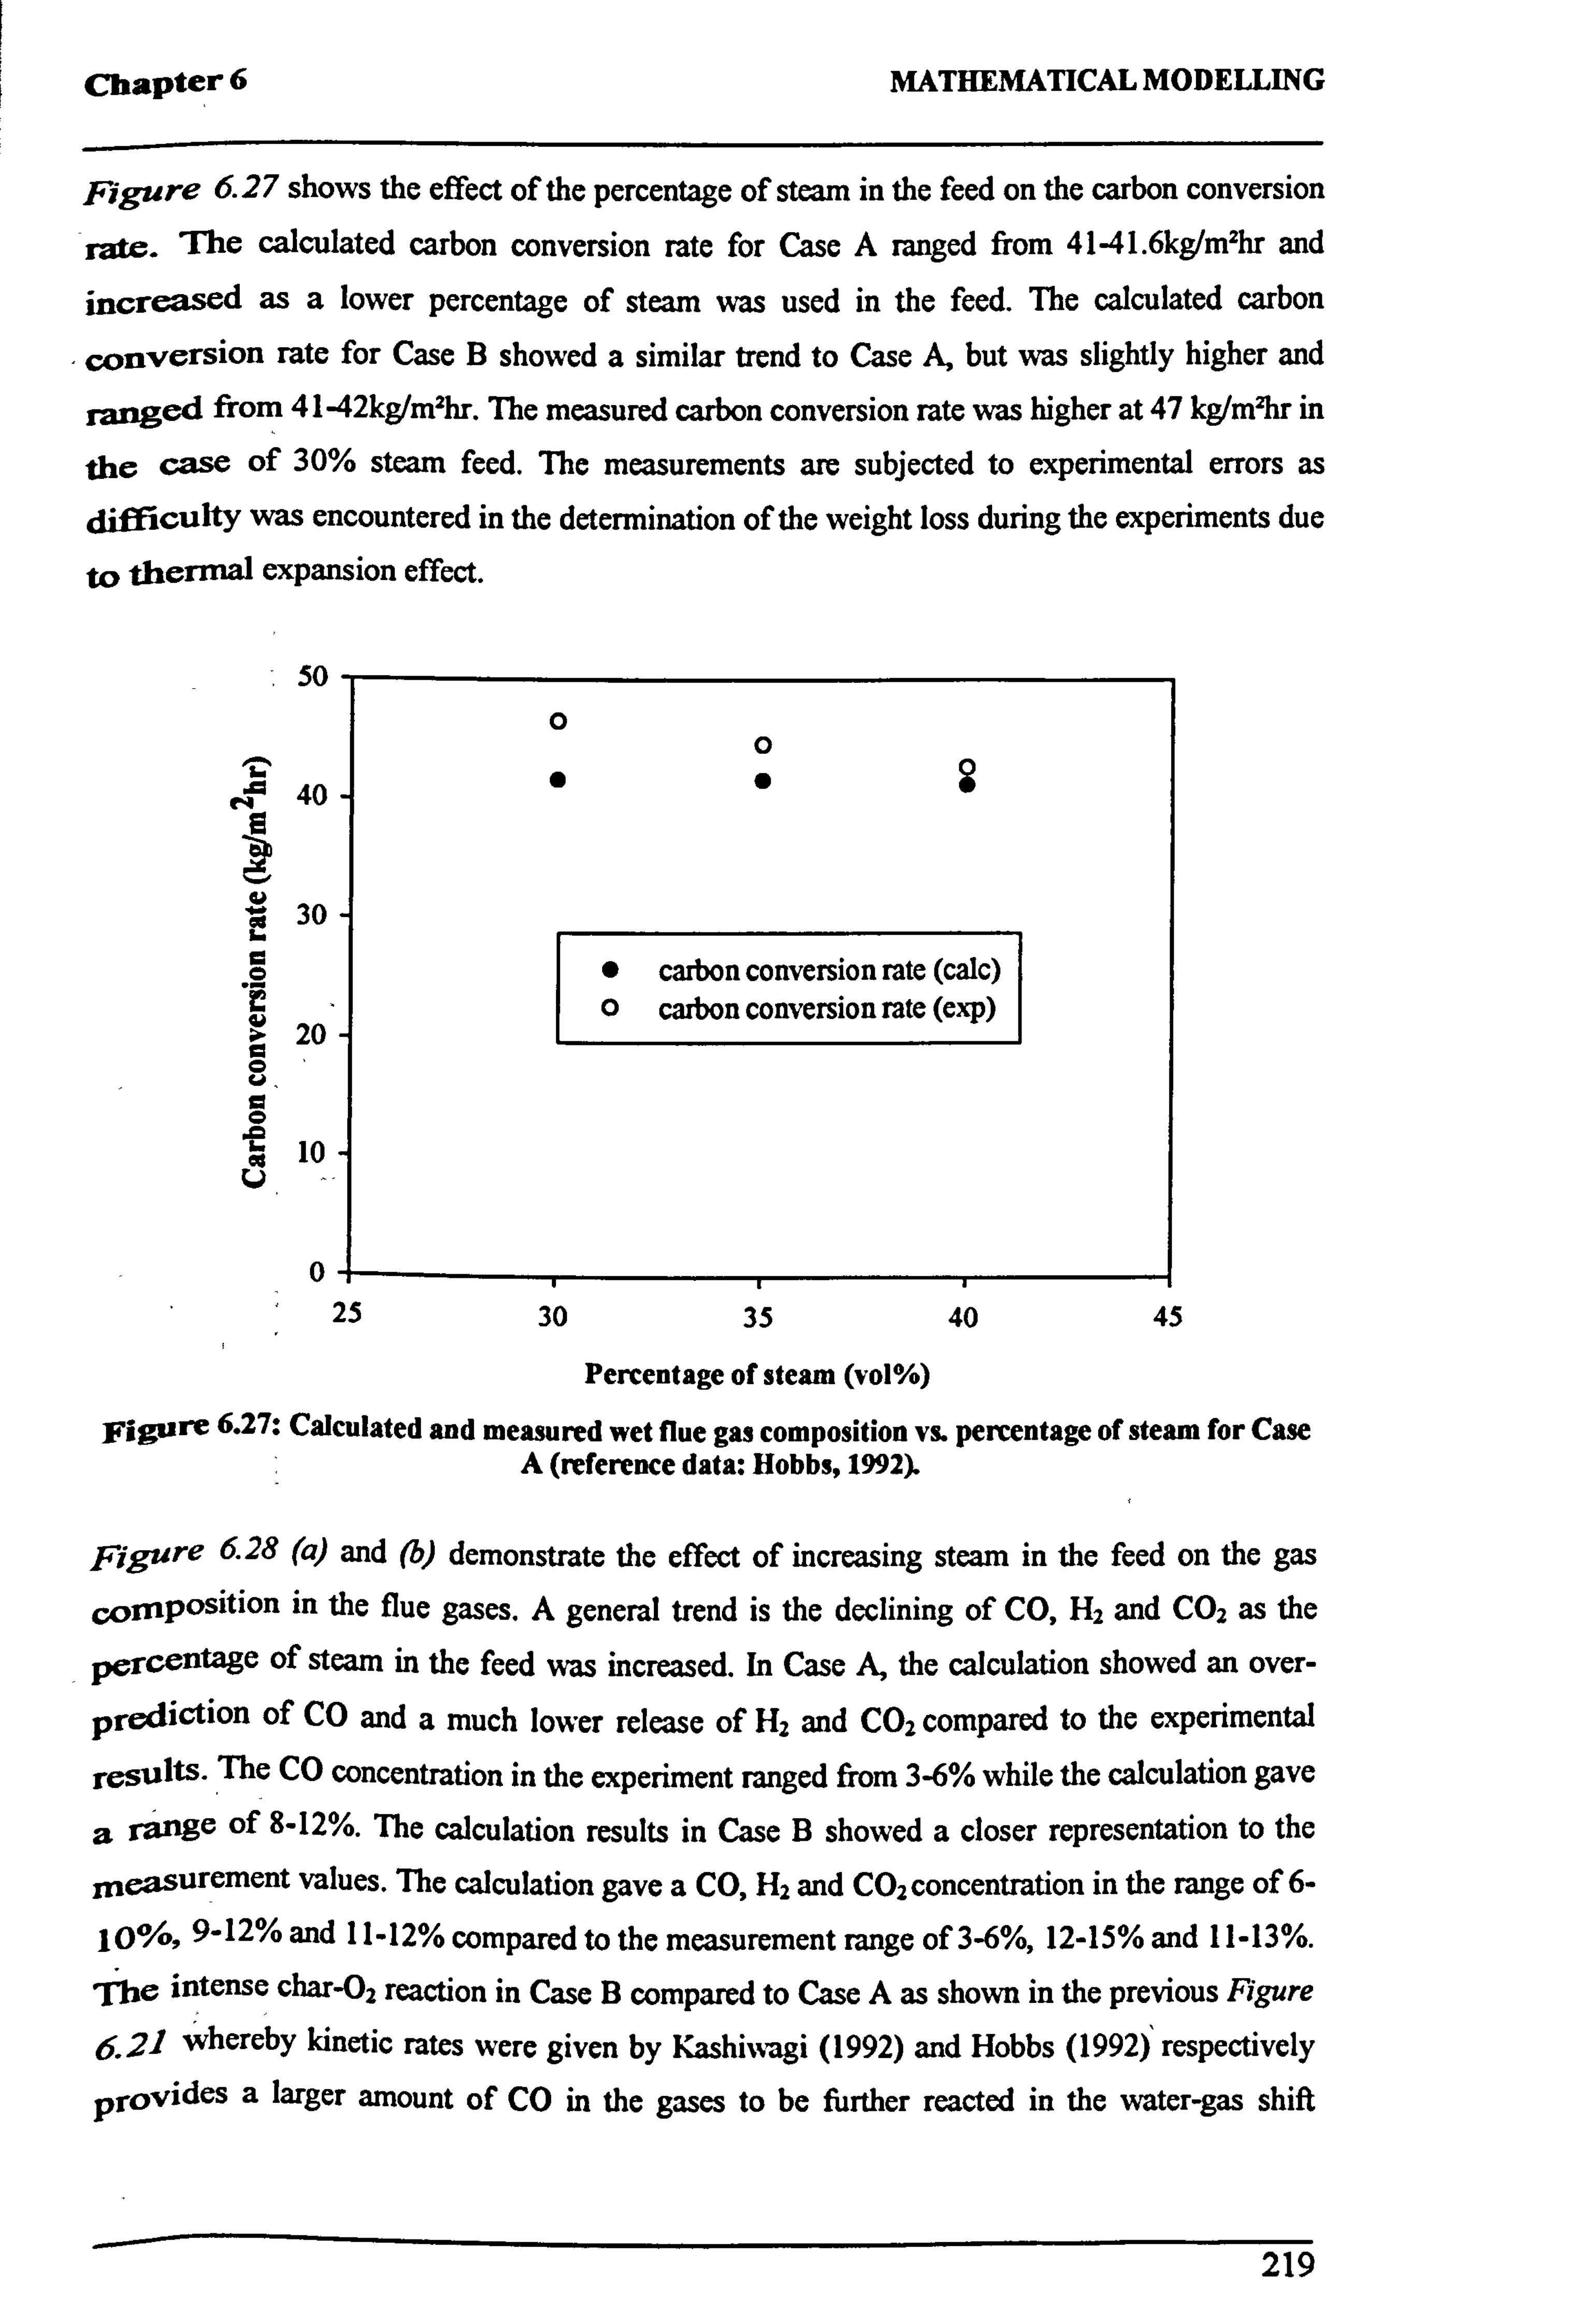
Chapter 6 MATHEMATICAL MODELLING
Figure 6 27 shows the effect of the percentage of steam in the feed on the carbon conversion
rate. The calculated carbon conversion rate for Case A ranged from 41-41.6kg/mzhr and
increased as a lower percentage of steam was used in the feed. The calculated carbon
conversion rate for Case B showed a similar trend to Case A, but was slightly higher and
ranged from 41-42kg/m2hr. The measured carbon conversion rate was higher at 47 kg/mzhr in
the case of 30% steam feed. The measurements are subjected to experimental errors as
difficulty was encountered in the determination of the weight loss during the experiments due
to thermal expansion effect.
50
L
im N
d O
b O V, C O
.` 04 U
40
30
20
10
0
0 0
"S
" carbon conversion rate (calc) 0 carbon conversion rate (exp)
25 30 35 40 45
Percentage of steam (vol%)
Figure 6.27: Calculated and measured wet flue gas composition vs. percentage of steam for Case A (reference data: Hobbs, 1992).
Figure 6.28 (a) and (b) demonstrate the effect of increasing steam in the feed on the gas
C, ornposition in the flue gases. A general trend is the declining of CO, H2 and CO2 as the
percentage of steam in the feed was increased. In Case A, the calculation showed an over-
prediction of CO and a much lower release of H2 and CO2 compared to the experimental
results. The CO concentration in the experiment ranged from 3-6% while the calculation gave
a range of 8-12%. The calculation results in Case B showed a closer representation to the
measurement values. The calculation gave a CO, H2 and CO2 concentration in the range of 6-
10%, 9-12% and 11-12% compared to the measurement range of 3-6%, 12-15% and 11-13%.
. fie intense char-O2 reaction in Case B compared to Case A as shown in the previous Figure
6.2-1 whereby kinetic rates were given by Kashi«agi (1992) and Hobbs (1992) respectively
provides a larger amount of CO in the gases to be further reacted in the water gas shift
219
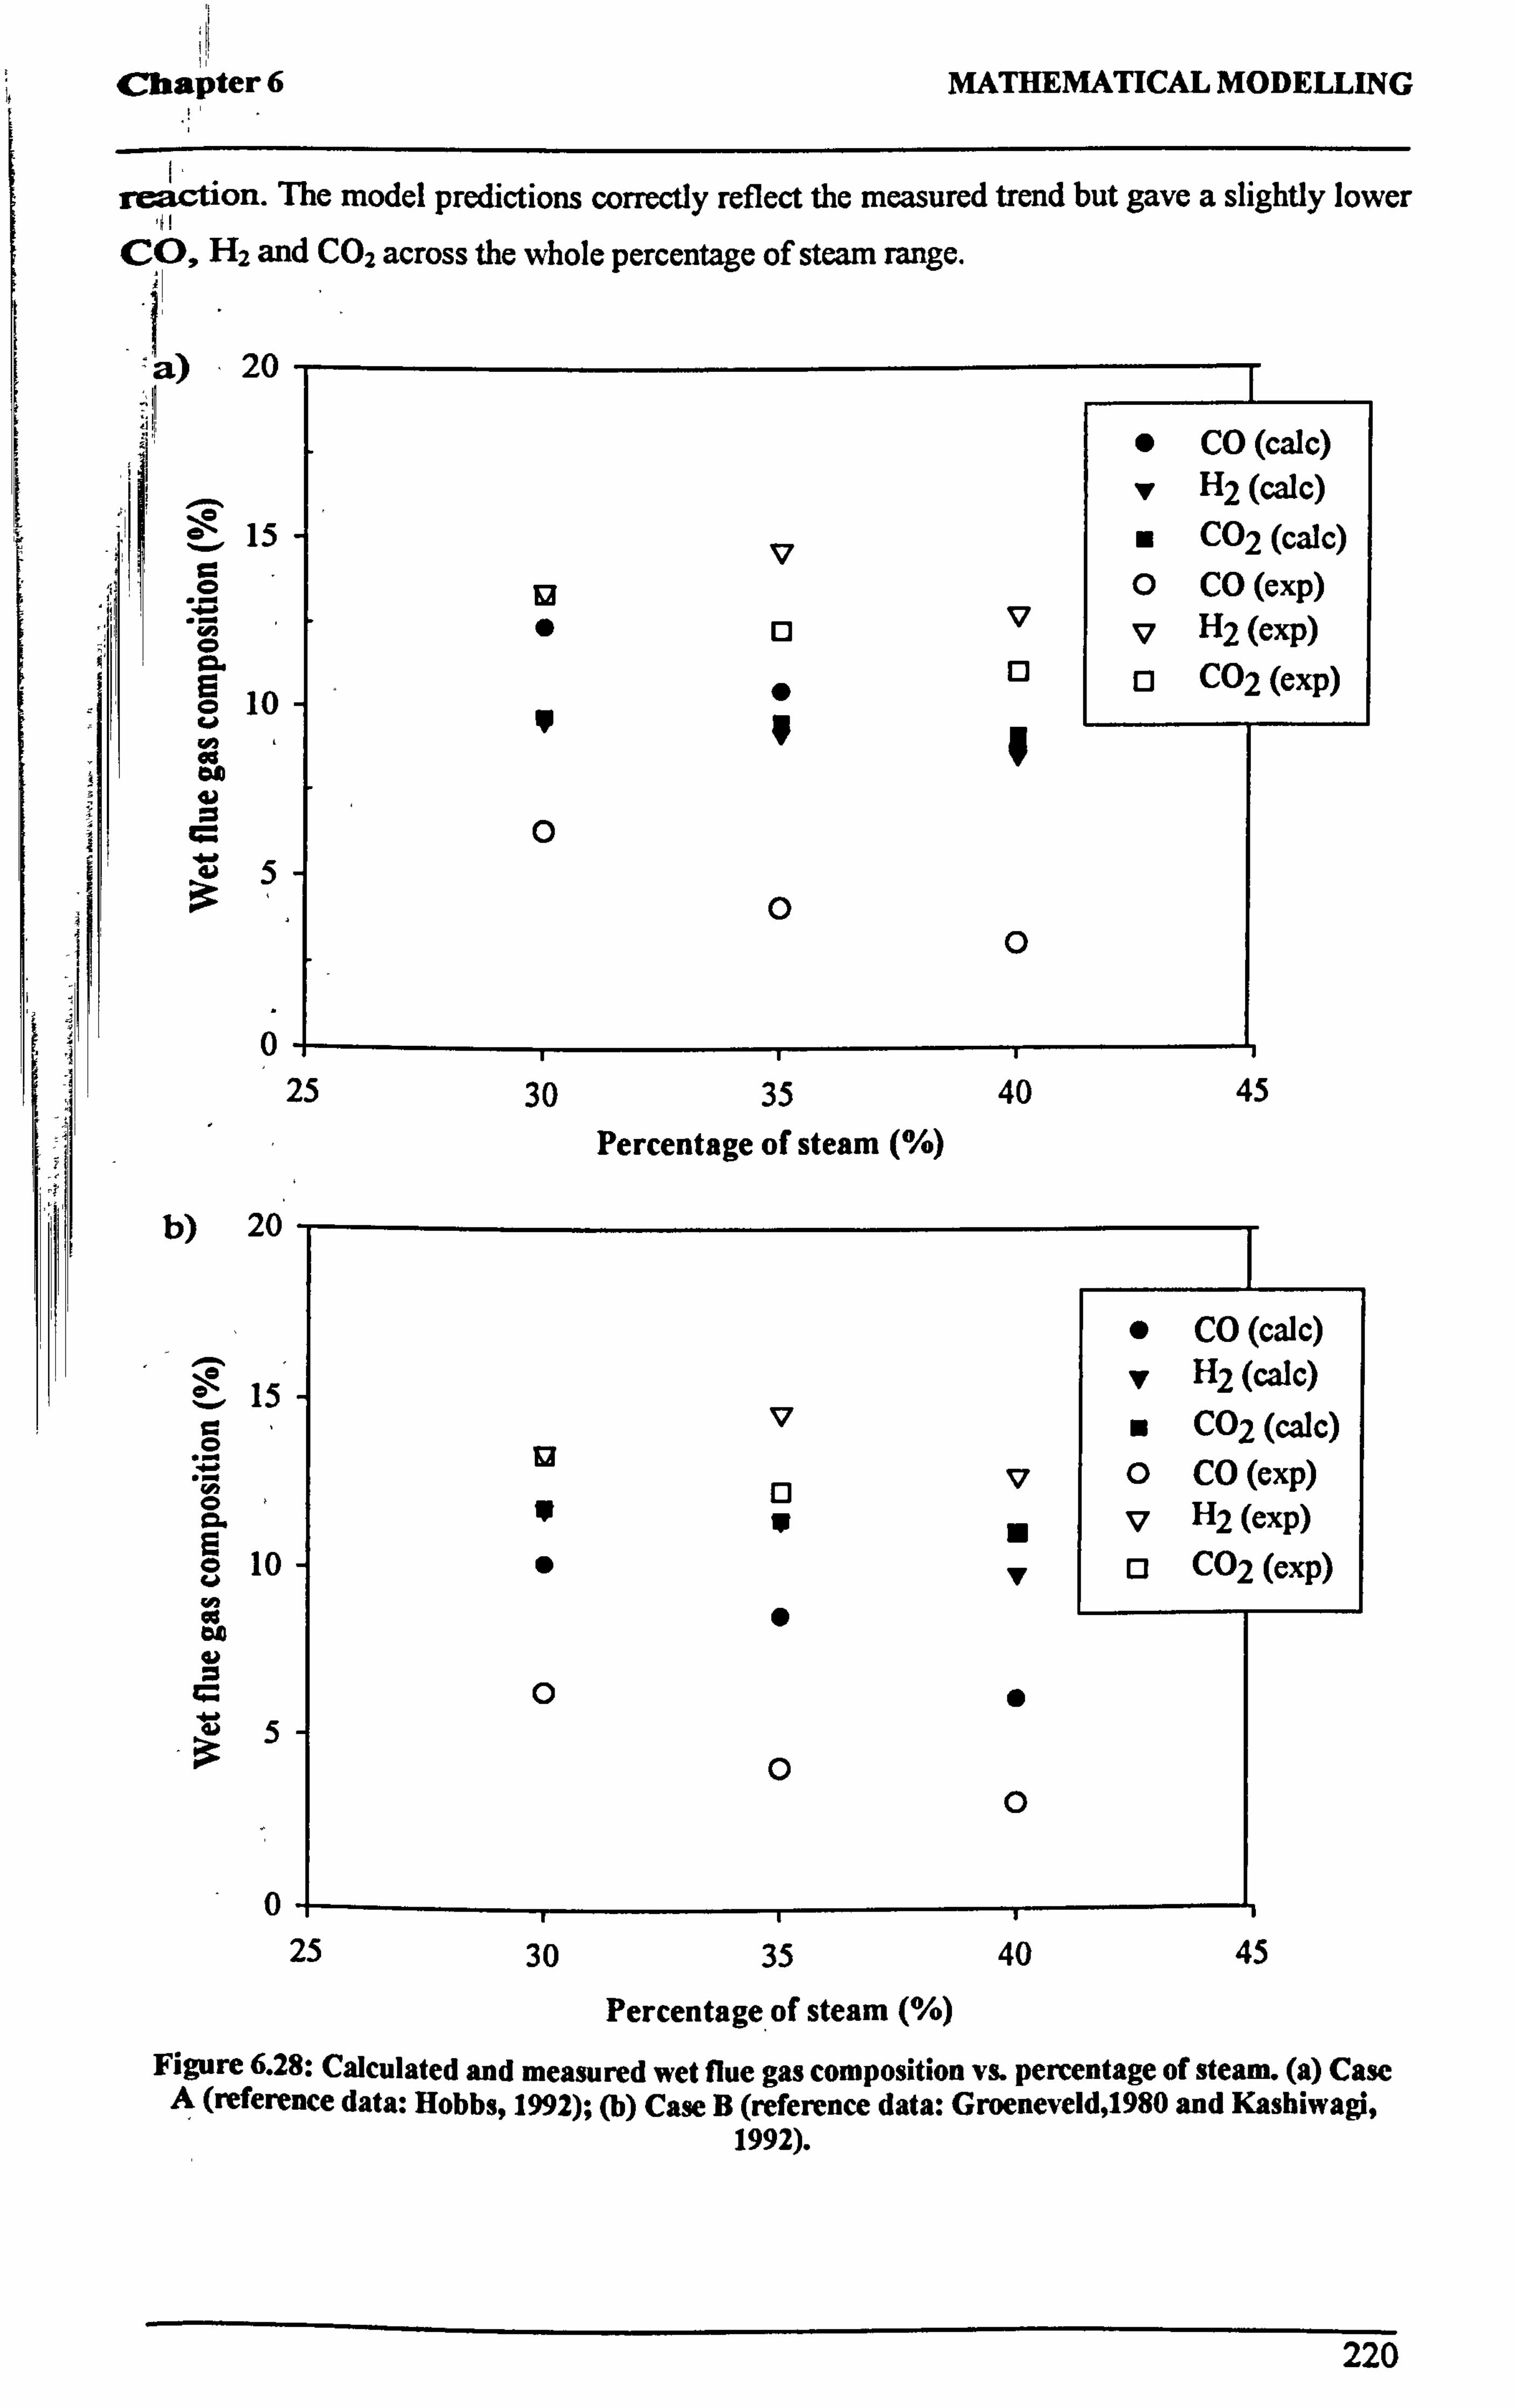
Chapter 6 MATHEMATICAL MODELLING
reaction. The model predictions correctly reflect the measured trend but gave a slightly lower
CO, H2 and CO2 across the whole percentage of steam range.
a 20
" CO (calc)
y H2 (mac) 15 0 CO2 (calc)
0 CO ex ö"ov v H2 (exp)
ö 10 " - O COZ (exp)
cis io d
0 5
3 0 0
0 25 30 35
Percentage of steam (%) 40 45
b) 20
15
13
CL
10. 1
3 5
v
0 "
"
0
V V
0
0
" CO (calc)
* H2 (calc)
CO2 (calc) O CO (exp) D H2 (exP)
o CO2 (exP)
0 25 30 35 40 45
Percentage of steam (%)
Figure 6.28: Calculated and measured wet flue gas composition vs. percentage of steam. (a) Case A (reference data: Hobbs, 1992); (b) Case B (reference data: Groeneveld, 1980 and Kashiwagi,
1992).
220

Chapter 6
6.4 . SUMMARY
Fixed Bed Combustion
MATHEMATICAL MODELLING
La the investigation concerning the bed modelling of the effect of fuel size on pinewood
combustion in a packed bed, the following conclusions can be drawn from the current study:
I. Large fuel particles produced a higher burning temperature in the bed.
2. The moisture evaporation is rapid due to the low moisture content of the wood. The
release of volatiles dominates the combustion process due to the large amount of
volatile material in the wood. 3. The individual processes; drying, devolatilisation and char combustion for larger fuel
overlapped, unlike smaller fuel particles where these processes occurred in series. 4. Burning rate decreases with increase in fuel particle size. 5. Ignition velocity is shorter with a bed of smaller particles than with larger particles at
the same operating conditions. 6. The rapid combustion of smaller size fuel resulted in a fuel-richer combustion and a
higher CO concentration in the flue gases. 7. The calculated temperature profile was lower compared to the measurement. The
difference could be attributed to measurement methods, or combustion phenomena like the channelling effect.
Fixed Bed Gasification
1. The production of hydrogen gas is influenced by the air to steam ratio and the total feed flow rate.
2. The CEA results indicated that the increase in steam input would cause a drop in CO
and H2 for cases carried out with 1101/min (270kg/mzhr) of air. However, the addition of steam to cases with 1001/min (245kg/m2hr) encourages the production of H2.
3. The calculated flue gas composition based on the carbon conversion rate of the
gasification experiments using the CEA matched the measurements. This implied that
the measurements were conducted when the bed was at equilibrium. 4. Although the equilibrium model is useful in predicting what is thermodynamically
attainable, the equilibrium model has its limitation. Therefore, the carbon conversion is considered by a detailed mathematical calculation, FLIC.
5. In the FLIC calculations, the effect of increasing steam in the feed led to a lower bed
temperature and carbon conversion rate. The flue gas composition varied as the calculation was carried out with kinetic data from different sources.
6. The predicted carbon conversion rate ranged from 40-42 kg/mzhr.
221

Chapter 6 MATHEMATICAL MODELLING
7_ . The FLIC calculation was able to give a close representation of the dynamic change in temperature along the stratified gasifier.
g. The calculation agreed qualitatively with the experiments and showed similar trends
in the performance of the gasifier with varying flow rates of the reactant feed.
9_ - Future work is required on determination of the kinetic rates of the gasification
reactions.
222
Chapter 7 OVERALL DISCUSSION
CHAPTER 7
OVERALL DISCUSSION ON `ENERGY FROM
BIOFUEL'
There is a growing interest in `Energy from Biofuel' as it is one of the key areas in the global
clean energy strategy. This thesis presents a detailed study on energy from biofuel through
two thermal-conversion processes; combustion and gasification. Energy crops with a high dry
matter content are suited to four main thermal-conversion processes; pyrolysis, gasification, liquefraction and combustion.
The introduction of biofuel has been fast in a few countries in Europe but there is still a lot of
research on biological and technical development needed for further improvement. In this
study, the performances of wood and woody material, herbaceous and refuse-derived fuels
(RDF) were tested in a fixed- bed combustor. Experimental investigation on a laboratory-
scale' plant provided detailed information on the structure, burning characteristics and gas
composition. The smaller-scale pot burner provided the flexibility required for assessing the
influence of parameters such as particle size and air flow rate, over wide ranges of the
combustion process. Complementary to this, research into using biomass materials such as
char from wood chips or fuel pellets derived from agricultural waste as a source of fuel in a
counter-current gasification reactor was also carried out. Product gas with higher heating
value of 4.52MJ/kg and 27% hydrogen content was successfully produced using a high
temperature steam-air gasification unit. This technology produces a more transportable and
valuable commodity; synthesis gas (syn gas). Another added advantage is the potential of hydrogen production as interest in hydrogen generation has grown dramatically. One of the impediments that the gasification technology has been facing is the ability to produce low tar
content producer gas. Tar removal is much more difficult compared to particle removal hence; one of the key issues for the successful application of biomass derived producer gas is
the reduction of tar content. In the tests carried out, the production of methane was negligible
and no higher hydrogen carbons were detected. Therefore, if combined with a first stage
pyrolyser unit, the high temperature char will act as a catalyst to crack the complex organic
compounds to carbon and gas. Investigation to improve the gasification process also includes
the influence of various parameters such as steam/air ratio, reactor temperature and particle
sizes on the gasification process. Mathematical models were applied to both the combustion
223
Chapter 7 OVERALL DISCUSSION
and gasification process and this provided a deeper understanding of the biomass process in
the bed.
The high temperature product gas formed from the gasification process if combined with hot
gas clean-up (HGCU) to reduce the thermal efficiency losses associated with gas quenching
could result in a higher efficiency energy recovery system such as the integrated gasification
combined cycle (IGCC). The gasification process offers the opportunity for integration with
combined cycle turbines or reciprocating engines, converting fuel energy to electricity more
efficiently (+40%). For greater improvement, fuel cells can be added to Integrated
Gasification Combined Cycle (IGCC) system, making it the Integrated Gasification Fuel Cell
system (IGFC). The lower volume of product gas from the gasification system requires a
smaller and less expensive gas cleaning equipment compared to the flue gas clean-up
technology. The higher partial pressure of contaminants in the lower gas volume also
increases the adsorption and particulate capture level. In terms of emission, the reducing
conditions in the gasification process minimize the formation of dioxins and large quantities
of SOx and NOx. As for the combustor, the energy is recovered through a steam cycle
influenced by the contaminants and tar content in the fuel. Limitation is placed on the steam
temperature to avoid excessive corrosion while economic reasons restrict the use of high
temperature alloys. Therefore, combustion boilers have very low efficiency (-30%) from the
point of view of thermal energy conversion to electricity.
Nevertheless, combustion is a well-established technology with historical operating
experience to provide `real' data and the control system of a conventional combustor is
relatively simpler compared to gasification. Gasification technology on the other hand, is in
its early stage of large-scale commercialisation as no suitable commercial biomass
gasification plant exists to date. Long-term operating results from industrial plants are needed
for gasification to become an attractive alternative to combustion. The success of these energy
recovery systems depends on the production of clean producer gas from the gasification
system and the development of ancillary systems for gas cleaning. The acceptable particle
content for an IC engine operation is <50mg/Nm3 and a tar content <100mg/Nm3. Similarly,
IGCC turbine's lifetime can be limited due to erosion and high temperature corrosion caused
by the impaction of particles and deposition of impurities.
The current hot gas clean-up method centres on the use of metal oxide sorbents for sulphur
removal and the utilization of a ceramic barrier filter for particulate cleaning. Innovative
investigation using a molten tin irrigated packed bed scrubber as a multi-component cleanup device is currently underway. The cleaning up for the gasification process is different from
224
Chapter 7 OVERALL DISCUSSION
combustion in which, the gasification impurities are removed prior to the combustion of the
gas. In a conventional combustion plant, the cleanup is carried out after the combustion,
requiring a much larger volume of stack gases to be cleaned. There are several technologies
related to synthesis gas cleaning. These technologies are known as cold gas clean-up (CGCU) and hot gas clean-up (HGCU) according to the fuel gas temperatures. Gasification
plants can be configured to reach very low levels of emission by integration with an advanced
clean up system. The study of the gasification process and the associated clean-up system is
vital to increase the environmental performance without compromising the efficiency, making the process competitive to energy generation from conventional fuels.
The research carried out in this PhD also showed that the high content of alkali in crops could
pose significant problems in the plant operation. Sintering of ashes was observed during the
combustion of Miscanthus pellets. Conventional combustion equipment is not designed for
the burning of energy crops and agricultural residues and some method for controlling alkali
emissions is required. The two common processes used to attain the desired alkali levels in
the producer gas are through adsorption and leaching. On the contrary, it was also reported in
the literature that the alkali metal salts, especially those containing potassium enhances the
gasification process. Thus, the high potassium found in herbaceous fuels could provide an inexpensive gasification catalyst. Therefore, further work on this topic is required.
gumming up, this PhD examines the conversion of biofuels through two processes;
combustion and gasification. The two mechanisms and end-use of the products differ
considerably; hence this critical evaluation of these two processes in the terms of the relevant
technologies and environmental issues has been carried out and the conclusions presented.
225
Chapter 8 CONCLUSIONS AND SUGGESTIONS FOR FUTURE WORK
CHAPTER 8
CONCLUSIONS AND SUGGESTIONS FOR
FUTURE WORK
TWs chapter highlights the conclusions of the research work. It also outlines a number of
suggestions for future work.
8.1 CONCLUSIONS
The main conclusions that can be drawn from this work are summarised below:
1. The experimental investigation on the fixed bed reactor successfully produced detailed measurements of temperature, burning rates, ignition front velocity and gas
composition for solid biomass fuel bed combustion. 2. The ignition front speed and burning rate increased with increasing air flow, while
leaving a smaller amount of char above the ignition front. The burning rate during the
char oxidation period was much smaller than that for the ignition propagation period. 3. Two woody samples had faster ignition propagation than pellet samples, where the
ignition front speed was inversely proportional to the bulk density.
4. The burning rate decreased linearly with the bulk density and difference between the
samples was relatively small. 5. Large particles have a lower ignition front speed and burning rate, while a larger
amount of char was left above the ignition front and the char oxidation period lasted longer. The temperature gradient at the ignition front also decreased with increasing
particle sizes. The thickness of the ignition front from 200°C to NOT was about the
order of the particle size. 6. Channelling was observed around the side wall of the reactor for the small
miscanthus pellets and at several locations in the bed for larger pinewood particles (35mm cubes).
7. The alkali index based on the elemental composition of bottom ash explained the
sintered agglomerates of miscanthus ashes.
226

, Chapter 8 CONCLUSIONS AND SUGGESTIONS FOR FUTURE WORK
g_ The experimental investigation of the high temperature counter-current biomass char
gasification process gave measurement details of temperature, flue gas composition
and char conversion rates.
9. The temperature profile showed that the bottom of the bed Evas the hottest due to the
-ý different chemical processes stratified along the reactor height.
10_ Hydrogen yield was sensitive to the steam/air ratio, feed flow rates, reactor temperature and particle size.
1_ Although hydrogen production generally increased with higher steam/air ratio, a too high steam/air ratio and a too low reactant flow will lower the reaction temperature,
and cause the hydrogen yield to decrease.
12. The char conversion race obtained in this experimental work ranged in the region of 26-42 kg/m2hr depending on the reactant input.
13. The optimum condition to produce the highest calorific value dry gases (4.52MJ/kg) is with 220kg/m2hr air and 147kg/m2hr steam at a reactor temperature of 850°C.
14. The maximum hydrogen production ratio obtained %Nus 15kg of hydrogen from 100kg
of char.
15. A computational code developed by SUWIC «-as used to successfully predict the
combustion and gasification process. 16. The fixed bed combustion model showed that the residual char burnout is the only
- process occurring in a bed of small particles during the final stage of combustion. However, both the char burnout and fuel devolatilisation occurred at the same time in
a bed of large particles.
17. Chemical equilibrium calculations were carried out using version 2 of NASA Glenn's
computer program Chemical Equilibrium with Application (CEA). The calculated gas phase composition was consistent with the experimental values.
1S. The calculated char conversion rate from (FLIC) for the gasification model showed good qualitative agreement with the experimental results.
227
Chapter 8 CONCLUSIONS AND SUGGESTIONS FOR FUTURE WORK
8.2 Suggestions for Future Work
The research work described in this thesis forms a useful basis and reference for future model development and investigation into the combustion and gasification behaviour of biomass
energy conversion systems.
Gasification has a benefit over direct combustion as the biomass is upgraded from a solid fuel
into a more viable source of energy - fuel gas. This increases the operating efficiencies and
allows possible process system de-coupling for the development of a sustainable future.
Based on the understanding gained in this PhD, the next step would be to combine the char
gasifier with a first stage pyrolyser unit. The gasifier differs from conventional systems as it
produces practically tar-free gas. The high operating temperature (about 800°C) acts as a
catalyst for the cracking of tar to carbon and gas. The proposed gasifier is part of a two stage integrated unit that aims ultimately at utilising biomass fuel such wood chips or fuel pellets derived from agricultural waste. The high temperature of the exit gas opens up the
opportunity to combine thermal gasification with a Stirling engine for use in a small
combined heat and power plant which has very high overall energy efficiency (>85%). An
advantage of the close-coupled arrangement is that an inefficiency in the gasifier, whereby the
gas contains a greater proportion of carbon dioxide (and hence a higher exit gas temperature)
does not affect the efficiency of the engine as all the gases will be burned to carbon dioxide in
the engine combustor. Figure 8.1 illustrates the schematic of the gasification rig constructed
as part of the two stage unit.
Other future work in the gasification should also include investigation into alternative
gasification processes with different main reactants; indirect gasification (steam only) and oxygen gasification. This would result in product gases with different calorific values and
composition. This should also include investigations into other contributing factors such as
pressure, temperature of the main reactants and variation in the solid fuel content.
Further improvements to FLIC should include the different expression used for the reaction kinetics in the case of the water-gas reaction. Additional data on the steam-char reaction rate
should also be sourced. FLIC should also incorporate the continuous or discontinuous
removal of ash during the gasification process to allow a simulation condition closer to the
experimental situation. Improvement to FLIC should be carried out in parallel with experimental work so that any development or improvement to the model can be
simultaneously validated.
228
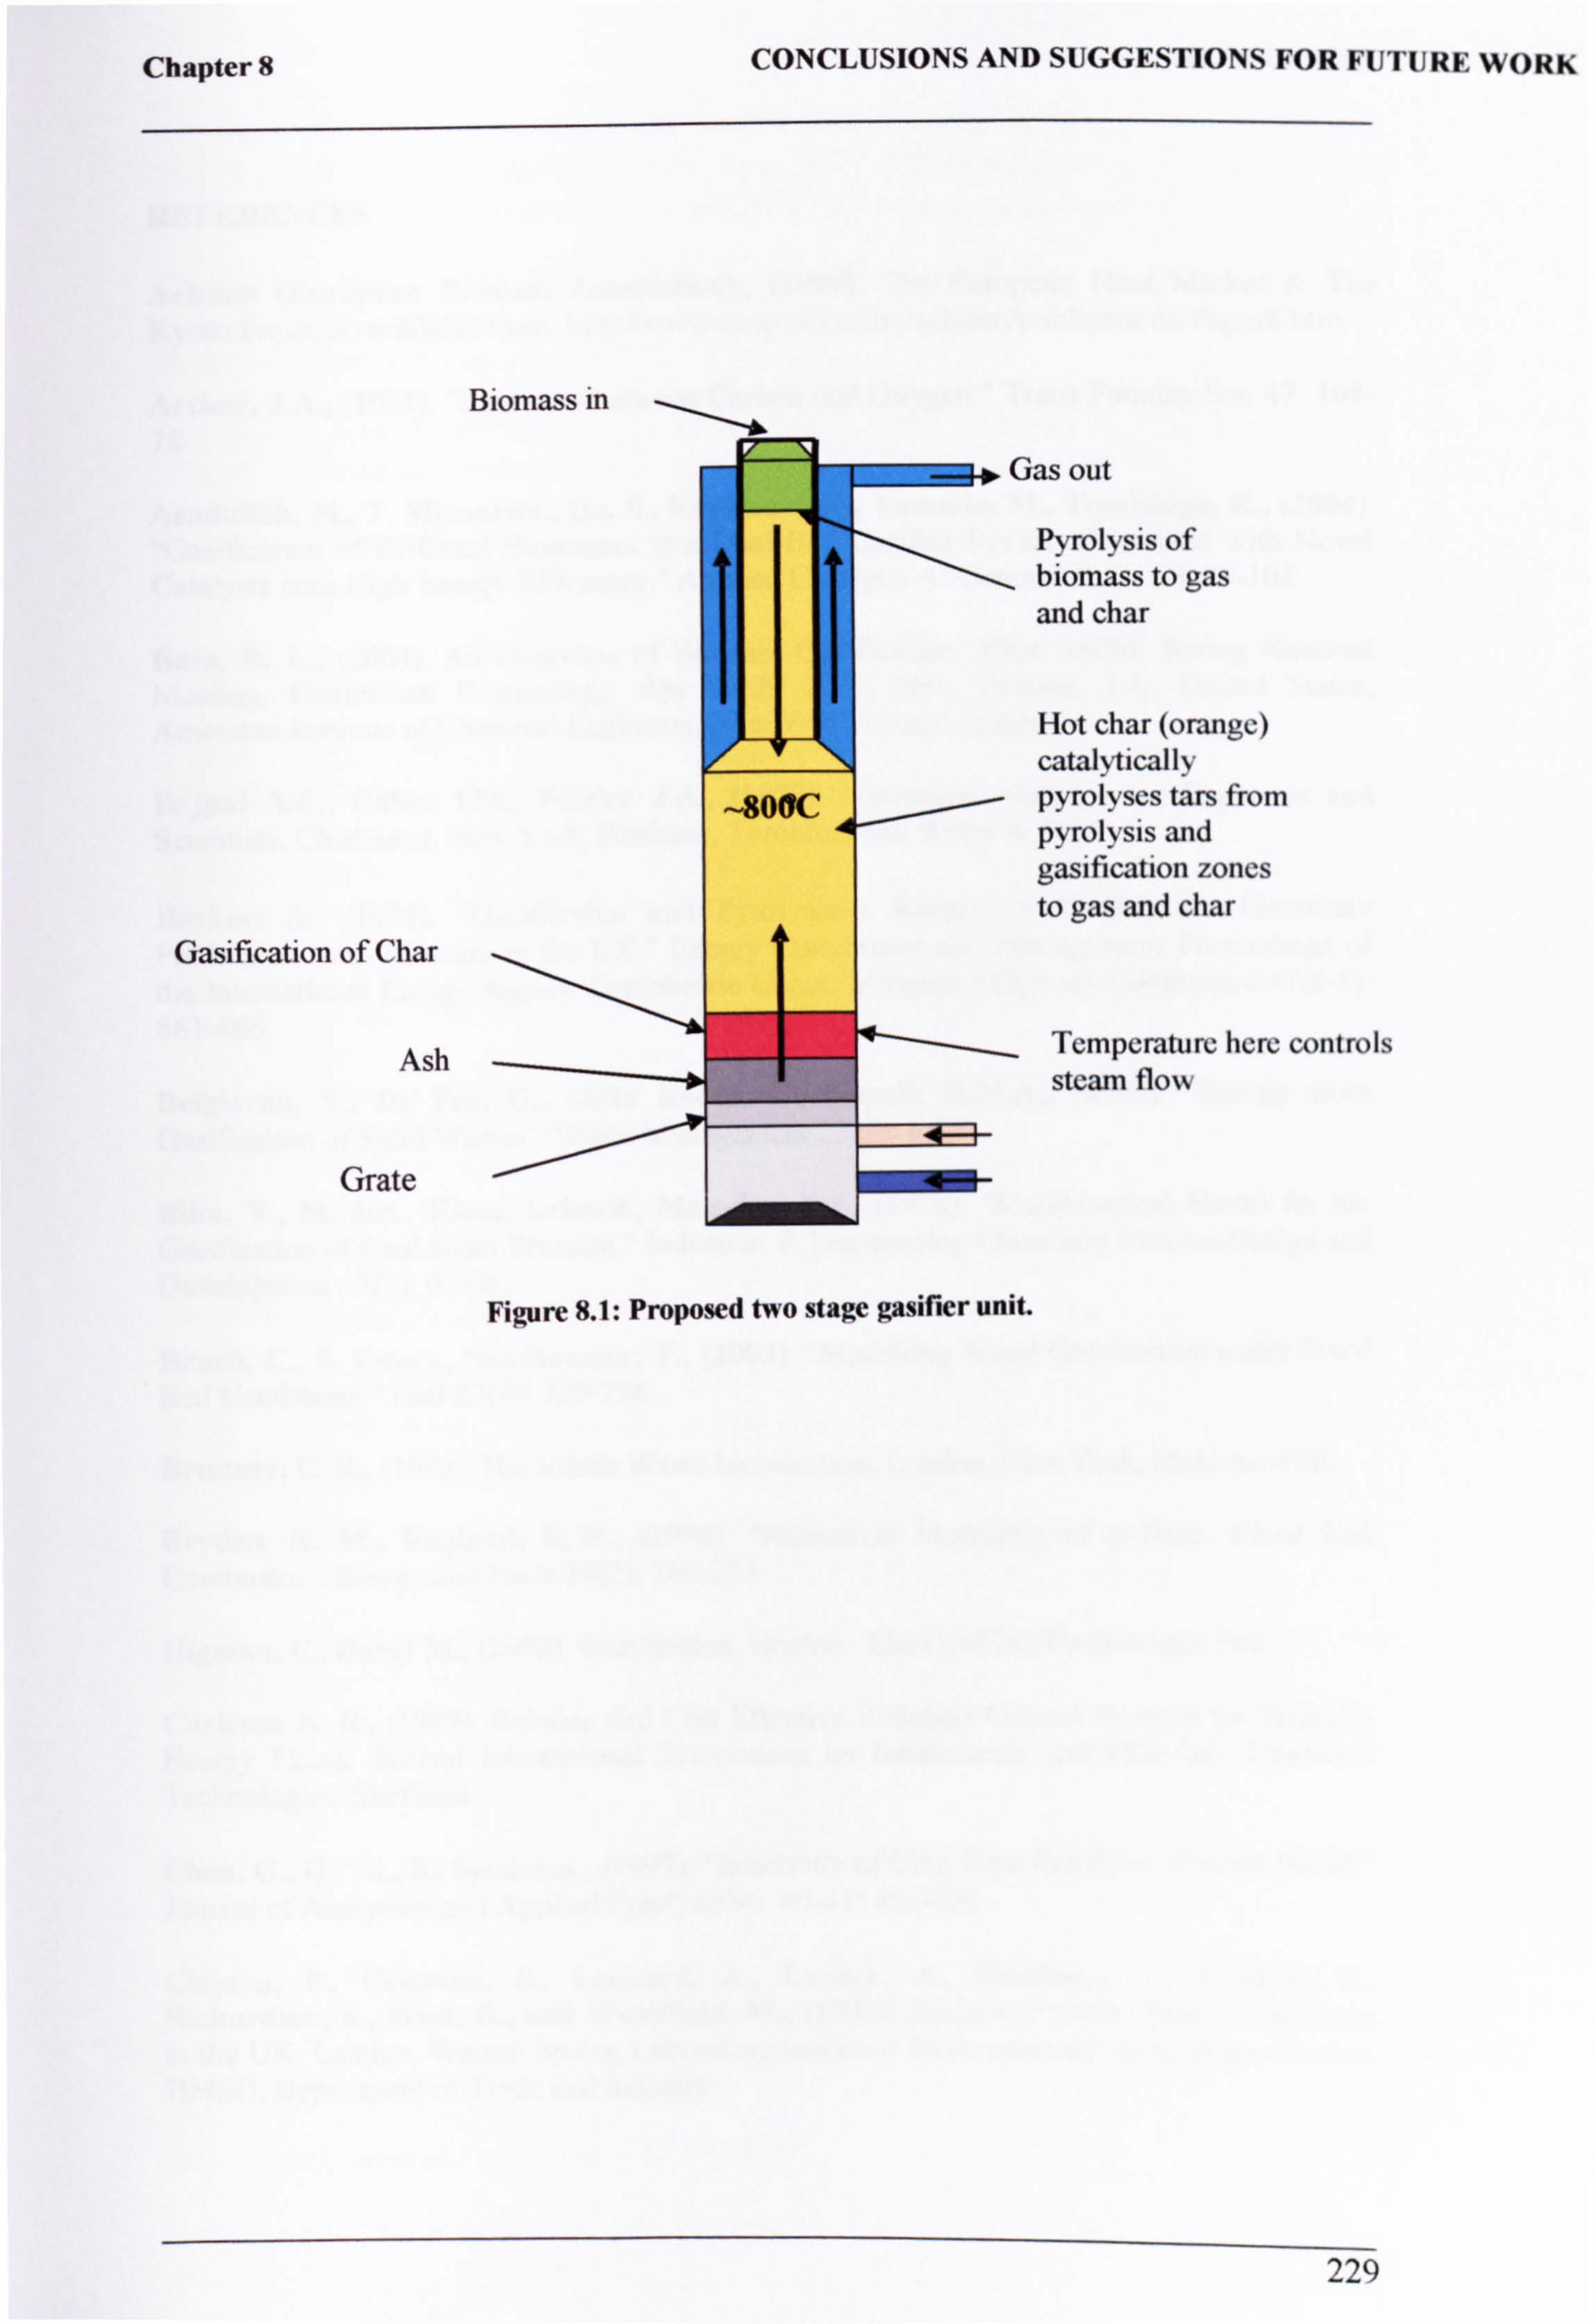
Chapter 8 CONCLUSIONS AND SUGGESTIONS FOR FUTURE WORK
Gasification of Char
Ash
Grate
las out
Pyrolysis of biomass to gas and char
Hot char (orange) catalytically pyrolyscs tars from pyrolysis and gasification zones to gas and char
Temperature here controls steam flow
Figure 8.1: Proposed two stage gasifier unit.
229
Biomass in
REFERENCES
REFERENCES
Aebiom (European Biomass Association)., (1999). The European Heat Market & The Kyoto Protocol, available from, http: //www. ecop. ucl. ac. be/aebiom/publications/Paper8. htm
Arthur, J. A., (1951). "Reactions between Carbon and Oxygen. " Trans Faraday Soc 47: 164- 78.
Asadullah, M., T. Miyazawa., Ito, S., Kunimori, K., Yamada. M., Tomishige, K., (2004). "Gasification of Different Biomasses in a Dual-Bed Gasifier System Combined with Novel Catalysts with High Energy Efficiency. " Applied Catalysis A: General 267(1-2): 95-102.
Bain, R. L., (2004). An Overview of Biomass Gasification. 2004 AIChE Spring National Meeting, Conference Proceedings, Apr 25-29 2004, New Orleans, LA, United States, American Institute of Chemical Engineers, New York, United States.
Bajpai A. C., Calus. I. M., Fairley J. A., (1977). Numerical Methods for Engineers and Scientists. Chichester, New York, Brisbane, Toronto, John Wiley & Sons.
Barker, S., (1996). "Gasification and Pyrolysis - Routes to Competitive Electricity production from Biomass in the UK. " Energy Conversion and Management Proceedings of the International Energy Agency Greenhouse Gases: Mitigation Options Conference 37(6-8): 861-866.
Belgiorno, ' V., De Feo, G., Della Rocca, C., Napoli, R. M. A., (2003). "Energy from Gasification of Solid Wastes. " Waste Management 23(1): 1-15.
Biba, V., M. Jiri., Klose, Erhard., Malecha, Jiri., (1978). "Mathematical Model for the Gasification of Coal under Pressure. " Industrial & Engineering Chemistry Process Design and Development 17(1): 92-98.
Bruch, C., B. Peters., Nussbaumer, T., (2003). "Modelling Wood Combustion under Fixed Bed Conditions. " Fuel 82(6): 729-738.
Brunner, C. R., (1993). Hazardous Waste Incineration. London, New York, McGraw-Hill.
Bryden, K. M., Ragland, K. W., (1996). "Numerical Modelling of a Deep, Fixed Bed Combustor. " Energy and Fuels 10(2): 269-275.
Higman, C., Burgt M., (2003). Gasification, Boston : Elsevier/Gulf Professional Pub.
Carlsson K. B., (1999). Reliable and Cost Effective Pollution Control Systems for Waste-to Energy Plants. Second International Symposium on Incineration and Flue Gas Treatment Technologies, Sheffield.
Chen, G., Q. Yu., K. Sjostrom., (1997). "Reactivity of Char from Pyrolysis of Birch Wood. " Journal of Analytical and Applied Pyrolysis'96.4041: 491-499.
Clayton, P., Coleman, P., Leonard, A., Loader, A., Marlower, - I., Micheal, D., Richardson, S., Scott, D., and Woodfield, M., (1991). Review of Solid Waste Incineration in the UK. London, Warren Spring Laboratory (national Environmental Technology Centre), j. IMSO, Department of Trade and Industry.
230

REFERENCES
Clir g., (1999). Public Sector Decisions on the Limits to Technological Assessment. Second
bteraationai Symposium on Incineration and Flue Gas Treatment Technologies, Sheffield.
'=ins C., (2003). Alternatives to Incineration for Dealing with Residual Municipal Waste
in the UK: Opportunities and Barriers. Proceedings of the 4th International Symposium on Waste Treatment Technologies, Sheffield.
Coggins. C., (1999). It's Role within an Integrated Waste Management Strategy. Second
mational Symposium on Incineration and Flue Gas Treatment Technologies, Sheffield.
Coombs., (1996). "Biomass Energy: Progress in the European Union. " Renewable Energy
S(1-5): 17-21.
Cooper, J., and W. L. H. Hallett., (2000). "A Numerical Model for Packed-Bed Combustion 'Char Particles. " Chemical Engineering Science 55(20): 4451-4460.
Coulson, J. M., (1996). Coulson & Richardson's Chemical Engineering. - Vol. 6 : Chemical
gizseering Design, Oxford : Butterworth-Heinemann.
ID, Feo, G., Belgiorno, V., Napoli, R. M. A., Papale, U., (2000). Solid Wastes Gasification.
SIDISA International Symposium on Sanitary and Environmental Engineering.
de Jong, W., A. Pirone., M. A. Wojtowicz., (2003). "Pyrolysis of Miscanthus Giganteus and Wood Pellets: TG-FTIR Analysis and Reaction Kinetics*. " Fuel 82(9): 1139-1147.
Defra, Department of Environment, Food and Rural Affair., (2003). Energy crop scheme: . blishment Grants, available from b ; //www. defra. gov. uk/corporate/regulat/fonns/erdp/ecs/ecs-estabgrant-explain. pdf
Defra, Department of Environment, Food and Rural Affair., (2004). Assessment Criteria
A"a, ilable ' for £32M New Technologies Funding, available from
http- . //www. defra-gov. uk/news/2004/040202d. htm
Defra, Department of Environment, Food and Rural Affair., (2005). Climate Change:
KyoW Protocol Force at the WWW http: //www. defra. gov. uk/news/latest/2005/climate- 0216. htm
peGroot, W. F., and G. N. Richards., (1988). "Effects of Ion-Exchanged Cobalt Catalysts
on the Gasification of Wood Chars in Carbon Dioxide. " Fuel 67(3): 345-351.
Dý $lasi, C., (1993). "Modelling and Simulation of Combustion Processes of Charring and Non-Charring Solid Fuels. " Progress in Energy and Combustion Science 19(1): 71-104.
$lasi, C., (2004). "Modelling Wood Gasification in a Counter-current Fixed-Bed Reactor. "
MChE Journal 50(9): 2306-2319.
DJi $lasi, C., B, Carmen., A, Santoro., Hernandez, E., (2001). "Pyrolytic Behaviour and pwducts of Some Wood Varieties. " Combustion and Flame 124(1-2): 165-177.
Di $lasi, C., G. Signorelli., G. Portoricco., (1999). "Countercurrent Fixed-Bed Gasification
of Biomass at Laboratory Scale. " Ind. Eng. Chem. Res. 38(7): 2571-2581.
DTj (Department of Trade and Industry)., (1999). Digest of UK Energy Statistics.
DTI (Department of Trade and Industry)., (2001). Digest of UK Energy Statistics.
231

REFERENCES
DTI (Department of Trade and Industry)., (1987) Straw as a Fuel in the UK. Energy from Biomass; 5: 27.
DTI (Department of Trade and Industry)., (1992) The Development of Compacted Straw Fuel. Energy from Biomass; 5: 34.
Eduljee, G., (2003). A Technical Perspective on Urban Waste Stress. Proceedings of the 4th International Symposium on Waste Treatment Technologies, Sheffield.
EECI (European Energy Crops Internetwork)., (1999). Legislation Relating to Energy Crops in Ireland, available from http: //www. ecci. net/archive/biobase[BIO13O. html
EECO (European Energy Crops Overview)., Biobase: Main findings of the European Energy Crops Overview (EECO) Project, European Energy Crops InterNetwork, available from http: //www. eeci. net/archive/biobase/Bl0054. htrnl
ELA, (European Information Administration). (2003). United Kingdom: Environmental Issues, available from http: //www. eia. doe. gov/emeu/cabs/ukenv. html
Encinar, J. M., Gonzalez, Juan F., Rodriguez, Juan J., Ramiro, Maria J., (2001). "Catalysed and Uncatalysed Steam Gasification of Eucalyptus Char. Influence of Variables
and Kinetic Study. " Fuel 80(14): 2025-2036.
Energex (2002) - Environmental Control and Waste Recycling - Topic V 75(3-4): 275-285.
Eurostat (2002). Recovery and Disposal of Municipal Waste. Environment and Energy Datasets.
Faaij, A., R. van Ree., L, Waldheim., E. Olsson., A. Oudhuism., van Wijk, C., Daey- Ouwens., W. Turkenburg., (1997). "Gasification of Biomass Wastes and Residues for Electricity Production. " Biomass and Bioenergy 12(6): 387-407.
Fristrom, R. M., (1995). Flame Structure and Processes. New York, Oxford University Press.
Fujita., (1999). Bioenergy at the WWW http: //www. fujitaresearch. com/reports/biomass. html.
Fushimi, C., K. Araki., Y. Yamaguchi., A. Tsutsumi., (2003). "Effect of Heating Rate on steam Gasification of Biomass. 1. Reactivity of Char. " Industrial and Engineering Chemistry Research 42(17): 3 922-3928.
Godavarty, A. and A. Agarwal., (2000). "Distribution and Catalytic Activity of Eutectic Salts in Steam Gasification of Coal. " Energy Fuels 14(3): 558-565.
Goetz, - G. J., (1983). Combustion and Gasification Kinetics of Chars from Four
Commercially Significant Coals of Varying Rank. Proceedings - 1983 International Conference on Coal Science, Pittsburgh, PA, USA.
Goh Y. R., Lim C. N., Zakaria R, Chan K. H., Reynolds H., Yang Y. B., Siddall R. G., Nasserzadeh V., Swithenbank J., (1999). Mixing, Modelling and Measurements of Incinerator Bed Combustion. Second International Symposium on incineration and Flue Gas Treatment Technologies, Sheffield.
232
REFERENCES
Gob, V. it, R. G. Siddall., V. Nasserzadeh., R. Zakaria., J. Swithenbank., D. Lawrence., N. Garrod and B. Jones., (1998). "Mathematical Modelling of the Burning Bed of a Waste incinerator. " Journal of the Institute of Energy 71(487): 110-118.
Gomez-Moreno, F. J., D. Sanz-Rivera., M. Martin-Espigares., D. Papameletiou., G. De S&nti and G. Kasper., (2003). "Characterization of Particulate Emissions During Pyrolysis and Incineration of Refuse Derived Fuel. " Journal of Aerosol Science 34(9): 1267-1275.
Gordon, S., and McBride, B. J., (1994). Computer Program for Calculation of Complex (emical Equilibrium Compositions and Applications, Part 1: Analysis, Nasa RP-1331., National Aeronautics and Space Administration (NASA), Cleveland, OR
C, Olrt R., (1995). On the Propagation of a Reaction Front in a Packed Bed: Thermal onyersion of Municipal Solid Waste and Biomass. Netherlands, Universitieit Twente Enchede.
Groeneveld, M. J., and W. P. M. van Swaaij., (1980). "Gasification of Char Particles with C02 AND H20. " Chemical Engineering Science 35(1-2): 307-313.
Illssler, P., and. T. Nussbaumer., (1999). "Gas Cleaning for IC Engine Applications from Fixed Bed Biomass Gasification. " Biomass and Bioenergy 16(6): 385-395.
Haut=ran, A. N., Dryer. F., Schlug KP., Glassman I., (1981). "A Multiple-Step Overall Kinetic Mechanism for the Oxidation of Hydrocarbons. " Combust Sci Technology 25: 219.
Hendriks, C., and K. Blok., (1996). "Regulation for Combined Heat and Power in the , uopean union. " Energy Conversion and Management Proceedings of the International Energy Agency Greenhouse Gases: Mitigation Options Conference 37(6-8): 729-734.
Hernandez Allica, J., A. J. Mitre., J. r. e. A. Gonzalez Bustamante., C. Itoiz., F. Blanco., 1.41korta and C. Garbisu., (2001). "Straw Quality for its Combustion in a Straw-Fired power Plant. " Biomass and Bioenergy 21(4): 249-258.
saki, Y., (2003). Mathematical Modelling of a Japanese Incinerator. PhD Thesis. Department of Chemical and Process Engineering. Sheffield, University of Sheffield.
141%4SO., (2000). The Energy Crops Regulation, statutory Instrument 2000 No. 3042,
available from http: //www. opsi. gov. uk/si/si2000/20003042. htm
l obbs, M. L. R., Predrag T., Smoot, Douglas L., (1992). "Modelling fixed-bed coal gasifiers. " AIChE Journal 38(5): 681-702.
Hoffman, E. J., (1978). Coal Conversion, Laramie, Wyo : Energon Co.
Howard, J. B., William, G. C., Fine, D. H., (1973). "Kinetics of Carbon Monoxide pxidation in Post-Flame Gases. " 14th Symposium (International) on Combustion, Pittsburgh: The Combustion Institute: 975-86.
Hunt, M. L., Tien, C. L., (1988). "Non-Darcian Convection in Cylindrical Beds. " J. Heat Transfer 110: 378-84. international Scientific Committee., (2005). International Symposium on the Stabilisation
of greenhouse gas concentrations, available from bttp: //www. stabilisation2005. com/Steering_Commitee Report. pdf
233
REFERENCES
Jenkins, B. M., L. L. Baxter., T. R. Miles Jr. and T. R. Miles., (1998). "Combustion Properties of Biomass. " Fuel Processing Technology 54(1-3): 17-46.
Johnson J. L., (1979). Kinetics of Coal Gasification. Canada, John Wiley & Sons.
Jorgensen K, M. H., (1999). Modem Control Systems for MSW Plants. Second International Symposium on Incineration and Flue Gas Treatment Technologies, Sheffield.
Jurado, F., A. Cano., J. Carpio., (2003). "Modelling of Combined Cycle Power Plants using Biomass. " Renewable Energy 28(5): 743-753.
Kashiwagi , T. N., Hidesaburo., (1992). "Global Kinetic Constants for Thermal Oxidative Degradation of a Cellulosic Paper. " Combustion and Flame 88: 345-368.
Klasen T, G. K, (1999). Numerical Calculation and Optimization of a Large Municipal Solid Waste Incinerator Plant. Second International Symposium on Incineration and Flue Gas Treatment Technologies, Sheffield.
Kuo J. T., Hsu. W. S., Yo T. C., (1997). "Effect of Air Distribution on Solid Fuel Bed Combustion. " American Society of Mechanical Engineering (ASME) 119: 120-128.
Kuo, T. J., Kuwata, M., Shieh, W. S., Essenhigh R. H., (1970). Combustion and Emission Phenomena in Incinerators. National Waste Incineration Conference, ASME: 327-330
Laurendeau, N. M., (1978). "Heterogeneous Kinetics of Coal Char Gasification and Combustion. " Progress in Energy and Combustion Science 4(4): 221-270.
Ledin, S., (1996). "Willow wood properties, production and economy. " Biomass and Bioenergy Modelling Short Rotation Forestry Growth 11(2-3): 75-83
Lewandowski, I., J. C. Clifton-Brown., J. M. 0. Scurlock and W. Huisman., (2000). "Miscanthus: European Experience with a Novel Energy Crop. " Biomass and Biocnergy 19(4): 209-227.
Li, S. and Y. Cheng., (1995). "Catalytic Gasification of Gas-Coal Char in CO2. " Fuel 74(3): 456-458.
Liliedahl, T. and K. Sjostrom., (1997). "Modelling of char-gas reaction kinetics. " Fuel 76(1): 29-37.
Mann, M. D., R. Z. Knutson., J. Erjavec and J. P. Jacobsen., (2004). "Modelling Reaction Kinetics of Steam Gasification for a Transport Gasifier. " Fuel Fundamental Mechanisms of Biomass, Pyrolysis and Oxidation 83(11-12): 1643-1650.
Martindale, L., (1985) The Potential for Straw as a Fuel in the UK. IMcch E Conference Publications: 125.
McKendry, P., (2002). "Energy Production from Biomass (part 1): Overview of biomass. " Bioresource Technology 83(1): 37-46.
McKendry, P., (2002). "Energy Production from Biomass (part 2): Conversion Technologies. " Bioresource Technology 83(1): 47-54.
McKendry, P., (2002). "Energy Production from Biomass (part 3): Gasification Technologies. " Bioresource Technology 83(1): 55-63.
234
REFERENCES
Merrick, D., (1984). Coal Combustion and Conversion Technology. London, Macmillan.
Morris, M. and L. Waldheim., (1998). "Energy Recovery from Solid Waste Fuels using Advanced Gasification Technology. " Waste Management 18(6-8): 557-564.
Mudge L. K., Sealock. L. J., Weber S. L., (1979). "Catalyzed Steam Gasification of Biomass. " Journal of Analytical and Applied Pyrolysis: 165-175.
Na, J. I., Park S. J., Y. K. Kim., J. G. Lee and J. H. Kim., (2003). "Characteristics of oxygen-Blown Gasification for Combustible Waste in a Fixed-Bed Gasifier. " Applied Energy
Nasserzadeh, V. N., (1990). Optimisation study of Incineration in' a Municipal Solid Waste Incinerator with a Vertical Radiation Shaft. PhD. Department of Chemical and Process Engineering, University of Sheffield.
Nieminen. J., Palonen. J., Kivela. M., (1999). "Circulating Fluidized Bed Gasifier for Biomass. " VGB PowerTech 79(10/99): 69-74.
Oman, J., M. Tacer and M. Tume., (1999). "Overfeed Fixed-Bed Combustion of Wood. " Bioresource Technology 67(2): 139-147.
ewer, E., (1984). The Measurement of air flow / by E. Ower and R. C. Pankhurst. - 5th ed. (in SI units).
patankar SV., (1980). Numerical Heat Transfer and Fluid Flow. New York: Hemisphere.
peters B., (1995). A Detailed Model for Devolatilisation and Combustion of Waste Material in Packed Beds. Third European Conference on Industrial Furnaces and Boilers (INFUB), Lisbon, Portugal; 18-21 April 1995.
peters, B., (2002). "Measurements and Application of a Discrete Particle Model (DPM) to Simulate Combustion of a Packed Bed of Individual Fel Particles. " Combustion and Flame 131(1-2): 132-146.
phillips, P. S., R. M. Pratt., K. Pike., (2001). "An Analysis of UK Waste Minimization Clubs: Key Requirements for Future Cost Effective Developments. " Waste Management 21(4): 389-404.
ponder, G. R. and G. N. Richard., (1994). "Oxygen and CO2 Gasification of Chars from Wood Treated with Iron (II) and Iron (III) Sulphates. " Energy & Fuels 8(3): 705-713.
pyle, D. L. and C. A. Zaror., (1984). "Heat Transfer and Kinetics in the Low Temperature pyrolysis of Solids. " Chemical Engineering Science 39(1): 147-158.
RCEP (Royal Commission on Environmental Pollution)., The alternatives to fossil fuels, available from http: //www. rcep. org. uk/pdf/chp7. pdf
Rogaume, T., M. Auzanneau., F. Jabouille., J. C. Goudeau and J. L. Torero., (2002). 'The Effects of Different Airflows on the Formation of Pollutants during Waste Incineration. " Fuel 81(17): 2277-22 88.
235
REFERENCES
Rogers, J. E. L., Sarofim, A. F and Howard, J. B., (1972). Effect of Underfire Air Rate on a Burning Simulated Refuse Bed. Proceedings of the National Incinerator Conference, New York.
Ronnback, M., Axell, M., Gustavsson, L., (2000). "Combustion Processes in a Biomass Fuel Bed-Experimental Results. " Progress in Thermochemical Biomass Conversion: 17-22.
Saastamoinen, J. J., R. Taipale., M. Horttanainen and P. Sarkomaa., (2000). "Propagation of the Ignition Front in Beds of Wood Particles. " Combustion and Flame 123(1- 2): 214-226.
Sarkar S., (1990). Fuels and Combustion, London ; Hyderabad, India : Sangam : Orient Longman.
Schilling, H: D., (1979). Coal Gasification. London, Graham & Trotman.
Schmidt U., Nasserzadeh. V., Swithenbank J, Lawrence D., Garrod N. P., Mildenstein P., (1999). Implications of the Draft Commission Proposal for a Directive on the Incineration of Waste for the UK's. Second International Symposium on Incineration and Flue Gas Treatment Technologies.
Scurlock, J. M. 0., (1998). Miscanthus: A Review of European Experience with a Novel Energy Crop, Oak Ridge National Laboratory Oak Ridge Tennessee.
Shafizadeh, F., (1982). "Introduction to Pyrolysis of Biomass. " Journal of Analytical and Applied Pyrolysis 3(4): 283-305.
Shafizadeh, F., Overend., R. P., Milne, TA., Mudge, L. K., Eds., (1985). "Pyrolytic geactions and Products of Biomass in Fundamentals of Biomass Thermochemical Conversion. " Elsevier: 183-217.
Shin, D. and S. Choi., (2000). "The Combustion of Simulated Waste Particles in a Fixed Bed. " Combustion and Flame 121(1-2): 167-180.
Simell, P. A., J. K. Leppalahti., and J. B: s. Bredenberg., (1992). "Catalytic Purification of Tarry Fuel Gas with Carbonate Rocks and Ferrous Materials. " Fuel 71(2): 211-218.
Siminski, V., Wright FJ., Edelman RB., Economos C., Fortune OF., (1972). "Research on Methods of Improving the Combustion Characteristics of Liquid Hydrocarbon Fuels. " AFAPL TR 72-74, Vols I and II, OH: Air Force Aeropropulsion Laboratory. Wright Patterson Air Force Base.
Smooth, L. D., Pratt, D. T., (1979). Pulverized-Coal Combustion and Gasification. New York, plenum Press.
Smoot, L. D., Smith, PJ., (1985). Coal Combustion and Gasification. New York, Plenum press.
$withenbank, J., Nasserzadeh. V., Wasantakoran. A., Lee. P. H and Swithenbank. C., (1999). Future Intergrated Waste, Energy and Pollution Management (WEP). Second International Symposium on Incineration and Flue Gas Treatment Technologies, Sheffield.
$withenbank, J., Yang. Y. B., Ryu. C., Goodfellow. J., Anderson. S and Nasserzadeh. V. $harifi., (2003). Waste Treatment: Strategic Research Achievement. Proceedings of the 4th International Symposium on Incineration and Flue Gas Treatment Technologies, Sheffield.
236
REFERENCES
Swithenbank. J., Nasserzadeh. V., Wasantakoran. A., Lee. PH and Swithenbank. C., (2003). Waste treatment: Strategic research achievement. Proceedings of the 4th International Symposium on Incineration and Flue Gas Treatment Technologies, Sheffield.
Tagashira, K., I. Torii., K. Myouyou., K. Takeda., T. Mizuko and Y. Tokushita., (1999). -, Combustion Characteristics and Dioxin Behaviour of Waste Fired CFB. " Chemical Engineering Science 54(22): 5599-5607.
Tancredi, N., T. Cordero., J. Rodriguez-Mirasol and J. J. Rodriguez., (1996). "CO2 Gasification of Eucalyptus Wood Chars. " Fuel 75(13): 1505-1508.
Taylor H. S., Neville. H. A., (1921). "Catalysis in the Interaction of Carbon with Steam and with Carbon Dioxide. " J. Am. Chem. Soc 43: 2055-71.
Thunman, H. and B. Leckner., (2001). "Ignition and Propagation of a Reaction Front in Cross-Current Bed Combustion of Wet Biofuels. " Fuel 80(4): 473-48 1.
Thunman, H. and B. Leckner., (2003). "Co-current and Counter-Current Fixed Bed Combustion of Biofuel-a Comparison*. " Fuel 82(3): 275-283.
Thurner, F., Mann, U., (1981). "Kinetic Investigation of Wood Pyrolysis. " Ind. Eng. Chem. proc. Des. Dev 20: 482.
Tillman, D. A., (1991). The Combustion of Solid Fuels and Wastes, San Diego : Academic press.
Ucnwelttechnick, W. E., (1995). W+E Umwelttechnick news 1/95 (1995) Information Newsletter, Zurich.
Vafai K., Sozen. M., (1990). "Analysis of Energy and Momentum Transport for Fluid Flow Through a Porous Bed. " J. Heat Transfer 112(690-9).
van der Lans, R. P., L. T. Pedersen., A. Jensen, P. Glarborg and K. Dam- Johansen., (2000). "Modelling and Experiments of Straw Combustion in a Grate Furnace. " Biomass and Bioenergy 19(3): 199-208.
Venendaal, R., U. Jorgensen and C. A. Foster., (1997). "European Energy Crops: A
. Synthesis. " Biomass and Bioenergy 13(3): 147-185.
Venturi, P. and G. Venturi., (2003). "Analysis of Energy Comparison for Crops in European Agricultural Systems. " Biomass and Bioenergy 25(3): 235-255.
von Fredersdorff, G. C., and Elliott, M. A., (1963). Coal Gasification, Chemistry of Coal Utilization: Supplementary Volume. New York, John Wiley and Sons.
Vyageningen, U., (2003). Switchgrass as an Alternative Energy Crop, (Chapt. 10: Management Guide for Panting and Production of Switchgrass as a Biomass Crop in Europe), available from http: //www. switchgrass. nl/pdf/Sw-FinalRep-chapterlO. pdf
Wakao N., Kaguei. S., (1982). Heat and Mass Transfer in Packed Beds. New York, Gordon and Breach.
Whiting, K. J., (2001). Large Scale MSW Incineration Technologies. Short Course on Incineration on Municipal Waste with Energy Recovery. Leeds, Department of Fuel and Energy, University of Leeds.
237
REFERENCES
Wikipedia.; The Free Encyclopedia, available from http: //en. wikipedia. org/wiki/Biofuel
Wiilen., (Technical Research Cent of Finland, Espoo, Finl)., Pekka S., Kai S., Jukka A., (1987). "Pelletization and Combustion of Straw. " Symposium Papers - Energy from Biomass
and Wastes: 469-484.
Williams, P. T., (1998). Waste Treatment and Disposal, Chichester : Wiley.
Yang Y. B., V. Nasserzadeh., Goodfellow J., Swithenbank J., (2003). "Simulation of Channel Growth in a Burning Bed of Solids. " Chemical Engineering Research and Design 81(2): 221-232.
Yang, Y. B., C. Ryu, Khor, A., Yates, NE., Sharifi, VN., Swithenbank, J., (2005). "Effect
of Fuel Properties on Biomass Combustion. Part II. Modelling Approach-Identification of the Controlling Factors. " Fuel 84(16): 2116-2130.
Yang, Y. B., C. Ryu, Khor, A., Sharifi, V. N., Swithenbank, J., (2005). "Fuel Size Effect
on Pinewood Combustion in a Packed Bed. " Fuel 84(16): 2026-2038.
Yang, Y. B., H. Yamauchi., V. Nasserzadeh and J. Swithenbank., (2003). "Effects of Fuel Devolatilisation on the Combustion of Wood Chips and Incineration of Simulated Municipal Solid Wastes in a Packed Bed. " Fuel 82(18): 2205-2221.
Yang, Y. B., V. Nasserzadeh., J. Goodfellow., Y. R. Goh and J. Swithenbank., (2002). "parameter Study on the Incineration of Municipal Solid Waste Fuels in Packed Beds. " Journal of the Institute of Energy 75(504): 66-80.
Yang, Y. B., V. Nasserzadeh., J. Goodfellow and J. Swithenbank., (2003). "Simulation of Channel Growth in a Burning Bed of Solids. " Chemical Engineering Research and Design 81(2): 221-232.
Yang, Y. B., Y. R. Goh., V. Nasserzadeh and J. Swithenbank., (2002). "Mathematical N4odelling of MSW Incineration on a Travelling Bed. " Waste Management 22(4): 369-380.
Zakaria, R., (2000). Static Incineration Bed Combustion. PhD Thesis. Department of Chemical and Process Engineering. Sheffield, University of Sheffield.
238
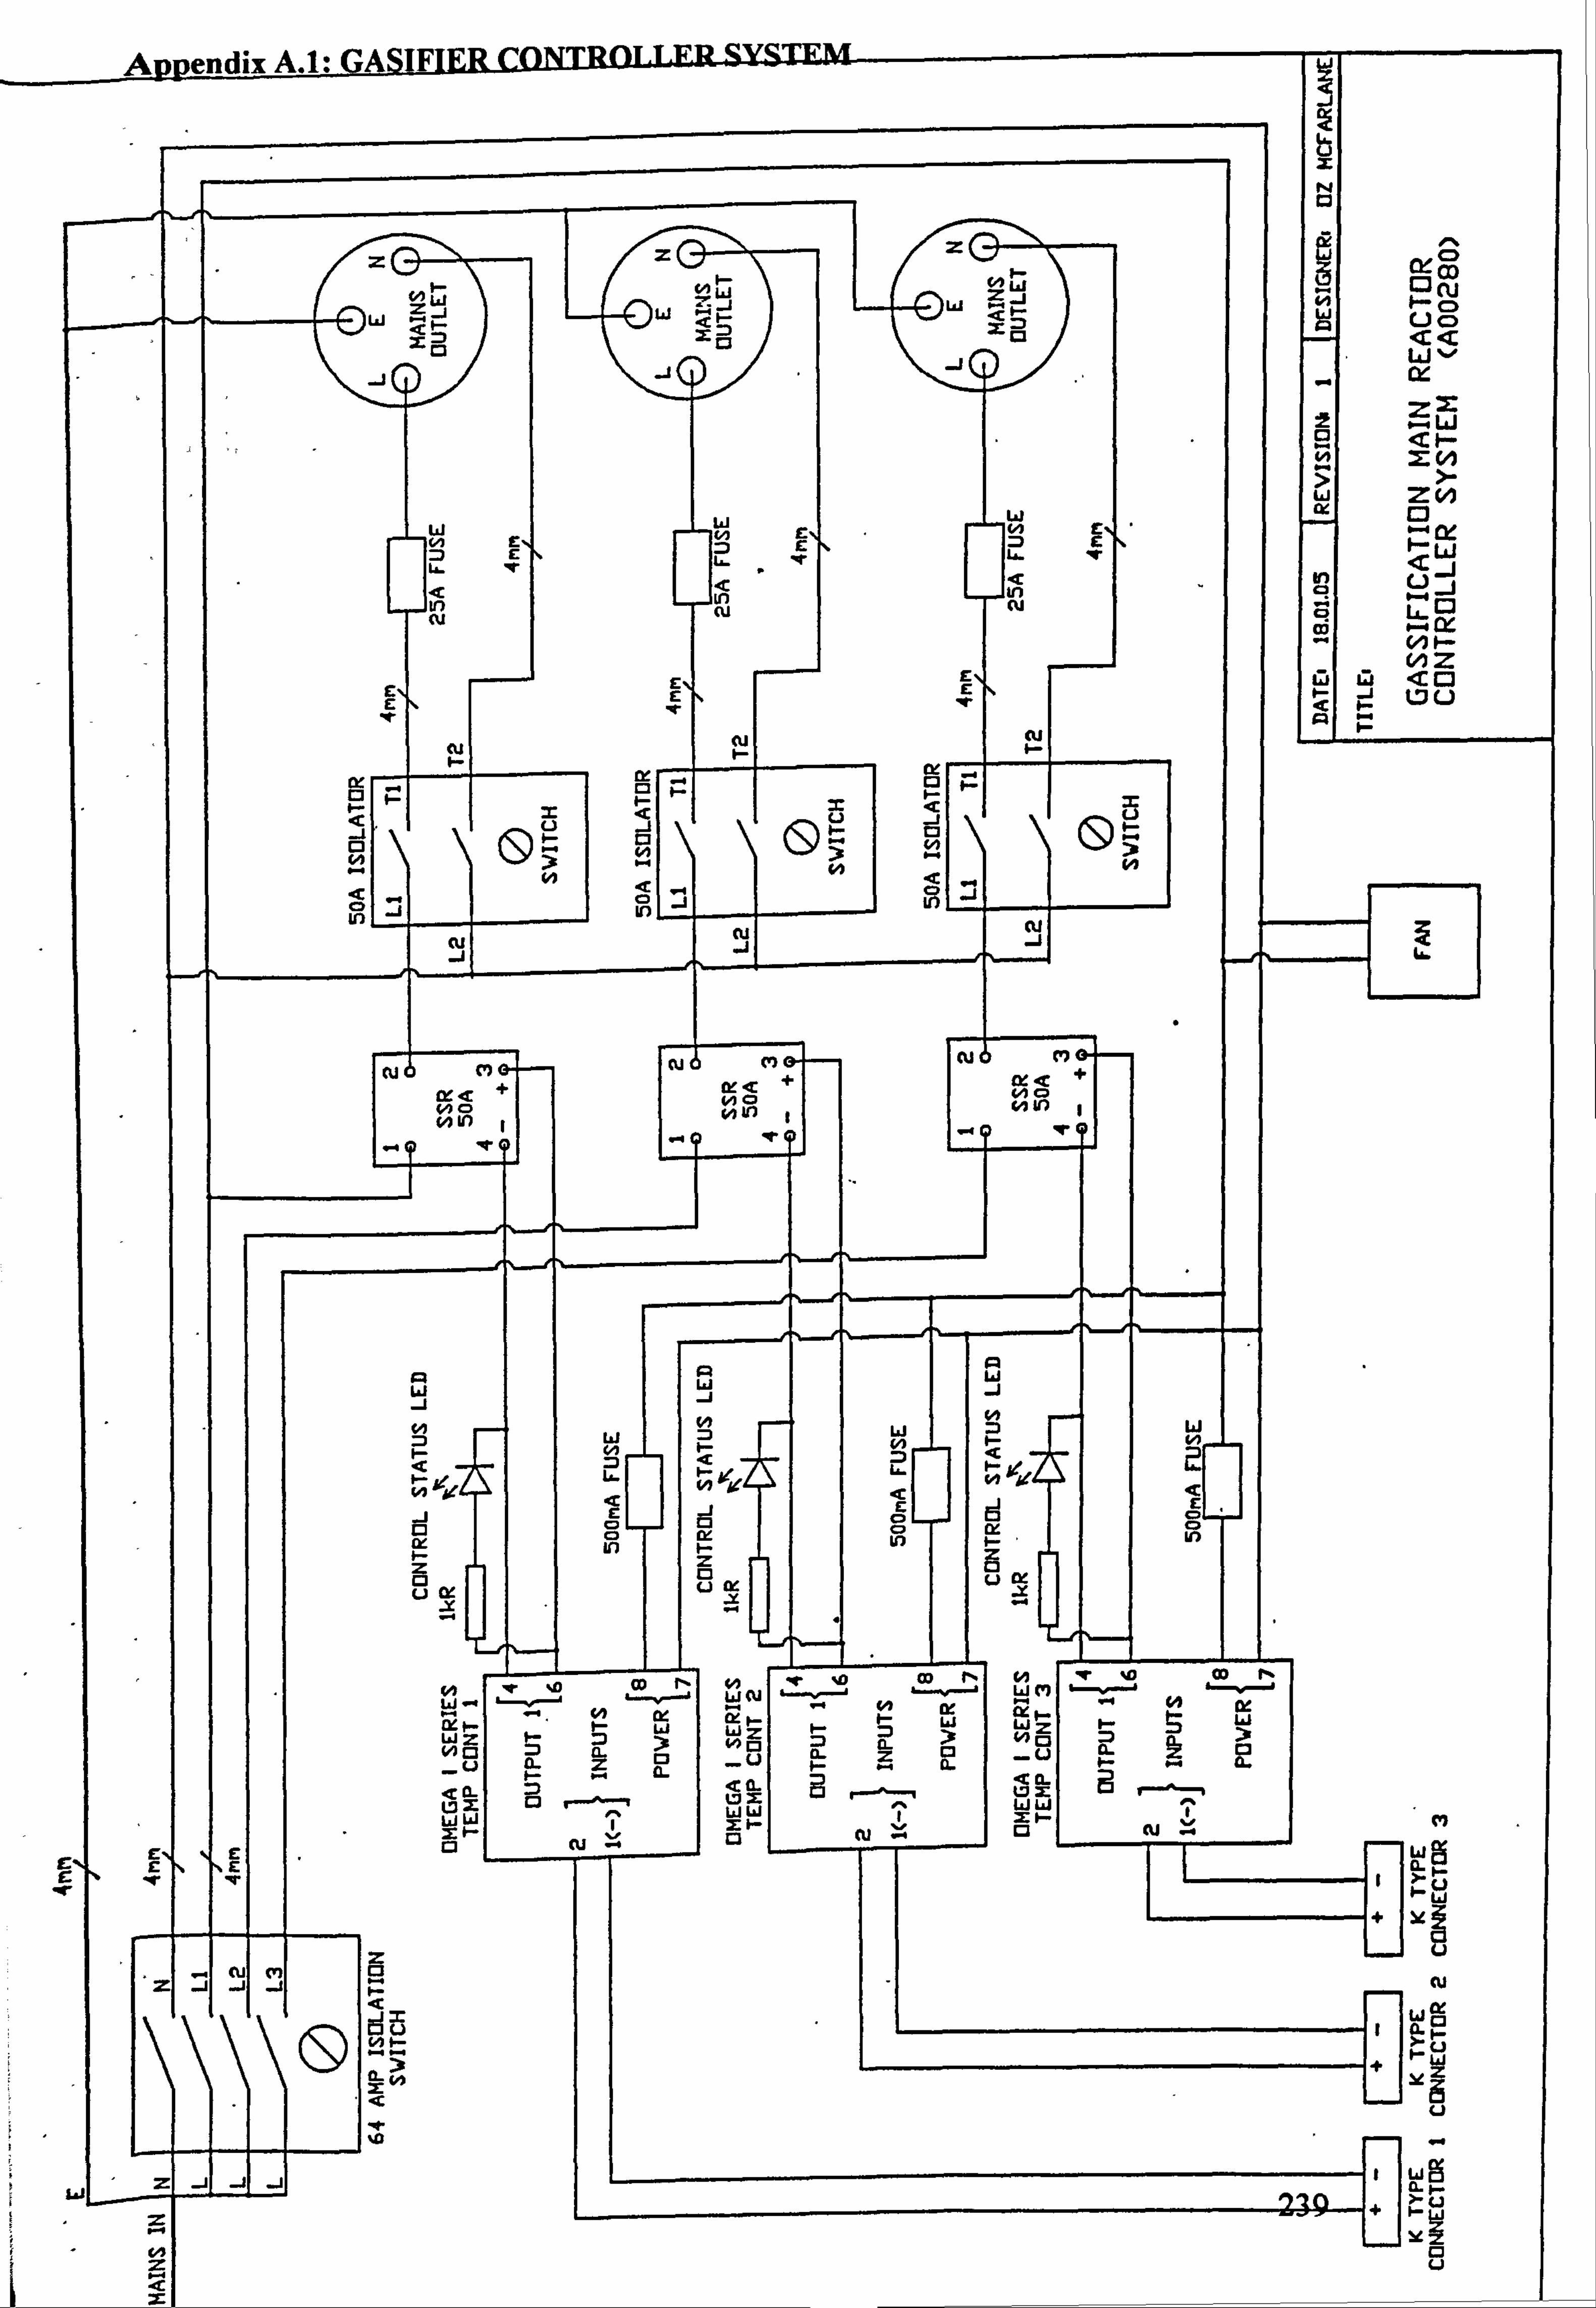
N O
zzz
WO
'T'. /
II (U I- C3 C3
~ZQ Ü
Q, M\ H -1 ýÖ yý3
.. yN
co, Ln U)
JJJ
INÖ C9 N6 co 7N ý+
KQ + 44 c2
+
NILn NÜ 1
yn
-Q v0 "4 °Q
Z
y Z
x
A J
Q J
N L. 1 Li N
W
ý ý
ä
N OK 4
N jC N I' ¢ Q
J E ö ,J O CD
. e- N
Z Z O
Ü te
D uy u
H W 5
W
WZ = 3 NO Z a 3 Na Z
O ä Z tl -V ia-
Z 0. -V 1- a.
Cl a
d Q0. Z r-"~ Z
ý W
ä1W- ra tu .. E F- O Nv
N
Z
73 Ný-
a3 Sy
ýý 5 N
CLI ö
Ocu º-
ö Uo QQ W
-W
<I- N ý(n
L w ZH 0 Of
J V) J 0-4 m ýIX
NF- v1 Z
WW <0
l7U
i L6
M WE CL ý- rv
W I
N
Q' O u
+ YZ
oU
W r
Y
Uu
Appendix A. 2
Elemental Analysis Service for CHN and S The samples are determined using the Perkin Elmer 2400 CHNS/O Series II Elemental
Analyzer, which uses a combustion method in pure oxygen environment to convert the
accurately weighted sample into the simple gases; CO2, H2O, N2, SO2. After reduction through pure copper the resulting C, H, N and S gases are then controlled to exact conditions
of pressure, temperature and volume where upon the system uses a steady state wave front
approach to separate the controlled gases. This approach involves separating a continuous homogenised mixture of gases through a chromatographic column. The gases eluting from the
column are measured as a function of their thermal conductivity.
240
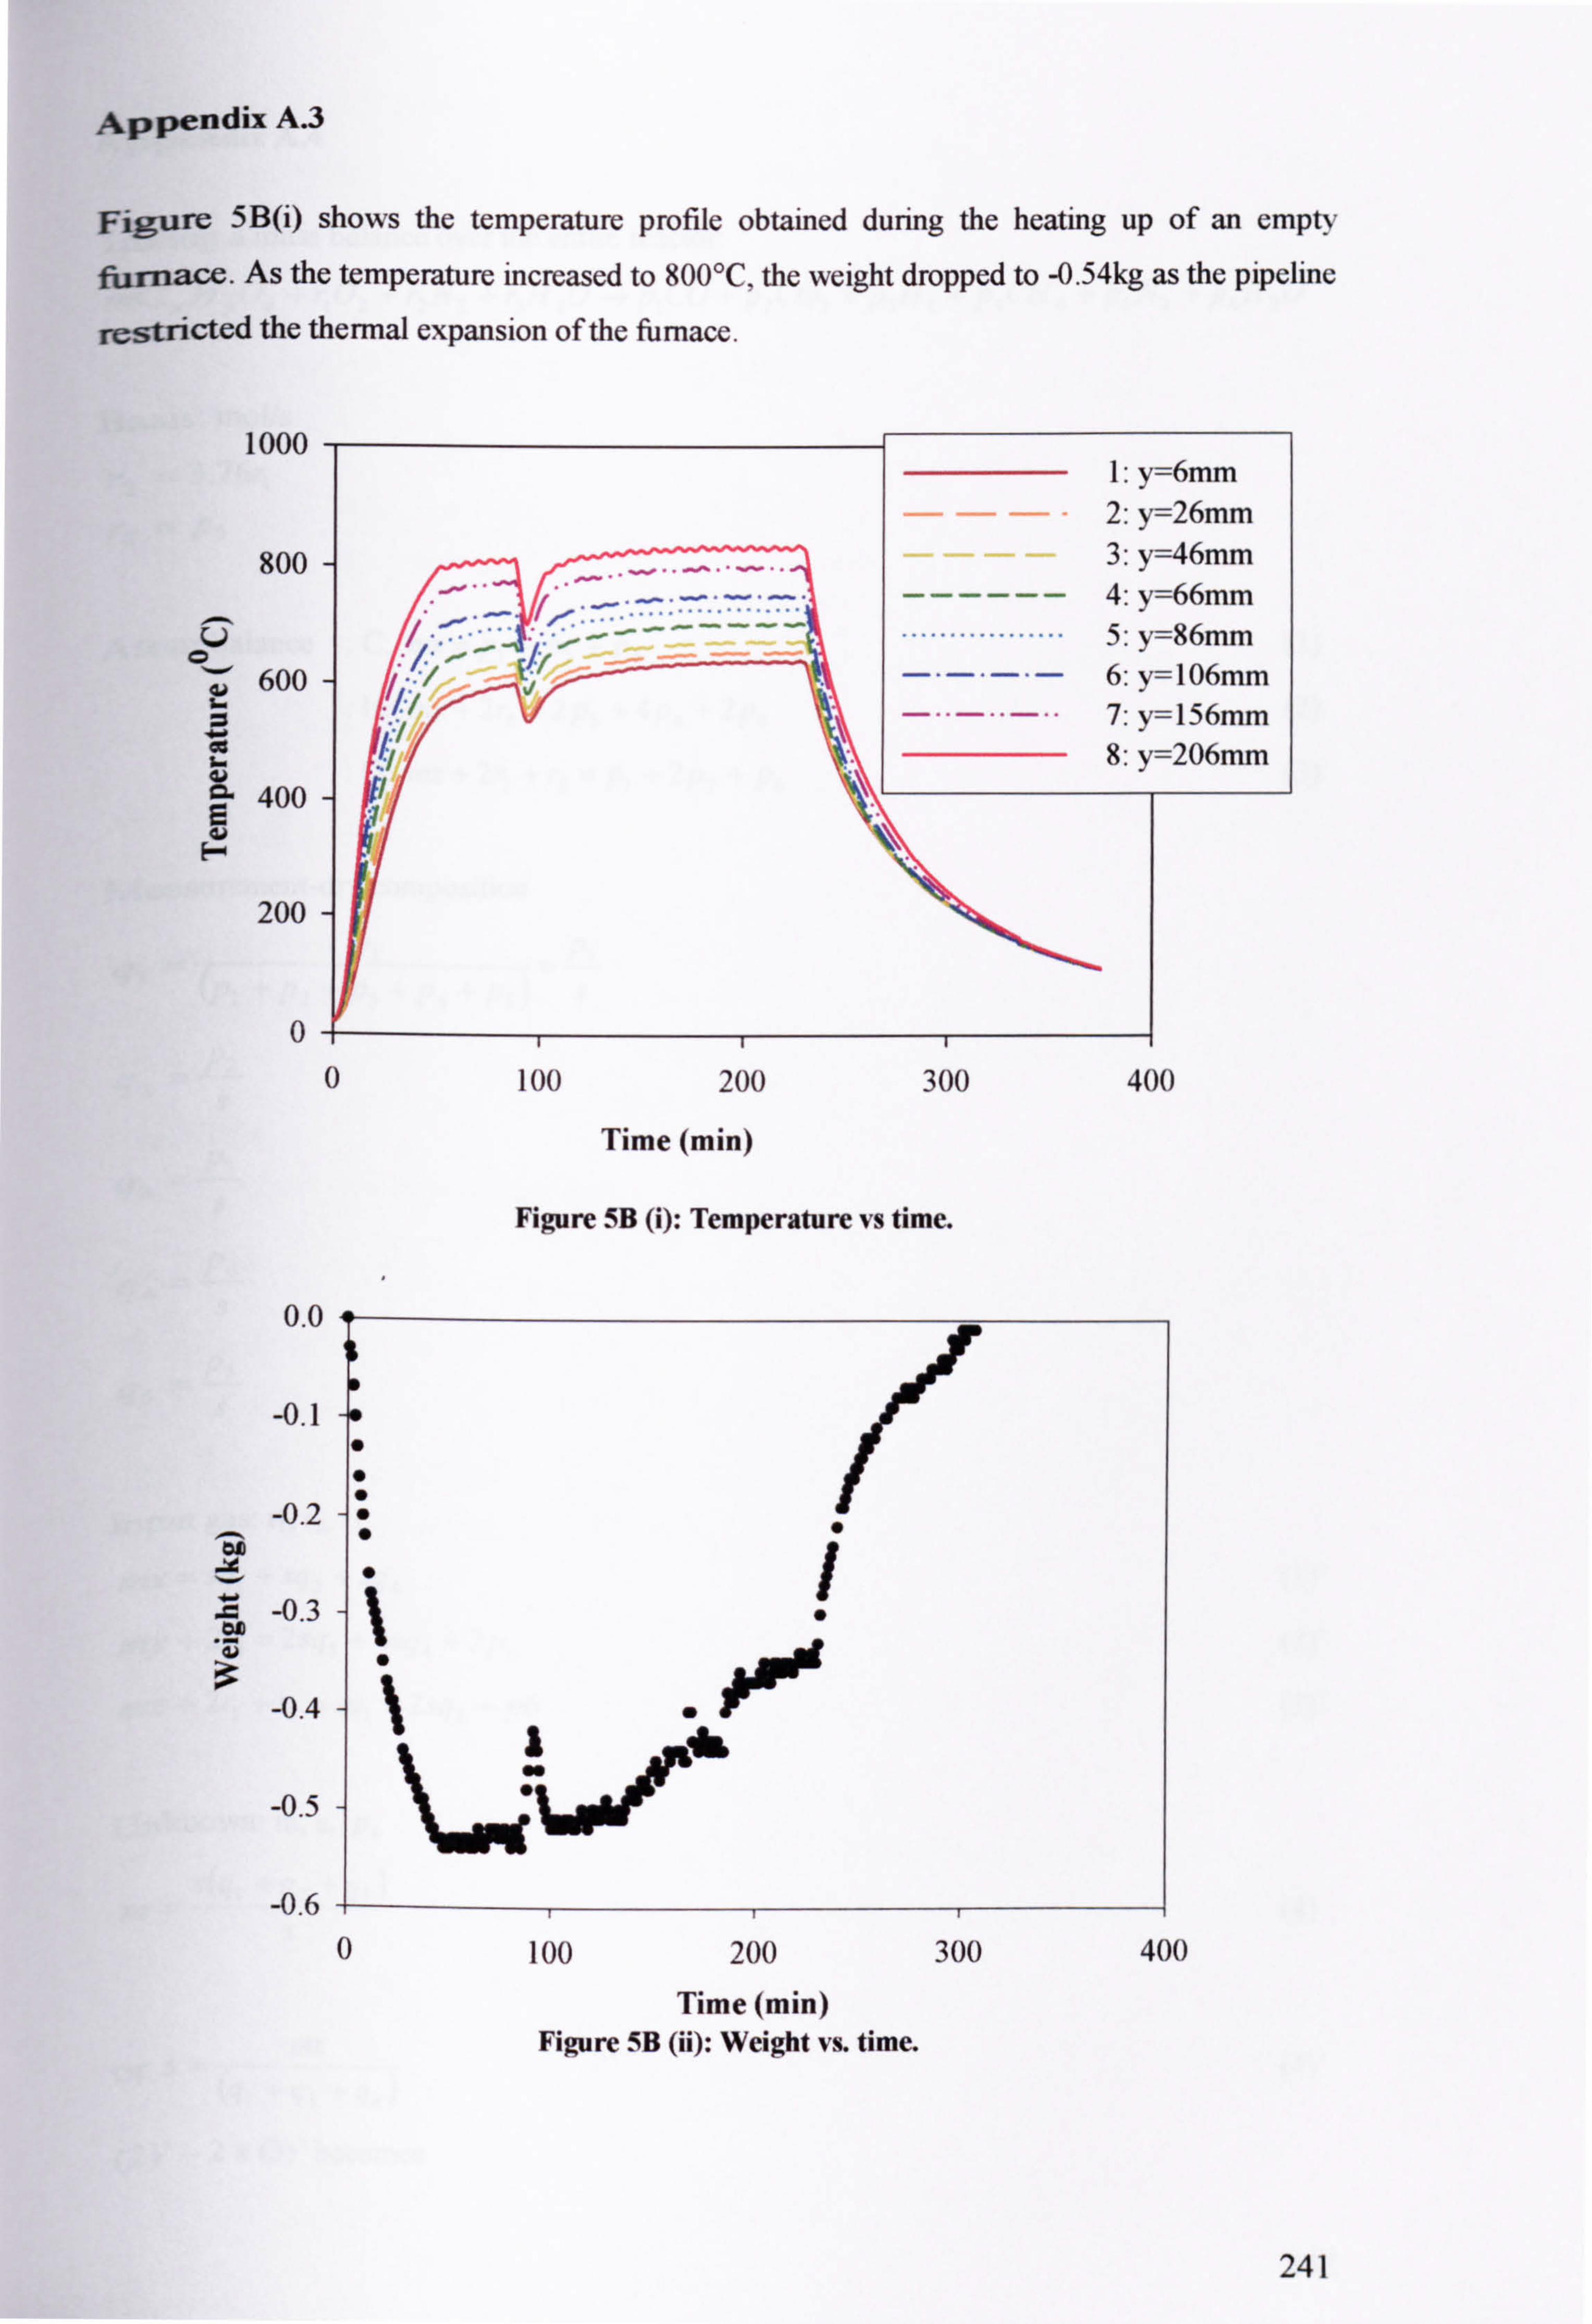
Appendix A. 3
Figure 5B(i) shows the temperature profile obtained during the heating up of an empty
furnace. As the temperature increased to 800°C, the weight dropped to -0.54kg as the pipeline
restricted the thermal expansion of the furnace.
1000
800
41 600 L
400
H
200
0.0
0- 0
/E :: ---
-
1: y=6mm 2: y=26mm 3: y=46mm
------4: y=66mm ................. 5: y=86mm ---- 6: y=106mm ---7: y=156mm
8: y=206mm
100 200 300
Time (min)
Figure 5B (i): Temperature vs time.
400
-0.1
-0.2 ao
-0.3 u V
-0.4
-0.5
-0.6 0
ell
100 200
Time (min) Figure 5B (ii): Weight vs. time.
300 400
241
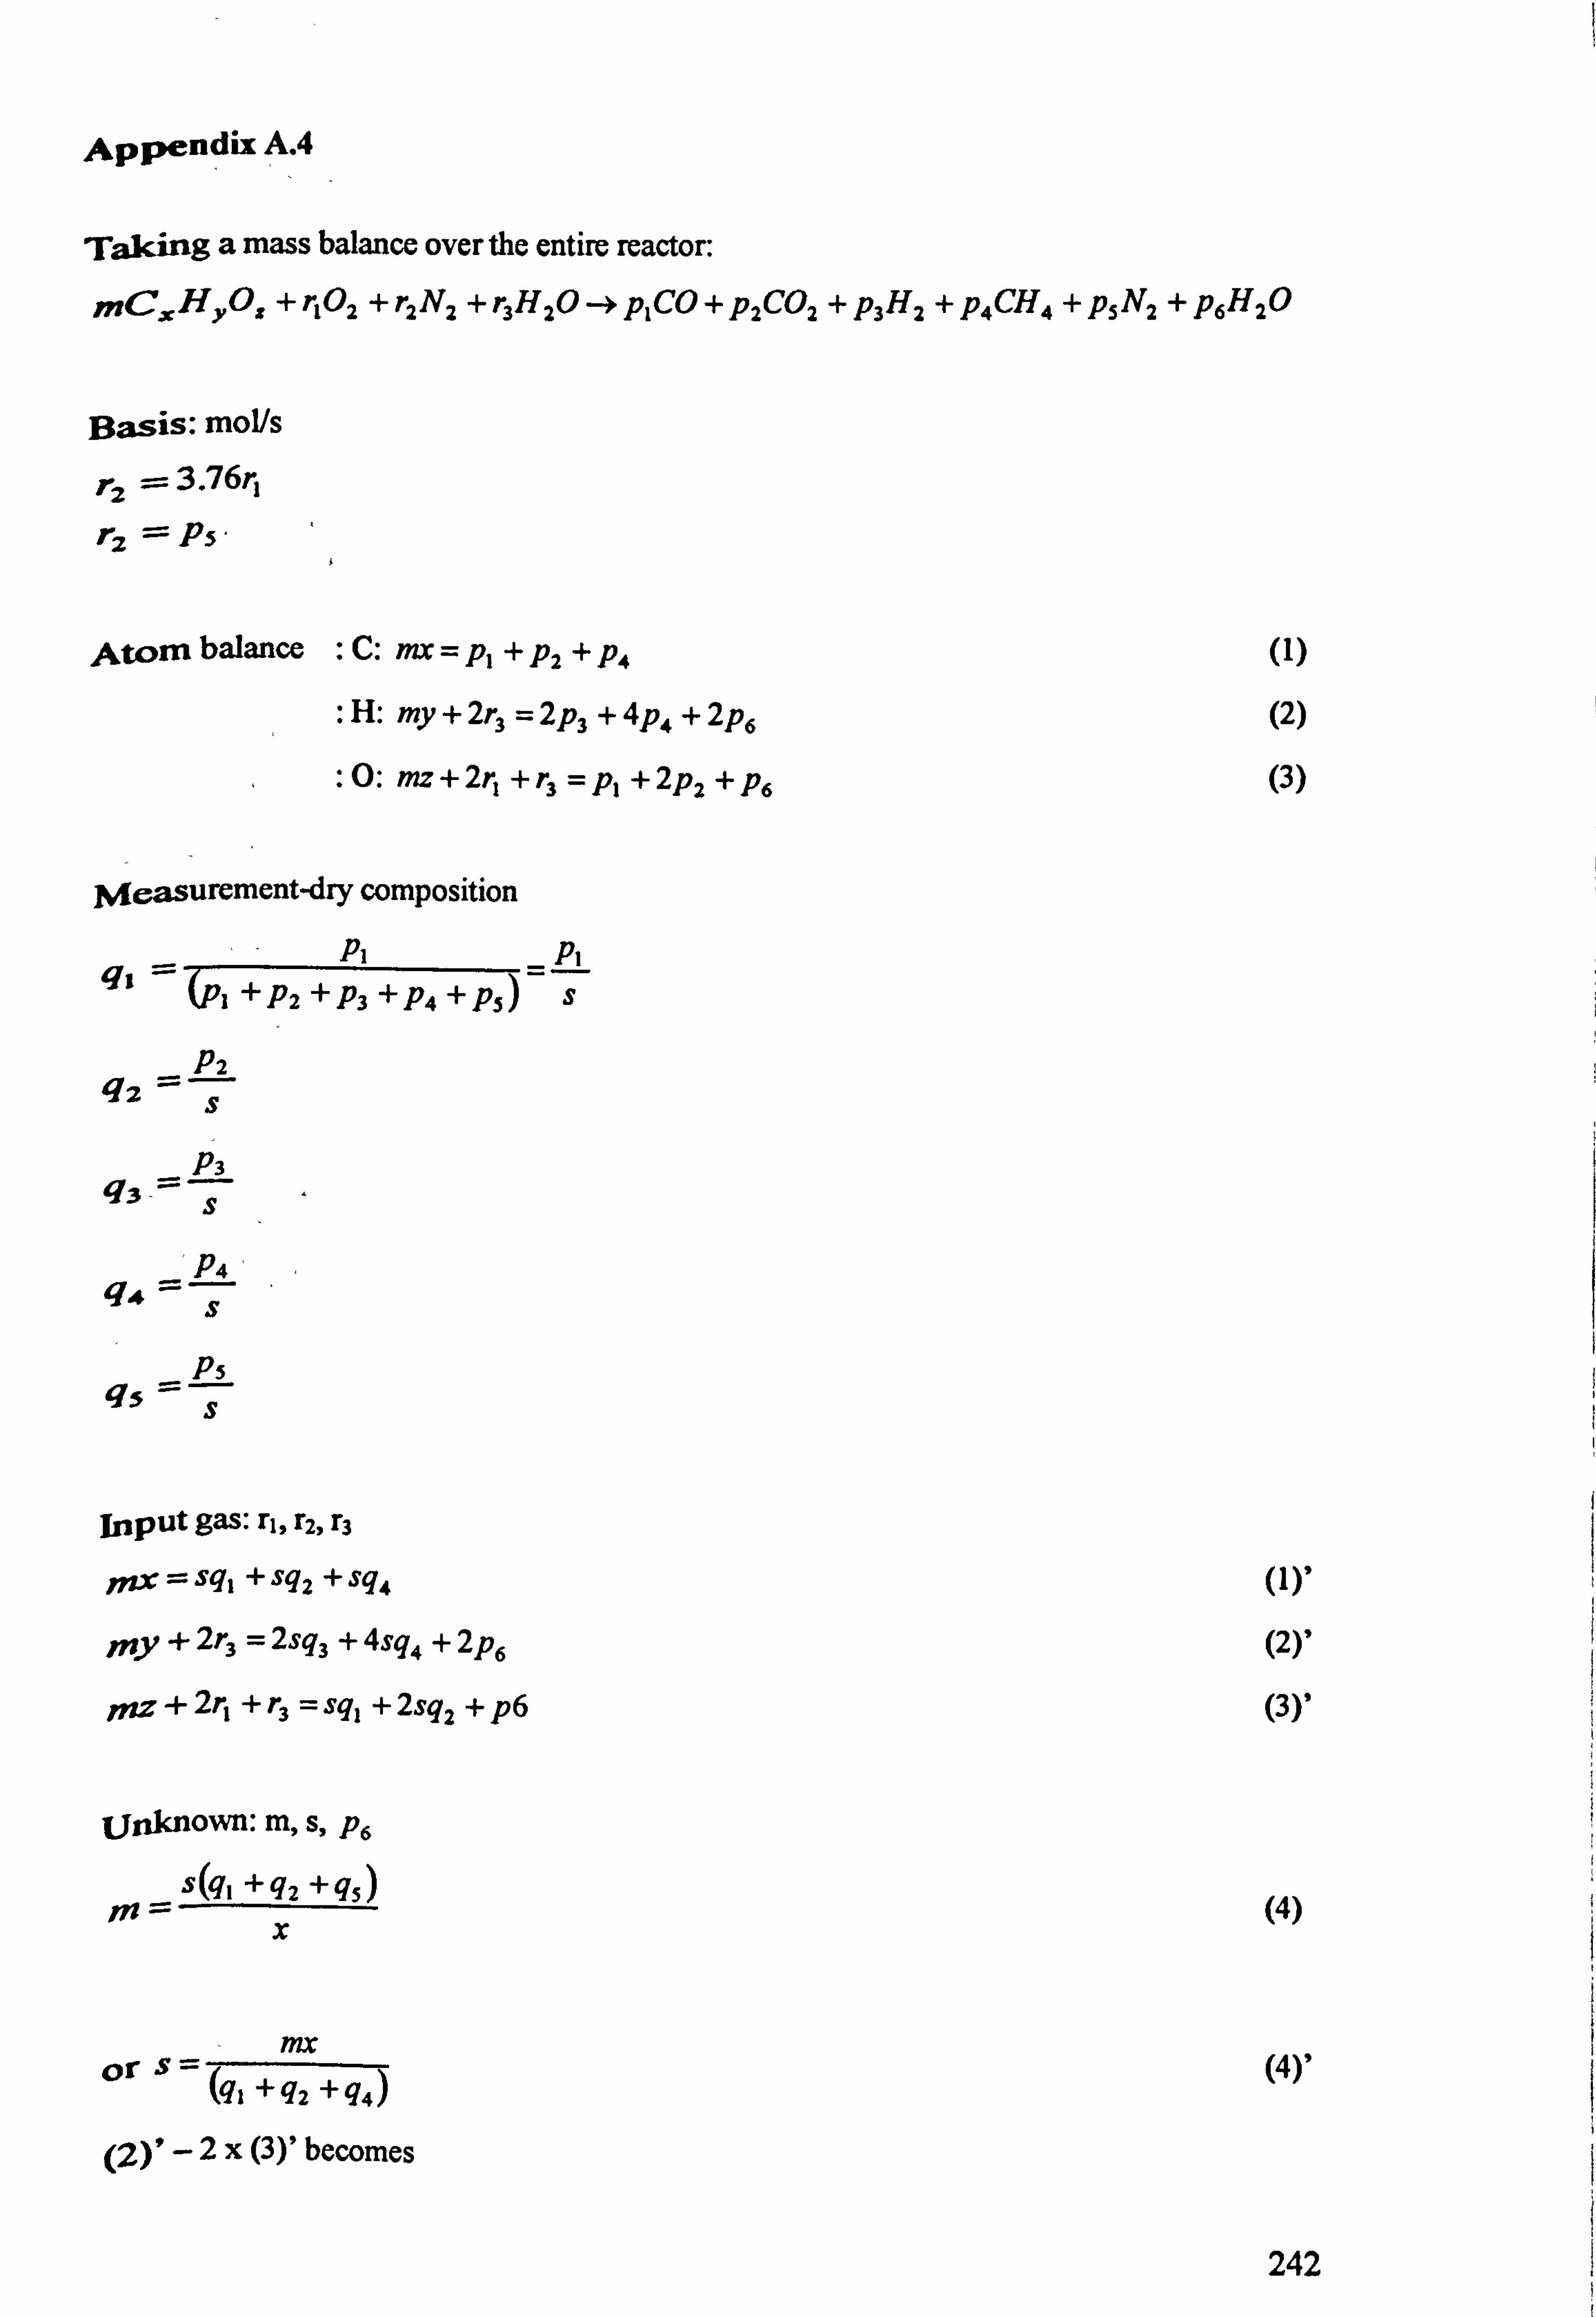
Appendix A. 4
Taking a mass balance over the entire reactor:
mCCHyOz +r102 +r2N2 +r3H2O-)P1CO+p2CO2 +p3H2 +p4CH4 +p5N2 +p6H2O
Basis: mol/s
r2 . 3.76r,
r2 Ps,
Atom balance : C: mx = p1 + P2 + P4 (1)
H: my+2r3 =2p; +4P4 +2P6 (2)
: 0: mz+2r1 + r3 = p, +2P2 +P6 (3)
Measurement-dry composition
ý- A
__ PA
4i - (Pi +'Pz +Ps +P4 +P5) S
P2 4z-s
P3 ßi3
s
P4 q4
s
p5 4s-s
Input gas: r1, r2, r3
rnz=sq, +sq2 +sq4 (1)'
my + 2r3 = 2sq3 + 4sq4 + 2P6 (2)'
'nz + 2r1 + r3 = sq1 + 2sg2 + p6 (3)'
unknown: m, s, P6
s(9, +q2 +q5) (4) x
mx or S- (41 + q2 + q4)
(4)'
(2)' -2x (3)' becomes
242
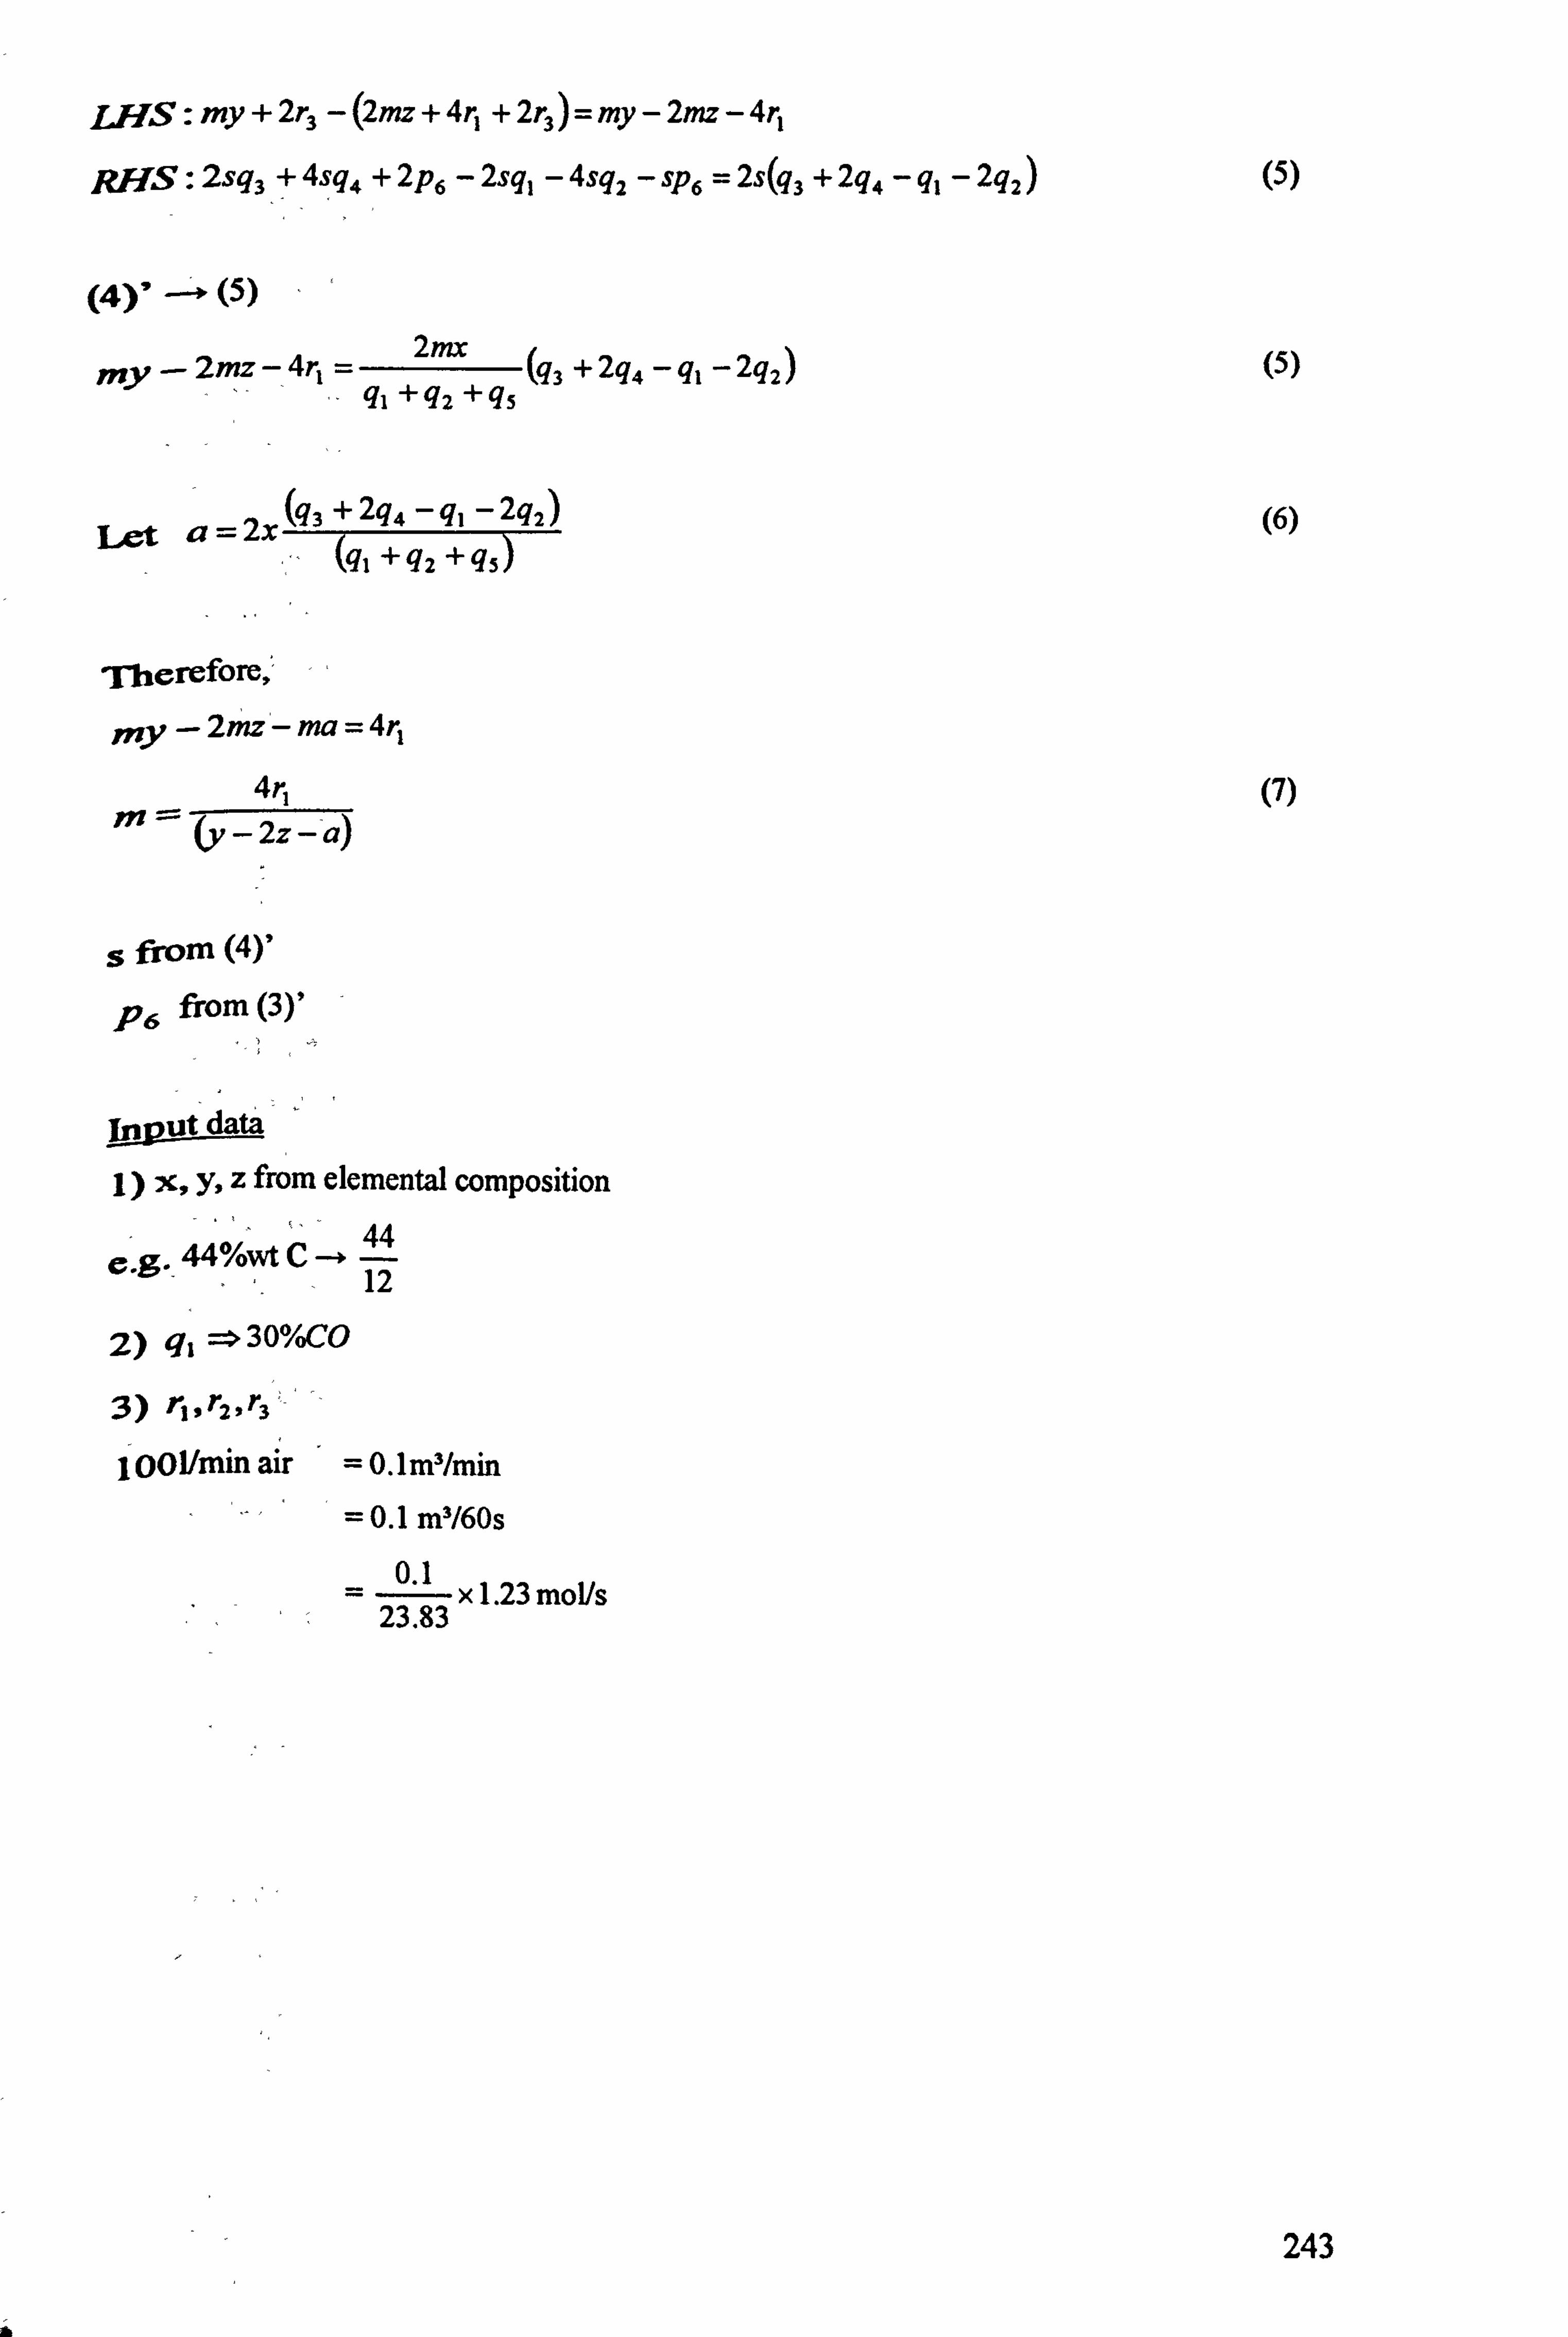
LMS: my+2r3 -(2mz+4r, +2r3)=my-2mz-4r1
RHS : 2sg3 + 4sg4 + 2P6 - 2sq, - 4sq2 - sP6 = 2s(g3 + 2q4 - ql - 2q2) (5)
(4)' ' (5)
my - 2mz - 4r1 =" (q3 +2q4 - 4i -2q2) (5) 4i+ +4s
Let a= 2x (43 + 244 - qI - 2q2) (6)
9i +q2 +Rs
-therefore, '
my-2mz-ma=4r1 4r, (7)
m= (, -2z-a)
s from (4)'
P6 from (3)'
data
iý x, y, z from elemental composition 44
e. g" 44%wt C --º 12
2) 41 30%CO
3) r, r2, rs'
1001/min air = 0.1m3/min
= 0.1 m3/60s
= 0.1
x1.23mol/s 23.83
243
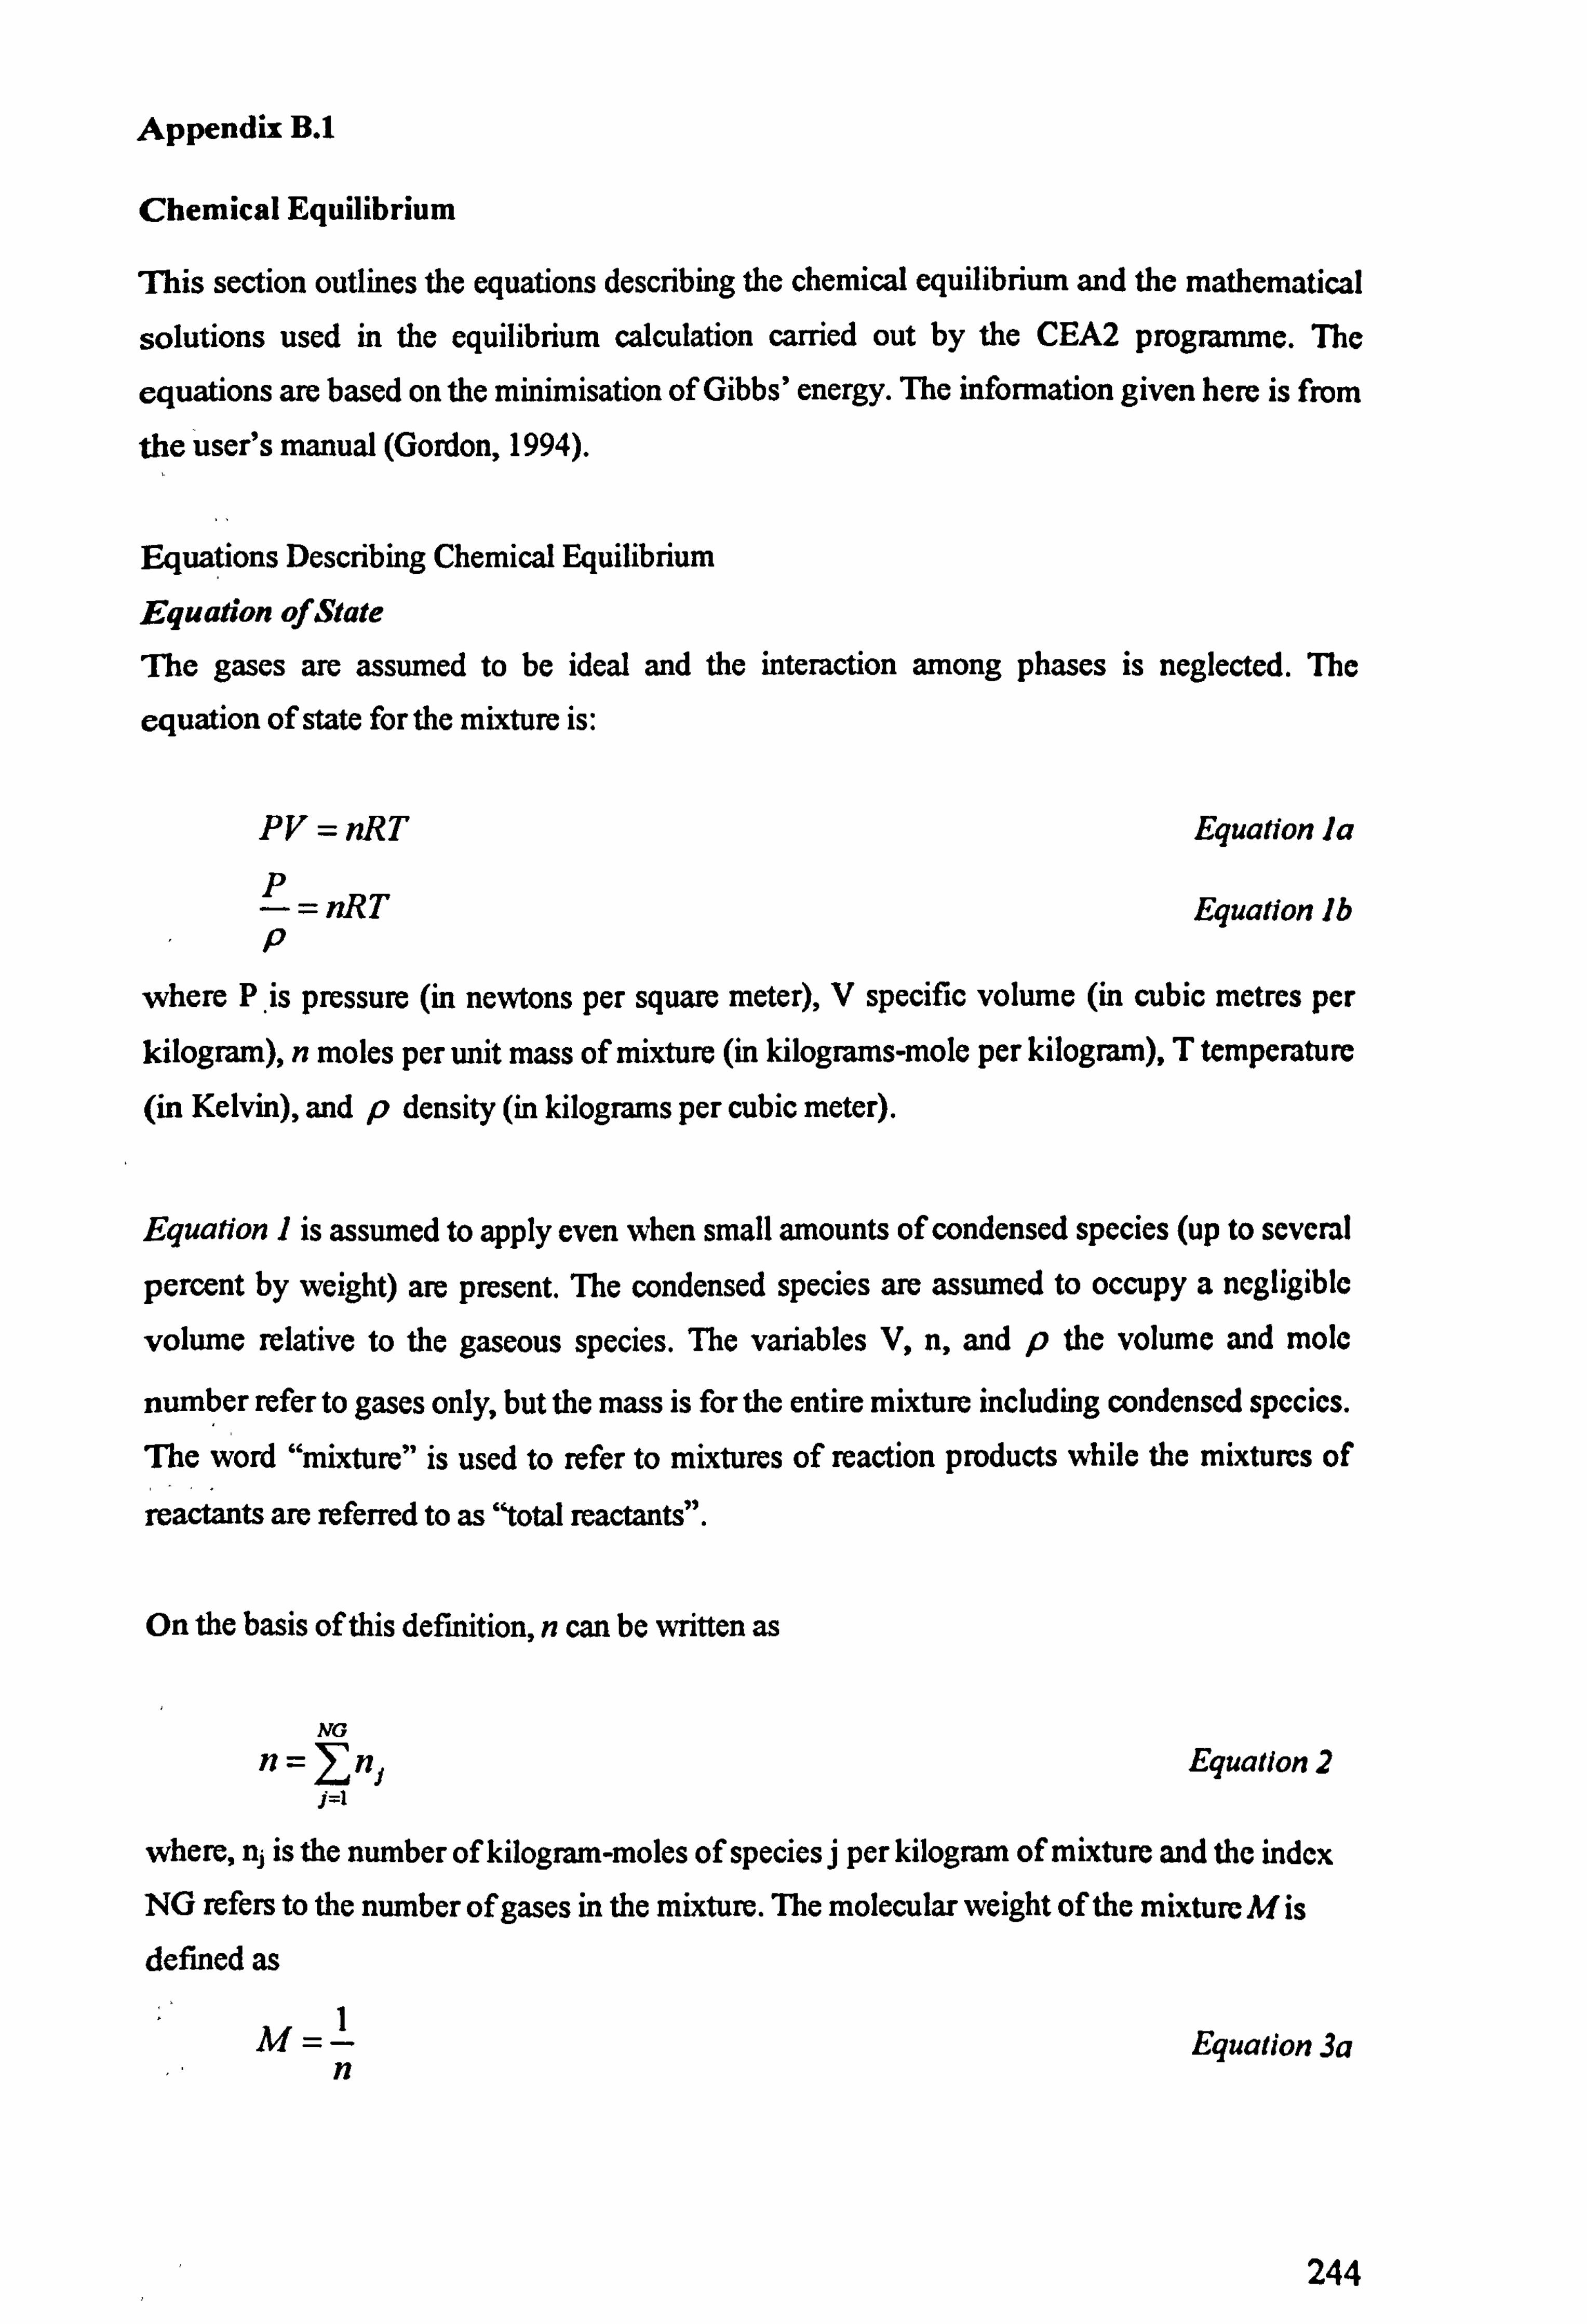
Appendix B. 1
Chemical Equilibrium
This section outlines the equations describing the chemical equilibrium and the mathematical
solutions used in the equilibrium calculation carried out by the CEA2 programme. The
equations are based on the minimisation of Gibbs' energy. The information given here is from
the user's manual (Gordon, 1994).
Equations Describing Chemical Equilibrium
Equation of State
The gases are assumed to be ideal and the interaction among phases is neglected. The
equation of state for the mixture is:
PV = nRT P
=nRT P
Equation la
Equation lb
where P. is pressure (in newtons per square meter), V specific volume (in cubic metres per kilogram), n moles per unit mass of mixture (in kilograms-mole per kilogram), T temperature
(in Kelvin), and p density (in kilograms per cubic meter).
Equation 1 is assumed to apply even when small amounts of condensed species (up to several
percent by weight) are present. The condensed species are assumed to occupy a negligible
volume relative to the gaseous species. The variables V, n, and p the volume and mole
number refer to gases only, but the mass is for the entire mixture including condensed species. The word "mixture" is used to refer to mixtures of reaction products while the mixtures of
reactants are referred to as "total reactants".
On the basis of this definition, n can be written as
NG n-2] nj
j=1 Equation 2
where, n; is the number of kilogram-moles of species j per kilogram of mixture and the index
NG refers to the number of gases in the mixture. The molecular weight of the mixture M is
defined as
M=1 Equation 3a n
244
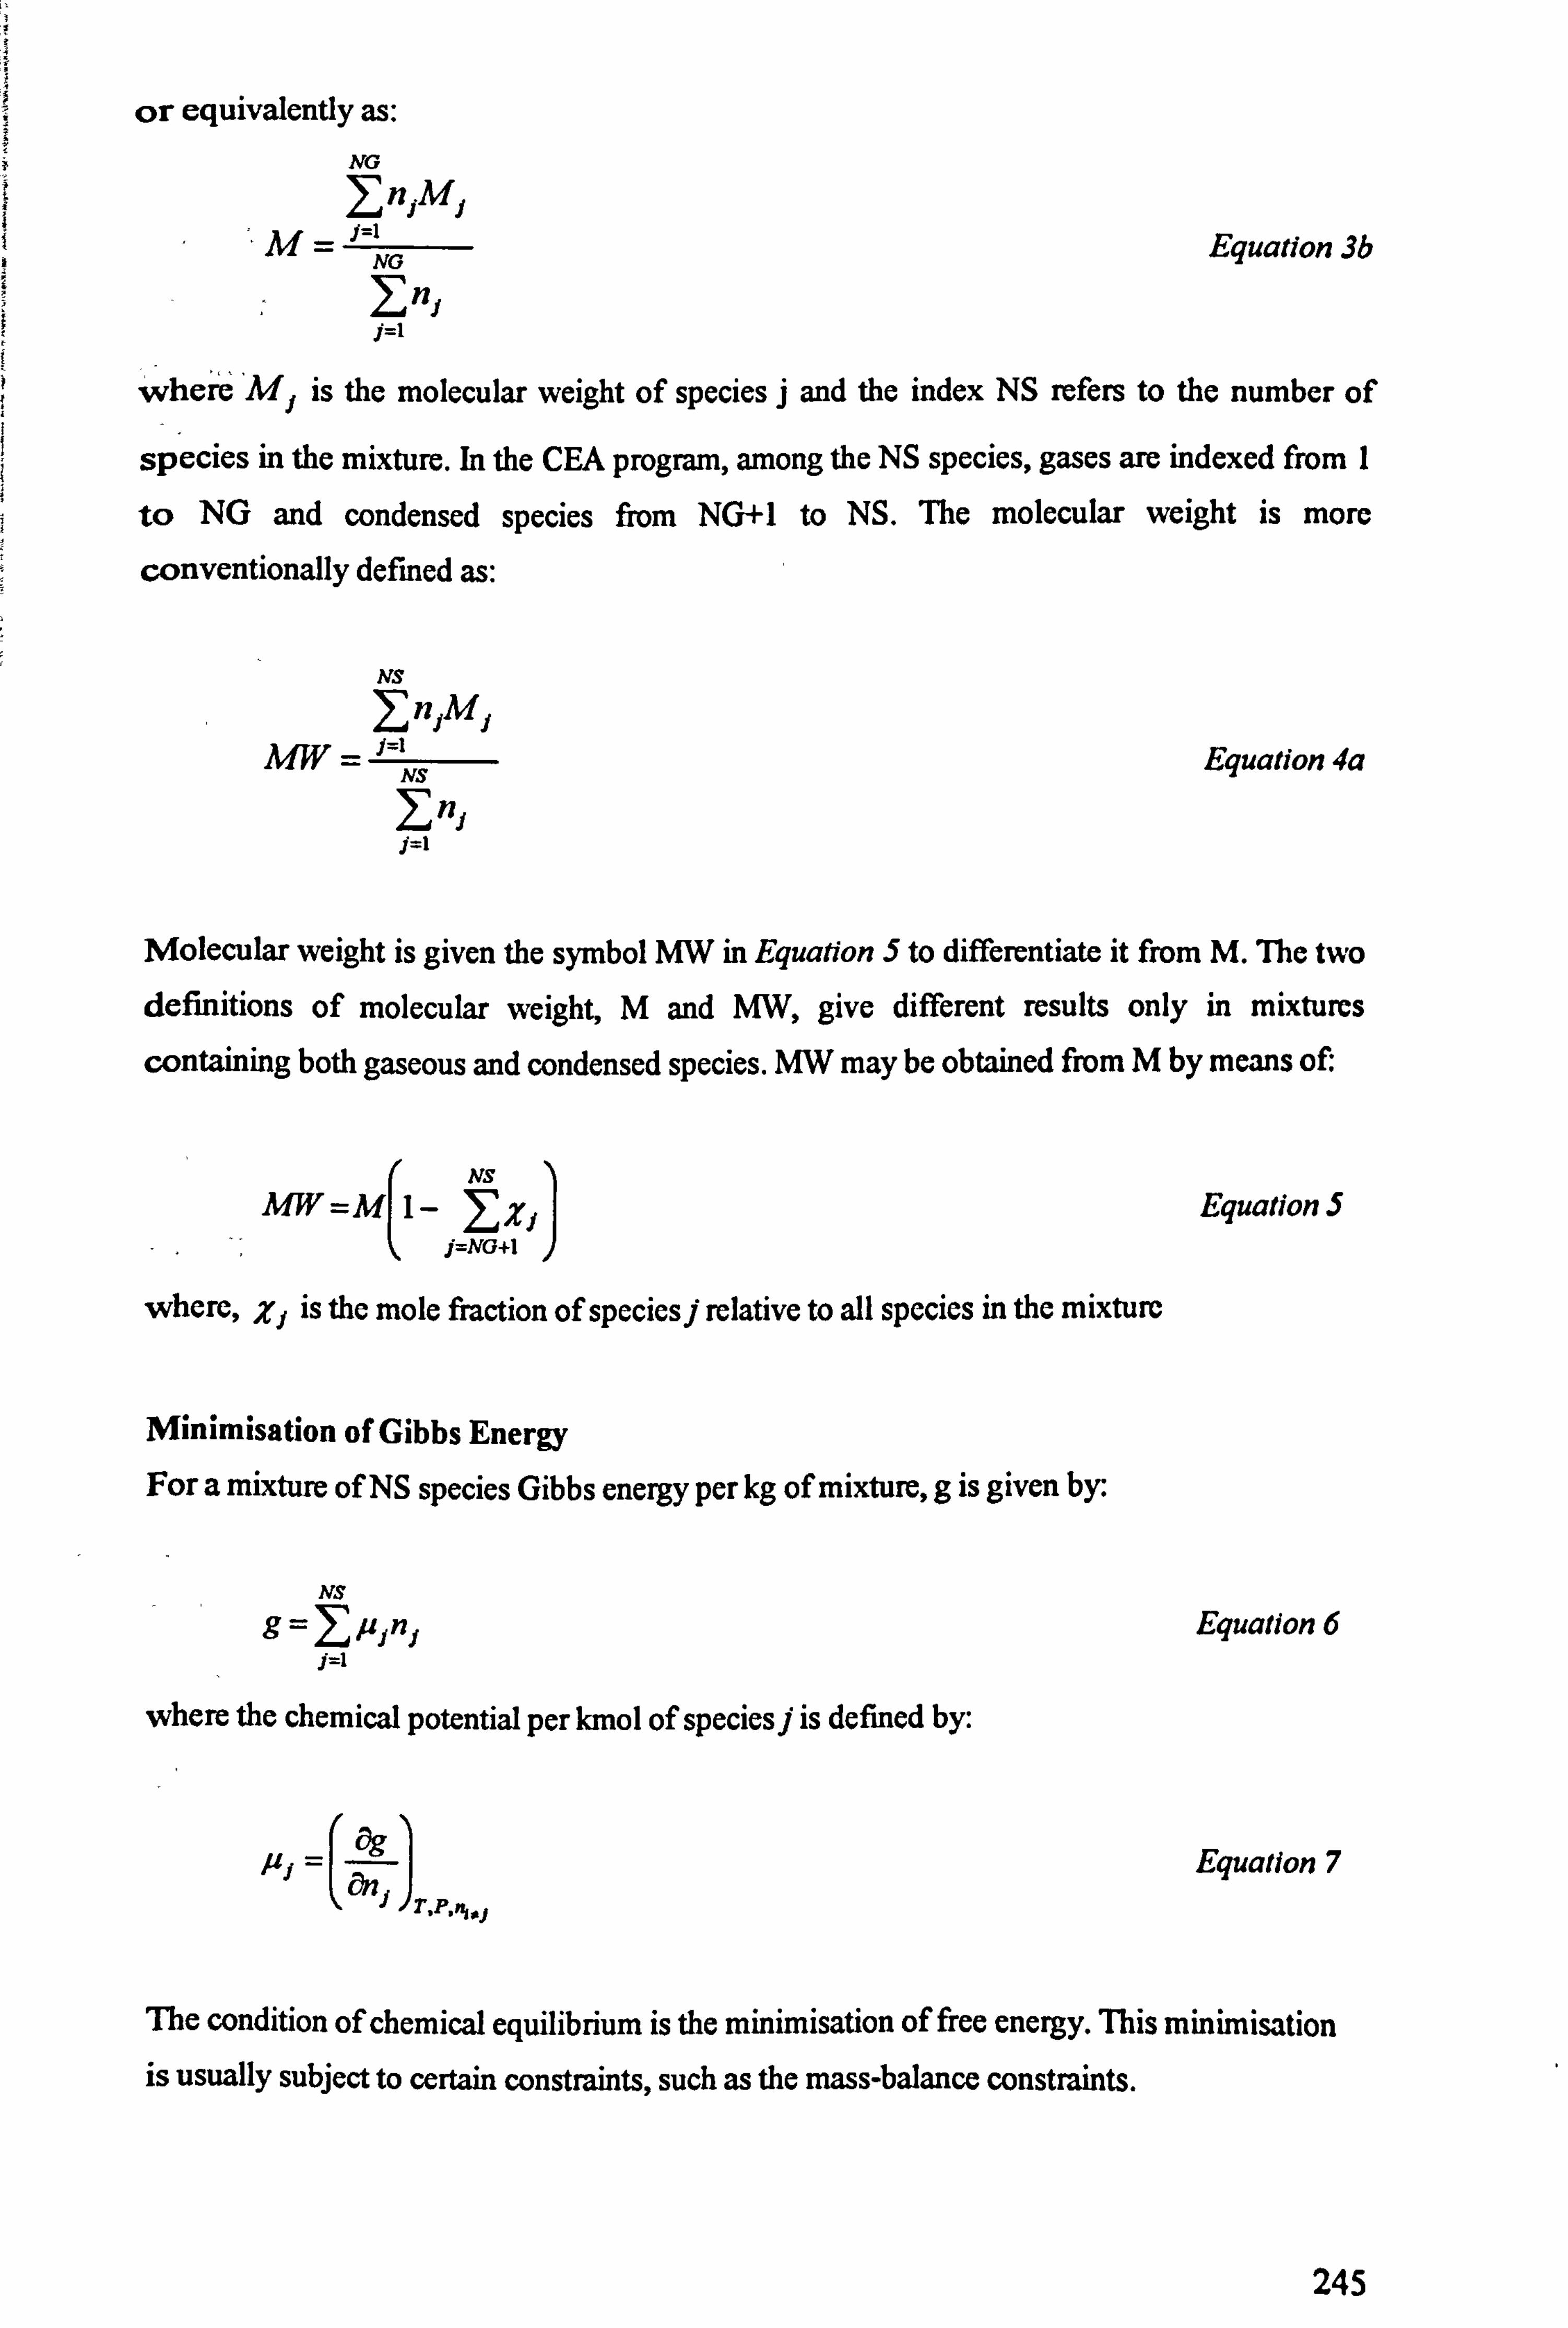
or equivalently as: NG InjM1
M= Equation 3b ýnj
where Mj is the molecular weight of species j and the index NS refers to the number of
species in the mixture. In the CEA program, among the NS species, gases are indexed from 1
to NG and condensed species from NG+1 to NS. The molecular weight is more
conventionally defined as:
NS
n1M1 NS
1: nj j=1
Equation 4a
Molecular weight is given the symbol MW in Equation 5 to differentiate it from M. The two definitions of molecular weight, M and MW, give different results only in mixtures
containing both gaseous and condensed species. MW may be obtained from M by means of
NS
MW=M 1- Ex, Equations j=NG+1
where, Zj is the mole fraction of species j relative to all species in the mixture
Minimisation of Gibbs Energy
For a mixture of NS species Gibbs energy per kg of mixture, g is given by:
NS
g=E pjnj Equation 6 j=1
where the chemical potential per kmol of species j is defined by:
fu j= Equation 7 5ý, T, p, Nsj
The condition of chemical equilibrium is the minimisation of free energy. This minimisation is usually subject to certain constraints, such as the mass-balance constraints.
245
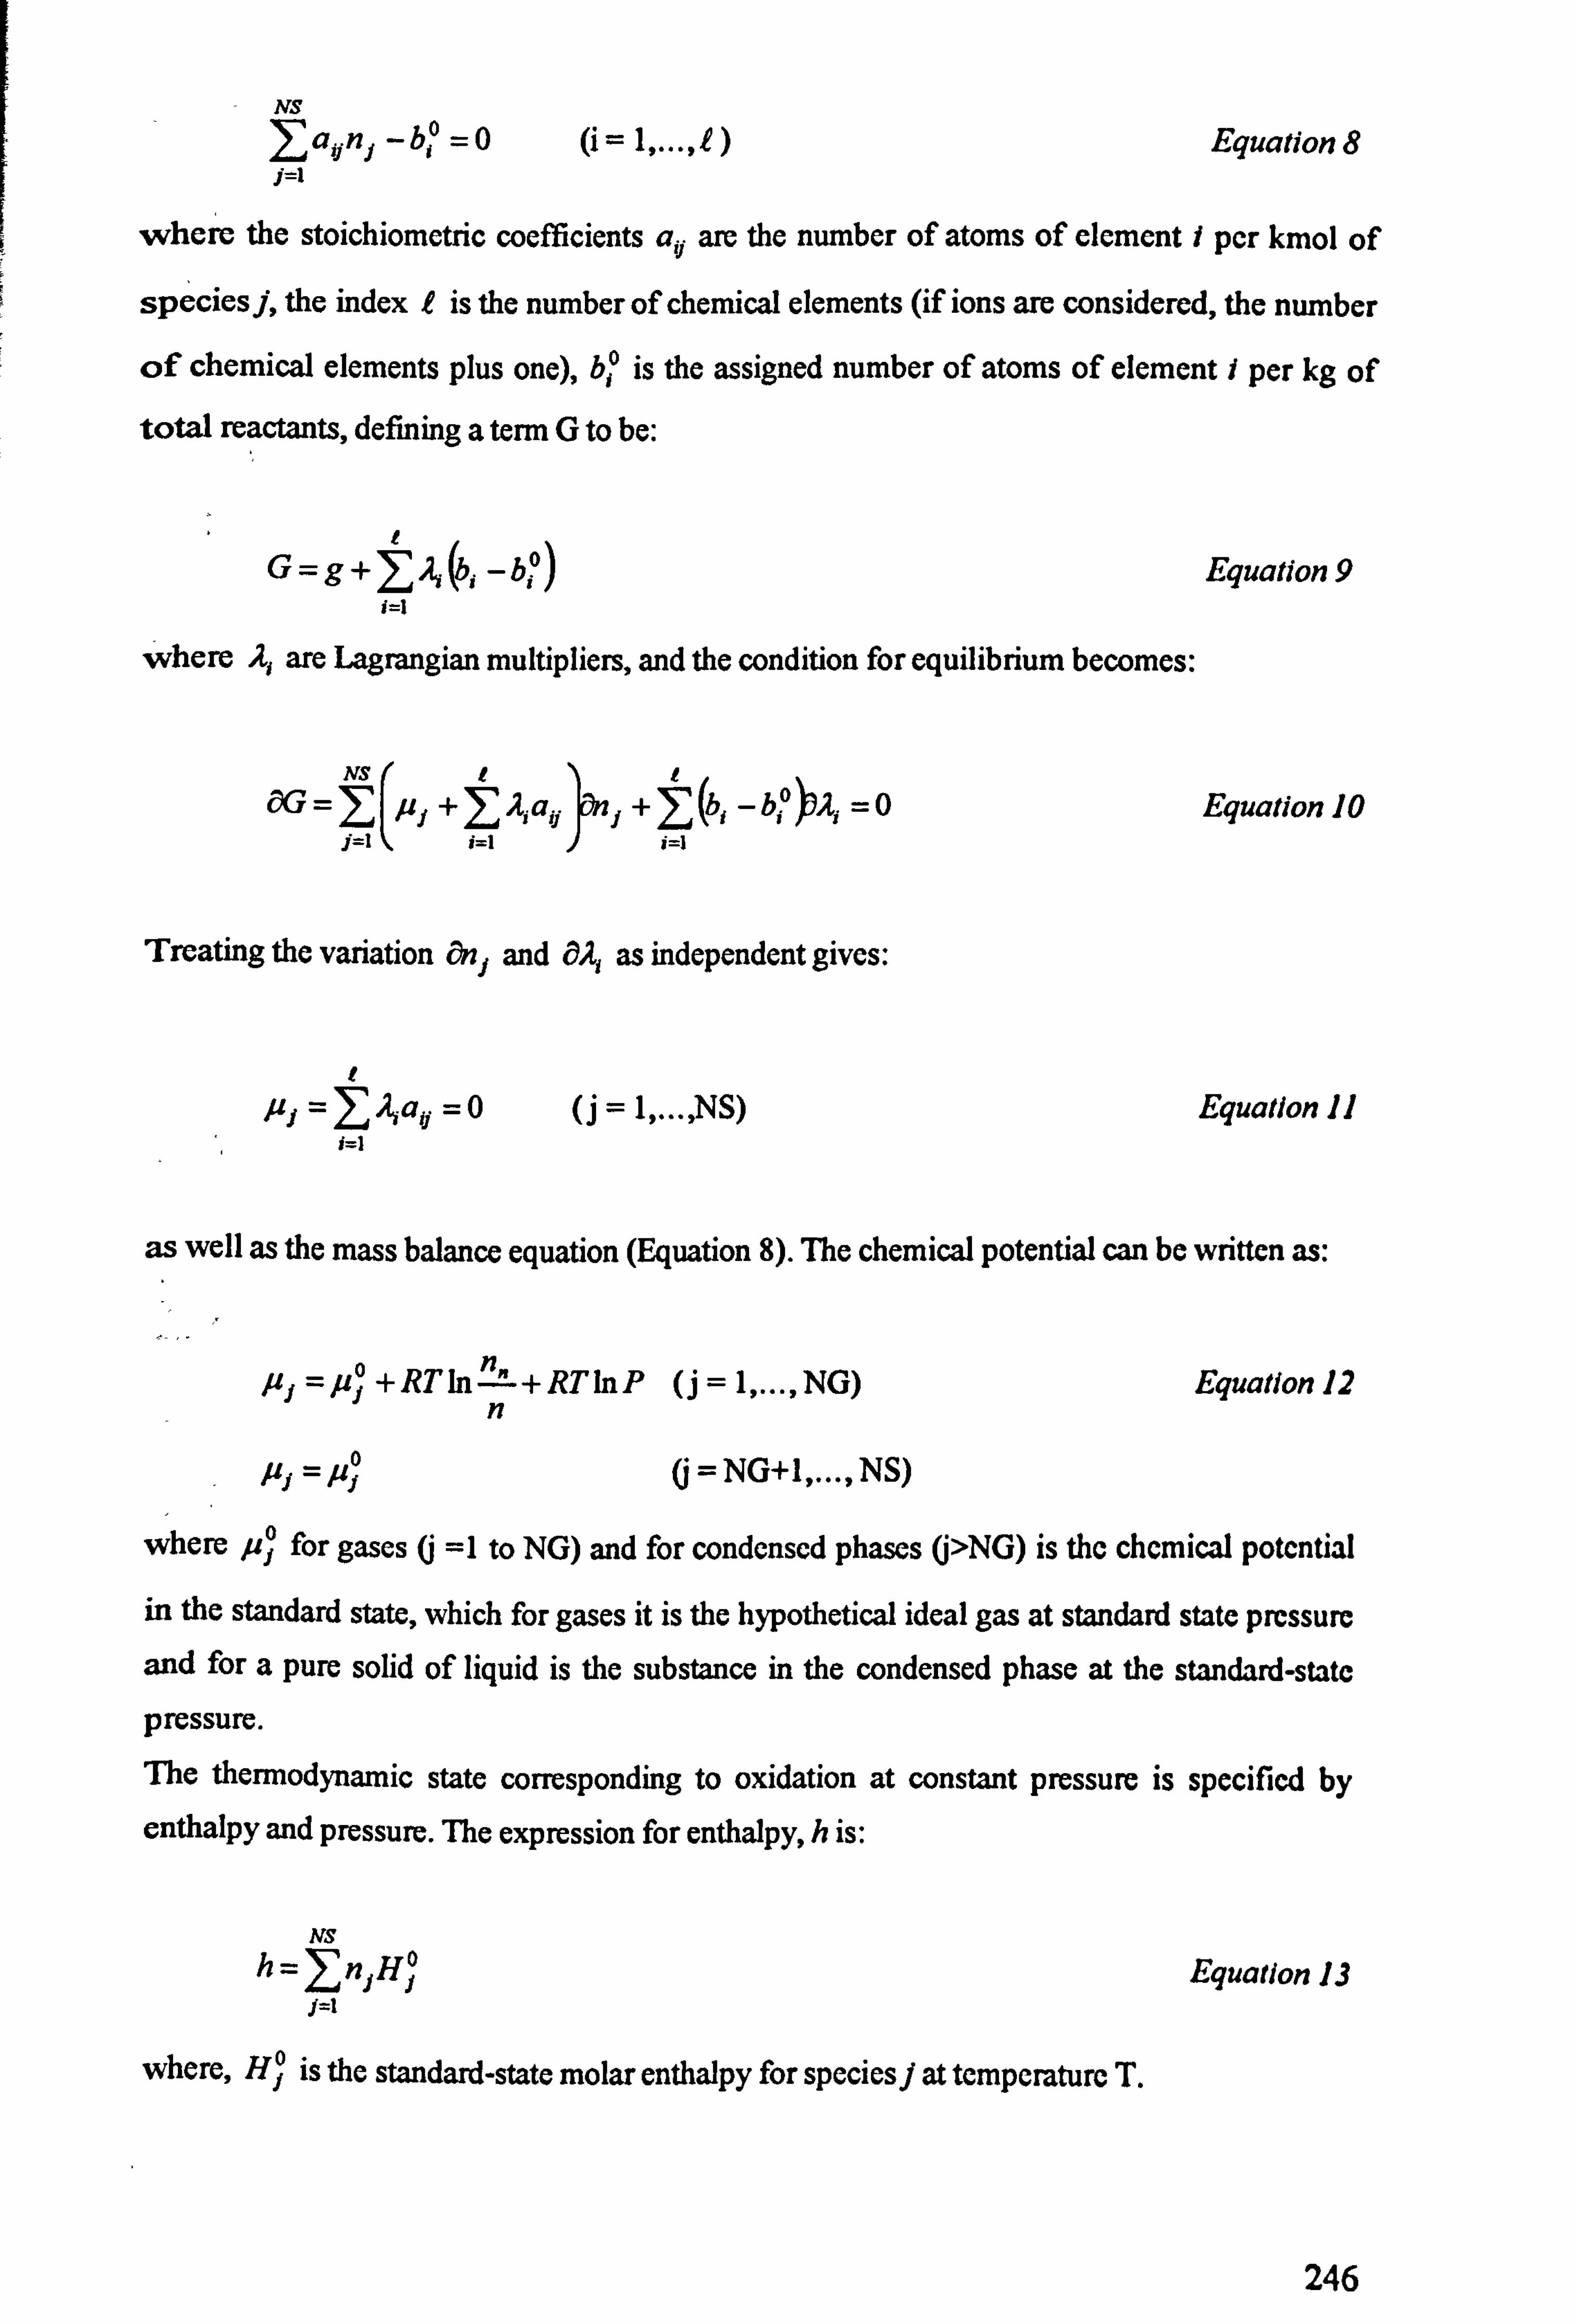
NS
=1
Equation 8
where the stoichiometric coefficients aij are the number of atoms of element i per kmol of
species j, the index I is the number of chemical elements (if ions are considered, the number
of chemical elements plus one), b° is the assigned number of atoms of element i per kg of
total reactants, defining a term G to be:
r G=g+I:. (b;
-b, °) Equation 9
i=l
where A, are Lagrangian multipliers, and the condition for equilibrium becomes:
N'N OG = 1+
2: A; a; ý 1+ (b;
- b,. ° ýA; =0 Equation 10
i=l i=l i=l
Treating the variation On, and ä2, as independent gives:
I j= . -at =0 (j = 1,..., NS) Equation I1
f=1
as well as the mass balance equation (Equation 8). The chemical potential can be written as:
p1 = pj + RT In n" + RT In P (j =1,..., NG) Equation 12
n
P, =pf (j=NG+1,..., NS)
where j for gases (j =1 to NG) and for condensed phases (j>NG) is the chemical potential
in the standard state, which for gases it is the hypothetical ideal gas at standard state pressure and for a pure solid of liquid is the substance in the condensed phase at the standard-state pressure. The thermodynamic state corresponding to oxidation at constant pressure is specified by
enthalpy and pressure. The expression for enthalpy, h is:
NS
h= 2]njHj Equation 13 j=t
where, HO is the standard-state molar enthalpy for species j at temperature T.
246
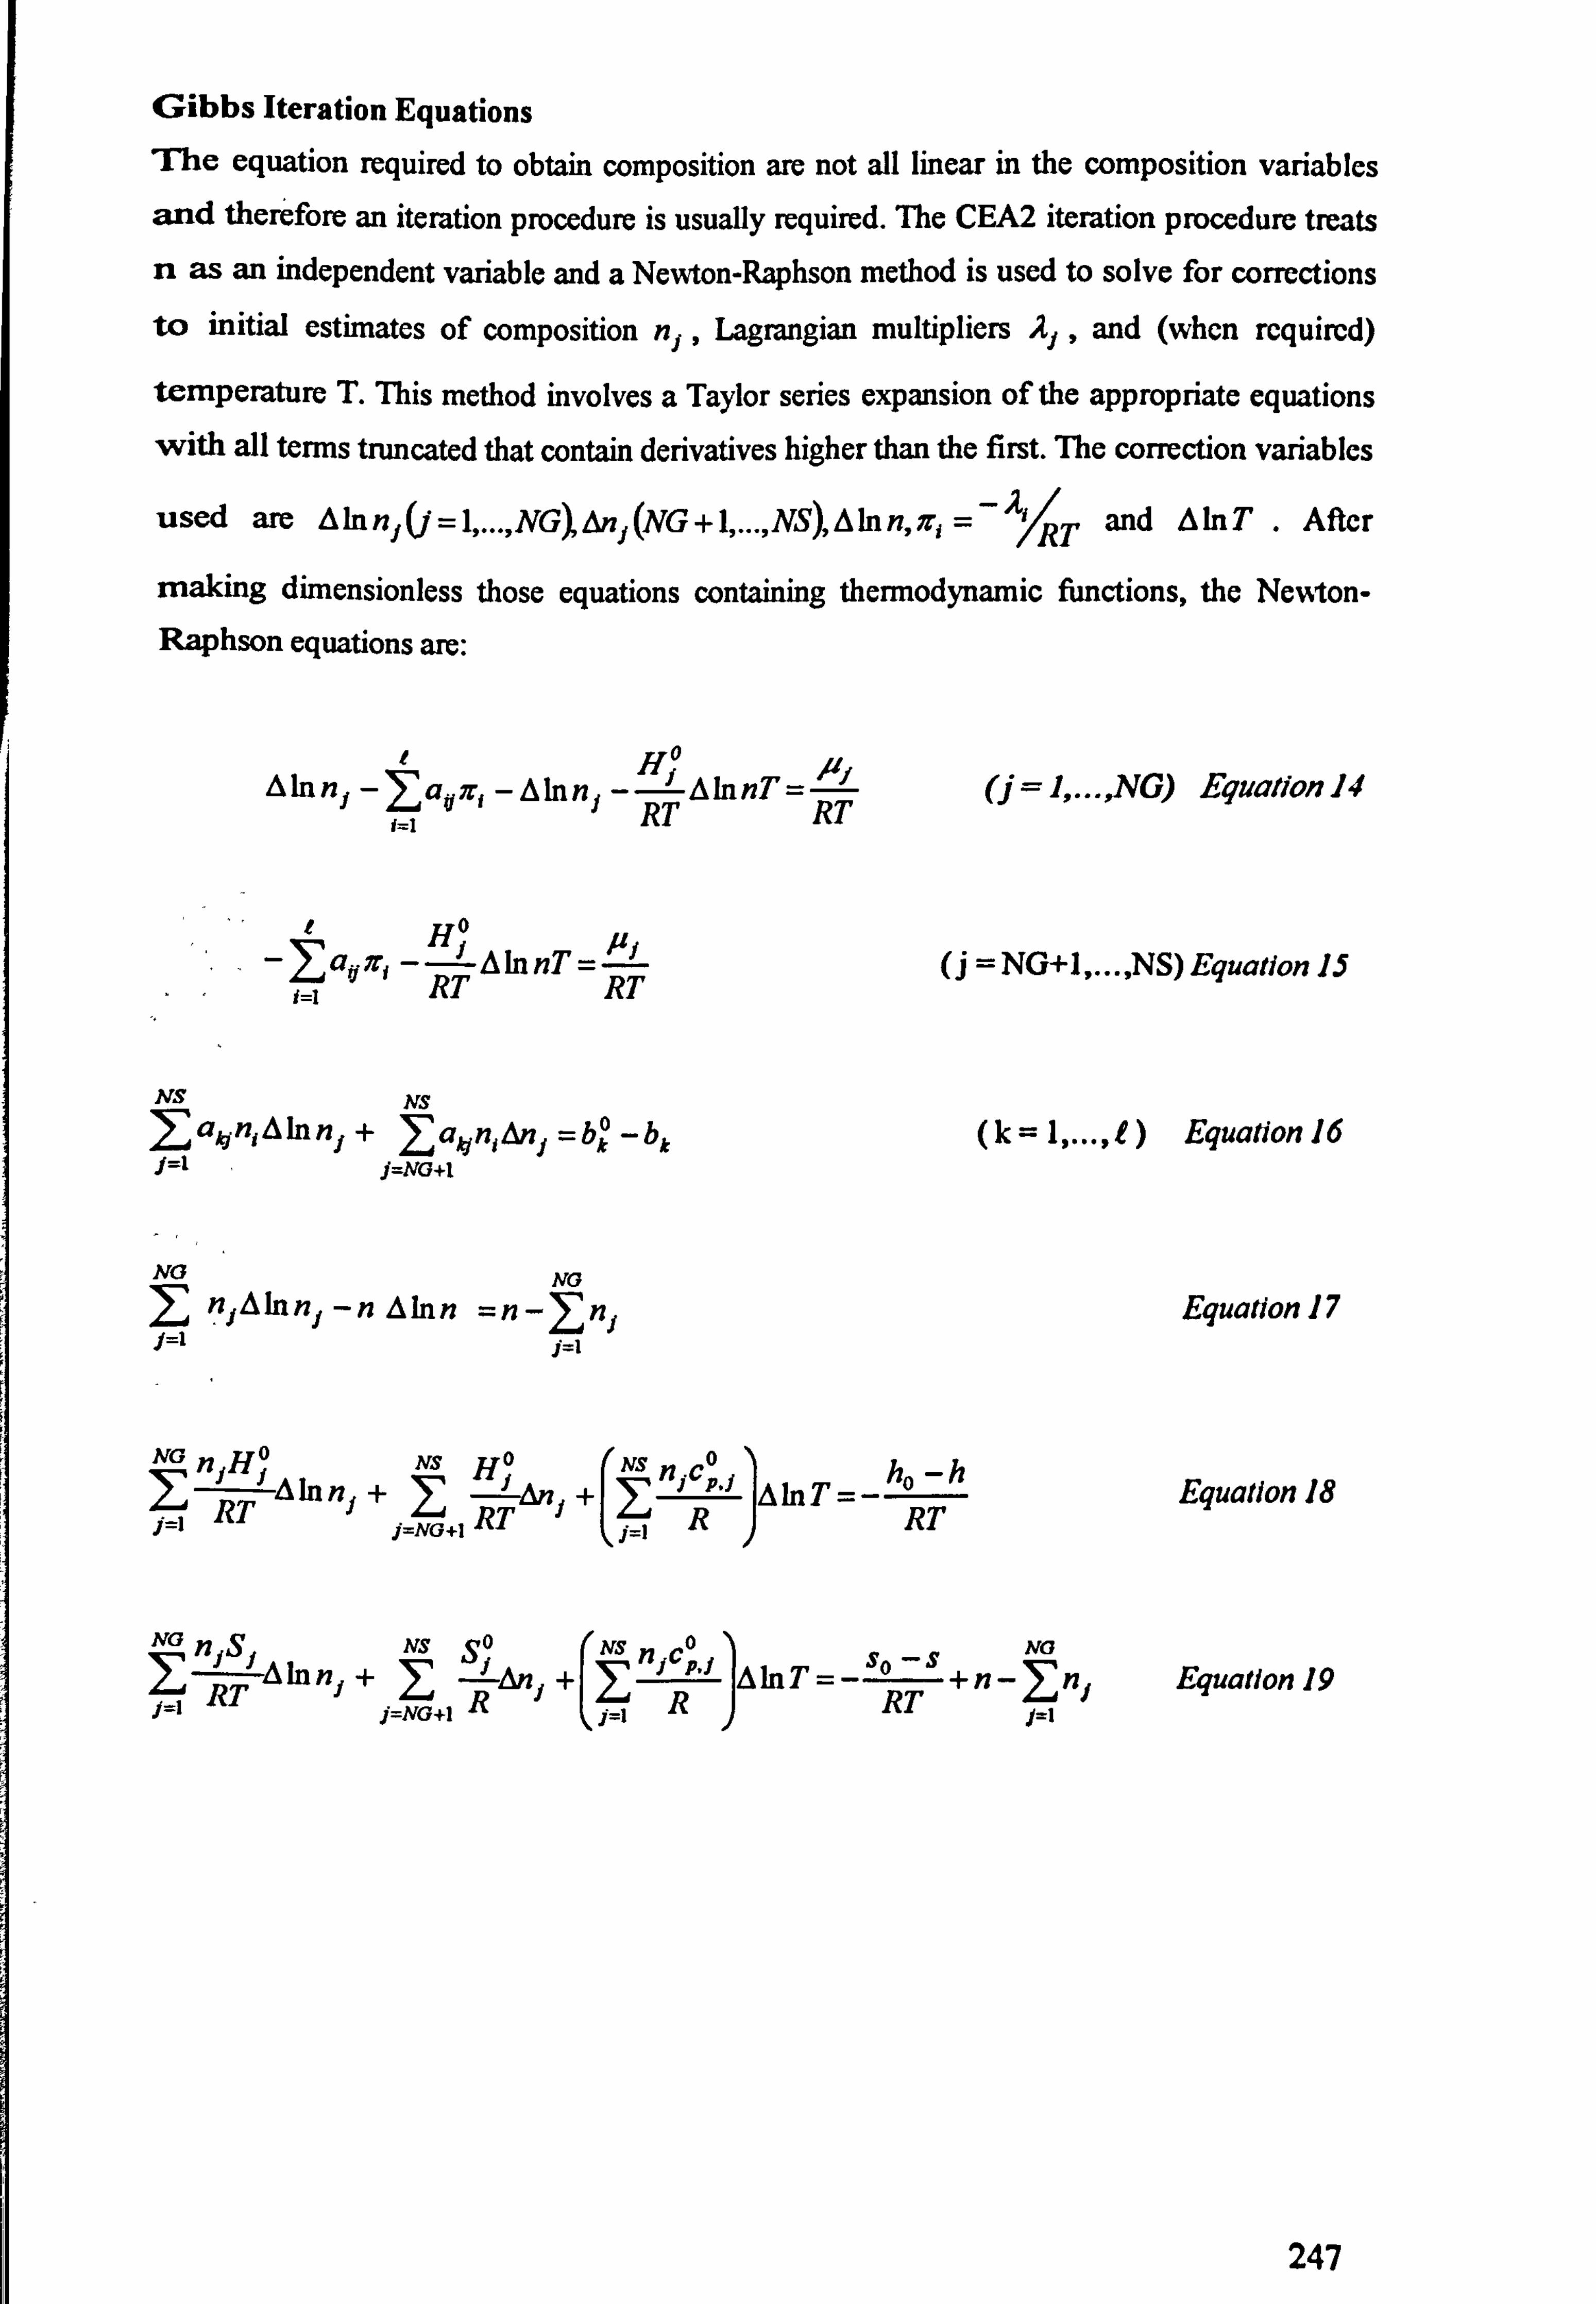
Gibbs Iteration Equations
The equation required to obtain composition are not all linear in the composition variables and therefore an iteration procedure is usually required. The CEA2 iteration procedure treats
n as an independent variable and a Newton-Raphson method is used to solve for corrections to initial estimates of composition nf, Lagrangian multipliers 2j , and (when required)
temperature T. This method involves a Taylor series expansion of the appropriate equations with all terms truncated that contain derivatives higher than the first. The correction variables
used are A In n, (j =1,..., NGIAnj (NG + 1,..., NS), A In n, nj = -A 1 RT and A In T. After
making dimensionless those equations containing thermodynamic functions, the Newton- Raphson equations are:
1o t In n1- E atl2r, -i In of -
Rt AIn nT = RT 1=I
A 1n nT =ý r_I RT RT
NS NS I: a,. n, MInn j+I: a, 1n, Mn1 =bk -bk J=1 f=NG+l
Nß NO
n1Alnnj -n Alen =n-ýnf >=1 ; =1
(j =1,..., NG) Equation 14
(j = NG+1,..., NS) Equation 15
(k =1,..., 1) Equation 16
rva nRT Ho NS O In ni +
Hi cp. i O In T ho -h
0 RT
; =NG+IRT i=l R RT
NG nS NS 0 NS 0 NO Inni+
-iQnj+ 2nicp. i O1nT=-SO-s+n-l: n, RT RT >_ý i=NG+1 R i=l R J_l
Equation 17
Equation 18
Equation 19
247
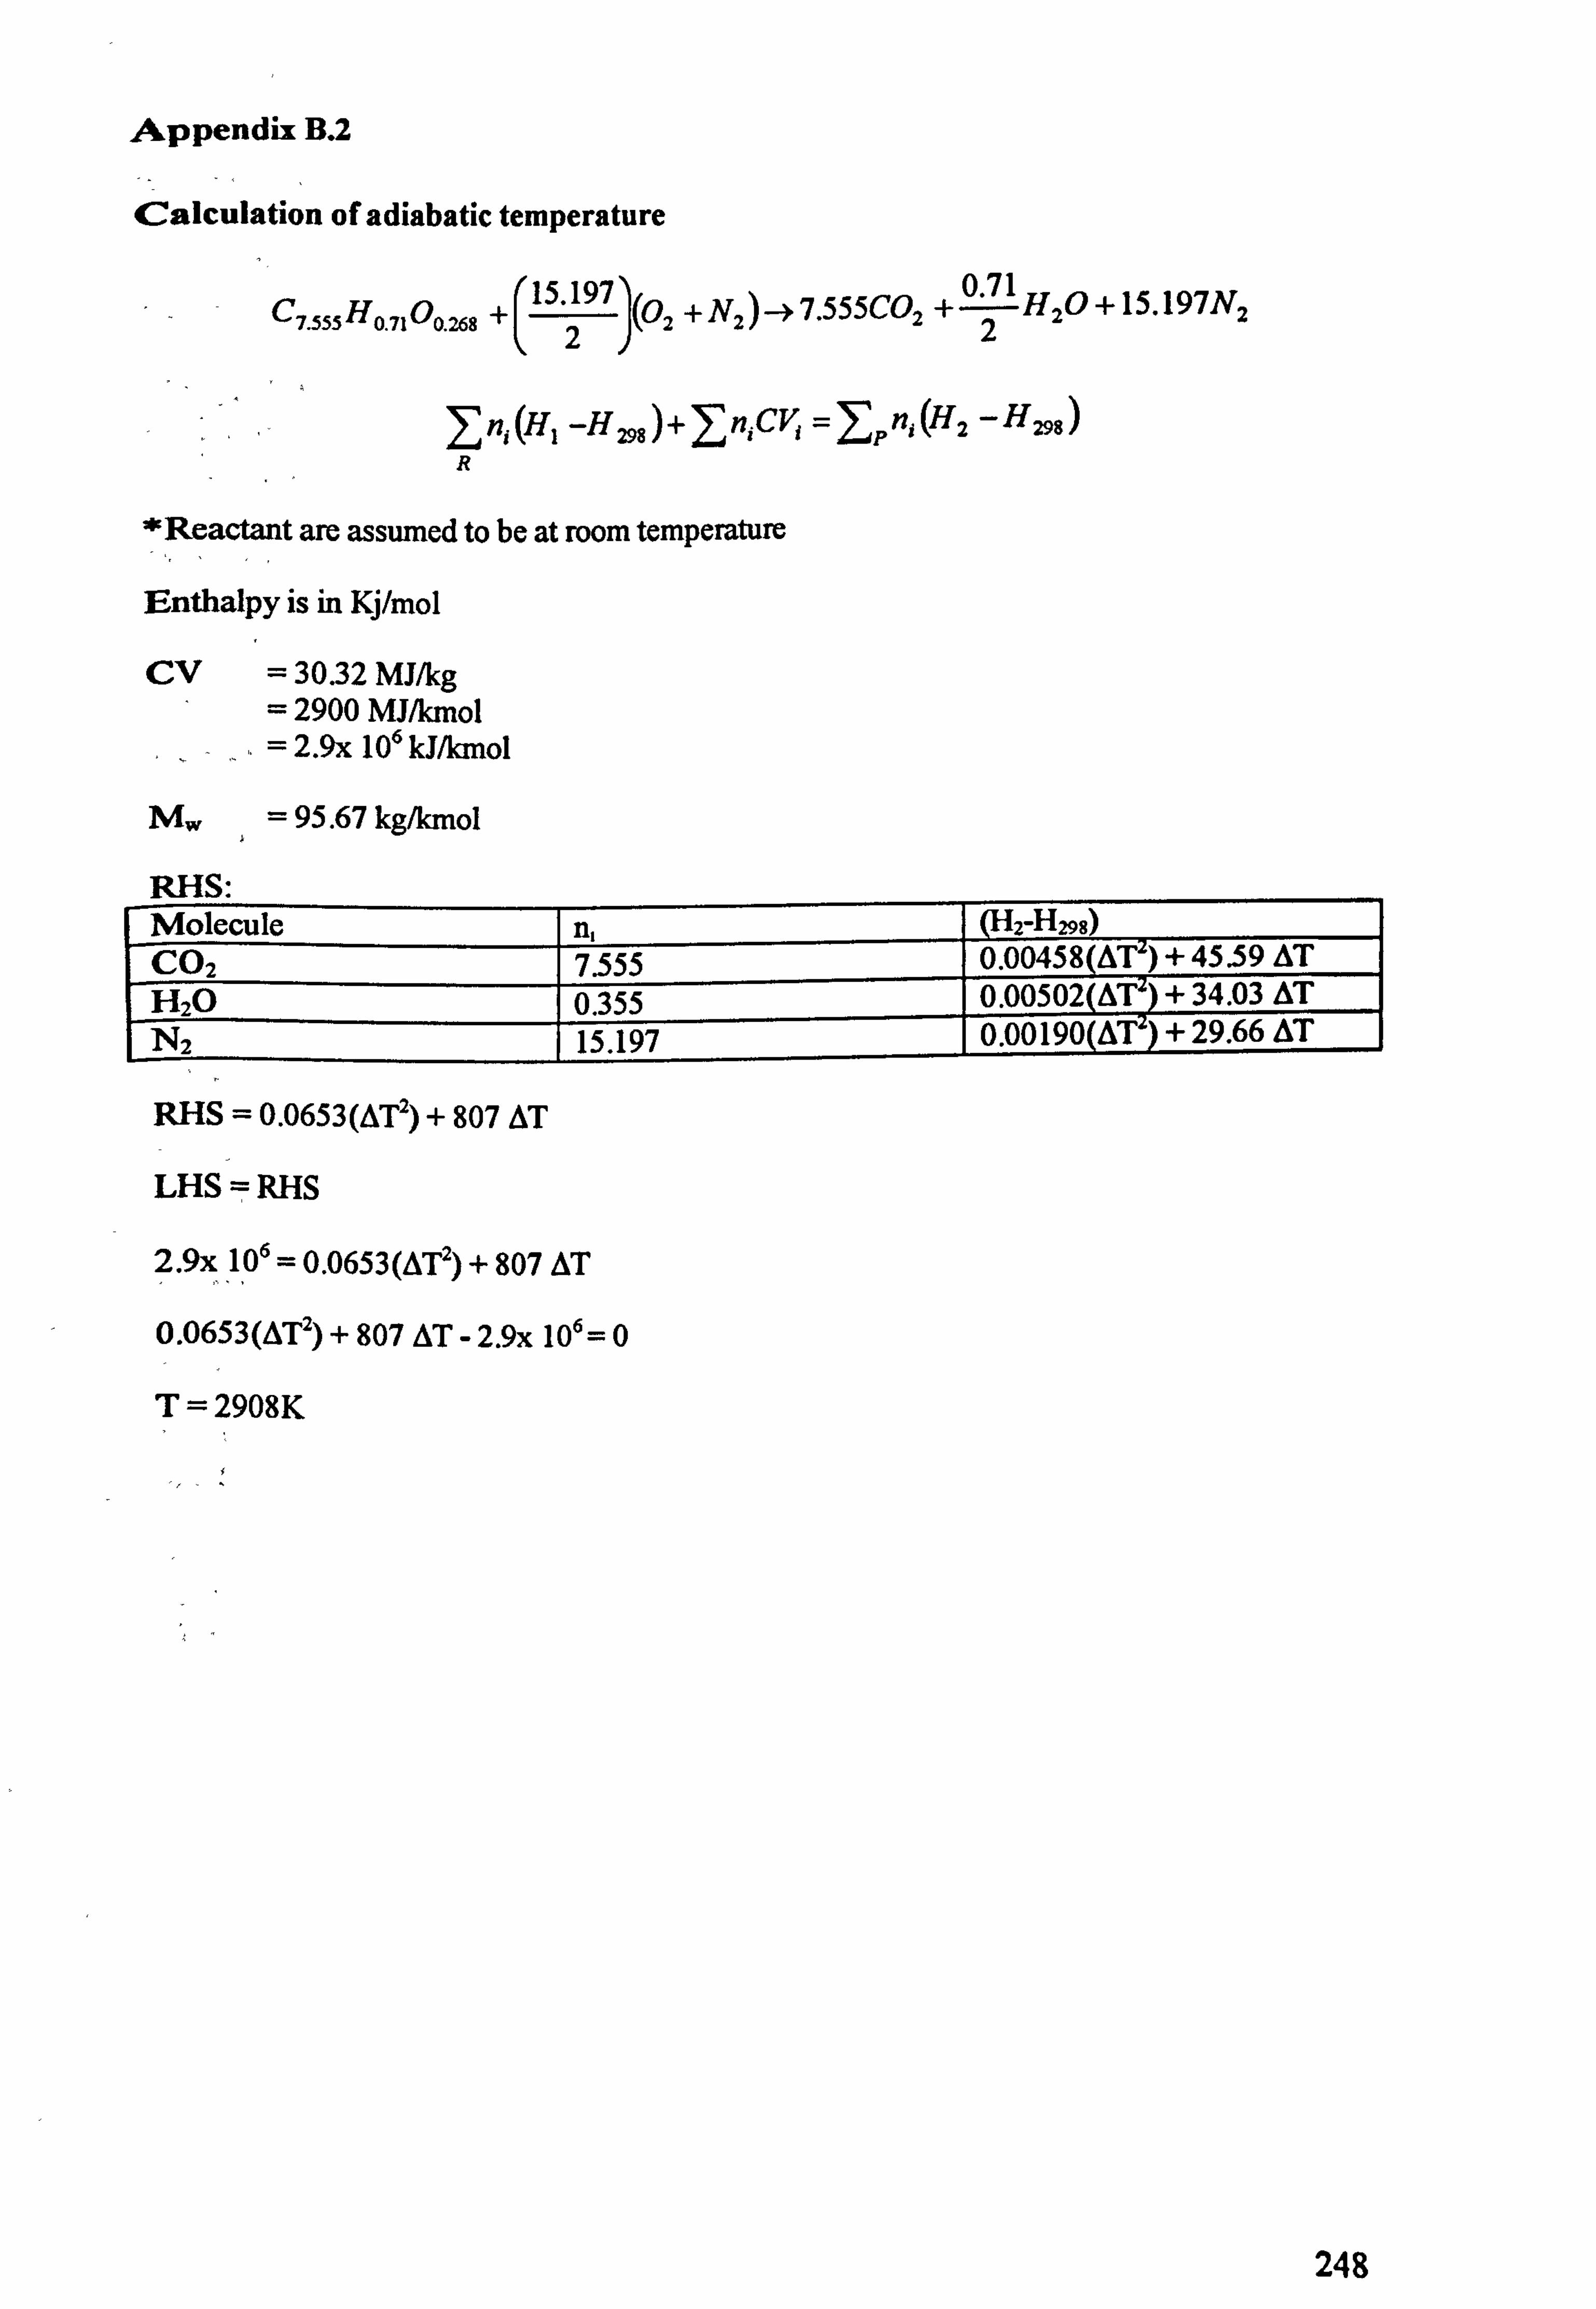
Appendix B. 2
Calculation of adiabatic temperature
C7 sssHo nOones (15.197
+J(02 +Nz)-ý7.555C02 +021H2O+15.197NZ
n, (HI -H298) +Zn; CY =J: Pn, (H2 -H298)
R
*Reactant are assumed to be at room temperature
Enthalpy is in Kj/mol
CV = 30.32 MJ/kg = 2900 MJ/kmol = 2.9x 10⁶ kJ/kmol
Mw = 95.67 kg/kmol
uuc" Molecule n, 2-H298) CO2 7.555 0.00458(A )+ 45.59 AT H2O 0.355 0.00502(AV) + 34.03 AT N2 15.197 0.00190(AV) + 29.66 AT
RHS = 0.0653(AT2) + 807 AT
LHS = RHS
2.9x 106 = 0.0653(AT2) + 807 AT
0.0653(OT2) + 807 AT - 2.9x 106= 0
T= 2908K
248
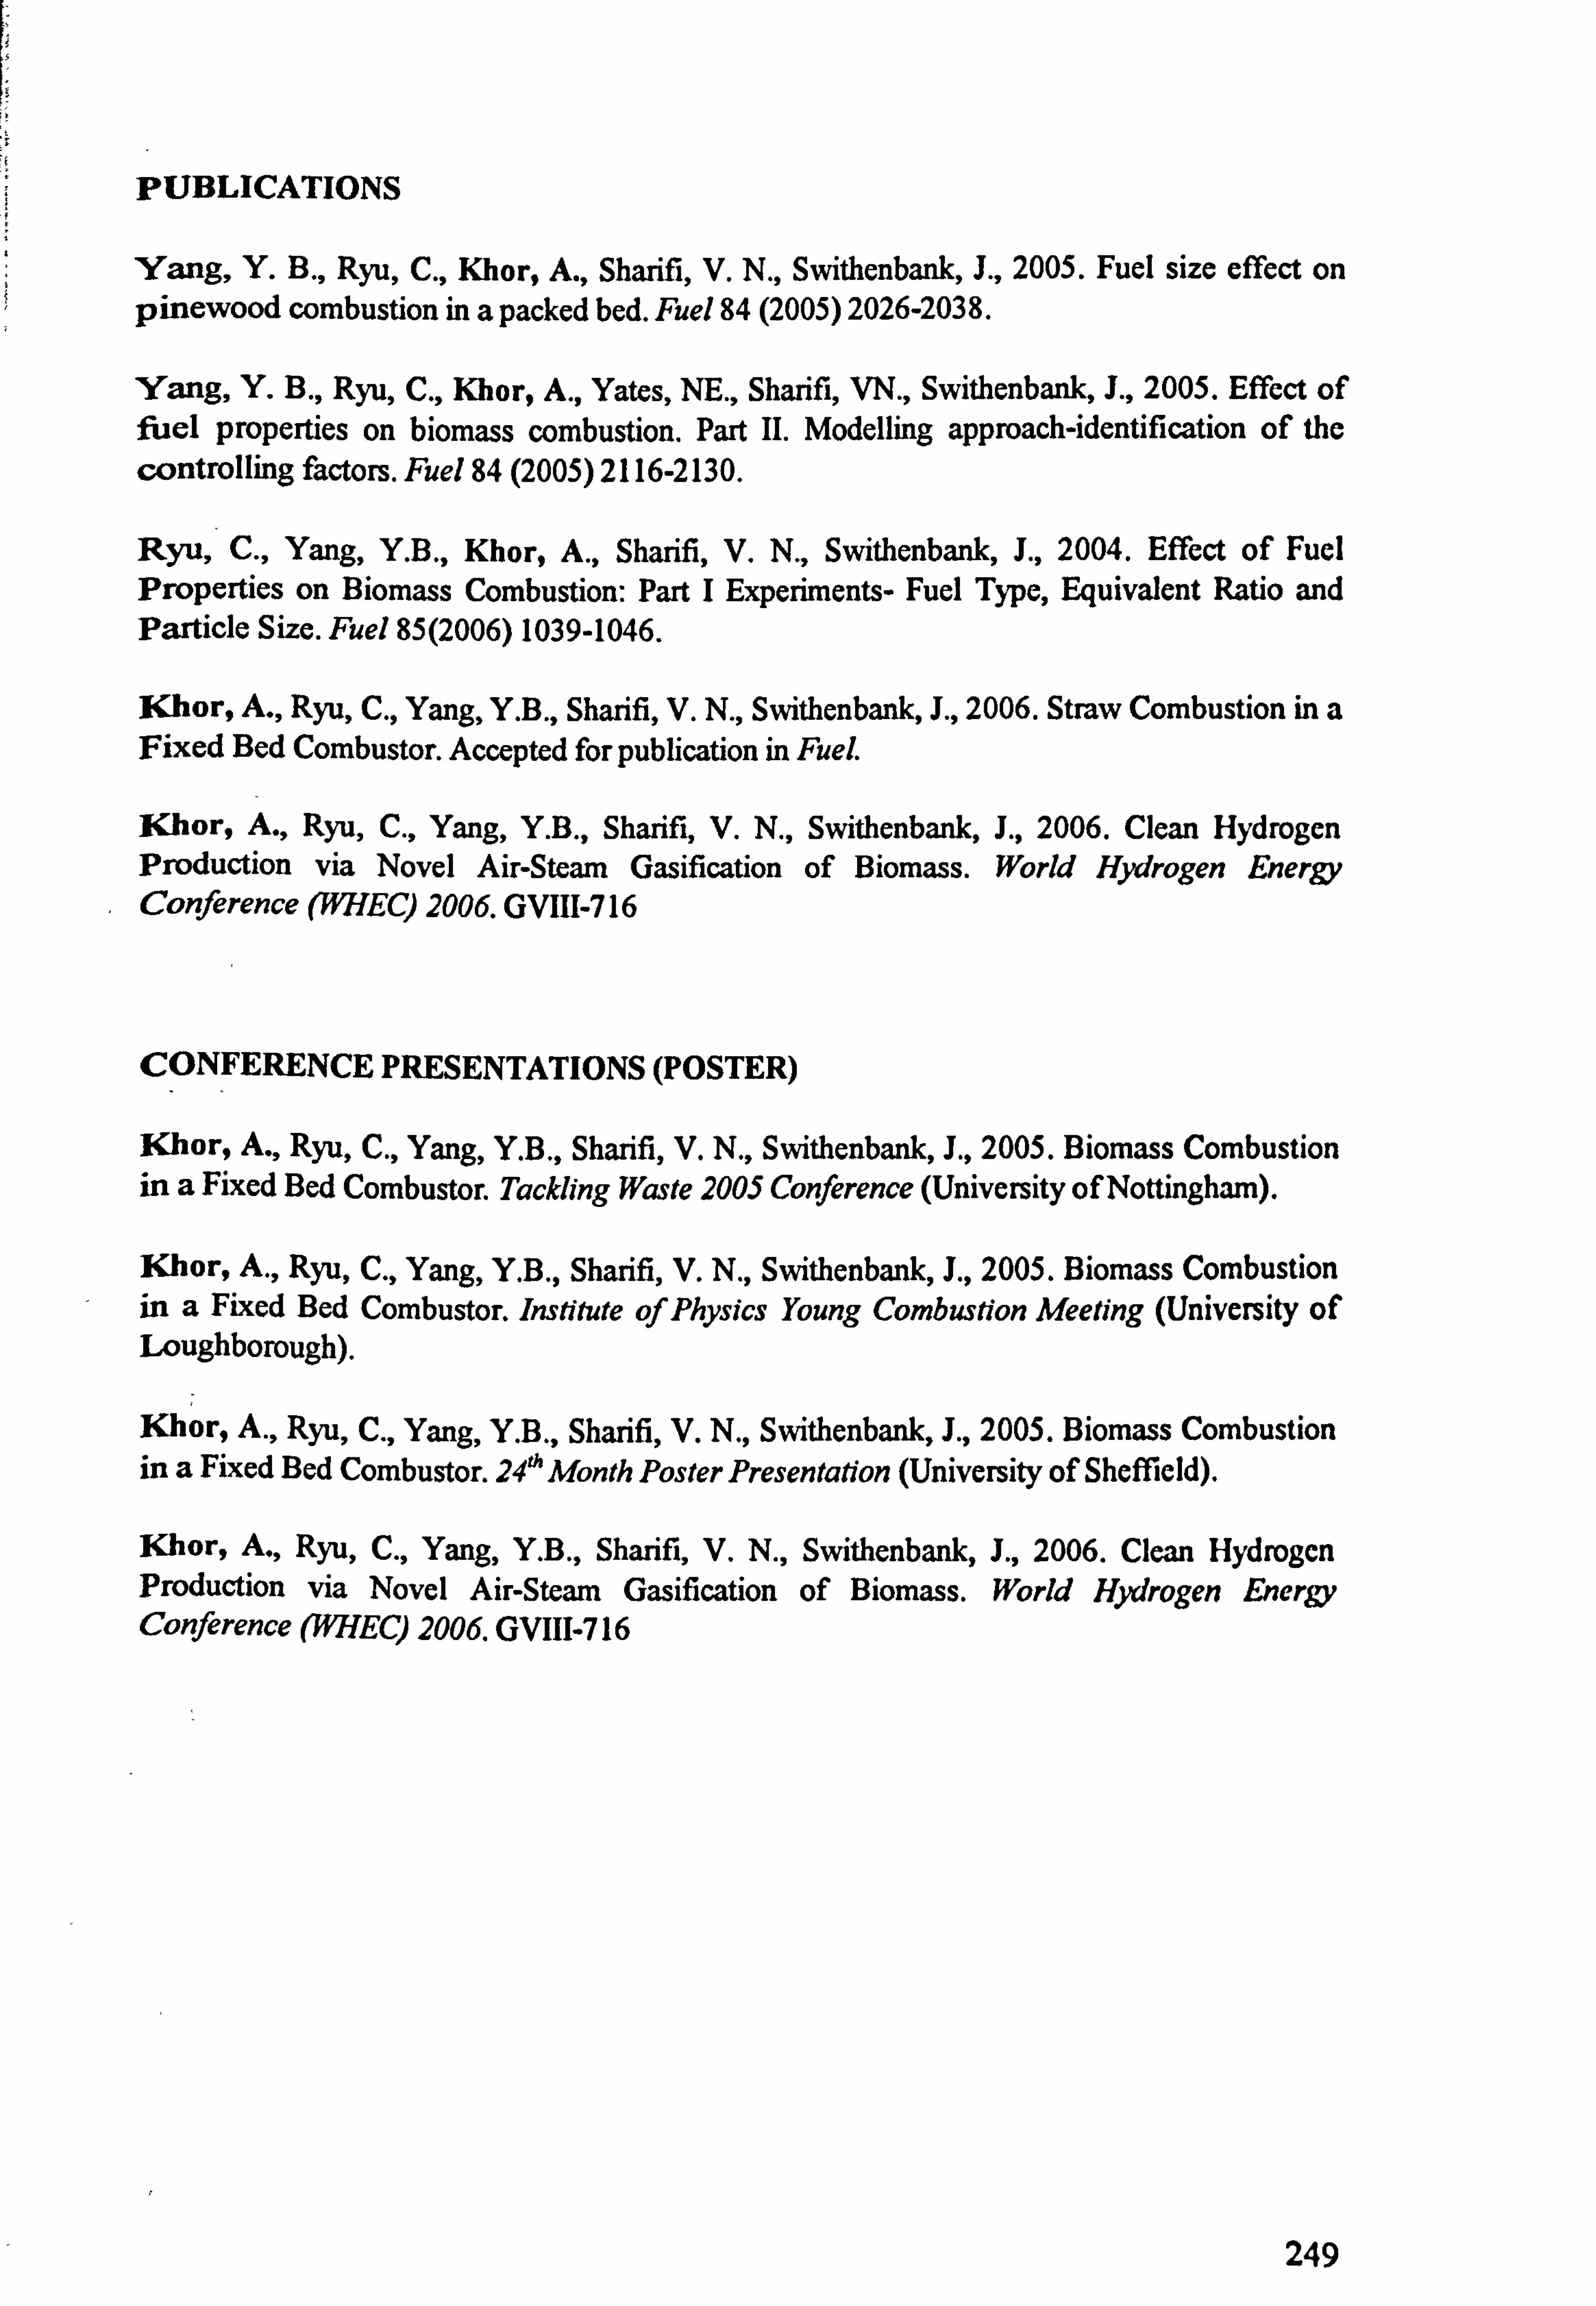
PUBLICATIONS
Yang, Y. B., Ryu, C., Khor, A., Sharifi, V. N., Swithenbank, J., 2005. Fuel size effect on pinewood combustion in a packed bed. Fuel 84 (2005) 2026-2038.
Yang, Y. B., Ryu, C., Khor, A., Yates, NE., Sharifi, VN., Swithenbank, J., 2005. Effect of fuel properties on biomass combustion. Part II. Modelling approach-identification of the controlling factors. Fuel 84 (2005) 2116-2130.
Ryu, C., Yang, Y. B., Khor, A., Sharifi, V. N., Swithenbank, J., 2004. Effect of Fuel Properties on Biomass Combustion: Part I Experiments- Fuel Type, Equivalent Ratio and Particle Size. Fuel 85(2006) 1039-1046.
Khor, A., Ryu, C., Yang, Y. B., Sharifi, V. N., Swithenbank, J., 2006. Straw Combustion in a Fixed Bed Combustor. Accepted for publication in Fuel.
Khor, A., Ryu, C., Yang, Y. B., Sharifi, V. N., Swithenbank, J., 2006. Clean Hydrogen Production via Novel Air-Steam Gasification of Biomass. World Hydrogen Energy Conference (WHEC) 2006. GVIII-716
CONFERENCE PRESENTATIONS (POSTER)
IKhor, A., Ryu, C., Yang, Y. B., Sharifi, V. N., Swithenbank, J., 2005. Biomass Combustion in a Fixed Bed Combustor. Tackling Waste 2005 Conference (University of Nottingham).
Khor, A., Ryu, C., Yang, Y. B., Sharifi, V. N., Swithenbank, J., 2005. Biomass Combustion in a Fixed Bed Combustor. Institute of Physics Young Combustion Meeting (University of Loughborough).
Khor, A., Ryu, C., Yang, Y. B., Sharifi, V. N., Swithenbank, J., 2005. Biomass Combustion in a Fixed Bed Combustor. 24'4 Month Poster Presentation (University of Sheffield).
Khor, A., Ryu, C., Yang, Y. B., Sharifi, V. N., Swithenbank, J., 2006. Clean Hydrogen Production via Novel Air-Steam Gasification of Biomass. World Hydrogen Energy Conference (WHECJ 2006. GVIII-716
249

A; :uý td
r lE E oE ýE Eas
>zE aä, ýýeý u ýu Jy'"ý i
YiEEýEý ýä 3E ý't Xm ää' . =D
? 'ä55 a77ä .ü .a>
jý ä" adý ,ý 'ý vC7 .r ýu E
"= üý Sz_ýý ýr ýÄ Teop
ýiý E 2ö % pdbdä.
53' $ceupý`ýeSýýýý >>3>>>EöxoG.,
ý 04
'cý dMýA "ÄýýIA-V5.. ä
ugaw3u5E" u> a38 ;ä$ ß$ E3ää?.
Av öEC? u7 f5 ä. a ä
oR Ä? n3
E2E
'E au $äää2 EU 2 Ei ýg
.JtuE a
hýyý vii' ham .. l.. wF F. Rýi? ji. ý
D+x äýw°"b s DG. ý"ý. <"<. i.
ý
E :mD. EE22Ea '3_
ag wu
I -E
re ä
R sr o> a Tai W
iE cý zý ý
''. ý E
JhLI
0,9- rý
"ý
IREyA!. UZÄ.
MCA`, ý
G
Itlulil
*, auE w oma3.4, t. g"
g OG
5
00 1j9U JJ
rýiý 7ýDLý 'ü
ýA.., J
miý ä aE ý äuaý ü3mýý iýý7 E E. 9
K
E _ey>qe ý7
' ý) dig Vý Qý Q~ Q "tl VQ ºý
ýiY ýi "C elf "i! . 1ý' i[ "Y
ý Cr Vý W 0'i vJ
u ,ýmm "a Ö i3 yn ä "C 33ne
.ý F+ $E "m
Y. ä 01 e "ý
`X'B' geERR
"ý 2 ", gu l8
8.9 C 25 ", ý
Est Leüý°
aqQ w T"- 9 Eý ý °cý' dü ý8EryN", -
1
"0-91'. ý
5
G ru
Ti
ýNýýýFý !0
Npý
±Lýs n,
w3ýyuý,
0zNa
E" e°$A t$ M. 2 Id ää
1III a3ý
1! 1 w'
51
¬g-8 1.41 99ä 1 m,
QE 9
°J `3
,ýo. a. :3 F11 lid]
IIIIIUI E$LS Yl ý+ FýyS ySäeq iii tE ýL
E 3Y° E
äL. c . ES , ýt ä5.11 ,
23`=8m2°1414 a BP llJffluillftUIflifl "ý'-`3uý
ameoog
ý4 ýa 8' Sü ý9u a-j >. 0>3
fljj4 g
"ä 9. L
-1 cd 5y6ý EULE b5
15 ; 9' w
1
13 Smy p ao
"ý jLi S"
ý Ee äE9ýE2 y'ý
. 3, ýEý=
1$ 9
dO- º+ pý'J' "'' $° ä$ O°p
EE tl äE"p'"ýmp
tot oýi
¢ "ý
1
0
-Vä '2 ý "e p
ý6 öýöüo$ýe
04
all
IPIiuI Vail
.. +üE vgi
`ý il 'ý"d w
.7 Yj
G« Sit g Sj
e gyý
c0 5E a
ll! IITI_
Ö g2gCu °< .S°ua$
"E "°yý
m= 'ý o .2~ý.
g
it; i
13 1 AE CA
im
ýe
e0 T "5 .GÖY0i wa LJi11$ä1. L iI al 81
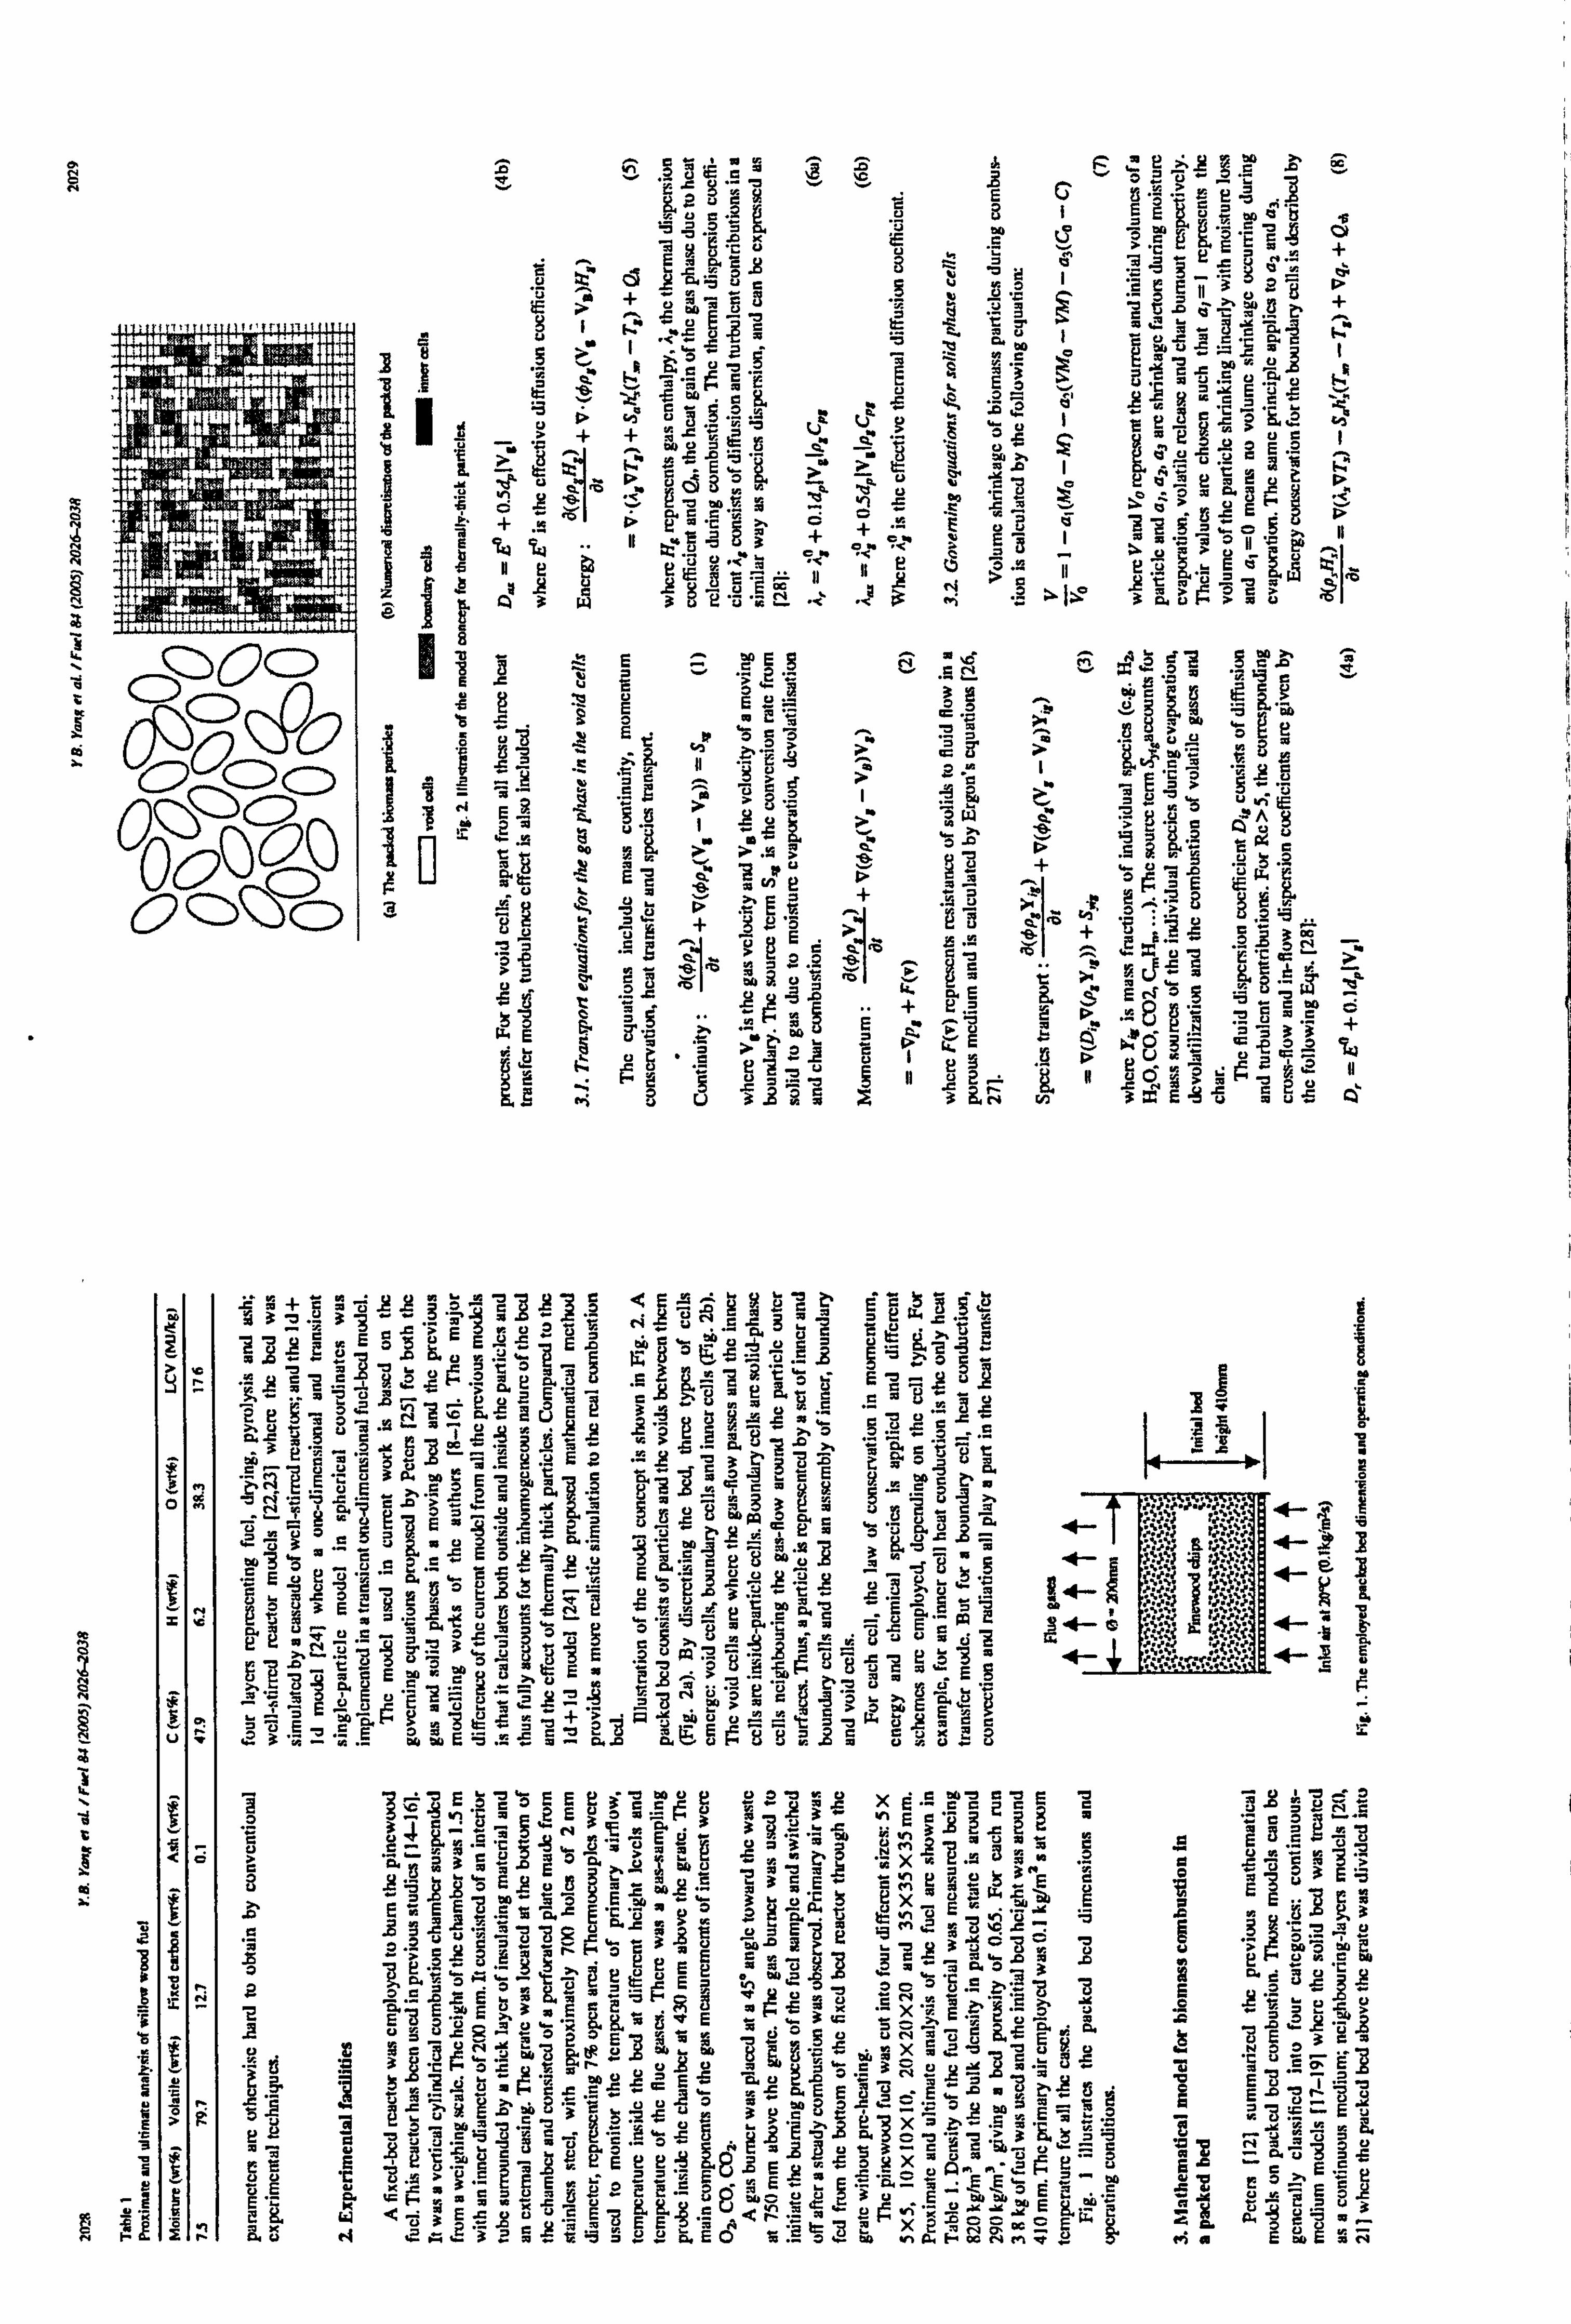
v v "E ö ,2i
a p0 '° Ü 1
u e$ E ý. Yt E
A u ý"
ü 'ý
dwe
wü 9 "ý v
ý ö I
3ý @= o
' E
' D - O 28 e3
3 h,
ß
"@ 9" ý.
ý ze `"
\ ?7
S 3.5 VV ý
3 m
` n ' CM
r 6 « C
a tl I E i5... ß. C=
C
"E >
> 2ý
+ +
ý"
är V
e ßa7'
4 2
c ,9 ä
1,2 . uv °r
i
x D
i i u v
C
' I s dää Z
'
uYe Oý tý ° ý c `ý E 4 D
P" K II r "vrý
xc + .2 I
'ý 9 i ýý ä° .p
D II
Eý W `(ý .. I I ü3 ein ? Z. E S
< 3üeü
ýi >>ý 3äv>s' p, S
A3 W "
ö rý L v
E E8 .ý2.
& mN .5
v 3 ßw ýý $öä
., a "p ý'3 G
v
o E
y 8' ,=3 -
' = m A4u.
a
a
R t C & '1;
II Cg i
I a
,mt f9
^ ', _ ýj > > e C3Ü
2 w u". u Sý It 1 W c 'e
'J .n `- Ou
. '3 d om, ý? i3 Z
r "F "aü
'_' C ý ea4 v ý 1 ýo v ia C i+ Yap ' ea y EYS
7 C c
t ýt O 2 `ý ýa ý` °E
'
S E`s° ß
. 48 1-m :2U .2 10 u cý
r u äý
E
v I
y
D U u ý , I`
7
._ II s ý ß e ö ý ý
r 2u U
S' ýi u c
U 333 x 3 r r vý sc
3t r= `ý umu Ö
4
Ö H
N_
Z
iý I i
B
.Q `s E E "c 3 5
H
Z m+ 2ä8 .8 .8-y. ,
m$ý eP '" Ea :n942G. E c, 99 fd-
E id 3"ß. r3 L' E ýSYo 6'rr '! u11rä G cuW . ýc p
e$ P°äe An üeCE -ý y pc TVavp
"rfI y `Ö
ýW Gý,
L yýi L ýI C !3
'ý -A "ý^J "ý ü
. ý. '7
LCF ýo"
eg3ý'ýä"'^ýýý`.. 'ý`e_'ý EE
=ýs'eýU3Z'3üD zÄ°ýý'$, ß'i6. c
Euü3 P°. memCe3ao "ý .. eE ep ö
EeoEe äu A3ävc `J -ecZ mý ýN
"- 'gis Eeý> "« ýA? °. ý_$ý ý'
.; AS! `ý
gý Y iý K tý aE 'a F$ 'bp pq o n, ýS }"+ +"ý" 'f. ý ;E E S, ý e2E:.
i Z` .:
s' s "ü p, L ý" fý
}ti: {: tr{? S. 8
Üzý 't m, ý S 54 '? ý. 7 9 f"fN ütJ. J. f ý
-ý c `'ýý
EueäEt äC .ýEý.;
Lm . ZUS ay ý0 f- gg. "'''5551ýýý p`. { E.
GTL7ÄCLyVd .j 'C
Y`JÜÄ .ýJ. fýS R""ý. "".
1 W
ib5? o `r v J, tmäE ýC 5 r, }y} rr. r'S a 3Eo. 3ý uGmeao. e "" p
Egoe `z G' 7°
A7 (ý öYÄ °" ., A pLEc ßý 2 . f_ 6' 'ti{ ys
6r'tiy){ 4- 6` aH'i Am7;
U 'fC'ý,
" JUpAE ý7 f L. 4 S". t. \ r
vEeEäc "ý AämE u" p> >e k" c' xn
w3''R= 'w .ämE5. m-osLE u Ic dAu". u A`
u
"ý! ' rczE2E2äcez' 3sß,
vXi E° ec°cEm Y`
c
CüeE ö. .. L..
'm o r. Aä3
V"' N 3en
°` E33 "` .mm vi 3sT$e
v^A>AsvyN ýn ' `Aý cEü .ý
cýjm3äzsE 0ciým ýz7äý mXn öLÜ ? Aý''^> E. 8 a i$ ä ý2 A
UV ä ji! nE Em3 ý' aE L^" A
-j -8 5, R
is
u1'"- ^ s6 ?u
.8iie0aA ýF 0cm °°s a4 73.0vu m% m r: 28oe.
°4öüA. ._°E°*
mfý ... 3 _o c-0Ei,..
= "a 'a
E E. d$ EypE t EEm'eE ý+E3c 'X
E 9t. 2 äö>; > Etc oöA.. R K. 8i z 5o.. c. ; ". A"3 .gu ýp
s "- AoEaEä r-0 A ci uucAüü&eE c' 1 iii 3 `j
ä3CNmÜ ý' V� mr OD "«^ XÄ
4ý. ýj 7 t! Cl VN 'J ". %
. ý3 ýi+ "ýcc s ýi YAruu "L' uA St e3No
.YaÄ .A$y "ä "e5E
°ý" rä"ä°TFcLt$«cE
r' °' F
ö" EE rý ' "`2 0y "OQ
-7äm 7Lý.. Om^U ,1 6s -E, it
9y -b
aL1 2vu; c
ýi `s vEC
s ý0 kKrE
eYuüc ij 'ii m ..: e "E ýrýi y "ý 13 a ^_ 'ý ü. ä ýi ` c. ü "¬ 78
L F. epKBEe8 '8 äQ =A
.ý«53_. züä g' v u` -0
üE 'ü ýU .. a >cA_ "v E `j sE ýd m EE .e _x o Gý ". " ° ý"ý .m6LE«e
.csm 'c pvE . c- °t °QäEu a- AEEE2ce g' vE
.2 ý.
WC3 Es v ü2 E S"ö. `,
ý'yQr"r. '- of"'^ xscc. 'ec ý. p»
ýE+ ', M$
A3 Ez E= ci ti ..? ý: ..
E. 3z fAe '3 äEO `A .= to, äq vxiä F+m Nßä 3' mwE äý äN
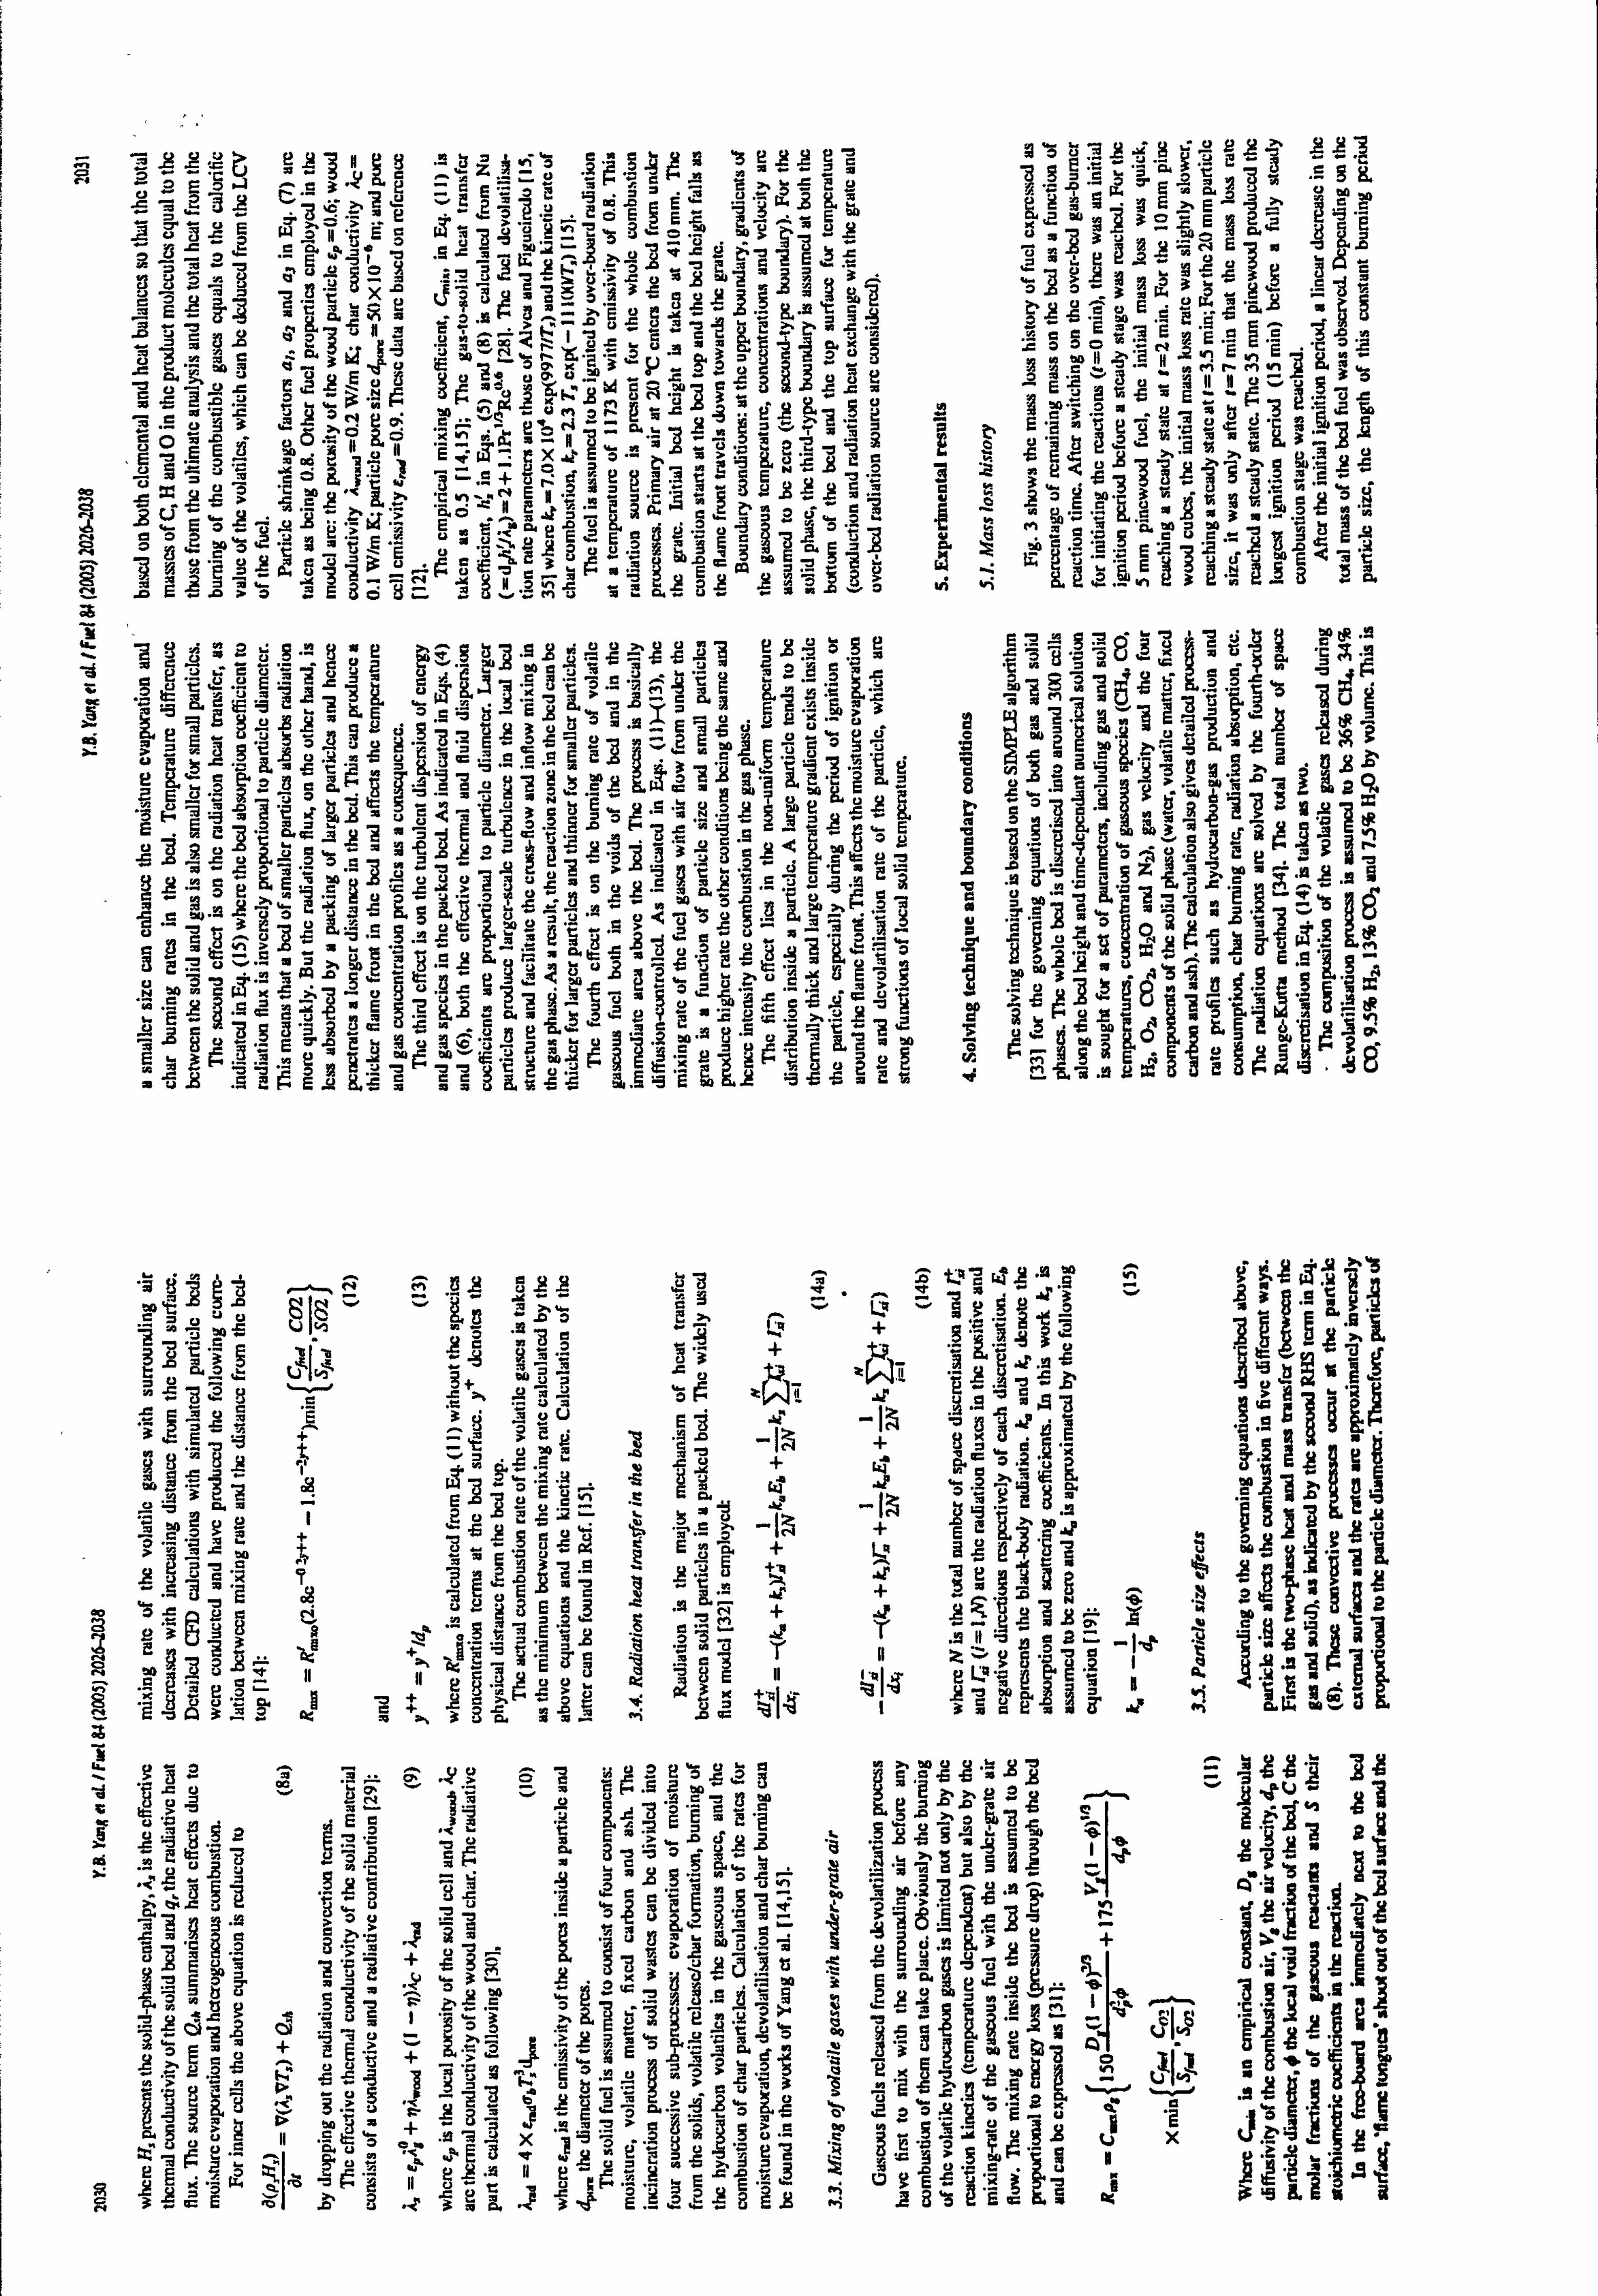
a
r
a s h s
z
y
?Ä 'B; 4 ;äg 0- R .8a8
'2; AC
UhIEJUdI C3 :ý'ý 33 ýi. aý ä ý"ý E
ý. E A.
_r mc
v ý_ý E µýý p t'-
Ec f+3änýo^ý üa
ýc yS 1S 3"R? Ew7S. s rý Ä7eE
w°'ý° . 9s m^+ý` ý, ýv7.. äö Ee. nA EU' Cu
{J Lý
vyýll VwJ tl"ý Gj7 Jý =-- ?
14, .,
>. G Vay "ý A="ý
y. i "ýt,
1 y '. . L+ 3
Fj a
G ., u= GtXe ts
p9^ ">
3LLuL "ý 7
.O^3Ä ýL
Üw4.. r
: _° E 23S aC ä^Jj
m . ýgJf $Eusp ä3jß eäEe «G '6 ý+ a
tltiE üN ay E`"Voý"'F. I ät=5- e E. i'->`ý'. es"a °°
E5; R E "E a°' üaC C4 . "f Ju-. `n it
"` ` u'a aC .COmOT: l NiniE 'K
q "«
vurL2EuSuä °d °° °-me5 11
«räE s2 y3u II Mu30
ä ;o ci oE .a ý� X l"" jj u tý "5 r; ýe u. näaEF. `"
-S 'St L mar G ao Ben Oýý3rýs 0'3 ýw
.5 mý a'öo äu3aöc e_ ý ri Cl. Eo«=° E'E mi0mäur
O4 "° uÖ"&°X ct aR -8 - "m a? «=2 9ý 2` u. 1X ämm33"0
E 'ý
EE6 '° ro NvN 'E - f+3 X ,FEö -4 t^ a° 'a jL"? TZ%A
.2 -S ao IL .ýa. c .}dE? «°Ea",. 3 :gAE '$
1t 'S ac
ýi el yý cm"< c,,, sNEgg= 3«9. «9 $ 'g 3t, ýää'yý'Puä`ltý > . 5i (j . ýE L.. "ý äöpä4-«24 do.. ö
, fi '� E
ö. w3w3a ._? w 'w öc L' .L "� v,
"< °' Lý E, E°äue° 'ý Cr 'ý' a "« °' eü0
.4 .81u1äev°. '. 3°Ä
eää E Ej ý+ dE ^a ä
E .'au 3' 'ý
^ g". +Ev w7 `ý E SE ý'L Eý Lß'ä $ 'S
sEE ýö 80 N. «n vmää= vý of w. r3°
"ý E :3
_ß` ?p -0 e$cm
ýc !3 li äS 11: 1 J! Sý m C: v 4ý üp9uuu Lý
.ý7swfäa1wüy "c . "N .19 AraV -M ü. äe .OG%
'ý
.3t 'ý 'ý 9
"a zOg
°j msý t "ý p- CV°d1, yý
7
yi vwE "_ L aý G "X_ C "j G "a P1 C "ý !0 'J 'ýyý ýti
.ý .t7 `79 ý
wE5ýS^E3 al "v iii V t3 V "q 63 E
E S'
_9 Ed
40 "-u ü-3 g9xE "' uEXFu... .dö eau püm .ý
-19 -4
3
E"5uu 'i .. ä8Znm°oaE "9 yý va
3E E ýi
Eusö 'L" .? aooPe¬u° .'äL3äis u yýý's. ý$a£" X, ý3 ý.... _
ýý q3 °i. 9 rýý'3""ýS d vý o°ýý'" ýY1 3r° ü ýä v el 0V .30ý
13 ý "a i5 8cEcý-_ý9s 5ý E=. aE°äowca5mmE8 .9
5- ý+ yý böB
3 '+ ,08mvzE "5 'm .« °g° 'ý9 aÄ $_ 5ä
E "C ac ,3 "$ m¬ac 'iý L
. 1iIt ä dq iý 3
ý' 6'a 3ä d$ fn E "> ]d 5ý ' 2S y
eäa3 0ä°äzre. 9
7r3 E"ý u ._ q° u it 3 c>` um 'ä ä sý O `ý tav tip
. -s H m äR1ä Zeeg6u. 9 2-
öü D° .aE B§ Irm3 1ý mu ys uE
mm ( Kr_ u uuL' Sý üaQ 2eýC°° °J ? -6 "ý 'E CGLJgje3 L
, 4>" u=. LL5 "L .
C_ A. «? 0p 9L
a"E pý
.89a4
mo5 e eeü$ ýEýEýoäý 35soäPý .fý. ^ö7ýiE'57ý
auEA! H. 6ama
"ä ý ý+ ý. Zi .ý
°u ýýý '$ v
't'A ä klý ý "'A Sv ýi
trý
. 5X
+° +
Q'A 7isijutýä CcN
16 3+ .2J. 5 P H
p 32 E_ +3C '> `ý' S
Eý Aý ay$ ý7
wa s+ fi_? aý5su -r ÄE -Icý + ýLý 'Pý ü I'm
ý+ u
.S7 "'E oý wE
A° "ýF' + 'S mäa
, `^I 'ý
Yp 7
E 21 -M A? ý'3ý
_ýý , fie "= ý ßüä
Eýý °ýý ai Y
ýý ýýö. ýu°ý
yý 'C
'ý' ý fl pö7ä^ I'd 'iý '" 'ý aý
ý 8 'ýS 3®+ý r' 2 'O ý iv j
Lu' °I+ II g ýe eAAO
E 3'ý p4 18
.
S ý'A ta z$.
33ä9 's z
ýý"i ' c' t'ial 3ö
Lam' m si lý' "ý' h
o. l. m ...
Ä 72" "Y> Q VIUýeý ß°F4:. 8 -0 "}i .CUvy 'A . ice C7>.
- ,y
"O U
au u .ý
k1 ° '. uäE du u_ I '% 6'
?ý cp Sy wC S u. , ý,
m. Sý `ýi. A ra Cý43d
y
p 'C i ,J
rý `" a7>mu .ýäVV, cY 3 ýI @+
ý'C D tJ
E ýý ÄY3mW37Gd7r$v«ü@ UJ S.
"% r tJ e 3ý 3E ý"ý j"9
K 'ä E' ö$ ps.. 9. , ". '' "E' .9¢'i; w`rV
"6 g ii ýý V `ýý ü 7 <`3
,Ti 'ý f uý 3
2eA
""'_ 13 ö£ öoö st 'E dr S3
r, E
Q avC , ̂ p
.äüc Gi x "S ý� ü3 Eý °u 'i 13 -0 .
'. e Ai Ym lc" '- ä1Lr
ý+ý II cEiý: uv
ký"ý ý '° E. v
ýyu. cuý 'ra' 3 .. cE %o ýý .l3a$. "ý 3 !ýE ._.......
ýi ýE ý3 n sý ý 'S Eý aý o:
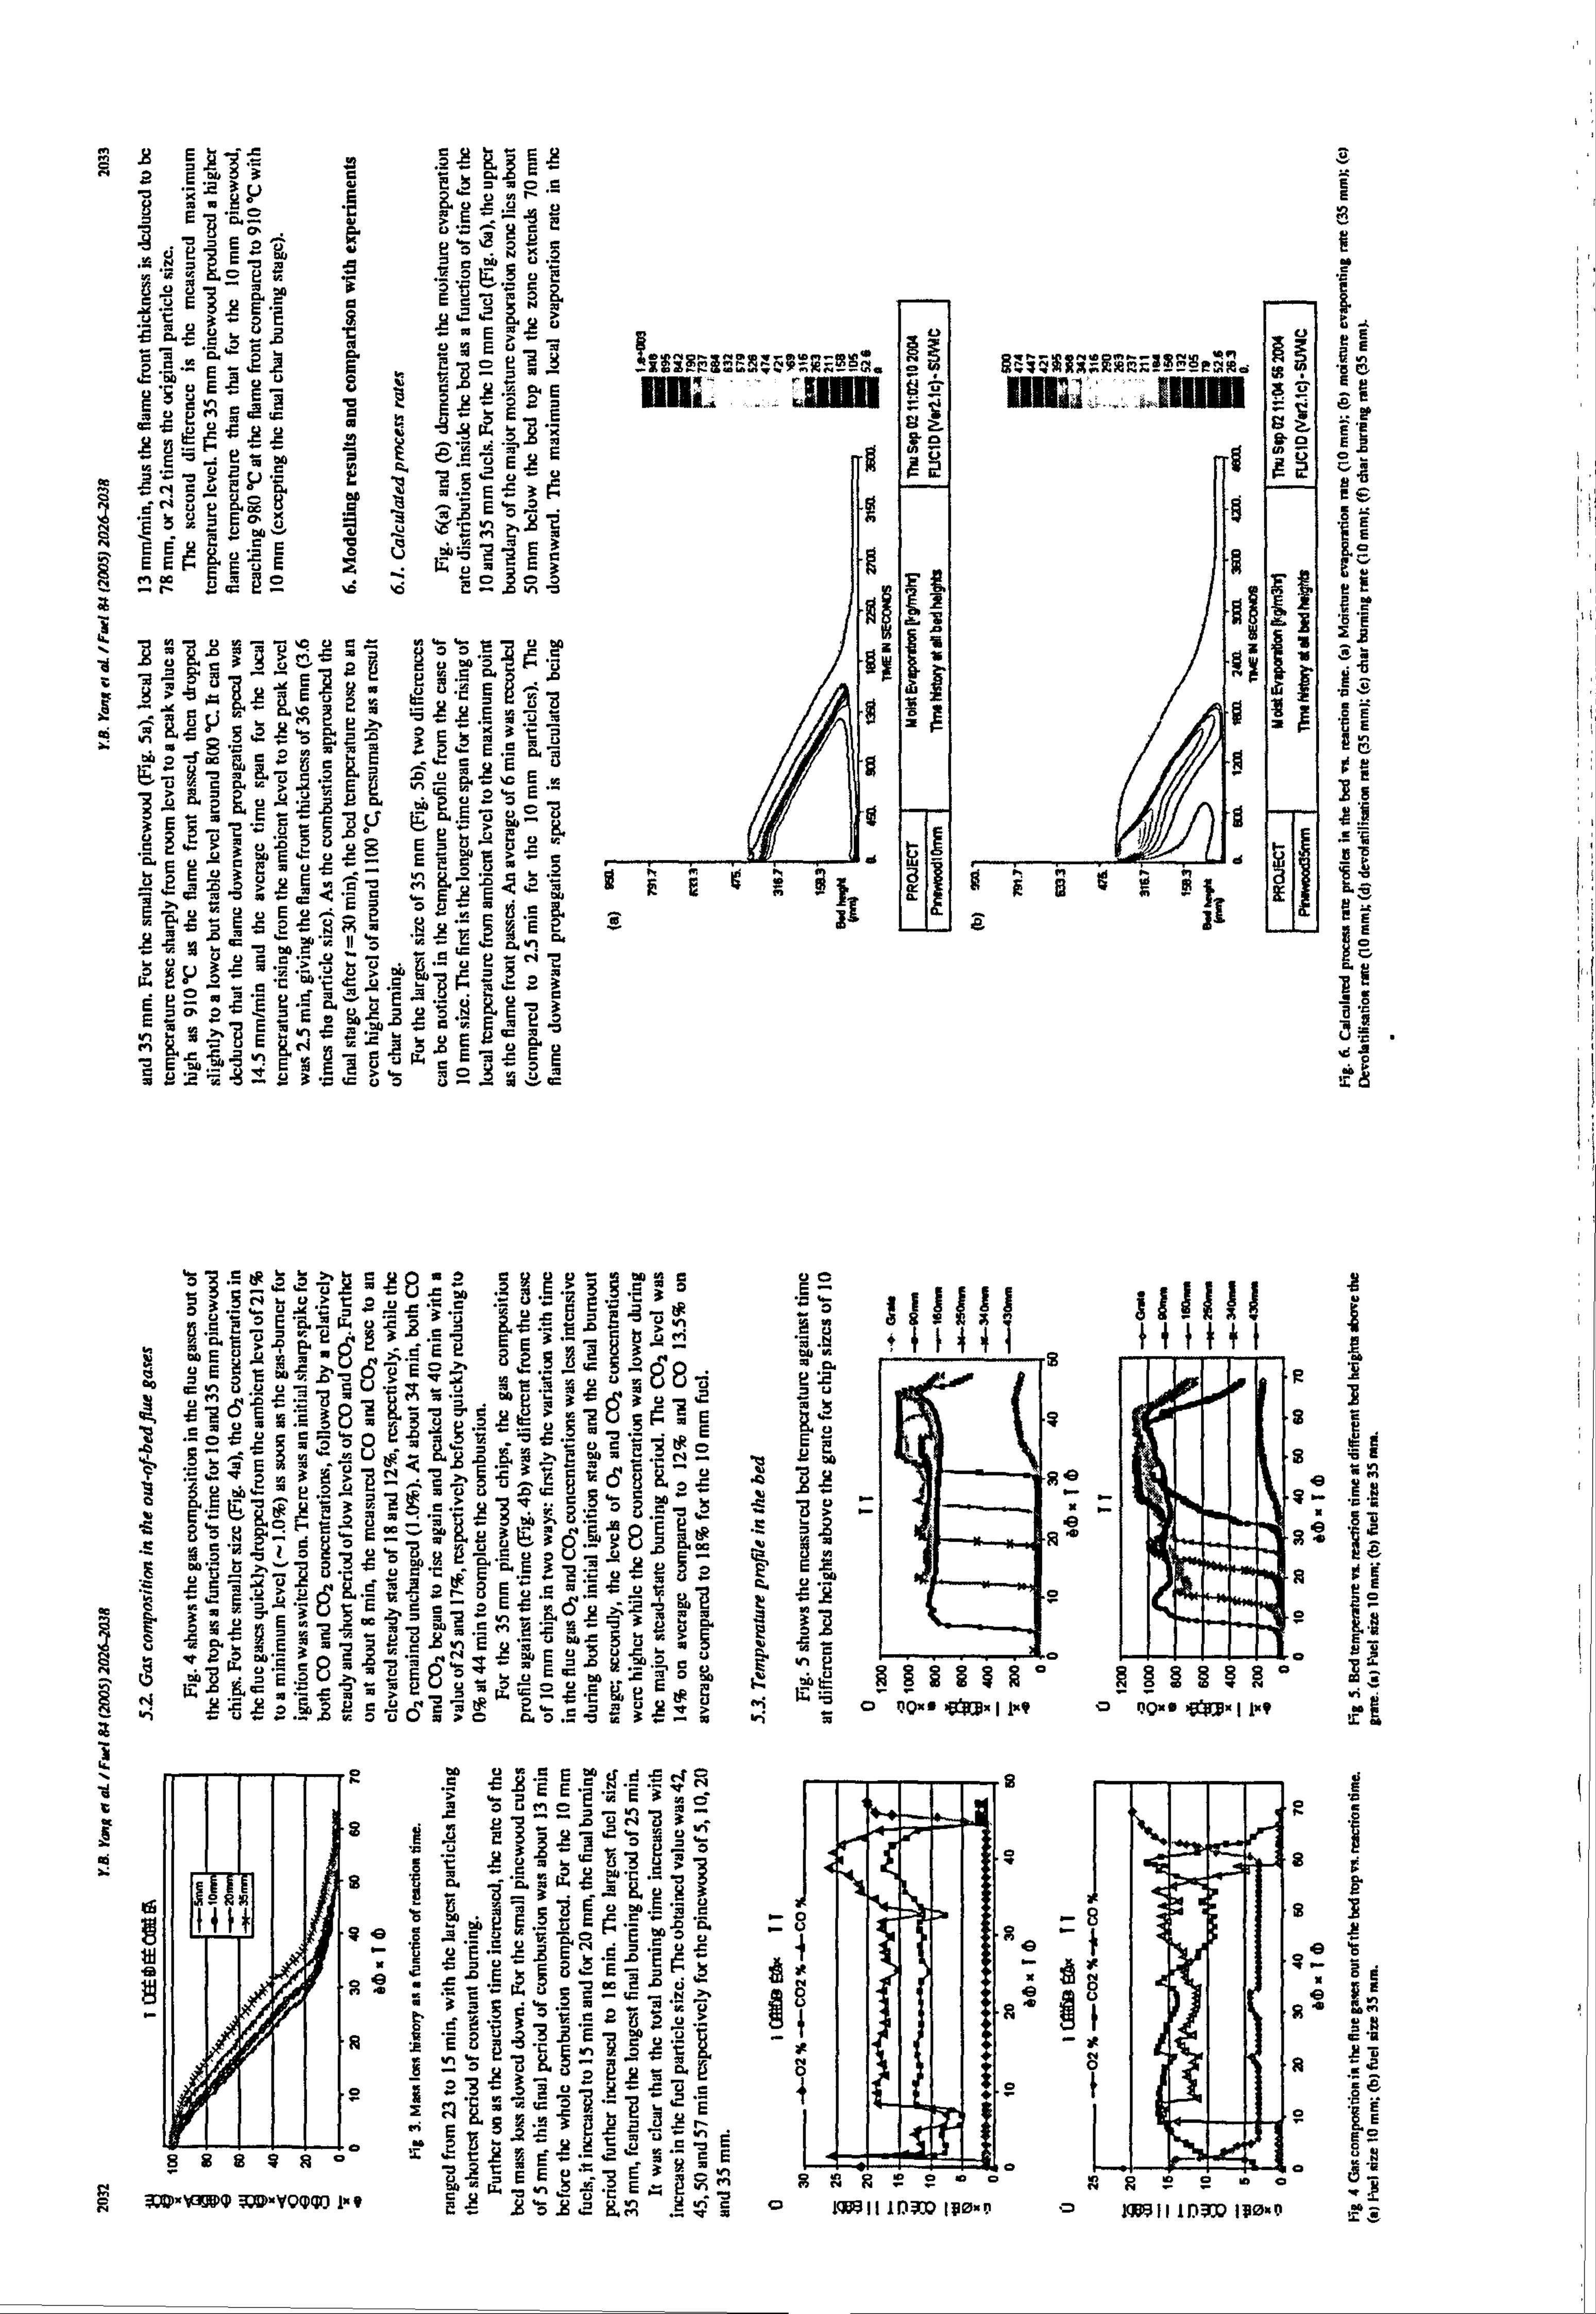
s E mý
3 c ý
ý
EWw°
$ ý
oe ýý u - ö, E 1
Y' E E° C
° ý
E>> ZS c w u uGýÄ ä -L
, 0 Zj m - Äý ý
uEus K0" .
Ec
au ý+
EE ýC väa
:c e W io2ö2Z EEE
(1
U le F- - «
EveC cöEE
. - CN eK
- Eau i3 E .a
ZK ýZ EE$ý, ýýE EEF EuE
o '$'
r V mýE°
s E; E =ý 2s2 °- Id u
e2° voice
4 D
Ö
h
H_
m
i:
ä3H411ev äIA J
11121; 1E1ä. 1'1
galeiatä°E a+ý .
A. H.
ä rý rEneE.. 2
c ... AoüE o° u EÄy F_ E? Ä?
E3- ETü äý m 'ý ü
.
E. E° p Eý
A t3 .F$.
II 'wG
N^ G me'K
IIf^ Vý G U
ÜU . r. 3
Eý ö" ýE ý'E ö "r c v'ö
ý, Äe3
su2
'ý Em
, Lw "'
E ü" wcEmsE
äý
I
2 ý
r I
s sZ
so
c. ý Fe
"a e EY 8 E°ý
E
o� Gý C
Ec
EE
CE pE E$
o
ý eýýý a, eýp .ýeyumÄeuog
. 3Nü. - "«-. - zo= -' iä E d2
MmE °° E'
°CTeE L', $2 'is
,c3 pp
"°ý-a" 4TrT1TTTT1 ,ý
°o u vi uyuÄUuLJät'üf: y uM Li.. '.. 3p ý pEä3 3uIý afs 3
tia o«ý^p ýO ýä«" G'
p2E ELi "C pwU ýE ýýÄa ýL ý0
,ý ýJ ý$E
O< E 3> Na c3ürt s+ ý' Ö S,
"ö ABe ý"ý ö äE öaý'=3 vgl z°` `r e« ü> ""-'ý x
g" a M -ý eree rýýä°ý;
E= mýg äpö. 74-:
ßp "ü
.. ums,
t
ý+ "ýý^ ' cri
mEUEuä
. °.. EEmC
ývxäy ý+ rrj E "aý.
ýe . ý. Et" ý', V ýj ýý äa30
yý r00 ßuä - er "ä 3EpýÄ ü 1I ät "A3 äýi'ýýNE
avS üc 3 °L'ý 8-
ýý m'- opÄEuG, 4oop. yy+
m OO.. , ýý. p o np. a . llw" j ü «. 3' c7 äö E4, e3 rM
tß" a-
4
s M_
4
O C
4 i
m
S
. Eil m9
99
88a4R
,, o� -VlNQ WD)-YQmcr] 1.9
u9Emds e4 c .ý
SSE E". , .0
0`G A'
t "'J E.
2w E° E? c E. E
NIN«
j2 J, .= E0pý" 3rC;
- Ä ... {C Ä rt
rPEa ns E3E1
23 -2 Y Eý
c- - e- E 2n E= .2"äE E° rEE3c
w .neE� ý^
lmN
lul X10 s
0
S
ü
1 ýe x x ö e i T x
4 ; s
MI 11f)ä0 1110-P 1W3 II1DQ 1110.0
s E "a
ge '`G
yý8
eO
öP' OE
o 'ýE
E°
oýQ
r ?y
ro ,
'cin ätß ýsstmýen"
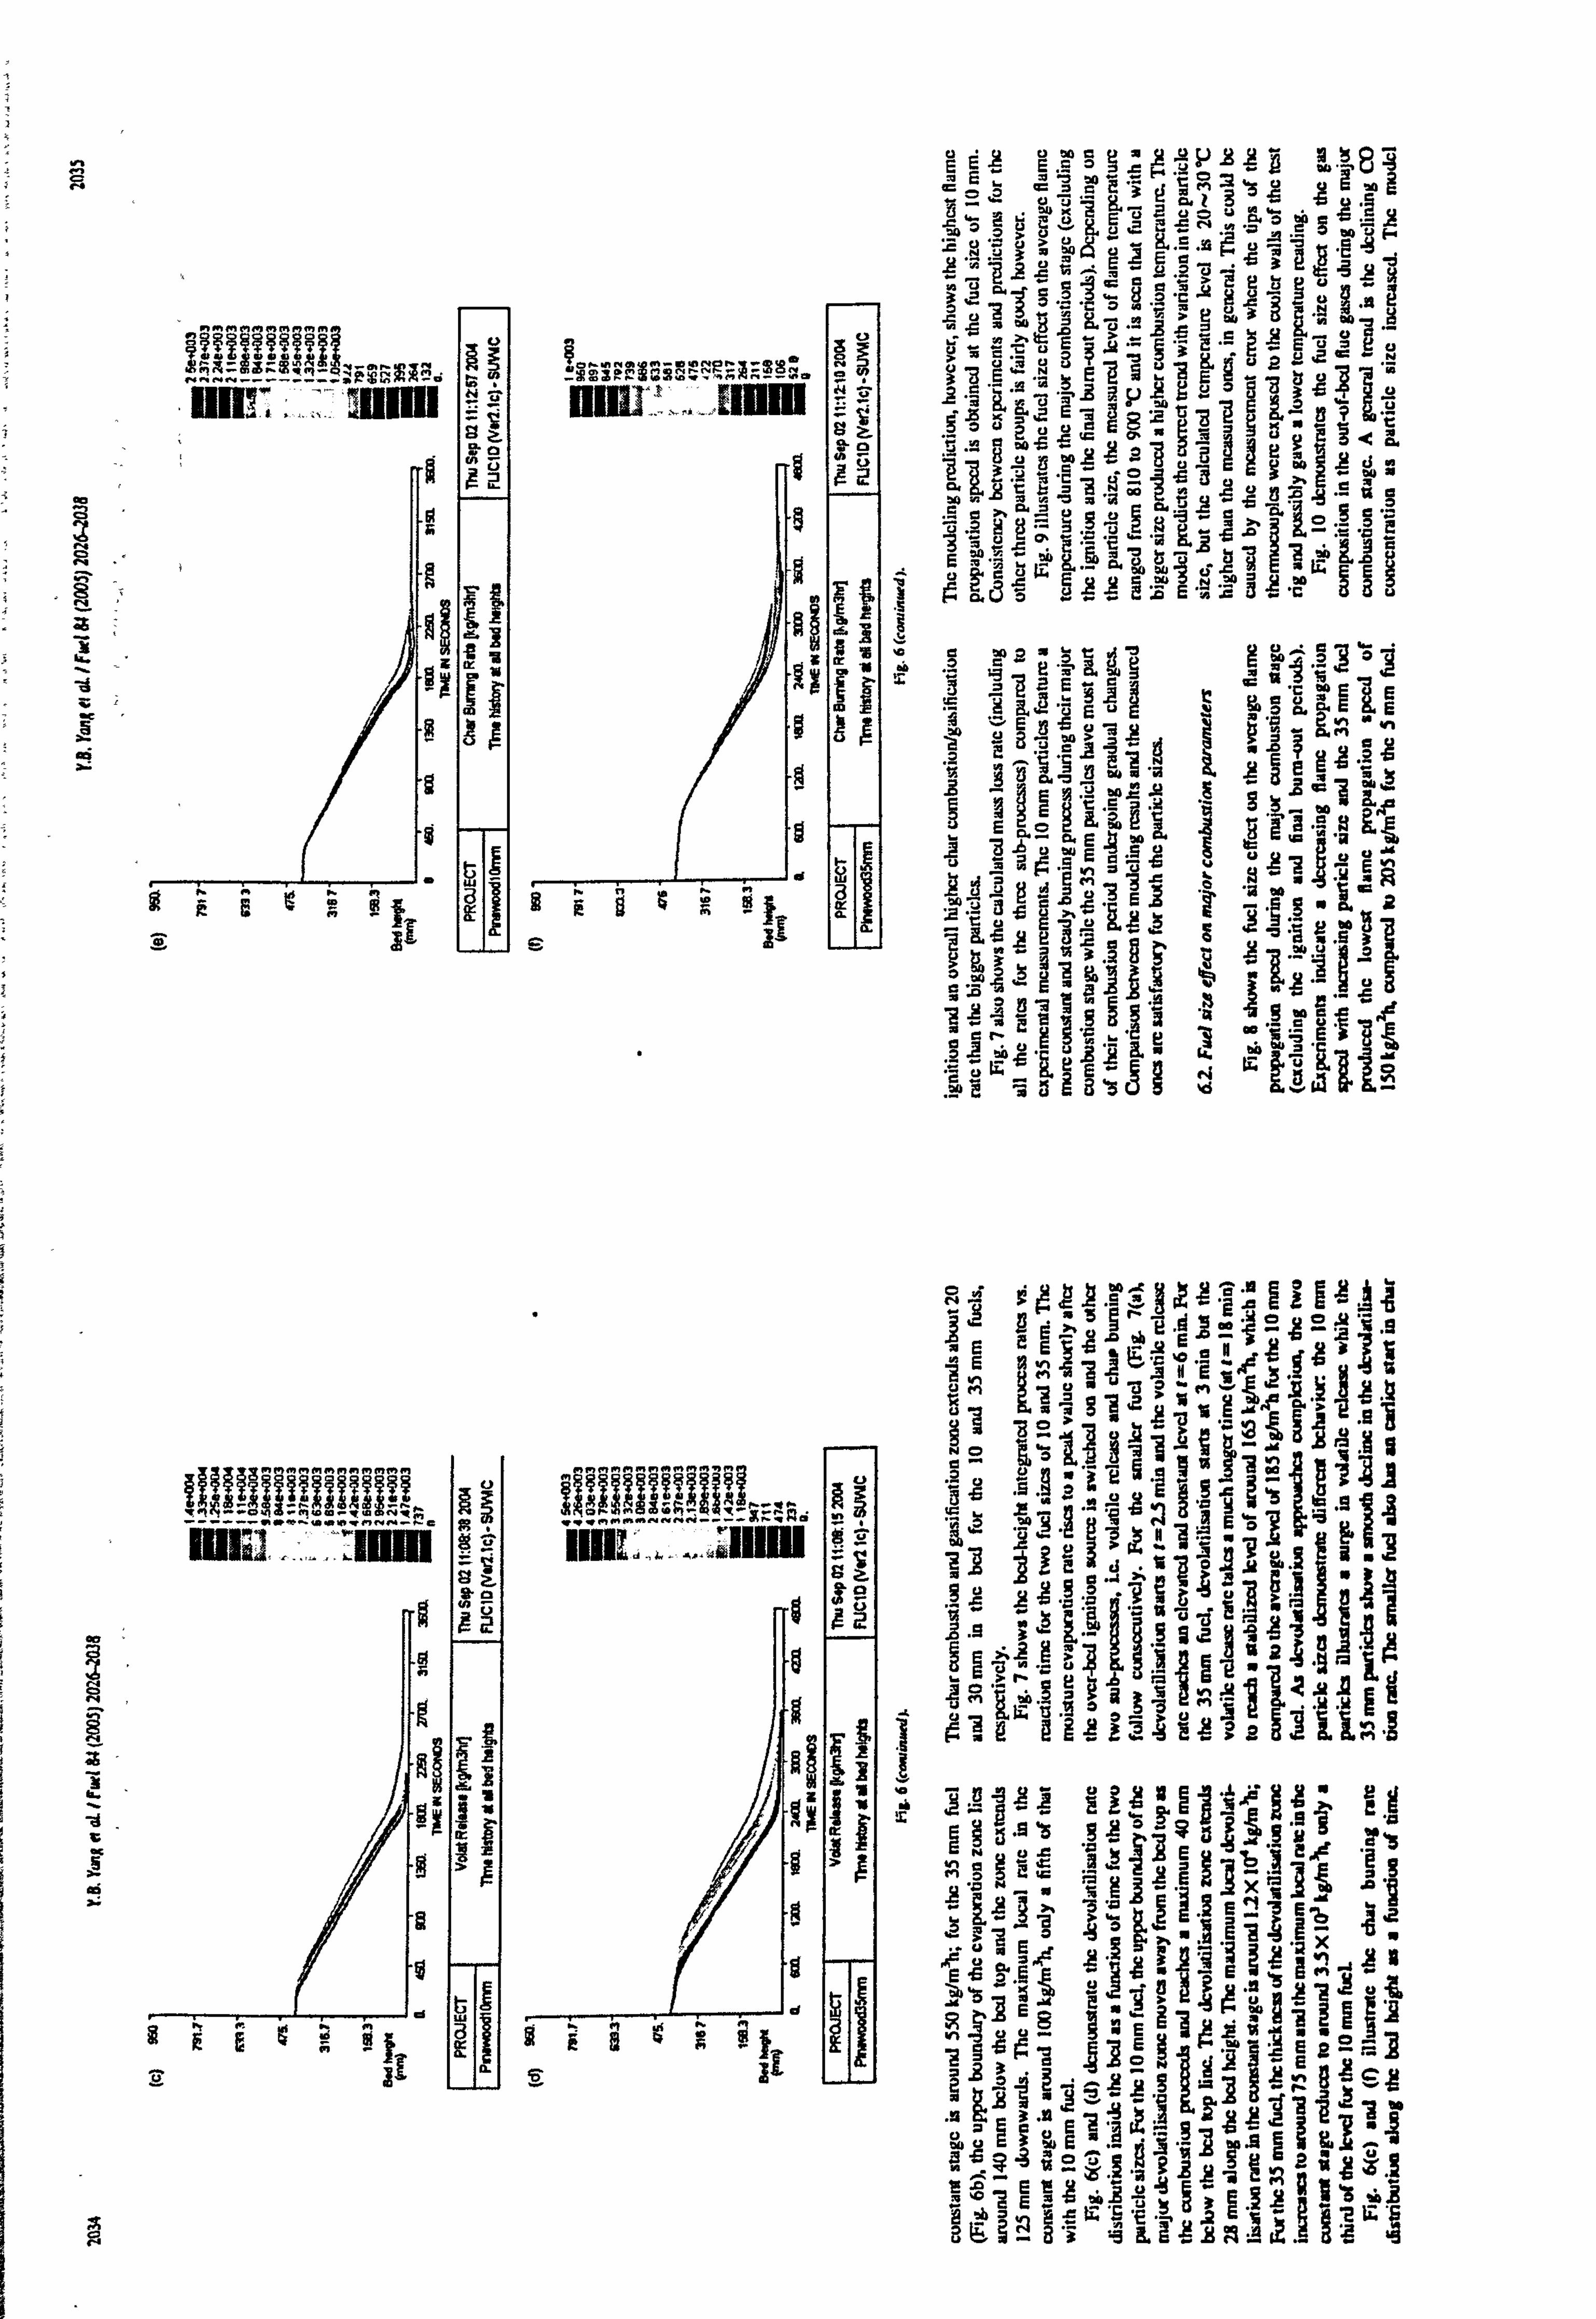
a N O H
N_
D
Y
0 i
nw- 11011
If
14 a IMP qirl
E
ýý
ü
öZ $o
92
II , _Ul ll
gL I 42
.s
ýwm ifI !z 11
11
01 0
Fro 4
jt
I
=se
EEEcöLFSö -8 -S
b 1. Cl
ýE Cý G L- C Mýý Lb
t7>LvÜW-NN "= C_ gj "U
E Q23ä > : fiEt °c35... uU "' "üý "y ý3
8" ýý5 ýEvo
ýE' u 3ýEý
"ý yý E°ýE? uýo 'b 3 iy+ ýu
31 n0 .
L.. rý
EP "A
'ýjy iý$ 3` ti d
a .ýgä tt e
AaOt: 73
oo. 53 il lz & F°äyryS; r- (y
8
ýaUcý ýSE: e'$ "c 3ýu
s ae ýmE ä$ iEv ý'o $eöEE
Lpo 'Eo
NC may.
tl E. 6 fl, EW ý° ar
Sý pýý rä o
. S! sý e3ow8
ill 'p-I äýýs mseE e e" w u.
a %d
M aý 3N'Ev 34
°ýyg 9ea
8°
ST
1.3,
9yu
NVAiEX 'rýý ý
, 'p ?
{ý
E6E ý` "E 4gin
u°E 1L
_ +ý o m -2 9 12 -g 13 EE F-I 3
Ed yý E9 $u dý V
10 'ýý'E
km"5ub33 .E ölz
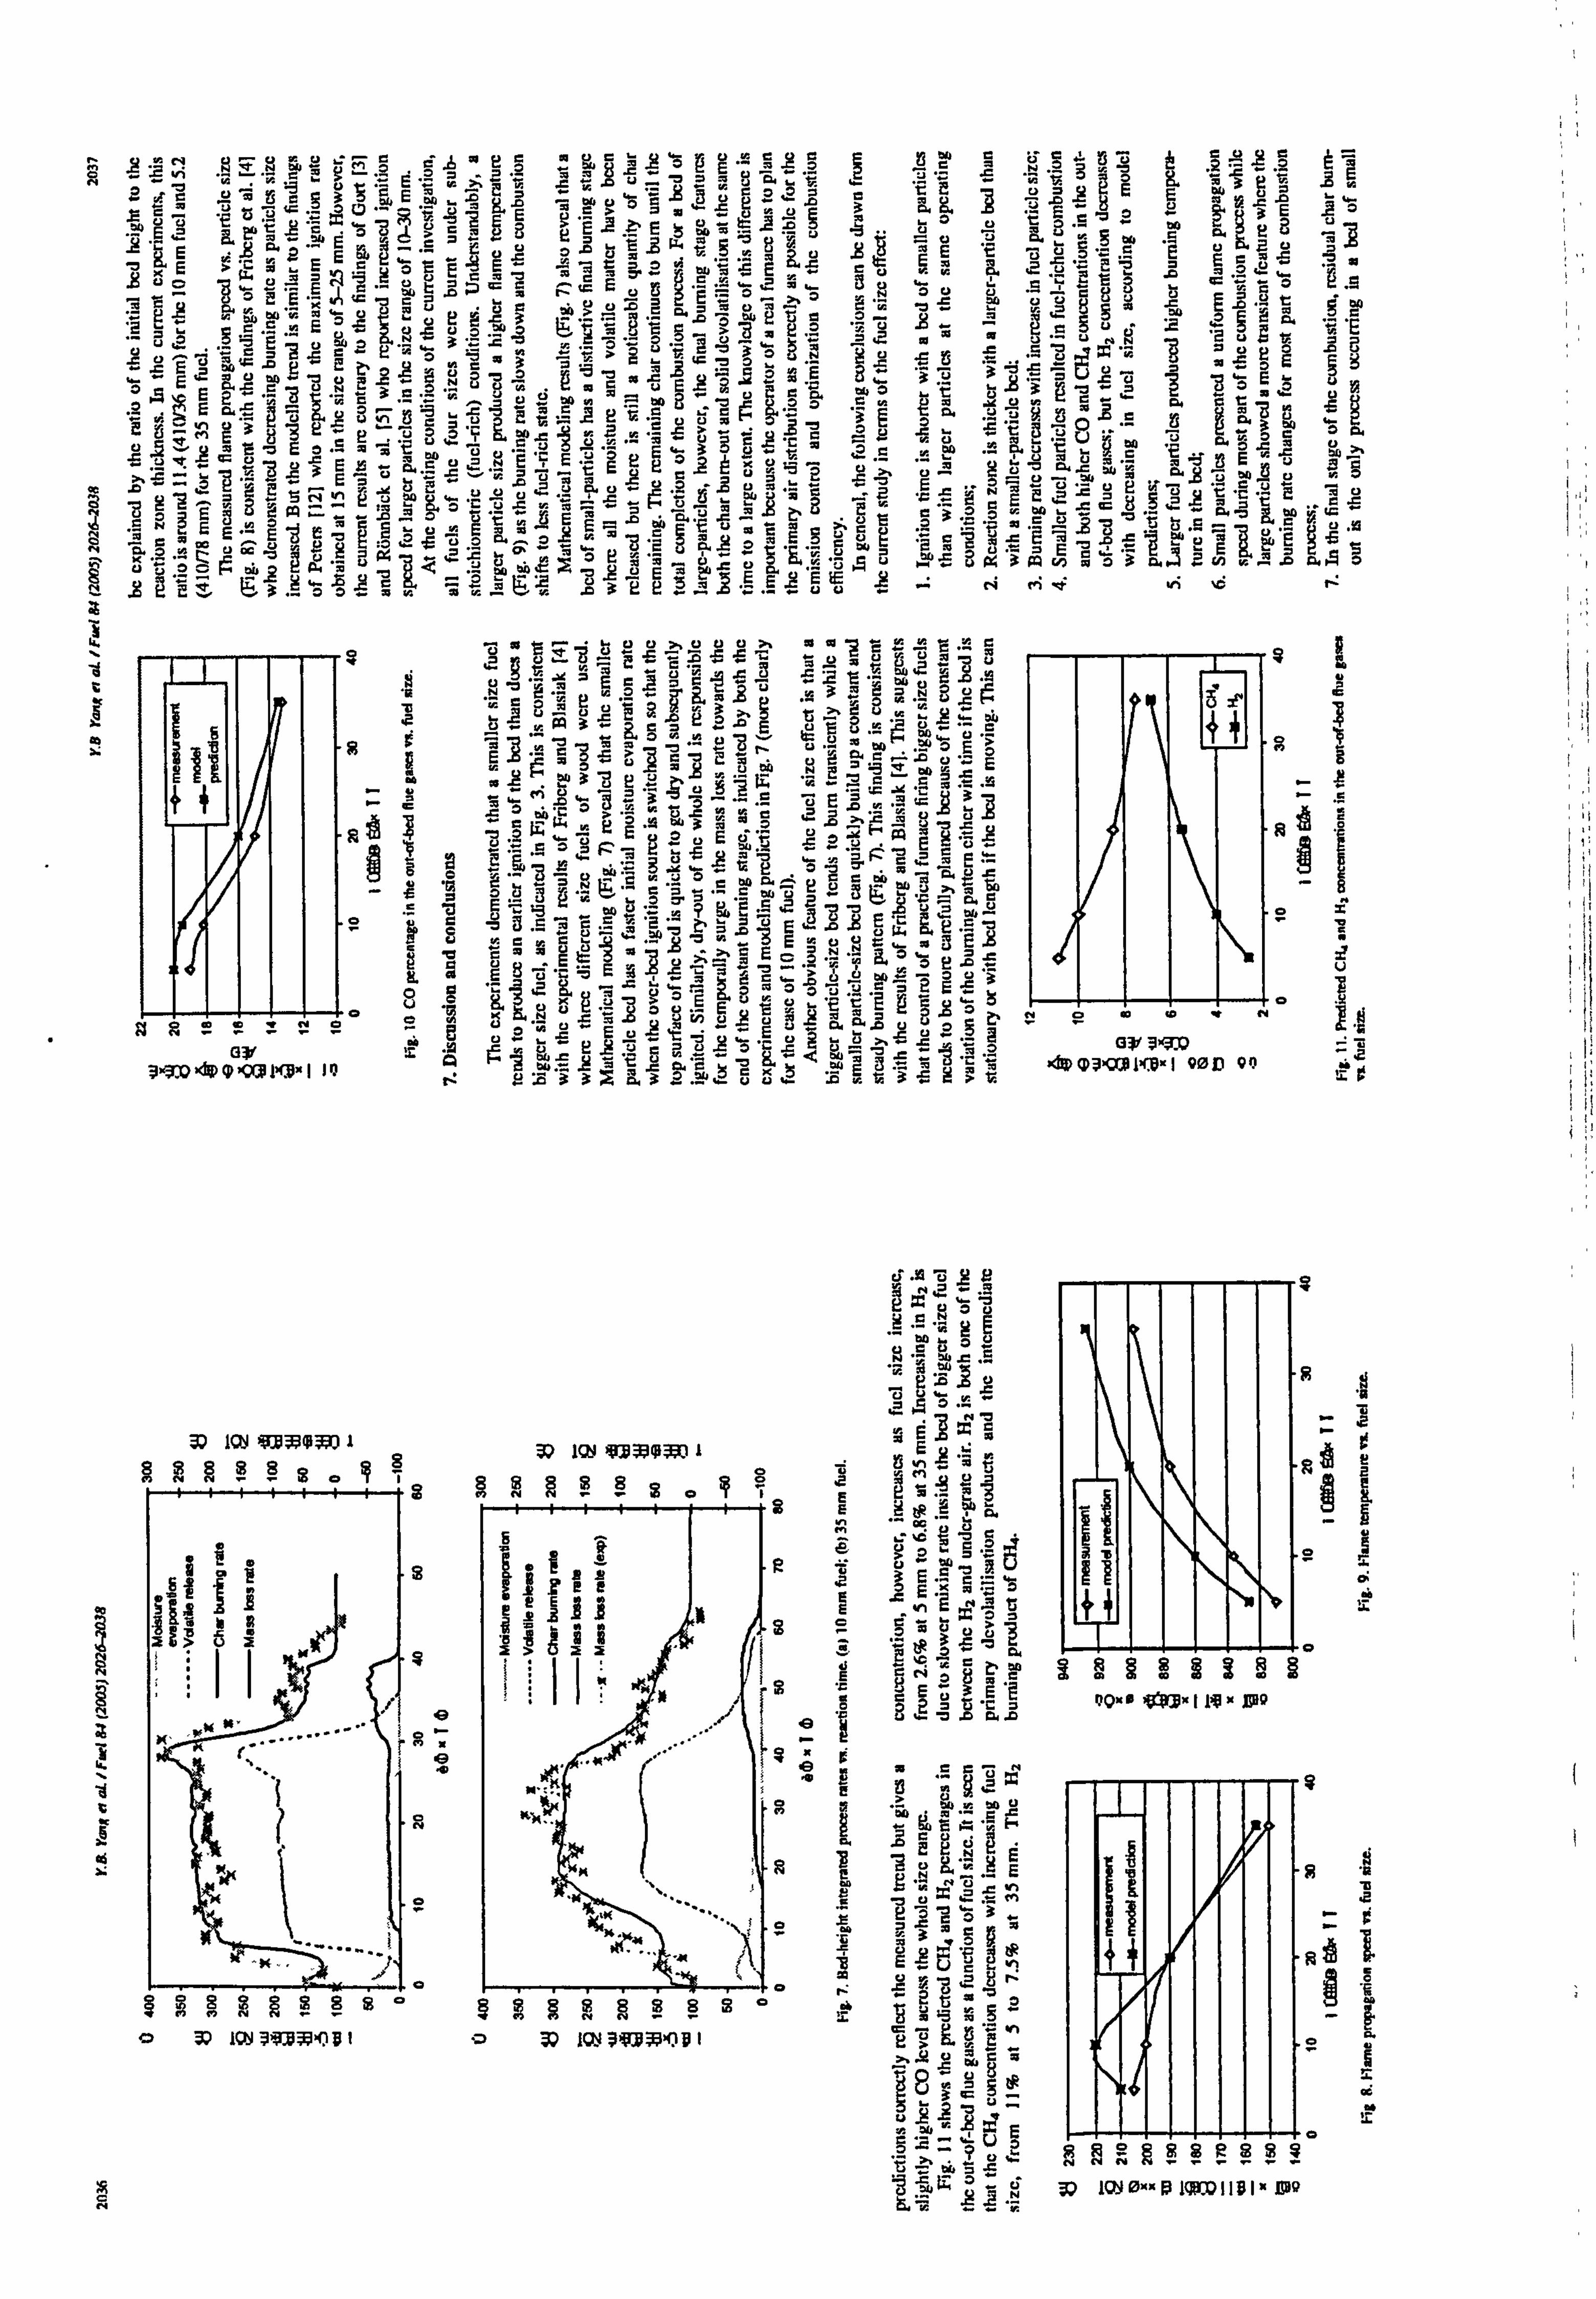
CJ W .J
"'gJ pen i« 09 Eu 'Äe5
y 21 AENCyE
72
2CaJaj
fF sJ
(7 ^4 E
'; Ü1KZ. C0Dm-L ü' 'D ; wE$
ý'Ä 'w x e? AE 5S ä7ä3 E_wü
E_ n' tsezn 'n EU i5 öa 'r $ü
' ''+w _ýE_U5ö ß sý " ý" ovk _'2"'
ýE äý ev H'ý 3 n.? v ý' üým
ýc `° ü E. ý $ý ý'F
mö E ?pc°m"? eo "o Xý ?n
,n hi 'y
Cýý yk ü` ýS eü ýp 'ý ý ".
°^. ý 'ý ý "°-
ýüäý 3''
m Eu 3ü 3' EntW '-0- S. c "n
'i i'r, ä« ü
E0 0
UUGWZCYä , 'mau� ä« tr ÜÄa .pea i-
K
äNEEE°Z. EzäEEa 'n °q aE mArc K$ KE `9 Eý«w E°
0AeEözE3
EE
a ö ö n
ö w
C
m a
3ý3od91 9(8x 11Q G",
N Op äVC YS Y O
L V« . '_J
g .ý3. C
E 12 uc rý y
cwPa ^$ a Eä
-2 ü'a t
L'c
äö s
't 0
? a 9 r
.8-
m 'v is u
2 -= 9u ¬
,i 0Cy
e yý OL
5 Ys Lýý :SEE
vm ö. utVäc '£J
aý vs E
x^ 'V
^A, 7 L4
.L J Aj
^Ü G
s 3
eE °ý Ercü ýS ä .'E ` e ' '
c
r .ß , t^- a ý, ý üc u 53
..,
ýL 0.3 A wý 3
.. ý
cn ä
cri fiv vi
Aö
r
:a- JE mr u7m Eý e
.Loc "C p
'^s7 2 O4 U mac'
'2 C , T}ýy mLV 'Z «
2" m°` Lyü>,
Guw
RüE ý' vE ci .vFE a-
ö
.. c "ý2J "ýA 'k
Gi ^a.
C '7 ý Cy C
p4 ÜLý «ýmýJ iý ý
00 w 13
ecyEuurmEb qÜm '° E_ 3'
mä E°
'v"'' 'rte Kg a' r
0aN g1 °
0,2 üy, LýS` ot yäy i'
Süo, u-9 yvC Q m= rcz
, 8`aoýu=fir .3 r' ßä33. $32 y' üvwä ti 3 `ý >
ü. 1 6 s! &' H. A
3 m 0 wg
gä3u
w40.
3J ILNý4A 1 Cg
3? KNýý3ý 1 _ !3VäY
lý l1 tV obO 1 18
Öl Til OO 1
_ ÄA
ö E tR. 'ö
3 Q U $ F. e ? 0EKÄ
ID x $
r : iix $
* E
.7 1
'D.
ü '. C I CN M ý'
Ö CI Ei
K ý tý s r
i
r K'N.. mSo' .; c g
I a ä -2 d
1
NE wý Vh
ý
.. .. ý
rt"... $ E3 ý7
0 T ° s &Rg§ 8 § 919988 8 y « p }; i ä 3
0 3ý tub 9 K? Eý 0 3ý 14 JO8I >. r= -n
3a: u^
U y.,
w N
ýVl Y
G 13-= ýäWm3a I'4e I vop 00
ii 0 41
ý fl E§FFýýý2 W Kn , o' 1 1181. JQ
SL
o x" 1 o .Y
3
i
d .A
5 P
i
R
'D 2
_ I.
a
it
40" 0 'J" 11'8 J
a N
N_
W
O Z
m i:
T 3j b; a ti :ÄE b8b bg b rA
Er gi 2E
C$8Gl'I eI!
iieý
ý ýä ýýg aas "ýý ýs "°c a ýýý ýý ý; äs bý p C7 E
ýý zü >ýýS ßa3 gu 43 ^ý. !ýýg3-Egapy.
5 g
U! hit! Ii; 1! JIi
I8 gt
Eiy
iL IL
a,. ýEEb, 1d ;. xb.
}, ý. qÖ xY gýN öýý'ý ? $a $m 9a$I ý; d $Yý N5
.3F i_<Z, >ý3c7m' nSmä 3. n 35 < _
EEmrsýYav3y ä< rte, > to
s . 1.2
7ýi QQ 5 ýj
ýýZaw. Ný he lot
ff, zßä t: »
ää 1g &!! 1ä $ In 6 JA'6 EyI 1. I! I I6 ý 'r ý!
ý' ahý.: 9 ai "g
911 0
U, 5. .1z1.9111
ZZ cc pg Qýg 00" $r
asSsBamZS . b3i
ýýE s7 "a
V 7;
IE rs IE II re ÄI
xEgIE -_
v Im miai :31xE
mý - i2 ö
E. 9s -'ice rSE cl Es p 3r3 43 8>
laQ 9BU :B .305
ICY 37 .4
a bat E
3cý
_p
ti ß
71 T
IE e&p +ý 4
.1 11
N
m II rwxScmZ. rpi ` ", ä° 9Id¬ , ý5
ä"ö 'p I
bd gý q äý e° =e ýS i2üEi 12 2u
.Yt ,DPý 51 1
Sa 0E gp= E° WEa32uv
m 'i Ic° D_ a- WUW pý E ä. .°aJCs.? IEhanu9
.ý> °_ 3Eau ý3 "p ypý ý, °ýI Fýý'23 2S1 'tý E° '> 2"_.
y ]Eß`03 ü 'ýE ä>ä ExE3 ýE Kf`nnd eäö üa'
> üw öÄ>
mU G1 &M V3. e° ae aä"iýl' "1 i3
H$m.. GwN MY 4
ö CK ýn ýi
IE I ly Iý ýggn IE
"7 A
=pý uE Eý ti °S ýgt EE a_
k' E
nkcuw D" d3ä ýä'" ä SS as7u
IEJ ýä E ä° a, c ,2e
"' E
}g ,ý°Lm rý
Na
S .ý vl .Sä
49 ý+ ö>33 +ý I. a D4 ° äý
I
WýöoecöE Jý Y- c+ äý ýa zbEnyvu^
b" ä 'W öqp
Soa üs ;výý 61Im lE ä1A
a? A "y
e i65yý "E °>S' ýii
S as a
.9 .StaöII ýq
Er1 *1 't ö 2{ý
eil vV Öý Guaa
"yG ý+
äTUý {ý { "G p ä¬
um aýq ýsalý
,i 37 ý{ 2p 0C
gE b' 8Iý_+ -0 eDEw
Kej w- aüyaa TJ "a S ?
ýa "ý 7
týýi ý,
I 's IIA
il
EEö4U. eüiE
Liii
'E
4 e'wwuJdl ujde "ö 4ww 4vIc" L wxes'd v t-L. L. r aj +t F+1 Ja äc9of
ýJ ö 4-4
oO "ý b
ö ö
10 u 0
dÖ m oO r
^r ö d El Ö , ý
ß 'jöý v
= 0c ä
' ý
.CN y ý
3N yl-. tl
ny
6 äý o
`= ä
4 cl w O bA 11 O
r V
Lý7 p
ý Rj ýgý
a' y
i.
ö
M3 "a En
ýz
s ä
a N 4
.5
I C
ýä
a `^ y2
Ö ýd Jý
g M1ý
üý
3
C
E .n
s $_
's p ä
I
y ýt
q saes x. 81 ýää 3t '. "9 $ 1ýmE a&I
11
13 4'
9 91 bd -2
$ý gea all ea iäL mE"aA "8ýý"E 9 ug Eý ä"g 's' a p°
w8 .y '7ý 82 ii
Nil >"s o
Jo 11.9 1
lug .! g tl 33
gI11n ýi .f 2-
1
it L
Iý
81
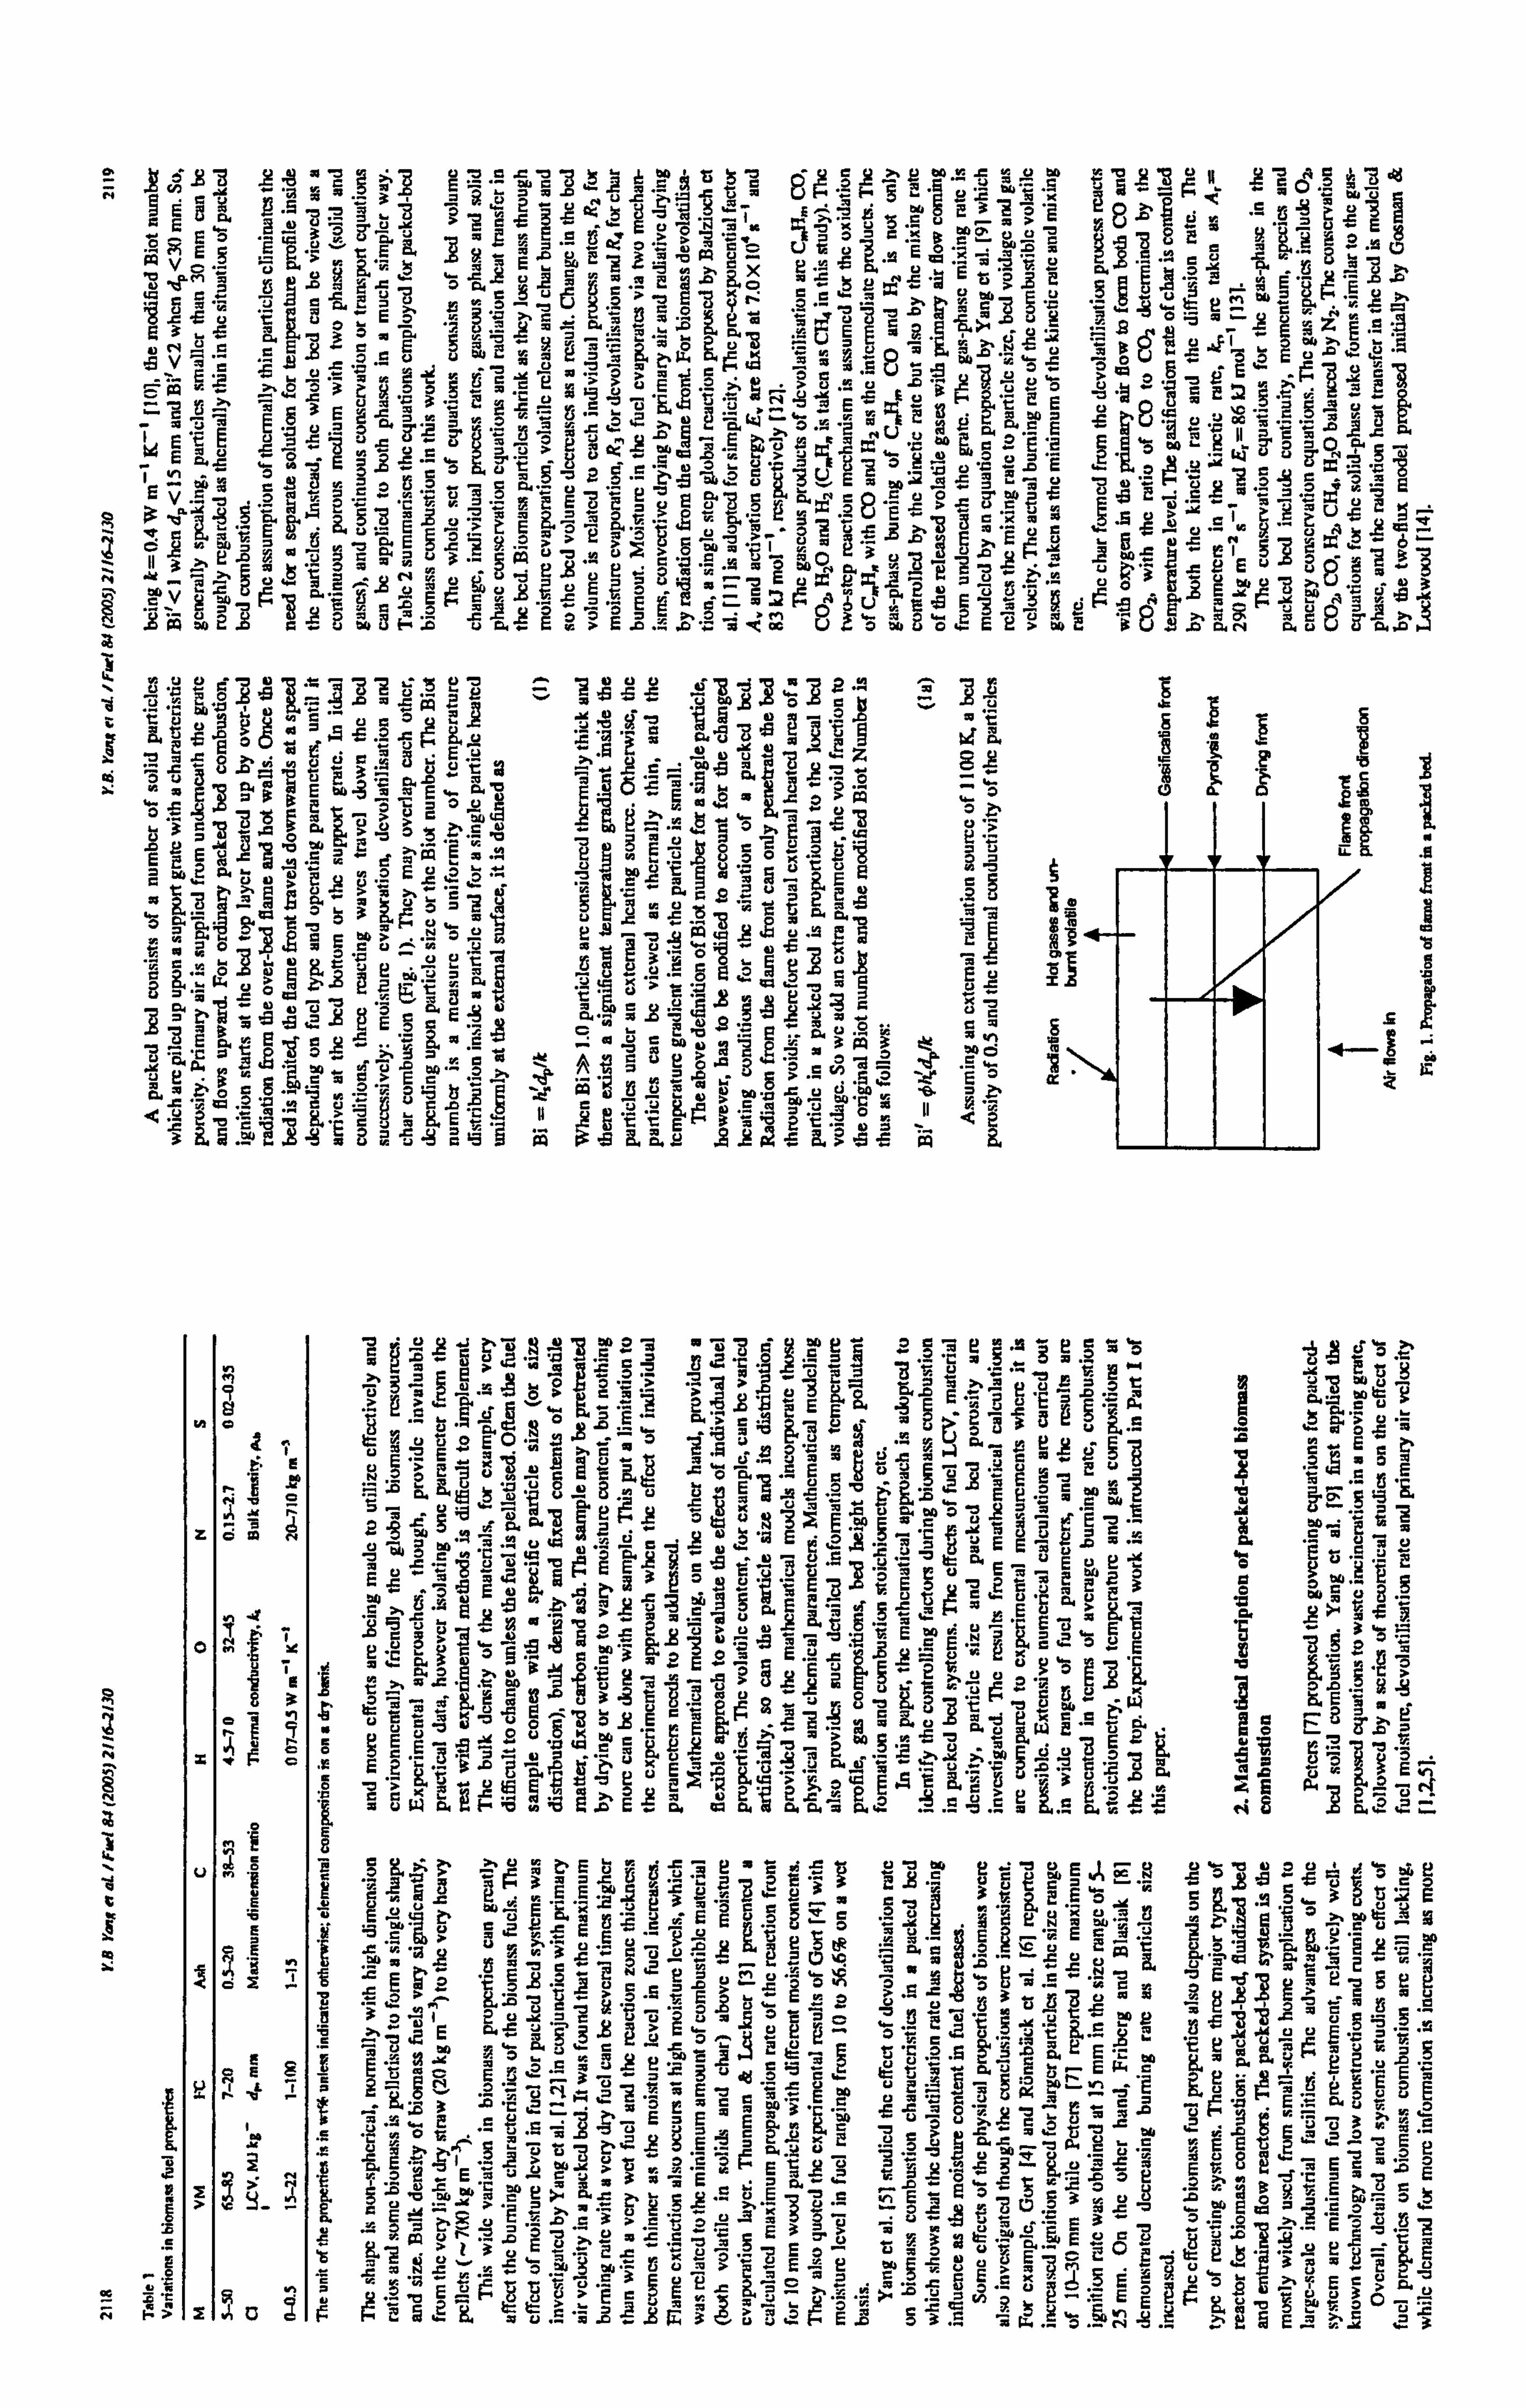
fA . 1L ^ *GI ÄÄÄEO7ÄL
Ä=
Lmp[. w '_ y 5a ^L W^ C
Eý .S3'ßw2uLZ.
« ý "=_
U73WSCE
U' aü iý äf'3 aEv 'ý 'a ä ýr 'x
v 'S A> E ýp 3 ITi c, a Z-
"ro°^ VCý .ýý "ý vtEý. 1-.. Eä'ýý..; = ä
ý
JG Gý dT yr O .ýU7>CY 14 p O' Ax >> v Cj 'L ÖSr"Pv 't uEý gý>ýý "r Yýz
"mp yTu '
p c4 .UOGE=EO u6 pAÖ
, Cu =U^zU
49 VS 'C EAt0SVu'p ii al I( Ä7'Ä {L F+
"A aä
, G, ' TWL., L
iC E«
w='pe >> vE Cp
{ýi vovs S2 ö
-2 Ä3üä 'A 3 ... c°, E2ev "ýyr ýLy
r+ '3`, ý 'E2 , ý"E°
g'EE
`sü "ý ¬EC yQ x? äw >ý °p' äW '-' mEE1. =
gyp(, Eäü 'Su=ü >aL'zä myý Eýi Y' `s y"ý "e O0 ý, ö°E'Ecu
äf E Z't"-
HudSuo
ý">- a ý^b° o"c' yam' E
IE VY? `"v
, ý'ý^ 9f.
EE üý °ix A°r>üe?
<ea Eý u" E ý> ZEp a^ ä "? uoä ýý us ý. m"- ue 3^B
1E' zmýýz= ý',
ý3 ,ýýwu "o hüýýýü
.ýz lö
ýO3
ýu
ý °-ý ýýa
V ,ý Fý "g °" "^Yt
`ý ýo u6Eum Fý a3 tj °i E
b' c4 ýu 'c i% äm e L' m cý
E. üäEääE ý' ä ". °^. emÜ0ý, $öwEEä öu
I 1
i
^p u F"v u . t^ 'TS E'er
ÄcDgO. S"ýrý qý Ä
öý yý rý ti G
,ýüVt g etu amwEä ek
Lg gp ääe wuý
E ý'c EÄrý°e'ý Gr
ä R1 ým . 'ý
mm2a1.0>O uA.
0Es`4,
mtÄ uý Äzü'.. e ei
c" y". pe m
äKC ßt7 ý°a ev
_ý wcv
c91
EöwEeE is T$m e' "ý'C 7POjW y de Ä
ýý
CICJ
"ý eäCý? ö "'' D` .ý
2; t, e ýö
ömr
m E
I H>
eEH P
bý
1
i. ~
ýo g
ä$
"Lu" mäö e^ýy
r° u
? yC
LÄx "~A
^EE C
O c +. ý ä ö Gý ä E ý « G p, ä
55
.. ä1Ö.. Äm
_Z = 72 2
C
- F
.e
w
70 a«ma. mä °ý >'E 'm '°
t =ý rte 3-'m e. EäC =ä>'ý'-tert mg
ü ä° to z 'H `c m°& ' S3'F -�°- KeEcEeZ EExq«r'd.., vm
sß smca«3Empm i
"E "ýi °üöee 10 9E°q 'Ä EP u° 4 rA E
e-, öa ig m u° v ii E .c 'o 2 if IEeo yp " "p tUmLG.
" .rC 04'
^7 ýw°ä dýyg ýLv'K''ýý¬ae-n°EäCaü$ Eý ý°
m0 m ä, ° `° cjy
W? m.
ý zauuey 'ý E -4 L°EE to 11: 2 1ý
_5 Et° s ä$ ä, ' E3üE '" -3 E° -J
Eää2 v' CE Eu . ri Z' "S 'a t° e
2. u"ap, tEi E3 9o mpul... c> L. a3mg my ppE .9d rý äm o Eü ý+ ä90sE3
9 '' `u E$r2 v> vu `1«i ý. 7
A V. E d+ wNE rTj 3 `3 :^
E Týäýoc3 E°öýEEs äää ga
3üw u$ 2'? Ký'u 52
W äE m
°uo xguý'ýeyo CEm>m>oýo ýý° yWE"ý« ýo C°8"a
EE ýýý ä° ý' ýu tý "J 96ý °ý ý emu duij8r,
2 ý' -e "ý
E2 YgaPý{ Z üEap ý, s3Laýý ö, mä üý vý atf '> ä° fä S3 e E% w> o Cp¬ .$ r$ e Yf 3
fý u. 6 P, E
GGKLö.. >ý 9 yit Awa
C' -9? OCeC9«.. m
«0 .0- h avWä Eaa ma Aa ev 5aw
jSam
-t mx rý
pN r¬ý 't E: ý
ý' ÄEv 79
'J If
Lu 04 JC >Ü ý` Et Oý oEäu.. eua3äEoy.. W
03a- üöE8a. ° mz.
e .äaö, chi
14
F'+ ý2ýsü "ms'ýb'ý 3v° ü r3ý E
UEE ufCe C.
ý-"w 2,
-Z-Z G Vß'C7
ýýýEýmmv il ý "ý ° a, eo 1k ýý ý'"
!eeu aeQ
b"' w$ a0ý"ý s«B m.
.3; A CY E ýý' äeÄz
_. t'
^tec2. qe "ßp11 pLA'sf-
1, -
-%wY
0 -f. CpS ý4' ý ,py
E' 9 'ti eWa ýý. ý mr Tc o v
o" eEwcý.
Eaa. ZuE
"«,
4siC. i 7" LsA -g- v- a-
3 i, cs ,2 ý° 'ü 3w
j Erz
..
22_.. L
u` üäVcäVe Yýq'
.. - 7cj ýJ
ý ýý o'z szE 4n üCzEe aý a Yý S ä. 3ec 3'° '' eE c2a
ü y° ü E° o g' üü `3
.c ý3 3äR
.ý cýýt
O Ea
t li . 2'309 Al ö; t. 3-s Q ýy A. Ü
Yi. výT° iC ES' v=E
CL ¬Op YS -"
8 e(g °_ -LeýuýyF. ELý 4 _, tz e
E. gu
U . "ý
-
OTC
-G9AYye
.Ea y
wU " `. ' Er e. Y -2 =, s m', äö
6u e'ý YvA Zý ZV '¬
Eý e
u gý '3 r 20 Eu 11 v
ýC ýäYUý
býq 'F Gl A
L- cK ý, r94 cl. IT
L.
0
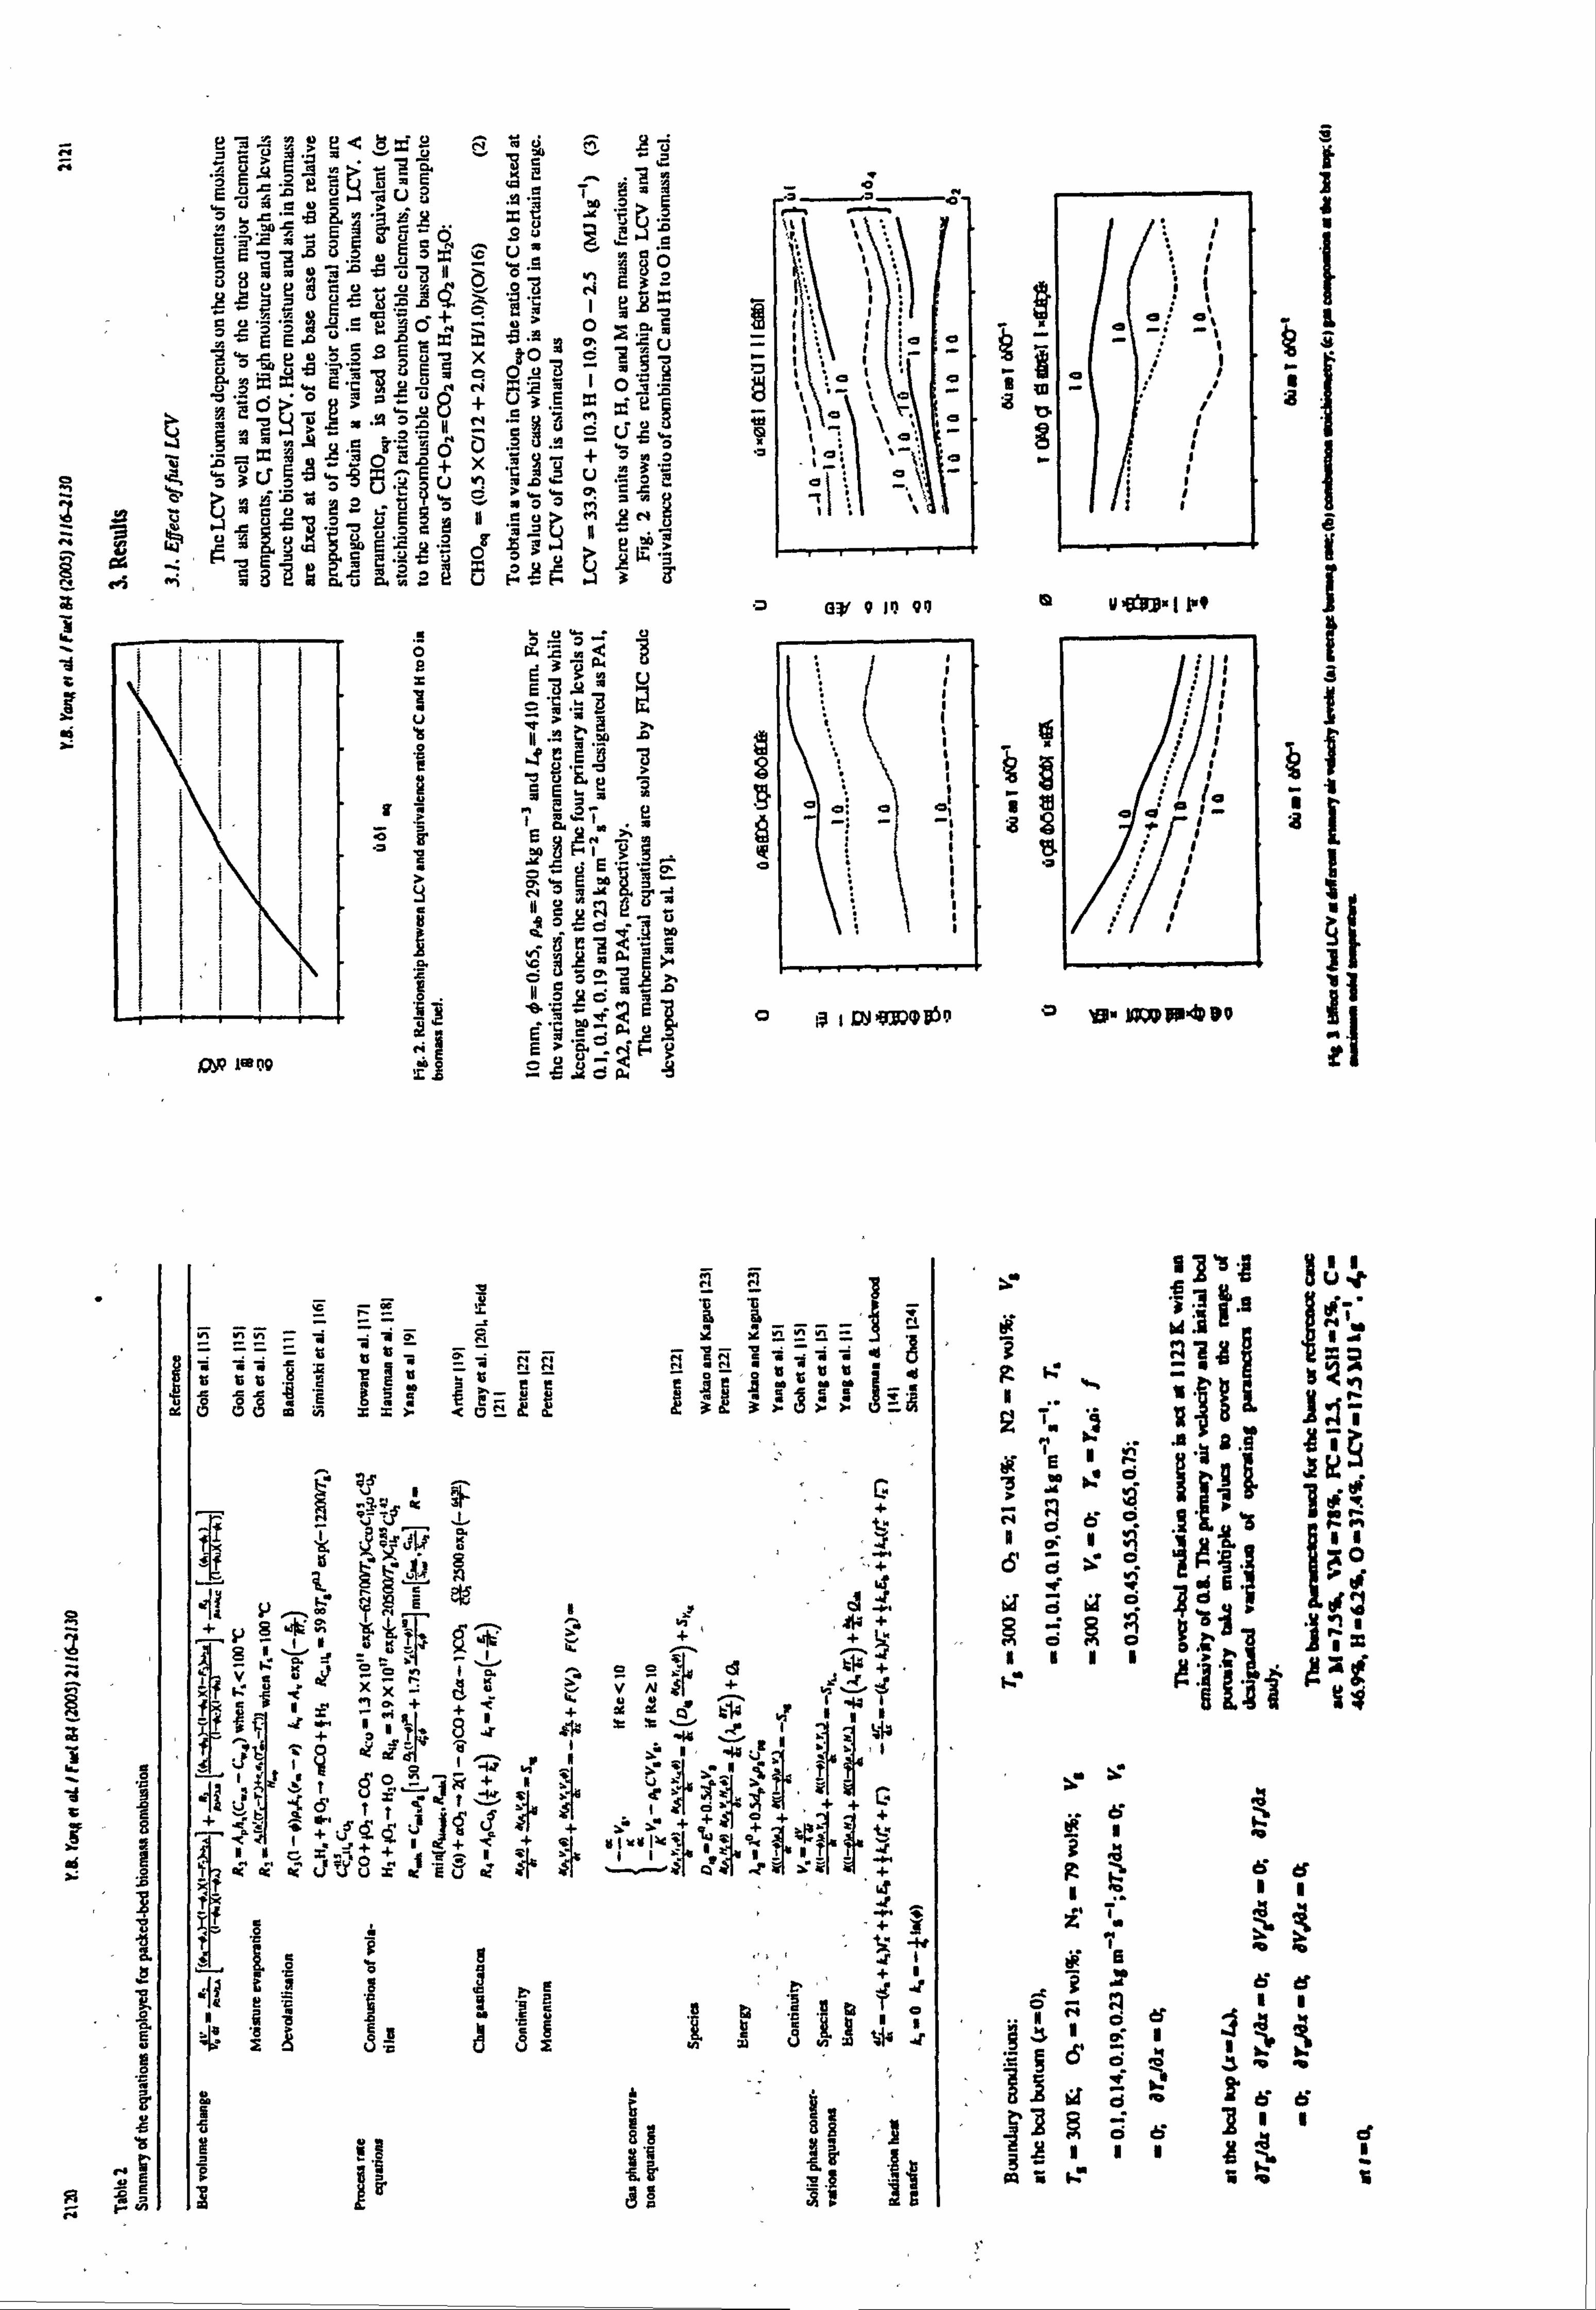
n_
t
tl
ä
I
A A
a a .:,
2äö r9 ä6 2'S' üA"t; p+ -i üca 'go w
2 Eý 1- E8
_2
ýE *: cU"-wO
eüüt°ä (' .au t3
E EA °°- -x
1Z ä"ý °; - sU
20 0' S2 E-3 X to o 'i . ýU -9 -3 iß
dm'. ý. ÄqJ9CO,..
14 "ýOS° >°°8+ U3 E BF
=U, j
xÄ i+ H
oß °° ?üaso rý °Y G
ýs°$ýi 0,2 E; 2 8 z, p' N_
Eä E_ O5 {z «i äaý ýd
aü ww - ýL U E»
ä3
OR lie 09
.p
ü aýg
ýEQ b4
T O
6
b
ý'. 0 ä E
.t
ö
N E
rh
ö wtd Q 3
;R E St
_ p 'Ä
j Z`m ä
Q$ AT
ý ý .7
N n uÄ
B gäi
- a. E A°' Eä ö ä'ßv
b ýýip "äD ý'ý ý'ý1 E
s
N7; PN
2112 n Yý tLES
@- C 3QO9A2
S>
1OUd
vU K if
ýi ih n �
1s
ýý< Yý O -O
r 16 j
X
ff ä- 4- Ä 1I p+ Y +
t
p
MÄ
ý{ ý1ýüe; "o i T
+ .ýwa, s
7 7 t
1 MO Sý 6 ` f oC KK tý .i
C+ 7 '2 U2KE
:I ÜK -
Xf f"
ö e d
ce
`b iý Ü "ä
9
ý ÜE
d
0Gf9 14 99
1
1 1 1
1 1 1 1
f 0; o e!
1 1 1 1
1
1 1
8
a
iä t GN ir»(D
-2 -2
- 57 nIt
3 W. ärr
ci
c
} 40 }
1 0o
Sý ý y+ V Al
tý t y. 'li. j
xtQ. tý .r t jý
yiYY iY *T, ý .
.
-if
n .t nýj ey o ý
ý
ýi 71 V Vl y3 N
I $I a p8 j
co g fi
s f 1 a
i a
e Y
a u" 11", a
I 7
Ö > ö
O Y
ed
6. "
aS d
1 Xi I
o I ý+ A UI 13 t 1 4
1 A
1 b.
N
J r Ö
ý 1
ýI 1
' .: 1r
d e q ö b p
a ö ö
ýp ö1 1
i xi
1 1 ti d
0i re .o %
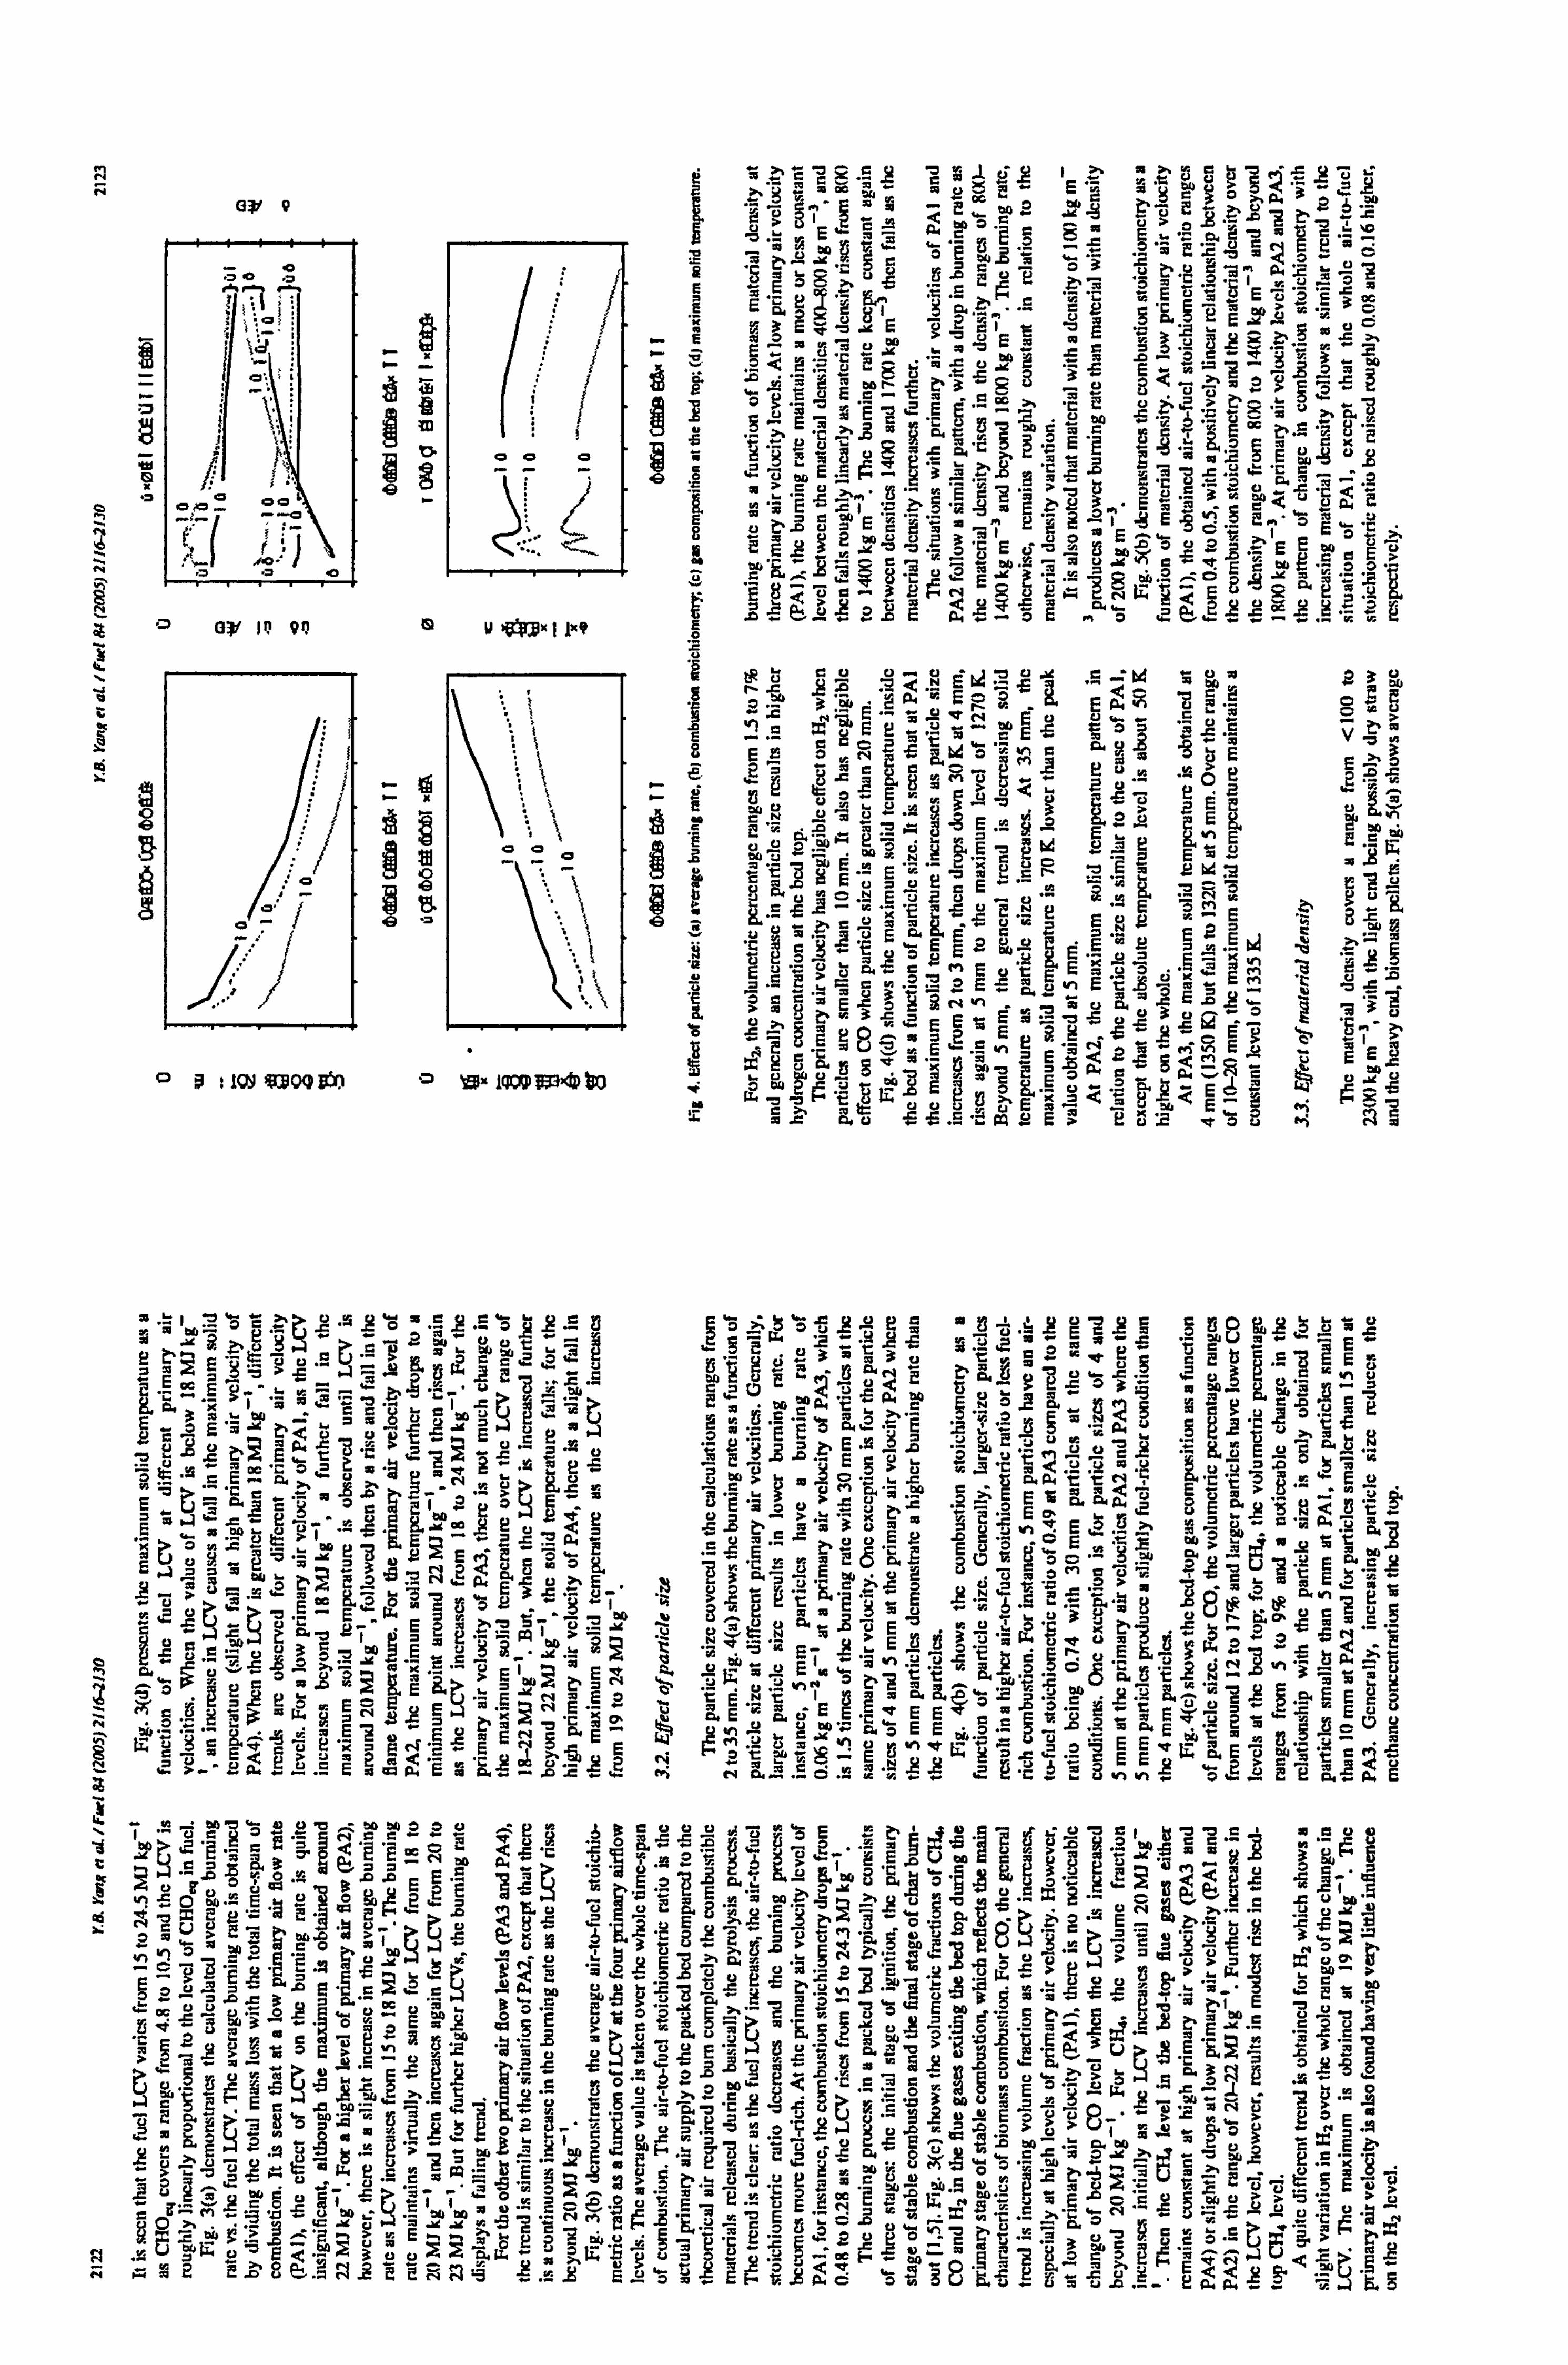
Gib' 9
`o
i
e
Oý° OO4
ýt- fro
ýý"".
"--....
a 1v 19 94 mY ox. 11.9
1 4ý
10 °- fý1
C
N
O
m
0ai 149 9[990 ion 0 W. 140o 1EM-t $0
' Äßm_ e ý"x ö'. äß öyy`ý"°- ü
.5ýmmma
Eä ÄäS otyE �1, e; ä
m0C HfjIhj
24 e- m-. u 3a
V ýj ?q
n '-0 ue0Eom
C" kq 'g r L_ ýS ? T:. 2 Wj( KG", VI
7 ý9 "ý
E G'' F. EE
ý{ r
öl E
tý. v Ti x. E ri
ýsEEN9EE
a-üw«. m cE2wä: äýar 3-
2
0
r N 8
N_
O t
O
e Z, -E -a H1IpmTüet ä^ ääEy wYäE Eý ýSjc o p.
ö3tU 622
E aoý ý ßj1 ni.. ýý "c Fý A d, ý 3,. Yr. 3E
'15 es
14
Äý$Eý E 13
- . 0b LIwjF_°aSm ZcL a, EC,
-GXE
s' ii -- . k° 'Aye 3n"GEzý3 a-. ,
QP
.8E "ý E
._o vi _ý
eL n. m :v UÄU2mUÜ3
.mImE . -. W "ü IOT 2E4 v ti v. ý^yEd _
üm ouf= t
«'EgEE EeEä_
ES3Qva 3kýca Se vk.: ý' g
'E 'E 22 MAM i<,. ee 40
ýry ýä p Epýi°"ýe eý6C ö eun '° «3 oui,
E IS SÄ4c &o^ M. «Ac
E §?
ä `^ '
ItE
0a s
R :R J E- äa` e m
ä . iýo Eua
, Eu
Eýä LU.. eý rEi E 0- EEäý
Eäß ;ö -3
ee' 3« «Eeü r= ÄÄ
uEt ýý$ N vý `m ua
K, E^ Es
rý `ý ý'u 3 am
uT urý Z. w3vý? E5 Eý '9 ., suu
s_ EE' w2E
3 uý .. p =cE
ý
o _u i
. 'N v
vQu. Yj
u E ä ä <E`
l M ,-x ' 'e . ý,
ý+ .äuü ms au = ßa7 M E. Eü
m ^ e icsu M
-. <3 s
üÜ33gcä .9;
WmeL -*
c. -= E~
yaCa qL u
ümäm 'a
c- ý .aäýttN
'L r5y $ELý-üä ;_8EEünäa, E +3Gl7't.
,z 'ä 3vz `° - ti -eEeÜa, iä ý- e ii P+ üy
sEvesa .«uEgEOgE ,zmw. 2 rý Ä 8ä C7 ye
" 'ý amO `z u5aU8 tR - 12. w. Iu Qj eN ý"a ü 'ý 'u 40 'G' 3os ti. aasc
yuka EI ý 'ant
.tvC "G. iS E N^ n3ä «a äü au., ný Z`ý ar 'Ä EKäEaaaý. WA3E
. 91 E
vEi emEäEEEtmav ^YS
oe
NÄaEnvZgweE E° l: ö E> eü -8
m ýi eý asEd .-K 'Y
-2A "c
3ünn; ^Y, L' ä« aE
10p ^ CI cC iii NGC '''"'
`V rý. "ý"
Ö
. S. «Eüyq yý qL vVy
'7 =I NCCm6Y8
,2rä^EEyUm° ;5 a° a r¢ ;l,
- t, m 0.
'" u Q . "1 "°- r° ý , v°. ' öuý
ya J, EE°m 'E ý "J y=
FLla ü ýp ö "S eýq3 rl äFca
«O. E Qý d5zC aý zu um= L
Eý _gE_F ä oa %L 22o 15. a eo ý
,ýý, u "o ""ý ý"c5e2erum .q
`c "- ý
/ý'^ uNä>.. _ ._a ýc u Ný2uüvßä^
ýs. OL. D 10 > ýj V«K 1j "Cý ii "ý Iillhjh1iI1i C3 "7
r `ý 3Exvo, 6" ä ,oo m^ >. u qý }e ;2
«9 0 `z
c m"a SE3 1ii: JI1Hi .$ o' jJIjT °ý Eýýýo
tu" "
.. p` , _' -g gp
aY>is Sa--
üEgU9Eam >. c
c rv -§ o>
` >. ýeýL'Q CE=ö . "E
ý ". wýF, 9 !2 sÜ^o
^ cý car "c a3mupx mý > r°L mzauu., yß u nEs
ü 'm
uEAu "> r ,='? Ji ýc qE
aa 2
ýc 9pc, «pü tý" -rrä "ý ucE }'`
> --5 fis' ä-
ee 72 ý^ Eý ü^ u ß°i3 eui oZ"=^,. ä=vCs'
"^., . ýrte. "xo'ýl- `. daýZ`, u LýPäem^_tii. äu Lý aýý-,.. tr. °i. ü.. >~FjEüü v b4 es a- amCpý L` u>
R g: " ý�ý .ýcoýýiým
IQ iA °y ýNýävfE "ý E ;ýEE2cýu Lý,
k_ Tý "= , ý.
cjNý "E . 'ýi ̂ «^ýv
.ýu>u if "2 Zöw .crE..
o.. $u° '^. e ý` .=ä3eve= [ý, ý "sý., '>
ý` x
uEQ3vuo. wm ;ýk. &yuo o° s ,?,
'm ý° m« Qa pa L 'ý 90s 'E n"1 >
. -. z2 Eý 8ý. ýa iýý' 2N`ý1°5 ý Y, Eý ö ýý Eý ý. isäc ö Lý 'ýCý Y. ü e "f; z üä ýF L'ää ýQ r. V. 1 ä. $
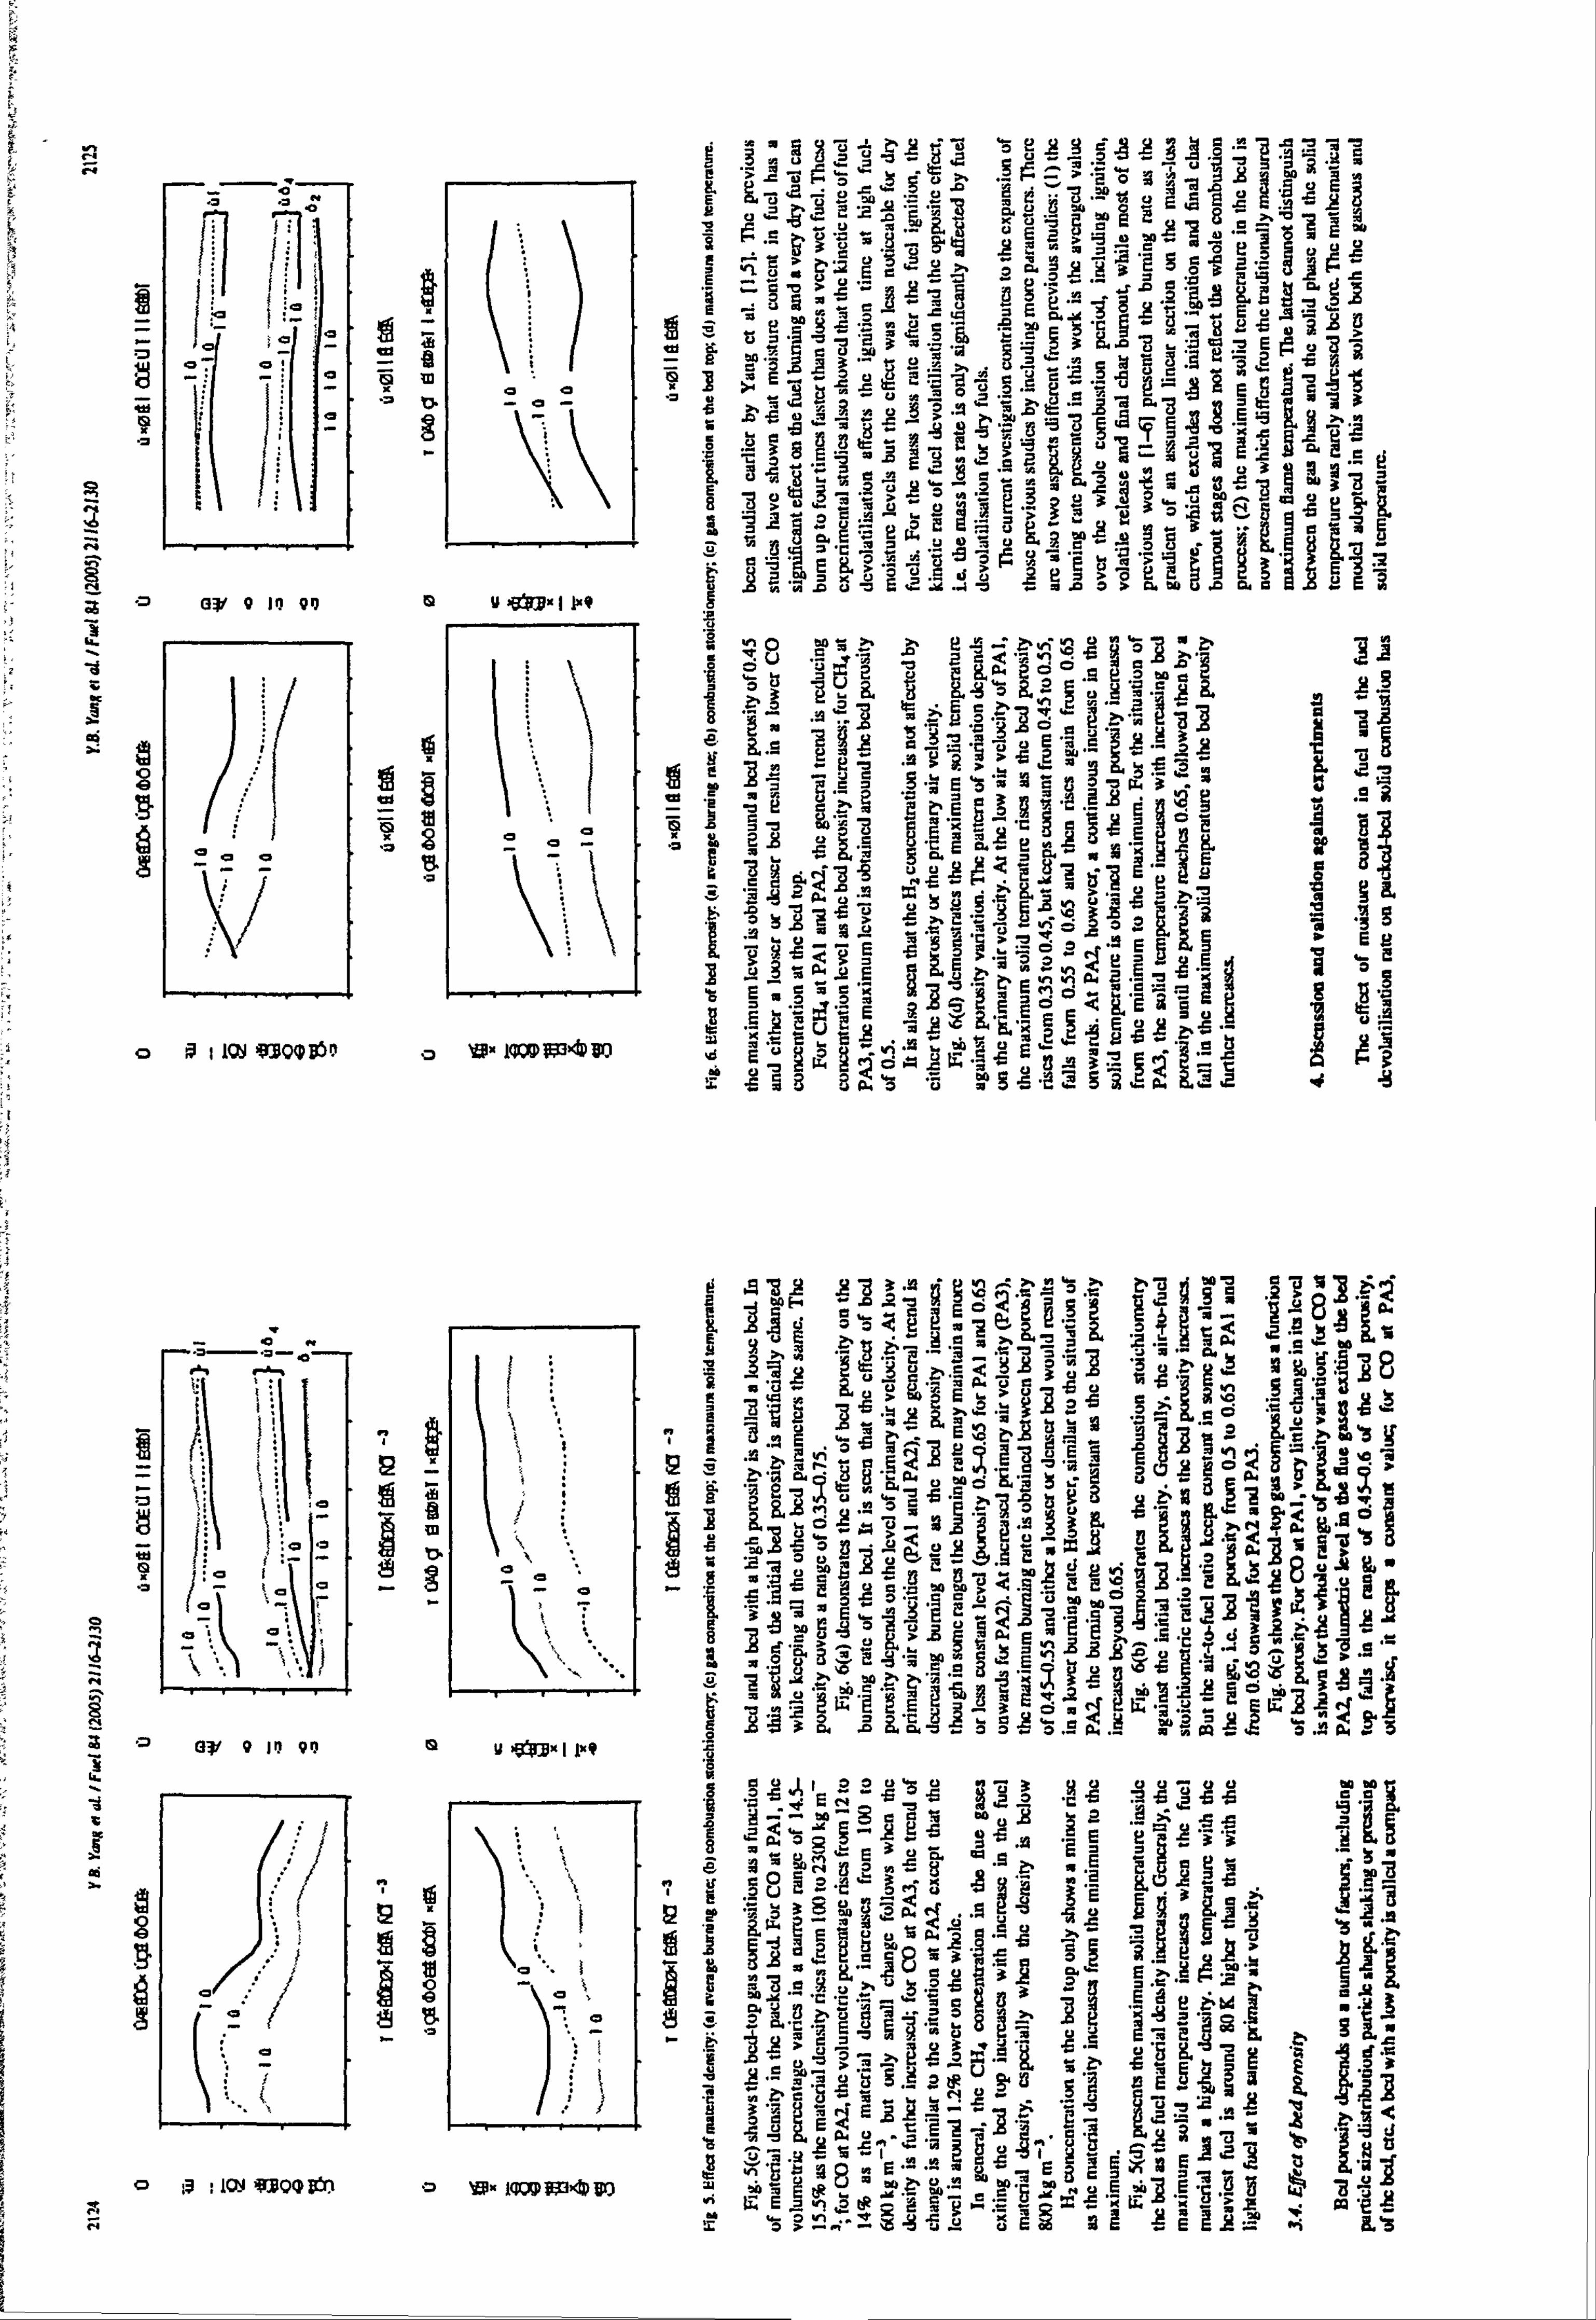
:°Eü ýt>3^
«w«Ä "n° Li °E uni Eo
ýý E ý_
v° `i rVÄý ýy tü? V°ýVCEýý 45 uý Al ýý
9y
f}E %1 ürEeäa3r
,q 73r.
2E So
42 yAte Eia
p 8ý EýAýý w°..
ý °- "ýa
ýýýaSýäý3 El ý
°6 C
SE i it ü8!
2- ä-ý 0c 011 -Rý 'nm:
rE^w °u 'ü fý' cyä
dIi
nýS10
QQ U! px. 11.9 suE as E
"; ;ý ýý, ere Ea. Ci 11
'7ýp
0m$°
, "o
° Yo 2lei J
"ý C
1ý Ea2
ý'4f ^6$o 5$ý >äý ,. ý SE 9E E
ý1 E_ Z° it! es
e'K ý. Z Ecýh m
e"-
$E q'a $4 E° C 8°
.g 2UE Eäi ý'IS'K EE rs "_ X o ip tICU 930mB5^ 0 1ý"1 ýdD$ýJ E°Ew'ý E? ý ý rret
Fý ý3
3äi ä85 Uýs$
äýa$
9 412.2 .8sa -R 13
mgF cEq
Lý sA _$
ýý8 y'3
ä
°° °ý Iü edýl3ýý35
3 Lat6g'u3ý: ý'Cj
- E: ¢=ýZ° "ý ý°ý °. ýýý E"A ý ö'ß'ä ýýý ö6 ýT ýýqe^>ä
a bo bG .iIt
. 84 o o
_° '5 c t3 °y
.ýu Ca
BE AE .S
ci ö
.e
9 IR 04 a Y'99ý"i 1"P .ä
w .0
b, ý 'dE3o$
wýEýý e°3 öB
U0 IL
twwE6uvad3 E2 ",
öo{w, ý
äx ýT, ýL+ öý q 3ý g` ý" =L mw b9t
,
ýs J 1II1i1I!! w. ý
g
U 4i ä jý f°
.3 1109 WQQIKn 15 1ýw 1WýiýdA8E7 ' sr. E výj t 'm`
ee 'Qm` E
'E P Oo
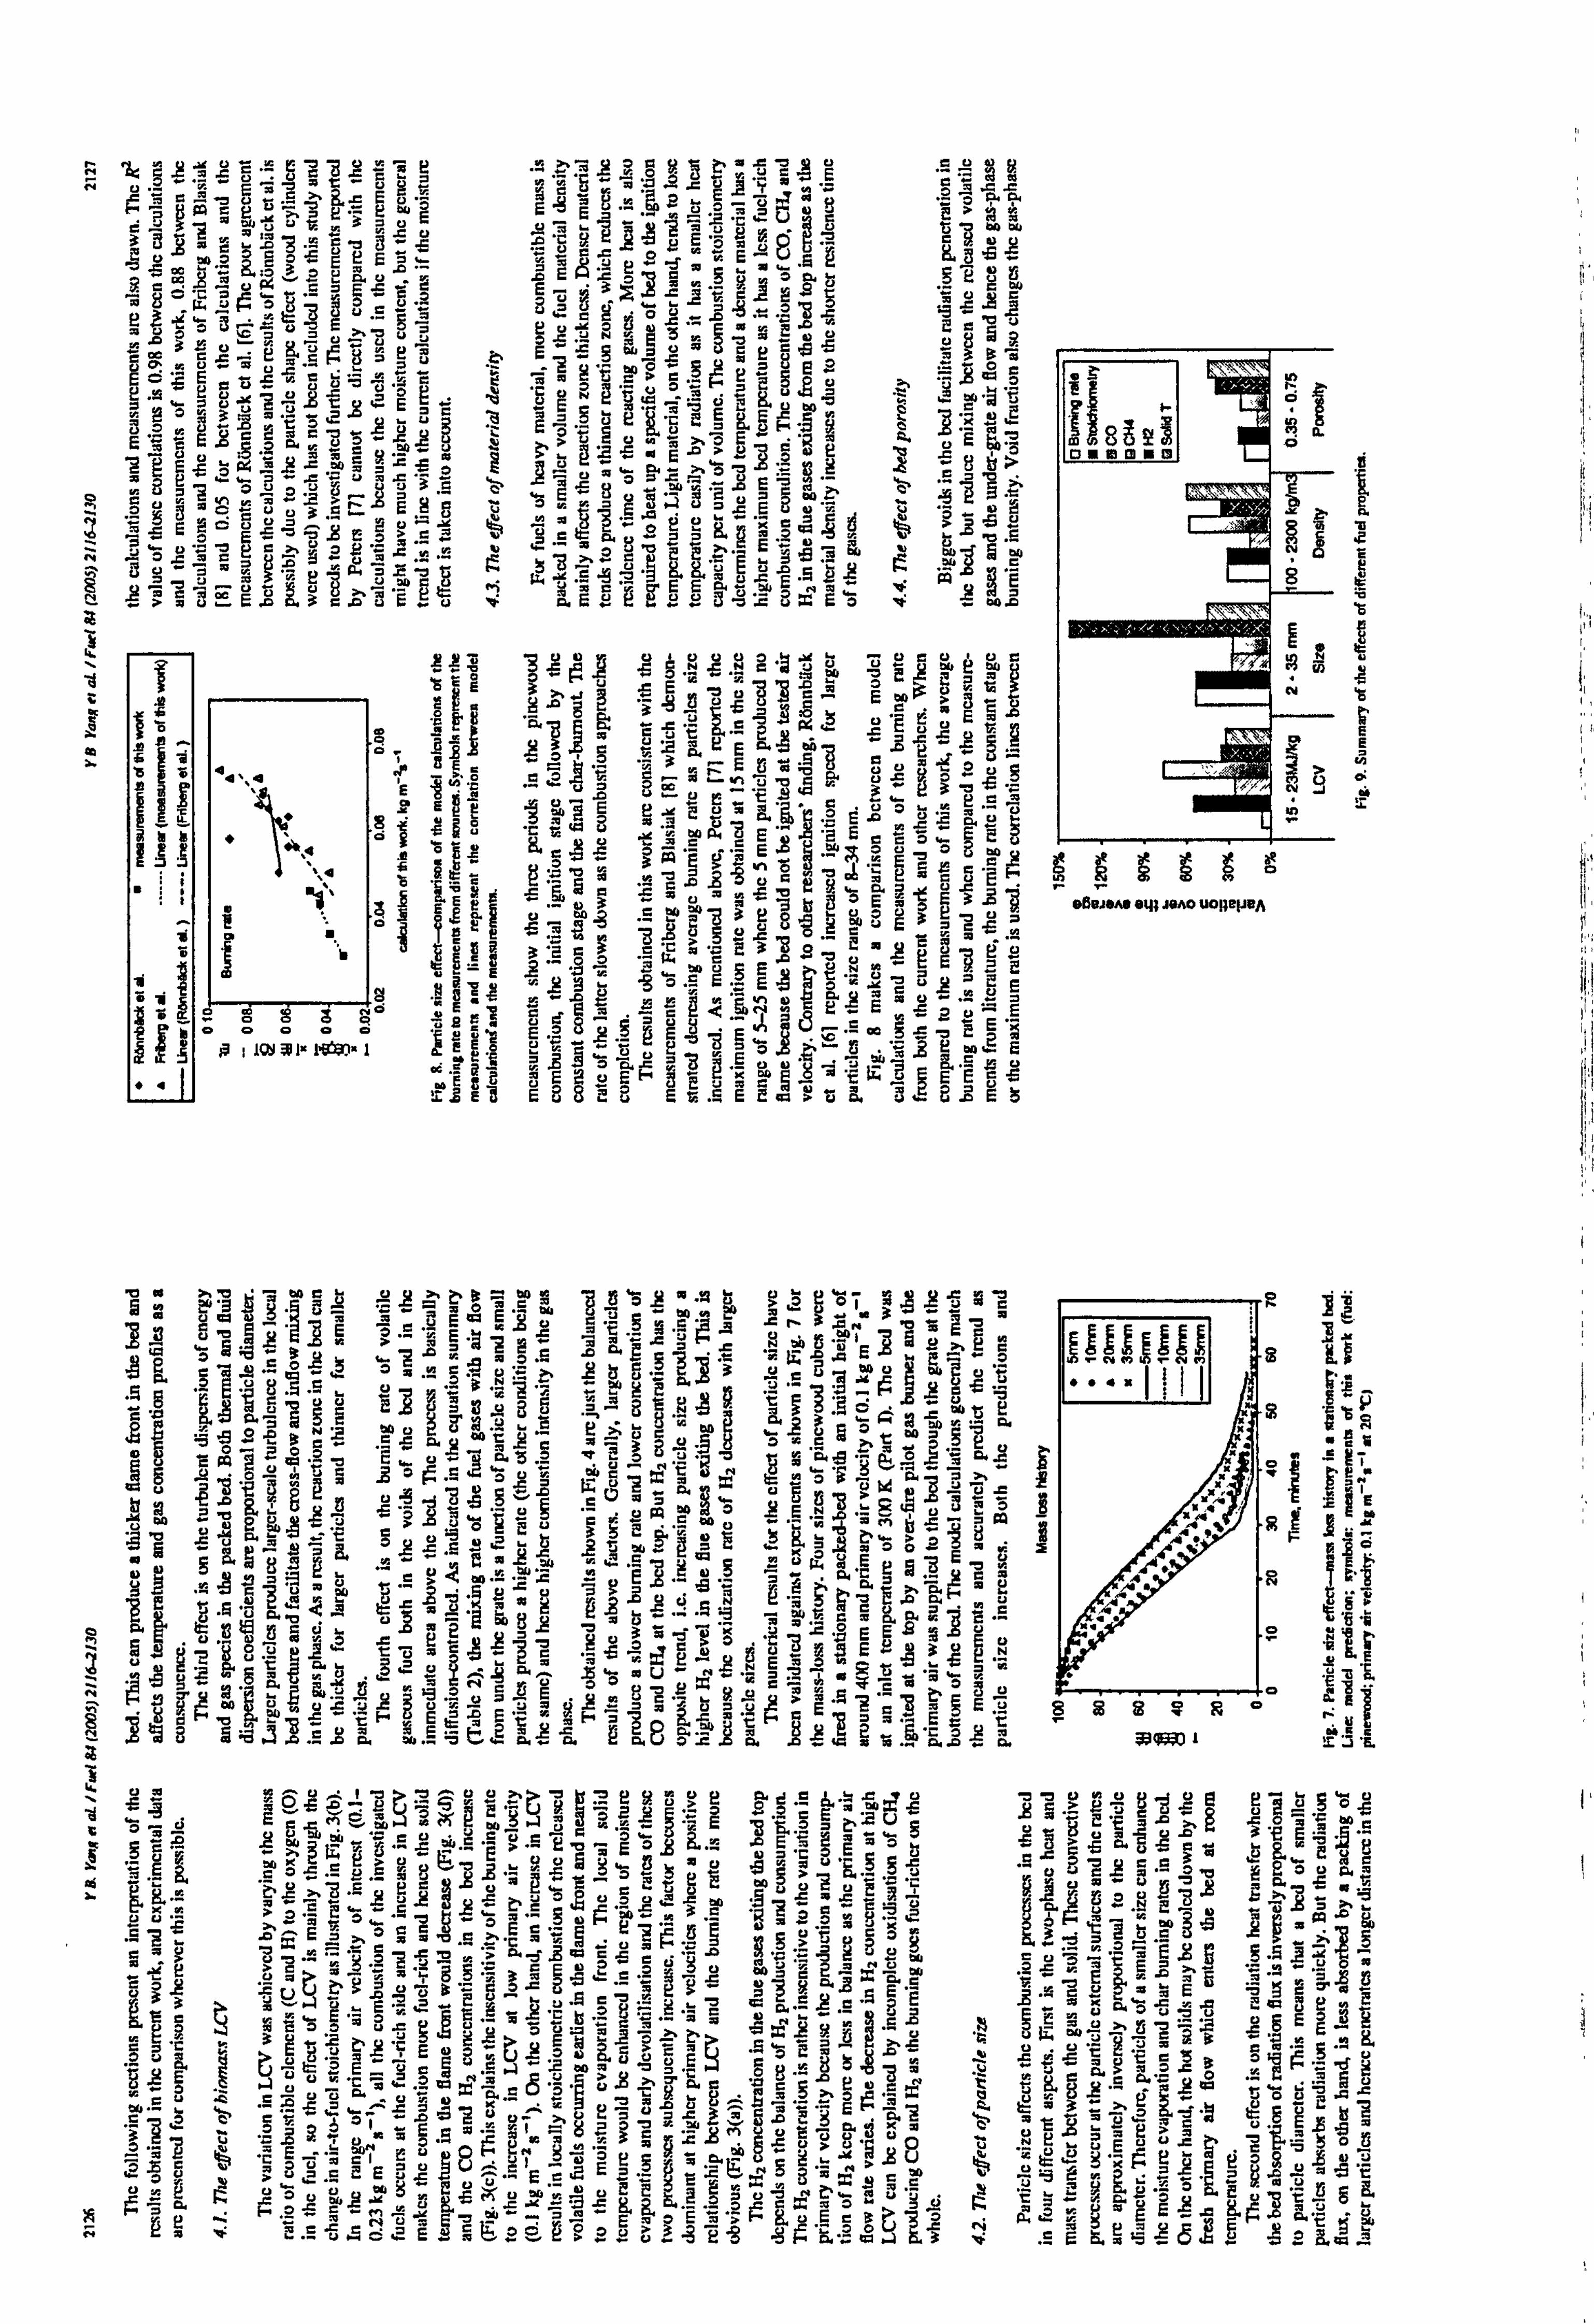
Qi -EyÖL
Cý o" ü
-j79ÜCE
yý A ý. -. L EYA
"ý"ýL E
'Q ýN
? wä ý e. aý iij ý"L EÜ "ý Axü3vE
.. ýa =E
"c w
U° e E°=
" 'yU" " >ä . ?ý
$cu PG t" c5 EL. e Eü
y3 rAXS ý' Yý m
ä "ý ö cý v? E L' uo iS mtw it u 't eý
C OC
3C
^'
e ýy G E'1 i E ý' LA9
L=1
y
Sö9 1 U Ed«Eaüe.
üb fe ý
"ý =V üý üLCWE C
`e
b
Y "M-TAW uýEBu
"U E
N" Äý Äý tl L "' U ý
y p
=Iwý
Yý C "ý "J = `2 ýä3 rý m .ýý ý2
ýu
` 'a
pq ä=ý ý`i B °L E ý, EL ö R«
sý Z EEoavuL ý"m Us eo zýL« ý' ý rý
ýýeEääý 3°
Eo ö r. > E .. 1 tý
ör ü U "C c c« EüP
S, ü
_
2 h 00. g
, ti A
" " .j MA Ea 1
ea 11 myta 1 g EE2
wE 1 L4«
IQ ux Eö
1
wP
O
N
8
4C. 4 V
O
ýýy uuv ä LF° wc «u ra c' .rCcuvc 'zm .ä eä
E3a «ý
«_ EoeEv Y°
öre p( , 5pEg`3C
3° eEä Sýjc,, cm ýi
X 1 1= "81Eöäaz 21
c p' f'i A An' ^2
EE ewc
ra E
22 öu
@g "ý _ý` p 'te' E2
5cCýäecüF "ý ý` 3E es
äe rýýýä«aý ýEri°E3
ö 'Y .t`$3
"2 ö. wä=P3M .4vv .2cE fý} P
öb .4
c- EüE
ö¢ ö8ö 2j, _9F
Eý <% 'n 0 e- Ee2. E
ü '° ümÜ°m r_ ER gýr üo00ofgE .vg it' EE ,ý
,ý ;o "- 2
aýÄ1 1Q1 ý 1" iai ich ýYa 3-5 E8uEFPKm pý iii Fý EE c«
"mEZuzcCv Es to $Ea8züEu-EP m> Zäu u- eAEb
eOMM ey; nano uopepep
I
E E
h
P Y
5üu"ä?
e+ E, Em
sPe to sr ý�m 3
"o m '° aE 1g E. -9 -g m
uýj, yJ äm
p ..
papa ,c e"£ ....
IiP
GCi;
iii
ti C
au vCu `c_ eJ ep cWL7, ar
2a-gý-e. vä2xüwö am ý" w ü `e GO A "ýE ,,,,
. ue "p m :3'
;q "=
8`l ýi- oFv 04 üz i3 x tt dý
ga '. =T
ýy .1
? ßoä ýýö äý
ýu ýS uoC'u
ýiEp. _Sýc
äu$ý3' ; ýY
32
ýo a°ýQýYýýýw"C ca ýo°c 3'i
om° lmý^64 °ý w1$.
ag Öy. ä5 Lýj
Emd yý ý;., ýe
p "F 'ü p, ppa mý_ ä ... .S '3
ltIllhlIIfl;
` i''frä (y it tý ýj ur Ea' 2qq =03m 'ý >c='E E$ Euo u. uy eý ü
'2 ý+ o u_ o, " >? mm "ý^ý «v 'ST E ý°-ý"
,EäSEE ýJ'
3nYE
-22
. sue Q" "to. üO.. «u. +ý ' Sj o". -. 3S '"- mU=7^a S< ii
,,, "ý a. ý. y ä° 69u =Cäoc ý-ý x$ oäzEm°i E$$ 13
blvd«t F'
EEt9F",, . E'g aE" 8" $$$R°r6L $ 9ö. ý. Z-ý' ö. ýuEww Üös ö u`ý
sýo. ýää ä ýý1 si`s
0
N
8
N_
i
Z
4 i
i
g -1 zeMvmm tYl pýq ̂ qe9 . eE :a 2 j! .f. LT MAp so e
$wG E
>ý'. o° v° E
. ý' ü r. E°ü . -5 m ä°
i3ä $ ä. Em
ýEL .- 0« e«9o.
üu
eCE "A a2 G- 0 SL
Ye
0p L C "ý Tý
et
eu CL, g S9 r
dl U= ''. " C
9 ,
8'c ree Up., 7 . ýy
rrs .G U
. YE Li
O` q
ýy ..
ü` U7A ý
j« J «
Trä7 `" .S".,
L j; ?;
C ý" ýC7 "90 v 'ým C
E ý G
M "ý
`A« ."
'ý Är . ýJ
SjKY?
C' '
« V
.ý CUi "k
a. 2
C ýY
'T ý1
Nj2
i
II
mm U e
1 v 7"-' r"ý a d3. ým Fý+. ä
72
J e« jý
"«U. 7 . U.
m uy
l .3 ä
,D v U" 't p 7. 'ßi .ýü
Om
$3 3
-ä rV Z` ý' ü3ü? s 9-,
;7 0 ;3°. "3 Ee
II Y
g 'S. ,. 5ý. äÄE5
" c ý. C . 4E- ` .$. Jy2Ä9
3omus '. . ° ' ' u
=de2mP. E
2 $e 'F
ýE m cxi cd ýü
"ý .ý °" -' `
B ü {ý
ý as $ý ý
L 'ä E E-
C t E- E ff e .
>äCEm77Vý, GvCA AýýE ýeýu "c
. Tr .ý; AL ö ýüýS ý
^
E
ä ' 5ý ' vv 'ý Ce
dý' m osa
_ ý" 7mv 1F d9
U C _ auvn .C üý' W 'v'z u .ý>.
ad e(ý p«5 d+
UxKL '« '
'7 ;yV fJ ^. -
c1ý "LI c'p
aeu ýj
. -A. yr 'J g"A
't
C rý eye d"a ýý
ä 3
?ýu q üp
. U", 9
� .^ 7
7
c r p3
, '_° 'ýu er - T° üüm
"'Ö" '.. d` 9
.aA .C ýx ärp 9ý t
eei '° `m" t1, rde
ä 9M5 81U0 Ü
' `"_- Ac "2 eZüAÜVt
" t9 8üä Aö ' *fl AC
pu ýq v
'D ü. jUOFg_. "ý 7f. "c Ac$ujue `m d-
ä u° EfE u .G.. E e 2-5 Er
` x
._>U M$mxae o,
u .UZ. x=ä .. - Sj .^E ýi "
ü "3 Gp` 'ý =
a5ý j5 vü cm
qcm üäC u v.
ü u upUömý. « cY, u ,ouuL
h? E ö
-ý Z` .rmü 'ü 't' Hä ý. t '? ° °" ß ' Es
c
2 em v
;m oEý> a- ü
. °. 0- E °3 q s«° ý' ä«« v 3-a 'd '8 $ Eeaý o F
ý. °ý mý .13 a
E . yý 2. p
E$ z äg dr Kg
ä... 2
991199
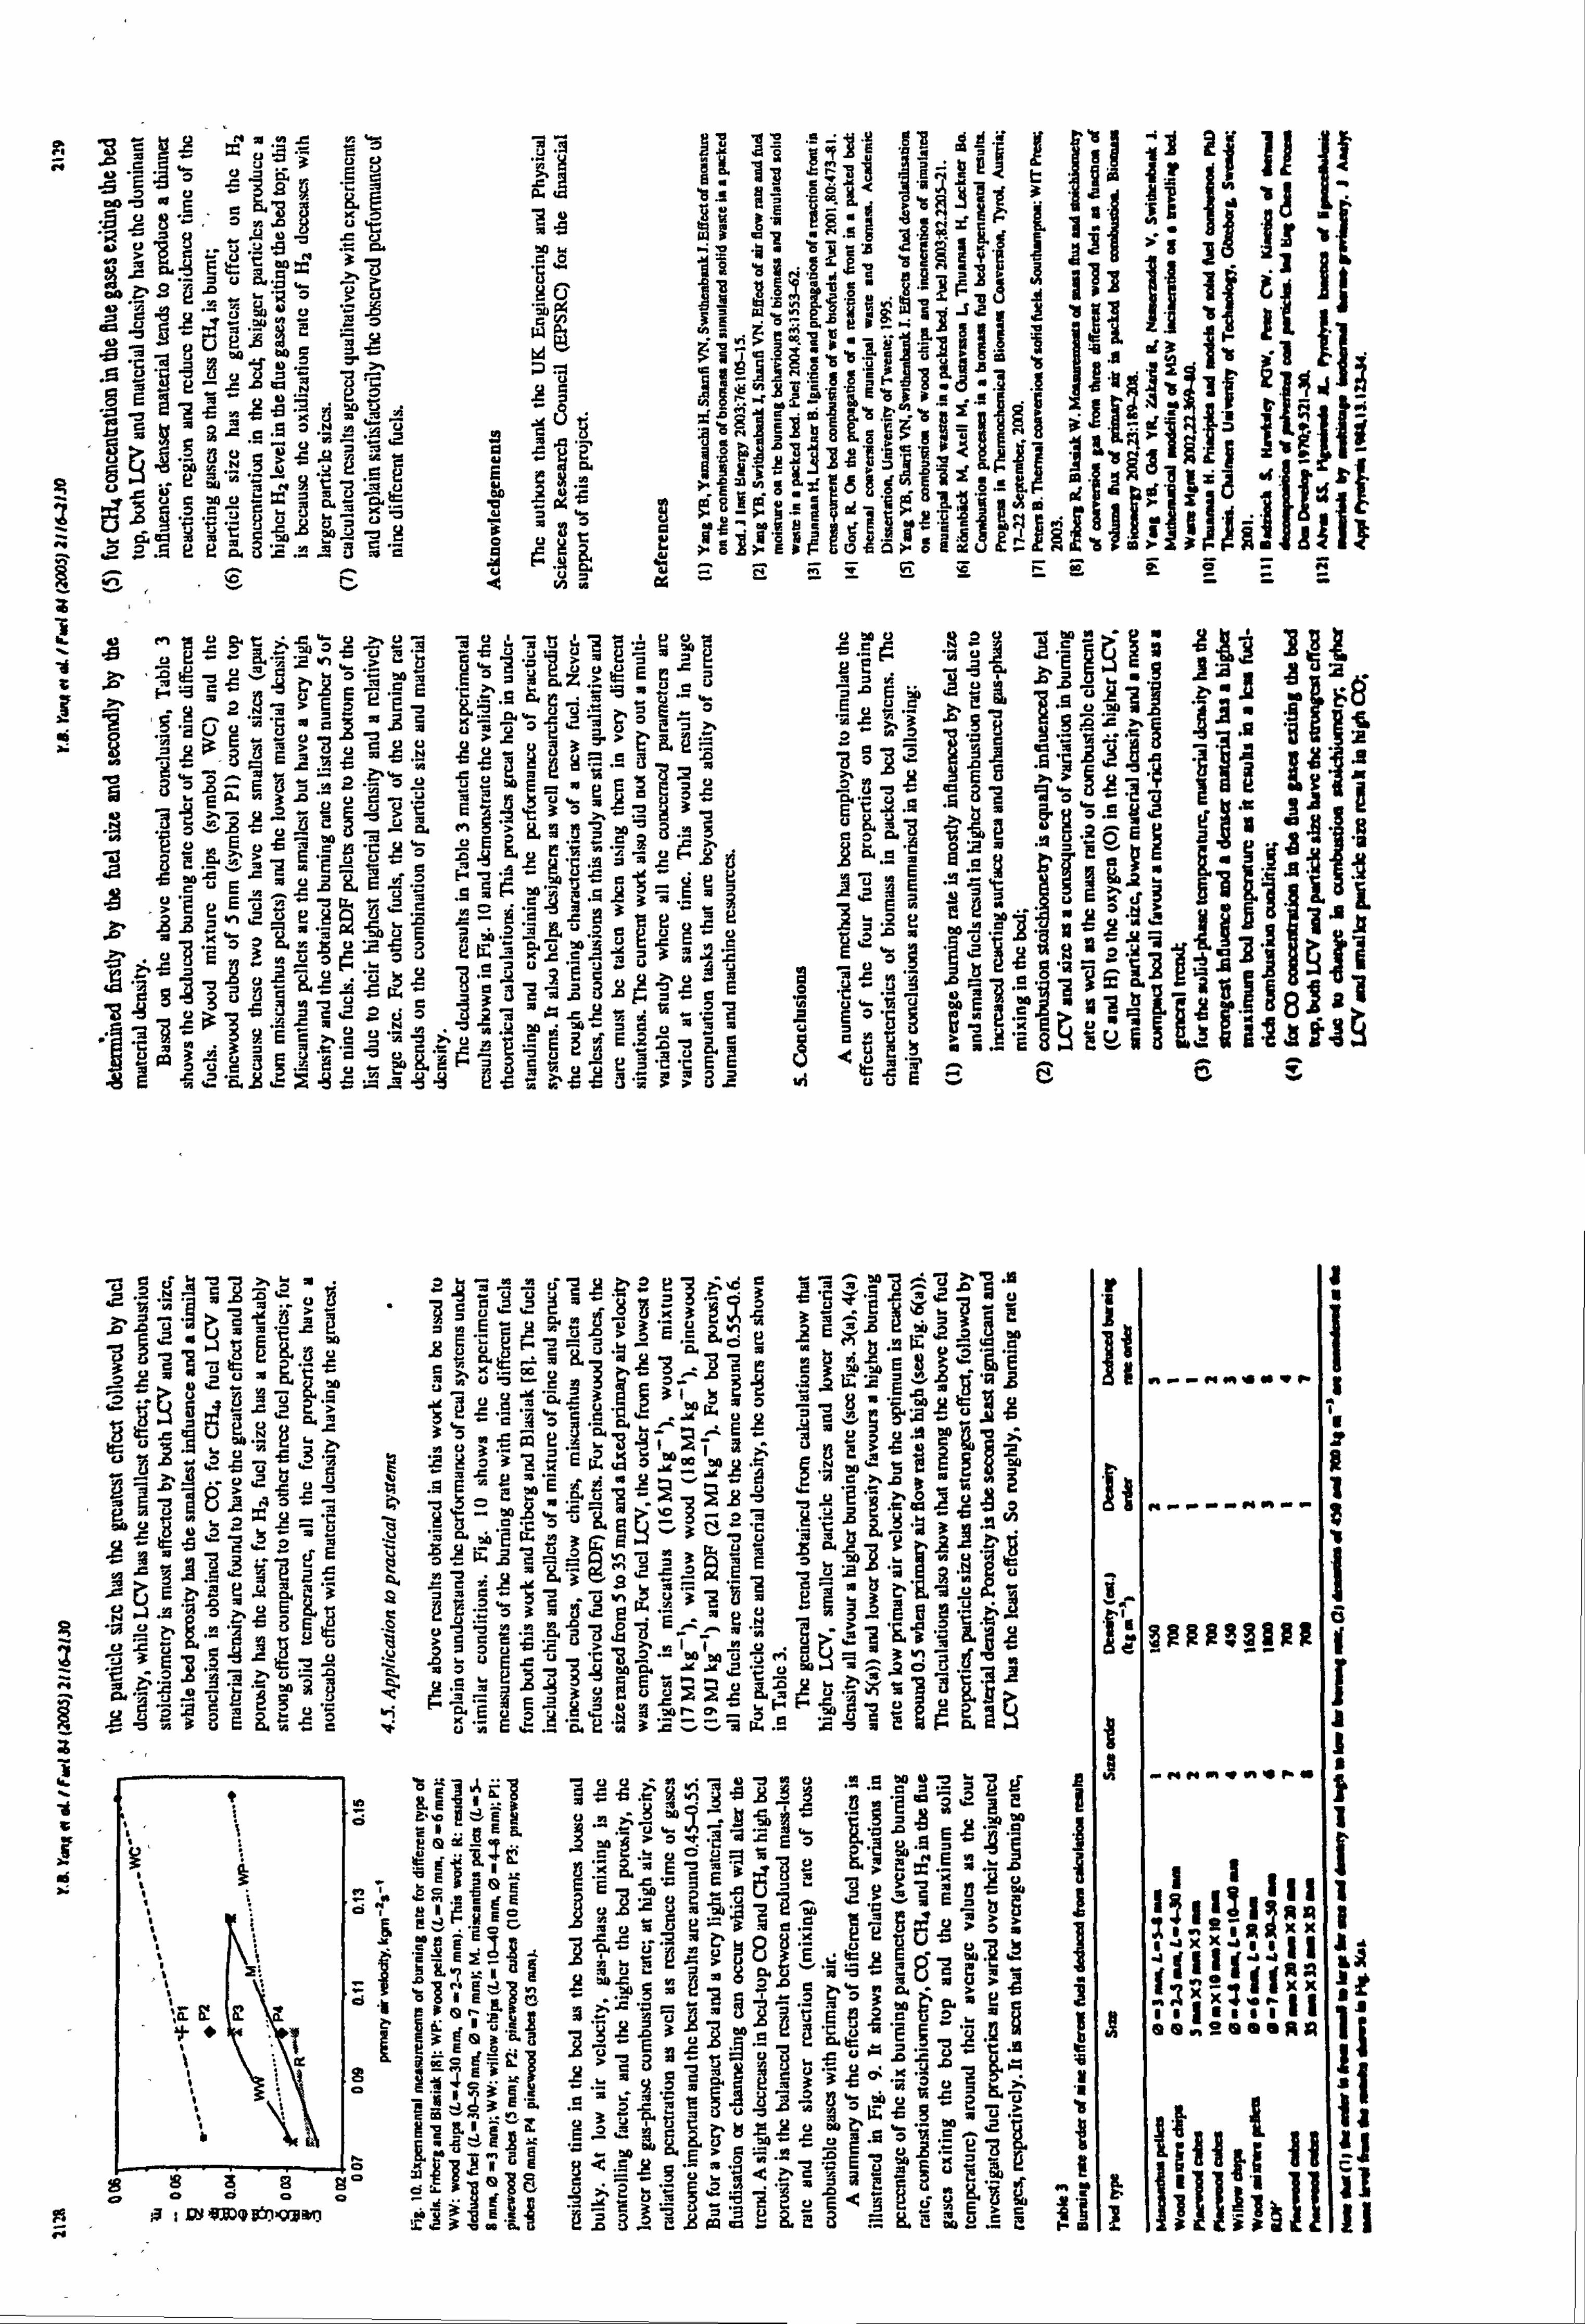
uE-II-ouää84 i' NB",
ýp p
,5am -a 1� Pils
2 "ö .a %b 0 .0MinIS
IL
s2ýý
ý"ý, AmuNypg5 eg
Hd fill
.ýýý cý iii ° "ý" >' X7 7ýS^gSo,; 'ö ig -2
g.
43 A
3f .9 11A, . "a s__ "Q l*
Ag9$Q
C. F Ci ýÖ P5 6ý NOY M=
I1! 11Hi1II1
°d ÖOi
Jil
"$ `ý s° 3' C °° üe
"ý '9
, c'°i "T' ü 'ý ýu 'a äm4..! 4 gü° ,ý "b ,ýS3ü
L Pý` H '"ý3 e« `ý
"ý Z' 3°°ýE "c ý°ý °' Z . >_ ýA°°°
i--E ý°
"yt
ýý
Pw 3i ýe c Eüö5r°E°ý. ý ý'
"9 um 'ý M
.ý6 . "U °" "rý '° °ü ^u L ý9
v°Äs-3g88g ä_ t a, F.
$ ý^ yß5P. _ oä1E. AEerü4 Eý TüY 'r
.ra .f°.... Ct ,ö >o9 ER at ,°G., ý.,
cý m ý, $ °82 3g '' E tJ
'4n E> t
a. HB. 2'R8r $' ýE yÖ
ý. ýEEýu ý6x'ß'P'° ä"`ýýý; 3ä. ýýe . 2Eý ýýý u ýJý g 4, ý,
T 13ýp^r eýý s c^
.ý Gig s' 9E ew uwwA ! 5S H
PA ý'ý'ä°ýi); wyl ", '-, ýý'ýf°yGý«° ALA m. ".
.rý. ýýi ýý
gý ýýjýý
oga Cy 3wL° `"5 § .10 11 üSä!
« -W -4
j "H JS . -1
'ýý} ýS}.
'Eea. ö°'Äý`i_., e°ý...
ý" JEýý ° ug ä"ýý Ü>ý Eýj E $Y {ýýj
". cu. 0. pl3. v' ýý"äýu°'"F+ýeýý ýs° t'ý? eaEü. dýOLU. Aý'C3i3ý1
Q. $ sC u ; uFý $Är. u e° CäE1UzvaC
° 23 ma8$ ý' EKS `r 3x °3 >8s vi uvEE. '
>. 7CY if äý .aw8 if 3 Ji 'rý 3ä oaW'egýrEta Cu ýýF-? ý E'ýE.
00Ä .i ßo'«0 ä
ýý uý aý u3Yex EoýSýj äv .9yu- .zä..
°e cc .B3
ým 5ý mo8° 'n °° iC
'ö
y. 4
u3r_ _Mx jiiI. fl1 .a
*0. e aco, sý
p ýy e O' =
"ad 3ý 'ý,
s52Ld''; ' 2L3 PG Ev "u 2äu
rcA" ý
N. 7 A ý, uErcC. ý q3ppW. u�uüQ QiQ
yrdef lopotlll
ry üs77u> .sýI1vf 'b a ; "g QO
ttýR 7ne ý7 8 ma"ýýc a', 2 u eu ä 3_A
' ýä L` :2ým 3i ý Cc' c
.? 3°Cüu 'k" u$äv Yi ä 'ü $F yý
cF ýL -14 y i7 83 u "o ri
ö. "H .. ý°. °ý "ý w^ in YuS. w«
cv ü' E9E. ir! 3r F+ ai
t ýäxgES 'ý" yýv f9 s
Eý a' EýI
'D: 10 1 .6i ;a 11 . ýE E8
:2E &= F0E0>`gsQi
Yý c
_"ßg0 3==ä0 +'L ýdr
K aý. L'eüUý>c x"i ;
Silt
ý .YE "8ý 1g Q' "V tJ UunE Jt
= JJ
d `obl Eý iý3 Tr. a ýC ?
"dt`D S yq aý e2g3Xi. aw t
+J f ýe r 3ßi0 ýg ý. 9 äau
eo aý '@ FC ,ý
ýi gen°amAtt is 0
t rc $äcß. --fl I, ä$ ü£ üxpe
EäA aco °i 5ü33 'E "ä cuI
-A t
13 äßu E3ur en ry i II !. dEýýýEc
. 3. a e W-
ý .9öa Yy
gb ýýý ýý0
öýý ,ýNZ8d .S 3`. t ý "ý z .ýT °ä EEsý "cKi
«C E°u ý
L' ,
ý',
Bas g° $9 qam3aCe .ý ng iR1
g4 ý ýFJ
SýOmSY1 ObýTl °S3e
ý'E a' .3-F3 fÄ
m-a e3
`öi IPA IF
hm
t
1
Y! Yi !i
I Io ýI ;=! U. i yA R§
7k It- VC pL9 Eg, i" g ,gE E2ý
< ý$ E]Iv"a
5 fi. 9,
j
öEü :
ä. ý� EUp fir, m
C7o 5^7iY :qcg
E+ý ý ý'ö 5ýEýý
E <8
CCC äýý.
>rea yýEý
p SOULPOüHßUS3N
of 11¬ >s" mg sg tiI
1ý2m. -
ý. P, '"
0E "Q
EE3 E"f
aysEcy ;s ý`j w
.t
pP t ýi^p
S ö<y`ýä 3 ETa
ö3ý' ý4n
9ýS7Egp ý'-.. yý. ýýý69ýäö8¬U rii
iS(7 6
vii mUiz iýS öe.
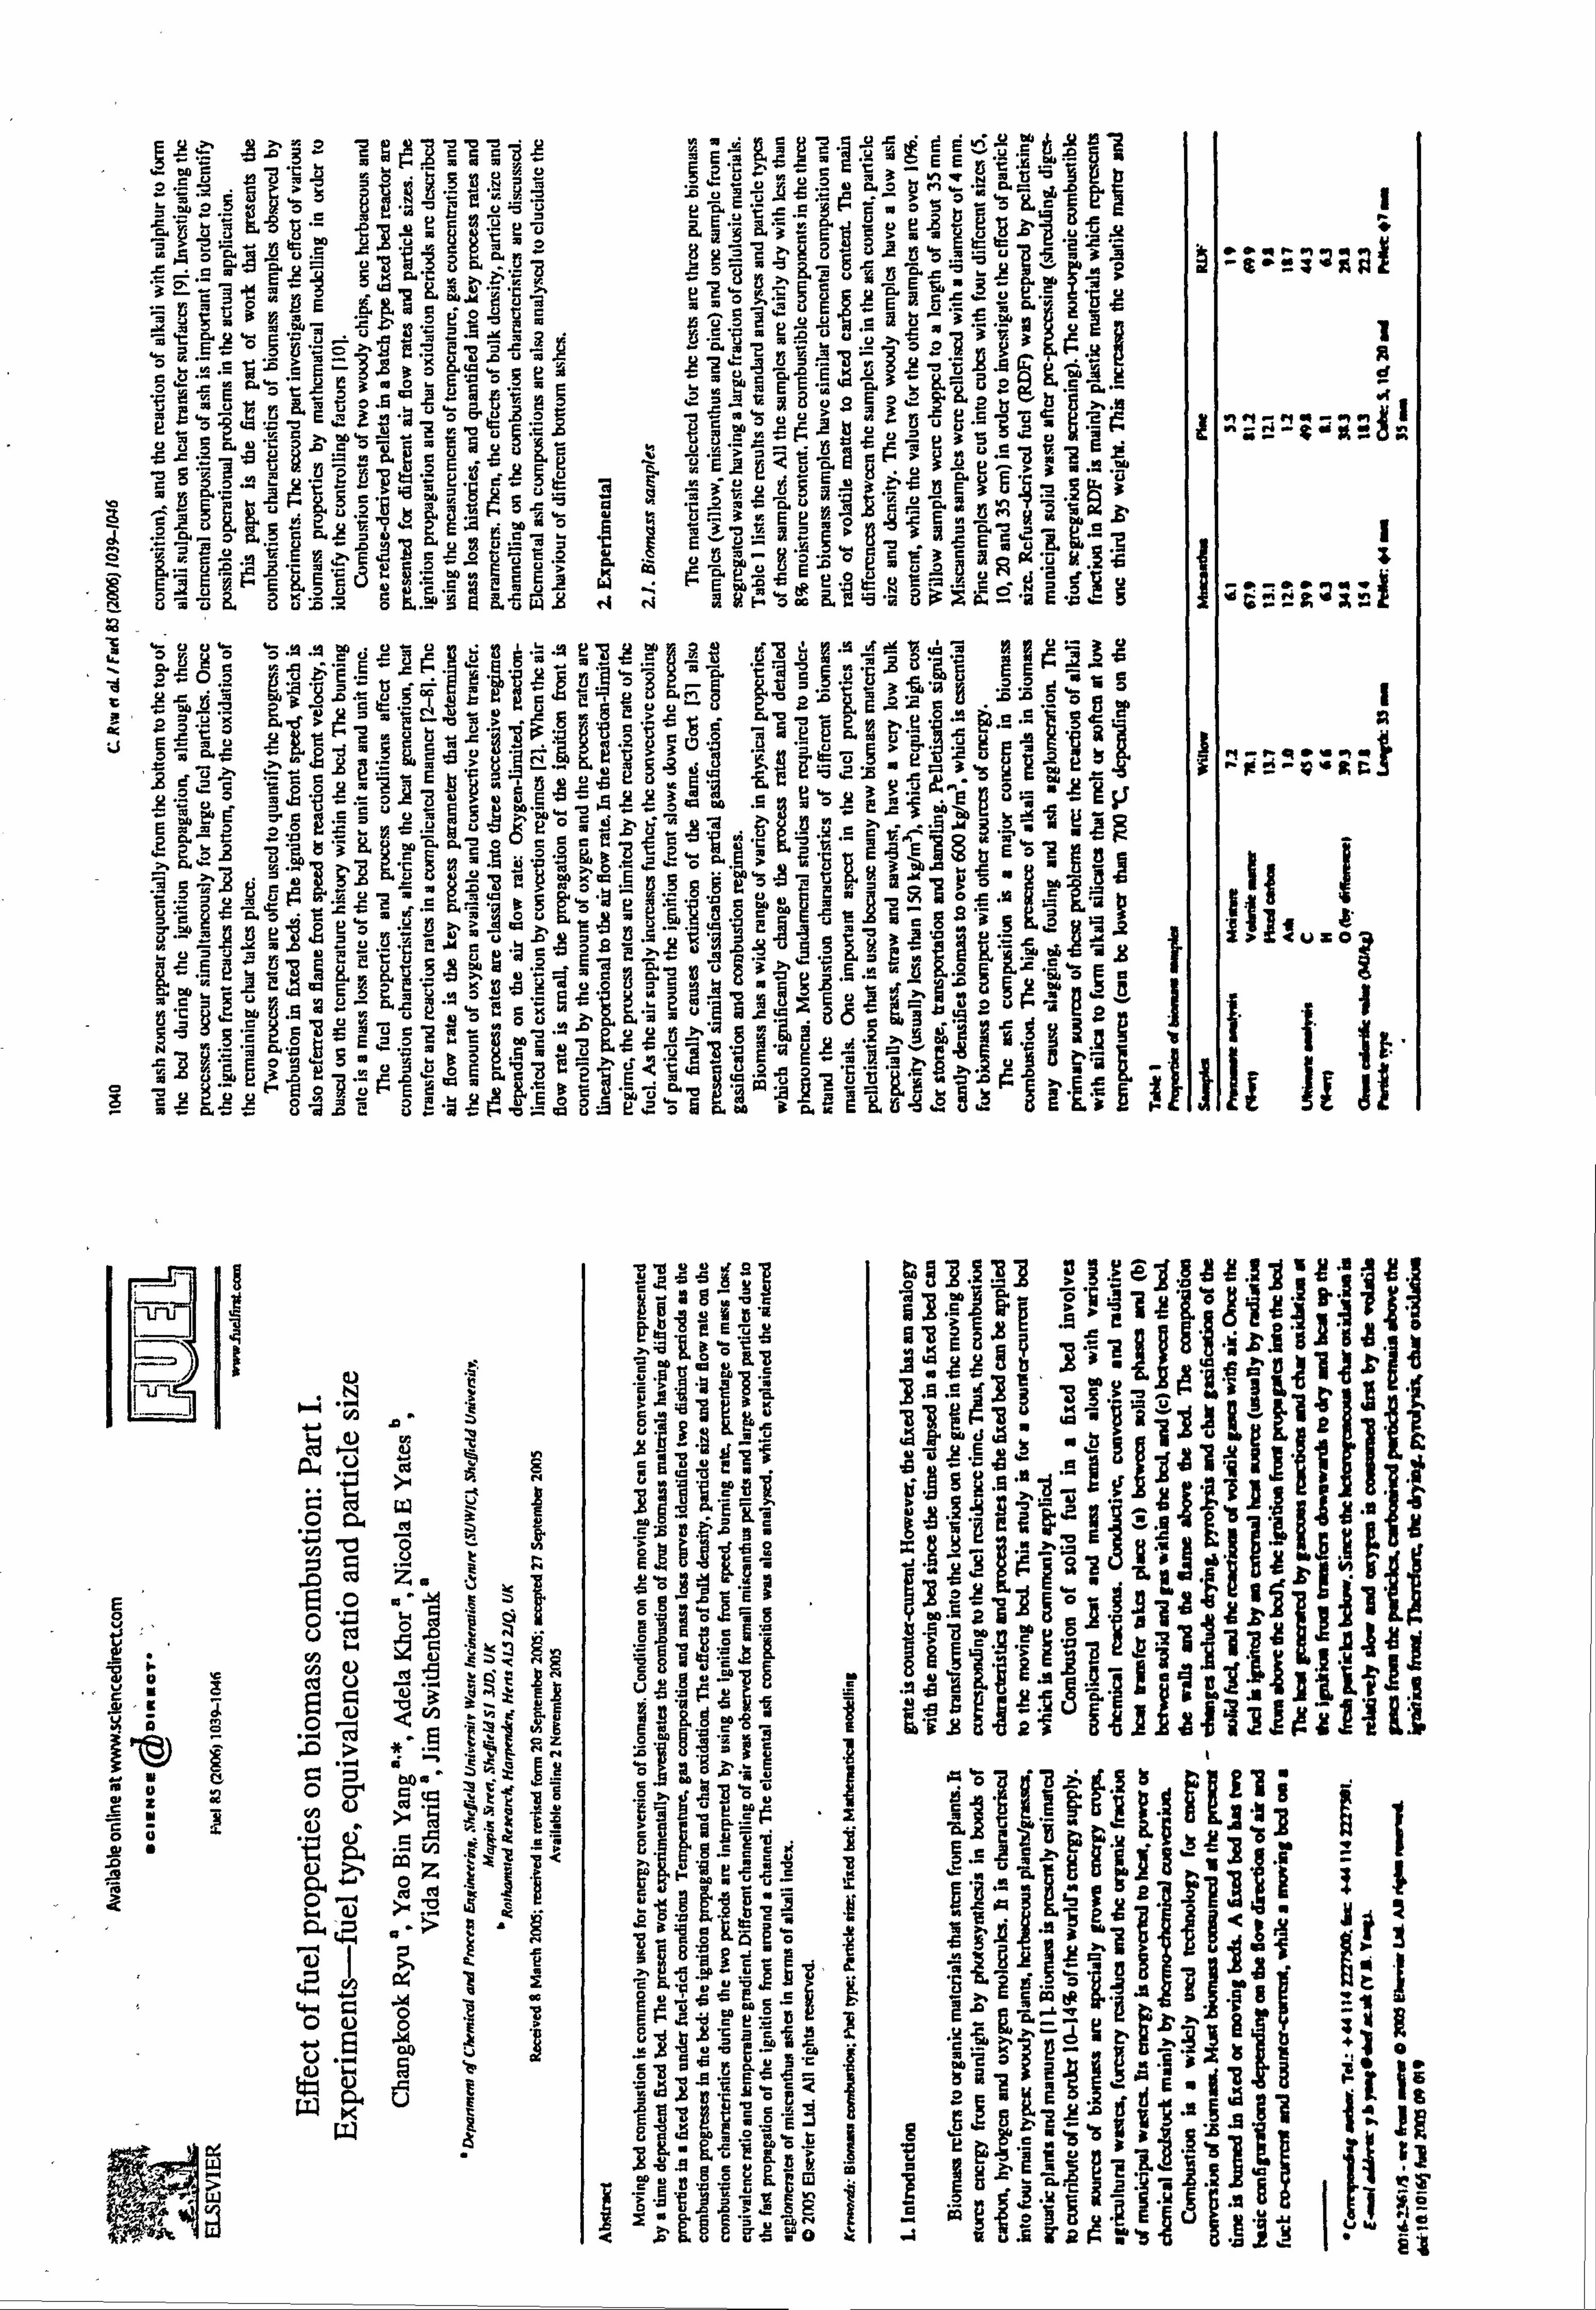
e a d C_ M
Z
V Z
7
q
YvCä1Ö
"ä 4E 5?. 5ä1
LA' °°9Ecý. ö
ä° '3 K
ßr
°Eä?. Y 3oo üa °$ aE
oca u- oywa9u
äü 8'äi ý o. ý ýS ý"ý
B ý'E
C c-- "C "pu'E Pie ue'
ö° pE " .:
üä""a "a
E- "- m wy
e° öä ä ýE
: r5°ý'SEüülFS
ri 'L äv 8vä. o
Y1 AuEve
yý �vä cý 7ý^ r eu
am Vý He I S. 2, T
Is. ü -YS EI7
.1a ý'wwu EE üt= äý
iEEfE 'ý^ý '.
Eýja vövc ý+"ý 3ä
O? EE1 G" Ea ff¬& 0c Si
:a3 "o roAä 'ý o oý
.1 . 79
C. E EýWäýE'? ý8aä_'ý+ý 3ý q
I
1 a d
z
ä3A . 'ý e tu .e
äi "m "'. ý Ä 'Qi c °Ti vü dEi 'ý ä5
. ý, Og
,u . Z' E
'E' ;
,ý. A-
"y` $a.
bk tja 9a
Z. ä I.,
72 -'r pJ
A°u yu; j .Sm ýt "° 'J
'CG U"
C]
E
. °f. pU", t"qý
LIWs Y-
$y
ýt "a uI "C "2 °i '3 °
ýenE" , one yw m5
fit'
t
WEE u"m ý
YE "$DA. C iii t° . wJ .y7UCG Yr. ii
ýQa AII
ä. äcpä "$
8r p- .S>513l "ä
SS ti Eöj pd
°wu Sý Ä a£g
4e E gö°
E ý° t3 'ý"g äa °n ý' ý"`-ý'ýäýý",
ýprýý
ýE'"'pýöüä'ýyä"ýuý8öcmý'ýAý'ýSSii3'ý"ý.. 'ýga
b"i "9, Ö
ÄE ý° E2ErK "3 ocD ma 3^2ac `°
Ee pýG z0uA^'. ý Qä yj ý 'ýý 9uu 9-ýöüyyp "I a6-LIjA
tg Yyýi me of «ä ýý ä $ý
t ý. 4 a5 o°ný G. q
95b IS
Äü 'Fm Ee 3p ý§ "_ y"
w° ä p, "o ýE4 "q ý
.ý öp
ý. 'ýý
m äý F°uä'oýi'.
«'ý FöEa°aýe2uöý icK
Gý wý°ü
DB iSSP rý
_- "y
äý
0 0.
E 0
ä0 ýý
v rY ýu c=
r öü S' "
3
4
42
a .a 0 U
G O
.G
b 9
U
U
cd
.. r
04 t,
. -r N
ti
a
aý 0
aý 4 w O U
W
a"
ö U
z. ö
yr' C
wYr d
td '. g
0Z tu tu
0
d
C
4
ü 3 a
r Y Ci
LI I
a
ýä k
5
-
ii A
d 3
r N
G E C
ög
ä
oZ
a
b t E
m E
I
I
III
li i !1 119- 1 Egli
oyss
üp L "dý
i ii .F "S
.. t A aý 'ý i
G.
tö ii. Äg g5Z'ý 4i iFSTe "ý771I ý iY 0 J.
.2
--6 -- ao =w V
oB Ei^ bd Eýü ' r- S
. b' SE 5E "-
1O ... t SL .
fi Fw tiS 'L .Lw8a
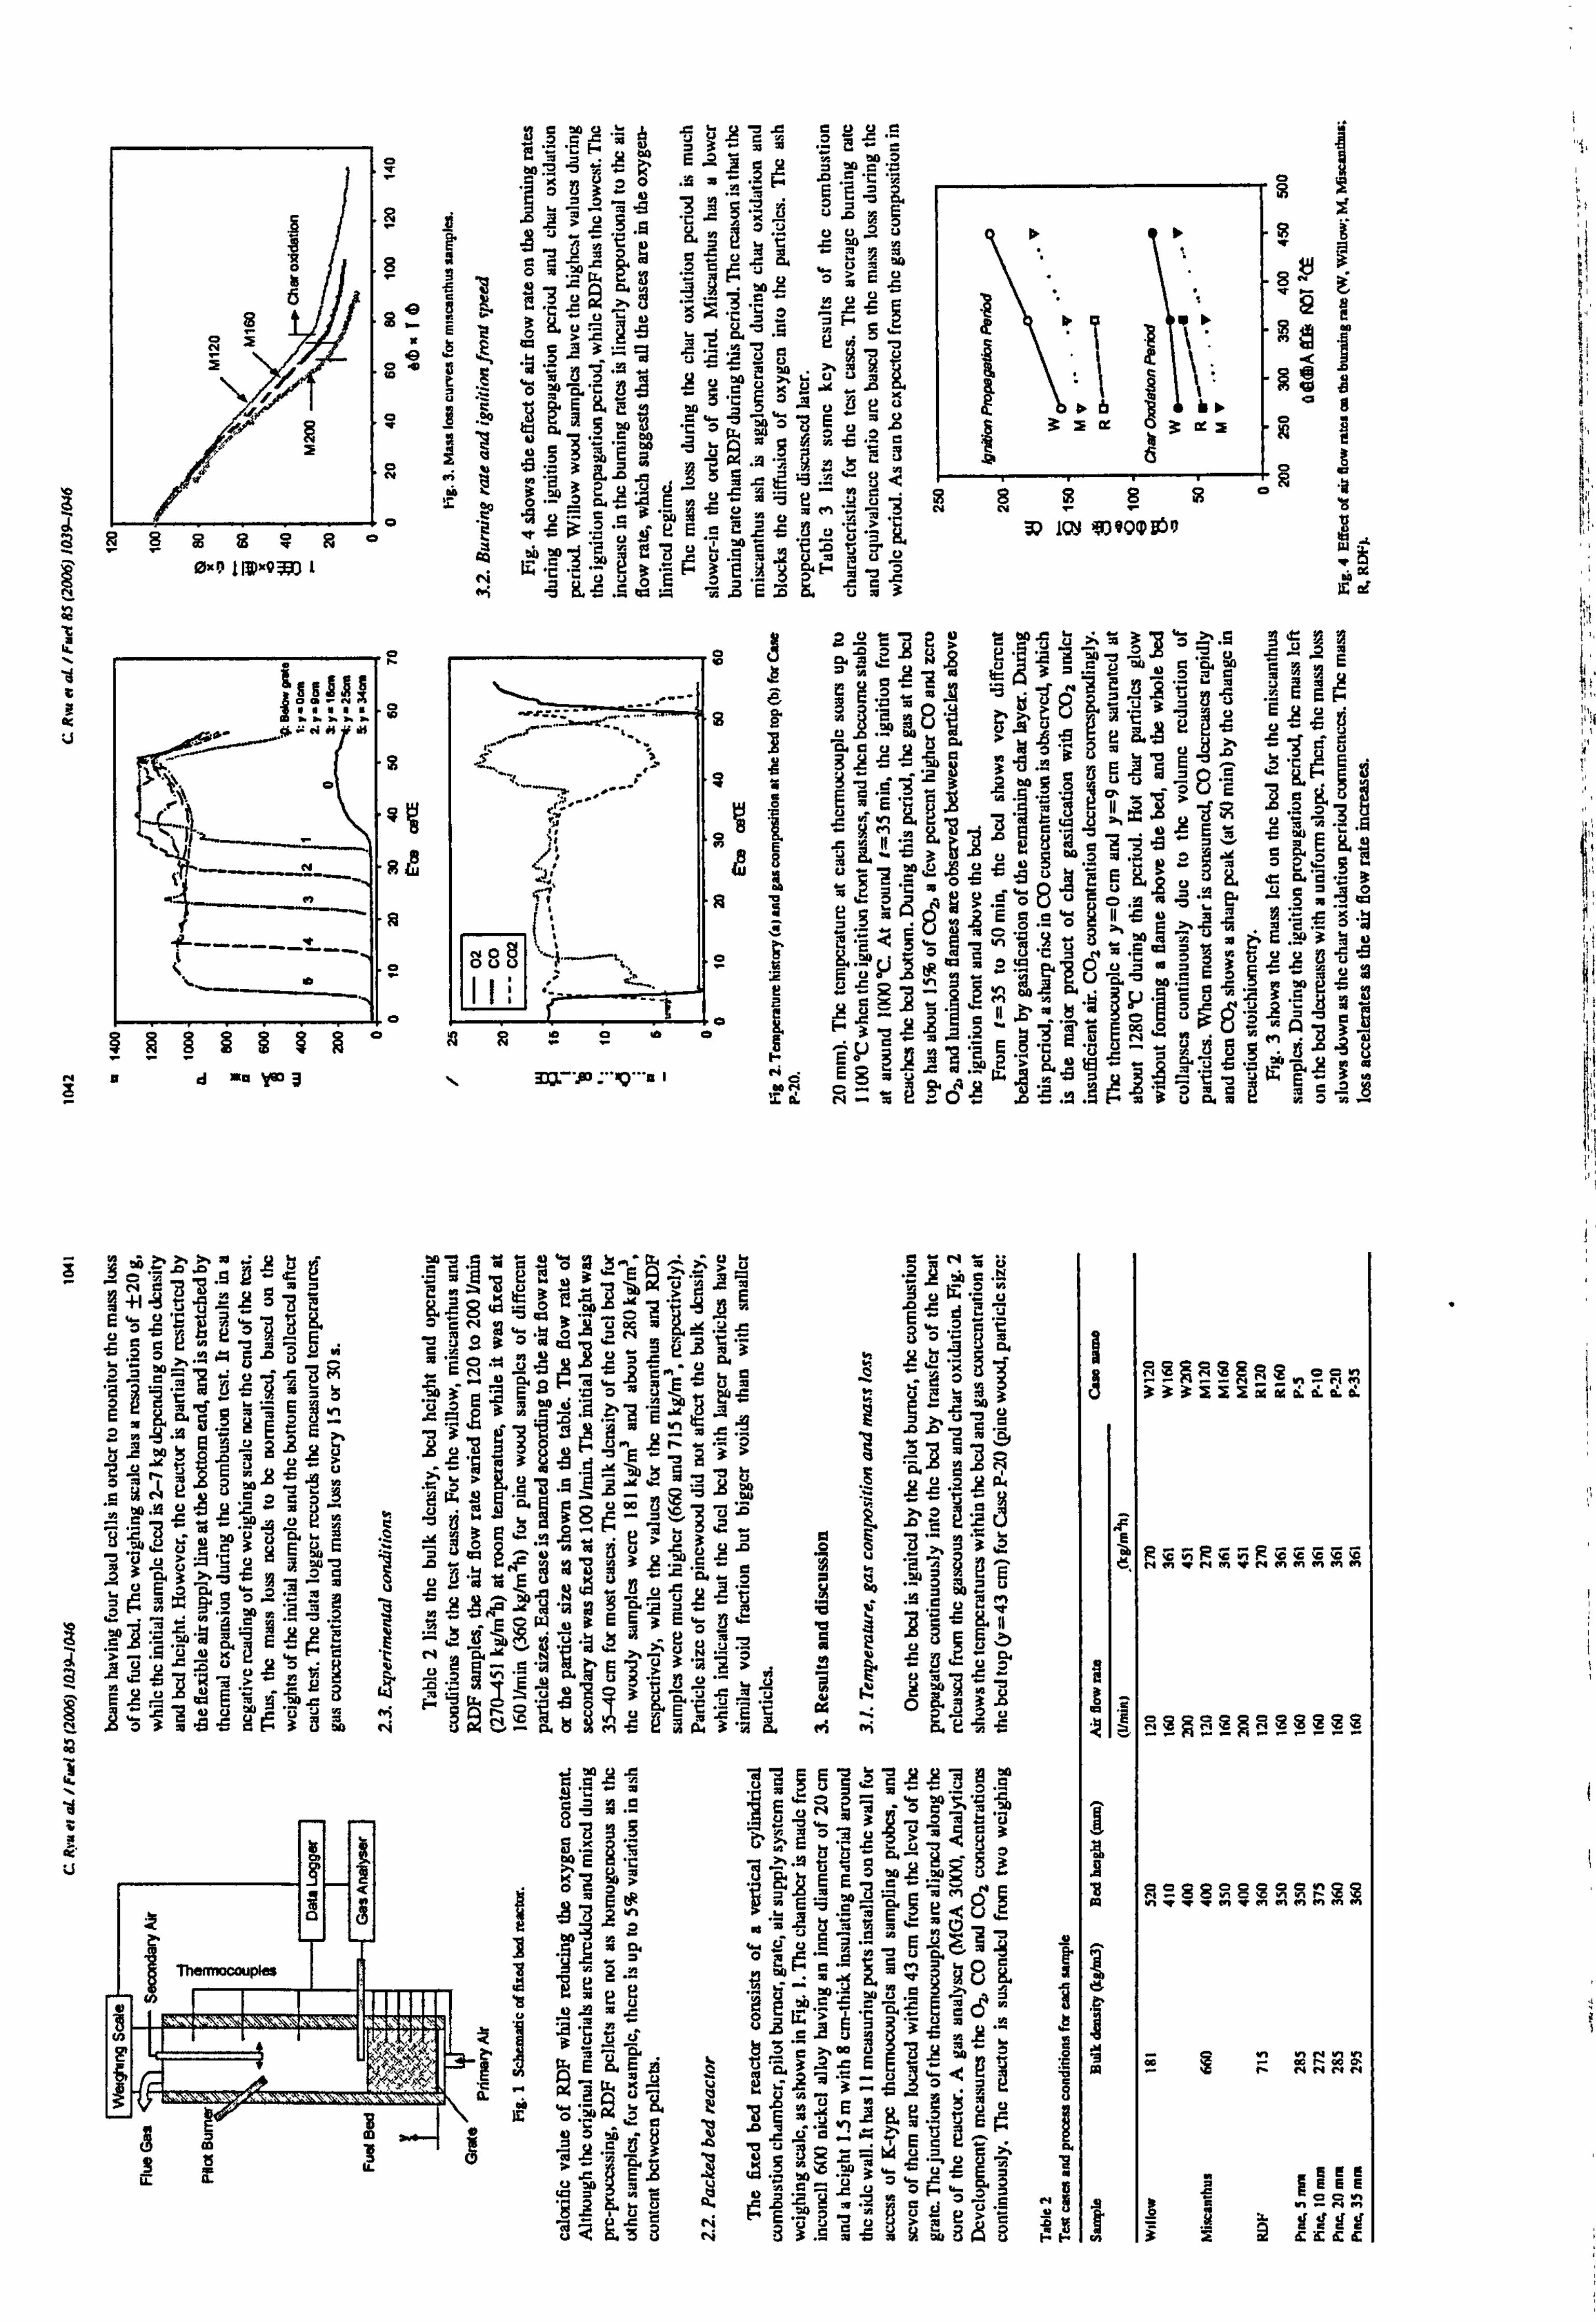
0 ö
6 NSW0PNa
ä 0"9 11v%V3; o l
NN_
I
ýNH iI
ýa eo oý8 'a üý esö L' ý"°- 3a "" LC GL '9 y
Eb- wo
R "9 :2ýaJ. r= ZAv "c sx
SGLLtJÖ ,C .GrÜ
73 Ay ! P"41 te3i wUU UU9C
rE3Ö. uvy
egy "s 8 "'J ut". ai ä
ö 'u ä'C ß°., c a EK
uv ,ý, y "' '^ ä ff'
"ý 3 ý' s -ü ýj
ýýLsý ý3 . _"_'-"
ý
cri aý
Ce a"- U aen z o "9 0"- e mE u
C "C- E' 3F3EFGs Mör wý
Ea wEua3
A
. ý_- ..
sý
[29
a0
äa -ý a
tii Z`ä na'. 8 üg 9ao
20ypys2w
_u
12 *a 1-1 ýo s eoýS
Ejý Cýý_$
oges q8m - 2ao3 u ., y, p2a
... CrF 70 y
vc3U ý' E
uyx°A PFc =vý_ýu
ü
U-
sE
sý
ß °s
os oC
s88 iº 3ýz 8ý; zs
Q
o ý ýk
ý3
$2t
QgC ýi
q4 Mý
oI
ýC
R8R8$ o" q
3ý 1Cý Jeomýý ý1 wy A
$. 2 2I $äg °° ü i. m %I
G
*3'U --Sz D. -2
2.9 ;e 'ý E ý"Ä
ä Äý ýý ý ýp
_ ý"S ýüü`E
ýFy
ý eý
3ü^aE pe
'UE d3
s° x' -c- 9
`48' u EV 0-% "(ý F
ä a'i'i r3 +' Up ýýJ R3p
u W, sö'-I 'ýE&. 2. a ` -g pý
äW. = o. "a "a s . A a{$ Eear
.g.
'. y+ri öe ow
ýÖ u rr
52
6 5U" gU Mi3.9 U
fa X3 R_° g` F
. i G.
UL m ri g 84
t5 J . 'ý".
0 it 0 ,a3gr
., a EN ^s 9 ta =L ,0w ro oý 9ä'.
2Et; a°
ý" a 3ä. g. ý2 ,ýEý$
p {oý=
m
E_ @>g 5 ou ¢y "u Wuü
yý 'ý aSva3 "y e $ mEý -o
aEoWd; EE E-
9
p ýCa E >3' ý ýc, aýýýý. ý3°i"quýrYiýrý
trz, a8 11L Eä 3äw
ýc ä
° EE c
Oc A
'ý yýy A7
t
g "ü ü
Ep ý"r aE is. IL
1
1£ ö. e_oW .. ý.
o
40 'ýi"n
ý3
Cu 6ü
0Näj yl CA
E= da äC
9
uýeý3
ö9^. 3,,
. pp ýe= ýi. 1>1
rU7
-;
t1i: 1
tom e
yA7ÄVg ]0 Z
T. ý3 ij 9 e0 oUX ,
ýJý 3
EE. h ý ä 31EV A
A b3 "ý Tm üýý Ti 'ýy 3? sE¬ ä
"o v uý '" = 064 =p
ý w Ä ý
m) A ýj ýA
ý
u"
q
.ý E
L',
ge
iz
3i5: iii mdidd
Rte: «mýRýýmMý
199,29FIMM
.ý s
ö
', ý w
9088ýýgmýýýý
nNNNN
I EEEE °-rn `yäggg
3 6166
ý LL
AL
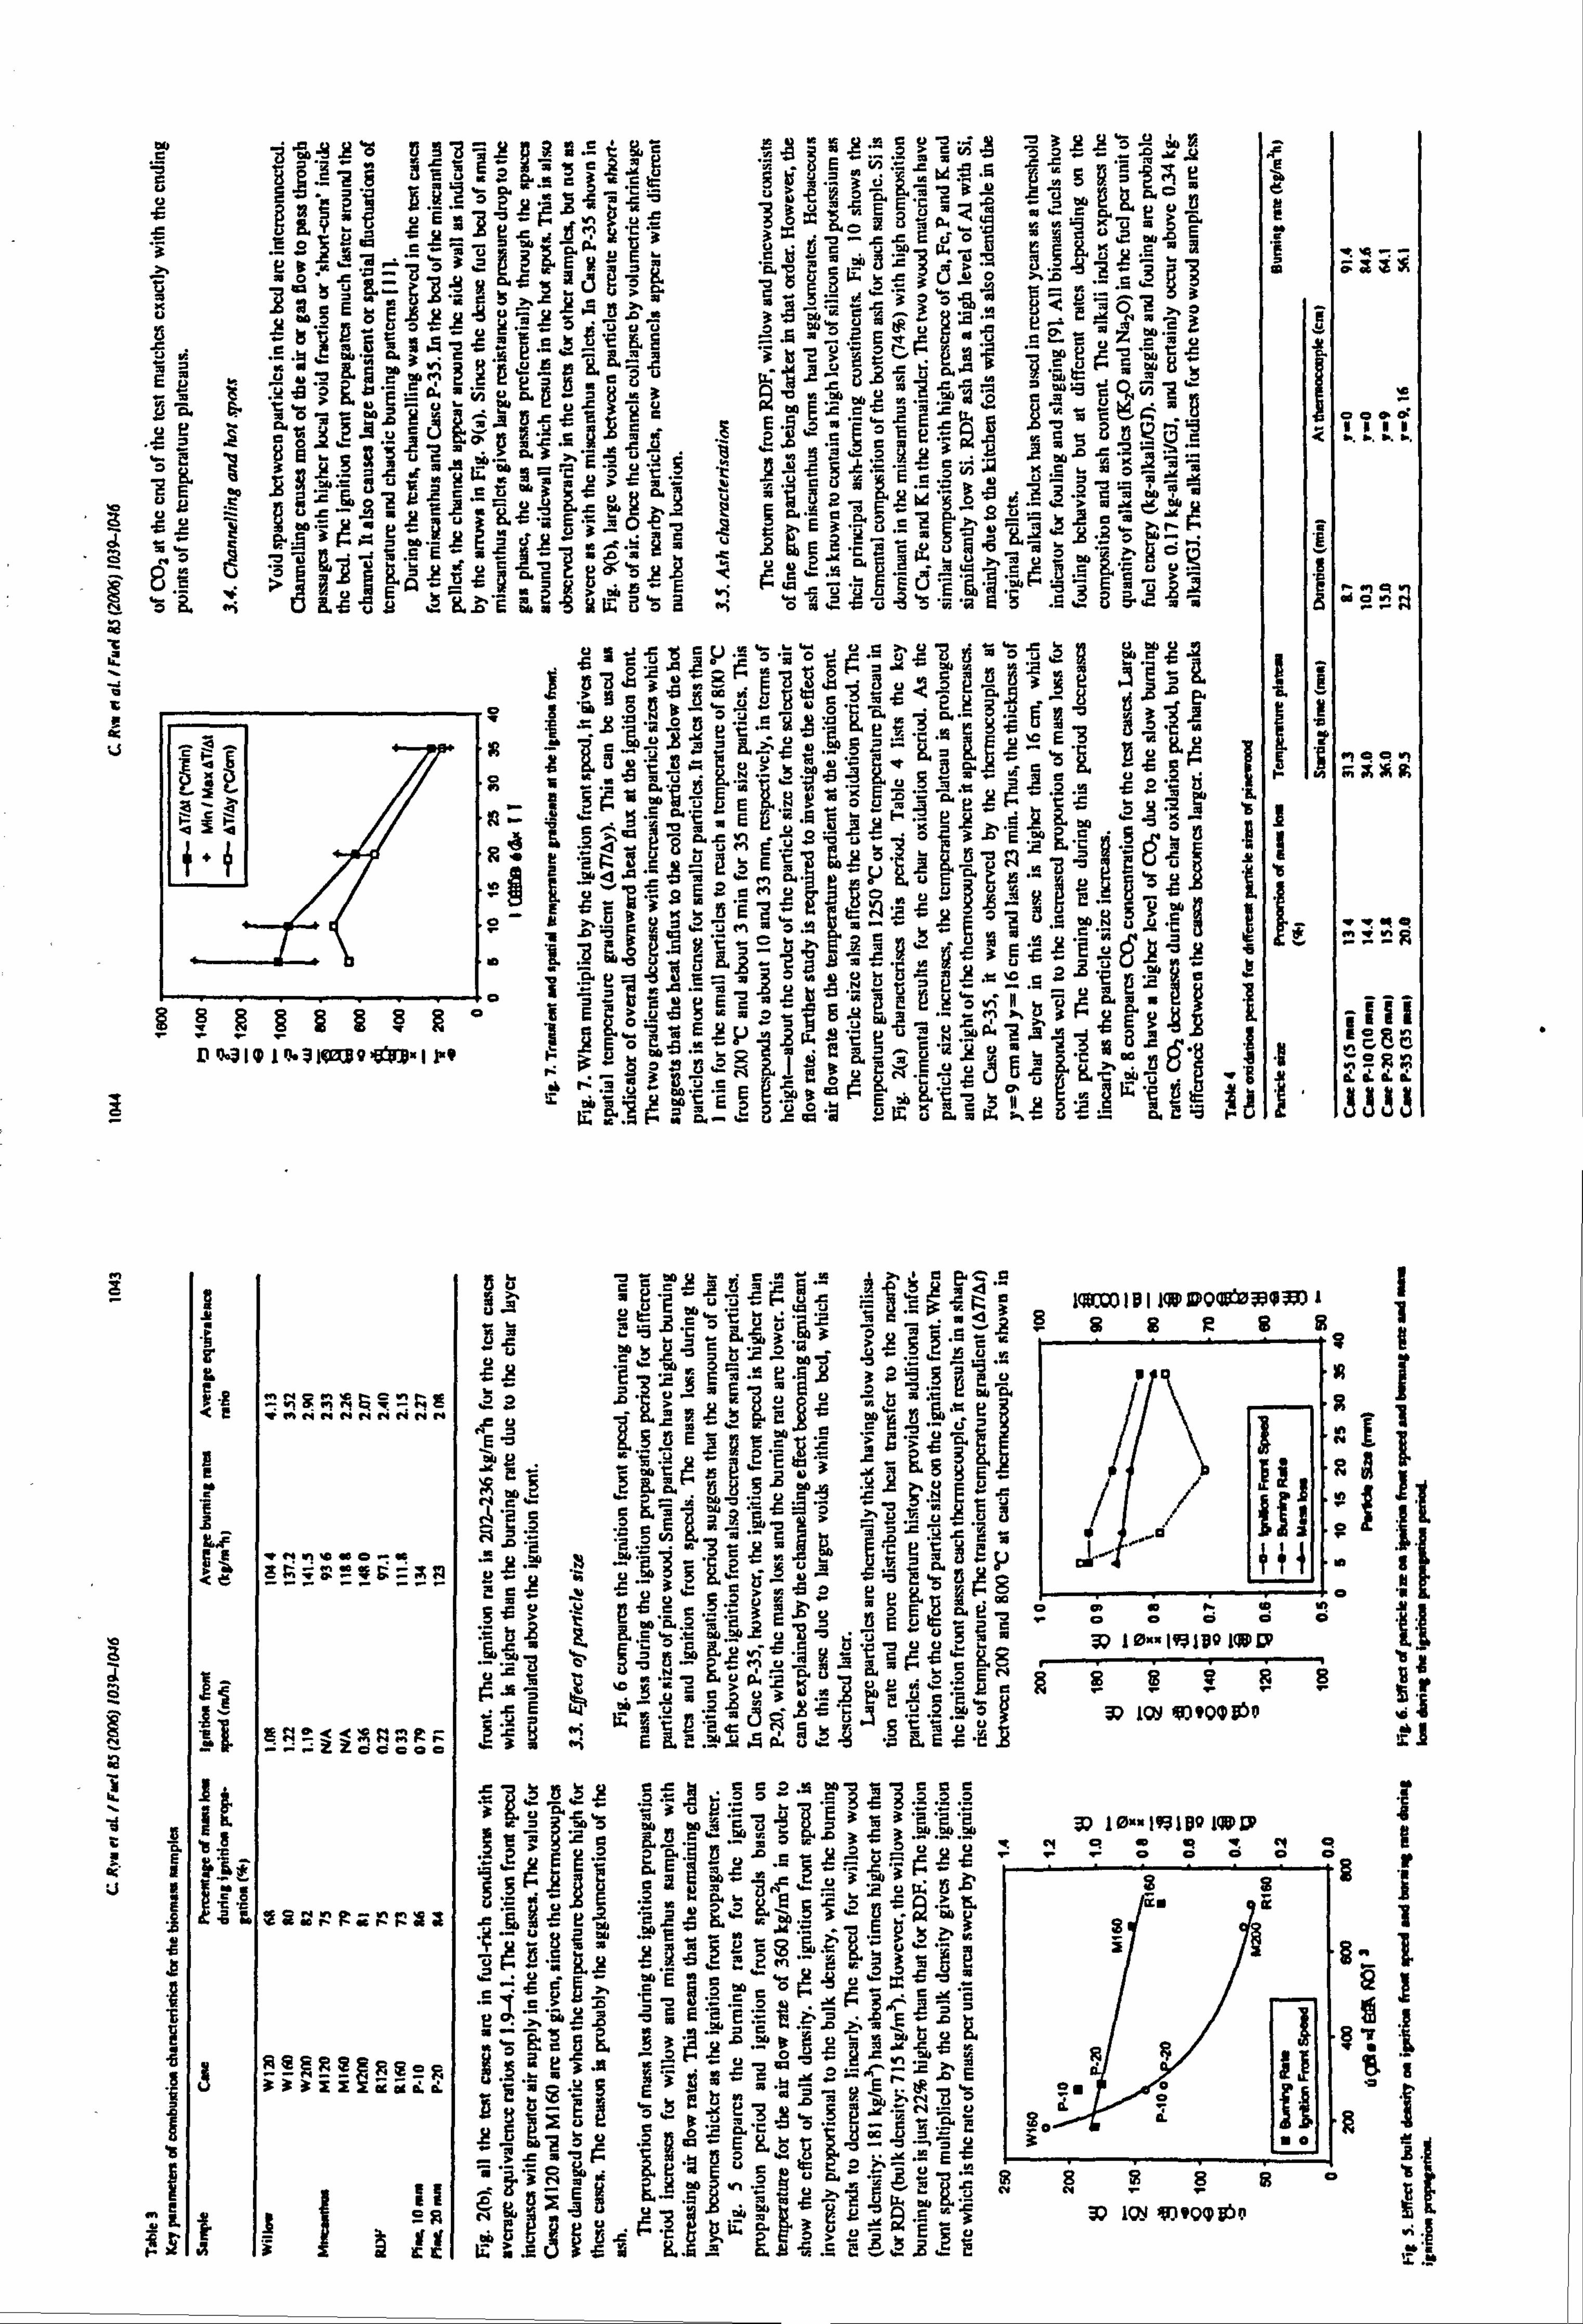
ý°eoýP`d 53ý 33c
u ,g "_ ß"3w p, s. g . ý. _ u> 'ä 3J -' S. ä7 :B
,
-"ý ýap a
s' 3'' atn "C EE
'D '.. c o.
EY 2.8 f. ý ýi$M iK it
iI6 ýsXa IN Ea '6 'o ý0 oa.
-
>. E ¬' E
'n. Si
i+ mý'ýqýS ö"mo'týG' "ý °'=ýSýC'ýýää '°'ýuýýýr3Cýe: ýo >, ä
Uý OWD EÖE?
ý ýi ýüÄý
'j
ý
{"_Uj UÜ7ýýýüWýUGý .Oe
p"
ýÄO
py ,2
aa Ea
"V
VpGMl°8u :LL t7 "° ÄÜ
'Li '
yý 4=
"t E av'": '°' °r
y tai 'o er'°"
«'°ý' ý°" °ýi '3 0. N
s °° °°6Erp
"° ea ýL i3 i3 881
-2 «
ä,
_ä3a-. ö süg?
'o 1 .2; .ä
ßäy3 - ýO .f a9
C u12 mI ji .z
yEýf: E Yiný7 ýem. _ ýý m
UCs .CLkm afý >aCUy .J ýJ L, a «E
eo ep Oa8 -ö 44 ''-ý
ö äu d« "> m ýi 6
ä. -
ý ýa'"ýr' Fr'1-em"eýtýýýýe. tO
oüvE .£'a..
m3 °s
. Lý 2 'ä W
ýä .0 M `° c_
°e 2S, 'c v5
ý'L ä $ßüä Eeaum mIt'a ä ýý r- =1 öýw ^c 55 'n MISS e ýL's2m^ý
b
a d 0
w ä
L I
K :. S e äO
i äýä
c äýä
4
Li tc ia31CoWQ'8b"Ir"
9
.g s ie
P
e a ä a Nn
4
i K U
il
0. E a R
3 i
I
Ea
C
I I '6 A
F
b. ý
14 Z 'L L
fTMNNNNNNN
ýN hýý Ori
13dc'ooo
°ýog öý ýsniýaiý
3 äce 33Ifid
3 eý li
ýý Rý
ýý o
io 0
9 .. 4
I BS a2 ¬i{; u Yý; ec 3 AyS A `3
= bI
i3. ßý"cgýýý>ýmü'°E<S'ýý-ýo`E7S
AS go On
z 'tiýäsia'L EI Fgo
to u9 11.1 9.
aý"a gý7üj
o 0-4 y ßpp
3' wM i0 74 ä EO AC
"9 üVC pg
78 Ig s3 E$ý? äN` 'ý eJ. 'c .4ý dy e E 'ý ö'ý 'S
ýäo r`ý 'yß ý
.ýýýý "ý rMä, ý 3ýý"
"ý Eý3
Y, ý+ z yy
'ý 33
ILI
OOP P
I
1
ýý Evan I
-ý"
eeýý °ýýc n°Rý Lddd
ýiA
arýý;
ýýi;, ý lWi7001 BI lW lIDOGBbý0397 i
M ý, l3 c Le- e,
3 1&iili 8$8R8 is
ä äK... äýj ý8ýgý^ t it
ý''ö ý}'E "ýý3eý'ý'
ýýýäýýý ý... 'rr TýI oE
rý ýe". r-g >O t9 «r, -E t' 3.0of aLýý o0/. on ýýII
`5 13 $c Ls ä'OU ý r=
"$ 'ý 13 E2ü2mooded
3Q10F «2 -
.. Ie91bo1WW bý
ýý >ý3 -E9888SR8r
ý {ý w
tos ýýýýýýýL )9Q Bev ý
am `3 äu 3m
"E v' tS 03 ýZ 3 '2 'Z 'B
ý? E dEsý cý'ýýbýf
G , yS
.ýEýýýA «" ý eye `ý-' °3 :2ý tr: !5ý
"2 % O. O -2 EE
p( m (i 20
(ý a
.vý eu Egýo, ýv
dm' . °eyE: cL2iE a äcr 5 ý' jä !v Ly wv 3
. ý3. m 3. l9a "L eýY ý: aý^-sä
E
`E uEb"Y ýi
a . 'ý AY f1 J
'r r
tp(, mt ,ýva-
mo t
wm
li. w .Efa2!
vw
3? 10" Iffä1Bo1WO? :! o oo R0 !0NQ e-0 0-
ý^ 8
ýq
0
I
r I 1
I
r. i
yY
ýnýbA
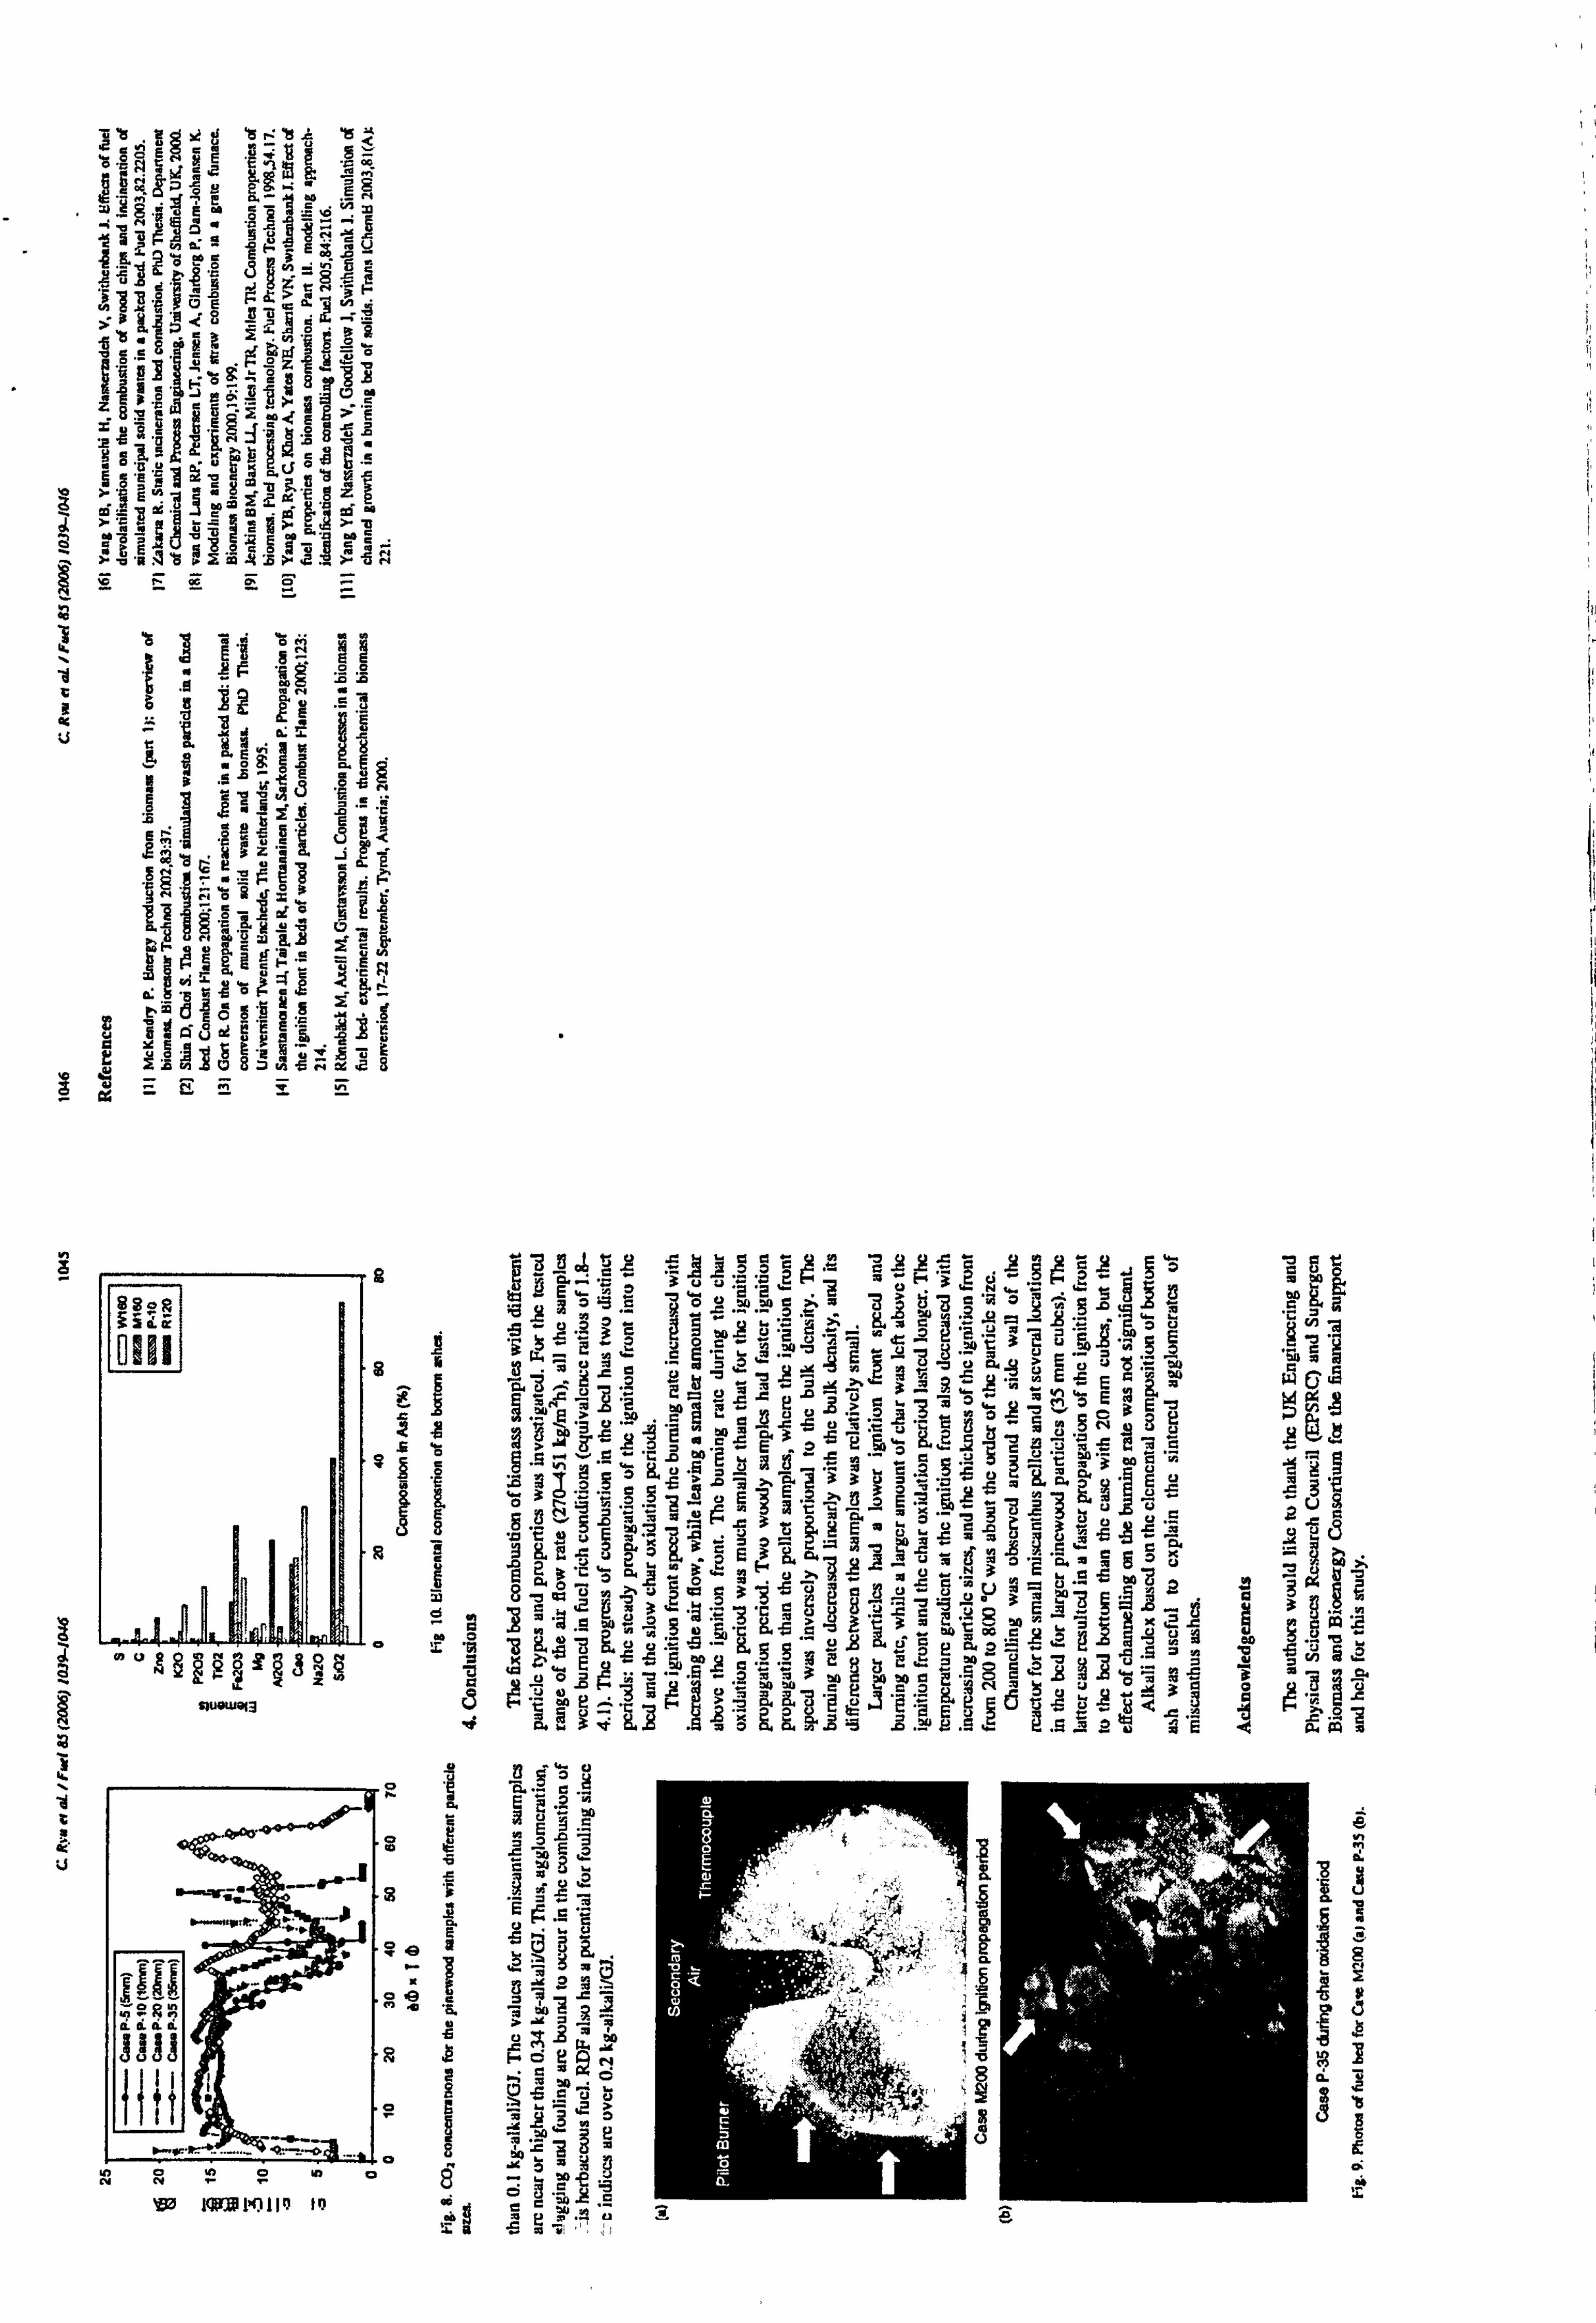
ýQOý ýzg tsýw' 'ýv
tp ý
08 G Ey
4 : 1.1 ry ö.
1y gaý I=
8,5 ý ý3 8.
f7 E ýýýä
fn
= 8"m cý
Eg
üý'
g ý hIi 99
pj 17 °o
ire äßö
rE'mk3 Z. Y üei
n a ä a
I z 3 rc :s
V d r
ýä
I d a
y
s a z
U
9E0 7w "22 -2 '> 3
-'F. t
5ü ?ý Eýö3oýw=wý. t' `3ýýýýüý3 aE hJÄý ._
Yt ý
S aýArý . °ýqý 9ýYTäp'ý°yEýEä'ä
r3w, ytue ;C y' "VpNpV
Se gý
E w. äpi $n "ý
ýEÄý ,ýýt3 ý'i ýE '0 vtäýv°ýÄý., ý LA
ý'0 fG o° 39 R fl E är r° ý{ 3 `e' oca av2pýE E3.,
`b'ý °ý yy
ýý v zýS zoo. A zý oü
E°OÜma. ayc;
ücyý üZ'. Uýäý"°-ýmý ýy . ̀3 m Eýg
aä', L ü3 '2 ij äv8
,ýteqZ3E3 äg ü
c4uüäeÄ 'E w vý 3 `8 o= 3ä
Ü ý+ -E en Q . 3'c
E. > wpp 'ý ýu
2EEÖT, a.. "ý ýj dL3
.fý. ýr 3vý.
.däS. S.. °, '. 3' a' . °U E .9 wýL . Jr' . o. ' "E
fill fl1 RR LLM1G
{{, ¢ nnrrý
'l lx? 1I IR
aä
Ae$J=3
yf ö
[` EÖC .EEsy ,
dr
iýEý. öÖ ü7rii55rxc' ü
_C=4
a
oý
c ä
E o. 8
E_= e E
rAa
ü « .ý ý'
yýÄ
Gc c "O wi
9 ýjq
p Y
4 ýJ a C O
ü J Y .
y= a
ý eUf
ý e
I;
s
a
s
4 U
mm
"Su z W ejuýä
ýOr
3 ýia: 2
v ern 9� äp
yF "ý.
L
tJQ f'+
Q(A A
Sy
V
I
CL j
g F a
e
P
Y i
of U¢ Q °p' ö nýý ýZ4 Q j2 ýC+ F
SFj N LLgwwel3
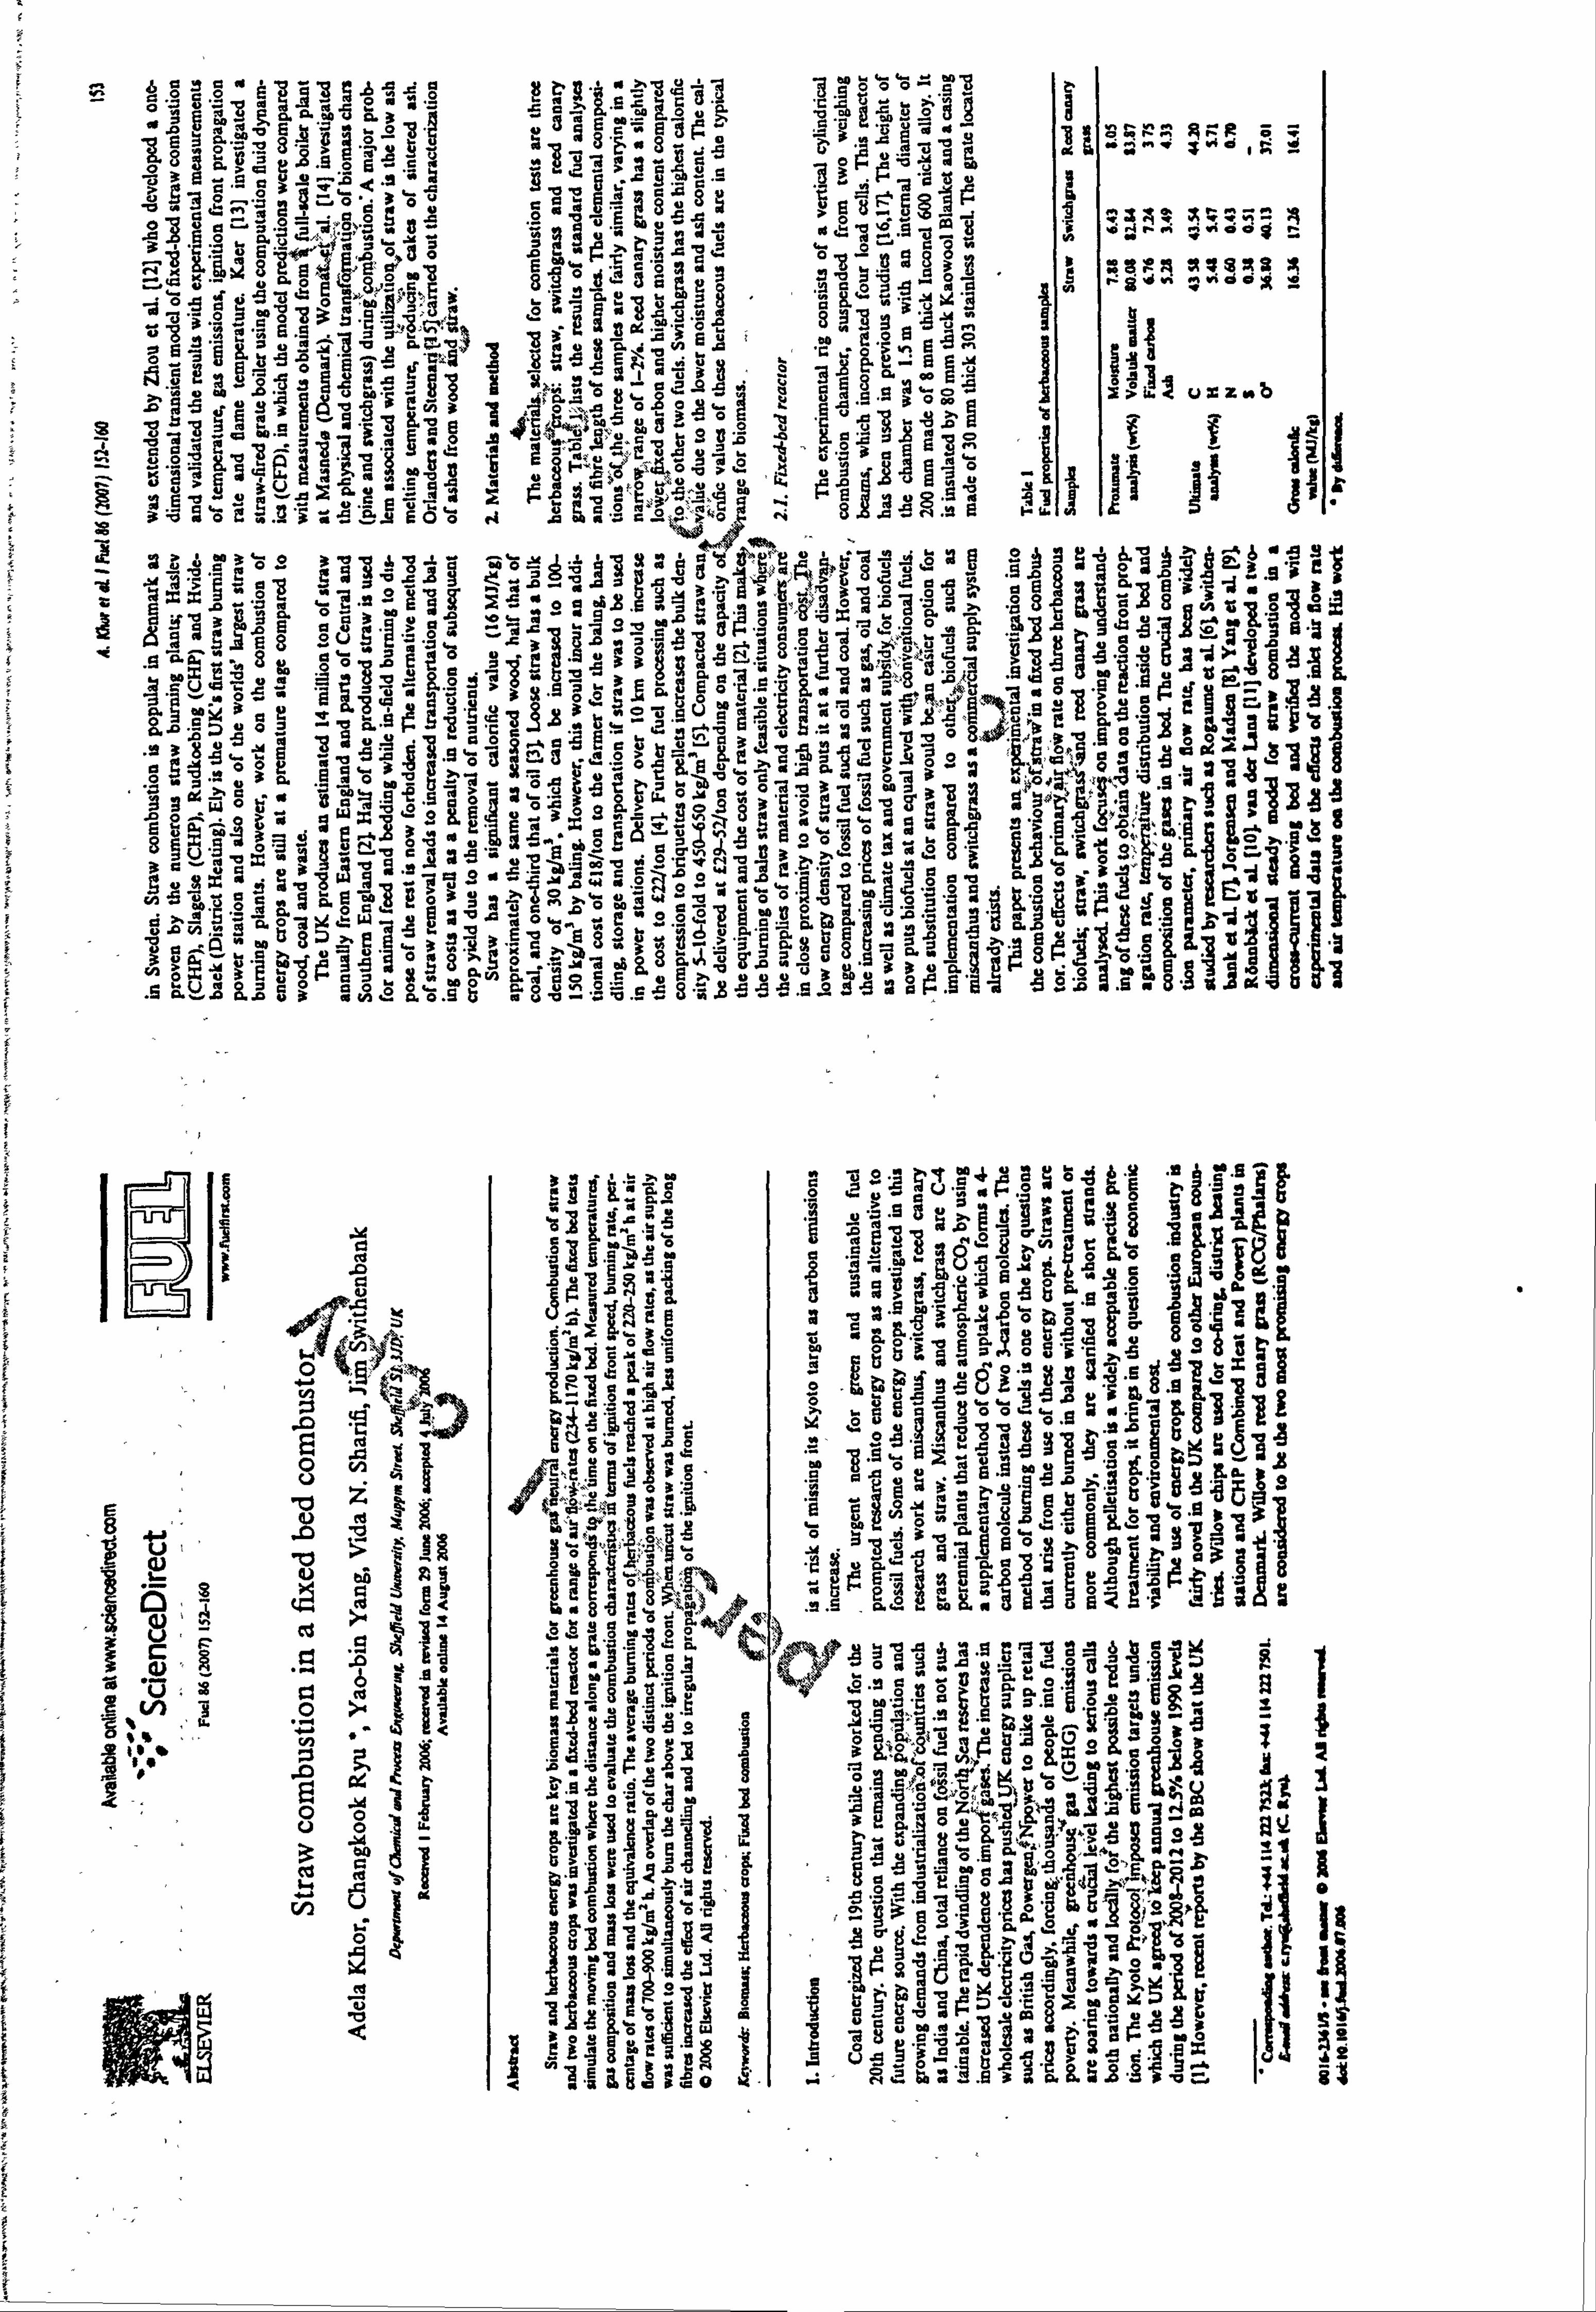
L
s
°! 1 °r w_. ýu "ý°0ööö". 5ü Z
m3 '9 -5 ß. 3g. 5= °r 0.9 g&Zý_eg ä Aa ein 6, 'ý 3ü uüiEeE äA .°ý0vaag Än-ß
'8 ýR --
5 5v $ ^2b `d$ .; crü 13 .t sr ,e
ýüa'- 3 e8°«ß.,: YKd fi r
3E 9° 398r90° aS a
12 .q . eßä - °_ä's Ü"E1re f8 33°, =u '2qty
°1ilh1!
tI' °0
y
ýý$ýö 5A
gý{ ö `? aw "a7Ssy, JW auyý
6Q J ", ý3iAýE` m L°06 ý. °� 8g '0 8 ..
e -5
E 1IJI! UIIý1iJ1 tiflfl1
3>°]! umzub
v °ö 2.01-11 A9Eäo JC 3^uýA, U$üb 'O ä° to
ý' a "5t �°, i y tý v w[ ý °$"
qý"`
! «ý, ýa_u a u° 'iii ü 'ä a°y 6eý
Wn
>5ü ýo i°y
~
wA S' e
äý uýamwME38
, ßy ,e-
uZ O
ii F` PO i'C
3>"ý. ýa'L ..: ä Vöa
3'v9öC7. x: 13° EÖö el s wzo"_° or $baýrv. S6 i-u
i1I1II 1111111 Ami°v°ýSt»g`d
ýä `, ' ý 9A$$ýý°9ä4`,
ý £39 = s ws. 12 m "e oöeä 6$ °i 8 'ý raö
. °ýä öw ä ä> e3A öö $$Nü o
ii
"ý 00 .ý°gc "° ow °ý ää
'ö "5 ýS ýmä6. id
- -2 o ff g
°1at"ý i�r3B'ý 3ý-Y°'`'»° 3 dý A
8.3 i3 .9
ýü ýö ýo °üv&ö äý öL$d -19 ü ä# 'A°»°
u' ýN a
.. ös: °üä ög o0
W, 6, ýaCýa°yýi%cýý` y3 W"
'$ ,ä99 `o ýcý{ Söö LA ö eý5 'ý
e ö° a, °°'°v, ý y m° o°L q
}ý g8
°3 .
9i° ti ýay u"o ii; itioii! IirtiiiUih1I e; e 3v pý ads
g'ý, ý Mr5t
Wäsy y g", >°-'fi! W9ö $° 'ý Eý2 rýy 'n, s. "u'$6ýdov'? 'evN"°B3 T`-ý
"ý"°"ü" ýGcs< °6 0 ýqýE
spr Ly wäö AgW WLýyoö'ýa ° 0.
q° a ., 6
joý '. [SU J°C"Opy6p0ýäO; y TýeOn Tý""o"W'°"7 w""Ö°ý'°Ö ýa'ýý
^n ýFµýO
ýý O° N
°6°p>. 1u pW iCS. 53 OAü3üa2G8..
eWC F& 8E0.
CCYaöuaOGs
111.
y91.
äi °° oý o^ ° `° -939 9: ý5 1u
aN 5 aö9 tý a v- . ''
(IE
l
L In,
IV '
6
all
c Co .o
ör
Ei cu
'e 11 Ub
aSS ýy
o I
as ý
00
ed
04
CCCýýT
3garm
ämEö
L ýeÖ ýÄa O
ö'-0
3SyöýýW°'
aý
e a" ý'ý
0.1 I g$9El
's
all ä. o
Ö 4? OCU'1 w. ' pg
IF-flit
8 o8°p0aoöýdö ý{ ' e6
wGä ö'ýq
°p a
öCw uü ý` yý+ ýý fw
ýä7ýOVf "C fý
rj
y{ ý 'g
=M
.gM . ýL9 g'
3DA
aJ
8 Q'rnöJ�ýOeöäaýrýý`öö. 88ý3
ýý, " ös"gF , ki ap äW
1H-fl* ýt
aý -ý 0a :gaa g dý A,. 9
x" ýý
11
ä 4 Qy .ý ,: 3 agö ýj W. 9 'r Fe g Z
3 c ,F" ,oböVs
3°' 3 it F" üoä, ývq m4ý ü m" °ý "x '.. ý
ä ä° 1y A }s
1^ eýiýi yJýN,
Yy V äJ3
gö .+
'
'" ap yam, Vl Ö7
}ý ýÖ Y. 't+ýFy fj ii
Q"nyýý. 9ý axý
ö"ý 6bý r°-W5ýr
"A
Cýg °n °"
i
9 ýIll. 9zllý ßb7 m0id -1 "1 t _ 4
e°rs. 6Lä3.93 a cG 8i
a
. v®
ýE( y3
0
I m
F
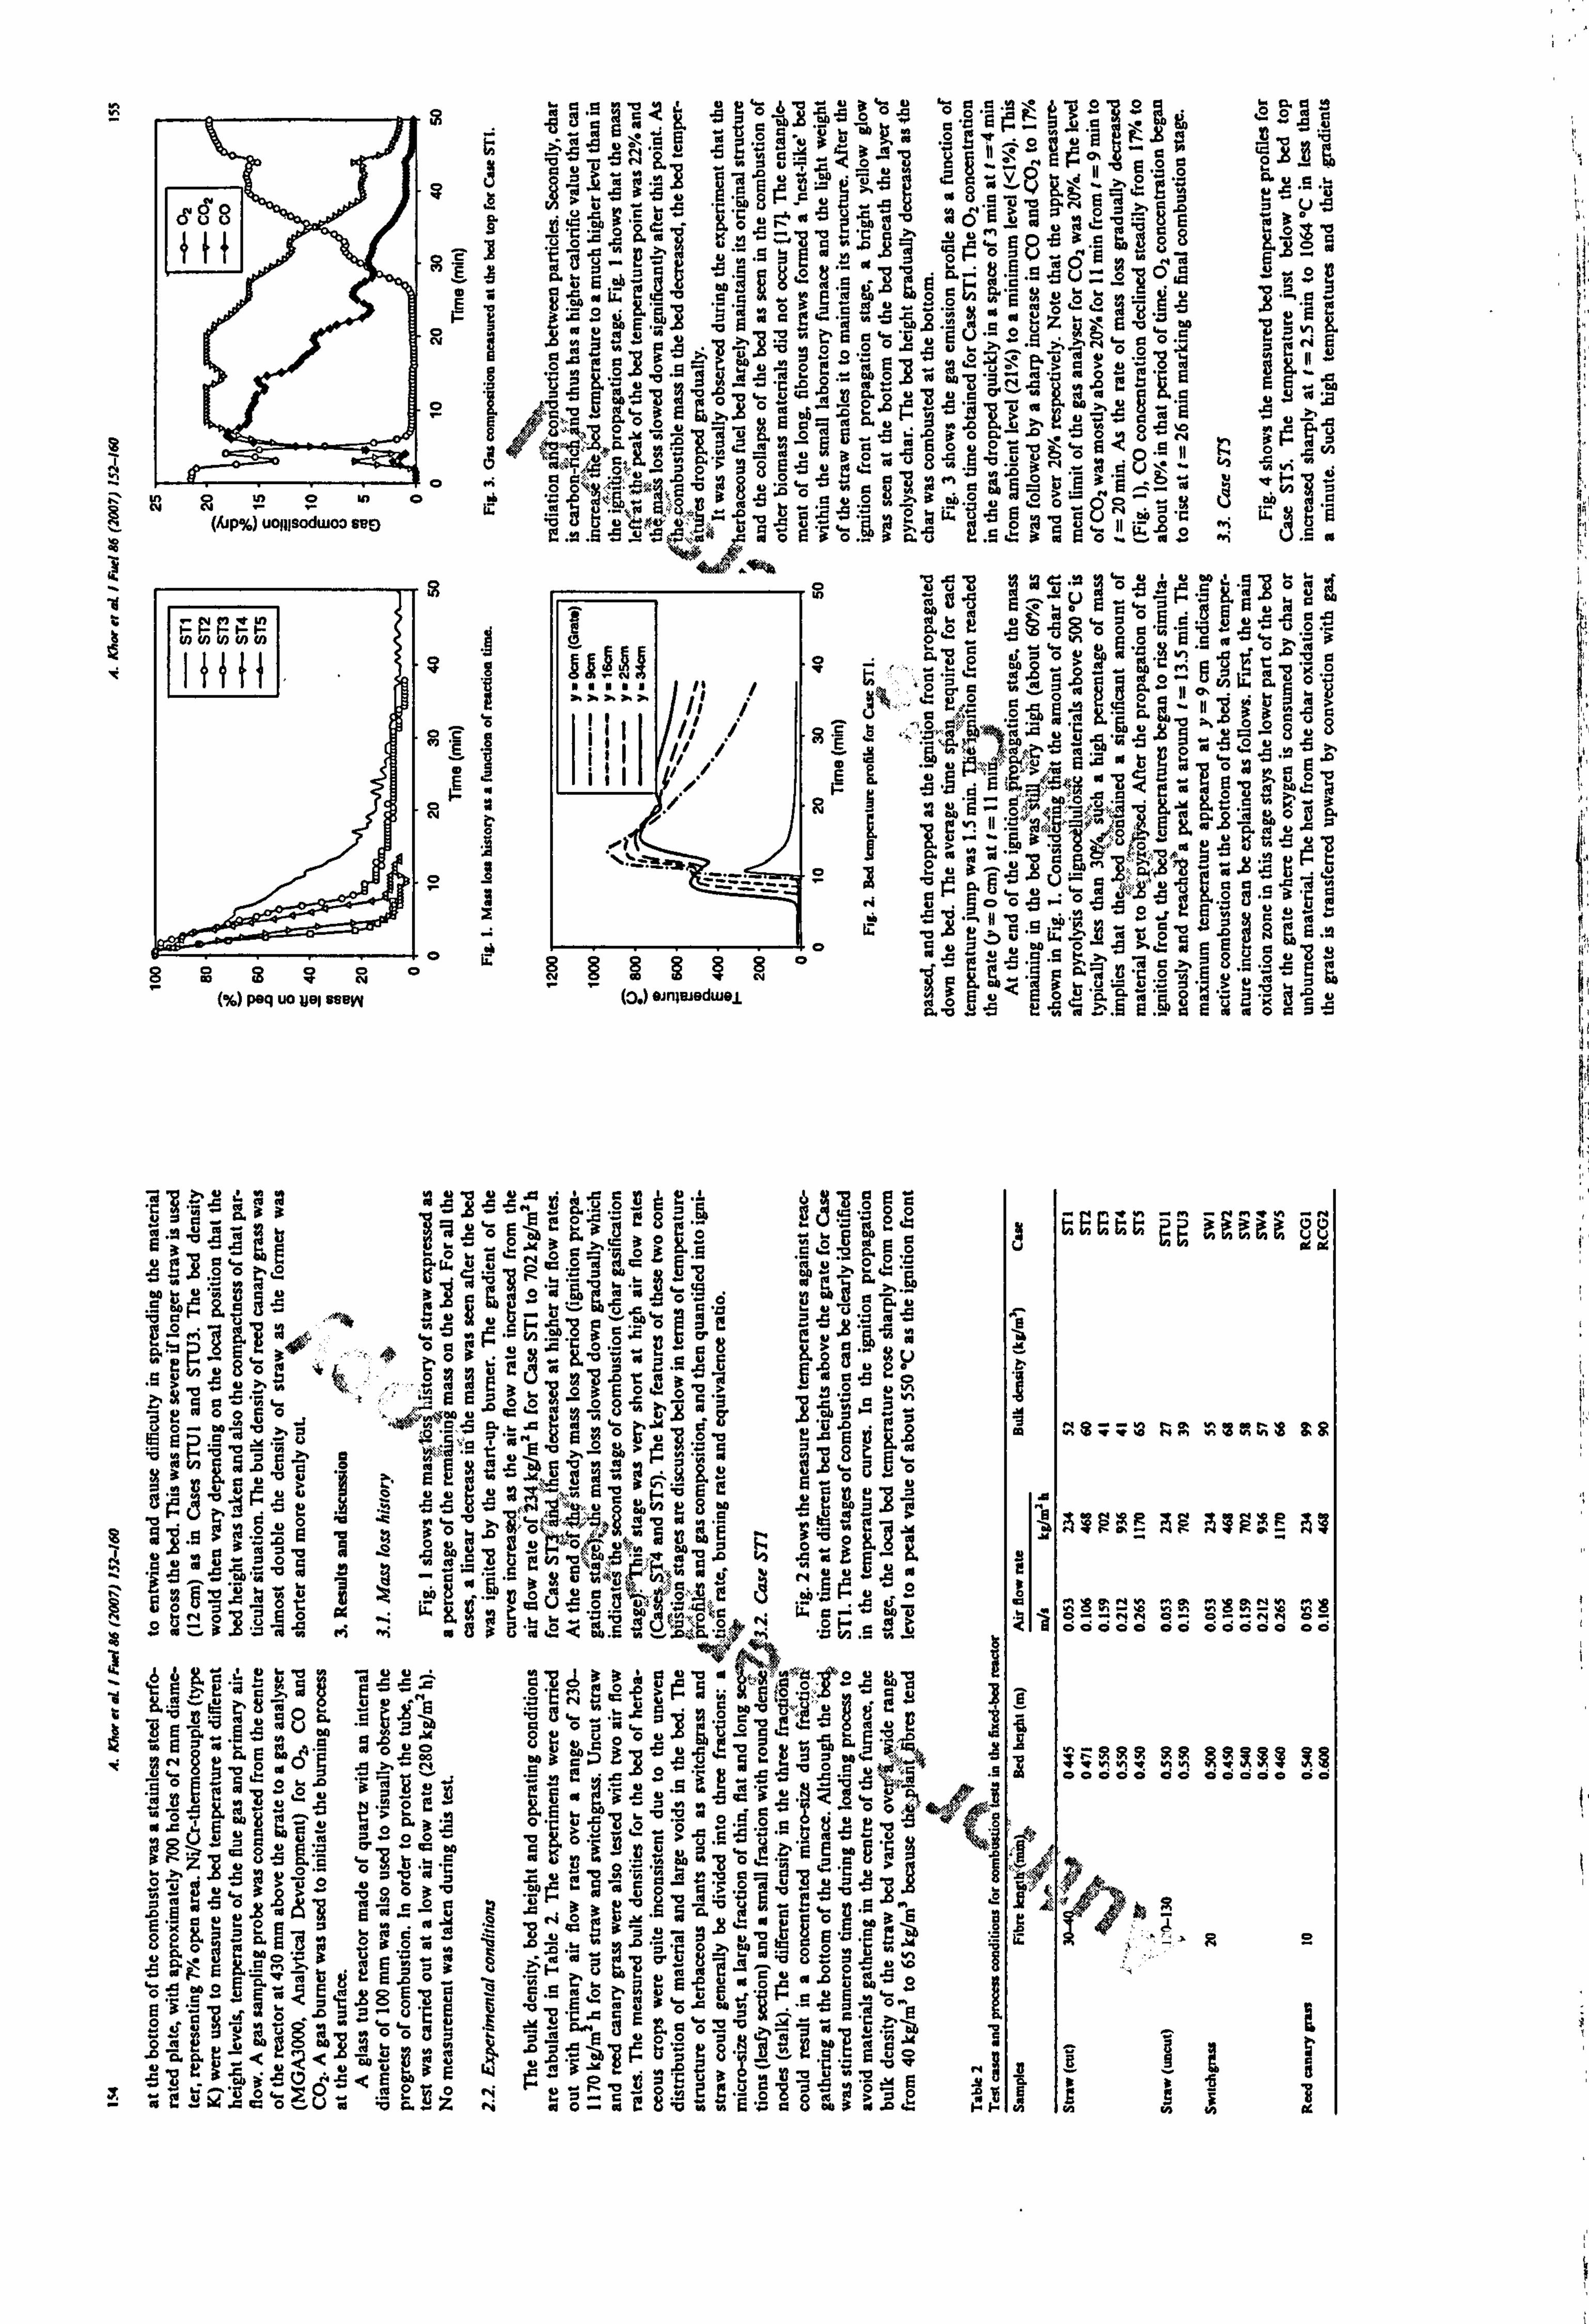
ý' }}
RE
m E
0 a
ý" RoNo (tip%) oolllsodwoo se9
ýR
NNNNN
ýIII1ý$
Rc
ppO S ON ID ORO
(%) PBq uo Vol ssew
ti
S
E 8
V.
a
S
n z
J
J ti
°9 a- s 39 '°
ö3 ý ü` °a .
''fin 'ö8 mý ý° .. n 19A °; Sö ü
, ýu, u=N °ý ap °1-. 1a lly
'gnu Elf 0b yaýV
"Ö ''J . 1iN O, 'J ÜwV^ CÖü GIIO Eq Ö° Öýi3 Öp
a jýý$ý 'c'S°üf f°y-
E cl E. $omi"fus -^ 10 1cII öý o
aý aq uns ü°na"8ý
°a °ýUýaÖ6yýýý 5ýýý
8 °°ý' ö cýý°q
EE ffiä
,c rS oo wü '`f j Ni b '6 ° JE.
_3 v 6"ý tali Zgr2 6 QgIQ'p,
ä I! ]; 38;
ö2 °"a. rýa. üöp\
üöö°so EI
E S3 I
ýrýý ö9ý ä uo a
mü'3rva'a"E E ým
ýqu °^ ü aý SuN W-Qjäa ge u9 ä c'a"ý öý- aE ýa. 3 °g m e6 ýý ýýäýý a. ý ° �ý öý "5 °-p, s
±o ýä ä'a p äý`ýa ýý ý' äks 6öu? evýý 6ý p° °`V
ýý 2y ö1r,
R° öI ý8
Ea. al ä9p 3$° e`j y
y. " Ný'F: týý"öI ýuý, °°ö'Eý°g°al NOW i°
ýCR+ýýý °oä
HAS
E w$$ 6ee rv ä .C ýy 6
H got äöA`°Sa
i-i i
//
:
/ IIIII
., . 8E
0 E F=
0
gýýýýso (0, ) anlaedwej.
moýýa. a ton as wö ö
G"oa 5. T1"5
ai Ell &I! 10 e4 'a E. '«. ö$i8
ö ß. 5. ö Ey
Fun t al
.: 11
. ýräÜ'ýgaý, eaBaaua
. 92 Mod syll lit An on-
i
a'° 8°"°. E5: j ca1ü2? s4
Eua öý''ääm'
o'ý' '=ý"O0 ä
«Sa 8° ä ý. ý E ýä Eäaöa ýý
c q. 1-aää 9-mý5E? a.. - -- ä $w
E x3ý>.. ö c ý ve
Oöö 3. T F °w
- ^m °c G 9
º. E
y
A Ch r aP7 aFo
"Ö Ake3y
. ý{ W gn NQ
k i .pV G_D Ö1ma
y- ä
6.
b'ýw N °ý. 0ý ÖF 77 P
7s'. i mEI 2u'A
E ODLp5
ý"e Eý Eco, O"o> Jý 5h leg-
u.
ý n t; E'o F 16 ý e ý e ' u i 2--8,0 tý . y uu 5 M s
nf s9eý9a
g jý w
N 1.5 'gym id 'ä
t
s
m1 . 8S °=. ökg qt 'O
ý 'O q Y
-O d ý
öuüýü_Ze t:. eo007 pm *Z A ýy, YW in '
F
r.. h V
ö"O° äA -L 5ä L l0 C Y Y qr
ý0' "ý .. ý. `^ d M rY /l 3 ý" 1i iri°ý f N
, a
ä"y ci !
W8 c ?6 a
,yR a0 äe 6ö, ý+ po ýc e°o ö ý'o o a`, ' 9 ý3ý "ý
w2öüy i7 al -
28.3 ý' ouE
d'$ °ä. a a yco30syý
8a mouQ? Py
. O+
. V.
3u 3
Os
.. Npy
J il .8eYu ay u ,
u, `C9 W .
O+ Lpy rN
vMR. QA ýi Ö3
ýmýGAd
GÖo. O
O$ a
tetl
Öý
O
e ýae. ýe aýý äýý. ýx
.s b e Y
Ö
.ý
ýi ý`i
=° o, ýa E r a y Al oOo ate- 3 p? ii ovpwý`CC
rJ' 1Eä
9 - O 1 7
"ý Ea .ýyý. 5 ýýý
Vii. äýý ýý g9
° °tü4 Tý
M$ 'ý 7G> ya - Q
äüpg, 5 0I vy . ývi"eý ` 9,
A r,
sýö3aY5a
-8
2-a°9E E. E'mQ
a6 öi.
2 -a A - =°rV vii . 11 "y
äv89 ' ° ý
4.
"ý ýý
ý ý. aýoü ac°a. n eau °
ü
"ý "y a°o
ö ý5°cý0yýauög33 .
d
i E'- cüwa0 a-ak8obg
o rp, yýý tea.
m oc
ýs:: ý rvs; xOrMs as
ýME AR! AME Al
ö==err ö= 00 öö
00000 00 0000
00
äsgRR RR ggeel a§ GCCCCCCCC6C0CC
fi 5yä
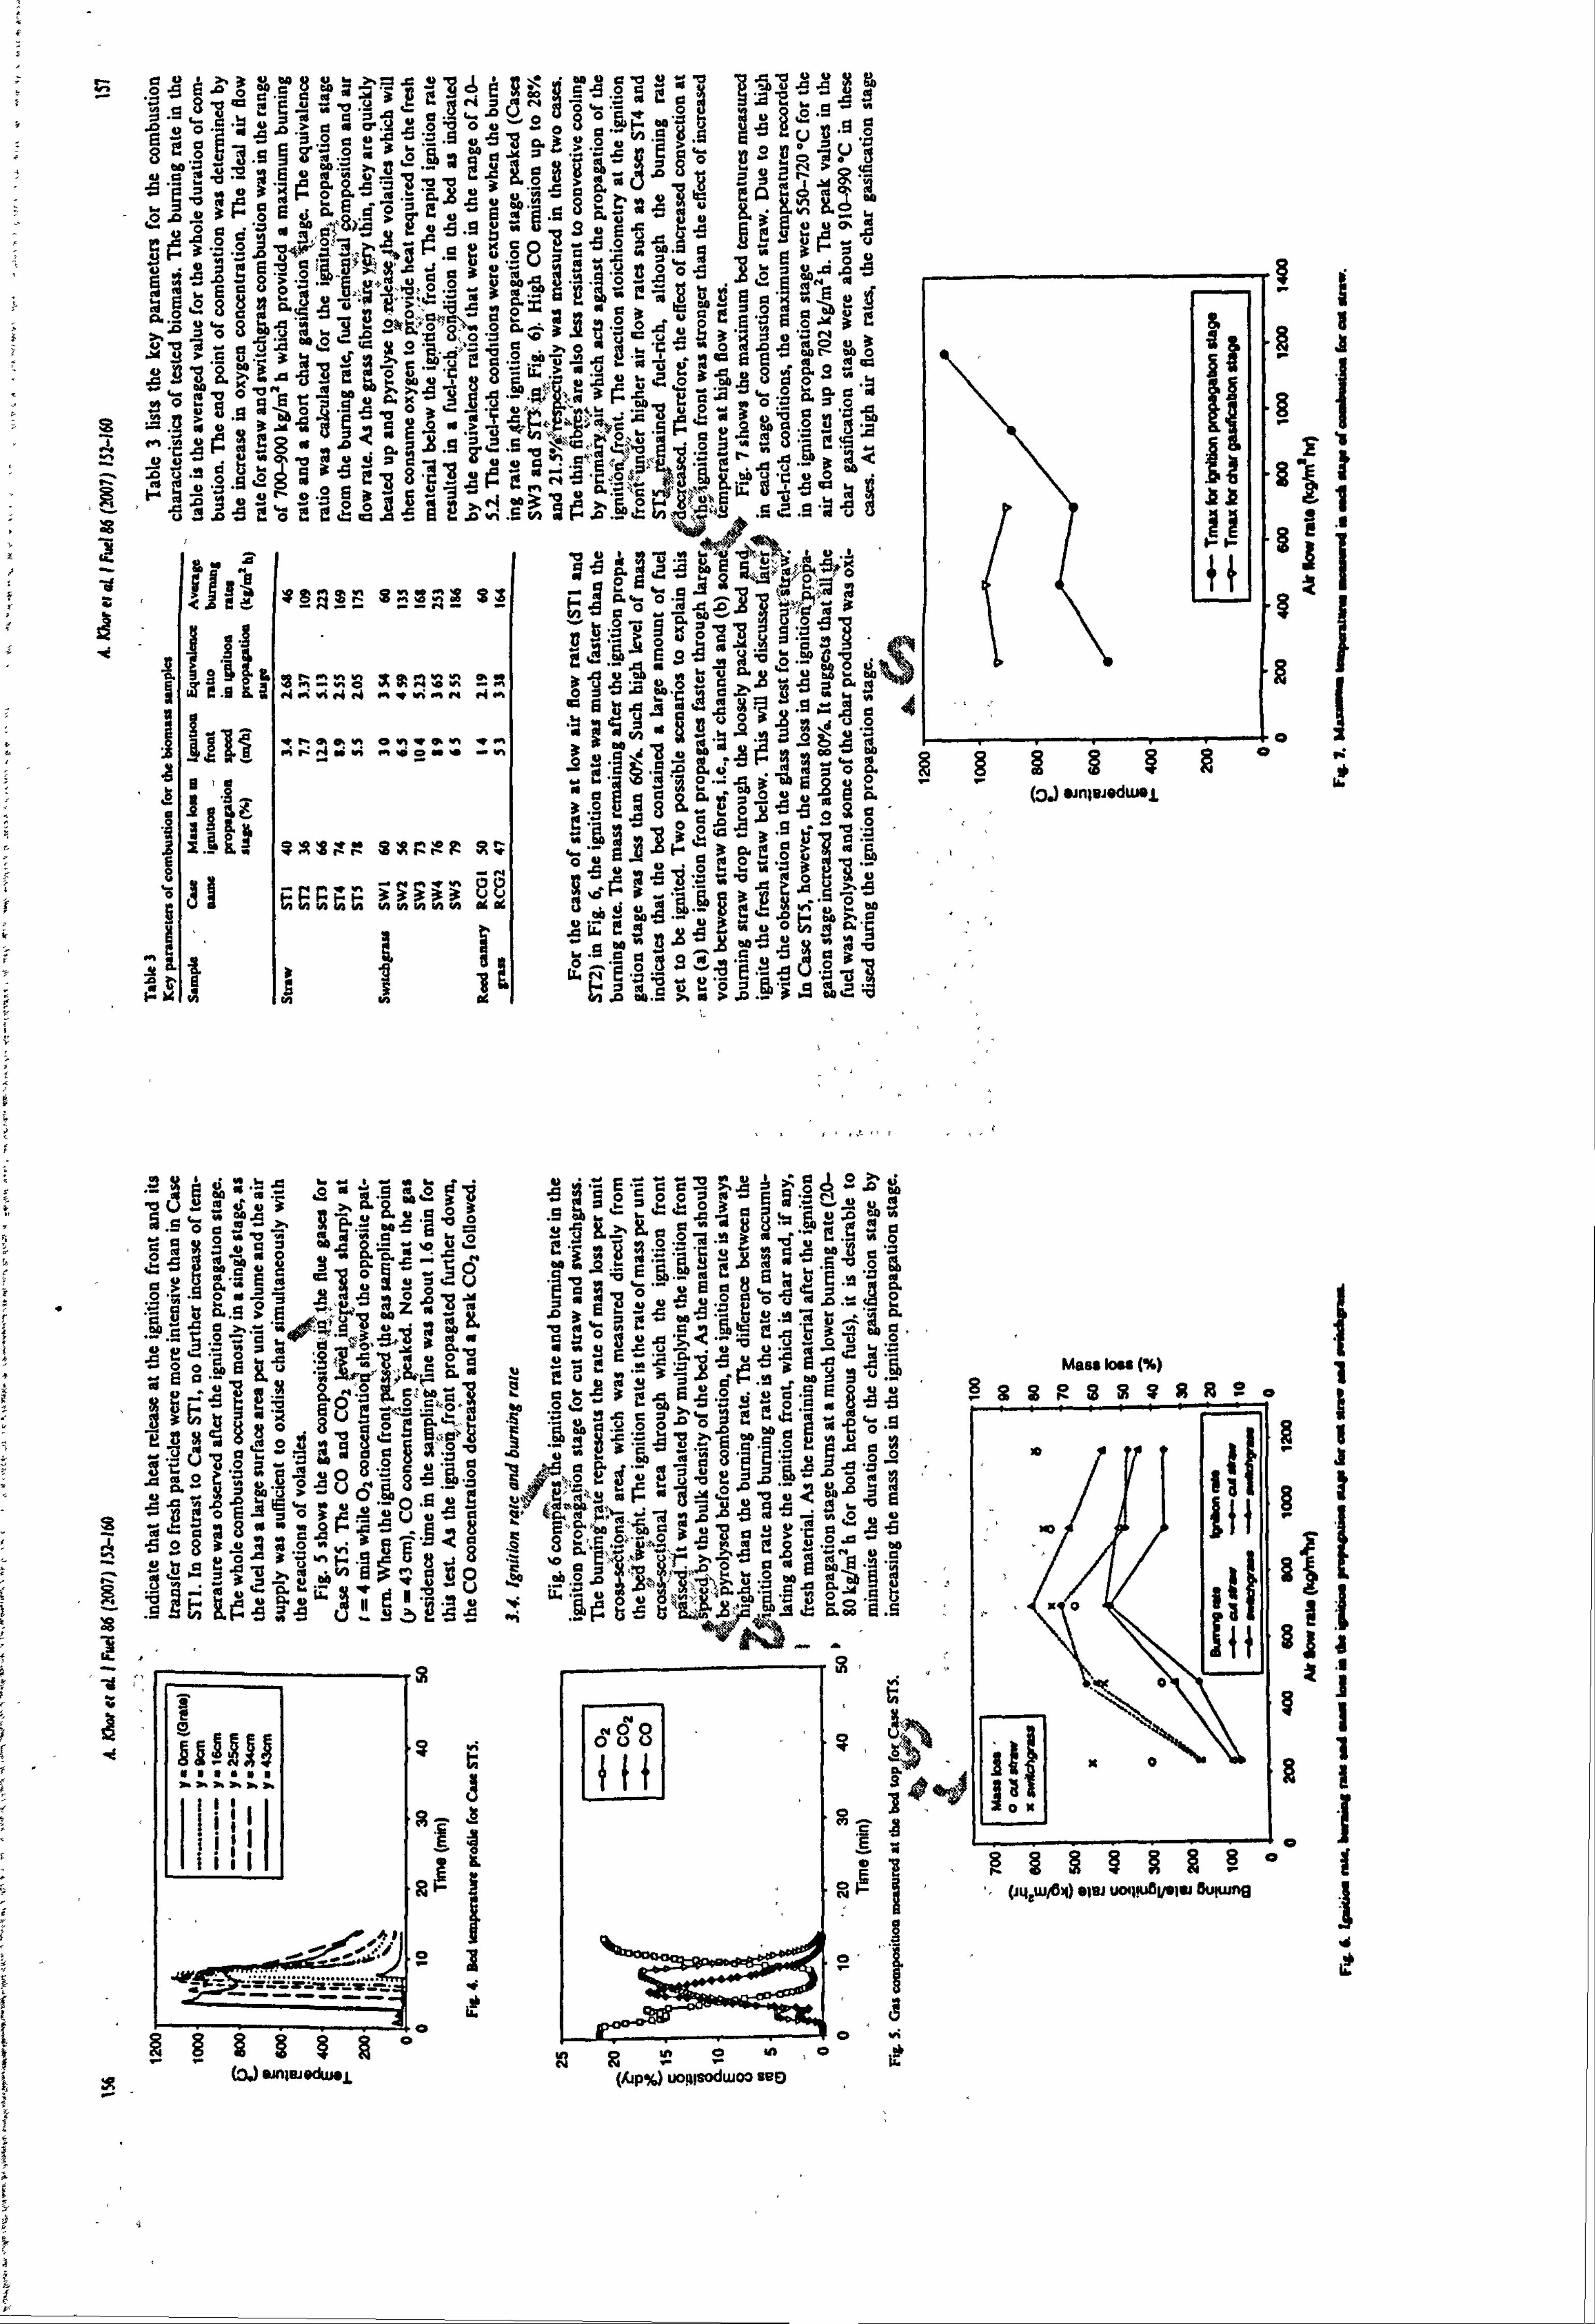
. ya ý3' YE°a. MM YSaa_C °aogw° "g ý°YÖ° äo
.. mo ý° ýv 3g Cýe3 ee°°v
oý; a °d Ca '33E "$. a"g
ýý". ý Y
03 ° as °° sU ° os 3g°
coo rya ? °ýýYfsooo°". °. e$ 9fÜg"9ö e. 2 ' $m31ý. 99Sx. '"3° jlpma$2 ;2
-5 'Eäß
rZ P1 ý3
"e ýi °°ý9Ec "E a'ý'' ý°m. h2 =ýöZ. ýý L° Q
. ý�i Z' °ýö"ZE9mo$Dä' urJ°. 98: C'4Sg °y'$ "ý
° ['3Eg oä
ß° 3 a"-JD 3-ý
u op a° 's a '5ý EapY ga 8E ýo
1- °a3a9. o
ga °53ö mit
aO-Y$a a55_i7 tss'öý, kL :, °2.4°EII1 A
'ý, D a°4_"cg. iA
.1am3L°°my$0
4' > 0-0
ý° a0
ý? yö9°a3
otý °$äög 'n Wgý. i. e $$ ;S'5.
W3 F' F
'ý Oäö üö ö"a
0p eg«'
'^ Y ö`" ya Eöw"3 e "ctýS pg°e °7 $°öä _A >O 0 it ý -ei
.! i a
'.. ý. 9ý°-25 ý°6 C". ý $, ü1äý C, ýevý3"ýoS7 s, e,
1! ýý o
5ý, oýY3 aoöDý >e3m3o o'uýE Oü y
ý ü9ý'3CoCL°ý: aaýýýaý. i=vý: ýoý^ý:
nýoA"3'S o2.9'ýuý
JäM 'ý ö
ýC 'S Q+ Y'p Wit' Ö
e96ýey 1ffiý$ý $_28ýY Sý vý ö`o °'ä
ýý3 ý;
'ý"; eN
ä
xSA is 4a ý, w"ýbg9 y ; 2'O. n ce ö "9ý eý°o.
$ m"týý 'g yý uT$ Z; i: f Z
mE1{ ý "s 39 g r7a pýO
ýy
yr pý Y
yý Ödu Oq
"I 2 °ý agyiY
1.42
Y "7
CVýY! ýNýýHNýNH
Oi OG , 7°"
ýýýý .
ý. ý ý }3Y W
.Dý "pSYp TÖ
SY-°R .7 F+
ö1 iý iii u1 wKÄ aýY. 9 T i0 >A
r9 0°0 v
3
Z\ ll
eý e0o C 0
R88 4S : 49 i0J un{eweduw j
`" ° ° 7 ° ý{ p.
ö. u °O
a CrO
to 3m
Ü e: .: ý yt
30 rte pp
ýp m«
"a A S a. ý` 0pü ecii ^ 1!
W
t7
d °' y
°
fluu ' 'a
S1 Ö 0 Cy CU . 9-0 v . -
Z 0 V-
'°öö"mE u : «+ m gEM I- -
1. a "E 5; ýs+ `E i
8Ö"ß cao. 1, 41
5 L, -
ug_ ; ; a ä ßi ö3 3 t'oaö0'5"ä 9sö. 9 ä 13.9
ar ;ý R x 8
,3 E . äßc $ä a» va `1 , a° 3m9OSIa'
I °
; 15 32''Eeöa? i. epý. ? cý "I ße83 u4 ýäE*ii E'A'"ßp8
ýý "ý U O
ý : 05ý`EoÄyýy 0
$ Ü "ug u S: ö+
° "ä L°" ä, 2aö s» 5« ou "
L »äE ýtfä 5$$ääö° s
g �°hFÖF-
ar°a » >yes=m
a2 ýe ý. ý"° 33 y_ýN8 äaO
ti ý e o g
e_Lö ±v , aý °
ý # w t;
d. {ß° "9 » "$ ýý
9 'J ýS ý M aý g'9 ýC äo°o '6
.S . ýFý Gýü
-ý `;
co t. llBJ ad Ij
All-AI
IIII1
Y
S
cý Rý
R
0
ÖÜO
H
k
9 e#
r. ý
m iF. ll'
y OX
3%3'
O
Mess km (%)
982 or 38SR99o
ýo.
EE I& I1g (igLWrea) "le, UO gwawIo eun, me
e°3 Rom, o (/+p%) uoIlsodwo3 sep
a
$: Z
I
0
$
$1
3
a 0
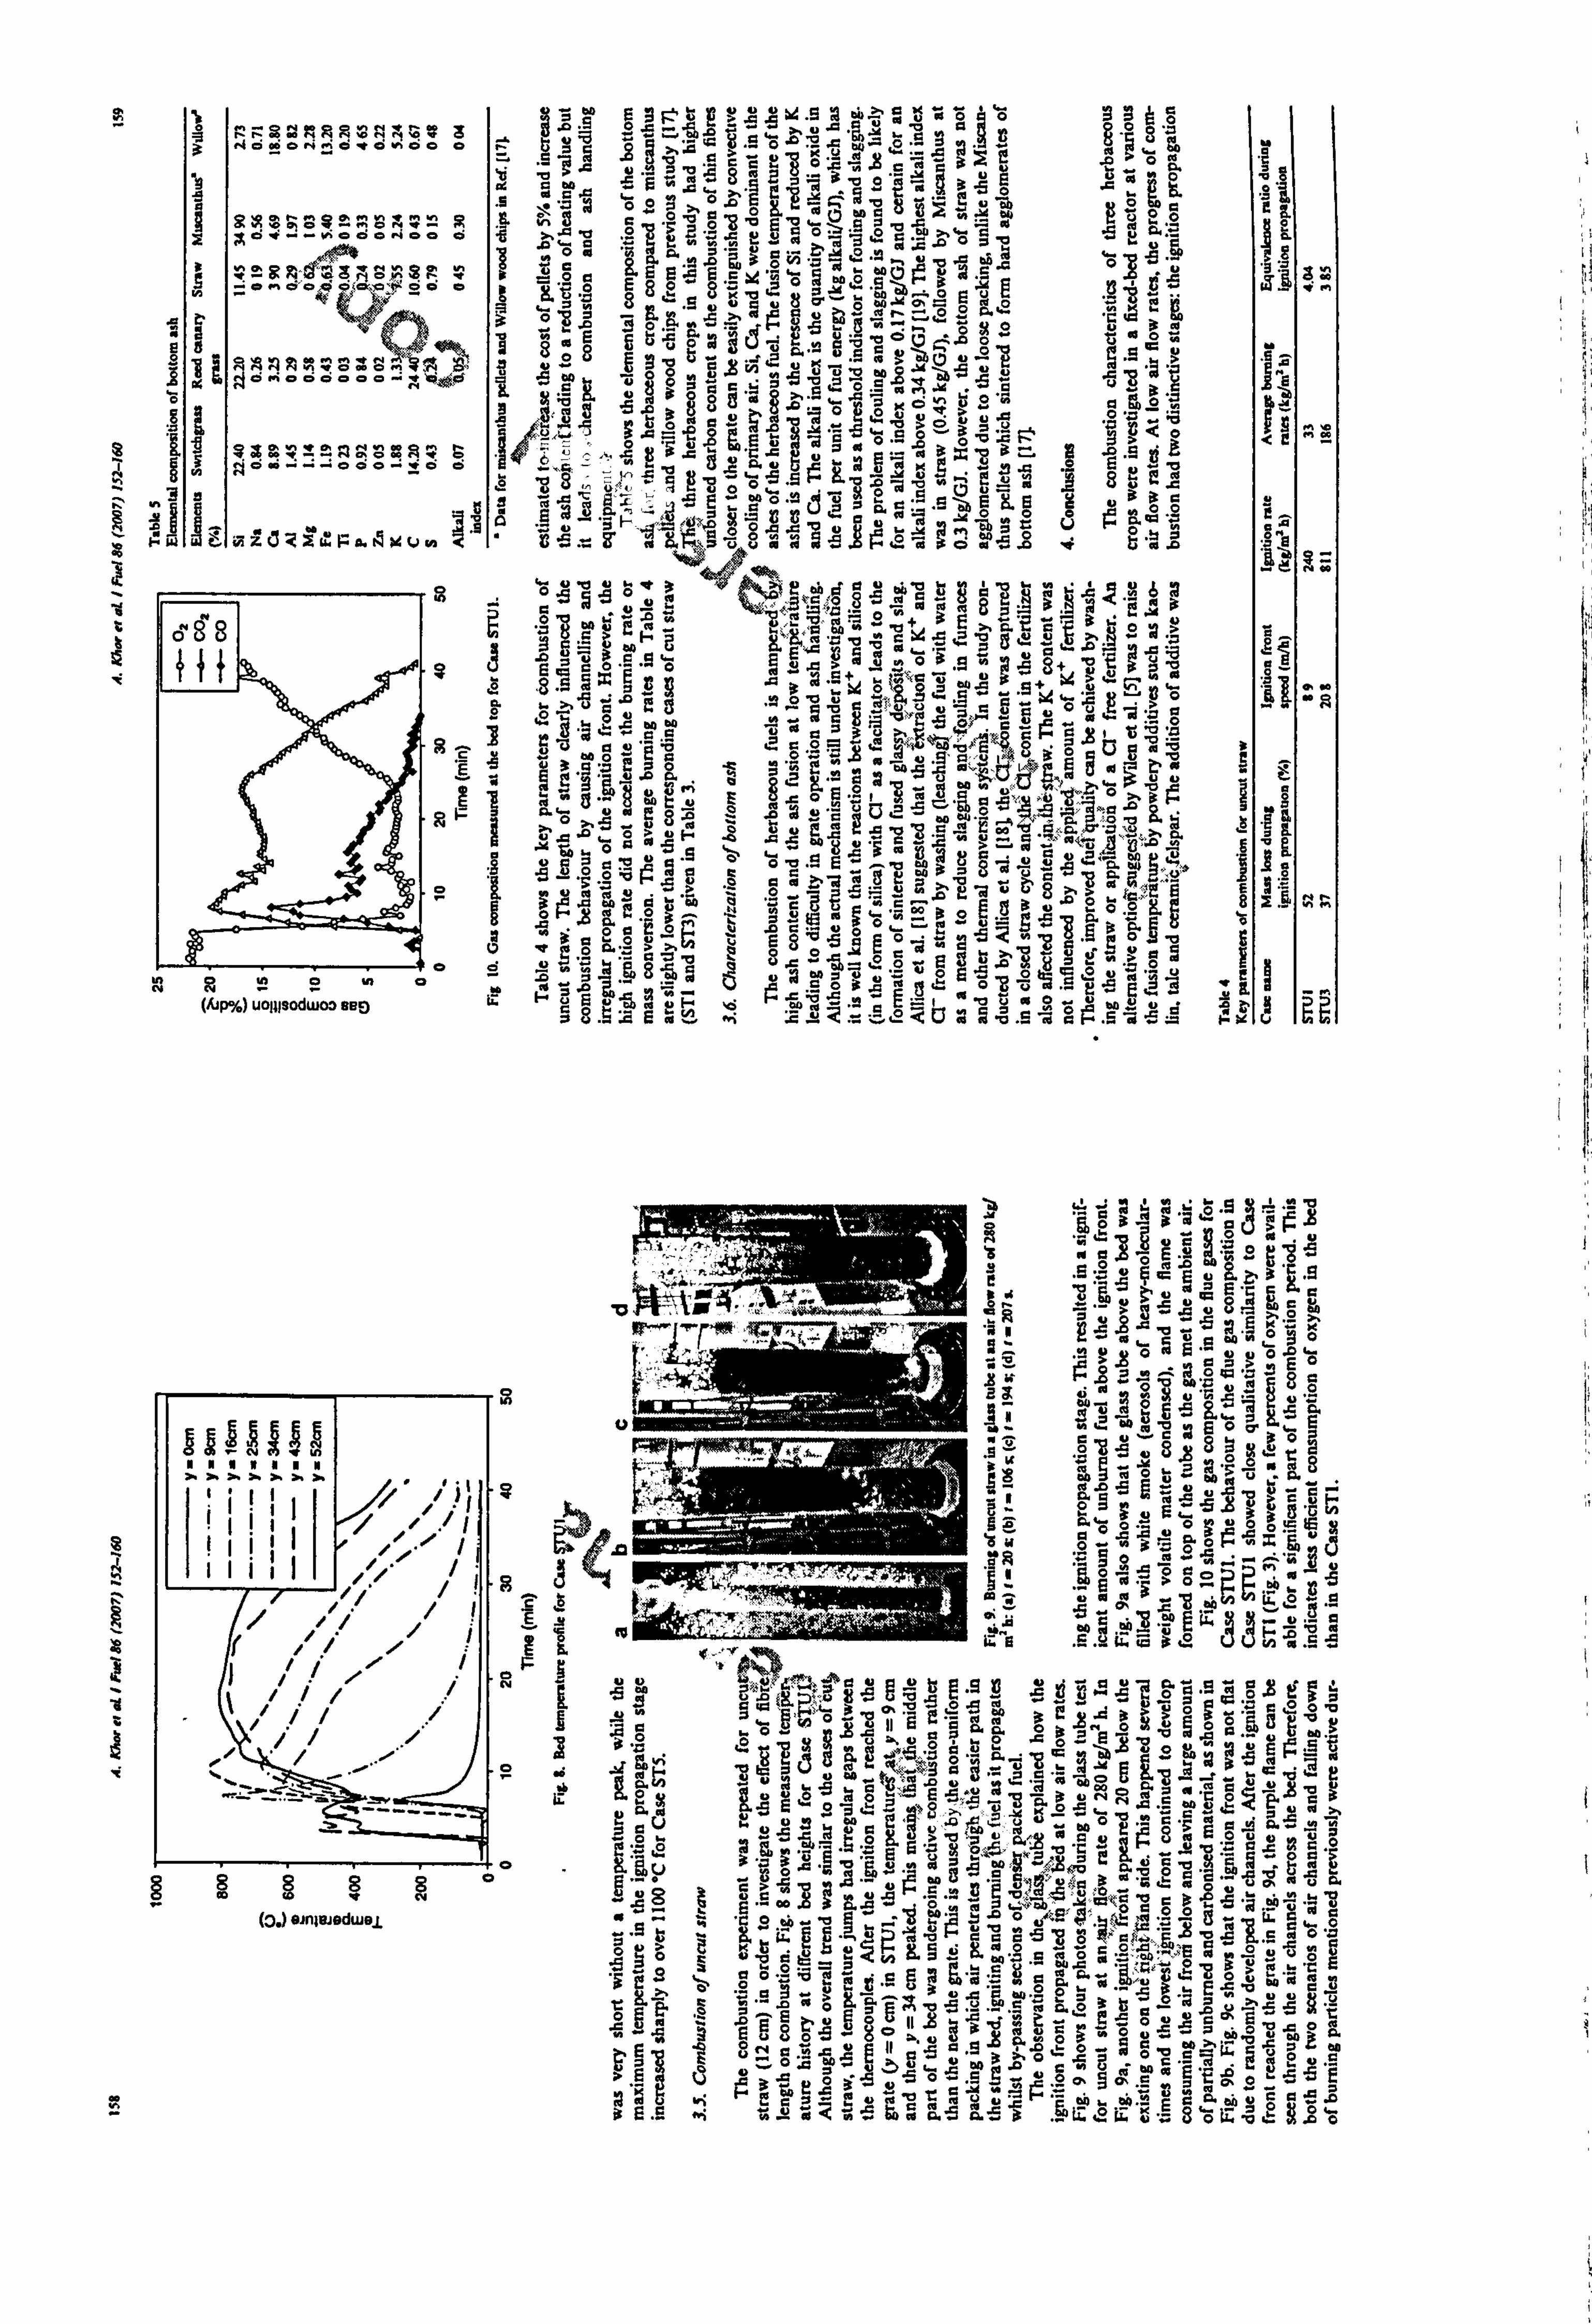
§öä e a' I .5
0s--Z ° ag i4.99 wy ä- ööh 3a_ ýy±{ ý$ ýerooNýCrd hÖO
oý ý/ 7ýg $5 Ta
ýja °ý MüWWýy
"I Nä ýa 'ý ö
13 '9 mcs ýý"'sý. ý"ýýy'0a'OEtR"3'S ö
to
$ 3. s C. x0v Aö ->
°°; $s"=.
m§ 15 ° R 5" c; üe °v a .°ö-;
i0
Xdvý_v+ doNee a ýs
J. 5'$ 9 N' Boä
°ý'E8 äß °ý -5 me
S r=&ý "^ý8°yev SR röa 8'iEy E cý'« ö .ä
2: S* eg &r y-
Cý °üs ßö'ä ýa_. Aýý$ýaýý, ^.. °. öý« "ý`ý3ý0
e8 ýy ae E ýi üýöä ýU^ ä: °vý(j ao ü'° o
a vöee ýýohs rsäg uoäoo. d gs-2, g. +a ö üüg $e üö osgg oý K=äßs' Eh, *Z BÄ$ "s"
a§°°
ggg 6gu ya
S ox cvS9 Ao^'. öoeo . 9" vS:.. ,sg Fo4ü o w°p äK
ape. T'ý a go E"°-at n
92, y3 "s3ý3p H äF'
f y`ý p 2,
a '9ý
ö$ öe , e°
HI iih:
7. zü'i WF+a tý2CVvl <ü $' 1143 ü$. ä 0".
2
° Hä ,ö m"5ä 4
e Ö
.ff
NNON
(/up%) uoplsodwoo seo
°m gee ü°g
gyp ý " ö w a, üäý °"ö a lu? a üöü "ß "ä ö 'ä^° uu
W- Z- in
"
ý'E L°
aö ' gÖ"ß u3
y k "SP oÜ
ý'c ý ^ä'°-eýu°ý °mdýýi }a°
ý a"ý Z`ä
ya g a k ý ý ý ý
g' ý5
0. ö MC .o ööä id a`
° ö
oe"_, g ýf vy :" ýa og° qÜ .°m eýiý ,ýää,
öo ß, Gu L° t0 C sv'$ °äm är. a 'ö E::
"8
u . Xs°a$F ö° ° °ý " 9's
w ,cýmý° cý ýý ""E Wau y °ý°s"-emä-ga-. em-ýäw MA
e , 2 ö , ä ö F° ä ý° ö °° °u ý-ý-
"°-, °Ö eo¬2a .
'Ö `o
ý ý 8ä9 E0. e WsäEýäce°"w ü 7 8.5s e äý 46
ssä _ýýäCt äßs ý . sa
; Ii AIM NII1IM
II1I Vii' '1
on. o
h
e
(3j einieredwey
ýý .ý
u
cg Ey
cF GE
6
O
0
i !s
E ü I
I r$ ä
Mý X
Sý :ý
s-
:s
ýý
0 -L aZ
". E «ý em 5uß. 3
9vö6aöäö Ä°
äa ;B P%ö mä42'. ß" gö
iN ye°. Wem` E$ö &
. 9s ° a-2.8Z8ö 91
äW sa
1[ IF: P
'0 a"ä ==üm5. aa MEILE 5 °"° 3n` d°: Re? 3
«"a y ý"B a° Yf üö
9aas3ä. E ä pä .
's ý ýýýoý'ü ý ý"ö ýa m3l! M -d 3ýäöQv
as $ . W, aý.
ýý n-°OO=a.: bz , 0t ry°ÄF°
pýýu Ön "ýn ov° 'W ^pp oj ° ppuý3Öýösýäý, äsä''ryýöü°ýföe m Leg
ö« Sý '3 ýi ü :TYVY. "äT
öV `$3 V 10. 'u" ää ME öü
ý' ä>sp ö °cý" üy'°ad_Go: w upA4a
s°g " =m E äýdj ö' A 3«gß ei aaeBJ ý=" ö
&a 0
dsöao 2ý ü. L`"^ 2 6o'ä °ää a"*
LY öe m- "c
C z; IM<>L-"mix -. 'y. 'O3 F. CÄä ö3 iS ä, -TU
"E'rý ßý 3ra°_rSlýl I'rýu°.
8ý'ýöýEäö"°ýT{'�"OgÜÖc Ü
ýc"vsý ö
ýý5 ö au c ký°ý u öö ýeEýö ýý3 E
`ý reouaaAbä-6 ,aý tZ VZ ö ö- B Eý «; "=ä<hý6'oaa"5aý°ü.
5"-3 oti. v ý:
ýpo

gpag g7Y5ý gy Cý lr
aa °sä H;
ýil C7t 33 "$ 'Stýiu'ge
iii
ý : am 5 spa t tl, äa on3 de $ ý!
J Y3t, ': i otýe get JC
411A tjl
pxa 94-. oa R °ý °L p jý 1ii
t" ý! ngili. 14411H ýaa >!, 1.
Aff
EEEF 57 tA
=coc ý_
z
1
eine spo
p. o am>ý'c >u'iy uo-Sts 9pä0s u"
°eGpI- 29 PC
ýy"py p ^ppW ÖÖmp.
n °> a° Y7
u" s00 aý0 0
ü> 2%zue e . -3 3 ä.
z- W 9ä ea gs mu
öäß u w� o
o c, o °ý 3 PO ý. iä e
E, 0o!
Z ýa2 en Kg w? $e ms
0 >s'- 3 Yrvy ýä Qq
ýv ö'ý wý
8ý of ° wý
3 c'
b8 $ Uäßi Ö M-= ligg ° . 9a ä% u
-. .
12 8S- 0. "-
9s s_ 3
u
1-
ga *0 ems 3-°
2ý °
>,
'O il 'i e Ly' ýyö° a0 Y 4.. p `y X2q7 "ii ^'Lý Na
9m"9"sýy ti. 9 e ý. = e 2"ä"as x a8 ýýS
it ßäP a
ll y w ýya1ýý tlý
ýi
iý q Pot' qý
uY
IN;: Im ý
gad '~ ý"e T S. a
boo,
9p Öüý7ý
µjýýýý
UAW HIS 9ý, na ýb 1EE
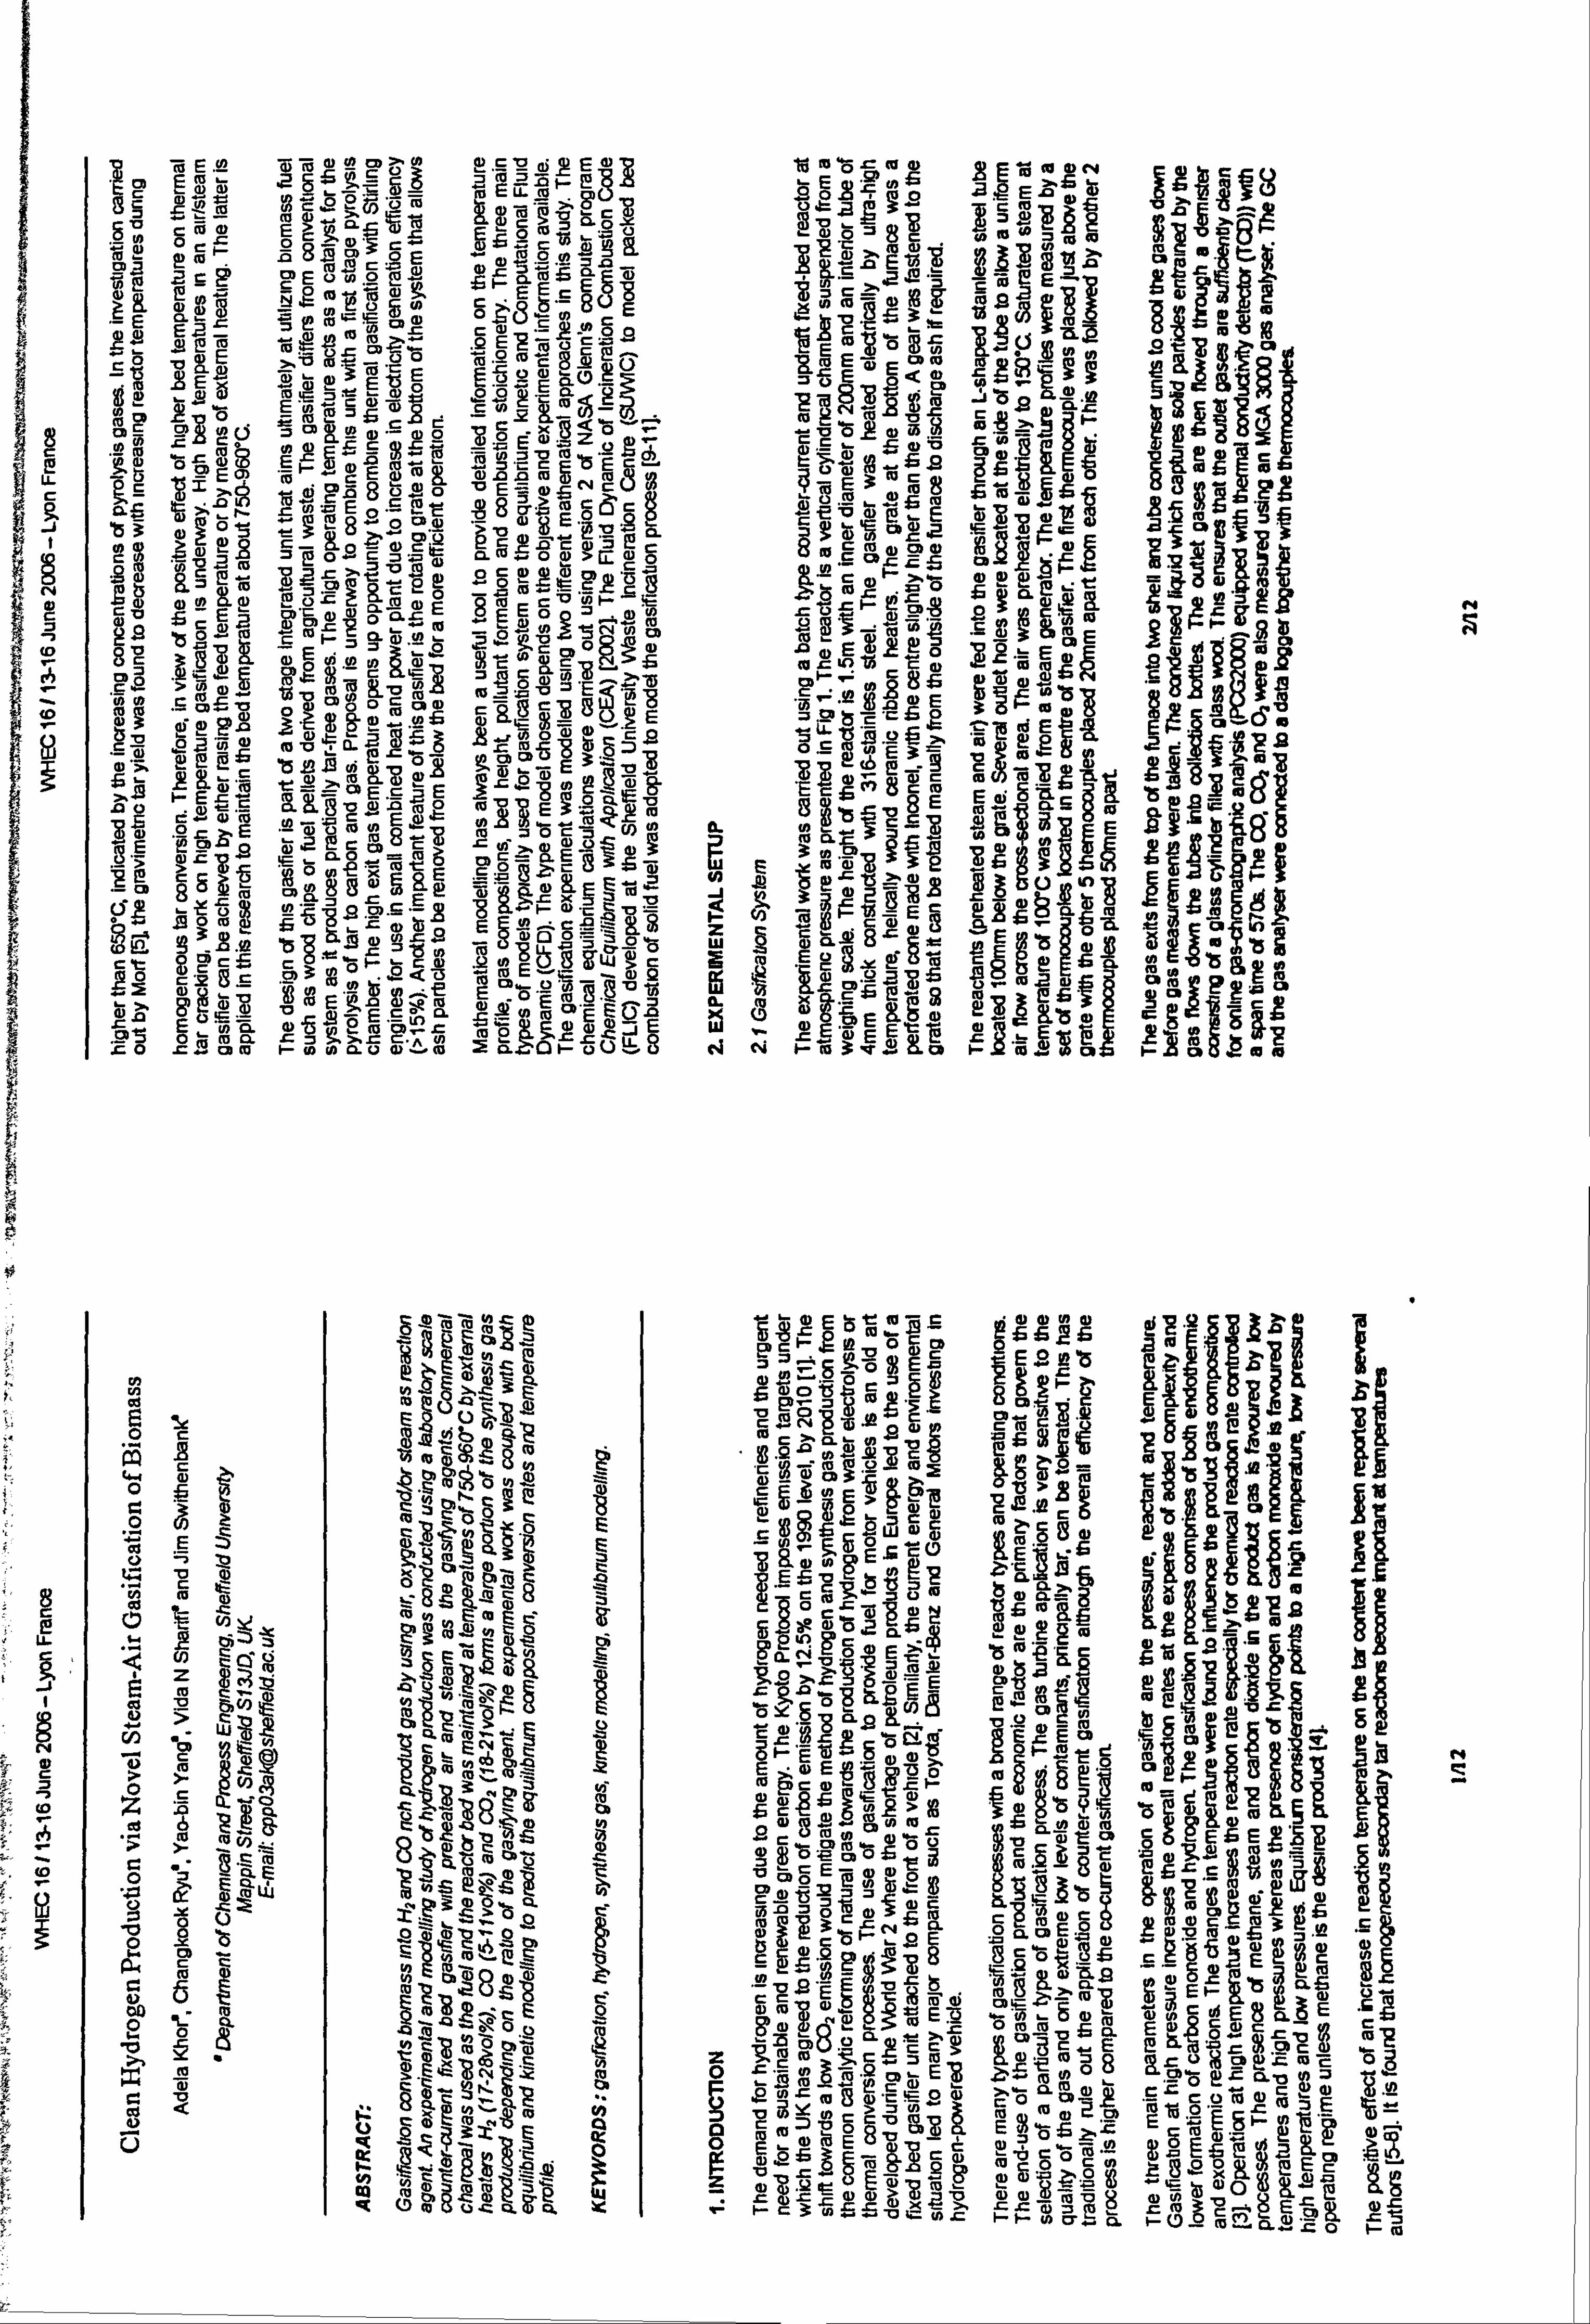
. ý° ¬mN Z -Z (U 0 CD >0 2! c -0
f. eg °rdg 5ý9°etEm YoEoso Nm
( )N cU
mN °m ý°, ELL. Co 12 äýr.
0 s3. 'äy$i ji Ue
Z Cl- 0 -<Y, -0 25 0 "92! °Cr ° h amo r= pc mö Nim
ä. E. c >. ý pý ým.
L+ Co j 2c9 1E0wöý e
JEI' aý cý42 mL12E Cn
E nýý ýýý ýaNi oýÜ N$ E ýV@ii2- 7öat`ý
aýL° °m 1O °4 Eý cs°8 cc ct (j 3 S' iß
fl v'r°$ om... EiýDINm ° äa' 1O N
s4w ýmý °EH
1) 0d 15 E$c¬.
-q mQ cp ctý l5) i 1,103
C, LÖN ýs m ný ýADc Lß ý...
ýQ yi pý °' NÜ cn&o mö diýQ$v" a$g'm, ýýi C Ný _t
cg, N £j X ýE Z°ýý c_c
. cmö cNjs c °w Em m1-
cE o1Oi$ ýd'ä $ mý týw 9$ geg
v 5ä ia: °asýmo 12 E-mr, N2C. % mý3mmý {mom fi
ýR Log
153QQ11 090$Q, r-? v99-L, a 'Eýýl¢{ý«'F. aDC °12
C97Öj9 i7
y Öy N> CAÖY N Cw L
L$ ý4a.
m
W4) 'CrnT,
2ppQ ýÖm'Y ZSU Cm~¢"a 00f2
t ý°
mNäm c') LCaNoN cv "N I- !C ý"
L F="" L/i C . Qý
f. t2 awWN .j
aci äcE $°crnmmöäýmE EO $
Q21
E
L^ý+ 89 >3O0-lu c 10 1-., y 0t g-.
C oý, 2N(pa° im Eäi ýo c
E°° t Q1
°p ý-1 N°k yC
0r- 'E
f. AIL-rýCým prýN41Fm
; Ng ä
IDm äö
ß Si g ig c-
'2 tba °ýýom ß-_äE C°m . '2 E ýN cao«a og °öo c 8cý8
ßw' a '3
B E2
UWE ° . Öe a
a p'y -r �rýJOdm". c rýýt5 °r '$ E 5- °2N m ma kn ýý 15= m bi ß
oSq ,°i28
ý` iýä ü 10 10 ý6ýý'äidý ýLÖE°-ýý
mE$ ä-O ~d£' t ää' 8adäýö p °-afE$
E 8r-E °i
ßbä5 12 A ö« mm N- pc Elk N üS
E mý $c 5äi äE .2 LI) Q. Ey2 L° c W$ ., i LN r° m
_v mN23~ 19 N > >L e -7ä- ý cö-mac 8 ý-y iu Em mäi E 8'{ ä
g8 .2 m gý m`
ýrn_gýi4L g "5e L1Ejmö n m2--ýý$ ý
m}Vý ýf öm acr5ös°' .. ö2i rmc-0a- F Gj ý6i e- mE gýäýýb ä3 ä{ i' 1q3 ä $ý=mýc8 E ä-. g, 9%K8 z cm
Lo ýL $8 3mß 0 m°ý8 xE cý t ý$a°iý °ý 1O $ý r_ -t 8c :E'o0 8giW
ow ýQ
_ic d EchiY 10 cE ýa mN $gqý N 'g o c's 85 rn3 2+ ~0
Q"3 '2 m8 Em4m L)m rm chi. - Wy Co E 10
mNy hS ý cam E o° o- ,ýa
Vi t ý°{ "ad cm 0Egoä °' 92 EEZ °" `° 9L ä' +° $,
tý Eä ms°ým'c a= my EUE Cam .; Q rö r®m -wo2.0 aw -u 2ä
ÖýcLiÜ..
- ým3cýää
ww am
-ýp eF gg 16ý° 1ä£'2r oY
Oiqý N=ýv ý°oý me E°! C$ CL) 0
r_ :3
Cd "' 9äEcE bý'8 scan Hg¬ ßää . 9t
g j2
H
UlmcO, m ßj. 4 N. 9i CN u+ m
9R
. Eg
fEn
oC ös C» 9) ä ýEbtý? ý "ämi X19
1111 1
y 10 Z. 0 fb lm ýo e$ 11 M. lb w9
gm mä ýb m
as my EUEý $ ý2a 5.2 ýý
R1~ $ý9 e coý? y ýý 2e 0. ag 10--. 5
QU e0° mm äýN ö°äýýö E$10L'ýc 15 3E
°iä ä
i'ýE
m' oý E L° y cu
gr
WAL g. > ý9
22. uýý $ä EW ° c ýyw2 8, -El1 mý E -i5!; ä > c10mým. ý ýcaEi}ýýrf°-
25ý zä aL" ä
38 ý
5ý$d m >ý'
0 em U" Kt --.
a'- - s$ le, °ooä ,3 ý(t c .5m -4
$ samtL .. cyý N_ "- @ oý8 aE mom'4 amoE-mmo 7S 5 ýi j5
Uý = 3ý $° c mýýo 3c0) ä öci öUICI
c `c Hm. SOS bc m4_ c8 99ýE8ä, ä8 w
EF ° ä5 ýL C3 mý ý'2Uýý c `5
Om m `- mdamG.. mE ?ý
ai °U ti 4 E¢ma
öeE °- mmýi mý
awu
wNCCEöaE c 0 2Om?: i"5, F. aEomcr yt m p& .
'-, '- ýjmöo . o$ 5`t oý° occý cE @acý, cäi
ýmx z- 4om ttý10$ zmc oý ý+ >. ýý$cv xmo E$ ý`., m 0'Ö ö ýP iy aý o ý";
IIr pi mE
W 12 LQ
'92 ý`ý"' ¬ý Qö dýiý
"ä`ý -0 xä ßwä $ m mo'ý`cýmý ec ramm äi °a mm ýaý mNýmoýä"L° °ý' Q Um ocnäin
wYr i-c3 m« NL cL 22 cm ýE. mL F- 1-- 0 Qmm. nHs (D mom. a- LoHN

E
wv 7E
c c
L
NN N
S
8i
c
t m om' ma
E o uo o 'r' o uo o o 'n o o
ý ä ä a ä ä ä ä ä ä ä ä
a)
ö a) ý cu C ý f")
C 04, C104
R) 1) O
R (`
q !f
u)
3p L r. j I
Q-: q 10 O
O O
c A
0 M -in
ß -R 10 oO
E E
(D
ý CO V m ý
ý (ý f0
r R m
y uJ
L E (0
o N
(0 ö N
CD o N
0
V
0
U, -
0 U,
V'
0 ,
Q
U) o) (D
U) o»
U) a) !O
O) m m
000 y N N N N N N N N
0 E
g g ý o 8 0 0 0 0 0 0
Wi e -s cE-9 aE ii °ý äy
"qm aöc C_ oc4i - tu oE« S- EAE'a Eo m
cwm3 ymyU- aomöE ~L°Ö m3ýr= ä
a'°'m m c» - HU E öý <{saý dv'N Log mom=. ¬ a, -gn gY$ NUE
Uý WN
'C F '"'a'",
Lý CNý ý+ Cý'O EW oEN aN
N$L 1--
d Bä
11 '8 q*
E'ps .53-, ä89.8 ' Lwm i4m
r- c N" a7 U ; (I O Q.
adUH NC
ý°tC� öywa
ömEs ß_ ^ý 3. -'S
3ý-08cý0ýa E a'm oc= Nc wmEc--« t wM. C, 2 m«tEaEy8ý
o tö moý a5 o0oZ a«_ dßn. 4ä coo ai ö ýýO= ýýpý r- c19 9 m. - _«om ö yU of oi
o E(p°co ö-
9'o 5äm e «g E. c' m cT 8= CEC . S2 CNC O/ °N,
ý"", N 10 C 33 ý
0 ! aiao - .-CcCý
EE ä°ýÖ6 ý
0MO Eh -mýýöao E LF cd ap «ý° maEm
3L E, v
35Y-i `w
i4^E °{, y0'°cao .2 cä> E 12 -, u FE c, c -cu Oe w of8; ýýa ßt5
d ý.
y m"}ýi g 2« v «c c 9J@' .0 : 2E E"T-- aý r«r
'^ aL :pcSmämc..
N c. ood . to
G/ GCWdpX l0
. "Cy g.
L�
Ifj C-
EQ o-2
Bn o" -o.. 0 X. cuy arE is iýc°
Co Z Al
cEa'(ro5ý ymmes n"_. _ E aci - ÖE
175 a) (on mr
f" 3 "ýo i. L ä {IIIi
Ö
- >s Ec 3öýýýyI
Jä äE d Eu öd oý"ý=m m. _ ca Q ýiEEEyÖý_m m m- E '0 ýLm°m 'A
5 E«Z a Zö ý vý
«
c9+aý. ýýýa QW g"ý ýac_Eldm 0) mömýS'
Loc'ý ý3öcci
"E EW 9ýa ffimý
cö ay äýe$ým
Evc=L d aýi°E"ýý
o'S3cýiEQýaoiý`mä
ri ýi t-Oooi--toEC$m. 2 hr-- 8 °«>°äa 8.8mH 0Z
C O
11 N
N 0)
D
N X
E
c m
0 ca m
d
6 LL
EE ._ El
ME
MtE ý5ý 10 2(00 CO öt5ýý Tom, N fV ýj
NL" =N
E$ý E
LAC
m. 2. E Co_ . ffi CU
ü? ""c cC
mawm
EE
ä20c C
ý.. S2 1n CO. 1T -Z
g1
«CV
i4 ýg Ör
N3^ýý
lý0 ýÄ
Qj E ". --
ýý 'C öÄ
VN N
wE CL Cýv
La' LCCG t-v m. ma
O (h fh O 'r
c N
I r Cl)
O N N n N m r N
Öy
C
E20 N U 2 p ý S = U
v X
a m
L 10
N T N
U
U N V U,
d N d
E " E 0 in ä
C
2ý ß
W
(S Wc
E2
L et
cE
l°00 äý K ILL E r4 pW!
Ad C
I
E J
d
m H
10 ýEm
m 0
'ý
E
E E
Co ®m(U
1ýNp 0(C Oy jý
TLd
7 Lu mE
Rf 12 FN
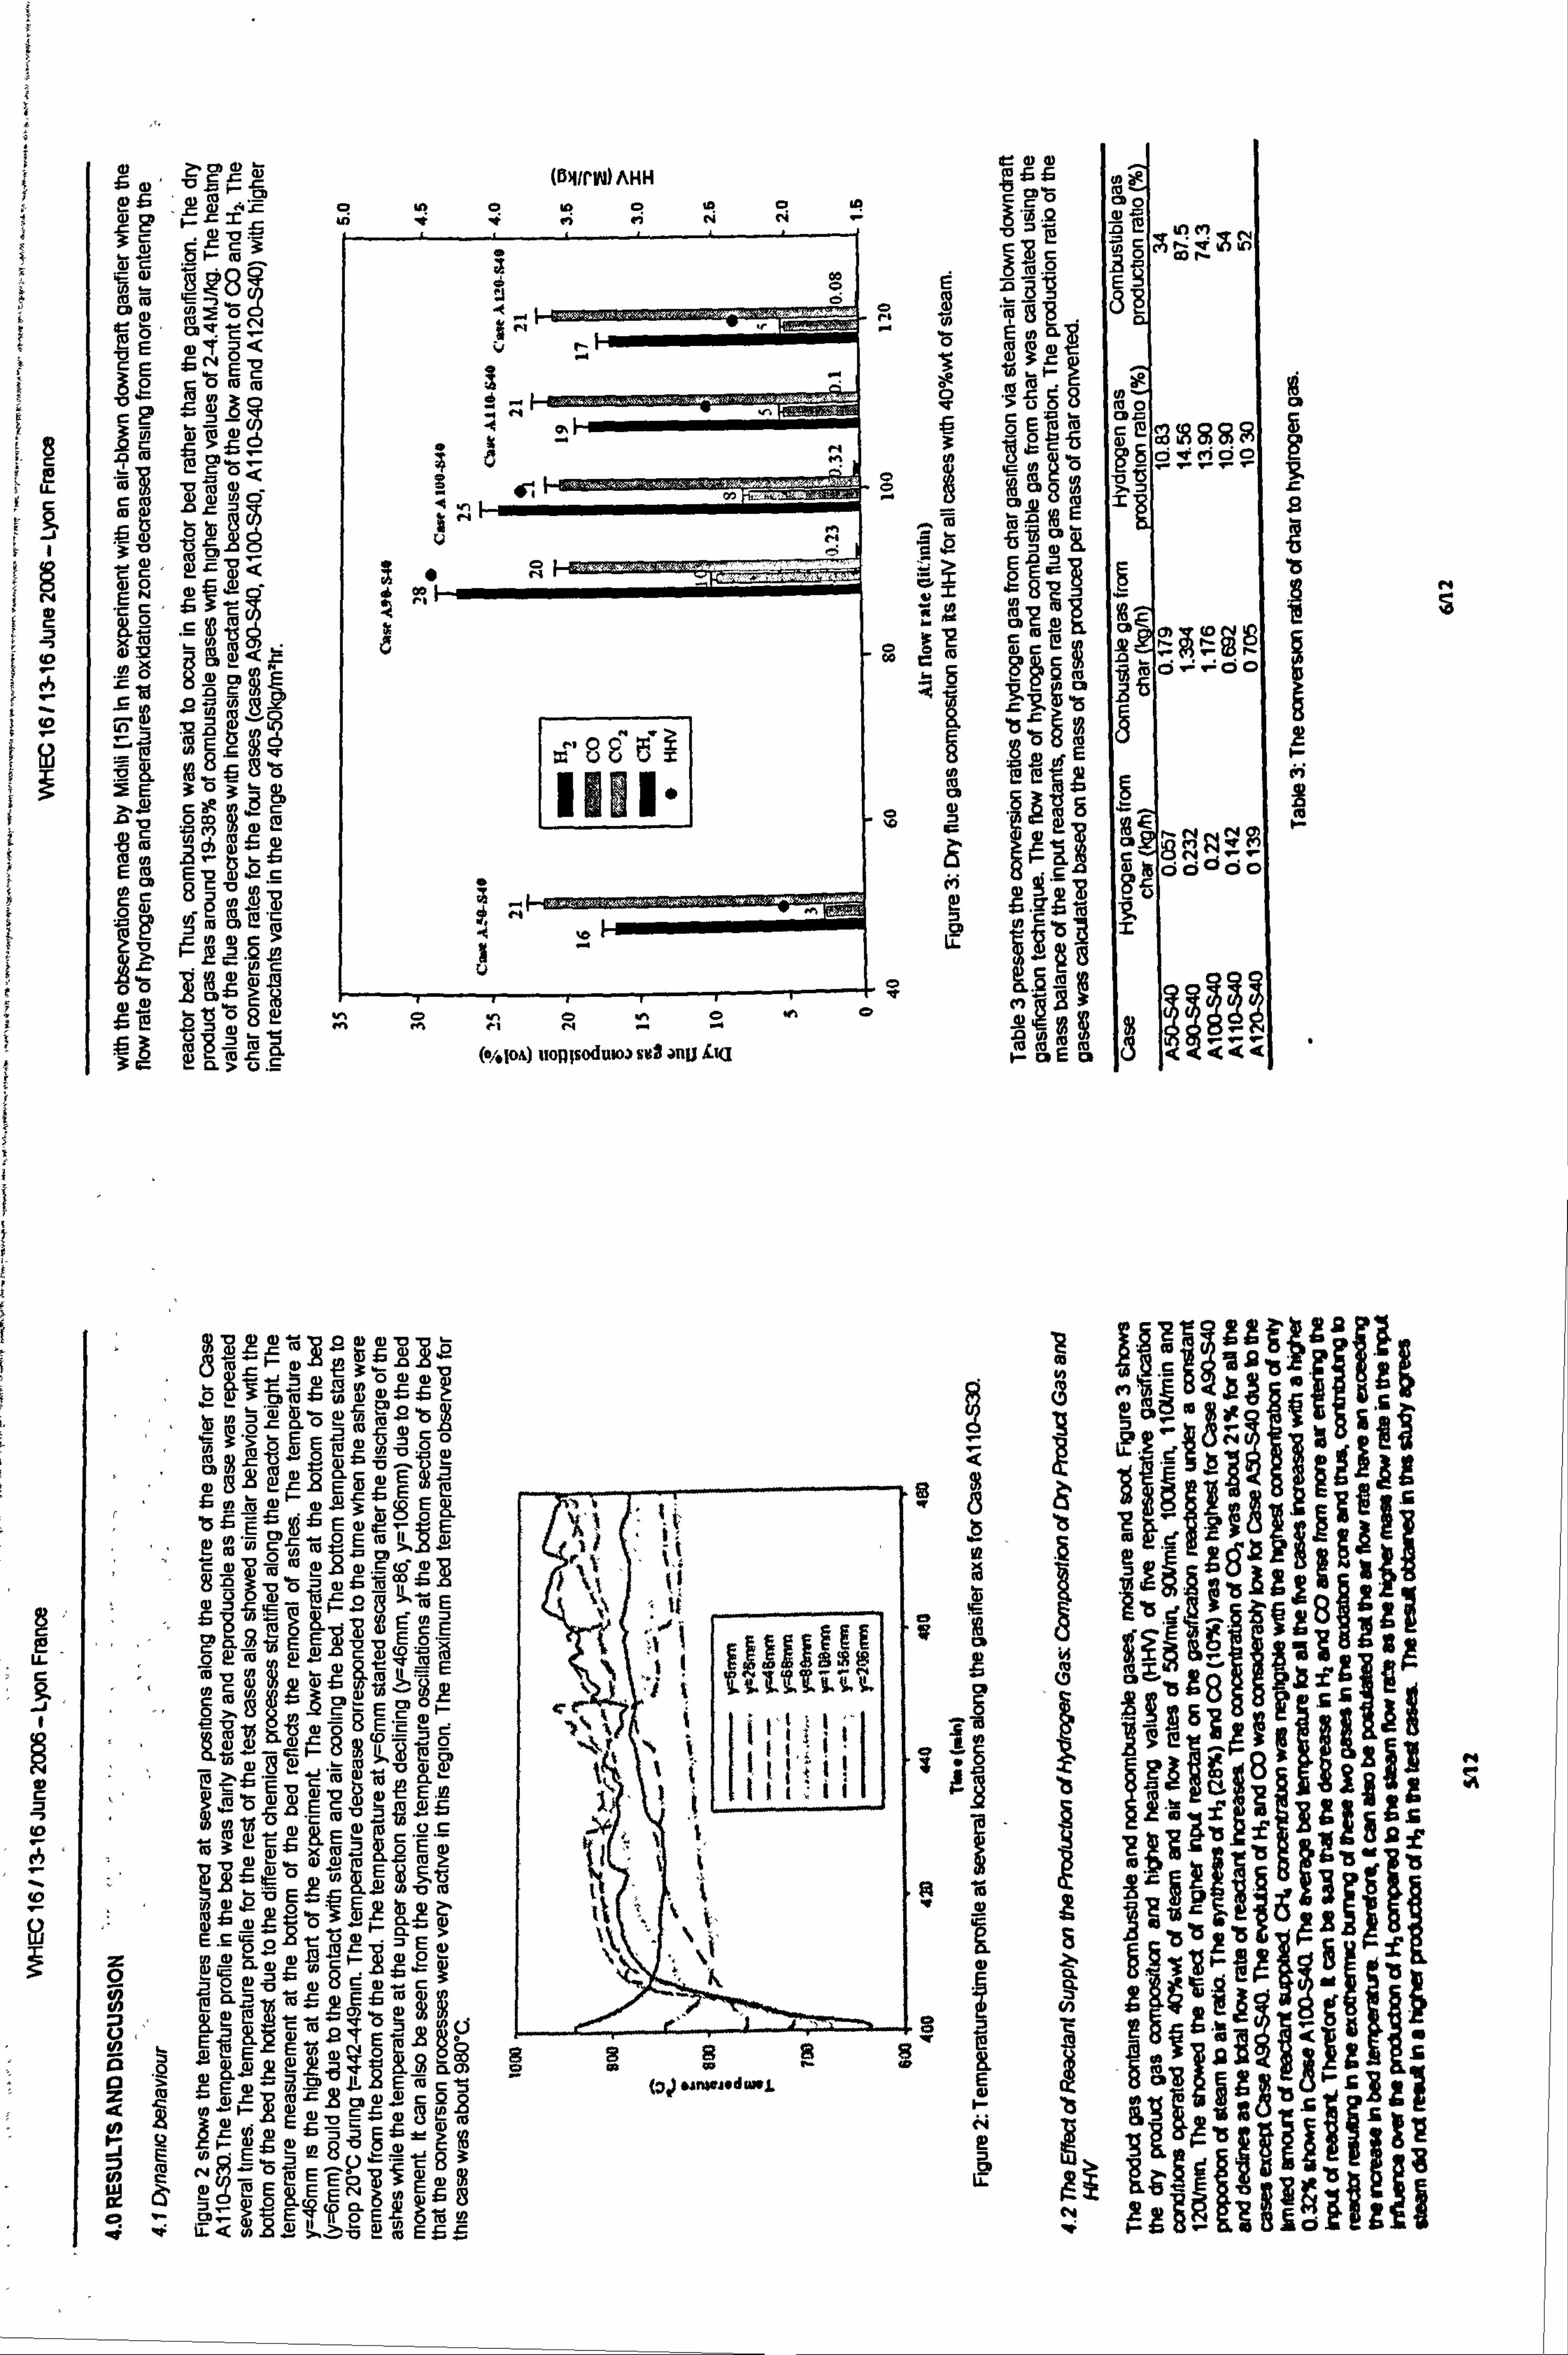
H m C 7
40
A
V
PO U. C
1
V
C (o A`
(o
dZ ýrn 0 hE- m) Co
aýof0 wýýd
2! OE
X60 CO (
«r7 % i7ý ýLJÖ
oGLNQ E14
a- 59 N
ýý ý.. 8 ýE Bä yý E
E 3öe
ýa r- äg a
U) d) tu M
EU 2p2:
CCO7y2j
p(0 01 e Lý'C
3c La>cLiý
(BHrrw) AHH OUObOOOb 1N Y !fhNN
NONONON0 en M1 fl N-
(^/. lo&) uopsoduaa set anu L«Q
d. 2 Leomda m 6'Öt~ ý3öyv
ý p°
tnÖN tLn ý`
EEmö0
ȟi=d - 0) f- WA
^' E ýý. EE . «NIL 0.2 3sEK
t«9: s9: GEWOf1 CE N NN N fL/1
ßE
yya0mdSd. 5
om C ti d 7
-@ FE 0E q
EEýEp'E oLý 0/
o ý
y a 1v4 E
NCNýý 41 fJ ý' ýýS
C, >A
dt§ ° tp ,ßý, 9 ED , r PflP
M. E 49
ia3 RE`ý BEd
öwa3ýý17 EfqJ1 2V N
O. ý/ N
aE N G! oZ«I- - y«d_ $
z 0
Ecic0 CAL gE> dnddwC0
« o8ýa) 2
ht 3
EtE Etu)Wo 9
`r ý'3$ärn ý ya yý
L ZN
Q
_ «a+L Ä ýS LE
ýCpSS N 1- E I C "ý p -m C1
> y E E8 SaC
l0 E{N
0
N N
unWi c _ E
Ný ýýL° E
Eö«?
Q100
ti li v
i¢ NS
«, waV 2m E««
E
Ör
3E
N
-N
pOp
ý lC
t0
{7
0 a
CNN
4 m's m ;sD 3ý U)
3
SLc'a ý71 i8$ m
ttöýý EA M co
m°v
Waý+E
lob ö
ýýQ ö
8
iE Ell C
ýý ýgtiý
Sg$ :% ri ci
ýýý ýýö
Ned ÖaO
ýý
Q Q
t S
I
r
m
Oýj R $WF
ig ýýý{
Vj ýO
9 jý--g i
It
lilt ýýº?!
ýý äg 8$ VE
N 6Z ýf
r ä
p4
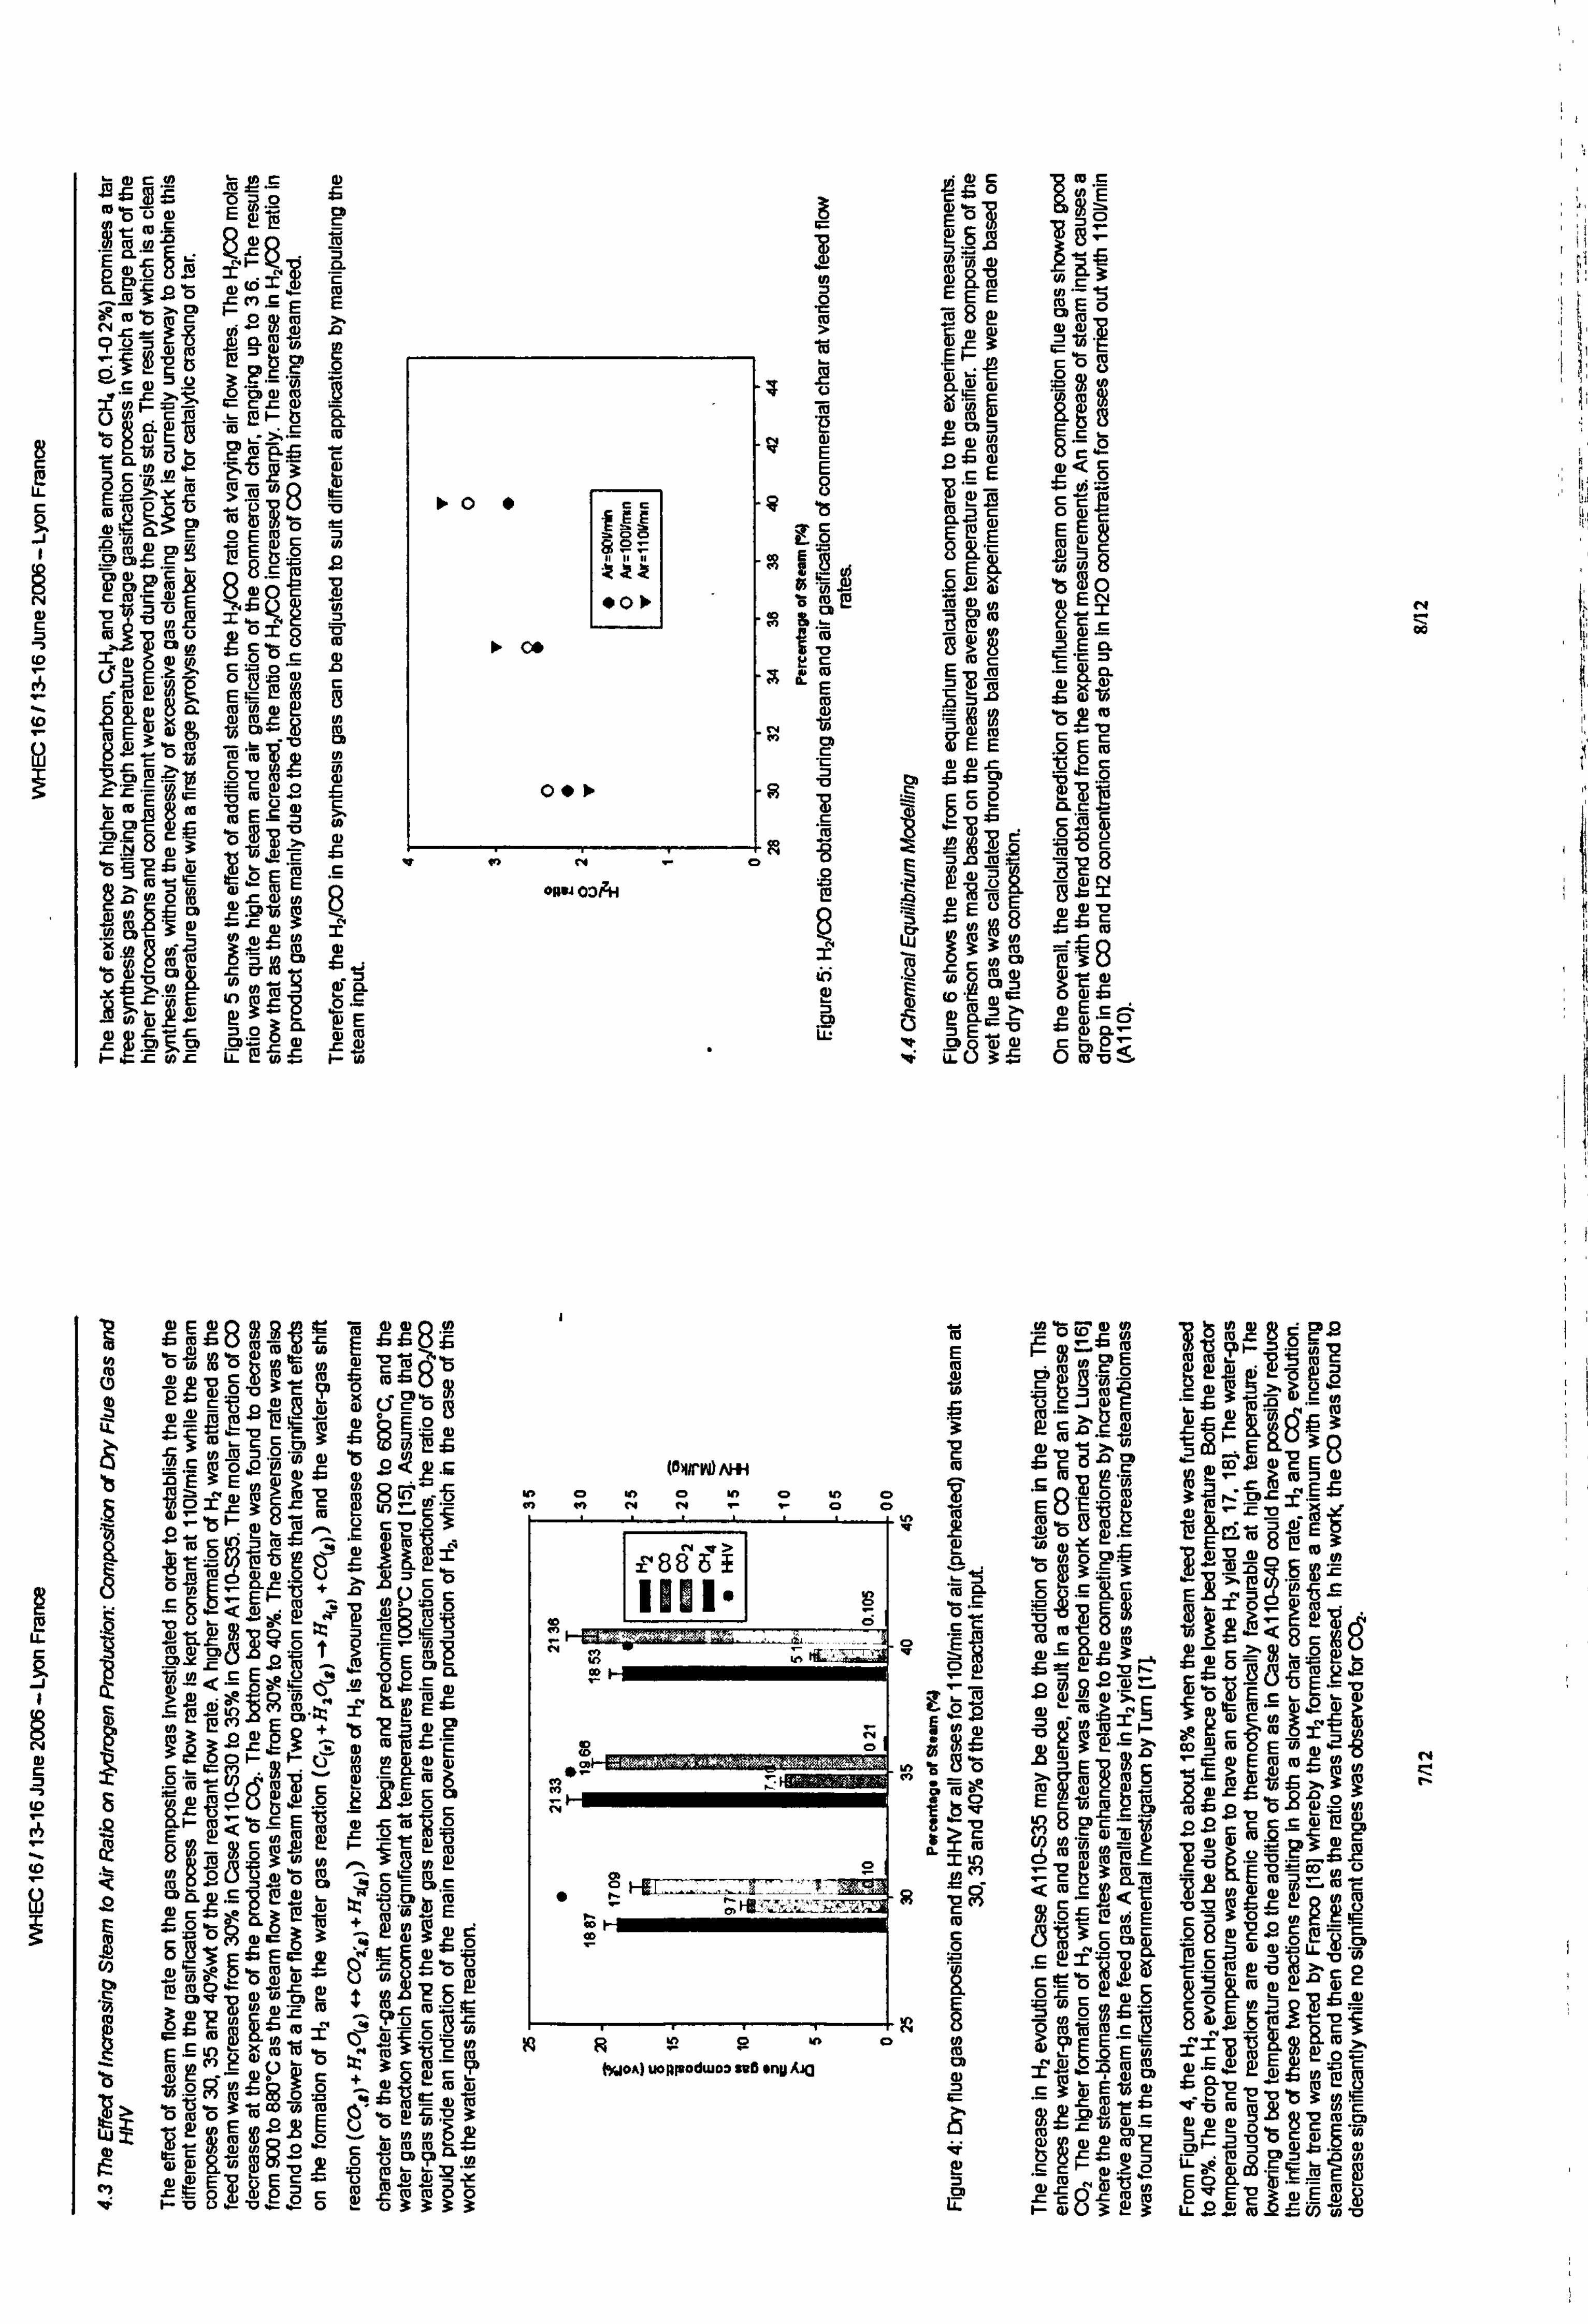
eý a) r- 0
ý
ýa 1Oc: -
~
ID Kj a) CO :s
a)-
C E
N öpc m.: ö
Eý L° $d
® 2 p
6 2 8' ýý
äm Sö r ýý E ö EEE
(4'
3Eý >ao C Üy
E O0
O. N ý'
N T
a c (0 >
m8ý C NN
aEo SÄ g
. �2 Cdc
12 m 2 O E1 dC Ö co
ÜNF G
j9 F Et 10
. Fý{ NC }fýý
l0 fl
gý pwtU . W-T
` - a in « d u=i " Ec.
CL Z
ý me E Yý0 cE
$rw Qö
c: Wp Tp
Qlj >ýý.
1pNIJ e
ºO" cc
E
'g }u ýp
y ui:
{6
, 52 S. 07 drac 03 üS` OEM :c
EE 110- L° E EE a)
ý DC EC, ,
8E1 12 `ii
2 p,
ppp
rEp NN (ý
? O)E? C. Pi 8 d0 ° -. e . Q2ä ä 20
= ýý m º Co äv *8 'cCL
NON Ct
,ýE .2 ?' OC
c :aO "- o 3a O, N ý°m M ;g
c Co M
Nc E '$ý0
m C O. s
ya
E �a UCo � .I dam e c-,
d3" m 9 °D " EE 4Em Z m-
tx 9m T.
- C "- C OVN +'
d 0 o' Oo
m Ö
r '
r"ig E c
o a c cýj
Qlc C
C ý
CO
$ a E
15 4 O
6§ : F.
8m o
uÖ
wy °ý c awn-
OBU O3 -H
o t
:r ..; 0 t'' 'g -
1Q
ßp2 w m t dLä $
i Q a -8 N 0 )v
41 Co ý-
ý' U d
N Gl _ ý °
V =
tr W ýp eN
N
_.. C
8 ý TMe O{ N _ý LQ
N jp f Co _ CC cl 7 ä ýC
E U) NC
ýý 2'
°c E
y
D LD Zac y ECr
o dtc Lj Ol (A
a o D):: L CO a ym LN LL- Q c 9 CA
E NN awn; C Q
ýýt 0C DENY rw v LLO S mvs 0
p
I
A
Co
19 10 mM8 yjw¬ {fa07 E 01
Of _cý? ßwý Nw CJcoý LL .C ihr= Q}ýE o
ý` {ýýp N] Np Iý L"O"O'ONO ýj
1
:E
Sý yi 0=L
3CL Oý Yom! C"U- an NHOO
9' ~
ý1 Cý
Jz-, C: Oye
8 8" f> CL ti
CE+LN 5ý FC'
1" Co
°'°J °cö ý_ö n' o
Eý4
°DXrQ m1EE äoý NN, CEN "O Cm
F'-
3
Ný Oý
p }` 'ý O
y7 yCo
^I ýNL
pym NpL GYJ
O Cý ÖCH
ýý
,Q aH l0ä $CNLOOLo
Q'4 $ fy`g
s 'öý08'
LH-. vm aItn N
0ßb N$ NnUN
20 Eý
«äo p m3 ;, ew3g ä
ä 52.5g97-.
T 21
c
v ä3e $ywO$ý 77
O `f $N a) 10
yLmNL l0 E
a10i ý' yU
C34 y'ý
` Iwoe)uoPROdwoa sa0 any /gyp t
$ONYÖ9 ti CN Co ;3W Coo N a' Lp l0 N.
3 WI C mäýý5ýý öV
ymm 215
-0 yyg'NED Lä a`Zs
v Iv (a _ew
övm j- 0323, E
2 ö27 11) w bOM ca'ccß
mýý ~ 23 AD m
1 -25 Wi.
-, z Z >.. ý c .
-
m'- O
ý äace 2 cE
RäEi ö
Co bm;
ýuýwe E_r
d-La2 y
NO cUf 01 aNN
ýy+cä'ß E =ö
ý3
a l0 O üNS
li$ 3L Q$ C
ýzp ý
EJi ý
hiDU
A DE
EicýmoL«'inýDO°
Ln 8 cm o cw@01 c a'ý 'p
C m'-L c aN 'ypý y- Oj
N W; d Öay,
Lý' 3 ý_
ýc$a a-oö Nc NL AQ dj ydO"C
CLN_ ONCOdaOC
=äa a [2 82
yj LL , Fo O-O
2-5 8O N7y
L{ WO
O_ (U
"ýp. pd~ pC
. ONtNCOOO.
2a'i«4? EöýöEmN m-
0: 2
c°dEäa+ýývoýý° ýyL°äc ýdd9.2ýýmFm
0 cu
CC f"' ö'
dýýyN
wU 33 to °.
E°'. m :E
Nv
N
n
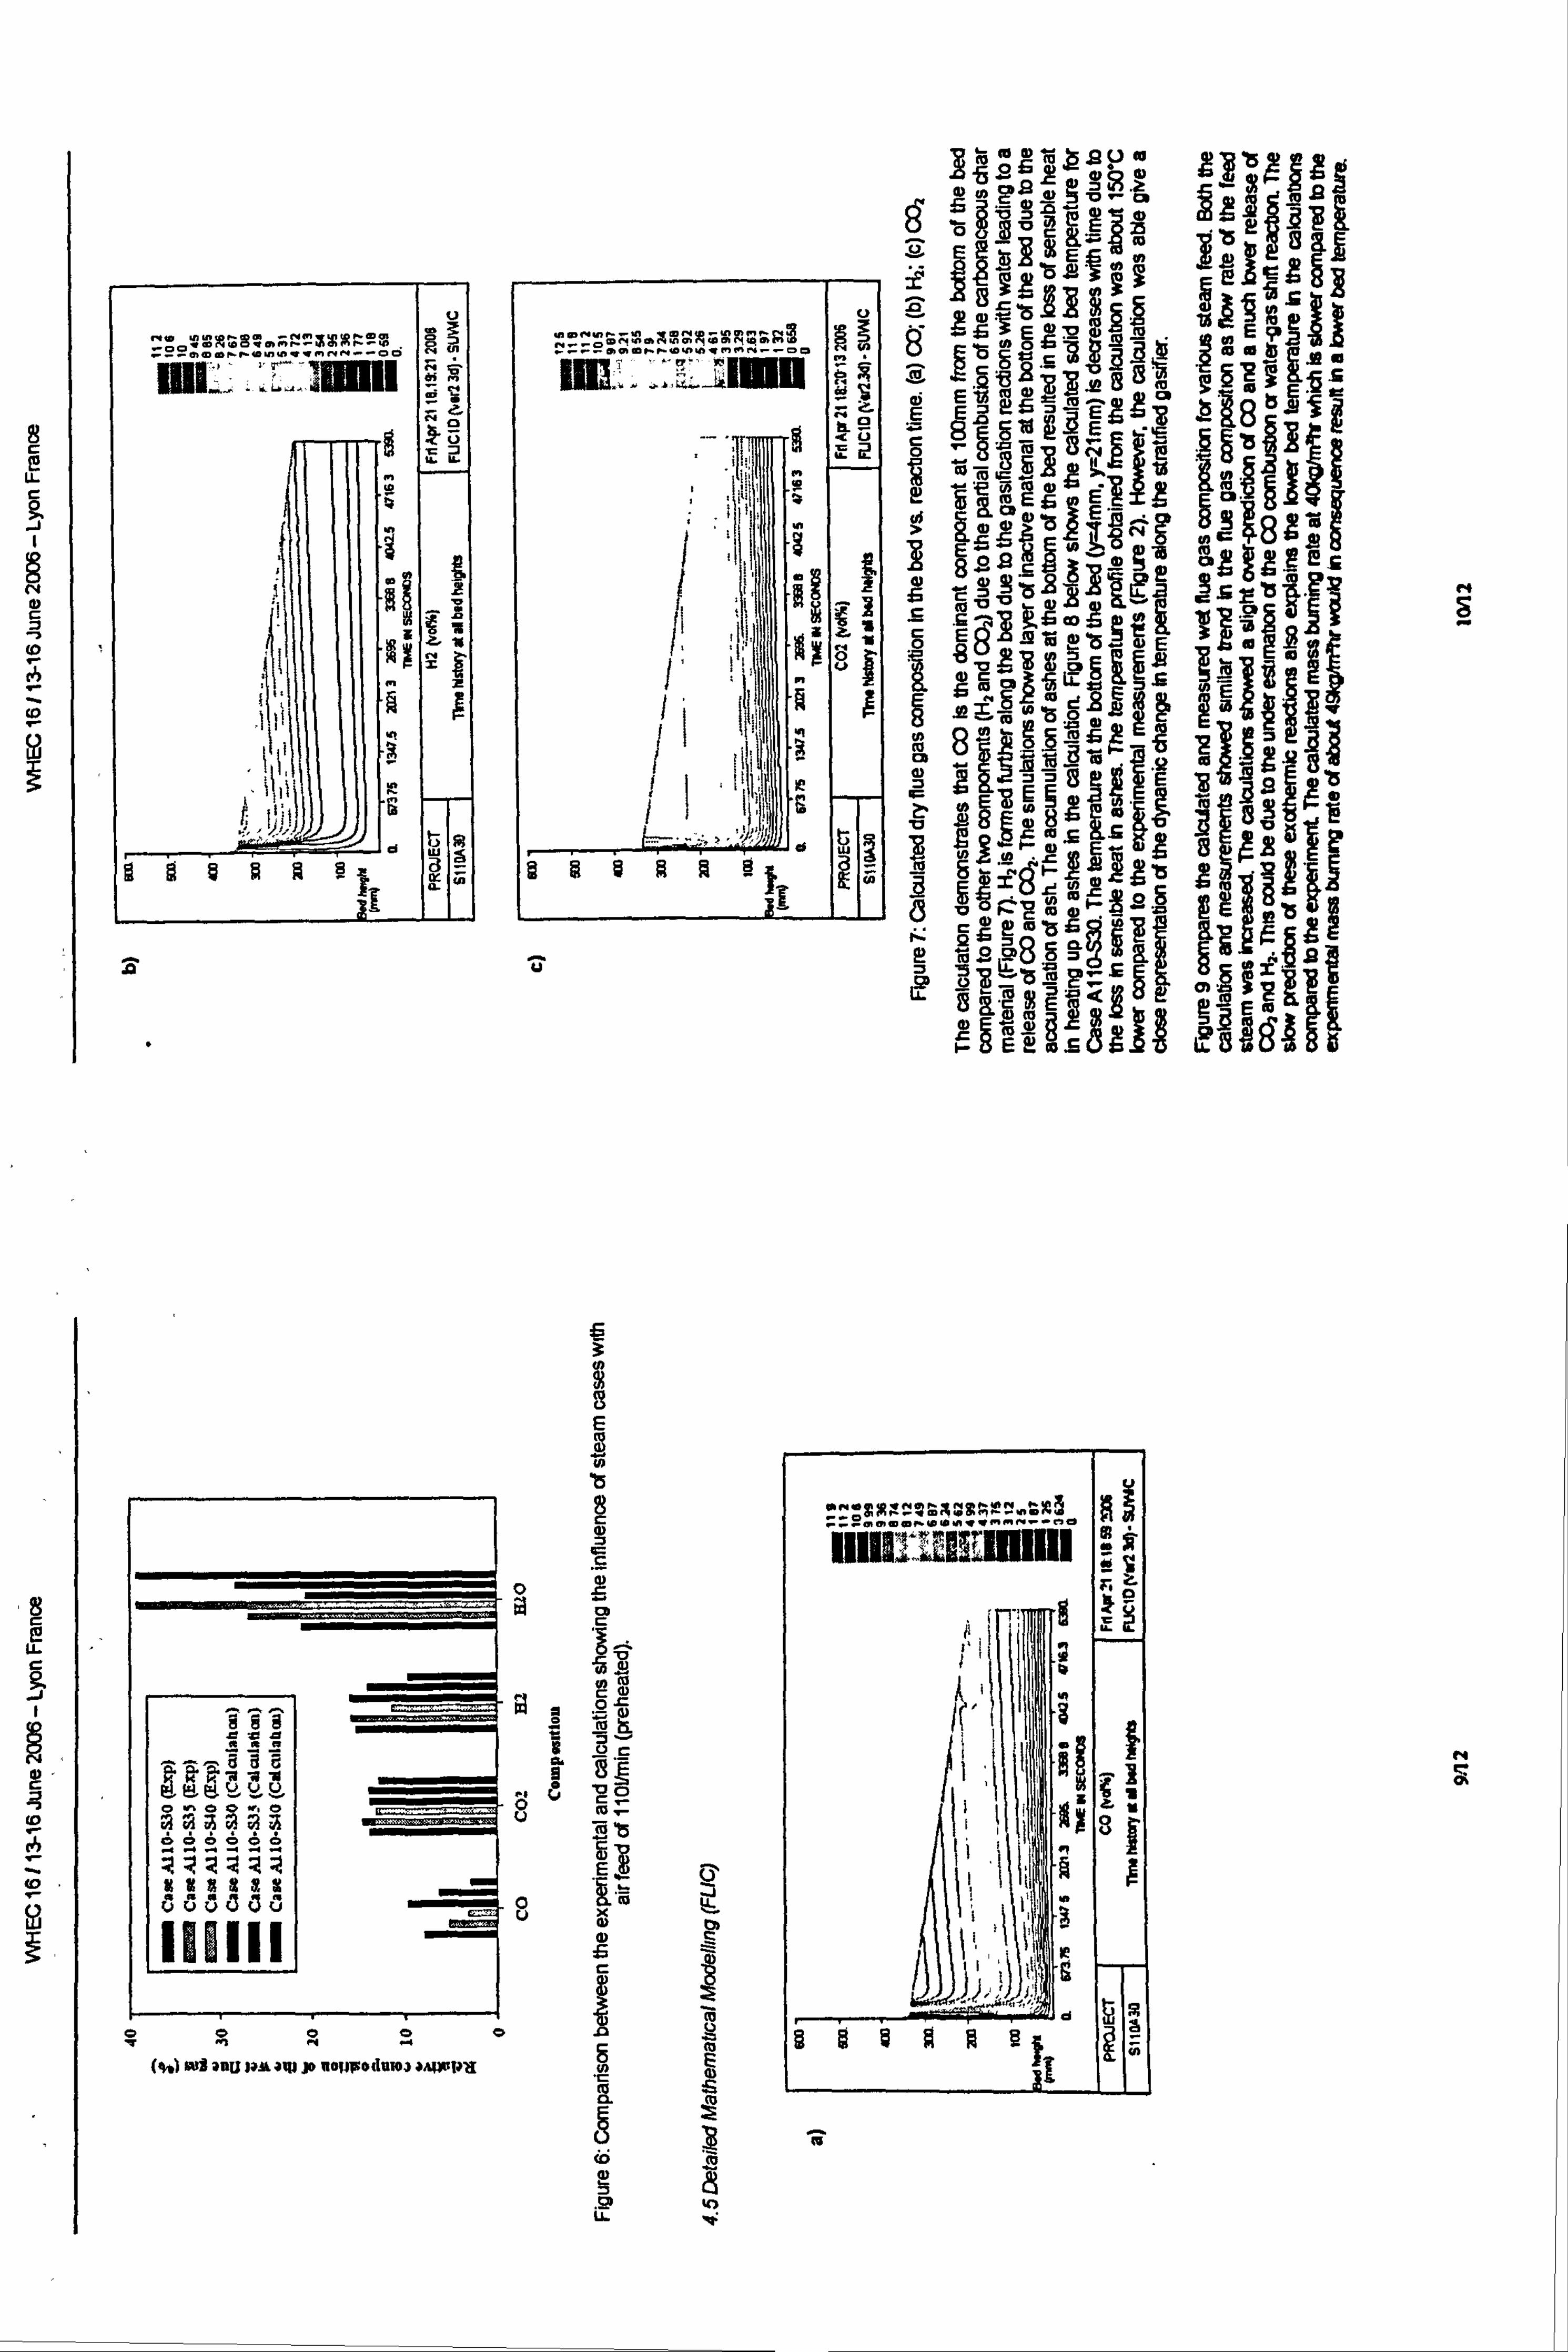
1111 Vie:: V rL p0
OR
I2
10 "
ä
ä6a ara
ý, Ö8G
aaýaea
xuýuxx
1l l' enn
. ý. ý
(%) ml anu aas aqi p eon odawa mwpa
-lit
ü
N
E `a4
N
N 7
C C
O L
A C, N0
N 20
O
ä Ü C
d
9 _
2Z tv O U
N'5
Eä
U y ý C
dE
LL a:
. 52 -SP -
0) y E? Q -.
p
0 '=D
aaE E3_
E02E a
E9ýýF Wlýr3 E
y9)E
ýýagöß
W gAtl
8 'A mf. ß "
8ý a~Lý E~ b
0419, . P Eaob
IIIpý1. ME1811ll tl F. ö
r'' Iö
W 11 P$dN
Ä
MIS
q Cie
as 9
IAA g,
jai
19
,
Hl I
NC
6
N Q
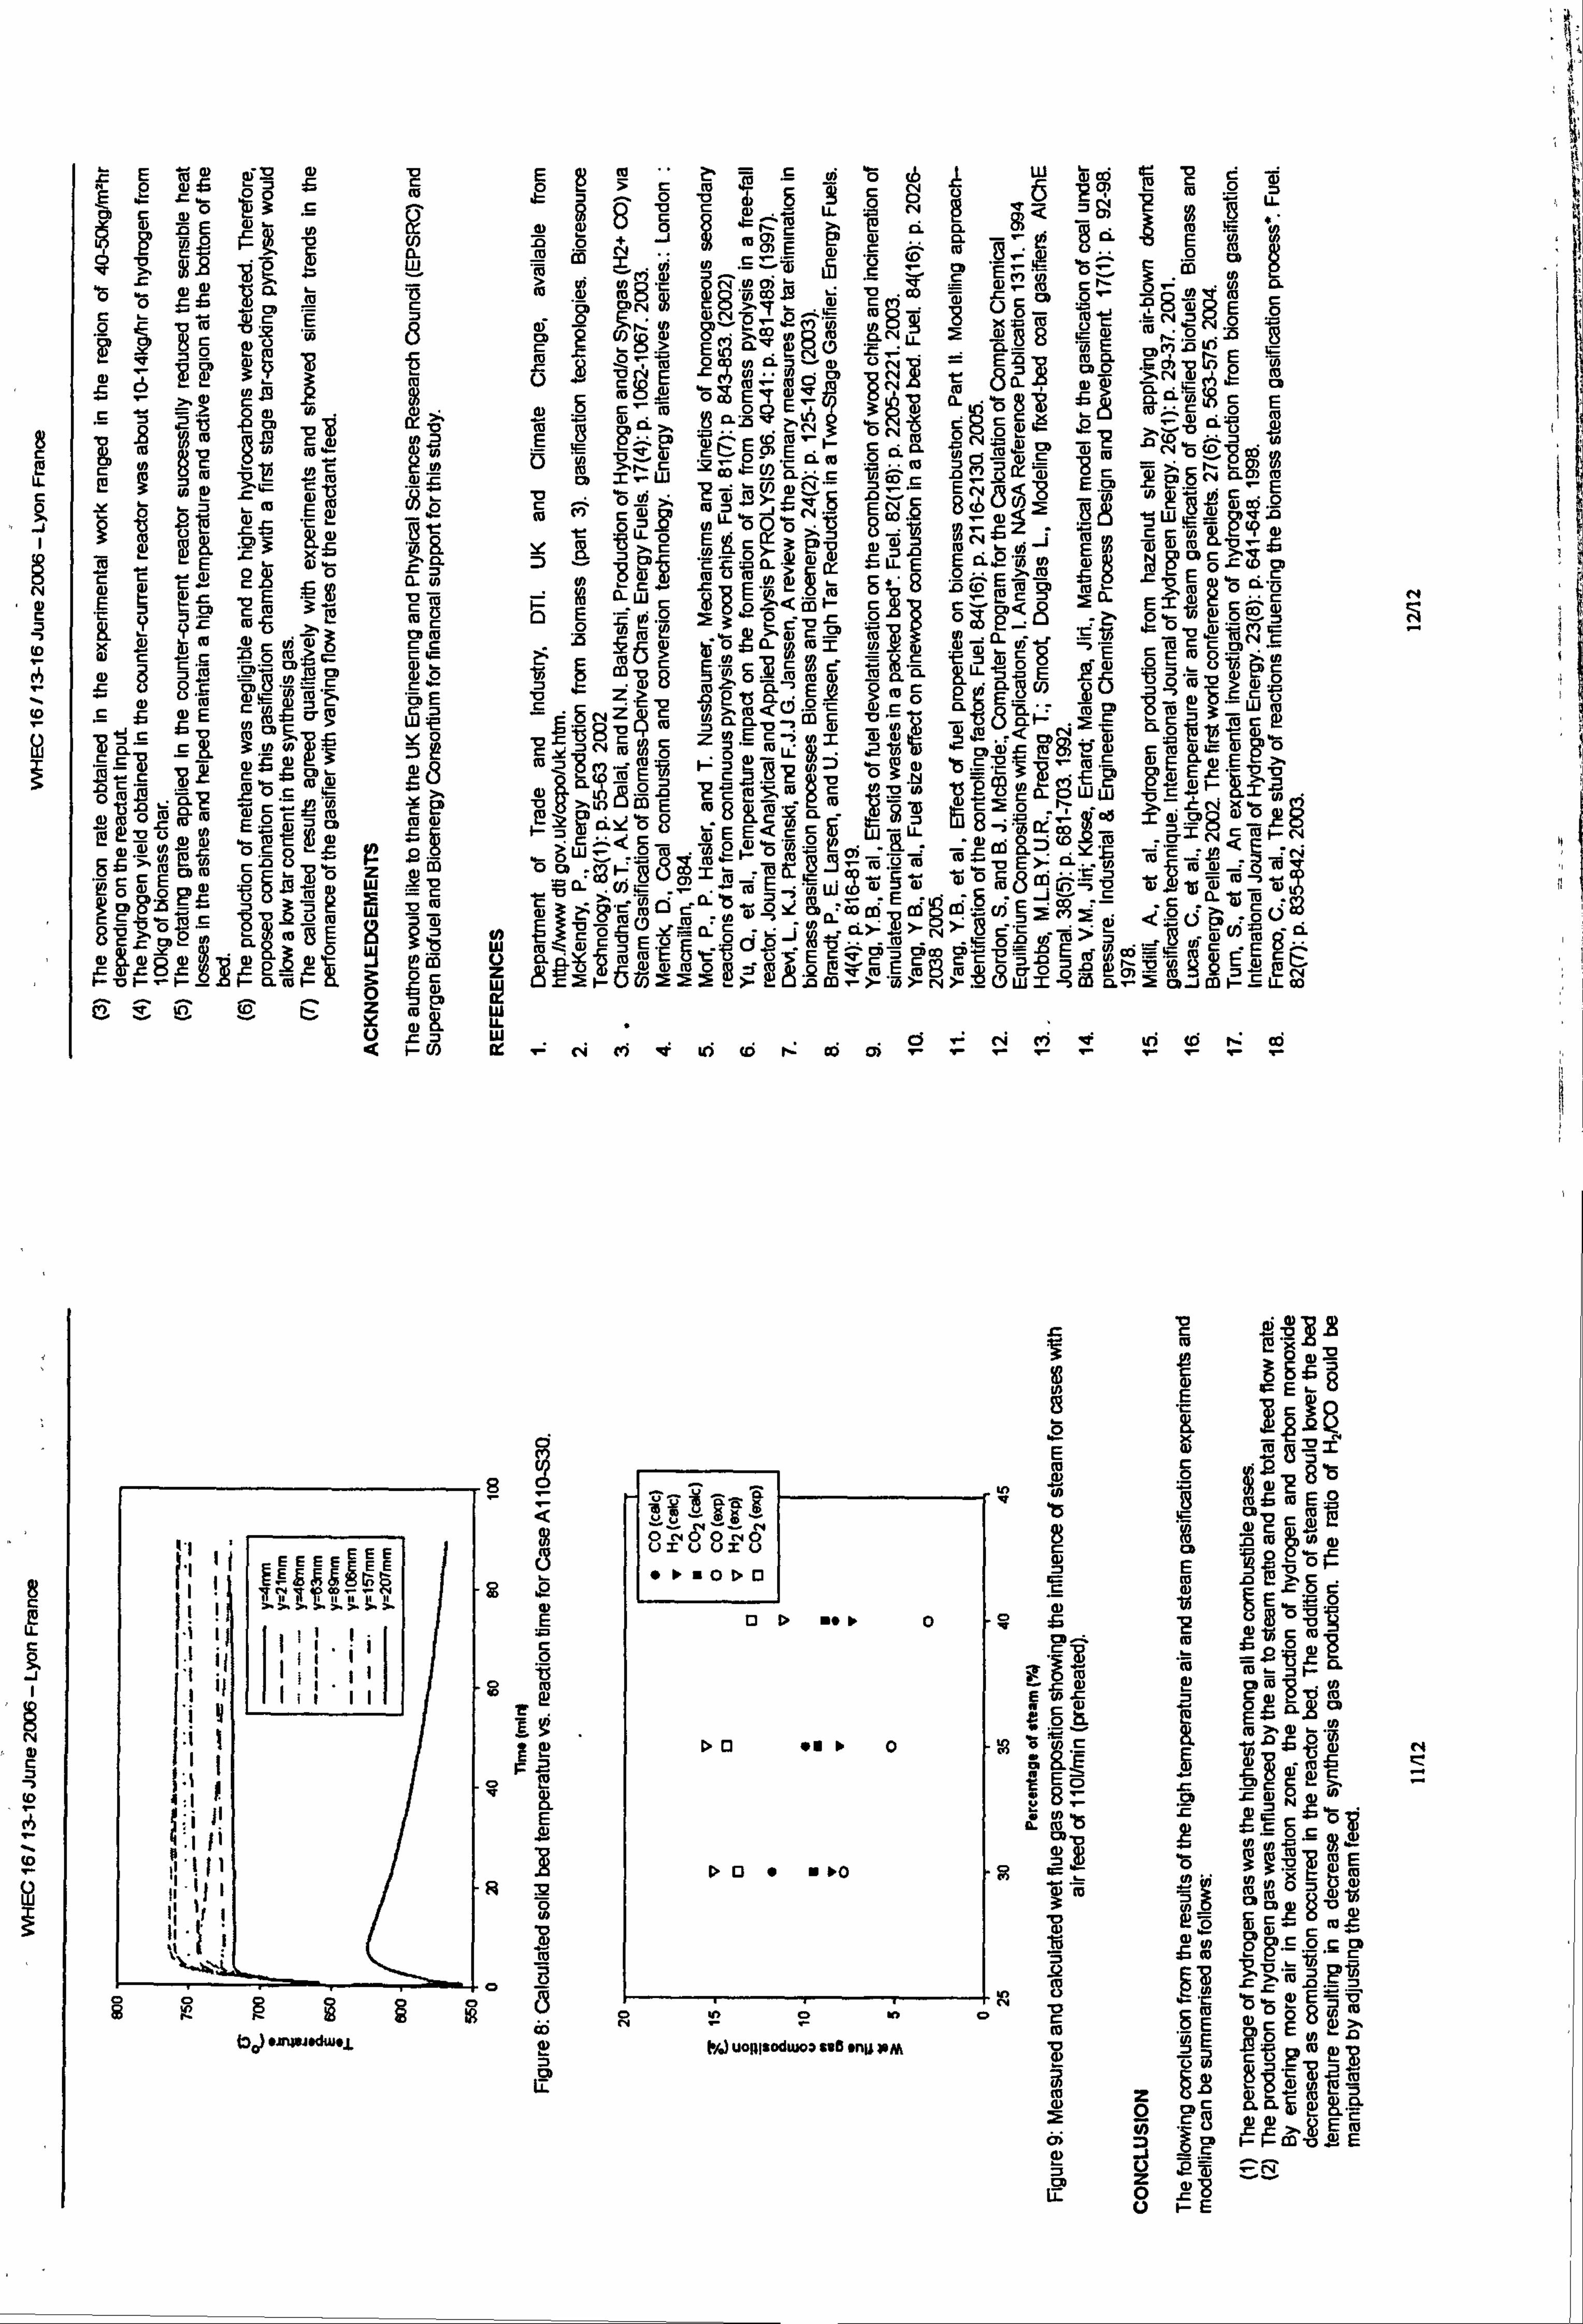
ddVNC1W EQ Lf öö EE>cm2S to rn 1O ö
LL. d°
3$8ac aý LL NQQ= P» 8. c ." LM Q)
N _m _E m c ip .. o cz p
Co t ý$ 5W
Co cri w ý"y W ., W ,g G) o --z3 mw m$ 'c NNW jg " "O Co
drim cý2 ö L. £ pý c cor. 4 >of
ýri w cm O O `O waýömEö
p_ N "ýjS ,ppO `h pD`"'ý< 'tn Q'N % x= M Aý $
Ci Z'Q
öýA
Q1
°{j0$ Bi
C7 c L` O-. _
E2
-ý _
EAU mi E
mnýnu^i
1 Lý' Lý 'S `tßLN @- NN OY.
03 pn .
mss Öl3 1IJ N
OOOEN Ol "ON S? TN
mm giy Va n Sýf o aZ ow a0ii ucm
oýö9Eý 3 Bi d en n
Q) aö E
Z 2t "ecm 29 m dT ýn. $ ZN SN sc ödw Q vd`ý °`°ý SNOc Co WOE (J .. ýy 'Q
E0c l0 pNp p7 ýy D f0
w : -: 7a 0 "p M0: NNN V'
ycgoEd {0 O C" nN
Ci l% C
-12
ýO
10 _N°O
CD y caQeycN5°-c3m 4-- to ä
.. c JC5 Z. - 2. mS c_
.ý L°
8 cnv Kg f0
Lý cm
-ö 73 .b .i -2 t ;5 u5 mM °ý 2. -W N 3mc EF_Q Eil _E
Yö w°
X10 Ea týO mM cdýO
10LLr- Eaý'o. 4 8cbý92 oWBvppýtný
fS 'CO p t. OLL Ny OOÖT7 S. y
yC
N, ý GTd L ýj TCEO.
j ý'gj N7
, =p IN6
N Ul
JEN a1 C ar' Ä
mE Co >>c aa" °S «CLLEp Eý. 2im a> ^ýý' ° °o
" C0CLO0. ON C{ýýj LON
IÖ OO .ÖÖE- -FU N-
.` V- NyöO dÜ
E: -, c» cm 3 cßä
ööamr öE öväQ
9: E 0.6 12 ÖE aWp ýö em
ao m ES öorý
m ä-$ 0N
wc ýc Böý c`c Za ýý5 ýy_ a 1O -SmmYp ec 6ö ýE
oým$ o ý'm äowN ® ýiö Ti ma$ ýaý mm` ßän '-5äE
äcaNiý Z
^E vc Z"ýv QtSa cL' öc 1°o e Eý. _
ýSco t G
ý_NZ c TmQý"-" c a. m "S m of `mä Qý u9 m no. a-gym
ýi a"a _n
8°-F' 2c nc
2°3m Wc mL
"pýjC -Y
Oy aL tS S,
2cZjEc
"'i N2N Co '. Q CO NpC G) ccchOC ]2 ZNOOOyN LL $"fZ Op NL
yýe NC l0 ýýG N ýÖ
0c Ný a tS ýt gi -pc. 2N 102 . 'n Lpcc Co
Tiaýn, dcz m cE° v Týzin ME m$ým" ýý 0n M` äoN axiö
12 mv 02- tu Ed 10 ° ^ý EogE E< cö W- ýy LLl $
-i 7 32 m cS NcmN ddNöcpwWdo u5 2 FT Öý« c
drý ý" Eämcä oý öZ ED 0 ca ýß Z =ý_ 38 .ý "a-p '932 YoýEmn. ý ý °° mý r g; W °c va
"ý -i LLl cb d°wmJý $i gý ä° äi möß .. > >ý` gm cwýe ao
ro .ý -Em mYýE cT
5a ! gym (ý °v ° Z'_öm10 aoa CL ý> r .c ai
.
-8ci Eoýý d 8a ý`°ö m8¬C°M_ °Lý't=a ` 0-_, cyrYý no 21
ý. CS W mid cýE 005 gepa N ýypý 10 ..
mp, vp aý ai d L'm Uaý öfi v Ecc ý
(CO °cE +7 IN- cZ'ýýý°ý°ýNý(ý EaECC
L Co LOLL e- LoZ Eý =r ýQ 4VE l0 p o" o o. 07 - l6 77 '-' ýN 12 0 cý. ý- nmý GGG Öy SLýH{ ýýý ýY LLLllcmý: > ri}. _C7W2-ßf3 aý a_ýmHZLL ao
Lam' CZ
a (p a ý: r4 r °r ULW
rt cri ei < ý[i c6 c6 ci
EEp EE
I+ EEU
II <1, P m 11
r
ýýTT
TTY T>
,IIi1I i9 {sf
+: I ip ý'. Ils
11 s(ri
li. i
p0) . n, w. dw. y
r F
0 v
8 L) Xu 3-:
0 D. BOB.
DQ " º0
DQ" º0
onon Nýr
1%) uoplsodwoa cab 'nµ PM
8
E m d ny
N
. CN
=C
? ýGI
Ew
ii
ä3ý
v d
Tn
8 m U
o to N V N_ to m ar
ai
_N
li
N
W E "c
a c 0
E Co Cu
tu m 0
I
N
N Co
E
O CC
yý ET
J_c
Ü ýE
8 r'. 75 E$
lý -a vä
WE m
cm, mo ° ýß ýl N
, NC
aýr r6 c Ereo
ßö 10
cý ti m 0«aw
0Td 11) cu
mÄ LNNN
Cy
NNCn E
xd NNOyC7 ýFK
M: s
. 2. r.
dE: v
uni°$ 19 °0` a
SEE F- lE m10
-N
NG
N
N
Copyright © 2022 FDOKUMEN