A Systematic Literature Review on the Automatic Creation of ...
31
processes Review A Systematic Literature Review on the Automatic Creation of Tactile Graphics for the Blind and Visually Impaired Mukhriddin Mukhiddinov 1 and Soon-Young Kim 2, * Citation: Mukhiddinov, M.; Kim, S.-Y. A Systematic Literature Review on the Automatic Creation of Tactile Graphics for the Blind and Visually Impaired. Processes 2021, 9, 1726. https://doi.org/10.3390/pr9101726 Academic Editor: Faisal Jamil Received: 2 September 2021 Accepted: 22 September 2021 Published: 26 September 2021 Publisher’s Note: MDPI stays neutral with regard to jurisdictional claims in published maps and institutional affil- iations. Copyright: © 2021 by the authors. Licensee MDPI, Basel, Switzerland. This article is an open access article distributed under the terms and conditions of the Creative Commons Attribution (CC BY) license (https:// creativecommons.org/licenses/by/ 4.0/). 1 Department of Computer Engineering, Gachon University, Sujeong-gu, Seongnam-si 13120, Korea; [email protected] 2 Department of Physical Education, College of Arts and Physical Education, Gachon University, Sujeong-gu, Seongnam-si 13120, Korea * Correspondence: [email protected] Abstract: Currently, a large amount of information is presented graphically. However, visually impaired individuals do not have access to visual information. Instead, they depend on tactile illustrations—raised lines, textures, and elevated graphics that are felt through touch—to perceive geometric and various other objects in textbooks. Tactile graphics are considered an important factor for students in the science, technology, engineering, and mathematics fields seeking a quality education because teaching materials in these fields are frequently conveyed with diagrams and geometric figures. In this paper, we conducted a systematic literature review to identify the current state of research in the field of automatic tactile graphics generation. Over 250 original research papers were screened and the most appropriate studies on automatic tactile graphic generation over the last six years were classified. The reviewed studies explained numerous current solutions in static and dynamic tactile graphics generation using conventional computer vision and artificial intelligence algorithms, such as refreshable tactile displays for education and machine learning models for tactile graphics classification. However, the price of refreshable tactile displays is still prohibitively expensive for low- and middle-income users, and the lack of training datasets for the machine learning model remains a problem. Keywords: tactile graphics generation; refreshable tactile displays; artificial intelligence; machine learning; visually impaired; computer vision; haptic devices 1. Introduction The sense of touch is an indispensable source of data for individuals investigating scenes in nearby areas. It passes various tactile data, such as pressing factor, torment, temperature, and vibration, to the focal sensory system, thereby helping people to perceive their environments and avoid potential wounds [1]. According to previous studies, the sensory system associated with the feeling of touch is superior to the visual and auditory systems in perceiving accurate and complete characteristics of objects [1]. As the 21st century has ushered in the information age, the amount of data available for downloading, archiving, searching, and browsing is nearly limitless. One of the main reasons for this phenomenon is the widespread use of the Internet by the public as people seek to learn more about their surroundings and the world in which they live. For visually impaired people, tactile forms of graphics are an essential means of studying and understanding the world. However, tactile graphics with raised lines designed with common materials, such as paper, are static. While accessible and refreshable braille displays can change content dynamically, they are excessively costly for some blind communities, and their dimensions and size are limited. These shortcomings prevent the widespread use of tactile graphics and limit the display of large graphics or datasets. The main purpose of this study was to provide an objective review of the current state of research on automated tactile graphic generation and the proposed solutions. The review Processes 2021, 9, 1726. https://doi.org/10.3390/pr9101726 https://www.mdpi.com/journal/processes
-
Upload
khangminh22 -
Category
Documents
-
view
0 -
download
0
Transcript of A Systematic Literature Review on the Automatic Creation of ...

processes
Review
A Systematic Literature Review on the Automatic Creation ofTactile Graphics for the Blind and Visually Impaired
Mukhriddin Mukhiddinov 1 and Soon-Young Kim 2,*
�����������������
Citation: Mukhiddinov, M.; Kim,
S.-Y. A Systematic Literature Review
on the Automatic Creation of Tactile
Graphics for the Blind and Visually
Impaired. Processes 2021, 9, 1726.
https://doi.org/10.3390/pr9101726
Academic Editor: Faisal Jamil
Received: 2 September 2021
Accepted: 22 September 2021
Published: 26 September 2021
Publisher’s Note: MDPI stays neutral
with regard to jurisdictional claims in
published maps and institutional affil-
iations.
Copyright: © 2021 by the authors.
Licensee MDPI, Basel, Switzerland.
This article is an open access article
distributed under the terms and
conditions of the Creative Commons
Attribution (CC BY) license (https://
creativecommons.org/licenses/by/
4.0/).
1 Department of Computer Engineering, Gachon University, Sujeong-gu, Seongnam-si 13120, Korea;[email protected]
2 Department of Physical Education, College of Arts and Physical Education, Gachon University,Sujeong-gu, Seongnam-si 13120, Korea
* Correspondence: [email protected]
Abstract: Currently, a large amount of information is presented graphically. However, visuallyimpaired individuals do not have access to visual information. Instead, they depend on tactileillustrations—raised lines, textures, and elevated graphics that are felt through touch—to perceivegeometric and various other objects in textbooks. Tactile graphics are considered an importantfactor for students in the science, technology, engineering, and mathematics fields seeking a qualityeducation because teaching materials in these fields are frequently conveyed with diagrams andgeometric figures. In this paper, we conducted a systematic literature review to identify the currentstate of research in the field of automatic tactile graphics generation. Over 250 original researchpapers were screened and the most appropriate studies on automatic tactile graphic generation overthe last six years were classified. The reviewed studies explained numerous current solutions instatic and dynamic tactile graphics generation using conventional computer vision and artificialintelligence algorithms, such as refreshable tactile displays for education and machine learningmodels for tactile graphics classification. However, the price of refreshable tactile displays is stillprohibitively expensive for low- and middle-income users, and the lack of training datasets for themachine learning model remains a problem.
Keywords: tactile graphics generation; refreshable tactile displays; artificial intelligence; machinelearning; visually impaired; computer vision; haptic devices
1. Introduction
The sense of touch is an indispensable source of data for individuals investigatingscenes in nearby areas. It passes various tactile data, such as pressing factor, torment,temperature, and vibration, to the focal sensory system, thereby helping people to perceivetheir environments and avoid potential wounds [1]. According to previous studies, thesensory system associated with the feeling of touch is superior to the visual and auditorysystems in perceiving accurate and complete characteristics of objects [1]. As the 21stcentury has ushered in the information age, the amount of data available for downloading,archiving, searching, and browsing is nearly limitless. One of the main reasons for thisphenomenon is the widespread use of the Internet by the public as people seek to learnmore about their surroundings and the world in which they live. For visually impairedpeople, tactile forms of graphics are an essential means of studying and understanding theworld. However, tactile graphics with raised lines designed with common materials, suchas paper, are static. While accessible and refreshable braille displays can change contentdynamically, they are excessively costly for some blind communities, and their dimensionsand size are limited. These shortcomings prevent the widespread use of tactile graphicsand limit the display of large graphics or datasets.
The main purpose of this study was to provide an objective review of the current stateof research on automated tactile graphic generation and the proposed solutions. The review
Processes 2021, 9, 1726. https://doi.org/10.3390/pr9101726 https://www.mdpi.com/journal/processes
Processes 2021, 9, 1726 2 of 31
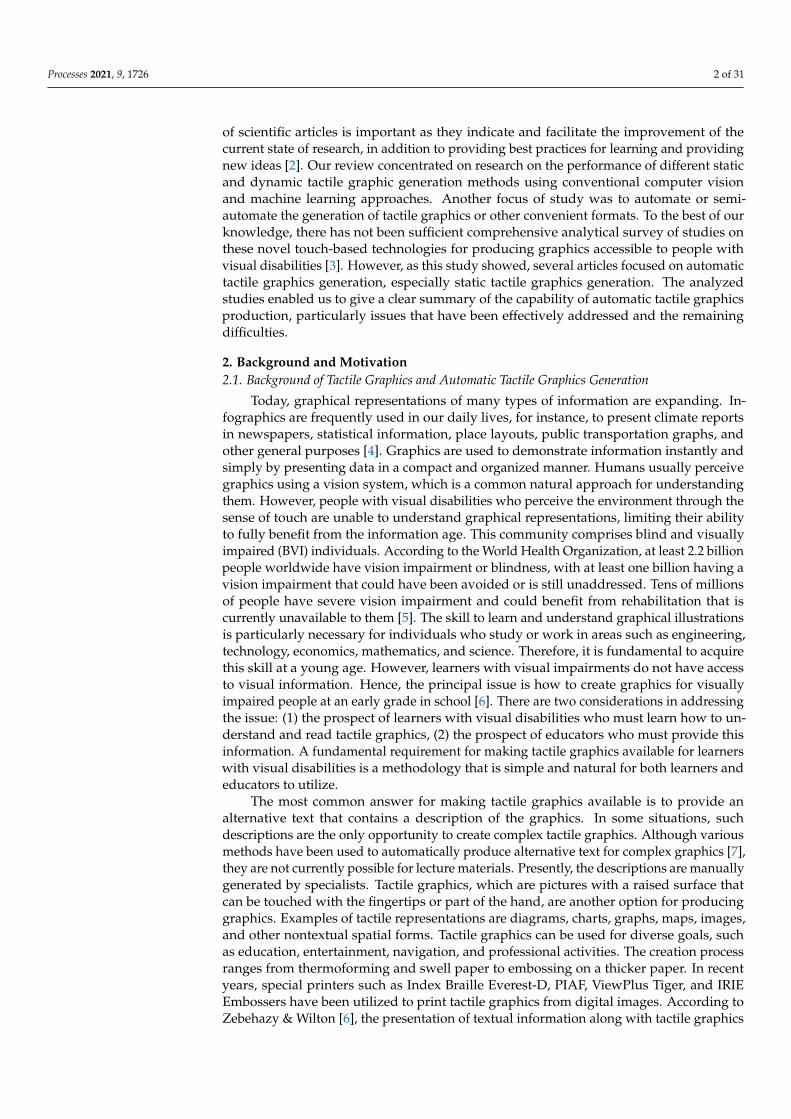
of scientific articles is important as they indicate and facilitate the improvement of thecurrent state of research, in addition to providing best practices for learning and providingnew ideas [2]. Our review concentrated on research on the performance of different staticand dynamic tactile graphic generation methods using conventional computer visionand machine learning approaches. Another focus of study was to automate or semi-automate the generation of tactile graphics or other convenient formats. To the best of ourknowledge, there has not been sufficient comprehensive analytical survey of studies onthese novel touch-based technologies for producing graphics accessible to people withvisual disabilities [3]. However, as this study showed, several articles focused on automatictactile graphics generation, especially static tactile graphics generation. The analyzedstudies enabled us to give a clear summary of the capability of automatic tactile graphicsproduction, particularly issues that have been effectively addressed and the remainingdifficulties.
2. Background and Motivation2.1. Background of Tactile Graphics and Automatic Tactile Graphics Generation
Today, graphical representations of many types of information are expanding. In-fographics are frequently used in our daily lives, for instance, to present climate reportsin newspapers, statistical information, place layouts, public transportation graphs, andother general purposes [4]. Graphics are used to demonstrate information instantly andsimply by presenting data in a compact and organized manner. Humans usually perceivegraphics using a vision system, which is a common natural approach for understandingthem. However, people with visual disabilities who perceive the environment through thesense of touch are unable to understand graphical representations, limiting their abilityto fully benefit from the information age. This community comprises blind and visuallyimpaired (BVI) individuals. According to the World Health Organization, at least 2.2 billionpeople worldwide have vision impairment or blindness, with at least one billion having avision impairment that could have been avoided or is still unaddressed. Tens of millionsof people have severe vision impairment and could benefit from rehabilitation that iscurrently unavailable to them [5]. The skill to learn and understand graphical illustrationsis particularly necessary for individuals who study or work in areas such as engineering,technology, economics, mathematics, and science. Therefore, it is fundamental to acquirethis skill at a young age. However, learners with visual impairments do not have accessto visual information. Hence, the principal issue is how to create graphics for visuallyimpaired people at an early grade in school [6]. There are two considerations in addressingthe issue: (1) the prospect of learners with visual disabilities who must learn how to un-derstand and read tactile graphics, (2) the prospect of educators who must provide thisinformation. A fundamental requirement for making tactile graphics available for learnerswith visual disabilities is a methodology that is simple and natural for both learners andeducators to utilize.
The most common answer for making tactile graphics available is to provide analternative text that contains a description of the graphics. In some situations, suchdescriptions are the only opportunity to create complex tactile graphics. Although variousmethods have been used to automatically produce alternative text for complex graphics [7],they are not currently possible for lecture materials. Presently, the descriptions are manuallygenerated by specialists. Tactile graphics, which are pictures with a raised surface thatcan be touched with the fingertips or part of the hand, are another option for producinggraphics. Examples of tactile representations are diagrams, charts, graphs, maps, images,and other nontextual spatial forms. Tactile graphics can be used for diverse goals, suchas education, entertainment, navigation, and professional activities. The creation processranges from thermoforming and swell paper to embossing on a thicker paper. In recentyears, special printers such as Index Braille Everest-D, PIAF, ViewPlus Tiger, and IRIEEmbossers have been utilized to print tactile graphics from digital images. According toZebehazy & Wilton [6], the presentation of textual information along with tactile graphics

Processes 2021, 9, 1726 3 of 31
is the most suitable form of presenting information to BVI students in school. In the study,the authors demonstrated the significance of tactile graphics in the learning results ofstudents with low vision and BVI students. The ability to independently study tactilegraphics, find information, and respond to information-related questions is considered anessential component of the learning process [6]. Pictures and diagrams are increasinglybeing utilized as individual means of providing information, as approximately 70% oftextbooks provide information using only diagrams without text descriptions [8]. Totranslate, understand, and use these visual images as tactile graphics, BVI students needsighted partners. Moreover, the diagram conversion process is quite expensive and cantake hours to complete, assuming that a professional is available.
The ability to effectively learn and understand tactile graphics and diagrams is anessential requirement of the education of visually impaired students, although it is anability that requires guidance and practice. Numerous educators have observed that BVIstudents have some inconveniences in exploring tactile graphics without personal guidance.Pictures are an essential element of science, technology, engineering, and mathematics(STEM) training, but they are frequently inaccessible to BVI students. One of the mainobstacles to the success of BVI students in STEM areas is lack of access to diagramsand charts in the training materials. Additionally, they may struggle to explain detaileddistinctions between line styles or textures and need to handle the narrow and complicatedarrangements of lines and braille. Problems with these formats limit BVI students fromindividually accessing educational content on tactical graphics because they require furtherexplanation from sighted partners. In many cases, diagrams and figures in books are not intactile graphics or other accessible formats. To address this issue, in some cases, specificdiagrams and figures are explained orally by educators. In other cases, tactile graphicsare created by selecting pictures from teaching material in which the text has previouslybeen converted into braille format; however, this is a costlier alternative. For instance,in a questionnaire of academically performing 9–19-year-old BVI students in the UnitedStates and Canada, 45% reported encountering three or more tactile graphics per week, 25%reported encountering one or two tactile graphics per week, 24% reported encounteringtactile graphics only a few times per month, and 6% reported never using tactile graphics inschool [9]. Despite this observation, the incorporation of as much as 93.3% of print graphicsin a tactile form in the braille transcriptions of secondary (9–12th grade) science and mathtextbooks (6.7% of graphics were found to be omitted in the Braille transcriptions) [10], andattitudes from the surveyed BVI students that tactile graphics are necessary, especially inSTEM [9,11].
While tactile graphics can be created manually by experts, the method is time-consuming. According to the self-reports of some experts, it can take from one hourto several hours to prepare and complete one tactile graphic. Although this process hasbeen slightly reduced with graphic manipulation programs (e.g., Adobe Photoshop orGimp, combined with instructions and texture kits [12]) that run on a regular computer, thetime required to complete the graphics is still considerable. Hence, fewer tactile graphicsare accessible to touch-based readers, and unless the images are used repeatedly, such as inclass, by different users over time, they are usually not accessible instantly upon request.Institutional sectors that require many charts, diagrams, and graphics, such as STEM, arefrequently underserved owing to the lack of technical facilities. Furthermore, because thesegraphs require significant funding, many BVI students living below the poverty line cannotuse them.
Automatic tactile graphic generation applications can significantly reduce the process-ing and development time of tactile graphics while increasing their accessibility to BVIindividuals of all ages. Furthermore, they can be used as a starting point for additionaldiagrammatic changes if an instructor desires to have control over the resulting graph-ics. Although various solutions have been implemented by some researchers and privatecompanies, not all the solutions facilitate learning. For instance, QuickTac, TactileView,and Firebird Graphics Editor are commercially available softwares for assisting teachers

Processes 2021, 9, 1726 4 of 31
of BVI students to produce computer-generated tactile graphics. However, they all havelimitations regarding functionality and adaptability, thus preventing their widespread use.Way et al. [13], one of the pioneers of automatic tactile graphics generation, investigatedthe use of image processing algorithms available between 1997 and 2007 for automatictactile graphics generation. However, stronger modern algorithms combined with imagesimplification and perspective correction were required, as well as user experiments andobservations with professional approaches [13–17]. Ladner et al. [18] studied the transfor-mation of geometrical graphs to tactile graphics; however, they did not consider diagramsand natural images.
Although the advantages of tactile graphics have been adequately documented, thereare a few drawbacks. One of the drawbacks is their limited capacity to hold informa-tion [19]. It is challenging to combine information, such as titles or explanations, withoutcreating an overly complex tactile graphic [20]. Consider, for instance, a tactile map that in-cludes crossings, streets, and numerous landmarks. It would be impractical to add a tactilelabel to each map characteristic. To solve this problem, researchers have been investigatingalternative techniques to supplement tactile graphics with additional data. Sound [21,22]and haptics [23] are two of the most promising methods. Sound has been implementedto explain the content of tactile graphics to provide text-to-speech information based onobject and text recognition [11], QR code [21], or haptic information [22]. Meanwhile,haptic-tactile graphs [24,25] can produce force-feedback based on user contact. Comparedwith conventional tactile graphics, these interactive tactile graphics could increase the ef-fectiveness of examining content and facilitate learning [19,20]. Meanwhile, these methodsdo have their weaknesses: they restrict the skills of the BVI student (1) to acquire instantsurveys of spatial knowledge with two-handed interaction [26] and (2) to compare variouspieces of the graphic spatially by utilizing the hands as a connecting point [27].
Another drawback of tactile graphics is their static content and high cost. In thelast decade, some researchers proposed several methods for automating tactile graphicdesign [16,28,29]; however, changing static tactile graphics after creation requires someeffort. Refreshable braille displays have been developed as a solution to this shortcoming.Dynamic tactile graphics can change their content in response to the interaction of BVIusers. Jungil et al. [30] proposed an education assistive technology (AT) system basedon a graphic-haptic electronic board. The system facilitated the automatic conversion ofimages to refreshable braille displays, enabling the authoring and real-time distribution ofeducation materials to BVI students. Kim et al. [31] proposed a 2D multi-array refreshablebraille display utilizing an electronic book translator software because of its accuracyand high speed. The procedure was versatile and applied a 2D multi-array refreshablebraille display to represent media content and shapes. HyperBraille [32] is a currentrefreshable braille display with one of the largest touch-sensitive pin-matrix displays onthe market (7200 pins arranged in 120 columns and 60 rows). Researchers have shownsome interactive systems that apply commercially available refreshable displays to producea dynamic tactile map with geographic commentary [33,34]. However, the price of arefreshable tactile display, such as HyperBraille, is expensive, ranging from 2000 USD foran 18-character display to 50,000 USD for a half-page of braille. Refreshable braille displaysuse several actuator technologies, such as piezoelectric actuators, electromagnetic actuators,electroactive polymers, shape memory alloys, and hydraulic and pneumatic actuation.
2.2. Artificial Intelligence Algorithms for Generating Tactile Graphics
The process of all of the aforementioned methods entails the translation of visualinformation into tactile graphics using conventional computer vision algorithms and theregular intervention of a sighted person; hence, the methods influence the independence ofBVI individuals [35]. Meanwhile, the final tactile graphics should preferably be examinedby a teacher of BVI students to define their quality. This is because the teacher has obtainedspecific training and certifications to satisfy the educational requirements of BVI students.However, owing to geographical, social, or economic circumstances, this role may be

Processes 2021, 9, 1726 5 of 31
performed by friends, parents, or teachers without sufficient training and experience ingenerating tactile graphics. Recent research advances have been made to produce anapplication capable of automatic translation. Nevertheless, the main limitation of thesemethods is that the quality of the final tactile graphics is not verified before receivingfeedback from a BVI student or tactile graphics maker. In recent years, the use of artificialintelligence (AI) technologies to overcome such limitations has been promoted by manyresearchers. For example, Gonzalez et al. [36] introduced a method for assessing the levelof complexity of images and then converting images that are understandable into tactilegraphics using a machine learning model. They also proposed a method for evaluatingthe score results using a simple qualitative scale with three values: good images >80%,fair images 30–79%, and bad images <30%. Good images can easily be transformed intotactile graphics. Although fair images may be used, the model cannot ensure good tactilegraphics with the given image. Meanwhile, bad images are too complex to be transformedinto acceptable tactile graphics. Researchers have also developed a touchscreen tablet withaudio feedback [37], an accessibility system for web documents [38], a tactile graphicsfinder [35], video description [39,40], bas-reliefs [41], and touchscreen interactions forenvironmental perception [42] using AI technologies to make visual information easy toexplain to BVI individuals.
The main contributions of the current study to the field of automatic tactile graphicsgeneration were as follows:
• It has become the first systematic review paper in the field of static and dynamictactile graphic generation using conventional computer vision and AI technologies.It provided an in-depth analysis of articles from the last six years and explained thecurrent state of this research field.
• It compared different tactile graphics generation approaches for BVI individuals andsummarized the results of the studies.
• It determined the level of importance of tactile graphics in the education and sociallife of BVI individuals.
• It defined the role of AI in automatic tactile graphics generation.
2.3. Existing Literature Review and Motivation
We conducted a search in the archives of selected electronic databases, journals, andopen-access publishers to find literature reviews on automatic tactile graphics generationover the last decade based on various keywords. The terms “literature survey” and“systematic literature reviews” were used to search on 12 electronic databases and fiveopen-access publishers, and journals in the fields of information technology and computerscience were selected. Through this methodology, we identified 30 literature reviews inthe fields of information technology and informatics. Most of the reviews were basicnonsystematic reviews and classic literature reviews.
Nevertheless, based on an in-depth analysis, we distinguished six systematic literaturereviews related to automatic tactile map generation [4], quantitative empirical evaluationsof technology designed for BVI individuals [2], touch-based accessible graphics [3], mathe-matics education for BVI students [43], image accessibility for screen-reader users [44], andtactile cartography in the digital age [45]. To the best of our knowledge, these systematicliterature reviews are some of the latest in this field, indicating that the literature on tactilegraphics has not been sufficiently analyzed. AI technologies for BVI individuals were notstudied. Additionally, the available literature was unable to answer the general questionsthat motivated the present study, which follow:
• What are the most advanced accomplishments and innovations in tactile graphicsgeneration?
• What is the impact of AI on automatic tactile graphics generation for BVI individuals?• What is the difference between scientific results and commercially available technolo-
gies in the life of BVI individuals?• What are the main gaps and difficulties that are not addressed in research today?

Processes 2021, 9, 1726 6 of 31
A systematic literature review was conducted in various research areas by the au-thors for a comprehensive study of the research direction, giving the results of recentachievements in the research field as well as shortcomings, and recommendations for thefuture development of this field. A systematic literature review fairly synthesizes existingachievements; the review should be done by a predefined search procedure, which securesthe absoluteness of the search [46]. It is a summary of fundamental research that includes aprecise description of the goals, techniques, and knowledge, and it is conducted using anexact and reproducible methodology.
The remainder of the paper is organized as follows: In Section 3, the review method-ology is clarified and research questions are identified. In Section 4, the results of theanalysis and answers to the questions are presented. In Section 5, some limitations andissues of existing solutions in the field of tactile graphics generation are highlighted andthe solutions are discussed. Finally, the summary of our findings is presented in Section 6.
3. Review Methodology
We conducted a systematic review of tactile graphics generation using conventionalcomputer vision and AI algorithms. Additionally, we assessed the quality of the literature anddiscussed potential representations of the results and future directions. The study followedcomprehensive systematic literature review guidelines for software engineering [46].
3.1. Research Questions
We also defined specific research questions (RQs) in this study to answer the generalquestions mentioned earlier. Based on the RQs, we searched for and selected the primaryliterature over the last six years. The principal focus was to analyze the role of tactilegraphics in the education of BVI individuals and their adaptation to the society (RQ1).We then identified the link between the current methods and commercially availabletechnologies (RQ2). Furthermore, we highlighted the advantages of solutions using AI andthe gaps that need to be addressed for future developments (RQ3). Thus, the following keyquestions were defined:
• RQ1: What is the role of tactile graphics in the education of BVI individuals and theiradaptation to the society?
• RQ2: What are the current methods and commercially available technologies fordynamic tactile graphics generation?
• RQ3: What are the advantages of solutions using AI and 3D printers and what are thegaps that need to be addressed for future developments?
These research questions were formulated not only to help analyze and compare thescientific results but also to determine the current state and future directions of this field.Inclusion and exclusion criteria were used to determine whether the initial articles qualifiedfor the systematic literature review.
3.2. Search Strategy
To identify relevant published studies and reduce search bias, we searched severalelectronic databases and digital libraries, including IEEE Xplore, ACM Digital Library, andWeb of Science multiple times (Table 1). We also considered the most suitable open-accesspublishers, using keywords from each category such as “target user”, “target Object”,“supported feature, and “supported devices” to reduce search bias (Tables 1 and 2). Thecategory of target user included “deaf-blind”, “visual impairment”, “blind”, “vision loss”,“visual disability”, and “low vision”. The category of target object included “tactile graph-ics”, “natural scene image”, “picture”, “painting and drawing”, and “diagram and map”.The category of supported feature consisted of “touch sense”, “feedback”, “braille celland pin”, and “haptic”. The category of supported device included “refreshable tactiledisplay”, “braille displays”, “tablet”, “touch screen”, and “tangible screen”. We includedstudies published between 1 January 2015 and 1 March 2021 (Figure 1) because there was

Processes 2021, 9, 1726 7 of 31
an increase in AT for BVI individuals and a transition from conventional algorithms to AIalgorithms during this period.
Processes 2021, 9, x FOR PEER REVIEW 8 of 31
arXiv https://arxiv.org/ 4 March 2021 5 Wiley OL https://onlinelibrary.wiley.com/ 4 March 2021 4 dblp CSB https://dblp.uni-trier.de/ 4 March 2021 7 PubMed https://pubmed.ncbi.nlm.nih.gov/ 4 March 2021 3
ERIC https://eric.ed.gov/ 4 March 2021 7
Table 2. Open access publishers used during the review process.
Source URL Date of Search Results MDPI https://www.mdpi.com/ 2 March 2021 5
Hindawi https://www.hindawi.com/ 3 March 2021 11 World Scientific https://www.worldscientific.com/ 4 March 2021 4
WASET https://publications.waset.org/ 4 March 2021 5 SAGE https://journals.sagepub.com/ 4 March 2021 14
3.5. Study Selection First, we reviewed the 257 studies in the initial corpus and selected articles that were
not duplicates and published in the last six years. At this stage, 86 studies were excluded because 52 were duplicates and 34 were incompatible with the purpose of this review. In the next step, we evaluated the quality of each study and analyzed the title, abstract, and keywords. Any inappropriate decisions reported by researchers are discussed together. As a result, 97 studies that did not match the quality evaluation were excluded from the study. The same evaluation process was applied to the analysis of the full papers, and 48 papers that were ineligible for the scope of this study were excluded from the literature review. After performing the inclusion, exclusion and quality assessment processes, 26 primary studies met the purpose of this review (Figure 1).
Figure 1. The flow diagram for the review process with the number of included and excluded arti-cles in each step. A PRISMA flow diagram [47].
Figure 1. The flow diagram for the review process with the number of included and excluded articlesin each step. A PRISMA flow diagram [47].
Table 1. Electronic databases and digital libraries used during the review process.
Source URL Date of Search Results
IEEE Xplore https://ieeexplore.ieee.org/ 1 March 2021 45
ACM DL https://dl.acm.org/ 1 March 2021 36
Web of Science http://webofknowledge.com/ 2 March 2021 18
Scopus https://www.scopus.com/ 2 March 2021 23
Google Scholar https://scholar.google.com/ 3 March 2021 56
Springer https://link.springer.com/ 3 March 2021 8
FreeFullPDf http://www.freefullpdf.com/ 3 March 2021 6
arXiv https://arxiv.org/ 4 March 2021 5
Wiley OL https://onlinelibrary.wiley.com/ 4 March 2021 4
dblp CSB https://dblp.uni-trier.de/ 4 March 2021 7
PubMed https://pubmed.ncbi.nlm.nih.gov/ 4 March 2021 3
ERIC https://eric.ed.gov/ 4 March 2021 7

Processes 2021, 9, 1726 8 of 31
Table 2. Open access publishers used during the review process.
Source URL Date of Search Results
MDPI https://www.mdpi.com/ 2 March 2021 5
Hindawi https://www.hindawi.com/ 3 March 2021 11
World Scientific https://www.worldscientific.com/ 4 March 2021 4
WASET https://publications.waset.org/ 4 March 2021 5
SAGE https://journals.sagepub.com/ 4 March 2021 14
3.3. Criteria for Inclusion and Exclusion
Afterward, we developed inclusion and exclusion criteria to evaluate the quality ofarticles found in these electronic databases for the initial corpus.
The most notable inclusion criteria were:
• The work must have related to tactile graphics generation for BVI individuals. Staticor dynamic tactile graphics generation were also considered.
• Works related to tactile drawing by sighted persons were considered but their resultswere examined in depth.
• All methods based on AI algorithms for BVI individuals were analyzed in-depth andthe results were sorted according to their novelty.
The most notable exclusion criteria were:
• Works related to tactile sensors for robotics were not considered.• All AT, including cane, audio output, and electronic mobility aids, were not considered.• Works that focus only on braille text were not considered.
3.4. Electronic Databases and Digital Libraries
As a result, 257 studies were identified for the primary corpus (Tables 1 and 2). Allthe collected articles were saved and managed using Mendeley reference managementsoftware. First, article duplications were checked and repeated articles were removed. Thetitles and abstracts of the articles were then analyzed and separated using tags.
Subsequently, we focused on articles from reputable sources describing tactile graph-ics generation: ACM Conference on Human Factors in Computing Systems (CHI), ACMSIGACCESS Conference on Computers and Accessibility (ASSETS), ACM Transactions onAccessible Computing (TACCESS), ACM Transactions on Computer-Human Interaction,ACM Symposium on User Interface Software and Technology, ACM International Confer-ence on PErvasive Technologies Related to Assistive Environments, ACM InternationalConference on Tangible, Embedded, and Embodied Interaction, and International Con-ference on Computers Helping People with Special Needs (ICCHP). We also focused onthe main journals in this field, such as the British Journal of Visual Impairment, Journal ofBlindness Innovation and Research, and Journal of Visual Impairment and Blindness.
3.5. Study Selection
First, we reviewed the 257 studies in the initial corpus and selected articles that werenot duplicates and published in the last six years. At this stage, 86 studies were excludedbecause 52 were duplicates and 34 were incompatible with the purpose of this review. Inthe next step, we evaluated the quality of each study and analyzed the title, abstract, andkeywords. Any inappropriate decisions reported by researchers are discussed together. Asa result, 97 studies that did not match the quality evaluation were excluded from the study.The same evaluation process was applied to the analysis of the full papers, and 48 papersthat were ineligible for the scope of this study were excluded from the literature review.After performing the inclusion, exclusion and quality assessment processes, 26 primarystudies met the purpose of this review (Figure 1).

Processes 2021, 9, 1726 9 of 31
4. Review Results
As a result of the systematic review, 26 studies qualified for further analysis. Thepapers were primarily summarized with regard to the three research questions defined inSection 3.
4.1. Overview
It should be noted that there has been an increasing interest among researchers indeveloping tactile graphics and AT for BVI individuals every year, as evidenced by thepublication of more articles. A review of the publication year of all the identified studiesshowed this increase (Figure 2). The 2021 publications were not routinely searched; hence,only 16 articles (until 1 March 2021) were reviewed. To the best of our knowledge, 79 paperswere published in this field in 2020, which was the highest number of publications inany year. Mendeley reference management software was used to save and manage all257 articles. Moreover, the years of publication, titles, and abstracts were analyzed, andappropriate classifications were made. Affiliates of the authors of published articles werealso noted, and it was found that researchers in 27 countries had researched this area, asshown in Figure 3. In terms of authors’ affiliation, the United States had the most papers,with 52. It was followed by Germany (19), France (18), Japan (18), India (16), and Italy (15).
Processes 2021, 9, x FOR PEER REVIEW 9 of 31
4. Review Results As a result of the systematic review, 26 studies qualified for further analysis. The
papers were primarily summarized with regard to the three research questions defined in Section 3.
4.1. Overview It should be noted that there has been an increasing interest among researchers in
developing tactile graphics and AT for BVI individuals every year, as evidenced by the publication of more articles. A review of the publication year of all the identified studies showed this increase (Figure 2). The 2021 publications were not routinely searched; hence, only 16 articles (until 1 March 2021) were reviewed. To the best of our knowledge, 79 papers were published in this field in 2020, which was the highest number of publications in any year. Mendeley reference management software was used to save and manage all 257 articles. Moreover, the years of publication, titles, and abstracts were analyzed, and appropriate classifications were made. Affiliates of the authors of published articles were also noted, and it was found that researchers in 27 countries had researched this area, as shown in Figure 3. In terms of authors’ affiliation, the United States had the most papers, with 52. It was followed by Germany (19), France (18), Japan (18), India (16), and Italy (15).
Figure 2. Number of papers analyzed in the abstract and keywords stage.
Figure 3. Number of papers published in the country of authors’ affiliation.
Figure 2. Number of papers analyzed in the abstract and keywords stage.
Processes 2021, 9, x FOR PEER REVIEW 9 of 31
4. Review Results As a result of the systematic review, 26 studies qualified for further analysis. The
papers were primarily summarized with regard to the three research questions defined in Section 3.
4.1. Overview It should be noted that there has been an increasing interest among researchers in
developing tactile graphics and AT for BVI individuals every year, as evidenced by the publication of more articles. A review of the publication year of all the identified studies showed this increase (Figure 2). The 2021 publications were not routinely searched; hence, only 16 articles (until 1 March 2021) were reviewed. To the best of our knowledge, 79 papers were published in this field in 2020, which was the highest number of publications in any year. Mendeley reference management software was used to save and manage all 257 articles. Moreover, the years of publication, titles, and abstracts were analyzed, and appropriate classifications were made. Affiliates of the authors of published articles were also noted, and it was found that researchers in 27 countries had researched this area, as shown in Figure 3. In terms of authors’ affiliation, the United States had the most papers, with 52. It was followed by Germany (19), France (18), Japan (18), India (16), and Italy (15).
Figure 2. Number of papers analyzed in the abstract and keywords stage.
Figure 3. Number of papers published in the country of authors’ affiliation.
Figure 3. Number of papers published in the country of authors’ affiliation.

Processes 2021, 9, 1726 10 of 31
4.2. Title and Abstract Analysis
In the title and abstract analyses, tags were utilized to identify the types of articles andtechnology used. We divided all the articles into 12 types of technologies related to tactilegraphics generation. Abstract and keywords analyses of all the 171 articles showed thatmore work was done in three major technology research areas: tactile graphics (36 articles,21.05%), 3D tactile graphics (29 articles, 17%), and audio with tactile graphics (23 articles,13%) (Figure 3). In contrast, tactile graphics editing and tactile overlay technologieshave not been sufficiently explored, with each having six (4%) and seven articles (4%),respectively. Accordingly, we have listed the number of articles and the correspondingpercentages in other technology research in Figure 4.
Processes 2021, 9, x FOR PEER REVIEW 10 of 31
4.2. Title and Abstract Analysis In the title and abstract analyses, tags were utilized to identify the types of articles
and technology used. We divided all the articles into 12 types of technologies related to tactile graphics generation. Abstract and keywords analyses of all the 171 articles showed that more work was done in three major technology research areas: tactile graphics (36 articles, 21.05%), 3D tactile graphics (29 articles, 17%), and audio with tactile graphics (23 articles, 13%) (Figure 3). In contrast, tactile graphics editing and tactile overlay technolo-gies have not been sufficiently explored, with each having six (4%) and seven articles (4%), respectively. Accordingly, we have listed the number of articles and the corresponding percentages in other technology research in Figure 4.
Figure 4. Technology research related to the tactile graphics field in the abstracts and keywords analyses stage.
4.3. Full-Paper Analysis In the second step of the analysis process, called full-paper screening, 26 primary
articles were selected. The number of articles on tactile graphics in 2019 and 2020 were 7 and 10, respectively, which was more than those in other years, as shown in Figure 5. It is clear, as shown in Figure 5, that in recent years, there has been a growing focus on creating tactile graphics for the blind.
Technologies and Venues According to these selected articles, it was determined that BVI individuals used tra-
ditional tactile graphics (9 articles), tactile graphics with audio (8 articles), 3D tactile graphics (3 articles), refreshable tactile display (2 articles), tactile graphics with AI, virtual reality (VR), and augmented reality (AR) (4 articles) to perceive visual information (Figure 4). A comprehensive review of these articles revealed that technologies such as audio and 3D modeling, which are closely related to tactile graphics, received considerable attention among researchers for delivering visual information to BVI individuals.
Figure 4. Technology research related to the tactile graphics field in the abstracts and keywordsanalyses stage.
4.3. Full-Paper Analysis
In the second step of the analysis process, called full-paper screening, 26 primaryarticles were selected. The number of articles on tactile graphics in 2019 and 2020 were 7and 10, respectively, which was more than those in other years, as shown in Figure 5. It isclear, as shown in Figure 5, that in recent years, there has been a growing focus on creatingtactile graphics for the blind.
Processes 2021, 9, x FOR PEER REVIEW 11 of 31
Figure 5. Selected papers for review by technology and year.
The final corpus contained 26 papers from nine unique sources. For easier under-standing, we have combined journals and conferences that belonged to a single electronic database, digital library, or open-access publisher under a single name. For example, ACM CHI, ACM ASSETS, ACM TACCESS, and others were categorized as ACM. The most extensive collection of papers was from ACM (11 papers, 42%). As shown in Figure 6, only one paper was collected from each of four sources: Sensors and Materials, Journal of Science Education, KSII T Internet Info, and Universidad de los Andes (totaling four papers, 16%).
Figure 6. Number of selected papers according to electronic database and digital library or open-access publisher.
The majority of articles obtained were categorized as full papers by their source. Ad-ditionally, some articles were considered to be accompanying poster papers or short pa-pers. Short papers do not typically expect the same uniformity of reliability in the assess-ment and include things such as initial research. Most of the short and poster papers were obtained from ACM ASSETS; hence, they can be considered full papers (Figure 7).
Figure 5. Selected papers for review by technology and year.

Processes 2021, 9, 1726 11 of 31
Technologies and Venues
According to these selected articles, it was determined that BVI individuals used tradi-tional tactile graphics (9 articles), tactile graphics with audio (8 articles), 3D tactile graphics(3 articles), refreshable tactile display (2 articles), tactile graphics with AI, virtual reality(VR), and augmented reality (AR) (4 articles) to perceive visual information (Figure 4). Acomprehensive review of these articles revealed that technologies such as audio and 3Dmodeling, which are closely related to tactile graphics, received considerable attentionamong researchers for delivering visual information to BVI individuals.
The final corpus contained 26 papers from nine unique sources. For easier under-standing, we have combined journals and conferences that belonged to a single electronicdatabase, digital library, or open-access publisher under a single name. For example, ACMCHI, ACM ASSETS, ACM TACCESS, and others were categorized as ACM. The mostextensive collection of papers was from ACM (11 papers, 42%). As shown in Figure 6,only one paper was collected from each of four sources: Sensors and Materials, Journalof Science Education, KSII T Internet Info, and Universidad de los Andes (totaling fourpapers, 16%).
Processes 2021, 9, x FOR PEER REVIEW 11 of 31
Figure 5. Selected papers for review by technology and year.
The final corpus contained 26 papers from nine unique sources. For easier under-standing, we have combined journals and conferences that belonged to a single electronic database, digital library, or open-access publisher under a single name. For example, ACM CHI, ACM ASSETS, ACM TACCESS, and others were categorized as ACM. The most extensive collection of papers was from ACM (11 papers, 42%). As shown in Figure 6, only one paper was collected from each of four sources: Sensors and Materials, Journal of Science Education, KSII T Internet Info, and Universidad de los Andes (totaling four papers, 16%).
Figure 6. Number of selected papers according to electronic database and digital library or open-access publisher.
The majority of articles obtained were categorized as full papers by their source. Ad-ditionally, some articles were considered to be accompanying poster papers or short pa-pers. Short papers do not typically expect the same uniformity of reliability in the assess-ment and include things such as initial research. Most of the short and poster papers were obtained from ACM ASSETS; hence, they can be considered full papers (Figure 7).
Figure 6. Number of selected papers according to electronic database and digital library or open-access publisher.
The majority of articles obtained were categorized as full papers by their source.Additionally, some articles were considered to be accompanying poster papers or shortpapers. Short papers do not typically expect the same uniformity of reliability in theassessment and include things such as initial research. Most of the short and poster paperswere obtained from ACM ASSETS; hence, they can be considered full papers (Figure 7).
Throughout the full-paper screening, descriptions were written to decide which ofthe research questions were answered by the 26 selected studies. More than 84% of theselected articles provided answers to RQ1, while 46% provided answers to RQ2. Moreover,approximately 20% of the selected articles responded to RQ3 (Figure 8).

Processes 2021, 9, 1726 12 of 31Processes 2021, 9, x FOR PEER REVIEW 12 of 31
Figure 7. Number of papers by type.
Throughout the full-paper screening, descriptions were written to decide which of the research questions were answered by the 26 selected studies. More than 84% of the selected articles provided answers to RQ1, while 46% provided answers to RQ2. Moreo-ver, approximately 20% of the selected articles responded to RQ3 (Figure 8).
Figure 8. Percentage of selected studies that provided answers to the three research questions.
4.4. Research Question 1: What Is the Role of Tactile Graphics in the Education of BVI Individuals and Their Adaptation of the BVI to the Society?
The importance of using tactile graphics in education and social life was discussed in most of the primary studies. The use of images and diagrams in educational materials, particularly in STEM subjects, was considered necessary. Accordingly, it is widely ac-cepted that producing graphical information accessible to BVI students would signifi-cantly enhance their educational and career opportunities. In recent years, there has been an increasing number of scientific studies on tactile graphics generation and their appli-cation to diverse subjects or the adaptation of BVI individuals to daily life.
4.4.1. The Role of Tactile Graphics A full analysis of the articles revealed that almost half of the primary studies on ed-
ucation (14 papers) and the other half (12 papers) contributed to the adaptation of BVI individuals to the society (Figure 9). Among the current technological advances, the role of tactile graphics technologies in the education and social life of BVI individuals cannot be replaced by other means (Figure 9).
Figure 7. Number of papers by type.
Processes 2021, 9, x FOR PEER REVIEW 12 of 31
Figure 7. Number of papers by type.
Throughout the full-paper screening, descriptions were written to decide which of the research questions were answered by the 26 selected studies. More than 84% of the selected articles provided answers to RQ1, while 46% provided answers to RQ2. Moreo-ver, approximately 20% of the selected articles responded to RQ3 (Figure 8).
Figure 8. Percentage of selected studies that provided answers to the three research questions.
4.4. Research Question 1: What Is the Role of Tactile Graphics in the Education of BVI Individuals and Their Adaptation of the BVI to the Society?
The importance of using tactile graphics in education and social life was discussed in most of the primary studies. The use of images and diagrams in educational materials, particularly in STEM subjects, was considered necessary. Accordingly, it is widely ac-cepted that producing graphical information accessible to BVI students would signifi-cantly enhance their educational and career opportunities. In recent years, there has been an increasing number of scientific studies on tactile graphics generation and their appli-cation to diverse subjects or the adaptation of BVI individuals to daily life.
4.4.1. The Role of Tactile Graphics A full analysis of the articles revealed that almost half of the primary studies on ed-
ucation (14 papers) and the other half (12 papers) contributed to the adaptation of BVI individuals to the society (Figure 9). Among the current technological advances, the role of tactile graphics technologies in the education and social life of BVI individuals cannot be replaced by other means (Figure 9).
Figure 8. Percentage of selected studies that provided answers to the three research questions.
4.4. Research Question 1: What Is the Role of Tactile Graphics in the Education of BVI Individualsand Their Adaptation of the BVI to the Society?
The importance of using tactile graphics in education and social life was discussedin most of the primary studies. The use of images and diagrams in educational materials,particularly in STEM subjects, was considered necessary. Accordingly, it is widely ac-cepted that producing graphical information accessible to BVI students would significantlyenhance their educational and career opportunities. In recent years, there has been anincreasing number of scientific studies on tactile graphics generation and their applicationto diverse subjects or the adaptation of BVI individuals to daily life.
4.4.1. The Role of Tactile Graphics
A full analysis of the articles revealed that almost half of the primary studies oneducation (14 papers) and the other half (12 papers) contributed to the adaptation of BVIindividuals to the society (Figure 9). Among the current technological advances, the role oftactile graphics technologies in the education and social life of BVI individuals cannot bereplaced by other means (Figure 9).

Processes 2021, 9, 1726 13 of 31Processes 2021, 9, x FOR PEER REVIEW 13 of 31
Figure 9. Number of primary papers based on the social life and education of BVI individuals (in years).
The tactile graphics that were introduced in primary studies for assisting BVI users are summarized in Table 3. The bulk of the tactile graphics used in education were de-signed to understand STEM subjects (8 papers), followed by braille books and images (2 papers). The rest of the electronic circuits, HTML web pages, computer science, and phys-ics fields were covered in one article each, respectively. Furthermore, while traveling and creating tactile graphics from natural scene images has been one of the dominant fields in adapting to social life (5 papers), only three articles aimed to support map and audio guid-ance field.
Table 3. The role of tactile graphics for use in a variety of fields.
Tactile Graphics’ Role Field Name Number of Papers Articles
Education
STEM subjects 8 [11,21,48–53] Braille books with images 2 [54,55]
Electronic circuits 1 [56] HTML web pages 1 [38]
Computer science and physics 1 [7] Virtual reality objects 1 [57]
Social Life
Travelling and tactile graphics 5 [35,36,58–60] Map and audio guidance 3 [61–63]
Artworks and object’s shape 2 [64,65] Haptic and braille display 2 [31,66] Orientation and Mobility 1 [62]
We identified types of input images to generate tactile graphics, as shown in Table 4. General images, such as natural scene images, were used the most (9 papers), followed by charts and diagrams (7 papers). These types of images can be used in the educational and social life of the BVI. Interestingly, geometric figures were used in five papers, while SVG images and book pages were utilized to make accessible web pages or educational mate-rials (3 papers), respectively. Visual artworks were used in two papers, maps in two pa-pers, and only one used images of electronic circuits, biological molecules, or node-link diagrams.
Figure 9. Number of primary papers based on the social life and education of BVI individuals (in years).
The tactile graphics that were introduced in primary studies for assisting BVI users aresummarized in Table 3. The bulk of the tactile graphics used in education were designedto understand STEM subjects (8 papers), followed by braille books and images (2 papers).The rest of the electronic circuits, HTML web pages, computer science, and physics fieldswere covered in one article each, respectively. Furthermore, while traveling and creatingtactile graphics from natural scene images has been one of the dominant fields in adaptingto social life (5 papers), only three articles aimed to support map and audio guidance field.
Table 3. The role of tactile graphics for use in a variety of fields.
Tactile Graphics’ Role Field Name Number of Papers Articles
Education
STEM subjects 8 [11,21,48–53]
Braille books with images 2 [54,55]
Electronic circuits 1 [56]
HTML web pages 1 [38]
Computer science and physics 1 [7]
Virtual reality objects 1 [57]
Social Life
Travelling and tactile graphics 5 [35,36,58–60]
Map and audio guidance 3 [61–63]
Artworks and object’s shape 2 [64,65]
Haptic and braille display 2 [31,66]
Orientation and Mobility 1 [62]
We identified types of input images to generate tactile graphics, as shown in Table 4.General images, such as natural scene images, were used the most (9 papers), followedby charts and diagrams (7 papers). These types of images can be used in the educationaland social life of the BVI. Interestingly, geometric figures were used in five papers, whileSVG images and book pages were utilized to make accessible web pages or educationalmaterials (3 papers), respectively. Visual artworks were used in two papers, maps in twopapers, and only one used images of electronic circuits, biological molecules, or node-linkdiagrams.

Processes 2021, 9, 1726 14 of 31
Table 4. Types of input images to generate tactile graphics.
Input Image Type Number of Papers Articles
General images 9 [31,35,36,55,58–61,65]
Different charts and diagrams 7 [11,21,31,48,51–53]
Geometric figures 5 [35,53,57,60,66]
SVG images 3 [7,38,63]
Book pages 3 [21,54,66]
Visual artworks 2 [64,65]
Maps 2 [62,63]
Electronic circuits 1 [56]
Biological molecules 1 [49]
Node-link diagrams 1 [50]
A brief summary, including information on article technology, tactile graphics in edu-cation and social life, tactile graphics generation methodology, experiments and evaluation,and results and conclusion of each primary paper, is presented in Appendix A.
4.4.2. Tactile Graphics for STEM Subjects and Braille Books
To the best of our knowledge, one of the current problems confronting BVI individualsis the lack of teaching materials in the field of education, especially in STEM subjects.Several primary studies, such as [11,49,50,56], presented different approaches as a solutionto this problem. Fusco and Morash [11] introduced a machine vision-based tactile graphicshelper (TGH), which followed the fingers of blind students as they investigated tactilegraphics and enabled them to obtain refined audio messages regarding the tactile graphicswithout sighted assistance. Show and Hadden-Perilla [49] developed a software pluginto quickly produce variable-height tactile graphics of proteins using the free biomolecu-lar visualization software, Visual Molecular Dynamics, and protein structure data. Thesoftware plugin could be used in scientific disciplines spanning biology, biochemistry, andbiophysics, relying on an understanding of protein structure to explain the mechanismsby which proteins carry out their functions. The software plugin could also be used toclassify strategies by which those functions can be improved or changed to heal diseasesand improve human health. Yang et al. [50] conducted a controlled study with BVI par-ticipants and compared four tactile network representations: organic node-link diagrams,grid node-link diagrams, adjacency matrices, and braille lists. Network forms are usuallyutilized to study and represent social networks, biological networks, and software in pop-ular media. Park et al. [54] proposed a method for automatically converting print booksinto electronic braille books based on algorithms for categorizing and analyzing imagesscanned from print books. Their method was intended to reduce the time and cost neededto design braille books and provide more study materials for BVI individuals, advancingnotable contributions to improving their education and social life. The system respondedto questions regarding STEM tactile graphics, such as “what is on this tactile graphic?”and “what is this I’m pointing to?” Race et al. [56] created a more observable collectionof schematic symbols for a popular textbook, and proposed a set of guidelines and thebest methods for teachers and designers to create their readable tactile schematics. Thereadable tactile version of six schematics, which is essential for learning electronics basics(battery, switch, resistor, and others), was completed after 11 rounds of iterations based onthe recommendations of blind participants.
4.4.3. Involvement of Blind and Visually Impaired
Visual status of participants. Almost two-thirds of the papers (18 papers) in the maincorpus evaluated the benefits of creating tactile graphics and experimented with visually

Processes 2021, 9, 1726 15 of 31
impaired participants. Overall, a total of 143 BVI people, 78 females and 65 males, partici-pated in all experiments of 18 papers. Of these participants, 68 were blind, 51 were blindwith some vision, and 24 had low vision. Additionally, in the remaining six papers, theexperiment was conducted and evaluated without the participation of visually impairedparticipants; however, in two papers, experiments and evaluations were not conducted.
Age of participants. Most of the papers that evaluated and experimented with BVIindividuals provided complete information regarding the age range and gender of theparticipants, and only five papers did not specify such information. However, those fivepapers stated that the participants were school, college, or university students, or over18 years of age. Based on the papers in which the age of the participants was clearlypresented, the youngest and oldest participants were 11 and 84 years, respectively. Themedian age of BVI participants was 47.6 years old.
Gender of participants. Presenting information on the gender of visually impairedparticipants is as important as their age. Although the gender of the participants was notfrequently stated, most of the papers presented the number of male and female participants.Approximately half of the primary studies (13 papers) reported gender information. Basedon the demographics in these articles, the number of female participants was slightly higherthan that of males: 78 and 65, respectively.
We summarized the involvement of BVI in the system development and evaluationprocesses in Table 5. We divided the experimental processes into four main parts: design,evaluation, concept, and no user study, according to methodology of system. As a result,we determined that 18 studies had used BVI people in their experiment and subjectiveassessment.
Table 5. BLV’s involvement in system design and evaluation.
Methodology Type of Process Number of Papers Articles
Participatory Design Design 2 [52,60]
Experiment & Subjective Assessment Evaluation 18 [7,11,21,48,50–54,56–59,61–65]
Interview & Survey Prototype 4 [11,21,63,64]
N/A No user study 8 [31,35,36,38,49,55,60,66]
4.4.4. Involvement of Sighted Teachers and Instructors
Three studies also included sighted teachers and instructors for creating tactile graph-ics and conducting experiments [7,60,63]. Melfi et al. [7] introduced an audio-tactile TPadsystem for an educational environment that combined a touchpad, a tactile graphic, andan accessible app. They also designed a questionnaire to study the experiences of twosighted teachers. The TPad system was discussed with the teachers by asking them eightopen-ended questions regarding their opinions before the study, and the workflow forutilizing it in the classroom was presented: creating a tactile version of a sample graphicfrom a school book with LibreOffice Draw, uploading a file to the repository, demonstratingthe functionalities of the repository’s web interface, and simulating the use of the system inthe classroom.
Surprisingly, Stangl et al. [60] investigated how six caregiver stakeholder groupswith 69 participants, including accessibility librarians (7), children’s librarians (8), talkingbook library volunteers (7), hacker engineers (3), interaction designers (4), orientationand mobility (O&M) specialists, and teachers of the visually impaired (40 specialists andteachers), attempted to produce purposeful 3D printable accessible tactile pictures withamateur-focused 3D modeling programs. Thevin and Brock [63] introduced a novel ARmethod that allowed learners to efficiently and instantly augment real objects with audiofeedback. In their method, three O&M instructors and three different teachers (biologyteacher, tutor, and primary school teacher) were asked to augment an existing tactile mapof the school and a tactile biological atlas.
Processes 2021, 9, 1726 16 of 31
4.4.5. Advantages and Disadvantages of Existing Solutions in Education and Adaptionof BVI
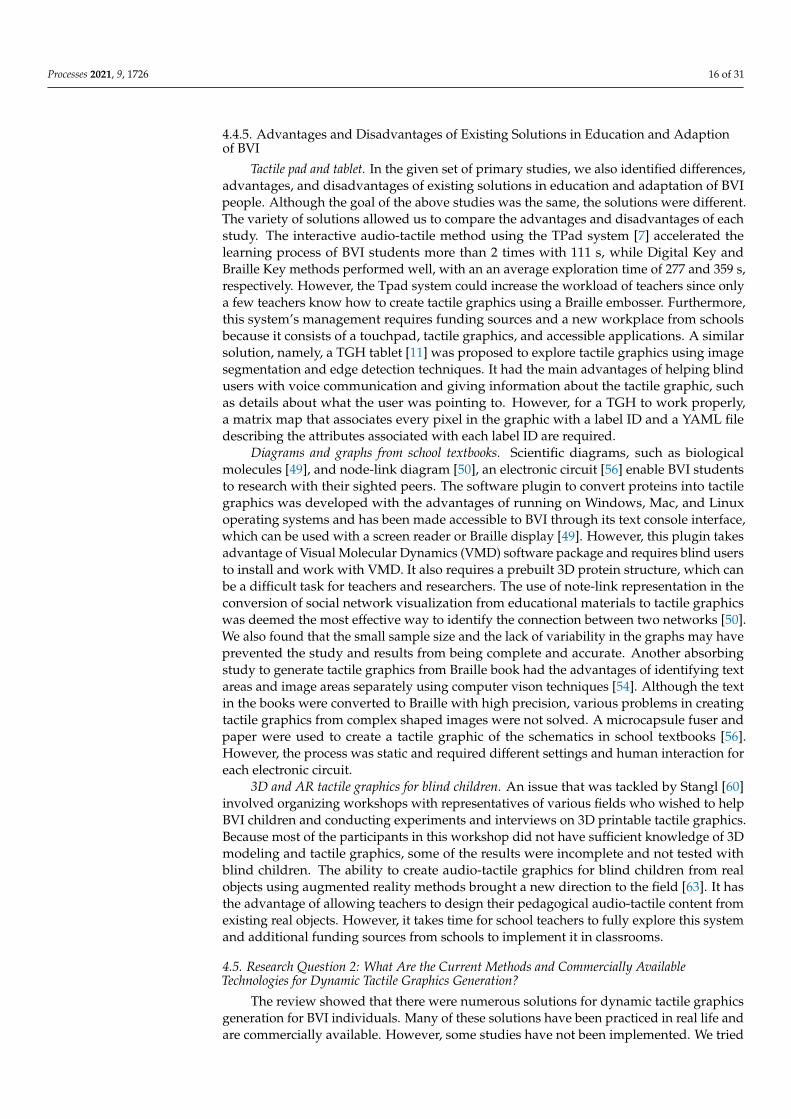
Tactile pad and tablet. In the given set of primary studies, we also identified differences,advantages, and disadvantages of existing solutions in education and adaptation of BVIpeople. Although the goal of the above studies was the same, the solutions were different.The variety of solutions allowed us to compare the advantages and disadvantages of eachstudy. The interactive audio-tactile method using the TPad system [7] accelerated thelearning process of BVI students more than 2 times with 111 s, while Digital Key andBraille Key methods performed well, with an an average exploration time of 277 and 359 s,respectively. However, the Tpad system could increase the workload of teachers since onlya few teachers know how to create tactile graphics using a Braille embosser. Furthermore,this system’s management requires funding sources and a new workplace from schoolsbecause it consists of a touchpad, tactile graphics, and accessible applications. A similarsolution, namely, a TGH tablet [11] was proposed to explore tactile graphics using imagesegmentation and edge detection techniques. It had the main advantages of helping blindusers with voice communication and giving information about the tactile graphic, suchas details about what the user was pointing to. However, for a TGH to work properly,a matrix map that associates every pixel in the graphic with a label ID and a YAML filedescribing the attributes associated with each label ID are required.
Diagrams and graphs from school textbooks. Scientific diagrams, such as biologicalmolecules [49], and node-link diagram [50], an electronic circuit [56] enable BVI studentsto research with their sighted peers. The software plugin to convert proteins into tactilegraphics was developed with the advantages of running on Windows, Mac, and Linuxoperating systems and has been made accessible to BVI through its text console interface,which can be used with a screen reader or Braille display [49]. However, this plugin takesadvantage of Visual Molecular Dynamics (VMD) software package and requires blind usersto install and work with VMD. It also requires a prebuilt 3D protein structure, which canbe a difficult task for teachers and researchers. The use of note-link representation in theconversion of social network visualization from educational materials to tactile graphicswas deemed the most effective way to identify the connection between two networks [50].We also found that the small sample size and the lack of variability in the graphs may haveprevented the study and results from being complete and accurate. Another absorbingstudy to generate tactile graphics from Braille book had the advantages of identifying textareas and image areas separately using computer vison techniques [54]. Although the textin the books were converted to Braille with high precision, various problems in creatingtactile graphics from complex shaped images were not solved. A microcapsule fuser andpaper were used to create a tactile graphic of the schematics in school textbooks [56].However, the process was static and required different settings and human interaction foreach electronic circuit.
3D and AR tactile graphics for blind children. An issue that was tackled by Stangl [60]involved organizing workshops with representatives of various fields who wished to helpBVI children and conducting experiments and interviews on 3D printable tactile graphics.Because most of the participants in this workshop did not have sufficient knowledge of 3Dmodeling and tactile graphics, some of the results were incomplete and not tested withblind children. The ability to create audio-tactile graphics for blind children from realobjects using augmented reality methods brought a new direction to the field [63]. It hasthe advantage of allowing teachers to design their pedagogical audio-tactile content fromexisting real objects. However, it takes time for school teachers to fully explore this systemand additional funding sources from schools to implement it in classrooms.
4.5. Research Question 2: What Are the Current Methods and Commercially AvailableTechnologies for Dynamic Tactile Graphics Generation?
The review showed that there were numerous solutions for dynamic tactile graphicsgeneration for BVI individuals. Many of these solutions have been practiced in real life andare commercially available. However, some studies have not been implemented. We tried

Processes 2021, 9, 1726 17 of 31
to explain this by analyzing the studies in the primary corpus to generate tactile graphicsand the most popular programs and technologies among BVI individuals on the Internetas shown in Table 6.
Table 6. Currently available tactile graphics creation methods, software and hardware.
Tactile Graphics (TG) Creation Currently Available Method Commercial Software and Hardware
General image to TG [35,36,55,58–61,65] [67–73]
Book to TG [21,54,66] [72–74]
Web pages to TG [7,38,63] [72]
Chart and diagram to TG [11,21,31,48,51–53] [67,68,70,72–74]
Art and culture to TG [64,65] [72–74]
Map and plan to TG [62,63] [67,68,70,73]
Figure to TG [35,53,57,60,66] [67–72,74]
Audio feedback support [21,51,52,61,64] [67,68,70,72–74]
Tactile display support [31,58,59,66] [67,68,70,72–74]
4.5.1. Currently Available Platform and Framework
The 2020 issue of the ICCHP, which has been held every two years since 1989, supportsthe advancement of information and communication technology and AT for people withdisabilities and the aging population. It has a special section for creating tactile graphicsand models for blind people and recognition of shapes by touch. Mackowski et al. [53]developed a platform that was not only designed to share the visual information used inmathematics but also to provide BVI individuals with self-learning in a step-by-step process,followed by evaluation of their development as students by a teacher or a psychologist. Themost notable progress was observed in the category of concept acquisition and selection ofinformation, which translated into improving the experiences of problem-solving and self-development of mathematical skills. Bose et al. [38] introduced a framework that acceptedsimple HTML web pages that included only graphics in scalable vector graphics formator a combination of text and graphics. The framework contained four modules: filtering,classification, transformation, and audio. The transformation module was responsiblefor generating the tactile representation of graphics to be displayed on a tactile device orembossed paper. Unfortunately, their platform [53] and framework [38] have not yet beenimplemented in practice and are not commercially available.
4.5.2. Currently Available Methods from Images
JinSoo Cho and his research team presented an interesting project in the field of ATand tactile graphics generation for BVI individuals [31,54,58,59,66]. Meanwhile, Yoonet al. [58] introduced a new method for extracting salient regions based on global contrastenhancement to improve the process of recognizing natural scene images for BVI individu-als. In the method, the contours of the salient regions were detected and translated intotactile graphics so that a BVI individual could perceive it using a refreshable braille deviceor printed swell paper. Abdusalomov et al. [59] proposed a saliency cuts method usinglocal adaptive thresholding to obtain four regions from a given saliency map [58]. In themethod, the salient object is cut and the outer and inner edges of the salient objects aredetected so that a BVI individual can effortlessly understand the content of an image. Thismethod was implemented in production and education processes in the training laboratoryof a specialized boarding school for the visually impaired by printed tactile graphics usingthe Index Braille Embosser.
4.5.3. Currently Available Methods from Electronic Books
Kim et al. [66] described a methodology for effectively converting multimedia content,DAISY, and EPUB formats to braille, as well as correctly rendering and displaying text,
Processes 2021, 9, 1726 18 of 31
images, audios, and videos on a 2D multi-array braille display. This new 2D multi-arraybraille display technology is efficient for BVI individuals as it expands their access tolearning and supports navigation through multimedia content. From an educationalviewpoint, the 2D mobile braille display can be beneficial for obtaining information suchas scientific figures, natural scene images, literature, and audio-based education [66]. Kimet al. [31] concentrated on the development of a 2D multi-array braille display utilizingan electronic book translator application because of its accuracy and high speed. To sharemultimedia content, they presented a braille electronic book reader application that couldshare a large number of figures, text, and audio content. Meanwhile, Tactile Pro and TactileEdu mobile tablets and Braille Contents Author software were created for BVI individualsby combining the methods and technologies [10,31,54,58,59,66].
4.5.4. Currently Available Methods Using Audio
Furthermore, we identified solutions created to develop tactile graphics using audio.Baker et al. [21] proposed a new system for embedding and accessing text in tactile graphicsby applying QR codes, which are small codes that quickly encode textual information.QR codes can be read by a smartphone application that scans QR codes and providesfeedback to help BVI users. If more than one QR code is visible, it requires information todetermine which QR code must be scanned. Therefore, finger pointing was implementedto differentiate which label to scan. Engel et al. [51] introduced a software to increasethe generation method and quality of tactile charts with audio. The current implementa-tion involves an accessible graphical user interface that supports well-designed defaultparameters for tactile chart generation. Their generation process was divided into fivebasic parts: (1) the input data, which are the raw data presented in the chart; (2) the userinput, which specifies characteristics that can be set or triggered by the user inside the userinterface; (3) the user interface that provides an interactive SVG file within the preview; (4)the rendering process, which receives the input data from the user interface to generatethe output data presented to the user; and (5) design guidelines, which highly depend onuser input, particularly on raw data [51]. Chase et al. [52] proposed a system that providedaudio and haptic direction through skin-stretch feedback to the dorsum of a BVI’s hand,while exploring a tactile graphic overlaid on a touchscreen. The system was able to supporttwo teaching scenarios (synchronous and asynchronous) and two guidance interactions(point-to-point and continuous) and demonstrate their use in two applications: a bar chartand tactile graphics of a marble rolling down an inclined plane. Hashimoto and Takagi [61]developed an audio-tactile graphic software executable on smartphones to overcome thelimitations of current audio-tactile graphic systems. The system had some limitation: (1)the system required for specialized devices that were often costly; (2) the system requiredusers to generate particular tactile graphics to the software because existing tactile graphicswere not available to the current software; (3) considering that specialized devices werelarge, this limited the portability of the systems. Cavazos et al. [64] presented an interactivemultimodal guide prototype that consisted of a touch-sensitive 2.5D artwork relief modelthat used audio and tactile graphics to enhance independent access to visual informationand knowledge of visual artworks. The current prototype was created for practice inan exhibition context. School art teachers showed interest in applying the design as aneducational instrument in the classroom. As a result of the analysis, additional audiofeedback was proven to be an effective method for making it easier for BVI individuals toperceive tactile graphics [7,11,51–53,61,64].
4.5.5. Commercially Available Software and Hardware
We also found several AT software and hardware systems that are now commerciallyavailable. While many of them have been competing in the market for several years, somehave contributed to the development of AT with new technologies in the last five years.Thinkable [67] has been manufacturing several applications and devices for many years.They specialize in products and services to create tactile graphics, and their products

Processes 2021, 9, 1726 19 of 31
are well known among BVI individuals, such as TactileView drawing software, TactiPadwith drawing tools, Motorized Drawing Arm, GraphGrid, and RouteTactile. The Amer-ican Printing House for the Blind [68] provides a tactile graphics kit, which includes acomprehensive set of elements that enable teachers, transcribers, and mobility instructorsto generate custom raised-line graphs, maps, diagrams, and charts. American Thermo-form [69] is one of the leaders providing tactile graphics machines and supplies such as theSwell Form Graphics Machine, Swell Touch Paper, and Swell Touch Pens. ViewPlus [70]developed an IVEO software that enables users to experience tactile graphics in an ap-pealing and interactive manner. Consisting of powerful content generation software andan intuitive touchpad for an audio-tactile response, IVEO provides unparalleled accessto tactile information. SeeWriteHear [71] produced tactile graphics with specific devicescapable of generating a wide range of textures and relief levels, along with control brailledescriptions and titles for education and government. PCT [72] created the world’s firstblind-only tablet PC (Tactile Pro and Tactile Edu) to print braille and tactile graphics inreal time, as well as numerous applications, including games, internet, editing documents.They also developed input and output devices for a braille input and a tactile display. OrbitResearch [73] developed a refreshable tactile graphics display to address the difficulty ofrendering on-screen graphics for BVI individuals. The device enables users to obtain abroad type of on-screen graphics by touch, for example, different charts and graphs, maps,geometric forms, line drawings, and dynamic graphical content. Bristol Braille [74] pro-duced Canute 360, a nine-line refreshable tactile graphics display to generate graphs, charts,musical notation, mathematics, tables, and special diagrams for schools and educationalinstitutions of the blind.
4.5.6. Currently Available Online Tutorials
We found it interesting that many publications and internet posts were aimed atcreating tactile graphics and teaching them among the blind. Many of them were specialschools and centers for BVI individuals, as well as various organizations around the world,such as the World Blind Union, and six regional organizations, National Federation of theBlind, American Foundation for the Blind, American Printing House for the Blind, BrailleAuthority of North America, National Industries for the Blind, Perkins School for the Blind,Light House for the Blind and Visually Impaired.
4.5.7. Intended Application Domains
We classified the intended application domains of articles in the main corpus andcommercially available technologies by analyzing them. The results of the analysis revealedthat the focus on education and daily routine domains remained high in 26 and 17 studies,respectively, followed by orientation and mobility, with 6 studies each (Table 7). Therewas little interest in the work environment or museum and art domains. We believe thatthese will be among the most dominant areas of future research and will focus on sportsactivities (which are not currently available for BVI people) with new solutions.
Table 7. Intended application domain of currently available methods, software and hardware.
Intended Application Domain Number of Papers Articles
Education 26 [7,11,21,31,38,48–60,66–74]
Daily routine 17 [31,35,36,38,54,55,58–60,63,65–70,72]
Orientation and mobility 6 [60–62,67,68,73]
Work environment 5 [54,60,61,71,72]
Museum and art 4 [60,64,65,74]
Other 5 [36,37,67,69,72]

Processes 2021, 9, 1726 20 of 31
A word cloud generated using words written in the titles and abstracts of papers inthe primary corpus is shown in Figure 10. It depicts the range and concentrations of termsfound in study titles and abstracts. Words that appear more frequently have a greaterweight.
Processes 2021, 9, x FOR PEER REVIEW 20 of 31
Table 7. Intended application domain of currently available methods, software and hardware.
Intended Application Domain Number of Papers Articles Education 26 [7,11,21,31,38,48–60,66,67–74]
Daily routine 17 [31,35,36,38,54,55,58–60,63,65–70,72] Orientation and mobility 6 [60–62,67,68,73]
Work environment 5 [54,60,61,71,72] Museum and art 4 [60,64,65,74]
Other 5 [36,37,67,69,72]
A word cloud generated using words written in the titles and abstracts of papers in the primary corpus is shown in Figure 10. It depicts the range and concentrations of terms found in study titles and abstracts. Words that appear more frequently have a greater weight.
Figure 10. The most frequent terms in tactile graphics generation for the BVI people based on our selected primary studies. Max word limit is 40.
4.5.8. Advantages and Disadvantages of Current Methods 2D multiarray braille display. Due to the development of embedded systems and
smartphones, static tactile graphics are being replaced by dynamic 2D braille displays. The main advantage of a 2D multiarray braille display is that it can display text content, painting, photographs and mathematical expressions from electronic books or online doc-uments in a short time via a refreshable braille cell [31,38,66]. An operating system and software package were developed for converting texts and images into braille text and tactile graphics. Although the developed operating system and software packages were tested in an Android-based simulator [31,66] or online website [38], the developed 2D multiarray braille display was not used for experimentation and evaluation with the blind. Hopefully, in the future, BVI users will be able to evaluate such 2D Braille displays, and the results will be made public.
Tactile graphics from natural scene images. One of many challenging tasks for the visu-ally impaired is to perceive objects which are located in real-life environments during traveling. To address this problem, salient object extraction methods [58,59] have several advantages, e.g., creating a mental map, analyzing the situation, and moving inde-pendently by perceiving surrounding objects. But this is only the software part of the sys-tem, and a hardware part, such as a 2D multiarray braille display or Tactile tablet, is also required to perceive the contours of objects in real-time. Purchasing such assistive devices creates a challenge for low-income users.
Figure 10. The most frequent terms in tactile graphics generation for the BVI people based on ourselected primary studies. Max word limit is 40.
4.5.8. Advantages and Disadvantages of Current Methods
2D multiarray braille display. Due to the development of embedded systems andsmartphones, static tactile graphics are being replaced by dynamic 2D braille displays.The main advantage of a 2D multiarray braille display is that it can display text content,painting, photographs and mathematical expressions from electronic books or onlinedocuments in a short time via a refreshable braille cell [31,38,66]. An operating systemand software package were developed for converting texts and images into braille textand tactile graphics. Although the developed operating system and software packageswere tested in an Android-based simulator [31,66] or online website [38], the developed2D multiarray braille display was not used for experimentation and evaluation with theblind. Hopefully, in the future, BVI users will be able to evaluate such 2D Braille displays,and the results will be made public.
Tactile graphics from natural scene images. One of many challenging tasks for the visuallyimpaired is to perceive objects which are located in real-life environments during traveling.To address this problem, salient object extraction methods [58,59] have several advantages,e.g., creating a mental map, analyzing the situation, and moving independently by perceiv-ing surrounding objects. But this is only the software part of the system, and a hardwarepart, such as a 2D multiarray braille display or Tactile tablet, is also required to perceivethe contours of objects in real-time. Purchasing such assistive devices creates a challengefor low-income users.
Tactile graphics with voice. Another effective way of delivering visual information toBVI users in real-time is to use audio descriptions. For the blind users who do not knowthe Braille alphabet, the method of using QR codes instead of texts on mathematical graphsand charts is notable for its simplicity and modernity. The advantage of this method isthat the overall process is similar to the creation of traditional tactile graphics, only thetexts are converted to QR code rather than the Braille alphabet. However, an applicationwas created for smartphones to read QR codes, which is required when perceiving tactilegraphics. Additionally, because current braille embossers cannot print ink, QR codes hadto be printed on a separate sheet of paper and glued onto the tactile graphic. In the lastthree years, the interactive use of tactile graphic, audio and haptic methods to explainschool teaching materials to blind students has been deemed an effective research directionby many scholars [51–53,61,64]. Creating different charts and converting them to a tactile

Processes 2021, 9, 1726 21 of 31
graphic with software that has an easy and convenient graphical user interface is not be aproblem, even for teachers without a good understanding of computers [51]. In addition,an audio-tactile tablet or an interactive audio-tactile pin matrix device can be used tointeract with the graphics. One of the device’s drawbacks is that the user interface isonly available in the German language and does not support other languages. Hapticguidance was also created as an aid to audio information in the teaching process in [52].Their device has the advantage of helping students understand complex mathematicalcharts and graphs through haptic point-to-point directional cues. The experiment showedthat, when the haptic cue was not coordinated with the audio, blind students had somedifficulty focusing on either the haptic cue or the audio. Placing tactile graphics on anAndroid-based tablet and providing additional audio information by detecting touchscreenpressed points has the advantage of applying a new interactive method to the teachingprocess of mathematical exercises at a lower cost [53]. Additionally, teachers are able tosend digital audio-tactile pictures to the tablet of blind students and evaluate, monitortheir learning progress through the developed web teacher application. However, suchapproaches require blind students to purchase tablets or schools to set up special interactiveclassrooms. The use of audio description in understanding tactile map [61] and 2.5D tactileartwork models [64] plays an important role in the independent movement of the visuallyimpaired and their perception of visual artwork. This tactile map with accompanyingsmartphone application [61] is one of the cheapest solutions in determining the location ofrooms in school buildings and large buildings. However, for the smartphone application towork accurately, it is necessary to create a simple tactile map, and this is complicated by thecomplexity of the location of rooms in many large buildings. The method of adding audiotags to a 2.5D tactile artwork gives art-loving blind people the advantage of perceivingvisual artwork and listening to audio information synchronously [64]. This system allowsthe blind to hear information about artworks by simply touching them without reading theBraille texts. In practice, at an exhibition, interactive zones in some of the artworks lackedambient audio information. Audio information should be added to the interaction zonesthat lack audio records, e.g., background or space, to control blind users’ expectations.
4.6. Research Question 3: What Are the Advantages of Solutions Using AI and 3D Printer and theGaps That Need to Be Addressed for Future Developments?
AI and machine learning are now being adopted in almost every field, and theirbenefits are enormous. When the source image is extremely complicated, tactile graphicsrequire accuracy, which can confuse visually impaired people. Each image to be trans-formed must be carefully reviewed to ensure that it is a reliable representation of theimage’s content. Therefore, a method is required to convert any complicated image into asimple, straightforward design that can be represented through tactile graphics. Recentadvances in AI and machine learning can assist researchers and developers in achievingsuch a solution [75].
4.6.1. Use of VR and Deep Learning
The importance of using AI and machine learning methods for creating automatictactile graphics generation was stated in [36]. Asakawa et al. [57] developed tactile educa-tional tools for presenting the shapes of objects to BVI individuals using VR. The systemused optical capture and a haptic device to solve the problem of the dynamic capabilityof the tracker device. Moreover, optical capture was utilized to identify the position andposture of the hand, and a haptic device was applied to provide tactile response to a userin a virtual space. A haptic device was developed using a servo motor as an actuator and afinger pad. Felipe and Guerra-Gomez [35] presented a framework that used machine learn-ing to analyze the quality of web and personal images and categorized them into differentclasses. The framework was very effective for teachers and parents of BVI individuals intesting whether images were suitable for creating tactile graphics. The machine learningmodel used Google Cloud AutoML for training, and several iterations were performed toachieve better results. In the first training, 1400 images were used as positive samples and
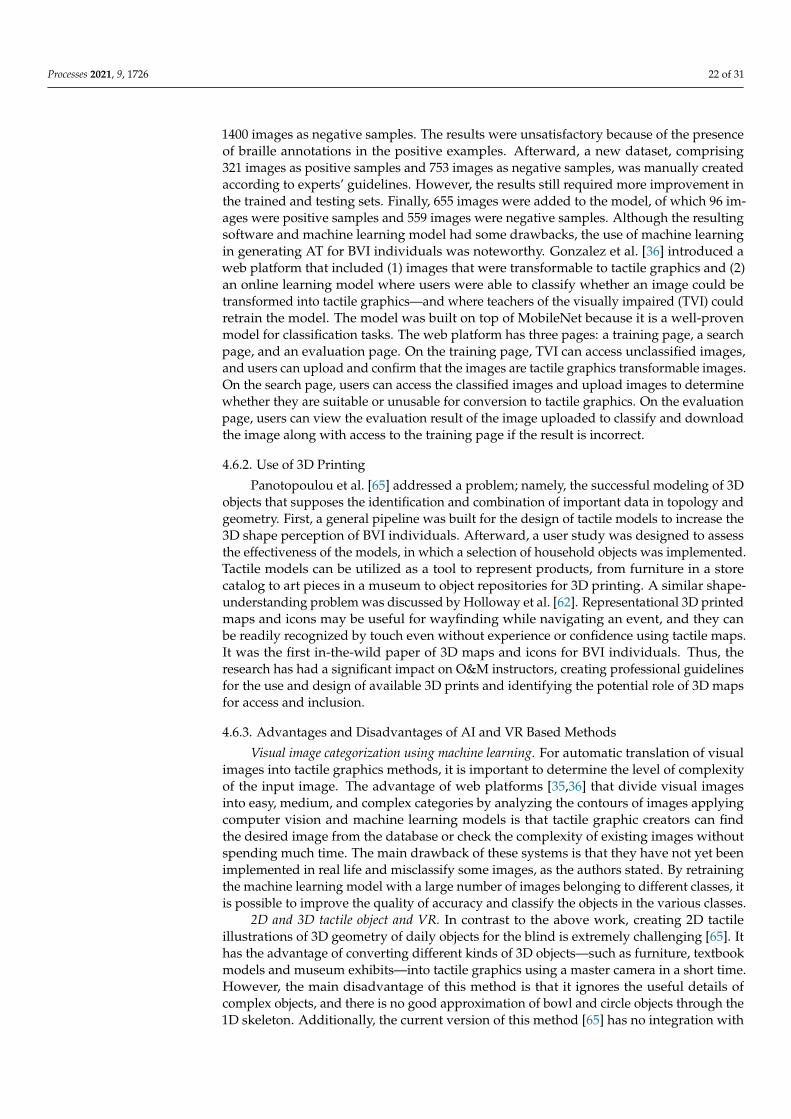
Processes 2021, 9, 1726 22 of 31
1400 images as negative samples. The results were unsatisfactory because of the presenceof braille annotations in the positive examples. Afterward, a new dataset, comprising321 images as positive samples and 753 images as negative samples, was manually createdaccording to experts’ guidelines. However, the results still required more improvement inthe trained and testing sets. Finally, 655 images were added to the model, of which 96 im-ages were positive samples and 559 images were negative samples. Although the resultingsoftware and machine learning model had some drawbacks, the use of machine learningin generating AT for BVI individuals was noteworthy. Gonzalez et al. [36] introduced aweb platform that included (1) images that were transformable to tactile graphics and (2)an online learning model where users were able to classify whether an image could betransformed into tactile graphics—and where teachers of the visually impaired (TVI) couldretrain the model. The model was built on top of MobileNet because it is a well-provenmodel for classification tasks. The web platform has three pages: a training page, a searchpage, and an evaluation page. On the training page, TVI can access unclassified images,and users can upload and confirm that the images are tactile graphics transformable images.On the search page, users can access the classified images and upload images to determinewhether they are suitable or unusable for conversion to tactile graphics. On the evaluationpage, users can view the evaluation result of the image uploaded to classify and downloadthe image along with access to the training page if the result is incorrect.
4.6.2. Use of 3D Printing
Panotopoulou et al. [65] addressed a problem; namely, the successful modeling of 3Dobjects that supposes the identification and combination of important data in topology andgeometry. First, a general pipeline was built for the design of tactile models to increase the3D shape perception of BVI individuals. Afterward, a user study was designed to assessthe effectiveness of the models, in which a selection of household objects was implemented.Tactile models can be utilized as a tool to represent products, from furniture in a storecatalog to art pieces in a museum to object repositories for 3D printing. A similar shape-understanding problem was discussed by Holloway et al. [62]. Representational 3D printedmaps and icons may be useful for wayfinding while navigating an event, and they canbe readily recognized by touch even without experience or confidence using tactile maps.It was the first in-the-wild paper of 3D maps and icons for BVI individuals. Thus, theresearch has had a significant impact on O&M instructors, creating professional guidelinesfor the use and design of available 3D prints and identifying the potential role of 3D mapsfor access and inclusion.
4.6.3. Advantages and Disadvantages of AI and VR Based Methods
Visual image categorization using machine learning. For automatic translation of visualimages into tactile graphics methods, it is important to determine the level of complexityof the input image. The advantage of web platforms [35,36] that divide visual imagesinto easy, medium, and complex categories by analyzing the contours of images applyingcomputer vision and machine learning models is that tactile graphic creators can findthe desired image from the database or check the complexity of existing images withoutspending much time. The main drawback of these systems is that they have not yet beenimplemented in real life and misclassify some images, as the authors stated. By retrainingthe machine learning model with a large number of images belonging to different classes, itis possible to improve the quality of accuracy and classify the objects in the various classes.
2D and 3D tactile object and VR. In contrast to the above work, creating 2D tactileillustrations of 3D geometry of daily objects for the blind is extremely challenging [65]. Ithas the advantage of converting different kinds of 3D objects—such as furniture, textbookmodels and museum exhibits—into tactile graphics using a master camera in a short time.However, the main disadvantage of this method is that it ignores the useful details ofcomplex objects, and there is no good approximation of bowl and circle objects through the1D skeleton. Additionally, the current version of this method [65] has no integration with

Processes 2021, 9, 1726 23 of 31
interactive tactile graphics, e.g., combined with interactive audio feedback, refreshabletactile graphics displays, or dynamic markers. 3D maps and signs are widely utilizedfor BVI people to have the skills to move around safely and to create the conditions forindependent living by introducing them to the local environment, new places, and routesbefore traveling [62]. This 3D map and icon creation method applied the traditionaltime-consuming semiautomatic approach and required separate work for each buildingmap, icon and object. All of the above works were for still objects, and the blind couldnot understand moving or growing and changing objects such as rolling balls, flutteringcurtains, flying insects, plants, animals, and organisms. Using VR technology, the BVI userfeels tactile sensation on the object by touching the surface of the virtual object [57]. Somelimitations of this VR system are as follows: it was challenged in recognizing the shape ofobjects because BVI individuals sense using only two fingers, and the system’s responsetime could be too slow to accurately reflect reality.
4.6.4. Summary for RQ3
To the best of our knowledge, the currently developed AI and machine learningmethods, platforms, and applications for mobile phones are not sufficient for the BVIcommunity. Based on our systematic review results, we can conclude that AI and machinelearning methods have been applied to the field of technologies that help BVI individualsin the last three years but still require extensive research and development (Table 8).
Table 8. AI- and 3D printing-based methods.
Type of Solution Method Articles
Deep learningImage categorization using Cloud Vision Auto ML model [35]
Image classification using MobileNet model [36]
3D printing2D graphics from 3D objects using multi-projection rendering [65]
3D maps for orientation and mobility training [62]
Virtual reality Touching object shapes using optical motion and haptic device [57]
5. Discussions
From the full-text review, we can conclude that most of the existing solutions in thefield of automatic tactile graphics generation were reported in studies conducted between2015 and 2020. This is particularly true when creating tactile graphics with audio and thewide use of 3D printers.
Communication and Collaboration Problems. We observed that the number of methods fortactile graphics generation steadily increased from 2015 to 2020 and we expect more articlesto be published in 2021. Meanwhile, we worried that many of the methods appeared to havebeen discontinued. To the best of our knowledge, the main reasons for these interruptionswere the lack of funds allocated for projects, insufficient life experiments owing to COVID-19, or that the solutions provided by research centers and laboratories were not applicablein real life. In our opinion, the lack of general communication and cooperation betweenresearchers and research centers is one of the obstacles to the development of this field.In this review, we have not observed collaborative projects between different countries orresearch centers, and they have not shared or transferred their solutions with others beforepapers were published. Overall, more than half of all the methods identified in the selectedprimary studies were dedicated to advancing educational systems for BVI individuals, inparticular STEM subjects. Some of the identified systems were intended to create O&Mtactile maps.
Low-priced Technologies in Tactile Graphics Generation. It is also interesting to note thatincreasingly low-priced technologies [11,21,35,54,55,59,62,66] were used to create automatictactile graphics, which reduces the cost of AT and facilitates independent BVI individuals.Additionally, the development of 3D printers has led to the transition from 2D tactile

Processes 2021, 9, 1726 24 of 31
graphics to 2.5D, and 3D tactile graphics are improving [62,65]. The reduced costs ofelectronic parts and devices make it possible to create refreshable braille displays andtactile pads for purchase [7,54]. In today’s fast-paced world, people expect to have instantaccess to all information; however, tactile graphic creators need to be very careful aboutthe quality of the information they produce.
The role of tactile graphics. After attempting to respond to RQ1, we can concludethat more than 80% of primary studies provided answers to RQ1. Different studies havesuggested ideas and methods to improve the quality of education for BVI individuals andsupport their adaptation to the society in a variety of areas. To do this, they cooperated withO&M instructors, TVI, librarians, engineers, and parents. They also used various methodsand tools, such as 3D printers and models, tactile graphics with audio labels, QR codes,braille embossers, refreshable braille displays, smartphone features, text-to-speech andmachine learning models. Almost two-thirds of the analyzed primary studies (18 papers)evaluated and experimented with BVI people to create technologies and methods. This isbecause tactile graphics, which seem easy and understandable to sighted people, can havecomplex shapes and incomprehensible lines to BVI individuals.
Currently Available Method, Software and Hardware. We addressed RQ2 by analyzingresearch articles and exploring commercially available technologies and software on theinternet. We found a wide range of approaches from the research studies and real-lifeproducts. Admittedly, some research studies have not been put into practice but new ideasand results are commendable for their effectiveness. The refreshable Tactile Edu and TactilePro [31,72], with a special braille operating system, and other applications were developedbased on scientific work. They are also available at low prices for BVI individuals. Otheravailable tactile graphic technologies and applications, such as TactileView and ViewPlus,for BVI individuals have also been evolving for many years; however, their cost is still highfor low- and middle-income users.
AI technologies in Tactile Graphics Generation. To answer RQ3, it was determined thatAI technologies are still not widely used in the field of tactile graphics and AT for BVIindividuals, and the question is not completely closed. Despite the fact that it took a longtime for researchers in recent years, AI and machine learning solutions in this area arestill scarce. Some web platforms that analyze the quality of web and personal images andclassify whether an image is transformable to a tactile graphic as well as VR systems thatpresent the shapes of objects have been developed using machine learning methods. Inthis context, a question arises: how will the current technological development in the AIera change the way traditional tactile graphics are created?
Currently Existing Gaps in Tactile Graphics Generation. We believe that this systematicreview provided a brief overview of the current state of research in the field of automatictactile graphics creation as well as new directions for development and research. Thecurrent gaps and issues we identified in the field of automatic tactile graphics generationduring the review are listed below:
1. Despite the variety of tactile graphics generation methods and algorithms available,it is difficult to create simple tactile graphics from materials and images in STEMsubjects.
2. Creating tactile graphics or 3D models requires a specialist and takes a long time toproduce quality results because the full process is not automated.
3. Researchers working on this topic have not collaborated with BVI individuals. Thus,many science-based solutions have remained theoretical without reaching the pro-duction stage.
4. The cost of commercially available technologies and applications remains prohibitivelyexpensive for low-income users.
5. Despite the development of AI algorithms for many years, methods for creating tactilegraphics have mostly used traditional methods. Hence, it is crucial to create customdatasets to develop machine-learning models.

Processes 2021, 9, 1726 25 of 31
6. Considering the increasing number of BVI people in the world, it is essential toexpand the range of AT that assists them in receiving quality education.
We hope that researchers and developers will consider these gaps and issues to be oneof the most important directions for them and find solutions.
6. Conclusions
Motivated by the lack of a systematic literature review on the status of researchregarding automatic tactile graphics generation for BVI individuals, we conducted a reviewof 257 studies from 2015 to March 2021. Research papers were reviewed to provide insightsinto the dynamic nature of this study and provide possible directions for researchers anddevelopers. We chose and reviewed 26 studies relevant to the objectives and questions ofthis research paper based on the rules of exclusion and inclusion. We analyzed the resultsfrom numerous digital libraries and electronic databases to provide a comprehensive datacollection. As a result of the analysis, it was clear that image processing methods and audioinformation to create tactile graphics have been widely used in this area. Moreover, theuse of 3D printers has led to the development of tactile graphics to a new level. The use ofrefreshable tactile displays and special software has advanced so far that they can displaydynamic tactile graphics nearly in real time and improve the quality of the teaching process.All of the analyzed articles were available to researchers to review but some were not free.This is one way in which our analysis could be useful.
During the review, we answered several research questions. A survey of existingapproaches could motivate researchers from all over the world to collaborate. In thesystematic literature review, we also discovered current research gaps and revealed asignificant requirement for new research contributions in this domain. We hope this willbe a source of inspiration and encourage the tactile graphics generation and AT researchcommunity by highlighting opportunities for work in the future.
Author Contributions: M.M. designed the study and identified digital sources; M.M. and S.-Y.K.performed the primary studies screening and quality assessment; M.M. wrote the paper and S.-Y.K.made corrections to the text. Both authors have read and agreed to the published version of themanuscript.
Funding: This research received no external funding.
Acknowledgments: The authors would like to express my sincere gratitude and appreciation toSoon-Young Kim (Gachon University) for her support and quality assessment, comments, remarks,and engagement over the period in which this manuscript was written.
Conflicts of Interest: The authors declare no conflict of interest.

Processes 2021, 9, 1726 26 of 31
Appendix A
Article TechnologyTactile Graphics in Education (E) and
Social Life (SL)Tactile Graphics Generation
MethodologyExperiments and Evaluation Results and Conclusion
[38]Tactile graphics
Generating accessible text and tactilegraphics for a variety of graphics types
in an HTML document. (E)
Machine learning models were developedto classify graphics into categories.
n/aThe software generated tactile graphics fordiagrams, trees, graphs, flowcharts digital
circuits, bar chart, etc.
[48]Tactile graphics
Tactile graphics of seven bar charts, sixline charts, three pie charts, and five
scatterplots. (E)
Tactile charts were developed withdifferent design characteristics to evaluate
their effectiveness.
48 blind participants tested the chart typesand design features in reading data values.
13 aspects were identified as essential inremote studies with blind people.
[58]Tactile graphics
Generating tactile graphics from imagesto perceive education materials and
environment. (SL)
Salient objects were extracted and contourswere detected from images using Canny
edge detection.
Quantitative and qualitative comparisons ofsalient object detection algorithms were
evaluated.
Visually salient objects were translated intoassistive technology systems for visually
impaired individuals.
[56]Tactile graphics
Tactile schematic symbols and nineguidelines were proposed to create
readable tactile graphics. (E)
11 rounds of iterations of six schematicswere completed to produce readable
versions.
The schematics were evaluated by low-visionand blind participants over the age of 18.
The schematic symbols of popular textbooksand guidelines were produced.
[59]Tactile graphics
Detecting the outer boundaries andinner edges of salient objects for simple
tactile graphics generation. (SL)
The contours of the extracted salientobjects were printed as tactile graphics
using Index Braille Embosser.
14 blind students evaluated the tactilegraphics and recognized the tactile graphics
content in one minute.
The visually impaired students clearlyidentified 74% of the tactile graphics.
[49]Tactile graphics
Software plugin for readily producingvariable-height tactile graphics of
biological molecules and proteins. (E)
The plugin introduced representationschemes designed to produce
variable-height tactile graphics.
Three-dimensional printed models andtactile graphics enabled blind students to
analyze the protein structures.
The results enabled undergraduate blindstudents to conduct quality research on
protein structure.
[50]Tactile graphics
A controlled user study of four tactilerepresentations of social networks and
biological networks. (E)
Four tactile representations of networkdata were generated using different
methods and swell paper.
Eight participants reported about theoverview, connectivity cluster, and common
connection of the network data.
All the participants noticed that the twonode-link diagram representations were
more natural and intuitive.
[54]Tactile graphics
Automatically translating characters andimages into tactile graphics for an
electronic braille page. (E)
The labeling and filtering of a scannedimage, character, and graphic labels were
determined.
10 visually impaired individuals evaluatedthe electronic braille pages printed by the
braille printer.
Time and cost were significantly reduced andmore reading materials were provided for
the visually impaired individuals.
[55]Tactile graphics
Automatically converting scannedtextbook images to tactile diagrams and
text into braille. (E)
This includes the extraction andrecognition of text and geometric lines and
circles.n/a
The first version of the software was capableof enhancing the productivity of tactile
designers.
[51]Tactile graphics with audio
Improving the tactile chart creationprocess by an automation tool that
includes an accessible GUI. (E)
The production process was divided intofive basic components such as Input Data,
User Input, etc.
Two blind participants evaluated the bar andline charts and scatterplots in two-hour
sessions.
The structure and elements of the charts andall properties were recognized by both
participants.
[11]Tactile graphics with audio
Tracking a student’s fingers by amachine vision-based tactile graphics
helper (TGH). (E)
The TGH includes a mounted cameraplaced across the tactile graphic andrecognizes different tactile graphics.
Three participants who were universitystudents with STEM majors tested the TGH
with six tactile graphics.
The TGH can improve STEM students’ skillsand efficiency in accessing educational
content.

Processes 2021, 9, 1726 27 of 31
Article TechnologyTactile Graphics in Education (E) and
Social Life (SL)Tactile Graphics Generation
MethodologyExperiments and Evaluation Results and Conclusion
[52]Tactile graphics with audio
A device that provides audio and hapticguidance via skin-stretch feedback to a
user’s hand. (E)
The device can support two teachingscenarios and two guidance interactions.
One blind engineering student evaluatedtwo developed applications that focused on
the learning scenario.
All the participants and experts of tactilegraphics commented for improving several
technical functions.
[21]Tactile graphics with audio
Tactile graphics with a voice (TGV), adevice used to access label information
in tactile graphics using QR codes toreplace the text. (E)
TGV comprises tactile graphics with QRcode labels and a smartphone application.
10 blind participants tested the tasks usingthree modes on the smartphone application
(1) no guidance, (2) verbal, (3)finger-pointing guidance.
The accuracy of the 12 tasks did not varyacross the different modes (silent mode: 88%;
verbal mode: 88%; finger Pointing mode:89%).
[7]Tactile graphics with audio
A mobile audio-tactile learningenvironment, TPad, which facilitates the
addition of real educational materials.(E)
The system consists of three components:1) touchpad, 2) a mobile app, and 3)
teacher’s interface.
Two teachers and five blind used the systemin mathematics, social science, handicraft,
computer science, and physics.
All the participants perceived a tactilegraphic faster and correctly answered more
than 70% of the questions.
[53]Tactile graphics with audio
A platform that shares graphic mathcontent (charts, geometric figures, etc.)in audio-tactile form for the blind. (E)
The test bench consists of a touch tabletand developed software for interactive
audio-tactile display.
10 blind students solved 15 math exercisescontaining graphic content available in
tactile form.
The developed method can be helpful forboth a teacher and a blind student for
self-study.
[61]Tactile graphics with audio
An audio-tactile graphic system outputsan audio guidance from iPhone. (SL)
The system uses edge detection from theRGB image and extracts coordinates of the
pixels.
Eight blind participants tested the system inthree sessions using the tactile maps with six,
12, and 30 rooms.
Audio guidance function is effective forunderstanding tactile graphics.
[64]Tactile graphics with audio
An interactive multi-modal guideprototype that uses the audio and tactile
experience of visual artworks. (SL)
Several techniques, i.e., 3Dlasertriangulation, were used to extract the
topographical information.
18 participants evaluated and compared themulti-modal and tactile graphic accessible
exhibits.
The approach is simple, easy to use, andimproves confidence when exploring visual
artworks.
[65]3D tactile graphics
Illustration design of 3D objects assumesthe identification of relevant data in
topology and geometry. (SL)
Multi-projection rendering strategy wasintroduced to display the geometric
information of 3D geometry.
20 blind participants tested the 3D objectreplication and tactile illustrations of teapot,
lamp, eyeglasses, chair, etc.
The results can be used as a tool to depictproducts ranging from furniture to art pieces
in a museum.
[62]3D tactile graphics
3D printed maps on-site at a publicevent to examine their suitability for the
design of future 3D maps. (SL)
All the 3D maps were designed by aresearcher with 20 years of experience in
tactile graphics.
10 participants tested the 3D maps andanswered different questions to evaluate the
usefulness of these maps.
Different recommendations were proposedfor the design and use of 3D printed maps
for accessibility.
[60]3D tactile graphics
Six stakeholder groups attempt to create3D printable accessible tactile pictures
(3DP-ATPs). (SL)
Libraries, schools, volunteer centers, artgalleries to offer workshops on 3DP-ATPs
at their sites.
69 participants focused on creating 3Dprintable 3DP-ATPs and reported their
different experiences.
The participants offered advice for makingthe design task: five different skillsets.

Processes 2021, 9, 1726 28 of 31
Article TechnologyTactile Graphics in Education (E) and
Social Life (SL)Tactile Graphics Generation
MethodologyExperiments and Evaluation Results and Conclusion
[31]Refreshabletactile displays
Two methodologies are presented fordelivering multimedia content to BVIindividuals using a haptic and braille
display. (SL)
A braille electronic book reader applicationthat can share text, figures, and audio
content.
The experiment was performed by using acombination of tablet and smartphone.
Braille display increases the accessibility ofBVI individuals to multimedia as well as 3D
and 2D haptic information delivery.
[66]Refreshabletactile displays
The transformation of DAISY and EPUBformats into 2D braille display. (SL)
This application was based on DAISY andEPUB. It supports contents display, text
highlight, MP3, TTS.
The tablets and smartphones used wereSamsung Tab S, Galaxy Tab S2 8.0, Samsung
S7 Edge, S6, and Note 5.
The 2D mobile braille displaycan be veryuseful for literature, scientific figures, and
education.
[63]Tactile graphics with AI
An AR to easily augment real objects, i.e.,botanical atlas with audio feedback. (SL)
Two main processes used: augment theobject with electrical components and
digitally represent the object.
Three instructors augmented an existingtactile map of the school. Five BVI students
tested the botanical atlas.
The participants found the interactivegraphics are new to use for their mental
imagery skills.
[36]Tactile graphics with AI
A machine learning (ML) model thatidentifies suitable and unsuitable images
for tactile graphics (TG). (SL)
The ML model was built on top ofMobileNet, and it classifies images into
two categories.
The identification, search, and retrainingfunctionalities were implemented in a web
platform.
A web platform consists of (1) images thatare transformable to TGs and (2) an online
learning model.
[57]Tactile graphics with AI
Tactile educational tools for presentingthe shapes of objects to visually impaired
students using VR. (E)
3D-CAD data were used to express theshapes of objects. A haptic device was
used to develop a system.
Two blind and five low-vision personsguessed the shape of the objects.
The participants seemed to have difficulty inidentifying the shape because of the reduced
amount of information.
[35]Tactile graphics with AI
Develop techniques for finding imageson the web that are suitable for use as
tactile graphics or test their own digitalimages. (SL)
The machine learning model used GoogleCloud AutoML. The system developed
used NodeJs, Express web framework, andMongoDB.
The model used 1729 train and 194 testimages, and it was reviewed by anaccessibility technologies expert.
In the review, the expert discovered thatsome of the images were wrongly classified.

Processes 2021, 9, 1726 29 of 31
References
1. Luo, S.; Bimbo, J.; Dahiya, R.; Liu, H. Robotic tactile perception of object properties: A review. Mechatronics 2017, 48, 54–67.[CrossRef]
2. Brulé, E.; Tomlinson, B.J.; Metatla, O.; Jouffrais, C.; Serrano, M. Review of Quantitative Empirical Evaluations of Technologyfor People with Visual Impairments. In Proceedings of the 2020 CHI Conference on Human Factors in Computing Systems,Honolulu, HI, USA, 25–30 April 2020; pp. 1–14.
3. Matthew, B.; Holloway, L.; Reinders, S.; Goncu, C.; Marriott, K. Technology Developments in Touch-Based Accessible Graphics: ASystematic Review of Research 2010–2020. In Proceedings of the 2021 CHI Conference on Human Factors in Computing Systems,Yokohama, Japan, 8–13 May 2021; pp. 1–15.
4. Wabinski, J.; Moscicka, A. Automatic (Tactile) Map Generation—A Systematic Literature Review. ISPRS Int. J. Geo-Inf. 2019, 8,293. [CrossRef]
5. World Health Organization. World Report on Vision; World Health Organization: Geneva, Switzerland, 2019; Licence: CCBY-NC-SA 3.0 IGO; Available online: https://www.who.int/publications/i/item/9789241516570 (accessed on 4 March 2021).
6. Zebehazy, K.T.; Wilton, A.P. Quality, importance, and instruction: The perspectives of teachers of students with visual impairmentson graphics use by students. J. Vis. Impair. Blind. 2014, 108, 5–16. [CrossRef]
7. Melfi, G.; Müller, K.; Schwarz, T.; Jaworek, G.; Stiefelhagen, R. Understanding what you feel: A mobile audio-tactile system forgraphics used at schools with students with visual impairment. In Proceedings of the 2020 CHI Conference on Human Factors inComputing Systems, Honolulu, HI, USA, 25–30 April 2020; pp. 1–12.
8. Ferro, T.J.; Pawluk, D.T. Automatic image conversion to tactile graphic. In Proceedings of the 15th International ACM SIGACCESSConference on Computers and Accessibility (ASSETS ’13), Bellevue, WA, USA, 21–23 October 2013; pp. 1–2.
9. Zebehazy, K.T.; Wilton, A.P. Straight from the source: Perceptions of students with visual impairments about graphic use. J. Vis.Impair. Blind. 2014, 108, 275–286. [CrossRef]
10. Smith, D.W.; Smothers, S.M. The role and characteristics of tactile graphics in secondary mathematics and science textbooks inbraille. J. Vis. Impair. Blind. 2012, 106, 543–554. [CrossRef]
11. Fusco, G.; Morash, V.S. The tactile graphics helper: Providing audio clarification for tactile graphics using machine vision. InProceedings of the 17th International ACM SIGACCESS Conference on Computers & Accessibility, Lisbon, Portugal, 26–28October 2015; pp. 97–106.
12. Ferro, T.J.; Pawluk, D.T. Providing Dynamic Access to Electronic Tactile Diagrams. In Proceedings of the International Conferenceon Universal Access in Human-Computer Interaction, Las Vegas, NV, USA, 15–20 July 2017; Springer: Cham, Switzerland, 2017;pp. 269–282.
13. Way, T.P.; Barner, K.E. Automatic visual to tactile translation—Part I: Human factors, access methods, and image manipulation.IEEE Trans. Rehabil. Eng. 1997, 5, 81–94. [CrossRef]
14. Way, T.P.; Barner, K.E. Automatic visual to tactile translation—Part II: Evaluation of the TACTile Image Creation System. IEEETrans. Rehabil. Eng. 1997, 5, 95–105. [CrossRef]
15. Krufka, S.E.; Barner, K.E.; Aysal, T.C. Visual to tactile conversion of vector graphics. IEEE Trans. Neural Syst. Rehabil. Eng. 2007,15, 310–321. [CrossRef]
16. Jayant, C.; Renzelmann, M.; Wen, D.; Krisnandi, S.; Ladner, R.; Comden, D. Automated Tactile Graphics Translation: In the Field.In Proceedings of the 9th International ACM SIGACCESS Conference on Computers and Accessibility, Tempe, AZ, USA, 15–17October 2007; pp. 75–82.
17. Hernandez, S.E.; Barner, K.E. Joint Region Merging Criteria for Watershed-Based Image Segmentaion. In Proceedings of theInternational Conference on Image Processing, Vancouver, BC, Canada, 10–13 September 2000; Volume 2, pp. 108–111.
18. Ladner, R.E.; Ivory, M.Y.; Rao, R.; Burgstahler, S.; Comden, D.; Hahn, S.; Renzelmann, M.J.; Krisnandi, S.; Ramasamy, M.; Slabosky,B.; et al. Automating tactile graphics translation. In Proceedings of the 7th International ACM SIGACCESS Conference onComputers and Accessibility, Baltimore, MD, USA, 9–12 October 2005; pp. 150–157.
19. Brock, A.M.; Truillet, P.; Oriola, B.; Picard, D.; Jouffrais, C. Interactivity improves usability of geographic maps for visuallyimpaired people. Hum. Comput. Interact. 2015, 30, 156–194. [CrossRef]
20. Suzuki, R.; Stangl, A.; Gross, M.D.; Yeh, T. FluxMarker: Enhancing Tactile Graphics with Dynamic Tactile Markers. In Proceedingsof the 19th International ACM SIGACCESS Conference on Computers and Accessibility, Baltimore, MD, USA, 29 October–1November 2017; pp. 190–199.
21. Baker, C.M.; Milne, L.R.; Scofield, J.; Bennett, C.L.; Ladner, R.E. Tactile graphics with a voice: Using QR codes to access text intactile graphics. In Proceedings of the 16th International ACM SIGACCESS Conference on Computers & Accessibility, New York,NY, USA, 20–22 October 2014; pp. 75–82.
22. Miele, J.A.; Landau, S.; Gilden, D. Talking TMAP: Automated generation of audio-tactile maps using Smith-Kettlewell’s TMAPsoftware. Br. J. Vis. Impair. 2006, 24, 93–100. [CrossRef]
23. Yu, W.; Ramloll, R.; Brewster, S. Haptic graphs for blind computer users. In Proceedings of the International Workshop onHaptic Human-Computer Interaction, Glasgow, UK, 31 August–1 September 2000; Springer: Berlin/Heidelberg, Germany, 2000;pp. 41–51.
24. Rice, M.; Jacobson, R.D.; Golledge, R.G.; Jones, D. Design considerations for haptic and auditory map interfaces. Cartogr. Geogr.Inf. Sci. 2005, 32, 381–391. [CrossRef]

Processes 2021, 9, 1726 30 of 31
25. Zeng, L.; Weber, G. Audio-haptic browser for a geographical information system. In Proceedings of the International Conferenceon Computers for Handicapped Persons, Vienna, Austria, 14–16 July 2010; Springer: Berlin, Germany, 2010; pp. 466–473.
26. McGookin, D.; Robertson, E.; Brewster, S. Clutching at straws: Using tangible interaction to provide non-visual access tographs. In Proceedings of the SIGCHI conference on human factors in computing systems, Atlanta, GA, USA, 10–15 April 2010;pp. 1715–1724.
27. Ramloll, R.; Yu, W.; Brewster, S.; Riedel, B.; Burton, M.; Dimigen, G. Constructing sonified haptic line graphs for the blind student:First steps. In Proceedings of the Fourth International ACM Conference on Assistive Technologies, Arlington, VA, USA, 13–15November 2000; pp. 17–25.
28. Brown, C.; Hurst, A. Viztouch: Automatically generated tactile visualizations of coordinate spaces. In Proceedings of the SixthInternational Conference on Tangible, Embedded and Embodied Interaction, Kingston, ON, Canada, 19–22 February 2012;pp. 131–138.
29. Štampach, R.; Mulícková, E. Automated generation of tactile maps. J. Maps 2016, 12, 532–540. [CrossRef]30. Jungil, J.; Hongchan, Y.; Hyelim, L.; Jinsoo, C. Graphic haptic electronic board-based education assistive technology system for
blind people. In Proceedings of the 2015 IEEE International Conference on Consumer Electronics (ICCE), Las Vegas, NV, USA,9–12 January 2015; pp. 364–365.
31. Kim, S.; Ryu, Y.; Cho, J.; Ryu, E.-S. Towards Tangible Vision for the Visually Impaired through 2D Multiarray Braille Display.Sensors 2019, 19, 5319. [CrossRef] [PubMed]
32. Prescher, D.; Weber, G.; Spindler, M. A tactile windowing system for blind users. In Proceedings of the 12th International ACMSIGACCESS conference on Computers and accessibility, Orlando, FL, USA, 25–27 October 2010; pp. 91–98.
33. Schmitz, B.; Ertl, T. Interactively displaying maps on a tactile graphics display. In Proceedings of the 2012 Workshop on SpatialKnowledge Acquisition with Limited Information Displays, Bavaria, Germany, 31 August 2012; pp. 13–18.
34. Zeng, L.; Weber, G. ATMap: Annotated tactile maps for the visually impaired. In Cognitive Behavioural Systems; Lecture Notes inComputer Science; Springer: Berlin, Germany, 2012; Volume 7403, pp. 290–298.
35. Felipe, M.P.; Guerra-Gómez, J.A. ML to Categorize and Find Tactile Graphics. Bachelor’s Thesis, Universidad de los Andes,Bogota, Columbia, 2020.
36. Gonzalez, R.; Gonzalez, C.; Guerra-Gomez, J.A. Tactiled: Towards more and better tactile graphics using machine learning. InProceedings of the 21st International ACM SIGACCESS Conference on Computers and Accessibility, Pittsburgh, PA, USA, 28–30October 2019; pp. 530–532.
37. Guinness, D.; Muehlbradt, A.; Szafir, D.; Kane, S.K. RoboGraphics: Dynamic Tactile Graphics Powered by Mobile Robots. InProceedings of the 21st International ACM SIGACCESS Conference on Computers and Accessibility, Pittsburgh, PA, USA, 28–30October 2019; pp. 318–328.
38. Bose, R.; Bauer, M.A.; Jürgensen, H. Utilizing Machine Learning Models for Developing a Comprehensive Accessibility Systemfor Visually Impaired People. In Proceedings of the International Conference on Computers Helping People with Special Needs,Lecco, Italy, 9–11 September 2020; p. 83.
39. Yuksel, B.F.; Fazli, P.; Mathur, U.; Bisht, V.; Kim, S.J.; Lee, J.J.; Jin, S.J.; Siu, Y.-T.; Miele, J.A.; Yoon, I. Human-in-the-Loop MachineLearning to Increase Video Accessibility for Visually Impaired and Blind Users. In Proceedings of the 2020 ACM DesigningInteractive Systems Conference, New York, NY, USA, 6–10 July 2020; pp. 47–60.
40. Yuksel, B.F.; Kim, S.J.; Jin, S.J.; Lee, J.J.; Fazli, P.; Mathur, U.; Bisht, V.; Yoon, I.; Siu, Y.-T.; Miele, J.A. Increasing Video Accessibilityfor Visually Impaired Users with Human-in-the-Loop Machine Learning. In Proceedings of the Extended Abstracts of the 2020CHI Conference on Human Factors in Computing Systems, Honolulu, HI, USA, 25–30 April 2020; pp. 1–9.
41. Buonamici, F.; Carfagni, M.; Furferi, R.; Governi, L.; Volpe, Y. Are we ready to build a system for assisting blind people in tactileexploration of bas-reliefs? Sensors 2016, 16, 1361. [CrossRef] [PubMed]
42. Lin, Y.; Wang, K.; Yi, W.; Lian, S. Deep learning based wearable assistive system for visually impaired people. In Proceedings ofthe IEEE/CVF International Conference on Computer Vision Workshops, Seoul, Korea, 27–28 October 2019.
43. Klingenberg, O.G.; Holkesvik, A.H.; Augestad, L.B.; Erdem, E. Research evidence for mathematics education for students withvisual impairment: A systematic review. Cogent Educ. 2019, 6, 1626322. [CrossRef]
44. Oh, U.; Joh, H.; Lee, Y.J. Image Accessibility for Screen Reader Users: A Systematic Review and a Road Map. Electronics 2021,10, 953. [CrossRef]
45. Cole, H. Tactile cartography in the digital age: A review and research agenda. Prog. Hum. Geogr. 2021, 45, 834–854.46. Kitchenham, B.A.; Charters, S. Guidelines for Performing Systematic Literature Reviews in Software Engineering Version 2.3; ACM
Press: New York, NY, USA, 2007.47. Page, M.J.; Moher, D.; Bossuyt, P.M.; Boutron, I.; Hoffmann, T.C.; Mulrow, C.D.; Shamseer, L.; Tetzlaff, J.M.; Akl, E.A.; Brennan,
S.E.; et al. PRISMA 2020 explanation and elaboration: Updated guidance and exemplars for reporting systematic reviews. Br.Med. J. 2021, 372. [CrossRef]
48. Engel, C.; Weber, G. User study: A detailed view on the effectiveness and design of tactile charts. In Proceedings of the IFIPConference on Human-Computer Interaction, Paphos, Cyprus, 2–6 September 2019; Springer: Cham, Switzerland, 2019; pp. 63–82.
49. Show, O.R.; Hadden-Perilla, J.A. TactViz: A VMD Plugin for Tactile Visualization of Protein Structures. J. Sci. Educ. Stud. Disabil.2020, 23, 14.

Processes 2021, 9, 1726 31 of 31
50. Yang, Y.; Marriott, K.; Butler, M.; Goncu, C.; Holloway, L. Tactile presentation of network data: Text, matrix or diagram? InProceedings of the Extended Abstracts of the 2020 CHI Conference on Human Factors in Computing Systems, Honolulu, HI,USA, 25–30 April 2020; pp. 1–12.
51. Engel, C.; Müller, E.F.; Weber, G. SVGPlott: An accessible tool to generate highly adaptable, accessible audio-tactile charts for andfrom blind and visually impaired people. In Proceedings of the 12th ACM International Conference on PErvasive TechnologiesRelated to Assistive Environments, Rhodes, Greece, 5–7 June 2019; pp. 186–195.
52. Chase, E.D.; Siu, A.F.; Boadi-Agyemang, A.; Kim, G.S.; Gonzalez, E.J.; Follmer, S. PantoGuide: A Haptic and Audio GuidanceSystem to Support Tactile Graphics Exploration. In Proceedings of the 22nd International ACM SIGACCESS Conference onComputers and Accessibility, Virtual Event, Greece, 26–28 October 2020; pp. 1–4.
53. Mackowski, M.; Brzoza, P.; Meisel, R.; Bas, M.; Spinczyk, D. Platform for Math Learning with Audio-Tactile Graphics for VisuallyImpaired Students. In Proceedings of the International Conference on Computers Helping People with Special Needs, Lecco,Italy, 9–11 September 2020; p. 75.
54. Park, T.; Jung, J.; Cho, J. A method for automatically translating print books into electronic Braille books. Sci. China Inf. Sci. 2016,59, 1–14. [CrossRef]
55. Gupta, R.; Balakrishnan, M.; Rao, P.V.M. Tactile diagrams for the visually impaired. IEEE Potentials 2017, 36, 14–18. [CrossRef]56. Race, L.; Fleet, C.; Miele, J.A.; Igoe, T.; Hurst, A. Designing Tactile Schematics: Improving Electronic Circuit Accessibility. In
Proceedings of the 21st International ACM SIGACCESS Conference on Computers and Accessibility, Pittsburgh, PA, USA, 28–30October 2019; pp. 581–583.
57. Asakawa, N.; Wada, H.; Shimomura, Y.; Takasugi, K. Development of VR Tactile Educational Tool for Visually Impaired Children:Adaptation of Optical Motion Capture as a Tracker. Sens. Mater. 2020, 32, 3617–3626.
58. Yoon, H.; Kim, B.-H.; Mukhiddinov, M.; Cho, J. Salient Region Extraction based on Global Contrast Enhancement and SaliencyCut for Image Information Recognition of the Visually Impaired. KSII Trans. Internet Inf. Syst. 2018, 12, 2287–2312.
59. Abdusalomov, A.; Mukhiddinov, M.; Djuraev, O.; Khamdamov, U.; Whangbo, T.K. Automatic salient object extraction based onlocally adaptive thresholding to generate tactile graphics. Appl. Sci. 2020, 10, 3350. [CrossRef]
60. Stangl, A.; Hsu, C.-L.; Yeh, T. Transcribing across the senses: Community efforts to create 3D printable accessible tactile pictures foryoung children with visual impairments. In Proceedings of the 17th International ACM SIGACCESS Conference on Computers &Accessibility, Lisbon, Portugal, 26–28 October 2015; pp. 127–137.
61. Hashimoto, Y.; Takagi, N. Development of audio-tactile graphic system aimed at facilitating access to visual information for blindpeople. In Proceedings of the 2018 IEEE International Conference on Systems, Man, and Cybernetics (SMC), Miyazaki, Japan,7–10 October 2018; pp. 2283–2288.
62. Holloway, L.; Marriott, K.; Butler, M.; Reinders, S. 3D Printed Maps and Icons for Inclusion: Testing in the Wild by People who areBlind or have Low Vision. In Proceedings of the 21st International ACM SIGACCESS Conference on Computers and Accessibility,Pittsburgh, PA, USA, 28–30 October 2019; pp. 183–195.
63. Thevin, L.; Brock, A.M. Augmented reality for people with visual impairments: Designing and creating audio-tactile contentfrom existing objects. In Proceedings of the International Conference on Computers Helping People with Special Needs, Linz,Austria, 11–13 July 2018; Springer: Cham, Switzerland, 2018; pp. 193–200.
64. Cavazos, Q.L.; Bartolomé, J.I.; Cho, J. Accessible Visual Artworks for Blind and Visually Impaired People: Comparing aMultimodal Approach with Tactile Graphics. Electronics. 2021, 10, 297. [CrossRef]
65. Panotopoulou, A.; Zhang, X.; Qiu, T.; Yang, X.-D.; Whiting, E. Tactile line drawings for improved shape understanding in blindand visually impaired users. ACM Trans. Graph. 2020, 39, 89. [CrossRef]
66. Kim, S.; Park, E.-S.; Ryu, E.-S. Multimedia vision for the visually impaired through 2D multiarray braille display. Appl. Sci. 2019,9, 878. [CrossRef]
67. Thinkable, Tactile Drawing Software. Available online: https://thinkable.nl/ (accessed on 4 March 2021).68. American Printing House, Tactile Graphics Kit. Available online: https://www.aph.org/product/tactile-graphics-kit/ (accessed
on 4 March 2021).69. American Thermoform, Tactile Graphics. Available online: http://www.americanthermoform.com/product-category/tactile-
graphics/ (accessed on 5 March 2021).70. ViewPlus, IVEO 3 Hands-On Learning System. Available online: https://viewplus.com/product/iveo-3-hands-on-learning-
system/ (accessed on 4 March 2021).71. SeeWriteHear, Braille & Tactile Graphics. Available online: https://www.seewritehear.com/services/document-accessibility/
braille-tactile-graphics/ (accessed on 5 March 2021).72. Power Contents Technology, Tactile Pro & Edu. Available online: http://www.powerct.kr/ (accessed on 5 March 2021).73. Orbit Research, Graphiti. Available online: http://www.orbitresearch.com/product/graphiti/ (accessed on 4 March 2021).74. Bristol Braille Technology, Canute 360. Available online: http://www.bristolbraille.co.uk/index.htm (accessed on 5 March 2021).75. González Álvarez, C.E. ML to Categorize and Translate Images into Tactile Graphics. Bachelor’s Thesis, Universidad de los
Andes, Bogota, Columbia, 2020.