online marketing and consumer buying behaviour of electronic
Upload
khangminh22Category
view
0download
0
Indian Journal of Science and Technology, Vol 9(35), DOI: 10.17485/ijst/2016/v9i35/80026, September 2016ISSN (Print) : 0974-6846
ISSN (Online) : 0974-5645
* Author for correspondence
1. Introduction
INDIA ranks seventh in the retail FDI confidence index -2015 after BRAZIL with a score of 1.79, indicating the huge potential here in the country for ORGANIZED retail in comparison to rest of the world(Figure -1), while the UNITED STATES is at the top with 2.1 score. This rank is further expected to improve as a result of changing demographics and increasing disposable income along with a favorable policy framework with emphasis on job creation and improved living standards. The size of the Indian Retail market rose from 275.86 Billion $ in 2008-09; to $482.76 billion in 2012-13; to $ 534.48 billion in 2013-14; $ 741.38 billion in 2014-15 and estimated to grow to 948.28 billion in 2018-19 according to CRISIL RESEARCH (Figure-2).
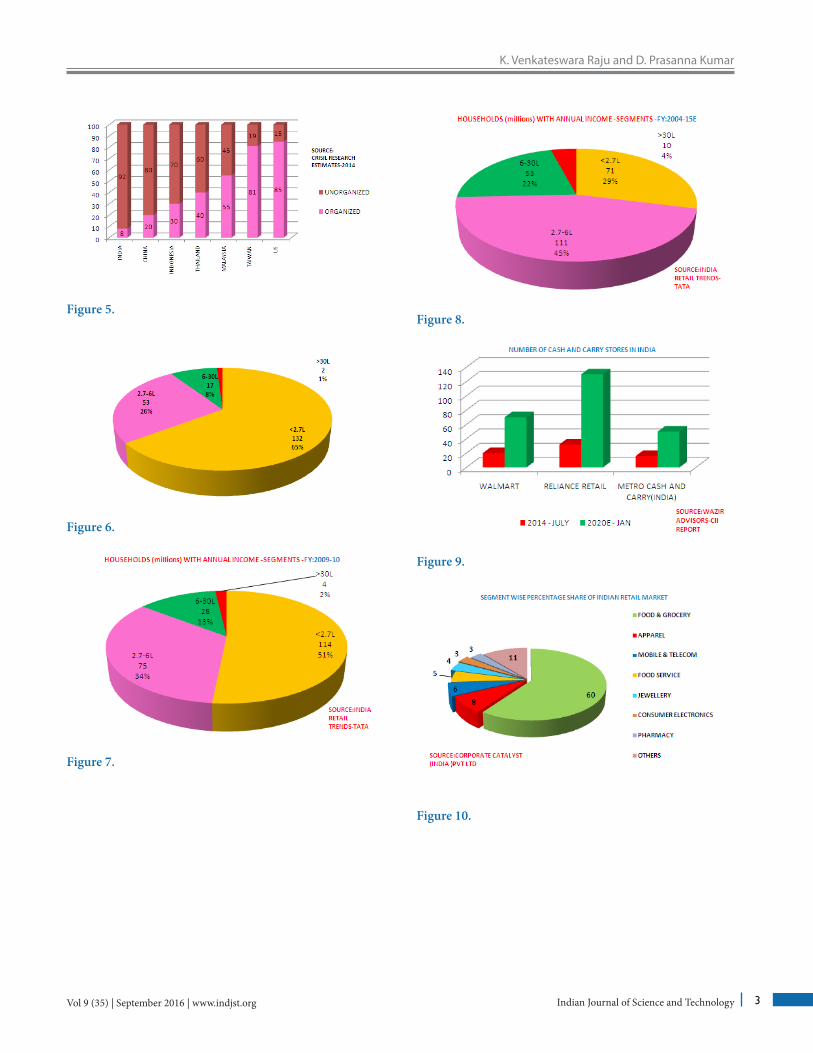
According to WAZIR ADVISORS-CII report (Figure-3), the size of Indian retail market is projected to rise from $ 550 Billion to $ 2100 billion and also the percentage penetration of Organized Retail Sector in the country rose from 5.8% in 2008-09 to 7.9% in 2013-14 and to 10% in 2018-19 according to a CRISIL RESEARCH ESTIMATE (Figure-4). The Percentage penetration of Organized Retail Sector in India is around 8%, wheras as in US it is 85%, 81 % in TAIWAN, 55 % IN MALAYSIA, 40 % IN THAILAND, 30 % IN INDONESIA, AND 20 % IN CHINA(Figure-5). The rise in organized retail can be attributed to the rise in HOUSEHOLD INCOMES as seen in the Figures -6, 7, 8) and TABLE-1 showing a reduction in the lower income bracket and growth in the higher income segments.
Lifestyle changes can be seen in most people as seen
AbstractOrganized Retail Sector is expanding at a rapid pace in India and it is leading to the phenomenon of Impulse buying by the customers at these stores which is not seen in the previous decade. The purpose of conducting the research is to find the Impact of Effective Visual Merchandising (VM) on the impulse buying behavior of customers at various retail stores in Andhra Pradesh. Objectives: To find the satisfaction attributes of Customers at Organized retail Outlets and how VISUAL MERCHANDIZING is affecting impulse decisions of the customer. Methods/Analysis: In this study we used various questions on life-style attributes and satisfaction with life scale variables for collecting information and tried to study their effect on customer impulse behavior. A survey of 488 retail customers was done and results interpreted in this paper. SPSS 16 was used to implement methods like CHI-SQUARE on the data and correlate the various factors needed. Findings: We provide a comprehensive insight into the various factors that are affecting the impulsiveness of the customer. As the previous research data was not focusing on the phenomenon of Impulse behavior and Visual merchandising, we tried to do depth analysis of the same which will be useful for future researchers.
Keywords: Display, FDI, Impulse, Layout, Organized, Visual Merchandise
A Study on Impulse Buying Behaviour in the Backdrop of Customer Perception towards Visual
Merchandising and Other Service Attributes at Organized Retail Outlets in Hyderabad
K. Venkateswara Raju* and D. Prasanna Kumar
Klu Business School, Kl University, Vijayawada – 522502, Andhra Pradesh, India; [email protected], [email protected]

Vol 9 (35) | September 2016 | www.indjst.org Indian Journal of Science and Technology2
A Study on Impulse Buying Behaviour in the Backdrop of Customer Perception towards Visual Merchandising and Other Service Attributes at Organized Retail Outlets in Hyderabad
in their shift form tailor made to readymade apparels, purchasing food and grocery from HYPERMARKETS instead of HAWKERS, going to MULTIPLEXES for cinemas instead of standalone movie theatres for entertainment, enjoying food services at RESTAURANTS instead of roadside eateries to indicate a few (TABLE-2). This preference of customers for organized retail can be seen in the rise of stores in various categories with time. Table-3 shows the increase in retail outlets of certain companies. An increase in the number of stores of WALMART, RELIANCE and METRO can be seen in the Figure-9.
The segment wise distribution of the overall INDIAN retail market can be seen below. FOOD & GROCERY segment tops the chart with a share of 60%, APPAREL segment with a percentage share of 8%, MOBILE & TELECOM with 6%, FOOD SERVICE with a share of 5%, JEWELLERY with 4%, CONSUMER ELECTRONICS AND PHARMACY with 3% EACH and others with 11 % (Figure-10). The ORGANIZED RETAIL MARKET has a different distribution and the APPAREL segment tops it with a share of 37%, FOOD & GROCERY and MOBILE&TELECOM with 11% EACH, CONSUMER ELECTRONICS with 8%, FOOD SERVICE 7%, JEWELLERY with 6 %, and FOOTWEAR with 4% and OTHERS with 20%. An illustration can be seen in Figure-11. According to an ASSOCHAM Estimate there is a sharp rise in INDIAN LUXURY MARKET SIZE which can be seen in Figure-12.
Figure 1.
Figure 2.
Figure 3.
Figure 4.
K. Venkateswara Raju and D. Prasanna Kumar
Vol 9 (35) | September 2016 | www.indjst.org Indian Journal of Science and Technology 3
Figure 5.
Figure 6.
Figure 7.
Figure 8.
Figure 9.
Figure 10.

Vol 9 (35) | September 2016 | www.indjst.org Indian Journal of Science and Technology4
A Study on Impulse Buying Behaviour in the Backdrop of Customer Perception towards Visual Merchandising and Other Service Attributes at Organized Retail Outlets in Hyderabad
Figure 11.
Table 1. HOUSEHOLDS (millions) with annual segment<2.7L 2.7-6L 6-30L >30L
2005-06 132 53 17 2<2.7L 2.7-6L 6-30L >30L
2009-10 114 75 28 4<2.7L 2.7-6L 6-30L >30L
2014-15E 71 111 53 10
Table 2. GENERATION LAST DECADE PRESENTAPPAREL TAILOR MADE READY MADEFOOD AND GROCERY
HAWKERS HYPERMARKETS
ENTERTAINMENT STANDALONE THEATRES
MULTIPLEXES
FOOD SERVICES ROADSIDE EATERIES
RESTAURANTS
Table 3. Peter England 300(2010) 672(2015)Van Heusen 120(2011) 257(2015)Max Fashion 27(2010) 80(2014)Pvr Cinemas 34(2011) 444(2015)Inox Cinemas 25(2011) 358(2015)Carnival Cinemas 3(2010_ 300(2015)Reliance Fresh 300(2011) 550(2014)6ten 169(2011) 344(2014)Cafe Coffeeday 800(2010) 210(2014)Pizza Hut 120(2010) 1480(2015)Kfc 100(2010) 431(2015)
2. Structural Challenges to Organized Retail in India
ORGANIZED RETAILERS in INDIA face some structural challenges which are illustrated below especially for FOOD and GROCERIES. As we can see the realizations are more for international retailers when compared with INDIAN retailers while the Rentals as Percentage of sales is high for them. SALES PER SQUARE FEET for International retailers is 8000-12000 Rs whereas for Indian retailers it is 1500-2500Rs.GROSS MARGINS as a percentage of sales for International retailers is 25-30 percent while for Indian retailers it is lesser at 18-22% (Figure-13). Alarmingly the RENTALS as a percentage of sales is higher for INDIAN Retailers at 3-6%, while for International retailers it is at 1.5-3%(Figure-14).
Property Tax rates for commercial, tenanted premises in different cities varies with location and in some states as we can see in case of KOLKATA its quite high and it won’t be a viable proposition to set shop there(Figure-15) and TABLE-4. In such cases the governments should try to reduce it for more organized retail penetration.
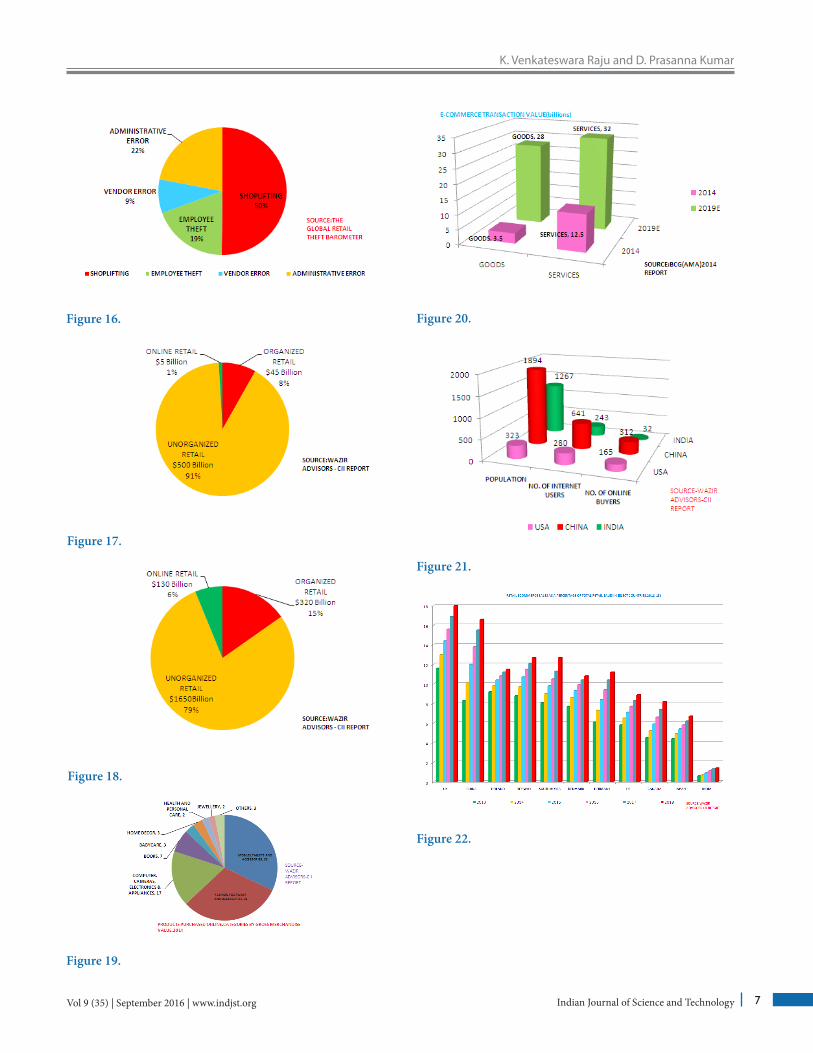
Organized retail in any country faces shrinkage due to factors like SHOPLIFTING, EMPLOYEE THEFT and other errors (TABLE-5).
According to a CII Report the ORGANISED RETAIL is projected to rise from $ 45 Billion to $ 320 Billion, UNORGANIZED RETAIL from $ 500 Billion to $ 1650 Billion and ONLINE RETAIL from $ 5 Billion to $ 130 Billion. Two figures, the first one with 2015E (Figure-17) and latter with 2025E (Figure-18) are illustrated at the end.
According to CII report on GROSS MERCHANDISE VALUE FOR VARIOUS SEGMENTS,MOBILES,TABLETS AND ACCESSORIES segment HAS THE TOP SLOT WITH 32% followed by FASHION, FOOTWEAR AND ACCESSORIES with 31%, COMPUTERS, CAMERAS, ELECTRONICS AND APPLIANCES with 17%, BOOKS 7%, BABYCARE and HOMEDECOR with 3% EACH, HEALTH AND PERSONAL CARE and JEWELLERY with 2% EACH and OTHERS with 3%(Figure-19).
According to a study by BCG Analysis both the GOODS and SERVICES segments of INDIAN E-COMMERCE market are project to show a rise and this

K. Venkateswara Raju and D. Prasanna Kumar
Vol 9 (35) | September 2016 | www.indjst.org Indian Journal of Science and Technology 5
might pose a slight risk to organized retail (Figure-20). At present Online Buyers is less in India when compared to US and CHINA, even when population is high is due to various factors like literacy rate, low trust in online security and absence of feel to touch when compared to Organized Retail (Figure-21) and TABLE-6.
This can be correlated with another CII report which showed a comparative analysis of Retail E-Commerce Sales as a percentage of Total Retails sales in Select countries where we find INDIA at the bottom (Figure-22). We can also observe the number of registered online sellers with various websites in the Figure-23. Usage of mobile internet also poses a risk to ORGANIZED RETAIL as more and more customers may opt for it due to ease in usage and style quotient associated with it. A graph showing rise in mobile subscribers from 48 million in June-12 to 91 million in June-13,110 million in OCT-13,130 million in DEC-13,155 million in MAR-14 and to 185 million in JULY-14 is shown in Figure-24.
Visual Merchandising involves steps like getting attention, create a sense of Appeal to the shopper and finally close the sale. As a profession it involves developing strategies for floor plans, fixtures and displays for maximizing sales, of goods and services with a purpose of attracting, engaging the shopper and encourage him to purchase various items on display and involves various things like making it easy to the customer in locating the department and category they desire and in finding the products that they need and also in getting products that match or blend with their requirements and also in finding specially promoted, displayed or strategic goods. Various Types of Displays (Window, Stock and Shelf) are used to improve the visual appeal of the merchandise.
Shopping in the past is a pastime that majority of people do not enjoy. Generally people like shopping in certain stores that they love to visit, and others that they will avoid at all costs the different experience between the perceptions of the different outlets1. Often we see cases where a person will like a store from the same retailer but hates the same store in another area.
Important to note is that most shopping experiences are affected by the visual appeal that one senses at the retail store and the retailer should have a clear understanding that he is providing “entertainment” to the customer who is inside his store. It is mandatory on the part of retailer to ensure that all or most of aspects within the store will be successful in capturing the attention of the customer and
excite him. The displays and decor should be able to hold the attention of the customer when he is inside the store.
Once the customer is in the proximity of the store the retailer should ensure that he is attracted to it because of its brand recognition or the way things are presented there or both which may not be always possible or practical due to the types of products on sale there and the tools he can use to achieve these attributes are designed to create the best satisfying experience to the shopper and turn browsers into buyers. Visual Merchandising should focus on overall impression that is obtained by the store, and not just the impulsive effect of the products on the shelf.
Customers shop with all their senses, not only visual appeal. Many retailers who are successful in Visual Merchandising are able to raise their bottom lines by doing simple things that are seen by the shopper as being a “Wow” factor. Sometimes even small kids tell their parents that they would like to go back to those stores.
Impulse buying behavior involves unplanned and sudden purchases with the cognitive and affective forces guiding the purchase typically initiated at the time and place of purchase2. Impulse buying generally is accompanied by strong affective reactions by a powerful urge to buy or feelings of pleasure and excitement 2. At least superficially, impulse buying seems to serve hedonic motives. In comparison with non impulsive buyers, impulse buyers exhibit hedonic rather than utilitarian motives for their purchases and their shopping experiences tend to be driven by high arousal emotions such as excitement and pleasure3.
Although there is an indication of element of fun involved in impulse buying from prior research, there is also evidence suggesting that impulse buying serves the function of alleviating unpleasant psychological states. People sometimes reward themselves with “self-gifts” as a means of elevating a negative mood4. People choose to sacrifice self-control and allow self to make impulsive purchases if they think such purchases might make them feel better5. There is a relationship between impulsive buying and both positive and negative mood states6. Based on these results it was proposed that the primary function of impulse buying might be as “a self-regulatory mechanism aimed at reducing negative feelings, especially when these feelings have a structural basis such as a failure to live up to valued standards or low self-esteem”3.
Subjective well-being is a broad construct that includes aspects of individuals’ positive and negative affective

Vol 9 (35) | September 2016 | www.indjst.org Indian Journal of Science and Technology6
A Study on Impulse Buying Behaviour in the Backdrop of Customer Perception towards Visual Merchandising and Other Service Attributes at Organized Retail Outlets in Hyderabad
responses, their satisfaction with specific aspects of their lives (e.g., work and family), and global judgments of life satisfaction7. Although the components of subjective well-being are frequently strongly correlated with each other8 and thus often examined as a single higher-order construct, research shows that the components of subjective well-being are separable constructs9. With this background in mind, the Satisfaction with Life Scale (SWLS) was developed to measure a person’s cognitive assessment of global life satisfaction without tapping into related constructs such as loneliness or positive/negative effect10. This instrument is among the most commonly used measures of subjective well-being, and has shown good psychometric properties, including high internal consistency, reliability over time10 and strong predictive validity11.
Successful retailers should be designing the layout of the store in such a way that it is consciously or unconsciously directing the shoppers towards places in the store where merchandize that has prospect of generating high sales is on display thereby stimulating the impulsiveness of the customer and also is resulting in improved efficiency and productiveness of shelf space14.
Layout should be designed in such a manner that it is creating an ease of understanding and facilitating the grasping nature of customers about the distribution of various categories of merchandize across the store. Customers have a tendency of creating a mental mapping about the design and the way a store is laid out and this mapping will be having information where to locate the products they need, the time to check-out etc which will be influencing convenience of the shopper as well as increase his impulsiveness to do a purchase14. Retailers generally choose among grid store layout and free-form store layout when it comes to designing a store.
Figure 12.
Figure 13.
Figure 14.
Figure 15.
K. Venkateswara Raju and D. Prasanna Kumar
Vol 9 (35) | September 2016 | www.indjst.org Indian Journal of Science and Technology 7
Figure 16.
Figure 17.
Figure 18.
Figure 19.
Figure 20.
Figure 21.
Figure 22.

Vol 9 (35) | September 2016 | www.indjst.org Indian Journal of Science and Technology8
A Study on Impulse Buying Behaviour in the Backdrop of Customer Perception towards Visual Merchandising and Other Service Attributes at Organized Retail Outlets in Hyderabad
Figure 23.
Table 4. Indian Retail Market : Source of Shrinkage Shoplifting 50.2Employee Theft 19.3Vendor Error 8.5Administrative Error 22
Table 5. Property Tax Rates For Commercial Tenanted Premises In Different Cities (Rs./Sq.ft./monthKolkata (KMC) 18.9Banglore 5.58Chennai 7.75Gurgaon 5.76Delhi 3.21Navi Mumbai 3
Table 6. Internet Users And Online Shoppers In India,Usa, China (Figures In Millions)
Population No.Of Internet Users
No.Of Online Buyers
Usa 323 280 165China 1894 641 312India 1267 243 32
3. Basic Types of Store Layout (Zentes, Morschett, and Schramm-Klein, 2007)
Grid store layout (Figure-will create a feel of convenience in the customers who like to pin pointedly locate the products they need with ease and also browse through the
store very fast and will facilitate retail managers to take steps that help in avoiding a crowded store and in general it is not a stimulus creating layout 14.
In contrast to Grid Store Layout (Figure-25), free-form layout (Figure-26), will provide the customers a path to make free movements in desired areas and due to the irregularity in its pattern, it will be conducive for a relaxed shopping experience.
ZENTES, MORSCHETT, AND SCHRAMM-KLEIN (2007)14 emphasized the importance of allocating shelf space which according to them must be designed on the basis of quality of the available space. Different regions in a store are given a different preference by different shoppers and they browse the store with varying speed and some areas in particular will be drawing the customer’s attention than the rest and also retail managers must be paying high attention to checking-out points as customers at this point are easily susceptible to impulse products.
On the whole, the layout should be designed such that it evokes the necessary emotions in the customer, create a sense of comfort when they are inside the store and also help in differentiation of the store from the rest.
Figure 24.
Figure 25.

K. Venkateswara Raju and D. Prasanna Kumar
Vol 9 (35) | September 2016 | www.indjst.org Indian Journal of Science and Technology 9
4. Objectives of the Study
• Study the various factors effecting IMPULSE BUYING BEHAVIOR.
• Study the effect of VISUAL MERCHANDIZING on buying decisions of Customers.
• To determine if decision of to buy/not choice is decided even before arriving at the Retail store or it is based on the VISUAL DISPLAYS at the store.
• Exploring the effectiveness of layout in a retail store on CUSTOMER BUYING BEHAVIOR.
• Analyze the customer’s ability to recall products on display using VISUAL MERCHANDISING.
• Assess the impact of various factors of VISUAL MERCHANDIZING.
5. Scope of Study
The Inferences from the study are based on the responses given by the CUSTOMERS at some Retail Stores only in specific areas. This study will be helpful in getting an insight into the effectiveness of VISUAL MERCHANDIZING on buying decisions of Customers.
6. Research Methodology
The study is based on both primary data and secondary data. The primary data was collected through structured questionnaire for which samples of 448 respondents were selected for this study. The collected samples using convenient sampling method was validated and took it for further analysis. Secondary data is also been collected from database sites and articles. The respondents are randomly selected for this study. Survey method is used for collecting data from CUSTOMERS at some Retail Stores. We requested all respondents to fill in the questionnaire, by self after explaining the various aspects mentioned in it. It contained both open and closed ended questions in a structured format very easy to understand on the first look. Respondents of the study were requested to complete the questionnaire on voluntary basis. Frequencies and cross tabulation have been calculated for the responses of the respondents. Chi – Square test analysis was conducted
Table 7. GENERAL PROFILE OF THE RESPONDENTSGeneder Male Female
192 296Age <28 28-45 46-60 >60
54 184 168 82
Education Diploma Graduation Pg193 196 99
Profession Pvt Job Govt Job Self-Employed Others
227 97 83 81Income <10,000 10,000-20,000 20,000-35000 >35000
41 159 217 71Family Members One Two Three four Five and
above73 58 186 134 37
Avg Monthly Purchase
Below 500 501-1500 1501-3000 3001-5000 500087 150 162 52 37
Factor Influncing Slection Of Rental Store
Distance Pricing Product Quality
Check Out Time
Word Of Mouth
83 114 106 44 141
Figure 26.
Vol 9 (35) | September 2016 | www.indjst.org Indian Journal of Science and Technology10
A Study on Impulse Buying Behaviour in the Backdrop of Customer Perception towards Visual Merchandising and Other Service Attributes at Organized Retail Outlets in Hyderabad
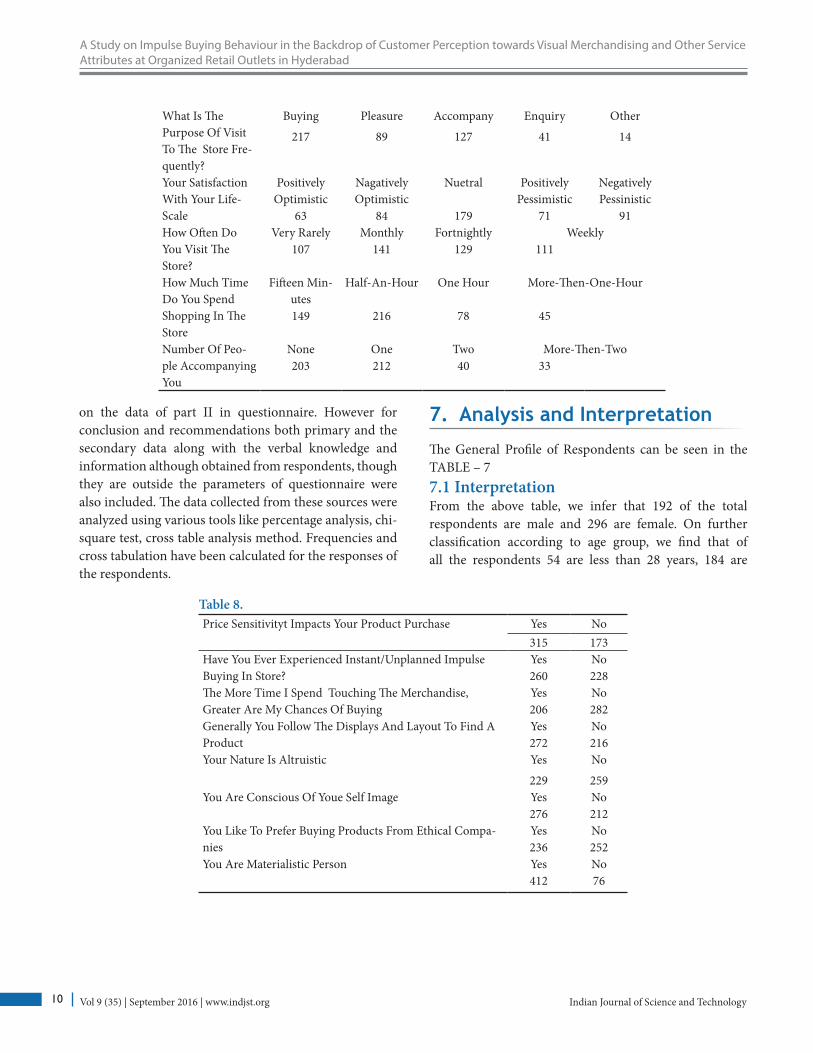
What Is The Purpose Of Visit To The Store Fre-quently?
Buying Pleasure Accompany Enquiry Other
217 89 127 41 14
Your Satisfaction With Your Life-Scale
Positively Optimistic
Nagatively Optimistic
Nuetral Positively Pessimistic
Negatively Pessinistic
63 84 179 71 91How Often Do You Visit The Store?
Very Rarely Monthly Fortnightly Weekly107 141 129 111
How Much Time Do You Spend Shopping In The Store
Fifteen Min-utes
Half-An-Hour One Hour More-Then-One-Hour
149 216 78 45
Number Of Peo-ple Accompanying You
None One Two More-Then-Two203 212 40 33
on the data of part II in questionnaire. However for conclusion and recommendations both primary and the secondary data along with the verbal knowledge and information although obtained from respondents, though they are outside the parameters of questionnaire were also included. The data collected from these sources were analyzed using various tools like percentage analysis, chi-square test, cross table analysis method. Frequencies and cross tabulation have been calculated for the responses of the respondents.
7. Analysis and Interpretation
The General Profile of Respondents can be seen in the TABLE – 77.1 InterpretationFrom the above table, we infer that 192 of the total respondents are male and 296 are female. On further classification according to age group, we find that of all the respondents 54 are less than 28 years, 184 are
Table 8. Price Sensitivityt Impacts Your Product Purchase Yes No
315 173Have You Ever Experienced Instant/Unplanned Impulse Buying In Store?
Yes No260 228
The More Time I Spend Touching The Merchandise, Greater Are My Chances Of Buying
Yes No206 282
Generally You Follow The Displays And Layout To Find A Product
Yes No272 216
Your Nature Is Altruistic Yes No
229 259You Are Conscious Of Youe Self Image Yes No
276 212You Like To Prefer Buying Products From Ethical Compa-nies
Yes No236 252
You Are Materialistic Person Yes No412 76

K. Venkateswara Raju and D. Prasanna Kumar
Vol 9 (35) | September 2016 | www.indjst.org Indian Journal of Science and Technology 11
Table 9. Always Take Time To Consider And Weight All Aspects Before Making Purchase
Yes No276 209
I Make A List When I Go Shopping And Buy Only What Is On The List
Yes No280 208
I Feel A Sense Of Excitement When I Make An Impulse Purchase Yes No255 233
The Music Playing In The Store Affects My Purchase Intention Yes No492 59
If I Like The Fragrance Inside The Store My Chances Of Buying Become Greater
Yes No286 202
I Spend More Time In The Store Looking Around ,If The Ambience And The Merchandise Colors And Arrengement
Yes No333 155
Brand Products Are Available At Affordable Price Yes No251 237
Table 10. When You Enter The Store....
You Go Stright To The Products Which You Want
You Walk Through The Store As It Leads Me
I Do Not Follow Any Pattern.I Just Walk Randomly And Pick Up Products
I Seek The Help Of Salesperson To Navigate In The Store
187 89 136 76How Do You Come To Know About New Product Arrival In The Store?
Through Display Of The Product
Through Announce-men
By Enquring Salesperson
You Will Search By Your Own
135 92 144 117While Shopping,How Do You Come To Know About THE Offers For The Day In The Store?
Sign Boards/Drop Downs
Promo Areas(Melas, Celebrations)
Sales People Pamphlets Announcements In The Store
172 75 114 73 54
Which Of These Is Most Relevant With Regard To Your Shopping?(Aggressive Buy)
I Bought What I Came To Buy .Nothing More.
I Bought A Little More Than What I Came For.
I Bought Lot More Than What I Came For.
I Bought Everything That Attracted Me
I Did Not Find What I Needed.So I Did Not Buy Anything.
97 95 104 111 81
Table 11. If You Have Bought Some Products Other Than What You Came To Buy,Which OF The Following Factors Made You Buy More?(Tick As Many As Applies)
Attractive Display Of The Product
Information Provided By Salesperson
When I See A Good Deal,I Tend To Buy More Then That I Intended To Buy.
135 94 218
Do The Way Of Product Arrangement & Display In The Store Attract You?
Always Mostly Sometimes Rarely Never127 97 139 74 51
Which Factor Influenced You More To Take Instant/Unplanned Buying Decision?
Influence Of Prouduct Arrangement
Influence Of Promotional Signage
Excitement In Trying A New Product
Influence Of Mannequin Display
None
49 202 73 72 92At Which Place You Tend To Do More Impulsive Buying In The Store?
Promo Area(Melas-,Celebrations)
NearBy Cash Counter While Waiting For Payment
None
168 139 181

Vol 9 (35) | September 2016 | www.indjst.org Indian Journal of Science and Technology12
A Study on Impulse Buying Behaviour in the Backdrop of Customer Perception towards Visual Merchandising and Other Service Attributes at Organized Retail Outlets in Hyderabad
Which Of The Following Factors Influence Your Buying Decisions In A Store?
Locatiing Prouducts Through Signs,Graph-ics Etc
Lighting Music Fragrance Colours
116 94 152 89 37What Do You Feel About The Product Arrangement In The Store?
Excellent Very Good Good Average Poor146 137 87 76 42
Table 12. Parameters Hs S Nuetral Ds HdsVisibility Of Display Of Mrp,Discount,Offers 126 79 208 59 16Reception Of Store Personnel Towards You? 129 191 94 54 20Quality Of Survice At Organized Retail Outlets? 87 215 61 74 51Variety In Payment Options Provided? 127 159 78 45 79Service Provided Through Membership Cards? 158 160 58 76 36Visibility Of The Billing Counter? 137 108 153 34 56How Is The Trolley Service? 152 111 158 46 21How Well Is The Product Assortment? 114 132 158 73 11Is The Checkout Time Taken Even? 187 87 145 48 21How Is The Home Delivery Service? 207 93 153 30 5Easiness In Locating The Products At The Store? 84 111 157 126 10Satisfied With Promotional Offers At Store? 83 73 115 104 113Satisfied With The Quality Of Products Available At The Store?
154 155 112 57 12
How Is The Ambience At The Store? 162 142 129 49 6Is The Parking Facility Satisfactory? 164 103 175 35 11Is Shopping At The Store A Pleasant And Pleasurable Experience?
117 113 174 61 23
What Do Feel About Size Of The Store? 202 88 138 44 16How Is The Availability Of Products At The Store? 115 152 65 51 105Visual Display/Presentation Of Products In The Store & Influence On My Buying
97 101 125 86 79
28-45 Years old, 168 are of the age group 46-60, and 82 are of the age group with more than 60 years. From the responses collected for Education 193 Are Diploma, 196 Are Graduation and 99 Are Post Graduation. On the basis of income 41 are earning less than 15000 Rs, 159 are earning 10000-20000, 217 are earning 20000-35000 and 71 are earning more than 35000.When it comes to family members 73 have ONE, 58 have TWO, 186 have THREE, 134 have FOUR and 37 have FIVE AND ABOVE. In terms of AVG MONTHLY PURCHASE 87 of respondents do Below 500, 150 of 501-1500, 162 of 1501-3000, 52 of 3001-5000 and 37 of 5000.
The Various responses of the Customers can be seen in the tables 8-12.
7.2 Chi-Square TestH10: There is no significant relation between the FAMILY MEMBERS OF THE RESPONDENT and his NUMBER OF VISITS TO THE RETAIL STORE.From the CHI-SQUARE Table -13 SPSS calculations we infer there is a significant relation between the FAMILY MEMBERS OF THE RESPONDENT and his NUMBER OF VISITS TO THE RETAIL STORE and thus reject H10
H20: There is no significant relation between NO OF PEOPLE ACCOMPANYING RESPONDENT and IMAGE CONSCIOUSNESS OF RESPONDENT.From the CHI-SQUARE Table -14 SPSS calculations we infer there is no relation between NO OF PEOPLE ACCOMPANYING RESPONDENT and IMAGE

K. Venkateswara Raju and D. Prasanna Kumar
Vol 9 (35) | September 2016 | www.indjst.org Indian Journal of Science and Technology 13
CONSCIOUSNESS OF RESPONDENT and thus accept H20.
H03: There is no significant relation between the SERVICE PROVIDED THROUGH MEMBERSHIP CARDS and QUALITY OF SERVICE AT ORGANIZED RETAIL OUTLETS.From the CHI-SQUARE Table -15 SPSS calculations we infer there is relation between SERVICE PROVIDED THROUGH MEMBERSHIP CARDS and QUALITY OF SERVICE AT ORGANIZED RETAIL OUTLETS and thus reject H30.
H04: There is no significant relation between EDUCATION OF RESPONDENT and HIS WEIGHING ALL ASPECTS BEFORE BUY.From the CHI-SQUARE Table -16 SPSS calculations we infer there is no relation between EDUCATION OF RESPONDENT and HIS WEIGHING ALL ASPECTS BEFORE BUY and thus accept H40.
H05: There is no significant relation between GENDER OF RESPONDENT and AGGRESSIVE BUYING NATURE.From the CHI-SQUARE Table -17 SPSS calculations we infer there is relation between GENDER OF RESPONDENT and AGGRESSIVE BUYING NATURE and thus reject H50.
H06: There is no significant relation between MATERIALISTIC NATURE OF RESPONDENT and EFFECTS OF VISUAL DISPLAY/PRESENTATION ON HIM.From the CHI-SQUARE Table -18 SPSS calculations we infer there is no relation between MATERIALISTIC NATURE OF RESPONDENT and EFFECTS OF VISUAL DISPLAY/PRESENTATION ON HIM and thus accept H60.
H07: There is no significant relation between AGE OF RESPONDENT and HIS PLACE OF IMPULSE BUY.From the CHI-SQUARE Table -19 SPSS calculations we infer there is relation between AGE OF RESPONDENT and HIS PLACE OF IMPULSE BUY and thus reject H70.
H08: There is no significant relation between AVG MONTHLY PURCHASE AT RETAIL STORE and RESPONDENTS HABIT OF PREPARING A LIST AND BUY ACCORDING TO IT .From the CHI-SQUARE Table -20 SPSS calculations we infer there is no relation between AVG MONTHLY PURCHASE AT RETAIL STORE and RESPONDENTS HABIT OF PREPARING A LIST AND BUY ACCORDING TO IT and thus accept H80.
H09: There is no significant relation between SATISFACTION WITH LIFE SCALE OF RESPONDENT and HIM EXPERIENCING IMPULSE BUY.From the CHI-SQUARE Table -21 SPSS calculations we infer there is relation between SATISFACTION WITH LIFE SCALE OF RESPONDENT and HIM EXPERIENCING IMPULSE BUY and thus reject H90.
H10: There is no significant relation between TIME SPENT AT THE STORE BY RESPONDENT and MORE TIME SPENT TOUCHING MERCHANDISE MEANS MORE BUY OUTCOME.From the CHI-SQUARE Table -22 SPSS calculations we infer there is no relation between relation between TIME SPENT AT THE STORE BY RESPONDENT and MORE TIME SPENT TOUCHING MERCHANDISE MEANS MORE BUY OUTCOME and thus reject H100.
H11: There is no significant relation between AFFORDABILITY OF BRAND and RESPONDENT FEELING EXCITED ON IMPULSE PURCHASE.From the CHI-SQUARE Table -23 SPSS calculations we infer there is relation between AFFORDABILITY OF BRAND and RESPONDENT FEELING EXCITED ON IMPULSE PURCHASE and thus reject H110.
Table 13. Test Statistics
Family Membere Of The Responsent
Number Of Visits To The Retail Store
Chi-Square 153.537a 5.721bdf 4 3Asynp.Sig. 0 0.126a.0 Cells (.0%) Have Expected Frequencies Less Than 5.The Minimum Expected Cell Frequency Is 97.6.b.0.Cells (.0%) Have Expected Frequencies Less Then 5.The Minimum Expected Cell Frequency Is 122.0.

Vol 9 (35) | September 2016 | www.indjst.org Indian Journal of Science and Technology14
A Study on Impulse Buying Behaviour in the Backdrop of Customer Perception towards Visual Merchandising and Other Service Attributes at Organized Retail Outlets in Hyderabad
Table 14. Test Statistics
No Of People Accompanying
Respondent
Image Consciousness Of
RespondentChi-Square 240.213a 8.393bdf 3 1Asym.Sig. 0 0.004a.0 Cells (.0%) Have Expected Frequencies Less Than 5.The Mini-mum Expected Cell Frequency Is 122.0.b. 0 Cells (0%) Have Expected Frequencies Less Than 5. The Mini-mum Expexted Cells Frequency Is 277.0.
Table 15. Test Statistics
Service Provided Through
Memembership Card
Quality Of Service At Organized Retail Outlets
Chi-Square 137.000a 184.049adf 4 4Asym.Sig. 0 0.873a.0 Cells (.0%) Have Expeceted Frequencies Less Than 5. The Minimum Expected Cells Frequency Is 97.6.b. 0.Cells (.0%) Have Expected Frequencies Less Than 5. The Minimum Expected Cells Frequency Is 86.7.
Table 16. Test Statistics
Education Of Respondent
Weighing All Aspects Before Buy
Chi-Square 37.406a 10.041bdf 2 1Asymp.Sig. 0 0.002a. 0 Cells (.0%) Have Expected Frequencies Less Than 5.The Minimum Expected Cells Frequency Is 162.7.b. 0 Cells (.0%) Have Expected Frequency Less Than 5.The Minimum Expected Cells Frequency Is 244.0.
Table 17. Test Statistics
Gender Aggressive Buying Nature
Chi-Square 22.164a 5.156bdf 1 4Asym.Sig. 0 0.272a. 0 Cells (.0%) Have Expected Frequencies Less Than 5.The Minimum Expected Cell Frequency Is 244b. 0 Cells (.0%) Have Expexted Frequencies Less Than 5.The Minimum Expected Cell Frequency Is 97.6.
Table 18. Test Statistics
Materialistic Nature
Visual Display/Presentation Of Products In The Store
Chi-Square 231.344a 12.738bdf 1 4Asymp.Sig. 0 0.013a.0 Cells (.0%) Have Expected Frequencies Less Than 5.The Minimum Expected Cells Frequency Is 244.0.b.0 Cells (.0%) Have Expected Frequencies Less Than 5.The Minimum Expected Cells Frequency Is 97.6.
Table 19. Test Statistics
Age Of Respondent His Place Of Impulse Buy
Chi-Square 99.869a 5.684bdf 3 2Asymp.Sig. 0 0.058a. 0 Cells (.0%) Have Expected Frequencies Less Than 5. The Minimum
Expected Cell Frequency Is 122.0.b. 0 Cells (.0%) Have Expected Frequencies Less Than 5. The Minimum
Expected Cell Frequency Is 162.7.
Table 20. Test Statistics
Avg Monthly Purchase At Retail Store
Prepare List And Buy According To It
Chi-Square 130.709a 10.623bdf 4 1
Asymp.sig. 0 0.001a. 0 Cells (.0%) Have Expected Frequencies Less Than 5.The Minimum Expected Cell Frequency Is 97.6b. 0 Cells (.0%) Have Expected Frequencies Less Than 5.The Minimum Expected Cells Frequency Is 244.0.
Table 21. Test Statistics
Satisfaction With Life Scale
Expreiences Imulse Buy
Chi-Square 89.746a 2.098bdf 4 1Asymp.Sig. 0 0.147a. 0 Cells (.0%) Have Expected Frequencies Less Than 5. The Minimum Expected Cell Frequency Is 97.6.b. 0 Cells (.0%) Have Expected Frequencies Less Than 5.The Minimum Expected Cell Frequency Is 244.0.

K. Venkateswara Raju and D. Prasanna Kumar
Vol 9 (35) | September 2016 | www.indjst.org Indian Journal of Science and Technology 15
Table 22. Test Statistics
Time Spent At The Store
More Time Spent Touching Merchandise Means More
BuyChi-Square 142.869a 11.836bdf 3 1Asym.Sig. 0 0.001a. 0 Cells (.0%) Have Expected Frequencies Less Than 5.The Minimum Expected Cell Frequency Is 122.0b. 0 Cells (.0%) Have Expexted Frequencies Less Than 5.The Minimum Expected Cell Frequency Is 244.0
Table 23. Test StatisticsBrand
AffordabilityExcitement On
Impulse PurchaseChi-Square .402a .992adf 1 1Asymp.Sig. 0.526 0.319a. 0 Cells (.0%) Have Expected Frequencies Less Than 5.The Minimum Expected Cell Frequency Is 244.0.
8. Findings
From the Analysis of the results and based on the objectives of the study the Following findings can be ascertained:
260 of the 488 respondents EXPERIENCED INSTANT/UNPLANNED IMPULSE BUYING IN STORE
PRICE SENSITIVITY IMPACTS YOUR PRODUCT PURCHASE of 315 out of the 488 people.
198 of the 488 told that VISUAL DISPLAY/PRESENTATION OF PRODUCTS IN THE STORE & INFLUENCE ON their BUYING DECISION
NEGATIVELY PESSIMISTIC Respondents (91) are more prone to impulse buy and this shows that people tend to buy impulsively to alleviate their negative emotions.
206 respondents told that MORE TIME THEY SPEND TOUCHING THE MERCHANDISE, GREATER ARE THEIR CHANCES OF BUYING
97 customers are influenced in their decision to buy more than what they tend to buy, the Main reasons being attractive product display and good deal/offer with the product.
135 respondents came to know about the new product
arrival through the display of the product, 92 through announcements, 144 by enquiring salesperson and 117 will search by your own.
Of the 488 respondents, 127 preferred to follow the displays and layout to find a product.
When customers enter the store, 187 go straight to the products they want, 92 walk through the store as it leads them, 136 do not follow any pattern, they just walk randomly and pick up products, 76 seek the help of salesperson to navigate in the store.
While shopping for knowing about different offers in the store 172 used sign boards/drop downs, 75 came to know through promo areas (MELAS, CELEBRATIONS), 114 through sales people, 73 through pamphlets and 54 through announcements.
Out of the factors that influenced customers more to take instant/unplanned buying decision 49 responded it as influence of product arrangement, 202 as influence of promotional signage, 73 as excitement in trying a new product, and 72 as influence of mannequin display. So it is stating that the visual merchandising of the stores is good.
139 respondents mentioned nearby cash counter while waiting for payment as the place at which place they tend to do more impulsive buying in the store 168 as promo area (MELAS, CELEBRATIONS).
When asked which of the following factors influence their buying decisions in a store 116 mentioned it as signs, graphics etc, and 94 as lighting, 152 as music, 89 as fragrance, and 37 as colors.
Allowing more FDI in retail will hasten the entry of MNC retailers like WALMART which will bring the latest technology and good retail practices practiced across the world which will benefit both customers and suppliers.
Improvement across the retail supply chain is the need of the day as logistics is the backbone of this industry.
Investments should be made in setting storage plants for storage of vegetable and fruit produce which will reduce wastage.
Organized retail will generate many employment opportunities across various sectors and improve the life standards.
SME sector will be able to export their products to other countries by way of entry of foreign retailers who will try to sell our products in other parts of the globe. Entrepreneurs are likely to benefit by gaining access to these supply chains
Vol 9 (35) | September 2016 | www.indjst.org Indian Journal of Science and Technology16
A Study on Impulse Buying Behaviour in the Backdrop of Customer Perception towards Visual Merchandising and Other Service Attributes at Organized Retail Outlets in Hyderabad
9. Suggestions
We must see that the Focus is on the Merchandise. The aim of the display is to set the scenery and make the products appear relevant to consumer’s needs. Space is an important consideration in visual merchandising. Customers don’t like the feeling of cramped or awkward, especially around the racks. Merchandise that moves will catch the eye, so it is better to have anything that moves – parrot clocks, moving toy and set them neatly. Right choice of colors is vital. Sound will play an important role for creation the right atmosphere for attracting buyers. Display themes to appropriately support the product. Point of Sale materials like signs are necessary to boost messages about the products. Customers are in a hurry. Retailers can use signage as well as displays to showcase departments and product categories as well. Display should complement the retailers other strategies. Setting up the merchandise outside the store, this can create a sense of Excitement and buzz: consider a “Street Fair” environment, with flags and Balloons. Cleanliness is the most important aspect not to be ignored. Change the display settings in frequent intervals. Retailers should plan changing the displays at least weekly. Great merchandising appeals to more than the eyes. Consider how store sounds, smells, and even feels.
10. On a Further Note
There are no real metrics for measuring the effectiveness of Visual merchandising. No accurate way is available to find out what work and what does not. We can just trying out new things. When product promotions are done frequently, putting increased effort on visual merchandising will help us to gauge the response of customers. Periodic monitoring on VM implementations can be a way to determine if the VM efforts are paying off.
11. References1. Currie H. The Simplicity of Visual Merchandizing. 2012;
2–12.2. Rook DW. The Buying Impulse. Journal of Consumer Re-
search. 1987; 14(2):189–99.3. Verplanken B, Herabadi AG, Perry JA, Silvera DH. Con-
sumer style and health: The role of impulsive buying in un-
healthy eating. Psychology and Health. 2005; 20(4):429–41.4. Mick DG, DeMoss M. Further Findings on Self-Gifts: Prod-
ucts, Qualities, and Socioeconomic Correlates. Advances in Consumer Research. 1992; 19:140–6.
5. Baumeister RF. Yielding to Temptation: Self-control failure, impulsive purchasing, and consumer behaviour. Journal of Consumer Research. 2002; 28(4):670–6.
6. Gardner MP, Rook DW. Effects of impulse purchases on consumer’s affective states. Advances in Consumer Re-search. 1988; 15(1):127–30.
7. Diener E, Suh EM, Lucas RE, Smith HL. Subjective Well-Being: Three Decades of Progress. Psychological Bul-letin. 1999; 125(2):276–302.
8. DeNeve KM, Cooper H. The happy personality: A meta analysis of 137 personality traits and subjective well-being. Psychological Bulletin. 1998; 124:197–229.
9. Lucas RE, Diener E, Suh E. Discriminant validity of well-be-ing measures. Journal of Personality and Social Psychology. 1996; 71:616–28.
10. Diener E, Emmons RA, Larsen RJ, Griffin S. The Satisfac-tion With Life Scale. Journal of Personality Assessment. 1985; 49(1):71–5.
11. Pavot W, Diener E, Randall Colvin C, Sandvik E. Further Validation of the Safisfaction with Life Scale: Evidence for the Cross-Method Convergence of Well-Being Measures. Journal of Personality Assessment. 1991; 57(1):149–61.
12. Dunne PM, Lusch RF. Retailing. 6th ed. Mason: Thomson Higher Education, 2008.
13. Pavot W, Diener E. Review of the Satisfaction with Life Scale. Psychological Assessment. 1993; 5:164–72.
14. Zentes J, Morschett D, Schramm-Klein H. Strategic Retail Management, 2007.
15. Agee T, Brett ASM. Planned or Impulse Purchases? How to Create Effective Infomercials. Journal of Advertising Re-search. 2001; 4(6):35–42.
16. Baker J, Grewal D. An experimental approach to making retail store environmental decisions. Journal of Retailing. 1992; 68(4):445–60.
17. Beatty SE, Elizabeth Ferrell M. Impulse buying: Modeling its precursors. Journal of Retailing. 1998; 74(2):169–91.
18. Chen MH. The determinants and traits of Impulsive buying behavior. Journal of Takming University. 2001; 17:59–74.
19. Dickens WT. Crime and Punishment Again: The Econom-ic Approach with a Psychological Twist. Journal of Public Economics. 1986; 30(1):97–107.
20. George A, Nick H. Self-Control in Loewenstein, George & Elster, Jon eds, Choice over Time, Russell Sage Foundation. 1992; 177–209.
21. Graves P. Consumerology: The Market Research Myth, The Truth about Consumers and The Psychology of Shopping, Nicholas Brealey Publishing, 2010.
22. Hair JF, Bush RP, Ortinau DJ. Marketing research: Within a changing information environment, McGraw-Hill. 2003; 22.
23. Hayes N, Joseph S. Big 5 correlates of three measures of

K. Venkateswara Raju and D. Prasanna Kumar
Vol 9 (35) | September 2016 | www.indjst.org Indian Journal of Science and Technology 17
subjective wellbeing. Personality and Individual Differenc-es. 2003; 34(4):723–7.
24. Hoch, Loewenstein. Time-inconsistent Preferences and Consumer Self-Control. Journal of Consumer Research. 1991; 17(4):492–507.
25. Jon E. Ulysses and the Sirens, Cambridge University Press, 1984.
26. Kerfoot S, Davies B, Ward P. Visual Merchandising and the Creation of Discernible Retail Brands. Internation-al Journal of Retail and Distribution Management. 2003; 31(3):143–52.
27. Kollat DT, Willett RP. Consumer impulse purchasing be-haviour. Journal of Marketing Research. 1967; 4(1):21–31.
28. O’Guinn TC, Faber RJ. Compulsive buying: a phenomeno-logical exploration. Journal of Consumer Research. 1989; 16(2):147–57.
29. Shepard. Personal Failures and the Bankruptcy Reform Act of 1978. Journal of Law and Economics. 1984; 27(2):419–37.
30. Silvera DH, Lavack AM, Kropp F. Impulse Buying: The Role of Affect, Social Influence, and Subjective Well-being. Jour-nal of Consumer Marketing. 2015; 25(1):23–33.
31. Silvera DH, Neilands TB, Perry JA. A Norwegian transla-tion of the selfliking and competence scale. Scandinavian Journal of Psychology. 2001; 42(5):417–27.
32. Tafarodi RW, Swann WB. Self-liking and self-competence as dimensions of global self-esteem: initial validation of a measure. Journal of Personality Assessment. 1995; 65(2):322–42.
33. Weun S, Jones MA, Beatty SE. The Development and Vali-dation of the Impulse Buying Tendency Scale. Psychologi-cal Reports. 1998; 82(3):1123–33.
34. Kim Y-B. A Tradeoff between National Income and Region-al Growth: Evidence from the EU. Indian Journal of Science and Technology. 2015 Jan; 8(1).
Copyright © 2022 FDOKUMEN