Core Self-Evaluations, life satisfaction, and sport satisfaction
International Journal of Scientific and Research Publications, Volume 4, Issue 12, December 20141
ISSN 2250-3153
A Study on Customer Satisfaction inAirways - Coimbatore City
R. Rajeswari
Teaching Associate, PSG Institute of Management
Abstract- Air transport being the most andthe quickest mode of transport have beengaining popularity. However, the exorbitantrates have made it the mode of travel ofthe rich or of the business community forwhom time is more expensive than airtravel. The main objective of the study wasto find out the customer satisfaction inairways in various objects like price,quality, services& source of booking.
Index Terms- Airport, Source of Booking,Customer Satisfaction
I. INDIAN AIR TRANSPORT INFRASTRUCTUREndian air transport is one of thefastest developing aviation sectors of
the world. In recent years, Indian airtransport has witnessed a boom which hasgiven rise to the need for improving Indianair transport infrastructure like neverbefore.
I
The reason for that is an upsurge indemand for air travel, much of which owesto the opening of a host of low-costairlines by the private sector.
Airlines in India Kingfisher Airlines, Air India andJet Airways are the most popular brands indomestic air travel in order of theirmarket share. These airlines connect morethan 80 cities across India and alsooperate overseas routes after theliberalization of Indian aviation. However,a large section of country's air transportsystem remains untapped, even though theMumbai-Delhi air corridor was ranked 6th by
the Official Airline Guide in 2007 amongthe world's busiest routes. India's vast unutilized airtransport network has attracted severalinvestments in the Indian air industry inthe past few years. More than half a dozenlow-cost carriers entered the Indian marketin 2004-05. Major new entrants include AirDeccan, Kingfisher Airlines, SpiceJet,GoAir, Paramount Airways and IndiGoAirlines. To meet India's rapidlyincreasing demand for air travel, Air Indiarecently placed orders for more than 68jets from Boeing for 7.5 billion USD whileIndian placed orders for 43 jets fromAirbus for 2.5 billion USD. Jet Airways,India's largest private carrier, hasinvested millions of dollars to increaseits fleet, but this has been put on holddue to the recent economic slowdown. Thistrend is not restricted to traditional aircarriers in India. IndiGo Airlines enteredthe limelight when it announced orders for100 Airbus A320s worth 6 billion USD duringthe Paris Air Show; the highest by anyAsian domestic carrier. Kingfisher Airlinesbecame the first Indian air carrier in June15, 2005 to order Airbus A380 aircraft. Thetotal deal with Airbus was worth 3 billionUSD.
Airports in India Thirty major airports and infiniteair terminal are genuinely trying to makeIndia an easily air accessible place fromseveral years. India is a massive countrywith excellent internal flight routes thatreaches almost every nooks and corner ofthe country. Airport Authority of Indiaadministers all the prominent airports
www.ijsrp.org
International Journal of Scientific and Research Publications, Volume 4, Issue 12, December 20142
ISSN 2250-3153 throughout the country. Airport Authoritywas come into being on 1st April 1995,which comprises of international as well asdomestic airports in India. To acceleratethe integrated progress, extension andmodernization of the amenities of airportthat meets the needs of the internationalstandard is the only objective of theAirport Authority of India (AAI). In the last few decades theinfrastructure of the country has undergonesevere change and development especially inthe civil aviation sector of India. Tomanage the enormous growth in the airlineindustry of India modern airports haveintroduced in all over the country. Thus inthe recent years several investments havebeen made in the air industry to make useof its large unutilized air transportnetwork. Low cost air terminal have alsointroduced in the Indian Market in last fewyears. This creates a boom in the Indianeconomy and thus causes huge benefits inthe tourism industry in India.
II. EXISTING POSITION There are 449 airports/airstrips in
the country. Among these, the AAIowns and manages 5 internationalairports, 87 domestic airports and 28civil enclaves at Defence airfieldsand provides air traffic servicesover the entire Indian airspace andadjoining oceanic areas.
In 1998-99, these 120 airports/civilenclaves handled 4.20 lakh aircraftmovements involving 24.17 milliondomestic and 12.83 millioninternational passengers and 221thousand metric tons of domesticcargo and 468 thousand metric tons ofinternational cargo. 51 percent oftraffic was handled at theinternational airports at Mumbai andDelhi. Presently various airlines areoperating only through 61 airports.The remaining are lying unutilised atbest handling occasional aircraftoperations.
The turnover of the Authority wasRs.1591.27 crores for the year endedMarch, 1999 and under audit figure ofthe Post Tax Profits for the yearended is Rs.208.41 crores as againstRs.196.14 crores for the year endedMarch, 1998.
Historically, air traffic at Indianairports has broadly followed aparticular distribution pattern,except that some airports havechanged their inter-se position vis-a-vis volume of traffic.
Air Traffic Control (ATC) Air traffic control (ATC) involvescommunication with aircraft to helpmaintain separation — that is, they ensurethat aircraft are sufficiently far enoughapart horizontally or vertically for norisk of collision. Controllers may co-ordinate position reports provided bypilots, or in high traffic areas (such asthe United States) they may use radar tosee aircraft positions.
There are generally four different types ofATC:
center controllers, who controlaircraft en route between airports
Control towers (including tower,ground control, clearance delivery,and other services), which controlaircraft within a small distance(typically 10–15 km horizontal, and1,000 m vertical) of an airport.
Oceanic controllers, who controlaircraft over international watersbetween continents, generally withoutradar service.
terminal controllers, who controlaircraft in a wider area (typically50–80 km) around busy airports.
Airports Authority of India The Airports Authority of India(AAI) is an organization working under theMinistry of Civil Aviation that manages allthe airports in India. The AAI manages andoperates 126 airports including 12
www.ijsrp.org
International Journal of Scientific and Research Publications, Volume 4, Issue 12, December 20143
ISSN 2250-3153 international airports, 89 domesticairports and 26 civil enclaves. Thecorporate headquarters(CHQ) are at RajivGandhi Bhawan, Safdarjung Airport, NewDelhi. V.P Agrawal is the current chairmanof the AAI.History The AAI was formed on 1 April 1995by merging the National Airports Authority(NAA) and the International AirportsAuthority of India (IAAI), to create acentralized organization that couldeffectively manage both the internationaland domestic airports. Presently, it isowned 100% by the Government of India.
Main Functions of AAI Control and management of the Indian
airspace extending beyond theterritorial limits of the country, asaccepted by ICAO
Design, Development, Operation andMaintenance of International andDomestic Airports and Civil Enclaves.
Construction, Modification andManagement of Passenger Terminals
Development and Management of CargoTerminals at International andDomestic airports.
Provision of Passenger Facilities andInformation System at the PassengerTerminals at airports.
Expansion and strengthening ofoperation area viz. Runways, Aprons,Taxiway, etc.
Provision of visual aids. Provision of Communication and
Navigational aids viz. ILS, DVOR,DME, Radar, etc.
III. AIRPORT CLASSIFICATIONAirports are presently classified in thefollowing manner:
International Airports: - These aredeclared as international airportsand are available for scheduledinternational operations by Indianand foreign carriers. Presently,Mumbai, Delhi, Chennai, Calcutta and
Thiruvananthapuram are in thiscategory.
Domestic Airports:a) Customs Airports with
limited internationaloperations: - These havecustoms and immigrationfacilities for limitedinternational operations bynational carriers and forforeign tourist and cargocharter flights. Theseinclude Bangalore (CE),Hyderabad, Ahmedabad,Calicut, Goa (CEVaranasi, Patna, Agra (CE),Jaipur, Amritsar,
Tiruchirapally,Coimbatore, Lucknow. (CE - Civil Enclave)
b) Model Airports:- Thesedomestic airports haveminimum runway length of7500 feet and adequateterminal capacity (400passengers or more) tohandle Airbus 320 type ofaircraft. These can cater tolimited internationaltraffic also, if required.These includeBhubaneswar, Guwahati,Nagpur, Vadodara, Imphaland Indore. Rest 6 Nos. ofairports, developed underModel Airports concept havegraduated to theclassification of CustomsAirports, given above.
c) Other Domestic Airports:-All other 71 domesticairports are covered in thiscategory.
d) Civil Enclaves inDefence Airport:- There are 28 civilenclaves in Defence airfields. Twenty civilenclaves are in operation.
Coimbatore Airport
www.ijsrp.org
International Journal of Scientific and Research Publications, Volume 4, Issue 12, December 20144
ISSN 2250-3153 Coimbatore Airport is anaccomplished airport of the city ofCoimbatore and is located in the Peelameduregion of the city. In the earlier years itwas known as the Peelamedu or CoimbatoreCivil Aerodrome and is at a distance of 13Miles (21 kilometers) from the city center.The airport had its commencement in the1940’s in the form of a civil aerodromewith just a few airplanes of the IndianAirlines. From that period for aconsiderable phase the air services wererestricted to the cities of Chennai andMumbai. However, in the later yearsservices to Cochin and Bangalore were alsoadded. The airport in the 80s had athorough transformation when it was closeddown for runway expansion so as to enablemodern day’s jets like Boeing 737 andAirbus to operate. The year 1987 is alandmark in the history of this airportsince on that year the project of runwayexpansion was completed and a new terminalstarted operation. Nowadays, the airport is served by10 airlines and 5 more are likely toinitiate their operations in the comingyears. In the meanwhile, two reputedinternational airlines SilkAir andSriLankan Airlines started operations toCoimbatore, linking Coimbatore withSingapore and Colombo. The other twointernational airlines that are operatingfrom here are Air Arabia and Air India-Express. In the airport there is also arunway that is 10,000 feet in length and itis destined that the final expansion willexpand it to12,500 ft in length. This willbe done to handle wide bodied aircrafts ina better manner. The airport is on the verge ofexpansion and projects are being chalkedout in this direction. The airportauthority is pondering over theconstruction of a parallel taxiway toreduce the runway occupancy time andturnaround of aircraft. In addition, plansfor modernizing the present terminal withall modern facilities are sought after.
History The airport commenced operations in1940 as a civil aerodrome with IndianAirlines operating Fokker F27, Douglas DC-3and later Hawker Siddeley HS 748 aircraft.[6] Beginning with services to Chennai andBangalore, other destinations like Cochinand Mumbai were added later. The airportwas modernized with an extended runway toaccommodate larger aircraft like the Boeing737 and was reopened in 1987. The Sulur AirForce Base located further east ofCoimbatore was temporarily used for civilaviation during this period. As of 2012,the airport is served by more than tendomestic and international carriers. The Prime Minister of India declaredthe government's intention to upgradeCoimbatore Airport to International statusin a meeting with senior ministers on 6June 2012 and the Union Cabinet granted itthe status of international airport onOctober 2, 2012.Infrastructure The airport has one runway that is9,760 feet (2,970 m) in length extendedfrom 8,500 ft (2,600 m) to accommodatelarger aircraft. The runway is furtherslated to be extended to 12,500 feet(3,800 m) to handle wide bodied aircraftsuch as the Airbus A380. New domestic andinternational divisions were added in 2010to the already existing common terminal andan Instrument Landing System (ILS) is inplace since 2008.[9] The airport has aparking management system with a capacityto accommodate nearly 300 cars.[10] Thereare two hangars in the airport; oneprovides housing for the planes ofCoimbatore Flying Club, the other providesshelter for private carriers. Although the status of Internationalairport was conferred only in 2012, theairport has had provisions for, and hasbeen receiving, international flights(primarily from Sharjah) since the 1990sand Silk Air from Singapore Changi airportsince 2006. Srilankan Airlines from Colombooperated for a short period. The servicewas stopped due to security reasons.
www.ijsrp.org

International Journal of Scientific and Research Publications, Volume 4, Issue 12, December 20145
ISSN 2250-3153 FluDudai is planning to start theiroperations in some time Airport Structure The airport has one runway that is9,760 feet (2,970 m) in length - previouslythe runway was 8,500 ft (2,600 m) inlength. Because of this runway expansion,the airport can accommodate aircraft suchas the Boeing 747 and Airbus A330. AnInstrument Landing System (ILS) is alsobeing installed The further proposed expansion ofthe airport includes the construction of aparallel taxiway to the runway. This willminimise the runway occupancy time andturnaround of aircraft, as aircraftcurrently taxi on the runway. Two moreparking bays will be added, raising thetotal number to eight. The terminal willalso be modernized with sliding doors,
aero-bridges, and modern systems forbaggage-handling.
Proposed Expansion The further proposed expansion ofthe airport includes extension of runway to12,500 ft (3,800 m) to accommodate largeraircraft such as the Boeing 747 and AirbusA380 and construction of a parallel taxiwayto the runway to minimize runway occupancytime and turnaround time of aircraft. Twomore parking bays will be added, raisingthe total number of bays to 10.Now theairport can accommodate a330 aircraftthough no airline flys one. The airport isexpected to accommodate a380 and 747 whenexpansion is complete. The airport hasreceived approval for expansion but workhas been postponed due to some localproblems.
Airlines in Coimbatore airport
Airlines DestinationsAir ArabiaAir CostaAir IndiaIndiGoJet KonnectSilkairSpiceJet
Blue Dart AviationYanda Airlines
SharjahBangalore, Hyderabad, Vijayawada, TirupatiDelhi, Kozhikode, MumbaiBhubaneswar, Chennai, Delhi, MumbaiBangalore, Chennai, MumbaiSingaporeAhmedabad, Chennai, Delhi, Hyderabad, MumbaiChennai, DelhiBangkok-Suvamabhumi, Sharjah
Boarding Systems Analytical and simulation resultsshow that group/zone boarding can speed upthe airplane boarding process. Airlines use
a number of different group/zone boardingsystems or boarding rules, the idea (thereare numerous variations) of some of them,are shown below. By pressing play you canview a simulation of different airplaneboarding strategies. Note, random boarding(i.e. boarding all rows at the same time)is faster than back-to-front boarding.Hence, you will actually speed up theboarding process if you board before yourturn in back-to-front boarding.
www.ijsrp.org

International Journal of Scientific and Research Publications, Volume 4, Issue 12, December 20146
ISSN 2250-3153 Airline meal An airline meal or in-flight meal isa meal served to passengers on board acommercial airliner. These meals areprepared by airline catering services.
IV. ENTERTAINMENT Interior modification andrefurbishment work provides an idealopportunity to improve passenger flightenjoyment with an upgrade to yourentertainment systems. With little or noincrease in downtime, we can enhance yourcabin's entertainment system with state-of-the-art CD/DVD players, flat screenmonitors, speakers & headsets, and Airshowmoving maps.
Airline complaints Airline complaints are any type offormal complaint filed by an airlinecustomer either to the airline responsiblefor the grievance or the government officeresponsible for overseeing the airlinesnational industry. Airline complaintsgenerally arise out of problems experiencedduring air travel that were leftunresolved.
Air safety Air safety is a term encompassingthe theory, investigation andcategorization of flight failures, and theprevention of such failures throughregulation, education and training. It canalso be applied in the context of campaignsthat inform the public as to the safety ofair travel.
Some of the air safety topics are:Lighting Ice and snowEngine failureFireBird strikeGround damageHuman factor
Booking of Airline Tickets
Booking airline tickets has becomean art form. One day too late, or choosethe wrong layover, and you're payinghundreds more than you need to. It takes alot of sleuthing and a bit of finesse toget the seat you want, the price you needand the dates you prefer. Here's how to getfrom point A to point B--on your own terms.
Instructions 1] Start your search at least 21days ahead of time to take advantage ofadvance-booking fares. Travel midweek andstay over a Saturday night wheneverpossible. Stay on your toes: The cheapseats always sell out first. 2] Look for flights on yourfrequent-flier carrier first and compareits cheapest rate to those on sites such asPriceline.com, Expedia.com andTravelocity.com. Also check outconsolidators such as AirTravelCenter.comand auction sites. Many airline Web sitesoffer lower Internet-only fares. 3] Consider flying through asecondary airport. Orange County andBurbank are alternatives to LAX, and NewarkInternational can substitute for the busierand oft-delayed JFK or LaGuardia airports.You may have to drive further, but ifflights are impossible to get or impossiblyexpensive, you might be surprised by theease of use and friendlier prices ofsmaller airports. 4] Request your seat preference(aisle or window) when buying your ticket.You could find yourself with a middle seatif you wait until check-in. SeatGuru.comhas detailed maps of the best and worstseats on specific planes, so you can avoidseats that don't recline and keep an eyeout for those with extra leg room. 5] Request any special assistanceor equipment (such as a wheelchair) fordisabled travelers prior to arriving at theairport. 6] Keep the length of the flight,the layovers, the amount of gear you'recarrying and the time of day in mind whendeciding whether to buy a seat (often
www.ijsrp.org
International Journal of Scientific and Research Publications, Volume 4, Issue 12, December 20147
ISSN 2250-3153 discounted) for an infant. Domesticcarriers permit you to hold children under2 years of age on your lap, whileinternational flights require a ticket anda seat for every passenger. 7] Place special meal orders at noextra charge, if they are offered on yourflight. For example, United offersdiabetic, low fat and low cholesterol, low-calorie, high-fiber, low-protein, low-sodium, kosher and vegan meals. There arealso meals for children. These specialmeals are often tastier than the regularfare. 8] Find out whether tickets arerefundable, transferable or changeable (andat what cost) before you buy. Get e-ticketswhen possible. Having paper tickets mailedusually involves an extra fee, and they'relike cash: If you lose them, they're gone.
V. REVIEW OF LITERATURE Vasu Krishnasami on 6 may 2006 thereview of Coimbatore airport is tiny! Toomany passengers use this airport. Thepotential of this City is enormous!Government needs to show some care forCoimbatore. Sharon Wilson on 28 April 2006Contrary to what I had expected to find ata small, domestic airport, the terminal wasbeautifully clean well laid out with thebenefit of some shops, friendly staff whohelped us through the security and check-in process. Ladies toilets (both Indian andWestern style) were acceptably clean. A/Cwas okay if you were standing under it. Iwould have no hesitation in travellingthrough this airport again on future visitsto India. Well done to those who maintainthe Airport - keep up the good work. Coimbatore airport expansion to takeoff soon By V.S. Palaniappan in his reviewCoimbatore Aug. 20. With the districtadministration gearing for the landacquisition process, the much-awaitedexpansion of the Coimbatore Airport atPeelamedu is set to take off shortly. Thepreliminary work of land acquisition for
airport expansion might get under waybefore September-end. The Collector, N. Muruganandam, saidan exclusive revenue team would be formedto acquire almost 114 acres most of whichare private ``patta lands'' lyingcontiguous to the airport. The administrative sanction whichthe district administration had sought fromthe State Government for setting up a teamfor acquisition is expected any time withina month. On obtaining it, the landacquisition process would get under way, hesaid. The entire exercise might take aminimum of six months to a year. The cost involved had been put atRs. 3.72 crores and the Airports Authorityof India had already given an assurancethat it would deposit the money with theGovernment the moment acquisition processbegins, the Airport Director, N.K. Sinha,told The Hindu. The AAI had been keenly pushingthrough the land acquisition process as therunway expansion and widening would be apre-requisite for enhancing the airport'scapacity in terms of passenger flow andcargo handling. The main constraint in increasingthe passenger/cargo capacity was the lengthof the runway. The present 7500 feet runway isinadequate to operate bigger and wider-bodied aircraft especially the higherversion of the Boeing or Jet aircraft. Bigger runways are a must for theAirbus 300 type of aircraft. The runway length had to beincreased to 9000 feet and correspondingstrengthening needed to make it suitable totake on higher aircraft load. The trade and industry in theCoimbatore region has been seekingexpansion for handling future increase inpassenger as well as cargo trafficconsidering the growing business potentialincluding the export/import of cargo to andfrom Coimbatore.
www.ijsrp.org
International Journal of Scientific and Research Publications, Volume 4, Issue 12, December 20148
ISSN 2250-3153 The airport authorities view thatlack of infrastructure in general andinadequate runway in particular at airportsin a way responsible for the limitedfreight operation. The AAI's renewed effort on runwayexpansion got a fillip after the visit bythe Parliamentary Consultative Committee onCivil Aviation to the Coimbatore airportrecently. Once the expansion work iscompleted, the AAI would be in a positionto lure various airliners to operateinternational flights from Coimbatore,which again depended largely on thepassenger traffic potential that Coimbatorecould generate, AAI officials pointed out.
Sujay Mehdudia in his review, a newintegrated terminal building was beingconstructed at the Madurai airport and theCoimbatore airport terminal building wouldbe expanded by May 2010. A master plan for upgrading theTuticorin airport in phases had beenprepared and the Tamil Nadu governmentasked to provide 586 acres of land free andwithout encumbrances to the AirportsAuthority of India, he said.
VI. RESEARCH METHODOLOGYSCOPE OF THE STUDY: The project aims to study thecustomer’s satisfaction level in airways invarious objects. For this purpose primarydata were collected by questionnairemethod.
OBJECTIVE OF THE STUDY:
To study about the consumers opinionon price, quality, services & sourcesof booking.
To study the consumers level ofsatisfaction towards various factorsof airline services.
To study the effectiveness of quality& service of the airlines.
To study the consumers satisfactionlevel in the boarding efficiency &baggage delivery timings.
To study the consumers satisfactionin overall courteous & helpfulness.
LIMITATIONS: This study covers only the customers
who travel in the air, sample of 75was selected together.
As the questionnaire method was usedthe analysis was carried out based onthe information provided by therespondents.
TOOLS USED: The following tools are used toanalyse the data for the various objectiveof the study.
Percentage analysis
Chi-square test
Rank analysis
PERCENTAGE ANALYSIS In this section different tableformed for all the data available from thissample. Further interpretation is given forthe entries given in table. This analysishelps a common man to understand, whatpercentage of respondents belongs to eachcategory. Also by giving information interm of percentage we use thestandardization. The results are given oneafter another.
CHI-SQUARE ANALYSIS This chi-square test is the study offinding whether any one factors hasassociation with other. The chi-squaretests were carried out at 5% levelsignificance. Under the hypothesis of
www.ijsrp.org
International Journal of Scientific and Research Publications, Volume 4, Issue 12, December 20149
ISSN 2250-3153 independent of attributes the expectedfrequencies for any of the frequencies canbe obtained on modifying in the dividingthe product by the total frequency N. Chi-square formulae, which is usedin this study is given below.
i
ii
EEO 2
2 )(
If p value is less than the αvalue , the Null hypothesis may berejected.
VII. ANALYSIS AND INTERPRETATION
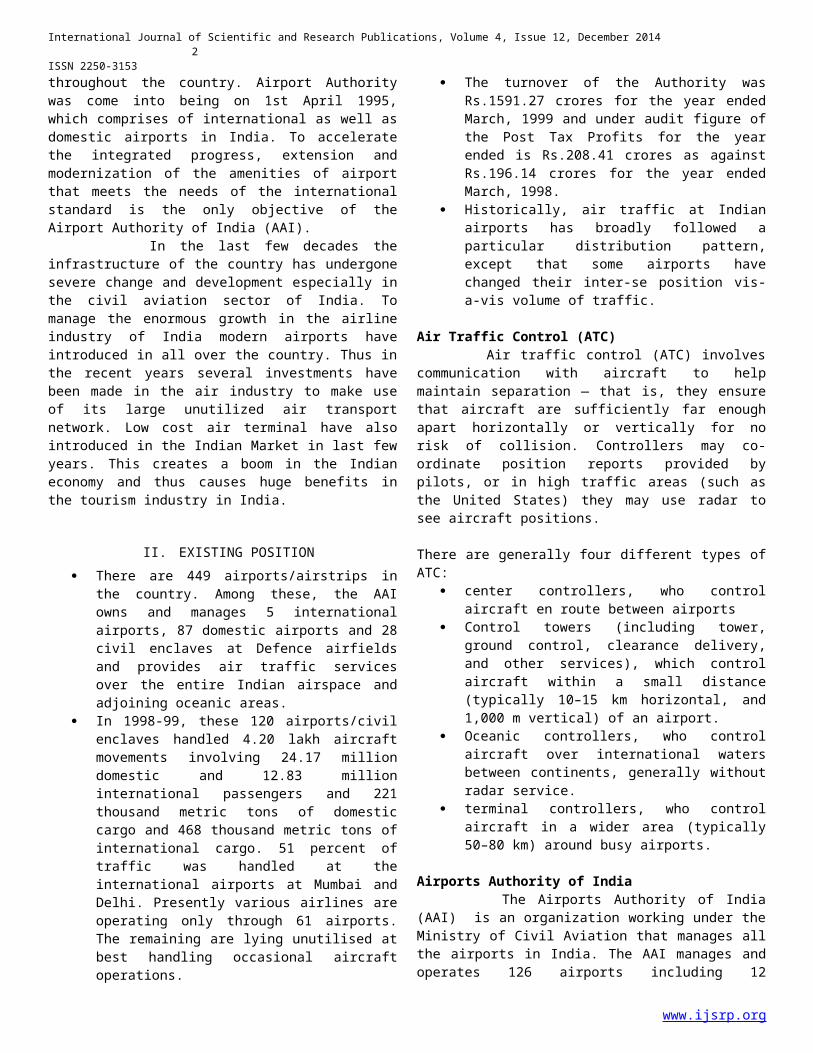
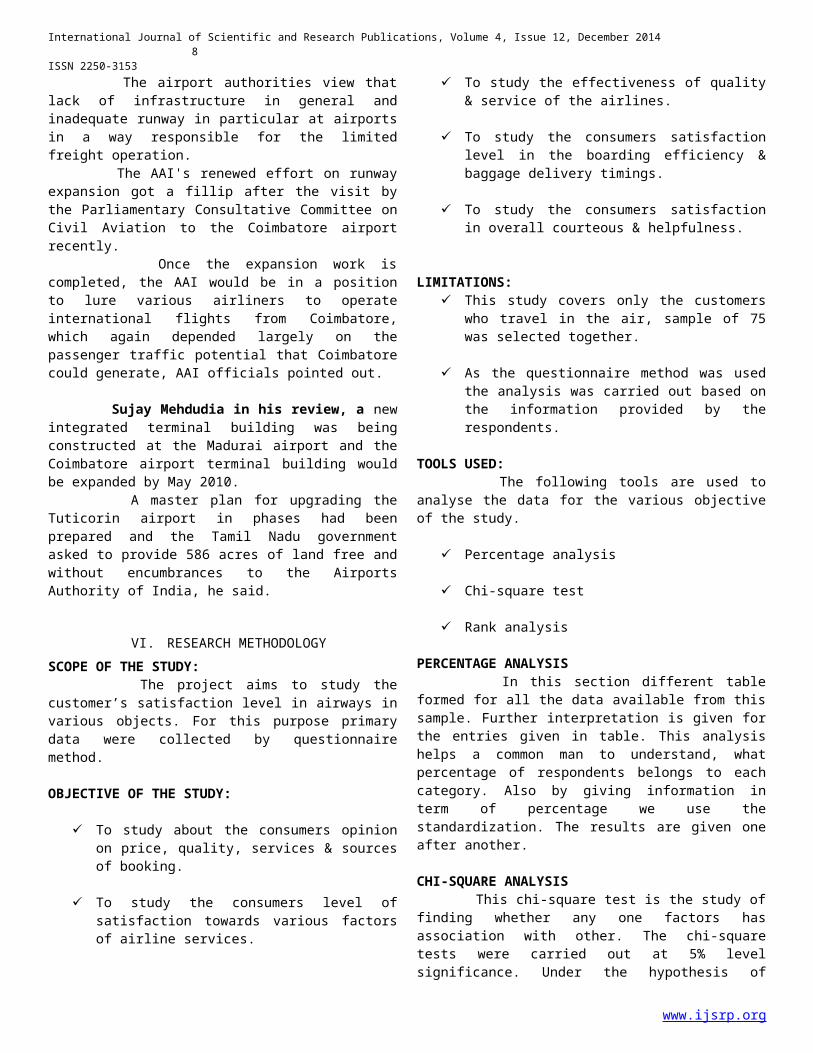
TABLE NO:1 The following table shows the gender details for 75 respondents.
gender
41 54.734 45.375 100.0
malefemaleTotal
ValidFrequency Percent
The above table shows that 54.7% of the respondents are males, 45.3% of therespondents are females.The majority of the respondents are males.
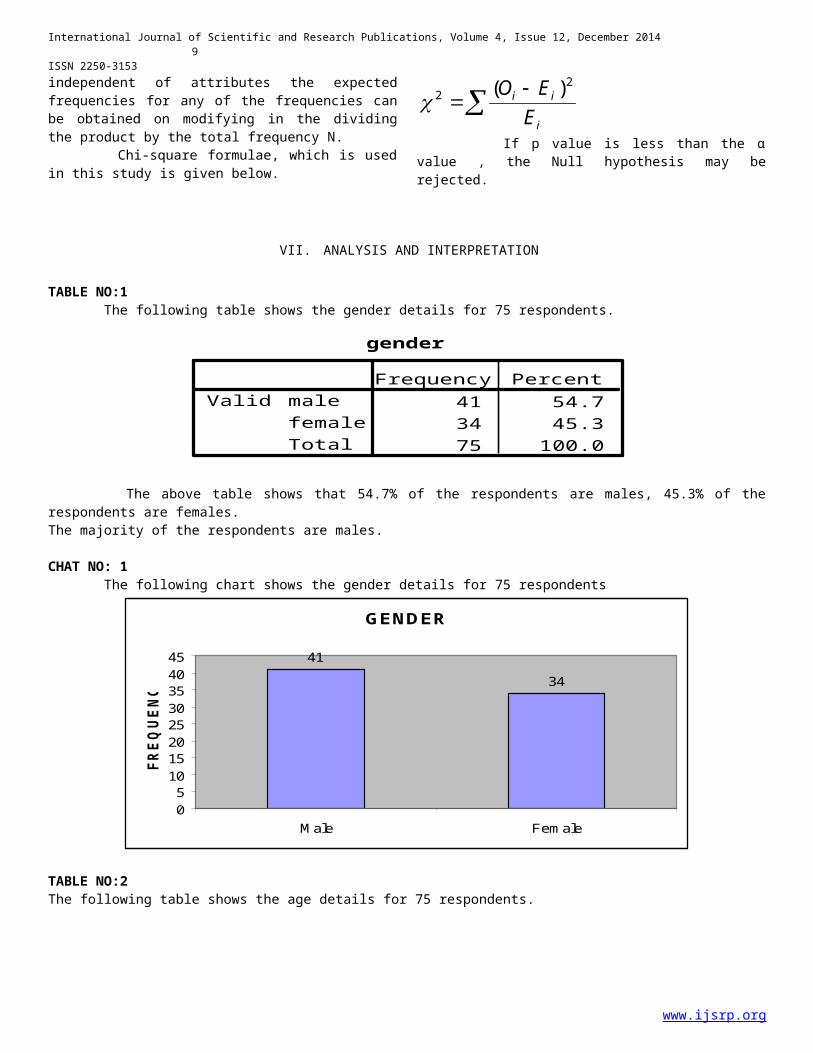
CHAT NO: 1 The following chart shows the gender details for 75 respondents
GENDER
4134
051015202530354045
M ale Fem ale
FREQ
UENC
Y
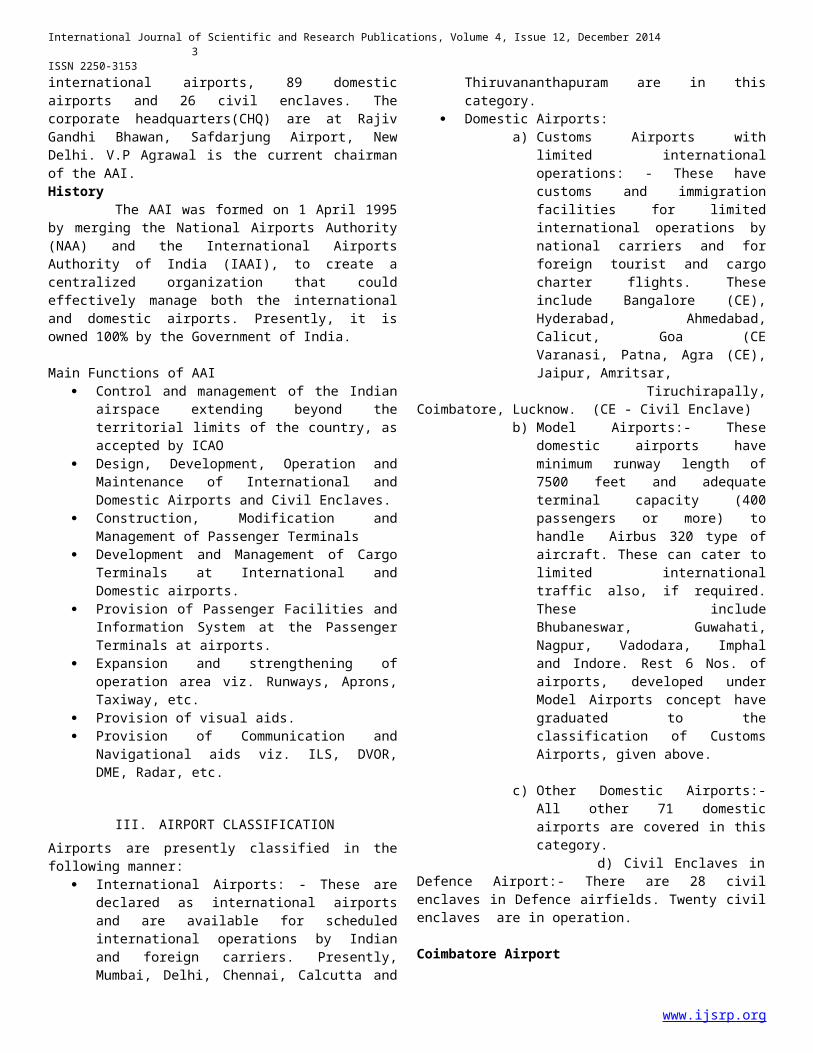
TABLE NO:2The following table shows the age details for 75 respondents.
www.ijsrp.org
International Journal of Scientific and Research Publications, Volume 4, Issue 12, December 201410
ISSN 2250-3153
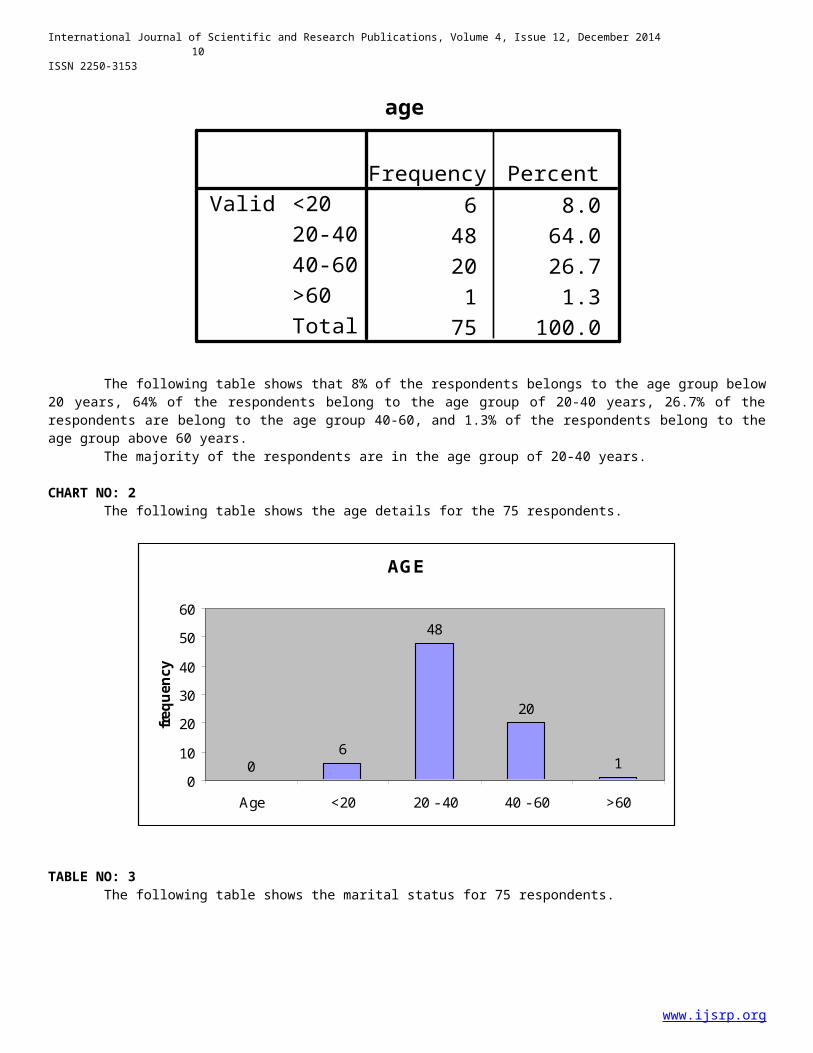
age
6 8.048 64.020 26.71 1.3
75 100.0
<2020-4040-60>60Total
ValidFrequency Percent
The following table shows that 8% of the respondents belongs to the age group below20 years, 64% of the respondents belong to the age group of 20-40 years, 26.7% of therespondents are belong to the age group 40-60, and 1.3% of the respondents belong to theage group above 60 years. The majority of the respondents are in the age group of 20-40 years.
CHART NO: 2 The following table shows the age details for the 75 respondents.
AGE
06
48
20
1010
203040
5060
Age <20 20 - 40 40 - 60 >60
frequ
ency
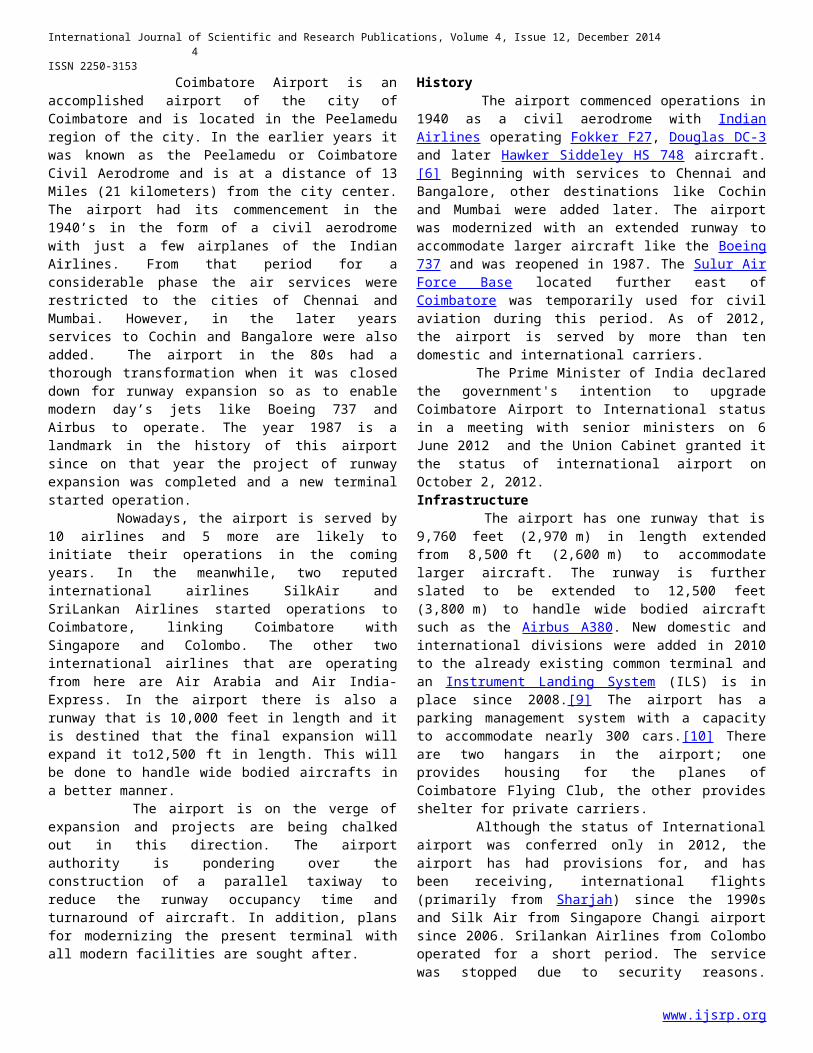
TABLE NO: 3 The following table shows the marital status for 75 respondents.
www.ijsrp.org
International Journal of Scientific and Research Publications, Volume 4, Issue 12, December 201411
ISSN 2250-3153
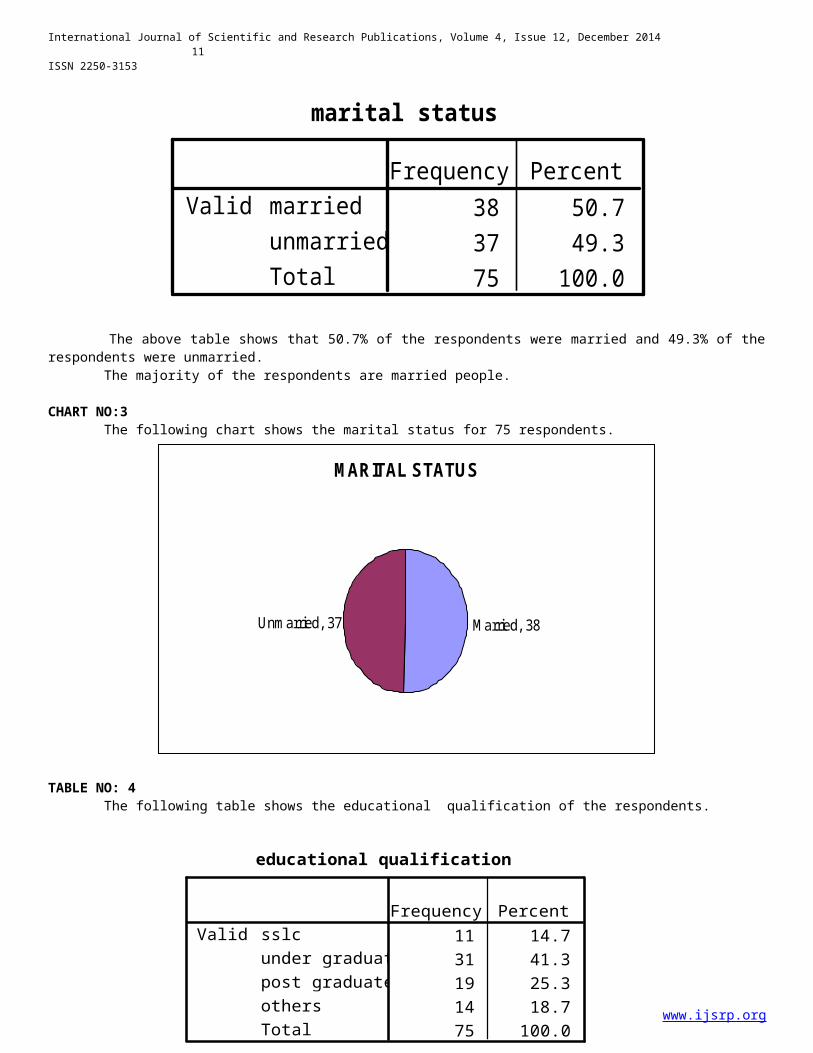
marital status
38 50.737 49.375 100.0
marriedunmarriedTotal
ValidFrequency Percent
The above table shows that 50.7% of the respondents were married and 49.3% of therespondents were unmarried. The majority of the respondents are married people.
CHART NO:3 The following chart shows the marital status for 75 respondents.
M ARITAL STATUS
M arried, 38Unm arried, 37
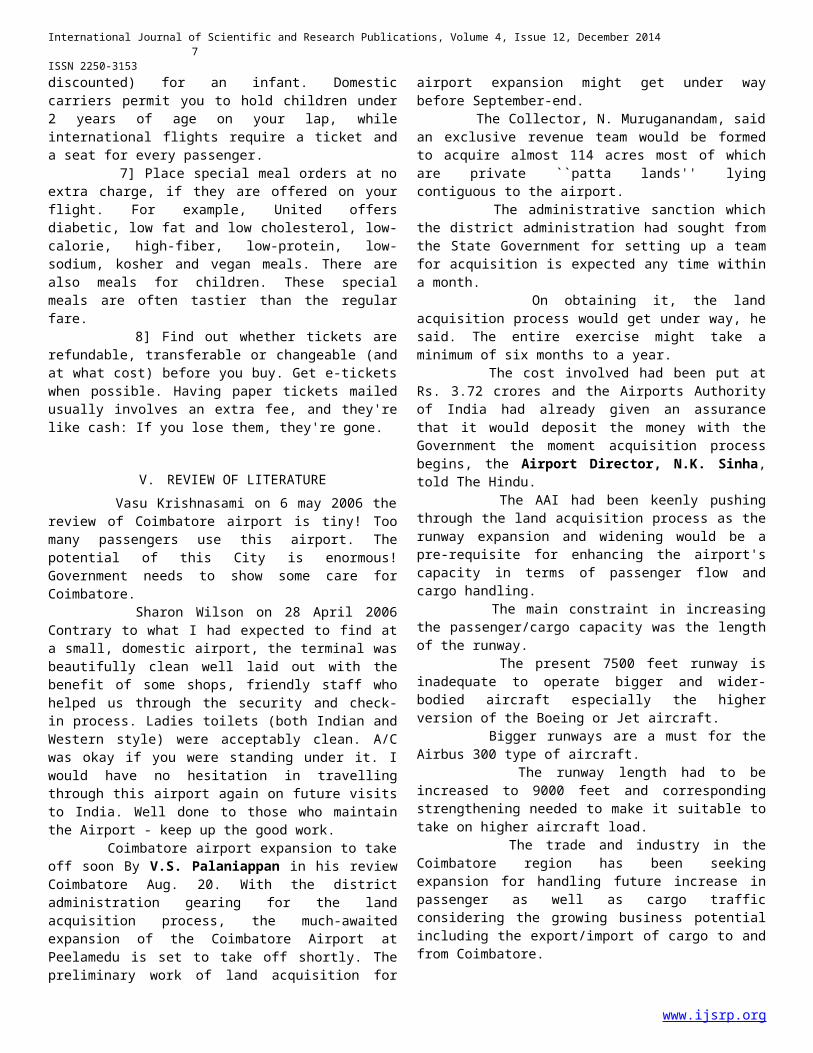
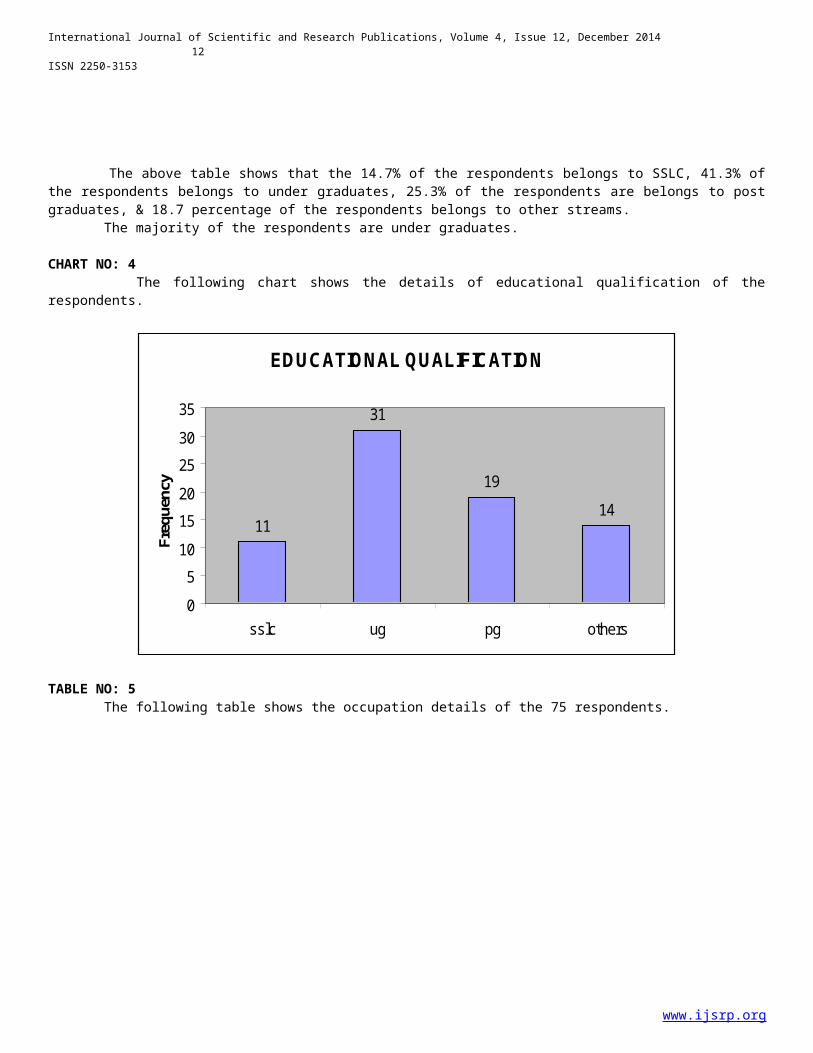
TABLE NO: 4 The following table shows the educational qualification of the respondents.
www.ijsrp.org
educational qualification
11 14.731 41.319 25.314 18.775 100.0
sslcunder graduatepost graduateothersTotal
ValidFrequency Percent
International Journal of Scientific and Research Publications, Volume 4, Issue 12, December 201412
ISSN 2250-3153
The above table shows that the 14.7% of the respondents belongs to SSLC, 41.3% ofthe respondents belongs to under graduates, 25.3% of the respondents are belongs to postgraduates, & 18.7 percentage of the respondents belongs to other streams. The majority of the respondents are under graduates.
CHART NO: 4 The following chart shows the details of educational qualification of therespondents.
EDUCATIONAL QUALIFICATION
11
31
1914
05101520253035
sslc ug pg others
Frequency
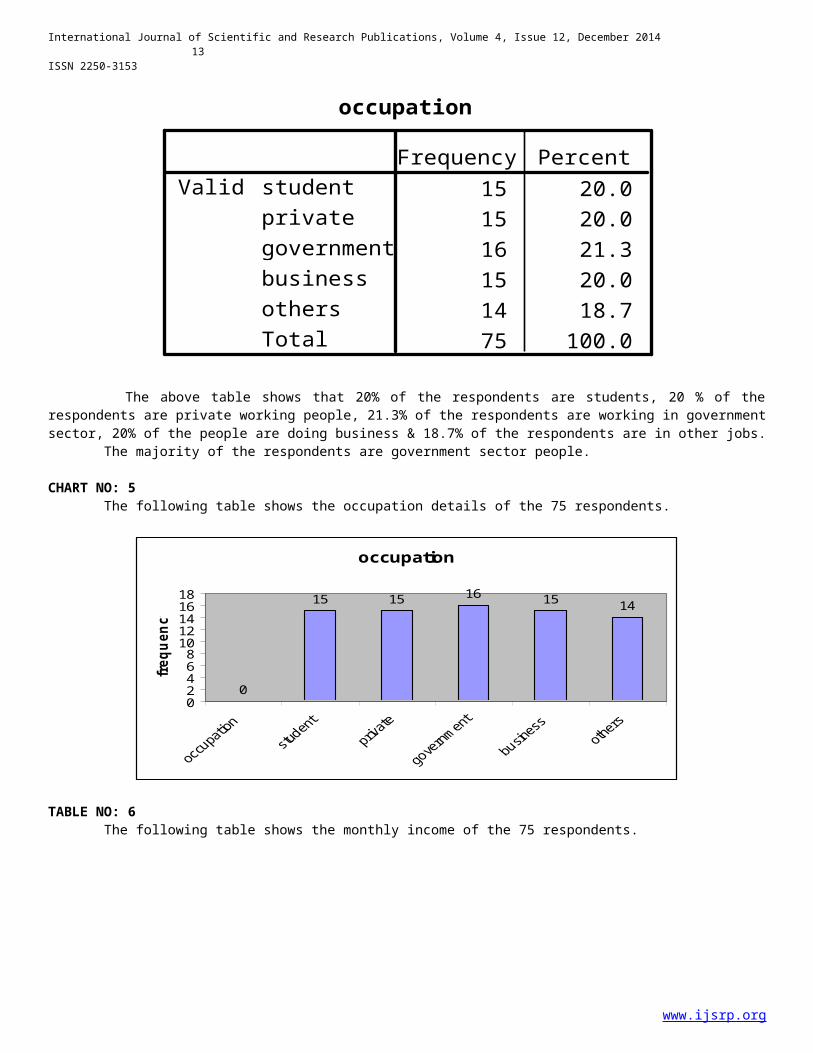
TABLE NO: 5 The following table shows the occupation details of the 75 respondents.
www.ijsrp.org
International Journal of Scientific and Research Publications, Volume 4, Issue 12, December 201413
ISSN 2250-3153
occupation
15 20.015 20.016 21.315 20.014 18.775 100.0
studentprivategovernmentbusinessothersTotal
ValidFrequency Percent
The above table shows that 20% of the respondents are students, 20 % of therespondents are private working people, 21.3% of the respondents are working in governmentsector, 20% of the people are doing business & 18.7% of the respondents are in other jobs. The majority of the respondents are government sector people.
CHART NO: 5 The following table shows the occupation details of the 75 respondents.
occupation
0
15 15 16 15 14
024681012141618
frequ
ency
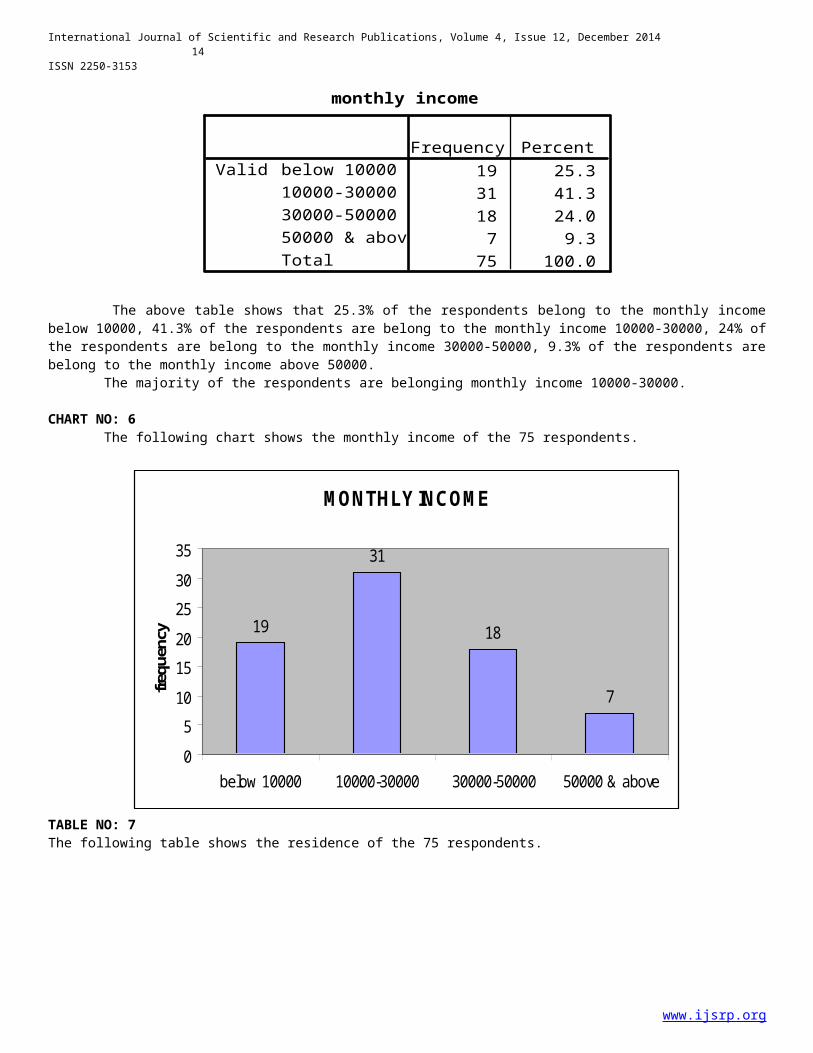
TABLE NO: 6 The following table shows the monthly income of the 75 respondents.
www.ijsrp.org
International Journal of Scientific and Research Publications, Volume 4, Issue 12, December 201414
ISSN 2250-3153
monthly income
19 25.331 41.318 24.07 9.3
75 100.0
below 1000010000-3000030000-5000050000 & aboveTotal
ValidFrequency Percent
The above table shows that 25.3% of the respondents belong to the monthly incomebelow 10000, 41.3% of the respondents are belong to the monthly income 10000-30000, 24% ofthe respondents are belong to the monthly income 30000-50000, 9.3% of the respondents arebelong to the monthly income above 50000. The majority of the respondents are belonging monthly income 10000-30000.
CHART NO: 6 The following chart shows the monthly income of the 75 respondents.
M ONTHLY INCOM E
19
31
18
7
05101520253035
below 10000 10000-30000 30000-50000 50000 & above
frequency
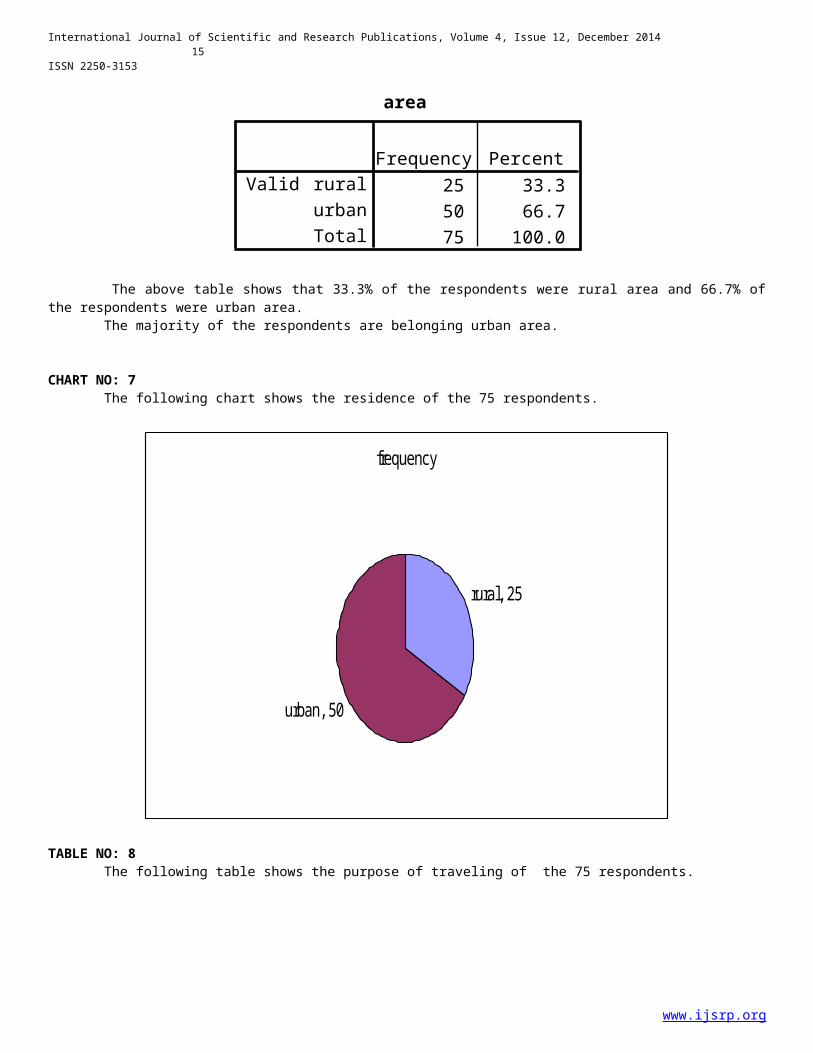
TABLE NO: 7The following table shows the residence of the 75 respondents.
www.ijsrp.org
International Journal of Scientific and Research Publications, Volume 4, Issue 12, December 201415
ISSN 2250-3153
area
25 33.350 66.775 100.0
ruralurbanTotal
ValidFrequency Percent
The above table shows that 33.3% of the respondents were rural area and 66.7% ofthe respondents were urban area. The majority of the respondents are belonging urban area.
CHART NO: 7 The following chart shows the residence of the 75 respondents.
frequency
rural, 25
urban, 50
TABLE NO: 8 The following table shows the purpose of traveling of the 75 respondents.
www.ijsrp.org

International Journal of Scientific and Research Publications, Volume 4, Issue 12, December 201416
ISSN 2250-3153
purpose of travelling
16 21.330 40.016 21.313 17.375 100.0
businesspersonal/vocationeduationothersTotal
ValidFrequency Percent
The above table shows that 21.3% of the respondents are travelling for the purposeof business, 40% of the respondents are travelling for the purpose of personal/vocation21.3% of the respondents are travelling for the purpose of education and 13% of therespondents are traveling for other purposes . The majority of the respondents are travelling for the purpose ofpersonal/vocation.
CHART NO: 8 The following chart shows the purpose of traveling of the 75 respondents.
PURPOSE OF TRAVELLING
business, 16
personal/vocation, 30
education, 16
others, 13
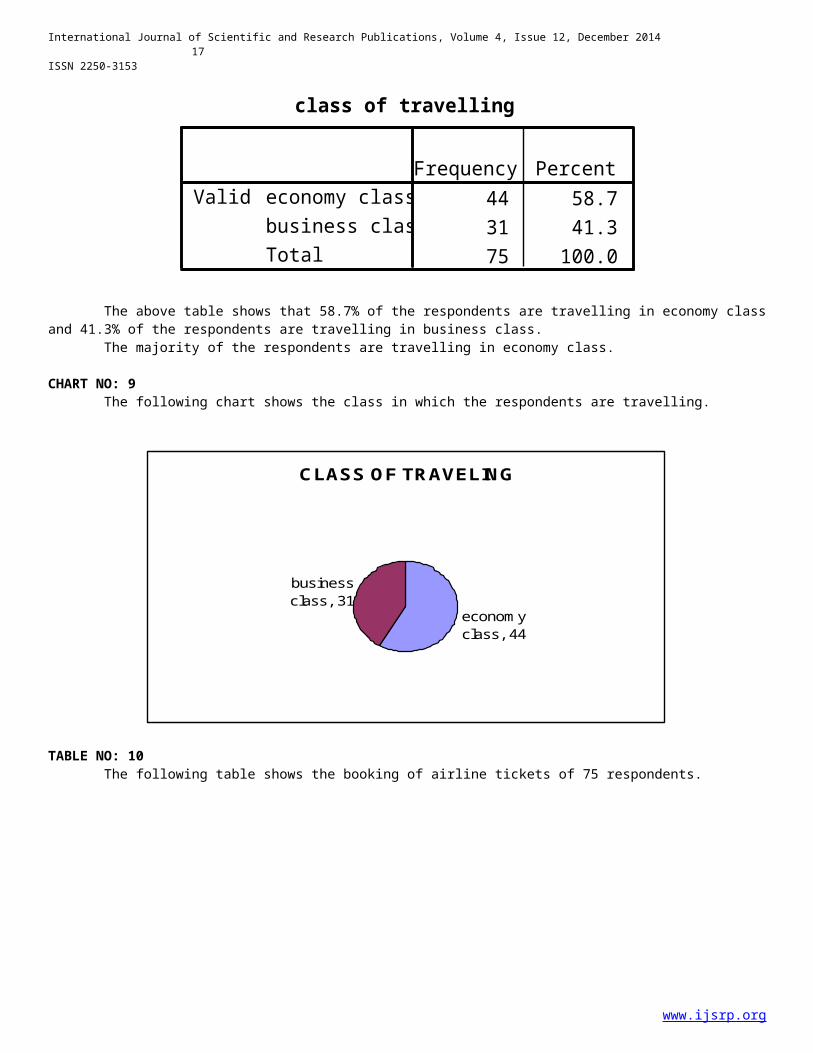
TABLE NO: 9 The following table shows the class in which the respondents are travelling.
www.ijsrp.org
International Journal of Scientific and Research Publications, Volume 4, Issue 12, December 201417
ISSN 2250-3153
class of travelling
44 58.731 41.375 100.0
economy classbusiness classTotal
ValidFrequency Percent
The above table shows that 58.7% of the respondents are travelling in economy classand 41.3% of the respondents are travelling in business class. The majority of the respondents are travelling in economy class.
CHART NO: 9 The following chart shows the class in which the respondents are travelling.
CLASS OF TRAVELING
econom y class, 44
business class, 31
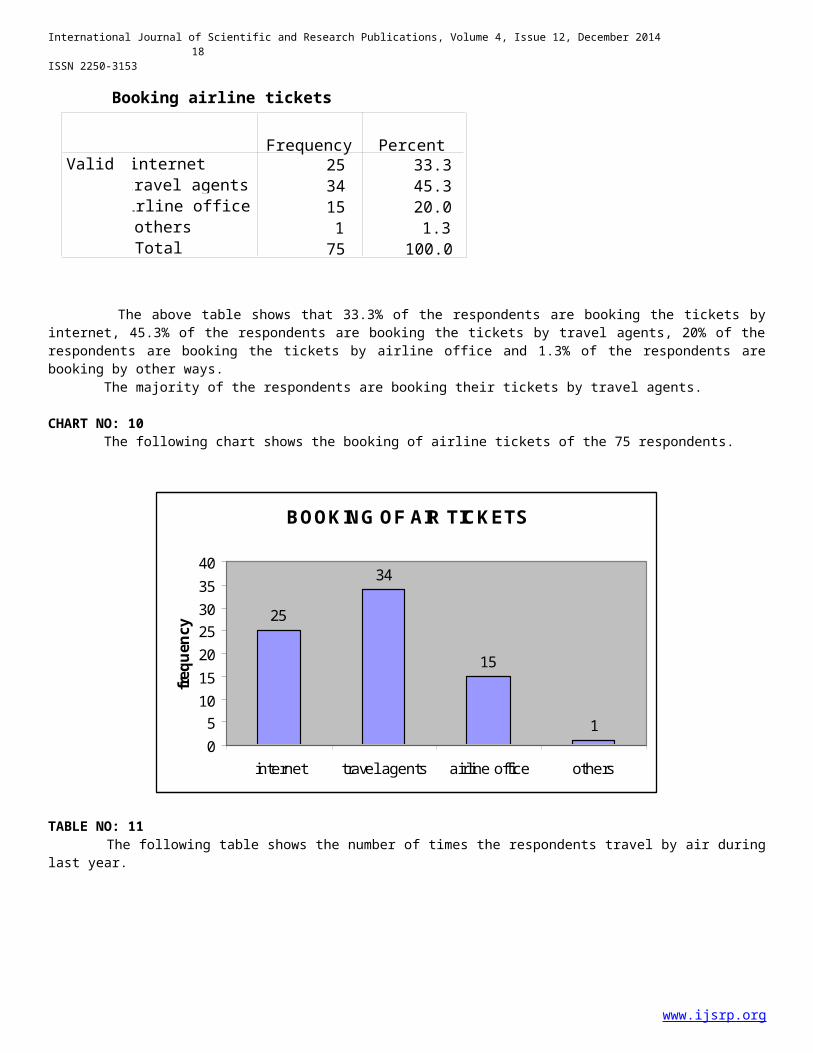
TABLE NO: 10 The following table shows the booking of airline tickets of 75 respondents.
www.ijsrp.org
International Journal of Scientific and Research Publications, Volume 4, Issue 12, December 201418
ISSN 2250-3153
The above table shows that 33.3% of the respondents are booking the tickets byinternet, 45.3% of the respondents are booking the tickets by travel agents, 20% of therespondents are booking the tickets by airline office and 1.3% of the respondents arebooking by other ways. The majority of the respondents are booking their tickets by travel agents.
CHART NO: 10 The following chart shows the booking of airline tickets of the 75 respondents.
BOOKING OF AIR TICKETS
25
34
15
10510152025303540
internet travel agents airline office others
frequ
ency
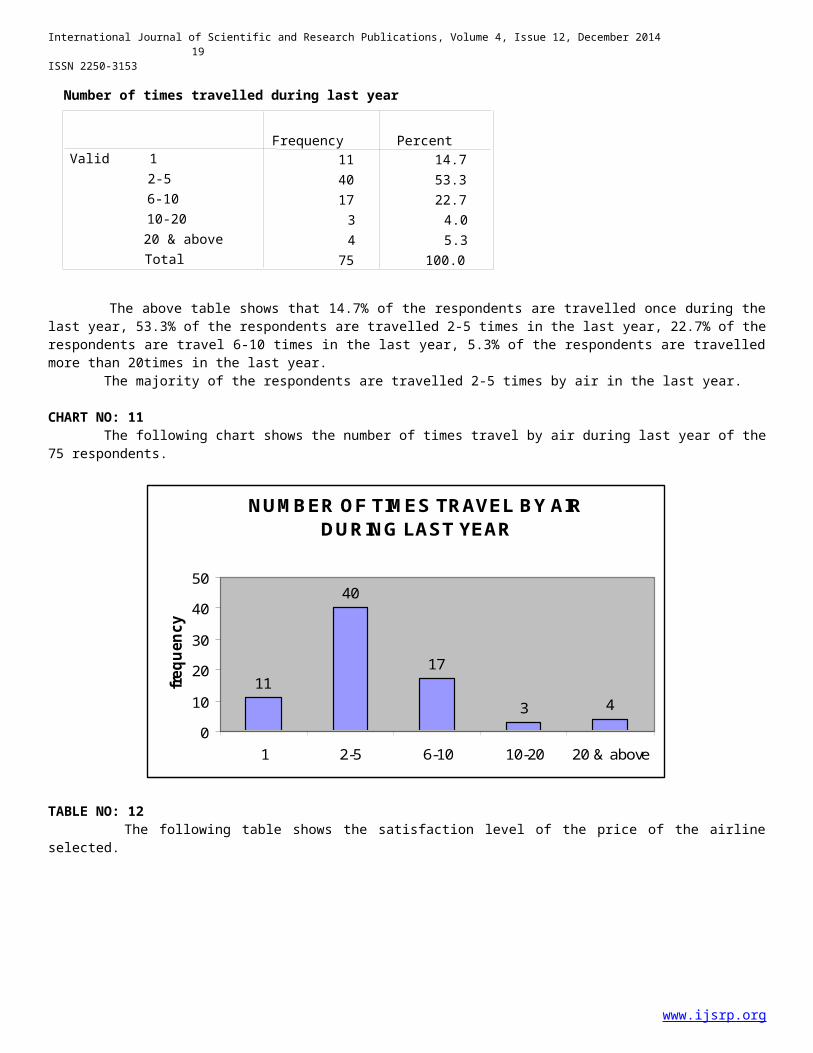
TABLE NO: 11 The following table shows the number of times the respondents travel by air duringlast year.
www.ijsrp.org
Booking airline tickets
25 33.334 45.315 20.01 1.375 100.0
internettravel agentsairline officeothersTotal
ValidFrequency Percent
International Journal of Scientific and Research Publications, Volume 4, Issue 12, December 201419
ISSN 2250-3153
The above table shows that 14.7% of the respondents are travelled once during thelast year, 53.3% of the respondents are travelled 2-5 times in the last year, 22.7% of therespondents are travel 6-10 times in the last year, 5.3% of the respondents are travelledmore than 20times in the last year. The majority of the respondents are travelled 2-5 times by air in the last year.
CHART NO: 11 The following chart shows the number of times travel by air during last year of the75 respondents.
NUM BER OF TIM ES TRAVEL BY AIR DURING LAST YEAR
11
40
17
3 40
10
20
30
40
50
1 2-5 6-10 10-20 20 & above
frequ
ency
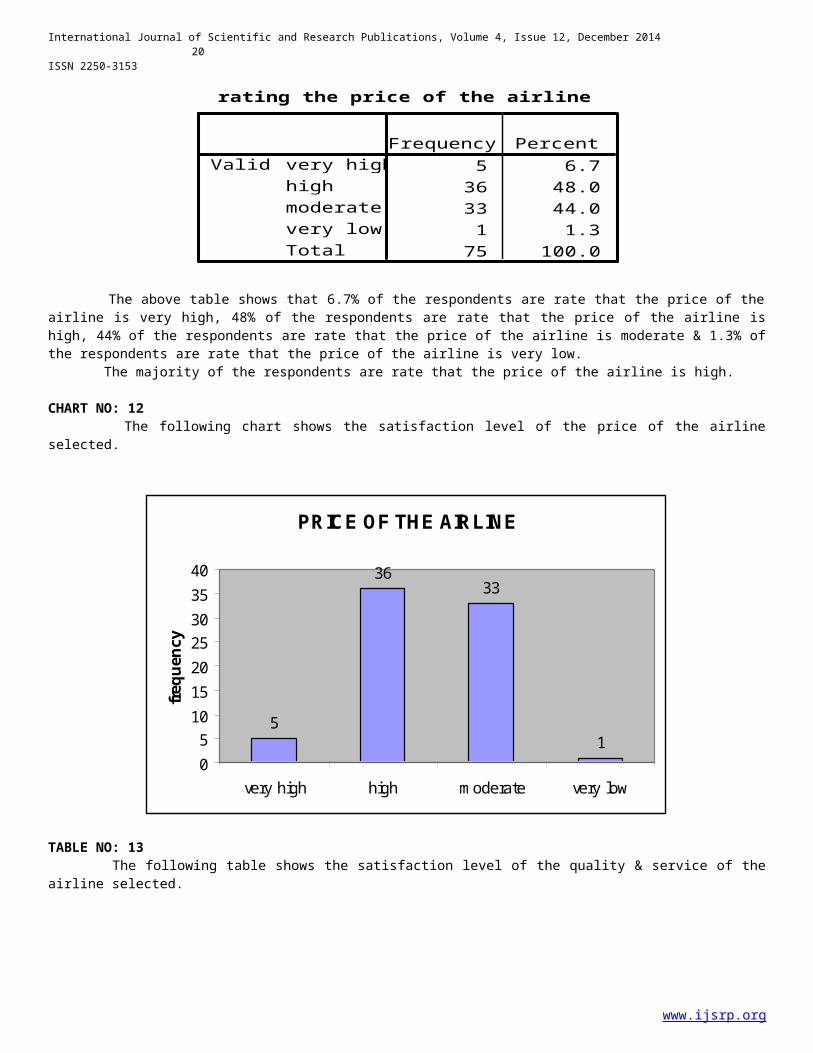
TABLE NO: 12 The following table shows the satisfaction level of the price of the airlineselected.
www.ijsrp.org
Number of times travelled during last year
11 14.740 53.317 22.73 4.04 5.3
75 100.0
12-56-1010-2020 & aboveTotal
ValidFrequency Percent
International Journal of Scientific and Research Publications, Volume 4, Issue 12, December 201420
ISSN 2250-3153
rating the price of the airline
5 6.736 48.033 44.01 1.3
75 100.0
very highhighmoderatevery lowTotal
ValidFrequency Percent
The above table shows that 6.7% of the respondents are rate that the price of theairline is very high, 48% of the respondents are rate that the price of the airline ishigh, 44% of the respondents are rate that the price of the airline is moderate & 1.3% ofthe respondents are rate that the price of the airline is very low. The majority of the respondents are rate that the price of the airline is high.
CHART NO: 12 The following chart shows the satisfaction level of the price of the airlineselected.
PRICE OF THE AIRLINE
5
3633
10510152025303540
very high high m oderate very low
frequ
ency
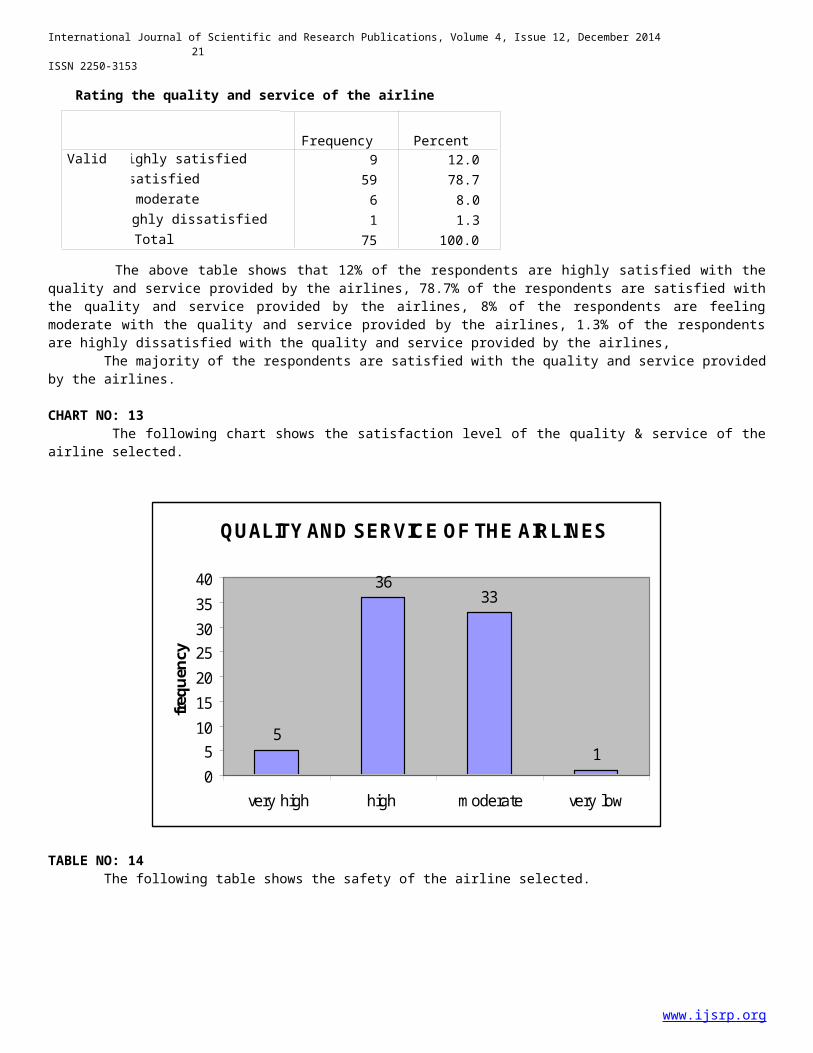
TABLE NO: 13 The following table shows the satisfaction level of the quality & service of theairline selected.
www.ijsrp.org
International Journal of Scientific and Research Publications, Volume 4, Issue 12, December 201421
ISSN 2250-3153
The above table shows that 12% of the respondents are highly satisfied with thequality and service provided by the airlines, 78.7% of the respondents are satisfied withthe quality and service provided by the airlines, 8% of the respondents are feelingmoderate with the quality and service provided by the airlines, 1.3% of the respondentsare highly dissatisfied with the quality and service provided by the airlines, The majority of the respondents are satisfied with the quality and service providedby the airlines.
CHART NO: 13 The following chart shows the satisfaction level of the quality & service of theairline selected.
QUALITY AND SERVICE OF THE AIRLINES
5
3633
10510152025303540
very high high m oderate very low
frequency
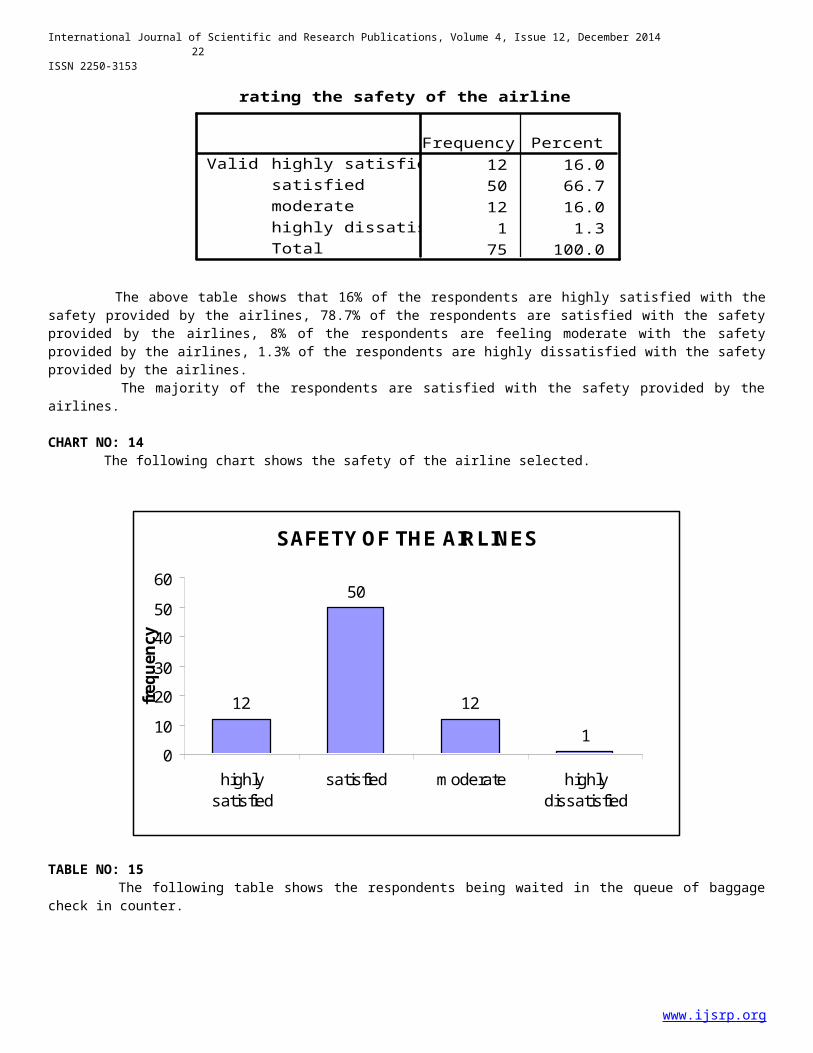
TABLE NO: 14 The following table shows the safety of the airline selected.
www.ijsrp.org
Rating the quality and service of the airline
9 12.059 78.76 8.01 1.3
75 100.0
highly satisfiedsatisfiedmoderate
highly dissatisfiedTotal
ValidFrequency Percent
International Journal of Scientific and Research Publications, Volume 4, Issue 12, December 201422
ISSN 2250-3153
rating the safety of the airline
12 16.050 66.712 16.01 1.3
75 100.0
highly satisfiedsatisfiedmoderatehighly dissatisfiedTotal
ValidFrequency Percent
The above table shows that 16% of the respondents are highly satisfied with thesafety provided by the airlines, 78.7% of the respondents are satisfied with the safetyprovided by the airlines, 8% of the respondents are feeling moderate with the safetyprovided by the airlines, 1.3% of the respondents are highly dissatisfied with the safetyprovided by the airlines. The majority of the respondents are satisfied with the safety provided by theairlines.
CHART NO: 14 The following chart shows the safety of the airline selected.
SAFETY OF THE AIRLINES
12
50
121
0102030405060
highlysatisfied
satisfied m oderate highlydissatisfied
frequ
ency
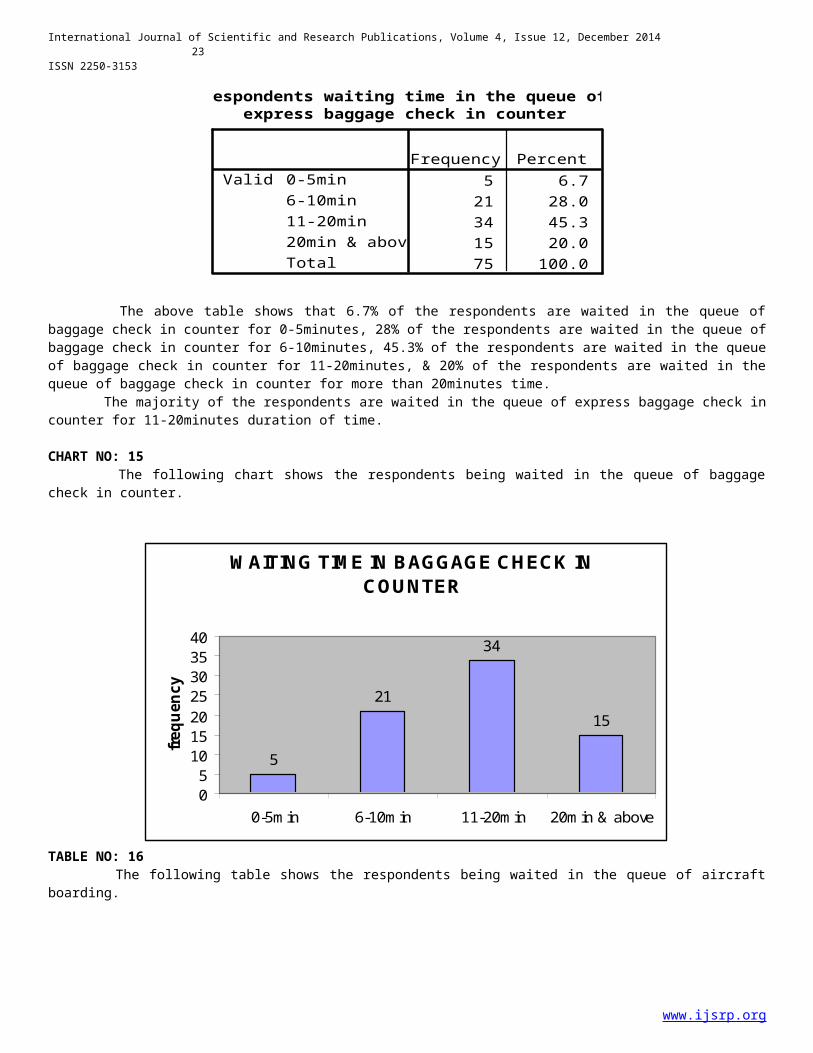
TABLE NO: 15 The following table shows the respondents being waited in the queue of baggagecheck in counter.
www.ijsrp.org
International Journal of Scientific and Research Publications, Volume 4, Issue 12, December 201423
ISSN 2250-3153
respondents waiting time in the queue ofexpress baggage check in counter
5 6.721 28.034 45.315 20.075 100.0
0-5min6-10min11-20min20min & aboveTotal
ValidFrequency Percent
The above table shows that 6.7% of the respondents are waited in the queue ofbaggage check in counter for 0-5minutes, 28% of the respondents are waited in the queue ofbaggage check in counter for 6-10minutes, 45.3% of the respondents are waited in the queueof baggage check in counter for 11-20minutes, & 20% of the respondents are waited in thequeue of baggage check in counter for more than 20minutes time. The majority of the respondents are waited in the queue of express baggage check incounter for 11-20minutes duration of time.
CHART NO: 15 The following chart shows the respondents being waited in the queue of baggagecheck in counter.
W AITING TIM E IN BAGGAGE CHECK IN COUNTER
5
21
34
15
0510152025303540
0-5m in 6-10m in 11-20m in 20m in & above
frequ
ency
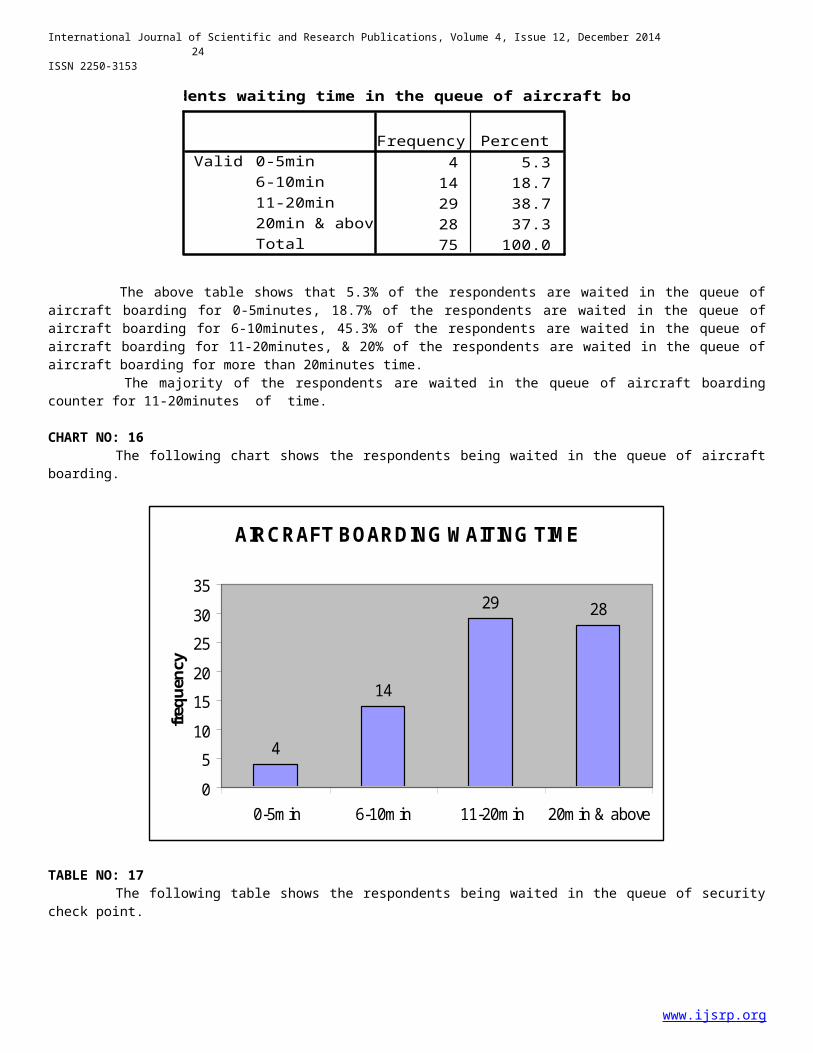
TABLE NO: 16 The following table shows the respondents being waited in the queue of aircraftboarding.
www.ijsrp.org
International Journal of Scientific and Research Publications, Volume 4, Issue 12, December 201424
ISSN 2250-3153
respondents waiting time in the queue of aircraft boarding
4 5.314 18.729 38.728 37.375 100.0
0-5min6-10min11-20min20min & aboveTotal
ValidFrequency Percent
The above table shows that 5.3% of the respondents are waited in the queue ofaircraft boarding for 0-5minutes, 18.7% of the respondents are waited in the queue ofaircraft boarding for 6-10minutes, 45.3% of the respondents are waited in the queue ofaircraft boarding for 11-20minutes, & 20% of the respondents are waited in the queue ofaircraft boarding for more than 20minutes time. The majority of the respondents are waited in the queue of aircraft boardingcounter for 11-20minutes of time.
CHART NO: 16 The following chart shows the respondents being waited in the queue of aircraftboarding.
AIRCRAFT BOARDING W AITING TIM E
4
14
29 28
05101520253035
0-5m in 6-10m in 11-20m in 20m in & above
frequency
TABLE NO: 17 The following table shows the respondents being waited in the queue of securitycheck point.
www.ijsrp.org

International Journal of Scientific and Research Publications, Volume 4, Issue 12, December 201425
ISSN 2250-3153
respondents waiting time in the queue ofsecurity check point
8 10.731 41.320 26.716 21.375 100.0
0-5min6-10min11-20min20min & aboveTotal
ValidFrequency Percent
The above table shows that 10.7% of the respondents are waited in the queue ofsecurity check point for 0-5minutes, 41.3% of the respondents are waited in the queue ofsecurity check point for 6-10minutes, 26.7% of the respondents are waited in the queue ofsecurity check point for 11-20minutes, & 21.3% of the respondents are waited in the queueof security check point for more than 20minutes time. The majority of the respondents are waited in the queue of security check pointcounter for 6-10minutes duration of time.
CHART NO: 17 The following chart shows the respondents being waited in the queue of aircraftboarding.
W AITING TIM E IN SECURITY CHECK POINT
8
31
2016
05101520253035
0-5m in 6-10m in 11-20m in 20m in & above
frequ
ency
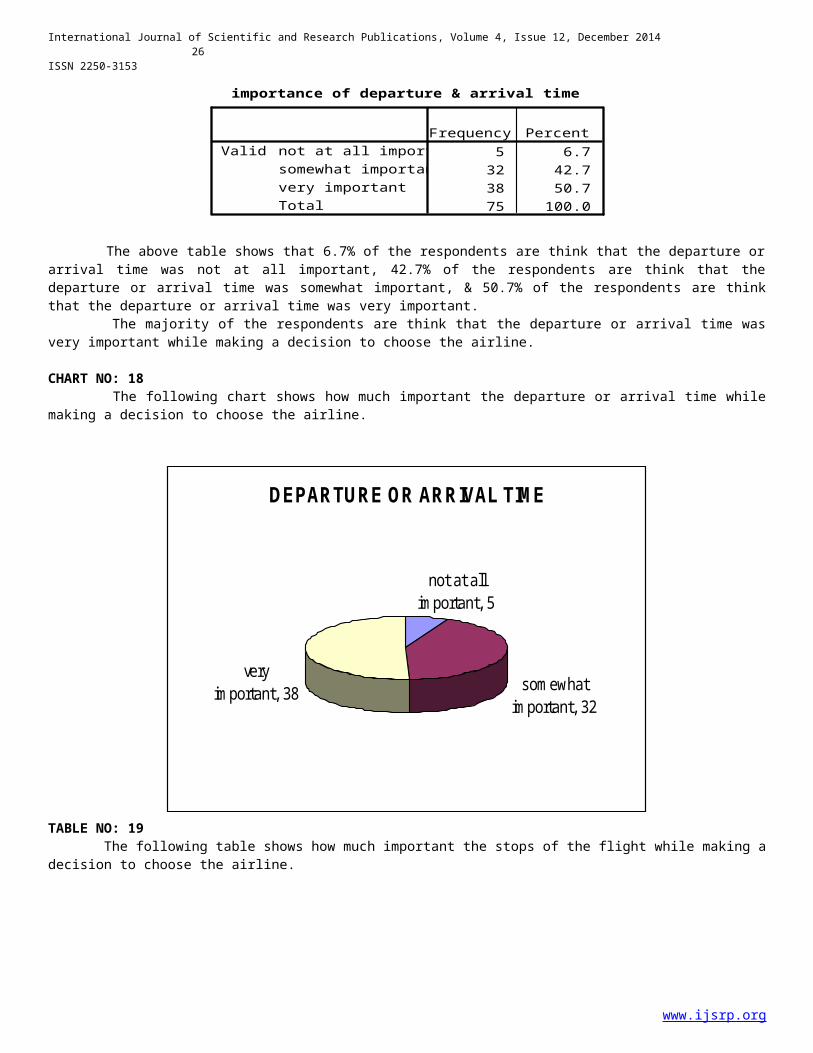
TABLE NO: 18 The following table shows how much important the departure or arrival time whilemaking a decision to choose the airline.
www.ijsrp.org
International Journal of Scientific and Research Publications, Volume 4, Issue 12, December 201426
ISSN 2250-3153
importance of departure & arrival time
5 6.732 42.738 50.775 100.0
not at all importantsomewhat importantvery importantTotal
ValidFrequency Percent
The above table shows that 6.7% of the respondents are think that the departure orarrival time was not at all important, 42.7% of the respondents are think that thedeparture or arrival time was somewhat important, & 50.7% of the respondents are thinkthat the departure or arrival time was very important. The majority of the respondents are think that the departure or arrival time wasvery important while making a decision to choose the airline.
CHART NO: 18 The following chart shows how much important the departure or arrival time whilemaking a decision to choose the airline.
DEPARTURE OR ARRIVAL TIM E
not at all im portant, 5
som ewhat im portant, 32
very im portant, 38
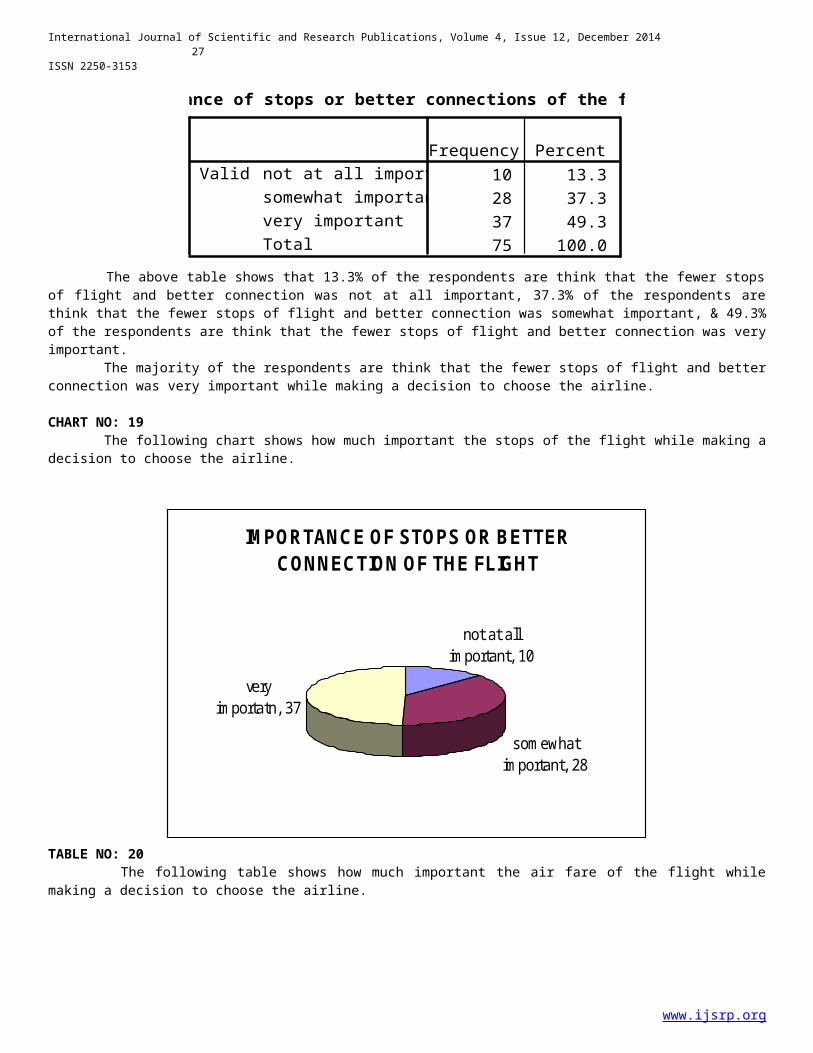
TABLE NO: 19 The following table shows how much important the stops of the flight while making adecision to choose the airline.
www.ijsrp.org
International Journal of Scientific and Research Publications, Volume 4, Issue 12, December 201427
ISSN 2250-3153
importance of stops or better connections of the flights
10 13.328 37.337 49.375 100.0
not at all importantsomewhat importantvery importantTotal
ValidFrequency Percent
The above table shows that 13.3% of the respondents are think that the fewer stopsof flight and better connection was not at all important, 37.3% of the respondents arethink that the fewer stops of flight and better connection was somewhat important, & 49.3%of the respondents are think that the fewer stops of flight and better connection was veryimportant. The majority of the respondents are think that the fewer stops of flight and betterconnection was very important while making a decision to choose the airline.
CHART NO: 19 The following chart shows how much important the stops of the flight while making adecision to choose the airline.
IM PORTANCE OF STOPS OR BETTER CONNECTION OF THE FLIGHT
not at all im portant, 10
som ewhat im portant, 28
very im portatn, 37
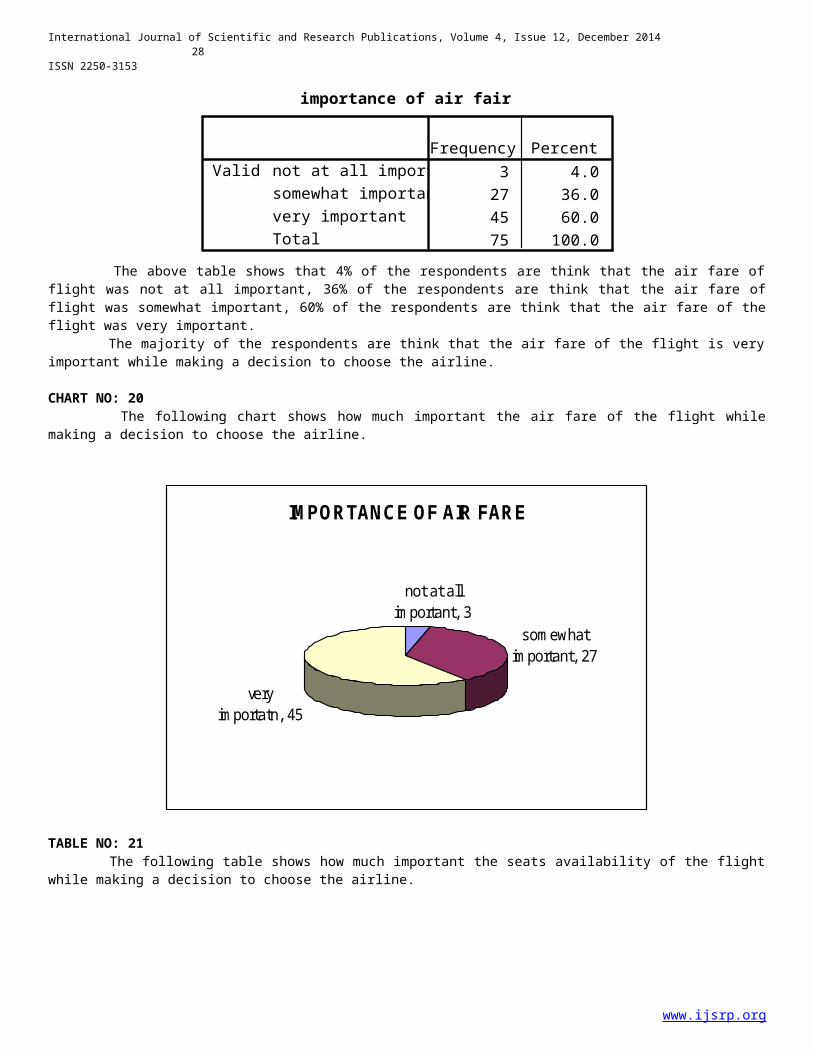
TABLE NO: 20 The following table shows how much important the air fare of the flight whilemaking a decision to choose the airline.
www.ijsrp.org
International Journal of Scientific and Research Publications, Volume 4, Issue 12, December 201428
ISSN 2250-3153
importance of air fair
3 4.027 36.045 60.075 100.0
not at all importantsomewhat importantvery importantTotal
ValidFrequency Percent
The above table shows that 4% of the respondents are think that the air fare offlight was not at all important, 36% of the respondents are think that the air fare offlight was somewhat important, 60% of the respondents are think that the air fare of theflight was very important. The majority of the respondents are think that the air fare of the flight is veryimportant while making a decision to choose the airline. CHART NO: 20 The following chart shows how much important the air fare of the flight whilemaking a decision to choose the airline.
IM PORTANCE OF AIR FARE
not at all im portant, 3
som ewhat im portant, 27
very im portatn, 45
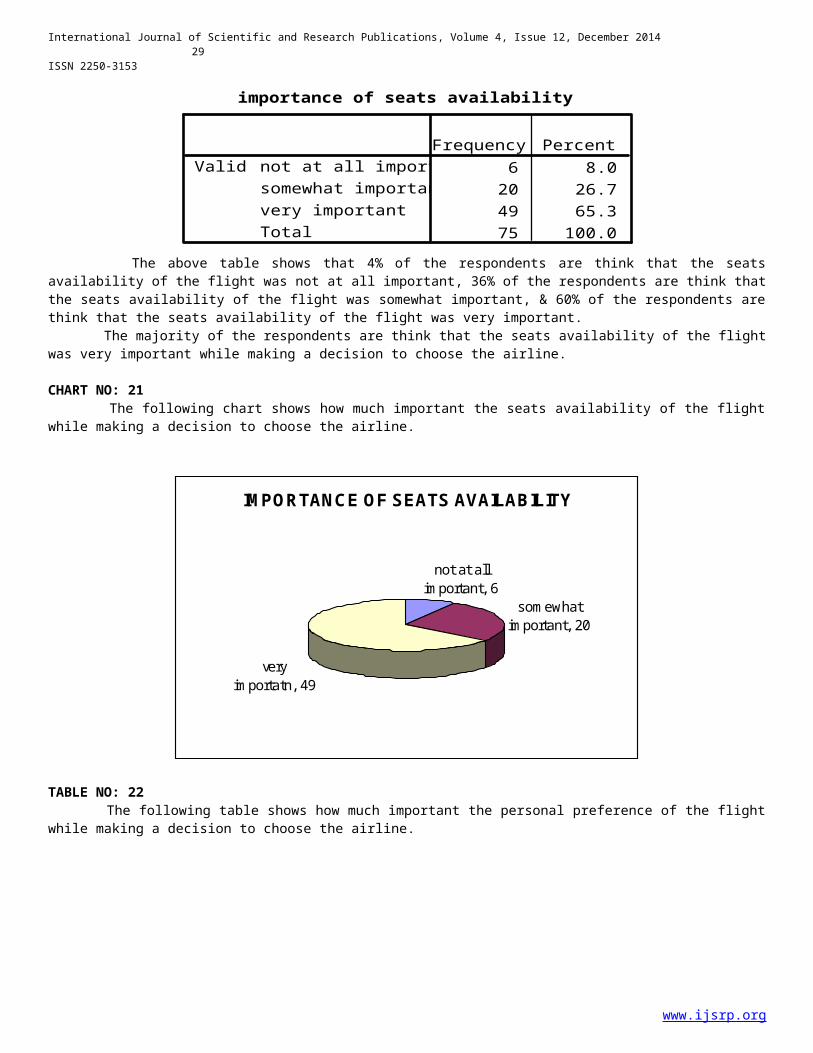
TABLE NO: 21 The following table shows how much important the seats availability of the flightwhile making a decision to choose the airline.
www.ijsrp.org
International Journal of Scientific and Research Publications, Volume 4, Issue 12, December 201429
ISSN 2250-3153
importance of seats availability
6 8.020 26.749 65.375 100.0
not at all importantsomewhat importantvery importantTotal
ValidFrequency Percent
The above table shows that 4% of the respondents are think that the seatsavailability of the flight was not at all important, 36% of the respondents are think thatthe seats availability of the flight was somewhat important, & 60% of the respondents arethink that the seats availability of the flight was very important. The majority of the respondents are think that the seats availability of the flightwas very important while making a decision to choose the airline.
CHART NO: 21 The following chart shows how much important the seats availability of the flightwhile making a decision to choose the airline.
IM PORTANCE OF SEATS AVAILABILITY
not at all im portant, 6
som ewhat im portant, 20
very im portatn, 49
TABLE NO: 22 The following table shows how much important the personal preference of the flightwhile making a decision to choose the airline.
www.ijsrp.org

International Journal of Scientific and Research Publications, Volume 4, Issue 12, December 201430
ISSN 2250-3153
importance of personal preference
16 21.323 30.736 48.075 100.0
not at all importantsomewhat importantvery importantTotal
ValidFrequency Percent
The above table shows that 21.3% of the respondents are think that the personalpreference of the flight was not at all important, 30.7% of the respondents are think thatthe personal preference of the flight was somewhat important, & 48% of the respondents arethink that the personal preference of the flight was very important. The majority of the respondents are thinking that the personal preference of theflight was very important while making a decision to choose the airline.
CHART NO: 22 The following chart how much important the personal preference of the flight whilemaking a decision to choose the airline.
IM PORTANCE OF PERSONAL PREFERENCE
not at all im portant, 16
som ewhat im portant, 23
very im portatn, 36
TABLE NO: 23 The following table shows how much important the aircraft preference of the flightwhile making a decision to choose the airline.
www.ijsrp.org

International Journal of Scientific and Research Publications, Volume 4, Issue 12, December 201431
ISSN 2250-3153
importance of aircraft preference
12 16.040 53.323 30.775 100.0
not at all importantsomewhat importantvery importantTotal
ValidFrequency Percent
The above table shows that 16% of the respondents are think that the aircraftpreference of the flight was not at all important, 53.3% of the respondents are think thatthe aircraft preference of the flight was somewhat important, & 30.7% of the respondentsare think that the aircraft preference of the flight was very important. The majority of the respondents are think that the aircraft preference of theflight was very important while making a decision to choose the airline.
CHART NO: 23 The following chart shows how much important the aircraft preference of the flightwhile making a decision to choose the airline.
IM PORTANCE OF AIRCRAFT PREFERENCE
not at all im portant, 12
som ewhat im portant, 40
very im portatn, 23
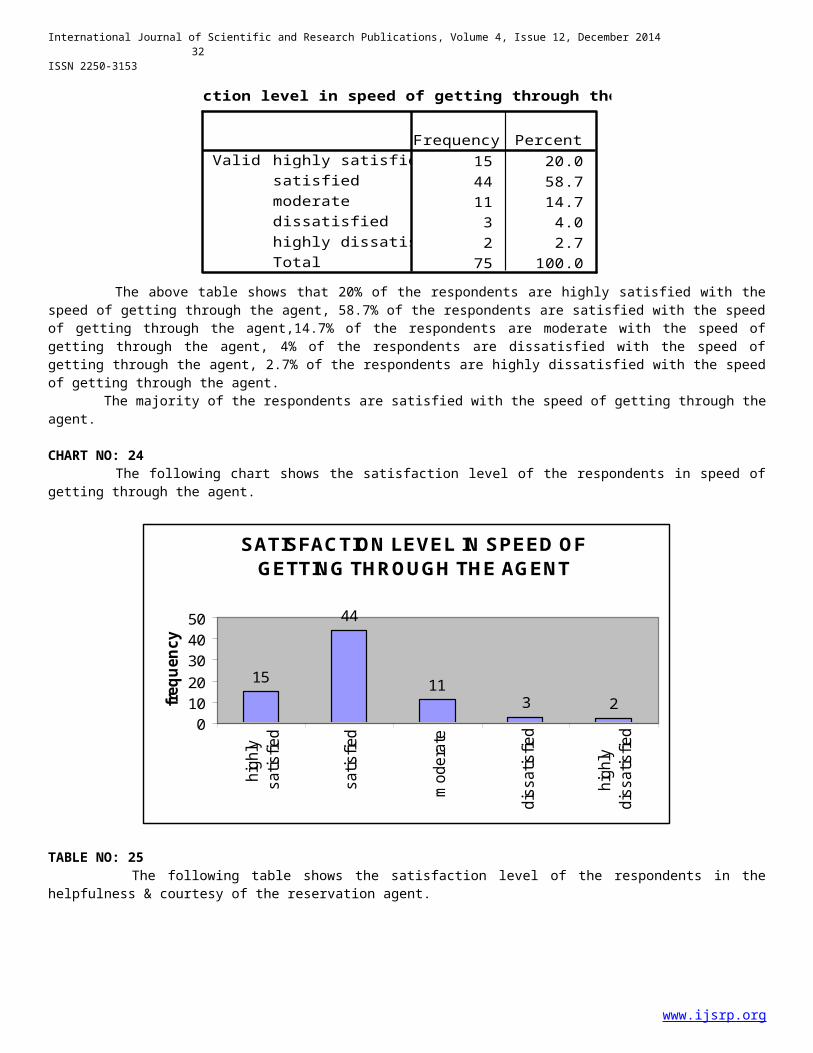
TABLE NO: 24 The following table shows the satisfaction level of the respondents in speed ofgetting through the agent.
www.ijsrp.org
International Journal of Scientific and Research Publications, Volume 4, Issue 12, December 201432
ISSN 2250-3153
satisfaction level in speed of getting through the agent
15 20.044 58.711 14.73 4.02 2.7
75 100.0
highly satisfiedsatisfiedmoderatedissatisfiedhighly dissatisfiedTotal
ValidFrequency Percent
The above table shows that 20% of the respondents are highly satisfied with thespeed of getting through the agent, 58.7% of the respondents are satisfied with the speedof getting through the agent,14.7% of the respondents are moderate with the speed ofgetting through the agent, 4% of the respondents are dissatisfied with the speed ofgetting through the agent, 2.7% of the respondents are highly dissatisfied with the speedof getting through the agent. The majority of the respondents are satisfied with the speed of getting through theagent.
CHART NO: 24 The following chart shows the satisfaction level of the respondents in speed ofgetting through the agent.
SATISFACTION LEVEL IN SPEED OF GETTING THROUGH THE AGENT
15
44
113 2
01020304050
highly
satisfied
satisfied
moderate
dissatisfied
highly
dissatisfied
frequ
ency
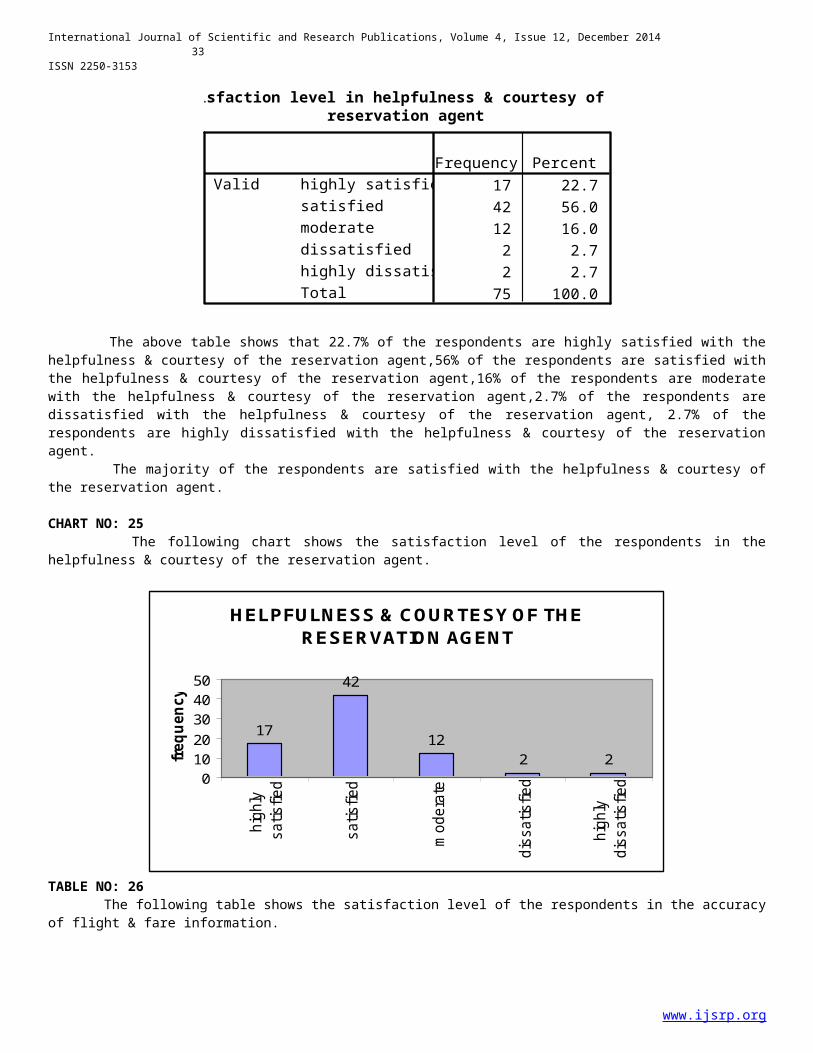
TABLE NO: 25 The following table shows the satisfaction level of the respondents in thehelpfulness & courtesy of the reservation agent.
www.ijsrp.org
International Journal of Scientific and Research Publications, Volume 4, Issue 12, December 201433
ISSN 2250-3153
satisfaction level in helpfulness & courtesy of thereservation agent
17 22.742 56.012 16.02 2.72 2.7
75 100.0
highly satisfiedsatisfiedmoderatedissatisfiedhighly dissatisfiedTotal
ValidFrequency Percent
The above table shows that 22.7% of the respondents are highly satisfied with thehelpfulness & courtesy of the reservation agent,56% of the respondents are satisfied withthe helpfulness & courtesy of the reservation agent,16% of the respondents are moderatewith the helpfulness & courtesy of the reservation agent,2.7% of the respondents aredissatisfied with the helpfulness & courtesy of the reservation agent, 2.7% of therespondents are highly dissatisfied with the helpfulness & courtesy of the reservationagent. The majority of the respondents are satisfied with the helpfulness & courtesy ofthe reservation agent.
CHART NO: 25 The following chart shows the satisfaction level of the respondents in thehelpfulness & courtesy of the reservation agent.
HELPFULNESS & COURTESY OF THE RESERVATION AGENT
17
42
122 2
01020304050
highly
satis
fied
satisfie
d
moderate
dissa
tisfie
d
highly
dissa
tisfied
frequ
ency
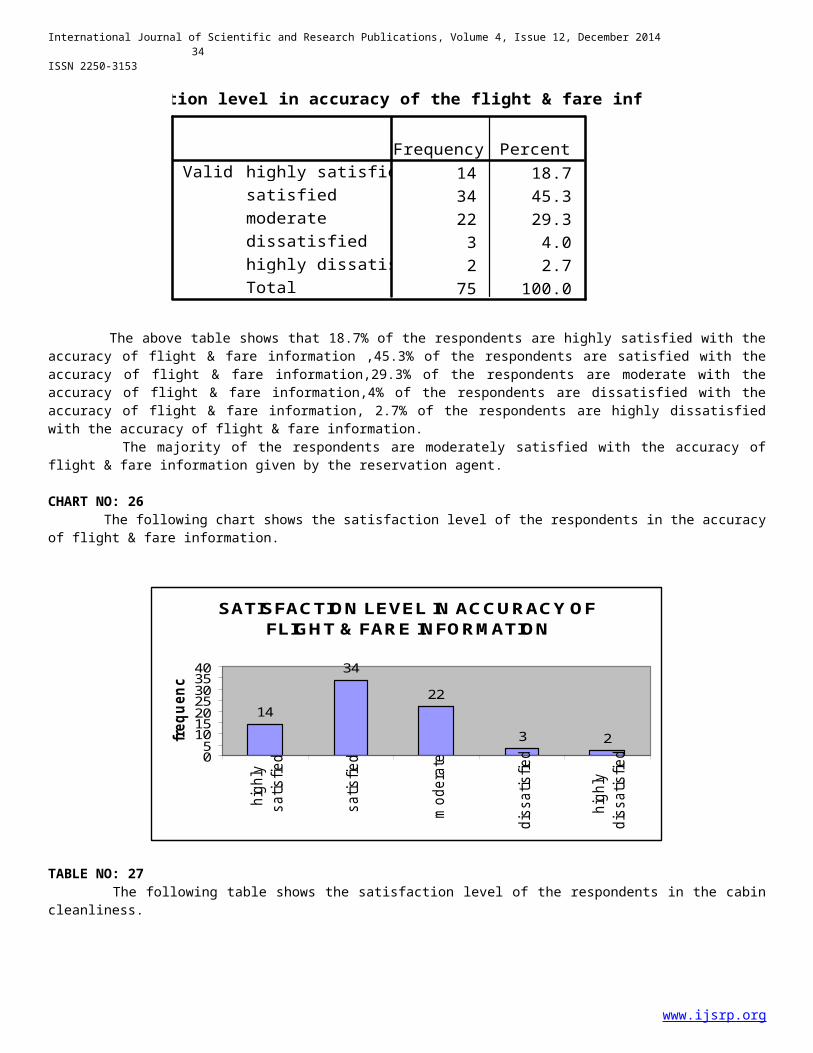
TABLE NO: 26 The following table shows the satisfaction level of the respondents in the accuracyof flight & fare information.
www.ijsrp.org
International Journal of Scientific and Research Publications, Volume 4, Issue 12, December 201434
ISSN 2250-3153
satisfaction level in accuracy of the flight & fare information
14 18.734 45.322 29.33 4.02 2.7
75 100.0
highly satisfiedsatisfiedmoderatedissatisfiedhighly dissatisfiedTotal
ValidFrequency Percent
The above table shows that 18.7% of the respondents are highly satisfied with theaccuracy of flight & fare information ,45.3% of the respondents are satisfied with theaccuracy of flight & fare information,29.3% of the respondents are moderate with theaccuracy of flight & fare information,4% of the respondents are dissatisfied with theaccuracy of flight & fare information, 2.7% of the respondents are highly dissatisfiedwith the accuracy of flight & fare information. The majority of the respondents are moderately satisfied with the accuracy offlight & fare information given by the reservation agent.
CHART NO: 26 The following chart shows the satisfaction level of the respondents in the accuracyof flight & fare information.
SATISFACTION LEVEL IN ACCURACY OF FLIGHT & FARE INFORM ATION
14
34
22
3 20510152025303540
highly
satis
fied
satis
fied
mod
erate
dissa
tisfie
d
highly
dissa
tisfie
d
frequ
ency
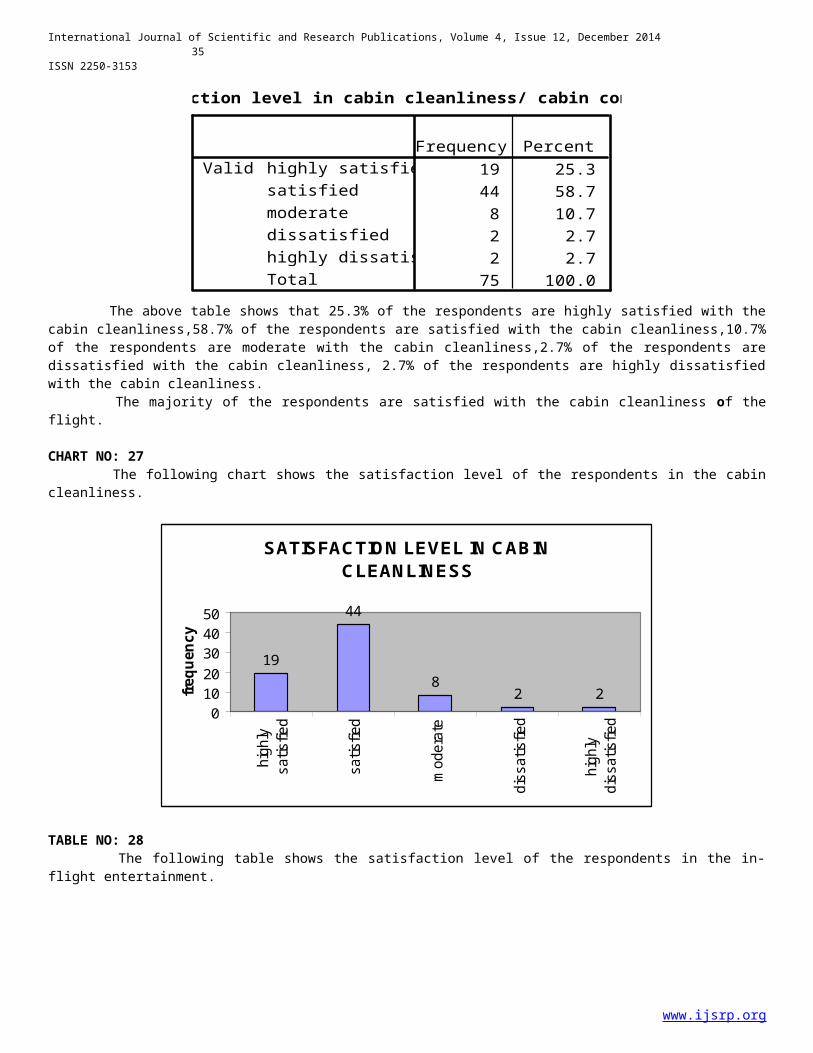
TABLE NO: 27 The following table shows the satisfaction level of the respondents in the cabincleanliness.
www.ijsrp.org
International Journal of Scientific and Research Publications, Volume 4, Issue 12, December 201435
ISSN 2250-3153
satisfaction level in cabin cleanliness/ cabin condition
19 25.344 58.78 10.72 2.72 2.7
75 100.0
highly satisfiedsatisfiedmoderatedissatisfiedhighly dissatisfiedTotal
ValidFrequency Percent
The above table shows that 25.3% of the respondents are highly satisfied with thecabin cleanliness,58.7% of the respondents are satisfied with the cabin cleanliness,10.7%of the respondents are moderate with the cabin cleanliness,2.7% of the respondents aredissatisfied with the cabin cleanliness, 2.7% of the respondents are highly dissatisfiedwith the cabin cleanliness. The majority of the respondents are satisfied with the cabin cleanliness of theflight.
CHART NO: 27 The following chart shows the satisfaction level of the respondents in the cabincleanliness.
SATISFACTION LEVEL IN CABIN CLEANLINESS
19
44
82 2
01020304050
highly
satisfied
satisfied
moderate
dissatisfied
highly
dissatisfied
frequ
ency
TABLE NO: 28 The following table shows the satisfaction level of the respondents in the in-flight entertainment.
www.ijsrp.org
International Journal of Scientific and Research Publications, Volume 4, Issue 12, December 201436
ISSN 2250-3153
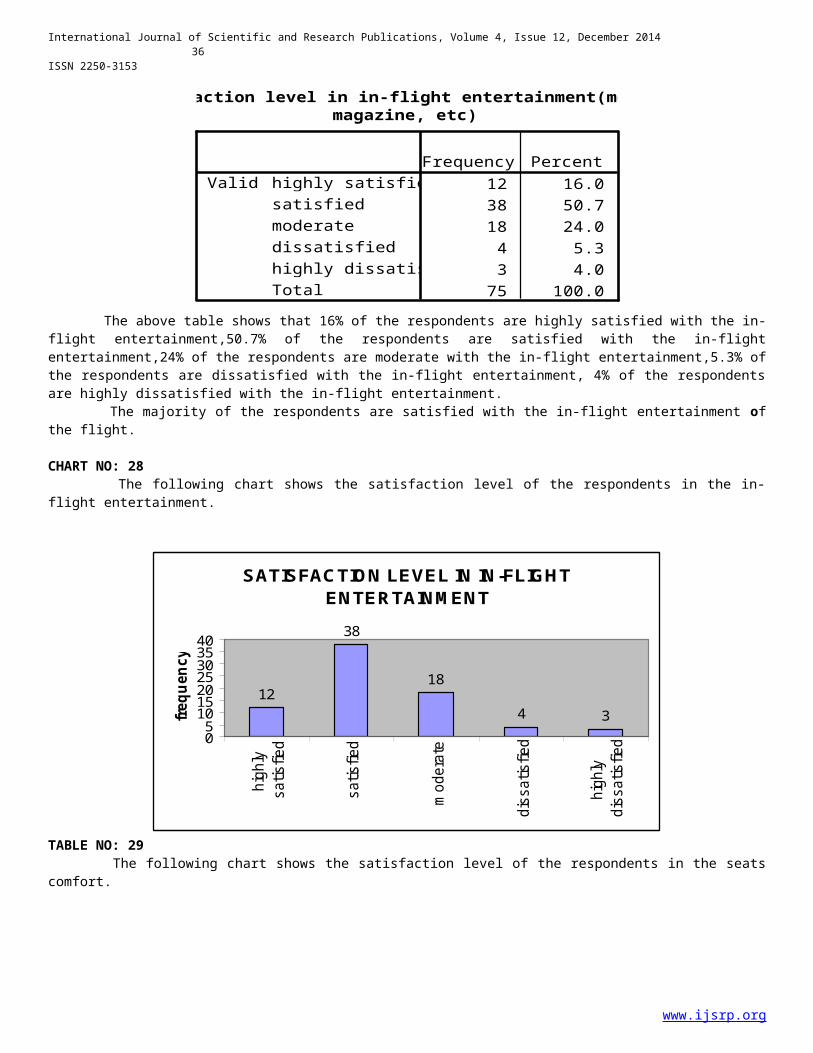
satisfaction level in in-flight entertainment(movies,magazine, etc)
12 16.038 50.718 24.04 5.33 4.0
75 100.0
highly satisfiedsatisfiedmoderatedissatisfiedhighly dissatisfiedTotal
ValidFrequency Percent
The above table shows that 16% of the respondents are highly satisfied with the in-flight entertainment,50.7% of the respondents are satisfied with the in-flightentertainment,24% of the respondents are moderate with the in-flight entertainment,5.3% ofthe respondents are dissatisfied with the in-flight entertainment, 4% of the respondentsare highly dissatisfied with the in-flight entertainment. The majority of the respondents are satisfied with the in-flight entertainment ofthe flight.
CHART NO: 28 The following chart shows the satisfaction level of the respondents in the in-flight entertainment.
SATISFACTION LEVEL IN IN-FLIGHT ENTERTAINM ENT
12
38
18
4 30510152025303540
highly
satisfied
satisfied
moderate
dissatisfied
highly
dissatisfied
frequ
ency
TABLE NO: 29 The following chart shows the satisfaction level of the respondents in the seatscomfort.
www.ijsrp.org
International Journal of Scientific and Research Publications, Volume 4, Issue 12, December 201437
ISSN 2250-3153
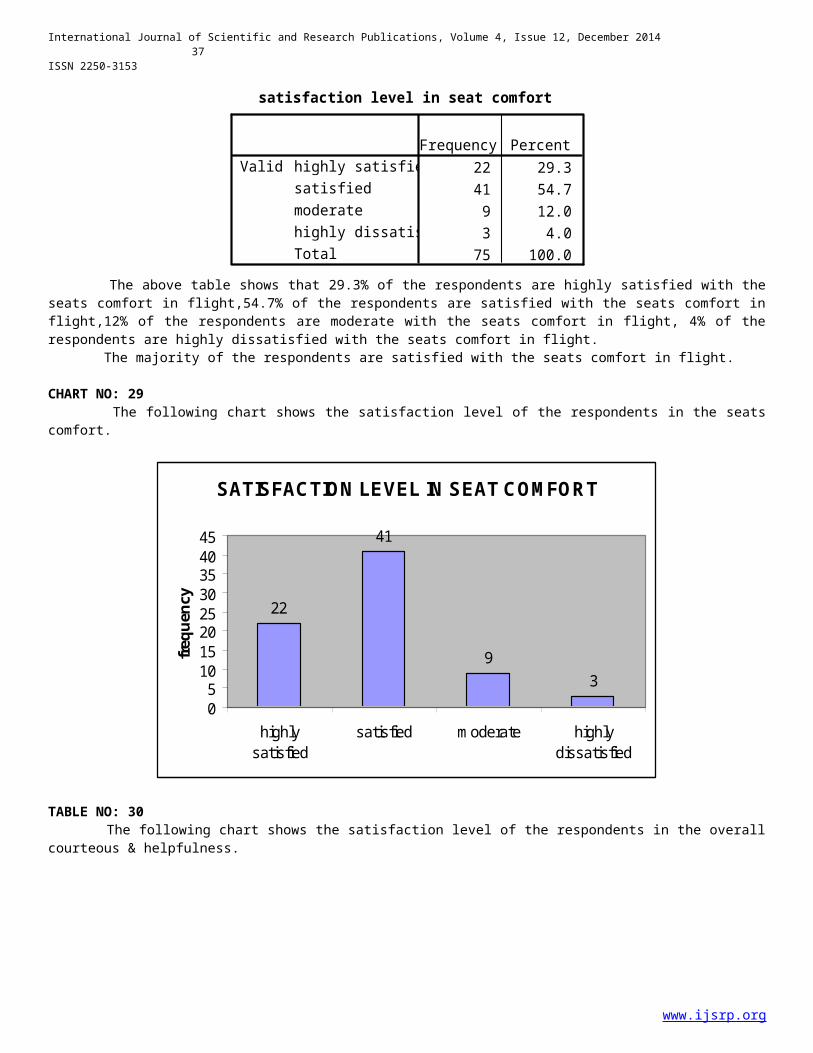
satisfaction level in seat comfort
22 29.341 54.79 12.03 4.0
75 100.0
highly satisfiedsatisfiedmoderatehighly dissatisfiedTotal
ValidFrequency Percent
The above table shows that 29.3% of the respondents are highly satisfied with theseats comfort in flight,54.7% of the respondents are satisfied with the seats comfort inflight,12% of the respondents are moderate with the seats comfort in flight, 4% of therespondents are highly dissatisfied with the seats comfort in flight. The majority of the respondents are satisfied with the seats comfort in flight.
CHART NO: 29 The following chart shows the satisfaction level of the respondents in the seatscomfort.
SATISFACTION LEVEL IN SEAT COM FORT
22
41
93
051015202530354045
highlysatisfied
satisfied m oderate highlydissatisfied
frequency
TABLE NO: 30 The following chart shows the satisfaction level of the respondents in the overallcourteous & helpfulness.
www.ijsrp.org
International Journal of Scientific and Research Publications, Volume 4, Issue 12, December 201438
ISSN 2250-3153
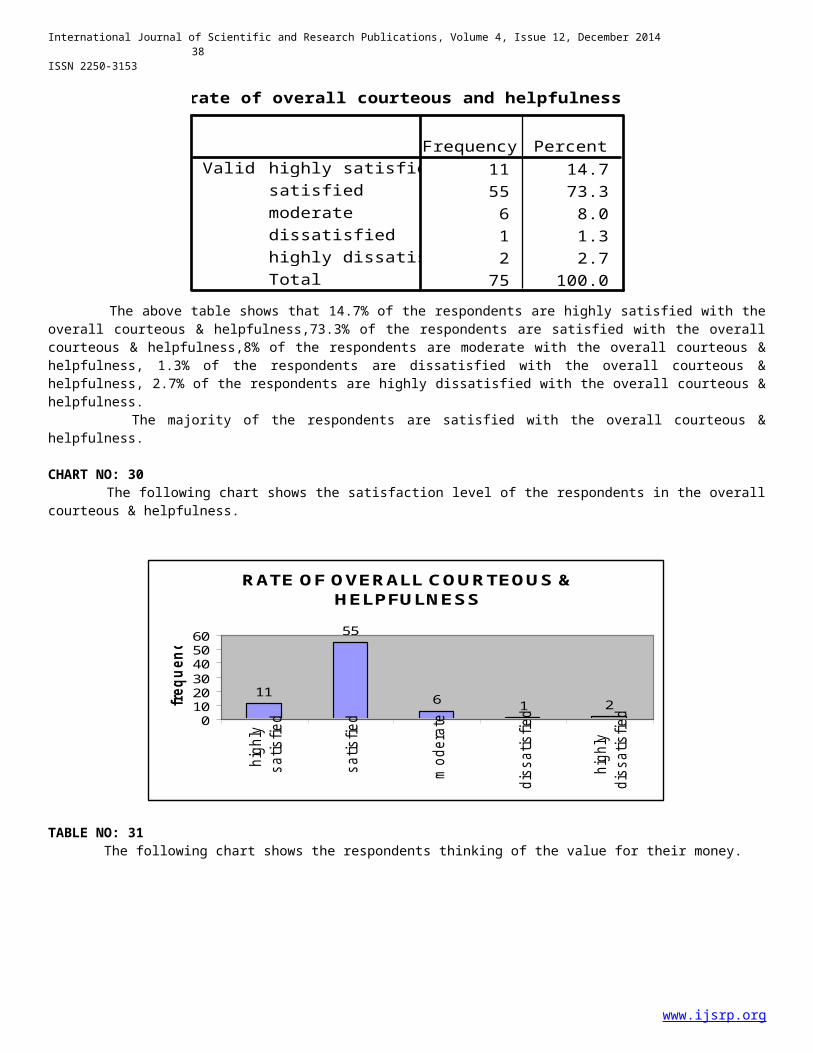
rate of overall courteous and helpfulness
11 14.755 73.36 8.01 1.32 2.7
75 100.0
highly satisfiedsatisfiedmoderatedissatisfiedhighly dissatisfiedTotal
ValidFrequency Percent
The above table shows that 14.7% of the respondents are highly satisfied with theoverall courteous & helpfulness,73.3% of the respondents are satisfied with the overallcourteous & helpfulness,8% of the respondents are moderate with the overall courteous &helpfulness, 1.3% of the respondents are dissatisfied with the overall courteous &helpfulness, 2.7% of the respondents are highly dissatisfied with the overall courteous &helpfulness. The majority of the respondents are satisfied with the overall courteous &helpfulness.
CHART NO: 30 The following chart shows the satisfaction level of the respondents in the overallcourteous & helpfulness.
RATE OF OVERALL COURTEOUS & HELPFULNESS
11
55
6 1 20102030405060
highly
satis
fied
satis
fied
mod
erate
dissa
tisfie
d
highly
dissa
tisfie
dfrequ
ency
TABLE NO: 31 The following chart shows the respondents thinking of the value for their money.
www.ijsrp.org

International Journal of Scientific and Research Publications, Volume 4, Issue 12, December 201439
ISSN 2250-3153
value for money in airline
66 88.09 12.0
75 100.0
highly satisfiedsatisfiedTotal
ValidFrequency Percent
The above table shows that 88% of the respondents are thinking that they aregetting high value for their money, 12% of the respondents are thinking that they are notgetting high value for their money. The majority of the respondents are getting high value for their money.
CHART NO: 31 The following chart shows the respondents thinking of the value for their money.
VALUE FOR M ONEY
yes , 66
no, 9
RANK ANALYSIS
TABLE NO: 32
Rate 1 2 3 4 5 6 Total RankScore (X) 77 63 54 46 37 23 Availability of theticket (F1) 23 45 13 7 2 5 5819 1XF1 1771 2835 702 322 74 115Price of the ticket (F2) 23 20 16 8 6 2 4531 2XF2 1771 1260 864 368 222 46
www.ijsrp.org
International Journal of Scientific and Research Publications, Volume 4, Issue 12, December 201440
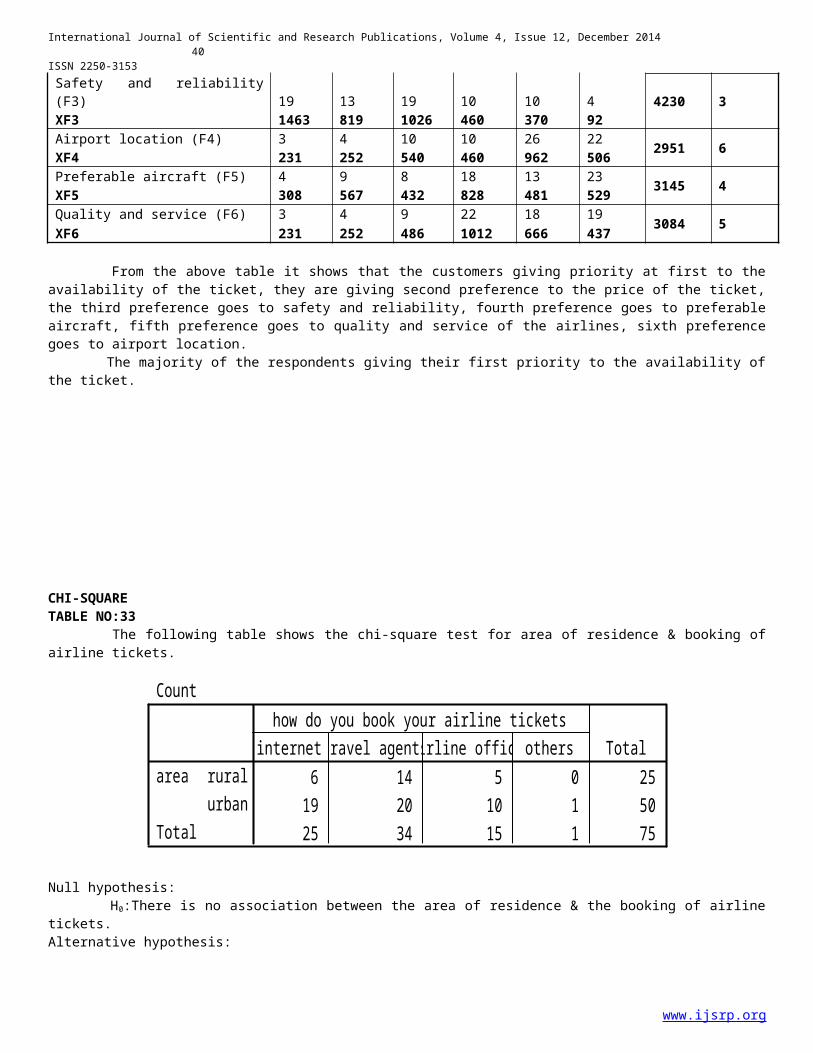
ISSN 2250-3153 Safety and reliability(F3) 19 13 19 10 10 4 4230 3XF3 1463 819 1026 460 370 92Airport location (F4) 3 4 10 10 26 22 2951 6XF4 231 252 540 460 962 506Preferable aircraft (F5) 4 9 8 18 13 23 3145 4XF5 308 567 432 828 481 529Quality and service (F6) 3 4 9 22 18 19 3084 5XF6 231 252 486 1012 666 437
From the above table it shows that the customers giving priority at first to theavailability of the ticket, they are giving second preference to the price of the ticket,the third preference goes to safety and reliability, fourth preference goes to preferableaircraft, fifth preference goes to quality and service of the airlines, sixth preferencegoes to airport location. The majority of the respondents giving their first priority to the availability ofthe ticket.
CHI-SQUARETABLE NO:33 The following table shows the chi-square test for area of residence & booking ofairline tickets.
Count
6 14 5 0 2519 20 10 1 5025 34 15 1 75
ruralurban
area
Total
internettravel agentsairline officeothershow do you book your airline tickets
Total
Null hypothesis: H0:There is no association between the area of residence & the booking of airlinetickets.Alternative hypothesis:
www.ijsrp.org
International Journal of Scientific and Research Publications, Volume 4, Issue 12, December 201441
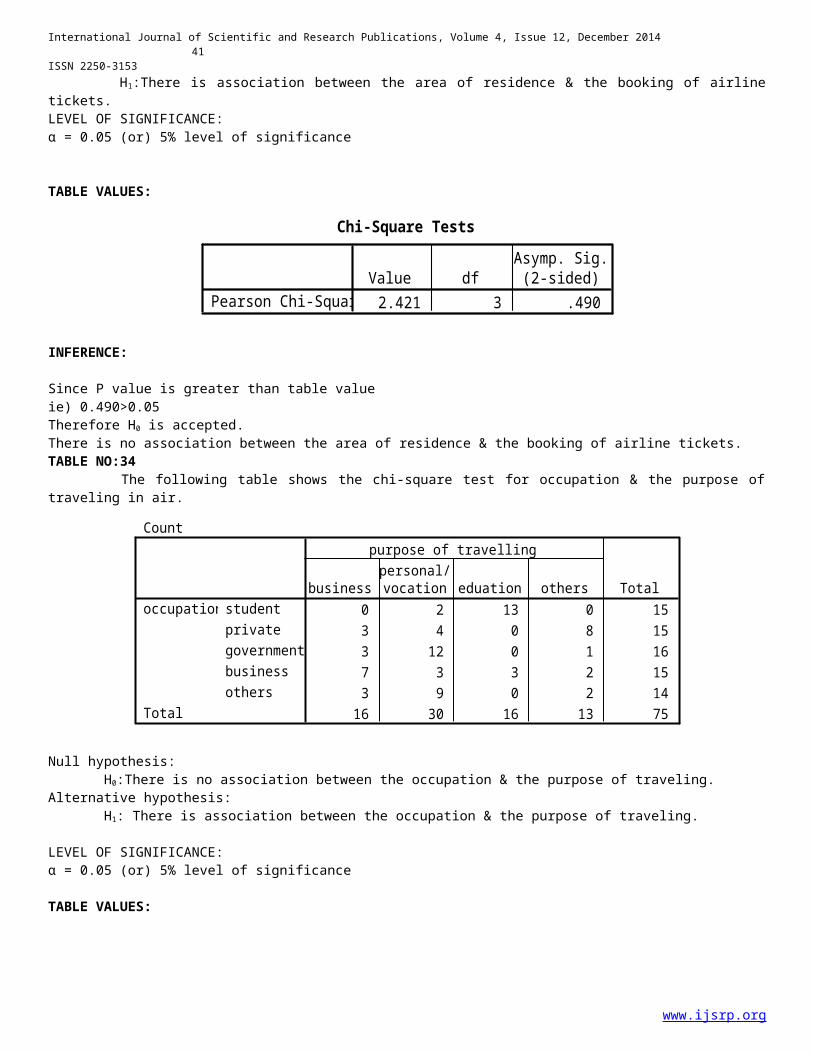
ISSN 2250-3153 H1:There is association between the area of residence & the booking of airlinetickets.LEVEL OF SIGNIFICANCE:α = 0.05 (or) 5% level of significance
TABLE VALUES:
Chi-Square Tests
2.421 3 .490Pearson Chi-SquareValue df
Asymp. Sig.(2-sided)
INFERENCE:
Since P value is greater than table valueie) 0.490>0.05Therefore H0 is accepted.There is no association between the area of residence & the booking of airline tickets.TABLE NO:34 The following table shows the chi-square test for occupation & the purpose oftraveling in air.
Count
0 2 13 0 153 4 0 8 153 12 0 1 167 3 3 2 153 9 0 2 14
16 30 16 13 75
studentprivategovernmentbusinessothers
occupation
Total
businesspersonal/vocation eduation others
purpose of travelling
Total
Null hypothesis: H0:There is no association between the occupation & the purpose of traveling.Alternative hypothesis: H1: There is association between the occupation & the purpose of traveling.
LEVEL OF SIGNIFICANCE:α = 0.05 (or) 5% level of significance
TABLE VALUES:
www.ijsrp.org

International Journal of Scientific and Research Publications, Volume 4, Issue 12, December 201442
ISSN 2250-3153
Chi-Square Tests
74.361 12 .000Pearson Chi-SquareValue df
Asymp. Sig.(2-sided)
INFERENCE:Since P value is less than table valueie) 0.000<0.05Therefore H0 is rejected.There is association between the occupation & the purpose of traveling.
TABLE NO:35 The following table shows the chi-square test for occupation & the number of timestravel by air during the last year.
Count
4 2 6 1 2 152 12 1 0 0 153 11 2 0 0 162 4 6 2 1 150 11 2 0 1 14
11 40 17 3 4 75
studentprivategovernmentbusinessothers
occupation
Total
1 2-5 6-10 10-20 20 & abovehow many time did you travel by air during the last year
Total
Null hypothesis: H0:There is no association between the occupation & the number of times travelledby air during the last year.Alternative hypothesis: H1: There is association between the occupation & the number of times travelled byair during the last year.LEVEL OF SIGNIFICANCE:α = 0.05 (or) 5% level of significance
TABLE VALUES:
Chi-Square Tests
30.386 16 .016Pearson Chi-SquareValue df
Asymp. Sig.(2-sided)
INFERENCE:Since P value is less than table valueie) 0.016<0.05
www.ijsrp.org
International Journal of Scientific and Research Publications, Volume 4, Issue 12, December 201443
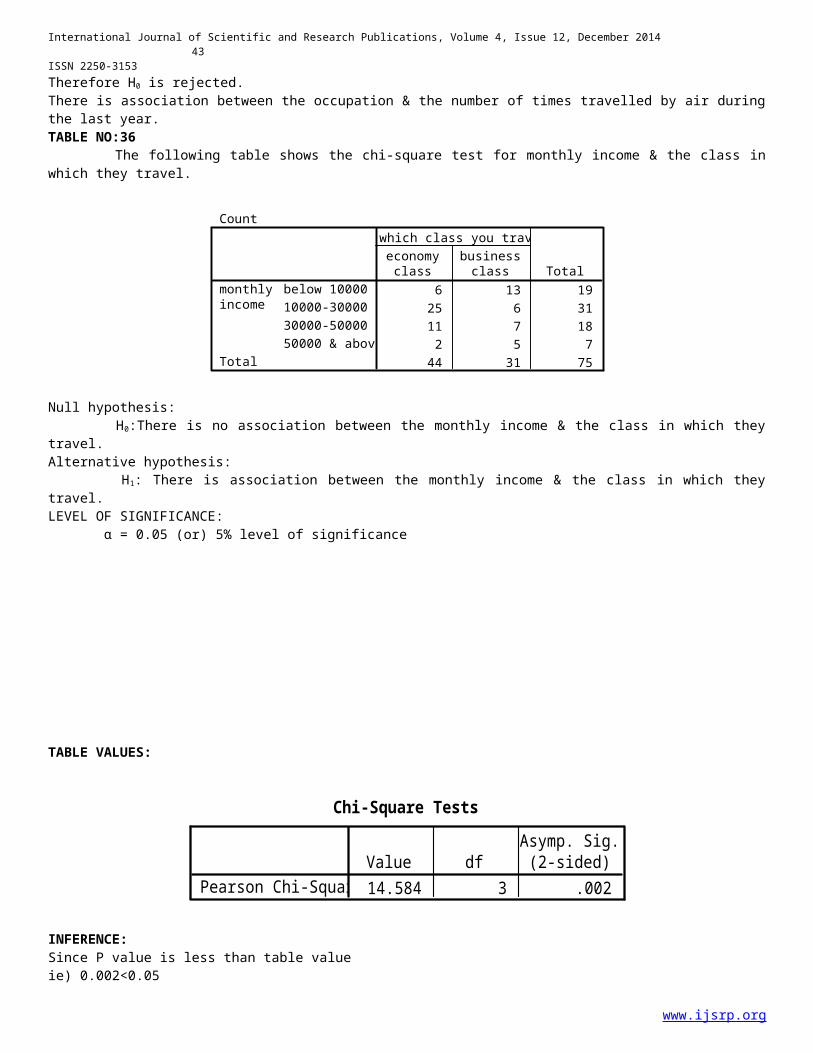
ISSN 2250-3153 Therefore H0 is rejected.There is association between the occupation & the number of times travelled by air duringthe last year.TABLE NO:36 The following table shows the chi-square test for monthly income & the class inwhich they travel.
Count
6 13 1925 6 3111 7 182 5 7
44 31 75
below 1000010000-3000030000-5000050000 & above
monthlyincome
Total
economyclass
businessclass
in which class you travel
Total
Null hypothesis: H0:There is no association between the monthly income & the class in which theytravel.Alternative hypothesis: H1: There is association between the monthly income & the class in which theytravel.LEVEL OF SIGNIFICANCE: α = 0.05 (or) 5% level of significance
TABLE VALUES:
Chi-Square Tests
14.584 3 .002Pearson Chi-SquareValue df
Asymp. Sig.(2-sided)
INFERENCE:Since P value is less than table valueie) 0.002<0.05
www.ijsrp.org
International Journal of Scientific and Research Publications, Volume 4, Issue 12, December 201444
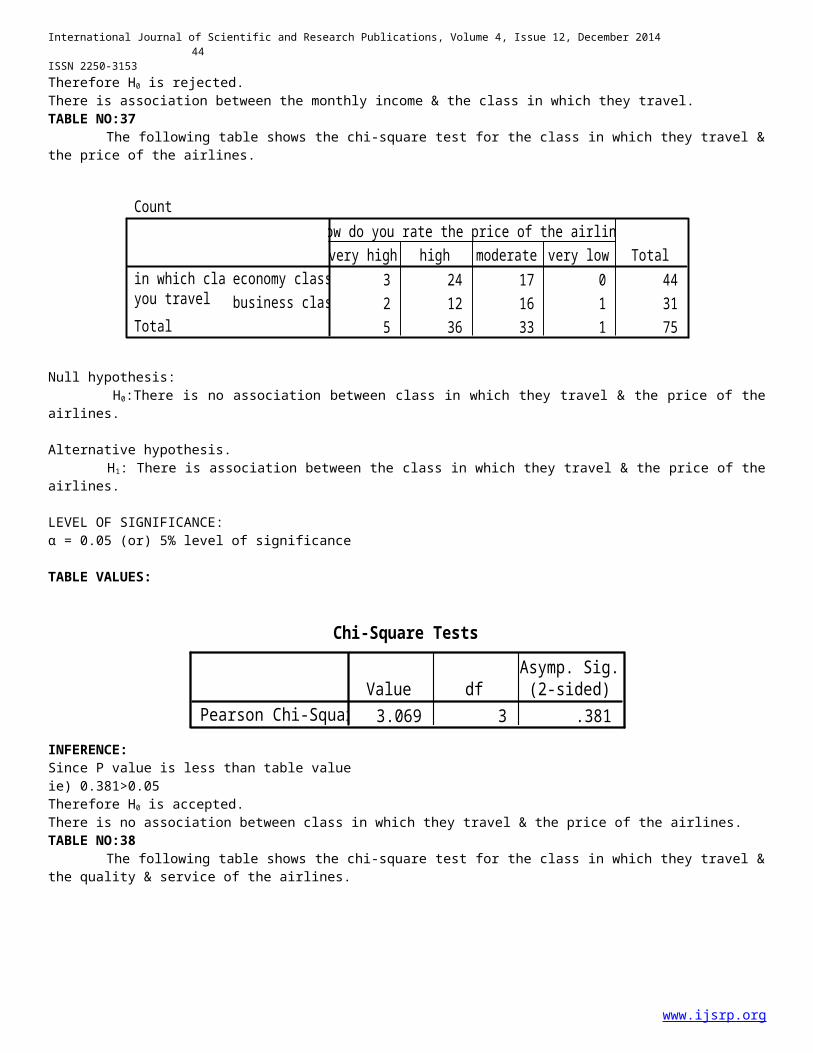
ISSN 2250-3153 Therefore H0 is rejected.There is association between the monthly income & the class in which they travel.TABLE NO:37 The following table shows the chi-square test for the class in which they travel &the price of the airlines.
Count
3 24 17 0 442 12 16 1 315 36 33 1 75
economy classbusiness class
in which classyou travelTotal
very high high moderate very lowhow do you rate the price of the airline
Total
Null hypothesis: H0:There is no association between class in which they travel & the price of theairlines.
Alternative hypothesis. H1: There is association between the class in which they travel & the price of theairlines.
LEVEL OF SIGNIFICANCE:α = 0.05 (or) 5% level of significance
TABLE VALUES:
Chi-Square Tests
3.069 3 .381Pearson Chi-SquareValue df
Asymp. Sig.(2-sided)
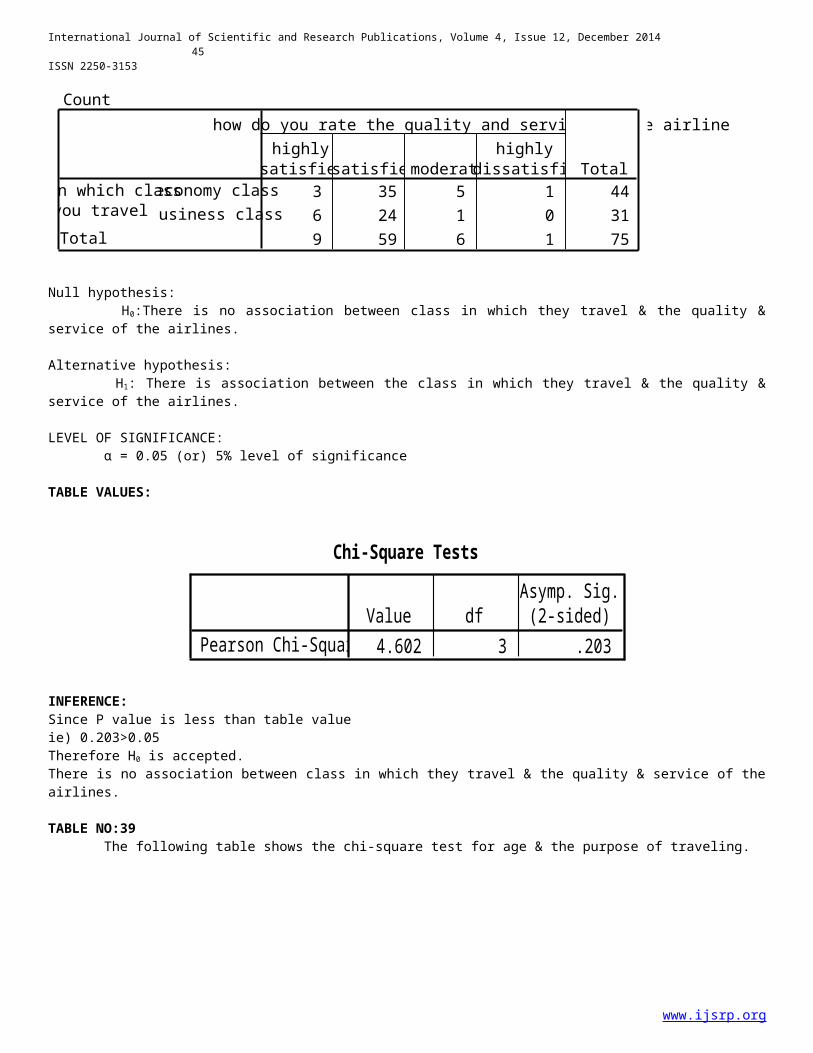
INFERENCE:Since P value is less than table valueie) 0.381>0.05Therefore H0 is accepted.There is no association between class in which they travel & the price of the airlines.TABLE NO:38 The following table shows the chi-square test for the class in which they travel &the quality & service of the airlines.
www.ijsrp.org
International Journal of Scientific and Research Publications, Volume 4, Issue 12, December 201445
ISSN 2250-3153
Null hypothesis: H0:There is no association between class in which they travel & the quality &service of the airlines.
Alternative hypothesis: H1: There is association between the class in which they travel & the quality &service of the airlines.
LEVEL OF SIGNIFICANCE: α = 0.05 (or) 5% level of significance
TABLE VALUES:
Chi-Square Tests
4.602 3 .203Pearson Chi-SquareValue df
Asymp. Sig.(2-sided)
INFERENCE:Since P value is less than table valueie) 0.203>0.05Therefore H0 is accepted.There is no association between class in which they travel & the quality & service of theairlines.
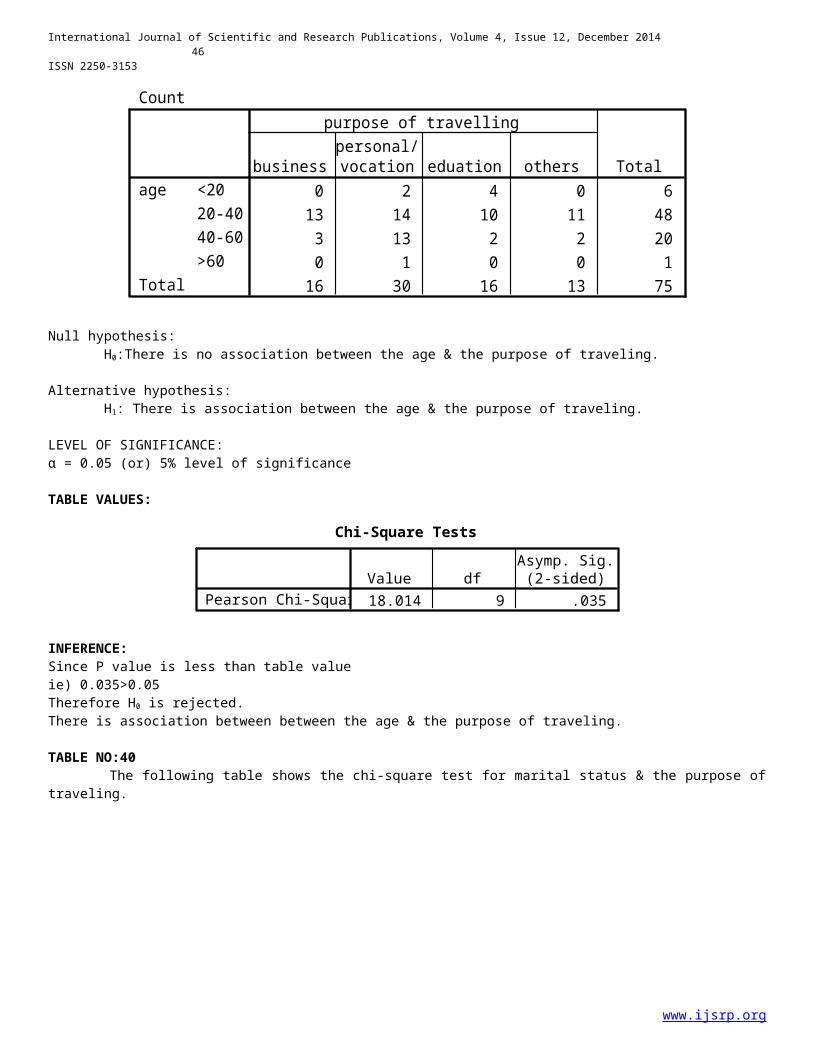
TABLE NO:39 The following table shows the chi-square test for age & the purpose of traveling.
www.ijsrp.org
Count
3 35 5 1 446 24 1 0 319 59 6 1 75
economy classbusiness class
in which classyou travelTotal
highlysatisfiedsatisfiedmoderate
highlydissatisfied
how do you rate the quality and service of the airline
Total
International Journal of Scientific and Research Publications, Volume 4, Issue 12, December 201446
ISSN 2250-3153
Count
0 2 4 0 613 14 10 11 483 13 2 2 200 1 0 0 1
16 30 16 13 75
<2020-4040-60>60
age
Total
businesspersonal/vocation eduation others
purpose of travelling
Total
Null hypothesis: H0:There is no association between the age & the purpose of traveling.
Alternative hypothesis: H1: There is association between the age & the purpose of traveling.
LEVEL OF SIGNIFICANCE:α = 0.05 (or) 5% level of significance
TABLE VALUES:
Chi-Square Tests
18.014 9 .035Pearson Chi-SquareValue df
Asymp. Sig.(2-sided)
INFERENCE:Since P value is less than table valueie) 0.035>0.05Therefore H0 is rejected.There is association between between the age & the purpose of traveling.
TABLE NO:40 The following table shows the chi-square test for marital status & the purpose oftraveling.
www.ijsrp.org

International Journal of Scientific and Research Publications, Volume 4, Issue 12, December 201447
ISSN 2250-3153
Count
11 18 3 6 385 12 13 7 37
16 30 16 13 75
marriedunmarried
maritalstatusTotal
businesspersonal/vocation eduation others
purpose of travelling
Total
Null hypothesis: H0:There is no association between the marital status & the purpose of traveling.
Alternative hypothesis: H1: There is association between the the marital status & the purpose of traveling.
LEVEL OF SIGNIFICANCE:α = 0.05 (or) 5% level of significance
TABLE VALUES:
Chi-Square Tests
9.765 3 .021Pearson Chi-SquareValue df
Asymp. Sig.(2-sided)
INFERENCE:Since P value is less than table valueie) 0.021>0.05Therefore H0 is rejected.There is association between the the marital status & the purpose of traveling.
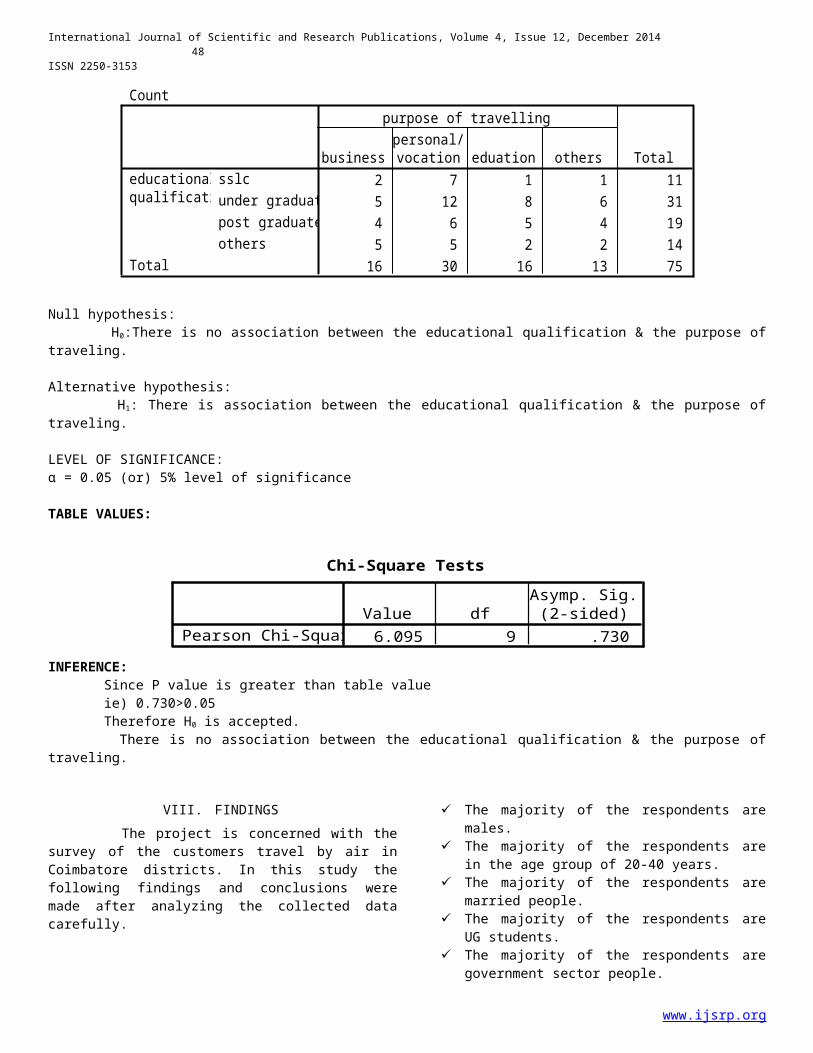
TABLE NO:41 The following table shows the chi-square test for educational qualification & thepurpose of traveling.
www.ijsrp.org
International Journal of Scientific and Research Publications, Volume 4, Issue 12, December 201448
ISSN 2250-3153
Count
2 7 1 1 115 12 8 6 314 6 5 4 195 5 2 2 14
16 30 16 13 75
sslcunder graduatepost graduateothers
educationalqualification
Total
businesspersonal/vocation eduation others
purpose of travelling
Total
Null hypothesis: H0:There is no association between the educational qualification & the purpose oftraveling.
Alternative hypothesis: H1: There is association between the educational qualification & the purpose oftraveling.
LEVEL OF SIGNIFICANCE:α = 0.05 (or) 5% level of significance
TABLE VALUES:
Chi-Square Tests
6.095 9 .730Pearson Chi-SquareValue df
Asymp. Sig.(2-sided)
INFERENCE: Since P value is greater than table value ie) 0.730>0.05 Therefore H0 is accepted. There is no association between the educational qualification & the purpose oftraveling.
VIII. FINDINGS The project is concerned with thesurvey of the customers travel by air inCoimbatore districts. In this study thefollowing findings and conclusions weremade after analyzing the collected datacarefully.
The majority of the respondents aremales.
The majority of the respondents arein the age group of 20-40 years.
The majority of the respondents aremarried people.
The majority of the respondents areUG students.
The majority of the respondents aregovernment sector people.
www.ijsrp.org

International Journal of Scientific and Research Publications, Volume 4, Issue 12, December 201449
ISSN 2250-3153 The majority of the respondents are
belonging monthly income 10000-30000. The majority of the respondents are
belonging to urban area. The majority of the respondents are
travelling for the purpose ofpersonal/vocation.
The majority of the respondents aretravelling in economy class.
The majority of the respondents arebooking their tickets by travelagents.
The majority of the respondents aretravelled 2-5 times by air in thelast year.
The majority of the respondents arerate that the price of the airline ishigh.
The majority of the respondents aresatisfied with the quality andservice provided by the airlines.
The majority of the respondents aresatisfied with the safety provided bythe airlines.
The majority of the respondents arewaited in the queue of expressbaggage check in counter for 11-20minutes duration of time.
The majority of the respondents arewaited in the queue of aircraftboarding counter for 11-20minutesduration of time.
The majority of the respondents arewaited in the queue of security checkpoint counter for 6-10minutesduration of time.
The majority of the respondents arethink that the departure or arrivaltime was very important while makinga decision to choose the airline.
The majority of the respondents arethink that the fewer stops of flightand better connection was veryimportant while making a decision tochoose the airline.
The majority of the respondents arethink that the air fare of the flightis very important while making adecision to choose the airline.
The majority of the respondents arethink that the seats availability ofthe flight was very important whilemaking a decision to choose theairline.
The majority of the respondents arethink that the personal preference ofthe flight was very important whilemaking a decision to choose theairline.
The majority of the respondents arethink that the aircraft preference ofthe flight was very important whilemaking a decision to choose theairline.
The majority of the respondents aresatisfied with the speed of gettingthrough the agent.
The majority of the respondents aresatisfied with the helpfulness &courtesy of the reservation agent.
The majority of the respondents aremoderate with the accuracy of flight& fare information given by thereservation agent.
The majority of the respondents aresatisfied with the cabin cleanlinessof the flight.
The majority of the respondents aresatisfied with the in-flightentertainment of the flight.
The majority of the respondents aresatisfied with the seats comfort inflight.
The majority of the respondents aresatisfied with the overall courteous& helpfulness.
The majority of the respondents aregetting high value for their money.
The majority of the respondentsgiving their first priority to theavailability of the ticket.
IX. CONCLUSION It is concluded from the study thatcustomers are satisfied with thequality ,service and, safety provided bythe airlines. Customers are also satisfiedwith the cabin cleanliness , in-flight
www.ijsrp.org

International Journal of Scientific and Research Publications, Volume 4, Issue 12, December 201450
ISSN 2250-3153 entertainment, and the seats comfort inflight. Customers are think that they aregetting high value for their money andsatisfied with the overall courteous &helpfulness.
X. SUGGESTIONFrom the above analysis the followingsuggestions are made.
The airlines may particularlyconcentrate in the time of boardingand baggage check-in counter.
The airlines should give importanceto the departure & arrival time.
The airlines should reduce the ticketprice.
The reservation agent should give theaccuracy of flight & should providefull information about the air fare.
AUTHORSFirst Author – R. Rajeswari, Teaching Associate, PSG Institute of Management
www.ijsrp.org
Copyright © 2022 FDOKUMEN