A study of nonwoven composites - TRACE: Tennessee ...
86
University of Tennessee, Knoxville University of Tennessee, Knoxville TRACE: Tennessee Research and Creative TRACE: Tennessee Research and Creative Exchange Exchange Masters Theses Graduate School 8-2002 A study of nonwoven composites A study of nonwoven composites Shaker Gaddam University of Tennessee - Knoxville Follow this and additional works at: https://trace.tennessee.edu/utk_gradthes Part of the Other Business Commons Recommended Citation Recommended Citation Gaddam, Shaker, "A study of nonwoven composites. " Master's Thesis, University of Tennessee, 2002. https://trace.tennessee.edu/utk_gradthes/2057 This Thesis is brought to you for free and open access by the Graduate School at TRACE: Tennessee Research and Creative Exchange. It has been accepted for inclusion in Masters Theses by an authorized administrator of TRACE: Tennessee Research and Creative Exchange. For more information, please contact [email protected].
-
Upload
khangminh22 -
Category
Documents
-
view
0 -
download
0
Transcript of A study of nonwoven composites - TRACE: Tennessee ...

University of Tennessee, Knoxville University of Tennessee, Knoxville
TRACE: Tennessee Research and Creative TRACE: Tennessee Research and Creative
Exchange Exchange
Masters Theses Graduate School
8-2002
A study of nonwoven composites A study of nonwoven composites
Shaker Gaddam University of Tennessee - Knoxville
Follow this and additional works at: https://trace.tennessee.edu/utk_gradthes
Part of the Other Business Commons
Recommended Citation Recommended Citation Gaddam, Shaker, "A study of nonwoven composites. " Master's Thesis, University of Tennessee, 2002. https://trace.tennessee.edu/utk_gradthes/2057
This Thesis is brought to you for free and open access by the Graduate School at TRACE: Tennessee Research and Creative Exchange. It has been accepted for inclusion in Masters Theses by an authorized administrator of TRACE: Tennessee Research and Creative Exchange. For more information, please contact [email protected].

To the Graduate Council:
I am submitting herewith a thesis written by Shaker Gaddam entitled "A study of nonwoven
composites." I have examined the final electronic copy of this thesis for form and content and
recommend that it be accepted in partial fulfillment of the requirements for the degree of
Master of Science, with a major in .
Dr. Larry C. Wadsworth, Major Professor
We have read this thesis and recommend its acceptance:
Dr. Randall R. Bresee, Dr. Gajanan S. Bhat
Accepted for the Council:
Carolyn R. Hodges
Vice Provost and Dean of the Graduate School
(Original signatures are on file with official student records.)

To the Graduate Council:
I am submitting here with a thesis written by SHAKER GADDAM entitled “A study of nonwoven composites”. I have examined the final electronic copy of this thesis for form and content and recommend that it be accepted in partial fulfillment of the requirements for the degree of Master of Science with a major in Textiles, Retailing & Consumer Sciences.
Dr. Larry C. Wadsworth
Major Professor
I have read this thesis
And recommend its acceptance
Dr. Randall R. Bresee
Dr. Gajanan S. Bhat
Accepted for the Council:
Dr. Anne Mayhew Vice Provost and Dean of Graduate Studies
doncahr
(Original signatures are on file with official student records.)

A STUDY OF NONWOVEN COMPOSITES
A Thesis
Presented For The
Master of Science
Degree
THE UNIVERSITY OF TENNESSEE, KNOXVILLE
Shaker Gaddam
August 2002

ii
DEDICATION
I dedicate this thesis
To Him To Whom
The Glory Is Justly Due
And
To my parents
Mr. G. Narsimha Reddy and Mrs. Vani
and
my brothers
Mr. G. Kishore and Mr. G. Rakesh

iii
ACKNOWLEDGEMENTS
I would like to thank my advisor, Dr. Larry C. Wadsworth for his continued guidance and encouragement through out my studies at the University of Tennessee. Sincere appreciation is extended to Dr. Randy. R. Bresee and Dr. Gajanan Bhat for being on my committee and for their advice and guidance. I would like to thank Rongguo Zhao, Jack and other lab technicians at TANDEC for their helping hand in processing the polymers and producing the samples. My sincere appreciation to the statistical consultants Mike Newman and Mike O’ Neil for their support in analyzing the results. I sincerely thank all my colleagues and friends at TANDEC for their timely help in many ways.

iv
ABSTRACT Preliminary work on nonwoven composites at The University of Tennessee showed that spunbond/meltblown (SM) and spunbond/meltblown/spunbond (SMS) nonwoven composites containing side-by-side (S/S) bicomponent PP/PE fiber meltblown webs had lower flexural rigidity than 100%PP SB webs and that the SM composites had discernibly softer hand than did the composites made from 100% PP in the meltblown component. This study further optimizes the production and processing parameters of the SM and SMS laminates containing MB webs with different ratios of the bicomponent polymer pairs PP and PE. The resultant laminates were tested for barrier performance, tensile strength, hydrostatic head (HH), air permeability (AP) and flexural rigidity (FR) properties. Response surface modeling was used for the analysis of the HH, AP, FR and tenacity of both the SM and SMS laminates. The effect of % polypropylene in the bicomponent meltblown web on the properties of the laminates was investigated using qualitative and statistical analysis methods.

v
TABLE OF CONTENTS
CHAPTER PAGE NO
1. INTRODUCTION 1 2. LITERATURE REVIEW 3
Spunbond Technology 3 Meltblown Technology 4 Bicomponent fibers 4 SM and SMS laminates 9
3. EXPERIMENTAL PROCEDURES 12 Production of nonwoven composites 15 Mechanical properties 21
4. RESULTS AND DISCUSSIONS 24 Comparison of properties of SM and SMS composites 24 Comparison of properties of SM produced with MB-on-top 28 and MB-in-bottom
Effects of PP percentage in the bicomponent PP/PE MB 30 web on laminates Statistical analysis 35 Optimization of the laminating conditions 47
5. SUMMARY AND CONCLUSIONS 59 REFERENCES 61 APPENDIX 65 VITA 74

vi
LIST OF TABLES
Table 1. Average fiber diameters of MB fibers 13 Table 2. Primary processing parameters of SB and MB webs 14 Table 3. Mechanical properties of 100 % PP SB produced on 1-meter 16
REICOFIL line Table 4. Factors and levels investigated 20

vii
LIST OF FIGURES Figure PAGE 1. Cross section of side-by-side bicomponent fibers 6 2. Cross section of sheath-core bicomponent fibers 6 3. PE sheath / PP core fiber 7 4. Production of SM Laminates by unwinding a MB web 17
on the bottom side of the unbonded SB web produced from the SB extrusion unit
5. Process for production of SM by unrolling a MB web 18 on top of an unbonded SB PP web
6. Process utilizing 1.0 m spunbond line simulating the 19 production of SMS laminates
7. Comparison of SM and SMS composites in air permeability 26 8. Comparison of SM and SMS composites in hydrostatic head 26 9. Comparison of SM and SMS composites in flexural rigidity 27 10. Comparison of SM and SMS composites in tensile strength 27 11. Air permeability of SM composites with MB-on-top and 29 MB-in-bottom 12. Hydrostatic head of SM composites with MB-on-top and 29 MB-in-bottom 13. SEM image of a SM sample 31 14. SEM image of a SMS sample 32 15. SEM image of a SM sample containing 100% PP MB fiber 33 16. Effect of PP proportion in bico-MB webs on air permeability 34 17. Effect of PP proportion in bico-MB webs on hydrostatic head 34 18. Treatment structure for preparation of laminates 37 19. Effect of % PP and weight on flexural rigidity 41 20. Effect of % PP and weight on hydrostatic head 41 21. Effect of % PP and weight on air permeability 42 22. Effect of % PP and weight on tenacity 42 23. Effect of % PP and temperature on flexural rigidity 43 24. Effect of % PP and temperature on air permeability 44 25. Effect of % PP and temperature on hydrostatic head 44 26. Effect of % PP and temperature on tenacity 45 27. Effect of % PP and weight on flexural rigidity 46 28. Effect of % PP and weight on hydrostatic head 46 29. Effect of % PP and weight on air permeability 48 30. Effect of % PP and weight on tenacity 48 31. Effect of % PP and temperature on flexural rigidity 49 32. Effect of % PP and temperature on hydrostatic head 49 33. Effect of % PP and temperature on air permeability 50 34. Effect of % PP and temperature on tenacity 50

viii
35. Prediction profile for flexural rigidity as affected by bonding 52 temperature, calender nip pressure, % PP and bicomponent basis weight
36. Prediction profile for air permeability as affected by bonding 52 temperature, calender nip pressure, % PP and bicomponent basis weight
37. Prediction profile for hydrostatic head as affected by bonding 53 temperature, calender nip pressure, % PP and bicomponent basis weight
38. Prediction profile for tenacity as affected by bonding 53 temperature, calender nip pressure, % PP and bicomponent basis weight
39. Prediction profile of FR with 12.5% PP 54 40. Prediction profile of FR with 24.8% PP 54 41. Prediction profile of FR with 39.9% PP 54 42. Prediction profile of FR with 50.2% PP 55 43. Prediction profile of FR with 74.8 %PP 55 44. Prediction profile of FR with 87.7% PP 55 45. Prediction profile of FR with 100% PP 56 46. Prediction profile of HH with 12.5% PP 56 47. Prediction profile of HH with 24.8% PP 56 48. Prediction profile of HH with 37.6% PP 57 49. Prediction profile of HH with 50.3% PP 57 50. Prediction profile of HH with 62.2% PP 57 51. Prediction profile of HH with 74.9% PP 58 52. Prediction profile of HH with 87.7% PP 58 53. Prediction profile of HH with 100% PP 58

ix
LIST OF ABBREVIATIONS
1. SB Spunbond 2. MB Meltblown 3. PP Polypropylene 4. PE Polyethylene 5. SM Spunbond/Meltblown 6. SMS Spunbond/Meltblown/Spunbond 7. Bico Bicomponent 8. INDA Association of Non-woven Fabrics Industry 9. ASTM American Society for Testing and Materials 10. HH Hydrostatic Head 11. AP Air Permeability 12. PLI Pounds per Linear Inch 13. SEM Scanning Electron Microscopy 14. SAS Statistical Analysis Software 15. GLM General Linear Model 16. RSM Response Surface Methodology 17. DCD Die-to-Collector Distance 18. LLDPE Linear Low Density Polyethylene

1
CHAPTER I
INTRODUCTION
“According to the Nonwoven Fabrics Handbook, nonwoven composites refers to the
products produced by a combination of one or more nonwoven fabric/technology
with other materials/technology to make a better performing whole with the
properties of the parts. The composites can be produced from the combination of any
of the webs of spunbond, meltblown, wet-laid, dry-laid and other webs produced
from nonwoven manufacturing processes” [5]. The laminate may contain two or
three or more layers of nonwoven webs resulting in a laminated web, which combines
the properties of the layers, used in the manufacture of the composite. Researchers
have been studying laminates, according to Michael Jocobson, since the mid 1980’s
[5]. During the past decade, nonwoven composites have drawn great attention from
both industry and universities, as evidenced by the rapidly growing number of
patents. The joining of different layers/fabrics/technologies has been a point of
interest for many researchers and the present study combines the spunbond (SB),
meltblown (MB) webs produced on the SB machine during the production of SB
fabric. The SM and SMS laminates combine the filtration properties of the ultra fine
MB fibers and the strength of the SB fibers. The MB webs were produced on the 24-
inch Reicofil bicomponent (bico) fiber MB machine in The Textiles and
Nonwovens Development Center (TANDEC), located at The University of
Tennessee. Bicomponent MB webs of various percentages of PP and PE were
produced to study the effects of the proportion of PP and PE in the bico pairs on the

2
bonding performance and physical and barrier properties of the SM and SMS
laminates. The various percentages studied were: 0%PE/100%PP, 25%PE/75%PP,
50%PE/50%PP, 75%PE/25%PP and 100%PP/0%PE. The MB webs and SB webs
were laminated on the Reifenhäuser SB machine at different conditions of
temperature and pressure, with the temperatures of 250, 275 and 300° F and with the
calender nip pressures of 240, 270 and 300 PLI. The SB fabric take-up speed was
maintained at 60.3 m/min for all trials. To understand and investigate the effect of
temperature, pressure, percentage of PP in the bico MB web and basis weight of
bicomponent on the performance of the laminated webs, the following properties of
the laminates were determined: basis weight, air permeability, thickness, flexural
rigidity, hydrostatic head and tensile strength. Response Surface Methodology
(RSM) was utilized to analyze the performance properties and to optimize the
processing parameters.

3
CHAPTER II
LITERATURE REVIEW
Spunbond Technology:
Spunbond (SB) and meltblown (MB) technologies are two of the most rapidly
growing nonwoven technologies. The SB process involves the extrusion of
continuous filaments from a spinneret. The extruded filaments are kept separated until
solidified by air quenching. After the quenching stage, the SB filaments are rapidly
drawn by air drag friction or by mechanical drafting rollers. The filaments are then
deposited in a random orientation onto the collecting belt. Thermal calendering
through air bonding, needle punching and other mechanical or chemical means then
bonds the filament webs. SB filaments generally have large average diameter (e.g. 12-
50 microns, typically 15-35 microns) that are heavier and stiffer than MB fibers
(e.g.0.5 to 10 microns, typically 2-4 microns). Spunbond fabrics generally have the
following properties:
A) Random fibrous structure and in general the web is white with high
opacity.
B) Typical basis weight ranges are 10 – 200 g/m2
C) Fiber diameter ranges between 15 and 35 µm
D) Web thickness range between 0.1 and 4.0 mm, typically 0.2-1.5 mm.
E) High strength to weight ratio.
F) High liquid retention capacity due to high void content.

4
Melt blowing technology:
Melt blowing is a process for manufacture of nonwoven fabric in which thermoplastic
polymer is extruded from a die tip having a row of spinneret orifices with typically 25-
35 holes/inch. The fibers exiting from the die tip are contacted with converging sheets
or jets of hot air to stretch or draw the fibers down to a ultra-fine diameters typically
ranging between 2-4 µm . The fibers are then deposited onto a collector in a random
manner and to form a nonwoven fabric. The fibers in the web are usually self-
entangled enough that additional bonding is not required. The melt blowing process
consists of the following elements: extruder, metering pumps, die assembly,
compressor or blower, air furnace and air delivery system to die.
Bicomponent fibers:
Bicomponent fibers (bico) are composed of two or more polymers of different
chemical and/or physical properties extruded from the same spinneret orifice with both
polymers within the same filament [18]. The first commercial bico was DuPont’s
“Cantrece”, which was not commercially successful. Later ICI or British Nylon
Spinners developed a bicomponent fiber named “Cambrelle”, a thermally bonded
Nylon 66/Nylon 6 bico, which is used in shoe interlining applications. Now the
United States produces 60 million pounds of bico fibers annually with Hoechst
Celanese being in the lead. The other U.S producers are BASF Corporation, DuPont
Company, Fiber Innovation Technology, Intercontinental Polymers, KoSa, and
Solutia. Bico fibers can be produced as very fine fibers with any cross sectional
geometry, and they can be thermally bonded. The difference in melting temperatures

5
of the two component polymers is made use in forming self-bulking or self-crimping
fibers. The properties of polymers can be best exploited by using bicomponent fiber
technology. The general cross sections and geometrical shapes of bicomponent fibers
produced are described below:
1. Side-by-side fibers:
The components used in the bicomponent fiber production should have good adhesion
to each other unless it is desirable to subsequently subject the fibers to mechanical
action such as hydro entanglement or chemical treatment such as using solvents to
cause the fibers to split, thereby producing much finer fibers. Feeding the two
components directly to the spinneret orifice produces side-by-side bico fibers and then
they are combined near the orifice. Side-by-side fiber production can produce self-
bulking and self-crimping fibers. Also “splittable” fibers forming fine filaments of
0.2 - 0.5 denier per filament are produced using side-by-side technology. Figure 1
shows different cross sections of side-by-side fibers.
2. Sheath/Core fibers:
Common sheath/core combinations are PE/PP, PE/PET, Co-PET/PET and PA/PET.
The sheath polymer possesses the desired aesthetic or low temperature bonding
properties and contains additives and colorants. The core polymer can either be a
recycled polymer or an electrically conductive material. The sheath/core cross section
is useful for applications where surface properties such as luster and dyeability and
core properties such as strength is needed. Figure 2 shows some of the cross sections
in which sheath/core fibers can be produced. Figure 3 shows a photomicrograph of
cross section of one particular sheath PE/core PP fiber.

6

7
Figure 3. PE sheath/PP core [Reference: HILLS, Inc., 7785 Ellis Road, W. Melbourne, FL 32904] 3. Tipped fibers:
These are used to produce special aesthetics and other properties.
The above cross sections can be produced in any of the following geometries. Round
cross-section, trilobal cross-section, sixteen segment pie, sixteen segment hollow pie
and islands-in-a-sea. The proportions of the components in the bico fiber can vary
from 10/90 to 80/20 depending on the applications and the polymers that are used.
Many bico fiber producers use PE as a sheath because it has excellent softness and has
a low bonding temperature and is used as a binder material in fiber blends and PP as a
core material as it has high strength. In addition to this, because of its low melting
temperature PE allows the process to run at high speeds. Bicomponent fabrics made

8
of PP/PE offer greater softness and greater ease of bonding to films or SB nonwovens
composed of PP. The following are some of the applications:
1. Nonwoven fabrics for diapers, feminine care, and adult incontinence products
(Top sheet, backsheet, leg cuffs, elastic waistband, transfer layers).
2. Air-laid nonwoven structures (Absorbent core, wet wipes).
3. Spunlaced nonwoven products (wet wipes, medical disposable textiles,
filtration products).
In the present research, bico PE/PP webs were produced on Reicofil Bicomponent
MB line. “The line, developed by Reifenhäuser GmbH & Co. of Troisdorf, Germany,
represents a leading innovation in bico MB technology. Resin melt is delivered via
two extruders, each with 50-kg/hr capacity. The hot air system capacity is 1,400 m3/hr
with a maximum temperature of 350°C. The MB die is oriented vertically with a die-
to-collector distance (DCD) range of 60 to 600 mm. The roll width is 24 inches
untrimmed and 20 inches trimmed” [18]. The 100% PP and bico PE/PP webs with
good basis weight and uniformity were produced on the new line with an air gap of 0.8
mm and a die tip set back of 1.0 mm. The polymers used were PP (Exxon Grade PP
3155) and PE (Dow Chemical 150 MI Linear Low Density Polyethylene (LLDPE)).
The MB webs produced have side-by-side configuration of PE/PP fibers. PP MB
webs comprise over 90% of the total MB production because of its low cost, ease of
processing, good mechanical properties, lack of heat shrinkage, chemical inertness and
ability to be drawn into fine fibers. As noted above, the PE allows for thermal bonding
at lower temperatures or greater speed thereby producing softer bonded structures. PE

9
also has an inherently softer hand than does PP. MB webs have the following general
properties.
1. Random fiber orientation.
2. Lower to moderate web strength; strength mainly due to mechanical
entanglement and frictional forces.
3. Generally high opacity (having a high cover factor).
4. Fiber diameter ranges from 0.5 to 9 µm, but typically from 2-4 µm.
5. Basis weight ranges from 5-300 g/m2, but typically 10-50 g/m2.
6. Micro fibers provide a high surface area for good insulation and filtration
characteristics.
7. Most MB webs are layered or shingled in structure even if produced from one die
tip and the number of layers increases with basis weight.
SM and SMS Laminates: Joining SB and MB webs together for the final laminated
web to attain the optimum properties of high strength of SB and barrier and filtration
properties of MB webs produce SM and SMS laminates. The composite structure of
the SB/MB/SB (SMS) and SB/MB (SM) are the most popular examples of the
composite structures. These composite structures have been tremendously successful
as they can be engineered to high strength products. SB and MB spinning beams are
placed on the same machine in a configuration to facilitate the production of SM and
SMS laminates. Some of the patents that are related to the present study are listed here
with the description of methods and novel ideas that are present in them. Nonwoven
SM laminates having higher tensile strength are disclosed in Brock et al U.S. Patent

10
No 4,041,203, which is assigned to Kimberly-Clark Corporation. The bulk, barrier and
air permeability of non-woven laminates were identified and it was noted they were
useful in protective clothing [22]. A SMS laminate produced and sold under the trade
name KLEENGUARD by Kimberly-Clark Corporation comprises of an internal
layer of MB fibers sandwiched between two layers of SB filaments of PP and PE [28].
The study of three-layered non-woven laminate with two exterior layers of SB PP and
an internal layer of mixture of MB PE and PP by Brock et al. [30] was found useful in
producing strong laminates with good barrier properties.
Apparatus for the manufacture of nonwoven webs and laminates including means to move the spinning assembly. [32]
A multi-station line consisting of at least one SB die assembly and at least one MB die
assembly produces SM and SMS laminates. Each station includes
a) A melt spinning die which can be selectively equipped with a SB die insert or a MB
die insert and
b) A moveable support structure for adjusting the proper die-to-collector (DCD)
distance, depending on SB or MB mode of operation. The multi-station line permits
the selective manufacture of a variety of SM or SMS laminates, including SMMS
laminates. The layers may be bonded together by compaction or by calendering and
exhibit outstanding strength properties, energy absorption, tensile strength and tear
resistance, and yet possess a soft, flexible hand. The SMS structure is typically made
inline wherein (A) SB filaments are laid on a moveable collector forming a first layer,
(B) MB filaments are deposited on the first layer, and finally (C) a second layer of SB
filaments is deposited on the top of the MB layer. The three-layered structure then can

11
be bonded together. The inline operation is restricted to manufacturing only one SM
and SMS laminates. However, the use of bico and/or blend fibers requires more
complex equipment than required for monofilaments, and can also require additional
processing steps. The Bico MB fibers can either be sheath/core or side-by-side. This
research was focused on SM and SMS composites made from side-by-side bico fiber
PP/PE MB webs. Preliminary work has shown that SM and SMS had a softer hand
and lower flexural rigidity than did laminates made from 100% PP MB [5].
The present study is based on lamination of different webs produced from SB and MB
processes with the concentration on studying the effect of % of PP on the laminates
produced. A statistical response surface design employed for the design of the
experiments to be conducted based on the processing parameters. The processing
parameters, mechanical properties together with the proportion of PP and PE were
studied for optimizing the processing parameters to achieve optimum values for basis
weight, air permeability, hydrostatic head and bending length. The Bico MB PP webs
and 100% PP, PE MB webs were produced on the 24-inch Reicofil MB line and were
unrolled during spinning of the SB filaments. Experimental studies were also made to
determine if better bonding and performance properties resulted from the MB being on
top against the patterned calender roll versus the MB against the smooth calender roll.

12
CHAPTER III
EXPERIMENTAL PROCEDURES
The MB webs of bicomponent (bico) fibers were produced on the 24-inch Reicofil
MB line at TANDEC. Polypropylene (PP) and Polyethylene (PE) were used as the
components of the MB fibers. In order to study the effect of the relative proportions
of PP and PE in the bico MB pairs on the performance properties of the laminates, MB
webs containing following percentages with two different basis weights (10g/m2 and
20 g/m2) were produced: 25%PP/75%PE, 50%PP/50%PE, 75%PP/75%PE, 100%PP
and 100%PE. The average fiber diameters of the MB webs are shown in Table 1.
Exxon PP 3155 (35 MFR) was used to produce the SB webs. Exxon PP 3546G (1200
MFR) and PE (Dow Chemical 150 MI Linear Low Density Polyethylene (LLDPE))
were used in the production of bico MB webs for the manufacture of SM and SMS
laminates. The processing parameters of both MB and SB webs produced are listed in
Table 2. The SB web was produced in line and bonded together with the MB webs to
produce SM laminates at three different thermal bonding temperatures and three
different calender nip pressures. Sandwiching the MB web between the SB webs
produced SMS laminates. For the production of SMS laminates, a slightly pre-bonded
100% PP SB nonwoven web was produced on the 1-meter Reicofil 2 SB line and
was placed on the smooth roll side. The MB webs were laid over the pre-bonded SB
webs and the top SB web was produced on-line and laid over the MB layers just prior
to the thermal bonding. The main processing parameters listed in Table 2.

13
Table 1. Average fiber diameters of the MB fibers
Meltblown webs
Fiber diameter (µm)
100% PE/0% PP (10 gsm)
3.10
100% PE/0% PP (20 gsm)
3.17
25% PP/75% PE (10 gsm)
2.48
25% PP/75% PE (20 gsm)
2.85
50% PP/50% PE (20 gsm)
2.52
75% PP/25% PE (10 gsm)
2.59
75% PP/25% PE (20 gsm)
2.54

14
Table 2. Primary processing parameters of the SB and MB webs
WEBS PRIMARY PROCESSING PARAMETERS
Spunbond Web Forming Bonding
Pre-bonded PP SB Upper Roll–247°F; Lower Roll-242°F; Nip Pressure-97PLI
In-line PP SB
Die melt temp. 445°F; Cooling Air temp. 66°F; Quench Chamber Pressure. 538Pa; Spin Belt Speed. 60.3 m/min; Suction Air speed. 1484 RPM See “Experimental
Design”
Melt Blown Die Temp °F
Through put
g/hole/min
Air RateSCFM
Air Temp °F
DCD in
75%PP/25%PE 500 0.546 350 480 6
50%PP/25%PE 500 0.557 348 479 6
25%PP/75%PE 500 0.546 348 478 6
100% PP 520 .546 298 514 6

15
The web was characterized according to current ASTM and INDA test methods for the
following properties and their values are shown in Table 3. In the case of both SM
and SMS laminates, the SB webs were produced in line under the same conditions in
terms of polymer throughput, die melt temperature, cooling air temperature, quench
air chamber pressure, suction speed and spin belt speed as shown in Table 2.
Production of nonwoven composites:
The SM composites were produced in two ways without utilizing the lightly pre-
bonded SB web. In one of them, the SB filament is formed directly onto the MB web
so that the SB web was in contact with the upper diamond patterned calender roll with
14.7% raised area as shown in Figure 4. In the other procedure, the MB web was
unwound onto the newly formed SB filament web before passing through the calender,
which allowed the MB web in contact with the upper calender roll as shown in
Figure 5. The processing conditions were maintained the same for both the SM and
MS laminates. In Figure 6, a process that closely simulates the production of SMS is
depicted in which the lightly pre-bonded SB component is on the bottom side. The
MB layer is unwound so that the SB filament web is formed directly onto the MB
web. The three-layered SMS laminate is passed through the calender allowing the
lightly pre-bonded SB web in contact with the lower smooth calender roll and the in-
line SB web in contact with the upper patterned calender roll. The production speed
for both SM and SMS was set at 60.3 m/min in order to keep the same basis weight of
in-line SB web as that of lightly pre-bonded SM web; whereas, the bonding
temperature and pressure varied according to the experimental design.

16
Table 3: Mechanical properties of the 100% PP SB produced on 1-meter Reicofil SB line
Mechanical Property
Value
Basis weight
11.6 g/m2
Thickness
0.163 mm
Bending length
2.15 cm
Bursting strength
8.5 lb/in2
Air permeability
170 ft3/ft2/min
Hydrostatic head
11.5 cm
Peak load
0.48 kg
Elongation-at-break
102 %

17
Figure 4. Production of SM Laminates by unwinding a MB web on the bottom side of the unbonded SB web produced from the SB extrusion unit
MB web
Smooth Calender Roller
Diamond Patterned Roller SB Extrusion unit
Unbonded SB web

18
Figure 5. Process for production of SM by unwinding a MB web on top of an unbonded SB PP web drawn from the extrusion unit
SB Extrusion unit
Diamond Patterned Roller
Smooth Calender Roller
MB web
Unbonded SB web

19
Figure 6. Production line utilizing 1.0 m SB line simulating the production of SMS laminates
Experimental Design and Characterization:
Four factors; thermal bonding temperature, calender nip pressure, percentage of PP in
the bico MB web and bico basis weight were particularly studied in this research. The
Response Surface Method (RSM) was employed to investigate the effects of these
factors on the SM and SMS end-use properties. Two factors had three levels as listed
in Table 4. Both SM and SMS were produced with two types of MB webs, 10 gm/m2
SB Extrusion unit
Unbonded SB web
Diamond Patterned Roller
Smooth Calender Roller
Lightly prebonded SB web
MB web

20
and 20gm/m2 respectively. Therefore the total number of runs in this research was 90.
After the production; the composites, as well as the single SB and MB webs, were
characterized according to the current ASTM and INDA test methods for the
following physical and performance properties: basis weight, thickness, bulk density,
hydrostatic head, air permeability and flexural rigidity which is calculated from the
bending length. With the 100% PP, we were not able to produce samples at a bonding
temperature of 300°F, and the final number of samples produced were different from
what we had expected to produce, though the results of the samples were analyzed
based on the four factors that were shown in Table 4.
Table 4: Factors and levels investigated
Factor Label Low Middle High
Temp Bonding temperature of top roll in °F 250 275 300
Pressure Bonding pressure in pound/linear inch 240 255 270
PP Percentage of PP in bico web
0
25
50
75
100
Bico weight Basis weight of the bicomponent PP/PE MB web
10
20

21
Mechanical properties:
SM and SMS webs thus produced were tested for mechanical properties according to
the INDA standards. The test methods are described below.
Basis weight [IST 130.2 (98)]
The mass per unit area of nonwovens is expressed in grams per square meter. It is
determined by cutting test pieces of 10”x10” from a nonwoven web and weighing
them using the Mettler AE 240 tester. The average of the fabrics weighed is converted
into Grams per Meter Square. 10 samples were taken and their average calculated.
Bursting strength [IST 30.1 & ASTM D3786-87]
A specimen of the fabric is clamped over an expandable diaphragm. The diaphragm is
expanded by fluid pressure to the point of specimen rupture. The difference between
the total pressures required to rupture the specimen and the pressure required to inflate
the diaphragm is noted down as bursting strength of the web. 5 samples were tested
for each sample and their average is the bursting strength of that particular sample.
The instrument used was “The Mullen Tester (Serial No 72 c 744) manufactured by
B.F. Perkins”.
Hydrostatic head [IST 80.6 (98)]
A nonwoven fabric specimen is mounted on the test head reservoir. The specimen is
subjected to a standardized water pressure, which is increased at a constant rate until
leakage appears on the specimen. Water pressure is measured as the hydrostatic head
height is reached at the first sign leakage in three separate areas on the specimen. A
higher value indicates greater resistance to water penetration. The average of five

22
samples was calculated using TEXTEST FX 3000 hydrostatic head tester.
Air permeability [IST 70.1 & ASTM D 737-96].
The rate of airflow passing perpendicularly through a known area of fabric is adjusted
to obtain a prescribed air pressure differential between the two fabric surfaces. From
this rate of airflow, the air permeability of the fabric is calculated. The average air
permeability value from 5 samples is determined using the TEXTEST FX 3300 Air
permeability tester.
Flexural rigidity [IST 90.1 (01) ASTM D 5732-95]
A rectangular specimen (10” x 1”) is slid at a specified rate in a direction parallel to its
long dimension, so that its leading edge projects from the edge of a horizontal surface.
The length of the overhang is measured when the tip of the specimen is depressed
under its own weight to the point where the line joining the top to the edge of the
platform makes a 0.785 rad (41.5°) angle with the horizontal. The stiffer the web or
the fabric, the longer it takes to bend, thus the higher number indicates a stiffer fabric.
Four rectangular samples were cut with the long dimension parallel to the machine
direction for each web and the four sides of each sample are tested using FRL
Cantilever bending tester [Made by Testing Machines Inc. Amityville, NY] and the
average is calculated which gives the bending length of the particular web. Flexural
rigidity of the web is calculated from the following formula
G = 9.809 x 10 6 x M x C3
Where G = Flexural rigidity, µN.m and
M = Fabric Mass per unit are g/m2 and C = Bending length in mm

23
Thickness [IST 20.1 & ASTM D5729-97]
Thickness of the nonwoven web is determined by observing the linear distance that a
movable plane is displaced from a parallel surface by the specimen while the specimen
is under pressure. The thickness of 5 samples was found using Thickness tester (Made
by TMI, Amityville, NY) and the average of them gives the thickness of the web.
Tensile testing [IST 110.4 & ASTM D 5035-95]
A test specimen is clamped in a tensile testing machine and a force applied to the
specimen until the specimen breaks. Values for breaking force and elongation of the
test specimen are obtained from machine scales, dials, autographic recording charts, or
a computer interfaced with the testing machine. Here 5 samples of each web are tested
and the values of peak load and elongation break of the web were calculated from the
machinery readings. United Testing Systems, Inc; Huntington Beach, California,
manufactures the machine (Model No SSTM.1.E.PC, Serial No 692522) used for
tensile testing.

24
CHAPTER IV
RESULTS & DISCUSSIONS
Comparison of properties of thermally bonded SM and SMS composites:
SM composites are made by a lamination process in which SB filaments formed
from the spunbond line are laid on the MB web and the SB web is in contact with
the upper diamond patterned roller or vice versa. The MB webs may be in contact
with the upper patterned roll and the other web is in contact with the heated
smooth steel roller. The MB webs were either mono components of PP or PE or
bicomponents (bico) of 25% PP/75% PE, 50% PP/50% PE, 75% PP/25% PE and
10g/m2 and 20 g/m2 respectively. Figures 7 and 8 show the comparison of SM and
SMS in AP and HH. The two composites exhibit approximately the same air
permeability with the same basis weight MB webs, although SM shows slightly
higher air permeability. As would be expected, composite containing thicker MB
webs (20g/m2) has much lower AP. Under the bonding conditions of 300° F/270
PLI and 60.3-m/min surface speed of calender roller, the difference in AP is
negligible. This may be due to the pinhole formation around the bond area in the
laminates containing lower basis weight bico MB, at the higher temperatures. For
hydrostatic head (HH), equal or higher values were observed for SMS composites
as shown in Figure 8. In the case of HH, slightly higher values were obtained for a
bonding temperature of 250°F and the bonding pressure of 240 PLI to 270 PLI.
However, SM composites produced at 300°F/240-270PLI exhibit lower HH,
which may be due to pinhole near or in the bonding points. This situation seems

25
less significant for SMS with 20 g/m2 with a ratio of 75%PP/ 25%PE MB web.
These results show that the PE component in the MB leads for responsiveness to
the bonding conditions, which will be an advantage with higher basis weight of
MB in the SM or SMS composite to achieve greater barrier properties. Figure 9
shows the flexural rigidity (FR) of the composites produced under different
processing conditions. In general, SMS composites have higher FR than the SM
composites do and those containing heavier MB webs are relatively stiffer than
those having lighter MB webs. Under higher bonding temperature (300°F), the
effect of bonding pressure on FR is significant. Both 10 and 20 g/m2 MB
containing SM composites possess notably lower FR at higher bonding pressure
(and the same bonding temperature of 300°F). Therefore the effects of bonding
conditions on FR depend on the layers of the laminate and the basis weight of the
layers. Combining data in Figures 7, 8 and 9 of 300°F/270 PLI, one may conclude
that high bonding temperature and pressure would generate thinner bonding points
with possible pinholes at edges, which leads to lower FR and HH but higher AP.
SMS composites containing heavier basis weight MB webs produced relatively
thick bonding points without pinholes; therefore, their FR and HH values are high,
and AP values are low. The tensile strength of the SM and SMS composites
produced under varying bonding conditions were presented in Figure 10. The bico
MB webs in these composites are 50%PP/50%PE, with a basis weight of 20 g/m2.
It is found that the tensile strength of these SMS composites remains nearly
constant, because the two SB layers (accounting for ~50% weight of SMS)
determine the tensile property.

26
Figure 7. Comparison of SM and SMS Composites in Air permeability (75%PP/25%PE)
Figure 8. Comparison of SM and SMS Composites in Hydrostatic Head (75%PP/25%PE)
02 04 06 08 0
1 0 01 2 01 4 0
2 5 0 /2 4 0 2 5 0 /2 7 0 3 0 0 /2 4 0 3 0 0 /2 7 0T e m p .( d e g . F ) /P r e s s u r e ( P L I )
AP
(ft^3
/ft^2
/min
)
S M - 1 0 g p s m S M - 2 0 g p s mS M S - 1 0 g p s m S M S - 2 0 g p s m
01 02 03 04 05 06 07 08 09 0
1 0 0
2 5 0 /2 4 0 2 5 0 /2 7 0 3 0 0 /2 4 0 3 0 0 /2 7 0T e m p . ( d e g . F ) /P r e s s u r e ( P L I )
Hyd
ro-H
ead
(cm
)
S M - 1 0 g p s m S M - 2 0 g p s mS M S - 1 0 g p s m S M S - 2 0 g p s m

27
Figure 9. Comparison of SM and SMS composites in Flexural Rigidity (75%PP/25%PE)
Figure 10. Comparison of SM and SMS Composites in Tensile Strength (50%PP/50%PE, 20gm/m2)
0
5 0
1 0 0
1 5 0
2 0 0
2 5 0
2 5 0 /2 4 0 2 5 0 /2 7 0 3 0 0 /2 4 0 3 0 0 /2 7 0T e m p . ( d e g . F ) /P r e s s u r e (P L I )
Flex
ural
Rig
idity
(mg-
cm) S M - 1 0 g p s m S M - 2 0 g p s m
S M S - 1 0 g p s m S M S - 2 0 g p s m
0
5
1015
20
25
30
234/255 275/230 275/255 275/280 300/270
Temp. (deg. F)/Pressure (PLI)
Tena
city
(mN
/tex) SM SMS

28
Comparison of properties of SM produced with MB-on-top and MB-in-bottom:
As described in the experimental production section, SM composites were produced
with the MB web on the top and bottom side of the SB filament web, respectively.
The testing results in HH and AP were plotted in Figures 11 and 12. For those
containing a 20g/m2 MB web, the SM composites produced in the two different ways
exhibit essentially the same AP at low bonding temperature. Notable difference in AP
is obtained with higher values of MB-on-top SM at high bonding temperature. This
difference is also observed as the percentage of PP in the bico MB web varies. The
results of HH seem more sensitive to material (MB webs) and bonding conditions, as
shown in Figure 12. At low bonding temperature, the two production procedures do
not affect the HH values notably for the 75% PP/25% PE MB containing SM; whereas
it is significant for 25% PP/75% PE containing SM, because the main component PE
has lower melting point and is more sensitive to pressure. At high bonding
temperature (300°F), SM laminates with 25% PP/75% PE MB on top against the
upper patterned roller was seemingly over-bonded, which results in lower HH. One
would not be surprised by this result because PE is the predominant component in that
bico MB web. Under the same conditions, higher HH values were obtained from the
SM composite with 75% PP MB on top. The apparent effect of the presence of % of
PE, which has a lower melting point than that of PP, on over-bonding and in turn on
the mechanical properties of the samples was studied using SEM images. SEM
images of the bonding points of the samples reveal that at the higher bonding
temperatures of 300°F over-bonding took place which may have resulted in the drop
of HH and FR values and a rise in AP values. Figure 13 shows the SEM image of the

29
Figure 11. Air permeability of SM composites with MB-on-top and MB-in-bottom (MB 20gm/m2)
Figure 12. Hydrostatic head of SM composites with MB-on-top and MB-in-bottom (MB 20gm/m2)
0102030405060708090
250/240 250 /270 300 /240Tem p. (deg. F )/P ressure (P LI)
AP
(ft^3
/ft^2
/min
)
25% PP M B -bottom 25% P P M B -top75% PP M B -bottom 75% PP M B -top
0
2 0
4 0
6 0
8 0
1 0 0
2 5 0 /2 4 0 2 5 0 /2 7 0 3 0 0 /2 4 0T e m p . (d e g . F )/P re s s u re (P L I)
Hyd
ro-H
ead
(cm
) 2 5 % P P M B -b o tto m 2 5 % P P M B -to p7 5 % P P M B -b o tto m 7 5 % P P M B -to p

30
SM sample containing 25 %PP/75%PE as bico MB fiber bonded at 300°F. The image
shows good bonding with MB and SB fibers being fused together. The flattened SB
filaments are still visible in the bond area. However, the SB filaments protruded from
the bond area. No breaking of the fibers at the bond points is apparent. Figure 14
shows the SEM image of SMS sample containing 25% PP/75% PE bico MB web
bonded at 300°F but at a lower PLI of 240. It shows almost the same degree of the
thermal fusion of the SB and MB fibers in the bonded area, as does the sample in
Figure 13, which was essentially the same except the PLI was lower at 240. Thus,
changing the bonding temperature appears to have a much larger effect on bonding
than does pressure. Figure 15 shows an image of SMS laminate containing 100% PP
MB fiber. It appears completely bonded. The resultant web may appear stiffer and
more brittle structure. It has low HH values, which may be due to pinhole formation.
Effects of PP percentage in the bico PP/PE MB web on laminates:
The percentage of PP in bico fiber MB web affects the physical performance of SM
and SMS composites as shown in Figure 16. This effect varies with the production
conditions therefore and is not an independent factor. In figures 16 and 17, the SM
and SMS composites were produced at a bonding temperature between 250° F and
270° F and a bonding pressure between 240 PLI and 255 PLI with the laminates. In
these ranges, barrier properties i.e. hydrostatic head and air permeability do not change
with the bonding temperature and pressure; therefore, the effect of PP percentage can
be investigated using the available data. The HH and AP values reach a maximum at
reach a maximum at 75%PP/25%PE.

31
Figure 13. SEM image of SM sample (300°F, 270 PLI, 25%PP/75%PE)

32
Figure 14. SEM image of SMS sample (300°F, 240 PLI, 25%PP)

33
Figure 15. SEM image of SMS sample containing 100% PP MB fiber (275°F, 260 PLI)

34
Figure 16. Effect of % PP in bico MB webs on Air permeability
Figure 17. Effect of % PP in bico MB webs on Hydrostatic head
0
10
20
30
40
50
60
70
80
0 25 50 75 100
Percentage of PP in Bico MB
Hyd
ro-h
ead(
cm)
SMSMS
0
10
20
30
40
50
60
0 25 20 75 100Percentage of PP in Bico MB
Airp
erm
eabi
lity(
ft^3/
ft^2/
min
)
SMSMS

35
Statistical analysis: The Response Surface Method (RSM) is a statistical technique for approaching a
system to assess the effects of factors on the behavior of measurable quantity
(Response). They are employed before, while and after a regression is performed on
the data. The experiment must be designed before the regression analysis by inputting
the factors that may have an effect on the desired/required responses. Optimization
methods and model testing procedures are employed after the regression is performed.
The subject of RSM enables us to gain a better understanding of the characteristics of
the response system under study.
Factors: Factors are processing conditions or input variables whose values or setting
can be controlled by the experimenter. If one changes the settings of the factors, the
value of response variable changes as well. In this research the factors are bico web
basis weight, bonding temperature, calender nip pressure and % PP in the bico PP/PE
MB web, which have an effect on the properties of the laminates.
Response: The response variable is the measured quantity whose values depend on
the levels of the factors. In this research hydrostatic head pressure (HH), air
permeability (AP), flexural rigidity (FR) and tenacity are the responses, which are
tested for all the samples produced with different combinations of the levels of the
factors.
Its applications generally include
1. Showing how a particular response is affected by a set of variables over some
specific region of interest.

36
2. Discovering the setting of factors that will give a product simultaneously
satisfying specifications for a number of response
3. Exploring the space of the factor variables to define the maximum response and
determine the nature of the maximum. [15]
The true value of the response corresponding to any particular combination of factor
levels and in the absence of experimental error is denoted by η. Experimental error
may result due to the production equipment, the testing equipment, the people who run
the experiment, and the other miscellaneous errors.
The experimental runs were conducted using a central composite uniform precision
technique in RSM to randomize the runs to minimize the variation within each
temperature zone. Temperature was taken as a whole unit factor to minimize the
production time of the laminates. Inserting the bico MB of varying proportions of PP
and PE and the two basis weights of 10 and 20 g/m2 produced laminates bonded at 250
°F and 240 pounds per linear inch (PLI). Only one MB roll of each proportion was
used to produce the various combinations of laminates so as to reduce the variation
due to between MB rolls. In other words laminates containing 25% PP were produced
using one MB roll which has 25% PP/ 75% PE. With the treatment structure
3X3X2X5X2, the total number of laminates, which were planned, was 180. But the
actual number of laminates produced were 90 due to technical problems and lack of
50%/50% PP/PE MB webs. The total number of laminates includes MS laminates,
which were produced to investigate the effect of MB as top layer and MB as bottom
layer of SM laminates. The experimental design for the laminates is shown in the
Figure 18.

37
270255
10075
2010
50250
240
300
270255240
275
270255240
250
DOEBonding Temperature inDegree Fahrenheit
Pressure in PLI
5 levles of % PP at each pressure
2 levels of bico basis weight (g/m2) at each % PP
Figure 18: Treatment structure for preparation of laminates 100 % PE laminates were not taken into analysis, as enough data for that particular level of PP is not available. Class Level Information Class Levels Values temp 3 250 275 300 press 3 240 255 270 pp 4 25 50 75 100 Weight 2 10 20 type 2 sm sms

38
SAS, statistical software was used to obtain correlations between the factors and
responses and for analyzing the effect of factors on the responses. Contour plots and
surface plots showing the variation of responses with 2 or more factors were drawn
using the above software. General linear models (GLM) and ANOVA were
performed using this software to analyze the data. Regression using the response
surface model was used to investigate the effect of factors on responses.
Observing the GLM procedure for FR; the probability values are significant at 0.05
level for % PP, weight and type indicating that these independent variables have a
significant effect on FR. Bonding temperature and calender nip pressure do not have
significant effects on FR. % PP * weight, % PP * type and weight * type are the
interaction terms that are significant for FR in addition to the main effects of % PP,
bico and type of the laminate. Significant variables affecting the HH are temperature,
% PP, weight and type of the laminate. The interaction terms that are significant are
[temp * % PP], [temp * weight], [temp * type], [% PP * weight], [% PP * type],
[weight * type. AP was not affected by bonding temperature and calender nip
pressure. Bico basis weight and type of the laminate have a significant effect on AP.
The interaction term that is present in the analysis is weight*type. A comparison
between temperatures 275 °F-300 °F is significant at 0.05 level. A comparison
between % PP is significant at 25%-50%, 25%-75% and 25%-100% levels. As little
as 25% PP and percentages more than 25 have modified the properties to a notable
extent. Maintaining PP at 75 % and varying the bico basis weight has a significant
effect on all of the properties. At the 100% PP level, both bico basis weight and type
of the laminate, whether it is SM or SMS, has a significant effect. From the analysis it

39
is observed that the effect of bonding temperature and calender nip pressure on the
laminates are not significant but the effect of % PP and bico basis weight have a
significant effect on the various responses studied. % PP and bico basis weight has a
strong correlation with the properties such as FR, HH and AP. SMS laminates
containing three layers have good mechanical properties compared with the SM
laminates containing two layers. Coefficient of determination (R2) values is low for
FR and AP, whereas for HH and tenacity the R2 value indicates that the responses
have correlation with the factors temperature, % PP and bico basis weight. Bonding
pressure does not have a significant effect on the responses. A study of the correlation
tables shows that HH and bico basis weight have a strong correlation, but a weak
inverse correlation with temperature and pressure. FR does not have strong
correlation with the pressure and temperature but has a weak correlation with the bico
basis weight and % PP. AP has a strong inverse correlation with the bico basis weight
and does not have significant correlation with the other factors. Tenacity has a
positive correlation with the temperature, indicating that tenacity increased with the
raise in temperature, but it has a negative correlation with the bico basis weight. The
tenacity values decreased with the increase of bico basis weight, as the MB web would
not be expected to contribute notably to the strength of the laminate.
Contour plots of the predicted values for SM laminates:
FR values reach a maximum at higher bico basis weights for SM laminates. Lower
basis weights of the bico web and lower % PP present in the bico PP/PE MB web
result in lower FR values and higher bico basis weights and a higher % PP result in
higher FR. The FR reaches a minimum at 100 % PP and 20-gsm bico basis weight.

40
Increase in the bico basis weight while maintaining the % PP at a constant level
increases the values of FR as shown in Figure 19. At lower % PP in bico MB web;
bico basis weight has a pronounced effect on FR of SM laminates than that of % PP
and at higher PP percentages the effect of % PP is more pronounced than that of bico
basis weight. Observing the contour plot of HH with bico basis weight and % PP in
Figure 20 shows that HH increases as the basis weight of the bico web increases.
Increase in % PP does not have significant effect but higher HH values were observed
at 67.5 % PP. The increase in HH values may be due to the hydrophobic nature of the
PP. Higher basis weight of bico results in higher HH values as the increase in weight
per unit area may enhance the HH values. The contour plot in Figure 21 shows that
AP values increase with a decrease in bico basis weight and the AP values are
minimum at 80% PP when basis weight of the bico MB web is maintained at a
constant level. A decrease in the values of AP was observed with an increase in bico
basis weight when the % PP was maintained at a constant level. The contour plot in
Figure 22 shows that the tenacity values are higher between 65 – 85% PP at lower
basis weights and the increase in bico basis weight does not have a significant effect.
The increase in the % PP results in increase in the tenacity but the effect is
comparatively insignificant when compared to other responses such as FR, HH and
AP. The contour plot in Figure 23 shows that the FR values were higher at 75% PP
and at a bonding temperature of 275 °F. The FR values increased as the % PP
increased from 25 to 75% over the temperature range of 250° F – 275° F and
decreased over the temperature range of 275° F – 300° F. From Figure 24, it can be

41
Figure 19: Effect of % PP and bico MB basis weight on flexural rigidity
Figure 20: Effect of % PP and bico MB basis weight on hydrostatic head

42
Figure 21: Effect of % PP and bico MB basis weight on air permeability
Figure 22: Effect of bico basis weight and % PP on tenacity

43
Figure 23: Effect of % PP and temperature on flexural rigidity
observed that the webs containing lower %PP bico MB have lower AP values at
higher temperatures and the variation in the AP values was not significant. Higher AP
values were obtained at 65% PP. The effects of increasing the temperature from 275°
F to 300° F was not significant as can be observed from Figure 24. Lower HH values
of SM laminates were predicted at lower and higher PP percentages of MB web and at
higher temperatures but higher HH values were observed at 75% PP and at moderate
or medium temperature of 275 °F as can be seen in Figure 25. It can be clearly
observed from the contour plot in Figure 26 that tenacity values are minimum at
65–75% PP and at a bonding temperature of 275 °F. The variation in tenacity values
is not significant from an engineering point of view.

44
Figure 24: Effect of temperature and % PP on air permeability
Figure 25: Effect of temperature and % PP on hydrostatic head

45
Figure26: Effect of % PP and temperature on tenacity
Contour plots of the predicted values for SMS laminates: As can be seen in Figure 27 higher basis weights of the bico MB webs and higher
%PP resulted in high FR values for SMS laminates. Higher % PP does not have
significant effect on FR values of SM laminates. The increase in FR values for SMS
laminates may be due to the compact adhesion/bonding of the bico MB web to the
laminate. From Figure 28, the maximum HH is observed at high bico basis weights
and when the content of PP in the bico MB web is 65%. As the % PP in the bico MB
web is increased from 65 to 100, HH values dropped significantly. Similar effect was
observed for SM laminates. It may be due to the higher brittle structure developed in
the laminate because of the higher % PP in the bico MB web. HH values did not vary
significantly at lower basis weights and at lower % PP values. From Figure 29, higher

46
Figure 27: Effect of %PP and bico basis weight on flexural rigidity
Figure 28: Effect of %PP and bico basis weight hydrostatic head

47
AP values were observed at lower bico basis weights and the effect of % PP on AP
was notably small. Similar effect was observed for SM laminates indicating that
higher bico basis weights result in lower AP values. From Figure 30, a higher % PP in
the bico MB web and higher bico basis weights resulted in higher tenacity values. An
inverse effect to that of SM laminates was observed as the SB web plays a major role
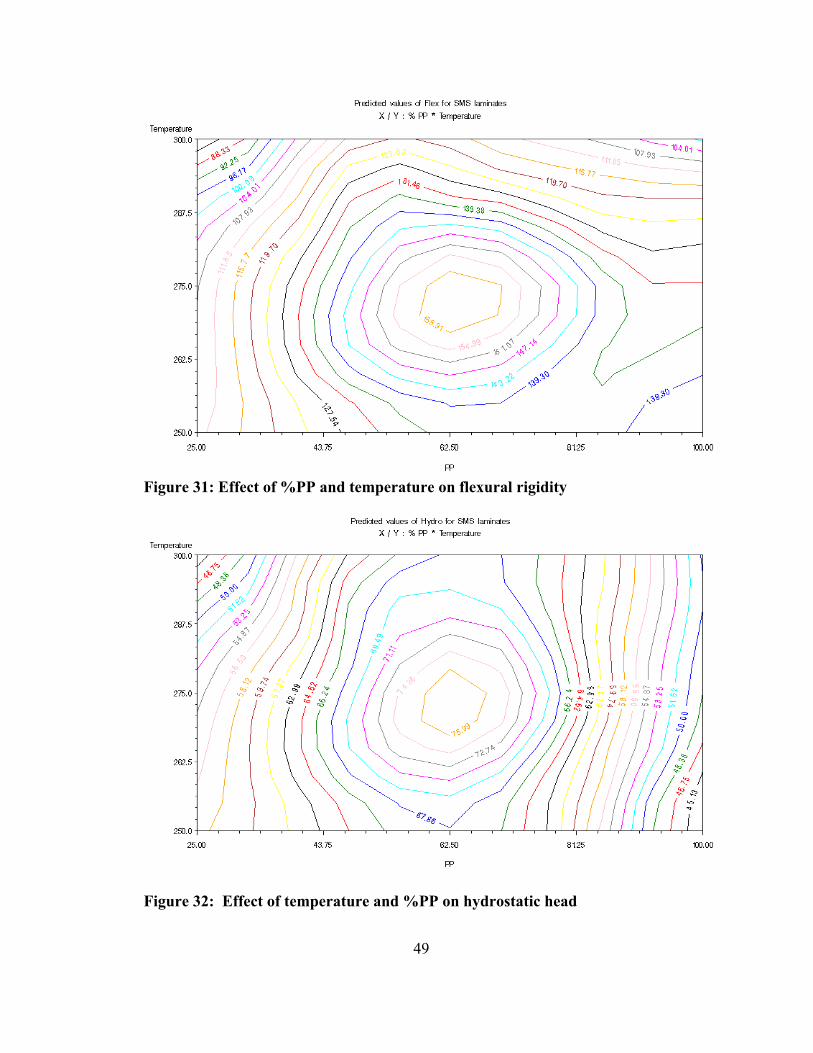
in the tensile strength of the laminate. From Figure 31, lower FR values were
observed at higher temperatures. Maximum FR was observed at 275 °F and when the
PP content in the bico web was 65 %. A similar trend was observed for SM laminates
but the FR values of SMS laminates was double to that of SM laminates. From Figure
32, Higher HH values were observed at medium temperatures and at a level of 65%
PP in the bico MB web. From Figure 33, it can be seen that no significant variation of
AP with the temperature was observed, as was in the case of SM laminates. Minimum
AP was observed at 65% PP content in the bico MB web in the SMS laminate. AP
values decreased on either side of the local maximum. Higher temperatures and
higher % PP content in the MB web helped in higher tenacity values of the SMS
laminates as can be observed from Figure 34. Similar effects ware observed for SM
laminates. Average tenacity values of the SMS laminates were 1.5 times greater than
that of SM laminates.
Optimization of the laminating conditions:
Although several other tests of the SM and SMS composites were performed, only air
permeability, hydrostatic head, tensile strength and flexural rigidity of the composites
were utilized as responses for optimization. After the percentage of PP in bico MB

48
Figure 29: Effect of %PP and weight on air permeability
Figure 30: Effect of %PP and bico basis weight on tenacity
49
Figure 31: Effect of %PP and temperature on flexural rigidity
Figure 32: Effect of temperature and %PP on hydrostatic head

50
Figure 33: Effect of %PP and temperature on air permeability
Figure 34: Effect of %PP and temperature on tenacity

51
web of 50%, bonding temperature is the most significant factor, and HH reached its
maximum value at temperatures ranging from 250° F to 280°F. The bonding pressure
between 240 PLI and 280 PLI was not significant. If PE was the main component in
the MB web, a lower pressure would be required to attain the better end-use
properties, i.e. higher air permeability and tenacity, In this case, increasing bonding
pressure will result in decrease in AP and tenacity without affecting HH. As the %PP
becomes greater than 50%, higher temperature and pressure are needed to achieve the
composite with optimum properties. It was obviously because of higher melting
temperature of PP. However, a temperature higher than 280° F, will more likely lead
to lower HH and to higher AP and tenacity, which may be due to the pinhole
formation at the edge areas of bonding area. Prediction profile graphs were drawn
using JMP software. The optimum processing conditions of bonding temperature,
calender nip pressure, % PP and bicomponent basis weight for optimum properties
were shown in the Figures 35 – 39. Figure 35 shows the prediction profile for FR
revealing that temperature and pressure do not have significant effect on FR. On the
other hand % PP and bico basis weight have a significant effect on FR. FR is lower at
lower % PP and at lower bico basis weights. Figure 36 show that the bonding pressure
and %PP do not have significant effect on the AP of the laminate. The effect of
temperature and bico basis weight can be seen from the above profiler graphs drawn
using response surface modeling. All four factors have a significant effect on the HH
of the laminates. Temperature, % PP and bico basis weight have a significant effect;
whereas bonding pressure has a marginal effect on the HH of the laminates, as can be
seen in Figure 37. Figure 38 shows that tenacity as affected by both bonding

52
Flex
ural
Rig
idity
257.8
10.107
101.7281
Temperature
250
300270.313
Pressure23
0
270257.438
% PP
25 10070.3125
Bico basis weight
10 2016.125
Figure 35: Prediction profile for flexural rigidity as affected by bonding temperature, calender nip pressure, % PP and bico MB basis weight
Air
perm
eabi
lity
122.4
40.34
67.11075
Temperature
250
300270.313Pressure
230
270257.438
% PP
25 10070.3125
Bico basis weight
10 2016.125
Figure 36: Prediction profile for air permeability as affected by bonding temperature, calender nip pressure, % PP and bico MB basis weight

53
temperature and bico basis weight whereas % PP and calender nip pressure has a
minimum effect on the tenacity and strength of the laminates. The prediction profile
graphs with varying proportions of % PP for FR are shown in Figures 39 - 45. The
prediction profile graphs for HH with varying proportions of % PP are shown in
Figures 46–53.
Hyd
ro h
ead
77.3
16
54.30106
Temperature
250
300270.313
Pressure
230
270257.438
% PP25 10
070.3125Bico basis weigh
10 2016.125
Figure 37: Prediction profile for HH as affected by bonding temperature, calender nip pressure, % PP and bico MB basis weight
Tena
city
53.03
7.2618
22.04106
Temperature
250
300270.313
Pressure
230
270257.438
% PP
25 10070.3125
Bico basis weight
10 2016.125
Figure 38: Prediction profile for tenacity as affected by bonding temperature, calender nip pressure, % PP and bico MB basis weight

54
Flex
ural
Rig
idity
257.8
10.107
65.6512
Temperature
250
300270.313
Pressure
230
270257.438
% PP
25 10012.5
Bico basis weight
10 2016.125
Figure 39: Prediction profile of FR with 12.5% PP
Flex
ural
Rig
idity
257.8
10.107
73.3268
Temperature
250
300270.313
Pressure
230
270257.438
% PP
25 10024.8Bico basis weight
10 2016.125
Figure 40: Prediction profile of FR with 24.8% PP
Flex
ural
Rig
idity
257.8
10.107
82.7497
Temperature
250
300270.313
Pressure
230
270257.438
% PP
25 10039.9
Bico basis weight
10 2016.125
Figure 41: Prediction profile of FR with 39.9% PP

55
Flex
ural
Rig
idity
257.8
10.107
89.17724
Temperature
250
300270.313
Pressure
230
270257.438
% PP
25 10050.2
Bico basis weight
10 2016.125
Figure 42: Prediction profile of FR with 50.2% PP
Flex
ural
Rig
idity
257.8
10.107
104.5284
Temperature
250
300270.313
Pressure
230
270257.438
% PP
25 10074.8
Bico basis weight
10 2016.125
Figure 43: Prediction profile of FR with 74.8 %PP
Flex
ural
Rig
idity 257.8
10.107
112.5785
Temperature
250
300270.313
Pressure
230
270257.438
% PP
25 10087.7
Bico basis weight
10 2016.125
Figure 44: Prediction profile of FR with 87.7% PP

56
Flex
ural
Rig
idity
257.8
10.107
120.3789
Temperature
250
300270.313
Pressure
230
270257.438
% PP
25 100100.2
Bico basis weight
10 2016.125
Figure 45: Prediction profile of FR with 100% PP
Hyd
ro h
ead
77.3
16
58.52631
Temperature
250
300270.313
Pressure
230
270257.438
% PP
25 10012.5
Bico basis weight10 2016.125
Figure 46: Prediction profile of HH with 12.5% PP
Hyd
ro h
ead
77.3
16
57.62736
Temperature
250
300270.313
Pressure
230
270257.438
% PP
25 10024.8
Bico basis weight
10 2016.125
Figure 47: Prediction profile of HH with 24.8% PP

57
Hyd
ro h
ead
77.3
16
56.69187
Temperature
250
300270.313
Pressure
230
270257.438
% PP
25 10037.6
Bico basis weight
10 2016.125
Figure 48: Prediction profile of HH with 37.6% PP
Hyd
ro h
ead
77.3
16
55.76368
Temperature
250
300270.313
Pressure
230
270257.438
% PP
25 10050.3
Bico basis weight
10 2016.125
Figure 49: Prediction profile of HH with 50.3% PP
Hyd
ro h
ead
77.3
16
54.89397
Temperature
250
300270.313
Pressure
230
270257.438
% PP
25 10062.2
Bico basis weight
10 2016.125
Figure 50: Prediction profile of HH with 62.2% PP

58
Hyd
ro h
ead
77.3
16
53.96578
Temperature
250
300270.313
Pressure
230
270257.438
% PP
25 10074.9
Bico basis weight
10 2016.125
Figure 51: Prediction profile of HH with 74.9% PP
Hyd
ro h
ead
77.3
16
53.03029
Temperature
250
300270.313
Pressure
230
270257.438
% PP
25 10087.7
Bico basis weight
10 2016.125
Figure 52: Prediction profile of HH with 87.7% PP
Hyd
ro h
ead
77.3
16
52.10211
Temperature
250
300270.313
Pressure
230
270257.438
% PP
25 100100.4
Bico basis weight
10 2016.125
Figure 53: Prediction profile of HH with 100% PP

59
CHAPTER V
SUMMARY & CONCLUSIONS
As the % of PP in the web was increased, better mechanical properties were observed
and the optimum percentage of PP is 70 – 75 % of the bico MB web and the increase
in percentage of the web thereafter does not have notable effect. The effect of %PP in
the bico MB web was more pronounced in SM laminates than in SMS laminates. This
is probably due to the much greater strength of SB than MB in SMS webs.
Possible optimal production conditions were suggested. As the % of PP in bico PP/PE
MB web increased, the best barrier properties were achieved at increased bonding
temperature and pressure in the production of SM composites with the MB component
on the bottom side against the smooth roll. When the SM was produced with the MB
on the top of SB so that the MB directly contacts the heated metal roller, over-bonding
may occur at relatively higher bonding temperature. This, however, may be avoided
by increasing the production speed. The Response Surface Design method was
successfully used in this research, which provides a feasible way in optimizing a
process involving multiple factors and is an efficient way of narrowing down the
optimum properties for the required end uses applications. The production of bico
PP/PE MB web containing SMS composites is not sensitive to the bonding conditions
in the experimental ranges studied. However, because of the lower melting point of
PE, it is expected that the advantage of bico PP/PE MB would be more notable with
higher basis weight. Thus, it would be feasible to produce SMS with a higher weight
of MB and with better barrier properties without decreasing the SMS production

60
speed. SM and SMS laminates containing 100% PP were produced. The effect of
temperature and calender nip pressure does not have notable effect on the properties of
the webs containing 100%PP. The variation in the values of the properties between
SM and SMS is chiefly due to the variation due to the number of layers present in
them. HH and AP values were significantly affected by the increase in % PP and bico
basis weight. The type of the laminate has a significant effect on all the properties.
Increase in bico basis weight has resulted in increase of HH, AP and FR. Bonding
temperature effects, although not significant, resulted in increases in tenacity and FR
values. Bonding pressure did not have any significant effect over the experimental
range studied, but it was observed that a higher a pressure yields better mechanical
properties. Similar trends of the contour lines for the predicted values were observed
for SM and SMS laminates. Higher temperatures and a higher % PP content in the
laminates resulted in higher tenacity for both the SM and SMS laminates. Lower FR,
lower HH values, higher AP and lower tenacity values were observed when the PP
content in bico PP/PE MB web is 65 –70% for SMS laminates. For SM laminates
higher tenacity values were observed with 65-70% PP in the bico MB web.

61
REFERENCES

62
1. Larry C. Wadsworth and Sanjiv R. Malkan “A review on melt blowing technology 1” INB Nonwovens 46-52
2. Larry C. Wadsworth and Sanjiv R. Malkan “A review on melt blowing
technology 2” INB Nonwovens 22-28
3. Larry C. Wadsworth and Sanjiv R. Malkan “A review on spunbond technology Part 1” INB Nonwovens 4-14
4. Larry C. Wadsworth and Sanjiv R. Malkan “A review on spunbond technology
Part 2” INB Nonwovens 24-33
5. Larry C. Wadsowrth, Rongguo Zhao, Dong Zhang and Qin (Christine) Sun “Production optimization and characterization of SM and SMS non-woven composites containing bicomponent PP/PE meltblown fibers”
6. Ramaiah Kotra and Haoming Rong Meltblown Technology [Online]
Available: http://trcs.he.utk.edu/textile/nonwovens/meltbl.html
7. John Hagewood. Barrier fabrics of spunbond specialty fibers for medical applications [online]. Available: http://www.hillsinc.net/Medical%20Spunbond%20Fabric.htm
7. Jeff Dugan (1999). Critical factors in engineering segmented bicomponent
fibers for specific end uses [online]. Available: http://www.fitfibers.com/files/Splittable%20Fibers.doc
8. Hagewood (1998 October) Ultra micro fibers: Beyond evolution [3 pages]
International Fiber Journal [online]. Available: http://www.ifj.com/issue/october98/story8.html
9. Bicomponent fibers [online]. Available: http://www.es-
fibervisions.com/bicomponent/bicomp.html
10. Arnold E. Wilkie (1999). New Products From Bicomponents [5 pages]. International Nonwovens Journal [online]. Available: http://www.inda.org/subscrip/inj99_1/newprod.html
11. Praveen Kumar Jangala and Ramaiah Kotra. Bicomponent fibers [online].
Available: http://trcs.he.utk.edu/textile/nonwovens/biocom.html
12. Barrie L. Davies. New developments in bicomponent fibers. Reicofil Bicomponent Melt blowing Technology Monograph.

63
13. Bicomponent Meltblown capability [online]. Available: http://www.hillsinc.net/meltblown.htm
14. Bicomponent fiber [online]. Available: http://www.fibersource.com/f-
tutor/bicomponent.htm
15. Dong Zhang, Christine Sun, Larry C. Wadsworth and Rongguo Zhao. Processing and Characterization of Mono- and Bi-Component Fiber Meltblown Nonwovens. Reicofil Bicomponent Melt blowing Technology Monograph
16. Larry C. Wadsworth, Qin (Christine) Sun, Dong Zhang and Rongguo Zhao
(1999 September). Enhanced barrier performance of bicomponent fiber meltblown nonwovens. Nonwovens World (August-September 1999) 40-46.
17. Larry C. Wadsworth, Qin (Christine) Sun, Dong Zhang and Rongguo Zhao
(1999 December). SM and SMS Laminates produced with 100% PP meltblown and bicomponent fiber PP/PE meltblown webs. Nonwovens Industry (December 1999) 68-74
18. TANDEC. (1999, Volume 3 Issue 1). Reicofil Bicomponent MB line started
up. TANDEC Bi-Annual Journal.
19. Hills Inc. An introduction to bicomponent fibers. Available: http://www.hillsinc.net/bicotech.htm
20. Fiber visions. Hygiene fibers. Available:
http://www.fibervisions.dk/hygigb.html
21. Larry C. Wadsworth, Christine Sun and Dong Zhang. Findings of Reicofil bicomponent meltblown research program.
22. Connor, U.S. Patent 5455110, assigned to Kimberly-Clark Corporation, 1994.
23. Carlson, U.S. Patent 5561863, assigned to Kimberly-Clark Corporation, 1994.
24. Shawver et al., U.S. Patent 5540976, assigned to Kimberly-Clark Corporation,
1995.
25. Strack et al., U.S. Patent 5681645, assigned to Kimberly-Clark Corporation, 1995.
26. Bornslaeger, U.S. Patent 4374888, assigned to Kimberly-Clark Corporation,
1981.

64
27. Assent et al., U.S. Patent 5236770, assigned to Carl Freudenberg, 1992.
28. Connor et al., U.S. Patent 5366786, assigned to Kimberly-Clark Corporation, 1992.
29. Gupta et al., U.S. Patent 5654088, assigned to Hercules Incorporated, 1995.
30. Brock et al., U.S. Patent 4766029, assigned to Kimberly-Clark Corporation,
1987.
31. Shawver, Susan Elaine, U.S. Patent 5709921, assigned to Kimberly-Clark Worldwide, Inc., 1995
32. Allen Martin A., U.S. Patent 6182732, assigned to Nordson Corporation, 1998.
33. Antonacci Paul N., U.S. Patent 5073436, assigned to Amoco Corporation
1990.
34. Willey; Jacqueline A., U.S. Patent 5766737, assigned to Fiberweb North America, Inc., 1996.
35. Srinivasan Ramesh, U.S. Patent 6025050, assigned to BBA Nonwovens
Simpsonville, Inc., 1998
36. Lickfield Deborah K., U.S. Patent 5804512, assigned to BBA Nonwovens Simpsonville, Inc., 1995.
37. Paul E. Spector. (1993) SAS programming for researchers and social scientists.
Newbury Park: Sage Publications.
38. Andre I. Khuri, John A. Cornell (1987) Response surfaces designs and analysis. New York: M. Dekker
39. Charles K. Bayne, Ira B. Rubin Practical experimental designs and
optimization methods for chemists. Deerfield Beach, FL, USA: VCH Publishers
40. N.R. Draper, H. Smith Applied regression analysis.
41. NIST/SEMATECH. Engineering Statistics Handbook. Available:
http://www.itl.nist.gov/div898/handbook/

65
APPENDIX

66
Following procedural statements were used for the analysis in SAS proc glm; class temp press pp bico type;
model flex hydro airperm tenacity= temp press pp bico type;
means temp press pp bico type;
means temp press pp bico type /tukey;
run;.
proc glm; class temp press pp bico type;
model flex = temp press pp bico type pp*bico pp*type bico*type;
means temp press pp bico type;
means temp press pp bico type /tukey;
run;.
proc glm; class temp press pp bico type;
model hydro = temp press pp bico type temp*pp temp*bico temp*type
pp*bico pp*type bico*type ;
means temp press pp bico type;
means temp press pp bico type /tukey;
lsmeans pp*bico / /*pdiff*/ slice=bico;
lsmeans pp*type / /*pdiff*/ slice=type; run;.
proc glm; class temp press pp bico type;
model airperm = temp press pp bico type bico*type;

67
means temp press pp bico type;
means temp press pp bico type /tukey;
run;.
proc sort;by pp; proc glm;by pp; class bico type;
model hydro = bico type ;
means bico type;
means bico type /tukey;
run;.
Significant main effects can be observed from the below data:
Dependent Variable: flex
Source DF Type I SS Mean Square F Value Pr > F
temp 2 11428.5756 5714.2878 3.70 0.0296
press 2 101.3278 50.6639 0.03 0.9677
pp 3 18982.4652 6327.4884 4.10 0.0097
bico 1 11014.4850 11014.4850 7.14 0.0094
type 1 146021.8382 146021.8382 94.64 <.0001

68
Source DF Type III SS Mean Square F Value Pr > F
temp 2 11428.5756 5714.2878 3.70 0.0296
press 2 101.3278 50.6639 0.03 0.9677
pp 3 18982.4652 6327.4884 4.10 0.0097
bico 1 11014.4850 11014.4850 7.14 0.0094
type 1 146021.8382 146021.8382 94.64 <.0001
Dependent Variable: hydro
Source DF Type I SS Mean Square F Value Pr > F
temp 2 621.051457 310.525728 4.75 0.0117
press 2 220.391653 110.195826 1.68 0.1930
pp 3 4201.472430 1400.490810 21.41 <.0001
bico 1 1481.806062 1481.806062 22.65 <.0001
type 1 1710.862738 1710.862738 26.15 <.0001
Source DF Type III SS Mean Square F Value Pr > F
temp 2 1683.311530 841.655765 12.87 <.000
press 2 59.558914 29.779457 0.46 0.6362
pp 3 2416.434152 805.478051 12.31 <.0001
bico 1 1669.011417 1669.011417 25.51 <.0001
type 1 1710.862738 1710.862738 26.15 <.0001

69
Dependent Variable: air permeability
Source DF Type I SS Mean Square F Value Pr > F
temp 2 621.051457 310.525728 4.75 0.0117
press 2 220.391653 110.195826 1.68 0.1930
pp 3 4201.472430 1400.490810 21.41 <.0001
bico 1 1481.806062 1481.806062 22.65 <.0001
type 1 1710.862738 1710.862738 26.15 <.0001
Source DF Type III SS Mean Square F Value Pr > F
temp 2 1683.311530 841.655765 12.87 <.0001
press 2 59.558914 29.779457 0.46 0.6362
pp 3 2416.434152 805.478051 12.31 <.0001
bico 1 1669.011417 1669.011417 25.51 <.0001
type 1 1710.862738 1710.862738 26.15 <.0001
Dependent Variable: tenacity
Source DF Type I SS Mean Square F Value Pr > F
temp 2 499.5578780 249.7789390 4.10 0.0207
press 2 18.6094320 9.3047160 0.15 0.8587
pp 3 429.9717462 143.3239154 2.35 0.0796

70
bico 1 500.1256046 500.1256046 8.21 0.0055
type 1 592.6305167 592.6305167 9.73 0.0026
Source DF Type III SS Mean Square F Value Pr > F
temp 2 474.3934594 237.1967297 3.89 0.0249
press 2 12.8349474 6.4174737 0.11 0.9002
pp 3 246.8840829 82.2946943 1.35 0.2651
bico 1 436.7032199 436.7032199 7.17 0.0092
type 1 592.6305167 592.6305167 9.73 0.0026
Significant interaction terms can be observed in below data:
Dependent variable: Flexural rigidity
Source DF Type I SS Mean Square F Value Pr > F
temp 2 11428.5756 5714.2878 3.74 0.0292
press 2 101.3278 50.6639 0.03 0.9674
pp 3 18982.4652 6327.4884 4.14 0.0096
bico 1 11014.4850 11014.4850 7.20 0.0093
type 1 146021.8382 146021.8382 95.47 <.0001
pp*bico 2 1745.7434 872.8717 0.57 0.5680
pp*type 3 4912.5133 1637.5044 1.07 0.3679
bico*type 1 3459.1438 3459.1438 2.26 0.1375

71
Source DF Type III SS Mean Square F Value Pr > F
temp 2 708.51743 354.25872 0.23 0.793
press 2 2481.12434 1240.56217 0.81 0.4489
pp 3 22013.42592 7337.80864 4.80 0.0045
bico 1 12343.42589 12343.42589 8.07 0.0060
type 1 99111.07651 99111.07651 64.80 <.0001
pp*bico 2 2892.02333 1446.01166 0.95 0.3939
pp*type 3 5406.51597 1802.17199 1.18 0.3250
bico*type 1 3459.14382 3459.14382 2.26 0.1375
Dependent variable: Hydrostatic head
Source DF Type I SS Mean Square F Value Pr > F
temp 2 11428.5756 5714.2878 3.74 0.029
press 2 101.3278 50.6639 0.03 0.9674
pp 3 18982.4652 6327.4884 4.14 0.0096
bico 1 11014.4850 11014.4850 7.20 0.0093
type 1 146021.8382 146021.8382 95.47 <.0001
pp*bico 2 1745.7434 872.8717 0.57 0.5680
pp*type 3 4912.5133 1637.5044 1.07 0.3679
bico*type 1 3459.1438 3459.1438 2.26 0.1375
Source DF Type III SS Mean Square F Value Pr > F

72
temp 2 708.51743 354.25872 0.23 0.7939
press 2 2481.12434 1240.56217 0.81 0.4489
pp 3 22013.42592 7337.80864 4.80 0.0045
bico 1 12343.42589 12343.42589 8.07 0.0060
type 1 99111.07651 99111.07651 64.80 <.0001
pp*bico 2 2892.02333 1446.01166 0.95 0.3939
pp*type 3 5406.51597 1802.17199 1.18 0.3250
bico*type 1 3459.14382 3459.14382 2.26 0.137
Dependent variable: Air permeability
Source DF Type I SS Mean Square F Value Pr > F
temp 2 699.54749 349.77375 1.23 0.2996
press 2 148.07715 74.03857 0.26 0.7721
pp 3 6403.73838 2134.57946 7.49 0.0002
bico 1 14080.72295 14080.72295 49.38 <.0001
type 1 1058.87608 1058.87608 3.71 0.0581
bico*type 1 192.57213 192.57213 0.68 0.4141
Source DF Type III SS Mean Square F Value Pr > F
temp 2 657.35392 328.67696 1.15 0.3218
press 2 55.49302 27.74651 0.10 0.9074
pp 3 1754.69574 584.89858 2.05 0.1148
bico 1 14183.33054 14183.33054 49.73 <.0001
type 1 1206.84966 1206.84966 4.23 0.0435
bico*type 1 192.57213 192.57213 0.68 0.414

73
Dependent variable: tenacity
Source DF Type I SS Mean Square F Value Pr > F
Temp 2 499.5578780 249.7789390 4.05 0.021
press 2 18.6094320 9.3047160 0.15 0.8603
pp 3 429.9717462 143.3239154 2.32 0.0826
bico 1 500.1256046 500.1256046 8.11 0.0058
type 1 592.6305167 592.6305167 9.61 0.0028
bico*type 1 8.2973363 8.2973363 0.13 0.7149
Source DF Type III SS Mean Square F Value Pr > F
Temp 2 477.7189604 238.8594802 3.87 0.0255 press 2 13.7318457 6.8659228 0.11 0.8948 pp 3 243.6155278 81.2051759 1.32 0.2762 bico 1 443.0260768 443.0260768 7.18 0.0092 type 1 595.4745066 595.4745066 9.65 0.0027 bico*type 1 8.2973363 8.2973363 0.13 0.7149

74
VITA
Shaker Gaddam was born in Karimnagar, India on August 30th, 1978. He grew up in
Andhra pradesh state and did his schooling in Karimnagar district. He joined Vignan
Intermediate College in Guntur district with his major concentration on mathematics,
physics and chemistry. He joined the Osmania University for his Bachelor’s degree
majoring in textile technology in 1995 and obtained his degree in 1999. In spring
2000, he joined the University of Tennessee, Knoxville. He was working as graduate
research assistant while he was studying for his Master’s degree in Textile Science.