A Study of Nontraditional Referral and Screening of Culturally ...
141
Louisiana State University Louisiana State University LSU Digital Commons LSU Digital Commons LSU Historical Dissertations and Theses Graduate School 1994 A Study of Nontraditional Referral and Screening of Culturally A Study of Nontraditional Referral and Screening of Culturally Different Gifted Children. Different Gifted Children. Jo Anne Welch Louisiana State University and Agricultural & Mechanical College Follow this and additional works at: https://digitalcommons.lsu.edu/gradschool_disstheses Recommended Citation Recommended Citation Welch, Jo Anne, "A Study of Nontraditional Referral and Screening of Culturally Different Gifted Children." (1994). LSU Historical Dissertations and Theses. 5704. https://digitalcommons.lsu.edu/gradschool_disstheses/5704 This Dissertation is brought to you for free and open access by the Graduate School at LSU Digital Commons. It has been accepted for inclusion in LSU Historical Dissertations and Theses by an authorized administrator of LSU Digital Commons. For more information, please contact [email protected].
-
Upload
khangminh22 -
Category
Documents
-
view
2 -
download
0
Transcript of A Study of Nontraditional Referral and Screening of Culturally ...

Louisiana State University Louisiana State University
LSU Digital Commons LSU Digital Commons
LSU Historical Dissertations and Theses Graduate School
1994
A Study of Nontraditional Referral and Screening of Culturally A Study of Nontraditional Referral and Screening of Culturally
Different Gifted Children. Different Gifted Children.
Jo Anne Welch Louisiana State University and Agricultural & Mechanical College
Follow this and additional works at: https://digitalcommons.lsu.edu/gradschool_disstheses
Recommended Citation Recommended Citation Welch, Jo Anne, "A Study of Nontraditional Referral and Screening of Culturally Different Gifted Children." (1994). LSU Historical Dissertations and Theses. 5704. https://digitalcommons.lsu.edu/gradschool_disstheses/5704
This Dissertation is brought to you for free and open access by the Graduate School at LSU Digital Commons. It has been accepted for inclusion in LSU Historical Dissertations and Theses by an authorized administrator of LSU Digital Commons. For more information, please contact [email protected].

INFORMATION TO USERS
This manuscript has been reproduced from the microfilm master. UMI films the text directly from the original or copy submitted. Thus, some thesis and dissertation copies are in typewriter face, while others may be from any type of computer printer.
The quality of this reproduction is dependent upon the quality of the copy submitted. Broken or indistinct print, colored or poor quality illustrations and photographs, print bleedthrough, substandard margins, and improper alignment can adversely affect reproduction.
In the unlikely event that the author did not send UMI a complete manuscript and there are missing pages, these will be noted. Also, if unauthorized copyright material had to be removed, a note will indicate the deletion.
Oversize materials (e.g., maps, drawings, charts) are reproduced by sectioning the original, beginning at the upper left-hand corner and continuing from left to right in equal sections with small overlaps. Each original is also photographed in one exposure and is included in reduced form at the back of the book.
Photographs included in the original manuscript have been reproduced xerographically in this copy. Higher quality 6" x 9" black and white photographic prints are available for any photographs or illustrations appearing in this copy for an additional charge. Contact UMI directly to order.
University Microfilms International A Bell & Howell Information Company
300 North Zeeb Road. Ann Arbor. Ml 48106-1346 USA 313/761-4700 800/521-0600


Order N um ber 9425234
A study o f nontraditional referral and screening of culturally different gifted children
Welch, Jo Anne, Ph.D.The Louisiana State University and Agricultural and Mechanical Col., 1994
UMI300 N. ZeebRd.Ann Arbor, MI 48106


A STUDY OFNONTRADITIONAL REFERRAL AND SCREENING OF
CULTURALLY DIFFERENT GIFTED CHILDREN
A Dissertation
Submitted to the Graduate Faculty of the Louisiana State University and
Agricultural and Mechanical College in partial fulfillment of the requirements for the degree of
Doctor of Philosophy
in
The Department of Curriculum and Instruction
byJo Anne Welch
B.A., Millsaps College, 1960 M.Ed., University of Southern Mississippi, 1977
May 1994

ACKNOWLEDGEMENTS
Sincere appreciation is expressed to Dr. F. Neil Mathews for his leadership as chair and major professor during my doctoral studies. Appreciation is also expressed to Dr. Diane Burts, Dr. Rita Culross, Dr. William E. Doll, Jr., Dr. Joe L. Green and Dr. Ann Trousdale for their time and assistance. I wish to thank Dr. Harry Hale and Dan Lindow for their expertise.
To Delta Kappa Gamma Society International, a special expression of appreciation is given for awarding me an international doctoral scholarship. To Phi Delta Kappa, special appreciation is given for awarding me the Howard M. Soule Doctoral Fellowship. To Pat Clay Dial and the Louisiana Office of Special Education, gratitude is given for allowing me to use data collected as a result of an 8(g) grant from the Louisiana Board of Elementary and Secondary Education (BESE).
Finally, my love and gratitude are extended to my husband, Thom, to our two sons and their wives, to my parents, other family members and friends for the encouragement and support they have given me throughout my doctoral pursuit.

TABLE OF CONTENTSpage
ACKNOWLEDGMENTS .................................... iiLIST OF TABLES ..................................... viABSTRACT ........................................... viiiCHAPTER
1 INTRODUCTION ............................. 1Statement of the Research Problem ........ 9Research Questions ....................... 10Definition of Terms ........... 11Limitations of the Study ................. 14Organization of the Chapters ............. 15
2 REVIEW OF THE RELATED LITERATURE ......... 16Historical Development of the
Concept of Gifted ..................... 16Identification Procedures for
Gifted Placement ...................... 24Characteristics of the Culturally
Different ............................. 36Underrepresentation Issues Among the
Culturally Different .................. 41Approaches in Identifying
Minority Gifted ........... 45Summary .................................. 48
3 METHODOLOGY .............................. 50Purpose of the Study ..................... 50Research Questions ....................... 50Design ................................... 51Subjects ......... 52Procedures ........ 55Nontraditional Procedures ................ 55
Nontraditional Referral ............... 55Nontraditional Screening .............. 56Assessment ............................ 57
Traditional Referral and Screening ....... 57Procedures ............................ 57
Development of Instruments ............... 58Instruments .............................. 60
Intelligence Test ..................... 60Achievement Tests ..................... 61Creativity and Leadership Scales ...... 62Demographic Questionnaire ............. 65Data Processing and Analysis .......... 65
iii

page
4 ANALYSIS OF THE DATA ..................... 67Research Questions ....................... 67Characteristics of the Sample ............ 68Descriptive Statistics for Each Research
Question ............................. 72Question 1: Analysis and Results ..... 72Question 2: Analysis and Results ..... 74Question 3: Analysis and Results ..... 76Question 4: Analysis and Results ..... 79Question 5: Analysis and Results ..... 79
Qualitative Analysis and Results . 81Quantitative Analysis and Results. 84
Question 6: Analysis and Results ..... 87Question 7: Analysis and Results ..... 88
5 SUMMARY, CONCLUSIONS, AND RECOMMENDATIONS . 92Research Questions ....................... 93Summary .................................. 94
Sample Characteristics ................ 94Conclusions ............... 95
Conclusion One ........................ 9 5Conclusion Two ........................ 9 6Conclusion Three ...................... 97Conclusion Four ....................... 9 8Conclusion Five .... 98Conclusion Six ........................ 99Conclusion Seven ...................... 99
Recommendations for Policy, Practice andFurther Research ...................... 101
REFERENCES .................................... 104APPENDICES
A. CREATIVITY CHECKLIST ................ IllB. CREATIVITY CHECKLIST FOR PARENTS AND
TEACHERS........................... 113C. LEADERSHIP CHECKLIST ................ 115D. LEADERSHIP CHECKLIST FOR PARENTS AND
TEACHERS .......................... 117E. PARENT DEMOGRAPHIC INFORMATION ...... 119F. TEACHER DEMOGRAPHIC INFORMATION....... 121G. FEDERAL DEFINITION OF ETHNIC
GROUPS ............................ 123
iv

page
H. EXAMPLES FOR CATEGORICALCONSTRUCTS ......................... 124
VITA ............................................ 126
V

LIST OF TABLESTABLE page1. Student Enrollment Data for 1991-92 Experimental
and Control Sites ............................... 532. Sample Data on Referrals for Screening by Race
in the Experimental and Control Sites ............ 543. Teacher Demographic Information for Experimental
and Control Schools ............................. 704. Chi-square Comparison of Minority Students
Referred by Nontraditional Methods in Experimental Schools and Traditional Methods in ControlSchools......................................... 73
5. Chi-square Comparison of White Students Referred by Nontraditional Methods in Experimental Schoolsand Traditional Methods in Control Schools...... 73
6. Chi-square Comparison of Minority Students Who Passed Screening by Nontraditional Methods in Experimental Schools and Traditional Methods in Control.Schools ................................ 75
7. Chi-square Comparison of White Students Who Passed Screening by Nontraditional Methods in Experimental Schools and Traditional Methods in Control Schools ................................ 75
8. Chi-square Comparison of Students Who Passed Nontraditional Screening Using Leadership Scalesby Teachers and Parents ........................ 77
9. Chi-square Comparison of Students Who Passed Nontraditional Screening Using Creativity Scalesby Teachers and Parents ........................ 78
10. Chi-square Comparison of Minority Students Who were Identified as Gifted when Assessed by Traditional Methods in the Experimental andControl Schools ........................ 80
11. Chi-square Comparison of White Students Who Were Identified as Gifted when Assessed by Traditional Methods in the Experimental and ControlSchools ........................................ 80
12. Frequency Counts of Teacher/Parent Responses on Creativity Items by Category ................... 82
vi

TABLE page13 . Frequency Counts of Teacher/Parent Responses on
Leadership Items by Category ..................... 8314. Chi-square Summary Comparison of Teacher/Parent
Scores on Creativity: Cognitive, Affective andBehavioral Category .............................. 86
15. Chi-square Summary Comparison of Teacher/Parent Scores on Leadership: Cognitive, Affective andBehavioral Category .............................. 86
16a. Chi-square Item Analysis of Significant Difference in Teacher/Parent Scores on CreativityCategories ....................................... 89
16b. Chi-square Item Analysis of Significant Difference in Teacher/Parent Scores on Leadership Categories ....................................... 91
vii

ABSTRACTThe purpose of this study was to determine the
effectiveness of using nontraditional referral and screening procedures to identify culturally different (minority) gifted children. The extreme disparity of representative frequencies of these groups within gifted programs nationally and in Louisiana prompted research in four parishes (counties) to compare nontraditional with traditional identification procedures. The nontraditional referral procedures included child search methods and parent and teacher training about the characteristics of giftedness among culturally different populations. Nontraditional screening procedures included the use of creativity and leadership checklists, analysis of achievement in all academic areas, and the use of the Matrix Analogies Test- Short Form (MAT-SF) as an intelligence measure. Chi-square tests of association and qualitative analyses were used to analyze data. Among the referral sample (M = 276) of
students in grades 1-5, larger numbers of minorities were referred and screened using nontraditional methods. A significant difference was found (p. < .001) in the
proportion of minorities ultimately identified as gifted. Final eligibility for program placement was based on achievement tests and intelligence tests.
A significant difference (p < .05) was found between teacher and parent ratings on the creativity checklist. In the qualitative analysis of parent/teacher narrative
viii

comments on the Creativity and Leadership Checklists (n=17), parents named significantly more indicators of creativity than did teachers. Similarities were found in parents' and teachers' observations of students concerning creativity and leadership behaviors. Using qualitative analysis, three categorical patterns in leadership and creativity indicators were identified: cognitive, affective and behavioral.
Further research should investigate specific nontraditional assessment procedures that include measures to determine cultural characteristics of minority gifted children. Particular attention should be given to the areas of creativity and leadership as a part of the total assessment process. Additionally, such research should attempt to determine the effectiveness of the assessment procedures to provide a description of the child's abilities socially, creatively, academically and intellectually.

CHAPTER 1 INTRODUCTION
The ideal aim for educational opportunities in American schools is that equal opportunities for appropriate education should exist for all. Although this aim is supported by parents, educators and the public in general, a critical review of the literature does not provide evidence that this American goal has been achieved. The reality is that extreme disparity and discrepancies are found in the ethnic representation of children in many programs, including those for academically gifted. The ethnic composition of the general population in the United States is currently 77% White, 12% African-American, 9% Hispanic, and almost 3% Asian Pacific (Poonwassie, 1992). White students are referred at a greater rate for gifted programs than are minority students. As a result, they are placed in programs for the gifted as a disproportionate majority (Cohen, 1990).
Some twenty years ago the Federal Government recognized the need for minority representation in educational programs for the academically gifted. Awareness was created by the Marland Report (1972) to Congress on the education of the gifted and talented which was the United States Office of Education's response to the Elementary and Secondary Education Amendments of 1969 (PL91-230). A priority recommendation made by this report was to support programs designed to improve the screening and

identification of gifted students representing varied cultures and backgrounds. In response to the Marland Report, the Office of Gifted and Talented was established in 1972.
Historically, the definition of "gifted and talented" was first specified within the Marland Report. PL91-230, Section 806 defines the terms as follows: "Gifted andtalented children are those identified by professionally qualified persons who by virtue of outstanding abilities are capable of high performance." Differentiated educational programs and/or services are required for these children beyond those normally provided by the regular school program in order that the realization of their potential contribution to self and society may be assured. . The high performance of children included those who demonstrate achievement and/or potential ability in any one or more of the following areas:
1. General intellectual ability2. Specific academic aptitude3. Creative or productive thinking4. Leadership ability5. Visual and performing arts6. Psychomotor ability.The most recent federal definition (PL100-297) resulted
from the Jacob K. Javits Gifted and Talented Students Education Act of 1988. This act amended the Elementary and Secondary Education Act's definition as follows:

The term "gifted and talented students" means children and youth who give evidence of high performance capability in areas such as intellectual, creative, artistic, or leadership capacity, or in specific academic fields, and who require service or activities not ordinarily provided by the school in order to fully develop such capabilities. (1988, Title IV, Part B,Sec. 4103)Using the broad criteria for identification of the
gifted and talented set forth in PL100-297, it can be generally assumed that 3% to 5% of the school population will qualify (c.f. Shore, Cornell, Robinson, Ward, 1991; Sisk, 1987). However, most identification procedures and programs continue to focus primarily on the intellectually gifted. According to the 1990 State of the States Gifted and Talented Report (1991), intelligence test scores comprise the main criteria of identification. In its annual report conducted by the Council of State Directors of Programs for the Gifted (1991), the survey results indicated that general intellectual ability and specific academic aptitude continue to comprise the primary definition of giftedness in 44 states.
A problem persists in identifying representative numbers of gifted children from minority populations. This is particularly problematic where the definition is limited to general intellectual ability or capacity as determined solely by intelligence tests. Conventional screening methods tend to identify a much higher representation of gifted children among the majority population than among the minority population.

A study conducted by the Richardson Foundation in Texas (Cox, 1985) addressed the issue of minority underrepresentation in its national survey. The focus of this study was upon the educational provision for high ability students who had been labeled "able learners." A major finding revealed the inefficiency and ineffectiveness of standardized instruments in identifying underrepresented gifted students, where neither language factors nor cultural strengths are taken into account. The issue of cultural bias in testing remains a concern since there is evidence that some intelligence and achievement tests contain items that are indicative of cultural bias (Bernal & Reyna, 1975; Cohen, 1990; Frasier, 1989; Marker, 1982; Richert, 1987; Torrance, 1977). The study concluded with a recommendation for the replacement of the practice of using a narrow range of identification methods with multi-faceted procedures that address multiple talents among many children (Cox, 1985). Passow (1984) recommends using a multi-dimensional, multimodal and multi-faceted practice that would provide a multicultural matrix for assessment of minority students.
The recommendation to use a variety of identification methods occurs throughout the research literature. The rationale is grounded in the theory of assessing the whole child to include cultural strengths, as well as academic and intellectual strengths. The idea of multiple criteria reduces the chance that poor, minority and other
systematically marginalized groups of children will be ignored. For example, Stanley (1984) recommended that "a variety of measures, general and specific, are needed to assure a more democratic procedure" (p. 177).
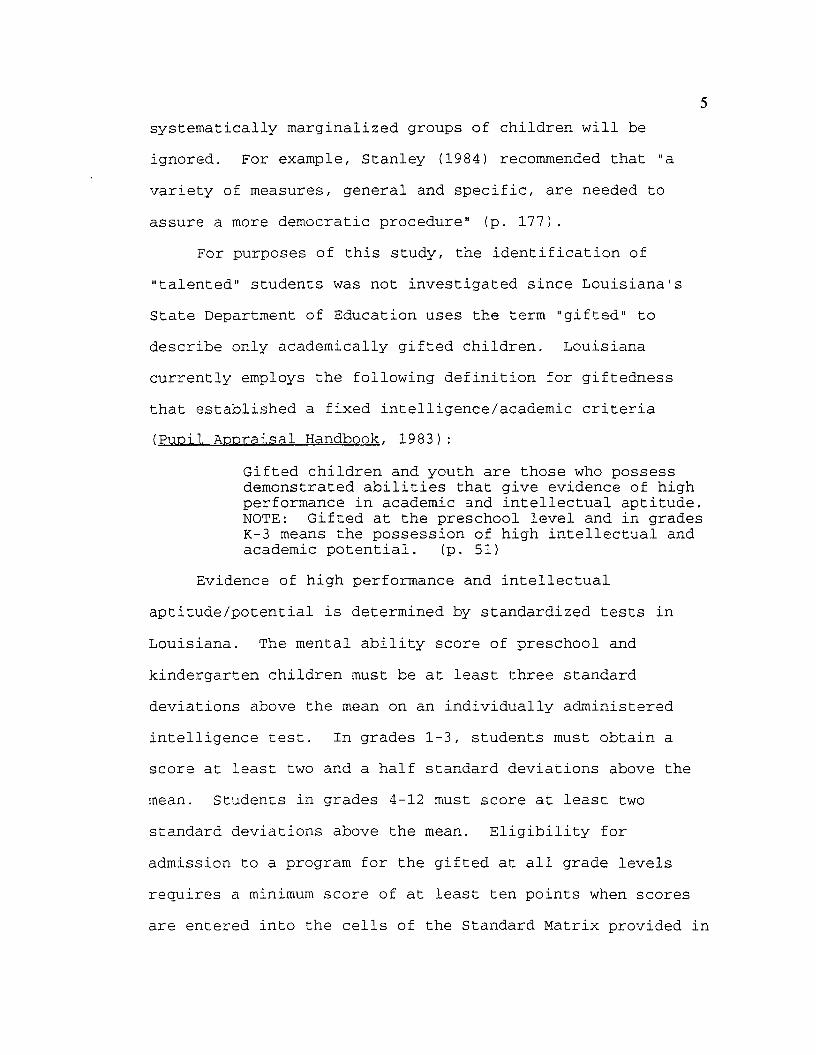
For purposes of this study, the identification of"talented" students was not investigated since Louisiana'sState Department of Education uses the term "gifted" todescribe only academically gifted children. Louisianacurrently employs the following definition for giftednessthat established a fixed intelligence/academic criteria(Pupil Appraisal Handbook. 1983):
Gifted children and youth are those who possess demonstrated abilities that give evidence of high performance in academic and intellectual aptitude. NOTE: Gifted at the preschool level and in gradesK-3 means the possession of high intellectual and academic potential. (p. 51)
Evidence of high performance and intellectual aptitude/potential is determined by standardized tests in Louisiana. The mental ability score of preschool and kindergarten children must be at least three standard deviations above the mean on an individually administered intelligence test. In grades 1-3, students must obtain a score at least two and a half standard deviations above the mean. Students in grades 4-12 must score at least two standard deviations above the mean. Eligibility for admission to a program for the gifted at all grade levels requires a minimum score of at least ten points when scores are entered into the cells of the Standard Matrix provided in

Bulletin 1508. At least four points must be earned on the aptitude/intelligence tests. Academic achievement in the areas of math and reading comprise the first and second cells of the matrix; intelligence is the third cell. For those students who obtain at least six points in the matrix, further evaluation is required (1983, p. 53).
The classroom teacher should be consulted to determine the student's educational performance within the classroom. Behavioral observations during performance on at least one structural or criterion referenced individually administered test also is required. Of special significance is the notation within the guidelines that calls attention to the influence of other factors on standardized testing.According to Bulletin 1508, "Few if any standardized assessment instruments adequately control for the effect of such factors as environmental impoverishment, cultural differences, or the lack of opportunities to learn" (p. 54).
Louisiana's Bulletin 1508 provides the latitude for the pupil appraisal staff to recommend whether or not a student should be classified as gifted. Students may be included who are from culturally diverse populations or are considered environmentally deprived of educational opportunities. Where significant discrepancies are found between formal testing and the student's customary behaviors and daily activities or discrepancies among test results, these observations should
be examined closely during the evaluation and addressed in the evaluation report.
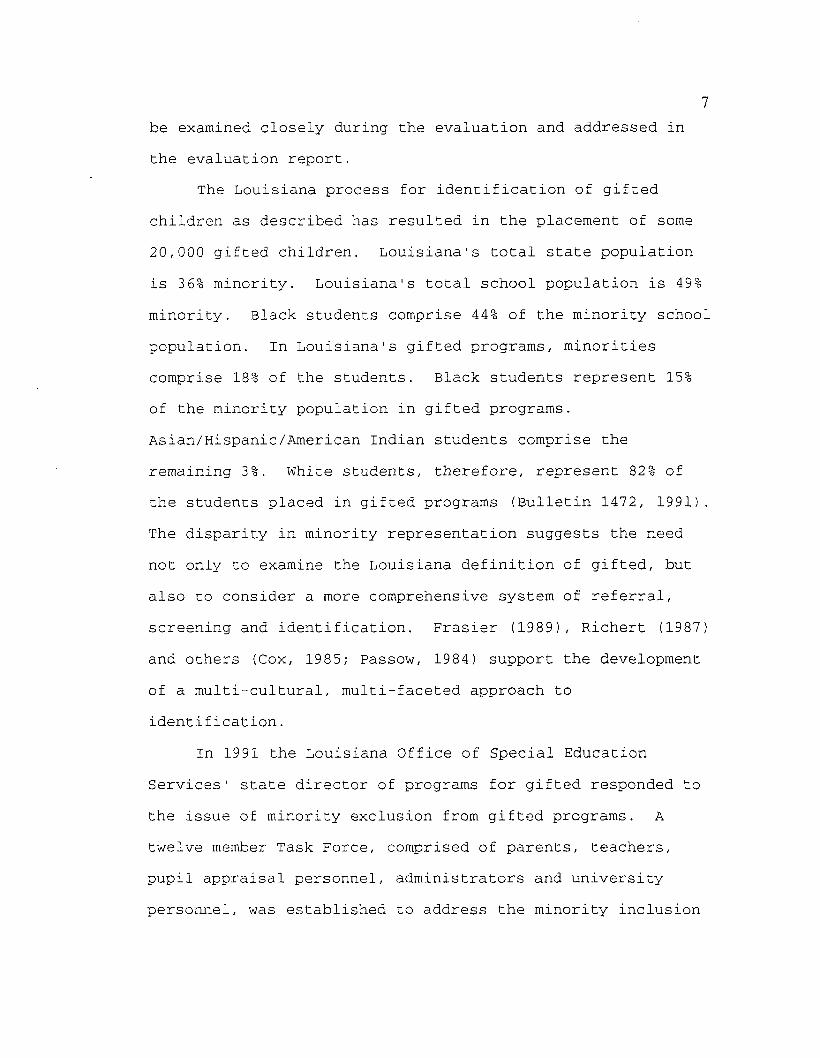
The Louisiana process for identification of gifted children as described has resulted in the placement of some 20,000 gifted children. Louisiana's total state population is 3 6% minority. Louisiana's total school population is 49% minority. Black students comprise 44% of the minority school population. In Louisiana's gifted programs, minorities comprise 18% of the students. Black students represent 15% of the minority population in gifted programs.As ian/Hispanic/American Indian students comprise the remaining 3%. White students, therefore, represent 82% of the students placed in gifted programs (Bulletin 1472, 1991). The disparity in minority representation suggests the need not only to examine the Louisiana definition of gifted, but also to consider a more comprehensive system of referral, screening and identification. Frasier (1989), Richert (1987) and others (Cox, 1985; Passow, 1984) support the development of a multi-cultural, multi-faceted approach to identification.
In 1991 the Louisiana Office of Special Education Services' state director of programs for gifted responded to the issue of minority exclusion from gifted programs. A twelve member Task Force, comprised of parents, teachers, pupil appraisal personnel, administrators and university personnel, was established to address the minority inclusion

ratios in gifted programs. The Task Force approved a three- year pilot study to determine whether minority representation in gifted programs could be increased within experimental sites by employing each of the following approaches:
1. Child search (see Definition of Terms, page 12).
2. Parent and teacher training to identify characteristics of minority gifted children.
3 . Use of a multiple criteria matrix that expanded referral and screening components.
4. Use of an alternative assessment matrix.The pilot study, now in its third year, was supported
and funded by a grant from Louisiana 8(g) monies received as revenues from special mineral trust funds. A copy of the three-year effort is on file in the office of the Louisiana state director of programs for gifted. The three-year pilot study to refer, screen and identify underrepresented minority children using nontraditional methods is singular in its importance to determine if the recommendations found within the literature apply to Louisiana.
No single method for referral and screening the gifted is practical, and it appears that there is consensus to support new and nontraditional approaches to locating minority gifted children. This research study was an attempt to examine the consistent recommendation for the use of multiple criteria to refer, screen and identify minority gifted.

Statement of the Research Problem
Louisiana defines an academically gifted student as one who has superior intellectual ability and evidences high academic performance. The mental development score of a gifted student should be found within two or more standard deviations above the mean on a standardized test of intelligence (Bulletin 1508, 1983).
When conventional measures of intellectual ability and academic achievement are the only criteria for inclusion in programs for gifted, minority students often fail to meet the criteria of such a limited definition. It is clear that undue reliance upon only two pieces of data for screening and identification of giftedness presents a primary obstacle to minority children being considered for placement.
Other cultural factors may have affected minority underrepresentation in the gifted population. The educational level of parents, educational opportunity in the community, support systems available within the minority populations and community bias against integration may each be considered as deterrents to the inclusion of minority gifted. While there may be varied assumptions for nonidentification, this study will only examine nontraditional referral, screening and identification procedures.
There appears to be disparity in the 18% minority placement in Louisiana's gifted programs compared with the 49% minority representation in the total school population.

10
This may suggest that referral and screening of minorities occurs infrequently or not at all.
The purpose of this study was to determine the effectiveness of nontraditional or alternative referral and screening procedures to address the identification issue of minority gifted children in Louisiana. The study was based on the assumption that if inadequate numbers of minority children are not referred for possible placement in a program for gifted, they cannot be identified. The study was accomplished through the analysis of data collected in 1991- 92 by the Louisiana Office of Special Education Service Director of Programs for Gifted.
Research QuestionsThe following questions frame the research:1. What effect does the Child Search procedure have on
the initiation of referrals for screening from parents and teachers?
2. Is there a significant difference in the frequency of culturally different (minority) students recommended for assessment who passed nontraditional screening when compared to those who passed traditional screening?
3. Is there a difference between the frequencies of students who passed screening either by scores from the teacher or by the parent scores on Creativity and Leadership scales?

4. Is there an increase in the frequency of culturally different children (minority) who are identified for gifted programs using nontraditional referral and screening and traditional assessment methods when compared to those identified using traditional referral, screening and assessment methods?
5. How are the creativity and leadership behaviors of those children who passed screening described by their parents and teachers?
6. Are there similarities in the students' creativity and leadership behaviors as described by parents and teachers?
7. What differences in students' creativity and leadership behaviors as described by parents and teachers appear to be significant?
Definition of Terms
The following definitions were used for terms within the study:
Academically crifted--the student who possesses superior
intellectual development at least two standard deviations above the mean, is capable of high performance, exhibits a majority of the characteristics of a gifted child and demonstrates the need for a special program.
Assessment--the complete evaluation process employed for
gifted eligibility determination, which may include individual standardized testing (i.e., intelligence,

12
achievement and others), creativity, leadership and other pertinent data.
Case studv--a single document containing an assortment
of data collected on an individual student who is nominated to be screened for gifted evaluation and placement. The data collected are compiled as a portfolio containing items such as teacher referral, parent referral, screening results, anecdotal information, student work samples and characteristics checklists.
Child Search--the procedures employed by the
experimental school districts to create awareness of the characteristics of minority gifted children. The procedures included: letters and a brochure sent to all parents; forparents who responded and for all teachers, an in-service session that further described characteristics of minority gifted.
Culturally different--a population group whose predominant culture is different from the majority of the population, i.e. those who are not white.
Disadvantaged--an economic definition of those children
from any culture who qualify for free or reduced lunch according to the guidelines set by the United States Congress July 1 of each year.
Identification--the process used to determine the
eligibility of a student for inclusion in an educational

program for the gifted. The process may include referrals, screening, individual testing and case studies.
Intelligence tests--a standardized test that uses the ratio of mental age to chronological age to obtain an index referred to as an intelligence quotient (IQ).
Leadership--behaviors exhibited by a student that are
rated by specific characteristics reflected as typical on a given scale attributed to leadership traits.
Minority aroup--a cultural group that is not a part of
the majority culture.Nontraditional--the practice or system that deviates
from that which is established or most frequently employed.Placement--the setting within a school facility to which
a gifted student is entitled following eligibility determination.
Portfolio--a collection of items for an individual
student that may include student's work samples, biographical data, anecdotal information, student products, characteristics checklists and referrals of parent and teachers. The contents are used to develop a case study.
Referral--the request from a person or persons to the
school that initiates the collection of data for gifted screening of a student for eligibility considerations in a gifted program.
Screening--the review of a student's performance which
may include academic achievement, group and individual
14
achievement tests, creativity, leadership, mental ability or other assessments preliminary to formal evaluation for determination of gifted eligibility.
Traditional--the established, popular or most frequently
accepted practices.Underrepresented--any group or culture group that is not
represented in an appropriate ratio to the majority group or culture group, for example, minorities, females or handicapped gifted.Note: Federal definitions of ethnic groups are found in
Appendix G. In this study, the term "black," used by school districts in their annual statistical report of ethnic groups to the Louisiana Department of Education, is used to represent African-American students.
Limitations of the Study
There were only four experimental sites that participated in nontraditional screening procedures for gifted children. An additional limitation was that the eight schools may not be similar in all respects and may not be representative of other areas of the state or the country. Matched pairing of schools occurred rather than random selection of students. A third limitation was that teachers and parents in the experimental sites were aware that minority students were being targeted for gifted referral; therefore, their survey results may have been affected by

this knowledge. A final limitation was that parents and teachers in the control schools may also have been aware of the research being conducted in the parish; therefore, the results of the study may have been affected by that knowledge. Actual conclusions are delimited to those particular parishes (counties) represented in the research.
Organization of the Chapters
The remaining chapters are organized in the following manner. The second chapter provides a review of studies that relate to the dissertation topic. There are five major sections: Historical Development of the Concept of Gifted,Identification Procedures for Gifted Placement, Characteristics of the Culturally Different, Underrepresentation Issues Among the Culturally Different, and Promising Approaches in Identifying Minority Gifted. The third chapter provides a discussion of the methodology of the study. Included is an overview, a description of the design, subjects, instruments, procedures and analysis. The fourth chapter provides a summary of the findings, interpretations, results and related analysis. The fifth chapter provides a summary of the results, conclusions, limitations of the study and implications/recommendations for policy, practice and future research.

CHAPTER 2 REVIEW OF THE RELATED LITERATURE
To examine the related research questions, literature relevant to this study has been organized in the following five sections:
A. Historical development of the concept of gifted.B. Identification procedures for gifted placement.C. Characteristics of the culturally different.D. Underrepresentation issues among the culturally
different.E. Promising approaches in identifying minority
gifted.The literature review reflects the use of terms and
language with reference to ethnic groups that are dependent on the context. The term "gifted" is used often as a categorical designation and as a noun throughout the literature. The researcher may have used the terms differently and has recognized the continuing controversy that exists in use of terms.
Historical Development ■Of._the_.CQnc.ept of GiftedThe ancient philosophers' search for a greater
understanding of the human mind is reflected in their writings. A brief review of the origins of education for gifted youth demonstrates that interest in the gifted population is a recurring phenomenon.
16

As early as 400 B. C., the philosopher Socrates viewed giftedness, in part, as the process of moving through a series of stages of knowledge more quickly, accompanied by higher levels of understanding. He recognized the need for more gifted people within society and was a proponent of early identification and development of the individual's intellectual gifts (Nettleship, 1966). Plato, who provides most of our knowledge of Socrates, advocated the selection of the most intellectually capable individuals to serve in government to assure a more perfect social order.
It appears that Plato (The Portable Plato, 1971) attributes to God the framing of men differently, suggesting an innate or hereditary component. In "The Republic III" (p. 408), Plato uses the analogy of gold to represent the ingredient in the citizens who are most capable and, thus, should receive the highest honors in society and the power to command others. Silver, brass and iron are used to represent citizens of lesser ability (p. 410). Green (1986) calls attention to Plato's wise caution to the Greeks to exercise care in the matter of the selection of those individuals possessing "potentiality" to receive the highest honors.This suggests that even the early philosophers believed caution should be used in the selection process of its potentially gifted.
In 1869 Galton, an English scientist and cousin of Charles Darwin, combined his interest in intellectual

18measurement and heredity to produce a crude measure of intelligence. His effort to develop an instrument capable of measuring intelligence was a forerunner of the gifted movement of the twentieth century and fostered the development of psychometric evaluation (Alexander & Muia,1982).
As the twentieth century began, Binet was commissioned by the French government to develop a scale to be used for instructional purposes that would identify students of intellectual extremes. His work with Simon produced an intelligence scale that stressed verbal skills, although at early age levels, motor responses were predominant in the scale. In 1911, Goddard succeeded in moving the Binet tests from their use with below-average children to their use with normal and above-average children (Colangelo & Davis, 1991).
According to Gould (1981), Binet's purpose in developing his test was to abstract a child's general potential with a single score. Potential, however, could be determined only by mixing together tests that measure different abilities. Binet is quoted as saying, "It matters very little what the tests are so long as they are numerous" (p. 150). Gould points out that environmental, nutritional and economic factors play key roles in any ethnic group's performance on various tests (p. 157).
The American psychologist Terman (192 5) supervised the Americanization of Binet-Simon tests and is best known for

his longitudinal studies of the gifted which continue to be updated today. He defined IQ as a measure of general intellectual ability; the highest 1% of the population were considered intellectually gifted.
While Galton, Binet and Terman represent the move from a philosophical view of human intelligence to that of scientific inquiry, they viewed intelligence as a global construct and the intelligence score as an unalterable representation of that construct. Others have sought to look at aptitudes or factors that characterize intellect.
In 1904, Spearman postulated the theory of two types of intellectual factors. The "g" factor represented the general aptitude common to all intellectual activities. The "s'1 factor referred to specific factors that are unique to a particular task performance.
Building on Spearman's theory, Thurstone (1938) analyzed the specific factors in "g" that were involved in the relationship of various tasks. The list of abilities he identified purported to account for the apparent relationship among tasks. Those listed are number factor, verbal factor, space relations, memory, reasoning, word fluency and perceptual speed.
Using the earlier work of Thurstone, Wechsler (1949) developed an intelligence scale for adults and children. His scale defined intelligence as that capacity of an individual

20which allows for purposeful action, rational thinking and effective interaction with the environment.
The role of the environment was recognized by Piaget (1952). His work focused on the dynamic nature of intelligence and the continuous development of cognitive structures. This development results in the individual's interaction between the pressures from the environment and cognitive growth. Progression occurs through various cognitive developmental stages. Assimilation and accommodation of the information results in interaction with environmental factors.
Guilford (1959) is another significant researcher who described a factor analytical model of intelligence. His model identified and classified 120 cognitive abilities within three dimensions: operations, contents and products. Guilford defined operations as intellectual activities involved in processing data, contents as the types of information on which the operations are performed, and products as the outcome of the processing of the information.
These seminal attempts to define intelligence are significant as the concept of giftedness is addressed. Although most of the early definitions focused on intellectual ability as the main indicator, attempts have been and are being made to broaden this narrow conceptualization.
21During the late 1950s and 1960s, the notion of
giftedness continued its evolution. Witty (1955) included achievement or performance as factors in his definition. He cautioned against overreliance on IQ as a means of identifying gifted children. Social superiority was included in the concepts of DeHaan and Havighurst (1957). They expanded the concept of giftedness to include leadership ability, artistic talent, mechanical and physical abilities.
New interest in gifted education occurred in 1957 with the launching of the Russian satellite, Sputnik. Tannenbaum (1979) describes the aftermath as a time within the United States of total talent mobilization. This interest related to what the schools were providing for the bright students by way of academic courses. Academic coursework was condensed, college courses were offered in high school, and foreign languages were taught in the elementary schools.Acceleration and ability grouping flourished. Efforts were made to identify gifted and talented minority children. New math and science curricula were developed. By the mid-1960s, however, the interest in gifted and talented students waned (Tannenbaum, 1979).
A resurgence of interest and a turning point in gifted education resulted from the intense investigation by the United States federal government into its programs for gifted children and guidelines for state gifted program development. Various programs throughout the nation reflected multiple

22approaches to serving the gifted, including the use of many definitions and requirements for placement. The first federal definition was stated in the Marland Report (1972): "Gifted and talented children are those identified by professionally qualified persons who by virtue of outstanding abilities are capable of high performance."
Children who are capable of "high performance" included those with demonstrated achievement and/or potential ability in any of the following areas, singly or in combination:
1. General intellectual ability2 . Specific academic thinking3 . Creative or productive thinking4. Leadership ability5. Visual and performing arts6. Psychomotor ability (Marland, 1972, p. x) .The Jacob K. Javits Gifted and Talented Students
Education Act of 1988 amended the 1972 Elementary andSecondary Education Act's definition, deleting the inclusionof psychomotor ability:
The term "gifted and talented students" means children and youth who give evidence of high performance capability in areas such as intellectual, creative, artistic, or leadership capacity, or in specific academic fields, and who require services not ordinarily provided by the school in order to fully develop such capabilities. (1988, Title IV, Part B, Sec. 4103)
These federal definitions of gifted and talented reflect the present day focus on individual differences. The early focus of the Greek philosophers on the human mind progressed

23to a modern focus of scientific inquiry. Currently the focus in gifted education is to view intelligence as multi-faceted rather than fixed and as requiring appropriate, intellectually stimulating experience to foster the development of potential ability, as well as demonstrated ability.
Among the new theories of intelligence that emerged in the 1980s were those of Gardner at Harvard University and Sternberg at Yale University. These theories were broader in scope than Terman's and Wechsler's, but more condensed than Guilford's (Eby & Smutny, 1990).
Gardner (1983) describes several relatively autonomous components of human intelligence, each having its own unique language, symbols and processes. In his view, each individual has relative strengths and weaknesses among the various types of intelligence. A profile of multiple intelligences results.
Gould (Clincy, 1993) concurs with Gardner by indicating that only recently has the public sector begun to understand how "devastatingly biased and limited the IQ tests, the academic achievement tests, and, indeed, most of our formal public schooling processes have been" (p. 607). Traditional modes have prompted only two (verbal and logicomathematical) of Gardner's seven intelligences, leaving out almost entirely his musical, visual, kinetic, personal and social intelligences.

24Sternberg's (1982) Triarchic Theory of Intelligence
suggests the inclusion of analytical, synthetic and practicalgiftedness into the intelligence concepts. He argues thatpeople actually possess some blend of the three, rather thanseparate components (Sternberg, 1991) . Gardner and Sternbergcontinue to create and validate assessment devices thatconfirm their views of intelligence.
Although Louisiana does provide a separate procedure foridentifying talent, this dissertation research focused onlyon the academically gifted, which is consistent with thatfacet of Louisiana's definition. That definition is:
Gifted children and youth are those who possess demonstrated abilities that give evidence of high performance in academic and intellectual aptitude.NOTE: Gifted at the preschool level and in grades K-3means the possession of high intellectual and academic potential. (Pupil Appraisal Handbook, 1983)
Identification Procedures for Gifted Placement
The rationale for identification of students as gifted in the United States has historically been to place them in appropriate educational settings that will assist in developing their abilities or potential to the maximum degree possible. Before public schools existed and before the subsequent establishment of special education programs with federal, state and local funding, gifted children were identified and educated at home by their parents (Sisk,1987) .

25Ward (1981) defines identification thusly:
Identification is the process of locating those students who meet the criteria of giftedness agreed upon by the school system. It should begin as early as possible, be a continuous process extending throughout the grades, and include screening procedures, individual testing and case studies. (p. 37)
This definition suggests that while the school districtdetermines eligibility criteria, it is important to use avariety of objective and subjective data in theidentification process. The criteria for eligibility withinthe schools usually follow state guidelines set forth by eachstate department of education.
The objective data obtained refers to information derived from tests that are usually standardized, such as intelligence tests and achievement tests and from grade-point averages. Subjective data include behavioral checklists and teacher, parent and peer recommendations (Alexander & Muia, 1982) .
Martinson (1974) recommended that a series of steps should be followed in the identification process. The first step is referral for screening through the use of multiple methods. These methods may include group tests of intelligence and achievement, creativity tests, teacher nomination, parent information, pupil data and products, teacher and parent notations on traits and behaviors, and any additional observational checklists, such as leadership, creativity, and communication. The second step is

26identification and case study which includes individual testing and review of all data that may have been assembled in step one as the case study. Eligibility determination should be followed by the development of an appropriate curriculum plan.
More recently Coleman and Gallagher (1991) proposed a similar approach concerning screening procedures in their report on State Policies for Identification of Nontraditional Gifted Students. Selecting a variety of screening procedures
is considered a key step. The screening process should identify a large pool of potentially eligible students. Coleman and Gallagher state that it is at this point of screening that many nontraditional gifted students are "ignored and are never given a chance to receive the thorough evaluation needed to establish their eligibility." Their report recommended the following:
1. Screening all student files for indicators of giftedness.
2. Requiring a plan for staff development for regular education staff to increase their ability to recognize nontraditional gifted students.
3. Encouraging the use of a checklist to help teachers recognize underachieving students who may be gifted.
4. Developing student profiles and case study examples of nontraditional gifted students.

275. Encouraging the use of autobiographies to assist
with the identification of gifted students from special populations.
6. Automatically requiring further assessment of all students who reach a certain score (i. e.,85th percentile) on standardized tests. (p. 17)
Teacher nomination is one of the most widely used methods of initiating the identification process of potentially gifted pupils. Research, however, does not support its usefulness or accuracy. The frequently cited Pegnato and Birch (1959) study in Pittsburgh of 1,400 middle grade students attempted to determine the effectiveness of several screening methods for identifying gifted. The teachers' effectiveness in identifying the gifted children were as follows: 50 children were overlooked, 113 weremisidentified and only 41 out of a group of 154 gifted were correctly identified. Teachers missed 28% even when nominating the highly gifted.
Gallagher (1985) summarized studies relative to the accuracy of teacher nominations. He found no studies that supported teachers as effective in recognizing gifted students with accuracy. Gallagher also found evidence of overnomination by some teachers of either boys or girls.
Teacher inadequacy and misidentification of the gifted may result from the ongoing confusion over the definition of gifted (Sisk, 1987). The Pegnato and Birch (1959) study

28concluded that teachers and administrators need to agree on the type of giftedness being identified. Further, they recommended that the measure used to screen the gifted should be compatible with the student population and the design of the gifted program.
Several viable reasons exist for including teacher judgement in the screening process. Coleman and Gallagher (1992) recommended staff development of regular education teachers and the use of checklists to assist them in recognizing the characteristics of nontraditional gifted students. Richert (1985) points out that all teachers are teachers of the gifted although they may have different roles. The inclusion of all teachers and staff is recommended to receive training concerning identification criteria, the academic and emotional needs of gifted children, and non-competitive evaluation procedures.Martinson (197 4) provides an additional reason for including teachers in the screening process: participation in the nomination and selection process may increase their interest in the gifted; it may also increase teacher awareness of the educational needs of gifted children.
One of the purposes that teachers serve in identifying giftedness is to verify subjectively what is indicated objectively (Tannenbaum, 1983). Tannenbaum recommends that teachers should be assisted in the process of capitalizing on their unique relationship with children in order to discover

29significant evidence of talents that would not be otherwise detected.
Many teacher rating scales used to identify characteristics of giftedness are available, generally based on characteristics lists constructed by Torrance (1977), Renzulli and Hartman (1976), Lucito (1972), and Plowman,Rice, Sato and others (1971). Many of these scales continue to be revised. Some school districts have compiled rating scales that reflect their own school population.
Parents often find and recognize cues of giftedness in their children. These cues should be used as a basis for referral for screening. Frasier (1991) suggests that staff development to implement awareness for identification of giftedness should include parents and students, and all school personnel (teachers, administrators and central office administrators). She recommends that any person with knowledge about a student should be provided with information about gifted programs and encouraged to submit nominations or referrals for screening.
Karnes (1983) supports the view that professionals can rely on parents to provide them with information that will lead to more accurate identification. In a study by Jacobs (1971), parents were found to be 76% effective and 61% efficient when compared with teachers, who were 9.5% effective and 4.4% efficient in identifying gifted children.

Martinson (197 4) reports that some school programs solicit the opinion of parents in the identification process. These may result in the submission of a name for a request for more elaborate information. A one-page form such as a checklist may be sent to all parents early in the school year. Items could include children's hobbies or interests; recent books they enjoyed or read; other special interests, problems or needs; present or past accomplishments, talents, and preferred activities when alone. All information from parents and teachers assist in the identification process and help provide a global view of the child. A case study or portfolio may be developed from the composite of information collected on an individual child. This is most beneficial in the total assessment process that leads to identification and placement.
Eligibility for placement in forty-six states requires high performance on an individually administered IQ test, according to the 1990 State of the States Gifted and Talented Education Report (1991). Individual intelligence tests have a number of advantages over group tests. A broader sampling of abilities is possible, better testing conditions can be provided, a greater range of abilities can be tested, and interpretation of the quality of performance can be determined (Martinson, 1974). The Stanford-Binet revised in 19 85 and the Wechsler Intelligence Scale for Children

31(hereafter called Wechsler) revised in 1991 remain the most commonly used intelligence tests.
Individual intelligence tests have been criticized because they rely heavily on verbal factors. The Wechsler samples the verbal and performance domains of cognitive functioning. Intelligence as measured on the Wechsler is less related to criterion performance expected in gifted programs than is intelligence as measured on the Stanford- Binet, which is heavily weighted on verbal skills. The Stanford-Binet is probably less accurate as a measure of the academic learning potential of superior students (Hawley et al., 1986).
Group intelligence tests are used by some school systems as a screening device for potentially gifted children.Alvino, McDonnel and Richert (1981) found that such tests are frequently interpreted by grade-level norms and are unreliable in assessing giftedness.
Robinson and Chamrod (1986) suggest that group intelligence tests are most appropriate when used as screening tools, while individual tests are necessary to confirm the strengths already suspected. They conclude that since our current educational system focuses on intellectual aptitude, intelligence tests meet the needs of the system.
Despite a history of abuse and their limitations, IQ tests should play a significant role in gifted identification, according to Borland (1986). He argues that

recent conceptions of giftedness seem to assume that it is better to identify only those well motivated students who are already groomed for success. If teachers and parents refer only the students highly motivated toward academics, the innovative and creative child who may not be highly motivated toward academics may be overlooked. These students may perform in the gifted range, however, on intelligence tests. Borland is concerned that if IQ tests are eliminated from the screening procedures, the innovative, creative thinkers who may not be highly motivated will be eliminated.
A strong argument for flexibility of selection procedures is made by Kirchenbaum (19 83). He presents evidence that every recommended and published system for identifying gifted and talented students is badly flawed. The findings of his study lend support to Kirchenbaum's argument for a broad-based, multi-faceted system of identification as the only appropriate alternative to the identification issue.
The National Report on Identification (Richert, Alvino, and McDonnell, 1982) found that high intelligence test scores may be useful in the identification of gifted children who possess high verbal, reasoning and mental skills. The report concludes, however, that failure to attain scores at or above the arbitrary cut-off score requirement for eligibility should not necessarily preclude a child's placement in a gifted program. Treffinger (19 84) adds to the argument to broaden the base by which students are selected for gifted
33programs. He makes a strong plea to abandon outdated, stereotypical conceptions of giftedness and advocates a dynamic definition of giftedness that focuses on "gifted behavior." Identification procedures should be used that assess those behaviors.
Achievement tests are sometimes used to determine eligibility, or as a part of the matrix for eligibility determination in forty-four states (State of the States Report, 1991) . When used as the sole criterion for eligibility, this method excludes many underachieving gifted children from programs that might benefit their education advancement. Minority children often tend to be excluded when achievement is used solely rather than as a part of a broad-based assessment (Hawley et al., 1986).
Due to the growing desire for a measure to assess human abilities and talents, interest in the development of creativity tests began to emerge based originally on the work of Guilford (1959, 1972, 1975). Most accurate interpretations of these tests focus on attempts to measure particular elements of creativity, rather than to measure creative thinking.
Torrance (1984) recommends the following practices for identification of the gifted and talented based on his experience and research:
1. Creativity should be one of the criteria in most assessment procedures, although not the sole

34criteria. Generally, when creativity indicators are used, students who might otherwise be missed should be included.
2. Multiple talents should be evaluated because our society needs different kinds of talents.
3. Where young children (3 to 6 years) are involved and those with disabilities or sensory handicaps, attention must be given to assure that assessment is in a modality appropriate for those students.
4. Where disadvantaged or culturally different children are involved, care must be given to the selection of test tasks that assess the kinds of excellence that are valued by the particular culture or subculture of the children being evaluated.
5. Selection of any test of creativity should be made of one that considers a wide variety of indicators rather than a single one.
Clark (1992) suggests that leadership, which is included in the Federal definition of gifted, often is ignored in screening and assessment for gifted placement. No formal standardized tests are presently available although many scales on leadership are available such as Bella Kranz Multidimensional Screening Device (Krantz, 1978), the Baldwin Identification Matrix (Baldwin, 1984), the scale developed by Renzulli and Hartman (1971), and the Perrone and Male (1981)

35GIFTS Talent Identification Procedures. According to Alvino et al. (1981) the area of leadership is the most significant area of deficiency in the identification of gifted individuals. Freidman, Freidman and Van Dyke (1984) found that nomination from self, peers and teachers could be used to predict leadership. Some school districts also use parents to provide information concerning the leadership characteristics of their children (1992).
There appears to be agreement within the literature that the identification of gifted students is a difficult task. Various solutions and alternatives are suggested. Feldhusen, Asher and Hoover (1984) raise issues of validity and purpose. They suggest that a sound identification process includes five major steps, each step viewed separately in order to determine its validity within the framework of the entire process: (1) define program goals and types of students tobe served; (2) define nomination procedures; (3) determine assessment procedures; (4) provide for individual differentiation; and (5) validate the identification process. The authors recommended that the process should be administered in a professionally defensible way.
While various researchers caution against the use of any one assessment criterion, there appears to be agreement in using a broad, multi-criteria approach to the entire process of identification. Whatever approach is used, it is recommended that individual characteristics be addressed

36including ethnic or cultural patterns that may warrant appropriate inclusion in the assessment process.
Characteristics of the Culturally Different
The Terman studies (1925, 1947) produced for America a stereotypical gifted child that was white, middle class, and whose parents were professionals exhibiting the majority cultural values of the community. Emphasis on re-organizing American schools followed the Sputnik era. It was at this time that efforts began to identify gifted minority children (Tannenbaum, 1979). The identification of societal cultural subgroups led to the need to make educational adjustments in content and environmental factors within the nation's classrooms. The interest in the discovery of giftedness from among the culturally different fostered a broadening of methods to characterize and identify these students.
Minority children are defined as those whose values, customs, language, patterns of thought or interests differ significantly from the dominant patterns of the society in which they live (Sattler, 1982). Of special importance to educators is the implication within this definition that the minority culture group children, when compared to the majority culture group children, may vary significantly above the norms in cultural differences.
The term educationally disadvantaged is used by Sato (1974) to define the culturally different individuals who make up one segment of a larger sub-population. Membership

37in a culture other than the dominant culture in a society appears to be the major factor these sub-populations hold in common. Conflict between the subculture and the dominant culture may be observed when poor children leave their primary culture group in an attempt to function within the dominant culture. Cultural deprivation or poverty causes the disadvantages to become more apparent and conflict results, according to Sisk (1981).
Attempts to assign specificity to characteristics of broad groups that would include African-American, native Americans, Hispanics and Asians should be made with extreme caution (Gallagher, 1985) . Generic characteristics may be more appropriate for each culture group.
The traditional distinction between "advantaged" and "disadvantaged" students has to do with those children who qualify for free or reduced lunch. This determination establishes the guidelines for low socio-economic status (Digest of Education Statistics, 1991) which is dependent on family income factors set by the United States Congress on July 1 of each year.
When discussing black students as culturally different, Sisk (1987) suggests that a difficulty exists because the literature does not control for socio-economic status; therefore, it is difficult to identify specific differences within the black subcultures. More research is needed to

38determine to what extent differences may exist and how they are observed.
Shade (1987) suggests that American society devalues individuals whose social and ethnic origins differ from the acceptable norm. According to Shade's research, the minority child excels in social skills rather than cognitive tasks such as test taking.
Passow (1986) points out that while there is considerable overlap between minority students and disadvantaged conditions, this does not mean that the two terms are synonymous. Frasier (1989) reports that more recent studies indicate similarity in the qualities of home life that promote achievement, regardless of income level.
Gallagher (1985) studied children described as disadvantaged because of low socio-economic status. His findings indicated a stereotypical viewpoint that the disadvantaged:
1. Have interests and attitudes reflecting a tendency to display action and competition in sports.
2. Display aptitudes to play musical instruments anddesire higher status occupations.
3. Experience more tension within the home.4. Are more apt to perform far below potential.Gallagher claims that there are special characteristics
of the culturally different. These students:

391. Are physical and visual rather than aural
learners.2. Are content rather than form centered.3. Are stimulated by concrete, external forces rather
than introspective.4. Utilize problem solving that is not abstract
centered.5. Are slow, methodical, careful and patient.6. Need structure and control in the learning
environment.While many of the aforementioned characteristcs appear
to suggest negative traits, positive characteristics of the culturally disadvantaged are addressed by Torrance (1977).He labels some eighteen groups of characteristics as creative positives. Those not previously listed by other researchers include the following:
1. Ability to express feelings and emotions.2. Ability to improvise with commonplace materials
and objects.3. Articulateness in role playing, sociodrama and
story telling.4. Enjoyment of and ability in creative movement,
dance and dramatics.5. Use of expressive speech.6. Fluency and flexibility in figural media.
407. Expressiveness of gestures, body language, and
ability to interpret body language.8. Humor.9. Richness of imagery in informal language.10. Emotional responsiveness.Bernal (1989) suggests that the bi-lingualism of Hispanic
children indicates linguistic strengths. While girls are not encouraged to excel within their culture, Hispanics foster learning for male children. Clark (1992) includes the following as positive characteristics unique to Mexican- American students: attitudes of cooperation; attitudesfostering education through high school; supportive family and community; affectionate, demonstrative parental relationship; unusual maturity and responsibility for their age; experience with giving advice and making judgement in disputes; planning strategies; eagerness to try out new ideas; ability to initiate and maintain meaningful transactions with adults; and facility for learning a second language.
Native American leaders and school teachers compiled a list of characteristics of American-Indian gifted children (Locke, 1982). These children are seen as curious, problem- solvers, interested in many areas, preferring older children for playmates/companions, persistent, viewed by others as leaders, trustworthy, independent-thinkers, having a well- developed memory, possessing keen understanding, and

41perceptive. Tonemah (1991) includes the characteristics of non-competitiveness and a strong sense of tribalism.
Some of the characteristics of Asian children have both positive and negative traits. Hasegawa, Woo, Chen and Kitano (1989) note strengths in math, science and technical areas, but weakness in the humanities and areas where verbal communication abilities are necessary. These children tend to be highly motivated to recitation/memorization learning, while creativity and risk-taking are weaker areas.
African-American children were found to score as high or higher than Anglo-American children on creative strengths (Torrance, 1989). Parental support or the lack thereof tend to determine the acquisition of skills necessary for success in the mainstream culture (Baldwin, Frasier, Torrance, 1989). The influence of parents upon their children is tantamount to the success of children in any culture group.
While traits among minority groups and each subculture vary, many characteristics are common. Attributes that are valued by the culture are a key factor in the determination of who is gifted within each culture group.
Underrepresentation Issues Among the Culturally Different
From the onset of formal identification of children for special programs, concern arose that various ethnic groups emerged as a majority in some programs. Shade (1987) found that black children were the majority in programs for the mentally retarded; whites were the majority in programs for

42gifted. Underrepresentation of African-American children, as well as other ethnic groups in programs for the gifted, may be the result of specific identification procedures.
Although the Federal definition (PL100-297, 1988) defines the gifted as those who give evidence of high performance capability in areas such as intelligence, creativity, art, leadership, or specific academic fields, this does not assure the public that assessment will occur within each area. General intellectual ability is the most common area of giftedness used within the United States. Forty-seven states use intelligence quotients in their definitions; 44 use specific academic aptitude; 37 use creative thinking ability; 32 use advanced ability in the fine/creative arts; and 26 include leadership ability in their definitions according to the 1990 State of the States Gifted and Talented Education Report (1991). Because there is concern that cultural bias is a factor in the language and structure of intelligence tests, the over-reliance on IQ and academic aptitude may be prime indicators for underrepresentation among culturally disadvantaged and ethnically diverse students (Frasier, 1989; Maker, 1982; Richert, 1987).
There is much agreement in the literature that minority students are underrepresented in gifted programs. The identification procedures used in the United States point to two primary areas of giftedness that are addressed in The 1990 State of the States . . . Report (1991) : intelligence

43and academic achievement. The home environment of minority cultures tends to stress social skills rather than cognitive tasks such as test taking. Standardized testing is very much a part of the identification process for giftedness in the intelligence and academic achievement areas.
Passow (19 86) cautions against overreliance on, misuse of and abuse of standardized tests. Passow asserts that the problem of minority underrepresentation is compounded by inadequate attention paid to the contextual influence of environment and culture upon the development and manifestation of giftedness in different minority groups. He recommends a multi-dimensional, multi-modal and multicultural matrix for assessment of minority students so that they no longer remain "the largest untapped resource of human intelligence and creativity" (1984).
Frasier (1989) adds additional weight to the evidence against present identification procedures for minorities. The limitations of a low socioeconomic status to stimulate and support the higher intellectual capacities of students have been indicated as exclusion factors for minority placement. She reveals that more recent studies, however, indicate the qualities of home life that promote achievement are similar, regardless of income level (p. 18).
Frasier (1989) also reports the persistence of teacher, administrator and community attitudes that giftedness simply cannot be found in some groups. She asserts that such

44negative attitudes are reinforced by narrow nomination and screening methods that further limit the access of underrepresented populations to gifted programs. The four primary barriers to the identification of minority gifted students seen as paramount, therefore, are:
1. The attitudes of people within our society regarding the abilities of these children to achieve.
2. Limited access due to screening procedures used in school districts.
3. Assessment that focuses on the standardized IQ tests.
4. Adaptations to the entire curricula existing within the classroom rather than making accommodations as needed for minority children. School and cultural factors both contribute in the size and strength of these barriers.
Baldwin (1985) adds another perspective to the underrepresentation issue. She points out that the literature itself has focused more on deficits than on strengths. Her assumptions are that:
1. Giftedness does exist in all human groups, but that it does not manifest itself in exactly the same behavior in all groups.
2. Techniques other than usual standardized tests can be used to identify giftedness.

45
3. Unique or special behaviors peculiar to a culture group serve as accurate indicators of high level conceptualizations and organizational capacities.
Her beliefs and studies with minority groups have led Baldwin to identify four factors that appear to be found more frequently in lower socio-economic groups: 1) parents whocannot speak English, 2) a home environment that lacks toys that stimulate cognitive and developmental skills, 3) a lack of conversation in the home to develop the art of dialogue, and 4) discipline that does not promote the development of an inner locus of control or foster self-motivation and problemsolving skills (p. 238).
The issue of underrepresentation of minorities was identified as one of six problem areas by Renzulli, Reid and Gubbins (1992) in their study to establish research priorities through the turn of the century. The resolution of this issue remains an area for much needed additional research.
Approaches in Identifying Minority Gifted
The most recent approaches have been summarized in the last few months through a U. S. Department of Education Jacob Javits Grant study conducted by Coleman and Gallagher (1992) called The Gifted Education Policy Studies Program (GEPSP). They identified four promising practices for identifying nontraditional gifted students which were revealed through an

46initial survey of the fifty states. These four major steps in the identification process could affect school district and state department of education policy statements allowing for a more thorough search for giftedness in minority representation. The steps were: (1) greater publicawareness, (2) screening procedures, (3) formal identification procedures, and (4) program initiatives.
The Coleman/Gallagher study (1992) noted specific strategies. In the area of greater public awareness, they recommended that an advisory council can be established with crosscultural representation to assist with the development and monitoring of state policies related to gifted students.A formal community awareness campaign could be conducted to recruit support and resources for talent development. An annual child find/child search for gifted students could be conducted, as is the case for individuals with disabilities, in cooperation with community and other state agencies.
The use of a variety of screening procedures is a key step in the eligibility determination process. This process should identify a large pool of potentially eligible students, followed by a more thorough review to determine final eligibility. Many nontraditional students are ignored and are never given a chance to receive the thorough evaluation required for entrance into a gifted program.
The Baldwin and Frasier approaches to screening use a global approach to the process of identification.
The Frasier-Talent Assessment Profile (1991) includes personal characteristics, special language considerations, environmental factors and curriculum options, in addition to academic aptitudes/achievement, motivation, leadership, the arts and creativity. The Baldwin Identification Matrix (1984) includes academic areas, IQ, teacher recommendations, psychomotor ability, peer nominations and four areas of the Scales for Rating the Behavioral Characteristics of Superior Students (Renzulli, Smith, White, Callahan, Hartman, 1977... Learning, Motivational, Creativity and Leadership Scales). These approaches to a more descriptive profile of the whole child represent the possibilities available at the screening and identification levels.
In the Coleman/Gallagher (1992) survey, the third area of promising practices relates to the formal identification procedure itself. This is the area of most concern in the literature that has tended to exclude rather than include the minority student. At this stage the use of multiple criteria is critical, as indicated in the Frasier (1991) and Baldwin (1984) approaches to aid in identification. Some of the appropriate strategies for this area include:
1. Establish child study teams to make the placement decision.
2. Develop/design the Individual Education Plan and coordinate appropriate services.

483. Use multiple identification criteria so that no one
single criterion includes or excludes students.4. Use portfolios of student work with accompanying
rating scores (Renzulli-Hartman, 1977).5. Develop guidelines on how to use subjective
information.6. Reevaluate or retest students who show compelling
reasons why scores may underestimate their true abilities (family crisis, illness, etc.).
7. Use alternative identification methods.These suggestions represent a definite departure from the
systems of identification presently being used in American schools. The argument for nontraditional referral for screening, screening and assessment is strong. Not only should minority children benefit from a multi-criteria approach to gifted placement, but this procedure would benefit all who evidence gifted characteristics.
Summary
The intent of this chapter was to (a) trace the historical concept of the term gifted, (b) review and identify procedures that have evolved in the identification process, (c) review existing studies that support consideration of the cultural attributes found among ethnic groups, (d) identify the underlying problems found within the underrepresentation of culturally different children in gifted programs, and (e) establish the need to consider

49multifaceted approaches in the identification of minority- gifted.
A review of the current approaches recommended to identify culturally different children supports the need of this study to examine nontraditional approaches to the initial referral and screening process in the identification problem. An examination of the application of multi-criteria in the referral and screening process is needed in order to obtain meaningful results. The involvement of parents and teachers in the identification process is supported by the literature review. The use of additional assessment in the areas of leadership and creativity is recommended in order to include cultural strengths.
In conclusion, it was determined that nontraditional approaches to refer and screen the culturally different are needed. Approaches to gifted identification such as those addressed in the research questions of this study may serve as a significant addition to extant knowledge concerning potentially successful methods for inclusion rather than exclusion of culturally different children.

CHAPTER 3 METHODOLOGY
This chapter presents a description of the following: purpose of the study, design, subjects, procedures, instrument development, instruments, and procedures used in collecting and analyzing the data.
Purpose of the Study The purpose of this study was to determine the
effectiveness of using nontraditional referral and screening procedures to identify culturally different gifted children. The research and analyses were built upon the following questions:Research Questions
1. What effect does the Child Search procedure have on the initiation of referrals for screening from parents and teachers?
2. Is there a significant difference in the frequency of culturally different (minority) students recommended for assessment who passed nontraditional screening when compared to those who passed traditional screening?
3. Is there a difference between the frequencies of students who passed screening either by scores from the teacher or by the parent scores on Creativity and Leadership scales?
50
4. Is there an increase in the frequency of culturally different children (minority) who are identified for gifted programs using nontraditional referral and screening and traditional assessment methods when compared to those identified using traditional referral, screening and assessment methods?
5. How are the creativity and leadership behaviors of those children who passed screening described by their parents and teachers?
6. Are there similarities in the students' creativity and leadership behaviors as described by parents and teachers?
7. What differences in students' creativity and leadership behaviors as described by parents and teachers appear to be significant?
Design
A quasi-experimental design was used to examine the research questions between intact schools since it was not possible to randomly assign subjects to treatment and control conditions within each school. The subjects for the research study were the students in grades 1-5 who were referred for gifted programs in eight schools in four parishes (counties) representing varied geographic areas of Louisiana. In an attempt to equalize the populations, two schools within each parish (county) were selected, one experimental and one control. Matched pairing occurred so that they had

52
approximately the same social characteristics. The eight schools were paired rural-rural in two parishes and urban- urban in two parishes by population, ethnicity, facilities and faculties. The ethnicity of each school represented African-Americans (Blacks), native Americans, Hispanics, Asian-Pacifics and Whites. In order to measure any disparity of representation in gifted referrals and screening, only students from the paired schools were compared.
The experimental schools received the treatment of nontraditional referral and screening procedures for gifted. The control schools received the traditional procedures for referral and screening as set forth by each of the four school systems.
The quasi-experimental design allowed the researcher to examine the effects that the independent variables (the nontraditional form of referral and screening) had upon the dependent variables (the number of students who passed screening and/or assessment). The design also assisted in determining the effectiveness of specific variables associated with the research questions.
SubjectsTable 1 indicates a total of 1,973 students in the
experimental schools and 1,900 in the control schools. In the experimental schools, 82 of the 27 6 students referred for screening were minority students (see Table 2). In the

53Table 1Student Enrollment Data for 1991-92 Experimental and ControlSites
SitesN
EthnicityWhite Minority
% N %Totals
Parish AExperimental 202 41% 288 59% 490Control 187 46% 223 54% 410Parish BExperimental 456 53% 404 47% 860Control 398 51% 382 49% 780Parish CExperimental 262 64% 147 36% 409Control 262 67% 131 33% 393Parish DExperimental 148 69% 66 31% 214Control 226 71% 91 29% 317Sub TotalsExperimental 1068 50% 905 50% 1973ControlTotalsExperimental
1073 52% 827 48% 1900
and Control 2141 55% 1732 45% 3873

54Table 2Sample Data on Referrals for Screening bv Race in the Experimental and Control Schools
Experimental ControlRace Freq. Percent Freq. Percent
White 154 65% 32 80%Minority* 82 35% 8 20%Totals 236 100% 40 100%
*Minority includes African-American (Black), Asian, American Indian and Hispanic.M = 276(Note: 3 4 students were not reported by race and did not complete the referral process. Therefore, the potential sample was a = 310.)

55control schools, 8 of the 40 students referred were minority. The total sample of referrals, minority and white, in the experimental and control schools was 310 because 3 4 students either were not reported by race or did not complete the referral process.
Procedures
A review of procedures used to collect data from September, 1991 through June, 1992 is provided in this section.
Nontraditional Procedures
Nontraditional procedures included a referral stage and a screening stage. The nontraditional referral procedures in the experimental schools included child search and parent/teacher training to identify characteristics of minority gifted children. Nontraditional screening procedures included the use of a multiple criteria matrix to expand referral/screening components.
Note: The use of an alternative assessment matrix wasnot a part of this study. That procedure was included in the second year phase of the three-year research plan.
Nontraditional Referral
A brochure was developed that included characteristics of gifted children. These characteristics were extracted from the Creativity and Leadership Checklists (Appendix B and D). In October, 1991, nontraditional child search procedures included the dissemination of the brochure describing seven

characteristics of gifted children in four languages (English, French, Spanish and Vietnamese) to every family in the experimental schools. The family was asked to complete a portion of the brochure and return that portion to their child's teacher. The respondents were invited to attend an educational session in late October at the school that further described characteristics of gifted children, including minority gifted children. Information on gifted children was embedded in the session and in no way were participants told that the traits characterized minority gifted only. The teachers also received similar training in each experimental school. Following the training, teachers and parents initiated the student referrals for further screening during the 1991-92 school year.
The creativity checklist, leadership checklist (Appendix B and Appendix D) and the parent demographic questionnaire (Appendix E) were completed at the parent training session or completed by the parent during the school year as referrals were made. The teacher demographic questionnaire (Appendix F) was completed at the end of the school year.Nontraditional Screening
The nontraditional multiple criteria screening matrix required the child referred to meet one of the following criteria in order to pass the screening stage:
1. A score of at least 24 or 80% on the creativity rating scale;

572. A score of at least 24 or 80% on the leadership
rating scale;3. Score at the 90th percentile or above on the Matrix
Analysis Test-Short Form (Naglieri, 1985);4. Score at the 90th percentile or above on any
standardized achievement test.The nontraditional screening matrix superseded the local
parish's screening criteria for a student to receive a complete assessment administered by parish pupil appraisal personnel. Rather, if one of the previously outlined multiple screening criteria was met, the child qualified to receive a final assessment.Assessment;
Complete assessment then followed Bulletin 1508 requirements to determine eligibility for placement in an academic gifted program. The primary components for individual assessment in Louisiana include the use of standardized intelligence tests and achievement tests in reading and math.
Traditional Re.ferral._ancLScrefininq ProceduresEach control school within the four parishes followed its
own parish referral and screening requirements. Referrals for screening initiated either by a parent or teacher were processed as they were received throughout the 1991-92 school year. Parents were contacted for written permission to conduct a final assessment in the event the child passed the

58screening criteria. One control school had no gifted referral or screening procedures. Any referral for the gifted program qualified the student to receive assessment according to Bulletin 1508 requirements. Traditional screening criteria employed by three of the control schools required the following:
1. Standard scores of at least six points on the standard matrix, four of which must be earned on aptitude/intelligence testa. three standard deviations above the mean for
preschool and kindergarten;b. two and a half standard deviations above the
mean for grades 1, 2, and 3;c. two standard deviations above the mean for
grades 4 through 12;2. Standard scores in math and reading on standardized
achievement tests, ranging from zero to four possible points.
The teacher demographic questionnaire (Appendix F) was distributed to the faculties within each control school and data was collected in May, 1992.
Development of Instruments
The pilot study conducted in the 1991-92 school year assisted in the development of two nontraditional screening instruments, one for creativity (Appendix A) and one for leadership (Appendix C). Existing creativity and leadership

59rating scales were examined to determine: (a) the inclusionof the various culture group strengths and (b) the appropriateness of items for use with Louisiana populations.
A ten item checklist for creativity and leadership was constructed in consultation with and approved by a twelve member task force. The task force representation included three minority parents, three university faculty, two pupil appraisal personnel, two school administrators and two state department of education officials. The use of language appropriate for the culture groups of Louisiana was carefully considered in the construction of each item for the two instruments. The validity and reliability of the creativity and leadership items are enhanced in that the items were constructed from characteristics that have been cited in rating scales currently available and referenced in the literature review. A three point Likert scale weighted the responses of the parents and teachers on each instrument. Results of the scales were analyzed to determine if students passed the screening criteria.
Demographic information forms concerning the parents (Appendix E) and teachers (Appendix F) were developed by the researcher. Following a review and revision of the demographic instruments by the task force, the parent questionnaire was distributed within the four experimental schools to each parent who made a referral or whose child was referred. The teacher questionnaire was used to collect data

60from each control and experimental school to determine the characteristics of the faculty.
Instruments
Within each experimental school, a standardized intelligence test, a standardized achievement test, the creativity and leadership scales, and the demographic questionnaire for parents and teachers were used to examine the research questions of this study. There is no established system of screening required by the Louisiana State Department of Education. Each of the 66 school districts may formulate their own referral and screening matrix.Intelligence Test
The task force reviewed a number of tests used as intelligence measures that were free of cultural bias and did not overly rely on language factors. Because the Matrix Analogies Test-Short Form (MAT-SF) employs patterns of
abstract designs and requires minimum written language, it was selected by the task force as a nontraditional screening instrument to measure the intellectual level of individuals between the ages of five and 17. Designated parish assessment personnel administered the MAT-SF to individuals or to a group of students referred for screening in the experimental schools. The instrument's test items, composed of 3 4 abstract designs of four types in a varying order included a) pattern completion, b) reasoning by analogy,

c) serial reasoning and d) spatial visualization. The MAT-SF provides tables to determine percentile ranks and stanines by- age. A score of 90th percentile or above indicated the student passed screening and qualified to receive complete assessment for possible academic gifted placement using Louisiana's Bulletin 1508 guidelines. The MAT-SF was originally standardized in 1984 on a sample of 4,468 students who represented the approximate geographic distribution of the 1980 U. S. Census data with regard to age, sex, ethnic group, geographic region and community size.
Test reliability coefficients of the instrument ranged from .63 to .89, indicating good internal consistency.Content validity was established by comparing the MAT-SF to the MAT-EF (Matrix Analogies Test - Extended Form, Naglierei, 1985) indicating that matrix tests are good measures of cognitive ability. Criterion validity was determined by comparing the MAT-SF to academic achievement. Results indicated high relationships (.60 to .70) to academic achievement in reading and math.Achievement Tests
Four different standardized achievement tests were used within each of the experimental schools. Nontraditional screening criteria allowed the use of scores of 90th percentile or above in any achievement area to indicate the student passed screening.

The four achievement tests included the a) Stanford Early Achievement Test Battery, b) California Achievement Test, c) SRA Achievement Test and d) Stanford Achievement Test. Each parish's experimental school reviewed the most recent scores from one of these standardized tests for any score in the 90th percentile range. Three of the control schools used a standardized achievement test as a screening mechanism. One control school assessed each child referred and had no screening requirement.Creativity and Leadership Scales
The creativity and leadership checklists were initially developed by university task force members. A careful review was made of numerous checklists and rating scales published by authorities in the field of gifted education (Lucito,1972; Plowman, Rice, Sato and others, 1971; Torrance, 1977; Renzulli and Hartman, 1976). Those checklists and rating scales were used to establish the content validity of the two scales developed for Louisiana's minority population.Research (Frasier, 1989; Gallagher, 1985) has found the characteristics included in them to be reliable indicators of giftedness in culturally different groups. The reliability coefficients for the rating scales developed were as follows: parent leadership, alpha = .7791; teacher leadership, alpha = .8844; parent creativity, alpha = .8081; teacher creativity, alpha = .8955. Each was considered reliable at the alpha levels obtained, indicating good internal consistency.
63Each student referred for screening was rated by the
parent and the teacher on the creativity and leadership scales (Appendix B and Appendix D). The school building level committee (SBLC) scored the rating scales (Appendix A and Appendix C) to determine if a passing score of 24 or 80% was achieved on any one of the four ratings (two ratings from a teacher and two from a parent). These rating scales represented nontraditional screening methods.
Because of incomplete data collection from three experimental schools, a qualitative analysis of the responses of parents and teachers from only one of the experimental sites was made by the researcher. Seventeen.students were found in one parish experimental school who passed the screening criteria score of 24 or 80% on Leadership, Creativity or both.
The qualitative data were analyzed in two ways. First, the researcher analyzed the patterns of language used by parents and teachers in their narrative responses on the Creativity and Leadership Checklists (Appendix B and D). Qualitative research is subjective in nature; therefore, no predetermined patterns were named (Kerlinger, 1986; Strauss & Corbin, 1990). Formulating pertinent questions assisted the researcher in identifying patterns (i. e., What do parents and teachers know most about a child? What behaviors do they describe to each other in a parent/teacher conference?).After continued reading of the parent/teacher comments over

the period of several months, four categories or constructs were identified: cognitive, affective, behavioral and noresponse. Cognitive category designations were assigned to responses that related to knowledge areas as indicators of a specific characteristic. Affective category designations were assigned to responses that described or indicated feelings and attitudes. Behavioral category designations were assigned to responses that did not reflect cognitive or affective indicators, but were simply something the child had been observed doing (i.e., babysits). A category of "no response" was assigned whenever the parent or teacher failed to indicate any response to an example of a designated characteristic item (for specific examples of each category, refer to Appendix H - Examples of Categorical Constructs). Parents and teachers sometimes listed several examples for a given characteristic item. Therefore, the examples given sometimes exceeded the 10 characteristics on the Leadership or Creativity Checklists. Next, each response was coded and the categories were tallied. The counts or frequencies within each category were then recorded for each of the 10 characteristics of Creativity and Leadership (Appendix B and Appendix D). Finally, the results of the categorical construct counts were statistically analyzed by using chi- square (e < .05) to test for degree of association between
teacher and parent categorical counts.

65Demographic Questionnaire
The parent and teacher demographic information survey forms (Appendix E and Appendix F) were developed by the researcher in consultation with university members of the task force. The entire task force reviewed the initial forms and made revisions that are reflected in the surveys distributed to the parishes.
The parent demographic questionnaire contained 14 items and yielded data for variables such as ethnicity, language spoken in the home, marital status, number of children, occupation and educational background. Parents (n = 23 6') completed all of the demographic questionnaires provided at the four experimental schools during the referral and screening process.
The teacher demographic questionnaire contained six items and surveyed variables of ethnicity, educational level, certification areas, years of teaching experience, awareness level of gifted children and referral rate. Data were collected from the teachers that responded (n = 164) in the
four experimental and the four control schools.Data Processing and Analysis
Once all data had been collected, quantitative and/or qualitative results were analyzed for each research question posed. Separate analyses were conducted for the demographic questionnaires for parents (Appendix E) and teachers (Appendix F).

Initial data analysis employed descriptive statistics to determine if characteristics of normal data distribution were present. Frequency counts were obtained by analysis of the data to characterize the sample population and the SPSS statistical analysis system was used. SPSS automatically accesses the Yates' corrected chi-square in computations for all 2 X 2 tables with a cell having an expected frequency of less than 5. Chi-square was used to test for significant differences (jg < .05) and degree of association between the
nominal independent variables (the non-traditional form of referral and screening) and the dependent variables (the number of students who passed screening and/or assessment). Total referrals for screening from the entire school populations in both experimental and control schools were used in the chi-square analysis.

CHAPTER 4 ANALYSIS OF THE DATA
The purpose of this study was to determine the effectiveness of using nontraditional referral and screening procedures to identify culturally different gifted children. The data came primarily from teachers and parents acquired in 1991-92 by permission of the Louisiana State Department of Education, Office of Special Education's supervisor of Gifted and Talented Education.
Research Questions
The research and analyses were built upon the following questions:
1. What effect does the Child Search procedure have on the initiation of referrals for screening from parents and teachers?
2. Is there a significant difference in the frequency of culturally different (minority) students recommended for assessment who passed nqntraditional screening when compared to those who passed traditional screening?
3. Is there a difference between the frequencies of students who passed screening either by scores from the teacher or by the parent scores on Creativity and Leadership scales?
4. Is there an increase in the frequency of culturally different children (minority) who are identified

68
for gifted programs using nontraditional referral and screening and traditional assessment methods when compared to those identified using traditional referral, screening and assessment methods?
5. How are the creativity and leadership behaviors of those children who passed screening described by their parents and teachers?
6. Are there similarities in the students' creativity and leadership behaviors as described by parents and teachers?
7. What differences in students' creativity and leadership behaviors as described by parents and teachers appear to be significant?
The chapter begins with an examination of descriptive statistics of the referral sample within the experimental and control schools. A review of the research questions, analyses and results follow. The chapter is concluded with the results of related analyses.
Characteristics of the Sample The sample was comprised of 82 minority students and 154
white students grades 1-5, in the experimental schools compared with 8 minority and 32 white students, grades 1-5, in the control schools as indicated in Table 2. While 310 students were referred for screening, 3 4 did not complete the screening process; therefore, 276 were screened in four

parishes' experimental and control schools. The results of this study may have been affected by the failure of 3 4 students to complete the screening process in the experimental schools. Of the data collected in theexperimental schools, 118 students (44%) were male; 126students (47%) were female. Twenty-six (9%) of the students were not reported by gender. Only parents from the experimental schools, not the control schools, completed the demographic questionnaire. Parents reported that 123 (42%) of the students live with both parents, 27 (9%) live with one parent, and 106 (49%) parents did not report this information. The mean educational level reported for the father was 13.5 years of school compared with 13.3 for the mother.
The teacher demographic questionnaire was distributed to both experimental and control schools in May, 1992. In theexperimental schools, 90 (82%) of 110 teachers returned thequestionnaire; 74 (60%) of 124 teachers in the control schools responded.
A majority of teachers in the experimental (63.3%) and control schools (71.6%) were certified in elementary education (see Table 3) and had a bachelor's degree (60% and 77% respectively). The remainder (40% and 23% respectively) of the teachers held a master's degree or above. The average years of teaching in the experimental school was 14.7 years and 12.8 in the control schools. Less than half the teachers

70
Table 3Teacher Demographic Information for Experimental and Control Schools
Experimental (n = 90)Item
(Mean)Years Freq.
(Mean) % Years
Control (n = 74)
Freq. %1. Certification
areaElementary- Early Childhood Other Total
5721190
63 .3% 2 .2%
3.4, ..5% 100.0%
538
I!74
71. 6% 10.9% 17.5%
100.0%Education levelBachelor Masters Beyond Masters Total
54201£90
60.0% 2 2 .2% 17 . 8%
100.0%
5711_£74
77.0%14.9%8 .1%
100.0%Total teaching ExperienceGifted awareness level
14.7 12 .8
Previous Training No Training Total
434790
47.8%52.2%
100.0%284fL74
39.8%60.2%
100.0%5. Referrals 1990-91
YesNoNo response Total
303590
33 .3% 38.9% 27.8%
100.0%
24381274
32.4%51.4%16.2%
100.0%

71
Table 3 (con’d)
Experimental (n = 90) Control (n = 74)Item
(Mean) (Mean)Years Freq. % Years Freq. %
5. Referrals (con'd) 1991-92YesNoNo response Total
48281490
53.3%31.1%lJUaiL
100.0%
28351174
37 .8% 47.3% 14.9%
100.0%Ethnicity of ReferralsMinorityWhiteNo response Total
5040_a90
55. 6% 44. 4%_Q___
100.0%
13174474
17.5% 23 .0%
100.0%6. Teacher Ethnicity
MinorityWhiteTotal
191190
21.1% 78.9%
100.0%1174
14.9%85.1%
100.0%

in both groups indicated that they had received any previous awareness training in gifted education or about the characteristics of gifted children (47.8% in the experimental and 37.8% in the control schools). Approximately one-third of the teachers in both groups made referrals in 1990-91, while the referral rate in the experimental schools increased from 33.3% in 1990-91 to 53.3% in 1991-92. No apparent change was noted in the control schools. The ethnicity of the referrals from the experimental schools was 55.6% minority as compared to 17.5% in the control schools.Teacher ethnicity in the experimental schools was 21.1% minority and in the control schools 14.9% minority.Descriptive Statistics for Each Research Question
Question 1: Analysis and Results
Chi-square was used to test if significant differences were found in the number of culturally different (minority) students referred for gifted placement when Child Search procedures (i.e., letters to parents and parent/teacher training) were used with parents and teachers. Table 4 indicates that 82 (9.1%) minority students were referred in the four experimental schools; 8 (1.0%) minority students were referred for screening in the four control schools; therefore, a significantly greater number of minority students were referred for screening in the experimental schools as compared to the control schools. Table 4
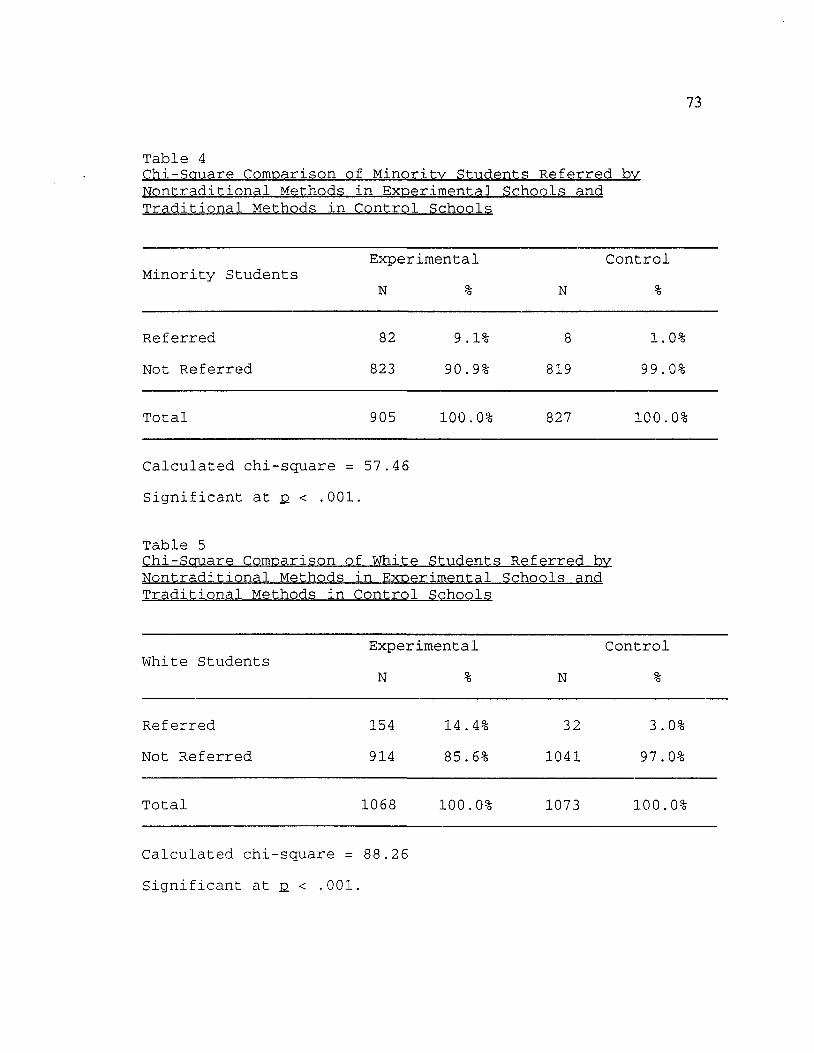
73
Table 4Chi-Sauare Comparison of Minority Students Referred bv Nontraditional Methods in Experimental Schools and Traditional Methods in Control Schools
Minority StudentsExperimental N % N
Control%
Referred 82 9.1% 8 1.0%Not Referred 823 90.9% 819 99.0%
Total 905 100.0% 827 100.0%
Calculated chi-square = 57.46Significant at e < .001.
Table 5Chi-Square Comparison of White Students Referred bvNontraditional Methods in Experimental Schools andTraditional Methods in Control Schools
White StudentsExperimental N % N
Control%
Referred 154 14.4% 32 3.0%Not Referred 914 85.6% 1041 97.0%
Total 1068 100.0% 1073 100.0%
Calculated chi-square = 88.26 Significant at e < .001.

74indicates a calculated chi-square of 57.46, significant at the .001 probability level.
Table 5 indicates that significantly greater number of white students also were referred for screening in the experimental schools as compared to the control schools.There were 154 (14.6%) white students referred in experimental schools; 32 (3.0%) were referred in control schools. The calculated chi-square was 88.26 and significant at e < .001 level.
Question 2: Analysis and Results
Chi-square was used to test if significant differences were found in the frequency of culturally different (minority) students who passed screening and were recommended for assessment when nontraditional screening and traditional screening were compared. The intent of the analysis was to determine if nontraditional referral and screening methods (i,e., referral: child search, parent/teacher training;screening: use of a multiple criteria matrix to expand screening components) increased the number of minority students recommended for assessment.
There was a significant difference in minority (see Table 6) and white students (see Table 7) who passed screening using the nontraditional method in experimental schools when compared to control schools using traditional screening methods. Fifty (5.5%) of the minority students passed

75
Table 6Chi-souare Comparison of Minority Students Who PassedScreening bv Nontraditional Methods in Experimental Schoolsand Traditional Methods in Control Schools
ExperimentalMinority Students
N % NControl
%
Passed Screening 50 5.5% 8 1.0%Did Not Pass Screening 855 94.5% 819 99 .0%
Total 905 100.0% 827 100.0%
Calculated chi-square = 27.73Significant at p < .001.
Table 7Chi-souare Comoarison of White Students Who Passed Screeningbv Nontraditional Methods in Exoerimental Schools ,andTraditional Methods in Control Schools
ExperimentalWhite Students
N % NControl
%
Passed Screening 108 10.1% 25 2.4%Did Not Pass Screening 960 89.9% 1048 97.6%
Total 1068 100.0% 1073 100.0%
Calculated chi-square = 55.64Significant at e < .001.
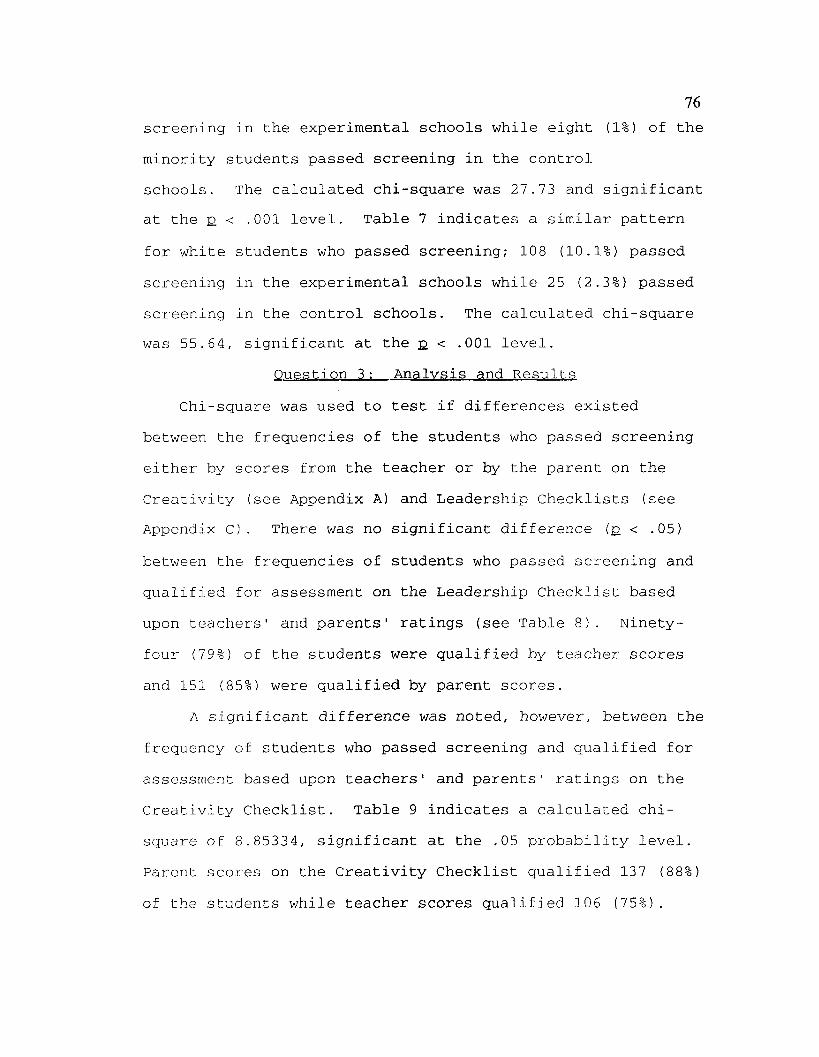
76screening in the experimental schools while eight (1%) of the minority students passed screening in the control schools. The calculated chi-square was 27.73 and significant at the p < .001 level. Table 7 indicates a similar pattern for white students who passed screening; 108 (10.1%) passed screening in the experimental schools while 25 (2.3%) passed screening in the control schools. The calculated chi-square was 55.64, significant at the p < .001 level.
Question 3: Analysis and ResultsChi-square was used to test if differences existed
between the frequencies of the students who passed screening either by scores from the teacher or by the parent on the Creativity (see Appendix A) and Leadership Checklists (see Appendix C). There was no significant difference (p < .05) between the frequencies of students who passed screening and qualified for assessment on the Leadership Checklist based upon teachers' and parents' ratings (see Table 8). Ninety- four (79%) of the students were qualified by teacher scores and 151 (85%) were qualified by parent scores.
A significant difference was noted, however, between the frequency of students who passed screening and qualified for assessment based upon teachers' and parents' ratings on the Creativity Checklist. Table 9 indicates a calculated chi- square of 8.85334, significant at the .05 probability level. Parent scores on the Creativity Checklist qualified 137 (88%) of the students while teacher scores qualified 106 (75%).

77Table 8Chi-sauare Comparison of Students Who Passed NontraditionalScreening using Leadership Scales bv Teachers and Parents
LeadershipTeachers Parents
Freq Percent Freq Percent
Not Qualified 24 21.0% 25 14.7%Qualified 94 79 .0% 151 85.3%
Total 118 100.0% 176 100.0%
n = 294
Calculated chi-square = 1.96415 Not significant at e < .05

78Table 9Chi-sauare Comparison of Students Who Passed NontraditionalScreening Using Creativity Scales bv Teachers and Parents
CreativityTeachers Parents
Freq. Percent Freq. Percent
Not qualified 34 24.8% 17 11.6%Qualified 106 75.2% 137 88.4%
Total 140 100.0% 154 100.0%
n = 294Calculated chi-square = 8.85334 Significant at jd < .05

79Question 4: Analysis and Results
Chi-square was used to test if there was an increase in the frequency of culturally different (minority) children who were identified for gifted programs using nontraditional referral and screening with traditional assessment methods when compared to those identified using traditional referral, screening and assessment methods.
In the experimental schools, 13 (1.4%) minority students were identified as gifted (see Table 10). Of the control schools, one (.1%) of the minority students was identified as gifted. The calculated chi-square was 9.33 and significant at p < .001.
Table 11 indicates that a significantly greater number of white students also were identified in the experimental schools as compared to the control schools. In the experimental schools, 19 (1.8%) of the white students were identified as gifted; 7 (.6%) were identified in the control schools. The calculated chi-square was 5.6 6 and significant at < .05 probability level.
Question 5: Analysis and Results
Qualitative methodology was used to identify categorical patterns of parent/teacher narrative comments. Then, chi- square was used to compare the frequencies of parents' and teachers' rating scores on Creativity (see Appendix A) and Leadership Checklists (see Appendix C) of those children who passed screening.

80
Table 10Chi-square Comparison of Minority Students Who Were Identified as Gifted when Assessed bv Traditional Methods in the Experimental and Control Schools
ExperimentalMinority Students
N % NControl
%
Qualified as Gifted 13 1.4% 1 .1%Did Not Qualify as Gifted 892 98.6% 826 99.9%
Total 905 100.0% 827 100.0%
Calculated chi-square = 9.33Significant at e < .001.
Table 11Chi-sauare ComDarison of White Students Who Were Identifiedas Gifted when Assessed bv Traditional Methods in theExoerimental and Control Schools
ExperimentalWhite Students
N %Control
N %
Qualified as Gifted 19 1.8% 7 0.6%Did Not Qualify as Gifted 1049 98.2% 1066 99.4%
Total 1068 100.0% 1073 100.0%
Calculated chi-square = 5.66 Significant at e < .05.

Qualitative Analysis and ResultsBecause of incomplete data collection in three schools,
data from only one experimental school were selected for the purpose of reviewing narrative responses of parents and teachers on the ten items found in the Creativity (see Appendix B) and Leadership Checklist (see Appendix D). Seventeen students were found who passed the screening criteria score of 24 (80%) on either leadership, creativity, or both.
The narrative examples given by parents and teachers for the creativity and leadership items provided the data for the qualitative analysis. Three categories were identified by using qualitative methodology. Both parents and teachers tended to provide multiple examples of a given characteristic on the Creativity (see Table 12) and Leadership Checklist (see Table 13) in the following categories or patterns: cognitive, affective and behavioral (see Appendix H for specific examples). A fourth category of "no response" was observed. To review, cognitive category designations were assigned to responses that related to knowledge areas as indicators of a specific characteristic. Affective category designations were assigned to responses that described or indicated feelings and attitudes. Behavioral category designations were assigned to responses that did not reflect cognitive or affective indicators, but were simply something the child had been observed doing (i.e., babysits). A

Table 12Frequency Counts of Teacher/Parent Responses on Creativity Items bv Category
CategoryItem Cognitive Affective Behavioral
Teacher Parent Teacher Parent Teacher Parent
1. Expressesfeelings 3 5 0 5 7 7
2. Uses everyday objects to create 8 12 0 0 0 1
3 . Displaysimagination 8 8 0 0 0 2
4. Is adventurous 0 0 0 0 5 13
5. Produces large number of items 3 8 0 0 1 4
6. Isplayful 0 0 0 0 10 10
7 . Uses descriptive language 9 9 0 2 7 3
8. Isinventive 4 13 0 0 0 0
9. Is hard to distract 0 1 0 0 5 13
10. Is curious; asksquestions 7 13 0 5 0 3
Totals 42 69 0 12 35 53

83Table 13Frequency Count of Teacher/Parent Responses on Leadership Items bv Category
Item CognitiveCategoryAffective Behavioral
Teacher Parent Teacher Parent Teacher Parent
1. Carriesoutresponsibility 0 5 0 0 10 11
2. Displaysself-confidence 0 0 0 0 10 8
3 . Participates in group activities 1 0 0 0 9 11
4 . Speaks well in front of a group 0 1 0 0 10 12
5. Enj oys problemsolving 6 10 1 4 1 0
6. Is alert; observant 9 11 0 0 0 1
7 . Is selfdirected 1 0 5 10 2 0
8. Completestasks 0 0 0 0 14 9
9 . Is viewed as a leader 0 1 0 0 6 7
10. Is open to the ideas of others 5 4 3 9 0 5
Totals 22 32 9 23 59 68

84category of "no response" was assigned whenever the parent or teacher failed to indicate any response to an example of a designated characteristic item. Parents and teachers sometimes listed several examples for a given characteristic item. Therefore, the examples given exceeded the 10 characteristics on the Leadership or Creativity checklists. The researcher then coded each response and counted the categories. The counts or frequencies within each category were then recorded for each of the 10 characteristics of Creativity and Leadership (Appendix B and Appendix D).
Using the Creativity Checklists, teachers identified 42 cognitive characteristics, no affective characteristics, and 3 5 behavior characteristics of the 17 students. Parents identified 69 cognitive characteristics, 12 affective characteristics and 53 behavior characteristics.
Using the Leadership Checklist, teachers identified 22 cognitive characteristics, 9 affective characteristics, and 59 behavior characteristics. Parents identified 32 cognitive characteristics, 23 affective characteristics, and 68 behavior characteristics.Quantitative Analysis and Results
On the Creativity and Leadership Checklists (Appendix Aand C), no points or zero score was assigned if no item waschecked, a score of 1 was assigned to items checked as"seldom", a score of 2 was assigned to items checked as "occasionally", and a score of 3 was assigned to items

85checked "frequently". A score of 0 or 1 was labeled a low score on a scale of 0 to 3 (see Table 14). A score of 2 or 3 was labeled a high score. Teacher and parent scores for the 17 students on the Creativity cognitive construct were analyzed using chi-square (p < .05) as a test of association. No significant difference (p < .05) was found between the
teacher and parent Creativity cognitive construct frequencies as revealed by a calculated chi-square of 3.03040.
A significant difference was found, however, in the Creativity affective construct as indicated by the calculated chi-square 3.94871 (p < .05). Because there was strong agreement between teachers' and parents' scores on the behavioral construct, no significant difference was found (chi-square of .00000, p = 1.00000).
For the Leadership Checklist (Table 15), no significant difference was found between the teachers’ and parents' ratings on the cognitive construct as revealed with a calculated chi-square of .12462 (p < .05). There was a
significant difference found between the teachers' and parents' scores on the affective construct, as indicated by the calculated chi-square 6.45920 (p < .05). Again, there
was no significant difference between teachers' and parents' scores on the behavioral construct as indicated by the calculated chi-square of .00000 (p = 1.00000).

86Table 14Chi-sauare Summary Comparison of Teacher/Parent: Scores on Creativity: Cognitive, Affective and Behavioral Category
Cognitive Teacher Parent
n = 17Affective Teacher Parent
n = 17Behavioral
Teacher Parent n = 17
LOW 12 7 15 10 12 12High 5 10 2 7 5 5Chi-square 3.03040 3 .94871* .00000
*Significant at E < .05
Table 15Chi-square Summary Comparison of Teacher/Parent Scores on Leadership: Cognitive, Affective and Behavioral Category
Cognitive Affective BehavioralTeacher Parent Teacher Parent Teacher Parent
n = 17 n = 17 n = 17
Low 11 10 16 10 9 9High 6 7 1 7 8 8Chi-square .12462 6.45920* .00000
^Significant at e < .05

87Question 6: Analysis and Results
Qualitative methodology was used to identify similar categorical patterns of parent/teacher narrative comments on Creativity (Appendix B) and Leadership Checklists (Appendix D). Chi-square was used to test associations between the frequency counts of the categorical constructs (cognitive, affective and behavioral) to determine if there were similarities in the creativity and leadership behaviors of children who passed screening as described by parents and teachers.
Similarities were noted between teachers and parents in the Creativity cognitive category (see Table 12) where there were strong agreement scores of 8 for Item 3, (displays imagination) and a score of 9 for Item 7 (uses descriptive language). Item 4 (is adventurous) and Item 6 (is playful) were both "no response" items for teachers and parents.
In the Creativity affective category, there was a “no response" agreement of teachers and parents for Items 2, 3,4, 5, 6, 8, 9, and 10 (see Table 12). Creativity behavioral agreements were noted for Item 1 (expresses feelings) with a score of 7 and Item 6 (is playful) with a common score of 10. A "no response" agreement was found in Item 8 (is inventive).
Leadership cognitive similarities (see Table 13) were noted between teachers1 and parents1 response on Item 2 (displays self-confidence) and Item 8 (completes tasks) where no responses were given.

88It is interesting to note that Leadership affective
similarities were found by no responses from teachers or parents in Items 1, 2, 3, 4, 6, 8, and 9. No common frequencies were found in the Leadership behavioral category.
Obviously, statistical analyses using chi-square found no significant differences for the items where there was equal agreement between parent and teacher ratings: creativitycognitive (Items 3 and 7, Table 12); creativity behavioral (Items 1 and 6, Table 12).
Question 7: Analysis and Results
Chi-square was used to test if there were significant statistical differences in the students' creativity and leadership behavior as observed by parents and teachers.These observations were coded using the qualitative method of sorting responses into the categories of cognitive, affective, and behavioral constructs. As seen in Table 16a, three items indicated significant differences (p < .05) in
teacher/parent scores in the Creativity cognitive category.The calculated chi-square significance of .03712
indicated a significant difference in teacher and parent scores on Item 2 (uses everyday objects to create). Item 5 (produces a large number of items) had a calculated chi- square significance of .00823, which was a significant difference between teacher/parent scores. A significant difference was found in Item 8 (is inventive) between

89
Table 16aChi-scruare Item Analysis of Significant Difference in Teacher/Parent Scores on Creativity Categories
Calculated Chi-square SignificanceItem Category
Cognitive Affective Behavioral
1 . Expresses feelings. .49146 .03491* 1.00000
2. Uses every day objects to create .03712* — — .08871
3 . Displaysimagination 1.00000 -- .54188
4. Is adventurous .23396 - - .03537*
5. Produces large number of items .00823* .27737
6. Isplayful -- -- 1.00000
7 . Uses descriptive language 1.00000 .12300 .26916
8. Isinventive .03712* - -
9. Is hard to distract .08871 - - .03537*
10. Is curious; asksquestions .14822 .03491* .23396
*Significant at 2 < .05
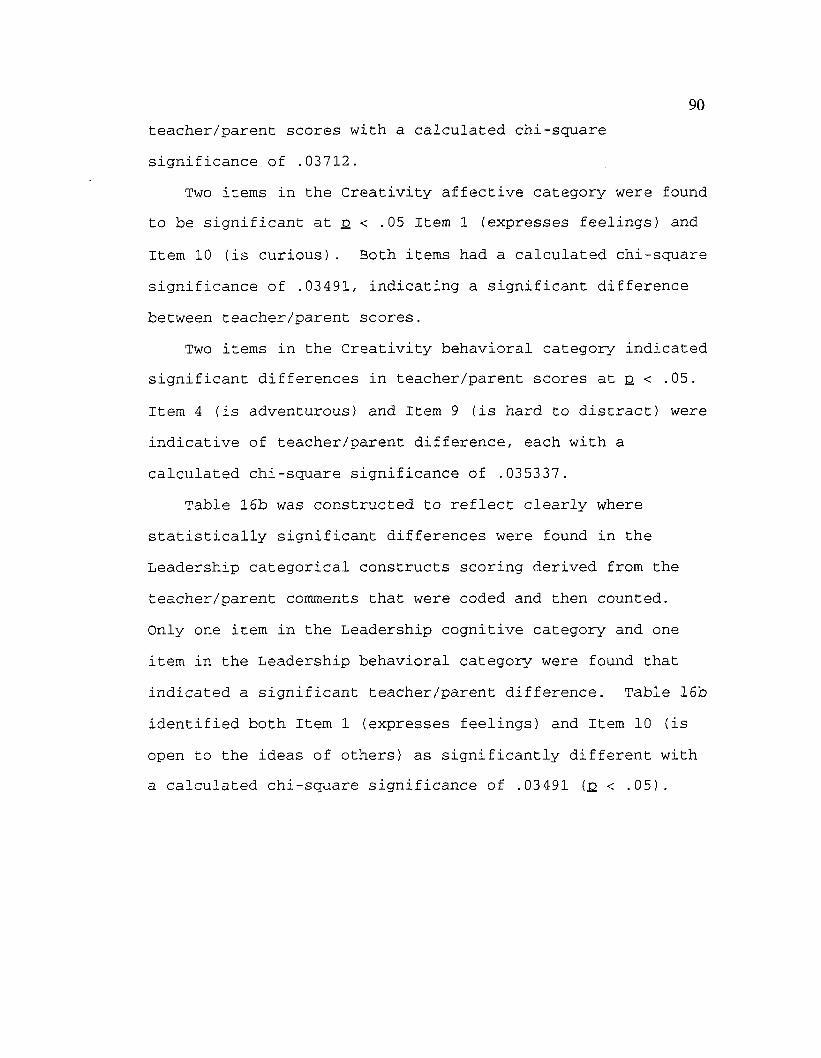
90teacher/parent scores with a calculated chi-square significance of .03712.
Two items in the Creativity affective category were found to be significant at e < .05 Item 1 (expresses feelings) and
Item 10 (is curious). Both items had a calculated chi-square significance of .03491, indicating a significant difference between teacher/parent scores.
Two items in the Creativity behavioral category indicated significant differences in teacher/parent scores at e < -05.
Item 4 (is adventurous) and Item 9 (is hard to distract) were indicative of teacher/parent difference, each with a calculated chi-square significance of .035337.
Table 16b was constructed to reflect clearly where statistically significant differences were found in the Leadership categorical constructs scoring derived from the teacher/parent comments that were coded and then counted.Only one item in the Leadership cognitive category and one item in the Leadership behavioral category were found that indicated a significant teacher/parent difference. Table 16b identified both Item 1 (expresses feelings) and Item 10 (is open to the ideas of others) as significantly different with a calculated chi-square significance of .03491 (2 < .05).

91
Table 16bChi-scmare Item Analysis of Significant Difference in Teacher/Parent Scores on Leadership Categories
ItemCalculated Chi-square Significance
Category AffectiveCognitive
1. Carries out responsibility .03491*
2. Displays self- confidence
3. Participates in group activities .08871
4. Speaks well in front of agroup .08871
5. Enjoys problemsolving .3 0222
6. Is alert; observant .48527
7. Is selfdirected .08871
8. Completes tasks
9. Is viewed asa leader .08871
10. Is open to the ideas of others .69725
06195
68172
.14822
Behavioral
.76521
.72972
.28807
.48112
.08871
.08871
.62724
.20438
.73620
.03491*
*Significant at p < .05

CHAPTER 5SUMMARY, CONCLUSIONS, AND RECOMMENDATIONS
The purpose of this study was to determine the effectiveness of using nontraditional referral and screening procedures to identify culturally different gifted children. Louisiana's current state definition emphasizes academic achievement and intellectual ability as eligibility criteria for gifted program accessibility. Such a definition does not address strengths which may be found in creativity and leadership areas possibly limits the inclusion of more minority students in academically gifted programs. A recent national survey (Ross, 1993) reported that states using IQ score cutoffs to identify gifted and talented students tend to have greater disparities among ethnic groups. Research indicates that a broad criteria for identification of the gifted will encompass 3% to 5% of the school population (Gallagher, 1985; Sisk, 1987).
Traditional screening methods tend to identify more students in the majority population when compared with minority representation. Louisiana has a 49% minority representation in its total school population, yet minorities comprise only 18% of the students in Louisiana's gifted programs compared with 82% who are white. The disparity in minority representation suggested the need not only to examine the definition of giftedness, but also to consider a
92

more comprehensive system of referral, screening and identification.
The following research questions were examined:Research Questions
1. What effect does the Child Search procedure have on the initiation of referrals for screening from parents and teachers?
2. Is there a significant difference in the frequency of culturally different (minority) students recommended for assessment who passed nontraditional screening when compared to those who passed traditional screening?
3. Is there a difference between the frequencies of students who passed screening either by scores from the teacher or by the parent scores on Creativity and Leadership scales?
4. Is there an increase in the frequency of culturally different children (minority) who are identified for gifted programs using nontraditional referral and screening and traditional assessment methods when compared to those identified using traditional referral, screening and assessment methods?
5. How are the creativity and leadership behaviors of those children who passed screening described by their parents and teachers?

94
6. Are there similarities in the students' creativity and leadership behaviors as described by parents and teachers?
7. What differences in students' creativity and leadership behaviors as described by parents and teachers appear to be significant?
A summary of the findings of the dissertation research is provided in this chapter. Conclusions presented in the second section of the chapter are based on the research findings and are drawn from the related literature. The last section lists recommendations for policy, practice and for further research.
SummarySample Characteristics
Descriptive data were examined to determine normal data distribution. The total population of the control and experimental schools was 3,873 students with 2,441 (55%) white students and 1,732 (45%) minority students. In the experimental schools, referrals for screening included 65%(n = 154) white students and 35% (n = 82) minority students. In the control schools, referrals for screening included 80% (n =32) white students and 20% (n = 8) minority students. In the total population of the experimental and control schools, referrals for screening provided a sample of 27 6 students.
Parent demographic data, collected only in the experimental schools, revealed that 42% of the students who

were referred for screening lived with both parents. The mean educational level of the father was 13.5 and 13.3 for the mother. A majority of the teachers in the experimental (63.3%) and control (71.6%) schools were certified in elementary education. Less than half the teachers in both groups (47.8% in experimental37.8% in control) indicated receiving any previous awareness training in gifted education or about the characteristics of gifted children. The teacher referrals for screening in the experimental schools increased from 33.3% in 1990-91 to 53.3% in 1991-92. The control school teacher referrals only increased from 32.4% in 1990-91 to 37.8% in 1991-92. It appears that the nontraditional method of child search and parent/teacher training may have resulted in the greater increase in student referrals in the experimental schools compared with the control schools.
ConclusionsSeveral important conclusions were generated as a result
of this research study.Conclusion One
There appeared to be a significant difference in the number of minority children (82 or 9.1%) referred for gifted screening when Child Search procedures (i.e., letters to parents and parent/teacher training) were used when compared with traditional referral procedures (8 or 1.0%). White students also were referred in significantly greater numbers (154 or 14.6%) when compared with traditional referral

96(32 or 3%). Therefore, it appeared that awareness training for parents and teachers (Child Search) was effective in the initiation of referrals overall (276) when compared with traditional referral procedures (40). These results were consistent with the findings reported by Richert (1987), Passow (1986) and Jacobs (1971).Conclusion Two
There was a significant difference in the number of both minority and white students who passed screening in the experimental schools using the nontraditional method compared with those in the control schools using the traditional method. Fifty (5.5%) minority students passed the screening in the experimental schools compared with 8 (1%) minority students who passed screening in the control schools. A similar pattern was observed for white students who passed screening using nontraditional methods (n = 108, 10.1%) compared with those who passed screening when traditional methods were employed (n = 25, 2.3%).
These results support the findings of Frasier (1991) and Torrance (1989) which indicate that when cultural traits and characteristics are included in the referral and screening criteria, more minority students will be considered. This research supports their findings that a multifaceted matrix that includes creativity and leadership should be used in the referral and screening process.

97
Conclusion ThreeInvolvement of parents and teachers in the
identification of students' creativity and leadership characteristics is recommended throughout the literature (Baldwin, 1989; Clark, 1992; Frasier, 1989). Although there was no significant relationship between teacher and parent scores on the Leadership Checklist, parents qualified more students at the screening stage (n = 151, 85%) than did teachers (n = 118, 79%). There was a significant difference, however, between teacher and parent scores on the Creativity Checklist. Parents were able to identify 137 (88%) of 155 students who passed the screening criteria while teachers identified 106 (75%) of 141. In addition, fewer students failed to pass screening on leadership and creativity when scored by parents than by teachers. Parents failed to pass 25 (14.7%) on leadership and 17 (11.6%) on creativity while teachers failed to pass 24 (21%) on leadership and 34 (24.8%) on creativity. When a sample (n = 17) from one school was
studied further, there appeared to be an association in the narrative responses of parents on the Creativity Checklists and the higher screening passing rate. Parents named more behaviors as indicators of creativity and leadership than did teachers. This also is consistent with the research found in the related literature previously cited. Teachers appeared

98
to have difficulty citing behaviors that were defined as creative.Conclusion Four
There appeared to be a significant difference in the number of minority children (n = 13, 26%) who were identified as gifted after nontraditional referral and screening methods had been employed. Traditional assessments relied on IQ and achievement tests in keeping with the requirements of Louisiana's Bulletin 1508. The findings of this research also suggest that minorities continue to be limited in the final identification process for gifted programs whether nontraditional referral/screening (n = 13, 26%) or traditional referral/screening (n = 1, 12.5%) was employed. The narrow final assessment criteria at the conclusion of the referral and screening process appeared to remain an exclusion factor for minorities. This finding is consistent with the results found in the research (Alvino, McDonnell, Richert, 1981; Borland, 1986; Cohen, 1990).Conclusion Five
It appeared that parents and teachers were able to describe students' behaviors in three categories of creativity and leadership. They named cognitive products that related to academic areas, affective indicators that related to students' feelings and behavioral observations relating to students' interest areas or other activities.This conclusion was consistent with the findings within the

99literature indicating that parents and teachers are able to identify students' leadership and creativity characteristics (Clark, 1992; Karnes, 1983).Conclusion Six
Several similarities were noted in parents' and teachers' observations of students concerning creativity and leadership behaviors. Additionally, there appeared to be some creativity and leadership areas where parents and teachers were unable to give specific examples to support a given characteristic. Both parents and teachers, however, were able to name indicators of playfulness and expressive feelings in the area of creativity. In the area of leadership, parents and teachers also were similar in their ability to specify examples of self-confidence and task completion behaviors in students. The findings within the literature support the conclusion of this research that Louisiana parents and teachers can site specific examples of creativity and leadership characteristics (Torrance, 1984; Treffinger, 1984).Conclusion Seven
When teachers and parents were asked to give examples to support a creativity or leadership characteristic, parents were consistently able to cite more indicators than teachers. The indicators cited fell into three categorical patterns: cognitive, affective and behavioral. For creativity, parents cited 69 cognitive indicators compared to 42 for teachers, 12

affective indicators compared to zero for teachers, and 53 behavioral indicators compared to 3 5 for teachers. For leadership, parents cited 32 cognitive indicators compared to 22 for teachers, 23 affective indicators compared to 9 for teachers, and 64 behavioral indicators compared to 62 for teachers. While parents were able to name more cognitive, affective and behavioral indicators compared with teachers on creativity and leadership items, teachers were unable to name any affective indicators on creativity items and only 9 on leadership items. Teachers appear either to be unwilling or unable to recount specific indicators or truly may not observe the affective indicators. Teachers were more successful in naming specific cognitive and behavioral indicators in leadership and creativity, but not as successful as parents. It appeared that parents were able to observe indicators of creativity and leadership over longer periods of time and in less structured settings than were teachers within a classroom setting. Also, teachers may not be providing students with opportunities to demonstrate creativity and leadership. Although parent and teacher observations differed, it was important to consider the indicators cited by both as a part of the portfolio approach to the identification process that is needed in order to obtain data relative to the whole child. This conclusion was consistent with the recommendations found within the

101literature (Coleman & Gallagher, 1992; Cox, 1985; Jacobs, 1971; Richert, 1985).
Recommendations for Policy. Practice and Further Research
Based on the findings of this research and the review of
the related literature, there are a number of implications and recommendations for policy, practice and for further
research that may be drawn from this study.Policy and Practice
First, the procedures in Louisiana for gifted identification is inadequate for all students, as well as
minority students. The State of Louisiana's definition of
giftedness should be expanded and modified so that greater
representative proportions of all ethnic groups of students
can be screened and identified. The reliance upon only two
criteria for identification, academic and intellectual achievement, fails to take into account creativity and
leadership measures which are consistently recommended in the
literature (Clark, 1992; Coleman & Gallagher, 1992, Frasier,
1989; Guilford, 1975; Torrance, 1984). It is recommended
that state identification procedures should be expanded to
include creativity and leadership. Various academic areas,
other than math and reading solely, should be included so that nontraditional screening can have a positive impact.
Second, the special education assessment teams need to
employ the option for additional assessment which is embedded in Bulletin 1508 (Pupil Appraisal Handbook. 1983). It

102appears that the assessment teams are not including evaluation measures which take into account the students from culturally diverse populations or those who are considered environmentally deprived of educational opportunities, as is called for in Bulletin 1508.
Third, the results of this study suggested that the inclusion of parents and teachers in the identification process is warranted to gather a more complete and multifaceted composite of the whole child. Parents and teachers were able to identify characteristics as indicators of giftedness that address individual strengths and potential for learning at an advanced level. Therefore, it is recommended that a portfolio approach to gathering data for gifted referrals be initiated within the state including various cultural indicators of giftedness. School districts need to implement awareness training for parents and teachers each year concerning characteristics of multicultural indicators of giftedness.
Fourth, the Louisiana State Department's Office of Special Education should disseminate and share information concerning nontraditional gifted identification to its 66 school districts.Further Research
First, the concept of giftedness should be an ongoing study and analysis in Louisiana. Reconsideration should be given to the dynamic demographic structure of the state that

103takes into account giftedness as a social construct. The human social and cultural construction of Louisiana needs to
be under continuous surveillance concerning placement of all
students in special programs, including gifted programs.
Second, further research should be considered to determine why teachers and parents do not focus on affective behaviors when they describe student behaviors. Research is needed to determine procedures to improve parent/teacher recognition skills of affective student behaviors.
Third, further research should be considered to examine the findings of Louisiana's three year study (1991-1994) using nontraditional referral, screening and assessment to identify minority gifted students. The research conducted in Louisiana may add to the current body of knowledge concerning minority gifted identification issues.
Fourth, this study did not look at socioeconomic status
and disadvantaged students. These factors may provide useful
data for future planning and development of gifted programs in Louisiana that would address the special needs of those
students.
Fifth, while this research did not look at gender differences, additional research is warranted in the area of gifted females, gifted individuals with disabilities and other cultures, as well as those found in Louisiana.
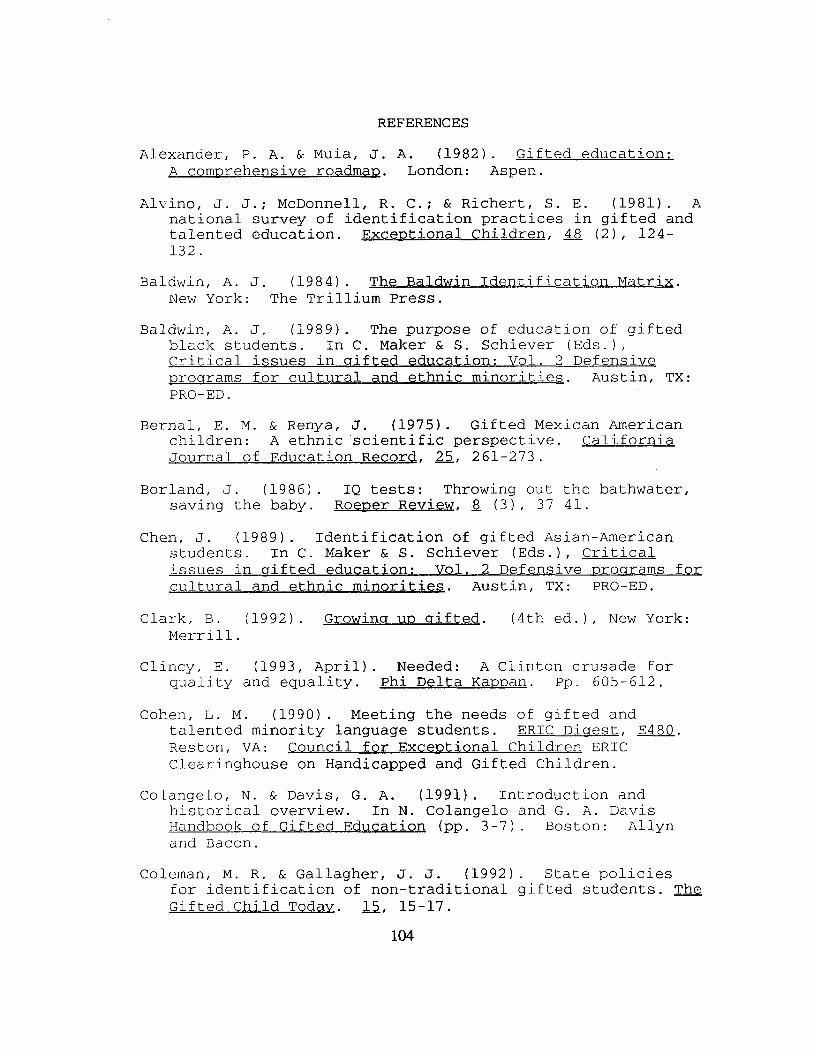
REFERENCESAlexander, P. A. & Muia, J. A. (1982). Gifted education:
A comprehensive roadmap. London: Aspen.
Alvino, J. J.; McDonnell, R. C.; & Richert, S. E. (1981). A national survey of identification practices in gifted and talented education. Exceptional Children, 48 (2), 124- 132 .
Baldwin, A. J. (1984). The Baldwin Identification Matrix. New York: The Trillium Press.
Baldwin, A. J. (1989). The purpose of education of gifted black students. In C. Maker & S. Schiever (Eds.),Critical issues in gifted education: Vol. 2 Defensive programs for cultural and ethnic minorities. Austin, TX: PRO-ED.
Bernal, E. M. & Renya, J. (1975). Gifted Mexican American children: A ethnic scientific perspective. CaliforniaJournal of Education Record. 25. 261-273 .
Borland, J. (1986). IQ tests: Throwing out the bathwater,saving the baby. Roeper Review. H (3), 37-41.
Chen, J. (1989). Identification of gifted Asian-American students. In C. Maker & S. Schiever (Eds.), Critical Issues in gifted education: Vol. 2 Defensive programs forcultural and ethnic minorities. Austin, TX: PRO-ED.
Clark, B. (1992). Growing up gifted. (4th ed.), New York:Merrill.
Clincy, E. (1993, April). Needed: A Clinton crusade forquality and equality. Phi Delta Kappan. Pp. 605-612.
Cohen, L. M. (1990) . Meeting the needs of gifted andtalented minority language students. ERIC Digest. E480. Reston, VA: Council for Exceptional Children ERICClearinghouse on Handicapped and Gifted Children.
Colangelo, N. & Davis, G. A. (1991). Introduction and historical overview. In N. Colangelo and G. A. Davis Handbook of Gifted Education (pp. 3-7). Boston: Allynand Bacon.
Coleman, M. R. & Gallagher, J. J. (1992). State policiesfor identification of non-traditional gifted students. The Gifted Child Today. 15. 15-17.
104

105Cox, J. (1985). The Richardson study: A national
investigation of educational opportunities for able learners. Fort Worth, TX: Texas Christian UniversityPress.
DeHaan, R. F. & Havighurst, R. J. (1957). Educating gifted children. Chicago: University of Chicago Press.Digest of Education Statistics. (1991). U. S.Department of Education, National Center for Education Statistics.
Digest of Education Statistics. (1991). U.S. Department of Education, National Center for Education Statistics.
Eby, J. W. Sc Smutny, J. F. (1990) . A thoughtful overview of gifted education. New York: Longman.
Frasier, M. M. (1989). Identification of gifted blackstudents: Developing new perspectives. In C. Maker &S. Schiever (Eds.), Critical issues in gifted education: Vol. 2 Defensive programs for cultural and ethnic minorities. Austin, TX: PRO-ED.
Frasier, M. M. (1989). Poor and minority students can begifted, too! Educational Leadership, 46, (6), 16-18.
Frasier, M. M. (1991). Disadvantaged and culturally diversestudents. Journal for the Education of the Gifted. 14.3, 234-245.
Friedman, P., Friedman, R. & Van Dyke, M. (1984).Identifying the leadership gifted: Self, peer, or teachernominations? Roeoer Review. 7. (2), 91-94.
Gallagher, J. J. (1985). Teaching the gifted child. Boston: Allyn and Bacon.
Gardner, H. (1983). Frames of mind.: The theory of multipleintelligences. New York: McGraw-Hill.
Gould, S. J. (1981) . The mismeasure of man. New York: W.W. Norton & Company.
Green, J. L. (1986) . On having gifts and being gifted: Ourgnarly notion of the brightest and best. In N. C.Burbules (Ed.), Philosophy of Education: 1986.Bloomington, IL: Philosophy of Education Society.

106Guilford, J. P. (1959). Three faces of intellect. American
Psychologist, £., 469-479.Guilford, J. P. (1972). Intellect and the gifted. Gifted
Child Quarterly. 15. 175-184.Guilford, J. P. (1975). Varities of creative giftedness:
Their measurement and development. Gifted Child Quarterly. 19. 107-121.
Hasegawa, C. (1989). The unmentioned minority. In C. Maker& S. Schiever (Eds.), Critical issues in gifted education: Vol. 2 Defensive programs for cultural and ethnic minorities. Austin, TX: PRO-ED.
Hawley, A., Hawley, C. Sc Pendarvis, E. (19 86). Teaching gifted children: Principles and strategies. Boston:Little Brown.
Jacobs, J. (1971). Effectiveness of teacher and parentidentification of gifted children as a function of school level. Psychology in the Schools. £., 140-142.
The Jacob K. Javits Gifted and Talented Students EducationAct of 1988. Title IV, Part B, Sec. 4103. U. S.Department of Education, Washington, D. C.: U. S.Government Printing Office.
Karnes, M. B. (1983). The role of the family. In M. B.Karnes (Ed.) The underserved: Our vouno gifted children.Reston, VA: ERIC Clearinghouse on Handicapped and GiftedChildren.
Kerlinger, F. N. (1986). Foundations of behavioralresearch. (3rd ed.), New York: Holt, Rinehart andWinston.
Kirchenbaum, R. J. (1983). Let's cut out the cut-off score in the identification of the gifted. Roeoer Review. 5.(4), 6-9.
Kitano, M. (1989). Critique of 11 Identification of Gifted Asian-American students." In C. Maker & S. Schiever (Eds.), Critical issues in gifted education: Vol. 2Defensive programs for cultural and ethnic minorities. Austin, TX: PRO
Locke, P. (.1982). The American Indian: Too few identified.Gifted Children Newsletter. 2 . (9), 4.

107Lucito, L. (1972). Creativity traits. Atlanta: Georgia
State University, unpublished manuscript.Maker, C. J. (1982). Curriculum development for the gifted.
Rockville, MD: Aspen.Maker, C. J. & Schiever, S. W., Eds. (1989). Critical
issues in gifted education: Vol. 2, Defensive programsfor cultural and ethnic minorities. Austin, TX: PRO-ED.
Marland, S. (1972). Education of the gifted and talented: Reoort to Congress. Washington, DC: U. S. GovernmentPrinting Office.
Naglieri, J. A. (1985). Matrix Analogies Test. Short Form. San Antonio, TX: The Psychological Corporation, HarcourtBrace Javanovich, Inc.
Nettleship, R. L. (1966). The four stages of intelligence. In A. Sesonke (Ed.), Plato's Republic. Belmont, CA: Wadsworth.
1990 Summary Statistic of Population and Housing: U. S.Census Bureau. Washington, DC: U. S. GovernmentalPrinting Office.
One Hundred Fortv-First Annual Financial and StatisticalReport. (1991). Bulletin 1472. Baton Rouge: Louisiana Department of Education.
Passow, A. H. (1984). Education of the gifted in world perspective. New York: Teachers College Press.
Passow, A. H. (1986) . Educational Programs forminoritv/disadvantaqed gifted students. New York:Teachers College Press.
Perrone, P. & Male, R. (1981). The developmental education and guidance of talent learners. Rockville, MD: AspenPublications.
Piaget, J. (1952). The origins of intelligence of children.New York: International University Press.
Plato. (1971). The Republic III. In S. Buchanan (Ed.),The Portable Plato 364-412. New York: The Viking Press.
Plowman, P., Rice, J., Sato, I., & Others. (1971). Education of mentally gifted minors. Sacramento: California State Department of Education.

108
Poonwassie, D. H. (1992). Perspectives on equality ofopportunity in education. In D. Ray and D. H. Poonwassie (Eds.), Education and Cultural Differences. New York: Garland Publishing Co.
Pupil Appraisal Handbook: Bulletin 1508. (1983).Baton Rouge: Louisiana Office of Special EducationalServices.
Renzulli, J. S. & Hartman, R. (1971). Scale for behavioral characteristics of superior students. Exceptional Children. M (3), 243-248.
Renzulli, J. S.; Smith, L. H.; White, A. J.; Callahan, C. M.& Hartman, R. K. (1977). Scales for rating the behavioral characteristics of superior students. Mansfield Center, Ct: Creative Learning Press.
Renzulli, J. S.; Reid, B. D.; and Gubbins, E. J. (1992).Setting an agenda: Research priorities for the gifted andtalented through the year 2000. Storrs, CT: The NationalResearch Center on the Gifted and Talented.
Richert, E. S., Alvino, J. J. & McDonnell, R. C. (1982). National report on identification. Sewell, NJ:Educational Improvement Center South.
Richert, E. S. (1985). Identification of gifted children in the United States: The need for pluralistic assessment.Roeoer Review, 8. (2), 68-72.
Richert, E. S. (1987). Rampant problems and promising practices in the identification of disadvantaged gifted students. Gifted Child Quarterly. 31. 149-54.
Robinson, N. M. & Chamrod, D. L. (1986). Appropriate uses of intelligence tests with gifted children. Roeoer Review. fL, 572-576.
Ross, P. 0. (1993). National Excellence: A Case forDeveloping America's Talent. Washington, DC: U.S.Government Printing Office.
Sato, I. S. (1974, May). The culturally different gifted child: The dawning of his day? Exceptional Children. 40(8), 572-576.
Sattler, J. M. (1972) Assessment of children's intelligence and special abilities. Boston: Allyn & Bacon.

109Shade, B. J. (1987). Ecological correlates of the educative
style of Afro-American children. The Journal of Negro Education. 56 (1), 88-89.
Shore, B. M., Cornell, D. G., Robinson, A., & Ward, V. S. (1991). Recommended practices in gifted education.New York: Teachers College Press.
Sisk, D. (1981). The challenge of education the gifted among the poor. In A. H. Kramer (Ed.), Gifted childrenchallenging their potential:__New perspectives andalternatives. (pp. 309-325). New York: Trillium Press.
Sisk, D. (1987). Creative teaching of the gifted.New York: McGraw-Hill.
Spearman, C. (1904). General intelligence objectivelydetermined and measured. American Journal of Psychology 15, 201-293.
Stanley, J. C. (1984). Use of general and specific aptitude measures in identification: Some principles and certaincautions. Gifted Child Quarterly, 28, 177-180.
Sternberg, R. J. (1982). Non-entrenchment in the assessment of intellectual giftedness. Gifted Child Quarterly, y (26), 63-67.
Sternberg, R. J. (1991). Giftedness according to thetriarchic theory of human intelligence. In N. Colangelo & G. A. Darris (Eds.), Handbook of gifted education, Boston: Allyn and Bacon.
Strauss, A. & Corbin, J. (1990). Basics of Qualitative research. Newbury Park, CA: SAGE Publications.
Tannenbaum, A. J. (1979). Pre-Sputnik to post-Watergateconcern about the gifted. In A. H. Passow (Ed.), The gifted and the talented (pp. 5-27). Chicago: NationalSociety for the Study of Education, 5-27.
Tannenbaum, A. J. (1983). Gifted children: Psychologicaland educational perspectives. New York: Macmillan.
Terman, L. M. (1947). Genetic studies of genius: Thegifted child grows up. Palo Alto, CA: Stanford University Press.
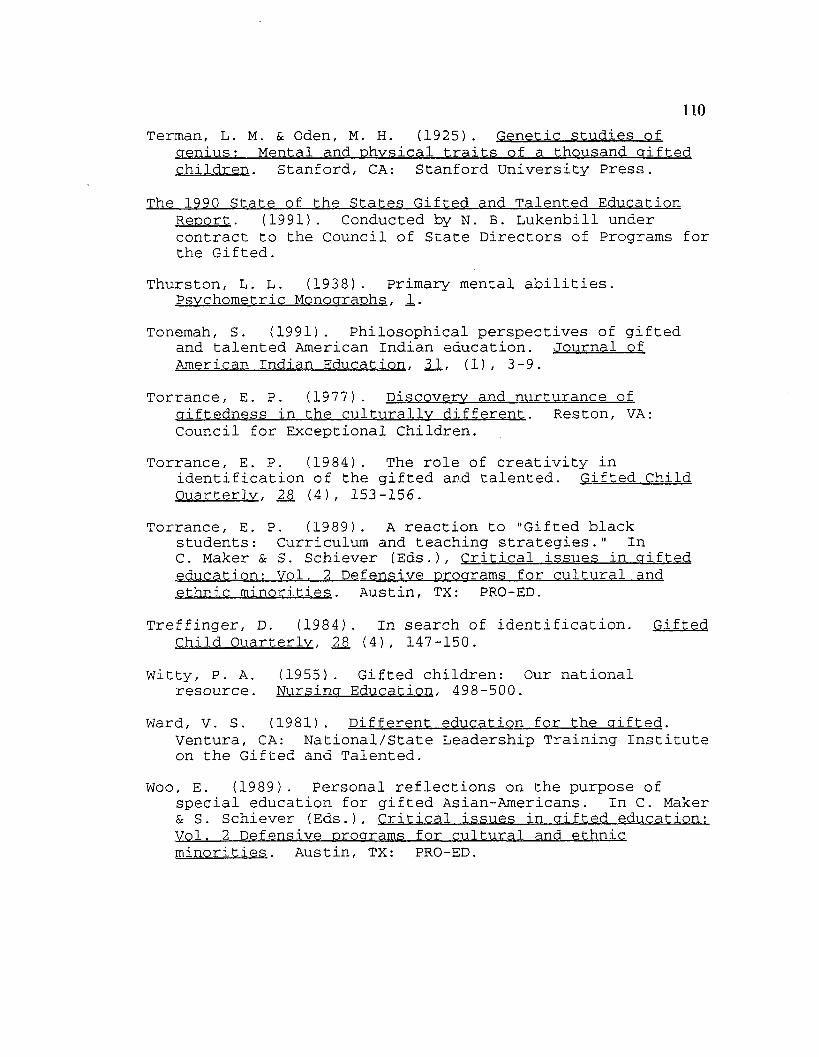
110Terman, L. M. & Oden, M. H. (1925). Genetic studies of
genius: Mental and physical traits of a thousand giftedchildren. Stanford, CA: Stanford University Press.
The 1990 State of the States Gifted and Talented Education Report. (1991). Conducted by N. B. Lukenbill undercontract to the Council of State Directors of Programs for the Gifted.
Thurston, L. L. (1938). Primary mental abilities.Psychometric Monographs. 1..
Tonemah, S. (1991). Philosophical perspectives of gifted and talented American Indian education. Journal of American Indian Education. 31. (1), 3-9.
Torrance, E. P. (1977). Discovery and nurturance ofgiftedness in the culturally different. Reston, VA: Council for Exceptional Children.
Torrance, E. P. (1984). The role of creativity inidentification of the gifted and talented. Gifted Child Quarterly. 28 (4), 153-156.
Torrance, E. P. (1989). A reaction to "Gifted blackstudents: Curriculum and teaching strategies." InC. Maker & S. Schiever (Eds.), Critical issues in gifted education: Vol. 2 Defensive programs for cultural and ethnic minorities. Austin, TX: PRO-ED.
Treffinger, D. (1984). In search of identification. Gifted Child Quarterly. 28 (4), 147-150.
Witty, P. A. (1955). Gifted children: Our nationalresource. Nursing Education. 498-500.
Ward, V. S. (1981). Different education for the gifted.Ventura, CA: National/State Leadership Training Instituteon the Gifted and Talented.
Woo, E. (1989). Personal reflections on the purpose ofspecial education for gifted Asian-Americans. In C. Maker & S. Schiever (Eds.), Critical issues in gifted education: Vol. 2 Defensive programs for cultural and ethnicminorities. Austin, TX: PRO-ED.

APPENDIX ACREATIVITY CHECKLIST
Score Guide--School Building Level Committee
Child's Name________________________ DateSchool______________________________ Grade
Seldom Occasionally FrequentlyEasily expresses feelings, emotions, and/or ideas,(e.g., facially, verbally, by body gestures, in role playing, etc.), but mayimitate or mimic others______________ __________ _______
Uses everyday objects to create inventions, games,toys, etc. _______ __________ _______
Displays imagination (makes up stories, acts out ideas), but may elaborate on thetruth_________________________ _______ __________ _______
Is adventurous, uninhibited, willing to take risks, but may have little regard forestablished rules _______ __________ _______
Produces large number or variety of ideas in work orPlay _______ __________ _______
Is playful, makes others laugh, sometimes at inappropriate times andplaces _______ __________ _______
Makes people see pictures when telling stories ordescribing situations _______ __________ _________
111

112
Appendix A (con'd)Seldom Occasionally Frequently
Is inventive; enjoys problem solving; produces unusual solutions toproblems _______ __________ _______Is hard to distract fromenjoyable activities_________ _______ __________ _______
Is curious; asks manyand unusual questions _______ __________ _______
SCHOOL BUILDING LEVEL COMMITTEE:
Step One:Total checks in each
column:_______________________ _______ ______________ _______
Multiply total checks in each column by theindicated weight: 1 __________ 2_______ 3
Weighted column scores: _______ __________ _______
Total Score (add the three weighted columnscores) :____________________ _______ __________ _______
Step Two:Refer this child for evaluation if the total score is 24 or above 80%.
Attach parent/teacher checklist with samples/examples to the back for documentation.
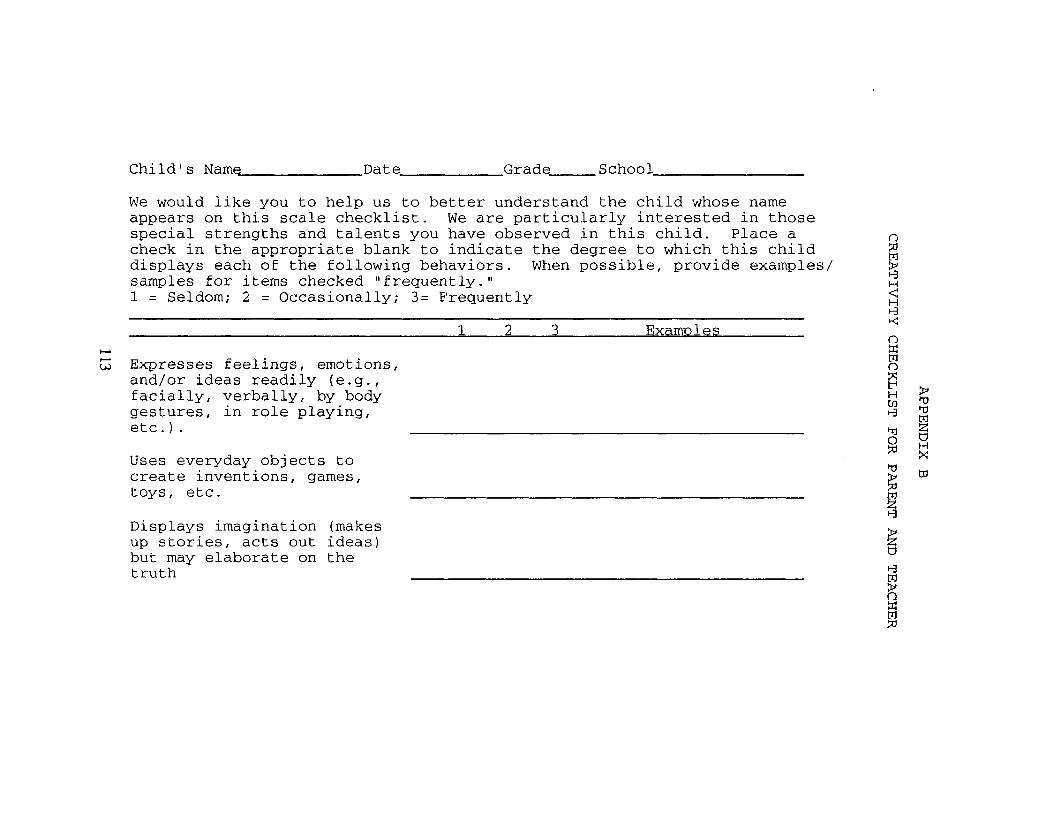
Child's Namq. Date Grade School
We would like you to help us to better understand the child whose name appears on this scale checklist. We are particularly interested in those special strengths and talents you have observed in this child. Place a check in the appropriate blank to indicate the degree to which this child displays each of the following behaviors. When possible, provide examples/ samples for items checked "frequently."1 = Seldom; 2 = Occasionally; 3= Frequently
____________ 1 2 3_________ Examples
Expresses feelings, emotions, and/or ideas readily (e.g., facially, verbally, by body gestures, in role playing,etc.). _________________________________
Uses everyday objects to create inventions, games,toys, etc. _________________________________
Displays imagination (makes up stories, acts out ideas) but may elaborate on thetruth _________________________________

_______________________________________ 1____ 2____ 3__________ ExamplesIs adventurous, uninhibited, willing to take risks, but may have little regard ofestablished rules __________________________________
Produces large number or variety of ideas in work or play
Is playful, makes others laugh, sometimes at inappropriate times and places.
Makes people see pictures when telling stories or describing situations
Is inventive, enjoys problem solving, produces unusual solutions to problems
Is hard to distract from enjoyable activities
Is curious, asks many and unusual questions.
Appendix B
(con'd)

APPENDIX C LEADERSHIP CHECKLIST
Score Guide--School Building Level Committee
Child's Name______ Date_________________ _______
School______________________________Grade_______________________
Seldom Occasionally Frequently
Carries out responsibilities and fulfills commitments withlittle supervision_____________ _____ _______ ______________
Displays self-confidence, butmay appear to brag or boast _____ _______ _____________
Participates readily in group activities; cooperates with others, but may tend todominate at times _____ _______ _____________
Speaks well in front of a grouphe/she feels comfortable with _____ _______ _______ _______
Enjoys problem solving/ decisionmaking; produces creative and effectivesolutions to problems _____ _______ _____________
Is alert, observant and a goodlistener_______________________ _____ _______ _________________
Is a self-directed, independent thinker, but may challengeauthority _____ _______ _____________
Attends to a task until it is completed, but may have littleregard for time schedules _____ _______ _____________
Is a leader as viewed byothers _____ _______ _____________
Is open to the ideas of others, but may be overly critical ofthose in authority_____________ _____ _______ _____________
115

116Appendix C (con'd)
SCHOOL BUILDING LEVEL COMMITTEE:Step One:
Total checks in each column: _
Score Guide--School Building Level Committee
Multiply total checks in each column by theindicated weight: 1 2 3____Weighted column scores: _____ _______ _________
Total Score (add the three weighted column
scores):__________________________ _______ ________
Step Two:Refer this child for evaluation if the total score is 24 or above 80%.
Attach parent/teacher checklist with samples/examples to the back for documentation.

Child's Namq. Date Grade. School
We would like you to help us to better understand the child whose name appears on this scale checklist. We are particularly interested in those special strengths and talents you have observed in this child. Place a check in the appropriate blank to indicate the degree to which this child displays each of the following behaviors. When possible, provide examples/samples for items checked "frequently."1 = Seldom; 2 = Occasionally; 3= Frequently to
Examples H
Carries out responsibilities £ and fulfills commitments with "J little supervision
Displays self-confidence, but may appear to brag or boast
Participates readily in group activities; cooperates with others, but may tend to dominate at times toSpeaks well in front of a group he/she feels comfortable with i-3M
a

1____ 2____ 2_________ ExamplesEnjoys problem solving/ decisions making, produces creative and effective solutions to problems
Is alert, observant, and a good listener
Is a self-directed independent thinker, but may challenge authority
Attends to a task until it is completed, but may have little regard for time schedulesIs a leader as viewed by others
Is open to the ideas of others, but may be overly critical of those in authority _
oo
Appendix D
(con'd)

APPENDIX EPARENT DEMOGRAPHIC INFORMATION
STUDENT
1. Name____________________2. Address_________________
Zip3. Birthday________________4. Language most often
spoken:By student ________
In the home ________
PARENT/GUARDIAN
8 . Name_______________________ ________
9. Address____________________________
Zip(omit if same as student)
10. Telephone:Home_______________________________Work_______________________________
11. Does child live with parent/guardian? Yes_______________ No__
5. Ethnic background:_____Native American_____Asian_____Black Hispanic_____White
6. Age_____________Years Month
7. Sex_____________Male Female
119

120
Appendix E (con'd)
12. Legal Guardian:__________Parent__________Mother__________Father__________Other Relationship.
13. Marital Status:__________Married__________ Separated__________ Divorced__________Single__________Widowed
14. Occupation:Mother______________________________________________
Father______________________________________________
15. Educational level (please indicate the highest grade school or college that you completed):Mother______________ _______________________________
Father___________ _____________ _____________________
16. Number of brothers ____________ sisters___________
17. Number of brothers and sisters in a Gifted program: brothers__________ sisters_________________

APPENDIX FTEACHER DEMOGRAPHIC INFORMATION
Directions: Please answer each of the following questions.1. Place a checkmark in the areas in which you are
certified:__________Elementary Certification__________Early Childhood Certification__________Kindergarten Certification__________Other (specify)______________ ________________
2. Indicate your present level of education:__________ Bachelor's Degree__________ Master's Degree__________ Plus 30__________ Specialist Degree__________ Doctorate________ _ Other (specify)___________________________
3. a. Indicate the TOTAL number of years you havetaught:__________________
b. If you have taught or teach in a gifted program, indicate the number of years you have taught:
4. Indicate awareness level concerning gifted children: a .__________ Courses Methods Sc Mtls for Teaching Gifted Characteristics of Gifted_____Survey of Exceptional Children_____Other___________________________________________
Workshops, date(s)__________.In-service concerning this grant Other____________________________
121

Appendix F (con'd)
5. Indicate if you have made a referral of a child for gifted placement in:a. 1990-91 School Year ________ Yes________Nob. 1991-92 School Year ________ Yes Noc. Ethnic background of child/children and number
referred for gifted placement in 1991-92. __________Native American__________As i an__________Black_________ Hispanic__________White__________Other
spec i fy_____________________________6. Indicate your ethnic background:
_____Native American_____Asian_____Black_____Hispanic_____White_____Other
spec i fy_______________________________________
122

APPENDIX GFEDERAL DEFINITIONS OF ETHNIC GROUPS
CAIJCASIAN/WHITE. not of Hispanic origin--persons having origins in any of the original peoples of Europe, North Africa, or the Middle East.
BLACK/AFRICAN AMERICAN, not of Hispanic origin--persons having origins in any of the Black racial groups of Africa.
ASIAN or PACIFIC ISLANDER--Chinese/Chinese-American--persons having origins in any of the original peoples of China.Japanese/Japanese-American--persons having origins in any of the original peoples of the Philippine Islands.
Filipino/Philipino--persons having origins in any of the original peoples of the Philippine Islands.Pakistan/East Indian--persons having origins in any of the original peoples of the Indian sub-continent.
other Asian--persons having origins in any of the peoples of the Far East (including Korea), Southeast Asia, or Pacific Islands (including Samoan), not included in any of the Asian categories listed above.AMERICAN INDIAN or ALASKAN NATIVE--persons having origins in any of the original American Indian peoples of North America, including Eskimos and Aleuts, or who maintain cultural identification through tribal affiliation or community recognition.
Hispanic, Including Black Individuals whose origins are Hispanic--
Mexican/Mexican-American/Chicano--persons of Mexican culture or origin, regardless of race.
Latino-American/Latino--persons of Latin American (e.g.. Central American, South American, Cuban, Puerto Rican) culture or origin, regardless of race.Other/Spanish/Spanish-American--persons of Spanish culture or origin, not included in any of the Hispanic categories listed above (Digest of Education Statistics, 1991).
123

APPENDIX HEXAMPLES OF CATEGORICAL CONSTRUCTS
Listed below are examples of parent and teacher comments for various items on the Creativity and Leadership Checklists (Appendix B and D). Each comment's source and checklist item are indicated within the parenthesis. P = parent,T = teacher, C = Creativity and L = Leadership.
Cognitive - comments relate to knowledge areas- "Loves to solve problem." "Reasoning ability; strong high order thinker." (T, L, Item 5)
- "Likes to solve problems, even one she doesn't; even understand." "Very enthusiastic about confronting problems and finding solutions." (P, L, Item 5)
- "Recall - locked in." " Always excellent in discussions in class." (T, L, Item 6)
- "Capacity for memory and details of things seen and heard and establishes inner relationships." (P, L,Item 6)
- "I've stopped counting the inventions and games he has created." "When she finishes her classwork early, she finds ways to expand on things she knows." (T, C,Item 2)
- "His kite broke. He took the pieces and made a bow and arrows and a bag to carry them in." "Like to take things apart and make things out of the parts; likes to draw and make guns and knives out of paper." (P, C, Item 2)
- "She loves to write stories. She writes stories and illustrates them." " Has a great imagination. Writes stories." (T, C, Item 3)
- "Has won a creative writing contest. Has also written several short stories." "Frequently writes stories in book form; often brings home newspaper items from class to type on computer." (P, C, Item 3)
- "Detailed, but lazy." "Gives reasons for why thingsare done." (T, C, Item 5)
- "Figured out a way to hook up on Christmas lights on front fence and then put them up by himself." "Lots of ideas - she'll run you nuts." Can usually think of an easier way to complete a task." (P, C, Item 5)
- "Has loved mazes since he was 4 yrs. old. Loves to domath problems.“ "Once hooked up a wagon behind his three-wheeler to haul grass in as he raked it up.""Has a lot of common sense. Can figure most things out and has worked in books since 2 yrs. old." (P, C,Item 8)
124

125Appendix H (con'd)Affective - comments relate to feelings and attitudes
- "Has a mind of her own and believes she is always right." (P, L, Item 7)
- "Gives a facial expression to let you know she's interested & likes to know why when she gets things wrong." (T, L, Item 7)
- "Always thinks 'her way' is best." (P, L, Item 7)- "Open, but likes his ideas best!" (T, L, Item 10)- "He listens to others' ideas, but he wants to improve
them." "Always worries about others." (P, L, Item. 10)- "She expresses her true feelings and emotions very
easily." (T, C, Item 1)- "Very sensitive to the poor, sick and old people. Wants
to help all organizations for children. Hard for her to understand why all kids don't have feelings for other people." (P, C, Item 1)
- "Is honest, seldom straying from the truth." (P, C, Item 3)
Behavioral - comments relate to a descriptive behavior
- "Can't leave things undone." (T, L, Item 1)- "Accepts tasks that are overwhelming." "Can fold
clothes very well and will also put them up." "Takes care of pets." (P, L, Item 1)
- "Great self confidence, but does not brag or boast."(T, L, Item 2)
- "Volunteers to do most anything, especially tractor driving, moving hay bales." (P, L, Item 2)
- "Dominates; a real leader; uninhibited." (T, L,Item 3)
- "Likes to boss and lead." (P, L, item 3)- "Very quick with a task." (T, L, Item 8)- "Will do what she's told, but on her time." (P, L,
Item 8)- "Was watching a fly in the house and following it
around playing like he had a remote control for it."(P, C, Item 2)
- "Adventurous risk in ideas, but definitely a rules follower." "Very adventurous, but does follow class rules." (T, C, Item 4)
- "He loves to build things such as adding to a treehousebut he's not supposed to go in the barn because it’sfalling down but he gets some of his lumber there.""Had an adventurous side but knows rules are to be followed." (P, C, Item 4)

VITA
JoAnne Welch was born in Columbia, Mississippi on December 23, 1937, the daughter of Melvin and Josephine Regan. After graduation from high school, she completed her Bachelor of Arts requirements in elementary education at Millsaps College in 1960. Following her marriage to Thomas Clyde Welch, she taught elementary grades in Mississippi, Texas and Tennessee. She has two married sons, Thomas Andrew and David Edward.
She pursued a double major in Special Education for Gifted and School Administration. She was awarded a Masters of Education degree and graduated with honors in 1977. She was employed as an administrative assistant to the superintendent of schools in Brookhaven, Mississippi prior to relocating to Monroe, Louisiana in January, 1985. She is employed at Northeast Louisiana University as an assistant professor in Curriculum and Instruction. She continued her studies at Louisiana State University and received a Doctor of Philosophy in May 1994, majoring in Curriculum and Instruction.
126

DOCTORAL EXAMINATION AND D ISSER TA TIO N REPORT
Candidate: Jo Anne Welch
Major Field: Education
Title of Dissertation: a Study of Nontraditional Referral and Screeningof Culturally Different Gifted Children
Approved:
EXAMINING COMMITTEE:
Date of Examination:December 6, 1993