A Study of Nigeria Maritime Trade and Transport
10
A Study of Nigeria Maritime Trade and Transport 1 Opuware, Kenny Alubeze Department of Maritime Transport and Business Studies, Delta State School of Marine Technology, Burutu 2 Ambakederemo, Owulupu Samuel Department of Maritime Transport and Business Studies, Delta State School of Marine Technology, Burutu Abstract Countries across the globe have developed policies aimed at achieving strategic objective to build and sustain an indigenous merchant marine in order to partake in cargo lifting in the international seaborne shipping trade and as such earn shipping freight revenues. Nigerian Maritime Administration like those of other countries has equally come up with such policies. Successful implementation and appraisal of these policies no doubt is dependent on quantitative calculation of shipping tonnage demand and other freight market indices. This research work analyses shipping tonnage demand in the Nigeria non-oil freight market. We conduct a parametric analysis to determine demand for shipping tonnage and shipping routes showing intense transport demand, based on shipment level data gathered from port terminals records. Trend analysis of aggregated trade volumes is conducted to assess the feasibility of Nigeria‟s seaborne trade in the short term. Policy framework aimed at development of indigenous shipping tonnage capacity, trade facilitation and sustenance are proposed. Key Words: Nigeria, Seaborne, Transport, shipping, tonnage, port, Maritime Introduction The International Chamber of Shipping states that it is hard to “quantify the volume of world seaborne trade in monetary figures for trade estimates are traditionally in terms of tones or tone- miles, and are therefore not comparable with monetary-based statistics for the value of the world economy.”(2018) However, the United Nations Conference on Trade and Development (UNCTAD) estimates that the operation of merchant ships contributes about US$380 billion in freight rates within the global economy, equivalent to about 5% of total global trade. During the most part of the last century, the shipping industry witnessed general increase in total volume. (2016:1) More than 80 percent of world merchandise trade by volume is transported through the sea. Hence, according to available literatures, seaborne trade remains the bedrock of international trade. Seaborne trade refers to the movement of merchandise by vessels between the ports of THE INT’L SCHOLAR JOURNAL OF MANAGEMENT AND SOCIAL SCIENCES Website: www.theinterscholar.org/isjmss E-mail: [email protected] Vol. 1 Issue 1, August, 2018
-
Upload
khangminh22 -
Category
Documents
-
view
3 -
download
0
Transcript of A Study of Nigeria Maritime Trade and Transport
A Study of Nigeria Maritime Trade and Transport
1Opuware, Kenny Alubeze
Department of Maritime Transport and Business Studies,
Delta State School of Marine Technology, Burutu
2Ambakederemo, Owulupu Samuel
Department of Maritime Transport and Business Studies,
Delta State School of Marine Technology, Burutu
Abstract
Countries across the globe have developed policies aimed at achieving strategic objective to build
and sustain an indigenous merchant marine in order to partake in cargo lifting in the international
seaborne shipping trade and as such earn shipping freight revenues. Nigerian Maritime
Administration like those of other countries has equally come up with such policies. Successful
implementation and appraisal of these policies no doubt is dependent on quantitative calculation
of shipping tonnage demand and other freight market indices. This research work analyses
shipping tonnage demand in the Nigeria non-oil freight market. We conduct a parametric analysis
to determine demand for shipping tonnage and shipping routes showing intense transport demand,
based on shipment level data gathered from port terminals records. Trend analysis of aggregated
trade volumes is conducted to assess the feasibility of Nigeria‟s seaborne trade in the short term.
Policy framework aimed at development of indigenous shipping tonnage capacity, trade
facilitation and sustenance are proposed.
Key Words: Nigeria, Seaborne, Transport, shipping, tonnage, port, Maritime
Introduction
The International Chamber of Shipping states that it is hard to “quantify the volume of world
seaborne trade in monetary figures for trade estimates are traditionally in terms of tones or tone-
miles, and are therefore not comparable with monetary-based statistics for the value of the world
economy.”(2018) However, the United Nations Conference on Trade and Development
(UNCTAD) estimates that the operation of merchant ships contributes about US$380 billion in
freight rates within the global economy, equivalent to about 5% of total global trade. During the
most part of the last century, the shipping industry witnessed general increase in total volume.
(2016:1)
More than 80 percent of world merchandise trade by volume is transported through the sea.
Hence, according to available literatures, seaborne trade remains the bedrock of international
trade. Seaborne trade refers to the movement of merchandise by vessels between the ports of
THE INT’L SCHOLAR JOURNAL OF MANAGEMENT AND SOCIAL SCIENCES
Website: www.theinterscholar.org/isjmss
E-mail: [email protected]
Vol. 1 Issue 1, August, 2018
Page 17
origin, where merchandise is received from the exporter to port of destination where the
merchandise is claimed by the importer (Stopford, 1997). The marine sector is vital in connecting
international seaborne commerce. Ocean-going vessels represent the most efficient method of
conveying volumes of basic commodities and finished products. In 2006, about 2.7 billion tons of
dry bulk cargo for instance, was carried by sea. This was over one-third of all international
seaborne trade (Genco Shipping, 2006). This represents an important demand for shipping
tonnage for countries involved in merchant shipping.
Africa is increasingly attracting attention as a region with significant potential for maritime transport and seaborne trade. Although Africa’s impact on shipping is still comparatively small, it is poised to expand as the continent sets out to exploit its vast resources and as consumption demand increases in tandem with improved income levels. Africa is becoming increasingly attractive, in particular to Asia, with the value of trade between the regions steadily rising . While the European Union remains Africa’s biggest trading partner, China has now overtaken the United States as Africa’s largest single trading partner. Trade flows between the United States and Africa were valued at about $123 billion in 2011, while China–Africa flows stood at about $133 billion (Fairplay 2013a).
Having a coastline of over 750km and eight major ports excluding oil terminals, Nigeria is a
maritime State. The national ports have a cargo handling capability of 35million tones annually.
These ports, over the past decade, have accounted for around 99 percent by volume and 95
percent by value of the country‟s total seaborne trade. The demand for shipping in Nigeria has
always been there, but Nigeria‟s indigenous shipping carriers lack adequate shipping capacity to
participate effectively in international trade (Damachi and Zhaosheng, 2005). As a result Nigeria
is losing enormous freight revenues to foreign shipping carriers which dominate our freight
transport market. Viewed from this perspective, it is an important challenge to the Nigerian
Maritime Administration to provide a more robust policy framework to encourage greater
participation of indigenous shipping carriers and improve trade relations with trading partner
countries. The question of shipping tonnage acquisition and supply requires a thorough
understanding of the following: the existing and potential market demand for shipping tonnage at
aggregate or disaggregated level; intensity of the demand along relevant sea routes, among other
shipping market characteristics. Consequently the present paper attempts to derive estimates of
shipping tonnage demand by routes and identifies specific routes showing intense shipping
tonnage demand.
The aim of research is to analyse Nigeria‟s dry bulk and general cargoes in order to determine the
demand for transport (shipping tonnages) along Nigeria‟s trading regions/routes. Specifically the
objectives of this research are to determine the following:
i. The tonnage of Nigeria‟s export and import of general and dry bulk cargoes.
Page 18
ii. The tonnage of cargoes by regions or shipping routes.
iii. Nigeria‟s major trading regions/partners.
iv. The growth potentials of Nigeria‟s seaborne trade.
In order to achieve the above stated objectives, the researchers would provide answers to the
following research questions;
i. What is the volume of Nigeria‟s seaborne trade by region?
ii. What is the percentage distribution of Nigeria‟s seaborne trade by routes within the study
period?
iii. Which countries are Nigeria‟s major trading partners
iv. What is the trend of Nigeria‟s seaborne trade?
To provide answers to the research questions, the following statistical hypothesis will be tested by
the researchers:
• The volume of seaborne trade through major regions is not significantly different from
zero.
• The volumes of Nigeria‟s seaborne general cargo and bulk trades (2006 – 2010) are not
significantly different from zero.
• The trend of Nigeria‟s seaborne trade for the period under consideration is not
significantly different from zero. All hypotheses are tested at α = 0.05 level of significance.
Most of the cargoes transported in dry bulk vessels are raw materials or semi-finished products
used as input for industrial production. Traditionally, dry bulk cargo is divided into five “major”
bulks (iron ore, Coal, grain, bauxite/aluminum and phosphate) in addition to the “minor” bulks.
There are five major factors that influence the demand for transportation. The development of the
world economy is an important factor. Growth in gross domestic product and industrial
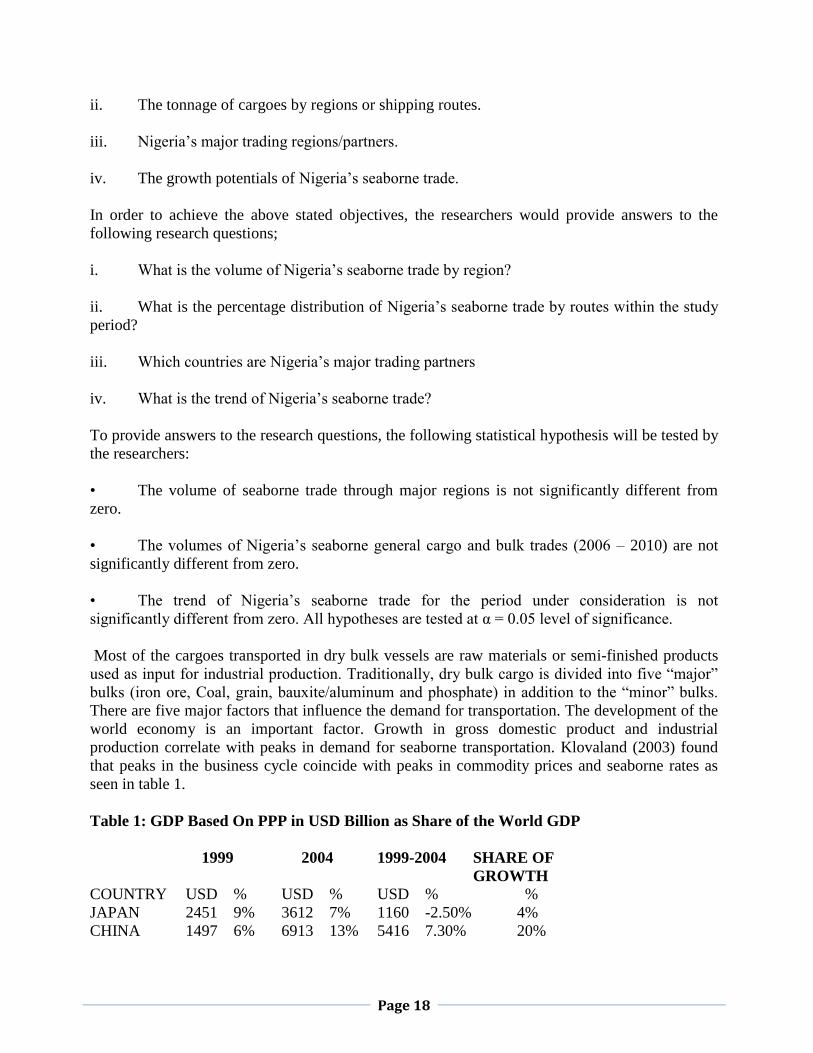
production correlate with peaks in demand for seaborne transportation. Klovaland (2003) found
that peaks in the business cycle coincide with peaks in commodity prices and seaborne rates as
seen in table 1.
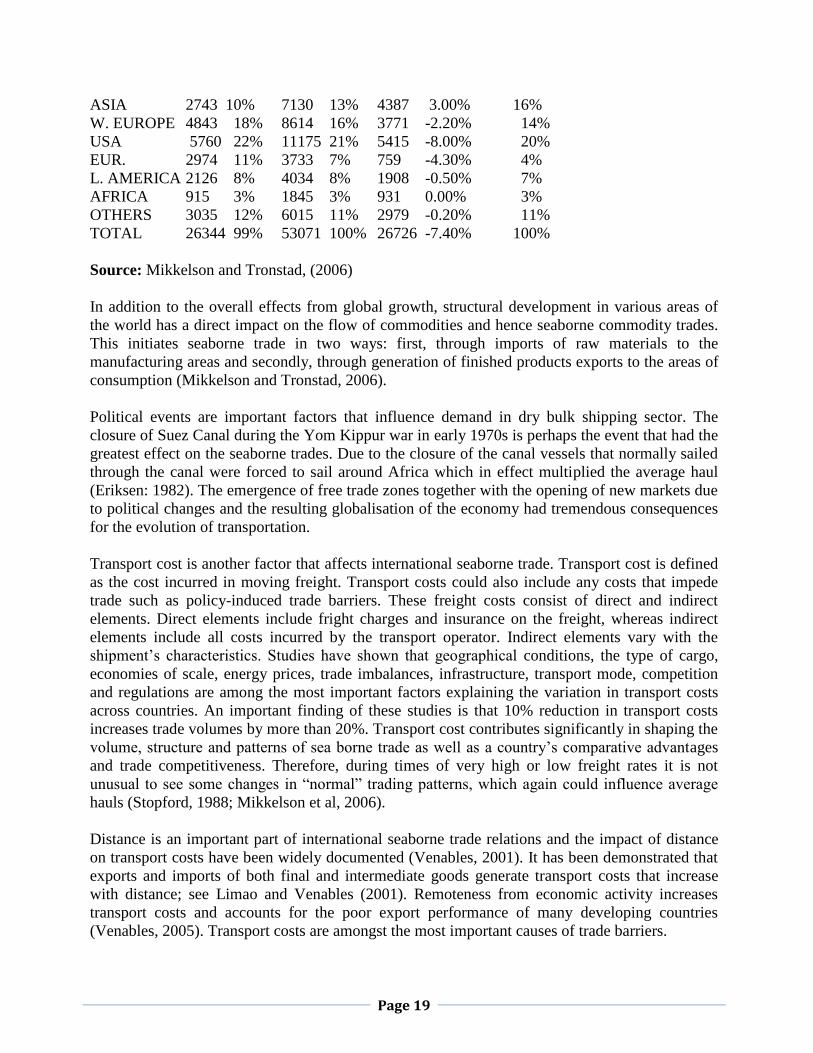
Table 1: GDP Based On PPP in USD Billion as Share of the World GDP
1999 2004 1999-2004 SHARE OF
GROWTH
COUNTRY USD % USD % USD % %
JAPAN 2451 9% 3612 7% 1160 -2.50% 4%
CHINA 1497 6% 6913 13% 5416 7.30% 20%
Page 19
ASIA 2743 10% 7130 13% 4387 3.00% 16%
W. EUROPE 4843 18% 8614 16% 3771 -2.20% 14%
USA 5760 22% 11175 21% 5415 -8.00% 20%
EUR. 2974 11% 3733 7% 759 -4.30% 4%
L. AMERICA 2126 8% 4034 8% 1908 -0.50% 7%
AFRICA 915 3% 1845 3% 931 0.00% 3%
OTHERS 3035 12% 6015 11% 2979 -0.20% 11%
TOTAL 26344 99% 53071 100% 26726 -7.40% 100%
Source: Mikkelson and Tronstad, (2006)
In addition to the overall effects from global growth, structural development in various areas of
the world has a direct impact on the flow of commodities and hence seaborne commodity trades.
This initiates seaborne trade in two ways: first, through imports of raw materials to the
manufacturing areas and secondly, through generation of finished products exports to the areas of
consumption (Mikkelson and Tronstad, 2006).
Political events are important factors that influence demand in dry bulk shipping sector. The
closure of Suez Canal during the Yom Kippur war in early 1970s is perhaps the event that had the
greatest effect on the seaborne trades. Due to the closure of the canal vessels that normally sailed
through the canal were forced to sail around Africa which in effect multiplied the average haul
(Eriksen: 1982). The emergence of free trade zones together with the opening of new markets due
to political changes and the resulting globalisation of the economy had tremendous consequences
for the evolution of transportation.
Transport cost is another factor that affects international seaborne trade. Transport cost is defined
as the cost incurred in moving freight. Transport costs could also include any costs that impede
trade such as policy-induced trade barriers. These freight costs consist of direct and indirect
elements. Direct elements include fright charges and insurance on the freight, whereas indirect
elements include all costs incurred by the transport operator. Indirect elements vary with the
shipment‟s characteristics. Studies have shown that geographical conditions, the type of cargo,
economies of scale, energy prices, trade imbalances, infrastructure, transport mode, competition
and regulations are among the most important factors explaining the variation in transport costs
across countries. An important finding of these studies is that 10% reduction in transport costs
increases trade volumes by more than 20%. Transport cost contributes significantly in shaping the
volume, structure and patterns of sea borne trade as well as a country‟s comparative advantages
and trade competitiveness. Therefore, during times of very high or low freight rates it is not
unusual to see some changes in “normal” trading patterns, which again could influence average
hauls (Stopford, 1988; Mikkelson et al, 2006).
Distance is an important part of international seaborne trade relations and the impact of distance
on transport costs have been widely documented (Venables, 2001). It has been demonstrated that
exports and imports of both final and intermediate goods generate transport costs that increase
with distance; see Limao and Venables (2001). Remoteness from economic activity increases
transport costs and accounts for the poor export performance of many developing countries
(Venables, 2005). Transport costs are amongst the most important causes of trade barriers.
Page 20
The demand for dry bulk carrier capacity is determined by the underlying demand for
commodities transported in dry bulk carriers, which in turn is influenced by trends in the global
economy. Growth in gross domestic product and industrial production however, correlates with
peaks in demand for seaborne transportation. Certain economics will act from time to time as the
“primary driver” of the dry bulk carrier market. In the 1990s, Japan acted as the primary driver
due to increased demand for seaborne trade and growth in Japanese industrial production.
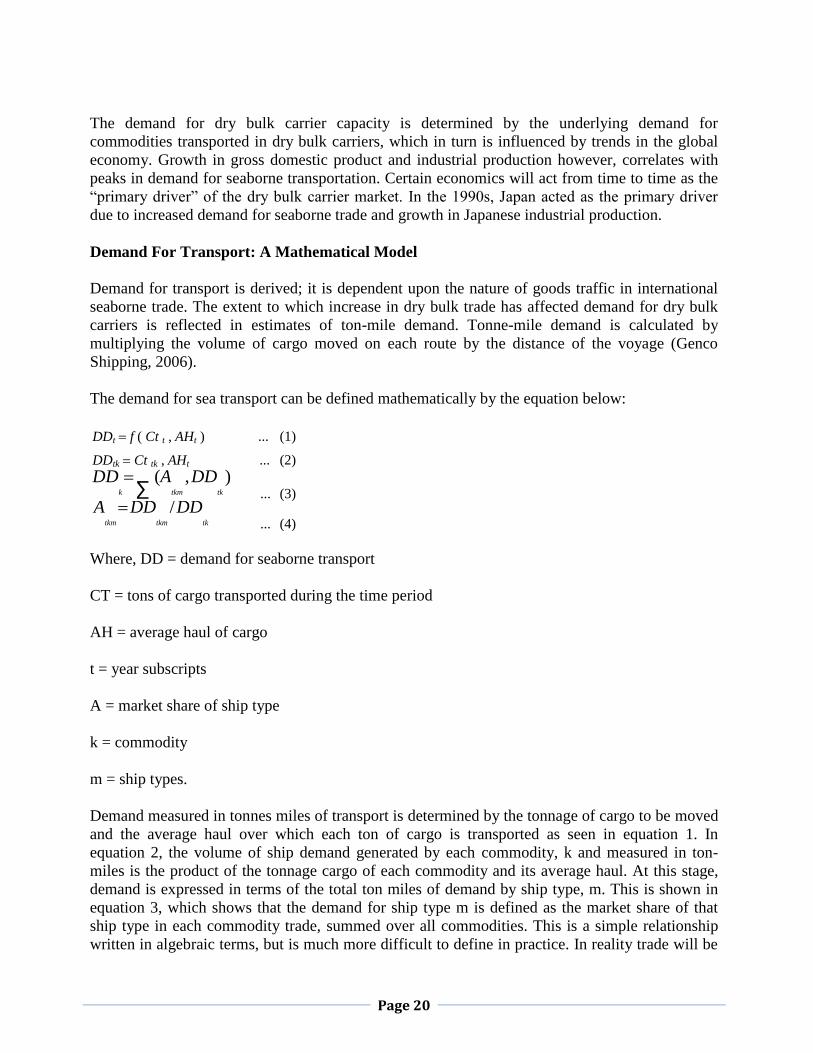
Demand For Transport: A Mathematical Model
Demand for transport is derived; it is dependent upon the nature of goods traffic in international
seaborne trade. The extent to which increase in dry bulk trade has affected demand for dry bulk
carriers is reflected in estimates of ton-mile demand. Tonne-mile demand is calculated by
multiplying the volume of cargo moved on each route by the distance of the voyage (Genco
Shipping, 2006).
The demand for sea transport can be defined mathematically by the equation below:
DDt f ( Ct t , AHt ) ... (1)
DDtk Ct tk , AHt ... (2)
DDk
∑
(Atkm
,
DDtk
) ... (3)
Atkm
DDtkm
/
DDtk ... (4)
Where, DD = demand for seaborne transport
CT = tons of cargo transported during the time period
AH = average haul of cargo
t = year subscripts
A = market share of ship type
k = commodity
m = ship types.
Demand measured in tonnes miles of transport is determined by the tonnage of cargo to be moved
and the average haul over which each ton of cargo is transported as seen in equation 1. In
equation 2, the volume of ship demand generated by each commodity, k and measured in ton-
miles is the product of the tonnage cargo of each commodity and its average haul. At this stage,
demand is expressed in terms of the total ton miles of demand by ship type, m. This is shown in
equation 3, which shows that the demand for ship type m is defined as the market share of that
ship type in each commodity trade, summed over all commodities. This is a simple relationship
written in algebraic terms, but is much more difficult to define in practice. In reality trade will be
Page 21
carried in whatever ships available which depend on what ship owners order, so analyzing trends
may be the answer (Stopford, 1997).
The international dry bulk shipping industry is highly fragmented and is divided among state
controlled and independent dry vessel owners. As a general principle, the smaller the cargo-
carrying capacity of a dry bulk vessel, the more fragmented is the market, both with regard to
charterers and vessel owners/operators. Charter hire rates paid for dry bulk carriers are primarily a
function of the underlying balance between vessel supply and demand; although at times other
factors may play a role. Furthermore, the pattern seen in charter hire rates is broadly mirrored
across the different dry bulk categories. However, because demand for larger dry bulk vessels is
affected by the volume and pattern of trade in a relatively small number of commodities, charter
hires rates of larger ships tends to be more volatile than those for smaller vessels. In the voyage
charter market, rates are influenced by cargo size, commodity, port dues and canal transit fees, as
well as delivery and redelivery regions. In general, a larger cargo size is quoted at a lower rate per
ton than a smaller cargo size. Routes with costly ports and canal generally command higher rates
than routes with low port dues and no canals to transit.
The global economy powered by rising seaborne trade volume would continued to increase and
African countries have steadily lost out in opportunity and economic growth, (Nigerian Annual
Financial Reviews, 2007). According to the United Nations Conference on Trade and
Development (UNCTAD), goods loaded at port worldwide in 2006 were estimated at 7.4 billion
tons, and equivalent to an annual growth rate of 4.3% dry cargo accounted for 63.9% of total
goods loaded with the inclusion of bulk, break bulk and containerized goods. By this, the world
seaborne trade is no doubt one the contributory factors of the improvement in the world GDP.
Sea borne trade will continue to be the backbone of international trade with over 80% of world
merchandise trade by volume being carried by sea. With an annual average growth rate of 4.3%,
World seaborne trade is expected to increase by 4.4% in 2020 and double by 2031, potentially
reaching 11.5 billion tons and 16.04 billion tons, respectively (Review of Maritime Transport,
UNCTAD, 2005). Manufactured goods account for over 70% of the world merchandise trade by
value. Trade in manufacturing goods includes consumption goods as well as intermediate goods
and semi-finished products. Over the years, the conjunction of several factors has contributed to
the dynamism of the international trade and maritime transport services. These include:
• Increased trade liberalization.
• Advances in information and communication technology (ICTS).
• Transport technology (larger ships size, tracking and tracing techno
• Sophisticated logistics services (e.g. third and forth party logistics).
In a related issue, Clarkson‟s Research Studies, recently posits that tons-mile for dry bulk cargoes
may be expected to continue to grow with China‟s iron ore needs being increasingly met by new
suppliers such as Latin America. In addition to the supply side factor of demand for dry bulk
transport (e.g. fleet, transport infrastructure and cargo availability), the performance of seaborne
trade is dictated by demand size consideration such as;

Page 22
• Level of development (e.g. matured, emerging or growing economies
• The structure of the economy (e.g. service economy, industrial or agricultural based
economies)
• The political and regulatory frame work (e.g. trade liberalization) as well as unforeseen
event e.g. weather strikes and political unrest.
An important poser in this regard is that, with all of these demand pull factors, what is the size of
Nigeria‟s fleet that can take advantage of the opportunities. The urgent task before Nigeria
according to experts is to develop its national fleet, human and economic resources. By so doing,
the country will cease to be treasurers of resources and opportunities and rather become utilizers.
In 1996, for instance the total seaborne dry trade in Nigeria was 2,810,359 tons and this figure
represents 6.25% of the entire seaborne trade (Abstracts of Port Statistics, 1996). However, within
ten years it has experienced a dynamic increase of about 12, 536, 236 tons or 28.89% of the entire
seaborne trade during that period. The positive trend is expected to continue in future and thus
represents shipping opportunities to charterers and ship owners.
Research Methodology
This research study is concerned with the estimation of shipping tonnage demand in Nigeria‟s
freight market. The main data for this research consist of shipment level data obtained from the
various terminals of Nigeria‟s ports Authority (NPA). The NPA publishes data on import and
export tonnages discharged or loaded in all the Nigerian ports terminals on annual basis.
Specifically, the publication contains the following: commodity types (classified according to
SITC format), type of packaging and origin/destination of commodities discharged or loaded at
the various port terminals across Nigeria. Tonnage values of non oil commodities were
aggregated from various issues of the publication. For more meaningful data analysis, the
aggregations were done over type of packaging and countries of origin/destination further
classified into origin or destination regions. The complete data set assembled and used for the
analysis is a panel data containing tonnage of non-oil commodities handled at various port
terminal from years 2006 – 2010.
To determine the extent of trade (shipping tonnages) that is generated between Nigeria and other
trading regions (made of up some countries); an analysis of means (ANOVA) was first employed
to test if variations in means (of tonnages) exist. Thus, using the shipping tonnages as an index of
shipping demand, it was possible to estimate the following: demand for shipping tonnage in the
Nigeria‟s non-oil commodity freight market, the routes or regions showing intense transport
demand. The trend of the total trade generated (imports and exports) over time was examined to
assess the future potentials of Nigeria‟s trade with her partners.
Presentation and Analysis of Data
In table 2 below five region shipment regions were identified where import and export
commodities are generated. The „unspecified‟ region represents commodities whose origin or

Page 23
destination could not be accounted for, but nonetheless adds to the size of Nigeria‟s trade with
other nations. Thus, for the period under study; the USA, countries in Asia and Europe traded
more with Nigeria. Their import and export volumes (combined) averaged over six (6) million
metric tonnes. African countries and an unspecified number of other countries accounted for an
average little above one million (1) metric tonnes of trade.
Table 2: Distribution of Nigeria's Trade ('000) By Trade Regions and Analysis
of Variance Results
REGIONS/ROUTES TONNES (MEAN STD DEV MIN MAX
AFRICA 2,222.57 908.498 1,008.86 3,974.12
ASIA 6,899.47 3,765.91 1,285.41 13,170.01
AUSTRALIA 66.1969 89.116 4.518 83.973
EUROPE 6,532.28 2,809.16 4,388.08 14,007.36
USA 8,598.75 4,817.22 2,616.13 16,850.56
UNSPECIFIED 2,493.35 3,220.21 92.86 8,621.60
ALL REGIONS 4,468.77 4,246.38 4.518 16,850.56
ANALYSIS OF VARIANCE
SUM OF SQUARES: Between 5.555
Within 5.083
F. Statistic: 11.800
Prob > F (5,114): 0.000
The F statistic computed from analysis of variation of means as shown in table 2 has a value of
11.80 and a P – value of 0.000. The significant P - value (at α = 0.05) indicates differences exist
in trade generated between Nigeria and her trading partners. It is also found that there is a
growing trend in Nigeria‟s seaborne trade at least in the short term. Table 3 below indicates a
positive trend (t) with a coefficient of 85,484.6 tonnes. The „t‟ statistics has a significant P – value
(0.006) at α = 0.05. This result indicates a positive future outlook for Nigeria‟s freight market.
Discussion of Findingss
The research findings are as follow: the average demand for shipping tonnage in the Nigeria‟s
non-oil freight market peaks over four (4) million metric tonnes during the study period. Of the
regions considered; the USA, Asia, and European countries showed intense transport demand
with the following tonnages: 8.6, 6.8 and 6.5 million tonnes respectively. While Africa, Australia
and „Unspecified‟ number of countries averaged to 2.2, 0.066 and 2.5 million tonnes respectively.
Therefore the major shipping routes are Nig-USA, Nig- Asia and Nig-Europe in that order. It is
also noteworthy that the estimated demand is sustainable at least in the short term given the
positive trend observed from the analysis.

Page 24
Developments in the world economy and changes in trade growth and patterns are influencing the
demand for commodities and determining the distances over which cargo travels. Final demand
for shipping services, measured in ton–miles, gives better understanding of maritime transport
activity and demand for ship capacity. In 2012, growth in ton–miles performed by maritime
transportation increased by 4.2 per cent, down from 4.9 per cent in 2011. Bulk commodities,
namely minerals and raw materials, accounted for nearly three quarters of the total ton–miles
performed in 2012. The five major dry bulks (that is, coal, iron ore, grain, bauxite/alumina and
phosphate rock) are the main engine of growth, with ton–miles increasing by 6.6 per cent, as
compared with 6.1 per cent for minor bulks, 3.9 per cent for other dry cargo including
containerized trade, 2.4 per cent for oil and petroleum products, and 0.7 per cent for gas. Much of
the growth was driven by a rapid (11.8 per cent) increase in coal ton–miles, followed by growth
generated by grain and iron-ore trades with ton–miles growing by 6.2 per cent and 4.1 per cent,
respectively.
Conclusion
Seaborne transport is one of the modes of transportation of goods. Maritime transport is important
to the proper operation of any nation‟s economy. According to Ekong (1984) over 96% of the
transportation of Nigeria‟s foreign trade is by sea. The average demand for shipping tonnage in
the Nigeria‟s non-oil freight market peaks over four (4) million metric tons during the study
period. Of the regions considered; the USA, Asia, and European countries showed intense
transport demand with the following tonnages: 8.6, 6.8 and 6.5 million tons respectively. While
Africa, Australia and „Unspecified‟ number of countries averaged to 2.2, 0.066 and 2.5 million
tons respectively. Therefore the major shipping routes are Nig-USA, Nig- Asia and Nig-Europe in
that order. It is also noteworthy that the estimated demand is sustainable at least in the short term
given the positive trend observed from the analysis. Shipping capital acquisition policies have for
a long time been made to address gap in cargo lifting capacity of indigenous shipping lines vis-a-
viz their foreign counterparts.
However, it appears these policies are not based on quantitative assessment of shipping and
freight market indices. The outcome of this paper is relevant to the government for planning
purposes. It may also serve as policy guide to private firms for focused shipping tonnage
investment strategy. The paper recommends thus: that the Nigerian Maritime Administration
should encourage more robust development indigenous shipping tonnage capacity since the
prospects of Nigeria‟s freight market is positive. That trade relations between major trading
regions (identified) be improved for sustainable seaborne trade. There is also need to improve
trade among African countries in order to take advantage of trade with nearest neighbor. The
reduced distance and hence transport cost savings from inter regional trade transactions would
accrue indirectly to the economy. The positive trends in seaborne trade observed should be
sustained through effective implementation of „Trade Facilitation policy‟. This would likely
enhance inward/outward hinterland shipments made especially by cargo shippers and hence
increase trade volumes.

Page 25
References
“World Seaborne Trade,” (2017). E-Book of Statistics.
http://stats.unctad.org/handbook/MaritimeTransport/WorldSeaborneTrade.html, retrieved on 08/07/2018
“World Seaborne Trade,” (2018) . International Chamber of Shipping Retrieved from http://www.ics-shipping.org/shipping-
facts/shipping-and-world-trade/world-seaborne-trade. Retrieved 07/07/2018
Damachi, B. B. and Zhaosheng, Y. (2005). The Nigerian Shipping and Indigenous Companies 32 (1). Routledge: Taylor & Francis
Group.
Eriksen, I.E (1982), The Demand for Bulk Ship Services. Menbra Hill Inc, 2nd
ed. New York.
Genco Shipping and Trading Limited (2006), http://www.gencoshipping.com/
Klovland, J.T (2003), Business Cycles, Commodity Prices and Shipping Freight Rates: Some Evidence from Pre – World War
Period.
Limao, N and Venables, A. J. (2001). Infracstructure, Geographical Distance; Transport Costs and Trade. World Bank Economic
Review, 451-479.
Mikkelson, Reinhard O.; Tronstad, Petter (2006), ‘Can Leading Indicators Be Used To Predict The Demand For Sea Borne
Dry Bulk Activity In The Far East’. An Unpublished M.Sc Thesis, Norwegian School of Economics And Business Administration,
Bergen. Retrieved from
http://brage.bibsys.no/nhh/bitstream/URN:NBN:no_bibsys_brage_22800/1/Tronstad%20and%20Mikkelson%202006.pdf
Nigerian Ports Authority (1996), Annual Abstacts of Port Statistics; An annual publication of Nigeria Ports Authority.
Marina Lagos.
Onwuegbuchunam Donatus and Okeudo Geraldine (2012) “An Evaluation of Nigeria’s Seaborne Trade and Demand for Sea Transport” in European Journal of Business and Management, Vol 4, No.13,9
Review of Maritime Transport (2005). United Nations Conference on Trade and Development (UNCTAD), New York & Geneva.
Review of Maritime Transport (2013). United Nations Conference on Trade and Development (UNCTAD), New York & Geneva.
Stopford, Martin (1988), Maritime Economics. 1st
ed. Routledge ,Taylor & Francis Group, New York.
Stopford, Martin (1997), Maritime Economics. 2nd
ed. Routledge ,Taylor & Francis Group, New York.
Venables, A. J. (2001). Geographical and International Inequalities: The Impact of New Technologies.
http://econ.Ise.ac.uk/staff/ajv/abcde3.pdf. Retrieved 3/01/11.
Venables, A. J. (2005). Geographical Economics: Notes on Africa. Journal of Development Perspectives , 63-84.
Winston, C. (1983). The Demand for Freight Transportation: Models and Application. Transportation Research , 27-419.