
A study of intraday trading behavior around tick size changes
34
A study of intraday trading behavior around tick size changes Roongkiat Ratanabancheun, Kanis Saengchote Chulalongkorn Business School
-
Upload
khangminh22 -
Category
Documents
-
view
0 -
download
0
Transcript of A study of intraday trading behavior around tick size changes

A study of intraday trading behavior around tick size changes
Roongkiat Ratanabancheun, Kanis Saengchote
Chulalongkorn Business School
Motivation
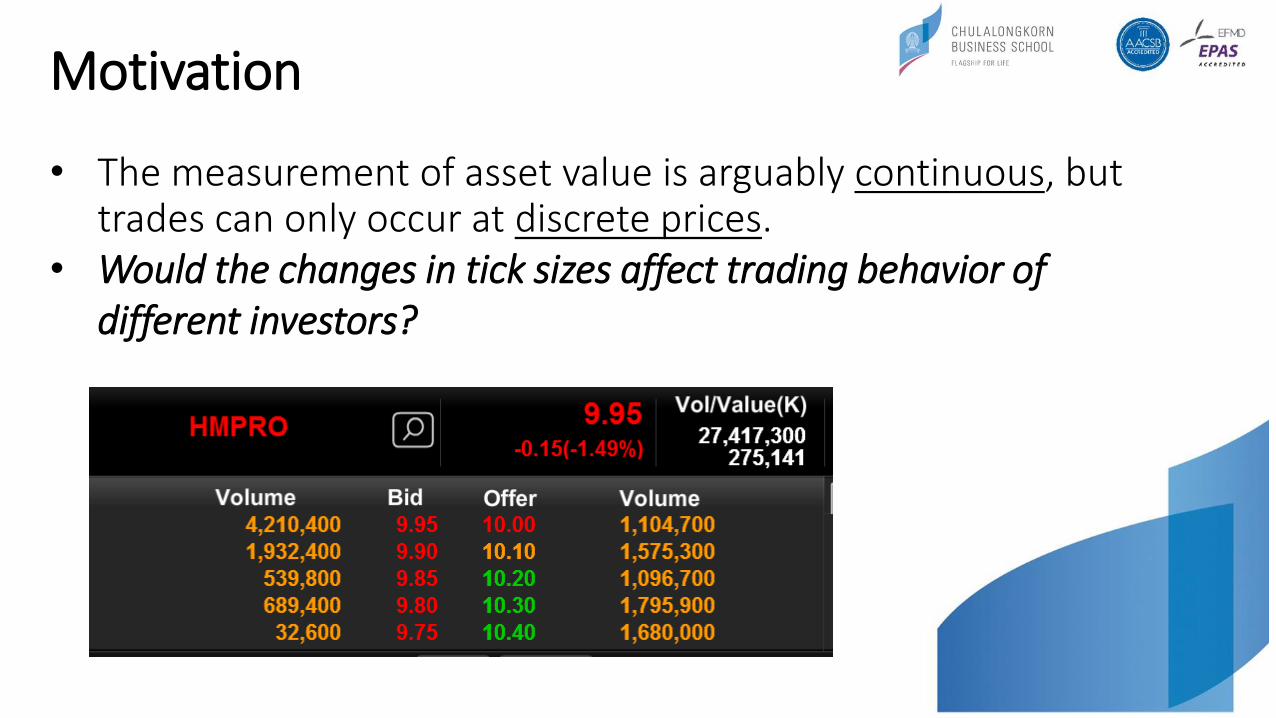
• The measurement of asset value is arguably continuous, but trades can only occur at discrete prices.
• Would the changes in tick sizes affect trading behavior of different investors?
Motivation
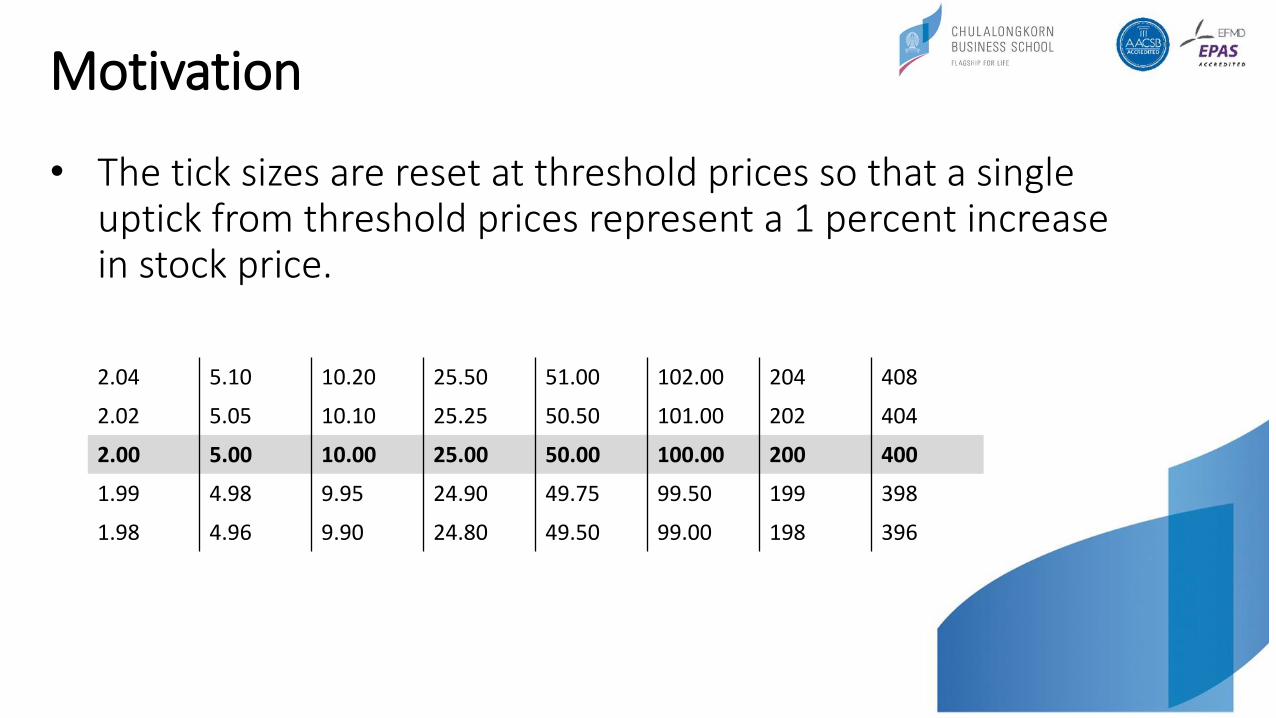
• The tick sizes are reset at threshold prices so that a single uptick from threshold prices represent a 1 percent increase in stock price.
2.04 5.10 10.20 25.50 51.00 102.00 204 408
2.02 5.05 10.10 25.25 50.50 101.00 202 404
2.00 5.00 10.00 25.00 50.00 100.00 200 400
1.99 4.98 9.95 24.90 49.75 99.50 199 398
1.98 4.96 9.90 24.80 49.50 99.00 198 396
Motivation
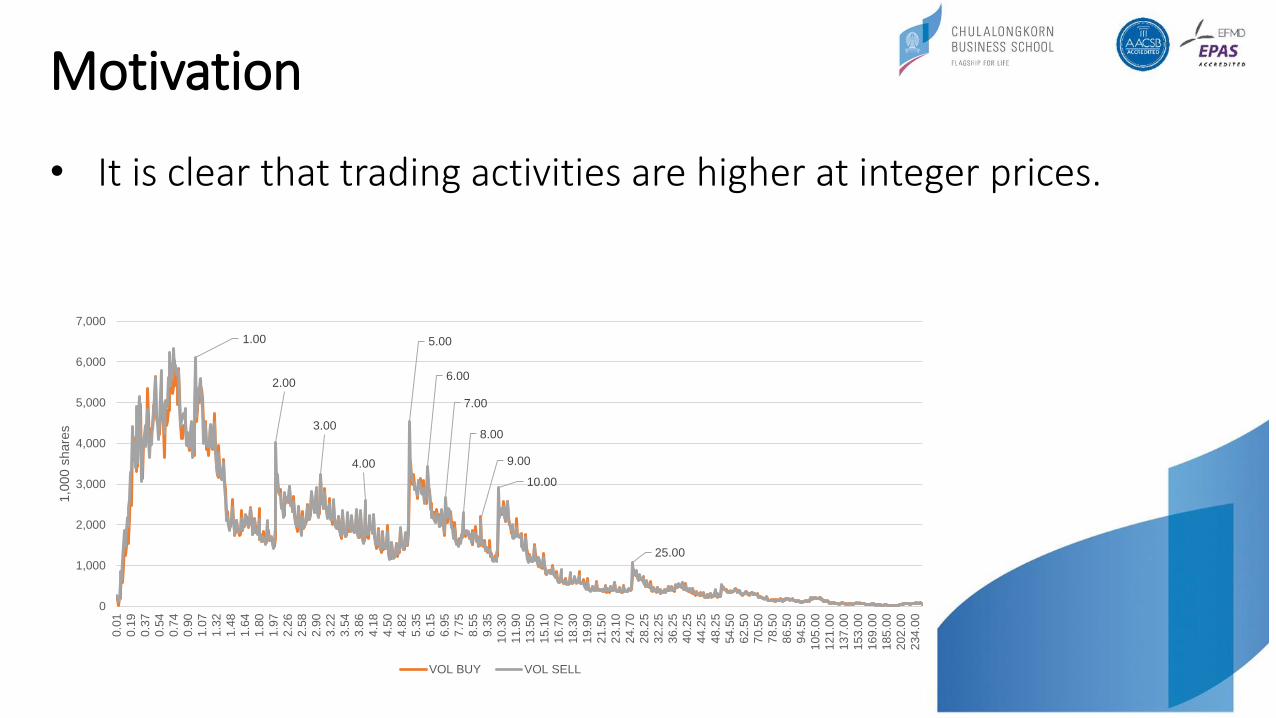
• It is clear that trading activities are higher at integer prices.
1.00
2.00
3.00
4.00
5.00
6.00
7.00
8.00
9.00
10.00
25.00
0
1,000
2,000
3,000
4,000
5,000
6,000
7,000
0.0
1
0.1
9
0.3
7
0.5
4
0.7
4
0.9
0
1.0
7
1.3
2
1.4
8
1.6
4
1.8
0
1.9
7
2.2
6
2.5
8
2.9
0
3.2
2
3.5
4
3.8
6
4.1
8
4.5
0
4.8
2
5.3
5
6.1
5
6.9
5
7.7
5
8.5
5
9.3
5
10.3
0
11.9
0
13.5
0
15.1
0
16.7
0
18.3
0
19.9
0
21.5
0
23.1
0
24.7
0
28.2
5
32.2
5
36.2
5
40.2
5
44.2
5
48.2
5
54.5
0
62.5
0
70.5
0
78.5
0
86.5
0
94.5
0
105
.00
121
.00
137
.00
153
.00
169
.00
185
.00
202
.00
234
.00
1,0
00 s
hare
s
VOL BUY VOL SELL

Motivation
• But imbalances – defined as buy volume minus sell volume – only occur at some prices.
2.005.00
10.00
25.00
-1,500
-1,000
-500
0
500
1,000
0.0
1
0.1
9
0.3
7
0.5
4
0.7
4
0.9
0
1.0
7
1.3
2
1.4
8
1.6
4
1.8
0
1.9
7
2.2
6
2.5
8
2.9
0
3.2
2
3.5
4
3.8
6
4.1
8
4.5
0
4.8
2
5.3
5
6.1
5
6.9
5
7.7
5
8.5
5
9.3
5
10.3
0
11.9
0
13.5
0
15.1
0
16.7
0
18.3
0
19.9
0
21.5
0
23.1
0
24.7
0
28.2
5
32.2
5
36.2
5
40.2
5
44.2
5
48.2
5
54.5
0
62.5
0
70.5
0
78.5
0
86.5
0
94.5
0
105
.00
121
.00
137
.00
153
.00
169
.00
185
.00
202
.00
234
.00
1,0
00 s
hare
s

Literature review
• The literature on tick size tends to focus on the impact on market liquidity (see, for example, Ahn et al. (1996), Bacidore (1997), Bessembinder (2000), Goldstein and Kavajecz (2000), and Chung et al. (2004)).
• The first prediction is by Harris (1994) who expects that bid-ask spreads should narrow following reductions in tick size.
• The general consensus in the literature is that a larger tick size is indeed associated with wider bid-ask spread, while the evidence on trading volume is mixed.

Literature review
• A related strand of research focuses on price clusters.
• Many studies have found that the stock prices tend to cluster around particular numbers (e.g. Harris (1991), Aitken et al. (1996), Brown et al. (2002), Chung et al. (2002), Chung et al. (2004), Ahn et al. (2005), Chung et al. (2005), Ohta (2006), and Chiao and Wang (2009).
• Even with decimalization of stock quotes, Ikenberry and Weston (2008) show that in the U.S., trade prices tend to cluster around integers, half-dollars and quarters.
Literature review
• Round numbers have also been linked to cognitive limitations and investors’ tendency to use “shortcuts” in their investment decisions.
• Brown and Yang (2016) analyze horse race betting data and find greater propensity to quote odds at round numbers, which they suggest is reflective of cognitive limitations of the agent who proposes the price.
• Kuo et al. (2015) find that investors who disproportionately submit more orders at round numbers (they classify this group as investors with limited cognitive abilities) tend to suffer greater investment losses.
Literature review
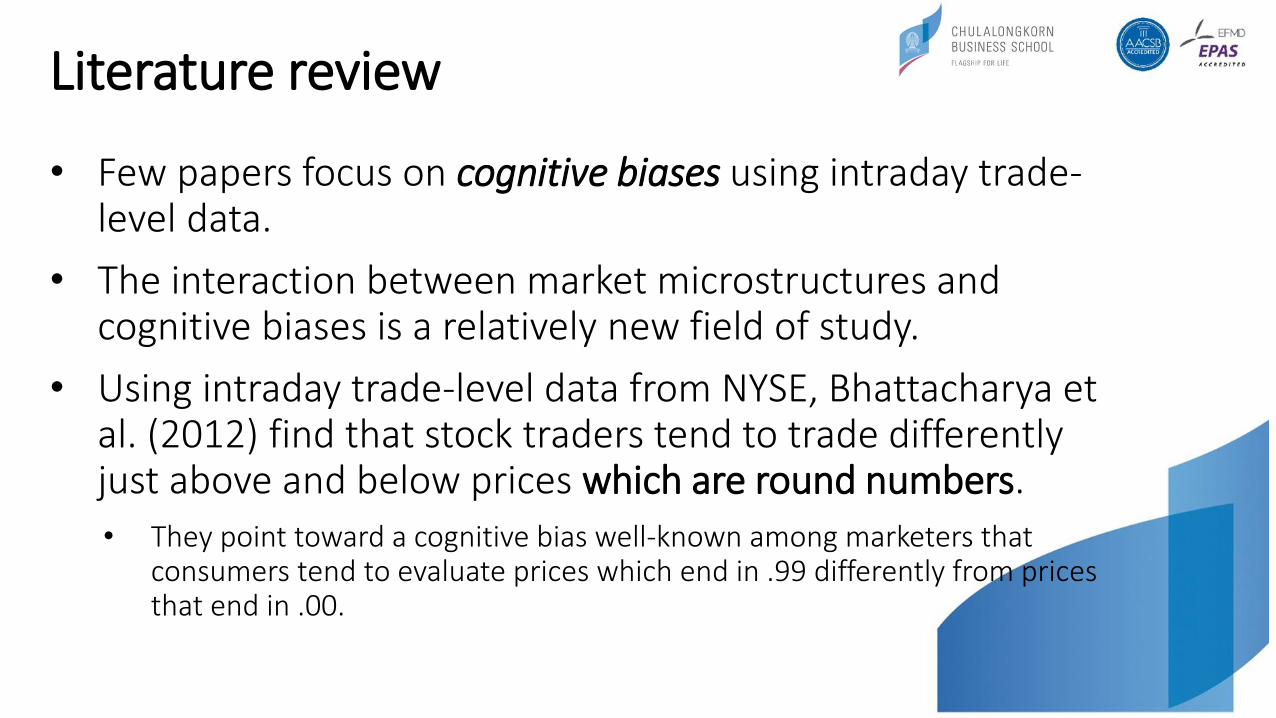
• Few papers focus on cognitive biases using intraday trade-level data.
• The interaction between market microstructures and cognitive biases is a relatively new field of study.
• Using intraday trade-level data from NYSE, Bhattacharya et al. (2012) find that stock traders tend to trade differently just above and below prices which are round numbers.• They point toward a cognitive bias well-known among marketers that
consumers tend to evaluate prices which end in .99 differently from prices that end in .00.

Hypothesis construction
• Assuming the geometric Brownian process with an expected return (ν) and a standard deviation (σ)
• We can find that the probability of an uptick and a downtick with different tick sizes will be different depending on the value of expected return and standard deviation.
𝑆𝑡 = 𝑆0𝑒𝜈𝑡+𝜎𝐵𝑡

Hypothesis construction
• Supposed that the daily expected return of a certain stock is 0.03% and the daily standard deviation of stock returns is around 1.5%.
• Because the Brownian process (Bt) is N(0,1), we can find the probability that stock prices will be no less than a one-step uptick is equal to around 26% and the probability that stock prices will be less than a one-step downtick is equal to 36%.
• The expected returns of investors who would sell immediately at either an uptick or a downtick will be equal to 0.08%.
Hypothesis construction
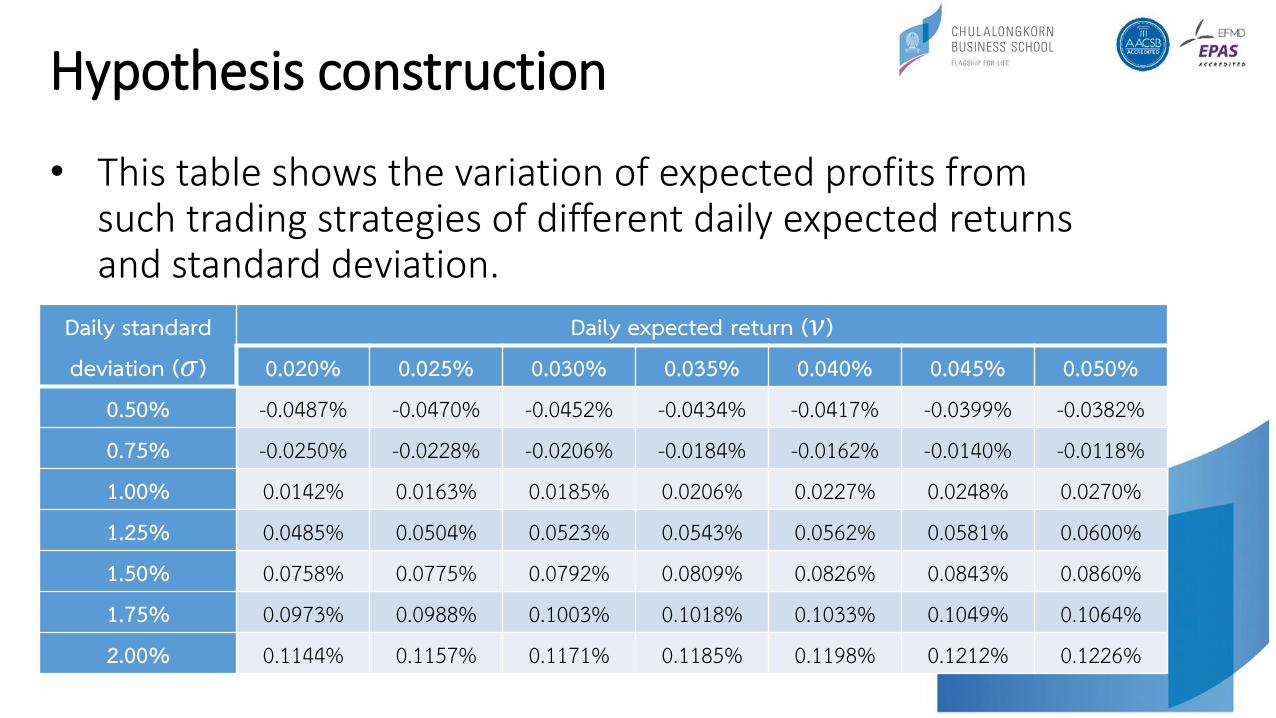
• This table shows the variation of expected profits from such trading strategies of different daily expected returns and standard deviation.
Daily standard deviation (𝜎)
Daily expected return (𝜈)0.020% 0.025% 0.030% 0.035% 0.040% 0.045% 0.050%
0.50% -0.0487% -0.0470% -0.0452% -0.0434% -0.0417% -0.0399% -0.0382%0.75% -0.0250% -0.0228% -0.0206% -0.0184% -0.0162% -0.0140% -0.0118%1.00% 0.0142% 0.0163% 0.0185% 0.0206% 0.0227% 0.0248% 0.0270%1.25% 0.0485% 0.0504% 0.0523% 0.0543% 0.0562% 0.0581% 0.0600%1.50% 0.0758% 0.0775% 0.0792% 0.0809% 0.0826% 0.0843% 0.0860%1.75% 0.0973% 0.0988% 0.1003% 0.1018% 0.1033% 0.1049% 0.1064%2.00% 0.1144% 0.1157% 0.1171% 0.1185% 0.1198% 0.1212% 0.1226%

Hypothesis construction
• It is interesting to investigate which types of market participants are more likely to implement such trading strategy and provide abnormal liquidity to the market at threshold prices.
• H1: The existence of different relative tick size changes at threshold prices may attract more trading activities of investors who would like to bet on short-term movement around threshold prices as long as their own estimate convinces them that the net expected return (after trading costs) is higher than zero.
Hypothesis construction
• H2: With respect to the type of market participants, we expect retail investors to be more likely to implement short-term speculative trading strategy than other types of market participants.
• Retail investors tend to exhibit a higher degree of cognitive biases such as the prospect theory (Tversky and Kahneman, 1992) and the myopic loss aversion (Benartzi and Thaler, 1995) than institutional investors.
• Retail investors would have a lower degree of risk tolerance.
• Buying at threshold prices would provide a margin of safety with a potential positive returns.
Hypothesis construction
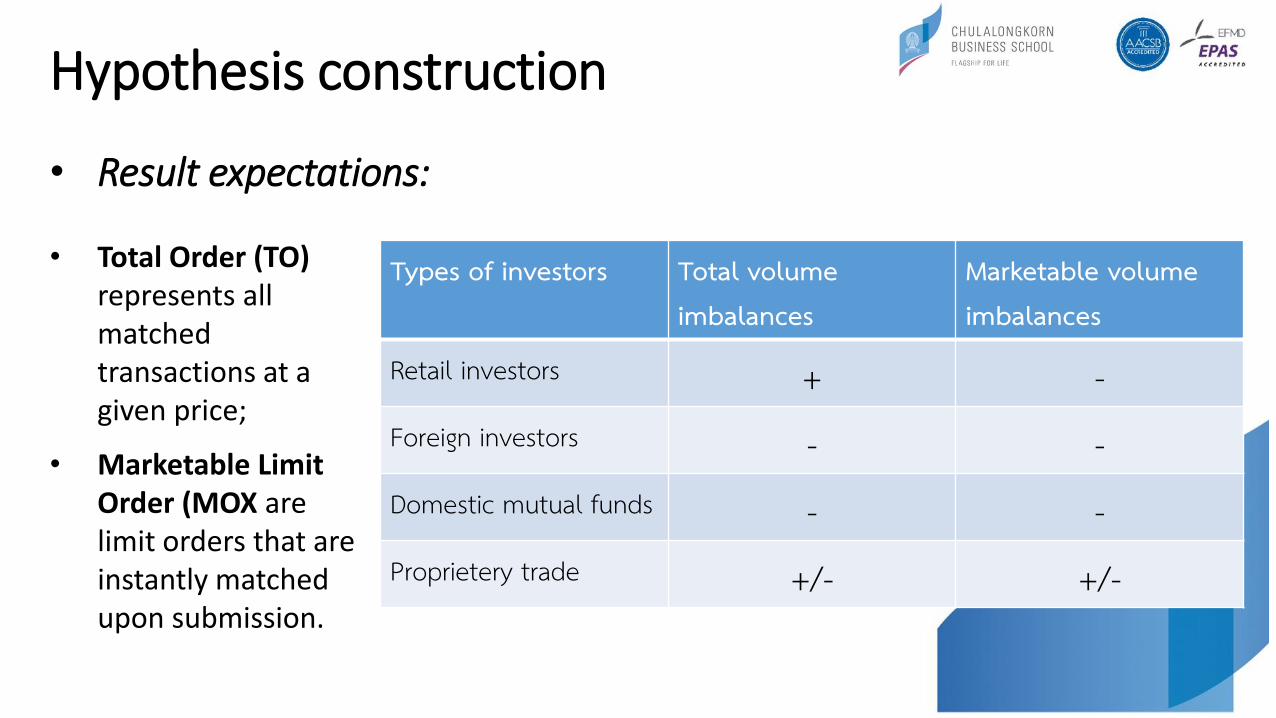
• Result expectations:
Types of investors Total volumeimbalances
Marketable volume imbalances
Retail investors + -Foreign investors - -Domestic mutual funds - -Proprietery trade +/- +/-
• Total Order (TO) represents all matched transactions at a given price;
• Marketable Limit Order (MOX are limit orders that are instantly matched upon submission.
Our data
• Transaction-level trade data from SET that are categorized by investor types.• Retail investors (R), • Proprietary trading (securities companies and brokers) (P), • Domestic mutual funds (M)• Foreign investors (F)
• The sample period of our study is between 2002 and 2008.
Measurement
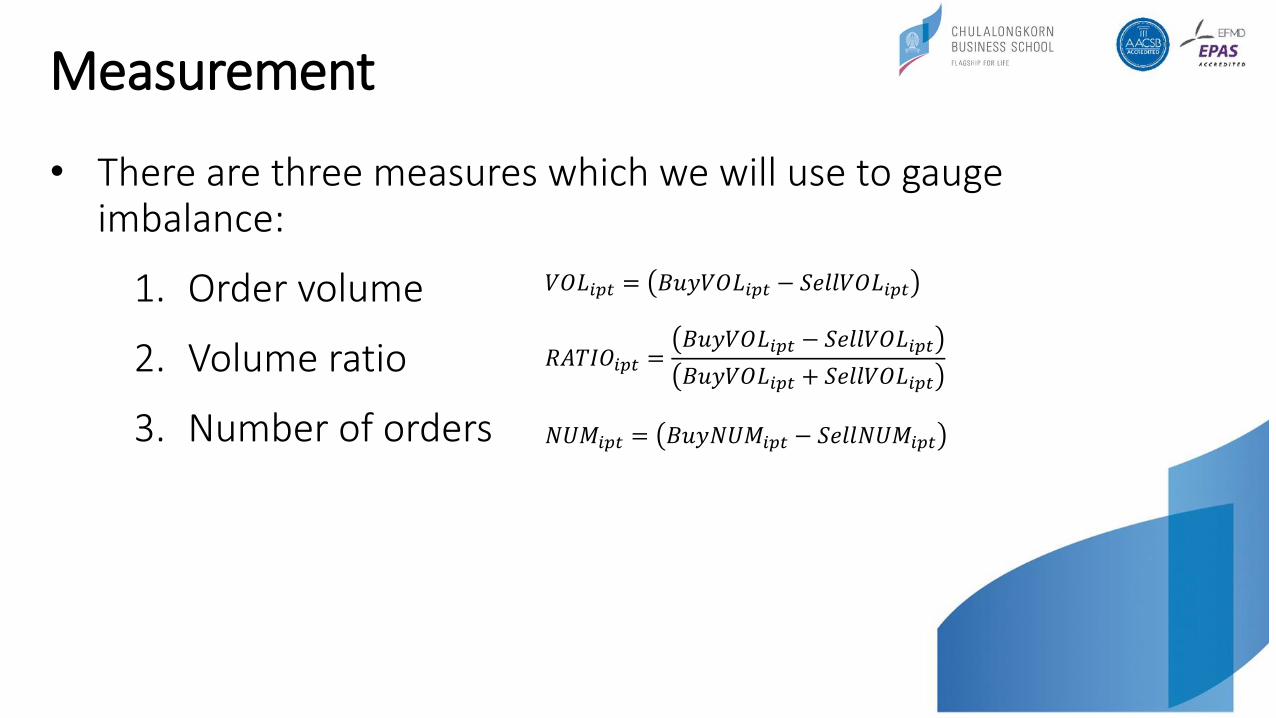
• There are three measures which we will use to gauge imbalance:
1. Order volume
2. Volume ratio
3. Number of orders
𝑉𝑂𝐿𝑖𝑝𝑡 = 𝐵𝑢𝑦𝑉𝑂𝐿𝑖𝑝𝑡 − 𝑆𝑒𝑙𝑙𝑉𝑂𝐿𝑖𝑝𝑡
𝑅𝐴𝑇𝐼𝑂𝑖𝑝𝑡 =𝐵𝑢𝑦𝑉𝑂𝐿𝑖𝑝𝑡 − 𝑆𝑒𝑙𝑙𝑉𝑂𝐿𝑖𝑝𝑡
𝐵𝑢𝑦𝑉𝑂𝐿𝑖𝑝𝑡 + 𝑆𝑒𝑙𝑙𝑉𝑂𝐿𝑖𝑝𝑡
𝑁𝑈𝑀𝑖𝑝𝑡 = 𝐵𝑢𝑦𝑁𝑈𝑀𝑖𝑝𝑡 − 𝑆𝑒𝑙𝑙𝑁𝑈𝑀𝑖𝑝𝑡
Result
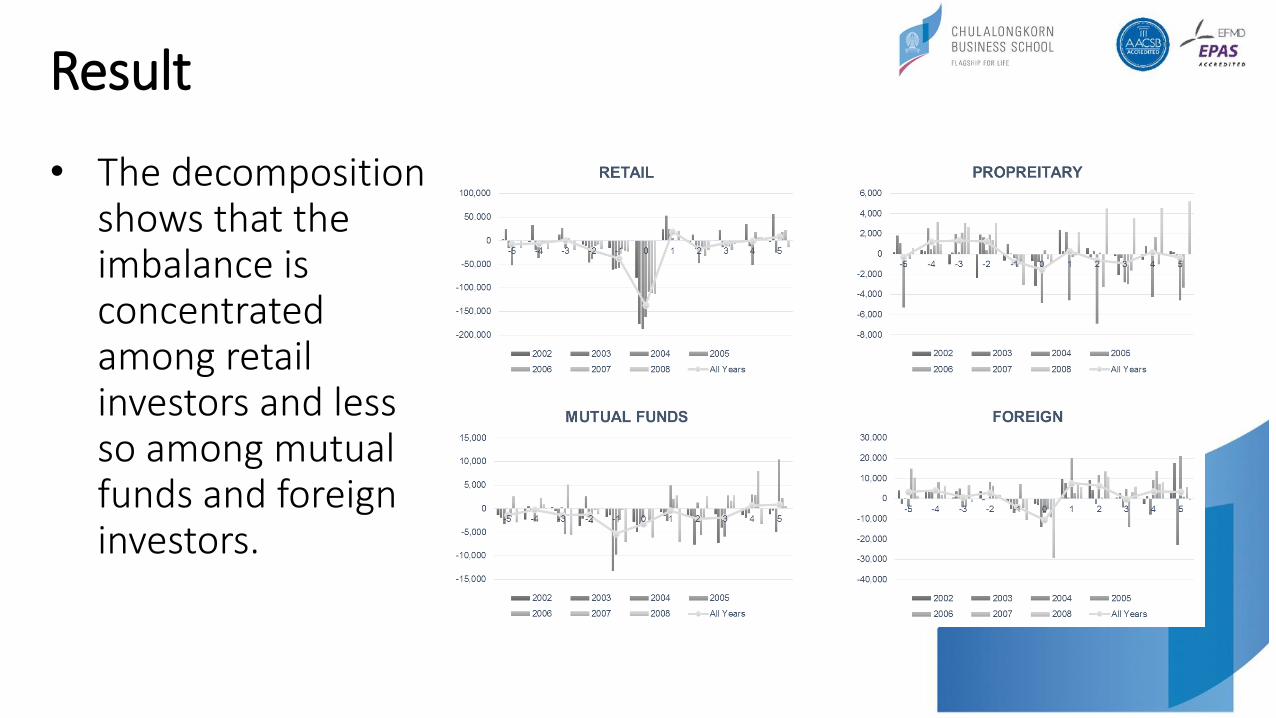
• The decomposition shows that the imbalance is concentrated among retail investors and less so among mutual funds and foreign investors.
Result
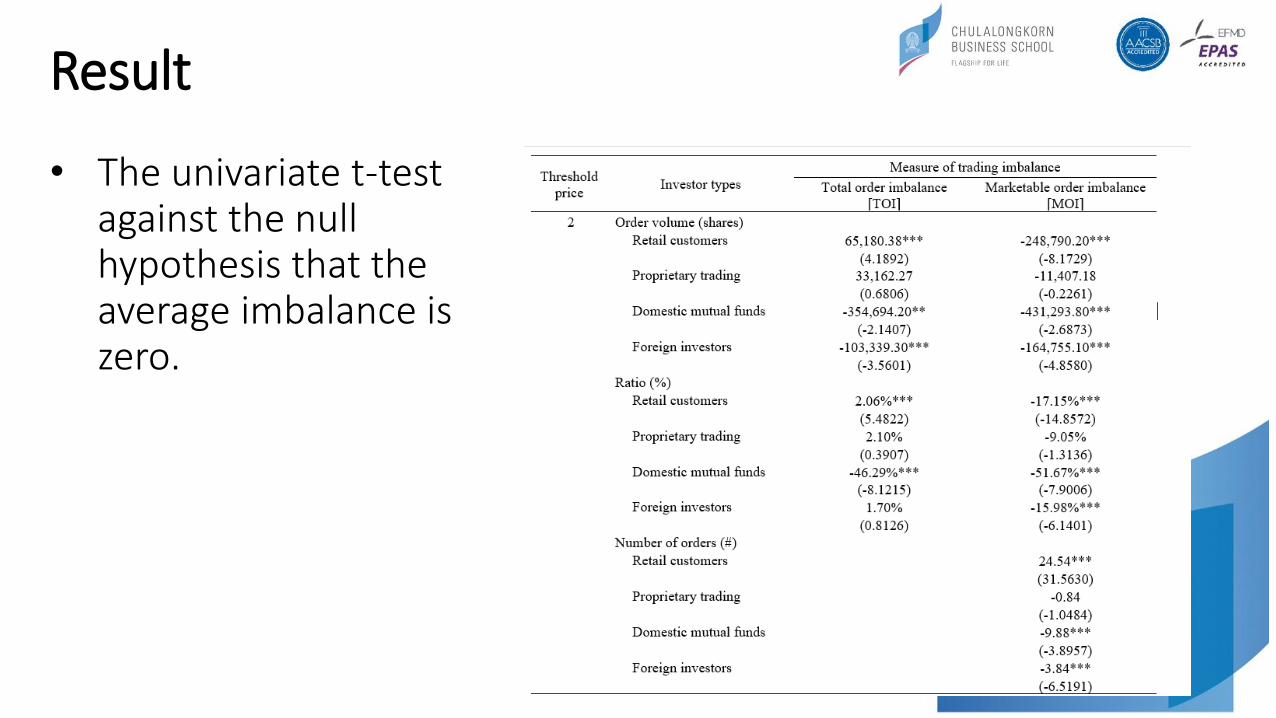
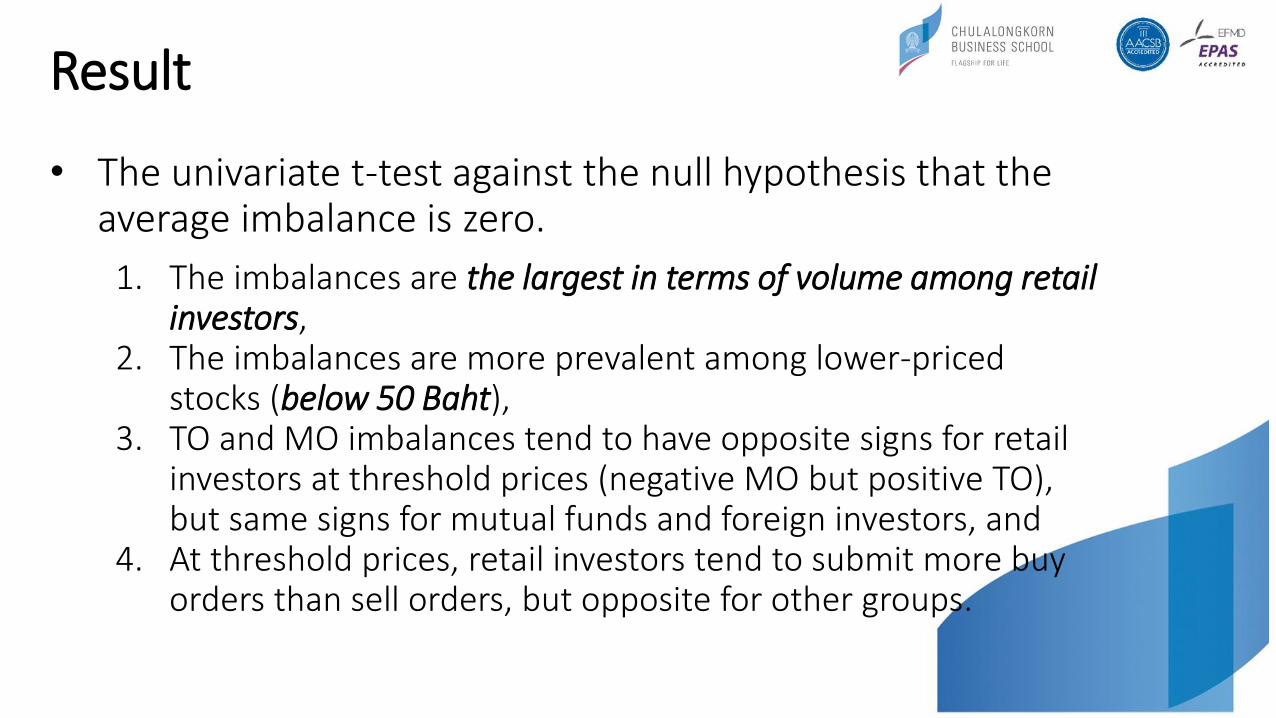
• The univariate t-test against the null hypothesis that the average imbalance is zero.
Result
• The univariate t-test against the null hypothesis that the average imbalance is zero.
1. The imbalances are the largest in terms of volume among retail investors,
2. The imbalances are more prevalent among lower-priced stocks (below 50 Baht),
3. TO and MO imbalances tend to have opposite signs for retail investors at threshold prices (negative MO but positive TO), but same signs for mutual funds and foreign investors, and
4. At threshold prices, retail investors tend to submit more buy orders than sell orders, but opposite for other groups.
Result
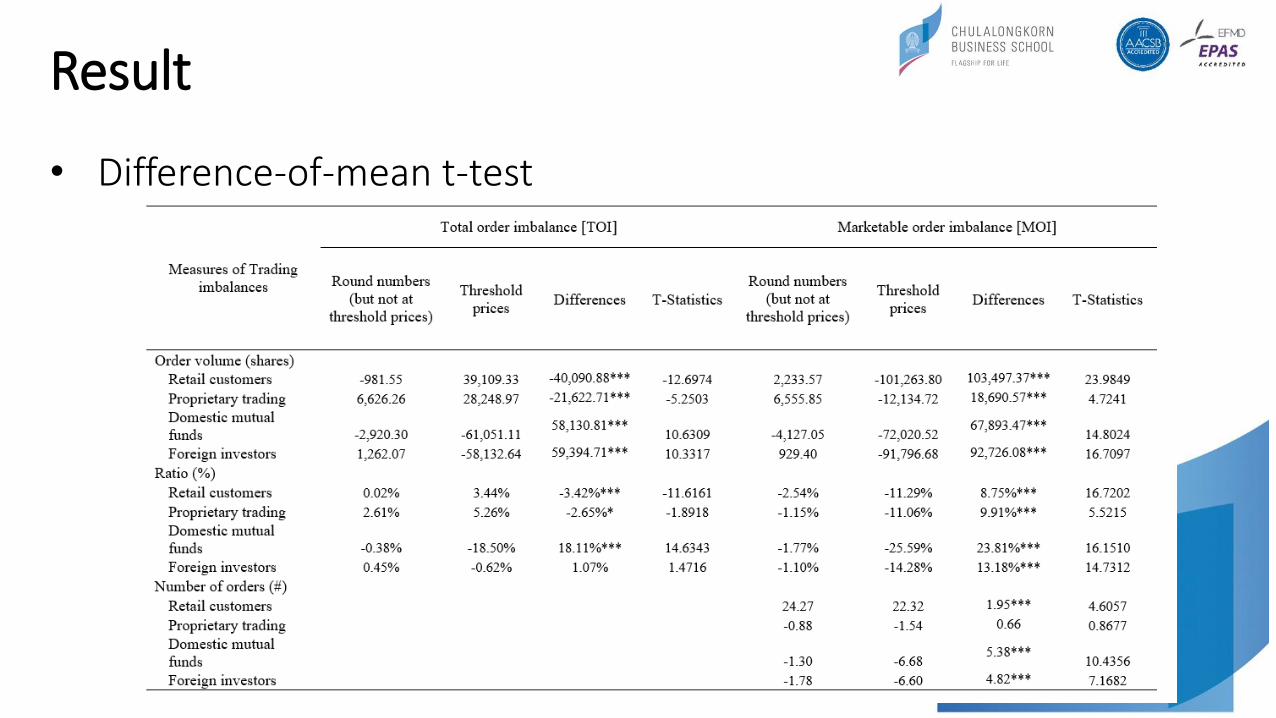
• Difference-of-mean t-test
Result
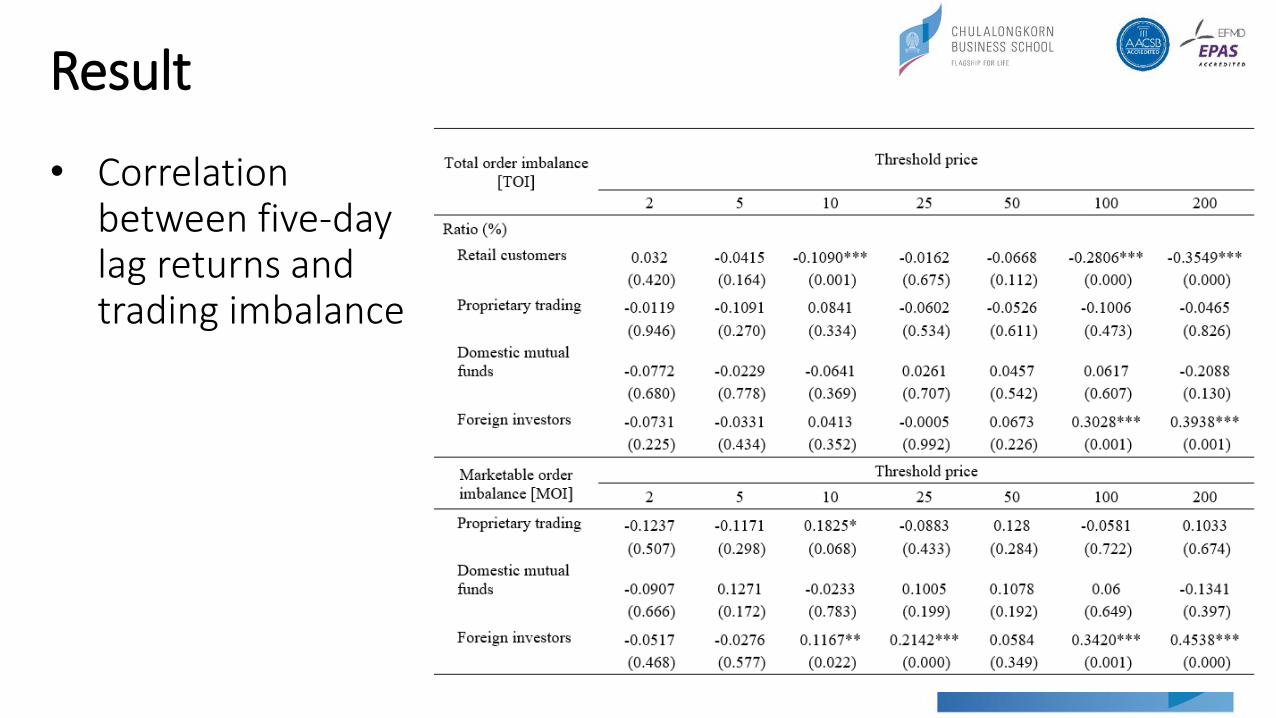
• Correlation between five-day lag returns and trading imbalance
Result
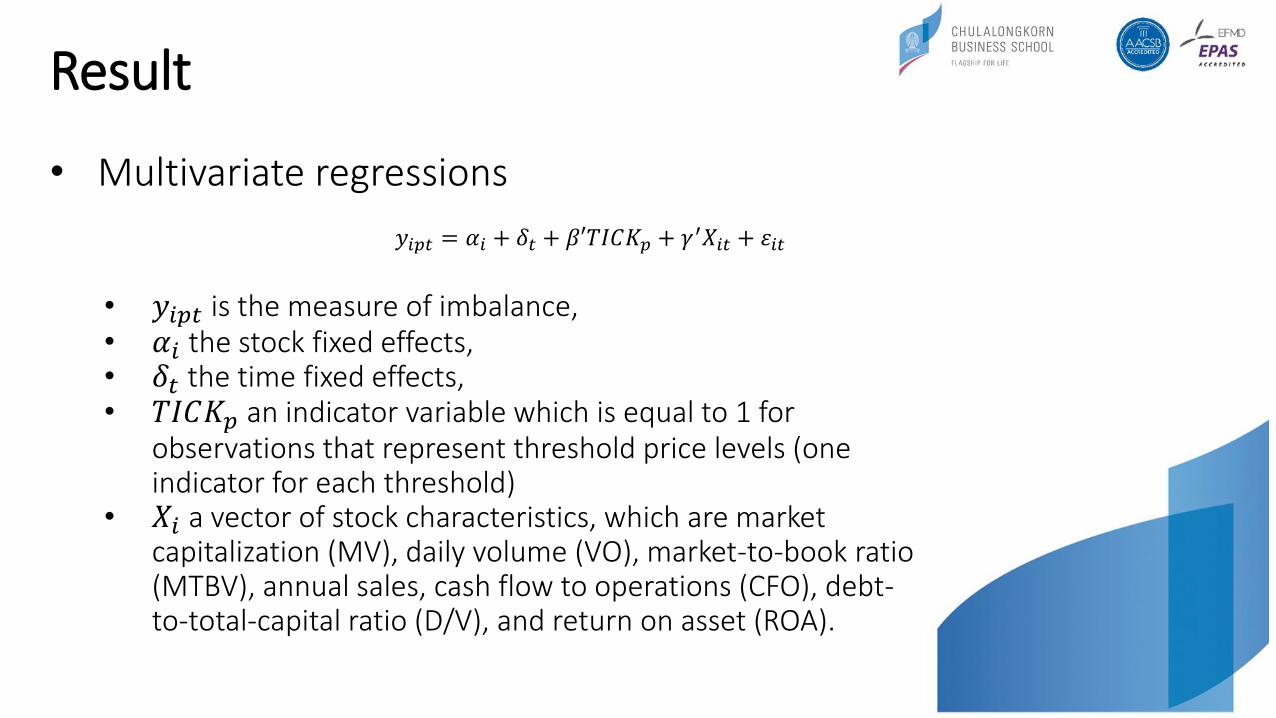
• Multivariate regressions
• 𝑦𝑖𝑝𝑡 is the measure of imbalance, • 𝛼𝑖 the stock fixed effects,• 𝛿𝑡 the time fixed effects, • 𝑇𝐼𝐶𝐾𝑝 an indicator variable which is equal to 1 for
observations that represent threshold price levels (one indicator for each threshold)
• 𝑋𝑖 a vector of stock characteristics, which are market capitalization (MV), daily volume (VO), market-to-book ratio (MTBV), annual sales, cash flow to operations (CFO), debt-to-total-capital ratio (D/V), and return on asset (ROA).
𝑦𝑖𝑝𝑡 = 𝛼𝑖 + 𝛿𝑡 + 𝛽′𝑇𝐼𝐶𝐾𝑝 + 𝛾′𝑋𝑖𝑡 + 휀𝑖𝑡
Result
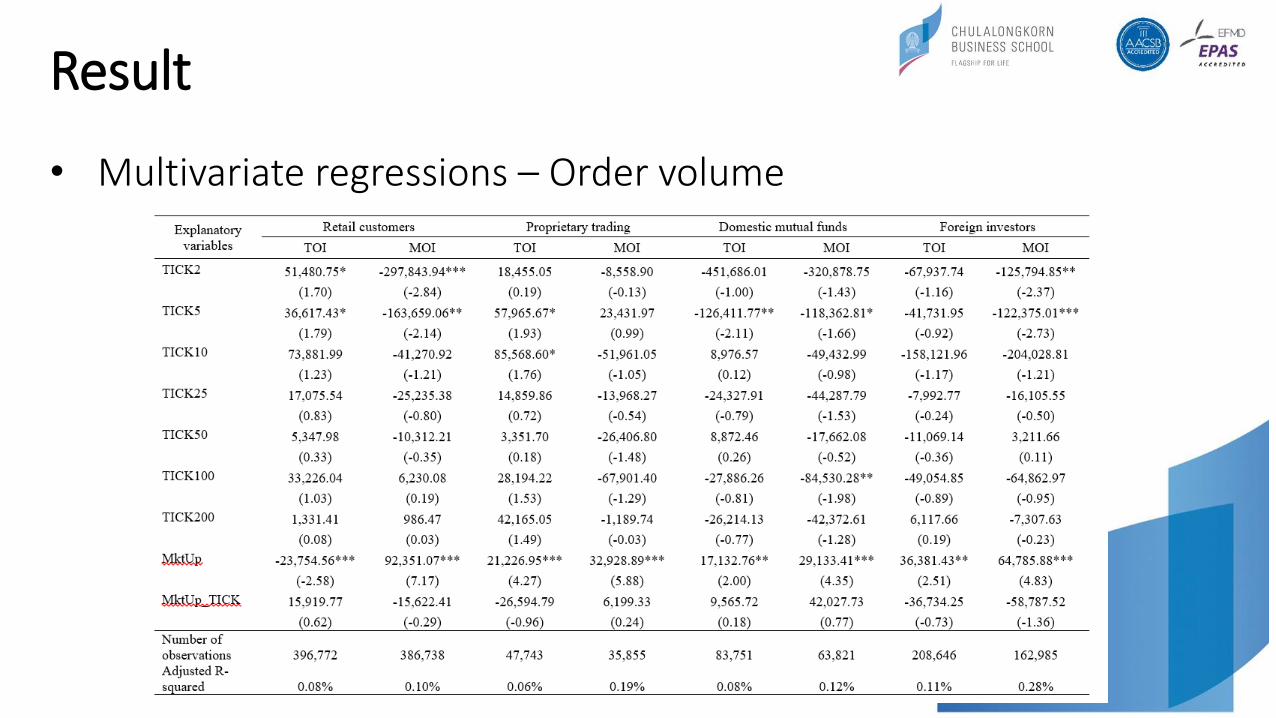
• Multivariate regressions – Order volume

Result
• Multivariate regressions – Volume ratio

Result
• Multivariate regressions – Number of transaction
Result
• Multivariate regressions
1. Strong negative imbalances at threshold prices among lower-priced stocks (10 Baht and below),
2. TO and MO imbalances tend to have opposite signs for retail investors at threshold prices (negative MO but positive TO), but same signs for mutual funds and foreign investors,
3. At threshold prices, retail investors tend to submit more buy orders than sell orders, but opposite for other groups.
Discussion
• More than 70 percent of transaction value can be accounted for by retail investors, and even as high 90 percent in the 2-Baht neighborhood. Thus, it seems that this threshold imbalance is predominantly a retail-customer phenomenon.
• When prices are just above and just below the threshold prices, retail investors are more likely to be submitted marketable limit-sell orders (that is, at prices just above the thresholds) than vice versa.
• Retail investors are sending sell orders of larger sizes when prices are just above threshold prices and sending buy orders of smaller sizes when prices are just below threshold prices.
Misestimating the profitability of short-term trading strategy
• The propensity to buy at threshold prices among some retail investors brings up the issue of whether a cognitive bias is influencing their decision.
• One possible explanation could be based on a misconception that at threshold prices, an up-move of one tick represents a gain of 1 percent, while a down-move of one tick only represents a loss of 0.4 to 0.5 percent.
Misestimating the profitability of short-term trading strategy
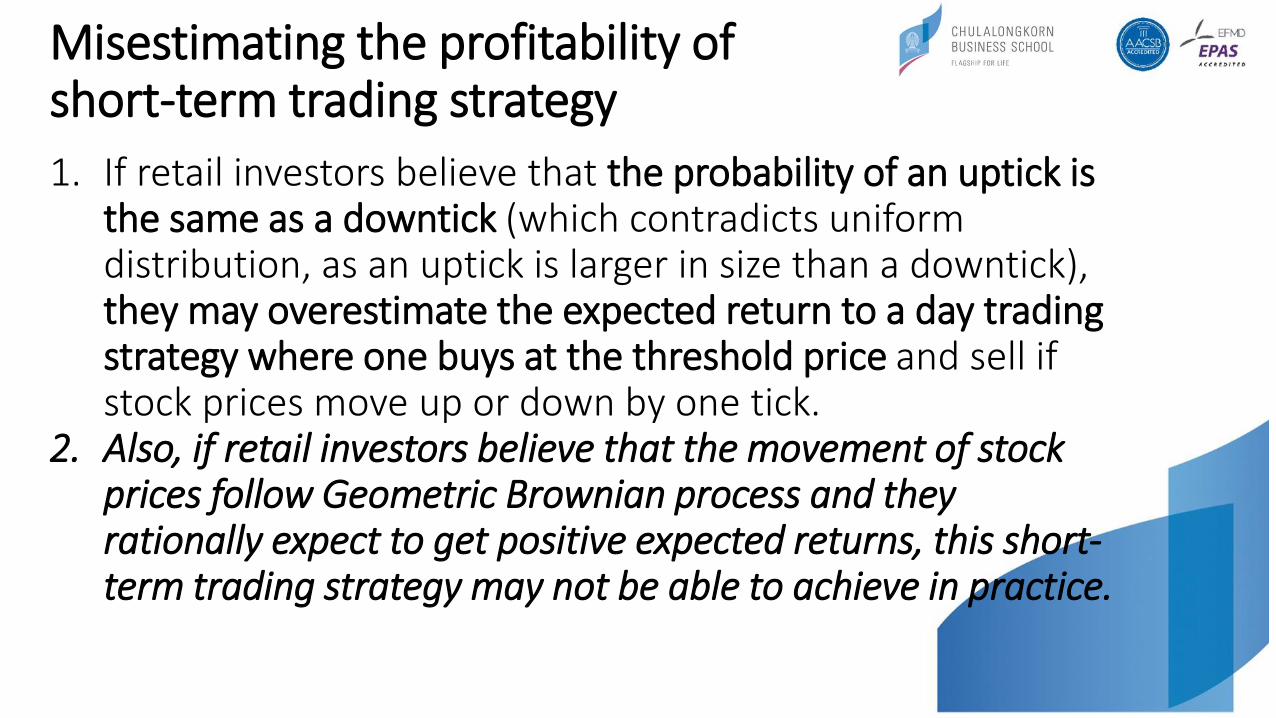
1. If retail investors believe that the probability of an uptick is the same as a downtick (which contradicts uniform distribution, as an uptick is larger in size than a downtick), they may overestimate the expected return to a day trading strategy where one buys at the threshold price and sell if stock prices move up or down by one tick.
2. Also, if retail investors believe that the movement of stock prices follow Geometric Brownian process and they rationally expect to get positive expected returns, this short-term trading strategy may not be able to achieve in practice.
Misestimating the profitability of short-term trading strategy
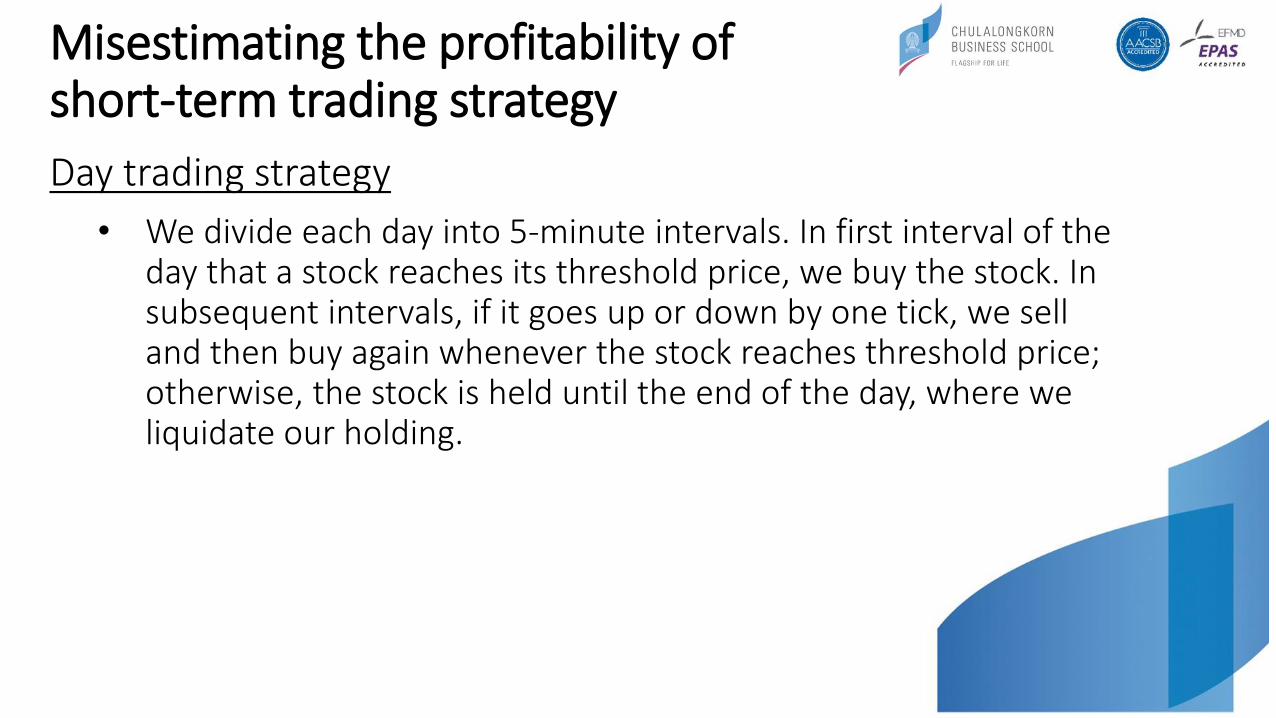
Day trading strategy
• We divide each day into 5-minute intervals. In first interval of the day that a stock reaches its threshold price, we buy the stock. In subsequent intervals, if it goes up or down by one tick, we sell and then buy again whenever the stock reaches threshold price; otherwise, the stock is held until the end of the day, where we liquidate our holding.
Misestimating the profitability of short-term trading strategy
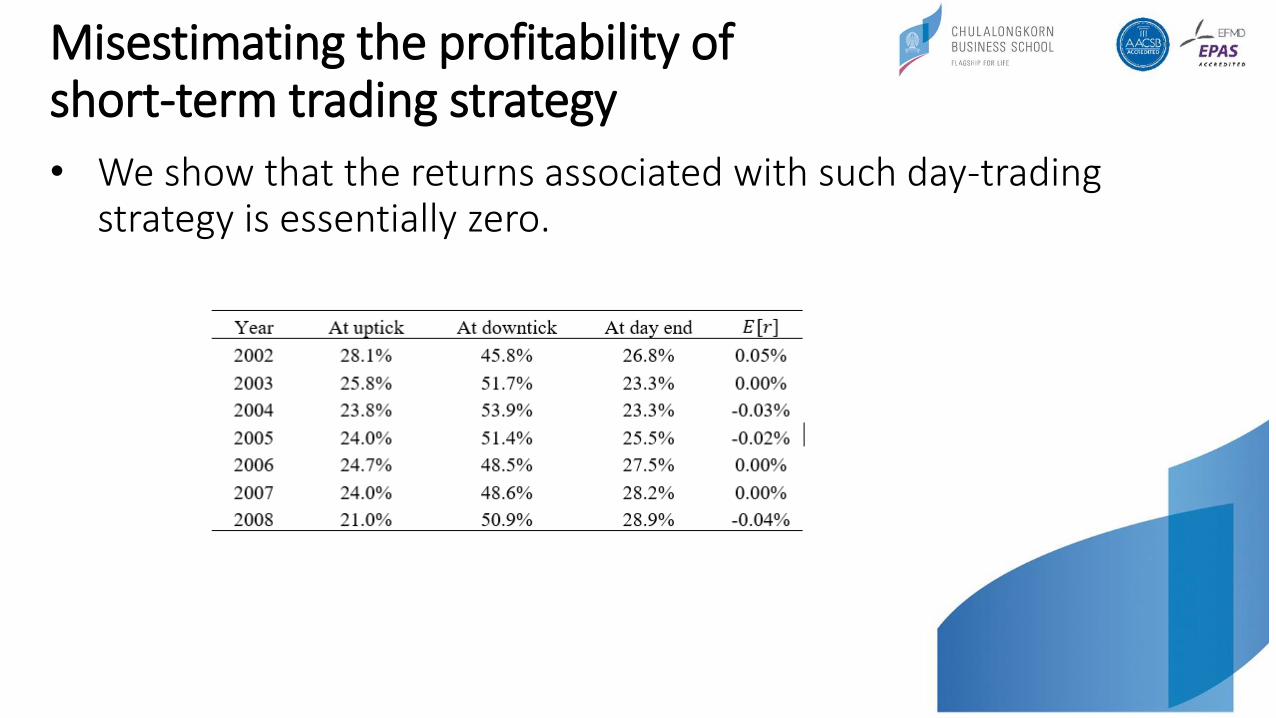
• We show that the returns associated with such day-trading strategy is essentially zero.
What about expecting to achieve positive 5-day returns?
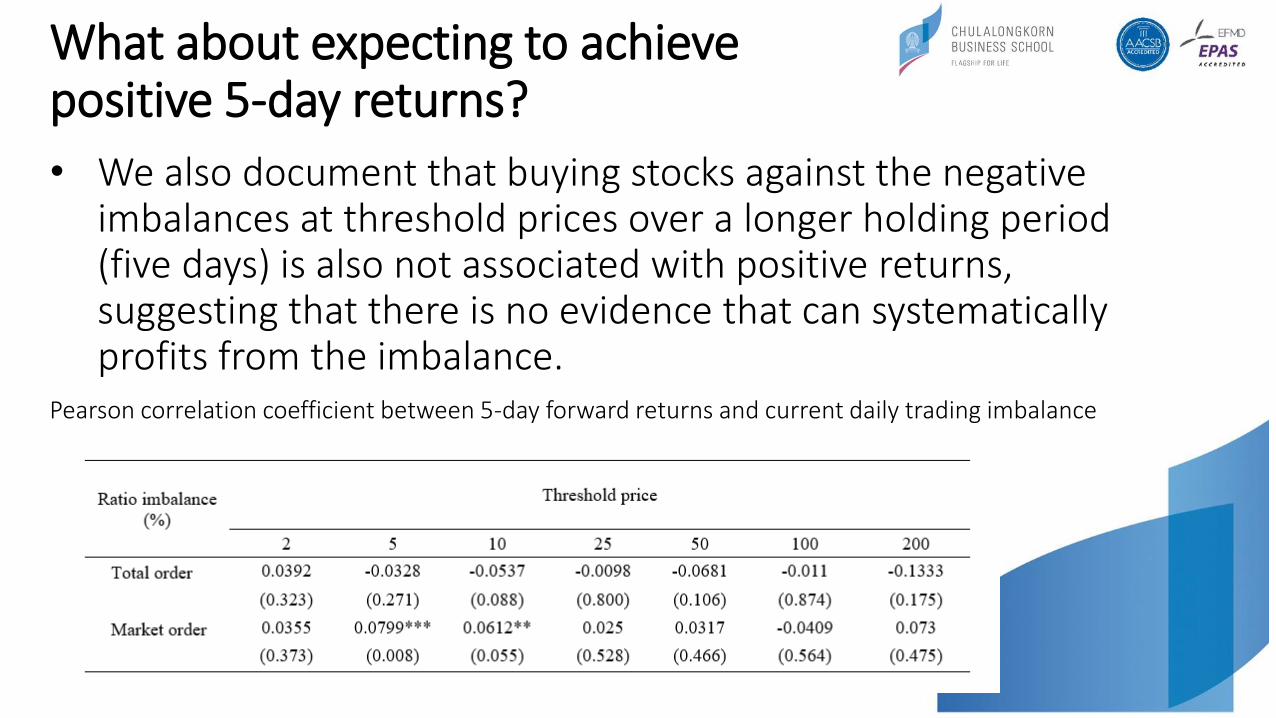
• We also document that buying stocks against the negative imbalances at threshold prices over a longer holding period (five days) is also not associated with positive returns, suggesting that there is no evidence that can systematically profits from the imbalance.
Pearson correlation coefficient between 5-day forward returns and current daily trading imbalance
Conclusion
• The propensity to buy at threshold prices among retail investors brings up the issue of whether they focus more heavily on short-term speculative trading rather than investing for long-term returns.
• However, the returns associated with such day-trading strategy is essentially zero.
• The bias of this retail investors’ trading strategy provide abnormal liquidity to the market at threshold prices.
• Abnormal liquidity benefits the trading of institutional investors.