A study of hidden talent search as a solution to skills crisis and ...
201
A study of hidden talent search as a solution to skills crisis and its impact on organizational performance with special reference to select large and medium size manufacturing and service industrial units in Pune region during the period 2010 - 2014 A Thesis submitted to Tilak Maharashtra Vidyapeeth, Pune. For the Degree of Vidyavachaspati (Ph.D.) (Doctor of Philosophy) in Management Under the Board of Management Studies By Mr. Avadhut Sharad Kulkarni Under the Guidance of Dr. Rajan N Dhamdhere January 2018
-
Upload
khangminh22 -
Category
Documents
-
view
0 -
download
0
Transcript of A study of hidden talent search as a solution to skills crisis and ...
A study of hidden talent search as a solution to skills crisis and its
impact on organizational performance
with special reference to
select large and medium size manufacturing and service industrial
units in Pune region during the period 2010 - 2014
A Thesis submitted to
Tilak Maharashtra Vidyapeeth, Pune.
For the Degree of Vidyavachaspati (Ph.D.)
(Doctor of Philosophy) in Management
Under the Board of Management Studies
By
Mr. Avadhut Sharad Kulkarni
Under the Guidance of
Dr. Rajan N Dhamdhere
January 2018

Tilak Maharashtra Vidyapeeth, Pune
Undertaking
I Avadhut Sharad Kulkarni am the Ph. D Scholar of the Tilak Maharashtra
Vidyapeeth in Management subject. Thesis entitled A Study of Hidden Talent Search
as a Solution to Skills Crisis and its Impact on Organizational Performance with
Special Reference to Select Large and Medium Size Manufacturing and Service
Industrial Units in Pune Region During the Period 2010 – 2014 under the supervision
of Dr Rajan N Dhamdhere, Solemnly affirm that the thesis submitted by me is my
own work. I have not copied it from any source. I have gone through extensive review
of literature of the related published / unpublished research works and the use of such
references made has been acknowledged in my thesis. The title and the content of
research is original. I understand that, in case of any complaint especially plagiarism,
regarding my Ph.D. research from any party, I have to go through the enquiry
procedure as decided by the Vidyapeeth at any point of time. I understand that, if my
Ph.D. thesis (or part of it) is found duplicate at any point of time, my research degree
will be withdrawn and in such circumstances, I will be solely responsible and liable
for any consequences arises thereby. I will not hold the TMV, Pune responsible and
liable in any case.
I have signed the above undertaking after reading carefully and knowing all the
aspects therein.
Signature :
Address : E 605, Saptasur Co-op. Hsg Soci., DSK Vishwa, Dhayari, Pune. 411041
Ph.No. : 9822861017 e-mail : [email protected]
Date : Place : Pune

Scanned by CamScanner

ACKNOWLEDGEMENT
Completion of this doctoral thesis was possible with the support of several
people. I would like to express my sincere gratitude to all of them.
I am extremely grateful to my research guide Prof. Dr. R. N. Dhamdhere for his
valuable guidance, scholarly inputs and unstinted support I received throughout
the research work. A person with an amicable and positive disposition, he has
always made himself available to clarify my doubts, and I consider it as a great
opportunity to do my doctoral research under his guidance and to learn from his
research expertise.
I am also thankful to Department of Management, TMV, Pune for necessary
help.
I would also like to thank Top Management Team of Vishwakarma Institute of
Technology, Pune under the strong leadership of Shri Bharatji Agarwal,
Managing Trustee, Vishwakarma Institutes, Pune for providing me precious
backing to pursue doctoral course and open-handed motivation from time to time
to carry out my research work.
I am obliged to Dr. Sriniwas N. Londhe who have not only motivated me to
pursue Doctoral study but also provided me required books. I would like to
express my sincere gratitude to Dr. Shailesh Kasande for sharing his immense
knowledge with me. I am fortunate to have been blessed with his guidance to
understand philosophy and to carry work ahead. Prof. Ashish Thite, without his
apt assistance, it would not have been possible to conclude the work. I appreciate
his sincere help. This research is an outcome of interaction with various
industries. Sincere thanks to all concerned dignitaries from all these industries.
Most important, none of this would have been possible without the love of my
team members at office and family members who provided me time for
completing my research work.
Last but not the least, I thank, the spirituality for blessing and supporting me.
Avadhut Sharad Kulkarni

-i-
Index
Details Page No
1 Introduction 1
1.1 History and Background of the Topic 1
1.2 Current State of Affairs 3
1.3 Relevance of the Research Study 7
1.3.1 Major Findings and Other Findings 7
1.3.2 Conclusion of Survey Report 8
1.4 Skill Sets 11
1.5 Skill Crisis 12
1.6 Business Crisis 13
1.7 Impact 14
1.8 Organizational Performance Indicator 14
1.9 Formal Process for Hidden Talent Search within the
Organization
14
1.10 Conclusion – Research Gap 15
2 Literature Review 17
2.1 Introduction 17
2.2 Books 17
2.2.1 Hidden Talent 17
2.2.2 The Talent Edge 20
2.2.3 Talent – Making People Your Competitive Advantage 22
2.2.4 Talent on Demand – Managing Talent in an Age of Uncertainty 24
2.2.5 Talent is Never Enough: Discover the Choices That Will Take
You Beyond Your Talent
26
2.2.6 Leadership Talent in Asia – How the Best Employers Deliver
Extra Ordinary Performance
27

-ii-
2.2.7 Reality Bytes – The Role of HR in Today’s World 30
2.2.8 Skills Development for Inclusive and Sustainable Growth in
Developing Asia – Pacific
31
2.2.9 The Seven Business Crises – How to Beat Them 34
2.2.10 Strategic Management – Creating Value in Turbulent Times 35
2.2.11 The Impact of Perception of Human Resource Management
Practices
37
2.3 Research Journals 38
2.3.1 A Study of Hidden Talent Management of Employees in IT
Sector with Reference to Pune City
38
2.3.2 Talent Attrition and Retention: Strategic Challenges for Indian
Industries in the Next Decade
38
2.3.3 Future of HR Management in Indian Scenario: Issues and
Challenges
39
2.3.4 Talent Management Scenario in the Banking Industry 40
2.3.5 Strategic Talent Management: A Review and Research Agenda 40
2.4 Research Magazines 42
2.4.1 Growing Talent as if Your Business Dependent on it 42
2.4.2 Make Your Company A Talent Factory 43
2.4.3 How to Keep Your Top Talent 44
2.4.4 The New Path to the C-Suite 45
2.4.5 A Study of HRD Concepts, Structure of HRD Departments, and
HRD Practices in India
46
2.5 White Paper 47
2.6 Seminars and Conferences – Research Paper, Research Article,
Proceeding
49
2.6.1 People Development – The Bharat Forge Way 49
2.6.2 Employability and Skill Set of Newly Graduated Engineers in
India
49
2.6.3 Perspectives on Skill Development in Maharashtra Matching
Aspirations to Opportunities
51

-iii-
2.6.4 The Interface Year Book 2014 52
2.7 Survey Reports – General and Subject Specific (Local, National
and International)
52
2.7.1 Managing the Talent Crisis in Global Manufacturing – Strategies
to Attract and Engage Generation Y
52
2.7.2 Spotting Talent 54
2.7.3 People and Change: Hidden Talents – Optimizing Investments in
Talent Management
55
2.7.4 India Talent Survey Report 2012 – Perspectives on Young
Talent in India
56
2.7.5 Employment Practices and Employability of the Hidden Talent
Pool: The Mature Workers
57
2.7.6 Paradigm Shift – Building a New Talent Management Model to
Boost Growth
59
2.7.7 National Employability Report ‘Graduates’, Annual Report 2013 60
2.7.8 Hidden Talents II: Re-engaging Young People, the Local Offer,
Local Government Association
61
2.7.9 Building the Right High Potential Pool – How Organizations
Define, Assess, and Calibrate Their Critical Talent
63
2.7.10 The Great Talent Shortage Awakening: Actions to Take for A
Sustainable Workforce
65
2.7.11 The India Skills Report: 2014 67
2.7.12 Totaling the Hidden Talent – Youth Unemployment and
Underemployment in England and Wales
68
2.8 Company Specific and Subject / Area wise Special Survey and
Study Reports
69
2.8.1 Hidden Talent: Opportunities for Action 69
2.8.2 Solving the Skill Crisis 70
2.8.3 Modern HR in the Cloud – Building Critical Talent Pipelines –
Creating a Plan for Staffing Critical Job Roles
71
2.8.4 4th
CII Global Summit on Skills Development 72

-iv-
2.9 M Phil and Ph D Thesis of Indian as well as Foreign Universities 73
A Study of Hidden Talent Management in same Status
Employees with Reference to Industries in Pimpri-Chinhwad
72
2.10 Internet Articles and Websites 74
2.10.1 The Talent Within: Finding Your Hidden Gems 74
2.10.2 Unleash the Hidden Talent of Your Employees 74
2.10.3 Winning the Takent War in Local Markets by Staying Global 75
2.10.4 Find the Hidden Talent in Your Organization 75
2.10.5 Discovering Hidden Talent within Your Organization 75
2.11 Observations and summary 76
2.12 Need and Significance of Study 77
2.13 Conclusion 77
3 Research Methodology 78
3.1 Introduction 78
3.2 Research in Business and Research Process 79
3.2.1 Business Crisis faced by Organizations 79
3.2.2 Formal process of Searching Hidden Talent 80
3.3 Problem Definition 80
3.4 Objectives 81
3.5 Hypotheses 83
3.6 Data Collection Method 83
3.7 Pilot Survey 84
3.7.1 Observations based on Pilot Survey 86
3.7.2 Conclusion based on Pilot Survey 87
3.8 Sampling Techniques / Methods used 87
3.9 Selection and Size of Sample 89
3.9.1 Selection of Size of Sample 89
3.10 Application of Statistical Tool 91
3.10.1 Introduction to Chi-square Test 91

-v-
3.10.2 Contingency Tables 92
3.11 Scope and Limitations 93
3.11.1 Scope 93
3.11.2 Limitations 99
3.12 Summary of Select Industries for Primary Data Collection 101
3.13 Summary 103
4 Data Collection, Analysis and Interpretation 104
4.1 Introduction 104
4.2 Data Interpretation 105
4.3 Analysis related to Hypotheses: Testing 130
4.3.1 Hypothesis 1 131
4.3.2 Hypothesis 2 136
4.3.3 Hypothesis 3 140
5 Findings and Conclusion, Suggestions and Recommendations 153
5.1 Major Findings 153
5.2 Conclusions 156
5.3 Suggestions 158
5.4 Solution 158
5.4.1 Suggested Model 159
5.5 Recommendations 163
Chapter 1 – References i
Chapter 2 - References ii
Chapter 3 - References vii
Bibliography viii
Appendix 1 – List of Respondents xiv
Appendix 2 - Questionnaire xx

-vi-
List of Tables
Table 3.1 Respondents of Pilot Survey 85
Table 3.2 Selection of Sample Size 90
Table 3.3 Contingency table 93
Table 3.4 List of Industries, with location, visited for Primary Data 95
Table 3.5 Service Sector Data Distribution 101
Table 3.6 Manufacturing Sector Data Distribution 102
Table 4.1 Distribution of Industries for Awareness of Hidden Talent 131
Table 4.2 Distribution of Industries for efforts to search Hidden Talent 132
Table 4.3 Ways to Search Hidden Talent 132
Table 4.4 Helpfulness to solve Business Crisis 133
Table 4.5 Impact of losing Key Talent 134
Table 4.6 p-value for ways to search Hidden Talent 136
Table 4.7 p-value for Efforts for Hidden Talent & its helpfulness – Large Industries 137
Table 4.8 p-value for Efforts for Hidden Talent & its helpfulness – Medium
Industries
138
Table 4.9 Business Growth 140
Table 4.10 p-value for Hidden Talent Awareness and business Growth 141
Table 4.11 p-value for efforts for Hidden Talent and Business Growth 141
Table 4.12 p-value for ways for Hidden Talent and Business Growth 142
Table 4.13 p-value for Helpfulness to solve Business Crisis & Business Growth 142
Table 4.14 p-value for Awareness & Turnover 143
Table 4.15 p-value for Efforts for Hidden Talent & Turnover 143
Table 4.16 p-value for Ways for Hidden Talent & Turnover 144
Table 4.17 p-value for Helpfulness to solve Business Crisis & Turnover 145
Table 4.18 p-value for Awareness and Branches / Customers 146
Table 4.19 p-value for Efforts for Hidden Talent & Branches / Customers 146
Table 4.20 p-value for Ways for Hidden Talent & Branches / Customers 147
Table 4.21 p-value for Helpfulness to solve Business Crisis & Branches / Customers 148
Table 5.1 Priority of training 154

-vii-
List of Graphs
Graph 4.1 Manufacturing V/s Service Industries 106
Graph 4.2 Size of Industries 106
Graph 4.3 Training Need Identification 107
Graph 4.4 Contents of Training 107
Graph 4.5 Frequency of Soft Skill Training 110
Graph 4.6 Frequency of Technical Training 112
Graph 4.7 Frequency of Succession Planning 113
Graph 4.8 Mechanism for Evaluation of Training Imparted 114
Graph 4.9 Opinion about Training 115
Graph 4.10 Infrastructure Availability 115
Graph 4.11 Trainers’ Availability 116
Graph 4.12 Qualitative Impact of Training Imparted 117
Graph 4.13 Quantitative Impact of Training 118
Graph 4.14 Awareness of Concept of Hidden Talent 119
Graph 4.15 Distribution of Industries for Hidden Talent Awareness 120
Graph 4.16 Efforts for Searching Hidden Talent 120
Graph 4.17 Distribution of Industries for Efforts for Hidden Talent 121
Graph 4.18 Ways to search Hidden Talent 122
Graph 4.19 Distribution of Industries for ways to search Hidden Talent 123
Graph 4.20 Helpfulness to solve Business Crisis 124
Graph 4.21 Distribution of Industries for Helpfulness to solve Business
Crisis
124
Graph 4.22 Impact of Losing Key Talent 125
Graph 4.23 Distribution of Industries for Impact of Losing Key Talent 126
Graph 4.24 Conduction of Exit Interview 127
Graph 4.25 Cognizance of Exit Interview 127
Graph 4.26 Business / Organizational Growth in 5 years 128
Graph 4.27 Change in Organization’s Turnover 129
Graph 4.28 Number of Branches / Customers / Dealers 130

-viii-
Graph 4.29 Awareness about Concept of Hidden Talent 131
Graph 4.30 Efforts to Search Hidden Talent 132
Graph 4.31 Ways to Search Hidden Talent 132
Graph 4.32 Helpfulness to solve Business Crisis 134
Graph 4.33 Impact of losing Key Talent 135
Graph 4.34 Ways to search Hidden Talent 137
Graph 4.35 Business Growth 140
Graph 4.36 Turnover / Profit of Industries 144

-ix-
List of Figures
Figure 1.1 Preferences for seeking new employment among different
generations of workers in India
9
Figure 1.2 Reasons noted across generations for changing a job 9
Figure 1.3 Views of different generations on effective retention strategies 9
Figure 1.4 Reasons cited by Millennial Tiger Cubs for staying with their
current employer
10
Figure 1.5 How do Indian employees assess the effectiveness of their
company’s HR and Talent activities
10
Figure 1.6 Demographics – Industry 11
Figure 3.1 Distribution of Industries – Pune region 95
Figure 5.1 Suggested Model 160

-x-
Glossary of Terms:
Chapter 1
MSME Micro, Small and Medium Enterprise
UK United Kingdom
HRD Human Resources Development
HRM Human Resources Management
CEDEC Community Economic Development and Employability Corporation
UG Undergraduate
PG Postgraduate
HR Human Resources
USA United States of America
I India
AIMA All India Management Association
NSDC National Skill Development Corporation
IT Information Technology
ITeS Information Technology Enabled Services
Chapter 2
Ph D Doctorate of Philosophy
EEOC Equal Employment Opportunity Commission
HC Human Capital
GLAT Google Lab Aptitude Test
CEO Chief Executive Officer
U S United States
MNC Multi National Company
CFO Chief Financial Officer
COO Chief Operating Officer
CTO Chief Technology Officer
HPCL Hindustan Petroleum Corporation Limited
ICICI Industrial Credit and Investment Corporation of India

-xi-
EVP Employee Value Proposition
ITI Industrial Training Institute
ITC Industrial Training Centers
PPP Public Private Partnership
IMC Institute Management Committee
MES Modular Employability Scheme
NCSD National Council for Skill Development
TCS Tata Consultancy Services
ADB Asian Development Bank
O P Organizational Performance
B C Business Crisis
S C Skill Crisis
NHRDN National Human Resource Development Network
FMCG Fast Moving Consumer Goods
HSBC Hongkong and Shanghai Banking Corporation
CIO Chief Information Officer
TQM Total Quality Management
MCCIA Mahratta Chamber of Commerce Industries and Agriculture
NIPM National Institute of Personnel Management
NASSCOM The National Association of Software and Services Companies
ABET Accreditation Board of Engineering and Technology
NBA National Board of Accreditation
FICCI Federation of Indian Chambers of Commerce and Industry
OEM Original Equipment Manufacturer
KPMG Klynveld Peat Marwick Goerdeler
ROI Return on Investment
AMCAT Aspiring Minds Computer Adaptive Test
IBM International Business Machines
NZ New Zealand
PA Personal Assistant

-xii-
CII Confederation of Indian Industries
SME Small and Medium Enterprises
LGA Local Government Association
BCG Boston Consulting Group
IGNOU Indira Gandhi National Open University
M Phil Master of Philosophy
PCMC Pimpri Chinchwad Muncipal Corporation
Chapter 3
TCS Tata Consultancy Services
MAHAGENCO Maharashtra State Power Generation Company
SSI Small Scale Industry
CMD Chairman and Managing Director
MIDC Maharashtra Industrial Development Corporation
RBI Reserve Bank of India
Chapter 4
M D Managing Director
V P Vice President
A V P Assistant / Associate Vice President
ERP Enterprise Resource Planning
LMS Learning Management System
IIM Indian Institute of Management
Chapter 5
NGO Non Governmental Organization

1
Chapter 1
Introduction
1.1 HISTORY AND BACKGROUND OF THE TOPIC:
In the current era of globalization & competition, it is very important but difficult for
organizations to gain and maintain the global status. The employees play a major role
in increasing the competency level of the organization. The talent of the employees is
the significant part which needs to be highlighted. However there are many
organizations having different sizes like small scale, MSME (Micro Small and
Medium Enterprise), and medium scale & large scale where there is hidden talent
which is not properly identified. This study talks about the searching of hidden talent
at different levels within the organization. Only search is not sufficient, its proper and
effective utilization, retention and development are equally important. This study
discusses its importance for the betterment of employees and also the organization.
The study is focused to identify the relationship between the hidden talent and the
growth of employees and organizations.
The history of human resources started with the evolution of large factories in 18th
century. The rapid development with new approach, like change in technology,
change in manufacturing process, providing services, etc., towards work changed the
world dramatically. Due to the factories act in United Kingdom1 (The Great Britain,
UK), in 1833, the industrial welfare concept emerged and there were various
amendments took place in the act over a period of time, because there were no
guidelines for factory owners / employers. In 20th
century, the industrial welfare
department changed its nomenclature to personnel department which was having
strictly an administrative role2.

2
The significant change was introduced after Second World War because military
developed many training programmes for soldiers. This was the period where the
concept of trade union came into force3. After 1960, the technology and globalization
changed the rules of the game. Now, the personnel department is still in existence
with the role of administrative functions only and the concept of human resource
management is emerged which is having wider scope and objectives than personnel
department.
Nearing the 21st century, due to work force mobility and collaborations, corporate
organizations started viewing employees as their assets. This has happened due to
globalization and tough competition. The new term HRD (Human Resources
Development) has become the key-word in all global organizations. The function of
HRD involves talent acquisition, retention management, development, change
management, etc4.
This type of talent management has given some good practices and benefits to all
global organizations.
Change is a constant thing which drives all the industries. These changes are termed
as mergers, acquisitions, strategic alliances, downsizing, leadership changes and
retirement of key knowledge holders. HRM department is forced to identify, nurture
and retain key knowledge holders and other employees who do have valuable skills
but generally are overlooked.
This process is known as “Identifying hidden talent” within the organizations.
The concept of Hidden Talent is explained below:
Definition of Hidden Talent:

3
1. If someone is unknown about talent / strength he / she possess and is made
aware of the same by someone else, it is known as Hidden Talent search.
2. Possession of talents / skills that is not known to others is Hidden Talent.
3. An ability or skill which is kept undisclosed knowingly or unknowingly.
4. “If something is hidden, most people do not know about it or understand it”
by Macmillan Dictionary5
“Hidden Talent” is a British Television Series released on 24th
April 2012 by Richard
Bacon and features members of the public demonstrating specific skills. Each week
ordinary members of the public take tests in certain fields or skills to identify any
previously unidentified talent, and those that test highest in each area are trained by
experts to maximize their potential in that skill. 900 people applied and were tested
for the show6.
Now, “Excellence is the new mantra” for all global corporations / industries, which
forces them to progress more and more of course with the help of human capital /
hidden talent.
1.2 CURRENT STATE OF AFFAIRS:
From year 2007 to year 2013, there have been a lot of articles, white papers, research
papers, study reports published and survey reports which are evident for a search and
quest for “Hidden Talent within the organizations”. To name a few, the core talks as
follows7:
1. Entrepreneurship and intrapreneurship
2. Uncovering the hidden talent
3. Core competencies

4
4. Loosing knowledge as a widespread change
5. Identifying key knowledge holders and other valuable employees
6. Linking knowledge with human resource strategy
7. Managing the talent crisis in global manufacturing
8. Optimizing investment in talent management through 3 steps
9. Learning and talent management in new perspective with current situation
10. Talent and organizational performance – solving the skill crisis
11. Crisis decision making analysis and use of talent management
12. Implication of crisis decision making on business performance
13. Crisis management and talent management correlation
Along with this, there is a social angle of ‘unemployment of people and related
issues’ in different countries like UK and Canada is explained below:
There was a problem which was addressed by an agency known as CEDEC
(Community Economic Development and Employability Corporation) in Quebec
region of Canada8, which says that by year 2036, the 50 % population of Quebec will
be above age 45. From year 2009, there was a rising problem of unemployment of
people above 45 years age and lot of contradictory points came out as a result of study
between employment practices and employability of the hidden talent pool (the
matured workers above age 45).
On the other side, the local government association in UK did undertake a survey and
published a report in January 2013 for hidden talents: Re-engaging the young people
of age group 16 to 24, the local offer9.

5
This study reveals that importance of long term youth unemployment is very high in
UK who are between the above age group of 16 to 24. The number of unemployed
youth is over a million from year 2007 and the figure is already increased drastically
from year 2008. They are neither engaged in work nor in learning environments
(education).
The study encourages the local governments to become partners with educational
institutes / organizations to solve this social problem in UK by arranging customized
solutions.
Lots of multinational companies operate globally. Nowadays, India has emerged as a
new market for lots of multinational companies. These companies want to establish
themselves in India and especially in Pune region. Now, Pune is on the world map
and all types of industries are present in Pune region. Hence, Pune has become a
globally recognized destination for corporate world.
The researcher has been functioning as a ‘training and placement officer’ from past 14
years at one of the UG and PG engineering institutes in Pune. Every year nearly 125 +
different industries visit the institute for recruitment of fresh engineers.
The consistent demand of fresh engineers along with different attrition rates for
various companies as well as various problems faced by HR representatives of
different industries in reference with recruitment, talent management, and retention of
employees is still a great challenge before these organizations.
A white paper, published in Outlook, 2011 edition by Accenture regarding “Talent
and organisational performance – solving the skill crisis” throws light on following
important points as given10
:

6
a. There is a skill gap faced by various organizations in USA and it affects
organizational performance and hence it is difficult for them to remain in business
competition.
b. It has suggested six strategic ways to address the skill gap, improve organizational
performance and enhance talent management practices.
One of those six strategic ways is “Mine your own organization for hidden talent”.
In recent past, the researcher had an opportunity to interact with the Technical
Director of Accenture (I) in connection with recruitment, talent management and
retention in current industrial scenario in India.
On one side recruiting industries make efforts to select / recruit talented fresh
graduates through campus placement and they ensure to see that these freshers join
and work with them. On the other side, companies do have working people with them
and also some senior employees get recruited as per demand of the organization.
However, after certain period, industries lose their employees from all categories like
junior level, middle level and senior level. So despite giving them training and
offering handsome packages they cannot retain them. This paradoxical situation
prompted the researcher to thoroughly study the problem.
In view of the points mentioned herein before and also the hands on experience of the
researcher in the field of recruitment , training and placement of fresh engineering
graduates, management graduates as well as experienced personnel in the corporate
world , especially in Pune & Mumbai region prompted to undertake and in-depth
study relating to Hidden Talent.
Now, it is clear that the hidden talent within the organization needs to be addressed.
The present study highlights on the search of hidden talent and its effective utilization

7
and its context with the betterment of industries in Pune region with special reference
to large and medium sized manufacturing and service industries and also to study
various effects on the performance of the organization and the individual employee.
1.3 RELEVANCE OF THE RESEARCH STUDY:
India Talent Survey Report11
2012: Perspectives on young talent in India, July 2012
given by Deloitte in association with AIMA (All India Management Association)
throws light on relevance of the topic chosen for the study.
The research team’s opinion and conclusion of the survey and statistics presented as
an outcome of the study is as follows:
The India talent survey 2012 was conducted to understand / examine “Employee
expectations” with respect to industry, geographic, generations and gender also.
Four major questions and categories were involved:
1. Employee attitudes and employer’s capitalization for changing mindset of
employees.
2. Employee perspectives across generation and gender on key talent issues.
3. Employees’ perception about HR and talent programmes along with HR
capabilities in global scenario.
4. Perception of your employees about organization and what difference it makes
to make your organization world class in global scenario.
1.3.1 Major findings and other findings:
I. Total 57 % employees look forward to continue with the same company.
II. There are three main methods which support the employees to stop from
leaving the organization are “Endorsement / job progression” (57 %), “Extra
reimbursement” (53 %), and the “Global opening” (46 %).

8
III. Though financial reimbursement may not mainly motivate employees to
continue or to leave, it is one of the basic preservation techniques.
IV. Non-provision of rewards and / or job options are the main causes influencing
generation X and millennial human resources to transit – double attention on
these aspects encompasses the top concerns of India’s Tiger Cubs.
V. Interestingly, “Flexible work arrangements” is identified as a need consistently
across generations and gender as an important retention strategy and an
incentive to delay retirement.
VI. Millennial “Tiger Cubs” differentiate themselves by recognizing a “Fun
working environment” as a prime thought for general staff knowledge and
brand.
VII. With increasing age, the necessities change to simple tasks, extra remuneration
and capability to join family, commitments towards society and job and
options to change fields.
VIII. For HR, there is a considerable opportunity and talent programmes to progress
the usefulness for the industries in achieving requirements of the staff.
1.3.2 Conclusion of survey report:
Lots of details are shared by this report to understand employees’ expectations /
perceptions and views with different attributes, which are really a point of concern for
every HR professional across the industries.

9
Figurre 1.1 Preferences for seeking new employment among different generations of workers in India
Figure 1.2 Reasons noted across generations for changing a job
Figure 1.3 Views of different ‘generations’ on effective retention strategies

10
Figure 1.4 Reasons cited by millennial “Tiger Cubs” for staying with their current employer
Figure 1.5 How do Indian employees assess the effectiveness of their company’s HR and talent activities

11
1.4 SKILL SETS:
To perform any kind of work related to junior management and above level in
manufacturing and service industries, employees require variety of skills.
The term skills / skill sets is not representing a particular domain or type of work
involved. When generalized, this term does not remain bounded for a particular trade.
It summarizes the overall abilities required in current era.
These are classified as follows:
Figure 1.6 Demographics industry

12
1. Soft skills: Core employability skills and communication skills
2. Professional skills: Domain specific technical skills (hard skills)
3. Low order thinking skills: Remembering and understanding
4. High order thinking skills: Analysis, creativity and solving the problem
Employer gives more importance to soft skills than hard skills (which is also required)
and expects all employees to have high order thinking skills12
.
In general by all employers following skills are predominantly looked for13
1. Performing with high creativity and analytical skills
2. Better contribution as a member in complex team environment
3. Ability of using various ways of communication to mix-up with multi-cultural
members
4. Best performer
5. Adaptive learner for upcoming technologies
6. Stable with employment
This is not an exhaustive list as there are different skill sets necessary or required
according to size, type, activities, area, location, market conditions, economical and
social conditions, etc.
1.5 SKILL CRISIS:
1. As per a report in March 2010 by World Economic Forum, India will face huge
skill gaps in few job categories due to low employability by 2030. The report has also
cautioned about “Scary Global Skill Crisis”14
.
2. Government of India has already set up NSDC (National Skill Development
Corporation) in 2009 to address the issue of skill gap and low employability15
.

13
3. By year 2013, NSDC met about 16.5 % of their skilling target. That is 1.4 Million
people were trained to bridge the skill gap of demand and supply and still 8.5 Million
are still balance for training16
.
4. Skill gaps observed in Pune region is very descriptive for various sectors with
different jobs and related skills and available in a full-fledged report17
. The sectors
mentioned in the report are
i. Auto and auto component
ii. Banking, financial service and insurance
iii. Building, construction industry and real estate services
iv. Chemical and pharmaceuticals
v. Education and skill development
vi. Food processing
vii. IT and ITeS
viii. Healthcare
ix. Logistics, warehousing and packaging
x. Media and entertainment
xi. Organized retail
xii. Textile
xiii. Tourism, travel, hospitality and trade
xiv. Unorganized sector
1.6 BUSINESS CRISIS:
It is defined as the problems faced by any business at various intervals due to various
reasons. Some of the reasons are due to “Skill crisis, financial crisis, talent
management issues in various aspects, etc.”
14
1.7 IMPACT:
The definition of impact is “A marked effect or influence of a process by a parameter
over another parameter”.
1.8 ORGANIZATIONAL PERFORMANCE INDICATORS:
1. Increase in sales / turnover
2. Increase in gross profit and net profit: Profitability
3. Decrease in attrition rate of employees at all levels
4. Increase in in-flow of / joining of new talented employees because of referral
schemes
5. Increase in R & D: Increase in import substituted products
6. Increase in number of product lines / products
7. Increase in number of branches / franchises
8. Increase in exports
9. Increase in brand value and market share
10. Increase in customer base, increase in repeat customers with repeat orders
11. Increase in moral of employees
12. Low / no wastage
13. Progress of organization in various aspects other than above mentioned
This is a representative list and may add some indicators depending upon different
situations, reasons, etc.
1.9 FORMAL PROCESS FOR HIDDEN TALENT SEARCH WITHIN THE
ORGANIZATION:
It is nothing but mining / searching the available talent within the organization and
searching the talent which was unidentified during process of recruitment and
selection at previous stages of talent management activities.

15
In manufacturing and service industries, there are various departments working in
synergy for growth of the industry. There are always evidences of “Process of Hidden
Talent Search”. Few of them are mentioned as example:
An employee working with one department (production) found to be best
orator / communicator and convincer during internal process got transferred to
another department (marketing) to take benefit of his ability (hidden talent)
for organizational performance growth.
A fresh graduate joined to industry was found to be adaptive and quick
learner in talent management process (search of hidden talent), he reached to
Top management level in short span of time.
1.10 CONCLUSION – RESEARCH GAP:
It is found through all reports and surveys that there is a skill gap observed across
various sectors and sizes of industries in Pune region, India and globally as well.
There, needs an improvement in human resource practices and policies for
improvement in organizational performance by overcoming skill crisis / talent
problems.
It has been understood through various sources from industry representatives that
there is more attrition rate at entrants or junior level of employees in comparison with
that of experienced people at middle level and senior level. So, it is felt necessary and
important that hidden talent search should give thrust on “Junior level entrants”.
Under utilization of talent generates high level of attrition, high level of skill crisis
and low performance of organization.

16
On the other hand, proper utilization of talent through hidden talent search generates
high morale, high satisfaction, higher motivation and higher performance amongst
employees and resultantly the growth of the organization.
The aforesaid discussion clearly depicts that, skills crisis and business crisis do affect
the organizational performance for which hidden talent search and its proper
utilization is the right solution.

17
Chapter 2
Literature Review
2.1 INTRODUCTION:
To formulate the problem statement thorough analysis of available literature was
necessary. The researcher studied various materials for the same. The study material
was available in different forms like books, articles, research papers, etc..
Following sources were used for making literature review:
1. Books
2. Research journals
3. Research magazines
4. Survey reports
5. Study reports
6. PhD thesis
7. White papers
8. Articles and websites
In this review 11 books, 5 research papers from different journals, 5 articles from
different magazines, 1 white paper, 4 papers from conferences, 12 survey reports, 4
study reports, 1 Ph D Thesis and 5 internet articles were referred.
2.2 BOOKS:
2.2.1. In the book ‘Hidden Talent – How Leading Companies Hire, Retain and
Benefit from People with Disabilities’, Hall, Praegr West Port, Connecticut,
London, 2007, Mark L. Lelgnick has expressed views about leading companies’

18
hiring, retaining procedures for people with disabilities18
. Disability may be physical
or mental. According to National Organization on disability report, the disability
increases with age as mentioned below:
Ages < 22 disability rates 1.7 %
22-44 disability rates 6.4 %
45–54 disability rates 11.5 %
55-64 disability rates 21.9 %
65-79 disability rates 27.8 %
> 80 disability rates 53.5 %
As observed in general, many employers are reluctant to hire people with disabilities.
In this book, the survey of the companies that have discovered the hidden talent of
people with disabilities is given. The practices for hiring, retention & benefit from
having people with disabilities in the workforce are also explained in detail.
Disability:
The Equal Employment Opportunity Commission (EEOC) defines disability as both
physical and mental impairments that substantially limit a major life activity of the
person.
The definition of disability used by the American Community Survey is based on
three questions.
1. Any of the long-lasting conditions
2. Any difficulty in doing regular life activities
3. Any difficulty in physical – mental coordinating activities

19
Disable people want to work and they have human capital which is useful for
employers. Three approaches are considered for people with disabilities: ignore,
comply or value.
Goals for the book:
To understand the range of policies, practices, and procedures used to hire and
retain people with disabilities.
To synthesize and integrate the information in order to develop some guidelines
for practice that other companies can use.
Main contents of the book:
It deals with the problem and the opportunity: People with disabilities need jobs and
employers need workers. It is explained that people with disabilities represent
untapped labor pool which can meet the demand. Employers ignore the resource of
people with disabilities because of unawareness of their potential contributions.
The cases of some companies who recruit such people are also discussed here. e.g.,
Hewlett – Packard has such employees. They have understood the needs of disable
people while using the products. So they have involved these people in designing
process so that the products will be friendly to all.
Another example is of Sun Trust Bank, where one branch manager is blind. But the
service he offers to other disable people is very useful for marketing the branch in
such community.
Microsoft also absorbs disable people even for summer intern. And to have effective
communication, all the trainers study the American Sign Language.

20
Marriott foundation has accepted and continued the culture of employing disable
people in all the activities.
It is very clear that employers will gain benefit from hiring disable people so the
companies should make the policies to hire disable people and retain them.
2.2.2. The book ‘The Talent Edge – A Behavioural Approach to Hiring,
Developing, and Keeping Top Performers’ by David S. Cohen, Wiley India Pvt.
Ltd., Reprint 2007 19
, talks about a behavioural approach for talent management.
Hiring, developing and retaining the talent (people with top performance) is always a
major task for any human resource’s professional and the task begins from hiring the
people. Here behavioural interviewing is playing more successful and efficient role
than other forms of interviewing. Here, the quotes of Lord Byron is used – “The best
prophet of the future is the past”. So, the main important aspect of behavioural
interviewing is examining the past to predict the future.
In the current scenario of global competition, cost for hiring people, time spent for
hiring people and outcome of the recruitment for top performers, behavioral
interviewing increases the chances of hiring right people for right job by 2 to 5 times.
In short behavioral information about the candidate is gathered, irrespective of any
relevance to the current position offered. This information is concerned with specific
events in an applicant’s past that were somehow, critical moments, indicative of key
decisions and actions. e.g., person’s extreme moments, biggest challenges, hardest
problems, most frustrating customer, most successful project, etc. with ‘rich’
information.
21
Every organization has a set of values which is nothing but strong belief with
emotionally charged, highly resistance to change and long standing. This explains
organizational instincts, philosophy, and source of its culture, strategy and work style.
Once, the values are decided as per the type of organization, and then organizational
vision, mission and culture along with goals and objectives are easily set.
Organizational culture is a pattern of basic assumptions invented, discovered /
developed by the group through its own learning to cope with different situations.
Organizational vision is never fully attained. It motivates and excites employees and
explains why you exist as a company.
Behavioral interviewing is useful for hiring right people but behavioral profiling
within the organization helps to identify and retain top performance. Importance of
developing behavioral competencies and concept of fit suited to the specific needs and
circumstances of organization is very important aspect for a very human resource
professional. It is having a great impact on the clarity and fairness by the way
employees are rewarded and recognized within the organization. When competencies
are the defining measure of success, assessment of an individual employee’s
performance is no longer linked to personal bias.
Developing behavioral profiles within the organization is a systematic process to be
followed for top performance for individual role and organization as a whole.
The process is as follows:
1. Identify, examine and describe “Top Performance”. It means how work is
accomplished by top performance in accordance with organization’s values and
strategic needs.
22
2. The critical incidents to be checked, to understand the nature of top performance
through examining the work and identifying the competencies in critical incidents
occurred during professional actions.
3. Creation of focus group – a group of top performers is identified through
behavioral interviews for critical incidents. Focus group is a mixture of variety of
key stakeholders within the organization, even internal and external customers.
4. Facilitators – facilitators are having organizational knowledge, well trained,
skillfully guide for a debate within focus group on “What constitutes top
performance”.
The discussion / open debate, questions asked within the focus group by facilitator
gives result for behavioral competencies which can be used as a benchmark for a role
within the organization.
The result is recorded in terms of writing the behavioral profile for different profiles
within the organization and the same is used as a guide while hiring people. There are
questions framed for behavioral interviews with specific competencies, e.g., courage,
responsibility, trust, etc.
This process of behavioral interviewing through behavioral profiling is nothing but
strengthening the people management policy for keeping the organization as top
performer.
2.2.3. In the book ‘Talent - Making People Your Competitive Advantage by
Edward E. Lawler III, Jossey – Bass, First Ed, 2008’, the demand for talent is
highlighted 20
. In today’s Global, competitive business environment, recruitment of
high quality people along with improvement in work environment and company
culture is highlighted through a survey done of senior executives globally.

23
From so many decades the top management and senior executives in the organization
always used to talk about “Giving importance to the talent (people) available in the
organization”. But it was not evident at all.
A new word is introduced by author as HC-centric. It is nothing but making
organization Human Capital Centric which is going to help organizations to sustain
globally.
Author emphasized features of HC-centric organizations as follows:
1. Business strategy is determined by talent considerations and it in turn drives
human capital management practices.
2. Every aspect of the organization is obsessed with talent and talent management.
3. Performance management is one of the most important activities.
4. The information system gives the same amount of attention and rigor to measures
of talent costs, performance, and condition as it does to measures of equipment,
materials, buildings, supplies, and financial assets.
5. The HR department is the most important staff group.
6. The corporate board has both the expertise and the information it needs to
understand and advise on talent issues.
7. Leadership is shared, and managers are highly skilled in talent management.
Managing talent for following organizations has been discussed by the author:
1. Goldman Sachs
2. Google: GLAT (Google Lab Aptitude Test) is introduced by Google
3. Wal-Mart’s efforts

24
4. Career customization in Deloitte and Touche
To make organization HC-centric, a change is unavoidable due to the large gap
between current state of organization and requirement as to be making it to HC-
centric.
There are four types of change needed and suggested by author for making the
organization from structure centric to HC-centric.
1. Low cost operator to high involvement organization
2. Low cost operator to global competitor
3. Bureaucratic to global competitor
4. Bureaucratic to high involvement
Author says that the future belongs to the HC-centric organizations.
2.2.4. Peter Cappelli has given view on Talent management in the book ‘Talent on
Demand – Managing Talent in an Age of Uncertainty, Harvard Business Press,
2008’ 21
. The current state of Talent Management for organization and employees is
totally mismatched. The two basic ways of talent management are traditionally as
follows:
1. Developing internal talent: Approach from 1950
2. Recruiting from available market: Approach from 1980
Both the approaches failed recently due to various reasons like globalization, internet,
technology upgrades, etc.
All the organizations always said that people practices or people are the main assets
for our growth. But they only said, never practiced due to their own thinking and
culture.

25
Lot of survey reports raised the curtain from year 2000 to expose this problem of
mismatch in talent management and it has given a rise for a new way to think about
new management.
New framework for talent management is suggested by author by his own study based
thought processes with four principles:
1. Make and buy to manage demand – side risk: It says that a balance between
two options of traditional talent management needs to be maintained, it also
says that it is not only internal development, but addition by recruitment.
2. Reduce the uncertainty on talent demands: It suggests that organizations need
to predict / forecast the short term plan for talent management by
understanding lot of parameters related to business. One of the important way
to do is succession planning. It is also suggested to have a short term plan than
a long term plan. Generally short term plans based on predictions supported by
perfect analysis of the situation give better result.
3. Earn a return on investment in developing employees by considering the
principle 1 and 2 with short term plan, develop the employees.
It is explained as follows:
a. The internal development of talent will have a short term full-fledged plan.
b. The newly recruited talent can be developed in batches with break-up and
short term training and joining the organization.
c. Asking the employees to share the cost of their own development.

26
d. Spot, identify and act fast on a, b and c in such a way that people will
understand that they are having advanced opportunity than other
organization.
4. Balance employee interest by using an internal market: This suggests
understanding / studying that what are the interests of employees to purpose a
particular role / job as well as the various openings available within the
organizations by satisfying the employees as well as achieving the goals of
organization.
This negotiation is definitely challenging and rewarding too for any organization.
This principle throws a light on total re-search and development of the organization,
since it is suggesting some models and approaches.
2.2.5. As per John C. Maxwell, “Talent is God’s Gift” which is explained in the book
‘Talent is Never Enough: Discover the Choices That Will Take You Beyond
Your Talent, , Pearson Power, 2008’ 22
. As well as “It is often overrated and
frequently misunderstood”. He also emphasizes on lot of examples of “Highly
talented and highly unsuccessful people” in life which are public figures also. He also
mentions following examples:
More than 50 % of all CEOs of Fortune 500 companies had C or C-averages
in college.
65 % of all U. S. senators came from the bottom half of their school classes.
75 % of U. S. presidents were in the lower-half club in school.
More than 50 % of millionaire entrepreneurs never finished college !
27
It is also mentioned in the report from ‘Money’ magazine 2006, that employees are
having difficulty finding the right people to fill jobs despite high unemployment in
Europe and USA as per the survey report by Manpower.
The gist of entire content of the book emphasizes on only one thing: “Talent is not the
only thing” for success, result, etc. There are few more things by which an individual
as well as organizations in a whole can get benefit from ‘Talent’, if they try to
maximize it by several 13 ways as mentioned below:
Belief lifts talent, passion energizes talent, initiative activates talent, focus directs
talent, preparation positions talent, practice sharpens talent, perseverance sustains
talent, courage tests talent, teach ability expands talent, character protects talent,
relationships influence talent, responsibility strengthens talent, teamwork multiplies
talent.
2.2.6. About the talent related to leadership, the book ‘Leadership Talent in Asia –
How the Best Employers Deliver Extra Ordinary Performance by Mick Bennett,
Andrew Bell, Hewitt, Wiley India Pvt. Ltd., Reprint 2009’ 23
gives explanation
with case studies. Leadership of any organization makes an impact on the
organization through ‘how they create clarity of purpose’ and it is always evident. The
example of Infosys is illustrated here. In 1992, when the economic reforms took place
and invited foreign investment in India, lot soft MNCs including IBM began to start.
Infosys had a great challenge, where Mr. Narayan Moorthi accepted it and created an
employee value proposition which was not only to retain the employees, but also to
evolve people practices like source, align, develop and reward for need of business.
There is one more concept of branding, which is coined here:
1. External branding & 2. Internal branding

28
Certain points are highlighted as follows:
Employees make the organization’s brand alive for customers.
It talks about spending existing investment more effectively instead of
spending more money on new progrmmes.
At selection, the best employers work harder than the rest.
Hire for attitude and train for skills: If certain skills are lacking, training can
be given for the same. But if the attitude is lacking, it is difficult to develop the
attitude and the values.
The fundamentals to the best employers’ success are strong brands, attention
to hiring and orientation.
Aggressive talent management by the best employers in Asia is a good example for
others. All the best employers start / concentrate more at the stage of recruitment
because; they know that focus on talent has multiplier effects.
1. The main goal in front of CEO of best employer organization is attract and
retain the “Best Talent”.
2. The next priority is given to a stronger emphasis on learning and development
for cultural, behavioral, attitude and values.
3. It is well understood by all these best organizations that training on skills
(technical + non-technical) is necessary but not sufficient to build a great
workforce.
4. Any organization, if cannot keep its key talent like various leaders e.g., CEO,
CFO, COO, CTO, etc. then there should not be internal growth and promotion
of the organization.
29
5. By discipline and rigor, any company can prove its own assessments towards
the focus of organization and towards the development of employees (people
at large).
Shaping a high performance culture within the organization is a task of the
leadership. It is nothing but the actions of the employees of the organizations, talk
about “Your Company Culture”. The strategy for company culture is always
evident through actions of employees. Culture is nothing but the way people
behave.
It is always influence and determined by leadership behavior, systems within the
organization, and processes within the organization.
High performance culture within the organization cannot be ignored in any way, since
it cannot happen as it is. It needs efforts to create and maintain. This is having major
impact.
Best employers in India:
As per this survey by Hewitt for people practices, for more than 500 companies in
India. In first year of studies there were lot of MNCs but there was increase in
participation from Indian Blue Chips, Public Sectors, etc.
Findings: Key distinguishing features:
Pride in company, faith in leadership, living their values, openness, technology for
difference, flexibility, approach towards life, thoughtful works, equality, work
opportunities and rewards, employee oriented work environment, cool things like
appreciation/s is okay but deeper treatment for lot of things is appreciated always.
Key themes of best employers:

30
View talent management as an important investment
Focus on building a high performance work environment
Articulate the elements of the organization’s culture
Use rewards as a differentiating tool
Drive leadership behavior throughout the organization
Out of India’s 29 best employers, few are mentioned below:
Agilent, Asian Paints, Bharat Heavy Electricals, Colgate Palmolive, Hindustan Lever
Ltd., HPCL, ICICI, etc.
2.2.7. The book ‘Reality Bytes – The Role of HR in Today’s World: A
Contemporary Ready Reckoner by Aparna Sharma, Foreword by Dr. T. V. Rao,
Vishwakarma Publications, 2015’ 24
was published and launched in March 2015
and the title of the book talks a lot about its relevance to the study undertaken by the
researcher. Author not only talks about talent management, but also entire gamut of
HR Along with total description of the theoretical topics, she has given caselets at the
end of every chapter which are nothing but thought prudent exercises for the readers.
As a practicing HR professional, having more than 20 years’ experience in HR, the
author has discussed the problems in the form of caselets. She has explained / covered
not only theory of HR but also current challenges in HR like Employee Value
Proposition (EVP), exit interviews, strategic HRM, etc. are mentioned in very
transparent manner. Because of this, any person who wants to study HRM practices
and current reality will get sufficient inputs as an individual.
Author has explained in detail the importance, updates, theory, practice, current
challenges, etc. of following important issues:

31
1. Exit of employee from organization
2. Strategic HRM
3. Current challenges in front of HR professionals
Thus, author suggests / submits inputs or each and every topic / issue / angle /
challenge for HRM. These bullet points are helpful for every person who is either
studying or practicing HRM.
2.2.8. Issues, concerns and prospects related to education and training are discussed
in the book ‘Skills Development for Inclusive and Sustainable Growth in
Developing Asia – Pacific; Technical and Vocational Education and Training:
Issues, Concerns and Prospects, Volume 19, 2013, Springer’ 25
i. Chapter 4 –Education, Employability, Employment and
Entrepreneurship: Meeting the Challenge of the 4 Es – Manish
Sabharwal
Author of this chapter, Mr. Manish Sabharwal, represents TeamLease Services Pvt.
Ltd., Bangalore, India. He has mentioned few points in this chapter. Those are as
follows:
A. Poor functioning of 3 Es and challenge of 4th
E
Education, Employability, Employment, Entrepreneurship
B. Labour market transition
Farm to non-farm, Rural to urban, Unorganized to organized, Subsistence self,
employment to descent wedge employment, School to work (freshers)
Team lease services studied the entire scenario in India with reference to points
mentioned above and the data is explained in variety. But the important point is 58 %

32
of India’s youth suffers in skill deprivation and unemployability. Unemployment is a
very smaller problem.
So, it is proposed to have reforms as follows:
1. Employment reform – problems and matching: supply and demand
2. Employability reform – improving supply for employability and problems
3. Education reform – creating a pipeline of educated and skilled workers and
problems
4. Entrepreneurship reform – entrepreneurial culture in education and
shortcomings – special focus on education system in India
The possible solutions for all above mentioned 4 reforms are clearly mentioned and it
is concluded by the author that the best time for such reforms is “Today”.
The entire discussion is supported by case studies, statistical data, frame work
observed through study, various outcomes of study, etc.
ii. Chapter 10 – Public Private Partnership to Meet the Skills
Challenges in India – Dilip Chenoy
For any country, the economic growth and social development are driven by skills and
knowledge. With higher and better skill levels, countries can adjust to the challenges
and opportunities of the world of work. As the population increases, it may result in
major labour shortage across the world.
Being second largest population in the world, India has the youngest population,
which can provide the domestic and world economies’ requirements in the next
decade.

33
To empower the youth, skill development various efforts have been taken by
government, establishment of Industrial Training Institutes (ITIs) is one of them.
Earlier, they were run by central government, from 1960, transferred to state
government. Private sector’s Industrial Training Centres (ITCs) were started. Both
these efforts helped to supply skilled labour to industries.
In 2005-2006, up-gradation of ITIs was planned through domestic resources, World
Bank assistance and through Public – Private – Partnership (PPP) mode. In 2007 – 08,
association of one industry with each ITI was done and Institute Management
Committee (IMC) was constituted.
To provide employable skills, Modular Employability Scheme (MES) was prepared in
2007. In view of skill provider by 2022, Indian Prime Minister, Hon. Manmohan
Singh, summarized his vision in 2008 and National Council for Skill Development
(NCSD) was established. National Skill Development Corporation (NSDC) was set as
a no – profit – no – loss company through PPP. In 2009, skill development policy was
announced which clarified the roles that different stakeholders would need to play.
To make available a drive to skilling mission, Mr. S. Ramadorai, Vice Chairman of
Tata Consultancy Services (TCS), was appointed as Skills Advisor to Prime Minister
of India in 2011.
Till June 2012, NSDC board had assured funds to 65 projects, partners had trained
over 2,10,000 people across India and ensured jobs for over 1,60,000 boys and girls
through 3,788 physical and mobile training centres in 365 districts nationwide. It
ensures an alteration in skills with new social entrepreneurs’ class.
iii. Chapter 20 – Skills for Inclusive and Sustainable Growth in
Developing Asia and the Pacific – Shanti Jagannathan

34
Due to globalization, technology up-gradations, along with growth of Asian
economies and corporations, there will be high growth rate with change in trade,
business and labour market. Strengthening education and skills will be the key factor
for development.
Jobs and skills are the biggest challenges for all developing countries, India is one of
them. India has a target of creating a pool of skilled workers of 500 million by 2022.
Improved skills increase prospects of better quality jobs which help small and
medium scale industries for growth.
Here, skill mismatch is addressed as not only up-skilling, but right skilling.
In this chapter, the survey reports of past and present were mentioned for various
attributes like
1. Percentage of employers found out: mismatch in skill
2. Growing incidence of graduate unemployment in Asia
3. Aligning skill training policies with economic and industrial policies
4. Leveraging skill training for competitiveness
5. Example of India: PPP in skills by NSDC
It is also discussed in detail, how to strengthen, skill training and workforce
development. Asian Development Bank (ADB) has proposed framework for
strengthening policies and practices in skill development.
2.2.9 V G Patel has explained different stages of crisis in the book ‘The seven
business Crises – How to Beat Them, Tata McGraw – Hill Publishing Company
Limited, 1995’ 26
.

35
Before starting any business, it is a mandatory requirement to study everything in
detail, to sustain in business in near future. This market study is to be done in all
senses. The overall experience plays a vital role in this market study. Otherwise,
educated people can understand all these things through the literature available e.g.,
by studying the book “The Seven Business Crises – How to Beat Them”, by V G
Patel. This book explains the seven business crises during various stages of any
organization at particular time interval with the help of Indian and International case
studies of business. This is not a perfect prediction / interpretation of all types of
businesses. So it is not accurate measure / interpretation, but in a broad overview,
gives a cautious learning for predictive hindrances. This is interpreted by author as
follows:
Seven crises:
Starting crisis
Cash crisis
Delegation crisis
Leadership crisis
Finance crisis
Prosperity crisis
Management succession crisis
2.2.10 This is just a guideline explained by Peter Fitzroy and James Hulbert based
on analysis of various case studies in ‘Strategic Management – Creating Value in
Turbulent Times – Wiley Student Edition, 2005’ 27
. There are lot of other inputs to
understand the relation between O.P., B.C. and S.C. This can be explained in points as
follows:
First three years
Three to seven years
Seven to ten years
Ten years onwards

36
1. Type of management of organization
2. Systems, methods, policies, procedures followed by management of every
organization (thought process of management)
3. External changes / factors
3.1. Technology up-gradation
3.2. Government rules and regulations, political changes
3.3. Economic and social changes
Based on above mentioned important points, every organization should devise a
strategy to check organizational performance in a scientific manner. The authors /
references gave the insight to understand “How to devise a strategy for O.P.”
a. Identifying key drivers of O.P. (Organizational Performance)
b. Focus on customers and their requirements
c. Focus on brand of the organization
d. Various internal measures
i. Innovation and learning within the organization
ii. Financial measures
iii. Measuring current performance
iv. Valuing future performance
e. Understanding corporate performance measures:
i. Market, external stakeholders
ii. Innovation and change management
Finance is a very important aspect to understand correlation between organizational
performances, through its summary. It takes time and cannot be predicted but it
stamps every organization whether they are winner / looser.

37
The people in every organization are very important and crucial factor for this profit
and loss through their participation in organizational performance in various ways.
This is a very tough task to prove since all above mentioned theory is reflecting in
individual’s behavior from time to time, which is having impact on O.P. and business
crisis faced by the individual organization.
2.2.11 Dr. P. Thirumalvalavan, Kirupa Priyadarsini M, Sunitha K had done
thorough study through questionnaire , and tested validity through pilot survey and
explained in book ‘The Impact of Perception of Human Resource Management
Practices,’ 28
.
By keeping two objectives in mind this study has been conducted for Public Sector
Manufacturing companies in and around Coimbatore. The relationship between HRM
practices and perceived organizational performance had been found out. Eight
dimensions for HRM practices were selected as recruitment and selection, training
and development, performance appraisal, job definition aspect, information sharing
and employee participation, career planning, compensation practices and industrial
relations. The relation of these eight with perceived organizational performance and
perceived market performance had been checked which clearly gave the picture of
organizational performance.
As per the result of this study, it was concluded that people in a company are the key
drivers for superior performance. Out of the eight dimensions, three are major for
organizational performance in manufacturing companies and its positive relations /
associations was proved.
These are:

38
1. Information sharing and employee participation
2. Compensation management
3. Career planning
This entire study was limited to one of the types of industry sectors located in and
around Coimbatore only.
2.3 RESEARCH JOURNALS:
2.3.1. As the title ‘A Study of Hidden Talent Management of Employees in IT
Sector with Reference to Pune City; International Journal of Business and
Management Tomorrow, ISSN: 2249-9962, Vol. 2, No. 7, July 2012, Rajesh
Kumar Agrawal, Dr. Daniel J Penkar, ’ suggests, this research study has focused
on hidden talent management of employees in IT sector of Pune city 29
.
Rajeshkumar Agrawal took lot of efforts to correlate the concept of hidden talent,
genders, training, and result of the organization in total.
Researcher did this survey through a proper questionnaire for selected sample size by
110 respondents and represented in chart form.
The conclusions are also mentioned which are of mixed reactions.
2.3.2. Results of a survey were discussed in ‘Talent Attrition and Retention:
Strategic Challenges for Indian Industries in the Next Decade by Lichia Yiu,
Raymond Saner in Elite Research Journal of Accounting and Business
Management Vol. 2(1), January 2014’ 30
.
This survey was conducted in October – November 2007 b sponsorship from CII.
Initial results were reported on 4th
December 2007 in Delhi and subsequently cited

39
during a webinar by NHRDN (National Human Resource Development Network) of
India on 26th
April 2011.
Objectives of the survey were to understand employee job turnover, key organization
factors for employee turnover and HR practices used with employee turnover.
The entire survey was conducted online. Total of 151 senior level / middle and top
management authorities responded from various sectors like manufacturing,
engineering, IT, service sub-sectors, etc.
Major causes of employee turnover are salary, career advancement, manager-staff
relationship. Authors have discussed a little bit about younger generation of
employees.
Paying high salary to retain employees may not be the full and final solution for any
organization since it may not help any company in global competition. Companies
can emphasize more for competence development and career planning of employees.
This is going to be useful for retention.
2.3.3. As the title suggests, Saleena Khan, Bhawna Chahar have focused on the
future of HRM in India in a paper ‘Future of HR Management in Indian Scenario:
Issues and Challenges in Asian Journal of Management Research, ISSN 2229 –
3795, 2011’ 31
. They have taken references of ancient Indian, Foreign scenario and
current updates.
They have also studied few Indian companies to understand the details. These Indian
companies are large scale MNCs. The predictions for future HRM in Indian scenario
are expressed in 10 important points as described below and its relevance is also
explained in detail:

40
Increase in education levels, technological developments, changing composition of
workforce, increasing government role, occupational health and safety, organizational
development, new work ethic, development planning, better appraisal and reward
systems, new personnel policies
Authors put into limelight, the old mix of HRM and new realities studied through this
research.
2.3.4. ‘Talent Management Scenario in the Banking Industry by Dr. Siddarth
Singh Bist, Ms. Nidhi Srivastava, Paripex in Indian Journal of Research,
Volume: 2, Issue: 4, April 2013, ISSN – 2250-1991’ 32
is the smallest research paper
observed by the researcher. But it gives clear-cut perspective and conclusions for
banking industries located in Ahmedabad region.
Since, it is a part of study for researcher to understand banking / finance sector under
service organizations in and around Pune, this research should be taken into
consideration.
This research study gives comparative statements in tabular form for various points
emerged as HRM practices. These are presented in the form of findings and
conclusions in detail for private sector banks and public sector banks.
Private sector banks are performing better in so many ways in comparison with public
sector banks, but due to support of Government with various schemes for employees,
it is in competition.
2.3.5. In the paper ‘Strategic Talent Management: A Review and Research
Agenda by David G Collings, Kamal Mellahi in Human Resource Management
Review 19 (2009), 304 – 313, Elsevier’ 33
, both the authors did refer lot of material,
which is evident in reference section of the paper.

41
The available material from 1964, till date of publication of paper was used.
While doing so, authors came to conclusion that the ‘subject’ as mentioned above
needs few inputs to all the researchers in future for their further research. These are as
follows:
1. Help to clarify conceptual boundaries of talent management
2. Providing a theoretical framework for research
3. Aid to HR managers to face issues
Authors suggested focusing on main important / pivotal positions of the organization,
which impact on organizational performance and business too. Here, it was suggested
to review / recheck the internal talent within the organization (Hidden Talent Search).
“Here, the importance is not given to search of internal talent, but importance is given
to search of internal talent (Hidden Talent) which matches with the pivotal positions”.
The paper says that organization should follow the below mentioned processes:
1. Find out pivotal positions for your organization
2. Identify, search, develop talent pool – internal, external
3. Creating a separate distinguished HR design
There is no standardized specific solution suggested but a thought process which
provokes every HR professional for designing specific strategy for benefit to the
organization by keeping following points into consideration:
1. Types of industry and size
2. Psychology / behavioral study
3. Motivation of individual
4. Attitude of individual

42
2.4 RESEARCH MAGAZINES:
2.4.1. The relation of Talent in organization is explained in ‘Growing Talent as if
Your Business Dependent on it by Jeffery M Cohn, Rakesh Khurana and Laura
Reeves in Harvard Business Review on Talent Management, Harvard Business
Press, Reprint 2008 – RO510C ’ 34
. This was originally published in October 2005;
reprint R0510C by HBR Press in 2008.
In all organizations, the main portfolio of “Talent” is always left for CEO and HR
Department of the organizations.
Searching a talent within the organization like succession planning, leadership
development etc. is nothing but the managing and developing the talent within the
organization is responsibility of all the key position holders within the organization,
because the entire business for the organization as well as survival of the organization
is only dependent on these factors.
Authors did search and found through a process that few companies not only
addressed the few points mentioned as above, but did take few more steps to get
success in business. The companies are mentioned as follows:
a. Tyson foods – family controlled company, Springdale, Arkansas
b. Starbucks Coffee
c. S. C. Johnson and son, Consumer Product Company
d. Mellon Financial, based in Pittsburgh, 136 old financial institution
As per the case studies and survey findings mentioned by authors, for all four
different organizations based in USA and few of them working Globally also, the

43
reactions, processes, outcome and understanding in the perspective of “Hidden Talent
Search” is found out as follows:
1. Every company did follow a process and a strategy according to its own
philosophy for business.
2. A leadership development checklist, a crash course, an exercise cum
observation period of 90 days is followed; involvement of senior
representatives in preparing blue print, etc. were separate initiatives by all
above mentioned organizations.
3. Every organization was successful as mentioned in this publication.
This is nothing but, the efforts taken by all these organizations to identify, nurture and
retain the talent within the organizations to save the business. This is the learning
from this publication.
2.4.2. View about people in organization is expressed in ‘Make Your Company A
Talent Factory by Douglas A. Ready and Jay A. Conger in Harvard Business
Review on Talent Management, Harvard Business Press, Reprint 2008 –
RO706D’ 35
. Originally published in June 2007, reprint R0706D
All leaders from all organizations always say that, people are the company’s most
important assets. Somehow this say and actual ground realities may differ due to
various business urgencies.
In this publication, authors have explained that at present the urgency and the
concentration should be on making your company as a talent factory. To explain this
concept, they have put forth the examples of following companies:
1. Procter and Gamble FMCG

44
2. HSBC Financial Group
Authors have explained two more concepts / theories as follows:
1. The functionality wheel
2. The Vitality Wheel – four important functions of business
Both the wheels do have various attributes and performance index related with each
attribute.
Authors designed a questionnaire and collected the data related with above mentioned
design for both the organizations.
Though the design and result are received for both diverse organizations following
results can be mentioned:
1. Both the companies are working in different geographical domains with
diversity in nature.
2. The practices and policies for hiring, retaining, searching and developing the
talent are different for both the organizations.
3. Both the organizations understood a common concept “Find, Nurture, Develop
Talent” for your organization as a whole.
2.4.3. Opinion about top talent is given in ‘How to Keep Your Top Talent by Jean
Martin, Conrad Schmidt in Harvard Business Review, 2010 Addressing the
Skills Shortage in Financial Services by Better Assessing Internal Talent, Sean
Conrad, March 2012’ 36
.
Practically every company these days has some form of program designed to nurture
its rising stars. With good reason—these high-achieving individuals can have an
enormous impact on business results.

45
Programs aimed at this class of talent are usually organized around some sort of
annual nomination process and offer targeted leadership-development opportunities
such as business rotations and special stretch assignments. But despite the prevalence
of these programs, most haven’t delivered much in the way of results. Our recent
research on leadership transitions demonstrates that nearly 40% of internal job moves
made by people identified by their companies as “high potentials” end in failure.
Moreover, disengagement within this cohort of employees has been remarkably high
since the start of the recession: In a September 2009 survey by the Corporate
Executive Board, one in three emerging stars reported feeling disengaged from his or
her company. Even more striking, 12% of all the high potentials in the companies we
studied said they were actively searching for a new job—suggesting that as the
economy rebounds and the labor market warms up, organizations may see their most
promising employees take flight in large numbers.
2.4.4. The word C-suite is used for the key posts in the organization like CEO, CIO,
CFO, etc. The article ‘The New Path to the C-Suite by Boris Groysberg, L. Kevin
Kelly, and Bryan MacDonald in Harvard Business Review, 2011’ 37
talks more
about the new traits required for leadership in particular domain. This research was
aimed to identify the critical traits of senior executives: past, present and future.
One important finding is once people reach the C-suite, technical and functional
expertise matters less than leadership skills and strong grasp on business
fundamentals.
A data was collected with the help of search firms, discussed changing business needs
in light of new technologies, conducted interviews with executives who were serving
and served in these positions as mentioned below:

46
The Chief Information Officer (CIO), the Chief Marketing and Sales Officer, the
Chief Financial Officer (CFO), etc.
Now all companies are expecting a whole new breed of top executives to lead their
business in multiple domains with happy team-work in new job requirements for
every C post are identified and noted down in this paper.
2.4.5. Various models of human resources development have been discussed in the
research article ‘A Study of HRD Concepts, Structure of HRD Departments, and
HRD Practices in India by T V Rao, Raju Rao, Taru Yadav in Vikalpa, Vol. 26,
No. 1, January-March 2007’ 38
. In India, the human resource development as a
function got evolved from 1975. After the evolvement, what are its practices, how is it
structured and implemented are the points which are discussed in this article.
The data were collected from 12 out of 50 organizations. These organizations differ
from each other with respect to number of employees, product type, regular
functioning, environmental / location wise.
Various areas like employees’ satisfaction, performance management systems,
feedback and counseling, Total Quality Management (TQM), training and
development were examined for analysis. As a result, it has been seen that the
implementation of HRD practices is still poor today because of
1. Lack of understanding and appreciation
2. Lack of competent HRD staff
3. Lack of professional preparation
4. Inadequate understanding of HRD conceptualization

47
The proper result oriented implementation in India may be possible only after
crossing the above mentioned barriers.
2.5 WHITE PAPER:
This white paper ‘Revitalizing Growth with Hidden Talent, Babson Executive
Education, 2007 by Susan Foley’ 39
is generated through a book “Entrepreneurs
Inside: Accelerating Business Growth with Corporate Entrepreneurs”, published in
2007. Author for the book & White Paper is same, Susan Foley.
There are two terms as follows:
1. Entrepreneurship
2. Intrapreneurship
Both these terms are very vital for the growth of any organization. We know,
entrepreneur is a person having lots of innovative ideas and he / she exploits the same;
where intrapreneurs are the individuals / set of people working within an organization
who are involved formally or informally in a process of investing new business
initiatives, products, services, business processes for driving the business growth.
It is a sole responsibility of CEO of any organization to become entrepreneur &
develop intrapreneurs within the organization and enhance the business growth of the
organization.
A CEO of any organization faces lots of hindrances / obstacles while performing this
major process. Few obstacles have been mentioned in this white paper which are:
a. A lack of commitment from senior executives
b. A lack of benchmarks or performance metrics
c. A dearth of entrepreneurial role models

48
d. Misdirected reward & evaluation systems
e. Resistance to change
To overcome the obstacles while performing as an entrepreneur, a CEO of any
organization should possess some competencies along with key behaviors. The
competencies of entrepreneur leader of an organization (CEO of the organization) are
ranked graphically from high to low by author. The competencies are as given below:
Ability to deal with unexpected challenges
Thrives in an environment of change
Takes initiative to follow through & honor commitments
High tolerance for stress
Displays willingness to take risks
Holds self & others accountable
Establish effective working relationships
Strong self-awareness
While performing the role of an entrepreneur, CEO may face number of challenges,
unwanted situations & replication of tough decisions. CEO should sustain & stand
firm.
A guideline with 3 important elements explaining into details is given in this white
paper for a mindset of CEO & organizations as given below:
a. Create the infrastructure
b. Practice & showcase what you preach
c. Measure your progress

49
Corporate/s should watch passively the hidden talent pool of corporate entrepreneurs
& implement a framework to identify, recruit & retain new breed of corporate
entrepreneurs by setting a new agenda for innovation & growth with understanding
competitive scenario of global economy.
2.6 SEMINARS AND CONFERENCES – RESEARCH PAPER, RESEARCH
ARTICLE, PROCEEDING:
2.6.1. Dr. S. V. Bhave, VP, HRD – Bharat Forge Ltd., Pune has written the article
‘People Development – The Bharat Forge Way in ‘Sampada’ – Journal by
MCCIA, September 2011’ 40
.
Here, Dr. Bhave has explained HR mission and the objectives for Bharat Forge
clearly. HR department has 3 innovative approaches for people development at Bharat
Forge, Ltd.
1. Apprentice shop
2. Talent pipeline programme
3. Collaboration with technical institutes – seven schemes to develop people at
different stages and levels.
It is also mentioned that there are accolades for Bharat Forge by 2 HR Excellence
awards offered by
1. NIPM – National Award for Best HR Practices in 2009 &
2. Golden Peacock HR Excellence Award in 2011
2.6.2. The article in research working paper ‘Employability and Skill Set of Newly
Graduated Engineers in India by Andreas Blom, Heroshi Saeki - The World
Bank, South Asia Region Education Team, April 2011, Policy, Research

50
Working Paper (WPS 5640)’ 41
, has given views about skill sets of new graduates.
The increased demand for engineers by various sectors of industries was considered
and higher education system in India responded for the same by increase in
engineering admissions by 800 % within 10 years from 1998 to 2008. During year
2005, NASSCOM along with Mckinsey reported that out of available engineering
graduates only 25 % are employable. Accreditation board of engineering and
technology ABET (Accreditation Board for Engineering and Technology) is working
in US where NBA (National Board of Accreditation) is important in India for the
same purpose quality of education in engineering. Both the ABET and NBA do have
a common membership of Washington Accord which recognizes engineering degree
across 12 member countries.
Keeping NBA learning outcomes in view, with the help of FICCI (Federation of
Indian Chambers of Commerce and Industry), to understand skill set required in
newly graduated engineer, world bank conducted a survey where they prepared
questionnaire and sent to industry representatives. These industry representatives are
from different sectors and from different regions allover India.
The survey was done during September 2009 to November 2009. It was found that
only 64 % of employers were somewhat satisfied with newly hired fresh engineering
graduates. All the required skill sets were identified & categorized into three factor
skills as:
1. Core employability skills
2. Professional skills
3. Communication skills

51
A similar survey was already conducted in US in 2004. So survey in India and survey
in US were compared for ranking of important skills in India and US by industry
professionals.
As per Bloom’s revised taxonomy high order thinking skills and low order thinking
skills were checked for outcome of this survey in India. It was found that the skill gap
is severe in high order thinking skills like creating, evaluating, analyzing. In India, the
importance is still given to low order thinking skills like remember understand and
apply. This is a traditional way of education on skills in India.
Dissatisfaction levels between Indian and US employers is also plotted in graphical
level.
Engineering students need to update their skill set for improving employability.
2.6.3. The paper ‘Perspectives on Skill Development in Maharashtra Matching
aspirations to opportunities, Delloite knowledge paper for SkillCon India, March
2013’ 42
has thrown light on skill gap and bridging the gap aspirations for various
industrial sectors in Maharashtra, like
1. Automotive sector and OEM
2. Textile sector
3. Telecom and telecommunication sector
4. Electronics and IT hardware industry
5. IT and ITeS industry
6. Agro processing sector

52
The skill gap for each and every type of industry sector is explained into detail in
tabular form. It is also mentioned about the requirement of faculty development
programme.
The paper also has explained little comparison for such study state wise within India
and few learning and take-away in comparison with other countries across the globe.
2.6.4. The survey report ‘The Interface Year Book 2014, Global Talent Track,
Power Ahead’ 43
was published in 2014.
This comprised of opinion and thought process of various leaders who represented
various industries and engineering education at graduate level. Few HR consulting
organizations, training provider organizations were also included.
Lots of research and survey reports were taken into consideration. This includes not
only India, but at Global levels too.
Current trends in employment, economy and demand, growth potential, growing
leadership gap, employee perceptions, talent scarcity, etc. were surveyed and plotted.
Experts’ opinion about bridging the industry academia gap, innovation in technical
education to meet emerging technical needs, technology in education, talent priorities
along with employment trends in manufacturing sector and trends of training for
improving employability were discussed at large.
2.7 SURVEY REPORTS – GENERAL AND SUBJECT SPECIFIC (LOCAL,
NATIONAL AND INTERNATIONAL):
2.7.1. A research Global manufacturing study ‘Managing the Talent Crisis in
Global Manufacturing – Strategies to Attract and Engage Generation Y by
Deloitte, ISBN 1-934025-02-X, 2007’ 44
related to the topic mentioned above was
published in year 2007.

53
The manufacturing industries always have global ambitions & the talent present in
industry never matches with these ambitions. This forces the industries to search for
new talent & manage the same.
The manufacturing industries are working at global level. Since, they have to market
their concept at global level; they have various challenges like coordinating globally
dispersed workforce with various skills & expectations.
The talent gap may hinder the progress of manufacturing industry. So industries
should be aware of lack of employability, improving the negative image of
manufacturing industry, changing pattern of engineering graduates, job related
continuing education, etc.
This report has focused on the topic “Challenges & Opportunity of Talent
Management” in emerging markets like China, South East Asia, India, Latin America,
Eastern Europe in connection with generation Y. Generation Y is defined as people
born between 1982 & 1993. As per the estimation, by year 2025, 40 % to 60 % of
workers across the world’s most populous nations including developed & emerging
markets is going to come from generation Y and more younger generations. The
greater challenge is to convince generation Y to accept and to have a career in
manufacturing jobs.
As per the survey report, change in working population (ages 20 to 64) from year
2005 to year 2025, it is proved that global manufacturing domain in all types of
industries will have a scarcity of attracting & retaining the talent.
The challenge & opportunities of talent management in emerging markets related to
the above mentioned is studied carefully & the same is connected to needs of
generation Y. New strategies & shortcomings of current approaches are taken into

54
consideration in connection with generation Y & a Develop – Deploy – Connect
model for manufacturing industry is proposed through Deloitte research study.
The Development – Deploy – Connect model is to be considered for generation of
capability, commitment & alignment, the basic requirement of performance
improvement. Effective implementation of this model can take care of the retention.
To address the social issue for global manufacturing sector, Deloitte took very good
steps & the results for the same can be seen from next survey report in near future.
2.7.2. The survey about talent ‘Spotting Talent, Catalyst Organization
Development Consultancy, 2009’ 45
, was done in 2009. The biggest challenge in
front of all organizations is nothing but finding, nurturing and keeping right people
with right skills. Some people do have “Something Extra: which results in overall
success of the organization. Unfortunately, such people are in “Short Supply”.
Now, the global talent crisis poses lot of questions related with spotting talent,
searching for hidden talent, searching for something extra, etc.
From various studies, surveys, it is found that talent is nothing but combination of
ability, attribute, behavior, track record, engagement, aspiration.
The key differentiations of successful people are purpose, self mastery, mindset,
action, change, and continuous learning.
To assess the individual against the points mentioned above (6+6), all managers need
training.
There are total 3 practical tried and tested tools to identify talent and known as talent
tools. These are as follows:
55
1. Career management matrix – Potential identification and comparison of talent
against standards of each level. (Leadership level and technical level – 1 to 5).
2. Performance and potential matrix
3. Talent forum – For tool 1 & 2, this tool is very much used. The forum
encourages constructive discussions and debate between peers at similar level
and hence, assessment of individual along with planning for their career
development.
By this way, the uncovering of hidden talent, which might have overlooked within the
layers and structures and unexposed to decision makers can be achieved.
2.7.3. This advisory report ‘People and Change: Hidden Talents – Optimizing
Investments in Talent Management by KPMG, RRD-161020, Advisory Report,
September 2009’ 46
was based on survey of HR & talent directors in May 2009. The
approach of KPMG towards talent management is based on three important points:
1. Understanding & optimizing efforts & money spent on talent by understanding
the best ROI (return on investment)
2. Identify & target critical roles in an organization where efforts & money spent
will be realized.
3. To translate the meaning & objective to these critical roles in an organization
into high value career paths for individuals to ensure the strategic goals of the
organization.
As per the survey done in May 2009 & the data analyzed about the objectives of
KPMG.co.uk, this is applicable to all types of industries, employees in UK.

56
2.7.4. The India talent survey 2012 ‘India Talent Survey Report 2012 –
Perspectives on Young Talent in India by Jeffschwartz, Pooja Bajpai - Deloitt,
AIMA, July 2012’ 47
was conducted to understand / examine “Employee
expectations” with respect to industry, geographic, generations and gender also. Four
major questions and categories were involved:
1. Employee attitudes and employer’s capitalization for changing mindset of
employees.
2. Employee perspectives across generation and gender on key talent issues.
3. Employees’ perception about HR and talent programmes along with HR
capabilities in global scenario.
4. Perception of your employees about organization and what difference it makes
to make your organization world class in global scenario.
Key Findings:
1. Among the total employees surveyed in India, 57 % expect to remain with
their current employers in the coming year.
2. The top retention strategies of the Indian work forces are “Promotion / job
advancement” (57 %), “Additional compensation” (53 %), and the
“Opportunity to work abroad” (46 %).
3. A cash incentive may not be the primary motivation for employees staying or
going, but our survey suggests it remains one of the fundamental retention
techniques for HR leaders.
4. Lack of compensation and lack of career options are the top reasons that
influence generation X and millennial employees to make a switch – this dual

57
focus on meaningful careers and compensation summarizes the top concerns
of India’s Tiger Cubs.
5. Interestingly, “Flexible work arrangements” is identified as a need consistently
across generations and gender as an important retention strategy and an
incentive to delay retirement.
6. Millennial “Tiger Cubs” distinguish themselves from other generations by
identifying a “Fun working environment” as a key consideration for the
overall employee experience and brand.
Some other findings:
1. Aging individual’s requirements are: easier workload, additional
compensation, ability to integrate family, community and work commitments
and opportunity to change fields.
2. There is a significant opportunity for HR and talent programmes to improve
their effectiveness, since the companies are at least meeting expectations of
their employees.
Conclusion:
Lots of details are shared by this report to understand employees expectations /
perceptions and views with different attributes, which are really a point of concern for
every HR professional across the industries.
2.7.5. A Canada based agency CEDEC (Community Economic Development and
Employability Corporation) did a survey ‘Employment Practices and
Employability of the Hidden Talent Pool: The Mature Workers, Survey Report
by Charles Shahar in October 2012’ 48
in Qubec region and the target / objective
was to study employability and employment practices of people above age 45 years.

58
They were termed in this report as “Matured Workers”. Interestingly, a contradictory
situation was observed through this report. This study was published in October 2012.
As per sensex projections in Canada, half of the population of Qubec is going to be
above the age of 45 by year 2036.
Through this survey a detailed study of employers, employees and employment
practices related with matured workers was done.
On one side, it was accepted by everybody that matured workers possess qualification
/ required skill set / experience. So, they should get employment very easily. On the
contrary, it was found that a big lot of matured workers is not employed. They found
it difficult to get employment due to various reasons:
1. Expectations of matured workers are different than employees’ expectations.
2. Computer literacy in matured worker is less.
3. Salary and job security expectations amongst mature workers are very high.
4. Learning new things and working for long hours is having a resistance from
matured workers.
CEDEC recommended few solutions to overcome this problem as follows:
1. Awareness campaigns at different levels and in different ways to meet the
objectives
2. Different training and development programmes
3. Different policies by addressing need of matured workers and encouraging
employers to hire mature workers
To address the forthcoming / future social problem of unemployment of matured
workers (above age 45 years) in Qubec (Canada) Government agencies, NGO,

59
employers, educational institutes, working professionals and matured workers are
motivated by various programmes, campaigns, policies.
In near future, the problem will be well addressed by results shown.
2.7.6. The title itself suggests that only a “Paradigm Shift” – a major shift in thinking
and assumption can help to tackle the global talent shortfall. This consulting company
did a survey ‘Paradigm Shift – Building a New Talent Management Model to
Boost Growth by Beth Brooke, Dina A. Pyron, Peter Matthews, Bill Leisy, Ernst
and Young, 2012’ 49
and presented a report where they have mentioned the key
challenges in front of companies as an outcome.
1. Corporate workforces are becoming more global, but talent management is not
keeping pace.
2. Companies struggle to invest strategically in talent management.
3. Measuring the effectiveness of talent management remains a challenge.
4. The skills and competencies required by future business leaders are changing.
5. Companies lack robust succession plans to identify the next generation of
leaders.
Here, the company mentioned a typical problem of talent management sector wise as
follows:
1. Oil and gas – search of the right skills
2. Automotive – search of balance
3. Consumer product – search of agility
4. Asset management – search of global reach
60
5. Mining and metals – search of new solutions
Key strategies for maximizing ROI:
1. Think long term
2. Measure the right outcomes
3. Adopt a disciplined approach
With the help of these three strategies, organizations can find solution for their current
problem.
2.7.7. Aspiring Minds is one of the world's leading assessment companies that helps
organizations, governments and institutions measure and identify talent, who
identifies the need of the companies about human resource requirements and
contacting academia to search for the workforce. It works for the human resource
graduate and above. The agency did survey ‘National Employability Report
‘Graduates’, Annual Report 2013 by Aspiring Minds’ 50
to find the employability
and based on the reports they have developed a special assessment module as
AMCAT (Aspiring Minds Computer Adaptive Test) under which there are various
tests designed to select the graduates.
Aspiring Minds undertook survey in India for consecutive three years as follows:
1. National Employability Report – Engineering Graduates 2011
2. National Employability Report – MBA Graduates 2012
3. National Employability Report – Graduates 2013
In the report of 2013, Aspiring Minds also learn through past experience and demand
– supply situation and focused the survey as follows:
1. Focus on graduates in India

61
2. Focus all over India: North, South, East, West
3. Focus on students studying in tier II and tier III cities: Urban and Rural India
4. Focus on employability of males and females
5. Focus on outcome of education system – needs to recheck
6. In allover India, 47 % of graduates are not employable in any sector of the
knowledge economy
2.7.8. A London based agency in UK, Local Government Association, published a
survey report titled ‘Hidden Talents II: Re-engaging Young People, the Local
Offer, Local Government Association, L 12-783, in January 2013 by David
Simmonds, Peter Box CBE’ 51
in January 2013.
The main aim of this survey was to understand the reasons behind too high
unemployment of youth in Britain for long term. To understand this problem deeply
and find out solutions for the same was main intention behind this survey.
From year 2008, the long term youth disengagement was found out. The numbers are
alarmingly high. So, this agency appealed to empower local authorities of
Government of UK to have a National programme / services to solve the problem by
targeting young people between the age group of 16 and 24. By this way, the social
problem of unemployment of youth in UK can be addressed successfully.
There are problems under long term youth disengagements like:
1. Long term youth unemployment by duration from 2008 – 2012
2. Young people claiming job-seeker allowance from 2007 – 2012 (it is
increasing from 2008)
3. Proportion of 16 to 18 years old, who are not in education, employment or
training (by year 2011)

62
Different local models (with local government agencies along with partners) emerged
out of these efforts. The details are named as:
1. Wakefield – early identification and targeted joint working
2. Derbyshire – reducing unknowns
3. Salford – early identification and effective data sharing
4. Nottingham City Council – supporting schools to reengage young people
5. Worcestershire – combining programmes with local services
6. Wolverhampton – multi – agency working around school
7. Hertfordshire – holistic approach for hardest to reach
8. Brighton and Hove – focus on employability
9. East riding – combining national and local provision
10. Lewisham – integrating local services around most disengaged
11. Gateshead – innovative council and provider partnership
12. York – supporting people with SEND towards employment
13. Hartlepool – bespoke employability programmes
14. Staffordshire – targeted preparation for employment
15. Basildon – trade school partnership and young engineers club
Different local agencies with partners came up for different reasons to solve the main
problem. This is as follows:
1. Transition from work to education – 3 different models / deals
2. Education for 16 to 24 years old – 6 proposals

63
3. Apprentiships – 5 proposals
4. Careers information, advice and guidance – 3 programmes
5. Support in the labor market – 3 proposals
6. Job centre plus – 5 funding programmes
7. Work programmes – 3 programmes
8. Wage subsidies – 3 initiatives
United Kingdom’s local government agencies along with their different partners did
work hard to design and implement to solve the problem. Various positive, potential
outcomes for young people of UK with National prosperity are expected by year
2015.
2.7.9. A study report ‘Building the Right High Potential Pool – How
Organizations Define, Assess, and Calibrate Their Critical Talent by Lorraine
Stomski, Jill Attkisson - Aon Hewitt, January 2013’ 52
was published by Aon
Hewitt, in January 2013.
In year 2001, Hewitt Associates started world’s most comprehensive longitudinal
study for leadership and leadership practices. More than 2000 organizations have
participated in this study from last 10 years, year after year. Now, the name of the
organization is changed to Hewitt Associates.
Through recent study in year 2013, it is stated that “Shortage of skill talent” is a
global and a real problem / threat in front of organizations. The statistics highlights
are as follows:
1. Shortage of skill talent was 30 % in year 2009, now it has reached to 34 %
currently.

64
2. The crisis is currently affecting all employers demographically as follows:
Japan – 81 %, Brazil – 71 %, Australia – 50 %, USA – 49 %, India – 48 %
Here, to solve the shortage of skill talent problem, lots of words are used for
discussions – e.g., critical talent, top talent, high potential, A, B and C players, high
performers, average players, etc.
The definition of high potential and the definition of high performers is different,
since high potential performers are always high performers; but the reverse is not true.
The high potential is classified into 3 major categories based on core competencies as:
1. Fundamental dimensions – cognitive and personality
2. Growth dimension – learning and motivation
3. Career dimension – leadership, performance, knowledge, cultural fit
There are various definitions stated by global top organizations about “High
potential” and labeled as follows:
High potentials, great performer with significant upside, great performer, promotable
AON Hewitt has defined “Potential” of an individual and it is categorized in 4 parts:
Individual’s performance, character, capability, motivation
It is furthermore categorized as per the demonstration by individual:
High potential, medium potential, at potential
High potential individuals should be placed in the spectrum by checking the
secondary component as “Readiness”. The influential factors for readiness are career
stage, location and diversity.
Ready now – less than 1 year, Ready soon – 1 to 3 years, ready future - >3 years

65
Assessing high talent pool is must and the competitive organizations already started
working on it to uncover “Hidden talent”. AON Hewitt did suggest a guideline based
on research and years of expertise during observation for best practices. There are 5
central components:
Legal and professional guideline, multiple methods, flexible, cost effective, promotes
ongoing development.
Here, the various examples regarding global organizations mentioned about “How top
companies calibrate top talent”. The names of organizations are as follows:
Pepsico, Aditya Birla Group, IBM, Target Corporation, NZ Refining, Whirlpool
Corporation, American Express, L’Oreal, North America Top Companies
A 5 step process is clearly explained here from identification of talent to sustain and
grow further:
1. Identify high potential talent in an objective, future – focused manner.
2. Calibrate this talent on a regular basis, using multiple inputs.
3. Create action plans and career maps for these top performers.
4. Recalibrate talent and move individuals on / off the high potential list
accordingly. and
5. Hold leadership meaningfully accountable for each of these steps.
2.7.10. In scenario of 2013 globally, the survey ‘The Great Talent Shortage
Awakening: Actions to Take for A Sustainable Workforce by Manpower Group,
2013’ 53
found out that the “Only Certainty” is “Uncertainty with lots of attributes”. It
is proved and found “35 %” of employees on an average report having difficulty
filling jobs due to lack of available talent.

66
There is a growing concern about the talents shortage’s impact on business. Here, the
global rate is compared with Japan and Brazil.
The top 3 reasons shared by employers:
Technical competencies (hard skills), lack of available applicants, lack of experience
Comparative talent shortage percentage of India and China:
As per the survey 2013, global 10 important jobs (employers having difficulty for
acquisition / filling)
Skilled trade workers, engineers, sales representatives, technicians, accounting and
finance staff, management / executives, IT staff, drivers, secretaries, PAs,
administrative assistants and office support staff, laborers.
Globally, 13 % of employers are redoubling their efforts to recruit from untapped
talent pools.
0
20
40
60
80
100
India China
2009
2013
Countries
Per
cen
tage
Graph 2.1 Comparative talent shortage percentages of India and China

67
Only 4 % are actively looking to recruit from young workers and only 2 % are from
adding women from workforce.
Here, the solution for the problem is suggested in different innovative ways, where
focus is on HR and the framework for talent development, new source of talent, agile
strategy from the outside and various strategies including collaboration with
educational institutions.
2.7.11. ‘The India Skills Report by People Strong, Wheebox, CII’ 54
was published
by People Strong in 2014.
People Strong is multi-process HR outsourcing and Technology Company. Wheebox
is online talent assessment company. CII, founded 113 years back, is India’s premier
business association with direct membership of 7,500 organizations, which includes
private, public sector, SME and MNCs and indirect membership of 83,000 companies
from various associations.
All these 3 brands came together to survey, study and understood following important
aspects of Indian job market:
1. Impact of rising demographics of employment
2. The great Indian talent conundrum
3. Requirement of different skill set in 2022
4. Shaping students for a sound corporate future – supply chain talent
5. Tapping the talent landscape: with the help of online assessment by Wheebox
– WEST (Wheebox employability skill test)
Some findings were also recorded through this study which are:
1. Various trends related to corporate job survey

68
2. Views of employers
3. Views from academicians
4. Views from jobseekers: freshers (students)
5. Bridging the demand supply gap: various ways
The researcher observed few points from this survey cum study report. These are as
given below:
1. One Lac students from 27 States and 7 Union Territories went through the
process
2. 100 + corporate organizations were involved in this process
3. Southern and Northern India was involved at highest level
4. Western India like Gujrat, Goa, Maharashtra, Madhya – Pradesh participated
after Northern and Southern India
5. Employability rate of students from Southern and Norther India is better than
Western India
6. It is very contradictory picture that corporate / companies want to get
themselves established in Maharashtra more as compared to other parts of
India; but on supply side Maharashtra is weak, which is evident from this
report.
7. The branches of education and difficult job roles are also explained
graphically in various forms to give exact picture of demand and supply chain
(education and industry)
2.7.12. In the report, ‘Totaling the Hidden Talent – Youth unemployment and
underemployment in England and Wales by Laura Gardiner, March 2014, A

69
Report Commissioned from the Centre for Economic and Social Inclusion by the
Local Government Association’ 55
, done in 2013, the Local Government Association
(LGA) has defined Hidden Talent in 5 categories and it is related to unemployment
and underemployment, which is a social problem in London and Wales.
As per the report, it is predicted that a third of all young people would be out of work
by 2018, if there would not be control by local areas over skills and training. LGA has
analyzed that of the 2.5 Million young people struggling to find enough work, around
five –sixth people will be kept unemployed or underemployed.
The report also says that the true scale of youth employment is being hidden. The
overall picture of the hidden talent in areas around London and Wales is predicted.
2.8 COMPANY SPECIFIC AND SUBJECT / AREA WISE SPECIAL SURVEY
AND STUDY REPORTS:
2.8.1. Boston Consulting Group published a study report ‘Hidden Talent:
Opportunities for action - Boston Consulting Group, article, July 2007 by
Anders Fahlander, Angela Schwartz’ 56
, in July 2007.
Due to current Technological, Industrial & Global changes, all industries are going
into a constant transition period. All corporate are facing this situation seriously. The
transition for corporations is happening through events as mergers, downsizing,
leadership changes, and retirement within the organization. This results into the key
knowledge leaving the organizations.
Corporate should take various steps to identify key knowledge holders, other valuable
employees within the organization. This important task is termed as identifying the
hidden talent within the organization.

70
To identify hidden talent, there are several ways / programmes & it may differ from
organization to organization.
Companies / organizations / corporate should device programmes to link the
knowledge aspect of organization with current human resource strategy. This is the
next step after identification of hidden talent.
A term is coined here as key knowledge holder. Here, key knowledge holders may be
group or team or individuals & they are labeled as
Problem solvers, mentors, bridges
A sample survey is explained of one US based industrial goods company. About 10 %
of key – knowledge holders are termed as critical knowledge holders & they should
be retained & necessary care should be taken.
The authors for this report are based in BCG office of San-Francisco & Atlanta. So,
this report may be majorly related with employees & employers in US. The report
was published in year 2007.
In conclusion, authors say that, baby boomers will retire. Concentrate on career
choices, key knowledge holders, other valuable employees & the knowledge
generated, learned, built by retired people, generation X & Y, working within the
organization.
2.8.2. Accenture published an article ‘Solving the skills crisis, Outlook – The
Journal of High-Performance Business (Accenture), Number 3, Article’ 57
, in
2011.
All four authors represent Accenture, which is consulting, service, delivery
organization in service sector, which was ranked at no. 50 globally in year 2010.

71
To start with the explanation of the problem a case study of USA based medical
device maker industry is explained. The problem is “Inadequate knowledge and skills
of employees and organization as a whole, about the product they were
manufacturing”.
The main important thing was highlighted as current industry do not use the term
“Unskilled labor, which is disappeared from vocabulary”.
Accenture did a research and conversation with executives from various industries for
addressing the current problem and finding out solutions.
The conclusion is as follows:
There are total six strategies suggested which should be taken into consideration for
all types of organizations to address the problem of skill gap and remain in
competition. These are as follows:
1. Think competencies and fit, not just skills
2. Use new recruiting and hiring techniques to attract the skills you need
3. Borrow talent in creative ways
4. Mine your own organization for hidden talent
5. Tap into learning innovations to more quickly develop the skills of your own
people
6. Redesign skills by redesigning the work
2.8.3. The study ‘Modern HR in the Cloud – Building Critical Talent Pipelines –
Creating a Plan for Staffing Critical Job Roles by Oracle Corporation’ 58
was
presented by oracle in 2013. While doing this study, the company has used various

72
research / survey / reports published from year 2008 to 2012. This is in reference with
companies from US and UK. The highlights of this study are as follows:
1. The impact of roles performed by that talent is not same for an organization.
2. Every role is assigned with either must be performed or perform well.
3. Building critical talent within the organization.
The study suggested 12 steps methodology for building critical talent pipeline as:
Determine current and future needs, assess the talent inventory, determine the Mix for
filling gaps, define the pool of internal candidates, assess and develop the pool.
Track development progress, track promotion and turnover rates, define the pool of
existing external candidates, define and execute campaigns to engage candidates,
assess and refine current sourcing strategies, implement and monitor sourcing
strategies, track the overall size and quality of internal and external pools
To implement the methodology, organization should use specific data, analytics and
robust technology platforms to address the issue.
Here, the data presented by oracle in tabular form with following three titles:
Strategic changes to HR in an economic crisis, Access to the data only for US
(whether yes or no ?), Attraction and retention difficulties – variance: North and
South America V/s Brazil, Canada and global Asia, Europe
2.8.4. 4th
CII Global Summit on Skills Development, 29-30 November 2010,
Trident, Nariman Point, Mumbai, Confederation of Indian Industry since 1895
(CII) 59.

73
As per vision by then Prime Minister of India in 2010, the task of creating 500
Million certified and skilled technically trained manpower by year 2022 was in focus
for this Global Summit by Confederation of Indian Industry (CII) .
The problem of education / training and un-employability was discussed in detail.
This forth Summit, progression of earlier 3 Summits, was the platform for “Words to
Action”, where Global Partnership for Skill Development for the cause was discussed
for 2 days.
In a discussion paper, “Skill Gap in the Indian Economy – A Basic Overview”, author
Dr. M. Rajesh, Regional Director, IGNOU Regional Centre, Mumbai, had explained
in detail.
He did notice 2 major areas of skill deficit in Indian Economy:
1. Engineering skills
2. Soft skills
He had suggested following points for bridging the skill deficit:
1. Public – Private Partnership
2. Government efforts – 3 ways
3. Industry – Academia joint efforts – 4 examples
Author was firm about his study and solutions suggested to meet the vision by Hon.
Prime Minster by 2022. He added that the goal could be met by 2020 only.
2.9 M. PHIL AND PH. D. THESIS OF INDIAN AS WELL AS FOREIGN
UNIVERSITIES:

74
A Study of Hidden Talent Management in same Status Employees with Special
Reference to Industries in Pimpri-Chinchwad (2000 to 2010) 60
, Thesis submitted
in 2013 by Rajesh Agarwal
Researcher is very much clear about “Hidden Talent Concept” for employees and
their relation for individual’s perspective and support to organization. He has
personally interviewed workers or assistant level employees in various organizations.
His area for survey was manufacturing industries in Pimpri Chinchwad region only.
The span for analysis he considered was of 10 years. He was successful for fulfilling
his objectives for his study purpose.
He has suggested to carry out further research on people of all cadres above worker or
assistant grade like supervisors, engineers, managers, etc.
2.10 INTERNET ARTICLES AND WEBSITES:
2.10.1. The article ‘The Talent Within: Finding Your Hidden Gems’ 61
on internet
is nothing but the experience of author Kevin Wheeler. He is very much concerned
about finding the hidden talent within organization. He has suggested three steps as
follows:
Simply ask, provide internal development, and force them to appear
As per Kevin Wheeler, it does have challenge, risk and benefits involved.
2.10.2. This concept is explained in an internet based article ‘Unleash the Hidden
Talents of Your Employees, 2009’ 62
by Ethan Chazin with a fictitious customer
service representative Jessica Rivera. The focus of this entire discussion is on Human
Capitol Development audit.
Author suggested few points which give increase in personal skills and organization
performance as a whole.
75
2.10.3. The article ‘Winning the Talent War in Local Markets by Staying Global,
Matthew Pettigrew, 2012’ 63
was drawn from conversation and interviews with
leaders of global firms and research done by company.
Many global companies are struggling to understand the challenges. To understand
the challenge and respond companies should act at both local and global level. This
activity should be implemented in such a way that whatever talent strategy you are
defining, it gives importance to the people and the skills, capacity needed at every
level and each location. It also says that always give importance to want and values of
your employees. Here, the example of TATA is given.
Examples of lot of Indian leaders for global organizations are already mentioned. Few
companies are as follows:
TATA, Master Card World Wide, Pepsico, Unilever, Johnson and Johnson, etc.
Building relations between employer brand and employees family is also an important
point for companies. Developing internal talent is must when you cannot attract the
talent from outside.
“Finding more leaders in local markets and improving ability and interest of X-
patriots from all over the world to work locally”; this task is quite challenging for all
the global companies.
2.10.4. An article ‘Find the Hidden Talent in your Organization, by Patrick Gray’
64, was published in April 2013.
The author understood this through a case study of his own experience. On this basis,
he said that hidden talent exists in all levels of most organizations.
2.10.5. In the article ‘Discovering Hidden Talent within Your Organization by
Paul Hebert’ 65
, the author has talked on a model of a labour market. The

76
combination and proposal for high talent, best pay package, commitment, incentives,
market for mediocre workers and inefficiently low output levels, while
simultaneously raising the wages for high talents has been given in the article.
2.11 OBSERVATIONS AND SUMMARY:
In view of the above literature review made, following important observations can be
noted:
1. Once upon a time, HR’s role was considered as administrative only. Now,
because of changing workforce demographics, HR needs to equip oneself to
solve the problems at all fronts, because people run the business.
2. The process of behavioural interviewing through behavioural profiling
strengthens the people management policy by keeping the organization as top
performer.
3. Employees in India across various age groups do perceive the things.
Employers need to understand the mindsets of employees in India, the region,
honing the understanding across generations and genders on key talent issues.
It helps employees for attracting and retaining key talent.
4. Not only engineering students but all graduate level students also need to
update their skill set for improving employability.
5. Skill mismatch is to be addressed not only up-skilling but right skilling.
6. There are various impact factors for individual’s talent. And ultimately
employee’s impact on organizational performance is to be targeted.

77
7. Individual employee does have hidden talent. Companies may or may not
address the same due to their demands. Searching of hidden talent within
organization may help employees.
8. Skill crisis and reasons, hidden talent, need of talented employees and its
fulfilment at age levels, recruitment, joining, HR policies through Human
Resource Development, attrition, retention, etc. need to be studied in detail
and the impact on organizational performance is to be understood.
2.12 NEED AND SIGNIFICANCE OF STUDY:
Hence, need to study the specific problem of hidden talent search and its effect on
skill crisis and organization performance in select industries in and around Pune
region felt necessary by the researcher.
Based on literature review, as well as interaction with Industry experts, few points
emerged as vital guiding facts which included that, only a survey which was already
undertaken by one PhD scholar who focused on hidden talent search at workers only
in Industries in PCMC (Pimpari Chinchwad Muncipal Corporation).
2.13 CONCLUSION
Hence, for this research, it was thought necessary to cover the talent search at junior
management to top level management in the organizations where the problem of
attrition is very grave. Thus the focus of this survey was purposefully selected
covering target respondents of industries in large and medium scale in Pune region.

78
Chapter 3
Research Methodology
3.1 INTRODUCTION:
When the researcher decided to conduct the research in certain area, i.e., manufacturing
industry and service industry, in and around Pune region, he found that there is always
requirement of all categories of employees like fresh graduates, experienced employees,
various positions in management e.g., junior level, medium level, senior level, etc. . But it
is not fulfilled at desired level from either side. Researcher has been working as Training
and Placement Officer since a decade, who is responsible for recruitment in industry at
entry level for engineering graduates and post graduates.
While working on the portfolio, he also understood that it is never restricted to
engineering, but entry level in manufacturing and service industries as a whole. This has
given a wider spectrum to the researcher to think about industry and recruitment. Hence,
the title was formulated as:
“A study of Hidden Talent Search as a solution to ‘Skills Crisis’ and its impact on
‘Organizational Performance’ with special reference to select Large and Medium size
Manufacturing and Service Industrial Units in Pune Region during the period 2010 –
2014.”
Research cannot be completed without a standard process and system. To conduct
research activity, one has to work on secondary data. The secondary data, which is easily
available in the form of research papers, results, articles, survey reports, etc.; which is the

79
evidence of activities took place in past. The secondary data gave the appropriate
direction for the actual work for research.
After studying the secondary data, the basic scope for primary data collection was
finalized. Then it was decided to collect primary data from the targeted respondents
through various means such as interviews – face to face or telephonic, questionnaire
response through email, etc. The steps to be followed after collection of primary data
were decided. Also the time frame for the collection of primary data was finalized.
3.2 RESEARCH IN BUSINESS AND RESEARCH PROCESS:
Industries allow conducting research formally or informally for their growth. They
always study the parameters; apply the results for their growth for day to day activities.
They never wait for the research to happen, since it is ongoing, continuous activity for
their existence. They never wait for things to happen; they propagate research for their
own interests.
Secondary data of this research is the outcome of their research.
Organizations always state problem statement for their business and they expect correct
solution in optimum time with optimum calculations as per the business.
This is evident and it helps industry to solve mutual goals and objectives, in a wider
spectrum, which in turn helps both and suggest some kind of solution at large.
3.2.1 Business crisis faced by organizations:
Each and every company / organization who runs business faces ‘Business Crisis’ during
various stages / phases of progression of business at intervals of time. These crises cannot
be termed as a typical problem occurring regularly. It is a complex situation with variety
80
of problems, which needs a proper and detailed analysis of the situation. It gives various
root causes and multiple solutions at various stages. Some of them can be categorized as
starting phase of the business, fund / money availability, leadership problem, internal
training and development, delegation of authority and succession problem, etc.
3.2.2 Formal process of searching hidden talent:
In many of the organizations, to have the sustainable growth of the organization, talented,
skilled, efficient employees are always seen as their assets. To fulfill this, organizations
do make efforts to recruit and retain them through talent management process. The
available pool of talent is known to HR Professional. The HR Professional of every
organization needs to scan and understand the “Pulse of the human talent within the
organization”. During this, the entire process of understanding the details of existing
talent within the organization, HR professional is supposed to do X-Ray scanning of the
human talent available. This detailed X-Ray scanning of the human talent and recording
of the same in details is known as “Searching of the hidden talent”.
This always helps to every HR professional of any organization to sort out multiple
problems faced by him / her.
It is nothing but mining / searching the available talent within the organization and
searching the talent which was unidentified during process of recruitment and selection at
previous stages of talent management activities.
3.3 PROBLEM DEFINITION:
As a practising training and placement officer of a premier technical institute affiliated to
Savitribai Phule Pune University, researcher came across few conclusions which forced

81
him to intervene the deep inside process of HRM and HRD. Few points can be mentioned
as follows:
1. There is always a requirement for fresh engineers as well as management
graduates / post graduates in all types of organizations in total.
2. This requirement is instigated by attrition rate.
3. The above fact results into widening gap as well as perception in organizations
leading to certain loop holes in the system of appropriate assessment of the need
of proper employees at different levels, their job engagement, process of training,
grooming and development, appraisal and feedback, etc.
These observations gave the identification of some problematic areas like business crisis,
skill gap, retention / attrition, etc. It was the basic requirement for the researcher to know
the causes for these situations and correlate them with his profession.
So the problem definition was formulated and a thought process was pipelined to decide
how to study these problems.
The problem statement was defined as:
“To study & correlate the search for Hidden Talent and its effective utilization for the
betterment of organizations in Pune Region with special reference to selected Large and
Medium size Manufacturing and Service Industries.”
3.4 OBJECTIVES:
1. To analyse the reasons for “Skills Crisis” which lead to business crisis and thereby
affects “organizational performance”

82
2. To search for hidden talent, its acquisition and their up-liftment through effective
utilization
3. To evaluate the efforts for hidden talent search on parameters for quality assessment
4. To suggest a model describing hidden talent search process and its effectiveness
(impact) for sustainable organizational growth
[ For any business / organization, growth is must along with profit margin. The growth
should be continual or continuous but it should be consistent over a longer period of time.
Such type of continued growth of business and organization is termed as “Sustainable
business growth”.]
Quality assessment parameters for hidden talent search:
1. Proactiveness
2. Helping others
3. Team leader
4. Team spirit
5. Leadership
6. Decision making skill
7. Time management follower
8. Communication skills
9. Technical expertise
10. Ability to learn – adaptiveness
11. Innovation

83
3.5 HYPOTHESES:
1. There is an awareness about the concept of “Hidden Talent” in large and medium size
organizations.
2. There is no formal process to identify “Hidden Talent” for organizational benefit and
solving the skill related business crisis
3. Hidden talent contributes towards sustainable organizational growth
3.6 DATA COLLECTION METHOD:
a. Primary data:
Based on the secondary data available, it was decided to seek and obtain opinions of
business leaders and managers, HR representatives from industries as per the scope of
research study decided. It was also decided to use steps as follows:
1. To conduct pilot survey for testing of questionnaire – actual face to face
interaction related to primary data for select industries
2. Based on the response for pilot survey, certain modifications were made in the
questionnaire.
3. To fulfill the objectives, sample size was selected.
4. Actual survey was made.
b. Secondary data:
Secondary data was available as a source of research material in various forms. Out of
which certain material was either directly connected / useful/ important with the present

84
research topic or also the other material though was not directly connected but was
relevant for confirming the objectives, hypothesis of the present research.
The said Material was categorized as follows:
1. Books
2. Research journals
3. Research magazines
4. White papers
5. Proceedings from seminars & conferences
6. Various survey reports : local / national / international
7. Company specific special survey & study reports : subject & area
8. M.Phil and Ph.D. thesis : Indian & Foreign Universities
9. Internet articles and websites
3.7 PILOT SURVEY:
As per pilot survey, HR representatives from total 15 different organizations in Pune
region were interviewed for “Understanding the search & relation of hidden talent within
organization”.
The details of organizations are as follows:
According to size of organization: (Total 15)
Large – 09, Medium – 06
According to type of organization: (Total 15)
Manufacturing – 04, Software Products & Development – 03, Electrical and Electronics
Products Development – 02, Software & IT Services – 02, Service – 04

85
Table 3.1 : Respondents of Pilot Survey
The researcher has conducted the pilot survey which was based on one to one
discussions with key personnel in HR department on the chosen area.
A questionnaire related to following points was prepared (as mentioned in Annexure II):
(i) No. of employees
(ii) Level of management
(iii) Type of activities / jobs
(iv) Age groups
(v) Qualifications
(vi) Training and development
Sr.
No. Name of the organization Place
Size of the
organization
1 Persistent Systems Ltd. Senapati Bapat Road L
2 John Deere Magarpatta City L
3 TCS Sahyadri Tech Park,
Hinjewadi, Phase II L
4 SMS India Pvt. Ltd. Near Mhatre Bridge,
Erandwana L
5 Watchem Infratech Pvt. Ltd. DSK Vishwa, Dhayari M
6 eQ Technologic (I) Pvt. Ltd. Bhandarkar Road M
7 Net Scout Systems (I) Ltd. Wakdewadi M
8 Oracle Financial Software Services Ltd. Ambrosia, Paud Road L
9 Maharashtra State Power Generation
Company Ltd. (MAHAGENCO)
Panshet Dam
L
10 Media Ocean Asia Pvt. Ltd. Wakad M
11 Tech Mahindra Hinjewadi, Phase II L
12 I Gate Corporation Bhosari MIDC L
13 Frank Faber (I) Ltd. Sanaswadi M
14 Siddhivinayak Hospital and Research Centre Nasarapur M
15 Tikona Digital Networks Pvt. Ltd. Viman Nagar L

86
(vii) Skill crisis during last 5 years
(viii) Trends in organizational performance and growth
(ix) Hidden talent search within organization
(x) Effective utilization of hidden talent and their impact on overall growth of
organization.
The reactions of HR representatives from all these fifteen global organizations were
mixed, due to type of policy for each organisation, level (designation) of a person
responding, etc.
3.7.1 Observations based on pilot survey:
1. Talent Management acquisition and retention was found in majority of the Large Scale
Organizations, however in case of Medium Scale Organizations there was less awareness
about the same.
2. Making orientation of “Hidden Talent Search” by the management of Medium
Industries is extremely necessary and important especially in the present era of
globalization and also a high rate of attrition which was found in medium scale
organizations especially at junior & middle level management.
3. Luring fresh talent for various jobs in medium scale industries through campus
interviews at various engineering, management and other colleges is already a common
practice. However a specific plan with a strategy to focus the junior level talent for their
acquisition and retention is very important.

87
4. Based on the survey undertaken it can be observed and suggested that with certain long
term plans these industries can bring the attrition rate down and there by not only retain
the talented employees but also can contribute in the performance of an organization.
3.7.2 Conclusion based on pilot survey:
To remain in global competition majority of Large Scale organizations need to take into
consideration “Talent management process by considering hidden talent within
organization”. This process is not done for freshers within the organization, but used for
the employees who are 1+ year experienced within organizations. But the same is
explained to freshers during their orientation sessions.
Paying high packages along with other lucrative things are still the main talent
management Processes by Medium Scale organizations. Now Medium Scale
Organizations have also started thinking like Large Scale Organization for Searching for
hidden talent.
In certain organizations, top management is having sensible approach towards “Hidden
Talent” and they are optimistic about utilising hidden talent for better performance of
employees and organization. Some of them have already started with “Searching &
Nurturing the Hidden Talent” within Organization.
3.8 SAMPLING TECHNIQUES / METHODS USED:
Based on pilot survey conducted, which enhanced the understanding of the researcher
about present research, certain modifications / changes were made in the questionnaire
based on the discussions / interviews with industry personnel in the pilot survey.
Convenience purposive sampling technique was used to make sample selection.

88
Since, the research is to understand HRM standard practices; researcher did not want to
limit himself to interview HRM practitioners only from various industries.
It is a thought provoked angle that HRM practitioner in any industry for the subject
matter as mentioned above is always at deciding end, but the line managers and
employees at various departments are at receiving end. So, a mixture of all, e.g., CEOs,
CMDs. HR Managers, Business Leaders, and Managers with different portfolios within
various industries were identified and interviewed as sample respondents.
Taking into account the growth of Pune region, having large number of manufacturing
and service organizations, it was considered logical to have coverage of sample from
selected industrial areas. It was as follows:
Area I: Hinjewadi Phase I to Phase III
Area II: Pimpri, Chinchwad, Bhosari
Area III: Dehu, Talegaon and Kamshet
Area IV: Chakan and Rajgurunagar
Area V: Sanaswadi and Ranjangaon
Area VI: Hadpsar, Jejuri and Saswad
Area VII: MIDC Kurkumbh
Area VIII: Khed Sivapur, Shirwal

89
3.9 SELECTION AND SIZE OF SAMPLE:
As mentioned above, the outcome of the overall study was relevant and the data collected
through samples should represent the required summary for further analysis. To select
number of samples, few authentic factual reports were studied which are shared below:
1. As per the Economic Survey of Maharashtra 2009-10 made by Dun and Bradstreet,
Pune region is having 56,663 MSMEs and 665 Large Scale Units 66
2. Large Scale Industries – 642, Medium Scale Industries 67
– 102 (July 2012)
3.9.1 Selection of size of sample:
Researcher surveyed various resources available on internet for online calculator / sample
size calculator and came to conclusion that all the material available for study was
showing similar type of content.
To decide for study, researcher followed Raosoft 68
There are points considered for sample size as follows:
1. Acceptable margin of error is 10 %
2. Required % of confidence level is 95 %
3. The available population size in Pune and PCMC is 744 numbers
4. Recommended sample size calculated is 86 numbers only.
The standard formulae available in reference are as follows:
(
)

90
√
where,
n = sample size
E = margin of error
N = population size
R = fraction of responses
C= confidence level
Z = critical value for confidence level [c/100]
(
)
Since the survey for primary data collection by the researcher was conducted in a
continuous period of three (3) months during February 2015 to April 2015, the assumed
sample size was considered as follows:
Table 3.2 : Selection of Sample Size
Sr.
No.
Total Population (Pune)
(Numbers)
Sample Select (Pune)
(Numbers)
Percentage of Sample Size
(%)
1 Large Industries – 642 70 10.9 %
2 Medium Industries – 102 21 20.6 %
It was decided to select samples from manufacturing sector and service sector. The focus
under these sectors was decided as follows:

91
Manufacturing sector:
Engineering product, equipment, plastics, chemical, misc (white goods, branded
garments, power generation), medicines (vaccines, ayurvedic, allopathic), electronics &
electrical, food
Service sector:
Education, IT services, software products and services, financial services (banking),
hospitality (hotels, tourism), insurance, healthcare (hospitals), service provider
(Telecommunication and Internet)
The main focus was on Large Scale Units and Medium Scale Units. To have more
coverage and variety of types of industries / activities, it was decided to sample minimum
5 industries from each type as mentioned above from manufacturing and service sectors
for collection of data. Over and above, if we get maximum number, as pre-decided, since
industry representatives as mentioned above, are always pre- occupied and never find
themselves for interaction as per the demand of individual industry. With great
persuasion and convincing them, the researcher could get success in achieving the target
for interaction.
3.10 APPLICATION OF STATISTICAL TOOL:
Chi Square test of association was selected as a statistical tool for testing of hypothesis.
3.10.1 Introduction to the Chi-Square Test : Chi-square (χ2) is a statistical test
commonly used to compare observed data with data we would expect to obtain according
to a specific hypothesis. This is one of the most popular tests of hypothesis.

92
One of the most common and useful ways to look at information about the world is in the
format of a table. Frequency tables of two variables presented simultaneously are called
contingency tables. A data set like this is often called an "R×C table," where R is the
number of rows and C is the number of columns. For example, if you surveyed the
frequencies of three pack colours (red, pink, white) in four stores, you would have a 3×4
table. You could also consider it a 4×3 table; it doesn't matter which variable is the
columns and which is the rows.
Hypothesis tests on contingency tables are based on the Chi-square statistic. The Chi-
square tests are performed on contingency tables in order to decide whether or not there
exist any relationships between the row and column variables. i.e. are the levels of the
row variable differentially distributed over levels of the column variables. Significance in
this hypothesis test means that interpretation of the cell frequencies is warranted. Non-
significance means that any differences in cell frequencies could be explained by chance.
3.10.2 Contingency Tables:
Contingency tables are constructed by listing all the levels of one variable as rows in a
table and the levels of the other variables as columns, then finding the joint or cell
frequency for each cell. The cell frequencies are then summed across both rows and
columns. The sums are placed in the margins, the values of which are called marginal
frequencies (i.e. row/column marginals). The lower right hand corner value contains the
sum of either the row or column marginal frequencies, which both must be equal to N.

93
Table 3.3 : Contingency Table
A 2*2 Contingency Table
Rows Column1 Column2 Total
Row1 Cell a Cell b Row Marginal1
Row2 Cell c Cell d Row Marginal2
Total Column Marginal1 Column Marginal2 TOTAL (N)
The procedure used to test the significance of contingency tables is similar to all other
hypothesis tests. To begin with we State the Null and Alternative Hypothesis:
Null Hypothesis (Ho): There is no significant difference between the categories of
observed frequencies for the data collected.
Alternative Hypothesis (Ha): There is a significant difference between the categories of
observed frequencies for the data collected.
3.11 SCOPE AND LIMITATIONS:
3.11.1 Scope:
Taking into account this, it was thought prudent to undertake a survey of considerable
number of sample companies from Large and Medium Scale Industries in the universe of
Pune region.
As per the rough estimate stated earlier 69
in Pune region there are nearly 744 Nos. - 642
Large Scale and 102 Medium Scale organizations.
MEDIUM SCALE ORGANIZATIONS:

94
According to Ministry of Industries as well as Ministry of banking & finance, Medium
Scale are Industrial units which are having original investments in plant & machinery is
from Rs. 2 Crores To Rs.5 Crores (Non SSI). The size of employees for Medium Scale
organization is from 100 to 500 Nos.
LARGE SCALE ORGANIZATIONS:
Large Scale organizations are neither SSI nor Medium Scale Organizations. The size of
employees for Large Scale Organizations is above 500 Nos.
The hidden talent search activity can be more effectively conducted where considerably
large number of employees exists. In such an organization, more possibilities of
effectively using well thought out plans for training, development, talent search and
acquisition, etc. exist. Considering this fact, the present research has purposefully
selected “Large and Medium Scale Organizations”.
On the above background, the researcher went through number of reports, journals,
statistical data relating to various types of Large, Medium scale Industries in Pune Region
published by MCCIA, RBI, financial institutions & banks, etc.
With an objective to give justice towards equitable distribution of sample selected, it was
considered to undertake a survey of targeted Industries in all four sides of Pune Region.
i.e. East , West , North , South

95
The said distribution of industries can be seen in the map of Pune Region
Table 3.4: List of Industries, with Location, visited for Primary Data
Sr
No
Name of the Industry Category
of Industry
Type of the
Industry
Location
1 Vishwakarma Institute of
Technology, Pune
Large Service Bibwewadi
2 Vishwakarma College of
Arts, Commerce & Science
Medium Service Kondhawa (Bk)
3 Vishwakarma Institute of
Information Technology,
Pune
Large Service Kondhawa (Bk)
4 Vishwakarma Institute of
Managament
Medium Service Kondhawa (Bk)
5 Pune Institute of Computer
Technology, Pune
Large Service Dhankawadi
Figure 3.1 Distribution of Industries – Pune region

96
Sr
No
Name of the Industry Category
of Industry
Type of the
Industry
Location
6 John Deere Large Manufacturing Magarpatta City
7 Kirloskar Pneumatic Co.
Ltd.
Large Manufacturing Hadapsar Industrial
Estate
8 Accelya Kale Solutions Ltd Large Manufacturing
& Service
Sharda Center,
Satara Road
9 Citi Corp Services (I) Pvt.
Ltd.
Large Manufacturing
& Service
Kharadi IT Park
10 MOJJ Engineering Systems
Ltd
Large Manufacturing Bhosari MIDC
11 Automotive Stampings and
Assemblies LTD
Large Manufacturing Pimpari MIDC
12 3 M India Ltd Large Manufacturing Ranjangaon MIDC
13 3 M Electro &
Communication (I) Pvt Ltd
Large Manufacturing Pimpari MIDC
14 Tech Mahindra Large Service Hinjewadi, Phase II
15 I gate Corporation Large Service Bhosari MIDC
16 Watchem Infratech Pvt Ltd Medium Manufacturing
Cum Trading
DSK Vishwa,
Dhayari
17 SMS India Pvt Ltd Large Manufacturing Near Mhatre
Bridge, Erandwana
18 Thermax Limited Large Manufacturing Wakadewadi
19 eQ Technologic (I) Pvt. Ltd. Medium Manufacturing
& Service
Bhandarkar Road
20 Persistent Systems Ltd. Large Manufacturing
& Service
Senapati Bapat
Road
21 Shree Mahila Gruh Udyog
Lijjat Papad
Large Manufacturing Dhayari
22 Mphasis Ltd. Large Service Magarpatta City
23 Tata Consultancy Services
Ltd.
Large Service Sahyadri Tech
Park, Hinjewadi,
Phase II
24 Whirlpool of (I) Ltd. Large Manufacturing Weikfield IT Park,
Vimannagar
25 Jehangir Hospital Large Service Pune Railway
Station
26 Aquapharm Chemicals Pvt.
Ltd.
Large Manufacturing Sadhu Waswani
Road, Camp
27 Deenanath Mangeshkar
Hospital and Research
Centre
Large Service Erandwana

97
Sr
No
Name of the Industry Category
of Industry
Type of the
Industry
Location
28 Allscripts (I) Pvt. Ltd. Large Service Kharadi IT Park
29 Life Insurance Corporation
of India
Large Service Near Alka Talkies
30 Bharat Sanchar Nigam Ltd. Large Service Near Hotel
Panchami, Pune
Satara Road
31 TATA Ficosa Automotive
Systems Ltd.
Large Manufacturing Hinjewadi
32 TATA Autocomp Systems
Ltd.
Large Manufacturing Off Law College
Road
33 TATA Toyo Radiator Ltd. Large Manufacturing Hinjewadi
34 Sudarshan Chemical India
Ltd.
Large Manufacturing Pune Railway
Station
35 Pravin Masalewale Large Manufacturing Hadapsar Industrial
Estate
36 Franke Faber (I) Ltd Medium Manufacturing
(Misc)
Sanaswadi
37 Shashwat Health Services
Pvt Ltd
Medium Service Happy Colony,
Kothrud
38 The Sarswat Co-op Bank Ltd Large Service Nalstop, Karve
Road
39 Net Scout Systems (I) Ltd. Medium Manufacturing
& Service
Wakadewadi
40 Suvarnayug Sahakari Bank
Ltd
Medium Service Bibwewadi
41 Bank of Maharshtra Large Service Shivajinagar
42 Sahyadri Hospitals Ltd Large Service Lokmanya Colony,
Paud Road
43 Kesari Tours Pvt Ltd Large Service FC Road,
Shivajinagar
44 Lear Automotive (I) Pvt Ltd Large Manufacturing Bhosari MIDC
45 Chitale Bandhu Mithaiwale Medium Manufacturing Sadashiv Peth
46 Pune Zilha Sahakari Dudh
Utpadak Sangh Maryadit
Large Manufacturing Katraj
47 Cosmos Cooperative Bank
(Multistate Scheduled Bank)
Large Service Dhankawadi
48 Indian Hotels Company Ltd.
(TATA Group, Taj Group)
Large Service Koregaon Park
49 Aker Power Gas Sub Sea Pvt
Ltd
Large Manufacturing
& Service
Baner

98
Sr
No
Name of the Industry Category
of Industry
Type of the
Industry
Location
50 State Bank of India Large Service Tilak Road
51 Cottonking Pvt. Ltd. Large Manufacturing Nalstop
52 Mitsubishi Electric (I) Pvt.
Ltd.
Large Manufacturing Bhosari MIDC
53 Bharati Airtel Ltd Large Service Swargate
54 Varroc Lighting Systems
Pvt. Ltd.
Large Manufacturing Hinjewadi
55 Eaton Industrial Systems
Pvt. Ltd.
Large Manufacturing Masulkar Colony,
Pimpari
56 Kansai Nerolac Paints Ltd Large Manufacturing East Street Camp
57 Hyatt Regency Pune Large Service Vimannagar
58 Ericsson India Pvt. Ltd Large Manufacturing
& Service
Vimannagar
59 Idea Cellular Ltd Large Service Swargate
60 Oracle Financial Software
Services Ltd. (OFSS)
Large Manufacturing
& Service
Ambrosia, Paud
Road
61 Maharashtra State Power
Generation Company Ltd.
(MAHAGENCO)
Large Manufacturing Panshet
62 Cognizant Technology
Solutions (I) Pvt. Ltd.
Large Service Hinjewadi
63 Media Ocean Asia Pvt. Ltd. Medium Manufacturing
& Service
Wakad
64 Bajaj Allianze Insurance
Company Ltd.
Large Service GE Plaza,
Yerawada
65 Bharti AXA General
Insurance Company Ltd.
Medium Service Dhole Patil Road
66 Royal Sundaram Alliance
Insurance Company Ltd.
Medium Service Shivajinagar
67 L & T General Insurance
Company Ltd.
Medium Service Ambedkar Road,
Pune Station
68 Philips India Ltd (Philips
Health Care Division)
Large Manufacturing IT Park, Pimpari
69 Serum Institute of India Ltd Large Manufacturing Hadapsar
70 Aayurved Rasashala Pune Medium Manufacturing Karve Road
71 Tilak Aayurved
Mahvidyalaya
Medium Service Rasta Peth
72 Tata Communications Ltd Large Service Dighi

99
Sr
No
Name of the Industry Category
of Industry
Type of the
Industry
Location
73 HDFC Standard Life
Insurance Company Ltd
Large Service Law College Road
74 Starwood Hotels & Resorts
Pvt Ltd (The Westin Pune)
Large Service Koregaon Park
75 Jubilant Food Works Ltd
(Domino's Pizza)
Large Service Nalstop
76 Siddhivinayak Hospital and
Research Centre
Medium Service Nasarapur
77 Fergusson College Large Service FC Road,
Shivajinagar
78 Alpha Multispeciality Digno
Center & Clinic Pvt. Ltd.
Medium Service Shukrawar Peth
79 Bharat Electronics Ltd. Large Manufacturing Pashan
80 Suburbon Diagnostics India
Pvt Ltd
Large Service Pune Satara Road
81 Wipro BPS Ltd Large Service Hinjewadi
82 Infosys BPO Ltd Large Service Hinjewadi
83 Sai Seva Foods (Smokin
Joes Pizza)
Medium Manufacturing
& Service
J M Road
84 VM Ware Software (I) Ltd. Medium Manufacturing
& Service
Wakadewadi
85 Weikfield foods Pvt ltd. Large Manufacturing Lonikand
86 KUONI Travel (I) Pvt Ltd Large Service Dhole Patil Road
87 Tikona Digital Networks Pvt
Ltd.
Large Service Vimannagar
88 Poona Hospital and
Research Centre
Large Service Sadashiv Peth
89 Sharangdhar Pvt Ltd Medium Manufacturing Sadashiv Peth
90 Ruby Hall Clinic Large Service Sasoon Road
91 Eisen Pharma Pvt Ltd Medium Manufacturing Erandwane
3.11.2 Limitations:
1. Although the researcher had a target to cover and study the maximum number of 744
Industrial Units , however despite sending them e-mails as well as messages they were
not either easily accessible or did not respond. This led the researcher to again make a

100
rigorous follow up and could get success in visiting 91 industrial units and 91 Executives
/ senior persons of these units.
2. In number of cases researcher was not allowed to enter in to organizations premises /
reach to industry respondents telephonically. Security guards & telephone operators
always became hurdle in such cases.
3. Respondents from organizations with foreign collaborations / foreign stake holders ,
were not easily ready to respond in any way. However due to serious follow up the
researcher was successful in meeting / interacting 91 numbers of industrial units.
4. In few of the cases it was observed that the executives were very casual or giving false/
misleading information with no logic.
5. It was also found that, there was a reservation, apprehension, threat or fear from the
respondent’s side in releasing / giving confidential data or information as this could have
impacted adversely on their job.
6. Initially a detailed / descriptive / open ended questionnaire was circulated and sent via
email with 32 industrial units. However it was surprising and shocking to receive
response from Only ONE Industrial unit.
7. Further the researcher selected few important areas of the questionnaire and made
changes accordingly which was again sent to respondents. They acted promptly as it was
containing few important questions. Then the modified questionnaire was prepared and
was sent through surveymonkey.com
8. Finally the questionnaire was reduced in length from 6 pages to 4 pages and given an
objective/ closed ended format, then it was accepted by the respondents.

101
9. It was found out and understood from experience of “Pilot Survey” that following
methods are important for the PhD survey for primary data collection as per the
descending priority:
a. One to one interaction – when researcher meets respondents for research work
b. Telephonic interaction – when researcher tries to conduct interview over telephone due
to respect to mutual work culture
c. E-mailing questionnaire and seeking response
10. For any of the above mentioned activity, prior discussion about research study with
details in any way is must
11. Industry representatives / target respondents from well-known MNC organizations
were always busy, so briefing him / her on a telephonic call prior to actual interview was
found extremely necessary to save their precious time.
12. The researcher had to convince the respondents that the findings / conclusions of
survey are ultimately going to help them in many ways either as an employee of the
organization or organization as a whole; only then the respondents were inclined / ready
to interact with researcher.
3.12 SUMMARY OF SELECT INDUSTRIES FOR PRIMARY DATA
COLLECTION:
Table No 3.5: Service sector Data Distribution
Service Sector
Business Total Large Scale Medium Scale
Education 7 4 3
IT Services 7 7 ---

102
Business Total Large Scale Medium Scale
Software Products & Services 8 5 3
Financial Services (Banking) 5 4 1
Hospitality (Hotels, Tourism) 6 6 ---
Insurance 6 3 3
Health Care (Hospitals) 9 6 3
Service Provider (Telecommunication &
Internet) 6 6 ---
Total 54 41 13
Table No 3.6: Manufacturing sector Data Distribution
Manufacturing Sector
Business Total Large Scale Medium Scale
Engineering Product, Equipment 8 8 ---
Plastics 5 5 ---
Chemical 6 5 1
Misc (White Goods, Branded Garments, Power
Generation) 3 2 1
Medicines ( Vaccines , Ayurvedic , Allopathic ) 4 1 3
Electronics & Electrical 5 4 1
Food 6 4 2
Total 37 29 8
Period covered under survey:
Researcher collected the data in two phases; during February 2014 to April 2014 and
March 2015 to June 2015 as the researcher had to depend on the convenience and
availability of respondents. Also In some cases certain responding authorities either got
transferred or left the organization. Hence to reestablish the contact to obtain the first
hand data, the survey had to be undertaken in phases. Though the data is up to 2014, the
researcher has made efforts to update the data / information up to 2016 with in-person
discussions with few industry respondents as far as possible.

103
3.13 SUMMARY:
As per the formula for calculation of sample size, actually total number of responding
industries was 86, however while undertaking a field survey, researcher was fortunate
enough to cover more than this which come to total number of surveyed units 91. Hence
in all data analysis tables, total number of respondents (industries) has been mentioned as
91 industries.

104
Chapter 4
Data Collection, Analysis and Interpretation
4.1 Introduction
The present chapter makes analysis of the data collected, its analysis and interpretation
there on. To explain this, the responses to the questionnaire were analyzed first as per the
type of industry and size of industry. Representation of the same is given in graphical
form.
Sequentially, all the answers to the questionnaire were given in graphical format followed
by brief explanation.
Based on the answers, the testing of hypothesis is done at the end of this chapter.
Totally 91 target industries were covered under the survey. The said target audience was
a mix of Large and Medium sector units in Pune region.
The respondents were mainly from the middle and top level of the organization
such as Chairman, M.D., CEO, COO, V.P., A.V.P., Director, Functional Heads,
and Managers of the companies.
The strata under the research was a blending of manufacturing as well as service
sector units having a further variety of types of industries like plastic, chemical,
electrical and electronics, mechanical equipments, pharmaceuticals, food as well
as finance and banking, insurance, internet and telecommunication, software
product, IT services.
105
The prime objective of this research survey was to have a reality check and to
understand from the target respondents about how the Hidden Talent Search is an
important part of a HR function as well as its positive implication on Business
Performance by solving a serious issue of “Skills Crisis”. In fact, it was also
aimed by the researcher to have a first-hand information from the Stake Holders /
Top Management relating to existence of Skills Crisis at different levels in the
organization, but having low or no cognizance towards the problem, resulting into
the non-utilization of Hidden Talent and having more attrition rate. To break this
vicious circle, the probable solution is to properly study the problem of Skills
Crisis at regular intervals by the Management and there by finding appropriate
solution to it.
Researcher collected the data in two phases; during February 2014 to April 2014
and March 2015 to June 2015
At certain times the researcher had to revisit the targeted companies due to various
reasons like Transfer of Managers, Change in Job, and Non-availability of proper
Authorities to speak on the subject, as well as year ending work.
4.2 DATA INTERPRETATION:
The foregoing paragraphs describe the analysis of Primary Data collected and its
interpretation.
1. Pie Chart of 91 Industries with clarification:
a. Manufacturing V/s Service:

106
The breakup of 91 industries is as follows:
i. Out of total industries Interviewed, the ratio of Manufacturing to Service
Industries is 2:3, which is 40.66 % (37 Nos.) : 59.34 % (54 Nos.).
ii. The contribution in this Survey is more by Large Scale Industries (70 Nos.)
followed by Medium Scale Industries (21 Nos.).
iii. In both the categories of Manufacturing & Service Industries, the number of
Large Scale Industries (29 Nos. for Manufacturing & 41 Nos. for Service )
are substantially more in comparison with other two types of Categories i.e.
Medium Scale Industries (8 Nos. for Manufacturing & 13 Nos. for Service)
b. Size of Industry:
70
21
Size of Industries
Large
Medium
Graph 4.1 Manufacturing V/s service sector industries
Graph 4.2 Size of industries

107
Out of 91 Industries, the major contribution is by Large (70 in number – 76.92 %)
followed by Medium (21 in number – 23.08 %).
2. B1: Is the training need identification done?
Out of the total number of Industries interviewed, 98.90 % (90 Nos.) of the
industries, irrespective of any type of classification, are following the process for
“Training Need Identification”; 1 Industry (1.09 %) is not doing training need
identification.
. B2 : Contents of training (specify) ?:
90 1 1
Is the Training Need Identification Done ?
Yes
No
33 33
5
55
72
0
20
40
60
80
Soft SkillTraining
TechnicalTraining
SuccessionPlanning
All 3 types ofTraining
Other
Contents of Training
Number of Industries
Graph 4.3 Training need identification
Graph 4.4 Contents of training

108
i. Out of 91 industries, 33 industries (36.26 %) give Soft Skill training to
employees
ii. Out of 91 industries, 33 industries (36.26 %) give Technical training to
employees
iii. Out of 91 industries, 5 industries (5.49 %) give training for Succession
Planning to employees
iv. Out of 91 industries, 55 industries (60.44 %) give all three types of training
(Soft Skill, Technical, Succession Planning) to their employees
v. Out of 91 industries, 72 industries (79.12 %) have devised their own contents
of training as per type and requirement of industry; in addition to the above
mentioned three types of training. These are as follows:
Presentation Skills, ERP, LMS, Six SIGMA, IIM – A Leadership Program,
Informal discussion, Faculty Development Program, Workshops / Seminars /
Conferences, Business English, Domain Specific Technology, Heart of
Effective Leadership, HIRI Software, Management Development Program,
Board Room Discussions, Technical Training related to Projects and Products
both, Annual Development Plan, Business Ethics, Negotiation Skills,
Supervisory Development Program, Safety Training, Induction Training,
Toast Master’s Club, Cultural Training – Cultural Ambassador Program,
Team Building, Customer Communication – International Customer,
Behavioral Training, Training as per Demand – New Tools / Technology /
Software, Latest Know – How in the Business, etc. (e.g., All 5-Star Hotels

109
give training about allergies from food items – regularly), Good
Manufacturing Practices, Research Technique Training, Cooking
Methodologies, etc.
vi. Out of the total number of Industries interviewed 60.44% (55 Nos.) of the
industries, irrespective of any type of classification, do follow the training
programme for Soft Skills, Technical Skills & Succession Planning.
vii. In addition to 60.44% (55 Nos.) of Industries as mentioned above there are
additional 18.68% (17 Nos.) Industries who have “Their own Training
Programme – Industry Specific” along with Training for Soft Skills, Technical
Skills & Succession Planning. Total 36.26% (33 Nos.) of Industries impart
Only Technical Skills training to their Employees. Total 36.26% (33 Nos.) of
the Industries impart Only Soft Skills training to their Employees. Total
5.49% (5 Nos.) of the Industries impart Only Training for Succession
Planning
viii. All Industries are aware of “Training Need Identification”, they also conduct
various types of Trainings, but there is NO Fixed Pattern set by Industries for
types of Training Imparted along with follow up and further actions.

110
3. B3 : Frequency of training (specify) ?:
Soft Skill Training:
For the 91 industries, the frequency of Soft Skill Training is as follows:
i. 1 industries - throughout the year
ii. 4 industries – as and when required
iii. 2 industry – As per calendar prepared
1 4
2
8
2
3
1
10
2 1
15
4
1
10
2 1
Frequency of Soft Skill Training
Throughout the year
As and when required
As per calendar prepared
Dynamic
Need Based
52 Mandays in a year
24 Mandays in a year
12 Mandays in a year
6 mandays in a year
5 Mandays in a year
4 Mandays in a year
3 Mandays in a year
2 Mandays in a year
1 Manday in a year
Once in 2 years
Once in 3 years
Graph 4.5 Frequency of soft skill training

111
iv. 8 industries – dynamic
v. 2 industries – need based
vi. 3 industries – 52 times in a year
vii. 1 industries – 24 times in a year
viii. 10 industries – 12 mandays in a year
ix. 2 industries – 6 mandays in a year
x. 1 industry – 5 mandays in a year
xi. 15 industries – 4 mandays in a year
xii. 4 industries – 3 mandays in a year
xiii. 1 industries – 2 mandays in a year
xiv. 10 industries – 1 day in a year
xv. 2 industries – once in 2 years
xvi. 1 industry – once in 3 years

112
Technical Training:
For the 91 industries, the frequency of Technical Training is as follows:
i. 7 industries - throughout the year
ii. 8 industries – as and when required
iii. 2 industry – as per calendar
iv. 3 industries – need based
v. 2 industries – dynamic
vi. 2 industries – 52 times in a year
vii. 1 industry – 24 times in a year
7
8
2
2
3
2
1
9
4 1
10
2
11
9
2 2
Frequency of Technical Training
Throughout the year
As and when required
As per calendar prepared
Dynamic
Need Based
52 Mandays in a year
24 Mandays in a year
12 Mandays in a year
6 mandays in a year
5 Mandays in a year
4 Mandays in a year
3 Mandays in a year
2 Mandays in a year
1 Manday in a year
Once in 2 years
Once in 5 years
Graph 4.6 Frequency of technical training

113
viii. 9 industries – 12 mandays in a year
ix. 4 industries – 6 mandays in a year
x. 1 industry – 5 mandays in a year
xi. 10 industries – 4 mandays in a year
xii. 2 industries – 3 mandays in a year
xiii. 11 industries – 2 mandays in a year
xiv. 9 industries – once in a year
xv. 2 industries – once in 2 years
xvi. 2 industries – once in 5 years
Succession Planning:
2
13
1
5
6 1 2
1
2
7
11
1
Frequency of Succession Planning
Throughout the year
As and when required
As per calendar prepared
Dynamic
Need Based
52 Mandays in a year
12 Mandays in a year
5 Mandays in a year
4 Mandays in a year
2 Mandays in a year
1 Manday in a year
Once in 2 years
Graph 4.7 Frequency of succession planning

114
For the 91 industries, the frequency of Succession Planning Training is as
follows:
i. 2 industries - throughout the year
ii. 13 industries – as and when required
iii. 1 industry – as per calendar
iv. 5 industries – dynamic
v. 6 industries – need based
vi. 1 industry – 52 times in a year
vii. 2 industries – 12 mandays in a year
viii. 1 industry – 5 mandays in a year
ix. 2 industries – 4 mandays in a year
x. 7 industries – 2 mandays in a year
xi. 11 industries – once in a year
xii. 1 industry – once in 2 years
4. B4 : Is there any mechanisms to evaluate training imparted ?
85
2 4 Mechanism for evaluation of Training Imparted
Yes
No
Not to be disclosed
Graph 4.8 Availability of mechanism for evaluation of training imparted

115
Out of the total Industries interviewed, 93.4% (85 Nos.) of Industries do have
mechanism in place for evaluation of training imparted & 2.19% (2 Nos.) of
industries do not have such mechanism and 4.4% (4 Nos.) of Industries denied
to disclose.
5. B5: Your opinion about application of training ?:
Application of Training imparted was felt useful for 85.71% (78 Nos.) of
respondents, whereas it was partially felt useful only for rest of the 14.29 %
respondents (13 Nos.).
6. B6: Training facilities ?:
a. Infrastructure availability:
78
13
13
Opinion about Training
Useful
Partially useful
0
100
Both
Inhouse
68
23
Infrastructure Availability
Graph 4.9 Opinion about training
Graph 4.10 Infrastructure availability

116
Out of the total industries interviewed 74.73% (68 Nos.) industries use
infrastructure for training in-house as well as outside both. Where 25.27% (23
Nos.) Industries use in-house Infrastructure facilities.
b.Trainers’ availability:
Out of the total industries interviewed 80.22% (73 Nos.) Industries use facility of
Trainer in-house as well as outside both. Where 16.48% (15 Nos.) Industries use
In-house Trainer facilities & 3.3% (3 Nos.) Industries use outside Trainer
facilities.
7. B7: Impact of training and development ?:
a. Qualitative:
Qualitative impact of training:
When asked about the qualitative impact of training and development, different
respondents gave different replies based on their experience. To have
convenience, to know about their responses, the researcher has segregated their
varied responses under common heads of impact which are as follows:
0
100
Inhouse
Outside
Both
15 3
73
Trainers' Availability
Graph 4.11 Trainer’s availability

117
1. Improvement in Knowledge / Skills / Attitude / Behavior of employees
2. Improvement in Efficiency / Quality of Work / Productivity of employees
3. Training is must - Having more scope
4. Increase in business growth / benefits to organization
5. Positive impact for meeting organizational objectives
6. Improvement in customer focus / services
7. Impact is mixed
8. Average
9. Huge positive impact
10. Can not specify quality and quantity of training imparted
In the following graph, the presentation about above factors is given.
0
5
10
15
20
25 23
17 15
12
8 7 6
1 1 1
Qualitative Impact of Training Imparted
Number of Industries
Graph 4.12 Qualitative impact of training imparted

118
The breakup of 91 industries for qualitative impact is as mentioned below:
23 industries said that there is improvement in knowledge / skills / attitude /
behavior of employees; whereas 17 industries said that there is efficiency /
quality of work / productivity of employees. As per 15 industries training is
must; there is increase in growth as per 12 industries; 8 industries said there is
positive impact of training for meeting the objectives. 7 industries said that
improvement in customer focus is observed due to training; 6 industries said that
impact of training is mixed. As per 1 industries the impact of training is average
and 1 industries said that there is high positive impact of training. 1 industry said
that the impact of training cannot be specified.
It was found that total 90.11 % (82 Nos.) Industries have “A positive qualitative
Impact of Training Imparted to their employees” where it is neither positive nor
negative for 8.79 % (8 Nos.) of Industries.
Only 1.09 % (1 No.) of Industries were still in a phase of ambiguity about
qualitative impact of training to employees. They were not in a position / process
to evaluate qualitative impact of training to employees.
b. Quantitative:
0
50
100
10% 10 - 25 % 25 - 50 % 50 % andabove
Blank
3 11 18
56
3
Quantitative Impact of Training
Graph 4.13 Quantitative impact of training imparted

119
Quantitative Impact of Training Imparted was found as follows:
Quantitative Impact 50% & Above – 61.54 % (56 Nos.)
Quantitative Impact 25 % to 50% – 19.78 % (18 Nos.)
Quantitative Impact 10% to 25% – 12.09 % (11 Nos.)
Quantitative Impact upto 10% Only – 3.3 % (3 Nos.)
Total 3.3 % (3 Nos.) Industries didn’t respond so it was found that they are not
serious about evaluation of Training Imparted.
8. C1: Are you aware of the concept “Hidden talent within organization”
Total 96.70 % of Industries (88 Nos.) are aware of the concept of “Hidden Talent
within Organizations”. Only 3.3 % Industries (3 Nos.) are not aware of this
concept. These 3.3 % Industries consists of 2.20 % of Large Scale Industries (2
Nos.) & 1.09 % (1 No.) of Medium Scale Industries.
88
3
Are you aware of the concept Hidden Talent
Yes
No
Graph 4.14 Awareness about concept of hidden talent - total

120
Awareness of the concept Hidden Talent – As per Category of Industry
Out of the majority component (88 industries – 96.70 %), 68 industries (74.73 %)
are Large and 20 industries (21.98 %) are Medium. Out of the unaware industries
(3 numbers – 3.3 %), 2 are Large industries (2.2 %) and 1 is Medium industry (1.1
%).
9. C2: Did you take efforts for searching of the hidden talent within the organization
?
0
10
20
30
40
50
60
70
Large Medium
68
20
2 1
Yes
No
80
11
Did you take efforts for searching Hidden Talent
Yes
No
Graph 4.15 Awareness about concept of hidden talent – size wise
Graph 4.16 Efforts for Searching Hidden Talent

121
Out of 91 industries, 80 industries (87.91 %) take efforts for searching Hidden
Talent, whereas 11 industries (12.09 %) do not take any efforts.
Efforts for Searching Hidden Talent – As per Category of Industry
The breakup of industries taking efforts is:
61 Large and 19 Medium
The breakup of industries not taking efforts is:
9 Large and 2 Medium
It was found that 87.91 % of Industries take efforts for “Searching Hidden talent
within organizations”. Total 12.09 % of Industries don’t take efforts for searching
Hidden talent within Organization.
10. C3: Efforts for nurturing and developing hidden talent within the organization ?
0
10
20
30
40
50
60
70
Large Medium
61
9
19
2
Yes
No
Graph 4.17 Distribution of Industries for Efforts for Hidden Talent

122
It was found that, there are various efforts taken by Industries for Nurturing &
developing Hidden talent within the organizations. Few Common efforts of
Industries using the same are mentioned below as :
1. Appeal to Employees – 18.68 % (17 Nos.) Industries
2. Organizing Competitions - 16.48 % (15 Nos.) Industries
3. Rewarding Outstanding Talent - 32.97 % (30 Nos.) Industries
4. Motivating Employees - 34.07 % (31 Nos.) Industries
Total 38.46 % (35 Nos.) of Industries take all the mentioned efforts. Total 40.66
% (37 Nos.) of Industries take all above mentioned 4 efforts and in addition they
also take some special efforts for “Nurturing & developing Hidden talent” as per
the size and type of Industry. It was also found out that some Industries take more
than one effort, but less than 4 types of efforts as mentioned above. There is
variety in Industries for taking such efforts.
17
15
30
31
35
37 Appeal to Employees
Organizing Competitions
Rewarding OutstandingTalent
Motivating Employees
All 4 mentioned above
Different Efforts
Graph 4.18 Ways to search hidden talent

123
Efforts for nurturing and developing Hidden Talent – As per Category of
Industry
Amongst 17 industries (18.68 %) who make appeal to employees, 11 are Large
(12.09 %) and 6 are Medium (6.59 %). Amongst the 15 industries (16.48 %)
organizing competitions, 13 are Large (14.29 %) and 2 are Medium (2.2 %).
Amongst 30 industries (32.97 %) rewarding outstanding talent, 22 are Large
(24.16 %) and 8 are Medium (8.79 %). Amongst 31 industries (34.07 %)
motivating employees, 23 are Large (25.27 %) and 8 are Medium (8.79 %). Out of
35 industries (38.46 %) taking all 4 above mentioned efforts, 30 are Large (32.97
%) and 5 are Medium (5.49 %). Amongst 37 industries (40.66 %) who take some
other efforts, 28 are Large (30.77 %) and 9 are Medium (9.89 %).
11
6
17
13
2
15
22
8
30
23
8
31 30
5
35
28
9
37
0
5
10
15
20
25
30
35
40
Large Medium Total
Appeal to Employees
Organizing Competitions
Rewarding Outstanding Talent
Motivating Employees
All 4 mentioned above
Different Efforts
Graph 4.19 Distribution of Industries for ways to search Hidden Talent

124
11. C4: Is it helpful to solve business crisis and / to improve organization
performance ?
Out of 91 industries 42 industries (46.15 %) fully agreed for the usefulness to
solve business crisis; 31 industries (34.07 %) agreed the usefulness; 17 industries
(18.68 %) somewhat accepted whereas 1 industry (1.1 %) did not accept the
usefulness to solve business crisis.
42
31
17 1
Is it helpful to solve business crisis / Improve Organizational performance
a (Fully agreed)
b (Agreed)
c (Somewhat agreed)
d (Not at all)
35
7
42
22
9
31
12
5
17
1 1
0
5
10
15
20
25
30
35
40
45
Large Medium Total
a (Fully agreed)
b (Agreed)
c (Somewhat agreed)
d (Not at all)
Graph 4.20 Helpfulness to solve Business Crisis
Graph 4.21 Distribution of Industries for Helpfulness to solve Business Crisis

125
Usefulness to solve Business Crisis – as per Category of Industry
Amongst 42 fully agreeing industries (46.15 %), 35 are Large (38.46 %) and 7 are
Medium (7.69 %). Amongst 31 agreeing industries (34.07 %), 22 are Large
(24.18 %) and 9 are Medium (9.89 %). Amongst the 17 industries (18.68 %),
somewhat accepting the usefulness, 12 are Large (13.19 %) and 5 are Medium
(5.49 %). 1 Large (1.1 %) did not accept the usefulness to solve business crisis.
It was found that “Useful of Searching for Hidden Talent within the Organization
to solve Business Crisis” is applicable to 80.22 % (73 Nos.) of Industries, where
18.68 % (17 Nos.) Industries partially accepted this statement. On the contrary 1.1
% (1 No.) of industries are not accepting this statement saying that, there are
various other additional parameters for “Solving the Business Crisis”.
12. C5: Impact of loosing key talent of the organization in connection with
organizational performance and growth ?
23
56
9 3
Impact of Losing Key Talent
a (Fully Agreed)
b (Somewhat Agreed)
c (No evidence as on date)
d (No Comment)
Graph 4.22 Impact of losing key talent

126
Out of 91 industries 23 industries (25.27 %) fully agreed for the impact of losing
key talent, majority number – 56 industries (61.54 %) somewhat agreed for this
impact and 9 industries (9.89 %) said that there is no such evidence as on date. 3
industries (3.3 % ) did not comment on this point.
Impact of loosing Key Talent – As per Category of Industry
While checking the impact of loosing key talent of the Organization & its
connection with organizational Performance & Growth, it was found that total
25.27 % (Total 23 Nos. = Large 18 + Medium 5) of industries accepted that
loosing key talent affects organizational performance & growth where 61.54 %
(Total 56 Nos. = Large 43 + Medium 13) Industries partially agreed with this
statement. On the contrary 9.89 % (9 Nos. = Large 7 + Medium 2) Industries
mentioned that, they don’t have any evidence of such Impact on Organizational
performance & Growth where 3.3 % (Total 3 Nos = 2 Large + 1 Medium) did not
answer the question.
18
5
23
43
13
56
7
2
9
2 1 3
0
10
20
30
40
50
60
Large Medium Total
a (Fully Agreed)
b (Somewhat Agreed)
c (No evidence as on date)
d (No Comment)
Graph 4.23 Distribution of Industries for Impact of Losing Key Talent

127
13. D1: Do you conduct exit interviews of employees when they leave the
organization?
94.51 % (86 Nos.) Industries conduct the exit interview of their employees where
5.49 % (5 Nos.) Industries do not conduct exit interview of their employees as a
formal process and documentation.
14. D2: Do you take cognizance on the valid points emerged through exit interviews?
86
5
Conduction of Exit Interview
Yes
No
81
10
0
10
20
30
40
50
60
70
80
90
Yes No
Cognizance of Exit Interview
Graph 4.24 Conduction of exit interview
Graph 4.25 Cognizance of exit interview
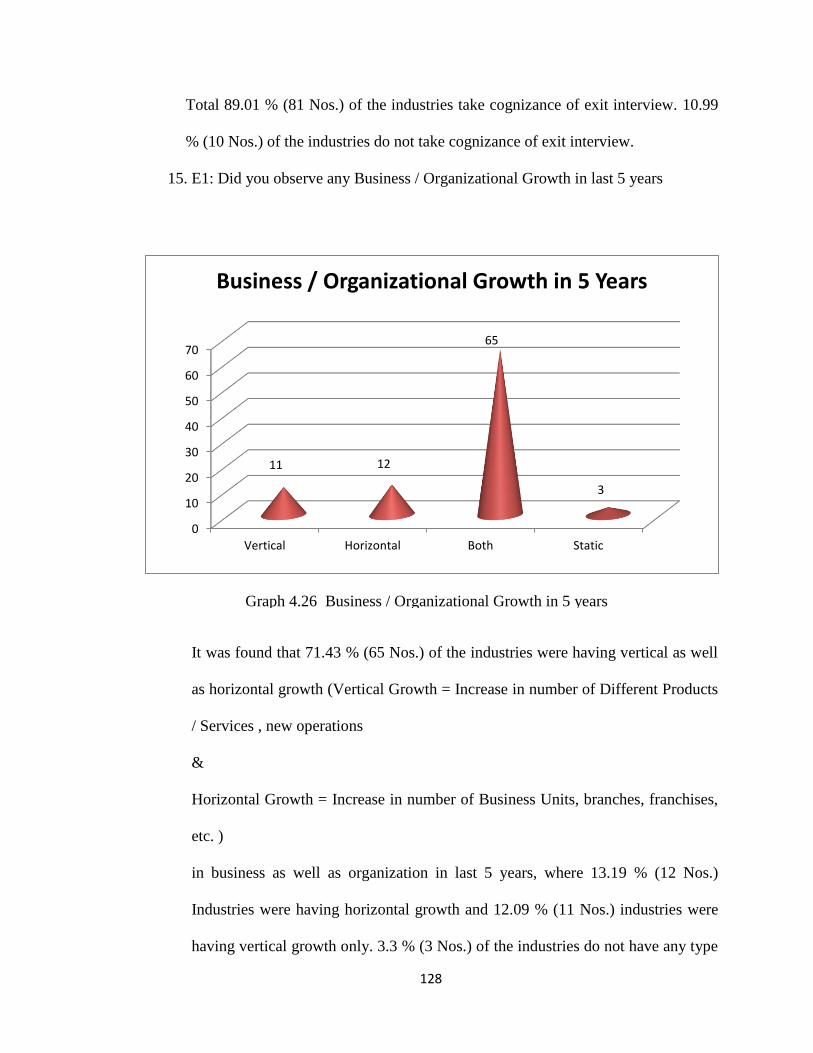
128
Total 89.01 % (81 Nos.) of the industries take cognizance of exit interview. 10.99
% (10 Nos.) of the industries do not take cognizance of exit interview.
15. E1: Did you observe any Business / Organizational Growth in last 5 years
It was found that 71.43 % (65 Nos.) of the industries were having vertical as well
as horizontal growth (Vertical Growth = Increase in number of Different Products
/ Services , new operations
&
Horizontal Growth = Increase in number of Business Units, branches, franchises,
etc. )
in business as well as organization in last 5 years, where 13.19 % (12 Nos.)
Industries were having horizontal growth and 12.09 % (11 Nos.) industries were
having vertical growth only. 3.3 % (3 Nos.) of the industries do not have any type
0
10
20
30
40
50
60
70
Vertical Horizontal Both Static
11 12
65
3
Business / Organizational Growth in 5 Years
Graph 4.26 Business / Organizational Growth in 5 years

129
of growth in last 5 years. They do have static growth, means constant from 5
years.
16. E2: Change in Organization's Turnover, Profit during last 05 Years ?
It was found that about organizations’ turnover / profit during last 5 years, 87.91
% (80 Nos.) industries do have increase in turnover or profit during last 5 years
where it is decreased for 5.49 % (5 Nos.) of industries and it remains unchanged
in value (i.e., static) for 3.3 % (3 Nos.) of industries. Total 3.3 % (3 Nos.) of the
industries did not respond for this question, due to policy of the organization and
business reasons.
17. E3: Number of branches / customers / dealers / distributors / stockiest in last 5
years ?
0
10
20
30
40
50
60
70
80
Increased Decreased Static Blank
80
5 3 3
Change in Organization's Turnover
Graph 4.27 Change in organizations’ turnover

130
Total 89.01 % (81 Nos.) of the industries mentioned that they have seen growth of
the industries in last 5 years by “Increase in number of branches / customers /
dealers / distributors / stockiest” in last 5 years, where it is decreased for 1.1 % (1
Nos.) of the industries and remain unchanged for 5.49 % (5 Nos.) of the
industries. 4.4 % (4 Nos.) of the industries said that this is not applicable for their
type of industry.
4.3 Analysis related to Hypotheses: Testing
The research study focused on three hypotheses. All the hypotheses have been tested
using statistical analysis on the data which was generated through the primary research.
The three hypotheses are reproduced below for easy reference:
4.3.1 Hypothesis 1 (H1) - There is awareness about the concept of Hidden Talent in
large and medium size organizations.
81
1 5
4
No. of Branches / Customers / Dealers
Increased
Decreased
Static
NA
Graph 4.28 Number of branches / customers / dealers

131
4.3.2 Hypothesis 2 (H2) - There is no formal process to identify Hidden Talent for
organizational benefit and solving the skill related business crisis.
4.3.3 Hypothesis 3 (H3) - Hidden Talent contributes towards sustainable
organizational growth.
4.3.1 Hypothesis 1 (H1) - There is awareness about the concept of Hidden Talent in
large and medium size organizations.
Analysis with respect to H1:
H1 was analyzed using cross tabulation of data based on Section C of the Questionnaire.
The cross tabulation of responses about awareness of the concept of Hidden Talent
within the organization with size of the organization indicates that of the 91 respondents
split across Large and Medium organizations. 88 respondents indicated that they were
68
20
2 1 0
10
20
30
40
50
60
70
80
Large Medium
Yes
No
C1
Yes No Total
Large 68 2 70
Medium 20 1 21
Total 88 3 91
Graph 4.29 Awareness about Concept of Hidden Talent
Null Hypothesis (H10) – There is No awareness about the concept of Hidden Talent in Large
and medium size organizations.
Hypothesis 1 (H1A) - There is awareness about the concept of Hidden Talent in large and
medium size organizations.
Table 4.1 Distribution of Industries
for Awareness of Hidden Talent

132
aware of the concept Hidden Talent within the organization. i.e., 96.7 % of respondents
were aware of the concept.
The awareness was uniformly strong across the categories. The findings are in agreement
with the existing literature in HR domain.
Of the total respondents 87.9 % (80 out of 91) indicated that their organizations had taken
efforts for searching of the hidden talent. The percentages across both categories were
87.14 % and 90.48 % respectively in Large and Medium organizations.
It can be concluded from the Table 4.2. Data that majority of the organizations (about
87.9 % ) did take efforts for searching of Hidden Talent.
61
19
9
2
0
10
20
30
40
50
60
70
Large Medium
Yes
No
41
11
43
7
52
13
53
13
0
10
20
30
40
50
60
Large Medium
a
b
c
d
C2
Yes No Not
Required Total
Large 61 9 0 70
Medium 19 2 0 21
Total 80 11 0 91
C3
a b c d Total
Large 41 43 52 53 189
Medium 11 7 13 13 44
Total 52 50 65 66 233
Graph 4.30 Efforts to Search Hidden Talent
Graph 4.31 Ways to Search Hidden Talent
Table 4.2 Distribution of Industries for
efforts to search Hidden Talent
Table 4.3 Ways to Search Hidden Talent
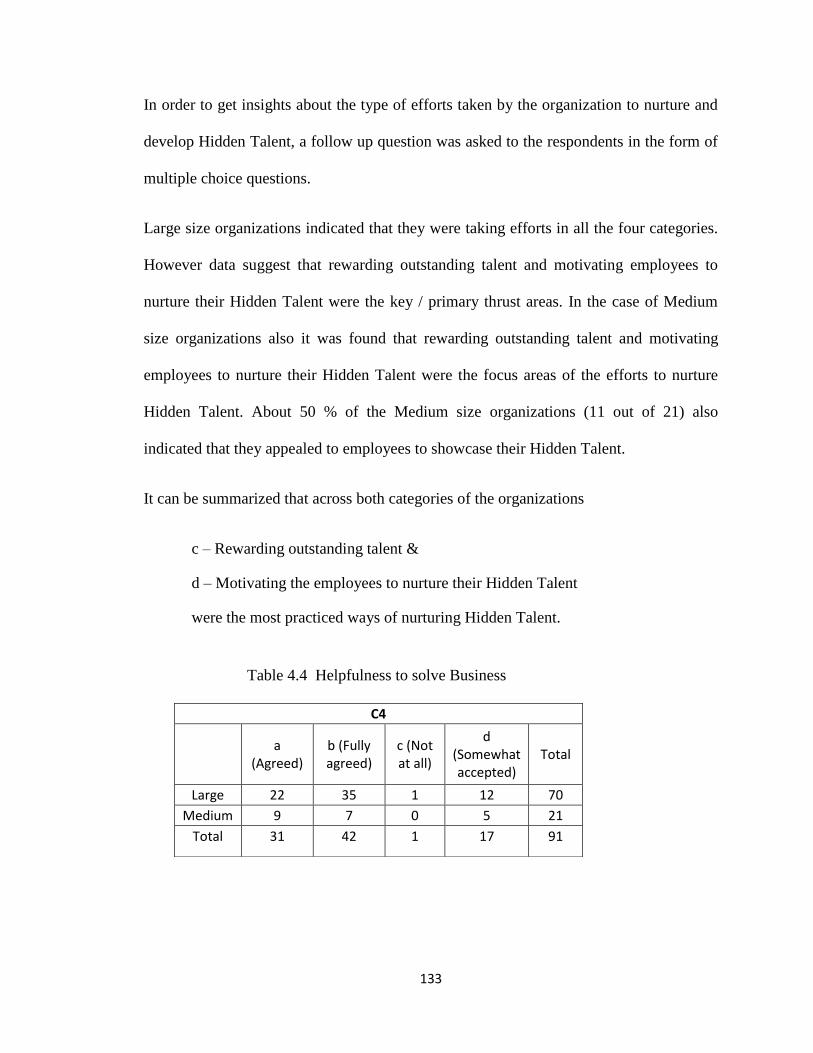
133
In order to get insights about the type of efforts taken by the organization to nurture and
develop Hidden Talent, a follow up question was asked to the respondents in the form of
multiple choice questions.
Large size organizations indicated that they were taking efforts in all the four categories.
However data suggest that rewarding outstanding talent and motivating employees to
nurture their Hidden Talent were the key / primary thrust areas. In the case of Medium
size organizations also it was found that rewarding outstanding talent and motivating
employees to nurture their Hidden Talent were the focus areas of the efforts to nurture
Hidden Talent. About 50 % of the Medium size organizations (11 out of 21) also
indicated that they appealed to employees to showcase their Hidden Talent.
It can be summarized that across both categories of the organizations
c – Rewarding outstanding talent &
d – Motivating the employees to nurture their Hidden Talent
were the most practiced ways of nurturing Hidden Talent.
C4
a
(Agreed) b (Fully agreed)
c (Not at all)
d (Somewhat accepted)
Total
Large 22 35 1 12 70
Medium 9 7 0 5 21
Total 31 42 1 17 91
Table 4.4 Helpfulness to solve Business
Crisis

134
About 80.22 % of the organizations surveyed indicated that nurturing Hidden Talent
within organization is helpful to solve business crisis or improve organizational
performance. The strength of agreement of views was also uniform across both categories
of industries. An insignificant number (1.1 % ) disagreed with the statement.
About 1/5th
of the respondents (18.68 %) were of the opinion that there is a weak linkage
between nurturing Hidden Talent and its utility to solve the business crisis or improve
organizational performance.
C5
a (No
evidence as on date)
b (Somewhat
agreed)
c (Fully
Agreed) Total
Large 9 43 18 70
Medium 3 13 5 21
Total 12 56 23 91
22
9
35
7
1
12
5
0
5
10
15
20
25
30
35
40
Large Medium
a (Agreed)
b (Fully agreed)
c (Not at all)
d (Somewhat accepted)
Graph 4.32
Graph 4.32
Table 4.5 Impact of losing Key Talent
Graph 4.32 Helpfulness to solve Business Crisis

135
There were an almost equal number of respondents, who agreed the linkage between
nurturing Hidden Talent and its utility to solve business crisis or improve organizational
performance. However in response to the question of evidence of the above relationship,
respondents who fully agreed were only half of these who indicated a lesser level of
agreement (23 : 56).
About 9.9 % of the respondents indicated that they had no evidence to support the
relationship suggesting that one cannot make a definite statement of the impact of losing
key talent on organizational performance and growth.
Based on the ongoing discussion it can be concluded that the NULL hypothesis that
“There is No awareness about the concept of Hidden Talent in Large and medium sized
organizations” is rejected.
7
2
43
13
18
5
0
5
10
15
20
25
30
35
40
45
50
Large Medium
a (No evidence as ondate)
b (Somewhat agreed)
c (Fully Agreed)
Graph 4.33 Impact of losing Key Talent

136
Therefore, it can be concluded that with respect to the sample survey, there is indeed
awareness of the concept of Hidden Talent and its relation with organizational
performance and growth.
4.3.2 Hypothesis 2 (H2) - There is no formal process to identify Hidden Talent for
organizational benefit and solving the skill related business crisis.
Analysis related to H2:
Observed
C3
a b c d Total
Large 41 43 52 53 189 p Value
Medium 11 7 13 13 44 C3
Total 52 50 65 66 233 0.792823701
Expected
C3
a b c d Total
Large 42.18026 40.55794 52.72532 53.53648 189
Medium 9.819742 9.44206 12.27468 12.46352 44
Total 52 50 65 66 233
Null Hypothesis (H20) – There is No formal process to identify Hidden Talent for
organizational benefit and solving the skill related business crisis.
Hypothesis 1 (H2A) - There is a formal process to identify Hidden Talent for organizational
benefit and solving the skill related business crisis.
Table 4.6 p-value for ways to search Hidden Talent

137
Observed
Large (C2 & C4)
C2
C4 Yes No Total
a (Not at all) 0 1 1
b (Somewhat accepted) 9 3 12
c (Agreed) 19 3 22
d (Fully agreed) 33 2 35
Total 61 9 70
Expected
Large (C2 & C4)
C2
C4 Yes No Total
a (Not at all) 0.871429 0.128571 1
b (Somewhat accepted) 10.45714 1.542857 12
c (Agreed) 19.17143 2.828571 22
d (Fully agreed) 30.5 4.5 35
Total 61 9 70
41
11
43
7
52
13
53
13
0
10
20
30
40
50
60
Large Medium
a
b
c
d
p Value
Large (C2 & C4)
0.01888551
Table 4.6
Table 4.7
Graph 4.34 Ways to search Hidden Talent
Table 4.7 p-value for Efforts for Hidden Talent & its helpfulness – Large Industries

138
C3
Since the P value (0.79) is more than the significance level (0.05), we accept the null hypothesis. Thus, we conclude that there is no association between a formal process to identify hidden talent for organizational benefit and solving the skill related business crisis.
C2 and C4 (Large)
Null There is no association between Efforts taken to search hidden talents and Benefits to solve crisis/improve organization performance for large scale organizations.
Alternate There is an association between Efforts taken to search hidden talents and Benefits to solve crisis/improve organization performance for large scale organizations.
Conclusion
Since the P value (0.01) is less than the significance level (0.05), we cannot accept the null hypothesis. Thus, we conclude that there is an association between efforts taken to search hidden talents and benefits received to solve crisis/improve organization performance for large scale organizations.
C2 and C4 (Medium)
Null There is no association between Efforts taken to search hidden talents and Benefits to solve crisis/improve organization performance for medium scale organizations.
Alternate There is an association between Efforts taken to search hidden talents and Benefits to solve crisis/improve organization performance for medium scale organizations.
Observed
Medium (C2 & C4)
C2
C4 Yes No Total
a (Not at all) 0 0 0
b (Somewhat accepted) 4 1 5
c (Agreed) 8 1 9
d (Fully agreed) 7 0 7
Total 19 2 21
Expected
Medium (C2 & C4)
C2
C4 Yes No Total
a (Not at all) 0 0 0
b (Somewhat accepted) 4.52381 0.47619 5
c (Agreed) 8.142857 0.857143 9
d (Fully agreed) 6.333333 0.666667 7
Total 19 2 21
p Value
Medium (C2 & C4)
0.496585304
Table 4.8 p-value for Efforts for Hidden Talent & its helpfulness – Medium Industries

139
Conclusion
Since the P value (0.49) is more than the significance level (0.05), we accept the null hypothesis. Thus, we conclude that there is no association between Efforts taken to search hidden talents and Benefits to solve crisis/improve organization performance for medium scale organizations.
Chi Square Test of Association was utilized to test Hypothesis H2, i.e., “There is No
formal process to identify Hidden Talent for organizational benefit and solving the skill
related business crisis”.
In Medium organizations investigated by the researcher, no association was found
between the efforts taken to identify “Hidden Talent” and the benefits derived by the
organization in solving the Skill related Business Crisis. The p-value of Chi Square Test
was 0.49
However in the case of Large organization the Chi Square Test indicated an association
between the efforts taken and the benefits. The p-value of the Chi Square Test was 0.01.
The above result point towards / indicate that, possibly the Large organizations do the
better job of identifying “Hidden Talent” for organizational benefits such as solving the
Skill related Business Crisis.
These results when looked at in combination with the statistics about awareness of
concept of “Hidden Talent” in Large and Medium organizations point towards mere
awareness in the Medium sector, but possibly little systematic focused and
institutionalized efforts to leverage “Hidden Talent” in the Medium organizations.

140
So the Null Hypothesis which is Hypothesis 2 states that “There is no formal process to
identify Hidden Talent for Organizational benefit and solving the skill related business
crisis” is accepted.
4.3.3 Hypothesis 3 (H3) - Hidden Talent contributes towards sustainable
organizational growth.
Analysis related to H3:
11 12
65
3
12.09 13.19
71.43
3.30
0
10
20
30
40
50
60
70
80
a)Vertical b)Horizontal c)Both d)Static
No. Of Companies
%
E1 Business Growth
No. Of
Companies %
a)Vertical 11 12.09
b)Horizontal 1412 13.19
c)Both 7665 71.43
d)Static 33 3.3
Null Hypothesis (H30) – “Hidden Talent” does not contribute towards sustainable
organizational growth.
Hypothesis 1 (H3A) - “Hidden Talent” contributes towards sustainable organizational growth.
Table 4.9 Business Growth
Graph 4.35 Business Growth

141
Observed
C1 - E1 HT Awareness V/s Growth E1
C1 Vertical Horizontal Both Static Total
Yes 11 10 64 3 88
No 0 2 1 0 3
Total 11 12 65 3 91
Expected
C1 - E1 HT Awareness V/s Growth E1
C1 Vertical Horizontal Both Static Total
Yes 10.6373626 11.6043956 62.8571429 2.9010989 88
No 0.36263736 0.3956044 2.14285714 0.0989011 3
Total 11 12 65 3 91
p Value
C1 - E1
0.049523
Observed
C2 - E1 HT Efforts V/s Growth E1
C2 Vertical Horizontal Both Static Total
Yes 8 9 60 3 80
No 3 3 5 0 11
Total 11 12 65 3 91
Expected
C2 - E1 HT Efforts V/s Growth E1
C2 Vertical Horizontal Both Static Total
Yes 9.67032967 10.5494505 57.1428571 2.63736264 80
No 1.32967033 1.45054945 7.85714286 0.36263736 11
Total 11 12 65 3 91
p Value
C2 - E1
0.11843
Table 4.10 p-value for Hidden Talent Awareness and business Growth
Table 4.11 p-value for efforts for Hidden Talent and Business Growth

142
Observed
C3 - E1 Types of Efforts for HT V/s Growth
E1
C3 Vertical Horizontal Both Static Total
a) Appeal to Employees 6 7 35 2 51
b)Organizing Competitions 7 8 32 1 48
c)Rewarding Outstanding 8 8 46 1 64
d) Motivating Employees 6 8 47 3 65
Total 27 31 160 7 228
Expected
C3 - E1 Types of Efforts for HT V/s Growth
E1
C3 Vertical Horizontal Both Static Total
a) Appeal to Employees 6.03947368 6.93421053 35.7894737 1.56578947 51
b)Organizing Competitions 5.68421053 6.52631579 33.6842105 1.47368421 48
c)Rewarding Outstanding 7.57894737 8.70175439 44.9122807 1.96491228 64
d) Motivating Employees 7.69736842 8.8377193 45.6140351 1.99561404 65
Total 27 31 160 7 228
p Value
C3 - E1
0.978248
Observed
C4 - E1 Solve Business Crisis & Organization Performance
V/s Growth E1
C4 Vertical Horizontal Both Static Total
Not at all 0 0 1 0 1
Somewhat Accepted 0 6 10 1 18
Agreed 6 3 21 1 31
Fully Agreed 5 3 33 1 42
Total 11 12 65 3 92
Table 4.12 p-value for ways for Hidden Talent and Business Growth
Table 4.13 p-value for Helpfulness to solve Business Crisis & Business Growth

143
Expected
C4 - E1 Solve Business Crisis & Organization Performance
V/s Growth E1
C4 Vertical Horizontal Both Static Total
Not at all 0.11956522 0.13043478 0.70652174 0.0326087 1
Somewhat Accepted 2.15217391 2.34782609 12.7173913 0.58695652 18
Agreed 3.70652174 4.04347826 21.9021739 1.01086957 31
Fully Agreed 5.02173913 5.47826087 29.673913 1.36956522 42
Total 11 12 65 3 92
p Value
C4 - E1
0.190211
Observed
C1 - E2 HT Awareness V/s Turnover / Profit
E2
C1 Increased Decreased Static NA Total
Yes 77 5 3 3 88
No 3 0 0 0 3
Total 80 5 3 3 91
Expected
C1 - E2 HT Awareness V/s Turnover / Profit
E2
C1 Increased Decreased Static NA Total
Yes 77.3626374 4.83516484 2.9010989 2.9010989 88
No 2.63736264 0.16483516 0.0989011 0.0989011 3
Total 80 5 3 3 91
p Value
C1 - E2
0.934702
Observed
C2 - E2 HT Efforts V/s Turnover / Profit
E2
C2 Increased Decreased Static NA Total
Yes 70 5 3 2 80
No 10 0 0 1 11
Total 80 5 3 3 91
Table 4.14 p-value for Awareness & Turnover
Table 4.15 p-value for Efforts for Hidden Talent & Turnover
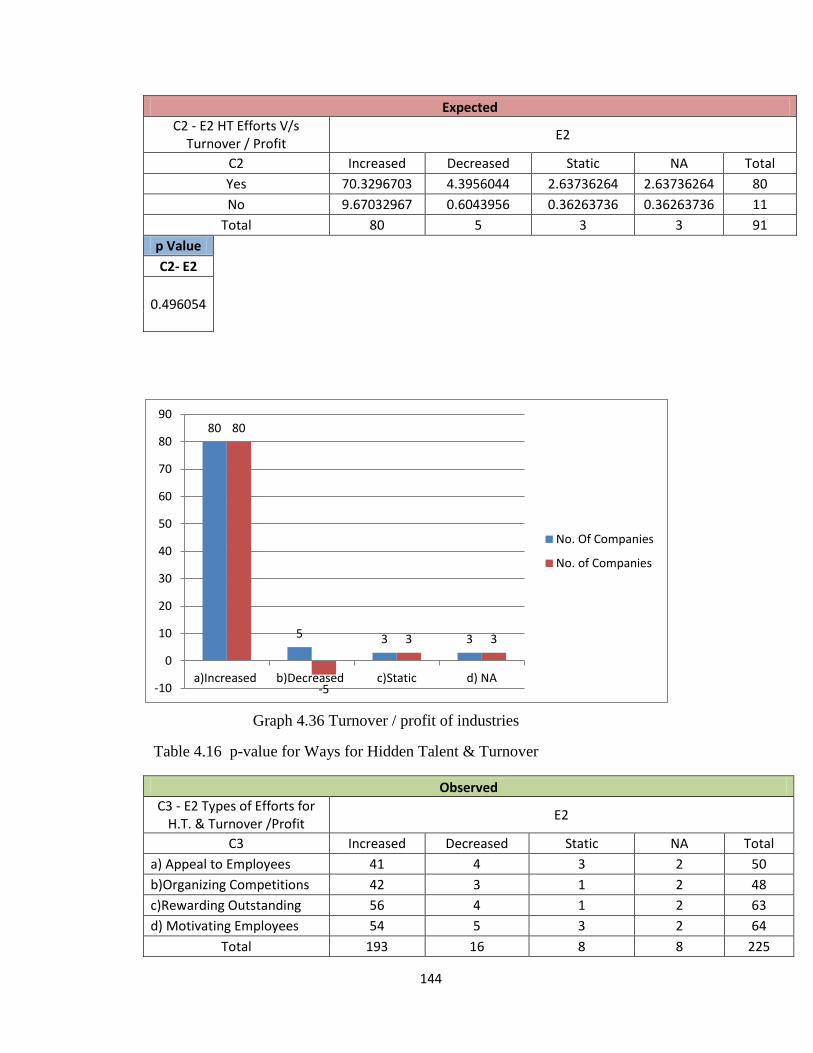
144
Expected
C2 - E2 HT Efforts V/s Turnover / Profit
E2
C2 Increased Decreased Static NA Total
Yes 70.3296703 4.3956044 2.63736264 2.63736264 80
No 9.67032967 0.6043956 0.36263736 0.36263736 11
Total 80 5 3 3 91
p Value
C2- E2
0.496054
Observed
C3 - E2 Types of Efforts for H.T. & Turnover /Profit
E2
C3 Increased Decreased Static NA Total
a) Appeal to Employees 41 4 3 2 50
b)Organizing Competitions 42 3 1 2 48
c)Rewarding Outstanding 56 4 1 2 63
d) Motivating Employees 54 5 3 2 64
Total 193 16 8 8 225
80
5 3 3
80
-5
3 3
-10
0
10
20
30
40
50
60
70
80
90
a)Increased b)Decreased c)Static d) NA
No. Of Companies
No. of Companies
Graph 4.36 Turnover / profit of industries
Table 4.16 p-value for Ways for Hidden Talent & Turnover

145
Expected
C3 - E2 Types of Efforts for H.T. & Turnover /Profit
E2
C3 Increased Decreased Static NA Total
a) Appeal to Employees 42.8888889 3.55555556 1.77777778 1.77777778 50
b)Organizing Competitions 41.1733333 3.41333333 1.70666667 1.70666667 48
c)Rewarding Outstanding 54.04 4.48 2.24 2.24 63
d) Motivating Employees 54.8977778 4.55111111 2.27555556 2.27555556 64
Total 193 16 8 8 225
p Value
C3 - E2
0.978824
Observed
C4 - E2 Solve Business Crisis & Organization Performance
V/s Turnover / Profit E2
C4 Increased Decreased Static NA Total
Not at all 1 0 0 0 1
Somewhat Accepted 14 1 2 0 17
Agreed 28 2 1 0 31
Fully Agreed 37 2 0 3 42
Total 80 5 3 3 91
Expected
C4 - E2 Solve Business Crisis & Organization Performance
V/s Turnover / Profit E2
C4 Increased Decreased Static NA Total
Not at all 0.87912088 0.05494505 0.03296703 0.03296703 1
Somewhat Accepted 14.9450549 0.93406593 0.56043956 0.56043956 17
Agreed 27.2527473 1.7032967 1.02197802 1.02197802 31
Fully Agreed 36.9230769 2.30769231 1.38461538 1.38461538 42
Total 80 5 3 3 91
p Value
C4 - E2
0.44982
Table 4.17 p-value for Helpfulness to solve Business Crisis & Turnover
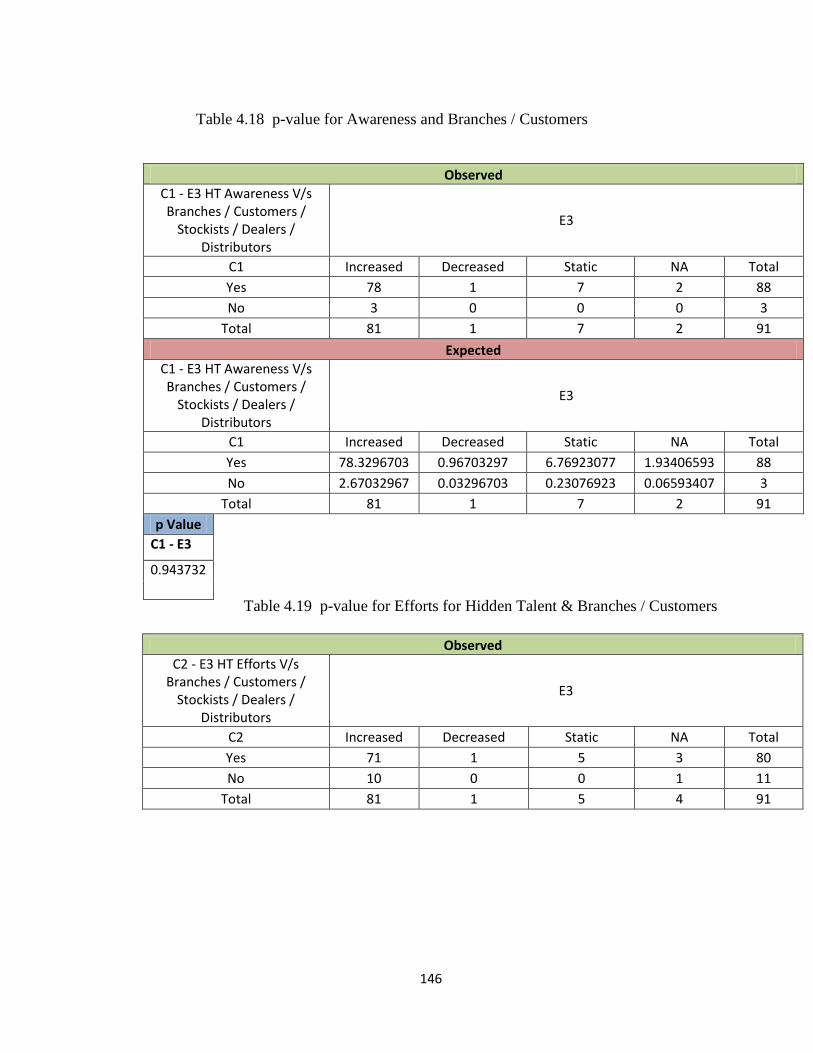
146
Observed
C1 - E3 HT Awareness V/s Branches / Customers /
Stockists / Dealers / Distributors
E3
C1 Increased Decreased Static NA Total
Yes 78 1 7 2 88
No 3 0 0 0 3
Total 81 1 7 2 91
Expected
C1 - E3 HT Awareness V/s Branches / Customers /
Stockists / Dealers / Distributors
E3
C1 Increased Decreased Static NA Total
Yes 78.3296703 0.96703297 6.76923077 1.93406593 88
No 2.67032967 0.03296703 0.23076923 0.06593407 3
Total 81 1 7 2 91
p Value
C1 - E3
0.943732
Observed
C2 - E3 HT Efforts V/s Branches / Customers /
Stockists / Dealers / Distributors
E3
C2 Increased Decreased Static NA Total
Yes 71 1 5 3 80
No 10 0 0 1 11
Total 81 1 5 4 91
Table 4.19 p-value for Efforts for Hidden Talent & Branches / Customers
Table 4.18 p-value for Awareness and Branches / Customers

147
Expected
C2 - E3 HT Efforts V/s Branches / Customers /
Stockists / Dealers / Distributors
E3
C2 Increased Decreased Static NA Total
Yes 71.2087912 0.87912088 4.3956044 3.51648352 80
No 9.79120879 0.12087912 0.6043956 0.48351648 11
Total 81 1 5 4 91
p Value
C2 - E3
0.692085
Observed
C3 - E3 Types of Efforts for HT V/s Branches /
Customers / Stockists / Dealers / Distributors
E3
C3 Increased Decreased Static NA Total
a) Appeal to Employees 43 0 5 2 50
b)Organizing Competitions 43 0 3 2 48
c)Rewarding Outstanding 57 0 4 2 63
d) Motivating Employees 56 1 5 2 64
Total 199 1 17 8 225
Expected
C3 - E3 Types of Efforts for HT V/s Branches /
Customers / Stockists / Dealers / Distributors
E3
C3 Increased Decreased Static NA Total
a) Appeal to Employees 44.2222222 0.22222222 3.77777778 1.77777778 50
b)Organizing Competitions 42.4533333 0.21333333 3.62666667 1.70666667 48
c)Rewarding Outstanding 55.72 0.28 4.76 2.24 63
d) Motivating Employees 56.6044444 0.28444444 4.83555556 2.27555556 64
Total 199 1 17 8 225
p Value
C3 - E3
.948287
Table 4.20 p-value for Ways for Hidden Talent & Branches / Customers
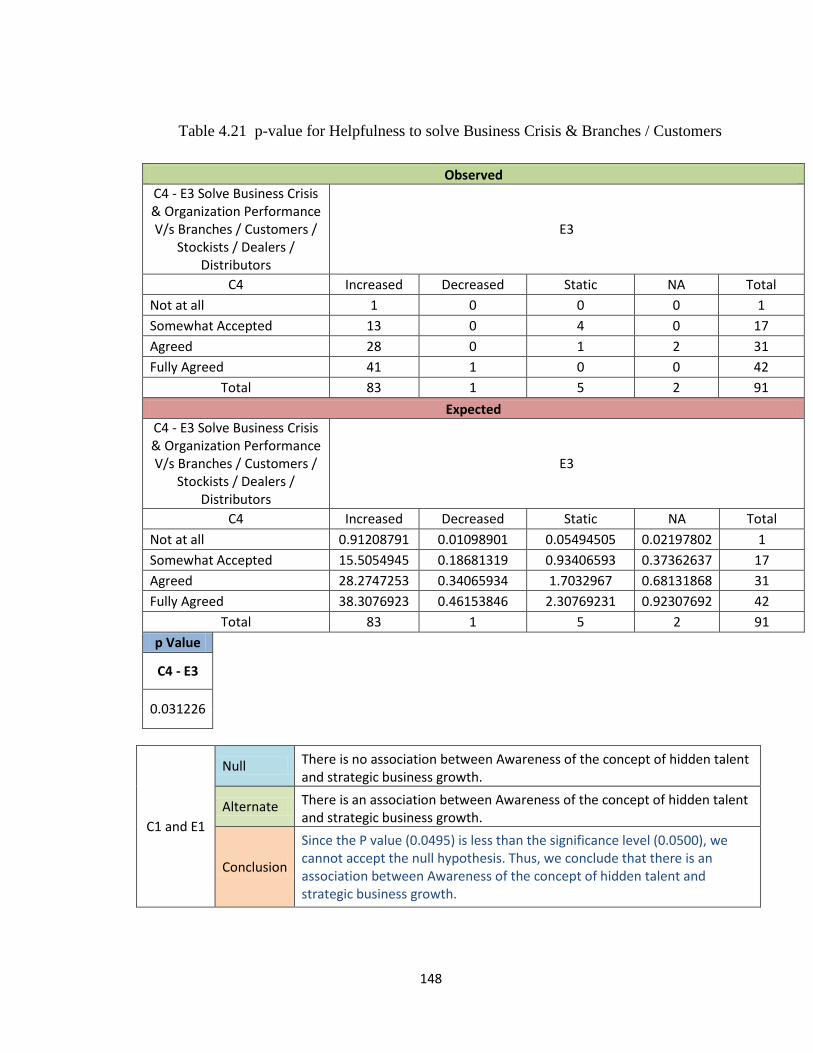
148
Observed
C4 - E3 Solve Business Crisis & Organization Performance V/s Branches / Customers /
Stockists / Dealers / Distributors
E3
C4 Increased Decreased Static NA Total
Not at all 1 0 0 0 1
Somewhat Accepted 13 0 4 0 17
Agreed 28 0 1 2 31
Fully Agreed 41 1 0 0 42
Total 83 1 5 2 91
Expected
C4 - E3 Solve Business Crisis & Organization Performance V/s Branches / Customers /
Stockists / Dealers / Distributors
E3
C4 Increased Decreased Static NA Total
Not at all 0.91208791 0.01098901 0.05494505 0.02197802 1
Somewhat Accepted 15.5054945 0.18681319 0.93406593 0.37362637 17
Agreed 28.2747253 0.34065934 1.7032967 0.68131868 31
Fully Agreed 38.3076923 0.46153846 2.30769231 0.92307692 42
Total 83 1 5 2 91
p Value
C4 - E3
0.031226
C1 and E1
Null There is no association between Awareness of the concept of hidden talent and strategic business growth.
Alternate There is an association between Awareness of the concept of hidden talent and strategic business growth.
Conclusion
Since the P value (0.0495) is less than the significance level (0.0500), we cannot accept the null hypothesis. Thus, we conclude that there is an association between Awareness of the concept of hidden talent and strategic business growth.
Table 4.21 p-value for Helpfulness to solve Business Crisis & Branches / Customers

149
C1 and E2
Null There is no association between Awareness of the concept of hidden talent and impact on profit.
Alternate There is an association between Awareness of the concept of hidden talent and impact on profit.
Conclusion Since the P value (0.9347) is more than the significance level (0.05), we accept the null hypothesis. Thus, we conclude that there is no association between Awareness of the concept of hidden talent and impact on profit.
C1 and E3
Null There is no association between Awareness of the concept of hidden talent and market business growth.
Alternate There is an association between Awareness of the concept of hidden talent and market business growth.
Conclusion
Since the P value (0.9437) is more than the significance level (0.05), we accept the null hypothesis. Thus, we conclude that there is no association between Awareness of the concept of hidden talent and market business growth.
C2 and E1
Null There is no association between Efforts taken to search hidden talents and strategic business growth.
Alternate There is an association between Efforts taken to search hidden talents and strategic business growth.
Conclusion
Since the P value (0.1184) is more than the significance level (0.05), we accept the null hypothesis. Thus, we conclude that there is no association between Efforts taken to search hidden talents and strategic business growth.
C2 and E2
Null There is no association between Efforts taken to search hidden talents and impact on profit.
Alternate There is an association between Efforts taken to search hidden talents and impact on profit.
Conclusion Since the P value (0.4960) is more than the significance level (0.05), we accept the null hypothesis. Thus, we conclude that there is no association between Efforts taken to search hidden talents and impact on profit.
C2 and E3
Null There is no association between Efforts taken to search hidden talents and market business growth.
Alternate There is an association between Efforts taken to search hidden talents and market business growth.
Conclusion
Since the P value (0.6920) is more than the significance level (0.05), we accept the null hypothesis. Thus, we conclude that there is no association between Efforts taken to search hidden talents and market business growth.

150
C3 and E1
Null There is no association between Efforts taken to nurture and develop hidden talents and strategic business growth.
Alternate There is an association between Efforts taken to nurture and develop hidden talents and strategic business growth.
Conclusion
Since the P value (0.9782) is more than the significance level (0.05), we accept the null hypothesis. Thus, we conclude that there is no association between Efforts taken to nurture and develop hidden talents and strategic business growth.
C3 and E2
Null There is no association between Efforts taken to nurture and develop hidden talents and impact on profit.
Alternate There is an association between Efforts taken to nurture and develop hidden talents and impact on profit.
Conclusion
Since the P value (0.9788) is more than the significance level (0.05), we accept the null hypothesis. Thus, we conclude that there is no association between Efforts taken to nurture and develop hidden talents and impact on profit.
C3 and E3
Null There is no association between Efforts taken to nurture and develop hidden talents and market business growth.
Alternate There is an association between Efforts taken to nurture and develop hidden talents and market business growth.
Conclusion
Since the P value (0.9482) is more than the significance level (0.05), we accept the null hypothesis. Thus, we conclude that there is no association between Efforts taken to nurture and develop hidden talents and market business growth.
C4 and E1
Null There is no association between Benefits to solve crisis/improve organization performance and strategic business growth.
Alternate There is an association between Benefits to solve crisis/improve organization performance and strategic business growth.
Conclusion
Since the P value (0.1902) is more than the significance level (0.05), we accept the null hypothesis. Thus, we conclude that there is no association between Benefits to solve crisis/improve organization performance and strategic business growth.

151
Sustainable organizational growth was measured using the three dimensions of
a. Vertical / horizontal growth
b. Increase in top line / bottom line (Turnover = top line, profitability = bottom
line)
c. Increase in distribution network
Likewise contribution of “Hidden Talent” was measured along the parameter of
awareness of the concept, efforts for identification of “Hidden Talent”, variety / types of
efforts and utility to solve business crisis.
H3 was tested using 12 pairs of cross tabulation (Four aspects of “Hidden Talent” and
three aspects of business growth) and Chi Square Test of Association utilized.
C4 and E2
Null There is no association between Benefits to solve crisis/improve organization performance and impact on profit.
Alternate There is an association between Benefits to solve crisis/improve organization performance and impact on profit.
Conclusion
Since the P value (0.4498) is more than the significance level (0.05), we accept the null hypothesis. Thus, we conclude that there is no association between Benefits to solve crisis/improve organization performance and impact on profit.
C4 and E3
Null There is no association between Benefits to solve crisis/improve organization performance and market business growth.
Alternate There is an association between Benefits to solve crisis/improve organization performance and market business growth.
Conclusion
Since the P value (0.0312) is less than the significance level (0.05), we cannot accept the null hypothesis. Thus, we conclude that there is an association between Benefits to solve crisis/improve organization performance and market business growth.

152
Except for the 2 cases out of 12 cases association was found between utility to solve
business crisis and increase in distribution network, no association was found in any other
case.
These results suggest that, there might be other dimensions at play in the relationship
between “Hidden Talent” and Business Growth.
So the Null Hypothesis that “Hidden Talent does not contribute towards sustainable
organizational Growth” is accepted and the Hypothesis 3 which states that “Hidden
Talent contributes towards Sustainable Organizational Growth” is rejected.

153
Chapter 5
Findings & Conclusion, Suggestions & Recommendations
5.1 Major Findings:
Researcher was trying to find out relation between different parameters e.g., search of
hidden talent, impact of losing key talent, relation of the both to solve business crisis and
organizational performance for select manufacturing and service sector industries in Pune
region and the major findings are as follow:
1. Due to globalization, manufacturing as well as service industries are facing
tremendous challenges due to neck to neck competition. To retain and win over they
need to implement various qualitative strategies to not only employ the talented
employees, but also to retain them. The concept of ‘key knowledge holders’ has
become obsolete nowadays and finding right job is a challenge. Ample availability of
opportunities for key performers gave rise in challenge for long term relationship
between employees and employers, retention of ‘key performers’.
2. Researcher has focused on “Hidden Talent Search of Employees” above worker level
(mainly focused on Junior Management level as well as few people from Top and
Middle Management level). Competition in manufacturing as well as service sectors
resulted into business loss for few industries, while trying to sustain with their
business growth. Start-ups, NGOs, changed policies for recruitment / retention are
helping big organizations to sustain the business growth.

154
3. Service industries are more focused on training on soft skills as compared to other
types of training, and manufacturing industries are more focused on technical training
than other types of training.
4. Large scale manufacturing as well as service industries are giving equal importance to
training in soft skills and technical skills.
5. Medium scale manufacturing industries are giving more importance to technical
training than medium scale service industries.
6. Training on succession planning is more practiced by large scale industries as
compared to medium scale industries.
7. Priority of training can be summarized as follows:
Table 5.1 Priority of Training
Sr.
No.
Industries
Types of Training
Manufacturing Service
Large Medium Large Medium
1 Soft Skill Training √ √ √ √
2 Technical Training √ √ √ --
3 Succession Planning √ -- √ √
4 Additional inputs
for Training,
Industry - wise
√ -- √ --
8. Thus, many of the large scale organizations plan ahead about their training needs with
different context as mentioned above march ahead in achieving their business
performance. As against this certain medium scale organizations although are
achieving business success however face certain problems in different phases towards
achieving their desired sustainable performance.
155
9. For both, manufacturing and service industries, some abilities are very common, i.e.,
high order and low order thinking skills, basic soft skills and hard skills. In addition
to these basic skills, some proficiency is looked for specific domain. These sector
wise expertise required are:
a. For manufacturing industries:
i. Technical skills
ii. Product(s) related skills
iii. Job related skills
iv. Project related skills
v. Negotiation skills
vi. Six Sigma, SAP, TQM, Lean manufacturing, etc.
b. For service industries:
i. Presentation
ii. Problem solving
iii. Communication
iv. Conflict solving
v. Customer management
vi. Hospitality
10. During the period of 2010 – 2017, out of 91 organizations, 37 organizations have
been positively doing some amount of hidden talent search. Although during the
survey, researcher was not given any official document about hidden talent search as
well as exact percentage of attrition as the area / topic was sensitive enough and
confidential also.

156
However, after interacting, discussing with many of the respondents, they agreed the
value and importance of hidden talent search. Further they told that due to observing
hidden talent search process in these organizations they could succeed in reducing the
attrition rate at junior and middle level employees to a limited extent.
5.2 Conclusions:
1. Organizations understood the need of training, but they are not serious about
“Training need identification”, which was proved during the study. The details are as
follows:
i. Companies are not having any action plan on feedback and outcome of training
programme conducted. Because of such policies, due weightage / cognizance is
not given to quality of training as well as feedback of training.
ii. This has sometimes resulted into not only the low quality of work performed by
trained employees, as also few talented employees leave their job. All this results
into high attrition rate amongst companies.
2. There is awareness of “Hidden talent” in industries, but efforts to nurture and develop
the same were not taken for use of “One solution for multiple problems”.
3. Out of the three hypotheses proposed by the researcher, two were proved and one
was disproved and mentioned as follows:
i. There is an awareness about the concept of “Hidden Talent” in Large and
Medium size organizations. : Proved
ii. There is no formal process to identify “Hidden Talent” for Organizational Benefit
and solving the Skill related Business Crisis : Proved

157
iii. Hidden Talent contributes towards Sustainable Organizational Growth :
Disproved
4. Search for Hidden Talent and its correlation among 91 units and impact on
organizational performance indicators are mentioned below. Out of 91 industries the
respondents who gave following views were from 70 large and remaining 21 from
medium.
i. Increase in sales / turnover
ii. Increase in number of branches / franchises
iii. Increase in customer base, increase in repeat customers with repeat orders
iv. Increase in in-flow of / joining of new talented employees because of referral
scheme
v. Increase in export
vi. Increase in morale of employees
Out of total parameters mentioned in questionnaire (13 parameters) excluding
above mentioned 6 parameters, majority of the respondent units, either they were
silent or hesitant to opine or were unable to express because of non-availability of
correct information / data with them. Hence the researcher could make
observation, and made finding on the basis of available information.
5. Attrition rate at junior level employees is high as compared to middle and senior level
employees across organizations. At present it varies between 15 % to 25 % in general
as reported by respondents.
6. It was experienced during survey that when the question about hidden talent search
and its acquisition was posed before employees at different levels of the industries,

158
three respondents expressed that there is no such process in the organization.
7. For few questions, the respondents had hesitation to answer due to company policy.
(e.g., actions on feedback after training of employees, performance appraisal process,
etc.) But when the same questions were reframed or tactfully asked with different
perspective, the researcher could get few answers from them.
8. HR consultancy firms can be given assignments on “Hidden talent search within the
organization” and its relation with skill and business crisis, sustainable business
growth along with organizational performance and such related studies.
5.3 Suggestions:
There should be continuous efforts made by Top management and Owners to see that
appropriate monitoring and tracking of performance at junior level employees is made,
observing them through “Hidden talent search process” for making them not only capable
and satisfied employees but the “True Asset” of the organization.
5.4 Solution:
On the backdrop of exponential growth of service sector due to liberal policy of
government of India to improve various types of customer services in different service
sector industries, naturally contribution of service sector in GDP (Gross Domestic
Product) stood at 57 % in the year 2013-14.
As against above, manufacturing sector though it made efforts to march ahead, however
could not achieve the set target due to various reasons and factors responsible.
Explanation is as follows:

159
In both of the above sectors talent recruitment, engagement, development and retention
has seen as a difficult task: Especially in service sector where more openings for the
freshers were made available, however due to heavy competition amongst each other,
every service sector organization in private as well as public sector (services like
banking, insurance, etc.) tried hard to satisfy customers having number of alternatives in
the market.
In manufacturing sector due to heavy taxes, duty, severe competition for Indian
companies from foreign companies in making innovative products, their pricing strategy,
international business environmental factors resulted into lagging behind the service
sector.
After interacting with both types of responding organizations it was observed that
irrespective of external factors, talent acquisition, assessment and retention has bound to
be an herculean task for them.
Due to high attrition rate at junior or middle level employees, where there is a tendency
of making frequently switch over of jobs which led to skill crisis and ultimately to
business crisis and loss.
Hence, to reduce attrition rate by searching and retaining “Hidden Talent” is considered
as appropriate solution which was unanimously accepted by these respondents.
5.4.1 Suggested Model :
Based on the research undertaken by researcher following model is suggested showing
hidden talent search process and its impact.

160
1. Business needs for Organization:
OUTPUT IN POSITIVE UPWARD DIRECTION
INPUT PROCESS
OUTPUT IN NEGATIVE MANNER
Model of Strategic Process Showing
Hidden Talent Search and its Impact POSITIVE OUTCOME
NEGATIVE OUTCOME
PROCESS
OF
HIDDEN
TALENT
SEARCH
START

161
1. Business Needs for Organization:
Every organization do need certain type of human resources as per the business
requirement laid down by Top Management of the organization which may be unique
for a particular type of industry. E.g., Skill sets knowledge, behavior, demographic
circumstances, etc.
2. Recruitment and Selection:
Based on the inputs from Top Management, HR department of every organization
collect the data from aspirant candidates and completes the process of manpower
hiring.
3. Training and Development:
All selected Human Resources through the process of Recruitment and Selection are
undergoing training at initial level which is known as induction training.
4. Employee Engagement:
Successful employees after training are given ‘Actual Job within the organization’.
5. Employee Performance and Retention:
At regular intervals decided by individual organization, performance evaluation of all
employees is conducted. Here every organization receives the real view of human
resource strength of the organization in positive and negative sense.
The real challenge for every Human Resource Practitioner lies here only.
162
There is a threat of migration of human talent due to various reasons and this
way of migration of talent leads to any organization for unwanted situation e.g.,
loss of talent, high cost of repeat recruitment, hampering growth, uncertain
future, etc.
To overcome this ‘Hurdle’, every HR practitioner needs to follow further steps
as mentioned.
6. Efforts to Retain through Hidden Talent:
Every organization needs to understand the “Hidden Talent within the Organization”
through various ways.
7. Skills Up-gradation Process:
The searched hidden talent needs to be nurtured and the acquired skills need to be
upgraded in subsequent time span.
8. Career Plan:
A separate career plan needs to be prepared and executed by the organization for all
such employees searched through ‘hidden talent hunt’.
9. Employee Performance:
The outcome of all above mentioned steps from 1 to 8 and execution of separate
career plan leads to excellent performance of individual employee always.
* As every organization strives hard to successfully achieve its goals with
suitable vision and mission, however certain hurdles do limit their performance.

163
Especially for better organizational performance it is extremely necessary to
identify and properly utilized hidden talent within the organization which
ultimately leads to sustainable growth.
Hence if the above model is utilized by the organization, at proper time, with
properly defined objectives it can certainly bring positive result.
5.5 Recommendation:
Further research could be undertaken to closely investigate relationships between Hidden
Talent Search within the organization and business growth; and ascertain whether any
mediating variables like any other aspects / points which are beyond the scope of this
research exist in the context.

i
References
Chapter 1
1. https://nationalarchives.gov.uk/documents/education/factory-actdoc.pdf
2. http://www.brighthubpm.com/resource-management/77199-walking-down-the-
timeline-of-hr-management-how-has-it-evolved/
3. https://www.britannica.com/topic/organized-labor
4. http://www.siop.org/tip/backissues/tipjan98/may.aspx
5. http://www.macmillandictionary.com/dictionary/british/hidden_1
6. http://www.channel4.com/programmes/hidden-talent
7. http://www.mcassociatesinc.com/finding-hidden-talent-in-your-organization/
8. Employment Practices and Employability of the Hidden Talent Pool: The Mature
Workers, CEDEC, page no. 1-26, Survey Report, Charles Shahar, October 2012
9. Hidden Talents II: Re-engaging Young People, the Local Offer, Local
Government Association, L 12-783, page no. 1-78, January 2013, David
Simmonds, Peter Box CBE
10. Solving the skills crisis, Outlook – The Journal of High-Performance Business
(Accenture), Number 3, page no. 1-12, Article, 2011
11. India Talent Survey Report 2012 – Perspectives on Young Talent in India,
Jeffschwartz, Pooja Bajpai, Deloitt, AIMA, July 2012
12. Employability and Skill Set of Newly Graduated Engineers in India, Andreas
Blom, Heroshi Saeki, The World Bank, South Asia Region Education Team, April
2011, Policy, Research Working Paper (WPS 5640)
13. https://economictimes.indiatimes.com/slideshows/work-career/top-career-trends-
of-2017/hot-career-trends-skills-in-demand-for-2017/slideshow/56351276.cms
ii
14. India to Face Huge Skill Gaps due to Low Employability,
rediff.com_Business_March 23, 2010
15. http://www.nsdcindia.org/organisation-profile
16. Business Today Cover Story, March 31, 2013 –
http://www.businesstoday.in/magazine/cover-story/companies-work-towards-
skills-gap-in-india/story/193097.html
17. National Skill Development Corporation (NSDC) engaged ICRA Management
Consulting Services Limited (IMaCS) to prepare this report .District wise Skill
gap Study for the state of Maharashtra (2012-17, 2017-22)
www.nsdcindia.org/sites/default/files/files/maha-sg-reports.pdf
Chapter 2
18. Hidden Talent – How Leading Companies Hire, Retain and Benefit from People
with Disabilities, Mark L. Lelgnick-Hall, Praegr West Port, Connecticut, London,
2007
19. The Talent Edge – A Behavioural Approach to Hiring, Developing, and Keeping
Top Performers, David S. Cohen, Wiley India Pvt. Ltd., Reprint 2007, pp
5,6,19,26,50,55,65,66,75 to 88, 112
20. Talent - Making People Your Competitive Advantage, Edward E. Lawler III,
Jossey – Bass, First Ed, 2008.
21. Talent on Demand – Managing Talent in an Age of Uncertainty, Peter Cappelli,
Harvard Business Press, 2008, pp 5 to 7, 10 to 21
22. Talent is Never Enough: Discover the Choices That Will Take You Beyond Your
Talent, John C. Maxwell, Pearson Power, 2008, pp 1-10, 273 – 275

iii
23. Leadership Talent in Asia – How the Best Employers Deliver Extra Ordinary
Performance, Mick Bennett, Andrew Bell, Hewitt, Wiley India Pvt. Ltd., Reprint
2009, pp 55, 79, 117, 217
24. Reality Bytes – The Role of HR in Today’s World: A Contemporary Ready
Reckoner, Aparna Sharma, Foreword by Dr. T. V. Rao, Vishwakarma
Publications, 2015, pp 148 to 183
25. Skills Development for Inclusive and Sustainable Growth in Developing Asia –
Pacific; Technical and Vocational Education and Training: Issues, Concerns and
Prospects, Volume 19, 2013, Springer
26. The seven business Crises – How to Beat Them, Tata McGraw – Hill Publishing
Company Limited, 1995, V G Patel
27. Strategic Management – Creating Value in Turbulent Times – Wiley Student
Edition, 2005, Peter Fitzroy and James Hulbert, Chapter 12: Measuring
Organizational Performance, page 351 to 388
28. The Impact of Perception of Human Resource Management Practices, Chapter
No. 5, The Impact of Perception of Human Resource Management Practices on
Perceived Organizational Performance, Dr. P. Thirumalvalavan, Kirupa
Priyadarsini M, Sunitha K, page 43 to 49
29. A Study of Hidden Talent Management of Employees in IT Sector with Reference
to Pune City, International Journal of Business and Management Tomorrow,
ISSN: 2249-9962, Vol. 2, No. 7, page no. 1-6, July 2012, Rajesh Kumar Agrawal,
Dr. Daniel J Penkar

iv
30. Talent Attrition and Retention: Strategic Challenges for Indian Industries in the
Next Decade, Lichia Yiu, Raymond Saner, Elite Research Journal of Accounting
and Business Management Vol. 2(1), pp. 1-9, January, 2014
31. Future of HR Management in Indian Scenario: Issues and Challenges, Saleena
Khan, Bhawna Chahar, Asian Journal of Management Research, ISSN 2229 –
3795, 2011
32. Talent Management Scenario in the Banking Industry, Dr. Siddarth Singh Bist,
Ms. Nidhi Srivastava, Paripex – Indian Journal of Research, Volume: 2, Issue: 4,
April 2013, ISSN – 2250-1991
33. Strategic Talent Management: A Review and Research Agenda, David G
Collings, Kamal Mellahi, Human Resource Management Review 19 (2009), 304 –
313, Elsevier, Journal homepage:www.elsevier.com/locate/humres
34. Growing Talent as if Your Business Dependent on it, Jeffery M Cohn, Rakesh
Khurana and Laura Reeves, Harvard Business Review on Talent Management,
Harvard Business Press, Reprint 2008 – RO510C
35. Make Your Company A Talent Factory, Douglas A. Ready and Jay A. Conger,
Harvard Business Review on Talent Management, Harvard Business Press,
Reprint 2008 – RO706D
36. How to Keep Your Top Talent, Jean Martin, Conrad Schmidt, Harvard Business
Review, 2010 Addressing the Skills Shortage in Financial Services by Better
Assessing Internal Talent, Sean Conrad, March 2012
37. The New Path to the C-Suite, Boris Groysberg, L. Kevin Kelly, and Bryan
MacDonald, Harvard Business Review, 2011

v
38. A Study of HRD Concepts, Structure of HRD Departments, and HRD Practices in
India, T V Rao, Raju Rao, Taru Yadav, Vikalpa, Vol. 26, No. 1, January-March
2007
39. Revitalizing Growth with Hidden Talent, Babson Executive Education, White
Paper, 2007, Susan Foley
40. People Development – The Bharat Forge Way, Dr. S. V. Bhave, MCCIA
Sampada, September 2011.
41. Employability and Skill Set of Newly Graduated Engineers in India, Andreas
Blom, Heroshi Saeki, The World Bank, South Asia Region Education Team, April
2011, Policy, Research Working Paper (WPS 5640)
42. Perspectives on Skill Development in Maharashtra Matching aspirations to
opportunities, Delloite knowledge paper for SkillCon India, March 2013
43. The Interface Year Book 2014, Global Talent Track, Power Ahead
44. Managing the Talent Crisis in Global Manufacturing – Strategies to Attract and
Engage Generation Y, Deloitte, ISBN 1-934025-02-X, page no. 1-20, 2007
45. Spotting Talent, Catalyst Organization Development Consultancy, 2009
46. People and Change: Hidden Talents – Optimizing Investments in Talent
Management, KPMG, RRD-161020, page no. 1-10, Advisory Report, September
2009
47. India Talent Survey Report 2012 – Perspectives on Young Talent in India,
Jeffschwartz, Pooja Bajpai, Deloitt, AIMA, July 2012
48. Employment Practices and Employability of the Hidden Talent Pool: The Mature
Workers, CEDEC, page no. 1-26, Survey Report, Charles Shahar, October 2012

vi
49. Paradigm Shift – Building a New Talent Management Model to Boost Growth,
Beth Brooke, Dina A. Pyron, Peter Matthews, Bill Leisy, Ernst and Young, 2012
50. National Employability Report ‘Graduates’, Annual Report 2013, Aspiring Minds
51. Hidden Talents II: Re-engaging Young People, the Local Offer, Local
Government Association, L 12-783, page no. 1-78, January 2013, David
Simmonds, Peter Box CBE
52. Building the Right High Potential Pool – How Organizations Define, Assess, and
Calibrate Their Critical Talent, Lorraine Stomski, Jill Attkisson, Aon Hewitt,
January 2013
53. The Great Talent Shortage Awakening: Actions to Take for A Sustainable
Workforce, Manpower Group, 2013
54. The India Skills Report, People Strong, Wheebox, CII, 2014
55. Totalling the Hidden Talent – Youth unemployment and underemployment in
England and Wales, Laura Gardiner, March 2014, A Report Commissioned from
the Centre for Economic and Social Inclusion by the Local Government
Association
56. Hidden Talent: Opportunities for action, Boston Consulting Group,, page no. 1-4,
article, July 2007, Anders Fahlander, Angela Schwartz
57. Solving the skills crisis, Outlook – The Journal of High-Performance Business
(Accenture), Number 3, page no. 1-12, Article, 2011
58. Modern HR in the Cloud – Building Critical Talent Pipelines – Creating a Plan for
Staffing Critical Job Roles, Oracle Corporation, 2013

vii
59. 4th CII Global Summit on Skills Development, 29-30 November 2010, Trident,
Nariman Point, Mumbai, Confederation of Indian Industry since 1895 (CII), page
no. 1,2,3, 69 – 86
60. A Study of Hidden Talent Management in same Status Employees with Special
Reference to Industries in Pimpri-Chinchwad (2000 to 2010), Thesis submitted in
2013
61. The Talent Within: Finding Your Hidden Gems, Article, August 2008, Kevin
Wheeler
62. Unleash the Hidden Talents of Your Employees, Article, July 2009, Ethan Chazin
63. Winning the Talent War in Local Markets by Staying Global, Matthew Pettigrew,
2012
64. Find the Hidden Talent in your Organization, Article, April 2013, Patrick Gray
65. Discovering Hidden Talent within Your Organization, Article, Paul Hebert
Chapter 3
66. https://www.dnb.co.in/smepune2010/ClusterOverview.asp
67. Dcmsme.gov.in/dips/IPS%20Pune%20New.pdf Brief Industrial Profile of Pune
District, MSME Development Institute, Ministry of MSME, Government of India,
Kurla Andheri Road, Sakinaka, Mumbai. 72; www.msmedimumbai.gov.in
68. http://www.raosoft.com/samplesize.html
69. Ministry of MSME, New.pdf

viii
BIBLIOGRAPHY
Books:
1. Hidden Talent – How Leading Companies Hire, Retain and Benefit from People with
Disabilities, Mark L. Lelgnick-Hall, Praegr West Port, Connecticut, London, 2007
2. The Talent Edge – A Behavioural Approach to Hiring, Developing, and Keeping Top
Performers, David S. Cohen, Wiley India Pvt. Ltd., Reprint 2007, pp
5,6,19,26,50,55,65,66,75 to 88, 112
3. Talent - Making People Your Competitive Advantage, Edward E. Lawler III, Jossey –
Bass, First Ed, 2008.
4. Talent on Demand – Managing Talent in an Age of Uncertainty, Peter Cappelli,
Harvard Business Press, 2008, pp 5 to 7, 10 to 21
5. Talent is Never Enough: Discover the Choices That Will Take You Beyond Your
Talent, John C. Maxwell, Pearson Power, 2008, pp 1-10, 273 – 275
6. Leadership Talent in Asia – How the Best Employers Deliver Extra Ordinary
Performance, Mick Bennett, Andrew Bell, Hewitt, Wiley India Pvt. Ltd., Reprint
2009, pp 55, 79, 117, 217
7. Reality Bytes – The Role of HR in Today’s World: A Contemporary Ready Reckoner,
Aparna Sharma, Foreword by Dr. T. V. Rao, Vishwakarma Publications, 2015, pp
148 to 183

ix
8. Skills Development for Inclusive and Sustainable Growth in Developing Asia –
Pacific; Technical and Vocational Education and Training: Issues, Concerns and
Prospects, Volume 19, 2013, Springer
9. The seven business Crises – How to Beat Them, Tata McGraw – Hill Publishing
Company Limited, 1995, V G Patel
10. Strategic Management – Creating Value in Turbulent Times – Wiley Student Edition,
2005, Peter Fitzroy and James Hulbert, Chapter 12: Measuring Organizational
Performance, page 351 to 388
11. The Impact of Perception of Human Resource Management Practices, Chapter No. 5,
The Impact of Perception of Human Resource Management Practices on Perceived
Organizational Performance, Dr. P. Thirumalvalavan, Kirupa Priyadarsini M,
Sunitha K, page 43 to 49
Research Jouranls:
12. A Study of Hidden Talent Management of Employees in IT Sector with Reference to
Pune City, International Journal of Business and Management Tomorrow, ISSN:
2249-9962, Vol. 2, No. 7, page no. 1-6, July 2012, Rajesh Kumar Agrawal, Dr.
Daniel J Penkar
13. Talent Attrition and Retention: Strategic Challenges for Indian Industries in the Next
Decade, Lichia Yiu, Raymond Saner, Elite Research Journal of Accounting and
Business Management Vol. 2(1), pp. 1-9, January, 2014
14. Future of HR Management in Indian Scenario: Issues and Challenges, Saleena Khan,
Bhawna Chahar, Asian Journal of Management Research, ISSN 2229 – 3795, 2011

x
15. Talent Management Scenario in the Banking Industry, Dr. Siddarth Singh Bist, Ms.
Nidhi Srivastava, Paripex – Indian Journal of Research, Volume: 2, Issue: 4, April
2013, ISSN – 2250-1991
16. Strategic Talent Management: A Review and Research Agenda, David G Collings,
Kamal Mellahi, Human Resource Management Review 19 (2009), 304 – 313,
Elsevier, Journal homepage:www.elsevier.com/locate/humres
Research Magazines:
17. Growing Talent as if Your Business Dependent on it, Jeffery M Cohn, Rakesh
Khurana and Laura Reeves, Harvard Business Review on Talent Management,
Harvard Business Press, Reprint 2008 – RO510C
18. Make Your Company A Talent Factory, Douglas A. Ready and Jay A. Conger,
Harvard Business Review on Talent Management, Harvard Business Press, Reprint
2008 – RO706D
19. How to Keep Your Top Talent, Jean Martin, Conrad Schmidt, Harvard Business
Review, 2010 Addressing the Skills Shortage in Financial Services by Better
Assessing Internal Talent, Sean Conrad, March 2012
20. The New Path to the C-Suite, Boris Groysberg, L. Kevin Kelly, and Bryan
MacDonald, Harvard Business Review, 2011
21. A Study of HRD Concepts, Structure of HRD Departments, and HRD Practices in
India, T V Rao, Raju Rao, Taru Yadav, Vikalpa, Vol. 26, No. 1, January-March
2007

xi
White Paper:
22. Revitalizing Growth with Hidden Talent, Babson Executive Education, White Paper,
2007, Susan Foley
Seminar and Conference – Research paper, research article, proceeding:
23. People Development – The Bharat Forge Way, Dr. S. V. Bhave, MCCIA Sampada,
September 2011.
24. Employability and Skill Set of Newly Graduated Engineers in India, Andreas Blom,
Heroshi Saeki, The World Bank, South Asia Region Education Team, April 2011,
Policy, Research Working Paper (WPS 5640)
25. Perspectives on Skill Development in Maharashtra Matching aspirations to
opportunities, Delloite knowledge paper for SkillCon India, March 2013
26. The Interface Year Book 2014, Global Talent Track, Power Ahead
Survey Reports
27. Managing the Talent Crisis in Global Manufacturing – Strategies to Attract and
Engage Generation Y, Deloitte, ISBN 1-934025-02-X, page no. 1-20, 2007
28. Spotting Talent, Catalyst Organization Development Consultancy, 2009
29. People and Change: Hidden Talents – Optimizing Investments in Talent
Management, KPMG, RRD-161020, page no. 1-10, Advisory Report, September
2009
30. India Talent Survey Report 2012 – Perspectives on Young Talent in India,
Jeffschwartz, Pooja Bajpai, Deloitt, AIMA, July 2012

xii
31. Employment Practices and Employability of the Hidden Talent Pool: The Mature
Workers, CEDEC, page no. 1-26, Survey Report, Charles Shahar, October 2012
32. Paradigm Shift – Building a New Talent Management Model to Boost Growth, Beth
Brooke, Dina A. Pyron, Peter Matthews, Bill Leisy, Ernst and Young, 2012
33. National Employability Report ‘Graduates’, Annual Report 2013, Aspiring Minds
34. Hidden Talents II: Re-engaging Young People, the Local Offer, Local Government
Association, L 12-783, page no. 1-78, January 2013, David Simmonds, Peter Box
CBE
35. Building the Right High Potential Pool – How Organizations Define, Assess, and
Calibrate Their Critical Talent, Lorraine Stomski, Jill Attkisson, Aon Hewitt,
January 2013
36. The Great Talent Shortage Awakening: Actions to Take for A Sustainable Workforce,
Manpower Group, 2013
37. The India Skills Report, People Strong, Wheebox, CII, 2014
38. Totalling the Hidden Talent – Youth unemployment and underemployment in
England and Wales, Laura Gardiner, March 2014, A Report Commissioned from the
Centre for Economic and Social Inclusion by the Local Government Association
Company Specific and subject / area wise special survey and study reports:
39. Hidden Talent: Opportunities for action, Boston Consulting Group,, page no. 1-4,
article, July 2007, Anders Fahlander, Angela Schwartz

xiii
40. Solving the skills crisis, Outlook – The Journal of High-Performance Business
(Accenture), Number 3, page no. 1-12, Article, 2011
41. Modern HR in the Cloud – Building Critical Talent Pipelines – Creating a Plan for
Staffing Critical Job Roles, Oracle Corporation, 2013
42. 4th
CII Global Summit on Skills Development, 29-30 November 2010, Trident,
Nariman Point, Mumbai, Confederation of Indian Industry since 1895 (CII), page no.
1,2,3, 69 - 86
M. Phil and Ph. D. Thesis of Indian as well as Foreign Universities:
43. A Study of Hidden Talent Management in same Status Employees with Special
Reference to Industries in Pimpri-Chinchwad (2000 to 2010), Thesis submitted in
2013
Internet Articles and websites:
44. The Talent Within: Finding Your Hidden Gems, Article, August 2008, Kevin
Wheeler
45. Unleash the Hidden Talents of Your Employees, Article, July 2009, Ethan Chazin
46. Winning the Talent War in Local Markets by Staying Global, Matthew Pettigrew,
2012
47. Find the Hidden Talent in your Organization, Article, April 2013, Patrick Gray
48. Discovering Hidden Talent within Your Organization, Article, Paul Hebert
49. The Economic Times, Top Career Trends 2017, January 5, 2017

Annexure 1: List of Industry Respondents
Sr
No Name of the Industry
Category
of
Industry
Type of the
Industry Business
Name of
Respondent
Designation of
Respondent
1
Vishwakarma Institute
of Technology, Pune Large Service
Technical Higher
Education
Dr. Jayant V
Kulkarni
Acting Director :
Dean Administration
& Registrar
2
Vishwakarma College of
Arts, Commerce &
Science Medium Service
Higher
Education, in
Arts, Commerce,
Science
Dr. Arun R
Patil Principal
3
Vishwakarma Institute
of Information
Technology, Pune Large Service
Technical Higher
Education
Dr. Mrs.
Bilavari S
Karkare Principal
4
Vishwakarma Institute
of Management Medium Service
Higher Education
in Management
Dr. Shailesh P
Kasande Director
5
Pune Institute of
Computer Technology,
Pune Large Service
Technical Higher
Education
Dr. Girish S
Mundada
Professor , T & P
Officer
6
John Deere (I) Pvt. Ltd.
Large
Manufacturi
ng
Engineering -
Equipments
Ms.
Neelambari
Ghare
Senior Executive,
India Talent
Acquisition, Human
Resources
7
Kirloskar Pneumatic Co.
Ltd. Large
Manufacturi
ng
Engineering –
Equipments
Mr. Jagdish
Purandare
Deputy General
Manager - HRD
8
Accelya Kale Solutions
Ltd Large
Manufacturi
ng &
Service
Software Product
& IT Mr. Rahul Patil
Manager, Human
Resources
9
Citi Corp Services (I)
Pvt. Ltd. Large
Manufacturi
ng &
Service
Software Product
& IT
Mr. Chaitanya
Karmarkar AVP R&D
10
MOJJ Engineering
Systems Ltd Large
Manufacturi
ng
Engineering –
Equipments
Mr. Rajendra
Khatri
Manager HR &
Admin
11
Automotive Stampings
and Assemblies LTD Large
Manufacturi
ng
Engineering –
Equipments
Mr. Abhijeet
Deshpande
Manager - Sales &
Business
Development
12
3 M India Ltd
Large
Manufacturi
ng Chemical
Mr.Venkatesh
S Suvarnkar
EHS Coordinator
Manufacturing &
Engineering
13
3 M Electro &
Communication (I) Pvt
Ltd Large
Manufacturi
ng Plastics
Mr. Sambhaji
Patade Sr. Manager EHS
14 Tech Mahindra
Large Service IT
Mr. Pankaj
Shipurkar Manager - Testing
15 I gate Corporation
Large Service IT
Mr.Govind
Shipurkar
Project Manager cum
Architect
16
Watchem Infratech Pvt
Ltd Medium
Manufacturi
ng Cum
Trading Chemical
Mr. Rishikesh
Khanvilkar Business Head
17 SMS India Pvt Ltd
Large
Manufacturi
ng
Engineering –
Equipments
Mr. Amol
Kulkarni Senior Engineer
18 Thermax Limited
Large
Manufacturi
ng Chemical
Mr. Devendra
Bora Group Head HR

Sr
No
Name of the Industry Category
of
Industry
Type of the
Industry Business
Name of
Respondent
Designation of
Respondent
19
eQ Technologic (I) Pvt.
Ltd. Medium
Manufacturi
ng &
Service
Software
Products &
Services
Ms. Doreen
D'souza Manager HR
20
Persistent Systems Ltd.
Large
Manufacturi
ng &
Service
Software
Products &
Services
Mr. Kaustubh
Bhadbhade Sr. Manager HR
21
Shree Mahila Gruh
Udyog Lijjat Papad Large
Manufacturi
ng Food
Mrs. Chetana
Nahar
Director, Dhayari
Unit
22 Mphasis Ltd.
Large Service IT
Mr. Shailesh
Kulkarni Programme Manager
23
Tata Consultancy
Services Ltd. Large Service IT
Mr. Shirish
Kulkarni
Assistant Consultant
(Manager)
24 Whirpool of (I) Ltd.
Large
Manufacturi
ng
Electronic
Products
Mr. Jose
Joseph
Senior Manager, HR
(Head HR for Pune)
25
Jehangir Hospital
Large Service Health Care
Dr.
Chandrashekha
r Kulkarni
Consultant -
Anesthetist
26
Aquafarma Chemicals
Pvt. Ltd. Large
Manufacturi
ng Chemical
Mr. Nitin
Kothari CEO
27
Deenanath Mangeshkar
Hospital and Research
Centre Large Service Health Care
Mr. Shirish
Yadkikar
Manager, Public
Relations
28 Allscripts (I) Pvt. Ltd.
Large Service
Software Product
& IT
Mrs. Aswini
Joshi
Associate Manager,
Product Development
29
Life Insurance
Corporation of India Large Service Insurance
Mr. Bhushan
Bhat Development Officer
30
Bharat Sanchar Nigam
Ltd. Large Service Service Provider
Mrs. Rohini
Honap
Senior Technical
Officer
31
TATA Ficosa
Automotive Systems
Ltd. Large
Manufacturi
ng Plastics
Mr. Gourav
Pathak
Head, Business
Development
32
TATA Autocomp
Systems Ltd. Large
Manufacturi
ng Plastic
Mr. Prashant
Mahindrakar
General Manager,
Projects
33
TATA Toyo Radiator
Ltd.
Large
Manufacturi
ng Equipment
Mr. Buddhiraj
Deshmukh
Senior General
Manager, Business
Development and
Business Excellence
34
Sudarshan Chemical
India Ltd. Large
Manufacturi
ng Chemical Ms. Nehi Jain
Manager HR, Admin
and CS
35 Pravin Masalewale
Large
Manufacturi
ng Food
M. Laxman
Sutar Executive HR
36 Franke Faber (I) Ltd
Medium
Manufacturi
ng (Misc)
Kitchen
Appliances
Mr. Anuj
Sharma
Senior Manager R &
D
37
Shashwat Health
Services Pvt Ltd Medium Service Health Care
Dr. Shekhar
Deshpande Director
38
The Sarswat Co-op
Bank Ltd Large Service Banking Ms. Pallavi Sali Chief Manager
39
Net Scout Systems (I)
Ltd. Medium
Manufacturi
ng &
Service
Electronic
Appliances
Mr. Vaibhav
Chandakkar
Lead - Software
Quality Analysis

Sr
No Name of the Industry
Category
of
Industry
Type of the
Industry Business
Name of
Respondent
Designation of
Respondent
40
Suvarnayug Sahakari
Bank Ltd Medium Service Banking
Ms. Arachana
Dabhekar Branch Manager
41 Bank of Maharashtra
Large Service Banking
Mr. Ashok
Shedshale
G. M Credit
Monitoring & IRM
42 Sahyadri Hospitals Ltd
Large Service Health Care
Mrs. Preeti
Panicker Asst Manger HR
43 Kesari Tours Pvt Ltd
Large Service Hospitality
Mr. Rakesh
Disale Manager
44
Lear Automotive (I) Pvt
Ltd Large
Manufacturi
ng
Seating Systems
of Automotives
Mr. Bharat
Ambike Asst Manger HR
45
Chitale Bandhu
Mithaiwale Medium
Manufacturi
ng Packed Food
Mr. Shrikrishna
Chitale Partner
46
Pune Zilha Sahakari
Dudh Utpadak Sangh
Maryadit Large
Manufacturi
ng
Packed Food
Products
Mr. N S
Rajgurav
Dy. Manager
Administration
47
Cosmos Cooperative
Bank (Multistate
Scheduled Bank) Large Service Banking
Mrs. Vaishali
Korde Assistant Manager
48
Indian Hotels Company
Ltd. (TATA Group, Taj
Group) Large Service Hospitality
Mr. Mohnish
Korde First Commis (Chef)
49
Aker Power Gas Sub
Sea Pvt Ltd Large
Manufacturi
ng &
Service
Engineering
Services
Mr.
Vijaykumar
Pawar
Deputy Engineer -
Design
50 State Bank of India Large Service Banking Mr. R K Gupta AGM
51 Cottonking Pvt. Ltd.
Large
Manufacturi
ng Misc
Mr. Koushik
Marathe Director
52
Mitsubishi Electric (I)
Pvt. Ltd.
Large
Manufacturi
ng
FAID (Factory
Automation and
Industry
Development
Mr .Santosh
Athanikar Sr. Manager R & D
53
Bharati Airtel Ltd
Large Service Service Provider
Mr. Kapil
Dhatingan
Business Head -
Gujarat, Maharashtra
& Goa Airtel
Businees, West
54
Verroc Lighting
Systems Pvt. Ltd. Large
Manufacturi
ng
Spare Parts for
Automotives
Mr. Mandar
Joshi
Head - Customer
Business Unit
55
Eaton Industrial Systems
Pvt. Ltd. Large
Manufacturi
ng
Automotive
Components Mr. L. Kiran
Business Head -
Marketing
56
Kansai Nerolac Paints
Ltd Large
Manufacturi
ng
Surface
Treatment
Consumables
Mr. Rajeev
Kulkarni
Zonal Manager ,
Industrial Coatings
57 Hyatt Regency Pune
Large Service Hospitality
Ms. Deepali
Singhal Training Manager
58
Ericsson India Pvt. Ltd
Large
Manufacturi
ng &
Service
Telecommunicati
on
Mr. Munish
Goyal Service Manager
59 Idea Cellular Ltd
Large Service Service Provider
Mr. Sachin
Shelke
Manager , Network
Subsystems

Sr
No Name of the Industry
Category
of
Industry
Type of the
Industry Business
Name of
Respondent
Designation of
Respondent
60
Oracle Financial
Software Services Ltd.
(OFSS) Large
Manufacturi
ng &
Service
Software
Products &
Services
Mr. V.
Ramakrishnan Business Analyst
61
Maharashtra State
Power Generation
Company Ltd.
(MAHAGENCO) Large
Manufacturi
ng
Power
Generation
Mr. G.T.
Dharmadhikari Assistant Engineer
62
Cognizant Technology
Solutions (I) Pvt. Ltd. Large Service Service Provider
Mr. Sandeep
Kulkarni
Senior Software
Developer
63
Media Ocean Asia Pvt.
Ltd. Medium
Manufacturi
ng &
Service
Software
Products &
Services
Mr. Sachin
Kulkarni
Senior Software
Developer
64
Bajaj Allianze Insurance
Company Ltd. Large Service Insurance
Mr. Tapan
Singhel MD and CEO
65
Bharti AXA General
Insurance Company Ltd. Medium Service Insurance
Mr. Ganesh
Herekar
Regional Manager -
Retail Claims
66
Royal Sundaram
Alliance Insurance
Company Ltd. Medium Service Insurance
Mr.
Someshwar
Joshi
Manager - Motor
Assessment
67
L & T General
Insurance Company Ltd. Medium Service Insurance
Mr. Shashank
Raut
Claims Manager -
Maharashtra & Goa
68
Philips India Ltd
(Philips Health Care
Division) Large
Manufacturi
ng Medical Devices
Mr. Rajesh
Kathuria
Director, Quality &
Regulatory
69
Serum Institute of India
Ltd Large
Manufacturi
ng Vaccines
Mr. Kedar
Ambikar Deputy, Manager HR
70
Aayurved Rasashala
Pune Medium
Manufacturi
ng
Aayurvedik
Products
Dr. Suhas
Kulkarni General Manager
71
Tilak Aayurved
Mahvidyalaya Medium Service Education
Dr Vijay
Doiphode President
72
Tata Communications
Ltd Large Service Internet Services
Mr. M N
Inamdar Quality Manager
73
HDFC Standard Life
Insurance Company Ltd Large Service Insurance
Mr. Harshad
Lasure Vice President
74
Starwood Hotels &
Resorts Pvt Ltd (The
Westin Pune) Large Service Hospitality
Mr. Dushyant
Bhosale
Assistant H R
Manager
75
Jubilant Food Works
Ltd (Domino's Pizza) Large Service Hospitality
Mr. Pankaj
Wagh Deputy Manager HR
76
Siddhivinayak Hospital
and Research Centre Medium Service Health Care
Dr. Rajendra
Dimbale Director
77 Fergusson College
Large Service Education
Dr. R. G.
Pardeshi Principal
78
Alpha Multispeciality
Digno Center & Clinic
Pvt. Ltd. Medium Service Health Care
Dr. Nayana
Bhurat Director
79
Bharat Electronics Ltd.
Large
Manufacturi
ng
Electronic
Products/
Components
Mr.
S.V.Kulkarni Manager QMD

Sr
No Name of the Industry
Category
of
Industry
Type of the
Industry Business
Name of
Respondent
Designation of
Respondent
80
Suburbon Diagnostics
India Pvt Ltd Large Service Health Care
Mr. Ajit
Khanvilkar
Assistant Manager
HR
81 Wipro BPS Ltd
Large Service ITES
Ms. Amruta
Kale Team Leader
82 Infosys BPO Ltd
Large Service ITES
Mr. Ganesh
Shirke Team Leader
83
Sai Seva Foods
(Smoking Joes Pizza) Medium
Manufacturi
ng &
Service Food
Mr. Pravin
Pandhare Partner
84
VM Ware Software (I)
Ltd. Medium
Manufacturi
ng &
Service Software Product
Mr. Deepesh
Bhatewara Architect
85
Weikfield foods pvt ltd.
Large
Manufacturi
ng Food
Mr.
Ramchandra
Jadhav AGM - HR & IR
86
KUONI Travel (I) Pvt
Ltd Large Service Hospitality Ms. Tanaz Irani Senior Manager Sales
87
Tikona Digital Networks
Pvt Ltd. Large Service
Telecommunicati
on
Mr. Amit
Pandey Vice President
88
Poona Hospital and
Research Centre Large Service Health Care
Mr. Thakar &
Mr. Jaswant Personal Officer
89
Sharangdhar Pvt Ltd
Medium
Manufacturi
ng Medicines
Mr.
Dnaneshwar
Kshatriya H.R. Representative
90 Ruby Hall Clinic
Large Service Health Care
Mr. Prabhakar
Shrivastav
Sr. Manager Hr and
Payroll
91 Eisen Pharma Pvt Ltd
Medium
Manufacturi
ng Medicines
Miss. Manish
Pandit Asst HR

Interview Questionnaire
A. Profile of the Organization:
1. Name of the Organization: _________________________________________
2. Address: _______________________________________________________
__________________________________________________________
_________________________________________________________
3. Year of establishment: _____________________
4. Status of the Organization: (Tick the appropriate)
a. Pvt. Ltd. b. Ltd. c. Joint Venture d. etc.
5. Activity: (Tick the appropriate)
a. Manufacturing b. Trading c. Auxiliary d. Service
e. Consultation f. Other (Please Specify): ______________________
B. Training and Development:
1. Is the Training Need Identification done? a. Yes b. No
2. Contents of Training (Specify):
a. Soft Skills: ___________________________________________
b.Technical Training: ___________________________________
c. Succession Planning: _________________________________
d.All of Above: _______________________________________________
3. Frequency of Training (Specify):
a. Soft Skills: ___________________________________________
b.Technical Training: ___________________________________
c. Succession Planning: _________________________________
4. Is there any mechanisms to evaluate Training Imparted
a. Yes b. No c. Not to be disclosed
5. Your Opinion about application of Training:
a. Partially Useful b. Useful c. Not Useful d. No Opinion
6. Training Facilities:
a. Infrastructure Availability:
i. In House ii. Outside / Hired iii. both
b.Trainer’s Availability:

i. In House ii. Outside / Hired iii. both
7. Impact of Training and Development:
a. Qualitative:
-------------------------------------------------------------------------------------------------------------
-----------------------------------------------------------------------
b.Quantitative: (Tick the appropriate)
i. 10 % ii. 10 – 25 % iii. 25 – 50 % iv. 50 % and above
C. Hidden Talent:
1. Are you aware of the concept “Hidden TalentWithin Organization” ?
a. Yes b. No
2. Did you take efforts for searching of the hidden talent within the organization?
a. Yes b. No
3. Efforts for nurturing and developing hidden talent within the organization.
a. Appeal to employees to showcase their “Hidden Talent”
b. Organizing Competitions like “Discovering Your Talent”
c. Rewarding Outstanding Talent
d. Motivating employees to nurture their “Hidden Talent”
e. All of the above
4. Is it helpful to solve business crisis and / to improve organization performance?
a. Not at all b. Somewhat accepted c. Agreed d. Fully agreed
5. Impact of loosing key talent of the organization in connection with organizational
performance and growth.
a. No evidence as on date b. somewhat agreed c. Fully agreed d. No comment
D. HRM Challenges:
1.Do you conduct exit interviews of employees when they leave the organization?
a. Yes b. No
2.Do you take cognizance on the valid points emerged through exit interviews?
a. Yes b. No

E. Business Aspects:
1. Did you observe any Business / Organizational Growth in last 5 years
a. Vertical b. Horizontal
2. Change in Organization's Turnover, Profit during last 05 Years.
a. Increased b. Decreased c. Static d. N. A.
3. Number of branches / customers / dealers / distributors / stockists in last 5 years:
a. Increased b. Decreased c. Static
4. CSR (Corporate Social Responsibility) aspects followed in last 5 years: ___ No.s
a. Increased b. Decreased
5. Your Opinion on Talent Acquisition & Retention in India / in Maharashtra / in Pune
----------------------------------------------------------------------------------------------------------------------
----------------------------------------------------------------------------------------------------------------------
----------------------------------------------------------------------------------------------------------------------
--------------------------------------
6. Your Views on Impact of Globalization on Companies / Organizations in India / in
Maharashtra / in Pune
----------------------------------------------------------------------------------------------------------------------
----------------------------------------------------------------------------------------------------------------------
----------------------------------------------------------------------------------------------------------------------
----------------------------------------------------------------------------------------------------------------------
------------------
7. What is your experience / opinion about more / low attrition rate at junior, middle or
senior level of employees in your organization ?
----------------------------------------------------------------------------------------------------------------------
----------------------------------------------------------------------------------------------------------------------
----------------------------------------------------------------------------------------------------------------------
----------------------------------------------------------------------------------------------------------------------
------------------
8. Kindly tick below the organizational performance indicators based on your experience:
a) Increase in sales / turnover
b) Increase in gross profit and net profit: Profitability

c) Decrease in attrition rate of employees at all levels
d) Increase in in-flow of / joining of new talented employees because of referred schemes
e) Increase in R & D: Increase in import substituted products
f) Increase in number of lines / products
g) Increase in number of branches / franchises
h) Increase in exports
i) Increase in brand value and market share
j) Increase in customer base, increase in repeat customers with repeat orders
k) Increase in morale of employees
l) Low / no wastage
m) Progress of organization in various aspects other than above mentioned