Institutional Strategic Planning Council November ... - Norco College
Upload
khangminh22Category
view
1download
0
4 IEEE TRANSACTIONS ON ENGINEERING MANAGEMENT, VOL. 56, NO. 1, FEBRUARY 2009
A Strategic Technology Planning Framework: A Caseof Taiwan’s Semiconductor Foundry Industry
Hongyi Chen, Jonathan C. Ho, and Dundar F. Kocaoglu, Fellow, IEEE
Abstract—The increasingly important role that technologiesplay in today’s business success is well known. To ensure properselection and development of the key technologies, a deliberatetechnology plan is needed. In this paper, a strategic technologyplanning framework is proposed. A hierarchical decision modeland its sensitivity analysis are presented as two major steps ofthe framework to provide effective technology assessment and togenerate technology scenarios. The hierarchical model links anorganization’s competitive goals and strategies in evaluating thetechnology alternatives’ overall contributions to business success;the sensitivity analysis helps to forecast and implement possible fu-ture changes in the economic environment, industry policies, andorganization strategies. With the proposed framework, organiza-tions can start to implement their technology plans synopticallyand follow up with incremental adaptations as necessary. A casestudy on Taiwan’s semiconductor foundry industry is presented todemonstrate the model in detail.
Index Terms—Hierarchical decision model, semiconductorfoundry industry, sensitivity analysis, strategic planning, technol-ogy plan.
I. INTRODUCTION
T ECHNOLOGY is critical in business: It creates and main-tains a firm’s core competences to outperform its competi-
tors and enables business success [7], [18], [36]. Having real-ized this, firms are striving to adopt technologies and put themin their business processes. Yet, technology should be properlydeployed before its economic benefit can be obtained. It is theconsistency or fit between technology and business operationthat sets the baseline for a successful technology implementa-tion [8], [13], [41].
To ensure long-term business survival, a firm’s technologystrategy should be integrated into its business strategy [7], [14]and linkage between the business goals and the technologiesselected to achieve the goals should be established [14]. There-fore, a formal planning procedure for technology, which ef-fectively facilitates the integration [7] and strives for a goodmatch between the organization’s external environment and in-ternal structures and processes [16], should be an integral partof the business strategy. Benefits of a deliberate technology plan
Manuscript received January 1, 2007; revised July 1 and November 1, 2007.First published August 4, 2008; current version published January 21, 2009.Review of this manuscript was arranged by Department Editor P. Bierly III.
H. Chen is with the Department of Mechanical and Industrial Engineer-ing, University of Minnesota Duluth, Duluth, MN 55812 USA (e-mail:[email protected]).
J. C. Ho is with the Department of Business Administration, Yuan ZeUniversity, Taoyuan 330, Taiwan, R.O.C.
D. F. Kocaoglu is with the Department of Engineering and TechnologyManagement, Portland State University, Portland, OR 97207 USA.
Color versions of one or more of the figures in this paper are available onlineat http://ieeexplore.ieee.org.
Digital Object Identifier 10.1109/TEM.2008.927815
include the identification of strategic opportunities and the coor-dination of all related activities across the organization to buildon success and to avoid redundancies [15].
Although the importance of strategic technology planningis understood and different planning modes are proposed andcompared in literature [5], [16], the specific planning proce-dures for technologies are seldom addressed in detail. In thispaper, we propose a strategic technology planning frameworkthat links an organization’s technology choices with its over-all mission through alignment with its competitive goals andstrategies, and suggests an optimized technology portfolio. Theframework starts with a comprehensive plan and is followedby periodic reevaluations and replanning, representing a com-bination of synoptic and adaptive planning modes. It can beapplied at the industry level to guide technology policies andat the company level for technology decisions. A case study onthe semiconductor foundry industry in Taiwan is presented toillustrate the application of the proposed framework. Insightsregarding the strategic technology planning for Taiwan’s semi-conductor foundry industry are also provided.
II. LITERATURE REVIEW
A. Strategic Planning
Strategic planning has been recommended as an essential toolfor managers [46]. Several researchers [17], [46], [52] comparethe financial performance of companies that use formal plan-ning with the ones that do not, and conclude that firms doingcomprehensive strategic planning usually outperform others.However, the importance of a comprehensive plan is questionedby some other researchers [2], [43], and a statistical analysisshowing negative relationship between comprehensiveness andperformance in unstable environments is demonstrated [16]. Asa result, the two types of models, synoptic planning mode andadaptive planning mode [1], [2], [16], [49], pervade the strategicplanning literature [37].
In a “synoptic” strategic process, an organization establishesthe overall mission, assesses the internal and external envi-ronments, evaluates alterative actions, and develops a plan toachieve the mission [1], [2], [16], [49]. While in “adaptive”planning, incremental plans are initiated in response to prob-lems or changes, and little attempt is made to integrate theeffect that such incremental change is likely to make on otherparts of the organization [16], [35]. Although most literaturetends to distinguish the two planning modes as polar ends ofa planning continuum [37], we agree with Mintzberg [35] thatfew organizations can rely on a pure mode: A mixed planningshould be followed in different time frames and situations to
0018-9391/$25.00 © 2008 IEEE
Authorized licensed use limited to: Amirkabir University of Technology Trial User. Downloaded on January 28, 2009 at 10:19 from IEEE Xplore. Restrictions apply.

CHEN et al.: STRATEGIC TECHNOLOGY PLANNING FRAMEWORK 5
develop organizational strategies and conduct strategic technol-ogy planning.
B. Technology Plan
As the role of technology has become increasingly critical, theimportance of effective integration of technological considera-tions into a business strategy has been realized by more and moreresearchers [7], [14]. A technology road-mapping idea is pro-posed in [14] to help companies organize a series of workshopsto discuss market drivers, product features, and technological so-lutions, and to link the three layers to a complete plan. In [31], thecritical questions such as “what are the potential impacts of eachtechnology on the businesses?,” “which technologies should thecompany invest in?,” etc., are highlighted in the technology plan-ning process. Krajewski states that assessing the current state oftechnology helps a company evaluate the degrees to which thetechnology alternatives support the business goals, understandthe influences of new technologies on its strategies, and priori-tize the technology investment options [26]. Betz regards fore-casting as a critical step in planning to anticipate and implementchanges in the core and pacing technologies of the firm, takinginto consideration the enterprise evolution, new or improved ca-pabilities of products, production, and marketing, etc. He alsonotes that it is critical for technology managers to understand theimpact of changes to industry policy or technology performanceon business and to let the business strategy drive the technologychanges [7]. The fuzzy hierarchical decision making (FHDM)is utilized in [42] to evaluate technology choices in the Indianiron-making industry. However, the paper is more focused on in-troducing the FHDM algorithm itself without going into detailsof the selection process for the evaluation criteria. Other meth-ods such as solving the problem of incorrect customer productattribute forecasting involved in the external information gath-ering stage before formal technology planning starts are alsoproposed [51].
C. Contributions of This Paper
Though the effectiveness of different planning modes havebeen explored in different industries, and different ideas havebeen proposed regarding the development of a technology plan,the existing literature has stayed at the conceptual level withoutgoing into details of developing a comprehensive plan, linkingtechnology choices to business goals through the alignment oforganization strategies, anticipating possible future changes andcreating contingency plans accordingly [35], and identifyingin which direction(s) incremental adaptive changes should bemade. In addition, a gap exists between synoptic and adaptiveplanning modes suggested by the two schools of researchers.As stated earlier, we believe that an organization should have acomprehensive plan before it starts to make adaptive changes. Agood linkage between the two planning modes can be achievedby analyzing the sensitivity of the initial plan, generating“what-if” scenarios and contingency plans, and enabling rapidresponses to changes. In the following section, we propose a
Fig. 1. Technology planning framework.
strategic technology planning framework to combine synopticand adaptive planning modes and link the technology choices toan organization’s overall mission through alignment with goalsand strategies.
III. GENERAL FRAMEWORK FOR TECHNOLOGY PLANNING
The framework contains nine steps to develop a comprehen-sive technology plan and forecast possible future changes andthe related adaptive solutions. The steps are iterative as the or-ganization’s environment changes. They are illustrated in detailas follows.
Steps 1 through 5: In the synoptic planning mode, alternativeactions are evaluated based on their contributions to a specific,preestablished organization mission [16]. Accordingly, as de-picted in Fig. 1, the first step in the proposed framework isto establish such a mission. Then, the overall mission is clar-ified and decomposed into more specific goals with differentpriorities. As noted by several researchers, the impact of tech-nologies on strategies and competitive goals can be understoodby linking the technologies to archetypes of strategies at variouslevels [32], [39]. It is also acknowledged that the fit betweentechnologies and strategy patterns determines a firm’s perfor-mance [34], [48]. Therefore, strategic archetypes’ evaluation isinserted as a middle step to link the assessment of technologyalternatives to organizational mission and goals.
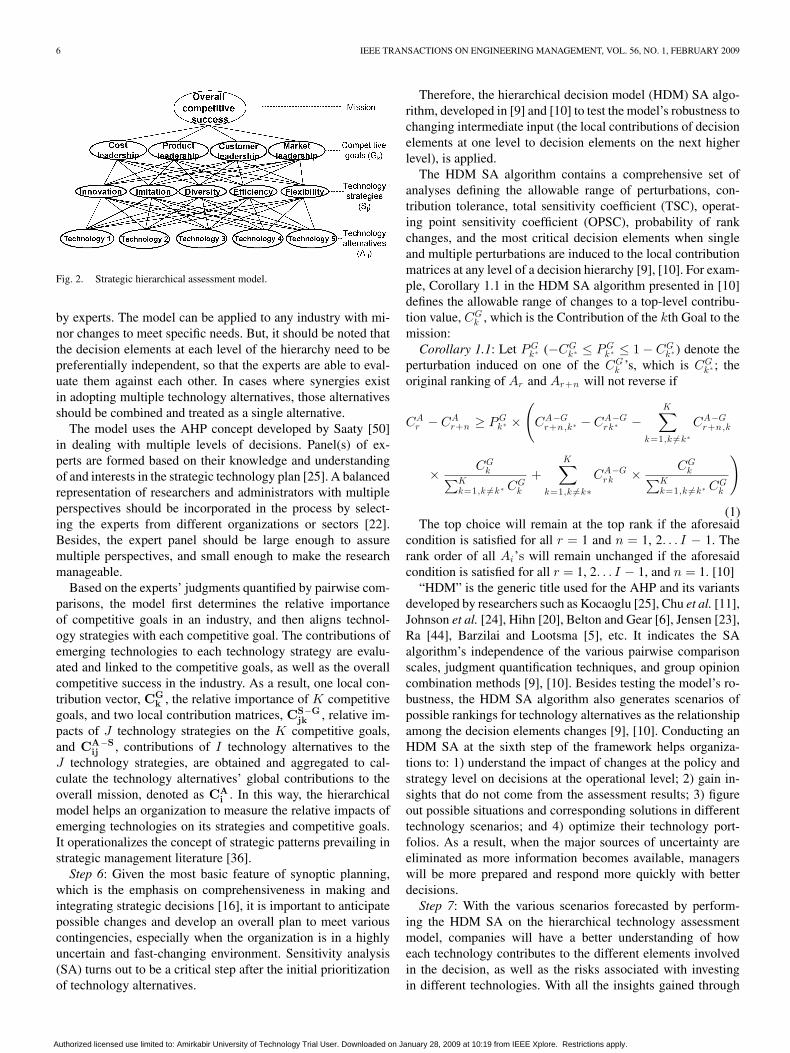
To assess the impacts of emerging technologies on varioustechnology strategies and competitive goals, a hierarchical tech-nology assessment model is developed by aggregating stepsone through five into hierarchical levels of interacting decisionelements, as shown in Fig. 2. The competitive goals and strate-gies on the hierarchy are identified from literature and validated
Authorized licensed use limited to: Amirkabir University of Technology Trial User. Downloaded on January 28, 2009 at 10:19 from IEEE Xplore. Restrictions apply.
6 IEEE TRANSACTIONS ON ENGINEERING MANAGEMENT, VOL. 56, NO. 1, FEBRUARY 2009
Fig. 2. Strategic hierarchical assessment model.
by experts. The model can be applied to any industry with mi-nor changes to meet specific needs. But, it should be noted thatthe decision elements at each level of the hierarchy need to bepreferentially independent, so that the experts are able to eval-uate them against each other. In cases where synergies existin adopting multiple technology alternatives, those alternativesshould be combined and treated as a single alternative.
The model uses the AHP concept developed by Saaty [50]in dealing with multiple levels of decisions. Panel(s) of ex-perts are formed based on their knowledge and understandingof and interests in the strategic technology plan [25]. A balancedrepresentation of researchers and administrators with multipleperspectives should be incorporated in the process by select-ing the experts from different organizations or sectors [22].Besides, the expert panel should be large enough to assuremultiple perspectives, and small enough to make the researchmanageable.
Based on the experts’ judgments quantified by pairwise com-parisons, the model first determines the relative importanceof competitive goals in an industry, and then aligns technol-ogy strategies with each competitive goal. The contributions ofemerging technologies to each technology strategy are evalu-ated and linked to the competitive goals, as well as the overallcompetitive success in the industry. As a result, one local con-tribution vector, CG
k , the relative importance of K competitivegoals, and two local contribution matrices, CS−G
jk , relative im-pacts of J technology strategies on the K competitive goals,and CA−S
ij , contributions of I technology alternatives to theJ technology strategies, are obtained and aggregated to cal-culate the technology alternatives’ global contributions to theoverall mission, denoted as CA
i . In this way, the hierarchicalmodel helps an organization to measure the relative impacts ofemerging technologies on its strategies and competitive goals.It operationalizes the concept of strategic patterns prevailing instrategic management literature [36].
Step 6: Given the most basic feature of synoptic planning,which is the emphasis on comprehensiveness in making andintegrating strategic decisions [16], it is important to anticipatepossible changes and develop an overall plan to meet variouscontingencies, especially when the organization is in a highlyuncertain and fast-changing environment. Sensitivity analysis(SA) turns out to be a critical step after the initial prioritizationof technology alternatives.
Therefore, the hierarchical decision model (HDM) SA algo-rithm, developed in [9] and [10] to test the model’s robustness tochanging intermediate input (the local contributions of decisionelements at one level to decision elements on the next higherlevel), is applied.
The HDM SA algorithm contains a comprehensive set ofanalyses defining the allowable range of perturbations, con-tribution tolerance, total sensitivity coefficient (TSC), operat-ing point sensitivity coefficient (OPSC), probability of rankchanges, and the most critical decision elements when singleand multiple perturbations are induced to the local contributionmatrices at any level of a decision hierarchy [9], [10]. For exam-ple, Corollary 1.1 in the HDM SA algorithm presented in [10]defines the allowable range of changes to a top-level contribu-tion value, CG
k , which is the Contribution of the kth Goal to themission:
Corollary 1.1: Let PGk ∗ (−CG
k ∗ ≤ PGk ∗ ≤ 1 − CG
k ∗) denote theperturbation induced on one of the CG
k ’s, which is CGk ∗ ; the
original ranking of Ar and Ar+n will not reverse if
CAr − CA
r+n ≥ PGk ∗ ×
(CA−G
r+n,k ∗ − CA−Grk ∗ −
K∑k=1,k �=k ∗
CA−Gr+n,k
× CGk∑K
k=1,k �=k ∗ CGk
+K∑
k=1,k �=k∗CA−G
rk × CGk∑K
k=1,k �=k ∗ CGk
)
(1)The top choice will remain at the top rank if the aforesaid
condition is satisfied for all r = 1 and n = 1, 2. . . I − 1. Therank order of all Ai’s will remain unchanged if the aforesaidcondition is satisfied for all r = 1, 2. . . I − 1, and n = 1. [10]
“HDM” is the generic title used for the AHP and its variantsdeveloped by researchers such as Kocaoglu [25], Chu et al. [11],Johnson et al. [24], Hihn [20], Belton and Gear [6], Jensen [23],Ra [44], Barzilai and Lootsma [5], etc. It indicates the SAalgorithm’s independence of the various pairwise comparisonscales, judgment quantification techniques, and group opinioncombination methods [9], [10]. Besides testing the model’s ro-bustness, the HDM SA algorithm also generates scenarios ofpossible rankings for technology alternatives as the relationshipamong the decision elements changes [9], [10]. Conducting anHDM SA at the sixth step of the framework helps organiza-tions to: 1) understand the impact of changes at the policy andstrategy level on decisions at the operational level; 2) gain in-sights that do not come from the assessment results; 3) figureout possible situations and corresponding solutions in differenttechnology scenarios; and 4) optimize their technology port-folios. As a result, when the major sources of uncertainty areeliminated as more information becomes available, managerswill be more prepared and respond more quickly with betterdecisions.
Step 7: With the various scenarios forecasted by perform-ing the HDM SA on the hierarchical technology assessmentmodel, companies will have a better understanding of howeach technology contributes to the different elements involvedin the decision, as well as the risks associated with investingin different technologies. With all the insights gained through
Authorized licensed use limited to: Amirkabir University of Technology Trial User. Downloaded on January 28, 2009 at 10:19 from IEEE Xplore. Restrictions apply.

CHEN et al.: STRATEGIC TECHNOLOGY PLANNING FRAMEWORK 7
step six, companies can then decide on an optimized portfolioof technology investment based on their available resources,maximizing the total overall contributions
∑Ii=1 Ci , where “I”
is the number of technology alternatives.Step 8: Based on the results from step seven, if an organization
has enough resources to invest in the most desirable technolo-gies, and the risks involved are acceptable, then the organizationwill invest in all of those technologies. On the other hand, if theorganization is resource-restricted and is only able to invest intechnologies that rank lower with the current evaluation, thenone of three options can be chosen: 1) make the investment, andcompare it with other scenarios to redefine the competitive goalsand/or shift the strategies based on the HDM SA scenario to jus-tify and maximize the benefit of such investment. Alternatingstrategies require change management in organizational struc-ture, procedures, and even culture, as discussed in the strategicmanagement literature [32], [33]; 2) If the organization is a ma-jor player in an industry or it has policy making power, it maychoose to influence environmental changes to shape favorablecontingencies for its investment choice. Performing HDM SA inthe sixth step enables an organization to be clear about situationsthat favor its current strategic action. Therefore, if an organiza-tion is able to initiate endogenous changes, it may seek to shapecontingencies in its favor [30]; and 3) Choose to defer the in-vestment if the previous two choices are not possible or optimal.
Step 9: The adaptive planning should follow step eight to ad-dress and incorporate internal and external changes into the planon a timely basis. Periodic evaluation of the business and techni-cal environment should be carried out. Special attention needs tobe given to emerging new technologies and the critical decisionelements identified earlier from HDM SA. Whenever dramaticchanges that cannot be analyzed by the original model and itssensitivity analysis occur, a new hierarchical model should bebuilt and all the steps should be repeated.
It should be noted that the framework is applicable at bothindustry policy level and company decision level. Just asLindblom’s “muddling” concept originates from the public pol-icy making and gets adopted by individual firms in developingadaptive plans [27], [28], [35], the industry consortium may ap-ply the framework to develop an industry-wide technology planto guide the general technology investment, while the firms mayuse the industry-wide plan as the overall constraint and considermore specific and detailed technology alternatives to develop thecompany-wide plans. If necessary, an additional bottom levelmay be added to the hierarchical model to break down the tech-nology alternatives into more specific techniques for firm-levelapplications. The major difference lies in the greater power thatan industry consortium has to influence environmental changesto favor its initial decision, and access to greater resources toafford the cost of formal comprehensive analysis [35]. While ap-plying the framework at the industry-level does not necessarilyoptimize the overall success of individual firms, an individualfirm implementing the process can come up with strategies thatdifferentiate itself to optimize its own success. The next sectiondemonstrates the application of the proposed model through acase study on the technology planning for Taiwan’s semicon-ductor foundry industry.
IV. CASE STUDY: TECHNOLOGY PLANNING FOR TAIWAN’S
SEMICONDUCTOR FOUNDRY INDUSTRY
The semiconductor foundry business provides contract inte-grated circuit (IC) manufacturing services to IC design compa-nies that do not have a manufacturing facility. Equipment sup-pliers, materials developers, and internal process R&D are themajor technology sources of the foundry industry. The industryconsortium, SEMATECH, in which all the aforesaid players par-ticipate, guides the technological trends for the industry. Withthe proposed framework, the industry as a whole is analyzed inthis paper to develop a general industry-wide strategic technol-ogy plan. The same model can be applied for individual firmsby involving experts directly associated with the firm to prior-itize the firm’s own competitive goals and strategies. Availableresources, risk attitude, and its influencing power in the industryall affect a firm’s decision.
A. Hierarchical Technology Assessment Model
Ten experts, including foundry and foundry supplier execu-tives, industry researchers for nonprofit organizations, and in-dustry policy makers from government, formed the expert panelfor the study. After a series of explanations, question and an-swers, discussions, and tests, consensus was reached for themodel’s logic, definitions and measurements of the decision el-ements, and other related issues. Among the decision elements,competitive goals and technology strategies were first extractedfrom literature, and emerging technologies were identified fromthe SEMATECH international roadmap. They were discussed,modified, and validated by the experts. The preferential inde-pendence among elements at each level was tested to validatethe model. The finalized elements in each level are summarizednext.
Level I: Mission—Overall Competitive SuccessThe overall competitive success is a complex concept. It
includes multiple measures in financial considerations, mar-ket considerations, sustainability considerations, and many oth-ers. According to Porter [40], the overall competitive suc-cess is demonstrated by attaining better return on investment(ROI) than the industry average. The same logic is followedin this research to use ROI as the indicator of the overallcompetitive success in Taiwan foundry industry, even thoughno detailed economic analysis of the different alternatives isinvolved.
Level II: Competitive Goals (Gk , k = 1, 2 . . . 4)1) Cost Leadership (G1): Keep overall costs low by reducing
cycle time, increasing yield, and utilizing economy ofscale.
2) Product Leadership (G2): Develop cutting edge and pro-prietary IC process technologies. (For foundry, productsare the services of IC manufacturing processes.)
3) Customer Leadership (G3): Maintain intimate customerrelationships to reduce lead time, to improve on-time de-livery, and to provide customized processes and services.
4) Market Leadership (G4): Develop new markets andstrengthen the position in the existing market to influencethe market and to benefit from scale of scope.
Authorized licensed use limited to: Amirkabir University of Technology Trial User. Downloaded on January 28, 2009 at 10:19 from IEEE Xplore. Restrictions apply.

8 IEEE TRANSACTIONS ON ENGINEERING MANAGEMENT, VOL. 56, NO. 1, FEBRUARY 2009
Level III: Technology Strategies (Sj , j = 1, 2. . . 5)1) Technology Innovation (S1): Use of advanced technol-
ogy to develop new products for the market. This strat-egy leads to developing new technologies and best perfor-mance products for the market.
2) Technology Imitation (S2): Quick application of a tech-nology to product development after the product leaderhas proven the technology successful. This strategy leadsto improving products without a heavy investment in tech-nology development.
3) Technology Diversity (S3): Use of technology to support aspectrum of products at different stages of their life cycles.This strategy leads to increasing the variety of products.
4) Technology Efficiency (S4): Use of technology to improvethe efficiency of production methods.
5) Technology Flexibility (S5): Use of technology forrapid development of products in response to chang-ing market demands. This strategy leads to developingproducts with flexibility to serve different market seg-ments and allows for quick adjustments in productionvolume.
Level IV: Technology Alternatives (Ai , i = 1, 2. . . 5)1) A1 : Increasing wafer size to 300 mm and beyond (from the
current 200 mm): Process technologies capable of massproduction of IC devices on 300 mm wafers.
2) A2 : Reducing linewidths to 90 nm and lower: Processtechnologies capable of mass production 90-nm-linewidthIC devices.
3) A3 : High-k gate dielectrics (with k greater than 25 thatreplaces oxynitride k = 7): High-k dielectrics are materi-als used to decrease gate thickness and reduce electricityleakage.
4) A4 : Low-k intermetallic dielectrics (with k less than 2.5that replaces silicate glass): Low-k dielectrics are inter-connecting materials among circuits of a device. Lower-ing interconnecting dielectrics increases the speed of ICdevices.
5) A5 : Factory Integration: Using technologies to coordinateand optimize various processes and tools, including equip-ment, material handling, facility, and other manufacturingsystems.
For a four-level decision hierarchy, one vector and two ma-trices of local contributions between successive levels wereneeded. The experts’ judgments were collected through judg-ment quantification instruments. The pairwise comparisons ob-tained from them were converted into a vector and two matrices:(For raw pairwise comparison data, please refer to [21])
Vector CGk : The relative importance of competitive goals
(Gk ) to overall competitive success.Experts believed that competitive advantage is gained by suc-
cessful execution of business strategies. They provided theirjudgment regarding the dimensions of competition in the indus-try. Their opinions on the relative importance of competitivegoals are averaged to derive the contribution vector, as shownin Table I.
Matrix CS−Gjk : Relative impacts of technology strategies (Sj )
on competitive goals (Gk ).
TABLE ICONTRIBUTIONS OF COMPETITIVE GOALS TO OVERALL COMPETITIVE SUCCESS
TABLE IICONTRIBUTIONS OF TECHNOLOGY STRATEGIES TO COMPETITIVE GOALS
TABLE IIICONTRIBUTIONS OF TECHNOLOGY ALTERNATIVES TO STRATEGIES
TABLE IVOVERALL CONTRIBUTION VECTOR CA
i
Technology strategies are the decision patterns to deploy tech-nologies in order to fulfil management objectives. In this case,these objectives are competitive goals in which the managementdecides to excel. Averaged judgments from the experts regard-ing the contributions of technology strategies to competitivegoals get the contribution matrix in Table II.
Matrix CA−Sij : Contributions of technology alternatives (Ai)
to technology strategies (Sj ).Experts determined the relative contributions of the technolo-
gies to various technology strategies, and their judgments wereaveraged to derive Table III.
Aggregating the local contribution matrices CGk , CS−G
jk ,
and CA−Sij into an overall contribution vector, CA
i (CAi =∑I
i=1∑J
j=1∑K
k=1 CGk CS−G
jk CA−Sij ), the global contributions
of technology alternatives to the overall competitive success arecalculated. Technology alternatives are prioritized and rankedbased on their CA
i values, as shown in Table IV.The results indicate that the top three technologies, “reducing
linewidth,” “factory integration,” and “increasing wafer size,”should be taken as the leading group for technology investment.Rationale behind the results is: Reducing linewidth and increas-ing wafer size are the two most advanced technologies in thesemiconductor industry; however, increasing wafer size has a
Authorized licensed use limited to: Amirkabir University of Technology Trial User. Downloaded on January 28, 2009 at 10:19 from IEEE Xplore. Restrictions apply.

CHEN et al.: STRATEGIC TECHNOLOGY PLANNING FRAMEWORK 9
relatively big investment risk on the foundry’s side. It is esti-mated that a 300 mm (12 in) wafer fab may cost up to 3 billiondollars, and it is a sunk cost to foundries; the expensive mask re-quired by reducing linewidth can be up to a half million dollarsbut is paid for by the foundry’s customers like the fables designhouses. As a result of the high capital investment requirementand the cost splitting risk-sharing scheme, increasing wafer sizeposes more financial risk on the foundry’s side than reducinglinewidth does. Factory integration is a relatively mature tech-nology and is critical to a foundry. Compared to increasing wafersize and reducing linewidth, it requires a moderate investment inequipment to increase efficiency and flexibility of foundry oper-ations. The risk (cost)–benefit analysis made factory integrationslightly preferred to increasing wafer size, based on the experts’judgment. The fact that material technologies “hi k” and “lok” gain less priorities than the top three technologies may bedue to the less attention paid to material technologies at thetime experts made their judgments. However, the situation maychange as the industry evolves over time. The closely rankedtechnologies and the dynamic nature of the foundry industrycall for further analysis of the model’s sensitivities.
B. Sensitivity Analysis and Scenario Forecast
Based on the assessment results from the previous section,sensitivity analysis is performed to study the influences on theoptimal technology portfolio when 1) changes in the economicclimate of the industry cause an organization to shift its em-phasis among competitive goals; 2) organization developmentscause changes in technology strategies to align with altered busi-ness strategies; and 3) actual technology performance does notreach the expected level or technological advances improve thetechnology performance dramatically.
Specific questions being answered by performing the HDMSA in this section include: 1) What are the critical decisionelements in keeping the current assessment result valid? 2) Whatare the probabilities of priority order changes when a certaindecision element varies? 3) What is the optimal technologyportfolio or the top investment choice in a most likely scenariowith the least risk? and 4) What are other technology scenariosin response to future changes?
1) Competitive-Goals Analysis: In the assessment model,four competitive goals have been evaluated according to theirrelative importance to overall competitive success, which are de-noted as CG
k (k = 1. . .4). Suppose changes to industry dynamicsor the economic climate demand an organization to shift its em-phasis to different competitive goals; the organization needs toknow whether its originally identified investment choice(s) willremain optimal. To prepare the solutions before changes hap-pen, the HDM SA is performed to generate technology scenarioswhen CG
k values vary. The most critical competitive goal worthspecial attention is also identified.
a) One-way SA: First analyzed is how variations of theCG
k values impact the rank order of technology alternatives. Aone-way SA determines the influence of changes to a single in-put by varying that input within its feasible range while keepingother inputs fixed at their base values [12], [45]. In our one-way
TABLE VHDM SA AT COMPETITIVE GOALS LEVEL TO PRESERVE THE RANKING OF THE
TOP Ai
SA analysis, when one contribution value changes, the otherrelated ones will be changed according to their original ratioscale relationships, so that the new contributions still sum up toone [9], [10].
Based on Corollary 1.1 presented in [10] and cited earlierin Section III, different sensitivity indicators are calculated andsummarized in Table V to deal with the situation when onlythe top-ranked technology is concerned. “Base value” is thevalue assigned to the corresponding CG
k based on experts’ pair-wise comparisons. “Allowable range of perturbations” deter-mines the thresholds of changes to CG
k values without changingthe rank order of technology alternatives, and “tolerance” isthe range in which CG
k value can change without altering therank order of technology alternatives. “Prob. of rank changes”indicates the probability that technology alternatives’ originalranking will be changed when the corresponding CG
k , assumedto be a random variable that distributed uniformly between zeroand one, changes within its feasible range (0, 1). Based on theuniformity assumption, this probability is the tolerance of CG
k
divided by the feasible range’s length. These definitions are thesame for SA at other levels of the hierarchy.
When limited resources restrict an organization to focuson only one emerging technology, the technology manageris mostly concerned with how robust the current top-rankedtechnology (“reducing linewidth” in this case) is at its currentrank when the relative importance of competitive goals shifts.As we can see from Table V, “reducing linewidth” technol-ogy is very robust at its current top rank. It will not be re-placed unless the relative importance of product leadership tooverall success increases above 0.427. Changes to the relativeimportance of the other three competitive goals hardly affectthe top-ranked technology: the probabilities of top choice be-ing replaced by other technologies are 7.5%, 0, and 0 in eachcase. This also makes “product leadership” the most criticalcompetitive goal in keeping “reducing linewidth” as the topchoice.
In other situations, such as when the top choices are closein their scores, or when an organization has formed its technol-ogy portfolio based on the current priority order, to keep suchchoices optimal, the rank orders of all the technology alterna-tives need to be looked at. Results of the analysis on the rankingof all technology alternatives, shown in Table VI, reveal that“product leadership (G2)” is the most critical competitive goalin this situation as well: its contribution value CG
2 has the small-est allowable change (0.008) and the second shortest tolerance(0.258) to keep the current technology ranking unchanged.
An in-depth investigation of how and under what conditionsthe rank of each technology alternative will change generated
Authorized licensed use limited to: Amirkabir University of Technology Trial User. Downloaded on January 28, 2009 at 10:19 from IEEE Xplore. Restrictions apply.

10 IEEE TRANSACTIONS ON ENGINEERING MANAGEMENT, VOL. 56, NO. 1, FEBRUARY 2009
TABLE VIHDM SA AT COMPETITIVE GOALS LEVEL TO PRESERVE THE RANKING
OF ALL Ai
TABLE VIISCENARIOS OF TECHNOLOGY ALTERNATIVES’ RANKING REGARDING
DIFFERENT CGk VALUES
the following technology ranking scenarios in Table VII. Thetechnology alternatives are ranked from one to five, as shownby the bold numbers in the parentheses, when the correspondingCG
k value changes from one range to another (the brackets inthe second column indicate those ranges). In each scenario, thepair of technology alternatives whose original rank order willbe changed is listed in the last column of Table VII.
From Table VII, we can see that the current top choice, “reduc-ing linewidth” technology, is very robust to changes that occurto customer leadership and market leadership: no matter howthe relative importance of these two goals change, “reducinglinewidth” remains to be the top technology choice. “Reducinglinewidth” dominates “factory Integration” in all scenarios. Thismeans that when an organization only has enough resources toinvest in one of these two technologies, “reducing linewidth”should always be selected. “Hi-k dielectrics” and “Lo-k di-electrics” technologies are dominated by other technologies ex-cept in one case when “increasing wafer size” drops to the fourthrank.
“Increasing wafer size” gets some chances to become the toptechnology choice when “product leadership” is emphasized or“cost leadership” is deemphasized to certain degrees. However,its ranking is unstable and sensitive to variations of the com-petitive goals, especially the cost leadership. Investing in thistechnology represents a relatively risky approach.
In the semiconductor foundry industry, return on investmenthighly depends on the equipment utilization rate, and thus is sub-ject to volatile market demands. To better utilize costly equip-ment investments during low seasons, foundries may shift theiremphasis to cost leadership. According to Table VII, if the rel-ative importance of cost leadership to overall success goes up,“reducing linewidth” and “factory integration” should be thetop two technology choices. Contrasting to industry low sea-sons, when production capacity is short, cost leadership may beconsidered less important; in which case “increasing wafer size”will become the second, or even the top-ranked technology for
Fig. 3. Two-way SA on CG2 and CG
4 .
Taiwan’s semiconductor industry to develop. The SA result alsoindicates that if there is more than a 17.7% shift of emphasisto product leadership, then “increasing wafer size” technologyshould be the top technology to be developed.
b) Two-way SA (two changes): Among the competitivegoals, product leadership (G2) and market leadership (G4) rep-resent engineering perspective and market perspective. As theproduct performance changes rapidly, marketing continues to bea dynamic activity in the high-tech industry [7]. Improvementsin technologies within and around the product system will ad-vance the product performance and growth of the market [7].To forecast and incorporate such progress, a two-way SA isperformed accordingly to analyze simultaneous changes to therelative importance of G2 and G4 .
Theorem 1 of the HDM SA algorithm presented in [10] dealswith multiple simultaneous changes in the top-level contribu-tion vector. Based on the theorem, a 2-D allowable region isidentified for perturbations induced on CG
2 and CG4 in order
to keep the current ranking of alternatives. (Due to limitedspace, the related theorems and corollaries in the HDM SAalgorithm will not be quoted. Interested readers please refer to[9] or [10].)
As shown in Fig. 3, two lines intersect the feasible regionand separate it into three parts representing three technologyscenarios when two perturbations, PG
2 and PG4 , are induced
on CG2 and CG
4 . “Feasible region” for PG2 and PG
4 is an areain which the two values can change without causing any newCG
k values to go below zero or above one. Therefore, the feasi-ble area is defined by (PG
2 ≥ −0.25 = −CG2 , PG
4 ≥ −0.18 =−CG
4 , PG2 + PG
4 ≤ 0.57 = −(CG1 + CG
3 )), where PG2 is rep-
resented by the x-axis and PG4 by the y-axis in Fig. 3. Origin rep-
resents the original judgment when CG2 and CG
4 are at their basevalues and PG
2 and PG4 are zero. Bold numbers in the parentheses
again represent the ranking of the technologies in each scenario.From Fig. 3, we can tell that the ranking of “increasing wafer
size” will either go up to the first or go down to the third. It is alsoshown that when the relative importance of product leadershipis increased to a certain point, no matter how the relative impor-tance of market leadership is shifted, “increasing wafer size” willbe the top technology choice for the semiconductor foundries.
Among the three scenarios, S1 is the allowable region ofperturbations introduced on CG
2 and CG4 to preserve the orig-
inal ranking of the technology alternatives: As long as thechanges to the relative importance of product leadership andmarket leadership are within this region, the current ranking of
Authorized licensed use limited to: Amirkabir University of Technology Trial User. Downloaded on January 28, 2009 at 10:19 from IEEE Xplore. Restrictions apply.

CHEN et al.: STRATEGIC TECHNOLOGY PLANNING FRAMEWORK 11
Fig. 4. Allowable region of P G2 and P G
4 .
all the technologies will remain unchanged. The inequalitiesdefining the sides of S1 are (0.1053PG
2 + 0.0453PG4 ≤
0.0008), (−0.25 ≤ PG2 ≤ 0.085), and (−0.18 ≤ PG
4 ≤ 0.599).As shown in Fig. 4, the (x, y) coordinates of important points
in S1 can be identified through trigonometry since equationsof the intersecting lines are known. Therefore, based on theHDM SA algorithm, the two criticality indicators, TSC (G2 &G4), which is the area of S1, and OPSC (G2 & G4), whichis the shortest distance from the origin to the sides of S1, arecalculated
TSC (G2 & G4) = Area (S1) = 0.335 × 0.779 × 0.5 = 0.13
OPSC (G2 & G4) = Dmin =√
0.0062 + 0.002582 = 0.0065.
Since the area of the allowable region (S1 = 0.13) is 13%of the feasible region (S1 + S2 + S3 = 1), there is an 87%chance that the current ranking of technology alternatives willbe changed when the relative importance of product leadershipand market leadership simultaneously change in their feasibleregions, based on the uniform distribution assumption.
2) Technology-Strategies Analysis: Along the technologyplanning horizon, organizations may get new or improved R&Dcapabilities, production capabilities, capitalization and asset ca-pabilities, and operational capabilities as a result of enterpriseevolution [7], or lose some of their research specialties due tocritical personnel leaving or company market direction shifts. Inaddition, the fables design houses, foundries’ customers, maydevelop new IC applications for a variety of markets. TheseIC chips need a wide range of manufacturing processes. Thus,new IC chips, especially those widely accepted by the market,may cause redeployment of technologies in a foundry and, as aresult, change the technology strategies. In those cases, the rel-ative impact of the technology strategies will be altered. Fromthe perspective of synoptic planning, it is important to anticipateand incorporate the changes into the technology plans. There-fore, the HDM SA is then performed to study how variations atthe technology-strategies level impact technology choices.
a) One-way SA: Based on [10, Corollary 2.1], the toler-ance of CS−G
jk , the relative impact of the jth technology strategyto the kth competitive goal, is calculated under two conditions:
Fig. 5. Two-way SA on CS−G24 and CS−G
54 .
1) to keep the original ranking of all technologies unchanged;and 2) to keep the current top choice the same.
The results reveal that increasing the relative impact of “inno-vation,” “imitation,” and “diversity” or decreasing that of “effi-ciency” and “flexibility” will reverse the rank order of “factoryintegration” and “increasing wafer size.” “Factory integration”will be the top-ranked technology when the relative impacts of“efficiency” increase. “Increasing wafer size” will become thefourth-ranked technology when “flexibility” is deemphasized.“Increasing wafer size” again has the most unstable rank whenCS−G
jk values change. “Reducing linewidth” is relatively stableat the top rank. The most influential factors at this level to keep itas the top choice are the relative impacts of different strategies,especially flexibility, to the cost leadership competitive goal.
b) Two-way SA: Because of the high uncertainty involvedthroughout the technology/product development life cycle [19],[47], especially when the technology is rapidly changing [38],disagreement may arise between experts while making judg-ment. Although averaging experts’ judgment, the method em-ployed in this study, is quite effective to aggregate differentopinions [3], [29], it is noted that the average opinion of expertsdoes not always yield useful results, and sometimes the realityis at one of the extremes of experts’ judgments [4]. To addressthis issue, two-way HDM SA is applied to test the robustness ofthe model regarding different experts’ opinions.
Among the impacts of technology strategies on competitivegoals, “flexibility” to “market leadership” (CS−G
54 ) and “imi-tation” to “market leadership” (CS−G
24 ) received the greatestdisagreement from the two experts who did the pairwise com-parisons at this level: expert C gave 0.07 to CS−G
24 and 0.4 toCS−G
54 , while expert D gave 0.34 to CS−G24 and 0.09 to CS−G
54 .Performing a two-way SA on the two contribution values, two
scenarios are generated, as shown in Fig. 5. S1 is the allowableregion for perturbations induced on CS−G
24 and CS−G54 to keep
the current ranking of all the technologies unchanged, and thejudgment of expert C falls in S1. The judgment of expert D fallsin S2, in which the rank order of “increasing wafer size” and“factory integration” will be reversed. But in either case, the top-ranked alternative, “reducing linewidth” technology, will not beaffected.
Authorized licensed use limited to: Amirkabir University of Technology Trial User. Downloaded on January 28, 2009 at 10:19 from IEEE Xplore. Restrictions apply.

12 IEEE TRANSACTIONS ON ENGINEERING MANAGEMENT, VOL. 56, NO. 1, FEBRUARY 2009
3) Technology Performance Analysis: As the technologiesare being developed, performance may fall short or exceedexpectations. Certain technologies may be progressing fasterthan others. In order for companies to respond quickly in theadaptive planning mode, it is helpful to anticipate different possi-bilities and incorporate technological advances into the technol-ogy plan, especially when the companies are in a fast-changingenvironment like the semiconductor industry. A good examplein this case study is the rapid progress to reduce line width:when the hierarchical technology assessment model was firstcalibrated in the year 2004, 90-nm line width was the state ofthe art. However, in less than two years, the same technology hasreached the point where 65 nm is applied in manufacturing and45 nm has been achieved in research laboratories. This advancemay alter the contribution matrix CA−S
ij and generally increasethe contributions of “reducing line width” technology. There-fore, the impact of technology advances on a semiconductorfoundry’s technology plan is evaluated.
Based on [10, Corollary 3.1], the allowable ranges of pertur-bations induced on CA−S
ij , contribution of the ith technologyalternative to the jth technology strategy, are calculated. The re-sults indicate that the smallest allowable change to CA−S
ij to pre-
serve the original ranking of all technologies happens on CA−S14 ,
the contribution of “increasing wafer size” to “efficiency,” mak-ing “increasing wafer size” the most critical decision element atthe technology-alternatives level to keep the current ranking oftechnologies. The contribution of “factory integration” to “flex-ibility” is also very critical: if it decreases by more than 0.0009,it will reverse the rank order of “increasing wafer size” and“factory integration.”
Since contribution matrix CA−Sij is at the bottom level of the
decision hierarchy, the ranking of technologies is more sensitiveto changes in this matrix. This results in much smaller thresholdvalues of the PA−S
ij ’s as compared to PS−Gjk ’s and PG
k ’s to keepthe technology rankings unchanged. Therefore, in determiningwhether the technology portfolio is optimal along the planninghorizon, the technological advancements are more critical thanindustry policy changes or organization strategy shifts. It isworth doing an in-depth analysis at this level to further investi-gate technology scenarios when each technology’s contributionto each strategy changes.
First analyzed is “reducing linewidth” technology, the currenttop choice that advances at the highest speed. Judging from thetrend of technology advancement, the contribution of “reducinglinewidth” is more likely to be increased. This will make theoriginal ranking of all technologies to be the same, as shown inTable VIII. The rank of “reducing linewidth” changes only whenits contributions decrease from the original value to a certainpoint, which is not likely to happen in the short future. “Hi-kdielectrics” and “Lo-k dielectrics” are again mostly dominatedby other technologies.
Then, the analysis goes to “increasing wafer size” technology,which is among the top three choices but with the most unstablerank based on the previous analysis. Results reveal that only “in-creasing wafer size” and “reducing linewidth” get the chances tobecome the top choice when contributions of “increasing wafersize” to strategies change. “Factor integration” stays at rank two
TABLE VIIIRANKING OF TECHNOLOGIES WHEN CONTRIBUTIONS OF “REDUCING
LINEWIDTH” TO STRATEGIES CHANGE
or three; “Hi-k dielectrics” and “Lo-k dielectrics” are mostlydominated by other technologies.
Applying the same analysis to “factor integration,” “reducinglinewidth” turns out to be the top choice in most cases, but it maydrop to the third rank in one scenario when “factory integration”becomes the top choice due to increases in its contributions tostrategies. “Increasing wafer size” takes either second or thirdrank. “Lo-k dielectrics” ranks fourth in most cases and third afew times, and “Hi-k dielectrics” remains as the last choice inevery scenario.
The analysis on “Hi-k dielectrics” and “Lo-k dielectrics” re-veals that in most cases “reducing linewidth” ranks first with“increasing wafer size” and “factory integration” ranks sec-ond, third, or fourth in different scenarios. “Hi-k dielectrics” or“Lo-k dielectrics” can move up to the first ranking only whentheir contributions to the strategies are increased dramatically.
C. Final Discussion
Based on results from the hierarchical technology assessmentmodel and its sensitivity analysis, a general conclusion can bereached: “reducing line width” is the top choice to be adoptedand should be allocated with the most resources. The decisiondifficulty lies in the choice between “factory integration” and“increasing wafer size,” which rank the second and the thirdwith very close overall contribution values. SA results revealthat “increasing wafer size” gets more chances to become thetop choice when changes occur to local contributions; however,its rank is relatively unstable and can drop from the first tothe fourth in different cases. Since the industry consortiumin Taiwan has strong influencing power, it is suggested that“increasing wafer size” should be chosen, and efforts should bemade to strengthen product leadership, because it is emphasizedthat, “reducing linewidth” and “increasing wafer size” will bethe top two choices. However, suppose a risk-averse companyadopted this framework and got the same model results, then
Authorized licensed use limited to: Amirkabir University of Technology Trial User. Downloaded on January 28, 2009 at 10:19 from IEEE Xplore. Restrictions apply.

CHEN et al.: STRATEGIC TECHNOLOGY PLANNING FRAMEWORK 13
“factory integration” should be adopted instead, since it poseslower risk to the company than what “increasing wafer size”does. “Hi-k dielectrics” and “Lo-k dielectrics” are dominated byother technologies in most cases. Unless their performances canbe improved dramatically, resulting in improved contributionsto the technology strategies to a certain degree, they will remainas the last choices and should be allocated the least resources.
SA at the technology strategies level indicates that “fac-tory integration” may become the top-ranked technology whenthe relative impacts of “efficiency” on the competitive goalsare increased, and “increasing wafer size” will drop to thefourth choice when “flexibility” is deemphasized. “Reducinglinewidth” is relatively insensitive to variations of the impactsof “diversity,” “flexibility,” and “imitation” except in a few sit-uations: decreasing the relative impact of “flexibility” to “costleadership” or increasing the relative impact of “imitation” to“cost leadership” will reverse the rank order of “increasing wafersize” and “reducing linewidth.” The same situation will happenwhen the “innovation” strategy is emphasized to a certain de-gree. Although the experts had great disagreement evaluatingthe relative impacts of “flexibility” and “imitation” on “mar-ket leadership,” SA results show that they do not affect the topchoice, “reducing linewidth,” only the rank order of “factoryintegration” and “increasing wafer size,” which are very closeanyway.
Factors at every level of the decision hierarchy all influencethe technology choices; however, the direction and speed oftechnological advancement are more critical than industry pol-icy changes and organizational strategy shifts in determiningthe optimal technology portfolio. Judging from current trends oftechnology developments, “reducing linewidth” and “increasingwafer size” are the two technologies that advance faster. There-fore, in the most likely scenario, the ranking of all the tech-nologies is “reducing linewidth” (1), “increasing wafer size”(2), “factory integration” (3), “Lo-k dielectrics” (4), and “Hi-kdielectrics” (5). Resources should be allocated to the top threetechnologies, with “reducing linewidth” getting the most. Unlessthere is a dramatic improvement on the “Lo-k dielectrics” and“Hi-k dielectrics” technologies, these two technologies shouldbe the lowest priority for investments.
Then, the available resource is considered in deciding howmany technologies to go with for investment and development.An optimized portfolio should be constructed to achieve highoverall contributions to the mission, while keeping the risks atan acceptable level. For a firm with limited resource, if it is onlyable to develop or acquire technologies that rank lower thanothers, or if it wants to justify its previous investments in thosetechnologies, it needs to shift its emphasis among competitivegoals, alter its strategies, or push for advancement of certaintechnologies in order to take full advantage of its investment.The changes need to be initiated in the directions indicated bythe HDM SA scenarios.
Periodical reevaluation of the business and technology en-vironment is needed to redirect organization development in atimely fashion to better utilize its technology investments. Insuch a periodic evaluation, “product leadership” and “innova-tion,” the most critical competitive goal and strategy, need spe-
cial attention since they have the greatest impact on technologychoices.
In addition, new technology options frequently become avail-able in the semiconductor foundry industry. These technologiesare either planned in the SEMATECH international roadmap oremerge from outside the industry. Emergence of critical newtechnologies should be incorporated along the way and be eval-uated together with the original technology alternatives. Forexample, system on a chip (SoC), which is not included in theoriginal model, may be an additional technology alternative forevaluation in this case.
Applying [10, Corollary 3.3], the condition that needs tobe satisfied in order for the current top choice, “reducinglinewidth,” to remain at its rank is
0.97CA−S61 + 0.75CA−S
62 + 0.97CA−S63 + 1.33CA−S
64
+ 1.17CA−S65 ≤ 1 (2)
where CA−S6j (j = 1, 2. . .5) are the contributions of the new
technology alternative, A6 , to the five technology-strategies.The conditions for the current second- and third-ranked tech-nologies to remain unchanged are
1.06CA−S61 + 0.77CA−S
62 + 0.94CA−S63 + 1.52CA−S
64
+ 1.25CA−S65 ≤ 1 (3)
1.16CA−S61 + 0.84CA−S
62 + CA−S63 + 1.46CA−S
64
+ 1.07CA−S65 ≤ 1. (4)
From inequalities (2)–(4), we can see that CA−S64 , the new
technology’s contribution to efficiency, is a relatively more crit-ical value in keeping the current top-, second-, and third-rankedtechnologies unchanged. If the new technology performs onan average level, and thus contributes to all the strategies nomore than one-sixth, the current top three choices will remainthe same. However, it is the combination of all CA−S
6j valuesthat determines whether the new technology should be adopted.With the assistance of the HDM SA, the stability of currenttechnology choices can be roughly assessed before determin-ing whether experts’ judgments are needed for new pairwisecomparisons at the technologies level.
Technology planning is a continuous process. Updating themodel is necessary to maintain its utility. Once the need forradical changes is identified from the periodic reevaluation, theorganization should restructure and calibrate the hierarchicalmodel with updated information and redo the planning processagain.
V. CONCLUSION
In this paper, a framework for strategic technology planningis proposed. The first five steps of the framework are integratedinto a hierarchical technology assessment model, through whichan organization’s overall business success, competitive goals,strategies, and the technology choices are linked together. Thishelps an organization to choose technologies that contributethe most to its mission through alignment with organizationalstrategies. The HDM SA algorithm developed in [9] and [10]
Authorized licensed use limited to: Amirkabir University of Technology Trial User. Downloaded on January 28, 2009 at 10:19 from IEEE Xplore. Restrictions apply.

14 IEEE TRANSACTIONS ON ENGINEERING MANAGEMENT, VOL. 56, NO. 1, FEBRUARY 2009
is then applied to the assessment results to test the stabilityof each technology alternative at its current rank and revealdominance relationships among the technologies. The analysisfurther explores the cause and effect relationships among de-cision elements, forecasts possible changes and correspondingsolutions, and provides organizations with insights for futureadaptive redirections. Conditions under which the current tech-nology choices will remain optimal are identified to help an or-ganization make better use of its investment in an unstable andfast-changing business environment. The analysis also benefitscompanies that have already invested in lower-ranked technolo-gies or are only able to adopt technologies that do not favor theircurrent competitive goals or strategies due to limited resources:directions in which those companies should influence the eco-nomic environment and industry policies or implement changesto their organizational strategies are highlighted.
The proposed framework offers a smooth transition betweensynoptic planning and adaptive planning modes. The paper ex-tends the conceptual strategic planning literature by providingindustry practitioners with a useful tool to guide them throughthe development of a technology plan. The procedures wereillustrated in detail through a case study, in which Taiwan’sfoundry industry, as a single organization that owns about 80%of world market share, was analyzed. Since the whole industrywas the initial user of the model, experts from a diversity ofcompanies in Taiwan semiconductor industry formed the panelto provide judgment. However, the model is equally applicableto technology planning at the firm level. Foundries with dif-ferent strategic positions may apply the model internally andgenerate their own strategic technology choices. More detailedtechnological alternatives may also be considered for firm-levelapplication. For example, reducing linewidth, as well as othertechnologies can be achieved by utilizing different techniquesand processes. A level of detailed techniques can be added undertechnology alternatives for evaluation. In that case, additionalpairwise comparisons will be needed to calculate those tech-niques’ contributions to the mission through alignment withtechnologies.
The model is also applicable to any other industry by restatingthe overall mission and decomposing it into different goals thatbetter represent the organization’s focus. Different strategiesand relevant technology choices may be identified based on theindustry characteristics. Though the focus of performing theHDM SA may be different, the general purpose and processwill remain the same.
While the proposed framework improves an organization’sability to react quickly to foreseeable changes, it is rather lim-ited in accommodating competitive dynamics: Impact of a com-pany’s competitors, suppliers, and customers needs to be an-alyzed and the organization’s responses need to be treated aschanges to its strategies and goals. Besides, dramatic changesthat bring new competitive goals and/or strategies into consid-eration need to be analyzed by reconstructing the model all overagain, which may increase the organization’s reaction time. Thesensitivity analysis addresses risks to a certain degree, but aneffective method needs to be developed in future research toquantify risks and better incorporate risks in the portfolio op-
timization. In addition, the model results depend highly uponexperts’ judgment, thus making the quality of information gath-ered by the experts very critical. External information, especiallyinput from customers, should not be neglected, and problemsaddressed by previous researchers such as product attribute bull-whip in technology forecasting [51] need additional attentionbefore the formal planning process starts.
ACKNOWLEDGMENT
All the constructive feedbacks from the three anonymousreviewers and the Department Editor are highly appreciated.
REFERENCES
[1] K. R. Andrews, The Concept of Corporate Strategy. Homewood, IL:Dow Jones-Irwin, 1971.
[2] H. I. Ansoff, “The changing shape of the strategic problem,” in StrategicManagement, D. E. Schendel and C. W. Hofer, Eds. Boston: Little,Brown, 1979, pp. 23–44.
[3] A. H. Ashton and R. H. Ashton, “Aggregating subjective forecasts: Someempirical results,” Manag. Sci., vol. 31, pp. 1499–1508, 1985.
[4] R. U. Ayres, “What have we learned?,” Technol. Forecast. Soc. Change,vol. 62, pp. 9–12, 1999.
[5] J. Barzilai and F. A. Lootsma, “Power relations and group aggregationin the multiplicative AHP and SMART,” J. Multi-Criteria Decis. Anal.,vol. 6, pp. 155–165, 1997.
[6] V. Belton and T. Gear, “On a short-coming of Saaty’s method of analytichierarchies,” Omega, vol. 11, no. 3, pp. 228–230, 1983.
[7] F. Betz, Managing Technological Innovation: Competitive Advantage fromChange, 2nd ed. New York: Wiley, 2003.
[8] A. D. Chandler, Strategy and Structure: Chapters in the History of theIndustrial Enterprise. Cambridge, MA: MIT Press, 1962.
[9] H. Chen, “Sensitivity analysis for hierarchical decision models” Ph.D.dissertation, Portland State Univ., Portland, OR, 2007.
[10] H. Chen and D. F. Kocaoglu, “A sensitivity analysis algorithm for hierar-chical decision models,” Eur. J. Oper. Res., vol. 185, no. 1, pp. 266–288,2008.
[11] A. T. W. Chu, R. E. Kalaba, and K. Spingarn, “A comparison of twomethods for determining the weights of belonging to fuzzy sets,” J.Optim. Theory Appl., vol. 27, no. 4, pp. 531–538, 1979.
[12] R. T. Clemen, Making Hard Decisions: An Introduction to Decision Anal-ysis. Boston, MA: PWS-Kent, 1996.
[13] D. W. Collier, “Linking business and technology strategy,” Plan. Rev.,Chicago, vol. 13, no. 5, pp. 28–35, 1985.
[14] C. Farrukh, R. Phaal, and D. Probert, “Technology roadmapping: Linkingtechnology resources into business planning,” Int. J. Technol. Manag.,vol. 26, no. 1, pp. 2–19, 2003.
[15] J. Fenn, A. Linden, and S. Fairchok, “Strategic technology planning:Picking the winners,” Gartner Res., R-20-3354, Jul. 2003.
[16] J. W. Fredrickson and T. R. Mitchell, “Strategic decision process: Com-prehensiveness and performance in an industry with an unstable environ-ment,” Acad. Manag. J., vol. 27, no. 2, pp. 399–423, 1984.
[17] J. W. Fredrickson, “The comprehensiveness of strategic decision pro-cesses: Extension, observations, future directions,” Acad. Manag. J.,vol. 27, no. 3, pp. 445–466, 1984.
[18] A. Fusfeld, “How to put technologies into corporate planning,” Technol.Rev., vol. 80, pp. 51–56, May 1978.
[19] N. Gerdsri, “An analytical approach on building a technology develop-ment envelope (TDE) for roadmapping of emerging technologies” Ph.D.dissertation, Portland State Univ., Portland, OR, 2005.
[20] J. M. Hihn, “A hierarchical approach to decision making: Economic the-ory and methodology,” Ph.D. dissertation, Univ. Maryland, College Park,1980.
[21] J. C. Ho, “Strategic evaluation of emerging technologies in the semicon-ductor foundry industry (special case: Taiwan semiconductor foundryindustry),” Ph.D. dissertation, Portland State Univ., Portland, OR,2004.
[22] L. R. Hoffman, “Improving the Problem-Solving Process in Manage-rial Groups,” in Improving Group Decision Making in Organization,R. A. Guzzo, Ed. New York: Academic, 1982.
Authorized licensed use limited to: Amirkabir University of Technology Trial User. Downloaded on January 28, 2009 at 10:19 from IEEE Xplore. Restrictions apply.

CHEN et al.: STRATEGIC TECHNOLOGY PLANNING FRAMEWORK 15
[23] R. E. Jensen, “An alternative scaling method of priorities in hierarchicalstructures,” J. Math. Psychol., vol. 28, pp. 317–332, 1984.
[24] C. R. Johnson, W. B. Beine, and T. J. Wang, “Right–left asymmetry in aneigenvector ranking procedure,” J. Math. Psychol., vol. 19, pp. 61–64,1980.
[25] D. F. Kocaoglu, “A participative approach to program evaluation,” IEEETrans. Eng. Manag., vol. EM-30, no. 3, pp. 37–44, Aug. 1983.
[26] K. Krajewski, “Five steps to effective strategic technology initiatives,”Int. IT, pp. 46–47, Sep. 2003.
[27] C. E. Lindblom, “The science of muddling through,” Public Admin. Rev.,vol. 19, pp. 79–88, 1959.
[28] C. E. Lindblom, “Still muddling, not yet through,” Public Admin. Rev.,vol. 39, pp. 517–526, 1979.
[29] S. Makridakis and R. L. Winkler, “Averages of forecasts: Some empiricalresults,” Manag. Sci., vol. 29, pp. 987–996, 1983.
[30] R. G. McGrath, “A real options logic for initiating technology positioninginvestments,” Acad. Manag. Rev., vol. 22, no. 4, pp. 974–996, 1997.
[31] N. W. McGuaghey, “Corporate technology planning,” Ind. Manag., pp. 1–2, Mar./Apr. 1990.
[32] R. E. Miles and C. C. Snow, Organizational Strategy, Structure, andProcess (McGraw-Hill Series in Management). New York: McGraw-Hill, 1978, vol. xiii, 274 pp.
[33] R. E. Miles and C. C. Snow, Fit, Failure, and The Hall of Fame: HowCompanies Succeed or Fail. New York: Free, vol. iv, 1994, p. 215.
[34] A. Miller, “A taxonomy of technological settings, with related strategiesand performance levels,” Strateg. Manag. J., vol. 9, no. 3, pp. 239–254,1988.
[35] H. Mintzberg, “Strategy-making in three modes,” Calif. Manag. Rev.,vol. 16, no. 2, pp. 44–53, 1973.
[36] H. Mintzberg, “Patterns in strategy formation,” Manag. Sci., vol. 24, no. 9,pp. 934–948, 1978.
[37] V. L. Mitchell and R. W. Zmud, “Endogenous adaptation: the effects oftechnology position and planning mode on IT-enabled change,” Decis.Sci., vol. 37, no. 3, pp. 325–355, 2006.
[38] R. T. Moriarty and T. J. Kosnik, “High-tech marketing: Concepts, conti-nuity, and change,” Sloan Manag. Rev., vol. 30, no. 4, pp. 7–17, 1989.
[39] M. E. Porter, Competitive Strategy: Techniques for Analyzing Industriesand Competitors, 1st ed. New York: Free, 1980, vol. xxviii, 396 pp.
[40] M. E. Porter, Competitive Advantage: Creating and Sustaining SuperiorPerformance. New York: Free, Collier Macmillan, 1985, vol. xviii,557 pp.
[41] M. E. Porter, “What is strategy?,” Harv. Bus. Rev., vol. 74, no. 6, pp. 61–78, 1996.
[42] T. R. Prabhu and K. Vizayakumar, “Technology choice using FHDM: Acase of iron-making technology,” IEEE Trans. Eng. Manag., vol. 48,no. 2, pp. 209–222, May 2001.
[43] J. B. Quinn, “Strategic change: Logical incrementalism,” Sloan Manag.Rev., vol. 20, no. 1, pp. 7–21, 1978.
[44] J. W. Ra, “Analysis of Expert Judgments in Hierarchical Decision Pro-cess,” Ph.D. dissertation, Univ. Pittsburgh, Pittsburgh, PA, 1988.
[45] T. Reilly, “Sensitivity analysis for dependant variables,” Decis. Sci.,vol. 31, no. 3, pp. 551–572, 2000.
[46] L. C. Rhyne, “The relationship of strategic planning to financial perfor-mance,” Strateg. Manag. J., vol. 7, no. 5, pp. 423–436, 1986.
[47] L. P. Santiago and T. G. Bifano, “Management of R&D projects under un-certainty: A multidimensional approach to managerial flexibility,” IEEETrans. Eng. Manag., vol. 52, no. 2, pp. 269–280, May 2005.
[48] Y. E. Spanos and S. Lioukas, “An examination into the causal logic of rentgeneration: Contrasting Porter’s competitive strategy framework and theresource-based perspective,” Strateg. Manag. J., vol. 22, no. 10, pp. 907–934, 2001.
[49] A. Segars and V. Grover, “Profiles of strategic information system plan-ning,” Inf. Syst. Res., vol. 10, no. 3, pp. 199–233, 1999.
[50] T. L. Saaty, The Analytic Hierarchy Process. New York: McGraw-Hill,1980.
[51] B. A. Vojak and C. A. Suarez-Nunez, “Product attribute bullwhip in thetechnology planning process and a methodology to reduce it,” IEEETrans. Eng. Manag., vol. 51, no. 3, pp. 288–299, Aug. 2004.
[52] D. R. Wood and R. L. LaForge, “The impact of comprehensive planningon financial performance,” Acad. Manag. J., vol. 22, pp. 516–526, 1979.
Hongyi Chen received the B.S. degree in power engi-neering economics from North China Electric PowerUniversity, Beijing, China, and the M.S. degree in en-gineering management and the Ph.D. degree in sys-tems science engineering management from PortlandUniversity, Portland, OR.
Currently, she is an Assistant Professor in theDepartment of Mechanical and Industrial Engineer-ing, University of Minnesota Duluth, Duluth, MN.She has served on the organizing committee for thePortland International Center for Management of En-
gineering and Technology (PICMET) and as a Reviewer for various conferencesand journals such as the IEEE Transactions on Engineering Management, theEuropean Journal of Operational Research, the Technovation, and the PICEMT.Her current research interests include strategic technology management, newproduct development, innovation management, and multicriteria decision mak-ing tools.
Dr. Chen is a member of The Institute for Operations Research and the Man-agement (INFORMS), the American Society of Engineering Management, theTau Beta Pi, and the Omega Rho.
Jonathan C. Ho was educated in Taiwan andthe United States. He received the B.S. degreefrom Chung-Yuan Christian University, Chung Li,Taiwan, R.O.C., the M.S. degree in mechanicaland aerospace engineering from the University ofMissouri—Columbia, MO, and the M.S. degree inengineering management and the Ph.D. degree in sys-tems science engineering management from PortlandState University, OR.
He is currently an Assistant Professor in the De-partment of Business Administration, Yuan Ze Uni-
versity, Taoyuan, Taiwan, R.O.C. He has been a Technology Researcher in theIndustry Technology Research Institute of Taiwan and a Quality Manager ofApplied Materials Inc. His current research interests include technology evalu-ation, technological forecasting, and strategic management of technology.
Dundar F. Kocaoglu (SM’84–F’91) received theB.S.C.E. from Robert College, Istanbul, Turkey, theM.S.C.E. degree from Lehigh University, Bethlehem,PA, the M.S.I.E. and Ph.D. degrees from the Univer-sity of Pittsburgh, Pittsburgh, PA.
He is currently a Professor and Chairman of theDepartment of Engineering and Technology Manage-ment, Portland State University, Portland, OR, andPresident and CEO of the Portland International Cen-ter for Management of Engineering and Technology(PICMET). He has been a Consultant to major inter-
national corporations, universities, and the United Nations. He is listed in morethan a dozen Who’s Who reference publications. He is the author or coauthor ofmore than 50 papers and is the author/editor of seven books. He has deliveredmore than 30 keynote speeches. His current research interests include decisiontheory, hierarchical decision modeling, technology management, project man-agement, R&D management, evaluation and selection of emerging technologies,and resource optimization.
Prof. Kocaoglu is a member of various committees of the National ResearchCouncil. He has served as a Reviewer for the National Science Foundation(NSF). He has served as the Editor of the IEEE TRANSACTIONS ON ENGINEERING
MANAGEMENT and the John Wiley Book Series on engineering and technologymanagement. He was the recipient of the IEEE Centennial Medal, the IEEE Mil-lennium Medal, and the Distinguished Research Mentor Award of the NationalScience Council of Taiwan.
Authorized licensed use limited to: Amirkabir University of Technology Trial User. Downloaded on January 28, 2009 at 10:19 from IEEE Xplore. Restrictions apply.
Copyright © 2022 FDOKUMEN