A Static Analysis Framework for Data Science Notebooks
10
A Static Analysis Framework for Data Science Notebooks Pavle Subotić [email protected] Microsoft Serbia Lazar Milikić [email protected] Microsoft Serbia Milan Stojić [email protected] Microsoft Serbia ABSTRACT Notebooks provide an interactive environment for programmers to develop code, analyse data and inject interleaved visualisations in a single environment. Despite their flexibility, a major pitfall that data scientists encounter is unexpected behaviour caused by the unique out-of-order execution model of notebooks. As a result, data scientists face various challenges ranging from notebook cor- rectness, reproducibility and cleaning. In this paper, we propose a framework that performs static analysis on notebooks, incorporat- ing their unique execution semantics. Our framework is general in the sense that it accommodates a wide range of analyses, useful for various notebook use cases. We have instantiated our framework on a diverse set of analyses and have evaluated them on 2211 real world notebooks. Our evaluation demonstrates that the vast major- ity (98.7%) of notebooks can be analysed in less than a second, well within the time frame required by interactive notebook clients. CCS CONCEPTS • Theory of computation → Program analysis; • Software and its engineering → Integrated and visual development environments. KEYWORDS static analysis, notebooks, data science ACM Reference Format: Pavle Subotić, Lazar Milikić, and Milan Stojić. 2022. A Static Analysis Framework for Data Science Notebooks. In 44nd International Conference on Software Engineering: Software Engineering in Practice (ICSE-SEIP ’22), May 21–29, 2022, Pittsburgh, PA, USA. ACM, New York, NY, USA, 10 pages. https://doi.org/10.1145/3510457.3513032 1 INTRODUCTION Notebooks have become an increasingly popular development en- vironment for data science. In 2020, JetBrains reported 10M note- books on GitHub [1], an increase from 200K in 2015 [5]. Notebooks provide a dynamic read-eval-print-loop (REPL) experience where developers can rapidly prototype code while interleaving data vi- sualizations including graphs, textual descriptions, tables etc. A notable peculiarity of notebooks is that the program i.e., notebook, is divided into non-scope inducing blocks of code called cells. Cells Permission to make digital or hard copies of all or part of this work for personal or classroom use is granted without fee provided that copies are not made or distributed for profit or commercial advantage and that copies bear this notice and the full citation on the first page. Copyrights for components of this work owned by others than ACM must be honored. Abstracting with credit is permitted. To copy otherwise, or republish, to post on servers or to redistribute to lists, requires prior specific permission and/or a fee. Request permissions from [email protected]. ICSE-SEIP ’22, May 21–29, 2022, Pittsburgh, PA, USA © 2022 Association for Computing Machinery. ACM ISBN 978-1-4503-9226-6/22/05. . . $15.00 https://doi.org/10.1145/3510457.3513032 can be added, edited and deleted on demand by the user. Most im- portantly, cells, regardless of their order in the notebook, can be executed (and re-executed) by the user in any given sequence. This provides a level of incrementalism that improves productivity and flexibility. At the same time, such execution semantics make note- book behaviour notoriously difficult to predict and reproduce. This observation is highlight in [17]. Here the difficulty of reproducing notebook results is investigated, concluding that from a large set of notebooks, only 25% of notebooks could be executed without an error and less than 5% were trivially reproducible. Moreover, in [18] it was observed that there is an abundance of code smells and bugs in real world notebooks. Thus, the authors of this study argue for more code analysis tooling to improve the quality of notebooks. To understand the source of this phenomena, consider the example below. Example 1.1 (Motivating Example). Consider the notebook in Figure 1 comprising of 5 cells. Each numbered from 1 to 5, indicated by the left hand side number in square brackets. In a script, the execution proceeds as if the cells were merged into a single cell and each statement is executed as dictated by the regular program control flow i.e., statements in cell 1 are executed sequentially, followed by cell 2, cell 3 and so on. However, in notebooks any given cell can be executed at any given time by the user. This produces a potentially infinite space of possible execution paths due to a lack of constraints on the order in which cells can be executed in. In the example notebook, cell 1 and cell 3 read data from a file into a data frame. In cell 2 data in variable d is normalized and in cell 4 the data is split into test and training segments. In cell 5 the model is trained, tested and assessed for accuracy. It is apparent that several legitimate executions exist in this notebook. For example, one could start by executing cell 3, cell 4 and cell 5. Another execution sequence is cell 1, followed by cell 2, cell 4 and cell 5. Note, it is common to have several alternate executions in a notebook for reasons of experimentation etc. Now consider the following scenario: suppose the user executes the sequence of cells 1, 2, 4, and 5. While this may not seem par- ticularly ominous, it will in fact result in a data leak bug [12] as the function in cell 2 normalizes the data and yet cell 4 splits the data in to train and test data after the normalization, thus result- ing in a what is know in data science as a data leak. Now, lets suppose the user, after some investigation, identifies this problem. They re-execute cell 1, skipping cell 2 (to avoid normalization) and execute cell 4 and cell 5. The user may be perplexed as the same issue re-occurs. The problem is that the user executed cell 4 which referred to variable x , which was previously computed by cell 2, resulting the using an old (or stale) value. One can see how a user
-
Upload
khangminh22 -
Category
Documents
-
view
2 -
download
0
Transcript of A Static Analysis Framework for Data Science Notebooks

A Static Analysis Framework for Data Science NotebooksPavle Subotić
Microsoft
Serbia
Lazar Milikić
Microsoft
Serbia
Milan Stojić
Microsoft
Serbia
ABSTRACT
Notebooks provide an interactive environment for programmers
to develop code, analyse data and inject interleaved visualisations
in a single environment. Despite their flexibility, a major pitfall
that data scientists encounter is unexpected behaviour caused by
the unique out-of-order execution model of notebooks. As a result,
data scientists face various challenges ranging from notebook cor-
rectness, reproducibility and cleaning. In this paper, we propose a
framework that performs static analysis on notebooks, incorporat-
ing their unique execution semantics. Our framework is general in
the sense that it accommodates a wide range of analyses, useful for
various notebook use cases. We have instantiated our framework
on a diverse set of analyses and have evaluated them on 2211 real
world notebooks. Our evaluation demonstrates that the vast major-
ity (98.7%) of notebooks can be analysed in less than a second, well
within the time frame required by interactive notebook clients.
CCS CONCEPTS
• Theory of computation → Program analysis; • Software
and its engineering → Integrated and visual development
environments.
KEYWORDS
static analysis, notebooks, data science
ACM Reference Format:
Pavle Subotić, Lazar Milikić, and Milan Stojić. 2022. A Static Analysis
Framework for Data Science Notebooks. In 44nd International Conferenceon Software Engineering: Software Engineering in Practice (ICSE-SEIP ’22),May 21–29, 2022, Pittsburgh, PA, USA. ACM, New York, NY, USA, 10 pages.
https://doi.org/10.1145/3510457.3513032
1 INTRODUCTION
Notebooks have become an increasingly popular development en-
vironment for data science. In 2020, JetBrains reported 10M note-
books on GitHub [1], an increase from 200K in 2015 [5]. Notebooks
provide a dynamic read-eval-print-loop (REPL) experience where
developers can rapidly prototype code while interleaving data vi-
sualizations including graphs, textual descriptions, tables etc. A
notable peculiarity of notebooks is that the program i.e., notebook,
is divided into non-scope inducing blocks of code called cells. Cells
Permission to make digital or hard copies of all or part of this work for personal or
classroom use is granted without fee provided that copies are not made or distributed
for profit or commercial advantage and that copies bear this notice and the full citation
on the first page. Copyrights for components of this work owned by others than ACM
must be honored. Abstracting with credit is permitted. To copy otherwise, or republish,
to post on servers or to redistribute to lists, requires prior specific permission and/or a
fee. Request permissions from [email protected].
ICSE-SEIP ’22, May 21–29, 2022, Pittsburgh, PA, USA© 2022 Association for Computing Machinery.
ACM ISBN 978-1-4503-9226-6/22/05. . . $15.00
https://doi.org/10.1145/3510457.3513032
can be added, edited and deleted on demand by the user. Most im-
portantly, cells, regardless of their order in the notebook, can be
executed (and re-executed) by the user in any given sequence. Thisprovides a level of incrementalism that improves productivity and
flexibility. At the same time, such execution semantics make note-
book behaviour notoriously difficult to predict and reproduce. This
observation is highlight in [17]. Here the difficulty of reproducing
notebook results is investigated, concluding that from a large set
of notebooks, only 25% of notebooks could be executed without an
error and less than 5% were trivially reproducible. Moreover, in [18]
it was observed that there is an abundance of code smells and bugs
in real world notebooks. Thus, the authors of this study argue for
more code analysis tooling to improve the quality of notebooks. To
understand the source of this phenomena, consider the example
below.
Example 1.1 (Motivating Example). Consider the notebook in
Figure 1 comprising of 5 cells. Each numbered from 1 to 5, indicated
by the left hand side number in square brackets. In a script, the
execution proceeds as if the cells were merged into a single cell and
each statement is executed as dictated by the regular program
control flow i.e., statements in cell 1 are executed sequentially,
followed by cell 2, cell 3 and so on. However, in notebooks any
given cell can be executed at any given time by the user. This
produces a potentially infinite space of possible execution paths
due to a lack of constraints on the order in which cells can be
executed in. In the example notebook, cell 1 and cell 3 read data
from a file into a data frame. In cell 2 data in variable d is normalized
and in cell 4 the data is split into test and training segments. In
cell 5 the model is trained, tested and assessed for accuracy. It is
apparent that several legitimate executions exist in this notebook.
For example, one could start by executing cell 3, cell 4 and cell 5.Another execution sequence is cell 1, followed by cell 2, cell 4 andcell 5. Note, it is common to have several alternate executions in a
notebook for reasons of experimentation etc.
Now consider the following scenario: suppose the user executes
the sequence of cells 1, 2, 4, and 5. While this may not seem par-
ticularly ominous, it will in fact result in a data leak bug [12] as
the function in cell 2 normalizes the data and yet cell 4 splits thedata in to train and test data after the normalization, thus result-
ing in a what is know in data science as a data leak. Now, lets
suppose the user, after some investigation, identifies this problem.
They re-execute cell 1, skipping cell 2 (to avoid normalization) and
execute cell 4 and cell 5. The user may be perplexed as the same
issue re-occurs. The problem is that the user executed cell 4 whichreferred to variable x , which was previously computed by cell 2,resulting the using an old (or stale) value. One can see how a user

ICSE-SEIP ’22, May 21–29, 2022, Pittsburgh, PA, USA Pavle Subotić, Lazar Milikić, and Milan Stojić
can quickly get into a confusing situation, even for this relatively
simple notebook1.
Each of the bugs above demonstrate the ease at which a seem-
ingly simple data science program can result in unforeseen be-
haviour in a notebook environment. Moreover, establishing the
root cause is similarity difficult without engaging in time consum-
ing post-mortem debugging that cannot prevent future bugs, or
generalize the cause of the bug. On the other hand, if we were to
restrict the notebook execution semantics, we would be removing
precisely the flexibility that has made notebooks so popular in the
last few years.
In this paper, we argue for the use of static analysis as an ante-
mortem debugging mechanism. Our technique co-exists with the
unique notebook execution flexibility, and yet reducing errors and
debugging efforts by warning users ahead of time of hypotheticalerroneous and safe actions. Due to the semantics of notebooks,
standard static analysis tools cannot be directly applied, and to the
best of our knowledge general static analyzers targeting notebooks
have not been proposed in the literature. Moreover, the interactive
nature of notebooks requires analyzers that are able to produce
feedback within a second [4] to not disrupt the flow of the user
experience. To this end, we propose NBLyzer, a static analysis
framework that provides notebook users the ability to perform a
what-if static analysis on given notebook actions. Notebook actionsconstitute opening a notebook, code changes, cell executions, cell
creation, deletion etc. Our framework soundly reports potential
issues that may occur for a given action within the time bounds
required for users not to notice a disruption. For instance, consider
the notebook in Example 1.1, as shown in Figure 1b, our framework
will warn the user that the event of executing cell 1 can lead to a
data leakage by executing cells 2, 4 and 5 in milliseconds. Moreover,
as shown in Figure 1c, it will warn in milliseconds that the event of
executing cell 1 can result in a stale state if cell 4 is executed before
cell 2. Conversely, our framework can recommend the execution
of the sequencecell 3, 4, 5 to be safe to execute after cell 1 is exe-cuted. Our framework supports a wide range of static analyses
2.
In Section 4 we present several analyses implemented in NBLyzer,
particularly targeting data science notebooks. Using these analyses,
we facilitate the automation of several other important notebook
development use cases including notebook correctness, notebook
debugging, notebook reproducibility, notebook auditing, and note-
book cleaning.
NBLyzer employs the theory of Abstract Interpretation [6] to
perform intra-cell static analyses i.e., on individual cells, and thus in-
cell termination is guaranteed for the price of an over-approximate
analysis result. The key idea is to over-approximate the notebook
semantics and computational state σ and instead produce an ab-
stract state σ ♯which comprises of an element of an abstract domain
that encodes the analysis property of interest. When analyses are
triggered by an event, an inter-cell analysis is performed by propa-
gating the analyses results (abstract state) to valid successor cells in
the notebook. To select valid successors, we introduce the notion
of cell propagation dependencies, which prunes away unnecessary
1in fact this example is based on a real life notebook sourced from stackoverflow,
where a user was experiencing a data leak
2that can be expressed as an abstract interpretation
sequences of cell executions on-the-fly, parametrized by the cur-
rent abstract state. In this way, the abstract state is propagated
efficiently while ensuring soundness and termination via both an
intra and inter-cell termination criteria. We evaluate NBLyzer on
2211 real world notebooks and several instantiated analyses to
demonstrate its utility and scalability. NBLyzer is able to analyze
98.7% of notebooks within a second. Overall, we claim the following
contributions:
(1) A novel static analysis framework specifically for notebooks
(2) Several instantiated industrial static analyses implemented
in NBLyzer, including a novel data leakage analysis that to
the best of our knowledge, has not been presented before in
the literature or implemented in any static analyzer.
(3) An extensive performance evaluation of NBLyzer that demon-
strates its adequate performance based on [4] to perform
only-the-fly static analysis within the notebook environment
without degrading the user notebook experience.
2 OVERVIEW
In this section we give an overview of the NBLyzer static analysis
framework for notebooks.
The high-level operation of the framework is depicted in Figure 2.
A user performs actions on a notebook such as opening notebooks,
adding cells, changing cells, executing cells, deleting cells among
others. For each event, the user may want to initiate a what-if
analysis, essentially asking NBLyzer what can occur if I executecell 1? This allows the user to ahead of time avoid putting the
notebook in a state that will lead to an error. Conversely, the user
may ask NBLyzerWhat executions are safe if I execute cell 1? Thisallows the user to choose from a set of possible safe execution paths.
Other examples of what-if questions includeWhich cells will becomeisolated if I rename d to x cell 2?, Which cells will become redundantin the notebook I opened? etc.
Each of these what-if questions can be useful for use cases in-
cluding reproducibility, security auditing, notebook cleaning and
simplification, debugging and education, among others.
From a systems perspective, a what-if analysis is a notebook
event that is associated/configured to a set of analyses. For example,
asking about notebook safety will entail a certain set of analyses,
and asking about notebook cleanliness will entail a distinct set of
analyses. NBLyzer therefore intercepts an event from the notebook
client and determines the appropriatemode of operation. Themodes
of operation are described below.
Maintenance mode. In the case that the event is a cell execu-
tion and the user has not attached analyses to this event, i.e., a
what-if analysis is not triggered, then NBLyzer will perform cell
maintenance for the executed cell. Since a cell execution will re-
sult in the concrete notebook state being updated, NBLyzer needs
to ensure that the corresponding abstract state for all future in-
voked analyses is maintained. In addition, code summaries that
enable faster analyses must also be updated. NBLyzer performs
maintenance by updating (if the code has changed) all intermediate
program representations including parsing the cell code into an
abstract syntax tree (AST), converted the AST to a control flow
graph (CFG) and producing use definition (U-D) chains. If the cell
code has not changed, these are retrieved from a cache. Using the

A Static Analysis Framework for Data Science Notebooks ICSE-SEIP ’22, May 21–29, 2022, Pittsburgh, PA, USA
[1] [1] [1]
[2][2][2]
[3] [3] [3]
[4][4][4]
[5] [5] [5]
1
2
3
1
(a) Initial notebook
[1] [1] [1]
[2][2][2]
[3] [3] [3]
[4][4][4]
[5] [5] [5]
1
2
3
1
(b) Data leak analysis
[1] [1] [1]
[2][2][2]
[3] [3] [3]
[4][4][4]
[5] [5] [5]
1
2
3
1
(c) Stale state analysis
Figure 1: Example Notebook
Notebook
report
eventevent handlerclient
allanalyses
analysesselected
What-If
Maintain
NBLyzer
Figure 2: Overview of NBLyzer
CFG the static analyses are performed to update the notebook’s ab-
stract state, i.e., the resultant state from a static analysis required to
perform future static analyses in the future. In the case the event is a
non-execution event an abstract state may not need to be computed
and only summary, AST, CFG and U-D information is updated. In
Section 3.2.1 we provide a detailed account of the maintenance
process.
Propagation mode. In the case of a what-if analysis, i.e., an
event with a subset of analyses associated with it, an inter-cell anal-
ysis is performed. Here starting from the global notebook abstract
state, a set of possible abstract states are computed corresponding
to the set of possible executions up to a limit K depth or a fixpoint
is reached on all branches. This process for each cell checks which
other cells have a dependency and propagates the computed ab-
stract state to the dependent cells, for which the incoming abstract
state is treated as an initial state. For each cell, the abstract state
is checked for correctness criteria, if an error is found a report is
updated which serves as instruction for notebook clients to alert the
user to the consequences of the event (e.g., by cell highlighting etc.).
In Section 3.2.2 we provide a detailed account of the maintenance
process.
3 TECHNICAL DESCRIPTION
In this section we provide a technical description of the NBLyzer
framework.
3.1 Notebook Program Model
3.1.1 Notebook. A Notebook N consists of a set of cells ci ∈ N .
A cell ci consists of a sequence of code statements st ij (l , l′) from a
location l to location l ′ in a control flow graph (CFG) where i refersto the cell number and j the index of the statement in the cell. As
an abuse of notation we allow ci to be also used as a label.
3.1.2 Cell Execution. An execution of a cell ci over a state spaceΣ = V → D where V is the set of notebook variables and D is
the concrete domain of execution, is denoted by σi+1 = Jci+1K(σi ),assuming the execution of ci+1 terminates. Here σi+1 ∈ Σ is the
output state and σi ∈ Σ is the input state previously computed by
a cell ci in the execution sequence. We denote access into a state
as σ (v) where v ∈ V and we denote updating a state as σ [v 7→ d]where v ∈ V and d ∈ D.
3.1.3 Notebook Execution. A notebook execution is a potentially
infinite execution sequenceσ0 →ci σ1 →c j . . . where ∀k ≥ 0, ck ∈
N ,σk ∈ Σ and i = j∨i , j . The choice of the next cell in a executionsequence is determined by the user from the space of all cells in a
notebook.
3.2 Analysis Framework
3.2.1 Intra Cell Analysis.
Events and Analyses. The inter-cell analysis is triggered by an
event e ∈ Event . An event is attached to a set of analyses A′ ⊂ Aby an mapping M : Event → ℘(A). An analysis a is a tuple of a
abstraction label abs and condition cond . The condition cond is an
assertion on an abstract state of the analysis of type abs .
Abstract state computation. From the sequence of statements in a
cell, we construct a control flow graph (CFG), a directed graph that
encodes the control flow of the statements in a cell. We define a
CFG as ⟨L,E⟩ where an edge (l , st , l ′) ∈ E reflects the semantics of
the cell statement st associated with the CFG edge from locations lto l ′ in the cell.
A sound over-approximation σ ♯of a state σ is computed by itera-
tively solving the semantic fixed point equationσ ♯ = σ♯0⊔JstK♯(σ ♯)
using the abstract semantics JstK♯ for statements st in a cell and
the initial abstract state (σ♯0). At the cell level this computation is
defined as Fci which we refer to a abstract cell transformer. Fci takesan abstract state and computes a fix-point solution [13, 14] in the
abstract domain.
Since a what-if analysis may not be triggered on every event,
and yet a cell is executed by the user, it is of small cost to maintain
the abstract state along with the concrete state, as our analyses are
designed to be faster than performing a concrete execution (See
Section 6). We therefore maintain an abstract state σ ♯which is
updated each time a cell is executed, in parallel to the concrete

ICSE-SEIP ’22, May 21–29, 2022, Pittsburgh, PA, USA Pavle Subotić, Lazar Milikić, and Milan Stojić
executions of a notebook cell. At each execution, a cell transformer
Fci for a cell ci is applied with the current global state, returning
an updated new global state i.e., Fci (σ♯) = σ ♯′
. We perform this
maintenance for two reasons: Firstly, we may want to perform a
static analysis just before cell execution, blocking execution if an
error was found. Secondly, the global abstract state is needed to
initiate a what-if analyses, once it’s triggered by a user.
To analyze a cell, we reduce the static analysis problem to the
computation of the least solution of a fix-point equation σ ♯ =
Fci (σ♯), σ ♯ ∈ Σ♯ where Σ♯ is a domain of abstract properties, and
Fci is the abstract transformer for the cell, i.e., a composition of
abstract statements transformers in the cell fix-point computation
to solve the static analysis problem. We refer to [6] for a compre-
hensive background on abstract interpretation.
Within the abstract interpretation framework several analyses
can co-exist by constructing an independent product of abstractdomains. We denote executing several transformers in parallel for
cell ci as FAci where A is a set of analyses. We refer the reader to [7]
on literature on combining abstract domains with independent
products.
Cell summary computation. Apart from computing the abstract
state, we compute pre-summaries. Pre-summaries are intra-cell com-
puted pre-conditions on a cell that are used to act as a pre-condition
guard on if an abstract state should be propagated to that cell. We
compute pre-summaries for each cell at notebook initialization time
and during cell code changes.
In order to compute a pre-summary preci for cell ci we constructuse-def (U-D) structure using standard data-flow techniques [9]. U-
Ds provide a mapping between variable usages and their definitions.
A variable is a defined if it is used as a right-hand-side expression in
a assignment statement or if it is a function st . A variable is used if
it is in a left-hand-side of an assignment statement or in a function
st . Thus, given a cell c we can define the following sets of variables
that define definitions and usages.
de f (c) ={v | ∀ st ∈ c s.t. v is defined in st} and
use(c) ={v | ∀ st ∈ c s.t. v is used in st}
The U-D structure is computed using a reaching definitions data-
flow analysis [9] and provides a mapping use-def for all symbols
v ∈ V in the cell. If a v ∈ use(c) has no definition, it is mapped
to ⊥. Using the U-D structure we compute the set of all unbound
variables in a cell:
preci = { v | v ∈ use(ci ) ∧ use-def(v) = ⊥}
Depending on the analysis we may want to expand the definition
of preci . For example, for access violation we may want to ignore
variables in cells where no access patterns occur and a variable
is never used to change and propagate information e.g., simply
printing data.
3.2.2 Inter Cell Analysis.
State propagation. The inter-cell analysis computes a set of ab-
stract states for the entire notebook up to a depth K or to a global
fixpoint solution (fixpoints on all active paths). The abstract state
from a source cell is propagated to other cells if and only if there
preci
precj
preck
precj+1
preck+1
�]
�]ci
�(�]ci
, precj) �(�]
ci, precj+1
)
�]cj
�]cj+1
�]ck+1�]
ck
�(�]cj
, preck+1)�(�]
cj, preck
)
Fci(�]) = �]
ci
Fcj(�]
ci) = �]
cjFcj+1
(�]ci
) = �]cj+1
. . .
Fck+1(�]
cj) = �]
ck+1Fck(�]
cj) = �]
ck
. . .
K = 3
Figure 3: Inter Cell Analysis
exists an edge that satisfies a cell propagation dependency. When
the propagation occurs, an intra-cell analysis computation is per-
formed that treats the incoming cell abstract state as the initial
state.
The inter-cell analysis propagation is depicted in Figure 3. Here
the what-if analysis is triggered by an event e for a source cell ci .A pre-defined value of K ∈ {1, . . . ,∞} is defined where K = ∞
meanswe compute until a fix-point, that determines the depth of the
analysis. The dependency is defined by determining if the abstract
state σ ′ci of the cell ci can be combined with the pre-summary
prec j of another cell c j (which may be cell ci itself). If there is adependency, the unbound variables in c j consume their values from
σ ′ci . This propagation is continued until all paths terminate either
by reaching the K limit, by achieving a fixpoint or by ϕ not holding
for all cells in the notebook.
We formalise cell dependencies in the form of a graph defini-
tion. Note, in our technique the graph is constructed lazily during
abstract state propagation phase.
Definition 3.1 (Cell Propagation Dependency Graph). We assume
the sequence of cells form a directed dependency graph G = ⟨N ,D⟩where N is a finite set of cells, and (ci ,R, c j ) ∈ R defines an arc
from cell ci ∈ N to c j ∈ N iff ϕ(σ♯ci ,prec j ). How ϕ(σ
♯ci ,prec j ) is
defined is analysis specific. In Section 4 we provide examples of
how analyses can be defined to fit into the NBLyzer framework.
Fixpoint pruning. The control-flow from inter-cell execution can
result in cycles. For example, a cell can be re-executed as the de-
pendency ϕ repeatedly holds in a given sequence. For analyses
with K = ∞ this can cause non-termination. Even, in the case for
bounded K values, ignoring fixpoints is a source of inefficiency.
Firstly, by fixpoint we mean that the state σ♯ci = σ
♯′
ci , that is, in an
analysis path (note many paths exist as shown in Figure 3), the
state resulting from first execution of cell ci does not change afterits next execution. There may or may not be execution of cells in
between. Regardless, this implies that we can prune this execution
path as other execution paths arising from the first execution of ciwill subsume any further executions from the second execution of
ci . For analyses with high or infinite lattices, extrapolation opera-
tors are needed for force convergence. Therefore, we detect when
we re-visit a cell and terminate the exploration on that path if a

A Static Analysis Framework for Data Science Notebooks ICSE-SEIP ’22, May 21–29, 2022, Pittsburgh, PA, USA
fixpoint is detected after the re-execution. In the case of high or in-
finite abstract domains, we extrapolate the fixpoint using standard
widening techniques [6] for the given abstract domain.
Observation 3.1 (Fixpoint Subsumption). Given a fixpoint ona cell execution path p = ⟨ci , . . . , ci+k ⟩ such that ci = ci+k andσ♯ci = σ
♯ci+k , any cell c j not in p executed after ci will produce the
same abstract state as being executed after ci+k .
Proof. Since the ci and ci+k are the same cell and since we
have a fixpoint i.e., σ♯ci = σ
♯ci+k , due to the monotonicity of the
transformers no cell in p changed the state, therefore executing
any cell c j after ci+k will be the same as executing it after ci andtherefore we can stop execution after p. □
Algorithm 1 Event_Handler(code, ci , e,K )
1: global variables
2: σ ♯(global abstract state)
3: pre (cell to pre-summary mapping)
4: cfg (cell to cfg mapping)
5: end global variables
6: A′ =M(e)7: if A′ = ∅ ∧ e = execute then8: σ ♯
:= Maintain(code, ci ,σ ♯ ,A)9: else
10: report := InterCell(σ ♯ , ci ,K , [],A′,η)
11: return report
3.2.3 Algorithmic Implementation. Our technique is described al-
gorithmically, starting with Algorithm 1 which receives an event
and determines if the computation should proceed in maintenance
mode or what-if analysis mode. Given an event e occurs, we ob-tain the source cell code code , identifier ci , event e and global ab-
stract state. At line 6, we determine if there exist any analyses
A′ ⊆ A that are attached to the event e . If not, we perform a main-
tenance in line 8 by calling Maintain(code, ci ,σ ♯ ,A) and updating
the global. Otherwise, we proceed with a what-if analysis by call-
ing InterCell(σ ♯ , ci ,K , [],A′,η) in line 10 and return the results of
the analysis to the notebook. Here apart from the global state σ ♯,
cell label ci , and the analyses A′, the K parameter is passed, along
with a report which is initialized to an empty list [] (to simplify
the algorithm description we represent the report as simply a list),
and a mapping η : N → Σ♯ which maps each cell label to its last
computed abstract state. This is required to detect fixpoints in the
analysis paths.
In Algorithm 2 we describe intra-cell analysis, namely cell main-
tenance. The function Maintain first checks to see if a code change
occurred. If so, the pre-summary preci is re-built and an intra cell
static analysis Fci (cfgci ,σ♯) is performed to produce a new abstract
state σ ♯. If the code has not changed, since the abstract state may
have changed in the meantime, we perform an intra-cell analysis
i.e., FAci (cfgci ,σ♯) for all analyses in A. Note, that we cache CFGs,
U-Ds, and pre-summaries to avoid unnecessary re-computation.
The InterCell algorithm described in Algorithm 3 performs the
what-if analysis. Here analyses in A′are executed on cells, starting
Algorithm 2 Maintain(code, ci ,σ♯ ,A)
1: if code not changed then
2: σ ♯′:= FAci (cfgci ,σ
♯)
3: return σ ♯′
4: ast := parse(code)5: cfgci := дetC f д(ast)6: ud := getUD(cfg)7: preci := getPre(ud)
8: σ ♯′:= FAci (cfgci ,σ
♯)
9: return σ ♯′
with the source cell ci in lines 2 and 5 and propagating the abstract
state to cells that have a dependency i.e., satisfy ϕ(σ ♯′,prec j ) asshown in lines 7 and 8. If K = 0 (line 1), meaning we have reached
the required depth or a fixpoint is detected (line 3) we terminate.
The algorithm worst case complexity is O(nK ) in the number of
cells n for a given K .
Algorithm 3 InterCell(σ ♯, ci , K , report , A
′, η)
1: if K = 0 then return report2: σ ♯′
:= FA′
ci (c f дci ,σ♯)
3: if σ ♯′ = ηci then return []
4: ηci := σ ♯′
5: report ′ := Check(σ ♯′,A′, report)6: for all c j ∈ N do
7: if ϕ(σ ♯′,preci ) then
8: report’ := report’ + InterCell(σ ♯′, c j , K − 1, report’, A’, η)
return report’
An optional operation that we omit here, is to perform inter-cell
widening. Widening is required for analyses with potential slow
convergence such as interval analysis. Adding widening requires an
extra condition in the code that checks if the abstract state increases
on a given variable. If so, the value for that variable is added as the
top element. A narrowing pass can be also performed to improve
precision.
3.2.4 Analysis Criteria and Contracts. The Check function in Algo-
rithm 2 and 3 checks the abstract state after a cell execution and
depending on the criteria determine if a violation has occurred. For
standard built in analyses (see Section 4) this is hard coded into
NBLyzer. However, for the available abstract domains, a user can
define contracts on lines of code, pre or post conditions on cells or
on the global notebook. NBLyzer exposes the set of available ab-
stractions, which can be seen as schema for which users can define
queries in a logic-based DSL that can assert expected behaviour.
4 INSTANTIATED ANALYSES
In this section we give a brief outline of several instantiations of
our analysis framework which we later evaluate in Section 6.

ICSE-SEIP ’22, May 21–29, 2022, Pittsburgh, PA, USA Pavle Subotić, Lazar Milikić, and Milan Stojić
4.1 Use Case I: Code Impact Analysis
When a code change occurs users need to know what other code is
affected or unaffected by that change. This has a number of usages
including automating notebook execution, stale cell state detection,
cell cleanup and simplification, among others.
4.1.1 Abstract Semantics. We define an abstract domain that maps
a variable (including symbols, function names, etc. ) v to a Boolean
indicating which variable has changed or not. Practically, the ab-
stract domain is implemented as a set of variables v ⊆ V . If avariable is in the set it has changed, otherwise it has not. Thus, the
lattice is a standard powerset lattice ℘(V ) common in data flow
analyses [9]. When a variable on the left-hand-side of a statement
has changed, we insert the right-hand-side in the set. Below we
state the propagation semantics for selected statements. In the
implementation, more variations are covered.
(1) Assignment:
λσ ♯ .Jy = f (x)K =
{σ ♯ ∪ {y} iff f ∈ σ ♯∨
∃x ∈ x s.t. x ∈ σ ♯
}(2) Functions:
λσ ♯ .Jf (x){y}K =
σ ♯ ∪ { f } iff
∃x ∈ x s.t. x ∈ σ ♯∨
∃y ∈ y s.t. y ∈ σ ♯
Similarly, joins andmeets that arise from control flow are handled
by the join operations of the abstract domain, i.e., set union and
disjunction.
The ϕ operation in this case holds if the intersection of the vari-
able in σ ♯and prec j are not null, i.e., there is at least one dependent
variable in c j to propagate to. More formally, we define ϕ as follows:
ϕ(σ♯ci ,prec j ) = {v : v ∈ σ
♯ci } ∩ prec j , ∅
This analysis has many use cases including automating cell ex-
ecutions for a given change by following the dependencies; stale
cell execution where cells that have intermediate impacted cells
between them and the source cell, can potentially be stale. Typically,
we execute this analysis with a bounded e.g., K = 3 for stale cell
analysis but in principle can be unbounded. Both options result in
similar overheads due to fixpoint subsumption. Other variations
include fresh cell analysis that detects cells that cannot cause stale-
ness when changed and an isolated cell analysis that detects cells
without dependencies on other cells and thus can be potentially
cleaned. These cells are typically found during experimentation
phases of development and need to be identified when the notebook
program is converted to a production script. This analysis is only
performed on K = 1 due to its nature.
4.1.2 Analysis Example. Consider the example in Figure 1. Here
we can see that the execution of cell 1 followed by cell 4 will create
staleness. This is because cell 2 is fresh and is the intermediate cell
between cell 1 and cell 4 dependencies. Suppose we change the file
in cell 1 then the variable d is in our abstract domain. As before we
propagate this to cell 2 and hence x is also in our abstract domain.
When we further propagate to cell 4 (i.e., K = 2) we can report
that all the right-hand-side variables are stale if the cell execution
sequence 1, 4 is performed.
4.2 Use Case II: ML Data Leakage
Data Leakage [12] is a common bug specific to data science. In
machine leaning applications a model typically requires normaliza-
tion of the input data, especially neural networks. Commonly, data
is normalized by performing a division of the existing data by its
average or maximum. Likewise, data is typically split into training
and test subsets. If the normalization is performed using the overalldata set, then information from the test set will now be influencing
the training subset. For this reason, any normalization should be
applied individually to the test and training subsets.
While the Data leakage commonly occurs in data science scripts
it is even further exacerbated by the execution semantics of note-
books. To this end, we have implemented a light-weight analysis to
detect potential data leakages in notebooks. Our abstraction tracks
which variable points to which data source and if the variable has
been used to train or test a model. When an operation is performed
on data that can introduce a leak, e.g., normalization, extrapolation
etc. we reset the data source propagation. Otherwise, we propagate
the source dependencies of left-hand-side variables to right-hand-
side variables. When a variable is an argument to a function that
is marked as training or testing a model, the variable is marked as
such. We assert that no two variables that are marked as train and
test, respectively point to the same data source.
4.2.1 Abstract Semantics. We define an abstract domain that maps
a variable v to a data leakage abstract domain ⟨L, ⊏⟩ where L =℘(v) × ℘({tr , ts}) such that L is partially ordered (⊏) point wise bythe subset relation ⊂ with meet ⊔ and join ⊓ are similarly defined
using point wise set union ∪ and intersection ∩, respectively. Thus,
an element in the abstract domain is a variable that maps to a set
of variables and an indicator if it has been an argument in a train
or test function (or both). We differentiate between which tuple
element in the product domain is access by σ ♯1(first tuple element)
and σ ♯2(second tuple element). We define a simplified abstract
semantics for three categories of operations below. Note, we do
not exhaustively cover all cases below for readability, and only
highlight the most important cases.
(1) reset:
λσ ♯ .Jy = f (x)K ={ ∀y ∈ y.σ ♯[y 7→ (x , ∅)]
iff f ∈ KBreset
}(2) propagate:
λσ ♯ .Jy = f (x)K ={ ∀y ∈ y.σ ♯[y 7→ σ ♯(y) ⊔
⊔x ∈x σ
♯(x)]iff f < KBreset,KBtest,KBtrain
}(3) sinks:
λσ ♯ .Jf (x)K =
∀x ∈ x .σ ♯[x 7→ (σ ♯1(x),σ ♯2(x) ⊔ {tr })]iff f ∈ KBtrain∀x ∈ x .σ ♯[x 7→ (σ ♯1(x),σ ♯2(x) ⊔ {ts})]iff f ∈ KBtest
The reset operations (1), occur when a function f is marked as
a reset function in the knowledge base KB. This is library specific
and rely on the data scientists to specify which functions may
cause leakage. Here we map each right-hand-side variable y to the
variables that are arguments to the reset function while resetting
its markings of test or train usage to ∅.
A Static Analysis Framework for Data Science Notebooks ICSE-SEIP ’22, May 21–29, 2022, Pittsburgh, PA, USA
In the case (2), we simply propagate information by joining all
abstract states of right-hand-side variables to the left-hand-side
variables existing abstract state.
Finally in the case of (3), we mark each argument with a {tr}
element if it is an argument to a train function, and {ts} if it is an
argument to a test function. If a variable marked as {tr} points to
the same source as a function marked as {ts} we issue a warning.
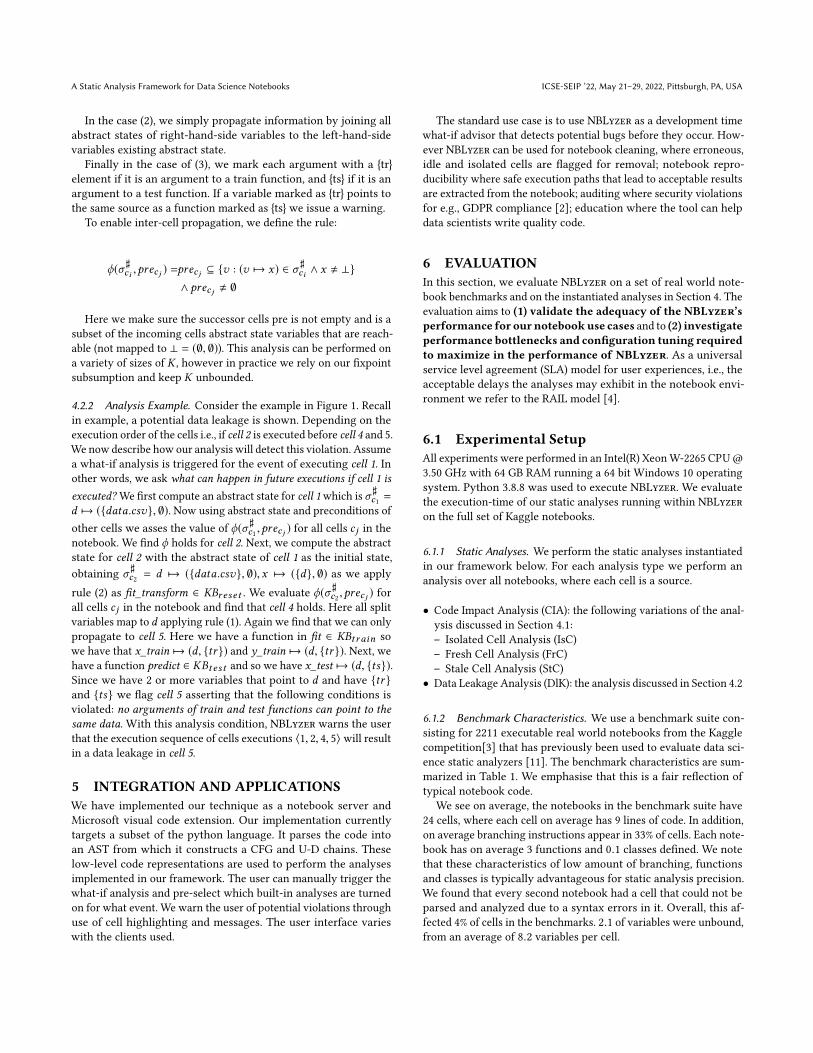
To enable inter-cell propagation, we define the rule:
ϕ(σ♯ci ,prec j ) =prec j ⊆ {v : (v 7→ x) ∈ σ
♯ci ∧ x , ⊥}
∧ prec j , ∅
Here we make sure the successor cells pre is not empty and is a
subset of the incoming cells abstract state variables that are reach-
able (not mapped to ⊥ = (∅, ∅)). This analysis can be performed on
a variety of sizes of K , however in practice we rely on our fixpoint
subsumption and keep K unbounded.
4.2.2 Analysis Example. Consider the example in Figure 1. Recall
in example, a potential data leakage is shown. Depending on the
execution order of the cells i.e., if cell 2 is executed before cell 4 and 5.
We now describe how our analysis will detect this violation. Assume
a what-if analysis is triggered for the event of executing cell 1. Inother words, we ask what can happen in future executions if cell 1 isexecuted? We first compute an abstract state for cell 1which is σ ♯
c1=
d 7→ ({data.csv}, ∅). Now using abstract state and preconditions of
other cells we asses the value of ϕ(σ♯c1,prec j ) for all cells c j in the
notebook. We find ϕ holds for cell 2. Next, we compute the abstract
state for cell 2 with the abstract state of cell 1 as the initial state,obtaining σ
♯c2= d 7→ ({data.csv}, ∅),x 7→ ({d}, ∅) as we apply
rule (2) as fit_transform ∈ KBr eset . We evaluate ϕ(σ♯c2,prec j ) for
all cells c j in the notebook and find that cell 4 holds. Here all splitvariables map to d applying rule (1). Again we find that we can only
propagate to cell 5. Here we have a function in fit ∈ KBtrain so
we have that x_train 7→ (d, {tr }) and y_train 7→ (d, {tr }). Next, wehave a function predict ∈ KBtest and so we have x_test 7→ (d, {ts}).Since we have 2 or more variables that point to d and have {tr }and {ts} we flag cell 5 asserting that the following conditions is
violated: no arguments of train and test functions can point to thesame data. With this analysis condition, NBLyzer warns the user
that the execution sequence of cells executions ⟨1, 2, 4, 5⟩ will result
in a data leakage in cell 5.
5 INTEGRATION AND APPLICATIONS
We have implemented our technique as a notebook server and
Microsoft visual code extension. Our implementation currently
targets a subset of the python language. It parses the code into
an AST from which it constructs a CFG and U-D chains. These
low-level code representations are used to perform the analyses
implemented in our framework. The user can manually trigger the
what-if analysis and pre-select which built-in analyses are turned
on for what event. We warn the user of potential violations through
use of cell highlighting and messages. The user interface varies
with the clients used.
The standard use case is to use NBLyzer as a development time
what-if advisor that detects potential bugs before they occur. How-
ever NBLyzer can be used for notebook cleaning, where erroneous,
idle and isolated cells are flagged for removal; notebook repro-
ducibility where safe execution paths that lead to acceptable results
are extracted from the notebook; auditing where security violations
for e.g., GDPR compliance [2]; education where the tool can help
data scientists write quality code.
6 EVALUATION
In this section, we evaluate NBLyzer on a set of real world note-
book benchmarks and on the instantiated analyses in Section 4. The
evaluation aims to (1) validate the adequacy of the NBLyzer’s
performance for our notebookuse cases and to (2) investigate
performance bottlenecks and configuration tuning required
to maximize in the performance of NBLyzer. As a universal
service level agreement (SLA) model for user experiences, i.e., the
acceptable delays the analyses may exhibit in the notebook envi-
ronment we refer to the RAIL model [4].
6.1 Experimental Setup
All experiments were performed in an Intel(R) XeonW-2265 CPU@
3.50 GHz with 64 GB RAM running a 64 bit Windows 10 operating
system. Python 3.8.8 was used to execute NBLyzer. We evaluate
the execution-time of our static analyses running within NBLyzer
on the full set of Kaggle notebooks.
6.1.1 Static Analyses. We perform the static analyses instantiated
in our framework below. For each analysis type we perform an
analysis over all notebooks, where each cell is a source.
• Code Impact Analysis (CIA): the following variations of the anal-
ysis discussed in Section 4.1:
– Isolated Cell Analysis (IsC)
– Fresh Cell Analysis (FrC)
– Stale Cell Analysis (StC)
• Data Leakage Analysis (DlK): the analysis discussed in Section 4.2
6.1.2 Benchmark Characteristics. We use a benchmark suite con-
sisting for 2211 executable real world notebooks from the Kaggle
competition[3] that has previously been used to evaluate data sci-
ence static analyzers [11]. The benchmark characteristics are sum-
marized in Table 1. We emphasise that this is a fair reflection of
typical notebook code.
We see on average, the notebooks in the benchmark suite have
24 cells, where each cell on average has 9 lines of code. In addition,
on average branching instructions appear in 33% of cells. Each note-
book has on average 3 functions and 0.1 classes defined. We note
that these characteristics of low amount of branching, functions
and classes is typically advantageous for static analysis precision.
We found that every second notebook had a cell that could not be
parsed and analyzed due to a syntax errors in it. Overall, this af-
fected 4% of cells in the benchmarks. 2.1 of variables were unbound,
from an average of 8.2 variables per cell.

ICSE-SEIP ’22, May 21–29, 2022, Pittsburgh, PA, USA Pavle Subotić, Lazar Milikić, and Milan Stojić
Characteristic Mean SD Max Min
Cells (per-notebook) 23.58 20.21 182 1
Lines of code (per-cell) 9.12 13.55 257 1
Branching instructions (per-cell) 0.43 2.49 76 0
Functions (per-notebook) 3.33 7.11 72 0
Classes (per-notebook) 0.14 0.64 11 0
Non-parsing cells (per-notebook) 0.5 0.98 20 0
Variables (per-cell) 8.2 2.3 552 0
Unbound variables (per-cell) 2.1 1.06 12 0
Table 1: Kaggle Notebook Benchmark Characteristics
6.2 Code Impact Analysis
We evaluate the performance of the code impact analyses for note-
book usage. Recall the CIA analyses reason about change propa-
gation in notebook cells. Also recall that many of these analyses
by definition have a fixed K . For the included evaluations, we also
evaluate stale cell analysis for various values of K including K = ∞,
since it can be run with such a parameter value. For each evaluation
of CIA analysis, we perform a random change in an source cell and
compute the analysis result. We do this for all cells in a notebook,
and for all notebooks in the benchmark suite. We omit notebook
cells that do not parse.
6.2.1 Isolated Cells. In Figure 7 the average analysis executions
per-notebook are shown. Overall, the results how that the aver-
age isolation analysis on a notebook takes 2.499 milliseconds. The
average analysis time, including the maximum outliers, are well
under the threshold for humans to notice a delay and does
not degrade the user experience. We were able to detect that 14%
of cells were in fact isolated and candidates for notebook clean-
ing or simplification. This highlights the need for automated
cleaning/simplification tooling for notebooks and the ability
of NBLyzer to detect such cells. Our manual observation of the
results could not detect any false positives.
6.2.2 Fresh Cell Analysis. In Figure 8 the average fresh cell analysisexecutions are shown. The results show that the average fresh
cell analysis on a notebook takes 2.98 milliseconds. Similarity, the
analysis time for average and maximum outliers iswell under the
threshold for users to notice a delay and does not degrade the
user experience. The analysis found that 74% of cells are fresh and
no false positives were observed by our manual inspection.
6.2.3 Stale Cell Analysis. In Figure 9 the average and maximum
stale analysis executions are shown. We show maximum results
because we ran the experiments for K = 3 and thus a propagation
occurs. The results show that the average stale cell analysis on a
notebook takes 2.49 milliseconds. The average maximum analysis
per notebook take 22.1 milliseconds, with a global maximum of
472.99 milliseconds. The analysis time for average and maximum
cases are well under the threshold for users to notice a delay
and does not degrade the user experience. While the global maxi-
mum analysis time is above the unnoticeable threshold, it is still
well under the threshold of any degradation of the user ex-
perience. The analysis found that 24% of cells can cause staleness
from a random change, highlighting the significant possibility
of such bugs occurring and utility of this analysis. Our manual
inspection found no false positives. We conjecture this is due to the
simplicity of data science code. Note, we do not expect this to be
the case for general python code as our analysis does not model
dynamic semantics.
6.3 Data Leakage Analysis
We evaluate the performance and utility of the data leakage anal-
ysis. This analysis is run on K = ∞, however we investigate its
performance on various fixed K values. This analysis is also diverse
in its use cases. On one hand it can be used during development
time to warn users of potential bugs and on the other hand it can be
used in a batch mode for semantic reproducibility of notebooks [16].
We evaluate if the performance of this analysis is compatible with
these use cases.
In Figure 4 the average and maximum data leakage analysis
for K = ∞ executions are shown. The results how that the aver-
age data leakage analysis on a notebook takes 41.45 milliseconds.
The average maximum analysis per notebook take 880.9 millisec-
onds, with a global maximum of 233 seconds. The analysis time
for average case is well under the threshold for users to no-
tice any delay and does not degrade the user experience. The
average maximum recorded analysis time is above the im-
mediate fell threshold, but below the threshold for the task
feeling out of flow (1000ms). The global maximum does cause a
considerable delay and user degradation. Below we investigate the
cause and remedies for such cases but note they are not common
and only 4% of all analyses execute for more than 1000ms and only
1% for more than 5000ms.
6.3.1 Varying K Bounds. To demonstrate the affect of reducing
K in Figures 5a and 5b we show the effect of vary the K from ∞
to bounded values of K = 8, 4, 2 and 1. We note that the speedup
of the analysis with smaller K values is not significant enough
on average to result in major performance improvements
overall for either analysis. A major reason for this as shown in
Figure 5c is that our fixpoint subsumption optimization increases
for large values of K resulting in modest average maximum depths
as shown in Figure 5e. This is further corroborated by the Figures 5d
and 5f.
6.3.2 Propagation Rate. Another explanation for the achieved per-
formance is the rate at which propagation occurs to other cells.
Given a worst case scenario this propagation rate could be large
and result in an execution tree that is very wide and deep. In Fig-
ure 6 we plot the average and maximum propagation rates for each
notebook (where each cell was a source cell). Here we find that ϕholds on average 9% of the time and the maximum propagation
rate for each notebook is on average 13% of the time. This figure
coincides with our experience that a typical notebook has sev-
eral alternate executions but not to the extent that all cells
depend on each other.
6.3.3 Bottleneck Sources. Next we investigate the 4% of notebooks
that take more than 1000ms to execute to determine where the
bottleneck is occurring and what can be done to bring them under
1000ms. For the 103 notebooks with a maximum analysis execution
of larger than 1000ms, we reduce K = 4. Here we were able to
bring 33% (34 notebooks) of the notebook executions to under the
1000ms. Thus, we are able to compute 98.7% of notebooks in
under 1000ms. We note, that this reduction exclusively occurred
for notebooks with maximum execution times < 10 seconds. Of
the 4 cases > 100s we found that they in fact had no significant
speedups by reducing the K value. We have investigated these

A Static Analysis Framework for Data Science Notebooks ICSE-SEIP ’22, May 21–29, 2022, Pittsburgh, PA, USA
200 400 600 800 1,000 1,200 1,400 1,600 1,800 2,000
10−4
10−1
102
Notebooks
Runtime(sec)
max
avg
Figure 4: Data Leakage Analysis Avg. and Max. Analysis Times
1 2 4 8 ∞0
0.2
0.4
0.6
0.8
K
Avg.Runtime(sec)
max
avg
(a) Avg. Data Leakage Runtime for K
1 2 4 8 ∞0
0.2
0.4
K
Avg.Runtime(sec)
max
avg
(b) Avg. CIA Runtime for K
1 2 4 8 ∞0
20
40
60
K
Avg.Subsumptions
(c) Avg. Subsumptions for K
1 2 4 8 ∞0
2,000
4,000
6,000
K
Avg.Nodes
(d) Avg. Number Nodes for K
1 2 4 8 ∞0
2
4
6
K
Avg.Max.Depth
(e) Avg. Max. Depth for K
1 2 4 8 ∞0
20
40
K
Avg.ReachKLimit
(f) Avg. Reached Limit for K
Figure 5: Avg. Performance for Benchmarks for K Values
500 1,000 1,500 2,000
0
0.2
0.4
0.6
0.8
Notebooks
Avg.PropagationRate
max
avg
Figure 6: Data Leakage Analysis Avg. and Max. Propagation Rates
notebook in question and narrowed down the poor performance to
a single cells with very large number and depth of branching and
large number of lines of code. For example, one of the notebooks
had a cell with 257 LOC and 71% of these were branching statements
often deeply nested. We argue that such code is not characteristic
of regular notebooks and would cause a challenge to most static
analyzers for the time frames we target. To mitigate such cases
we would need to improve our rather standard intra-cell analysis
fixpoint iteration techniques and employ techniques such as [8]
which is left for future work.
7 RELATEDWORK
Compared to static analysis tools for data science scripts [15],
NBLyzer targets notebooks and incorporates their semantics in
the analysis. We do this by deciding on-the-fly which cell should
be analysed next depending on our cell propagation dependency
graph. The use of static provenance is related to our technique in
the sense that provenance information is propagated forward and
can be modeled as an abstract domain [11]. Unlike NBLyzer this
work targets scripts and is limited to loop free programs. The lin-
eage technique in [10] targets notebooks. Using this static lineage
information computed by data flow analysis and runtime time-
stamps the technique is able to perform stale state detections. This
technique relies on both runtime information and compile time
(liveness data-flow analysis). NBLyzer can perform such analyses
statically and does not require information at cell execution. More-
over, this technique is limited to a single analysis where NBLyzer
is a general static analysis framework and can incorporate various
abstract domains. The technique in [16] attempts to reconstruct
executions in notebooks by finding dependencies using syntactic
means on the AST. NBLyzer builds dependencies wrt. the abstract
domain and performs a semantic analysis. Regarding our ML data
leakage analysis, we have not found any static analysis method for
detecting data leaks in data science code.
8 CONCLUSION
In this paper we have described NBLyzer, a static analysis frame-
work that considers the execution semantics of notebook environ-
ments. We have instantiated several analyses in our framework,
with applications including notebook debugging, notebook veri-
fication, notebook cleaning, and notebook reproducibility. As far
as we are aware, we are the first to suggest a general abstract
interpretation-based static analysis framework specific for note-
book semantics.

ICSE-SEIP ’22, May 21–29, 2022, Pittsburgh, PA, USA Pavle Subotić, Lazar Milikić, and Milan Stojić
200 400 600 800 1,000 1,200 1,400 1,600 1,800 2,000
10−3
10−2
10−1
100
Notebooks
Runtime(sec)
Figure 7: Isolated Cell Analysis Avg. Times
200 400 600 800 1,000 1,200 1,400 1,600 1,800 2,000
10−3
10−2
10−1
100
Notebooks
Runtime(sec)
Figure 8: Fresh Cell Analysis Avg. Analysis Times
200 400 600 800 1,000 1,200 1,400 1,600 1,800 2,000
10−3
10−2
10−1
100
Notebooks
Runtime(sec)
max
avg
Figure 9: Stale Cell Analysis Avg. and Max Analysis Times
ACKNOWLEDGEMENT
We thank our colleagues at Gray Systems Lab (GSL), for making
available the benchmarks suite used in [11]. We thank our col-
leagues from Azure Data Labs for their feedback and the anony-
mous ICSE reviewers for their suggested improvements.
REFERENCES
[1] 2020. We downloaded 10M Jupyter notebooks from github this is what we
learned. https://blog.jetbrains.com/datalore/2020/12/17/we-downloaded-10-000-
000-jupyter-notebooks-from-github-this-is-what-we-learned/. Accessed: 22-
01-22.
[2] 2021. GDPR Compliance. https://docs.microsoft.com/en-us/compliance/
regulatory/gdpr. Accessed: 2021-09-30.
[3] 2021. Kaggle. http://kaggle.com. Accessed: 2021-09-30.
[4] 2021. RAIL model. https://web.dev/rail/. Accessed: 2021-09-30.
[5] 2021. Why Jupyter is data scientists computational notebook of choice. https:
//www.nature.com/articles/d41586-018-07196-1. Accessed: 2021-09-30.
[6] Patrick Cousot and Radhia Cousot. 1977. Abstract Interpretation: A Unified
Lattice Model for Static Analysis of Programs by Construction or Approximation
of Fixpoints. In Proc. POPL. 238–252.[7] Patrick Cousot and Radhia Cousot. 1979. Systematic Design of Program Analysis
Frameworks. In Proc. POPL. 269–282.[8] Herbert Jordan, Bernhard Scholz, and Pavle Subotic. 2016. Soufflé: On Synthesis
of Program Analyzers. In Proc. CAV. 422–430.[9] Uday P. Khedker, Amitabha Sanyal, and Bageshri Sathe. 2009. Data Flow Analysis
- Theory and Practice. CRC Press.
[10] Stephen Macke, Hongpu Gong, Doris Jung Lin Lee, Andrew Head, Doris Xin,
and Aditya G. Parameswaran. 2020. Fine-Grained Lineage for Safer Notebook
Interactions. CoRR abs/2012.06981 (2020). arXiv:2012.06981 https://arxiv.org/
abs/2012.06981
[11] Mohammad Hossein Namaki, Avrilia Floratou, Fotis Psallidas, Subru Krishnan,
Ashvin Agrawal, Yinghui Wu, Yiwen Zhu, and Markus Weimer. 2020. Vamsa:
Automated Provenance Tracking in Data Science Scripts. In Proc. KDD. 1542–1551.
[12] Panagiotis Papadimitriou and Hector Garcia-Molina. 2009. A Model for Data
Leakage Detection. In Proc. ICDE. 1307–1310.[13] Peter Schrammel and Pavle Subotic. 2013. Logico-Numerical Max-Strategy Itera-
tion. In Proc. VMCAI. 414–433.[14] Alfred Tarski. 1955. A lattice-theoretical fixpoint theorem and its applications.
Pacific J. Math. 5, 2 (1955), 285–309.[15] Caterina Urban. 2019. Static Analysis of Data Science Software. In Proc. SAS.
17–23.
[16] Jiawei Wang, Tzu-yang Kuo, Li Li, and Andreas Zeller. 2020. Assessing and
Restoring Reproducibility of Jupyter Notebooks. In Proc. ASE. 138–149.[17] Jiawei Wang, Tzu-yang Kuo, Li Li, and Andreas Zeller. 2020. Restoring Repro-
ducibility of Jupyter Notebooks. In Proc. ICSE. 288–289.[18] Jiawei Wang, Li Li, and Andreas Zeller. 2020. Better Code, Better Sharing: On
the Need of Analyzing Jupyter Notebooks. In Proc. ICSE - NIER. 53–56.