A stakeholder perspective on mission statements: an international empirical study
22
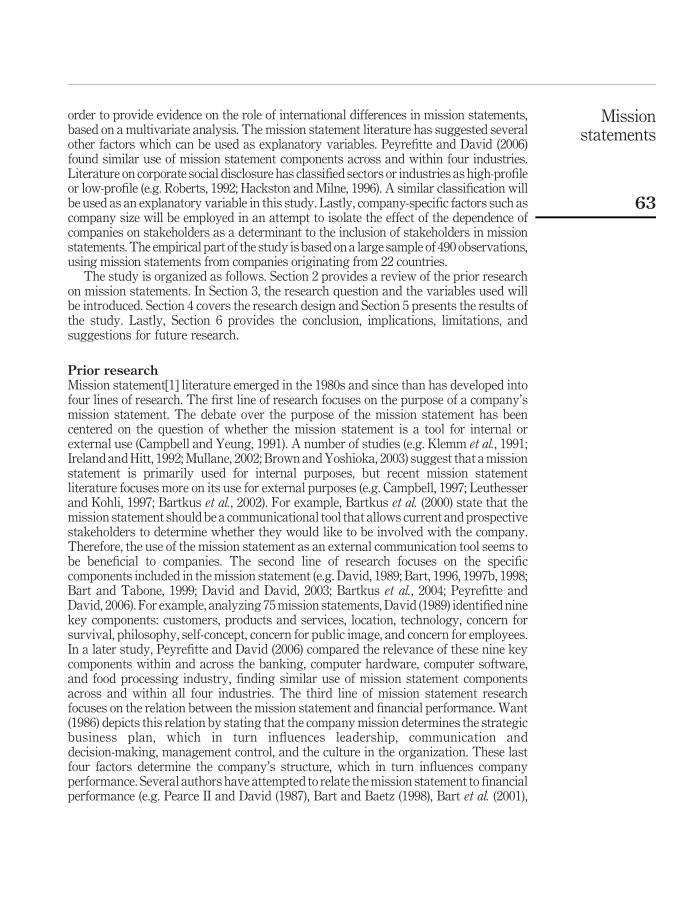
A stakeholder perspective on mission statements: an international empirical study Gertjan van Nimwegen, Laury Bollen, Harold Hassink and Thomas Thijssens Faculty of Economics and Business Administration, Accounting and Information Management, Maastricht University, Maastricht, The Netherlands Abstract Purpose – This study uses a stakeholder perspective to explain the content of mission statements, in particular the inclusion of stakeholder groups. The study uses stakeholder dependency theory and resource dependency theory to explain the content of mission statement. In line with this perspective, stakeholders in this study will be classified as either being resource providers, such as employees and customers, or non-resource providers, such as the community and the environment. The primary aim of the study is to find evidence for the theoretical relationship between the importance of stakeholders to the company and the inclusion of stakeholder groups in the company’s mission statement. Design/methodology/approach – The use of a large dataset with 490 observations enables a multivariate analysis of mission statement content, focusing on country-, industry-, and company-specific factors. Findings – The study finds that stakeholder groups the company is more dependent on, are addressed in mission statements more frequently. In addition, the profile of an industry, legal origin and ownership concentration are found to be related with stakeholder inclusion in mission statements. Research limitations/implications – The database used adopts a broad definition of a mission statement, as a result of which the study may also include documents such as vision statements. Additional factors might exist that could explain the inclusion of stakeholder groups in the mission statement. For example, Hope states that both legal origin and culture are important in explaining corporate disclosure. Therefore, literature on cultural dimensions by Hofstede and Schwartz might also be used as explanatory variables in future research. Finally, additional evidence on the industry classification developed in this study is required to further substantiate these results. Practical implications – The observed differences in mission statement content with respect to stakeholder management signify the fact that the mission statement is not a standardized document which can simply be ignored by managers. Therefore, managers must be aware of the environment in which the company is situated, in order to approach the stakeholders which are most important to the organization. A failure to recognize and include essential stakeholders in the mission statement may be costly in the long run, particularly when competitors are better able to address these stakeholders. Originality/value – This study adds to the existing stream of literature on mission statements by introducing the dependence of the company on the stakeholder as an explanatory factor for the inclusion of stakeholders in mission statements. Consequently, the study uses stakeholder dependency theory and resource dependency theory to explain the content of mission statement, rather than signaling theory. Furthermore, this is one of few empirical studies on mission statements that uses a large dataset with 490 observations, enabling a multivariate analysis of mission statement content. Keywords Mission statements, Stakeholder analysis Paper type Research paper The current issue and full text archive of this journal is available at www.emeraldinsight.com/1934-8835.htm The authors would like to thank Sustainable Investment Research International (SiRi) and Dutch Sustainability Research (DSR) for supplying the data used in this research. Mission statements 61 International Journal of Organizational Analysis Vol. 16 No. 1/2, 2008 pp. 61-82 q Emerald Group Publishing Limited 1934-8835 DOI 10.1108/19348830810915505
-
Upload
independent -
Category
Documents
-
view
1 -
download
0
Transcript of A stakeholder perspective on mission statements: an international empirical study

A stakeholder perspectiveon mission statements:
an international empirical studyGertjan van Nimwegen, Laury Bollen, Harold Hassink and
Thomas ThijssensFaculty of Economics and Business Administration,
Accounting and Information Management, Maastricht University,Maastricht, The Netherlands
Abstract
Purpose – This study uses a stakeholder perspective to explain the content of mission statements,in particular the inclusion of stakeholder groups. The study uses stakeholder dependency theory andresource dependency theory to explain the content of mission statement. In line with this perspective,stakeholders in this study will be classified as either being resource providers, such as employees andcustomers, or non-resource providers, such as the community and the environment. The primary aimof the study is to find evidence for the theoretical relationship between the importance of stakeholdersto the company and the inclusion of stakeholder groups in the company’s mission statement.
Design/methodology/approach – The use of a large dataset with 490 observations enables amultivariate analysis of mission statement content, focusing on country-, industry-, andcompany-specific factors.
Findings – The study finds that stakeholder groups the company is more dependent on, areaddressed in mission statements more frequently. In addition, the profile of an industry, legal originand ownership concentration are found to be related with stakeholder inclusion in mission statements.
Research limitations/implications – The database used adopts a broad definition of a missionstatement, as a result of which the study may also include documents such as vision statements.Additional factors might exist that could explain the inclusion of stakeholder groups in the missionstatement. For example, Hope states that both legal origin and culture are important in explainingcorporate disclosure. Therefore, literature on cultural dimensions by Hofstede and Schwartz mightalso be used as explanatory variables in future research. Finally, additional evidence on the industryclassification developed in this study is required to further substantiate these results.
Practical implications – The observed differences in mission statement content with respect tostakeholder management signify the fact that the mission statement is not a standardized documentwhich can simply be ignored by managers. Therefore, managers must be aware of the environment inwhich the company is situated, in order to approach the stakeholders which are most important tothe organization. A failure to recognize and include essential stakeholders in the mission statement maybe costly in the long run, particularly when competitors are better able to address these stakeholders.
Originality/value – This study adds to the existing stream of literature on mission statements byintroducing the dependence of the company on the stakeholder as an explanatory factor for theinclusion of stakeholders in mission statements. Consequently, the study uses stakeholder dependencytheory and resource dependency theory to explain the content of mission statement, rather thansignaling theory. Furthermore, this is one of few empirical studies on mission statements that uses alarge dataset with 490 observations, enabling a multivariate analysis of mission statement content.
Keywords Mission statements, Stakeholder analysis
Paper type Research paper
The current issue and full text archive of this journal is available at
www.emeraldinsight.com/1934-8835.htm
The authors would like to thank Sustainable Investment Research International (SiRi) and DutchSustainability Research (DSR) for supplying the data used in this research.
Missionstatements
61
International Journal ofOrganizational Analysis
Vol. 16 No. 1/2, 2008pp. 61-82
q Emerald Group Publishing Limited1934-8835
DOI 10.1108/19348830810915505

IntroductionThe importance of mission statements and the actual purpose of a mission statementhave been subject to much debate in the academic literature. First of all, some authors(e.g. Wright, 2002) argue that the mission statement is primarily used as a ‘publicrelations statement,’ and therefore mission statements do not reflect reality. However,authors with a less cynical view to mission statements have primarily identified themission statement as a tool for internal purposes, such as the development ofcompany strategy, providing leadership, and performance evaluation (e.g. Drucker,1977; Klemm et al., 1991). For example, Drucker stressed the strategic importance ofthe company mission (Drucker, 1977, p. 66): “Only a clear definition of the mission andpurpose of the business makes possible clear and realistic business objectives. It is thefoundation for priorities, strategies, plans, and work assignments.” Others havestressed the importance of mission statements for external communication purposes,for example to influence the perceptions of stakeholders (e.g. Campbell, 1997;Bartkus et al., 2000).
To empirically asses the purpose of mission statements, Bart (1997a) andLeuthesser and Kohli (1997) have studied the inclusion of stakeholder groups inmission statements and found that some stakeholder groups are mentioned more oftenthan others. In both studies customers were the most frequently cited stakeholdergroup, stressing the external focus of mission statements. Campbell et al. (2001) alsotried to explain the inclusion of stakeholder groups in mission statements. The studyconcludes that given the fact that a wide range of stakeholders are mentioned inmission statements, the purpose of these statements is not limited to internal purposes.In Campbell et al. (2001) stakeholders were classified as more or less economicallydependent on the company. The results of the study indicate that mission statementsmore often refer to economically less-dependent stakeholders. The authors suggestthat “those stakeholders that are less-dependent are those that the organization itselfdepends [..] upon” (Campbell et al., 2001, p. 70). The results of the study therefore wouldsuggest that companies more often address stakeholders which they depend upon.Building on this suggestion, we argue that it is the economic dependence of thecompany on the respective stakeholders rather than the dependence of the stakeholderon the company, that determines the content of the mission statement.
Therefore, this study adds to the existing stream of literature on mission statements byintroducing the dependence of the company on the stakeholder as an explanatory factorfor the inclusion of stakeholders in mission statements. Consequently, the study usesstakeholder dependency theory and resource dependency theory to explain the content ofmission statement, rather than signaling theory. Pfeffer and Salancik (1978) havedocumented the dependence of the company on others for necessary resources in their‘resource dependence perspective’. In line with this perspective, stakeholders in this studywill be classified as either being resource providers, such as employees and customers, ornon-resource providers, such as the community and the environment. The primary aim ofthe study is to find evidence for the theoretical relationship between the importance ofstakeholders to the company and the inclusion of stakeholder groups in the company’smission statement. In addition, country-level factors are introduced as explanatoryvariables. Although differences in mission statement content between countries have beenidentified by Brabet and Klemm (1994) and Bartkus et al. (2004), the current study isamong the first in the mission statement literature to introduce country-level variables in
IJOA16,1/2
62
order to provide evidence on the role of international differences in mission statements,based on a multivariate analysis. The mission statement literature has suggested severalother factors which can be used as explanatory variables. Peyrefitte and David (2006)found similar use of mission statement components across and within four industries.Literature on corporate social disclosure has classified sectors or industries as high-profileor low-profile (e.g. Roberts, 1992; Hackston and Milne, 1996). A similar classification willbe used as an explanatory variable in this study. Lastly, company-specific factors such ascompany size will be employed in an attempt to isolate the effect of the dependence ofcompanies on stakeholders as a determinant to the inclusion of stakeholders in missionstatements. The empirical part of the study is based on a large sample of 490 observations,using mission statements from companies originating from 22 countries.
The study is organized as follows. Section 2 provides a review of the prior researchon mission statements. In Section 3, the research question and the variables used willbe introduced. Section 4 covers the research design and Section 5 presents the results ofthe study. Lastly, Section 6 provides the conclusion, implications, limitations, andsuggestions for future research.
Prior researchMission statement[1] literature emerged in the 1980s and since than has developed intofour lines of research. The first line of research focuses on the purpose of a company’smission statement. The debate over the purpose of the mission statement has beencentered on the question of whether the mission statement is a tool for internal orexternal use (Campbell and Yeung, 1991). A number of studies (e.g. Klemm et al., 1991;Ireland and Hitt, 1992; Mullane, 2002; Brown and Yoshioka, 2003) suggest that a missionstatement is primarily used for internal purposes, but recent mission statementliterature focuses more on its use for external purposes (e.g. Campbell, 1997; Leuthesserand Kohli, 1997; Bartkus et al., 2002). For example, Bartkus et al. (2000) state that themission statement should be a communicational tool that allows current and prospectivestakeholders to determine whether they would like to be involved with the company.Therefore, the use of the mission statement as an external communication tool seems tobe beneficial to companies. The second line of research focuses on the specificcomponents included in the mission statement (e.g. David, 1989; Bart, 1996, 1997b, 1998;Bart and Tabone, 1999; David and David, 2003; Bartkus et al., 2004; Peyrefitte andDavid, 2006). For example, analyzing 75 mission statements, David (1989) identified ninekey components: customers, products and services, location, technology, concern forsurvival, philosophy, self-concept, concern for public image, and concern for employees.In a later study, Peyrefitte and David (2006) compared the relevance of these nine keycomponents within and across the banking, computer hardware, computer software,and food processing industry, finding similar use of mission statement componentsacross and within all four industries. The third line of mission statement researchfocuses on the relation between the mission statement and financial performance. Want(1986) depicts this relation by stating that the company mission determines the strategicbusiness plan, which in turn influences leadership, communication anddecision-making, management control, and the culture in the organization. These lastfour factors determine the company’s structure, which in turn influences companyperformance. Several authors have attempted to relate the mission statement to financialperformance (e.g. Pearce II and David (1987), Bart and Baetz (1998), Bart et al. (2001),
Missionstatements
63

Omran et al. (2002), Atrill et al. (2005) and Bartkus et al. (2006)). However, these studies donot provide an overall consistent view. According to Bartkus et al. (2006) potentialexplanations for this lack of consistency could be explained by the fact that as anexternal communication tool, the mission statement includes current activities, ratherthan offering a future direction.
The fourth line of research focuses on the inclusion of stakeholder groups in themission statement. Pearce II (1982) notes that companies must recognize andacknowledge the legitimate claims of stakeholders in defining or redefining thecompany mission. Leuthesser and Kohi (1997) examine the content of 63 missionstatements from the Business Week 1000, which contain customers (90.5 percent),shareholders (60.3 percent), employees (66.7 percent), and suppliers (15.9 percent).In addition, Bartkus et al. (2004) compare the inclusion of stakeholder groups in missionstatements between Europe, Japan, and the US, observing that on average, Japanesemission statements less often refer to employees and investors, but more often refer tosociety. A potential explanations for the inclusion of stakeholders in mission statementsis based on the involvement of stakeholders in the design of mission statements. Baetzand Bart (1996) note that all relevant stakeholders should be included in the developmentprocess of the mission statement to safeguard the content on the different stakeholdersand their potentially conflicting interests. On the other hand, Ireland and Hitt (1992)argue that too large a number or diversity of stakeholders can inhibit a successfuldrafting process. As a result, only a limited number of stakeholders may be included inthe drafting process, as a result of which these particular stakeholders may bementioned more often in the mission statement. There is not much empirical evidence tosupport the assumption that all relevant stakeholders are included in the developmentprocess of mission statements. First, Brabet and Klemm (1994) identified largeinternational differences between the drafting process of mission statements. Forexample, French companies involve parties at all levels of the organization, often alsoinvolving customers and employees, in the drafting process, whereas missionstatements in the UK are more commonly drawn up by managers. As a result, in the UKthere is no link between the role of stakeholders in the drafting process and the inclusionof stakeholders in the mission statement. Furthermore, Bart (1997a), using a sample of88 leading North American companies, found that while customers are frequently citedin mission statements, the group is not often involved in the drafting process.
Campbell et al. (2001) studied the inclusion of stakeholders in mission statements,looking at sector-specific effects and differences in the dependence of stakeholders to thecompany. Stakeholders are defined as less-dependent or more-dependent stakeholders,depending on their ability to disengage from the company. For example, less-dependentstakeholders are customers and shareholders, while more-dependent stakeholders areemployees, the community and the environment. Although one of the findings is thatmission statements focus more on less-dependent stakeholders the results on employeesare rather ambiguous, and there seems to be little agreement among the samplecompanies as to which of the more-dependent stakeholders should be included in themission statement (Campbell et al., 2001, p. 84).
The current study adds to the existing literature on the inclusion of stakeholders inmission statements by focusing on an alternative theoretical approach. While Campbellet al. (2001) explain the inclusion of stakeholder groups in mission statements bylooking at the dependence of the stakeholder on the company, the current study will
IJOA16,1/2
64
explain the inclusion of stakeholder groups in mission statements by focusing on thedependence of the company on these stakeholder groups. The following section willdevelop the theoretical approach used in this study in more detail.
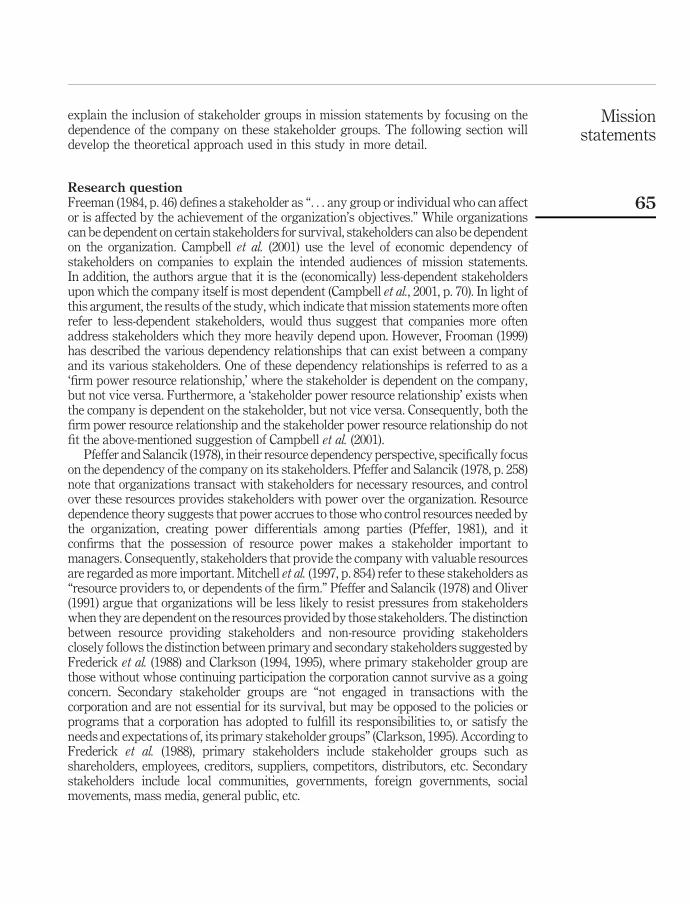
Research questionFreeman (1984, p. 46) defines a stakeholder as “. . . any group or individual who can affector is affected by the achievement of the organization’s objectives.” While organizationscan be dependent on certain stakeholders for survival, stakeholders can also be dependenton the organization. Campbell et al. (2001) use the level of economic dependency ofstakeholders on companies to explain the intended audiences of mission statements.In addition, the authors argue that it is the (economically) less-dependent stakeholdersupon which the company itself is most dependent (Campbell et al., 2001, p. 70). In light ofthis argument, the results of the study, which indicate that mission statements more oftenrefer to less-dependent stakeholders, would thus suggest that companies more oftenaddress stakeholders which they more heavily depend upon. However, Frooman (1999)has described the various dependency relationships that can exist between a companyand its various stakeholders. One of these dependency relationships is referred to as a‘firm power resource relationship,’ where the stakeholder is dependent on the company,but not vice versa. Furthermore, a ‘stakeholder power resource relationship’ exists whenthe company is dependent on the stakeholder, but not vice versa. Consequently, both thefirm power resource relationship and the stakeholder power resource relationship do notfit the above-mentioned suggestion of Campbell et al. (2001).
Pfeffer and Salancik (1978), in their resource dependency perspective, specifically focuson the dependency of the company on its stakeholders. Pfeffer and Salancik (1978, p. 258)note that organizations transact with stakeholders for necessary resources, and controlover these resources provides stakeholders with power over the organization. Resourcedependence theory suggests that power accrues to those who control resources needed bythe organization, creating power differentials among parties (Pfeffer, 1981), and itconfirms that the possession of resource power makes a stakeholder important tomanagers. Consequently, stakeholders that provide the company with valuable resourcesare regarded as more important. Mitchell et al. (1997, p. 854) refer to these stakeholders as“resource providers to, or dependents of the firm.” Pfeffer and Salancik (1978) and Oliver(1991) argue that organizations will be less likely to resist pressures from stakeholderswhen they are dependent on the resources provided by those stakeholders. The distinctionbetween resource providing stakeholders and non-resource providing stakeholdersclosely follows the distinction between primary and secondary stakeholders suggested byFrederick et al. (1988) and Clarkson (1994, 1995), where primary stakeholder group arethose without whose continuing participation the corporation cannot survive as a goingconcern. Secondary stakeholder groups are “not engaged in transactions with thecorporation and are not essential for its survival, but may be opposed to the policies orprograms that a corporation has adopted to fulfill its responsibilities to, or satisfy theneeds and expectations of, its primary stakeholder groups” (Clarkson, 1995). According toFrederick et al. (1988), primary stakeholders include stakeholder groups such asshareholders, employees, creditors, suppliers, competitors, distributors, etc. Secondarystakeholders include local communities, governments, foreign governments, socialmovements, mass media, general public, etc.
Missionstatements
65
In the current study, the resource dependence theory by Pfeffer and Salancik (1978)will be used to explain the inclusion of stakeholders in mission statements, making adistinction between stakeholders which provide resources to the company (resourceproviders) and stakeholders which are merely dependent on the actions of the company(non-resource providers). Due to the relative importance to the company of resourceproviders in comparison to non-resource providers, the former is expected tobe included more frequently in mission statements than the latter. Therefore, thefollowing research question is formulated.
Are resource providing stakeholder groups addressed more frequentlyin mission statements in comparison to non-resource providingstakeholder groups?The existing literature on mission statements has suggested several other explanatoryvariables for the determinants of stakeholder inclusion in mission statements. Brabet andKlemm (1994) and Bartkus et al. (2004) found that international differences exist in thecontents of mission statements. According to Bartkus et al. (2004), mission statements inJapan refer to less stakeholder groups in comparison to mission statements in Europe andthe USA. Suggested explanations for the low inclusion of stakeholders in missionstatements in Japan include the reliance on face-to-face communication and the practice oflifetime employment. From the study by Bartkus et al. (2004) it also becomes clear thatJapanese mission statements less frequently refer to resource providers (i.e. employees andinvestors), but more frequently refer to non-resource providers (i.e. society) in comparisonto mission statements from Europe and the USA. International differences betweenmission statements may be solely dependent on the distinctive characteristics of theindividual countries. However, some countries have commonalities that might alsoexplain the inclusion of stakeholder groups in mission statements. La Porta et al. (1998)studied the legal rules covering the protection of shareholders and creditors and thequality of their enforcement in 49 countries. Countries can be grouped on the basis of theirlegal tradition (code law versus common law), legal origin (English, French, German, andScandinavian) and ownership concentration of shares, among other factors. Leuz et al.(2003) have used and adapted some of the variables by La Porta et al. (1997, 1998) to studythe differences in earnings management across 31 countries. We will use some of thevariables employed by Leuz et al. (2003) to test for international differences in missionstatement content. In doing so, we imply that legal factors may influence the inclusion ofresource providers and non-resource providers in mission statements. Although theresults of previous studies indicate that country-specific factors may affect the inclusion ofstakeholder groups in mission statements, so far there is no empirical evidence that theresource dependency of organizations towards specific stakeholder groups varies overcountries. Therefore, we have no a priori expectation with respect to the role of countryspecific factors on the inclusion of stakeholder groups in mission statements.
Second, the industry of the company will be used as an explanatory factor forstakeholder inclusion. For example, Peyrefitte and David (2006) found similar use ofseveral mission statement components across and within the banking, computerhardware, computer software, and food processing industry. Amato and Amato (2002)analyzed mission statements to find a relationship between commitment to quality of lifeand company size, profitability and industry. The results of the study indicate thatcompanies in the financial services industry are more likely to include social concerns,
IJOA16,1/2
66

whereas companies in the mining, metals and construction industry and lightmanufacturing industry are more likely to include ecological concerns. One possibleexplanation for the similarity of mission statement content within industries mightbe the ‘keeping up with the Joneses’ effect. According to Dimaggio and Powell (1983) thesimilarity between organizations is caused by coercive, mimetic, and normativeisomorphism.[2] Coercive isomorphism results from the pressures exerted by other partieson which the company is dependent and the cultural expectations by society. In addition,failing to take into account important issues or leaving out important stakeholders in themission statement might have adverse consequences for the company if the competitiondoes otherwise. Then again, according to Urbany (2005), external symbolism might harmthe company in the long-run if there is no internal legitimacy. That is, stakeholders will notbe convinced by a company’s mission of stakeholder orientation, if it is not backed up byevidence of genuine stakeholder management (e.g. by means of implementation of formalprograms or management systems). This implies that isomorphic behavior withinindustries, regarding stakeholder inclusion in missions, will not be acts of puresymbolism. Further motivation for industry behavior can be drawn from theoreticalinsights from other literature, more specifically the literature on corporate socialresponsibility (CSR). In CSR disclosure literature, industry is frequently mentioned as adeterminant (for an overview of studies using industry as an explanatory variable for CSRdisclosure, see Hibbitt, 2004), based on the idea that industries that are more visiblewill bemore inclined to engage in CSR activities. Similarly, the expectation is that the inclusion ofstakeholders in mission statements is higher in highly visible industries in comparison tonon-visible industries. In addition, visible industries are expected to include morenon-resource providers in comparison to resource providers in mission statements. Thehigher level of visibility might increase the need for companies to address the interests ofnon-resource providing stakeholders in order to avoid negative publicity.
Third, company-specific factors can be used as explanatory factors for stakeholderinclusion in mission statements. Toftoy and Chatterjee (2004) surveyed 220 smallbusinesses in the greater Washington, DC area and found that only 29% of thecompanies had a formal mission statement which was accessible to all employees.Therefore, smaller businesses might be less inclined to use the mission statement toinfluence their stakeholders. Larger companies might have more means at theirdisposal to take care of the needs of the various stakeholders (e.g. Cormier et al. (2005)),which might lead to an increase the number of stakeholders addressed in missionstatements. In addition, as discussed in the previous section, larger companies are morevisible to society, which might demand assurances on certain activities. A similar lineof reasoning may be applied to company size, in the sense that a higher level ofvisibility might increase the need for companies to address non-resource providingstakeholders. Therefore, larger companies are expected to include more non-resourceproviding stakeholders as opposed to resource providing stakeholders in their missionstatement.
Research designDependent variablesThe primary research question of this study will be tested using the frequencies ofresource providing stakeholder groups versus non-resource providing stakeholder groupsaddressed in mission statements. Therefore, a ratio (FRACTION) is constructed. It is
Missionstatements
67
calculated as the number of resource providing stakeholder groups addressed in themission statement divided by the total number of stakeholder groups mentioned in themission statement. The interpretation of this variable is that if the fraction is lower than0.5, the number of resource providing stakeholder groups addressed is lower than thenumber of non-resource providing stakeholder groups addressed.[3] In total threeresource providing stakeholders are included (1) employees (EMPLOY), (2) customers(CUSTOM), and (3) shareholders (GOVERN).[4] Resources are provided to the companyby employees through labor, by customers through consumption and by shareholdersthrough capital. Also three non-resource providing stakeholders are identified, whichare (1) community (COMMUN), (2) environment (ENVIR), and (3) human rights andsupply chain (HUMAN). The community is represented by people living in the vicinity ofthe business activities of the company. The environment is represented by individuals ororganizations which aim to protect the environment from any negative impact of thebusiness activities of the company. Finally, human rights and supply chain isrepresented by NGOs addressing issues such as the working conditions of theemployees or child labor. Whereas an employee can stop working or customers canrefrain from buying goods or services, non-resource providing stakeholders are not ableto exert such power over the organization since they do not control resources themselves.In this study, all stakeholders which provide resources to the company (i.e. customers,employees, and shareholders) are considered as stakeholders on which the company isdependent. Although it is possible that individual companies are more dependent on acertain stakeholder than others, for example because in certain instances somestakeholders might be fairly easy to replace[5], the data used in this study do not allow usto determine the dependence of individual companies on the resources of individualstakeholder groups.
Independent variablesCountry-specific factors. La Porta et al. (1998) studied the legal rules covering theprotection of shareholders and creditors and the quality of their enforcement in49 countries. Leuz et al. (2003) have used and adapted some of the variables by La Portaet al. (1997, 1998) to study the differences in earnings management across 31 countries.[6]The following variables used by Leuz et al. (2003) will also be used in this study: (1) LegalOrigin, (2) Legal Tradition, (3) Outside Investor Rights, (4) Importance of Equity Market,and (5) Ownership Concentration.[7] The factor Legal Origin, which contains fourdummy variables, can be either German (LGERMAN), French (LFRENCH), English(LENGLISH), or Scandinavian (LSCANDI). The Legal Tradition of the country(LCOMMON) will be a single dummy variable (value ‘0’ for a code-law country, andvalue ‘1’ for a common-law country). The third factor, originally called the anti-directorrights index by La Porta et al. (1998), is ‘Outside Investor Rights’ (RIGHTS), being ameasure of the minority shareholder rights in the country. The fourth factor,‘Importance of Equity Market’ (EQUITYMA), is the average score of three variables inLa Porta et al. (1997).[8] The fifth factor, ‘Ownership Concentration’ (OWNERSHI), isconstructed by La Porta et al. (1998).[9] The last three variables are all scale variables.
Industry factors. Industries are classified based on their visibility. Visibility hasbeen operationalized in previous studies in various ways. Initial studies attempted todifferentiate between industries by classifying them as either being high-profile orlow-profile (see Roberts (1992) and Hackston and Milne (1996)). More recent CSR
IJOA16,1/2
68
literature suggests that visibility consists of “organizational visibility” as well as“issue visibility.”
Organizational visibility is high when an organization “can be easily seen by relevantconstituents” (Bowen, 2000, p. 93). A specific instance of “organizational visibility” is“consumer visibility”, which is based on the idea that some companies are more visibleamong (end)consumers whereas others are not. Carter (2006) measures consumervisibility by interaction with end consumer based on industry SIC code (Carter, 2006),although she does not provide a ready-to-use industry classification.
Issue visibility is high when issues “are easily noticeable by groups inside or outsidethe organization” (Bowen, 2000, p. 93). This measure of visibility builds on the idea thatsome companies or industries are more visible due to an inherent impact of theiractivities on society. Brammer and Millington (2004) provide a useful classification of“politically and/or socially sensitive” industries, to account for “industries withpotentially significant environmental or social consequences.” They classify industrieswith high environmental impact, large social externalities (alcohol and tobacco) andindustries with ethical issues (pharmaceuticals and defense) as ‘sensitive.’
The measure of visibility used in this study is based on a composite of previousclassifications taking into account both consumer visibility and issue visibility. Next tothe Roberts (1992) and Hackston and Milne (1996) industry classifications, we useBrammer and Millington (2004) as the basis for our classification. Brammer andMillington (2004) distinguish between industries with high environmental impact(chemicals, oil, metal, Pulp and Paper, mining, water and energy production anddistribution), high social impact (tobacco and alcohol), and high ethical concerns(defense and pharmaceuticals). We have complemented the resulting classificationwith a number of industries that that have not been classified by previous studies ashighly visible, yet which industries have faced major controversies regarding social orethical issues (Carroll and Buchholtz, 2006). Consequently, we have classified thehousehold and personal products industries to have high ethical impact (due to animalrights issues), whereas the food, drug/health care equipment, and automobilesindustries (due to safety issues), the apparel and retail industries (based on humanrights issues such as sweatshops and child labor), and the telecommunication serviceindustries (due to quality concerns as a result of privatization, see Carroll andBuchholtz, 2006) were classified as high social impact industries. An industry visibilitymeasure was created, based on a dichotomous variable, taking the value ‘1’ if anindustry was classified as having high visibility and taking the value ‘0’ otherwise.
Company-specific factors. Company size is calculated as the natural log of thenumber of employees (LNEMP), the total assets (LNASSET), the net sales or revenues(LNSALES), and the market capitalization (LNMCAP).[10]
Sample. From the database we collected data on 630 listed companies in 22 countries.The largest number of observations in the sample are from the UK (127), the US (100),Japan (78), Canada (48), Italy (41), France (39), and Switzerland (39).[11] In total17 companies are eliminated from the data set. These companies are excluded since themission statement is not publicly disclosed. The data is retrieved from the 2001-2002SiRi Global Profiles. The SiRi Global Profiles contain data on various stakeholder issuesper company, grouped under various headings such as community, corporategovernance, customers, employees, the environment and human rights and supplychain.[12] These headings correspond to the various stakeholder groups identified in
Missionstatements
69

this study. Directly relevant for this study is the identification of specific stakeholderissue groups as they are addressed in the mission statement for each company.
Empirical results and discussionDescriptive statisticsTable I contains the descriptive statistics for the independent and dependent variables.Out of the total sample of 613 companies, 490 companies (80 percent) disclose a missionstatement, 100 companies (16.3 percent) do not disclose a mission statement, and for23 companies (3.7 percent) the existence of the mission statement cannot be confirmed.
Descriptive statistics of the dependent variableFor the total sample, the descriptive statistics of the dependent variable, FRACTION,show a minimum value of 0.20 and a maximum value of 0.80. The minimum value of0.20 relates to companies that only includes stakeholder issue groups in the missionstatement which do not provide resources to the company, such as the environment, thecommunity and human rights. Alternatively, the maximum value of 0.80 is achievedwhen a company only includes stakeholder issue groups that do provide resources to thecompany, such as employees, customers, and corporate governance. The mean value of0.5853 indicates that on average companies address stakeholder issue groups whichprovide resources to the company more frequently than stakeholder issue groups that donot provide resources to the company. The one-sample t-test of FRACTION indicatesthat this score is significantly higher than 0.5 at the 0.01 level.
Table II contains the number of stakeholder issue groups addressed by companies intheir mission statement, separated per country and per industry. The variableFRACTION is lowest in Japan (0.5136) and highest in Hong Kong/Singapore (0.6423) andthe US (0.6325). Based on a series of one sample t-tests, the finding that FRACTION is
Part A: Continuous variables N Minimum Maximum Mean SDDependent variableFRACTION 490 0.20 0.80 0.5853 0.1169Independent variablesRIGHTS 486 0 5 3.65 1.5310EQUITYMA 486 5.0 28.8 19.053 6.8001OWNERSHI 486 0.012 0.62 0.2668 0.1678CSRPERF 214 0.29 0.87 0.5563 0.0999LNEMP 413 2.51 6.14 4.4504 0.6085LNASSET 420 5.02 9.07 7.1937 0.7358LNSALES 419 4.97 8.39 6.9305 0.5976LNMCAP 390 9.85 18.99 16.1046 1.3960Part B: Dichotomous variables
Value ¼ 0 Value ¼ 1N Frequency Percentage Frequency Percentage
Independent variablesVISIBLE 490 268 54.7 222 45.3LGERMAN 490 365 75.1 121 24.9LFRENCH 490 385 79.2 101 20.8LENGLISH 490 254 52.3 232 47.7LSCANDI 490 454 93.4 32 6.6LCOMMON 490 254 52.3 232 47.7
Table I.Descriptive statisticsof dependent andindependent variables
IJOA16,1/2
70

Nu
mb
erof
reso
urc
eb
ased
stak
ehol
der
gro
up
sm
enti
oned
Nu
mb
erof
non
-res
ourc
eb
ased
stak
ehol
der
gro
up
sm
enti
oned
Fra
ctio
nv
aria
ble
01
23
01
23
Mea
nS
DM
inM
axN
Fu
llsa
mp
le33
103
178
176
155
129
152
540.
5853
0.11
70.
250.
8049
0E
uro
pe
1361
104
118
9170
9936
0.58
920.
106
0.25
0.80
296
Un
ited
Sta
tes
08
3733
2422
207
0.63
250.
112
0.40
0.80
78C
anad
a5
410
29
84
00.
5756
0.07
70.
500.
7521
Jap
an14
2716
1119
2023
60.
5136
0.13
90.
250.
8068
Au
stra
lia/
New
Zea
lan
d0
35
61
55
30.
5468
0.09
30.
400.
7514
Hon
gK
ong
/S
ing
apor
e1
06
66
41
20.
6423
0.15
30.
330.
8013
Fin
anci
als
221
2939
4022
245
0.63
160.
1098
0.33
0.80
91E
ner
gy
01
39
13
45
0.55
710.
0771
0.43
0.67
13U
tili
ties
35
1115
49
156
0.53
760.
0912
0.33
0.75
34M
ater
ials
57
2017
811
246
0.54
030.
0842
0.25
0.75
49In
du
stri
als
416
2330
2322
244
0.59
750.
1241
0.25
0.80
73C
onsu
mer
–st
aple
s1
914
176
914
120.
5390
0.10
390.
330.
8041
Con
sum
er–
dis
cret
ion
ary
619
3719
3223
188
0.59
620.
1260
0.25
0.80
81H
ealt
hca
re3
515
115
1512
20.
5627
0.09
830.
250.
8034
Tel
ecom
mu
nic
atio
ns
27
105
113
64
0.58
040.
1389
0.33
0.80
24In
form
atio
nte
chn
olog
y7
1316
1425
1211
20.
6049
0.12
890.
250.
8050
Table II.Number of stakeholder
issue groups
Missionstatements
71

significantly higher than 0.5 holds for all country groups, except for Japan. With respectto industries, although some differences can be found with respect to the mean ofFRACTION, the finding that the mean is significantly different from 0.5 holds for allindividual industries.
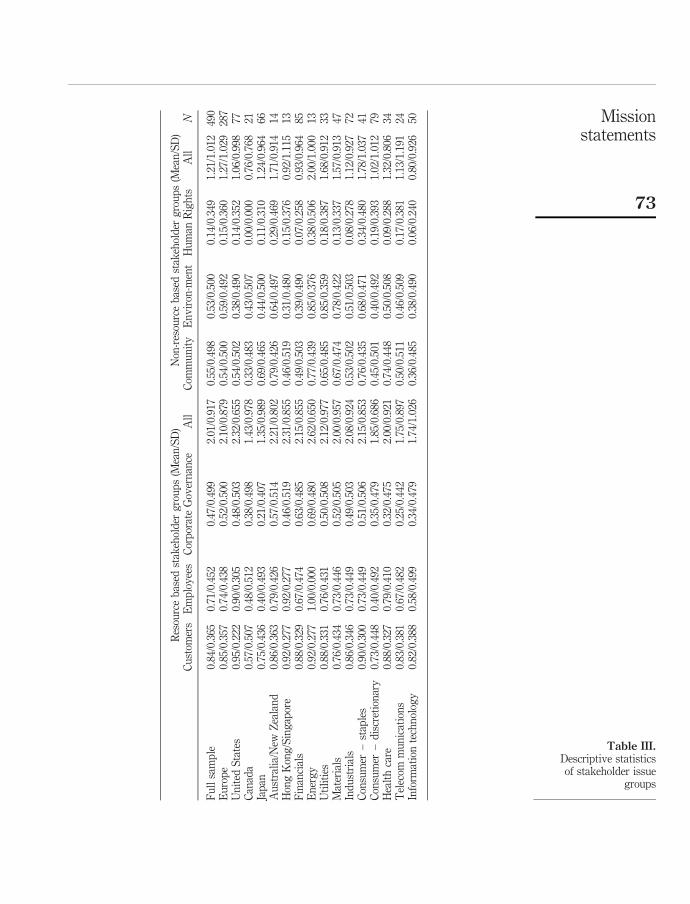
Table III contains the descriptive statistics for the individual stakeholder issue groups.The stakeholder issue group which is most frequently addressed in the mission statementis Customers (84 percent), followed by Employees (71 percent), Community (55 percent),Environment (53 percent), Corporate Governance (47 percent), and Human Rights andSupply Chain (14 percent). The average number of stakeholder issue groups in a missionstatement is 3.23. In total, 21 companies (3.4 percent) address zero stakeholder issuegroups, whereas 41 companies (6.7 percent) address all six stakeholder issue groups.A paired sample t-test confirms that resource based stakeholders groups are mentionedmore often than non-resource based stakeholder groups. Table III also indicates that theaverage amount of stakeholder issue groups addressed in mission statements tends tovary between countries and industries. The highest amount of stakeholder issue groupsare addressed in Australia/New Zealand (3.92), whereas the lowest amounts of stakeholderissue groups are addressed in Canada (2.19) and Japan (2.59). However, Japan is the onlycountry where the number of resource based stakeholders groups is not significantlyhigher than the number of non-resource based stakeholder groups. With respect toindustry differences, the number of stakeholder groups mentioned is particularly low inthe information technology industry (2.54) and relatively high in the energy industry(4.62). However, for all individual industries the number of resource based stakeholdergroups is significantly higher than the number of non-resource based stakeholder groups.
The descriptive statistics presented here are in line with the findings of priorresearch. According to Bartkus et al. (2004), mission statements in Japan contain onaverage the least amount of stakeholders in comparison to mission statements inEurope and the US. The descriptive statistics support this outcome, since the amountof stakeholder issue groups in the mission statement is lower in Japan (2.59) than inEurope (3.37) and the US (3.38). In addition, Bartkus et al. (2004) found that Japanesemission statements contain less frequently employees and investors, but contain morefrequently the society in comparison to mission statements from Europe and the US.The descriptive statistics also support this outcome. For example, the stakeholder issuegroup ‘Community’ is addressed in the mission statement in both Europe and the US in54% of the cases, whereas in Japan the “Community” is addressed in 69 percent of thestatements.
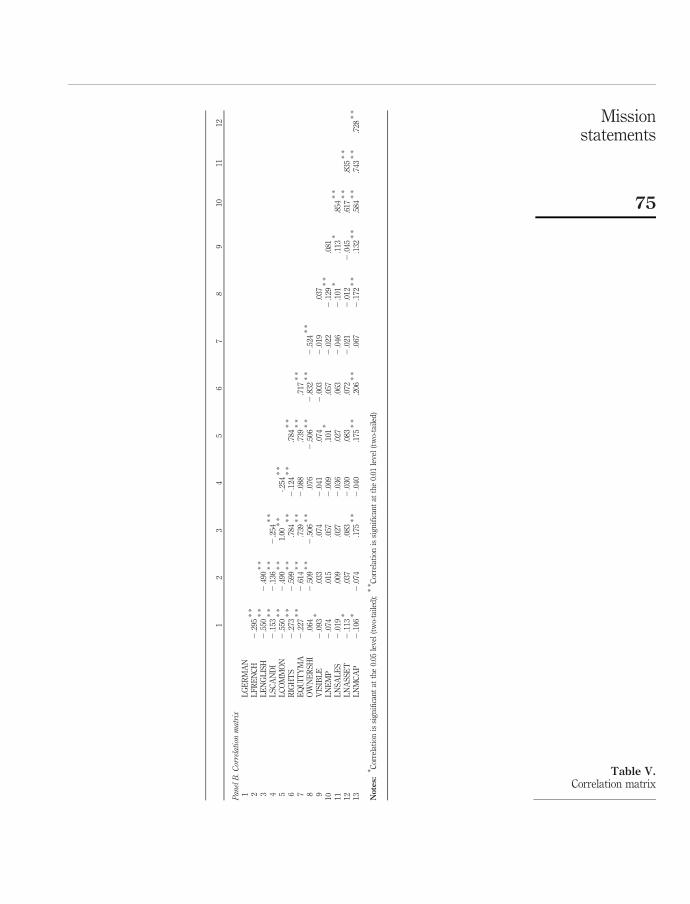
Univariate analysisTable IV contains the Pearson correlations between the dependent variable and theindependent variables. Table V shows the correlation matrix. First, severalcountry-specific variables correlate significantly with the dependent variable(FRACTION). The dummy variable “German Legal Origin” (LGERMAN) shows asignificant negative correlation, whereas the dummy variables “English Legal Origin”(LENGLISH) and “Legal Tradition: Common Law” (LCOMMON) show significantpositive correlations. Also the variable “Ownership Concentration” (OWNERSHI)shows a positive correlation to the dependent variable. Since these country-specificvariables have not been used before as independent variables in mission statementresearch, no clear expectation on the correlations has been formulated.
IJOA16,1/2
72
Res
ourc
eb
ased
stak
ehol
der
gro
up
s(M
ean
/SD
)N
on-r
esou
rce
bas
edst
akeh
old
erg
rou
ps
(Mea
n/S
D)
Cu
stom
ers
Em
plo
yee
sC
orp
orat
eG
over
nan
ceA
llC
omm
un
ity
En
vir
on-m
ent
Hu
man
Rig
hts
All
N
Fu
llsa
mp
le0.
84/0
.365
0.71
/0.4
520.
47/0
.499
2.01
/0.9
170.
55/0
.498
0.53
/0.5
000.
14/0
.349
1.21
/1.0
1249
0E
uro
pe
0.85
/0.3
570.
74/0
.438
0.52
/0.5
002.
10/0
.879
0.54
/0.5
000.
59/0
.492
0.15
/0.3
601.
27/1
.029
287
Un
ited
Sta
tes
0.95
/0.2
220.
90/0
.305
0.48
/0.5
032.
32/0
.655
0.54
/0.5
020.
38/0
.490
0.14
/0.3
521.
06/0
.998
77C
anad
a0.
57/0
.507
0.48
/0.5
120.
38/0
.498
1.43
/0.9
780.
33/0
.483
0.43
/0.5
070.
00/0
.000
0.76
/0.7
6821
Jap
an0.
75/0
.436
0.40
/0.4
930.
21/0
.407
1.35
/0.9
890.
69/0
.465
0.44
/0.5
000.
11/0
.310
1.24
/0.9
6466
Au
stra
lia/
New
Zea
lan
d0.
86/0
.363
0.79
/0.4
260.
57/0
.514
2.21
/0.8
020.
79/0
.426
0.64
/0.4
970.
29/0
.469
1.71
/0.9
1414
Hon
gK
ong
/Sin
gap
ore
0.92
/0.2
770.
92/0
.277
0.46
/0.5
192.
31/0
.855
0.46
/0.5
190.
31/0
.480
0.15
/0.3
760.
92/1
.115
13F
inan
cial
s0.
88/0
.329
0.67
/0.4
740.
63/0
.485
2.15
/0.8
550.
49/0
.503
0.39
/0.4
900.
07/0
.258
0.93
/0.9
6485
En
erg
y0.
92/0
.277
1.00
/0.0
000.
69/0
.480
2.62
/0.6
500.
77/0
.439
0.85
/0.3
760.
38/0
.506
2.00
/1.0
0013
Uti
liti
es0.
88/0
.331
0.76
/0.4
310.
50/0
.508
2.12
/0.9
770.
65/0
.485
0.85
/0.3
590.
18/0
.387
1.68
/0.9
1233
Mat
eria
ls0.
76/0
.434
0.73
/0.4
460.
52/0
.505
2.00
/0.9
570.
67/0
.474
0.78
/0.4
220.
13/0
.337
1.57
/0.9
1347
Ind
ust
rial
s0.
86/0
.346
0.73
/0.4
490.
49/0
.503
2.08
/0.9
240.
53/0
.502
0.51
/0.5
030.
08/0
.278
1.12
/0.9
2772
Con
sum
er–
stap
les
0.90
/0.3
000.
73/0
.449
0.51
/0.5
062.
15/0
.853
0.76
/0.4
350.
68/0
.471
0.34
/0.4
801.
78/1
.037
41C
onsu
mer
–d
iscr
etio
nar
y0.
73/0
.448
0.40
/0.4
920.
35/0
.479
1.85
/0.6
860.
45/0
.501
0.40
/0.4
920.
19/0
.393
1.02
/1.0
1279
Hea
lth
care
0.88
/0.3
270.
79/0
.410
0.32
/0.4
752.
00/0
.921
0.74
/0.4
480.
50/0
.508
0.09
/0.2
881.
32/0
.806
34T
elec
omm
un
icat
ion
s0.
83/0
.381
0.67
/0.4
820.
25/0
.442
1.75
/0.8
970.
50/0
.511
0.46
/0.5
090.
17/0
.381
1.13
/1.1
9124
Info
rmat
ion
tech
nol
ogy
0.82
/0.3
880.
58/0
.499
0.34
/0.4
791.
74/1
.026
0.36
/0.4
850.
38/0
.490
0.06
/0.2
400.
80/0
.926
50
Table III.Descriptive statisticsof stakeholder issue
groups
Missionstatements
73

The dummy variables LENGLISH and LCOMMON have identical correlations to thedependent variable since the variables are perfectly correlated to each other.[13]Therefore, the dummy variable LCOMMON will be excluded in the multivariateanalysis. Second, the visibility of the industry (VISIBLE) shows a significant negativecorrelation to the dependent variable. Therefore, companies which are positioned in ahighly visible industry address relatively more stakeholder issue groups which do notprovide resources to the company in comparison to stakeholder issue groups which doprovide resources to the company. The negative correlation is expected since a higherlevel of visibility might increase the need for companies to provide assurances tonon-resource providing stakeholders in the attempt to avoid (any) negative publicity.Third, the company-specific variables “Number of employees” (LNEMP) and “NetSales or Revenues” (LNSALES) have a significant negative correlation with thedependent variable. The negative correlation is expected since larger companies areexpected to include more non-resource providing stakeholders as opposed to resourceproviding stakeholders in their mission statement because a higher level of consumervisibility and political risk might increase the need for companies to addressnon-resource providing stakeholders.
The variables LNEMP, LNSALES, LNASSET, and LNMCAP all have a significantpositive correlation with each other. In addition, the variable LNEMP has a significantpositive correlation with the stakeholder issue group “Employees.” Therefore, thevariable LNSALES will be used in the multivariate analysis as a proxy for company size.
Multivariate analysisTable VI contains the output of the multivariate regression analysis[14].
Several significant variables are identified in the multivariate analysis. First, fromthe country-specific variables, “German Legal Origin” (LGERMAN) and “French LegalOrigin” (LFRENCH) have a significant negative relationship with the dependentvariable (FRACTION). Countries with a German Legal Origin are Austria, Germany,
Independent variable Correlation with FRACTION
Panel A. Univariate testsLGERMAN 20.175 * * *
LFRENCH 0.053LENGLISH 0.096 * *
LSCANDI 0.023LCOMMON 0.096 * *
RIGHTS 20.028EQUITYMA 0.002OWNERSHI 0.129 * * *
VISIBLELNEMP 20.193 * * *
20.118 * *
LNSALES 20.125 * * *
LNASSET 20.045LNMCAP 20.071
Notes: Pearson correlations are used since none of the variables have an ordinal scale. Significant atthe *0.10; * *0.05; * * *0.01 levels, respectively
Table IV.Univariate tests
IJOA16,1/2
74
12
34
56
78
910
1112
PanelB.Correlation
matrix
1L
GE
RM
AN
2L
FR
EN
CH
2.2
95*
*
3L
EN
GL
ISH
2.5
50*
*2
.490
**
4L
SC
AN
DI
2.1
53*
*2
.136
**
2.2
54*
*
5L
CO
MM
ON
2.5
50*
*2
.490
**
1.00
**
-.254
**
6R
IGH
TS
2.2
73*
*2
.599
**
.784
**
2.1
24*
*.7
84*
*
7E
QU
ITY
MA
2.2
27*
*2
.614
**
.739
**
2.0
88.7
39*
*.7
17*
*
8O
WN
ER
SH
I.0
642
.509
**
2.5
06*
*.0
762
.506
**
2.8
32*
*2
.524
**
9V
ISIB
LE
2.0
93*
.033
.074
2.0
41.0
742
.003
2.0
19.0
3710
LN
EM
P2
.074
.015
.057
2.0
09.1
01*
.057
2.0
222
.129
**
.081
11L
NS
AL
ES
2.0
19.0
09.0
272
.036
.027
.063
2.0
462
.101
*.1
13*
.854
**
12L
NA
SS
ET
2.1
13*
.037
.083
2.0
30.0
83.0
722
.021
2.0
122
.045
.617
**
.835
**
13L
NM
CA
P2
.106
*2
.074
.175
**
2.0
40.1
75*
*.2
06*
*.0
672
.172
**
.132
**
.584
**
.743
**
.728
**
Notes:
* Cor
rela
tion
issi
gn
ifica
nt
atth
e0.
05le
vel
(tw
o-ta
iled
);*
* Cor
rela
tion
issi
gn
ifica
nt
atth
e0.
01le
vel
(tw
o-ta
iled
)
Table V.Correlation matrix
Missionstatements
75

Japan, and Switzerland. Countries with a French legal origin are Belgium, France, Italy,and Spain. According to Hope (2003) both legal origin and culture are important inexplaining corporate disclosure. He states that, having common law as a referencegroup, French and German legal regimes are associated with lower disclosure, whereasthe Scandinavian (Nordic) legal regime is associated with higher disclosure. Second,the variable “Ownership Concentration” (OWNERSHI) has a significant positiverelationship with the dependent variable at the 5 percent level. Countries with a lowlevel of ownership concentration are the US, UK, and Japan, whereas countries with ahigh level of ownership concentration are Italy, Germany and Belgium. The positiverelationship might be explained by reduced information asymmetries in companieswith a higher level of ownership concentration. Since information can more effectivelybe communicated via private channels in high concentration companies, thesecompanies might have a lesser need to focus on public disclosure to provide assurancesto shareholders. Third, the industry-specific variable VISIBLE has a significantnegative relationship with FRACTION at the 1 percent level, suggesting that, asexpected, high-profile companies might be inclined to address non-resource providingstakeholders in the attempt to avoid negative publicity. Lastly, in concordance with theunivariate analysis, the multivariate analysis indicates that the company-specificvariable LNSALES has a significant negative correlation with FRACTION. As the sizeof a company appears to be positively related to the level of corporate disclosure(Cormier et al., 2005), the size of a company similarly is related to the content of themission statement where larger companies address more non-resource basedstakeholder groups compared to smaller companies.
ConclusionThis study introduces the dependence of the company on the stakeholder as anexplanatory factor for the inclusion of stakeholders in mission statements. Utilizing theresource dependence perspective by Pfeffer and Salancik (1978), stakeholders whichprovide resources to the company are assumed to be more important to the companythan stakeholders which do not provide resources. As a consequence, mission statementcontent is expected to be more focused on the first group in comparison to the latter. The
FRACTION ¼ b0 þ b1 LGERMAN þ b2 LFRENCH þ b3 LSCANDI þ b4 RIGHTS þ b5
EQUITYMA þ b6 OWNERSHI þ b7 VISIBLE þ b8 LNSALES þ 1Variable Expected sign Coeff T-value P-value
CONSTANT ? 0.782 8.329 0.000 * * *
LGERMAN ? 20.083 23.862 0.000 * * *
LFRENCH ? 20.054 21.914 0.056 *
LSCANDI ? 20.036 21.301 0.194RIGHTS ? 0.000 20.023 0.982EQUITYMA ? 20.002 21.493 0.136OWNERSHI ? 0.125 1.917 0.056 *
VISIBLE 2 20.056 25.143 0.000 * * *
LNSALES 2 20.019 22.123 0.034 * *
Notes: Adjusted R 2 ¼ 0.110 ; F ¼ 7.633 (0.000); Durbin-Watson ¼ 1.963. *, * * and * * *Significant atthe 0.10, 0.05 and 0.01 levels, respectively
Table VI.Multivariate results
IJOA16,1/2
76
results show that, on average, stakeholder groups which provide resources areaddressed more frequently in mission statements in comparison to stakeholder groupswhich do not provide resources, confirming our main research question. These resultshold for all individual countries in our sample except Japan, and for all industries.Consequently, stakeholder dependency theory can be used to explain the content ofmission statements, in particular the frequency of references to stakeholder groups inthese statements. Therefore, further studies that try to explain the content and role ofmission statements might be based on the dependence of the company on stakeholders,rather than the dependence of stakeholders on the company as used in previous studies.
In addition, several further explanatory variables have been tested in this study. First,due to the large sample size of 490 observations, international differences in missionstatement content are observed using legal factors introduced by La Porta et al. (1997,1998). Second, industry-specific differences are captured by classifying industries as eitherhigh-profile or low-profile. Third, the size of the company is used to account forcompany-specific differences. Descriptive statistics on country-specific differences inmission statement content appears to be consistent with the study by Bartkus et al. (2004).The multivariate regression analysis confirms that both country-specific variables andindustry-specific variables have an influence on the dependent variable (the number ofstakeholder issue groups which provide resources to the company divided by the totalnumber of stakeholder issue groups). First, with respect to the country-specific variables,“German Legal Origin” and “French legal Origin” have a significant negative relationshipand “Ownership Concentration” has a significant positive relationship with the proportionof resource-based stakeholders mentioned in mission statements. Second, the visibility ofthe industry appears to have a highly significant negative relationship with the dependentvariable as well as the size of a company.
The findings of this study have several implications for organizations. The observeddifferences in mission statement content with respect to stakeholder managementsignify the fact that the mission statement is not a standardized document which cansimply be ignored by managers. According to this study, stakeholder inclusion inmission statements appears to be dependent on both country- and industry-specificfactors. Therefore, managers must be aware of the environment in which the company issituated, in order to approach the stakeholders which are most important to theorganization. A failure to recognize and include essential stakeholders in the missionstatement may be costly in the long run, particularly when competitors are better able toaddress these stakeholders. Therefore, this result is particularly important fororganizations which currently do not have a mission statement or for organizationswhere stakeholder management has no significant role in the creation of the missionstatement.
The main limitations of this study are threefold. First, the database used adopts abroad definition of a mission statement, as a result of which the study may also includedocuments such as vision statements. Second, additional factors might exist that couldexplain the inclusion of stakeholder groups in the mission statement. For example,Hope (2003) states that both legal origin and culture are important in explainingcorporate disclosure. Therefore, literature on cultural dimensions by Hofstede (1980)and Schwartz (1994) might also be used as explanatory variables in future research.Finally, the industry classification scheme partly was newly developed in this study
Missionstatements
77
and some additional evidence with respect to the classification of various industrieswill be required to further substantiate the industry results found in this study.
The results of the study indicate that further research on the use of the missionstatement for external purposes is called for. This study uses a separation of stakeholdergroups based on the resource dependence perspective, focusing on the dependence of thecompany. In this study, the definition of both groups has been kept constant over allcompanies and industries. However, it may be argued that not all companies or industriesare equally dependent on a particular stakeholder group. For example, within the serviceindustry, companies may be particularly dependent on employees whereas companieswithin the chemical sector may be more dependent on investors for providing funds toinvest in plants and technologies. Future studies should therefore develop more precisemeasures of the dependency of companies on stakeholder groups. In addition, stakeholdergroups can also be classified in other ways which might provide further explanations ofstakeholder inclusion in mission statements. A second issue for further research is theinternational differences in mission statements. In comparison to previous studies, this isthe first study where country-specific variables have been used in order to explain missionstatement content. Since both German legal origin and ownership concentration are foundto be significant explanatory variables, additional research on the influence of legal andinstitutional factors on mission statement content is needed.
Notes
1. Campbell et al. (2001, p. 65): “The mission statement is the formal statement of a company’smission”.
2. Oxford University Press (2003, p. 919) on ‘Isomorphic’: “Corresponding to or similar in formand relations. . . . ”.
3. To enhance the variability in the scale for FRACTION, it is calculated as follows: (number ofresource providing stakeholder groups þ1)/((number of resource providing stakeholdergroups þ1) þ (number of non-resource providing stakeholder groups þ1)). The theoreticalminimum of 0.20 is reached when a mission statement contains zero resource providingstakeholder groups and three non-resource providing stakeholder groups[ ¼ (0 þ 1)/((0 þ 1) þ (3 þ 1))]. The theoretical maximum of 0.80 is reached when amission statement contains three resource providing stakeholder groups and 0 non-resourceproviding stakeholder groups. When FRACTION is equal to 0.5, a mission statementcontains the same amount of resource providing stakeholder groups as non-resourceproviding stakeholder groups.
4. The data that is used in the empirical part of the study, uses information on corporategovernance issues to address the references to shareholders in mission statement.
5. Frooman (1999, p. 195) has listed the conditions for resource dependence: “Operationalized,resource dependence is said to exist when one actor is supplying another with a resource thatis marked by (1) concentration (suppliers are few in number), (2) controllability,(3) nonmobility, (4) nonsubstitutability (Barney, 1991; Emerson, 1962; Jacobs, 1974; Pfefferand Salancik, 1978), or (5) essentiality”.
6. The variables “Legal Enforcement” and “The Importance of Equity Market” in Leuz et al.(2003) are the mean score of variables in La Porta et al. (1997, 1998). Other variables fromLa Porta et al. (1998) have been used by Leuz et al. (2003) without additional adaptations. Forfurther reference see Leuz et al. (2003), pp. 516-17.
7. First, the variable “Legal Enforcement” is not included in this study, since the lowest scalescore reached in this study is considerably higher than the lowest scale score reached in Leuz
IJOA16,1/2
78

et al. (2003). Second, the variable “Disclosure Index”, which is a measure for the inclusion of90 items in the annual report of 1990 is not included, since there are serious doubts whetherthese data are comparable to the content of today’s annual reports.
8. Leuz et al. (2003, p. 516): “The Importance of Equity Market is measured by the mean rankacross three variables used in La Porta et al. (1997): (1) the ratio of the aggregate stockmarket capitalization held by minorities to gross national product, (2) the number of listeddomestic firms relative to the population, and (3) the number of IPOs relative to thepopulation”.
9. La Porta et al. (1998, p. 1125): “Ownership, 10 largest private firms: The average percentageof common shares owned by the three largest shareholders in the 10 largest nonfinancial,privately owned domestic firms in a given country. A firm is considered privately owned ifthe state is not a known shareholder in it”.
10. Datastream Advance has been used to extract the data. Mnemonic codes: number ofemployees (WC07011), total assets (WC02999), net sales or revenues (WC01001) (WC08001).
11. Other countries are Australia (16), Austria (1), Belgium (15), Denmark (6), Finland (8),Germany (32), Hong Kong (7), Ireland (5), Luxembourg (2), the Netherlands (24), New Zealand (4),Norway (3), Singapore (7), Spain (11) and Sweden (17).
12. For a full detail on the content of the SiRi Global Profiles, visit http://www.siricompany.com/
13. The following countries have both a Common Law Tradition and an English Legal Origin:Australia, Canada, Hong Kong, UK, and United States.
14. The Durbin-Watson statistic of 1.963 is within acceptable parameters indicating no sign ofautocorrelation. Also, no abnormal VIF scores are observed indicating an absence ofmulticollinearity problems.
References
Amato, C.H. and Amato, L.H. (2002), “Corporate commitment to quality of life: evidence fromcompany mission statements”, Journal of Marketing Theory and Practice, Vol. 10 No. 4,pp. 69-87.
Atrill, P., Omran, M. and Pointon, J. (2005), “Company mission statements and financialperformance”, Corporate Ownership and Control, Vol. 2 No. 3, pp. 28-35.
Baetz, M.C. and Bart, C.K. (1996), “Developing mission statements which work”, Long RangePlanning, Vol. 29 No. 4, pp. 526-33.
Barney, J. (1991), “Firm resources and sustained competitive advantage”, Journal ofManagement, Vol. 17 No. 1, pp. 99-120.
Bart, C.K. (1996), “High tech firms: does mission matter?”, Journal of High TechnologyManagement Research, Vol. 7 No. 2, pp. 209-25.
Bart, C.K. (1997a), “Sex, lies, and mission statements”, Business Horizons, Vol. 40 No. 6, pp. 9-18.
Bart, C.K. and Baetz, M.C. (1998), “The relationship between mission statements and firmperformance: an exploratory study”, Journal ofManagement Studies, Vol. 35 No. 6, pp. 823-53.
Bart, C.K. and Tabone, J.C. (1999), “Mission statement content and hospital performance in theCanadian not-for-profit health care sector”, Health Care Management Review, Vol. 24 No. 3,pp. 18-29.
Bart, C.K., Bontis, N. and Tagger, S. (2001), “A model of the impact of mission statements on firmperformance”, Management Decision, Vol. 39 No. 1, pp. 19-35.
Bartkus, B., Glassman, M. and McAfee, R.B. (2000), “Mission statements: Are they smoke andmirrors?”, Business Horizons, Vol. 43 No. 6, pp. 23-8.
Missionstatements
79
Bartkus, B., Glassman, M. and McAfee, R.B. (2002), “Do large European, US and Japanese firmsuse their web sites to communicate their mission?”, EuropeanManagement Journal, Vol. 20No. 4, pp. 423-9.
Bartkus, B., Glassman, M. and McAfee, R.B. (2004), “A comparison of the quality of European”,Japanese and US mission statements: a content analysis. European Management Journal,Vol. 22 No. 4, pp. 393-401.
Bartkus, B., Glassman, M. and McAfee, R.B. (2006), “Mission statement quality and financialperformance”, European Management Journal, Vol. 24 No. 1, pp. 86-94.
Bowen, F.E. (2000), “Environmental visibility: a trigger of green organizational response?”,Business Strategy and the Environment, Vol. 9 No. 2, pp. 92-107.
Brabet, J. and Klemm, M. (1994), “Sharing the vision: company mission statements in Britain andFrance”, Long Range Planning, Vol. 27 No. 1, pp. 84-94.
Brammer, S. and Millington, A. (2004), “The development of corporate charitable contributions in theUK: a stakeholder analysis”, Journal of Management Studies, Vol. 41 No. 8, pp. 1411-34.
Brown, W.A. and Yoshioka, C.F. (2003), “Mission attachment and satisfaction as factorsin employee retention”, Nonprofit Management and Leadership, Vol. 14 No. 1, pp. 5-18.
Campbell, A. (1997), “Mission statements”, Long Range Planning, Vol. 30 No. 6, pp. 931-2.
Campbell, A. and Yeung, S. (1991), “Creating a sense of mission”, Long Range Planning, Vol. 24No. 4, pp. 10-20.
Campbell, D., Shrives, P. and Bohmbach-Saager, H. (2001), “Voluntary disclosure of missionstatements in corporate annual reports: signaling what and to whom?”, Business andSociety Review, Vol. 106 No. 1, pp. 65-87.
Carroll, A.B. and Buchholtz, A.K. (2006), Business and Society: Ethics and StakeholderManagement, Thomson South-Western, Mason, OH.
Carter, S.M. (2006), “The interaction of top management group, stakeholder, and situationalfactors on certain corporate reputation management activities”, Journal of ManagementStudies, Vol. 43 No. 5, pp. 1145-76.
Clarkson, M.B.E. (1994), “A risk based model of stakeholder theory”, Proceedings of the 2ndToronto Conference on Stakeholder Theory, Centre for Corporate Social Performance andEthics, University of Toronto, Toronto.
Clarkson, M.B.E. (1995), “A stakeholder framework for analyzing and evaluating corporate socialperformance”, Academy of Management Review, Vol. 20 No. 1, pp. 92-117.
Cormier, D., Magnan, M. and Van Velthoven, B. (2005), “Environmental disclosure quality inlarge German companies: Economic incentives, public pressures or institutionalconditions?”, European Accounting Review, Vol. 14 No. 1, pp. 3-39.
David, F.R. (1989), “How companies define their mission”, Long Range Planning, Vol. 22 No. 1,pp. 90-7.
David, F.R. and David, F.R. (2003), “It’s time to redraft your mission statement”, Journal ofBusiness Strategy, Vol. 24 No. 1, pp. 11-14.
Dimaggio, P.J. and Powell, W.W. (1983), “The iron cage revisited: institutional isomorphism andcollective rationality in organizational fields”, American Sociological Review, Vol. 48 No. 2,pp. 147-60.
Drucker, P.F. (1977),An IntroductoryView ofManagement, Harper’s College Press, New York, NY.
Emerson, R.M. (1962), “Power-dependence relations”, American Sociological Review, Vol. 27,pp. 31-41.
IJOA16,1/2
80

Frederick, W., Davis, K. and Post, J. (1988), Business and Society. Corporate Strategy, PublicPolicy, Ethics, McGraw Hill, New York, NY.
Freeman, R.E. (1984), Strategic Management: A Stakeholder Approach, Pitman Publishing,Boston, MA.
Frooman, J. (1999), “Stakeholder influence strategies”, Academy of Management Review, Vol. 24No. 2, pp. 191-205.
Hackston, D. and Milne, M.J. (1996), “Some determinants of social and environmental disclosuresin New Zealand companies”, Accounting, Auditing and Accountability Journal, Vol. 9 No. 1,pp. 77-108.
Hibbitt, C. (2004), “External environmental disclosure and reporting by large Europeancompanies: an economic, social and political analysis of managerial behaviour”,unpublished PhD thesis, Vrije Universiteit, Amsterdam.
Hofstede, G. (1980), Culture’s Consequences: International Differences in Work Related Values,Sage Publications, Beverly Hills, CA.
Hope, O. (2003), “Firm-level disclosures and the relative roles of culture and legal origin”, Journalof International Financial Management and Accounting, Vol. 14 No. 3, pp. 218-48.
Ireland, R.D. and Hitt, M.A. (1992), “Mission statements: importance, challenge, andrecommendations for development”, Business Horizons, Vol. 35 No. 3, pp. 34-42.
Jacobs, D. (1974), “Dependency and vulnerability: an exchange approach to the control oforganizations”, Administrative Science Quarterly, Vol. 19, pp. 45-59.
Klemm, M., Sanderson, S. and Luffman, G. (1991), “Mission statements: selling corporate valuesto employees”, Long Range Planning, Vol. 24 No. 3, pp. 73-8.
La Porta, R., Lopez-de-Silanes, F., Shleifer, A. and Vishny, R. (1997), “Legal determinants ofexternal finance”, Journal of Finance, Vol. 52 No. 3, pp. 1131-50.
La Porta, R., Lopez-de-Silanes, F., Shleifer, A. and Vishny, R. (1998), “Law and finance”, Journalof Political Economy, Vol. 106 No. 6, pp. 1113-55.
Leuthesser, L. and Kohli, C. (1997), “Corporate identity: the role of mission statements”, BusinessHorizons, Vol. 40 No. 3, pp. 59-66.
Leuz, C., Nanda, D. and Wysocki, P. (2003), “Earnings management and investor protection:an international comparison”, Journal of Financial Economics, Vol. 69 No. 3, pp. 505-27.
Mitchell, R.K., Agle, B.R. and Wood, D.J. (1997), “Toward a theory of stakeholder identificationand salience: defining the principle of who and what really counts”, Academy ofManagement Review, Vol. 22 No. 4, pp. 853-86.
Mullane, J.V. (2002), “The mission statement is a strategic tool: when used properly”,Management Decision, Vol. 40 No. 5, pp. 448-55.
Oliver, C. (1991), “Strategic responses to institutional processes”, Academy of ManagementReview, Vol. 16 No. 1, pp. 145-79.
Omran, M., Atrill, P. and Pointon, J. (2002), “Shareholders versus stakeholders: corporate missionstatements and investor returns”, Business Ethics: A European Review, Vol. 11 No. 4,pp. 318-26.
Pearce, J.A. II (1982), “The company mission as a strategic tool”, Sloan Management Review,Vol. 23 No. 3, pp. 15-25.
Pearce, J.A. II and David, F.R. (1987), “Corporate mission statements: the bottom line”, Academyof Management Executive, Vol. 1 No. 2, pp. 109-15.
Missionstatements
81

Peyrefitte, J. and David, F.R. (2006), “A content analysis of the mission statements of UnitedStates firms in four industries”, International Journal of Management, Vol. 23 No. 2,pp. 296-301.
Pfeffer, J. and Salancik, G.R. (1978), The External Control of Organizations: A ResourceDependence Perspective, Harper & Row, New York, NY.
Roberts, R. (1992), “Determinants of corporate social responsibility disclosure: an application ofstakeholder theory”, Accounting, Organizations and Society, Vol. 17 No. 6, pp. 592-612.
Schwartz, S.H. (1994), “Beyond individualism/collectivism: new cultural dimensions of values”,in Kim, U (Ed.), Individualism and Collectivism: Theory, Method and Applications, SagePublications, CA, pp. 85-119.
Toftoy, C.N. and Chatterjee, J. (2004), “Mission statements and the small business”, BusinessStrategy Review, Vol. 15 No. 3, pp. 41-4.
Urbany, J.E. (2005), “Inspiration and cynicism in values statements”, Journal of Business Ethics,Vol. 62 No. 2, pp. 169-82.
Want, J.H. (1986), “Corporate mission: the intangible contributor to performance”, ManagementReview, Vol. 75 No. 8, pp. 46-50.
Wright, J.N. (2002), “Mission and reality and why not?”, Journal of Change Management, Vol. 3No. 1, pp. 30-44.
Further reading
Bart, C.K. (1997b), “Industrial firms and the power of mission”, Industrial MarketingManagement, Vol. 26 No. 4, pp. 371-83.
Bart, C.K. (1998), “A comparison of mission statements and their rationales in innovative andnon-innovative firms”, International Journal of Technology Management, Vol. 16 Nos 1/3,pp. 64-77.
Brammer, S. and Pavelin, S. (2006), “Corporate reputation and social performance: the importanceof fit”, Journal of Management Studies, Vol. 43 No. 3, pp. 435-55.
Campbell, D. and Slack, R. (2006), “Public visibility as a determinant of the rate of coporatecharitable donations”, Business Ethics: A European Review, Vol. 15 No. 1, pp. 19-28.
Clarke, J. and Gibson-Sweet, M. (1999), “The use of corporate social disclosures in themanagement of reputation and legitimacy: a cross sectoral analysis of UK Top 100Companies”, Business Ethics: A European Review, Vol. 8 No. 1, pp. 5-13.
Oxford Dictionary of English (2003), 2nd ed., Oxford University Press, Oxford.
Corresponding authorLaury Bollen can be contacted at: [email protected]
IJOA16,1/2
82
To purchase reprints of this article please e-mail: [email protected] visit our web site for further details: www.emeraldinsight.com/reprints