A spatial econometric analysis of cross-border accessibility and development in Portugal and Spain
17
CROSS-BORDER ACCESSIBILITY AND SPATIAL DEVELOPMENT IN PORTUGAL AND SPAIN A. S. N. Ribeiro and J. M. R. Silva ABSTRACT Cross-border Regional development is one of the EU current major concerns. These regions are usually less dynamic socio-economically and tend to be peripheral areas in each country. Some of these regions have recently benefited from new roads, which have mainly been funded through the European financial program of Transnational Transport Networks, TEN- T. Almost twenty years after implementation started and after initial observations on the impacts, some development problems are unexpectedly getting worse. Using socioeconomic data from the Portugal/Spain cross-border area a model able to measure the relation between accessibility and development in this region is being calibrated. This paper is an initial study on the calibration process for some Portuguese municipalities in the border area for the period 1991-2001. This initial study also prepares the setting for a more complete study covering both sides of the border, therefore including some Spanish data 1 INTRODUCTION The spatial distribution of activities is the result of opportunities and localization strategies outlined in terms of specific objectives. If we take into account that most human activities involve using and sharing limited resources it is easy to see that the decision processes are complex and involve an important economic component. The acceleration of regional development, particularly in peripheral and border regions - as in our case – seems generally to be associated with substantial capital investment, the allocation of sophisticated technical and scientific resources to production systems, and a thorough renovation of the economy. Building new infrastructure in these areas also leads to significant public investment to make private capital more productive, and it is hoped, therefore, that the expansion of networks and systems will, in the first place, enable firms to operate at lower costs and achieve better performance and, second, mean that the resulting productivity gains will increase the range of
Transcript of A spatial econometric analysis of cross-border accessibility and development in Portugal and Spain

CROSS-BORDER ACCESSIBILITY AND SPATIAL DEVELOPMENT
IN PORTUGAL AND SPAIN
A. S. N. Ribeiro and J. M. R. Silva
ABSTRACT
Cross-border Regional development is one of the EU current major concerns. These regions
are usually less dynamic socio-economically and tend to be peripheral areas in each country.
Some of these regions have recently benefited from new roads, which have mainly been
funded through the European financial program of Transnational Transport Networks, TEN-
T. Almost twenty years after implementation started and after initial observations on the
impacts, some development problems are unexpectedly getting worse. Using socioeconomic
data from the Portugal/Spain cross-border area a model able to measure the relation between
accessibility and development in this region is being calibrated. This paper is an initial study
on the calibration process for some Portuguese municipalities in the border area for the period
1991-2001. This initial study also prepares the setting for a more complete study covering
both sides of the border, therefore including some Spanish data
1 INTRODUCTION
The spatial distribution of activities is the result of opportunities and localization strategies
outlined in terms of specific objectives. If we take into account that most human activities
involve using and sharing limited resources it is easy to see that the decision processes are
complex and involve an important economic component. The acceleration of regional
development, particularly in peripheral and border regions - as in our case – seems generally
to be associated with substantial capital investment, the allocation of sophisticated technical
and scientific resources to production systems, and a thorough renovation of the economy.
Building new infrastructure in these areas also leads to significant public investment to make
private capital more productive, and it is hoped, therefore, that the expansion of networks and
systems will, in the first place, enable firms to operate at lower costs and achieve better
performance and, second, mean that the resulting productivity gains will increase the range of
regional economic activity. Our geographical working area is considered a peripheral region;
it is facing a sharp population decline, weak business dynamics, and its transport
infrastructure is referred to as being little in line with the local development needs.
Two characteristics of this type of territory can help us better understand these local needs.
First, based on census data, there is a significant trend for the number of young people to fall
and the elderly population to increase, with particularly disturbing future implications. In fact,
although this is only a reduction in the younger population, it necessarily implies a future
reduction in workforce; this trend means that an increasingly small active population will
have to support a growing number of elderly people. The region can realistically only
establish a trend towards population stabilization if people come from outside, that is, if the
territories are attractive, because there is no credible prospect of a change in the sign
(negative) of natural increase. And a young potentially active population is essential for
regional development.
Second, the topography and water courses (as well as political decisions) have always
conditioned the structure of the main road network of the area. This situation has changed
very little in recent years. Apart from the delay that has been systematically observed in
improving some of the main roads crossing the region - essential to both the permeation of the
national territory and to penetrating either side of the border - the capillary network has not
been properly addressed by the authorities. These networks are doubly important for the
integrated development of the region. From an inside point of view it represents more direct
links between Portuguese towns. From a wider strategic point of view, it represents links to
neighboring Spanish settlements. This latter issue is fundamental to a cross-border
cooperation (CBC) pattern which age-old tradition needs to preserve and enhance in order to
improve local economic dynamics.
Accessibility in general and the transport infrastructure in particular are fundamental to the
integrated development of any region. To achieve this target it is necessary they exist and act
as such. However, although some components have not yet gone beyond the virtual planning
stage, the region - on both sides of the border - is already endowed with an interesting range
of transport infrastructure. One issue here is that not all of these new or improved roads
operate at full use of their capacity (or else they do not do so in network).
While infrastructure construction and the implementation of transport systems in these
regions, which are simultaneously remote and border areas, may be guided by the principle of
territorial equity, we are also aware that logic should prevail in local claims; any requests for
investment of generic utility should be replaced by more selective interests that are easier to
support technically and economically.
Whilst it is not possible to eliminate the effects of the past it is nonetheless legitimate to
balance any development opportunities in this region with scenarios of more and/or improved
accessibility at national, interregional and cross border levels.
These background considerations demonstrate the importance of this subject, although it has
not been treated in any depth in the literature.
In fact, recent examination of the most prestigious science databases shows that specific
papers devoted to this issue are quite rare, and even fewer have focused on cross-border
accessibility, and most of these are qualitative in nature. This paper thus aims to provide some
new scientific knowledge about the impact of accessibility on sustainable development. A
specific cross-border region between Portugal and Spain has been chosen as a case study, and
previous results in similar studies are also used.
First we selected a group of 15 cross-border municipalities and through a classical regression
analysis we evaluated the above relationship, considering only these municipalities’ access
connections within Portugal. Then we repeated the process but added information concerning
access connections with Spain for those 15 municipalities. Finally we include some
information about Spanish municipalities directly connected to the other side of the border,
next to the Portuguese municipalities. These three stages are the focus of this paper.
In a fourth stage this work will be extended to all municipalities on both sides of the entire
Portugal/Spain border. This later stage will also be developed within a spatial regression
framework, with the addition of the ‘location’ variable as an explanatory variable for
development.
2 LITERATURE REVIEW
Considerable investment has been made in new road infrastructure in recent decades. This
investment has mainly been supported by the argument that road links are important tools in
improving social and economic cohesion. In Europe the related policies and actions aim to
consolidate the Trans-European Transport Networks (TEN-T) and provide closer links
between core and peripheral countries (European Commission, 2007). The positive influence
of transport infrastructure (through improved accessibility) in development is a widely
accepted concept. But the full validity of this concept has not yet been established. The great
majority of studies about how accessibility impacts on development apply on a spatially
aggregated basis and use methodologies and models such as cost benefit analysis with
production functions (Aschauer, 1989), among others. Piet Rietveld and Frank Bruinsma
(1998) and David Banister and Joseph Berechman (2000) report a wide range of approaches.
Research in Portugal uses the same aggregated approaches to show that new transport
infrastructure positively affects the global Portuguese economic performance (Pereira and
Andraz, 2005). The growing complexity of spatial socio-economic interactions has recently
called for the use of more disaggregated spatial units and the inclusion of the ‘location’ factor,
arguing that the positive effects are weaker when looking at it on a local basis (Mas et al,
1996; Guild, 2000). The use of accessibility indicators is an important step forward, as seen in
the work of Roger Vickerman (1995), Kenneth Button (1995), Ulla Forslund and Bjorn
Johansson (1995) and Javier Gutiérrez and J. Urbano (1996) and, more recently, of Lopez and
Javier Gutierrez (2008) related to important new European transport infrastructures and
consolidating the concept of ‘potential accessibility’. However, the calculation of accessibility
is not enough to measure the way it acts as a development factor. Antonio Páez makes some
important advances by using the same type of accessibility indicators as variables in a spatial
regression analysis framework (Páez, 2004), supported by the spatial econometrics work of
Luc Anselin (1988). Besides Paez, the work of Anselin has inspired great number of
contributions since the beginning of the millennium, e.g. Jesus Mur (2009).The same
methodology is now used in recent Portuguese work (Ribeiro, 2009). The number of
kilometers of Portugal’s network of major roads has increased substantially in the last twenty
years (through the TEN-T program), as has happened in many European countries (Santos et
al, 2009). Consequently, most of the country felt a huge increase in accessibility but the
corresponding improvement in development has not matched expectations, since in many
areas population continues to decline (Gaspar et al, 2002). These negative effects are more

pronounced in cross-border areas, where a spatial regression analysis is used to explain to
what extent the new accessibility achieved by the new roads has affected population growth at
municipality level (Ribeiro et al, 2010). Overall, cross-border areas have become increasingly
important in the context of European integration, particularly since the recent enlargement.
Usually, but not always, peripheral to the main city centers within their country’s spatial
structure, these regions suffer from chronic development problems (many of them related to
centuries of history and changing boundaries). Among other similar programs, the European
Commission approved recently (2007) a European program for cross-border cooperation
between Spain and Portugal for the period 2007-2013 (http://www.poctep.eu). The efforts are
now concentrating on improving connectivity and basic infrastructures in the border areas in a
new approach aimed at improving competitiveness, promoting employment and enhancing
socio-economic and institutional integration in the border regions. Therefore, it is
fundamental to analyze how the existing transport infrastructures can do better to meet those
objectives. The scientific background (to the relation between accessibility and development)
does not go much further than the literature mentioned above, and on cross-border issues it is
extremely recent, largely resulting from recent European funded projects (and mainly
qualitative). And there is no article on the application of spatial regression analysis to this
subject. In fact, the most prestigious relevant database contains very few articles about cross-
border regions, development and accessibility (or transport), (Mesarec and Lep, 2009;
Johnson, 2009; Lopez et al, 2009). As Portuguese examples, several articles have examined
the same type of issues. For example, Jorge Silva (2005) and Cavaleiro et al (2009). But
again, these important studies consider the availability of direct transport infrastructure as the
indicator for development and do not analyze the significance of that potential impact.
Globally, there seems to be a lack of scientific research on transport infrastructure impact as a
spatial development factor for cross border regions.
This paper broaches a process of spatial regression analysis, starting to build up a model to be
applied to the entire Portugal/Spain cross-border region that is able to quantify this impact. In
fact, the spatial nature of this impact suggests that the use of regression techniques can
include the space factor, which is particularly important in the analysis of cross-border
territories. Spatial regression analysis (SRA) is included in the larger field of spatial
econometrics (SE), using space as an explicative factor in models built to explain economic
phenomena. For this research, the selected methods refer to the spatial regression analysis
(SRA), (Florax and Nijkamp, 2004; Arbia, 2006; Bailey and Gatrell, 1995).
The selected area for the first approach described in this paper is limited to the application of
spatial regression techniques (only 15 units) and does not consider Spanish data. Therefore
and for now we will focus only on the application of classical regression. Finally, we hope
this research approach will contribute quite significantly to the scientific information available
about the important connection between transport infrastructure and development in cross-
border regions. As currently seen by the European Commission these regions represent
strategic factors for the future strengthening of European integration, since cooperation is now
one of the three main European Union objectives.
3 STUDY AREA, DATA AND METHODOLOGY
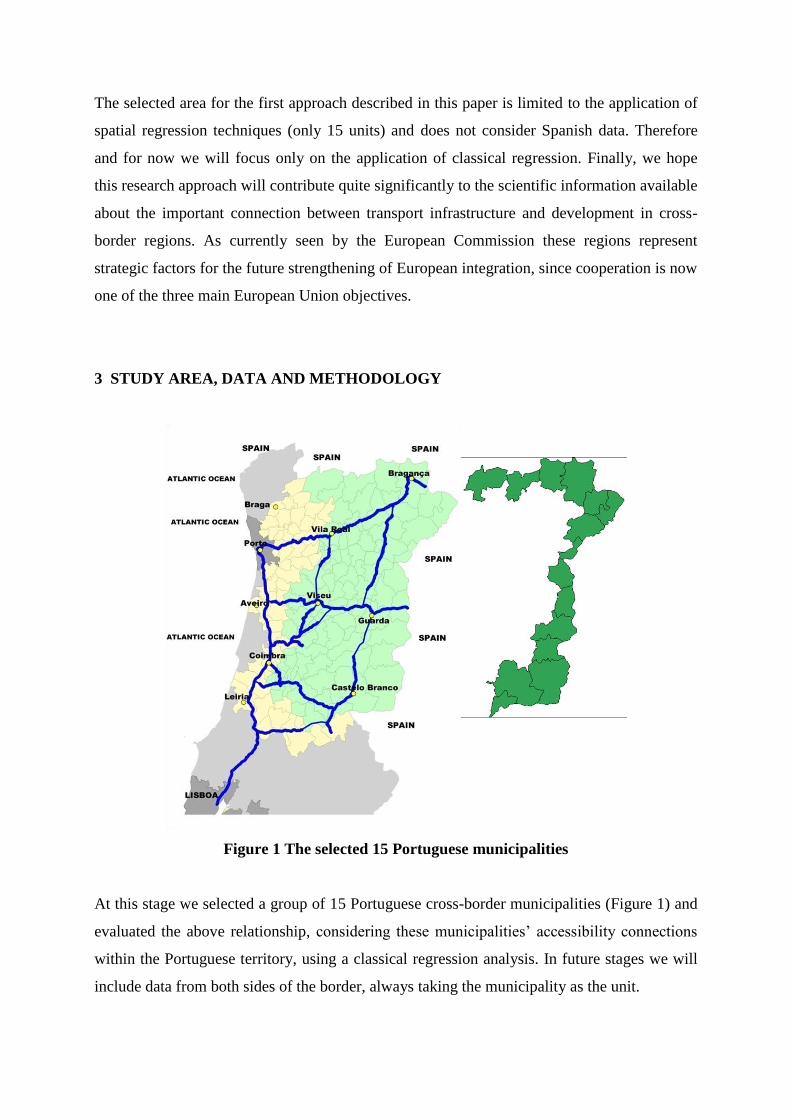
Figure 1 The selected 15 Portuguese municipalities
At this stage we selected a group of 15 Portuguese cross-border municipalities (Figure 1) and
evaluated the above relationship, considering these municipalities’ accessibility connections
within the Portuguese territory, using a classical regression analysis. In future stages we will
include data from both sides of the border, always taking the municipality as the unit.

Two sets of variables are needed for the regression: those that could reflect development and
those that could induce development. The variables that could reflect spatial development are
socio-economic (e.g. population variation, if taken as a good proxy for product data1). The
variables that could induce development (or not) include population literacy (School
Background) and/or accessibility levels (Accessibility); the later one potentially inducing
development and closer to transport infrastructure investment. Variables like population
variation and population literacy will be collected from current Census data and/or correlated
databases2. The accessibility variables (potential accessibility) are calculated using population
and time/distance (calculated from digitalized transport networks)3.. These transport networks
are those appropriate to serve the spatial structure formed by the spatial units selected.
Table 1 Number and type of cross-border connections of each municipality
Municipalities
(from North
to South)
Motorway
(T=7)
International
Road
(T=6)
Interregional
Road
(T=5)
Surfaced
Road
(T=4)
Unsurfaced
Road
(T=3)
Road Subject
to Restrictions
(T=2)
Railway
(T=1)
Montalegre
3
Chaves
1
Vinhais
1
Bragança
1 1 1
Vimioso
1
Miranda
do Douro 1 2 1
Mogadouro
1
Freixo de
Espada à Cinta 1
Figueira de
Castelo Rodrigo 1
Almeida 1
1
1
Sabugal
Penamacor
1
Idanha-a-Nova
1 2
Castelo Branco
Vila Velha
de Rodão 1
1 There is no reliable information on product at municipality level.
2 Of interest is the Census Data Collection expected within Portuguese territory for 2011, which means an
excellent opportunity to enhance the accuracy of our results. 3 Potential accessibility of a municipality is the total activity (population, product, etc.) reachable within a certain
time distance from that municipality to the others that are part of a certain study area.
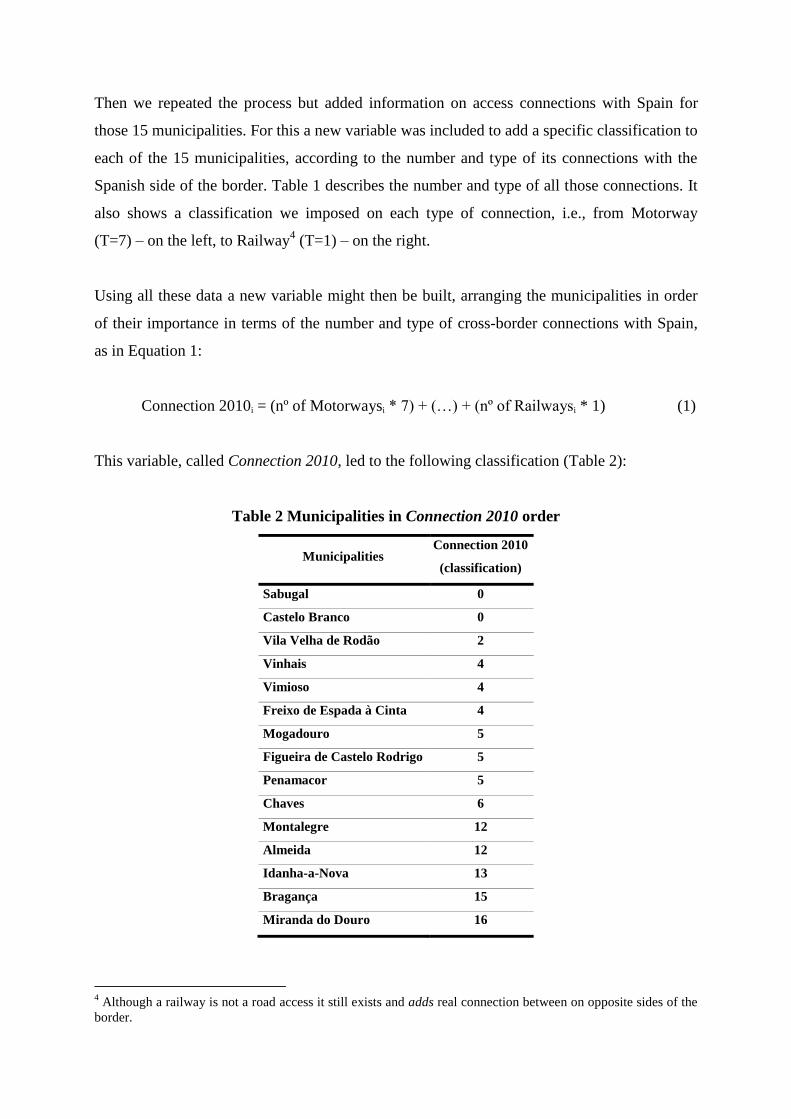
Then we repeated the process but added information on access connections with Spain for
those 15 municipalities. For this a new variable was included to add a specific classification to
each of the 15 municipalities, according to the number and type of its connections with the
Spanish side of the border. Table 1 describes the number and type of all those connections. It
also shows a classification we imposed on each type of connection, i.e., from Motorway
(T=7) – on the left, to Railway4 (T=1) – on the right.
Using all these data a new variable might then be built, arranging the municipalities in order
of their importance in terms of the number and type of cross-border connections with Spain,
as in Equation 1:
Connection 2010i = (nº of Motorwaysi * 7) + (…) + (nº of Railwaysi * 1) (1)
This variable, called Connection 2010, led to the following classification (Table 2):
Table 2 Municipalities in Connection 2010 order
Municipalities Connection 2010
(classification)
Sabugal 0
Castelo Branco 0
Vila Velha de Rodão 2
Vinhais 4
Vimioso 4
Freixo de Espada à Cinta 4
Mogadouro 5
Figueira de Castelo Rodrigo 5
Penamacor 5
Chaves 6
Montalegre 12
Almeida 12
Idanha-a-Nova 13
Bragança 15
Miranda do Douro 16
4 Although a railway is not a road access it still exists and adds real connection between on opposite sides of the
border.
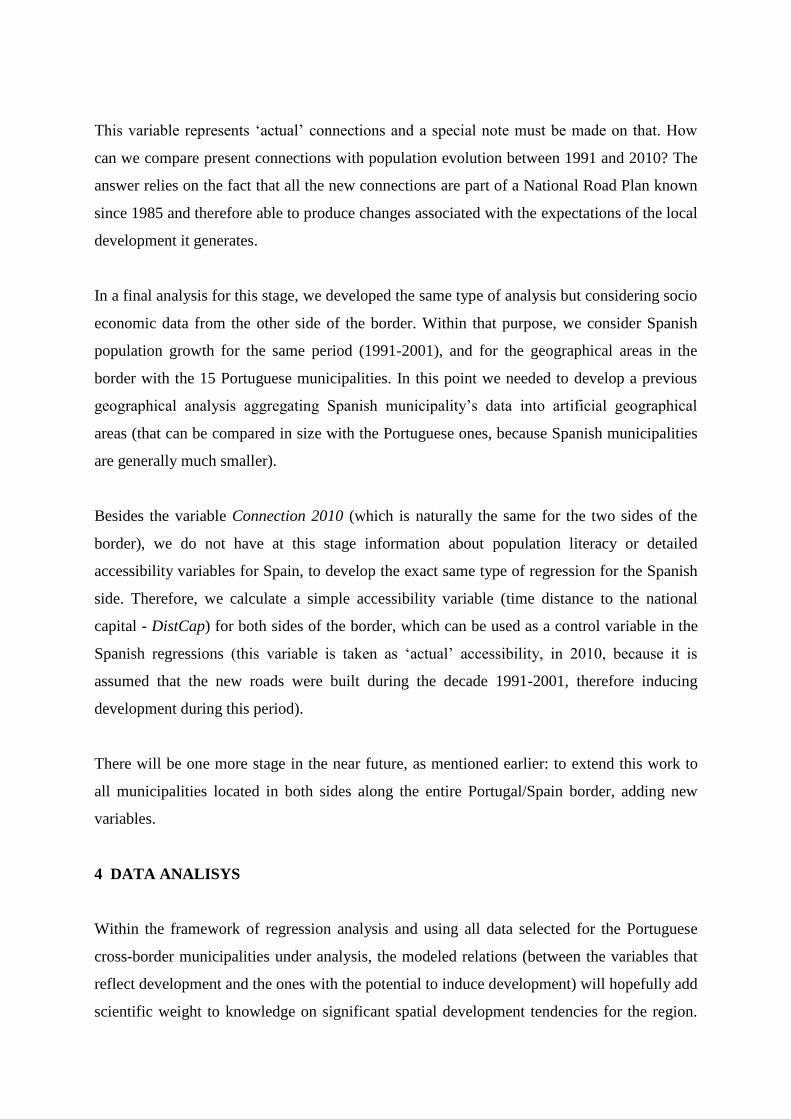
This variable represents ‘actual’ connections and a special note must be made on that. How
can we compare present connections with population evolution between 1991 and 2010? The
answer relies on the fact that all the new connections are part of a National Road Plan known
since 1985 and therefore able to produce changes associated with the expectations of the local
development it generates.
In a final analysis for this stage, we developed the same type of analysis but considering socio
economic data from the other side of the border. Within that purpose, we consider Spanish
population growth for the same period (1991-2001), and for the geographical areas in the
border with the 15 Portuguese municipalities. In this point we needed to develop a previous
geographical analysis aggregating Spanish municipality’s data into artificial geographical
areas (that can be compared in size with the Portuguese ones, because Spanish municipalities
are generally much smaller).
Besides the variable Connection 2010 (which is naturally the same for the two sides of the
border), we do not have at this stage information about population literacy or detailed
accessibility variables for Spain, to develop the exact same type of regression for the Spanish
side. Therefore, we calculate a simple accessibility variable (time distance to the national
capital - DistCap) for both sides of the border, which can be used as a control variable in the
Spanish regressions (this variable is taken as ‘actual’ accessibility, in 2010, because it is
assumed that the new roads were built during the decade 1991-2001, therefore inducing
development during this period).
There will be one more stage in the near future, as mentioned earlier: to extend this work to
all municipalities located in both sides along the entire Portugal/Spain border, adding new
variables.
4 DATA ANALISYS
Within the framework of regression analysis and using all data selected for the Portuguese
cross-border municipalities under analysis, the modeled relations (between the variables that
reflect development and the ones with the potential to induce development) will hopefully add
scientific weight to knowledge on significant spatial development tendencies for the region.
Accessibility variables enter in the regression as independent ones, therefore as variables
potentially able to induce development.
So, as previously mentioned, next points refer: a) to the use of Portuguese socio-economic
and accessibility data, b) to the inclusion of variable Connection 2010 in the previous
analysis, and c) to the use of some available Spanish socio-economic and accessibility data,
keeping Connection 2010 as a common variable. In this later analysis, the Spanish regression
was also compared with the Portuguese identical regression, i.e.:
a) One assuming a relationship in which nothing exists beyond the border:
PopulationPt1991-2001 = f (AcessibilityPt1991-2001; School BackgroundPt1991) (2)
Where: PopulationPt1991-2001 and AcessibilityPt1991-2001 respectively represent population
variation and potential accessibility variation between 1991 and 2001; and the School
BackgroundPt1991 represents the highest education level achieved by the population in 1991.
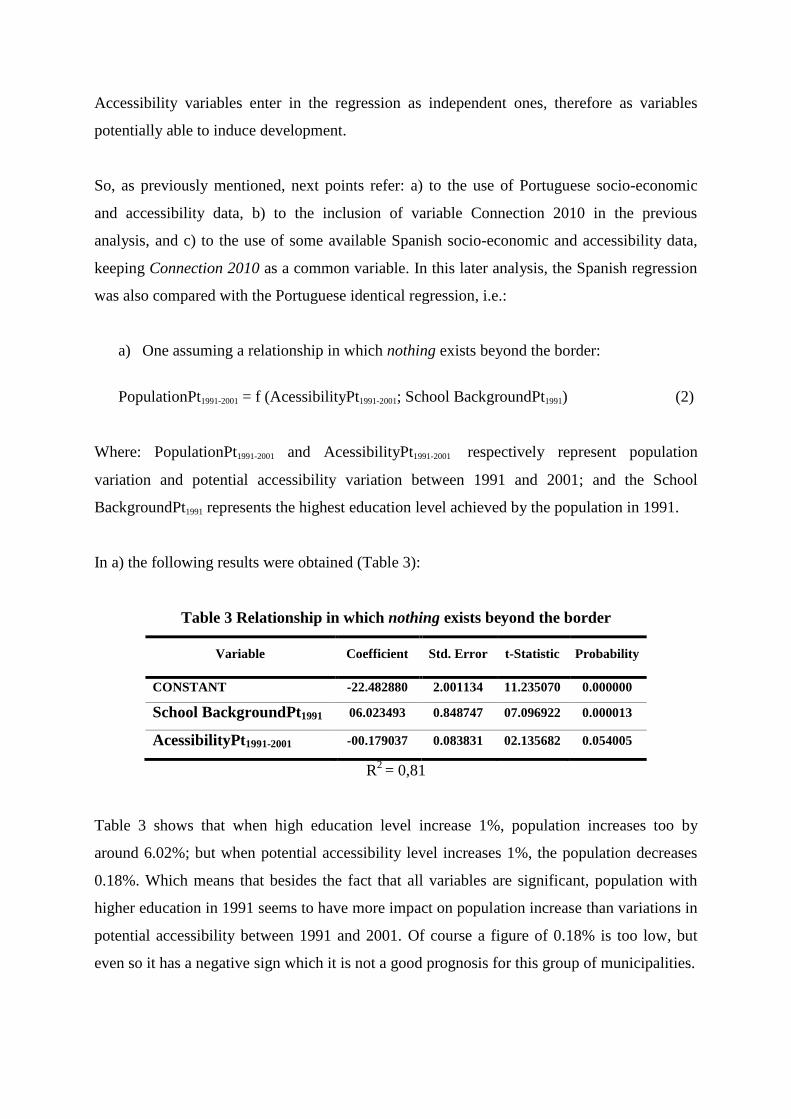
In a) the following results were obtained (Table 3):
Table 3 Relationship in which nothing exists beyond the border
Variable Coefficient Std. Error t-Statistic Probability
CONSTANT -22.482880 2.001134 11.235070 0.000000
School BackgroundPt1991 06.023493 0.848747 07.096922 0.000013
AcessibilityPt1991-2001 -00.179037 0.083831 02.135682 0.054005
R2
= 0,81
Table 3 shows that when high education level increase 1%, population increases too by
around 6.02%; but when potential accessibility level increases 1%, the population decreases
0.18%. Which means that besides the fact that all variables are significant, population with
higher education in 1991 seems to have more impact on population increase than variations in
potential accessibility between 1991 and 2001. Of course a figure of 0.18% is too low, but
even so it has a negative sign which it is not a good prognosis for this group of municipalities.
In addition, taking into account its socio-economic characteristics, this result was expected: if
the territory does not have enough infrastructures to ensure welfare the population will try to
leave the territory as soon as appears accessibility increases and/or improves.
b) One adding data concerning the above mentioned cross-border connections:
PopulationPt1991-2001 = f (AcessibilityPt1991-2001; School BackgroundPt1991; ConnectionPtSp2010)
(3)
where the new variable ConnectionPtSp2010, represents the importance of cross-border
connections with Spain, in 2010, as mentioned in Table 2.
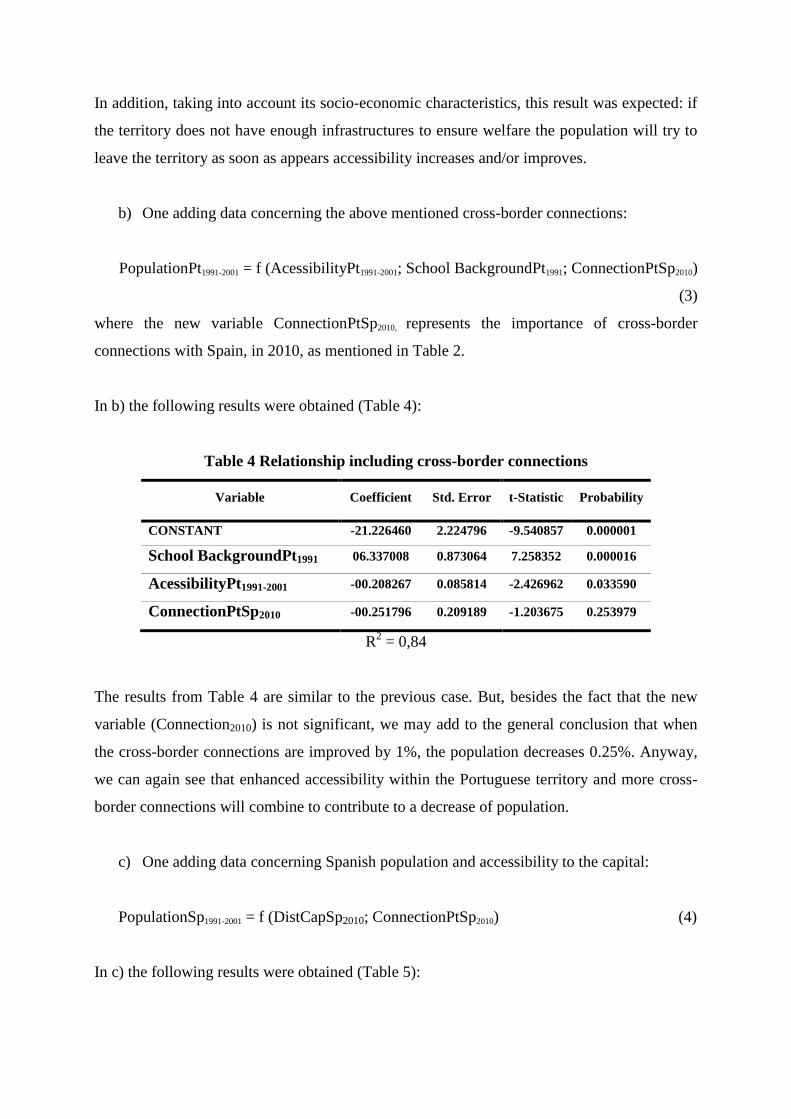
In b) the following results were obtained (Table 4):
Table 4 Relationship including cross-border connections
Variable Coefficient Std. Error t-Statistic Probability
CONSTANT -21.226460 2.224796 -9.540857 0.000001
School BackgroundPt1991 06.337008 0.873064 7.258352 0.000016
AcessibilityPt1991-2001 -00.208267 0.085814 -2.426962 0.033590
ConnectionPtSp2010 -00.251796 0.209189 -1.203675 0.253979
R2 = 0,84
The results from Table 4 are similar to the previous case. But, besides the fact that the new
variable (Connection2010) is not significant, we may add to the general conclusion that when
the cross-border connections are improved by 1%, the population decreases 0.25%. Anyway,
we can again see that enhanced accessibility within the Portuguese territory and more cross-
border connections will combine to contribute to a decrease of population.
c) One adding data concerning Spanish population and accessibility to the capital:
PopulationSp1991-2001 = f (DistCapSp2010; ConnectionPtSp2010) (4)
In c) the following results were obtained (Table 5):
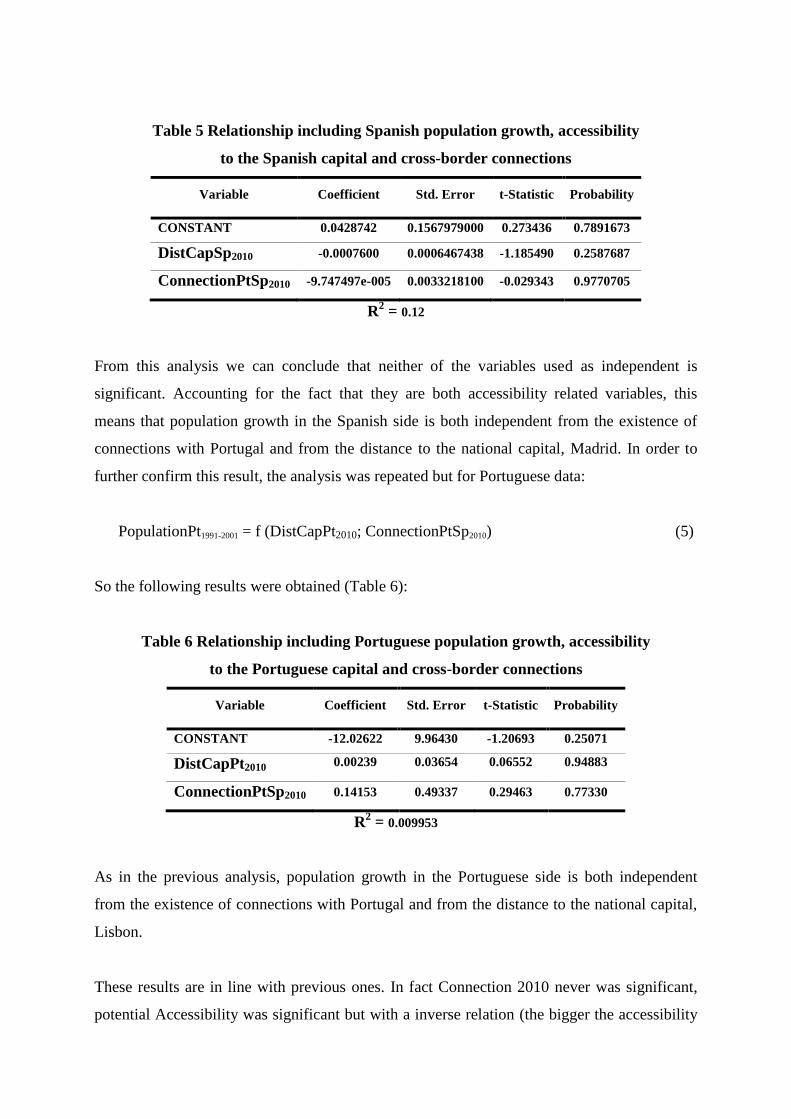
Table 5 Relationship including Spanish population growth, accessibility
to the Spanish capital and cross-border connections
Variable Coefficient Std. Error t-Statistic Probability
CONSTANT 0.0428742 0.1567979000 0.273436 0.7891673
DistCapSp2010 -0.0007600 0.0006467438 -1.185490 0.2587687
ConnectionPtSp2010 -9.747497e-005 0.0033218100 -0.029343 0.9770705
R2 = 0.12
From this analysis we can conclude that neither of the variables used as independent is
significant. Accounting for the fact that they are both accessibility related variables, this
means that population growth in the Spanish side is both independent from the existence of
connections with Portugal and from the distance to the national capital, Madrid. In order to
further confirm this result, the analysis was repeated but for Portuguese data:
PopulationPt1991-2001 = f (DistCapPt2010; ConnectionPtSp2010) (5)
So the following results were obtained (Table 6):
Table 6 Relationship including Portuguese population growth, accessibility
to the Portuguese capital and cross-border connections
Variable Coefficient Std. Error t-Statistic Probability
CONSTANT -12.02622 9.96430 -1.20693 0.25071
DistCapPt2010 0.00239 0.03654 0.06552 0.94883
ConnectionPtSp2010 0.14153 0.49337 0.29463 0.77330
R2 = 0.009953
As in the previous analysis, population growth in the Portuguese side is both independent
from the existence of connections with Portugal and from the distance to the national capital,
Lisbon.
These results are in line with previous ones. In fact Connection 2010 never was significant,
potential Accessibility was significant but with a inverse relation (the bigger the accessibility
the smaller the population growth), and the only determinant variable in Population growth
was the School Background of resident population.
Further analyses should investigate deeply these conclusions, measuring more precisely the
‘perverse’ accessibility effect for cross border regions. For these future analyses, a more
accurate definition of comparable geographical areas in both sides of the border is desirable, a
work absolutely needed for investigation and for cross-border cooperation projects. This is the
first and main objective of further steps.
5 CONCLUSIONS
This work’s main objective is to build a model able to measure the relation between
accessibility and development for all the municipalities in the Portugal/Spain cross-border
area. This scientific opportunity stems from the observation of huge road infrastructure
investment, often indicated as being little in line with the local development needs in
peripheral regions that are currently facing sharp population decline and weak business
dynamics.
At the same time, and since this subject is of so much importance, it is surprising that very
few studies have focused on quantitatively measuring the complex relationship between
accessibility and development.
This study has selected the particular case of cross-border regions, since these are usually the
most depressed areas in both countries. It will be developed in four main stages and this paper
deals with the first two:
First we selected a group of 15 cross-border municipalities and through a classical regression
analysis we evaluated the above relationship, considering only these municipalities’ access
connections within Portugal. Then we repeated the process but added information concerning
access connections with Spain for those 15 municipalities.
In the third stage we data on the Spanish municipalities directly connected to the other side of
the border, next to the Portuguese municipalities.
In a fourth stage this work will be extended to all municipalities on both sides of the entire
Portugal/Spain border.
So far, the results suggest that increased accessibility within the countries and good
connections with Portugal/Spain, respectively, are less relevant for local development than
school background, or are insignificant. Moreover, an increase in national potential
accessibility or in connection seems to have a negative influence on population increase.
These results show that locally, and particularly for cross-border municipalities, accessibility
seems to be an irrelevant factor in development. The fourth stage of this analysis (see above)
will help to consolidate the conclusions that have been drawn in this paper as the launching
pad for this important analysis.
6 REFERENCES
Anselin, L. (1988) Spatial Econometrics: Methods and Models, Kluwer Academic
Publishers, Dordrecht.
Arbia, G. (2006) Spatial Econometrics - Statistical Foundations and Applications to
Regional Convergence. Advances in Spatial Science, Springer-Verlag, Heidelberg.
Aschauer, D. A. (1989) Is public expenditure productive?, Journal of Monetary Economics,
23, 177–200.
Bailey, T. and Gatrell, A. (1995) Interactive spatial data analysis, Longman, Harlow.
Banister, D. and Berechman, J. (2000) Transportation Investment and economic
development, University College London, London.
Button, K. (1995) What can meta analysis tell us about the implications of transport?,
Regional Studies, 29(6), 507-517.
Cavaleiro, V., Manso, J. e Silva, J. (2009) UE, Desenvolvimento Regional e Relação
Periferia-Acessibilidade, Anais de Economia Aplicada da ASEPELT’ 09, ISBN 978-84-
92453-69-6, 437-451.
European Commission (2007) Introduction for the Community Guidelines for the
development of the Trans-European Transport Network, Trans-European Networks,
European Commission, Brussels.
Florax, R. J. and Nijkamp, P. (2004), Misspecification in Linear Spatial Regression Models,
Tinbergen Institution Discussion Papers, 2003-081/3.
Forslund, U. and Johansson, B. (1995) Assessing road investments – accessibility changes,
cost – benefit and production effects, Annals of Regional Science, 29(2), 155-174.
Gaspar, J., Marques da Costa, E., Rodriguez, J., Carvalho, L. e Vieira, S. (2002) Uma
Estratégia de Ordenamento e de Desenvolvimento para Valorizar o Efeito Auto-Estrada
na Beira Interior, Comissão de Coordenação da Região Centro, Coimbra, ISBN 972-569-
120-2.
Guild, R. L. (2000) Infrastructure Investment and Interregional Development, Public Works
Management and Policy, 4(4), 274-285.
Gutiérrez, J. and Urbano, J. (1996) Accessibility in the European Union: the Impact of the
Trans-European Road Network, Journal of Transport Geography, 4, 15-25.
Johnson, C. M. (2009) Cross-Border regions and Territorial Restructuring in Central Europe
for Morev Cross-border Space, European Urban and Regional Studies, 16(2), 177-191,
DOI: 10.1177/0969776409102190.
López, E., Gutiérrez, J. and Gómez, G. (2008) Measuring regional cohesion effects of large-
scale transport infrastructure investments: an accessibility approach, European Planning
Studies, 16(2), 277-301.
Lopez, E., Monzon, A., Ortega, E. and Quintana, S. M. (2009) Assessment of Cross-Border
Spillover Effects of National Transport Infrastructure Plans: An Accessibility Approach,
Transport Reviews, 29(4), 515-536.
Mas, M., Maudos, J., Pérez, F. and Uriel, E. (1996) Infrastructures and Productivity in the
Spanish Regions, Regional Studies, 30(7), 641-649.
Mesarec and Lep (2009) Combining the grid-based Spatial Planning and network-based
Transport Planning, Technological and Economic development of Economy, 15(1), 60-77.
Mur, J., Lopez, F. and Angulo, A. (2009) Testing the Hypothesis of Stability in Spatial
Econometric Models, Papers in Regional Science, 88, 409-444.
Páez, A. (2004) Network Accessibility and the Spatial Distribution of Economic Activity in
Eastern Asia, Urban Studies, 41(11), 2211-2230.
Pereira, A. and Andraz, J. (2005) Public Investment in Transportation Infrastructures and
Economic Performance in Portugal, Review of Development Economics, 9(2), 177-196.
Ribeiro, A. (2009) As infra-estruturas rodoviárias e o desenvolvimento regional. Tese de
Doutororamento em Ordenamento do Território e Transportes, Faculdade de Ciências e
Tecnologia da Universidade de Coimbra, Coimbra.
Ribeiro, A., Antunes, A., and Páez, A. (2010) Road accessibility and economic development:
Empirical evidence from Portugal based on spatial econometric models, Journal of
Transport Geography, 18(1) 125-132, DOI:10.1016/j.jtrangeo.2009.03.002.
Rietveld, P. and Bruinsma, F. (1998) Is Transport Infrastructure Effective? Transport
Infrastructure and Accessibility: Impacts on the Space Economy. Springer-Verlag, Berlin.
Santos, B., Antunes, A. and Miller, E. (2009) Multiobjective Approach to Long-Term
Interurban Multilevel Road Network Planning, Journal of Transportation Engineering,
September 2009, DOI: 10.1061/_ASCE_TE.1943-5436.0000043.

Silva, J. (2005) As Acessibilidades como Factor do Desenvolvimento de Regiões
Periféricas. O Caso da Beira Interior, Tese de Doutoramento em Transportes, Instituto
Superior Técnico da Universidade Técnica de Lisboa, Lisboa (Tese também editada em 2006
conjuntamente pelas UBI e FCT, ISBN: 972-8790-54-6).
Vickerman, R. (1995) The regional impacts of Trans-European networks, Annals of Regional
Science, 29(2), 237-254.