Experimental and Numerical Investigation of a Small-Scale ...
Upload
khangminh22Category
view
0download
0
A small-scale experimental investigation on the benefits of a hybrid pile/footing systemon sand Maadheedi, M.A.; Hytiris, N.; Mickovski, S.B.
Published in:DFI Journal
DOI:10.37308/DFIJnl.20200929.225
Publication date:2021
Document VersionAuthor accepted manuscript
Link to publication in ResearchOnline
Citation for published version (Harvard):Maadheedi, MA, Hytiris, N & Mickovski, SB 2021, 'A small-scale experimental investigation on the benefits of ahybrid pile/footing system on sand', DFI Journal, vol. 15, no. 2. https://doi.org/10.37308/DFIJnl.20200929.225
General rightsCopyright and moral rights for the publications made accessible in the public portal are retained by the authors and/or other copyright ownersand it is a condition of accessing publications that users recognise and abide by the legal requirements associated with these rights.
Take down policyIf you believe that this document breaches copyright please view our takedown policy at https://edshare.gcu.ac.uk/id/eprint/5179 for detailsof how to contact us.
Download date: 15. Jul. 2022
1
A small-scale experimental investigation on the benefits of a hybrid
pile/footing system on sand
Mohammed Al Maadheedi1*, Nick Hytiris2* and Slobodan B. Mickovski3*
Abstract This paper explores the capacity effects of a square steel plate welded at the ground surface on a driven
open-ended steel pile (i.e. the plate would touch the ground surface after the pile achieves the required
penetration). A series of strain-controlled, 1-g small-scale laboratory tests were undertaken on piles with
and without a square steel plate attached. The piles were driven in dry, loosely packed, uniform sand. Two
plates were used, one with a breadth equal to two times the diameter of the pile (2D) and the other with a
breadth equal to three times the diameter of the piles (3D). A 20% increase in capacity was recorded for
the 2D plate, and a 110% increase in capacity was recorded for the 3D plate when compared to the pile
without an attached steel plate. The back-analysis of the results allowed the derivation of a new expression
to calculate the capacity of bearing plates and plot its load-settlement profile, which accounted for the
effects of sands compaction and dilation. By extrapolating the findings of these tests to a hypothetical
scenario, a model design problem was described where the length of a pile can be reduced by 20% to 60%
(depending on the load) by using a plate attached to the pile. The results of this study can help designers to
minimise penetration depth; thus, achieving a more economical and sustainable design.
Keywords: Steel Piles, Pipe piles, Deep Foundations, Ground Improvement, Hybrid pile/footing.
Introduction Piled foundations are conventionally used to either overcome weak and compressible soil
conditions or to bear relatively high loads. This paper explores a more sustainable and economical
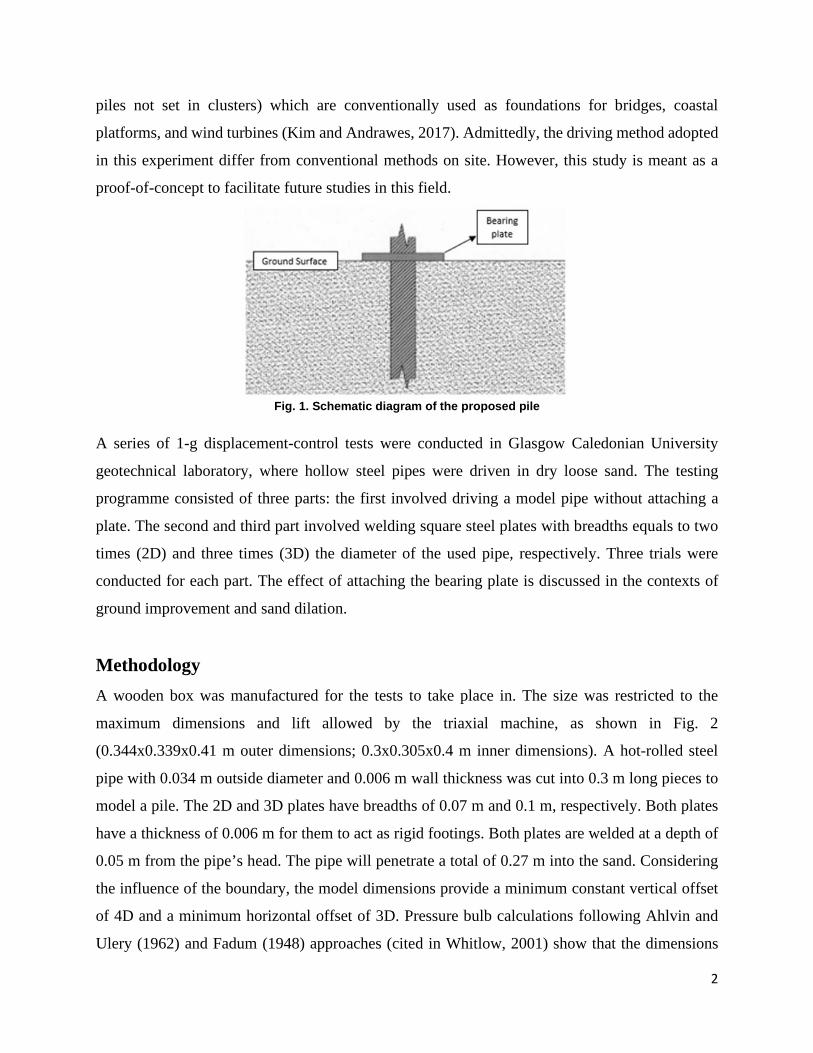
pile design. The proposed pile is shown in Fig. 1, where the bearing plate helps to compact the
surface soil and acts as a surface footing. This increases the overall capacity of the pile, which in
turn reduces the depth of the pile and/or provide an additional factor of safety against either
excessive settlement or failure. It should be noted that this research covers single jacked piles (i.e.
1 Graduate Geotechnical Engineer at Wood Thilsted, B.Sc, M.Sc, E: [email protected] 2 Professor in Civil Engineering/Geotechnics and Environmental Geotechnology, BSc., MSc.,PhD,.C.Eng.,FHEA.,Mem.Tech.Chamb.Greece, (former FGS.,MCIMM.,MIHT.), E: [email protected] 3 Professor in Civil Engineering & Environmental Technology, PhD, CEng MICE, SFHEA, E: [email protected] * Glasgow Caledonian University, Glasgow, UK,
2
piles not set in clusters) which are conventionally used as foundations for bridges, coastal
platforms, and wind turbines (Kim and Andrawes, 2017). Admittedly, the driving method adopted
in this experiment differ from conventional methods on site. However, this study is meant as a
proof-of-concept to facilitate future studies in this field.
Fig. 1. Schematic diagram of the proposed pile
A series of 1-g displacement-control tests were conducted in Glasgow Caledonian University
geotechnical laboratory, where hollow steel pipes were driven in dry loose sand. The testing
programme consisted of three parts: the first involved driving a model pipe without attaching a
plate. The second and third part involved welding square steel plates with breadths equals to two
times (2D) and three times (3D) the diameter of the used pipe, respectively. Three trials were
conducted for each part. The effect of attaching the bearing plate is discussed in the contexts of
ground improvement and sand dilation.
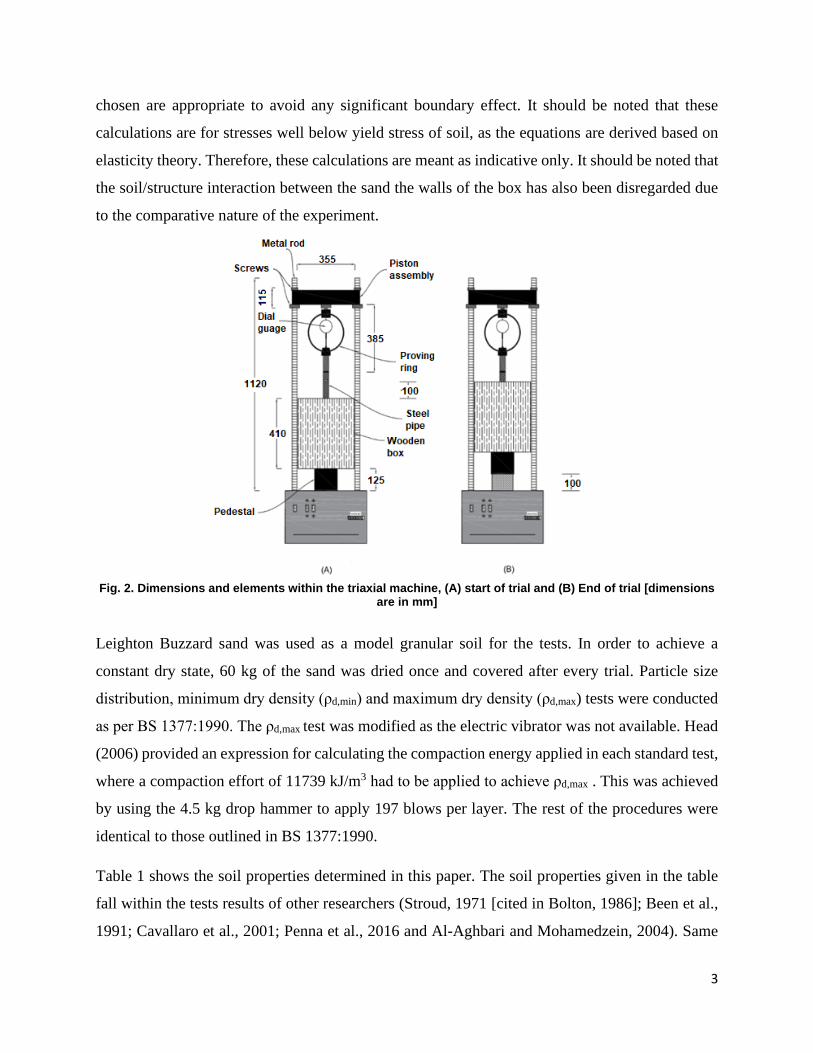
Methodology A wooden box was manufactured for the tests to take place in. The size was restricted to the
maximum dimensions and lift allowed by the triaxial machine, as shown in Fig. 2
(0.344x0.339x0.41 m outer dimensions; 0.3x0.305x0.4 m inner dimensions). A hot-rolled steel
pipe with 0.034 m outside diameter and 0.006 m wall thickness was cut into 0.3 m long pieces to
model a pile. The 2D and 3D plates have breadths of 0.07 m and 0.1 m, respectively. Both plates
have a thickness of 0.006 m for them to act as rigid footings. Both plates are welded at a depth of
0.05 m from the pipe’s head. The pipe will penetrate a total of 0.27 m into the sand. Considering
the influence of the boundary, the model dimensions provide a minimum constant vertical offset
of 4D and a minimum horizontal offset of 3D. Pressure bulb calculations following Ahlvin and
Ulery (1962) and Fadum (1948) approaches (cited in Whitlow, 2001) show that the dimensions
3
chosen are appropriate to avoid any significant boundary effect. It should be noted that these
calculations are for stresses well below yield stress of soil, as the equations are derived based on
elasticity theory. Therefore, these calculations are meant as indicative only. It should be noted that
the soil/structure interaction between the sand the walls of the box has also been disregarded due
to the comparative nature of the experiment.
Fig. 2. Dimensions and elements within the triaxial machine, (A) start of trial and (B) End of trial [dimensions
are in mm]
Leighton Buzzard sand was used as a model granular soil for the tests. In order to achieve a
constant dry state, 60 kg of the sand was dried once and covered after every trial. Particle size
distribution, minimum dry density (ρd,min) and maximum dry density (ρd,max) tests were conducted
as per BS 1377:1990. The ρd,max test was modified as the electric vibrator was not available. Head
(2006) provided an expression for calculating the compaction energy applied in each standard test,
where a compaction effort of 11739 kJ/m3 had to be applied to achieve ρd,max . This was achieved
by using the 4.5 kg drop hammer to apply 197 blows per layer. The rest of the procedures were
identical to those outlined in BS 1377:1990. Table 1 shows the soil properties determined in this paper. The soil properties given in the table
fall within the tests results of other researchers (Stroud, 1971 [cited in Bolton, 1986]; Been et al.,
1991; Cavallaro et al., 2001; Penna et al., 2016 and Al-Aghbari and Mohamedzein, 2004). Same

4
researchers report specific gravity (Gs) ranging from 2.64 to 2.68, and Cu values ranging from 1.39
to 2.13.
Table 1. Leighton Buzzard sand properties obtained from lab tests
ρd,min, kg/m3 ρd,max, kg/m3 d10 (mm) d50 (mm) Coefficient of uniformity, Cu
1428 1818 0.08 0.2 2.75
To explore the effect of the plate on loose sands, the relative density (ID) must be between 0.15 to
0.35 (Whitlow, 2001). A density of 1500 kg/m3 was selected to achieve a constant ID of 0.22. A
50 mm scale was drawn inside the box marking various layers, where each layer was filled with
6.86 kg of sand to control the density. Once the box is filled, the model pipe was manually pushed
0.17 m into the sand. The triaxial apparatus used in this experiment is modified where the cell is
removed and the box is fitted on the pedestal, to allow strain-controlled tests. This allows a further
penetration of 0.1 m to be applied at a rate of 5 mm/minute. The dial gauge was read every 15
seconds (or 1.25 mm penetration); thus, each trial lasted for approximately 20 minutes. Several
control measures were put in place to ensure the consistency of the obtained results:
• Ensuring both verticality and no concentricity,
• Emptying and refilling the box after each trial, to control the density of the soil,
• Checking the mass of the sand before and after every trial,
• Periodically checking the moisture content of the stored sand to ensure a dry state,
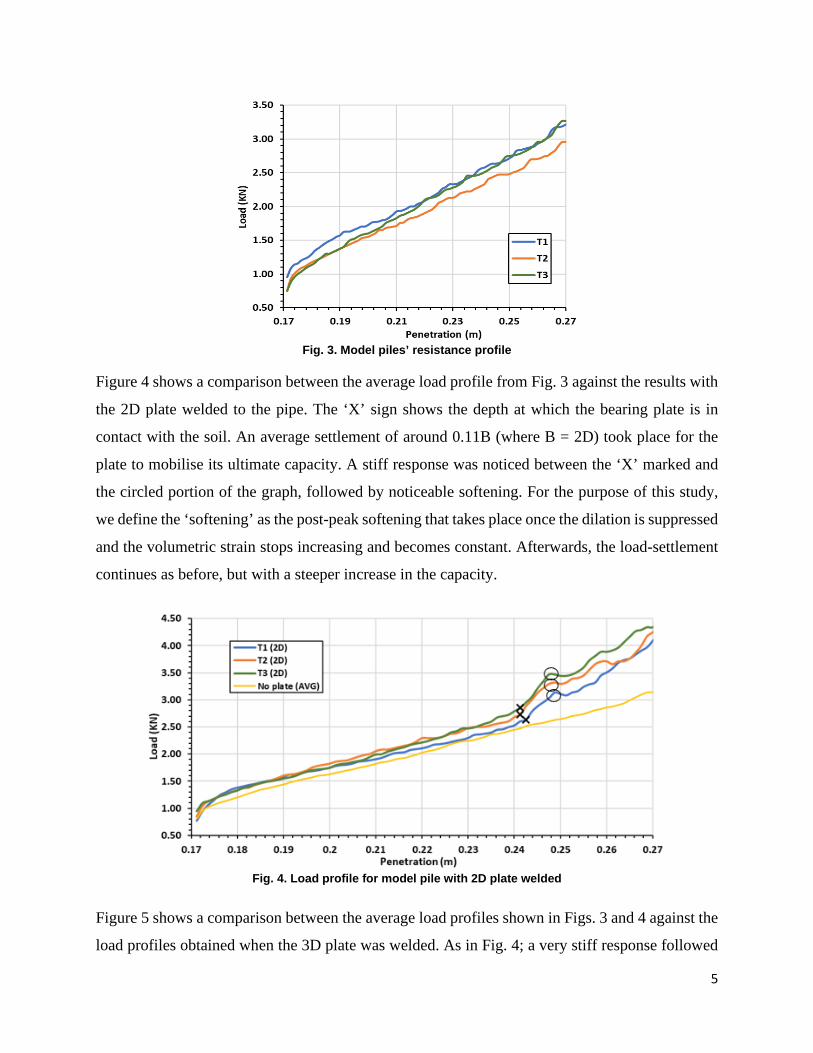
• Pouring the sand gently over the box to avoid dynamic compaction. Results Figure 3 shows the results of the first experimental programme. The coefficient of variability of
load resistance between T1, T2 and T3 varied between 3% to 7% at different depths, with an
average of 4.4%. This reflects an adequate control over the extraneous variables which might have
affected the results. However, initial load resistance varies between trials as the pile was initially
manually inserted but this variation appears to be minimal. The plug length after manual driving
was equal to 100 mm ± 5 mm. It stayed constant after mechanical driving by the triaxial machine;
this is consistent with Igoe et al. (2001) and Deeks et al. (2005) findings for jacked piles.
5
Fig. 3. Model piles’ resistance profile
Figure 4 shows a comparison between the average load profile from Fig. 3 against the results with
the 2D plate welded to the pipe. The ‘X’ sign shows the depth at which the bearing plate is in
contact with the soil. An average settlement of around 0.11B (where B = 2D) took place for the
plate to mobilise its ultimate capacity. A stiff response was noticed between the ‘X’ marked and
the circled portion of the graph, followed by noticeable softening. For the purpose of this study,
we define the ‘softening’ as the post-peak softening that takes place once the dilation is suppressed
and the volumetric strain stops increasing and becomes constant. Afterwards, the load-settlement
continues as before, but with a steeper increase in the capacity.
Fig. 4. Load profile for model pile with 2D plate welded
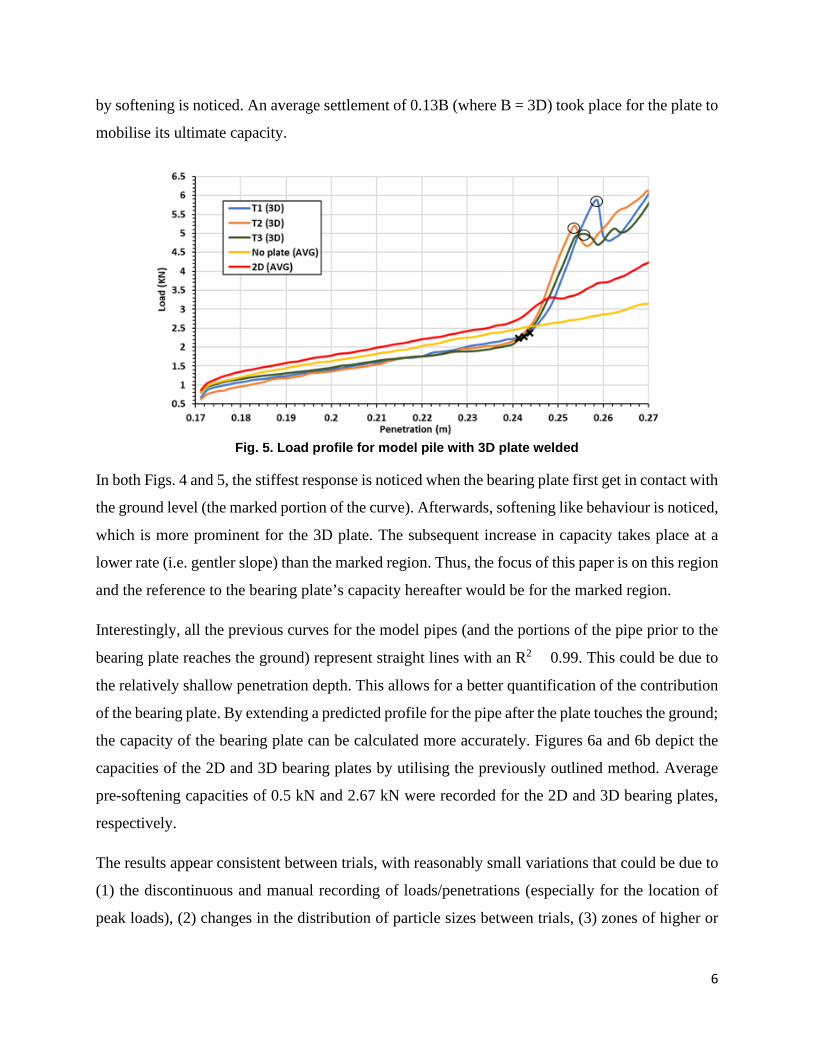
Figure 5 shows a comparison between the average load profiles shown in Figs. 3 and 4 against the
load profiles obtained when the 3D plate was welded. As in Fig. 4; a very stiff response followed
6
by softening is noticed. An average settlement of 0.13B (where B = 3D) took place for the plate to
mobilise its ultimate capacity.
Fig. 5. Load profile for model pile with 3D plate welded
In both Figs. 4 and 5, the stiffest response is noticed when the bearing plate first get in contact with
the ground level (the marked portion of the curve). Afterwards, softening like behaviour is noticed,
which is more prominent for the 3D plate. The subsequent increase in capacity takes place at a
lower rate (i.e. gentler slope) than the marked region. Thus, the focus of this paper is on this region
and the reference to the bearing plate’s capacity hereafter would be for the marked region. Interestingly, all the previous curves for the model pipes (and the portions of the pipe prior to the
bearing plate reaches the ground) represent straight lines with an R2 > 0.99. This could be due to
the relatively shallow penetration depth. This allows for a better quantification of the contribution
of the bearing plate. By extending a predicted profile for the pipe after the plate touches the ground;
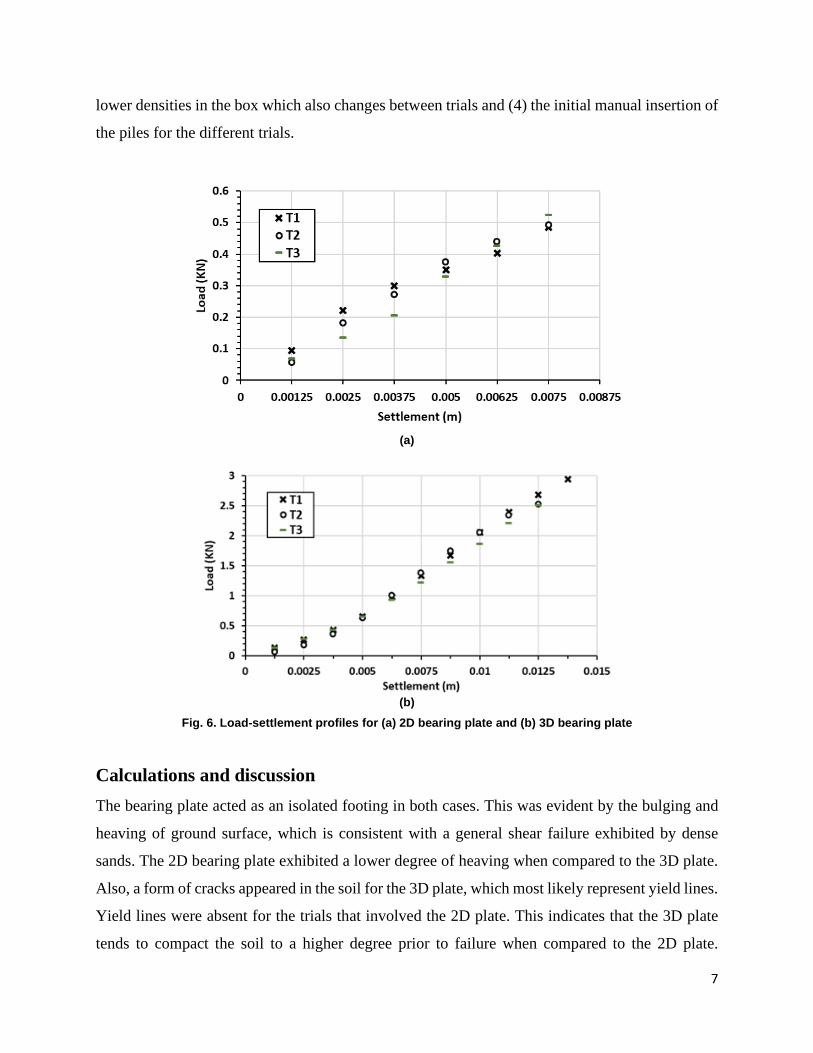
the capacity of the bearing plate can be calculated more accurately. Figures 6a and 6b depict the
capacities of the 2D and 3D bearing plates by utilising the previously outlined method. Average
pre-softening capacities of 0.5 kN and 2.67 kN were recorded for the 2D and 3D bearing plates,
respectively. The results appear consistent between trials, with reasonably small variations that could be due to
(1) the discontinuous and manual recording of loads/penetrations (especially for the location of
peak loads), (2) changes in the distribution of particle sizes between trials, (3) zones of higher or
7
lower densities in the box which also changes between trials and (4) the initial manual insertion of
the piles for the different trials.
(a)
(b)
Fig. 6. Load-settlement profiles for (a) 2D bearing plate and (b) 3D bearing plate
Calculations and discussion The bearing plate acted as an isolated footing in both cases. This was evident by the bulging and
heaving of ground surface, which is consistent with a general shear failure exhibited by dense
sands. The 2D bearing plate exhibited a lower degree of heaving when compared to the 3D plate.
Also, a form of cracks appeared in the soil for the 3D plate, which most likely represent yield lines.
Yield lines were absent for the trials that involved the 2D plate. This indicates that the 3D plate
tends to compact the soil to a higher degree prior to failure when compared to the 2D plate.
8
Additionally, the post-failure softening observed for the 3D plate (Fig 5) was much greater than
the 2D plate (Fig 4); which indicates a denser sand. Conventional bearing capacity equation grossly underestimate the capacities of both plates as the
effects of dilations and compaction are not accounted for. The dilation of sands can be captured
by Bolton (1986) approach. This consists of calculating an effective frictional angle (ϕ’eff) which
primarily depends on the effective stress levels (p’) applied to the soil and the relative density, as
shown by equation [1]: 𝜙𝜙′𝑒𝑒𝑒𝑒𝑒𝑒 = 𝜙𝜙′𝑐𝑐𝑐𝑐𝑐𝑐𝑐𝑐 + 𝑚𝑚[{𝐼𝐼𝐷𝐷(𝑄𝑄 − 𝑙𝑙𝑙𝑙𝑝𝑝′)} − 1] [1] Where ϕ’crit is the critical friction angle, m is the mobilised peak strength (=3 for triaxial conditions)
and Q is the crushing strength of sand (=10 for silica-based sands). The values of m and Q are
taken as recommended by Bolton (1986). This would indicate that the Nγ (or ϕ’eff) of the 3D plate
would be smaller than that of the 2D plate due to the difference in stresses. In fact, other researchers
have noted that smaller footings mobilise greater ϕeff (Golder, 1941; Zhu et al., 2001; Teh, 2007
and White et al., 2008). In contrast, the initial back-calculation of the experimental results showed
Nγ values of 440 and 684 for the 2D and 3D plates, respectively. This leads to the conclusion that
the relative densities differ between them; meaning that the 3D plate tends to compact the soil
more than the 2D plate, resulting in a greater ϕeff (and hence Nγ). The previously cited research
investigated dense sands only, where minimal compaction would take place prior to failure. To calculate the capacity of similar plates, three things need to be considered: (1) the change in
density due to compression, (2) the dilation of the sand and (3) the effective stress p’. The first
factor can be accounted for by using the following relationship for isotropic compression and
swelling: 𝑒𝑒 = 𝑒𝑒0 − 𝜅𝜅. ln𝑝𝑝′ [2] Where e0 is the initial void ratio, e is the final void ratio and κ is the slope of the Swelling-
Recompression Line (SRL). At some circumstances using the slope of the Normal Compression
Line (NCL) would be more appropriate as crushing of particles may take place (either very high
stresses or sands with low crushing strength). Some researchers employed empiricism to determine
p’ by correlating it with the bearing resistance (q). Teh (2007) and White et al. (2008)
9
recommended the following correlation based on the back-analysis of centrifuge tests on conical
and circular footings on sand: 𝑝𝑝′ = 0.15𝑞𝑞 [3] Circular footings are similar to square footings as both are under axisymmetric conditions. Thus;
this relationship can also be applied to square footings. Equation [2] can be substituted into the
equation of relative density to calculate the new relative density gained upon loading. The previous
equation along with equation [3] can be substituted into equation [1] to calculate ϕ’eff with respect
to three previously mentioned factors:
𝜙𝜙′𝑒𝑒𝑒𝑒𝑒𝑒 = 𝜙𝜙′𝑐𝑐𝑐𝑐𝑐𝑐𝑐𝑐 + 𝑚𝑚 ��𝑒𝑒𝑚𝑚𝑚𝑚𝑚𝑚−(𝑒𝑒0−𝜅𝜅.ln 0.15𝑞𝑞)𝑒𝑒𝑚𝑚𝑚𝑚𝑚𝑚−𝑒𝑒𝑚𝑚𝑚𝑚𝑚𝑚
(𝑄𝑄 − ln 0.15𝑞𝑞)� − 1� [4]
Teh (2007) and White et al. (2008) suggested incorporating dilatancy equation into the bearing
capacity equation. A similar approach is adopted here where equation [4] is incorporated in the
bearing capacity equation with the Nγ proposed by Hansen (1961), the Nq proposed by Reissner
(1924) and the shape factor sγ proposed by Vesic (1970), all cited in Whitlow (2001):
𝑞𝑞 = 0.5. 𝛾𝛾.𝐵𝐵′.𝑁𝑁𝛾𝛾. 𝑠𝑠𝛾𝛾
= 0.5. 𝛾𝛾.𝐵𝐵′. 1.8�𝑁𝑁𝑞𝑞 − 1�𝑡𝑡𝑡𝑡𝑙𝑙𝜙𝜙′𝑒𝑒𝑒𝑒𝑒𝑒. 0.6
= 0.54. 𝛾𝛾.𝐵𝐵′. �𝑒𝑒𝜋𝜋 𝑐𝑐𝑡𝑡𝑡𝑡𝜙𝜙′𝑒𝑒𝑒𝑒𝑒𝑒 . 𝑡𝑡𝑡𝑡𝑙𝑙2 �45 + 0.5𝜙𝜙′𝑒𝑒𝑒𝑒𝑒𝑒� − 1� . 𝑡𝑡𝑡𝑡𝑙𝑙𝜙𝜙′𝑒𝑒𝑒𝑒𝑒𝑒 [5]
Where γ is the unit weight of the soil and B’ is the effective breadth of the plate ([area of pile –
area of plate]1/2). The calculation of the bearing capacity can be done iteratively between equations
[4] and [5]. This can be swiftly solved in MS Excel by using the built-in iterative solver. If the
plate is to be buried at a shallow depth and then refilled with soil, an Nq term would be added to
equation [5] and the iterative process would go as usual. However, this effect is yet to be studied
experimentally.
As far as the experimental results are concerned, the availability of the values of q for both plates
allows the calculation of ϕ’eff from equation [5]. The only unknowns would be ϕ’crit and κ. Stroud
(1971; cited in Bolton, 1986) gave a ϕ’crit value of Leighton Buzzard sand of 35o. As density
changes with load, ID was back-calculated and a new γ value would be inputted in equation [5];
until the back-calculated γ converges with the inputted value. Table 2 shows the results of back-
10
analysing the experimental data. A unique κ value of 0.058 gave rise to an average ϕ’crit of 35o for
both plates. Also, as noticed during laboratory procedures, the 3D plate compacts the soil to a
higher degree which is reflected in an ID value greater than that of 2D plate. The ϕ’eff for the 3D
plate agrees well with the experimental results of Al-Aghbari and Mohamedzein (2004) for dense
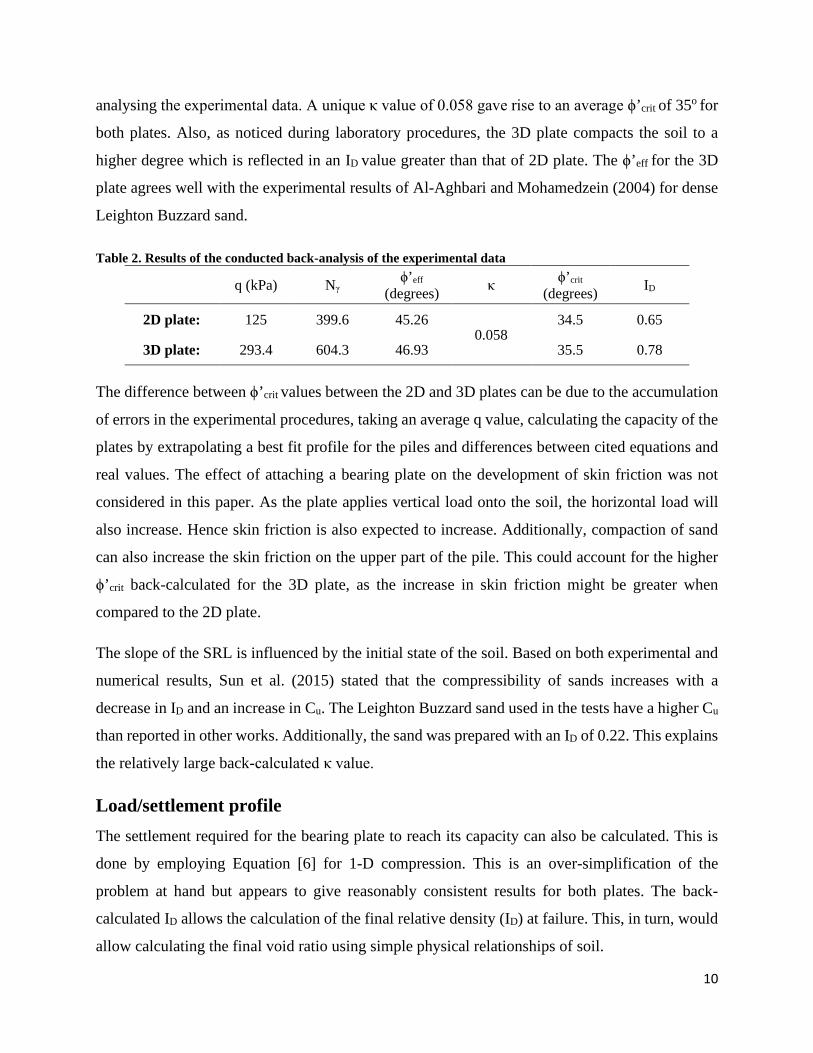
Leighton Buzzard sand. Table 2. Results of the conducted back-analysis of the experimental data
q (kPa) Nγ ϕ’eff
(degrees) κ ϕ’crit
(degrees) ID
2D plate: 125 399.6 45.26 0.058
34.5 0.65
3D plate: 293.4 604.3 46.93 35.5 0.78
The difference between ϕ’crit values between the 2D and 3D plates can be due to the accumulation
of errors in the experimental procedures, taking an average q value, calculating the capacity of the
plates by extrapolating a best fit profile for the piles and differences between cited equations and
real values. The effect of attaching a bearing plate on the development of skin friction was not
considered in this paper. As the plate applies vertical load onto the soil, the horizontal load will
also increase. Hence skin friction is also expected to increase. Additionally, compaction of sand
can also increase the skin friction on the upper part of the pile. This could account for the higher
ϕ’crit back-calculated for the 3D plate, as the increase in skin friction might be greater when
compared to the 2D plate.
The slope of the SRL is influenced by the initial state of the soil. Based on both experimental and
numerical results, Sun et al. (2015) stated that the compressibility of sands increases with a
decrease in ID and an increase in Cu. The Leighton Buzzard sand used in the tests have a higher Cu
than reported in other works. Additionally, the sand was prepared with an ID of 0.22. This explains
the relatively large back-calculated κ value.
Load/settlement profile The settlement required for the bearing plate to reach its capacity can also be calculated. This is
done by employing Equation [6] for 1-D compression. This is an over-simplification of the
problem at hand but appears to give reasonably consistent results for both plates. The back-
calculated ID allows the calculation of the final relative density (ID) at failure. This, in turn, would
allow calculating the final void ratio using simple physical relationships of soil.
11
∆𝑒𝑒1+𝑒𝑒𝑜𝑜
= ∆ℎℎ𝑜𝑜
[6]
Where ∆e is the difference between the initial void ratio and back-calculated voids ratio after
loading (calculated from final ID) , ∆h is the settlement required to reach the capacity of the plate
(Fig. 6) and ho is the depth of soil over which compression would take place (Whitlow, 2001).
Since both ∆e and ∆h are known, ho was back-calculated for both 2D and 3D plates. Interestingly,
ho equals 1.12B and B for the 2D and 3D plates, respectively. It should be noted that this approach
is an over-simplification of the problem, as volumetric changes take place in a 3-dimensional
manner. This approach allows a simplified calculation of the final settlement exhibited by the
footing. Alternatively, the simple 1-D compression model can be extended to plot the entire load settlement
profile. The underlying model developed to capture the load-settlement profile assumes that as the
load increases, the effective depth at which soil compression takes place (ho) also increases. The change in ho with settlement was back-calculated from the experimental results by first taking
the increments of bearing capacity (qinc) prior to the average failure stresses (q). Afterwards, ∆e
and the resulting eo were back-calculated from Equations [2] and [3] for each value of qinc. This
allowed the calculation of ∆h / ho from Equation [6]. But since the settlement (∆h) is also known,
it was also possible to calculate ho for each value of qinc and for each trial. This allowed the
empirical derivation of Equation [7] linking the settlement of the footing and the development of
failure stresses:
ℎ𝑜𝑜 = �0.508 𝑒𝑒0.7 𝑞𝑞𝑚𝑚𝑚𝑚𝑖𝑖𝑞𝑞 �𝐵𝐵′ [7]
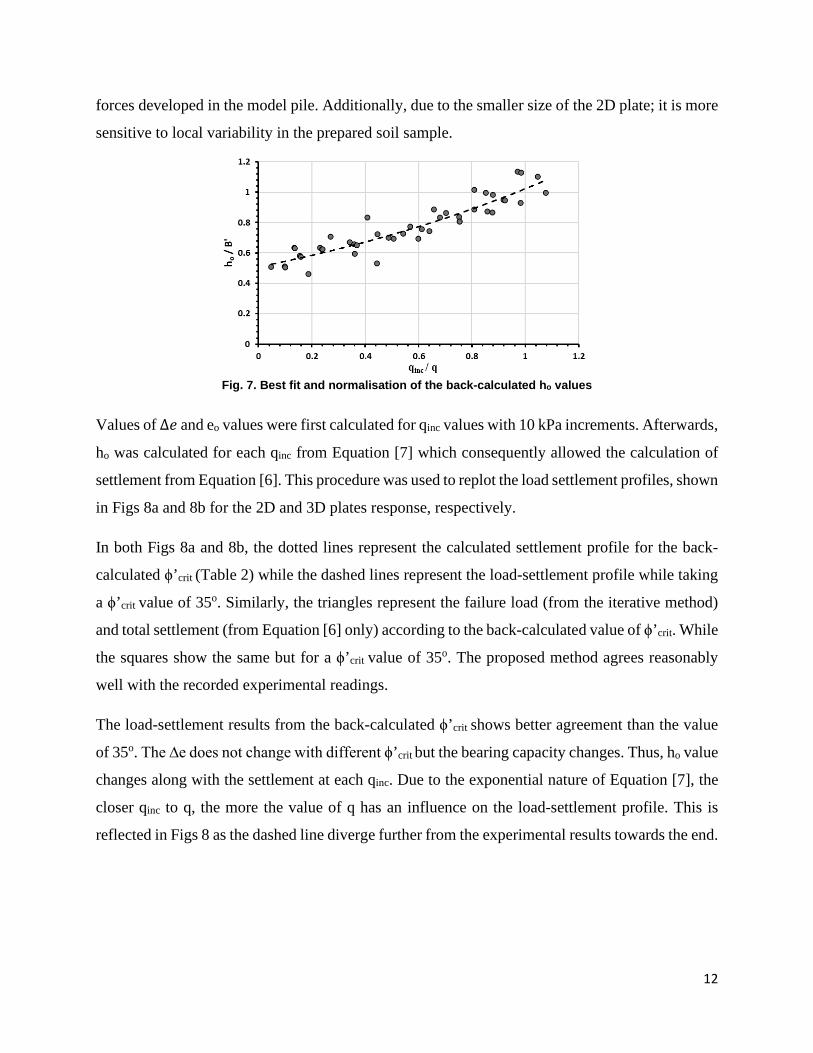
Figure 7 shows that the empirical equation (Equation [7], the dashed line) agrees reasonably well
with the back-calculated values of ho, with an R2 ≈ 0.85. The load-settlement profile of the 2D
plate (Fig. 8a next) is not as consistent as the 3D profile. This accounts for some of the outlying
points shown in figure 7. When compared to the 3D plate, the 2D plate exhibits a lower increase
of stress and a lower final settlement. Thus, the load settlement profile of the 2D plate is more
sensitive to inaccuracies regarding the recording of dial gauge readings and the extrapolation of
12
forces developed in the model pile. Additionally, due to the smaller size of the 2D plate; it is more
sensitive to local variability in the prepared soil sample.
Fig. 7. Best fit and normalisation of the back-calculated ho values
Values of ∆𝑒𝑒 and eo values were first calculated for qinc values with 10 kPa increments. Afterwards,
ho was calculated for each qinc from Equation [7] which consequently allowed the calculation of
settlement from Equation [6]. This procedure was used to replot the load settlement profiles, shown
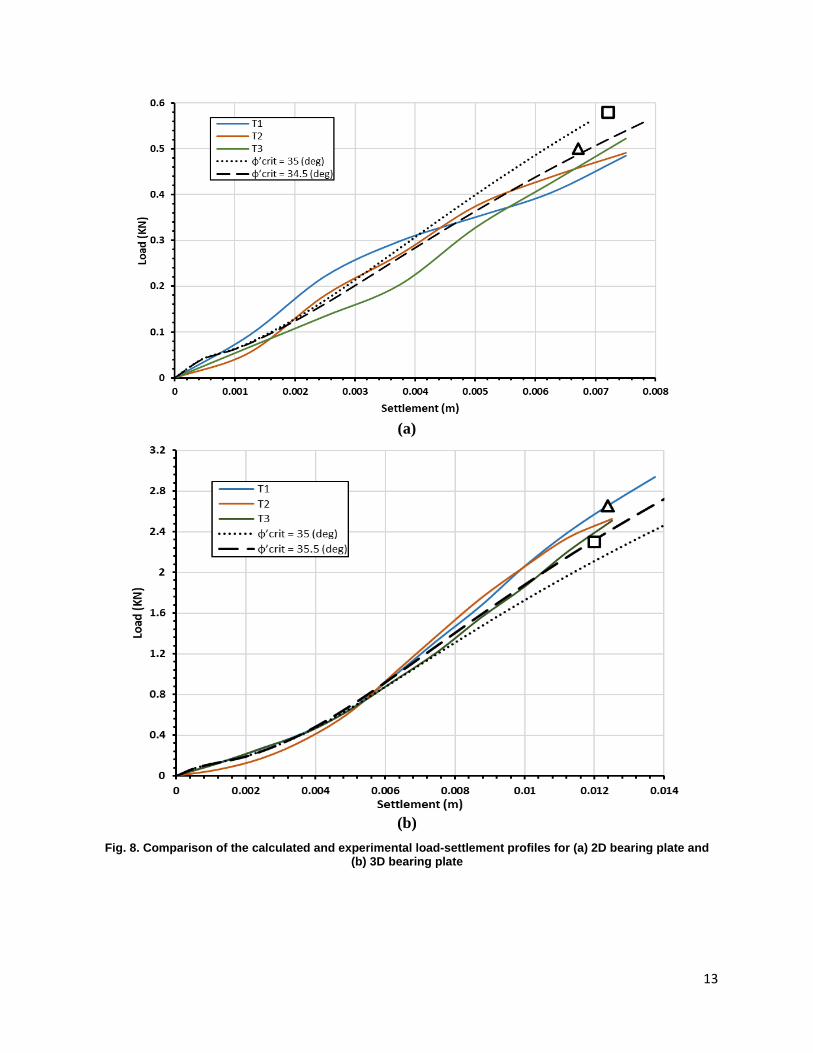
in Figs 8a and 8b for the 2D and 3D plates response, respectively. In both Figs 8a and 8b, the dotted lines represent the calculated settlement profile for the back-
calculated ϕ’crit (Table 2) while the dashed lines represent the load-settlement profile while taking
a ϕ’crit value of 35o. Similarly, the triangles represent the failure load (from the iterative method)
and total settlement (from Equation [6] only) according to the back-calculated value of ϕ’crit. While
the squares show the same but for a ϕ’crit value of 35o. The proposed method agrees reasonably
well with the recorded experimental readings. The load-settlement results from the back-calculated ϕ’crit shows better agreement than the value
of 35o. The ∆e does not change with different ϕ’crit but the bearing capacity changes. Thus, ho value
changes along with the settlement at each qinc. Due to the exponential nature of Equation [7], the
closer qinc to q, the more the value of q has an influence on the load-settlement profile. This is
reflected in Figs 8 as the dashed line diverge further from the experimental results towards the end.
13
(a)
(b)
Fig. 8. Comparison of the calculated and experimental load-settlement profiles for (a) 2D bearing plate and (b) 3D bearing plate
14
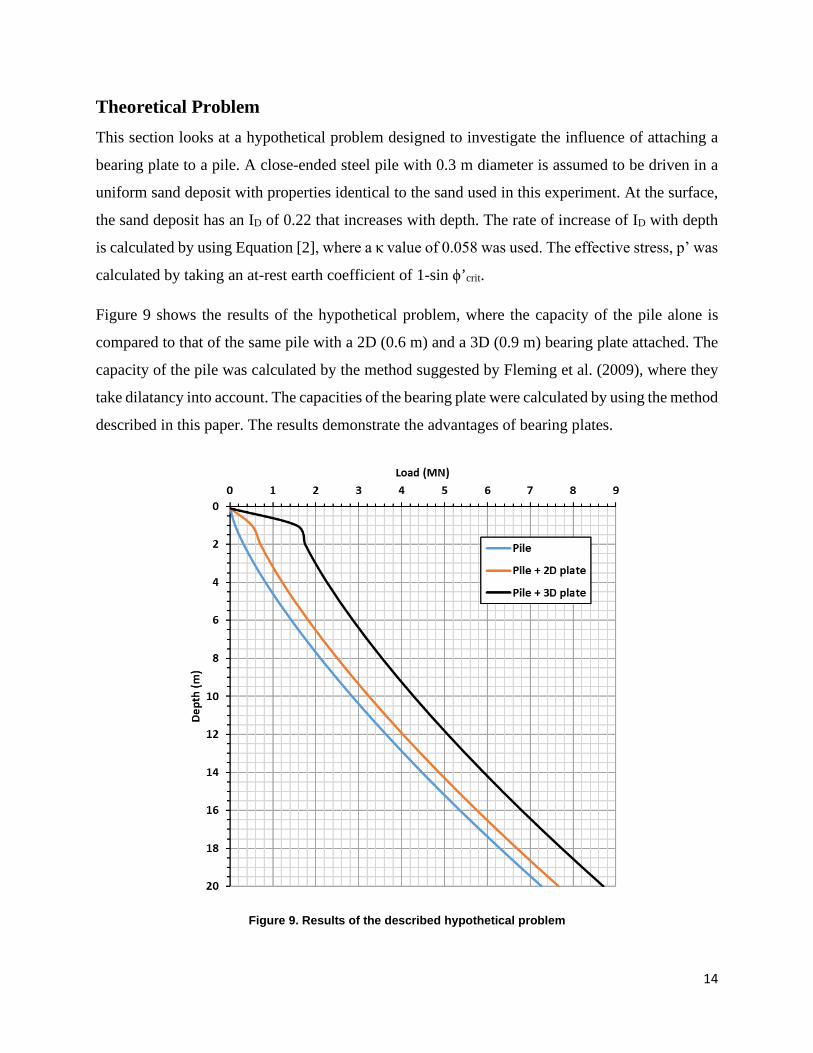
Theoretical Problem This section looks at a hypothetical problem designed to investigate the influence of attaching a
bearing plate to a pile. A close-ended steel pile with 0.3 m diameter is assumed to be driven in a
uniform sand deposit with properties identical to the sand used in this experiment. At the surface,
the sand deposit has an ID of 0.22 that increases with depth. The rate of increase of ID with depth
is calculated by using Equation [2], where a κ value of 0.058 was used. The effective stress, p’ was
calculated by taking an at-rest earth coefficient of 1-sin ϕ’crit. Figure 9 shows the results of the hypothetical problem, where the capacity of the pile alone is
compared to that of the same pile with a 2D (0.6 m) and a 3D (0.9 m) bearing plate attached. The
capacity of the pile was calculated by the method suggested by Fleming et al. (2009), where they
take dilatancy into account. The capacities of the bearing plate were calculated by using the method
described in this paper. The results demonstrate the advantages of bearing plates.
Figure 9. Results of the described hypothetical problem

15
As per equation [6], settlements of 0.09 m and 0.16 m would be required to mobilise the capacities
of the 2D and 3D plates used in Fig. 9. It is worth noting that with an increased stress, the rate of
increase in settlement is lower. This is due to the logarithmic nature of the compression curve.
This shows that as a footing gets larger, the rate of increase in compaction is smaller. This
ultimately leads to a lower degree of dilation as p’ would be greater but ID will remain relatively
constant.
As per Fig.9, if the pile is required to carry a load of 2 MN, then it needs to be driven to a depth of
7.8 m. However, if the 2D plate is attached, the driving depth would reduce to 6.5 m. Alternatively,
if the 3D plate is attached, then the pile needs to be driven to a depth 3 m only. This shows that
attaching either the 2D or the 3D plate can save 0.94 m2 and 3.78 m2 of steel. However, if the pile
is required to support a load of 6 MN, then the saving in steel reduces to 0.56 m2 for the 2D plate
and 2.28 m2 for the 3D plate. The reason behind that is that ID increases with depth. Additionally,
at higher loads, small savings in steel may not be as attractive. It is worth noting that these calculations are for close-ended driven piles, for other types of piles,
Fleming et al. (2009) advises reducing the calculated capacities to 30 to 50% of end-bearing for
bored piles and 80% of end-bearing for open-ended piles. Moreover, friction fatigue was not
considered here, where it would be reduced with decreasing driving depths. By taking these factors
into account, bearing plates could be more beneficial for different type of piles and different
considerations. Summary and Conclusion
Three test programmes of 1-g small-scale displacement tests were conducted to investigate the
effect of attaching plates of variable sizes to model pipes driven in dry, loosely packed, uniform
Leighton Buzzard sand. The results show average increases in capacity of 0.5 kN for the 2D plate
(20%) and 2.67 kN (110%) for the 3D plate, when compared to the average increase in capacity
with depth for the same model pipe. The conducted back-analysis showed reasonable results that
agreed with the general premise of the paper where the relative density increased for the larger
plates which results in increasing the degree of dilation. An expression was derived that was used
to back-calculate the critical frictional angle of the sand, which agreed well with values in
16
literature. A hypothetical scenario was outlined that showed a potential to reduce the overall depth
of piles by using the plate. The new pile design shows a potential to ensure a more efficient use of resources to reduce costs
and carbon footprint associated with the manufacturing, handling and disposal of materials, despite
the limitation of using thicker material for the plate in order to achieve rigidity and the additional
preparatory work needed for installation. Ultimately, the exact nature of the benefit of attaching a
bearing plate to a pile would be project- specific. For example, a soil stratum of strong-over-weak
layer would make the use of a bearing plate even more advantageous. On looser sandy deposits
(as of the soil prepared in this experiment); the bearing plate tends to compact the surface soil to a
higher density resulting in a greater capacity. Alternatively, a bearing plate can be used to add a
factor of safety in circumstances where the magnitude of load is not yet determined (e.g. design
build tenders, where the substructure is built before the superstructure is designed).
By examining the test results in Figures 8a and to a greater extent 8b, the slope of the
load/displacement curves increases as load increases. It is believed that this is due to the
rearrangement of the sand particles to a denser state near the vicinity of the plate. This was also
visually noticed during the experiments. This may show that there is an increase in both total
resistance but more importantly a decrease in deflection at the same loads which is very important
at a service level displacement.
The exact construction method can differ; instead of welding the plate, a key-lock mechanism can
be used to join the plate and the pile. This can allow the plate to be jacked in the soil before it gets
connected to the pile; to ensure a stiff response upon loading. Alternatively, in more flexible
structures where settlement is allowed, the plate could be designed to add a factor of safety against
shear failure. This shows the flexibility of incorporating such design into the construction industry
although it may be challenging due to the current practice of cutting or splicing the piles in order
to attain the required capacity where the depth of embedment of is variable due to the uncertainty
in subsurface conditions.
In terms of application of the results from this study to practical problems, it should be noted that
the current study is largely a ‘proof of concept’ and the practical contribution of the results will
17
have to be verified with testing and monitoring. Centrifuge or full-scale testing are necessary to
validate the use of bearing plates and further explore any scale effect. Although dilation has been
considered, the stress levels in the conducted experiments are significantly smaller than the ones
encountered on site. Similarly, future tests and monitoring should look into the group effects and
the measurements obtained from strain gauges instrumented piles on the side resistance shadowing
from the plate bearing pressures; the determination of any influence of the stress bulb on group
axial/lateral resistance and possible scale effects would also need to be investigated Additionally,
further studies are required to determine the optimal construction technology of the bearing plate
and whether post-installation jacking is possible.
18
References Al-Aghbari, M.Y. And Mohamedzein, T.E.A., 2004. Model testing of strip footings with structural
skirts. Ground Improvement. Vol. 7, No. 1, 1–7 Been, K., Jefferiest, M.G. And Hachey, J. 1991. The critical state of sands. Géotechnique, 41(3),
365-381. Bolton, M.D. 1986. The Strength and Dilatancy of Sands. Géotechnique, Vol. 36, pp. 65-78. Cavallaro, A., Maugeri M., and Mazzarella, R., 2001. Static and Dynamic Properties of Leighton
Buzzard Sand from Laboratory Tests. 4th International Conferences on Recent Advances in Geotechnical Earthquake Engineering and Soil Dynamics. Missouri, USA. Paper No. 1-13.
Deeks, A.D., White, D.J. and Bolton, M.D., 2005. A comparison of jacked, driven and bored piles
in sand. In ICSMGE. T. Committee (Ed.), Proceedings of the 16th International Conference on Soil Mechanics and Geotechnical Engineering. Osaka, Japan ed., Vol. 4, pp. 2103-2106. Rotterdam, Netherlands: Millpress.
Fleming, W.K., Weltman, A.J., Randolph, M.F. and Elson, W.K. (1992). Piling engineering (3rd
ed.). Milton Park, Abingdon, Oxon. Taylor & Francis Group. Golder, H.Q., Fellenius, W., Kogler, F., Meischeider, H., Krey, H. & Prandtl, L. 1941. the ultimate
bearing pressure of rectangular footings. Journal of the Institution of Civil Engineers, Vol.17, 161-174.
Head, K. (2006). Manual of soil laboratory testing Vol. 1, Soil classification and compaction tests
(3rd ed.). Dunbeath, Scotland: Whittles Publishing. Pp. 316-318 Igoe, D.J., Gavin, K.G. and O’Kelly, B.C., 2011. Shaft capacity of open-ended piles in sand.
Journal of Geotechnical and Geoenvironmental Engineering, Vol. 137, 903-913. Kim, K.E. and Andrawes, B., 2017. Retrofitting of bridge abutment timber piles using fiber-
reinforced polymer composites. Journal of structural integrity and maintenance. Vol. 2, NO. 1, 29–38
Penna, A., Sorrentino, G., d’Onofrio, A., Silvestrie, F. and Simonelli, A.L., 2016. Dynamic
behaviour of the Leighton Buzzard Sand-B under very low confining stresses. 1st IMEKO TC-4 International Workshop on Metrology for Geotechnics Benevento, Italy, March 17-18. 200-203
Sun, Y., Xiao, Y. and Hanif, K. F., 2015. Compressibility dependence on grain size distribution
and relative density in sands. Science China. Technological Sciences, 58 (3), 443-448
19
Teh, K.L., 2007. Punch-Through of Spudcan Foundation in Sand Overlying Clay. PhD thesis. National University of Singapore.
White, D.J., Teh, K.L., Leung, C.F. and Chow, Y.K. 2008. A comparison of the bearing capacity
of flat and conical circular foundations on sand. Geotechnique, 58, 781-792. Whitlow, R., 2001. Basic soil mechanics (4th ed.). Essex, England. Pearson Education Limited. Zhu, F.Y., Clark, J.I. and Phillips, R. 2001. Scale effect of strip and circular footings resting on
dense sand. Journal of Geotechnical and Geoenvironmental Engineering, Vol. 127, 613-621.
Copyright © 2022 FDOKUMEN