A simple Introduction to Social Work Research
75
Katherasala Srinivas M.S.W Social Work Research Unit – I Meaning of Science The word science is derived from the Latin word ‘scienta’ which means ‘to know’. Throughout history, people have been very keen to acquire knowledge by using various methods. However, it was felt necessary to evolve a method by which individual thinking has no effect on the conclusions. In other words, the method should be such that the ultimate conclusion of every man is the same. Endeavours to acquire knowledge, which involved such methods, came to be known as science. The term ‘science’ has been defined in different ways. To some, science means an objective investigation of empirical phenomena, to others science denotes an accumulation of systematic knowledge; to still others, it means all knowledge collected by means of the scientific methodology. Nevertheless, whatever may be the way of defining, science is united by its methodology. Hence it would be easier to understand science if we first consider science as a method of approach, and then discuss its aims and functions. What Is Research ? When we observe certain objects or phenomena, often unaware of our biases, we do not question them and so we attribute our observations entirely to the objects or phenomena being observed. In this process, it is possible to arrive at right decision on the basis of wrong reasons or vice versa. This questions the process of observation. Was the observation error free? Every method of knowing has certain limitations. While observing are we aware of our limitations? Any study to create new knowledge or aims to increase existing fund of knowledge may it be through observation or by some other methods, is called research if it takes into account the biases, the errors and limitations. As such, research may be described as systematic and critical investigation of phenomena toward increasing the stream of knowledge.
Transcript of A simple Introduction to Social Work Research
Katherasala Srinivas M.S.W
Social Work Research Unit – I
Meaning of Science
The word science is derived from the Latin word ‘scienta’ which means ‘to know’. Throughout history, people have been very keen to acquire knowledge by using various methods. However, it was felt necessary toevolve a method by which individual thinking has no effect on the conclusions. In other words, the method should be such that the ultimate conclusion of every man is the same. Endeavours to acquire knowledge, which involved such methods, came to be known as science.
The term ‘science’ has been defined in different ways. To some, science means an objective investigation of empirical phenomena, to others science denotes an accumulation of systematic knowledge; to still others, it means all knowledge collected by means of the scientific methodology. Nevertheless, whatever may be the way of defining, science is united by its methodology. Hence it would be easier to understand science if we first consider science as a methodof approach, and then discuss its aims and functions.
What Is Research ?
When we observe certain objects or phenomena, often unaware of our biases, we do not question them and so we attribute our observations entirely to the objects or phenomena being observed. In this process,it is possible to arrive at right decision on the basis of wrong reasons or vice versa. This questions the process of observation. Was the observation error free? Every method of knowing has certain limitations. While observing are we aware of our limitations? Any study to create new knowledge or aims to increase existing fund of knowledge may it be through observation or by some other methods, is called research if it takes into account the biases, the errors and limitations. As such, research may be described as systematic and critical investigation of phenomena toward increasing the stream of knowledge.
Katherasala Srinivas M.S.W
Scientific Research Science aims at description, explanation and understanding of variousobjects or phenomena in nature and research are special endeavours, which involves systematic and critical investigation. Thus, towards increasing the stream of knowledge now it is easier to define scientific research. We may define scientific research as a systematic and critical investigation about the natural phenomena to describe, explain and finally to understand the relations among them
Scientific Method It is obvious that it would be impossible to comprehend the nature and content of research without an appreciation of a method. The method used in scientific research is usually designated as scientific method. According to George Lundberg (1946), scientific method consists of three basic steps, systematic observation, classification and interpretation of data. Through these steps, scientific method brings about not only verifiability of the facts, but also it lays the confidence in the validity of conclusions.
The definition requires some more explanations. First when Lundberg (1946) says that scientific method is systematic observation, he meansin effect, the scientific investigation is not ordered, it aims only at discovering facts as they actually are and not as they are desiredto be and as such the investigators can have critical confidence in their conclusions. Second, the scientific method is concerned with classes of objects’ not ‘individual objects’. Universality and predictability are other features of scientific method. The method makes it possible to predict about a phenomenon with sufficient accuracy.
Use of Scientific Method in Social Work Social work primarily deals with human behaviour, which is, by and large, complex and dynamic in nature. One cannot, therefore investigate under guided conditions as in natural and physical sciences. This creates many problems to the researcher such as the

Katherasala Srinivas M.S.W
problems of subjectivity and individualistic generalizations etc. The problem arising out of the nature and content of social work do not seriously diminish the importance of scientific method for socialworkers. Not withstanding the inherent limitations scientific method can be used for the study of problems related with social work so faras it helps to arrive at valid generalisations.
Meaning of Social Work Research In a very broad sense, social work research is the application of research methods to solve problems that social workers confront in the practice of social work. It provides information that can be taken into consideration by social workers prior to making decisions, that affect their clients, programmes or agencies such as use of alternative intervention techniques or change or modification of programme/ client/objectives and so forth. Following are some of the situations which call for application of social work research methods and techniques:
1. A social caseworker is interested in assessing the nature and extent of the problem of her client who has been facing marital maladjustment. She may be interested in obtaining information about the actual or potential effectiveness of the client. She may also be keen to know to what extent the intervention would be effective.
2. A group worker wishes to assess the extent to which the technique of role play is more or less effective than group discussion in increasing knowledge of drug abuse among school going children.
3. A community organiser wants to know the views of the community before he takes a decision to change the programme/objectives.
4. A director of special school for mentally retarded children wants to know whether group therapy is as effective as individual therapy in increasing adaptability of mentally retarded children.
5. A social work administrator is concerned about effectiveness of implementation of new programme launched.
Katherasala Srinivas M.S.W
Social Work Research: Definition
Social work research may be defined as systematic investigation into the problems in the field of social work. The study of concepts, principles, theories underlying social work methods and skills are the major areas of social work research. It involves the study of the relationship of social workers with their clients; individuals, groups or communities on various levels of interaction or therapy as well as their natural relationships and functioning within the organisational structure of social agencies.
Social Work Research: The Process
It must be borne in mind that the process of social work research is not completely identical to social research. In fact, there are many similarities between this process and the traditional research process. The process however, has some additional steps designed to suit the objectives of social work research. By following the processsocial work researchers are in a position to know precisely what intervention was applied and how much effect was produced. The process also links research and practice. Social work research startswith problem identification and setting up of goals. This is followedby the process of assessment (or need assessment) of the client’s problems. During these initial stages, the researcher strives to obtain a clear and specific
understanding of the problem, using assessment tools such as interviewing (Monette, et. al., 1986). After the problem is identified and needs are assessed, the next step is to set up goals to be achieved. The goals are required to be specific, precisely defined and measurable in some way. The third step in the process isto have a pre-intervention measurement, that is, measurement prior tointervention; the preintervention measurement is used as basis from which to compare the client’s condition after the intervention is

Katherasala Srinivas M.S.W
introduced. Next stage in the process is to introduce intervention. It is important here to note that only a single, coherent intervention be applied during any intervention phase. In the last stage, we assess the effects of intervention by comparing the two measurements, that is, preintervention measurement and measurements during intervention.
1 .Identification of Problems 2. Need Assessment 3. Selection of Social Work Research Design Introduce 4. Pre-Intervention Measurement (Data Collection) 5. IntroduceIntervention 6. Assess the Intervention Effects (Data Collection)
Relevance of Research in Social Work Social work is a practice profession. As such, the major objective ofsocial work research is to search for answers to questions raised regarding interventions or practice effectiveness. In other words social work research attempts to provide knowledge about what interventions or treatments really help or hinder the attainment of social work goals. In addition, it also helps in searching for answers to
problems or difficulties faced by social work practitioners in the practice of their profession. Ultimately it helps building knowledge base for social work theory and practice.
Social work research also deals with problems faced by professional social workers, social work agencies and community in its concern with social work functions. In other words in social work research
Katherasala Srinivas M.S.W
the problems to be investigated are always found in the course of doing social work or planning to do it (Dasgupta, 1968).
It is obvious that in social work research the study of a problem is from the point of view of social work and that of professional socialwork. The designing of research problems, data collection and its interpretation will have to be attempted in a manner as would be useful to professional social work which would add new knowledge to the social work theory and practice and improve the efficiency of professional social workers.
Social work research is regarded as the systematic use of research concepts, methods, techniques and strategies to provide information related to the objectives of social work programmes and practices. Thus the unit of analysis of social work research could be individuals, groups, families or programme of the agency. That is, social work research, typically focuses on assessment of practitioner’s work with individuals, groups, families, communities or appraisal of agencies or programmes that involve the continued efforts of practitioners with many clients. As such, the research design, data collection and analytic strategies in social work research vary as a function of unit of analysis and programme of agencies of social work practitioner.
Social work research is the use of the scientific method in the search of knowledge, including knowledge of alternate practice and intervention techniques, which would be of direct use to the social work profession and thus enhance the practice of social work methods.Social work research focuses on or confines itself to select aspects of behaviour and alternate models of behaviour modifications. Socialwork research helps to find ways and means to enhance social functioning at the individual, group, community and societal levels.
Social work research lays special emphasis on evaluation. This is oneof the reasons that social work research is also understood as evaluative research. Under social work research, varieties of evaluative researches are undertaken. Some of the researches are on impacts or effects, efficacy and effectiveness. Evaluation of

Katherasala Srinivas M.S.W
agencies and its projects and programmes are some of the specialized areas of social work research.
Scope of Social Work Research Social work profession has a scientific base, which consists of a special body of knowledge; tested knowledge, hypothetical knowledge and assumptive knowledge. Assumptive knowledge requires transformation into hypothetical knowledge, which in turn needs transformation into tested knowledge. Social work research has significant role in transforming the hypothetical and assumptive knowledge to tested knowledge (Khinduka,1965).
Identification of social work needs and resources, evaluation of programmes and services of social work agencies are some of the areasin which social work researches are undertaken. Social work research may be conducted to know the problems faced by professional social workers in social work agencies and communities in its concern with social work functions. Thus, social work research embraces the entire gamut of social work profession; concepts, theories, methods, programmes, services and the problems faced by social workers in their practice.
Goals and Limitations of Social Work Research
Social work research offers an opportunity for all social workers to make differences in their practice. There is no doubt about the fact that social worker will be more effective practitioner guided by the findings of social work research. Thus, social work research seeks toaccomplish the same humanistic goals, as does a social work method. Social work research deals with those methods and issues, which are useful in evaluating social work programmes and practices. It explains the methodology of social research and illustrates its applications in social work settings.
A substantive part of social work practice is concerned with the micro-level practice, such as working with individuals, groups, or a
Katherasala Srinivas M.S.W
community. Social work research has to take into consideration the limitations of micro level design of study and techniques.
Social work research is basically a practice based research which mostly draws its inferences through inductive reasoning. That is, inferring something about a whole group or a class of objects from the facts or knowledge of one or few members of that group/class. Thus, in practice based research inductive reasoning carries us from observation to theory through intervention/assessment. Practitioners,for example, may observe that delinquents tend to come from family with low socio-economic status. Based on the assumption that the parent-child bond is weaker in low socio-economic families and that such parents, therefore, have less control over their children, the practitioners may inductively conclude that a weak parent-child bond leads to delinquency.
A substantive part of social work practice is concerned with the micro-level practice, such as working with individuals, groups, or a community. Practice based research has to take into consideration thelimitations of micro level practice. Accordingly, practice based research has to have special design of study and techniques.
Steps of the research process
Scientific research involves a systematic process that focuses on being objective and gathering a multitude of information for analysis so that the researcher can come to a conclusion. This process is used in all research and evaluation projects, regardless of the research method (scientific method of inquiry, evaluation research, or action research). The process focuses on testing hunches or ideas in a park and recreation setting through a systematic process. In this process, the study is documented in such a way that another individual can conduct the same study again. This is referred to as replicating the study. Any research done without documenting the study so that others

Katherasala Srinivas M.S.W
can review the process and results is not an investigation using the scientific research process. The scientific research process is a multiple-step process where the steps are interlinked with the other steps in the process. If changes are made in one step of the process, the researcher must review all the other steps to ensure that the changes are reflected throughout the process.
Step 1: Identify the ProblemThe first step in the process is to identify a problem or develop a research question. The research problem may be something the agency identifies as a problem, some knowledge or information that is needed by the agency, or the desire to identify a recreation trend nationally. In the example in table 2.4, the problem that the agency has identified is childhood obesity, which is a local problem and concern within the community. This serves as the focus of the study.
Step 2: Review the LiteratureNow that the problem has been identified, the researcher must learn more about the topic under investigation. To do this, the researcher

Katherasala Srinivas M.S.W
must review the literature related to the research problem. This step provides foundational knowledge about the problem area. The review of literature also educates the researcher about what studies have been conducted in the past, how these studies were conducted, and the conclusions in the problem area. In the obesity study, the review of literature enables the programmer to discover horrifying statistics related to the long-term effects of childhood obesity in terms of health issues, death rates, and projected medical costs. In addition, the programmer finds several articles and information from the Centersfor Disease Control and Prevention that describe the benefits of walking 10,000 steps a day. Step 3: Clarify the Problem In step 3 of the process, the researcher clarifies the problem and narrows the scope of the study. This can only be done after the literature has been reviewed. The knowledge gained through the review of literature guides the researcher in clarifying and narrowing the research project. In the example, the programmer has identified childhood obesity as the problem and the purpose of the study. This topic is very broad and could be studied based on genetics, family environment, diet, exercise, self-confidence, leisure activities, or health issues. All of these areas cannot be investigated in a single study; therefore, the problem and purpose of the study must be more clearly defined. The programmer has decided that the purpose of the study is to determine if walking 10,000 steps a day for three days a week will improve the individual’s health. Step 4: Clearly Define Terms and Concepts Terms or concepts often have different definitions depending on who is reading the study. To minimize confusion about what the terms & phrases mean, the researcher must specifically define them for the study. In the obesity study, the concept of “individual’s health” can be defined in hundreds of ways, such as physical, mental, emotional, or spiritual health. For this study, the individual’s health is defined as physical health. The concept of physical health may also bedefined and measured in many ways. In this case, the programmer decides to more narrowly define “individual health” to refer to the areas of weight, percentage of body fat, and cholesterol. By defining the terms or concepts more narrowly, the scope of the study is more manageable for the programmer, making it easier to collect the necessary data for the study. Step 5: Define the Population
Katherasala Srinivas M.S.W
Research projects can focus on a specific group of people, facilities,park development, employee evaluations, programs, financial status, marketing efforts, or the integration of technology into the operations. For example, if a researcher wants to examine a specific group of people in the community, the study could examine a specific age group, males or females, people living in a specific geographic area, or a specific ethnic group. Literally thousands of options are available to the researcher to specifically identify the group to study. The research problem and the purpose of the study assist the researcher in identifying the group to involve in the study. In research terms, the group to involve in the study is always called thepopulation. Defining the population assists the researcher in several ways. First, it narrows the scope of the study from a very large population to one that is manageable. Second, the population identifies the group that the researcher’s efforts will be focused on within the study. This helps ensure that the researcher stays on the right path during the study. Finally, by defining the population, the researcher identifies the group that the results will apply to at the conclusion of the study. In the example in table 2.4, the programmer has identified the population of the study as children ages 10 to 12 years.
Step 6: Develop the Instrumentation PlanThe plan for the study is referred to as the instrumentation plan. Theinstrumentation plan serves as the road map for the entire study, specifying who will participate in the study; how, when, and where data will be collected; and the content of the program. This plan is composed of numerous decisions and considerations that are addressed in chapter 8 of this text. In the obesity study, the researcher has decided to have the children participate in a walking program for six months. The group of participants is called the sample, which is a smaller group selected from the population specified for the study. The study cannot possibly include every 10- to 12-year-old child in the community, so a smaller group is used to represent the population.The researcher develops the plan for the walking program, indicating what data will be collected, when and how the data will be collected, who will collect the data, and how the data will be analyzed. The instrumentation plan specifies all the steps that must be completed for the study. This ensures that the programmer has carefully thought through all these decisions and that she provides a step-by-step plan to be followed in the study.

Katherasala Srinivas M.S.W
Step 7: Collect DataOnce the instrumentation plan is completed, the actual study begins with the collection of data. The collection of data is a critical stepin providing the information needed to answer the research question. Every study includes the collection of some type of data—whether it isfrom the literature or from subjects—to answer the research question. Data can be collected in the form of words on a survey, with a questionnaire, through observations, or from the literature. In the obesity study, the programmers will be collecting data on the defined variables: weight, percentage of body fat, cholesterol levels, and thenumber of days the person walked a total of 10,000 steps during the class.The researcher collects these data at the first session and at the last session of the program. These two sets of data are necessary to determine the effect of the walking program on weight, body fat, and cholesterol level. Once the data are collected on the variables, the researcher is ready to move to the final step of the process, which isthe data analysis.Step 8: Analyze the DataAll the time, effort, and resources dedicated to steps 1 through 7 of the research process culminate in this final step. The researcher finally has data to analyze so that the research question can be answered. In the instrumentation plan, the researcher specified how the data will be analyzed. The researcher now analyzes the data according to the plan. The results of this analysis are then reviewed and summarized in a manner directly related to the research questions.In the obesity study, the researcher compares the measurements of weight, percentage of body fat, and cholesterol that were taken at thefirst meeting of the subjects to the measurements of the same variables at the final program session. These two sets of data will beanalyzed to determine if there was a difference between the first measurement and the second measurement for each individual in the program. Then, the data will be analyzed to determine if the differences are statistically significant. If the differences are statistically significant, the study validates the theory that was thefocus of the study. The results of the study also provide valuable information about one strategy to combat childhood obesity in the community.As you have probably concluded, conducting studies using the eight steps of the scientific research process requires you to dedicate timeand effort to the planning process. You cannot conduct a study using
Katherasala Srinivas M.S.W
the scientific research process when time is limited or the study is done at the last minute. Researchers who do this conduct studies that result in either false conclusions or conclusions that are not of any value to the organization.
Social Work Research Unit – II
Basic elements of research
Concept
A concept is an abstraction representing an object, a property of an object, are a certain phenomenon for example ‘ water “, mass, weight and density, are concepts used by physical scientists. Concepts such as, a social status, role, caste, religion, and family are common among sociologist
A concept of more intrest to social researher is social status its is an abstraction formed from the observation of certain traits of individuals. This traits are associated with the possision of individuals in the society, etc. The assessment of various indicators put together and expresed in a word - social status
Every scientific discripstion has developed its unique set of conceptsfor communicating its reserach findings the improtances of concepts inscientific investigation may be gauged from the fact that the conceptual system
Concept and construct
In research we enumerate two sets of terms the 1st includes the terms ar words which we point to and object the term ro ward represents for example, when we say house we can point to an object the word represents , we can also mesure the area on which its exists, the height width and thicknes of wall and such other dimensions of the house, there are many similar terms such as tree, temple, book, chalk,

Katherasala Srinivas M.S.W
and so on for which we can point of numerous objects mesure their dimensions , the seconds set of terms susch as a race, religion, intelligence, achivements,etc does not have objects to point out this terms are abstraction from the observation
Hence we frist define this terms anthen we respond to the definitions instead of observable characteristics, the terms of the 1st set which have direct empirical refference are reffered to as concepts where as the terms in second set have no direct empirical refference and are reffered as construct
variables
Very simply, a VARIABLE is a measurable characteristic that varies. Itmay change from group to group, person to person, or even within one person over time. There are six common variable type
Case example of descriptive study variables Variables are important to understand because they are the basic unitsof the information studied and interpreted in researchstudies. Researchers carefully analyze and interpret the value(s) of each variable to make sense of how things relate to each other in a descriptive study or what has happened in an experiment.
DEPENDENT VARIABLES
show the effect of manipulating or introducing the independent

Katherasala Srinivas M.S.W
variables. For example, if the independent variable is the useor non-use of a new language teaching procedure, then the dependent variable might be students' scores on a test of the content taught using that procedure. In other words, the variation in the dependent variable depends on the variation in the independent variable.
INDEPENDENT VARIABLES
. . . are those that the researcher has control over. This "control" may involve manipulating existing variables (e.g., modifying existing methods of instruction) or introducing new variables (e.g., adopting a totally new method for some sections of a class) in the research setting. Whatever the case may be, the researcher expects that the independent variable(s) will have some effect on (or relationship with) the dependent variables.
INTERVENING VARIABLES
refer to abstract processes that are not directly observable but that link the independent and dependent variables. In language learning and teaching, they are usually inside the subjects' heads, including various language learning processeswhich the researcher cannot observe. For example, if the use of a particular teaching technique is the independent variableand mastery of the objectives is the dependent variable, then the language learning processes used by the subjects are the intervening variables.
MODERATOR VARIABLES
affect the relationship between the independent and dependent variables by modifying the effect of the intervening variable(s). Unlike extraneous variables, moderator variables are measured and taken into consideration. Typical moderator variables in TESL and language acquisition research (when theyare not the major focus of the study) include the sex, age, culture, or language proficiency of the subjects.
Katherasala Srinivas M.S.W
CONTROL VARIABLES
Language learning and teaching are very complex processes. It is not possible to consider every variable in a single study. Therefore, the variables that are not measured in a particularstudy must be held constant, neutralized/balanced, or eliminated, so they will not have a biasing effect on the other variables. Variables that have been controlled in this way are called control variables.
EXTRANEOUS VARIABLES
are those factors in the research environment which may have an effect on the dependent variable(s) but which are not controlled. Extraneous variables are dangerous. They may damage a study's validity, making it impossible to know whether the effects were caused by the independent and moderator variables or some extraneous factor. If they cannot be controlled, extraneous variables must at least be taken into consideration when interpreting results.
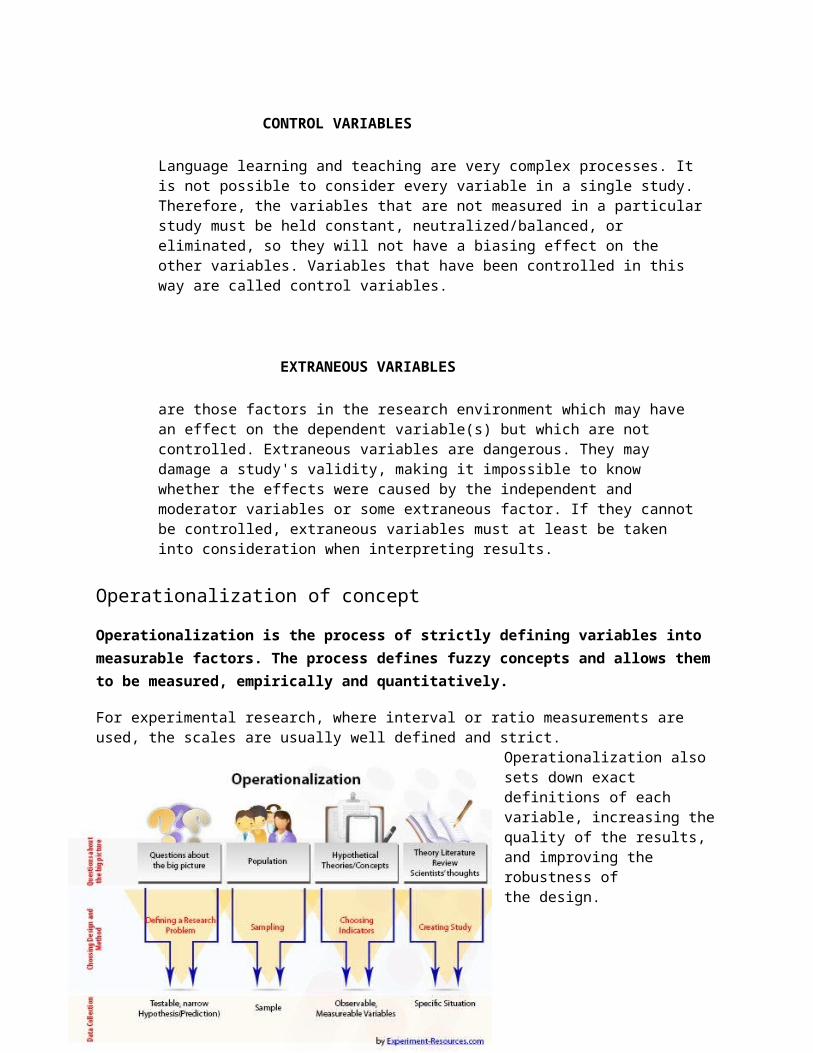
Operationalization of concept
Operationalization is the process of strictly defining variables into measurable factors. The process defines fuzzy concepts and allows themto be measured, empirically and quantitatively.
For experimental research, where interval or ratio measurements are used, the scales are usually well defined and strict.
Operationalization also sets down exact definitions of each variable, increasing thequality of the results, and improving the robustness of the design.
Katherasala Srinivas M.S.W
For many fields, such as social science, which often use ordinal measurements, operationalization is essential. It determines how the researchers are going to measure an emotion or concept, such as the level of distress or aggression.
Such measurements are arbitrary, but allow others to replicate the research, as well as perform statistical analysis of the results.
Fuzzy Concepts Fuzzy concepts are vague ideas, concepts that lack clarity or are onlypartially true. These are often referred to as "conceptual variables".
It is important to define the variables to facilitate accurate replication of theresearch process. For example, a scientist might propose the hypothesis:
“Children grow more quickly if they eat vegetables.” What does the statement mean by 'children'? Are they from America or Africa. What age are they? Are the children boys or girls? There are billions of children in the world, so how do you define the sample groups?
How is 'growth' defined? Is it weight, height, mental growth or strength? The statement does not strictly define the measurable, dependent variable.What does the term 'more quickly' mean? What units, and what timescale, will be used to measure this? A short-term experiment, lasting one month, may give wildly different results than a longer-term study.The frequency of sampling is important for operationalization, too.
If you were conducting the experiment over one year, it would not be practical to test the weight every 5 minutes, or even every month. Thefirst is impractical, and the latter will not generate enough analyzable data points.
What are 'vegetables'? There are hundreds of different types of vegetable, each containing different levels of vitamins and minerals.
Katherasala Srinivas M.S.W
Are the children fed raw vegetables, or are they cooked? How does the researcher standardize diets, and ensure that the children eat their greens?
OperationalizationThe above hypothesis is not a bad statement, but it needs clarifying and strengthening, a process called operationalization.The researcher could narrow down the range of children, by specifying age, sex, nationality, or a combination of attributes. As long as the sample group is representative of the wider group, then the statement is more clearly defined.
Growth may be defined as height or weight. The researcher must select a definable and measurable variable, which will form part of the research problemand hypothesis.Again, 'more quickly' would be redefined as a period of time, and stipulate the frequency of sampling. The initial research design couldspecify three months or one year, giving a reasonable time scale and taking into account time and budget restraints.
Each sample group could be fed the same diet, or different combinations of vegetables. The researcher might decide that the hypothesis could revolve around vitamin C intake, so the vegetables could be analyzed for the average vitamin content.
Alternatively, a researcher might decide to use an ordinal scale of measurement, asking subjects to fill in a questionnaire about their dietary habits.Already, the fuzzy concept has undergone a period of operationalization, and the hypothesis takes on a testable format.
The Importance of OperationalizationOf course, strictly speaking, concepts such as seconds, kilograms and centigrade are artificial constructs, a way in which we define variables.
Katherasala Srinivas M.S.W
Pounds and Fahrenheit are no less accurate, but were jettisoned in favor of the metric system. A researcher must justify their scale of scientific measurement.Operationalization defines the exact measuring method used, and allowsother scientists to follow exactly the same methodology. One example of the dangers of non-operationalization is the failure of the Mars Climate Orbiter.
This expensive satellite was lost, somewhere above Mars, and the mission completely failed. Subsequent investigation found that the engineers at the sub-contractor, Lockheed, had used imperial units instead of metric units of force.
A failure in operationalization meant that the units used during the construction and simulations were not standardized. The US engineers used pound force, the other engineers and software designers, correctly, used metric Newtons.
This led to a huge error in the thrust calculations, and the spacecraft ended up in a lower orbit around Mars, burning up from atmospheric friction. This failure in operationalization cost hundredsof millions of dollars, and years of planning and construction were wasted.
How To Formulate Research Problem?Formulating the research problem and hypothesis acts as a majorstep or phase in the research methodology. In research, theforemost step that comes into play is that of defining theresearch problem and it becomes almost a necessity to have thebasic knowledge and understanding of most of its elements as thiswould help a lot in making a correct decision. The researchproblem can be said to be complete only if it is able to specifyabout the unit of analysis, time and space boundaries, featuresthat are under study, specific environmental conditions that arepresent in addition to prerequisite of the research process.
Katherasala Srinivas M.S.W
ResearchProcessResearch process is very commonly referred to as the planningprocess. One important point to be kept in mind here is tounderstand that the main aim of the research process is that ofimproving,the.knowledge.ofthe.humanbeings.1.The.Primarystage:This,stage,includes –a. Observation – The first step in the research process is that ofthe observation, research work starts with the observation whichcan be either unaided visual observation or guided and controlledobservation.It can be said that an observation leads to research,the results obtained from research result in final observationswhich can play a crucial part in carrying out further research.Deliberate and guided observations also play an important part inthis primary stage. This method is very simple and helps a greatdeal in framing of the hypothesis as it is very accurate in naturebut it also has some major limitations like some of theoccurrences may not be open to the observation and the occurrenceswhich may be open for observation may not be studied conveniently.
b. Interest – As studied in the above paragraph, research starts withthe observation and it leads to a curiosity to learn and gain moreand more about what has been observed. Hence it can be said thatobservation results in the creation of an interest in the mind ofthe researcher.The interest can be either academic in nature or itmay be a policy making interest. It may be a self interest or agroup interest. Group interest is also referred to as the socialinterest
c. Crystallization – It can be defined as the process involving thedesigning of the definite form of research to be used in the study
Katherasala Srinivas M.S.W
of the subject matter that has been observed. During this stage,the research project gets a concrete shape and structure.
d. Formulating a research problem – A research problem can belong toone of the following two categories – it can belong to thecategory in which there can be relationships between variousvariables or it may belong to the other category, which is basedon nature. In the beginning, it is important for a researcher tofind out the general interest or the subject matter, which hewants to study. By this the researcher will be able to state aproblem more broadly and also in a much generalized form then theambiguities linked to the problem can be referred and understood.This really supports in the formulation of a problem of aresearch. Although this process is not that simple and requiresmany fruitful discussions in order to achieve a proper conclusionor a decision.
e. Primary Synopsis – Before starting with the actual study work, itis very necessary for a researcher to prepare a summary or a planabout the activities he has to perform in connection with researchoperation. This will help him a lot to get a definite idea or anunderstanding of what would be written in the final report.
f. Conceptual Clarity – It is very much important for a researcher tohave in depth knowledge and understanding of the subject or thetopic he has to study as it helps a lot in achieving one’s goaland objectives in a much easier and also a comparatively muchsimpler way.
g. Documentation – The documents help in providing importantinformation to a researcher, document is something in writing itcan be a record, files or diaries etc. may be published orunpublished in nature. Documents can be extracted and can be usedin the research work. Various documents can be classified as –

Katherasala Srinivas M.S.W
2. Secondary stage: – This stage of the research consists of allthe features that are actually required to run a research project.This stage includes the following –a. Research project planning: – Involves selection of the future courses
of action for conducting and directing a research project. Aresearch project plan gives a rational approach to research bywhich one is able to decide in advance about what to do, how todo, when to do, where to do and who is to do a particular taskin a specific activity.
b. Research Project formulation: – After the planning of the projecthas been done the researcher follows this with a practicalapproach in order to carry out the project. This step of thesecondary stage involves the systematic setting forth of thetotal research project, with an aim of conducting a systematicstudy.
c. Data collection: – This step involves the in depth meaning for theconcepts that are to be investigated and looks forward to dataanalysis, data requirement etc… Sources of understatement oroverstatement should be avoided and the data should be freefrom any type of error. The data collection planning should bedone or implemented in a very careful manner, with the help ofspecialist researchers. The data should be good and meaningfulin nature should not only be a collection of words but shouldprovide meaningful information.
d. Classification and tabulation – Classification can be defined as thearrangement of the data into groups and classes depending onthe resemblance and the similarities. By classification, thedata can be condensed in a very elegant way by which thevarious important features can be easily noticed i.e. one caneasily highlight the various salient features of the data at aglance. Tabulation of the data can be defined as the orderlyarrangement of the data in columns and the rows this step also
Katherasala Srinivas M.S.W
helps a great deal in the condensation of the data and also inthe analysation of the relations, trends etc
e. Data Analysis – In this step, the collected data is arrangedaccording to some pattern or a particular format and thisanalysation of the data is done mainly to provide the data witha meaning. It is actually the computing of the some of themeasures supported by the search for the relationship patterns,existing among the group of the data.
f. Testing of a hypothesis: – This step of testing acts as the back boneof the data analysis. Various tests like “t” test, “z” test. Chisquare test are used by the statisticians for the testing of thehypothesis.g. Interpretation of results: – It is very important that the results areinterpreted into action recommendations and the results should beable to refer to a decision i.e. should help in drawing aconclusion.
3.FinalStage:-This.stage.involves –a. Conclusions and recommendations – This act as the crux of theresearch project work. Recommendations are based on theconclusions obtained and further these conclusions are based onthe interpretation of the results of data analysis. But a majorpoint to be kept in mind here is that all these conclusions andthe recommendations should be linked to the research hypothesisstated.b. Report Writing - For the researcher as well as the reader, reportwriting is very crucial as it acts as the best way forcommunication between the two. Report written must be very simplein nature with easy language, high clarity. Report writing cannotbe done by everyone and requires an especial skilled person forthis purpose.
Katherasala Srinivas M.S.W
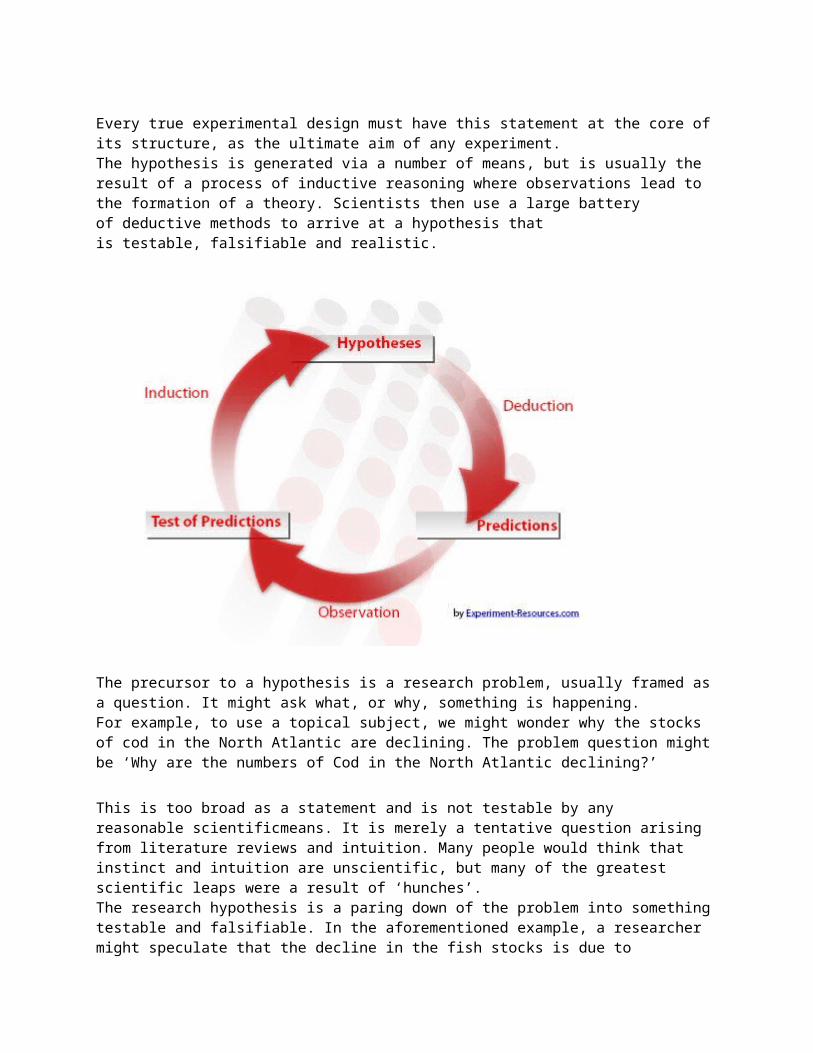
Every true experimental design must have this statement at the core ofits structure, as the ultimate aim of any experiment.The hypothesis is generated via a number of means, but is usually the result of a process of inductive reasoning where observations lead to the formation of a theory. Scientists then use a large battery of deductive methods to arrive at a hypothesis that is testable, falsifiable and realistic.
The precursor to a hypothesis is a research problem, usually framed asa question. It might ask what, or why, something is happening.For example, to use a topical subject, we might wonder why the stocks of cod in the North Atlantic are declining. The problem question mightbe ‘Why are the numbers of Cod in the North Atlantic declining?’
This is too broad as a statement and is not testable by any reasonable scientificmeans. It is merely a tentative question arising from literature reviews and intuition. Many people would think that instinct and intuition are unscientific, but many of the greatest scientific leaps were a result of ‘hunches’.The research hypothesis is a paring down of the problem into somethingtestable and falsifiable. In the aforementioned example, a researcher might speculate that the decline in the fish stocks is due to
Katherasala Srinivas M.S.W
prolonged over fishing. Scientists must generate a realistic and testable hypothesis around which they can build the experiment.
Hypothesis FormulationWhen research is conducted hypothesis formulation is one of the most preliminary step. Hypothesis formulation helps in formulating researchproblem. Hypothesis formulation is not a necessary but an important step of research. A valid and reasonable research can be conducted without any hypothesis. Hypothesis can be one and it can be as many aspossible.
Definition of Hypothesis:
A hypothesis is a possible answer to a research question. It is a presumption or a hunch on the bases of which a study has to be conducted. This hypothesis is tested for possible rejection or approval. If hypothesis get accepted it shows that your hunch was right if it get rejected it still does not mean that your research wasnot valid but ti means that it is the opposite way you thought and perceived. Whether it is approved or not it gives you some conclusion and adds to the available body of knowledge.
A hypothesis which has been tested again and again by various researchers can still be tested for making it more valid but if the hypothesis ha been approved in such a manner that it has become a law than it is better to test something that adds to the available knowledge rather than approving something which has been approved manytimes before.
Example:For example if you want to conduct a study on the Effects of Parental Depression on the Academic Performance of Children, you may like to conduct it without any hypothesis but then you will have many dimensions to think upon and will be more likely get distracted. If you formulate a hypothesis, that parental depression results in

Katherasala Srinivas M.S.W
depression in children too and this depression leads to low grades, your research will get a direction and you will not think about the broader effects of depression everything is well defined you have to test the impact of depression on the children's depression and as wellas on the grades of children. You may not need to test the impacts on the extra curricular activities, class conduct and other such things.
Characteristics of a Well-formulated Research Hypothesis: Testable and Verifiable: A research hypothesis has t5o be checked for possible approval or rejection. This analysis is done statistically and, therefore it should be such that can be tested and analyzed. After analysis the results can be obtained. Some hypothesis can not be tested because they are too subjective and they are not suitable for research. Research needs objectivity and evidences without these two things any research is impossible to conduct. For example you may wantto conduct a research on the existence of God but to prove the existence of God is a far different phenomenon and even you may formulate a hypothesis is but you can not test it statistically, therefore, such hypothesis and research questions should be avoided.
Simple and Clear: The wording of the hypothesis should have to be simple and clear. Any complex ideas and wordings should be avoided. A simple hypothesis will make it easier for you to carry on through out the research and will be easy for the reader to understand. In addition to the terminology and phrasing the hypothesis should have tobe clear in your mind from every perspective. If there are any ambiguities or questions in your mind, resolve them at this stage; if they are not clear you will find it hard to conduct the study in laterstages.
Relevant: The hypothesis should have to be relevant to the study that you are about to conduct. An irrelevant hypothesis will lead to an invalid research. Hypothesis is the possible answer to your research question if your presumption or your presumed answer is wrong and irrelevant your method to find its accuracy too will not result in anyrelevant conclusions. Check whether your hypothesis is related to the direction in which you have planned to take your research or not.
Katherasala Srinivas M.S.W
Importance of Research Hypothesis: For a new researcher it is important to have research hypothesis so asto be directional. Research hypothesis can be present in research and it may not be but if it is present it can have following benefits.
Clarity: Hypothesis brings clarity to research. It makes your mind clear about the way in which you have to carry on the research. Methodology of research depends greatly on research hypothesis. Clarity brings 50 % chances of success in research. At each step you need to be clear about every aspect and dimension. If you are not clear about a single thing you should not go forward, stay where ever you are and resolve the issue and then move to the next step.
Focus: You formulate your research hypothesis and you get a focal point in your research. You need not go off the track and stay intact to the main objective which you set after the hypothesis. Your research becomes organized and haphazard actions are minimized.
Direction: Hypothesis sets a direction of research. This direction shows you what should be the objectives, methodology, mode of analysisand research design. With hypothesis you have a confidence that whatever you have presumed will be tested rather than testing something that is irrelevant to the research.
Objectivity: Every research requires objectivity but without hypothesis you may collect data which is not relevant to the research and hence decreases the objectivity of the research. When you know that your hypothesis only deals with a particular aspect of the phenomenon you will not collect data that is not required and the objectivity and validity of the research increases.
Add to the Body of Knowledge: A hypothesis add to the available body of knowledge. For example you study different literature and you find out that this much work has already been done on this topic and you should concentrate on the gaps that are yet to be filled by new research you formulate a hypothesis and keep your direction towards it.
Katherasala Srinivas M.S.W
Types of Hypothesis1.Research HypothesisThe hypothesis derived from theiries is termed as research, hypothesis or working hypothesis. The researcher, wh wishes to study asocial phenomenon, looks for various theories about the social phenomenon, because theories explain the nature of things or events. Thus, these explanation are regraded as supposition, or tentative statements about reality until their are verified to the researcher’s satisfaction. These suppositions or statements identified by the researcher for testing know as research hypothesis and conventionally symbolized as H1. Example of research hypothesis are: female visit cinema oftener than make or broken homes lead to juvenile delinquency.
2.Null Hypothesis For the purpose of testing a research hypothesis, a researcher formulate the corollary of it which is termed as null hypothesis. Itis in one way, the reverse of research hypothesis, which refutes or denies the relationship expressed in research hypothesis. In other words, a null hypotheisis states that there is no difference or relationship between variables. Let us consider the research hypothesis dicussed above
H1 Female visit cinema ofterner than Male. H2 Broken homes leads to juvenile delinquency. The null hypotheses for the above research hypotheses would be:
H0 Females and males do not differ in respect of the frequency of visting cinema. H0 There is no relationship between broken homes and juvenile delinquency.
Conventionally, the null hypothesis is tested in researach because it is ordinarily more exact, and is easy to disprove. Statistical techniques are better adopted to test a null hypothesis.
Katherasala Srinivas M.S.W
Step in Testing Hypothesis Step 1: State the research Hypothesis. (H1) : There is a ignificant difference between undergraduate and post-graduate students with regards to their reading habits Step 2; Formulate the Null Hypothesis (H2) : There is no significant difference between undergraduate and post-graduate students with regard to their reading habits. Step 3: Choose a Statistical Test : Let us suppose that we have decided to use chi-square statistic(X 2) totest the relationship between the variables considered in the researchhypothesis. Step 4: Specify a Significance Level : Further, we soppose that we would like to test our hypothesis at .05 level of significance.
Step 5: Compute the Statistical Test : In this step the researcher has to cross-tabulate his data and computechi-square test Step 6: Reject/Accept the H0 : If the calculate value of chi-square is more than critical value we reject the null hypothesis Step 7: Draw the Inference, i.e., Accept/Reject H1 : we accept the research hypothesis because the null hypothesis has been rejected.Hence,we can infer that there is asiginificant difference between undergraduate and post-graduate students with regard to their reading habbits.
Type I and Type II Errors Unlike physiscal sciences,in social sciences we do not find propositions that indicate certainty in real world almost all the propositions generally indicate some sort of probabilities.Thus instead of stating that if A is true,B must follow,we say only if A istrue,B will probably also be true. We thus admit the possibillity that B may be false even if A is true. Thus,if we reject A whenever B is false,we also run the risk of makingerror that of rejected a true research hypothesis (H1). We refer to this kind of error as type I error or α error. Otherwise if we fail to reject (accept) A when B is true, we again runthe risk of making an error, since A may actually be false.Accepting a
Katherasala Srinivas M.S.W
false research hypothesis (H1) is referred to as type II error or β error.
Examples: 1. Most members will conform to sociental norm (A). 2.It is a norm of society not to steal. 3. B is a member of society
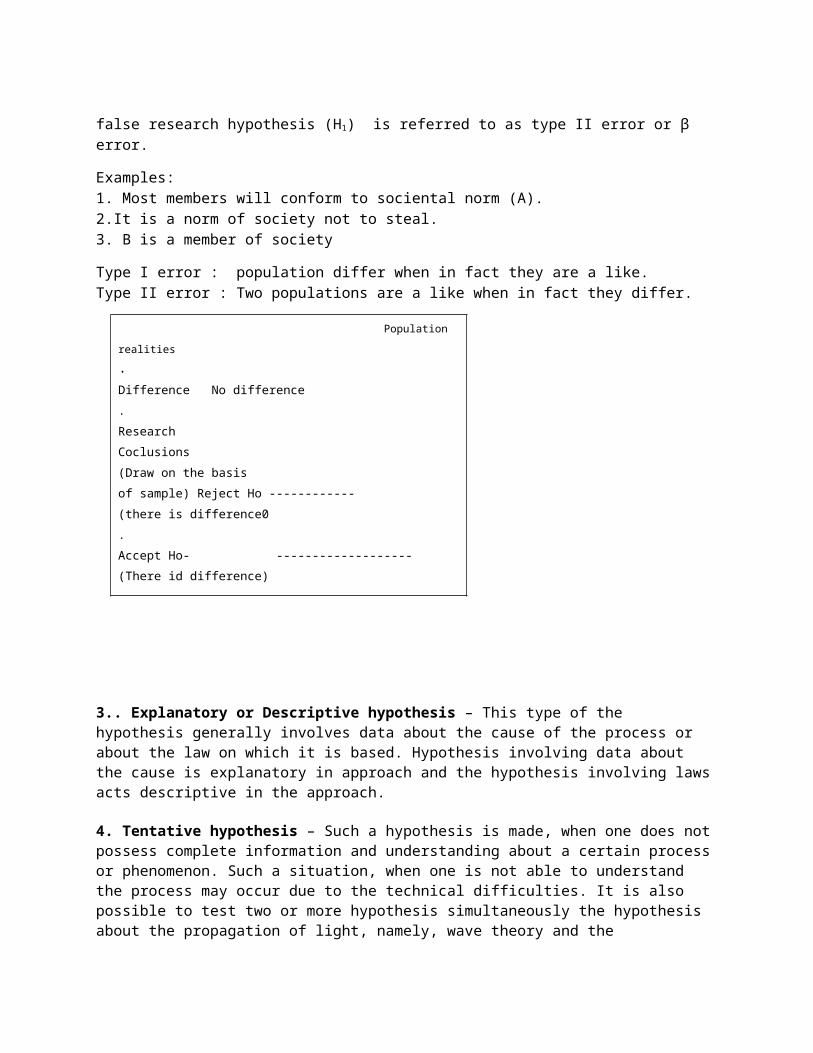
Type I error : population differ when in fact they are a like. Type II error : Two populations are a like when in fact they differ.
Population realities . Difference No difference . Research Coclusions (Draw on the basis of sample) Reject Ho ------------ (there is difference0 . Accept Ho- ------------------- (There id difference)
3.. Explanatory or Descriptive hypothesis – This type of the hypothesis generally involves data about the cause of the process or about the law on which it is based. Hypothesis involving data about the cause is explanatory in approach and the hypothesis involving lawsacts descriptive in the approach.
4. Tentative hypothesis – Such a hypothesis is made, when one does notpossess complete information and understanding about a certain processor phenomenon. Such a situation, when one is not able to understand the process may occur due to the technical difficulties. It is also possible to test two or more hypothesis simultaneously the hypothesis about the propagation of light, namely, wave theory and the

Katherasala Srinivas M.S.W
corpuscular theory of light both describe the light’ s phenomenon but among both of these none of them is final hence these can be referred to as tentative in nature.
5.. Representative fictions – Some hypothesis are based on the assumptions and depending on the nature of the case, it is not at all possible to prove these assumptions by the direct means such hypothesis is referred to as the representative fictions. The only positive point of these representative fictions is that they are very suitable in order to explain the whole phenomenon.
Problems faced during hypothesis formulationFormulating a hypothesis is not at all an easy process and is faced with a large number of difficulties. According to Goode and Hatt, the various difficulties faced during the formulation of the hypothesis generally include the lack of the knowledge about the scientific approach of the method involved, as sometimes it becomes impossible togather the complete information about a particular scientific method. One other major difficulty in the formulation of the hypothesis is thelack of clear theoretical background. Because of this problem of unclear and indefinite background of theory one is not able to arrive to a conclusion easily.
But with time answers to all such problems are available and these difficulties that arise during the hypothesis formulation can be easily removed by having complete and accurate information about the concepts of the subjects involved. Also the hypothesis should not be very long and should be timely in nature.
Katherasala Srinivas M.S.W
Social work Research Unit-III
Research DesignConventional Designs
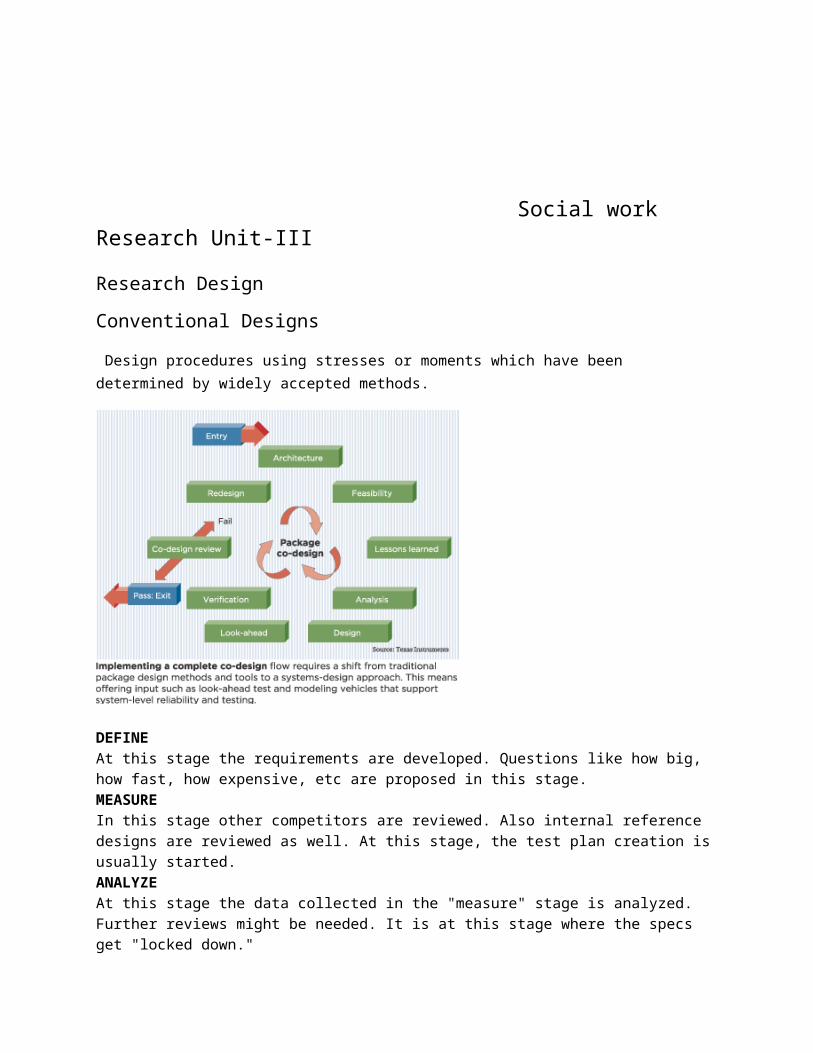
Design procedures using stresses or moments which have been determined by widely accepted methods.
DEFINEAt this stage the requirements are developed. Questions like how big, how fast, how expensive, etc are proposed in this stage. MEASUREIn this stage other competitors are reviewed. Also internal reference designs are reviewed as well. At this stage, the test plan creation isusually started. ANALYZEAt this stage the data collected in the "measure" stage is analyzed. Further reviews might be needed. It is at this stage where the specs get "locked down."

Katherasala Srinivas M.S.W
DESIGN At this stage the design work begins. Engineers use tools such as CAD,spreadsheets, FEAs and verification (prototype) designs are developed.The design is further refined at this stage. VERIFY At this stage the designs go through the qualification testing, as well as any regulatory testing. Failure to complete this stage is at its most expensive, since tools have been created, lines have been created etc. Failure to pass regulatory tests can push the release of a design up to 1 year later.
PRODUCTION The design is released for production. Further improvements and cost reduction activities start and continue at this stage for the life of the product. OBSOLESCENCE All good things come to an end. At this stage, perhaps competitor comes out with a better design, the cost of the raw materials have gone up, the tools get old, the market no longer wants it, key components are going obsolete, whatever. It is at this stage that the decision is made to retire the design. A new product may be needed, which will start the process all over again.
Research Purpose The purpose of your research can be exploratory, descriptive, explanatory or policy-oriented. These categories are not mutually exclusive, they are a matter of emphasis. As any research study will change and develop over time, you may identify more than one purpose. These four types of research are discussed below. Exploratory Research
Exploratory research might involve a literature search or conducting focus group
interviews. The exploration of new phenomena in this way may help theresearcher’s need for better understanding, may test the feasibility of a more extensive study, or determine the best methods to be used in a subsequent study. For these reasons, exploratory research is broad

Katherasala Srinivas M.S.W
in focus and rarely provides definite answers to specific research issues. The objective of exploratory research is to identify key issues and key variables. For example, one outcome might be a better system of measurement for a specific variable.Ifyoudefineyourstudyasexploratoryresearch,thenyouneedtoclearlydefinete objectives. Calling your report “exploratory” inot an excusefor lack of definition. EXAMPLE An example in the business environment might be an exploratory study of a new management technique in order to brief a management team. This would be a vital first step before deciding whether to embrace the technique
Descriptive Research As its name suggests, descriptive research seeks to provide an accurate description of observations of a phenomena. The object of thecollection of census data is to accurately describe basic information about a national population at a particular point in time. The objective of much descriptive research is tomap the terrain of a specific phenomenon. A study of this type could start with questions such as: ‘What similarities or contrasts exist between A and B?’,whereA and B are differentdepartments in the same organisation, different regional operations of the same firm, or different companies in the same industry. Such descriptive comparisonscan produce useful insightsand lead to hypothesis-formation.
EXAMPLE A detailed set of data on the profile of clients would be an example of thistype of report. By understanding the customer better,sales and marketing management will be able to take better decisions on new product development. Explanatory Research Explanatory studies look for explanations of the nature
Katherasala Srinivas M.S.W
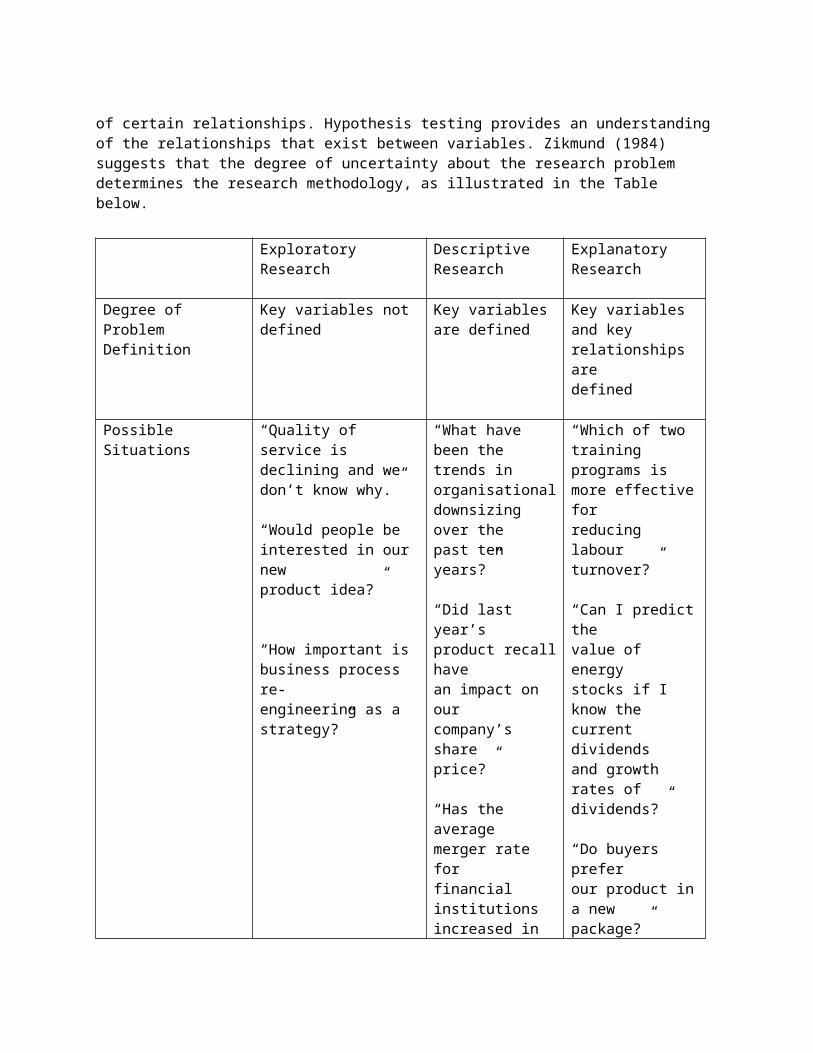
of certain relationships. Hypothesis testing provides an understandingof the relationships that exist between variables. Zikmund (1984) suggests that the degree of uncertainty about the research problem determines the research methodology, as illustrated in the Table below.
Exploratory Research
Descriptive Research
Explanatory Research
Degree of Problem Definition
Key variables not defined
Key variables are defined
Key variables and key relationships are defined
Possible Situations
“Quality of service is declining and we don’t know why.”
“Would people be interested in our new product idea?”
“How important is business process re-engineering as a strategy?”
“What have been the trends in organisationaldownsizing over the past ten years?”
“Did last year’s product recallhave an impact on our company’s share price?”
“Has the average merger rate for financial institutions increased in
“Which of two training programs is more effectivefor reducing labour turnover?”
“Can I predictthe value of energy stocks if I know the current dividends and growth rates of dividends?”
“Do buyers prefer our product ina new package?”
Katherasala Srinivas M.S.W
the past decade?”
Experimental Study Design
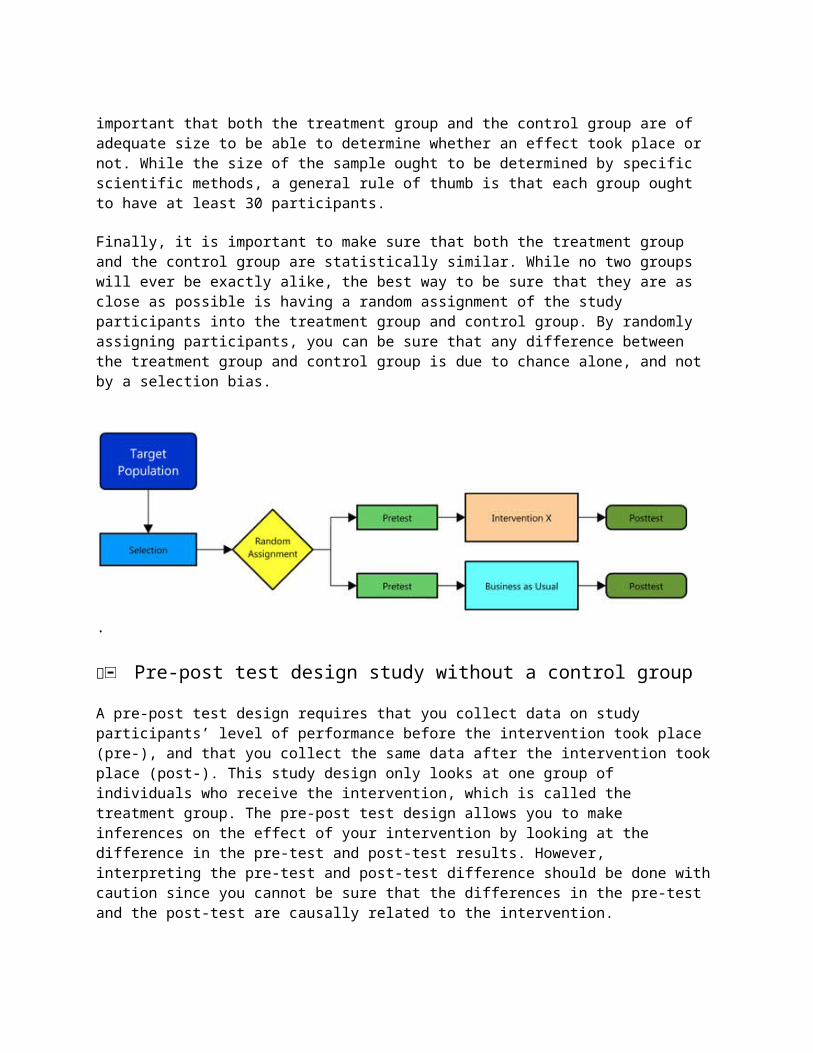
An experimental study is a type of evaluation that seeks to determine whether a program or intervention had the intended causal effect on program participants. There are three key components of an experimental study design:
(1) pre-post test design, (2) a treatment group and a control group, and (3) random assignment of study participants.
A pre-post test design requires that you collect data on study participants’ level of performance before the intervention took plac (pre-), and that you collect the same data on where study participants are after the intervention took place (post). This designis the best way to be sure that your intervention had a causal effect.
To get the true effects of the program or intervention, it is necessary to have both a treatment group and a control group. As the name suggests, the treatment group receives the intervention. The control group, however, gets the business-as-usual conditions, meaningthey only receive interventions that they would have gotten if they had not participated in the study. By having both a group that received the intervention and another group that did not, researchers control for the possibility that other factors not related to the intervention (e.g., students getting accustomed to a test, or simple maturation over the intervening time) are responsible for the difference between the pre-test and post-test results. It is also
Katherasala Srinivas M.S.W
important that both the treatment group and the control group are of adequate size to be able to determine whether an effect took place or not. While the size of the sample ought to be determined by specific scientific methods, a general rule of thumb is that each group ought to have at least 30 participants.
Finally, it is important to make sure that both the treatment group and the control group are statistically similar. While no two groups will ever be exactly alike, the best way to be sure that they are as close as possible is having a random assignment of the study participants into the treatment group and control group. By randomly assigning participants, you can be sure that any difference between the treatment group and control group is due to chance alone, and not by a selection bias.
.
Pre-post test design study without a control group
A pre-post test design requires that you collect data on study participants’ level of performance before the intervention took place (pre-), and that you collect the same data after the intervention tookplace (post-). This study design only looks at one group of individuals who receive the intervention, which is called the treatment group. The pre-post test design allows you to make inferences on the effect of your intervention by looking at the difference in the pre-test and post-test results. However, interpreting the pre-test and post-test difference should be done withcaution since you cannot be sure that the differences in the pre-test and the post-test are causally related to the intervention.
Katherasala Srinivas M.S.W
Pre-post test design with a control group
While the pre-post test design will allow you to measure the potentialeffects of an intervention by examining the difference in the pre-testand post-test results, it does not allow you to test whether this difference would have occurred in the absence of your intervention. For example, perhaps the effect of improved academic achievement is due to the students getting used to taking a test rather than the use of educational software. To get the true effects of the program or intervention, it is necessary to have both a treatment group and a control group. As the names suggest, the treatment group receives the intervention. The control group, however, gets the business-as-usual conditions, meaning they only receive interventions that they would have gotten if they had not participated in the study. By having both a group that received the intervention and another group that did not,researchers control for the possibility that other factors not relatedto the intervention (e.g., students getting accustomed to a test, or simple maturation over the intervening time) are responsible for the difference between the pre-test and post-test results. It is also important that both the treatment group and the control group are of adequate size to be able to determine whether an effect took place or not. While the size of the sample ought to be determined by specific scientific methods, a general rule of thumb is that each group ought to have at least 30 participants.
Quasi-Experimental Study
A quasi-experimental study is a type of evaluation which aims to determine whether a program or intervention has the intended effect ona study’s participants. Quasi-experimental studies take on many forms,but may best be defined as lacking key components of a true experiment. While a true experiment includes (1) pre-post test design, (2) atreatment group and a control group, and (3) random assignment of study participants, quasi-experimental studies lack one or more of these design elements.
Since the most common form of a quasi-experimental study includes a pre-post test design with both a treatment group and a control group, quasi-experimental studies are often an impact evaluation that assignsmembers to the treatment group and control group by a method other than random assignment. Because of the danger that the treatment and
Katherasala Srinivas M.S.W
control group may differ at the outset, researchers conducting quasi-experimental studies attempt to address this in a number of other ways(e.g., by matching treatment groups to like control groups or by controlling for these differences in analyses). This section focuses on two forms of quasi-experimental studies: a pre-post test design study without a control group and a pre-post test design with a control group.
Single Subject Research Single subject research is a study which aims to examine whether an intervention has the intended effect on an individual, or on many individuals viewed as one group. The two most common single subject research designs are the A-B-A-B design, and multiple baseline design. Each ofthese designs has two main components: (1) a focus on the individual and (2) a design in which each individual is used as his or her own control observation. The focus on the individual differs from other research designs, such as experimental and quasi-experimental designs, which look at the average effect of an intervention within or between groups of people. In single subject research, researchers often use more than one individual, but results are examined by using each individual as his or her own control, rather than averaging results of different groups.Comparisons are made on the behavior of one individual to that same individual at a different point in time. Single subject research has an important role to play in identifying and documenting solutions for individuals with disabilities. The fieldneeds much more evidence on what works for whom, under what conditions, for which tasks, etc. Although individuals with disabilities—even those with the same diagnosis—often experience unique needs, solutions may be adaptable in different environments, and knowledge sharing can inform others working on assistive solutions Multiple baseline design Because single subject designs focus on studying individuals rather than groups, they can be particularly vulnerable to threats to
Katherasala Srinivas M.S.W
internal validity. Internal validity addresses how valid it is to makecausal inferences about the intervention in the study. For more, see section on validity. Particular internal validity threats in the A-B-A-B single subject research design are maturation (the natural growth in the study participant’s ability over time) and test-retest (a study participant doing better on each administration of a test due to their experience taking the test). The multiple baseline design helps to control for these threatsto internal validity by having a study participant give multiple baseline observations before using the intervention. Further, if multiple individuals are tested with the treatment given at different time points for different individuals, researchers can have a better understanding of whether or not the treatment is effective. Unlike A-B-A-B single subject research designs,.
Time series DesignsIn many ways the single subject approach is similar to a time series analysis in that the stabiity and changes in behavior are studied across time or experimental sessions. Time series analysis is characterized by repeated measurements of the dependent variable over time with an introduction of the independent variable at a particular point in time.Trends or patterns of behavior are observed both before and after introduction of the independent variable. Consistent with the theme of this chapter, the time series analysis can be conducted with more than one participant but data analysis is typically focused on individual participants. Because time series analysis is characterized by relatively long

Katherasala Srinivas M.S.W
term measurements of some dependentvariable, you must be careful to consider extraneous variables often associated with repeated measures designs. These include history, maturation, attrition, instrumentation, and carryover effects. In some cases, a change in thelevel of behavior may be the result of one of these extraneous variables rather than the introduction of the independent variable.
Time series analysis is also a technique that is often used to track changes in behavior that occur on a large scale. For example, does a full moon make people more likely to commit crimes? One could track crime statistics on a daily basis over a long period of time andrelatethose statistics to the fullness of the moon. Note that this is not anexperimental design because there is no independent variable manipulated by the researcher. Thus, cause/effect conclusions would not be warranted. A time series analysis in which there is a bit more control would involve the tracking of crime statisticsbothbefore and after a new law is passed that increases the punishment for a particularcrime. One primary purpose of such a law isto cause a reduction in the incidence of the crime. Even in this latter example it is very difficult to verify the effect of this new law because there are so many other factors that influence crime rate that are likely to vary over time (e.g., the economy). However, this is not to suggest that time series analysis of such questions should not take place. In fact, they should. What we do suggest is that we all need to evaluate such information with a very critical eye.
Definition of Program Evaluation Evaluation is the systematic application of scientific methods to assess the design, implementation, improvement or outcomes of a program (Rossi & Freeman, 1993; Short, Hennessy, & Campbell, 1996). The term "program" may include any organized action such as media campaigns, service provision, educational services, public policies, research projects, etc. (Center for Disease Control and Prevention [CDC], 1999). Purposes for Program Evaluation Demonstrate program effectiveness to funders Improve the implementation and effectiveness of programsBetter manage limited resourcesDocument program accomplishmentsJustify current program fundingSupport the need for increased levels of funding
Katherasala Srinivas M.S.W
Satisfy ethical responsibility to clients to demonstrate positive and negative effects of program participation (Short, Hennessy, & Campbell, 1996). Document program development and activities to help ensure successful replication
Barriers Program evaluations require funding, time and technical skills: requirements that are often perceived as diverting limited program resources from clients. Program staff are often concerned that evaluation activities will inhibit timely accessibility to services orcompromise the safety of clients. Evaluation can necessitate alliancesbetween historically separate community groups (e.g. academia, advocacy groups, service providers; Short, Hennessy, & Campbell, 1996). Mutual misperceptions regarding the goals and process of evaluation can result in adverse attitudes (CDC, 1999; Chalk & King, 1998).
Overcoming Barriers Collaboration is the key to successful program evaluation. In evaluation terminology, stakeholders are defined as entities or individuals that are affected by the program and its evaluation (Rossi& Freeman, 1993; CDC, 1999). Involvement of these stakeholders is an integral part of program evaluation. Stakeholders include but are not limited to program staff, program clients, decision makers, and evaluators. A participatory approach to evaluation based on respect for one another's roles and equal partnership in the process overcomesbarriers to a mutually beneficial evaluation (Burt, Harrell, Newmark, Aron, & Jacobs, 1997; Chalk & King, 1998). Identifying an evaluator with the necessary technical skills as well as a collaborative approach to the process is integral. Programs have several options foridentifying an evaluator. Health departments, other state agencies, local universities, evaluation associations and other programs can provide recommendations. Additionally, several companies and university departments providing these services can be located on the internet. Selecting an evaluator entails finding an individual who hasan understanding of the program and funding requirements for evaluations, demonstrated experience, and knowledge of the issue that the program is targeting (CDC, 1992).
Katherasala Srinivas M.S.W
Types of Evaluation Various types of evaluation can be used to assess different aspects orstages of program development. As terminology and definitions of evaluation types are not uniform, an effort has been made to briefly introduce a number of types here.
Context Evaluation Investigating how the program operates or will operate in a particular social, political, physical and economic environment. This type of evaluation could include a community needs or organizational assessment (http://www.wkkf.org/Publications/evalhdbk/default.htm). Sample question: What are the environmental barriers to accessing program services? Formative Evaluation Assessing needs that a new program should fulfill (Short, Hennessy, & Campbell, 1996), examining the early stages of a program's development (Rossi & Freeman, 1993), or testing a program on a small scale before broad dissemination (Coyle, Boruch, & Turner, 1991). Sample question: Who is the intended audiencefor the program? Process Evaluation Examining the implementation and operation of program components. Sample question: Was the program administered as planned? Impact Evaluation Investigating the magnitudeof both positive and negative changes produced by a program (Rossi & Freeman, 1993). Some evaluators limit these changes to those occurringimmediately (Green & Kreuter, 1991). Sample question: Did participantknowledge change after attending the program? Outcome
Evaluation Assessing the short and long-term results of a program. Sample question: What are the long-term positive effects of program participation? Performance or Program Monitoring
Similar to process evaluation, differing only by providing regular updates of evaluation results to stakeholders rather than summarizing results at the evaluation's conclusion (Rossi & Freeman, 1993; Burt, Harrell, Newmark, Aron, & Jacobs, 1997).
Evaluation Standards and Designs

Katherasala Srinivas M.S.W
Evaluation should be incorporated during the initial stages of programdevelopment. An initial step of the evaluation process is to describe the program in detail. This collaborative activity can create a mutualunderstanding of the program, the evaluation process, and program and evaluation terminology. Developing a program description also helps ensure that program activities and objectives are clearly defined and that the objectives can be measured. In general, the evaluation shouldbe feasible, useful, culturally competent, ethical and accurate (CDC, 1999). Data should be collected over time using multiple instruments that are valid, meaning they measure what they are supposed to measure, and reliable, meaning they produce similar results consistently (Rossi & Freeman, 1993). The use of qualitative as well as quantitative data can provide a more comprehensive picture of the program. Evaluations of programs aimed at violence prevention should also be particularly sensitive to issues of safety and confidentiality. Experimental designs are defined by the random assignment of individuals to a group participating in the program or to a control group not receiving the program. These ideal experimentalconditions are not always practical or ethical in "real world" constraints of program delivery. A possible solution to blending the need for a comparison group with feasibility is the quasi-experimentaldesign in which an equivalent group (i.e. individuals receiving standard services) is compared to the group participating in the target program. However, the use of this design may introduce difficulties in attributing the causation of effects to the target program. While non-experimental designs may be easiest to implement ina program setting and provide a large quantity of data, drawing conclusions of program effects are difficult. Participatory Research Methods Participatory research comprises a range of methodological approaches and techniques, all with the objective of handing power from the researcher to research participants, who are often community members or community-based organisations. In participatory research, participants have control over the research agenda, the process and actions. Most importantly, people themselves are the ones who analyse and reflect on the information generated, in order to obtain the findings and conclusions of the researchprocess. Participatory research involves inquiry, but also action. People not only discuss their problems, they also think about possible solutions to them and actions which need to be taken. The research conducted by the Participatory Research Group (PRG) aims to influence decision-making processes and impact peoples’ lives locally and nationally. The

Katherasala Srinivas M.S.W
challenge is that the views of the most marginalised people are by definition largely absent in public forums, which further excludes them and in turn amplifies the perspectives of the more powerful groups. Bringing these people and perspectives into policy processes is not a straightforward task. Participatory research is one way that these perspectives can be articulated, and yet there are many challenges in how to do this well.
Methods used in Participate research
The research studies used a range of techniques. These included focus groups and multi stakeholder meetings, participatory inquiry, action research, oral testimonies and story collection as a foundation for collective analysis, photo- digital stories, photovoice, drawing and essay writing competitions, participatory video, and immersions.
Characteristics of Participatory Research
In sharp contrast to elitist research the key features of participatory research are:
people are the subjects of research: the dichotomy between subject andobject is brokenpeople themselves collect the data, and then process and analyse the information using methods easily understood by themthe knowledge generated is used to promote actions for change or to improve existing local actionsthe knowledge belongs to the people and they are the primary beneficiaries of the knowledge creationresearch and action are inseparable – they represent a unityresearch is a praxis rhythm of action-reflection where knowledge creation supports actionpeople function as organic intellectualsthere is an built-in mechanism to ensure authenticity and genuineness of the information that is generated because people themselves use theinformation for life improvement.
Katherasala Srinivas M.S.W
Such participatory research may not get written up. Oral and visual methods characterise this process of knowledge creation. If people canbe stimulated to write them up in their own idiom then such research could be an important source of a people’s literature, and reading materialsfor a wider public.
Some of the material could be translated into pictures, cartoons, graphics, posters and slogans which may be a more effective method of communication. Such documentation may be carried out by community activists who are well placed to articulate the community’s way of thinking.
collect informationreflect and analyse ituse the results as a knowledge base for life improvement, andwhenever possible, to document the results for wider dissemination ie for the creation of a people’s literature.
The key processes of Participatory Research The promotion of participatory research is basically an exercise in stimulating the people to:
Social Work Research Unit – IVSampling
Researchers usually cannot make direct observations of every individual in the population they are studying. Instead, they collect data from a subset of individuals – a sample – and use those observations to make inferences about the entire population.
Katherasala Srinivas M.S.W
Ideally, the sample corresponds to the larger population on thecharacteristic(s) of interest. In that case, the researcher's conclusions from the sample are probably applicable to the entire population.
This type of correspondence between the sample and the larger population is most important when a researcher wants to know what proportion of the population has a certain characteristic – like a particular opinion or a demographic feature. Public opinion polls that try to describe the percentage of the population that plans to vote for a particular candidate, for example, require a sample that is highly representative of the population.
Types of Sampling Desing
When conducting research, it is almost always impossible to study theentire population that you are interested in. For example, if you werestudying political views among college students in the United States , it would be nearly impossible to survey every single college student across the country. If you wereto survey the entire population, it would be extremely timely and costly. As a result, researcher use sample asa a way to gather data.
A sample is a subset of the population being studied. It represents the larger population and is used to draw inferences about that population. It is a research technique widely used in the social sciences as a way to gather information about a population without having to measure the entire population.
There are several different types and ways of choosing a sample from apopulation, from simple to complex
Katherasala Srinivas M.S.W
Non-probability Sampling Techniques
Non-probability sampling is a sampling technique where the samples are gathered in a process that does not give all the individuals in the population equal chances of being selected.
Reliance On Available Subjects. Relying on available subjects, such asstopping people on a street corner as they pass by, is one method of sampling, although it is extremely risky and comes with many cautions.This method, sometimes referred to as a convenience sample, does not allow the researcher to have any control over the representativeness of the sample. It is only justified if the researcher wants to study the characteristics of people passing by the street corner at a certain point in time or if other sampling methods are not possible. The researcher must also take caution to not use results from a convenience sample to generalize to a wider population.
Purposive or Judgmental Sample. A purposive, or judgmental, sample is one that is selected based on the knowledge of a population and the purpose of the study. For example, if a researcher is studying the nature of school spirit as exhibited at a school pep rally, he or she might interview people who did not appear to be caught up in the emotions of the crowd or students who did not attend the rally at all.In this case, the researcher is using a purposive sample because thosebeing interviewed fit a specific purpose or description.
Snowball Sample. A snowball sample is appropriate to use in research when the members of a population are difficult to locate, such as homeless individuals, migrant workers, or undocumented immigrants. A snowball sample is one in which the researcher collects data on the few members of the target population he or she can locate, then asks those individuals to provide information needed to locate other members of that population whom they know. For example, if a

Katherasala Srinivas M.S.W
researcher wishes to interview undocumented immigrants from Mexico, heor she might interview a few undocumented individuals that he or she knows or can locate and would then rely on those subjects to help locate more undocumented individuals. This process continues until theresearcher has all the interviews he or she needs or until all contacts have been exhausted.
Quota Sample. A quota sample is one in which units are selected into asample on the basis of pre-specified characteristics so that the totalsample has the same distribution of characteristics assumed to exist in the population being studied. For example, if you a researcher conducting a national quota sample, you might need to know what proportion of the population is male and what proportion is female as well as what proportions of each gender fall into different age categories, race or ethnic categories, educational categories, etc. The researcher would then collect a sample with the same proportions as the national population.
Probability Sampling Techniques
Probability sampling is a sampling technique where the samples are gathered in a process that gives all the individuals in the populationequal chances of being selected.
Simple Random Sample. The simple random sample is the basic sampling method assumed in statistical methods and computations. To collect a simple random sample, each unit of the target population is assigned anumber. A set of random numbers is then generated and the units havingthose numbers are included in the sample. For example, let’s say you have a population of 1,000 people and you wish to choose a simple random sample of 50 people. First, each person is numbered 1 through 1,000. Then, you generate a list of 50 random numbers (typically with a computer program) and those individuals assigned those numbers are the ones you include in the sample.
Katherasala Srinivas M.S.W
Systematic Sample. In a systematic sample, the elements of the population are put into a list and then every kth element in the list is chosen (systematically) for inclusion in the sample. For example, if the population of study contained 2,000 students at a high school and the researcher wanted a sample of 100 students, the students wouldbe put into list form and then every 20th student would be selected for inclusion in the sample. To ensure against any possible human biasin this method, the researcher should select the first individual at random. This is technically called a systematic sample with a random start.
Stratified Sample. A stratified sample is a sampling technique in which the researcher divided the entire target population into different subgroups, or strata, and then randomly selects the final subjects proportionally from the different strata. This type of sampling is used when the researcher wants to highlight specific subgroups within the population. For example, to obtain a stratified sample of university students, the researcher would first organize thepopulation by college class and then select appropriate numbers of freshmen, sophomores, juniors, and seniors. This ensures that the researcher has adequate amounts of subjects from each class in the final sample.
Cluster Sample. Cluster sampling may be used when it is either impossible or impractical to compile an exhaustive list of the elements that make up the target population. Usually, however, the population elements are already grouped into subpopulations and lists of those subpopulations already exist or can be created. For example, let’s say the target population in a study was church members in the United States. There is no list of all church members in the country. The researcher could, however, create a list of churches in the UnitedStates, choose a sample of churches, and then obtain lists of members from those churches.
Katherasala Srinivas M.S.W
Simple Random Samples
The simplest type of random sample is a simple random sample, often called an SRS. Moore and McCabe define a simple random sample as follows: "A simple random sample (SRS) of size n consists of n individuals from the population chosen in such a way that every set of n individuals has an equal chance to be the sample actually selected."1.
Here, population refers to the collection of people, animals, locations,etc. that the study is focusing on. Some examples:
1. In a medical study, the population might be all adults over age 50 who have high blood pressure.
2. In another study, the population might be all hospitals in the U.S. that perform heart bypass surgery.
3. If we are studying whether a certain die is fair or weighted, thepopulation would be all possible tosses of the die.
In Example 3, it is fairly easy to get a simple random sample: Just toss the die n times, and record each outcome.
Selecting a simple random sample in examples 1 and 2 is much harder. Agood way to select a simple random sample for Example 2 would proceed as follows:
First, obtain or make a list of all hospitals in the U.S. that performheart bypass surgery. Number them 1, 2, ... up to to the total number M of hospitals in the population. (Such a list is called a sampling frame.)Then use some sort of random number generating process2 to obtain a simple random sample of size n from the population of integers 1, 2, ..., M. The simple random sample of hospitals would consist of the hospitals in the list that correspond to the numbers in the SRS ofnumbers.

Katherasala Srinivas M.S.W
In theory, the same process could be used in Example 1. However, obtaining the sampling frame would be much harder -- probably impossible. So some compromises may need to be made. Unfortunately, these compromises can easily lead to a sample that is biased or otherwise not close enough to random to be suitable for the statistical procedures used.
Indeed, even the sampling procedure described above is a compromise and may not be suitable in some situations, described in the next
section.
stratified
A stratified sample is a probability sampling technique in which the researcher divides the entire target population into different subgroups, or strata, and then randomly selects the final subjects proportionally from the different strata. This type of sampling is used when the researcher wants to highlight specific subgroups within the population.
For example, to obtain a stratified sample of university students, theresearcher would first organize the population by college class and then select appropriate numbers of freshmen, sophomores, juniors, and seniors. This ensures that the researcher has adequate amounts of subjects from each class in the final sample.
It is important to note that the strata used in stratified sampling must not overlap. Having overlapping subgroups will give some individuals a higher chance of being selected as subjects in the sample. If this happened, it would not be a probability sample.

Katherasala Srinivas M.S.W
Some of the most common strata used in stratified random sampling are age, gender, religion, educational attainment, socioeconomic status, and nationality
When To Use Stratified Sampling
There are many situations in which researchers would choose stratifiedrandom sampling over other types of sampling. First, it is used when the researcher wants to highlight a specific subgroup within the population. Stratified sampling is good for this because it ensures the presence of key subgroups within the sample.
Researchers also use stratified random sampling when they want to observe relationships between two or more subgroups. With this type ofsampling, the researcher is guaranteed subjects from each subgroup areincluded in the final sample, whereas simple random sampling does not ensure that subgroups are represented equally or proportionately within the sample.
Researchers who are interested in rare extremes of a population often use stratified random sampling because he or she can representatively sample even the smallest and most inaccessible subgroups of the population. Simple random sampling does not allow this.
Stratified random samples generally require smaller sample sizes, which in turn can save a lot of time, money, and effort for the researchers. This is because this type of sampling technique has a high statistical precision compared to simple random sampling due to the fact that the variability within the subgroups is lower compare tothe variations of dealing with an entire population.
Proportionate Stratified Random Sample
In proportional stratified random sampling, the size of each strata isproportionate to the population size of the strata when looked at across the entire population. This means that each stratum has the
Katherasala Srinivas M.S.W
same sampling fraction. For example, let’s say you have four strata with population sizes of 200, 400, 600, and 800. If you choose a sampling fraction of ½, this means you must randomly sample 100, 200, 300, and 400 subjects from each stratum respectively. The same sampling fraction is used for eachstratum regardless of the differences in population size of the strata.
Disproportionate Stratified Random Sample
In disproportionate stratified random sampling, the different strata do not have the same sampling fractions as each other. For instance, if your four strata contain 200, 400, 600, and 800 people, you may choose to have different sampling fractions for each stratum. Perhaps the first strata with 200 people has a sampling fraction of ½, resulting in 100 people selected for the sample, while the last stratawith 800 people has a sampling fraction of ¼, resulting in 200 people selected for the sample. The precision ofusing disproportionate stratified random sampling is highly dependent on the sampling fractions chosen and used by the researcher. Here, theresearcher must be very careful and know exactly what he or she is doing. Mistakes made in choosing and using sampling fractions could result in a stratum that is overrepresented or underrepresented, resulting in skewed results.
Advantages of Stratified Sampling
Using a stratified sample will always achieve greater precision than asimple random sample, provided that the strata have been chosen so that members of the same stratum are as similar as possible in terms of the characteristic of interest. The greater the differences betweenthe strata, the greater the gain in precision. Administratively, it is often more convenient to stratify a sample than to select a simple random sample. For instance, interviewers can be trained on how to best deal with a particular age or ethnic group while others are trained on the best way to deal with a different age or ethnic group. This way the interviewers can concentrate on and refine a small set of skills and it is less timely and costly for the researcher. A final advantage that stratified random sampling has over simple random sampling is that is guarantees better coverage of the population. The researcher has control over the subgroups that are
Katherasala Srinivas M.S.W
included in the sample, whereas simple random sampling does not guarantee than any one type of person will be included in the final sample.
Disadvantages of Stratified Sampling One main disadvantage of stratified random sampling is that is can be difficult to identify appropriate strata for a study. A second disadvantage is that it is more complex to organize and analyze the results compared to simple random sampling.
Social WoRK Research Unit – VMethods and tools of Data Collection : Primary and Secondary Data CollectionWhen you’re working on any kind of research, there are going to be twotypes of data: primary and secondary. Primary data is collected from afirst-hand experience and is reliable and authentic. Secondary data isalready published. Just because one type of data is primary does not mean that it is less important. You need primary and secondary data collection in all types of projects to make sure that your conclusionsare well informed. We can work on both types of data collection for you so that you can be sure your project will come out complete.
Primary Data Collection Primary data can be collected by using experiments, surveys, questionnaires, interviews, and observations. If you’ve already gathered this information, we can then analyze it and then come up with accurate results based on your needs. But if you haven’t already gotten this information together, no problem! We can also help with that step of data collection as well.
We Make Primary Data Collection Easy
We Create a Questionnaire We Design a Survey
Katherasala Srinivas M.S.W
We Choose the Sample We Analyze the Data
Secondary Data Collection Secondary data comes from resources that have already been published. You may have a running list of certain sources but there are so many published items in the world, it can be hard to find the one thing that will make a difference to your project. Collection of data from secondary sources is a treasure hunt and we are skilled researchers with an eye for diamonds. We have developed extensive lists of secondary sources of data collection and will utilize them for your project. Just because something is listed as a secondary source for data collection doesn’t mean that it’s less important though.
Secondary Data Collection Has Never Been Easier
We Define the Values We Surf the Webpages We Create a Custom Table We Analyze and Interpret
Official Statistics
Official statistics are all statistics produced by government departments and specified crown entities. They are the cornerstones ofgood government, and support public confidence in good government. They provide a window to the work and performance of government by showing the scale of activity in areas of public policy, and by allowing citizens to assess the impact of public policies and actions.It is a government responsibility to provide such statistics and to maintain their long-term sustainability.
Official statistics can be collected through surveys or compiled from administrative records collected by government agencies in their dailywork. The majority of official statistics are produced by Statistics
Katherasala Srinivas M.S.W
NZ although many other government agencies produce information that isalso highly valued.
Statistical Data:A sequence of observation, made on a set of objects included in the sample drawn from population is known as statistical data.
(1) Ungrouped Data:Data which have been arranged in a systematic order are called raw data or ungrouped data.
(2) Grouped Data:Data presented in the form of frequency distribution is called grouped data.
Collection of Data:The first step in any enquiry (investigation) is collection of data. The data may be collected for the whole population or for asample only. It is mostly collected on sample basis. Collection of data is very difficult job. The enumerator or investigator is the well trained person who collects the statistical data. The respondents (information) are the persons whom the information iscollected.
Types of Data:There are two types (sources) for the collection of data.(1) Primary Data (2) Secondary Data
(1) Primary Data:The primary data are the first hand information collected, compiled and published by organization for some purpose. They are most originaldata in character and have not undergone any sort of statistical treatment.Example: Population census reports are primary data because these are collected, complied and published by the population census organization.
(2) Secondary Data:The secondary data are the second hand information which are already collected by some one (organization) for some purpose and are
Katherasala Srinivas M.S.W
available for the present study. The secondary data are not pure in character and have undergone some treatment at least once.Example: Economics survey of England is secondary data because these are collected by more than one organization like Bureau of statistics,Board of Revenue, the Banks etc…
Methods of Collecting Primary Data:Primary data are collected by the following methods:
Personal Investigation: The researcher conducts the survey him/herself and collects data from it. The data collected in this way is usually accurate and reliable. This method of collecting data is only applicable in case of small research projects.
Through Investigation: Trained investigators are employed to collectthe data. These investigators contact the individuals and fill in questionnaire after asking the required information. Most of the organizing implied this method.
Collection through Questionnaire: The researchers get the data fromlocal representation or agents that are based upon their own experience. This method is quick but gives only rough estimate. Through Telephone: The researchers get information through telephone this method is quick and give accurate information.
Methods of Collecting Secondary Data:The secondary data are collected by the following sources:
Official: e.g. The publications of the Statistical Division, Ministry of Finance, the Federal Bureaus of Statistics, Ministries of Food, Agriculture, Industry, Labor etc… Semi-Official: e.g. State Bank, Railway Board, Central Cotton Committee, Boards of (a) Economic Enquiry etc… (b) Publication of Trade Associations, Chambers of Commerce etc… (c) Technical and Trade Journals and Newspapers. (d) Research Organizations such as Universities and other institutions.
Difference between Primary and Secondary Data:The difference between primary and secondary data is only a change of hand. The primary data are the first hand data information which is

Katherasala Srinivas M.S.W
directly collected form one source. They are most original data in character and have not undergone any sort of statistical treatment while the secondary data are obtained from some other sources or agencies. They are not pure in character and have undergone some treatment at least once.For Example: Suppose we interested to find the average age of MS students. We collect the age’s data by two methods; either by directlycollecting from each student himself personally or getting their ages from the university record. The data collected by the direct personal investigation is called primary data and the data obtained from the university record is called secondary data. Editing of Data:After collecting the data either from primary or secondary source, thenext step is its editing. Editing means the examination of collected data to discover any error and mistake before presenting it. It has tobe decided before hand what degree of accuracy is wanted and what extent of errors can be tolerated in the inquiry. The editing of secondary data is simpler than that of primary data.
Observation
Origins and History
Observation is a fundamental way of finding out about the world aroundus. As human beings, we are very well equipped to pick up detailed information about our environment through our senses. However, as a method of data collection for research purposes, observation is more than just looking or listening. Research, simply defined, is “systematic enquiry made public” (Stenhouse, 1975). Firstly, in order to become systematic, observation must in some way be selective. We are constantly bombarded by huge amounts of sensory information. Humanbeings are good at selectively attending to what is perceived as most useful to us. Observation harnesses this ability; systematic observation entails careful planning of what we want to observe. Secondly, in order to make observation ‘public’, what we see or hear
Katherasala Srinivas M.S.W
has to be recorded in some way to allow the information to be analysedand interpreted.
The origins of observation as a research technique coincide with the early development of science itself. In the natural sciences, for example, early progress was made primarily through very careful, systematic observation and recording of descriptions of phenomena in the natural world. The work of Charles Darwin would be a good example of the way in which careful observation provided the evidence which enabled him to build his theory of evolution in The Origin of Species.Observation in contemporary educational and social research deals withhighly complex social phenomena and provides major challenges for the researcher.
The Role and Purpose of Observation
Quantitative Research
The term 'systematic' observation is usually associated with observation undertaken from the perspective of quantitative research where the purpose is to provide reliable, quantifiable data. This usually involves the use of some kind of formal, structured observation instrument or schedule. The observation method being used will clearly identify: the variables to be observed, perhaps by means of some kind of behavioural checklist; who or what will be observed; how the observation is to be conducted; and when and where the observations will take place.
Qualitative Research
Observation can provide rich qualitative data, sometimes described as 'thick description' (Geertz, 1973), for example, where the relevant phenomena have been carefully observed and detailed field notes have been recorded. Typically, the researcher would not approach the observation with pre-determined categories or questions in mind. Because of this openness, observation in qualitative research is oftenreferred to as unstructured.
Katherasala Srinivas M.S.W
Structured observation is more likely to be carried out by those operating from a 'positivist' perspective, or who at least believe it is possible to clearly define and quantify behaviours. Unstructured observation is more likely to be carried out by those operating from an 'interpretive' or 'critical' perspective where the focus is on understanding the meanings participants, in the contexts observed, attribute to events and actions. Positivist and critical researchers are likely to be operating from a 'realist' perspective, namely that there is a 'real world' with 'real impact' on people's lives and this can best be studied by looking at social settings directly.
Many of the issues studied in this unit apply both to quantitative andqualitative approaches but we shall consider them separately.
Ethical Considerations
Observation poses potential ethical problems for researchers. The assumption of participation in research being on the basis of fully informed consent is challenged where there is a need for the observation to be unobtrusive and hence legitimate concern on the partof the researcher over the observer effect, i.e. where the behaviour under consideration will change when those being observed are aware ofthe presence of the observer. This is precisely the kind of situation which calls for the involvement of an ethics committee to weigh up thedesirability of the research to go ahead against the interests of participants being fully informed of the research taking place. Another potential ethical issue arises with observational research as it does with any kind of research, namely, the duty of the researcher to protect participants from any harm. This, for example, would make an observational study of school bullying unethical. If a child were observed bullying another, there would be a responsibility on the partof the researcher to intervene in the situation to prevent any harm.
. Introduction
Interviews are particularly useful for getting the story behind a participant's experiences. The interviewer can pursue in-depth information around a topic. Interviews may be useful as follow-up to certain respondents to questionnaires, e.g., to further investigate

Katherasala Srinivas M.S.W
their responses. Usually open-ended questions are asked during interviews.
Before you start to design your interview questions and process, clearly articulate to yourself what problem or need is to be addressedusing the information to be gathered by the interviews. This helps youkeep clear focus on the intent of each question.
Preparation for Interview
1. Choose a setting with little distraction. Avoid loud lights or noises, ensure the interviewee is comfortable (you might ask themif they are), etc. Often, they may feel more comfortable at theirown places of work or homes.
2. Explain the purpose of the interview.3. Address terms of confidentiality. Note any terms of
confidentiality. (Be careful here. Rarely can you absolutely promise anything. Courts may get access to information, in certain circumstances.) Explain who will get access to their answers and how their answers will be analyzed. If their commentsare to be used as quotes, get their written permission to do so. See getting informed consent.
4. Explain the format of the interview. Explain the type of interview you are conducting and its nature. If you want them to ask questions, specify if they're to do so as they have them or wait until the end of the interview.
5. Indicate how long the interview usually takes.6. Tell them how to get in touch with you later if they want to.7. Ask them if they have any questions before you both get started
with the interview.8. Don't count on your memory to recall their answers. Ask for
permission to record the interview or bring along someone to takenotes.
Types of Interviews
1. Informal, conversational interview - no predetermined questions are asked, in order to remain as open and adaptable as possible to the interviewee's nature and priorities; during the interview,the interviewer "goes with the flow".

Katherasala Srinivas M.S.W
2. General interview guide approach - the guide approach is intendedto ensure that the same general areas of information are collected from each interviewee; this provides more focus than the conversational approach, but still allows a degree of freedomand adaptability in getting information from the interviewee.
3. Standardized, open-ended interview - here, the same open-ended questions are asked to all interviewees (an open-ended question is where respondents are free to choose how to answer the question, i.e., they don't select "yes" or "no" or provide a numeric rating, etc.); this approach facilitates faster interviews that can be more easily analyzed and compared.
4. Closed, fixed-response interview - where all interviewees are asked the same questions and asked to choose answers from among the same set of alternatives. This format is useful for those notpracticed in interviewing.
Types of Topics in Questions
Patton notes six kinds of questions. One can ask questions about:
1. Behaviors - about what a person has done or is doing2. Opinions/values - about what a person thinks about a topic3. Feelings - note that respondents sometimes respond with "I
think ..." so be careful to note that you're looking for feelings4. Knowledge - to get facts about a topic5. Sensory - about what people have seen, touched, heard, tasted or
smelled6. Background/demographics - standard background questions, such as
age, education, etc.
Note that the above questions can be asked in terms of past, present or future.
Sequence of Questions
1. Get the respondents involved in the interview as soon as possible.
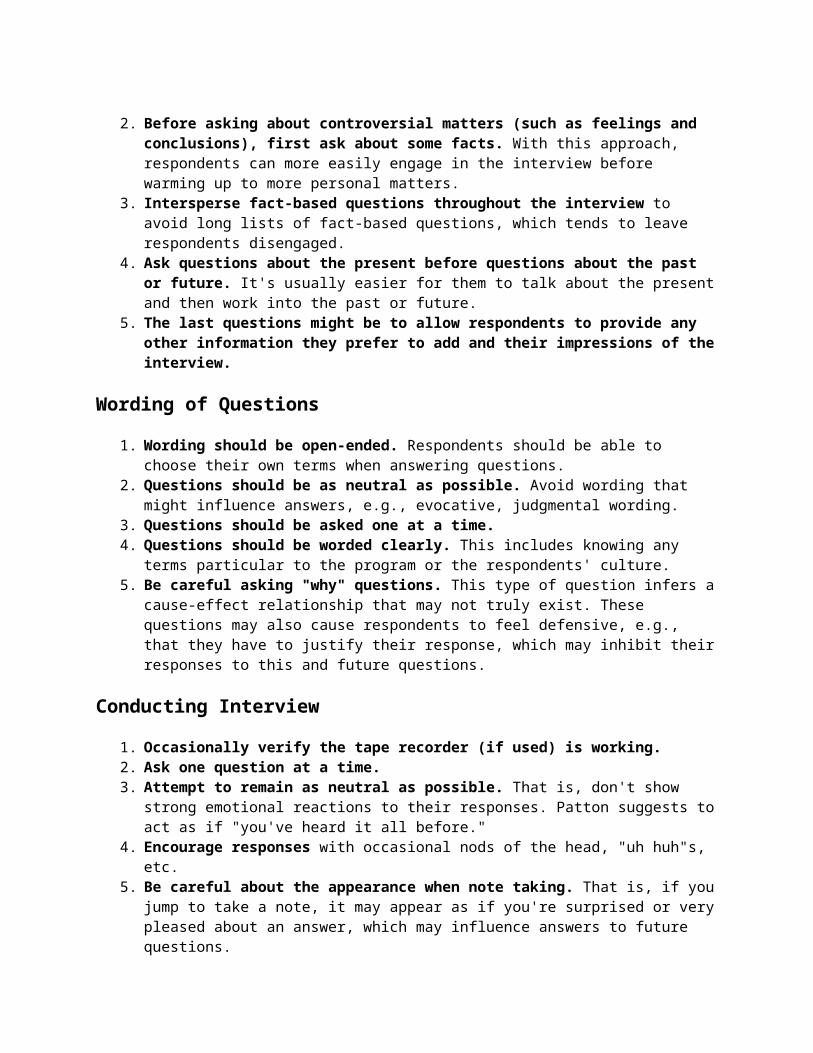
Katherasala Srinivas M.S.W
2. Before asking about controversial matters (such as feelings and conclusions), first ask about some facts. With this approach, respondents can more easily engage in the interview before warming up to more personal matters.
3. Intersperse fact-based questions throughout the interview to avoid long lists of fact-based questions, which tends to leave respondents disengaged.
4. Ask questions about the present before questions about the past or future. It's usually easier for them to talk about the presentand then work into the past or future.
5. The last questions might be to allow respondents to provide any other information they prefer to add and their impressions of theinterview.
Wording of Questions
1. Wording should be open-ended. Respondents should be able to choose their own terms when answering questions.
2. Questions should be as neutral as possible. Avoid wording that might influence answers, e.g., evocative, judgmental wording.
3. Questions should be asked one at a time. 4. Questions should be worded clearly. This includes knowing any
terms particular to the program or the respondents' culture.5. Be careful asking "why" questions. This type of question infers a
cause-effect relationship that may not truly exist. These questions may also cause respondents to feel defensive, e.g., that they have to justify their response, which may inhibit theirresponses to this and future questions.
Conducting Interview
1. Occasionally verify the tape recorder (if used) is working.2. Ask one question at a time.3. Attempt to remain as neutral as possible. That is, don't show
strong emotional reactions to their responses. Patton suggests toact as if "you've heard it all before."
4. Encourage responses with occasional nods of the head, "uh huh"s, etc.
5. Be careful about the appearance when note taking. That is, if youjump to take a note, it may appear as if you're surprised or verypleased about an answer, which may influence answers to future questions.

Katherasala Srinivas M.S.W
6. Provide transition between major topics, e.g., "we've been talking about (some topic) and now I'd like to move on to (another topic)."
7. Don't lose control of the interview. This can occur when respondents stray to another topic, take so long to answer a question that times begins to run out, or even begin asking questions
8. to the interviewer.
Immediately After Interview
1. Verify if the tape recorder, if used, worked throughout the interview.
2. Make any notes on your written notes, e.g., to clarify any scratchings, ensure pages are numbered, fill out any notes that don't make senses, etc.
3. Write down any observations made during the interview. For example, where did the interview occur and when, was the respondent particularly nervous at any time? Were there any surprises during the interview? Did the tape recorder break?
Questionnaires
Introduction
A questionnaire is simply a ‘tool’ for collecting and recording information about a particular issue of interest. It is mainly made upof a list of questions, but should also include clear instructions andspace for answers or administrative details. Questionnaires should always have a definite purpose that is related to the objectives of the research, and it needs to be clear from the outset how the findings will be used. Respondents also need to be made aware of the purpose of the research wherever possible, and should be told how and when they will receive feedback on the findings.
Structured questionnaires are usually associated with quantitative research, i.e. research that is concerned with numbers (how many? howoften? how satisfied?). Within this context, questionnaires can be

Katherasala Srinivas M.S.W
used in a variety of survey situations, for example postal, electronic, face-to-face and telephone. Postal and electronic questionnaires are known as selfcompletion questionnaires, i.e. respondents complete them by themselves in their own time. Face-to-face (F2F) and telephone questionnaires are used by interviewers to ask a standard set of questions and record the responses that people give them. Questionnaires that are used by interviewers in this way are sometimes known as interview schedules.
Questionnaires are commonly used:
• to collect factual information in order to classify people and theircircumstances • to gather straightforward information relating to people’s behaviour • to look at the basic attitudes/opinions of a group of people relating to a particular issue • to measure the satisfaction of customers with a product or service • to collect ‘baseline’ information which can then be tracked over time to examine changes
Questionnaires should not be used:
• to explore complex issues in great depth • to explore new, difficult or potentially controversial issues (NB: longer, relatively unstructured depth interviews would be more appropriate here) • as an ‘easy’ option which will require little time or effort (a commonerror)
Advantages and disadvantages of using questionnaires
Advantages
Disadvantages
• Can contact a large number of people at arelatively low cost (postal and telephone)
• Response rates can be low (postal) and refusal rates high (telephone, F2F)
• Easy to reach people who arespread across a wide
• There is little control over who completes a postal

Katherasala Srinivas M.S.W
geographical area or who live in remote locations (postal and phone)
questionnaire, which can lead to bias
• Respondents are able to complete postal questionnairesin their own time and telephone call-backs can be arranged for a more convenienttime
• Postal questionnaires are inappropriate for people with reading difficulties or visual impairments and those who do not read English
• Telephone questionnaires canmake it easier to consult somedisabled people
• Postal and phone questionnairesmust be kept relatively short
• F2F questionnaires can make it easier to identify the appropriate person to completethe questionnaire
• F2F and phone questionnaires require the use of trained interviewers
• F2F questionnaires can be longer than postal and phone questionnaires, collect more information and allow the use of ‘visual aids’
• F2F questionnaires are time consuming for respondents, more costly and more labour intensive than other methods
Questionnaire design
In order to gather useful and relevant information it is essential that careful consideration is given to the design of your questionnaire. A well-designed questionnaire requires thought and effort, and needs to be planned and developed in a number of stages:
(a)Initial considerations (b)Question content, phrasing and response format (c)Question sequence and layout (d)Pre-test (pilot) and revision (e)Final questionnair
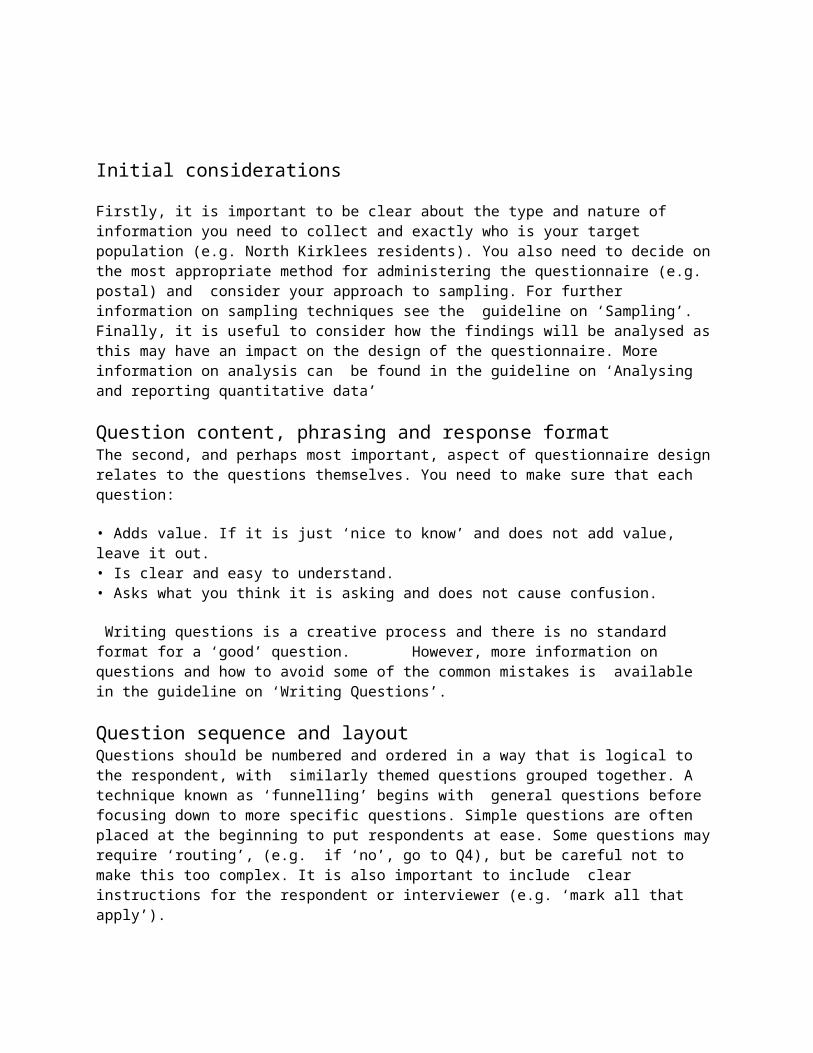
Katherasala Srinivas M.S.W
Initial considerations
Firstly, it is important to be clear about the type and nature of information you need to collect and exactly who is your target population (e.g. North Kirklees residents). You also need to decide onthe most appropriate method for administering the questionnaire (e.g. postal) and consider your approach to sampling. For further information on sampling techniques see the guideline on ‘Sampling’. Finally, it is useful to consider how the findings will be analysed asthis may have an impact on the design of the questionnaire. More information on analysis can be found in the guideline on ‘Analysing and reporting quantitative data’
Question content, phrasing and response format The second, and perhaps most important, aspect of questionnaire designrelates to the questions themselves. You need to make sure that each question:
• Adds value. If it is just ‘nice to know’ and does not add value, leave it out. • Is clear and easy to understand. • Asks what you think it is asking and does not cause confusion.
Writing questions is a creative process and there is no standard format for a ‘good’ question. However, more information on questions and how to avoid some of the common mistakes is available in the guideline on ‘Writing Questions’.
Question sequence and layout Questions should be numbered and ordered in a way that is logical to the respondent, with similarly themed questions grouped together. A technique known as ‘funnelling’ begins with general questions before focusing down to more specific questions. Simple questions are often placed at the beginning to put respondents at ease. Some questions mayrequire ‘routing’, (e.g. if ‘no’, go to Q4), but be careful not to make this too complex. It is also important to include clear instructions for the respondent or interviewer (e.g. ‘mark all that apply’).

Katherasala Srinivas M.S.W
Equalities When designing your questionnaire you also need to remember to accountfor equalities issues.
For example: • Questions on gender, age, ethnic origin and disability are sometimesused to monitor whether a representative cross-section of the population was reached (but it is bad practice to ask these questionsand simply store the data rather than using it for a specific purpose). • You may need to include a paragraph translated into minority ethnic languages for people who do not speak/read English as their first language. This should explain the focus of the survey and allow them to request a translated copy of the questionnaire. • You may also need to include a statement in large print indicating that respondents can request a copy of the questionnaire transcribed into Braille or Large Text.
Confidentiality
Respondents need to be reassured that the information they provide on the questionnaire is confidential. This means that their identities orpersonal details must not be disclosed to others, except for researchpurposes, and any data used in the report will not be linked to any respondents. If the questionnaire is not exclusively for research (forexample, if it is used to update a database that is used for purposesother than research), then this should be made clear to respondents and the questionnaire cannot be described as confidential survey research.
Piloting the questionnaire
It is good practice to ‘pilot’ or pre-test your questionnaire with a small sample of respondents before use. The pilot should check people’s understanding and ability to answer the questions, highlightareas of confusion and look for any routing errors, as well as providing an estimate of the average time each questionnaire will take to complete. Any amendments highlighted by the pilot should be made to the questionnaire before issuing a final version.
Katherasala Srinivas M.S.W
Maximising the response rate
Questionnaires can suffer from low response rates, which are a source of bias. The following table outlines some of the steps that can be taken to help improve your survey response rate: In addition to this, the length of the questionnaire, ease of completion and the relevance/interest of the subject matter to respondents are likely to affect the overall survey response rate.
RATING SCALESRating scales are one of the more common ways of collecting data in the social sciences. Scales can represent any of a number of concepts.For example, illness terms can be rated on their degree of severity, cars can be rated on “likelihood to purchase” scales, and political candidates can be rated on how well liked their policies are. Items can be rated on a single conceptual scale or each may be rated on a series of scales representing a variety of concepts or attributes. Frequently rating scales are combined to create indices. Although rating scales are usually used to collect ordered data, they may also be used to collect similarity data. To collect similarity data, pairs of items are rated on a scale of similarity. Rating scales are most reliable with literates in a written format. Rating scales are the most widely used technique for questionnaire data collection.
Types of ScalesMost frequently used Scales
1. Nominal Scale2. Ordinal Scale3. Interval Scale
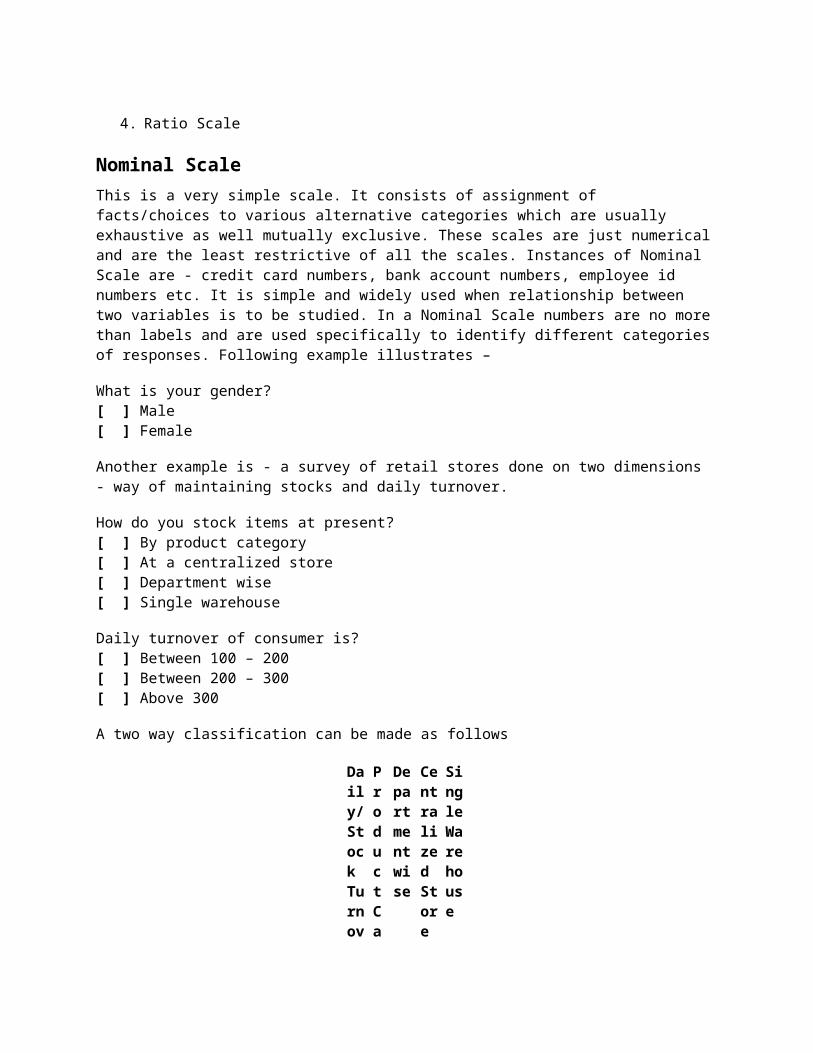
Katherasala Srinivas M.S.W
4. Ratio Scale
Nominal ScaleThis is a very simple scale. It consists of assignment of facts/choices to various alternative categories which are usually exhaustive as well mutually exclusive. These scales are just numericaland are the least restrictive of all the scales. Instances of Nominal Scale are - credit card numbers, bank account numbers, employee id numbers etc. It is simple and widely used when relationship between two variables is to be studied. In a Nominal Scale numbers are no morethan labels and are used specifically to identify different categoriesof responses. Following example illustrates –
What is your gender?[ ] Male[ ] Female
Another example is - a survey of retail stores done on two dimensions - way of maintaining stocks and daily turnover.
How do you stock items at present?[ ] By product category[ ] At a centralized store[ ] Department wise[ ] Single warehouse
Daily turnover of consumer is?[ ] Between 100 – 200[ ] Between 200 – 300[ ] Above 300
A two way classification can be made as follows
Daily/Stock Turnov
ProductCa
Departmentwise
Centralized Store
SingleWarehouse

Katherasala Srinivas M.S.W
erMethod
tegory
100 – 200
200 – 300
Above 300
Mode is frequently used for response category.
Ordinal ScaleOrdinal scales are the simplest attitude measuring scale used in Marketing Research. It is more powerful than a nominal scale in that the numbers possess the property of rank order. The ranking of certain product attributes/benefits as deemed important by the respondents is obtained through the scale.
Example 1: Rank the following attributes (1 - 5), on their importance in a microwave oven.
1. Company Name2. Functions3. Price4. Comfort5. Design

Katherasala Srinivas M.S.W
The most important attribute is ranked 1 by the respondents and the least important is ranked 5. Instead of numbers, letters or symbols too can be used to rate in a ordinal scale. Such scale makes no attempt to measure the degree of favourability of different rankings.
The most important attribute is ranked 1 by the respondents and the least important is ranked 5. Instead of numbers, letters or symbols too can be used to rate in a ordinal scale. Such scale makes no attempt to measure the degree of favourability of different rankings.
Example 2 - If there are 4 different types of fertilizers and if they are ordered on the basis of quality as Grade A, Grade B, Grade C, Grade D is again an Ordinal Scale.
Example 3 - If there are 5 different brands of Talcom Powder and if a respondent ranks them based on say, “Freshness” into Rank 1 having maximum Freshness Rank 2 the second maximum Freshness, and so on, an Ordinal Scale results.
Median and mode are meaningful for ordinal scale.
Interval ScaleHerein the distance between the various categories unlike in Nominal, or numbers unlike in Ordinal, are equal in case of Interval Scales. The Interval Scales are also termed as Rating Scales. An Interval Scale has an arbitrary Zero point with further numbers placed at equal intervals. A very good example ofInterval Scale is a Thermometer.
Illustration 1 - How do you rate your present refrigerator for the following qualities.
Com Le 12345We

Katherasala Srinivas M.S.W
pany Name
ssKnown
llKnown
Functions
Few 12345Many
Price
Low 12345High
Design
Poor 12345Good
Overall Satisfaction
VeryDis-Satisfied
12345
VerySatisfied
Such a scale permits the researcher to say that position 5 on thescale is above position 4 and also the distance from 5 to 4 is same as distance from 4 to 3. Such a scale however does not permit conclusion that position 4 is twice as strong as position 2 because no zero position has been established. The data obtained from the Interval Scale can be used to calculate the Mean scores of each attributes over all respondents. The StandardDeviation (a measure of dispersion) can also be calculated.
Ratio ScaleRatio Scales are not widely used in Marketing Research unless a base item is made available for comparison. In the above example of Interval scale, a score of 4 in one quality does not necessarily mean that the respondent is twice more satisfied than
Katherasala Srinivas M.S.W
the respondent who marks 2 on the scale. A Ratio scale has a natural zero point and further numbers are placed at equally appearing intervals. For example scales for measuring physical quantities like - length, weight, etc.
The ratio scales are very common in physical scenarios. Quantified responses forming a ratio scale analytically are the most versatile. Rati scale possess all he characteristics of an internal scale, and the ratios of the numbers on these scales have meaningful interpretations. Data on certain demographic or descriptive attributes, if they are obtained through open-ended questions, will have ratio-scale properties. Consider the following questions :
Q 1) What is your annual income before taxes? ______ $Q 2) How far is the Theater from your home ? ______ miles
Answers to these questions have a natural, unambiguous starting point, namely zero. Since starting point is not chosen arbitrarily, computing and interpreting ratio makes sense. For example we can say that a respondent with an annual income of $ 40,000 earns twice as much as one with an annual income of $ 20,000.