
A Sheffield Hallam University thesis
262
Hot gas welds in unplasticised polyvinyl chloride. ABRAM, J. E. Available from the Sheffield Hallam University Research Archive (SHURA) at: http://shura.shu.ac.uk/19193/ A Sheffield Hallam University thesis This thesis is protected by copyright which belongs to the author. The content must not be changed in any way or sold commercially in any format or medium without the formal permission of the author. When referring to this work, full bibliographic details including the author, title, awarding institution and date of the thesis must be given. Please visit http://shura.shu.ac.uk/19193/ and http://shura.shu.ac.uk/information.html for further details about copyright and re-use permissions.
-
Upload
khangminh22 -
Category
Documents
-
view
4 -
download
0
Transcript of A Sheffield Hallam University thesis

Hot gas welds in unplasticised polyvinyl chloride.
ABRAM, J. E.
Available from the Sheffield Hallam University Research Archive (SHURA) at:
http://shura.shu.ac.uk/19193/
A Sheffield Hallam University thesis
This thesis is protected by copyright which belongs to the author.
The content must not be changed in any way or sold commercially in any format or medium without the formal permission of the author.
When referring to this work, full bibliographic details including the author, title, awarding institution and date of the thesis must be given.
Please visit http://shura.shu.ac.uk/19193/ and http://shura.shu.ac.uk/information.html for further details about copyright and re-use permissions.


ProQuest Number: 10694073
All rights reserved
INFORMATION TO ALL USERS The quality of this reproduction is dependent upon the quality of the copy submitted.
In the unlikely event that the author did not send a com p le te manuscript and there are missing pages, these will be noted. Also, if material had to be removed,
a note will indicate the deletion.
uestProQuest 10694073
Published by ProQuest LLC(2017). Copyright of the Dissertation is held by the Author.
All rights reserved.This work is protected against unauthorized copying under Title 17, United States C ode
Microform Edition © ProQuest LLC.
ProQuest LLC.789 East Eisenhower Parkway
P.O. Box 1346 Ann Arbor, Ml 48106- 1346

HOT GAS WELDS IN UNPLASTICISED POLYVINYL CHLORIDE
J.E. AbramY J \ ,
ABSTRACT
Low weld tensile strengths are shown to be a feature of hot gas welded clear unplasticised polyvinyl chloride (UPVC), Typical weld strengths are 20-30 MPa compared to 45 MPa for hot gas welded filled UPVC and 61 MPa for hot tool welded clear UPVC.A short mechanical, microstructural and chemical analysis revealed only minor differences between clear sheet and rod.An examination of weld fracture surfaces revealed the presence of unfused regions (flaws) which act as fracture initiation sites. In over 80% of the surfaces studied fracture occurred at such sites, at or close to the weld surface. These regions were observed for both hot gas welded clear and filled UPVC but npt in hot tool welded clear UPVC. It was concluded that these regions were a feature of hot gas welding and that clear UPVC was more sensitive to them than filled UPVC. A range of linear elastic fracture mechanics (LEFM) test techniques,were used to establish that,clear UPVC had a K of 2.1 MPam2 , which dropped to 1.5 MPam 2 after welding. Tne filled UPVC examined was too tough to allow K to be measured. However, embrittlement of the welded filled UPVC was indicated, as only brittle fracture, with no plastic zone, occurred. A simplistic LEFM analysis based on measured flaw sizes and failure stresses for welds confirmed the embrittlement of hot gas welded clear UPVC. Two approaches were tried to improve weld strengths: 1) to reduce the size and number of flaws and 2) to increase the toughness of the weld rod. An initial study indicated that changes to the rod lubricant system and the inclusion of 10 phr methyl methacrylate-butadiene-styrene in the rod composition led to improved and more consistent weld strengths. However, improvements were limited to weld strengths of 32 MPa and to achieve any further improvement the clear sheet toughness would need to be increased.
Ill

HOT GAS WELDS IN
UNPLASTICISED POLYVINYL CHLORIDE
A thesis submitted to the Council for National Academic
Awards in partial fulfilment for the degree of
DOCTOR OF PHILOSOPHY
by
John Edward Abram
Collaborating Establishment:- Sponsoring Establishment:-
British Nuclear Fuels Ltd., Department of Metallurgy,Sellafield, Sheffield City PolytechnicCumbria, Sheffield, South Yorkshire
February, 1983,

$POND7929465 ©'2--

Preface
All the work reported in this thesis was carried out during the period for which the candidate was registered for a higher degree. No part of this thesis has been submitted for a degree at any other polytechnic, university or college.
During the period 1977 - 1978 the following modules of the postgraduate course "Metallurgical Process and Management" were attended
1) Numerical Methods and Programming2) Metals and Competitive Materials3) Accountancy4) Economics
A two week period of welding training was received at British Nuclear Fuels Ltd, Sellafield, in May 1977.
Over the period 1980 - 1982 two papers based on this work have been published
1) J. Abram, D.W. Clegg and D.V, Quayle, "The Strength of Welds in UPVC", Plastics and Rubber International, 1_ (1982), 58.
2) J. Abram, D.W. Clegg and D.V. Quayle, "The Mechanical Properties of Welds in UPVC", Proc. 3rd Polytechnic Symposium on Manufacturing Engineering, Wolverhampton,May, 1982, p. 168.
(See Appendix for copies.)
I

Acknowle d gemen t s
The author would like to thank Dr. D.V. Quayle and Dr. D.W. Clegg for their encouragement, assistance and guidance given throughout this project.
The author also wishes to thank Dr. A.D.W. Hills for allowing the resources and facilities of the Department of Metallurgy to be used during the course of this work. Grateful appreciation is expressed to the whole of the technical staff of the department whose cooperation, advice and encouragement were invaluable. Special thanks go to Mr, R. Day and his workshop staff whose help and advice in sample preparation made a difficult job much easier; to Dr. D.B. Lewis for his assistance with the scanning electron microscopy; to Mr, D. Fitzgerald for his assistance with the Instron work and Mr. S. Cassey for his assistance in both optical microscopy and photography.
Thanks are also due to the Departments of Physics, Chemistry and Mechanical Engineering who provided extra facilities, and to their technical staff who freely offered advice and expertise whenever required. Special mention must be made to Dr, G.C. Corfield and Dr, A,T. Ellis who made much of the chemistry work possible and to Mr. M. Jackson whose advice on hot gas welding and thermoplastics processing in general were most appreciated.
The provisions of welding materials and welding training by British Nuclear Fuels Ltd, Sellafield, are especially acknowledged.
Thanks are due to friends and colleagues at the Department of Non-Metallic Materials, Brunei University, for their encouragement (nagging) and assistance during the preparation of this thesis and especially to Mrs. D. Frankland who carried out the typing.
Finally, to Caroline, my wife, without whom this work would still be on the drawing board, all my love.
II

HOT GAS WELDS IN UNPLASTICISED POLYVINYL CHLORIDE
J.E. Abram
ABSTRACT
Low weld tensile strengths are shown to be a feature of hot gas welded clear unplasticised polyvinyl chloride (UPVC), Typical weld strengths are 20-30 MPa compared to 45 MPa for hot gas welded filled UPVC and 61 MPa for hot tool welded clear UPVC.A short mechanical, microstructural and chemical analysis revealed only minor differences between clear sheet and rod.An examination of weld fracture surfaces revealed the presence of unfused regions (flaws) which act as fracture initiation sites. In over 80% of the surfaces studied fracture occurred at such sites, at or close to the weld surface. These regions were observed for both hot gas welded clear and filled UPVC but not in hot tool welded clear UPVC. It was concluded that these regions were a feature of hot gas welding and that clear UPVC was more sensitive to them than filled UPVC. A range of linear elastic fracture mechanics (LEFM) test techniques,were used to establish that,clear UPVC had a K of 2,1 MPam2, which dropped to 1.5 MPam 2 after welding. The filled UPVC examined was too tough to allow K to be measured. However, embrittlement of the welded filled UPVC was indicated, as only brittle fracture, with no plastic zone, occurred. A simplistic LEFM analysis based on measured flaw sizes and failure stresses for welds confirmed the embrittlement of hot gas welded clear UPVC. Two approaches were tried to improve weld strengths: 1) to reduce the size and number of flaws and 2) to increase the toughness of the weld rod. An initial study indicated that changes to the rod lubricant system and the inclusion of 10 phr methyl methacrylate-butadiene-styrene in the rod composition led to improved and more consistent weld strengths. However, improvements were limited to weld strengths of 32 MPa and to achieve any further improvement the clear sheet toughness would need to be increased.
Ill
CONTENTSPage
Preface IAcknowledgements IIAbstract III
1. Introduction 11.1. Thermal Welding of UPVC 21.1.1. Hot Tool Welding 31.1.2. Hot Gas Welding 31.2. Construction of Glove Boxes 41.3. General Practice and Guidelines for Hot 5
Gas Welding1.4. Weld Efficiency 7
2. Literature 92.1. Polyvinyl Chloride Polymer 92.1.1. Polymerisation 102.1.2. Molecular Weight 112.1.3. Glass Transition Temperature, T , and 11
Other Transition ®2.1.4. Degradation of PVC 122.2. Additives and Processing 132.2.1, Additives 132.2.2. Processing 162.3 Mechanical Properties of UPVC 172.3.1. Temperature and Rate of Testing 172.3.2. Molecular Weight Dependence 182.3.3, Effects of Additives 192.3.4, Thermal History and Orientation 212.4. Fracture and Fractography 242.4.1. Crazing and Brittle Fracture 242.4.2. Fractography 252.5, Fracture Mechanics 272.5.1. Fracture Mechanics Theory 272.5.2. Fracture Mechanics Testing 292.5.3. Fracture Mechanics and Polymers 33
IV

Page
2.6. Hot Gas Welding of UPVC 372.6.1. Sheet Preparation 372.6.2. Welding Gas 382.6.3. Weld Rod 382.6.4. Welding Technique 392.6.5. Testing of Welds 40
3, Experimental 443.1. Mechanical Properties of the As-Received 45
Materials3.1.1. Yield Stress Determination for UPVC 463.1.2. Yield Stress Determination of the Clear 47
Weld Rod
3.1.3. Tensile Modulus 493.1.4. Flexural Modulus 503.2. Microstructure 513.2.1. Molecular Weight Distribution 523.2.2. Glass Transition Temperature T^ 523.2.3. Thermally Induced Shrinkage 533.2.4. Birefringence 543.3. Chemical Analysis 543.3.1. Extraction of Additives from the As-Received 54
Materials3.3.2. Analysis of the Separated Polymer and 56
Additives3.3.3. The Effects of Solvent Washes on Weld Rod 583.4. Welding of Standard Materials 593.4.1. Hot Gas Welding 593.4.2. Hot Tool Welding 633.4.3. Examination of the Interior of the Welds 643.4.4. Tensile Testing of Welds 653.4.5. Fracture Surface Studies 653.4.6. Automatic Hot Gas Welding Rig 663.4.7. Commercial Welds 683.5. Fracture Mechanics Testing 703.5.1. Cantilever Beam Methods 713.5.2. Weld Fracture Mechanics 753.5.3. Single Edge Notch Testing 77
V

Page
3.6. Pre-Weld Treatments and Changes to the Weld 77Rod Composition
3.6.1. Pre-Weld Treatment of Weld Rod 793.6.2. Changes to Weld Rod Composition 79
4. Results 824.1. Mechanical Properties 824.1.1. Tensile Yield Stress 834.1.2. Tensile Modulus 854.1.3. Flexural Modulus 864.2. Microstructure 874.2.1. GPC Results 874.2.2. Determination of T 88g4.2.3. Thermally Induced Shrinkage 894.2.4. Birefringence 914.3. Chemical Analysis 924.3.1. Extraction 934.3.2. Analysis of Additive-Free Polymer 944.3.3. Analysis of Extracted Additives 954.3.4. The Effects of Solvent Washes on the Weld Rod 984.4. Weld Results 994.4.1. Polytechnic Welds 1004.4.2. Commercial Welds 1014.4.3. Fracture Surface Studies 1024.4.4. Weld Rig 1034.5. Fracture Mechanics 1044.5.1. Unwelded Sheet Fracture Mechanics 1044.5.2. Weld Fracture Mechanics 1094.5.3. Fracture Surface Studies 1114.6. Pre-Weld Treatments and Changes to the Weld 113
Rod Composition4.6.1. Pre-Weld Treatments 1144.6.2. Changes to the Weld Rod Composition 115
5. Discussion 1175,1. Standard Welds 117
YI

Page
5.2. Fracture Mechanics 1235.3. Modified Welding Procedure and Changes to 129
Weld Rod Composition
6. Conclusions and Further Work 1396.1. Conclusions 1396.2. Further Work 140
References 143
Tables 155
Figures 187
Appendix 236
VII

Introduction
It is normal when dealing with hazardous chemicals, such as those present during the reprocessing of low level radioactive waste, to handle them in airtight glove boxes. By vising such boxes the need for special protective clothing or remote handling facilities is minimised.
These boxes need to be made from materials which are resistant . both to the chemicals contained inside them and to accidental damage which would lead to leaks. In the past, such, boxes have been produced as welded stainless steel boxesf into the sides of which are incorporated the glove and viewing ports. This construction is adequate for the smaller sized boxes with sides up to lm long. However, larger boxes suffer several drawbacks:
1) To obtain adequate viewing of the interior, large sections of the wall have to be replaced by transparent material. This makes the maintaining of an airtight environment difficult due to the large amount of sealing around each viewport. It further leads to weakness in the overall structure resulting from the number of holes that are cvit in the walls.
2) Even with a large number of viewports it is virtually impossible to eliminate all the blind spots in the hox?i.e. areas into which the handler cannot readily see,
3) The welded construction of these boxes leaves sharp corners which act as dirt traps and are difficult to keep clean. Further the welds along the base of the box are particularly vulnerable to attack by spilled chemicals.
4) In the case where they are used for the reprocessing of radioactive materials, the disposal of contaminated boxes at the end of their useful life is very expensive.
British Nuclear Fuels Ltd, Windscale site (now Sellafield, and hereafter referred to as BNFL) decided upon a new approach. To overcome the first two drawbacks, a totally transparent material, which could be easily cut or sealed, was required. The third drawback could be overcome if■the material was easily shaped so that the sharp corners could be rounded out. Fvirther, with a

material which was easily moulded, the base of the box could be moulded as a shallow tray thereby lifting vulnerbale joints above any spilled chemicals. The fourth drawback could be overcome if the material was easily destroyed, say by ashing, with any contamination being recovered from the residue.
One class of materials which satisfies the above requirements are the glassy amorphous thermoplastics, such as polystyrene, polymethyl methacrylate, rigid polyvinyl chloride, and polycarbonate. However, the other requirements of a glove box material, the good chemical resistance and toughness, reduced the choice to clear rigid polyvinyl chloride. This material is- better known as clear unplasticised polyvinyl chloride, clear TJPyC,
To fabricate UPVC structures, four methods of jointing are. available:
1) mechanical fixation, screws, bolts, clips, etc.*2) adhesive bonding3) solvent welding4) thermal welding
The first two methods introduce a second material into the structure, which may be attacked by the chemicals, and are not particularly successful in producing airtight seals. The third method of solvent welding involves the use of large quantities of organic solvents which introduce unacceptable health and fire hazards. However, thermal welding methods are well established in the plastics fabrication industries, being capable of producing strong, airtight joints with little or no operator risk.
1.1, Thermal Welding of UPVC.
UPVC does not become completely fluid when heated * However, if parts are heated to between 175-190°C and moderate pressure applied, then fusion joints can be formed.
The methods of supplying heat to the parts include ultrasonic, friction, radio frequency electric fields, heated tools and hot
-2-
gas jets [1].For large structures and thicker sheets only the last two are applicable, this work being concerned mainly with the last method.
1. Hot Tool Welding
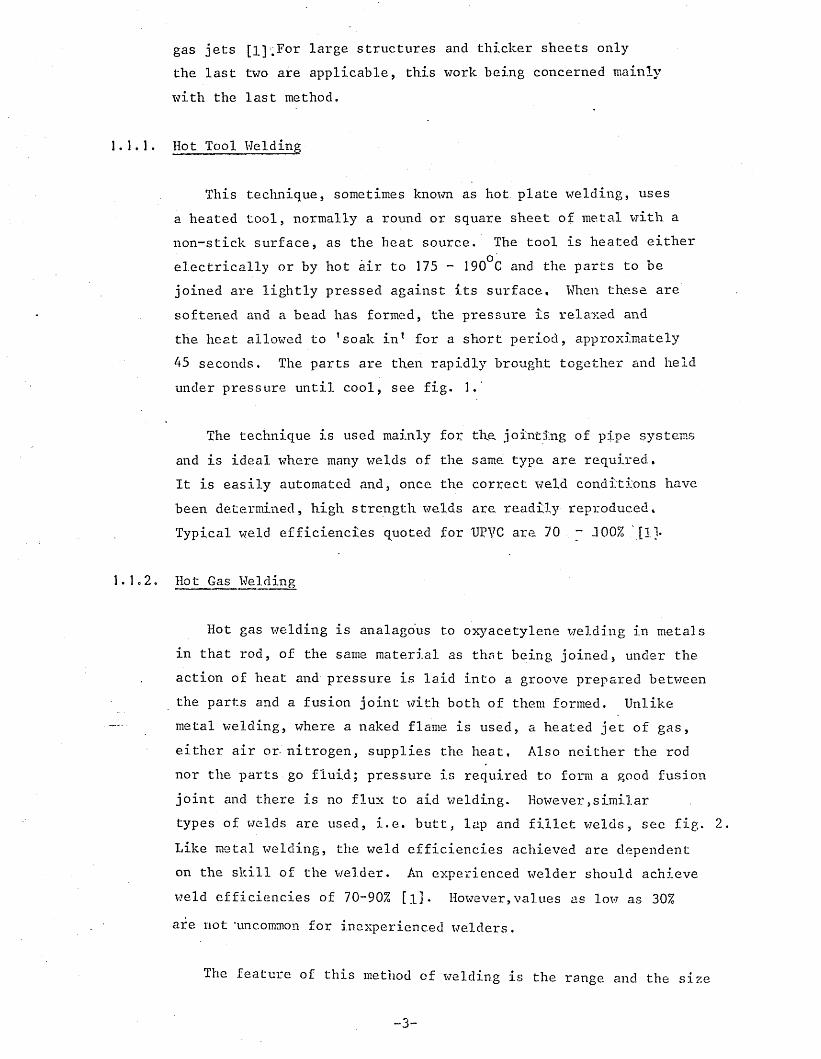
This technique, sometimes known as hot plate welding, uses a heated tool, normally a round or square sheet of metal with a non-stick surface, as the heat source. The tool is heated either electrically or by hot air to 175 - 190°C and the parts to be joined are lightly pressed against its surface. When these are softened and a bead has formed, the pressure is relaxed and the heat allowed to ’soak in1 for a short period, approximately 45 seconds. The parts are then rapidly brought together and held under pressure until cool, see fig. 1.
The technique is used mainly for the jointing of pipe systems and is ideal where many welds of the same type are required.It is easily automated and, once the correct weld conditions have been determined, high strength welds are readily reproduced.Typical weld efficiencies quoted for UPVC are 70 ~ 300% [!,!•
2. Hot Gas Welding
Hot gas welding is analagous to oxyacetylene welding in metals in that rod, of the same material as that being joined, under the action of heat and pressure is laid into a groove prepared between the parts and a fusion joint with both of them formed. Unlike metal welding, where a naked flame is used, a heated jet of gas, either air or-nitrogen, supplies the heat, Also neither the rod nor the parts go fluid; pressure is required to form a good fusion joint and there is no flux to aid welding. However,similar types of welds are used, i.e. butt, lap and fillet welds, see fig. 2. Like metal welding, the weld efficiencies achieved are dependent on the skill of the welder. An experienced welder should achieve weld efficiencies of 70-90% [iJ. However,values as low as 30% are not -uncommon for inexperienced welders.
The feature of this method of welding is the range and the size
-3-

of structures which can be fabricated using it. Typical uses include ventilator ducting, fume extraction systems and tank lining.
Some automation has been developed, but only finds a use where simple straight line welding is required, for example in floor covering.
1.2. Construction of Glove Boxes
The hot tool welding method would seem to offer the best fabrication route, requiring less skill and time than hot gas welding whilst producing stronger welds. However, two drawbacks are apparent when considering glove box construction:
1) when two lengths of sheet need to be joined, to make aside wall, the weld would have to be completed at everypoint along the length at the same time. If a weld length of 2m was required, the hot tool would have to be of a similar or larger size. This presents problems in terms of the power requirements to heat the tool .and in the accurate control of the temperature along the tool.
2) hot tool welding is best suited to cases where a largenumber of identical welds need to be made. This is notthe case in glove box construction in which each glove box is tailor-made for a specific job. Further, in each box there is a large number of different welds used. They range from simple straight butt welds to corner welds, to fillet welds, these being used to fabricate shelves or support structures inside the box.
These present no obstacles to hot gas welding, which was therefore, adopted as the main fabrication method.
However, during routine testing at BNFL, the efficiency of hot gas welded clear UPVC sheet was found to be typically only 40%, far short of the 70-90% efficiencies quoted in the literature. The following research investigation was inspired by a need to:
J) determine the reasons for the low weld efficiencies- achieved by the BNFL welders.
2) determine the ways to improve the weld efficiencies.

A more detailed description of the hot gas welding methods is given next , along with guidelines and typical conditions used. However,details of the research into hot gas welding,as reported in the literature, are given in section 2.6.
1.3. General Practice and Guidelines for Hot Gas Welding
Hot gas welding is really still an art and as such the experience and skill of the welder is considered the main factor controlling the strength of the finished weld. It is normal, therefore, to find the practice and conditions for welding being given only as guidelines, with the final details being determined by the welder to suit both him and the material, The following concerns the practice for the welding together of two UPVC sheets using a butt weld.
As in all types of welding,cleanliness is important both in the welding gas and the surfaces to be joined,
A groove is formed between the sheets by chamfering the edges to give an included angle of 60-70°, The chamfered surfaces and. the rod are wiped clean and any grease or oil removed with a volatile solvent. The sheets are then clamped leaving a gap, not greater than 1mm, between them, see fig, 3.
The rod, known as either weld or filler rod., is normally supplied with a circular cross section of 3mm diameter. B.od with2,4 and 5mm diameter is sometimes used and the use of triangular and cloverleaf cross-sections is becoming more common. Prior to welding, one end of the rod is cut to a 30° angle to aid the start of the weld.
The gas jet is heated and directed by a hand held welding torch, or gun, in which the gas either passes over electrically heated elements or through gas heated coils, see fig. 4. The electric torch is more common today and recent versions contain heater control systems which allow particular gas temperatures to be selected and maintained without having to alter the gas flow
-5-

conditions. The torch may also be supplied with a small fan compressor built into the handle, this supplies air as the welding gas, at a sufficient flox<7 rate and pressure for most welding. A wide range of nozzles may be fitted to the torch depending on the type of welding being done, these being either a push or screw fit.
The following gas conditions may be taken as being typical of those used in industry, although, individual welders may' nse slightly different ones:-
Gas : Dry, oil-free air or nitrogenFlow : 15-40 litre/minPressure : 20-100KPaOptimum Temperature: 300°C measured 3mm from the nozzle end.
The gas temperature should be monitored at a set distance from the nozzle but the usual practice of experienced welders is to play the gas jet over the palm of their hand from a distance of 3 - 4 inches. The welder then varies either the gas flowrate or the heater power to get the ’right’ temperature.
With both types of torch a period of 5 - 10 minutes shouldbe allowed after turning on, for the welding gas temperature to stabilise. With the electric torch, the gas should be flowing all the time power is on, and should be left on for 5 10 minutesafter power is switched off to avoid damaging the heater elements,.
There are three types of hot gas welding: tack, hand, and speed. Tack welding provides a temporary weld with sufficient strength to hold pieces in place until a more permanent weld is carried out. Nozzle A in fig. 5 is used and the blade is drawn along the root of the groove causing a weak fusion joint to be formed.
Hand welding is the basic method of hot gas welding. Both hands are used, the torch being held in one hand and the rod fed into the groove with the other. A simple round nozzle, B in fig. 5
-6-

is used. The hot gas is directed into the groove and at the tip of the rod, the cut end, which is held vertically above the start of the weld. The rod is pressed into the groove and once softened and fused with the sheet will begin to bend
O •through 90 and lay horizontally in the groove. If correct conditions are maintained, a bow wave of softened material should be observed at the bottom of the rod. As this happens, the torch is advanced along the groove, continuing to heat the base of the rod and the groove, see fig. 6, A pendulum action is commonly used, the jet being directed in an arc from a point just in front of the weld bow wave to a point on the rod just above the bow wave and back again. The full cycle is normally repeated between one and three times a second. Once started, typical speeds of 100-200mm/min are obtainable, After finishing a run, a short time is allowed for the weld to cool. Degraded material is then removed from the weld by scraping and the next run started.
Speed welding is used for long straight runs with Nozzle C, see fig. 5, fixed to the torch. This nozzle has a. preheating guide tube down which the weld rod is fed prior to entering the heating zone of the gas jet. The shoe at the end of the tuba is used to force the rod into the groove and maintains the torch a uniform distance from the weld. Typical speeds are ]-2m/min and this technique has the advantage of freeing one of the welder’s hands to hold the parts together.
For both hand, and speed welding it is usual to use sufficient weld runs to overfill the groove by 30%, see fig. 7. Dressing of the weld, that is the removal of excess weld material above the surface of the sheet, is not normally carried out except for aethestic reasons.
Weld Efficiency
The determination of weld efficiencies is carried out in thesame way for both hot tool and hot gas welds. Two sheets of UPVCare welded and the resultant plate is cut across the weld intonarrow parallel sided test pieces. These' are then tested in tension

and the resulting load at failure recorded. The load at failure, normally yield „ of similar sized samples of unwelded material is also determined. The ratio of welded to unwelded failure load is then expressed in percent and is called the weld efficiency, weld factor or weld quality.
\

2 . Literature
In the following chapter a review of the literature relevant to the work carried out will be given. As such it has been divided into six main sections. The first two are brief reviews of the polymerisation of polyvinyl chloride, the physical properties of the polymer and the additives and processing required to convert the polymer into a finished product. The third is a review of the mechanical properties of unplasticised polyvinyl chloride and the factors which affect them. Section four covers fracture and fractography, whilst section five reviews the subject of fracture mechanics and its application tc polymers, The final section reviews the research carried out and gives a more detailed description of hot gas welding as applied to unpiasticised polyvinyl chloride.
2,1, Polyvinyl Chloride Polymer
The polymerisation, processing and properties of polyvinyl chloride have been extensively reviewed [2-5] , and as part of this work is concerned with a materials characterisation, a brief summary is included.
It is important to understand the difference between a polyvinyl chloride product and the polymer polyvinyl chloride.The product is made from a mix of polymer plus additives which has undergone some processing. Different products may contain a different molecular weight polymer, and the additives and the processing may also be changed. A variation in any of these three parameters may affect the mechanical and physical properties of the product [6]. Therefore, whenever comparing results from different polyvinyl chloride products, allowances need to be made not only for differences in the testing conditions but also on the processing history of the material.
In the following, PVC will refer to the polymer, polyvinyl chloride, whilst UPVC and PPVC will refer to unplasticised and plasticised polyvinyl chloride products respectively.
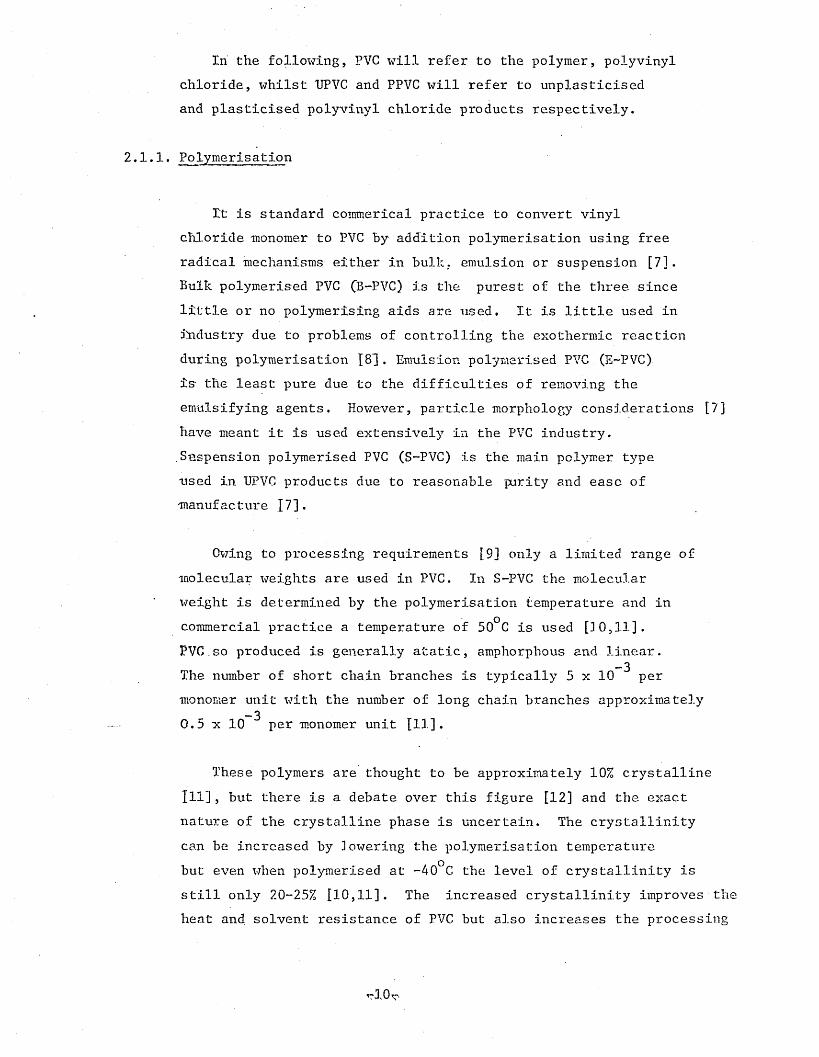
2.1.1. Polymerisation
It is standard commerical practice to convert vinyl chloride monomer to PVC by addition polymerisation using free radical mechanisms either in bulk, emulsion or suspension [7].Bulk polymerised PVC (B~-PVC) -j_s purest of the three sincelittle or no polymerising aids are used. It is little used in industry due to problems of controlling the exothermic reaction during polymerisation 181. Emulsion polymerised PVC (E-PVC) is the least pure due to the difficulties of removing the emulsifying agents. However, particle morphology considerations [7] have meant it is used extensively in the PVC industry.Suspension polymerised PVC (S-PVC) is the main polymer type used in UPVC products due to reasonable purity and ease of manufacture 17].
Owing to processing requirements [9] only a limited range ofmolecular weights are used in PVC. In S-PVC the molecularweight is determined by the polymerisation temperature and incommercial practice a temperature of 50°C is used [10,11].PVC.so produced is generally atatic, amphorphous and linear.
-3The number of short chain branches is typically 5 x 10 permonomer unit with the number of long cha5.n branches approximately
-30.5 x 10 per monomer unit [11].
These polymers are thought to be approximately 10% crystalline 111], but there is a debate over this figure [12] and the exact nature of the crystalline phase is uncertain. The crystallinity can be increased by lowering the polymerisation temperature but even when polymerised at -40°C the level of crystallinity is still only 20-25% [10,11], The increased crystallinity improves the heat and solvent resistance of PVC but also increases the processing
<rl0^

difficulties and is not generally used in industry [13].
2.1.2. Molecular Weight
The statistical nature of the addition polymerisation meanspolymers are produced with a range of molecular weights. Themolecular weight may be defined with respect to either number,viscosity, weight or z average, M , M , M , M , respectively.n v w zThese are single value parameters, with the ratio of M /M^ sometimes used as a measure of the width of the distribution. [14] . Although the first three molecular weights can be determined experimentally from fundamental properties of the polymer,it is normal commercial practice to characterise the polymer using a simple relative viscosity measurement 115, 16], The measurements are transformed into a single value parameter usually reported as the K number which is dependent not only on molecular weight but also the solvent and the temperature of thetest. The relationship between M , M and K for a range ofn w &solvents and test temperatures has been given 117], see Table 1.
A more versatile method which will give all four molecular weight averages is that of gel permeation chromatography.OgPC) > [18,19]• However, this method is again only relative, needing to be calibrated using known molecular weight polymer
A study of several industrially available PVC’s [20], has shownthat the value of M /M is typically 2.2.w n J r J
2.1.3. Glass Transition Temperature, T^, and other Transitions' 1—1r " ' ' ----- - - ----- - - g . . - - . ^
An amorphous polymer is considered to be either glassy or rubbery depending on where its glass transition temperature T ,Olies with respect to the testing temperature. In the former case it lies far above and for the latter it lies far below. The glass transition occurs when, with increasing temperature, the polymer chain which was frozen becomes capable of extensive carbon- carbon bond rotations and hence becomes flexible [21]. This transition has been observed to affect many of the polymer’s properties, i.e. mechanical, dielectric and thermal. However>this
-11-

transition is rate-dependent: with the transition occurring at lower temperatures for 'slow* mechanical tests than for high frequency dielectric tests.
It is also common to find other transitions occurring atlower temperatures than T , these being labelled B,6,y and £ in2order of decreasing temperature of transition. Thesn are usually- associated wTith either side group rotations or short chain- segmental local mode rotations 121].
The glass transition temperature of PVC is dependent on molecular weight but for molecular weights used commercially' the difference is negligible 122]. for industrially- available PVC the T , determined using a slow thermal method is 78°C . The £ transition is usually quoted as lying between ^40° - 0°C as the frequency Hz used in the test changes from 100Hz to 2200Hz 122,233 However, there is evidence of a small transition lying between the glass transition and the £ transition which only appears forPVC quenched from above the T [23,24].2
2.1.4. Degradation of PVC
PVC is renowned for its susceptibility to degrade when subjected to typical processing temperatures, Degradation manifests itself by the elimination of hydrogen chloride from the polymer chain, and in many cases, the discolouration of the material. Despite extensive research the mechanisms of thermally activated degradation have not been fully clarified 125-28]. The main problem is that the degradation process is extremely sensitive to many factors including : the presence or absence of oxygen; the effects of mechanical working; the presence of defects in the polymer chain; and the presence of polymerisation additives.Further, the relevance of the literature concerning PVC degradation is limited since every commercially used PVC product contains additives designed to prevent or slow down the degradation process.
In general, PVC degradation involves not only the elimination of hydrogen chloride but also the competing reactions of chain scission and crosslinking. One of these will dominate depending
-12-
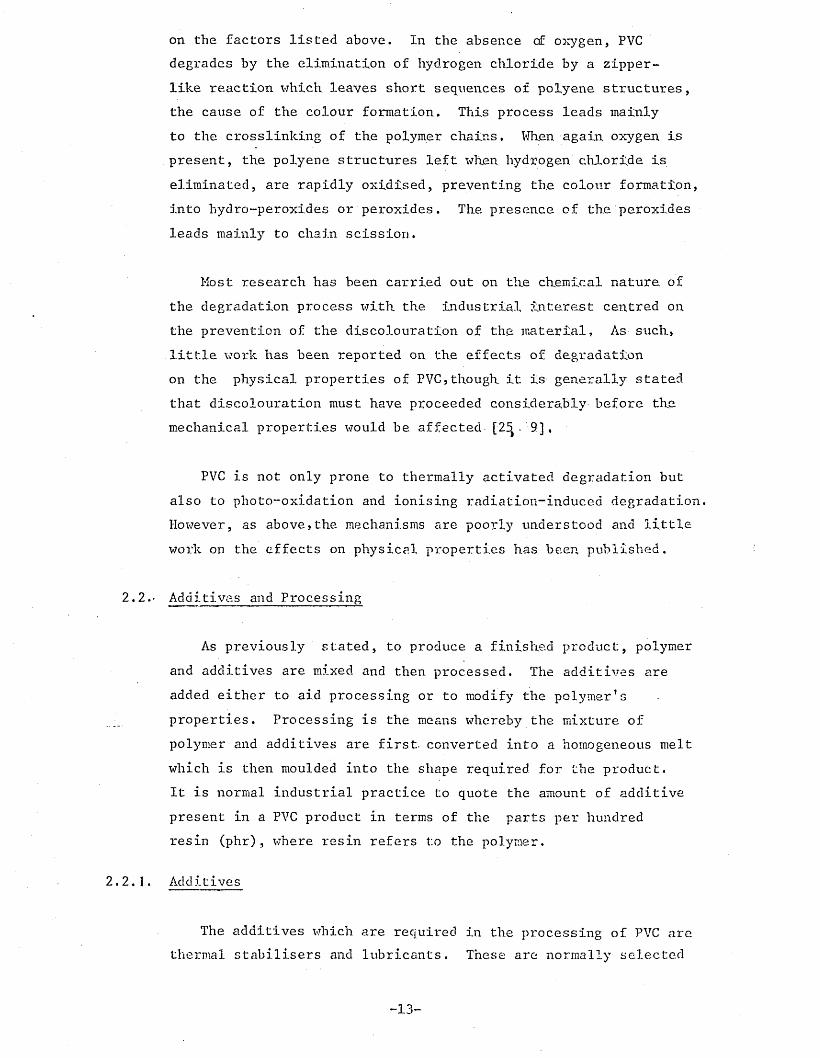
on the factors listed above. In the absence of oxygen, PVC degrades by the elimination of hydrogen chloride by a zipperlike reaction which leaves short sequences of polyene structures, the cause of the colour formation. This process leads mainly to the crosslinking of the polymer chains. When again oxygen is present, the polyene structures left when hydrogen chloride is eliminated, are rapidly oxidised, preventing the colour formation, into hydro-peroxides or peroxides. The presence of the peroxides leads mainly to chain scission.
Most research has been carried out on the chemical nature of the degradation process with the industrial interest centred on the prevention of the discolouration of the material, As such, little work has been reported on the effects of degradation on the physical properties of PVC,though it is generally stated that discolouration must have proceeded considerably before the mechanical properties would be affected [2^. 9],
PVC is not only prone to thermally activated degradation but also to photo-oxidation and ionising radiation-induced degradation. However, as above,the mechanisms are poorly understood and little work on the effects on physical properties has been published.
2.2.- Additives and Processing
As previously stated, to produce a finished product, polymer and additives are mixed and then processed. The additives are added either to aid processing or to modify the polymer's properties. Processing is the means whereby the mixture of polymer and additives are first, converted into a homogeneous melt which is then moulded into the shape required for the product.It is normal industrial practice to quote the amount of additive present in a PVC product in terms of the parts per hundred resin (phr), where resin refers to the polymer.
2.2.1. Additives
The additives which are required in the processing of PVC are thermal stabilisers and lubricants. These are normally selected
-13-

to have the minimum effect on the properties of the product. Additives used to modify the properties of the product include U-V absorbers, pigments, fillers, impact modifiers and, in the case of PPVC, plasticisers 16, 30-323.
The thermal requirements, for processing UPVC are such that unstabilised PVC would rapidly degrade, The stabilisers generally employed are based on lead, tin, barium-cadmium, and cadmium-zinc organo-metallic compounds 133], However, when clarity is an important requirement for the finished product, organofc.in compounds are used. For exceptional clarity the choice is further limited to the sulphur containing organotin compounds 134].
Lubricants are generally classed as either internal or external depending on the function they fulfil. This classification is based on their compatibility with PVC. Those which are more compatible are classed as internal lubricants and function to control the mixing and shear heating. Those which are less compatible are classed as external lubricants and act to prevent PVC sticking to the hot metal of the processing equipment.
This categorisation is only a guide since no lubricant is either completely compatible or non-compatible and each lubricant will act in both modes to some degree. The details of lubricant action are poorly understood and the types and levels of lubricants required for a particular processing system are usually determined by trial and error I35J. Furthermore, because of the time and cost of these trials, details of the lubricant system and indeed the composition in general are rarely reported.
Commonly used external lubricants are synthetic waxes; fatty esters, ethers and alcohols; low-molecular weight polythylenes; and lead stearate. Internal lubricants include long chain fatty acids, calcium stearates,,alkylated fatty acids, and long chain alkyl amines [30].
Pure PVC is not thought to be susceptible to U-V attack. However, PVC which has undergone processing and therefore may be
-14-

slightly degraded or PVC which contains traces of polymerisation additives is known to degrade during exposure to U-V radiation.This degradation is mainly observed as embrittlement in clear products and embrittlement and discolouration in filled products[29,36] U't-V absorbers are, therefore, added to the composition. For clear products these are usually either derivatives of 2- hydroxy- Benzo-phenuone, 2-(2H-benzotriazol -2-yl) - phenols or phenyl esters. Filled products may also incorporate these, though more use is made of titanium dioxide and carbon black [30].
Figments are generally used to colour the product although they are sometimes used to give further protection against U-V attack,
'Fillers are generally added to 1JPVC composition to reduce costs. Typical fillers are the clays, calcium carbonate and titanium dioxide at loadings up to 30% by weight [30].
Impact modifiers improve the toughness of UPVC products by introducing a second phase of rubbery material such as acrylonitrile- Butadiene-styrene (ABS) terpolymers, methyl methacrylate-butadiene- styrene (MBS) terpolymers,chlorinated polyethylene and ethylene- 'Vinyl acetate (EVA) copolymers. These are usually added at the 5^10% level and tend to reduce the yield stress from 55MPa to 42MPa 130]. The impact strength may also be improved if precipitated calcium carbonate, with a particle size less than 0,1pm, is used as the filler 137].
The mechanical and physical properties of a PVC product are most dramatically changed when plasticisers are added to the composition. The addition of 30phr dioctyl plithalate (DOP) may reduce the polymer yield stress to values lower than 25M?a. The product so formed is no longer a glassy material but a rubbery flexible material. The range of materials used as plasticisers is extensive and the levels at which the}7 are used varies between 20-100phr [38].
The main point concerning additives is that not only is there

an extensive choice of materials to perform a wide range of functions but that each material acts not just in one mode, but to a degree, in two or more. The selection of additives for a particular composition is therefore very complicated and the final choice is only arrived at after several trials.
Typical formulations for a clear UPVC extruder composition and calendering composition are given in Table 2,
2,2,2, Processing
Many routes are available to the processor7 to convert a mixture of polymer and additives into a homogeneous melt and then from a melt into a particular shaped object. Some of the more common ones include extrusion, calendering, compression moulding, blow moulding and injection moulding,1391.
For this work the two methods of importance are extrusion and calendering. These two, in essence, are very similar processes requiring similar molecular weight polymer and similar additives. They also introduce s5.milar levels of orientation and similar thermal histories, when compared to injection moulding [39],
To manufacture weld rod a simple extrusion process would be used, whilst to manufacture sheet a calendering process followed by a press lamination process would be used, To manufacture the thickness of sheet used, foils of UPVC, approximately 0,5-1,Oram thick, are first calendered. Then the number of foils required to make up the thickness of sheet desired are stacked in *h press, heated to about 180°C and are then pressed together until they have fused.
It has been noted [40,41] that two-roll milling, a standard industrial method of mixing polymer and additives prior to both extrusion and calendering, may result in a reduction in the polymer molecular weight. Typically, the reduction was found to be 20% for PVC milled for 5 minutes at 190^0 [41],
-16-

2.3. Mechanical Properties of UPVC
Commercially available clear UPVC is described as a glassy, amorphous thermoplastic, at ambient temperatures. Other important materials in this class are polymethyl methacrylate (PMMA), polystyrene (PS) and polycarbonate (PC).
The mechanical properties of this class of materials are sensitive not only to the temperature and rate of testing but .also to the presence of additives and the thermal history of the material. There has been no full assessment of the effect of additives or thermal history for the as-supplied commercial materials although it has been suggested that they would only produce variations in properties of up to 20% [42] . However this value still means caution is required when comparing mechanical data obtained from different grades of material.
2,3.1, Temperature and Pate of Testing
As with all thermoplastics the mechanical properties ofUPVC vary with the temperature and rate of testing. There isalso a slight dependence on pressure but it has been shownthat it requires an increase in pressure of 1000 atmospheres toraise the T by 11°C 143] and therefore pressure may be ignored 8as far as normal testing is concerned.
The effects of temperature and rate have been studied by 'Vincent 144] and Bauwens et al [45] . It is concluded that the tensile yield stress increases betivreen 0.7 - 0.9 MPa for each 1°C decrease in temperature and increases between 1.7 - 2.7MPa each time the strain rate is doubled. The Bauwens et al study used the Eyring rate theory [46] to analyse their data. They found that as the temperature decreased or the strain rate increased more account had to be taken of the 6 transition.They showed that at any temperature a test done below a certain rate was dominated by the glass transition, whilst above that rate it was controlled by both the glass and the 3 transition.In their study they found that at 0°C and 23°C the critical strain rates were 0.008s ^ and 0.04? ^ respectively.
-17-

The.temperature dependence of the yield stress in the glass transition controlled region is confirmed by Williams and Isherwood 147], and Rawson and Rider [48]. In the same region the rate dependence is confirmed by Pezzin et al [49] and Shinozaki et al 150].
Williams and Isherwood 147] and Harrell.and Chartoff [253 both report a decrease in tensile modulus of 0.01 - 0.02 GPa with an increase in test temperature of 1°C, Pezzin et al [49]and Shinozaki et al 150] have shown that a doubling of strainrate increases 'the tensile modulus by 0.03 - 0.05 GPa.
From these studies, TJPVC is found to have a tensile yield stress of 55 - 65MPa and a tensile modulus of 2.7 - 4.1 GPa
O owhen tested at 20 C using a strain rate of 10 s “ .
The brittle strength of UPVC, and thermoplastics in general, is less sensitive than yield stress to changes in test temperature and strain rate 151] . This reduced dependence on temperature means that as the temperature is reduced, the yield stress increases and the probability of brittle failure increases. The brittle-ductile transition [52] occurs when the temperature is such that half the specimens tested fail in a brittle manner, see fig. 8 . In amphorous polymersthis transition has been associated with the 3 transition [53, 54]-In the case of UPVC the 3 transition occurs between -40 - 0°C as does the brittle-ductile transition.
2.3.2, Molecular Weight Dependence
The properties of UPVC are dependent on molecular weightand possibly molecular weight distribution. However, as mostcommercially available UPVC is processed from PVC havingM /M e 2.2 [20], the effects of molecular weight distribution w nare not discussed.
The T of PVC increases rapidly with molecular weight 8
-18-

but plateaus at = 78°C for molecular weights exceeding =10.000 122], The yield stress for UPVC with M = 50,000 - 500,000whas been shown to be "sensibly" constant although energy-to-breakand flexural brittle strength increase for M less than 200,000 [44].wPezzin and ZinelLi 141] reported no molecular weight dependencefor either yield stress or tensile modulus for M greater thanw70.000 but were unable to test UPVC with M = 26,000 due towdifficulties of processing. Shinozaki et al [50] reported a constant yield stress for a range of commercially available UPVC’s, with different molecular weights, but a slight decrease in tensile modulus with increasing molecular weight.
Other properties shown to be dependent on molecular weight are time-to-rupture under fatigue loading 155], discontinuous growth band formation during fatigue testing 156], craze stability 157,58], heat stability, impact strength and softening point 1591.
2,3,3. Effects of Additives
It has been shown that the presence of some soluble, liquid additives increase certain properties such as yield stress, whilst insoluble, solid additives lead to a decrease [60], see fig. 9.
The clearest example of how additives affect the propertiesof PVC is seen when plasticisers are added to the composition.The addition of 50phr of di-octyl phthalate (DOP) to PVCreduces the material yield stress to 21MPa whilst increasingthe elongation-to-break to 290 /?[38]. This is achieved bydepressing the polymer T either closer to or below room8temperature.
However, some plasticisers exhibit anomalous behaviour inthat when at low concentrations, less than lOphr, they increasethe yield stress and reduce the elongation-to-break, but stilldepress the polymer T 161]. This effect has been called8anti-plasticisation. Mascia [62] has studied this effect in PVC, using tri-cresyl phosphate (TCP), by examining the
-19-

dynamic response and creep response at various temperatures.He showed that the anti-plasticisation effect is absent for material tested at or above 40°C. Indeed above 40°C the material showed the typical plasticisation effect. This confirmed the results of work carried out by Peukert 163] on plasticised weld rod.
Tile effects of the; presence, of particulate fillers on the mechanical properties of UPyC haye been extensively^ studied,Vincent I44] examined the effects of adding titanium dioxide, calcium stearate, PMMA butadiene-methyl methacrylate copolymer, and vinyl acetate on the yield stress, impact strength and elongation-to-break. Increasing the loading of titanium dioxide increased the impact strength and decreased the yield stress. At 30phr the impact strength had increased 150% whilst the yield stress had decreased 10%. The addition of up to 2phr calcium stearate lead to a reduction in yield stress of 15%. When PMMA or vinyl acetate were blended or copolymerised with UPVC the yield stress increased and the impact strength decreased. However, when butadiene-methyl methacrylate was blended with UPVC the yield stress decreased and the impact strength increased. Similar effects were shown by Weldon I59] when calcium stearate and vinyl acetate were added to UPVC.
Studies of the. effects on mechanical properties of addingcalcium carbonate to UPVC are complicated by particle size andagglomeration effects 164] . The major effect of particle sizeis that the impact strength increases as the size decreases,A 20% loading of calcium carbonate has been shown to increase
2 2the notched Charpy impact strength from 6,5KJ/fb to 9.6KJ/r42for a particle size of 2.4ym but will increase it to 36KJ/rn
for a particle size of 0.07ym [64], However, at this loading the yield stress drops by 14% and 21% respectively,
Baum [65] has studied the weathering of UPVC stabilised with three different organotin compounds with and without particulate U—V stabilisers, He reported that the yield stress for unweathered material was significantly less for the UPVC containing the U-V stabilisers.
-20-

The increase in yield stress for a UPVC composition containing soluble additives is noted in one of the supplier's literature 166]. The specific example quoted being a liquid organotin stabiliser as used in clear sheet, Xt is further noted that there is an attendant increase in brittleness when such additives are used.This is also reported by- workers 167] studying the creep and fatigue response of various grades of UPVC,
Dunlqp et al 168] whilst studying the effects,- of;.iplas.ticiserson the T of PVC showed that the addition, of a liquid organotin
^ ostabiliser at the 2phr level reduced the PVC X to 69 C, Theygconsidered it to be a plasticising additive. A barium-cadmium particulate stabiliser only reduced the T to 77°C, Similar findings were reported by Duiser and Kei.jzer 169] who found thatthe T of a PVC composition containing 2phr of liquid organoting 0stabiliser was reduced at 65 C,
2.3.4. Thermal History and Orientation
Turner 170] reported a marked reduction in the Tang term creepcompliance of UPVC when conditioned at 60°C for 12 weeks prior totesting. He reported that rapid cooling from above T then restoredgthe compliance. Dunn and Turner 171] monitored the short term modulus, 100 sec, creep modulus at 0 ,2% strain, after various times of conditioning at 60°C. They found a 70% increase after 6.6 years, and also report that conditioning at 20°C for 3.5 years raised the modulus by 8%. Mascia [62] reports a similar trend in the results for creep compliance and sheer modulus, when comparing unconditioned UPVC with UPVC kept at 60°C for 3 months prior to testing.
Wright [72] studied the effects of annealing UPVC for different lengths of time, at various temperatures between 40°C and 60^C. He reported the expected improvemrnt in creep modulus with increasing anneal time for the longer duration annealed material. A further improvement was obtained when a delay time was introduced between annealing and testing. In all cases, though, this improvement was cnly towards the creep modulus obtained for UPVC conditioned at 20°C for 2 years. However, he also
-21-

reported an anomalous effect for the high temperature, short duration annealed material in that as the time of the anneal increased the creep modulus x as initially observed to drop before showing the usual improvement.
Struilc 173] also reports an improvement in creep modulus with onged storage at 20°C when coi
from material quenched from 9.0°C,prolonged storage at 20°C when compared with the values obtained
Illers 174] reports an increase in density- and yield stressand a reduction in elongation^-tor-break for Tipyc annealed at 70°Ccompared to material quenched from above T . Mills [75] and
8Cross and Hctward [76] have shown that quenching UPVC from above T8produces a material which at low- strain rates will yield in a uniform manner without showing any signs of necking* This yield occurred at a lower stress than for unquenched material. They found this state to be unstable in that when increasing delay times were introduced between quenching and testing the material behaviour gradually returned to that of unquenched material. Rider and Hargreaves [77] report a drop of 10% in yield stress for UPVC annealed at 71°C but give no details of the cooling rates used. Shinozaki et al [50] annealed injection moulded UPVC specimens at 110°C and found that both tensile modulus and yield stress- increased with annealing times up to 20 minutes but they then remained constant. The increase in modulus and yield stress was between 10-20% whilst elongation-to-break decreased from 140% to 80%,Again, no details were given for cooling rates from the annealing temperature.
The methods of differential scanning calorijne.try (DSC! havebeen used extensively to study the effects of varying thermalhistory on UPVC, Illers 174,78], McKinney and -foltz ]79] , andGray and Gilbert [80] all report the presence of an endothermicpeak super-imposed over the glass transition for UPVC annealedbelow T . The area under this peak is dependent on the rate ofcooling and heating and the time and temperature of the anneal.Heating to above T and quenching removed the peak,g

Wolpert et al 1.81] studied the effects of using differentheating and cooling rates on the T for a range of thermoplastics8including PVC. They showed that similar rates for coolingand heating produced the standard glass transition with fasterrates moving the transition to higher temperatures. Slowcooling and fast heating produced the endothermal peak super-imposedover the glass transition. Fast cooling and slow heatingproduced a small exothermic peak super-imposed, just prior tothe glass transition, see fig. 10. These extra peaks wereexplained as being due to the rate effects varying the relaxationof free volume. Illers 178] and Gray and Gilbert [80] explainexothermic peaks super-imposed on the curve between T^ at 200°Cas being caused by crystallinity formed during annealingtreatments above 'I of previously quenched PVC, the exothermic
^ opeak occurring between 10-20 C lower than the annealing temperature,
The effect of orientation on lipyc has been studied byRider and Hargreaves 177], They examined the yield stressdependence on draw ratio, draw direction and dra,vr temperature,
0 oeither 71 C or 90 C, The lower temperature drawn material had a yield stress up to 200 % greater than the undrawn material., when tested in the draw direction for draw ratios in the range 0 - 7. In the same range the high temperature drawn material Ts yield stress only increased up to 50%. Both high and low temperature drawn material had yield stresses lower than the undrawn material when tested at 9.0°C to the draw direction, see fig,ll.. Rawson and Rider 148] found no change in the temperature dependence of the yield stress for the Hot drawn material compared to the undrawn sheet. However, they report a slight anisotropy in the yield stress for the as-received sheet (less than 8%) which was not observed by Rider and Hargreaves.
Rawson and Rider [82] extended their study to include the effects of hot drawing on tensile modulus using an ultrasonic method [83] to determine, the elastic constants of the materials.They reported a linear relationship between tensile modulusand yield stress for a range of draw directions and birefringence,birefringence being used as a measure of draw ralio.

Brady and Jabarin [84] studied the effects of cold drawing (23°C) UPVC. They observed that the temperature at which shrinkage occurred was reduced from 70°C, for undrawn material, to 45°C. However, the yield stress increased from 72HPa to 88.3MPa, To try to preserve the improved mechanical properties whilst improving the shrinkage temperature, they studied the effects of two annealing treatments. Both were carried out at 70 C for 3 days. In the first, the sample was constrained in its drawn state, whilst the second was unconstrained,Undrawn sheet was also annealed at 70'C for 3 days, -unconstrained for tise as a comparison. Their results-, for each treatment, for the shrinkage temperature,yield stress-, modulus, total shrinkage and T^ are given in table 3.
2.4. 'Fracture and Frac tography-
A material may fracture in either of two modes, ductile or brittle. Ductile failure is usually observed as slow tearing with large deformations and is associated with yielding of the bulk polymer. Brittle failure, however, is usually a low stress, low energy and small scale deformation process resulting in planar surfaces covered with cleavage type features.
2.4.1.' Crazing ana Brittle Fracture
Brittle failure in glassy thermoplastics is usually prexeded by craze formation through which the crack grown, in either a slow stable manner or a fast catastrophic fashion 185]] ,
The crazing behaviour and craze morphology have been extensively studied but the complete details have not been fully established. Craze formation is dependent on many factors including: the level and duration of applied stress, temperature, polymer, molecular weight and the presence of orientation in the polymer [58] . Crazing develops under a tensile stress only, the plane of the craze being normal to the stress direction. The crazes usually initiate at surfaces but can develop internally from notches or inclusions. Crazes tend to be wedge shaped, the distance between the craze wTalls increasing with distance from the craze tip,
-24-
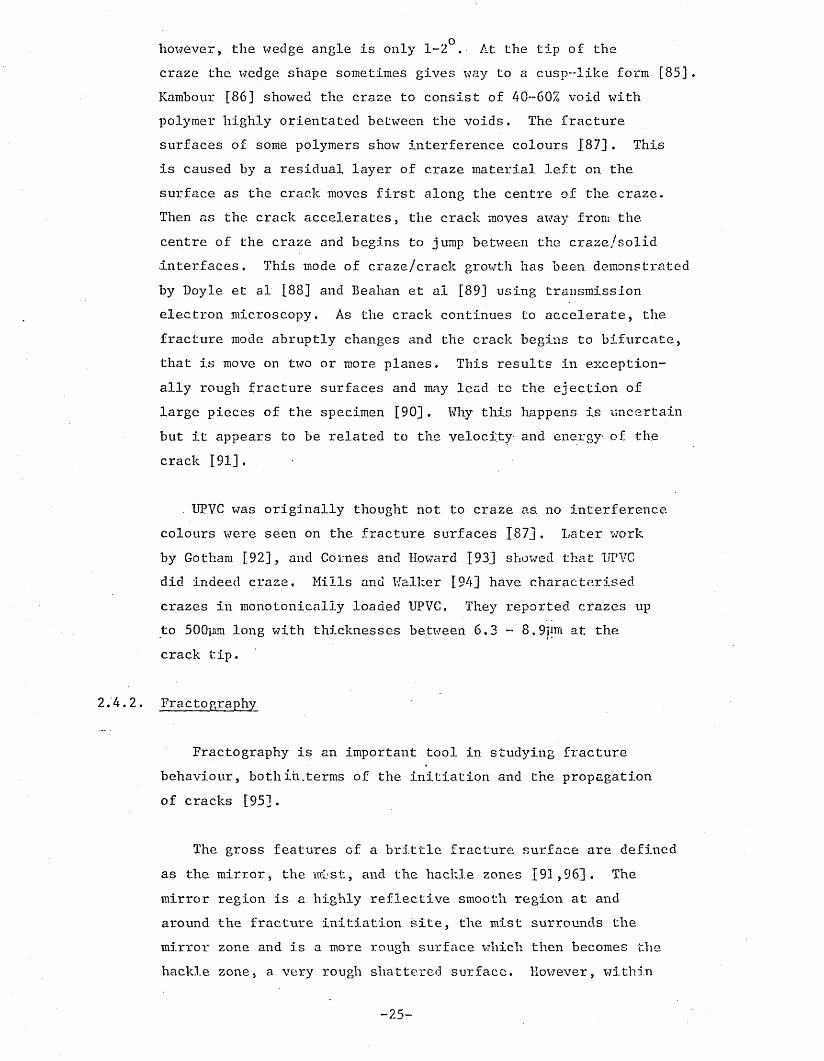
however, the wedge angle is only 1-2°. At the tip of the craze the wedge shape sometimes gives way to a cusp-like form [85]. Kambour [86] showed the craze to consist of 40-60% void with polymer highly orientated between the voids. The fracture surfaces of some polymers show interference colours 187] . This is caused by a residual layer of craze material left on the surface as the crack moves first along the centre of the craze.Then as the crack accelerates, the crack moves away from the centre of the craze and begins to jump between the craze/solid interfaces. This mode of craze/crack growth has been demonstrated by Doyle et al [88] and Beahan et al [89] using transmission electron microscopy. As the crack continues to accelerate, the fracture mode abruptly changes and the crack begins to bifurcate, that is move on two or more planes. This results in exceptionally rough fracture surfaces and may lead to the ejection of large pieces of the specimen 190]. Why this happens is uncertain but it appears to be related to the velocity' and energy of the crack 191].
UPVC was originally thought not to craze as no interference colours were seen on the fracture surfaces 187] . Later work by Gotham [92], and Cornes and Howard 193] showed that UPVC did indeed craze. Mills and Walker 194] have characterised crazes in monotonicaliy loaded UPVC. They reported crazes up to 500yim long with thicknesses between 6.3 - 8 .9hm at the crack tip.
2.4.2. Fractography
Fractography is an important tool in studying fracture behaviour, both in.terms of the initiation and the propagation of cracks [95].
The gross features of a brittle fracture surface are defined as the mirror, the wist, and the hackle zones [91,96]. The mirror region is a highly reflective smooth region at and around the fracture initiation site, the mist surrounds the mirror zone and is a more rough surface which then becomes the hackle zone, a very rough shattered surface. However, within
-25-

each of these regions there are further finer features.
It is generally considered that the mirror region corresponds to slow crack growth through the preceding craze, the mist is a transition zone and the hackle is the fast fracture region 197]. Within the mirror zone penny shaped features may be observed [94], these being formed either by void coalescence or by secondary fractures in advance of the main crack, The features most studied in the transition zone are the patch or mackerel patterns observed 011 the fracture surfaces of PS. These patterns have been attributed to the craze wedge first separating from one craze/solid interface,then from the other 197], The hackle zone contains four main features, rough shatter bands, fine striations, river markings and Wallner lines. The shatter bands and the fine striations are thought to be essentially similar [88] with the shatter bands,being caused by excess energy in the crack, This causes the crack not to move through the preceding craze, thereby leaving a striation, but into, the bundle of crazes which stirround the crack tip, hence leaving a shatter band.River markings are seen when the crack has been moving on two or more different levels which gradually meet as- the crack advances 198]. Wallner lines are perturbations of the crack caused by the interference between stress waves reflected by the specimen surfaces and the crack front [99]. These are normally observed as curved bands of roughened material which show in some cases, an unexplained periodicity. Where two or more sets are present definite over-lapping may be seen. These lines have been used as a means of determining the crack velocity, when the stress wave velocity is known and have been shown to occur when the crack is moving with a velocity close to its maximum [98]. Ultrasonic pulses have been used to artificially modulate the crack front to allow crack velocity determinations in glassy thermoplastics [100].
The fine striations observed on PS fracture surfaces have also been observed on UPVC 156^ 5 lj 98, 101], styrene-diene triblock copolymers [102] and polymethyl-a-cyanoacrylate adhesive [103] fracture surfaces. They are all characterised by spacings typicaJly 10-30pm with a high degree of regularity in size and
-26-

spacing. They lie parallel to the crack front and do not' 4overlap, as do Wallner lines, they have a well defined leading edge behind which lies a craze band which fades into a featureless zone approximately equal in length to the craze band. Similar lines have been seen, on the fracture surfaces of PC [104] but with a much larger spacing.
2.5. Fracture Mechanics
In the engineering context the study of brittle failure is through the theories of fracture mechanics J105-107J , For the case where failure occurs at leads low- compared to the yield stress and when the material is approximately obeying Hooke’s law, a linear elastic fracture mechanics (LEFM) approach may be used,
2.5.1. Fracture Mechanics Theory
Inglis [108] has shown that for a small elliptical hole in a uniformly stressed, linear elastic plate, the stresses around the hole are modified so that a maximum local stress, a , isobserved at point C, see fig. 12, equal to
aL = °A [1 * 2 (a/p)2J -(1)
Where o^ is the applied stress, 2a is the major axis length and p is the radius of curvature of the ellipse at point' C*.
Griffiths [109, 110] used Inglis’s analysis with an energy balance criterion for failure to derive the failure stress cr■ , for a line crack (the limiting case of an ellipse) as
0F «* (2E Y/irad _ (2)
in plane stress, or°F = (2E Y/ira(l - V2) )* -(3)
in plane strain E is the material’s Young’s Modulus, y is thesurface energy, 2a, the crack length and v Poisson’s ratio.
-27-

Irwin [111], using a stress analysis approach showed the stresses around the crack tip to have the following form
cr.j = Kf(r) g.j (0) -(4)
Where K is termed the stress intensity factor and f(r) and g-* (o)Jare radial and angular functions. K is defined as
K = a ^ A a ~(5)
K is usually referred to the mode of opening of the crack, i.e,Kj. is the K relevant to Mode I opening, see fig* 13,
Irwin suggested that fracture occurs .when K reaches a critical value Ih, this value being a constant for the material, that is the same way as yield stress is a constant, i.e., allowing for rate and temperature dependence.
The equivalence of Griffith’s and Irwin’s approach was demonstrated by Irwin who introduced the strain energy release rate parameter G. At the instance of fracture, this parameter has a constant value G^, which equals the surface energy term y', of Griffiths which, substituted into C2) and (3) and using (L5\ gives
K = cv /tts- = ( E G ) 5'c F c - ( 6 )
for plane stress and
Kc - (E Gc/(1 - v2))1 _ (?)
for plane strain,
Irwin 11113 an(j Qrowan T112] suggested that plastic work, Yp done at the crack tip should be included in the surface energy term and that in engineering materials y is very much greater than y Irwin went on to show that this work was independent of the external conditions, provided the volume of plastically deformed material was small, with respect to the specimen
-28-

2.5.2.
dimensions, and therefore could be used in place of y.The zone of plastically deformed material has been analysed by Dugdale [113] who shovjed that it extended beyond the crack tip by an amount Aa, given by
( 1:0A/2o ) - \, .a y~(8)
Where a is the yield stress,y
Fracture Mechanics Testing
To allow for the finite size of test specimens equation (5^ is modified by the inclusion of a geometric factor, Y. such that
K = cr Y/~a K 9 )c r
These geometric factors have been determined for a number of test geometries [114, 115].
The dependence of and K on specimen thickness is simplified through the plane strain/plane stress approximations, that is thick/thin plate respectively, and in practice the approximation is determined empirically. The surface of the specimen is assumed to be in plane stress and this state is assumed to continue into the sample for a depth approximately equal to the plastic zone size Aa. Provided the sample is thicker than 2Aa the middle is assumed to be in plane strain.
The usual parameter studied in fracture mechanics is the plane strain fracture toughness, K ,for mode I opening. TheJ_ wplane strain state prevents the relaxation of the strain by through-the'-thickness yielding and leads to a brittle, flat fracture at relatively low loads.
A G r versus thickness plot for aluminium is shovm in fig, 14, JL U[116].
^29-

The insensitivty of G to specimen thickness in the plane-L0strain regions allows tests to be done under more controlled conditions. If specimen thicknesses less than those necessary for plane strain testing are used then large differences in G .£ are caused by small variations in thickness.
In metals, the minimum thickness conditions for plane strain testing is given by [114].
b * 2.5 (K. / a ) 2-(10)
The condition is semi-'empirical , based on results for aluminium and a value judgement that fifty times- the plastic zone size is sufficient thickness to ensure minimal effects due to the plane stress surface region [117],
Other specimen dimensions such as crack length and distance from the crack tip to the opposite edge of the specimen' should also be greater than (10) for valid plane strain testing 1114].
Plane strain fracture toughness testing may be divided into two sections. The first section uses methods and specimens which give one result per test specimen and the second uses methods •and specimens which give more than one result per specimen.
In the first category are tests using single edge notch (SEN),double edge notch (DEN) and the centre notch (CN) specimens intension and the SEN specimen in bend, see fig, 15, The featureof these is that once the crack propagates, it is unable tocome to rest again within the sample and hence completely-fractures the specimen. The fracture toughness, Krr,, islvdetermined through (9) using standard geometric factors Jlf4,115] ,
In the second category samples are used which are sufficiently large that under fixed grip (constant displacement) testing the propagating crack is able to come to rest within the sample. If the grip separation is increased until the crack propagates again and is then held constant, the crack may again come to rest within
-30-

the sample. With the correct design and a suitable material this procedure may be repeated many times before the crack completely separates the sample. Using this type of testing, two types of behaviour are observed: slow stable crack growth and fast stick-slip fracture; typical load-extension curves are shown in fig. 16. During testing, the grip displacement is increased at a constant rate. With some designs- and materials the crack grows so slowly that the movement of the grips serves to drive the crack forward without it stopping, thus giving slow crack growth. However, with, other designs and materials the crack movement is so fast that the grips are effectively frozen during propagation and therefore no further work is done on the sample. This results in stick-slip fracture.
Specimens for this type of test are sho>m in fig. 17 and they are known as double cantilever beam (DCB). s tapered double cantilever beam (TDCB) , compact tension (CT)_ and double torsion Q)' specimens,
For each, specimen type, air appropriate, geometric factor has been determined 1118,119,114,1203 thus-permitting a direct calculation of K-j-q* However all four specimens can also be used to determine G ^ using compliance methods. If a calibration curve of compliance against crack length is produced then can be calculated from [121].
Pf dc2b X da -(11)
Where is the failure load, o is the specimen compliance and dc/da is the rate of change of compliance with crack length, at that crack length, and b is the specimen thickness, see fig. 17. The compliance calibration curve is produced by measuring the specimen compliance, that is the deflection of the ends of the beams divided by the load, for a range of different crack lengths.
When using either the DCB or CT specimens, both the load

and the crack length are required before can be calculated.By careful design the dc/da term can be made constant for a range of crack lengths and therefore whilst the crack is within that region only the load at failure is required in the calculation of the G 1121], To produce a constant dc/da, the DCB design isj-Lmodified to a taper. Strictly it should be contoured, but a simple taper is a reasonable approximation for a limited size of cracks 1122],
In almost all of the multi-result tests the specimens are grooved along their centre line to guide the crack and to prevent it wandering out of the side of the specimen,
The two types of crack, behaviour, i.e. slow or fast crack growth, provide different information about the crack. When slow crack growth occurs, data may be obtained about crack propagation and about the way- in which cracks, too small to produce catastrophic failure, may grow to a critical size. Fast catastrophic failure only gives information on the crack initiation behaviour [123].
Mai et al J124] have analysed the various TDCB designs and have shown that crack growth is more stable, when smaller taper angles are used. They also shox? that arm break-off becomes ■more common when smaller taper angles are used, and therefore specimen grooving becomes essential. Arm break-off may be reduced if designs with smaller e/w values are used, where w is the specimen length and e is the extra beam length, necessary to bring the taper to its apex, They suggest that the most stable crack growth will occur for TDCB!s which are reverse loaded, that is loaded at the end away from the apex.
Kobayashi and Broughtman 1125] have suggested that the bonding of stiff side plates to the specimen may reduce the incidence of arm break-off. They developed the technique to permit a fracture mechanics analysis to be carried out on a rubber modified acrylic, PMMA was used for the side-plates.
One important requirement for reliable fracture mechanics
-32-

testing is the need for reproducible,sharp,starter cracks.Marshall et al [126] have demonstrated the need for care whennotching PS. They shoved that slow razor notched, impactrazor notch and fatigue notched PS TDCBs’ gave K values of
I 1^1.87, 1.32 and 0,45 MPam'2 respectively. They found that both forms of razor notching and low frequency fatigue notching (less than 30Hz) produced a bundle of crazes at the crack tip.These crazes acted as energy sinks prior to crack propagation.High frequency fatigue notching (greater than 30Kz) lead to the creation and growth of a single craze at the crack tip thereby lowering the fracture surface energy, B.azor notching of PMMA. was found to be adequate as only a single craze formed at the crack tip,
2.5.3. Fracture Mechanics and Polymers
The methods of 1EFM have been applied to many glassy polymers, in particular PMMA 1127-132], PS 1126,127,130,134-136], PC 1.135-139], epoxy resins 1121,140-147] and UPVC 147,56,57,93,94,148-156].
The majority of work has concentrated on either PMMA or epoxy.resins. PMMA has been considered an ideal material with which to use LEFM, since in many tests considerable spans of slow stable crack growth can be achieved. This permits the" evaluation of K_ for both crack initiation and propagation over a wide range of test rates and temperatures; typical curves are shown in fig. 18 and fig, 19 1131, 132],
• The epoxy resins have been studied because of their extensiveuse as adhesives and as the matrix material in many fibre composites. They also provide a means of evaluating the effects of chemical structure on fracture behaviour. It is possible, by the careful selection of catalyst or hardener, to vary the crosslink density of the cured.resin, and therefore to examine how crosslinking affects fracture behaviour. The dependence of K on crosshead speed and test temperature has been studied and typical curves are given in fig. 20 and fig. 21 1147]. At low crosshead speeds, crack propagation is stick-slip. However, as the crosshead speed increases, the K decreases, and when it equals
-33-

the arrest value of K, K , then crack propagation is slow and cont-la.inuous. At high temperatures K is very much larger than K
jli» laand crack propagation is sticlc-slip; but as the temperaturedecreases, K decreases until equal to K , and again slow il* lacontinuous crack propagation is observed,
A comparison between PMMA and epoxy resins is made difficult since different aspects of IC are reported. However, it would seem that with PMMA, slow stable crack propagation is favoured by slow crosshead speeds and high temperatures whilst the reverse applies for epoxy resins.
In the case of UPVC various factors affecting and G , such as specimen dimensions, rate and temperature of testing, composition and orientation have been studied.
Cornes and Howard 193] reported a value of 2.45 KN/m andI
for K^, of 2,9 MPa.ni2 for 1 and 2mm thick clear rigid PVC SEN’S tested at -40°C, At the same temperature, using a notched three- point bend test, Williams et al 1123] reported an identical value for G , although no information was given concerning thelusheet thickness.
Guild et al [148] used UPVC with PMMA to study the effects on•fracture behaviour of bonding together different materials. Usinga grooved DCB method with a nett section thickness of 1.5mm, UPVC
+ -was reported to have a K of 3.56 - 0.20 MPam2 • Initial notching11*
was carried out with a Stanley knife.
Mills 1149], using centre notched specimens and a photoelastic analysis, studied the effects of annealing and quenching on for 1 and 2mm thick UPVC sheet. The annealed and as-received
+ v,sheet fractured in a brittle manner with = 2.0 - 0.2 MPanr .Quenched 1mm sheet failed by shear yielding, but 80% of thequenched 2mm sheet failed in a brittle manner.
Mills and Ualker[94] used clear rigid UPVC SENS with thicknesses 1,2,3 and 6mm to study craze growth and the effects of thermal

history on K • They reported that as-received sheet had aKTr, of 2.00 MPam5. After quenching, the 2nim sheet had a K of2.57 - 0.24 MPam5 whilst 3 and 6mm sheet had a K of 1.95- 0.16 l iMPam5. The quenched 2mm sheet had a K of 1.94 io.17 IIPam5 .whenXUtested 21 days after quenching. They investigated the method of notching and found that fatigue notching did not produce significantly lower values for K _ than razor notching. PoorXUalignment of the loading system and the notch was blamed forihigher values of recorded (up to 2.9 MPam5). They concluded that using the energy balance approach of Griffiths implies slow stable crack growth is possible with the material. They, however, proposed a theory of advance fracture formation which would tend to prevent slow stable crack growth, which they failed to observe. They suggest analyses should be presented in terms of the critical stress intensity factor, and not fracture surface energies, G .
Brown arid Chin [150] used 6mm thick UPVC and a compact itension test method to determine a value for K of 1.3 MPam2 . They did not observe any stable crack growth and no shear lips were seen on the fracture surfaces.
iGreen and Pratt [151] reported a dynamic of 2 MPam2 for
cracks in UPVC travelling at speeds between 5.10-590 in/s. At velocities above 590 m/s the crack bifurcated and an approximate
Iof 2.6 MPam5 was estimated. The UPVC used formed a large
craze bundle, approximately 300-400um, during notching. In propagating through this bundle, the crack accelerated to speeds of greater than 500 m/s and they were unable to reportvalues of for crack velocities less than 500 m/s. Theysuggest that although the grade of UPVC used has a low dynamic toughness the presence of the craze bundle would lead to a more useful toughness under practical conditions of loading. However, once fracture had started it: would be more catastrophic than PMMA.
Plati and Williams [152] used an instrumented impact tester to determine G for UPVC. Over the temperature range -100 to

+60°C, using notches with a 50pm radius, G was found to be between 1.3 and 1.4 KNyM. When tested at 20°C using notch tip radii of 250pm and 500pm, G^rose to 2.0 and 3,8 KN/m respectively.
hadon [153] and Johnson and R,adon [154] used impact and slow bend tests to study the temperature dependence of for UPVC, They report maxima in the curves of K^c versus temperature which varied with testing speed. They suggest that: these maxima correspond to an effect due to the gtransition.
Miller et al I155J orientated UPVC by hot drawing and thenexamined the effects of differing degrees of orientation onfracture surface energy using a grooved DCB method, Theyreported slow stable crack growth, with a resultant non^reflectivesurface, and a diminishing fracture surface energy withincreasing orientation. Above a certain orientation, indicated
-3by a birefringence of 2 x 10 , the crack growth propagatedin a jerky manner with a highly reflective fracture surface,For undrawn material of 1mm thickness a value of fracture surface energy of 3,6KN/m was determined,
Skibo et al 156, 101] used LEFK to study the effects of molecular weight and plasticiser on the properties of PVC, They
Ishowed that for unplasticised PVC, K varied from 0.7 - 2.4 MPam5
5 5for Mw from 0.605 x 10 - 2.25 x 10 , when 6.4mm thick sheetswere tested.
The effects of specimen dimensions and notching method onK^c have been studied using a pipe grade UPVC [156]. It wasconcluded that, provided the size requirements recommended formetals, i.e that the important sample dimensions are greater
2than 2.5 (K^/ 1 ) s are met, then LEFM may be used. Further, that razor blade pre-craclcing produces acceptable crack tips under these test conditions.
Chauffoureaux [64] reports the results of impact tests on DEN specimens of UPVC containing differing amounts of two
-36-

calcium carbonates of different particle size. The unfilledI
UPVC had a K of 2.3 IIPam2 and the 20% by weight filled UPVC, fine particle size, had a of 2.7 MPam5. It is, however, pointed out that the filled UPVC fracture surfaces showed evidence of plastic yielding at the notch, tip which may invalidate the results for the filled materials.
2-6- Hot Gas Welding of UPVC
The basic techniques of hot gas welding of thermoplastics were patented Independently by Reinhardt in the'U,S,A« 1158]) and Henning in Germany 1159] between 1937 and 19381 However, almost all the development work and later studies- were carried out in German}71. Except for improvements in, equipment and the introduction of speed welding, there has been little change in the methods of hot gas welding since they were first patented.As such it still remains a skill which is learnt by experience over months and years of welding.
In general the literature concerning hot gas welding of UPVC contains recommendations for good welding procedure with little research or explanation of why one set of conditions are better than another.
2.6.1. Sheet Preparation
Voigt [154] gave recommendations for the preparation of the groove formed between two sheets to be butt welded. The groove was to be a single-vee configuration for thin sheet and a double- vee for sheet thicker than 6mm’; the included angle of each vee. should be 60°- 70°. The use of a double-vee groove for thick sheets was to save both time and material, as it required more rods to fill a single large vee than two smaller vee’s. When using a single-vee groove special attention is drawn to the need to ensure good root penetration, this being helped by leaving a slight gap, 0.5 - 1.0mm, between the bevelled e.dges of the sheets. It is further advised that an extra reinforcing weld rod should be welded along the root from the reverse side of the groove.
-37-
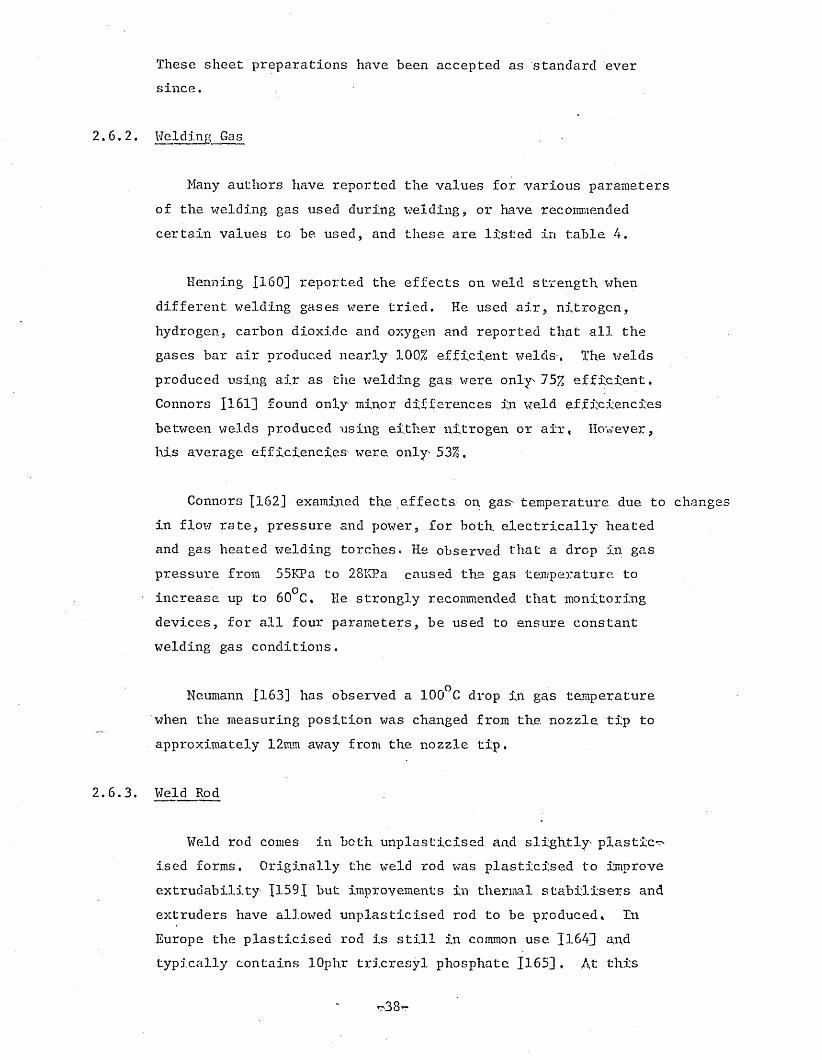
These sheet preparations have been accepted as standard ever since.
2.6.2. Welding Gas
Many authors have reported the values for various parameters of the welding gas used during welding, or have recommended certain values tc be used, and these are listed in table 4.
Henning J160] reported the effects on weld strength when different welding gases were tried. He used air, nitrogen, hydrogen, carbon dioxide and oxygen and reported that all the gases bar air produced nearly 100% efficient welds-. The welds produced using air as the welding gas were only\75% efficient,Connors 1161] found only minor differences in weld efficiencies between welds produced using either nitrogen or air, However, his average efficiencies were only- 53%,
Connors [162] examined the effects on gas: temperature due to changes in flow rate, pressure and power, for both electrically heated and gas heated welding torches. He observed that a drop in gas pressure from 55KPa to 28KPa caused the gas temperature to increase up to 60°C, He strongly recommended that monitoring devices, for all four parameters, be used to ensure constant welding gas conditions.
Neumann [163] has observed a 100°C drop in gas temperature when the measuring position was changed from the nozzle tip to approximately 12mm away from the nozzle tip.
2.6.3. Weld Rod
Weld rod comes in both unplasticised and slightly^ plastic^ i.sed forms. Originally the weld rod was plasticised to improve extrudability I159I but improvements in thermal stabilisers and extruders have allowed unplasticised rod to be produced. Tn Europe the plasticised rod is still in common use J164]j and typically contains lOphr tricresyl phosphate 1165]. At this
v38-

level it is acting as an anti-plasticiser [62]. Peukerts [63] has reported that welds made with plasticised rods are stronger than those made with unplasticised rods when tested at temperatures less than 40°C, but that their efficiencies drop below those of unplasticised rod welds when tested aboye 40°C. Plasticised rods were also observed to char 'more easily- at higher weld temperatures.
Yoigt J159] examined the effect of weld rod shape on weld efficiencies. He tried rods with circular, hexagonal, square and triangular cross sections and found that the weld efficiencies decreased in that order from 85% for welds with circular rod to 50% for welds with triangular rod,
2.6.4. Welding Technique
It is suggested 1159,165] that good welding technique is indicated when a bow wave of softened material is observed at the junction of rod and sheet during welding, see fig. 22.Further along the line of the welded rod and to either side of the rod, a small ripple of material should be seen, see fig. 23.
During welding, the weld rod should be pushed vertically into the groove with a force of approximately^ II.65],.If the weld rod is pushed into the groove at an acute angle, see fig. 24, stretching of the rod will occur. Stretching may also occur if too great a force is used 1159]. This may cause the rod to fracture as it cools or as a second weld rod is welded over the first, see fig. 25, 1165], It is recommended that the rod length is measured before and after welding, so that the length of rod used to produce a certain length of weld can be determined and hence the degree of stretch in the rod can be calculated. Some stretching is considered unavoidable and up to 15% stretch is considered harmless 1165]. The effects of pushing the rod into the groove at angles other than 90° on the weld strength have been reported [1], see fig. 26.
In the introduction, see section 1.3, the torch action
-39r-

during welding, is described as simply being advanced along the weld. Some authors prefer the use of a pendulum action [159,165], For this the gas jet is continuously directed through a short arc first onto the rod then back.to the groove thereby- giving a more uniform heating between the rod and the sheet.
The effects of improper heating of the parts on the weld efficiencies and associated characteristic features of the resultant weld have been described 1159], see table 5,
2,6.5. Testing of Welds
Two tests are commonly used to ascertain the quality of the weld: firstly, a visual examination of a polished cross- section of the weld 1159,161], and secondly, tensile testing of samples cut across the weld 1161,166,167].
UPVC does not go completely fluid during welding and examination1 of the polished crossr-section of the weld usually reveals that the weld rods and sheet have retained, to a degree, their original shapes 1159,161], The weld'rods- during welding soften and as they are pushed into the groove they tend to distort their cross-section to match with the groove configuration. This distortion has been taken as a sign that a good welding technique has been used. Examples of typical cross-sectionsare given in figs. 27-30. Fig. 27 shows the cross-r-section ofa satisfactory double-vee butt weld. Note the homogeneity through the weld and the distortion of the groove wall and rods.Figs. 28-30 show the cross-section for some typical faults in hot gas welding of UPVC. In the first, fig. 28, the temperaturewas too low: there is no deformation of the rods and little orno fusion. Fig. 29 shows the cross-section of a weld for which the temperature was too high and the materials have charred.Fig. 30 shows a double-vee butt weld in which no root penetration has occurred.
Voigt [159] examined the cross-sections of hot gas welds in clear UPVC using polarised light and observed complex fringe
-40-

patterns. These he suggested were indicative of the large residual strains caused by thermally induced shrinkage of the rods across the weld.
The second means of assessing the quality- of the weld is- to conduct tensile tests on specimens cut across- the weld with the weld perpendicular to the direction of loading. This has been commonly used and the method is the subject of ASTM D1789-77 1167] and BS 4994 1166], In the literature, as- in the standard, the weld efficiency is calculated from the ratio of weld failure strength to unwelded sheet failure strength, with failure strength defined as being the maximum load sustained by the sample divided by the sheet thickness and specimen width,
ASTM D1789-77 [167] defines a satisfactory- weld as. one with a weld efficiency- greater than 75%, whilst BS 49.94 1166] requires efficiencies greater than 90%,,Xn the literature weld efficiencies range from 100%I165] to 50% I16’l] and it is suggested [163] that weld efficiencies of as low as 30% are common for inexperienced welders, However, interpreting the literature values for weld efficiencies is made difficult as the definition of weld efficiency fails to take into account the different weld configurations and differing degrees of filling of the weld groove used by different welders,
A comparison of the different weld configurations used showed that the single-vee weld with a backing run was strongest,90% efficient; a double-vee butt weld had an efficiency of 80% while a single--vee butt weld without a backing run was only 70% efficient [163]. The same author claimed that the dressing of a weld, i.e, the removal of welded material in excess of the sheet thickness, lead to a 25% reduction in efficiency.
The effects of storage at temperatures between 80°C and 180°C for times between 15 minutes and 24 hours on the efficiency of welded sheet and unwelded sheet have been studied, Frior to testing, the materials were either slow-cooled or quenched to

the testing temperature. Henning [160] reported that both slow-cooled welded and unwelded sheets had tensile strengths up to 10% less than the untreated materials. The quenched unwelded sheet had a tensile strength up to 15% less than the untreated sheet but the quenched welded sheet showed no reduction in tensile strength.
The effect of various chemical environments on weld efficiency have been studied by Connors 1161] and Henning 1160]. Connor's results are given in table 6 . His examples were immersed for 10 da}'s in the reagents. Only the sulphuric acid immersion shows an improved weld efficiency. However, Henning, who used very much more concentrated reagents at higher temperatures, found that out of sulphuric, hydrochloric, and nitric acids and sodium hydroxide only the hydrochloric acid caused the weld efficiencies to drop. For the other reagents weld efficiencies increased on average 25% over the first ten days of immersion after which they remained reasonably constant [160].
Henning [160] further showed that over the temperature range 0°C - 40°C weld strengths for welds using unplasticised rod remained nearly constant whilst for welds using plasticised rod the strengths dropped at approximately the same rate as the sheet yield stress,
A more recent study by Alf et al 1168] has confirmed most of the previously described trends in weld strength and efficiency behaviour as far as temperature and weld configuration effects are concerned. They extended their study to include long term mechanical tests, i.e, creep, and fatigue tests, In the short teruijWeld efficiency dropped as the sheet thickness increased and varied with temperature as in fig, 31. From fig. 31, the scatter of results at 20°C. gives efficiencies between 70% and 90%.
For the higher efficiency welds cracks were noticed to start in the weld prior to the main failure.' The creep and fatigue results showed a similar dependence on weld configuration to that seen during short term testing. They found that dressing
r-42-

the welds prior to short term testing did not effect the average efficiency but did increase the scatter. However, dressing the welds gave significantly better results during fatigue testing. For this work they used two types of welds: one was produced by a skilled welder, whilst the other was produced by a semi-automatic welding rig set up to produce welds with reproducible efficiencies of 60%. For all types of tests the machine welds were found to be poorer than the hand welds, particularly so in the fatigue tests.
The main observation made during mechanical testing of hot gas welds in TJPVC by many authors 1159, 161, 165, 168,169J is the extreme brittleness of the welds. This is attributed to the notch sensitivity of the sheet material and to the presence of strain left in the weld during the cooling process after welding.
-43-

3. Experimental
The work described in this and the subsequent chapters is shown diagrammatically in fig. 32. The first step in the programme, after a period of welding training, was to prepare and test hot gas welds to establish the level of weld strengths attainable with clear UPVC. For comparison, hot gas welds in filled UPVC and hot tool welds in clear UPVC were prepared by the author and hot gas welds in clear UPVC were prepared by experienced industrial welders.
The standard materials, of sheet and rod, were then subjected to a characterisation programme which included mechanical testing, microstructural analysis and chemical analysis. This programme being carried out to ensure that there was no basic incompatibility between the materials which could result in poor weld strengths.
At the same time, weld fracture surfaces were examined'and the importance of notches and flaws within the weld zone became increasingly apparent. The notch sensitivity of both clear and filled UPVC was examined using the methods of linear elastic fracture mechanics. The effect of welding on the notch sensitivity was also examined.
From above, it was decided that there were two possible ways to improve weld strengths, these being the removal of the flaws in the weld zone and the reduction of the materials1 notch sensitivity. The work to examine the two approaches concentrated mainly on modifying the chemical composition of the weld rod.Weld rods of various compositions were prepared, in conjunction with I.C.I. and hot gas welds produced and tested.
However, for the purposes of writing,the work is reported in the order of materials characterisation, standard welds, fracture mechanics and modified weld rod composition and weld procedure.
During the course of this work a range of commercially available materials were used. The majority of the work was carried out using I.C.I. Darvic clear 025 sheet, hereafter referred to as

clear sheet, which was supplied in 10, 9.5, 6 and 3nim thicknesses and as sheets 2438mm x 1219mm. A characteristic feature of the sheet was its blue mauve colouring. For most of the welding a water clear weld rod was used, which came supplied in 2Kg loads of lm long, 3mm diameter circular cross-section rods. This rod is hereafter referred to as clear rod.
Other sheets used were I.C,I, industrial grade Darvic 909,6mm thick, and Placon, a 10mm thick water-clear grade supplied by the Plastics Construction (Northern)Ltd, The industrial grade Darvic 909 is hereafter referred to as failed UPVC.
Two other weld rods were used, both I.C.I, materials, one was supplied as 3mm diameter circular cross-section rod and one with a triangular cross-section, base width 5.5mm and height 2.8mm.The circular rod was supplied in a continuous coil whilst the triangular rod was supplied in lm lengths. Both materials had a blue mauve colouring similar^to the I.C,I, clear sheet.
3.1. Mechanical Properties of the As-Received Materials ■
The mechanical properties of the sheet materials were characterised by the determination of yield stress in tension, tensile modulus and flexural modulus. However,only the clear rod was examined in this work since the form of the other rods prevented them being tested.
All mechanical testing was carried out using either a floor model TT-CM Instron or a table-top model TT-%}112 Instron. Prior to testing, the machines were allowed to stabilise and then were calibrated, in the case of the floor model by dead weight loading and for the table top model by a built-in electronic calibration system.
All tests were carried out in ambient conditions as the Instrons were not in environment controlled laboratories. Except where otherwise stated, all testing was carried out using a
-45*-

crosshead rate of 5mm/min. Where parallel sided samples, with no shoulders,were used the gauge length refers to the original grip separation distance. Where dumbbell specimens were used the gauge length refers to the length of the parallel sided centre section of the specimen. The cross-sectional area of all specimens were determined, prior to testing, using a micrometer.
3.1.1. Yield Stress Determination for UPVC Sheet Materials
Sixteen specimens of clear sheet were prepared and tested in accordance with BS 2782 Method 320A [170], but with a thickness of 10mm.
Due to the time required to prepare such specimens subsequent test specimens were prepared with a simple parallel sided geometry without the use of shoulders, see fig, 33, These specimens were cut from the sheet using either a handsaw or acircular saw. The machined surfaces were smoothed using arange of emery papers down to the 600 grade.
Initially this specimen design was required for the tensile modulus testing. During that test programme the sheet yield stress was also determined and a difference observed between those results and those obtained using the dumbbell specimen of BS' 2782. A short series of trials were then conducted to evaluate the cause. Possible causes considered were orientation, cross-section, ageing, strain rate and temperature.
To test for orientation effects specimens were taken parallelto both the length and the width of the sheet. To check ifchanges in cross-sectional area would cause the difference the
2 2area was varied between 50mm and 250mm , for subsequent tests2the cross-sectional area was maintained at 150mm . It was
thought possible that changes in the delay time between machining and testing might be important. This was tested for by carrying out tests on specimens machined less than an hour before and by testing others left for 35 days after machining. The strain rate dependence was examined by changing the gauge length of
-46-

the specimens from 40mm to 180mm. The temperature dependence was examined by testing specimens maintained for 2 hours at the ambient temperature of 16°C whilst a second set were tested at 25°C. The second set were conditioned in an air oven, maintained at 25°C, for 2 hours, prior to testing. During testing they were kept at temperature using a fan heater placed so that an air temperature of approximately 25°C was maintained about the specimens.
Plastics Construction sheet, Placon, was tested using2parallel sided specimens of cross-sectional area 3 50mm and
gauge length 90mm.
I.C.I. filled sheet was tested by taking parallel sided samples parallel to both the.length and width of the sheet.These specimens were prepared with a cross-sectional area of
290mm and a gauge length of 100mm.
Yield Stress Determination of the Clear Weld Rod
3.1.2, Initial tests were carried out with the rod placed directlyin the wedge type grips of the Intron with the result that all the rods failed in a brittle manner, in the grips, with no signs
■ of yielding. To circumvent this two approaches were tried, the first of moulding rod granules into a sheet, from which test specimens could be machined, and second, the bonding of the ends of the rods into metal blocks which could then be gripped without damaging the rod.
For a sheet,278mm x 202mm x' 3mm, the.size of the.mould available, it was calculated that approximately 0.23Kgs. of rod material would be required. Therefore, it was decided that the same material would be used for each pressing until the correct pressing conditions were established. Although some degradation was apparent after the third pressing the same material was still used.
The rod and the pressed sheet were granulated using a laboratory granulator which gave granules approximately 20mmT’.
-47-

The compression moulder was a Vinipart. with a maximum limit of 20MPa. Before each moulding the mould was preheated to 100°C, in an air oven, and was sprayed with a silicon release agent before the granules were added. Once the pressing was finished the mould was transferred to a water-cooled press where it was allowed to cool to room temperature, see table 7 , for pressing conditions tried.
After five attempts at pressing the resultant sheet still retained a granular character, see fig. 34 ? and cracked along the granule boundaries when flexed. The material was badly degraded and this approach was abandoned.
For the second approach, 12.5mm square cross-section steel bar was cut into 25mm lengths. A 3mm diameter hole was then drilled into the length of each block, to a depth of approximately J5ram.
Initially,Devco epoxy resin, 5 minute cure time was used as the bonding agent. However during trials the rods tended to slip from one of the blocks. Roughening of the ends of the rods only lead to rods fracturing at the block. Some rods were prepared with thinned centre sections to produce dumbbell specimens. The thinning was achieved by careful scraping using a scalpel followed by smoothing with 600grade emery paper. By reducing the diameter of the rod to approximately 2.5mm yielding was observed. However, the difficulties in reproducing the thinning operation and the time required for it lead to other adhesives being used.
A cyanoacrylate adhesive, Superglue 3, was tried9again using rods whose ends had been roughened with the result that the rods still fractured at the blocks.
Two points were noted:
i) endr-roughening of the rods was usually required to fit the rods into the holes.
ii) this adhesive set in approximately 10 seconds and block alignment became critical.
-48-

The first point suggested that the 3mm diameter hole was too small. Initially a g inch diameter drill hit was tried but later 3.1mm and 3.2mm diameter drill bits were used. For as- received rod the 3.1mm diameter hole was found most satisfactory and end_roughening was stopped.
The second point lead to the rod being cemented separately into each block with the second block being accurately aligned with the first, to prevent any twisting force being applied to the rod during the test,
A range of cyanoacrylates were used; Superglue 3, IS.12 and IS .495. All were Loctite products^-with the latter giving the most consistent results. The adhesive was usually allowed to cure overnight, prior to testing. Four specimens were prepared using steel rods in place of the weld rod. Tests on these showed that for IS,495 adhesive failure occurred at-loads typically, four times greater than the failure load of the weld rods.
With careful manufacturing the number of premature brittle failures was reduced but the fraction of samples which failed during yielding, before cold drawing, remained high.
Using this method it was possible for rods to draw their entire •length before failure, see fig. 35. Often two necks would form in different positions along the rod, though only one would draw.
A range of gauge lengths were used, this, being the distance between the blocks, with typical lengths being 150, 200 and 250mm although some specimens were prepared with gauge lengths up to 450mm.
3.1.3. Tensile Modulus
Only the 10mm thick Darvic 025 sheet and the clear weld rod were tested.
The sheet was prepared as parallel sided test pieces, as in
-49-

2section 3.1.1, each with a cross-section of approximately 60mm and a length of approximately 250mm. An initial grip separation distance of 200mm was used.
Once a specimen had been clamped in the grips of the Instron, a clip-on strain gauge extensometer, Instron G-51t~14-MtA ? with a 50mm gauge length, was attached to the central portion of the specimen. The strain gauge amplifier was set up in accordance with the maker’s instruction. This extensometer can be used to measure strains in the range between 0% and either 5%, 10%,25% or 50% depending on the accuracy required.
After trials using the 0% to 25%, 0% to 10% and 0% to 5% strain ranges a series of JO specimens were tested using the 0% to 5% strain range. To ensure reasonable accuracy in measuring strain the load full scale deflection was 5000M,
The weld rod tensile, modulus was determined both from the load-extension curves obtained during the previous yield stress testing, and by using an Instron clip-on strain gauge extensometer, G-51-16.
During the yield stress testing of the rod, the initial load • full-scale deflection was set as J00N and only as the pen reached
full-scale deflection was it adjusted to either 500N or 1000N,
For the extensometer measurements the rod was clamped inHoun^sfield rod grips, adapted to fit the Instron, The gripseparation was 100mm and the load full-scale deflection was 401bs. This extensometer was used on its minimum measuring range of 0% to 1% strain.
3.1,4, Flexural Modulus
Darvic 025 sheet, 10mm and 3mm thick, and clear rod were tested,
The three-point bend rig used is shown in fig, 36, This rig had
-50-

a maximum span of 102mm and a maximum width 20mm. All bearing surfaces have a radius of curvature of 3mm.
For this test an Instron tension-compression load cell was used with the plunger connected to the load cell which was bolted £nto the top fixed crosshead of the Instron. The frame was taped to the moving crosshead so that the plunger acted through the centre of the span and at right angles to the length of the span.
According to the ASTM D790-66 .[171] the ratio of the span to the depth of a specimen should be at least 16:1. This could not be achieved with this rig for the 10mm sheet and so the maximumspan available was used. Similarly the width of 3mm sheetshould be 25mm which was too large to fit the rig and so the width was cut the same as the 10mm sheet.
Both the 10mm and 3mm thick samples were cut to be J6rcm wide and 150mm long, The 10mm samples were tested using a span of 102mm and a crosshead rate of 5mm/min. The 3mm samples were tested using a span of 47.6mm and a crosshead rate of 1 .25mm/min.The welding rod was cut into 150mm lengths and tested using a span of 47.6mm and a crosshead rate of 1.2 5 mm/Train.
The 10mm sheet specimens were only loaded so as to give the.straight line response of load and extension whilst the 3mm sheet and rod specimens were tested through yield.
Eight samples of 10mm sheet, twelve samples of 3mm sheet and twelve samples of rod were used during testing.
3.2. Microstructure
Four aspects of microstructure were studied: the molecular weight distribution, the glass transition temperature, the shrinkage caused by various thermal treatments and the birefringence. Only iOnm clear sheet and the clear weld rod were examined with respect to shrinkage and birefringence whilst I.C,I, weld rod was also included in the molecular weight distribution and glass transition temperature studies.
-51-

2.1. Molecular Weight: Distribution
These were obtained via the RAPRA Service. Samples were sent to RAPRA where they were dissolved in tetrahydrofuran (THF) and analysed using gel permeation chromatography. The RAPRA service includes a computer analysis of the molecular weight distribution which gives the number,weight, viscosity and z averaged molecular weights. Samples sent for testing included sheet and clear rod,as-received,and sheet, clear rod and I.C.I. triangular rod both as-received and post a 10 minute, 160°C thermal treatment.
2.2. Glass Transition Temperature, T- g
Initially, the T^ was studied using the technique cf differential thermal analysis, (DTA) with a Du Pent 900 Thermal Analyser, set up with the DTA head. Samples were taken from granulated material. However, due to experimental requirements, only the very fine powder not the granules was used. Glass micro spheres were used as the reference material. A starting temperature of 30°C and a heating rate of 10°C/min were used. After ten trial runs this method was dropped due to the poor reproducibility of the results. The T analysis was, then, based on the technique of differential scanning calorimetry (DSC) again using the Du Pont 900 Thermal Analyser, this time fitted with the DSC head. Samples were taken either from the granulated stock, this time using the granules, or from shavings taken directly from the materials.
Samples, approximately 15mg', were accurately weighed into aluminium pans which were then hermetically sealed. A pan containing a similar weight of glass microspheres was prepared as the reference.
For most of the study a temperature range from 30°C to J00°C was used, with a heating rate of !0°C/min. In certain cases this range was extended down to -100°C, using the manufacturer;’s cooling attachment, or up to 330°C. In these cases a heating
r-52-

rate of 20°C/min. was used. Some samples were cycled, that is heated to 100°C, cooled, either in air or in the cell, back to 30°C and then x^ere retested.
It was found necessary to use the machine on its most sensitive range and spurious peaks x ere sometimes observed due to fluctuations in the purging gas flox?. The heating rate was checked with a stop-xtfatch and the temperature calibration checked using a polystyrene standard.
3.2.3. Thermally Induced Shrinkage
Due to differences in manufacturing processes, the sheet and weld rod may be expected to have different residual stresses in their as-received form. To investigate this, their relaxation at elevated temperatures x-;ere studied.
The 10mm clear sheet was tested as required in BS3757 pt.1. [172]. For this, a 12inch square of material has a .lOinch diameter circle scribed about the centre of the square. The sheet is then placed in a pre-heated air oven set at 120°C, on a glass plate covered with cloth. After 45 minutes the sheet is withdraxm and allowed to cool on the glass plate. Once cooled a second lOinch circle, is scribed about the centre and the difference between the original and second circle is taken as a measure of the relieved internal strain.
A second test used 4 inch squares of sheet... About the centre of the square, a grid of four horizontal and four vertical lines, spaced 20mm apart, were scribed, drawing out nine squares in a square pattern. Each block x-jas labelled, and the position of fifteen of the points were measured x^ith respect to one corner point, using a travelling microscope. The thickness was measured at each corner.
One block was then placed in an oven, set at either 110°C,130°C, 150°C or 170°C, on a PTFE sheet. Then at specified times the block and base \jere withdraxra and allowed to cool. Once
-53-

cool, measurements were made of the grid and the thickness and the block then returned to the oven. At the higher temperatures the blocks were found to stick slightly to the PTFE sheet.
In the case of the weld rod, 150mm lengths were used.Initially tests were done using a ’non-stick’ baking tray as the base, however this was later changed to a PTFE sheet and then later still to a bed of glass microspheres. These changes were made as the rod was found to stick to the first two base materials, at higher temperatures. Heat treatments used temperatures between 70°C and 180°C, for a range of times, up to several hours, except where limited by degradation of the rod. Once heated the rod usually became curved, which caused difficulties when measuring the length. To straighten them the rods were allowed to air cool until just flexible and were then held against a wood-former until rigid again. Measurements of the length were made with a 150mm steel rule and of the diameter with a micrometer.
3,2.4. Birefringence
The birefringences of both clear sheet and clear weld rod were determined using a calibrated quartz wedge attachment on a Vickers M55 Microscope. The stress-optic-coefficient of clear sheet was determined using cantilever beam specimens loaded between the crossed polars of a circular polari.scope,
3.3. Chemical Analysis
This section is in three parts, the first is concerned with the extraction of the additives from the as-received materials, the second with the analysis of the additive-free polymer and extracted additives and the third with the effects of solvent washes and wipes of weld rods,(sometimes recommended prior to welding) .
3.3.1. Extraction of Additives from the As-Received Materials
For the majority of this work a Soxhlet- extraction technique, using ether or methanol as a solvent, was used to separate the
-54-

polymer from the additives. This method was used on the sheetand both the clear and the I.C.I. weld rods.
A tetrahydrofuran (THF) recovery process was used for the 6mmthick grey sheet and as a cross-check on the sheet.
The materials for the Soxhlet extraction were granulated such3that the largest granules were approximately 20mm . The weld rod
granules were more uniform than the sheet granules as they were generally broken across the diameter.
Two Soxhlet extraction systems were set up so that both sheet and rod could undergo extraction at the same time.
The Soxhlet thimble was weighed and then either an approximate lOgm or 20gm of sample were added to the thimble which was again weighed. The flask, containing 2 or 3 bumping granules was weighed prior to the solvent being added. Approximately 3 50 ^ 200ml of solvent was used.
Initial runs were for 2 days, using laboratory ether. Solvent was later evaporated off the extract by gently heating the flasks in isomantles. However, the additives degraded during the evaporation and a second extraction on fresh material was carried out. This time the solvent was removed using a rotary evaporator under a slight vacuum.
Due to doubts concerning the purity of the ether used, a third run was carried out using AR diethyl ether. At the end of 3 days continuous extraction the ether flask was replaced by one containing AR methanol, and a subsequent 3 day extraction was carried out on the same polymer. To check that the majority of the additives had been extracted a 5 day AR diethyl ether extraction was carried out, with a subsequent 5 day AR diethyl ether extraction to confirm that little more could be extracted.Finally the I.C.I. rod and the clear rod were subjected to a 5 day AR diethyl ether extraction.
The solvent removal procedure was extended to include 24 hours

in a vacuum oven at 30°C, after rotary evaporation, as traces of solvent were detected after rotary evaporation only.
After the solvent was removed, the flasks were weighed and labelled. To maintain purity, the flasks were kept sealed at all times, except when samples were being removed for analysis.These samples were generally retained.
The THF recovery technique was applied both to the clear sheet and the grey sheet, A sample between I .and 2gms , was accurately weighed and then dissolved in THF in a large centrifuge tube. When fully dissolved the solution was centrifuged at 3000 to 4000 r.p.m. for 2 hours. The tube x as then topped up with fresh THF and centrifuged for a further 1 hour. The resulting liquid x as poured off and saved, The precipitate x-7as x^ashed xtfith THF, recentrifuged and the liquid then added to the previously poured-off liquid,.
The precipitate was dried in a vacuum oyen at 40°C until constant weight was achieved. The polymer x?as precipitated from the cooled stirred liquid by the dropx^ise addition of AR methanol.The precipitated polymer was separated from the remaining liquid by filtering through a previously weighed sintered glass filter. Several warm ether washes XvTere used before the polymer was dried to a constant weight in a vacuum oven at 40°C. The remaining solution x as transferred to a flask of knoxm x^eight and the solvent was driven off using a rotary evaporator. The residue was kept at 30°C in a vacuum oven until a constant v/eig’nt x?as achieved.
In the case of the grey sheet the centrifuging procedure failed to give a clear solution despite extended centrifuging,
3*3.2. Analysis of the Separated polymer and Additives
The polymer granules, after the initial 2 day extraction were dried in air and then subjected to a sequence of drying programmes in an attempt to achieve constant x-reight, see table 8 ,The polymer granules from the second 2 day ether extraction were also subjected to this drying programme excluding the step
-56-

where they were dried for 30 minutes at 100°C.
Samples of both the sheet and filler rod granules post the 2 day ether extraction and the 3 day ether, 3 day methanol extraction were examined using the DSC technique described in section 3.2,2.
The additives as extracted, with no further separation, were examined by four methods :infra-red and ultra-violet spectrophotometry (IRS and UVS respectively),nuclear magnetic resonance (NMR)and DSC.
IRS was carried out using a Pye Unicam SP1000. Specimens were taken either direct from the extract or from a solution with carbon tetrachloride and were placed onto one face of a 1 inch diameter sodium chloride crystal. A second crystal was brought into contact with the first and the liquid was squeezed between the two crystals giving an even thickness film. The crystals were clamped together, leaving an area free for the infra-red beam to pass normally through the film. The clamp was placed in the detector and a spectral scan was made using the automatic program.Air was used in the reference beam.
The crj'stals were regularly run blank, after carbon tetrachloride washes, to ensure they were free of contamination. The spectrophotometer calibration was regularly checked using a polystyrene standard.
UVS was carried out using either a Pye Unicam SP800 or a .SP800A. Spectroscopically pure ethanol was used as the sample solvent reference and the samples were made up to a concentration of approximately 550:1 by weight, solvent to extract. Glass cells were used and prior to each run a baseline was recorded, using a second cell of solvent in the sample beam. All records were obtained using the fast automatic programme.
NMR analysis was carried out on a Jeol C60HL which was operated as a service by the Chemistry Department of Sheffield City Polytechnic. Samples were prepared by dissolving the extract in deuterated chloroform. Tetramethyi silane was the reference.
- 57-

DSC was carried out using the technique described in section 3.2.2. The extracts were cooled to 0°C so as to be solid.Samples were scraped into the aluminum pans which were then sealed. Initially the temperature range examined was 20°C to 100°C but this was extended to -100°C to 100°C. Cycling was not attempted due to sample weight losses after the initial heating.
In those cases where the extract was dissolved in a solvent as part of the sample preparation, once the sample had been taken, the solvent was driven off the extract by rotary evaporationand drying in a vacuum oven at 40°C.
Samples of commercially available additives were examined bythe above methods to produce reference spectra. In certain casessolid samples were prepared for IRS by the potassium bromide disc method, the ratio of additive to potassium bromide being adjusted to give the optimum spectrum.
The precipitated powder from the centrifuging of the THF grey sheet solution was examined with respect to its chemical composition and its particle size. As it was suspected to be calcium carbonate a small sample was placed in a test tube to which dilute hydrochloric acid was added, The resulting gas was passed through lime water,
A second sample was placed in a small beaker to which acetone was added. After 5 minutes agitation in an ultrasonic, bath, a few drops of the resultant suspension were deposited onto a scanning electron microscope (SEM) sample stub. Once the acetone had evaporated, the stub was coated with gold in a sputter- coater, and then examined in a Cambridge SEM, This SEM was fitted with a wavelength dispersive analyser and this was used to confirm the presence of calcium. A qualitative examination of the powder particle size was also carried out on the sample,
3.3.3. The Effects of Solvent Washes on Weld Rod
Two effects were studied, the first was solvent absorption and the second the possible extraction of additives from the rod.
-58-

The solvent absorption was investigated by immersing four 50mm lengths of clear weld rod in methy-ethyl-ketone (MEK). for 5, 10, 20 and 30 seconds. Their weights prior to immersion, and after a range of evaporation times and procedures were noted. Evaporation times, in air, were up to a week after immersion, followed by 3 days under vacuum, followed by 5 days at 30°C.
The extraction of additives was investigated by immersingtwelve 50mm lengths of clear weld rod in 50ml of chloroform contained in a flask of known weight. The flask was gently agitated for approximately 1 minute and the rods removed. The solvent was removed by rotary evaporation and by drying in a vacuum oven at 30°C for 24 hours. After weighing, some chloroform was added and a sample taken for IRS examination.
3.4* Welding of Standard Materials
The work carried out in this section includes the hand, welding of sheet using circular and triangular rod, speed welding of sheet using circular rod and the hot plate welding of sheet.•Details are given of the design and trial runs of the welding rig built to allow hot gas welding to be carried out under controlled conditions. It also includes the details of the tensile testing of welds, the visual examination of weld.interiors and the fracture surface studies.
3.4.1. Hot Gas Welding
Basic training in hot gas welding was obtained from the welders at British Nuclear Fuels Limited, Windscale site, over a.2 week period. Two months were then spent practising the technique at Sheffield City Polytechnic, before any test pieces were prepared. Initially the test pieces were prepared for the fracture toughness testing, see Section 3.5.2., though later work concentrated on tensile strength studies.
The sheet material was prepared into rectangular pieces , 300mm
r59-

by 75mm, using a circular saw. The edge of one of the long sides was chamfered either by filing, using a coarse file, or by cutting, using the variable angle cutting facility on the circular saw. Initially, filing was used as this was the method used by industrial welders. This was superseded by cutting on the circular saw as this gave a more accurate and consistent angle of chamfer plus a better surface finish. Two angles were employed, initially a 90° included angle was used but this was changed to a 70° included angle for the majority of the welding to conform to standard recommendations. All welds were produced with a symmetrical double-vee configuration.
Two welding facilities x ere used, A and B. The early work was carried out using the welding equipment belonging to the Department of Mechanical Engineering, Sheffield City Polytechnic, and hereafter is called system A. This consisted of a Goodburn. High Speed Torch connected to a compressed air supply via a gas control board. This board provided both the means of cleaning the gas and regulating both the pressure and flow rate of the gas. The torch was fitted with a 600 watt heater cartridge and the HS/N4 nozzle; this is a standard round nozzle, to which has been added a tack welding tip which is screwed into the end of the torch. The welding gas was always turned on before the torch was switched on and when it was switched off the gas supply was left on for a further 5 - 1 0 minutes whilst the torch cooled. The compressed air was regulated to a pressure of 0.2 bar and a flow rate of 35L/min. The gas temperature, approximately 3mm from the end of the nozzle, was measured, using a mercury thermometer, and was found to be 280°C.
One of the pieces to be welded was clamped to a wooden bench. The second piece was then held in position, by hand, whilst a tack weld was made'to provide the initial fixation.Hand welding was then carried out, using either three or six weld rods each side to fill the weld. The first rod was welded into position and the weld allowed to cool for 2 - 3 minutes. The weld piece was then turned over and, keeping the welding direction the same, the second rod was welded into position. Thereafter the sheet was turned over after each weld run, after a brief
v 60-
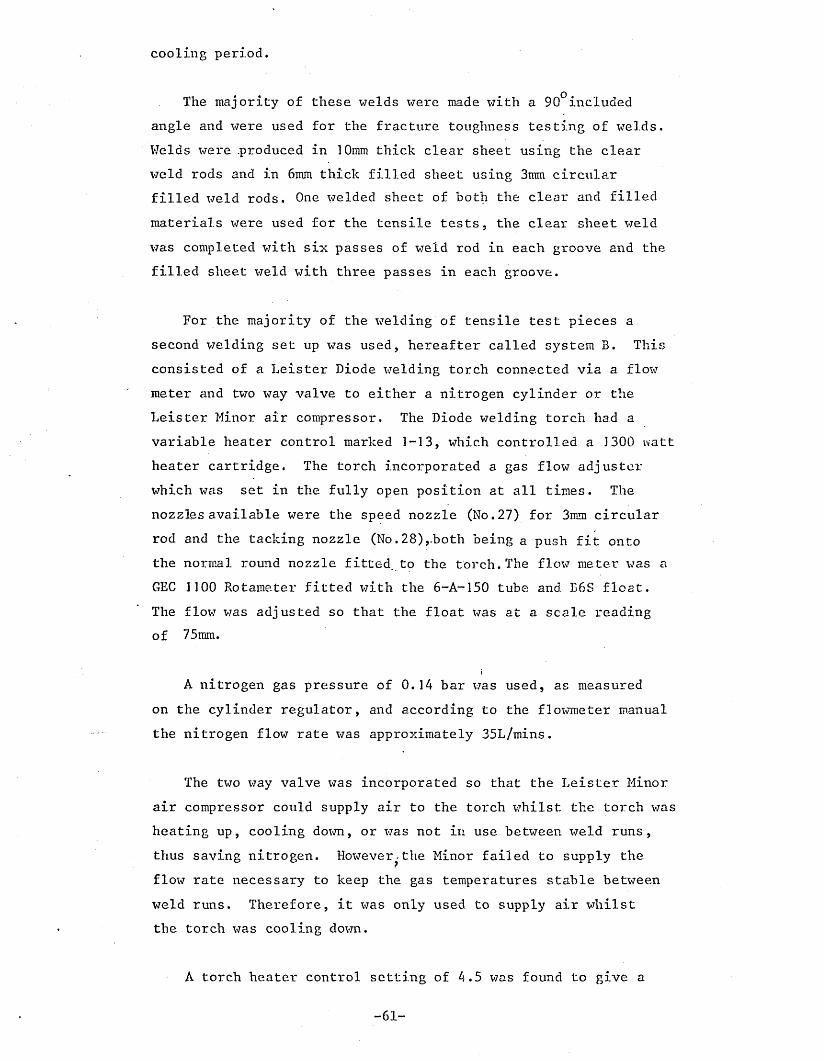
cooling period.
The majority of these welds were made with a 90°included angle and were used for the fracture toughness testing of welds. Welds were .produced in 10mm thick clear sheet using the clear weld rods and in 6mm thick filled sheet using 3mm circular filled weld rods. One welded sheet of both the clear and filled materials were used for the tensile tests, the clear sheet weld was completed with six passes of weld rod in each groove and the filled sheet weld with three passes in each groove.
For the majority of the welding of tensile test pieces a second welding set up was used, hereafter called system B. This consisted of a Leister Diode welding torch connected via a flow meter and two way valve to either a nitrogen cylinder or the Leister Minor air compressor. The Diode welding torch had a variable heater control marked 1-13, which controlled a 1300 watt heater cartridge. The torch incorporated a gas flow adjuster which was set in the fully open position at all times. The nozzles available were the speed nozzle (No.27) for 3mm circular rod and the tacking nozzle (No.28),-both being a push fit onto the normal round nozzle fitted, to the torch. The flow meter was a GEC 1100 Rotameter fitted with the 6-A-150 tube and B6S float.The flow was adjusted so that the float was at a scale reading of 75mm.
A nitrogen gas pressure of 0.14 bar was used, as measured on the cylinder regulator, and according to the flowmeter manual the nitrogen flow rate was approximately 35L/mins.
The two way valve was incorporated so that the Leister Minor air compressor could supply air to the torch whilst the torch was heating up, cooling down, or was not in use between weld runs, thus saving nitrogen. However^the Minor failed to supply the flow rate necessary to keep the gas temperatures stable between weld runs. Therefore, it was only used to supply air whilst the torch was cooling down.
A torch heater control setting of 4.5 was found to give a
-61-

gas temperature of 270-280°C when measured 3mm from the end of the standard round nozzle. When the tacking nozzle was used a setting of 5.5 was necessary whilst a setting of 5.2 was used when the speed welding nozzle was fitted. When welding the large triangular cross-section I.C.I. weld rod the control setting was raised to 7.0. Sheets were prepared for welding by chamfering to give a symmetrical double-vee configuration, with an included angle of 70°. Two weld pieces were clamped to the weld bed of the welding rig, see Section 3.A.6 , leaving a gap of approximately 0.5min between the chamfered edges.To conform to industrial practice, one vee was filled first before the second was started, although a brief cooling period of approximately 2 minutes was allowed before each run. The pieces were not tack welded.
During hand welding, standard practices concerning welding were followed. The starting end of the welding rod was cut to a 30° angle and softened in the welding gas. The start of the vee was then softened and the rod pressed into the vee. The rod } under a pressure of approximately 1.3MPa, (equal to a load of 0.9Kgs) was then forced into and along the vee. Once moving along the vee only a vertical pressure needed to be applied to the rod.
The welding torch was drawn back along the vee at the same rate as the .rod filled the vee. The torch was held approximately parallel both to the surface of the sheet and the line of the weld. The gas jet was mainly directed at the base of the rod from a distance sufficient to cause a bow wave at the base of the rod (typically 10mm to 20mm). Only a slight pendulum action was used directing the gas jet between a point just above the weld rod base and to a point just along the rod from the weld rod base. The action was repeated once or twice a second.Little degradation was observed.
Regular checks on the speed of welding were made by noting the time taken to complete one length of welding using a stop watch. The degree of stretching of the weld rod was also checked by measuring the initial length of rod and the length of rod left
-62-

after a known length of welding.
Using the hand welding method, two welded sheets were prepared using three passes of clear rod in each groove. A third welded sheet was prepared with three passes of I.C.I. rod in each groove, and. a fourth was prepared- with a.single pass of I.C.I. triangular weld rod in each groove.
Speed welding was carried out using both clear and I.C.I. blue weld rods. Three welds were prepared, two using clear rod and one with the I.C.I. rod. Each weld was completed with six passes of rod in each groove. One speed weld completed with clear rod and the one with I.C.I. rod were prepared very carefully at a relatively slow speed. The second speed weld, using clear rod, was prepared at a faster rate.
3.A.2. Hot Tool Welding
The hot tool welding of the 10mm thick clear sheet.was carried out on a Haxey Engineering pipe welding rig, see. flg^37 The rig consist? of .one..fixed and one moving frame, in which the pipe clamps are fitted, mounted on steel guide.rods. The moving frame is driven backwards and forwards by compressed air. The pressure associated with the movement is displayed on the gauge incorporated in the movement control box.
The rig was adapted to weld sheet by using the fittings shown in fig. 38. The cylindrical ends were loosely fitted into the pipe clamps, in the frames, so that the sheet clamp ends faced each other. The fittings were carefully aligned and then the pipe clamps were fully tightened.
The fittings were designed to accept plates 100mm square, up to 15mm thick, leaving 20mm of plate proud for welding. Two plates of 10mm thick clear sheet were prepared, 100mm square, and fitted to the clamps, again ensuring the correct alignment before being clamped .
The hot tool was a circular plate of diameter 250mm .
-63-

and thickness 20mm, fitted with PTFE sheet on both faces It was electrically heated and thermostatically controlled.The controls were present to give a tool surface temperature of190°C. The temperature variation across the tool was measured
• • • *1* ousing a digital thermometer and was found to be - 5 C.
Welding was carried out using standard procedures. The heated tool was placed between the frames and the moving frame driven forward until both plates were in contact with the tool surface. A pressure of 0.6 bar, as measured on the gauge, was applied until a l-2mm bead of softened material had formed round both plates. The pressure was dropped to zero and the material allowed to ’heat soak1 for 45 seconds. The moving frame was then pulled back, the tool removed and the frame brought forward so that the plates were again in contact. A pressure of 0.4 bar was applied and maintained for 5 minutes. The pressure was then reduced to zero and the welded plates removed.
The tensile strength of the weld was determined as in Section 3.4.4.
.3. Examination of the Interior of the Welds
A visual examination of the interior of the welds was made prior to and during the testing.of the welds. The number of samples required for the testing x ere cut from the welded sheet, using a bandsaw. The samples were 15mm wide parallel strips cut so that the weld lay across the 15mm width, perpendicular to the length of the sample., she fig. 39. They were cut in order, starting at the same end as the welding was started.Each sample had scribed on to it a number which identified both the welded sheet and the particular sample. This number also served to identify the orientation of the sample.
The machined surfaces of the piece were ground using a range of emery papers from 120 to 600 grit. The surfaces were then polished using 6pm diamond paste. This was normally sufficient to enable the examination of the interior. However, some were further polished using lym diamond paste.
-64-

Internal flaws could be highlighted by viewing at an oblique angle into the polished surface. The interior was examined both visually and through a stereo microscope, photographs \«7ere taken using a Canon AE1 fitted with a macro lens.
Certain samples were examined between the crossed polars of the circular polariscope described in section 3.2.4.
3.4c4. Tensile Testing of Welds
At least five samples from each weld were prepared as above. However certain welds had their entire lengths prepared astensile test pieces. The first specimen, the one which includedthe start of the weld, was not used in the tensile test programme.
All test pieces were conditioned in the laboratory for atleast 2 days prior to testing and ambient temperature were used.The cross-section of each test piece, approximately 20mm either side of the weld, was determined using a micrometer.
All tests were carried out using either the floor model or table top model Instron set up as in section 3.1.0. A gauge length of 90mm was used, i.e. the distance between the grips, and the crosshead rate was 5mm/min, A visual examination of the weld region was maintained during testing. All tests were taken to failure.
3.4.5. Fracture Surface Studies
All fracture surfaces were examined visually and selected ones were further examined using either light or scranning electron microscopy.
The light microscopy was carried out using either the stereo microscope or a Zeiss Ultraphot fitted with a macro head. Photographs were taken using either the Canon AE1 using a macro lens or the Ultraphot. The depth of the unfused region at the centre of fracture initiation, on selected samples, was measured
-65-

using a travelling microscope.
Scanning electron microscopy was carried out using a Philips 500 SEM, on samples which had been sputter-coated with gold.
3.4,6. Automatic Hot Gas Welding Rig
The welding rig was required to provide a facility by which the following welding parameters could be controlled: welding speed, welding gas temperature, pressure and flowrate, welding gas jet direction, distance between the torch and the weld and the pressure and direction of pressure applied to the weld rod.
As such it was divided into three parts:
1) the main chassis and moving weld bed system2) the welding torch and gas control systems3) the weld rod feed system,
A moving weld bed system was chosen rather than a movingtorch and rod feed' system assembly as it was thought to provide a more flexible design if changes had to be made, The weld bed was a comb i.nat ion of steel base plate covered by a 10mm thick sheet of Sindanyo, an asbestos-cement product of high density.•The base plate of 350mm x 200mm x 20mm, was mounted, lengthwise, on two steel guide rods, lm long, using brass bearing rings fitted beneath each corner. Two guide rods plus two similar rods were bolted, at both ends, through the corners of two 200mm square steel endtplates thereby forming a long rectangular box frame,a lead screw was mounted between the centres of the end plates andwas connected to the base plate through a floating coupling.
t
The asbestos-cement sheet was used to cover the base plate so that the heat loss, during welding, through the weld bed would be reduced. This would better simulate welding done on a wooden bench top. A lengthwise groove 10mm- wide by 4mm deep was machined along the centre of the sheet. This was to allow a double- vee butt weld to be turned over and clamped without causing distortion even when the down facing vee had been overfilled. The clamps,
-66-

to secure the sheets to be welded, were mounted on the baseplate, through holes cut in the Sindanyo sheet.
The weld bed had approximately 600mm of travel between theend plates„ The bed was driven by means of a variable speed,high torque, reversible electric motor connected to the lead screw by a drill chuck. Safety stops were mounted on the end plates to prevent the bed being driven into them. Manual positioning of the bed was affected by rotating a handle connected to the lead screw, after the screw was disconnected from the motor by undoing the chuck.
Both the weld bed assembly and the motor were secured to the tubular metal frame chassis, see fig. 40 • It was also intended that the fittings to support the welding torch and the weld rod feed system would be mounted to the chassis.
The welding torch and gas control system were those described in section 3.4.1. as System B, consisting of the Leister Diode torch using nitrogen as the welding gas. During trials the torch was held in position using a retort stand and clamp.
For the trials the weld rod was fed by hand. The maximum speed of the welding bed was found experimentally, to be 300mm Attached to the bed was a marker which pointed down to the chassis. Secured to the chassis, below the marker, was a 300mm rule. This, in conjunction with a clock, allowed the speed of welding to be determined.
Welding trials were carried out using two welding gas temperatures, one of 220°C and one of 280°C. One double-rvee butt weld was made using the 220°C condition whilst two were made using the 280°C. These welds us< d three weld rods in each vee.
The gas pressure was 0.14 bar and the flow rate was 35L/min. Each weld was initially tack welded and the tacking nozzle was left on during the subsequent weld runs. After tack welding
*-67-

the sheets, by hand, the torch was clamped into the welding position. This was predetermined during trial runs made with the torch switched off. The torch was set with a slight downward angle of approximately 15° with the nozzle approximately 10mm to 15mm above the surface of the sheets.
A length of weld rod was welded to a piece of scrap material to determine the approximate speed of welding for the set weld gas temperature.
The weld bed was fitted with the pieces to be welded and was positioned just behind the welding torch. The weld rod was cut to a 350mm length and one end softened in the welding gas. When softened the welding bed motor was turned on, preset for the welding speed, and the weld bed drive engaged. The rod was pressed into the vee and the speed adjusted to maintain the rod in the same position relative to the torch. This was complicated by having to adjust the pressure on the rod to ensure that a good bow wave was being formed.
The remaining weld rods were laid down on alternate sides, after a brief cooling period, using the conditions determined above.The torch position was adjusted to allow for the change in position and height due to the earlier weld runs.
The weld speed found suitable when using a gas temperature of 220°C was 120mm/min - 14mm/min; when using 280°C the speed was increased to 180mm/min ~ 20mm/min.
3.4.7. Commercial Welds
L .Samples of weld as used m industry were obtained from BNFL, Windscale, Plastics Construction Ltd, Bolton, and Leister, Germany.In addition, a visit to the-Plastics Construction factory was arranged so that welding could be observed.
Five BNFL welders each prepared a cample of -welded sheet. The sheet was 10mm thick clear Darvic sheet and the weld rod was small triangular I.C.I. rod. They all prepared double-^yee butt
-68-

welds but they each used a different number of weld rods to fill the vee's. Mien received the sheets were coded A - E.
At least five test pieces, from each weld, were prepared as in section'3.4.3. and tested as in section 3.4.4. A further five pieces were taken from weld D but were dressed before testing. This involved filing the weld region flat, parallel to the sheet surface. Filing was continued until there were no traces of the original weld, surface. The filed surfaces were then smoothed using 320 and 600 grit paper, see fig. 41.
Plastics Construction Ltd. kindly provided the services of an experienced welder, who prepared welds from the materials used in this project as well as from materials provided by Plastics Construction Ltd.
The welder prepared four welds using 10mm thick clear Darvic sheet. The first weld was welded using the I.C.I. circular weld rod,the second was similar except the welder dressed the weld. Thethird used I.C.I,’s small triangular rod and the fourth used the clear weld rod.
The welder was asked to prepare the welds in his usual manner. The weld configuration was an asymmetric double-vee butt weld as shown in fig. 42. The sheets were chamfered using a hand held grinding tool. The chamfer angle, proportioning of the vee’s and the land section were judged by eye. Dressing of the weld was done using the chamfering tool.
A Leister Diode torch was used. There were no systems for monitoring or regulating the gas pressure or flow rate. The welder gauged the gas temperature using the ’palm of the hand’ method.
One sheet was clamped and the other tack welded to it. The jwelder used the speed welding technique when welding withcircular rod and the hand welding method when welding with triangular rod. In both cases he filled the larger vee first before starting the smaller vee. He used six circular or
-69-

three triangular rods to fill the larger vee and three circular or one triangular rod to fill the smaller vee. The rods were welded one after the other with no time allowed for cooling.
The same welder then prepared three welds using the Plastics Construction Ltd materials. Again the weld configuration was the asymmetric double-vee butt weld. The first two welds were speed welded, one used six weld rods to fill the larger vee whilst the.second used ten. Both used three rods to fill the smaller vee. The third weld was done using the hand welding method for the root runs either side,the remaining runs being speed welded. As before the larger vee was filled first before the smaller vee was started, with no time being allowed for the weld to cool.
When hand welding the welder used a pendulum technique and welded at a speed of approximately 180mm/min. When speed welding a welding speed of approximately lm/min was maintained.
Test pieces for examination x^ere prepared as in section 3,4,3. and were tested as in section 3.4.4.
A single welded sheet, prepared by a Leister welder, was obtained by Dr. D.V. Quayle whilst visiting Germany. The welder used a standard double-vee butt weld configuration, each vee being filled with a single large triangular grey weld rod. These were prepared and tested as above.
3.5. Fracture Mechanics Testing
This section concerns the work carried out in evaluating theand both for sheet material
and welded material. The original x ork concentrated on methods using cantilever beam systems. However,‘UPVC appeared to be particularly unsuited to this approach, requiring large quantities of material to obtain only a few results. Later work x-7as then carried out using a single edge notch system. This has the particular advantage of simulating the tensile test conditions applied to welds during normal testing.
-70-
fracture mechanic parameters

The resulting fracture surfaces from both methods, cantilever beam and single edge notch, were examined.
3.5.1. Cantilever Beam Methods
Three variations of this method were used :
1) double cantilever beam (DCB)2) tapered double cantilever beam (TDCB)3) double tension (DT)
The original work was carried out using the TDCB method, thisbeing experimentally the more simple. In the course of thisstudy a large number of samples were tried, covering a widerange of designs and test conditions.
The first specimen, shown in fig. 43 was based on a . commonly employed design. The taper angle, a > was tan *0.2 Shoulders were used to strengthen tKe specimen at the • loading points. Sidegrooves were used to control the crack growth direction.
A rectangular sheet 270mm by 150mm was cut using a circular saw. A line was accurately scored 75mm from one edge along the length of the sheet, on both sides. The specimen geometry was cut from graph paper, to serve as a template. This template was carefully aligned, using the scored line, and taped into position. The design was then scribed onto the sheet. The side grooves were then machined, 2mm deep, into the.sheet using a 0. 01 inch diamond slitting saw.
The nett section at the shouldered end was machined, using the saw, to leave a swallow tail section, see fig. 44. The distance from the narrow end of the specimen to the section was approximately 35mm. The section was used to ease crack initiation and to have an initial crack length of 20mm. The specimen was then cut from the plate, using a band saw, and the loading pin holes drilled.
-71-
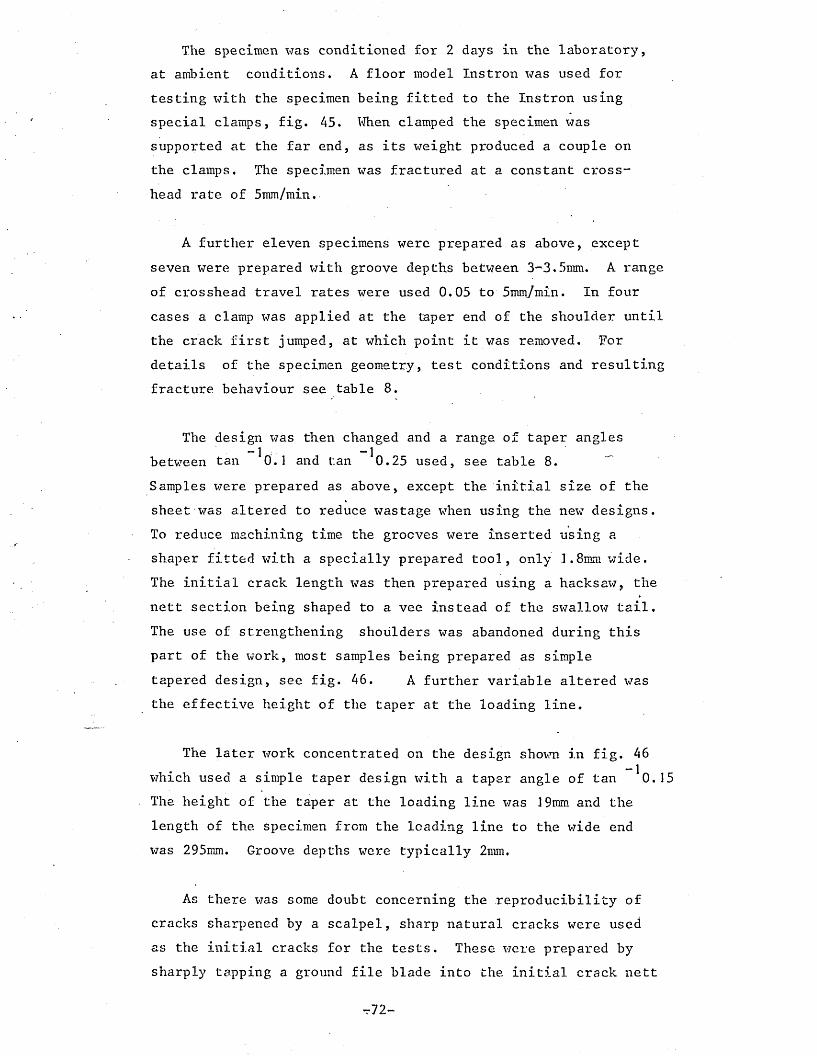
The specimen was conditioned for 2 days in the laboratory, at ambient conditions. A floor model Instron was used for testing with the specimen being fitted to the Instron using special clamps, fig. 45. When clamped the specimen was supported at the far end, as its weight produced a couple on the clamps. The specimen was fractured at a constant crosshead rate of 5mm/min,
A further eleven specimens were prepared as above, except seven were prepared with groove depths between 3-3.5mm. A range of crosshead travel rates were used 0.05 to 5mm/min. In four cases a clamp was applied at the taper end of the shoulder until the crack first jumped, at which point it was removed. For details of the specimen geometry, test conditions and resulting fracture behaviour see table 8 .
The design was then changed and a range of taper angles between tan 10.1 and tan *0.25 used, see table 8.Samples were prepared as above, except the initial size of the sheet was altered to reduce wastage when using the new designs.To reduce machining time the grooves were inserted using a shaper fitted with a specially prepared tool, only J.8mm wide.The initial crack length was then prepared using a hacksaw, the nett section being shaped to a vee instead of the swallow tail. The use of strengthening shoulders was abandoned during this part of the work, most samples being prepared as simple tapered design, see fig. 46. A further variable altered was the effective height of the taper at the loading line.
The later work concentrated on the design shown in fig. 46 which used a simple taper design with a taper angle of tan *0.15 The height of the taper at the loading line was 19mm and the length of the specimen from the loading line to the wide end was 295mm. Groove depths were typically 2mm.
As there was some doubt concerning the reproducibility of cracks sharpened by a scalpel, sharp natural cracks were used as the initial cracks for the tests. These were prepared by sharply tapping a ground file blade into the initial crack nett
r r ! 2 -

section. This method usually produced a single naturally sharp crack approximately 50 to 80mm long.
Due to work reported elsewhere 11243 a sample was reverse loaded, i.e. at the thick end of the taper, so that the crack grew tox^ards the narrow end.
As a large part of the initial work was concerned with establishing the conditions for slow crack growth only two compliance calibration curves were prepared, one for the original design and one for the latter design, 'shown in fig. 43 and 46.Each calibration curve for the change of specimen compliance with crack length was prepared using compliance data obtained for pre-inserted simulated cracks. These cracks were inserted using a hacksaw. At any particular crack length the sample was loaded to produce a load-extension curve. The sample was then unloaded and the crack extended and the sample reloaded. This procedure was then repeated for a range of pre-inserted crack lengths.
As it has been shown [124] that more stable crack growth occurred for reduced taper angles, it was then decided to use the DCB system (taper angle of 0°).
The same methods of sample preparation and testing were used as for the TDCB samples except the specimen design was cut when the original rectangle of sheet was prepared. However, the groove guidelines were accurately scribed doxm the centre of the sheets. A range of beam heights and groove depths were used. The grooves were machined using either the slitting saw or the shaper. Crosshead travel rates x ere varied betx^een 0.5 - 250mm;For the details of specimens used see table 10.
The third method of testing, DT, x as used both to see if this produced slow crack growth and because it more closely simulated in-service conditions for welded and unxv’elded sheet.
A specimen rig was designed for this test and is shoxvrn in
r73-

fig. 47. This rig allowed 150mm wide welded or unwelded sheet to be tested with lengths up to 340mm. For the details of the plunger andM support system dimensions see fig. 48. The rig was designed to fit the table top model Instron. The plunger screwed into the load cell and the support bed was bolted to the moving crosshead. The load cell was operated in compression by driving the crosshead up to the plunger.
However, at a later stage, it was discovered that this type of Instron is designed only to apply loads with a downward moving crosshead. The moving crosshead contains anti-whiplash springs which hold the bearing surfaces of the drive components against each other. If loaded incorrectly, at a load of 35Kgs. the springs compress and the load extension curve is distorted. Further, as there was a risk of damage being done to these springs if testing in this manner was continued, the DT test programme was curtailed and there was insufficient time to redesign the rig for proper Instron operation.
During trials 8 specimens were used. These were rectangles 300mm x 150mm with a groove 2mm deep down the centre of the length of one face. During testing the groove was always on the bottom surface. Only a crosshead travel rate of 5mm was used. At the loading end of the specimen the nett section was reduced, as in fig. 49 by hacksawing. Initial crack lengths were typically 10 - 30mm. A naturally sharp starter crack was produced as with the TDCB method. Once the crack has jumped it takes on a characteristic shape and therefore crack lengths were always measured along the bottom surface.
Selected samples of typical fracture surfaces from all three types of specimens were taken for scanning electron microscopy examination.

3.5.2, Weld Fracture Mechanics
The three cantilever beam methods of fracture mechanics testing used with the 10mm thick cleat UPVC were applied to hot gas welded clear HPVC. Only welds produced with clear rod were used in this programmme of work.
The programme was divided into two parts, A B, The initial work, part A, employed the DCB and TDCB methods on sheets welded using welding system A described in section 3,4,1.The latter work, part B, used the DT method to test sheets welded using welding system B described in section 3.4,1,
Specimen preparation for both parts of the programme were similar. Each weld was prepared from two rectangular sheets, typically- 300mm x 75mm, which had been chamfered along their lengths to produce a symmetric double-vee butt weld configuration. Specimens produced in part A of the work used an included angle of 90° whilst those prepared in part B used an included angle of 70°. Welds were then carried out using the appropriate welding system and were completed -using, as required, either one , three or six passes of rod to fill each groove. For DCB and DT testing the to-berwelded sheets were machined with the width required for the particular test.The welded sheets for the TDCB specimens were prepared with widths sufficient to allow the required TDCB design to be machined from them. The TDCB geometry was scribed onto and cut from the welded sheet as in section 3.5,1, but with the template being referenced to th,e chamfered edges of the weld groove.
In all the tests carried out, the specimens were loaded so that the crack should have moved along the weld seam, see fig, 50, The starter notch was prepared in the same way for all the specimens tested, with the notch being first prepared with a hacksaw and then sharpened with a scalpel,
As was the case for the DCB and TDCB testing of clear UPVC,
v75-

a wide range of specimen designs and crosshead travel rates were used to establish if slow crack growth were possible, see table 11 and table 12. During part A of the work It was observed that over 50% of the specimens failed by arm break-off or with the crack moving out of the weld zone. Two methods were used to try to overcome this problem. Initially', crack path controlling grooves, as used in the unwelded specimens, were machined along the centre of the weld seams on both sides of the welds. However, only- a slight reduction in arm break-off was achieved and a second method using bonded side plates was tried. It was thought that the bonding of side plates onto welded TDCB's might lead not only- to reduced levels of arm break-off 1125] but also to an increased, possibility of slow controlled crack growth 1148]], TDCB specimens were machined, from welded sheets, to the standard TDCB design, shownin fig, 46, Side plates of the same design, but allowing for
\the weld groove, were prepared from 1/16 inch thick steel,3/16 inch thick aluminium, 6mm thick Perspex and 3mm and 10mm thick clear UPVC sheeting. Identical side plates were bonded onto both sides of the test specimen using IS 495, see fig, 51,After allowing at least 4 hours for the adhesiye to cure, the specimens were tested using a crosshead travel rate in the range 5-20mm?/min, see table 12 for details of the specimens used,A compliance calibration curve was only produced for a welded TDCB with 3mm thick clear UPVC side plates-.
For part B of this programme only- two welded DT specimens were produced, both were symmetric double-rvee butt welds, having the same dimensions as the unwelded DT specimens, see section 3.5.1. The first specimen was completed with one pass of rod in each groove whilst the second was completed with just one pass of rod in the upper groove and none in the lower.Both specimens were tested using a crosshead travel rate, of 5mm/min, This part of the programme was curtailed once it was realised that the continued use of the DT test could have led to the Instron being damaged.
t-76-

3.5.3. Single Edge Notch.Testing
Materials tested'by this technique included 10mm and 6mm thick clear Darvic, and 6mm filled Darvic. The materials were prepared as 12-15mm wide strips approximately- 200mm long using a band saw. The machined surfaces were ground smooth using 320-600 grit papers and in some cases- were polished using 6pm diamond paste.
At the centre of the length of each strip, a shallow-grooye was cut across the width, perpendicular to the length Where the notch was to be a naturally sharp crack, the groove depth was approximately 0.5mm. Where the notch was inserted as a scalpel-sharpened groove, the groove was first cut to the depth required using a hacksaw. The naturally sharp cracks were produced in a similar fashion to those in the cantilever beam systems, i.e. by tapping a sharp wedge into the groove.Varying notch depths were obtained as an inherent feature of this method of production. Generally- the razorvsharpened notches were used for the filled sheet and 6mm clear sheet as- there was a greater occurrence of through-specimen failure using the other method, of notching. For the early work on the 10mm clear UPVC and the 6mm filled UPVC, the notches were introduced into the specimen so that the crack would grow across the width of the specimen. However, to simulate the failure of welded tensile test pieces, latter specimens had notches introduced such that the crack grew into the thickness- of the sheet,
Samples were tested either on a table top or floor model Instron> at ambient temperatures. A gauge length of 90mm and a crosshead rate of 5mm/min were used for all tests. Notch depths were measured, using a travelling microscope, from the fracture surfaces. Selected fracture surfaces were examined using scanning electron microscopy.
3.6. Pre-Weld Treatments and Changes to the Weld Rod Composition
From the previous work, the importance of notches and defects
- 77-
within the weld zone became increasingly apparent. It was decided that, in order to improve the weld strength of hot gas welded clear UPVC, either the size or number of notches had to be reduced, or the materials used had to be made less sensitive to the presence of notches.
Two factors were proposed as being possible causes of the notches or, rather, unfused regions within the weld zone. These were:
1) the presence of frozen^in orientation in the as-received weld rod
2) a possible layer on the surface of the weld rod of either diffused additives or difficult to remove dirt which acts as a physical barrier to fusion.
To make the weld strength less sensitiyh to the presence of notches in the weld zone, it is necessary to improve the toughs ness of the materials used to make the weld. It was considered impractical,in the short term,to change the composition of the sheet. However, changes to the weld rod formulation were quite feasible and would allow the incorporation of impact modifiers into the weld rod, thereby improving the toughness of one of the components cf. the weld.
The work carried out to explore both approaches to improving weld strengths was divided into two parts. In the first varied pre-weld treatments to the weld rod and sheet were used, whilst in the second, materials of different composition were obtained, converted into weld rod and used to produce hot gas welds, As such the second part was concerned not just with improving the toughness of the weld rod but also with trying to prevent the formation of any layer of additives on the surface of the weld rod.
All the welds prepared for this work were prepared as 300mm long symmetric double-vee butt welds with an included angle of
-78-

70°. Unless otherwise stated, each groove was filled with three passes of \?eld rod. Welding was carried out using system B described in section 3.4.1. with, a gas jet temperature of approximately 280°C, measured 3mm from the end of the nozzle. Specimens were cut from the welded sheets and were prepared and tested as in.section 3.4,3. ^ 3,4,5,
3.6.1. Pre-Weld Treatment of Weld Rod
Hot gas \tfelds were prepared using clear weld rods which had been subjected to either an annealing treatment or a solvent . wash.
Six weld rods, 390mm long, were annealed for ten minutes at 150°C, on a bed of glass microspheres. After cooling in air, their lengths were found to be between 350-355mm, indicating that some relaxation of orientation had taken place. One weld sheet was prepared with the annealed rod.
One of two solvents, either methanol or trichloroethylene, was used to wipe down both the surface of weld rods, and the surfaces of the grooves and rods already welded in place, prior to each pass of weld rod. During welding, polyethylene gloves were worn to avoid re-contaminating the weld rod surface.Two welded sheets were prepared, one with rod washed with methanol and one with rod washed in trichloroethylene.
3.6.2. Changes to Weld Rod Composition
In conjunction with I.C.I. various changes to the standard weld rod composition were decided upon, see table 13. Representatives of I.C.I. supplied the new compositions in the form of sheets cut from the hide produced by a two-roll mixer. Approximately 300gms of each composition was supplied.
Weld rods of each composition were prepared by extruding the granulated sheets using a Davenport Rheometer' as a ram extruder.The sheets were first granulated such that the largest granules
-79-

were approximately 20mm . The rheometer was allowed to stabilise oat 190- 5 C and approximately 70gm of granules were used to
charge the barrel. The charge was added in lOgm lots which were tamped down after each, addition. Once the barrel was full, the ram was lowered until a slight pressure was read and the charge allowed to come to temperature oyer a 3-4 minute period.Ram extrusion was then carried out with the ram speed being adjusted to the fastest rate consistent with the production of smooth, bubble-free rod. Typical ram speeds were 10mmj?min, The rod was allowed to extrude to a length of 350jnm before being cut at the die. The extruded rods were then allowed to cool on a wooden bench top and were marked in the order they were extruded.
To extrude 3mm diameter rod it was necessary to manufacture new dies for the rheometer. The widest bore available in the standard set of dies supplied by the manufacturer had an internal diameter of 2mm, During trials, using this die and granules of clear Darvic, the extruded rod was found to hqve a diameter of 2.5mm. It was calculated that a bore of 2,5mm internal diameter was required, assuming constant die swell, to produce rod with a diameter of 3,1mm, Two stainless steel dies were produced, identical in size to the supplied dies except their bores had an internal diameter of 2.5mm. A H extrusion of weld rod of the new compositions was carried out using these dies,
It was normally possible to extrude 13^14 350mm lengths ofrod from each 70gm charge. Although the barrel would take a larger charge, degradation of the polymer prevented any further useful rods being produced. The barrel and die were carefully cleaned after each run to prevent contamination of subsequent runs.
Only one welded sheet was prepared using rod of eachcomposition except in the case of formulation No.9, see table 13,for which a second welded sheet was prepared. This second sheetwas welded using six passes of rod in each groove, whichrequired two extra batches of rod to be extruded.
-80-
Selected samples of extruded rod were subjected to a heat treatment of 170°C for 10 minutes to determine the level of frozen-in orientation caused by the extrusion process. The length of each rod, before and after the heat treatment, was measured. The rods were kept on a bed of glass microspheres during the heat treatment and the subsequent cooling.
-81-
Results
In the following chapter the results of the previously described experimental work are presented. The results are discussed in the context of the experiment from which they were obtained along with, their general significance to the overall programme of work. However, a more detailed discussion relating specifically to the welding and fracture mechanics work is reserved for the next chapter.
Mechanical Properties
All the stresses reported here are engineering stresses-, and are calculated 1170] as the load, P, divided by' the specimen initial cross-sectional area, Aq,
a F/Ao -(12)
A true s t r e s s , , is defined as the load divided by the instantaneous cross-sectional area, A? and is related to the engineering stress, assuming a constant -volume deformation process, by
a - o x (1/1 )T ° -C13)
where 1 is the specimen gauge length under the applied load and 1- is the specimen's original gauge length. At yield, for UPVC, the true stress is typically 6% higher than the engineering stress [77].
Engineering strain, e, is defined 1170] as,
e = C1 ■ 1o)/1o -C14)
The tensile modulus, E, is defined 1170] as,

E = a/e -(15)
where the ratio a/e is taken from the initial linear part of the load - extension/strain curve. A secant modulus is defined as the stress required to produce a specific strain divided by that strain.
The flexural modulus, for rectangular crossesection bars, is defined 1173] as
E. = cAl/GMlVi B * 0.61
where L is the length, of the span between the outer supports of the 3-point bend rig, b is the width of the bar, h is the thickness and y is the deflection induced at the centre of the bar by the applied load, P,
For a circular cross^-section rod, the flexural modulus is defined 11743 as
E = C4 L3P)/(3w d4y)-CL7)
where d is the diameter of the rod,
4.1,1. Tensile Yield Stress
During the tensile testing programme three types of failure behaviour were observed: necking and cold drawing, necking rupture and brittle fracture. When either of the first two types were seen failure was deemed to have occurred once the load sustained by the specimen began to drop, A yield stress, a , was then calculated from (12) using the maximum load sustained by the specimen. When brittle fracture occurred a fracture stress, a„, was calculated from 'Cl2) using the load at which fracture occurred. Where the term tensile strength is used it is taken as being either the yield stress or the
-83-

fracture stress.
The yield stress of the 10mm thick clear, sheet was determined as 67.5^ 1.4MPa when the dumbbell specimens were used and as 61.4- 1.4MPa when the parallel sided specimens were used (as part of the tensile modulus programme). When the sheet was later examined for orientation, the yield stress along the length of the sheet was calculated as 64.7- 1.6MPa whilst across the width, it was 65.6- 1.4MPa.
A short test programme revealed that the yield stress was not dependent on specimen cross-sectional area or ageing but that it was dependent on the strain rate and temperature of the test. Although the programme was not particularly detailed it was possible to establish that the yield stress increased approximately 1.5MPa each time the strain rate was doubled and that it decreased by approximately 0.8MPa for each 1°C increase in test temperature. These results are in general agreement with the values reported in the literature 1 44,45 ] , allowing for the range of strain rates and temperatures used. After allowances were made for the different strain rates used in the various tests there was still a difference between the yield stresses of approximately 4MPa. This may be explained as being caused by fluctuations in the test temperature. Although the specimens were conditioned in the test laboratory for at least 24 hours prior to testing, the laboratory temperature itself was observed to change between 12°C and 28°C over a 12 month period and even up to 5°C over the normal working day.
The weld rod yield stress was determined to be 70.0- 1.5MPa from the specimens bonded into the steel blocks. This value was calculated assuming a rod diameter of 3.0mm. However, it was generally observed that the rod cross-section was an ellipse with a major axis diameter typically 0.1mm greater than the minor axis diameter. Further, it was noted that there was a variation in these dimensions along the length of the rod.
- 84-

After averaging several measurements taken from various positions along different rods, it was found that 3.0mm was a reasonable value for the rod diameter. However, it is probable that by using this value the yield stress is underestimated by up to 5%.
This implies that the clear rod yield stress is significantly higher than that of the sheet, especially as the strain rate used was usually half that used for sheet testing. Even allowing for small variations in the temperature of testing between the sheet and rod tests there is still a difference in the yield stresses. This difference probably reflects the slightly increased levels of orientation frozen-in the rod during processing.
The yield stress of the Plastics Construction sheet material was found to be 67.0- l.OMPa. The filled TJPVC sheet was tested for orientation induced by processing. The yield stress when measured in the direction of the surface texture was 53.3- 0.7MPa. whilst perpendicular to this it was 50.6- 0,7MPa.
4.1.2. Tensile Modulus
When measured for strains less than 0.4%, that is within the initial linear part of the load-strain curve, the 10mm thicksheet was found to have a tensile modulus of 3.60- 0.15GPa.However, the secant modulus measured at 0.8%, 2%, and 4% strain was found to be 3.0- O.IGPa and approximately 2.0GPa and 1.5GPa respectively.
The weld rod was observed to have a very much longer linear part for its load-extension curve and the tensile modulus measured at up to 1% strain was 3.42- O.lOGPa. A result confirmed by the extensometer measurements. Once again, this value is thought to be an under-estimate on the grounds that the rod was assumed to have a diameter of 3mm. If the cross- sectional area has been over-estimated by 5% then the tensilemodulus would really be 3.6GPa. However, if the work of
- 85-

Rawson and Rider [82] is examined, the fact that the weld rod yield stress is higher than that of the clear sheet because of orientation, then the tensile modulus of the weld rod should also be higher than that for the sheet. From their work, an approximate relationship between the ratios of yield stress and tensile modulus for orientated and unorientated material may be written as
(a - cr )/o = 1.45 (E - E )/ Eo u u o u u-(18)
where subscript o refers to the orientated material property and subscript u refers to the unorientated material property. If the yield stress and tensile modulus values for sheet are representative of unorientated material then from the clear rod yield stress value, the clear rod tensile modulus would be expected to be 3.8GPa. Two reasons may be proposed to explain why this value was not observedr
1) different test temperatures were used
2) the rod and sheet materials are not identical and the relationship given in 0.8} does not apply.
4,1.3. Flexural Modulus
The flexural modulus of the 10mm thick clear sheet was found to be 3.07- 0.09GPa, whilst the 3mm thick clear sheet had a modulus of 2.90- O.lOGPa. The clear weld rod had a modulus of 3.12- 0.20GPa. As before, the modulus for the rod was calculated assuming a rod diameter of 3mm and therefore it is probably an underestimate. Allowing for this and the fact that the 10mm thick sheet was tested using a strain rate three times that used for the rod implies that the rod flexural modulus is significantly higher than the sheet.
The difference in the values of the flexural modulus for the sheet and rod is further evidence that the rod contains
-86-

frozen-in orientation. The flexural modulus test demonstrates this better than either the yield stress or tensile modulus tests since it primarily tests the outer skin of the rod.It is in just this layer that one would expect any frozen-in orientation to be concentrated and therefore for it to have a marked influence on the modulus measurement.
4.2. Microstructure
The following sections, 4.2.1 - 4,2,4, deal with the results of the microstructural analysis stage of the materials characterisation programme. The first section deals with differences in the base polymers used and the effects on molecular weight distribution caused by heat treating the materials. The second examines the thermal properties of the materials and discusses how they, are affected by thermal history and additives. The third and fourth sections examine the orientation left in the materials by their different processing histories,through thermally induced shrinkage and birefringence studies. The fourth section also examines the dependence of birefringence on the applied stress for the sheet material,
4.2.1. GPC Results
Although GPC is a quick method to determine the molecular weight distribution of polymers it suffers from batch to batch variability. The normal practice was, therefore, to include a standard sample of clear sheet which could be used as a reference. The results for the two GPC analyses carried out are given in table 14.
Despite there being a large scatter in the insults it would seem reasonable to assume that the I.C.I. materials, both sheet and rod, are based on the same polymer. The clear weld rod would seem to be based on a different polymer but one with a similar molecular weight distribution.
-87-
The GPC analyses of the heat treated samples would indicate that they have been little affected, with respect to molecular weight distributions, by being kept at elevated temperatures for a time similar to that experienced during welding.
4.2.2. Determination of T g
The DTA work was not easily reproducible and as sample preparation was time consuming it was decided to abandon this method at an early stage, in favour of .DSC.
The DSC method normally gave reproducible results, of a standard form, for the sheet material examined in the range 30 - 100°C, see fig, 52. Spurious peaks and slight variations were accounted for by either sample movement within the pans 198] or erratic purge gas flow. Cycling of the sheet in the range 30 - 100°C produced no changes in the output thermogram.
However, the clear rod thermograms showed an endothermal peak over the glass transition region during the first heating run. Cycling of the rod produced thermograms of the standard form, see fig. 53.
The glass transition temperatures were determined using the Tcrossed-line’ method recommended by Griffiths and "Maisey [175], see fig. 54.
The Tg of the sheet was found to be 67.0- 1.5°C, with no change with cycling. The clear rod T was 64.9- 1,9°C for the initial heating but dropped to 58,6- 1.1°C after cycling. This large difference was due to the presence of the endothermal peakover the T region during the first heating.8
The endothermal peak was, at first, thought to be due to the presence of a lubricant additive, Wax E, a Hoechst product, which has been observed to cause problems in interpreting the glass transition curve for PVC. This lubricant has a melting
-88-

peak in the region of the polymer T . This peak was observedSto decrease in size and the polymer was found to decrease by several degrees when the sample was cycled 1176] .
That the endothermal peak would arise as a product of the heating rate used was originally thought unlikely since to produce the peak a slow cooling and fast heating cycle is required [81]. It was thought that in the extrusion process the extruded rod would be rapidly quenched into a cold water bath during the haul-off. However, it is a common practice to extrude into a warm water bath, to prevent the formation of bubbles within the rod. This may be sufficient, combined with a long storage time, to give rise to the endothermal peak and to account for its removal by cycling.
The study of thermal behaviour of the sheet and rod over the temperature range -100°C to 0°C was of little use as the curves were masked by excessive noise. This seemed to be a problem associated with using the thermal analyser on its most sensitive setting and at low temperatures.
The high temperature study, 30°C to 350°C, was limited to two runs to prevent any damage to the DSC cell, caused by the hydrogen chloride given off by the PVC degrading. The thermograms for sheet and rod are given in fig. 55, The main difference appears to be that the exothermic reaction associated with degradation starts at 170°C for the rod and at 195°C for the sheet. This suggests that during hot gas welding the rod is more likely to degrade than the sheet. Considerably more work is required before anything more definite could be concluded but this technique might prove useful in comparing the sheet and rod in any further study.
4.2.3. Thermally Induced Shrinkage
The BS shrinkage test [172] for sheet, indicated that the sheet shrank less than 1% with only a small degree of orientation being left in the sheet after processing.
- 89-

The shrinkages measured using the square block method rose to 3%, for heat treatments of 170°C for 1 hour. See table 15 for details of the measured shrinkages resulting from various heat treatments. The scatter in results prevented any detailed analysis relating to frozen-in orientation.It was estimated that when measuring the blocks the error was up to 0.5% of the measured shrinkage which would mask any small effects due to orientation indicated by the results. However, any orientation would appear to cause less than 5% difference in the shrinkages measured parallel and perpendicular to the sheet length. It is assumed that the maximum difference would be observed when measured in these directions.In all cases the sheet thickness was observed to increase approximately 5% with the first 10 minutes of the heat treatment and remain constant thereafter.
The rod was found to shrink up to 25% along the length of the rod when heated to 180°C for 15 minutes, see fig. 56.The rod did adhere to some of the surfaces used for supporting the rods during the heat treatment and this may explain some of the scatter in the results. See table 16 for the measured shrinkages resulting from various thermal treatments to the rods. Measurement of the shrinkage was made using a 150mm steel rule since the heat treated rods were rarely straight enough to justify the use of a travelling microscope. A feature of all the rods was their tendency to become curved during cooling.Some scatter in the results for the shrinkages may have been induced by the method of straightening the rods as they cooled. The diameter of the heat treated rods was generally found to have increased, after allowing for the variations previously discussedin the diameter of rods prior to heat treatment.The rod diameter increase appeared consistent with the rod maintaining a constant volume during the shrinkage, although the measurements are not accurate enough to be conclusive.
v Typically the rod diameter increased 10 - 15% for the rods showing the maximum shrinkage.
- 90-

4.2.4. Birefringence
The orientation in the sheet and rod was measured using a quartz wedge system on the Vickers M55 microscope. The scale reading, S, at which extinction was observed was converted to the retardation, R, in nm using the quartz wedge calibration.
R = 28.36 S + 174.19-(19)
The birefringence, An was then calculated using An = R/t
" ( 20)
where t is the specimen thickness.
For the 10mm thick clear sheet the birefringence was typically -4 -40.65 x 10 - 0.85 x 10 , whilst for the rod it was approximately-41.85 x 10 . Although the difference between the sheet and rod
birefringences is large both values are small when compared to the values for UPVC showing marked anisotropy in its mechanical properties [77].
The stress optic coefficient, C, was originally determined so that a photoelastic stress analysis of the hot gas welds could be carried out. The value of C was determined, for the sheet, using the cantilever beam method. A cantilever beam of sheet was loaded.at its free end, between the crossed polars of a circular polariscope. The stresses along the resulting isochromatic lines were calculated using standard beam equations and C was then calculated from
R = nX = C(cr- ( 21)
Where o and are principal stresses in the beam (in this method is assumed to equal zero), X is the wavelength of the incident light (in this case a sodium lamp was used withX - 589nm) and n is the isochromatic fringe number [177].
+ -12 2 For the sheet, C was found to be 6,51 - 0.36 x 10 m /N.
- 91-
This result is in good agreement with values reported in the literature 1178, 179] and confirms the fact that UPVC is a material unsuited to photoelastic analysis as its birefringence is relatively insensitive to stress.
4.3. Chemical Analysis
The chemical analysis of the sheet and rod materials was considered necessary since the presence or absence of particular additives will affect the mechanical properties of the finished product. Examples of such additives are plasticisers, impact modifiers and certain of the thermal stabilisers.
*
To carry out an exhaustive quantitative analysis was considered outside the scope of this project, since considerable time and special expertise are required. The basic problem of the analysis is the wide range of materials in use as additives. The analysis of TJPVC is further complicated by the relatively large number of additives used in a particular formulation and the low levels at which they are present. In a typical unfilled non-impact modified TJPVC the major additive is 1 - 2% thermal stabiliser with a number of lubricants, all at the 0.5% level, a U-V absorber, at the 0.2% level, and sometimes, pigments at the 0*1% level. However, a semi- quantitative analysis, in which most of the additives might be identified, was considered possible.
There were several clues from the previous work on which to base the analysis. The clear sheet was believed to contain an organotin stabiliser: it would be expected as a requirement of clarity. Further the yield stress and T of the sheet would suggest the presence of an anti-plasticising agent such as an organotin [62]. The sheet was unlikely to contain any plasticiser nor would it contain any impact modifiers. These dramatically reduce yield stress when used in their normal concentrations. The rod might have contained a plasticiser, plasticised weld rod being popular in Europe, though the
- 92-

yield stress suggested otherwise. The presence of a particular lubricant, the Hoechst product, Wax E, was also suggested as it provided one explanation for the endothermal peak seen over the glass transition region of the clear rod [176].
4.3.1. Extraction
Only the 10mm thick clear Darvic sheet, the I.C,I. weld rod and the clear weld rod were studied in detail. However, the filled Darvic sheet was also examined to determine which filler had been used.
The extraction method used for the clear materials was an ether extraction using the Soxhlet apparatus, as recommended by Haslam et al [180]. In their extraction, they start with a finely divided powder polymer sample and reflux the solvent over the sample for 6-7 hours. For most additives they found ether to be an acceptable solvent, although hot methanol was required when polymeric additives were present.
As there were no facilities to provide a finely dividedsample the materials were granulated using a laboratory
3granulator which produced granules approximately 20mm . To allow for the increased volume that the solvent had to extract through, the extraction time was extended first to 48 hours and then up to 240 hours. To obtain a reasonable amount of extract the sample size was increased from 2gms to 20gms. Although a hot methanol extraction was carried out, subsequent to the ether extraction, only a minute extract was obtained and it was not adopted as part of the general extraction programme. The different extraction conditions and the weight of extracted materials are given in table 17,
It had been suggested [181] that variations in the weight of extracted additives probably resulted from the minor variations in composition, between batches, arising from the day-to-day changes in processing conditions. Allowing for this,
- 9.3-
the sheet contained approximately 2.9% extractable additives whilst both the rod materials contained approximately 4.1% extractable additives. This difference is believed to be due to the different types and levels of additives required for the different processing conditions. These levels are in agreement with those quoted by Comes and Hqward [93] .The levels of additives indicated that neither impact modifiers, plasticisers nor processing aids were used in these materials, since these additives would normally be present at the 10% level.
A second method of separating the polymer from the additives, the THE recovery method also recommended by Haslam et al [180], was used to confirm the levels of additives in the clear sheet and to allow the determination of the filler in the filled sheet. The clear sheet material was found to contain 3.75% soluble additives and 1.3% insoluble additives. Although these values are higher than those from the Soxhlet extraction,they confirm the level of additives as being no higher than the 5% level. The difference is thought to be due to :
1) the granules used in the Soxhlet extraction being of a sufficient size to prevent complete extraction.
2) the insoluble additives centrifuged off probably containing both some crosslinked polymer and the dirt particles trapped in the material during processing ( a visual examination of the sheet reveals numerous inclusions within the sheet).
The recovery method was only used to separate the filler from the filled UPVC sheet and the insoluble additive content was found to be 12%.
4.3.2. Analysis of Additive-Free Polymer
After Soxhlet extraction, the polymer granules were subjected to various drying procedures, in an attempt
- 94-

get a constant weight measurement. However, the granules were found to increase in weight with increasing time of exposure to air, see table 8 for drying conditions used and the resulting granule weights. The granules were found to gain approximately 2% weight compared to the sample weight prior to extraction. This would indicate an increase in polymer weight of approximately 6%, allowing for the removal of additives.
After the ether extraction the granules appeared unchanged. However, the granules of both sheet and clear rod developed a milky white translucence during drying after the methanol extraction. Sample granules, taken after the methanol extraction, were found to contain voids when cut open and examined using a light microscope. It is thought that the hot methanol swells the polymer granules during extraction and during drying the granules are constrained to their swollen shapes. The polymer can return to its normal density only by forming internal voids.
Dried granules of both sheet and clear rod were subjected to a DSC analysis, see fig. 57. The resulting thermogramsindicate a reduction in polymer T to approximately 45°C.8This, combined with the increased weight of the granules, suggests they still retain some solvent which is acting as a plasticiser [182].
4.3.3. Analysis of Extracted Additives
The author would like to take this opportunity to acknowledge the assistance of Dr. G. Corfield and Dr. A. Ellis in the following work and the co-operation extended by the technical services sections of I.C.I., Hoechst Chemicals and Ciba-Geigy.
The analysis programme chosen reflected the need to gather the maximum information in the shortest time. It was expected that some of the additives would remain unidentified and that
- 95-

no quantitative information concerning the level of the individual additives would, he obtained.
The programme consisted of submitting the dried extracts,without further separation, to analysis using standard I-R,U-V, NMR and DSC techniques. The first three are recommended by Haslam et al 1183]. The last was expected to provide melting point information and thus allow an estimate of the number of additives present in each extract. The resultsfor the extracts from these methods were then comparedagainst results obtained for pure samples of a range of additives, selected as possibly being present in the extract, and against results given by Haslam et al 11843. It was appreciated that the identification of some of the additives would prove impossible due to chemical changes brought about by processing and that some would be masked by other additives in the extract.
The extracts from both the clear sheet and the I,C.I. rod were similar in appearance. Both were a brown slurry which largely solidified with time, though they melted if warmed in the hand. The clear rod extract was a blue slurry which solidified with time and also melted if warmed in the hand.
The I-R, U-V, and NMR spectra for the sheet and two rod extracts are given in figs. 58-66. The DSC thermogram for the sheet and clear rod extracts is given in fig. 67. Details of additives obtained as standards and with which method they were analysed are given in table 18.
As the extracts are mixtures, a comparison of spectra with standards can only provide indications as to which additives are present.
The I-R spectra of the sheet extract strongly indicated the presence of di-octyl tin di-octyl thioglycollate, an
- 96-

organotin liquid stabiliser. The U-V spectra was identified with that for the U-V absorber 2-(2-hydroxy-5-methyl-phenyl)- 2H-benzotriazole. The NMR spectra failed to compare with any of the standards.
The I-R spectra of the I.C.I. rod extract suggested the presence of ethyl palmitate, a lubricant with no indications tc the type of thermal stabiliser used. The U-V spectra was similar to that of the sheet extract, suggesting the same U-V absorber. Again there was no match of the NMR spectra with that of any of the standards,
The I-R, U-V and NMR spectra for the clear rod extract all pointed to a phthalate-containing additive. This would usually indicate a plasticiser such as di-octyl phthalate. However, it was suggested that at these levels, i.e. less than 5%, it was probably a phthalate type lubricant such as stearyl phthalate [185], The standard produced similar I-R and U-V spectra but IRS and UVS do not readily differentiate between the octyl and stearyl forms. [186],
The DSC thermograms for both the sheet and clear rod extracts indicated several melting points. However, the DSC equipment failed before all the standards could be examined.The limited temperature range used for the extracts does not include temperatures at which most lubricants melt, i.e. above 100°C, and no results were obtained for the liquid additives.
The stabiliser in the clear rod was determined to be aMdi-butyl tin di-octyl maleate by R.Clarkson using a Mossbauer technique [187]. He concluded that there was considerably more stabiliser in the clear rod than in the sheet.
During the consultations with I.C.I, concerning new weld rod formulations the additives identified in the I.C.I, materials were confirmed. The weld rod stabiliser was given as a di-butyl tin maleate with the lubricant systems
- 97-

in the sheet and I.C.I. rod similar although the levels in the sheet were lower.
The insoluble additives separated from the filled sheet using the THF recovery method mainly consisted of a fine greyish-white powder. The powder was analysed, using a wavelength dispersive analyser, as containing only calcium in significant quantities. However, this system was not able to detect elements of atomic number less than twelve. The powder was observed to consist of particles with dimensions up to 20ym, see fig. 68. The gas evolved after hydrochloric acid was added to the powder was identified as being carbon dioxide.It was concluded that the filler was mainly calcium carbonate which was added to reduce cost rather than to improve impact properties.
4.3.4. The Effects of Solvent Washes on the Weld Rod
It had been suggested that wiping the weld rod with a solvent prior to welding leads to an improved weld strength 1188]. Two experiments were carried out to examine whether such an improvement was due to either the removal of an additive from the surface of the rod or to the absorption of the solvent into the rod leading to a surface layer of plasticised material.
For the first experiment clear weld rod was soaked in a flask of chloroform for 1 minute. After the rod was removed, the chloroform was driven off and the flask weighed. Approximately 0.15% by weight of additive was found to have been extracted. Examination of the extract using infra-red spectrophotometry indicated that the extract was similar to that obtained during Soxhlet extraction.
For the second experiment clear weld rod was immersed in methyl ethyl, ketone for various times. The weight of the rod before immersion and after various drying procedures was
- 98-

recorded, see table 19.
From the experiments it would seem that solvent washes can lead to both the extraction of additives and the absorption of solvent into the rod. Although both effects are small they may be significant since they are localised to the surface of the rod and it is the condition of the surface of the- rod which critically controls the fusion obtained during welding.
4.4. Weld Results
The weld failure stress was calculated using (12) with the cross-sectional area defined as the width of the specimen, at the weld, times the average thickness of the sheet, away from the weld. The stress, so defined, is the gross specimen stress and not the stress experienced at the weld. However, this definition of stress permits the assessment of the load bearing capacity of the welded sheet and is also the same stress normally used in fracture mechanics analysis. The drawback of this stress is that it does not permit an assessment of differences in bond strength due to technique when different weld configurations are used.
The efficiencies of the welds were calculated using
Weld efficiency = Weld failure stresssheet yield stress
“ (22)
with the sheet yield stress being taken as 65.0MPa for welds using clear sheet and 53.0MPa where grey sheet was used. As Alf et al [168] have shown that weld failure stress is relatively insensitive to variations in temperature, for temperatures about 20°C, no allowances were made for variations in the temperature of testing. The choice of the materials’ yield stress values were based on the results of tensile tests on similar sized specimens of unwelded sheet.
-99-

The description of differences observed between welds during the examination of their interiors is only qualitative as it was not considered possible to make it quantitative.
At least one specimen from each weld tested was examined between the crossed polars of a circular polariscope. A typical isochromatic fringe pattern is shown in fig. 69.As can be seen, the poor photoelastic response of TJPVC combined with the complex stress system resulting from the welding process and the interference of lines due to the etching of the boundaries of the foils makes analysis extremely difficult.It was decided that such an analysis was beyond the scope of this work, !
4.4.1. Polytechnic Welds
In the majority of cases the main feature of the examination of the interiors of hot gas welds was that the various weld boundaries, i.e. rod/rod and rod/sheet, were invisible when viewed from an oblique angle.
The usual indication of a weld boundary was the presence of slightly degraded material, showing up as light green/brown streaks, within the'weld zone. Sometimes trapped particles of dirt or more heavily degraded material were present along a boundary. Sometimes a weld rod was observed to have bubbles within it. However, in virtually every welded tensile test specimen at least one boundary would be revealed by having a silver streak along it. These streaks had the characteristics of planar cracks in that they had sharply defined but irregular boundaries in the plane of the streak and were very thin along the plane, A typical hot gas weld interior showing all the above features is shown in fig. 70,
When the weld interior was viewed head-on the weld boundaries were more clearly indicated, since the presence of degraded material along the boundaries reduced the amount of light transmitted along them, see fig. 71.
-100-

A further feature observed in welded specimens when viewed in this direction was the presence of a zone of changed refractive index in the sheet about the weld, see fig. 72.It would seem reasonable to associate this with a heat affected zone (HAZ), as found in metal welding. The horizontal lines seen in the sheet appear to be boundaries between the foils of UPVC, which are pressed together to form the thickness of the sheet, which have been preferentially etched during the final stages of polishing.
The filled sheet welds examined in this way showed good homogeneity across the weld zone except at the root, see fig. 73. There was no evidence cf an HAZ.
The hot tool welded specimens viewed at an oblique angle gave little indication as to the position of the weld boundary. Only when viewed head-on could the boundary be seen and then only as a very thin dark line. There was in this caseevidence of an HAZ, see fig. 74.
During tensile testing of the welds, the silver streaks were observed to form or grow in a jerky manner accompanied by audible clicks. This growth usually occurred at loads approximately 25% that of the failure load.
The results of the tensile tests are given in table 20.
4,4.2, Commercial Welds
As described in section 3.4.7. a wide range of weld configurations and conditions were used by the industrial welders.
In most respects the features seen in the interiors of theindustrial welds were little different from those observed in weldsprepared by the author. However, two differences were noted:
1) for all the Plastic Construction welds there had been no attempt to achieve weld root penetration, see fig. 75
-10.1-

2) the general number and size of internal flaws (silver streaks)were smaller than those seen in the author’s welds, discounting the flaw at the root of the Plastic Construction welds.
The large flaws at the root of the Plastics Construction welds were the result of a deliberate policy in which a large flat is left at the root of the weld to allow easier alignment of the parts during welding. The second point noted in the industrial welds would appear to result from the greater skill and experience of the industrial welders. However, the silver streaks were, again, observed to form and grow during the tensile testing of the welds.
The results of the tensile tests are given in table 20.
In almost all cases failure occurred with one crack growing straight across the specimen. However, in three specimens, one Plastics Construction and two BNFL, failure occurred with the entire weld region being ejected, in one piece, from the specimen, see fig. 76.
4.4.3. Fracture Surface Studies
Light and scanning electron microscopy of the weld fracture surfaces revealed the presence of regions within the weld zone which acted as fracture initiation sites. These regions had irregular but sharply defined boundaries, see fig.77, and appeared to be related to the silver streaks seen in the interior of welds prior to and during testing. The surfaces of these regions had a characteristic smooth appearance which was consistent with them being surfaces at which little.or zero fusion had occurred, see fig. 78,
A measurement of the size of the region at the fracture initiation site, for selected welds, was made Using a travelling microscope. The surface of the region was assumed to be horizontal for the purposes of this measurement although it was most often ridge-like or at an angle to the horizontal, see
-102-
fig. 79. The average flaw size for each of the welds examined is given in table 21.- In nearly 80% of the weld fractures examined, the initiation site appeared along either a rod/rod or rod/sheet boundary near or at the surface of the weld. In some cases, this proximity to the surface prevented the measurement of the size of the region, as it was impossible to distinguish where the region ended and the surface began.
Several features became apparent during this work:
1) fracture initiation did not always occur at the widest part of the region, see fig. 80.
2) examination of the fracture initiation sites revealed no slow fracture and little evidence of crazing, see fig. 77.
3) the fracture surfaces were typical of fast brittle fracture, see fig. 81.
4) the morphology of the fracture surface was related to the failure stress. For low failure stresses the fracture surface was planar and very smooth but as failure stress increased the degree of surface roughness also increased. At the high failure stresses the surfaces were extremely rough with extensive hackle and crack bifurcation, see fig. 82 and fig. 83.
5) once the crack propagated it moved perpendicular to the loading direction with no tendency to follow weld boundaries at which fusion had occurred, see fig. 84.
6) the fracture surfaces of welds in which the weldzone was completely separated from the two sheets were distinctive in that one surface was rough whilst the other was extremely smooth, see fig. 85 and fig. 86.
7) only rarely was the same flaw found to run through more than two adjacent test pieces of a weld.
4.4,4. Weld Rig
Although only a few trials were carried out using the rig it became obvious early on that it was very difficult to produce welds when all the parameters were held constant. The two
-103-

parameters which appeared to have the greatest influence on welding were the welding speed and the pressure being applied to the rod. In other welding rigs the welding speed is usually left as a free variable as the rig is effectively moved along by the weld rod being pushed into the groove. With the welding speed held constant, the base of the weld rod was found to gradually move out of the heated gas jet, if the bow wave was being maintained. It seemed that the speed of welding needed constant re-adjustment to maintain proper welding conditions and as this was impractical the work on the rig was stopped.
4.5. Fracture Mechanics
As described in the previous section flaws or notches within the weld zone appeared to be an important feature of the failure of welds. The effects of such flaws on weld strength can be estimated through the theories of fracture mechanics. In the case of hot gas welded UPVC the fact that failure occurs at stresses typically less than half the unwelded sheet yield stress and the fact that the load-extension curves are generally linear up to failure allows the methods of linear elastic fracture mechanics to be used.
In the first part of this programme the notch sensitivity of unwelded UPVC was studied both for filled and unfilled UPVC. The second part examined how the welding process had affected the notch sensitivity of the UPVC, whilst the third part was an examination of how the fracture surfaces differed between unwelded and welded specimens.
4.5.1. Unwelded Sheet Fracture Mechanics
It was originally expected that both the initiation and the propagation values of the stress intensity factor, K, and the strain energy release rate, G, could be determined. In the case of most polymers it is possible to observe first slow stable crack growth, from which propagation values are determined, followed by fast unstable crack growth, from which initiation values are determined (jsee section 2.51. However, in this work
-104-
using UPVC, it was impossible to achieve reproducible slow stable crack growth and the work concentrated on determining the initiation values for K and G.
The initial approach, was that of determining G using crack line loaded tapered double cantilever beams. When this typeof test has been used with other polymers it has been possibleto get considerable data from each specimen. However, with clear UPVC,as slow crack growth occurred only rarely and as the cracks tended to jump over 100mm at each propagation,only" two or three results were generated from each specimen. Of these only one result could be obtained using the simplified experimental procedure permitted by the use of this type of test. The compliance calibration curves for the two main TDCB designs used are shown in fig. 87 and fig. 88. Through these- it was possible to get results from the data for crack propagations outside the region over which the specimen compliance changes linearly with crack length. All the results were calculated using the dC/da factor appropriate to the particular crack length at which the crack propagated, instead of using the approximation of constant dC/da and CL1)
GIC ■ Pf x dc— da2b . c
where b^ is the nett section thickness of the specimen in the plane of the groove. The results of the G _ analysis arelugiven in table. 22.
Designs of TDCB other than the two standard designs were only tried to examine if more slow crack growth or an increased number of crack propagations were possible. Within the TDCB programme no particular design was found to give rise to either of these conditions. For all the designs used slow crack growth was only observed for one or two specimens out of each set of ten specimens tested. It did appear that if a crosshead rate of lOmm/min was used, then slow crack growth was more probable but the evidence was inconclusive. For the majority of
- 105-

this programme it was assumed that slow crack growth was more probable the slower the crosshead rate used, as is the case for PMMA 1131]. However, it would seem that in this respect UPVC is more like epoxy resin and requires- higher crosshead rates to produce slow" crack growth.
The use of reverse-end loaded TDCBs as suggested by- Mai et al {124J to achieve more controlled crack growth was tried. The initial crack propagated to within a 30mm of the end of the specimen and did not appear to offer any advantages over the standard TDCB work.
The data from the TDCB programme was also treated using a similar analysis to that used for the DCB programme to derive K^c through (9)
Kic = <rfY/7 .
with the calibration factor, Y, being derived from beam theory. The actual equation used was
■ pf o> V 1-C23I
where P- is the load at failure and b is the sheet thickness, fThe calibration factor was calculated from
Y = (12a2/H3 + 4/H)*-(24)
where a is the crack length and H is the height of one of the tapered arms at that crack length 1131]. The results are given in table 22, fewer results are given than for the G analysis1\jas the above equations were assumed to be only valid for crack propagations in the range, .
2H < a < W-H-C25)
where w is the length of the specimen.1131]. A similar, analysis
rlQ6r-

based on boundary collocation methods [119] was also used and was found to give results typically 5 - 10% higher than above.
The DCB programme was only used to generate K resultsJ-Was no compliance calibration curves were prepared. The data was analysed using (23) but with Y given by
Y = (2.38 + 3.46 a/H) /H*-(26)
this factor being derived from boundary collocation methods 1118], The results are given in table 22, again the boundary condition (25) applies. Using the DCB specimens slow fracture was observed in eight tests out of the seventeen carried out. No analysis was attempted on the slow fracture as it was only observed late in the programme and after it was realised that slow fracture was not observed in welded specimens. However, some points were noted:
1) crack speeds were typically' 8Qmm7min2) crack lengths were unpredictable, varying
between 50 - 200mm3) all slow fractures terminated in arm break-
off.
The DT data were analysed using (23) with Y given by
Y = 1 C3 Cl + v) / (b2 W)^C27I
Where 1 is the moment arm of the applied load and W is the width of the specimen 1120,1321, see fig. 17. Tke results are given in table 22. Each. DT specimen gave two results, with the crack first propagating 90 - 120mm and then completely severing the specimen. There was no evidence of slow fracture for any of the specimens. The cracks had the distinctive shape normal for this method and all crack lengths were measured along the bottom surface of the specimen.
- 107-
Throughout the cantilever beam test programme there was no evidence of plane stress effects, nor that changes in the notching procedure significantly affected the results.
To supplement the cantilever beam programme an SEN programme was initiated, this having the advantage of more closely simulating the tensile test on welds. Results from this programme were analysed using (9) with Y given by
Y = 1.99 - 0.41d + 18.7d2 - 38.48d3 + 53.85d4”(28)
where d equals a/W and W is the specimen width 1114] see fig. 15.To actually determine K the data was plotted as failure stress,
“1cr , against the reciprocal corrected crack length (Y /a) , and the best straight line fit determined using standard least squares analysis, see fig. 89 for the graph of clear UPVC SEN data and fig. 90 for the graph for filled UPVC SEN data. Two straight line fits were used:
y = Ax + B”(29)
andy = Ax
”(30)
with y equal to the failure stress and x equal to the recriprocal corrected crack length. The constant A is then equal to K^, and the constant B the intercept of the stress axis. The second equation (30) is the solution to (9), but the first equation (29) allows an extra degree of freedom in the analysis. The first equation was preferred since for most of the SEN tests the boundary conditions (10)
a, W, t > 2,5 (KIC /ay)2
could not be met and the analysis based on (29) would allow for this better/than (30). The results, for both analyses, of the
-108-

SEN tests for clear UPVC for specimens with W = 15mm and W = 9.5mm and for the filled UPVC with. W" - 6mm are given in table 22.
In the case of clear UPVC SENs, the requirements* for valid plane strain fracture toughness testing appear to have been met. Fracture stresses were typically* less than half the sheet yield stress; the load’rextension curve shewed little sign of non-linearity* and the fracture surfaces* showed only* cleavage fracture markings. In general there was no evidence to suggest that any of the test geometries used have, in fact, infringed (101.
However, the filled UPVC SEUs clearly* infringed the requirements for plane strain fracture toughness testing.For all the geometries used in which the crack. grew* along the thickness of the sheet, failure occurred by* through-section yielding with gross stress whitening. Only in the case where cracks grew into the thickness of the sheet did brittle fracture occur. In this case fracture stresses*were usually over 90% of the sheet yield stress •; the load^extensdbon curve showed gross non-linearity and stress whitening could be seen on the fracture surface about the fracture initiation site,
4.5.2. Weld Fracture Mechanics
The main feature cf the welded TDCB test programme was the lack of results. Of the twenty-nine specimens prepared and tested, eighteen failed by arm break-off, three failed with the crack moving out of the weld zone and three failed with the first propagation completely severing the specimen. Further, the only specimens to show more than one useful crack propagation were those to which side-plates had been bonded, see table 12.The only compliance calibration curve prepared for the welded TDCBs was for the design incorporating 3mm thick clear UPVC side plates, see fig. 91. Only one specimen of this design
- 109-

was tested and this only gave one result, see table 22.
When the calibration curves for the 10mm thick clear UPVC, fig. 88, and the welded TDCB with 3mm thick clear UPVC side plates, fig, 91, are compared it seems that over the linear range, i.e, for crack lengths 70 - 150mm, the ratios of dC/da are inversely related to the effective beam thickness.This implies that any effects due to welding are constrained to a very small volume about the weld zone. This might, permit the calibration curve for unwelded specimens to be used for welded specimens of the same design if results could be obtained from the welded specimens.
Although the use of side plates bonded to welded TDCB specimens gave more control of the crack growth^difficulties and the time involved in specimen preparation lead to the curtailment of this work.
The DCB method generated more results in that only four of the eight specimens tested failed to produce a result.However, the four specimens which gave results only gave one result per specimen. These results were analysed using the boundary collocation method via C23J and (26J and the result'* is given in table 22. This result is the average of the results obtained from three DCBs welded with one weld pass in each groove and from one DCB welded with three passes of rod in each groove. However, the value of these results is undermined in that the load measurement, at the significant crack propagation, was made from charts for which the full scale deflection was that necessary to measure the initial crack failure load, which was typically ten times greater than the relevant crack failure load.
The DT method was only applied to two welded specimens but generated seven results, see table 22. Again two weld types were used but the results were averaged.
- 110-
Two features were noted concerning the weld fracture mechanics work:
1) there was no evidence of slow crack growth2) the arms separated either by arm break-off or
the; severance of a specimen were so distorted after fracture they could not be fully mated together. This distortion was in the form of a bowing in the plane of the arms which causeda gap at the centre of the specimen, see fig. 92.
The first feature lead to the fracture mechanics work for both unwelded and welded specimens concentrating solely on fracture initiation values of G and K. The second feature would seem to indicate the presence of residual stresses within the weld and might form the basis of a future study of hot gas welding.
4.5.3. Fracture Surface Studies
The fracture surfaces of the TDCB and DCB specimens showed the usual features associated with brittle fracture, that is mirror, haze and hackle zones. However, because of the constraints of these tests, in that the crack comes to a halt subsequent to the hackle zone, the remaining fracture surface up to the next crack arrest had a mirror-like surface. Typically the initial fracture surface features appeared over the first 5 - 10mm of crack growth with the following 100 - 200mm showing just the mirror features.
A microscopical examination of this mirror-like surface revealed that it was covered with fine striations. These were typical of the striations previously discussed, see section 2.4.2. They had a leading edge followed by what appeared to be craze material which gradually faded into a featureless band prior to the start of the next striation, see fig. 93, These striations were typically 10 - 12pm wide and were extremely regular and parallel down the length of the specimen. A detailed examination of two TDCBs suggested that this spacing was constant and
*-111-

independent of crack length. Occasionally two sets of bands were observed across the crack front. They did not intersect or overlap as did the Wallner lines seen in the haze and hackle zones, but rather they gradually merged into one single set of striations. It is thought these striations are intimately associated with the crack front and that two or more sets are created when different parts of the crack front are moving at different speeds. The sets merge as the crack front comes to equilibrium. Two further features of these striations are that they do not appear to be affected by crack velocity as they appeared: withtn the hackle and haze zone, and they^are not dependent on specimen size or design as they- appear on the SEN1 fracture surfaces and could, be seen on the fracture surfaces of scrap UPVC which had Been randomly* fractured.
Although these striations have been previously reported they have not been seen on such a large scale. As the reason for their existence has not yet been ascertained, these cantilever beam methods might be a useful way of generating them for a more detailed study,
The fracture surfaces of specimens which had regions of slow crack growth were also examined. Despite examination at up to x 8Q0 magnification these slow crack growth surfaces appeared devoid of any significant regular features.
The DT specimens* fracture surfaces also showed characteristic brittle fracture features, though modified by the crack geometry, see fig, 94. Again, after the usual sequence of mirror-haze- hackle zones there was a further haze and mirror zone. The mirror zone was covered with the fine striations but the larger number of minor crack arrest bands prevented such large areas of uninterrupted striations being seen.
The clear UPVC SENs showed brittle fracture markings, although this time they were characteristic of complete catastrophic failure. Following the mirror and haze zones, the
- 112-

hackle region was usually extremely rough and showed no signs of abating before the crack severed the sample. The degree of roughness was generally related to the failure stress in that higher failure stresses gave rougher surfaces.
The filled TJPVC SENs showed both types of failure behaviour, yielding and brittle fracture. Brittle fracture was only observed when the crack grew through the thickness of the sheet. These brittle fracture surfaces showed, in general, 1 - 2mm of stress whitening about the fracture initiation site before showing the cleavage markings of fast fracture, see fig. 95.As such these surfaces only showed coarse fracture markings presumably because of the presence of the filler. The necking rupture surfaces* (^yielding failure .y showed the usual features of gross stress whitening, reduction of specimen cross-section and occasional advance fractures.
The major feature of the failure of welded TDCBs and DCBs was the large number of specimens in which the crack grew through the unwelded sheet rather than through the weld zone. Where the crack did grow along the weld and through the weld rod fracture surface markings were very similar to those seen for unwelded specimens, However, one difference was the increased amount of haze observed between the hackle and the subsequent mirror zone. This would suggest that fracture speeds are somewhat higher than in unwelded specimens. This might explain the high levels of arm break^-off since high crack velocities encourage crack bifurcation 1151] and explain also why cracks tended to completely sever the specimen from the first crack propagation.
4,6, Pre-rWeld Treatments and Changes to the Weld Rod Composition
As already briefly discussed in section 3,6,, and further discussed in section 5.2., the previous work lead to the conclusion that the major cause of the poor weld strength in hot gas welded clear UPVC sheet was the presence of flaws or cracks within the weld. On this basis, two approaches were
- 113-

adopted to improve the weld strength:
1) to reduce the size and number of these flaws.2) to reduce the notch sensitivity of the materials
used,
The flaws were assumed to arise either from some incompatibility between the sheet and rod or from the contamination of the surface of the materials, probably by additives in the materials, which created a physical barrier to welding. As a result of the materials characterisation programme the major difference between the sheet and rod, except for additive content, appeared to be in the degree of orientation left in by processing. To reduce the difference, weld rod was annealed prior to welding, to thermally relax the excess orientation.To reduce any contamination of the weld surfaces, two methods were explored:
1) solvent cleaning of the weld surfaces just prior to welding
2) the removal or replacement of various lubricant additives in the rod composition.
As such ,the second method overlapped with the approach of reducing the notch sensitivity of the materials in that again the rod composition was altered but this time by adding an impact modifier at various loadings.
Pre-weld treatments therefore cover the annealing of weld rod and the solvent cleaning of the rod. Changes to the rod composition includes both the changes to the lubricant package and the addition of an impact modifier.
4,6,1, Pre-Weld Treatments
The tensile test results for the welds which had undergone the various pre-weld treatments are given in table 23.
The annealed rod was observed to be particularly susceptible
- 114-

to degradation during welding and this caused a significant quantity of degraded material to be left within the weld zone. However, no systematic fault was noted in the fractured specimens which suggests that the low weld strengths are a feature of welds prepared with annealed rod.
The weld prepared with a methanol wash treatment was not noticeably different during welding or in testing. The poor failure stress, has been mainly caused by two low results_, less than 12MPa, which result from a systematic fault across two test pieces. If these results are excluded, the average weld strength improves- to 17,6 - 2.2 MPa.
As was the case with annealing the weld rod, the trichloro- ethylene wash treatment lead to excessive degradation of the weld rod, particularly' in rod which was being heated by a second pass of rod. However, the main cause of failure was the presence of a systematic flaw between one of the outer rods and the sheet material. This makes the interpretation of this result difficult, as the poor weld strength may result from poor welding technique.
4.6.2. Changes to the Weld Rod Composition «
During the granulation stage, formulations 8 - 12, see table 13, all exhibited marked toughness in that the hides were extremely difficult to break up for granulation. All the hides of these formulations were prone to yielding with gross stress whitening. The hides of the remaining formulations all failed in a brittle manner.
There appeared to be no major differences between the formulations in their extrusion behaviour or their susceptibility to degrade during extrusion. Randomly selected rodsv showed less than 1% shrinkage when subjected to an annealing treatment of 170°C for l'O minutes. When this is compared to commercially available rod, which showed typically 10%
-115-

shrinkage when subjected to the same treatment, it indicates that the new formulation rods contain much less frozen-in orientation than the standard rods.
The examination of the interiors of the welds, prepared with the new rod materials, was hindered by the fact the rods of some of the compositions were opaque or only translucent. This problem particularly affected those rods containing either MBS or ESBO. However, those features seen in the interiors were typical of those seen in the standard welds.
The results of the tensile tests are given in table 13:.
The average flaw sizes, as measured on the fracture surfaces,are given in table 13. A flaw size could not be determined for all the welds since some flaws occurred at the surface of the weld, which made determining the flaw boundaries difficult.In the case’of those welds prepared with rod containing MBS,the fracture surfaces were extremely rough and difficult to interpret. Almost all these welds failed from internal flaws but it was impossible to determine, with any degree of accuracy, the flaw boundary which bordered against the weld rod. Stress whitening about the fracture initiation site was common, see fig. 96. For those welds prepared with rod not containing MBS fracture usually occurred at or near to the weld surface.
One interesting feature of the fracture befiaviour of these welds was that in two specimens the weld zone was completely ejected. In one case the weld zone was ejected from a specimen, prepared with rod formulation 9, which failed at 30.5MPa, whilst in the second it was ejected from a specimen, prepared with formulation 6, which failed at only 19.7MPa. Previously it had been thought that the ejection of a weld zone was associated with high failure stresses but the above indicates otherwise. The fracture surfaces,characteristic of these types of fracture, see section 4.4.3., were observed for both the specimens.
- 116-

5. Discussion
This chapter is divided into three sections: standard welds, fracture mechanics and modified weld procedure and rod composition. This follows the basic diagrammatic layout of fig. 32, with the materials characterisation programme being treated as support work rather than a main section in its own right. Thus, the discussion follows the progress and reasoning behind each stage of the work,will describe the conclusions drawn at each stage and show how the sections are linked together.
5.1. Standard Welds
The tensile test results for the standard hot gas welds produced by the author and by industry confirm that low weld efficiencies are a feature of hot gas welds made with clear UPVC. Hot gas welds produced with filled TJPVC have weld efficiencies typical of those quoted in the literature.This fact and the fact that the amount of clear UPVC hot gas welded by industry is relatively small suggests that the literature values are only applicable to welds produced with filled UPVC.
Filled UPVC hot gas weld efficiencies can be over 100% greater than those for clear UPVC welds. However, this difference is reduced when weld strengths are compared as* the efficiency is defined as the weld strength divided by the sheet yield stress. In the case of filled UPVC the sheet yield stress is 20% lower than that of the clear UPVC and this alone means that even if the weld strengths were equal, clear UPVC would have a poorer weld efficiency, £t is therefore felt that weld strength is> a more meaningful parameter for comparison than efficiency-.
Throughout the remainder of this section where a weld number is given,this number identifies a weld whose tensile test results are given in table 20 under that number.
*■117-

The definition of weld strength, is that of the load at failure divided by the specimen cross-section area, measured away from the weld. This is a useful design parameter, as far as the load bearing capacity of the weld is concerned, but does not provide a true insight into the strength of the fusion bond. The definition ignores the fact that different weld configurations can have different load bearing capacities but may have similar weld bond strengths. This is demonstrated when the weld strengths of weld no.7 and no.8 are compared. Weld no.7 was completed with three passes of rod in each groove and had an average weld strength of 18,5MPa. Weld no.8 was completed with six passes of rod in each groove and had an average weld strength of 22.4MPa. Although both welds were prepared using identical materials and techniques, by increasing the number of rods used, and hence the degree of overfill, an increase in weld strength of 20% is achieved. Therefore, caution is required when comparing welds of different configurations, in terms of weld strength alone.
In general the author*s- welds have lower weld strengths when compared with those produced by industrial welders and this is explained in two ways. In the first instance, as just described, differences in weld configuration can lead to differences in weld strength. All the welds produced by industrial welders had a considerable amount of overfill, when compared with those of the author. They normally used more than twice the number of rods used by the author to complete their welds when using circular rod, and when using triangular rod, which has a larger cross-section, used at least the same: number and often more, see fig. 42. Weld no.8, produced by the author, with six passes, of rod in each groove,, more closely matches the degree of overfill used by the industrial welders and the weld strength obtained is within the range observed for the industrial welds. However, a second cause is undoubtedly the author 's inexperience when compared with industrial welders-. This is reflected in the size and number of faults within the weld zone. Qualitative evidence of this was seen when weld interiors were examined prior to and during testing.
- 118-
More quantitative evidence is seen in data for the average size of the fracture initiation sites, for various welds, given in table 21, An approximate relationship between average flaw size and average weld strength can be seen in that as the flaw size decreases the weld strength increases.The authorTs welds are found to contain, generally, large flaws and these result from the lack of experience in welding.
Of the industrial welds tested, those produced by the Plastics Construction welder seem to have the higher weld strengths and smaller flaw sizes. One major difference in the way these welds were produced was that the speed welding technique was used instead of the hand welding method. In the past speed welding has been associated with faster welding but poorer weld strengths. The Plastics Construction welds indicate that not only can speed welding reduce weld times but in skilled hands can also increase the weld strengths.Three speed welds were prepared by the author, weld numbers 3, 4 and 5, Two were produced using the clear rod but were welded using different speeds and one was produced using the I.C.I. rod using a s-low'weld speed. As can be seen, weld no, 3 and no,5, both carried out using a low speed, are clearly stronger than weld no.8 which was only hand welded, and are comparable to the Plastics Construction welds. Weld no.4 was welded at a faster rate and the decreased weld strength indicates how sensitive weld strength is to weld speed.
It should be noted that weld numbers^ 15, 16, 17 and 24 show that high weld strengths may be achieved using the hand welding technique but it is felt that the speed welding method, when used with care, may permit these levels of strengths to be achieved by the less skilled welder. This is thought to be due to the way in which speed welding reduces the control required by the welder on certain weld variables, For example, the distance of the torch from the weld zone is controlled by the use of the speed welding nozzle, which also serves to give better control of the pressure applied to the rod.
- 119-

One interesting feature of the welds prepared by the author is the difference in the average weld strength for welds prepared using clear rod, no.7, and the I.C.I. rod, no.9. The clear rod weld has an average strength of 18.5MPa whilst the I.C.I. rod weld had an average strength of 24.2MPa. The scatter in the results means there is some overlap, but the difference would appear to be significant. There would seem to be three possible explanations:
11 there are major differences between the rods due either to composition or processing
2) the weld techiiique was modified to allow forthe curved nature of the I.C.I. rod
3) the authorTs general technique significantly improved for the time when the I.C.I rod weld was being prepared.
The third explanation is discounted on the basis that weld no,9 was prepared after weld no.6 and before weld no,8 and therefore one would, reasonably, expect any improvement in general technique to be reflected in weld no,8. The first explanation may account for part of the difference since the welds produced by the Plastics Construction welder show a similar though • smaller difference. However, the second explanation appears to be the more relevant, as the curved nature of the T.C.I, rod would prevent excess pressure being applied to the rod. Anexcess pressure might be used to obtain the bow- wave conditionwhen the weld thermal conditions are incorrectly adjusted.This would explain the reduced difference between the welds produced by the Plastics Construction welder since he used the speed welding technique which would suppress- this- factor.
When looking at how the differences in rod composition might affect weld strengths it is interesting to observe that the Leister produced weld, no.25, was prepared using a filled weld rod. As the mechanical properties of filled TJPYC are significantly different to that of clear UPYC, a marked change in the weld strength might have been expected. The average weld strength, however, is typical of the values obtained with the standard clear materials.
- 120-

The use of only five tensile test pieces being taken from a weld for testing was adopted so that sufficient welded material would be left to carry out the double torsion fracture mechanics test on the weld. Both BS 4994 11661 and ASTM D1789 11671 recommend the use of three test pieces but it was decided that, since the hot gas weld strengths showed a considerable degree of scatter, more pieces were required.A comparison of the results for weld no.6 and no.8 show that using five test pieces gives a reasonable measure cf the weld strength. In some cases, where more scatter was observed or further results were felt necessary, the number of tests were increased.
The weld efficiency of 95% obtained for hot tool welded clear UPVC, weld no,10, is a value typically' quoted for UPVC 111, The fact that such a high efficiency'nay'he obtained suggests that when a good thermal bond is -achieved the bond strength is comparable to that of.the sheet.
One reason for such a high efficiency may be that only identical materials are being joined without the introduction of an intermediate rod material. This would imply that the rod/sheet bond is much weaker than the sheet/sheet bond or that some incompatibility between the sheet and rod prevents a uniform bond forming.
A second reason may be that the hot tool welding process is a much more controlled one than the hot gas welding process. During hot tool welding, a uniform thermal cycle is applied over the weld faces and a constant pressure is applied across the weld interface. During hot gas welding the welder continually adjusts the thermal energy supplied to the weld zone and the pressure applied to the rod to achieve the optimum bow wave condition. Distractions and tiredness can lead to the welder varying these parameters thereby causing variations vin the uniformity of the weld process. At points in the weld where this occurs a poor bond, or no bond at all, may result.
-121 -

Observations of the fracture surface of hot gas welds indicate that normally the rod/sheet bond has a strength comparable to that of the sheet. If this bond was significantly weaker than the sheet then the crack would tend to move along this interface, as it would be the path of least resistance to crack growth- However, the crack once started moves perpendicularly to the applied force and not along any of the weld boundaries. The fracture surfaces do show that the fracture initiation sites are areas at which either very poor bonding or no bonding has occurred between either rod/sheet, rod/rod, or even sheet/sheet. The fact that little or no bonding has occurred is indicated by either the presence of pre-weld machining marks on the sheet or by the shiny undist^ orted surfaces of the rod.
Three further observations, which support the suggestion that it is not some basic weakness in the rod/sheet bond which leads to low weld strengths, are:
1) some weld pieces had weld efficiencies- as high as 70%
2) the internal flaws commonly seen in the hotgas weld test pieces were not seen in thehot tool test pieces
3) the large standard deviation in the resultsfor the hot gas welds is not consistentwith a uniform weakness being a cause of low efficiencies.
The following observations were made during the above work:
1) using clear sheet and standard weld rod, average hot gas weld efficiencies were not greater than 51%
2) using filled sheet and rod, average hot gas weld efficiencies of 85% may readily be achieved
3) hot tool welded clear sheet may be welded with average efficiencies of 9.4%
4) the internal flaws seen in hot gas welds-
- 122-
in clear materials are not present in hot tool welded clear sheet. Also, in general, they have a random distribution
5) these internal flaws form and grow during tensile testing and have the characteristics of sharp cracks
6) fracture initiation occurs at sites where little or no fusion has occurred across the rod/rod, sheet/rod or sheet/sheet interfaces in both clear and filled hot gas welds-
7). the fracture initiation sites and the internal flaws observed in clear welds are of a comparable size and geometry
8) that speed welding may improve weld efficiencies by increasing the uniformity of the hot gas welding process.
It was therefore concluded that the hot gas welded clear materials failed from areas of poor fusion which arise during welding. Where fusion occurred, the bond across the various interfaces could have a strength of nearly 95% that of the sheet. These areas of poor fusion were an inherent feature of hot gas welds occurring in both clear and filled TJPVC welds. The clear sheet, however, was much more sensitive to the presence of these flaws than was the filled sheet.
5.2. Fracture Mechanics
As described, weld fractures appear to be initiated at the boundaries of areas of poor or zero fusion across the weld interfaces. The unfused region may be treated as a crack and its effect on weld strength analysed using linear elastic fracture mechanics (LEFM).
Using a number of methods both and were determined for the 10mm clear sheet and for welded clear 10mm sheet.Only K was determined for the 6mjn clear and filled sheet.JLwDespite using several test geometries and test rates no test conditions were found which would give reproducible slow
- 123-

stable fracture. The analysis therefore concentrated on the crack initiation values of K and G.
The values of these parameters for the clear sheet, as shown in table 22, are in agreement with, values reported by Mills and Walker 194] and Cornes and Howard 193] , The higher values reported by other workers are thought to be the result of either using specimen geometries and sizes which infringe the plane strain boundary conditions 1114] or of using poor notching techniques. The higher scatter in the results, i.e. 15% compared to 10% reported by Mills and Walker 194], may be explained by variations in testing temperature as the test laboratory was not temperature controlled. Mills and Walker [94] suggested that slow fracture was impossible with clear UPVC but slow fracture was observed in twenty-one tests, Hpweyer,this behaviour was extremely erratic.
The DCB, TDCB and DT methods gave K^c results for the 10mm clear sheet in good agreement, However, using the standard equations, the SEN method gave results nearly 20% higher. If the SEN data was-analysed using the lehst squares fit for a straight line-of equation (29)
y = Ax + Bwhere y = cr , A of the line with the stress axis, the obtained was a much better fit with the results from the other methods, see table 22. The reason for this might be that the reduced specimen sizes used for the SEN method infringed the plane strain boundary conditions, However, the similarity between the results for 10mm and 6mm clear sheet would suggest otherwise and the reason may lie in the notch geometry.
From section 2,5.1, K^r and G are related through C7L
= x = / (Y Va) and B - the intercept
- 124-

* I C ? = G E /( 1 - V 2)
If the experimentally determined values of G _ and E arelvjinserted into the equation and a Poisson’s ratio of 0.4iassumed [189] then a value of K^, = 2.87 MPam5 is obtained.The value taken for the tensile modulus , 3.6GPa,is that appropriate for strains less than 0.4%. However, in the SEN tests failure strains were typically 1.5% at which level the tensile modulus has decreased to approximately 2.2GPa. When this value is used, a value of K^, = 2.3MPam^ is obtained, in much better agreement with the experimentally determined value of K-j-q *
The filled sheet was only tested using the SEN method and two features were noted:
1) when the crack moved perpendicular to the thickness failure only occurred by ductile tearing
2) when the crack moved parallel to the thickness of the sheet brittle fracture occurred but the fracture surface showed evidence of a large plastic zone with, stress whitening and failure occurredat loads just lower than those expected for yield.
It was therefore concluded that plane stress effects were much more significant in the failure of notched filled materials, causing in most cases through-thickness or nett-section yielding. These effects were so important that even when brittle failure occurred the failure stress was insensitive to notch size. Therefore, the basic requirements for LEFM analysis were not met and no analysis was possible.
This therefore supports the conclusion drawn from work on standard welds, that the clear UPVC sheet is an extremely notch sensitive material, when compared to the filled UPVCsheet, and that this, combined with the existence of flaws
- 125-
left in the weld region,by the nature of the weld process, leads to the low weld strengths seen in hot gas welded clear UPVC sheet.
A simplistic analysis, based on the assumption that these flaws act as surface notches, may be carried out using flaw sizes and weld strengths typical of both clear and filled UPVC welds. In over 80% of all welds tested failure was initiated from flaws at-or very near to one surface. Assuming a flaw size of 1mm and a failure stress of 22MPa, values typical of welds produced by the author, the value of for welded sheet is calculated to be 1.5MPam2, using the standard SEN equations. The same analysis using the average flaw sizes and average weld strengths observed for each of the industrial welds gives a value K^, = 1,4 - 0.2MPam^.In the case of the filled UPVC a flaw size of 0.75mm and a
iweld strength of 42MPa may be used which gives = 2.5MPam2, but since the requirements of LEFM are not met for this material the result is not very meaningful.
Although the above SEN analysis is crude, variations inshape, size, position, and tip radius of the unfused regions,combined with the irregular weld cross-section and the thermalhistory of the weld material, make a more refined analysisimpractical. However, some justification for the use of theSEN analysis may be seen if the results for weld no,11 areexamined. This was the only standard weld to fail predominantlyfrom the weld root. If a centre notch model is used 11141then, using the measured flaw sizes and weld strengths, a
+ ivalue of = 1.4 - 0.2MPam2 is obtained. Both these analyses support the conclusion that poor weld strengths are due to the presence of unfused regions, but also imply that embrittle-' ment of the UPVC has taken place during welding.
One particular result of LEFM is that a flaw well within a sample has to be nearly twice the size of one at the surface to cause the same reduction in failure stress. Therefore,
- 126-

even if one assumes the flaws within the welds are the same size as those at the surface, the removal of the surface flaw should lead to a significant improvement in the failure stress. Two welds, no,16 and no.19 (see table 20) were prepared with the weld surface dressed, either by filing or by grinding, until there was no sign of the original weld surface remaining. Weld no,16 test pieces were in fact taken from weld no.15, this weld already having been shown to have a high failure strength, whilst weld no.19 was prepared in an identical manner to weld no..18, Both welds were prepared by experienced industrial welders. As can be seen from the results the apparent removal of surface flaws did not lead to any major improvement in weld strength.An examination of the fracture surfaces revealed that weld no,16 had failed from surface flaws and weld no.19 had failed from both surface flaws and internal flaws. The internal flaws in weld no.19. were usually associated with the weld root which, following normal Plastics' Construction practice, was typically 1,7mm deep. However, two of the test pieces, from weld no,J9_, had internal flaws- approximately 0.3 ^ 0,5mm deep and these pieces' had failure stresses- over 40MPa, It seems, therefore, that the dressing of a weld does not lead to improved weld strengths due to difficulties in ensuring the complete removal of surface flaws.
Both the experimentally determined values- of G__ andfor clear welded UPVC support the above analyses and confirming
the increased notch sensitivity of the clear UPVC, see table 22. Both and are found to drop to values between 60 - 70% of those for unwelded material. The fact that both K and G^£ drop by similar amounts may be accounted for if one assumes that the tensile modulus of the UPVC is also re'duced by the welding process.
Observations of the fracture surfaces of the filled hot gas welds support the suggestion that the material is embrittled during welding since there is no evidence of stress whitening
- 127-

nor of a plastic zone in the region of the fracture initiation sites.
Mills and Walker 194] examined the effects of different thermal histories on for clear TJFVC and found that except for freshly quenched material, quenched from 90°C,K.^ did not change. However, none of their thermal treatments involved temperatures greater than 90°C, Certain processes which are rate or temperature dependent may not show changes over the time for which their samples were heat treated.During the hot gas welding process, temperatures over 180°C may he experienced by the materials. They then air cool, : but may experience a further heat treatment. At these temperatures three effects may become pronounced;
1) densification of material and an increase in yield stress
2} degradation3] the setting up of interna! stresses due
to thermally induced expansion and contraction.Illers . [74] has reported the occurrence of the first but
this was compared with quenched material. It is felt that, except for a small increase in crystallinity, the heat treatment is unlikely to result in significant increases in either density or yield stress compared to that of the as-received material.
Degradation leads to both chain scission and cross-linking and both of these can cause embrittlement. However, the results of the GPC analysis for heat treated and as-received sheet and rod reveal no significant changes in the molecular weight averages. The work of Vincent 144] indicates that a major change in molecular weight is required to produce significant changes in the mechanical properties of UPVC. Furthermore, a general observation made 125, 29] is that degradation has to proceed beyond the colour change stage before the mechanical properties of TJPVC are affected. Therefore, it would appear
-128-
that degradation although occurring during welding is not the major cause of embrittlement.
Thermally induced internal stresses have been reported in hot gas welded UPVC by Voigt I159j, They arise from the expansion and contraction induced in the material as it is heated and then cooled during welding. They may also arise from the relaxation of the residual orientation of the weld rod or the stretching of the weld rod.resulting from a poor welding technique. They may be demonstrated when clear welds are examined between crossed polars. A complex pattern of isochromatic fringes is observed, within and around the weld zone, which is difficult to analyse due to the weak photoelastic response of clear UPVC causing poor resolution, see fig. 69. They are also demonstrated by the fact that the severed arms of TDCB, DCB and DT specimens cannot be mated together, see fig. 92. They are distorted in the plane of the sheet and this distortion is typical of that seen in samples containing residual stresses which have had layers of material removed [190]. No analysis was attempted as it was considered beyond the scope of this work.
However, assuming the degree of embrittlement is similar in both clear and filled hot gas welds and in clear hot tool welds, the overriding cause of low weld strengths is the presence of unfused regions in a notch sensitive material.This would suggest that two approaches may be made to improve weld strengths;
1) reduction in the size and number of unfused regions
2) a reduction in the notch sensitivity of the materials in use,
5.3, Modified Welding Procedure and Changes to Weld Bod Composition
Before proceeding with an investigation into the ways- to reduce the number and size of the unfused regions' within the
-129-

weld, it is first necessary to understand how they arise.Four causes were proposed:
1) they are an inherent feature of the type of welding method
2} they are the result of poor welding technique
• 3} they are the result of a mismatch in the properties Between the rod and sheet
41 they are the result of a physical Barrier to fusion which is formed during the welding process.
In over 200 tensile tests of welds produced By eight different welders, using a range of rod profiles and materials and Both welding methods only three weld pieces- had .weld* strengths greater than 40MPa, This would indicate that there is, inherent in the welding process, a minimum level of size and number of unfused regions which will occur. This further suggests that it may be possible under the most closely controlled conditions to produce welds with this minimum level. However, it is felt that the welds produced contain the minimum level of unfused regions which it is practically possible to produce within industrially acceptable constraints.
As a result of the materials characterisation programme, the only significant mismatch in properties, between the rod and sheet, arises from the residual orientation in the rod caused by extrusion. The differences in properties might be expected to be reduced after the welding process has annealed the orientation out of the rod. This would only be the case if the rod is allowed to relax the orientation in an unconstrained fashion, But during welding the rod is prevented from a free relaxation by the fusion with the sheet and other rods. However, it is not the differences in mechanical properties which would cause the unfused region but the residual orientation itself. Therefore a weld was prepared using rods which had been given a heat treatment of 150°C for 10 minutes on a bed of glass microspheres to relax
-130-

the orientation. These rods showed a shrinkage of J2% in their length. This weld, see table 23, weld no.3, had an average weld strength of only 13.8MPa.
This result suggests that either the residual orientation has a beneficial effect on weld strength, or that the heat treatment has lead to either an increase in notch sensitivity or an increase in the number and size of the unfused regions.It is difficult to see how,in the context of hot gas welds, residual orientation could have a beneficial effect on weld strengths and therefore more attention was directed to the effects of the heat treatment. The means whereby the heat treatment might lead to an increase in notch sensitivity have already been considered when discussing the embrittlement of hot gas welds. It is felt that the main effect of this thermal treatment would be degradation and that this would not, on its own, account for such a dramatic drop in the weld strength. It would, therefore, appear that the thermal treatment gives rise to an increase in the number and size of unfused regions.
This then leaves only the fourth suggested cause of unfused regions, that is, that some physical barrier to fusion arises during the welding process. Examples of such barriers which may arise when insufficient care is- taken during welding are layers of either grease, dirt or water deposited on the to-be-welded surfaces which then prevent good fusion.
On the basis of the assumption that the surfaces of the weld materials and the weld gas were uncontaminated, and the result for the weld strength of the weld made with heat treated rod, it was decided that the most likely cause was the thermally activated diffusion of an additive to the surface of the materials.
If it is assumed, for such a process to occur, that the additive would need to be incompatible with the polymer, the
- 131-

first additive to be examined has to be the external lubricant.Two investigations were made:
1) all the to-be-welded surfaces were wiped before and between welding with either trichloroethylene or methanol to remove any additives on the surfaces
2) in conjunction with I.C.I,, the lubricant package of the rod was modified.
Trichloroethylene was chosen as one solvent as it is one of the few solvents capable of dissolving Wax E, a Hoechst product, [185] which was originally thought to be present in the rod. Methanol was chosen in place of di-ethyl ether on the grounds of availability and on the basis that it was a solvent recommended for the Soxhlet extraction of additives from PVC 1180].
The results of the weld strengths for welds produced using the solvent wash procedures are given in table 23, weld no.2 and no.3. When the fracture surfaces of the methanol washed weld were examined, two adjacent test pieces were found to have a particularly bad flaw which appeared to have resulted from poor weld technique. If these results are excluded from the analysis, the average weld strength then improves to that obtained for other welds produced by the author, Therefore, a methanol wash appears to have little effect on weld strength.The trichloroethylene washed weld fracture surfaces indicated the presence of a systematic flaw throughout the test pieces.This is probably the result of poor weld technique but in any case the use of a trichloroethylene wash does not lead to an improvement in weld strength. An observation, made at the time of welding, was the increased tendency- of the weld surfaces to degrade, which indicated the removal of the thermal stabiliser. However, the fact that unfused regions occur in filled materials which use a non^liquid, nonrorganotin stabiliser I66j would indicate that the stabiliser is- not the cause of a barrier to fusion.
The second investigation was combined with the worh on
vl3.2

changing the notch sensitivity of the rod material used.In conjunction with I.C.I., material was prepared with modification to the standard rod formulation and then ram extruded into weld rods. The method of extrusion gave an added advantage in that the rods were found to suffer little thermally induced shrinkage. The formulations used and the results for welds prepared with these materials are given in table 13. Formulation 1 was the standard formulation used as the reference, formulations 2 - 7 involved changes to the lubricant system of the rod. Formulations 8 - 1 1 were designed to alter the notch sensitivity of the weld rod via the addition of methyl methacrylate-butadiene-styrene (MBS) terpolymer. Formulation 12 was an attempt to incorporate both a change to the lubricant system and a reduction in notch sensitivity to achieve the best possible weld strength.In the remainder of this section any references to particular weld numbers are based upon the weld and formulation number in table 13.
In formulations 2 - 4 , the levels of both internal and external lubricants were step wise reduced to zero. The results of the tensile tests indicate that by reducing the external lubricant.level to zero the average weld strength goes up by over 30%‘. However the reduction of the internal lubricant level to zero appears to have no significant effect on weld strength. In formulation 5 the standard lubricants were replaced with 3phr epoxidised soya bean oil CESBO} since it was considered impractical to manufacture weld rod, without any lubricant, on a commercial scale. As can be seen, the improved weld strength was retained. To examine how ESBO affected the standard formulation, as it acts not only as a lubricant but also as a plasticiser, ESBO was added to it at both the 3phr and lOphr level, formulations 6 and 7 respectively. The weld strength results indicate that these have slightly improved weld strengths but that they do not have any major effect on weld strength. A feature of the welds prepared with rod of formulations 2 - 6 was the very high degree of scatter in the weld strengths.
- 133-

The fracture surface examination revealed that for weld numbers 2 - 7 failure, occurred from surface flaws. Although there were no systematic flaws, the majority of flaws were found in the boundary between one of the outer weld rods and the sheet material. In these cases, the crack moved into and through the sheet material rather than into the weld. It was not possible to correlate flaw size with failure stress. It is felt that this was partly due to the difficulties in obtaining an accurate measure of the size of flaws at the surface of the weld. Furthermore, a positive correlation would imply that the fracture toughness for the different welds was similar. The fact that the rods were prepared from material of different compositions and in a batch process would make this unlikely. However, if a SEN analysis is carried out for these welds using the flaw sizes and failure stresses as measured, then the values of calculated all fall within the range,of 1.4 - .0.2MPa5, found for standard welds. The fact that the average flaw sizes for weld numbers 2 - 4 do not decrease as the lubricant level is decreased would suggest that the improvement in weld strengths is not due to a reduction in flaw size.But this cannot be stated conclusively as the measurement of the flaw size is relatively crude and does not take into account the shape of the flaw. Furthermore, the small sample size used only permits one to draw the more general conclusion that the removal of the standard external lubricant leads to improved weld strengths.
If one assumes that either through the use of solvent washes or through the changing of the lubricant system of the rod, welds were produced with the minimum practically obtainable flaw size then the observed flaws must be inherent to and be a result of the welding process. If this is the case, then, despite the fact that the average inherent flaw size may be reduced by improved welding technique, on the basis of the results of the work • on standard welds, the smallest average inherent flaw will still cause low weld strengths in clear hot gas welded UPVC.
-13.4-

Therefore, if there is an inherent flaw which cannot be reduced or removed, then the only way to obtain high weld strengths is to increase the toughness of the welded material. This was attempted by adding MBS to the standard rod formulation, see formulations 8-11.
As can be seen, the average weld strength increases up to 60% as the level of MBS is increased up to lOphr, but weld no.11, containing 15phr MBS, has a weld strength only 60% that of the standard. However, an examination of the fracture surfaces of weld no.11 showed large, approximately 4mm deep, internal flaws. These were associated with the poor bonding of the root weld rod in each groove. Therefore it is suggested that the low weld strength reflects a faulty welding technique rather than being a feature of the rod material.
A significant feature of the results for the welds toughened with 10 - 15phr MBS was the reduction in the standard deviations for the weld strengths. The exception to this was weld no.10 which was prepared with rod of the same formulation used for weld no.9 but was prepared with six passes of rod in each groove. The results for this weld are even more unusual in that the weld strength does not show the expected improvement, over that of weld no.9, considering the increased amount of overfill. The fracture surfaces also indicated that the fracture behaviour was not the same as for the other MBS toughened welds. The crack was observed to have generally moved into and through sheet material, having started from small flaws at the boundary between the outer layer of rods and the sheet material. Large sections of the ueld zone were found to be ejected as major secondary fractures were common.It is felt that the above effects are not the cause of a faulty welding technique but rather reflect the different thermal histories involved. It has been reported the MBS modified UPVC loses its -improved toughness when subjected to weathering []9l ] and one might assume that this loss is accelerated when modified UPVC is subjected to elevated
-135-

temperatures. The major difference between weld no.9 and weld no.10 is the increased exposure to elevated temperatures due to the extra passes of rod,, suffered by weld no.10.
The main feature of the fracture surfaces of weld no.8 and weld no,9 was that fracture appeared to be initiated within the weld, away from the surfaces, and to have propagated through or around the weld rods. In both welds fracture initiated from flaws associated with the weld root and the poor bonding of the root weld rods. In weld no.9, as for all welds prepared using rod containing lOphr or more MBS, bands of stress-whitened material could be seen : at the points where the crack started into the weld rods. Furthermore, for both weld no.8 and weld no.9, the fracture surfaces showed that either the crack was prone to following weld boundaries, i.e. the rod/rod or rod/sheet interfaces, or the initial flaws were extremely large, of the order2 - 4mm deep. It may be that the blunting of the edges ofinitially small flaws prevents cracks growing into the sheet material, which would result in a low stress fracture, but forces them to grow along poorly bonded weld interfaces until they are large enough to cause fracture through the weld rods. However, interpretation of the fracture- surfaces was made difficult by the lack of detail shown on the surfaces where the crack propagated through the weld rods.
It was therefore concluded that the addition of MBS to the weld rod formulation has a beneficial effect on weld strength in that it was both improved and more reproducible. However, the addition of MBS does not lead to the same levelsof weld strengths as achieved for filled UPVC and it isprobably necessary to modify the sheet material before these will be achieved.
Weld rod formulation 12 was an attempt to combine the improvements obtained by the replacing of the standard external lubricant with ESBO and the addition of MBS to the standard rod formulation. But, by accident, the standard
-136-

lubricant was still added to the formulation. The average weld strength obtained was over 20% lower than that for weld no.9 but was still 30% higher than the standard. The results for weld no.8, the standard plus 3 phr ESBO, indicated that the addition of ESBO to the standard formulation had no major effect on weld strength. Therefore, the poor weld strength must result from the combination of MBS and ESBO.The fracture surfaces revealed that all the fractures resulted from the crack moving directly into the sheet and not through the rod, normally from a small surface flaw. It is not understood why this happens, nor why the combination of MBS and ESBO should lead to it.
Two major points concerning the work on the modified weld rod and welding procedure need to be emphasised:
1) the work was only an initial study and the conclusions are based on the result of only one weld per modification
2) all the welds were prepared by the author and it may be that experienced welders would obtain even better results for some of the materials tested.
The first point means that only general conclusions may be drawn from this work. Many more welds need to be prepared for each modification to both reduce the effects of variations in the welding technique and to allow a more detailed explanation of how the modifications affect tire weld strength.. The second point affects the conclusion that the inherent flaws present in hot gas welded clear UPVC limit the practically achievable weld strength to a value of the order, only 30MPa. It is probable that a more skillful welding technique would leave smaller inherent flaws and this might lead to higher weld strengths. Therefore, in any future study, welds should be prepared by a number of skilled welders, to ensure that both the optimum result and a typical range of results are obtained.
However, after taking these points into consideration, it is felt that the results do justify the conclusions that
- 137-

a general solvent wash does not lead to improved weld strengths but that, independently, both the changing of the rod lubricant system and the addition of MBS impact modifier do lead to improved weld strengths.
- 138-

6. Conclusions and Further Work
6.1. Conclusions
1) Low weld strengths, typically less than 30MPa, are a feature of hot gas welded clear UPVC. Weld strength achieved is dependent on the skill of the welder, the welding method used (hand or speed), and the weld configuration and degree of overfill used. Using the same welding technique, the author was able to obtain a weld strength of 45MPa for filled UPVC.
2) Weld failure occurs by brittle fracture initiated at sites of poor or zero fusion along either the rod/rod, rod/sheet or sheet/sheet interfaces. Fracture usually occurs from those sites located at or near to the weld surface.
3) The sites of poor or zero fusion may be considered to be flaws and are an inherent feature in hot gas welded UPVC, both clear and filled. They are not found in hot tool welded clear UPVC.
4) Clear UPVC is more notch sensitive than filled UPVC.Using the methods of linear elastic fracture mechanics, i
for clear UPVC was found to be approximately 2.1MPam2, but filled UPVC proved to be too tough to measure using these methods.
5) The low weld strength for hot gas welded clear UPVC is a result of the existence of flaws and the high notch sensitivity of clear UPVC.
6) The notch sensitivity of UPVC is increased by the hot gas welding process. The for hot gas welded clear UPVC,was found to be nearly 30% lower than for unwelded clear UPVC when measured directly and when calculated using a simplistic single edge notch model.
- 139-

7) The removal of surface notches by the dressing of the weld failed to improve weld strength. Flaws at the surface are the most common cause of failure but the removal of surface flaws by dressing causes what were internal flaws to become surface flaws.
8) The use of solvent washes prior to and during welding does not lead to improved weld strengths.
9) Modifying the lubricant system used in the standard weld rod may lead to an improvement in weld strengths.In particular, by replacing the standard external lubricant with 3 phr epoxidised soya bean oil a30% increase in weld strength was achieved.
10) Higher and more consistent weld strengths are achieved when methacrylate-butadiene-styrene impact modifieris added to the rod composition. An improvement of 66% over the standard welds is achieved through the addition of 10 phr MBS.
11) Modifications to the rod formulation still only give weld strengths of up to 30MPa. To achieve a major improvement in weld strength, the sheet notch sensitivity needs tobe greatly reduced.
6.2. Further Work
1) Any future work on hot gas welded UPVC would benefit greatly if a facility to manufacture well characterised and controlled welds were available. To do this a controlled welding rig is necessary but as realised during this work, too much control makes the production of welds extremely difficult and a major re-think on the design of such a rig is required. However, such a rig would not only remove the human factor from welding, but would also permit a study into how changes in weld parameters, such as gas temperature,
- 140-

distance of the torch from the weld, the pressure applied to the weld rod and speed of welding affect the weld strength.
2) As stated in the Conclusions, the welded UPVC appears tobe more notch sensitive than the unwelded UPVC, Thisconclusion was partly based on the direct measurementof K and Gxp for welded UPVC. However, the number of J.L 1Lresults was small and further work is required to confirm this conclusion. The author would recommend that any auch study be based upon the double torsion test method. Furthermore, since slow crack growth was observed during the testing of unwelded material, the test conditions should be varied to see whether slow crack growth is possible in welded UPVC.
3) One suggested cause of the increased brittleness of welded UPVC was.the setting up of internal stresses in the weld zone during welding. A study into the parameters affecting the levels of internal stresses and the ways to reduce them may lead to improved weld strengths.
4) The work described under Changes to the Weld Rod Composition can only be considered an initial study. This work needsto be expanded to give more comprehensive data on how changes to the lubricant system and the addition of impact modifiers affect the weld strength. It would be of particular interest to determine whether or not the same kind of improvement, provided by these changes, as seen in the author’s welds are reflected in welds prepared by more experienced welders.
5) One part of the initial planned programme of work which ’ was not carried out in this study was to determine how the xcreld strength is affected after the weld has been immersed in various chemicals. In view of the possible changes to the weld rod composition, this work takes ona new importance in ensuring that any improvements in weld
-141-
strength are not lost if the weld is subject to immersion in particular chemicals.
- 142-

References
1) "Thermal and Chemical Welding of Plastics Materials" (EEUA Handbook No.35), Engineering Equipment Users Association, London, 1976, Sect. 6.
2) G.A.R. Matthews, "Vinyl and Allied Polymers Vol.2", Iliffe, London, 1972.
3) H.A. Sarvetnick, "Polyvinyl Chloride", Reinhold, New York, 1969.
4) W.S. Penn, "PVC Technology", 2nd.Ed., Maclaren, London, 1966.
5) J.A. Brydson, "Plastics Materials", 2nd.Ed., Iliffe, London, 1969.
6) A.W. Birley, in "Thermoplastics : Properties and Design", (Ed. R.M. Ogorkiewicz), Wiley Interscience, London,1974, p. 24 - 26.
7) G.A.R. Matthews, "Vinyl and Allied Polymers Vol.2", Iliffe, London, 1972, Ch. 3.
8) G.C. Marks, in "Developments in PVC Technology",(Ed. J.H.L. Henson and A. Whelan), Applied Science, London, 1973, Ch. 2.
9) G.A.R. Matthews, "Vinyl and Allied Polymers Vol.2", Iliffe, London, 1972, p. 57 - 59.
10) S.A. Iobst, Ph. D. thesis, Lehigh University, U.S.A, 1970.
11) M.E. Carrega, Pure Appl. Chem., 49 (1977), 569.
12) R.S. Straff and D.R. Uhlmann, J.Polym. Sci. Phys.Ed., 14 (1976), 353.
13) G.A.R. Matthews, "Vinyl and Allied Polymers Vol.2",Iliffe, London, 1972, p. 42.
-143-

14) M.J.R. Cantow and J.F. Johnson, in "Encyclopedia ofPolymer Science and Technology Vol.9", Wiley Interscience, New York, 1968, p. 182.
15) G.A.R. Matthews, "Vinyl and Allied Polymers Vol.2", Iliffe, London, 1972, p. 43 - 45.
16) IS0/R174 - 1961 (E).
17) G.A.R, Matthews, "Vinyl and Allied Polymers Vol.2", Iliffe. London, 1972, p. 320.
18) D.D. Bly, Science, 168 (1970), 527.
19) F.W. Billmeyer, Jr ., "Textbook of Polymer Science", 2nd. Ed., Wiley Interscience, New York,1971, p. 53-56.
20) J. Lyngaae-J^rgensen, J. Polym, Sci., C33 (.1971), 39.
21) N.G. McCrum, B.E. Read and G, Williams, "Anelastic andDielectric Effects inPolymeric Solids", Wiley, London, 1967, Ch. 11.
22) G. Pezzin, F. Zilio-Grandi and P. Sanmartin, Eur. Polym. J., 6 (1970), 1053.
23) E.R. Harrell, Jr., and R.P. Chartoff, J. Macromol. Sci.Phys., B14 (1977), 277.
24) R. Diaz Calleja, Polym. Eng. Sci., \9_ (1979), 596.
25) G.A.R. Matthews, "Vinyl and Allied Polymers Vol.2", Iliffe, London, 1972, Ch. 5.
26) F. Tudos, T. Kelen and T.T. Nagy, in "Developments inPolymer Degradation Vol.2" (Ed. N. Grassie),Applied Science, London, 1979, Ch. 7.
27) H.O. Wirth and H. Andreas, Pure Appl. Chem., A9_ (1977), 627.
28) G. Ayrey, B.C. Head and R.C. Poller, J. Polym. Sci. Macromol Revs., 8 (1974), 1 .
-144-

29) J. Stepek and C. Jirkal, Chem. Listy, 59 (1965), 1201.
30) C.A. Brighton, in "Encylcopedia of Polymer Science and Technology Vol.14.", Wiley Interscience, New York, 1971, p. 414.
31) W.V. Titow, in "Developments in PVC Production and Technology Vol. 1", (Ed. A. Whelan and J.L. Croft), Applied Science, London, 1977, Ch. 4.
32) L. Mascia, "The Role of Additives in Plastics", Edward Arnold, London, 1974, Ch. 3.
33) A. Guyot and A. Michel, in "Developments in PolymerStabilisation Vol. 2", (Ed. G. Scott), Applied Science, London, 1979,Ch. 3.
34) G. Ayrey and R Poller, in "Developments in PolymerStabilisation Vol.2", (Ed. G. Scott) , Applied Science,London, 1979, Ch. 1.
35) R.K. Khanna, Plast. and Polym., 42 (1974), 80.
36) C.W. Fletcher and D. Dieckmann, 39th SPE ANTEC, 1981, p. 529.
37) K. Mathur and S, Driscoll, 39th SPE ANTEC, 1981, p. 912.
38) G.A.R. Matthews, "Vinyl and Allied Polymers Vol. 2", Iliffe, London, 1972, Ch. 6.
39) C.A. Brighton, in "Encyclopedia of Polymer Science andTechnology Vol.14", Wiley Interscience, New York, 1971, p. 434,
40) E.A. Collins and C.A. Krier, J. Appl. Polym. Sci., K) (1966), 1573.
41) G.,Pezzin and G. Zinelli, J. Appl. Polym. Sci., 12 (1968), 1119.
42) P.B. Bowden,in "The Physics of Glassy Polymers", (Ed, R.N. Haward), Applied Science, London 1973, p. 306.
43) E. Jones Parry and D. Tabor, Polymer, 14 (1973), 623.
-145-
44) P.I. Vincent, Plastics, 28 (1963), 120.
45) C. Bauwens-Crowet, J.C. Bauwens and G. Homes, J. Polym. Sci. A - 2, 7 (1969), 735.
46) H. Eyring, J. Chem. Phys. , 4- (1936), 283.
47) D.P. Isherwood and J.G. Williams, Eng. Frac. Mech., 2_ (1970),19
48) F.F. Rawson and J.G. Rider, J. Polym. Sci., C33 (197.1), 87.
49) G. Pezzin, G. Ajroldi, T. Casiraghi, C, Garbuglio and G. Vittadini, J. Appl. Polym. Sci., 16 (1972), 1839.
50) D.M. Shinozaki, K. Woo, J. Vlachopoulos and A. Hamielec, J. Appl. Polym. Sci,, 21 (1977), 3345.
51) P.I. Vincent, Plastics, (1961), 141,
52) P.I. Vincent, Polymer, (1960), 425.
53) W. Retting, Eur. Polym. J., 6 (1970), 853.
54) H. Oberst and W. Retting, J. Macromol. Sci:. Phys., B5 (.1971), 559.
55) J.R. Martin and J.F. Johnson, J. Appl. Polym. Sci., Jl_8(1974), 257.
56) M.D. Skibo, R.W. Hertzberg, J.A. Manson and S.L. Kim, J. Mater.Sci., 12 (1977), 531.
57) M. Skibo, J.A. Manson, R.W, Hertzberg and E.A. Collins, J. Macromonol. Sci. Phys., B14 (1977), 525.
58) R.P. Kambour, J. Polym. Sci. Macromol. Rev. , 7_ (1973), 1
59) L.H.P. Weldon, Plast. Inst. Trans., 24 (1956), 303.
60) P.I. Vincent, in "Encyclopedia of Polymer Science and Technology Vol.7", Wiley Interscience, New York, 1967, p. 336.
-146-

61) W.J. Jackson and J.R. Caldwell, J. Appl. Polym. Sci'.,11 Cl 967), 211.
62) L. Mascia, Polymer, P9 (1978), 325.
63) H. Penkert, Kunststoffe, 45 (1955), 257.
64) J.C. Chauffoureaux, Pure Appl, Chem., 51_ Q979), J125.
65) G.A. Baum, Appl. Polym. Symp., b_ (1967), 189.
66) I.C.I. Technical Service Note W121. 2nd. ed. 1980, p.14.
67) K.V. Gotham and S. Turner, Polym, Eng. Sci,, 13 0973), 113.
68) L.H. Dunlap, C.R. Foltz and A.G. Mitchell, J. Polym. Sci. Phys. Ed., 10 (1972), 2223.
69) J.A. Duiser and A.E.M. Keijzers, Polymer, 19 (1978), 889,
70) S. Turner, Brit. Plastics, J37_ (1964), 682.
71) C.M.R. Dunn and S. Turner, Polymer, jl5 (1974), 451.
72) D.C. Wright, Polymer, 17 (1976), 77.
73) L.C.E. Struik, 3rd. Int. Conf. Deformation, Yield and Fracture of Polymers, Cambridge, Mar. 1976, 2/1.
74) K.H. Illers, Makromol. Chem., 127 (1969), 1.
75) N.J. Mills, 2nd. Int. Conf. Deformation, Yield and Fracture of Polymers, Cambridge, Mar. 1973, 6/1.
76) A. Cross and R.N. Haward, Polymer, 19 (1978), 677.
77) J.G. Rider and E. Hargreaves, J. Polym, Sci. A - 2, 7_ (1969), 829.
-147-

K.H. Illers, J. Macromol. Sci. Phys., B1A (1977), 471.
P.V. McKinney and C.R. Foltz, J. Appl. Polym. Sci., _1J_ (1967),1189.
A. Gray and M. Gilbert, Polymer, Y7_ (1976), 44.
S.M. Wolpert, A. Weitz and B. Wunderlich, J. Polym. Sci. A - 2,9 (1971), 1887.
F.F. Rawson and J.G. Rider, Polymer, JJ5 (1974), 107.
F.F. Rawson and J.G. Rider, J. Phys. D, Appl. Phys., 1_ (1974), 41.
T.E. Brady and S.A. Jabain, Polym. Eng. Sci., Y7_ (1977), 686.
E.H. Andrews, in "The Physics of Glassy Polymers" (Ed. R.N Haward),Applied Science, London, 1973, p. 423 - 424.
R.P; Kambour, J. Polym. Sci. A, 2 (1964), 4159.
R.P. Kambour, J. Polym. Sci. A -2, 4_ (1966), 17.
M.J. Doyle, A. Maranci, E. Orowan and S.T. Stark, Proc. Roy.Soc., Lond., A329 (1972), 137.
P. Beahan, M. Bevis and D. Hull, Phil. Mag., 24 (1971), 1267.
J.E. Field, Contemp. Phys., J[2 (1971), 1.
B.R. Lawn and T.R. Wilshaw, "Fracture of Brittle Solids",Cambridge University Press, Cambridge, 1975, p. 100.
K.V. Gotham, Plast. and Polym. 37 (1969), 303.
P.L, Cornes and R.N. Haward, Polymer, J[5 (1974), 149.
N.J. Mills and N. Walker, Polymer, 17 (1976), 335.

95) I.Wolock and S.B. Neumann, in ’’Fracture Processes in Polymeric Solids” (Ed. B. Rosen), Wiley Interscience,New York, 1964, p. 235.
96) E.H. Andrews, J. Appl. Phys., 3(3 (1959), 740.
97) P. Beahan, M. Bevis and D. Hull, Proc. Roy. Soc. Lond,A343 (1975), 525.
98) N, Walker, Ph.D. thesis, Birmingham University, Birmingham, 1976.
99) H. Wallner, Z. Physik, JH4 C3939), 368.
100) K. Takahashi, M. Kimura and S. Hyodo, J. Mater. Sci, Letters, JL3 (1978), 2718.
101) M. Skibo, J.A. Manson, R.W. Hertzberg and E.A. Collins,J. Macromol, Sci. Phys., B14 0977), 525.
102) A. Weill and R. Pixa, J. Polym, Sci., C58 0977), 381,
103) M.J. Doyle, J. Mater, Sci., _K) 0975), 159.
104) G.H. Jacoby, ASTM STP 453, 1969, p. 147.
105) B.R. Lawn and T.R. Wilshaw, ’’Fracture of Brittle Solids”,Cambridge University Press, Cambridge, 1975.
106) J.F. Knott, "Fundamentals of Fracture Mechanics”, Butterworths, London, 1973.
107) D. Broek, "Elementary Engineering Fracture Mechanics",Noordhoff, Leyden, 1974.
108) C.E. Inglis, Trans. Inst. Naval Archit., S5 (1913), 219.
109) A.A. Griffith, Phil. Trans. Roy. Soc. Lond,, A221 (.1920), 163.
110) A.A, Griffith, Proc. 1st Int. Cong, Appl. Mech,, Delft, 1924, p. 55.
111) G. Irwin, in "Handbuch der Physik Vol.6", Springer-Verlag, Berlin, 1958, p. 551.
-149-

112) E. Orowan, Welding J. Res. Supp., 34 (1955), 157.
113) D.S. Dugdale, J. Mech. Phys. Solids, 8 (.I960), 100.
114) W.F. Brown Jr., and J.E. Srawley, ASTM STP 410, 1966.
115) D.P. Rooke and D.J. Cartwright, "Compendium of Stress Intensity Factors", HMSO, London, 1976.
116) J.F. Knott, "Fundamentals of Fracture Mechanics"r Butterworths, London, 1973, p. 116.
117) J.F. Knott, "Fundamentals of Fracture Mechanics", Butterworths, London, 1973, p. 136.
118) B. Gross and J.E. Srawley, NASA TN D3295, 1966.
119) J.E. Srawley and B. Gross, NASA TN D3820, J957,
120) J.O. Outwater, M.C. Murphy, R.G, Kumble and J.T. Berry, ASTM STP 559, 1974, p.127.
121) S. Mostovoy, C.F, Bersch and E.J. Ripling, Nat. SAMPE Tech. Conf. 1970, Vol. 2, p. 273.
122) J.G. Williams, "Stress Analysis of Polymers", Longman, London, 1973, p. 264 - 265.
123) J.G. Williams, J.C. Radon and C.E, Turner, Polym. Eng. Sci., 8 (1968), 130.
124) Y.M. Mai, A.G. Atkins and R.M, Caddell, Int. J, Frac., 21(1975), 939.
125) T. Koboyashi and L.J. Broutman, J. Appl. Polym. Sci., 17 (1973), 1909.
126) G.P. Marshall, L.E. Culver and J.G. Williams, Int. J. Frac,, 9 (1973), 295,
127) J.J. Benbow, Proc. Phys. Soc., 78 (.1961), 970.
-150-

128)
129)
130)
131)
132)
133)
134)
135)
136)
137)
138)
139)
140)
141)
142)
143)
144)
J.P. Berry, J. Appl. Phys., 4_ (1963), 62.
J.P. Berry, J. Polym. Sci. A, _1_ (1963), 993.
L.J. Broutman and F.J. McGarry, J. Appl. Polym. Sci. 9_(1965), 589.
G.P. Marshall, L.E. Culver and J.G, Williams, Plast. and Polym. 37 (1969), 75.
G.P. Marshall, L.H. Coutts and J.G. Williams, J. Mater. Sci.9 (1974) , 1409.
P.W.R. Beaumont and R.J, Young, J. Mater. Sci., _1_0 (1975), 1334.
J.P. Berry, J. Polym. Sci., J_ (1961), 313.
D. Kells, Ph.D. thesis, Birmingham University, Birmingham, 1976.
A. van den Boogaart and C.E. Turner, J. Plast. Inst., 31_ (1963), 109.
M. Parvin and J.G. Williams, Int. J. Frac., (1975), 963.
M. Parvin and J.G. Williams, J. Mater. Sci., _[0 (1975), 1883.
R.P. Kambour and S. Miller, J. Mater. Sci., _1_1_ (1976), 823.
S. Mostovoy, P.B. Crosley and E.J. Ripling, J. Materials, 2_ (1967), 661.
S. Mostovoy and E.J. Ripling, J. Appl. Polym. Sci., J_0 (1966)1351.
G.G. Trantina, J. Composite Mater., 6_ (1972), 192.
W.T. Evans and B.I.G. Barr, J. Strain Anal., 9_ (1974), 166.
K. Selby and L.E. Miller, J. Mater. Sci., JK) (1975), 12.
- 151-

145) S. Yamini and R.J. Young, Polymer, _lj} (1977), 1075.
146) R.A. Glendhill, A.J. Kinloch, S. Yamini and R.J. Young, Polymer, \9_ (1978), 574.
147) R.J. Young, in "Developments in Polymer Fracture Vol.l"(Ed, E.H. Andrews), Applied Science, London, 1979, Ch. 6.
148) F.J. Guild, B. Harris and A.G. Atkins, J. Mater. Sci., 13 (1978), 2295.
149) N.J. Mills, Eng. Frac. Mech., 6 (1974), 537.
150) H.R. Brown and T.H. Chin, J. Mater. Sci., J5. (1980), 677.
151) A.K. Green and P.L. Pratt, 5th Int. Conf. Experimental StressAnalysis, Udine, 1974, paper 19.
152) E. Plati and J.G. Williams, Polymer, 0975), 915.
153) J.C. Radon, Polym. Eng. Sci., J_2 (1972), 425.
154) F.A. Johnson and J.C. Radon, J. Polym. Sci, Chem. Ed.,J2 0975), 495.
155) L.E. Miller, K.E. Puttick and J.G. Rider, J. Polym. Sci. , C33(1971), 13.
156) A.Y. Darwish, J.F. Mandell and F.J, McGarry, 39th SPE ANTEC,1981, p. 2.
157) R.C. Reinhardt, U.S. Patent, 2,220,545, 1937.
158) A. Henning, D.R. Patent, 739,340, 1938.
159) P. Voigt, Plastics, J_3 (1949), 307.
160) A. Henning, Kunststoffe, 33 (1942), 103.
161) F.L. Connors, Australian Plastics, May (1954), 6.
-152-

162) F.L. Connors, Australian Plastics, April (1954), 6.
163) J.A. Neumann and F.J. Bockhoff, "Welding of Plastics", Reinhold, New York, 1959, Ch. 2.
164) J. Parker, Welwyn Tool Co., Private Communication.
165) G. Haim, "Manual for Plastic Welding Vol.3. Polyvinyl Chloride", Crosby Lockwood, London, 1959, Ch. 9.
166) BS 4994 : Section 5.5. : 1973.
167) ASTM 1789 - 65 (Reapproved 1977).
168) E. Alf, H. Potente and G. Menges, 5th Cranfield Conf, Designing to Avoid Mechanical Failure, Plast. Inst., 1973, paper 6.
169) M.W. Birch, J.G. Williams and G.P. Marshall, 3rd Int. Conf.Deformation, Yield and Fracture of Polymers, Cambridge, Mar. 1976, paper 6.
170) BS 2782: Part 3: Methods 320A to 320F : 1976.
171) ASTM 790 - 66.
172) BS 3757 :Part 1 : Appendix E : 1964.
173) BS 2782 :Part 3 : Method 335A : 1978.
174) "Handbook of Chemistry and Physics", Chemical Rubber Co., Cleveland, 1964, F 39 (Elastic Moduli).
175) M.D. Griffiths and L.J. Maisey, Polymer, V7_ (1976), 869.
176) L.F. King and F. Noel, Polym. Eng. Sci., J2 (1972), 112,
177) A. Kuske and G. Robertson, "Photoelastic Stress Analysis", Wiley, New York,1974, Ch. 5.
178) R.D. Andrews and Y. Kazama, J. Appl. Phys., 39_ (1968), 4891.
-153-

179)
180)
181)
182)
183)
184)
185)
186)
187)
188)
189)
190)
191)
A. Utsuo and R,S. Stein, J. Polym. Sci. A-2, 5 (1967), 583.
J. Haslam, H.A. Willis and D.C.M. Squirrell, "Identification and Analysis of Plastics", 2nd Ed, Iliffe, London ,1972, p. 144.
D. Ardem, Technical Services, Ciba-Geigy Plastics and Additives Co., Private Communication.
A. Packter and M.S. Nerurkar, Kolloid Z.,229 (1967), 7.
J. Haslam, H.A. Willis and D.C.M. Squirrell, "Identification and Analysis of Plastics", 2nd Ed., Iliffe, London 1972,Ch. 1 and 2.
J. Haslam, H.A. Willis and D.C.M. Squirrell, "Identification and Analysis of Plastics", 2nd Ed., Iliffe, London, 1972, p 721- 729.
R- Miller, Technical Services, Hoechst Chemicals Ltd, Private Communication.
G.C. Corfield, Dept, of Chemistry, Sheffield City Polytechnic, Private Communication.
D.W. Allen, J.S. Brookes, R.W. Clarkson, M.T.J. Mellor andA.G. Williamson, J. Organometallic Chem., 199 (1980), 299.
C.R. Bailey, British Nuclear Fuels Ltd., Sellafield, Private Communication.
I.C.I. Technical Service Note D113, 1974, Table 4.
B. Haworth, C.S. Hindle, G.J. Sandilands and J.R. White, Plastics and Rubber Processing and Applications,_2_(1982), 59.
G. Scott and M. Tahan, Eur. Polym. J. , 13 (1977), 997.
-154-

Table 1. Correlations for a number of different common methods of characterising molecular weights of vinyl chloride polymers, see [17].
Viscosity number
ISO/R174-1961(E)
1
I.C.I.K-value
K-value 0.5gm/100cc cyclohexanone at
25°C
Specific viscosity
0.5gm/100cc cyclohexanone at
25°C
Weight average
molecular weight
Number average
molecular weight
50 42 45 0.25 40,000 20,00054 44 47 0.27 50,000 24,00057 45 48 0.28 54,000 26,00061 47 50.5 0.31 60,000 30,00067 49 52.7 0.34 67,000 34,00073 51 55 0.37 74,000 38,00080 53 57.2 0.40 86,000 42,00083 54 58.3 0.42 92,000 43,50087 55 59.5 0.44 100,000 45,50090 56 60.6 0.45 105,000 47,50094 57 61.9 0.47 114,000 50,00098 58 62.9 0.49 122,000 52,000102 59 64 0.51 132,000 53,500105 60 65.2 0.53 140,000 55,000109 61 66.3 0.55 150,000 57,000121 64 69.7 0.61 182,000 62,500130 66 71.2 0.65 209,000 66,500149 71 75.5 0.75 272,000 75,000
-155-

Table 2 Formulations for the extrusion and calendering of clear rigid polyvinyl chloride.
Extrusion formulation^
Suspension homopolymer of ISO Viscosity No.90 100 partsSulphur containing organotin stabiliser 2-3 partsAcrylic processing aid 2 partsMontan ester wax 0.6 partsCetyl stearyl alcohol 0.6 partsMineral oil 0.1 partsLow molecular weight polythene 0.1 parts
2Calendering formulation3Suspension homopolymer, K value 58-62 100 parts
Sulphur containing organotin stabiliser 1.2 partsMontan ester wax 0.5 partsAmide wax 0.1 partsGlycerine monostearate 0,3 parts
1) See 12], p 149.2) Taken from "Hoechst Waxes as lubricants in plastics
processing", Hoechst leaflet W 219 e, 1974, formulation no. FK. 3434.
3) Method of determining K not given.
-156-

Table 3 Summary of physical properties of cold formed polyvinyl chloride (see 184]).
Mechanicaltreatment
Thermaltreatment
None
None
None
3 days @ 70 C
Drawn 2:1 at 23°C 12.7mm/minNone
Drawn 2:1 at 23°C 12.7mm/min3 Days @ 70 C restrained
Drawn 2:1 at 23°C 12.7mm/min3 Days @ 70 Cunrestrained
PROPERTY Shrinkage Onset T, °C 45 75 74Total,% 42 35 33
Mechanical Yield stress 71.7 65.5 88.3 89.6 75.8MPaModulus, GPa 2.3 1.8 3.8 2.8 2.0Thermal T , °C 78 86 81 87 86g’
Table 4 Gas conditions used for hot gas welding of UPVC. Gas used: compressed air.
Reference Gas T Distance Gas flow Gas(°C) measured (L/min) Pressure
from nozzle (mm) (KPa)Voigt 1159] 250 5 . .Connors 1161] 270-280 6 40 35Neumann andBockhoff [163] 290 - 15-50 35Haim [165] 280 6 15-30 36r-60EEUA [1] 300 3 15-40 20-100ASTM 1789 [167] 280 6 - -Alf et al [168] 315 0 45-50 —
J 57-

Table
5 Influence
of correct
heating
of parent material and wel
d rod on
strength of
"Vinidur"
welds
(see
[159]).
Weld
stre
ngth
1
30%
30 - 50%
>2O*n 50%
1
>2OO
3 3 .3 O 3P Pi T—1 3) 33 XI T“H 3 •4J 3 •f-l 3 3 4JCJ r—1 CO S *> 33 3 •rl 4J 3 PP > 3 3 X O*4-1 •rl X 3*4-4 r—t 3g o i—1 CO • 3 3 r*Hcu •P Pt 3 P 3 3
X 0) 4J 3 O 3 3 &5 o CO O •P UcO O 4J 3 4J 30) *4-1 00 o U O •rl •PCJ P 3 3 3g 3 • •r-l 3 3 3 o 3cu cn CO p Pi P cu Pp 3 3 3 *3 3 3 33 00 00 *1-1 4J 3 4—13 4J •3 g 3 E a Pi CJ 3 4Ja. o 3 3 3 P 3 3 3 3CU t—i X P 3 P P 3< < Pi CJ Pu X Pu 3 P4 X
o CJ 3
4-J 4J3 a) 3p 3 3 •3 ,3 X p *4-1 P 34J W 3 O o o 3o O3 *4-1 *4-1 3 3 3 Np o o i—I 3 rPP*4 3 00 3 3CO CO 3 S O<4-4 0) 3 3 • Po 00 00 3 • 3 4J3 •3 ♦ •rH 3 4-1 •rH •PG 3 3 3) X 3 3o r—1 p 4J 3 p 3*P 00 00 3 3 X 3 34-) g 3 b X 00 3 X P•H o O 4-1 c 4J 4-1cn «—1 1—1 3 •rH o 3 •rHo < < M w r-l X w 3?-• 3 4-J •rH
*4-1 1 3 4-J 3 3CO O *4-1 *3 3 3 3 3 o r*H3 00 *4-1 O o 33 3 O 4J 3 ♦ 00 o3 00 3 CO 3 00 Pi •P r—1X • iH •rl P 4J 3 3 s •
g o *3 Pi CO 3 4J 3 3 4-J 3 3 3 •P P 4Jo g 3 •3 3 3 •r-l*3 a a O *4-4 3 3 3 3 3FQ 3 >.•rl •3 i—l 3 3 3 CU E X 3 > 3 3j-i 3 O 3 3 3 • 3 3 3 3 3 3 3 O 3 3 X*4-1 o O X i—l •> O S 4-J X 3 3 X X P 3o •3 X 3 31 4-1 S 3 CJ *4-1 30) 00 P* 3 O 3 3 3 4-J 3 3 3 O P 3 O 30) i—i 3 3 3 Pi 4J 3 X Pi 3 3 O P r—1 4J 3 3 P 34J 4-J •P CU 3 3 3 CO Pi •H X P P 3 3 3 CU 3 3to 4-1*3 O S •3 3 5 3 X 3 2 3 o 5 34-J •H 3 Pi 4-J i—I•r4 4-1 •3 X 4-1-3 3 X 3 00 p 4J T—13cn ►J O P-. 3 3 o 3 3 CJ •r-l 3 3 CJ 3 3 3 Cu 3 3 O,3 X & •rl X 3 3 3 • P 3 3 X £ P
1 3)>, *44 3) 33 r—1 >>*4-1 3 4-J 4-J3 '3 4J i— 1 3 4-J 3 >. 3o 3 3 4-1 CO 3 3 r-H 3•H c0 3 a 3 • 3 X p X •4-1 •P 3 •H •3 X 3 3 3•P 3 O Pi 3 Pi >> CU 33 o •rl Pi 4J 4J 3 r—1 O 4J 3 4-1g Pi *4-1 O 3 3 > P P 3 3 3o *4-1 CJ 3 3 O 3 Cu 3 3 3CJ ■3 3 X X CU X 3 Xi—1 CO 3 CO 33 O 3 3 3 300 3 3 O >% O P O 4J O >>g £ •P • Pi r-i—i Pi Cu P r* 3 P f“H•P 3 •3 4J 3 3 P4-J x 4J 3 ■3 3 3 3 4J 3 3 X 3 3(0 4J 3 4J H 4-J 3 »“H 3 r"H 4J P rH CUa) o 3 3 <U 3 •rl 0) 3 3 3 3 3 OX FQ X 3 & 3 CJ & X 3 > 13 PCO .3 X •r-4 3 X O CU
158-
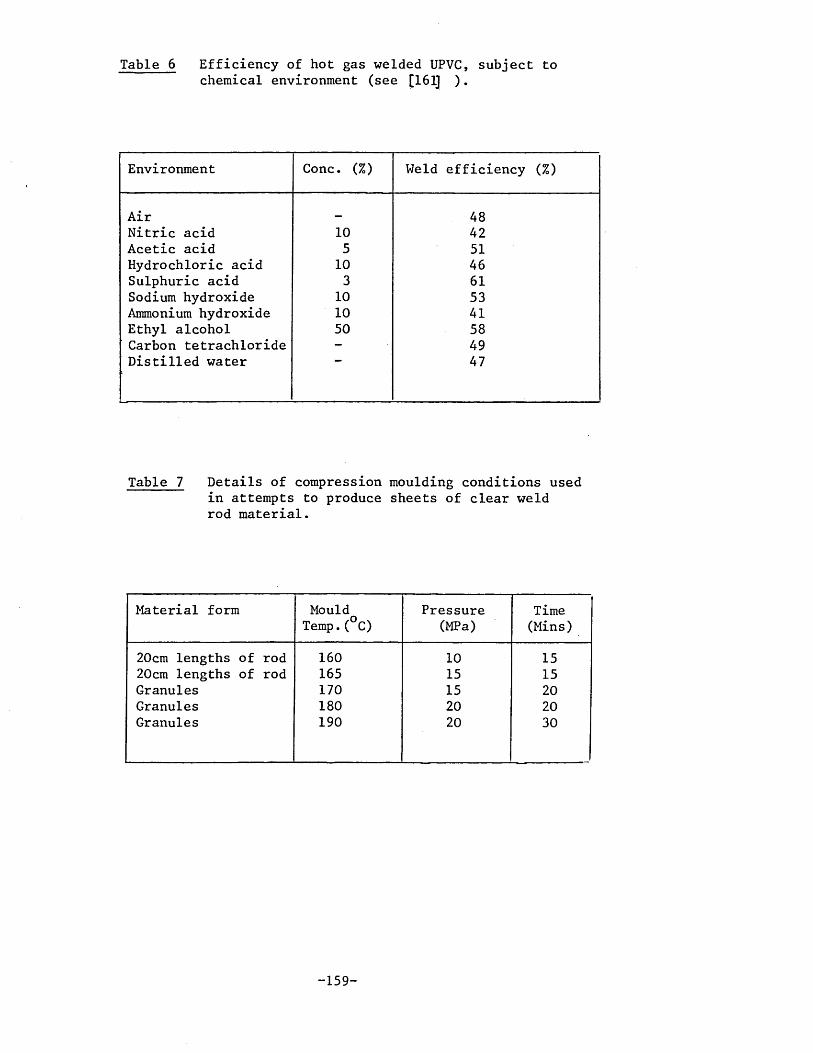
Table 6 Efficiency of hot gas welded UPVC, subject to chemical environment (see [161] )•
Environment Cone. (%) Weld efficiency (%)
Air 48Nitric acid 10 42Acetic acid 5 51Hydrochloric acid 10 46Sulphuric acid 3 61Sodium hydroxide 10 53Ammonium hydroxide 10 41Ethyl alcohol 50 58Carbon tetrachloride - 49Distilled water 47
Table 7 Details of compression moulding conditions used in attempts to produce sheets of clear weld rod material.
Material form Mould Temp.(°C)
Pressure(MPa)
Time(Mins)
20cm lengths of rod 160 10 1520cm lengths of rod 165 15 15Granules 170 15 20Granules 180 20 20Granules 190 20 30
-159-

T a b l e 8.
a) Initial two-day ether extraction (mass of extracted additives: sheet = 0.08gm; clear weld rod = O.lOgm.)
Detailsof
drying
Mass of thimble
+sheet(gm)
Mass of thimble (gm)
Mass of sheet (gm)
Mass of thimble
+weld rod
(gm)
Mass of thimble
(gm)
Mass of weld rod
(gm)
Beforeinitialextraction
12.59 2.84 9.75 12.61 2.71 9.9
30 mins. at 100°C + 90mins. at 50°C.
12.79 12.95
+ 5 days in air
12.86 - - 12.97 - -
+ 36 hrs in vac.
12.79 - - 12.88 - —
+ 5 days in vac. at 40°C
12.73 12.76
+ 10 mins. in air
12.75 - - 12.78 - -
+ 30 mins in air
12.79 2.77 10.02 — — —
b) Second two-day ether extraction (mass of extracted additives: sheet = 0.21gm; clear weld rod = 0.26gm.)
Detailsof
drying
Thimble+
sheet(gm)
Thimble(gm)
Sheet(gm)
Thimble+
weld rod (gm)
Thimble(gm)
Weld rod (gm)
Beforeinitialextraction
12.57 2.58 9.99 12.54 2.55 9.99
5 days in vac. at 40°C
12.89 12.80
+ 20mins in air
12.90 - - 12.81 - -
+ 30 mins in air
— — 12.83 2.53 10.31
- 1 6 0 -

T a b l e 9 . S p e c i f i c a t i o n s a n d d e t a i l s o f c r a c k g r o w t h f o r t a p e r e dd o u b l e c a n t i l e v e r b e a m ( T D C B ) s p e c i m e n s t e s t e d .
TDCB taper angle, a = TAN * 0.1
Ho(mm)
bc(mm)-
Gw(mm)
ICL(mm)
LLL(mm)
CHR(mm/min)
Comments Fracture + crack length (mm)
-L101 2.5 1.3 47 295 0.5 FF 152;185;210;28510* 2.5 1.3 20 295 5 FF 112;121;245101 5.6 1.3 55 295 0. 1 FF 71; 95; AB10; 7.0 1.3 15 290 - FF 40; AB10* 7.0 1.3 63 290 0.5 FF 83;116;166;177; AB15 3.0 1.3 7 290 10 SF 185; AB35* 3.0 1.3 15 95 - SF 9018 6,4 5.0 10 245 12.5 SF 35; AB18 8.5 5.0 15 235 AB
J tT specimen shouldered, shoulder height 15mm.* specimen prepared from remains of previous test specimen
TDCB, a = TAN 1 0.15
H b G ICL LLL CHR Comments0(mm)
c(mm)'
w(mm) (mm) (mm) (mm/min) Fracture + crack
length (mm)
1]51 3.2 1.3 5 295 _ FF 37;95;157;28015’ 3.0 1.3 5 290 10 SF 20; AB24* 3.0 1.3 10 230 10 SF 165; AB, also
-L severed remainder151 3.6 1.3 15 275 0.5 FF 90;148;222;265;TTE151 6. 1 1.3 60 255 20 FF 107;248; CW15' 6.7 1.3 35 280 0.5 FF 93; AB19 6.2 0.9 52 294 5 FF 18819 6.0 0.9 65 283 5 FF 27419 5.3 0.9 82 283 5 FF TTE19 5.5 0.9 10 283 5 SF 50; AB19 5.5 0.9 37 283 5 AB19 6.3 0.9 65 283 5 AB19 5.2 0.9 55 283 5 FF 145; TTE19 5. 1 0.9 70 283 5 FF 270;280&19
5.0 0.9 82 283 5 FF 28; TTE5. 1 0.9 72 283 5 FF TTE
57 4.6 0.9 32 283 5 FF 232; AB19 4.6 0.9 80 283 5 FF 250; TTE
continued/
- 1 6 1 -

T a b l e 9. ( c o n t i n u e d )
Ho(mm)
bc(mm)
Gw(mm)
ICL(mm)
LLL(mm)
CHR(mm/min)
Comments Fracture + crack length (mm)
19 5. 1 0.9 71 283 5 FF 280; TTE19 4.9 0.9 17 283 5 AB19 5.3 0.9 53 283 5 FF 165; 27519 5.3 0.9 110 283 5 FF 175,280;CW19 4,9 0.9 • 17 273 5 FF 78;21519 4.9 0.9 17 273 5 FF 127;185;TTE19 5.2 o,Q 18 273 5 FF 81; AB19 4.8 0.9 55 273 5 FF 265; TTE19 5. 1 0.9 65 275 5 FF 267; TTE19 5.0 0.9 71 273 5 FF AB19 5.4 0,9 72 273 5 FF 15 3;CW19 5.0 0.9 69 273 5 FF 267;TTE19 5.0 0.9 7 273 5 AB19 5.1 0.9 71 273 5 FF 18419 4.9 0.9 72 273 5 FF TTE19 5.3 0.9 72 273 5 FF 25619 5.3 0.9 72 273 5 FF 124 ; 255;267; TTE19 5. 1 0.9 69 273 5 FF 25519 4.9 0.9 70 273 5 FF 189;258;26519 5,5 0.25 40 273 5 AB19 5.2 0.25 45 273 5 FF 145; AB19 5,5 0.9 47 273 5 AB19 5.5 0.25 54 273 5 AB
* specimen prepared from remainder of previous specimen.i' specimen shouldered, shoulder height 19mm a.reverse end loaded
TDCB, a = TAN” 1 0.20
Ho(mm)
bc(mm)
Gw(mm)
ICL(mm)
LLL(mm)
CHR(mm/min)
Comments Fracture + crack length(mm)
±*5! 2.5 0.25 10 250 AB :
3.0 0.25 15 250 2 FF 126; 174;24515l 3.0 0.25 20 250 5 SF 45; AB15' 4.0 0.25 15 250 0.2 Crack wandered about
groove
Continued/
- 1 6 2 -

T a b l e 9. ( c o n t i n u e d )
Ho(mm)
bc(mm)
G-w(mm)
ICL(mm)
LLL(mm)
CHR(mm/min)
Comments Fracture + cradk length Cram)
i4.0 0.25 15 250 2 FF 110;133;193;2404.0 0.25 20 250 0.2 FF 77 ; 117;155;283
151 4.0 0.25 10 250 2 FF 60;173;242151 5.6 0.25 15 250 1 FF 51 ; 131;24015; 6.0 0.25 10 250 0.5 FF 32;110; AB15| 6.0 0,25 10 25Q 5 SF 40; AB15; 6.0 0.25 10 250 5 FF 95;145;245i5; 6,5 0.25 20 250 0.5 FF 69;24015’ 6.5 0.25 22 250 5 FF 50;174;240
1’ specimen shouldered, shoulder height 30mm
TDCB, a « TAN"1 0.25
H - o(mm)
b c(mm)
Gw(mm)
ICL(mm)
LLL(mm)
CHR(mm/min)
Comments Fracture + crack length (mm)
1539
2.52.3
1.31.3
50
295130
0.5 FF 40; 131 ;287 FF TTE
Key.
o : taper height at loading line SF : slow fracture
b : crack width FF : fast fracturecr . . TTE t through.T'to-end: groove width &
ICL : initial crack lengthLLL : specimen length from loading line
CHR : crosshead rateV : V groovegAB : arm break-off
- 1 6 3 -
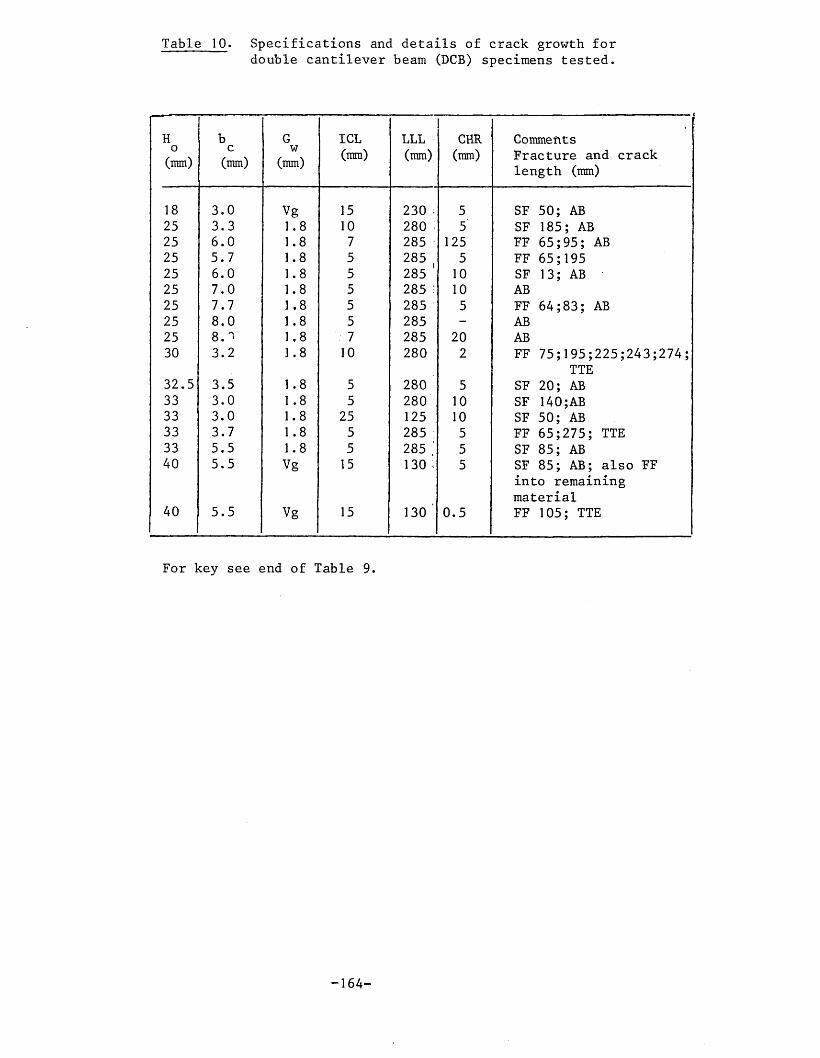
Table 10. Specifications and details of crack growth fordouble cantilever beam (DCB) specimens tested.
Ho(mm)
bc(mm)
Gw(mm)
ICL(mm)
LLL(mm)
CHR(mm)
CommentsFracture and crack length (mm)
18 3.0 Vg 15 230 ; 5 SF 50; AB25 3.3 1.8 10 280 • 5 SF 185; AB25 6.0 1.8 7 285 125 FF 65;95; AB25 5.7 1.8 5 285 5 FF 65;19525 6.0 1.8 5 285 ' 10 SF 13; AB25 7.0 1.8 5 285 : 10 AB25 7.7 1.8 5 285 5 FF 64;83; AB25 8.0 1.8 5 285 - AB25 8. " 1.8 7 285 20 AB30 3.2 1.8 10 280 2 FF 75;195;225;243;274;
TTE32.5 3.5 1.8 5 280 5 SF 20; AB33 3.0 1 .8 5 280 10 SF 140;AB33 3.0 1.8 25 125 10 SF 50; AB33 3.7 1.8 5 285 5 FF 65;275; TTE33 5.5 1.8 5 285 ; 5 SF 85; AB40 5.5 Vg 15 130 ; 5 SF 85; AB; also FF
into remaining material
40 5.5 Vg 15 130 0.5 FF 105; TTE
For key see end of Table 9.
-164-

Table 11. Specifications and details of crack growth forwelded double cantilever beam (DCB) specimenstested.
2V11C'Welded DCB
Ho(mm)
bc(mm)
Gw(mm)
I CL (mm)
LLL(mm)
CHR(mm/min)
CommentsFracture + crack length (mm)
25 - - 15 255 10 AB31 3,8 1.0 20 285 5 FF 150; TTE
32.5 3.2 1.0 43 280 5 FF 52; TTE33 4.8 1.0 0 285 5 FF 206; TTE
37.5 5 295 5 FF 66; AB
•k2V33C Welded DCB
27 — - 15 245 10 AB37 — - 5 290 5 FF 170; AB64 ““ 5 255 20 AB
For key see end of table 9.
* 2V : double-vee butt weld11 : one pass of rod in each groove33 : three passes of rod in each grooveC : circular cross-section weld rod
-165-

T a b 1 e 1 2 . S p e c i f i c a t i o n s a n d d e t a i l s o f c r a c k g r o w t h f o rw e l d e d t a p e r e d d o u b l e c a n t i l e v e r b e a m ( T D C B )s p e c i m e n s t e s t e d .
2V11C Welded TDCB, a = TAN 1 0.1
Hr\
(mm)b(mm)
Gw(mm)
ICL(mm)
LLL(mm)
CHR(mm/min)
CommentsFracture + crack length (mm)
25 - - 0 290 - FF 30; AB37 63 165 10 FF TTE
2V11C Welded TDCB a = TAN'_1 0.15, with side plates
H Side Plates ICL LLL CHR Commentso (mm) (mm) (mm/min) Fracture + crack(mm) length (mm)
20 3mm DC 5 250 5 FF 20;65;115;23522 10mm DC 0 275 5 FF 60;220
DC = Darvic clear grade sheet.
DC = Darvic clear grade sheet.
2V33C Welded TDCB, a = TAN * 0.15, with side plates
Ho(mm)
Side Plates ICL(mm)
LLL(mm)
CHR(mm/min)
CommentsFracture + crack length (mm)
23 3mm DC 50 230 - FF 145; AB23 6mm P 00 230 - FF AB20 3mm AL 15 265 20 FF 43; AB20 3mm AL 15 270 10 FF 68; Crack wandered
out of weld.20 3mm AL 17 265 10 FF 80; 24520 0. 8mm S 12 265 10 FF 48; 130;Crack wan
dered out of weld.20 0. 8mm S 35 265 1 FF 47; 255; Crack
wandered out of weld.
P = Perspex; AL = Aluminium; S = Steelcontinued/
- 1 6 6 -

T a b l e 12 ( c o n t i n u e d )
2V11C Welded TDCB, a = TAN~1 0.2
Ho(mm)
bc(mm)
G ' w(mm)
ICL(mm)
LLL(mm)
CHR(mm/min)
CommentsFracture + crack length(mm)
14, — _ 40 225 25 FF 60; AB151 - 5 250 - FF 35; AB15V 5.0 1 ,5 17 250 - FF 75; AB32* - - 72 195 25 FF 110; AB :39 5.0 1.5 0 123 — FF TTE
x1 These specimens had rectangular shoulders at height 30mm at loading line.
* Prepared from remainder of previous specimen.
2Y33C Welded TDCB, a = T A ^ f1 0,2
Ho(mm)
bc(mm)
Gw(mm)
ICL(mm)
LLL(mm)
CHR(mm/min)
CommentsFracture + crack length(mm) '
i151 — _ 0 250 FF 50; AB15! - - 0 250 - FF 70; AB15' 5.0 1.5 15 250 5 FF 60;68;82;93; AB
XX20- — — 0 250 0.5 FF 15; 45; AB20- 5.5 1.5 22 250 5 FF 70; AB2 0- 5.5 1.5 25 250 - FF 95; AB201 ’ 5.5 1.5 33 250 —* FF 90; TTE :
i’ Specimens shouldered, shoulder height 30mm XX— Specimens shouldered, shoulder height 35mm
continued/....
- 1 6 7 -

T a b l e 12 ( c o n t i n u e d )
2V11C welded TDCB, a = TAN_ 1 0.25
Ho(mm)
bc(mm)
Gw(mm)
ICL(mm)
LLL(mm)
CHR(mm/min)
CommentsFracture + crack length (mm)
- - 65 245 - AB15’ - - 60 195 - FF 90; AB but crack
t15t 70 195
also severed remainder of specimen FF but crack wandered
-L15’ 70 230 _
about weld AB
20 - - 0 265 - AB21* ““ 75 240 FF 100; AB
x’ Specimen shouldered, shoulder height 35mm
* Prepared from remainder of previous specimen
For key see end of table 9.
- 1 6 8 -

Table
13 . Fo
rmul
atio
ns
for
modified
weld
rod
material
and
the
weld
tensile
strengths
for
welds
prepared
with
the
modified
rod, details
of 'the
average
flaw
size,
and
type
are
also
incl
uded
. All
welds
were
prep
ared
using
Darvic
UP 025
clear
sheet
with
3 passes
of rod
in
each
vee,
except
10 which
used
six
passes
of r
do
Number
Samp
les
00 m o uo uo uo U0 U0 10 U0 uo
PhG m c i—>CM U0 CO -<rCM CMX £ . . . • . . . . . . »£ pL| LO 00 CM CM 1"- O CO VD <r vDg g CM CM CO co CM CM CM co CO CO CM
pHG• O 00 «■—Ico O O av 1—1O' VO£ £ . • • • • . • • .• H 0 I m ON i""r- vd m 00 av CM O i-ig g ' ' CM CM CM
B*Smhmh 00 o c n o I'-'.OO vd o n-w CM CO •<fcCO co co co CO <r CM CO
O £ CO ON o 00 o CO m CM vd -cr• pj • . . . — . . . . . » .co g co m vd Hfrco CM CO 1CM
pHG o vO o CO uo 1—.O rp o CM• £ • • . • . . . • • • . •> Ed 00 CM in in o ac CM O',CO<d g CM CM CM CM CM CM CO CM CM
•X£ CD CO CO CO£ CL •">r—1 CO CO CO CO CO CO o C c u CJ COpH P
> i£ SrH • •H- H- H- H--H►H—MH CD o-vr> VO av• N . • • • 1 1 1 1 ( [ 1 1> -P o o o o<3 erf
CO COp pd £ £ o£ £ £ PQ£ CJ CJ CO•p •iH w. p pP rd rd CO£ X £ £O CD rH Ip +•P p OP /•—N £ £ . • O PQ CO CO CO CO£ d •P CO £ p p PQ CO CO pq pq pq PQrH O 4-1 a £ £ CO W pq § § 3e3ga P £ £ •H •p • P w §B O £ P P P P p p£ CJ•P O rd d d O p r£ P .£ r£ J£ rCO •P P •P £ £ £ CQ r£ CL.£ CL CL CL aPh > O P rH £ £ CO CL O CLo o uo oP £ rd w CO uo 1-1 1—1i—i1—1£ d £ • . .& CDT—14J P P p + + + + + + +P X X X• • <d a) QJ Cl . . . . . . .d 6M! P CO d d d d d d dp O £ 6S 5s? 6^ p p p p p p pCO uo •P o O O + CO CO CO CO CO CO CO
d •rH O<d s 1—1CM co uo CD C'-00 CT\o 1— CM&
COrd £ £CO 60 rH CDa> ip Bp d CDp CD PCO O £P £ COd CDip £rH s P CDa) t>0£ e• H T-1 COPo O £CL IfP dCDCJ CO CDaj> P-£ CL, r £CO P CDCD >£ £ •rH <D•P ip P£ CO•p CLO CDdP Q CDd 6 aCDd £CO CD p cp£ P a Prd d £ ££ & COPo £ BO r*•H CD£ r£c CD P•H CD £a CL CD <P•p P Oip CO tnmh p p kOa) p CO P£ 1 *PII CL CD B£ *iH» II CD Xip *P Oip p d Pw r£ £ CLCL P£ CD£ rd r£O rH 1 P•H £ CDP £ P P£ P £ o•P <Di—i> P So CDCD £ P CJd •P CJ ££ tpdP£d££
.£PB
P fn rHCO Ar£ £tP P 60II £ CD CD£ B PO P P• CD II •HCO PX CO £CD CQ £CO gCO II H-CD rvp .rH •p P •iH >CO X o £<D i— 1CD £ MHp ££ d CD iprP P rd O•P ££ d £ CDIP £ Po CL£ OII P CO PCOPH d PG II CD . £CO £•V . •p £ £CD d d rH •P60 p •p UH S£ CO X oP o CD dCD n CL P <D> £ <D P P£ Ed £ CLII CDII m a CDvO O r£. CQ II P '> <P CO< O PQ CJ •K
- 1 6 9 -
being
take
n.

Table 14. Results of the RAPRA GPC analysis of molecular weights for the polyvinyl chloride materials used for hot gas welding
Sample . M n Mw MV
Mz M /M w nFirst seriesI.C.I. Darvic UP 025 sheet
35,000 78,000 72,000 160,000 2.27
Clear weld rod 31,000 87,000 76,000 250,000 2.8
Second seriesI.C.I. Darvic UP 025 sheet
38,000 77,000 71,000 140,000 2.04
I.C.I. Darvic UP 025 sheet annealed @ 160°C lOmins.
36,000 76,000 71,000 130,000 2.09
I.C.I. clear triangular weld rod
35,000 72,000 68,000 120,000 2.08
I.C.I. clear triangular weld rod annealed @ 160°C lOmins.
35,000 74,000 69,000 130,000 2.10
Clear weld rod
43,000 96,000 88,000 180,000 2 .21
Clear weld rod annealed ; @ 180°C 2 mins.
47,000 94,000 88,000 170,000 1.99
-170-

Table 15 Effect of various thermal treatments on the dimensional stability of clear Darvic sheet.
Time Temperature(.mins)
1 10°C 130°C 150°C 170°C
0 VM 59.8 60. 1 60.0 59.6HM 60. 1 59.6 60.0 59.9
5 VM - - - 59. 1HM - - - 59.3
10 VM 59.8 59.6 59.3 59.0HM 59.3 61.3* 59.5 59.2
30 VM - - - 57.9HM - - - 59.3
90 VM - - 58.8 -HM - - 59.2 -
190 VM 59.2 - - -HM 59.5 - - -
337 VM 59. 1 - - -HM 59.5 - - -
1020 VM - 59.3 - -HM - 59.4 - -
1140 VM - - 58.6 -HM 59.0
VM = Vertical measurement from identification mark, (mml
HM = Horizontal measurement from identification mark (mm)
Thickness measurement was approximately 10.65mm after 10 mins. heating at all temperatures
* This appears to be the result of a systematic error in the taking of the measurement.
- 171 -

T a b l e 1 6 . E f f e c t o f v a r i o u s t h e r m a l t r e a t m e n t s o n t h e d i m e n s i o n a ls t a b i l i t y o f c l e a r w e l d r o d . ( i n i t i a l l e n g t h o f r o d s ,1 5 0 m m ) .
Temperature(°C)
Support surface during thermal treatmentBaking Tray Teflon Sheet Glass Hie.rospheres
Time(mins)
Length(mm)
Time (mins )
Length(mm)
Time (mins )
Length(mm)
70 __ — _ 1 149.5- - - - 2 149.55 149.0 - - 5 148.510 148.7 - - 10 148.515 148.5 - - - -20 148.5 - — — —
80 _ _ _ 1 149.5- - - - 2 146.5- - - - 5 146.5" " 10 146
90 _ _ __ _ 1 146.5- - - - 2 145.5- - - - 5 145.710 148.0 - - 10 145.020 147.5 - - - -30 148.0 - - - -40 147.7 — —
100 _ _ _ 1 145.5- - - 2 145.5- - - - 5 145
10 145
110 5 147.7 5 147.210 147.2 - - - -15 147.0 - - - -20 147.0 20 146.5 - -- - 90 - - -— 330 145.7 - —
120 — _ _ _ 1 144.5- - - - 2 144.05 146.7 - - 5 143.510 147.0 - - - -20 146.5 - - - -30 146.3 —* — —
continued/- 1 7 2 -

T a b l e 16 ( c o n t i n u e d )
\
Support surface during thermal treatment
Baking Tray- Teflon Sheet Glass ^licrospheres
Temperature(°C)
Time (mins )
Length(mm)
Time (mins)
Length(mm)
Time(mins)
Length(mm)
130 _ __ 5 146.0 __- - 20 145.5 - -- - 90 144.5 - -
180 143.6 — —
140 - - - - 12
143.0141.8
144.0 - - 5 139.710152030
142.5 - - - -142.0 - - - -141.7 - - - -141.0
150 5 139.0 5 143.0 _10 138.0 - - - -15 137.5 - - - -20 137.7 20 139.0 - -— 90 133.0 — —
160 _ _ _ 1 140.5- - - - 2 138.35 131.0 t_ ■“ 5 136.5
170 5 125.0 _ _ _ _10 122.0 - - - -25 116.0 - - - -35 115.0 —■ “ j
175 3 117.5 __ _ —6 115.0 - - - -9 113.0 - - - -12 111.7 - - - -15 111.0 - - - -18 110.7
~ “
continued/
- 1 7 3 -

Table 16. (continued)
Temperature(°c )
Support surface during thermal treatment
Baking Tray Teflon Sheet Glass Microspheres
Time(mins)
Length(ram)
Time ' (mins )
Length(mm)
Time(mins)
Length(mm)
180 ; ' i 135.5- / 2 132.0
- - ; 5 121.616 114.0 ""
-174-

Table 17. Weight of additives extracted after different extraction processes from I.C.T, sheet and weld rod and from clear weld rod
Batch Extractiontime(days)
Solvent Mass and percentage of additives . extracted (gmt) and (%)Clear rod Sheet I.C.I. rod(gm) (%) (gm) (%) (gm) (%) :
1 2 Ether 0. 10 1.01 0.08 0.82 2 Ether 0.26 2.6 0.21 2.1 - -
3a 3 AR Ether 0,41 4.1 0.23 2,3 _3b 3 AR Methanol 0.01 0,1 0,0.2 0.2 - —■
4a 5 AR Ether 0.76 3.8 0.53 2.6 _4b 5 AR Ether 0.09 0.5 0.06 0.35 5 AR Ether 0.82 4.1 - - 0.82 4.1
3b and 4b were subsequent extractions carried out on the same materials as used in 3a and 4a,
- 175-

Table 18. List of additives obtained as standards and the methods with which they were examined.
Additive Chemical Composition IRS UVS NMR DSC
Lubricants
Wax E Ester wax from montanic acids. / / / / '
Wax OP Partly saponified ester wax from montanic acids. / / / /
VPARE 1 Stearyl phthalate.f / / - /PE 190 Polyethylene wax MW approx.
9000. / - - /UV absorbers
Tinuvin P 2-(2-hydroxy-5-methyl- phenyl)- benzotriazole / / / /
Tinuvin 320 2-(2-hydroxy-3,5-di- tertiary-butyl-phenyl)- benzotriazole. / / / /
ThermalStabilisers
Irgas tab 17M0K Di-n-octyl tin dithiogly- collic acid esters / / /
Irgastab 17M Dibutyl tin mercaptides / / - -Irgastab DBTM Dibutyl tin maleate / - -
Plasticiser
Reomol DOP Dioctyl phthalate / / / -
NB. All lubricants were supplied by Hoechst Chemicals Ltd. and all other additives by Ciba-Geigy Plastics and Additives Co.
+ S e e [ 1 8 5 ] .
- 1 7 6 -

Table 19. Methyl ethyl ketone absorption measurements on 50mm lengths of clear weld rod.
Immersion Time (s) 5 10 20 30
Sample mass before immersion (gm)
0.482 0.499 0.502 0.492
Sample mass after drying under various conditions (gm)
2 mins in Air 20 mins in Air1 week in Air3 days in vacuum 5 days at 30°C
0.4820.4820.4820.4820.482
0.5010,5000.4990.4990.499
0.5090.5060.5040.5040.504
0.4980.4960.4930.4930.492
Weighings accurate to - 0.0005 gm.
-177-

Table
20.
Summary
of weld
tensile
stre
ngths.
in<u4-1 ,-m O PMEo ce m
Pmb• cd X PmS scoQJ*H4-JUCJpmouPMnO
e•H
4M<4MP0
st 00 —CM CM srco inCM stCMmcnCM
SfCO
Ost CO StCM —
m
CMvOCM vO
uo00 StCN CM COCM
CMSt onCM
00CM COCO CO
CMVD
OVD
stav
pCO
Pm
><
vDCM
00CO
CMCM
COCM m
CMm
oCO
oo
StstvDm CM oo r-.CM
vd
ooin
oo CMCM StCM
CTVO
•HCd4-10)n0
TOsco
noO5m
4-4O
vd nO O4-J U QJa) noJO QJ in *—i
1-4 O *H •H 1+-4 > *Ml Cd Cd pL|P §COno in QJrH II rH•H >-, Pm b
n oO5-1OMno50cdQJQJJOcoo•H>54cdP
n oO54Jmcd0)
4-J noQJ QJqj n o
JO rH CO QJ £o•h n o > QJ 54 QJ Cd CM P CO
1norH CD £ •
QJno 4-> aj cd a> piPMCO 54
QJ4-1 4-J 3 CO JO Cd 14-4QJ> cd oMO 4-1cd cdco n o
< J QJ
n oO54CJ
4-J n oQJ QJ QJ n oJO rH CO QJ
„ 12 •h n o > QJ 54 QJcd pm CO co
n oO5m
54cdQJ
4-)QJQJJOCOo•H>54cdP
a j£QJ4-1cd5*4cdPM QJ CO V—'QJ>OMOcdCO<S
n oO5mJMcdQJ
4-JQJajPCOa•H>PicdP
noo54o4-1QJQJMOCOa•H>54cdP
QJPMfn4-1
5-4 noQJ i— If SS3
O£3
COn orHQJ&
5mOJO4-Jb<
ucocn>CM
P<>CM
CJVOvD>CM
CJVDVO>CM
OvOVD>CMaCOCO>CM
CJCOCO>CMOVDvO>CM
CJCOCO>CM
norHa)&
VO 00
oo4-J4-JoJOr\4JQJQJ
JOCOcj n o•H QJ> n o5m i— 1 cd qj p &
- 1 78 -
Cont
inue
d/

Table
20.
(continued)
No
of
Sa
mp
les
<n <n m m m uo O
o•i—c
C<4 54Cd 4-1• r - r~- CO 00 CO CO CO <U CM r— 1X cd » • • • • . . .cd pL| 00 00 CM o < r uo r— < r
S S CN CM CM CO CO CO Pn COCOcd
PuCd OO — m m 04 04 CO d av CM
CO • cd • • - • • • • cd . •CU d Pu o O CTV l > 00 co O•t-4 •rH *4 CN CM i— ■ CM CN CM x CN CM4-J S <u54 COCU m dCU •o <44 OV vO 00 CM 04 00 vO o r—1 r—I54 <4-4 B S CO CO CO CN CO <t <r rd uoP4 W i— 1 15cdx »H 541-4 • 54 <UCU Q cd CU O *-4 t— 1 UO CO x COJ3 • Qj ■M • • » • • • • T-1 » .
CO S cd CO <r co CJv CO CM 04 CU CO c-e £W a)U efu 1-4 cd
G r4 vO CO i—i <— < CN r - CO uo CM• UJ x • • • • • • • #> £4 <U m CO 00 .— i CM r—I Ov a) vC CO< T“H CM CM CM CO CO CN r d CM CO
cuXX<U
&
Tdd t-4cd t-4
cdCO • •
X COo <u X )54 CU r-4
>v <u<4-1 4-J E»o
x cu5u t-4 t-4<U CU cd
- s £ aB COd X )
S3 d
OS3
<u
<4-1dd
60d•HCOd
xa)5-4cdcua>5-iP,CU5-i<U£
COx
<u5-io<4-1a)rOX a) co co cu5-<
x
<J CQ CJ Q WX X X X Xt—i t-4 r-4 r 4 r— 1cu (U (U CU CU& t s
w 6C d•H
X 4-J I— I CO CU CU & 4-J
CU&
co CO<i-i CO CO CO CO
<1 <3 CO < < < <CO CO <1 CO vO vO vOvO CO <!■ co vO vO vO> > > > > > >CM CM CM CM CM CN CM
r—1 CN CO •vf UO vO r-r“i T""“1 t—1 ' ' ~
>•>rOxcu}-<cdcucu5-4CuCU5-<CU£
COXx—icu£
I—(r-4cd
COx1—I 0) E2do•r-f4-Jod544-JCOdo<jCOo•H4-JCOcdr-4CU
xo54CJM4-J XCU CUcu xrd I— ICO CU
&Cd*t4 X> cu5-i <U Cd CU Q co
do*r44-1cd5-< d 50•H
<4-1doa
rdcuCOCOCU5-1X4->drda)>ojdcdCO<
CJ CJCO COvO VO> >CM CN
-'179-
Cont
inue
d/,

Table
20 (continued)
No .of
Samp
les
st St VO VO 00 00
Pmb• O vO «—■ CN vn m^ cd . • * • . .cd cm o VO CN 00 OV oa § co OO CO CN CO CO
Pmb• CTV 00 <T> 00 CN OvC cd * • • • • •
co p|_| T—1 rs >— > 00 m VOQJ S § CN CM CN CN r—1•H4-1P IMQJ U-l B S 00 av Ov st o «— 1CU W CO st CO 00 m stOPPmbrH p « VO co T—< 00 n- COQJ • Cm • * • • »& oo § CO NT st CO m st
Pmb 00 00 T—< CN co VO• cd » - » • » »> Pd <r T—l CO CN CN VO< g <N CO CN CN CO CN
brv QJ bb b b r* oo CJ r—1 b pM b Cd QJ oQJ X £ b P bP QJ QJ QJcd CU b b QJ M r-M
QJ CO O QJ CU Cd r— tCO r—4 #1 P QJ CO M •iMr-4 a CO CU CM•H t-M 4-1 CO COcd 4J b cd o I— 1 4-1 4-1+j QJ QJ •H O 4-1 cd QJ b QJ0) QJ rd P M co •H QJ Q) QJb X r-M 0) r. QJ M X Td XCO QJ 4-J QJ P QJ CO r-M COb £ cd > 4-1 Q)r—1 /-N a E b o rd cd b O £ OQJ b •H no QJ XI QJ E QJ •r4 •M& QJ > QJ * b cd b - b > b >d P QJ CJ r-4 t— i Cd rM p fd P
C3 cd cu * QJ CO QJ - QJ cd cd cd*M P co CM £ <5 £ Pm £ P X Q4-JCnCJNwJ
bs COcd br—tCO QJb tso QJp CU CJOM—1 p •iMo 4-J o
b O CO CO Pp r-i d Cd •V Cd Cd <3 <1QJ <D p co o CO CO «—1X £ 4-J vO r—1 vO VO co6 CO > > > > > >0 CJ CM CN CN CN CN b CNs o I— 1
CO aj&CO• CJ Po •iM QJ
!3 4-1 4-1CO CO
rd cd •iMT““i «— i O •—i CN CO QJ mQ) Pm CN CN CN CN CN P CN&
bQJOC•H4-1CjC;O
-180-

curP•u
CU cu 4-Jcl £ ato cu CU4-) p >—< COcuTd > E 5-t1—4 1 cd cdcu cu X T-1£ 1—1 CU P
X aTd T) P 5-i 5-i/—\ CU p o O •r4Td CO cd Q P>4 a<U pP TdP CO o
•H e 544-1 5-tp CU Tdo 4-3 r—1o CU > CO' <4-4 £ CNJ CO aO• <44o oCNJ 54cd 5-icu CO cur-4 CO XrO o E
P I—1 pH u 53
Po
•r44JPuD00•H
<44Poa
4-JP O
P P 4Jo rP
CO COTd up CJ p» CO > <4-1
XI p PL, P1—4 X X 54<U£ Td 4-J
a P Pcu P t-4 PrP p i—t X4-1 •r4 •H CO
o <4-14-1 •H aO 14-4 P •H
<4-4 >CU P P u
X O p•r4 II QCO Td• p Td5-1 <4-4 CO pCU <4-4 p P
rP H rCl4-1 Td•r-t CO PP »> •iH co
p PP O Xo •iH a CO
4J •H pp Ctf .p 12p •H £> > Td
p OX Td • x t(J o 4-1P Td X PP u E
p 4-1P Td CL 00*iH P P P
P CJ •n4p 4-1 X Td£ CO p i—!o p
xi II r £P
Td • Oj Td•H Q § pp • <n pr-4 CO \D XCDT3o5-1COCOPP<U
TdO5-i
PO•H
u-io
CUrP4-1
Td Td 4J P T)o o CO 54 Pu 5-4 4-J 4-Jp CO Pu 54 54 4-1P P p Td COr—4 t-4 t—4 t-4P P •H P • P00 00 P •r4 p COP P <4-1 P | •r4P P § J2 .•i-4 *r4 II 4-J co U m54 54 P P CN4-1 4-1 F>4 P rP ob X <4-4 4-JP t-4 CO O O ?40C T“t n £5-1 ctf P CJ CO PP E 00 > CO 54 pX CO p P4 P P tj54 P3 54 rP pP 4-J £ 54> 54 CO 00P P 4-1P Td CL 54II rH t—I P Pa P O PX CO > •H X 1—1< < < p w o
8
- 1 8 ] -

Table 21. Details of sizes of flaws as'observed on the fracture surfaces of the standard welds tensile test pieces.
WeldaNo.
Av. CT- MPa
Av.flaw size,mm
S.Dmm
Type of flaw
Number of samples
Author’swelds
1 44.9 0.75 0,55 C 52b 15.6 0.90 0.35 S 53 21A - S -
4 18.7 2.05 1.10 C 55C 27.1 - C/S6 18.6 0.85 0.30 S 57 18.5 1.05 0,30 S 98 22.4 1.15 0.35 C/S 99 24.2 0.80 0.40 S 510 61,1 No flaws observed
BNFL welds
1 1 25.6 1.95 0.50 C 512 23.7 0.90 0.30 S 513 18.3 1.50 0.60 S 514 21.1 1.40 0.65 S 515b 32.1 0,40 0.05 S 516 31.2 — - S -
17 29.7 1.00 0.65 S 5Plastic ConstructicmWelds
18 26.5 0.50 0.20 S 419° 33.2 - C/S -
20 24.8 0.80 0.50 s 421 31.8 0.74 0.25 s 422h 25.1 0.75 0.30 s 423 22.2 — s -
24 32.3 0.55 0.20 S 5
Leister weld
25 26.6 0.70 0,25 s 3
a) for details of weld type see table 20.b) the proximity of the surface of the weld prevented the flaw
size being determined.c) surfaces were too rough to allow flaws to be defined,
/Continued.,,,.*
-182-

Table 21. (continued)
Glossary
Av. = average, S.D. = standard deviation, C = centre flaw, S = surface flaw.
NB. the type of notch refers to the dominant type of flaw,flaws occurring at the surface of the weld and those with a boundary within l-2mm of the weld surface are considered to be surface flaws.
-183-

Table
22.
Summary
of the
results
for
the
fracture mechanics
test
prog
ramm
e
U-C COo QJ
rH>H CuQJ E a \ i n v o s f m u o m M UO UO < fX cd CM — ~ CM — CME COa53
as as
O cd
PCD
dcdcu
S
I I I IT) T3 T3 H
CM CD CM O CM CO CO CD
CM CO O CO
I I I I I I I
-C f VO CM N M NI I I I vo vo i i i i i i i
Oas
CM
o ICM
—I«sio Bcd
PCD
d■ cd cu £
0 3 0 3 0 3 0 3 03 03 03 03t n c o o o - ' - o o o rv cm in oocMcMcococor^o—• >—• •—i oO O O O O O C M O o o o o
CM UO — CM — CM
O O O
C O M M M I ^ r s ^ N—>cO'— <t o o ^ cocm CM CM Ml- 00 N N CD vO
as m CO vO CO
CM CM CM CM CM CM CM CM CM CM CM
03 03 O CO CM —
d o
v o r " . <1- r -
CM
oo
PCD
dcdcu• s
CO Ov CO CM I
O O
I I I I I I I I I I I I
CM O Os O I I I I I I 1 I I I
(UoCO I I
I I
I I
03oX4-1CU6uco(U
H
UO O r —' CM
d oT Td d
cd cd4-1 4-1
II IIa a
PQ PQ O O P P E-c H
co cuI—I§* cd/->. co E
u o ♦ 6 S cr> v o w
CD
UO
II II II >-1I—f
ts ts cdO O O wPQ H P U Q 2 P W
CD
COQJ
rH
e^ ✓ n td^ Ei w
UO UO | 53 — . v o W
OV CD
II II II rH r*Hts 12 £2 cd
53wCD
UO
O
PQ PQ H O O P P P H
4->CUCU
. dCO
O>gs03QJ
•HP>4
vO VD
II IIrs &53 S3 W WCD CD
J 84-
Cont
inue
d/
a) analysis based
on 24
resu
lts.
b) linear
regression
analysis
assuming y
= Ax
+ B,
oq is t
he resulting
intercept
of the
stra
ight
line
with
the
stress
axis
and
corresponds
to B
in the an
alys
is.
c) linear
regression
analysis
assuming y
= Ax.
rdU•r-44Jco4Jcd4-JC/3
cdoPdr-~t"-
CJ
CM
CO
XOCU
X» 4-1
C/36 60O fd
•H4-J COcd Id
•r4> 4-J .(U 3 cu
X ) O 6Ccd
Td Td X54 cu ocd •i—( cdTd 5-4 (XCd 5-1cd cd CO4-4 CJ •r4CO CO
CO4-J cd r-4o £ cdcd cd
CO cdTd •r-4e CO r—4cd rO cd
. r—1 oCO 4-J cd •r-4u r-4 cd 4-Jo 3 cd COu CO •r-454 CU cd 4-1(U 5-4 o cd
•H 4-Jod CU CO CO54 fd COcd o cu /—s
od 54 cdcd 60 ocd r - l CU Td4-J cd 5-1 cdCO o o
5-4 X<U CO cd54 cd CU #vcd £ cd 5*.
•r-4 +JCU <u r-M cuCO 5-4 •HCU CU r-4 o
X X r —4 o4J 4-1 cd C/3
✓—s f \ PQTd CU 53
- 185-

Table
23.
Summary
of weld
tensile
strength
results
for welds
prepared
using
pre-weld
rod
trea
tmen
ts.
No. of
Samp
les
m <r
Pmb• 00 00 OOX 3 • . .3 pU r'- vo oE S CN
PMb43 3 o CN CO* 0 i • • •E E 00 CN ON
4444 Bv? CN IDw CN CN CN
Q 3 f". OOCO § <r — coPmb 00 co r-'-• 3 • • •> 00 NT vO<J E
i r3 r34-1 X 4-J 33 rH •H %H3 3 &E IS4-J X X3 3 3 33 3 X X54 O CQ 3 CQ4-J 44 3 3 33 IS 3 ISX X i—1i—1 CQ Po CQ3 X 3 r3 3IS 3 U 3 31 t—I 3 3 33 3 4-4 o 443 3 3 3 3 iHCM 3 3 o 3 o3 CQr—l CQ 33 X 3X o X XX toC rH •H rH 3o 3 3 3 3 3pci•H rs 3 £2 E
X33CQ 3X CUO Pn3 3 U o O44 X oo OO ooO rH OO OO CO3 > > >O £ CN CN CN55
X •t—I o3 JS <—• CN COBs
oCN
X34-J44OEo4-J4-1O
X
QJQJCQ
,0BQJ
X4-JO4-1>nQJQJXx33XQJCO3cqe3QJ4-J4-4 OPo3cdcqcqorHtoo5-J O Pm
O5-iXr—HQJ54cdQJ
XI3cdUOCNOCU3>o•H>54cdQ54cdQJ
X0)CQ3X3cdXoX4-JQJB603•Hi—I0)X33XQJ
X4-J»-34-J•HisXQJ543CU354CU3543ISCQXrH3IS
e
- 186-
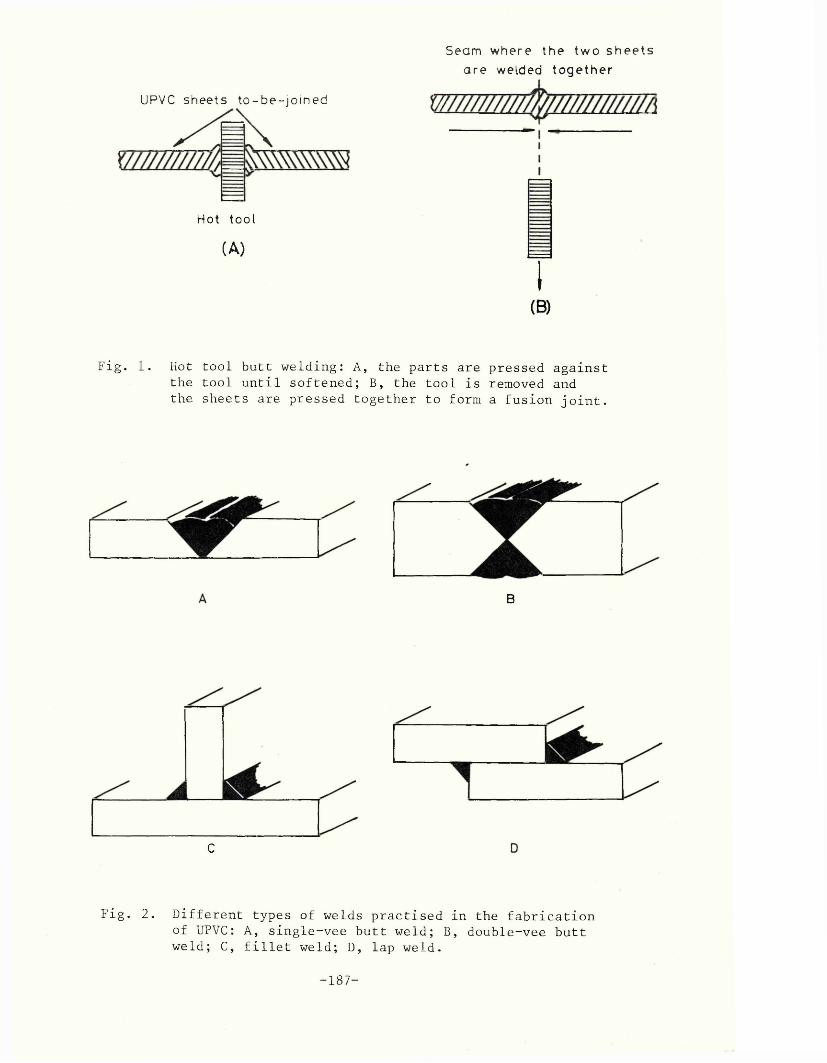
S e a m w h e r e t h e t w o s h e e t s
a r e w e l d e d t o g e t h e r
H o t t o o l
(A) I(B)
Fig. 1. Hot tool butt welding: A, the parts are pressed againstthe tool until softened; B, the tool is removed andthe sheets are pressed together to form a fusion joint.
B
C
Fig. 2. Different types of welds practised in the fabrication of UPVC: A, single-vee butt weld; B, double-vee butt weld; C, fillet weld; D, lap weld.
U P V C s h e e t s t o - b e - j o i n e d
- 1 8 7 -
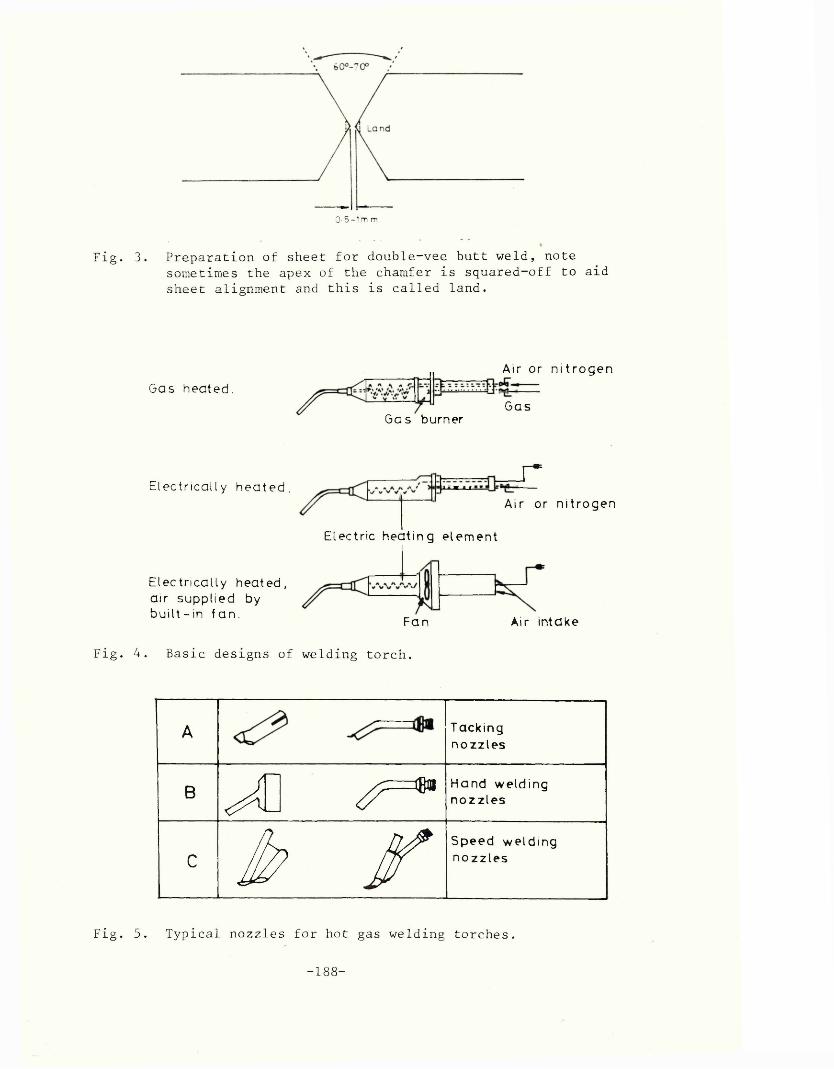
— I0 '5 - lm m
Fig. 3. Preparation of sheet for double-vee butt weld, notesometimes the apex of the chamfer is squared-off to aid sheet alignment and this is called land.
G a s h e a t e d .
A i r o r n i t r o g e n
G a s
G a s b u r n e r
E l e c t r i c a l l y h e a t e d .
E l e c t r i c a l l y h e a t e d ,
a i r s u p p l i e d b y
b u i l t - i n f a n .
t i l l !r
A i r o r n i t r o g e n
E l e c t r i c h e a t i n g e l e m e n t
A i r i n t a k eF a n
Fig. 4. Basic designs of welding torch.
A T a c k i n g
n o z z l e s
BA - ^
H a n d w e l d i n g
n o z z l e s
C > f
S p e e d w e l d i n g
n o z z l e s
F i g . 5. T y p i c a l n o z z l e s f o r h o t g a s w e l d i n g t o r c h e s .
- 1 8 8 -

N i t r o g e n o r c o m p r e s s e d a i r
U P V C w e l d r o d
W e l d i n g t o r c h
U P V C s h e e t s
t o - b e - w e l d e d 903,
H o t g a s d i r e c t e d
o n r o d 8 . s h e e t s 70°
Fig. 6. Hot gas welding of UPVC.
0 v e r f i
O v e r t i l
F i g . 7. O v e r f i l l i n g o f w e l d g r o o v e s .
- 1 8 9 -

Yie
ld
str
es
s
(M
Pa
)f r a c t u r e s t r e s s
min<L
y i e l d s t r e s su)
T e m p e r a t u r e
Fig. 8. The effect of temperature on the fracture and yield stresses of thermoplastics and the brittle-ductile transition temperature.
60
20
20 A O 60 80C o n c e n t r a t i o n o f a d d i t i v e s ( w t °/o)
Fig. 9. Effect of additives on the tensile yield stress for UPVC: A, soluble additives; B, insoluble additives (see [ 60] ).
- 1 9 0 -
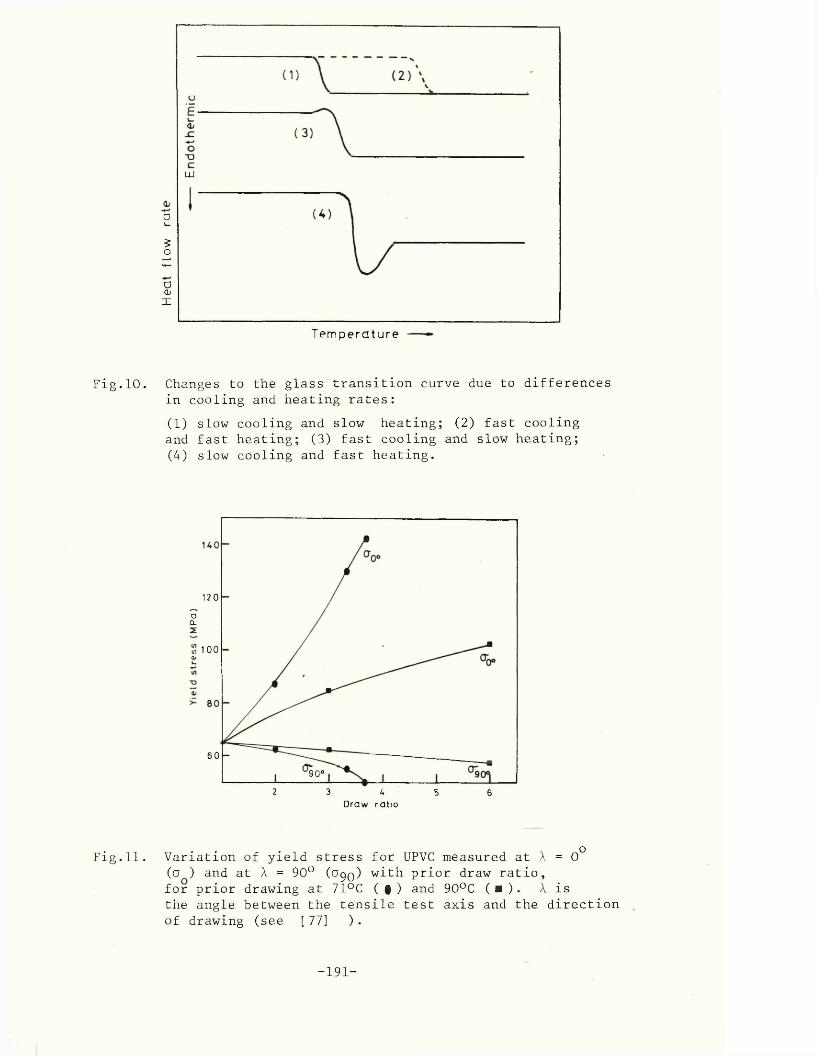
T3LU
O£o
oo>X
T e m p e r a t u r e
Fig.10. Changes to the glass transition curve due to differences in cooling and heating rates:(1) slow cooling and slow heating; (2) fast cooling and fast heating; (3) fast cooling and slow heating;(4) slow cooling and fast heating.
120
oCL
m 100Qj
60
90°
2 3 A 5 6Draw ratio
Fig.11. Variation of yield stress for UPVC measured at A = 0°(a ) and at A = 90° (c q ) with prior draw ratio, for prior drawing at 71°C ( #) and 90°C ( ■ ). A is the angle between the tensile test axis and the direction of drawing (see [77] ).
- 1 9 1 -

Fig.
Fig.
12. Plate containing an elliptical hole, semiaxes, a and b, subjected to uniform applied tension, G .
13. Crack opening modes.
- 1 9 2 -

200
150
ENz-it:U
dT 50
5 10 15 20Spec imen t h i c k n e s s (mm)
Fig. 14. Variation of G with thickness for 7075 Alloy (Al-Zn-Mg) -T6 (See [116] ).
SEN
P
2W
a a
DEN
2W
2a
CN
P
S EN in bend
Wt a4 t
P/2 P/2
Fig. 15. Single edge notch (SEN), double edge notch (DEN), centre notch (CN) and SEN in bend test geometries.
- 1 9 3 -

TDCB
‘v D C B
E x te n s io n
TDCB
DCB
TOooExtens ion
Fig. 16. Typical load extension curves for (a) slow stable crack growth and (b) stick-slip fracture for both tapered double cantilever beam (TDCB) and double cantilever beam (DCB) specimen geometries.
TDCB
Fig. 17. Double cantilever beam (DCB), tapered doublecantilever beam (TDCB), double torsion (DT) and compact tension (CT) test geometries.
- 1 9 4 -
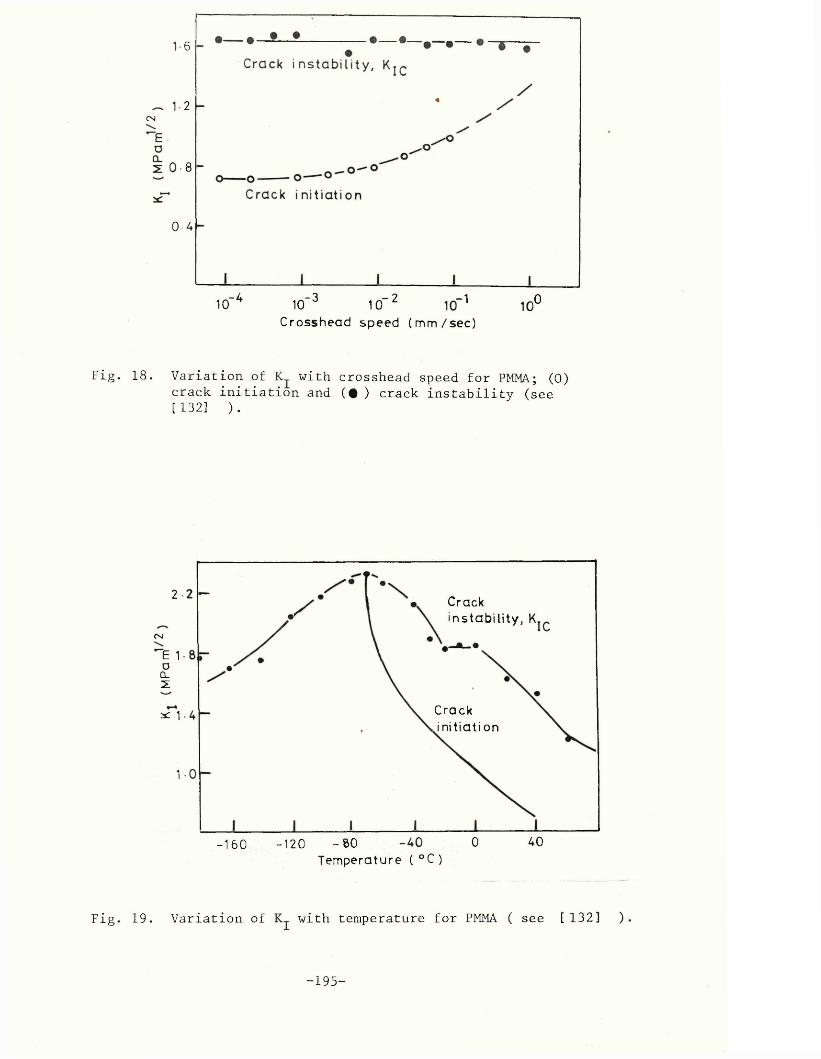
— •— ©—6
2csi
8
0-4
.-4 -3 2 1 >010' 10 10Crosshead speed ( m m / s e c )
Fig. 18. Variation of K with crosshead speed for PMMA; (0) crack initiation and (• ) crack instability (see [ 1323 ).
2 Cracki n s t a b i l i t y , K
CslE 1 oCL2!
Crack . i n i t ia t i on
* 1
1
400- 6 0-120-160Tempera ture ( ° C )
Fig. 19. Variation of with temperature for PMMA ( see [132] ).
- 1 9 5 -

0-8
0-7
0-6
0-1 0-2 0-5 1-0 20 5-0Crosshead speed (m m /sec)
Fig. 20. Variation of with crosshead speed for epoxy resin:( □ , ■ ) 6mm thick specimen, ( © } • ) 3.7mm thickspecimens, region A stick slip fracture, region B continuous crack growth (see [145] ).
2-5
~ 2 01=oCL21-5
■ ■■ 10
0-5
Fig. 21. Variation of with temperature for epoxy resin:region A continuous crack growth, B stick-slip fracture (see [ 145] ).
250 300 350Temperature ( ° K )
- 196-

Fig. 22. Bow wave of softened material at the base of the weld rod during hot gas welding UPVC, this is taken to indicate that the correct welding conditions are being used (see [165] ).
;
ig g lfI HHsB
xPIPp
Fig. 23. Ripple of softened weld rod material along both sides of the weld rod as seen after correct welding (see [165] ).
- 1 9 7 -

g g ©■h - k :a*• . ■ V-: '“
Fig. 24. Stretching of the weld rod will result if the weldrod is pushed into the weld at an angle less than 90 , (see [165] ).
Fig. 25. In cases where the weld rod has been stretched fracture of the rod may occur either when it is being welded or during latter passes of rod (see [165] ).
- 1 9 8 -
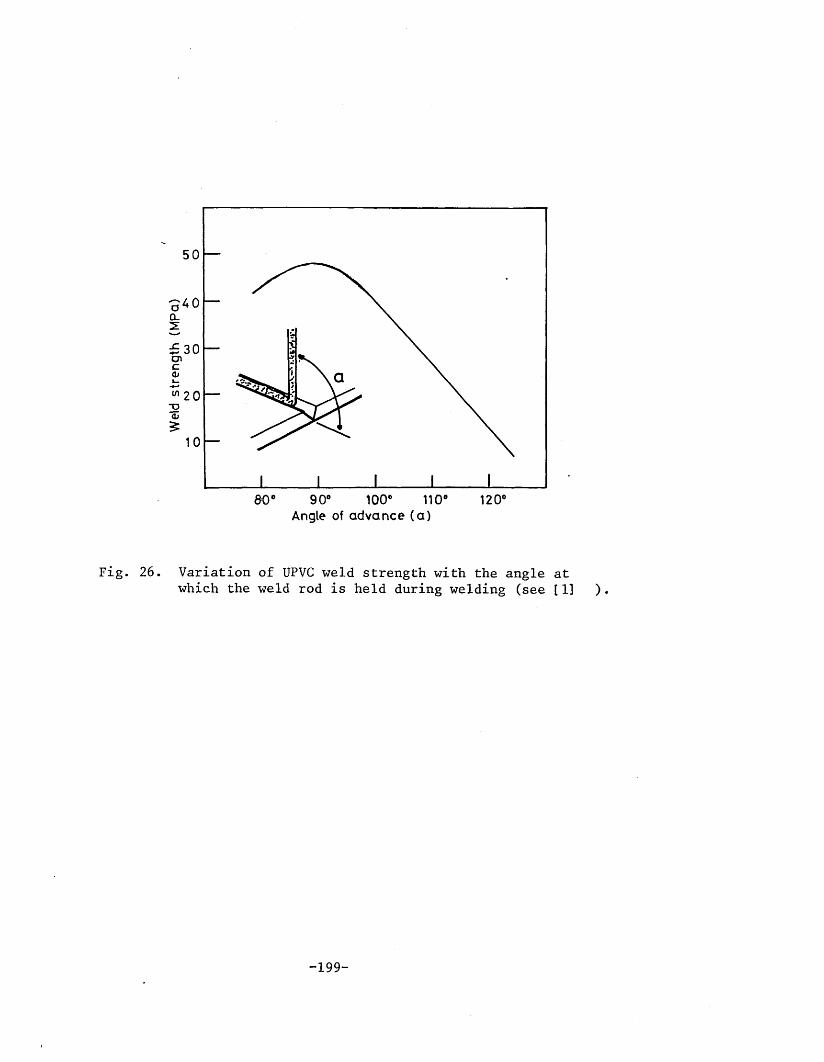
50
£ 3 0cn
80° 90° 100° 110° 120°Angle of advance (a )
Fig. 26. Variation of UPVC weld strength with the angle atwhich the weld rod is held during welding (see [1] ).
- 199-

V>'
rig* 27. S31isfactory double—vss butt see (165] )
Fig. 28. Single-vee butt weld ried out with too low a gas temperature, note lit deformation and fusion of the rods (see [165]
- 2 0

Fig. 29. Single-vee butt weld carried out with too high a gas temperature, note charring of rod and sheet at the weld root (see [165] ).
■ ■
w m r n m m i
Fig. 30. Double-vee butt weld, unsatisfactory because of insufficient root penetration (see [165] ).
- 2 0 1 -

Weld
ef
ficie
ncy
(%»)
90
8 0
10 20 30 40 50Tem perature ( 0 C )
Fig. 31. Variation of emulsion polymerised UPVC weld strength with temperature : (o ) double-vee butt weld in 8mm thick sheet, ( ■ ) single-vee butt weld in 4mm thick sheet (see [168] ).
-202-

Comparison
TensileTests
CompatibilityJ
ChemicalMechanical Microstructural
Fracture Mechanics
Microscopy of weld fracture surfaces
Clear UPVC containing no welds TDCB, DCB, DT, SEN tests.
Filled UPVC containing no welds and hot gas welded filled UPVC, SEN, test.
Welded hot gas samples of clear UPVC,TDCB,DCB, DT, SEN, tests.
Clear UPVC and filled UPVC containing no welds.Hot tool welded clear UPVC.Hot gas welded filled UPVC.
welded clear UPVCWeak welds in Hot Gas
UPVC: Unplasticised PVC(DARVIC)
TDCB: Tapered doublecantilever beam.
DCB: Double cantileverbeam.
DT: Double torsion.SEN: Single edge
notch.
Change composition of weld rod to:
A) Reduce flaw sizeB) Increase toughness
Fig. 32. Flow chart of the work programme.
-203-

I try ,Y« *\» V f : IV
«•* * ;• , • '•ci V - j y. « { • .
Fig. 33. Dumbbell and parallel-sided tensile test specimen,note yielding occurring at centre of both specimens.
Fig. 34. Pressed sheet of weld rod material showing its retained granular nature.
- 2 0 4 -
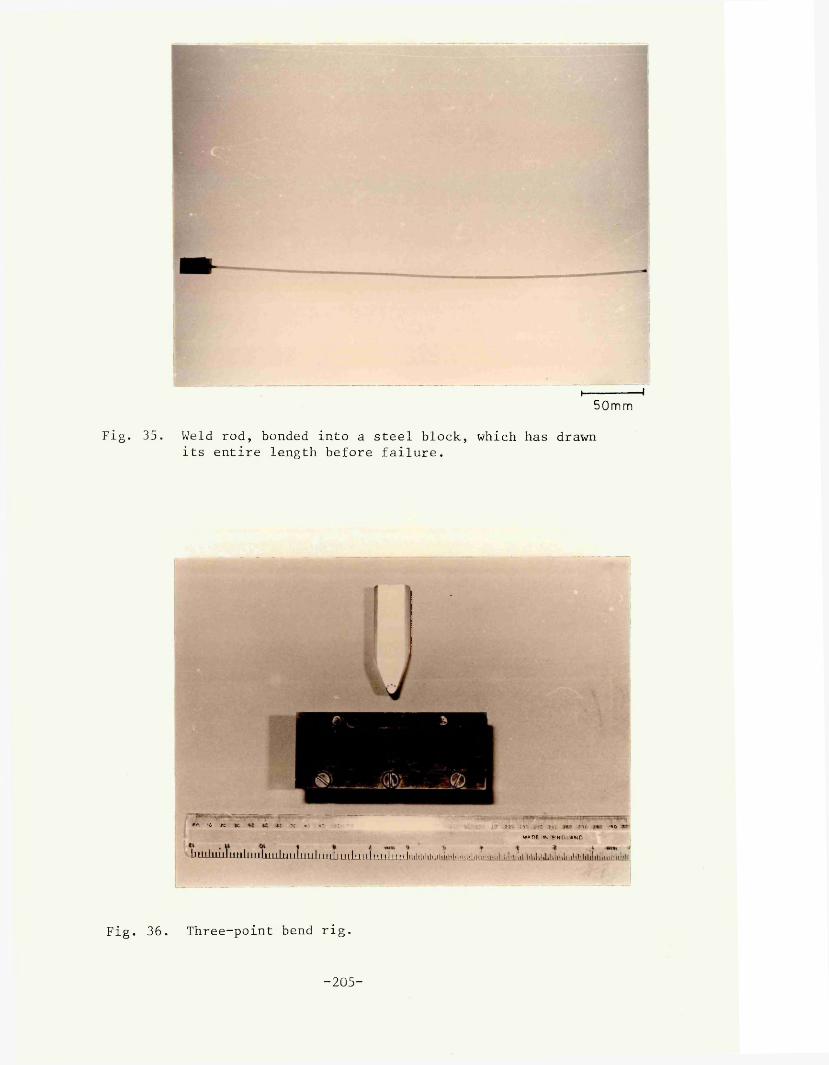
I------- 150mm
Fig. 35. Weld rod, bonded into a steel block, which has drawn its entire length before failure.
inn 10 K SC !v et 1C r; fT 'ZZ • 2C: 2 r 22, 21T* --C m ztc '^c
mahf w etmtftKP
J l l l l l l l l l l l l l l II I 11 l l ILlJlll il l 111 11111111 liiiiu L lL I 11I I J.I llllllhllllillllllltllllllllililllilllililiMlllllllllllllJjIililillllltlilllililililiilil'il
Fig. 36. Three-point bend rig.
- 2 0 5 -

Fig. 37. Hot tool pipe welding rig.
Fig. 38. Plate holders fitted into pipe clamps.
- 2 0 6 -

> p
Polished Jsurface
/ 150Area a s s u m e d in c a l c u l a t i o nof fa i lu re s t re s s
Al l d im e n s io n s in mm
Fig. 39. Weld tensile test piece.
Fig. 40. Automatic weld rig, weld bed and drive assembly.
- 2 0 7 -

Fig. 41. Weld tensile test piece, dressed.
Fig. 42. Asymmetric weld configuration as used by the Plastics Construction welder.
- 2 0 8 -
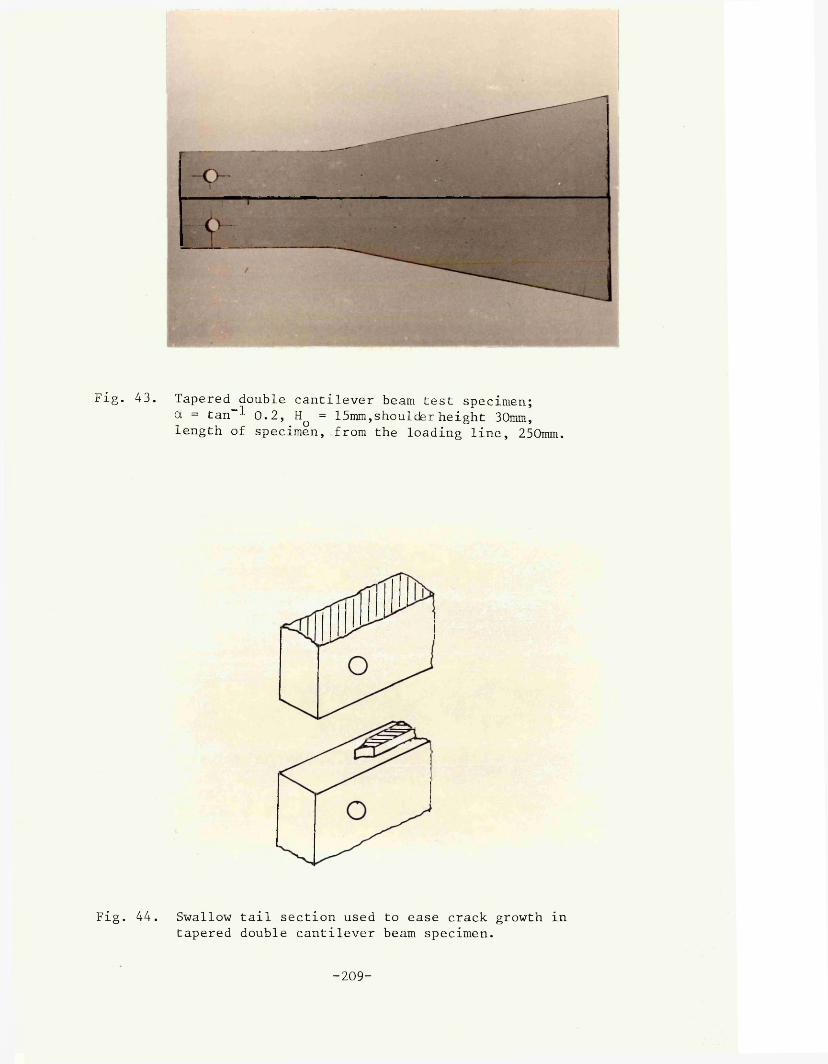
Fig. 43. Tapered double cantilever beam test specimen;a = tan--*- 0.2, Hq = 15mm,shoulder height 30mm, length of specimen, from the loading line, 250mm.
Fig. 44. Swallow tail section used to ease crack growth in tapered double cantilever beam specimen.
- 2 0 9 -

Fig. 45. Clamps used to apply the load to the tapered doublecantilever beam and double cantilever beam specimens.
Fig. 46. Tapered double cantilever beam test specimen: a = tan--*- 0.15, HQ = 19mm, length of specimen, from the loading line, 295mm.
- 2 1 0 -

11111 i11i i*| 111111111 i i n 11 it 11111 u I i 11111111 {-! 11111111 n 111 .
Fig. 47. Double torsion test rig.
W=160
1 = 51
Test specimen
All d imensions in mm
Fig. 48. Details of the loading plunger and support system for the double torsion test rig.
- 2 1 1 -

Fig. 49. Reduced groove section at the initial crack position for double torsion test specimens.
-212-

Fig. 50. Welded double cantilever beam test specimen: H = 25mm.
Fig. 51. Welded tapered double cantilever beam tests specimenwith bonded steel side plates; a = tan- - 0.15, HQ = 20mm, length of specimen, from loading line, 265mm.
- 2 1 3 -
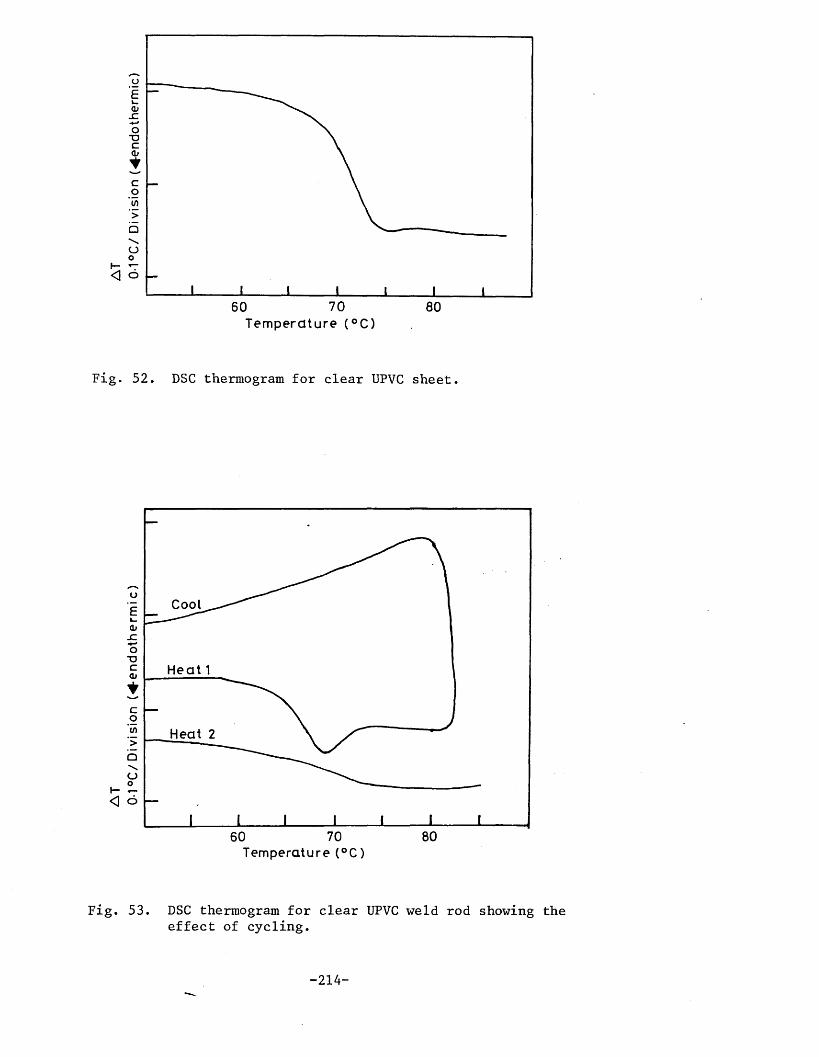
T3
Oh- 'T< O -
70 8060T e m p e ra tu re ( ° C )
Fig. 52. DSC thermogram for clear UPVC sheet.
Cool
H e a t 1
Heat 2
< o
70 8060Tem perature (°C )
Fig. 53. DSC thermogram for clear UPVC weld rod showing the effect of cycling.
- 214-

0-1 °
C/
Di v
isio
n (4
-en
do
ther
mic
)
xTem p era tu re
Fig. 54. Crossed line method of determining T from the DSC thermogram (see [175] ). ^
250100 150 200Tem perature (°C )
Fig. 55. DSC thermogram for clear UPVC sheet and clear weld rod over the temperature range 30-300°C.
- 215-

0-2
°C/D
i vi
sio
n (^
-end
o th
erm
ic)
Fig. 56. Length shrinkage in weld rod. Top, 150mm lengthof rod; middle, 150mm length of rod after 1 min at 180°C; bottom, 150mm length of rod after 5 min at 180°C.
(a)
60 80400 20T e m p e r a t u r e (°C)
Fig. 57. DSC thermograms for the post-Soxhlet extraction PVC granules: (a) sheet and (b) clear weld rod after the second 2 day ether extraction .

80
3500 3000 2500 2000 1800 1600 1400 1200 1000 800W avenum ber (cm-1 )
Fig. 58. I-R spectrum for additives extracted from clear UPVC sheet.
80
3500 3000 2500 2000 1800 1600 1400 1200 1000 800Wavenumber (cm-1)
Fig. 59. I-R spectrum for additives extracted from ICI weld rod.
80
a> 60
3500 3000 2500 2000 1800 1600 1400 1200 1000 800Wavenumber (cm'1)
Fig. 60. I-R spectrum for additives extracted from clear weld rod.
- 217-

350 400300250200Wavelength (nm)
Fig. 61. U-V spectrum for additives extracted from clear UPVC sheet.
-O< 0-4
250 300 350 400200Wavelength (nm)
Fig. 62. U-V spectrum for additives extracted from ICI weld rod.
jO<0-4
200 300250 350 400W avelength (nm)
Fig. 63. U-V spectrum for additives extracted from clear weld rod.
- 218-
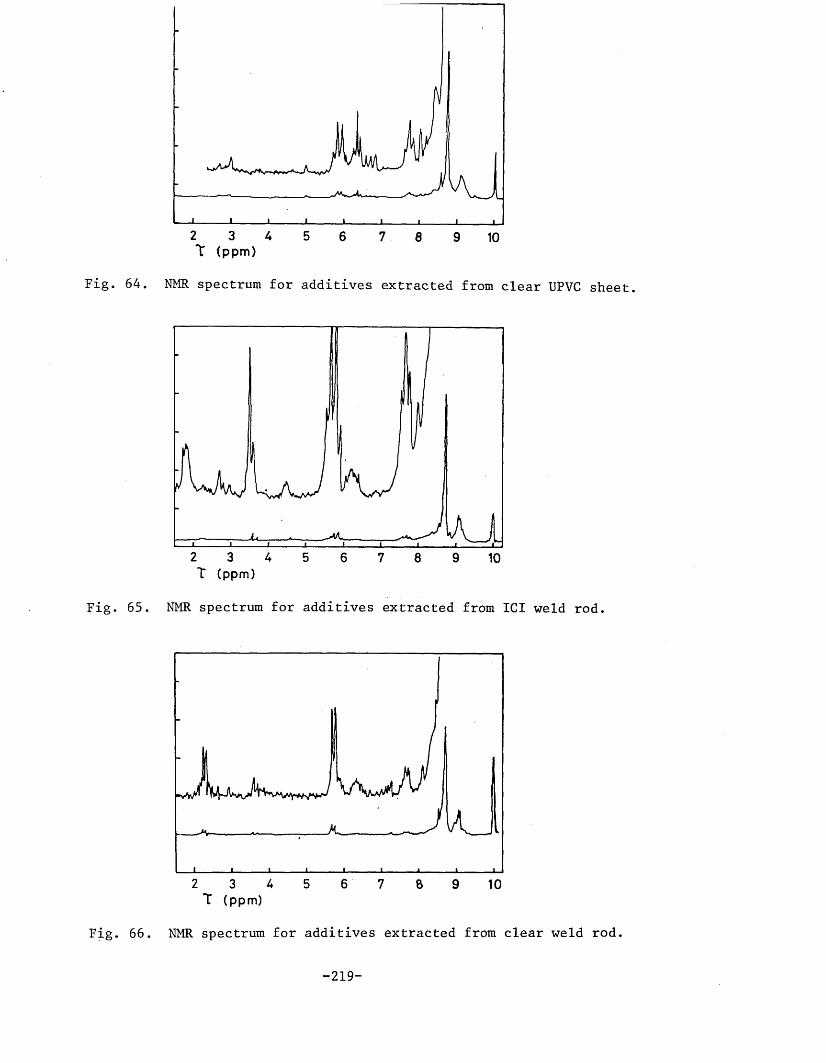
2 3 54 6 7 8 9 10*t (ppm)
Fig. 64. NMR spectrum for additives extracted from clear UPVC sheet.
2 3 4 5 6 7 8 9 10T (ppm)
Fig. 65. NMR spectrum for additives extracted from ICI weld rod.
2 3 6 75 9 108T (ppm)
Fig. 66. NMR spectrum for additives extracted from clear weld rod.
- 219-

0-2
°C/D
ivis
ion
(<
en
do
the
rmic
)
- 8 0 - 6 0 - 4 0 -20 0 20 40 60 80T e m pe ra tu re (°C)
. 67. DSC thermogram for additives extracted from: A, clear UPVC sheet and B, clear weld rod.
20pm
68. Filler particles after separation from filled UPVC.

Fig. 69. Typical hot gas welded clear UPVC tensile test piece as viewed between the crossed polars of a circular polariscope.
Fig. 70. Interior of a hot gas welded clear UPVC tensile test piece as viewed from an oblique angle.
- 2 2 1 -

Fig. 71. Hot gas welded clear UPVC tensile test piece viewed head-
Fig. 72. Heat affected zone either side of the weld zone.
on.
- 2 2 2 -

Fig. 73. Hot gas weld prepared using filled UPVC sheet and rod; 6mm thick.
Fig. 74. Hot tool welded clear UPVC, note thin dark line between weld beads.
- 2 2 3 -

Fig. 75. Poor root penetration typical of the Plastic Construction welds, weld viewed from an oblique angle.
Fig. 76. Complete separation of weld zone from UPVC sheets.
- 2 2 4 -

F i g . 77. F r a c t u r e i n i t i a t i o n s i t e o n w e l d f r a c t u r e s u r f a c e , n o t en o e v i d e n c e o f s l o w c r a c k g r o w t h .
I------------1500pm
Fig. 78. Surface of fracture initiation site, indicating that this surface has not been fused with another.
- 2 2 5 -

Crack Path
Fig. 79. Schematic of weld failure initiating at a ridge-like flaw within the weld.
-----11 m m
Fig. 80. Fracture initiation (see arrows) did not always occur at the widest part of the flaw.
- 2 2 6 -
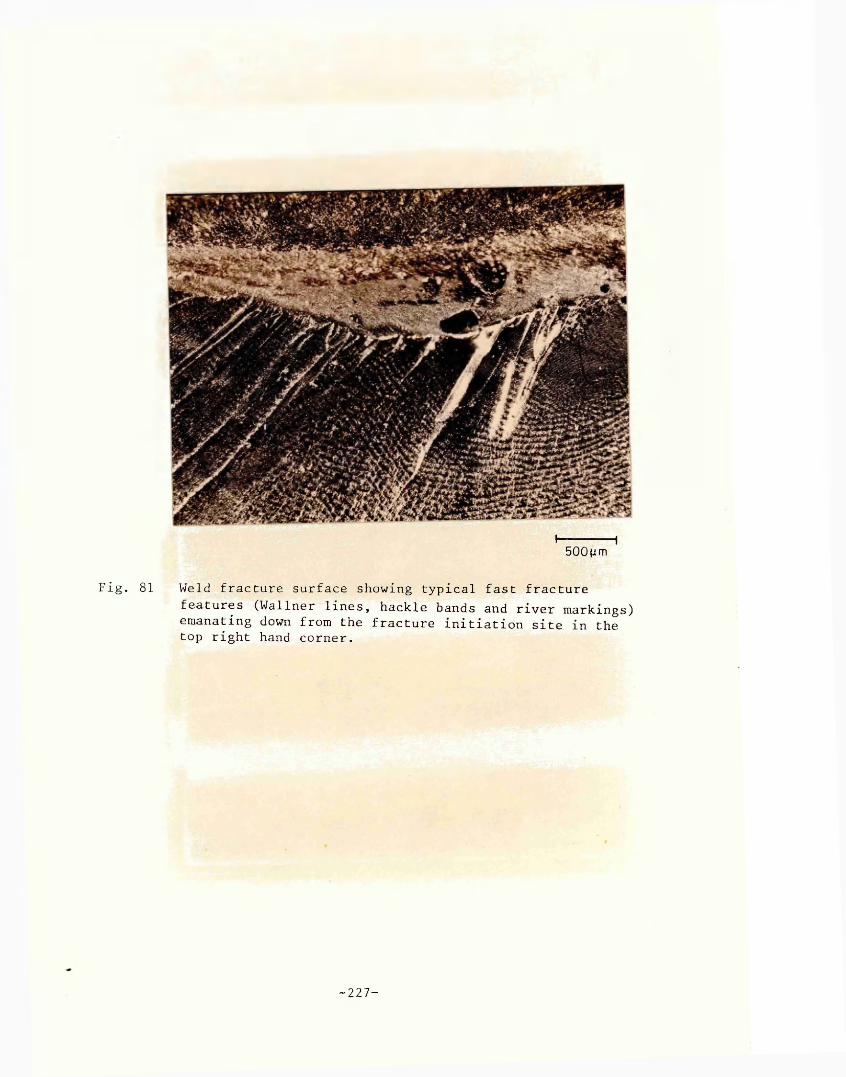
I------- 1500|im
Fig. 81 Weld fracture surface showing typical fast fracturefeatures (Wallner lines, hackle bands and river markings) emanating down from the fracture initiation site in the top right hand corner.
- 2 2 7 -

F i g . 8 2 . S m o o t h ^ p l a n a r f r a c t u r e s u r f a c e t y p i c a l o f l o w s t r e s s w e l d
Fig. 83. Rough fracture surface associated with high stress weld failures.
- 2 2 8 -

Fig. 84. Crack propagation perpendicular to the tensile axis, note crack moves hack into weld zone with no deviation of path.
- 2 2 9 -

Fig. 85. Rough fracture surface characteristic of one of the fracturesurfaces in the case where the complete weld zone was ejected.
Fig. 86. Smooth fracture surface characteristic of one of the fracture surfaces in cases where the complete weld zone was ejected.
- 2 3 0 -

80
70
60
z 50
w 40
= 30CL
o 20
10 -
40 80 120 160 200 240Crack length (m m )
Fig. 87. Compliance calibration curve for the geometry with H0 = 15mm, a = tan-l 0.2, specimen length, from loading line, 250mm, note this design used shoulders 30mm high at the loading line.
80
70
60
50
240120 20080 16040Crack length (mm)
Fig. 88. Compliance calibration curve for the TDCB geometry with HQ = 19mm, a = tan 0.15, specimen length, from loading line, 295mm.
- 231-

4 0
/3 0
3 2 0 • •IL
10
84 12 2016
Fig. 89. SEN data for clear UPVC sheet: ( ▲ ), w = 6mm; ( ■ ), W = 9.5mm; ( • ), W = 15mm.
40 -
oa.s
0;2 20oo
10
20168 1241 / [Y a l / 2 ] (m"1 / 2 )
Fig. 90. SEN data for filled UPVC sheet, W = 6mm.
-232-

80
70
60
2 50
CL
o 20
2402001601208040Crack length (mm)
Fig. 91. Compliance calibration curve for welded TDCB with 3mm thick clear UPVC side plates: HQ = 20mm, a = tan-1 0.15; length of specimen, from loading line, 230mm.
Fig. 92. Completely severed welded DCB showing the specimen distortion preventing the fracture surfaces mating together.
- 2 3 3 -

I--------- —I10 pm
Fig. 93. Striations on the fracture surface of a clear UPVC TDCB specimen, crack moving left to right.
Fig. 94. Characteristic crack front for the DT test geometry.
- 2 3 4 -
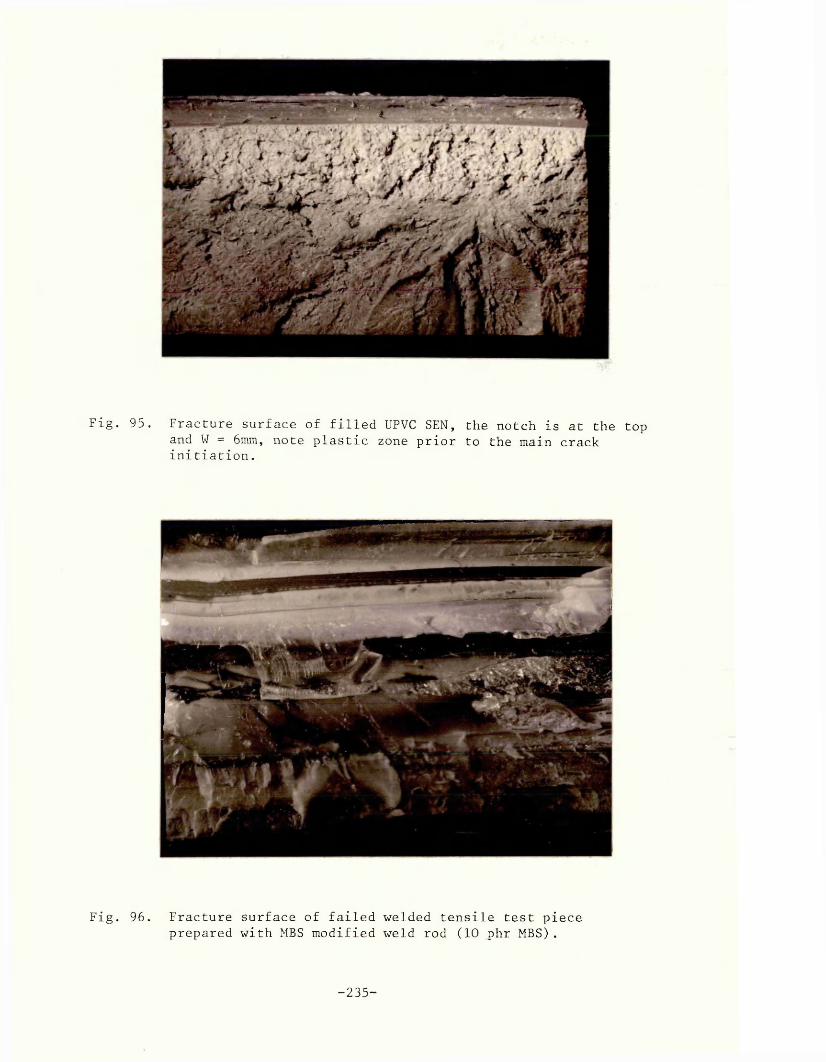
Fig. 95. Fracture surface of filled UPVC SEN, the notch is at the top and W = 6mm, note plastic zone prior to the main crack initiation.
Fig. 96. Fracture surface of failed welded tensile test piece prepared with MBS modified weld rod (10 phr MBS).
- 2 3 5 -

The strength of welds in uPVCJ Abram, D W Clegg and D V Quayle
Unplasticized PVC (uPVC) is available in a wide range of formulations designed to meet various specific requirements: such as clarity. However, one of the few common factors between clear and opaque grades of uPVC is that they contain no plasticizer. In other respects varying amounts of types of reinforcing fillers, extenders, processing aids and stabilizers may be present resulting in materials with varying mechanical and physical properties. One notable difference is that water-clear grades contain no reinforcing or extending fillers.
Joining of uPVC is often necessary and hot gas welding is a commonly used process capable of producing satisfactory joints. While hot plate welding is capable of producing higher strength joints it is applicable only to fabrications such as pipework where the joint geometry is simple and reasonably symmetrical. In more complex and ‘one o ff fabrications hot gas welding is the most suitable process.
This article considers the problems involved in obtaining high joint strengths when hot gas welding clear grades of uPVC and discusses the factors contributing to these difficulties.
Experimental results MaterialsIC I Darvic 025 uPVC was chosen for this study. This material is available as a clear grade and also as an opaque grey grade. Both of these were investigated together with weld filler rods of similar materials. However, the majority of welds made were between clear Darvic sheets. This material was 10 mm thick and in common with grey Darvic is manufactured by hot pressing calendered PVC foils.
Chemical characterizationChemical analyses and molecular weight measurements were carried out on all the materials used in the study and the main results are summarized in Tables 1 and 2.
While molecular weights were found to be similar for grey and clear Darvic, the constitution of these materials was found to be significantly different. This is because, in the interests of clarity, fillers and extenders are omitted in the clear grade and organo-tin stabilizers are used instead of the more commonly used lead, barium-cadmium and calcium-zinc types. In general additives are kept to a minimum in clear Darvic and in all other types of clear uPVC. The weld filler rods were found to contain greater amounts of the thermal stabilizers than the sheet materials in order to stabilize the material during the welding operation, as well as during manufacture by extrusion. The
David Clegg graduated in Metallurgy from Sheffield University and was later awarded a PhD. Since then he has been a Senior Lecturer in Materials in the Department of Metallurgy at Sheffield City Polytechnic. He is currently researching into radiation resistant elastomers and high performance rubber toughened thermoplastics. Donald Quayle graduated in Physics while working in the plastics industry. He was awarded a PhD while lecturing at Derby Lonsdale College before his appointment as Principal Lecturer in Polymer Technology to the Department of Metallurgy at Sheffield City Polytechnic. He is now Head of Science at Cambridgeshire College of Arts and Technology.John Abram graduated in Physics from Warwick University and was then appointed research assistant in the Department of Metallurgy at Sheffield City Polytechnic. He is now a research fellow in the Department of Non-Metallic Materials at Brunei University.
58
Fig 1 Cross-section of a hot gas weld in uPVC
glass transition temperature was found by differential scanning calorimetry to be 64.5°C compared with a value of 67°C for the sheet material.1 This difference was attributed to the plasticizing effect of the increased levels of organo-tin stabilizer in the welding rod.2 The sheet material contains sufficient stabilizer for protection during processing. Little remains for stabilization during the welding process.
Mechanical propertiesThe tensile strengths of weld filler rods and sheet materials were measured. The clear Darvic sheet was found to have a tensile yield strength of 67 MPa3 showing little directionality. Only minor changes in tensile strengths were detected on annealing the sheet, varying the strain rate or varying the sample cross-sectional area. However, it should be noted that the tensile strength of PVC is dependent on testing temperature.
Grey Darvic sheet was observed to have a tensile yield strength of 53 MPa significantly less than that of the clear grade reflecting the contribution of extending agents to strength reduction.4
Clear Darvic weld filler rod was tested by cementing lengths of the rod into steel blocks with IS495 adhesive and then mounting the blocks into the jaws of the tensile testing machine. This avoided premature failure due to stress concentration effects experienced when samples were mounted directly in the jaws of the testing machine. A tensile yield strength of 71 MPa was observed, significantly higher than that of the sheet Darvic. It was also noted that annealing
Table 1. Molecular weightdeterminationsfor clear and grey Darvic sheet and for weld filler rod material
Molecular weight
Sheet Weld filler rod
Mn 3.46 x 10⁴ 3.06 x l()4Mw 7.85 x l()4 8.57 x | 0 4Mw/AY/i 2.27 2.80

Table 2, Chemical constitution of ICI Darvic uPVC clear and grey sheet and clear weld filler rod
Main constituents and Approximate composition (weight %)function -----------------------------------------------------
Clear sheet Grey sheet Weld fillerrod
ICI Corvic bal bal bal
Organo tin thermal and uv stabilizers 1.5 _ 4.0
Calcium zinc stearate thermal stabilizer _ 1.5 _External and internal lubricants, uv absorbers, pigments
1% 1% 1%
Calcium carbonate filler — 15% —
Fig 2 Angled view of weld in clear uPVC showing interior defects in weld zone
of the rod produced shrinkages of as great as 25%. The general conclusion was that severe orientation was present in the weld filler rod due to its manufacture by extrusion, whereas little orientation existed in Darvic sheet.5
Hot gas weldingManual welding was employed in which weld filler rods were laid down in the previously prepared joint bv hand. This method has been extensively described elsewhere.'’ 7 A simple design of electrically heated gun was used to heat the rod and surrounding sheet material. Nitrogen gas at a temperature of 280°C, measured 3 mm from the nozzle, and a flow rate of 35 l/min was used in conjunction with a double vee edge preparation with an included angle of 70 degrees. Three filler rods were laid down on either side of the joints as can be seen in Fig 1. Operator skill is crucial in obtaining high quality welds. In order to ensure that the best possible welds were obtained skilled welders from several different establishments each produced test welds during the course of the investigation.
Mechanical properties of weldsEach test weld was sliced across the joint into strips which were tested to assess tensile strength. Several tensile strength values per weld were thus obtained. Results of typical tests are shown in Table 3. These are for welds made by one of the authors. Values for a hot plate weld of clear sheet and for a hot gas weld of grey Darvic sheet carried out by the same person are included for comparison. Weld efficiences have been caluc- lated as a percentage of the tensile strength values of the sheet materials. It can be seen that efficiencies for the case of clear Darvic welds were at best 29% and that the scatter in results of tests on the same weld was considerable.
Industrial welders using the speed welding technique or
more extensive filling of the weld achieved results of up to 50% average efficiency, using clear Darvic.
Visual examination of weldsThe sides of the tensile test pieces were polished and the weld zones examined using a low power microscope both before and during testing. This was fairly straight-forward in the case of the clear Darvic where unfused regions, which appear as black lines along the weld, could be seen, see Fig 2. Other defects present are streaks due to flow of degraded material along the weld zone. Even in apparently defect-free welds flaws were generated under low tensile loading, typically 25% of the failure stress. Although the opacity of the grey Darvic made visual examinatioin of the hot gas welds in this material impractical it was concluded from the nature of fracture surfaces examined by SEM, in both clear and grey Darvic that similar infused regions were also present in grey Darvic and that fracture initiated from them, see Figs 3a, b. However, the small reduction in the net section of the welds due to unfused material in clear Darvic was not sufficient to account for the low weld efficiences observed. On the other hand no unfused zones were observed in the case of hot plate welds.
DiscussionNo distinction is made in the literature between the strengths ar welds made in clear and filled grades of uPVC.6-7 8 The results quoted are presumably applicable to the filled grades only.
A critical factor in producing high strength welds in uPVC is the production of an intimately fused defect free weld zone. This appears to be obtainable in the case of clear Darvic by hot plate welding resulting in excellent weld efficiences. However, greater difficulty is encountered in the case of hot gas
Table 3. Mechanical properties of typical welds in uPVC
Materials Tensile strength (MPa)* Efficiency (% ) Number of Weld type
Min Max Standarddeviation
Averagesamples
Grey uPVC 40.6 47.0 2.6 44.9 85 5 Hot gasClear u PVC 12.6 25.4 5.2 IS.6 29 5 Hot gasClear uPVC 14.1 24.4 3.0 IS.5 28 14 Hot gasClear u PVC 60.2 61.9 0.4 61.0 94 5 Hot plate
‘ C alculated Irom load at failure
width of weld * thickness of sheet
59

WAt
EDGEOF_5AMPLE
FRACTUREINITIATION
WALLNER LINES EVIDENT A^fNTERSECTING C U R V E S /
I mm .
Fig 3a Scanning electron micrograph or a weld fracture surface in clear uPVC showing unfused regions; b diagram of Fig 3a showing location of fracture initiation and unfused regions
welding and weld zones in both clear and grey Darvic contain defects in the form of unfused regions. The important questions to be answered are first of all why do these unfused regions develop and secondly why are weld efficiencies so much poorer in the case of clear Darvic than in the case of grey Darvic. Some of the possible factors contributing to these observations will be discussed.
In view of the similar microstructure of welds in both clear and grey Darvic, the differences in weld properties indicate that the underlying causes are associated with differences in bulk material properties originating in differences in formulation. One important difference in properties is the higher notch sensitivity of the clear Darvic attributable to the soluble organo tin stabilizer.10 Coupled with the presence of internal unfused regions and surface irregularities at the welded joints an analysis based on fracture mechanics is desirable." However, it should be noted that the removal of surface irregularities by weld dressing was not found to increase weld strength significantly. Consequently, the unfused regions within the joints are almost certainly more important than surface defects. In addition the high degree of orientation present in the weld filler rods may contribute to significant residual stress levels in the welds. Degradation may also play an important part and the common practice of allowing visible discolouration to develop during hot gas welding as an indication of good fusion may in fact produce regions of embrittled material within the weld zone. This aspect is being investigated in detail at the present time by the authors using techniques previously employed in the study of thermal degradation in bulk PVC .12 Clearly thermal degradation during welding is a potentially more serious problem in the sheet than in the welding rod material as at this stage the former contains very little active thermal stabilizer.
Possible methods of improving hot-gas weld strengths in clear Darvic are being explored. The obvious approach is to ensure that unfused regions do not occur in the weld zones. Out of 200 tests one industrial weld achieved a failure stress of 45.3 MPa and fracture did not originate within the weld interior. This result exceeds the next highest failure stress by 8 MPa. Presumably in this one sample no flaw was present in the weld. Statistically it is very unlikely that no unfused region would occur in a weld run. The overall strength of the weld would depend on the severest flaw. However, the method of hot gas welding, the poor thermal stability of PVC and its high pseudomelt viscosity all make perfect fusion very difficult and highly unlikely.
An alternative approach is to improve the toughness of the weld zone in some way without sacrificing tensile strength at
normal and elevated temperatures. This precludes the use of plasticized rod which is in fact commercially available.g The use of toughened grades of PVC in the weld zone is a more attractive approach and the construction of welds using toughened filler rods is a subject of a continuing investigation at Sheffield City Polytechnic.
ConclusionsHot gas welds in clear unplasticized PVC possess significantly lower strengths than in comparable filled grades. Considerable scatter exists in the strengths of hot gas welds in clear uPVC. However, hot plate welds in clear and hot gas welds in filled uPVC exhibit satisfactory strengths and reduced scatter about a mean value.
Unfused regions are invariably present in hot gas weld zones in both clear and filled grades of uPVC and these flaws are a main cause for the low tensile strengths of welds in clear uPVC due to its high notch sensitivity.
AcknowledgementsWe would like to thank British Nuclear Fuels Ltd for financiall support and IC I Ltd for valuable discussions. The invaluable: advice of Dr G C Corfield of the Department of Applied! Chemistry, Sheffield City Polytechnic is much appreciated.
References1 Cross, A and Haward, R N Polymer 19 (1978) 6772 Dunlap, IH , Folz, C R and Mitchell, AG J Polvm Sci:
Phys Ed 10 (1972) 22233 IC I Ltd, Tech Man D106, 3rd ed (Sept 1980)4 Vincent, P I ‘Fracture’, Enc Polymer Science and Tech 7,
Fig 31,3365 Brady, T E and Jabarin, S A Polymer Eng Sci 17 (1977)
6866 E EU A Handbook, Thermal and Chemical Welding of
Plastics Materials. No 35 (1976)7 Haim G Manual for Plastic Welding: Vol3 PVC (1956)8 Connors, F L Australian Plastics (May 1954) 69 Alf, E, Potentes, H and Menges G Designing to Avoid!
Mechanical Failure. PI Conference (1973)10 IC I Ltd, Tech Service Note W121.2nd Edn (1980)11 Clegg, D W and Abram, J To be published12 Allen, D W, Brooks, J S and Clarkson, R \ \ J Organometal
Chem 199(1980)299-310
60

25th May - 2feth May, 1982
THE MECHANICAL PROPERTIES OF WELDS IN U-PVC
J Abram*, D W Clegg and D V Quayle+Department of Metallurgy, Sheffield City Polytechnic *now at Brunei University+now at Cambridgeshire College of Arts & Technology
Tensile strengths of hot gas and hot plate welds in clear and filled grades of unplasticised PVC have been determined. The mechanical properties of hot gas welds have been assessed using linear elastic fracture mechanics. Attempts have been made to relate variations in observed mechanical properties to microstruct- ural features in the weld zones, material constitution and differences between the welding processes.
INTRODUCTION
Unplasticised PVC (U-PVC) is available in a wide range of formulations designed to meet various specific requirements. Such a requirement is clarity and clear grades of U-PVC may be used as part of, or for the whole of, welded fabrications. However, one of the few common factors between clear and opaque grades of U-PVC is that they contain no plasticiser.In other respects varying amounts and types of reinforcing fillers, extenders, processing aids and stabilisers may be present resulting in materials with varying mechanical and physical properties. One notable difference is that water clear grades contain no reinforcing or extending fillers.
Joining of U-PVC is often necessary and hot gas welding is a commonly used process capable of producing satisfactory joints. While hot plate welding is capable of producing higher strength joints it is applicable only to fabrications such as pipework where the joint geometry is simple and reasonably symmetical. In more complex and 'one off1 fabrications hot gas welding is the most suitable process.
This paper draws attention to the problems of obtaining high joint strengths when hot gas welding clear grades of U-PVC and discusses the factors contributing to these difficulties. The properties of welds in clear grades are compared with those of the more commonly used filled grades.
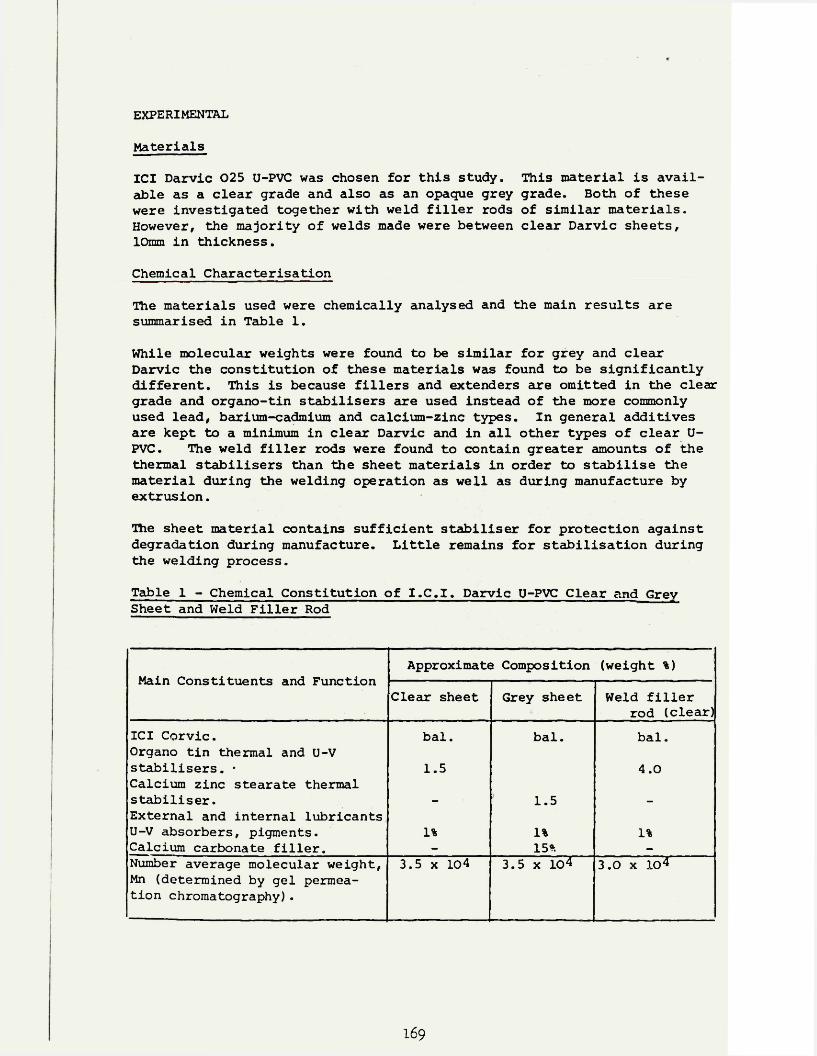
experimental
MaterialsICI Darvic 025 U-PVC was chosen for this study. This material is available as a clear grade and also as an opaque grey grade. Both of these were investigated together with weld filler rods of similar materials. However, the majority of welds made were between clear Darvic sheets,10mm in thickness.Chemical CharacterisationThe materials used were chemically analysed and the main results are summarised in Table 1.While molecular weights were found to be similar for grey and clear Darvic the constitution of these materials was found to be significantly different. This is because fillers and extenders are omitted in the clear grade and organo-tin stabilisers are used instead of the more commonly used lead, barium-cadmium and calcium-zinc types. In general additives are kept to a minimum in clear Darvic and in all other types of clear U- PVC. The weld filler rods were found to contain greater amounts of the thermal stabilisers than the sheet materials in order to stabilise the material during the welding operation as well as during manufacture by extrusion.The sheet material contains sufficient stabiliser for protection against degradation during manufacture. Little remains for stabilisation during the welding process.Table 1 - Chemical Constitution of I.C.I. Darvic U-PVC Clear and Grey Sheet and Weld Filler Rod
Main Constituents and FunctionApproximate Composition (weight %)
Clear sheet Grey sheet Weld filler rod (clear)
ICI Corvic.Organo tin thermal and U-V
bal. bal. bal.stabilisers. •Calcium zinc stearate thermal
1.5 4.0stabiliser.External and internal lubricants
— 1.5 -U-V absorbers, pigments. 1% 1% 1%Calcium carbonate filler. - 15?. -
Number average molecular weight, Mn (determined by gel permeation chromatography).
3.5 x 10⁴ 3.5 x 10⁴ 3.0 x IO4
169

Mechanical Properties
The tensile strengths of weld filler rods and sheet materials were measured. The clear Darvic sheet was found to have a tensile yield strength of 67 MPa1 showing little directionality.
Grey Darvic sheet was found to have a tensile yield strength of 53 MPa significantly less than that of the clear grade reflecting the contribution of extending agents to strength reduction^.
However, clear Darvic weld filler rod was found to have a tensile yield strength of 71 MPa, sigriificantly higher than that of the sheet Darvic.It was also noted that annealing of the rod produced shrinkages of as great as 25%. The general conclusion was that severe orientation was present in the weld filler rod due to being manufactured by extrusion, whereas little orientation existed in Darvic sheet^.
Hot Gas Welding
A‘ manual welding method was employed in which weld filler rods were laid down in the previously prepared joint by hand. This method has been extensively described elsewhere4,5. An electrically heated gun was used to heat the rod and surrounding'sheet material. Nitrogren gas at a temperature of 280°C, measured 3mm from the nozzle, and a flow rate of 35 1/min was used in conjunction with a double vee edge preparation with an included angle of 70 degrees. Three filler rods were laid down on either side of the joints as can be seen in Fig.l. Operator skill is crucial in obtaining high quality welds. In order to ensure that the best possible welds were obtained skilled welders from several different establishments each produced test welds during the course of the investigation. Some welds were produced by a high speed welding method and a few were overfilled. However, welds consisting of the type described above formed the main area of investigation.
Tensile Properties of Welds
Each test weld was sliced across the joint into strips which were tested to assess tensile strength. Several tensile strength values per weld were thus obtained. Results of typical tests are shown in Table 2.These are for welds made by one of the authors. Values for a hot plate weld of clear sheet and for a hot gas weld of grey Darvic sheet carried out by the same person are included for comparison. Weld efficiencies have been calculated as a percentage of the tensile strength values of the sheet materials. It can be seen that efficiencies for the case of clear Darvic welds were at best 29% and that the scatter in results of tests from the same weld run was considerable. However, the hot gas weld in grey Darvic exhibited an efficiency of 80% and the hot plate weld in clear Darvic an efficiency of 94%.
Industrial welders using the speed welding technique or more extensive filling of the weld achieved results of up to 50% maximum average efficiency, using clear Darvic.
170

Table 2 - Mechanical Properties of Typical Welds in U-PVC
MaterialsTensile Strength (MPa)*
Efficiency(%)
Number of Samples
WeldTypeMin. Max. Standard
DeviationAverage
Grey U-PVC 40.6 47.0 2.6 44.9 85 5 Hot gasClear U-PVC 12.6 25.4 5.2 18.6 29 5 Hot gasClear U-PVC 14.1 24.4 3.0 18.5 28 14 Hot gasClear U-PVC 60.2 61.9 0.4 61.0 94 5 Hot plate
*calculated from load at Failure, _ . . , , width of weld x thickness of sheetVisual Examination of Welds
The sides of the tensile test pieces were polished and the weld zones examined using a low power microscope both before and during testing.This was fairly straight forward in the case of the clear Darvic where unfused regions, which appear as black lines along the weld, could be seen, See Fig.2. Other defects usually present are streaks due to flow of degraded material along the weld zone. One weld was found to contain a sharp crack running within a weld filler rod along the length of the weld, see Fig.3. Even in apparently defect-free welds, flaws were generated under low tensile loading, typically 25% of the failure stress. Although the opacity of the grey Darvic made visual examination of the hot gas welds in this material impractical it was concluded from the nature of fracture surfaces examined by S.E.M., in both clear and grey Darvic that similar unfused regions were also present in grey Darvic and that fracture initiated from them, see Fig.4. However, the small reduction in the net section of the welds due to unfused material in clear Darvic was not sufficient to account for the low weld efficiencies observed. On the other hand no unfused zones were observed in the case of hot plate welds.
Fracture mechanics
As described, weld fractures appear to be initiated at the boundaries of unfused weld rod. The crack shown in Fig.3 is also a prime initiation site. The unfused region may be treated as a crack and its effect on the weld strength analysed using linear elastic fracture mechanics(LEFM) .
LEFM uses two parameters, the stress intensity factor K and the strainenergy release rate, G, to characterise the stress state within a loadedbody containing a crack. The fracture criterion is that the crack willpropagate catastrophically when these two reach a particular value whichis characteristic of the material. For mode I opening these values aredenoted K and G,. and are called the fracture toughness and fracture ^ Ic Icsurface energy respectively.
The two are related, under plane strain conditions, by:
K c = E Gic/ (1-v2) (l)
171

Where E is the materials Young's modulus and V the Poisson's ratio.
The fracture toughness may be determined by a notched bar method using the following equation:
Kic = a F /a“ Y ...................... (2)
where a F is the gross section failure stress, a is the notch depth and Y is a geometric factor which takes into account different specimen geometries, sizes and loading conditions. For methods based on the cantilever beam, specific equations have been calculated and data are available^.
The fracture surface energy is derived fromG. = P3 dc/da............................................. (3)ic f
2b
where P^ is the failure load, b is the specimen thickness and dc/da is the rate of change of the specimen compliance, C, with crack length, a. Acalibration curve of compliance with crack length is prepared using adummy specimen and during actual testing a record of both load and crack length is required.
The fracture toughness of the 10 mm clear sheet was determined using sing- le-edge-notch (SEN), double-cantilever-beam (DCB) and double torsion (DT) methods whilst the fracture surface energy was determined using a tapered- double-cantilever-beam (TDCB) method. Typical specimen dimensions are given in fig.5. Only the fracture toughness was determined, using the SEM method, for the 6mm clear and filled material.
The DCB, DT and TDCB methods were used since with other materials it is usually possible to obtain many results, up to 20, from each specimen.When used in 'fixed-grip' loading the crack growth is stable in that the crack should stop again as once it is growing no more -energy is delivered by the loading system. Normally crack growth is either slow stable or in short sudden jumps. However, with this material (U-PVC) it was only possible to get at best 2 or 3 results per specimen. Slow stable crack growth only occurred for cross head rates between 0.5-2 cm min”l and even then it only occurred with some specimens. The normal behaviour was for the frist crack to jump to within a few centimetres of the end of the specimen where the equations become invalid.
For the SEN specimens K was calculated using equation (2) with Y given by:-
Y = 1.99 - 0.41(a/w) + 18.7 (a/w)2 - 38.48(a/w)3 + 53.85(a/w)4 (4)
Where w is the depth of the specimen.g
For the DCB specimens K^c was calculated using
K , = P_ 3 . 4 6 ( a / H + 0 . 7 ) (5)IC — t------- r--------------bc
1 7 2

where H is the height of the arm of the specimen and bc is the net section thickness in the plane of the crack, in the case where a groove is used to control the crack path^.
10For the DT specimens K^c is calculated using
K. - P L (3(1 + v)h (6)ic f -— r"rr—b bJD c
Where L is the distance between the loading points and D is the width of the specimen.
The TDCB method was used since by careful design the factor dc/da can be made nearly constant for a large range of crack lengths, thus removing the need to monitor crack length whilst the crack is in this range.
The size requirements for valid plane strain fracture toughness testing^"1 could only be met for the DCB, DT and TDCB specimens. In the case of the SEN's it was decided to simulate weld failure by having the crack grow through the thickness of the sheet which meant that either the initial crack length or the length of material left infringed the size requirements. It has been shown that the size requirement is conservative for the clear material but evidence for the filled material suggested that for unwelded material plane stress effects were becoming important but were not so important for the welded material.
The DCB, DT and TDCB methods were used in the same way to study the welded material by preparing specimens with the hot-gas weld seam arranged along the crack growth direction. The specimens were in other respects as shown in fig.5.
The results from these techniques are given in Table 3.
Table 3 - K and G Data for Unwelded + Welded Material ---------- ic i c ------------------------------------
Sample type and thickness
SEN .K (MPa m ) ic
DCB ,K (MPa m ) ic K (MPa n?2) ic
DT ,K (MPa m )
I C
TDCB G c (Nm”l)
Clear 10 mm 2.1 3.0 2.1 2.9 2100Clear 6 mm 2.3 - - - -Filled 6 mm 2.9 - - - -Clear 10 mm hot gas welded
1.5* 2.4 1.6 2.6 1400
Filled 6 mm hot gas welded
2.5*
*Estimated using SEN analysis
173

The value of KIc» for 10 mm clear sheet, determined by the DCB method using equation (5) is much larger than that calculated from the SEN method,however other workers^ have found that the presence of the crack controlling grooves used in DCB specimens causes calculated values of K to be 50% too high. The corrected value shown in Table 3 shows much better agreement. The DT method also gives a higher value of K but this may be due to the different notch geometry found with these specimens.
The fracture surface energy value may be used with values of the materialsYoung's Modulus, appropriate to the testing conditions, and equation (1)to cross check the fracture toughness. The quoted Young's Modulus ofE = 3.6 GPa is that measured at 0.2% strain. However, at the strainsobserved for fracture in SEN specimens (1.5%) this value has dropped toE = 2.2 GPa and when this is used the calculated fracture toughness isK =2.3 MPam*3.IcWhen the values of K for the welded DCB's are corrected, for grooving, they suggest that the welding process has lead to a 40% decrease in fracture toughness. This drop is reflected in the fracture surface energy though the decrease is not as big as expected if calculated from equation (1). This is thought to be due to the effects of welding on the materials Young's Modulus.
If a welded tensile test piece is analysed as if it were an SEN specimen with a notch depth the same length as an unfused region as observed in the weld, then the welded material's fracture toughness can be estimated.Using typical values of a = 1 mm and Up = 22 MPa (for welds in 10 mm clear sheet) then a fracture toughness of K = 1.5 MPam^ is derived. If the same is done for the filled material welds using a = 0.75 mm and aF = 42 MPa then a fracture toughness K = 2.5 MPam*2 is obtained.
Although the SEN analysis is crude, the variation in notch shape shape, size, position and notch tip radius of the unfused region combined with the irregular weld cross section and the thermal history of the weld material make a more refined analysis impractical. It does indicate that the poor weld strengths are due to the embrittlement of welded structures and the presence of unfused weld rod.
DISCUSSION
No distinction is made in the literature between the strengths of welds made in clear and filled grades of U-PVC^'^, 13. results quoted arepresumably applicable to the filled grades only.
A critical factor in producing high strength welds in U-PVC and the thermoplastics in general is the production of an intimately fused defect free weld zone. This appears to be obtainable in the case of clear Darvic by hot plate welding resulting in excellent weld efficiencies. Far greater difficulty is encountered in the case of hot gas welding and weld zones in both clear and grey Darvic contain several types of defects including those in the form of unfused regions.
In view of the similar microstructures of welds in both clear and grey Darvic the differences in weld properties indicate that the underlying causes are associated with differences in bulk material properties origina-
1 7 ^

ting from differences in formulation„ One important difference in properties is the higher notch sensitivity of the clear Darvic attributable to the soluble organo-tin stabiliser^. Coupled with the presence of internal unfused regions and surface irregularities at the welded joints an analysis
based on fracture mechanics is clearly appropriate. The analogy between tensile test samples and SEN fracture toughness samples yields direct evidence that internal defects of the sizes observed are responsible for the low values of fracture toughness measured.
It should be noted that the removal of surface irregularities by weld dressing was not found to significantly increase weld strength. Consequently, the unfused regions within the joints are almost certainly more important than surface defects. In addition the high degree of orientation present in the weld filler rods may contribute to significant residual stress levels in the welds. Degradation may also play an important part and the common practice of allowing visible discolouration to develop during hot gas welding as an indication of good fusion may in fact produce regions of embrittled material within the weld zone. Clearly thermal degradation during welding is a potentially more serious problem in the sheet than in the welding rod material as at this stage the former contains very little active thermal stabiliser. Increasing the level of stabiliser in the sheet is an economically unattractive proposition.
Possible methods of improving hot-gas weld strengths in clear Darvic are being explored. The obvious approach is to ensure that unfused regions do not occur in the weld zones. Out of 200 tests one industrial weld achieved a failure stress of 45.3MPa and fracture did not originate within the weld interior. This result exceeds the next highest failure stress by 8MPa. Presumably in this one sample no flaw was present in the weld. Statistically it is very unlikely that no unfused region would occur in a weld run. The overall strength of the weld would depend on the severest flaw. However, the method of hot gas welding, the poor thermal stability of PVC and its high melt viscosity make perfect fusion highly unlikely. As a result the weld zone is a complex region and potential source of weakness. An alternative approach is to improve the toughness of the weld zone in some way without sacrificing tensile strength at normal and elevated temperatures. This precludes the use of plasticised rod which is in fact commercially available. The use of toughened grades of PVC in the weld zone isa more attractive approach and is being investigated.
CONCLUSIONS
Hot gas welding is a convenient and economic method of joining U-PVC and other thermoplastics. It is a flexible process allowing complex fabrications to be produced. However, in general lower joint efficiencies are produced than in other welding methods, notably hot plate welding. The weld region is complex and contains various types of defect, such as degraded zones and unfused areas. The effect of these on weld strengths depends on the precise material formulation, even minor changes in composition leading to serious reductions in some cases.
Hot gas welds in clear U-PVC have significantly lower strengths and efficiencies than in similar filled grades. In the case of clear U-PVC considerable scatter in the strength of a weld exists along its length. Hotgas welds in filled U-PVC and hot plate welds in U-PVC have high strengths and efficiencies and reduced scatter.
175

Unfused regions are present in hot gas weld zones in clear and filled U- PVC and are the major factor in the production of low strengths and fraction toughness values in the case of clear U-PVC welds. This is probably due to the high notch sensitivity of clear U-PVC brought about by the use of organo-tin thermal stabilisers.
Considerable care is required in hot gas welding PVC to minimise weld flaws and to ensure optimum fusion. The use of weld filler rods manufactured from toughened U-PVC is an attractive proposition.
Tensile testing gives a useful indication of weld properties and fracture mechanics offers a promising basis for complementary testing procedures.
ACKNOWLEDGEMENTS
We would like to thank British Nuclear Fuels Ltd for financial support and ICI Ltd for valuable discussions.
REFERENCES
1. I.C.I. Ltd. Tech. Man. D106. 3rd Ed. Sept. 1980.
2. Vincent, P.I. 'Fracture', Fig.31 Enc. Polymer Science and Tech.2, 336.
3. Brady, T.E. and Jabarin, S.A. 'Polymer Eng.Sci.' 1977, 17, 686
4. E.E.U.A. Handbook,'Thermal and Chemical Welding of Plastics Materials'. No.35 1976.
5. Haim, G.'Manual for Plastic Welding', vol.3 PVC, 1956.
6. Bucknall, C.B., Drinkwater, I.C. and Smith, G.R. 'Polymer Eng. Sci.'1980 20 432.
7. Rooke, D.P. and Cartwright, D.J. 'Compendium of Stress Intensity Factors'. HMSO 1976.
8. Gross,B and Srawley,J.E. NASA TN D 3295, 1966.
9. Marshall, G.P., Culver, L.E. and Williams, J.G. Plastics andPolymers Feb. 1969, 75.
10. Marshall, G.P., Coutts, L.H. and Williams, J.G. J. Mat. Sci.1974, 9 1409.
11. ASTM. STP 410.
12. Connors, F.L. Australian Plastics, May 1954, 6_.
13. Alf, E. Potentes, H. and Menges, G. 'Designing to Avoid Mechanical Failure'. Plastics Inst. Conf. 1973.
14. I.C.I. Ltd., Tech. Service Note W121 2nd Ed. 1980.
176

Fig.l Cross-section of a hot gas weld in clear U-PVC
Fig.3 Sharp crack within a weld filler rod
Fig.2 View through hot gass weld in clear U-PVC showing interior defects
Fig. 4 Scanning electron micrograph of a weld fracture surface in U-PVC
177
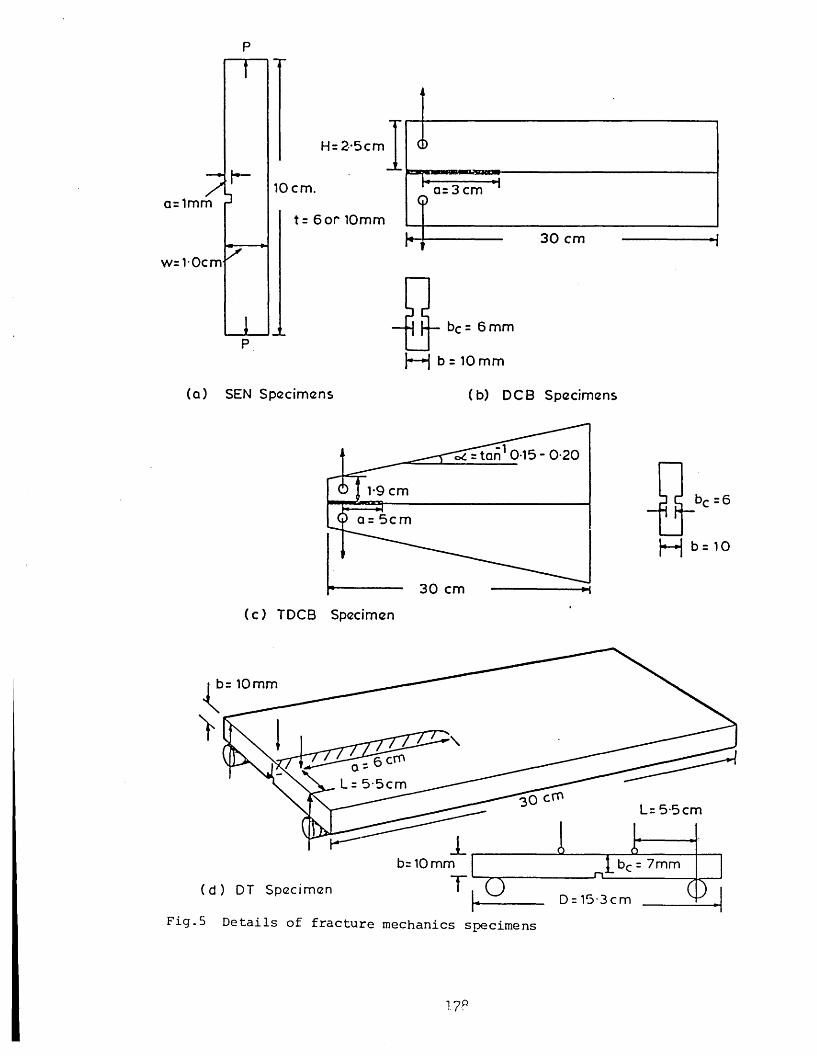
/ Ia= 1mm
h -
w=1-0cm
Hr 2*5cm
10 cm.
t = 6 o r 10mm
a= 3 cm
30 cm
3 C— | [-— bc = 6 mm
(a) SEN Specimens
b = 10 mm
(b) DCB Specimens
ex's tan 0-15-0-20
O I 1-9 cm
a : 5cm
30 cm
(c ) TDCB Specimen
br =6
b = 1 0
br 10mm
- ^ T 6 crnLr 5 5cm
30 C'1' Lr 5-5 cm
br 10 mm br r 7mmn( d ) DT Specimen
Fig.5 Details of fracture mechanics specimens
1.7P