A Sheffield Hallam University thesis
223
Effects of polyphosphates on frozen chickens. DOUGLASS, Maureen. Available from the Sheffield Hallam University Research Archive (SHURA) at: http://shura.shu.ac.uk/19577/ A Sheffield Hallam University thesis This thesis is protected by copyright which belongs to the author. The content must not be changed in any way or sold commercially in any format or medium without the formal permission of the author. When referring to this work, full bibliographic details including the author, title, awarding institution and date of the thesis must be given. Please visit http://shura.shu.ac.uk/19577/ and http://shura.shu.ac.uk/information.html for further details about copyright and re-use permissions.
-
Upload
khangminh22 -
Category
Documents
-
view
2 -
download
0
Transcript of A Sheffield Hallam University thesis

Effects of polyphosphates on frozen chickens.
DOUGLASS, Maureen.
Available from the Sheffield Hallam University Research Archive (SHURA) at:
http://shura.shu.ac.uk/19577/
A Sheffield Hallam University thesis
This thesis is protected by copyright which belongs to the author.
The content must not be changed in any way or sold commercially in any format or medium without the formal permission of the author.
When referring to this work, full bibliographic details including the author, title, awarding institution and date of the thesis must be given.
Please visit http://shura.shu.ac.uk/19577/ and http://shura.shu.ac.uk/information.html for further details about copyright and re-use permissions.

POLYTECHNIC LIBRARY POND SiRLE1
SHEFFIELD SI 1WB
Sheffield City Polytechnic
Eric M ensforth Library
REFERENCE ONLYThis book must not be taken from the Library
PL/26R5193
ProQuest Number: 10694458
All rights reserved
INFORMATION TO ALL USERS The quality of this reproduction is dependent upon the quality of the copy submitted.
In the unlikely event that the author did not send a com p le te manuscript and there are missing pages, these will be noted. Also, if material had to be removed,
a note will indicate the deletion.
uestProQuest 10694458
Published by ProQuest LLC(2017). Copyright of the Dissertation is held by the Author.
All rights reserved.This work is protected against unauthorized copying under Title 17, United States C ode
Microform Edition © ProQuest LLC.
ProQuest LLC.789 East Eisenhower Parkway
P.O. Box 1346 Ann Arbor, Ml 48106- 1346
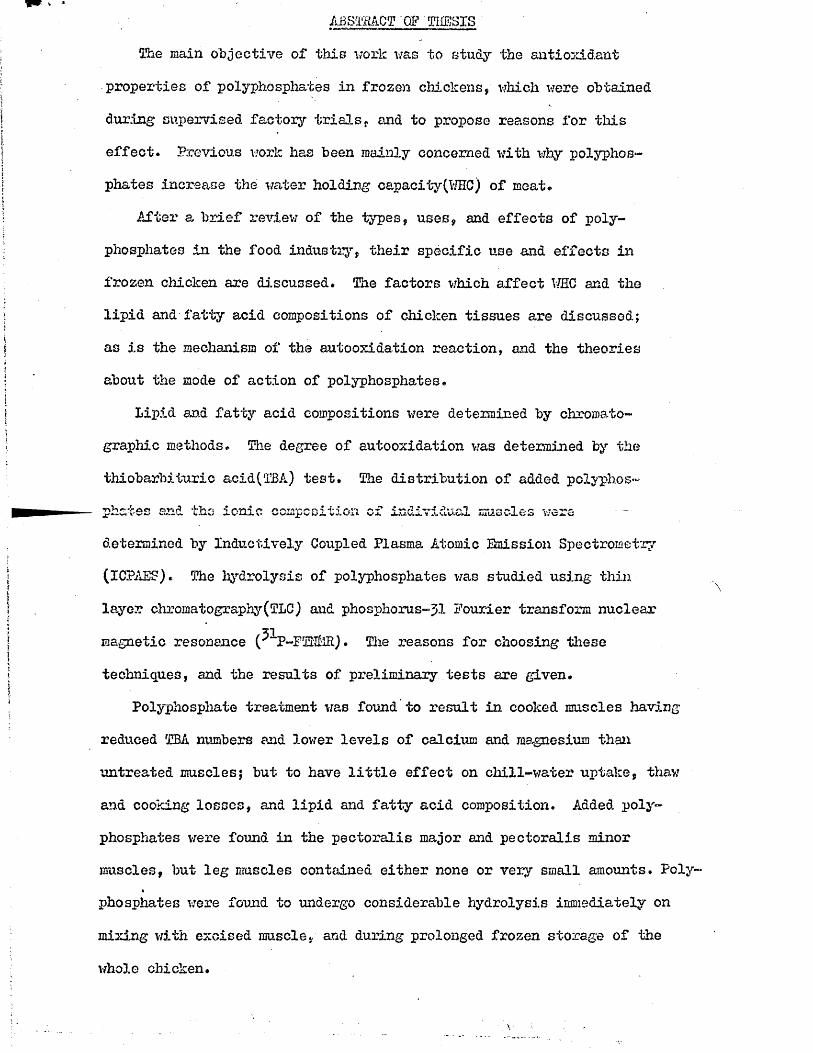
ABSTRACT OF THESIS
The main objective of this work was to study the antioxidant
properties of polyphosphates in frozen chickens, which were obtained
during supervised factory trials, and to propose reasons for this
effect. Previous work has been mainly concerned with why polyphos
phates increase the water holding capacity(V/HC) of meat.
After a brief review of the types, uses, and effects of poly
phosphates in the food industry, their specific use and effects in frozen chicken are discussed. The factors which affect WHC and the lipid and fatty acid compositions of chicken tissues are discussed;
as is the mechanism of the autooxidation reaction, and the theories
about the mode of action of polyphosphates.
Lipid and fatty acid compositions were determined by chromatographic methods. The degree of autooxidation was determined by the
thiobarbituric acid(TM) test. The distribution of added polyphos
phates and the ionic composition of individual muscles were
determined by Inductively Coupled Plasma Atomic Emission Spectrometry
(ICPAES). The hydrolysis of polyphosphates was studied using thin
layer chromatography(TLC) and phosphorus-Jl Fourier transform nuclear
magnetic resonance . The reasons for choosing these
techniques, and the results of preliminary tests are given.
Polyphosphate treatment was found to result in cooked muscles having
reduced TEA numbers and lower levels of calcium and magnesium than
untreated muscles; but to have little effect on chill-water uptake, thaw
and cooking losses, and lipid and fatty acid composition. Added poly
phosphates were found in the pectoralis major and pectoralis minor muscles, but leg muscles contained either none or very small amounts. Pol
phosphates were found to undergo considerable hydrolysis immediately on
mixing with excised muscle, and during prolonged frozen storage of the
whole chicken.
The general conclusions concern the lipid and fatty acid
composition of chicken muscles, the autooxidation process, and the scope and reliability of the TEA test.
It was concluded that polyphosphates remove calcium and
magnesium from thawed muscle, and that they perhaps associate with
phospholipids.
EFFECTS OF POLYPHOSPHATES ON
FROZEN CHICKENS
A thesis submitted for the degree of Doctor of Philosophy
by Maureen Douglass Grad. R.I.C. Department of Hotel & Catering Studies & Home Economics, Sheffield City Polytechnic
August 1979

'1'k, bl-li.Olf/
2b D
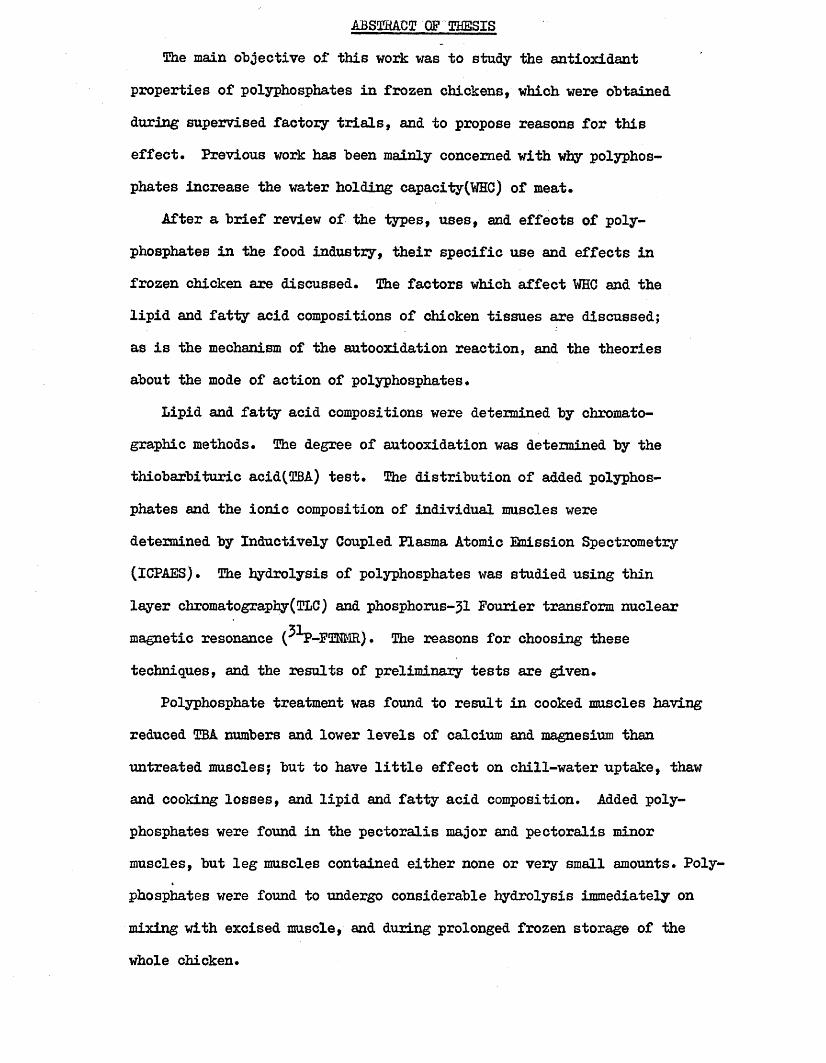
ABSTRACT OF THESISThe main objective of this work was to study the antioxidant
properties of polyphosphates in frozen chickens, which were obtained during supervised factory trials, and to propose reasons for this effect. Previous work has been mainly concerned with why polyphosphates increase the water holding capacity(WHC) of meat.
After a brief review of the types, uses, and effects of polyphosphates in the food industry, their specific use and effects in frozen chicken are discussed. The factors which affect WHO and the lipid and fatty acid compositions of chicken tissues are discussed; as is the mechanism of the autooxidation reaction, and the theories about the mode of action of polyphosphates.
Lipid and fatty acid compositions were determined by chromatographic methods. The degree of autooxidation was determined by the thiobarbituric acid(TBA) test. The distribution of added polyphosphates and the ionic composition of individual muscles were determined by Inductively Coupled Plasma Atomic Philssion Spectrometry (ICPAES). The hydrolysis of polyphosphates was studied using thin layer chromatography(TLC) and phosphorus-31 Fourier transform nuclear
techniques, and the results of preliminary tests are given.Polyphosphate treatment was found to result in cooked muscles having
reduced TEA numbers and lower levels of calcium and magnesium than untreated muscles; but to have little effect on chill-water uptake, thaw and cooking losses, and lipid and fatty acid composition. Added polyphosphates were found in the pectoralis major and pectoralis minor muscles, but leg muscles contained either none or very small amounts. Polyphosphates were found to undergo considerable hydrolysis immediately on mixing with excised muscle, and during prolonged frozen storage of the whole chicken.
The reasons for choosing these
The general conclusions concern the lipid and fatty acid composition of chicken muscles, the autooxidation process, and the scope and reliability of the TBA test.
It was concluded that polyphosphates remove calcium and magnesium from thawed muscle, and that they perhaps associate with phospholipids.
ACKNOWLEDGEMENTSThe author wishes to thank Dr. R.C. Osner and Dr. M.P.
McDonald for their guidance and encouragement during all stages of this woa±.
Grateful acknowledgement is made to Albright & Wilson Ltd., Oldbury, for their practical assistance and continued interest in this work. Also, the author wishes to acknowledge the assistance of Eastwoods Ltd., Newark; and J.P. Wood & Sons, Craven Arms, during factory trials.
The author is indebted to members of the teaching and technical staff of the Department of Hotel & Catering Studies & Home Economics, the Department of Chemistry, and the Department of Biology, for their useful comments during all stages of this work. Also, to Professor I.D. Morton, and members of the F.R.I., Norwich, and B.F.M.I.H.A., Leatherhead, for helpful discussions during various stages of this work.
Grateful acknowledgement is made to Mrs. P. Webster who typed this manuscript.
C O N T E N T SPage
ABSTRACT ACKNOWLEDGEMENTS INDEX TO TABLES INDEX TO FIGURES
1. INTRODUCTION 11.1 GENERAL USES OF POLYPHOSPHATES IN THE FOOD INDUSTRY 11.2 APPLICATION OF POLYPHOSPHATES TO CHICKEN 21.3 EFFECT OF POLYPHOSPHATES ON WATER RETENTION AND 4
COOKING LOSS1.31 THE WATER HOLDING CAPACITY OF MEAT 41.32 WATER UPTAKE DURING PROCESSING 51.33 CONTROL OF WATER CONTENT BY POLYPHOSPHATES 61.34 SUMMARY 12
1.4 EFFECT OF POLYPHOSPHATES ON AUTOOXIDATIVE RANCIDITY 121.41 LIPID COMPOSITION OF CHICKEN 141*411 Summary 19
1.42 MECHANISM OF AUTOOXIDATION 201.43 INHIBITION OF AUTOOXIDATIVE RANCIDITY BY POLY- 22
PHOSPHATES1.5 OTHER EFFECTS OF POLYPHOSPHATES 241.51 COLOUR 241.52 FLAVOUR 251.53 MICROBIAL SPOILAGE 271.6 MODE OF ACTION OF POLYPHOSPHATES 321.61 ACTION ON WATER RETENTION 321.611 pH and Ionic Strength 321.612 Chelation of Metal Ions 341.613 Analogy with Adenosine Triphosphate 36
1.62 ACTION ON COOKING LOSS 381.63 ACTION ON AUTOOXIDATIVE RANCIDITY 39
1.64 HYDROLYSIS OF POLYPHOSPHATES 39
2. METHODS - 432.1 STATISTICAL ANALYSES 432.2 CHICKEN SAMPLES 432.3 THIQBAHBITURIC ACID TEST TO ASSESS THE DEGHEE 44
OF RANCIDITY2.31 CHOICE OF METHOD 442.32 APPARATUS AND REAGENTS 462.33 PROCEDURE 462.34 CALIBRATION 48
2.4 LIPID ANALYSES 512.41 CHOICE OF METHODS 512.42 EXTRACTION OF TOTAL LIPID 522*421 Moisture Determination 522.422 Procedure 522.43 SEPARATION OF TOTAL LIPID INTO NEUTRAL LIPID 53
AND PHOSPHOLIPID BY COLUMN CHROMATOGRAPHY2.431 Preparation of Adsorbent 532.432 Preparation of Column and Elution Procedure 542*433 Identification of Lipids by Thin Layer
Chromatography 552.44 METHYLATIGN OF LIPIDS 582*441 Choice of Method 582.442 Procedure 582.443 Determination of Percentage Methylation 582.45 GAS LIQUID CHROMATOGRAPHIC ANALYSIS OF FATTY 60
ACID METHYL ESTERS2.451 Nomenclature of Fatty Acids 602*452 Operating Conditions 602*453 Qualitative Analysis 632*454 Quantitative Analysis 642*4541 Measurement of Peak Areas 64
2*4542 Calibration Procedure 642*4545 Calculations 66
2*5 DETERMINATION OP PHOSPHORUS, SODIUM, CALCIUM, 72MAGNESIUM AMD IRON
2.51 DIGESTION PROCEDURE 722.52 CALCULATIONS 752.6 DETERMINATION OP THE DEGREE CP HYDROLYSIS CP 75
ADDED PHOSPHATES2.61 THIN LAYER CHROMATOGRAPHIC PROCEDURE 752.62 PHOSPHORUS - 51 FOURIER TRANSFORM NUCLEAR 74
MAGNETIC RESONANCE PROCEDURE2.621 Principles of Nuclear Magnetic Resonance 742.622 Procedure 752*625 Calculations 76
2.7 DETERMINATION OP TOTAL HAEM 78
2.8 DETERMINATION OP MICRO-ORGANISM CONTENT OP 78 MINCED MUSCLE
5* RESULTS AND DISCUSSION 795.1 PRELIMINARY INVESTIGATION CP THE EFFECTS OP 79
POLYPHOSPHATE TREATMENT ON RAW AND COOKED BATCH A CHICKENS AFTER 21 MONTHS STORAGE AT -18°C.
5.2 TEA ANALYSIS, AND LIPID AND PATTY ACID COMPOSITION 82 OP RAW PECTORALIS MAJOR AND LEG MUSCLES OP TREATEDAND UNTREATED BATCH A CHICKENS AFTER 56 MONTHS STORAGE AT -18°C
5.21 LIPID COMPOSITION 855*22 PATTY ACID COMPOSITION 855.25 CORRELATION COEFFICIENTS BETWEEN LIPID AND PATTY 85
ACID COMPOSITIONS5.24 TEA NUMBERS 905.25 CORRELATION COEFFICIENTS BETWEEN TBA NUMBERS AND 90
PATTY ACID LEVELS5.26 CORRELATION COEFFICIENTS BETWEEN TBA NUMBERS AND
LIPID LEVELS92
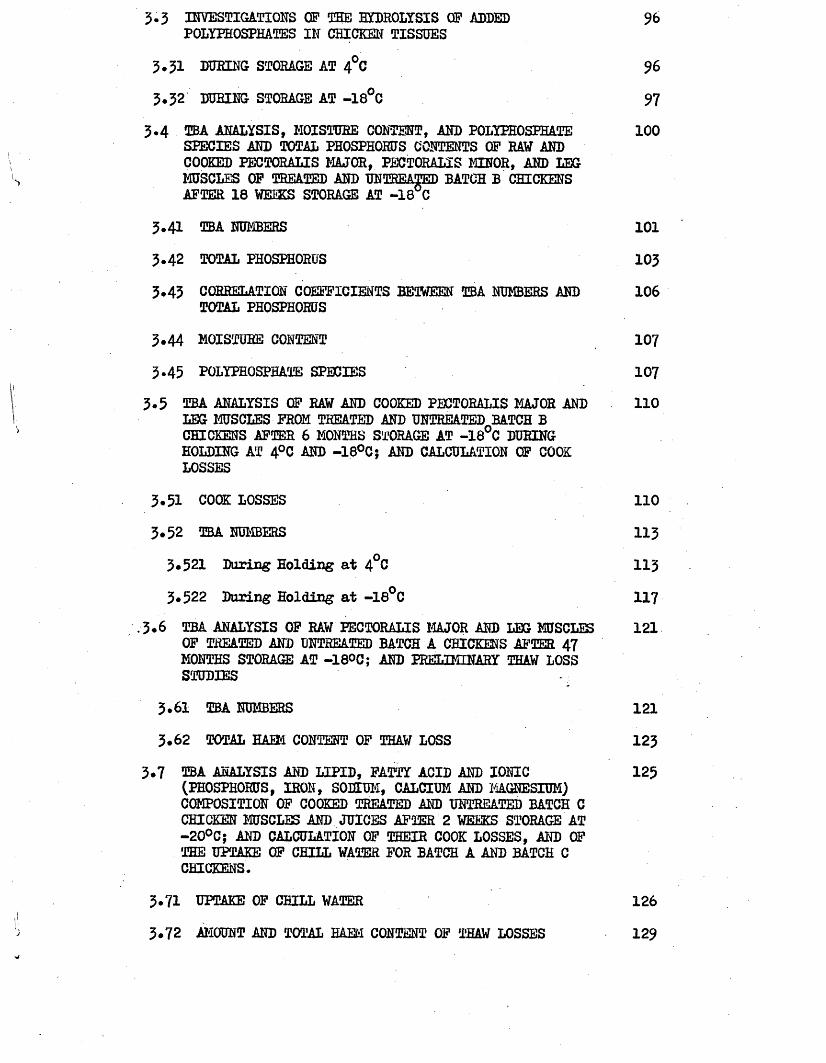
3.3 INVESTIGATIONS op the hydrolysis op added 96POLYPHOSPHATES IN CHICKEN TISSUES
3.31 DURING STORAGE AT 4°C 963.32 DURING STORAGE AT -18°C 97
3 .4 TBA ANALYSIS, MOISTURE CONTENT, AND POLYPHOSPHATE 100SPECIES AND TOTAL PHOSPHORUS CONTENTS OP RAW ANDCOOKED PECTORALIS MAJOR, PECTORALIS MINOR, AND LEG MUSCLES OP TREATED AND UNTREATED BATCH B CHICKENS AFTER 18 WEEKS STORAGE AT -18 C
3.41 eba NUMBERS 1013.42 TOTAL PHOSPHORUS 1033.43 CORRELATION COEFFICIENTS BETWEEN TBA NUMBERS AND 106
TOTAL PHOSPHORUS3.44 MOISTURE CONTENT 1073.45 POLYPHOSPHATE SPECIES 107
3.5 TBA ANALYSIS OP RAW AND COOKED PECTORALIS MAJOR AND 110LEG MUSCLES PROM TREATED AND UNTREATED BATCH B CHICKENS AFTER 6 MONTHS STORAGE AT -18°C DURING HOLDING AT 4°C AND -18°C; AND CALCULATION OP COOK LOSSES
3.51 COCK LOSSES 1103.52 TBA NUMBERS 1133*521 Daring Holding at 4°C 1133.522 During Holding at -18°C 117
,3.6 TBA ANALYSIS OP RAW PECTORALIS MAJOR AND LEG MUSCLES 121OP TREATED AND UNTREATED BATCH A CHICKENS AFTER 47 MONTHS STORAGE AT -18°C; AND PRELIMINARY THAW LOSS STUDIES
3*61 SEA NUMBERS 1213.62 TOTAL H A M CONTENT OP THAW LOSS 123
3.7 EBA ANALYSIS AND LIPID, PATTY ACID AND IONIC 125(PHOSPHORUS, IRON, SODIUM, CALCIUM AND MAGNESIUM)COMPOSITION OP COOKED TREATED AND UNTREATED BATCH C CHICKEN MUSCLES AND JUICES AFTER 2 WEEKS STORAGE AT -20°C; AND CALCULATION OP THEIR COOK LOSSES, AND OP THE UPTAKE OP CHILL WATER FOR BATCH A AND BATCH C CHICKENS-
3.71 UPTAKE OP CHILL WATER 1263.72 AMOUNT AND TOTAL H A M CONTENT OP THAW LOSSES 129
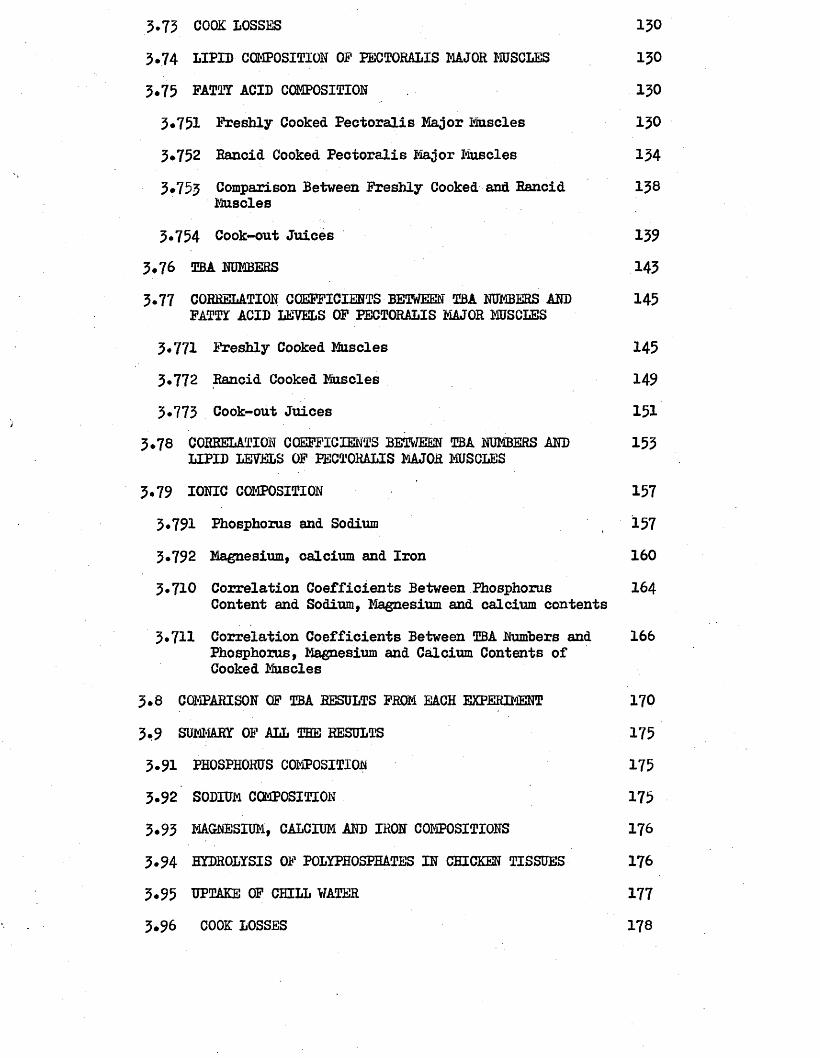
3*73 COOK LOSSES 130
3.74 LIPID COMPOSITION OP PECTORALIS MAJOR MUSCLES 1303.75 FATTY ACID COMPOSITION 1303*751 Freshly Cooked Pectoralis Major Muscles 1303*752 Rancid Cooked Pectoralis Major Muscles 1343*753 Comparison Between Freshly Cooked and Rancid 138
Muscles3*754 Cook-out Juices 139
3*76 TBA NUMBERS 1433*77 CORRELATION COEFFICIENTS BETWEEN TBA NUMBERS AND 145
FATTY ACID LEVELS OF PECTORALIS MAJOR MUSCLES3.771 Freshly Cooked Muscles 1453*772 Rancid Cooked Muscles 1493*773 Cook-out Juices 151
3*78 CORRELATION COEFFICIENTS BETWEEN TBA NUMBERS AND 153LIPID LEVELS OF PECTORALIS MAJOR MUSCLES
3*79 IONIC COMPOSITION 1573.791 Phosphorus and Sodium 1573*792 Magnesium, calcium and Iron 1603*710 Correlation Coefficients Between Phosphorus 164
Content and Sodium, Magnesium and calcium contents3*711 Correlation Coefficients Between TBA Numbers and 166
Phosphorus, Magnesium and Calcium Contents of Cooked Muscles
3*8 COMPARISON OF TBA RESULTS FROM EACH EXPERIMENT 1703*9 SUMMARY OF ALL THE RESULTS 1753*91 PHOSPHORUS COMPOSITION 1753*92 SODIUM COMPOSITION 1753*93 MAGNESIUM, CALCIUM AND IRON COMPOSITIONS 1763*94 HYDROLYSIS OP POLYPHOSPHATES IN CHICKEN TISSUES 1763*95 UPTAKE OF CHILL WATER 1773*96 COOK LOSSES 178
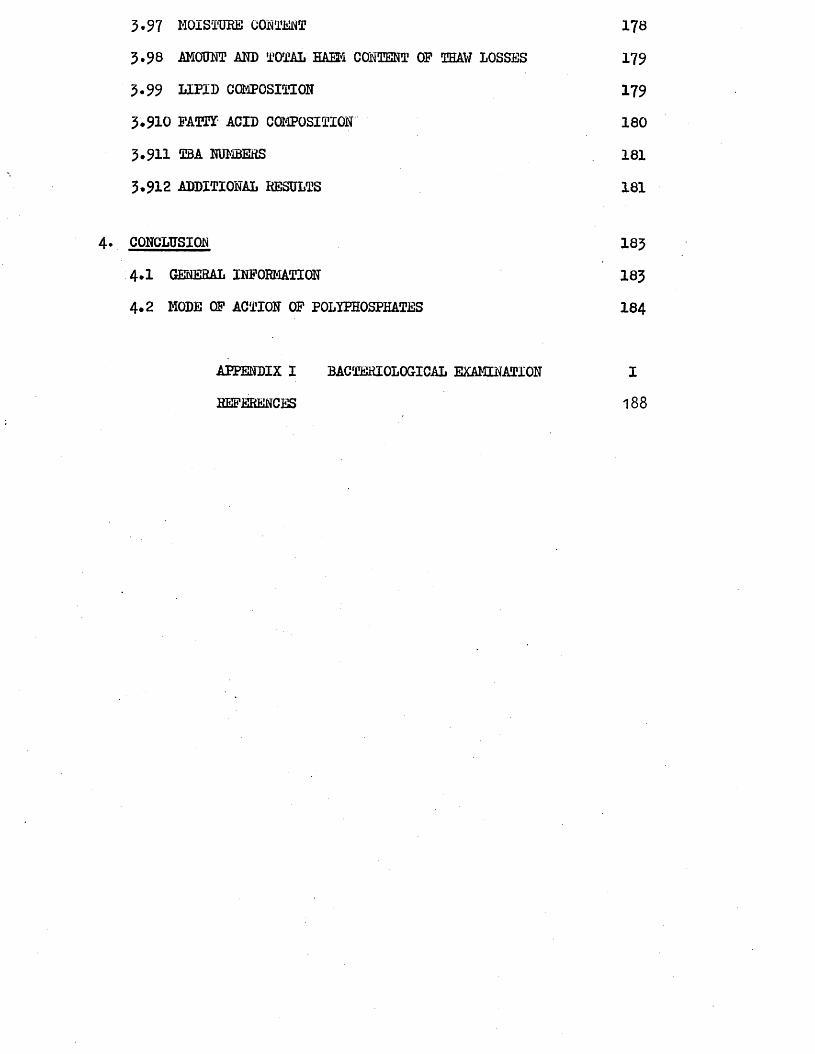
3-97 MOISTURE CONTENT 1783.98 AMOUNT AND TOTAL EAMI CONTENT OF THAW LOSSES 1793.99 LIPID CCMPOSITION 1793.910 FATTY ACID COMPOSITION 1803.911 TBA NUMBERS 1813.912 ADDITIONAL RESULTS 181
4. CONCLUSION 1834.1 GENERAL INFORMATION 1834.2 MODE OF ACTION OF POLYPHOSPHATES 184
APPENDIX I BACTERIOLOGICAL EXAMINATION REFERENCES
I188
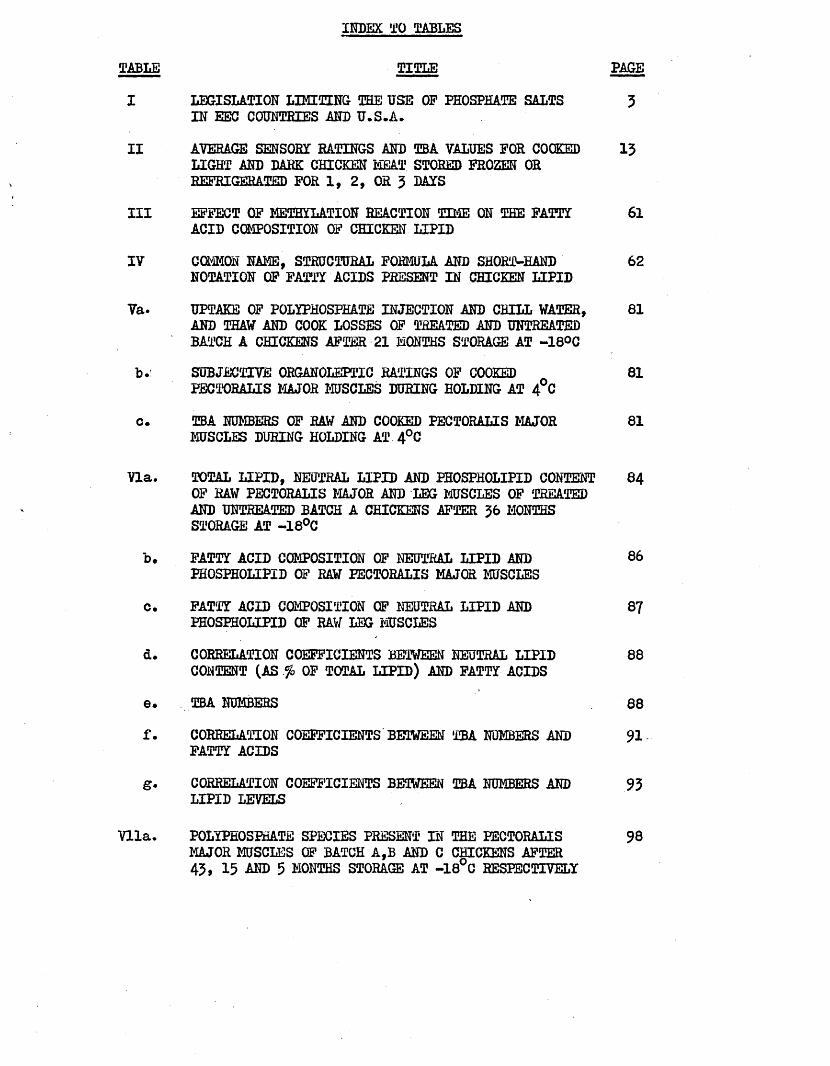
INDEX TO TABLES
TABLEI
II
III
IV
Va.
b.:
c.
Via.
b.
c.
d.
e.f.
g*
Vila.
TITLELEGISLATION LIMITING THE USE OP PHOSPHATE SALTS IN EEC COUNTRIES AND U.S.A.AVERAGE SENSOR! EATINGS AND TBA VALUES FOR COCKED LIGHT AND DARK CHICKEN MEAT STORED FROZEN OR REFRIGERATED FOR 1, 2, OR 3 LAYSEFFECT OF MBTHYLATION REACTION TIME ON THE FATTY ACID COMPOSITION OF CHICKEN LIPIDCCMMON NAME, STRUCTURAL FORMULA AND SHORT-HAND NOTATION OF FATTY ACIDS PRESENT IN CHICKEN LIPIDUPTAKE OF POLYPHOSPHATE INJECTION AND CHILL WATER, AND THAW AND COOK LOSSES OF TREATED AND UNTREATED BATCH A CHICKENS AFTER 21 MONTHS STORAGE AT -18°CSUBJECTIVE ORGANOLEPTIC RATINGS OF COOKED PECTORALIS MAJOR MUSCLES DURING HOLDING AT 4°CTBA NUMBERS OF RAW AND COOKED PECTORALIS MAJOR MUSCLES DURING HOLDING AT 4°C
TOTAL LIPID, NEUTRAL LIPID AND PHOSPHOLIPID CONTENT OF RAW PECTORALIS MAJOR AND LEG MUSCLES OF TREATED AND UNTREATED BATCH A CHICKENS AFTER 36 MONTHS STORAGE AT -18°CFATTY ACID COMPOSITION OF NEUTRAL LIPID AND PHOSPHOLIPID OF RAW PECTORALIS MAJOR MUSCLESFATTY ACID COMPOSITION OF NEUTRAL LIPID AND PHOSPHOLIPID OF RAW LEG MUSCLESCORRELATION COEFFICIENTS BETWEEN NEUTRAL LIPID CONTENT (AS fo OF TOTAL LIPID) AND FATTY ACIDSTBA NUMBERSCORRELATION COEFFICIENTS BETWEEN TBA NUMBERS AND FATTY ACIDSCORRELATION COEFFICIENTS BETWEEN TBA NUMBERS AND LIPID LEVELS
POLYPHOSPHATE SPECIES PRESENT IN THE PECTORALIS MAJOR MUSCLES OF BATCH A,B AND C CHICKENS AFTER 43, 15 AND 5 MONTHS STORAGE AT -18°C RESPECTIVELY
PAGE
5
13
61
62
81
81
81
84
86
87
88
8891
93
98
Villa.
to.
c.
lXa.
to.c.
d. 6 •
Xe *
XI a.
to.c.
d*
e.
f.
8 *
h.
i.
TBA NUMBERS OP HAW AND COOKED PECTORALIS MAJOR, PECTORALIS MINOR AND LEG MUSCLES OP TREATED AND UNTREATED BATCH B CHICKENS AFTER 18 WEEKS STORAGE AT -18°C AND DURING HOLDING OP THE COOKED MUSCLE AT 4°CTOTAL PHOSPHORUS CONTENT OP RAW AND COOKED MUSCLES AFTER 18 WEEKS STORAGE AT -18°CMOISTURE CONTENT OP RAW MUSCLES AFTER 18 WEEKS STORAGE AT -18°C
COCK LOSSES OP PECTORALIS MAJOR AND LEG MUSCLES OP TREATED AND UNTREATED BATCH B CHICKENS AFTER 6 MONTHS STORAGE AT -18°CTBA NUMBERS OF COOKED MUSCLES DURING HOLDING AT 4°C TBA NUMBERS OP RAW MUSCLES DURING HOLDING AT 4°C TBA NUMBERS OP RAW MUSCLES DURING HOLDING AT -18°C TBA NUMBERS OF COCKED MUSCLES DURING HOLDING AT -18°C
TBA NUMBERS OF RAW PECTORALIS MAJOR AND LEG MUSCLES OF TREATED AND UNTREATED BATCH A CHICKENS AFTER 47 MONTHS STORAGE AT -18°C, DURING HOLDING AT 4°C
UPTAKE OP CHILL WATER, AND AMOUNT AND TOTAL H A M CONTENT OF THAW LOSSES FROM TREATED AND UNTREATED BATCH C CHICKENS AFTER 2 WEEKS STORAGE AT -20°CCOOK LOSSES OF PECTORALIS MAJOR AND LEG MUSCLESTOTAL LIPID, NEUTRAL LIPID AND PHOSPHOLIPID CONTENT OP FRESHLY COOKED AND RANCID PECTORALIS MAJOR MUSCLESFATTY ACID COMPOSITION OF NEUTRAL LIPID AND PHOSPHOLIPID OF FRESHLY COOKED PECTORALIS MAJOR MUSCLESFATTY ACID COMPOSITION OP TOTAL LIPID OP FRESHLY COOKED PECTORALIS MAJOR MUSCLESFATTY ACID COMPOSITION OF NEUTRAL LIPID AND PHOSPHOLIPID OP RANCID COOKED PECTORALIS MAJOR MUSCLESFATTY ACID COMPOSITION OP TOTAL LIPID OP RANCID COOKED PECTORALIS MAJOR MUSCLESFATTY ACID COMPOSITION OF TOTAL LIPID OP COOK-OUT JUICES OF PECTORALIS MAJOR MUSCLESFATTY ACID COMPOSITION OF TOTAL LIPID OP COOK-OUT JUICES OP LEG MUSCLES
102
104
108
111
114115 118
115
122
127
127151
152
155
136
140
141
142
d*
k.
L.
m.
n.
o.
P-
r.
s.
Xlla.
b.
TBA NUMBERS OP COOKED PECTORALIS MAJOR AND LEG MUSCLES, DURING HOLDING FOR 2 AND 6 WEEKS RESPECTIVELY AT - 20°CCORRELATION COEFFICIENTS BETWEEN TBA NUMBERS AND FATTY ACID LEVELS OF FRESHLY COOKED PECTORALIS MAJOR MUSCLESCORRELATION COEFFICIENTS BETWEEN TBA NUMBERS AND FATTY ACID LEVELS OF RANCID COOKED PECTORALIS MAJOR MUSCLESCORRELATION COEFFICIENTS BETWEEN TBA. NUMBERS AND FAT1Y ACID LEVELS OF THE COOK-OUT JUICES FROM PECTORALIS MAJOR MUSCLESCORRELATION COEFFICIENTS BETWEEN TBA NUMBERS AND FATTY ACID LEVELS OF THE COOK-OUT JUICES FROM LEG MUSCLESCORRELATION COEFFICIENTS BETWEEN TBA NUMBERS AND LIPID LEVELS OF FRESHLY COOKED AND RANCID PECTORALIS MAJOR MUSCLESPHOSPHORUS AND SODIUM CONTENTS OF THAW LOSSES, COOKED MUSCLES, AND THEIR COOK-OUT JUICESMAGNESIUM, CALCIUM AND IRON CONTENTS OF THAW LOSSES, COOKED MUSCLES AND THEIR COOK-OUT JUICESCORRELATION COEFFICIENTS BETWEEN PHOSPHORUS CONTENT AND SODIUM, MAGNESIUM AND CALCIUM CONTENTS OF THAW LOSSES, COCKED MUSCLES AND THEIR COOK-OUT JUICESCORRELATION COEFFICIENTS BETWEEN TBA NUMBERS AND PHOSPHORUS, MAGNESIUM, AND CALCIUM CONTENTS OF PECTORALIS MAJOR AND LEG MUSCLES
MEAN TBA NUMBERS OF RAW AND COOKED PECTORALIS MAJOR AND LEG MUSCLES FROM CHICKENS AFTER VARIOUS PERIODS OF STORAGE AT -18°C, DURING 0 DAYS HOLDINGTBA NUMBERS OF RAW AND COOKED PECTORALIS MAJOR MUSCLES FROM CHICKENS AFTER VARIOUS PERIODS OF STORAGE AT -180C, DURING 1 TO 9 DAYS HOLDING AT 4°C
144
146
147
152
152
154
158
161
165
167
171
175
INDEX TO FIGURES
FIGURE TITLEI Structure of orthophosphoric, diphosphoric and
tripolyphosphoric acids
II Fatty acid composition of chicken adipose tissue as influenced by dietary fat supplements
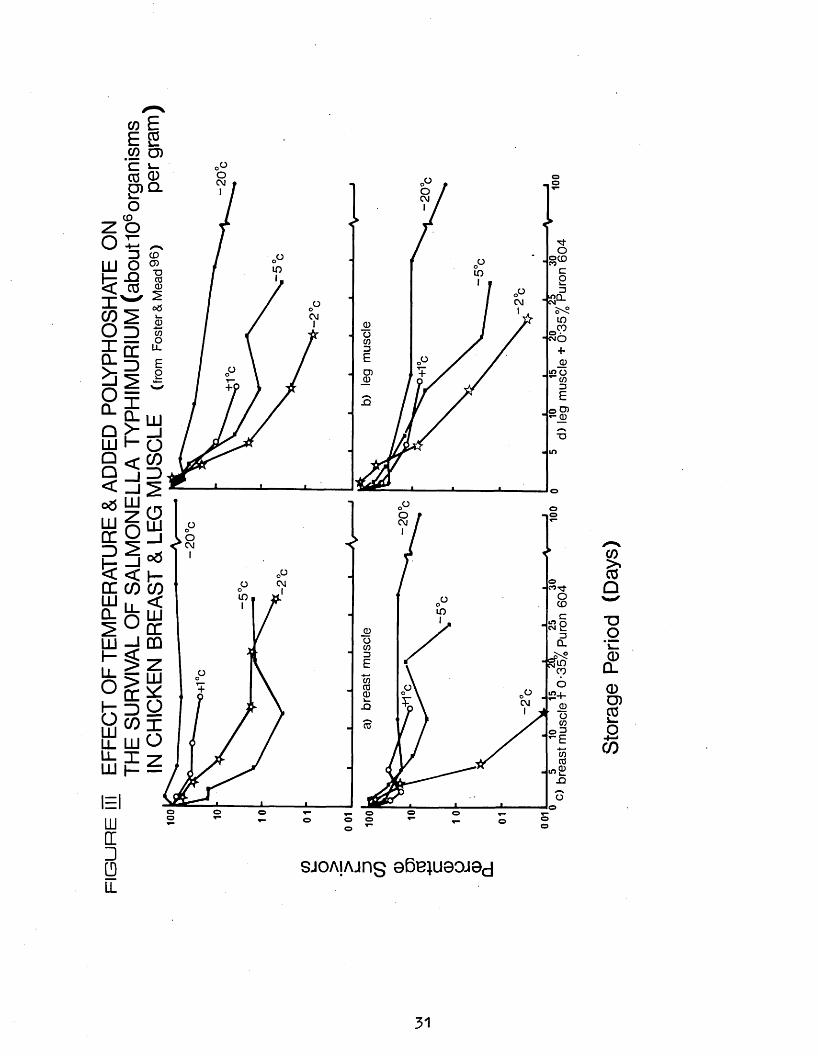
III Effect of temperature and added polyphosphate on thesurvival of salmonella typhimurium (about 10® organisms per gram) in chicken breast and leg muscle
IV Distillation apparatus used in the TBA test
V Standard curve for TBA test
VI Graph to calculate the percentage recovery of malonaldehyde in the TBA test
VII Elution pattern for separation of total lipid by Florisil column chromatography
VIII Identification of lipids by TLC
IX Methylating device
X GLC trace of chicken neutral lipid
XI GLG calibration curve for methyl palmitate
XII GLC calibration curve for methyl stearate
XIII GLC calibration curve for methyl oleate
XIV GLC calibration curve for methyl linoleate
XV GLC calibration curve for methyl linolenate
XVL ^P-FTNMR spectra of tripolyphosphate andchicken muscle.
PAGE1
17a
31
47
49
50
56
57
59
65
67
68
69
70
71
77
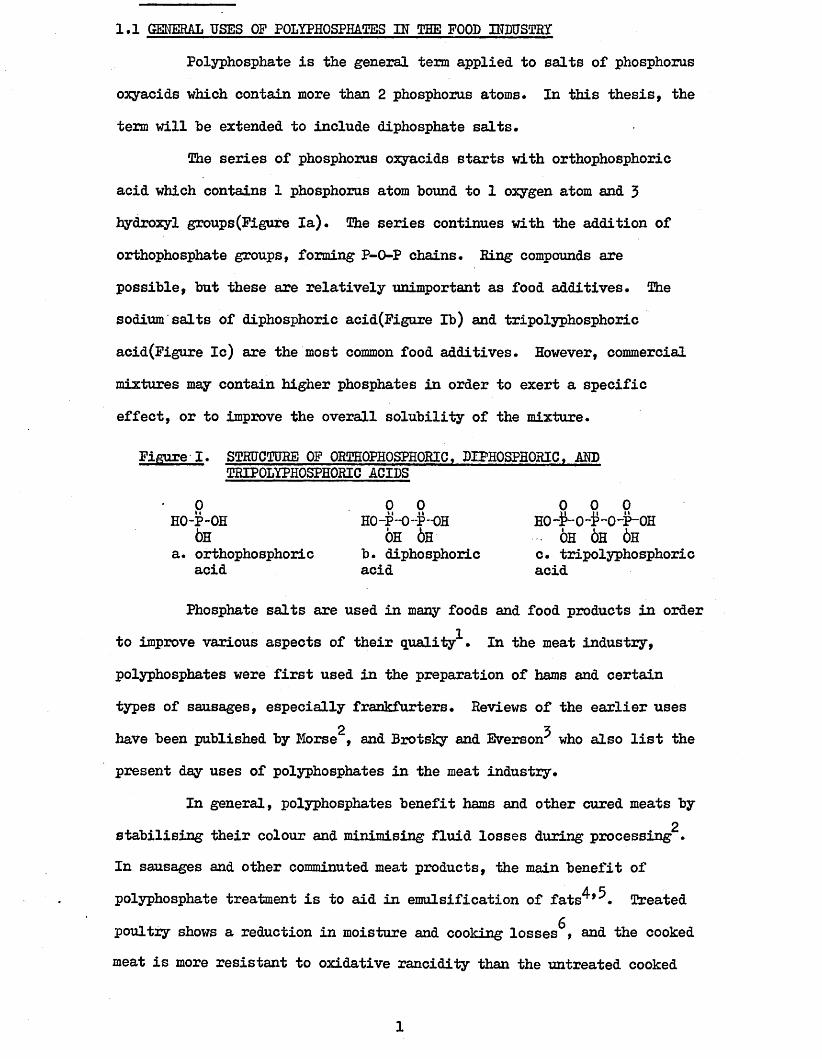
1.1 GENERAL USES OF POLYPHOSPHATES IN THE POOD INDUSTRYPolyphosphate is the general term applied to salts of phosphorus
oxyacids which contain more than 2 phosphorus atoms. In this thesis, the term will he extended to include diphosphate salts.
The series of phosphorus oxyacids starts with orthophosphoric acid which contains 1 phosphorus atom hound to 1 oxygen atom and 3 hydroxyl groups(Figure la). The series continues with the addition of orthophosphate groups, forming P-O-P chains. Ring compounds are possible, hut these axe relatively unimportant as food additives. The sodium salts of diphosphoric acid(Figure Ih) and tripolyphosphoric acid(Figure Ic) are the most common food additives. However, commercial mixtures may contain higher phosphates in order to exert a specific effect, or to improve the overall solubility of the mixture.
Figure I. STRUCTURE OF ORTHOPHOSPHORIC. DIPHOSPHORIC. AND TRIPOLYPHOSPHORIC ACIDS
0 0 0 0 0 0HO-P-OH H0-P~O--P~0H H0-#-0-£-0-P-0H
6h oh 6h oh 6h 6ha. orthophosphoric h. diphosphoric c. tripolyphosphoric
acid acid acid
Phosphate salts are used in many foods and food products in order to improve various aspects of their quality^-. In the meat industry, polyphosphates were first used in the preparation of hams and certaintypes of sausages, especially frankfurters. Reviews of the earlier uses
2 3have been published by Morse , and Brotsky and Everson- who also list thepresent day uses of polyphosphates in the meat industry.
In general, polyphosphates benefit hams and other cured meats bystabilising their colour and minimising fluid losses during processing .In sausages and other comminuted meat products, the main benefit ofpolyphosphate treatment is to aid in emulsification of fats^*^. Treated
£poultry shows a reduction in moisture and cooking losses , and the cooked meat is more resistant to oxidative rancidity than the untreated cooked
1
Y 8meat. It is the sodium salts of diphosphoric and tripolyphosphoric9acids which are the most effective in poultry and other meats.
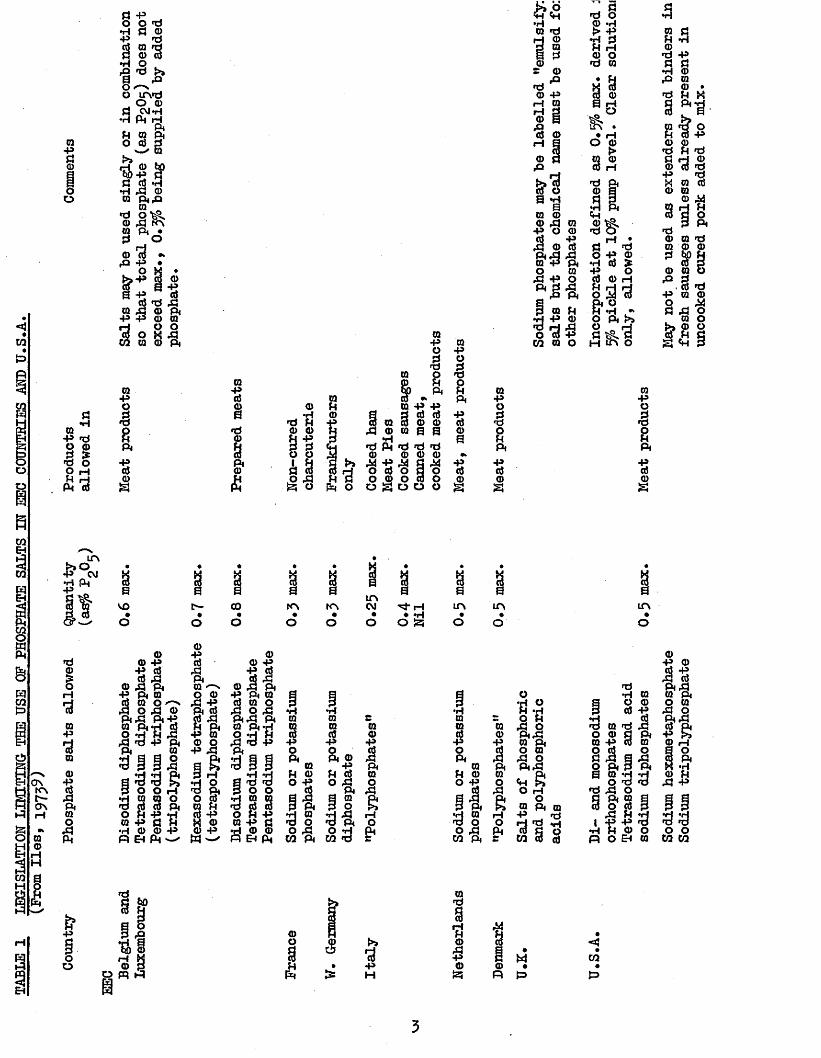
1.2 APPLICATION OF POLYPHOSPHATES TO CHICKENIt is generally accepted that incorporation of up to 0*5$
(as P^O^) by weight of polyphosphates into meat results in beneficialeffects, but above this level adverse effects such as deterioration of
9flavour and appearance may result. Table I shows the maximum levelsof phosphate salts allowed in meat products in the USA and EEC countriesother than the UK, who have yet to provide such legislation.
Since chickens are usually processed as the whole carcase, earlymethods of administering polyphosphates involved soaking the evisceratedcarcase in a solution of polyphosphates. However, the skin and adiposetissue of chicken act as a barrier to absorption, and the majordisadvantage of the soaking technique is the long period of immersionnecessary to ensure adequate uptake of phosphate.^ In fact, earlyexperiments on the polyphosphate treatment of poultry involved soakingin chill solutions for up to 22 hour s. Other methods of application
12 13include adding to the cook water, 9 and post-cook cooling in12polyphosphate solutions. Obviously, these 2 methods would be limited
to the retail of cooked chicken. A British patent^ states thataddition of solid polyphosphates to the surface of poultry results inadequate absorption and distribution of phosphate throughout the carcase.The scientific literature oh the polyphosphates treatment of poultry byinjection is scarce. Undoubtedly, much of this work has been carriedout by polyphosphate manufacturers and poultry processors and research
15institutes; and is to be found in the patent literature. However, at least 4 papers have been published which determine the effects of polyphosphate injection into chicken.12,16,17,18
Further information about this literature is given in section
1-33-
2
TABLE
1 LEGISLATION
LIMITING THE USE
OF
PHOSPHATE
SALTS
IN EEC COUNTRIES
AND U.S.A
09p3©oo
«09 ’H p *d O ©3 £*d O O rH£ d PM <6
apoJB8Piai§
09"5<D0»d09P<(D£
<D 0
09PO£a o 0 Pi §> Pi
0 P PJ d a (6 09 3 <D 0
q 09 a 0H»d Pi »d *d *d 0) 0 0 0^*8 *7$ § £O to O 3 oo © o a oO s o o o
0pIa*800"8i§
0pogsPipa0a
0
9 8B<g0 0 0 ,3 0 P O OI s !ffS'S0 0 .3 p o2 £a1 0 U•HPO>0O TO PCO 0 o
0po£sPi*80s
LTV•&* CM
8 *pl a80
VO GO
• • •
8a 8a aUN
1NN KN CM rH• • • ♦ *Ho o o O S3
LfN UN0un
o
ONKNf—ON
•d08rH
■a0p■a001*sPM0Ofi
0 © Pp a
© j? PM P PM 00 o*~> . 0 3 © PM 3 PMP 0 PM*HIPi33O0sao 0 ap p 3 0 0 & PM
IPM0
£eiH
&TJp
0*81PM0O 0 £ P
9 1£P0P
PM0O*3a a
0 0 P
0 3 PM P PM 0 3 0 0 3 0 3 PM 3 Pi 0 PM *H O *H H
3 d P PM _ _
r lO8*8p©p
3o
1PM Eh Pm
I
•H00£Pi, 01 Pi 0O P
Pi •h 0 'd oO 3
CO PM
001PM0iapHOPM
OI sPi «3 0 PM O 0ftJJ<H SO H Ofa PM 0 P »d1 1 1
0 PM
0 rH
° a*d 3
3 a sf\ Au
0 C0 CO
&P
oo
'I3 34 8
O pq 3
>»•apH
0•dSfl03P03
«*«toS=>
3
uncooked cur
ed por
k add
ed to
mix
Following the development of an efficient and reproducible 19injection unit, this method of polyphosphate treatment is now used
commercially for chickens which are to he subsequently frozen. More20up-to-date equipment is now available. The chicken is injected into both
sides of the breast with a pneumatically operated hand injector.(Turkeys over 7kg in weight should also be injected into the thigh muscles.
To ensure distribution of injected polyphosphate throughout20the carcase before freezing, it is reported that injection should be
carried out after evisceration and before spin-chilling, with a 15 to50 minute holding period at 0°C to 4°C before freezing. However,
21(Truman and Hi ekes, found no or very little added phosphorus in theleg muscles of commercially treated chickens, although the treated leg muscles did contain more sodium than the untreated muscles. (The phosphorus contents (% wet tissue) of the leg muscles from these treated and untreated chickens were, 0.19 and. 0*25, and 0.17 and 0.19
respectively; and the sodium contents, 0.094 and 0.097> and 0.062 and 0.075, respectively. Since only 2 chickens from each treatment were analysed, these findings are inconclusive.
1.5 EFFECT OF POLYPHOSPHATES ON WATER BETENTIOH AND COOKING LOSS1.51 THE WATER HOLDING CAPACITY OF MEAT
All meat has an inherent ability to retain its natural moisture, which in chicken comprises about 75$ of its weight; and to absorb additional water. This is called the water holding capacity (WHC), andis affected by properties of the meat, including pH and muscle
pg 25 24 25structure; * 7 and by external processes such as rate of freezing.Further details of WHC are given in section 1.611.
A decrease in WHC results in loss of fluid from the meat, andit is this loss which has presented problems to poultry processors. Theloss of fluid from fresh whole and cut-up carcases (weep) during storage
4
and marketing, leads to an unsightly packaged product, as well aspresenting problems of weight control. Frozen carcases lose fluidon thawing, which may be considerable and, coupled with the cook loss,may result in a tough dry product. This loss of ability of meat tohold water is caused by protein denaturation and proteolysis, and itis important to remember that both poultry weep and thaw loss resultin loss of proteinacious material from the carcase, which may lead
26to a decrease in the nutritive value.The pH of the post-rigor muscle is one of the factors which
affect these protein changes. The ultimate pH of the muscle after post-mortem glycolysis is about 5«5> and the WHO is at a minimum at this point. This is because this pH is near to the isoelectric point of the myofibrillar proteins which are primarily responsible for the binding of water; and, therefore, at this pH the proteins carry minimum nett charge, and their packing density is thus at its maximum and the hydration at a minimum. Generally, as the muscle pH decreases, the volume of thaw loss and weep are increased. Cooking also produces a decrease in WHO because heat denaturation of tissue proteins leads to loss of f luids.Meat may lose more than 30$ of its weight during cooking.
1.32 WATER UPTAKE HPBIHG PROCESSINGPoultry comes into contact with water during the slaughtering
and processing stages, and some of this water will be taken up by thecarcase. Most of this added water is taken up during the chillingstages, and the amount increases with immersion time, chill watertemperature, and with agitation; as well as being dependant oncharacteristics of the individual bird. Very little water is absorbedthrough intact skin, and the primary sites of water absorption are
27through cut and damaged surfaces. 1 Some of the water taken up in this way will be lost on the drip-line following the chill tanks and preceding
5
the packing table. However, the added water that does remain in thebird is of concern to legislative bodies because of its doubtfulhygienic status. The chilling process has recently been the subject
28of EEC legislation. However, considerable controversy surrounds29this legislation because of its economic implications, and doubts
as to whether or not hygiene will be improved since the chillingprocess is not the only stage at which potentially unwholesome watermay enter the carcase.
A very important aspect of polyphosphate treatment is thatthe injection process inevitably leads to water being introduced intothe carcase, and this has led to consumer and governmental complaints.However, the water content of fresh and processed chicken is subjectto the variations discussed above, and providing the volume ofpolyphosphate injection lies within acceptable limits, the chickenshould benefit from such treatment. As yet, the UK has no legislationas to the amount of added water permitted, but in the USA the amountinjected is limited to no more than jfo of the weight of the evisceratedcarcase. The EEC are expected to enforce standards for the water
31content of poultry for all member countries. Without legislationthe injection process is open to abuse, but a chicken containing a
32high level of water may infringe other legislation.*^ It is worthmentioning that the most common complaint directed toward polyphosphatetreated chickens:that of “selling the consumer water11, is entirelymisguided, since frozen chickens are less expensive to buy per kg than
33fresh or untreated chilled chickens.
1 .3 3 CONTROL OF WATER CONTENT BY POLYPHOSPHATESMost of the published work on the effects of polyphosphates on
the moisture content of chickens involves administration of the salts via the chill-water which necessitates long periods of soak(3 to 22 hours). Absorption of up to 1 0 of the eviscerated carcase weight may
6
11occur during these times, which is too much by present-day standards • (see section 1*52). Also, most of this data is of limited use in this discussion since uptake of phosphate is not calculated, and the difference between polyphosphate-treated and untreated samples is not ali/ays tested for statistical significance* Added to these problems are many associated with the variables due to test conditions and chicken type, which makes direct comparison of different sets of results very difficult. However, a review of the most useful literature does reveal some consistent trends.
Klose et ai,^ chilled hen and chicken fryer eviscerated carcases for 22 hours in a 5$ commercial polyphosphate solution and found a significant decrease in the amount of chill water absorbed due to treatment. Fryer chickens (1 to l*5kg eviscerated weight) absorbed more water than hens (l*5kg eviscerated weight). Treatment also resulted in a higher mean cooked yield for hens after simmering for 2 hours and fryer chickens after deep-fat frying.
Schermerhom et al,^ also found a significant decrease in chill- water uptake due to polyphosphate treatment (6 hour chill in 0,8 and 12$ polyphosphate solutions), for eviscerated broiler carcases, which decreased with increasing level of treatment. Although the 4$ level of treatment did not result in decreased chill-water absorption, carcases so treated, along with those from the 8 and 12$ polyphosphate solutions, did lose significantly less moisture during a 16 hour storage period at 2°C compared to controls. However, this loss did not significantly decrease with increasing level of treatment. All treatment levels resulted in significantly increased cooked yields compared to controls when the carcases were cut up and deep-fat fried, although this effect was largely independant of treatment level. There was little difference in effect between sodium tripolyphosphate and a commercial polyphosphate at any given treatment level.
Schermerhorn and Stadelman, conducted similar experiments to the above using hens, and found the same trends due to treatment on chill-water absorption with little difference in overall effectiveness between sodium tripolyphosphate and a commercial polyphosphate*However, no significant differences between treated and control carcases on moisture loss during storage for 24 hours at 2°C and on cooking lossafter baking (heavy hens) or boiling (light hens) were noticed, although
-j-reateeC Tko.^ cenrols# Ih is possible -fo cc.Tip***'®- resolfs cUreetUj w»fA.~tiiaSe -for
mean values tended to be lower for/^broilers because apart fromvariations in breed and cooking method, a different statistical criterionwas used {jfo level of probability for broilers and Ifo level for hens).
34These authors cited Mahon, 1963, who stated that for polyphosphates tobe effective in controlling moisture loss, 0.3 to 0*5e/° added phosphatein the tissue is necessary. Phosphate analyses of the breast muscleshowed that light hens absorbed more than the heavy hens which containedless than 0*3f° phosphate after each treatment level. Although there wasno significant difference in moisture loss results, the chill-waterabsorption results were statistically significant for light hens whenQ»3f° ox more of phosphate had been absorbed by the breast. However, itwas not made clear whether the raw or cooked breast muscles wereanalysed for phosphate; and, also, these results must be treated withcaution since phosphate uptake by breast muscle is unlikely to reflectmoisture losses from the whole carcase. Light hens also absorbed morechill-water than heavy hens and had greater cook losses, although thiswas reported to be due to the degree of cooking rather than the cookingmethod. This increase in chill-water absorption seems likely to be dueto differing skin/fat ratios rather than the increase in phosphateabsorption noted for light hens.
35Monk et al, investigated the effect of cooking method and post-evisceration chilling in polyphosphate solutions (5 hour chill in 6fo commercial phosphate solution) on the cooking losses of hens and broilers. Prior to chilling, each carcase was cut longitudinally in
half and one half treated with polyphosphate and the other used as control* Phosphate analyses of the raw flesh from 2 broilers and 2 hens showed that the broilers had more than 0*3% added phosphate while the hens had less than 0*2$, suggesting greater phosphorus uptake by broilers compared to hens. Cooking in an electronic oven resulted in lower cook losses for all samples than did boiling or pressure cooking methods, which generally resulted in higher cook losses with increasing cooking temperature. Treated broiler samples had significantly higher cook yields than controls after each method of cooking, but there was little difference between treated and control hen samples; which could be a result of insufficient phosphorus uptake.
The effect of post-evisceration chilling in polyphosphatesolutions (6 hours in solutions containing 0,4,8, and 10 oz per gallonof a commercial polyphosphate) on the moisture loss from broilersduring cutting-up and storage at 2°C for 7 days was investigated by
36May et al.^ In this case the lowest level of treatment significantly increased water uptake during chilling compared to all other treatments, but the highest level of treatment significantly decreased water uptake over all other treatments. All groups lost weight during the cutting-up process with treated groups losing significantly more weight than controls. However, treatment significantly decreased weight losses of the cut-up carcases during storage, with all the treated portions being heavier than controls after 7 days. Portion weights increased with the level of treatment, but the portions from the high and intermediate treatments did not differ significantly from one another. Cooked yields
7were not calculated in this experiment, but Landes, directly treatedbroiler portions by marination in polyphosphate solutions at 2°C for 12
<
hours, and found increased cooked yields after baking, for portions from the 12fo marination, but not from the 6fo. Phosphate analyses of light and dark meat showed that uptake for both types of tissue from the 12$
solution was greater than 0#3$, hut this was only trae for the whitemeat from the Gfo solution.
Hie retail benefits of reducing weep from packaged chickenparts are obvious, and more recently an injection process for thepolyphosphate treatment of broiler parts suitable for commercial use
16has been reported. Two different types of multi-needle injection units were compared to overnight marination in a 3/0 commercial polyphosphate solution at 3°C. Broiler legs were injected with a &fo
commercial polyphosphate solution to give an approximately Qfo weight increase. All treatments resulted in significantly increased cookedyields after both water cooking and frying, with no significant
12difference among treatments. However, Parr and May, reported thatbroiler parts injected with a solution containing 10^ sodium chlorideand % commercial polyphosphate had increased cooked yields comparedto other methods of treatment (addition of sodium chloride and/orpolyphosphate to the cook water or to the post-cook cooling water).These authors stated that broiler parts so injected had a phosphate uptakenear to 0.3$, and that the other 2 methods of treatment resulted inimproved cooked yields when 0.2$ or more of phosphate was incorporatedinto the tissue. However, no analytical data was provided to illustratethese claims or to illustrate the well-known synergism between sodiumchloride and polyphosphates, which seems likely to account for thesuperiority of the injection process.
17Van Hoof and Baelman, reported the effects of polyphosphate injections at various stages of a commercial processing procedure on the volume of thaw loss collected during 36 hours at +8°C from broiler carcases. They found that broilers which were treated with polyphosphates (presumably after evisceration) by injection into the breast muscle either before, after, or in the absence of spinchilling procedures, had a lower percentage thaw loss than birds similarly treated with injections
10
of water. Also, the mean thaw loss value of 5 broilers was lower foreach polyphosphate treated group than for the group which underwentspinchilling with no injection of water. In contrast, Truman and
21Dickes, found that the mean thaw loss value of 8 treated chickenswas higher than the mean value for untreated birds, but this differencewas not statistically significant. However, the amount of thaw lossobtained from frozen meat depends on various factors includingtemperature of freezing, method of collection, and time and temperature
23 24 25of thawing, Since the results of Truman and Dickes seemed tohave been obtained from chickens purchased from retail outlets, it is probable that processing differences caused such variations in thaw loss volume as to make direct comparison between treated and controls invalid.
18Recently, Grey et al have reported results on the effect of commercial polyphosphate injection as practised in the UK (see section 1.2), on the amount of chill water uptake and levels of thaw and cooking losses of broilers. They determined the level of chill water uptake on about 1000 each of treated and untreated broilers during normal factory processing, and found no significant difference due to polyphosphate treatment, (however see section 3*71)* Thaw and cooking losses were determined for 48 each of treated and untreated broilers, and there were no significant differences in either value due to treatment.However, the cooked yield of treated broilers was greater than that of untreated broilers, which they calculated was due to the retention of an amount equivalent to 80fo of the injected fluid. It appeared that uptake of phosphate by raw pectoralis major muscle was greater than 0*3^* These experiments which involved analysing large numbers of broilers which were obtained during 8 days of normal commercial processing over a period of 13 months, obviously produced a more accurate account of the effects of commercial polyphosphate injection than did the previous 2 experiments. Although no overall statistical differences were found
11
between treated and untreated broilers, the injection process was found to produce a variable effect on chill water uptake, and also chill water uptake was found to vary according to the day of the experiment.
1.34 SUMMARYThe moisture content of chicken is affected by polyphosphate
treatment in the following ways:a) A reduction in the amount of water taken up during chilling when polyphosphates are added to the chill water, but a variable and statistically insignificant effect on chill water uptake when treatment is by pre-chill injection.b) A variable effect on thaw and cooking losses; but an overall increase in cooked yield, whether treatment is by soaking in chill solutions of polyphosphates, or by pre-chill injection.
These effects are apparent when at least of phosphate has been incorporated into the tissue. Application by injection is more rapid and economically viable than by immersing carcases in polyphosphate solutions. However, the injection process leads to extra water being introduced into the carcase. This is not of great importance when considered in conjunction with the normal movement of water into and out of a carcase during processing and cooking. However, legislative control is required to stop unnecessarily large amounts of water being introduced in this way.
1.4 EFFECT OF POLYPHOSPHATES ON AUTOOXIDATIVE RAHCIDITYBoth raw^*^*^ and cooked^ meats develop off-odours
and off-flavours during storage at refrigerator and frozen temperatures.In fact, Jacobson and Koehler^ found that cooked chicken and turkey meats deteriorated in flavour after 1 to 4 days of refrigerated storage (4°C) and to a lesser extent during frozen storage (-20°G). Their results of organoleptic and thiobarbituric acid (TBA) tests for light and dark chicken meat appear in Table II.
12
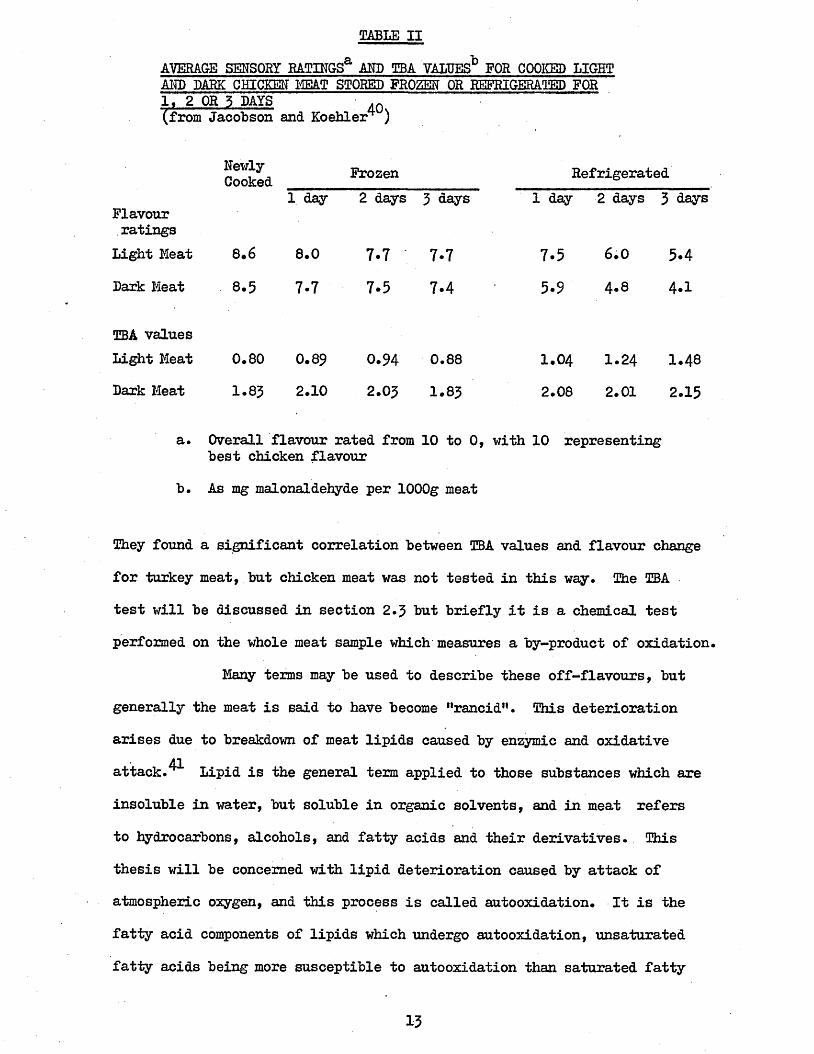
TABLE IIAVERAGE SENSORY EATINGS8, AND TBA VALUES^ FOR COOKED LIGHT AND DARK CHICKEN MEAT STORED FROZEN OR REFRIGERATED FOR1> jjDRJJMIS /0\(from Jacobson and Koehler^- )
Cooked Frozen Refrigerated1 day 2 days 3 days 1 day 2 days 3 days
Flavourratings
Light Meat 8.6 8.0 7*7 7*7 7*5 6.0 5.4Dark Meat 8.5 7*7 7^5 7*4 5*9 4-8 4*1
TBA valuesLight Meat 0.80 0.89 0.94 0.88 1.04 1.24 1*48Dark Meat 1.83 2.10 2.03 1*83 2.08 2.01 2.15
a. Overall flavour rated from 10 to 0, with 10 representing best chicken flavour
b. As mg malonaldehyde per lOOOg meat
They found a significant correlation between TBA values and flavour change for turkey meat, but chicken meat was not tested in this way. The TBA test will be discussed in section 2.3 but briefly it is a chemical test performed on the whole meat sample which measures a by-product of oxidation.
Many terms may be used to describe these off-flavours, but generally the meat is said to have become "rancid11 • This deterioration arises due to breakdown of meat lipids caused by enzymic and oxidative attack.^" Lipid is the general term applied to those substances which are insoluble in water, but soluble in organic solvents, and in meat refers to hydrocarbons, alcohols, and fatty acids and their derivatives. This thesis will be concerned with lipid deterioration caused by attack of atmospheric oxygen, and this process is called autooxidation. It is the fatty acid components of lipids which undergo autooxidation, unsaturated fatty acids being more susceptible to autooxidation than saturated fatty
15
acids; and the ease of oxidation increases with the degree of unsaturation. In fact, Enser^ reports that the relative susceptibility of oleic, linoleic and linolenic acids to oxidation is, 1:12:100. Therefore, it is necessary to consider the fatty acid composition of ohicken lipids before discussing their autooxidation and subsequent rancidity.
3..41 LIPID COMPOSITION OF CHICKENThe fatty acid composition and total lipid content of chicken
tissues varies with the type of muscle. An extensive review of post-19604.3literature on the lipids of chicken has been published. The total
lipid content of light meat (combined values for breast and wing meat) was 1.05gm/l00gm muscle, and for dark meat (thigh, drumstick and back tissue) 3*97* for broiler/fryer class of chickens. Higher values were obtained for roaster and stewing hens. The average factor derived from the literature data for calculating the grams of fatty acid per gram of tissue fat for like tissues of all three classes of chicken varied by less than 1 >. Light meat contained an average of 0.81gm fatty acid per gram of tissue fat, dark meat 0.86 and skin 0.94* It was established that the distribution of fatty acids within a given type of tissue varied no more among classes of chicken than within a single class.The major fatty acid constituents of chicken tissues were found to be palmitic, oleic and linoleic acids which comprised at least 68 > of the total fatty acids in each tissue. The problems associated with obtaining reliable data when conducting literature surveys of this kind were discussed in a separate paper.^
The phospholipids of meat tissues are the primary site of autooxidation due to their high unsaturated fatty acid content and the fact that they exist in closer contact with tissue catalysts of oxidationthan do triglycerides (the major component of neutral lipids)
39However, Shorland, who studied oxidative development in beef and lamb
14
during frozen storage, suggested that phospholipids are protected against autooxidation by their close association with muscle proteins; and that neutral lipids play the major role in the development of rancidity during frozen storage of raw meats.
46Marion and Woodroof, found that the phospholipids in breast,thigh and skin tissues contained higher levels of 18-carbon saturatedand 20-24 carbon unsaturated (3 to 6 double bonds) fatty acids than thetriglycerides which contained higher levels of 18-carbon mono- anddiunsaturated fatty acids than the phospholipids. Breast musclescontained the highest proportion of phospholipids to neutral lipids,followed by thigh and then skin tissue lipids. Marion and Miller^ found that an inverse relationship existed between the level ofphospholipid and the total lipid content of chicken tissues indicatingthat higher lipid levels arise primarily from the deposition of neutrallipids.
The lipid composition of chicken changes during post-mortem ageing,^® frozen s t o r a g e , c o o k i n g ; 5^*52 Generally, phospho
lipid content decreases and free fatty acid and triglyceride content increases during frozen storage and to a lesser extent during 48 hour post-mortem ageing. These changes suggest phospholipase activity at freezer temperature and in the early stages of ageing, and in conjunction with protein changes they are important in determining meat tenderness.Gooking with no added fat does not greatly change the fatty acid profiles
43of tissues, although an increase in linolenic acid due to cooking has 51 53been noticed. ’ J
Factors such as age, sex and diet of chickens affects the lipid54composition of their tissues. Edwards et al ^ analysed the entire minced
carcase (minus feathers) of broilers at 4*8,12,16 and 20 weeks of age, and found maximum lipid levels at 16 weeks for both males and females.At all ages, females had a greater lipid content than males. The percentage carcase lipid varied with age between 6.7 and 13 • ! for males
15
and between 8*0 and 20*8 for females. The fatty acid composition of the adipose tissue of these birds at 12,16 and 20 weeks of age, showed only small, inconsistent changes with age and between sexes. However, the stearic acid content of males was higher than that of females of the same age. She same inconsistent changes were found in other experiments using male broilers at 4*6,8 and 10 weeks of age; exceptthat the palmitoleic acid content increased with age in both the
53 55 53abdominal adipose tissue and breast muscle.54Edwards et al^ conducted a separate experiment to the above
using broilers as previously, but housed in smaller groups in wire- floored battery brooders and growing pens instead of on shavings like the previous group. In this experiment, the weight and lipid content of the carcases at a particular age were higher than for the previous birds, but again the females contained more lipid than the males at each age. Thus, environment also affects the composition of chicken.
The previous investigations concerned total lipid changes in56the whole carcase, but Singh and Essary, found no significant
differences due to age or sex in the total lipid content of either breast or thigh muscles of broilers, although the combined age values for each muscle were higher in females than in males. However, it has been reported elsewhere^ that the total lipid of both breast and thigh muscles of male broilers was higher in 20 week old birds than in 8 week old birds.
The effect of diet on the composition of chicken has been studiedextensively, in order to obtain optimum growth rates and to produce abird of acceptable fatness from a flavour and texture point of view. Itbecame clear that the fatty acid, composition of poultry lipids wasaffected by lipid supplements in the diet, and therefore could effect
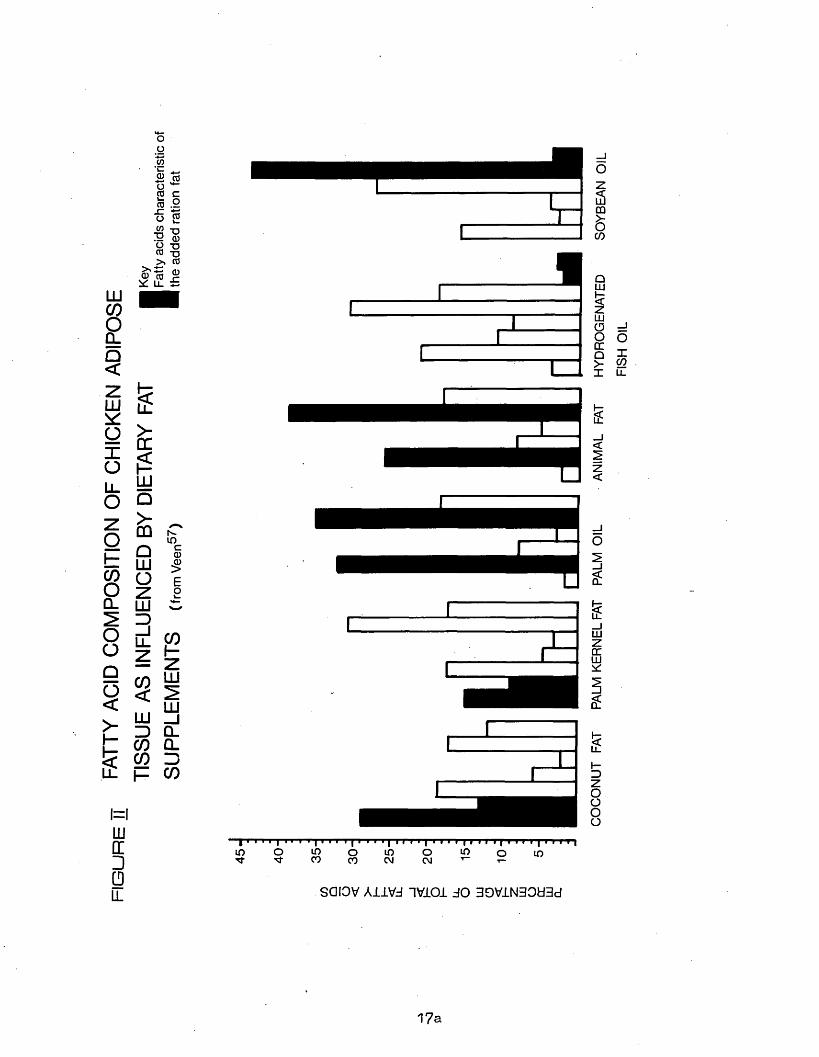
57the susceptibility of the bird to autooxidative rancidity. Veen, reported results of feeding broilers diets containing &/o added fats
16
which were coconut fat, palm kernel oil, palm oil, animal fat, soybean oil and hydrogenated fish oil* It seemed probable that the broilers received the diets until slaughter at 5 to 7 weeks of age, but the exact experimental details were not supplied. Samples of adipose fat were taken from 10 birds from each diet group and mixed, and the main fatty acids determined (Figure II). The characteristic acids of the addedfats were clearly recognizable in the adipose fats.
54.Edwards et al, determined the influence of dietary cottonseed oil, acidulated cottonseed soapstock, beef tallow and poultry fat at levels of 3*25f° 3n starter rations and 5*23$ in finisher rations, on carcase composition of broilers. Gross body composition was not influenced by these supplements, but there was a tendency for the birds which received these supplements to have a slightly higher carcase fat content than those on the basal diet. This was to be expected since the supplemented diets had slightly wider calorie rprotein ratios than the basal diet. Generally, the whole carcase fat content of all the experimental birds increased with age, and in females the largest increase occurred between the 4th and 5th week and in males between the 6th and 7th week. The fatty acid composition of the carcase adipose tissue from 8 and 9 week old birds showed large differences due to diet. Linoleic acid accounted for more than 50$ of the total fatty acids in cottonseed oil and in acidulated cottonseed soapstock, and birds fed these lipids had a much larger linoleic acid content than birds fed the basal diet, or those diets containing other supplements. Similarly, the adipose tissue of birds fed beef tallow contained more stearic and oleic acids than the other birds, since this supplement was very much richer in both these acids than the other fats. Consequently, the isolated adipose tissue from beef tallow fed birds was much firmer to the touch than that from birds fed more unsaturated fats. The fatty acid composition of the total carcase lipids from 8 week old birds
17
LUCOoQ_Q<
XoLLO
& co
Z LU £
cc£LUQm
t s8 z0- LLI C 2 =}8 td joQ O <1-
co<COCOI-CO
1=1LUcr□uLL
N-IDCQ)§Eo
I—y ,n m
LULU 3 CLCLDCO
T T“|-m i I 11 i "i |iii i | i i i ij i r i i | iii i i i ii »|i i i i | i i i i |
O l O o i O O l O o i OCO CO CM CM T“ T-
SQIOV A11V3 IV lO l 30 3DV±N30H3d
aLULUUOcca>-x
17a
FISH
OIL
showed similar changes due to diet, hut contained more palmitic acidthan the adipose tissue lipids.
55Jen et al, investigated the effect of com oil, lard, beef tallow and hydrogenated coconut oil added at a 1 Cffo level to the finisher rations (at 4 weeks of age) of broilers, on the fatty acid composition of the abdominal adipose tissue. Again, it was found that the fatty acid composition of the total lipid extracted from the adipose tissue tended to reflect the fatty acid composition of the dietary fats. These fatty acid patterns were incorporated into the tissue within 2 weeks of starting the experimental diets. The neutral lipids of adipose tissues had similar fatty acid patterns to the total lipids from the corresponding tissue, but all neutral lipids had a higher percentage of saturated fatty acids and a lower linoleic acid content than the total lipids. Ho significant differences in flavour or rancidity (as measured by the thiobarbituric acid test) due to diet were apparent in freshly cooked
58skin and adipose tissue from 10 week old birds. However, Marion et al, reported a correlation between TBA numbers of raw breast muscle after 12 days’ storage at 2°C and the diet which the broilers had received. They reared broilers to 58 days of age on rations differing in protein level (16 or 24fo)f and in type of supplemental fat (5 > of coconut oil, beef tallow, safflower oil, or menhaden oil). The total lipid of the breast muscle was separated into neutral lipids, and the phospholipids, cephalin and lecithin. All the lipid fractions showed fatty acid changes due to the different dietary fats. The neutral lipid fractions exhibited most pronounced changes in the 16- and 18- carbon fatty acids; whilst the phospholipids showed most marked changes in the longer chain fatty acids. The TBA Numbers were generally higher for the muscles from the birds fed the high protein diet, and the highest values were obtained from the muscles of the birds fed menhaden oil, which resulted in higher levels of 20- to 22- carbon polyunsaturated fatty acids than the other dietary
18
fats. These results were in agreement with those of a similar 59experiment.
In all the preceding papers, high levels (5ft or more) of lipidsupplements were added to the rations of experimental birds, but Bartov
60and Bomstein, determined the minimum levels of dietary vegetable oils which have an effect on the composition of carcase.fat. These vegetable oils were supplied by either soybean oil added to the starter rations or derived from the dietary grain (com or milo). The addition of Om fo soybean oil or 20 » yellow com or 40$ milo, caused marked increases in the degree of unsaturation of abdominal fat as compared to control diets. This increase was caused mainly by an increase in linoleic acid, and resulted in increased susceptibility to oxidation (as determined by the TBA test). Higher levels of dietary oils caused further increases in unsaturation of abdominal fat. These increases decreased the oxidative stability of the abdominal fat when soybean oil or milo was added, but not when com oil was added. This was thought to be because diets containing com oil had a higher natural antioxidant (a-tocopherol) content than the other diets, and that this fact could also partly explain the fact that linoleic acid derived from com oil was deposited into adipose tissue at a significantly higher rate than that derived from milo or soybean oil.
1.411 Summary
The main fatty acids present in chicken tissues are, palmitic, oleic and stearic acids. Phospholipids contain more long chain polyunsaturated fatty acids than neutral lipids, and are thus more susceptible to oxidative rancidity than neutral lipids. The fatty acid composition of carcase lipids tends to reflect the fatty acid composition of lipids present in the diet. Age and sex have little affect on the fatty acid composition of lipids, but have an affect on the total lipid levels, which increase with age, and are higher in females than in males.
19
1.42 MECHANISM OF AUTOOXIDATIOHAutooxidation is a free-radical chain reaction believed to
involve 3 stages:^(1) Initiation This step involves the breakdown of unsaturatedfatty acids to form free-radicals,
initiator p. p.RH ““ f
fat moleculeand constitutes the induction period, which is the time that elapsesbefore rancidity becomes organoleptically detectable. Initiators
62 63 64 65include, light, heat, and heavy metals especially copper and iron.Oxidised meat pigments may also act as initiators^*(2) Propagation The free-radicals formed during initiation combine with atmospheric oxygen to form peroxide free-radicals, which then act as secondary initiators in the initiation process by reacting with substrate to form more fatty free-radicals and hydroperoxides:
R* + 02 __________ R00*R00* + RH___________ > ROOH + R#
70It is thought that all hydroperoxides are odourless and tasteless, 1
and it is therefore the decomposition products of these hydroperoxides which are responsible for the off-odours and off-flavours of rancid fats. Breakdown of hydroperoxides via the weak 0 - 0 bond is theexpected mechanism, but thermodynamics predicts degradation rates of2 5 o10 to 10 times slcwer than actually found at temperatures of 60 C
O'*' 71to 100; 0. In fact, the degradation process is catalysed or71"molecularly assisted” by agents such as, metals, acids, bases, andhaem
72compounds. Transition metals are thought to increase the rate ofdecomposition of hydroperoxides to free-radicals, by a series of one
6l 71electron transfer reactions s f l
BOOH + M2+ _________> BO’ + OH- + M3+' BOOH + M3+ __________ BO’ + H+ + M2+
20
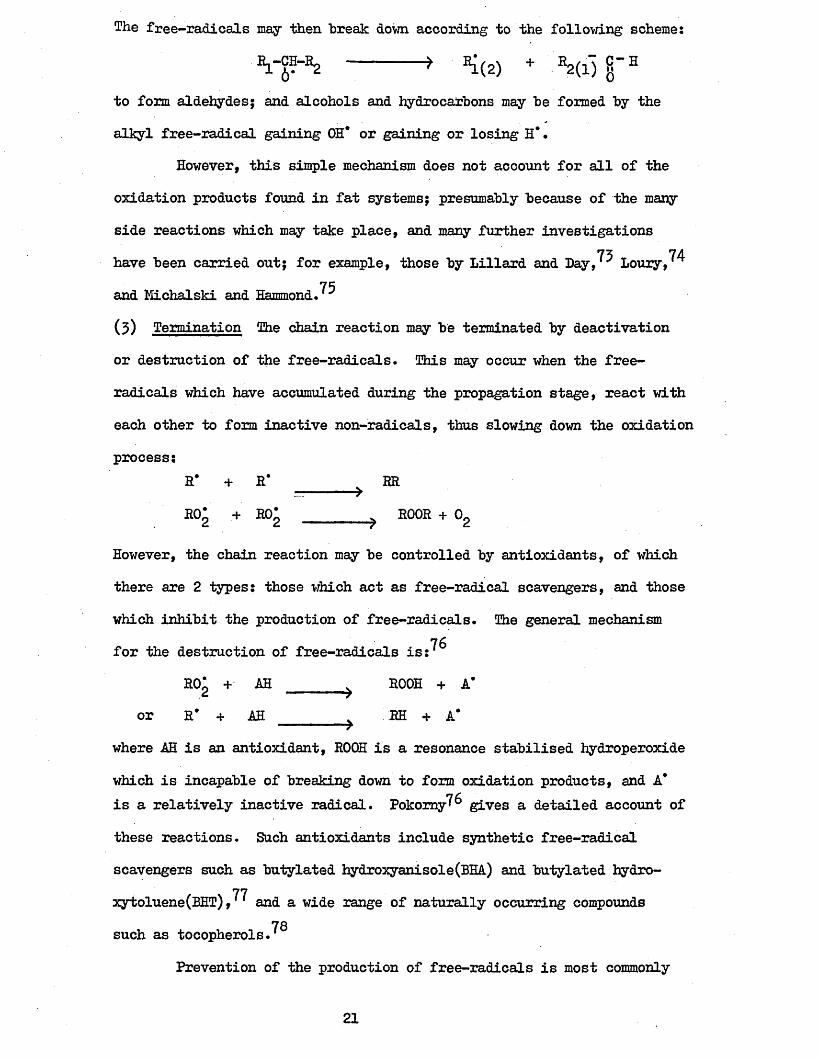
The free-radicals may then break dcwn according to the following scheme:
-------- > K ( 2 ) + V l Pto form aldehydes; and alcohols and hydrocarbons may be formed by thealkyl free-radical gaining OH* or gaining or losing H’ •
However, this simple mechanism does not account for all of theoxidation products found in fat systems; presumably because of the manyside reactions which may take place, and many further investigationshave been carried out; for example, those by Lillard and Day,^ Loury,^
75and Michalski and Hammond.(3) Termination The chain reaction may be terminated by deactivation or destruction of the free-radicals. This may occur when the free-radicals which have accumulated during the propagation stage, react witheach other to form inactive non-radicals, thus slowing down the oxidation process:
R* + R* _______ RRRO* + RO* ________ ROOR + 02
However, the chain reaction may be controlled by antioxidants, of whichthere are 2 types: those which act as free-radical scavengers, and thosewhich inhibit the production of free-radicals. The general mechanism
76for the destruction of free-radicals is:RO* + AH _______ ROOH + A*
or R* + AH _________ RH + A*where AH is an antioxidant, ROOH is a resonance stabilised hydroperoxidewhich is incapable of breaking down to form oxidation products, and A* is a relatively inactive radical. Pokomy^ gives a detailed account ofthese reactions. Such antioxidants include synthetic free-radicalscavengers such as butylated hydroxyanisole(BHA) and butylated hydro-
77xytoluene(BHT), and a wide range of naturally occurring compounds78such as tocopherols.
Prevention of the production of free-radicals is most commonly
21
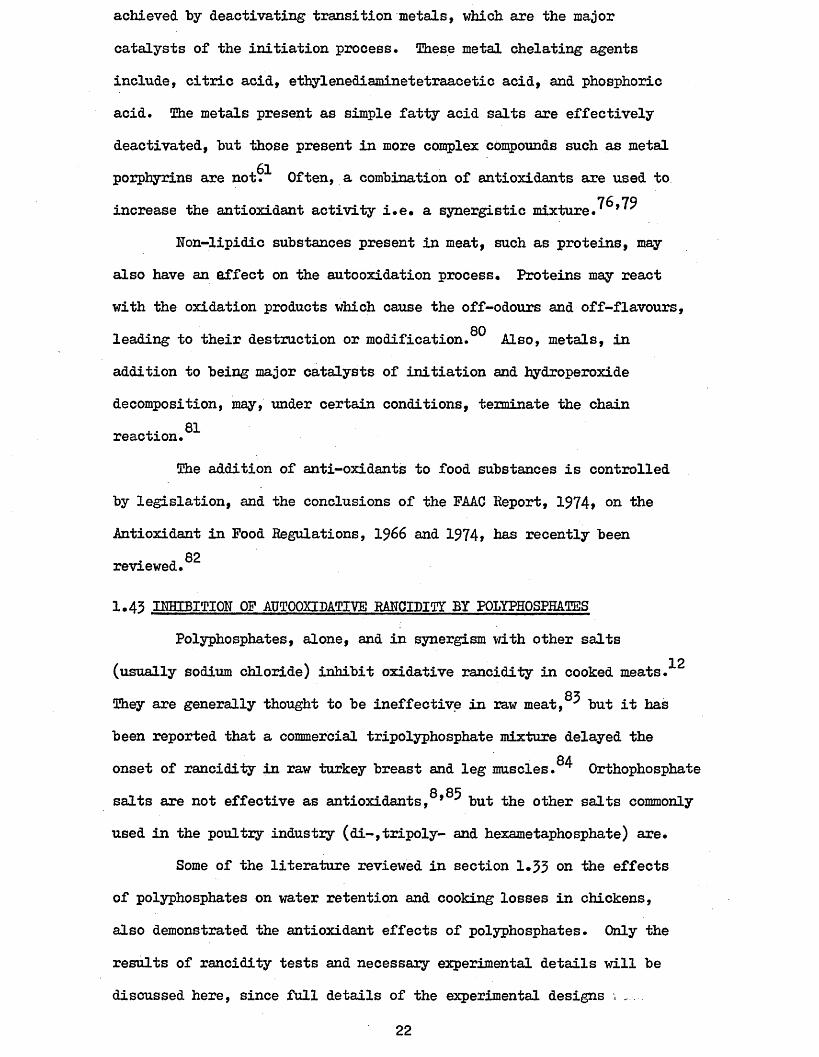
achieved by deactivating transition metals, which are the majorcatalysts of the initiation process. These metal chelating agentsinclude, citric acid, ethylenediaminetetraacetic acid, and phosphoricacid. The metals present as simple fatty acid salts are effectivelydeactivated, "but those present in more complex compounds such as metal
61porphyrins are not. Often, a combination of antioxidants are used to76 79increase the antioxidant activity i.e. a synergistic mixture. 9
Non-lipidic substances present in meat, such as proteins, mayalso have an affect on the autooxidation process. Proteins may reantwith the oxidation products which cause the off-odours and off-flavours,
80leading to their destruction or modification. Also, metals, in addition to being major catalysts of initiation and hydroperoxide decomposition, may, under certain conditions, terminate the chain reaction.^
The addition of anti-oxidants to food substances is controlled by legislation, and the conclusions of the PAAC Report, 1974* on theAntioxidant in Pood Regulations, 1966 and 1974> bas recently been
, 82 reviewed.
1.43 INHIBITION OF AUT00XIPATIVE RANCIDITY BY POLYPHOSPHATESPolyphosphates, alone, and in synergism with other salts
12(usually sodium chloride) inhibit oxidative rancidity in cooked meats.They are generally thought to be ineffective in raw meat,^ but it has been reported that a commercial tripolyphosphate mixture delayed the onset of rancidity in raw turkey breast and leg muscles.^ Orthophosphate
Q QC
salts are not effective as antioxidants, * but the other salts commonly used in the poultry industry (di-,tripoly- and hexametaphosphate) are.
Some of the literature reviewed in section 1*33 on ‘tbe effects of polyphosphates on water retention and cooking losses in chickens, also demonstrated the antioxidant effects of polyphosphates. Only the results of rancidity tests and necessary experimental details will be discussed here, since full details of the experimental designs . .
22
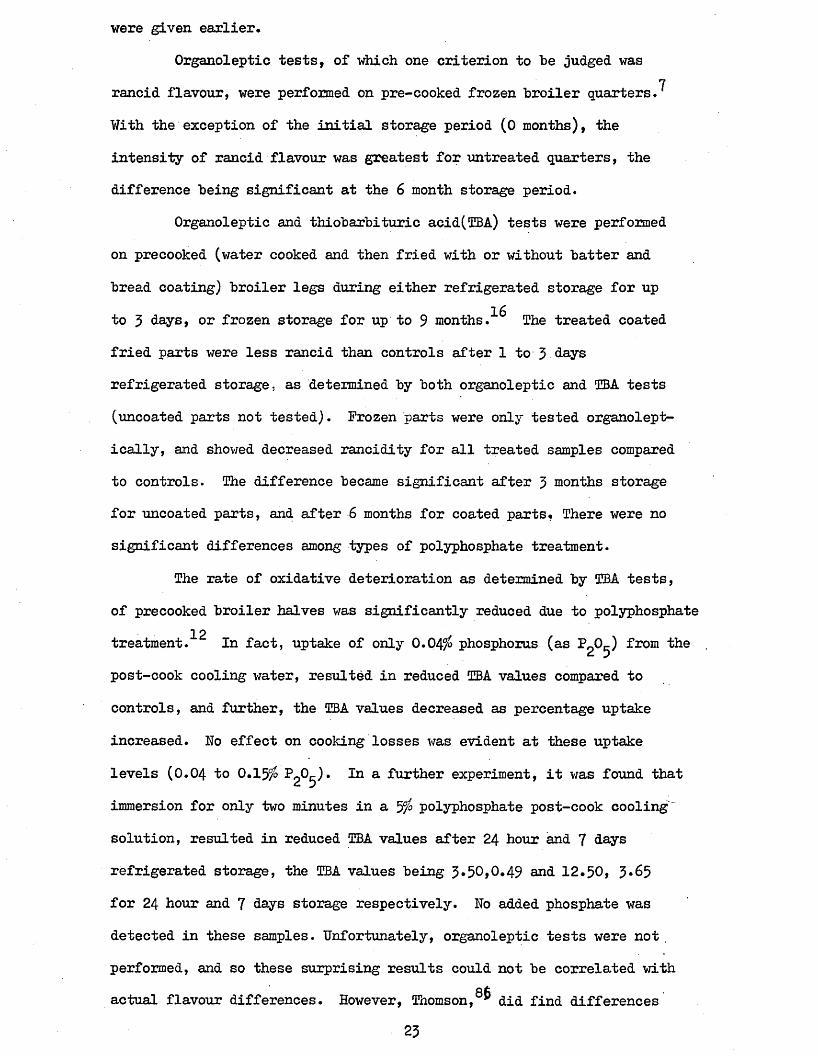
were given earlier.Organoleptic tests, of which one criterion to he judged was
7rancid flavour, were performed on pre-cooked frozen broiler quarters.With the exception of the initial storage period (0 months), theintensity of rancid flavour was greatest for untreated quarters, thedifference being significant at the 6 month storage period.
Organoleptic and thiobarbituric acid(TBA) tests were performedon precooked (water cooked and then fried with or without batter andbread coating) broiler legs during either refrigerated storage for up
16to 3 days, or frozen storage for up to 9 months. The treated coated fried parts were less rancid than controls after 1 to 3 days refrigerated storage, as determined by both organoleptic and TBA tests (uncoated parts not tested). Frozen parts were only tested organoleptically, and showed decreased rancidity for all treated samples compared to controls. The difference became significant after 3 months storage for uncoated parts, and after 6 months for coated parts, There were no significant differences among types of polyphosphate treatment.
The rate of oxidative deterioration as determined by TBA tests,of precooked broiler halves was significantly reduced due to polyphosphate
12treatment. In fact, uptake of only 0.04$ phosphorus (as P^O^) from the post-cook cooling water, resulted in reduced TBA values compared to controls, and further, the TBA values decreased as percentage uptake increased. No effect on cooking losses was evident at these uptake levels (0.04 to 0.15$ 3h a further experiment, it was found thatimmersion for only two minutes in a 5$ polyphosphate post-cook cooling" solution, resulted in reduced TBA values after 24 hour and 7 days refrigerated storage, the TBA values being 3*50,0.49 and 12.50, 3*65 for 24 hour and 7 days storage respectively. No added phosphate was detected in these samples. Unfortunately, organoleptic tests were not . performed, and so these surprising results could not be correlated with actual flavour differences. However, Thomson,®^ did find differences
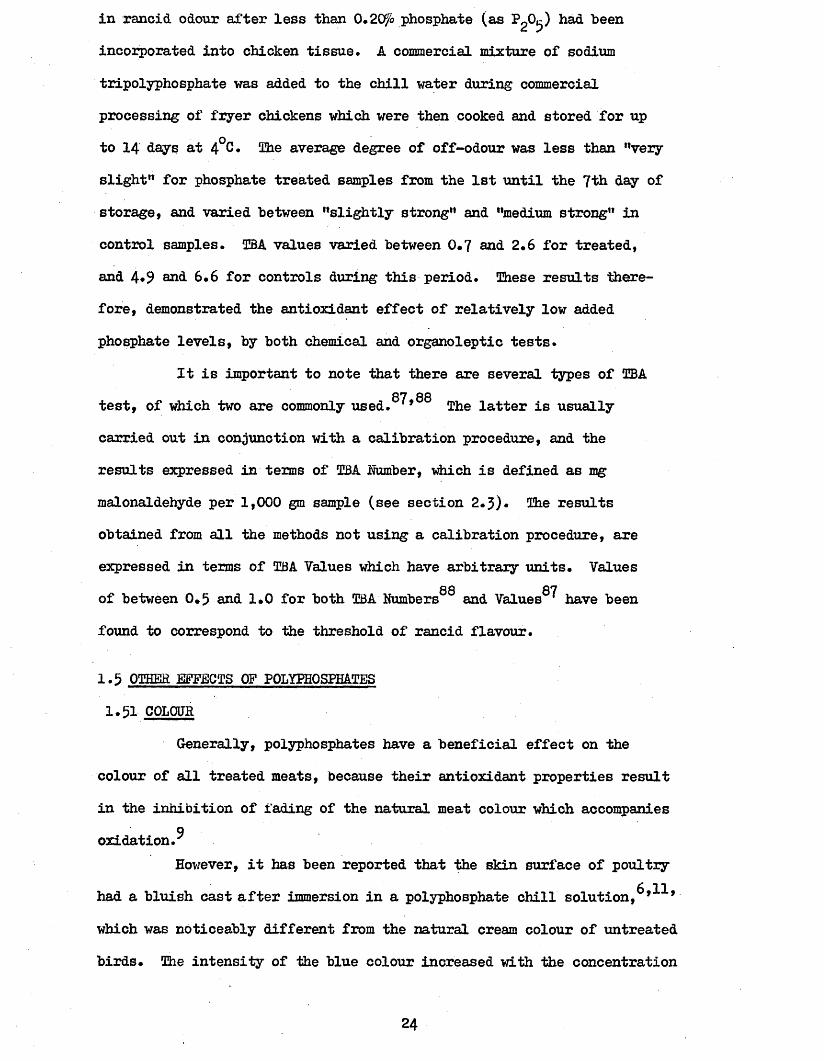
in rancid odour after less than 0.2Cf/o phosphate (as PgO^) had been incorporated into chicken tissue. A commercial mixture of sodium tripolyphosphate was added to the chill water during commercial processing of fryer chickens which were then cooked and stored for up to 14 days at 4°C. The average degree of off-odour was less than "very slight” for phosphate treated samples from the 1st until the 7th day of storage, and varied between "slightly strong” and "medium strong" in control samples. TBA values varied between 0.7 and 2.6 for treated, and 4*9 and 6.6 for controls during this period. These results therefore, demonstrated the antioxidant effect of relatively low added phosphate levels, by both chemical and organoleptic tests.
It is important to note that there are several types of TBA87 88test, of which two are commonly used. , The latter is usually
carried out in conjunction with a calibration procedure, and theresults expressed in terms of TBA Humber, which is defined as mgmalonaldehyde per 1,000 gm sample (see section 2.3)« The resultsobtained from all the methods not using a calibration procedure, areexpressed in terms of TBA Values which have arbitrary units. Values
88 87of between 0.5 and 1.0 for both TBA Numbers and Values 1 have been found to correspond to the threshold of rancid flavour.
1.5 OTHER.BEEECTS OF POLYPHOSPHATES1.51 COLOUR
Generally, polyphosphates have a beneficial effect on thecolour of all treated meats, because their antioxidant properties resultin the inhibition of fading of the natural meat colour which accompanies
9oxidation.However, it has been reported that the skin surface of poultry
6 11had a bluish cast after immersion in a polyphosphate chill solution, * *which was noticeably different from the natural cream colour of untreated birds. The intensity of the blue colour increased with the concentration
24
of polyphosphate, and was also detected below the surface of the skin. However, in both cases the colour of the treated cooked products was not noticeably different from that of the controls. This effect on colour could be due to over-application of polyphosphates, but the uptake of phosphorus was not determined in either of these reports.
When high levels (0.5,1*0 and 2.0$ w/w) of polyphosphates were incorporated into raw minced chicken meat, the colour of the cooked products darkened (as measured by diffuse reflectance using a colour difference meter) with increasing levels of polyphosphate.^ There was a highly significant negative correlation between diffuse reflectance values and the level of treatment. The colour was found to be "unacceptable" at the 2$ level.
1.52 FLAVOURThe most important effect on flavour is the reduction in off-
flavours in treated chicken due to the antioxidant properties of polyphosphates. However, the use of all food additives are subject to legislation, of which their effect on the natural food flavour is an important consideration.
A salty flavour is sometimes associated with polyphosphate:C o f i C e r & c c A i c r * £ c f -j-j
treatment, but this may be due to high Tgvel-fl . Klose,reported saltiness in hens which had been soaked for 22 hours in a 5$ chill solution before cooking, but no saltiness was detected in fryer chickens which received similar treatment for 3 or 22 hours. Levels of phosphorus uptake were not reported. This salty flavour was also
enoted by Froning, after addition of 0.5,1*0 and 2.0$ of polyphosphateinto minced chicken meat, but was only found to be objectionable atthe 2.0$ level. Polyphosphate added to the cook water of chicken parts,
12was found to produce a salty taste above 4*0$ addition.7Landes, reported a baking soda-like flavour in treated broiler
quarters, which increased with the level of polyphosphate treatment (12
25
hour immersion in chill water containing 6*0 or 12.0$ polyphosphate),and reduced the over-all flavour ratings for treated parts compared tocontrols. Chicken and meaty flavours were also reduced hy polyphosphatetreatment, as was rancid flavour. Uptake of phosphorus (as PgO^)appeared to be above 0.5$, and therefore the deterioration in over-allflavour could be attributed to ove2>application of polyphosphate.
The over-all flavour of white and dark meat from broilers chilledfor 6 hours in polyphosphate solutions (4,8 or 10 ounces of polyphosphateper gallon of water), was not significantly different from controls, but
36treated groups had higher mean flavour scores than controls. This7apparent contradiction between these and Landes results for over-all
flavour could be due to the different levels of treatment, but it isworth noting differences in organoleptic tests. The term •’flavour”,
36used in May’s tests, is very vague, and the results probably reflectincreased rancid flavour in controls compared to treated samples;especially since the samples were cooked and tested organolepticallyafter 7 days storage at 2°C. This one case points to the fact thatorganoleptic results from different sources are not easy to compare.
Cut-up chicken pieces which were marinated in a 5f° polyphosphatesolution for 12 hours, and then dipped in a mixture containing poultryseasoning and salt before cooking, showed no differences in flavour due
89to treatment. It is not possible to compare these results with the others quoted here, since the addition of seasonings could have masked any salty flavour due to treatment. Also, the terms used in the organoleptic test were vague.
It is thought that carbonyl compounds are responsible for the"chicken” aroma of cooked chicken, and sulphur containing compounds for
90 /the "meaty” aroma. These workers found that polyphosphate (at 1.0and 2.0$ levels in chunks of canned chicken meat which were heatprocessed at 121°C for 55 min.) caused increases in meaty aroma and inthe hydrogen sulphide and methyl mercaptan volatiles, compared to controls.
26
The 1.0$ level of treatment produced better average aroma scores than
the control, but the 2.0$ level was judged to be less acceptable thanthe 1.0$ level, because of an extremely strong meaty odour. Carbonylvolatiles were reduced due to treatment, but corresponding sensorytests for chicken odour were not performed. TBA values were reduced
due to treatment, but there was no difference between treatment levels.Also, when polyphosphates were added to fresh, minced broiler meatprior to TBA tests, no difference due to treatment was apparent. It
was therefore assumed that polyphosphates inhibit malonaldehyde (theoxidation by-product measured in the TBA test) production during heatprocessing, and the reduction in total carbonyls due to treatment was,at least in part, due to the antioxidant properties of polyphosphates.This effect was also thought to account for the improved aroma scores
of treated samples compared to controls. Samples of meat and depotfat were cooked under oxidative conditions, and polyphosphates werefound to greatly affect the formation of sulphur containing and
carbonyl volatiles during cooking. Again, meaty aroma and sulphurcontaining volatiles increased with treatment, and carbonyls decreased.
The reduction in carbonyls was greater in meat than in depot fat, and
no sulphur containing volatiles were detected for either control ortreated samples of depot fat. The effect of cooking chicken with
polyphosphates, on the carbonyl volatiles has been studied in greater91detail, using chromatographic techniques. Treatment caused a
reduction in dicarbonyls, methyl ketones and 2,4- dienals, but there were no qualitative differences between control and treated volatiles.
1.55 MICROBIAL SPOILAGESome evidence exists to show that polyphosphates exert anti-
92 92microbial activity in foodstuffs. This survey lists the effects of polyphosphates on various bacteria arid the patented claims for the antimicrobial effect of polyphosphates as well as discussing their
27
specific effect on the keeping quality of foodstuffs, including raw poultry. Generally, the antimicrobial effect of polyphosphates isthought to be due to their metal chelation properties.
93Spencer and Smith, found that chicken fryer carcases which were chilled for 6 hours in a solution of a commercial polyphosphate, showed a reduced rate of microbial spoilage, as measured by plate counts, U.V. fluorescence, and off-odour, compared to controls. Theshelf life of treated carcases was increased by 1 to 2 days. In more
94-detailed experiments Steinhauer and Banwart, determined the effect of tripolyphosphate and a commercial mixture of polyphosphates on the different spoilage organisms present in poultry. They chilled broiler carcases for 6 hours in solutions of the polyphosphates, and then sampled the breast area of each during storage at 5°C. Treatment did not appear to alter the type of organisms present, but did result in lower average bacterial counts compared to controls. The differences in total and proteolytic counts were not significant, but in one experiment treatment with the commercial mixture of polyphosphates resulted in a significant drop in the number of lipolytic type microorganisms. Both treatments inhibited odour production, slime formation, and discolouration of the carcases during storage. In fact, after 20 days storage, the treated carcases gave off only a slightly noticeable putrid odour and had maintained their natural bluish colour, whereas, the controls gave off a strong putrid odour after only 16 days of storage, and had turned a yellowish colour. Slime formation was observed over the whole of the control carcases at 16 days of storage,when the treated carcases were just beginning to show slime areas.
95Elliott et al, found that both a commercial polyphosphate and an equivalent mixture of chemically pure polyphosphates inhibited the growth of nonfluorescent pseudomonads in a synthetic medium, but fluorescent strains grew after a short time lag. However, in the mixed
28
culture of chicken spoilage, only when polyphosphates were present in overwhelming amounts (870 solution), and in intimate and continuous contact with the spoiling surfaces, did they completely prevent growth of the nonfluorescent organisms. Growth of the fluorescent organisms was delayed by both the 5$ and 8$ solutions of the polyphosphates. Overnight chilling of chicken carcases in the 5$ and &fo polyphosphate solutions lengthened their subsequent shelf life 17 and 25$ respectively. Chickens held in continuous contact with these solutions during storage at 2.2°C kept 17 and 67$ longer respectively. These authors also investigated the mode of action of polyphosphates as antimicrobial agents and concluded that this was not due to pH changes, but rather by chelation of metal ions essential to the growth of bacteria.
Ill of the above investigations were carried out on whole96chicken carcases, but Foster and Mead, investigated the effect of
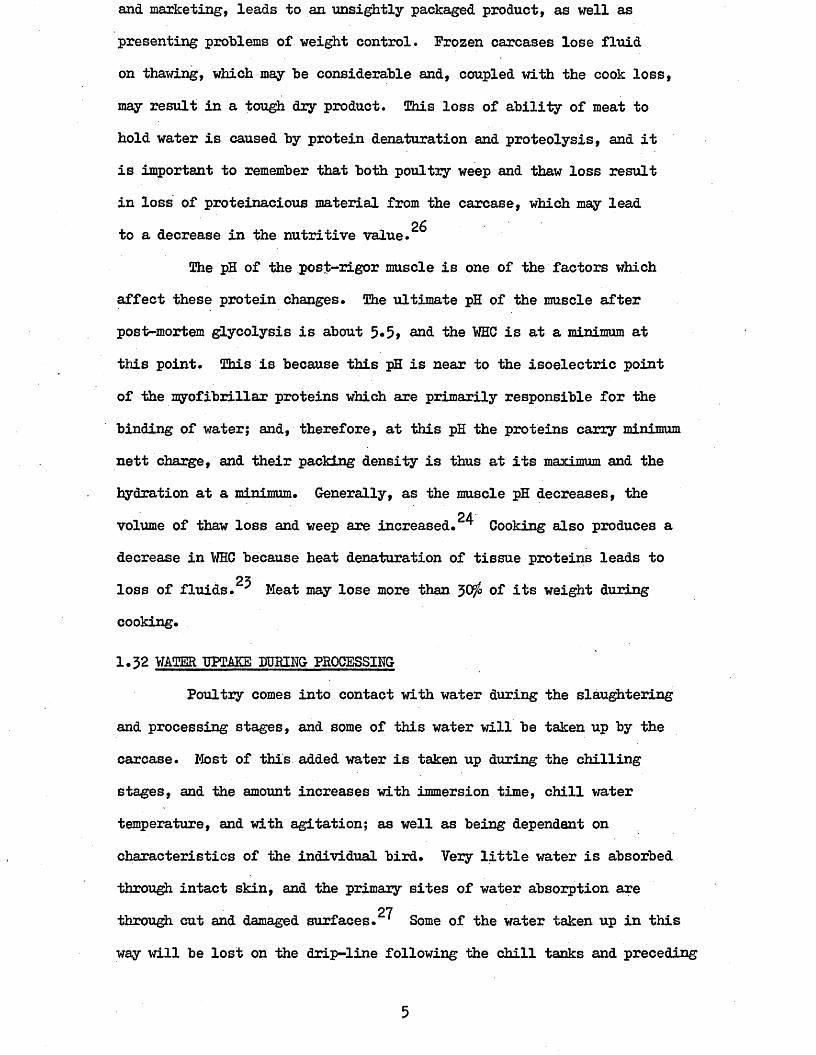
added polyphosphates on the survival of saimonellae in minced chicken breast and leg muscles. The minced muscles from freshly slaughtered chickens held at 1°C overnight, were treated with 0.55$ of a commercial polyphosphate, and inoculated with 5 different salmonella cultures.( S. typhimurium. S. agona. S.cerro. S.haardt, S. livings tone). Samples were stored at -20oC,-5°C,-2OC and +1°C, and the resulting trends observed for all 5 strains of salmonella were similar. Consequently only survival data for S.typhimurium were given in detail; and these results are given in Figure III. , In the absence of polyphosphates, survival of the test organisms was greater in breast than in leg muscle at all 4 temperatures. Polyphosphates increased the death rate in breast at -2°C and - 20°C, but had little or no effect on leg muscle at any temperature, Type of substrate and pH were found to influence the survival of saimonellae at -2°C, which was very much greater in hydrogen iodide broth at pH 5*8 and 6.4> than in breast muscle at its normal pH of 5*8 and leg muscle at its normal pH of 6.4« Addition of
29
hydrochloric acid to reduce the pH value of leg to 5*8 increased survival, hut raising that of hreast to 6.4 hy the addition of sodium hydroxide had little effect. Addition of polyphosphates increased the pH of both muscles by 0.4 units, but the difference between treated breast and leg muscles could not be explained solely in terms of pH.
30
C/5 05
Ml O ®
- cmO
CO COID"Oo0CL0052o
CO
SJOAjAJnS 8BBlU0OJ9d
31
1.6 MODE OF ACTION OF POLYPHOSPHATESThere is no one hypothesis which fully explains the effects of
polyphosphate salts on meat. The action of polyphosphates on water retention in raw meat has been investigated extensively, and the theories put forward to explain this effect have been extended to include cooked meat products, and even to explain the antioxidant properties of these salts. In fact, the antioxidant properties of polyphosphates are not well understood, but in order to study this effect it is necessary to summarise the theories concerning water retention and cooking losses.
1.61 ACTION ON WATER BETENTION1.611 pH and Ionic Strength
Increases in ionic strength and pH cause the water holding capacity of meat to increase. Generally, this effect is noticed when the pH is greater than the iso-electric point (about pH 5*0) of the major muscle protein, actomyosin. At this pH the WHC is at a minimum due to maximum attraction between proteins, but on increasing the pH and salt concentration this attraction is decreased allowing entry of
22water. A full account of these effects appear in the review by Hamm.22This review also summarises the current understanding of the
state of water in muscles. About 5$ of the total water is tightly bound to the myofibrillar protein molecules as hydration water and is hardly influenced by changes in the structure of the proteins during rigor, cooking etc., and does not freeze at normal freezer temperatures. This fraction is usually referred to as “bound” water. The remaining 95f<> of water is referred to as "free" water, although it is more or less immobilised within the system of myofibrillar proteins. Part of this water may be squeezed from muscle by low pressure, while some is strongly immobilised and can only be expressed with difficulty, but there seems to be a continuous transition between these 2 states. Therefore, calculation of the WHC of a muscle system depends on the
32

method of measurement of this nfreeM water. It is this "free" water which is strongly influenced by changes in the spatial molecular structure of the muscle filaments, brought about by changes in pH and ionic strength.
Alkaline polyphosphate salts cause increases in both pH andionic strength of treated muscles, and therefore, on this basis alone
97would be expected to increase WHC. However, experimental results show that diphosphate, and to a smaller extent, tripolyphosphate, have a specific effect on WHC, which cannot be explained solely in terms of these two factors, since compared to the longer-chain phosphates, they have neither a high pH nor ionic strength. Also, in practical terms the addition of the recommended amount of polyphosphates to meat (about 0*3 > as no^ likely to cause asignificant increase in pH.
98However, it is worth mentioning the detailed work of Sherman,who investigated the effects of sodium chloride and polyphosphates(tetrasodium diphosphate and a commercial mixture) on the fluidretention of fresh pork at 0°C and 100°C. He found that fluid retentionat both temperatures depended on the solution-meat ratio, and on themethod used for its determination. Kiese facts may, in part, account
9for the apparent contradictions in the literature reviewed by lies, and in section 1.33* Fluid retention at both temperatures improved with increasing concentrations of salts. At 0°C, fluid retention of the phosphate treated meat after ageing was significantly correlated with the pH of the aged mixtures, which must be above 6.25 i*1 order to improve fluid retention. Ho such relationship was found for retention of fluid from sodium chloride solutions, where the pH of the aged meat-solutions depended on the original pH of the meat.Fluid retention at 100°C did not correlate with pH for either salt - or phosphate-meat solutions.
33
Sherman studied the actual absorption of ions by meat proteins and concluded that the ionic strength of the additive solution was important only in so far as it controlled the rate of ion absorption by proteins. The greater the ionic strength thegreater the absorption of ions. This theory was extended by later
99 ostudies, when it was found that at 0 C the influence of alkalinepolyphosphates on water retention in fresh pork was related to ionicabsorption. Cations were preferentially absorbed, but the effectwas very pH dependent with the difference between cation and anionabsorption decreasing with increasing pH. Thus, phosphate ionabsorption must be operative in some way. However, at 100°C theprimary factors governing fluid retention were protein changesrelated to the influence of heat and the amount of actomyosinsolubilised (see section 1.615) at 0°C.17ater retention from sodiumchloride solutions at both temperatures was linearly related to theconcentrations of ions absorbed, with cations and anions beingabsorbed to approximately the same extent.
Hamm, 1955*1960, and Hellendoom, 1962 (cited by Iles,^) and97Bendall, all found that when comparison of various phosphate salts
were made at a controlled pH, then diphosphate and tripolyphosphate were more effective in increasing water retention than the others.
The results presented above point to the fact that ions are actually absorbed by meat proteins, and that the effect of added phosphate salts may not be explained solely in terms of ionic strength and pH.1.612 Chelation of Metal Ions
As we have discussed in the previous section, an increase in ionic strength or pH of meat causes the attraction between proteins to decrease, so allowing water to enter. A similar effect could be envisaged if the calcium and magnesium which bridge muscle proteins
54
were to be removed. However, if this were true, then removal of these metal ions by any means should result in increased water retention.
QHamm and co-workers, 1955-60, 1970-71 (cited by lies ), considered thatEDTA and oxalate, both calcium-complexing agents, did increase muscle
98hydration. However, Sherman' found that EDTA had little effect onwater retention in pork. Perhaps, as pointed out by Hamm,^^ the largeEDTA molecule is prevented from approaching protein-bound metal. ionsbecause of steric reasons.
It has also been demonstrated that 60$ of the calcium and 20$of the magnesium is firmly bound to muscle proteins and is therefore
101thought to be unavailable for reaction with added chelating agents.This was demonstrated by dialysis and extraction-centrifuge procedures which were used to determine the amounts of free and bound metals.Only metals not bound to proteins would pass through the dialysis tubing or into the supematent during centrifuging. Addition of 0.4$ polyphosphates (ortho-, di-, tripoly- and glassy phosphates) did not alter the amounts of calcium or magnesium remaining in the meat (L- dorsi beef muscle) after dialysis of both the raw meat and that after heating to 70°C, compared to sodium chloride/meat standards (2.0$ sodium chloride). Similar results were obtained by the centrifuging procedure for raw meat.
102Baldwin and deMan, studied the distribution of calcium andmagnesium in muscle (hip of beef) in greater detail than Inklaar^^ by determining a) the total calcium and magnesium in the meat, b) thetotal in the juice expressed from the meat, c) the total in the ultrafiltrate of the juice i.e. the total soluble calcium and magnesium.The total amounts of protein-bound metals appeared to be similar to those reported by Inklaar. However, the soluble protein-bound calcium increased and the insoluble protein-bound calcium decreased as the chain length of the phosphate additive increased. This suggests that
35
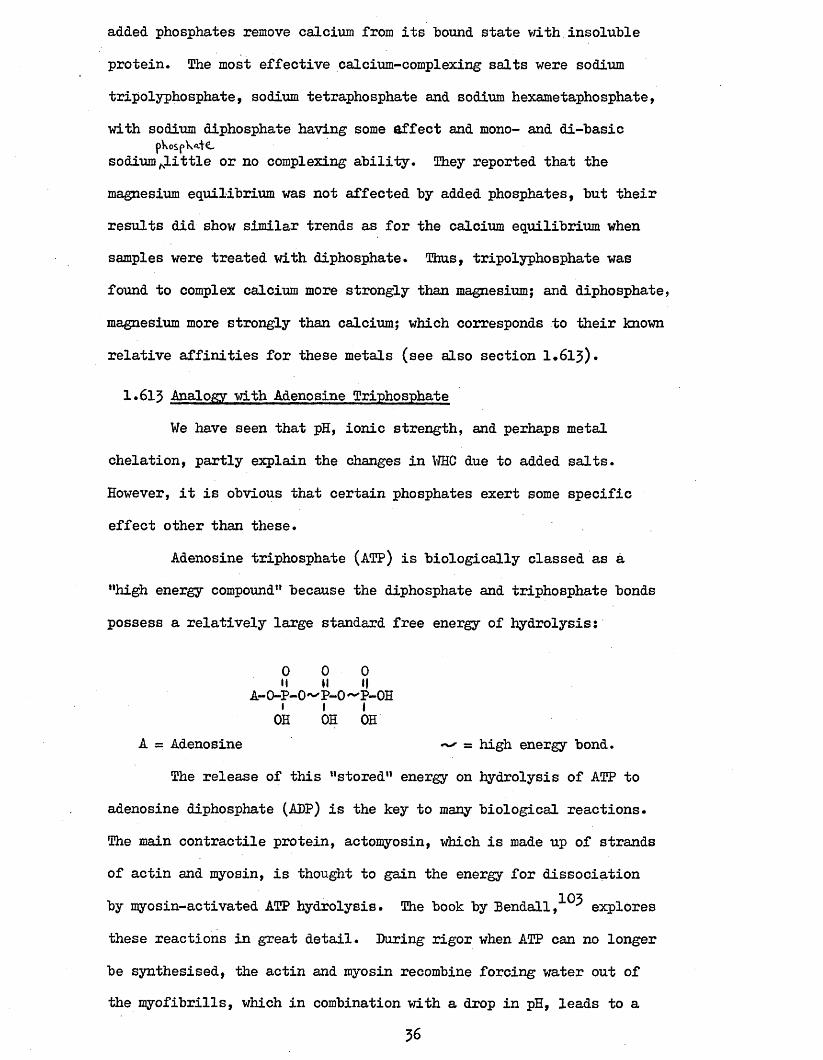
added phosphates remove calcium from its hound state with insolubleprotein. The most effective calcium-complexing salts were sodiumtripolyphosphate, sodium tetraphosphate and sodium hexametaphosphate,with sodium diphosphate having some affect and mono- and di-basic
pkospk<ctCsodium little or no complexing ability. They reported that the magnesium equilibrium was not affected by added phosphates, but their results did show similar trends as for the calcium equilibrium when samples were treated with diphosphate. Thus, tripolyphosphate was found to complex calcium more strongly than magnesium; and diphosphate, magnesium more strongly than calcium; which corresponds to their known relative affinities for these metals (see also section 1.613)*
1.613 Analogy with Adenosine TriphosphateWe have seen that pH, ionic strength, and perhaps metal
chelation, partly explain the changes in WHC due to added salts. However, it is obvious that certain phosphates exert some specific effect other than these.
Adenosine triphosphate (ATP) is biologically classed as a •'high energy compound” because the diphosphate and triphosphate bonds possess a relatively large standard free energy of hydrolysis;
0 0 0II II IIO-P-O^P-O 1 1 ~P-!|OH OH OH
A = Adenosine = high energy bond.The release of this “stored” energy on hydrolysis of ATP to
adenosine diphosphate (ADP) is the key to many biological reactions.The main contractile protein, actomyosin, which is made up of strandsof actin and myosin, is thought to gain the energy for dissociation
103by myosin-activated ATP hydrolysis. The book by Bendall, J explores these reactions in great detail. During rigor when ATP can no longer be synthesised, the actin and myosin recombine forcing water out of the myofibrills, which in combination with a drop in pH, leads to a
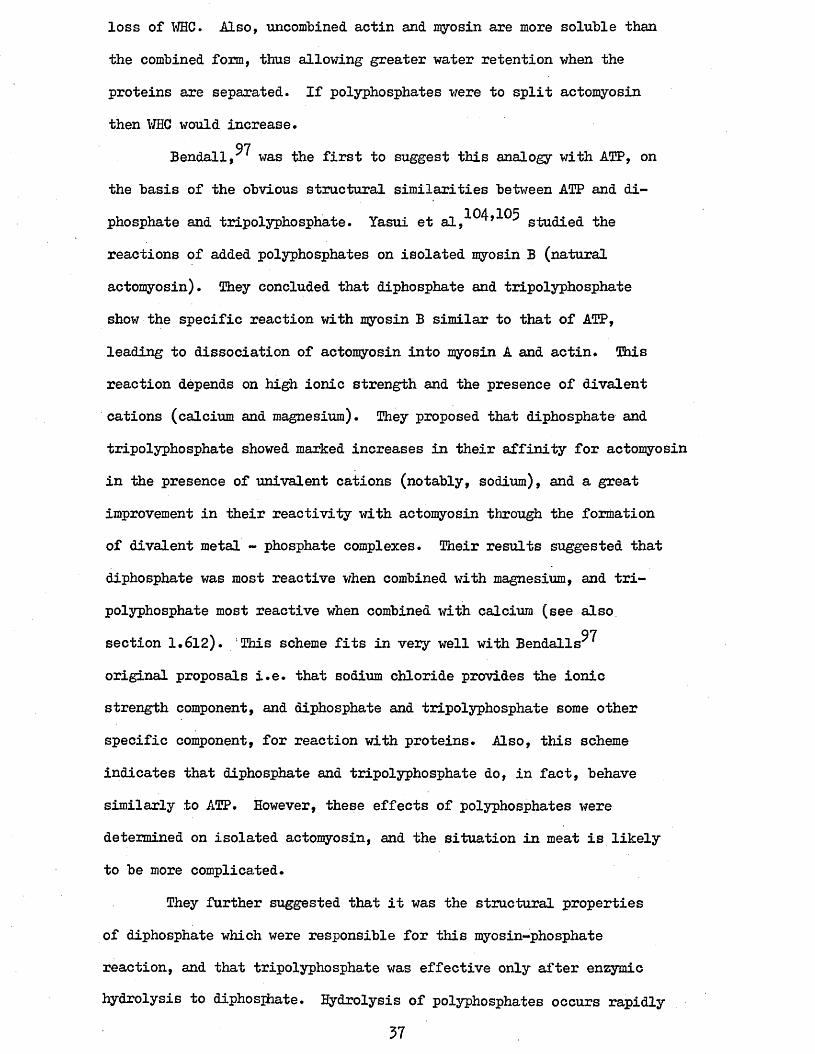
loss of WHC. Also, uncombined actin and myosin are more soluble than the combined form, thus allowing greater water retention when the proteins are separated. If polyphosphates were to split actomyosinthen WHC would increase.
97Bendall, was the first to suggest this analogy with ATP, on the basis of the obvious structural similarities between ATP and diphosphate and tripolyphosphate. Yasui et ai,^^»105 g-fo^g^ the reactions of added polyphosphates on isolated myosin B (natural actomyosin). They concluded that diphosphate and tripolyphosphate show the specific reaction with myosin B similar to that of ATP, leading to dissociation of actomyosin into myosin A and actin. This reaction depends on high ionic strength and the presence of divalent cations (calcium and magnesium). They proposed that diphosphate and tripolyphosphate showed marked increases in their affinity for actomyosin in the presence of univalent cations (notably, sodium), and a great improvement in their reactivity with actomyosin through the formation of divalent metal - phosphate complexes. Their results suggested that diphosphate was most reactive when combined with magnesium, and tripolyphosphate most reactive when combined with calcium (see also section 1.612). This scheme fits in very well with Bendalls^ original proposals i.e. that sodium chloride provides the ionic strength component, and diphosphate and tripolyphosphate some other specific component, for reaction with proteins. Also, this scheme indicates that diphosphate and tripolyphosphate do, in fact, behave similarly to ATP. However, these effects of polyphosphates were determined on isolated actomyosin, and the situation in meat is likely to be more complicated.
They further suggested that it was the structural properties of diphosphate which were responsible for this myosin-phosphate reaction, and that tripolyphosphate was effective only after enzymic hydrolysis to diphosjhate. Hydrolysis of polyphosphates occurs rapidly
37
in meat and will be discussed in section 1 ,6 4 *
Many workers have presented evidence for the strong affinityof diphosphate with myosin (see the reviews by Iles,^ and Hamm,^^ ) but it is by no means certain whether the resulting complex actuallyleads to dissociation of actomyosin. Chemical tests on the freefluid from meat-salt systems showed that treatment with diphosphateresulted in a greater amount of solubilised actomyosin than treatment
98 97with sodium chloride. Also, Bendall, found that the free fluidfrom muscle treated with diphosphate plus sodium chloride was veryviscous and contained actomyosin, when the total ionic strengths ofthe additives was above 0.40, but when the high ionic strength wasdue to sodium chloride alone then no such dissolution of actomyosinwas found. Ihese tests were not able to show whether dissociationof actomyosin had occurred. However, electron microscopy studies ofmeat-salt systems showed that polyphosphates are unlikely to actuallysplit actomyosin, although some protein-phosphate reaction hadundoubtedly taken place.
1.62 ACTION OH COOKING LOSSGenerally, treated meat loses less fluid on cooking than meat
that is not treated. Since phosphates are usually added to raw meat,treatment must result in a change in some property of the raw meatwhich is extended to the cooked product.
It has been suggested that the actin and myosin which may besolubilised by phosphates, forms a gel on heating, which is capable of
98 99retaining water within the meat, ’ Alternatively, the dissolved proteins may form a fine, fibrous network on heating, which constitutes a barrier to fluid loss.^ Shermans work^*^ on the influence of ion absorption on V/HC, showed that at 100°C the fluid retention in lean pork treated with phosphates appeared to be related to the concentration of actomyosin which was dissolved at 0°C during ageing of the solution/
38
phosphates used* Moreover, when the unretained fluid at 0°C was removed by centrifugation before heating to 100°C, the water content of the heated meat was reduced by O.lg for every lmg of soluble nitrogen removed. This relationship was true for both sodium chloride and polyphosphate solutions, and compared to results obtained without salt addition, suggested that these salts reduce the loss of those meat proteins responsible for retention of water at 100°C. There was little difference in the total protein nitrogen in the aqueous extracts from pork treated with either sodium chloride or polyphosphates at concentrations of 0*5 and l.Ofo. The amount of actomyosin nitrogen however was greatest in polyphosphate treated extracts.
1.63 ACTION ON AUTOQXIDATIVE RANCIDITYIt has been suggested that polyphosphates act as antioxidants
either because they chelate metal ions which are catalysts of oxidation,or the "coagulated1* protein as well as preventing fluid loss, also
9prevents the entry of oxygen. However, the discussion above points to the fact that both of these effects are subject to doubt, and hence no satisfactory explanation of the antioxident action of polyphosphates has been proposed.
1.64 HYDROLYSIS OF POLYPHOSPHATESPolyphosphates are readily hydrolysed in solution, usually by
107 108 109an acid catalysed reaction. 9 9 * In meat products the hydrolysisof added polyphosphates is brought about by muscle phosphatases, and this is a very rapid process.
1100*Neill and Richards, used phosphorus-31 nuclear magneticresonance to detect polyphosphate species in treated chicken muscle.'They demonstrated that the hydrolysis of polyphosphates is effectivelystopped by addition of EDTA; and that during the thawing process
111hydrolysis proceeds very rapidly. Jozefowicz et al reported that
59
vexy Aiv&Le nyaroxysis 01 poiypnospnates occurred. in cnicicen muscle during 6 months storage at -18°C. Presumably, these latter workers halted the hydrolysis by addition of EDTA. to the frozen samples, since preliminary work reported by O'Neill and Richards,showed that there were no added polyphosphates in the muscles of commercially treated chickens which had been allowed to thaw*
No other accounts of polyphosphate hydrolysis in chicken muscle have been reported* However, several accounts of polyphosphate hydrolysis in other meats have been published, and these are summarised below.
112Mihalyi-Kengyel and Kormendy, found that 40 to 5 oftripolyphosphate hydrolysed immediately after addition to minced porkmuscle* During storage at 4°C* the hydrolysis of diphosphate wascomplete within 3 days, and of tripolyphosphate within 4 days. This
ll2)rapid hydrolysis has also been reported in fish.The hydrolysis is thought to be a step-wise reaction:
kl k2tripolyphosphate — > diphosphate — » orthophosphate113Sutton, ' found that k2 was very much less than k^ in beef muscle, but
that all of the diphosphate had disappeared within 24 hours at 25°C. Thehydrolysis rate decreased with temperature, and was dependent on theprotein concentration (an approximate measure of the enzyme concentration}.The rate of hydrolysis in cured, non-comminuted pork was lower than in theuncured, minced muscle, and it was suggested that non-hydrolysis breakdown
112reactions occur for diphosphate.104Yasui et al, proposed that diphosphate and tripolyphosphate
reacted with salt-free myosin B, especially in the presence of high salt concentrations and divalent cations (calcium and magnesium). Muscle is known to contain sufficient amounts of these ions for reaction to take place. Recently Neraal & Hamm ^ave published a series of •papers on the occurrence of diphosphatases and tripolyphosphatases in beef muscle, and the rate of hydrolysis of added diphosphate and tripolyphosphate.
40
Awviuui vuav wagucDXhUU xuuct WC1C JJi.XIiicU.Xi.Jf X'KBpuUBlUXS JL UX* 1/116 Ql**
phosphatase activity, and calcium ions for the tripolyphosphatase activity*They studied the hydrolysis of diphosphate and tripolyphosphate in heefmuscle and found that 0*5^ added diphosphate was broken down within 2 to
11612 hours, whereas 0*5jo tripolyphosphate in the same muscle took only*1*1 c 1179 to 19 minutes* Van Hoof, mentioned earlier work by Heraal and
Hamm in which they found that diphosphatase activity was higher in prerigor beef muscle (pH optimum 7*0) than in post-rigor muscle, whereas, tripolyphosphatase activity increased during the first 2 or 3 days postmortem (pH optimum 5*7) • He confirmed their findings that tripolyphosphatase was more sensitive to heat denaturation than diphosphatase, by his results obtained with pork muscle. Heating to an internal temperature of 72°C did not inhibit further hydrolysis of diphosphate during storage of pork muscle at 4°C, whereas it completely inhibited the further hydrolysis of residual tripolyphosphate under the same conditions. Tripolyphosphatase activity was again found to be greater than diphosphatase activity, and increased with the time post-mortem. In fact, addition of 0 .y/o tripolyphosphate (expressed as P^O^) at 1 hour post-mortem resulted in complete hydrolysis within 5 hours, whereas addition at 48 hours postmortem resulted in complete hydrolysis in only 30 minutes* Diphosphate added 1 hour post-mortem was 5&/° hydrolysed in 5 minutes, and completely hydrolysed within 5 to 24 hours, whereas complete hydrolysis occurred within 9 to 72 hours after addition at 48 hours post-mortem* Hydrolysis of both diphosphate and tripolyphosphate was higher in meat of normalquality (pH 6.0), than in PSE meat quality (pH 5*5)*
118Awad, also found that appreciable hydrolysis of polyphosphates took place immediately after addition to meat and continued with time* Also, when the meat was heated to destroy phosphatases before treatment, some initial hydrolysis still took place, which was independent of the amount of polyphosphate added and did not increase
41
with time. Thus some factors other than enzymic hydrolysis, such as pHand ionic environment, must also bring about polyphosphate hydrolysis.
The effects of added polyphosphates are apparent even afterprolonged storage and cooking (see sections 1.23 and. 1.43), when thepolyphosphates have undoubtedly been hydrolysed to orthophosphate which
8 85has little or no effect. 9 Therefore the changes in treated meat which bring about these effects on moisture losses and oxidative rancidity, must depend on some irreversible reaction which takes place soon after treatment.
42

2. METHODS
2.1 STATISTICAL ANALYSESStatistically significant differences between polyphosphate
treated and untreated samples, were determined, according to the value of the Student*s t Test statistic:
"fc “ f wm ^ J“ V u £' where n is the number of polyphosphate treatedy p gs^ + Sp samples (which equalled the number of untreated
samples); *u and S, are the mean values of untreated and polyphosphate2 2treated samples, respectively; and s^ and s^ are the variances
2 ^ 2(s‘ = U x - r Y ) of the results for untreated and treated samples, n - 1n - i j------
respectively. Standard deviations (s) were calculated from I - x)V n - 1
The calculated value of t was checked for significance at 9 orhigher probability level, from statistical tables, using the two-tailcriterion, and 2n - 2 degrees of freedom.
Correlation coefficients (r) between 2 sets of resultsobtained from the same sample were calculated as follows:
n J ^ X g “ (Hx2) 'r - — ----- - 1 1 ■ ■ where n is the numberV n E xf - (1^)2) („2>2 _ ( £ X2)2j
of samples and x^ and axe the results of the two experiments.Statistical significance at 95$ or higher probability level was determined for n - 2 degrees of freedom from statistical tables.
For both of these tests, when a result was statisticallysignificant at the 9Of° probability level, this was taken as statistically invalid for sample sizes of 3 or 6. In these cases, the results were said to follow a trend, or to approach significance.
2.2 CHICKEN SAMPLESBatches of 12 polyphosphate treated and 12 untreated frozen
broiler chickens were obtained direct from the factory, and transported to the laboratory packed in solid carbon dioxide. They were stored in a
45
freezer at - 18°C or -20°C until required for analysis.Batch A were obtained from Eastwoods, Newark. Factory trials
were supervised by Dr. R.C. Osner of Sheffield City Polytechnic. (SCP). The carcases were treated after evisceration and before spin-chilling with a 4$ solution of Puron 604 by injection into both sides of the breast muscle using an automatic injection device. The level of injection varied between 7*9^ and 12.4^ of the eviscerated carcase weight. All of the chickens were weighed after spin-chilling and drip to calculate the uptake of chill water.
Batch B were obtained from J.P.-Wood & Sons, Craven Arms, by arrangement with Albright and Wilson Ltd., Oldbury (A & W). Factory trials were supervised by Mr. J. Bennett (A & W), Dr. Osner (SCP) and the author. The carcases were treated after evisceration and before spin-chilling with a 5$ solution of Puron 604 (supplied by A & V/), by injection into both sides of the breast muscle using an automatic injection device. The level of injection varied between 4»2 > and 6.9^*
Batch C were obtained as for Batch B, with Mr. R. Krakowicz (A & V/) and the author supervising factory trials. The carcases we re treated after evisceration and before spin-chilling with a 5 solution of Puron 604 injected by hand using a syringe, into both sides of the breast muscle. The level of injection varied between 4*8^ and 5 The uptake of chill water was calculated for both treated and untreated chickens.
2.3 THIOBARBITDRIG ACID TEST TO ASSESS THE DEGREE OF RANCIDITY
2.31 CHOICE OF METHODGenerally, the methods of determining the degree of rancidity
may be divided into those that measure some property related to protein breakdown, and those that are related to fat spoilage. In this work, the extent of fat spoilage after frozen storage and during holding was to be determined, and the results of polyphosphate-treated and untreated
44
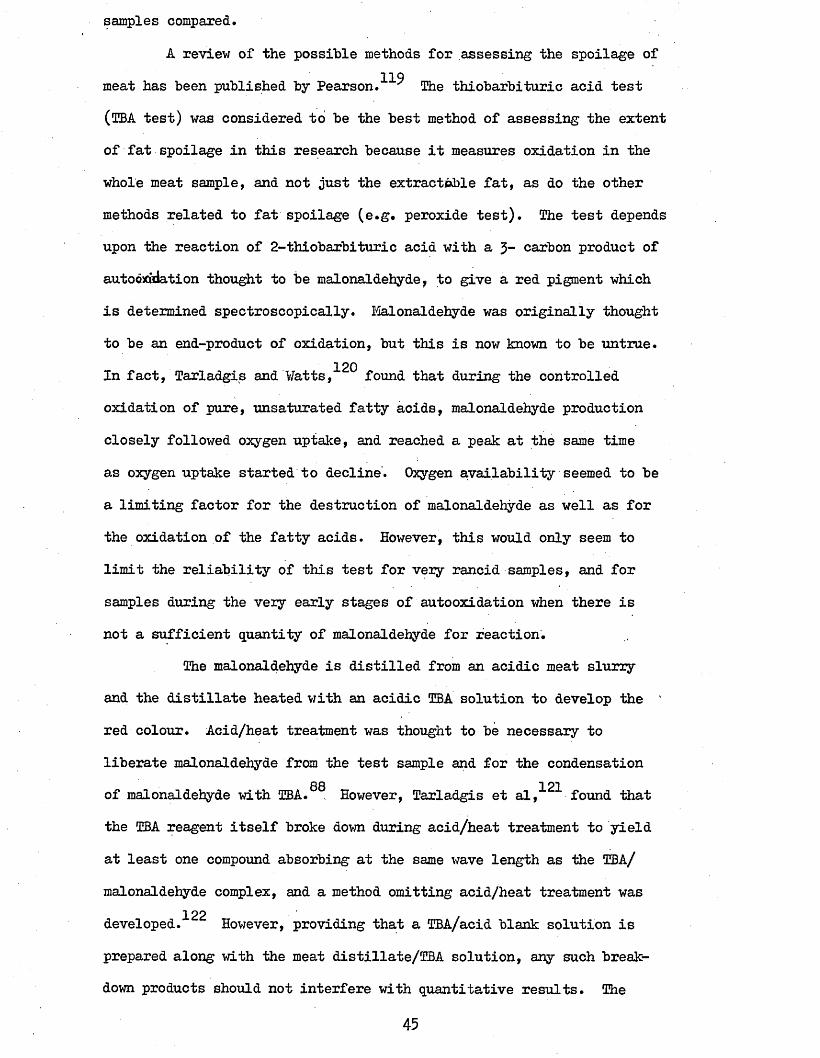
samples compared.A review of the possible methods for assessing the spoilage of
119meat has been published by Pearson. The thiobarbituric acid test(TBA test) was considered to be the best method of assessing the extentof fat spoilage in this research because it measures oxidation in thewhole meat sample, and not just the extract able fat, as do the othermethods related to fat spoilage (e.g. peroxide test). The test dependsupon the reaction of 2-thiobarbituric acid with a 3“ carbon product ofautowccdation thought to be malonaldehyde, to give a red pigment whichis determined spectroscopically. Malonaldehyde was originally thoughtto be an end-product of oxidation, but this is now known to be untrue.
120In fact, Tarladgis and Watts, found that during the controlled oxidation of pure, unsaturated fatty acids, malonaldehyde production closely followed oxygen uptake, and reached a peak at the same time as oxygen uptake started to decline. Oxygen availability seemed to be a limiting factor for the destruction of malonaldehyde as well as for the oxidation of the fatty acids. However, this would only seem to limit the reliability of this test for very rancid samples, and for samples during the very early stages of autooxidation when there is not a sufficient quantity of malonaldehyde for reaction.
The malonaldehyde is distilled from an acidic meat slurry and the distillate heated with an acidic TBA solution to develop the red colour. Acid/heat treatment was thought to be necessary toliberate malonaldehyde from the test sample and for the condensation
88 121 of malonaldehyde with TBA. . However, Tarladgis et al, found thatthe TBA reagent itself broke down during acid/heat treatment to yieldat least one compound absorbing at the same wave length as the TBA/malonaldehyde complex, and a method omitting acid/heat treatment was
122developed. However, providing that a TBA/acid blank solution is prepared along with the meat distillate/TBA solution, any such breakdown products should not interfere with quantitative results. The
45

test may "be quantified by using 1, 1, 3> 3> tetraethoxypropane (TEP)which hydolyses on acid/heat treatment to yield malonaldehyde, and theresults are expressed as TBA Numbers, which are a measure of the mg ofmalonaldehyde per lOOOg sample. TBA Numbers have been correlated with
40 86 88odour ratings, 9 9 and with levels of fatty acids in various lipidfractions of chicken pectoralis major muscles'^ (see section 3*25)•
. The intensity of the red colour is very dependent on the actualtest conditions e.g. pH of the meat slurry, time of distillation and the
88quantity of distillate collected. Various different methods have been proposed,®7»88»122,123. one et al®® has been the
most widely used and was chosen for this research. It has been favourably124compared to other meat spoilage tests by Pearson.
2.52 APPARATUS AND REAGENTS
The apparatus is shown in Figure IV. The heating mantle was3obtained from Electrothermal. The time taken to collect 50 cm
distillate did not vary by more than 2 minutes between the 6 heatingmantles when the controls were at maximum. The. distillation glass warewas standard quick-fit.
A lOOcm^ capacity homogenisor- was used (M.S.E.), andcpticaldensities were measured using a Unicam SP 500 spectrophotometer.
The stock solution of 1,1,3>3> tetraethoxypropane (TEP) (BDH Chemi- —5 Mcals Ltd.) was 1 x 10 in distilled water; and the solution of thio-
barbituric acid (TBA) (BDH Chemicals Ltd.) was 0.02 M in JO?o glacial acetic acid. Antifoam B was obtained from Sigma Chemical Co. Ltd.
2.33 PROCEDURE3Ten grams of muscle were homogenised with 50cnr of distilled
water. The mixture was quantitatively transferred to a distillation3 3flask with 47*5cm of distilled water, and 2.5cm of hydrochloric acid
(4EVn0L.‘ dm^) added to bring the pH to 1.5* A few drops of Antifoam B
46
X 1VJIVJXVJU X V
DISTILLATION APPARATUS USED IN THE TBA TEST

were put onto the neck of the flask, and glass heads added to prevent3bumping, The distillation was continued until 5Qcm of distillate were
3 3collected. Five cur of distillate were pipetted into a 50cnr glass3boiling tube, and 5 cm of TBA reagent added. The tube was stoppered
and the contents mixed and immersed in a boiling water bath for exactly 55min. A distilled water/TBA reagent blank was prepared and heated
along with the sample tubes.After heating, the tubes were cooled in tap water for exactly
lOrnin, and then the optical density (O.D.) of the solutions was determined against the blank at 532nm using 10mm cuvettes. Sometimes only 5g of muscle were tested, and the results were treated accordingly.
2.54 CALIBRATION
A malonaldehyde standard curve was constructed by makingappropriate dilutions of the stock TEP solution and determining the redTBA/malonaldehyde complex by the method described for testing the meatdistillate. The results are plotted in Figure V, and show that BeersLaw was obeyed over the entire range of test concentrations.
The percentage recovery of malonaldehyde was determined byfollowing the distillation procedure for various standard solutions andcomparing the results of these distillations (Figure VI) with those ofthe standard curve (Figure V) as follows;
$ recovery = O.D. distillate x 100O.D. original solution
3 3But, 50cm distillate collected from lQOcnr solution, therefore, the distillate value must be divided by 2s
” O.D. distillate r 2 x qqO.D. original solution
= slope Figure VI f 2 x 10oslope Figure Y
= (1.98 x 10⁷) 7 2 * 1001.58 x 10?
io recovery = 'Jl.Gfo
48
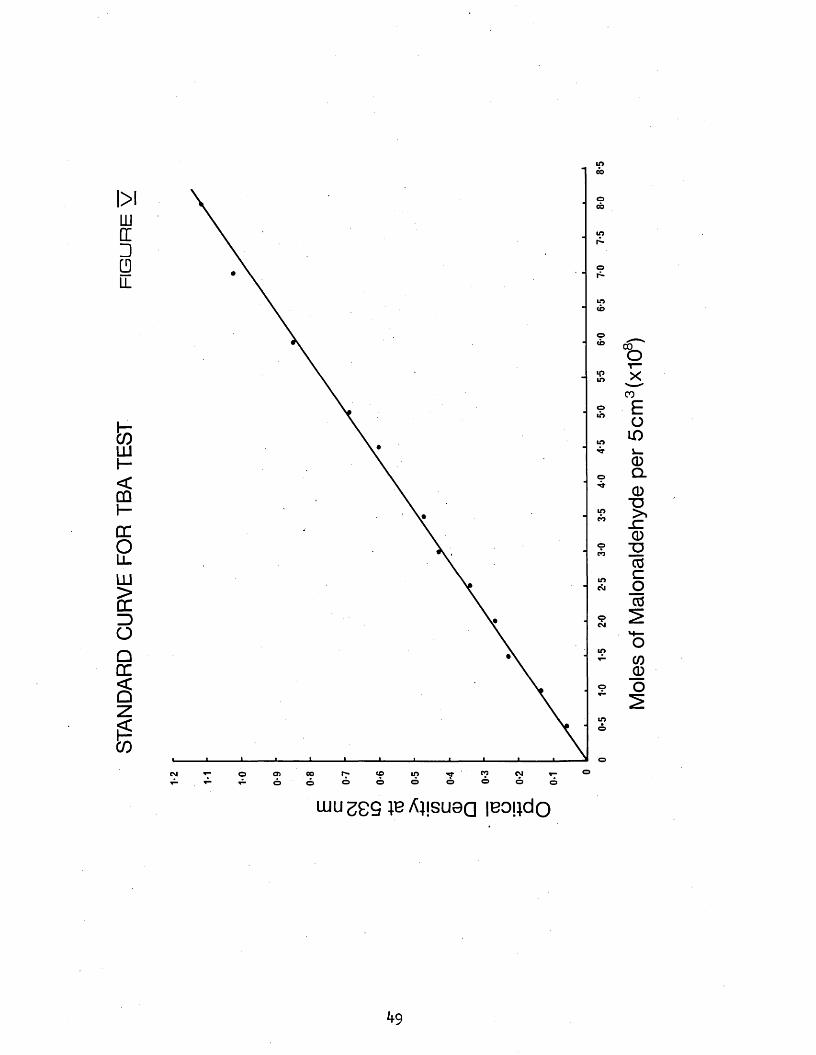
ineo
oCO©
CO©
CMro
CO©
CM o O) in© © o oo
wusgg iBAjjsuea leoi.jdo
^9
Moles
of Mal
onalde
hyde
per 5
cm3(x
108)
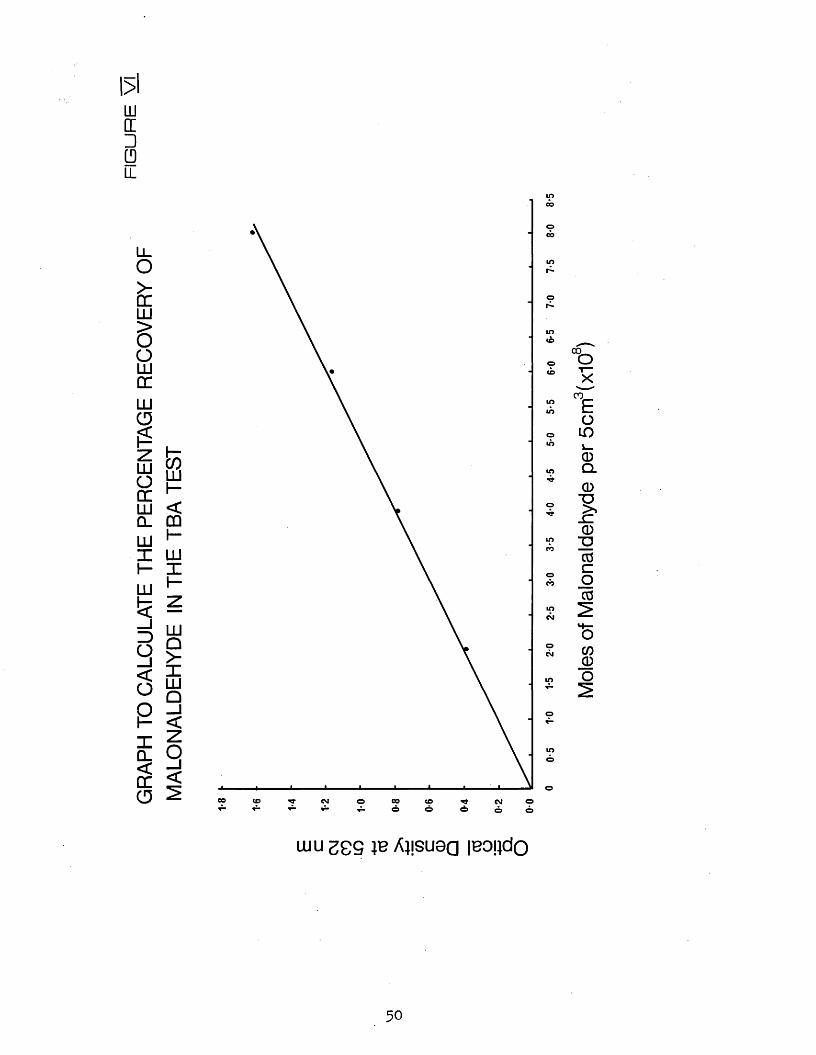
I>lLUDC□LL
o>■QC LU
acrLUo£ zLU0 CC LU CLLU1 HLU
I= )
a < o2h- <L
£ |
0 ^
COLUH<CDLUX
LUQ>XLUQ
00 CM CO©
o o©<6 CM
©
b
"EolO(1)Q.0"O>_ c0
P0Co0
O00O
wu 2£S je A}!SU8Q iBOj do
50
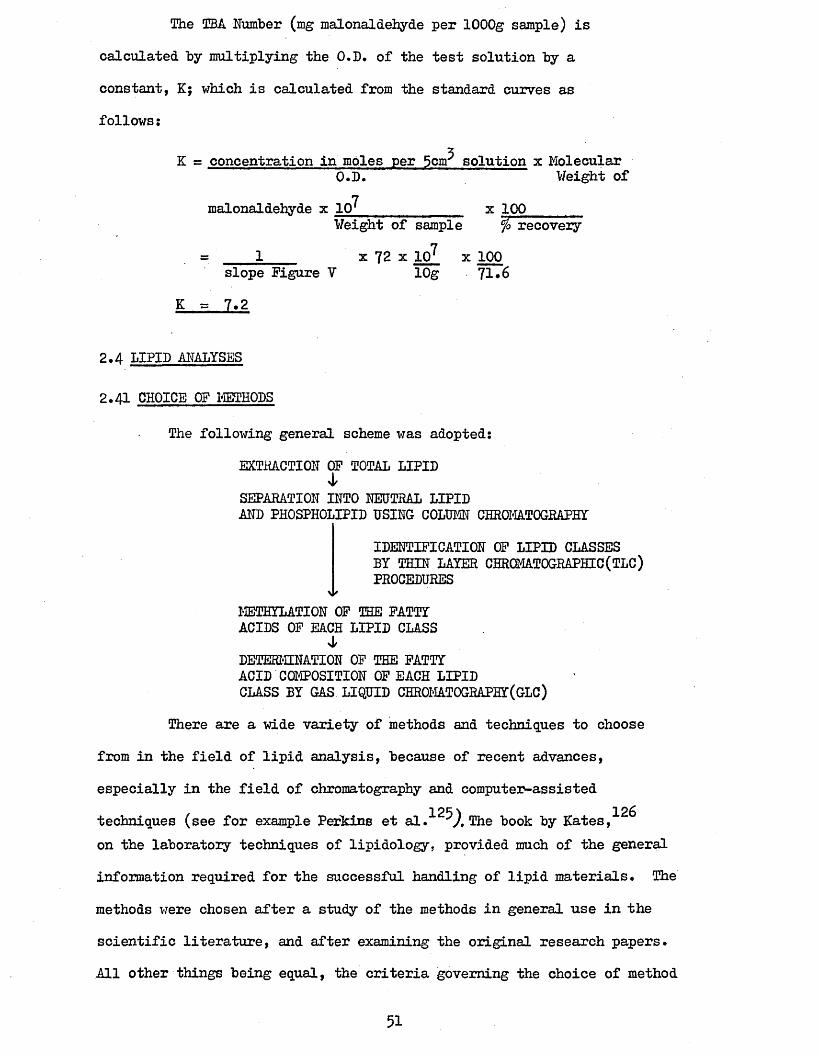
The TBA Number (mg malonaldehyde per lOOOg sample) is calculated by multiplying the O.D. of the test solution by a constant, K; which is calculated from the standard curves as follows:
3K = concentration in moles per 5cm solution x MolecularO.D. Weight of
7malonaldehyde x lCr______________ x 100______Weight of sample fo recovery
= 1 x 72 x 10l x 100slope Figure V lOg 71*6
K = 7*2
2.4 LIPID ANALYSES
2.41 CHOICE OF METHODS
The following general scheme was adopted:EXTRACTION OF TOTAL LIPID
4,SEPARATION INTO NEUTRAL LIPIDAND PHOSPHOLIPID USING COLUMN CHROMATOGRAPHY
IDENTIFICATION OF LIPID CLASSES BY THIN LAYER CHROMATOGRAPHIC (TLC) PROCEDURES
METBYLATION OF THE FATTY ACIDS OF EACH LIPID CLASS
4,DETERMINATION OF THE FATTYACID COMPOSITION OF EACH LIPIDCLASS BY GAS LIQUID CHROMATOGRAPHY (GLC)
There are a wide variety of methods and techniques to choosefrom in the field of lipid analysis, because of recent advances,especially in the field of chromatography and computer-assistedtechniques (see for example Perkins et al.^*^). The book by Kates, on the laboratory techniques of lipidology, provided much of the generalinformation required for the successful handling of lipid materials. Themethods we re chosen after a study of the methods in general use in thescientific literature, and after examining the original research papers.All other things being equal, the criteria governing the choice of method
51

were, speed, availibility of apparatus and reagents, and previous experience of the techniques involved.
2.42 EXTRACTION OF TOTAL LIPID
2.421 Moisture DeterminationThe moisture content of muscles was determined in order to
calculate the solvent to water ratio in the lipid extraction procedure, hy drying duplicate samples to constant weight in a vacuum oven at 95°C and 100 mm mercury pressure.
2.422 Procedure127The procedure of Bligh and I)yer, 1 was employed. Samples of
wet muscle between 15g and lOOg were taken and homogenised, in either a Waring blender or Ato mix, with chloroform and methanol for 2 min. The quantities of solvent used were such that the proportions of chloroforms methanols water were Is2:0.8. A further volume of chloroform was added and the mixture homogenised for 30 sec, before adding an equal volume of distilled water and blending for 30 sec. The proportion of solvents to water was now 2:2si.8. The homogenate was then filtered through a Whatman No.l filter paper on a Coors No. 3 Buchner funnel with slight suction applied, and the filtrate transferred to a measuring cylinder.The blender jar was rinsed with 1 volume of chloroform which was filtered as before and the filtrate added to that in the measuring cylinder.
The proportions of solvents were calculated to ensure complete phase separation, and any cloudiness at this stage always disappeared on standing, to leave a slightly turbid upper aqueous layer, and a clear yellow chloroform layer which contained the total lipid.
The volume of the chloroform layer was recorded and the aqueousxlayer carefully removed, along with the first few cnr of the chloroform
layer in order to avoid contamination of the lipid extract with non-lipid material. An aliquot of the chloroform extract was taken and evaporated to dryness tinder a stream of nitrogen on a water bath at 50°C, mcL the
52
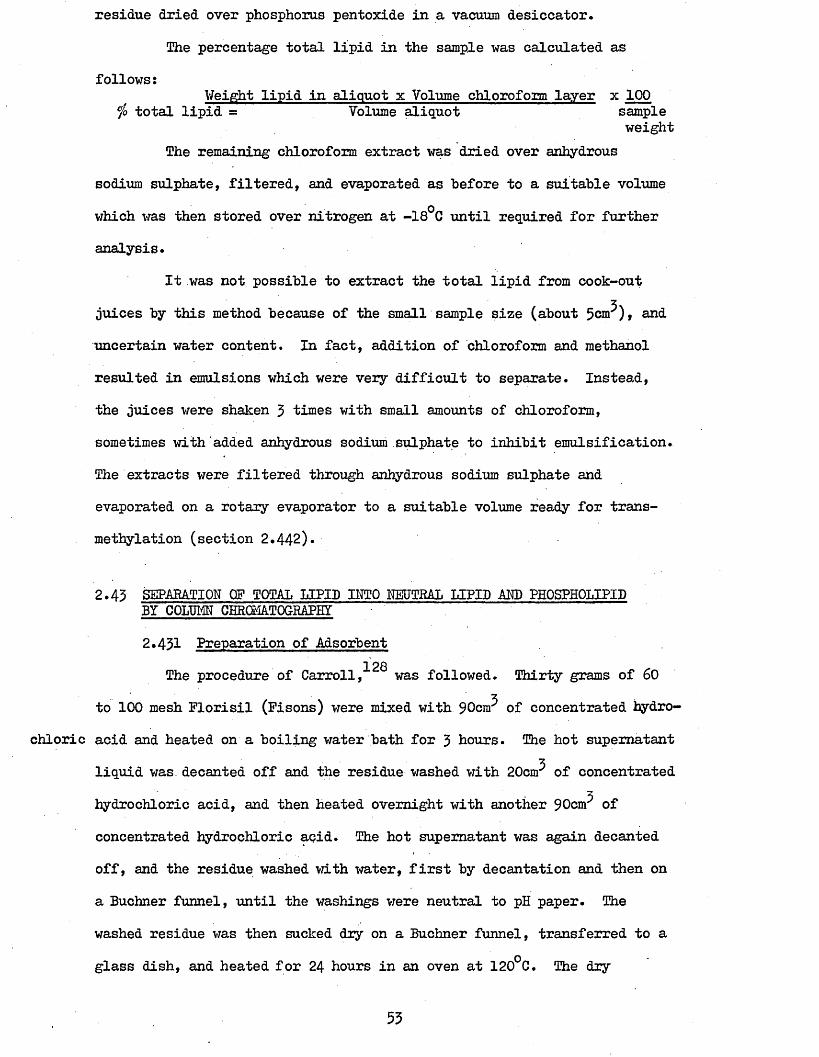
residue dried over phosphorus pentoxide in a vacuum desiccator,The percentage total lipid in the sample was calculated as
follows:Weigfct lipid in aliquot x Volume chloroform layer x 100
i* total lipid = Volume aliquot sampleweight
The remaining chloroform extract was dried over anhydrous sodium sulphate, filtered, and evaporated as before to a suitable volume which was then stored over nitrogen at -18°C until required for further analysis.
It was not possible to extract the total lipid from cook-out3\juices by this method because of the small sample size (about 5cm ), and
uncertain water content. In fact, addition of chloroform and methanol resulted in emulsions which were very difficult to separate. Instead, the juices were shaken 3 times with small amounts of chloroform, sometimes with added anhydrous sodium sulphate to inhibit emulsification. The extracts were filtered through anhydrous sodium sulphate and evaporated on a rotary evaporator to a suitable volume ready for transmethylation (section 2.442).
2.43 SEPARATION OF TOTAL LIPID INTO NEUTRAL LIPID AMD PHOSPHOLIPID BY COLUMN CHRCmPOGRAPHT2.431 Preparation of Adsorbent
The procedure of Carroll, was followed. Thirty grams of 60 to 100 mesh Florisil (Pisons) were mixed with 90cm^ of concentrated hydro
chloric acid and heated on a boiling water bath for 3 hours. The hot supernatantliquid was decanted off and the residue washed with 20cm of concentrated
3hydrochloric acid, and then heated overnight with another 90cm of concentrated hydrochloric acid. The hot supernatant was again decanted off, and the residue washed with water, first by decantation and then on a Buchner funnel, until the washings were neutral to pH paper. The washed residue was then sucked dry on a Buchner funnel, transferred to a glass dish, and heated for 24 hours in an oven at 120°C. The dry
53
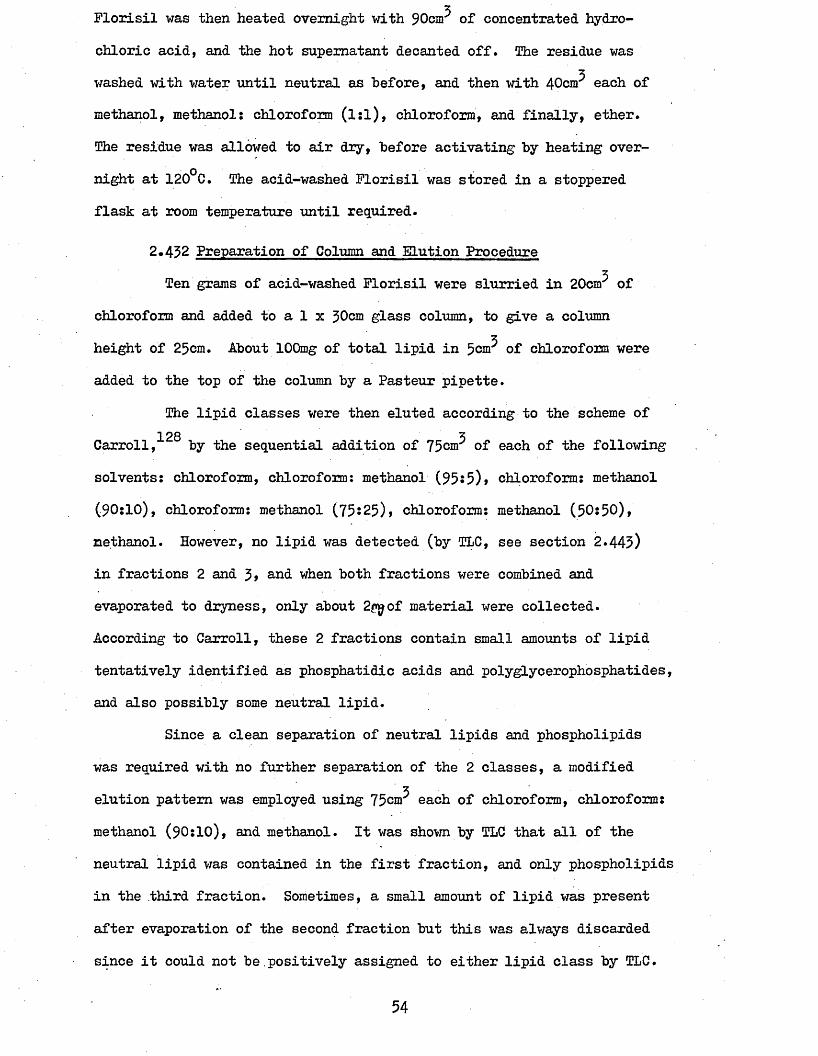
3Florisil was then heated overnight with 90cm of concentrated hydro
chloric acid, and the hot supernatant decanted off. The residue was3washed with water until neutral as before, and then with 40cm each of
methanol, methanol: chloroform (l:l), chloroform, and finally, ether.The residue was allowed to air dry, before activating by heating overnight at 120°C. The acid-washed Florisil was stored in a stoppered flask at room temperature until required.
2.452 Preparation of Column and Elution Procedure3Ten grams of acid-washed Florisil were slurried in 20cm of
chloroform and added to a 1 x 30cm glass column, to give a column3height of 25cm. About lOOmg of total lipid in 5 cm of chloroform were
added to the top of the column by a Pasteur pipette.The lipid classes were then eluted according to the scheme of128 3Carroll, by the sequential addition of 75cm of each of the following
solvents: chloroform, chloroform: methanol (95*5)> chloroform: methanol(90:10), chloroform: methanol (75i25), chloroform: methanol (50:50),methanol. However, no lipid was detected (by TLC, see section 2.445)in fractions 2 and 3> and when both fractions were combined andevaporated to dryness, only about 2p^of material were collected.According to Carroll, these 2 fractions contain small amounts of lipidtentatively identified as phosphatidic acids and polyglycerophosphatides,and also possibly some neutral lipid.
Since a clean separation of neutral lipids and phospholipidswas required with no further separation of the 2 classes, a modified
3elution pattern was employed using 75cm each of chloroform, chloroform:
methanol (90:10), and methanol. It was shown by TLC that all of the neutral lipid was contained in the first fraction, and only phospholipids in the third fraction. Sometimes, a small amount of lipid was present
after evaporation of the second fraction but this was always discarded
since it could not be positively assigned to either lipid class by TLC.
54
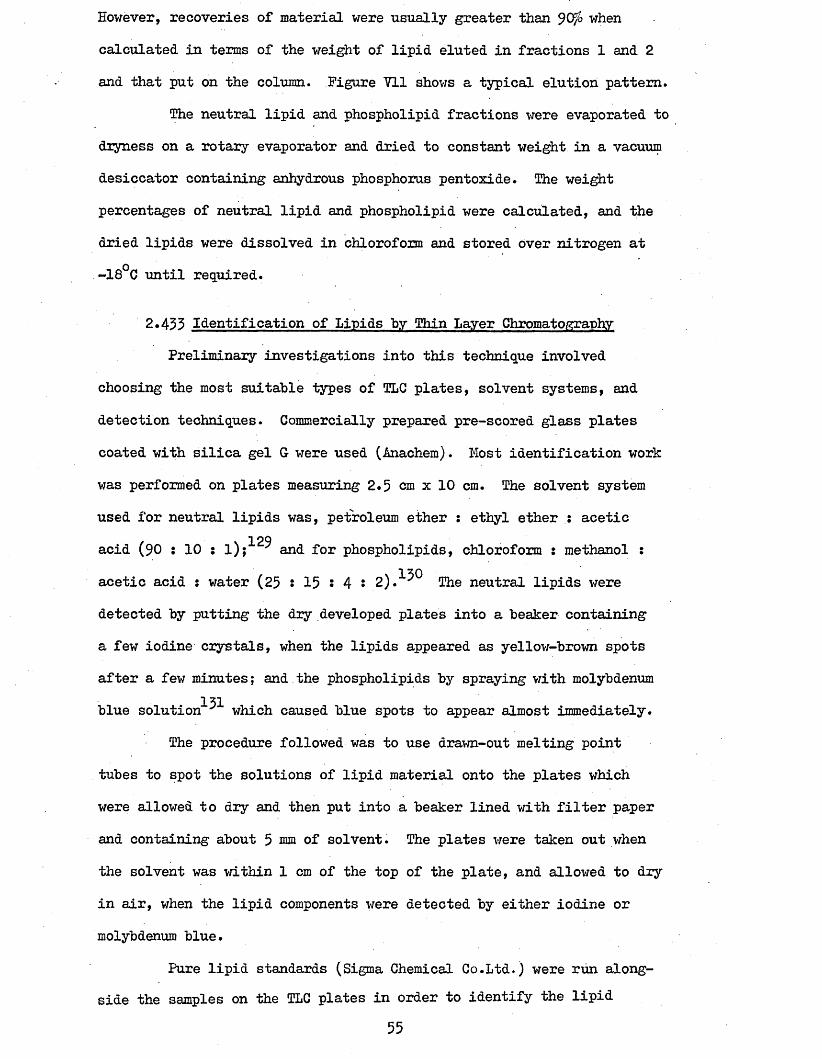
However, recoveries of material were usually greater than J O fo when calculated in terms of the weight of lipid eluted in fractions 1 and 2 and that put on the column. Figure Yll shows a typical elution pattern.
The neutral lipid and phospholipid fractions were evaporated to dryness on a rotary evaporator and dried to constant weight in a vacuum desiccator containing anhydrous phosphorus pent oxide. The weight percentages of neutral lipid and phospholipid were calculated, and the dried lipids were dissolved in chloroform and stored Over nitrogen at -18°C until required.
2*433 Identification of Lipids by Thin Layer ChromatographyPreliminary investigations into this technique involved
choosing the most suitable types of TLC plates, solvent systems, anddetection techniques. Commercially prepared pre-scored glass platescoated with silica gel G were used (Anachem). Most identification workwas performed on plates measuring 2*5 cm x 10 cm. The solvent systemused for neutral lipids was, petroleum ether : ethyl ether s aceticacid (90 : 10 s l); and for phospholipids, chloroform : methanol s
acetic acid : water (25 s 15 s 4 s 2).^° The neutral lipids weredetected by putting the dry developed plates into a beaker containinga few iodine crystals, when the lipids appeared as yellow-brown spotsafter a few minutes; and the phospholipids by spraying with molybdenum
131blue solution ' which caused blue spots to appear almost immediately.The procedure followed was to use drawn-out melting point
tubes to spot the solutions of lipid material onto the plates which were allowed to dry and then put into a beaker lined with filter paper and containing about 5 12m of solvent. The plates we re taken out when the solvent was within 1 cm of the top of the plate, and allowed to dry in air, when the lipid components we re detected by either iodine or molybdenum blue.
Pure lipid standards (Sigma Chemical Co.Ltd.) were run alongside the samples on the TLC plates in order to identify the lipid
55
FIG
UR
E W
ELUTIO
N PAT
TERN
FOR SEPARATION OF
TOTAL
LIPID
BY FLO
RISIL
COLUMN CH
ROMA
TOGR
APHY
0 O)•4— > £c wD "O1 »05
56
Fraction
Number (
15cm3 fractions)
FIGURE \ /n i
IDENTIFICATION OF LIPIDS BY TLC
1 2 3 4
Neutral Lipid System
1 Chicken neutral lipid2 Cholesterol3 Glycerol tripalmitate4 Stearic acid
1
Phospholipid System
1 Chicken phospholipid2 95% egg lecithin
(phosphatidyl choline)
57
components. Figure VIII shows some typical results.
2.44 METHYLATION OF LIPIDS2.441 Choice of MethodFatty acids are too polar to he easily separated hy GLC
procedures, and it is necessary to prepare their methyl esters which mayhe separated successfully hy GLC. A modification of the transmethylation
132procedure of Peisker, which was partially developed for this research 133hy Mrs. Thomas, ^ was used. This method was chosen because it does not
require the use of dangerous materials (as do some others) and it is the least time-consuming of all methods.
2.442 ProcedureAhout 30 mg lipid and 1 cm'* methylating reagent (chloroform s
methanol : concentrated sulphuric acid 100 j 100 : l) were added to the reaction tuhe and the apparatus assembled as in Figure IX and inserted into an aluminium heating block. After reaction at 190°C for 40 minutes,
s.the device was cooled under running water before carefully releasing thepressure. A small piece of zinc was added to the reaction mixture toneutralise any unreacted acid, and the excess solvent evaporated offunder a stream of nitrogen on a warm water hath, The product was washed
3with lcnr distilled water and extracted 3 times with petroleum ether.The ether extracts were dried over anhydrous sodium sulphate and the mixture of methyl esters evaporated to a suitable volume ready for direct injection onto the GLC column. If the esters were to he stored before GLC analysis, the petroleum ether was evaporated off and the esters redissolved in chloroform and stored under nitrogen at -18°C.
2.443 Determination of Percentage MethylationPure fatty acids underwent complete methylation in 10 min.
(as determined hy TLC), hut chicken lipid required a longer reaction time. The optimum reaction time was determined hy analysing chicken lipid mixtures after 20,30 and 40 min. reaction. The fatty acid composition of
58
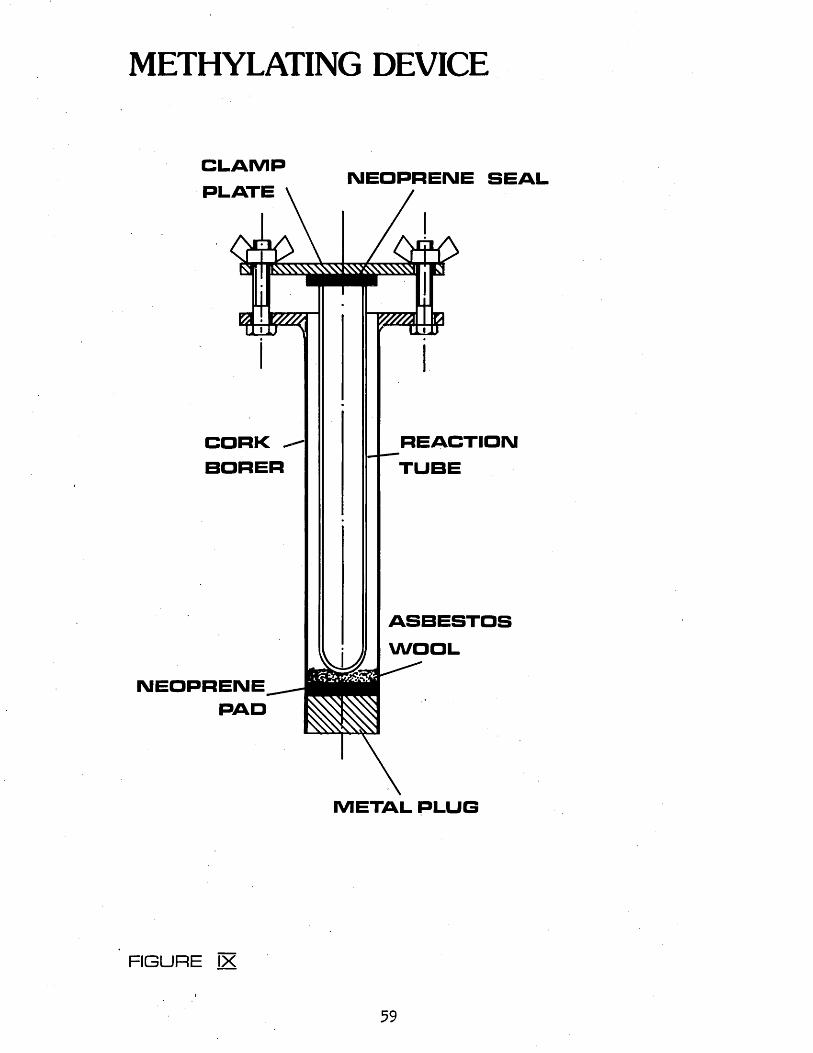
METHYLATING DEVICE
CLAMPPLATE
NEOPRENE SEAL
m m
CORK ~ BORER
NEOPRENEPAD
REACTIONTUBE
ASBESTOSWOOL
METAL PLUG
FIGURE IX
59
the mixtures was qualitatively determined by GLC (section 2.4545)» an^
the degree of methylation was l6.8fo, 76* 4$ and 85•&$> respectively. TLC results of samples after 45 and 50 min. reaction indicated that methylation did not proceed further, and therefore 40 min. was chosen as the optimum time. The fatty acid composition of the reaction mixtures after 20,50 and 40 min., (Table III) were similar, indicating that incomplete methylation did not occur at the expense of any one acid.
2.45 GAS LIQUID CHROMATOGRAPHIC ANALYSIS OF FATTY ACID METHYL ESTERS 2.451 Nomenclature of Fatty Acids
A convenient manner of referring to a fatty acid is to write its number of carbon atoms plus its number of double bonds e.g. stearic acid has 18 carbon atoms and no double bonds, thus: C18:0 or just 18:0. Well- known fatty acids continue to be called by their "common” name, in preference to their systematic name (according to IUPAC conventions), and these, along with structural formulae and short-hand notations appear in Table IV.
2.452 Operating ConditionsA considerable amount of preliminary work was carried out to
establish the most suitable type of column adsorbent and operatingconditions for fatty acid analysis. This preliminary work was started
155by Mrs. Thomas,A Pye Unlearn GCV Gas Liquid Chromatograph was used throughout for
all of the results presented here, although earlier work was carried out on a Pye 105 chromatograph.
Diethyleneglycol succinate (LEGS) was chosen as column adsorbent with 60 - 80 mesh chromosorb W as the stationary phase and nitrogen at 50 cm^ per min. as the carrier gas. Glass columns (5 feet by \ inch) of 15$ LEGS were purchased from Pye Unicam Ltd., Cambridge, as required, according to the column efficiency as determined by the resolution (R),
i
which is a measure of the degree of separation of 2 peaks, according to
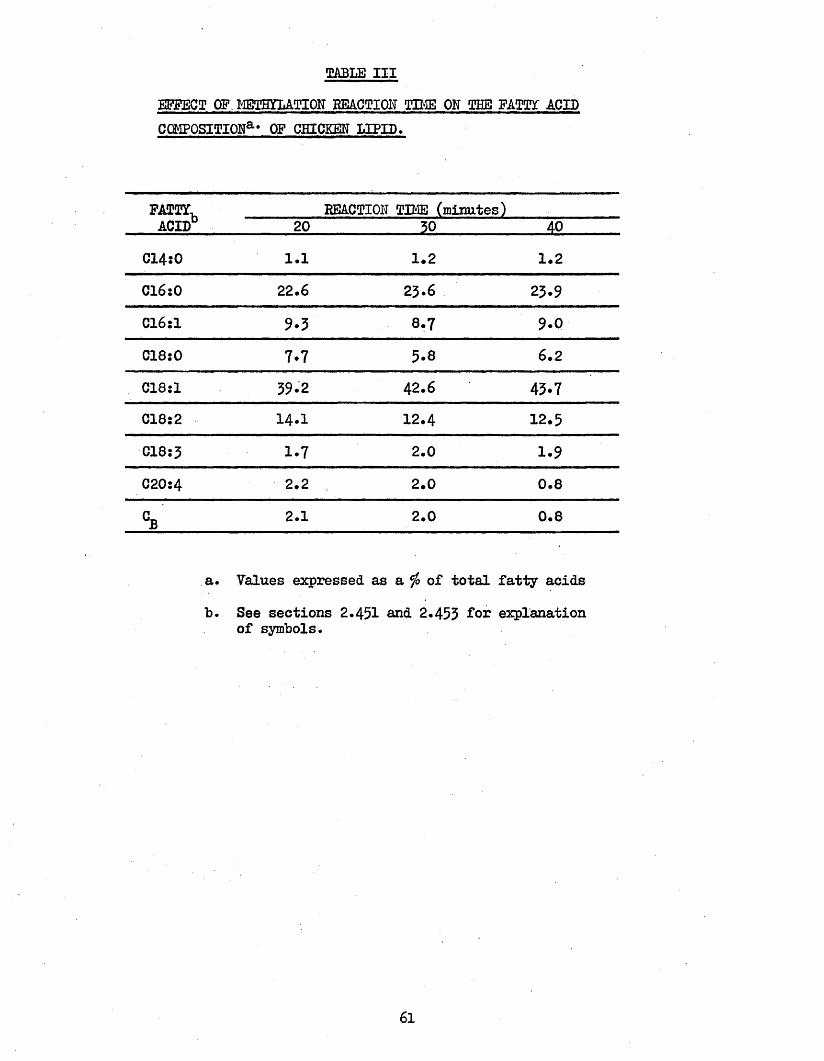
SABLE IIIEFFECT OF METHYLATION REACTION TIME ON SHE FATS! ACID COMPOSITION8** OF CHICKEN LIPID,
FATTY, REACTION TIME (minutes)ACID 20 30 40
C14s0 1.1 1.2 1.2Cl6s0 22.6 23.6 23.9C16:1 9.5 8.7 9-0C18:0 7.7 5.8 6.2C18:l 59.2 42.6 43.7018:2 14.1 12.4 12.5C18:3 1.7 2.0 1.9C20s4 2.2 2.0 0.8
2.1 2.0 0.8
a. Values expressed as a $ of total fatty acidsb. See sections 2.451 and 2.455 fo* explanation
of symbols.
61
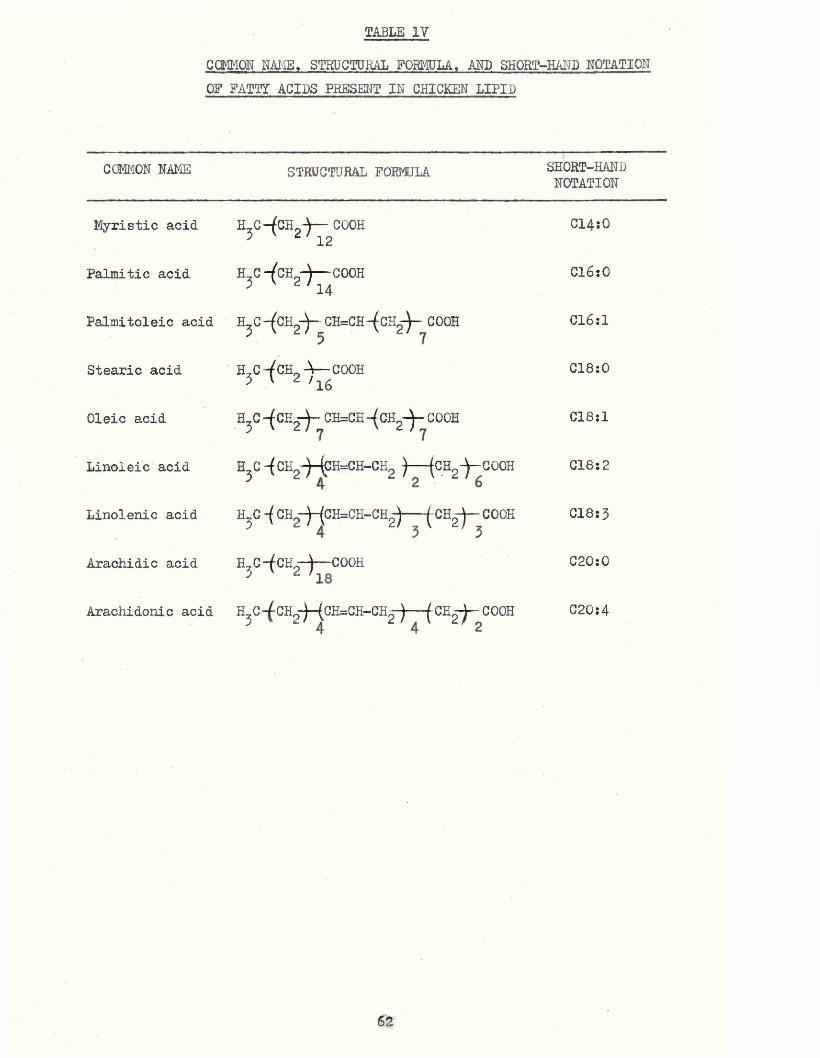
TABLE IVCOMMON NAME, STRUCTURAL FORMULA, AND SHORT-HAND NOTATION OF FATTY ACIDS PRESENT IN CHICKEN LIPID
COMMON NAME STRUCTURAL FORMULA SHORT-HANDNOTATION
Myristic acid H_C—fCH_-\— COOH 5 v 2 7 12
C14:0
Palmitic acid H,C-/CH_-)— COOH 3 V 2 '14
Cl6:0
Palmitoleic acid H^C -fCH^- CH=CH-(CH2-^- COOH C16:1
Stearic acid H2C-fCH0 V-COOH 3 V 2 'l6
C18:0
Oleic acid H^C -(CH2-j- CH=CH-(CH2-^- COOH C18il
Linoleic acid H5C-(CH2-)-(CH=CH-CH2 )-- (CH2-y-COOH C18:2
Linolenic acid H^C -( CH2~)-(CH=CH-CH2 ---( CH2-j- COOH C18:3
Arachidic acid H^C-fCH^— COOH C20:0
Arachidonic acid H^ C CH2-)-(CH=:CH-CH2-J--(CH2-j- COOH C20:4
62
■the following equation:
2(tg — %)R = -•--- - ,■■■*" , where t0 and t, are the retention times of1 + 2
C18:l and C18:0, and and ¥2 their baseline widths. A resolution of
1.0 is required for good quantitative results.The column temperature used was either 180°C, 185°C or 190°C,
depending on the age of the particular column. This was because column adsorbent is slowly eluted with time, which decreases retention time and hence R; and decreasing the temperature off-sets this change. When a new column was used and/or the column temperature changed, a calibration mixture was injected onto the column and the fatty acid composition of the mixture determined to see if the change in conditions altered the analysis (see section 2.4543)*
A flame ionisation detector (FID) was employed using a hydrogen3 o(at 55cm per min) and air (oxygen 'JVfo and nitrogen 19^) flame at 220 C.
Briefly, this type of detector depends on measuring the potentialdifference caused by ionisation of column eluents in the flame. Thiscurrent is amplified and the signal recorded. A Philips dual channel
2recorder was used. The attenuation setting was varied between 2x10nand 64x10 , to give peaks of 20 to 60fo full-scale deflection.
Samples were injected onto the column using syringes (S.G.E) of either lyul or 1( *1 capacity. The temperature of the injection port heater was 190°C.
2.453 Qualitative AnalysisPeaks were identified by comparing their retention time with
those of pure fatty acid methyl esters (either obtained from Sigma or prepared from fatty acids by the transmethylation procedure in section 2.442). The retention time of a particular compound is related to its boiling point, with volatile compounds being eluted before compounds of higher boiling point. In these experiments using a BEGS column, the
65
order of elution of fatty acid methyl esters followed the number of carbon atoms, except for C18:3 which was eluted after C20:0. Where fatty acid standards were not available, the peaks were tentatively identified from a study of the literature. Fatty acid methyl esters of C20:4 and C22:l standards had the same retention time, but this peak was assigned to C20:4 in the chicken lipids after a study of the literature. She peaks identified only as C. and C_ are likely to
A ±5
arise from high carbon number (polyunsaturated fatty acids.A typical chromatogram of chicken muscle fatty acids is
illustrated in Figure X.2.454 Quantitative Analysis2.4541 Measurement of Peak Areas
When a flame ionisation detector is employed, the area underany peak is proportional to the amount of compound present. Duringpreliminary investigations, peak areas were measured by determining theproduct of the peak height and the width of the peak at half height.Reproducible results were obtained, but the method was very time-consuming and involved the measurement of very small distances,especially the peak widths of the earlier sharp peaks. Therefore, thequicker method of determining the product of peak height and retentiontime was used. An advantage of this method is that it involved only 2measurements of relatively large distances. Theoretical justification
134of this method of measuring peak areas has been given by Bartlet.
2*4542 Calibration ProcedureAlthough the area under any peak is proportional to the amount
of compound present, the response f a c t o r s P-°ftcen^ra^ on J 0f each fattypeam area ’
acid may differ slightly.An internal standard method was employed to determine the
relative response factor(f= f i ^ e m a f s t L d S d ^ eaoh of the main fatty acids present in chicken tissue. A standard mixture of Cl6:0,C18:0,
64
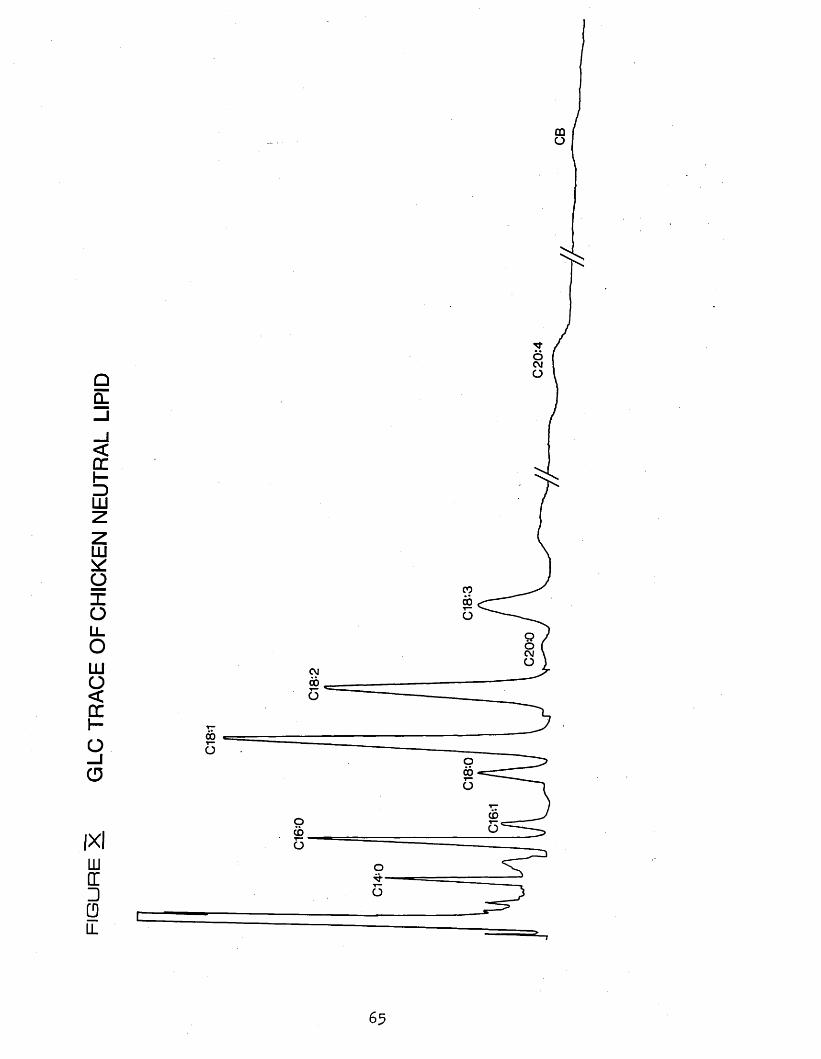
fig
ure
x
GLC
TRAC
E OF
CH
ICKE
N NE
UTRA
L LI
PID
CM
7
65
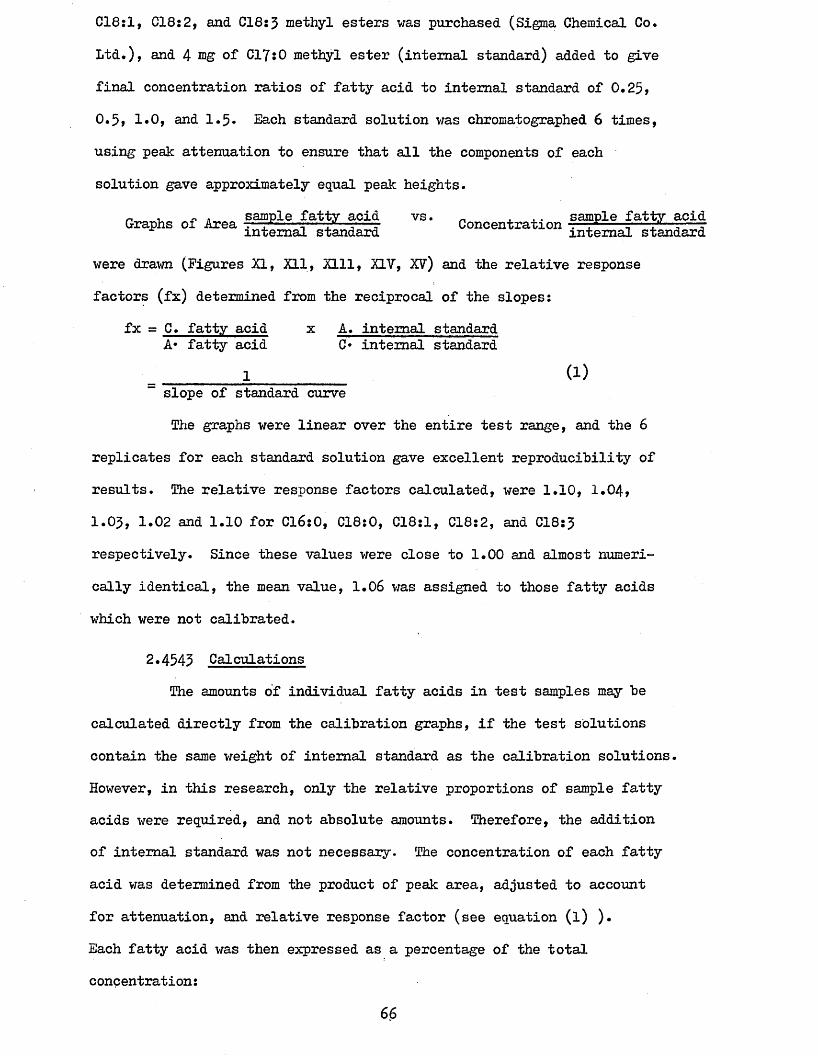
C18:l, 018:2, and C18:3 methyl esters was purchased (Sigma Chemical Co.
Ltd.), and 4 rag of C17:0 methyl ester (internal standard) added to give final concentration ratios of fatty acid to internal standard of 0.25>0.51 1*0, and 1.5* Each standard solution was chromatographed 6 times, using peak attenuation to ensure that all the components of each solution gave approximately equal peak heights.
Granhs of Area -fefrfr a-cid vs* Concentration sajDple fa t ty ac i^Graphs 01 Area internal standard Concentration internal standard
were drawn (Figures XI, Xll, Xlll, XIV, XV) and the relative response factors (fx) determined from the reciprocal of the slopes:
fx = C. fatty acid x A. internal standard A« fatty acid C» internal standard
(1)slope of standard curveThe graphs were linear over the entire test range, and the 6
replicates for each standard solution gave excellent reproducibility of results. The relative response factors calculated, were 1.10, 1.04,1.03, 1.02 and 1.10 for Cl6:0, C18:0, C18:l, C18:2, and C18:3 respectively. Since these values were close to 1.00 and almost numerically identical, the mean value, 1.06 was assigned to those fatty acids which were not calibrated.
2.4545 CalculationsThe amounts of individual fatty acids in test samples may be
calculated directly from the calibration graphs, if the test solutions contain the same weight of internal standard as the calibration solutions, However, in this research, only the relative proportions of sample fatty acids were required, and not absolute amounts. Therefore, the addition of internal standard was not necessary. The concentration of each fatty
acid was determined from the product of peak area, adjusted to account for attenuation, and relative response factor (see equation (l) ).Each fatty acid was then expressed as a percentage of the total concentration:
66
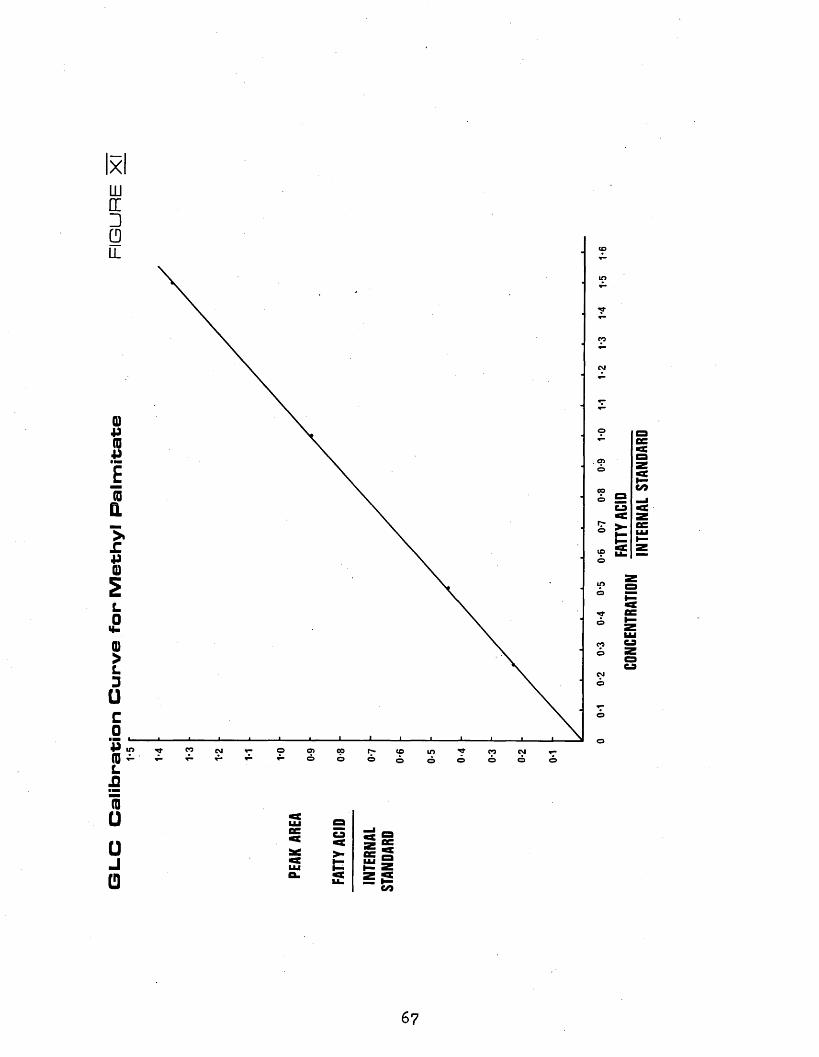
IxlLUDCD
>
L00>L3C0
«/?
IDu uJ(3
67
4975
0985

GLC
C
alib
ration
Curv
e fo
r M
eth
yl
Ste
ara
te
FIG
URE
XII
to CMCO oin CMin©co6 © ooo
— 1/7
68
CONC
ENTR
ATIO
N
4675
4675
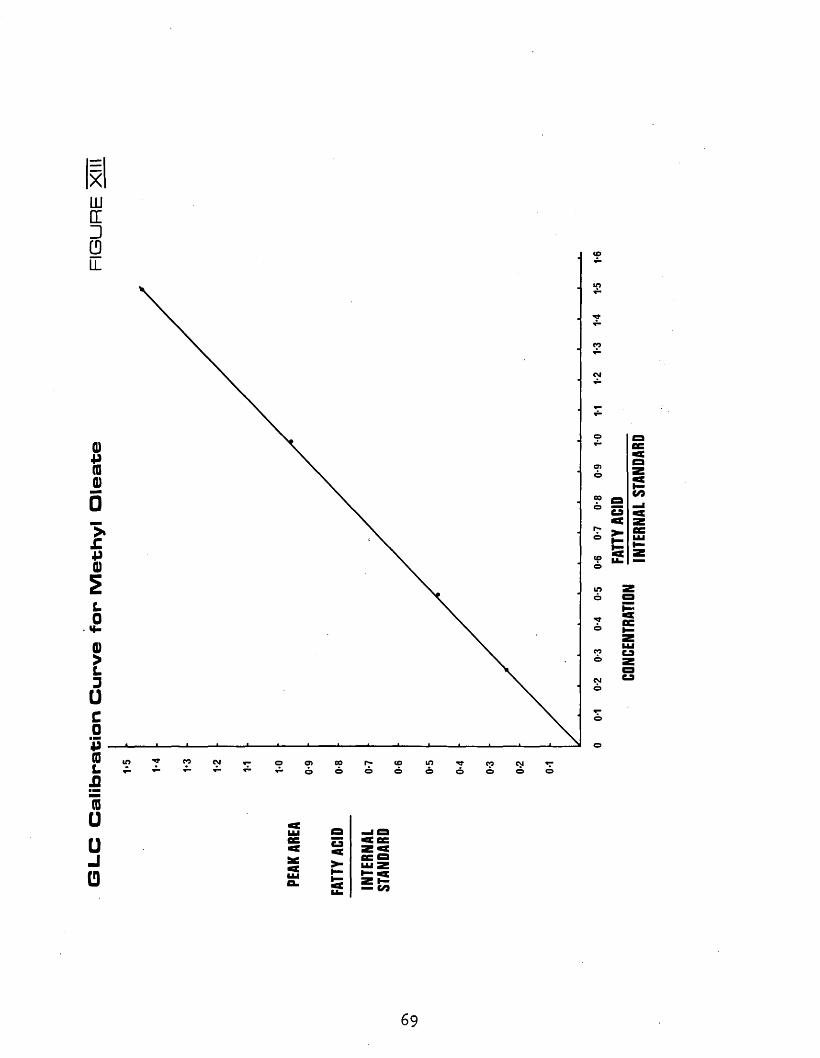
XIUJcr□
UJJJ(00)□>£8s10*-0)>L3uc0S
(Du uJ□
u
— V ?
69
CONC
ENTR
ATIO
N
7975
^985
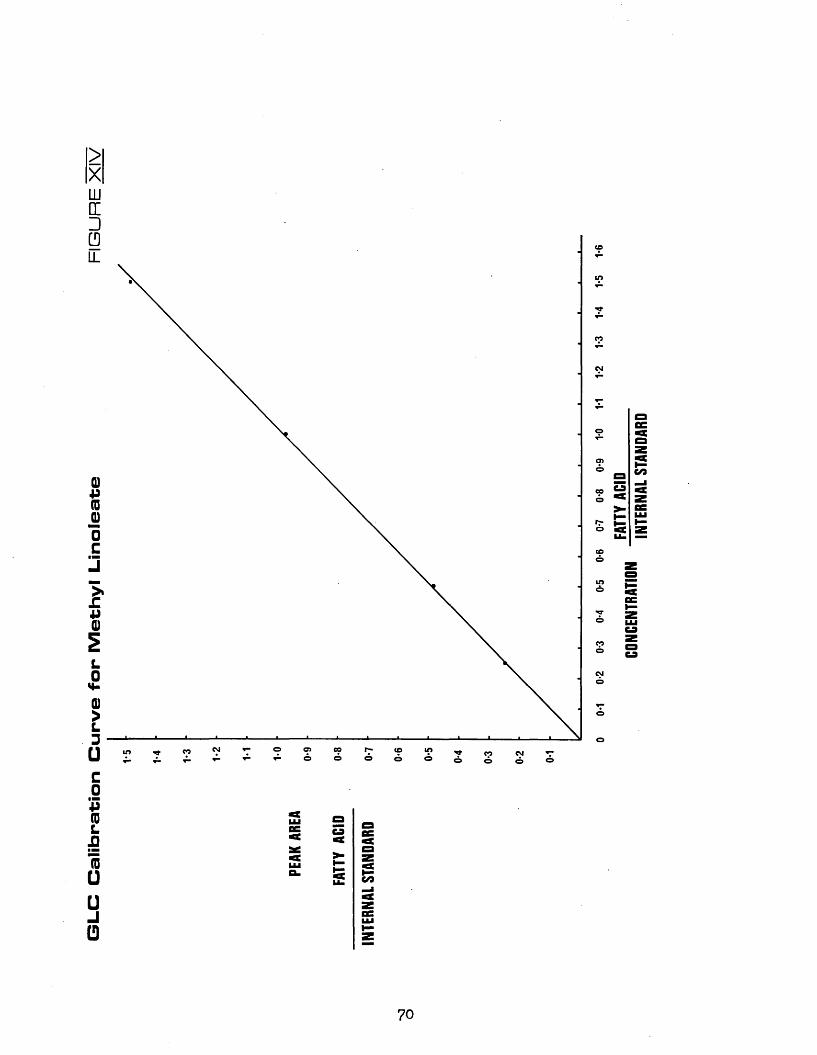
GLC
C
alib
ration
Curv
e fo
r M
eth
yl
Lin
ole
ate
FI
GURE
XIV
CNJ o O) CO© r*© co in©coin CNJCO© ©
t/7
70
CONC
ENTR
ATIO
N
4975
^975
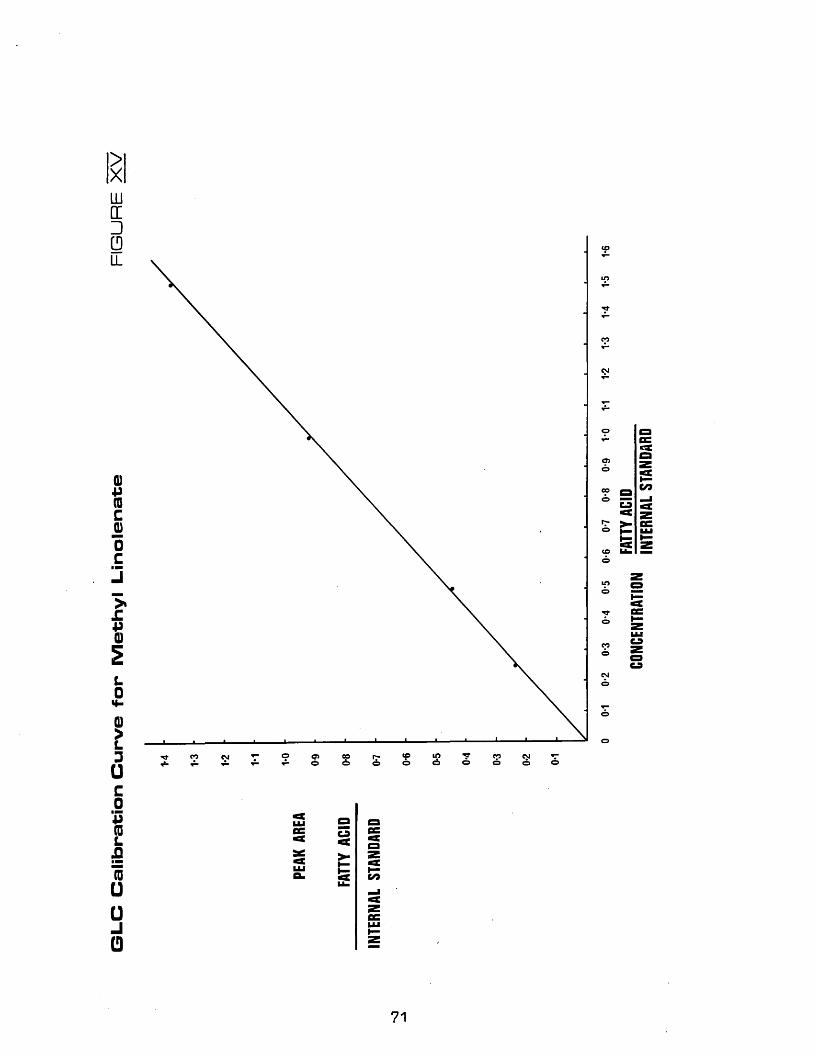
0UJcr□CDLL
Q)(UCQ)0cJ>£Q)EL0*-0>L3uc0*3(D1£■iiuuj0
co© inco cmCM
S/7U
C9•a>-
71
07
4685
concentration fatty acid x iQO (2)fo fatty acid = jT concentration fatty acid
The internal standard method was used to determine the degreeof methylation of chicken lipid samples (see section 2.445)• Pourmilligrams^ of C17:0 methyl ester were added to a known weight of lipidprior to methylation, and the resulting esters were analysed hy GLC.The percentage methylation was calculated from:
H concentration fatty acids x 4 - qq /*\ fo methylation = sample weight (mg) ' '
Fatty acid analyses were carried out on various chicken samples during a 2 year period. Column performance during this time was monitered hy periodically chromatographing calibration solutions, to see if changes in the column temperature (to maintain good separation on ageing columns - see section 2.452) altered the fatty acid distribution. These calibration solutions were stored under nitrogen at -18°C.
2.5 DETERMINATION OF PHOSPHORUS, SODIUM, CALCIUM, MAGNESIUM AND IRONThese ions were determined in chicken muscle, cook-out juices
and thaw losses. The analyses were carried out by the Analytical Department of Albright and Wilson Ltd., on the solutions prepared in this laboratory as in section 2*51» using Inductively Coupled Plasma Atomic Emission Spectrometry (ICPAES).
2.51 DIGESTION PROCEDUBEThe following procedure, which was suggested by Albright &
Wilson Ltd., was employed:3About 2g muscle or exactly 5 cm thaw loss and cook-out
3juice, were accurately weighed and transferred to a 250 cnr tall form beaker. Ten cubic centimetres of concentrated sulphuric acid were added, and the mixture was heated until the sample charred. The beaker was then covered with a watch glass, and heating was continued until the sulphuric acid was nearly fuming, when concentrated nitric acid was added
dropwise until the solution became clear. The solution was allowed to72
cool and then 5 omJ nitric acid was added, and the solution boiled until3the excess nitric acid had disappeared. After cooling, 5 cnr nitric
3acid and 1 cm perchloric acid were added, and the solution was heated
until the perchloric acid ceased to fume. The solution was then allowed3to cool, when 150 cm distilled water and a few anti-bumping stones were
added, and the solution boiled for 20 minutes in order to hydrolyse any condensed phosphates. After the solution had cooled, it was made up to
3exactly 250 cnr and transferred to a plastic bottle and transported to Albright and Wilson Ltd.
Distilled water and polyphosphate injection solution blanks were determined as above.
2.52 CALCULATIONSThe concentrations of phosphorus, sodium, calcium, magnesium
and iron in the digested solution were determined as micrograms per
cubic centimetre of solution. The results were corrected for reagent blanks, and then these figures were used to calculate the concentration of each ion in the whole muscle and in the total volumes of thaw and
cook losses.The concentrations of phosphorus and sodium were reported as
percentages (g per lOOg or 100 cm sample); and of calcium, magnesium and iron, as ppm (microg per g or cm of sample).
2.6 DETERMINATION OF THE DECREE OF HYDROLYSIS OF ADDED PHOSPHATES
2.61 THIN LAYER CHROMATOGRAPHIC PROCEDURE3Samples were prepared by macerating lOg muscle with 40 cm of
10io trichloroacetic acid for 2 min. Trichloroacetic acid has been found113to effectively halt the hydrolysis reaction, by Sutton. The homogenate
was then centrifuged at 0°C for 50 min. at 11000 G, and the supematent taken for analysis.
135The TLC procedure was adapted from that of Gibson and Murray.
Cellulose coated plates were used as support material, and the developing
73
solution was made up of isopropanol (200cm^)» n-propanol (l75cm^)trichloroacetic acid (25g)» 0*88 ammonia (lcm^), and water (125cm''').Large plates (20 x 8.5 cm) were developed at room temperature for atleast 12 hours, and smaller plates for 1 to 2 hours.
After development, the plates were dried in air and thensprayed with Vyo ammonium molybdate, allowed to dry and sprayed with1fo stannous chloride in lOfo hydrochloric acid. The colour was allowedto develop' in the dark, when blue spots appeared on a white background*However, background colour was often very intense, and the developing
136reagent of Mikes 79 which gave better results, was used in the laterstages of these experiments. This reagent was made up of Vfo ammonium
3 3molybdate with 5cm 60^ perchloric acid and lcm hydrochloric acid per3100cm of solution. This solution was sprayed onto the dry developed
plates, which were dried in an oven at 70°0 for a few minutes and then exposed to W light, when blue spots appeared on a white background.
Sample spots were identified by comparison with orthophosphate, diphosphate and tripolyphosphate solutions. The Rf value of orthophosphate was 0.70, of diphosphate 0.40, and of tripolyphosphate 0.20.The spot presents on the base line in samples of Puron 604 and treated chicken lipid solutions, was taken to be due to polyphosphates higher than tripolyphosphate.
The concentration of sample spots was calculated by eye from comparison of their colour intensity with standard polyphosphate solutions which were run alongside the samples on the TLC plates.
2.62 PHOSPHOKUS-51 FOURIER TRANSFORM NUCLEAR MAGNETIC RESONANCE PROCEDURE 2*621 Principle of Nuclear Magnetic Resonance
Conventional nuclear magnetic resonance (NMR) involves either a continuous change of frequency or of magnetic field, over the resonance frequency range of the observed nucleus. Only a narrow frequency band contributes to the excitation of the resonance at any instant, which results in a low signal to noise ratio, leading to low sensitivity. Each
74
spectrum takes a matter of minutes to record.Pulsed HMR consists of excitation of the sample by a short,
intense pulse of radio-frequency energy; and measurement of the resulting free induction decay signal from the nuclear spins in the sample as a function of time. M l of the frequencies of the molecule may be excited by the single high energy pulse in a period of microseconds, and the signal to noise ratio is improved compared to conventional MR. Further improvements in sensitivity may be obtained by computer averaging of the decay signals from a large number of pulses. The computer averaged decay signal may be converted into a conventional MIR spectrum by Fourier transformation from the timedomain to the frequency domain.
31Since the P nucleus is relatively insensitive to MIR, this Fourier transform MIR (FTMIR) technique using computer averaging is particularly useful for the analysis of phosphorus compounds, when well resolved spectra may be obtained in a few minutes.
2.622 Procedure31P-FTMR has been used to detect added polyphosphates in chicken
by O'Neill and Richards,and the present method is a modification of this procedure.
Approximately 10 g samples of pectoralis major and leg muscle were excised from frozen chicken using a band-saw. The samples were packed in solid carbon dioxide and transported to the Laboratory of the Government Chemist, London, where they were stored in a freezer until required for analysis.
The samples were prepared for analysis by macerating the frozenmuscle with 1 g of disodium ethylenediamine tetraacetic acid, whichinhibits hydrolysis of the polyphosphates during subsequent thawing.Approximately 3 g of the macerate were tamped into a 10 mm o.d. MIRtube, and a capillary containing a D 0 solution of sodium methylenedi-
2
75
phosphonate as marker was inserted co-axially through the centre of the sample. The M R spectra were recorded by Dr. Richards, using a JEOL PFT-100P spectrometer operating at room temperature and 40*3 MHz with deuterium field frequency lock. Bach sample received 400 x 8 /l* . s pulses (flip angle 36°C) with a repetition time of 2*25 s. Data were collected in 4095 points with spectral observation and frequency filter settings of 5000 Hz. The resulting spectra were automatically integrated to obtain the peak areas.
Spectra of pure tripolyphosphate and injection solutions were also obtained.
2.623 CalculationsSpecies were identified by comparing the chemical shifts of
sample peaks with those of tripolyphosphate (Figure XVla). The splitting patterns of sample peaks (Figure XVlb) were more complicatedthan those of tripolyphosphate due to the presence of higher phosphates.
137Chemical shifts of polyphosphate species are pH sensitive , and therefore, slightly different values were obtained from the various samples relative to the standard of sodium methylenediphosphonate which is -I6.8ppm from external 85$ phosphoric acid.
The relative amounts of orthophosphate and higher phosphates were calculated from the integrated peak areas, which were normalised with respect to that of the standard which was assigned an integral of1.0 arbitrary units.
The total added polyphosphate was calculated from the normalised areas of the higher phosphates and the excess orthophosphate arising from the hydrolysis of the added phosphates, relative to that of naturally occurring orthophosphate. In each case the level of naturally occurring orthophosphate was taken as that present in untreated chicken. The fraction of polyphosphate hydrolysed was then calculated from the excess orthophosphate and the total added phosphate:
76
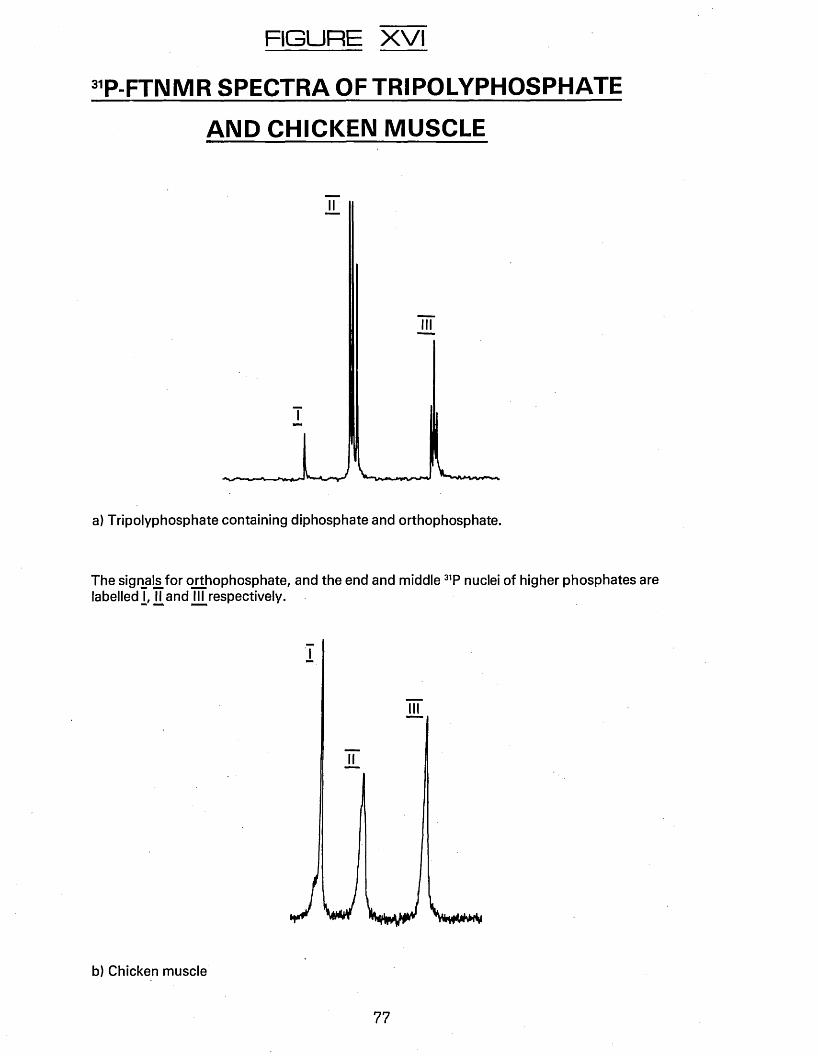
FIGURE XVI 31P - F T N M R S P E C T R A O F T R I P O L Y P H O S P H A T E
A N D C H I C K E N M U S C L E
a) Tripolyphosphate containing diphosphate and orthophosphate.
The signals for orthophosphate, and the end and middle 31P nuclei of higher phosphates are labelled!, II and III respectively.
b) Chicken muscle
77
excess orthophosphate________ x 100%o polyphosphate hydrolysed = total amount polyphosphate added
2.7 DE'MEfl-UMTION OF TOTAL HAEMThis simple method for estimating the blood content of exudate
26was a modification of that of Osner and Shrimp ton, Aliquots of thawloss were diluted 10 times with sodium hydroxide (O.lmpU- dn?) and the solution filtered if not clear. The absorbancy at 415nm was determined, and the resulting value multiplied by the total volume of thaw loss.This value was taken as an estimate of the total haem content of the thaw loss. Values from all samples were compared, and no quantitative results were obtained.
2.8 DETEBMIHATION OF MICRO-ORGANISM CONTENT OF MINCED MJSCLEThe micro-organism content of minced muscle samples was
determined by streaking samples onto nutrient Agar plates using asterile wire. An attempt was made to obtain quantitative results by
2applying sterile gauze (lcm ) to the surface of the muscle, and stamping this onto the plate. Plates were incubated at 37° C for 3 days, and then the colony count was visually determined.
These determinations were not carried out under sterile conditions, and therefore, the results were thought to be of insufficient accuracy to quote in the results section of this work. However, since there was a distinct difference between polyphosphate-treated samples and untreated samples, it was thought that the results should be included, and they are reported in Appendix I.
78
3* results and discussion3.1 PRELIMINARY INVESTIGATION OF THE EFFECTS OF POLYPHOSPHATE
TREATMENT ON RAW AND COOKED BATCH A CHICKENS AFTER 21 MONTHS STORAGE AT -18°C.
One polyphosphate treated chicken and one untreated chicken from batch A, which had been in frozen storage at -18° C for 21 months, were allowed to thaw in the bag at 4°C for 64 hours. Thaw loss and processing weight changes were calculated (Table Va). The pectoralis major muscles were excised and trimmed of fat and connective tissue. One muscle from each chicken was minced and held at 4°C. The other 2 muscles were cooked with no added fat or water in an oven at 350°C for 20 min.Cooking losses were calculated from the initial and drained muscle weights (Table Va). About 4g of each muscle was reserved at 4°C for organoleptic tests, the remainder being minced and held under the same conditions as the raw muscles. TBA and organoleptic tests were performed during holding. The organoleptic test used a 6 point hedonic scale rating for rancid odour and chicken flavour (a value of 6 represented no detectable rancid odour or very good chicken flavour).This test was performed by 1 person, and was therefore subjective, and no statistical weight could be given to these results. They did indicate, however, the general trends expected in tests of this type (Table Vb).
The TBA results clearly demonstrated the antioxidant effect of polyphosphates in cooked meat (Table Vc). However, the raw, treated muscle was also protected against autooxidation, which is contrary to other results (see section 1*43)• Ro explanation can be offered for this result at this stage other than that the chickens had been stored for a considerable time before this experiment was carried out (see section 3*61).
Table Va shows that both the thaw and cook losses were reduced due to treatment, and also that the treated bird picked up less of the chill water than the untreated bird. However, the level of injection
79
(l2.3fo) was very high and would be considered illegal in some countries (see section 1*32) • This high level of treatment could account for the poor texture and chicken flavour of the treated sample, although rancid odour was reduced compared to the control sample (Table Vb).
80
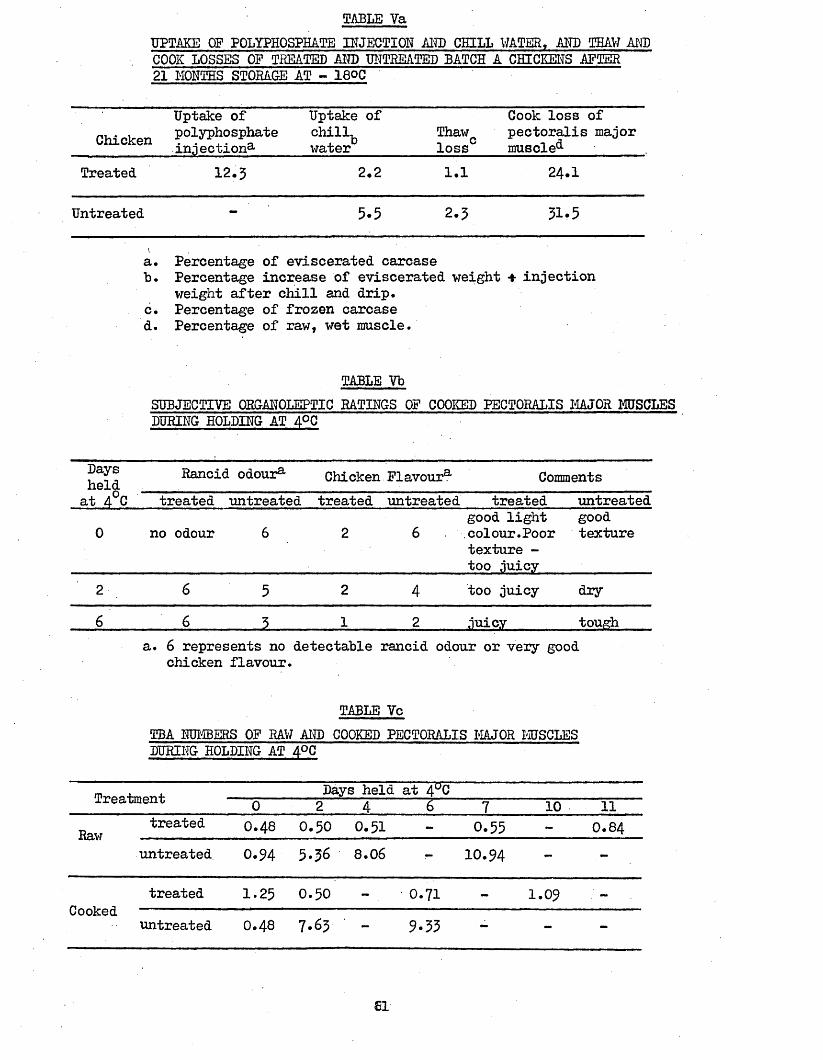
TABLE VaUPTAKE OF POLYPHOSPHATE INJECTION M D CHILL WATER, AND THAW AKD COOK LOSSES OF TREATED AND UNTREATED BATCH A CHICKENS AFTER 21 MOUTHS STORAGE AT - 18QC
ChickenUptake of polypho sphate injection3-
Uptake ofchillywater
Thawloss0
Cook loss of pectoralis major muscle^
Treated 12.3 2.2 1.1 24.1
Untreated - 5.5 2.5 31.5
a. Percentage of eviscerated carcaseb. Percentage increase of eviscerated weight + injection
weight after chill and drip.c. Percentage of frozen carcased. Percentage of raw, wet muscle.
TABLE VbSUBJECTIVE ORGANOLEPTIC RATINGS OF COOKED PECTORALIS MAJOR MUSCLES DURING HOLDING AT 4°C
Daysheld Rancid odour3” Chicken Flavour3, Commentsat 4°C treated untreated treated untreated treated untreated0 no odour 6 2 6
good light colour.Poor texture - too juicy
goodtexture
2 6 5 2 4 too juicy dry6 - .6 3 1 2 juicy .. tough
a. 6 represents no detectable rancid odour or very good chicken flavour.
TABLE YcTBA NUMBERS OF RAW AND COOKED PECTORALIS MAJOR MJSCLES DURING HOLDING AT 4°C
Treatment Days held at 4UC0 2 4 6 7 10 11
treatedRaw O .48 0.50 0.51 - 0.55 - 0.84untreated 0.94 5.36 8.06 - 10.94 -
treated 1.25 0.50 - 0.71 - 1.09Cooked " " '
untreated 0.48 7.63 - 9.33 - - -
SI
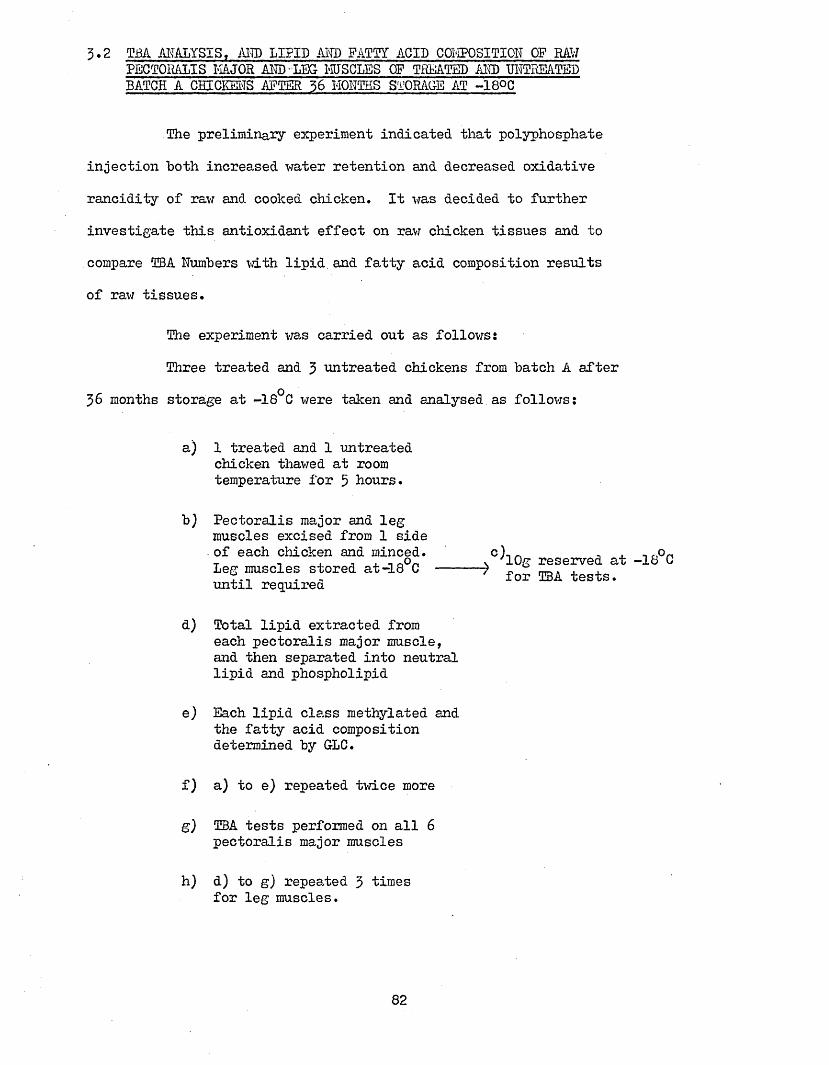
3.2 TBA ANALYSIS, AND LIPID AND FATTY ACID COMPOSITION OP RAW PECTORALIS FiAJOR AM) LEG MSCLES OP TREATED AM) UNTREATED BATCH A CHICKENS AFTER 56 M O M S STORAGE AT -18QC
The preliminary experiment indicated that polyphosphate injection both increased water retention and decreased oxidative rancidity of raw and cooked chicken. It was decided to further investigate this antioxidant effect on raw chicken tissues and to compare TBA Numbers with lipid and fatty acid composition results of raw tissues.
The experiment was carried out as follows:Three treated and 3 untreated chickens from batch A after
36 months storage at -18° C were taken and analysed as follows:
a) 1 treated and 1 untreated chicken thawed at room temperature for 5 hours.
b) Pectoralis major and leg muscles excised from 1 side• of each chicken and minced.Leg muscles stored at-18 C until required
d) Total lipid extracted from each pectoralis major muscle, and then separated into neutral lipid and phospholipid
e) Each lipid class methylated and the fatty acid composition determined by GLC.
f) a) to e) repeated twice more
g) TBA tests performed on all 6 pectoralis major muscles
h) d) to g) repeated 3 times for leg muscles.
.C^10g reserved at -18°C for TBA tests.
82
3.21 LIPID COMPOSITION
Table Via shows the total lipid, neutral lipid and phospholipid contents of treated and untreated pectoralis major and leg muscles. The only statistically significant differences between treated and untreated samples occurred for the phospholipid content (when expressed as a percentage of wet tissue, but not total lipid) of pectoralis major muscles. The treated muscles contained significantly lower amounts than the untreated muscles, but the actual numerical differences were very small, ho such differences were found for the leg muscles.
There was very little interchicken variation in the phospholipid contents (?'c wet tissue), whereas the neutral lipid contents wet tissue) of both pectoralis major and leg muscles showed relatively large interchicken variations. This sugests that neutral lipid is affected to a far greater extent than phospholipid by the factors, such as diet and age, discussed in section 1.4-1. In addition there was a direct relationship between total lipid and neutral lipid levels, indicating that higher lipid levels arise primarily from the deposition of neutral lipid, as suggested by Marion and Miller,^ Also, leg muscles contained more total lipid and a higher proportion of neutral lipid than pectoralis major muscles.
These general trends are in agreement with those discussed in section 1.41. However, it was not possible to directly compare the present results with those from other workers, because there is some evidence of lipase and phospholipase activity at temperatures down to -20°C (Fishwick, 1968, cited by El-Warraki et al,^).
83
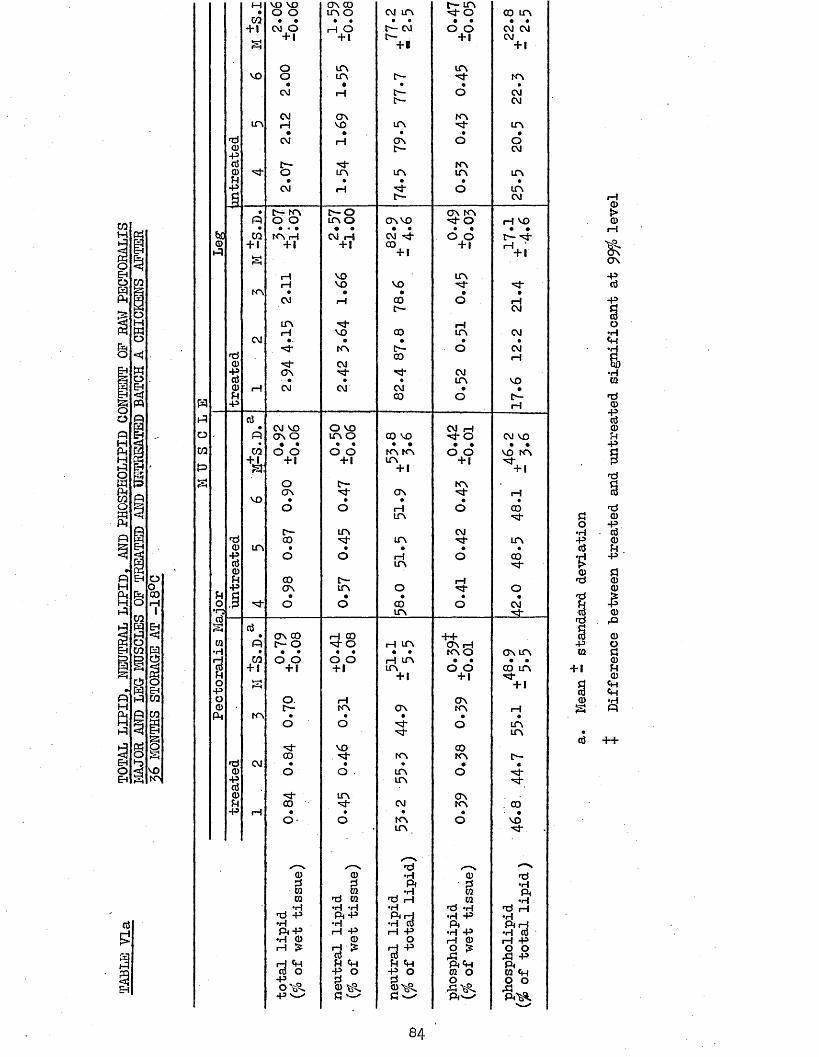
TABLE
Via
TOTAL
LIPID, N
EUTRAL LIPID, A
ND PHOSPHOLIPID CONTE
NT OF
RAW
PECTOBALIS
‘ MAJ
OR AND
LEG MSCLES OF
TREATED
AND DET
KSA.TE
D BAT
CH A
CHICKENS AFTER
56 MONTHS STORAGE
AT -18
°C ’
M VO VO ON 00 C- UN• O O LfN O CM UN -4 -0 00 UN
C/2 • • • • • • • • • •+ 1 CM O i—1 o t"- CM o o CM CM
+ 1 4*1 t— +1 CM+ B + 1
O UN UNVO o UN C— •4* NN
• • • • •CM rH C— O CM
c— CMCM ON NN
LTV rH VO UN *4- UN• • • -• •
'd CM i—I ON O OCD t— CM-p0 Er 4* NN0 4* o UN UN UN UNFh • • • • •-p CM rH 4 O UNa CM
• t"- NN Cv— O ON NNP O O UN O ON VO -4 -0 rH VO• • • • • • • • •CO NN rH CM rH CM 4 0 . 0 t— 4CD +1 + 1 +1 00 , + 1 rH '
Pa
+ 1 + 1
rH VO UNrH VO vo 4 4
NN • • • • •CM rH 00 O rH
t— CMLTV 4" rHrH VO CO UN CM
CM • • • •4 - NN c— O CM'd 00 rH
0 4 - CMON 4* 4 CM
0 ■ • • • UN vo0 iH CM CM CM • •FH CO O r --P rH
0 • CM VO O VO CM rH- p ON O UN O CO vo -4 -0 CM VO• • • • • • • • • • •
CO o o o o UN NN o o VO NN4 ! +1 +1 UN +1 4a + 1 + 1
o t - NNON 4 ON -4* rH
vo • • • • •o o rH O 00
UN 4t"- UN CM
rd 00 4* UN -4- UN0 UN • • • • •-P o o rH O 000 UN 40Fh 00 C— rH-P ON UN O -4* O
PH fj • • • • •O rP 4" o o 00 O CM•r; UN 4 * ....0
0 • ON 00 rH 00 ++m P c— o 4h O rH UN ON rH•H • • • • • • • NN O ON UNH o o o o rH UN • • • •
+ 1 + 1 +1 UN o o 00 UNFh + 1 +1 4O a + 1-PO o . rH ONCD r— NN ON NN i—1P NN • • • • •
o o ''4* O UN'4* UN
4 - v o 0000 . 4" NN NN t—
*d CM • • 9 • •0 o o - UN O 4-Pfrt UN 4vU0 4 - UN ONFh 00 4* CM NN . 00-P rH • • • • •
o - o NN O v o’
UN 4
^d r—» r—s0 0 •H 0 <dd d P d •Hw m ♦H 0 P0 rd 0 *d rH 0 •H•rH •H -H •H rd *H rd rH
•d 4> P4> •H -P •H•H •H •h cd p P rHP -P rH -P rH -P •H -P •H CD•rH 0 0 O rH 0 rH 4srH £ rH IS
P - « T 5 *O O X\ -P
rH «H FH <H Fh «h P«H PCO O 4s O H° O 0 O 0 «H■P _ d _ d . O ^ O O
0 ^ 2 ^ P „-P '— PJ P w P ^ .
o•H0<D'da<d§-p0
+ 19©
84
5.22 FATTY ACID COMPOSITIONTable Vlb shows the fatty acid composition of pectoralis major
muscles, and Table Ylc the fatty acid composition of leg muscles. The same general trends were observed for both pectoralis major and leg muscles.
It may be seen that the main fatty acids in neutral lipid and phospholipid are Cl6:0, C18:l and C18:2; with phospholipids also containing large amounts of 018:0. Phospholipids also contained larger amounts of 020:4 than the neutral lipids. These general trends are in agreement with the literature (see section 1.41). However, higher levels of 020:4 were expected to be present in the phospholipids of both tissues. The low levels found may be due to autooxidation of this polyunsaturated fatty acid during the extended frozen storage period of these chickens prior to analysis.
Ho difference in fatty acid composition between treated and untreated leg or pectoralis major muscles were apparent from these figures. However, interchicken differences may have obscured any differences due to treatment. Therefore, to help account for the inter- chicken variations, the level of C16:0 was assumed to be constant (i.e. unaffected by autooxidation), and the amounts of total unsaturated acids we re calculated with respect to C16:0 for each set of figures. Again, there we re no significant differences between treated and untreated muscles.
5.25 C0KRELATI0H COEPFIGMTS BETV7EEH LIPID AKD FATTT ACID COMPOSITIONS
Table Vld shows that there were statistically significant negative correlation coefficients between the neutral lipid content (expressed as a percentage of the total lipid) and the amounts of 018:2 and of the total amount of unsaturated fatty acids in the neutral lipid of pectoralis major treated and untreated muscles. A negative correlation for C18:2, but a positive correlation for unsaturated acids,
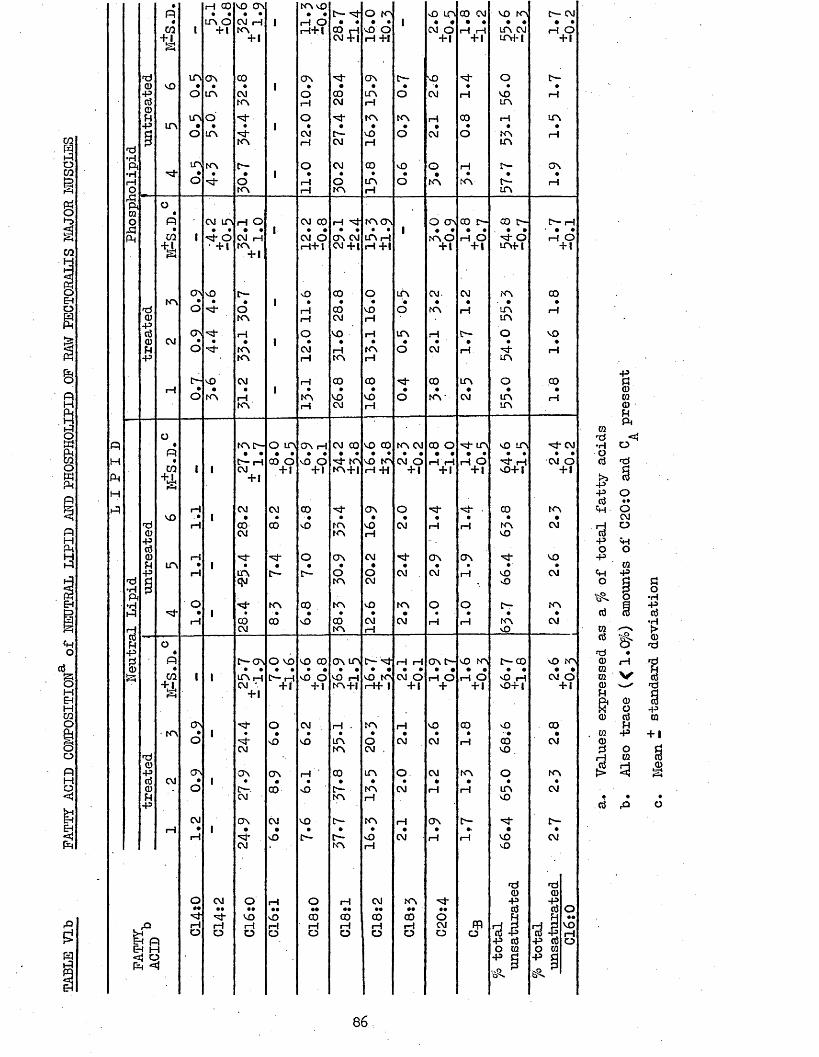
TABLE
VTb
FATTY
ACID
COMPOSITION
of NEUTRAL
LIPID
ADD PHOSPHOLIPID OF
RAW PECTORALIS MAJOR
MUSCLES
•Hft•HrHO43ft0o+3ft
ftHftHft
•Hft•Hft
ftPgft
d0p00ftP
•P•w
+ 1a
VO
in
st*
1
in•
o
m•
o
in•
o
rH CO • •
in o + 1
on•in
o•
in
kn•st*
VO ON • •
CM rHin
+1
CO•CMkn
st*•
st*kn
c—•
okn
1
1
1
1
KN ft • •
i—1 orH+l
ON•OrHO
•CMrH
O•rHrH
t - s* • •
00 rHCM + |
sj*•
ooCMsj*
•t—CM
CM•
OKN
O in • •ft O
rH +1
ON•
ini—1KN•
f trH
CD•inrH
1
tr— •
O
KN•
O
f t•o
f t in • •
CM O + 1
ft••CM
H•CM
O•
KN
00 CM • •
•st*•H
00•O
H•KN
ft KN • •
in cmm u
o•voin
rH•
KNUN
n-•f -m
n - cm • •
rH O + 1
t—•rH
in•i—1
ON•i—1
o •P cm in rH O CM 00 rH sf KNON O ON co r - co c— C— rH• • • • • 1 • • • • • • 1 • • • • • • ' • •CO 1 st- o CM rH CM O ON CM in rH KVO rH O •st* O H .O
+1 +1 tn rH+| CM +1 rH +1 + t + 1 KM-I +1a +1
o>vO c— ft CO O in CM CM KN 00kn • • • 1 • • « • • • > • •
d o o <—1 00 ft o KN rH in rH0 1 1 kn rH CM i—1 inT”7d CTvst* ■—I O ft rH in rH C— o ft0 CM • • • 1 • • • • • • • «ft o *=+ m CM rH KN o CM rH •st* rHP kn rH KN i—! in
ft CM rH 00 00 st* 00 UN o .00rH • • • 1 • • • • • • • •
o KN i—i KN ft ft o KV CM in <—1KV rH CM rH in
o • kn c— o in ON i—1CM 00 ft CO KN CM 00 O •st- in f t in ■st* CMp • • • • • • • • • • • • • • • • • • • •• t— rH 00 o f t O st* KNf t tn CM O rH rH rH O st* rH CM o
CO i 1 CM + 1 + 1 KN+| rH *H + 1 + 1 + 1 f t+ l + 1+L + 1a
rH CM CM 00 st* ON O •st* •st* • CO KNVO . • 1 • • ■ • • • • • • • •
d rH 00 00 ft in f t CM rH rH KN CM0 CM KN rH ftpd0 rH s+ st* o ON CM st* ON ON sf ftft in • 1 • • • • • • • • •' •P rH m c— r— O O CM CM rH ft CM§ <N KN CM ft
O st* kn co KN f t KN o O t— KNst* • 1 • - • • • • • • • • •
i—1 CO 00 ft 00 CM CM rH rl KN CMCM KN i—1 ft
o•
P c—on O VO f t 00 on in t— sf rH rH ON t - f t KN t— CO f t KN• • • • • • • • • • « • • • • • • • • • •
CO 1 1 in h C— rH ft o ft I—1ft K> CM O rH O rH O ft rH CM O+ 1 CM • + 1 + 1 mH-t rH+ I + 1 + + 1 f t+ | + 1a +1
ON st* o CM H • KN H f t 00 f t 00kn • 1 • • • • • • • • • • •
O st* f t f t in O CM CM i—! 00 CMCM KN CM . f t .
d0P ON ON ON rH CO in O CM KN o KNd CM • 1 • • • • • • * • • •0 o C-. CO f t r - KN CM rH rH in CMft CM KN rH f tp
CM ON CM f t O- KN i—1 ON C— •st* t—•—i • 1 • • • • • • • • •
H St* f t •C— n- ft CM rH rH ft CMCM ■ KN i—1 ft
*d <d0 0
O CM O i—1 o rH CM KN •st* p P•• • • •• •• •• •• •• •• ~ •• d d osf st* VO f t 00 00 00 00 O ••
f t rH rH 1—1 rH rH rH rH rH CM PR rH p d P voO O o O O O O O O o d p d p rHH P p d p d OH H O 0 O 0t} O p d p dH «i
’6^
•s0CQ0ftfto
CQ rd •H O Cj Kt>5P+3dfta•po-pftodCQd■d0000fta0003g
oCMo
0p
8*rH
0Odft-P
O0
0} ft
O♦HP0}0•ft»d■ftp0+ 10S
86

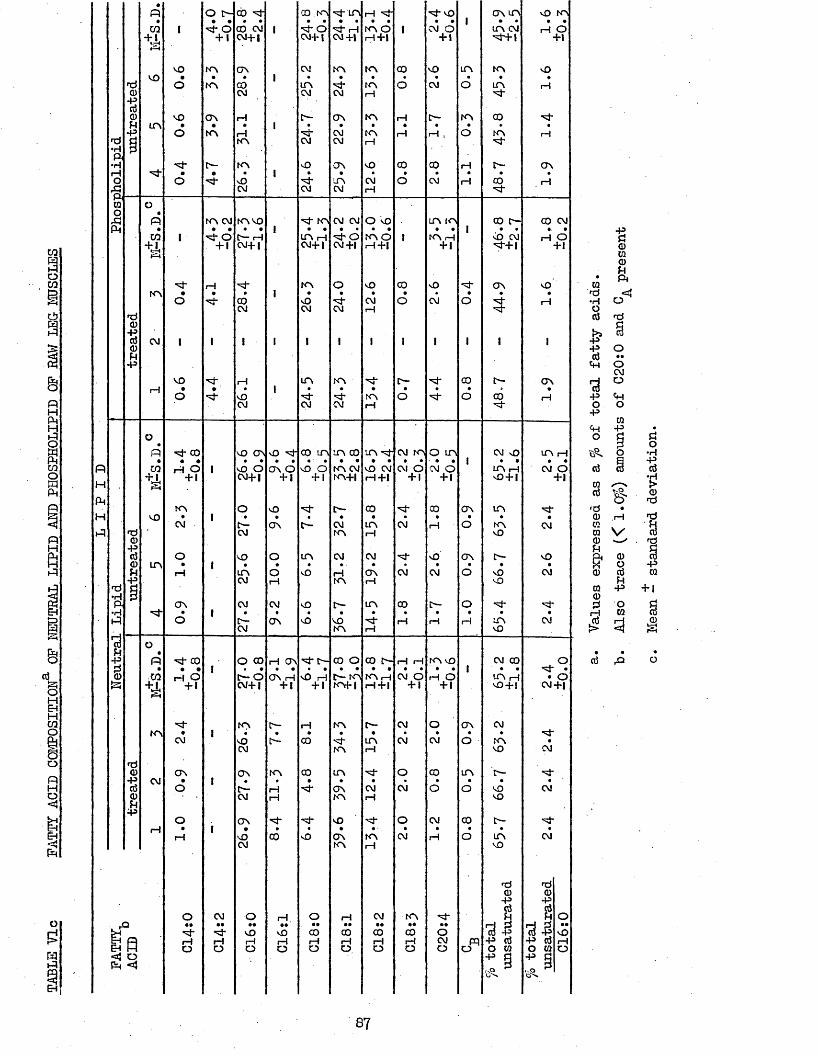
TABLE
Vic
FATTY
ACID
COMPOSITION
OF I'M
JTRAL
LIPID
AND PHOSPHOLIPID OF
HAW
LEG MUSCLES
•H•HPI11Pi
C/0+i
VO
in
PiCOP«
k n
CM
oPi•m t L
vO
in
oPito
%
in
CM
U S<J opH
vOovoo
o
VOo
CO • •rH O + 1inCMorH
ON
o
^ CO • •rH O + 1
CM
ON•OorH
-st*rHO
o r- • •^ o + 1KNKNONKN
KN CM • •-si* O +1
*'
CM•••M-rHO
CO • •CO CM CM+|
ON
i—I KNKN
KN VO • •
C— rH CM+|
vO ONvO O CM+|O ' •l>-CM
VO•inCMCMo-CMO COi>-dCM+|
KN
ON
t—CMON•vOCM
vOrHO
vO "vj- # •
ON O + 1MOON
orH
CMON
rH ON • •
On i—I +1
t— t—KNi—I rH
•'3'CO
i—I ••MO i—Io
-X) KN • •^ oCM+|
CM
inCM
"vi-CMMO'■'3*CM
■M* KN • •
i n rH CM+|
KN
inCM
oo in •■ •
vO O + 1
in
vO
^ r-vO rH + 1
co
00
'M*MO
00rHO
'M-m • •
rHCM+lKN•CMON
ON
mCM
CM CMOCM+|
CM
KN
CM
in co • •KN CM K N +|
CMKNCMi—I KN
VOKN
CO O • •
C— KN KN+1
KNKNin
ONKN
vOONKN
COrHO
rH • •KN OrH + |
KN
KN (—ItnKNMO
O MO • •
KN O rH + |
KN
in •+ • •
MO CM rH+l
COin
CMON I—Iin
rH
CO C— • •
KN i—I rH+l
ini—i
KNrH
CM••COrHO
r—o
CM KN • •
CM O + 1
CM
CM00 i—I
rH rH • •
CM O + 1
KN••COrHO
•«+ M0 • •
CM O + 1
1—I i
in in • •
KN rH + 1
O in - • •CM O + 1
L--
I—1
KN MO • *rH O + 1
oCMO
inoKNO
*st*o
ONoON
o
ON
oino
&o
o n mtn cm '=3'+1k n
in*3*CO
KN
co
co r—MO CM ^+1
ON
co
CM MO • •
in rH M0 + |
inKNMO
MOM0
inMOCM CO • •in i—i mo+i
CM
KNMO
MOMO
inMO
nd0+>8
3 3•p dO CQ
U''*
MO KN • •i—I O +1
MOi—I
ON
i—I
CO CM •i—I O +1
MO
O N
i—I
in r H • •
CM O +1-3-CM
MOCM
CM
O• o
CM +|
■'M*CM
CM
CM
3 3+> d O CQ-p q
•pq0co0H• PHCQ
nd <4•rH Ood h3
•p•pd
+>o•podCQd
CQ0q
oCMOOcq-p
9s*fd 0 rH
co V 0 U&0
0OdfH+3OCQ
2J
+ i0
87
standard deviation.

TABLE Vld
CORRELATION COEFFICIENTS3, BETWEEN NEUTRAL LIPID CONTENT {.% of total lipid) AND FATTY ACIDS
MUSCLE PATTY ACIDCl6s0 C18s2
fo total unsaturated
PectoralisMajor +0.75 . -0.88° -0.82°
Leg +0.41 -0.53 +0.51
a. Based on data in Tables Via, Vlb and Vic o Significant at 95fo level
2ABLE VieTBA NUMBERS
TREATMENTMUSCLE Treated Untreated
1 2 3 M-SDa 4 5 6 M-SDPectoralisMajor 0.46 0.43 0.17 0.55 - 0.16 1.07 0.96 0.42 0.82 ± 0.55
Leg 1.99 0.92 0.75 1.22 - 0.67 0.47 0.84 0.65 0.65 i 0.19
a. Mean - standard deviation
88
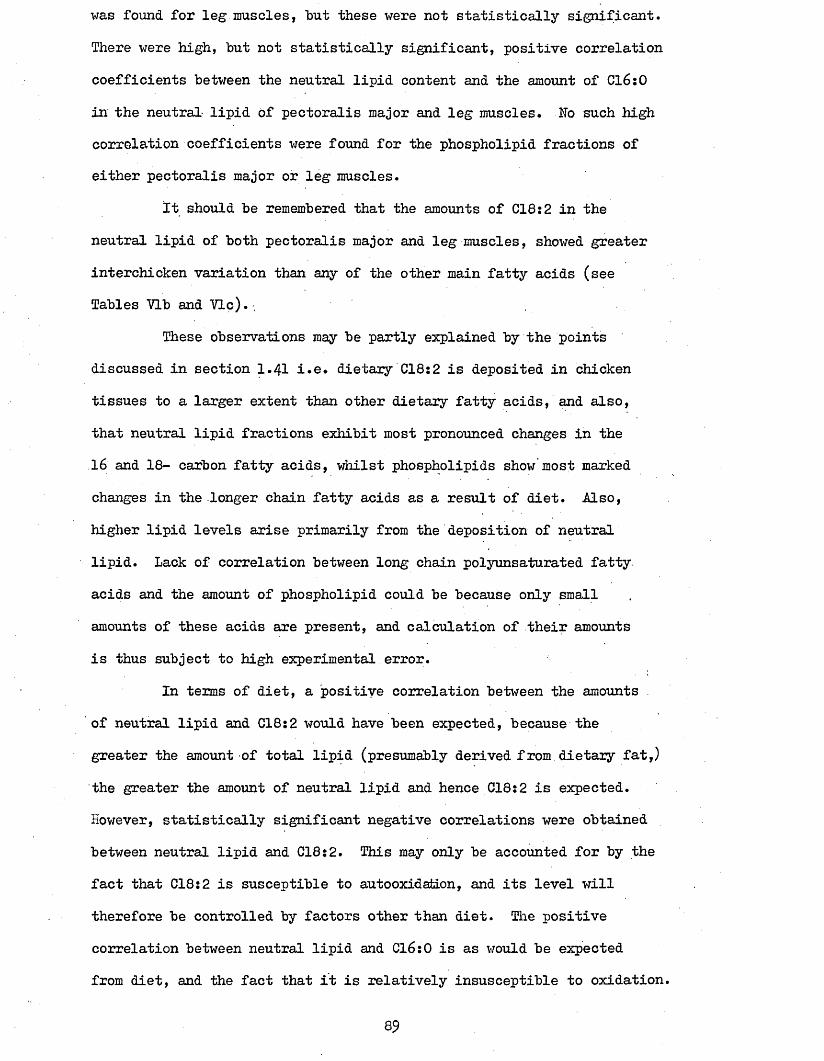
was found for leg muscles, but these were not statistically significant. There were high, hut not statistically significant, positive correlation coefficients between the neutral lipid content and the amount of Cl6:0 in the neutral- lipid of pectoralis major and leg muscles. No such high correlation coefficients were found for the phospholipid fractions of either pectoralis major or leg muscles.
It should be remembered that the amounts of C18i2 in the neutral lipid of both pectoralis major and leg muscles, showed greater interchicken variation than any of the other main fatty acids (see Tables Vlb and Vic).
These observations may be partly explained by the points discussed in section 1.41 i.e. dietary C18:2 is deposited in chicken tissues to a larger extent than other dietary fatty acids, and also, that neutral lipid fractions exhibit most pronounced changes in the 16 and 18- carbon fatty acids, whilst phospholipids show most marked changes in the longer chain fatty acids as a result of diet. Also, higher lipid levels arise primarily from the deposition of neutral lipid. Lack of correlation between long chain polyunsaturated fatty acids and the amount of phospholipid could be because only small amounts of these acids are present, and calculation of their amounts is thus subject to high experimental error.
In terms of diet, a positive correlation between the amounts . of neutral lipid and C18:2 would have been expected, because the greater the amount of total lipid (presumably derived from dietary fat,) the greater the amount of neutral lipid and hence C18:2 is expected. However, statistically significant negative correlations were obtained between neutral lipid and 018:2. This may only be accounted for by the fact that C18:2 is susceptible to autooxidation, and its level will therefore be controlled by factors other than diet. The positive correlation between neutral lipid and Cl6:0 is as would be expected from diet, and the fact that it is relatively insusceptible to oxidation.
89
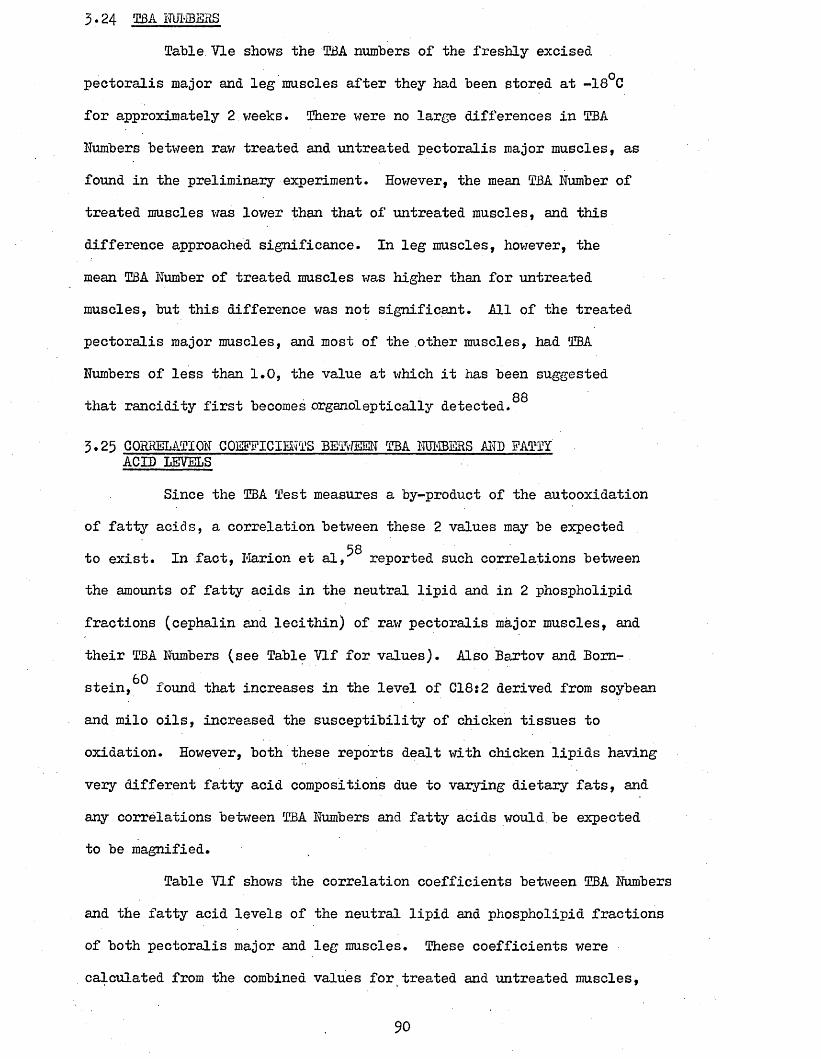
3.24 tba numbersTable Vie shows the TBA numbers of the freshly excised
pectoralis major and leg muscles after they had been stored at -18°Cfor approximately 2.weeks. There were no large differences in TBANumbers between raw treated and untreated pectoralis major muscles, asfound in the preliminary experiment. However, the mean TBA Number oftreated muscles was lower than that of untreated muscles, and thisdifference approached significance. In leg muscles, however, themean TBA Number of treated muscles was higher than for untreatedmuscles, but this difference was not significant. All of the treatedpectoralis major muscles, and most of the other muscles, had TBANumbers of less than 1.0, the value at which it has been suggested
88that rancidity first becomes organoleptically detected.
3.25 CORRELATION COEFFICIENTS BETWEEN TBA NUMBERS AND FATTY ACID LEVELS
Since the TBA Test measures a by-product of the autooxidationof fatty acids, a correlation between these 2 values may be expected
58to exist. In fact, Marion et al, reported such correlations between the amounts of fatty acids in the neutral lipid and in 2 phospholipid fractions (cephalin and lecithin) of raw pectoralis major muscles, and their TBA Numbers (see Table Vlf for values). Also Bartov and Bom- stein,^ found that increases in the level of C18:2 derived from soybean and milo oils, increased the susceptibility of chicken tissues to oxidation. However, both these reports dealt with chicken lipids having very different fatty acid compositions due to varying dietary fats, and any correlations between TBA Numbers and fatty acids would be expected to be magnified.
Table Vlf shows the correlation coefficients between TBA Numbers and the fatty acid levels of the neutral lipid and phospholipid fractions of both pectoralis major and leg muscles. These coefficients were calculated from the combined values for treated and untreated muscles,
90
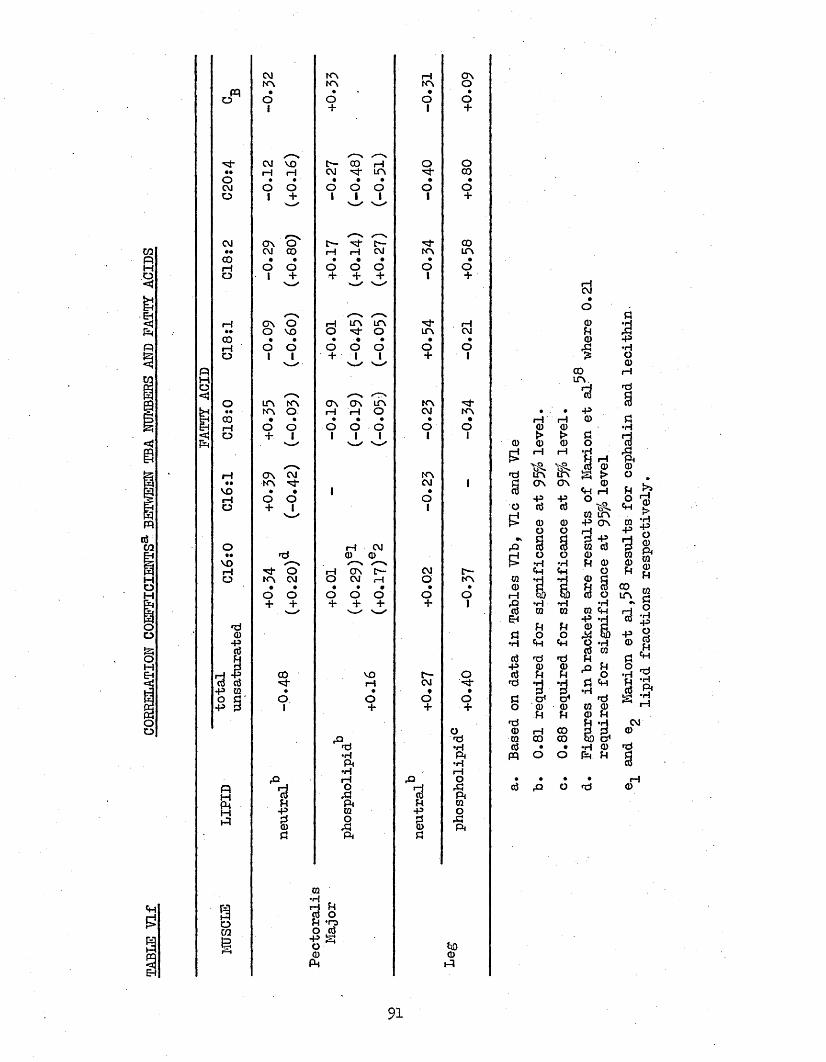
TABLE
Vlf
CORRELATION
COEFFICIENTS
BETWEEN
TBA NUMBERS
AND FAT
TY ACIDS
CM KN rH ONKN KN KN O
PQ • • • •O o O O o
1 + 1 +
CM vo c— 'cD i—1 o o•• rH rH CM 'st in 00o • • ' • • • • •CM O O o O o o oO 1 + 1 1 I 1 +
‘ " v '
p nCM ON O C— -sf c— 00•• CM 00 rH rH CM KN inCO • • • • • • •rH o o O o o o oO 1 + + + + 1 +
r-NrH ON o rH in in •'tf- . rH•• O vo O o t n CM
CO • • • • • • •rH o o O o o o OO 1 1 + i i + 1
NO in KN ON ON in KN "Sf«• KN O rH I—1 O CM KN
00 • • • • • • •rH o o O o o O OO + . 1 1 1 1 1 1
s" x 'w '
rH ON CM KN•• KN CM 1
VO • • 1 •rH o o OO + 1 1
o rH CM•• •xi CD CD
v o / \ y-—"SrH o rH ON C— CM r—O KN CM O CM <—t O KN
• • • • • • •o o O O o o o+ + + + + + 1
s—1*njCD-p
s00 vo c— o
co <d rH CM ■'3*•P CQ • • • •O fl' o o o o•p 3 1 + + +
o£2 <t3•H
•H ftft •H•H i—12 rH ,Q OnH ■3 OA $ £}ftft ?H ft CO
H ■P CQ -P oh ? O ps &CD A 0 ft
G ft S
9Omm«
023 8J4 *o o cdoft
m in
co ^© at k a
CQ CM
© £
CQ 0
CQ 00 •H Oft HCd ,Q pHCD
CDHi
91
since there were no significant differences in fatty acid composition or TBA Numbers between the 2 treatments.
It may be seen that although the correlation coefficients were not statistically significant, they did show the general relationships expected between the degree of autooxidation and fatty acid levels. The 16- and 18- carbon fatty acids of neutral lipid, and the polyunsaturated
20 plus- carbon fatty acids of phospholipid, appeared to be the most important indicators of the degree of autooxidation in both pectoralis major and leg muscles.
One would expect negative correlation coefficients between unsaturated fatty acids and TBA Numbers, and positive correlation coefficients between saturated fatty acids and TBA Numbers. The most notable exceptions to this were the positive correlation between the level of Gg in the phospholipid fraction of pectoralis major muscles
.and their TBA Numbers; and the high positive correlation between C20:4 in the phospholipid fraction of leg muscles and their TBA Numbers. However, since each fatty acid is expressed as a percentage of the total amount of fatty acids, losses of one acid automatically causes an increase in the others. Also, the amounts of the long-chain fatty acids were small (less than 4 an(! their determination is thus subject to high experimental error.
3.26 CORRELATION COEFFICIENTS BETWEEN TBA NOMBERS AND LIPID LEVELS Table Tig shows the correlation coefficients between TBA
Numbers and lipid levels for treated, untreated and treated plus untreated muscles. The correlation coefficients between TBA Numbers and phospholipid levels were calculated for treated and untreated separately, as well as in combination because there was a significant difference in the phospholipid content (°/o of wet tissue) between treated and untreated muscles (see Table Via). There were no
92
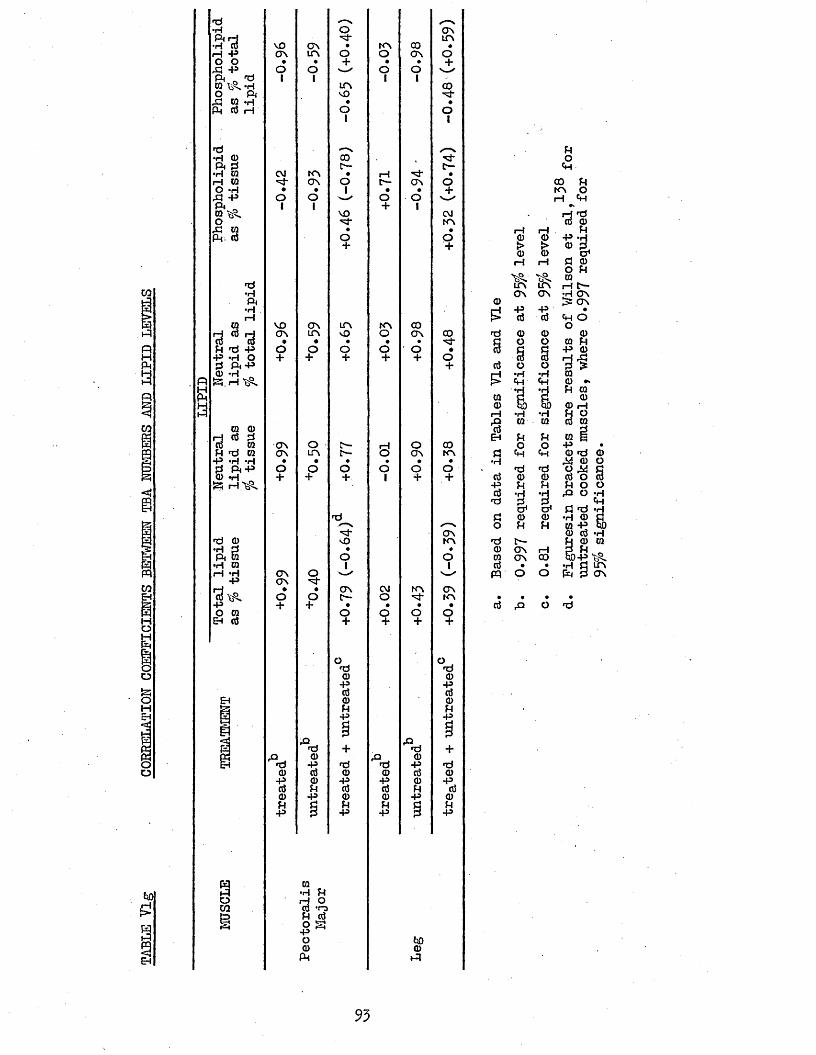
TABLE
Vlg
CORRELATION
COEFFICIENTS BETWEEN
TBA NUMBERS
AND LIP
ID LEVELS
rp•HP< rH •H CO rH -P O O& -P Pi 0 "P CQO Pi rP CQ *H pH P H
rp•H 0 Pi B •rH 0 rH CQ O *H ,P +> Pi „ 0 ^ o& 0 Pi P
rp•HPi•HrH
CQ
•P -P •H O Pi -P *H _rH ^
CQ 0
3 rt §P rp CQ -P *H *H P Pi 4° 0 *H!Si
rp 0 •H fS Pi 0 •H 0 rH *H
•P
o ra EH P
aoCO
o ON*‘3* UNvo ON • KN CO •ON UN o O ON o• • + • • +o o O o1 1 1 1
UN COvO
• •O1
o1
<--* /—N.00C— C—
CM KN • rH •ON O C— ON o• • I • • +o o O o
1 1 + 1vo CMKN• •o o
+ +
vo ON UN KN COON UN vO O ON CO• • • • • 'n!-o O o o o •+ + + + + o
+
ON o t"— 1—1 o COON UN t— o ON KN• • • • • •o O o o o o
+ + + 1 + +
rp-r“"xON
vO KN• •
O o1 1
ON o \_/ON
• • ON CM KN ONo o o- O KN+ + • • • •o o O o
+ + + +
o orp rp0 0-P •PP P0 0P P•P •P
JQ rQrp + •P +a 0 rQ 0rp +3 rp •P •P rp0 P 0 0 P 0-p 0 -P •P 0 •Pp P P P P P0 -P 0 0 -P 0p P P P•p +3 -P •P
$CQH P O raP P° sO0
PifcO0«-3
H ON
CH O-P 0
•P 0
0 0-P^
P ,Q O rp
93
significant differences between treated and untreated muscles for the other lipid levels, but the separated values were also calculated. However, any numerical differences between these values for treated and untreated muscles, are obviously due to inherent ' inter-chicken variations, and,not to polyphosphate treatment.
Positive correlation coefficients were obtained between TBA Numbers and total lipid and neutral lipid (fo of total lipid and wet tissue) levels, and these approached significance in the case of pectoralis major muscles. These observations would seem tosuggest that neutral lipid plays a major role in raw tissue oxidation.
39This bears out the findings of Shorland, who found that the fatty acids of neutral lipid of raw beef and lamb after prolonged frozen \ storage, had undergone considerably greater oxidation than those of phospholipids. It seems, therefore, that phospholipids are protected against oxidation during frozen storage, presumably by their close association with muscles proteins. However, in the present work there were positive correlation coefficients between TBA Numbers and phospholipid ($> of wet tissue) levels for treated plus untreated muscles, but these values were small and statistically insignificant. Also, these coefficients for treated and untreated pectoralis major muscles separately, were negative, and in the case of untreated muscles the value approached significance. This finding, along with the fact that the phospholipid contents of treated and untreated muscles were significantly different, seems to indicate that polyphosphates may have some direct effect on the phospholipids of pectoralis major muscles. However, this evidence is too tenuous to pursue this discussion.
All of these correlation coefficients were opposite in sign
to those obtained in untreated cooked chicken muscles by Wilson et 138al, (see Table Vlg for values). Their correlations were not
94
statistically significant, and, in fact, were calculated from the results obtained from only 5-chicken samples. However, it was thought that it was valid to compare these results with the present ones, since the numerical values of the coefficients from both experiments were relatively high. Wilson et al, interpreted their results as evidence of phospholipids playing the major role in cooked muscle autooxidation; and that this was because of their high polyunsaturated fatty acid content. Since the present results show that it is the neutral lipids which play the major role in raw muscle autooxidation, it is suggested that heat may loosen any phospholipid-protein associations, and thus allow phospholipid oxidation to proceed (see section 3*78)•
95
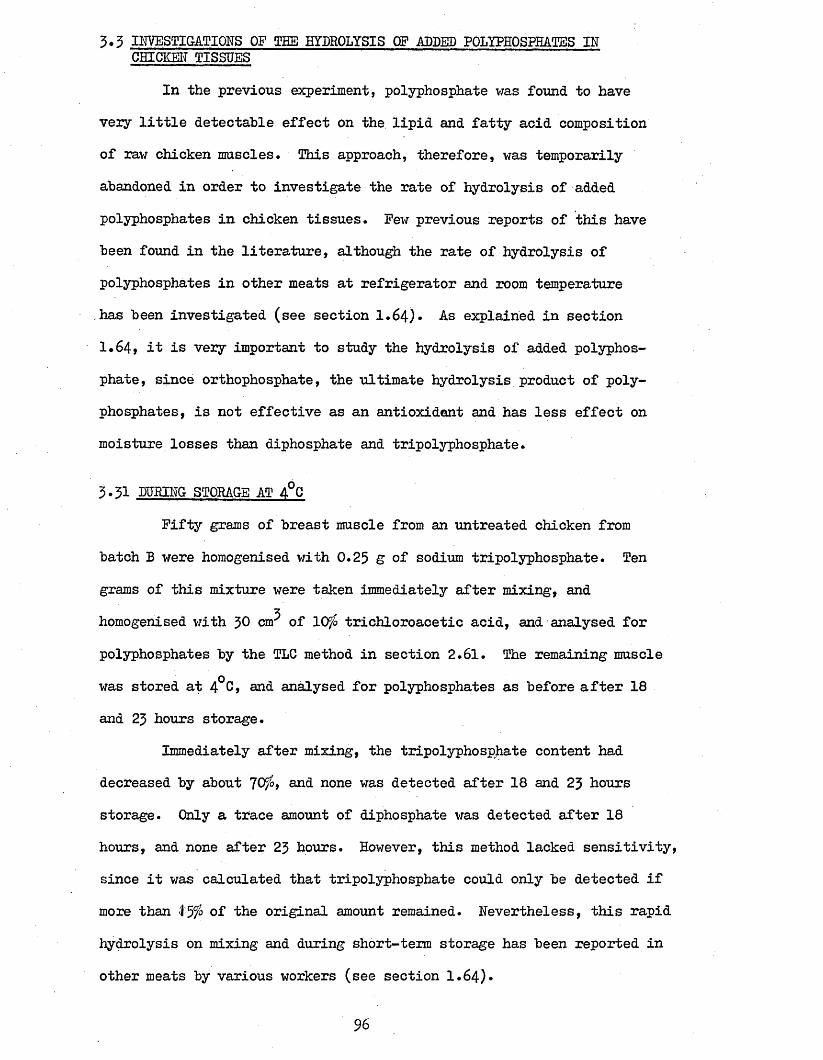
3*3 INVESTIGATIONS OF THE HYDROLYSIS OF ADDED POLYPHOSPHATES IN CHICKEN TISSUES
In the previous experiment, polyphosphate was found to have very little detectable effect on the. lipid and fatty acid composition of raw chicken muscles. This approach, therefore, was temporarily abandoned in order to investigate the rate of hydrolysis of added polyphosphates in chicken tissues. Pew previous reports of this have been found in the literature, although the rate of hydrolysis of polyphosphates in other meats at refrigerator and room temperature has been investigated (see section 1.64)* As explained in section 1.64, it is very important to study the hydrolysis of added polyphosphate, since orthophosphate, the ultimate hydrolysis product of polyphosphates, is not effective as an antioxidant and has less effect on moisture losses than diphosphate and tripolyphosphate.
3.51 DURING STORAGE AT A°CFifty grams of breast muscle from an untreated chicken from
batch B were homogenised with 0.25 8 o f sodium tripolyphosphate. Ten grams of this mixture were taken immediately after mixing, and
zthomogenised with 30 cm o f IQffo trichloroacetic acid, and analysed for polyphosphates by the TLC method in section 2.61. The remaining muscle was stored at 4°C, and analysed for polyphosphates as before after 18 and 23 hours storage.
Immediately after mixing, the tripolyphosphate content had decreased by about ^Ofo, and none was detected after 18 and 23 hours storage. Only a trace amount of diphosphate was detected after 18 hours, and none after 23 hours. However, this method lacked sensitivity, since it was calculated that tripolyphosphate could only be detected if more than \%}o of the original amount remained. Nevertheless, this rapid hydrolysis on mixing and during short-term storage has been reported in other meats by various workers (see section 1.64)»
96
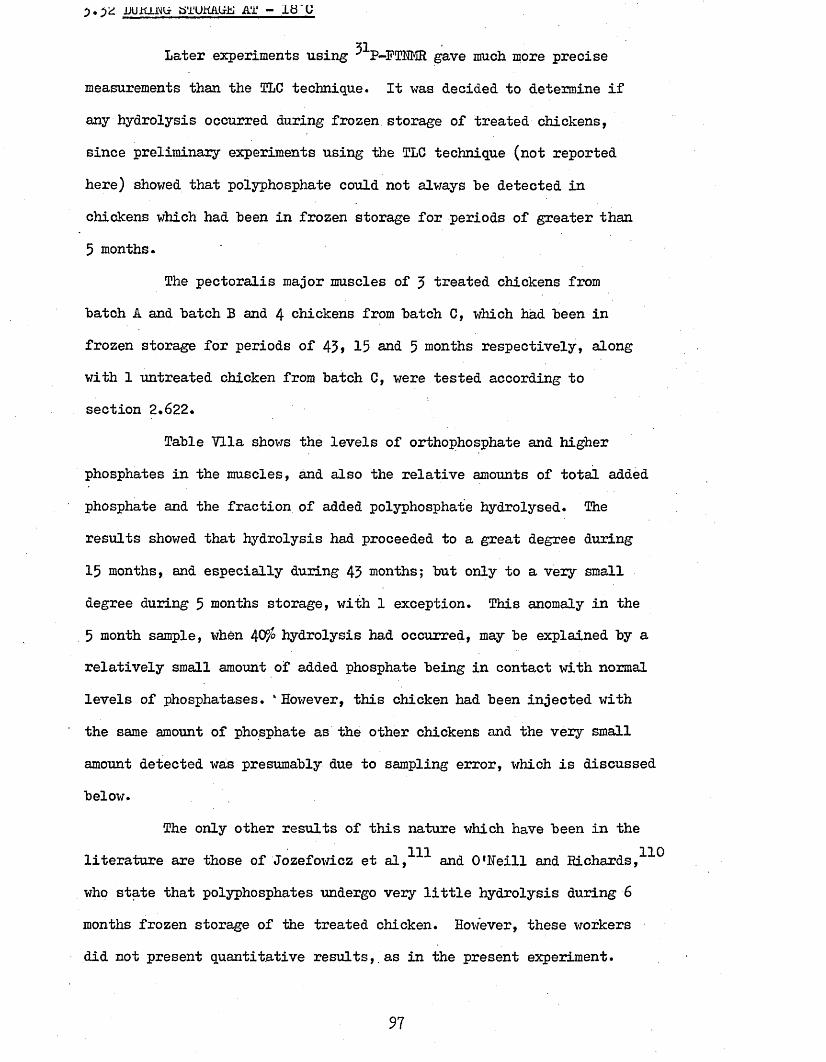
P O Z DUitmUx STUttflUfl AT - Ib U
31Later experiments using J P-FTMR gave much more precise measurements than the TLC technique. It was decided to determine if any hydrolysis occurred during frozen storage of treated chickens, since preliminary experiments using the TLC technique (not reported here) showed that polyphosphate could not always he detected in chickens which had been in frozen storage for periods of greater than 5 months.
The pectoralis major muscles of 5 treated chickens from hatch A and hatch B and 4 chickens from hatch C, which had heen in frozen storage for periods of 43» 15 and 5 months respectively, along with 1 untreated chicken from hatch C, were tested according to section 2.622.
Tahle Vila shows the levels of orthophosphate and higher phosphates in the muscles, and also the relative amounts of total added phosphate and the fraction of added polyphosphate hydrolysed. The results showed that hydrolysis had proceeded to a great degree during 15 months, and especially during 43 months; hut only to a very small degree during 5 months storage, with 1 exception. This anomaly in the 5 month sample, when 40% hydrolysis had occurred, may he explained hy a relatively small amount of added phosphate heing in contact with normal levels of phosphatases. * However, this chicken had heen injected with the same amount of phosphate as the other chickens and the very small amount detected was presumably due to sampling error, which is discussed below.
The only other results of this nature which have heen in the literature are those of Jozefowicz et al,^”*" and O'Neill and Richards, who state that polyphosphates undergo very little hydrolysis during 6 months frozen storage of the treated chicken. However, these workers did not present quantitative results, as in the present experiment.
97
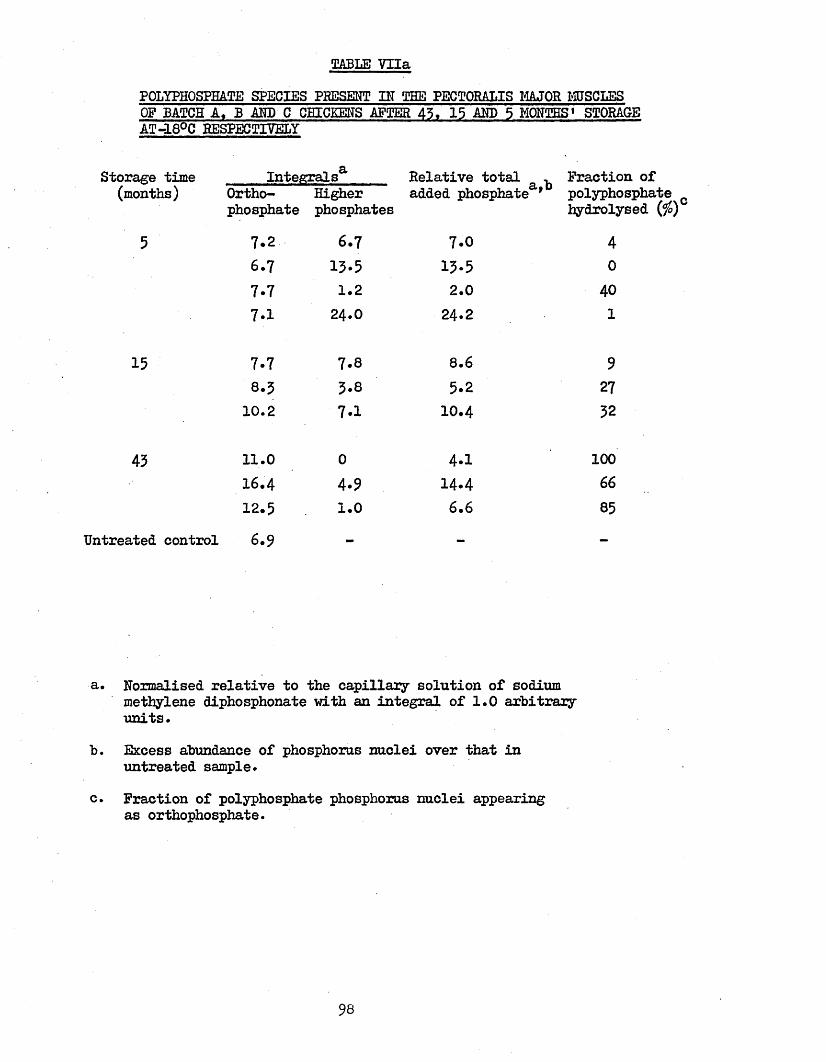
TABLE VilaPOLYPHOSPHATE SPECIES PRESENT IN THE PECTORALIS MAJOR MUSCLES OP BATCH A, B AND C CHICKENS AFTER 45, 15 AND 5 MONTHS1 STORAGE AT-18°C RESPECTIVELY
Storage time Integrals Relative total ^ Fraction of(months) Ortho- Higher added phosphate * polyphosphate
phosphate phosphates hydrolysed ($)5 7.2 6.7 7.0 4
6.7 13.5 13.5 07.7 1.2 2.0 407.1 24.0 24.2 1
15 7.7 7.8 8.6 98.3 3.8 5*2 2710.2 7-1 10.4 32
43 11.0 0 4.1 10016.4 4*9 14.4 6612.5 1.0 6.6 85
Untreated control 6.9 - - -
a. Normalised relative to the capillary solution of sodium methylene diphosphonate with an integral of 1.0 arbitrary units.
b. Excess abundance of phosphorus nuclei over that in untreated sample.
c. Fraction of polyphosphate phosphorus nuclei appearing as orthophosphate.
98
Although these results show a consistent trend of hydrolysis with frozen storage time, two approximations were made in the procedure. First, the percentage hydrolysis was calculated taking the level of naturally occurring orthophosphate in chicken muscle as that present in only 1 untreated chicken. This was thought to be justifiable because the naturally occurring orthophosphate is present in relatively large amounts compared to the injected amount, and also the natural amount is reasonably constant between chickens (see sections 3*42 and 3*791)*Second, differences in the location of the actual sample site relative to the injection site, which was not exactly known, were likely to produce errors because of the unknown efficiency of distribution of injected phosphates.
Since orthophosphate, the ultimate hydrolysis product of polyphosphates, is not effective as an antioxident (and relatively ineffective in controlling WHO), the fact that hydrolysis of polyphosphates has been found to occur during frozen storage is of considerable importance when considering the mode of action of polyphosphates. This will be furtherdiscussed in section 4*2.
31This ■ P-FTNMR technique only became available at the end of this research, and more detailed studies of the distribution and hydrolysis of polyphosphates added to chicken were not possible. However, some of the leg muscles from the batch B and batch C chickens used here were analysed for polyphosphates using this technique, and the results are mentioned in sections 3*42 and 3*791*
99
3.4 £BA ANALYSIS, MOISTURE CONTENT, AND POLYPHOSPHATE SPECIES AND TOTAL PHOSPHORUS CONTENTS OF RAW AND COOKED PECTORALIS MAJOR,PECTORALIS MINOR AND LEG MUSCLES OF TREATED A ED UNTREATED BATCH B CHICKENS AFTER 18 WEEKS STORAGE AT -18°C.
This experiment was designed to investigate the distribution of injected polyphosphates in chicken, since very little published information is available on this subject (see section 1.2). The TBA Numbers of various samples were determined to see if any correlation existed between phosphorus content and degree of oxidation.
The experimental design was as follows:a) 3 treated and 3 untreated
chickens from batch B after 18 weeks storage at -18°Cwere thawed at 4°C for 18 hours.
b) 1 pectoralis major, pectoralis minor and leg muscle excised from each chicken and stored at -18°C until required.
5g each treated pectoralis major muscle immediately analysed for polyphosphate species by the TLC technique. TBA tests performed on 5g each muscle. Remainder stored at -18°C.
d) 2g each muscle reserved for total phosphorus and water determinations. Remainder cooked by heating in glass jars at 83-90°C for 45 lain*Cooled and treated as in c), except remainder stored at 4 C for 2 or 3 days, then TBA tests performed on 5S each muscle.
e) Water determinations and digestion procedure for total phosphorus carried out on lg amounts of each raw and cooked muscle.
f) c) to e) performed on pectoralis minor and then leg muscles.
g) All digested solutions sent to Albright and Wilson for total phosphorus analyses.
100
5*41 TBA NUMBERS
Table Villa shows that there were no statistically significantdifferences in TBA Numbers between treated and untreated muscles whenraw or freshly cooked. However, all mean values for treated muscleswere lower than those for untreated muscles. There were relativelylarge interchicken variations in TBA Numbers for all 5 types of muscle,and no clear inter-muscle differences we re apparent. All values werebelow 1.00, as would be expected for fresh raw muscles and freshlycooked muscles after a relatively short period of frozen storage.
As expected, the TBA Numbers of cooked treated pectoralis majormuscles were significantly lower than those of untreated muscles after2 days holding. Unfortunately, the TBA Numbers of cooked treatedpectoralis minor and leg muscles were not determined, and therefore,the effect of polyphosphate treatment on these 2 muscles could not bedetermined. The TBA Numbers of these untreated muscles were very highafter 5 days holding.
All untreated cooked muscles after 2 or 5 days of holding hadvery much higher TBA Numbers than those found by Jacobson and Koehlar,^(see Table 11, section 1.4) • However, these workers used the TBA test
122of Tarladgis et al, which does not use acid-heat treatment (seesection 2.31 for discussion of this point), and lower values may havebeen expected. However, the freshly cooked values for the presentexperiment and those of Jacobson and Koehlar were similar. Also, Wilson
158et al, who used the same TBA test as in the present experiment, found much higher TBA Numbers than the present ones, for both raw and cookedchicken after 0 and 2 days holding at 4°C (see section 3*521 for their
86 87cooked values). Thomson, who used the TBA test of Turner et al,reported similar TBA Numbers to the present ones for both treated anduntreated cooked muscles during refrigerated storage. It should be notedthat each of these 3 sets of workers tested chicken muscles which were
101
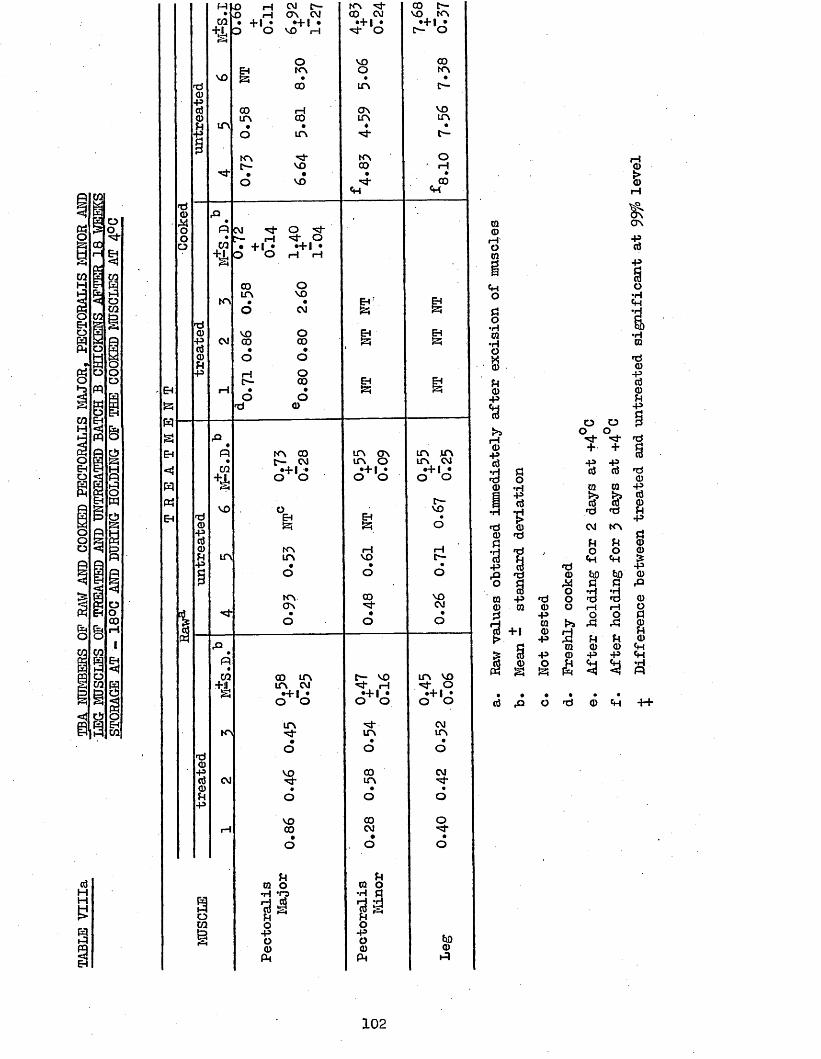
TABLE
Villa
TBA NUMBERS
OF RAW AND COO
KED PECTORALIS MAJOR, P
ECTORALIS
MOTOR
AHD
LEG MUSCLES
OF TREATED
ARB UNTREATED
BATCH
B CHICKENS AFT
ER 18
WEEKS
STORAG
E AT
- 18Q
C AND DURIN
G HOLDING
OF THE COO
KED MJSCLES
AT 4°C
H O rH CM C— KN ■<3* co t>-• O H CTv CM 00 CM vo KNCQ • +1 • M-l • •+l • •+l •% O O VO rH O D- o
O VO COEH KN O KNVO Br • • •d 00 LA C—0)•PaJ 00 rH ON VOCD in co LA LAR tr\ • • * •■P o LA •*3" c—
KN ^ KN oC*- VO 00 rH• • • •o VO •'3* 00<R <R
do rQM ♦o CM ^ OO • >. rH >st* Oo CO • +1 • *+l •3 O H rHp
00 OLA VOkn • • EH RO CM &ido VO O b EH■p CM 00 00 izigS • • 1(D£j o on•P rH Of- 00 EH ShrH • • 3o od e
,Q • KN 00 LA ON LA LA• [■— CM LA O LA CMCQ •+1 • •+1 • •+1 •+*L o o o o o os
t—VO o vod EH •<D 5 !z< o•PgJcd KN i—1 rHR LA LA vo C—-P • • •O o oKN 00 VOON CMd3 • • •3 o o o
rQPCQ 00 LA c— vo LA VO+1 LA CM rH ■sj* Os •+1 • •+l • • + Uo o o o o o
LA CMKN IA LA• • •o o Od0)-p vo 00 CMg3 CM •sf LA<D • • •R o o O•P
vo 00 orH 00 CM• • •o o o
R RCQ O CQ O•H ‘O •H da ■31 gj {£«o R Rm O O-P -PO o &Q<D cu 0)PH Ph h )
Oo•Hm•HO0)R(1)•P
<D
<Dao•HIS
d <D CD da‘d-p
dI
CQ -P CD CQ2s +>p .
I(C rQ
O OO O
+ +- P - Pa ctfCQ CQ
aJ g5rd dCM KNR RO O
d<D tlDG
d oo 3 3
o o i—1 i— i■ p o oCQ ACD H
• P R RCQ a> <D
• P CD - p - PO R
P H
• • • •o d <D
102
Difference between
treated
and untreated
significant
at level
different in all aspects including source, treatment, cooking method, and storage conditions, from each other and from the present experiment. Therefore, these 3 comparisons highlight the difficulty of comparing TBA numbers from different sources, owing, not only to the use of different TBA tests, but to the actual samples tested and their treatment.
3>42 TOTAL PHOSPHORUSTable Vlllb shows the total phosphorus contents of raw and
cooked pectoralis major, pectoralis minor and leg muscles. It may be seen that the total phosphorus content of untreated muscles showed very little interchicken variation for each of the 3 types of muscle. The phosphorus levels in all 3 types of cooked untreated muscle were similar to each other, whilst the raw leg muscles contained lower amounts .of phosphorus than the other 2 types of raw muscle.
The values for the raw pectoralis major muscles were similar139to those obtained by Grey et al, ' on the entire breast muscle of
untreated and commercially treated broilers. The ranges of their values were, 0.37 - 0*44^> 'and 0.20 - 0.23 > for treated and untreated muscles respectively. Their mean values are given in Table Vlllb.
Both raw and cooked pectoralis major and pectoralis minor muscles from treated chickens contained significantly more phosphorus than muscles from untreated chickens. This shows that added phosphorus is present in both these breast muscles, although the major muscles contained more added phosphorus than the minor muscles. The minor muscle is situated behind the major muscle into which the injection is given, and therefore it appears that the injected polyphosphate is not evenly distributed throughout the carcase.
. There were no statistically significant differences in phosphorus content between the leg muscles from treated and untreated chickens when they were either raw or cooked. This is in agreement
103
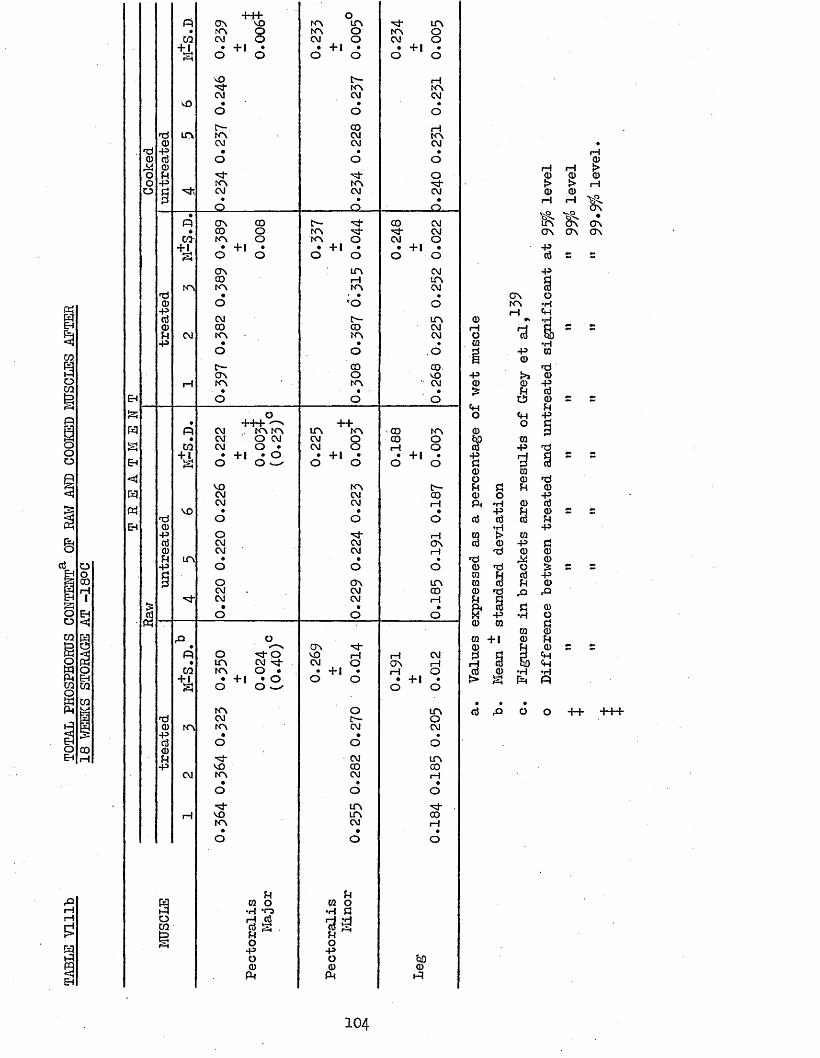
TABLE
Vlllb
TOTAL
PHOSPHOHqS CONTENT
OF RAW AND
COOKED
MUSCLES
AFTER
18 WEEKS
STORA
GE AT
-180C
-PH- oft o n N O K N UN •np UN• KN Q K N O KN OCO CM O CM O CM O
+ 1 • + 1 • • + 1 • • + | .F t o o O O o o
NO P - 1— 1■nj- KN KNCM CM CMNO • • •
o O Ot'-. CO i— 1
nd U N K N CM K N0 CM CM CM-P • • •
0 n3 O O OX 0o 14 *nj- oo -P KN KN ■'sf-o jd CM CM CMn • • •
O o O•p» ON CO t"- Kf CO CM• CO O KN •nj- CMca- K N O K N O CM O
+i • + 1 • • + 1 • • + 1 •a o o o o o o
ON UN CMCO rH UN
KN KN KN CMnd • • • •0 O < o O•P
CM C— UN0 CO CO CMU CM KN KN CM-P • • •
o o , oc— CO CO.ON o MO
I— I KN KN CM- • • •O o o
o• - 1 1- tT T T + +ft CM , KN KN U N K N ' 00 KN• CM O CM CM O CO OCO CM O • CM O rH O
+ i • +1 • o * + 1 • • + 1 •a O O — ' o o O O
NO K N C--CM CM 00CM CM rHNO • • •
nd O O o0•P o •nj- rHrt CM CM ON0 CM CM rH14 UN • • ••p O O O§ o ON UNCM CM CO
•** CM CM rH£ • • •a O o oW
fi o• ✓— N. ONft o -nj- o NO rH rH CM• U N CM '=p CM O O N rHCO K N O • • + 1 • rH O
• H • + | • O o o • + 1 •a o o ^ o o
KN o U Nnd CM t— O0 KN KN CM CMP> • • •cti O O O0 CM UN-P NO CO CO
CM KN CM 1— 1• • •o O o*3- UN ■Kj-
rH NO UN 00KN CM rH• • •O O o
aoco
uto o•H •r-3rHrf k— i FHUO-Po0ft
u0 o •H fl
o•po0to
*300to
i—« 0 > 0
i—Is>CDrH
i—I 0 > 0 i—I
^ *u n o n o nON O N ON
% r =*p3
ON oKN •Hi— 1 to
0 ■r|rHOCQ •HH -P 0H 0
nd•p ►>9 00 0 -P£ u £
0«H 14o <H -P
O d0 3& ra0 -p d
*s ■3 u0 CQO 0 nd14 £ 14 00 o -Pft •H 0 cti
•P 0cS £ 14-p
CO f> mc3 0 -p £
nd 0 0nd X 00 nd o £0 H (6 -pCQ ro H 00 nd fii fiU tifi< 3 £ 0
-p •H o0 £0 00 + i 0 140 fJ 0
£ £ p f tg
00 •Hto•H
a to ft• • •
ctf o O ++ +++
104
with results obtained in the experiment reported in section 5*32*These were, that no added phosphates were found in the leg muscles from treated chickens which had been stored at -18°C for 5 or 15 months.
These, findings that added phosphate is not reaching the legmuscles of chickens injected with polyphosphates under normalcommercial conditions has not been reported in such detail before,
21although the inconclusive evidence of Truman and Dickes, did point toX 8this fact (see section 1.2); and, also, Grey et al stated that leg
muscles did not contain added phosphates, but they gave no experimentalvalues (see section 1.53)* However, it is recognised that turkeys sotreated require injection into the leg, as well as the breast muscles,to ensure adequate distribution (see section 1.2).
Each cooked muscle contained a higher concentration of phosphorusthan the corresponding raw muscles. Since the results were expressed as apercentage of wet tissue weight, this higher concentration in cookedmuscle is due to the fact that the ratio of phosphorus to muscle isincreased in the cooked muscle because of moisture loss during cooking.It was not possible to accurately determine if phosphorus was lost duringcooking by comparing dry muscle values, because the cook losses were onlycalculated approximately from cook-out juice volumes. .However, from theapproximate figure obtained, it appeared that sample number 1 lost about5»5/o phosphorus during cooking, number 2 about 6*5/o, and number 3 didnot appear to have lost any phosphorus. All untreated pectoralis majormuscles lost phosphorus during cooking, but the values are not givenbecause they were approximate. For this reason, phosphorus losses ofthe other 2 types of muscle were not calculated. The reason for quotingtreated pectoralis major results is that these may be compared with theTBA Numbers of the cooked muscles (see section 3,43), whereas the TBANumbers of the other 2 types of cooked muscle were not determined.
105
3*43 CORRELATION COEFFICIENTS BETWEEN TBA NUMBERS AND TOTAL PHOSPHORUSSince polyphosphates reduce the TBA Numbers of cooked muscles,
a correlation coefficient between phosphorus content and TBA Numbers86may be expected to exist* In fact, Thomson, reported a significant
negative correlation between percentage phosphorus and TBA Numbers of polyphosphate treated commercially cooked fryer chickens, but the phosphorus results to support this claim were not given.
In the present work, a correlation coefficient of -0*49 was found between TBA Numbers for freshly cooked treated pectoralis major muscles and their phosphorus content ($ wet tissue). This coefficient was not statistically significant. Since the correlation was negative, it would appear that high phosphorus levels in cooked muscles, which presumably arise from high levels of treatment, result in reduced TBA Numbers. However, because of the effect of cook losses, as discussed in the previous section, a more valid comparison would be obtained by taking the phosphorus content as a percentage of dry muscle weight.When the approximate (see section 3*42) dry weight figures were used, a negative correlation coefficient of similar magnitude to the above was found.
However, these correlations assume that there is no interchicken variation in natural phosphorus content. When this is taken into account by comparing the difference in phosphorus content between the raw and cooked treated muscles and their TBA Numbers, negative correlations were again obtained. In this case the correlation coefficient was -0*96 when phosphorus was calculated as both a percentage of wet and dry muscle. Despite this high numerical value, the correlation was not statistically significant, presumably because the sample size was small. This correlation means that as the difference in phosphorus content between raw and cooked muscles increases, the TBA Number of the freshly cooked muscles decreases. Since muscles lose
106
phosphorus during cooking (see section 3*42), it follows that, the greater the amount of phosphorus lost during cooking, the lower the TBA Number of the cooked muscle is. However, sample number 3> which did not appear to lose any phosphorus during cooking, and has a lower TBA Number than the other 2 muscles when ffcediLy cooked had a much higher TBA Number than the other 2 muscles after holding for 2 days.
It is obvious that phosphorus levels alone cannot adequately explain these findings, since, for instance, loss of phosphorus during cooking may be related to loss of prooxidont metal ions.These points are discussed further in sections 3*710 and 3*7H» where more detailed ionic analyses were performed.
3.44 MOISTURE CONTENTTable Vlllc shows that treated pectoralis major muscles
contained significantly more water than the untreated muscles, presumably as a direct result of polyphosphate injection. There was no difference, however, between treated and untreated pectoralis minor muscles, despite the fact that treated muscles contained significant amounts of added phosphorus. There were no differences between treated and untreated leg muscles, although the values were higher
Pithan previously reported by Truman and Hi eke s.
3*45 POLYPHOSPHATE SPECIESNo tripolyphosphate was found in any of the muscles immediately
after thawing, and diphosphate was detected in only 1 of the treated pectoralis major muscles. However, polyphosphates higher than tripolyphosphate were found in each of the treated raw and cooked pectoralis major and pectoralis minor muscles; but none we re detected in any of the treated leg muscles, which corresponds to the findings that leg muscles contain no added total phosphorus.
Even allowing for the relative insensitivity of the TLC method used here, compared to the P—FTNMR method used in the other experiment
107
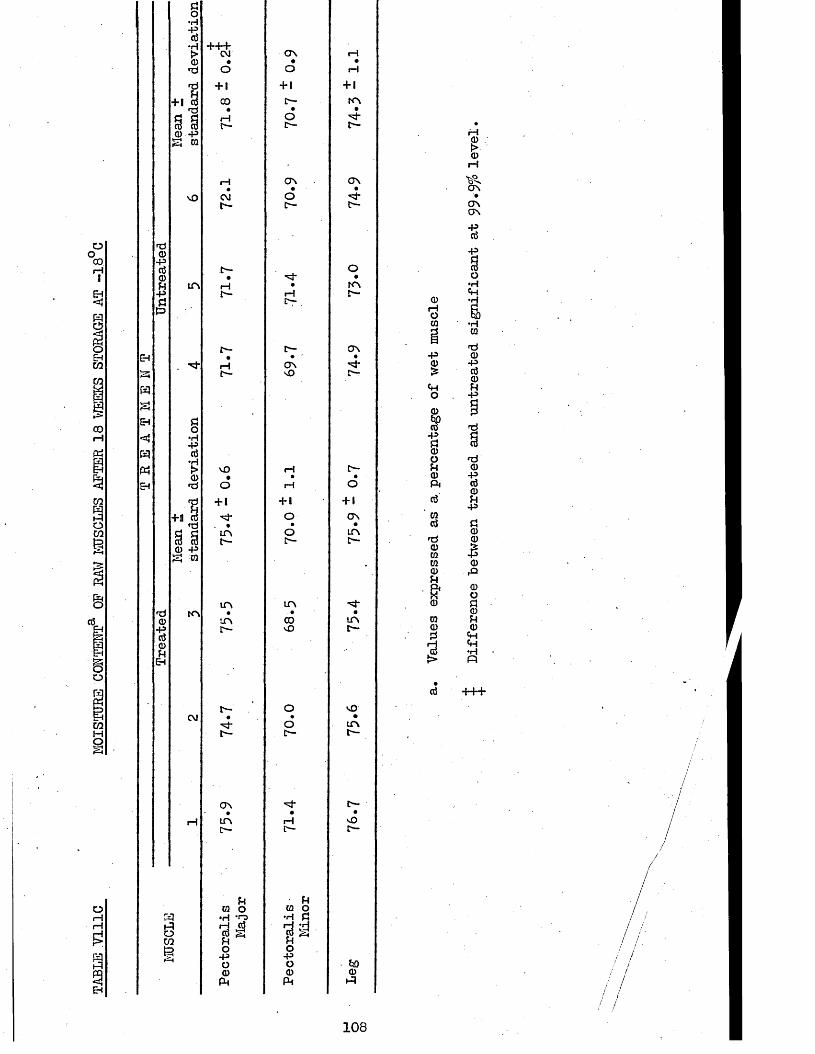
TABLE
V111C
MOISTURE CONTENT
OP RAW MUSCLES
APTER
18 WEEKS
STORAG
E AT
-18 C

(see section 3*32), these findings for pectoralis major muscles werenot expected. These present chickens had been stored at -18°C foronly 18 weeks, and previously (see section 3*32), very littlehydrolysis had taken place in pectoralis major muscles during 5 monthsstorage at -18°C. Since the present breast muscles containedsignificant amounts of added total phosphorus, it would seem thatrapid hydrolysis of polyphosphates does occur during thawing; assuggested by O'Neill and Richards,(see section.1,64)• Thispresent experiment, therefore, was probably not valid; but it was
31performed before the *' P-FTNMR technique and other workers findings,were discovered. It should be mentioned here that no added
31phosphates were detected by P-FTMMR in leg muscles from treated chickens which had been in frozen storage for 5 arid 15 months (see section 3*32 for experimental details).
109
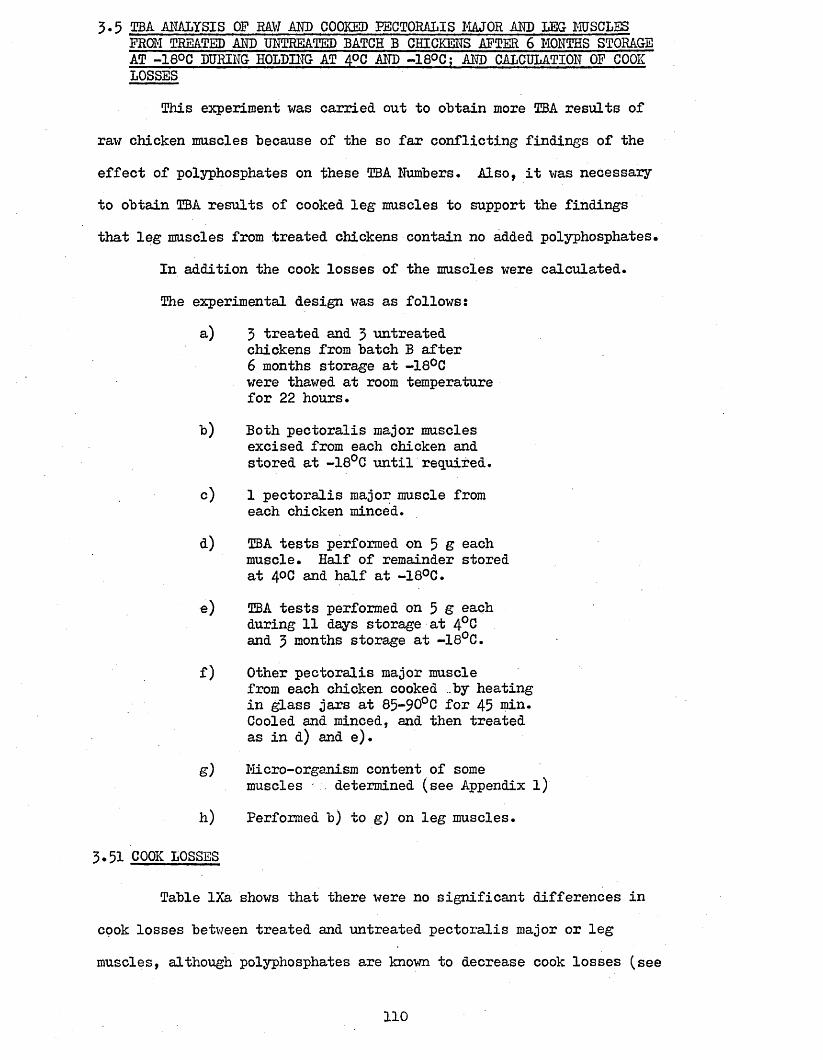
3.5 TBk ANALYSIS OF HAW AND COOKED PECTORALIS MAJOR AND LEG MUSCLES FROM TREATED AND UNTREATED BATCH B CHICKENS AFTER 6 MONTHS STORAGE AT -16°C DURING HOLDING AT 4°C M R -18°C; AND CALCULATION OF COOK LOSSES
This experiment was carried out to obtain more TBA results of raw chicken muscles because of the so far conflicting findings of the effect of polyphosphates on these TBA Numbers. Also, it was necessary to obtain TBA results of cooked leg muscles to support the findings that leg muscles from treated chickens contain no added polyphosphates*
In addition the cook losses of the muscles were calculated.The experimental design was as follows:
a) 3 treated and 3 untreated chickens from batch B after 6 months storage at -18°C were thawed at room temperature for 22 hours.
b) Both pectoralis major muscles excised from each chicken and stored at -18°C until required.
c) 1 pectoralis major muscle from each chicken minced.
d) TBA tests performed on 5 g eachmuscle. Half of remainder stored at 4°C and half at -18°C.
e) TBA tests performed on 5 g eachduring 11 days storage at 4°C and 3 months storage at -18°C.
f) Other pectoralis major musclefrom each chicken cooked by heating in glass jars at 85-90°C for 45 Cooled and minced, and then treated as in d) and e).
g) Micro-organism content of somemuscles determined (see Appendix l)
h) Performed b) to g ) on leg muscles.
3*51 COOK LOSSES
Table lXa shows that there were no significant differences in cook losses between treated and untreated pectoralis major or leg muscles, although polyphosphates are known to decrease cook losses (see
110
$iH9EH
rO •n ON rH ON C—• • +1 • • +1 •c/3 in rH c— CM
t l CM CMa
CO KNVO • •
■ * ONCM CM
*d0-P0 ON inCD in • •jh in ON-p CM CM
o CO"vf • •
"3"CM CM
EH
3
wMEh «ft ON rH rH vO• • • • •
C/3 GO + | KN c— +ro ‘+4jft CM CM
P=JEH
rH c—in • •
C— d—CM CM
<dCD-P0CD CM?H CM • ••P I—• sO
CM CM
in CO- • •H CM vO
KN CM
CQ•H ?H
3 % isO 3O -pto o tot3 CD CDC—1ft ft ft
0rHOCQ
§u
O0to0
+3a0o •n0 oft •H
-Po3 0•HCQ0 0*d0 rdra HCQ CO0 rd
i(U•p
0 CQCQ + 102 pj
3 0S
• •0 ft
111
section 1.35)• However, the steam method of cooking used here, may have been expected to mask any differences due to treatment because of the saturated water vapour atmosphere. In fact, Table la shows that the cook loss of 1 treated pectoralis major muscle after roasting with no added fat, was much lower than that of 1 untreated muscle.Also, it seems likely that increased cook yields of whole and portioned chickens (as discussed in section 1.33)» ane not reflected in the individual muscles because skin, tendons, and connective tissue have been removed.
112
3.52 TBA NUMBERS
3-521 During Holding at 4°C
Table lXb shows the TBA Numbers of cooked muscles during holding at 4°C, and Table lXc, the TBA Numbers of raw muscles during holding at 4°C.
For cooked muscles, the difference between treated and untreated pectoralis major muscles was always highly significant throughout 9 days of holding. This again indicates that polyphosphates inhibit autooxidation in cooked chicken tissues (cf. Tables Vc and Villa). .However, there were no significant differences between treated and untreated leg muscles throughout 5 days of holding. This was the first time in this work that the TBA Numbers of cooked leg muscles had been determined. This lack of difference between leg muscles from treated and untreated chickens clearly corresponds to the findings in sections 3.42 and 3-791> that injected polyphosphate does not reach the leg muscles.
By comparing these results from pectoralis major and leg muscles, it may be seen that the TBA Numbers of leg muscles after 2 days of holding were very much lower than those of untreated pectoralis major muscles after 1 day. However, the values for leg muscles after 5 days were higher than those of untreated pectoralis major muscles after 7 and 9 days. Thus, cooked leg muscles were found to undergo autooxidation at a slower rate than pectoralis major muscles. This delayedonset of rancidity in leg muscles compared to pectoralis major muscles
138was not found by Wilson et al, ' whose mean TBA Numbers for 3 cooked minced, muscles were, 3-96 - 1.03 for dark muscles and 3-13 ~ 1*76 for white muscle immediately after cooking. These values rose to 9-20 - 0.69 and 8.60 - 0.72, respectively, after 2 days holding at 4°C (however, see discussion in section 3-41> about the difficulty of comparing TBA Numbers from different sources).
113
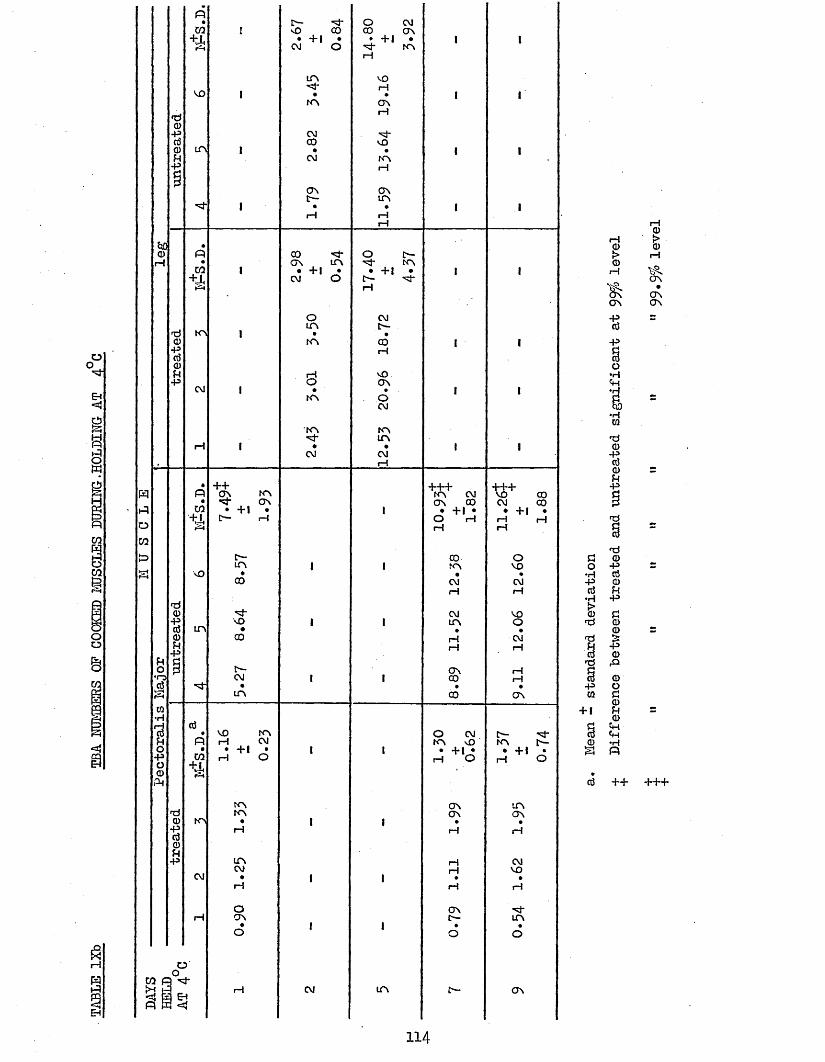
o
§Eh
un
tre
ate
d
pw
+±
NO
UN
I
1
1
1
E— "3* •O CO
• +1 •CM O
in•
KN
CMCO
•CM
ONt—•i—1
O CM CO ON
• +1 •'vf KN rH
vOrH•ONrH
'vhVO
•KNrH
ON UN
• rH t—I
1
1
1
1
1
1
1
1
bQ •Q) P CO O t'-rH • on in ^ KN
w 1 • + l • • +1 • I 1+1, CM O C— ”'3"Pi H
O CMin
fd KN 1 • •CD KN CO I 1-p rHdCD{4 rH vO-P O ONC\l 1 • • I 1
KN OCM
KN KN•<fr in
rH 1 • • 1 1CM CM. rH
• ++ +~n* +++P ON KN KN CM VO GO• "4* ON ON CO CM COto • +1 • 1 • +1 • • +1 •t l D- i—1 O rH rH pHp « rH i—I
t— CO Om 1 1 KN VOvO • • •
CO CM CMpH rH
<dCD ,=- CM VO•p NO 1 1 in Od in • • •CD CO rH CMH rH rH-p
n piO p t>- ON rH•o CM 1 1 CO rHd • • •£ in CO ONCQ•H
•a d • VO KN O CM I— 'xfP iH CM KN vO KN t'—
O • • + | . 1 1 • +1 • • +1 ••P to H O rH O H OO + l.CDP
KN ON UNrd KN ON ONCD KN • 1 I • •-Pfrl rH rH rH(uCDfH-P in pH CM
CM rH VOCM • 1 I • •rH rH rH
a ONrH ON C— UN• I | • •o o o
OO
0 (=H ""tf*•H 1- rH CM UN c— ON H EH
3 n4 <!
GO•H- Pd
t•d'dClJ<n§-pCQ
+1<Da
•—i(u>0rHO N•ONO N
d + + + + +
114
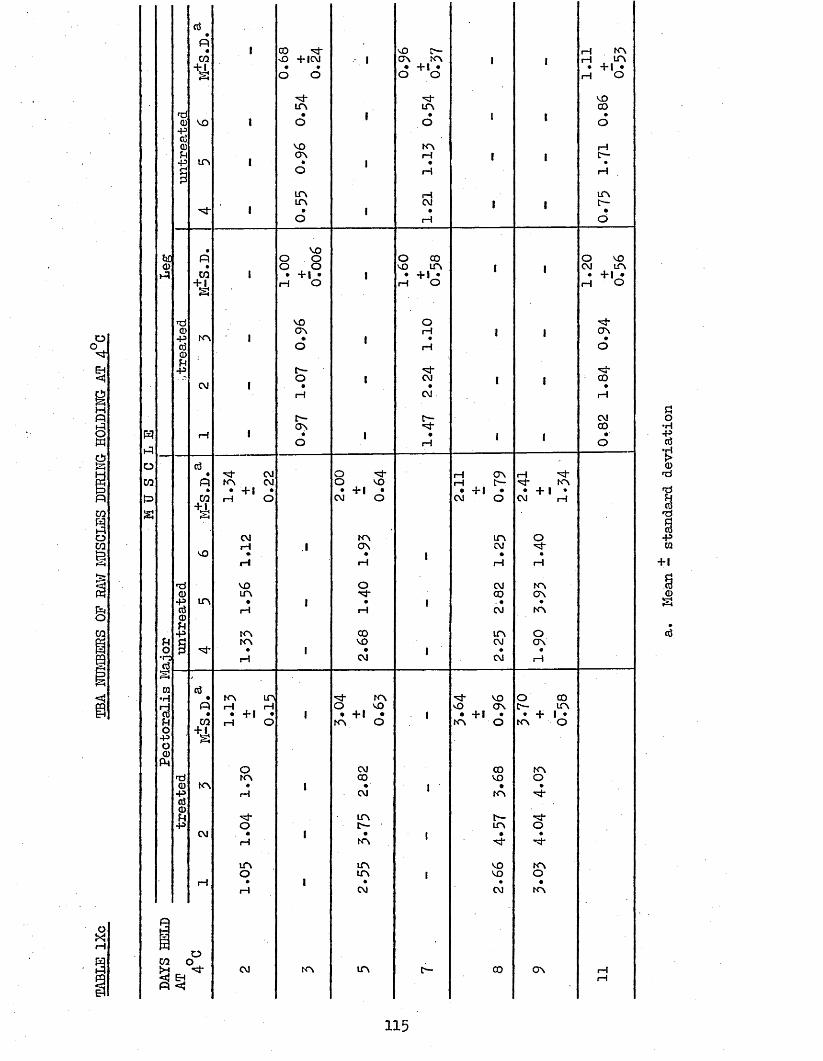
o
%
gaiciJ
Pco9oCO
§CO
©
$H
a
c3
CO
+i
vo
in
co+sJi
kn
CM
P4CO
«o
in
o co o H ^ <J Eh P
"'xt* CMk n c m• +1 •rH O
CM
VOin
k nk n
• KN LOp rH rH« • +1 •CO pH O+ 1a
OKNKN «
rH
'xt-oCM •
pH
inorH •
CM
CO Kf- O + 1 CM
■'shin
voON
inin
vo8 S • +1 •pH O
VOON
OH
tON
KN
O ^O vo• +| •CM O
KNON
O
coVOCM
^ K NO VO• +1 •KN O
CMCO
CM
inK N
ininCM
in
'O c—ON KN • + • •O O
•'xt*in
KNrH
i—ICM
O COvo in• +i .rH O
OrH
-3-CMCM
■xf I—I
in OCM• •
rH rH
CM KNCO ON. • •CM K N
in OCM O N• •CM rH
-xj* VO O COvO O N c—■ m• +1 • • + I •K N O K N O
COvoKN
tin
vovoCM
CO
pH ON i— 1 "■xfrH KN• + 1 • • + 1 •CM O CM rH
KNO
O
KNOKN
O N
rH KN• +1 •
rH O
VOCO•opH £—rH
m c—
O vo cm in • +1 •rH O
ON
■'3*CO
CMCO
pHrH
a0•H+»
£d)n3
1Ti
+»CQ+ 1Q)S
115
For raw muscles, the mean TBA Numbers of treated muscles were generally higher than those of -untreated muscles, but these differences were not significant. Therefore, polyphosphate treatment was not found to inhibit autooxidation in raw muscles, as it was in section 3*1 (also, cf. Table Xa).
By comparing these results from pectoralis mao or and leg muscles, it may be seen that the mean TBA Numbers of leg muscles were lower than those of pectoralis major muscles throughout the 11 day holding period. This would seem to correspond to the discussion in section 3*26, that phospholipids are protected against autooxidation in raw muscles by their close association with muscle proteins. This is because leg muscles contain a greater amount of phospholipids than pectoralis major muscles (Table Via), and therefore autooxidation would proceed less rapidly in leg muscles than pectoralis major muscles. However, from the discussion in section 3*26, it may be seen that neutral lipids are presumed to play a major role in raw muscle oxidation. Since leg muscles contain much larger amounts of neutral lipids than pectoralis major muscles, (Table Via) it may be expected that raw leg muscles would be more susoeptible to oxidation than raw pectoralis major muscles. Because they have been found not to be, must be a reflection of the small polyunsaturated fatty acid content of neutral lipids compared to phospholipids.
It is surprising to note that the TBA Numbers of raw treatedpectoralis major muscles were higher than those of cooked treatedpectoralis major muscles, which were very low throughout the holding
86period. Thomson, also found that cooked treated muscles had very low TBA Numbers throughout 14 days of refrigerated storage (see section 1*43 for the values). Heat would be expected to accelerate the auto- oxidative process, resulting in a higher degree of rancidity in cooked muscles compared to raw muscles. That this was not found to be the
116
case, could be because the cooked muscles were in the latter stages ofrancidity when the amount of malonaldehyde had been depleted (seesection 2*51)» leading to low TBA Numbers. However, this does notexplain why the untreated cooked muscles had very high TBA Numbersthroughout the holding period.
It seems that polyphosphate treatment could result in cookedmuscles having very low TBA Numbers by some mechanism other thaninhibition of autooxidative rancidity. For instance, polyphosphatesmay act by destroying carbonyl by-products of autooxidation and notby inhibiting oxygen attack on fatty acids. From the presentexperiment it is not possible to determine absolutely which, ifeither, of these 2 mechanisms is correct. However, since raw treatedmuscles have very similar TBA Numbers to untreated muscles, it seemsthat polyphosphates do not directly interfere with the initial stages
90 91of autooxidation. . Bao et al, ’ also encountered difficulties in interpreting their carbonyl results which are reported in section 1.52.
5*522 Paring Holding at -18°CTable lXd shows the TBA Numbers of raw muscles during 4 months
holding at -18°C, and Table IXe the TBA Numbers of cooked muscles during 5 months holding at -18°C.
For raw muscles, it may be seen that there were no significant differences between treated and untreated muscles. This again suggests that polyphosphates do not inhibit autooxidation in raw muscles. For pectoralis major muscles, the TBA Numbers after 4 months at -18°C were similar to those obtained after 2 days holding at 4°C. This suggests that little or no oxidation had occurred during 4 months frozen storage. For leg muscles, however, the mean values obtained after 4 months at -18°C, were much higher than those obtained after 11 days holding at 4°C. These leg muscle values during frozen storage were very variable, ranging from 0.86 to £).ll. The only explanation which may be offered for this variability is that, blood vessels could not always be easily
117
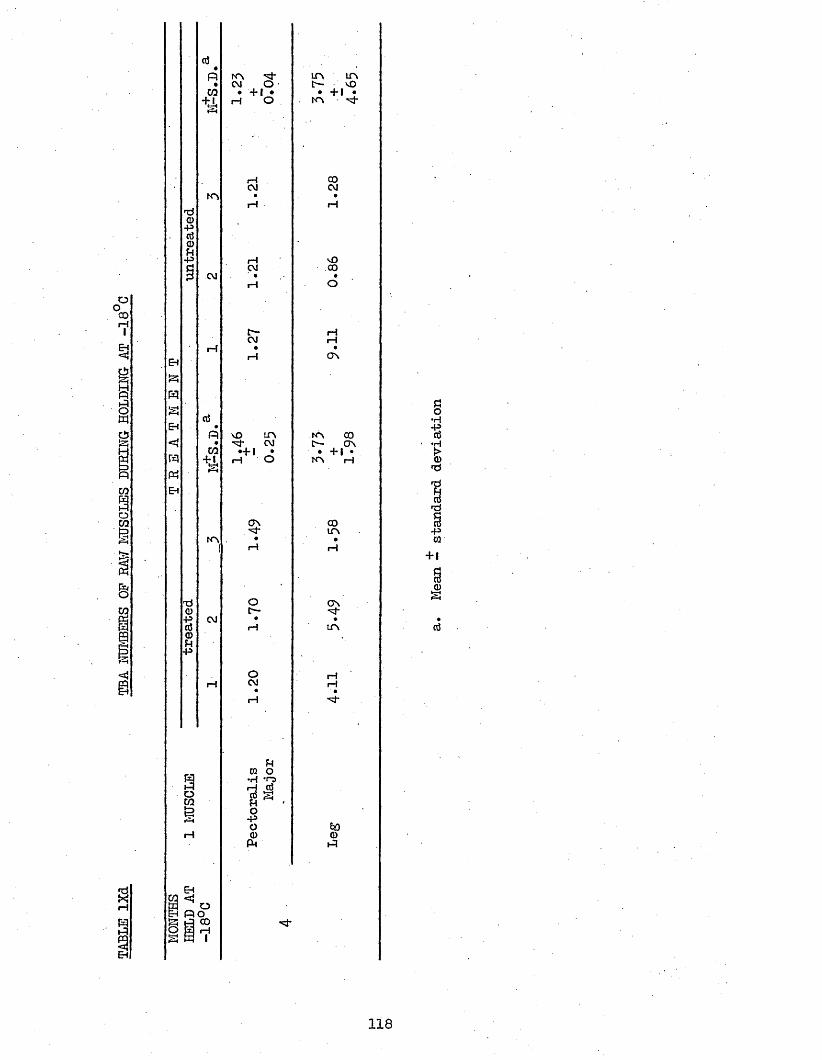
TABLE
lXd
TBA NUMBERS
OP RAW MUSCLES
DURING
HOLDING
AT -18
C
ctf•R KN *3- LfN ITN• CM O t— vO02 • +1 • • +1 •+J< rH O KN
rH COCM CMkn • •
rH rHo•pttf0•P rH vOP* CM CO3 CM • •
rH O
t— i—1CM i— 1f-r • •
rH ONEH12;ms ctfEH •R vO LTV KN CO<< • -3- CM C— ON02 •+1 • • 4* I •Tx) ■ u rH O KN rH«EH
ON CO. ITN
kn • •i— 1 rH
o ON0 c—-p CM • •rJ rH ITN0fH•p
O rHrH CM rH• ■ •rH •'tf-
54m o•H ’OIHo rH 0&
02 54 >& Os -P
O EiOrH 0 0P4 R
EHM <{ OEh flO3 ij COO 1—1s 1
+ 1
I
118
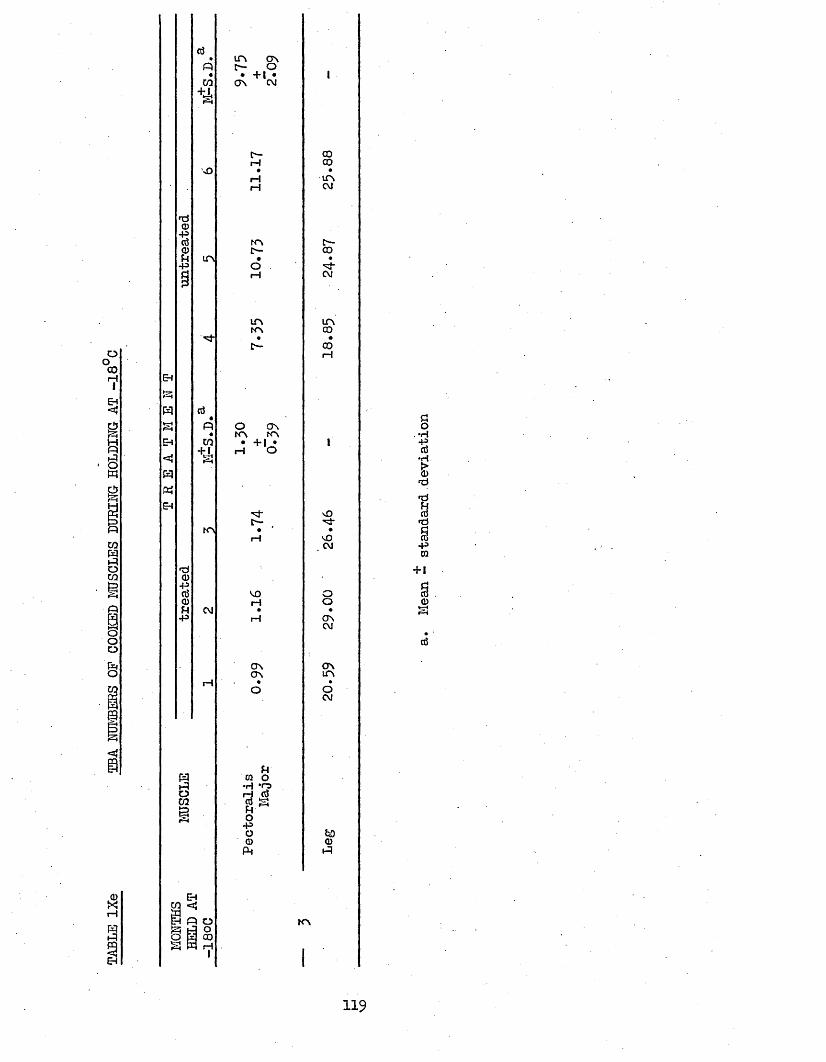
TABLE
lXe
TBA NUMBERS
OF COO
KED MUSCLES
DURING
HOLDING
AT -18 C
Aco
NO
in
•A o ON• KN KN
CO • + 1rH o
KN
CVI
A O
in cn r- o• +i •ON CM
£— rH
rHrH
k nt—•o
ink n
cocoinCM
CO■Mf"CM
incoCOrH
C—
M3rH
ONON
O
M3*3*M3CM
OOONCM
ONin
•oCM
UO*racSS
bD0)A
KN
ao•H
•HSnd'd9•d
-Pto+ 10)SI
119
separated from the leg muscles during excision and mincing. (Thus,
samples of leg muscles probably contained varying amounts of pro- oxident haem compounds, which contributed to increased development of rancidity during 4 months at -18°C, but not to such a marked extent during 11 days at 4°C (cf. Table lXc).
For cooked muscles, the difference between treated and untreated pectoralis major muscles was highly significant, but this was not true of leg muscles. These findings are as expected from the results of cooked muscles during holding at 4°C. The values for leg muscles were very much higher than those of pectoralis major muscles, which corresponds to the results obtained on the 5th day of holding at 4°C (see section 5*521). By comparing the results at 4° and -18°C, it also appeared that autooxidation had proceeded in the
leg muscles during frozen storage, and, perhaps, in the untreated pectoralis major muscles.
Thus, autooxidation was found to have occurred in untreated cooked muscles during 3 months frozen storage, but not in raw muscles (except for some leg muscles), see above) during 4 months frozen storage. This obviously reflects the greater susceptibility of cooked muscles to autooxidation compared to raw muscles.
120
3.6 TBA ANALYSIS OF RAM PECTORALIS MAJOR AND LEG MUSCLES OF TREATEDAMD tfflTREATED BATCH A CHICKENS AFTER 47 M O M S STORAGE AT -18°C;AND PBELUCQTARY THAW LOSS STUDIES.
This experiment was carried out to see if during further prolonged frozen storage, raw treated hatch A chickens were protected against autooxidation as ohewas found to be after 21 months frozen storage (section 3*1)• Subsequent TBA analyses of raw muscles did not conclusively show this protection of raw treated muscles (see sections
3.24, 3.4I and 3.52).The experiment was carried out as follows:Two treated and 2 untreated chickens from batch A after 47 months
storage at -18°C were placed on 2 trays and thawed at room temperature for 16 hours. The pectoralis major and leg muscles from 1 side of each chicken were excised and minced. All muscles gave off rancid odours.TBA tests were carried out during holding at 4°C.
5.61 TBA NUMBERS-Table Xa shows the TBA Numbers of treated and untreated pectoralis
major and leg muscles during holding at 4°C for 8 days. The mean TBA Numbers of treated muscles were lower than those of untreated muscles for both pectoralis major and leg muscles throughout the 8 day holding period. These differences were not statistically significant, due in part no doubt to the small sample size and relatively large standard deviations. However, it should be noted that except for the 8th day of storage, both treated pectoralis major muscles had lower TBA Numbers than the 2 untreated muscles. This was not true of the leg muscles.
For both pectoralis major and leg muscles, all values were lower than those of batch B chickens after 6 months storage at -18°C, during holding at 4°C (section 3.521), Table lXc). A possible explanation of this is that the present chickens had undergone considerable autooxidation during their 47 months of frozen storage (all muscles gave
off rancid odours after excision); and maionaidehyde, the autooxidation
121
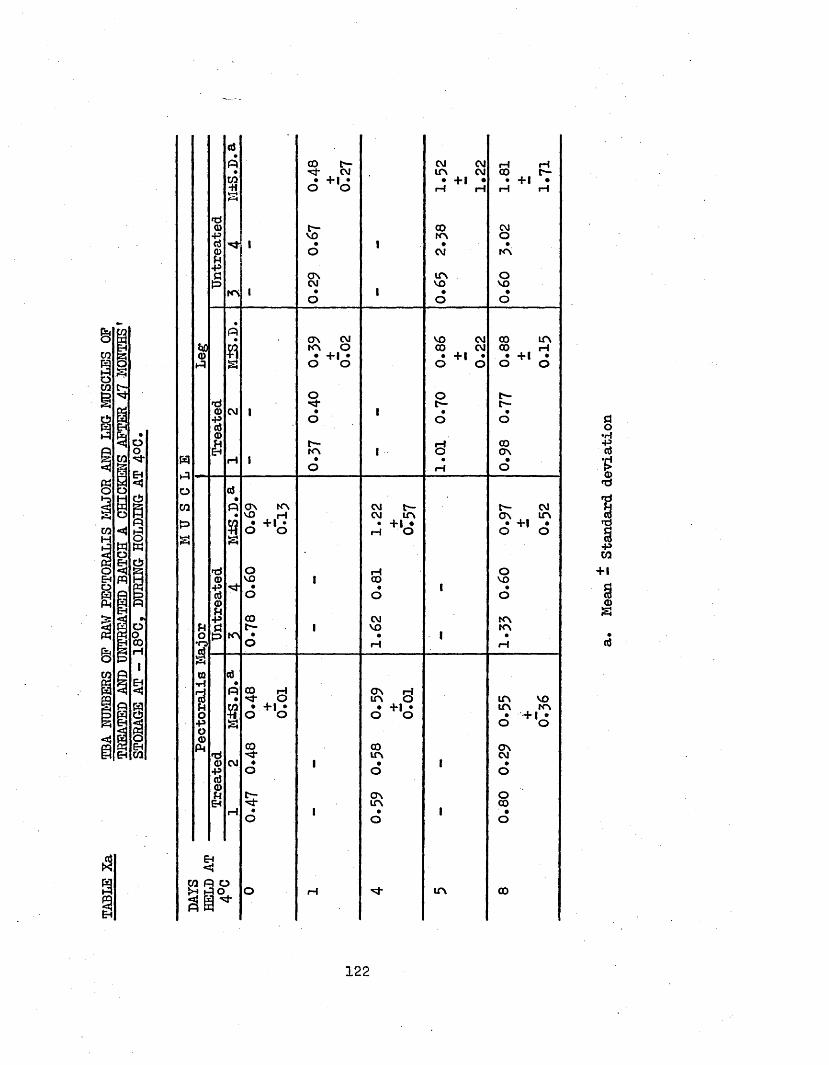
TABLE
Xa TBA NUMBERS
OF RAW PECTORALI
S MAJ
OR AND LEG- MUSCLES
OPTREATED AND UNTREATED
BATCH
A CHICKENS AFTER
47 MONTHS'
STORAGE
AT - 18°C,
DURING HOLDING
AT 4°C.
Untr
eate
d
<a•R
ik—4
KN
1
1
CO c~~ p* CM• 4*1 •o o
t*—vo•o
ONCM•o
1
1
CM CM UN CM • +1 •rH rH
coKN•CM
UNvo•o
p p 00 f- • +1 •P P
CMO•KN
Ovo•o
•P• ON CM vo CM 00 UN
t>o KN O CD CM 00 P© +1 • +1 • • +1 • • +1 •P o o o o o o
o ot— c—0) CM I • 1 • •S o o oTO0) t**- p coeh KN I o ON
rH 1 • • •o p ooj•p ON KN CM t— C— CM• ''O P CM UN ON . UN(7} • 4*1 • • +1 • • 4*1 •§
o o rH O O O
P o rH o0) vo 1 CO VO•p 'sf • • 1 •0} o O o©U■P CO CM KN
U a r- 1 VO KNO p KN • • 1 ••rs o rH P
a aP •p p CO P ON rHTo • p- O UN O UN VOH © • +1 • • +1 • UN KNO +i o o o o • 4*1 ••P s O OowPM 00 CO ONUN CMo CM • 1 • 1 •
*8o o oCO© c~~ ON o
EH ■"Sf UN COH • 1 • 1 ’ •
EH
o O o
a p oH >.3 O o 1H UN ©g p*
a0•r|•Paj1
'xi-Pw+1<Ds
122
product which is measured in the TBA test, is not a stable end-productof autooxidation (see section 2.51)* Therefore, lower concentrations ofthis aldehyde would be expected to be present in rancid musclescompared with those which had only been stored for 6 months at -18°C.However, if this were the case, then it may seem inconsistent that theTBA Numbers of the present muscles increased during holding. It shouldbe remembered, however, that TBA Numbers have been shown to varyinconsistently during holding (see Table lXc); and, also, that the levelof malonaldehyde present at any one time is thought to depend on the
120amount of available oxygen- It seems reasonable to assume that autooxidation during 47 months frozen storage leads to the production (and destruction) of near the maximum amount of malonaldehyde from the most oxidation-susceptible fatty acids, whilst the more inert acids undergo oxidation during holding at 4°C*
These TBA results agree with those of sections 3*24 (Table Vie),3.41 (Table Villa), and 3*521 (Table lXc), in that no definite inhibition of autooxidation in raw treated muscles has been found. In particular, this experiment failed to confirm the results of experiment 3*1, where it was found that an untreated pectoralis major muscle from this batch of chickens after 21 months of frozen storage, had very much higher TBA Numbers throughout 7 days holding at 4°C than a treated muscle.
3*62 TOTAL H A M CONTENT OP THAW LOSSThe combined thaw losses from the treated chickens seemed to
contain more blood than the combined thaw losses of the untreated chickens. This observation was confirmed by measurement of the total haem content of aliquots of both thaw losses by the method of section 2.6. The values (absorbance x total volume) for treated and untreated thaw losses we re 5*7 and 2.6 respectively.
This difference in thaw loss composition between treated and untreated chickens had not been noticed in earlier experiments, and no accounts J
123
have been found in the literature. It seems likely that disruption of
muscle protein structure caused by polyphosphates (see section 1*6), would lead to loss of haemoproteins. Also, removal of pro oxidant haem compounds would be expected to inhibit autooxidation, and, therefore, these observations have very important implications. Further studies on the total haem content of thaw losses are reported in section 3»72*
124
3.? TBA ANALYSIS ADD LIPID. FATTY ACID ADD IONIC (PHOSPHORUS, IROD, SODIUM, CALCIUM, ADD MAGDES1UH) COMPOSITION Off COOKED TREATED ADD UNTREATED BATCH C CHICKED MUSCLES ADD JUICES AFTER 2 WEEKSSTORAGE AT -20°C: ADD CALCULATION OF THEIR CQQK-LQSSSS, ADD OF THE UPTAKE OF CHILL WATER FOR BATCH A ADD BATCH C CHICKEDS.
Most of the previous experiments were carried out on chickens which had been in frozen storage for longer periods than would be used in the retail trade. It was therefore thought necessary to check some of the previous findings against those obtained from chickens after short term frozen storage. Also, previous fatty acid composition results of raw muscles failed to distinguish between treated and untreated samples, and it was thought that results of cooked muscles would be far more likely to do this. In addition to repeating previous analyses, the ionic composition of muscles and juices were determined in order to check conflicting literature reports of the metal chelation properties of polyphosphates in meat. Sodium analyses were carried out to see if this ion was distributed throughout the carcase in a similar way to polyphosphate.
The experiment was carried out as follows:Six treated.(T1 to 6) and 6 untreated (U1 to 6) chickens from
batch C after 2 weeks storage at *-20°C, were inverted in large funnels and thawed at room temperature for 16 hours, and the thaw-drips collected in measuring cylinders. The amount of chill water these chickens had absorbed was known from weights taken in the factory. The pectoralis major and leg muscles from 1 side of each chicken were excised and stored at -20°C until required for cooking, when they were thawed and cooked by heating in glass jars at 85 - 90°C for 45 minutes. The muscles were cooled, minced, and divided into portions for the various analyses. At all times the muscles were returned to the freezer as quickly as possible when not immediately required for analysis, except for the muscles whichwere allowed to become rancid by leaving at room temperature for 5 days.Phosphorus, iron, sodium, calcium and magnesium (P,Fe,Da,Ca, and 1%,
125
respectively) determinations were carried out by Albright & Wilson Ltd. on solutions prepared as in section 2.51*
The analyses were performed on various muscles and juices asfollows:
SAMPLEThaw loss
Freshly cooked muscle
Cook-out juices
Rancid cooked muscle
ANALYSESTotal haem and P,Fe,Na,Ca, and Mg content of T1 to 6 and TJ1 to 6 .Lipid composition and fatty acid composition of the neutral lipid and phospholipid of pectoralis major muscles of Tl, 2 and 3, and Ul, 2 and 3*P,Fe,Na,Ca, and Mg content of pectoralis major muscles of Tl to 6 and Ul to 6, and of leg muscles of Tl to 6 and Ul to 6.TBA Numbers of pectoralis major of GIL, 2 and 3, and Ul, 2 and 3 , and of leg muscles of Tl to 6 and Ul to 6, after 2 and 6 weeks storage at -20 C, respectively.Fatty acid composition of total lipid, and P,Fe, Na,Ca, and Mg content of pectoralis major muscles Tl to 6 and Ul to 6, and of leg muscles Tl to 6 and Ul to 6.Lipid composition of pectoralis major muscles !EL to 6 and Ul to 6.Fatty acid composition of neutral lipid and phospholipid of pectoralis major muscles Tl, 2 and 3, and Ul, 2 and 3; and of total lipid of pectoralis major muscles T4, 5 and 6, and U4, 5 and 6.
5.71 UPTAKE OF CHILL WATERTable Xla shows that there was no significant difference in the
amount of chill water absorbed between treated and untreated chickens;although the mean value for treated chickens was lower than that foruntreated chickens. However, the mean values for the total number of 11
+ +treated and 11 untreated batch 0 chickens were, 4*8 - 1*0 and 6.2 - 1.2, respectively, and this difference was statistically significant. Also,the mean values for the total number of 12 treated and 12 untreated batch
+ +A chickens were, 3*0 - 1.0 and 5*2 - 2.5, respectively, and this difference was statistically significant. The chill water uptakes of batch i3 chickens were not known.
Uptake of chill water is governed by the conditions in the chill tank, and by the physical characteristics of the carcase (see section I.32)
126
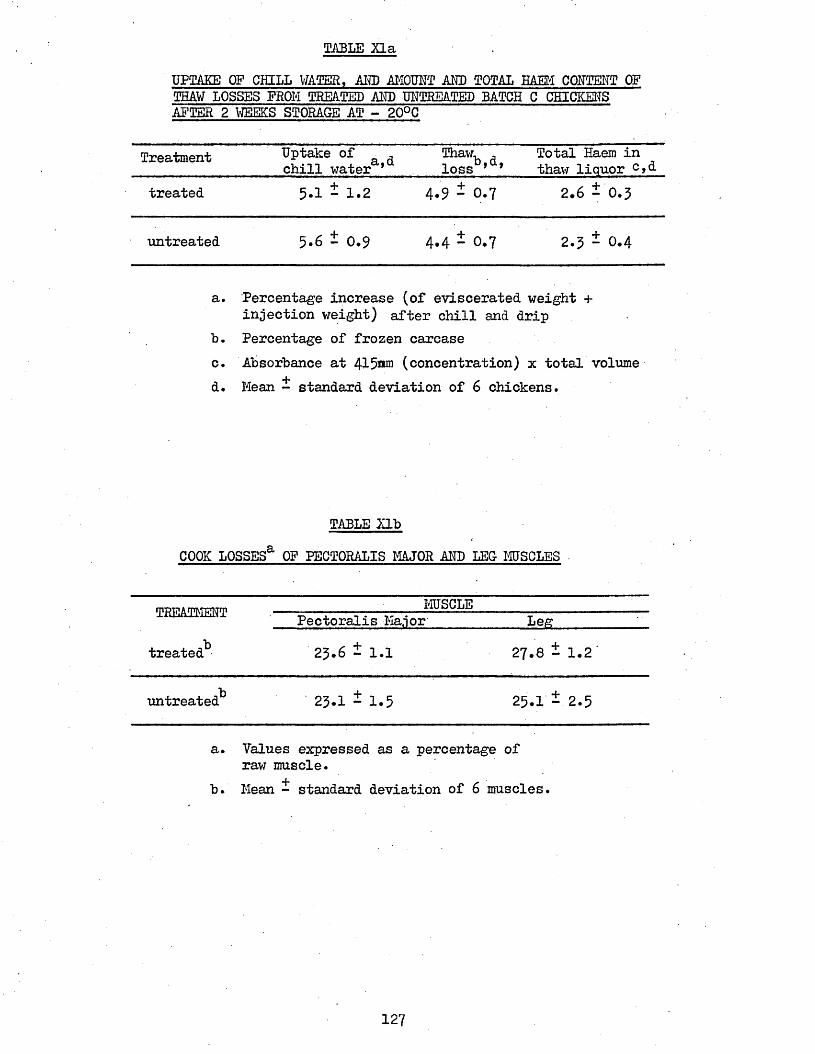
TABLE XlaUPTAKE OF CHILL WATER, AKD AMOUNT AND TOTAL H A M CONTENT OF THAW LOSSES FROM TREATED AMD UNTREATED BATCH C CHICKENS AFTER 2 WEEKS STORAGE AT - 20°C
Treatment Uptake of , ^ b . d , Total Haem inchill watera’ loss * * thaw liquor C><1
treated 5.1 £ 1.2 4.9 ± 0.7 2.6 £ 0.3
untreated 5.6 £ 0.9 4 .4 ± 0.7 2.3 £ 0.4
a. Percentage increase (of eviscerated weight + injection weight) after chill and drip
b. Percentage of frozen carcasec. Absorbance at 4 1 (concentration) x total volume
+ /*d. Mean - standard deviation of 6 chickens.
TABLE XlbCOOK LOSSES3, OF PECTORALIS MAJOR AKD LEG MUSCLES
__________ MUSCLE_______________Pectoralis Major _________Leg_____
2^.6 £ 1.1 27.8 ± 1.2 '
untreated*3 ' 23.I £ 1.5 25.I £ 2.5
a. Values expressed as a percentage of raw muscle.
b. Mean £ standard deviation of 6 muscles.
TREATMENTtreated13
127
Therefore, the differences in the levels of uptake between hatch C and and batch A chickens were to be expected. However, it could be significant that treated batch A chickens, which had absorbed less chill water than treated batch C chickens, had received a larger percentage injection than batch C chickens (the mean values were, 9*&fo and 5*1% respectively). There was no relationship, however, between the levels of injection and amount of chill water uptake for the batch A and batch C chickens separately. This may have been because there was little interchicken variation in injection levels for each of the separate batches of chickens.
18These results are in agreement with those of Grey et al, in that commercial polyphosphate injection has no consistent effect on the level of chill water uptake (see section 1,33)* However, their mean value for percentage chill water uptake of 1019 untreated chickens was 7*W°t of 957 treated chickens 7*6^. These 2 values are very similar to each other, but they seemed to have calculated them as:- weight after chilling -(eviscerated weight + injection weight) ▼ eviscerated weight only x 100; and not as in the present experiment:- 7 eviscerated weight + injection weight. Thus, their method of calculation gives higher treated values than would be obtained by the present method. The present results may be explained by considering the following:
V/ater taken Up during chilling is thought to accumulate between27the skin and tissue, and to only slowly diffuse into the muscle.
Presumably, therefore, only a certain amount of water may be readily absorbed during the 30 to 45 minutes that these chickens spent in the chill tank. The injected chickens already contain added water, some of which has, almost certainly, been absorbed by the subcutaneous tissue. Therefore, it is suggested that, polyphosphate injected chickens absorb less chill water than untreated chickens because the subcutaneous tissue, the major site of water accumulation, is partly hydrated. This theory
128
is supported by the fact that chickens from batch C which had received 5°Jo injections of water only, absorbed less chill water than uninjected chickens. In fact, their mean value (of 6 chickens) was which wasvery similar to the mean value of 4*8^ for polyphosphate injected chickens.
3.72 -AMOUNT M D TOTAL H A M CONTENT OF THAW LOSSESTable Xla shows that there was no significant difference in
the amount of thaw loss between treated and untreated chickens. Thiscontradicts the results shown in Table Va and the results of Van Hoof and
17Haelman, (see section 1.33)> where treated chickens were found to havereduced thaw losses compared to untreated chickens.. However, Grey et
18 21 al, and Truman and Dickes, found no significant difference in thawloss values between treated and untreated chickens, (see section 1.33)•
It is impossible to account for the differences between the present results and those from other sources, because the WHC of meat is subject to several factors (see section I.3I and 1.32).
Table Xla also shows that there was no significant difference in the total haem content of the thaw losses between treated and untreated chickens, although the mean value for treated chickens was greater than that for untreated chickens. In addition, both mean values were similar to that of untreated thaw losses from chickens after 47 months frozen storage (see section 3*62). However, these latter treated chickens lost more than twice as muGh total haem than the present treated chickens, which had been frozen for only 2 weeks. It would seem, therefore, that polyphosphate-induced denaturation of muscle proteins which leads to loss of haem compounds (see section 3*62) occurs during extended frozen storage but not during short-term storage.
Therefore, polyphosphate treatment was found to have no effect on either the amount of total haem content of thaw losses after shortterm frozen storage.
129
3*73 COOK LOSSESTable XTb shows that there was no significant difference in
cook loss between treated and untreated pectoralis major or leg muscles. These results correspond to those of section 3*51 (.Table lXa), where they are discussed with respect to the method of cooking.
3*74 LIPID COIiPOSITIOIT OF PECTORALIS MAJOR MJSCLESTable Xlc shows the total lipid, neutral lipid and phospho
lipid contents of treated and untreated pectoralis major muscles, when freshly cooked and rancid. It may be seen that there were no significant differences between treated and untreated muscles for any of the lipid fractions. Also, there were no consistent differences in individual muscles between the values for freshly cooked and rancid samples ( for example, not all rancid muscles had decreased lipid levels compared to freshly cooked muscles). ■
It may be seen that the lipid composition of these cooked pectoralis major muscles shows greater interchicken variation than that of raw muscles, as determined in section 3*21, Table Via, This was to be expected, since cook-out juices contain some lipid material (see section 3*754); and, also, loss of fluid on cooking will lead to variations in the ratio of lipid to wet muscle. Because of the effects of factors such as age, diet and storage time on the lipid composition of chicken muscles (see section 1*41) it was not possible to directly compare these results with those of raw muscles in section 3*2.
3.75 FATTY ACID COMPOSITION3.751 Freshly Cooked Pectoralis Hajor Muscles
Table Xld shows that the neutral lipid of freshly cooked T1 and T3 contained no C18:2 and very high levels of Cl6:0. However,018:2 was present in the neutral lipid of these rancid same muscles (Table Xlf), and also in the phospholipid fractions of both freshly cooked and rancid samples. This suggests that these anomalous results
130
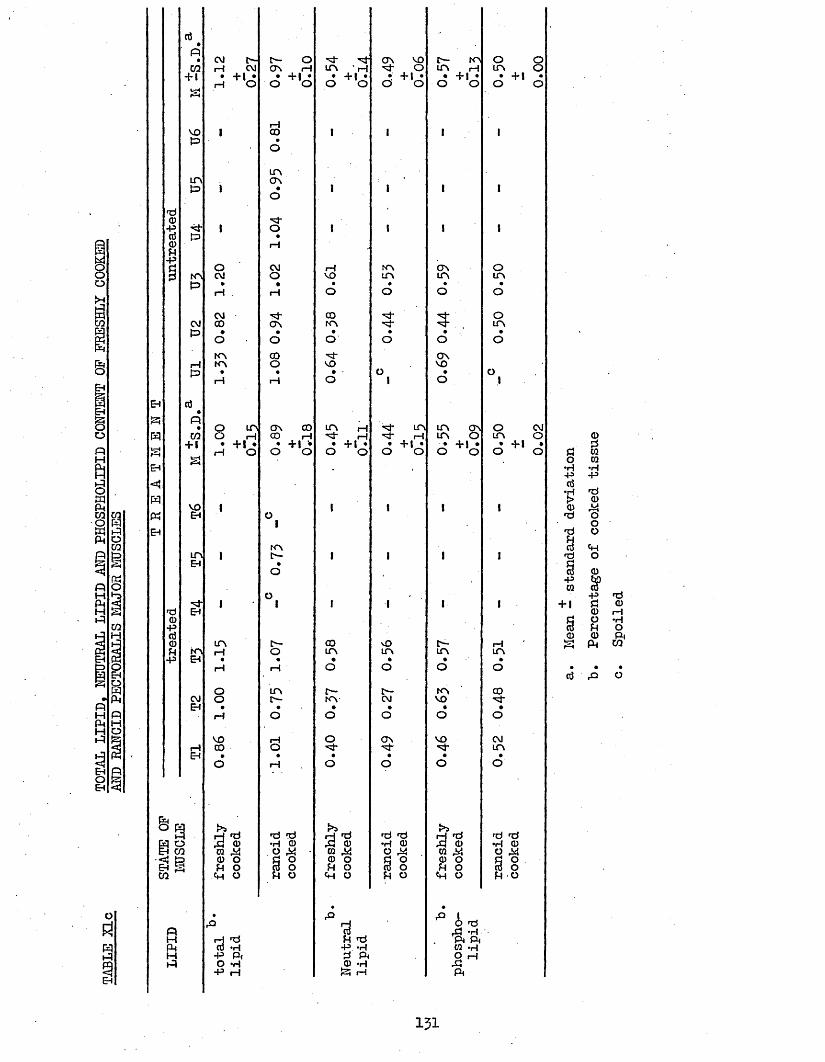
01pqP001BAPSo
0WP1
EHPHgEHg«
EH
p01
+ i
VOp
inP
P
KNP
*p • O in01 O rH
+1 • +1 •rH O
S
VOEH
inEH
EH
inEH
EH
O
001&
PHPHP
CM t^-rH CM• +1 •
rH O
OCM
CMCOinKN
in
OO
voco
H rd P a) w 0) o?H O Ch o
■ard •H
•P P O P
-P rH
£— O ON VO 0— m 0 0ON rH in ■ h M- O in rH in 0
* +1^ • +1 • • +1 • • +1 • • +1 •O O O 0 O O O O O O
rHCO 1 1 1 10
inON | | I |0 1 1 1 1
M-O 1 1 1 11—1
CM rH m ON OO VO in in in
• • • • •rH O O 0 O
■si" CO OON m . in
• • • • •O O O 0 OCD M* OnO VO vo• • - 0 • 0
rH O 1 O l
ON CO in rH ■'3' in in on O CMCD rH ^ rH rH in o j in 0 CD• + | • • +1 * • +1 . ^ +1 • • H-l • _ d
O O O O O O 0 0 O O d C20 ra•H *H-P +3CO•rH rd>■ CD
1 I l 1 Q) MO rd O
1 0rd Ofj
m ^ Cp1 1 1 1 rd O
• r|O CO CD
-p &)CQ CO
0 •P rd1 1 1 1 1 + 1 d CD
CD rHd O *HcO FH OCD CD P
c~- 00 MO C"- rH g P wO in in in in• • • • •
rH 0 O O O • • ♦
a b c
in c— m coC1— KN CM vo
• • • • •0 O O 0 O
1—1 O ON vo CM0 in• • • • •
rH O O 0 O
rd <dr**rH rd rd ^ H 'd rd rd
•H O P CD ♦H CD P CD •«H CD0 M tQ M 0 p . 01 M O M3 0 CD O § 0 CD O d oCO O H O cO O M O cO OH O p O U 0 «H O M O
• •P P i _
gO TO
P *HH TJ P P*P »H m »hd P O rHCD «H p
P rH p
151
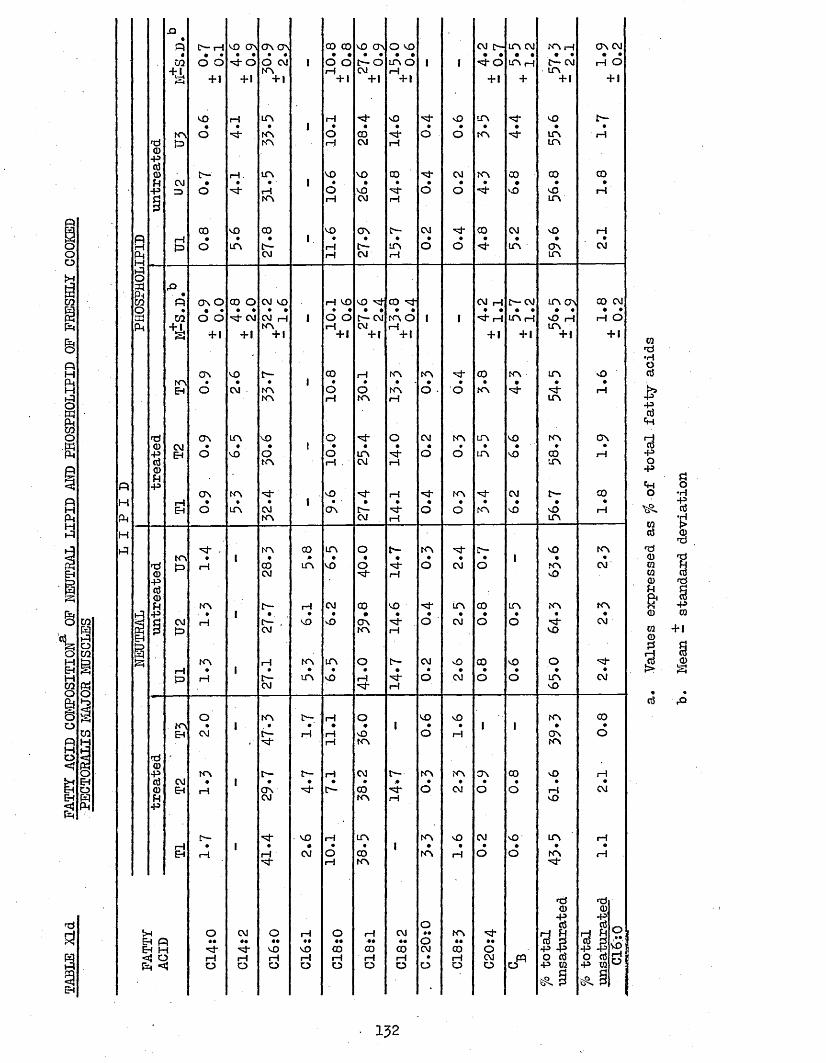
TABLE
XId
FATTY
ACID
COMPOSITION3, OF
MJTRAL LIP
ID AND PHOSPHOLIPID OF
FRESHLY
COOKED
PECTORALIS MAJ
OR MUSCLES
PH
H
S.3 - •n [ 1— 1 M2 ON O N ON CO CO M2 ON O M2 CM C— LO CM t O pH O N CM• • * • • • • • • • • • • • • • • • • • •02 0 0 O O CM I O O t— O LO O 1 1 ^ O LO pH £— CM rH O
+ 1 to pH CM rH. LOV-rl +1 + 1 + \ + 1 + 1 + 1 + 1 + + 1 + 1
M2 rH IO pH M2 M2 IO M2 t—• • • I • • • » • • • • •to O «3- to O CO ■'3* O O to L O pH
d p> to pH CM rH LO0-p/*♦TO0 t— pH . LO M2 M2 CO '3* CM t o CO CO COn CO • • • - 1 • • • • • • • • •-P O 'M* pH O M3 'M' O O -3- M2 M2 rH
to pH CM pH LO
CO M2 CO M2 ON c— CM CO CM M2 pHrH • • • 1 • • • • • • • • •{3 0 to C— H C— LO O O to O N CM
CM pH CM 1— 1 LO
•p ON O CO 0 CM M2 p H M2 M2 ^ CO CM pH C— CM LO CO 00 CM• • • • • • * ■ • • • • • • • • • • • - • • •
M 0.0 ^ CM CM pH 1 O O £— CM t o O 1 1 •'3* rH LO pH M2 pH pH O+ | to p H CM 1— I L O
+1 + 1. + 1 + 1 + 1 +1 + 1 + 1 + 1 + 1
ON M2 00 1— 1 to to ■'H* CO to LO M2fO • • • 1 • • • • # • • • •Eh 0 CM t o 0 O to O • O to -Sj- pH
to pH to rH I O
d ON IO M2 O O CM to LO M2 to ON0 CVI • • • I ■* • • • • • • • ••P EH O M2 O O IO O O LO M2 00 p Hd to p H . CM pH LO0FH-P ON to M2 pH to CM c— 00
iH • % • 1 • ' • • • • • • • •Eh O IO CM ON r— ■"=3* O 0 NO M2 M2 pH
to CM rH IO
^ - to 00 IO O t'- t o I>- M2 toto • I • 0 • • • • • • I • 9
d £3 pH CO LO M2 O O CM O to CM0 CM nr pH M2■pd0Fh to c— pH CM CO M2 “St* LO 00 LO to t o•p . • I • • • • • • • • • • •
CM H r— , M2 M2 ON O CM 0 O -3* CMCM to pH M2
to pH to LO 0 t— CM M2 00 M2 OrH • I • - • • # • t • • • • •P rH t— LO M2 pH O CM 0 O LO CM
CM pH M2
O to t - ’rH O M2 M2 to COto • 1 • • • • 1 • • 1 1 • •EH CM t— rH rH M2 O rH ON 0
rH to tord0-P to t— t— pH CM to to ON CO M2 rHd CM • I • • • • 0 • • • • • •0 EH pH ON ■4* C- CO O CM O O rH CMFH CM to rH M2-P
C~ M2 pH LO to M2 CM M2 LO 1— IrH • I • • • • I • • • • • •EH 1—I pH CM O CO to pH O O to 1— 1
"St" rH to 'M'
d d0 0•P +30 d d
-j O CM O rH O pH CM «• to *=3* OH P •• •• • • •• •• •• 0 •• • • d p d p **■H H M2 M2 CO CO co CM CO O •p -P 43 45SO3} O pH pH rH pH pH rH pH • pH CM pq 0 d 0 d Hr >*4 < O O O O O O O O O O 0 +» m -p to w
^ § ^ §
03d•HOd
♦po-p
o03dd003CO0n&0ra0 d1
o♦H%
0dd9d-P03+ 1
1^2

were due to experimental error, presumably during the methylation stage,since both of these methylation mixtures were black after reaction.Because of these 2 anomalous results, it was not possible to comparetreated and untreated neutral lipid results.
There were no significant differences in the fatty acidcomposition of phospholipid fractions between treated and untreatedmuscles; even when the inherent interchicken variations were partiallyallowed for by dividing the total amount of unsaturated fatty acids bythe amount of C16:0 (see section 3*22).
The phospholipids of both treated and untreated muscles werevery much richer in C20:4 and CL. than raw muscles after long-terma
frozen storage (see section 3*22, Table 71b). This suggests that autooxidation had proceeded to some extent during frozen storage of these raw muscles; although the amounts of total unsaturated fatty acids were similar for both these raw muscles and the present cooked muscles. It is important to note that only general comparisons may be made between these 2 sets of results because of the effects of diet, age, sex, and frozen storage time on the lipid and fatty acid levels (see section 1.41)*
There were no high correlation coefficients between the percentage neutral lipid and levels of Cl6:0, C18:2, and total unsaturated fatty acids, as was found for raw muscles (Table Tld). In fact, the C18:2 content of these muscles (except for T1 and T3) was very constant, unlike for the raw muscles, when C18:2 was found to vary more between muscles to a greater extent than any other fatty acids (Table 71b). In addition, each of the other fatty acids of both neutral lipid and phospholipid showed relatively small interchicken variations. This seems surprising in view of the differing oxidation levels, as determined by TBA Numbers (Table XLj). It would appear, therefore, thatA
only very small changes in fatty acid composition are required to cause measurable differences in TBA Number. Also, heat alone, may have been
133
expected to cause relatively large changes in fatty acid composition by increasing reaction rates. It therefore follows that relatively large interchicken variations would be expected in cooked muscles, because the raw muscle variations would be magnified on heating. However, other workers also have reported that cooking has very little measurable effect on the fatty acid composition of chicken muscles (see section 1*41)•
Table Xle shows the fatty acid composition of the total lipid of these muscles which were calculated from the known neutral lipid and phospholipid levels (in order to compare with the rancid muscle results, Table XLg, and the cook-out juice results, Table Xlh); but, again, there were no differences between treated and untreated muscles, when the anomalous results of T1 and T3 were taken into account.
3*752 Rancid Cooked Pectoralis Major MusclesTable Xlf shows that there was more C18:2 and a greater
percentage of total unsaturated fatty acids in the neutral lipid of rancid treated muscles compared with untreated muscles. The difference in total unsaturated fatty acids between treated and untreated muscles was statistically significant at the 95f° level, but the difference in CJ18;2 only approached significance. However, only a small number of muscles were tested. Y/hen the inherent interchicken differences were allowed for by comparing the amounts of total unsaturated fatty acids to the level of Cl6:0, each treated muscle was shown t o contain a greater percentage of unsaturated acids than either of the untreated muscles. However, this difference only approached significance.
That treated muscles contain more C18:2 and total unsaturated fatty acids than untreated muscles, would be expected since polyphosphates protect cooked muscles against autooxidation (see below
134
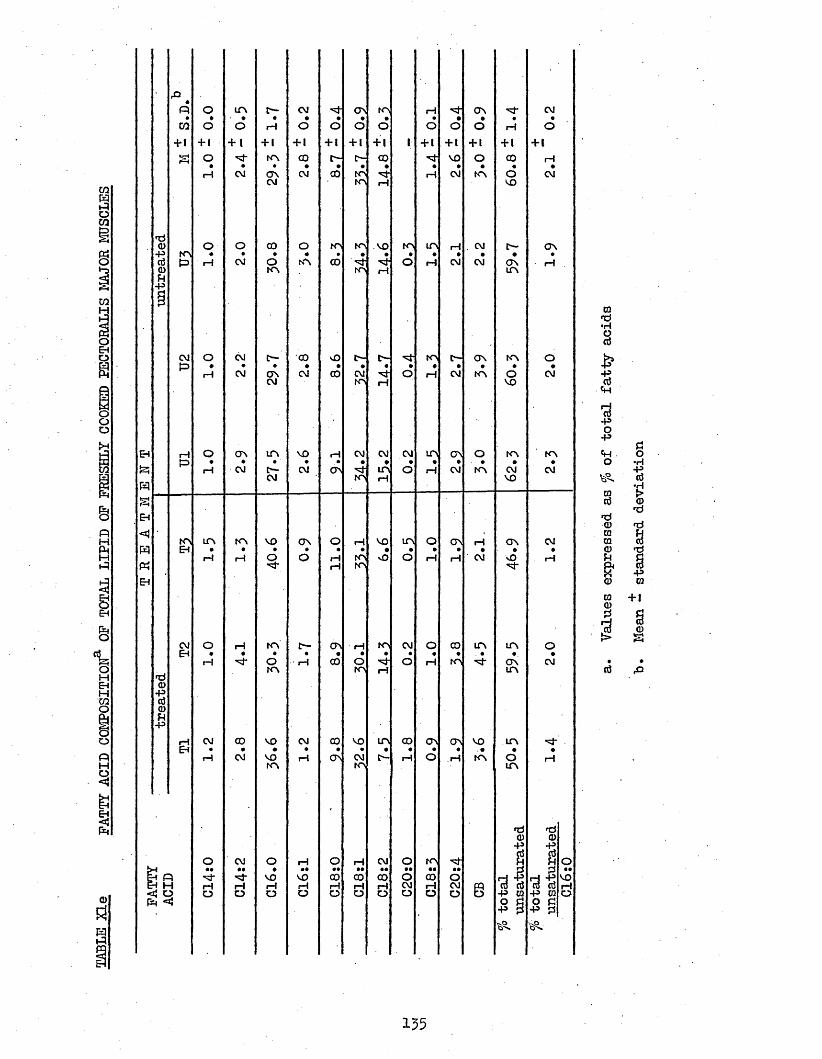
TABLE
XIe
FATTY ACI
D COMPOSITION
OF TOT
AL LIP
ID OF
FRESHLY
COOKED
PECTORALIS MAJ
OR MUSCLES
rQ•
Q O LTV £■— CM -St ON KN rH v f ON CM• • • • • • • • • • • » •
W O O rH O o O o O o o rH o+ 1 + 1 + 1 + 1 + 1 +1 + 1 +1 1 + 1 +1 +1 + 1 +1
s o KN CO C"- o - CO vo o CO 1—1• • • • • • • • • • • •
iH CM o \ CM CO K> -3- rH CM KN o CMCM KN rH vo
dCD O O CO O K> KN VO KN in i—1 CM c— ON
p KN • • • • • • • • • • • • •d P rH CM O t n CO o rH CM CM ON rHCDf i KN KN r—1 UNM
P
CM O CM C— GO vO C— c*~ KN C"- ON KN op • • • • • • • • • • • • •
H CM ON CM CO CM o rH CM KN o CMCM KN 1—1 v o
rH O c r\ m VO rH CM CM CM UN ON O KN KNp • • • • • • • • • • • • •
rH CM c— CM ON "3- in o rH CM KN CM CMCM KN H vo
KN UN k n v£> ON O rH v o in O ON rH ON CMtr» • • • • • • • - • • • • • •
rH rH o o rH KN vO o rH rH CM sO rH-3- rH KN
CM O rH k n [— ON rH KN CM O CO i n in oEH • • • • • • • • • • . • • •
H o •' 1—1 CO O o rH KN ON CMk n KN rH in
'uCD
PdCDH
p
rH CM CD v o CM CO v o in CO ON ON vo UNEH • • • • • • • • • • . • • •
rH CM v o r—1 ON CM c*- rH O rH KN o Hk n KN UN
'
d P<D 0
P P$ d
O CM O rH o rH CM o KN H U o• • • • • • • • • • • • • • • • • • • d d • •h n "si* vo VO CO CO CO o CO O rH -g r-J P vo
H H rH rH rH rH rH rH rH CM rH CM IP to d d d rHJj Q O O o O O U O O O U P P CQ P CQ OC <1} o d o dp 3 p ps
03•d•HOd
"5
Pop«H ■ OCOd
•d<D03CQ<Du»CD03CD3
d
do•HPd
CD rdd
P03
+ 1
135
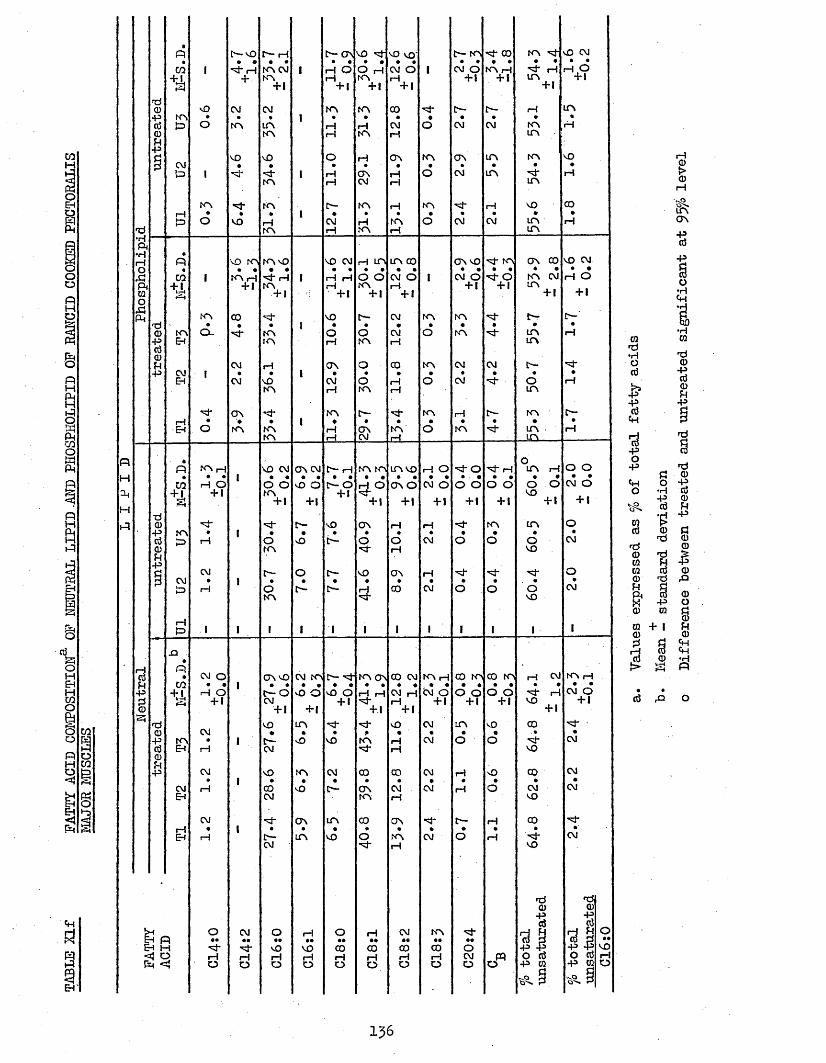
TABLE
Xlf
FATTY
ACID
COMPOSITION
OF NEUTRAL
LIPID
-AND
PHOSPHOLIPID OF
RANCID
COO
KED PECTORALIS
MAJOR
MUSCLES
ft*Hft•HrHOftftCQOftft
ftH
H
ft
ftm
+ .1
k nft
m + 1
KNEh
ftm
%
KNft
ft«
C/2
KNEh
Eh ft Eh H <J O ft <3
M2
O
KN
o
KN
O -
o
K N H • •
rH O + i
CM
CM O • ' •
H O + 1CM
CM
CM
O
t>-M 2
rH + •
CM
k n
M2
**1*VO
M2 k n • •
KN rH + 1CO
OsKN
CM••
rHO
KN CM KN + 1CM
LTNKN
M2
*3-KN
K n
rHKN
KN M2 • •rH
KN + 1
KNf<~N
M2KN
KNKN
M2 CM • •o o
KN + 1
OKN
OKN
ON M2 • •t~oCM+ 1M2
r ~CM
M2
t -CM
M2rHO
ON CM • •
M2 O
+ 1C—
M2
O
t—
CM KN • •M2 O
+ 1LfN
•M2
KN•
M2
ON•LfN
M2rHO
C— ON • •
rH Oi—1+ 1KN
•rHrH
M2 • •
O rH KN + 1KN
M2 CM
+ 1M2•OrH
ON
KN
t— «H • •0-0 + 1M2
• •M2 O
+ 1
M2
CM
LfN
M2
O••COrHO
M2 vo • •CM O
H + l
CO
rHKN
ONCM
KN
HKN
rH LfN • •o o
KN + 1
oKN
O«o
KN
ONCM
KN KN • •
+ 1
ON
O
M2
KN ON
4 -+ i
KN
CO
ONKN
CO«
O
COrHO
ON
KNrH
LfN 00 • •
CM O rH
+ !
CM•
CMrH
CO
KNjd L
LfN M2 • •
ON O
+ 1rH
orH
ON•
CO
CO CM
CM H rH
+ 1
M2•
rHrH
co
ON
KNrH
CM••
COi—Io
KN
KN
o
KN
oKN
oKN
rH O • •
CM O
+ 1
rH ■ •CM
rH•
CM
KN rH • •
CM O + 1
CM
KN••
COrHO
C*~ KN • •
CM O + 1
CM
ON♦
CM
-=3-
CM
ON M2 • •
CM O + 1
KN
KN
i—I KN
" 3 -0 • ■ •o o+ 1
-st-
o
O
CO KNO O
+ 1
LfN
OCMO
*vt* CO • •
KN rH + 1
CM
LfN
LfN
KN • ♦
"Stf* O + 1
CM
^ rH • •o o+ 1
KN
o
CO KN
o o + 1
.fto
KN • •
rHLfN
+ 1
KNLfN
M2 CM • •
H O + 1
LfN
KN
LfN
M2
LfNLfN
M2
CO
ON CO • •
KN CM LfN + 1
LfNLfN
OLfN
KN
LfNJjCl.
LfN rH
O M2 + 1ITN
•OM2
OM2
rH CM • •
*3- HM2 + 1CO . ♦■St-M2
CO
CMM2
COH i-M2
ft<1>
"8
M2 CM • •
rH O
+ 1
rH
O O • •
CM O
+ 1O
CM
O•
CM
KN rH • •
CM O + 1•‘3*CM
CM•
CM
•'CM
f t l02
■3 jJ-P -P O cti *P CQ
M2rHO
CQft•HC2<£-P-P
ft■3-po•p
fto
CQCtf
ftd)CQCQ02R
02
CQ02
Id ft
136
Mean
- standard deviation
Difference between
treated
and untreated
significant
at 95
7° l
evel
for TBA Numbers). From these results it is clear that C18j2 is the only individual fatty acid which shows measurable changes due to autooxidation (and also due to diet), see section 3*23)* Despite the presence of fatty acids which are more unsaturated, and therefore more susceptible to autooxidation than C18:2, it is suggested that C18:2 is the only acid which shows measurable differences because it is present in larger amounts than the other unsaturated fatty acids.
The TBA Numbers of treated freshly cooked muscles after 2 weeks storage at -20°C, were much lower than those of untreated muscles (Table XIj) and it may therefore be assumed that this difference would have been even larger between rancid treated and untreated muscles. Therefore, it appears that only very small changes in fatty acids produce large differences in TBA Numbers, (see also section 3*751)*
No consistent differences in the fatty acid composition of thephospholipid fractions between treated and untreated, muscles wereapparent. This was surprising because phospholipids would be expectedto be more susceptible to autooxidation than neutral lipids, because oftheir increased polyunsaturated fatty acid content. Therefore, differencesbetween treated and untreated muscles, due to differences in the degree ofautooxidation, would be expected. Previous results have suggested thatphospholipids are protected against autooxidation in raw muscles by theirclose association with muscle proteins (see section 3*26). However, heatwould be expected to break this association, and therefore expose thephospholipids to oxygen. However, phospholipids contain much greateramounts of C20:4 and CL than neutral lipids, and these acids will undergo±>autooxidation more rapidly than the other unsaturated fatty acids. Since there is less than of C20:4 and Gg present in phospholipids, their determination is subject to relatively large experimental error, and this could have obscured any differences between treated and untreated muscles. In fact, the mean amounts of C20:4 and (L in treated muscles were higher than those in "untreated muscles. Comparison of these levels, and the
levels of total unsaturated fatty acids, with Cl6:0 failed to show any statistically significant differences between treated and untreated muscles. Only these values for total unsaturated fatty acids are given in Table Xlf because the values for C20:4 ancl. Cg were very small, and subject to relatively large experimental errors as discussed above.
Table Xlg shows the fatty acid composition of the total lipid of rancid cooked muscles. The values for Tl, 2, 3 and Ul, 2, 3> were calculated from the known levels of neutral lipid and phospholipid (Table Xlc); and the values for T4,5>6 and H4,5>6 were determined directly on the total lipid. There were no consistent differences between treated and untreated muscles, although the mean values for C18:2, C20:4 and Cg were higher for treated muscles. Also, the mean value for the amount of total unsaturated fatty acids was greater for treated muscles, when the interchicken variability was partially overcome by dividing the levels by the amount of C16:0, but not when this was not taken into account.
3*753 Comparison Between Freshly Cooked and Rancid Muscles.By comparing Tables Xld and Xlf it is seen that the greatest
changes in the fatty acids of neutral lipid between freshly cooked and rancid muscles occurred for 018:2, which decreased with rancidity.However, because comparisons for Tl and T3 were not possible (because no C18j2 was detected in these freshly cooked muscles), no statistical weight could be given to these observations.
The greatest changes in the fatty acids of phospholipid between fresh and rancid muscles, occurred for C20:4 and Cg, but there were no consistent differences between treated and untreated samples; although the mean loss for treated muscles was less than that for untreated muscles. That treated muscles lose lower amounts of unsaturated fatty acids on becoming rancid, is to be expected from the TBA Numbers (Table Xlj). However, once again it may be seen that large
138
differences in TBA Numbers are caused by only slight changes in fatty acid composition. In addition, all rancid phospholipid fractions contained lower amounts of C18:2 and total unsaturated fatty acids than the freshly cooked fractions. The mean difference for the treated muscles was lower than for the untreated muscles, hut this difference was not statistically significant.
By comparing Tables Xle and Xlg it is seen that the differences in fatty acid composition of the total lipid of Tl,2,3 and TJ1,2,3 between freshly cooked and rancid muscles showed the same general trends as those for the neutral lipid and phospholipid fractions.
3.754 Cook-out Juices.Table Xlh shows the fatty acid composition of the cook-out
juices of pectoralis major muscles, and it may be seen that there were relatively large interchicken variations for each of the fatty acids. There were no consistent differences between treated and untreated samples, although the mean levels of individual and total amounts of unsaturated fatty acids were greater for treated samples.
There were no consistent relationships between these results and those of the cooked muscles, i.e. large amounts of an acid in a particular cook-out juice, did not always correspond to low amounts of this acid in the cooked muscle. However,t it was not possible to make comparisons because, for instance, a low level of an acid in the cook- out juice does not necessarily mean that the cooked muscle had retained a high level of this acid.
Table Xli shows the fatty acid composition of the cook-out juices from leg muscles. There were relatively large interchicken variations, as for the pectoralis major samples. However, in this case the mean unsaturated fatty acid values for treated samples were not higher than those for the untreated samples. This corresponds to the fact that no added phosphate is present in the leg muscles from treated
159
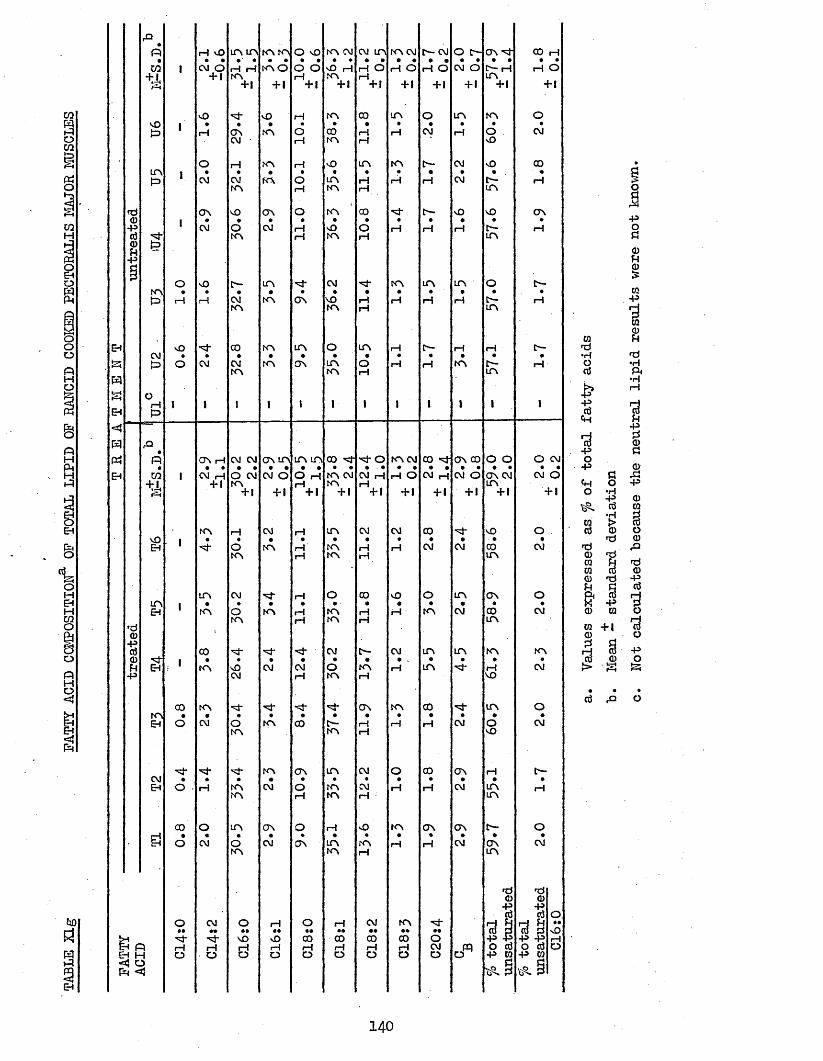
TABLE
Xlg
FATTY
ACID
COMPOSITION3, OP
TOTAL
LIPID
OF RAN
CID COO
KED PECTORALIS MAJ
OR MUSCLES
ehPWEh*=3H«EH
£
rO •n•CO+J.
1rH nO • •CM O +1
in in •' •rH rH KN + 1
KN KN • •KN O+ 1
10.0
±
0.6 KN CM • •
nO rH KN + 1 11
.2. ±
Q_.5
_._-.
KN CM • •<—1 O+ 1 +
x-7
-
0.2 O f- • •
CM O+ 1
ON 3 • •C 1—! UN + 1
CO rH • •rH O+ 1
VOP 1nO•1—1
3*•ONCM
nO•KN
rH•OrH
KN•00KN
00•rHrH
UN•rH
0•CM
UN•rH
KN•OM0
O•CM
inP IO•CM
1—1 •CMKN
KNKN
1—! •OrH
nO•UNKN
UN•rHrH
KN•rH
t--«rH
CM•CM
vO•c—UN
CO•1—1
'ntP1
ONCM
NO•OKN
ON•CM
O•rHrH
KN•vOKN
CO•0rH
3•rH
f-•rH
NO•rH
nO«t— UN
ON•rH
KNPO•1—1
nO•rH
C— •CMKN
in•KN
3ON
CM•NOKN
3•rHrH
KN•1—1
UN•H
UN•H
O•C— UN
t>-•rH
COp
sO*O
•nj-•CM
CO•CMKN
KN•KN
in•ON
O•UNKN
UN•OrH
rH•rH
£— •1—1
rH•KN
rH•l>-UN
C— •H
0rHP 1 1 t 1 I 1 1 1 I 1 1 1
P •n•w 1
ON rH • •CM rH + 1
CM CM • •O CM KN + 1
on in • •CM O+ 1
in in • •0 1—1H +l
00 3 • •KN CM KN + 1
-=3- O • . •CM rH rH+ 1
KN CM • •rH O+ 1
00 3 • •CM rH+ 1
ON 00 • •CM O+ 1
O O • •ON CM UN + 1
O CM • •CM O+ 1
nQE< 1
KN•*3"
H•OKN
CM•KN
rH•rHrH
UN•KNKN
CM•rHH
CM•1—1
CO•CM
3•CM
NO ■ •COUN
O•CM
mEH 1
in•KN
CM•OKN
•KN
rH•rHrH
O • •KNKN
00«rHrH
M0•rH
O•KN
UN.CM
ON•COUN
O•CM
S , 1CO•KN
"3-.nOCM
•CM
3•CMrH
CM•OKN
C—.KNrH
CM • .1—1
UN•UN
UN•3
KN•1—1NO
KNCM
tnEH
00•0
KN•CM*vi-•OKN
3-•KN
3•CO
3•r—KNON•rHrH
KN•rH
00•H
3•CM
UN•ONO
O•CM
CMEH
"St*•O •
■3*•rH
*3*•KNKN
KN•CM
ON•O1—1
UN•rnKN
CM•CMrH
O•rH
CO•rH
ON•CM
rH•UNUN
C— •rH
£CO ' •0
O•CM
in•0KN
ON•CM
O•ON
1—1 •inKN
sO•KNrH
KN•rH
ON•rH
ON•CM
C— •ONUN
O•CM
HJ>3J
0••■'3*rHO
CM■nj-rHO
O••NOd
H••vO1—1O
O«•COrHO
1—1 ••COrHO
CM••00rHO
KN••00 1—1 0
3••OCMO
rd<d-p
■si-p -p0 a-P CQ
pj
nd<1)*Pc6 O rH Fh *• 03 d mo
-P -P rH O id O -P CQ
03*d•rHOctf
£-pnJ■d*Po-p A o•H -poCQnj (D
ndnd<D nd
9idCQ CQ <DI '$CD CQ
CQ + | ® _
5 §f> sc3 f i O
140
Not calculated because
the neutral
lip
id results
were
not known.

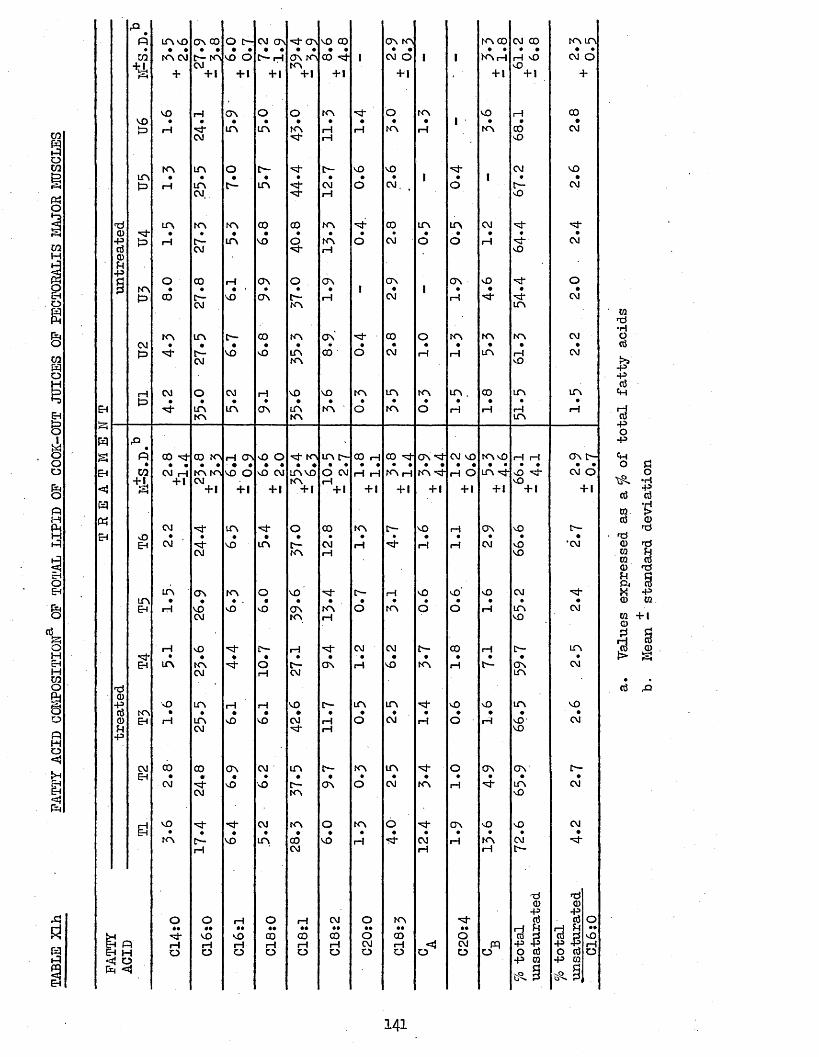
9
,0 •PI in^o ON co O C— CM ON ON vo CO ON KN KN 00 CM 00 KN UN• • • • • • • • • • • • • • • • • • • • •CO mcvi t— kn VO O t— rH ON KN CO 1 CM O 1 1 KN rH rH vO CM O+ 1 CM KN vO£ + +l + 1 + 1 + 1 +1 + 1 + 1 +1 +
VO rH ON O O KN O KN vO rH COvo • • • • • • • • • 1 • • •P> rH in UN KN rH rH KN rH KN CO CM
CM -**• 1—1 vO
kn in O ■st* C- vo VO CM VOin • • • • • • • • 1 • 1 • •1—1 in t— UN <- CM O CM, O t- CM
CM, «H vO
d in KN KN CO CO KN 00 UN in CM -3*CD *rf • • • • • • • • • • • • ••P i3 rH t UN VO O KN O CM O 0 rH ''3* CMd CM rH vO014•P O CO rH ON O ON ON ON vO 'M- Ort kn • • • ■ • • • 1 • 1 • • • •- £> CO c— VO ON t- rH CM rH CM
CM KN UN
k n in E— CO KN ON '•'sh CO O KN KN KN CMCM • • • • • • • • • • • • •}=> t— VO vO in CO O CM rH rH UN 1—1 CM
CM KN vO
rH CM O CM rH vO VO KN UN KN UN , CO UN UNto • • • • • • • • • • • • •
t- in UN ON UN KN O KN O rH rH rH rHKN KN UN
rd •PI CO -rj-CO KN rH ON vO O ■<4- KN UN t>- CO rH 00 ON CM VO KN vO rH rH ON t>-• • • • • ■ • * • • • • • • • • • • • • • • • • • • • •CO CM rH KN KN VO O vO CM UN VO O CM rH rH KN rH KN *>f rH O UN •>3-vO CM O-f 1 + 1 CM KN rH vO
+ 1 +1 + 1 + 1 + 1 + 1 + 1 + 1 + 1 + 1 +1 + 1
CM ■3 - UN O CO KN t— VO rH ON vO t—VO • • • • • • • • • • • • •EH CM VO UN t— CM rH ■'3- rH rH CM vO ‘CM
CM KN rH VO
in ON KN O vo’ C— 1—1 VO vO vO CM <*3-in • • • . • • • • • • • • • •EH rH VO O vO ON KN O KN O O rH UN CM
CM KN rH VO
1—1 vO "3- C- 1—1 CM CM t— CO rH t— UN-sf- • • • • • • - • • • • • • •EH in KN O t— ON rH VO KN rH t- ON CM
CM rH CM inrdCD-P vO UN rH rH VO C— UN UN -si* VO vO in VOo5 kn • • • • • • • • • • • • •O EH 1—i UN vO vO CM 1—1 O CM rH O rH vO' CM
CM rH VO•P
CM CO CO ON CM UN C— KN in O ON ON C—EH • m • • • • • • • • • • •
CM -3- vO VO t— ON O CM KN H UN CMCM KN vO
rH VO ■vtf- CM KN O KN O *■3- ON vO vO CMEH • • • • • - • • • • • • • •
kn C— vo UN CO VO rH CM rH KN CMH CM rH rH
•d d<D CD-P -pO O rH O rH CM O KN $ cd O«• •• •• •• •• •• •• •• •• rH ^ ••
VO vO CO CO CO O CO O CD p vO^ PI rH rH rH 1—1 rH rH CM 1—1 <4 CM pq -P -P -P -P rHM H O O O 0 O O O 0 O O O O CtS 0 d O3 0 -P CQ -P CQci «al d 0 P
2
CQd•HOOJ-P-Po3.■3•po-pO P O •H•Pctf ci
Idd CD rd•s 5CQ CD CD rd
14 P ft KCD
-PCQ .CQ + 1 CD
■§ ^ I £c3
141

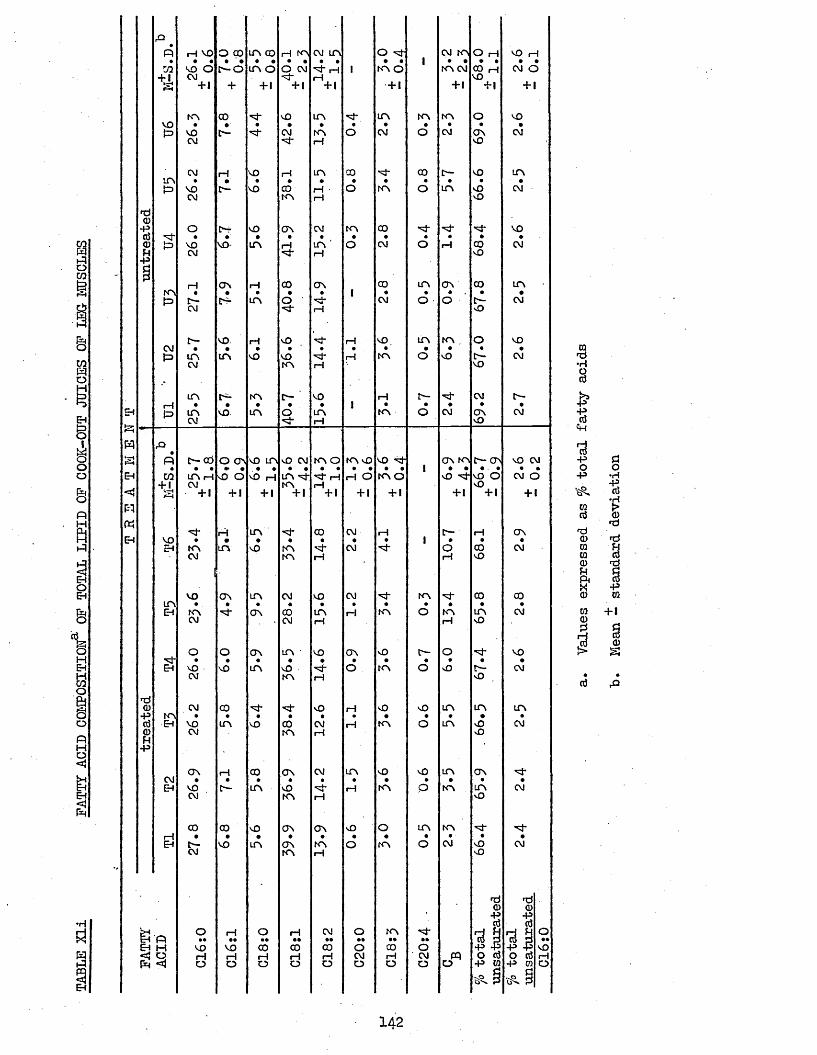
TABLE
XLi
FATTY
ACID
COMPOSITION3, OF
TOTAL
LIPID OF
COOK-OUT JUICES OF
LEG MUSCLES
•ft 1—1 VO O CO in co H KN CM in O CM KN O rH f t rH• • • • • • • • • • • • • 1 • • • • • •M VO O t> -o in 0 O CM ■St* rH 1 KN O KN CM CO rH CM O
+ 1 CM 1—1 f ts + 1 + + l + 1 + 1 + 1 + 1 + 1 + 1
KN CO sj- f t in ■"4* in KN KN O VOM3 • • • • « • • • • •f t VO "sf CM KN O CM O CM ON CM
CM "Sj- 1—I f t
CM rH vo H in 00 "st- CO C"— f t inin • • • • • • • • • • •f t VO C— vo CO rH ■ O KN O in f t CM
CM KN rH f t
fda>-p O t*T f t ON CM KN 00 -St- "st* VOd ■si* • • • • • • • ft • • •<D ft VO vo- in 1—1 in ' O CM O rH CO CMh CM rH f t•P
H ON rH CO ON co in ON CO inkn • • • • • 1 • ft • • •f t t— C*~ in 0 •st- CM O • O t— CM
C\J ■si- H f t
t— VD H f t rH f t , in KN , 0 f tCM • • • • • • • • • ft •f t LfN LfN f t f t "3* rH KN O f t t*- CM
CM KN rH f t
LfN t— KN r - VO rH f - -sj- CM C'-rH • • • • • 1 • • • • •f t ITN VO in 0 in KN O CM ON CM
CM "si rH f t
ft •ft C— 00 O ONf t in f t CM KN O KN f t f t ON KN £— ON f t CM• • • » • . • • • • • • • • • • 1 • • • . • • ft
CO IfN rH f t O f t rH in -vt" "'Si* rH 1—1 O KN O f t "sj- VO O CM O+ 1 CM KN rH f tv—1 f—1 + 1 + 1 + 1 + 1 + 1 + 1 + 1 + 1 + 1 + 1
"st* rH in ■sj- CO CM rH O- rH ONM3 • • - • • • • • 1 • • •cH KN in f t KN "Sj* CM •sf O CO CM
CM KN rH rH f t
vo ON in CM f t CM "Sj- KN ■si- CO COin • • • • • • • • • • •EH KN ■st- ON CO in rH KN O KN in CM
CM CM 1—1 H f t
O 0 ON in f t ON f t t— O •sj- f t•si- • • • • • • • • ft • •EH VO f t in f t "sf- O KN O ft t— CM
CM KN rH f t
*d<D CM CO ■st- f t rH f t f t in in in•P KN • • • • • • • • • • •aj EH VO in f t CO CM rH KN O in ft CM<D CM KN rH ftU-P •
o \ rH CO ON CM in f t f t in ON •sj*CM • • • • • • • ft • • •EH VO t— in f t "si* rH KN P KN in CM
CM KN rH f t
CO CO f t ON ON ft O in KN ■St* "Sj*rH • • • • • • • • •' ' • •EH c— f t in ON KN O KN O CM ft CM
CM KN rH ft
nd TiCD CD' •P -Pd ClJ
O rH 0 H CM O KN ■St- d 3 0Ec ft •• •• •ft •• •• •• •• ft* d p CO p •ftEj H VO f t CO CO CO O CO 0 -P -P -p -p f t<| 0 rH 1—1 rH rH rH CM rH CM W O ClJ 0 c3 rH
O 0 O O O O O O O -P CQ-P CQOfj a^ 3 P
CQ<d•H§£•P
•3•po
-p
wciJ'Pa>CQCQ<DUftK0CQCD21CtJ
011»d*d:S■d-pCQ
+ 1CD
142
chickens (Table Xlp), and that there are no differences in the TBA Numbers between treated and untreated leg muscles (Table Xlj).
It is difficult to account for these large interchicken variations in the fatty acid composition of cook-out juices. However, the results show that large amounts of and were sometimes present in the cook-out juices, and it is assumed that these arose from the phospholipid fraction:;:, which is richer in these acids than the neutral lipid (although both raw and cooked muscles contained only very small amounts of and its level has not been given in this experiment, or in section 3*2)• Therefore, it would seem that protein denaturation during heating, which would result in the cleavage of any phospholipid- protein associations, plays an important part in determining the amount and types of fatty acids lost during cooking.
3.76 TBA NUMBERSTable XIj shows that, as expected, the TBA Numbers of cooked
treated pectoralis major muscles were significantly lower than those of untreated muscles; indicating that polyphosphates inhibit autooxidation in cooked muscles. There was no significant difference between treated and untreated leg muscles, confirming previous results (section 3*521, Table IXb).
The TBA Numbers of untreated pectoralis major muscles were very much higher than those of untreated muscles after 18 weeks frozen storage during holding for 0 days at 4°c -(Table Villa).
Also, the TBA Numbers of the treated and untreated leg muscles were similar to those of these 18 week muscles after holding for 3 days at 4°C (Table Villa). However, it must be remembered that the present freshly cooked pectoralis major and leg muscles had been stored at -18°C for 2 and 6 weeks respectively, prior to TBA analysis, and were thawed for approximately l-£ hours before testing. Therefore, these higher TBA Numbers were probably a consequence of autooxidation during this thawing
145
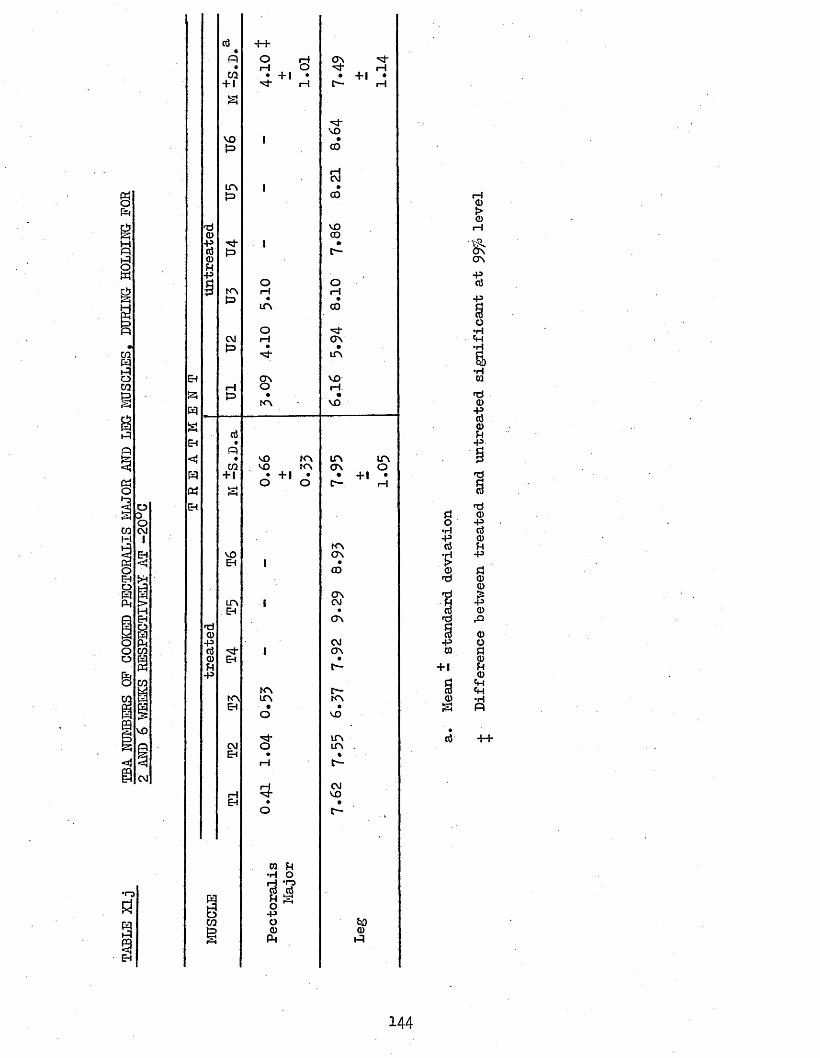
TABLE
Xlj
TBA NUMBERS
OF COO
KED PECTORALIS MAJ
OR AND
LEG MUSCLES, DUR
ING- HOLDING
FOR
2 AND 6 WEE
KS RESPECTIVELY AT
-2Q°C
' '
++ONi—1 rH
+ 1 rH rH
■sj-vo
vo
LfN
•P
rH
VOrH
ON
inON+ 1
inON
ONcviON
ON
VO
in
rH<D > <D i—I'ftON
*5-p§o•H
•H
6•HCQ
<D"§<1>H-P
d0•H-p£<d'd1'd-p03
+1<uS
*d0)-pcj0)fHP>d<D(1)45<D&<DOdCDfH<DtH«H
3++
144
period, since TBA lumbers of cooked untreated muscles have been found to increase rapidly during holding. Since, cooked treated muscles are protected against oxidation, then it is not surprising that the TBA Numbers of the present treated muscles and those of chickens after 18 weeks of frozen storage were similar.
3.77 CORRELATION COEFFICIENTS BETWEEN T B A NUMBERS M D F A T T Y ACID LEVELS OP PECTORALIS MAJOR MJSCLES.
The TBA tests were performed on freshly cooked pectoralis major muscles after 2 weeks storage at -20°C. However, the TBA Numbers of both treated and untreated pectoralis major muscles were found in a previous experiment to have changed by only a small extent during 3 months storage at -18°C, section 3*522, Table IXe). Therefore, it was thought that it was valid to compare the present TBA Numbers with the fatty acid levels of the freshly cooked muscles. Also, it was thought that useful trends would be revealed by comparing these TBA Numbers with
the fatty acid levels, of the rancid cooked muscles. However, it must be remembered that TBA Numbers fluctuate inconsistently during the course of autooxidation (see for example Table lXb), and therefore, these correlations will only be approximate.
The correlation coefficients for treated and untreated muscles were calculated separately because their TBA Numbers were significantly different.
3*771 Freshly Cooked MusclesTable Xlk shows that the highest coefficients were obtained
between TBA Numbers and the levels of total unsaturated fatty acids and C20:4 of the phospholipids, for both treated and untreated muscles. It should be noted that the numerical values of the coefficients for total unsaturated fatty acids divided by the levels of Cl6:0 (which helps to account for inherent interchicken variations, see section 3.22), were lower than those for the levels of total unsaturated fatty acids alone,
145
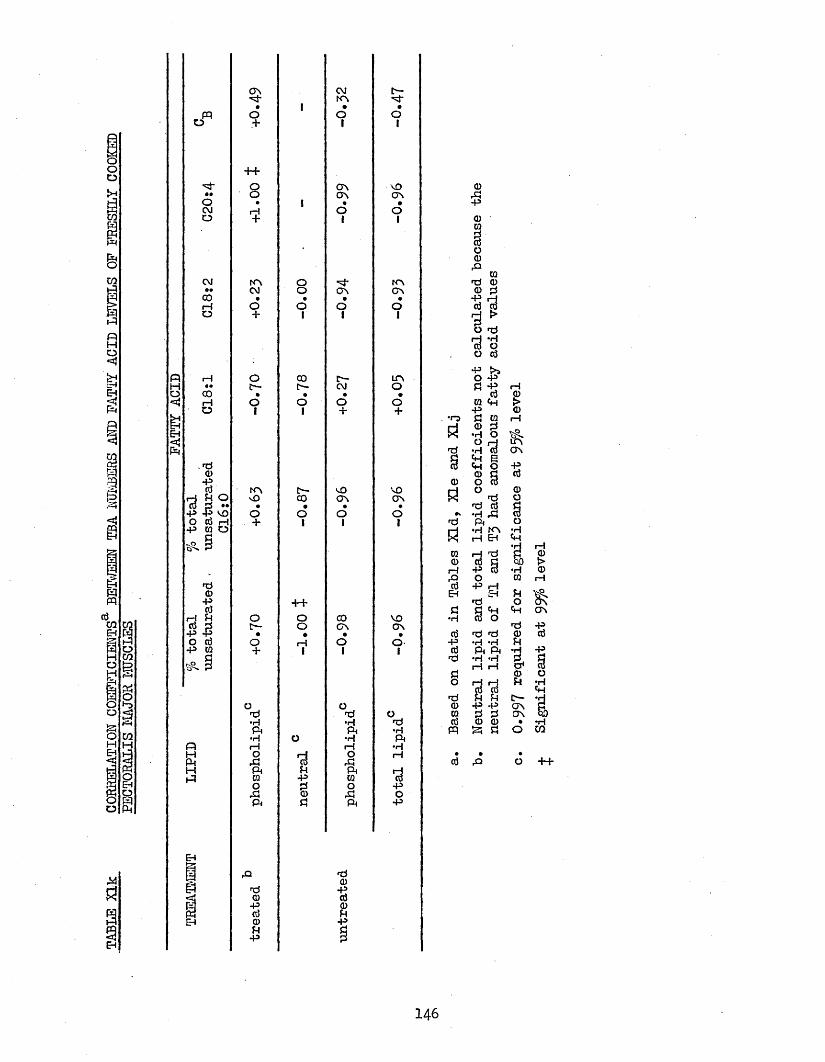
TABLE
XLk
CORRELATION
COEFFICIENTS
BETWEEN
TBA TOBEHS AHB FATTT
ACID
LEVELS OF
FRESHLY
COOKED
PECTORALIS MAJOR
MUSCLES
ON CM IPKN 'St-• 1 • •
f t O o OO + I 1
P f
"st* Q ON MO• • o ON ONO • 1 • •CM rH o oO + 1 1
CM K \ o ■vj- k n• • CM o ON ON
CO • • • •rH O o o oO + 1 1 1
f t rH o CO inH • • c— r - CM oO co • • • •*3$ rH o o O o
O i 1 + +
uEM<r|f t
. nd©
Pd _ KN p f t vo
■3 8 2f t
•00
•ON
•ON
•P P vo o o o oO tfi H + 1 I 1p to o
ur
©P + +d
rH ft o o 00 vo*5 P t — o ON ONP P • • • •o d o 1—1 o oP TO + 1 1 1
§
o o•ft *d o•H •H ndf t f t •H•H o •H f t
f t rH rH •HH O r j O Hf t f t JO f tH f t f t f t r-}f t TO p TO CO
O ft O Pf t © f t Of t f t f t P
EM
f t
e nd©
p© d[Vj P ©
S d ftEM © p
ft dP
3
•a
1<1>•s
CQ©rH
■3EM
ft•H
dP©fto©©dm© ft
'd <d *H *H f t f t
•H 'H rH rH
++
146
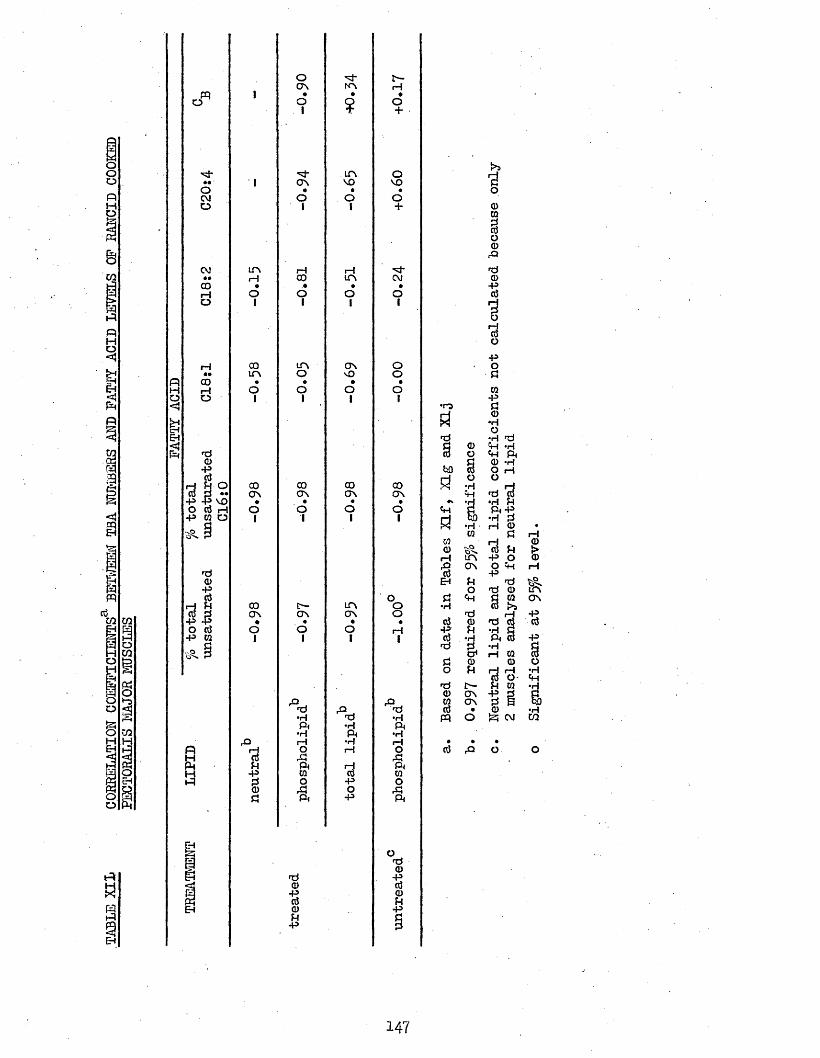
TABLE
XIL
CORRELATION
COEm
CIEN
TS
BETWEEN
TBA BOMBERS
AMB PAT
TY ACI
D LEVELS OF
RANCI
D COOKED
PECTORALIS MAJ
OR MUSCLES
O r—ON NN rHft 1 • • •
O o Q O1 T +
UN O«•' 1 ON VO voo • • •CM o o oO 1 1 +
CO LT\ rH 1—1•• i—1 CO UN CMCD • .• • •i—1 o o o oo 1 1 1 1
H CO UN ON o•• un O vO of t CD • • • •H rH O o o oO O 1 1 I 1<
uEH<5ft do*PofCu
d B O CD CO CO 00d p •• ON ON ON ON-p -p vo ♦ • • ' •O (j rl O o o o•P W O 1 1 1 1
sfc. §
d0-po5 o
d y CO t— UN oCD 3 CT\ ON ON o■p -p • • • •o cD o o o rH•p w 1 1 1 1Vi’"* P
ft_. f td ft_ d•H d •rHPi •H f t•H f t •H
f t i—1 •H rHf tH ■3
Of t
rH OftPM JH Pi rH PiH -P W CD W
ft pJ O *P O0 ft O ftPJ f t -P ft
t3 o0 d
n d0-p0 o3|rl •p 02 ci3 fH
tH 0 -PU*P
fd C— <D ON W CTN
C\3 f t
147
■but were still relatively high. The coefficient for C20:4 o f the phospholipids of treated muscles was statistically significant, and this value for the untreated muscles approached significance, as did their value for the total amount of unsaturated fatty acids. However, all the coefficients, except for 018:1, for treated muscles were positive, and those for untreated muscles, negative, except for C18:l.
One would expect negative coefficients between TBA Numbers and the levels of unsaturated fatty acids, i.e. as the amount of unsaturated .fatty acid decreases due to auto oxidation, then the TBA Number should increase. It appears therefore, that this is the case for untreated muscles, but not for treated. The TBA number (Table XLj) showed that autooxidation had proceeded to a much greater extent in untreated compared to treated muscles. Therefore, since it appears that it is not possible to detect changes in fatty acids during the early stages of autooxidation, (sections 3*751* 3*752 and 3*753)> it is perhaps not surprising that the fatty acids of treated muscles were not negatively correlated with their TBA Numbers. The converse is true, of course, for untreated muscles where autooxidation had proceeded.
However, it could also be the case that, if high amounts of unsaturated fatty acids are lost in the cook-out juices, then this would leave lower amounts of autooxidation-susceptible fatty acids in the cooked muscles. This would result in low TBA Numbers due to reduced autooxidation. In this case therefore, positive correlation coefficients would be expected between TBA Numbers and the levels of unsaturated fatty acids in the cooked muscles. Therefore, because positive correlation coefficients were, found for treated muscles it could mean that polyphosphates lead to a greater amount of unsaturated acids being lost during cooking. However, the fatty acid results for the total lipid of freshly cooked muscles (Table Xle) and the cook-out juices (Table Xlh) did not show this, although it must be remembered that the fatty acid composition of freshly cooked Tl and T3 could not be compared with the cook-out juice
148
results (see section 3*751)* Y/hen the total percentage of unsaturatedfatty acids divided by C16:0 for the total lipid of rancid cookedmuscles (Table Xlg) were compared with these levels in the cook-outjuices, it was seen that the treated muscles lost 2.2, 1.0 and 0.6^,and the untreated muscles 0.5 and during cooking. However, thesevalues do not necessarily mean that lower amounts of unsaturated fatty acids were lost from, untreated muscles compared to treated, since the levels of unsaturated acids in rancid muscles will have been affected by autooxidation. These points are further discussed in section 3*773*
The coefficients for the neutral lipids of treated muscles were not calculated because of the anomalous fatty acid values which were obtained for Tl and T3* All of these coefficients for untreated muscles, however, were negative. The coefficients for C20:4 and. Cg were not calculated because only trace amounts of these acids were present. The coefficient for the level of total unsaturated fatty acids was statistically significant, and approached significance when divided by Cl6:0.
The coefficients for the total lipid fatty acids of untreated muscles showed the same general trends as for the neutral lipid and phospholipid fatty acids, with the values for the levels of total unsaturated fatty acids alone and divided by CI6:0, and for C18:2 and 020:4* approaching significance.
3*772 Rancid Cooked MusclesTable X2L shows that all of the correlation coefficients
between TBA Numbers and the fatty acid levels of the neutral lipid and phospholipid of treated muscles were negativej and approached significance in the case of all but C18:l and C18:2. The fact that high negative coefficients were found indicates that as autooxidation proceeds, then the TBA Numbers may be correlated with decrease of unsaturated fatty acids. This bears out the discussion above for freshly cooked muscles,
where the TBA Numbers of treated muscles were, not negatively correlated with fatty acids, presumably because the decrease in fatty acids during the early stages of autooxidation are too small to produce statistically significant trends. However, this discussion also suggested that TBA Numbers were positively correlated with fatty acid levels in freshly cooked treated muscles, because polyphosphates may cause a greater amount of unsaturated' fatty acids to be lost on cooking. If this were the case, however, then negative correlations in the rancid muscles would still be expected since the unsaturated fatty acids remaining in the cooked muscles would have undergone considerable oxidation during the course of rancidity.
The correlation coefficients for the total lipid fatty acids of treated muscles showed the same general trends as those for neutral lipid and phospholipid acids, except for Cg where a small positive correlation was found.
For untreated muscles, only the correlation coefficients between TBA Numbers and the fatty acids of phospholipids were calculated. This was because only 2 of these muscles were analysed for neutral lipid fatty acids, and it is not possible to correlate 2 sets of results. As with the freshly cooked untreated muscles, there were high negative correlations between TBA Numbers and the levels of total unsaturated fatty acids alone and when divided by C16:0. In fact, this coefficient for the total unsaturated fatty acids was statistically significant. However, positive correlations were obtained for C20:4 and C , but the numerical value of these were relatively small.
The 18- carbon fatty acids of neutral lipid and the 20 plus polyunsaturated fatty acids of phospholipids, were found to be the most important indicators of auto oxidation, as they were for the raw muscles (see section 3*25)*
It should be remembered that these coefficients were calculated between rancid muscle fatty acid levels and the TBA Numbers of the freshly
150
rauscxes. it is tberefore not possible to arrive at definite conclusions from these results. This point is discussed in the introductory paragraph (section 3*77).
All of the coefficients for both freshly cooked and rancid cooked muscles, were numerically higher than those obtained for raw muscles (Table Vld)• This again indicates that during the early stages of autooxidation, as was the case for the raw muscles, then the changes in fatty acids are too small to produce the expected correlations between their levels and TBA Numbers.
3.773 Cook-Out JuicesTable Xlm shows the correlation coefficients between TBA
Numbers and the fatty acids of the total lipid of the cook-out juices of pectoralis major muscles. It is difficult to discuss these results in detail because of the large interchicken variations in the fatty acid composition (Table Xlh), and also, of course, the TBA tests wereperformed on the cooked muscles and not on the cook-out juices.However, it may be significant that the correlation coefficients for the total percentage of unsaturated fatty acids alone, and when divided by Cl6:0, were negative for treated samples and positive for untreated samples. This suggests that, low TBA Numbers in the cooked treated muscles are a result of high levels of unsaturated fatty acids in the treated cook-out juices, and vice versa for the untreated samples. Therefore, the discussions in sections 3-771 and 3*772 seem valid i.e. that polyphosphates lead to greater amounts of unsaturated fatty acids being lost during cooking, which reduces the autooxidation in these freshly cooked muscles leading to low TBA Numbers. ■
Table Xln shows the correlation coefficients between TBA Numbersand the fatty acids of the total lipid of the cook-out juices of leg muscles. In this case, since there was no statistically significant difference in the TBA Numbers between treated and untreated muscles,
151
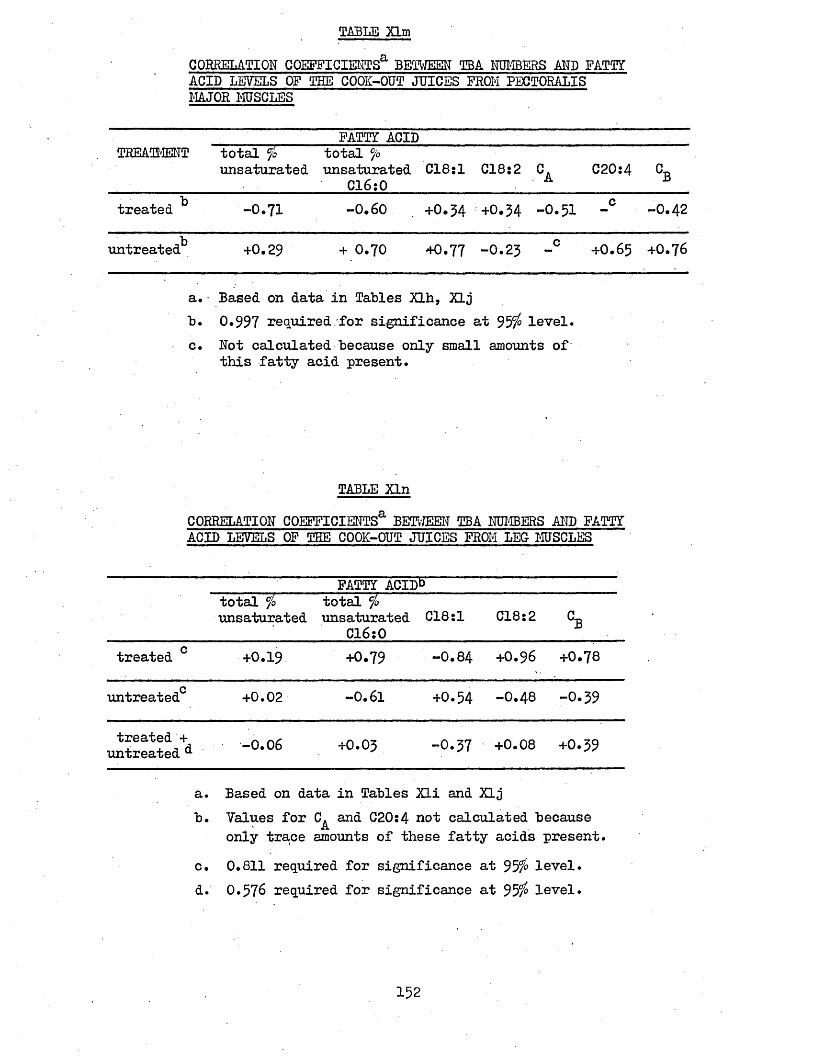
TABLE XLmCORRELATION COEFFICIENTS3, BETWEEN' TBA NUMBERS AND FATTYACID LEVELS OF THE COOK-OUT JUICES FROM PECTORALIS MAJOR MUSCLES
FATTY ACIDTREATMENT total %
unsaturatedtotal °/o unsaturated
C16:0C18:l C18:2 CA C20:4 °B
treated ^ -0.71 -0.60 +O.54 +0.54 -0.51 J O -0.42
untreated^ +0.29 + 0.70 +0.77 -0.25 c +0.65 +0.76
a. Based on data in Tables Xlh, Xljb. 0.997 . required .-for significance at 95$ level.c. Not calculated because only small amounts of
this fatty acid present.
TABLE XlnCORRELATION COEFFICIENTS3, BETWEEN TBA NUMBERS AND FATTY ACID LEVELS OF THE COOK-OUT JUICES FROM LEG MUSCLES
FATTY ACID&total $ unsaturated
total $ unsaturated
C16:0C18:l C18:2 CB
treated c +0.19 +0.79 -0.84 +0.96 +0*78
untreated0 +0.02 -0.61 +0.54 -O.48 -O.59
treated + untreated -0.06 +0.05 -0.57 +0.08 +0.59
a. Based on data in Tables Xli and XIjb. Values for C^ and C20:4 not calculated because
only tra,ce amounts of these fatty acids present.c. 0.811 required for significance at 95$ level.d. 0.576 required for significance at 95$ level.
152
the coefficients were calculated for treated and untreated muscles together, as well as separately. The correlation values for the total percentage of unsaturated fatty acids divided by Cl6;0 approached significance for both treated and untreated samples separately.However, the treated value was positive, and the untreated value, negative. For treated and untreated together, a very small positive value was obtained. The coefficients for the other fatty acids of treated and untreated samples separately, were also of opposite signs.It is difficult to account for these differences between treated and untreated results, especially since the signs of both sets of coefficients were opposite to those obtained for the cook-out juices of pectoralis major muscles. Since the leg muscles from treated chickens were found to contain no added phosphorus or sodium (Table Xlp) and to have similar TBA Numbers to the leg muscles from untreated chickens (Table XIj) it may have been expected that these correlations between TBA Numbers and fatty acids would be identical for both treated and untreated samples. It can only be assumed that the large interchicken variations in the cook-out juice fatty acids (Table Xli) resulted in unequal distribution of the results between the 2 sets of samples. Unfortunately, the fatty acid composition of the freshly cooked and rancid leg muscles were not determined, and so these correlation coefficients could not be compared with the present ones.
J.78 CORRELATION COEFFICIENTS BETWEEN TBA NUMBERS AND LIPID LEVELS OF PECTORALIS MAJOR MUSCLES
Table Xlo shows the correlation coefficients between TBA Numbersand the lipid levels of both freshly cooked and rancid treated anduntreated pectoralis major muscles. The coefficients between TBA Numbersand the total lipid and phospholipid levels of untreated muscles were of
138the same sign as those obtained by Wilson et al (see Table Vlg for values)*
153
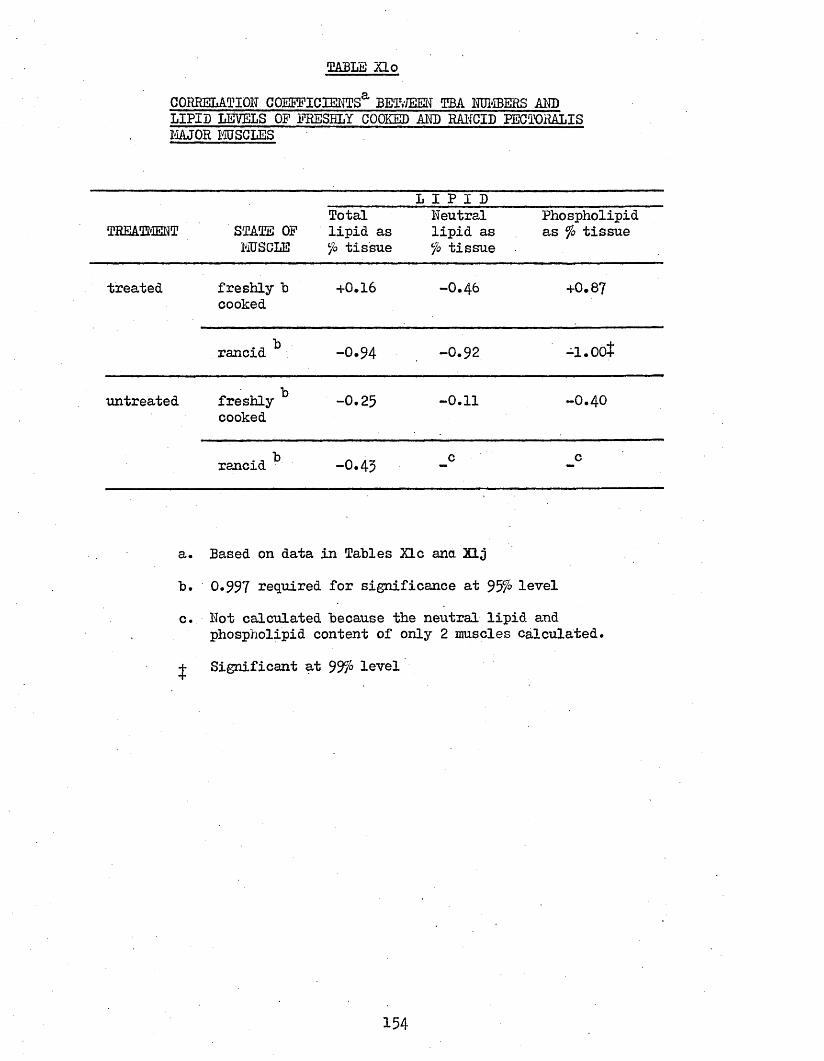
TABLE Xlo
CORRELATION COEFFICIENTS3, BE1V/EM TBA NUMBERS ANDLIPID LEVELS OF FRESHLY COOKED AND RANCID PECTORALIS MAJOR MUSCLES
L I P I DTREATMENT STATS OF
MUSCLETotal lipid as vjo tissue
Neutral lipid as c/'o tissue
Phospholipid as fo tissue
treated freshly b cooked
+0.16 -0.4b +0.87
rancid b -0.94 -0.92 -l.oot
untreated freshly cooked
-0.25 -0.11 -0.40
rancid -0.45 _c c
a. Based on data in Tables XLc ana 22jb. 0.997 required for significance at 957° levelc. Not calculated because the neutral lipid and
phospholipid content of only 2 muscles calculated.•j- Significant at 99?° level
The coefficient between TBA Numbers and the phospholipid content (fo of tissue) of freshly cooked treated muscles was positive and approached significance, whilst that for untreated muscles was negative and relatively small. That this coefficient for treated muscles was positive, indicates that phospholipids .play the major role in autooxidation of freshly cooked muscles, compared with the finding that neutral lipids play the major role in both treated and untreated raw muscle autooxidation (section 5*26). Two points arise from these findings. First, that there is a difference between treated and untreated cooked muscle autooxidation, and second that there is a difference between raw and cooked muscle autooxidation.
This first point seems to indicate that polyphosphates react in some way with phospholipids, which was also suggested by the results obtained from raw muscles in section 5*26. However, there was no significant difference in the phospholipid content of treated and untreated cooked muscles, unlike for the raw muscles, when the treated muscles contained significantly less phospholipid than the untreated muscles, (Table Via). However, the mean value for the treated cooked muscles was lower than that for the untreated cooked muscles. This evidence for polyphosphate interaction with phospholipids which leads to changes in the TBA Numbers of both raw and cooked muscles, is tenuous, being based entirely on statistically insignificant correlations between TBA Numbers and phospholipids (see also the discussion in section 3*26). Also, of course, any interaction between phospholipids and polyphosphates would be expected to shield the phospholipids against auotoxidation, and it is surprising, therefore, that as the phospholipid content of treated cooked muscles increases, then so do the TBA Numbers. However, it must be remembered that these positive correlations also indicate that phospholipids play a major role in cooked tissue autooxidation (presumably because any phospholipid-protein associations which prevent phospholipids undergoing
155
autooxidation in raw tissues, are destroyed during cooking, thus exposing phospholipids to oxygen; see section 3*26). This fact will undoubtedly overshadow any decrease, in autooxidation of treated cooked tissue due to phospholipid-polyphosphate associations. Also, of course, any phospholipid-polyphosphate associations will also be expected to have been destroyed by heat.
This discussion only serves to illustrate the difficulty in interpreting any correlation coefficients when more than 2 variables are operating. It is important to stress at this point that correlation coefficients only serve to indicate trends, and in themselves do not provide experimental evidence, but may be used to support results from independent experiments (see for example, Neville and Kennedy*1*^).
For rancid cooked muscles, a statistically significant negative correlation was obtained between TBA Numbers and the phospholipid content of treated muscles. The'correlations for total lipid and neutral lipid were also negative and approached significance. These correlations between the TBA Numbers and neutral .lipid and phospholipid contents of untreated muscles were not calculated because only 2 of these muscles were analysed for these lipid fractions. The untreated value for the total lipid was also negative, however. This indicates that increasing TBA Numbers are associated with decreasing lipid levels in rancid cooked muscles.
It must be remembered that these correlations were between the TBA Numbers of freshly cooked muscles and the lipid levels of rancid cooked muscles. Since TBA Numbers have been found to fluctuate inconsistently during autooxidation, these coefficients may be subject to error (see also, section 3*77)* Nevertheless, from these coefficients, it appears that as autooxidation proceeds, high TBA Numbers are associated with low levels of total lipid, neutral lipid and phospholipid.
156
However, these lipid levels varied inconsistently between freshly cooked and rancid muscles, i.e. not all rancid muscles had lower lipid levels than the freshly cooked muscles (Table Xlc).
' By comparing the results of freshly cooked'and rancid muscles, it appears that during the 5 day storage period, TBA Numbers change from being dependent on the phospholipid levels, to being independent of any one lipid fraction. This is presumably because lipases are active during this storage period. Therefore, the rancid lipid levels will be partially determined by the extent of enzymatic breakdown, and will not be a reflection of the oxidative status of the muscle only.Also, of course, during the later stages of autooxidation, the unsaturated fatty acids of neutral lipid would be expected to have oxidised, as v/ell as the highly susceptible fatty acids of phospholipids.
3.79 IONIC COMPOSITIONThere is a paucity of information on the ionic composition of
chicken tissues, especially after polyphosphate treatment. . The figures of Ad a m s , w h i c h are quoted in Tables Xlp and Xlq for phosphorus, sodium, calcium and iron, were calculated from literature values obtained from a variety of sources for composite samples of light meat and dark meat from chickens cooked by roasting. No values are available from broilers which were steamed as in the present work-.
3*791 Phosphorus and Sodium , Table Xlp shows the phosphorus and sodium contents of all thaw
losses, muscles and their cook-out juices. The values for untreated pectoralis major and leg muscles were of the same order as thos-e calculated by Adains,^^ for composite samples of light meat and dark meat. These values are given in this Table.
The phosphorus contents of pectoralis major muscles were similar to those of batch B chickens (see Table Vlllb), but higher values were obtained for both treated and untreated leg muscles in the present
157
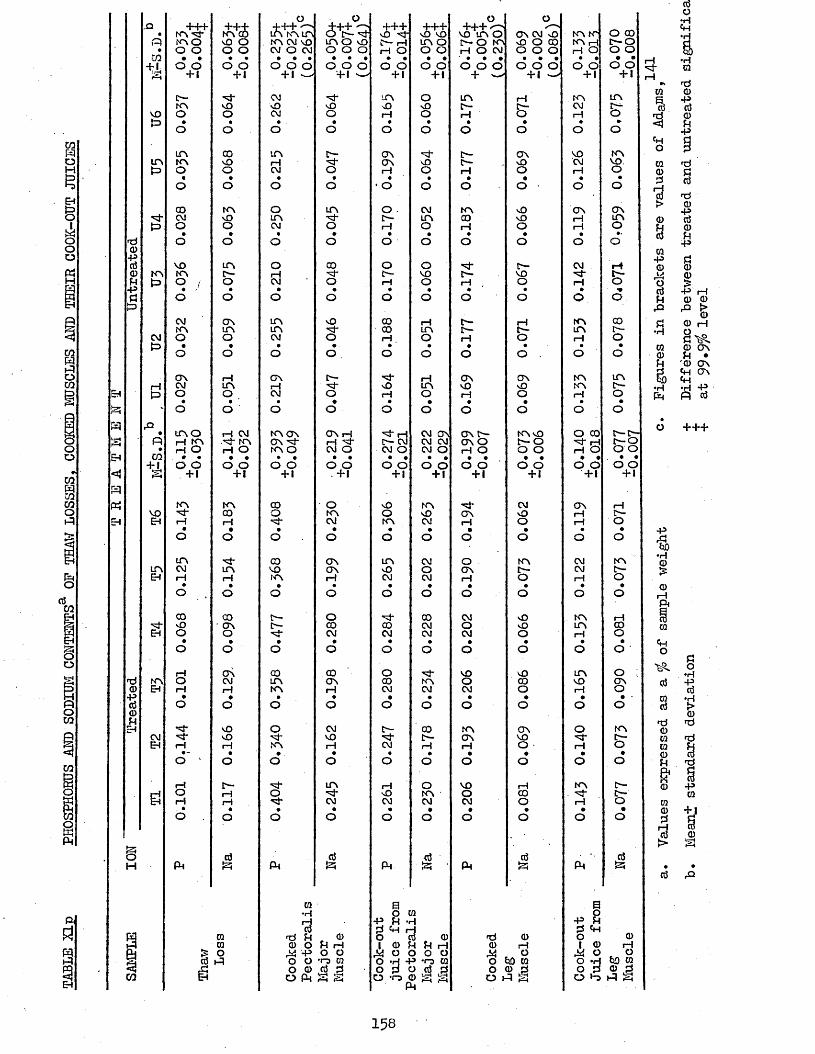
TABLE
Xlp
PHOSPHORUS AM)
SODIUM
CONTENTS
OF THA
W LOSSES,
COOKED
MUSCLES
AND THE
IR COOK-OUT JUICES
d0)©PH-P§
EHPHIs—IEH
m
£H
d0Id0u
Ul
VOP
inft
•'3-ft
mft
CMP
rHP
ftCOtlp«
voEH
inEH
g-
mEH
CMEH
gH
m m o o o • •o o +1C—mo•oinmO
ooCMO
vomo
CMmo
o nCMO
tno H mrH O • •o o +1m•<3-rH
inCMrH
COM3o
HOrH
OoI—1
ft
&+<iM3 Oo o * •o o +1-3-voooCOM3o
mM3o
inr-o
ONinooi—iino
rH CMm rH O • •O O + !mcoo■<-int—I
00ONO
ONCMrH
M3M0rH
C— rH rH
&ft
oi01£ o cd ft
a
o+++ '-H in m in m CM mo cm o CM • • • o o o +1 -
CMvoCM
inrHCM•O
omCM
Oi—I CM
ininCM
ON i—i CM
m o \ONm o
• •o o +100o*3-
00VOmor—o00inm
Ovj-m
o
ft
oi n o mo o o o • • •o o o •H —
M3O
O
ino
GO'vl*OoM3
O
C—oo
Eds • •O O . +1
omCM
ONONrH
OCOCM
00ONH
CMVO
inCMO
£ft
01 •rHd Ph 0 O
id -P o o° ^ O P S
0Ph «—iO C3O 01I
O C3+++ +++ ++H- /■—>M3 •<3- M3 M3 vo i n o ON CM M3 m fo O 00C— rH in o f - O KN M3 O 00 KN rH C— OrH O o o rH O CM O O O H O o o• • • ♦ ■ • • • • • • • • • •o o o o o o o o o o o o o o+1 +1 + ^ +1 + 1 +1m o in rH KN inMO M3 c— r— CM r^ -rH o rH o rH o
• • • • • »O o o o O oON t - ON VO KNON M3 c— M3 CM vo.i—1 O i—i O i—1 O• • • • • •• o o o o O oo . CM m M3 ON ONr— in GO M3 i—I inH o rH O rH o• • • • • ♦*O o O O o oo o c— CM rHC— vo c— vo E—rH o 1—1 o rH O• • • • • ■9o o o o o oCO rH r— rH KN 00CO m f- C— in t"-rH o rH o i—i o• • • • • •o O o o . o o
rH ON ON KN inMO in M3 M3 KN r—rH O rH O rH o• • • • • •o o O O O o^ rH CM ON ON t"- KN M3 O CO i— r —■C— CM CM CM ON O n - o ^ rH c— oCM O CM O rH O o o rH O o o• • • • • • • • • • • •o o o o o o o o o o o o+1 +1 +1 +1 +1 +i
M3 m CM ON 1—1O MO ON M3 rH f'-wm CM rH O rH o• • • • • •o o O o O oin CM o KN CM KNM3 O ON n- CM D—CM CM i—1 o rH O
• • • • • •O o o o O o•'3* CO CM M3 KN rH00 CM O M3 in 00CM CM CM O rH o
• • • • • •o o o O o oo vo M3 in o00 m O CO M3 ONCM CM CM O rH O
• • • • • • ■o O O o o oC— 00 m ON o KNON VO fc-CM 1—1 rH o rH O• • • • • •O o o o O oi—1 o VO rH KN t"-M3 m o 00 . C"CM CM CM O r—1 o• • • • • •O o O o o o
cd cd cdf t P f t P f t p
a aO 01 o-P PH •<H •P PHP ft rH p f to cd 0 d 0 o 01 0 PH Ph h 0 i—1 1 0 I—1id o 0 O C3 id O id O oO *H -P *0 01 O QD 01 O *H fclO wo p C3 cd p O 0 P o p 0 Po -o 0 S S O P S o d P Sft
rH01
%.
ft001 0 310u01•P0•§cdPHft.a010U&pd
Ul0
g
0 0 ■“ t,0 H0 ON PH •
' 0 ON f t ON ft•H -P ft Cd
+++
-pft ho •H Q) £0i—ip
ft0cd01 td
CJo•HId0
d
dd 0 01 01 0PH d
S* |0 -P 01
+.1
158

experiment compared to the previous analyses.As expected, the treated pectoralis major muscles contained
significantly more phosphorus and sodium than the untreated muscles.This was true also of the treated thaw losses and the pectoralis major cook-out juices. This indicates that sodium polyphosphates, which are injected into the breast muscles, result in increased levels of both ions in the cooked pectoralis major muscles and their cook-out juices.In addition, treated chickens lose more of both these ions on thawing, than untreated chickens.
The treated leg muscles contained significantly more phosphorusthan the untreated muscles. The actual numerical difference, however,was small, and also there was no significant difference in TBA Numbers between treated and untreated leg muscles (see Table Xlj); and very small phosphorus uptake has been reported to decrease TBA Numbers (see section 1.43)* Also, there was no significant difference in phosphorus content between treated and untreated cook-out juices from leg muscles. These points suggest that the difference in phosphorus content between treated and untreated leg muscles was only statistically significant because the interchicken variation was very small. Also, previous results (Table Vlllb) showed that there were no statistically significant differences in phosphorus content between treated and untreated raw or cooked leg muscles (see also section 3*42).
There was no significant difference in the sodium content between treated and untreated leg muscles, although the mean value for treated muscles was higher than that for untreated muscles.
The results presented here and in Table Vlllb conclusively showthat very little, if any, added phosphorus and sodium is present in theleg muscle of chicken treated with sodium polyphosphate by injection into the breast muscles of the eviscerated carcase; despite claims that even distribution is achieved by this procedure (see section 1.2). The only other results of this nature which have been found in the literature
159
21are those of Truman and Dickes, who analysed raw muscles. Theirresults would seem to agree with the present findings that addedphosphate is not present in the leg muscles of treated chickens; butthey did find that leg muscles from treated chickens contained moresodium than those from untreated chickens (see section 1.2 for thevalues). However, these results were obtained from only 2 treatedand 2 untreated chickens of unspecified origin and therefore must be
18treated with caution. Also Grey et al, stated that they found no added phosphorus in the leg muscles from commercially treated chickens, but they gave no values, nor did they analyse for sodium.
It seems unlikely that chickens so treated with polyphosphates would be cut up and sold as breast and leg portions declared as containing added'phosphates; but this possibility does exist.
It should be noted that all of the cook-out juices contained relatively high concentrations of both phosphorus and sodium, • indicating that these ions are lost during cooking of both treated and untreated muscles. By analysing the cook-out juices in this way, the question of whether or not ions are leached out during cooking may be resolved without having to express the muscle results on a dry weight basis c.f. discussion in section 3*42.
3.792 Magnesium, Calcium and IronTable Xlq shows the magnesium, calcium and iron contents of all
thaw losses, muscles and their cook-out juices. The calcium and iron •.contents of untreated pectoralis major and leg muscles were of the same order as those calculated by A d a m s , f o r composite samples of light meat and dark meat, ana these values are given in this Table.
All tissues and juices contained only small amounts of iron, and these results were of little value. It is possible that the determination of iron was hindered by the presence of other ions, especially phosphorus, although this possibility was taken into account
160
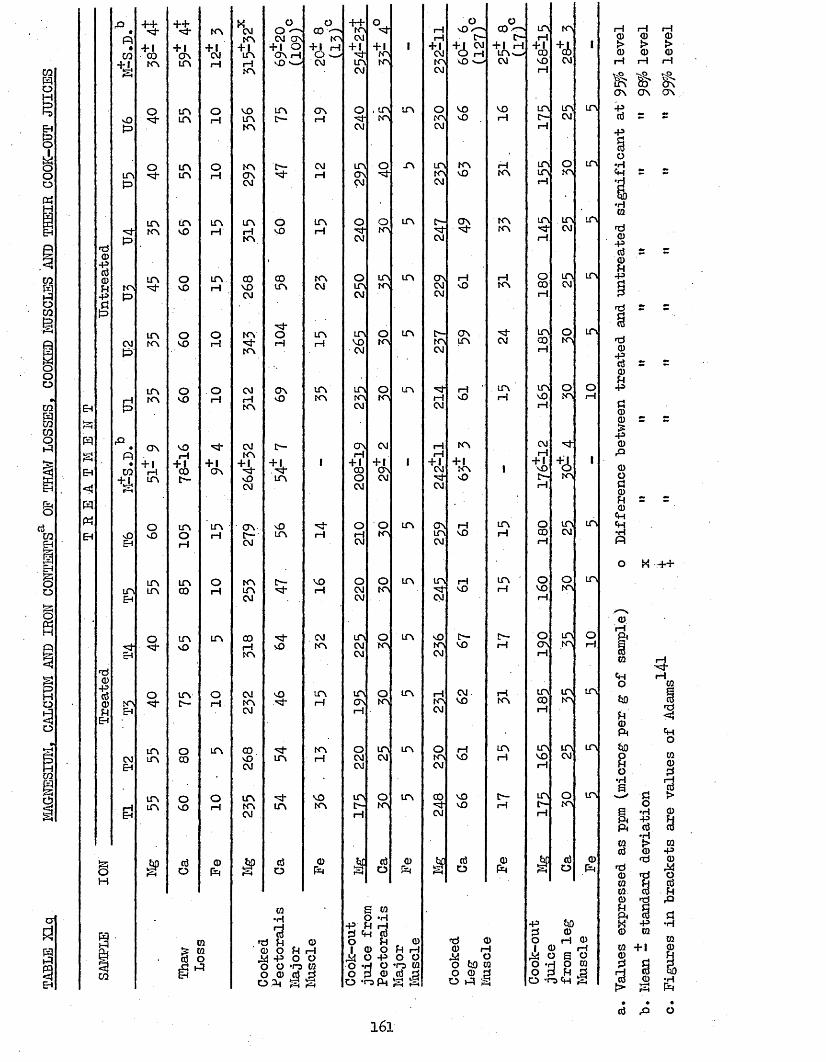
TABLE
XIq
MAGNESIUM. CAL
CIUM
AND IRO
N CONTENTS
OF THA
W LOSSES,
COOKED
MUSCLES
AEP THE
IR COOK-OUT JUICES
PPCO
Op
rd©"S0)£t§
EhPHEH
HPSEH
•d©43g3©PHEH
§H
+ 1CO
O■'3'
UNP
*3P
K>P
CMP
m+ 4»=-»
UOEH
o•3-
U \KN
UN"3*
UNKN
inkn
O N+ lpHin
OvO
inEH
•3-CH
KNEH
CMEH
I—IEH
inin
O*3*
o*3*
inin
inin
IP
+4+ lONin
inin
inin
invo
ovo
oCO
OCO
CO i—I+<ic—
inorH
inCO
invO
int—
OCO
OcO
cSo
KN
+dl’rH
OrH
in
inI—I
orH
OrH
+ 1ON
inrH
in
orH
in
CDPh
CD £ 02 03 o p ft
KN
COinKN
KNONCM
inrHKN
COCOCM
K NKN
CMrHKN
CMKN+L•3-vOCM
ONt—CM
KNinCM
COi— !KN
CMKNCM
COvOCM
inKNCM
If
o O "CM ON|+ 1 oON rH<D '
in
ocO
COUN
*3"Oft
ONvO
+4in
MDin
c—*3-
*3-sO
M3*3"
*3-in
in
c3o
oCO •«- KN]
+i dCM
ONrH
CM
UNrH
KNCM
UNrH
UNKN
*3-rH
COrH
CMKN
UNrH
KNrH
COKN
©PH
CD •H■3
*d Ph © O X -P o o *o to o © rt d
©PH rH O O
-H-KN|CM
+ 1UNCM
O*3"CM
inONCM
O*31CM
OUNCM
UNcoCM
UNKNCM
ON] rH + 1COOCM
in !CMCM
UNON
int"-«H
If
+1KNKN
inKN
oKNl
inKN
OKN
OKN
CM+ 1ON]CM
OKN
OKN
OKNl
OKNl
UN]CM
OKNl
UN
n
UN
UN
UN
UN
UN
in
UN
UN
UN
UN
©Ph
E co O -H£■3
Ph © o o 4s•3 8•oft
©PH rH O O ‘O COS 4
i—I + 1CMKN]CM
OKN|CM
UNKNCM
*3"CM
ONCMCM
r~-KNCM
*3-rHCM
rHi—1 + 1CM*31CM
ONUNCM
UN*3"CM
sOKNCM
i—1KNCM
OKNCM
CO•'31CM
vO.
+ i CMvO
NOU>
KNvO
ON*54"
I—I■O
ONUN
rHvO
KN+ 1KNvO
rHNO
NO
t— NO
CMNO
rHNO
NOvO
0}O
OCO - M
CM
NOrH
HKN
KNKN
i—IKN
*3"CM
UNft
UNft
UNft
£•—ft
KN
UNft
©ft
>d ©© ftjy . oO tlO COo © d o ft jsj
UN ft + 1CONOft
UN i—I
inin
UN•3-rH
UN00ft
UNNOft
CM ft + 1NOrftft
oNOft
oON]ft
UNCO
UNNO
UNf-ft
KNj
+J>CM
UNCM
OKNj
inCM
UNCM
OKN
OKNl
+iKN
in !CM
oKN]
UNKN
UNKN
in !CM
oKNj
UN
UN
UN
UN
UN
UN
UN
in
UN
UN
©©ft
x o a oO -H O COo 3 Ph jgO T 5« H S
ft©S>ft
ft©>©ft
ft©>©ft
s- &ON O N ON
O K -r++
to
So
© 02
02 +1 <1>
Cl} p O161
during the analyses. However, small amounts (< 20ppm) were also found in cooked chicken tissues by A d a m s , ( s e e Table Xlq) and by Rognerud,'*'^
The mean values for the magnesium and calcium contents of treated thaw losses were significantly higher than those of the untreated thaw losses; indicating that polyphosphates remove these ions from chicken tissues. This effect was further illustrated by the factthat the mean values for the magnesium and calcium contents of treatedpectoralis major muscles were less than those for untreated muscles.This difference was statistically significant in the case of magnesium, but not in the case of calcium. However, there were only relatively small amounts of calcium in the muscles and the interchicken variation was large; and therefore lack of statistical significance may have been expected.
Also, each of the treated cook-out juices from pectoralis major muscles contained less magnesium than the untreated muscles, and the difference between the mean value was statistically significant.The mean value for the calcium content of these treated juices was significantly lower than the value for the untreated juices.
There were no significant differences in magnesium or calciumcontents between treated and untreated leg muscles or their cook-out juices. In fact, the treated mean values were all higher than the untreated values.
These results indicate therefore, that added polyphosphates react with magnesium and calcium in some way which results in the loss of these ions during thawing, leading to reduced levels in the cooked pectoralis major muscles and their cook-out juices. On this basis it is not surprising that there we re no significant differences in the magnesium and calcium contents of treated and untreated leg muscles and their cook-out juices, because no, or very little, added phosphorus (or sodium) was found in these muscles (see Table Xlp).
162
Treated thaw losses contained about 25cjo more of both calcium and magnesium than the untreated samples, indicating that these ions are lost to the same degree during thawing. This seems to contradict the findings of Inklaar,^^ and Baldwin and deMan^^ (cited in section 1.612), that about 5 times more calcium than magnesium is firmly bound to muscle proteins,, and is therefore unavailable for reaction with added phosphates. However, factors other than that they tested beef muscle, make direct comparisons between their results and the present ones impossible. First, the amounts of ions present in the free, and soluble and insoluble protein-bound states were not calculated here, and therefore the effect of polyphosphates on this equilibrium could not be determined. The importance of specifying the state of the ions is illustrated by comparing the work of Baldwin and deMan, who did, and Inklaar, who did not (see section 1.612). Second, individual polyphosphate species have, different relative affinities for these metals (see sections 1.612 and 1.613), and therefore the difference in ionic composition between treated and untreated samples depends not only on the.relative availabilities of magnesium and calcium; but on the levels of the individual' polyphosphates - which were not known exactly. Consequently, the most that can be said of these thaw loss results is that, Puron 604 results in calcium and magnesium being lost to the same extent during thawing, from chickens injected, stored and analysed as specified here.
The treated pectoralis major muscles contained 22fo less calcium than the untreated muscles, and 16fo less magnesium; and the cook-out juices from treated pectoralis major muscles 12fo less calcium and I8/0
less magnesium than the -untreated juices. Calcium and magnesium, therefore, were lost to the same degree from treated muscles plus cook- out juices. These losses were very high, and since metals are known to be prooxid&nts (see section 1.42), it seems that this removal of calcium and magnesium by polyphospnates must, at least in part, explain their
I63
antioxidant properties. In addition, these findings reinforce the explanations of the effect of polyphosphates.on WHO which depend on polyphosphate chelation of calcium and magnesium (see section 1.612).
Thawed raw treated muscles must also contain less calcium and magnesium than untreated muscles, although the raw-samples were not analysed. However, polyphosphates have been shown to have little or no antioxident effect on raw muscles. It can only be assumed that heat greatly increases the prooxidant properties of metals.
These ionic composition results are very important since they conclusively show that polyphosphate treated chicken muscles contain less calcium and magnesium than untreated muscles after thawing. To the author's knowledge this is the first time that the ionic composition of commercially treated chicken muscles have been compared to untreated muscles in this manner. .
It must be remembered that literature values are usually quoted on a wet weight basis, and therefore, it is not possible to determine^lf ions are leached out during cooking, because of the effect of moisture losses during cooking (see section 3*42; and, for example, the discussion of Zenoble and Bowers Analysis of the cook-out juices overcomes thisproblem and provides a more accurate determination than would values calculated from a comparison of raw and cooked dry weight values.
3.710 Correlation Coefficients between Phosphorus Content and Sodium, Magnesium and Calcium Contents
Table Xlr shows the correlation coefficients between phosphorus content and sodium, magnesium and calcium contents of all thaw losses, cooked muscles and cook-out juices.
These coefficients were primarily calculated in order to see if loss of calcium and magnesium during cooking was directly related to the loss of phosphorus i.e. to see if calcium and magnesium were lost from treated muscles as a result of chela/tion with phosphate anions, as was suggested in section 3»43*
164
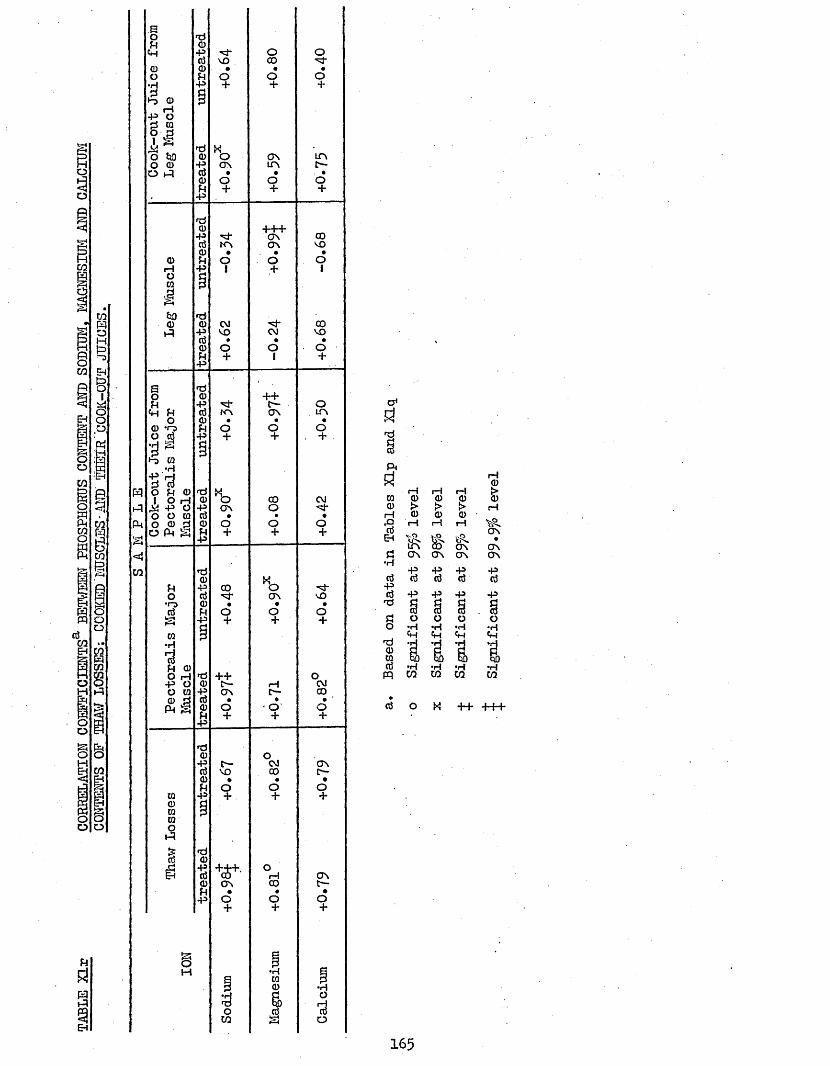
TABLE
XLr
CORRELATION
COEFFICIENTS
BETWEEN
PHOSPHORUS CONTENT
MB SODIUM,
MAGNESIUM
AND CALCIUM
CONTENTS OF
THAW
LOSSES;
COOKED
MUSCLES - AND
THEIR
COON-OUT JTJ
ICES.
ui
Co
ok
-ou
t J
uic
e
fro
m
Leg
Mu
sc
le
(tre
ate
d
un
tre
ate
d
"«a-VO
•o+
HoON
•o+
oCD
•o+
ONLTV
•O+
o•
o+
LfNt - . •o+
fd0 ■M'H*•P ON CDd KN ON VO0 • • •
0 U o o Oi—i •P I ,+ 1o riCO P1£t0 *d<D 0 CM •■d* 00
-P vo CM vod • • •0 o O OU + I +4s
s >do 0 + +u +» t* t - ot*H H d KN ON LfN
o 0 • • •a> *o (4 o o oo d *p + + +3 8 £jw
CQ
O H © nd MI O rH 0 O CD CM
,14 -P O -P ON O -3-O o IQ d • • •O 0 0 0 o o oO PM g H + + +
-P
*d0 M
H •p CO O -3-o d ON vO•o 0 • ’• •d f4 o o otr1 •P + + +Ul §•H■314 0O rH *d + + o•P O © r— rH CMo co -P ON C— CD0 d d • • •
P4 g 0 o - o o
a + + +
'd© o-p r— CM ONd vo CD t—0 • • •
o O oUl •P + + +0 d0 pUlo
& •dd 0
§ d +<s+ -o
rH ON0 ON CD t—u • • ••P o O o
+ + +
gO pH •H S
s Ul 3p 0 •i43 8)
OrH
o d dUl s O
a1
to to
pq co ui m
d
165
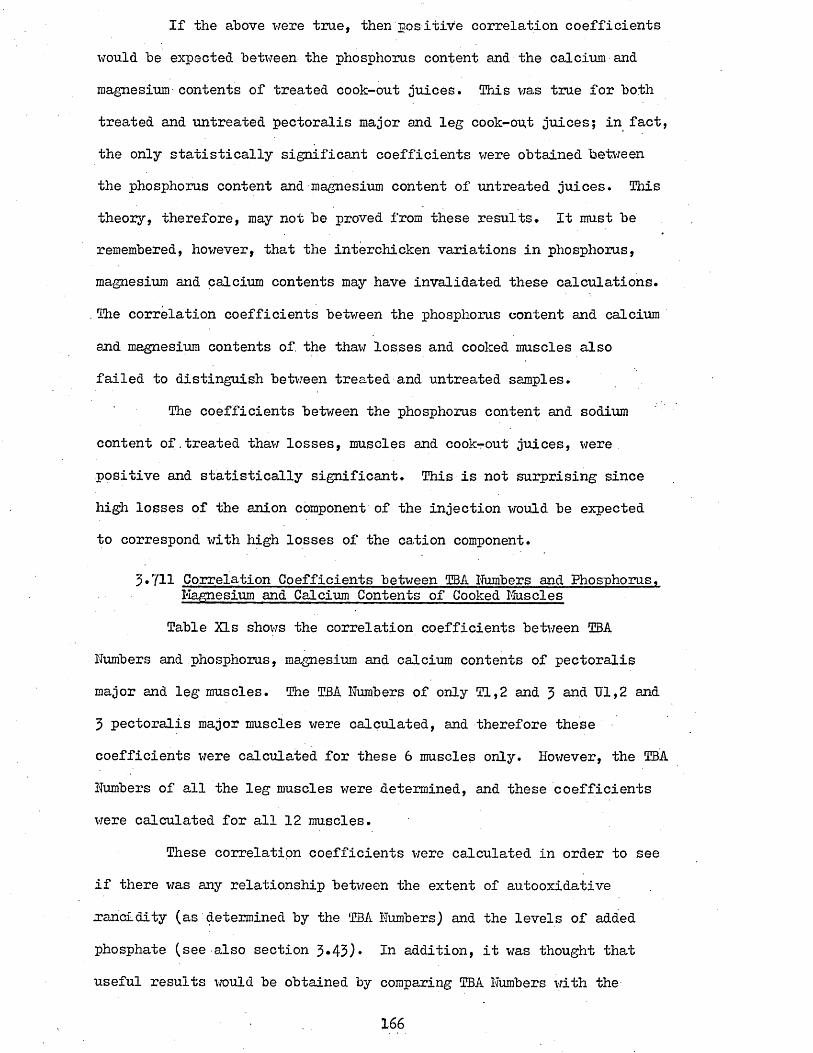
If the above were true, then positive correlation coefficients would be expected between the phosphorus content and the calcium and magnesium contents of treated cook-out juices. This was true for both treated and untreated pectoralis major and leg cook-out juices; in fact, the only statistically significant coefficients were obtained between the phosphorus content and magnesium content of untreated juices. This theory, therefore, may not be proved from these results. It must be remembered, however, that the interchicken variations in phosphorus, magnesium and calcium contents may have invalidated these calculations. The correlation coefficients between the phosphorus content and calcium and magnesium contents of, the thaw losses and cooked muscles also failed to distinguish between treated and untreated samples.
The coefficients between the phosphorus content and sodium content of.treated thaw losses, muscles and cook-out juices, were positive and statistically significant. This is not surprising since high losses of the anion component of the injection would be expected to correspond with high losses of the cation component.
3*711 Correlation Coefficients between TBA Numbers and Phosphorus.Magnesium and Calcium Contents of Cooked Muscles
Table Xls shows the correlation coefficients between TBA Numbers and phosphorus, magnesium and calcium contents of pectoralis major and leg muscles. The TBA Numbers of only Tl,2 and 3 and Ul,2 and 3 pectoralis major muscles were calculated, and therefore these coefficients were calculated for these 6 muscles only. However, the TBA Numbers of all the leg muscles were determined, and these coefficients were calculated for all 12 muscles.
These correlation coefficients we re calculated in order to see if there was any relationship between the extent of autooxidative xancdLdity (as determined by the TBA Numbers) and the levels of added phosphate (see also section 3*43)* 3n addition, it was thought that useful results would be obtained by comparing TBA Numbers with the
166
TABLE XIsCORRELATION COEFFICIENTS3, BETWEEN TBA NUMBERS AND PHOSPHORUS,MAGNESIUM AND CALCIUM CONTENTS OF PECTORALIS MAJOR AND LEG-MUSCLES
S A M P L E' ION Pectoralis Major Muscle0 Leg Muscle^
treated untreated treated untreatedPhosphorus -0.83 -0.19 -O.76 +O.35
Magnesium +0.97 -0.58 -0.69 +0.32
Calcium +0.34 -0.23 -0.23 +0.18
a. Based on data in Tables XIj, XLp and Xlqb. 0.997 required for significance at 95f° levelc. 0.811 required for significance at 95^ level
167
levels of magnesium and calcium.It may be seen from Table Xls that the correlation coefficients
between TBA Numbers and phosphorus levels of treated pectoralis majorand leg muscles were negative and numerically high, although they we re
86not statistically significant. Thomson, also found a negative correlation between TBA Nunbers and phosphorus levels of treated, cooked fryer chickens. Since polyphosphates decrease the TBA Number of treated, cooked chicken, then these negative correlations are as would be
expected i.e* as the amount of added phosphate increases, then the TBA Number decreases. It is interesting to note thattreated leg muscles exhibited this behaviour, although there was no significant difference in TBA Numbers between treated and untreated leg muscles (see also
section 3*791J.These correlation coefficients between TBA Numbers and
phosphorus levels for untreated leg and pectoralis major muscles were numerically small, and impossible to interpret. This is because there is no justification for expecting a significant correlation between these variables in untreated chicken muscle, and the values are only given here so that they may be compared with the treated results.
The correlation coefficients between TBA Numbers and magnesium
and calcium contents are more difficult to interpret. In untreated muscles, a positive correlation would be expected since high concentrations of metal ions, which are pro-oxidevnts, would be expected to result in high TBA Numbers. Also, the same would be expected of treated leg muscles because there was no significant difference in magnesium or calcium contents between treated and untreated leg muscles. Such positive correlations were found for untrea/fced leg muscles, but not for treated leg muscles or untreated pectoralis major muscles. In any case these coefficients were not statistically significant.
168
For treated muscles, the same reasoning as for untreated muscles applies, but with the additional variables of the effect of added phosphates on the IEBA Numbers.and on the metal ion concentration. Such positive correlations were obtained for treated pectoralis major muscles, but again these were not statistically significant. Further discussion of these results would be pointless in view of the variables mentioned above.
169
3.8 COMPARISON OF TBA RESULTS FROM EACH EXITIRPIENTSince the TBA Numbers of both raw and cooked muscles we re
determined on muscles from chickens after -g- to 47 months of frozen storage, it was thought that a comparison of each set of results would yield important information about the nature of the TBA test itself.
Table Xlla shows all of the mean TBA Numbers of raw and cooked muscles after 0 days- of holding, i.e. "immediately*' after excision of the raw muscles, and after cooking of cooked muscles, within the time limit of sample preparation and after no more than 2 weeks storage of the excised muscle at -18°C. It may be seen that each set of values were similar to each other, except for untreated cooked pectoralis major muscles after month of frozen storage. This anomaly is accounted for in section 3*76* Three important points arise from this observation:
1., Freshly excised and freshly cooked muscles have similar TBA Numbers. This indicates that autooxidation does not proceed to any great degree during the cooking process used in this work, nor during the cooling, mincing and sample preparation stages (at least 1 hour in total).
2. Raw and cooked muscles from chickens after short-term frozen storage have similar TBA Numbers to those from chickens after long-term frozen storage, during 0 days of holding. This indicates that the TBA test when performed during 0 days of holding, is not suitable for determining the oxidative status of muscles (see section 3*61, where freshly excised muscles from chickens after 47 months frozen storage gave off rancid odours).
3* The above 2 points apply to muscles from both treated and untreated chickens. This indicates that the TBA test is not suitable for * distinguishing, between treated and untreated muscles, when performed during 0 days of holding of either the raw or cooked muscles.
170
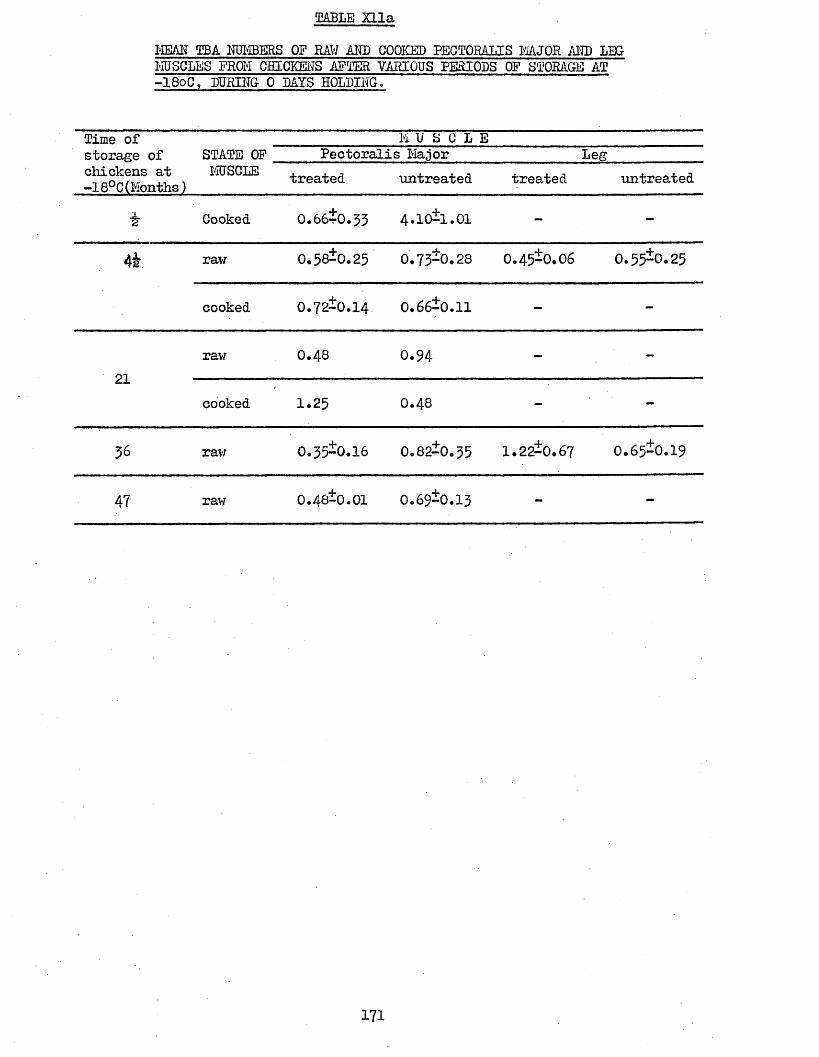
(CABLE Xlla
MEAN TBA NUMBERS OF RAW AND COOKED PECTORALIS MAJOR AND LEGMUSCLES FROM CHICKENS AFTER VARIOUS PERIODS OF STORAGE AT-180C, DURING 0 BAYS HOLDING.
Time of M U S C L Estorage of STATE OP Pectoralis Major Legchickens at -18°C (Months)
MUSCLE treated untreated treated untreated
4 Cooked 0.66to.33 4 .10*1.01 - -
44 raw 0.58±0.25 0.73-0.28 0.45-0.06 0.55-0.25
cooked 0.72-0.14 0.66-0.11 - -
Olraw 0.48 0.94 - -
c.L
cooked 1.25 O .48 - -
36 raw 0.35-0.16 0.82-0.35 1.22-0.67 0.65^0.19
47 raw 0.48-0.01 0.69-0.13 - -
171
Table Xllb shows all of the TBA Numbers of raw and cooked
pectoralis major muscles during 1 to 9 days of holding at 4°C* It should be noted that the TBA Numbers of muscles after 21 months frozen storage, during holding at 4°C (Table Vc) are not given in this Table. This is because of their unrepresentative nature (see section* J>*1) .
Two important points are illustrated in this Table:1. For cooked muscles, the TBA Numbers of treated muscles were
always significantly lower than those of untreated muscles during 1 to 9 days holding (cf. point 3 above).
2. For raw muscles, the TBA Numbers of muscles from chickens after 6 months frozen storage were much higher than those of muscles from chickens after 47 months frozen storage, during 8 days of holding. This was presumed to be because autooddation had proceeded during 47 months frozen storage leading to reduced levels of malonaldehyde in these chicken tissues (see section 3*61). Thus, TBA analysis of muscles during holding for 1 or more days, distinguished between muscles from chickens after short-term and long-term frozen storage.
It may be seen therefore, that TBA tests should be performed throughout a period of holding in order to gain the maximum amount of information in experiments of the present type. In fact, if TBA tests had been performed on only freshly cooked muscles, in this work, then it would have been concluded that polyphosphate treatment had little effect on autooxidation of cooked chicken tissue. This finding is in
addition to'the'known limitations of the TBA test during the very early and very late stages of autooxidation (see section 2.31)*
A further .point which is illustrated in Table Xllb is thatthe TBA Numbers of some individual raw and treated cooked samplesfluctuated during holding, and did not steadily increase to a plateau,as may have been expected. These fluctuations in untreated raw and
38cooked meat muscles have also been reported by Keskinel et al; and
172
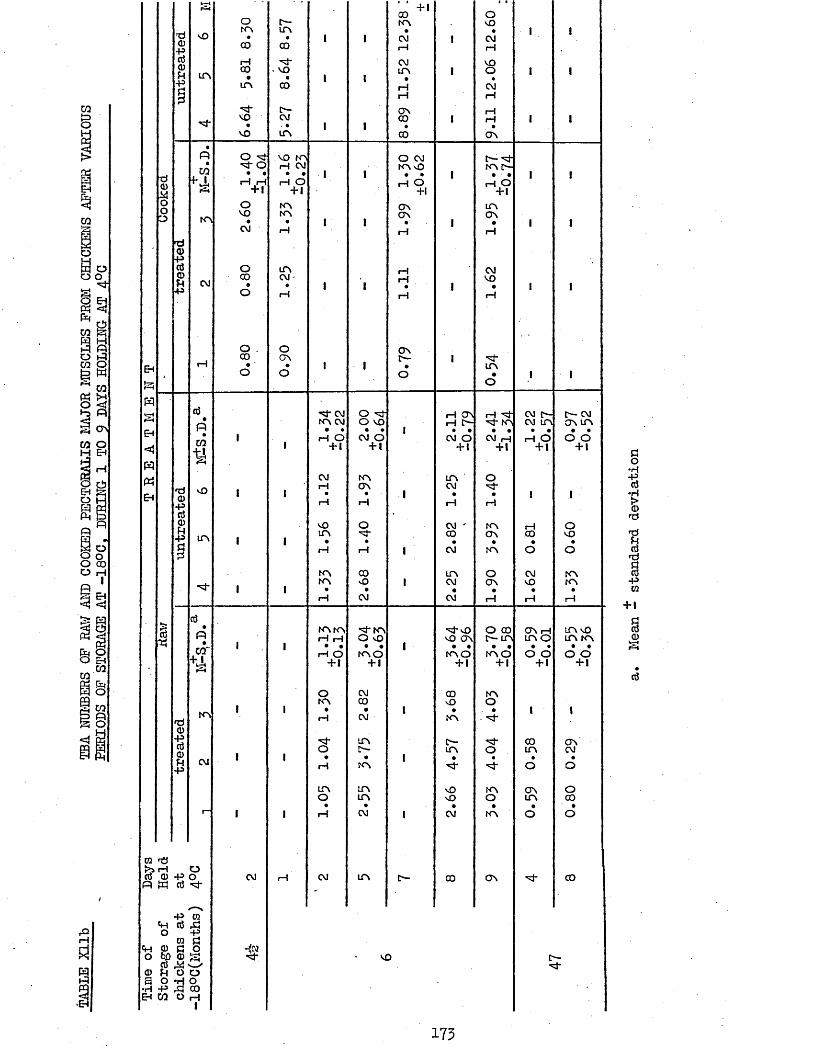
TABLE
Xllb
TBA NUM
BERS
OP RAW AND COO
KED PEC
TORALI
S MAJ
OR MUS
CLES
PROM
CHICKE
NS AFT
ER VARIOUS
PERIOD
S OP
STORAG
E AT
-18QC,
DURI
NG 1 TO
9 DAY
S HOL
DING
AT 4°C
_
C*Ho0s
•H
I untreated
t-H
MO
m
3*
Otn•
COrHCO
•in
3*vo
•VO
f -in
•CO3*
, vo •
CO
[— CM . •in
1
I
1
1
1
1
+ lCOm•CMrHCMin
•rHi—1ONCO•CO
1
1
1
9.11
12.06
12.60
_
1
1
1
1
I
1
•O 3 vo m O CM t— 3•f A 3 - o rH CM m vo nne>-UJ • • • • I I • • | • - • | |Tirt\ +*J< rH rH iH O rH O rH Ou/ + 1 + 1 +• + 1
o o m ON inoo m vo
•m• 1 I
ON• |ON
• | |OJ rH I—I rH
0prt O in rH CMoJ4 OJ
CO•
CM• | | i—1 • | VO. | |p O rH rH rH
o . O ONCO on t— 1 •"3*rH • ■ • 1 1 • ino o O • 1 1
o
cS 3* CM O 3 rH ON rH 3 CM C- r— cm• m cm O VO rH £— •3* m cm in on mM • • • • 1 * • • • • • « ••«A 1 rH O CM O CM O CM rH rH O o oC/3t l
1 + 1 +1 + 1 + 1 + 1 +1Pi
CM m in Ot J vO 1 1
i—1 • ON« |CM• 3• | 10
p rH H rH rH00 VO O CM ' m rH oFHP in 1 1
in• 3*• CO• ON• CO• vo•
rH rH 1 CM m o o
m CO in o CM m3* 1 1
m• MO• 1 CM• ON• MO• m•H CM CM rH rH rH
0§ • m m •'3* m •"3*0 O 00 ON i—1 in MOTO-y* rH rH O MO vO ON f-tn m o in m-H 1 1 • • • • I • • • . • • • .CO rH O m o m o m o o o o oPi + ! + 1 + l + l +1 +1
O CM CO mm CO MO oI 1 • • | • • 1 1
fdm rH CM m • 3
0p <- in £— 3* CO ONCDsit O r— UN O in CMup
C\J 1 1 •i—1
•m 1 •■vi*
•3 •o .oin in O m ON oo in MO o in co• • • • • •r~ 1 1 rH CM 1 CM m o o
i—1 o0 P o CM rH CM in t— 00 ON 3 COw 0 3* -
P cq0 .G
o pm G
0 G O -<02§P 0 lr-4F—4 3* vO C—0 AS ^ 3*H o Oop a
OCO
CO O H 1
GO•H00'd
rGPW+ 19030
113
86in treated and untreated cooked chicken muscles by Thomson, Also,Jacobson and Koehler,^ (see Table II for values) and Arafa and Chan,^^ have observed these fluctuations during holding of untreated cooked
145chicken tissues. It seems reasonable to assume, as Dawson and Schierholz, did, that the products responsible for TBA reaction are produced andrecombined in meat systems in an "erratic fashion"..
174
3*9 Sul#lARY OP ALL THE RESULTS 3.91 PHOSPHORUS COMPOSITION
The phosphorus contents of raw and cooked pectoralis major, pectoralis minor, and leg muscles were determined (Table 7111b); and of thaw losses, cooked pectoralis major and leg muscles, and their cook-out juices (Table Xlp). There were clear differences between treated and untreated samples:
All treated thaw losses, raw and cooked pectoralis major and pectoralis minor muscles, and the cook-out juices from pectoralis major muscles, contained significantly more phosphorus than the untreated samples. Also, one batch of cooked treated leg muscles contained significantly more phosphorus than the untreated muscles, but this difference \ as very small compared to the differences between treated and untreated breast muscles. Also, there was no significant difference in phosphorus content between the treated and untreated cook-out juices from these leg muscles (Table Xlp). For the other batch of leg muscles, there were no significant differences between either the raw or cooked treated and untreated muscles (Table Vlllb).
Therefore, polyphosphate treatment of eviscerated chickens by injection into the breast muscles prior to chilling and freezing, results in increased levels of phosphorus in the thaw losses and in the raw and cooked pectoralis major and pectoralis minor muscles. Also, the cook-out juices from treated pectoralis major muscles contain significantly more phosphorus than those from untreated, chickens. However, little or no added phosphorus was found in the leg muscles from treated chickens.
3*92 SODIUM COMPOSITIONThe sodium contents of thaw losses, cooked pectoralis major
and leg muscles, and their cook-out juices were determined (Table Xlp). The differences between treated and untreated samples were the same as for the phosphorus contents, except for the leg muscles, when there was
175
no significant difference in sodium content between treated and untreated muscles.
Therefore, chickens injected with sodium polyphosphate, as detailed above, have increased levels of sodium in their thaw losses and cooked pectoraiis muscles and cook-out juices, but not in their leg muscles and cook-out juices.
3*93 MAGNESIUM, CALCIUM AND IRON COMPOSITIONSThe magnesium, calcium and iron contents of thaw losses, cooked
pectoraiis major and leg muscles, and their cook-out juices were determined (Table XLq). The mean values for the magnesium and calcium contents of treated thaw losses were significantly higher than those of untreated thaw losses; and these mean values for treated cooked pectoraiis major muscles and cook-out juices were significantly lower than the mean untreated values. There were no significant differences between treated and untreated leg muscles and cook-out juices for either the calcium or magnesium contents. The levels of iron in all of these samples were very low and of little value for comparing treated and.untreated samples.
Therefore, polyphosphate treatment was found to result in calcium and magnesium being lost from frozen chickens during thawing.The treated pectoraiis major muscles and their cook-out juices contained less calcium and'magnesium than the untreated muscles, but the treated leg muscles and cook-out juices did not.
3*94 HYDROLYSIS OF POLYPHOSPHATES IN CHICKEN TISSUESAttempts were made to study the rate of hydrolysis of sodium
tripolyphosphate after mixing with excised chicken muscles, and during subsequent storage at 4°C (section 3«3!)• However, the TLC method used to detect and measure the amount of polyphosphate species present, lacked sensitivity, and the results only pointed to the fact that considerable hydrolysis occurred immediately after mixing and was probably complete after 23 hours of refrigerated storage.
176
31A further experiment was conducted using y P-FTMR to detect and determine polyphosphate species (section 3*52). Samples of pectoraiis major muscles from treated chickens after 5» 15 and 45 months storage.at -18°C were analysed. The fraction of polyphosphates hydrolysed in the 5 month muscles ranged from 0 to 4% 5 in the 15 month muscles, 5 -to 32^; and in the 43 month muscles, 66 to lOOfo (Table Vila). There was an anomalous result in the 5 month samples, where 4 hydrolysis occurred, but this was explained (see section 3*32).
Therefore, this first experiment found that considerable hydrolysis of sodium tripolyphosphate occurred in excised chicken muscle immediately after mixing, and was probably complete within 23 hours at 4°C. The second experiment showed that hydrolysis of a commercial
' mixture of sodium polyphosphates (Puron 604) progressed through 15 to 43 months of frozen storage, but that very little hydrolysis had occurred after 5 months of frozen storage.
5*95 UPTAKE OF CHILL WATER. Of the 3 separate batches of chickens used in these experiments,
the uptake of chill water was calculated in 2 of them, as the difference in pre-chill and post-chill (and drain) weights, (section 3*71)• There was no significant difference in chill water uptake between 6 treated and 6 untreated hatch C chickens (Table KLa). However, for the total number of 11 treated and 11 untreated batch C chickens, the mean value for the treated chickens was significantly less than that for the untreated chickens. Also, the mean value for the total number of 12 treated batch A chickens was significantly less than the mean value for the total number of 12 untreated chickens. In addition, mean values showed that the treated batch A chickens took up less chill water, and received a higher level of polyphosphate injection, than the treated batch C chickens.
Therefore, polyphosphate injection by pre-chill injection,
177
was found to result in a deprease of chill water uptake, when the mean values of the entire hatch of treated and untreated chickens were compared. Also, there was some evidence of the amount of chill'water uptake decreasing with increasing levels of injection.
5.96 COOIC LOSSESThe cook losses of excised pectoraiis major and leg muscles after
steam cooking were determined (Tables lXa, Xlb). Also, the cook losses of 1- treated and 1 untreated pectoraiis major muscle after roasting with no added fat were determined (Table Va). There were no significant differences in cook losses between treated and untreated samples for either the pectoraiis major or leg muscles after steam Cooking. However, after roasting, the treated pectoraiis major muscle had a considerably higher cooked yield than the untreated muscle. .It was not possible, however, to take this as proof that polyphosphates reduce cook losses during roasting, because only 1 muscle from each treatment was tested.
Therefore, polyphosphate treatment was found to have no effect on cook losses after steam cooking, but there was some evidence that roasting losses may be reduced by polyphosphates.
5.97 MOISTURE CONTENTThe moisture content of raw pectoraiis major, pectoraiis
minor, and leg muscles were determined (Table Vlllc). The treated pectoraiis major muscles contained significantly more water than the untreated muscles, but there were no significant differences between treated and untreated pectoraiis minor or leg muscles.
Therefore, polyphosphate treatment by injection into the breast muscles was found to result in increased levels of water in the raw pectcpralis major muscles, but not in the pectoraiis minor or leg muscles.
178
3.98 AMOUNT AND TOTAL HAW l CONTENT OF THAW LOSSESThe volume of thaw losses from treated and untreated chickens
was determined (Tables Va and Xla). One treated chicken after 21 months of frozen storage was found to have less fluid on thawing than 1 untreated chicken (Table Va). However, there was no significant difference in the mean thaw loss values between 6 treated and 6 untreated chickens after 2 weeks frozen storage (Table Xla).
The total haera content of the thaw losses from treated and untreated chickens was determined (sections 3 ,6 2 and 5*72, Table Xla). Preliminary studies on 2 treated and 2 untreated chickens after 47 months frozen storage, indicated that the treated thaw losses contained more than twice as much total haem than the untreated thaw losses (section 3*62). However, analysis of the thaw losses from 6 treated and 6 untreated chickens after 2 weeks storage at -18°C, showed that there was no significant difference between treated and untreated thaw losses (Table Xla).
Therefore, polyphosphate treatment was found to have no affect on the volume of thaw loss from chickens after 2 weeks frozen storage; but there was some evidence to suggest that it reduced thaw loss in chickens after 21 months frozen storage. Also, polyphosphate treatment was found to result in increased amounts of total haem in the thaw losses of chickens after 47 months frozen storage, but not after 2 weeks frozen storage.
3.99 LIPID COMPOSITIONThe lipid composition of both raw (Table Via) and cooked
(Table Xlc) muscles were determined. For raw muscles, it was found that neutral lipid showed greater interchicken variation than phospholipid.Also, there was a direct relationship between the neutral lipid and total lipid levels, indicating that higher lipid levels arise primarily from the deposition of neutral lipid. Leg muscles contained more total lipid
179

and a higher proportion of neutral lipid than the pectoraiis major muscles. For both freshly cooked and rancid cooked muscles there were no consistent interchicken differences.
The only significant difference between polyphosphate- treated and untreated muscles occurred for the phospholipid contents
o wet tissue) of raw pectoraiis major muscles; when the treated muscles contained significantly less phospholipid than the untreated muscles.
Therefore, on the whole there were no significant differences in lipid composition between treated and untreated raw or cooked muscles.
3.91° FATTY ACID COMPOSITIONThe fatty acid composition of raw pectoraiis major (Table Vlb)
and leg (Table Vic) muscles, freshly cooked and rancid cooked pectoraiis major muscles (Tables Xld and Xlf), and of the cook-out juices of pectoraiis major (Table XLh) and leg (Table Xli) muscles were determined. The main fatty acids in both neutral lipid and phospholipid fractions were Cl6:0, C18:l and C18:2, with phospholipids also containing large amounts of C18:0, and more C20:4 and other long-chain fatty acids than the neutral lipids. This was true of both raw and cooked muscles, although the interchicken variation in the raw muscles was small, and that of the cooked muscles relatively large. The total lipid of the cook-out juices usually contained large amounts of 016:0, C18:l and C18:2, but there were very large interchicken variations.
There were no statistically significant differences between polyphosphate-treated and untreated raw or freshly cooked muscles, or cook-out juices. However, for rancid cooked pectoraiis major muscles, the neutral lipid of treated muscles contained significantly more total unsaturated fatty acids than that of untreated muscles.
Therefore, on the whole, there were no significant differences in fatty acid composition between treated and untreated muscles.
180
3*911 TBA NPKBEBS
The TBA .Numbers of treated and untreated raw (Tables Vc, Vie, Villa, IXc, Xa) and cooked (Tables Vc, Villa, lXb), pectoraiis major muscles were determined during 0 to 11 days of holding at 4°C« These results are summarised in section 3*8*
There were no significant differences in TBA Numbers between raw treated and untreated pectoraiis major muscles. However, the TBA Numbers of cooked treated pectoraiis major muscles were significantly lower than those of untreated muscles throughout 1 to 11 days of holding, but not after 0 days. For leg muscles (Tables Vie, Villa, lXb, IXc, Xa), there were no significant differences between treated . and untreated rav; or cooked muscles (presumably because little or no added phosphate was present in leg muscles, see section 3*42 and 3*791)*
Therefore, polyphosphate treatment was found to produce low TBA Numbers in cooked pectoraiis major muscles after 1 or more days of holding, and to have no effect on the TBA Numbers of rav; pectoraiis major muscles and rav; or cooked leg muscles.
3*912 ADDITIONAL RESULTSCorrelation coefficients between various sets of results were
calculated, and a number of important points arose from these calculations. There was some evidence to suggest that:
a) Dietary C18:2 is deposited in chicken tissues to a larger extent than other dietary fatty acids; and also that neutral lipids exhibit most pronounced changes in the 16-' and 18- carbon fatty acids, and phospholipids in the long-chain fatty acids, as a result of diet (section
3*23).
b) The 16- and 18- carbon fatty acids of neutral lipid, and the polyunsaturated 20 plus- carbon fatty acids of phospholipids are the most important indicators of the degree of autooxidation in raw (section 3*25) and cooked (section 3*772) muscles. However, fatty.acid levels were not
181

significantly correlated with TBA Numbers during the early stages of rav; and cooked muscle autooxidation; but these values approached significance during the later stages of autooxidation - as in rancid cooked muscles (section 5*772).
c) The neutral lipids play the major role in raw muscle autooxidation (section 3*26), and the phospholipids in cooked muscle autooxidation, although autooxidation in rancid cooked muscles is independent of any one lipid level (section 3*78)*
d) TBA Numbers of treated cooked pectoraiis major muscles decrease as the level of polyphosphate treatment increases (section 3*711)*
e) Polyphosphate treatment results in increased levels of unsaturated fatty acids being lost in the cook-out juices of treated muscles compared to untreated samples (sections 3•7719 3*772 and 3*773)-
182
4. CONCLUSION4.1 GENERAL INFORMATION
The bulk of this work was concerned with the determination of the degree of autooxidation of chicken tissues (as measured by the TBA test), and the effect of the fatty acid composition of muscles on these values* Unfortunately, it was apparent that large interchicken differences in TBA numbers were not a result of measurable differences in fatty acid composition* However, the fatty acid composition of rancid cooked muscles showed much greater interchicken variation than that of freshly cooked and raw muscles; and some correlation coefficients between TBA numbers and fatty acid levels approached significance* These correlations were negative for unsaturated fatty acids, which means that TBA Numbers increase as the levels of unsaturated fatty acids decrease, as would be expected*
Thus, it appears that the changes in fatty acid composition caused by autooxidation are too small to be detected by the GLC procedure used in this work. The TBA test, on the other hand, proved to be a sensitive method for determining the carbonyl by-products of autooxidation*
It was suggested that autooxidation seems to depend more on the fatty acids of neutral lipids than those of phospholipids in raw muscle because the phospholipids, which are highly susceptible to autooxidation because of their high polyunsaturated fatty acid content, are in close association with muscle proteins and are therefore unavailable for reaction* In cooked muscles, however, phospholipids were found to play the major role in autooxidation; and it was assumed that this was because the phospholipid-protein associations were destroyed by heat*In rancid cooked muscles autooxidation was found to be independent of any one lipid level. It was assumed that this was because, in addition to autooxidation, lipase action would have affected the lipid levels during the 5 day holding period. Also, of course, during the late
183
stages of autooxidation, the less susceptible unsaturated fatty acids of neutral lipid would have been oxidised, as well as the highly susceptible polyunsaturated fatty acids of phospholipids*
4.2 MODE OP ACTION OF POLYPHOSPHATESIt is convenient at this stage to summarise the effects of
polyphosphates in frozen chickens, before going on to discuss the possible reasons for these effects.Polyphosphate treatment of eviscerated chicken carcases by injectioninto the breast muscles, prior to chilling and freezing, has been foundto affect the chicken in the following ways:
1* To have a variable effect on the amount of chill water uptakeand thaw and cook losses* The bulk of the present work suggested thatpolyphosphates have no effect on any of these levels, but a few resultsshowed that each of these levels were reduced due to treatment. Grey
18et al, reported these same inconsistent results. However, it must be stressed that they found that treatment resulted in a net increase in the weight of the carcase at all stages of processing and cooking, compared to untreated samples*
2* To result in increased amounts of haem compounds in the thaw losses of chickens after long-term storage, but not after short-term storage*
3* To have no measurable effect on the lipid and fatty acid composition of freshly cooked chicken muscles. However, there was some evidence to suggest that treatment resulted in decreased levels of phospholipid in raw muscles, and increased levels of unsaturated fatty acids in rancid cooked muscles.
4. To result in reduced TBA numbers in cooked muscles after the first day of holding, but to have no effect on raw muscle values.
I84
5* To result in increased moisture levels in raw pectoraiis major muscles, but to have no effect on the moisture content of pectoraiis minor or leg muscles.
6. To result in increased levels of calcium and magnesium in thaw losses, and decreased levels in cooked muscles and cook-out juices.
It should be noted that leg muscles from treated chickens were found to contain very little or no added phosphate. Therefore, there were no differences between the leg muscles from treated and untreated chickens, and each of the above points apply only to the pectoraiis major muscles.
Perhaps the most important finding of this work was that polyphosphate treatment was found to result in increased levels of calcium and magnesium in thaw losses, and decreased amounts in cooked muscles and their cook-out juices (and therefore in raw muscles).This finding proved that polyphosphates actually remove these metal ions from chicken muscles; whereas previous work by other workers has only indicated that polyphosphates alter the calcium and magnesium equilibrium in meat tissues.
Therefore, it seems that added polyphosphates are able to form stronger complexes than proteins with metals, resulting in loss of these metals from chicken muscles. However, the present work tells us nothing about the mechanism of this reaction; nor whether polyphosphates remove metal ions simply by virtue of their well-known metal chelation properties, or because of their structural similarity to ATP.
There was some indirect evidence to suggest that polyphosphates are associated in some way with the phospholipids of raw and cooked chicken tissues. This seems feasible since the polar phospholipids are themselves associated with muscle proteins, and would perhaps be affected by the removal of calcium and magnesium ions which bridge muscle proteins.
A further important point to arise from this work was that added polyphosphates were found to undergo considerable hydrolysis immediately after mixing with excised chicken muscle, and also sifter 15 and 45 months of frozen storage of the commercially injected chickens. This rapid hydrolysis on mixing has been found in other types of meat, but chicken tissues have not been studied in this way before. Also, no polyphosphate analyses have previously been carried out on chickens after prolonged frozen storage. Orthophosphate, the ultimate hydrolysis product, is not effective as an antioxidant, but cooked treated muscles after prolonged frozen storage have been found to have lower TBA numbers than untreated muscles. Therefore, injected polyphosphates must have some immediate and irreversible effect on chicken tissues. Metal- chelation leading to loss of metal ions from the treated thawed chicken, could well be such an immediate and irreversible reaction.
It must be remembered at this point that loss of calcium and magnesium from chicken tissues could both increase WHO and inhibit autooxidation, as explained in section 1.6.
Therefore, each of the 5 points above explain the effects of polyphosphates by their ability to chelate and remove calcium and magnesium from chicken tissues. However, this cannot be the sole reason for the effectiveness of polyphosphates because other workers have found that individual polyphosphate species and other metal- chelation agents such as EDTA do not affect meat tissues in proportion to their metal-chelatlon strength.
Lipid and fatty acid analyses failed to distinguish between treated and untreated samples. However, correlation coefficients between TBA Numbers and fatty acid levels indicated that polyphosphate treatment may result in increased amounts of unsaturated fatty acids being lost from cooked treated muscles compared to untreated muscles.
186
This effect would obviously help to account for the fact that cooked treated muscles have lower TBA Numbers than cooked untreated muscles • However, it was not possible from the present work to determine the mechanism by which this reaction could take place; unless it is connected with the suggestion that polyphosphates associate in some way with phospholipids.
This work has therefore proved that added polyphosphates remove calcium and magnesium from thawed chicken carcases, and this fact alone may partly explain the mode of action of polyphosphates. There was some evidence to suggest that added polyphosphates may also be associated with the phospholipids of raw and cooked tissues, and to result in loss of unsaturated fatty acids during cooking.
187
APPENDIX I BACTERIOLOGICAL EXAMINATION
In experiment 3*5 it was decided to check for the presence of micro-organisms in the cooked pectoraiis major muscles held at 4°C when it was noticed that there were no objectionable odours after 7 days of holding, and that the TBA Numbers of treated muscles remained very low. The method is outlined in section 2.8, and the qualitative nature of these results is also explained in this section.
Preliminary qualitative methods showed that after 8 days ofholding at 4°C samples of all 3 treated muscles showed colony growthafter incubation on nutrient Agar plates. No growth was apparent forany of the untreated samples. After 10 days of holding each treatedmuscle again showed colony growth and so did number 4, and to a lesserextent number 6 of the untreated samples. It has been suggested thatmicro-organisms destroy the carbonyl compounds measured in the TBA
145test, and, therefore, contaminated samples might be eaqpected to have reduced TBA Numbers. However, although the TBA Number of sample number 4 was always considerably lower than that of number 5 during 9 days of holding, that of number 6 was higher (Table lXb). No bacteriological tests were carded out on the raw muscles, and so the slightly higher TBA Numbers of treated samples compared to untreated samples (Table IXc) could not be checked against microbial growth, to see if micro-organisms do, in fact, reduce the carbonyl content of muscle.
Raw leg muscles after 7 days of holding at 4°C showed no overall differences in micro-organism content between muscles from treated and untreated chickens. These results would seem to bear out the results of section 3*42 and 3*791 that little or no polyphosphate reaches the leg muscle of treated chickens. However,Poster and Mead, 6 (see section 1.53 for experimental details), found
I
that whilst polyphosphate inhibited micro-organism growth in raw breast muscle, it had little effect on raw leg muscle.
This growth promotion effect of polyphosphate on cooked pectoraiis major muscle, is in direct conflict with the reasonably well established antimicrobial effects of polyphosphates (see section 1*35)* However, this antimicrobial effect has been reported in raw chicken muscles, and no results for cooked muscles have been found in the literature. This is understandable, since microbial spoilage is of much greater importance in raw meat because the cooking process destroys all vegetative micro-organisms. Unfortunately, no tests on raw pectoraiis major muscles were carried out here because detailed microbiological work was beyond the scope and time limit of this research. However, raw treated pectoraiis major muscles had objectionable rancid odours and a "sweaty" appearance after $ days of holding at 4°C, whilst untreated samples were of normal texture and had only slight off-odours after this time. In addition, all of the literature quoted in section 1.53 tested the microbial status of chicken tissues after immersion of the whole bird in polyphosphate solutions, or of intimate mixtures of polyphosphate and chicken muscle. It is conceivable that treatment by injection, as in this research, may affect the micro-organisms in a different way.
This is undoubtedly an area which warrants further research;especially in view of the fact that micro-organisms may destroy thecarbonyl compounds which are measured in the TBA test, and this couldhelp to account for the wide range of TBA Numbers found for similarly
146treated samples, as suggested by Moerck and Ball.
II
REFERENCES
1. Anon (1975) Phosphates for new food processing techniques.Pood Process. Ind., November, 32.
2. Morse, R.E. (1955) How phosphates can benefit meats. Pood Eng.,21, 84-3* Brotsky, E., Everson, C.W. (1975) Polyphosphate use in meat and
other muscle foods. Proc. Meat Ind. Res. Conf., 107*4* Hotter, L., Fischer, A. (1975) The influence of phosphates or
polyphosphates on the stability of foams and emulsions in meat technology. Die Fleisehwirtschaft, j>, 365?
5* Froning, G.W. (1966) Effect of various additives on the bindingproperties of chicken meat. Poult. Sci., 45,* 185*
6. Schermerhom, E.P., Adams, R.L., Stadelman, W.J. (1963) Effects of polyphosphates on water uptake, moisture retention, and cooking loss in broilers. Poult. Sci., 42, 107*
7* Landes, D.R. (1972) The effects of polyphosphates on severalorganoleptic, physical, and chemical properties of stored precooked frozen chickens. Poult. Sci., 51. 641*
8. Tims, M.J., Watts, B.M. (1958) Protection of cooked meats with phosphates. Pood Teohnol., 12, 240.
9# lies, N.A. (1975) Phosphates in meat and meat products - a survey. BFMIRA Sci. Tech. Survey No.81.
10. Mahon, J.H., Schlamb, K., Brotsky, E. (1971) General concepts applicable to the use of polyphosphates in red meat, poultry, and seafood processing. Phosphates in Food Processing Ed. DeMan and Melnychyn (Avi Pub. Co., Inc., Westport, Conn.) p. 158.
11. KLose, A.A., Campbell A.A., Hanson, H.L. (1963) Influence of polyphosphates in chilling water on quality of poultry meat.Poult. Sci., 42, 745*
12. Parr, A.J., May, K.N. (1970) The effect of polyphosphates and sodium chloride on cooking yields and oxidative stability of chicken. Poult. Sci., 42, 268.
13* Albright and Wilson Ltd. (1967) Cooking poultry with phosphate.Brit. Pat. No. 1,087,289*
14* Albright and Wilson Ltd. (1967) Poultry treatment with solidphosphate. Brit. Pat. No. 1,087,290.
15* Albright and Wilson Ltd. (1977) Preservation of meat. Brit. Pat*No. 1,460,913-
lb. Brotsky, E. (1976) Automatic injection of chicken parts with polyphosphate. Poult. Sci., 653*
17* Van Hoof, J., Daelman, W. (1975) The use of monosodiumglutamate and polyphosphates during slaughter and chilling of broilers: Influence on the 'drip-volume and the analysis of the residues after defrosting. Proc. of the Second Europ. Symp. on Poult. Meat Quality, p.44f (Ed* Erdtsieck, B) Spelderholt Institute for Poultry Research, Beekbergen, The Netherlands.
188
18* Grey, T.C., Robinson, D., Jones, J.M. (1978) The effects on broiler chicken of polyphosphate injection during commercial processing. J. Food Technol., lj, 529*
19* Albright and Wilson Ltd. ,(1972) Puron metering unit. Technical Service Rote.
20. Albright and Wilson Ltd., (1977) The treatment of poultry by injection with Puron polyphosphate, Technical Service Rote.
21. Truman, R.W., Dickes, G.J. (1978) The detection of polyphosphate added to frozen chicken. J. Assoc. Publ. Analysts, 1£, 5*
22. Hamm, R. (1973) Water-holding capacity of meat. Proc. of the 21 Easter School in Agric. Sci., IJniv. Rottingham, 1974 (Butterworths).p. 321.
23* Tarrant, P.V. (1975) The biochemistry of meat quality. Rutr. Food Sci., 41, 11
24. Callow, E.H. (1952) Frozen meat. J. Sci. Food Agric., 3 , 45*25. Penny, I.F. (1974) The effect of freezing on the amount of drip
from meat. Proc. M.R.I. Symp. No.3 Heat Freezing : why and how. p.8.26. Osner, R.C., Shrimp ton, D.H. (1966) Relation between loss of fluid
from thawing chicken carcases and uptake of water during processing. Brit. Poult. Sci., 2, 135*
27. Erdtsieck, B. (1975) Ou the water absorption during poultry processing. Proc. of the Second Europ. Sym. on Poult. Meat Quality, p. 3 9 1 (Ed. Erdtsieck,B) Spelderholt Institute for Poultry Research, Beekbergen, The Retherlands.
28. EEC legislation directive Ro. 71A 18 and its amendment Ro. 75/431 •
29* Roberts, D.E. (1974) Poultry meat hygiene - the next three years. R.S.H., j>, 226.
30. Thomas, R.L. (1977) The continuous chilling of poultry in relation to EEC requirements. J. Food Technol., 12, 99.
31. EEC regulation Ro. 2967/76.
32. Food and Drugs Act 1955*
33. Jul, M. (1975) Proc. of the Second Europe Symp. on Poult. Meat Quality,p.38. (Ed. Erdsieck, B) Spelderholt Institute for Poultry Research,Beekbergen, The Retnerlanas.34* Schermerhorn, E.P., Stadelman, W.J. (1964) Treating hen carcases with polyphosphates to control hydration and cooking losses.Food Technol., 18, 101.
35* Monk, J.A., Mountney, G.J., Prudent, I. (1964) Effect of phosphate treatment and cooking method on moisture losses of poultry meat.Food Technol., 18, 226.
36. May, K.R., Helmer, R.L., Saffle, R.L. (1963) Effect of phosphate treatment on carcase-weight changes and organoleptic quality of cut-up chicken. Poult. Sci., 42, 24.
37* Keller, J.D., Kinsella, J.E. (1973) Phospholipid changes and lipid oxidation during cooking and frozen storage of raw ground beef.J. Food Sci., j58, 1200.
189
38. Keskinel, A., Ayres, J.C., Snyder, H.E. (1964) Determination of oxidative changes in raw meats by the 2-thiobarbituric acid method. Food Technol., 18, 223•
39* Shorland, F.B. (1976) Deteriorative changes in frozen meat.New Zealand J. Sci., 12, 199
40. Jacobson, M., Koehler, H.H. (1970) Development of rancidity during short-time storage of cooked poultry meat. J. Agric. Food Chem.,
1069.41* Galliard, T. (1975) Biochemical causes of rancidity. I.F.S.T. Proc.,
6, 188.42. Enser, M. (1974) Factors affecting the development of oxidative
rancidity in frozen meat. Proc. M.R.I. Symp. No.3 Meat freezing : why and how. p. 11.
45- Fristrom, G.A., Weihrauch, J.L. (1976) Comprehensive evaluation of fatty acids in foods. J. Am. Diet. Assoc., 62, 517*
44. Kinsella, J.E., Posati, L., Weihrauch, J., Anderson, B. (1975)Lipids in foods : problems and procedures in collating data.CRC Critical Reviews in Food Technol., 2* 299*
45* Love, J.D., Pearson, A.M. (1971) Lipid oxidation in meat and meat products - a review. J. Am. Oil Chem. Soc., ^8 , 547*
46. Marion, J.E., Woodroof, J.G. (1965) Lipid fractions of chicken broiler tissues and their fatty acid composition. J. Food Sci.,2 0, 38.
47 • Marion, J.E., Miller, W.O. (1968) Phospholipids and component fatty acids in chicken tissues. Poult. Sci., £J_, 1455*
48. Hay, J.D., Currie, R.W., Wolfe, F.H. (1975) Effect of postmortem aging on chicken muscle lipids. J. Food Sci., jj& , 696.
49* Davidkova, E., Khan, A.W. (1967) Changes in lipid composition of chicken muscle during frozen storage. J. Food Sci., 32, 35*
50. El-Warraki, A.G., Abdel Aziz, M.A., Goma, M.A., El-Zifzaf, S.Y. (1975) Changes in the lipids of frozen chickens. Elelmiszerwizsgalati Kozlemenyek, 21, 318.
51. Chang, I.C.L., Watts, B.M. (1952) The fatty acid content of meat and poultry before and after cooking. J. Am. Oil Chem. Soc.,August, 354*
52. Myers, S.J., Harris, N.D. (1975) Effect of electronic cooking on fatty acids in meats. J. Am. Diet. Assoc., 67, 232.
53* Schuler, G.A., Essaiy, E.O. (1971) Fatty acid composition of lipids from broilers fed saturated and unsaturated fats. J. Food Sci.,2£* 451
54* Edwards Jr., H.M., Denman, F., Abou-Ashour, A., Nugara, D. (1975) Influences of age, sex and type of dietary fat supplementation on total carcase and fatty acid composition. Poult. Sci., 52, 954*
55* Jen, J.J., Williams Jr., W.P., Acton, J.C., Paynter, V.A. (1971)Effect of dietary fats on the fatty acid contents of chicken adipose tissue. J. Food Sci., ^ 6 , 925
56. Singh, S.P., Essary, E.O. (1974) Factors influencing dressingpercentage and tissue composition of broilers. Poult. Sci., 22* 2143•
190
57* Veen, W.A.G. (1975) She influence of animal fat, hydrogenatedfish oil and several vegetable oils on fatty acid composition and taste of broiler carcases. Proc. of the Second Europ. Symp. on Poult. Meat Quality, p. 47* (Ed, Erdtsieck, B.). Spelderholt Institute for Poultry Research, Beekbergen, The Netherlands.
58. Marion, J.E., Boggess Jr., I.S., Woodroof, J.G. (1967) Effect of dietary fat and protein on lipid composition and oxidation in chicken muscle. J. Pood Sci., j£2, 426.
59* Marion, J.E., Woodroof, J.G. (1966) Composition and stability of broiler carcases as affected by dietary protein and fat.Poult. Sci., j g j 241
60. Bartov, I., Bomstein, S. (1976) Minimum levels of dietary oils, grain oils or supplementary oil, affecting the composition and stability of carcase fat and meat of broilers. Poult. Sci., 55 > 1036.
61. Kochar, S.P. (1975) A survey of the literature on oxidative reactions in edible oils as it applies to the problem of off-flavours in foodstuffs. B.F.M.I.R.A* Sci. Tech. Survey No. 87*
62. TJri, N. (1975) 2he chemical causes of oxidative rancidity.I.F.S.T. Proc., 6, 179.
65. Rampley, D.N., Hasnip, J.A. (1976) Autooxidation and antioxidants.J. Oil Col. Chem. Assoc., 59. 556.
64* El-Zeany, B.A., Pokomy, J., Janicek, 0. (1974) Effect of metals on the autooxidation of lipid-protein mixtures and on the lipid browning reaction. Third International Symp. on Metal-Catalysed Lipid Oxidation, Institute des Corps Gras, Paris. P. 177*
65* Ohlson, R. (1974) Pats and oils demetalisation : Its influence on their oxidative stability. Ibid. p. 184.
66. Hirano, Y., Olcott, H.S. (1971) Effect of haem compounds on lipid oxidation. J. Am. Oil Chem. Soc., 4§, 525.
67* Love, J.D., Pearson, A.M. (1974) Metnjyoglobin and nonhaem iron as prooxidants in cooked meat. J. Agric* Pood Chem., 22. 10J2
68. Easchnitz, R.M., Hatefi, Y. (1975) Lipid oxidation in biological membranes. Archives of Biochem. and Biophys., 171. 292.
69* Love, J.D., Pearson, A.M. (1976) Metmyoglobin and nonhaem iron as prooxidants in egg-yolk phospholipid dispersions and cooked meat.J. Agric. Pood Chem., 24, 494*
70. Henick, A.S., Benca, M.P., Mitchell Jr., J.H. (1954) Estimating carbonyl compounds in rancid fats and foods. J. Am. Oil Chem. Soc., 31, 88.
71* Hiatt, R.R. (1975) Hydroperoxide destroyers and how they work. Critical Reviews in Food Sci. and Nutr*, 2*
72. Tarladgis, B.G. (1968) The ligandfield theory and the mechanism of the haem catalysed lipid oxidation. Metal Catalysed Lipid Oxidation. Ed. Marcuse, R. S1E Report No. 240, Goteborg, p. 155.
75* Lillard, D.A., Day, E.A. (1964) Degradation of monocarbonyls from antooxidising lipids. J. Am. Oil Chem. Soc., 41, 549.
74* Loury, M. (1972) Possible mechanisms of autooxidative rancidity. Lipids, 2, 671.
191
75* Michalski, S.T., Hammond, E.G. (1972) Use of labelled compounds to study the mechanism of flavour formation in oxidising fats.J. 1m. Oil Chem. Soc., 42., 563*
76. Pokomy, J. (1972) Protection of lipids against autooxidation. Zeszyty Problemowe Postepow Nauk Rolniczych, 156. 45•
77* Boehm, E.E., Maddox, D.N. (1975) Phenolic antioxidants. I.F.S.T. Proc#, j6, 210.
78. KLaui, E. (1973) Naturally occurring antioxidants. Ibid. p. 195*79* Berger, G. (1975) Catalysis and inhibition of oxidation processes.
Chem. Ind., 194*80. Pokomy, J., Luan, Rr-T., Kondratenko, S.S., Janicek, G. (1976)
Changes of sensory value by interaction of alkanals with amino acids and proteins. Die Nahrong, 20, 267*
81. Kanner, J., Mendel, H. (1977) Prooxidant and antioxidant effects of ascorbic acid and metal salts in a p-carotene-linoleate model system. J. Pood Sci., £ 2 , 60.
82. Anon (1975) Antioxidants. Brit. Pood J., May/June, 73*85. Greene, B.E. (1969) Lipid oxidation and pigment changes in raw beef.
J. Pood Sci., 110.84* Marion, W.W., Porsythe, E.H. (1962) Protection afforded lipids of
turkey meat by butylated hydroxyanisole, egg white solids, gelatin and tripolyphosphate (Kena). Poult. Sci., 41. I663.
85. Sari, B.R. (1961) Antioxidant effect of polyphosphates in cured meat products. Pleischwirtschaft, 15. 403.
86. Thomson, J.E. (1964) Effect of polyphosphates on oxidative deterioration of commercially cooked fryer chickens.Pood Technol., 18.1805.
87* Turner, E.W., Paynter, W.D., Montie, E.J., Bessert, M.W.,Struck, G.M., Olson, P.C. (1954) Use of the 2-thiobarbituric acid reagent to measure rancidity in frozen pork. Pood Technol., 8, 326.
88. Tarladgis, B.G., Watts, B.M., Younathan, M.T. (I960) A distillation method for the quantitative determination of malonaldehyde in rancid foods. J. Am. Oil Chem. Soc., 57. 44*
89* Dawson, L.E., Sison, E.C. (1973) Stability and acceptability of phosphate-treated and precooked chicken pieces reheated with microwave energy. J. Food Sci., 58. 161.
90. Rao, CH. S., Dilworth, B.C., Day, E.J., Chen, T.C. (1975) Effects of polyphosphates on the flavour volatiles of poultry meat.J. Pood Sci., 40, 847*
91. Rao, CH. S., Day, E.J., Chen, T.C., Crawford, D.A., Minyard, J.P. (1976) Effects of polyphosphates on carbonyl volatiles of poultry meat. J. Pood Sci., 41, 241.
92. Hargreaves, L.L., Wood, J.M., Jarvis, B. (1972) The antimicrobial effect of phosphates with particular reference to food products. B.F.M.I.R.A. Sci. Tech. Survey No. 76.
93* Spencer, J.V., Smith, L.E. (1962) The effect of chilling chicken fryers in a solution of polyphosphates upon moisture uptake, microbial spoilage, tenderness, juiciness, and flavour.Poult. Sci., 4 1, 1685•
192
94* Steinhaner, J.E., Banwart, G.J. (1964) The effect of food grade polyphosphates on the microbial population of chicken meat.Poult. Sci., 42, 618.
95* Elliott, R.P., Straka, K.P., Garibaldi, J.A. (1964) Polyphosphate inhibition of growth of pseudomonads from poultry meat. Applied Microbiol., 12, 517.
96. Poster, R.D., Mead, G.C. (1976) Effect of temperature and added polyphosphate on the survival of salmonellae in poultry meat during cold storage. J. Applied Bacteriol., 41, 505*
97* Bendall, J.R. (1954) The swelling effect of polyphosphates on lean meat. J. Sci. Pood Agric., 2* 468.
98. Sherman, P. (1961) The water binding capacity of fresh pork. 1.Pood Technol., 1£, 79*
99* Sherman, P. (1962) The water binding capacity of fresh pork. 4*Ibid, 16, 91.
100. Hamm, R. (1971) Interactions between phosphates and meat proteins. Phosphates in Pood Processing. Ed. DeMan and Melnychyn (Avi. Pub.Co., Inc., Westport, Conn), p.65*
101. Inklaar, P.A. (1967) Interaction between polyphosphates and meat.J. Pood Sci., 22, 525*
102. Baldwin, T.T., deMan, J.M. (1968) Mineral composition of meat treated with citrate and phosphates. J. Inst. Can. Technol.Aliment., .1, 164*
105* Bendall, J.R. (1970) Muscles, molecules and movement. (Heinemann).IO4. Yasui, T., Sakanishi, M., Hashimoto, Y. (1964) Effect of
inorganic polyphosphates on the solubility and extractibility of myosin B. Agric. and Pood Chem., 12. 592.
105* Yasui, T., Pukazawa, T., Takahashi, K., Sakanishi, M., Hashimoto, Y. (1964) Specific interaction of inorganic polyphosphates with myosin B. Ibid, 599*
106. Lewis, D.F., Jewell, G.G. (1975) Personal communication.107. Watanabe, M. (1974) The mechanism of the hydrolysis of condensed
phosphates. 1. Bull, of the Chem. Soc. of Japan, 47. 2048.108. Watanabe, M., Sato, S., Saito, H. (1975) The mechanism of the
hydrolysis of condensed phosphates. 111. Ibid. 48. 5593•109. Watanabe, M., Sato, S., Saito, H. (1976) The mechanism of the
hydrolysis of condensed phosphate. IV. Ibid. 49, 2474*110. O’Heill, I.K., Richards, C.P. (1978) Specific detection of
polyphosphates in frozen chicken by combination of enzyme blocking and 3lp HMR spectroscopy. Chem. Ind., 65.
111. Jozefowicz, M.L., 0Weill, I.K., Prosser, H.J., Richards, C.P. (1976) Quantitative **-3c and 31p FTHMR in food applications. Paper given at NATO Advanced Study Institute on Advances in HMR, Sicily.
112. Mihalyi-Kengyel, V., Kormendy, L. (1973) Behaviour of polyphosphates during the storage of meat products. Acta Aliment., 2 , 69.
113. Sutton, A.H. (1973) The hydrolysis of sodium triphosphate in cod and beef muscle. J. Food Technol., 8(, 185*
193
114* Neraal, R., Haimn, R. (1977a*) On the enzymatic breakdown oftripolyphosphate and diphosphate in minced meat. 1. Z. Lebensm. Unters.-Forsch., 165. 14*
115* Neraal R., Hamm, R. (1977k•) On the enzymatic breakdown oftripolyphosphate and diphosphate in minced meat. 11. Ibid, 18.
116. Neraal, R., Hamm, R. (1977c.) On the enzymatic breakdown oftripolyphosphate and diphosphate in minced meat. 111. Ibid. 125*
117* Van Hoof, J. (1975) Breakdown of diphosphate and tripolyphosphate in pork. Proc. of the Europ. Meeting of Meat Res. Workers No. 21, 55.
118. Awad, M.K. (1968) Hydrolysis of polyphosphates added to meat.M. Sc .Thesis, Dept. Food Sci., Univ. Alberta, Edmonton.
119* Pearson, D. (1968) Assessment of meat freshness in qualitycontrol employing chemical techniques : A review. J. Sci. Food Agric., 12, 357*
120. Tarladgis, B.G., Watts, B.M. (I960) Malonaldehyde productionduring the controlled oxidation of pure, unsaturated fatty acids.J. Am. Oil Chem. Soc., 57. 405*
121. Tarladgis, B.G., Pearson, A.M., Dugan Jr., L.R. (1962) TheChemistry of the 2-thiobarbituric acid test for the determination of oxidative rancidity in foods. 1. Ibid. 59. 34*
122. Tarladgis, B.G., Pearson, A.M., Dugan Jr., L.R. (1964) Chemistry of the 2-thiobarbituric acid test for the determination of oxidative rancidity in foods. 11. J. Sci. Food Agric., 15. 602.
123* Yu, T.C., Sinnhuber, R.O. (1957) 2-thiobarbituric acid method for the measurement of rancidity in fishery products. Food Technol.,11, 104.
124* Pearson, D. (1968) Application of chemical methods for theassessment of beef quality. 111. J. Sci. Food Agric., 19. 553*
125* Perkins, E.G., Means, J.C., Picciano, M.F. (1977) Recent advances in the instrumental analysis of lipids. French Review des Corps Gras, 73*
126. Kates, M. (1972) Techniques of lipidology. (North-Holland Pub. Co. Amsterdam).
127* Bligh, E.G., Ityer, W.J. (1959) A rapid method of total lipidextraction and purification. Can. J. Biochem. Physiol., 37. 911*
128. Carroll, K.K. (1963) Acid-treated Florisil as an adsorbent forcolumn chromatography. J. Am. Oil Chem. Soc., 40. 413*
129* Mangold, H.K., Malins, D.C. (I960) Fractionation of fats, oils, and waxes on thin layers of silicic acid. Ibid. 37. 383.
130. Skipski, V.P., Peterson, R.F., Barclay, M. (1964) Quantitativeanalysis of phospholipids by thin-layer chromatography.Biochem. J., £0, 374*
131* Randerath, K. (1966) Thin-layer chromatography. (Verlag Chemie.Academic Press) 2nd Edition, p. 154*
132. Peisker, K V. (1964) A rapid semi-micro method for preparation ofmethyl esters from triglycerides using chloroform, methanol, sulphuric acid. J. Am. Oil Chem. Soc., 41. 87.
194
135* Thomas, K. (1975) The separation of three fatty acids (stearic, oleic and linoleic) present in poultry meat using gas-liquid chromatography. Project Report, Dept. Chemistry, Sheffield City Polytechnic.
134* Bartlet, J.C. (1966) Estimation of fatty acid composition by gas chromatography using peak heights and retention time. J.A.O.A.C.
21.135* Gibson, D •M., Murray, C.K. (1975) Polyphosphates and fish: some
chemical studies. J. Pood Technol., 8 f 197-136. Mikes, 0. (1966) Laboratory handbook of chromatographic methods.
(D. Van Nostrand Co.Ltd., London), p. 154*137. Moon, R.B., Richards, J.E. (1975) Determination of intracellular
pH by 31p magnetic resonance. J. Biol. Chem., 248. 7276.138. Wilson, B.R., Pearson, A.M., Shorland, P.B. (1976) Effect of
total lipids and phospholipids on warmed-over flavour in red and white muscle from several species as measured by thiobarbituric acid analysis. J. Agric. Pood Chem., 2£, 7*
139. Grey, T.C., Robinson, D., Jones, J.M. (1977) The detection of polyphosphate in broiler chicken breast muscle. J. Sci. Pood Agric., 28, 822.
140. Neville, A.M., Kennedy, J.B. (1968) Basic statistical methods for engineers and scientists. (Scranton, International Textbook Co.).
141 Adams, C.P. (1975) Nutritive value of American foods. Agric. Handbook No. 456, USBA, Washington, B.C.
142. Rognerud, G. (1972) Contents of some nutrients in raw and prepared chicken. 1. Tidsskrift For Hermetikindustri, 35. 123*
143* Zenoble, O.C., Bowers, J.A. (1977) Copper, zinc and iron content of turkey muscles. J. Food Sci., 42, 1408.
144* Arafa, A.S, Chen, T.C. (1976) Quality characteristics ofconvenience chicken products as related to packaging and storage.J. Food Sci., ^i, 18.
145* Bawson, L.E., Schierholz, K. (1976) Influence of grinding, cooking and refrigerated storage on lipid stability in turkey. Poult. Sci.,
618.146. Moerck, K.E., Ball Jr., H.R. (1974) Lipid autooxidation in
mechanically deboned chicken meat. J. Pood Sci., 876.
195