A seventy-two-year record of diminishing deep-water oxygen in the St. Lawrence estuary: The...
13
1654 Limnol. Oceanogr., 50(5), 2005, 1654–1666 q 2005, by the American Society of Limnology and Oceanography, Inc. A seventy-two-year record of diminishing deep-water oxygen in the St. Lawrence estuary: The northwest Atlantic connection Denis Gilbert 1 Maurice Lamontagne Institute, Fisheries and Oceans Canada, P.O. Box 1000, Mont-Joli, Que ´bec G5H 3Z4, Canada Bjorn Sundby Institut des Sciences de la Mer de Rimouski, 310 Alle ´e des Ursulines, Rimouski, Que ´bec G5L 3A1, Canada; Department of Earth and Planetary Sciences, McGill University, 3450 University Street, Montre ´al, Que ´bec H3A 2A7, Canada Charles Gobeil Maurice Lamontagne Institute, Fisheries and Oceans Canada, P.O. Box 1000, Mont-Joli, Que ´bec G5H 3Z4, Canada; Institut National de la Recherche Scientifique, Centre Eau, Terre et Environnement, 490 rue de la Couronne, Que ´bec G1K 9A9, Canada Alfonso Mucci Department of Earth and Planetary Sciences, McGill University, 3450 University Street, Montre ´al, Que ´bec H3A 2A7, Canada Gilles-H. Tremblay Maurice Lamontagne Institute, Fisheries and Oceans Canada, P.O. Box 1000, Mont-Joli, Que ´bec G5H 3Z4, Canada Abstract Oxygen concentrations in the bottom waters of the Lower St. Lawrence estuary (LSLE) decreased from 125 mmol L 21 (37.7% saturation) in the 1930s to an average of 65 mmol L 21 (20.7% saturation) for the 1984–2003 period. A concurrent 1.658C warming of the bottom water from the 1930s to the 1980s suggests that changes in the relative proportions of cold, fresh, oxygen-rich Labrador Current Water (LCW) and warm, salty, oxygen-poor North Atlantic Central Water (NACW) in the water mass entering the Laurentian Channel probably played a role in the oxygen depletion. We estimate that about one half to two thirds of the oxygen loss in the bottom waters of the LSLE can be attributed to a decreased proportion of LCW. This leaves between one third and one half of the oxygen decrease to be explained by causes other than changes in water mass composition. An increase in the along-channel oxygen gradient from Cabot Strait to the LSLE over the past decades, combined with data from sediment cores, suggests that increased sediment oxygen demand may be partly responsible for the remainder of the oxygen decline. In July 2003, approximately 1,300 km 2 of seafloor in the LSLE was bathed in hypoxic water (,62.5 mmol L 21 ). Severe hypoxia is a condition that occurs in the water column when oxygen (O 2 ) falls below the 2 mg L 21 or 62.5 1 Corresponding author ([email protected]). Acknowledgments Alain Gagne ´ and Laure Devine provided oxygen data collected as part of Canada’s Atlantic Zone oceanographic monitoring pro- gram. Michel Starr made available oxygen measurements from the Rimouski oceanographic monitoring station in 2002 and 2003. Claude Savenkoff provided oxygen data from the Gulf of St. Lawr- ence JGOFS program and a digitized version of the data set col- lected by the McGill University Marine Science Centre in the late 1960s and early 1970s. Discussions with Anne de Vernal helped interpret the sedimentary record. We thank the anonymous review- ers as well as Mary Scranton, Brian Petrie, Charles Hannah, and Claude Savenkoff for comments on a previous version of the paper. The captains and crews of the R/V Alcide C. Horth, the R/V Cor- iolis II, and DFO research vessels provided essential assistance dur- ing field operations. The study was financed by the Natural Sciences and Engineering Research Council of Canada and the Department of Fisheries and Oceans Canada. mmol L 21 level necessary to sustain most animal life (Diaz and Rosenberg 1995). Hypoxia occurs naturally in many coastal environments with restricted circulation, such as fjords, but hypoxia in coastal and estuarine areas with less restricted circulation appears to be on the rise due to an- thropogenic nutrient loading and coastal eutrophication (Cloern 2001). Environments with a shallow, seasonally stratified water column can be ventilated by seasonal mix- ing events and are not generally hypoxic throughout the year (Rabalais et al. 2001). We report here on the recent emergence of persistent, year-round hypoxia (,62.5 mmol L 21 ) in the Lower St. Lawrence estuary, an estuarine system that receives the second largest freshwater discharge in North America (10,900 m 3 s 21 ; Bourgault and Koutitonsky 1999). The dominant bathymetric feature in the Lower St. Law- rence estuary (LSLE) is the Laurentian Channel, a submarine valley with depths everywhere exceeding 250 m. The Chan- nel extends 1,240 km landward from the continental shelf edge to Tadoussac (Fig. 1). The circulation in the Laurentian
Transcript of A seventy-two-year record of diminishing deep-water oxygen in the St. Lawrence estuary: The...

1654
Limnol. Oceanogr., 50(5), 2005, 1654–1666q 2005, by the American Society of Limnology and Oceanography, Inc.
A seventy-two-year record of diminishing deep-water oxygen in theSt. Lawrence estuary: The northwest Atlantic connection
Denis Gilbert1
Maurice Lamontagne Institute, Fisheries and Oceans Canada, P.O. Box 1000, Mont-Joli, Quebec G5H 3Z4, Canada
Bjorn SundbyInstitut des Sciences de la Mer de Rimouski, 310 Allee des Ursulines, Rimouski, Quebec G5L 3A1, Canada; Departmentof Earth and Planetary Sciences, McGill University, 3450 University Street, Montreal, Quebec H3A 2A7, Canada
Charles GobeilMaurice Lamontagne Institute, Fisheries and Oceans Canada, P.O. Box 1000, Mont-Joli, Quebec G5H 3Z4, Canada;Institut National de la Recherche Scientifique, Centre Eau, Terre et Environnement, 490 rue de la Couronne,Quebec G1K 9A9, Canada
Alfonso MucciDepartment of Earth and Planetary Sciences, McGill University, 3450 University Street, Montreal,Quebec H3A 2A7, Canada
Gilles-H. TremblayMaurice Lamontagne Institute, Fisheries and Oceans Canada, P.O. Box 1000, Mont-Joli, Quebec G5H 3Z4, Canada
Abstract
Oxygen concentrations in the bottom waters of the Lower St. Lawrence estuary (LSLE) decreased from 125 mmolL21 (37.7% saturation) in the 1930s to an average of 65 mmol L21 (20.7% saturation) for the 1984–2003 period. Aconcurrent 1.658C warming of the bottom water from the 1930s to the 1980s suggests that changes in the relativeproportions of cold, fresh, oxygen-rich Labrador Current Water (LCW) and warm, salty, oxygen-poor North AtlanticCentral Water (NACW) in the water mass entering the Laurentian Channel probably played a role in the oxygendepletion. We estimate that about one half to two thirds of the oxygen loss in the bottom waters of the LSLE can beattributed to a decreased proportion of LCW. This leaves between one third and one half of the oxygen decrease tobe explained by causes other than changes in water mass composition. An increase in the along-channel oxygengradient from Cabot Strait to the LSLE over the past decades, combined with data from sediment cores, suggests thatincreased sediment oxygen demand may be partly responsible for the remainder of the oxygen decline. In July 2003,approximately 1,300 km2 of seafloor in the LSLE was bathed in hypoxic water (,62.5 mmol L21).
Severe hypoxia is a condition that occurs in the watercolumn when oxygen (O2) falls below the 2 mg L21 or 62.5
1 Corresponding author ([email protected]).
AcknowledgmentsAlain Gagne and Laure Devine provided oxygen data collected
as part of Canada’s Atlantic Zone oceanographic monitoring pro-gram. Michel Starr made available oxygen measurements from theRimouski oceanographic monitoring station in 2002 and 2003.Claude Savenkoff provided oxygen data from the Gulf of St. Lawr-ence JGOFS program and a digitized version of the data set col-lected by the McGill University Marine Science Centre in the late1960s and early 1970s. Discussions with Anne de Vernal helpedinterpret the sedimentary record. We thank the anonymous review-ers as well as Mary Scranton, Brian Petrie, Charles Hannah, andClaude Savenkoff for comments on a previous version of the paper.The captains and crews of the R/V Alcide C. Horth, the R/V Cor-iolis II, and DFO research vessels provided essential assistance dur-ing field operations. The study was financed by the Natural Sciencesand Engineering Research Council of Canada and the Departmentof Fisheries and Oceans Canada.
mmol L21 level necessary to sustain most animal life (Diazand Rosenberg 1995). Hypoxia occurs naturally in manycoastal environments with restricted circulation, such asfjords, but hypoxia in coastal and estuarine areas with lessrestricted circulation appears to be on the rise due to an-thropogenic nutrient loading and coastal eutrophication(Cloern 2001). Environments with a shallow, seasonallystratified water column can be ventilated by seasonal mix-ing events and are not generally hypoxic throughout theyear (Rabalais et al. 2001). We report here on the recentemergence of persistent, year-round hypoxia (,62.5 mmolL21) in the Lower St. Lawrence estuary, an estuarine systemthat receives the second largest freshwater discharge inNorth America (10,900 m3 s21; Bourgault and Koutitonsky1999).
The dominant bathymetric feature in the Lower St. Law-rence estuary (LSLE) is the Laurentian Channel, a submarinevalley with depths everywhere exceeding 250 m. The Chan-nel extends 1,240 km landward from the continental shelfedge to Tadoussac (Fig. 1). The circulation in the Laurentian
1655St. Lawrence estuary deep-water oxygen
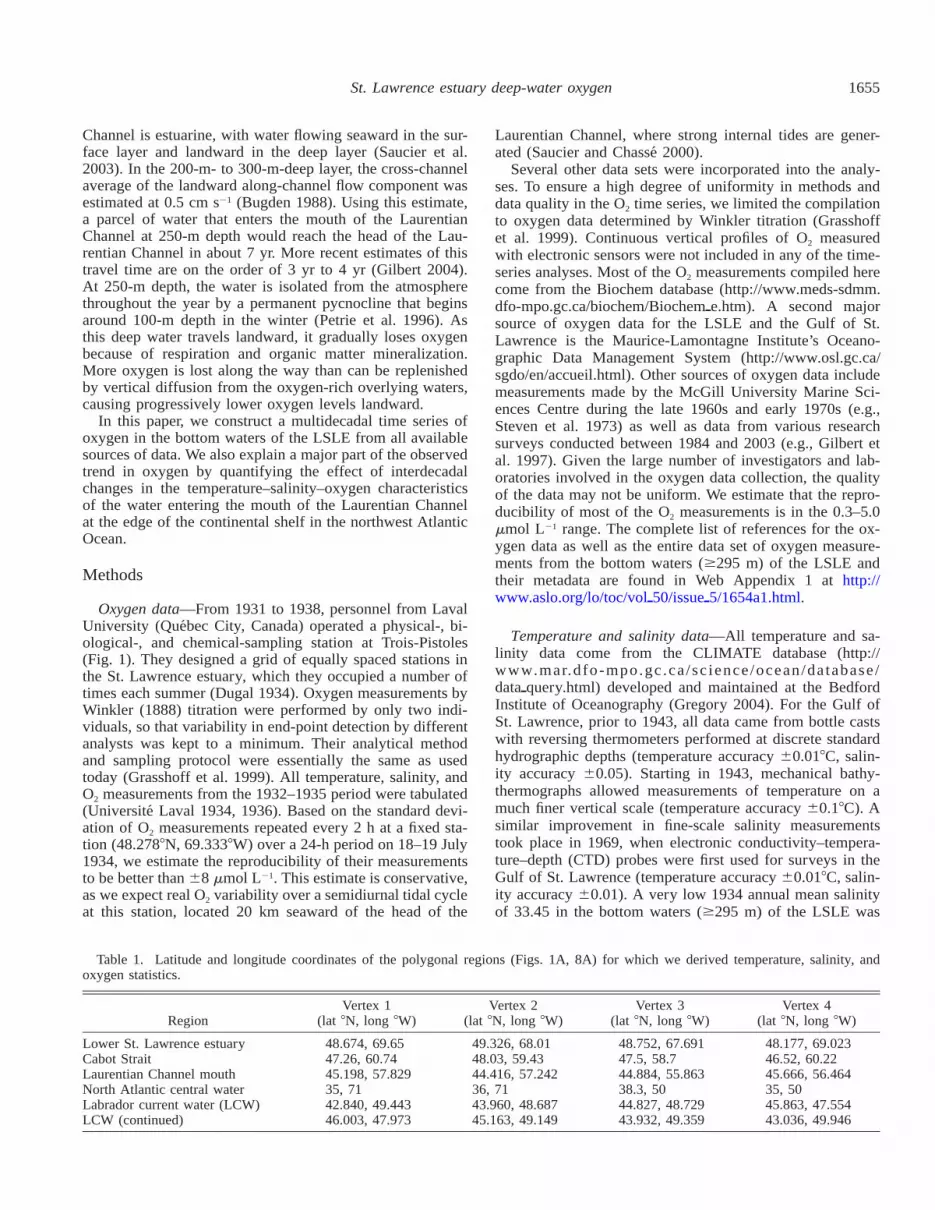
Table 1. Latitude and longitude coordinates of the polygonal regions (Figs. 1A, 8A) for which we derived temperature, salinity, andoxygen statistics.
RegionVertex 1
(lat 8N, long 8W)Vertex 2
(lat 8N, long 8W)Vertex 3
(lat 8N, long 8W)Vertex 4
(lat 8N, long 8W)
Lower St. Lawrence estuaryCabot StraitLaurentian Channel mouthNorth Atlantic central waterLabrador current water (LCW)LCW (continued)
48.674, 69.6547.26, 60.7445.198, 57.82935, 7142.840, 49.44346.003, 47.973
49.326, 68.0148.03, 59.4344.416, 57.24236, 7143.960, 48.68745.163, 49.149
48.752, 67.69147.5, 58.744.884, 55.86338.3, 5044.827, 48.72943.932, 49.359
48.177, 69.02346.52, 60.2245.666, 56.46435, 5045.863, 47.55443.036, 49.946
Channel is estuarine, with water flowing seaward in the sur-face layer and landward in the deep layer (Saucier et al.2003). In the 200-m- to 300-m-deep layer, the cross-channelaverage of the landward along-channel flow component wasestimated at 0.5 cm s21 (Bugden 1988). Using this estimate,a parcel of water that enters the mouth of the LaurentianChannel at 250-m depth would reach the head of the Lau-rentian Channel in about 7 yr. More recent estimates of thistravel time are on the order of 3 yr to 4 yr (Gilbert 2004).At 250-m depth, the water is isolated from the atmospherethroughout the year by a permanent pycnocline that beginsaround 100-m depth in the winter (Petrie et al. 1996). Asthis deep water travels landward, it gradually loses oxygenbecause of respiration and organic matter mineralization.More oxygen is lost along the way than can be replenishedby vertical diffusion from the oxygen-rich overlying waters,causing progressively lower oxygen levels landward.
In this paper, we construct a multidecadal time series ofoxygen in the bottom waters of the LSLE from all availablesources of data. We also explain a major part of the observedtrend in oxygen by quantifying the effect of interdecadalchanges in the temperature–salinity–oxygen characteristicsof the water entering the mouth of the Laurentian Channelat the edge of the continental shelf in the northwest AtlanticOcean.
Methods
Oxygen data—From 1931 to 1938, personnel from LavalUniversity (Quebec City, Canada) operated a physical-, bi-ological-, and chemical-sampling station at Trois-Pistoles(Fig. 1). They designed a grid of equally spaced stations inthe St. Lawrence estuary, which they occupied a number oftimes each summer (Dugal 1934). Oxygen measurements byWinkler (1888) titration were performed by only two indi-viduals, so that variability in end-point detection by differentanalysts was kept to a minimum. Their analytical methodand sampling protocol were essentially the same as usedtoday (Grasshoff et al. 1999). All temperature, salinity, andO2 measurements from the 1932–1935 period were tabulated(Universite Laval 1934, 1936). Based on the standard devi-ation of O2 measurements repeated every 2 h at a fixed sta-tion (48.2788N, 69.3338W) over a 24-h period on 18–19 July1934, we estimate the reproducibility of their measurementsto be better than 68 mmol L21. This estimate is conservative,as we expect real O2 variability over a semidiurnal tidal cycleat this station, located 20 km seaward of the head of the
Laurentian Channel, where strong internal tides are gener-ated (Saucier and Chasse 2000).
Several other data sets were incorporated into the analy-ses. To ensure a high degree of uniformity in methods anddata quality in the O2 time series, we limited the compilationto oxygen data determined by Winkler titration (Grasshoffet al. 1999). Continuous vertical profiles of O2 measuredwith electronic sensors were not included in any of the time-series analyses. Most of the O2 measurements compiled herecome from the Biochem database (http://www.meds-sdmm.dfo-mpo.gc.ca/biochem/Biochempe.htm). A second majorsource of oxygen data for the LSLE and the Gulf of St.Lawrence is the Maurice-Lamontagne Institute’s Oceano-graphic Data Management System (http://www.osl.gc.ca/sgdo/en/accueil.html). Other sources of oxygen data includemeasurements made by the McGill University Marine Sci-ences Centre during the late 1960s and early 1970s (e.g.,Steven et al. 1973) as well as data from various researchsurveys conducted between 1984 and 2003 (e.g., Gilbert etal. 1997). Given the large number of investigators and lab-oratories involved in the oxygen data collection, the qualityof the data may not be uniform. We estimate that the repro-ducibility of most of the O2 measurements is in the 0.3–5.0mmol L21 range. The complete list of references for the ox-ygen data as well as the entire data set of oxygen measure-ments from the bottom waters ($295 m) of the LSLE andtheir metadata are found in Web Appendix 1 at http://www.aslo.org/lo/toc/volp50/issuep5/1654a1.html.
Temperature and salinity data—All temperature and sa-linity data come from the CLIMATE database (http://www.mar.dfo-mpo.gc .ca /sc ience/ocean/database /datapquery.html) developed and maintained at the BedfordInstitute of Oceanography (Gregory 2004). For the Gulf ofSt. Lawrence, prior to 1943, all data came from bottle castswith reversing thermometers performed at discrete standardhydrographic depths (temperature accuracy 60.018C, salin-ity accuracy 60.05). Starting in 1943, mechanical bathy-thermographs allowed measurements of temperature on amuch finer vertical scale (temperature accuracy 60.18C). Asimilar improvement in fine-scale salinity measurementstook place in 1969, when electronic conductivity–tempera-ture–depth (CTD) probes were first used for surveys in theGulf of St. Lawrence (temperature accuracy 60.018C, salin-ity accuracy 60.01). A very low 1934 annual mean salinityof 33.45 in the bottom waters ($295 m) of the LSLE was
1656 Gilbert et al.
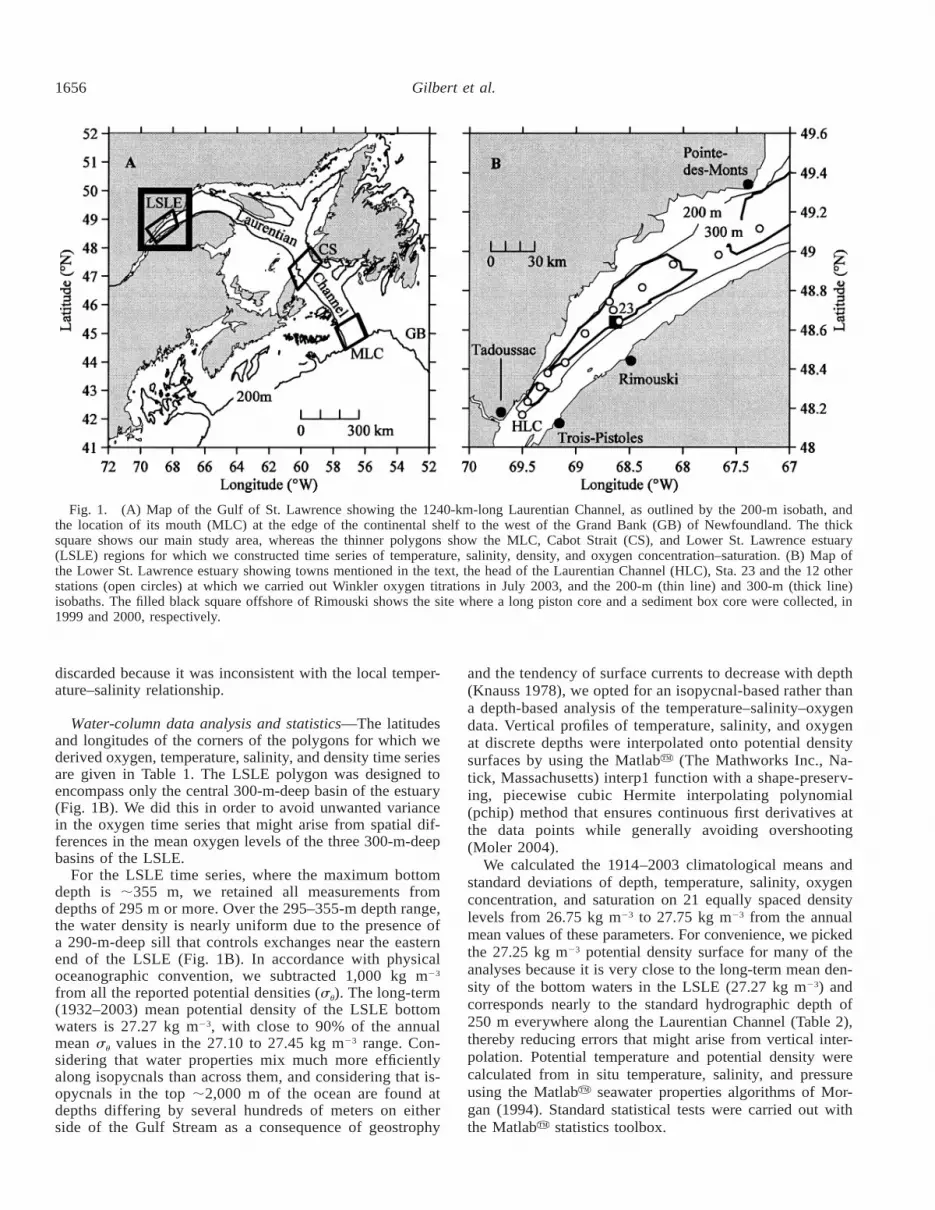
Fig. 1. (A) Map of the Gulf of St. Lawrence showing the 1240-km-long Laurentian Channel, as outlined by the 200-m isobath, andthe location of its mouth (MLC) at the edge of the continental shelf to the west of the Grand Bank (GB) of Newfoundland. The thicksquare shows our main study area, whereas the thinner polygons show the MLC, Cabot Strait (CS), and Lower St. Lawrence estuary(LSLE) regions for which we constructed time series of temperature, salinity, density, and oxygen concentration–saturation. (B) Map ofthe Lower St. Lawrence estuary showing towns mentioned in the text, the head of the Laurentian Channel (HLC), Sta. 23 and the 12 otherstations (open circles) at which we carried out Winkler oxygen titrations in July 2003, and the 200-m (thin line) and 300-m (thick line)isobaths. The filled black square offshore of Rimouski shows the site where a long piston core and a sediment box core were collected, in1999 and 2000, respectively.
discarded because it was inconsistent with the local temper-ature–salinity relationship.
Water-column data analysis and statistics—The latitudesand longitudes of the corners of the polygons for which wederived oxygen, temperature, salinity, and density time seriesare given in Table 1. The LSLE polygon was designed toencompass only the central 300-m-deep basin of the estuary(Fig. 1B). We did this in order to avoid unwanted variancein the oxygen time series that might arise from spatial dif-ferences in the mean oxygen levels of the three 300-m-deepbasins of the LSLE.
For the LSLE time series, where the maximum bottomdepth is ;355 m, we retained all measurements fromdepths of 295 m or more. Over the 295–355-m depth range,the water density is nearly uniform due to the presence ofa 290-m-deep sill that controls exchanges near the easternend of the LSLE (Fig. 1B). In accordance with physicaloceanographic convention, we subtracted 1,000 kg m23
from all the reported potential densities (su). The long-term(1932–2003) mean potential density of the LSLE bottomwaters is 27.27 kg m23, with close to 90% of the annualmean su values in the 27.10 to 27.45 kg m23 range. Con-sidering that water properties mix much more efficientlyalong isopycnals than across them, and considering that is-opycnals in the top ;2,000 m of the ocean are found atdepths differing by several hundreds of meters on eitherside of the Gulf Stream as a consequence of geostrophy
and the tendency of surface currents to decrease with depth(Knauss 1978), we opted for an isopycnal-based rather thana depth-based analysis of the temperature–salinity–oxygendata. Vertical profiles of temperature, salinity, and oxygenat discrete depths were interpolated onto potential densitysurfaces by using the Matlaby (The Mathworks Inc., Na-tick, Massachusetts) interp1 function with a shape-preserv-ing, piecewise cubic Hermite interpolating polynomial(pchip) method that ensures continuous first derivatives atthe data points while generally avoiding overshooting(Moler 2004).
We calculated the 1914–2003 climatological means andstandard deviations of depth, temperature, salinity, oxygenconcentration, and saturation on 21 equally spaced densitylevels from 26.75 kg m23 to 27.75 kg m23 from the annualmean values of these parameters. For convenience, we pickedthe 27.25 kg m23 potential density surface for many of theanalyses because it is very close to the long-term mean den-sity of the bottom waters in the LSLE (27.27 kg m23) andcorresponds nearly to the standard hydrographic depth of250 m everywhere along the Laurentian Channel (Table 2),thereby reducing errors that might arise from vertical inter-polation. Potential temperature and potential density werecalculated from in situ temperature, salinity, and pressureusing the Matlaby seawater properties algorithms of Mor-gan (1994). Standard statistical tests were carried out withthe Matlaby statistics toolbox.
1657St. Lawrence estuary deep-water oxygen
Table 2. Climatological means and standard deviations (1914–2003) of depth, temperature, salinity, and oxygen concentration andsaturation on potential density surfaces for the polygons defined in Table 1. The number of years and the total number of profiles for whichwe have coincident temperature–salinity (T–S) data and coincident temperature–salinity–oxygen (T–S–O2) data are indicated.
Density su
(kg m23)Depth(m)
Temperature(8C) Salinity
No. of years,No. of profiles
(T–S)O2
(mmol L21)O2 saturation
(%)
No. of years,No. of profiles
(T–S–O2)
Lower St. Lawrence estuary27.0027.25
187.5628.5249.5633.8
3.4460.534.2160.86
33.9560.0634.3660.11
35, 108327, 441
104.9625.674.6626.3
32.267.323.467.6
16, 8810, 30
Cabot Strait27.0027.2527.50
190.3619.0249.1624.8351.6628.8
4.2660.965.1360.764.9360.46
34.0660.1234.4960.1134.7760.07
61, 132259, 107555, 732
201.4620.8178.1620.4179.7618.9
62.766.156.565.956.865.8
16, 9116, 8016, 48
Laurentian Channel mouth27.0027.2527.50
187.3638.0246.6642.5342.0640.1
5.7861.616.1560.925.1860.52
34.3160.2434.6660.1534.8160.09
46, 46042, 39530, 285
225.7619.9199.2619.1214.2615.6
70.864.963.464.467.864.2
8, 498, 458, 30
Labrador current water27.0027.1027.2527.50
118.2636.9136.5638.2170.8642.2263.5646.7
0.6560.791.0560.821.5460.712.6660.51
33.7060.0833.8560.0834.0760.0734.4960.06
82, 217181, 205279, 183677, 1466
320.2615.6311.6618.6298.9622.3289.0622.8
92.262.990.563.287.664.786.865.5
20, 10120, 8920, 7918, 58
North Atlantic central water27.0027.1027.2527.50
724.8667.6772.7664.4849.5663.8985.9662.5
12.2860.3611.1460.38
9.4360.387.0060.46
35.6060.0935.4560.0935.2660.0935.1160.10
57, 163157, 161757, 158857, 1492
169.0613.1164.2613.1163.2614.2189.4613.7
63.065.159.764.857.464.862.964.4
42, 80742, 80042, 79542, 763
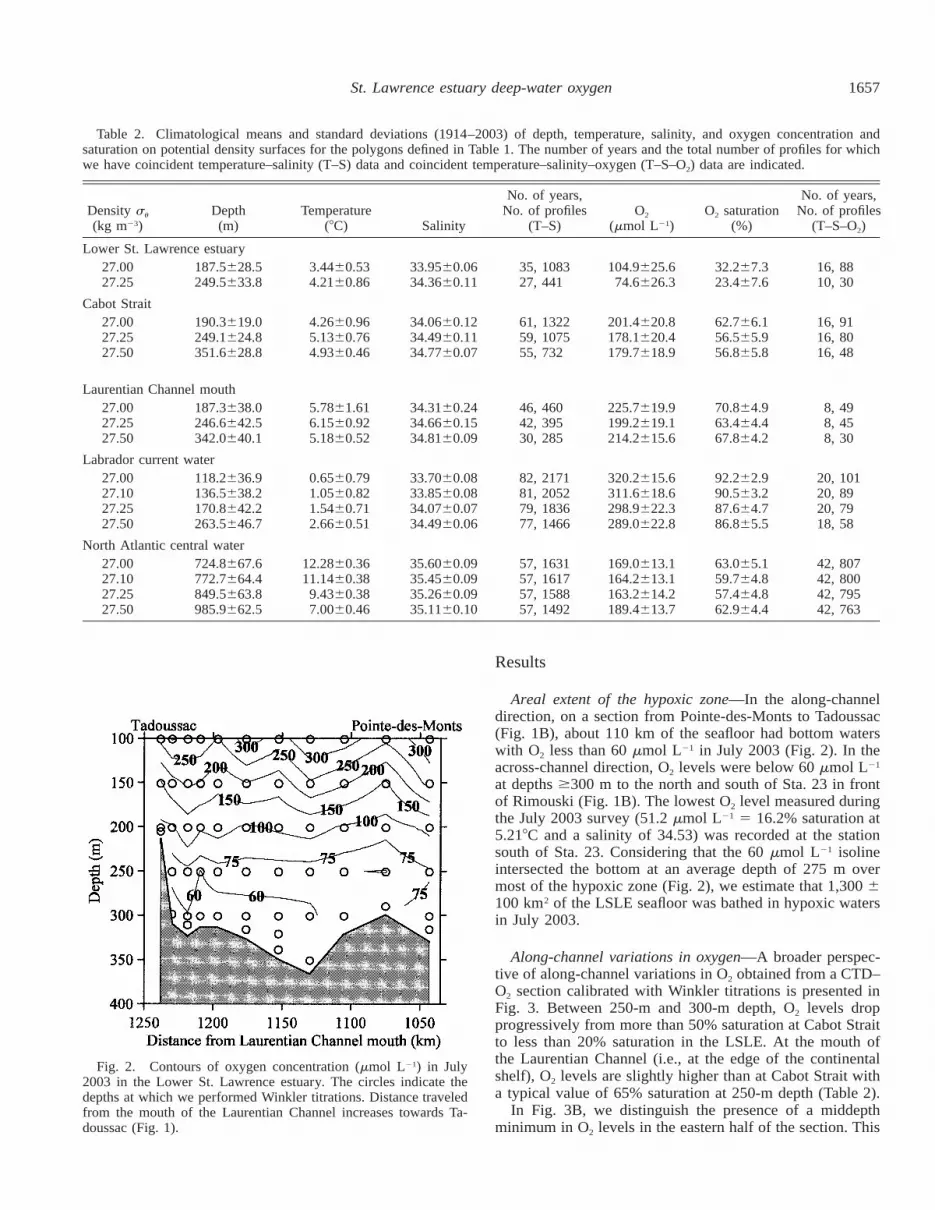
Fig. 2. Contours of oxygen concentration (mmol L21) in July2003 in the Lower St. Lawrence estuary. The circles indicate thedepths at which we performed Winkler titrations. Distance traveledfrom the mouth of the Laurentian Channel increases towards Ta-doussac (Fig. 1).
Results
Areal extent of the hypoxic zone—In the along-channeldirection, on a section from Pointe-des-Monts to Tadoussac(Fig. 1B), about 110 km of the seafloor had bottom waterswith O2 less than 60 mmol L21 in July 2003 (Fig. 2). In theacross-channel direction, O2 levels were below 60 mmol L21
at depths $300 m to the north and south of Sta. 23 in frontof Rimouski (Fig. 1B). The lowest O2 level measured duringthe July 2003 survey (51.2 mmol L21 5 16.2% saturation at5.218C and a salinity of 34.53) was recorded at the stationsouth of Sta. 23. Considering that the 60 mmol L21 isolineintersected the bottom at an average depth of 275 m overmost of the hypoxic zone (Fig. 2), we estimate that 1,300 6100 km2 of the LSLE seafloor was bathed in hypoxic watersin July 2003.
Along-channel variations in oxygen—A broader perspec-tive of along-channel variations in O2 obtained from a CTD–O2 section calibrated with Winkler titrations is presented inFig. 3. Between 250-m and 300-m depth, O2 levels dropprogressively from more than 50% saturation at Cabot Straitto less than 20% saturation in the LSLE. At the mouth ofthe Laurentian Channel (i.e., at the edge of the continentalshelf), O2 levels are slightly higher than at Cabot Strait witha typical value of 65% saturation at 250-m depth (Table 2).
In Fig. 3B, we distinguish the presence of a middepthminimum in O2 levels in the eastern half of the section. This

1658 Gilbert et al.
Fig. 3. (A) Map of the Gulf of St. Lawrence showing the po-sitions of 14 stations where we collected vertical profiles of salinity,temperature, depth, and oxygen (STD-O2) with a Seabird 911plusCTD equipped with a SBE-43 oxygen sensor in early November2002. (B) Contours of oxygen saturation from Cabot Strait (right)to Rimouski (left). The circles indicate the locations of the STD-O2
stations. (C) Contours of potential density highlighting the 27.25 kgm23 density surface which roughly corresponds to the density ofbottom waters in the LSLE.
Fig. 4. Annual cycles of (A) temperature and (B) oxygen con-centration in the bottom waters ($295 m) of the LSLE for the1984–2003 period of relatively stable temperature and oxygen con-ditions. The dashed lines represent the 10th and 90th percentiles ofindividual observations and the error bars show the 95% confidenceintervals for the monthly means.
middepth O2 minimum corresponds roughly to the 27.25 kgm23 potential density surface (Fig. 3C) and serves as a tracerof the landward flow of the estuarine circulation at this den-sity level.
Seasonal cycle of temperature and oxygen—The bottomwaters of the LSLE remain isolated from the surface watersyear-round as the maximum wintertime surface mixed layerdensity never exceeds 26.5 kg m23 in the Gulf of St. Law-rence (Petrie et al. 1996), resulting in a maximum wintersurface mixed layer depth of about 125 m (Fig. 3C). Near-
bottom water temperatures are therefore stable throughoutthe year, without a detectable seasonal cycle (Fig. 4A). Like-wise, oxygen concentrations in the bottom waters of theLSLE are essentially constant throughout the year: the larg-est difference between any two monthly means is on theorder of 10 mmol L21 (Fig. 4B). Such weak seasonal varia-tions of temperature and oxygen in the bottom waters of theLSLE allow us to pool data from all months of the year toconstruct interannual time series.
Temporal change in oxygen and temperature—A 72-yrtime series of O2 in the bottom waters of the LSLE is pre-sented in Fig. 5. Despite substantial interannual variability,three distinct clusters of points indicate that bottom waterO2 decreased from 110–135 mmol L21 (33–41% saturation)in the 1930s to 95–120 mmol L21 in the early 1970s andthen to 55–85 mmol L21 (18–26% saturation) in the 1990s.The annual mean bottom water O2 concentration measuredin 2003 (58.6 mmol L21) is the second lowest ever observedduring the 28 yr for which measurements are available; thelowest annual mean value (56.4 mmol L21) was recorded in1993. We also note that 8 of the 10 lowest annual meanvalues occurred in the last 12 yr. The difference in O2 con-centrations between the 1932–1935 period (124.7 mmol L21
5 37.7% saturation) and the 1984–2003 period (65.5 mmolL21 5 20.7% saturation) amounts to 59.2 6 9.1 mmol L21
at the 95% confidence level. A least squares linear fit applied
1659St. Lawrence estuary deep-water oxygen
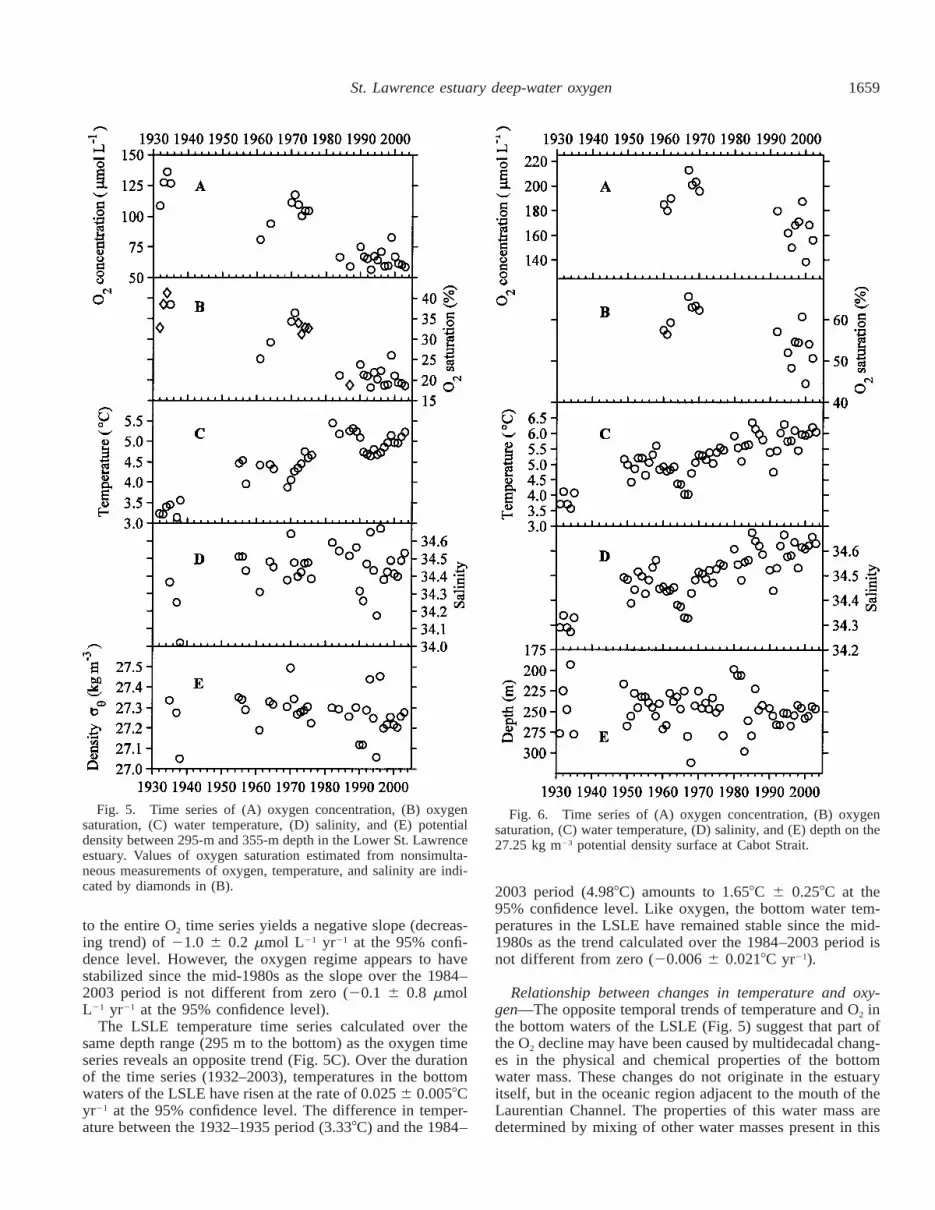
Fig. 5. Time series of (A) oxygen concentration, (B) oxygensaturation, (C) water temperature, (D) salinity, and (E) potentialdensity between 295-m and 355-m depth in the Lower St. Lawrenceestuary. Values of oxygen saturation estimated from nonsimulta-neous measurements of oxygen, temperature, and salinity are indi-cated by diamonds in (B).
Fig. 6. Time series of (A) oxygen concentration, (B) oxygensaturation, (C) water temperature, (D) salinity, and (E) depth on the27.25 kg m23 potential density surface at Cabot Strait.
to the entire O2 time series yields a negative slope (decreas-ing trend) of 21.0 6 0.2 mmol L21 yr21 at the 95% confi-dence level. However, the oxygen regime appears to havestabilized since the mid-1980s as the slope over the 1984–2003 period is not different from zero (20.1 6 0.8 mmolL21 yr21 at the 95% confidence level).
The LSLE temperature time series calculated over thesame depth range (295 m to the bottom) as the oxygen timeseries reveals an opposite trend (Fig. 5C). Over the durationof the time series (1932–2003), temperatures in the bottomwaters of the LSLE have risen at the rate of 0.025 6 0.0058Cyr21 at the 95% confidence level. The difference in temper-ature between the 1932–1935 period (3.338C) and the 1984–
2003 period (4.988C) amounts to 1.658C 6 0.258C at the95% confidence level. Like oxygen, the bottom water tem-peratures in the LSLE have remained stable since the mid-1980s as the trend calculated over the 1984–2003 period isnot different from zero (20.006 6 0.0218C yr21).
Relationship between changes in temperature and oxy-gen—The opposite temporal trends of temperature and O2 inthe bottom waters of the LSLE (Fig. 5) suggest that part ofthe O2 decline may have been caused by multidecadal chang-es in the physical and chemical properties of the bottomwater mass. These changes do not originate in the estuaryitself, but in the oceanic region adjacent to the mouth of theLaurentian Channel. The properties of this water mass aredetermined by mixing of other water masses present in this
1660 Gilbert et al.
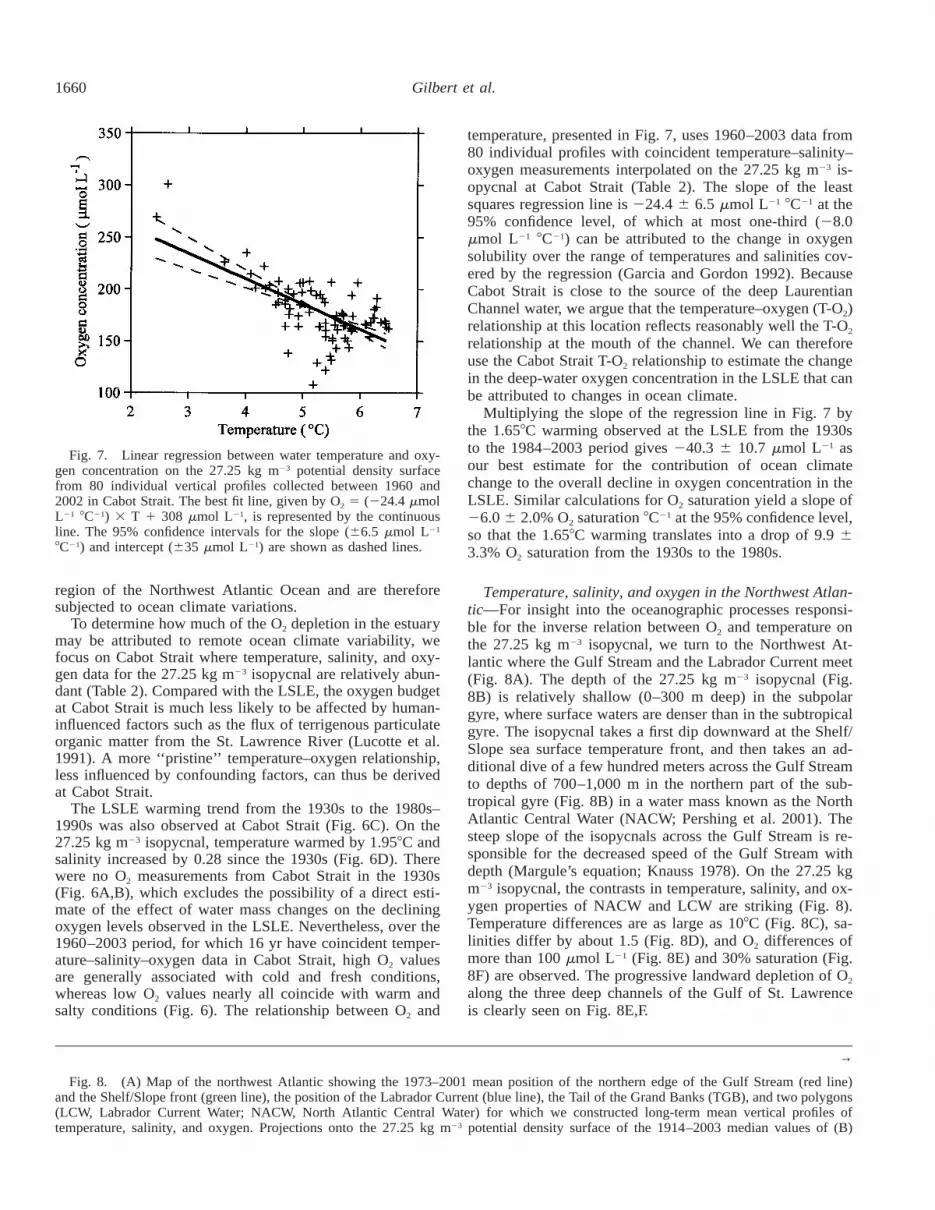
Fig. 7. Linear regression between water temperature and oxy-gen concentration on the 27.25 kg m23 potential density surfacefrom 80 individual vertical profiles collected between 1960 and2002 in Cabot Strait. The best fit line, given by O2 5 (224.4 mmolL21 8C21) 3 T 1 308 mmol L21, is represented by the continuousline. The 95% confidence intervals for the slope (66.5 mmol L21
8C21) and intercept (635 mmol L21) are shown as dashed lines.
→
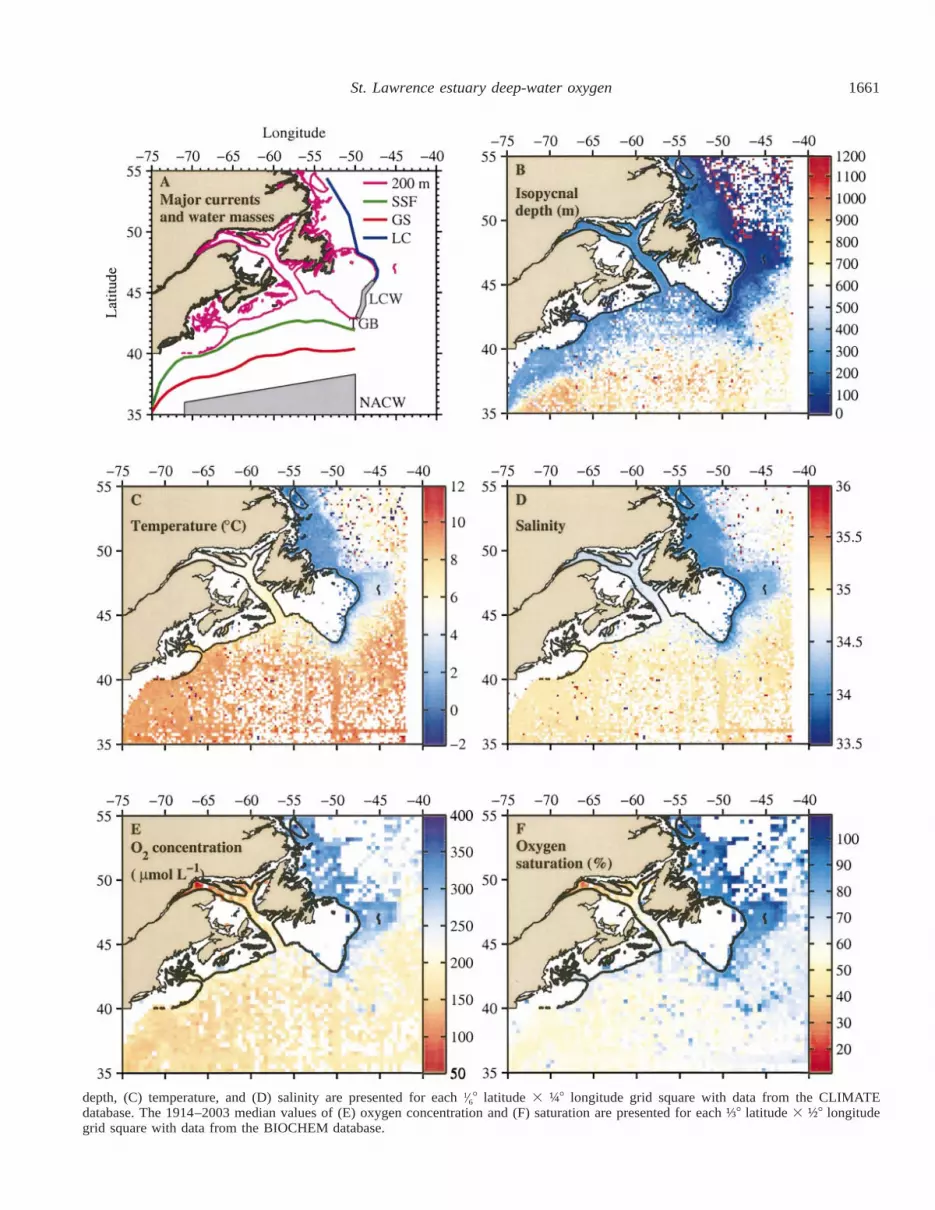
Fig. 8. (A) Map of the northwest Atlantic showing the 1973–2001 mean position of the northern edge of the Gulf Stream (red line)and the Shelf/Slope front (green line), the position of the Labrador Current (blue line), the Tail of the Grand Banks (TGB), and two polygons(LCW, Labrador Current Water; NACW, North Atlantic Central Water) for which we constructed long-term mean vertical profiles oftemperature, salinity, and oxygen. Projections onto the 27.25 kg m23 potential density surface of the 1914–2003 median values of (B)
region of the Northwest Atlantic Ocean and are thereforesubjected to ocean climate variations.
To determine how much of the O2 depletion in the estuarymay be attributed to remote ocean climate variability, wefocus on Cabot Strait where temperature, salinity, and oxy-gen data for the 27.25 kg m23 isopycnal are relatively abun-dant (Table 2). Compared with the LSLE, the oxygen budgetat Cabot Strait is much less likely to be affected by human-influenced factors such as the flux of terrigenous particulateorganic matter from the St. Lawrence River (Lucotte et al.1991). A more ‘‘pristine’’ temperature–oxygen relationship,less influenced by confounding factors, can thus be derivedat Cabot Strait.
The LSLE warming trend from the 1930s to the 1980s–1990s was also observed at Cabot Strait (Fig. 6C). On the27.25 kg m23 isopycnal, temperature warmed by 1.958C andsalinity increased by 0.28 since the 1930s (Fig. 6D). Therewere no O2 measurements from Cabot Strait in the 1930s(Fig. 6A,B), which excludes the possibility of a direct esti-mate of the effect of water mass changes on the decliningoxygen levels observed in the LSLE. Nevertheless, over the1960–2003 period, for which 16 yr have coincident temper-ature–salinity–oxygen data in Cabot Strait, high O2 valuesare generally associated with cold and fresh conditions,whereas low O2 values nearly all coincide with warm andsalty conditions (Fig. 6). The relationship between O2 and
temperature, presented in Fig. 7, uses 1960–2003 data from80 individual profiles with coincident temperature–salinity–oxygen measurements interpolated on the 27.25 kg m23 is-opycnal at Cabot Strait (Table 2). The slope of the leastsquares regression line is 224.4 6 6.5 mmol L21 8C21 at the95% confidence level, of which at most one-third (28.0mmol L21 8C21) can be attributed to the change in oxygensolubility over the range of temperatures and salinities cov-ered by the regression (Garcia and Gordon 1992). BecauseCabot Strait is close to the source of the deep LaurentianChannel water, we argue that the temperature–oxygen (T-O2)relationship at this location reflects reasonably well the T-O2
relationship at the mouth of the channel. We can thereforeuse the Cabot Strait T-O2 relationship to estimate the changein the deep-water oxygen concentration in the LSLE that canbe attributed to changes in ocean climate.
Multiplying the slope of the regression line in Fig. 7 bythe 1.658C warming observed at the LSLE from the 1930sto the 1984–2003 period gives 240.3 6 10.7 mmol L21 asour best estimate for the contribution of ocean climatechange to the overall decline in oxygen concentration in theLSLE. Similar calculations for O2 saturation yield a slope of26.0 6 2.0% O2 saturation 8C21 at the 95% confidence level,so that the 1.658C warming translates into a drop of 9.9 63.3% O2 saturation from the 1930s to the 1980s.
Temperature, salinity, and oxygen in the Northwest Atlan-tic—For insight into the oceanographic processes responsi-ble for the inverse relation between O2 and temperature onthe 27.25 kg m23 isopycnal, we turn to the Northwest At-lantic where the Gulf Stream and the Labrador Current meet(Fig. 8A). The depth of the 27.25 kg m23 isopycnal (Fig.8B) is relatively shallow (0–300 m deep) in the subpolargyre, where surface waters are denser than in the subtropicalgyre. The isopycnal takes a first dip downward at the Shelf/Slope sea surface temperature front, and then takes an ad-ditional dive of a few hundred meters across the Gulf Streamto depths of 700–1,000 m in the northern part of the sub-tropical gyre (Fig. 8B) in a water mass known as the NorthAtlantic Central Water (NACW; Pershing et al. 2001). Thesteep slope of the isopycnals across the Gulf Stream is re-sponsible for the decreased speed of the Gulf Stream withdepth (Margule’s equation; Knauss 1978). On the 27.25 kgm23 isopycnal, the contrasts in temperature, salinity, and ox-ygen properties of NACW and LCW are striking (Fig. 8).Temperature differences are as large as 108C (Fig. 8C), sa-linities differ by about 1.5 (Fig. 8D), and O2 differences ofmore than 100 mmol L21 (Fig. 8E) and 30% saturation (Fig.8F) are observed. The progressive landward depletion of O2
along the three deep channels of the Gulf of St. Lawrenceis clearly seen on Fig. 8E,F.
1661St. Lawrence estuary deep-water oxygen
depth, (C) temperature, and (D) salinity are presented for each 1⁄68 latitude 3 ¼8 longitude grid square with data from the CLIMATEdatabase. The 1914–2003 median values of (E) oxygen concentration and (F) saturation are presented for each ⅓8 latitude 3 ½8 longitudegrid square with data from the BIOCHEM database.
1662 Gilbert et al.
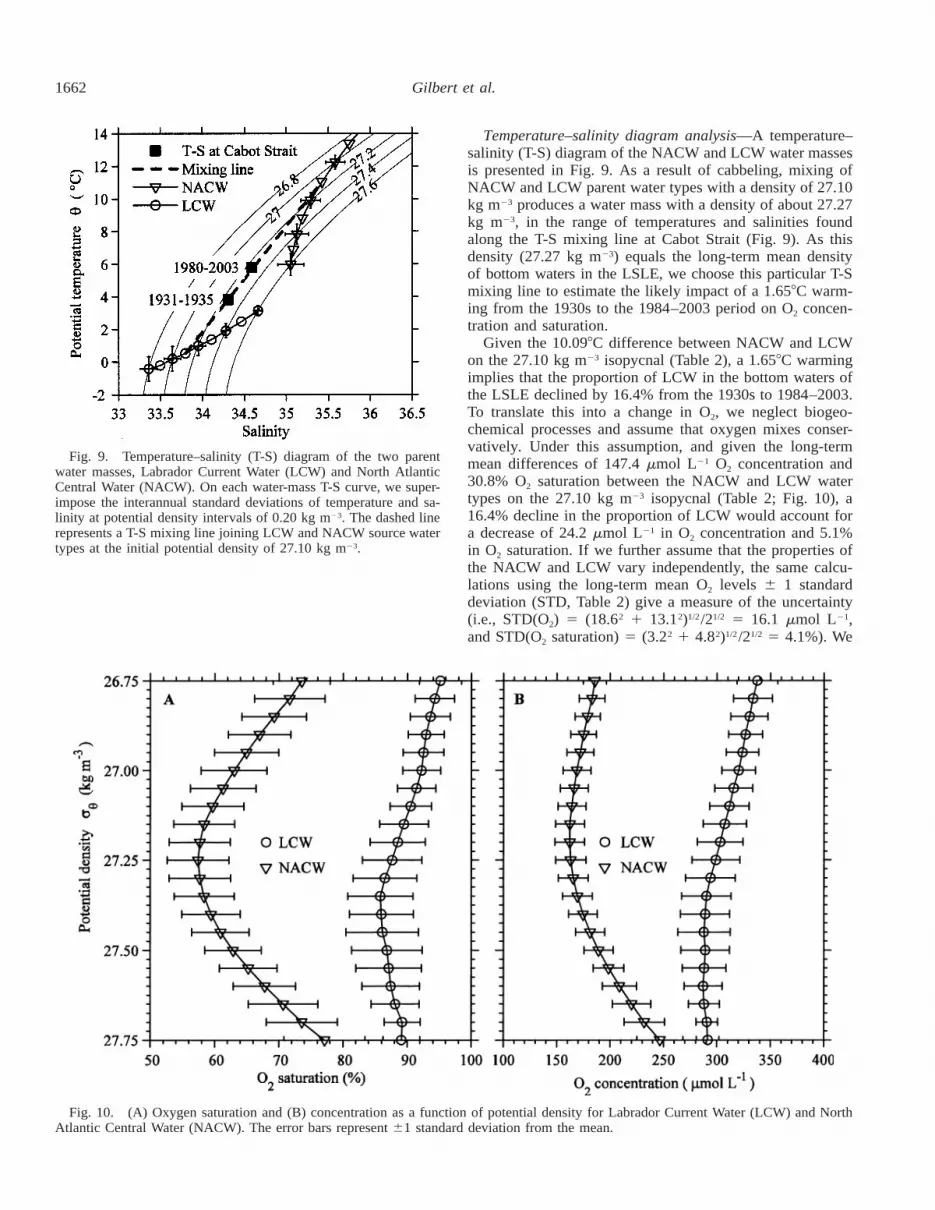
Fig. 9. Temperature–salinity (T-S) diagram of the two parentwater masses, Labrador Current Water (LCW) and North AtlanticCentral Water (NACW). On each water-mass T-S curve, we super-impose the interannual standard deviations of temperature and sa-linity at potential density intervals of 0.20 kg m23. The dashed linerepresents a T-S mixing line joining LCW and NACW source watertypes at the initial potential density of 27.10 kg m23.
Fig. 10. (A) Oxygen saturation and (B) concentration as a function of potential density for Labrador Current Water (LCW) and NorthAtlantic Central Water (NACW). The error bars represent 61 standard deviation from the mean.
Temperature–salinity diagram analysis—A temperature–salinity (T-S) diagram of the NACW and LCW water massesis presented in Fig. 9. As a result of cabbeling, mixing ofNACW and LCW parent water types with a density of 27.10kg m23 produces a water mass with a density of about 27.27kg m23, in the range of temperatures and salinities foundalong the T-S mixing line at Cabot Strait (Fig. 9). As thisdensity (27.27 kg m23) equals the long-term mean densityof bottom waters in the LSLE, we choose this particular T-Smixing line to estimate the likely impact of a 1.658C warm-ing from the 1930s to the 1984–2003 period on O2 concen-tration and saturation.
Given the 10.098C difference between NACW and LCWon the 27.10 kg m23 isopycnal (Table 2), a 1.658C warmingimplies that the proportion of LCW in the bottom waters ofthe LSLE declined by 16.4% from the 1930s to 1984–2003.To translate this into a change in O2, we neglect biogeo-chemical processes and assume that oxygen mixes conser-vatively. Under this assumption, and given the long-termmean differences of 147.4 mmol L21 O2 concentration and30.8% O2 saturation between the NACW and LCW watertypes on the 27.10 kg m23 isopycnal (Table 2; Fig. 10), a16.4% decline in the proportion of LCW would account fora decrease of 24.2 mmol L21 in O2 concentration and 5.1%in O2 saturation. If we further assume that the properties ofthe NACW and LCW vary independently, the same calcu-lations using the long-term mean O2 levels 6 1 standarddeviation (STD, Table 2) give a measure of the uncertainty(i.e., STD(O2) 5 (18.62 1 13.12)1/2/21/2 5 16.1 mmol L21,and STD(O2 saturation) 5 (3.22 1 4.82)1/2/21/2 5 4.1%). We
1663St. Lawrence estuary deep-water oxygen
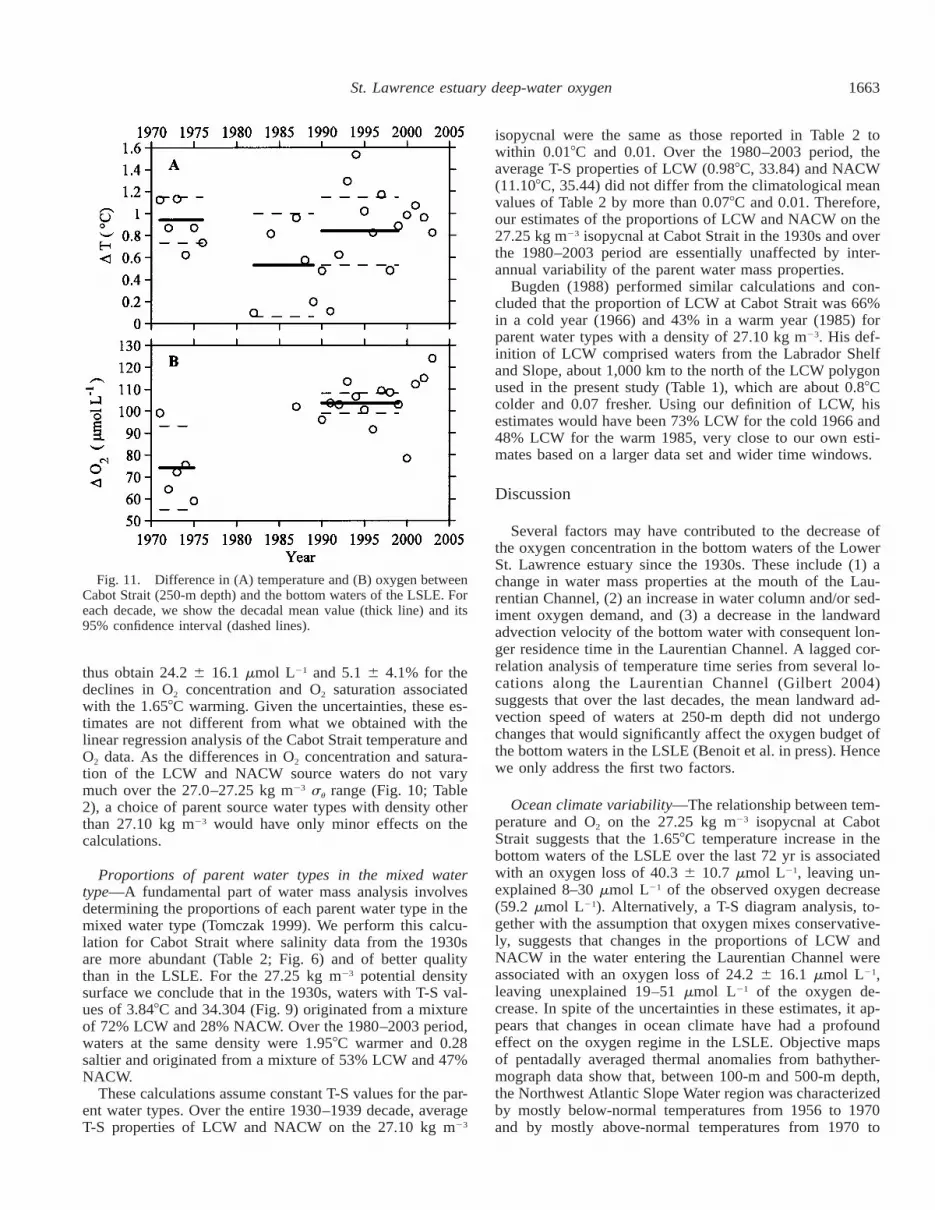
Fig. 11. Difference in (A) temperature and (B) oxygen betweenCabot Strait (250-m depth) and the bottom waters of the LSLE. Foreach decade, we show the decadal mean value (thick line) and its95% confidence interval (dashed lines).
thus obtain 24.2 6 16.1 mmol L21 and 5.1 6 4.1% for thedeclines in O2 concentration and O2 saturation associatedwith the 1.658C warming. Given the uncertainties, these es-timates are not different from what we obtained with thelinear regression analysis of the Cabot Strait temperature andO2 data. As the differences in O2 concentration and satura-tion of the LCW and NACW source waters do not varymuch over the 27.0–27.25 kg m23 su range (Fig. 10; Table2), a choice of parent source water types with density otherthan 27.10 kg m23 would have only minor effects on thecalculations.
Proportions of parent water types in the mixed watertype—A fundamental part of water mass analysis involvesdetermining the proportions of each parent water type in themixed water type (Tomczak 1999). We perform this calcu-lation for Cabot Strait where salinity data from the 1930sare more abundant (Table 2; Fig. 6) and of better qualitythan in the LSLE. For the 27.25 kg m23 potential densitysurface we conclude that in the 1930s, waters with T-S val-ues of 3.848C and 34.304 (Fig. 9) originated from a mixtureof 72% LCW and 28% NACW. Over the 1980–2003 period,waters at the same density were 1.958C warmer and 0.28saltier and originated from a mixture of 53% LCW and 47%NACW.
These calculations assume constant T-S values for the par-ent water types. Over the entire 1930–1939 decade, averageT-S properties of LCW and NACW on the 27.10 kg m23
isopycnal were the same as those reported in Table 2 towithin 0.018C and 0.01. Over the 1980–2003 period, theaverage T-S properties of LCW (0.988C, 33.84) and NACW(11.108C, 35.44) did not differ from the climatological meanvalues of Table 2 by more than 0.078C and 0.01. Therefore,our estimates of the proportions of LCW and NACW on the27.25 kg m23 isopycnal at Cabot Strait in the 1930s and overthe 1980–2003 period are essentially unaffected by inter-annual variability of the parent water mass properties.
Bugden (1988) performed similar calculations and con-cluded that the proportion of LCW at Cabot Strait was 66%in a cold year (1966) and 43% in a warm year (1985) forparent water types with a density of 27.10 kg m23. His def-inition of LCW comprised waters from the Labrador Shelfand Slope, about 1,000 km to the north of the LCW polygonused in the present study (Table 1), which are about 0.88Ccolder and 0.07 fresher. Using our definition of LCW, hisestimates would have been 73% LCW for the cold 1966 and48% LCW for the warm 1985, very close to our own esti-mates based on a larger data set and wider time windows.
Discussion
Several factors may have contributed to the decrease ofthe oxygen concentration in the bottom waters of the LowerSt. Lawrence estuary since the 1930s. These include (1) achange in water mass properties at the mouth of the Lau-rentian Channel, (2) an increase in water column and/or sed-iment oxygen demand, and (3) a decrease in the landwardadvection velocity of the bottom water with consequent lon-ger residence time in the Laurentian Channel. A lagged cor-relation analysis of temperature time series from several lo-cations along the Laurentian Channel (Gilbert 2004)suggests that over the last decades, the mean landward ad-vection speed of waters at 250-m depth did not undergochanges that would significantly affect the oxygen budget ofthe bottom waters in the LSLE (Benoit et al. in press). Hencewe only address the first two factors.
Ocean climate variability—The relationship between tem-perature and O2 on the 27.25 kg m23 isopycnal at CabotStrait suggests that the 1.658C temperature increase in thebottom waters of the LSLE over the last 72 yr is associatedwith an oxygen loss of 40.3 6 10.7 mmol L21, leaving un-explained 8–30 mmol L21 of the observed oxygen decrease(59.2 mmol L21). Alternatively, a T-S diagram analysis, to-gether with the assumption that oxygen mixes conservative-ly, suggests that changes in the proportions of LCW andNACW in the water entering the Laurentian Channel wereassociated with an oxygen loss of 24.2 6 16.1 mmol L21,leaving unexplained 19–51 mmol L21 of the oxygen de-crease. In spite of the uncertainties in these estimates, it ap-pears that changes in ocean climate have had a profoundeffect on the oxygen regime in the LSLE. Objective mapsof pentadally averaged thermal anomalies from bathyther-mograph data show that, between 100-m and 500-m depth,the Northwest Atlantic Slope Water region was characterizedby mostly below-normal temperatures from 1956 to 1970and by mostly above-normal temperatures from 1970 to
1664 Gilbert et al.
1994 (Grey et al. 2000). But what drives this ocean climatevariability?
Petrie and Drinkwater (1993) have shown that the west-ward transport of LCW along the continental shelf edge tothe south of the Grand Banks of Newfoundland (Fig. 8A)can vary by about a factor of 4 and that it is the most im-portant factor driving interannual variability of temperatureand salinity in the Laurentian Channel as well as in the deepbasins of the Scotian Shelf and the Gulf of Maine. Theydemonstrated that despite slightly warmer and saltier thannormal LCW properties in the 1960s, the mid-1960s werecharacterized by much colder than normal water tempera-tures in the 100-m to 300-m depth range in the LaurentianChannel, Emerald Basin, and Gulf of Maine. Based on geo-strophic transport calculations, they estimated that the vol-ume transport of the Labrador Current in the 1960s was larg-er than in the 1970s by ;1–4 3 106 m3 s21. This findingwas further substantiated by the modeling study of Loder etal. (2001), who showed that the cold conditions of the mid-1960s were linked to a 1–2 3 106 m3 s21 increase in thewestward shelf-edge flow of LCW during the winter.
Another possible driver of interdecadal climate variabilityinvolves large-scale shifts in atmospheric pressure systemsand wind patterns, as exemplified by the North Atlantic Os-cillation (NAO) index derived from the sea level pressuredifference between Lisbon, Portugal, and Stykkisholmur/Reykjavik, Iceland (Hurrell 1995). However, taking into ac-count the effects of serial correlation (Ebisuzaki 1997), thecorrelations between the NAO index and temperature timeseries on the 27.25 kg m23 isopycnal at the three polygonsalong the Laurentian Channel (Fig. 1) were not statisticallydifferent from zero. Other attempts to link the NAO withtemperature indices between 100-m and 300-m depth furtherwest along the edge of the Scotian Shelf have also beenunsuccessful (Pershing et al. 2001).
Excursions in the north–south direction of both the Shelf/Slope sea surface temperature (SST) front and the northernedge of the Gulf Stream (Fig. 8A) may also influence waterproperties in the Laurentian Channel, as suggested by Bug-den (1988). Gilbert (2004) computed lagged correlationswith the temperature time series at the mouth of the Lau-rentian Channel on the 27.25 kg m23 density surface using1973 to 2001 time series of the latitudinal position of thesetwo SST fronts at intervals of 18 longitude from 758W to508W (Drinkwater et al. 1994). For lags of 0 yr to 4 yr andat longitudes between 658W and 508W, he found a dominantpattern of weak (r , 0.5) but positive correlations betweenthe latitudinal position of the northern edge of the GulfStream and temperature time series from the mouth of theLaurentian Channel. This could imply that warm, salty, ox-ygen-poor Gulf Stream waters have a higher likelihood ofmixing with the Slope and Shelf Waters to the north whenthe Gulf Stream moves further north than its normal position(Fig. 8A). This would promote conditions that generate wa-ter at the mouth of the Laurentian Channel that is warmer,saltier, and more oxygen depleted than usual.
Oxygen variation not related to ocean climate variabili-ty—A comparison between changes over time of the along-channel gradients of temperature and oxygen concentration
reveals that recent variations in oxygen are not entirely driv-en by ocean climate variability. Figure 11A shows that thedifference in temperature between waters at 250 6 10-mdepth at Cabot Strait and the bottom waters of the LSLEwas stable from the 1970s (0.94 6 0.218C) to the 1990s(0.84 6 0.318C). The along-channel temperature gradient(;0.98C 800 km21 5 1.13 3 10258C km21) on the 27.25 kgm23 isopycnal results from vertical mixing of colder over-lying waters during the landward estuarine flow and is den-sity compensated by a salinity gradient of the same sign asthe temperature gradient (Bugden 1988).
In contrast, the corresponding along-channel O2 gradientincreased from 74.1 6 19.1 mmol L21 in the 1970s to 103.66 4.6 mmol L21 in the 1990s. The difference is 29.5 6 11.9mmol L21 at the 95% confidence level. The fact that thealong-channel gradient of O2 increased while the along-chan-nel gradient of temperature remained unchanged suggeststhat perhaps as much as 18–41 mmol L21 of the O2 declinemay be attributable to factors other than ocean climate var-iability. This result is consistent with our earlier result thatchanges in ocean climate could not explain between 8 mmolL21 and 51 mmol L21 of the observed oxygen decrease. Whatother factor(s) could be responsible for the remaining declinein O2? The answer may reside in the sediment record.
Changes in organic matter fluxes and sediment oxygendemand—A composite profile of two sediment cores recov-ered at a station situated across from Rimouski in the LSLE(Fig. 1B) revealed that the organic carbon (CORG) content ofthe sediment increased following European settlement in thearea around the 17th century (St-Onge et al. 2003). Concom-itantly, the CORG : N ratio of the preserved sedimentary or-ganic carbon increased from ;8 to 14 (A. Mucci unpubl.data), and the d13C ratio (St-Onge et al. 2003, BackgroundDataset, Fig. 1) decreased from 224.1‰ in the 1600s to224.7‰ around 1970, as a greater proportion of terrigenousorganic matter was accumulating in the sediment (Lucotteet al. 1991). Deforestation and accompanying soil erosion,which began in the 17th century and continues to this day,is a potentially important source of terrigenous organic car-bon to the LSLE system. Other possible sources of terrige-nous organic matter include municipal sewage and pulp andpaper mill wastewaters. Since about 1970, the carbon iso-topic trend has reversed, and the d13C values have increasedto 224.3‰ (St-Onge et al. 2003). The recent d13C increasesuggests that the proportion of marine organic matter deliv-ered to the sediment may have become more important. Theshift in d13C is accompanied by a significant increase in theabundance of dinocysts and organic linings of benthic fo-raminifera (B. Thibodeau et al. pers. comm.). Whereas theformer could be interpreted as a proxy of increased primaryproduction in the surface waters, the latter may reflect a con-comitant increase of benthic production (B. Thibodeau et al.pers. comm.). These preliminary results are consistent andsuggest strongly that an increase in primary production, pos-sibly in relation to coastal eutrophication (Cloern 2001), mayhave taken place over the last two to three decades in theSt. Lawrence estuary.
Irrespective of source, any increase in the delivery of me-tabolizable organic matter to the deep waters and sediments
1665St. Lawrence estuary deep-water oxygen
of the Laurentian Channel will translate into a greater oxy-gen demand. The results of a numerical model that coupleswater transport with a diagenetic model of oxic organic mat-ter mineralization in the sediment reveal that, for realisticvalues of mean advection velocity and vertical and horizon-tal eddy diffusivities, the present flux of organic carbon tothe sediment is sufficient to generate hypoxic waters in thebottom waters of the LSLE (Benoit et al. in press). Giventhe warming trends presented here, future diagenetic modelstudies could examine the possibility that higher bottom wa-ter temperatures may cause greater sediment oxygen demanddue to higher bacterial decomposition rates.
Oxygen in the bottom waters of the LSLE declined by 60mmol L21 between the 1930s and the 1990s. Over the sameperiod of time, the temperature of the bottom waters warmedby 1.658C. A linear regression analysis of the T-O2 relation-ship suggests that this warming is associated with 30–50mmol L21 of the oxygen decrease. Alternatively, a T-S-O2
diagram analysis suggests that a reduction in the proportionof LCW in the bottom waters of the LSLE explains 8–40mmol L21 of the oxygen decrease. We therefore concludethat about one half to two thirds of the observed historicaloxygen loss in the LSLE can be attributed to a decreasingproportion of oxygen-rich LCW in the water mass enteringthe Laurentian Channel, leaving between one third and onehalf of the oxygen decrease unexplained.
Further evidence that factors other than changes in watermass composition contributed to the oxygen decline comesfrom an analysis of the temporal evolution of along-channelgradients of temperature and oxygen in the Laurentian Chan-nel. Whereas the temperature difference between the bottomwaters of the LSLE and waters at 250-m depth in CabotStrait did not change from the 1970s to the 1990s, the ox-ygen gradient between these two locations increased by 29.56 11.9 mmol L21 over the same period. Preliminary datafrom the sediment suggest that increases in sediment oxygendemand in the estuary may be partly responsible for thischange in along-channel oxygen gradient.
References
BENOIT, P., Y. GRATTON, AND A. MUCCI. In press. Modeling ofdissolved oxygen levels in the bottom waters of the Lower St.Lawrence Estuary: Coupling of benthic and pelagic processes.Mar. Chem.
BOURGAULT, D., AND V. G. KOUTITONSKY. 1999. Real-time moni-toring of the freshwater discharge at the head of the St. Law-rence Estuary. Atmosphere-Ocean 37: 203–220.
BUGDEN, G. L. 1988. Oceanographic conditions in the deeper watersof the Gulf of St. Lawrence in relation to local and oceanicforcing. NAFO SCR document 88/87.
CLOERN, J. E. 2001. Our evolving conceptual model of the coastaleutrophication problem. Mar. Ecol. Prog. Ser. 210: 223–253.
DIAZ, R. J., AND R. ROSENBERG. 1995. Marine benthic hypoxia: Areview of its ecological effects and the behavioural responsesof benthic macrofauna. Oceanogr. Mar. Biol. Ann. Rev. 33:245–303.
DRINKWATER, K. F., R. A. MYERS, R. G. PETTIPAS, AND T. L.WRIGHT. 1994. Climatic data for the Northwest Atlantic: Theposition of the shelf/slope front and the northern boundary ofthe Gulf Stream between 508W and 758W, 1973–1992. Can.Data Rep. Fish. Ocean Sci. No. 125.
DUGAL, L.-P. 1934. Observations sur le chlore total et l’oxygenedissous de l’estuaire du Saint-Laurent, saisons 1932–1933. Nat.Can. 61: 165–181.
EBISUZAKI, W. 1997. A method to estimate the statistical signifi-cance of a correlation when the data are serially correlated. J.Clim. 10: 2147–2153.
GARCIA, H. E., AND L. I. GORDON. 1992. Oxygen solubility in sea-water: Better fitting equations. Limnol. Oceanogr. 37: 1307–1312.
GILBERT, D. 2004. Propagation of temperature signals from thenorthwest Atlantic continental shelf edge into the LaurentianChannel. ICES CM 2004/N:07.
, A. F. VEZINA, B. PETTIGREW, D. P. SWAIN, P. S. GAL-BRAITH, L. DEVINE, AND N. ROY. 1997. Etat du Golfe du Saint-Laurent: Conditions oceanographiques en 1995. Rapp. Tech.Can. Hydrogr. Sci. Ocean. No. 191.
GRASSHOFF, K., K. KREMLING, AND M. EHRHARDT. 1999. Methodsof seawater analysis, 3rd ed. Wiley-VCH.
GREGORY, D. N. 2004. Climate: A database of temperature andsalinity observations for the northwest Atlantic. Canadian Sci-ence Advisory Secretariat research document 2004/075.
GREY, S. M., K. HAINES, AND A. TROCCOLI. 2000. A study of tem-perature changes in the upper North Atlantic: 1950–94. J.Clim. 13: 2697–2711.
HURRELL, J. W. 1995. Decadal trends in the North Atlantic Oscil-lation: Regional temperatures and precipitation. Science 269:676–679.
KNAUSS, J. A. 1978. Introduction to physical oceanography. Pren-tice-Hall.
LODER, J. W., J. A. SHORE, C. G. HANNAH, AND B. D. PETRIE. 2001.Decadal-scale hydrographic and circulation variability in theScotia-Maine region. Deep-Sea Res. II 48: 3–35. [doi: 10.1016/S0967-0645(00)00080-1]
LUCOTTE, M., C. HILLAIRE-MARCEL, AND P. LOUCHOUARN. 1991.First-order organic carbon budget in the St. Lawrence LowerEstuary from 13C data. Estuar. Coast. Shelf Sci. 32: 297–312.
MOLER, C. 2004. Numerical computing with MATLAB. Society forIndustrial and Applied Mathematics.
MORGAN, P. P. 1994. SEAWATER: A library of MATLAB com-putational routines for the properties of sea water. CSIRO Ma-rine Laboratories Rep. No. 222.
PERSHING, A. J., AND OTHERS. 2001. Oceanographic responses toclimate in the Northwest Atlantic. Oceanography 14: 76–82.
PETRIE, B., K. DRINKWATER, A. SANDSTROM, R. PETTIPAS, D.GREGORY, D. GILBERT, AND P. SEKHON. 1996. Temperature,salinity and sigma-t atlas for the Gulf of St. Lawrence. Can.Tech. Rep. Hydrogr. Ocean Sci. No. 178.
, AND K. DRINKWATER. 1993. Temperature and salinity var-iability on the Scotian Shelf and in the Gulf of Maine 1945–1990. J. Geophys. Res. 98: 20079–20089.
RABALAIS, N. N., R. E. TURNER, AND W. J. WISEMAN, JR. 2001.Hypoxia in the Gulf of Mexico. J. Environ. Qual. 30: 320–329.
SAUCIER, F. J., AND J. CHASSE. 2000. Tidal circulation and buoyancyeffects in the St. Lawrence Estuary. Atmosphere-Ocean 38:505–556.
, F. ROY, D. GILBERT, P. PELLERIN, AND H. RITCHIE. 2003.Modeling the formation and circulation processes of watermasses and sea ice in the Gulf of St. Lawrence, Canada. J.Geophys. Res. 108(C8). [doi: 10.1029/2000JC000686]
STEVEN, D. M., J. ACREMAN, F. AXELSEN, M. BRENNAN, AND C.SPENCE. 1973. Measurements of primary and secondary pro-duction in the Gulf of St. Lawrence. McGill Univ. Marine Sci-ences Centre Manuscript Rep. Nos. 23, 24, 25.
ST-ONGE, G., J. S. STONER, AND C. HILLAIRE-MARCEL. 2003. Ho-locene paleomagnetic records from the St. Lawrence Estuary,

1666 Gilbert et al.
eastern Canada: Centennial- to millennial-scale geomagneticmodulation of cosmogenic isotopes. Earth Plan. Sci. Lett. 209:113–130. [doi: 10.1016/S0012-821X(03)00079-7]
TOMCZAK, M. 1999. Some historical, theoretical and applied aspectsof quantitative water mass analysis. J. Mar. Res. 57: 275–303.
UNIVERSITE LAVAL. 1934. Station biologique du Saint-Laurent aTrois-Pistoles, deuxieme rapport 1932–1933. Station biolo-gique du Saint-Laurent a Trois-Pistoles, Universite Laval.
. 1936. Station biologique du Saint-Laurent a Trois-Pistoles,
troisieme rapport 1934–1935. Station biologique du Saint-Lau-rent a Trois-Pistoles, Universite Laval.
WINKLER, L. W. 1888. Die Bestimmung des im Wasser gelostenSauerstoffen. [The determination of dissolved oxygen]. Ber.Dtsch. Chem. Ges. 21: 2843–2855. [In German.]
Received: 15 March 2004Accepted: 23 February 2005
Amended: 28 April 2005