Obesogenic Family Types Identified through Latent Profile Analysis
Original Research
E-KINDEX: A Dietary Screening Tool to Assess Children’sObesogenic Dietary Habits
Chrystalleni Lazarou, MSc, Demosthenes B. Panagiotakos, Dr Med Sci, George Spanoudis, PhD, Antonia-Leda Matalas,
PhD
Harokopio University, Department of Nutrition-Dietetics, Athens, GREECE (C.L., D.B.P., A.-L.M.), University of Cyprus,
Department of Psychology, Nicosia, CYPRUS (G.S.)
Key words: dietary index, childhood obesity, dietary patterns, self-monitoring tool, dietary assessment
Background: To date, no published dietary indices have evaluated the overall effects of various dietary
components, beliefs, and practices on the development of obesity in children.
Objective: To develop a dietary index that contains dietary characteristics and practices implicated in the
development of obesity.
Methods: The proposed index (i.e., the E-KINDEX [Electronic Kids Dietary Index]) incorporates 3
subindices: (1) a food groups intake index (13 items), (2) an index related to eating beliefs and behaviors (8
items), and (3) an index that evaluates dietary practices (9 items). The theoretical overall score ranges from 1
(worst) to 87 (best). For validation of the E-KINDEX, multiple linear and logistic regression analyses were
applied that had as dependent outcomes various body composition indices of 622 children (9–13 years) from the
CYKIDS (Cyprus Kids) study. In all models, adjustments were made for age, gender, physical activity level, TV
viewing time, socioeconomic status, breastfeeding, and parental obesity status.
Results: The highest E-KINDEX category (.60 points) was associated with 85% less likelihood of a child
being obese or overweight (odds ratio [OR], 0.15; 95% confidence interval [CI], 0.05–0.41) and 86% less
likelihood of having a waist circumference �75th percentile (OR, 0.14; 95% CI, 0.05–0.43). The correct
classification rate of E-KINDEX (C-statistic) against excess body fat percentage was 84% (CI, 0.74–0.94).
Moreover, for a single SD increase in the index score (i.e., 7.81 units), a decrease of 2.31 6 0.23 kg/m2 in body
mass index (BMI), of 2.23 6 0.35 in percent of body fat (BF%), and of 2.16 6 0.61 cm in waist circumference
was observed. Similar results were found during 1-year follow-up of study participants. In particular, baseline E-
KINDEX levels were inversely associated with children’s BMI at 1-year follow-up (p ¼ 0.024). Latent class
analysis showed that the index has good discriminative value for only 68% of the total sample.
Conclusion: The proposed E-KINDEX could be helpful in dietary assessment and in further research in the
field of childhood obesity.
INTRODUCTION
Childhood obesity is a growing global epidemic [1] that not
only affects wellness during childhood, but also jeopardizes
health in adulthood, as one third to one half of obese preschool-
and school-aged children become obese adults [1,2]. Conse-
quently, prevention of childhood obesity has become an area of
considerable interest among public health professionals [3].
Global increases in overweight and obese children can be
attributed to lifestyle factors and to several other determinants
that influence energy balance. Recently, the American
Academy of Pediatrics (AAP) underlined the need for research
aimed at developing suitable tools to comprehensively assess
all behaviors that could be determinants of obesity [4].
However, effective, simple, and accurate prevention and
screening tools for evaluating overall diet quality and
associating it with obesity development among children are
unavailable.
Lack of research in this area may be due to several
methodologic barriers that do not permit overall evaluation of
unhealthy behaviors. In the dietary assessment, analysis of
overall dietary patterns is a valuable approach that has been
Address reprint requests to: Chrystalleni Lazarou, MSc, 28 Kronos Street, 2369 Ayios Dhometios, Nicosia, CYPRUS. E-mail: [email protected]
Journal of the American College of Nutrition, Vol. 30, No. 2, 100–112 (2011)
Published by the American College of Nutrition
100
used in nutritional epidemiology over the past few years. It
permits the evaluation of dietary habits as a whole, as it
accommodates the complexity of food consumption practices.
To evaluate the level of adherence to specific dietary patterns or
recommendations, various quantitative indices have been
proposed [5,6]. Application of these indices has revealed the
relationship between diet and several risk factors for chronic
disease or mortality from cardiovascular disease and cancer [7–
9]. However, data related to the application of dietary pattern
analysis in children, and consequently of indices associated
with the status of their health, are scarce [10–14]. Only a few
dietary indices that can be used to evaluate the relationship of
various characteristics to obesity status or body mass index
(BMI) in populations of children have been located thus far
[11,12]. However, in general, observed associations were
weak. Thus, the development of valid dietary indices to screen
for unhealthy dietary behaviors that relate to the development
of obesity would be a valuable tool in the prevention of
childhood obesity and in primary health care.
The present study aimed to develop a composite dietary
index while assessing its relationship to obesity levels in
children. The proposed index concurrently assesses and
summarizes (in a single score) several food habits, dietary
beliefs, and practices known to be implicated in the
development of childhood obesity.
METHODS
Development of the E-KINDEX (Electronic KidsDietary Index): An Obesity Dietary Index for Kids
Several reviews [15–17], a recent consensus [18], and the
AAP’S Expert Committee recommendations [4,19–21] suggest
that targeted dietary parameters for obesity prevention and
management in children and adolescents should include eating
habits (including meal patterns, child feeding practices, and
environmental dietary triggers such as advertising) and
consumption of foods that are rich in calories but of low
nutritional value. Moreover, evidence from intervention studies
supports the notion that psychological and behavioral aspects
of food consumption may be of more importance in obesity
management than actual diet composition [20,22,23].
Following the previous rationale, we chose to include in the
proposed index several factors from each of the 3 main aspects
of the diet—diet composition, eating habits (including meal
patterns), and dietary beliefs—to develop a dietary obesity
index. We named this index the E-KINDEX (Electronic Kids
Dietary Index) because it is planned to be available in
electronic form as well. To assess the effects of combined
dietary behaviors on overall risk of developing obesity, the E-
KINDEX incorporates (into a score) the components of 3
dietary indices: (1) the Foods E-KINDEX (consisting of food
group components), (2) the Dietary Behavior E-KINDEX (with
components related to the psychology of eating), and (3) the
Dietary Habits E-KINDEX (composed of dietary practices
[including meal patterns] components); these indices comprise
13, 8, and 9 components, respectively.
The rationale behind the development of 3 distinct indices
and their combination is 3-fold: (1) to assess the relative
contribution of each dietary aspect to the overall score and thus
determine its individual association with observed obesity
status; (2) to determine whether the approach of total diet
assessment offers distinct advantages over the evaluation of
single dietary variables; and (3) to enable potential users to gain
insight into how each factor contributes to a final score, and
thus to facilitate further decisions and measures regarding
obesity prevention and management.
A detailed description of the 3 main parts of the index,
together with the scoring method, is provided here.
E-KINDEX components 1 through 13 evaluate the overall
quality of diet, as this is assessed by the balance of food choices
and methods of cooking; components 14 through 21 evaluate
psychological aspects of eating; and components 22 through 30
evaluate aspects of diet quality with reference to dietary practices
and meal patterns. The main focus is on food components and
additional aspects of the diet, as previously recommended in the
literature [11]. Components and relevant questions have been
designed in such a way as to permit their use by children and by
their parents or their administration by an interviewer (pediatri-
cian, dietitian, or nurse). Such an index is deemed suitable for
intervention and health education purposes.
Part 1 (Foods E-KINDEX) consists of 11 foods or food
groups and 2 aspects of cooking techniques; it seeks to assess the
quality of the diet from the perspective of varied and balanced
food choices. Overall quality of diet is a potential contributory
factor to adiposity [4,19–21,24]. The AAP and other scientific
bodies emphasize the importance of overall diet quality and
balanced food choices [4,15,17] in prevention and management
of childhood adiposity. Foods from all food groups were
included to address the basic principle of dietary variety.
Moreover, food items were selected on the basis that as whole
foods or as sources of fat, fiber, sugar, and less so, calcium, they
have been associated with obesity [15].
Part 2 (Behavior E-KINDEX) consists of 8 dietary attitudes
and their related behaviors; it aims to serve as a proxy indicator
of cognitive schemas regarding diet. Cognitive schemas are
fundamental in the development and shaping of children’s
dietary preferences, choices, and behaviors, and are significant
in the development of obesity [21,23].
Part 3 (Dietary Habits E-KINDEX) includes 9 items that
evaluate meal patterns and behaviors, as several studies have
examined the connection between these particular meal
patterns and behaviors and obesity [4,15,17].
A 4-point scoring system comprising monotonic and
nonmonotonic functions (ranging from 0 to 3 or the reverse)
was used for most components of the index. Nonmonotonic
JOURNAL OF THE AMERICAN COLLEGE OF NUTRITION 101
A Dietary Screening Tool Associated with Obesity
functions were used primarily for items such as sweets, soft
drinks, fried foods, and meat items, taking into account the fact
that guidelines call for moderate consumption rather than total
exclusion of these foods from the diet [17]. Nonmonotonic
scoring was used when (1) intermediate choices were well below
the recommended consumption (e.g., ‘‘frequency of eating
bread,’’ ‘‘frequency of eating meals in afternoon school’’); (2)
intermediate choices were acceptable as the top range category
(e.g., ‘‘frequency of eating legumes’’); (3) top range choices
seemed unrealistic (with the possibility of an increased
likelihood of overestimation, e.g., ‘‘frequency of eating fish
and seafood’’); and (4) only 2 choices were possible: yes/no
(e.g., ‘‘whether eating foods because they are advertised’’).
With the rationale of using wide range scoring to develop
informative and accurate scales [25], we used scores ranging
between 0 and 3 for most items of the E-KINDEX. The specific
scores used for each item were based on existing dietary
recommendations for children [4,17,18], given available
evidence from published studies regarding the influence of
diet on childhood obesity [4,15,17] and the results of univariate
analysis of each variable of interest to obesity status, as
suggested by experts in the field of dietary index development
[25,26]. Higher scores indicate a healthier quality of diet,
which inhibits the development of childhood obesity. Maxi-
mum score values (i.e., 2 or 3) varied according to (1) the
importance of the specific item in the overall dietary
assessment, and (2) the results of univariate analysis of each
variable of interest to the obesity status. Thus, an indirect
weight, as suggested by the literature on development of
dietary screening tools [25,26], was given to items considered
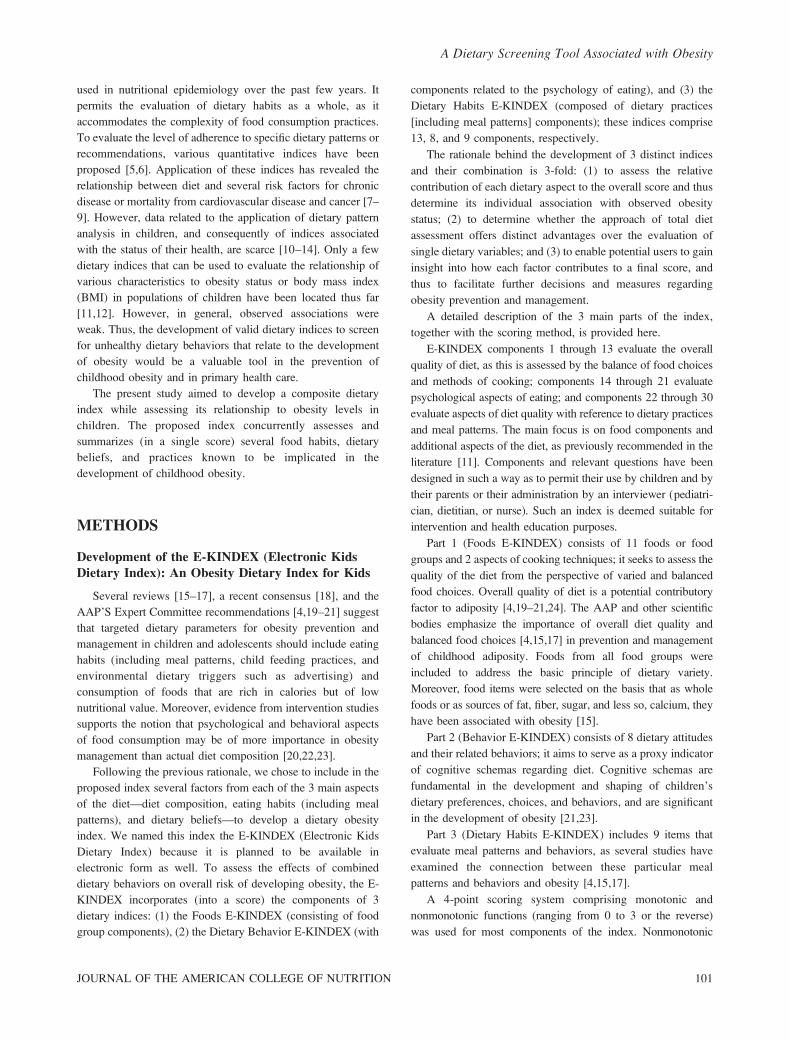
more significant in the development of obesity. The method of
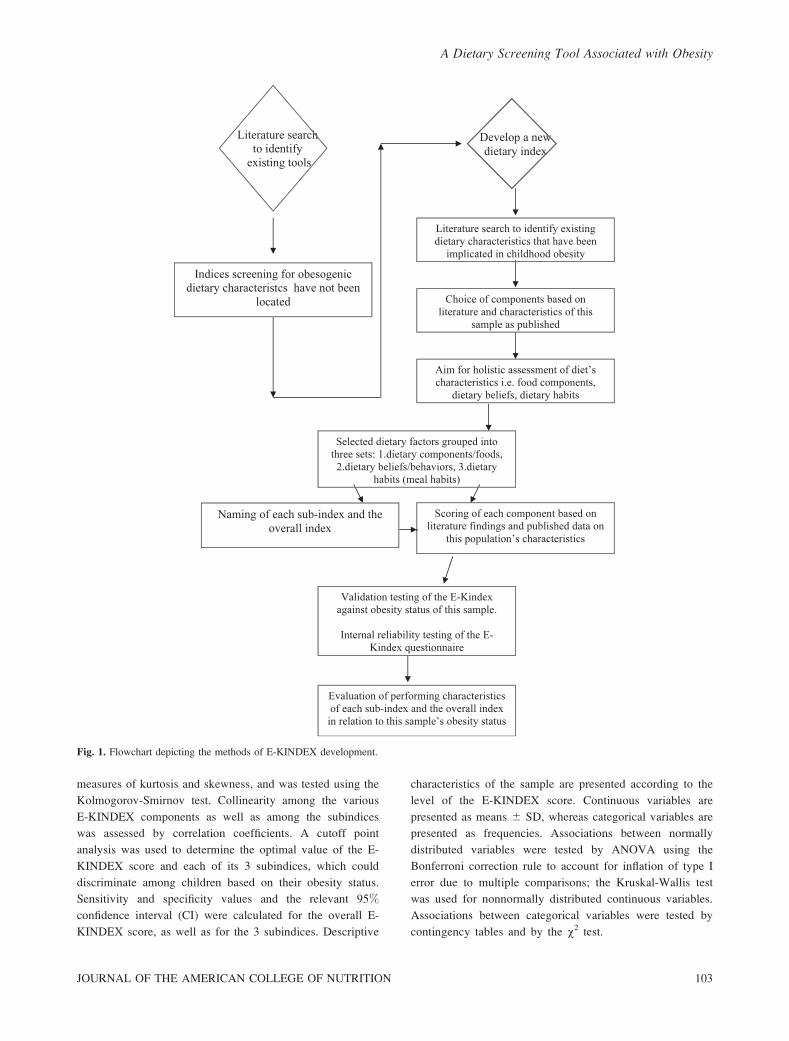
E-KINDEX development is depicted and summarized in Fig. 1.
The theoretical score of E-KINDEX ranges from 1 (worst)
to 87 (best). We purposefully let the lower response category
be equal to 1 point (and not 0) to render the index more user
friendly when used by children, as suggested by childhood
educational psychology [27]. Other dietary indices in adult and
child populations have used the value of 1 or some other
positive number as the lower cutoff value [28,29]. The
components of E-KINDEX, along with the scoring system,
the upper and lower cutoff points of each component, and the 4
E-KINDEX score range categories (based on degree of
achievement of maximum points), are presented in Table 1.
Validation Dataset
To test the diagnostic accuracy of the proposed index, data
from the Cyprus Kids Study (CYKIDS) were used. In 2005, a
total of 1589 children from the fourth, fifth, and sixth grades
(9–13 years; mean age, 10.7 6 0.98 years) from 24 primary
schools in all urban and rural areas of Cyprus were identified as
suitable participants; 1140 of these children agreed to
participate in the study (72% participation rate). Sampling
was multistage and was stratified by the number of students in
each of the 5 provinces, as provided by the Ministry of
Education (data available on request from the Department of
Primary Education), and by place of residence (place of school
was used as a proxy)—urban or rural—as provided by the
Cyprus Statistical Service. Further details of the sampling
procedure have been provided elsewhere [30]. The study
design was approved by the Harokopio Institutional Review
Board and by the Cyprus Ministry of Education and Culture
(Department of Primary Education). Signed informed consent
was provided by the parent or guardian of each child.
Dietary assessment was based on a validated [30] semiquan-
titative food frequency questionnaire (FFQ) consisting of 154
food items (including all of the foods commonly used in the
Greek-Cypriot cuisine) and on 3 supplementary questionnaires,
which evaluated other aspects of dietary habits. A detailed
description of the questionnaires is provided elsewhere [30].
Questionnaires were administered to students by a registered
dietitian during school hours between February and June 2005,
as prescribed by a written protocol describing the standardized
method for dietary data collection. A validated [31] physical
activity index (PAI) was calculated on the basis of 2 variables
that measured the frequency of all walking and running activities
performed on a weekly basis. Additionally, daily average TV
(television) viewing time (including weekends) was assessed.
Anthropometric data (i.e., weight, height, and waist
circumference [WC]) were collected from a subsample of
622 children, according to a standard protocol described by
Heymsfield et al. [32]. Obesity was defined by the International
Obesity Task Force on the basis of age- and gender-specific
body mass index (BMI) cutoff criteria [33]. Body fat
percentage (%BF) was calculated using the Deurenberg
formula [34]. Furthermore, a new variable called generalized
obesity [31] was computed, based on children’s BMI status and
WC, that could take 1 of 3 values: (1) both BMI and WC
normal (WC , 75th percentile); (2) either BMI or WC above
normal measures (WC � 75th percentile); or (3) both BMI and
WC above normal (WC � 75th percentile).
In addition to direct measurements, the weight and height of
all children were reported via questionnaire by parents at 2
times that were 1 year apart. Finally, parental overweight and
obesity status were evaluated via parental self-report as
described elsewhere [35].
Family socioeconomic status (SES) was defined by the
InterCollege Research Center of Cyprus, based on parents’
profession and educational level; the highest level of profession
reported by either parent was used as a proxy of the family’s
SES level, along with family income [35].
Statistical Analyses
The distribution of the E-KINDEX score is presented as
the mean, standard deviation, coefficient of variation,
tertiles, and range. The normality of the E-KINDEX score
variable was evaluated with the use of P-P plots, that is,
102 VOL. 30, NO. 2
A Dietary Screening Tool Associated with Obesity
measures of kurtosis and skewness, and was tested using the
Kolmogorov-Smirnov test. Collinearity among the various
E-KINDEX components as well as among the subindices
was assessed by correlation coefficients. A cutoff point
analysis was used to determine the optimal value of the E-
KINDEX score and each of its 3 subindices, which could
discriminate among children based on their obesity status.
Sensitivity and specificity values and the relevant 95%
confidence interval (CI) were calculated for the overall E-
KINDEX score, as well as for the 3 subindices. Descriptive
characteristics of the sample are presented according to the
level of the E-KINDEX score. Continuous variables are
presented as means 6 SD, whereas categorical variables are
presented as frequencies. Associations between normally
distributed variables were tested by ANOVA using the
Bonferroni correction rule to account for inflation of type I
error due to multiple comparisons; the Kruskal-Wallis test
was used for nonnormally distributed continuous variables.
Associations between categorical variables were tested by
contingency tables and by the v2 test.
Fig. 1. Flowchart depicting the methods of E-KINDEX development.
JOURNAL OF THE AMERICAN COLLEGE OF NUTRITION 103
A Dietary Screening Tool Associated with Obesity
Multiple linear regression analysis was applied to evaluate
the association between E-KINDEX score and body compo-
sition indices (BMI, %BF, and WC) at baseline and at 1-year
follow-up; logistic regression analyses were applied to evaluate
the association between E-KINDEX score and obesity status,
WC, and generalized obesity levels. All models were adjusted
for age, gender, physical activity level, TV viewing time, SES,
breastfeeding, and parental obesity status.
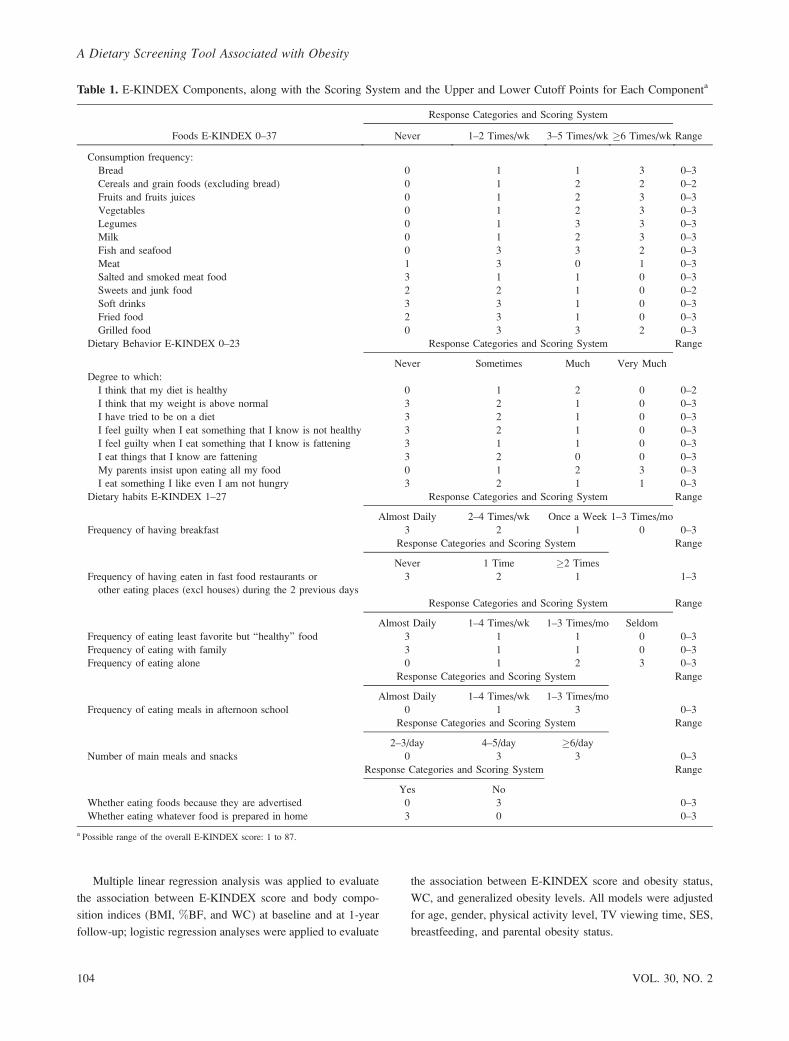
Table 1. E-KINDEX Components, along with the Scoring System and the Upper and Lower Cutoff Points for Each Componenta
Foods E-KINDEX 0–37
Response Categories and Scoring System
RangeNever 1–2 Times/wk 3–5 Times/wk �6 Times/wk
Consumption frequency:
Bread 0 1 1 3 0–3
Cereals and grain foods (excluding bread) 0 1 2 2 0–2
Fruits and fruits juices 0 1 2 3 0–3
Vegetables 0 1 2 3 0–3
Legumes 0 1 3 3 0–3
Milk 0 1 2 3 0–3
Fish and seafood 0 3 3 2 0–3
Meat 1 3 0 1 0–3
Salted and smoked meat food 3 1 1 0 0–3
Sweets and junk food 2 2 1 0 0–2
Soft drinks 3 3 1 0 0–3
Fried food 2 3 1 0 0–3
Grilled food 0 3 3 2 0–3
Dietary Behavior E-KINDEX 0–23 Response Categories and Scoring System Range
Never Sometimes Much Very Much
Degree to which:
I think that my diet is healthy 0 1 2 0 0–2
I think that my weight is above normal 3 2 1 0 0–3
I have tried to be on a diet 3 2 1 0 0–3
I feel guilty when I eat something that I know is not healthy 3 2 1 0 0–3
I feel guilty when I eat something that I know is fattening 3 1 1 0 0–3
I eat things that I know are fattening 3 2 0 0 0–3
My parents insist upon eating all my food 0 1 2 3 0–3
I eat something I like even I am not hungry 3 2 1 1 0–3
Dietary habits E-KINDEX 1–27 Response Categories and Scoring System Range
Almost Daily 2–4 Times/wk Once a Week 1–3 Times/mo
Frequency of having breakfast 3 2 1 0 0–3
Response Categories and Scoring System Range
Never 1 Time �2 Times
Frequency of having eaten in fast food restaurants or
other eating places (excl houses) during the 2 previous days
3 2 1 1–3
Response Categories and Scoring System Range
Almost Daily 1–4 Times/wk 1–3 Times/mo Seldom
Frequency of eating least favorite but ‘‘healthy’’ food 3 1 1 0 0–3
Frequency of eating with family 3 1 1 0 0–3
Frequency of eating alone 0 1 2 3 0–3
Response Categories and Scoring System Range
Almost Daily 1–4 Times/wk 1–3 Times/mo
Frequency of eating meals in afternoon school 0 1 3 0–3
Response Categories and Scoring System Range
2–3/day 4–5/day �6/day
Number of main meals and snacks 0 3 3 0–3
Response Categories and Scoring System Range
Yes No
Whether eating foods because they are advertised 0 3 0–3
Whether eating whatever food is prepared in home 3 0 0–3
a Possible range of the overall E-KINDEX score: 1 to 87.
104 VOL. 30, NO. 2
A Dietary Screening Tool Associated with Obesity
Receiver operating characteristic (ROC) curve analysis was
used to estimate the sensitivity and specificity characteristics of
the proposed index and its subindices, and thus finally to
determine the diagnostic ability of the index.
C-statistics derived from ROC curves were used to assess
the discriminative power of the logistic regression models. The
internal reliability of the index was examined by Cronbach’s
alpha statistic (values of the statistic �0.6 suggest that the items
may be considered 1-dimensional and may be combined into a
single index or scale [36]). All reported p values were based on
2-sided hypotheses and on the 0.05 level of statistical
significance. Statistical analyses were performed using the
Statistical Package for the Social Sciences (SPSS), release 14.0
(SPSS Inc, Chicago, IL; 2005).
Latent class cluster analysis (LCA), using Latent GOLD 4.5
software (Vermunt & Magidson, 2008; Statistical Innovations,
Belmont, MA), was performed to evaluate potential heteroge-
neity among subindices of the E-KINDEX in relation to obesity
status. LCA was designed to reveal subgroups of children for
whom the E-KINDEX had low predictive value. The C-statistic
was computed using unweighted and weighted predicted values
for each latent cluster. The Akaike Information Criterion (AIC)
was calculated; lower values suggest a better model. The
weight was the proportion of each cluster in the total sample.
RESULTS
Description of the E-KINDEX Score
The range of the total E-KINDEX score in the present
sample was 32.0 to 77.0 points (mean 6 SD, 58.2 6 7.8).
Scores did not differ between genders (p ¼ 0.173). The
frequency distribution of the score was symmetrical and normal
(data not shown here). Correlation coefficients between total
and individual component scores ranged from r , 0.001 to
0.47 (with p values between 0.99 and ,0.001; data not shown).
Similarly, all 3 individual correlation coefficients among the 3
subindices were less than 0.118 (p . 0.05). The internal
reliability of the E-KINDEX as examined by Cronbach’s alpha
statistic was 0.601, which suggests that the index can be
proposed as a fairly reliable tool to screen for obesity risk–
linked dietary behaviors [36].
Descriptive Characteristics of Children Based onTheir E-KINDEX Score
Selected sociodemographic, anthropometric, and lifestyle
characteristics are presented in Table 2. With regard to obesity
status, the E-KINDEX was 51.4 (69.2) among obese children,
56.5 (67.5) among overweight children, and 59.4 (67.4)
among children of normal weight (p , 0.0001) (Table 2).
These values reflect an average of 59%, 65%, and 73%
achievement of dietary goals as evaluated by E-KINDEX for
obese (OB), overweight (OW), and normal weight (NW)
children, respectively. Relationships to other characteristics are
provided in Table 2.
Evaluation of the Accuracy of the E-KINDEX
The prevalence of OW and OB children in this nationwide
sample (of about 2% of the reference population) was 22.7%
and 7.6%, respectively. Given that no significant differences
between genders were observed regarding the prevalence of
OW/OB (v2¼2.37; df¼2; p¼0.144) or scores obtained for E-
KINDEX items, all analyses were performed without gender
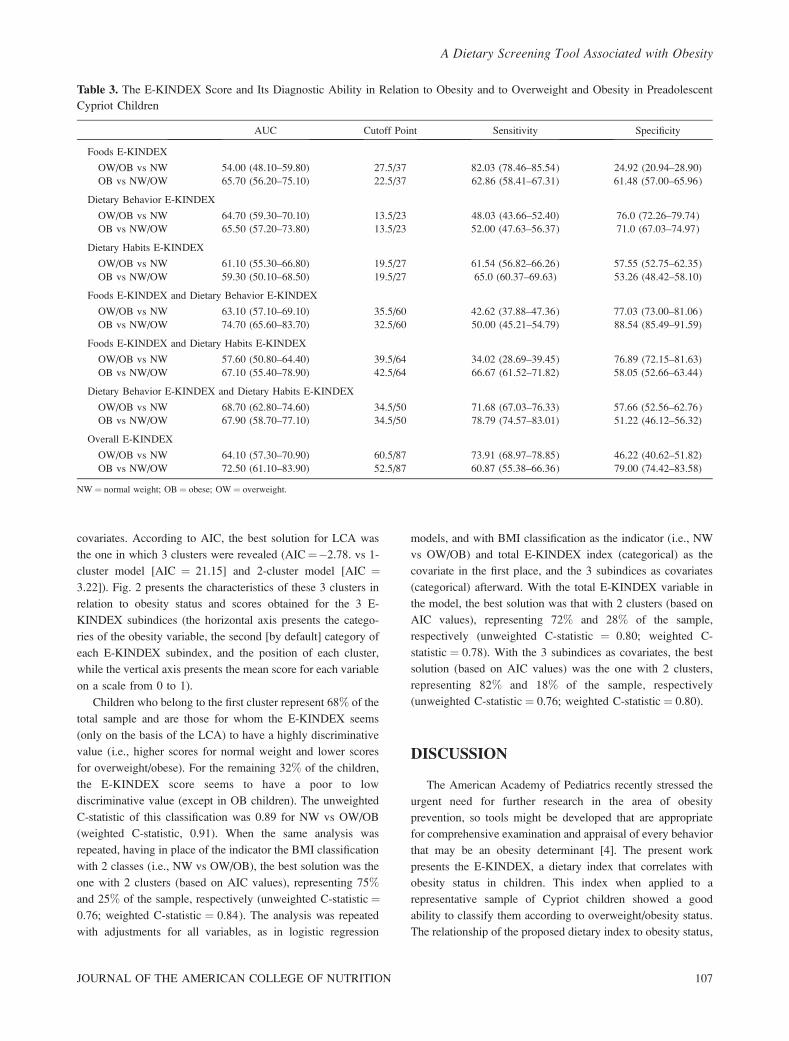
stratification. Table 3 presents the characteristics of E-KINDEX
based on its ability to discriminate children’s obesity status.
Overall, the diagnostic ability of the score (as assessed by area
under the curve [AUC] from ROC analysis) appears to be more
effective in screening for obesity than for overweight status in
this sample. Cutoff point analysis showed that the optimal
value that best discriminates OW/OB from NW is 61 out of 87
(which is the highest possible total score of the index)
(sensitivity ¼ 74%), and OB from NW/OW children is 53
out of 87 (sensitivity ¼ 61%). Details on characteristics of the
overall E-KINDEX and its subindices are provided in Table 3.
Multiple linear regression analysis, after adjustments for
age, gender, physical activity, TV viewing, SES, breastfeeding,
and parental obesity status, revealed that each 1 SD (i.e., 7.81
points) increase in the E-KINDEX score was associated with a
2.31 6 0.23 kg/m2 decrease in BMI (p , 0.001), a 2.23 6 0.35
decrease in calculated %BF (p , 0.001), and a 2.16 6 0.61 cm
decrease in WC (p , 0.001).
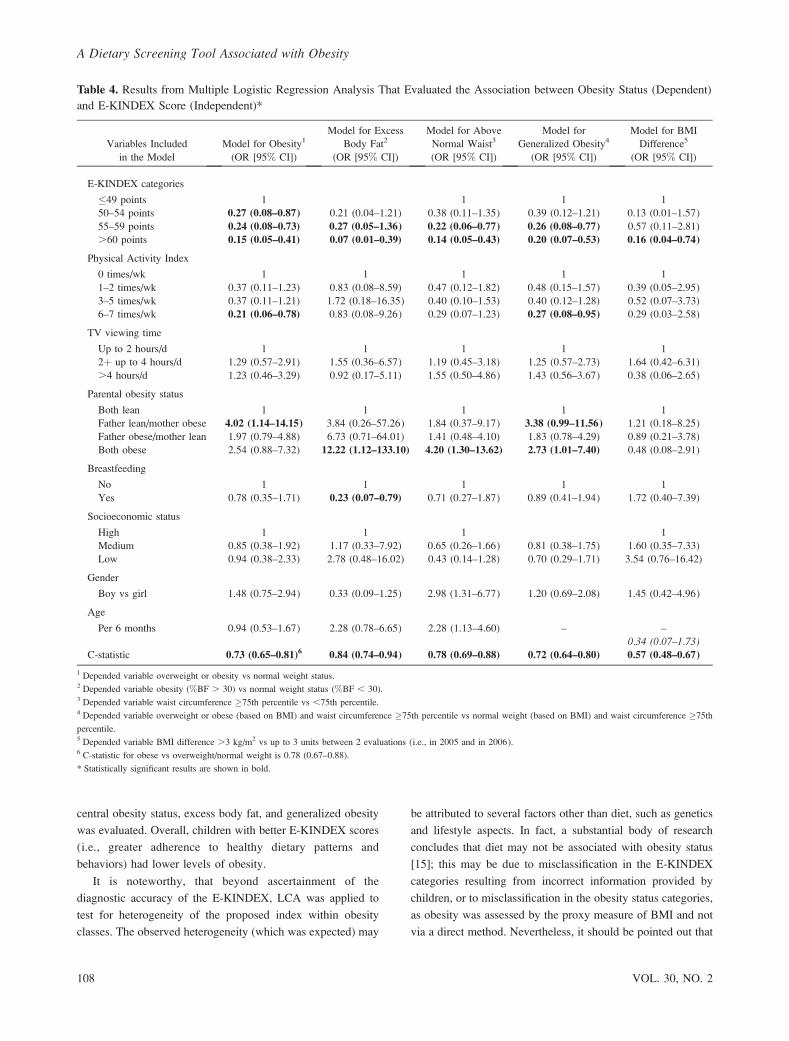
Table 4 presents results from logistic regression models
with 4 obesity markers (i.e., BMI, %BF, WC, and generalized
obesity) as dependent outcomes. Significant and consistent
inverse associations between the E-KINDEX score and these
outcomes were observed in all models. Specifically, compared
with children belonging to the lowest E-KINDEX category
(i.e., �49 points), those with scores in the second, third, and
fourth categories had, on average, a 73%, 76%, and 85%
decreased likelihood of being overweight/obese, respectively.
Similarly, children with scores that fell into the second, third,
and fourth categories were, respectively, 62%, 78%, and 86%
less likely to exhibit WC � 75th percentile (Table 4).
Application of these 4 models in data obtained at 1-year
follow-up revealed similar results. In particular, being classified
in the highest scored category was associated with an 84%
decreased likelihood of an increase in BMI greater than 3 kg/
m2 in 1 year (odds ratio [OR], 0.16; 95% CI, 0.04–0.74).
The C-statistic of the logistic models ranged from 0.71 to
0.84 (Table 4), suggesting good predictive ability for the
population studied [37,38]; nevertheless, the predictive ability
of these models cannot be generalized.
LCA was performed and children’s BMI classification
(categorical) was used as the indicator variable, while
categorical variables of the 3 subindices were used as
JOURNAL OF THE AMERICAN COLLEGE OF NUTRITION 105
A Dietary Screening Tool Associated with Obesity
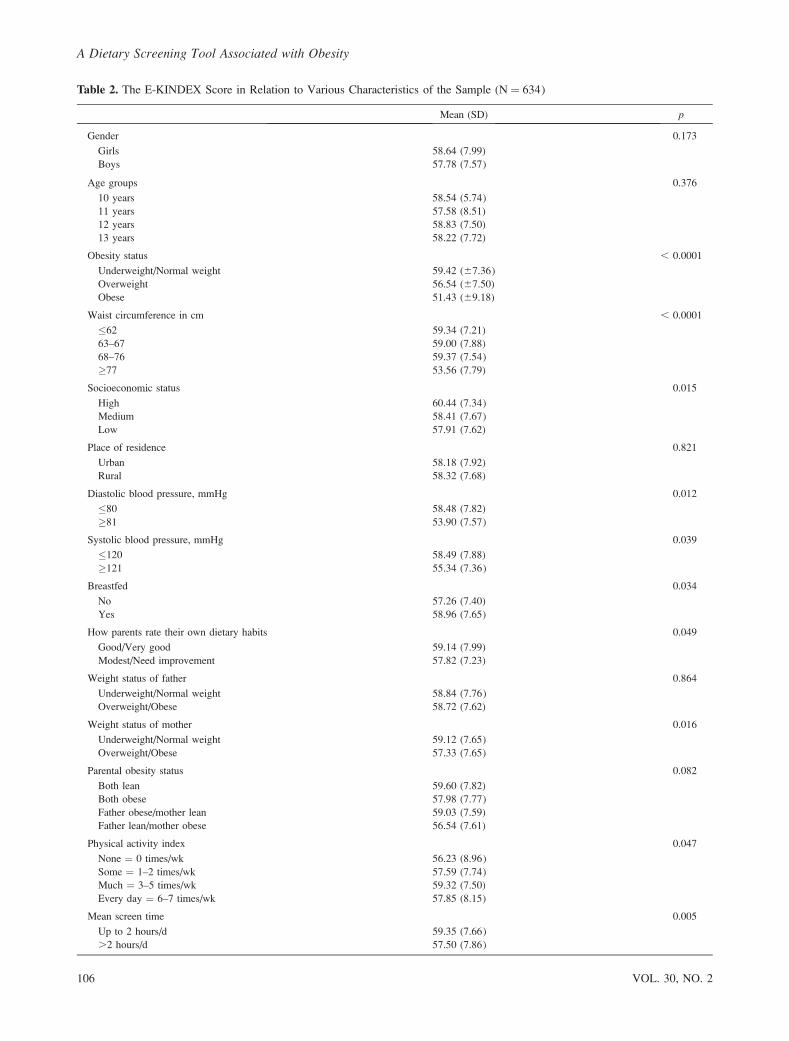
Table 2. The E-KINDEX Score in Relation to Various Characteristics of the Sample (N ¼ 634)
Mean (SD) p
Gender 0.173
Girls 58.64 (7.99)
Boys 57.78 (7.57)
Age groups 0.376
10 years 58.54 (5.74)
11 years 57.58 (8.51)
12 years 58.83 (7.50)
13 years 58.22 (7.72)
Obesity status , 0.0001
Underweight/Normal weight 59.42 (67.36)
Overweight 56.54 (67.50)
Obese 51.43 (69.18)
Waist circumference in cm , 0.0001
�62 59.34 (7.21)
63–67 59.00 (7.88)
68–76 59.37 (7.54)
�77 53.56 (7.79)
Socioeconomic status 0.015
High 60.44 (7.34)
Medium 58.41 (7.67)
Low 57.91 (7.62)
Place of residence 0.821
Urban 58.18 (7.92)
Rural 58.32 (7.68)
Diastolic blood pressure, mmHg 0.012
�80 58.48 (7.82)
�81 53.90 (7.57)
Systolic blood pressure, mmHg 0.039
�120 58.49 (7.88)
�121 55.34 (7.36)
Breastfed 0.034
No 57.26 (7.40)
Yes 58.96 (7.65)
How parents rate their own dietary habits 0.049
Good/Very good 59.14 (7.99)
Modest/Need improvement 57.82 (7.23)
Weight status of father 0.864
Underweight/Normal weight 58.84 (7.76)
Overweight/Obese 58.72 (7.62)
Weight status of mother 0.016
Underweight/Normal weight 59.12 (7.65)
Overweight/Obese 57.33 (7.65)
Parental obesity status 0.082
Both lean 59.60 (7.82)
Both obese 57.98 (7.77)
Father obese/mother lean 59.03 (7.59)
Father lean/mother obese 56.54 (7.61)
Physical activity index 0.047
None ¼ 0 times/wk 56.23 (8.96)
Some ¼ 1–2 times/wk 57.59 (7.74)
Much ¼ 3–5 times/wk 59.32 (7.50)
Every day ¼ 6–7 times/wk 57.85 (8.15)
Mean screen time 0.005
Up to 2 hours/d 59.35 (7.66)
.2 hours/d 57.50 (7.86)
106 VOL. 30, NO. 2
A Dietary Screening Tool Associated with Obesity
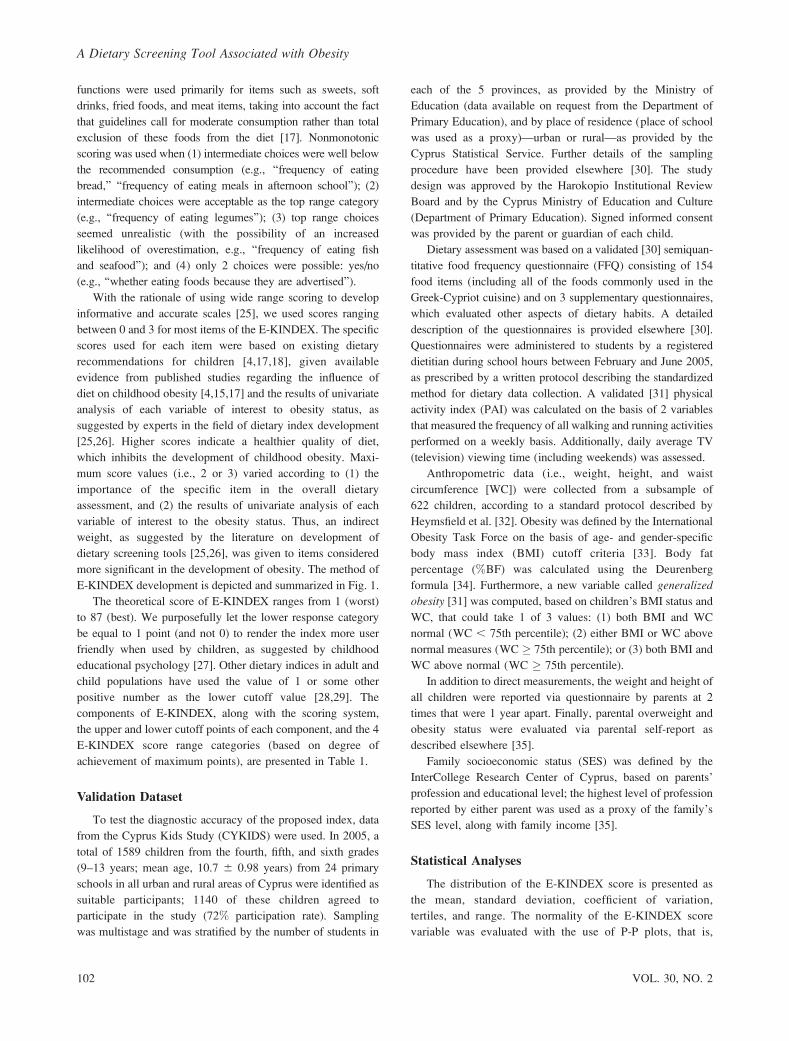
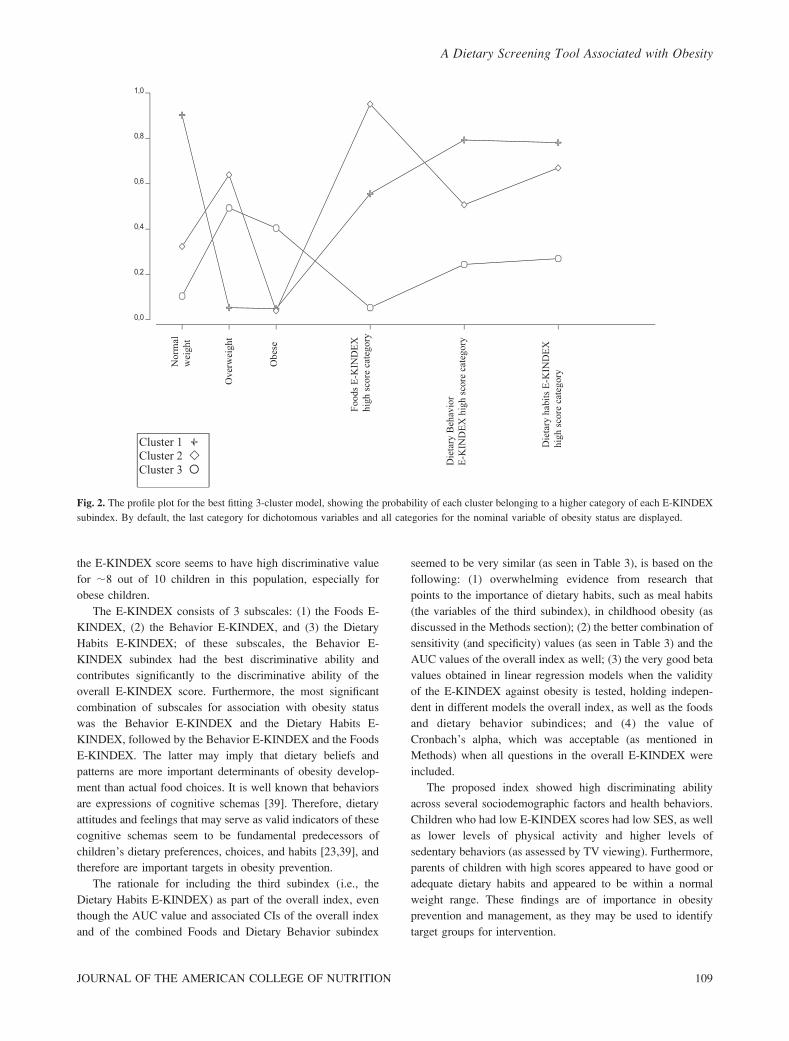
covariates. According to AIC, the best solution for LCA was
the one in which 3 clusters were revealed (AIC¼�2.78. vs 1-
cluster model [AIC ¼ 21.15] and 2-cluster model [AIC ¼3.22]). Fig. 2 presents the characteristics of these 3 clusters in
relation to obesity status and scores obtained for the 3 E-
KINDEX subindices (the horizontal axis presents the catego-
ries of the obesity variable, the second [by default] category of
each E-KINDEX subindex, and the position of each cluster,
while the vertical axis presents the mean score for each variable
on a scale from 0 to 1).
Children who belong to the first cluster represent 68% of the
total sample and are those for whom the E-KINDEX seems
(only on the basis of the LCA) to have a highly discriminative
value (i.e., higher scores for normal weight and lower scores
for overweight/obese). For the remaining 32% of the children,
the E-KINDEX score seems to have a poor to low
discriminative value (except in OB children). The unweighted
C-statistic of this classification was 0.89 for NW vs OW/OB
(weighted C-statistic, 0.91). When the same analysis was
repeated, having in place of the indicator the BMI classification
with 2 classes (i.e., NW vs OW/OB), the best solution was the
one with 2 clusters (based on AIC values), representing 75%
and 25% of the sample, respectively (unweighted C-statistic¼0.76; weighted C-statistic ¼ 0.84). The analysis was repeated
with adjustments for all variables, as in logistic regression
models, and with BMI classification as the indicator (i.e., NW
vs OW/OB) and total E-KINDEX index (categorical) as the
covariate in the first place, and the 3 subindices as covariates
(categorical) afterward. With the total E-KINDEX variable in
the model, the best solution was that with 2 clusters (based on
AIC values), representing 72% and 28% of the sample,
respectively (unweighted C-statistic ¼ 0.80; weighted C-
statistic ¼ 0.78). With the 3 subindices as covariates, the best
solution (based on AIC values) was the one with 2 clusters,
representing 82% and 18% of the sample, respectively
(unweighted C-statistic¼ 0.76; weighted C-statistic ¼ 0.80).
DISCUSSION
The American Academy of Pediatrics recently stressed the
urgent need for further research in the area of obesity
prevention, so tools might be developed that are appropriate
for comprehensive examination and appraisal of every behavior
that may be an obesity determinant [4]. The present work
presents the E-KINDEX, a dietary index that correlates with
obesity status in children. This index when applied to a
representative sample of Cypriot children showed a good
ability to classify them according to overweight/obesity status.
The relationship of the proposed dietary index to obesity status,
Table 3. The E-KINDEX Score and Its Diagnostic Ability in Relation to Obesity and to Overweight and Obesity in Preadolescent
Cypriot Children
AUC Cutoff Point Sensitivity Specificity
Foods E-KINDEX
OW/OB vs NW 54.00 (48.10–59.80) 27.5/37 82.03 (78.46–85.54) 24.92 (20.94–28.90)
OB vs NW/OW 65.70 (56.20–75.10) 22.5/37 62.86 (58.41–67.31) 61.48 (57.00–65.96)
Dietary Behavior E-KINDEX
OW/OB vs NW 64.70 (59.30–70.10) 13.5/23 48.03 (43.66–52.40) 76.0 (72.26–79.74)
OB vs NW/OW 65.50 (57.20–73.80) 13.5/23 52.00 (47.63–56.37) 71.0 (67.03–74.97)
Dietary Habits E-KINDEX
OW/OB vs NW 61.10 (55.30–66.80) 19.5/27 61.54 (56.82–66.26) 57.55 (52.75–62.35)
OB vs NW/OW 59.30 (50.10–68.50) 19.5/27 65.0 (60.37–69.63) 53.26 (48.42–58.10)
Foods E-KINDEX and Dietary Behavior E-KINDEX
OW/OB vs NW 63.10 (57.10–69.10) 35.5/60 42.62 (37.88–47.36) 77.03 (73.00–81.06)
OB vs NW/OW 74.70 (65.60–83.70) 32.5/60 50.00 (45.21–54.79) 88.54 (85.49–91.59)
Foods E-KINDEX and Dietary Habits E-KINDEX
OW/OB vs NW 57.60 (50.80–64.40) 39.5/64 34.02 (28.69–39.45) 76.89 (72.15–81.63)
OB vs NW/OW 67.10 (55.40–78.90) 42.5/64 66.67 (61.52–71.82) 58.05 (52.66–63.44)
Dietary Behavior E-KINDEX and Dietary Habits E-KINDEX
OW/OB vs NW 68.70 (62.80–74.60) 34.5/50 71.68 (67.03–76.33) 57.66 (52.56–62.76)
OB vs NW/OW 67.90 (58.70–77.10) 34.5/50 78.79 (74.57–83.01) 51.22 (46.12–56.32)
Overall E-KINDEX
OW/OB vs NW 64.10 (57.30–70.90) 60.5/87 73.91 (68.97–78.85) 46.22 (40.62–51.82)
OB vs NW/OW 72.50 (61.10–83.90) 52.5/87 60.87 (55.38–66.36) 79.00 (74.42–83.58)
NW ¼ normal weight; OB¼ obese; OW ¼ overweight.
JOURNAL OF THE AMERICAN COLLEGE OF NUTRITION 107
A Dietary Screening Tool Associated with Obesity
central obesity status, excess body fat, and generalized obesity
was evaluated. Overall, children with better E-KINDEX scores
(i.e., greater adherence to healthy dietary patterns and
behaviors) had lower levels of obesity.
It is noteworthy, that beyond ascertainment of the
diagnostic accuracy of the E-KINDEX, LCA was applied to
test for heterogeneity of the proposed index within obesity
classes. The observed heterogeneity (which was expected) may
be attributed to several factors other than diet, such as genetics
and lifestyle aspects. In fact, a substantial body of research
concludes that diet may not be associated with obesity status
[15]; this may be due to misclassification in the E-KINDEX
categories resulting from incorrect information provided by
children, or to misclassification in the obesity status categories,
as obesity was assessed by the proxy measure of BMI and not
via a direct method. Nevertheless, it should be pointed out that
Table 4. Results from Multiple Logistic Regression Analysis That Evaluated the Association between Obesity Status (Dependent)
and E-KINDEX Score (Independent)*
Variables Included
in the Model
Model for Obesity1
(OR [95% CI])
Model for Excess
Body Fat2
(OR [95% CI])
Model for Above
Normal Waist3
(OR [95% CI])
Model for
Generalized Obesity4
(OR [95% CI])
Model for BMI
Difference5
(OR [95% CI])
E-KINDEX categories
�49 points 1 1 1 1
50–54 points 0.27 (0.08–0.87) 0.21 (0.04–1.21) 0.38 (0.11–1.35) 0.39 (0.12–1.21) 0.13 (0.01–1.57)
55–59 points 0.24 (0.08–0.73) 0.27 (0.05–1.36) 0.22 (0.06–0.77) 0.26 (0.08–0.77) 0.57 (0.11–2.81)
.60 points 0.15 (0.05–0.41) 0.07 (0.01–0.39) 0.14 (0.05–0.43) 0.20 (0.07–0.53) 0.16 (0.04–0.74)
Physical Activity Index
0 times/wk 1 1 1 1 1
1–2 times/wk 0.37 (0.11–1.23) 0.83 (0.08–8.59) 0.47 (0.12–1.82) 0.48 (0.15–1.57) 0.39 (0.05–2.95)
3–5 times/wk 0.37 (0.11–1.21) 1.72 (0.18–16.35) 0.40 (0.10–1.53) 0.40 (0.12–1.28) 0.52 (0.07–3.73)
6–7 times/wk 0.21 (0.06–0.78) 0.83 (0.08–9.26) 0.29 (0.07–1.23) 0.27 (0.08–0.95) 0.29 (0.03–2.58)
TV viewing time
Up to 2 hours/d 1 1 1 1 1
2þ up to 4 hours/d 1.29 (0.57–2.91) 1.55 (0.36–6.57) 1.19 (0.45–3.18) 1.25 (0.57–2.73) 1.64 (0.42–6.31)
.4 hours/d 1.23 (0.46–3.29) 0.92 (0.17–5.11) 1.55 (0.50–4.86) 1.43 (0.56–3.67) 0.38 (0.06–2.65)
Parental obesity status
Both lean 1 1 1 1 1
Father lean/mother obese 4.02 (1.14–14.15) 3.84 (0.26–57.26) 1.84 (0.37–9.17) 3.38 (0.99–11.56) 1.21 (0.18–8.25)
Father obese/mother lean 1.97 (0.79–4.88) 6.73 (0.71–64.01) 1.41 (0.48–4.10) 1.83 (0.78–4.29) 0.89 (0.21–3.78)
Both obese 2.54 (0.88–7.32) 12.22 (1.12–133.10) 4.20 (1.30–13.62) 2.73 (1.01–7.40) 0.48 (0.08–2.91)
Breastfeeding
No 1 1 1 1 1
Yes 0.78 (0.35–1.71) 0.23 (0.07–0.79) 0.71 (0.27–1.87) 0.89 (0.41–1.94) 1.72 (0.40–7.39)
Socioeconomic status
High 1 1 1 1
Medium 0.85 (0.38–1.92) 1.17 (0.33–7.92) 0.65 (0.26–1.66) 0.81 (0.38–1.75) 1.60 (0.35–7.33)
Low 0.94 (0.38–2.33) 2.78 (0.48–16.02) 0.43 (0.14–1.28) 0.70 (0.29–1.71) 3.54 (0.76–16.42)
Gender
Boy vs girl 1.48 (0.75–2.94) 0.33 (0.09–1.25) 2.98 (1.31–6.77) 1.20 (0.69–2.08) 1.45 (0.42–4.96)
Age
Per 6 months 0.94 (0.53–1.67) 2.28 (0.78–6.65) 2.28 (1.13–4.60) – –
0.34 (0.07–1.73)C-statistic 0.73 (0.65–0.81)6 0.84 (0.74–0.94) 0.78 (0.69–0.88) 0.72 (0.64–0.80) 0.57 (0.48–0.67)
1 Depended variable overweight or obesity vs normal weight status.2 Depended variable obesity (%BF . 30) vs normal weight status (%BF , 30).3 Depended variable waist circumference �75th percentile vs ,75th percentile.4 Depended variable overweight or obese (based on BMI) and waist circumference �75th percentile vs normal weight (based on BMI) and waist circumference �75th
percentile.5 Depended variable BMI difference .3 kg/m2 vs up to 3 units between 2 evaluations (i.e., in 2005 and in 2006).6 C-statistic for obese vs overweight/normal weight is 0.78 (0.67–0.88).
* Statistically significant results are shown in bold.
108 VOL. 30, NO. 2
A Dietary Screening Tool Associated with Obesity
the E-KINDEX score seems to have high discriminative value
for ;8 out of 10 children in this population, especially for
obese children.
The E-KINDEX consists of 3 subscales: (1) the Foods E-
KINDEX, (2) the Behavior E-KINDEX, and (3) the Dietary
Habits E-KINDEX; of these subscales, the Behavior E-
KINDEX subindex had the best discriminative ability and
contributes significantly to the discriminative ability of the
overall E-KINDEX score. Furthermore, the most significant
combination of subscales for association with obesity status
was the Behavior E-KINDEX and the Dietary Habits E-
KINDEX, followed by the Behavior E-KINDEX and the Foods
E-KINDEX. The latter may imply that dietary beliefs and
patterns are more important determinants of obesity develop-
ment than actual food choices. It is well known that behaviors
are expressions of cognitive schemas [39]. Therefore, dietary
attitudes and feelings that may serve as valid indicators of these
cognitive schemas seem to be fundamental predecessors of
children’s dietary preferences, choices, and habits [23,39], and
therefore are important targets in obesity prevention.
The rationale for including the third subindex (i.e., the
Dietary Habits E-KINDEX) as part of the overall index, even
though the AUC value and associated CIs of the overall index
and of the combined Foods and Dietary Behavior subindex
seemed to be very similar (as seen in Table 3), is based on the
following: (1) overwhelming evidence from research that
points to the importance of dietary habits, such as meal habits
(the variables of the third subindex), in childhood obesity (as
discussed in the Methods section); (2) the better combination of
sensitivity (and specificity) values (as seen in Table 3) and the
AUC values of the overall index as well; (3) the very good beta
values obtained in linear regression models when the validity
of the E-KINDEX against obesity is tested, holding indepen-
dent in different models the overall index, as well as the foods
and dietary behavior subindices; and (4) the value of
Cronbach’s alpha, which was acceptable (as mentioned in
Methods) when all questions in the overall E-KINDEX were
included.
The proposed index showed high discriminating ability
across several sociodemographic factors and health behaviors.
Children who had low E-KINDEX scores had low SES, as well
as lower levels of physical activity and higher levels of
sedentary behaviors (as assessed by TV viewing). Furthermore,
parents of children with high scores appeared to have good or
adequate dietary habits and appeared to be within a normal
weight range. These findings are of importance in obesity
prevention and management, as they may be used to identify
target groups for intervention.
Fig. 2. The profile plot for the best fitting 3-cluster model, showing the probability of each cluster belonging to a higher category of each E-KINDEX
subindex. By default, the last category for dichotomous variables and all categories for the nominal variable of obesity status are displayed.
JOURNAL OF THE AMERICAN COLLEGE OF NUTRITION 109
A Dietary Screening Tool Associated with Obesity
Previous research conducted on the development and
validation of dietary indices in children is limited. Among
the few published dietary indices for children, all were
originally validated against dietary quality and nutritional
status only [11–13,40], and only a few were tested against
obesity [11–13,41–43]. Specifically, of those dietary indices
tested against obesity in children, most failed to show any
significant associations [11,12], or, when significant inverse
relationships were shown, they did not adjust for possible
confounders [11,41,42], or the adjustments made were only
partial [42,43].
The discrepancy observed between findings of the present
study and those of previous studies that showed no significant
results when dietary indices against obesity were evaluated
may be attributed to the initial aims of these studies.
Specifically, previously tested indices were developed to assess
dietary quality in children, whereas in the E-KINDEX, dietary
components associated with childhood obesity were purpose-
fully included to assess the obesogenic dietary habits of
children. The discrepancy may also be due to the fact that
dietary factors may not be strongly associated with obesity
status, as demonstrated by other studies that did not use dietary
indices [15].
Limitations and Strengths
Despite the significance of the findings already described,
the present study has some limitations that might affect the
characteristics of the proposed index. First, obesity was
assessed according to BMI, which although highly specific is
not sensitive for the identification of obesity [44]; therefore,
some cases may have been misclassified. Thus, the diagnostic
ability of the E-KINDEX may have been incorrectly evaluated.
Second, direct anthropometric measurements were not avail-
able prospectively; parentally referenced values were used
instead. Third, validation of this index remains to be tested in
more extensive follow-up studies and with other ethnic
populations; this will permit objective assessment of the
discriminatory/predictive ability of the test. Moreover, it should
be emphasized that the accuracy of a dietary index is limited to
the availability and strength of dietary guidelines related to the
disease or health index under investigation [45]. This is
particularly true for childhood obesity, in which the contribu-
tions of individual dietary factors are investigated; in general,
no definite answers have been obtained as to what, how, and to
what degree particular dietary factors contribute to obesity [15].
As a result, the selection of individual components, the
definition of cutoff points for each component, and the relative
contribution of each component to the total score possess a
degree of subjectivity [45]. Strengths of this work include the
detailed analytical procedures followed and the fact that it is a
first attempt at developing a monitoring tool that concurrently
assesses a wide range of dietary behaviors in relation to
childhood obesity.
Implications and Applications
The proposed tool may be used as an aid for various
preventive and management procedures in attempts to confront
obesity in children. It may be used by dietitians, pediatricians,
educators, and even parents, as a practical set of guidelines for
the prevention or management of childhood obesity. Although
various guidelines exist [4,15,20], they have not been tested as
a set for their synergistic contribution to obesity prevention. It
has been demonstrated here that all 3 aspects of dietary
behavior (i.e., diet composition, psychology of eating, and
dietary-meal behaviors) should be taken into consideration
when dietitians assess and advise for childhood obesity. Thus
dietitians could use this tool to demonstrate to their clients the
combined role of several dietary factors in obesity prevention.
Furthermore, even though children often know what and how
they should eat to prevent/manage obesity [46], behavioral
modification and maintenance are often achieved at very low
rates [46]. A dietary index such as the E-KINDEX may serve as
a visual educational tool (depicts assessment in the form of a
number/a score) to indicate to a child where she or he stands,
thus promoting compliance with dietary guidelines. It can
therefore provide continuous feedback in a measurable and
easily understandable way to children and their parents.
Moreover, individual components of the proposed index can
be used to determine specific areas and goals for improvement
in relation to its components; thus counseling and dietary
intervention can be targeted into everyone’s individual needs.
For instance, dietitians may use it as counseling tool to
demonstrate how small changes in dietary habits can lead to
significant improvements that may have an impact on obesity
status as well.
The proposed index has other potential applications in the
public health sector and in research. The total score of the index
could potentially be used to rank and/or compare within and
between individuals or groups of individuals (such as school
populations or certain subgroups within a population), to
identify individuals at high risk of developing obesity, thus
helping to target public health programs for these populations,
and to monitor trends in dietary patterns over time. In addition,
this score may help the clinician to gain an understanding of
why specific populations have higher or lower prevalence of
obesity, thus supporting obesity prevention programs. Finally,
the E-KINDEX can be used in research to investigate
associations between eating patterns and obesity or other
health outcomes.
CONCLUSIONS
In summary, this study may represent the first attempt to
develop and test a self-monitoring tool that holistically assesses
aspects of dietary factors that may be implicated in the
development of childhood obesity. The proposed E-KINDEX
110 VOL. 30, NO. 2
A Dietary Screening Tool Associated with Obesity
is a promising tool for screening obesity in children, although
improvements to this index may be needed. The proposed
dietary obesity index has applications in public health,
education, private clinical settings, and research. Dietitians
should consider all 3 aspects of dietary behavior (i.e., diet
composition, psychology of eating, and dietary-meal behav-
iors) when assessing and advising for childhood obesity.
Further research is needed to test this index prospectively and
in diverse populations.
ACKNOWLEDGMENTS
This work was supported by a Cyprus Research Promotion
Foundation research grant (AKGEN/0506/05) and was
partially supported by the ‘‘Charalambides’’ dairies and the
Cyprus Dietetic Association. The authors would like to
sincerely thank participating children and their parents.
Finally, we would like to thank the Cyprus Ministry of
Education and Culture (Department of Primary Education)
and all teachers who readily consented to carry out the study
during school hours.
The contributions of the authors were as follows: CL
designed the study, obtained the funding, performed the data
analysis, interpreted the results, and wrote the paper; DBP
supervised the design of the study and the statistical analyses,
contributed to presentation and interpretation of the results, and
critically reviewed the paper; GS contributed to data analysis
and interpretation of results and critically reviewed the paper;
and A-LM contributed to the presentation and interpretation of
results and critically reviewed the paper. All authors contrib-
uted to the final version of the manuscript.
REFERENCES
1. Kosti RI, Panagiotakos DB: The epidemic of obesity in children
and adolescents in the world. Cent Eur J Public Health 14:151–
159, 2006.
2. Starc G, Strel J: Tracking excess weight and obesity from
childhood to young adulthood: a 12-year prospective cohort study
in Slovenia. Public Health Nutr 14:49–55, 2011.
3. World Health Organization: ‘‘Obesity and Overweight.’’ Fact Sheet
311, updated March 2011. Accessed at: http://www.who.int/
mediacentre/factsheets/fs311/en/index.html
4. Barlow SE, Expert Committee: Expert committee recommenda-
tions regarding the prevention, assessment, and treatment of child
and adolescent overweight and obesity: summary report. Pediatrics
120:S164–S192, 2007.
5. Kant AK: Dietary patterns and health outcomes. J Am Diet Assoc
104:615–635, 2004.
6. Bach A, Serra-Majem L, Carrasco JL, Roman B, Ngo J, Bertomeu
I, Obrador B: The use of indexes evaluating the adherence to the
Mediterranean diet in epidemiological studies: a review. Public
Health Nutr 9:132–146, 2006.
7. Wirt A, Collins CE: Diet quality: what is it and does it matter?
Public Health Nutr 12:2473–2492, 2009.
8. Trichopoulou A, Costacou T, Bamia C, Trichopoulos D:
Adherence to a Mediterranean diet and survival in a Greek
population. N Engl J Med 348:2599–2608, 2003.
9. Panagiotakos DB, Pitsavos C, Arvaniti F, Stefanadis C: Adherence
to the Mediterranean food pattern predicts the prevalence of
hypertension, hypercholesterolemia, diabetes and obesity, among
healthy adults: the accuracy of the MedDietScore. Prev Med
44:335–340, 2007.
10. Alexy U, Sichert-Hellert W, Kersting M, Schultze-Pawlitschko V:
Pattern of long-term fat intake and BMI during childhood and
adolescence: results of the DONALD Study. Int J Obes Relat
Metab Disord 28:1203–1209, 2004.
11. Feskanich D, Rockett HR, Colditz GA: Modifying the Healthy
Eating Index to assess diet quality in children and adolescents. J
Am Diet Assoc 104:1375–1383, 2004.
12. Royo-Bordonada MA, Gorgojo L, Ortega H, Martin-Moreno JM,
Lasuncion MA, Garces C, Gil A, Rodriguez-Artalejo F, de Oya M,
Investigators of the Four Provinces Study: Greater dietary variety
is associated with better biochemical nutritional status in Spanish
children: the Four Provinces Study. Nutr Metab Cardiovasc Dis
13:357–364, 2003.
13. Kranz S, Hartman T, Siega-Riz AM, Herring AH: A diet quality
index for American preschoolers based on current dietary intake
recommendations and an indicator of energy balance. J Am Diet
Assoc 106:1594–1604, 2006.
14. Serra-Majem L, Ribas L, Ngo J, Ortega RM, Garcia A, Perez-
Rodrigo C, Aranceta J: Food, youth and the Mediterranean diet in
Spain: development of KIDMED, Mediterranean Diet Quality Index
in children and adolescents. Public Health Nutr 7:931–935, 2004.
15. Woodward-Lopez G, Ritchie LD, Gerstein DE, Crawford PB
(eds): ‘‘Obesity: Dietary and Developmental Influences.’’ Boca
Raton, FL: CRC Press, 2006.
16. Dietz WH, Robinson TN: Clinical practice: overweight children
and adolescents. N Engl J Med 352:2100–2109, 2005.
17. Gidding SS, Dennison BA, Birch LL, Daniels SR, Gillman MW,
Lichtenstein AH, Rattay KT, Steinberger J, Stettler N, Van Horn L,
American Heart Association: Dietary recommendations for
children and adolescents: a guide for practitioners. Pediatrics
117:544–559, 2006.
18. Childhood Obesity Action Network (COAN): ‘‘Appendix: Expert
Committee Recommendations on the Assessment, Prevention, and
Treatment of Child and Adolescent Overweight and Obesity,’’
January 25, 2007. Accessed at: http://www.ama-assn.org/ama1/
pub/upload/mm/433/ped_obesity_recs.pdf
19. Krebs NF, Himes JH, Jacobson D, Nicklas TA, Guilday P, Styne
D: Assessment of child and adolescent overweight and obesity.
Pediatrics 120:S193–S228, 2007.
20. Spear BA, Barlow SE, Ervin C, Ludwig DS, Saelens BE,
Schetzina KE, Taveras EM: Recommendations for treatment of
child and adolescent overweight and obesity. Pediatrics 120:S254–
S288, 2007.
21. Davis MM, Gance-Cleveland B, Hassink S, Johnson R, Paradis G,
Resnicow K: Recommendations for prevention of childhood
obesity. Pediatrics 120:S229–S253, 2007.
22. Tanofsky-Kraff M, Cohen ML, Yanovski SZ, Cox C, Theim KR,
Keil M, Reynolds JC, Yanovski JA: A prospective study of
JOURNAL OF THE AMERICAN COLLEGE OF NUTRITION 111
A Dietary Screening Tool Associated with Obesity
psychological predictors of body fat gain among children at high
risk for adult obesity. Pediatrics 117:1203–1209, 2006.
23. Sharma M, Wagner DI, Wilkerson J: Predicting childhood obesity
prevention behaviors using social cognitive theory. Int Q
Community Health Educ 24:191–203, 2005–2006.
24. Nicklas TA, Yang SJ, Baranowski T, Zakeri I, Berenson G: Eating
patterns and obesity in children. The Bogalusa Heart Study. Am J
Prev Med 25:9–16, 2003.
25. Panagiotakos D: Health measurement scales: methodological
issues. Open Cardiovasc Med J 3:160–165, 2009.
26. Jones JM: Development of a nutritional screening or assessment
tool using a multivariate technique. Nutrition 20:298–306, 2004.
27. Marzano RJ: ‘‘Transforming Classroom Grading.’’ Alexandria,
VA: Association for Supervision and Curriculum Development,
2000.
28. McCullough ML, Feskanich D, Stampfer MJ, Giovannucci EL,
Rimm EB, Hu FB, Spiegelman D, Hunter DJ, Colditz GA, Willett
WC: Diet quality and major chronic disease risk in men and
women: moving toward improved dietary guidance. Am J Clin
Nutr 76:1261–1271, 2002.
29. Yannakoulia M, Papanikolaou K, Hatzopoulou I, Efstathiou E,
Papoutsakis C, Dedoussis GV: Association between family divorce
and children’s BMI and meal patterns: the GENDAI Study.
Obesity (Silver Spring) 16:1382–1387, 2008.
30. Lazarou C, Panagiotakos DB, Kouta C, Matalas A-L: Dietary and
other lifestyle characteristics of Cypriot children: results from the
nationwide CYKIDS study. BMC Public Health 9:147, 2009.
31. Lazarou C, Soteriades ES: Children’s physical activity, TV
watching and obesity in Cyprus: the CYKIDS study. Eur J Public
Health 20:70–77, 2010.
32. Heymsfield SB, Lohman TG, Wang Z, Going SB (eds): ‘‘Human
Body Composition,’’ 2nd ed. Champaign, IL: Human Kinetics,
2005.
33. Cole TJ, Bellizzi MC, Flegal KM, Dietz WH: Establishing a
standard definition for child overweight and obesity worldwide:
international survey. BMJ 320:1240–1243, 2000.
34. Deurenberg P, Weststrate JA, Seidell JC: Body mass index as a
measure of body fatness: age- and sex-specific prediction formulas.
Br J Nutr 65:105–114, 1991.
35. Lazarou C, Panagiotakos DB, Panayiotou G, Matalas AL:
Overweight and obesity in preadolescent children and their parents
in Cyprus: prevalence and associated socio-demographic factors.
The CYKIDS Study. Obes Rev 9:185–193, 2008.
36. Indrayan A, Sarmukaddam SB: ‘‘Medical Biostatistics.’’ Boca
Raton, FL: CRC Taylor & Francis, p 562, 2001.
37. Liu J, Hong Y, D’Agostino RB Sr, Wu Z, Wang W, Sun J, Wilson
PW, Kannel WB, Zhao D: Predictive value for the Chinese
population of the Framingham CHD risk assessment tool
compared with the Chinese Multi-Provincial Cohort Study. JAMA
291:2591–2599, 2004.
38. Liao Y, McGee DL, Cooper RS, Sutkowski MB: How
generalizable are coronary risk prediction models? Comparison
of Framingham and two national cohorts. Am Heart J 137:837–
845, 1999.
39. Pliner P: Cognitive schemas: how can we use them to improve
children’s acceptance of diverse and unfamiliar foods? Br J Nutr
99:S2–S6, 2008.
40. Serra-Majem L, Ribas L, Garcva A, Prez-Rodrigo C, Aranceta J:
Nutrient adequacy and Mediterranean Diet in Spanish school
children and adolescents. Eur J Clin Nutr 57(Suppl 1):S35–S39,
2003.
41. Hurley KM, Oberlander SE, Merry BC, Wrobleski MM, Klassen
AC, Black MM: The healthy eating index and the youth healthy
eating index are unique, nonredundant measures of diet quality
among low-income, African American adolescents. J Nutr
139:359–364, 2009.
42. Kranz S, Findeis JL, Shrestha SS: Use of the Revised Children’s
Diet Quality Index to assess preschooler’s diet quality, its
sociodemographic predictors, and its association with body weight
status. J Pediatr (Rio J) 84:26–34, 2008.
43. Kontogianni MD, Vidra N, Farmaki AE, Koinaki S, Belogianni K,
Sofrona S, Magkanari F, Yannakoulia M: Adherence rates to the
Mediterranean diet are low in a representative sample of Greek
children and adolescents. J Nutr 138:1951–1956, 2008.
44. Neovius MG, Linni YM, Barkeling BS, Rossner SO: Sensitivity
and specificity of classification systems for fatness in adolescents.
Am J Clin Nutr 80:597–603, 2004.
45. Waijers PM, Feskens EJ, Ocke MC: A critical review of predefined
diet quality scores. Br J Nutr 97:219–231, 2007.
46. Sahota P, Rudolf MC, Dixey R, Hill AJ, Barth JH, Cade J:
Randomised controlled trial of primary school based intervention
to reduce risk factors for obesity. BMJ 323:1029–1032, 2001.
Received February 11, 2010; revision accepted November 16,
2010.
112 VOL. 30, NO. 2
A Dietary Screening Tool Associated with Obesity
Copyright © 2022 FDOKUMEN