
A Roller Bearing Fault Diagnosis Method Based on LCD Energy Entropy and ACROA-SVM
13
Research Article A Roller Bearing Fault Diagnosis Method Based on LCD Energy Entropy and ACROA-SVM HungLinh Ao, 1,2,3 Junsheng Cheng, 1,2 Kenli Li, 4 and Tung Khac Truong 4,5 1 State Key Laboratory of Advanced Design and Manufacturing for Vehicle Body, Hunan University, Changsha 410082, China 2 College of Mechanical and Automotive Engineering, Hunan University, Changsha 410082, China 3 Faculty of Mechanical Engineering, Industrial University of Ho Chi Minh City, Ho Chi Minh 70550, Vietnam 4 College of Information Science and Engineering, Hunan University, National Supercomputing Centre in Changsha, Changsha 410082, China 5 Faculty of Information Technology, Industrial University of Ho Chi Minh City, Ho Chi Minh 70550, Vietnam Correspondence should be addressed to HungLinh Ao; [email protected] Received 11 April 2013; Accepted 24 June 2013; Published 24 February 2014 Academic Editor: Valder Steffen Copyright © 2014 HungLinh Ao et al. is is an open access article distributed under the Creative Commons Attribution License, which permits unrestricted use, distribution, and reproduction in any medium, provided the original work is properly cited. is study investigates a novel method for roller bearing fault diagnosis based on local characteristic-scale decomposition (LCD) energy entropy, together with a support vector machine designed using an Artificial Chemical Reaction Optimisation Algorithm, referred to as an ACROA-SVM. First, the original acceleration vibration signals are decomposed into intrinsic scale components (ISCs). Second, the concept of LCD energy entropy is introduced. ird, the energy features extracted from a number of ISCs that contain the most dominant fault information serve as input vectors for the support vector machine classifier. Finally, the ACROA- SVM classifier is proposed to recognize the faulty roller bearing pattern. e analysis of roller bearing signals with inner-race and outer-race faults shows that the diagnostic approach based on the ACROA-SVM and using LCD to extract the energy levels of the various frequency bands as features can identify roller bearing fault patterns accurately and effectively. e proposed method is superior to approaches based on Empirical Mode Decomposition method and requires less time. 1. Introduction Roller bearings are important and frequently encountered components in rotating machines, which are found in widespread industrial applications. Roller bearing fault diag- nosis is therefore meaningful. Fault diagnosis includes two aspects: feature extraction and pattern recognition. When a fault occurs in a roller bearing, it is very difficult to extract the fault characteristic information from the nonstationary vibration signals [1, 2]. e traditional diagnosis techniques extract the fault characteristic information from the waveforms of the vibra- tion signals in either the time domain or the frequency domain. en, criterion functions are constructed to identify the condition of the roller bearing. However, it is very difficult to accurately evaluate the condition of a roller bearing through an analysis in the time or frequency domain only [2, 3]. e Empirical Mode Decomposition (EMD) method of feature extraction is based on the local characteristic time scale of the signal and can adaptively decompose a complicated multicomponent signal into a sum of intrinsic mode functions (IMFs) whose instantaneous frequencies have physical significance [4, 5]. By applying an envelope analysis to each IMF component, the characteristic informa- tion of original signal can be extracted more accurately and effectively. In addition, the frequency components involved in each IMF are related not only to the sampling frequency but to changes in the signal itself; that is, EMD can be regarded as a self-adaptive filter whose bandwidth and central frequency change with the signal itself. erefore, EMD is a self-adaptive signal processing method that can be applied to nonlinear and nonstationary processes [6]. However, amplitude and frequency information is lost because of the cubic spline and the Hilbert transform used in the EMD [7]. Rilling Hindawi Publishing Corporation Shock and Vibration Volume 2014, Article ID 825825, 12 pages http://dx.doi.org/10.1155/2014/825825
-
Upload
independent -
Category
Documents
-
view
2 -
download
0
Transcript of A Roller Bearing Fault Diagnosis Method Based on LCD Energy Entropy and ACROA-SVM

Research ArticleA Roller Bearing Fault Diagnosis Method Based on LCD EnergyEntropy and ACROA-SVM
HungLinh Ao123 Junsheng Cheng12 Kenli Li4 and Tung Khac Truong45
1 State Key Laboratory of Advanced Design and Manufacturing for Vehicle Body Hunan University Changsha 410082 China2 College of Mechanical and Automotive Engineering Hunan University Changsha 410082 China3 Faculty of Mechanical Engineering Industrial University of Ho Chi Minh City Ho Chi Minh 70550 Vietnam4College of Information Science and Engineering Hunan University National Supercomputing Centre in ChangshaChangsha 410082 China
5 Faculty of Information Technology Industrial University of Ho Chi Minh City Ho Chi Minh 70550 Vietnam
Correspondence should be addressed to HungLinh Ao aohunglinh09yahoocomvn
Received 11 April 2013 Accepted 24 June 2013 Published 24 February 2014
Academic Editor Valder Steffen
Copyright copy 2014 HungLinh Ao et al This is an open access article distributed under the Creative Commons Attribution Licensewhich permits unrestricted use distribution and reproduction in any medium provided the original work is properly cited
This study investigates a novel method for roller bearing fault diagnosis based on local characteristic-scale decomposition (LCD)energy entropy together with a support vector machine designed using an Artificial Chemical Reaction Optimisation Algorithmreferred to as an ACROA-SVM First the original acceleration vibration signals are decomposed into intrinsic scale components(ISCs) Second the concept of LCD energy entropy is introduced Third the energy features extracted from a number of ISCs thatcontain the most dominant fault information serve as input vectors for the support vector machine classifier Finally the ACROA-SVM classifier is proposed to recognize the faulty roller bearing pattern The analysis of roller bearing signals with inner-race andouter-race faults shows that the diagnostic approach based on the ACROA-SVM and using LCD to extract the energy levels of thevarious frequency bands as features can identify roller bearing fault patterns accurately and effectively The proposed method issuperior to approaches based on Empirical Mode Decomposition method and requires less time
1 Introduction
Roller bearings are important and frequently encounteredcomponents in rotating machines which are found inwidespread industrial applications Roller bearing fault diag-nosis is therefore meaningful Fault diagnosis includes twoaspects feature extraction and pattern recognition When afault occurs in a roller bearing it is very difficult to extractthe fault characteristic information from the nonstationaryvibration signals [1 2]
The traditional diagnosis techniques extract the faultcharacteristic information from the waveforms of the vibra-tion signals in either the time domain or the frequencydomainThen criterion functions are constructed to identifythe condition of the roller bearing However it is very difficultto accurately evaluate the condition of a roller bearingthrough an analysis in the time or frequency domain only[2 3]
The Empirical Mode Decomposition (EMD) methodof feature extraction is based on the local characteristictime scale of the signal and can adaptively decompose acomplicated multicomponent signal into a sum of intrinsicmode functions (IMFs) whose instantaneous frequencieshave physical significance [4 5] By applying an envelopeanalysis to each IMF component the characteristic informa-tion of original signal can be extracted more accurately andeffectively In addition the frequency components involved ineach IMF are related not only to the sampling frequency butto changes in the signal itself that is EMD can be regarded asa self-adaptive filter whose bandwidth and central frequencychangewith the signal itselfTherefore EMD is a self-adaptivesignal processing method that can be applied to nonlinearand nonstationary processes [6] However amplitude andfrequency information is lost because of the cubic splineand the Hilbert transform used in the EMD [7] Rilling
Hindawi Publishing CorporationShock and VibrationVolume 2014 Article ID 825825 12 pageshttpdxdoiorg1011552014825825
2 Shock and Vibration
and Flandrin asserted that two tones can be separated usingEMD and numerical experiments supported their claims[8] Wu and Huang [9] found that two components whosefrequencies lie within an octave cannot be separated byEMD However there are currently no rules or guidelines fordeciding when two separate components can be separatedusing EMD Furthermore the end effect [10] mode mixing[11] overshoot and undershoot [12] negative frequencies-instantaneous frequency [13] and a lack of a theoreticalfoundation [14] are all current drawbacks of EMD
Recently Cheng et al developed a new signal analysismethod the local characteristic-scale decomposition (LCD)that defines intrinsic scale components and with the physicalinstantaneous frequency this method can decompose a com-plicated signal into several intrinsic scale components (ISC)[15] By analysing each resulting ISC which involves the localcharacteristic of the signal the characteristic informationof the original signal can be extracted more accuracy andeffectively The LCD method is superior to the Hilbert-Huang Transform method in reducing the end effect andthe iteration time and in the accuracy of the instantaneouscharacteristic
Pattern recognition is the other aspect of roller bearingfault diagnosis Traditional statistical pattern recognitionmethods and Artificial Neural Network (ANN) classifiersassume that sufficient samples are available which is notalways true in practice [16] The Support Vector Machine(SVM) is a powerful machine learning method based on sta-tistical learning theory and the structural risk minimizationprinciple that has been successfully applied in classificationand regression problems [17] SVMs not only can solve theproblems of overfitting local optimal solutions and slowconvergence rates that exist in ANNs but they also havean excellent generalization capability in situations wherethere are a small number of samples Furthermore SVMscan solve nonlinear high-dimensional pattern recognitionproblems with a limited number of samples and representnonlinear relationships between the input and the output [18]SVMs have been found to be remarkably effective in manypractical applications This method is widely used in areassuch as pattern recognition [19] time-series forecasting [20]diagnostics [21ndash25] robotics [26] signal processing [25 27]speech and word recognition [28] machine vision [29] andfinancial forecasting [30] In SVMs the kernel parametershave an influence on the generalization performance and theregularization constant 119862 determines the trade-off betweenminimizing the training error and minimizing the modelcomplexity The parameters of the kernel function implicitlydefine the nonlinear mapping from the input space to thehigh-dimensional feature space [31] The performance ofthe SVM will be degraded if these parameters are notproperly chosen There are several methods for choosing theparameters of the SVM such as trial-and-error procedures[32] the grid algorithm [33] the cross-validation method[34] the generalization error estimationmethod [35] and thegradient descent method [36] These methods have severaldrawbacks for example both the grid method and the cross-validation method require long and complicated calculations[33]
In recent years heuristic algorithms have been developedand are widely usedThese algorithms use simple approachesfound in heuristic optimisation algorithms Some heuristicalgorithms that have been used to optimise SVM param-eters are Ant Colony Optimization (ACO) [37] ParticleSwarm Optimization (PSO) [38ndash40] the Genetic Algorithm(GA) [41] and the Bee Colony Algorithm (BCA) [42]The Artificial Chemical Reaction Optimisation Algorithm(ACROA) which was introduced by Bilal Alatas is a novelcomputational method that was inspired by chemical reac-tions [43] The ACROA has been applied successfully tooptimisation problems and the mining of classification rules[44] Compared with the GA the ACROA can reach a globaloptimum in a very short time and the classification result isthe same The ACROA is adapted to the solution procedureto an optimisation problem This algorithm is based on thesecond law of thermodynamics that is a system tends towardthe highest entropy and the lowest enthalpy [45] In theACROA the enthalpy or potential energy and the entropy canbe used as the objective functions for the minimisation andmaximisation problems respectively for the optimisationproblem of interestThe ACROA is robust and thus we chosethe ACROA to solve our problem In this study the ACROAis applied to optimise the SVM parameters
In this paper LCD is applied to diagnose the rollerbearing faults First the original acceleration vibration signalis decomposed using LCD and the ISC components areobtained and then the concept of LCD energy entropy isintroduced which can reflect the actual condition and thefault pattern of the roller bearing The LCD energy entropiesof different vibration signals illustrate that the energy of thevibration signal in different frequency bands will changewhen a bearing fault occurs To identify the condition of theroller bearing further the ACROA-SVM serves as a classifierand the extracted energy features of the stationary ISCsare taken as classifier input vectors so that a faulty bearingcan be distinguished from a normal bearing To verify thesuperiority of the LCD method it is compared with theEMD method As in the LCD method the original signalis decomposed with EMD and then the energy features areextracted These resulting features are also used as inputvectors to the ACROA-SVM to identify the condition ofa roller bearing The experimental results show that thediagnostic approach of the ACROA-SVM based on LCDenergy entropy has better identification accuracy than EMDand is faster
The remainder of this paper is organised as followsSection 2 discusses the LCD method In Section 3 the con-cept of LCD energy entropy is proposed and the LCDenergy entropies of different vibration signals are calculatedto illustrate that the energy of an acceleration signal indifferent frequency bands changes when a roller bearing faultoccurs Section 4 explains the ACROA and the parameteroptimisation of an SVM based on the ACROA In Section 5the fault diagnosis method based on LCD and the ACROA-SVM is given in which the energy features extracted froma number of ISCs are used as input vectors to the ACROA-SVM In Section 6 the fault diagnosis method is used todiagnose the condition of actual roller bearings and is
Shock and Vibration 3
B
A
x(t)
t
(a) A sine signal
B
Ax(t)
t
(120591k Xk)
(120591k+2 Xk+2)
(b) An AM signal
B
A
x(t)
t
(c) A FM signal
B
A
x(t)
t
(d) An AM-FM signal
Figure 1 Four types of typical signal owning instantaneous frequency with physical meaning
compared with the EMD method The conclusions drawnfrom this research are given in Section 7
2 LCD Method
Figure 1 shows four types of signals having an instantaneousfrequency with physical significance In Figure 1 point A isthe value of the line connecting two adjacent peaks at the timewhere theminimumoccurs between the twomaximums andpoint B is theminimumpointThe LCDmethod is developedfrom the simple assumptions that any complicated signalconsists of several ISCs and any two ISCs are independent ofeach other In this way each signal can be decomposed intoa number of ISCs each of which must satisfy the followingdefinition [15]
(I) In the entire data set all the localmaxima are positiveall the local minima are negative and the signal ismonotonic between any two adjacent extreme points
(II) Among the data let all themaximal points be denotedas (120591119896 119883119896) 119896 = 1 2 119872 where119872 is the number ofmaximal points
The line formed by any two adjacent extreme points 119897119896 atthe 120591119896+1 as 119860119896+1 is specified as follows
119897119896 =(119883119896+2 minus 119883119896) (119905 minus 120591119896)
(120591119896+2 minus 120591119896)+ 119883119896 (1)
Then the relation
119886119860119896+1 + (1 minus 119886)119883119896+1 = 0 119886 isin (0 1) (2)
should be true where
119860119896+1 =(120591119896+1 minus 120591119896)
(120591119896+2 minus 120591119896)(119883119896+2 minus 119883119896) + 119883119896 (3)
Generally 119886 = 05 when 119860119896+1 = minus119883119896+1Based on the definition of the ISC component a real-
valued signal 119909(119905) (119905 gt 0) can be decomposed into a numberof ISCs using the LCD method in the following way(1) Let (120591119896 119883119896) (119896 = 1 2 119872) denote the extrema of
the signal 119909(119905) and let 119860119896 (119896 = 2 3 119872 minus 1) be calculatedas in (3) Then the values 119871119896 (119896 = 2 3 119872 minus 1) can becalculated as follows
119871119896 =119860119896 + 119883119896
2 119896 = 2 3 119872 minus 1 (4)
Note that the values of119860119896 and 119871119896 are for 119896 from 2 to119872minus1Hence we must extend the boundaries of the data which can
4 Shock and Vibration
be achieved inmany different ways such as themethods usedin EMD [10 46]
By extension the two end extrema (1205910 1198830) and(120591119872+1 119883119872+1) can be obtained According to (3) and(4) we can obtain 1198711 and 119871119872 Otherwise we can extend thesequence 119871119896 directly from the known values(2)Connect all the 119871119896 with a cubic spline to form the base
line denoted as 1198611(119905) Theoretically the difference betweenthe original data and the base line 1198611(119905) is the first ISC ℎ1(119905)that is
ℎ1 (119905) = 119909 (119905) minus 1198611 (119905) (5)
If ℎ1(119905) meets conditions (I) and (II) then it is an ISCcomponent and ℎ1(119905) is chosen as the first ISC(3) Or see the ℎ1(119905) as the original data and repeat the
above step defining
ℎ11 (119905) = ℎ1 (119905) minus 11986811 (119905) (6)
If ℎ11(119905) does not satisfy conditions (I) and (II) repeatthis step 119896 times until ℎ1119896(119905) satisfies the ISC conditions thendenote ℎ1119896(119905) as the first ISC 1198681(119905)(4) Separate 1198681(119905) from the initial data and define the
residue as 1199061(119905)
1199061 (119905) = 119909 (119905) minus 1198681 (119905) (7)
(5) Next add 1199061(119905) to the original data and repeat steps(1)ndash(4) Similarly we obtain 1198682(119905) 119868119899(119905) until the residue119906119899(119905) is either a monotonic or a constant functionThen 119909(119905)is decomposed into 119899 ISCs and a residue 119906119899(119905) that is
119909 (119905) =
119899
sum
119894=1
119868119894 (119905) + 119906119899 (119905) (8)
Similar to the Cauchy convergence test the standarddeviation (SD) is defined as
SD =119879
sum
119905=0
[
1003816100381610038161003816ℎ119894119896(119905) minus ℎ119894(119896minus1)(119905)1003816100381610038161003816
2
ℎ2
119894(119896minus1)(119905)
] (9)
where 119879 is the length of time The sifting process is stoppedwhen SD is less than a chosen value Generally a value of SDless than 03 is ideal for an ISC
Figure 2 shows a multicomponent modulated signal thatis defined by the following function
119909 (119905) = 2 sin (21205871198911119905) + 4 sin (21205871198912119905) sin (21205871198913119905)
+ sin (21205871198914119905) (10)
where 1198911 = 15 1198912 = 10 1198913 = 01 and 1198914 = 5The decomposed results in Figure 3 show that the LCD
method is superior to the EMD method with the same stepsof decomposition Intuitively in contrast with IMFs ISCsprovide more information on the modulation characteristics
0 01 02 03 04 05 06 07 08 09 1Time (s)
minus5
minus4
minus3
minus2
minus1
0
1
2
3
4
5
x(t)
Figure 2 The multicomponent modulated signal
Table 1 The LCD energy entropies of the vibration signals of theroller bearing with different faults
Normal Outer-race fault Inner-race fault11504 10887 08333
3 LCD Energy Entropy
The vibration signal from a faulty roller bearing reflectsthe corresponding resonant frequency components and itsenergy changes with the frequency distributionTherefore inthis study the LCD energy entropy is proposed to capture thischange
It is assumed that the vibration signal of a faulty rollerbearing 119909(119905) has been decomposed with LCD into 119899 ISCsand a residue 119906119899(119905) where the energies of the 119899 ISCs are1198641 1198642 119864119899 The sum of the energies of the 119899 ISCs shouldbe equal to the total energy of the original signal when theresidue 119906119899(119905) is ignored Because the ISCs 1198681(119905) 1198682(119905) 119868119899(119905)include various frequency components 119864 = 1198641 1198642 119864119899forms an energy distribution in the frequency domain ofthe roller bearing vibration signal The corresponding LCDenergy entropy is defined as
119867EN = minus119899
sum
119894=1
119902119894 log 119902119894 (11)
where 119902119894 = 119864119894119864 is the percentage of the energy of 119868119894(119905) in thetotal signal energy (119864 = sum119899
119894=1119864119894)
Figures 4(a) 4(b) and 4(c) show the three cases of theroller bearing vibration signal normal with an outer-racefault and with an inner-race fault respectively Table 1 showsthat the energy entropy of the vibration signal of a normalroller bearing is greater than that of the others because theenergy distribution of this kind of signals in each frequencyband is comparatively even anduncertain For a roller bearingwith an outer-race fault the energy entropy is lower becausethe energy is distributed mainly in the resonant frequencyband and the distribution uncertainty is lower Moreover thehigher resonant frequency components are produced in theroller bearing with an inner-race fault and the impact is moresevere so the energy entropy in this case would be the least
Shock and Vibration 5
Time (s)
0
5c 1
minus5
0
05
r 3
minus05
0 02 04 06 08 1
0 02 04 06 08 1
0 02 04 06 08 1
0 02 04 06 08 1
0
2
minus2
0
2
minus2
c 2c 3
(a)
Time (s)
0 02 04 06 08 1
0 02 04 06 08 1
0 02 04 06 08 1
0 02 04 06 08 1
0
5
I 1
minus5
0
2
minus2
I 2
0
1
minus1
I 3
0
05
r 3
minus05
(b)
Figure 3 The EMD (a) and LCD (b) decomposed results of the multicomponent modulated signal shown in Figure 2
0 0002 0004 0006 0008 001 0012 0014 0016 0018 002Time (s)
0
05
minus05Acce
lera
tion
(ms2)
(a)
0 0002 0004 0006 0008 001 0012 0014 0016 0018 002Time (s)
0
2
minus2Acce
lera
tion
(ms2)
(b)
0 0002 0004 0006 0008 001 0012 0014 0016 0018 002Time (s)
0
2
minus2Acce
lera
tion
(ms2)
(c)
Figure 4 The vibration acceleration signal of the normal roller bearing (a) out-race fault (b) and inner-race fault (c) respectively
It can be concluded from the preceding analysis that theenergy entropy based on LCD can reflect the condition andthe fault pattern of the roller bearing However for eachroller bearing the LCD energy entropy varies for the samecondition Therefore it is not sufficient to distinguish thecondition and the fault pattern only according to the LCDenergy entropy further analysis is desirable
4 ACROA-SVM
41 Artificial Chemical ReactionOptimizationAlgorithm TheACROA is an adaptive optimisation techniqueThe stochasticsearch algorithm of the ACROA is based on the process ofchemical reactions A chemical reaction is a process that leadsto the transformation of one set of chemical substances into
6 Shock and Vibration
No
One moleculeselection
Two or more moleculesselection
Decompositionreaction
Synthesis reaction
Displacementsreaction
Redox 2 reaction
Redox 1 reaction
Reversiblereaction
Setting the initial reactants and evaluation
Problem and algorithm
parameter
Start
Is reactionmonomolecular orbi-monomolecular
Monomolecular
Bi-monomolecular
Chemical reactionselection
Redox
Chemical reactionselection
Is enthalpy reduced
Decomposition
NoYes
Is termination criterion met
Yes
End
Synthesis
Displacements
Redoxinitialization
Figure 5 Flow chart of ACROA [43]
another Two key reactions in the ACROA are bimolecularand monomolecular reactions [43] The principle of theACROA is presented in the flow chart in Figure 5 and consistsof the following five steps [44]
Step 1 Define the problem and the algorithm parameters
Step 2 Initialize the reactants and evaluate them
Step 3 Simulate the chemical reactions
Step 4 Update the reactants
Step 5 Check the termination criterion
The optimization problem is specified as follows
maximize 119891 (119909)
subject to 119909119895 isin 119863119895 = [119897119895 119906119895] 119895 = 1 2 119873
(12)
where 119891(119909) is a fitness function 119909 = (1199091 1199092 119909119873) is thevector of decision variables 119873 is the number of decisionvariables and 119863119895 is the range of feasible values for decisionvariable 119895 where 119897119895 and 119906119895 are the lower and upper boundsof the jth decision variable respectively More details aboutthese steps can be found in [43 44]
42 Support Vector Machine (SVM) The SVM is developedfrom the optimal separation plane under linearly separableconditions The basic idea of the SVM is to map the trainingsamples from the input space into a higher dimensionalfeature space via a mapping function 120601 [37] Suppose there is
a given training sample set119866 = (119909119894 119910119894) 119894 = 1 2 119897 whereeach sample 119909119894 isin 119877
119889 belongs to a class determined by 119910 isin+1 minus1 When the training data are not linearly separablein the feature space the target function can be expressed asfollows [17]
min 120601 (120596) =1
2⟨120596 sdot 120596⟩ + 119862
119897
sum
119894=1
120585119894
st 119910119894 (⟨120596 sdot 120601 (119909119894)⟩ + 119887) ge 1 minus 120585119894
120585119894 ge 0 119894 = 1 2 119897
(13)
where120596 is the normal vector of the hyperplane119862 is a penaltyparameter 119887 is the bias that is a scalar 120585119894 are nonnegative slackvariables and 120601(119909) is a mapping function
By introducing Lagrangemultipliers120572119894 ge 0 the optimiza-tion problem can be rewritten as follows
Maximize
119871 (120596 119887 120572) =
119897
sum
119894=1
120572119894 minus1
2
119897
sum
119894119895=1
120572119894120572119895119910119894119910119895119870(119909119894 sdot 119909119895) (14)
Subject to
0 le 120572119894 le 119862
119897
sum
119894=1
120572119894119910119894 = 0
(15)
The decision function can be obtained as follows
119891 (119909) = sign(119897
sum
119894=1
120572119894119910119894119870(119909119894 sdot 119909) + 119887) (16)
Shock and Vibration 7
The most common kernel functions used in SVMs are asfollows
(i) linear kernel
119870(119909 119909119894) = ⟨119909 sdot 119909119894⟩ (17)
(ii) polynomial kernel
119870(119909 119909119894) = (⟨119909 sdot 119909119894⟩ + 119888)119889 (18)
(iii) RBF kernel
119870(119909 119909119894) = exp(minus1003817100381710038171003817119909 minus 119909119894
1003817100381710038171003817
2
21205902) (19)
where 119889 and 120590 are kernel parametersIn this paper the radial basis function kernel is used
because of its universal application and good performance
43 Optimisation of the SVM Parameters Using the ACROASVM parameters have an important effect on the classifica-tion accuracy The parameters of the Gaussian kernel func-tion include a penalty factor 119862 and the standard deviation120590 The selection of the SVM parameters is very difficultGenerally 119862 and 120590 are selected according to experience Inthis paper the ACROA is used to optimise the parameters ofthe SVMThese variables are119862 and120590 and the fitness functionis the accuracy of the SVMThe fitness of the SVM is definedas follows
fitness (119909) = accuracySVM (119909) (20)
where 119909 = (119862 120590) and the accuracy of the SVM is defined as
accuracySVM
=Number of correct classifications of test samples
Total number of samples in test set
(21)
The flow chart of the ACROA-SVM is shown in Figure 6
44 Experimental Results To evaluate the performance ofthe proposed ACROA-SVMmethod we used three commonbenchmark data sets from the UCI benchmark the IrisThyroid and Seed data sets The sizes of the training and testsets can be found in Table 2
The Iris data set contains 150 instances and four attributesIn this data set the class attribute is typed and there are threeclasses Setosa Versicolor and Virginica
The Thyroid data set is used for the diagnosis of hyper-thyroidism or hypothyroidism This data set contains 215patterns and 5 attributes and there are three classes normalhyper and hypo
The Seed data set was obtained from the high-qualityvisualization of the internal structure of wheat kernels TheSeed data set contains 210 instances of wheat samples with 7
ACROA
Training SVM modelTraining samplessets
Calculating the fitness function
Optimal SVM parameters obtained
Is stop condition satisfied
Yes
No
120590SVM parameters C
Figure 6 Parameter optimization flow chart of SVM based onACROA
Table 2 Properties of the problems
Name Data Train Test Input ClassIris 150 114 36 4 3Thyroid 215 162 53 5 3Seed 210 159 51 7 3
inputs and there are three classes included Kama Rosa andCanadian
Fourmethods theACROA-SVM theGA-SVM the PSO-SVM and the SVM were used to classify these data sets FortheGA the generation andpopulation sizeswere set to 50 and20 respectively To make a fair comparison the values of theACROA were chosen to be the same for example iterations= 50 ReacNum = 20 For the PSO the parameters were fixedwith the values given in the literature [39 40] that is119882 =
075 1198881 = 1198882 = 15 the numbers of particles was 20 and theiteration count was 50 In the SVM method the values of 119862and 120590were chosen by default and thus the computation timewas not calculated The results in Tables 3 4 and 5 show thatthe values of 119862 and 120590 obtained by each method are differentThe test error value of the ACROA-SVM method is betterthan those of the GA-SVM the PSO-SVM and the SVMmethod Furthermore the computation time of the proposedACROA-SVMmethod is less than those of the GA-SVM andthe PSO-SVMmethodsThe ACROA-SVMmethod was nextapplied to a roller bearing fault diagnosis problem
5 Roller Bearing Fault Diagnosis MethodBased on LCD and ACROA-SVM
It can be observed from the preceding analysis that theLCD energy entropies of the vibration signals of the roller
8 Shock and Vibration
Table 3 The identification result of IRIS data set
Method Training samples Test samples 119862 120590 Cost time (s) Test error ()ACROA-SVM1 114 36 22455 426 8376 0ACROA-SVM2 76 24 24030 483 437128 0GA-SVM1 114 36 1810026 124 54363 0GA-SVM2 76 24 1800001 132 23191 0PSO-SVM1 114 36 18534 136 42689 0PSO-SVM2 76 24 17921 145 24712 0SVM1 114 36 200 1 0SVM2 76 24 200 1 417
Table 4 The identification result of THYROID data set
Method Training samples Test samples 119862 120590 Cost time (s) Test error ()ACROA-SVM1 162 53 21409 491 18751 755ACROA-SVM2 142 43 22697 106 91814 465GA-SVM1 162 53 24562 298 123972 1133GA-SVM2 142 43 22477 262 40733 93PSO-SVM1 162 53 24873 301 118983 1133PSO-SVM2 142 43 22618 275 39725 93SVM1 162 53 200 1 1887SVM2 142 43 200 1 1861
Table 5 The identification result of SEED data set
Method Training samples Test samples 119862 120590 Cost time (s) Test error ()ACROA-SVM1 159 51 1635601 431 23806 0ACROA-SVM2 106 34 18605 485 13507 0GA-SVM1 159 51 1801 101 54944 392GA-SVM2 106 34 18028 227 484 0PSO-SVM1 159 51 18526 135 47211 0PSO-SVM2 106 34 17823 189 38345 0SVM1 159 51 200 1 392SVM2 106 34 200 1 0
bearings with different conditions and fault patterns areobviously different which shows that the energy of each ISCchanges when the roller bearing develops a fault In thispaper by taking the energy feature of each ISC componentas the ACROA-SVM input vector the condition and the faultpattern of the roller bearing can be identified effectively Theflow chart of the roller bearing fault diagnosis method basedon LCD and the ACROA-SVM is shown in Figure 7
The fault diagnosismethod consists of the following sevensteps [47](1) Collect signals from the roller bearings as samples for
the three conditions normal outer-race fault and inner-racefault(2) Decompose the original vibration signals into several
ISCs and choose the first 119898 ISCs that include the mostdominant fault information to extract the feature
(3) Calculate the total energy 119864119894 of the first119898 ISCs from
119864119894 = int
+infin
minusinfin
1003816100381610038161003816119868119894(119905)1003816100381610038161003816
2119889119905 (119894 = 1 2 119898) (22)
(4) Construct the feature vector 119879 with the energy levelsas its elements as follows
119879 = [1198641 1198642 119864119898] (23)
Considering that the energy is sometimes biggest 119879 isadjusted by normalizing the feature to simplify the subse-quent analysis and processing
Let
119864 = (
119898
sum
119894=1
10038161003816100381610038161198641198941003816100381610038161003816
2)
12
(24)
Shock and Vibration 9
ACROA
Training SVM modelComputer the
energy of the ISC components
Calculating the fitness function
Optimal SVM parameters obtained
Is stop condition satisfied
Yes
No
LCD
Roller bearing vibration signals
SVM parameter C 120590
Figure 7The flow chart of the roller bearing fault diagnosismethodbased on LCD and ACROA-SVM
Then
1198791015840= [
1198641
1198641198642
119864
119864119898
119864] (25)
and the vector 1198791015840 is a normalized vector(5) Run the ACROA-SVM where the SVM parameters
namely 119862 and 120590 are optimized by the ACROA(6) Input the vector 1198791015840 into the ACROA-SVM classifier
and perform the training The fitness function is given by(20)The resulting values of119862 and 120590 are input to the ACROA-SVM classifier(7) For ACROA-SVM1 define the condition of an outer-
race fault with the label 119910 = +1 and the other conditionswith the label 119910 = minus1 Thus the outer-race fault canbe separated from the other conditions by ACROA-SVM1Similarly define the condition of an inner-race fault withthe label 119910 = +1 and the other conditions with the label119910 = minus1 for ACROA-SVM2 Thus the inner-race faultcan be separated from other conditions by ACROA-SVM2Similarly the roller fault can be separated from the otherconditions by ACROA-SVM3 and so on
6 Application
The test rig is shown in Figure 8 and includes a motora coupling a rotor and a shaft with two roller bearingsThe roller bearings are of the 6311 type This test rig ispopular for testing imbalances misalignment and varioustypes of bearing faults The shaft rotational frequency is
Driver motor
Bearing Rotor
Worktable
Coupling Shaft
Figure 8 Test rig
25Hz and the rotorrsquos polar moment of inertia is 003 kgsdotm2After the impulse excitation experiment to the roller bearingthe first three resonance frequencies of the roller bearingare determined as 420Hz 732Hz and 1016Hz respectivelyAccording to Nyquist sampling theorem sampling frequency119891119904 is chosen as follows [48]
119891119904 ge 2119891max (26)
where 119891119904 is the sampling frequency and 119891max is the highestfrequency contained in the signal
The sampling frequency value can be chosen as 3ndash5119891max Thus the sampling frequency can be taken as 4096HzThe vibration signal is obtained from the acceleration sen-sor mounted on the bearing housing when the rotationalfrequency of the shaft is steady Because the roller bearingusually turns at a constant speed the starting and stoppingprocesses are not considered The inner-race and outer-racedefects were created by cutting slots having a width and adepth of 015mm and 013mm respectively with a laser Theroller bearings with the three conditions (normal inner-racefault (IR fault) and outer-race fault (OR fault)) were testedand 60 vibration signals from the bearings in each conditionwere obtained fromwhich 45 groupswere selected at randomas the training data
First after the original vibration signals were decom-posed into ISCs using LCD the first five ISCs that include themost dominant fault information were chosen and arrangedfrom high to low according to the frequency componentsas 1198681(119905) 1198682(119905) 1198685(119905) Then the fault feature vector 1198791015840was obtained according to (22) (23) (24) and (25) TheACROA-SVM was used to identify the various patternsThe identification results for the test samples based on LCDpreprocessing are shown in Table 6
In order to make a fair comparison the same originalvibration signals were chosen These signals were decom-posed into IMFs using EMD Five IMFs were chosen andthey were arranged from high to low according to thefrequency components as 1198881(119905) 1198882(119905) 1198885(119905) and then thefault feature vector 1198791015840 was obtained according to (21) (22)(23) and (24) Next the ACROA-SVM was used to identifythe various patterns The identification results of the testsamples based on EMD preprocessing are shown in Table 7and are compared with those using LCD
When used as the preprocessor to extract the energyin each frequency band as ACROA-SVM input vector bothmethods (LCD and EMD based) are capable of identifyingthe faults in the bearings As mentioned in Section 5 outer-race condition is separated by SVM1 and inner-race condi-tion is separated by SVM2 For SVM1 LCD-ACROA-SVM1
10 Shock and Vibration
Table 6 The identification results based on LCD and ACROA-SVMmethod
Test samples 1198641 1198642 1198643 1198644 1198645 LCD-ACROA-SVM1 LCD-ACROA-SVM2 Identification resultsOR fault 09745 02185 00455 00182 00028 (+1) OR faultOR fault 09755 02785 00515 00192 00035 (+1) OR faultOR fault 09735 02271 00238 00118 00061 (+1) OR faultOR fault 09787 02010 00405 00092 00069 (+1) OR faultOR fault 09373 03484 02070 00766 00291 (+1) OR faultIR fault 09846 01645 00536 00213 00158 (minus1) (+1) IR faultIR fault 09766 01638 00662 00210 00159 (minus1) (+1) IR faultIR fault 09718 01049 00400 00304 00258 (minus1) (+1) IR faultIR fault 09950 00917 00358 00120 00138 (minus1) (+1) IR faultIR fault 09961 00774 00331 00220 00162 (minus1) (+1) IR faultNormal 09685 02077 01042 00649 00611 (minus1) (minus1) NormalNormal 09621 02326 01123 00715 00512 (minus1) (minus1) NormalNormal 09741 01978 00908 00547 00277 (minus1) (minus1) NormalNormal 09666 02137 01236 00616 00312 (minus1) (minus1) NormalNormal 09764 02317 01326 00636 00317 (minus1) (minus1) Normal
Table 7 The identification results of LCD-ACROA-SVM compared with EMD-ACROA-SVM or LCD-SVM with EMD-SVM
Method Training samples Test samples 119862 120590 Cost time (s) Test error ()LCD-ACROA-SVM1 45 15 28780 294 559 0LCD- SVM1 45 15 200 1 667EMD-ACROA-SVM1 45 15 195547 292 667 667EMD-SVM1 45 15 200 1 1334LCD-ACROA-SVM2 30 10 28561 471 457 0LCD- SVM2 30 10 200 1 10EMD-ACROA-SVM2 30 10 157016 099 574 0EMD-SVM2 30 10 200 1 10
classifier has higher accuracy than the LCD-SVM1 the EMD-ACROA-SVM1 and the EMD-SVM1 classifier For SVM2the accuracy rate of the LCD-ACROA-SVM2 and the EMD-ACROA-SVM2 are the same In summary it can be observedfrom Table 7 that the ACROA-SVM method based on LCDhas higher accuracy (ie less error) than the method basedon EMD and has shorter computation times
7 Conclusion
A roller bearing fault diagnosis method based on LCDenergy entropy and theACROA-SVMwas investigated in thispaper First the original vibration signals were preprocessedusing the LCD method The LCD energy entropy was usedas the input to the ACROA-SVM classifier A theoreticalanalysis and experimental results show that the ACROA-SVM combined with the LCD method has higher accuracyand shorter computation times than when combined withEMD Furthermore the analysis shows that the LCDmethodis a self-adaptive signal processing method and is superior tothe EMDmethod This signal-processing method is adaptiveand suitable for nonlinear and nonstationary process
Conflict of Interests
The authors declare that there is no conflict of interestsregarding the publication of this paper
Acknowledgments
The authors would like to acknowledge the financial supportfrom Chinese National Science Foundation Grant (nos51075131 and 51175158) and the Nature Science Foundation ofHunan Province China (no 11IJ2026)
References
[1] D Ho and R B Randall ldquoOptimization of bearing diagnostictechniques using simulated and actual bearing fault signalsrdquoMechanical Systems and Signal Processing vol 14 no 5 pp 763ndash788 2000
[2] Z Peng F Chu andYHe ldquoVibration signal analysis and featureextraction based on reassigned wavelet scalogramrdquo Journal ofSound and Vibration vol 253 no 5 pp 1087ndash1100 2003
[3] C J Li and S M Wu ldquoOn-line detection of localized defects inbearings by pattern recognition analysisrdquo Journal of engineeringfor industry vol 111 no 4 pp 331ndash336 1989
Shock and Vibration 11
[4] N E Huang Z Shen S R Long et al ldquoThe empirical modedecomposition and the Hilbert spectrum for nonlinear andnon-stationary time series analysisrdquo Proceedings of the RoyalSociety A vol 454 no 1971 pp 903ndash995 1998
[5] N E Huang Z Shen and S R Long ldquoA new view of nonlinearwater waves the Hilbert spectrumrdquo Annual Review of FluidMechanics vol 31 pp 417ndash457 1999
[6] Y Yang D Yu and J Cheng ldquoA fault diagnosis approach forroller bearing based on IMF envelope spectrum and SVMrdquoMeasurement vol 40 no 9-10 pp 943ndash950 2007
[7] J S Smith ldquoThe local mean decomposition and its applicationto EEG perception datardquo Journal of the Royal Society Interfacevol 2 no 5 pp 443ndash454 2005
[8] G Rilling and P Flandrin ldquoOne or two frequencies Theempirical mode decomposition answersrdquo IEEE Transactions onSignal Processing vol 56 pp 85ndash95 2008
[9] Z Wu and N E Huang ldquoA study of the characteristics ofwhite noise using the empirical mode decomposition methodrdquoProceedings of the Royal Society A vol 460 no 2046 pp 1597ndash1611 2004
[10] J Cheng D Yu and Y Yang ldquoApplication of support vectorregression machines to the processing of end effects of Hilbert-Huang transformrdquo Mechanical Systems and Signal Processingvol 21 no 3 pp 1197ndash1211 2007
[11] M Datig and T Schlurmann ldquoPerformance and limitations ofthe Hilbert-Huang transformation (HHT) with an applicationto irregular water wavesrdquo Ocean Engineering vol 31 no 14-15pp 1783ndash1834 2004
[12] S-s Long T-b Zhang and F Long ldquoCauses and solutions ofovershoot and undershoot and end swing in Hilbert-Huangtransformrdquo Acta Seismologica Sinica vol 18 no 5 pp 602ndash6102005
[13] M-K Hsu J-C Sheu and C Hsue ldquoOvercoming the negativefrequencies instantaneous frequency and amplitude estimationusing Osculating Circle methodrdquo Journal of Marine Science andTechnology vol 19 no 5 pp 514ndash521 2011
[14] Y Kopsinis and S McLaughlin ldquoEnhanced empirical modedecomposition using a novel sifting-based interpolation pointsdetectionrdquo in Proceedings of the 14th WorkShoP on StatisticalSignal Processing (SSP rsquo07) pp 725ndash729 August 2007
[15] J Cheng Jinde Zheng and Y Yang ldquoEmpirical envelopedemodulation approarch based on local characteristic-scaledecomposition and its applications to mechanical fault diagno-sisrdquo Chinese Journal of Mechanical Engineering 10 vol 46 pp148ndash155 2010
[16] M Zacksenhouse S Braun M Feldman and M SidahmedldquoToward helicopter gearbox diagnostics from a small numberof examplesrdquoMechanical Systems and Signal Processing vol 14no 4 pp 523ndash543 2000
[17] V N Vapnik Statistical Learning Theory John Wiley and SonsNew York NY USA 1998
[18] C-L Jia H-S Wu and D-W Gong ldquoCoal demand predictionbased on a support vector machine modelrdquo Journal of ChinaUniversity of Mining and Technology vol 36 no 1 pp 107ndash1102007
[19] J Jang K R Park J Kim and Y Lee ldquoNew focus assessmentmethod for iris recognition systemsrdquo Pattern Recognition Let-ters vol 29 no 13 pp 1759ndash1767 2008
[20] K W Lau and Q H Wu ldquoLocal prediction of non-linear timeseries using support vector regressionrdquo Pattern Recognition vol41 no 5 pp 1556ndash1564 2008
[21] B Long S Tian Q Miao and M Pecht ldquoResearch on featuresfor diagnostics of filtered analog circuits based on LS-SVMrdquoin Proceedings of the AUTOTESTCON pp 360ndash366 September2011
[22] M Saimurugan K I Ramachandran V Sugumaran and NR Sakthivel ldquoMulti component fault diagnosis of rotationalmechanical system based on decision tree and support vectormachinerdquo Expert Systems with Applications vol 38 no 4 pp3819ndash3826 2011
[23] S Abbasion A Rafsanjani A Farshidianfar and N IranildquoRolling element bearings multi-fault classification based onthe wavelet denoising and support vector machinerdquoMechanicalSystems and Signal Processing vol 21 no 7 pp 2933ndash2945 2007
[24] K C Gryllias and I A Antoniadis ldquoA Support Vector Machineapproach based on physical model training for rolling elementbearing fault detection in industrial environmentsrdquo EngineeringApplications of Artificial Intelligence vol 25 no 2 pp 326ndash3442012
[25] J Cheng D Yu J Tang and Y Yang ldquoApplication of SVM andSVD technique based on EMD to the fault diagnosis of therotating machineryrdquo Shock and Vibration vol 16 no 1 pp 89ndash98 2009
[26] M-J Han J-H Hsu K-T Song and F-Y Chang ldquoA newinformation fusionmethod for bimodal robotic emotion recog-nitionrdquo Journal of Computers vol 3 no 7 pp 39ndash47 2008
[27] S Ari K Hembram and G Saha ldquoDetection of cardiacabnormality from PCG signal using LMS based least squareSVM classifierrdquo Expert Systems with Applications vol 37 no 12pp 8019ndash8026 2010
[28] J Manikandan and B Venkataramani ldquoDesign of a real timeautomatic speech recognition system using Modified OneAgainst All SVM classifierrdquo Microprocessors and Microsystemsvol 35 no 6 pp 568ndash578 2011
[29] S Bouhouche L Laksir Yazid S Hocine and J Bast ldquoEval-uation using online support-vector-machines and fuzzy rea-soning application to condition monitoring of speeds rollingprocessrdquo Control Engineering Practice vol 18 no 9 pp 1060ndash1068 2010
[30] C-J Lu T-S Lee and C-C Chiu ldquoFinancial time seriesforecasting using independent component analysis and supportvector regressionrdquo Decision Support Systems vol 47 no 2 pp115ndash125 2009
[31] K Duan S S Keerthi and A N Poo ldquoEvaluation of simpleperformancemeasures for tuning SVMhyperparametersrdquoNeu-rocomputing vol 51 pp 41ndash59 2003
[32] F Imbault and K Lebart ldquoA stochastic optimization approachfor parameter tuning of Support Vector Machinesrdquo in Proceed-ings of the 17th International Conference on Pattern Recognition(ICPR rsquo04) pp 597ndash600 August 2004
[33] F Friedrichs and C Igel ldquoEvolutionary tuning of multiple SVMparametersrdquoNeurocomputing vol 64 no 1ndash4 pp 107ndash117 2005
[34] S Abe Advances in Pattern Recognition Springer London UK2005
[35] S S Keerthi ldquoEfficient tuning of SVM hyperparameters usingradiusmargin bound and iterative algorithmsrdquo IEEE Transac-tions on Neural Networks vol 13 no 5 pp 1225ndash1229 2002
[36] OChapelle VVapnikO Bousquet and SMukherjee ldquoChoos-ing multiple parameters for support vector machinesrdquoMachineLearning vol 46 no 1ndash3 pp 131ndash159 2002
[37] X L Zhang X F Chen and Z J He ldquoAnACO-based algorithmfor parameter optimization of support vector machinesrdquo ExpertSystems with Applications vol 37 no 9 pp 6618ndash6628 2010
12 Shock and Vibration
[38] M J Abdi S M Hosseini and M Rezghi ldquoA novel weightedsupport vector machine based on particle swarm optimizationfor gene selection and tumor classificationrdquo Computational andMathematicalMethods inMedicine vol 2012 Article ID 3206987 pages 2012
[39] F Ardjani K Sadouni and M Benyettou ldquoOptimization ofSVMmulticlass by particle swarm (PSO-SVM)rdquo in Proceedingsof the 2nd International Workshop on Database Technology andApplications (DBTA rsquo10) November 2010
[40] K Chandramouli and E Izquierdo ldquoImage classification usingchaotic particle swarm optimizationrdquo in Proceedings of theInternational Conference on Image Processing (ICIP rsquo06) pp3001ndash3004 October 2006
[41] L Yu H Chen S Wang and K K Lai ldquoEvolving least squaressupport vector machines for stock market trend miningrdquo IEEETransactions on Evolutionary Computation vol 13 no 1 pp 87ndash102 2009
[42] T-J Hsieh and W-C Yeh ldquoKnowledge discovery employinggrid scheme least squares support vector machines based onorthogonal design bee colony algorithmrdquo IEEE Transactions onSystems Man and Cybernetics B vol 41 no 5 pp 1198ndash12122011
[43] B Alatas ldquoACROA artificial chemical reaction optimizationalgorithm for global optimizationrdquo Expert Systems with Appli-cations vol 38 no 10 pp 13170ndash13180 2011
[44] B Alatas ldquoA novel chemistry based metaheuristic optimizationmethod for mining of classification rulesrdquo Expert Systems withApplications vol 39 pp 11080ndash11088 2012
[45] P K Nag Engineering Thermodynamics McGraw-Hill 4thedition 2008
[46] D Huang ldquoPractical implementation of the Hilbert-Huangtransform algorimthrdquo Acta Oceanologica Sinica vol 25 no 1pp 1ndash11 2003
[47] Y Yu Y YuDejie and C Junsheng ldquoA roller bearing faultdiagnosis method based on EMD energy entropy and ANNrdquoJournal of Sound and Vibration vol 294 no 1-2 pp 269ndash2772006
[48] J G Proakis and D G Manolakis Digital Signal ProcessingPrinciples Algorithms and Applications 2nd edition 1992
Submit your manuscripts athttpwwwhindawicom
VLSI Design
Hindawi Publishing Corporationhttpwwwhindawicom Volume 2014
International Journal of
RotatingMachinery
Hindawi Publishing Corporationhttpwwwhindawicom Volume 2014
Hindawi Publishing Corporation httpwwwhindawicom
Journal ofEngineeringVolume 2014
Hindawi Publishing Corporationhttpwwwhindawicom Volume 2014
Shock and Vibration
Hindawi Publishing Corporationhttpwwwhindawicom Volume 2014
Mechanical Engineering
Advances in
Hindawi Publishing Corporationhttpwwwhindawicom Volume 2014
Civil EngineeringAdvances in
Acoustics and VibrationAdvances in
Hindawi Publishing Corporationhttpwwwhindawicom Volume 2014
Hindawi Publishing Corporationhttpwwwhindawicom Volume 2014
Electrical and Computer Engineering
Journal of
Hindawi Publishing Corporationhttpwwwhindawicom Volume 2014
Distributed Sensor Networks
International Journal of
The Scientific World JournalHindawi Publishing Corporation httpwwwhindawicom Volume 2014
SensorsJournal of
Hindawi Publishing Corporationhttpwwwhindawicom Volume 2014
Modelling amp Simulation in EngineeringHindawi Publishing Corporation httpwwwhindawicom Volume 2014
Hindawi Publishing Corporationhttpwwwhindawicom Volume 2014
Active and Passive Electronic Components
Hindawi Publishing Corporationhttpwwwhindawicom Volume 2014
Chemical EngineeringInternational Journal of
Control Scienceand Engineering
Journal of
Hindawi Publishing Corporationhttpwwwhindawicom Volume 2014
Antennas andPropagation
International Journal of
Hindawi Publishing Corporationhttpwwwhindawicom Volume 2014
Hindawi Publishing Corporationhttpwwwhindawicom Volume 2014
Navigation and Observation
International Journal of
Advances inOptoElectronics
Hindawi Publishing Corporation httpwwwhindawicom
Volume 2014
RoboticsJournal of
Hindawi Publishing Corporationhttpwwwhindawicom Volume 2014
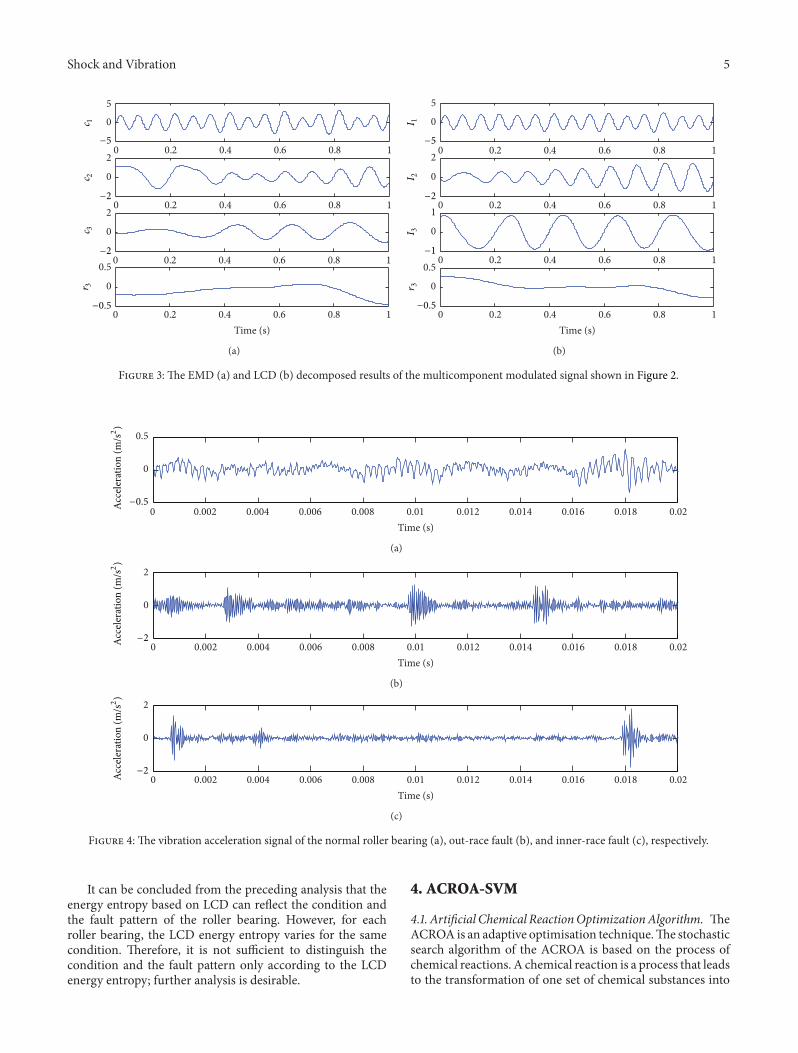
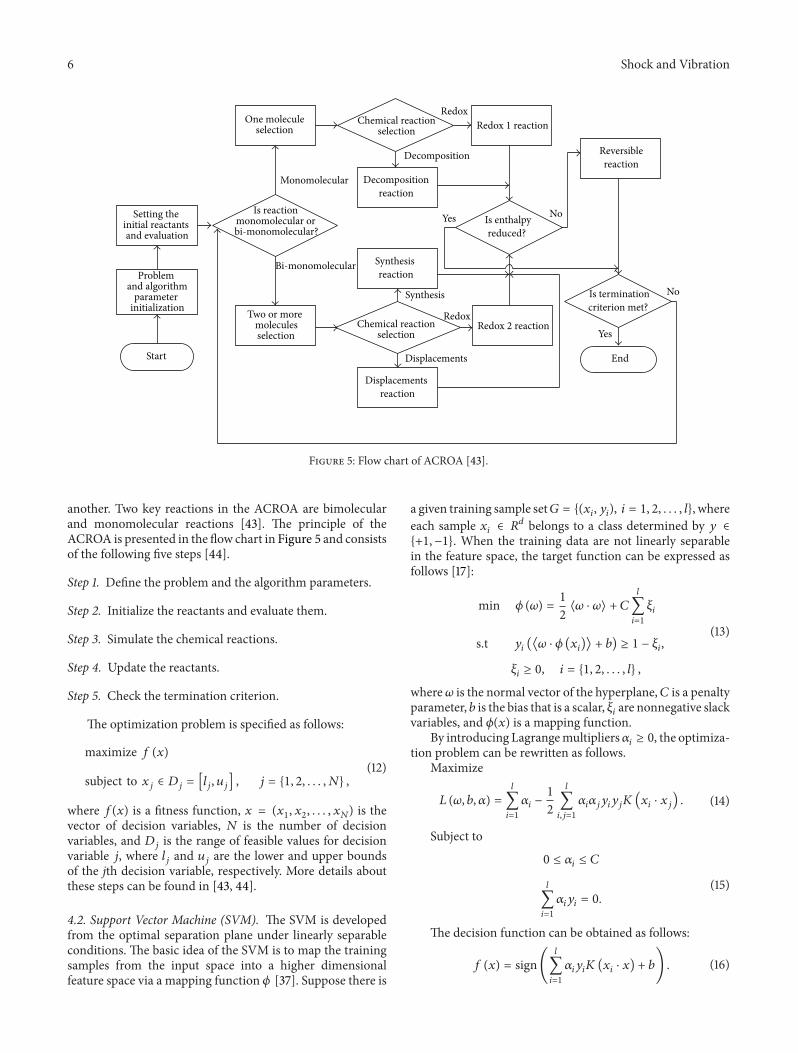
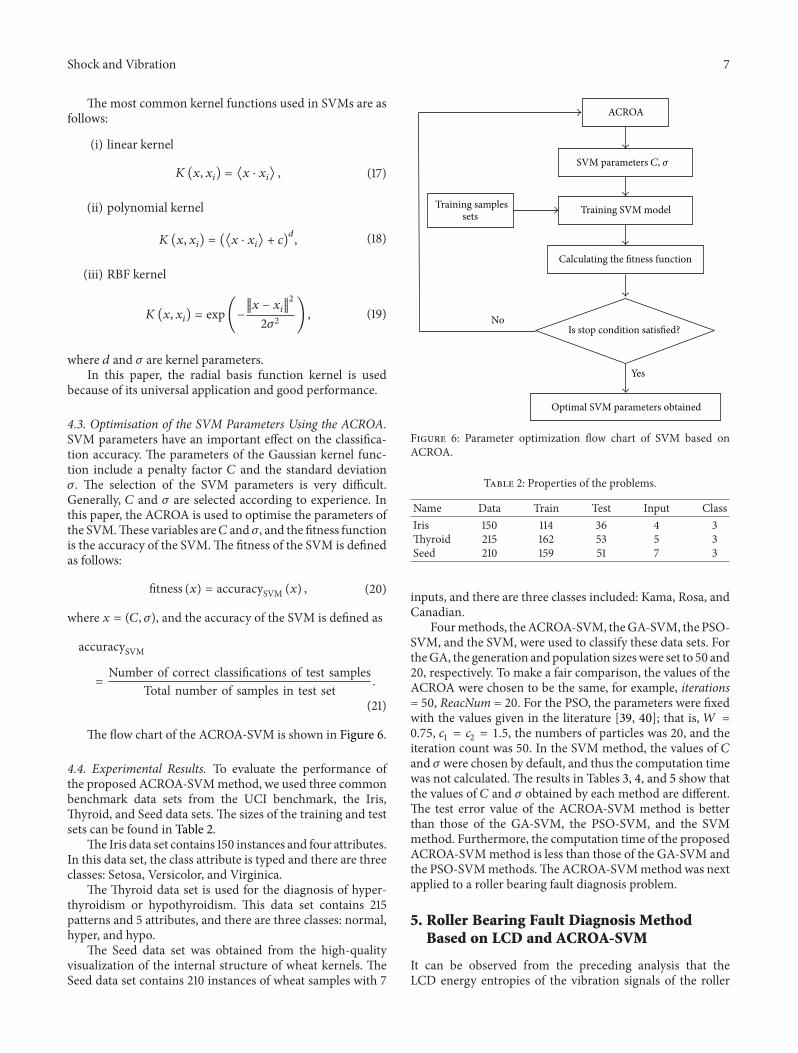
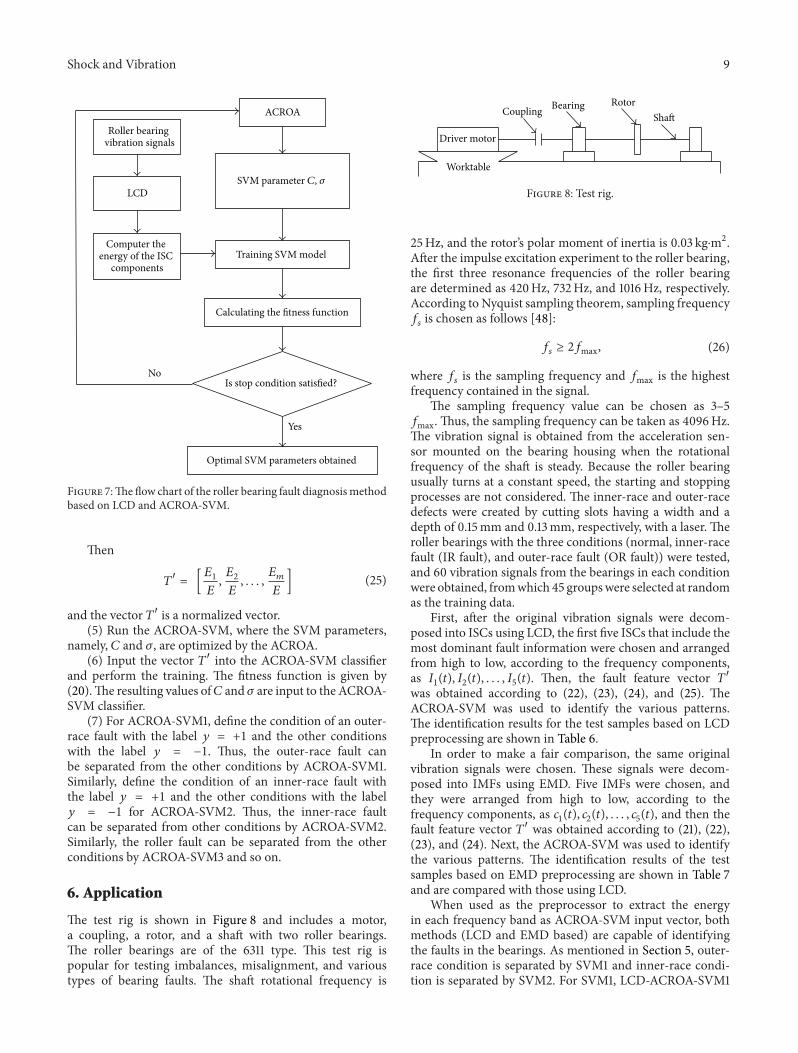
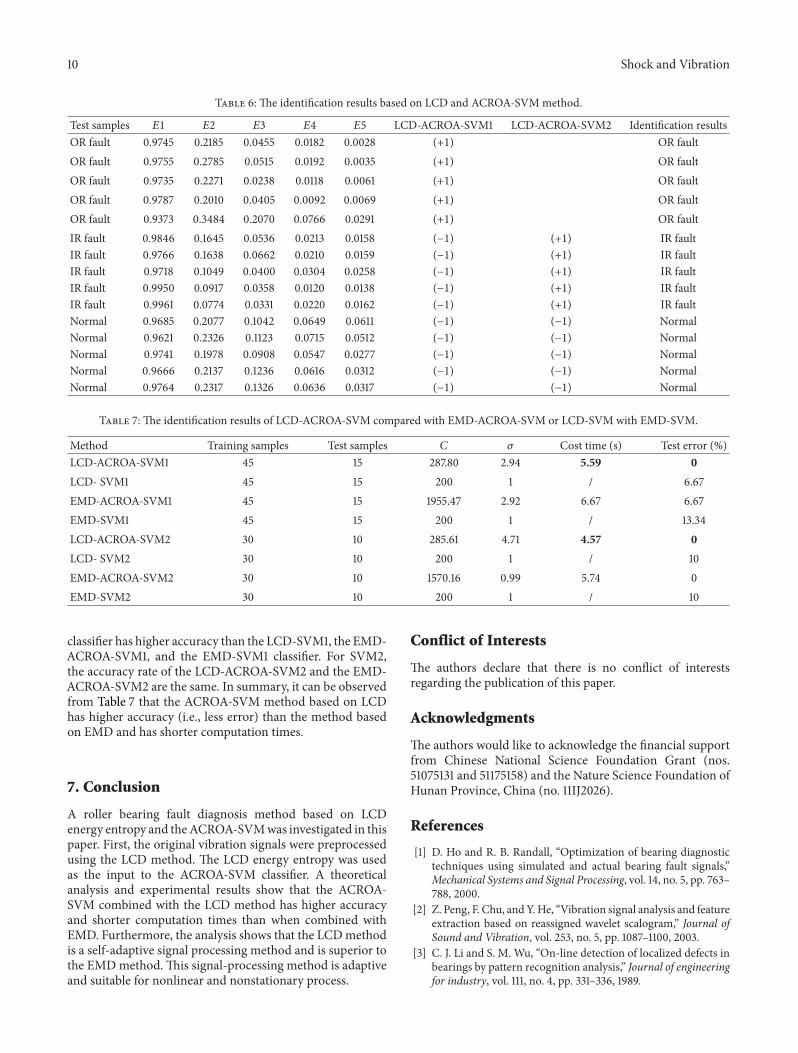