A Review of the History of Air Carrier Bankruptcy Forecasting and the Application of Various Models...
32
Published in: Credit and Financial Management Review , XII No. 3, (3rd Quarter 2006), 11-30. A Review of Air Carrier Bankruptcy Forecasting Methodologies and Directions for Future Research* Richard D. Gritta, Ph.D., Professor of Finance, University of Portland Bahram Adrangi, Ph.D., Professor of Economics, University of Portland Sergio Davalos, Ph.D., Associate Professor of Business, University of Washington Don Bright-Bureau of Transportation Statistics ABSTRACT Airline bankruptcy has become an everyday event in the year 2006. Braniff was the first major carrier to fail way back in 1982. It was followed shortly by the receivership of Continental the next year. It seems to have reached its peak the past several years with UAL, US Airways, Delta and Northwest seeking court protection. Obviously, methods that could predict insolvency, or at least gauge relative financial condition, are important. This paper will present many models that have been employed in this task. Some are discriminant models, some are neural networks, and some take the form of logit regressions. Covered are such models are the Altman Z Score (and one of its derivatives, the Z”), the Altman Zeta model, the Airscore Model, several NNs built on air carrier data, the Pilarski P-Score, genetic algorithms, the Gudmundsson model (which incorporates some management variables in the analysis), and a “fuzzy logic” model. Finally, directions for future research will be discussed briefly.
Transcript of A Review of the History of Air Carrier Bankruptcy Forecasting and the Application of Various Models...
Published in: Credit and Financial ManagementReview, XII No. 3, (3rd Quarter 2006), 11-30.
A Review of Air Carrier Bankruptcy ForecastingMethodologies and Directions for Future Research*
Richard D. Gritta, Ph.D., Professor of Finance, Universityof Portland
Bahram Adrangi, Ph.D., Professor of Economics, University ofPortland
Sergio Davalos, Ph.D., Associate Professor of Business,University of Washington
Don Bright-Bureau of Transportation Statistics
ABSTRACT
Airline bankruptcy has become an everyday event in the year2006. Braniff was the first major carrier to fail way backin 1982. It was followed shortly by the receivership ofContinental the next year. It seems to have reached itspeak the past several years with UAL, US Airways, Delta andNorthwest seeking court protection. Obviously, methods thatcould predict insolvency, or at least gauge relativefinancial condition, are important.
This paper will present many models that have been employedin this task. Some are discriminant models, some are neuralnetworks, and some take the form of logit regressions.Covered are such models are the Altman Z Score (and one ofits derivatives, the Z”), the Altman Zeta model, theAirscore Model, several NNs built on air carrier data, thePilarski P-Score, genetic algorithms, the Gudmundsson model(which incorporates some management variables in theanalysis), and a “fuzzy logic” model. Finally, directionsfor future research will be discussed briefly.

*Some of the material contained in this article is part of a paperentitled, “Air Carrier Financial Condition: A Review ofDiscriminant, Logit and Neural Network Models for Measuring theFinancial Fitness of the U.S. Airline Industry,” by Richard D. Grittawhich appears in the Handbook of Transportation Strategy, Policy, andInstitutions, Vol. 6. (Elsevier Press, 2005), Ch.32, 547-560. ** The views expressed here do not represent the official position of the U.S. Dept. of Transportation and/or any division within DOT.
I. Introduction:
Airline bankruptcy, once an unheard event, has now becomecommonplace. Since the first airline bankruptcy filing byBraniff in 1982, over 148 air carriers have sought courtprotection and many have ceased to exist, including suchfamous names as Braniff, Eastern, Pan Am, and TWA. Severalothers could well follow their predecessors into oblivion.
Financial analysts, bondholders, other credits,stockholders, lessors, governmental agencies, and manyothers have become interested in forecasting which carriersface significant financial stress and thus may file. Thepurpose of this paper is to outline and briefly discuss manyof the different models, both generic and industry specific,that have been used to assess the financial health of airtransportation, such a vital industry in the U.S. economy.
II. Financial Ratios as Predictors of Stress:

Financial analysts have long used different types offinancial ratios to assess four different aspects offinancial well-being. These four types of ratios measureliquidity (the ability of a firm to pay its obligations asthey come due), leverage (the extent to which a firm usesdebt as a method of finance), activity or turnover (theefficiency of asset usage), and profitability. More recentlyfinancial researchers have begun to combine these financialratios into models that produce an overall score that can beused to both assess financial stress and to predictbankruptcy well in advance of the event. What follows is asummary of some of the models that the authors have used,and in some cases designed, for this purpose. This paperwill discuss the following:
1. The Altman Z Score Model (and its variant, the Z”Score).
2. The Altman ZETA® Model3. The Chow/Gritta/Leung AIRSCORE Model4. The Pilarski or P-SCORE Model5. Neural Networks (NN)6. Genetic Algorithms (GA)7. The Gudmundsson Model (An International Model)8. The Silva/A. Espirito Santo/Portugal “Fuzzy Logic”
Model (An International Model)
The first two models are generic; the latter six weredesigned using airline data only. It is hoped that thispaper will continue to spark further research in predictivemodels that portend financial stress.
Non-Industry Specific Models:
(1) The Altman Z and Z” Models:
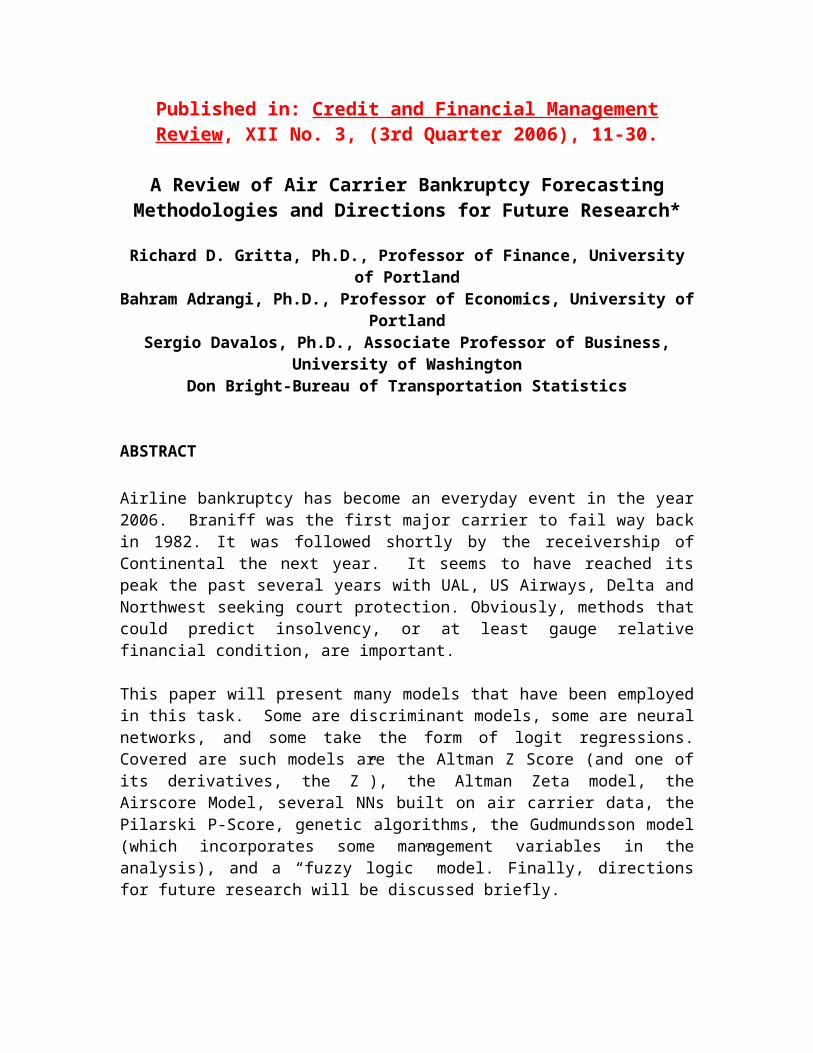
The “father of financial bankruptcy forecasting” is EdwardAltman of NYU. Early research by Altman in 1968 resultingin the design of what is perhaps the most famous bankruptcy-forecasting model, the Z Score [Altman, 1968]. Designedusing a database of 33 failed and 33 non-failedmanufacturing companies, Altman used a stepwise multiplediscriminant regression to specify the following:
Z= 0.012X1 + 0.014X2 + 0.033X3 + 0.006X4 + 0.999X5
Where X1 – X5 are ratios that measured each of the aspects of strength.
X1 = net working capital to total assets-a liquidity ratioX2 = retained earnings to total assets-a past profitability ratioX3 = operating profit to total assets-a current profitability ratioX4 = market value of equity to book value of debt-a leverage ratioX5 = operating revenues to total assets-a turnover ratio
The higher each of these ratios, the greater is thecontribution to the total Z Score. The critical values of Zare 1.81 and 2.99. Firms with scores of <1.81 fit abankruptcy profile, while firms with Zs >2.99 fit thesolvency profile. Score between the two values lie in whatAltman called the “zone of ignorance’ where profiling ismore difficult. Altman argued for a 2.67 cutoff, if onebarrier was desired. The model’s success rate in forecastinginsolvency was 76%. In should be noted that the model canalso be used to assess overall relative financial strength.
Gritta used the basic Altman Model and forecasted theinsolvencies of both Braniff and Continental several yearsbefore their actual filings. [Gritta, 1982]. Subsequently,

Gritta used the model to assess the industry in severalother published studies [for example, Gritta, Chow, Davalos,2002]. The following chart summarizes Z Scores for thedecade of the 1990s and for the period just before 9/11.
1988 1989 1990 1991 1992
1993
1994
1995
1996
1997
1998 1999 2000
2001
Alaska 2.00 2.15 1.36 1.23 0.63
0.91
1.11
1.26
1.49
1.76
2.36 1.92 1.40
1.04
Amer.West* - - 0.81 0.29 -.08
0.66
1.47
1.75
1.52
NA NA NA NA NA
American 1.65 1.76 1.06 1.02 0.96
1.13
1.21
1.25
1.46
1.75
1.96 1.60 1.60
1.37
Braniff* 1.81 B B -3.75
B B B B B B B B B B
Continental*
0.93 1.08 0.30 -0.04
-.20
0.88
0.50
0.99
1.61
1.75
1.83 1.46 1.59
0.90
Delta 2.41 2.59 1.60 1.43 1.11
1.15
1.12
1.51
1.55
1.97
1.98 1.49 1.33
0.64
Eastern* -.01 -0.95
-1.17
B B B B B B B B B B B
Northwest 2.03 2.22 1.40 1.26 1.10
1.38
1.53
1.56
1.75
1.70
0.89 1.20 1.26
0.70
Pan Am* 0.45 -0.23
-1.94
NA NA NA NA NA NA NA NA NA NA NA
Southwest 1.80 1.92 1.86 1.79 2.33
3.36
3.07
2.71
2.85
3.03
3.61 3.82 4.21
3.83
TWA* 1.24 0.96 0.67 -0.32
0.02
0.68
0.44
1.20
0.79
0.88
0.75 0.12 0.12
-.06
United* 1.92 2.16 1.60 1.28 0.94
1.26
1.16
1.39
1.50
1.42
1.24 1.17 0.82
-.13
US Airways*
1.76 0.85 0.67 0.67 0.31
0.42
0.01
0.46
0.71
1.43
1.68 1.08 0.82
0.04

Source: All ratios are calculated from raw data in Air Carrier FinancialStatistics Quarterly, various issues. Market price data are from the Value Line Investment Survey.
*Indicates a carrier that has filed receivership/bankruptcy
America West filed receivership in 1991 and continues to operate.Braniff filed receivership in 1989 and continues to operate, fails againand ceases operations.Continental filed receivership in 1990Eastern filed bankruptcy in 1991 and ceases operationsPan Am filed bankruptcy in 1991 and operates now as a regional carrierTWA filed receivership in 1992 and again in 1995 and continues to operateUnited filed receivership in 2003 and is operating under Chapter 11 protection USAirways filed receivership in 2002 and exited from Chapter 11 in 2003
The chart clearly shows the usefulness of the Z Score inboth signaling an early warning and in assessing therelative financial strengths of the major carriers.
A variation of the model has been in use at the U.S. Bureauof Transportation Statistics to track airline financialhealth. That model is referred to as the Z” Score. Someanalysts feel that the X5 ratio can distort the resultsbecause of the significant use of operating leases by aircarriers. Such leases do not appear on the balance sheet ofthe carrier, but the revenues resulting from these leasesappear on the carrier’s income statement [Gritta, Chou andLippman, 1995]. The result is to inflate the ratio for onecarrier using operating leases over the ratio of acomparable carrier that owns its aircraft. Altman suggestedthe use of a variant of the original Z Score to circumventthis problem [Altman 1983]. Called the Z” Score todifferentiate it from the Z Score, the model gets aroundthis problem by deleting the turnover ratio. The resultingmodel is:
Z = 6.56X1 +3.26X2 + 6.72X3+ 1.05X4

This model utilizes four input variables; X1 –X4 as definedabove.
A Z Score of 1.1 or less indicates a high probability ofbankruptcy in the near future. A Z Score of 2.6 or aboveindicates a high probability that bankruptcy will not occur.A Z Score between these two numbers indicates that there isinsufficient statistical significance to make a prediction.As in the Z Score Model, Altman originally referred toscores in this range as the “zone of ignorance.” In thiszone, lie some firms that have failed and some that haveremained solvent. The following table shows Z” Scores forthe major carriers for the year end 2004.
CARRIER Z”_ScoreAmerican -1.209711065Alaska 1.030260765Continental -0.680997649Delta -2.436372612AmericaWest -1.214482870Northwest -0.307042506United -4.113404597US Airways -2.455284490Southwest 2.597307223
The very poor scores for all the carriers except Southwest,and to some extent Alaska, confirm the very shaky positionof the major carriers despite the economic recovery, andsignal the filings of both Delta and Northwest.
(2) The Altman ZETA® Credit Score Model
While the Z Score (and its variant) was over 76% successfulin predicting insolvency, Altman later added several

variables to his original model in an effort to increase itspredictive powers. Called the ZETA® credit score model[Altman, Haldeman and Narayanan, 1977], it takes the form:
ZETA® = a1X1+a2X2+a3X3+ a4X4+a5X5+a6X6+a7X7
Where X1-X7 are:
X1 = return on assets (the same ratio as X3 in the Z Score Model)X2 = earnings stability (the deviation around a ten-year trend line of (X1)X3 =debt serviceX4 =cumulative profitability (the same as X2 in Z Score)X5 =liquidity (measured by the current ratio)X6 =the ratio of equity to debt (using market values and a five year trend)X7 =firm size (measured by the log of the firm’s total assets).
The ZETA® credit score model is centered on 0. Scores lessthan 0 indicate stress. The model was applied to the airlineindustry in 1984 and was found to be reliable [Altman andGritta, 1984]. The scores flashed warnings for severalcarriers that subsequently failed. These were US Airways (-0.06), TWA (-0.13), Eastern (-3.85), Pan Am (-4.17),Continental (-4.99), and Braniff (-15.42). Unfortunately,the model is proprietary and the intercept terms in theequation are not published. ZETA® credit scores are onlyavailable by subscription from ZETA® Services ofMountainside, New Jersey. This limits its availability, atleast to academic researchers. The following are scores forthe major airlines just prior to and after September 11,2001. (The scores are courtesy of Bob Haldeman of ZETA®
Services.)

Carrier Dec.
00
Aug.0
1
Dec.
01Alaska -
0.19
-0.56 -
0.73American
West
-
1.14
-1.84 -
2.79American 2.54 1.90 -
0.99Continental 1.02 0.37 -
0.45Delta 1.75 0.94 -
1.06Northwest -
1.62
-1.96 -
2.15Southwest 6.87 7.65 6.03United -
0.10
-1.16 -
2.02US Airways -
2.72
-2.42 -
6.21
Again, the poor scores for many of the airlines indicate theindustry’s problems well in advance of the events ofSeptember 11, 2001.
Industry Specific Models:

(3) The Chow/Gritta/Leung AIRSCORE Model:
It could be argued, however, that a model derived from asample of the same industry would be even more accurate thata generalize model such as the Altman Z Score or ZETA®
credit scores. With that in mind, an industry specificmodel, AIRSCORE, was specified using a sample restricted tothe airline industry [Chow, Gritta and Leung, 1991]. Itincluded a significant sample of the large and smallercarriers (the latter referred to as regional airlines).Using the MDA approached utilized by Altman, the model thusderived was:
AIRSCORE= -.34140X1 + .00003X2 +.36134X3
The three ratios that were predictive of insolvency or
stress were:
X1 = interest/ total liabilities (the imputed interest rate on debt)X2 =operating revenues per air mile X3 = shareholders’ equity/ total liabilities
Because the distribution of the scores made the applicationof a single cut-off point difficult and inappropriate,several “gray zones” were defined and the model yieldedresults similar to the Altman Z Score and to ZETA® creditscores. It was able to achieve accuracy rates of between 76%and 83%, depending on the zone used. While the model wassomewhat accurate, it did seem to be a bit biased toward thelarger carriers in the sample. The interested reader isreferred to the source for scores and details. CurrentAIRSCORES, as well as a history of the scores over the pasttwo decades, appear in a position paper by researchers atMIT [Burke, 2004].

(4) Pilarski (P-Score) Model:
Logistics regression analysis has also been used to forecastfinancial stress and has become widely accepted [Ohlson,1980]. Logit models estimate the probability of bankruptcyand are also useful in ranking firms in terms of financialstrength. A logit model has been used to specify a model forairline financial stress [Pilarski and Dinh, 1999]. CalledP-Score, the model takes the form:
W = -1.98X1 –4.95X2 –1.96X3 –0.14X4 –2.38X5
Where:X1 = operating revenues/total assets X2 = retained earnings/total assets X3 = equity/total debt obligationsX4 = liquid assets/current maturities of total debt
obligationsX5 = earnings before interest and taxes/operating
revenues
The number P is determined by: P = 1/[1+e-w]
Note that several of the input ratios (X1, X2 and X3) areratios from the Altman Z Score model. Rather than producinga score that must be compared to a scale, as is the casewith the previous models, this model produces theprobability of bankruptcy. P is that probability. Thehigher the P value, the greater is the financial stress andthe more likely is the chance of failure. The authors usedthe P-Score to assess the financial condition of the majorcarriers and found the model to be correlated to the AltmanZ” [Goodfriend, Gritta, Adrangi & Davalos, 2005]. Thefollowing charts from that article present P-Scores for twogroups of carriers; the high risk and the intermediate riskcarriers. The scores for the other majors are not shownsince they are so low (that is, probabilities of default arenear zero).

P-SCO RE(High P-Score Group)
0
0.1
0.2
0.3
0.4
0.5
0.6
0.7
0.8
0.9
11993_4
1994_2
1994_4
1995_2
1995_4
1996_2
1996_4
1997_2
1997_4
1998_2
1998_4
1999_2
1999_4
2000_2
2000_4
2001_2
2001_4
2002_2
2002_4
2003_2
2003_4
Year_Quarter
P-Sc
ore AA
TW AUAUS
TW
US
UA
P-SCO RE(Interm ediate Risk G roup)
0
0.1
0.2
0.3
0.4
0.5
0.6
0.7
0.8
0.9
1
1993_4
1994_2
1994_4
1995_2
1995_4
1996_2
1996_4
1997_2
1997_4
1998_2
1998_4
1999_2
1999_4
2000_2
2000_4
2001_2
2001_4
2002_2
2002_4
2003_2
2003_4
Year_Quarter
P-Sc
ore CO
DLHP

The following chart presents more recent results, the P-Scores for the 4th quarter of 2004.
They do show the continuing weaken condition of the majorairlines and flash warnings for Delta and Northwest.
CARRIER P-Score
American0.15257046
9
Alaska0.00376352
9
Continental0.09502783
9
Delta0.39039259
1
America West0.04888106
0
Northwest0.08584244
7
United0.68635738
1
US Airways0.25706433
8
Southwest0.00061650
4

(5) Neural Networks: (Davalos/Gritta/Chow Models)
In the continuing search for even more accurate methods ofgauging financial strength, some researchers have pursued anewer approach-the use of artificial neural networks (NNs).The use of artificial intelligence has gained widespreadsupport for a variety of uses in finance, forecastingsolvency being one major area of application.
NNs mirror the architecture of the brain and are derivedfrom research on the neural architecture of the brain[Caudill, 1989]. NNs are composed of inter-connected neuronslinked together through a network of layers. Inputs of dataare provided to the network along with desired outputs. Thenetwork then trains itself to classify new information basedon the abilities it derives to separate the groups inputinto the model. NNs have several advantages over the MDAtechnique [Udo, 1993]. They can be run on smaller samplesthan MDA models, they can tolerate “noise” or missing data,they can self-organize and learn by changing the networkconnections, and they can find and establish complexrelationships among input variables. The actualconstruction of NN is, as the case with the MDA technique,quite complex. The interested reader should consultreferences provided at the end of the paper.
Several of the authors trained a neural network using onlyairline data. Two separate studies were conducted on the aircarriers using the NN. Inputting 21 pieces of financialinformation from carrier balance sheets and incomestatements, a NN was specified for the major U.S. airlines[Davalos, Gritta and Chow, 1999]. In a second study, a NNwas trained to identify bankrupt/stressed smaller carriers,known as large and medium regional airlines [Gritta,Davalos, Chow, and Huang, 2002]. The first studysuccessfully classified all the major carriers that filedfor receivership. The second study achieved an overallsuccess rate of 88% in predicting stress for the smallerairlines. The use of neural networks thus provides an

interesting supplement to the analyst in appraisingfinancial health. The following chart shows the sample ofsmaller carriers and the results.
RESULTS OF THE NEURAL NET Delta Rule-Tan H
1 input layer-3 hidden neurons150,000 iterations
Carrier
Desired
Actual
Prediction
1 01
01
Correct
2 10
10
Correct
3 01
01
Correct
4 01
01
Correct
5 01
01
Correct
6 01
01
Correct
7 01
01
Correct
8 01
01
Correct
9 10
10
Correct
10 10
10
Correct
11 01
01
Correct
12 01
01
Correct
13 01
01
Correct

14 01
01
Correct
15 10
10
Correct
16 10
10
Correct
17 10
10
Correct
18 01
10
Type I
19 01
10
Type I
20 01
01
Correct
21 01
01
Correct
22 10
10
Correct
23 01
10
Type I
24 01
01
Correct
25 01
01
Correct
26 01
01
Correct
27 01
01
Correct
28 01
01
Correct
29 01
01
Correct
30 10
10
Correct
31 01
01
Correct
32 10
01
Type II

NOTE: Desired Code of (0 1) indicates a bankrupt orfinancially stressed carrier and (1 0), a solvent
carrier.
Type I errors occur when a carrier is predicted to remainsolvent but the carrier did fail. A Type II error is thereverse. The prediction is insolvency and the carrier hassurvived.
(6) Genetic Algorithms: (Davalos/Gritta/Adrangi Model)
While Neural Networks (NN) have been used successfully toclassify organizations in terms of solvency, they arelimited in degree of generalization either by requiringlinearly separable variables, lack of knowledge of how aconclusion is reached, or lack of a consistent approach fordealing with local optimal solution whether maximum orminimum. Because of this, the authors decided to try aneven newer approach to the problem-a genetic algorithm (GA).A GA has the ability of the NN method to deal with linearlyinseparable variables and incomplete, noisy data; but at thesame time, it resolves the problem of falling into a localoptimum in searching the problems space.
The concept behind the GA is not new. It is based onsurvival of the fittest and evolution. Starting withmembers of a candidate population of solutions, thispopulation is evolved to the best set of solutions in anevolutionary manner. GAs are stochastic, global searchtechniques that can search large, complicated spaces[Goldberg, 1989]. It was thus decided to apply a GA toairline data, focusing on ratios that assess liquidity,leverage, activity and profitability [Davalos, Gritta,Goodfriend and Adrangi, 2005].
The steps in the design of the genetic algorithm are asfollows:

1. A population of candidate solutions israndomly generated.
2. Members of this population are thenevaluated for fitness based on a fitnessfunction. The fitness function is used todetermine how well the solution performs. Thefitness function cannot be derived automaticallybut must be developed based on the judgment ofthe developer. 3. Once all members of the current populationhave been evaluated the next step is to removemembers from the population and introduce newmembers. The weakest performing members areremoved. The number removed depends on how manyare in the population, but this number removedmust be consistent. 4. New members of the population are generatedon the basis of reproduction and mutation.Through reproduction a potentially betterperforming offspring is produced. Throughmutation new members are introduced which havethe potential of introducing a solution thatwould not have been derived through thereproduction method since mutations are random.5. The new population then goes through steps 2-4 until a predetermined level of fitness isreached or enough iterations have been conductedwithout any improvement.
The fitness function evaluates the quality of each rule(individual). The fitness function is based on the followingfour different types of results that can occur for aprediction: • true positive (tp) - the rule predicts that the firm isfinancially insolvent and it is.

• false positive (fp) – the rule predicts that the firm isfinancially insolvent and it is not.• true negative (tn) - the rule predicts that the firm isfinancially solvent and it is;• false negative (fn) - the rule predicts that that the firmis financially solvent and it is not.
Our fitness function combines two indicators commonly usedin statistical analysis, namely the sensitivity (Se) and thespecificity (Sp), defined as follows:
Se = tp / (tp + fn) (1)
Sp = tn / (tn + fp) (2)
Finally, the fitness function used by our system is definedas the product of these two indicators, i.e.:
fitness = Se * Sp (3)
The goal is to maximize both the Se and the Sp at the sametime, and the product shown in equation (3) provides a goodgradient for the function.
Twenty-one financial variables from the carrier incomestatements and balance sheets were first collected for thedata set. Seven ratios were used based on the three typesof financial ratios that measure liquidity, profitability,operating efficiency and financial leverage. The sevenwere: A liquidity measure- current liabilities to totalassets (CLIAB/TA); a profitability measure- retainedearnings to total assets (REARN/TA); an efficiency ratio-operating expenses to revenue (OE/REV); anotherprofitability ratio- profit to operating expenses(PROFIT/OE); a financial leverage measure-total liabilitiesto total assets (TLIAB/TA); another liquidity measure-current assets to total assets (CA/TA); and lastly, anotherliquidity measure-current assets to operating revenue

(CA/REV). These ratios where then calculated for each datapoint. A string of the following form was used:
String(Var1, Var2, … VarN, Op1, Op2, …, OpN, X1, X2, …, XN).
This string represented a rule that compared each ofselected variable given by Var1 using the relationaloperator Op against the variable value, X. The particularvariable used could be randomly selected. Rules werelimited to only four of the seven ratios. Rules could takeon the following form:
If Var1 > X1, And Var2 < X2, … And VarN > XN
then the prediction would be Solvency. (Specific operatorswere used to better illustrate the format).
A training set was used to train the GA and then a test setwas used to evaluate the outcome. Several iterations wereconducted to examine variations in performance. The averageprediction accuracy was 91%. The result of the mostsuccessful GA is a rule that can then is applied to theratios in order to determine a firm’s solvency.
The table below depicts the results of a run with 94%accuracy. All seven ratios were used in this run: CLIAB/TA,REARN/TA, OE/REV, PROFIT/OE, TLIAB/TASSET, CA/TA, CA/REV.The data row references the ratio used. The operators areeither 1 or 2 with a 1 for “<” and a 2 for “>=”
In the example below there are five rules.Rule 1 is as follows: If CA/TA < 0.22 THEN TRUE; IF NOT THENFALSERule 2 is If CA/TA < 0.189 THEN TRUE ELSE FALSE. Rule 3 is If CA/REV < 0.239 THEN TRUE ELSE FALSERule 4 is If EXP/SALES < 0.996 THEN TRUE ELSE FALSERule 5 is If TLIAB/TA < 0.603 THEN TRUE ELSE FALSE

CLIAB/TA REARN/TA OE/REV PROFIT/OE TLIAB/TASSET CA/TA CA/REV1 2 3 4 5 6 7
Rule # 1 2 3 4 5ValueRange
data 6 6 7 3 51 - 7[INT]
operator 1 1 1 1 11 - 2[INT]
cutoff 0.322 0.189 0.239 0.996 0.603 0 - 1
For a company to be predicted as financially solvent, allfive rules have to be true.
(7) The Gudmundsson Model: (An International Model)
Gudmundsson argued that, while financial variables areobviously important to the prediction process, other non-financial variables also play a role, especially whenforecasting multi-country failure [Gudmundsson, 2002]. LikePilarski, he also felt that logistic regression analysis(LRA) provides a better forecast than MDA. Gudmundssonspecified the following model:
Z = Bo + B1X1 + B2X2 + B3X3 + B4X4 + ………..BnXn
and:
P = 1/[1+e-z]
As in the case the Pilarski Model, P is the probability ofbankruptcy.
The independent variables in the regression are as follows:
X1 =load factorX2 =number of passengers per departureX3 =number of hours flown per pilot

X4 =number of departures per aircraftX5 =number of pilots per aircraftX6 =number of employees per aircraftX7 =average age of aircraft fleetX8 =annual inflation rate in economy of the carrierX9 =number of different brands of aircraft operatedX10=political influence (a dummy variable: yes=1; no=0)
The dataset used by Gudmundsson consisted of ratios, as wellas continuous and nominal variables collected over a threeyear period (1996-1998) for 41 commercial airlinesworldwide. (Data was collected from the Air TransportWorld’s Airline Report, IATA World Airline Statistics andICAO Annual Digest of Statistics.). While all the variablesallowed to enter the model were not statisticallysignificant, the overall accuracy rate of his model was90.2%.
(8) Fuzzy Logic Model (Silva/A. Spirito Santo/Portugal-AnInternational Model)
Several researchers have utilized yet another approachto forecasting air carrier insolvency. Silva, A. EspiritoSanto, and Portugal (2005) used a multivariate techniquecalled Hybrid Financial Statement Analysis (HFSAT) to testseveral American and Brazilian carriers’ financialconditions and to pinpoint the probability of bankruptcy.HFSAT is the result of the application of Fuzzy Logic and adiscriminant analysis multiple-variable model to a firm’seconomic and financial data. The authors argued that theHFSAT application demonstrates the following advantages:
a) It can classify a firm’s financial conditionusing a consistent theoretical base; b) It frees the analyst from the slow process ofinvestigating a company economic and financialstructure by means of a large set of indexes;

c) It is a functional and easily implementedalgorithm; d) Its quantitative and qualitative measures areintuitive to the analyst; e) It can be used to compare companies indifferent markets, since the source data includesall the same classification criteria; f) It is flexible and it can be used by aviationregulatory agencies, shareholders, managers etc.to support the decision making process.
Discriminate analysis is a statistical tool used toclassify a certain element in a determining group over theexistent groups (G1, G2… Gn). This requires that the elementto be classified really belongs to one of the groups andalso that the characteristics of the elements of the twogroups are known, so that comparisons among thecharacteristics of the elements of the several groups can bemade. Those characteristics are specified starting from agroup of aleatory variables n (X1, ...Xn) [Silva, 1983].According to Hair et. al. (1995), the discriminant method isparticularly useful in those situations where the totalsample can be divided in groups based on the dependentvariable, characterizing well-known classes. Those classescan be represented by dicotomic or multicotomics variables(e.g. male/female, high-medium-low, etc.). The methodologyfor the financial analysis has both a discriminant techniqueand Fuzzy Logic as a base. Fuzzy Logic consists of modelingthe human thought structure for the problems resolution anddecision making by means of mathematical instruments. Thoseinstruments derive of the set theory, algebra and so on, andthey can be represented by discrete models or even by meansof integrals (integral-fuzzy). Zadeh (1975) argues that oneof the great advantages of Fuzzy Logic is to obtain, bymeans of the fuzzy set properties, the translation oflinguistic terms used in the daily communications (naturallanguage) in mathematical expressions. According to Ross(1995),

“in classical, or crisp, sets the transition for anelement in the universe between membership and non-membership in a given set is abrupt and well-defined(said to be “crisp”).
For an element in a universe that contains fuzzy sets, thistransition can be gradual. Its transition among variousdegrees of membership can be thought of conforming to thefact that the boundaries of the fuzzy sets are vague andambiguous. Hence, membership of an element from the universein this set is measured by a function that attempts todescribe vagueness and ambiguity. The fuzzy setrepresentation can be given by means of discrete orcontinuous expressions as;
Discrete expression (when the universe is finite): Let the universe X be
X = {x1, x2, ..., xn}Then, a fuzzy set A on X can be represented as follows:
A = μA(x1)/x1 + μA(x2)/x2 ….+ μA(xn)/xn
= ∑ μA(xi)/x1Continuous expression (when the universe is infinite): When the universeX is not infinite set, a fuzzy set A on X can be represented as follows:
A = ∫ μA(xi)/x1
Source: An Introduction to Fuzzy Logic for Practical Applications(Tanaka, 1997).
HFSAT combines the use of the Fuzzy Logic, an ArtificialIntelligence tool with Discriminant Analysis, an econometricmultiple-variable model, by means of an algorithm applied toa given economic and financial data. The effect is toprovide a comprehensive extension of the business situationof the airlines represented by the data bank. The stepsrequired to specify the model include database structuring

together with the calculation of an economic and financialindex and the use of Fuzzy Logic. Silva, A. Espirito Santo, and Portugal structured thedatabase dividing the air carriers into 3 categories(healthy, high risk and insolvent). Twenty-nine ratios(measuring profitability, liquidity, etc.) were thenselected and a "stepwise regression" with a "forward andbackward" method was used to specify the discriminantfunction.1 The inputs were from the financial statements ofairlines on file with the Brazilian Department of CivilAviation and from carrier websites. The output of themultiple regression was Equation 1.
Z = 2.637 - 0.879X1 + 0.466X2 – 0.268X3 – 0.28X4 (EQ1)
Where: X1 = Shareholder Funds by Total Assets (Equity ÷ TotalAsset) X2 = Liquidity ((Current Liabilities + Long TermLiabilities) ÷ Total Asset) X3 = Net Operating Revenue by Total Assets (Net Op.Revenue ÷ Total Asset) X4 = Fixed Assets by Total Assets (Fixed Assets ÷ TotalAsset)
Using the regression results, Silva, Espirito Santo, andPortugal argued that there were five groups evident (basedon Z values). Firms were groups as follows; healthy, lowrisk, moderate risk, high risk and insolvent.2 Using
1 This method removes and adds variables to the regression model in order of identifying the best set of predictor’s variables.2 The categories were determined by the Z values:
Classification Limit of Z HealthyZ ≤ 1.862Low Risk1.862 ≤ Z ≤ 2.2Moderate Risk2.2 ≤ Z ≤ 2.515High Risk2.515 ≤ Z ≤ 2.73Insolvent Z ≥ 2.73

Tanaka’s approach (1997), the authors then applied a fuzzylogic model using the following equations;
The output of these equations indicates the percentageidentification with each category. If µ(G1)=1.0 or 100%,then that carrier is clearly in the healthy range. A µ(G2)in the midrange indicates moderate to high risk, and aµ(G3)at 1.0 or 100% indicates an insolvency profile. As acase study, Silva et. al. applied the above approach toeight carriers: American, United, Southwest, LanChile,Varig, Vasp, TAM, and GOL. The study encompassed three yearof data, 2002-2004. The following chart shows most of theresults for these carriers.
Carrier Year
Z µ(G1
)µ(G2
)µ(G3
)Status
American
2004
2.60
2% 91% 42% High Risk
2003
2.62
2% 89% 43% High Risk

Southwest
2004
1.84
100%
1% 0% Healthy
2003
1.81
100%
0% 0% Healthy
United 2004
3.08
0% 2% 99% Insolvent
2003
2.93
0% 13% 89% Insolvent
LanChile
2004
2.34
20% 69% 13% ModerateRisk
2003
2.39
13% 84% 18% ModerateRisk
GOL 2003
1.83
100%
0% 0% Healthy
Varig 2003
5.80
0% 0% 100%
Insolvent
2002
4.93
0% 0% 100%
Insolvent
Vasp 2003
2.69
1% 75% 55% High Risk
2002
2.69
1% 76% 55% High Risk
TAM 2003
2.58
2% 98% 38% High Risk
2002
2.58
2% 97% 39% High Risk
Source: Silva, A. Spirito Santo, Portugal
The authors’ results of the preliminary test wereinteresting and show promise for future research. The intentof several authors of this paper is to collaborate on astudy involving a much larger sample and an extended timehorizon.
III. Conclusion and Directions for Future Research:

This paper has examined a range of different statisticaltechniques useful in forecast airline bankruptcy and/orfinancial stress. Two of the models are generic or non-industry specific. The others are all industry specific,having been designed using only airline data. Two weredeveloped using an international database. All of the modelshave proven useful, but there is always room forimprovement. The authors intend to pursue further work inthis area. The authors are in the data gathering stage andintend to design a logit model, which unlike all pastresearch attempts with the exception of the GudmundssonModel, will incorporate operating (that is, trafficstatistics) in the models. The research will include alonger time horizon than the former study and will includeonly U.S. carrier in the mix. Later an international modelmay be developed.
References
Altman, E. (1968). Financial Ratios, Discriminant Analysisand the Prediction of Corporate Bankruptcy. Journal of Finance.23(4), 589-609.
Altman, E. (1983). Corporate Financial Distress: A Complete Guide toPredicting, Avoiding and Dealing with Bankruptcy. New York. John Wiley& Sons.
Altman, E. and Gritta, R. (1884). Airline BankruptcyPropensities: A ZETA® Analysis. Journal of the TransportationResearch Forum. 25(1), 150-154.
Altman, E., Haldeman R. and Narayanan. (1977). ZETA®
Analysis: A New Model for Bankruptcy Classification. Journalof Banking and Finance. Summer 1977.

Burke, John-Paul, Lee A. and Miller B. (2004). Is AirTransportation Financially Sustainable? Research Report. MITCenter for International Air Transportation. Boston, Mass:Massachusetts Institute of Technology. 1-23.
Caudill, M. (1989). Neural Network Primer. AI Expert 4, 61-67. Chow, G., Gritta R., and Leung, E. (1991). A MultipleDiscriminant Analysis Approach to Gauging Air CarrierBankruptcy Propensities: The AIRSCORE Model. Journal of theTransportation Research Forum. 31(2), 371-377.
Davalos, S., Gritta R. and Chow, G. (1999). The Applicationof Artificial Intelligence to Predicting Bankruptcy RisksFacing the Major U.S. Air Carriers, 1979-1996: A NeuralNetwork Approach. Journal of Air Transport Management , 5(1), 81-86.
Davalos S., Gritta R. and Wang W. (2002). Small U.S. AirCarrier Financial Condition: A Back Propagation NeuralNetwork Approach to Forecasting Bankruptcy and FinancialStress. Journal of the Transportation Research Forum, LVI, No.2(Spring 2002), 35-46.
Davalos, S., Gritta R., Goodfriend J., and Adrangi B.(2005). The Use of a Genetic Algorithm in Forecasting AirCarrier Financial Stress and Insolvency. Credit and FinancialReview, 11(2) 2nd Quarter 2005).
Elam, R. (1975). The Effect of Lease Data on the PredictiveAbility of Financial Ratios. The Accounting Review. January1975, 25-43.
Goldberg, D.E. (1989). Genetic Algorithms in Search,Optimization, and Machine Learning, Addison-Wesley.
Goodfriend, Jason, Gritta R., Adrangi B., and Davalos S.(2005). Assessing the Financial Condition of the Major U.S.

Passenger Airlines Over the 1993-2003 Period Using the P-Score and Z” Score Discriminant Models. Credit and FinancialManagement Review, 10 (4)(December 2004).
Gritta, R., (1982). Bankruptcy Risks Facing the Major U.S.Airlines. Journal of Air Law & Commerce. 48(Fall), 89-107.
Gritta, R. Chow, G. and Lippman, E. (1995). The Impact ofthe Capitalization of Leases on Financial Analysis: An IssueRevisited. Logistics and Transportation Review. 30 (2), 189-202.
Gritta, R., Chow G. and Davalos S. (2002). Air CarrierFinancial Fitness: An Assessment Over the 1966-1996 Period.Journal of the Transportation Research Forum. 39(2), 171-181.
Gritta, R., Davalos S., Chow, G. and Huang M. (2002). SmallU.S. Air Carrier Financial Condition: A Back PropagationNeural Network Approach to Forecasting Bankruptcy andFinancial Stress, Journal of the Transportation Research Forum, 56(2),35-46.
Gritta R., Davalos S., and Chow G. (2003). Gauging theFinancial Condition of the Major U.S. Air Carriers. Journalof Transportation Law, Logistics and Policy, LXXI No. 1 (Fall), 116-122.
Gudmundsson, S. (2002). Airline Distress Prediction UsingNon-Financial Indicators. Journal of Air Transportation. 7(2), 3-23.
Hair, J. (1995) Multivariate Data Analysis with Readings.New York: Prentice Hall.
Kingdom, J. and Feldman, K.,(1995). Genetic Algorithms forBankruptcy Prediction, Search Space Research Report, No.01-95,Search Space Ltd. London.

Ohlson, J. (1980). Financial Ratios and the ProbabilisticPrediction of Bankruptcy. Journal of Accounting Research. 18(1),109-131.
Pilarski, A., and Dinh, T. (1999). Numerical ScoringApproach to Credit Risk Analysis. Handbook of Airline Finance.McGraw-Hill, 329-342.
Ross, T.J. (1995) Fuzzy Logic with Engineering Applications. New York:McGraw-Hill.
Silva, V.P. (1983). Aministracao de Credito e Previsao de Insolvencia,Atlas, San Paulo, Brazil.
Silva, Vladimir, A. Spirito Santo, Respicio, and da SilvaPortugal, Licinio (2005). Using the “Hybrid FinancialStatement Analysis Technique” to Rate and Monitor Airlines’Financial Status. Proceedings of the Air Transportation Research Society,World Conference on Transport Research. Paper presented inRio de Janeiro, July 6, 2005.
Shin, K., & Han, I. (2004). A Genetic AlgorithmApplication in Bankruptcy Prediction Modeling. Knowledge-Based Intelligent Information and Engineering Systems: 8th InternationalConference, KES 2004, Wellington, New Zealand, September 20-25, 2004, Proceedings, Part II Editors: Mircea Gh. Negoita,Robert J. Howlett, Lakhmi C. Jain. Lecture Notes inComputer Science, 3214/2004.
Tanaka, K. (1997). An Introduction to Fuzzy Logic for PracticalApplications. New York: Springer-Verlag.
Udo, G. ( 1993) Neural Network Performance on theBankruptcy Classification Problem. Computer and IndustrialEngineering. 25, 377-380.
Zadeh, L.A. (1975). Fuzzy Sets and their Application to Cognitive andDecision Making Processes. New York: Academic Press.