A Review and Synthesis of Fisheries Data in Thailand
34
A Review and Synthesis of Fisheries Data in Thailand Barry Bendell Petchrung Sukpong GREENPEACE International August, 2011
-
Upload
independent -
Category
Documents
-
view
1 -
download
0
Transcript of A Review and Synthesis of Fisheries Data in Thailand
A Review and Synthesis of Fisheries
Data in Thailand
Barry Bendell
Petchrung Sukpong
GREENPEACE International
August, 2011
A Review and Synthesis of Fisheries Data in Thailand August, 2011
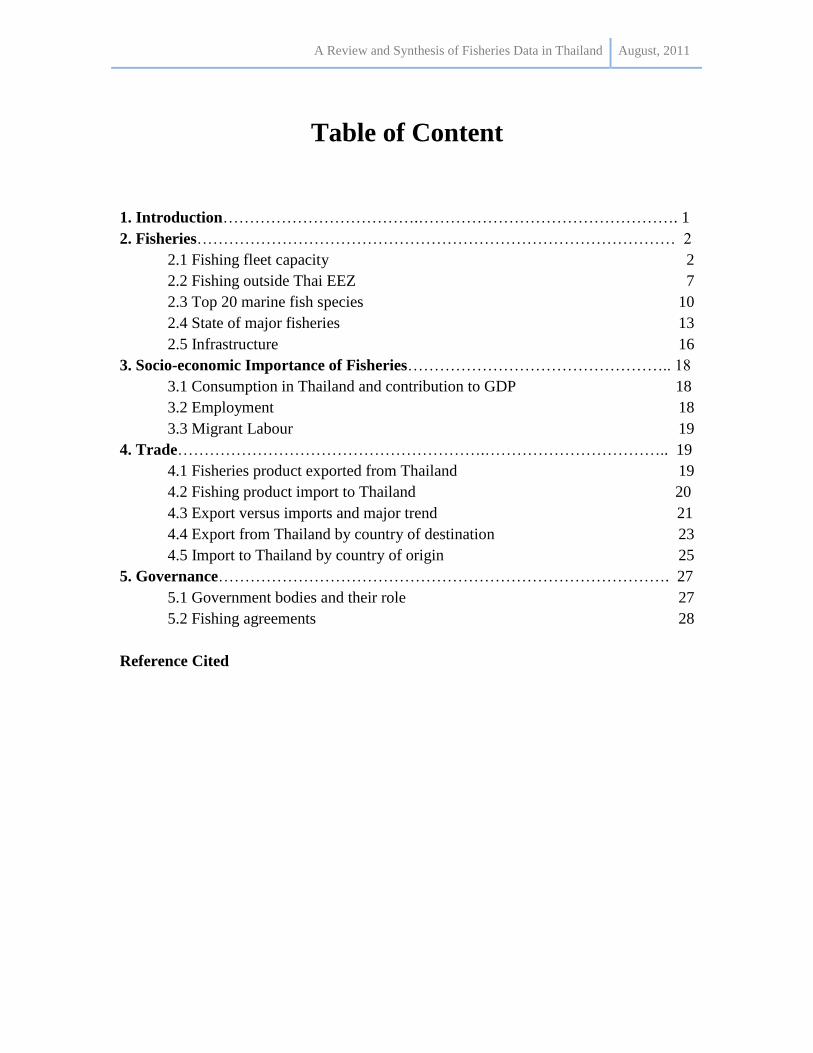
Table of Content
1. Introduction……………………………….…………………………………………. 1
2. Fisheries……………………………………………………………………………… 2
2.1 Fishing fleet capacity 2
2.2 Fishing outside Thai EEZ 7
2.3 Top 20 marine fish species 10
2.4 State of major fisheries 13
2.5 Infrastructure 16
3. Socio-economic Importance of Fisheries………………………………………….. 18
3.1 Consumption in Thailand and contribution to GDP 18
3.2 Employment 18
3.3 Migrant Labour 19
4. Trade………………………………………………….…………………………….. 19
4.1 Fisheries product exported from Thailand 19
4.2 Fishing product import to Thailand 20
4.3 Export versus imports and major trend 21
4.4 Export from Thailand by country of destination 23
4.5 Import to Thailand by country of origin 25
5. Governance…………………………………………………………………………. 27
5.1 Government bodies and their role 27
5.2 Fishing agreements 28
Reference Cited
A Review and Synthesis of Fisheries Data in Thailand August, 2011
1
A REVIEW AND SYNTHESIS OF FISHERIES DATA IN THAILAND
1. Introduction
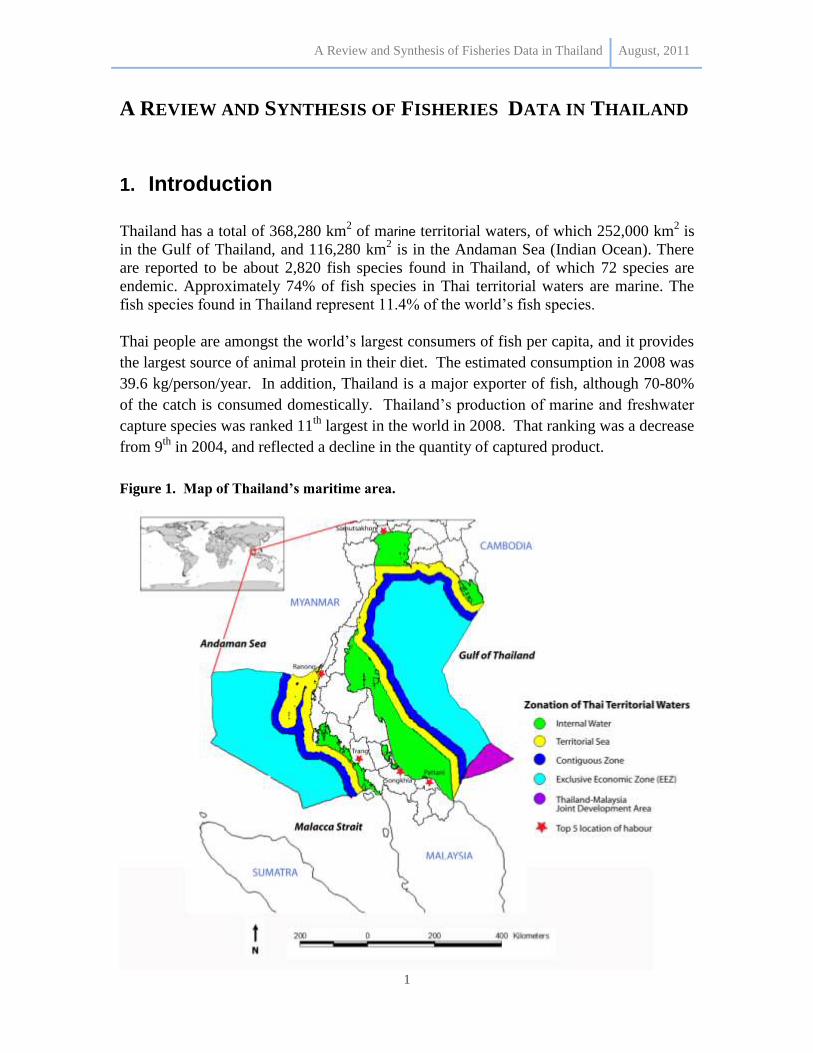
Thailand has a total of 368,280 km2 of marine territorial waters, of which 252,000 km
2 is
in the Gulf of Thailand, and 116,280 km2 is in the Andaman Sea (Indian Ocean). There
are reported to be about 2,820 fish species found in Thailand, of which 72 species are
endemic. Approximately 74% of fish species in Thai territorial waters are marine. The
fish species found in Thailand represent 11.4% of the world‟s fish species.
Thai people are amongst the world‟s largest consumers of fish per capita, and it provides
the largest source of animal protein in their diet. The estimated consumption in 2008 was
39.6 kg/person/year. In addition, Thailand is a major exporter of fish, although 70-80%
of the catch is consumed domestically. Thailand‟s production of marine and freshwater
capture species was ranked 11th
largest in the world in 2008. That ranking was a decrease
from 9th
in 2004, and reflected a decline in the quantity of captured product.
Figure 1. Map of Thailand’s maritime area.
A Review and Synthesis of Fisheries Data in Thailand August, 2011
2
2. Fisheries
2.1 Fishing fleet capacity
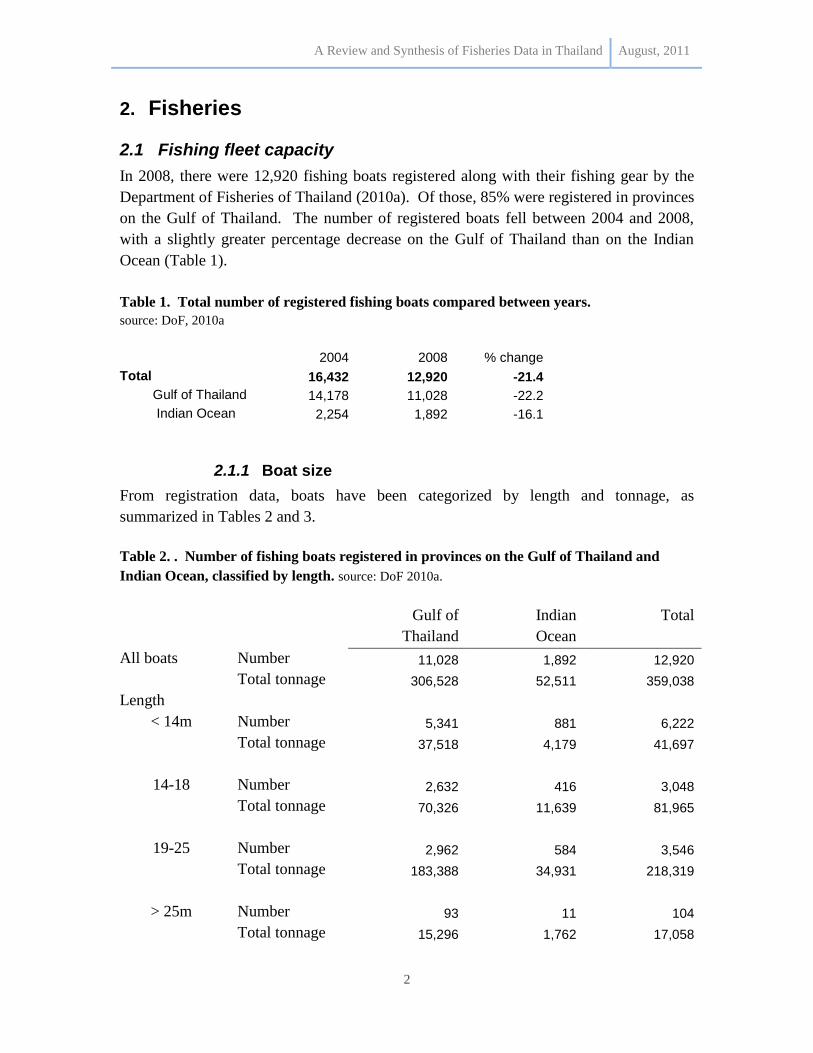
In 2008, there were 12,920 fishing boats registered along with their fishing gear by the
Department of Fisheries of Thailand (2010a). Of those, 85% were registered in provinces
on the Gulf of Thailand. The number of registered boats fell between 2004 and 2008,
with a slightly greater percentage decrease on the Gulf of Thailand than on the Indian
Ocean (Table 1).
Table 1. Total number of registered fishing boats compared between years.
source: DoF, 2010a
2004 2008 % change
Total 16,432 12,920 -21.4
Gulf of Thailand 14,178 11,028 -22.2
Indian Ocean 2,254 1,892 -16.1
2.1.1 Boat size
From registration data, boats have been categorized by length and tonnage, as
summarized in Tables 2 and 3.
Table 2. . Number of fishing boats registered in provinces on the Gulf of Thailand and
Indian Ocean, classified by length. source: DoF 2010a.
Gulf of
Thailand
Indian
Ocean
Total
All boats Number 11,028 1,892 12,920
Total tonnage 306,528 52,511 359,038
Length
< 14m Number 5,341 881 6,222
Total tonnage 37,518 4,179 41,697
14-18 Number 2,632 416 3,048
Total tonnage 70,326 11,639 81,965
19-25 Number 2,962 584 3,546
Total tonnage 183,388 34,931 218,319
> 25m Number 93 11 104
Total tonnage 15,296 1,762 17,058
A Review and Synthesis of Fisheries Data in Thailand August, 2011
3
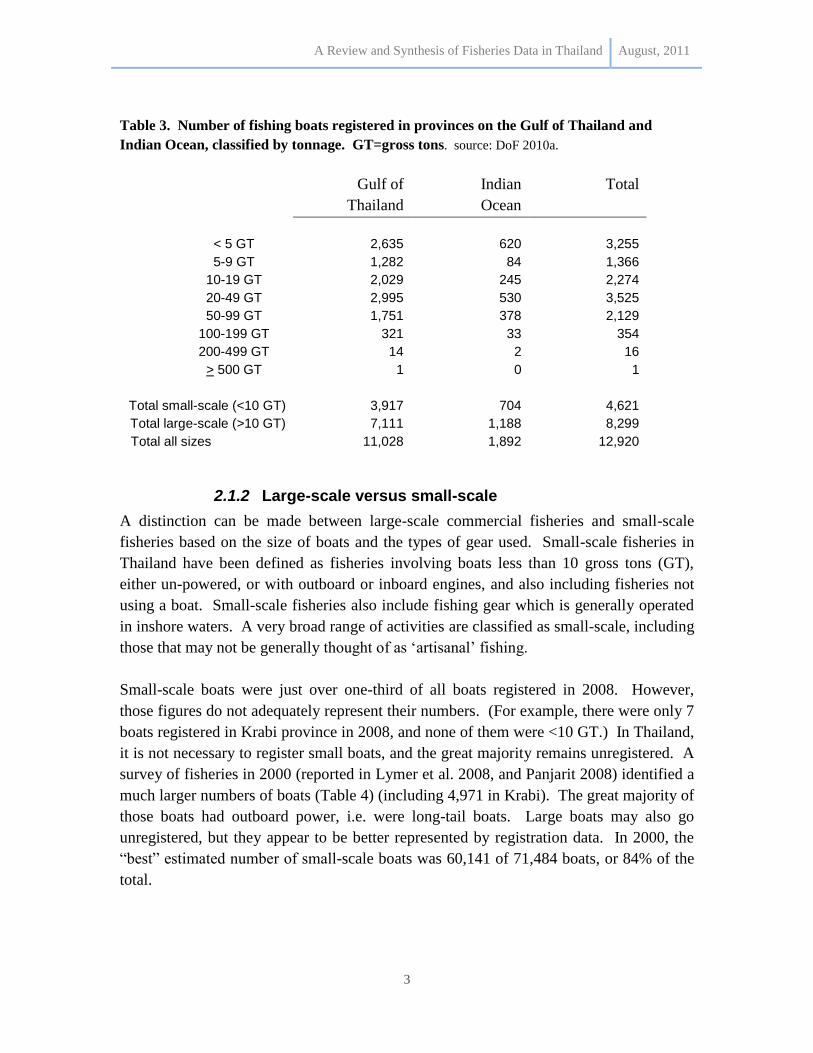
Table 3. Number of fishing boats registered in provinces on the Gulf of Thailand and
Indian Ocean, classified by tonnage. GT=gross tons. source: DoF 2010a.
Gulf of
Thailand
Indian
Ocean
Total
< 5 GT 2,635 620 3,255
5-9 GT 1,282 84 1,366
10-19 GT 2,029 245 2,274
20-49 GT 2,995 530 3,525
50-99 GT 1,751 378 2,129
100-199 GT 321 33 354
200-499 GT 14 2 16
> 500 GT 1 0 1
Total small-scale (<10 GT) 3,917 704 4,621
Total large-scale (>10 GT) 7,111 1,188 8,299
Total all sizes 11,028 1,892 12,920
2.1.2 Large-scale versus small-scale
A distinction can be made between large-scale commercial fisheries and small-scale
fisheries based on the size of boats and the types of gear used. Small-scale fisheries in
Thailand have been defined as fisheries involving boats less than 10 gross tons (GT),
either un-powered, or with outboard or inboard engines, and also including fisheries not
using a boat. Small-scale fisheries also include fishing gear which is generally operated
in inshore waters. A very broad range of activities are classified as small-scale, including
those that may not be generally thought of as „artisanal‟ fishing.
Small-scale boats were just over one-third of all boats registered in 2008. However,
those figures do not adequately represent their numbers. (For example, there were only 7
boats registered in Krabi province in 2008, and none of them were <10 GT.) In Thailand,
it is not necessary to register small boats, and the great majority remains unregistered. A
survey of fisheries in 2000 (reported in Lymer et al. 2008, and Panjarit 2008) identified a
much larger numbers of boats (Table 4) (including 4,971 in Krabi). The great majority of
those boats had outboard power, i.e. were long-tail boats. Large boats may also go
unregistered, but they appear to be better represented by registration data. In 2000, the
“best” estimated number of small-scale boats was 60,141 of 71,484 boats, or 84% of the
total.
A Review and Synthesis of Fisheries Data in Thailand August, 2011
4
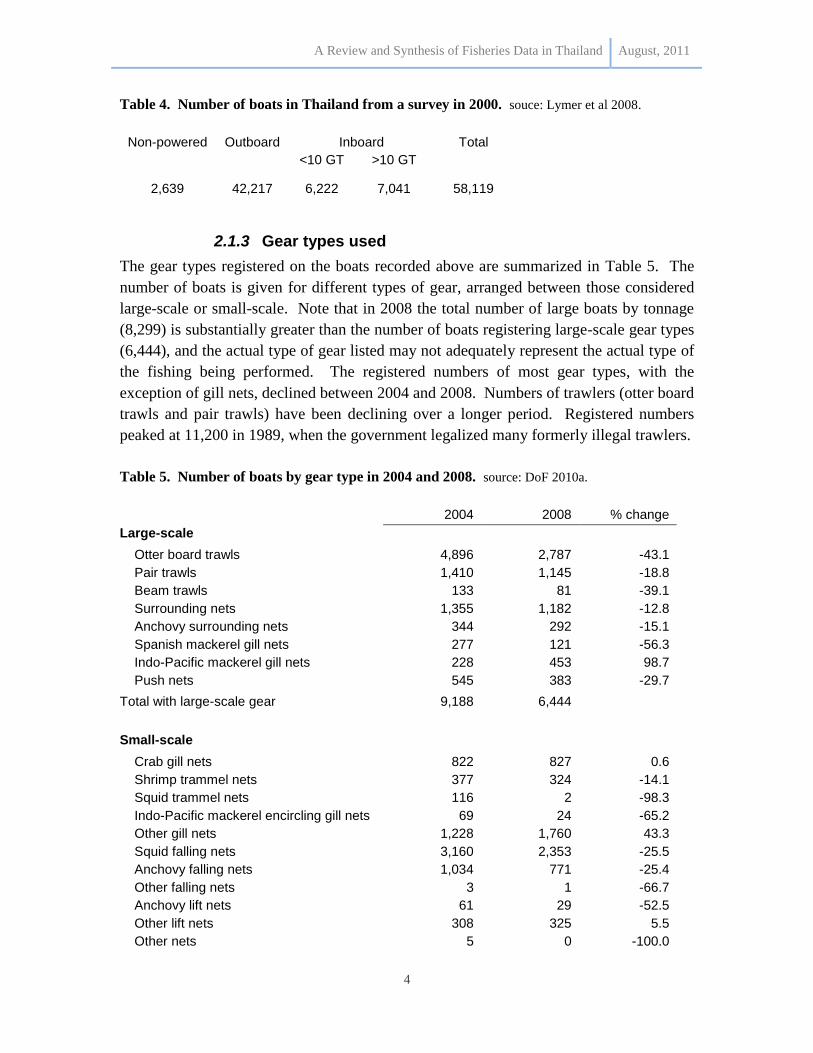
Table 4. Number of boats in Thailand from a survey in 2000. souce: Lymer et al 2008.
Non-powered Outboard Inboard Total
<10 GT >10 GT
2,639 42,217 6,222 7,041 58,119
2.1.3 Gear types used
The gear types registered on the boats recorded above are summarized in Table 5. The
number of boats is given for different types of gear, arranged between those considered
large-scale or small-scale. Note that in 2008 the total number of large boats by tonnage
(8,299) is substantially greater than the number of boats registering large-scale gear types
(6,444), and the actual type of gear listed may not adequately represent the actual type of
the fishing being performed. The registered numbers of most gear types, with the
exception of gill nets, declined between 2004 and 2008. Numbers of trawlers (otter board
trawls and pair trawls) have been declining over a longer period. Registered numbers
peaked at 11,200 in 1989, when the government legalized many formerly illegal trawlers.
Table 5. Number of boats by gear type in 2004 and 2008. source: DoF 2010a.
2004 2008 % change
Large-scale
Otter board trawls 4,896 2,787 -43.1
Pair trawls 1,410 1,145 -18.8
Beam trawls 133 81 -39.1
Surrounding nets 1,355 1,182 -12.8
Anchovy surrounding nets 344 292 -15.1
Spanish mackerel gill nets 277 121 -56.3
Indo-Pacific mackerel gill nets 228 453 98.7
Push nets 545 383 -29.7
Total with large-scale gear 9,188 6,444
Small-scale
Crab gill nets 822 827 0.6
Shrimp trammel nets 377 324 -14.1
Squid trammel nets 116 2 -98.3
Indo-Pacific mackerel encircling gill nets 69 24 -65.2
Other gill nets 1,228 1,760 43.3
Squid falling nets 3,160 2,353 -25.5
Anchovy falling nets 1,034 771 -25.4
Other falling nets 3 1 -66.7
Anchovy lift nets 61 29 -52.5
Other lift nets 308 325 5.5
Other nets 5 0 -100.0
A Review and Synthesis of Fisheries Data in Thailand August, 2011
5
2004 2008 % change
Long line 56 35 -37.5
Other gear 5 25 400.0
Total with small-scale gear 7,244 6,476
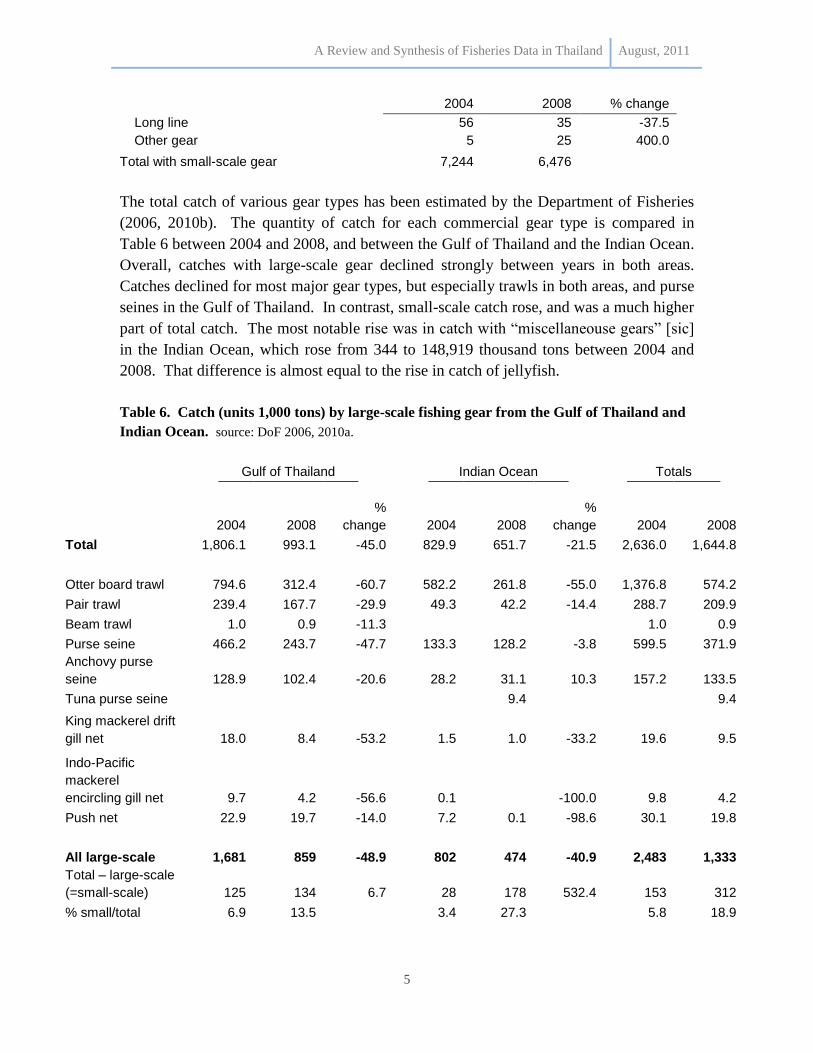
The total catch of various gear types has been estimated by the Department of Fisheries
(2006, 2010b). The quantity of catch for each commercial gear type is compared in
Table 6 between 2004 and 2008, and between the Gulf of Thailand and the Indian Ocean.
Overall, catches with large-scale gear declined strongly between years in both areas.
Catches declined for most major gear types, but especially trawls in both areas, and purse
seines in the Gulf of Thailand. In contrast, small-scale catch rose, and was a much higher
part of total catch. The most notable rise was in catch with “miscellaneouse gears” [sic]
in the Indian Ocean, which rose from 344 to 148,919 thousand tons between 2004 and
2008. That difference is almost equal to the rise in catch of jellyfish.
Table 6. Catch (units 1,000 tons) by large-scale fishing gear from the Gulf of Thailand and
Indian Ocean. source: DoF 2006, 2010a.
Gulf of Thailand Indian Ocean Totals
2004 2008
%
change 2004 2008
%
change 2004 2008
Total 1,806.1 993.1 -45.0 829.9 651.7 -21.5 2,636.0 1,644.8
Otter board trawl 794.6 312.4 -60.7 582.2 261.8 -55.0 1,376.8 574.2
Pair trawl 239.4 167.7 -29.9 49.3 42.2 -14.4 288.7 209.9
Beam trawl 1.0 0.9 -11.3 1.0 0.9
Purse seine 466.2 243.7 -47.7 133.3 128.2 -3.8 599.5 371.9
Anchovy purse
seine 128.9 102.4 -20.6 28.2 31.1 10.3 157.2 133.5
Tuna purse seine 9.4 9.4
King mackerel drift
gill net 18.0 8.4 -53.2 1.5 1.0 -33.2 19.6 9.5
Indo-Pacific
mackerel
encircling gill net 9.7 4.2 -56.6 0.1 -100.0 9.8 4.2
Push net 22.9 19.7 -14.0 7.2 0.1 -98.6 30.1 19.8
All large-scale 1,681 859 -48.9 802 474 -40.9 2,483 1,333
Total – large-scale
(=small-scale) 125 134 6.7 28 178 532.4 153 312
% small/total 6.9 13.5 3.4 27.3 5.8 18.9
A Review and Synthesis of Fisheries Data in Thailand August, 2011
6
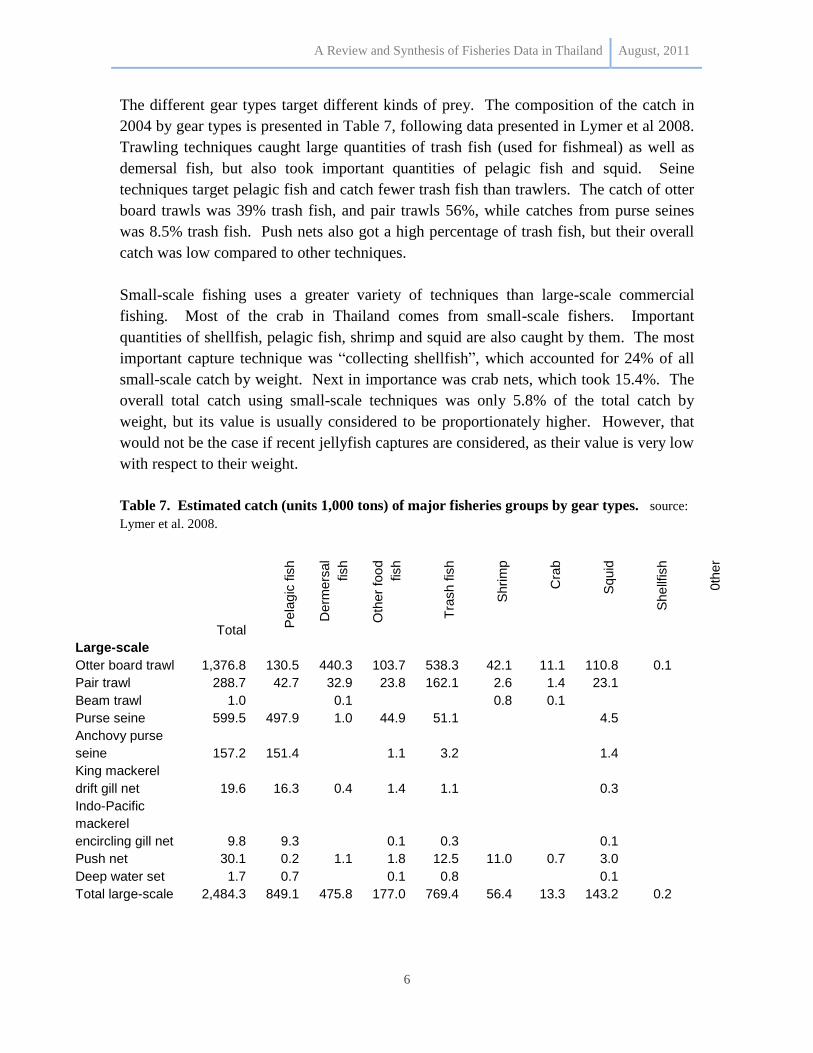
The different gear types target different kinds of prey. The composition of the catch in
2004 by gear types is presented in Table 7, following data presented in Lymer et al 2008.
Trawling techniques caught large quantities of trash fish (used for fishmeal) as well as
demersal fish, but also took important quantities of pelagic fish and squid. Seine
techniques target pelagic fish and catch fewer trash fish than trawlers. The catch of otter
board trawls was 39% trash fish, and pair trawls 56%, while catches from purse seines
was 8.5% trash fish. Push nets also got a high percentage of trash fish, but their overall
catch was low compared to other techniques.
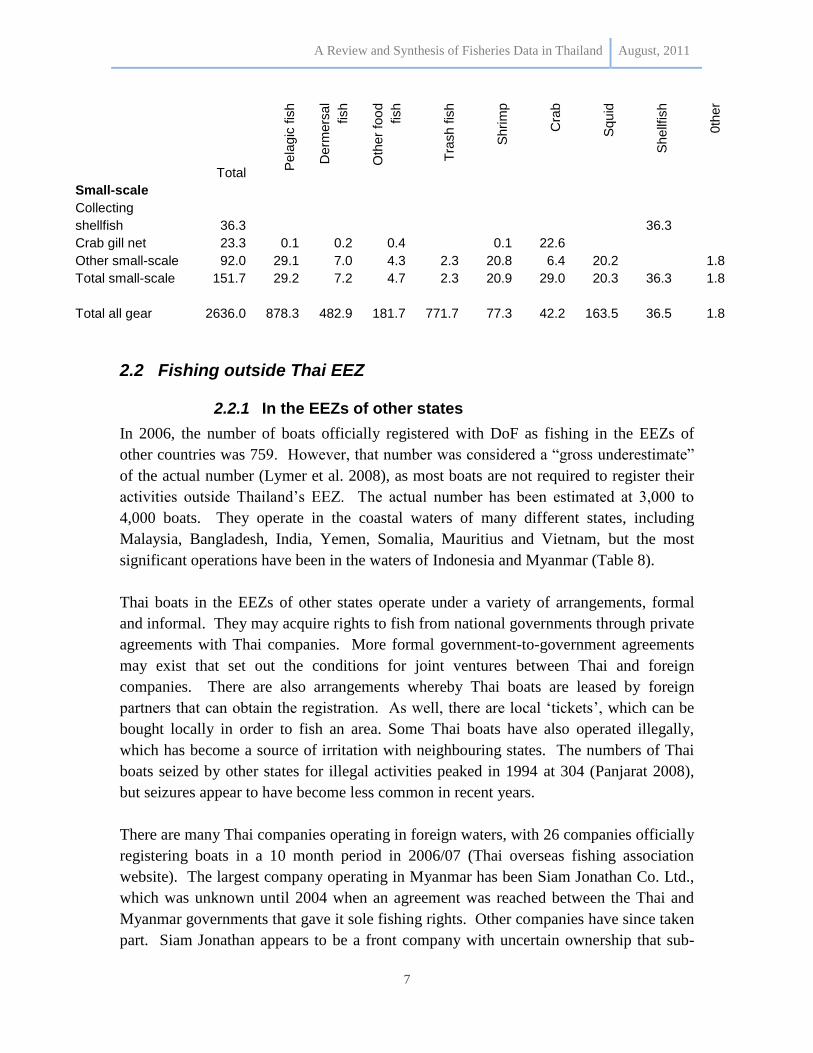
Small-scale fishing uses a greater variety of techniques than large-scale commercial
fishing. Most of the crab in Thailand comes from small-scale fishers. Important
quantities of shellfish, pelagic fish, shrimp and squid are also caught by them. The most
important capture technique was “collecting shellfish”, which accounted for 24% of all
small-scale catch by weight. Next in importance was crab nets, which took 15.4%. The
overall total catch using small-scale techniques was only 5.8% of the total catch by
weight, but its value is usually considered to be proportionately higher. However, that
would not be the case if recent jellyfish captures are considered, as their value is very low
with respect to their weight.
Table 7. Estimated catch (units 1,000 tons) of major fisheries groups by gear types. source:
Lymer et al. 2008.
Total
Pela
gic
fis
h
Derm
ers
al
fish
Oth
er
foo
d
fish
Tra
sh fis
h
Shri
mp
Cra
b
Squ
id
She
llfis
h
0th
er
Large-scale
Otter board trawl 1,376.8 130.5 440.3 103.7 538.3 42.1 11.1 110.8 0.1
Pair trawl 288.7 42.7 32.9 23.8 162.1 2.6 1.4 23.1
Beam trawl 1.0 0.1 0.8 0.1
Purse seine 599.5 497.9 1.0 44.9 51.1 4.5
Anchovy purse
seine 157.2 151.4 1.1 3.2 1.4
King mackerel
drift gill net 19.6 16.3 0.4 1.4 1.1 0.3
Indo-Pacific
mackerel
encircling gill net 9.8 9.3 0.1 0.3 0.1
Push net 30.1 0.2 1.1 1.8 12.5 11.0 0.7 3.0
Deep water set 1.7 0.7 0.1 0.8 0.1
Total large-scale 2,484.3 849.1 475.8 177.0 769.4 56.4 13.3 143.2 0.2
A Review and Synthesis of Fisheries Data in Thailand August, 2011
7
Total
Pela
gic
fis
h
Derm
ers
al
fish
Oth
er
foo
d
fish
Tra
sh fis
h
Shri
mp
Cra
b
Squ
id
She
llfis
h
0th
er
Small-scale
Collecting
shellfish 36.3 36.3
Crab gill net 23.3 0.1 0.2 0.4 0.1 22.6
Other small-scale 92.0 29.1 7.0 4.3 2.3 20.8 6.4 20.2 1.8
Total small-scale 151.7 29.2 7.2 4.7 2.3 20.9 29.0 20.3 36.3 1.8
Total all gear 2636.0 878.3 482.9 181.7 771.7 77.3 42.2 163.5 36.5 1.8
2.2 Fishing outside Thai EEZ
2.2.1 In the EEZs of other states
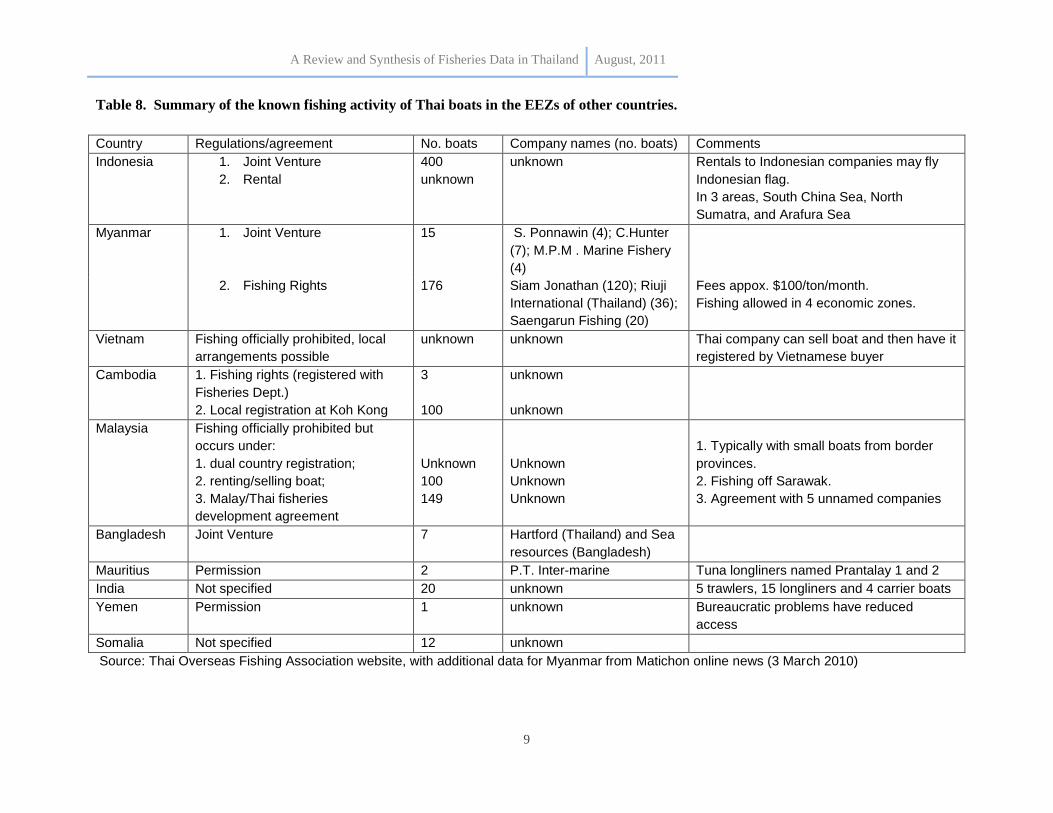
In 2006, the number of boats officially registered with DoF as fishing in the EEZs of
other countries was 759. However, that number was considered a “gross underestimate”
of the actual number (Lymer et al. 2008), as most boats are not required to register their
activities outside Thailand‟s EEZ. The actual number has been estimated at 3,000 to
4,000 boats. They operate in the coastal waters of many different states, including
Malaysia, Bangladesh, India, Yemen, Somalia, Mauritius and Vietnam, but the most
significant operations have been in the waters of Indonesia and Myanmar (Table 8).
Thai boats in the EEZs of other states operate under a variety of arrangements, formal
and informal. They may acquire rights to fish from national governments through private
agreements with Thai companies. More formal government-to-government agreements
may exist that set out the conditions for joint ventures between Thai and foreign
companies. There are also arrangements whereby Thai boats are leased by foreign
partners that can obtain the registration. As well, there are local „tickets‟, which can be
bought locally in order to fish an area. Some Thai boats have also operated illegally,
which has become a source of irritation with neighbouring states. The numbers of Thai
boats seized by other states for illegal activities peaked in 1994 at 304 (Panjarat 2008),
but seizures appear to have become less common in recent years.
There are many Thai companies operating in foreign waters, with 26 companies officially
registering boats in a 10 month period in 2006/07 (Thai overseas fishing association
website). The largest company operating in Myanmar has been Siam Jonathan Co. Ltd.,
which was unknown until 2004 when an agreement was reached between the Thai and
Myanmar governments that gave it sole fishing rights. Other companies have since taken
part. Siam Jonathan appears to be a front company with uncertain ownership that sub-
A Review and Synthesis of Fisheries Data in Thailand August, 2011
8
leases its fishing rights to other Thai companies (Irrawaddy Magazine, Vol. 12, No. 8,
August 2004).
In 2004, catch from outside the EEZ was estimated at 1.15 million tons, or approximately
44% of Thailand‟s total catch of 2.64 million tons (Lymer et al. 2008). The quantities of
major individual fish species caught outside the EEZ have been estimated (Table 9).
Most of the catch of several important species came from outside, including demersal
species from trawling, such as threadfin bream, big-eyes and lizard fish, as well as
pelagic species from seining, such as longtail tuna and eastern little tuna.
The high level of activity by Thai boats in the waters of other states is related to the lack
of product in Thai waters as a consequence of over-exploitation. Commercial fishing
developed rapidly in Thailand by successfully applying new technologies and adapting
them as fisheries became over-exploited (Tokrisna 2006). Coastal waters around
Thailand were soon over-fished and catches fell, and so experienced Thai fisherman
sought new fishing areas, with the support of the Thai government (Lymer et al 2008).
The methods applied in the EEZ of other states are similar to those applied in the
domestic EEZ. Fleets in distant waters include carrier boats which bring catches back to
Thai ports for processing.
A Review and Synthesis of Fisheries Data in Thailand August, 2011
9
Table 8. Summary of the known fishing activity of Thai boats in the EEZs of other countries.
Country Regulations/agreement No. boats Company names (no. boats) Comments
Indonesia 1. Joint Venture
2. Rental
400
unknown
unknown Rentals to Indonesian companies may fly
Indonesian flag.
In 3 areas, South China Sea, North
Sumatra, and Arafura Sea
Myanmar 1. Joint Venture 15 S. Ponnawin (4); C.Hunter
(7); M.P.M . Marine Fishery
(4)
2. Fishing Rights 176 Siam Jonathan (120); Riuji
International (Thailand) (36);
Saengarun Fishing (20)
Fees appox. $100/ton/month.
Fishing allowed in 4 economic zones.
Vietnam Fishing officially prohibited, local
arrangements possible
unknown unknown Thai company can sell boat and then have it
registered by Vietnamese buyer
Cambodia 1. Fishing rights (registered with
Fisheries Dept.)
3 unknown
2. Local registration at Koh Kong 100 unknown
Malaysia Fishing officially prohibited but
occurs under:
1. dual country registration;
2. renting/selling boat;
3. Malay/Thai fisheries
development agreement
Unknown
100
149
Unknown
Unknown
Unknown
1. Typically with small boats from border
provinces.
2. Fishing off Sarawak.
3. Agreement with 5 unnamed companies
Bangladesh Joint Venture 7 Hartford (Thailand) and Sea
resources (Bangladesh)
Mauritius Permission 2 P.T. Inter-marine Tuna longliners named Prantalay 1 and 2
India Not specified 20 unknown 5 trawlers, 15 longliners and 4 carrier boats
Yemen Permission 1 unknown Bureaucratic problems have reduced
access
Somalia Not specified 12 unknown
Source: Thai Overseas Fishing Association website, with additional data for Myanmar from Matichon online news (3 March 2010)
A Review and Synthesis of Fisheries Data in Thailand August, 2011
10
2.2.2 Flags of convenience
Many Thai boats operating in Indonesian waters fly the Indonesian flag, especially those
boats operating as rentals to Indonesian companies. Boats based in the border provinces
with Malaysia may be registered in both countries and fly both flags.
2.2.3 High seas tuna fishery
Thailand has had a very limited fishery on the high seas. Although it is a major canner of
tuna, Thailand must import 85% of the raw product (Thai Frozen Food Association
newsletter 2011), and so has been interested in developing its own high seas tuna
production. In 2000 and 2001, a single tuna purse seiner was operating, but was not very
successful. In 2005, the fishery was revived with 6 vessels operating in the Indian Ocean.
Currently, there are 9 Thai boats from 4 companies fishing for tuna in the high seas of the
Indian Ocean (Thai Overseas Fisheries Association web site). They included 4
longliners, 2 each from the Siam Tuna Fishery Co. Ltd. (boat names Andaman Pearl 18
and 28) and the Firestar Tuna Line Co. Ltd. (Tuna Hunter 1 and 2); along with 5 purse
seiners, 1 from the Thai Tuna Fishing Co, Ltd. (Glorious Harmony), and 4 from the Siam
Deep Sea Fishing Co, Ltd. (Golden Success, Prosperous, Eternity, Longevity).
Tuna caught by longline is used for premium sushi. Longliners from several nations
operate in the eastern Indian Ocean and land their tuna at the Thai port of Phuket from
where it is flown to market in Japan (Nootmorn 2004). The tuna fishery is monitored by
the Indian Ocean Tuna Commission (IOTC), which is mandated to manage tuna in the
Indian Ocean.
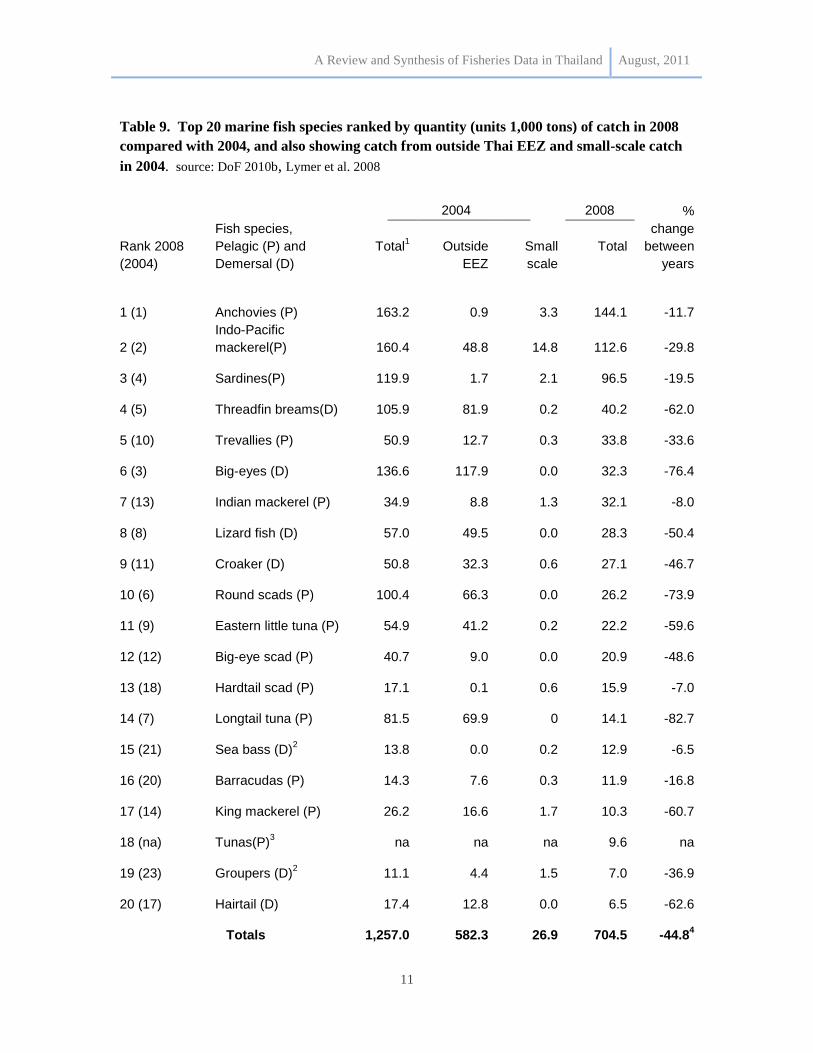
2.3 Top 20 marine fish species
The top 20 fish species ranked by quantity and value in 2008 are shown in Tables 9 and
10 respectively. When compared with 2004 data, all major fish species had a reduced
catch in 2008. Estimates of catch by species showed that some species (reported in
Lymer et al 2008) came predominantly from outside the EEZ, such as threadfin breams,
and big-eyes. Those species also tended to show the greatest drop in catch between 2004
and 2008. Small-scale catch of fish has also been estimated by species in 2004. Those
catches represented only 5.8% of total fish catch, and more than half was Indo-Pacific
mackerel.
A Review and Synthesis of Fisheries Data in Thailand August, 2011
11
Table 9. Top 20 marine fish species ranked by quantity (units 1,000 tons) of catch in 2008
compared with 2004, and also showing catch from outside Thai EEZ and small-scale catch
in 2004. source: DoF 2010b, Lymer et al. 2008
Rank 2008
(2004)
Fish species,
Pelagic (P) and
Demersal (D)
2004 2008 %
change
between
years
Total1
Outside
EEZ
Small
scale
Total
1 (1) Anchovies (P) 163.2 0.9 3.3 144.1 -11.7
2 (2)
Indo-Pacific
mackerel(P) 160.4 48.8 14.8 112.6 -29.8
3 (4) Sardines(P) 119.9 1.7 2.1 96.5 -19.5
4 (5) Threadfin breams(D) 105.9 81.9 0.2 40.2 -62.0
5 (10) Trevallies (P) 50.9 12.7 0.3 33.8 -33.6
6 (3) Big-eyes (D) 136.6 117.9 0.0 32.3 -76.4
7 (13) Indian mackerel (P) 34.9 8.8 1.3 32.1 -8.0
8 (8) Lizard fish (D) 57.0 49.5 0.0 28.3 -50.4
9 (11) Croaker (D) 50.8 32.3 0.6 27.1 -46.7
10 (6) Round scads (P) 100.4 66.3 0.0 26.2 -73.9
11 (9) Eastern little tuna (P) 54.9 41.2 0.2 22.2 -59.6
12 (12) Big-eye scad (P) 40.7 9.0 0.0 20.9 -48.6
13 (18) Hardtail scad (P) 17.1 0.1 0.6 15.9 -7.0
14 (7) Longtail tuna (P) 81.5 69.9 0 14.1 -82.7
15 (21) Sea bass (D)2
13.8 0.0 0.2 12.9 -6.5
16 (20) Barracudas (P) 14.3 7.6 0.3 11.9 -16.8
17 (14) King mackerel (P) 26.2 16.6 1.7 10.3 -60.7
18 (na) Tunas(P)3 na na na 9.6 na
19 (23) Groupers (D)2
11.1 4.4 1.5 7.0 -36.9
20 (17) Hairtail (D) 17.4 12.8 0.0 6.5 -62.6
Totals 1,257.0 582.3 26.9 704.5 -44.8
4
A Review and Synthesis of Fisheries Data in Thailand August, 2011
12
1includes all catch inside and outside EEZ, large- and small-scale.
2includes cultured fish in yearly totals.
3not included as a category in 2004 data
4percentage change from 2004 of the total amount of all listed species, not including the
„Tunas‟ category.
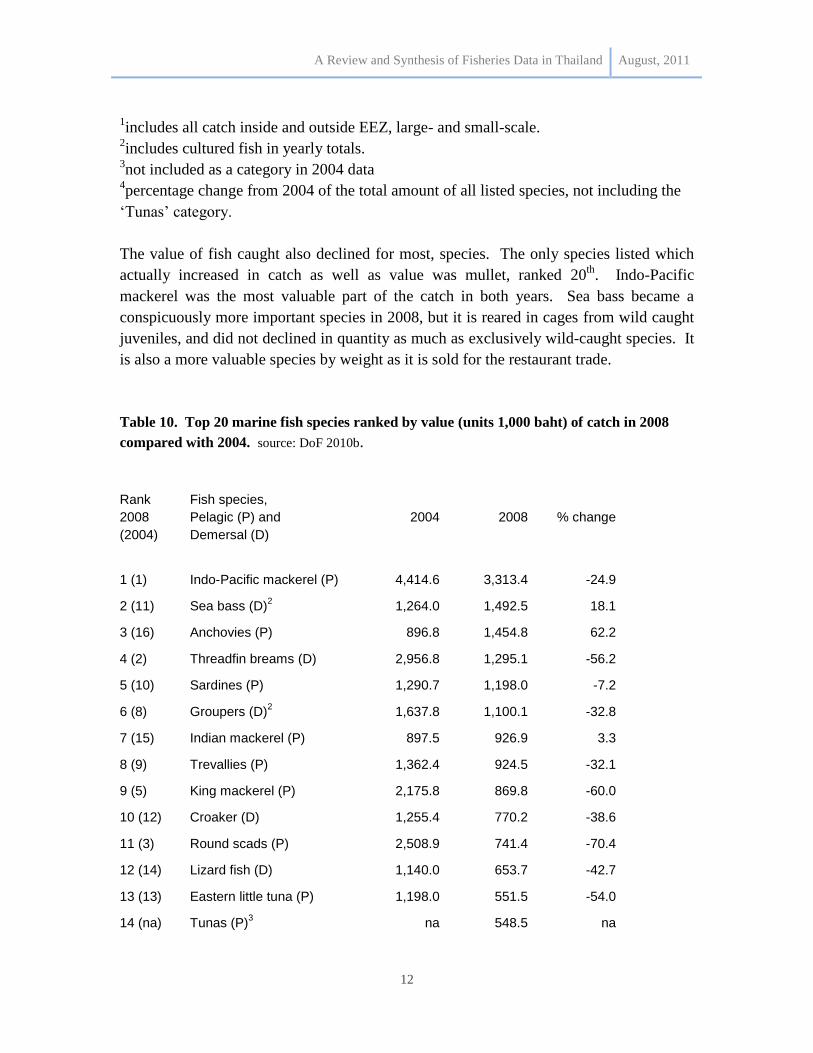
The value of fish caught also declined for most, species. The only species listed which
actually increased in catch as well as value was mullet, ranked 20th
. Indo-Pacific
mackerel was the most valuable part of the catch in both years. Sea bass became a
conspicuously more important species in 2008, but it is reared in cages from wild caught
juveniles, and did not declined in quantity as much as exclusively wild-caught species. It
is also a more valuable species by weight as it is sold for the restaurant trade.
Table 10. Top 20 marine fish species ranked by value (units 1,000 baht) of catch in 2008
compared with 2004. source: DoF 2010b.
Rank
2008
(2004)
Fish species,
Pelagic (P) and
Demersal (D) 2004 2008 % change
1 (1) Indo-Pacific mackerel (P) 4,414.6 3,313.4 -24.9
2 (11) Sea bass (D)2
1,264.0 1,492.5 18.1
3 (16) Anchovies (P) 896.8 1,454.8 62.2
4 (2) Threadfin breams (D) 2,956.8 1,295.1 -56.2
5 (10) Sardines (P) 1,290.7 1,198.0 -7.2
6 (8) Groupers (D)2
1,637.8 1,100.1 -32.8
7 (15) Indian mackerel (P) 897.5 926.9 3.3
8 (9) Trevallies (P) 1,362.4 924.5 -32.1
9 (5) King mackerel (P) 2,175.8 869.8 -60.0
10 (12) Croaker (D) 1,255.4 770.2 -38.6
11 (3) Round scads (P) 2,508.9 741.4 -70.4
12 (14) Lizard fish (D) 1,140.0 653.7 -42.7
13 (13) Eastern little tuna (P) 1,198.0 551.5 -54.0
14 (na) Tunas (P)3
na 548.5 na
A Review and Synthesis of Fisheries Data in Thailand August, 2011
13
Rank
2008
(2004)
Fish species,
Pelagic (P) and
Demersal (D) 2004 2008 % change
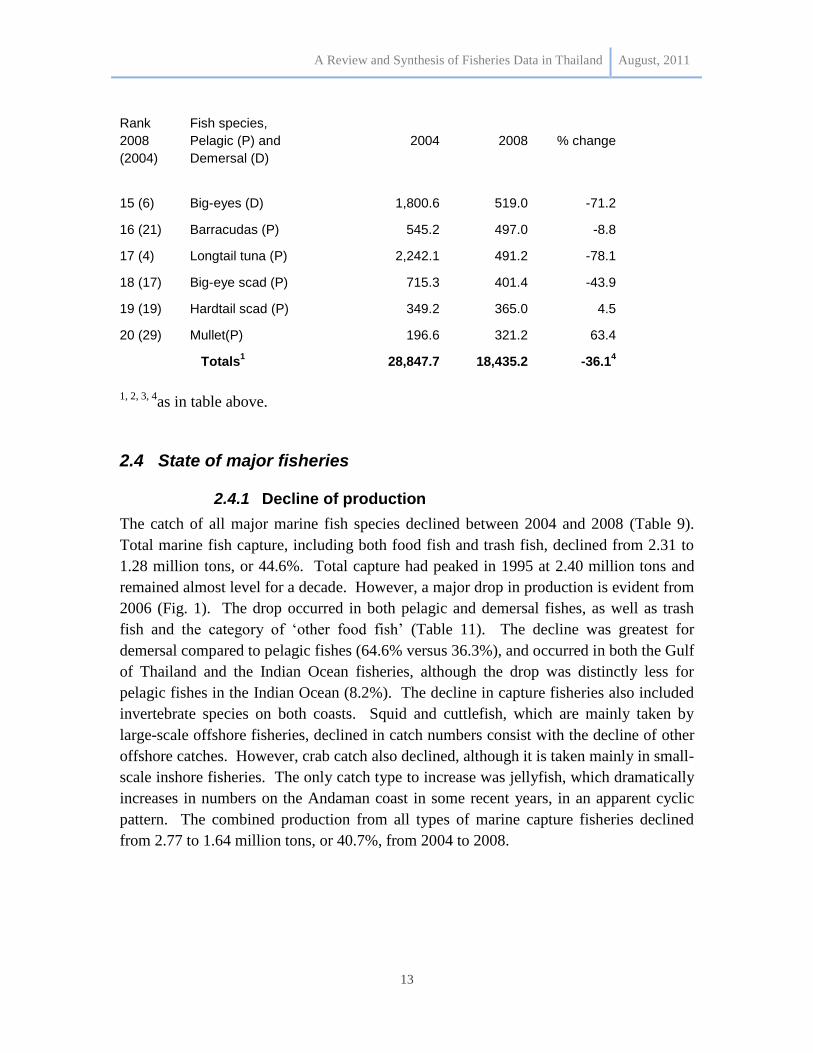
15 (6) Big-eyes (D) 1,800.6 519.0 -71.2
16 (21) Barracudas (P) 545.2 497.0 -8.8
17 (4) Longtail tuna (P) 2,242.1 491.2 -78.1
18 (17) Big-eye scad (P) 715.3 401.4 -43.9
19 (19) Hardtail scad (P) 349.2 365.0 4.5
20 (29) Mullet(P) 196.6 321.2 63.4
Totals
1 28,847.7 18,435.2 -36.1
4
1, 2, 3, 4
as in table above.
2.4 State of major fisheries
2.4.1 Decline of production
The catch of all major marine fish species declined between 2004 and 2008 (Table 9).
Total marine fish capture, including both food fish and trash fish, declined from 2.31 to
1.28 million tons, or 44.6%. Total capture had peaked in 1995 at 2.40 million tons and
remained almost level for a decade. However, a major drop in production is evident from
2006 (Fig. 1). The drop occurred in both pelagic and demersal fishes, as well as trash
fish and the category of „other food fish‟ (Table 11). The decline was greatest for
demersal compared to pelagic fishes (64.6% versus 36.3%), and occurred in both the Gulf
of Thailand and the Indian Ocean fisheries, although the drop was distinctly less for
pelagic fishes in the Indian Ocean (8.2%). The decline in capture fisheries also included
invertebrate species on both coasts. Squid and cuttlefish, which are mainly taken by
large-scale offshore fisheries, declined in catch numbers consist with the decline of other
offshore catches. However, crab catch also declined, although it is taken mainly in small-
scale inshore fisheries. The only catch type to increase was jellyfish, which dramatically
increases in numbers on the Andaman coast in some recent years, in an apparent cyclic
pattern. The combined production from all types of marine capture fisheries declined
from 2.77 to 1.64 million tons, or 40.7%, from 2004 to 2008.
A Review and Synthesis of Fisheries Data in Thailand August, 2011
14
0.0
500.0
1000.0
1500.0
2000.0
2500.0
2000 2001 2002 2003 2004 2005 2006 2007 2008
1,0
00 T
on
s
Trash fish
Food fish
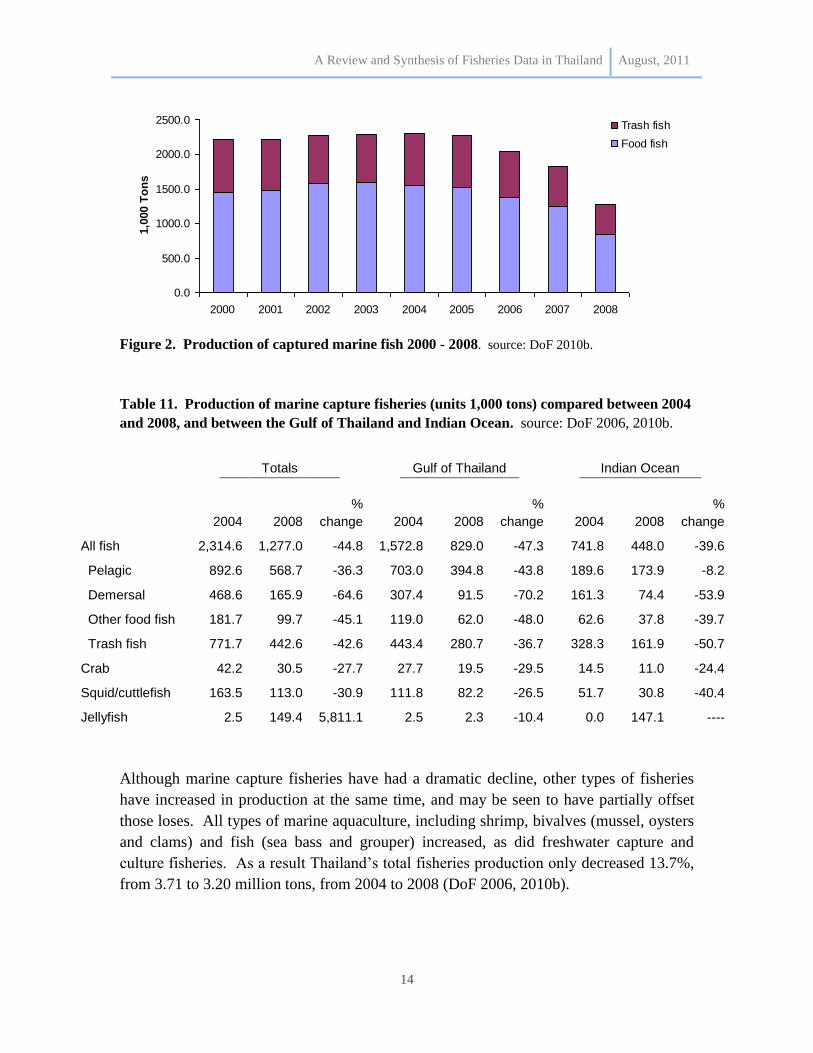
Figure 2. Production of captured marine fish 2000 - 2008. source: DoF 2010b.
Table 11. Production of marine capture fisheries (units 1,000 tons) compared between 2004
and 2008, and between the Gulf of Thailand and Indian Ocean. source: DoF 2006, 2010b.
Totals Gulf of Thailand Indian Ocean
2004 2008
%
change 2004 2008
%
change 2004 2008
%
change
All fish 2,314.6 1,277.0 -44.8 1,572.8 829.0 -47.3 741.8 448.0 -39.6
Pelagic 892.6 568.7 -36.3 703.0 394.8 -43.8 189.6 173.9 -8.2
Demersal 468.6 165.9 -64.6 307.4 91.5 -70.2 161.3 74.4 -53.9
Other food fish 181.7 99.7 -45.1 119.0 62.0 -48.0 62.6 37.8 -39.7
Trash fish 771.7 442.6 -42.6 443.4 280.7 -36.7 328.3 161.9 -50.7
Crab 42.2 30.5 -27.7 27.7 19.5 -29.5 14.5 11.0 -24.4
Squid/cuttlefish 163.5 113.0 -30.9 111.8 82.2 -26.5 51.7 30.8 -40.4
Jellyfish 2.5 149.4 5,811.1 2.5 2.3 -10.4 0.0 147.1 ----
Although marine capture fisheries have had a dramatic decline, other types of fisheries
have increased in production at the same time, and may be seen to have partially offset
those loses. All types of marine aquaculture, including shrimp, bivalves (mussel, oysters
and clams) and fish (sea bass and grouper) increased, as did freshwater capture and
culture fisheries. As a result Thailand‟s total fisheries production only decreased 13.7%,
from 3.71 to 3.20 million tons, from 2004 to 2008 (DoF 2006, 2010b).
A Review and Synthesis of Fisheries Data in Thailand August, 2011
15
2.4.2 Causes of decline
Several reasons can be advanced for the recent decline in landings of marine fish. They
are:
Overfishing
Habitat degradation
Increased costs, especially of fuel
Restricted access for Thai boats to the fishing grounds of other states
Of those, over-fishing is the most compelling reason for the decline. Evidence of over-
fishing has been well documented in the Gulf of Thailand over a long period.
Commercial trawling began in the 1960‟s in the Gulf, and catches of demersal fishes and
trash fish peaked in 1987 (Ahmed et al. 2007). By 1995, the biomass of demersal and
trash fishes, estimated from survey trawl data, had declined to only 8.2% of their biomass
in 1961 (reported in Stobutzki et al. 2006). Demersal fish populations are believed to
have been over-fished since 1973 (Panjarat 2008). There were also declines recorded on
the Andaman coast. The catch per unit effort (CPUE) for demersal fish in Phang-nga
Bay in 1988 was about 16% of what it had been in 1966 (reported in Panjarat 2008).
Estimates of maximum sustainable yields for pelagic fishes also show that many of the
species have been fully- or over-exploited since the 1980s in the Gulf of Thailand. More
recent estimates confirm earlier conclusions. Of 14 species evaluated in 2009, including
demersals, pelagics and cephalopods from the Gulf of Thailand, all were either over- or
fully-exploited (FAO 2010a). Those same groups were also considered over- or fully-
exploited on the Andaman coast (Lymer et al. 2010).
Despite the early evidence of over-fishing, total overall catches appeared to plateau at
high levels for many years. That reflected the inclusion in catch statistics of catches from
outside of the domestic EEZ, as well as changes in technology and increased fishing
effort.
Broad ecological impacts from over-fishing were evident in changes in the species
composition of the catch. Large, highly-valued species became a smaller part of the
overall catch but were replaced by smaller, low-valued species, such as anchovies and
squid (Chotiyaputta et al. 2002). This is part of the process of “fishing down the food
web”, where small prey species are targeted once their larger predators have been
eliminated. The low-valued part of the catch has become more important, as species that
were once considered trash fish (e.g. lizard fish and croakers) are now retained for surimi
(fish-purée used to make fish balls etc.) (Lymer et al. 2010). Trash fish is turned into fish
meal, which has had a ready market in the expanding aquaculture industry. As a result, a
wide range of targeted and non-targeted marine organisms have been over-fished, and the
A Review and Synthesis of Fisheries Data in Thailand August, 2011
16
process is likely to have more far-reaching ecosystem impacts than over-exploitation of
single species.
Other factors may have played a role in the recorded reduction of fish catches, but they
have been considered secondary to over-fishing. Deterioration of the environment has
probably affected fish stocks. Fishing gear, such as trawls and push nets, damage the sea
floor and reduce habitat quality for fish. In addition, water quality has been degraded by
sedimentation and pollution from land-based activities, especially around the Gulf of
Thailand. Lower catches per unit effort are also likely to make fishers more sensitive to
rising fuel prices, and discourage them from fishing. That may have been a factor
affecting the comparisons made here between the years 2004 and 2008, as fuel prices
were substantially higher in the latter year. Improved enforcement and restrictions on
Thai boats operating in foreign EEZs have limited access to fishing grounds, which
would reduce landings recorded at Thai ports, and increased pressure on the domestic
EEZ.
2.5 Infrastructure
2.5.1 Harbours
Thailand has a total of 735 fishing piers and docks of various sizes. There are 18 docks
operated by the government-owned Fish Marketing Organization. Private companies and
fishing cooperatives control 524 piers, and another 193 are controlled by other
government agencies, including local governments. The five most important provinces
ranked by tonnage of landed marine animals are shown in Table 12. They received 57%
of the total landings.
Table 12. Total quantity of marine animals (units 1,000 tons) landed at all places, and in
the five highest ranked provinces by landings. Source: DoF, 2010b.
Total 1,187.2
Samut Sakhon 226.8
Pattani 167.0
Songkhla 126.0
Ranong 83.5
Trang 71.1
2.5.2 Processing facilities
Fish processing occurred at a large number of facilities, of which the largest group were
small establishments involved in drying or salting fish and squid etc, or making fish
A Review and Synthesis of Fisheries Data in Thailand August, 2011
17
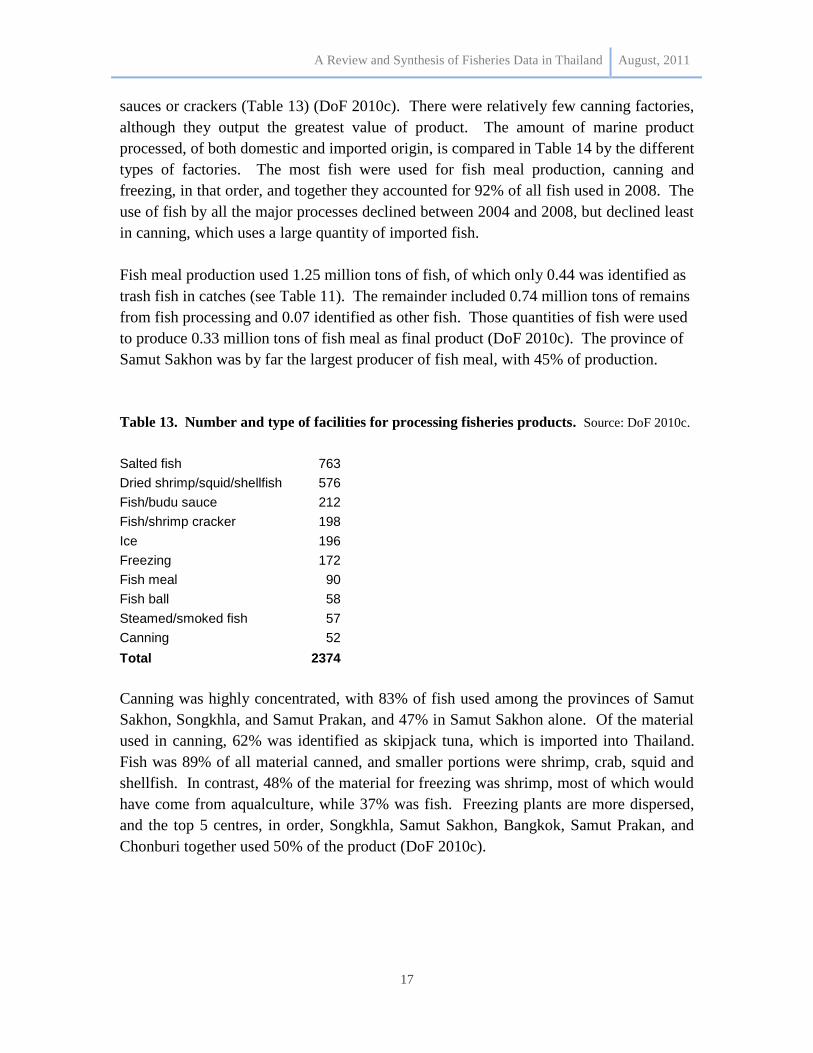
sauces or crackers (Table 13) (DoF 2010c). There were relatively few canning factories,
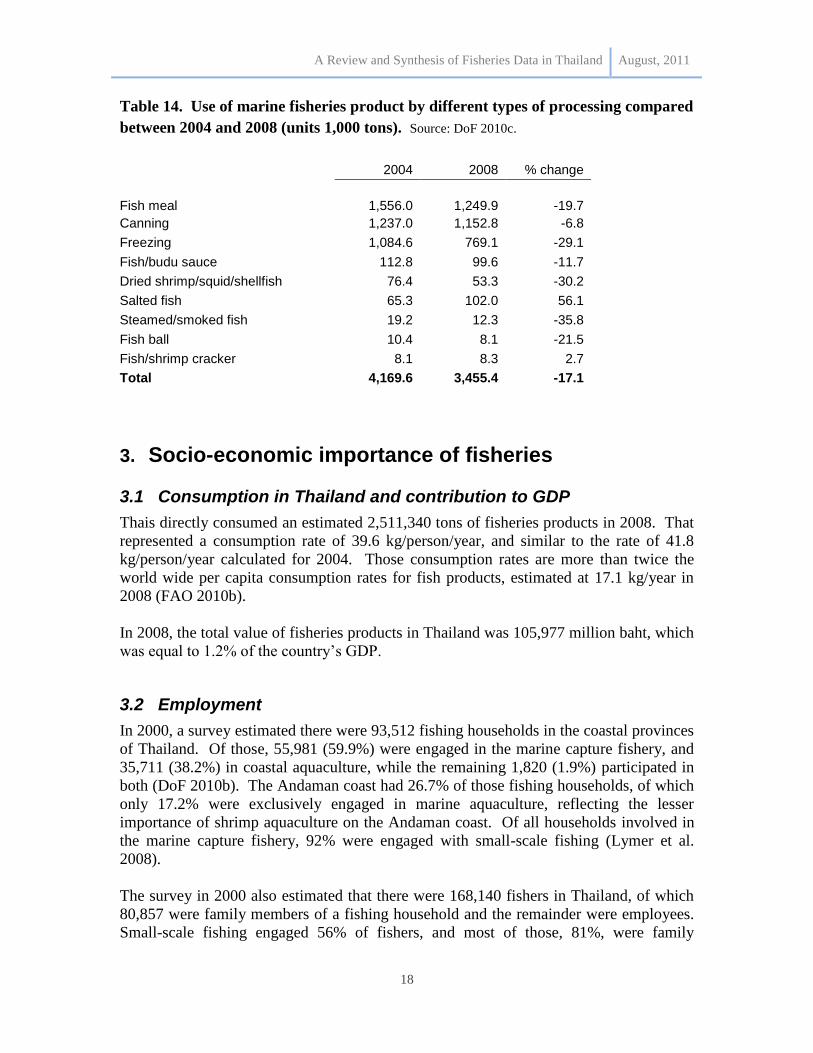
although they output the greatest value of product. The amount of marine product
processed, of both domestic and imported origin, is compared in Table 14 by the different
types of factories. The most fish were used for fish meal production, canning and
freezing, in that order, and together they accounted for 92% of all fish used in 2008. The
use of fish by all the major processes declined between 2004 and 2008, but declined least
in canning, which uses a large quantity of imported fish.
Fish meal production used 1.25 million tons of fish, of which only 0.44 was identified as
trash fish in catches (see Table 11). The remainder included 0.74 million tons of remains
from fish processing and 0.07 identified as other fish. Those quantities of fish were used
to produce 0.33 million tons of fish meal as final product (DoF 2010c). The province of
Samut Sakhon was by far the largest producer of fish meal, with 45% of production.
Table 13. Number and type of facilities for processing fisheries products. Source: DoF 2010c.
Salted fish 763
Dried shrimp/squid/shellfish 576
Fish/budu sauce 212
Fish/shrimp cracker 198
Ice 196
Freezing 172
Fish meal 90
Fish ball 58
Steamed/smoked fish 57
Canning 52
Total 2374
Canning was highly concentrated, with 83% of fish used among the provinces of Samut
Sakhon, Songkhla, and Samut Prakan, and 47% in Samut Sakhon alone. Of the material
used in canning, 62% was identified as skipjack tuna, which is imported into Thailand.
Fish was 89% of all material canned, and smaller portions were shrimp, crab, squid and
shellfish. In contrast, 48% of the material for freezing was shrimp, most of which would
have come from aqualculture, while 37% was fish. Freezing plants are more dispersed,
and the top 5 centres, in order, Songkhla, Samut Sakhon, Bangkok, Samut Prakan, and
Chonburi together used 50% of the product (DoF 2010c).
A Review and Synthesis of Fisheries Data in Thailand August, 2011
18
Table 14. Use of marine fisheries product by different types of processing compared
between 2004 and 2008 (units 1,000 tons). Source: DoF 2010c.
2004 2008 % change
Fish meal 1,556.0 1,249.9 -19.7
Canning 1,237.0 1,152.8 -6.8
Freezing 1,084.6 769.1 -29.1
Fish/budu sauce 112.8 99.6 -11.7
Dried shrimp/squid/shellfish 76.4 53.3 -30.2
Salted fish 65.3 102.0 56.1
Steamed/smoked fish 19.2 12.3 -35.8
Fish ball 10.4 8.1 -21.5
Fish/shrimp cracker 8.1 8.3 2.7
Total 4,169.6 3,455.4 -17.1
3. Socio-economic importance of fisheries
3.1 Consumption in Thailand and contribution to GDP
Thais directly consumed an estimated 2,511,340 tons of fisheries products in 2008. That
represented a consumption rate of 39.6 kg/person/year, and similar to the rate of 41.8
kg/person/year calculated for 2004. Those consumption rates are more than twice the
world wide per capita consumption rates for fish products, estimated at 17.1 kg/year in
2008 (FAO 2010b).
In 2008, the total value of fisheries products in Thailand was 105,977 million baht, which
was equal to 1.2% of the country‟s GDP.
3.2 Employment
In 2000, a survey estimated there were 93,512 fishing households in the coastal provinces
of Thailand. Of those, 55,981 (59.9%) were engaged in the marine capture fishery, and
35,711 (38.2%) in coastal aquaculture, while the remaining 1,820 (1.9%) participated in
both (DoF 2010b). The Andaman coast had 26.7% of those fishing households, of which
only 17.2% were exclusively engaged in marine aquaculture, reflecting the lesser
importance of shrimp aquaculture on the Andaman coast. Of all households involved in
the marine capture fishery, 92% were engaged with small-scale fishing (Lymer et al.
2008).
The survey in 2000 also estimated that there were 168,140 fishers in Thailand, of which
80,857 were family members of a fishing household and the remainder were employees.
Small-scale fishing engaged 56% of fishers, and most of those, 81%, were family
A Review and Synthesis of Fisheries Data in Thailand August, 2011
19
members (Lymer et al. 2008). Fishers in large-scale industry are mainly employees. Sea
food processing employed 184,423 persons, of which 80% were female. (Note: it seems
likely that these employment data are low and do not take account of large numbers of
undocumented migrant workers.)
3.3 Migrant labour
It has been estimated that there are as many as 250,000 migrant workers from Myanmar
(Burma) working in the Thai fishing industry as fishermen and fish-processing workers.
However, only about 70,000 of those are legally documented (numbers reported by Al
Jazeera below). Although Burmese are the most numerous, there are illegal migrant
workers from other neighbouring states, especially Cambodia, working in the fishing
industry. Migrant men and boys have been trafficked into Thailand by agents who sell
them on to other agents for work on long-distance fishing boats. There have been many
reports of long hours of forced labour under extremely harsh conditions. Some are
reported to spend years at sea, unable to come ashore, living a slave-like existence, and
subject to severe violence. That situation has been reported by major media outlets, e.g.
BBC (http://www.bbc.co.uk/news/world-asia-pacific-12881982) and Al Jazeera
(http://www.youtube.com/watch?v=BEKsZ8dqZB8, http://www.youtube.com/watch?v
=VtDJaConQ1w) and international labour organizations, e.g. the International Trade
Union Confederation (http://www.ituc-csi.org/human-trafficking-for-forced.html). See
also reports of the International Organization for Migration (2011), and the United
Nations Inter-Agency Project on Human Trafficking (UNIAP) (2009).
4. Trade
4.1 Fisheries products exported from Thailand
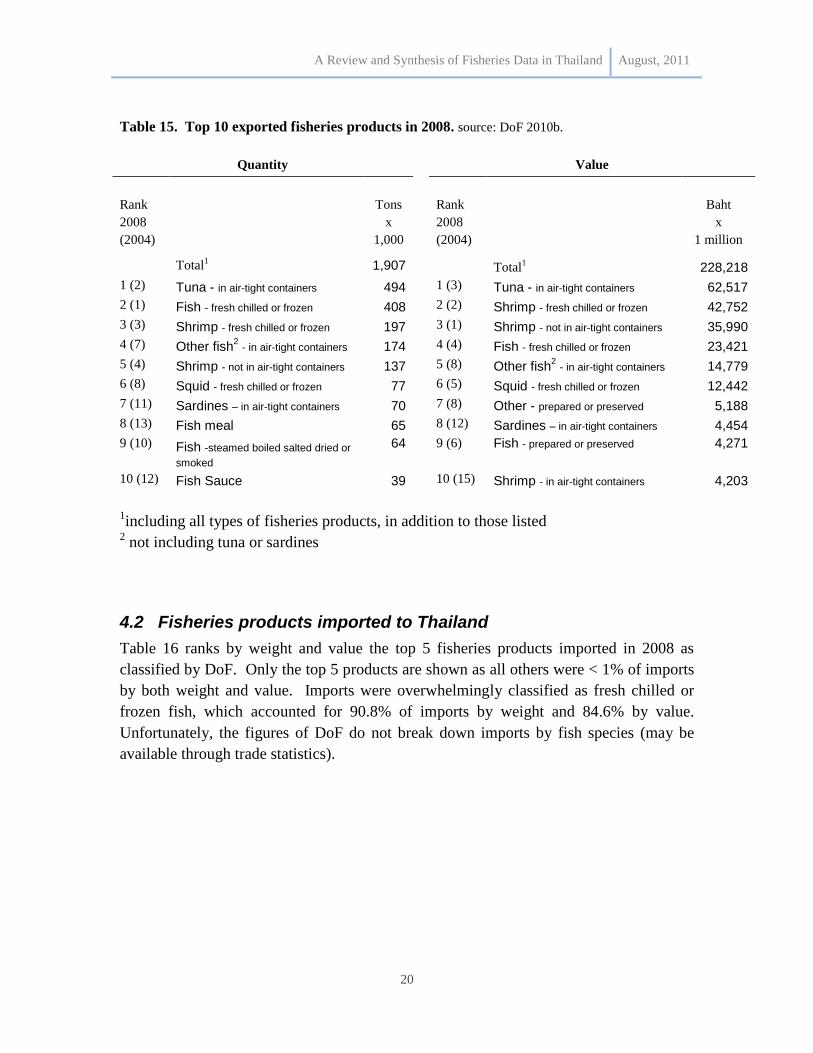
Table 15 ranks by weight and value the top 10 fisheries products exported in 2008 as
classified by DoF (2010b). Tuna in air-tight containers (i.e. cans) was the largest export
item by both quantity and value, with 25.9% and 27.4% of the respective totals.
However, the sum of shrimp products (which were mainly classified as “fresh chilled and
frozen” or “not in air-tight containers”) had a greater total value, 36.4%. All fish
products combined were 71.3% of export weight, but 50.9% by value, reflecting the
greater value per weight of shrimp. As 90% of shrimp production was from marine
aquaculture, it has less direct importance than fish capture for over-fishing.
A Review and Synthesis of Fisheries Data in Thailand August, 2011
20
Table 15. Top 10 exported fisheries products in 2008. source: DoF 2010b.
Quantity
Value
Rank
2008
(2004)
Tons
x
1,000
Rank
2008
(2004)
Baht
x
1 million
Total1
1,907 Total1 228,218
1 (2) Tuna - in air-tight containers 494 1 (3) Tuna - in air-tight containers 62,517
2 (1) Fish - fresh chilled or frozen 408 2 (2) Shrimp - fresh chilled or frozen 42,752
3 (3) Shrimp - fresh chilled or frozen 197 3 (1) Shrimp - not in air-tight containers 35,990
4 (7) Other fish2 - in air-tight containers 174 4 (4) Fish - fresh chilled or frozen 23,421
5 (4) Shrimp - not in air-tight containers 137 5 (8) Other fish2 - in air-tight containers 14,779
6 (8) Squid - fresh chilled or frozen 77 6 (5) Squid - fresh chilled or frozen 12,442
7 (11) Sardines – in air-tight containers 70 7 (8) Other - prepared or preserved 5,188
8 (13) Fish meal 65 8 (12) Sardines – in air-tight containers 4,454
9 (10) Fish -steamed boiled salted dried or
smoked
64
9 (6) Fish - prepared or preserved 4,271
10 (12) Fish Sauce 39 10 (15) Shrimp - in air-tight containers 4,203
1including all types of fisheries products, in addition to those listed
2 not including tuna or sardines
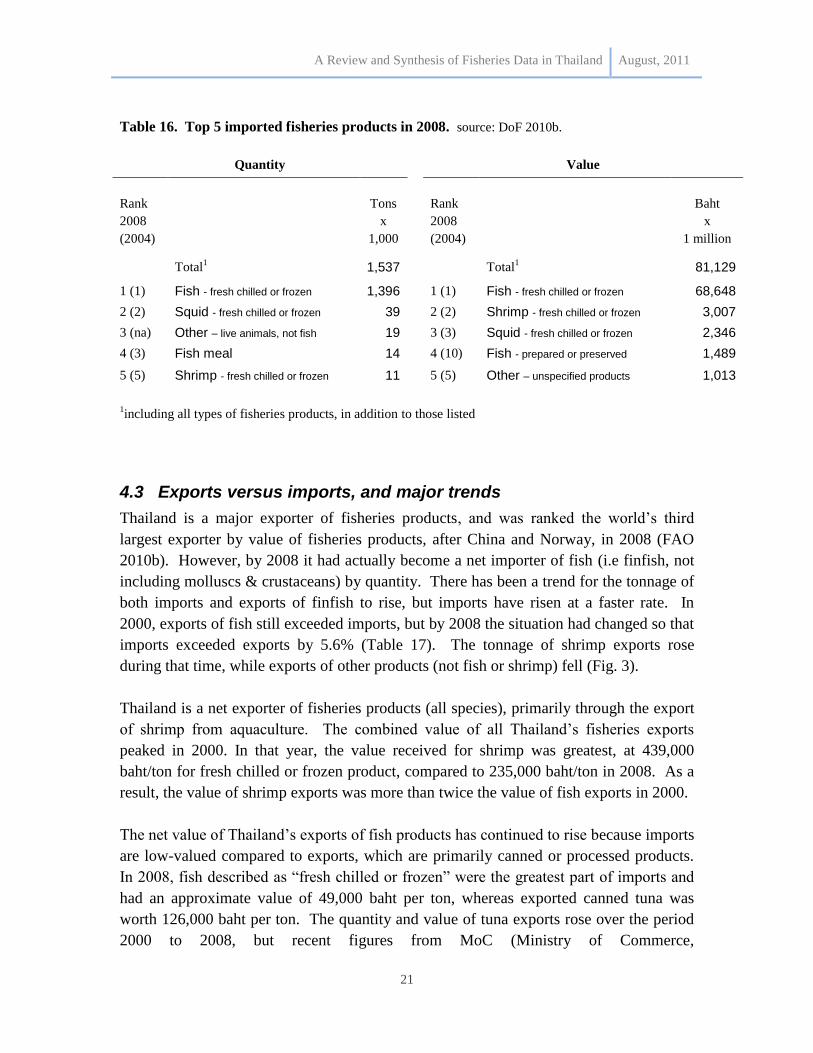
4.2 Fisheries products imported to Thailand
Table 16 ranks by weight and value the top 5 fisheries products imported in 2008 as
classified by DoF. Only the top 5 products are shown as all others were < 1% of imports
by both weight and value. Imports were overwhelmingly classified as fresh chilled or
frozen fish, which accounted for 90.8% of imports by weight and 84.6% by value.
Unfortunately, the figures of DoF do not break down imports by fish species (may be
available through trade statistics).
A Review and Synthesis of Fisheries Data in Thailand August, 2011
21
Table 16. Top 5 imported fisheries products in 2008. source: DoF 2010b.
Quantity
Value
Rank
2008
(2004)
Tons
x
1,000
Rank
2008
(2004)
Baht
x
1 million
Total1 1,537 Total
1 81,129
1 (1) Fish - fresh chilled or frozen 1,396 1 (1) Fish - fresh chilled or frozen 68,648
2 (2) Squid - fresh chilled or frozen 39 2 (2) Shrimp - fresh chilled or frozen 3,007
3 (na) Other – live animals, not fish 19 3 (3) Squid - fresh chilled or frozen 2,346
4 (3) Fish meal 14 4 (10) Fish - prepared or preserved 1,489
5 (5) Shrimp - fresh chilled or frozen 11 5 (5) Other – unspecified products 1,013
1including all types of fisheries products, in addition to those listed
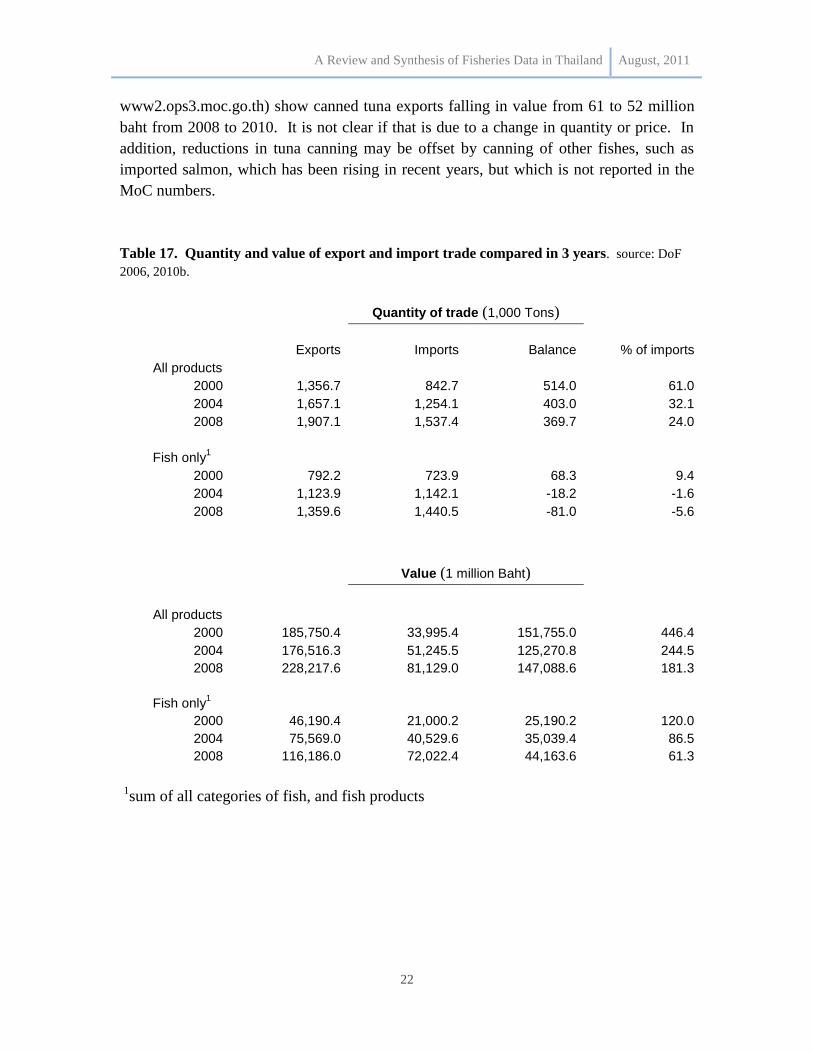
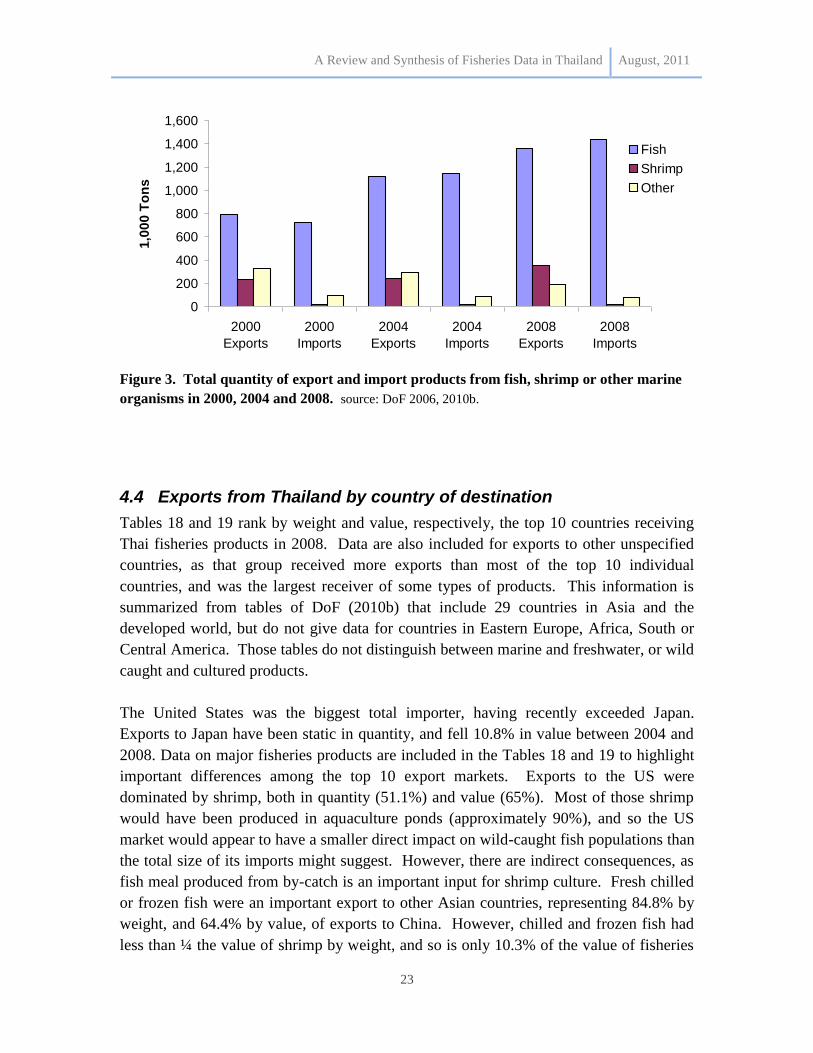
4.3 Exports versus imports, and major trends
Thailand is a major exporter of fisheries products, and was ranked the world‟s third
largest exporter by value of fisheries products, after China and Norway, in 2008 (FAO
2010b). However, by 2008 it had actually become a net importer of fish (i.e finfish, not
including molluscs & crustaceans) by quantity. There has been a trend for the tonnage of
both imports and exports of finfish to rise, but imports have risen at a faster rate. In
2000, exports of fish still exceeded imports, but by 2008 the situation had changed so that
imports exceeded exports by 5.6% (Table 17). The tonnage of shrimp exports rose
during that time, while exports of other products (not fish or shrimp) fell (Fig. 3).
Thailand is a net exporter of fisheries products (all species), primarily through the export
of shrimp from aquaculture. The combined value of all Thailand‟s fisheries exports
peaked in 2000. In that year, the value received for shrimp was greatest, at 439,000
baht/ton for fresh chilled or frozen product, compared to 235,000 baht/ton in 2008. As a
result, the value of shrimp exports was more than twice the value of fish exports in 2000.
The net value of Thailand‟s exports of fish products has continued to rise because imports
are low-valued compared to exports, which are primarily canned or processed products.
In 2008, fish described as “fresh chilled or frozen” were the greatest part of imports and
had an approximate value of 49,000 baht per ton, whereas exported canned tuna was
worth 126,000 baht per ton. The quantity and value of tuna exports rose over the period
2000 to 2008, but recent figures from MoC (Ministry of Commerce,
A Review and Synthesis of Fisheries Data in Thailand August, 2011
22
www2.ops3.moc.go.th) show canned tuna exports falling in value from 61 to 52 million
baht from 2008 to 2010. It is not clear if that is due to a change in quantity or price. In
addition, reductions in tuna canning may be offset by canning of other fishes, such as
imported salmon, which has been rising in recent years, but which is not reported in the
MoC numbers.
Table 17. Quantity and value of export and import trade compared in 3 years. source: DoF
2006, 2010b.
Quantity of trade (1,000 Tons)
Exports Imports Balance
% of imports
All products
2000 1,356.7 842.7 514.0 61.0
2004 1,657.1 1,254.1 403.0 32.1
2008 1,907.1 1,537.4 369.7 24.0
Fish only1
2000 792.2 723.9 68.3 9.4
2004 1,123.9 1,142.1 -18.2 -1.6
2008 1,359.6 1,440.5 -81.0 -5.6
Value (1 million Baht)
All products
2000 185,750.4 33,995.4 151,755.0 446.4
2004 176,516.3 51,245.5 125,270.8 244.5
2008 228,217.6 81,129.0 147,088.6 181.3
Fish only1
2000 46,190.4 21,000.2 25,190.2 120.0
2004 75,569.0 40,529.6 35,039.4 86.5
2008 116,186.0 72,022.4 44,163.6 61.3
1sum of all categories of fish, and fish products
A Review and Synthesis of Fisheries Data in Thailand August, 2011
23
0
200
400
600
800
1,000
1,200
1,400
1,600
2000
Exports
2000
Imports
2004
Exports
2004
Imports
2008
Exports
2008
Imports
1,0
00
To
ns
Fish
Shrimp
Other
Figure 3. Total quantity of export and import products from fish, shrimp or other marine
organisms in 2000, 2004 and 2008. source: DoF 2006, 2010b.
4.4 Exports from Thailand by country of destination
Tables 18 and 19 rank by weight and value, respectively, the top 10 countries receiving
Thai fisheries products in 2008. Data are also included for exports to other unspecified
countries, as that group received more exports than most of the top 10 individual
countries, and was the largest receiver of some types of products. This information is
summarized from tables of DoF (2010b) that include 29 countries in Asia and the
developed world, but do not give data for countries in Eastern Europe, Africa, South or
Central America. Those tables do not distinguish between marine and freshwater, or wild
caught and cultured products.
The United States was the biggest total importer, having recently exceeded Japan.
Exports to Japan have been static in quantity, and fell 10.8% in value between 2004 and
2008. Data on major fisheries products are included in the Tables 18 and 19 to highlight
important differences among the top 10 export markets. Exports to the US were
dominated by shrimp, both in quantity (51.1%) and value (65%). Most of those shrimp
would have been produced in aquaculture ponds (approximately 90%), and so the US
market would appear to have a smaller direct impact on wild-caught fish populations than
the total size of its imports might suggest. However, there are indirect consequences, as
fish meal produced from by-catch is an important input for shrimp culture. Fresh chilled
or frozen fish were an important export to other Asian countries, representing 84.8% by
weight, and 64.4% by value, of exports to China. However, chilled and frozen fish had
less than ¼ the value of shrimp by weight, and so is only 10.3% of the value of fisheries
A Review and Synthesis of Fisheries Data in Thailand August, 2011
24
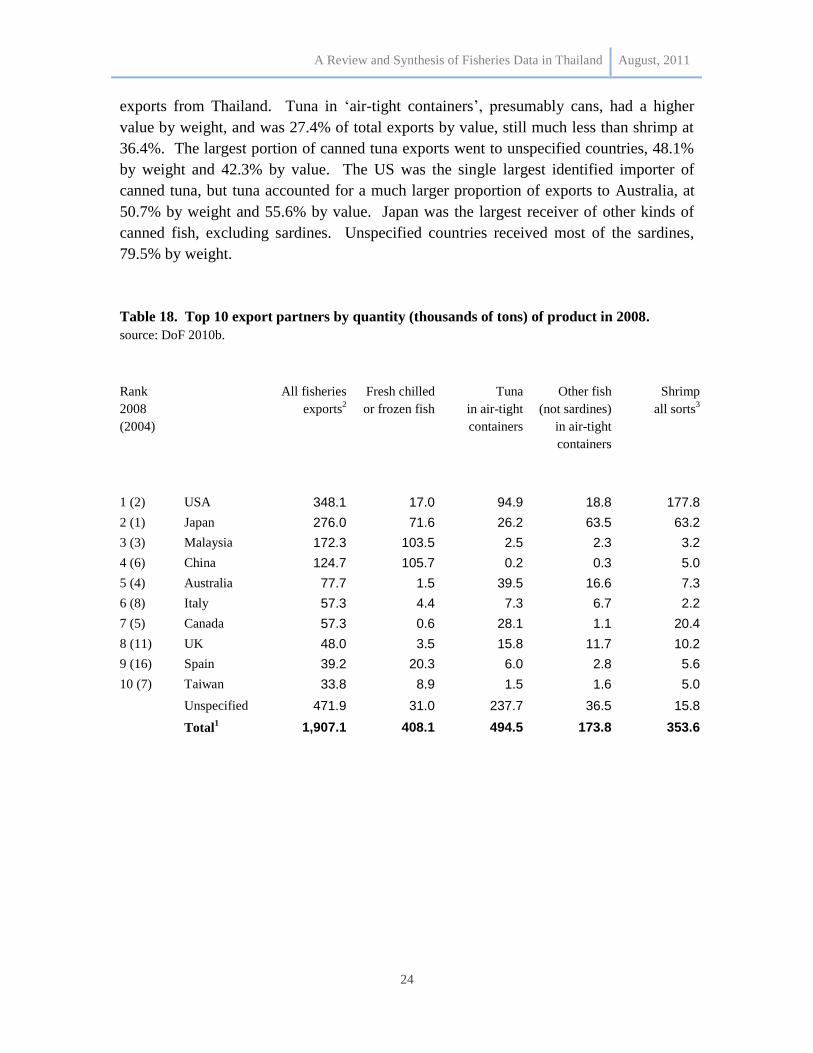
exports from Thailand. Tuna in „air-tight containers‟, presumably cans, had a higher
value by weight, and was 27.4% of total exports by value, still much less than shrimp at
36.4%. The largest portion of canned tuna exports went to unspecified countries, 48.1%
by weight and 42.3% by value. The US was the single largest identified importer of
canned tuna, but tuna accounted for a much larger proportion of exports to Australia, at
50.7% by weight and 55.6% by value. Japan was the largest receiver of other kinds of
canned fish, excluding sardines. Unspecified countries received most of the sardines,
79.5% by weight.
Table 18. Top 10 export partners by quantity (thousands of tons) of product in 2008.
source: DoF 2010b.
Rank
2008
(2004)
All fisheries
exports2
Fresh chilled
or frozen fish
Tuna
in air-tight
containers
Other fish
(not sardines)
in air-tight
containers
Shrimp
all sorts3
1 (2) USA 348.1 17.0 94.9 18.8 177.8
2 (1) Japan 276.0 71.6 26.2 63.5 63.2
3 (3) Malaysia 172.3 103.5 2.5 2.3 3.2
4 (6) China 124.7 105.7 0.2 0.3 5.0
5 (4) Australia 77.7 1.5 39.5 16.6 7.3
6 (8) Italy 57.3 4.4 7.3 6.7 2.2
7 (5) Canada 57.3 0.6 28.1 1.1 20.4
8 (11) UK 48.0 3.5 15.8 11.7 10.2
9 (16) Spain 39.2 20.3 6.0 2.8 5.6
10 (7) Taiwan 33.8 8.9 1.5 1.6 5.0
Unspecified 471.9 31.0 237.7 36.5 15.8
Total1 1,907.1 408.1 494.5 173.8 353.6
A Review and Synthesis of Fisheries Data in Thailand August, 2011
25
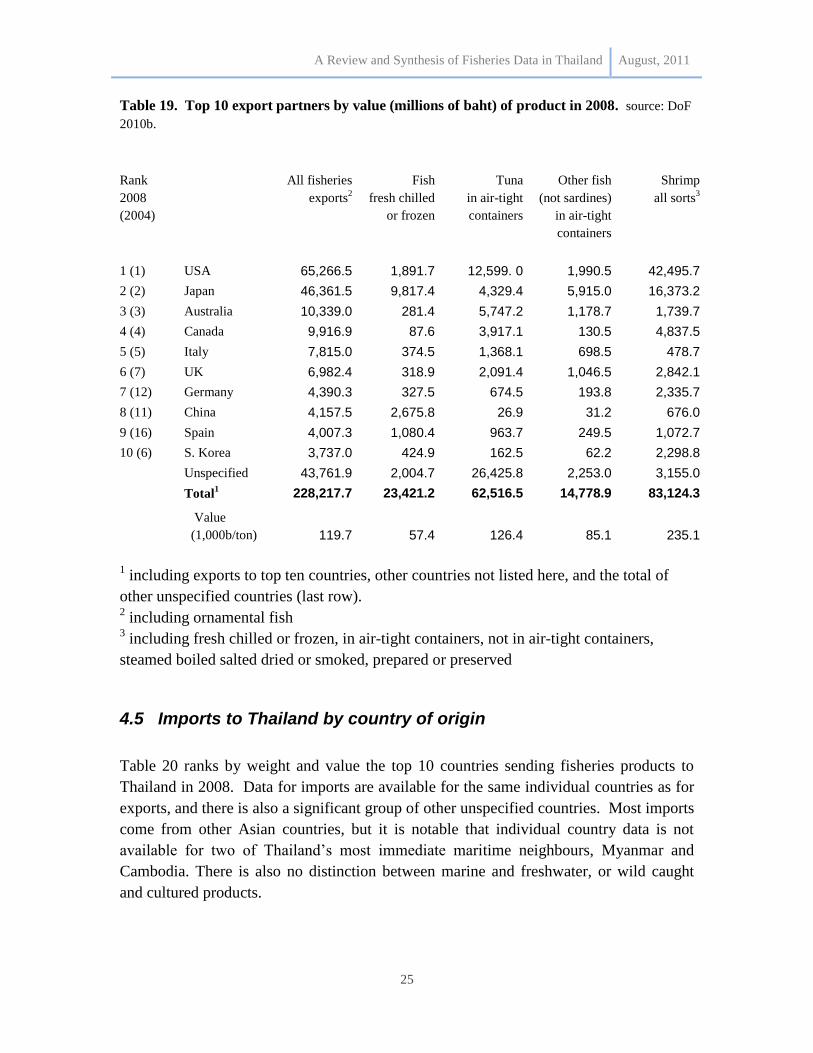
Table 19. Top 10 export partners by value (millions of baht) of product in 2008. source: DoF
2010b.
Rank
2008
(2004)
All fisheries
exports2
Fish
fresh chilled
or frozen
Tuna
in air-tight
containers
Other fish
(not sardines)
in air-tight
containers
Shrimp
all sorts3
1 (1) USA 65,266.5 1,891.7 12,599. 0 1,990.5 42,495.7
2 (2) Japan 46,361.5 9,817.4 4,329.4 5,915.0 16,373.2
3 (3) Australia 10,339.0 281.4 5,747.2 1,178.7 1,739.7
4 (4) Canada 9,916.9 87.6 3,917.1 130.5 4,837.5
5 (5) Italy 7,815.0 374.5 1,368.1 698.5 478.7
6 (7) UK 6,982.4 318.9 2,091.4 1,046.5 2,842.1
7 (12) Germany 4,390.3 327.5 674.5 193.8 2,335.7
8 (11) China 4,157.5 2,675.8 26.9 31.2 676.0
9 (16) Spain 4,007.3 1,080.4 963.7 249.5 1,072.7
10 (6) S. Korea 3,737.0 424.9 162.5 62.2 2,298.8
Unspecified 43,761.9 2,004.7 26,425.8 2,253.0 3,155.0
Total1 228,217.7 23,421.2 62,516.5 14,778.9 83,124.3
Value
(1,000b/ton) 119.7 57.4 126.4 85.1 235.1
1 including exports to top ten countries, other countries not listed here, and the total of
other unspecified countries (last row). 2 including ornamental fish
3 including fresh chilled or frozen, in air-tight containers, not in air-tight containers,
steamed boiled salted dried or smoked, prepared or preserved
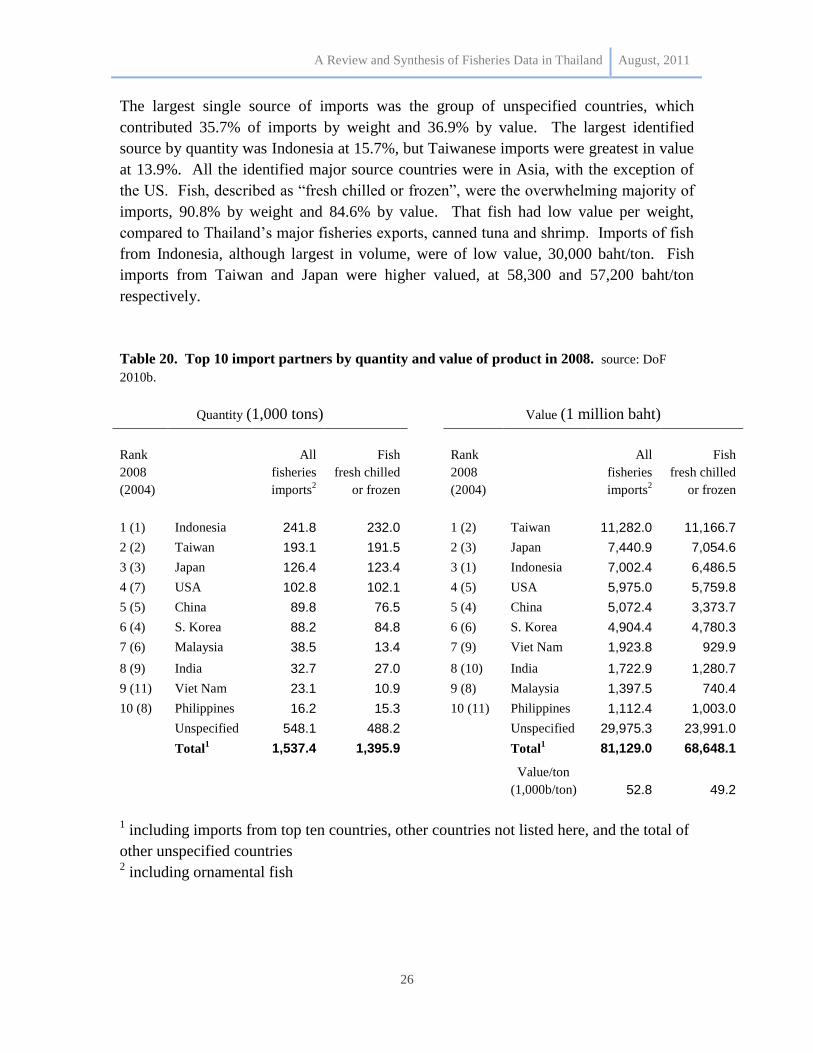
4.5 Imports to Thailand by country of origin
Table 20 ranks by weight and value the top 10 countries sending fisheries products to
Thailand in 2008. Data for imports are available for the same individual countries as for
exports, and there is also a significant group of other unspecified countries. Most imports
come from other Asian countries, but it is notable that individual country data is not
available for two of Thailand‟s most immediate maritime neighbours, Myanmar and
Cambodia. There is also no distinction between marine and freshwater, or wild caught
and cultured products.
A Review and Synthesis of Fisheries Data in Thailand August, 2011
26
The largest single source of imports was the group of unspecified countries, which
contributed 35.7% of imports by weight and 36.9% by value. The largest identified
source by quantity was Indonesia at 15.7%, but Taiwanese imports were greatest in value
at 13.9%. All the identified major source countries were in Asia, with the exception of
the US. Fish, described as “fresh chilled or frozen”, were the overwhelming majority of
imports, 90.8% by weight and 84.6% by value. That fish had low value per weight,
compared to Thailand‟s major fisheries exports, canned tuna and shrimp. Imports of fish
from Indonesia, although largest in volume, were of low value, 30,000 baht/ton. Fish
imports from Taiwan and Japan were higher valued, at 58,300 and 57,200 baht/ton
respectively.
Table 20. Top 10 import partners by quantity and value of product in 2008. source: DoF
2010b.
1 including imports from top ten countries, other countries not listed here, and the total of
other unspecified countries 2 including ornamental fish
Quantity (1,000 tons) Value (1 million baht)
Rank
2008
(2004)
All
fisheries
imports2
Fish
fresh chilled
or frozen
Rank
2008
(2004)
All
fisheries
imports2
Fish
fresh chilled
or frozen
1 (1) Indonesia 241.8 232.0 1 (2) Taiwan 11,282.0 11,166.7
2 (2) Taiwan 193.1 191.5 2 (3) Japan 7,440.9 7,054.6
3 (3) Japan 126.4 123.4 3 (1) Indonesia 7,002.4 6,486.5
4 (7) USA 102.8 102.1 4 (5) USA 5,975.0 5,759.8
5 (5) China 89.8 76.5 5 (4) China 5,072.4 3,373.7
6 (4) S. Korea 88.2 84.8 6 (6) S. Korea 4,904.4 4,780.3
7 (6) Malaysia 38.5 13.4 7 (9) Viet Nam 1,923.8 929.9
8 (9) India 32.7 27.0 8 (10) India 1,722.9 1,280.7
9 (11) Viet Nam 23.1 10.9 9 (8) Malaysia 1,397.5 740.4
10 (8) Philippines 16.2 15.3 10 (11) Philippines 1,112.4 1,003.0
Unspecified 548.1 488.2 Unspecified 29,975.3 23,991.0
Total1 1,537.4 1,395.9 Total
1 81,129.0 68,648.1
Value/ton
(1,000b/ton) 52.8 49.2
A Review and Synthesis of Fisheries Data in Thailand August, 2011
27
5. Governance
5.1 Government bodies and their roles
Department of Fisheries under the Ministry of Agriculture and Cooperatives (MoAC) is
the main government agency responsible for fisheries law and related policy in Thailand.
1) The Department of Fisheries (DoF) has played an active role in promoting
fisheries and aquaculture development in Thailand. Reengineered in B.E. 2545 (2002), it
has engaged in study, research and development on fisheries resources management; in
controlling of fishing and aquaculture; in promoting sufficient fisheries products with
sanitary standards for domestic and export demand; and in sustainable and optimum
utilization of fisheries and aquatic resources. The Department of Fisheries is responsible
for implementing the Fisheries Act B.E. 2490 (1947) (at present under the process of
amendment), Act Governing the Right to Fish within Thai Waters B.E. 2482 (1939), Act
Organizing the Activities of Fish Market B.E. 2496(1953), Wildlife Reservation and
Protection Act B.E.2535 (1992), and other related laws and regulations.
2) Department of Marine and Coastal Resources (DMCR) under the Ministry of
Natural Resources and Environment (MoNRE) was been given the mandate to develop
appropriate regulations in order to achieve updated and effective management of marine
and coastal ecosystems. DMCR has proposed a new law which emphasizes marine
resources management. This law will empower communities to manage their local
resources. Phuket Marine Biological Center (PMBC), under the DMCR umbrella, is the
biggest marine research center in Thailand, and is taking an important role in research on
coral reefs and associated ecosystems, oceanography and maintains a marine species
reference collection for the Andaman Sea.
3) The Office of Natural Resources and Environmental Policy and Planning
(ONEP) (www.onep.go.th) under the Ministry of Natural Resources and Environment
(MoNRE) is responsible for environmental policies including Marine Protected Areas
and international agreements/ conventions.
4) The Royal Forestry Department is in general responsible for protected area
management, such as National Parks, Wildlife Sanctuaries, Forest Reserve Areas and
Marine National Parks.
5) Pollution Control Department (PCD) is the main agency implementing the
national policy on pollution control.
6) Marine Department (MD) under the Ministry of Transport aims to enforce
the Marine Promotion Act, Navigation in Thai Waters Act, Thai Vessels Act, Prevention
of Ship Collision Act; to cooperate and coordinate with relevant local and international
organisations in the field of water transport and the shipping industry including
agreements and international conventions. (www.md.go.th)
A Review and Synthesis of Fisheries Data in Thailand August, 2011
28
Although many regulations exist for fisheries resources in Thailand, a major limitation
has always been the lack of enforcement of existing regulations. A prime example has
been the stipulation that trawlers and push-nets fish in waters beyond 3 kilometers from
the shore. Small-scale fishermen have long complained of incursions by those boats into
local waters, resulting in the depletion of in-shore fisheries resources, as well as the loss
of stationary fishing gear. Authorities do not usually have the resources or manpower to
police fishing limits. However, the limits have been enforced in some areas because of
pressure on local authorities from small-scale fishing associations and NGOs.
It has long been recognized that Thailand had an overcapacity in its fishing fleet. In a
cabinet resolution in 1978 the government supported a policy of limiting the number of
new trawlers and push-nets entering the fishery. However, it took several years to
implement that policy, during which time the number of trawlers expanded to peak
numbers in 1989. Policies since 1990 have been implemented to gradually reduce the
number of trawlers and push-nets by withholding new licenses. However, the policy has
not been very effective at reducing the level of fishing, but may have slowed the
expansion of the fleet (Ahmed et al. 2007). It is not clear if the decline in the number of
trawlers in the last few years has been affected by government policy, or is the result of
retirement from the industry because of poor profits.
There are other organizations related to fisheries in Thailand :
- Southeast Asian Fisheries Development Center (SEAFDEC) is an
intergovernmental organization established in December 1967 for the purpose of
promoting sustainable fisheries development in the region.
- The Thai Overseas Fisheries Association (TOFA) (www.tofa.or.th)
- Fish Marketing Organisation (www.fishmarket.co.th)
- National Fisheries Association Thailand
- Thai Marine Navigation Company Limited
- Thai Shipowner's Association
- Thai National Shippers' Council
- Marine Science Association of Thailand
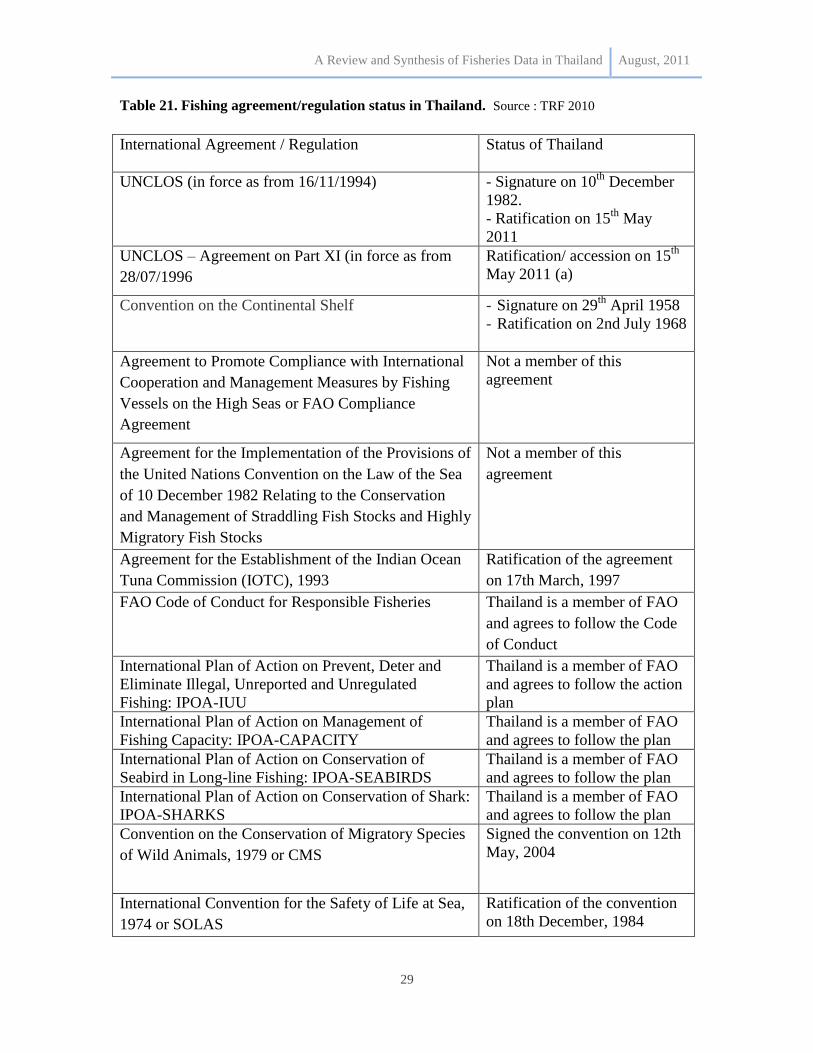
5.2 Fishing agreements
The United Nations Convention on the Law of the Sea 1982 (UNCLOS 1982) is an
international fishing agreement that Thailand ratified in May 2011. Table 21 shows the
status of Thailand on fishing agreements in the high seas. A review of fishing agreements
within EEZs of other countries is given in Table 8.
A Review and Synthesis of Fisheries Data in Thailand August, 2011
29
Table 21. Fishing agreement/regulation status in Thailand. Source : TRF 2010
International Agreement / Regulation Status of Thailand
UNCLOS (in force as from 16/11/1994) - Signature on 10th
December
1982.
- Ratification on 15th
May
2011
UNCLOS – Agreement on Part XI (in force as from
28/07/1996
Ratification/ accession on 15th
May 2011 (a)
Convention on the Continental Shelf - Signature on 29th
April 1958
- Ratification on 2nd July 1968
Agreement to Promote Compliance with International
Cooperation and Management Measures by Fishing
Vessels on the High Seas or FAO Compliance
Agreement
Not a member of this
agreement
Agreement for the Implementation of the Provisions of
the United Nations Convention on the Law of the Sea
of 10 December 1982 Relating to the Conservation
and Management of Straddling Fish Stocks and Highly
Migratory Fish Stocks
Not a member of this
agreement
Agreement for the Establishment of the Indian Ocean
Tuna Commission (IOTC), 1993
Ratification of the agreement
on 17th March, 1997
FAO Code of Conduct for Responsible Fisheries Thailand is a member of FAO
and agrees to follow the Code
of Conduct
International Plan of Action on Prevent, Deter and
Eliminate Illegal, Unreported and Unregulated
Fishing: IPOA-IUU
Thailand is a member of FAO
and agrees to follow the action
plan
International Plan of Action on Management of
Fishing Capacity: IPOA-CAPACITY
Thailand is a member of FAO
and agrees to follow the plan
International Plan of Action on Conservation of
Seabird in Long-line Fishing: IPOA-SEABIRDS
Thailand is a member of FAO
and agrees to follow the plan
International Plan of Action on Conservation of Shark:
IPOA-SHARKS
Thailand is a member of FAO
and agrees to follow the plan
Convention on the Conservation of Migratory Species
of Wild Animals, 1979 or CMS
Signed the convention on 12th
May, 2004
International Convention for the Safety of Life at Sea,
1974 or SOLAS
Ratification of the convention
on 18th December, 1984
A Review and Synthesis of Fisheries Data in Thailand August, 2011
30
Other regional fisheries management organizations that Thailand is a member of, in
addition to the IOTC listed above, include:
The Bay of Bengal Large Marine Ecosystem (BOBLME) established for the co-ordination of
the management of coastal and near-shore resources of member states around the Bay of
Bengal, including Bangladesh, India, Indonesia, Malaysia, Maldives, Myanmar and Sri
Lanka.
The Asia-Pacific Fisheries Commission (APFIC) established through the FAO among 20
states around Pacific and Indian Oceans, and based in Bangkok, for the promotion and
development and good management of living aquatic resources in the region.
The Coordinating Body in the Sea of East Asia (COBSEA) established among ten
member states (Australia, Cambodia, People‟s Republic of China, Republic of Korea,
Indonesia, Malaysia, Philippines, Singapore, Vietnam, and Thailand) to promote co-
ordination of activities amongst governments, NGOs, the UN and donour organizations
concerned with the East Asian marine environment.
Southeast Asian Fishery Development Centre (SEAFDEC), the major regional fisheries
organization, is an autonomous intergovernmental organization involving 11 member states
which promotes the development of fisheries potential through training, research and the
dissemination of information. Other regional fisheries management organizations that
Thailand is a member of, in addition to the IOTC listed above, include:
References cited
Ahmed, M., Boonchuwongse, P., Dechboon, W., Squires, D., 2007. Overfishing in the
Gulf of Thailand: policy challenges and bioeconomic analysis. Environment and
Development Economics 12, 145-172.
Chotiyaputta, C., Nootmorn, P., Jirapunpipat, K., 2002. Review of cephalopod fishery
production and long term changes in fish communities in the Gulf of Thailand. Bulletin
of Marine Science 71, 223-238.
Department of Fisheries, 2006, Fisheries statistics of Thailand, 2004. Fishery Information
Technology Center, Department of Fisheries, Ministry of Agriculture and Cooperatives,
Thailand. No. 4/2006, 91 p.
Department of Fisheries, 2010a, Thai fishing vessels statistics, 2008. Fishery Information
Technology Center, Department of Fisheries, Ministry of Agriculture and Cooperatives,
Thailand. No. 5/2010, 114 p.
A Review and Synthesis of Fisheries Data in Thailand August, 2011
31
Department of Fisheries, 2010b, Fisheries statistics of Thailand, 2008. Fishery
Information Technology Center, Department of Fisheries, Ministry of Agriculture and
Cooperatives, Thailand. No. 12/2010, 91 p.
Department of Fisheries, 2010c, Statistics of fisheries factory, 2008. Fishery Information
Technology Center, Department of Fisheries, Ministry of Agriculture and Cooperatives,
Thailand. No. 13/2010, 39 p.
Department of Industry, 2004. Developing a national strategy to increased capacity of
business investment, Thailand. (in Thai).
FAO, 2010a, Report of the second workshop on the assessment of fishery stock status in
South and Southeast Asia. Bangkok, 5–9 October 2009., FAO Fisheries and Aquaculture
Report. No. 940. FAO, Rome, 54 p.
FAO, 2010b. State of world fisheries and aquaculture, 2010. Food and Agriculture
Organization of the United Nations, Fisheries and Aquaculture Department, Rome. 197 p.
International Organization for Migration, 2011, Trafficking of fishermen in Thailand.
International Organization for Migration (IOM), Bangkok, 91 p.
Lymer, D., Funge-smith, S., Khemakorn, P., Naruepon, S., Ubolratana, S., 2008, A
review and synthesis of capture fisheries data in Thailand – large versus small-scale
fisheries. RAP Publication 2008/17. FAO Regional Office for Asia and the Pacific,
Bangkok, Thailand, 51 p.
Lymer, D., Funge-smith, S., Miao, W., 2010, Status and potential of fisheries and
aquaculture in Asia and the Pacific 2010. RAP Publication 2010/17. FAO Regional
Office for Asia and the Pacific, Bangkok, Thailand, 85 p.
Nootmorn, P. 2004, Final Report of Sampling Program on Tuna Longline Vessels
Unloading in Phuket, April 2003 to March 2004. Andaman Sea Fisheries Research and
Development Centre.
Panjarat, S., 2008, Sustainable fisheries in the Andaman Sea Coast of Thailand. Division
for ocean affairs and the law of the sea, Office of legal affairs, The United Nations, New
York, 107 p.
A Review and Synthesis of Fisheries Data in Thailand August, 2011
32
Stobutzki, I.C., Silvestre, G.T., Abu Talib, A., Krongprom, A., Supongpan, M.,
Khemakorn, P., Armada, N., Garces, L.R., 2006. Decline of demersal coastal fisheries
resources in three developing Asian countries. Fisheries Research 78, 130-142.
Thai Frozen Food Association (TFFA) newsletter, February 2011, Crisis in the tuna
industry, p. 4-7 (in Thai).
Thailand Research Fund, 2010. http://www.mkh.in.th/index.php/2010-03-22-18-03-
43/2010-03-25-08-38-55 (in Thai).
Tokrisna, R., 2006. Global fisheries and local problems: how ecost might help ameliorate
overfishing in Thailand? 10 p. in: Proceedings of the Thirteenth Biennial Conference of
the International Institute of Fisheries Economics & Trade, July 11-14, 2006, Portsmouth,
UK: Rebuilding Fisheries in an Uncertain Environment. Compiled by Ann L. Shriver.
United Nations Inter-Agency Project on Human Trafficking, 2009, Exploitation of
Cambodian men at Sea: facts about the trafficking of Cambodian men onto Thai fishing
boats. Siren case analysis, Strategic Information Response Network, United Nations
Inter-Agency Project on Human Trafficking (UNIAP): Phase III, Bangkok, 8 p.