A rationale for continuing mass antibiotic distributions for trachoma
10
BioMed Central Page 1 of 10 (page number not for citation purposes) BMC Infectious Diseases Open Access Research article A rationale for continuing mass antibiotic distributions for trachoma Kathryn J Ray* 1,2 , Travis C Porco 1,3 , Kevin C Hong 1 , David C Lee 1 , Wondu Alemayehu 4 , Muluken Melese 4 , Takele Lakew 4 , Elizabeth Yi 1 , Jenafir House 1 , Jaya D Chidambaram 1 , John P Whitcher 1,5,6,7 , Bruce D Gaynor 1,5 and Thomas M Lietman 1,5,6,7 Address: 1 Francis I. Proctor Foundation, University of California, San Francisco, USA, 2 Mathematics Department, San Francisco State University, USA, 3 Department of Public Health, San Francisco, USA, 4 Orbis International, Addis Ababa, Ethiopia, 5 Department of Ophthalmology, University of California, San Francisco, USA, 6 Department of Epidemiology & Biostatistics, University of California, San Francisco, USA and 7 Institute for Global Health, University of California, San Francisco, USA Email: Kathryn J Ray* - [email protected]; Travis C Porco - [email protected]; Kevin C Hong - [email protected]; David C Lee - [email protected]; Wondu Alemayehu - [email protected]; Muluken Melese - [email protected]; Takele Lakew - [email protected]; Elizabeth Yi - [email protected]; Jenafir House - [email protected]; Jaya D Chidambaram - [email protected]; John P Whitcher - [email protected]; Bruce D Gaynor - [email protected]; Thomas M Lietman - [email protected] * Corresponding author Abstract Background: The World Health Organization recommends periodic mass antibiotic distributions to reduce the ocular strains of chlamydia that cause trachoma, the world's leading cause of infectious blindness. Their stated goal is to control infection, not to completely eliminate it. A single mass distribution can dramatically reduce the prevalence of infection. However, if infection is not eliminated in every individual in the community, it may gradually return back into the community, so often repeated treatments are necessary. Since public health groups are reluctant to distribute antibiotics indefinitely, we are still in need of a proven long-term rationale. Here we use mathematical models to demonstrate that repeated antibiotic distributions can eliminate infection in a reasonable time period. Methods: We fit parameters of a stochastic epidemiological transmission model to data collected before and 6 months after a mass antibiotic distribution in a region of Ethiopia that is one of the most severely affected areas in the world. We validate the model by comparing our predicted results to Ethiopian data which was collected biannually for two years past the initial mass antibiotic distribution. We use the model to simulate the effect of different treatment programs in terms of local elimination of infection. Results: Simulations show that the average prevalence of infection across all villages progressively decreases after each treatment, as long as the frequency and coverage of antibiotics are high enough. Infection can be eliminated in more villages with each round of treatment. However, in the communities where infection is not eliminated, it returns to the same average level, forming the same stationary distribution. This phenomenon is also seen in subsequent epidemiological data Published: 7 August 2007 BMC Infectious Diseases 2007, 7:91 doi:10.1186/1471-2334-7-91 Received: 8 December 2006 Accepted: 7 August 2007 This article is available from: http://www.biomedcentral.com/1471-2334/7/91 © 2007 Ray et al; licensee BioMed Central Ltd. This is an Open Access article distributed under the terms of the Creative Commons Attribution License (http://creativecommons.org/licenses/by/2.0 ), which permits unrestricted use, distribution, and reproduction in any medium, provided the original work is properly cited.
-
Upload
independent -
Category
Documents
-
view
1 -
download
0
Transcript of A rationale for continuing mass antibiotic distributions for trachoma
BioMed CentralBMC Infectious Diseases
ss
Open AcceResearch articleA rationale for continuing mass antibiotic distributions for trachomaKathryn J Ray*1,2, Travis C Porco1,3, Kevin C Hong1, David C Lee1, Wondu Alemayehu4, Muluken Melese4, Takele Lakew4, Elizabeth Yi1, Jenafir House1, Jaya D Chidambaram1, John P Whitcher1,5,6,7, Bruce D Gaynor1,5 and Thomas M Lietman1,5,6,7Address: 1Francis I. Proctor Foundation, University of California, San Francisco, USA, 2Mathematics Department, San Francisco State University, USA, 3Department of Public Health, San Francisco, USA, 4Orbis International, Addis Ababa, Ethiopia, 5Department of Ophthalmology, University of California, San Francisco, USA, 6Department of Epidemiology & Biostatistics, University of California, San Francisco, USA and 7Institute for Global Health, University of California, San Francisco, USA
Email: Kathryn J Ray* - [email protected]; Travis C Porco - [email protected]; Kevin C Hong - [email protected]; David C Lee - [email protected]; Wondu Alemayehu - [email protected]; Muluken Melese - [email protected]; Takele Lakew - [email protected]; Elizabeth Yi - [email protected]; Jenafir House - [email protected]; Jaya D Chidambaram - [email protected]; John P Whitcher - [email protected]; Bruce D Gaynor - [email protected]; Thomas M Lietman - [email protected]
* Corresponding author
AbstractBackground: The World Health Organization recommends periodic mass antibiotic distributionsto reduce the ocular strains of chlamydia that cause trachoma, the world's leading cause ofinfectious blindness. Their stated goal is to control infection, not to completely eliminate it. A singlemass distribution can dramatically reduce the prevalence of infection. However, if infection is noteliminated in every individual in the community, it may gradually return back into the community,so often repeated treatments are necessary. Since public health groups are reluctant to distributeantibiotics indefinitely, we are still in need of a proven long-term rationale. Here we usemathematical models to demonstrate that repeated antibiotic distributions can eliminate infectionin a reasonable time period.
Methods: We fit parameters of a stochastic epidemiological transmission model to data collectedbefore and 6 months after a mass antibiotic distribution in a region of Ethiopia that is one of themost severely affected areas in the world. We validate the model by comparing our predictedresults to Ethiopian data which was collected biannually for two years past the initial mass antibioticdistribution. We use the model to simulate the effect of different treatment programs in terms oflocal elimination of infection.
Results: Simulations show that the average prevalence of infection across all villages progressivelydecreases after each treatment, as long as the frequency and coverage of antibiotics are highenough. Infection can be eliminated in more villages with each round of treatment. However, in thecommunities where infection is not eliminated, it returns to the same average level, forming thesame stationary distribution. This phenomenon is also seen in subsequent epidemiological data
Published: 7 August 2007
BMC Infectious Diseases 2007, 7:91 doi:10.1186/1471-2334-7-91
Received: 8 December 2006Accepted: 7 August 2007
This article is available from: http://www.biomedcentral.com/1471-2334/7/91
© 2007 Ray et al; licensee BioMed Central Ltd. This is an Open Access article distributed under the terms of the Creative Commons Attribution License (http://creativecommons.org/licenses/by/2.0), which permits unrestricted use, distribution, and reproduction in any medium, provided the original work is properly cited.
Page 1 of 10(page number not for citation purposes)
BMC Infectious Diseases 2007, 7:91 http://www.biomedcentral.com/1471-2334/7/91
from Ethiopia. Simulations suggest that a biannual treatment plan implemented for 5 years will leadto elimination in 95% of all villages.
Conclusion: Local elimination from a community is theoretically possible, even in the mostseverely infected communities. However, elimination from larger areas may require repeatedbiannual treatments and prevention of re-introduction from outside to treated areas.
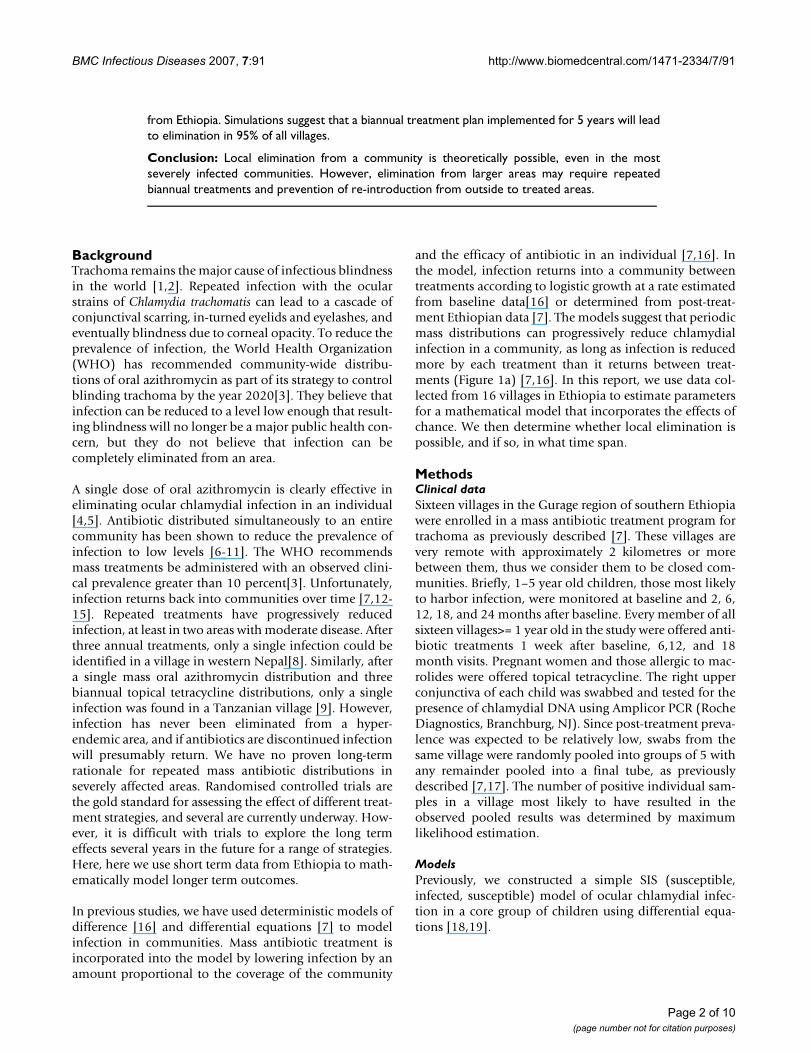
BackgroundTrachoma remains the major cause of infectious blindnessin the world [1,2]. Repeated infection with the ocularstrains of Chlamydia trachomatis can lead to a cascade ofconjunctival scarring, in-turned eyelids and eyelashes, andeventually blindness due to corneal opacity. To reduce theprevalence of infection, the World Health Organization(WHO) has recommended community-wide distribu-tions of oral azithromycin as part of its strategy to controlblinding trachoma by the year 2020[3]. They believe thatinfection can be reduced to a level low enough that result-ing blindness will no longer be a major public health con-cern, but they do not believe that infection can becompletely eliminated from an area.
A single dose of oral azithromycin is clearly effective ineliminating ocular chlamydial infection in an individual[4,5]. Antibiotic distributed simultaneously to an entirecommunity has been shown to reduce the prevalence ofinfection to low levels [6-11]. The WHO recommendsmass treatments be administered with an observed clini-cal prevalence greater than 10 percent[3]. Unfortunately,infection returns back into communities over time [7,12-15]. Repeated treatments have progressively reducedinfection, at least in two areas with moderate disease. Afterthree annual treatments, only a single infection could beidentified in a village in western Nepal[8]. Similarly, aftera single mass oral azithromycin distribution and threebiannual topical tetracycline distributions, only a singleinfection was found in a Tanzanian village [9]. However,infection has never been eliminated from a hyper-endemic area, and if antibiotics are discontinued infectionwill presumably return. We have no proven long-termrationale for repeated mass antibiotic distributions inseverely affected areas. Randomised controlled trials arethe gold standard for assessing the effect of different treat-ment strategies, and several are currently underway. How-ever, it is difficult with trials to explore the long termeffects several years in the future for a range of strategies.Here, here we use short term data from Ethiopia to math-ematically model longer term outcomes.
In previous studies, we have used deterministic models ofdifference [16] and differential equations [7] to modelinfection in communities. Mass antibiotic treatment isincorporated into the model by lowering infection by anamount proportional to the coverage of the community
and the efficacy of antibiotic in an individual [7,16]. Inthe model, infection returns into a community betweentreatments according to logistic growth at a rate estimatedfrom baseline data[16] or determined from post-treat-ment Ethiopian data [7]. The models suggest that periodicmass distributions can progressively reduce chlamydialinfection in a community, as long as infection is reducedmore by each treatment than it returns between treat-ments (Figure 1a) [7,16]. In this report, we use data col-lected from 16 villages in Ethiopia to estimate parametersfor a mathematical model that incorporates the effects ofchance. We then determine whether local elimination ispossible, and if so, in what time span.
MethodsClinical dataSixteen villages in the Gurage region of southern Ethiopiawere enrolled in a mass antibiotic treatment program fortrachoma as previously described [7]. These villages arevery remote with approximately 2 kilometres or morebetween them, thus we consider them to be closed com-munities. Briefly, 1–5 year old children, those most likelyto harbor infection, were monitored at baseline and 2, 6,12, 18, and 24 months after baseline. Every member of allsixteen villages>= 1 year old in the study were offered anti-biotic treatments 1 week after baseline, 6,12, and 18month visits. Pregnant women and those allergic to mac-rolides were offered topical tetracycline. The right upperconjunctiva of each child was swabbed and tested for thepresence of chlamydial DNA using Amplicor PCR (RocheDiagnostics, Branchburg, NJ). Since post-treatment preva-lence was expected to be relatively low, swabs from thesame village were randomly pooled into groups of 5 withany remainder pooled into a final tube, as previouslydescribed [7,17]. The number of positive individual sam-ples in a village most likely to have resulted in theobserved pooled results was determined by maximumlikelihood estimation.
ModelsPreviously, we constructed a simple SIS (susceptible,infected, susceptible) model of ocular chlamydial infec-tion in a core group of children using differential equa-tions [18,19].
Page 2 of 10(page number not for citation purposes)
BMC Infectious Diseases 2007, 7:91 http://www.biomedcentral.com/1471-2334/7/91
where I is number of infectious cases, t is time, γ is the rateof recovery from infection, β is a transmission parameter,and N is the effective population size. Treatment was sim-ulated by reducing the number of individuals infected by
d I
d tN I
I
NI
( )
( )( )= − −β γ (1)
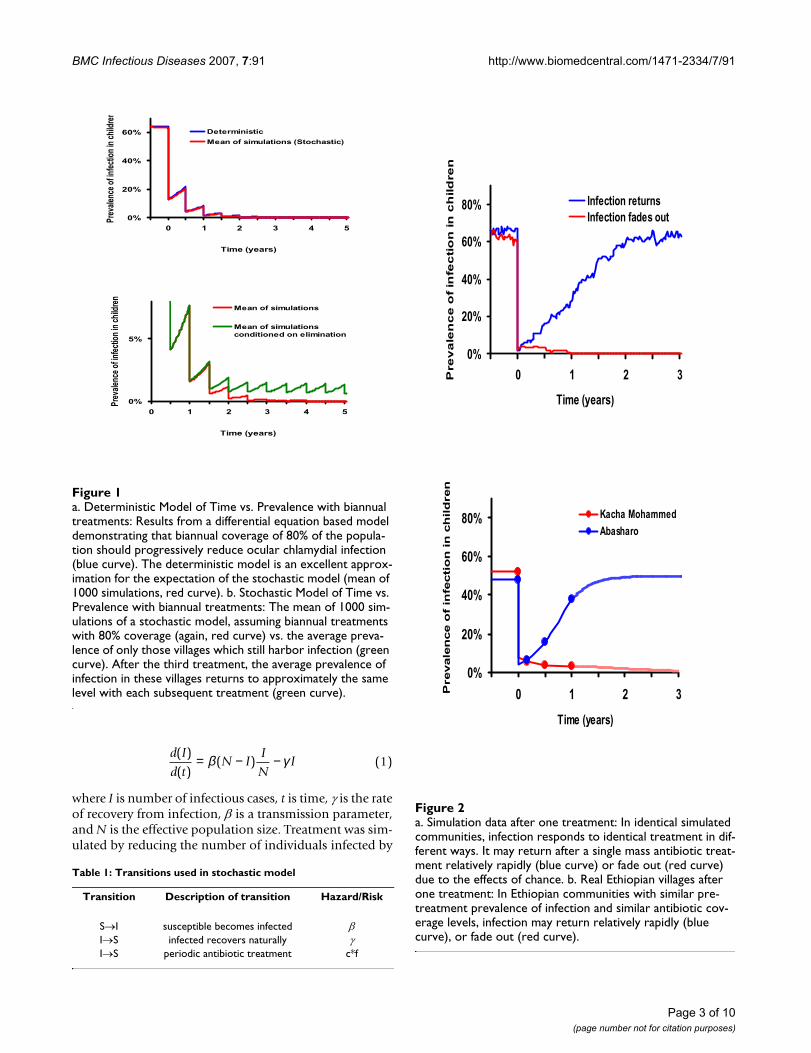
a. Simulation data after one treatment: In identical simulated communities, infection responds to identical treatment in dif-ferent ways. It may return after a single mass antibiotic treat-ment relatively rapidly (blue curve) or fade out (red curve) due to the effects of chanceFigure 2a. Simulation data after one treatment: In identical simulated communities, infection responds to identical treatment in dif-ferent ways. It may return after a single mass antibiotic treat-ment relatively rapidly (blue curve) or fade out (red curve) due to the effects of chance. b. Real Ethiopian villages after one treatment: In Ethiopian communities with similar pre-treatment prevalence of infection and similar antibiotic cov-erage levels, infection may return relatively rapidly (blue curve), or fade out (red curve).
0%
20%
40%
60%
80%
-0.5 0 0.5 1 1.5 2 2.5 3
Time (years)
Pre
va
len
ce
of
infe
cti
on
in
ch
ild
ren
Infection returnsInfection fades out
Figure 2b. Real Ethiopian villages after one treatment
0%
40%
60%
80%
-0.5 0 0.5 1 1.5 2 2.5 3
Time (years)
Pre
vale
nf
infe
cti
on
in
ch
ild
ren
Kacha Mohammed Abasharo
20%ce o
a. Deterministic Model of Time vs. Prevalence with biannual treatments: Results from a differential equation based model demonstrating that biannual coverage of 80% of the popula-tion should progressively reduce ocular chlamydial infection (blue curve)Figure 1a. Deterministic Model of Time vs. Prevalence with biannual treatments: Results from a differential equation based model demonstrating that biannual coverage of 80% of the popula-tion should progressively reduce ocular chlamydial infection (blue curve). The deterministic model is an excellent approx-imation for the expectation of the stochastic model (mean of 1000 simulations, red curve). b. Stochastic Model of Time vs. Prevalence with biannual treatments: The mean of 1000 sim-ulations of a stochastic model, assuming biannual treatments with 80% coverage (again, red curve) vs. the average preva-lence of only those villages which still harbor infection (green curve). After the third treatment, the average prevalence of infection in these villages returns to approximately the same level with each subsequent treatment (green curve).
0%
20%
40%
60%
-0.5
0 0.5 1 1.5 2 2.5 3 3.5 4 4.5 5
Time (years)
Prev
alenc
e of in
fect
ion
in ch
ildre
n
Deterministic
Mean of simulations (Stochastic)
0%
5%
0 0.5 1 1.5 2 2.5 3 3.5 4 4.5 5
Time (years)
Prev
alenc
e of in
fect
ion
in ch
ildre
n
Mean of simulations
Mean of simulationsconditioned on elimination
Table 1: Transitions used in stochastic model
Transition Description of transition Hazard/Risk
S→I susceptible becomes infected βI→S infected recovers naturally γI→S periodic antibiotic treatment c*f
Page 3 of 10(page number not for citation purposes)
BMC Infectious Diseases 2007, 7:91 http://www.biomedcentral.com/1471-2334/7/91
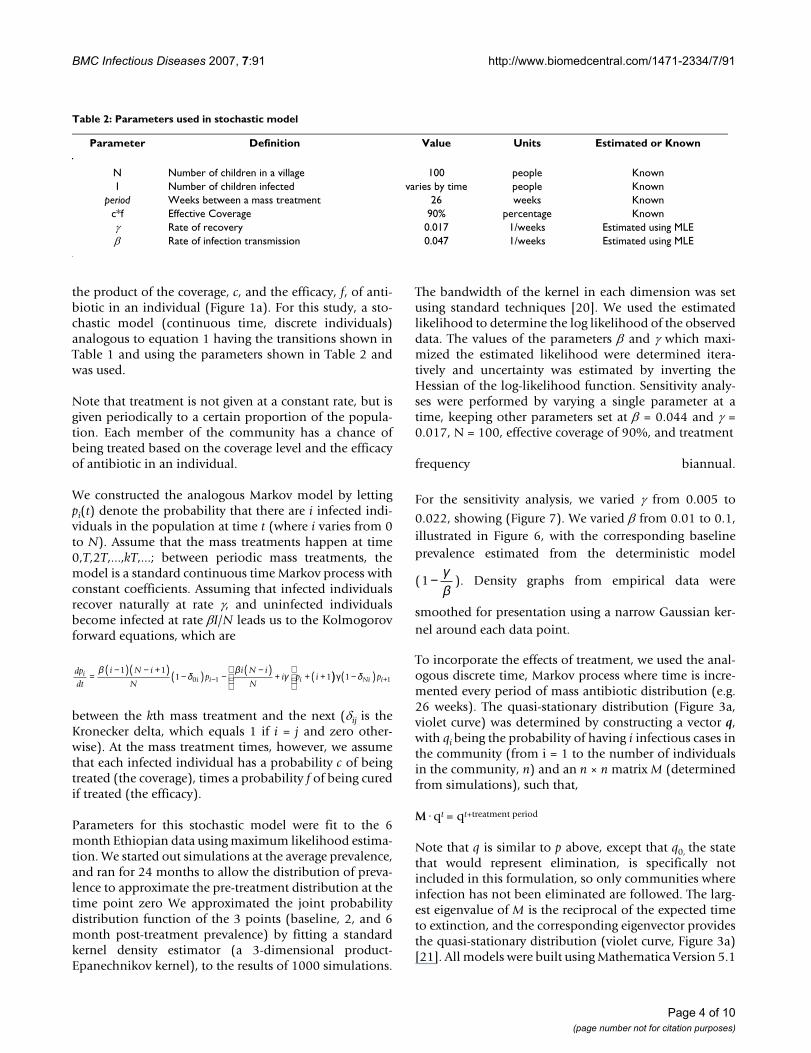
the product of the coverage, c, and the efficacy, f, of anti-biotic in an individual (Figure 1a). For this study, a sto-chastic model (continuous time, discrete individuals)analogous to equation 1 having the transitions shown inTable 1 and using the parameters shown in Table 2 andwas used.
Note that treatment is not given at a constant rate, but isgiven periodically to a certain proportion of the popula-tion. Each member of the community has a chance ofbeing treated based on the coverage level and the efficacyof antibiotic in an individual.
We constructed the analogous Markov model by lettingpi(t) denote the probability that there are i infected indi-viduals in the population at time t (where i varies from 0to N). Assume that the mass treatments happen at time0,T,2T,...,kT,...; between periodic mass treatments, themodel is a standard continuous time Markov process withconstant coefficients. Assuming that infected individualsrecover naturally at rate γ, and uninfected individualsbecome infected at rate βI/N leads us to the Kolmogorovforward equations, which are
between the kth mass treatment and the next (δij is theKronecker delta, which equals 1 if i = j and zero other-wise). At the mass treatment times, however, we assumethat each infected individual has a probability c of beingtreated (the coverage), times a probability f of being curedif treated (the efficacy).
Parameters for this stochastic model were fit to the 6month Ethiopian data using maximum likelihood estima-tion. We started out simulations at the average prevalence,and ran for 24 months to allow the distribution of preva-lence to approximate the pre-treatment distribution at thetime point zero We approximated the joint probabilitydistribution function of the 3 points (baseline, 2, and 6month post-treatment prevalence) by fitting a standardkernel density estimator (a 3-dimensional product-Epanechnikov kernel), to the results of 1000 simulations.
The bandwidth of the kernel in each dimension was setusing standard techniques [20]. We used the estimatedlikelihood to determine the log likelihood of the observeddata. The values of the parameters β and γ which maxi-mized the estimated likelihood were determined itera-tively and uncertainty was estimated by inverting theHessian of the log-likelihood function. Sensitivity analy-ses were performed by varying a single parameter at atime, keeping other parameters set at β = 0.044 and γ =0.017, N = 100, effective coverage of 90%, and treatment
frequency biannual.
For the sensitivity analysis, we varied γ from 0.005 to
0.022, showing (Figure 7). We varied β from 0.01 to 0.1,illustrated in Figure 6, with the corresponding baselineprevalence estimated from the deterministic model
( ). Density graphs from empirical data were
smoothed for presentation using a narrow Gaussian ker-nel around each data point.
To incorporate the effects of treatment, we used the anal-ogous discrete time, Markov process where time is incre-mented every period of mass antibiotic distribution (e.g.26 weeks). The quasi-stationary distribution (Figure 3a,violet curve) was determined by constructing a vector q,with qi being the probability of having i infectious cases inthe community (from i = 1 to the number of individualsin the community, n) and an n × n matrix M (determinedfrom simulations), such that,
M·qt = qt+treatment period
Note that q is similar to p above, except that q0, the statethat would represent elimination, is specifically notincluded in this formulation, so only communities whereinfection has not been eliminated are followed. The larg-est eigenvalue of M is the reciprocal of the expected timeto extinction, and the corresponding eigenvector providesthe quasi-stationary distribution (violet curve, Figure 3a)[21]. All models were built using Mathematica Version 5.1
dp
dt
i N i
Np
i N i
Ni p ii
i i i=−( ) − +( )
−( ) −−( )
+
+ +(−
βδ
βγ
1 11 10 1 )) −( ) +γ 1 1δNi ip
1− γβ
Table 2: Parameters used in stochastic model
Parameter Definition Value Units Estimated or Known
N Number of children in a village 100 people KnownI Number of children infected varies by time people Known
period Weeks between a mass treatment 26 weeks Knownc*f Effective Coverage 90% percentage Knownγ Rate of recovery 0.017 1/weeks Estimated using MLEβ Rate of infection transmission 0.047 1/weeks Estimated using MLE
Page 4 of 10(page number not for citation purposes)
BMC Infectious Diseases 2007, 7:91 http://www.biomedcentral.com/1471-2334/7/91
using the statistical packages Discrete Distributions andContinuous Distributions.
Results and DiscussionParameters for a stochastic model were estimated fromlongitudinal data from approximately 5000 peoplewithin 16 separate Ethiopian villages during the first 6months after a mass distribution. The MLE estimates forour model gave β = 0.044 and γ = 0.017. Gamma can beinterpreted as the reciprocal of the duration of infection,and here would be approximately 1 year.
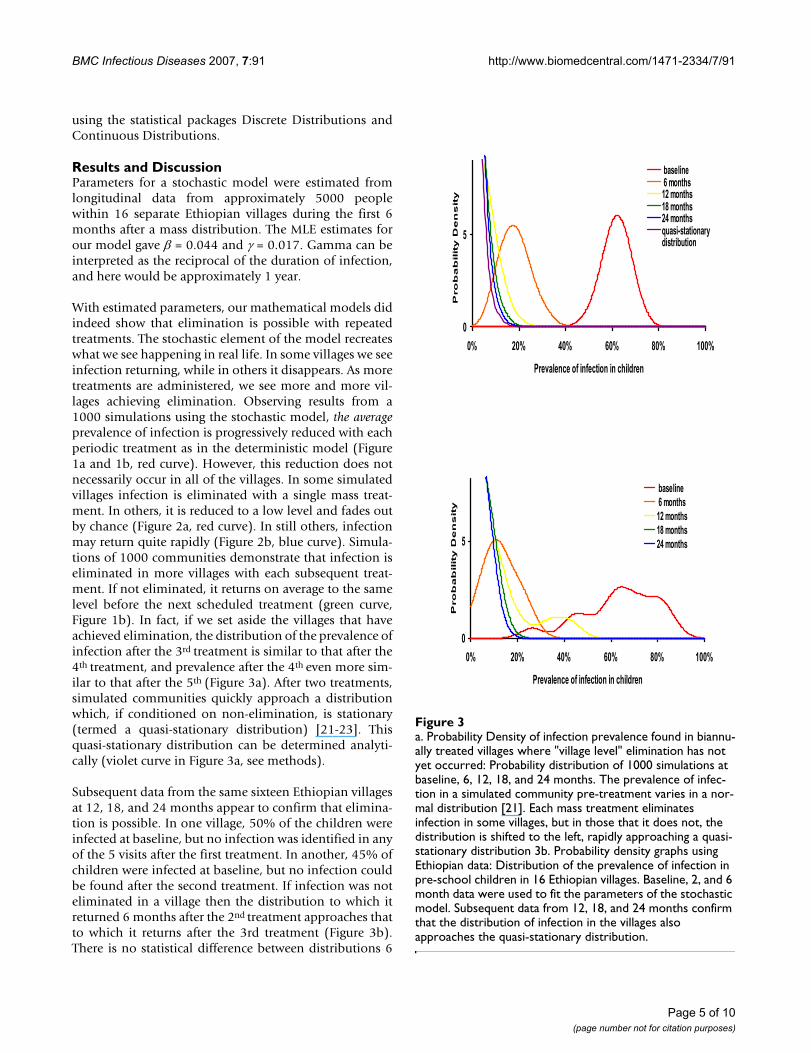
With estimated parameters, our mathematical models didindeed show that elimination is possible with repeatedtreatments. The stochastic element of the model recreateswhat we see happening in real life. In some villages we seeinfection returning, while in others it disappears. As moretreatments are administered, we see more and more vil-lages achieving elimination. Observing results from a1000 simulations using the stochastic model, the averageprevalence of infection is progressively reduced with eachperiodic treatment as in the deterministic model (Figure1a and 1b, red curve). However, this reduction does notnecessarily occur in all of the villages. In some simulatedvillages infection is eliminated with a single mass treat-ment. In others, it is reduced to a low level and fades outby chance (Figure 2a, red curve). In still others, infectionmay return quite rapidly (Figure 2b, blue curve). Simula-tions of 1000 communities demonstrate that infection iseliminated in more villages with each subsequent treat-ment. If not eliminated, it returns on average to the samelevel before the next scheduled treatment (green curve,Figure 1b). In fact, if we set aside the villages that haveachieved elimination, the distribution of the prevalence ofinfection after the 3rd treatment is similar to that after the4th treatment, and prevalence after the 4th even more sim-ilar to that after the 5th (Figure 3a). After two treatments,simulated communities quickly approach a distributionwhich, if conditioned on non-elimination, is stationary(termed a quasi-stationary distribution) [21-23]. Thisquasi-stationary distribution can be determined analyti-cally (violet curve in Figure 3a, see methods).
Subsequent data from the same sixteen Ethiopian villagesat 12, 18, and 24 months appear to confirm that elimina-tion is possible. In one village, 50% of the children wereinfected at baseline, but no infection was identified in anyof the 5 visits after the first treatment. In another, 45% ofchildren were infected at baseline, but no infection couldbe found after the second treatment. If infection was noteliminated in a village then the distribution to which itreturned 6 months after the 2nd treatment approaches thatto which it returns after the 3rd treatment (Figure 3b).There is no statistical difference between distributions 6
a. Probability Density of infection prevalence found in biannu-ally treated villages where "village level" elimination has not yet occurred: Probability distribution of 1000 simulations at baseline, 6, 12, 18, and 24 monthsFigure 3a. Probability Density of infection prevalence found in biannu-ally treated villages where "village level" elimination has not yet occurred: Probability distribution of 1000 simulations at baseline, 6, 12, 18, and 24 months. The prevalence of infec-tion in a simulated community pre-treatment varies in a nor-mal distribution [21]. Each mass treatment eliminates infection in some villages, but in those that it does not, the distribution is shifted to the left, rapidly approaching a quasi-stationary distribution 3b. Probability density graphs using Ethiopian data: Distribution of the prevalence of infection in pre-school children in 16 Ethiopian villages. Baseline, 2, and 6 month data were used to fit the parameters of the stochastic model. Subsequent data from 12, 18, and 24 months confirm that the distribution of infection in the villages also approaches the quasi-stationary distribution.
0
5
0% 20% 40% 60% 80% 100%
Prevalence of infection in children
Pro
ba
bilit
y D
en
sit
y
baseline 6 months12 months18 months24 monthsquasi-stationarydistribution
0
5
0% 20% 40% 60% 80% 100%
Prevalence of infection in children
Pro
ba
bilit
y D
en
sit
y
baseline 6 months12 months18 months24 months
Page 5 of 10(page number not for citation purposes)

BMC Infectious Diseases 2007, 7:91 http://www.biomedcentral.com/1471-2334/7/91
months after the 3rd and 4th treatments (Kolmogorov-Smirnov test, P = 0.95 comparing 18 and 24 month data).
This stochastic model does not incorporate re-introduc-tion of infection from neighbouring villages. The rate thatinfection is re-introduced is not known and is difficult toestimate. Re-introduction appears not to be frequent, ascommunities do well in the short term, whether or notneighbouring villages were treated (unpublished data).On the other hand, it may well be occurring [13]. Somevillages in which no infection could be found in childrenfor several visits had infection identified at a subsequentvisit. Even occasional transmission from other communi-ties would prevent sustained elimination. Interestingly,the quasi-stationary distribution can be estimated frommodels by only considering villages where infection hasoccurred (the limiting case of the curves in Figure 3), bypreventing the last infectious case from disappearing (vio-let curve in Figure 3a), or by artificially introducing a sin-gle infection into a community whenever infection hasbeen eliminated, much as might be expected with re-introduction[21]. Since each of these methods mimics re-introduction, then the quasi-stationary distribution maybe a reasonable estimate of the distribution of prevalenceof infection.
Investigators are struggling to determine why infectionreturns in some villages and not others. This search isimportant, but may not be fruitful, since a great deal ofvariation is expected even in otherwise similar villages.Simulations allow us to construct communities that areabsolutely identical, and variation is still observed due tothe vagaries of who infects whom. Infection will be elim-inated in some fortunate villages. In other, essentiallyidentical villages, it will continue to return to the sameaverage level even after multiple treatments (Figure 2a). Inpractice, we have also observed a varied response to treat-ment in similar villages (Figure 2b) [12].
Often overall prevalence is reported, but we believe thereneeds to be a shift in the way we evaluate progress. Theaverage prevalence of infection across several villages canbe misleading. A regional prevalence of 5% does notmean that 1 in 20 children in each village are infected.More likely, infection has been eliminated in most vil-lages but has returned in a few villages to a level that mayfar exceed 5%. A better measure of success of a trachomaprogram may be the proportion of villages in which infec-tion has been eliminated. While the power of samplingallows the mean prevalence to be obtained relatively eas-ily, it should be interpreted in terms of what it revealsabout the underlying process; after several rounds of treat-ment, the mean represents some villages where infection
Number of months between treatments vs. Years until elimi-nation: Here we vary treatment frequency in the stochastic model, while keeping other parameters the sameFigure 5Number of months between treatments vs. Years until elimi-nation: Here we vary treatment frequency in the stochastic model, while keeping other parameters the same. Other parameters are 90% effective coverage, an effective popula-tion size of 100 children, γ = 0.017, and β = 0.044.
0
5
10
15
20
25
0 6 12 18 24 30
Number of months between treatments
Years
un
til elim
inati
on
elimination in 50% of villages
elimination in 75% of villages
elimination in 95% of villages
Coverage vs. Years until elimination: Here we vary coverage in the stochastic model, while keeping other parameters the sameFigure 4Coverage vs. Years until elimination: Here we vary coverage in the stochastic model, while keeping other parameters the same. Other parameters are biannual treatment an effective population size of 100 children, γ = 0.017, and β = 0.044.
0
4
8
12
0% 65% 75% 85% 95%
Coverage*
Yea
rs u
nti
l elim
inat
ion elimination in 50% of villages
elimination in 75% of villages
elimination in 95% of villages
*assuming 95% efficacy
Page 6 of 10(page number not for citation purposes)
BMC Infectious Diseases 2007, 7:91 http://www.biomedcentral.com/1471-2334/7/91
has been completely eliminated and others where infec-tion has returned to a level chosen from the quasi-station-ary distribution. Thus the decision for stoppingdistributions may need to depend on whether infectionhas been eliminated locally.
Periodic mass antibiotic treatments can locally eliminatethe ocular chlamydia that cause blinding trachoma, ifgiven frequently and to a large portion of the population[7,16]. Models suggest it will return to the same distribu-tion before the next scheduled treatment. If infection isnot eliminated from a community after several mass treat-ments, then stochastic Ethiopian data demonstrates thatthis quasi-stationary distribution is closely approachedafter only two or three treatments. The WHO's strategyrequires only for antibiotics to reduce the level of infec-tion and expects that other measures will be necessary fora permanent solution. Their current recommendation ofthree treatments before re-evaluation is reasonable. If con-stant re-infection of communities prevents elimination,then subsequent treatments may only serve to maintainthe prevalence in a stationary distribution, not lower it.However, if infection between neighbouring communi-ties is rare or can be reduced by treating large areas withina narrow time frame, then elimination over larger areasthan a village may be achieved. There is some concern thatcommunities from which trachoma has been partiallyeliminated will lose much of their immunity to chlamy-
dia, only to have it return with a vengeance after treat-ments have been discontinued [24-26]. This has yet to bedemonstrated convincingly in practice [26], but potentialloss of immunity could easily be included in future mod-els.
Partners in the WHO's trachoma program have distrib-uted over 30 million doses of oral azithromycin so far,and over 1 million in Ethiopia. These programs areexpanding rapidly. There has been evidence of subsequentre-emergence of infection in some recent trials of azithro-mycin, suggesting coverage and dosing intervals in masstherapy need careful consideration [7,14,24,27]. Biannualtreatments are costly, require more resources, and maycontribute to antibiotic resistance in chlamydia and otherpathogens such as Streptococcus pneumoniae [26,28-30].The benefits of mass therapy thus need to be weighedagainst the potential emergence of antibiotic resistancewhich will require long term surveillance. But if necessaryfor local elimination biannual distributions may be morecost effective in the long run in severely affected areas. Theelimination of a bacterial disease from a large area withmass antibiotics would be major medical breakthrough.
Simulations were run to estimate the number of rounds oftreatment necessary to achieve elimination in 50%, 75%,and 95% of the villages. Elimination depends on the effi-
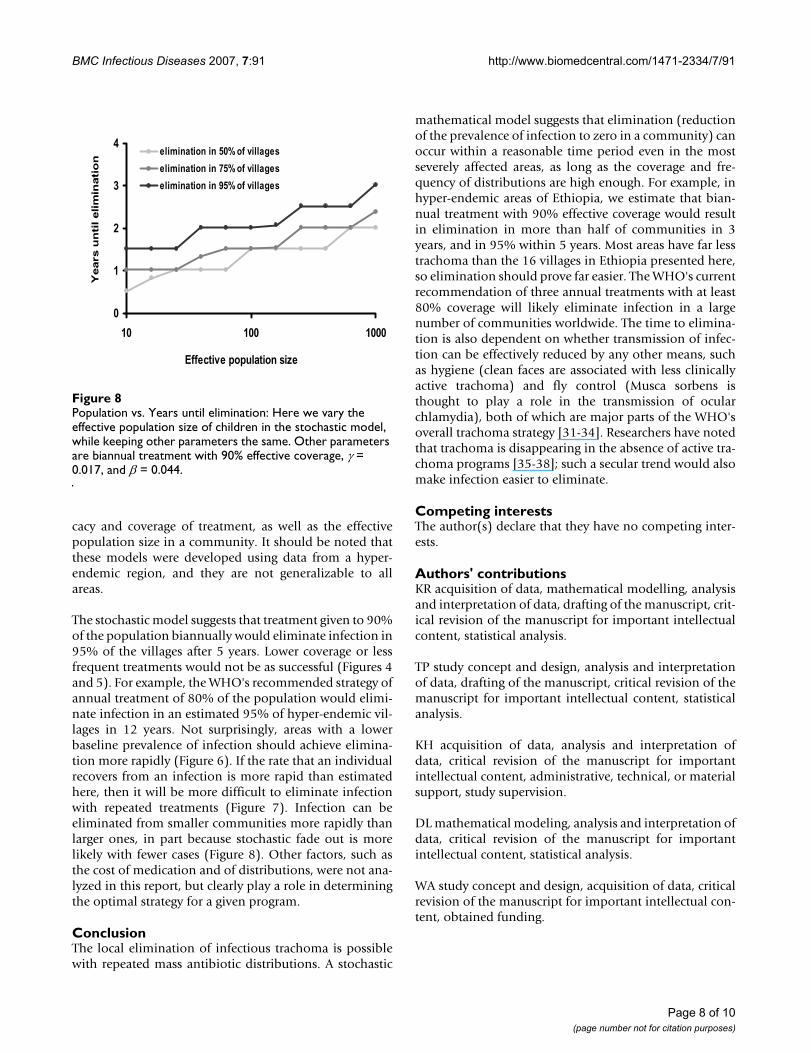
Recovery rate vs. Years until elimination: Here we vary the recovery rate in the stochastic model, while keeping other parameters the sameFigure 7Recovery rate vs. Years until elimination: Here we vary the recovery rate in the stochastic model, while keeping other parameters the same. Other parameters are biannual treat-ment with 90% effective coverage, an effective population size of 100 children, and β = 0.044.
0
1
2
3
4
5
6
10 20 30 40 50Recovery Rate (weeks)
Years u
nti
l elim
inati
on
elimination in 50% of villages
elimination in 75% of villages
elimination in 95% of villages
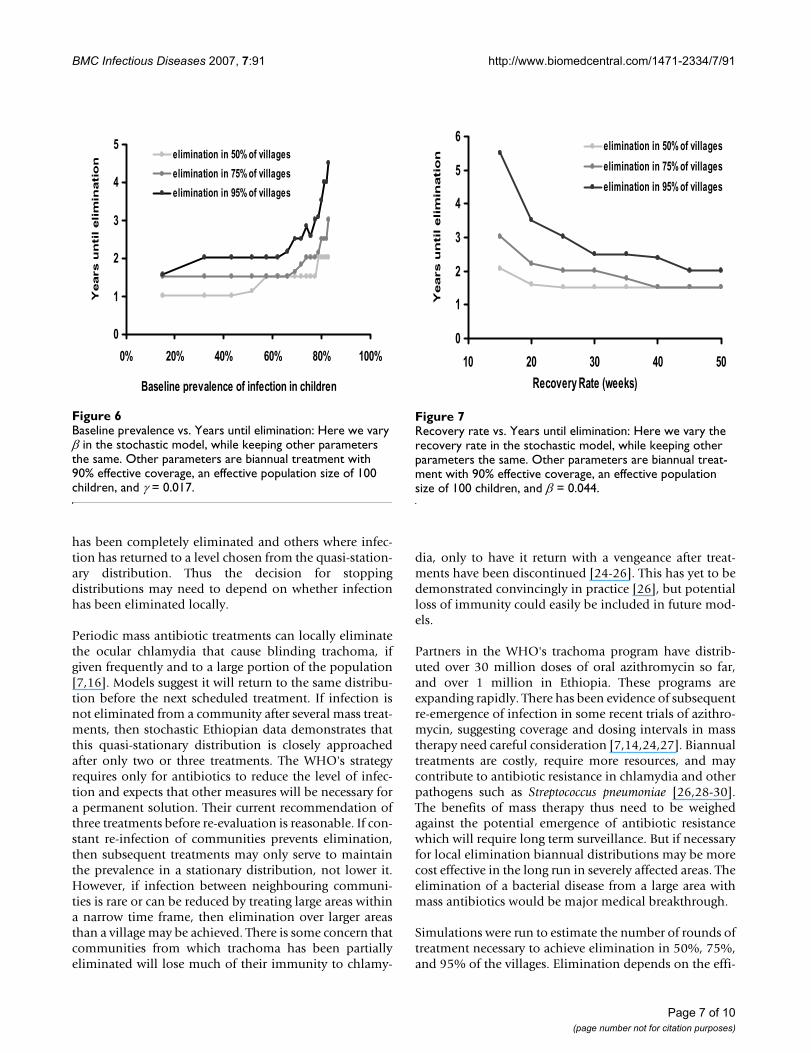
Baseline prevalence vs. Years until elimination: Here we vary β in the stochastic model, while keeping other parameters the sameFigure 6Baseline prevalence vs. Years until elimination: Here we vary β in the stochastic model, while keeping other parameters the same. Other parameters are biannual treatment with 90% effective coverage, an effective population size of 100 children, and γ = 0.017.
0
1
2
3
4
5
0% 20% 40% 60% 80% 100%
Baseline prevalence of infection in children
Years
un
til elim
inati
on
elimination in 50% of villages
elimination in 75% of villages
elimination in 95% of villages
Page 7 of 10(page number not for citation purposes)
BMC Infectious Diseases 2007, 7:91 http://www.biomedcentral.com/1471-2334/7/91
cacy and coverage of treatment, as well as the effectivepopulation size in a community. It should be noted thatthese models were developed using data from a hyper-endemic region, and they are not generalizable to allareas.
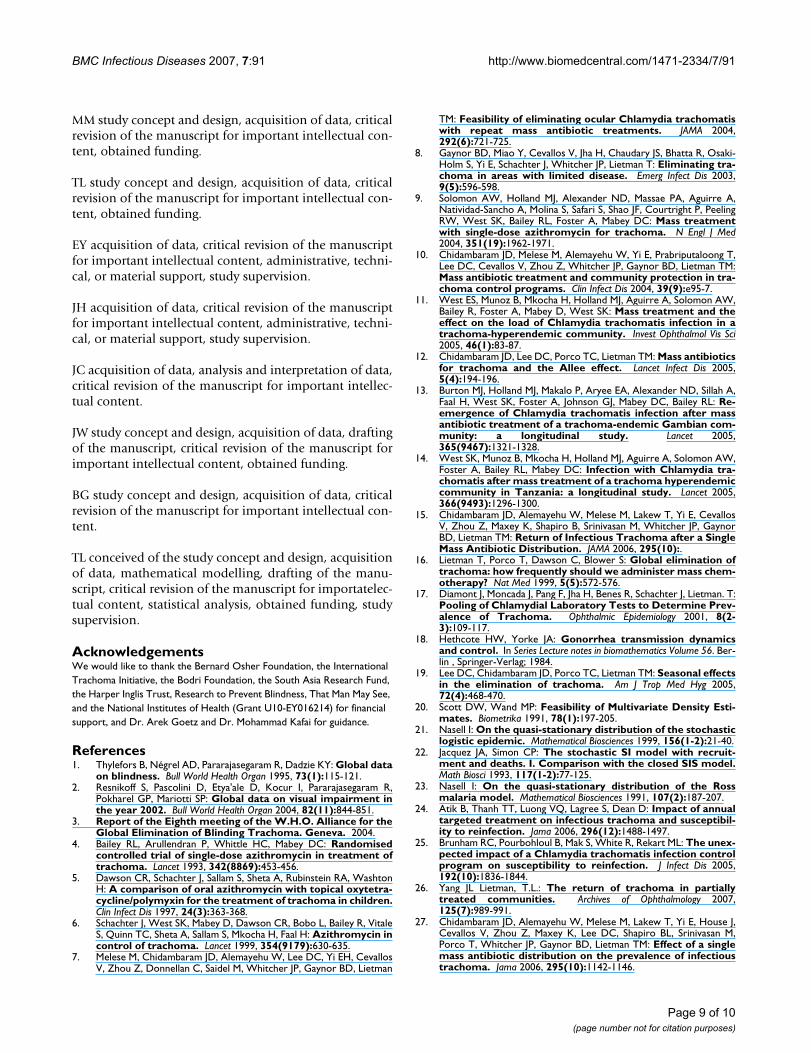
The stochastic model suggests that treatment given to 90%of the population biannually would eliminate infection in95% of the villages after 5 years. Lower coverage or lessfrequent treatments would not be as successful (Figures 4and 5). For example, the WHO's recommended strategy ofannual treatment of 80% of the population would elimi-nate infection in an estimated 95% of hyper-endemic vil-lages in 12 years. Not surprisingly, areas with a lowerbaseline prevalence of infection should achieve elimina-tion more rapidly (Figure 6). If the rate that an individualrecovers from an infection is more rapid than estimatedhere, then it will be more difficult to eliminate infectionwith repeated treatments (Figure 7). Infection can beeliminated from smaller communities more rapidly thanlarger ones, in part because stochastic fade out is morelikely with fewer cases (Figure 8). Other factors, such asthe cost of medication and of distributions, were not ana-lyzed in this report, but clearly play a role in determiningthe optimal strategy for a given program.
ConclusionThe local elimination of infectious trachoma is possiblewith repeated mass antibiotic distributions. A stochastic
mathematical model suggests that elimination (reductionof the prevalence of infection to zero in a community) canoccur within a reasonable time period even in the mostseverely affected areas, as long as the coverage and fre-quency of distributions are high enough. For example, inhyper-endemic areas of Ethiopia, we estimate that bian-nual treatment with 90% effective coverage would resultin elimination in more than half of communities in 3years, and in 95% within 5 years. Most areas have far lesstrachoma than the 16 villages in Ethiopia presented here,so elimination should prove far easier. The WHO's currentrecommendation of three annual treatments with at least80% coverage will likely eliminate infection in a largenumber of communities worldwide. The time to elimina-tion is also dependent on whether transmission of infec-tion can be effectively reduced by any other means, suchas hygiene (clean faces are associated with less clinicallyactive trachoma) and fly control (Musca sorbens isthought to play a role in the transmission of ocularchlamydia), both of which are major parts of the WHO'soverall trachoma strategy [31-34]. Researchers have notedthat trachoma is disappearing in the absence of active tra-choma programs [35-38]; such a secular trend would alsomake infection easier to eliminate.
Competing interestsThe author(s) declare that they have no competing inter-ests.
Authors' contributionsKR acquisition of data, mathematical modelling, analysisand interpretation of data, drafting of the manuscript, crit-ical revision of the manuscript for important intellectualcontent, statistical analysis.
TP study concept and design, analysis and interpretationof data, drafting of the manuscript, critical revision of themanuscript for important intellectual content, statisticalanalysis.
KH acquisition of data, analysis and interpretation ofdata, critical revision of the manuscript for importantintellectual content, administrative, technical, or materialsupport, study supervision.
DL mathematical modeling, analysis and interpretation ofdata, critical revision of the manuscript for importantintellectual content, statistical analysis.
WA study concept and design, acquisition of data, criticalrevision of the manuscript for important intellectual con-tent, obtained funding.
Population vs. Years until elimination: Here we vary the effective population size of children in the stochastic model, while keeping other parameters the sameFigure 8Population vs. Years until elimination: Here we vary the effective population size of children in the stochastic model, while keeping other parameters the same. Other parameters are biannual treatment with 90% effective coverage, γ = 0.017, and β = 0.044.
0
1
2
3
4
10 100 1000
Effective population size
Years
un
til elim
inati
on
elimination in 50% of villages
elimination in 75% of villages
elimination in 95% of villages
Page 8 of 10(page number not for citation purposes)
BMC Infectious Diseases 2007, 7:91 http://www.biomedcentral.com/1471-2334/7/91
MM study concept and design, acquisition of data, criticalrevision of the manuscript for important intellectual con-tent, obtained funding.
TL study concept and design, acquisition of data, criticalrevision of the manuscript for important intellectual con-tent, obtained funding.
EY acquisition of data, critical revision of the manuscriptfor important intellectual content, administrative, techni-cal, or material support, study supervision.
JH acquisition of data, critical revision of the manuscriptfor important intellectual content, administrative, techni-cal, or material support, study supervision.
JC acquisition of data, analysis and interpretation of data,critical revision of the manuscript for important intellec-tual content.
JW study concept and design, acquisition of data, draftingof the manuscript, critical revision of the manuscript forimportant intellectual content, obtained funding.
BG study concept and design, acquisition of data, criticalrevision of the manuscript for important intellectual con-tent.
TL conceived of the study concept and design, acquisitionof data, mathematical modelling, drafting of the manu-script, critical revision of the manuscript for importatelec-tual content, statistical analysis, obtained funding, studysupervision.
AcknowledgementsWe would like to thank the Bernard Osher Foundation, the International Trachoma Initiative, the Bodri Foundation, the South Asia Research Fund, the Harper Inglis Trust, Research to Prevent Blindness, That Man May See, and the National Institutes of Health (Grant U10-EY016214) for financial support, and Dr. Arek Goetz and Dr. Mohammad Kafai for guidance.
References1. Thylefors B, Négrel AD, Pararajasegaram R, Dadzie KY: Global data
on blindness. Bull World Health Organ 1995, 73(1):115-121.2. Resnikoff S, Pascolini D, Etya'ale D, Kocur I, Pararajasegaram R,
Pokharel GP, Mariotti SP: Global data on visual impairment inthe year 2002. Bull World Health Organ 2004, 82(11):844-851.
3. Report of the Eighth meeting of the W.H.O. Alliance for theGlobal Elimination of Blinding Trachoma. Geneva. 2004.
4. Bailey RL, Arullendran P, Whittle HC, Mabey DC: Randomisedcontrolled trial of single-dose azithromycin in treatment oftrachoma. Lancet 1993, 342(8869):453-456.
5. Dawson CR, Schachter J, Sallam S, Sheta A, Rubinstein RA, WashtonH: A comparison of oral azithromycin with topical oxytetra-cycline/polymyxin for the treatment of trachoma in children.Clin Infect Dis 1997, 24(3):363-368.
6. Schachter J, West SK, Mabey D, Dawson CR, Bobo L, Bailey R, VitaleS, Quinn TC, Sheta A, Sallam S, Mkocha H, Faal H: Azithromycin incontrol of trachoma. Lancet 1999, 354(9179):630-635.
7. Melese M, Chidambaram JD, Alemayehu W, Lee DC, Yi EH, CevallosV, Zhou Z, Donnellan C, Saidel M, Whitcher JP, Gaynor BD, Lietman
TM: Feasibility of eliminating ocular Chlamydia trachomatiswith repeat mass antibiotic treatments. JAMA 2004,292(6):721-725.
8. Gaynor BD, Miao Y, Cevallos V, Jha H, Chaudary JS, Bhatta R, Osaki-Holm S, Yi E, Schachter J, Whitcher JP, Lietman T: Eliminating tra-choma in areas with limited disease. Emerg Infect Dis 2003,9(5):596-598.
9. Solomon AW, Holland MJ, Alexander ND, Massae PA, Aguirre A,Natividad-Sancho A, Molina S, Safari S, Shao JF, Courtright P, PeelingRW, West SK, Bailey RL, Foster A, Mabey DC: Mass treatmentwith single-dose azithromycin for trachoma. N Engl J Med2004, 351(19):1962-1971.
10. Chidambaram JD, Melese M, Alemayehu W, Yi E, Prabriputaloong T,Lee DC, Cevallos V, Zhou Z, Whitcher JP, Gaynor BD, Lietman TM:Mass antibiotic treatment and community protection in tra-choma control programs. Clin Infect Dis 2004, 39(9):e95-7.
11. West ES, Munoz B, Mkocha H, Holland MJ, Aguirre A, Solomon AW,Bailey R, Foster A, Mabey D, West SK: Mass treatment and theeffect on the load of Chlamydia trachomatis infection in atrachoma-hyperendemic community. Invest Ophthalmol Vis Sci2005, 46(1):83-87.
12. Chidambaram JD, Lee DC, Porco TC, Lietman TM: Mass antibioticsfor trachoma and the Allee effect. Lancet Infect Dis 2005,5(4):194-196.
13. Burton MJ, Holland MJ, Makalo P, Aryee EA, Alexander ND, Sillah A,Faal H, West SK, Foster A, Johnson GJ, Mabey DC, Bailey RL: Re-emergence of Chlamydia trachomatis infection after massantibiotic treatment of a trachoma-endemic Gambian com-munity: a longitudinal study. Lancet 2005,365(9467):1321-1328.
14. West SK, Munoz B, Mkocha H, Holland MJ, Aguirre A, Solomon AW,Foster A, Bailey RL, Mabey DC: Infection with Chlamydia tra-chomatis after mass treatment of a trachoma hyperendemiccommunity in Tanzania: a longitudinal study. Lancet 2005,366(9493):1296-1300.
15. Chidambaram JD, Alemayehu W, Melese M, Lakew T, Yi E, CevallosV, Zhou Z, Maxey K, Shapiro B, Srinivasan M, Whitcher JP, GaynorBD, Lietman TM: Return of Infectious Trachoma after a SingleMass Antibiotic Distribution. JAMA 2006, 295(10):.
16. Lietman T, Porco T, Dawson C, Blower S: Global elimination oftrachoma: how frequently should we administer mass chem-otherapy? Nat Med 1999, 5(5):572-576.
17. Diamont J, Moncada J, Pang F, Jha H, Benes R, Schachter J, Lietman. T:Pooling of Chlamydial Laboratory Tests to Determine Prev-alence of Trachoma. Ophthalmic Epidemiology 2001, 8(2-3):109-117.
18. Hethcote HW, Yorke JA: Gonorrhea transmission dynamicsand control. In Series Lecture notes in biomathematics Volume 56. Ber-lin , Springer-Verlag; 1984.
19. Lee DC, Chidambaram JD, Porco TC, Lietman TM: Seasonal effectsin the elimination of trachoma. Am J Trop Med Hyg 2005,72(4):468-470.
20. Scott DW, Wand MP: Feasibility of Multivariate Density Esti-mates. Biometrika 1991, 78(1):197-205.
21. Nasell I: On the quasi-stationary distribution of the stochasticlogistic epidemic. Mathematical Biosciences 1999, 156(1-2):21-40.
22. Jacquez JA, Simon CP: The stochastic SI model with recruit-ment and deaths. I. Comparison with the closed SIS model.Math Biosci 1993, 117(1-2):77-125.
23. Nasell I: On the quasi-stationary distribution of the Rossmalaria model. Mathematical Biosciences 1991, 107(2):187-207.
24. Atik B, Thanh TT, Luong VQ, Lagree S, Dean D: Impact of annualtargeted treatment on infectious trachoma and susceptibil-ity to reinfection. Jama 2006, 296(12):1488-1497.
25. Brunham RC, Pourbohloul B, Mak S, White R, Rekart ML: The unex-pected impact of a Chlamydia trachomatis infection controlprogram on susceptibility to reinfection. J Infect Dis 2005,192(10):1836-1844.
26. Yang JL Lietman, T.L.: The return of trachoma in partiallytreated communities. Archives of Ophthalmology 2007,125(7):989-991.
27. Chidambaram JD, Alemayehu W, Melese M, Lakew T, Yi E, House J,Cevallos V, Zhou Z, Maxey K, Lee DC, Shapiro BL, Srinivasan M,Porco T, Whitcher JP, Gaynor BD, Lietman TM: Effect of a singlemass antibiotic distribution on the prevalence of infectioustrachoma. Jama 2006, 295(10):1142-1146.
Page 9 of 10(page number not for citation purposes)
http://www.ncbi.nlm.nih.gov/entrez/query.fcgi?cmd=Retrieve&db=PubMed&dopt=Abstract&list_uids=7704921
http://www.ncbi.nlm.nih.gov/entrez/query.fcgi?cmd=Retrieve&db=PubMed&dopt=Abstract&list_uids=7704921
http://www.ncbi.nlm.nih.gov/entrez/query.fcgi?cmd=Retrieve&db=PubMed&dopt=Abstract&list_uids=8102427
http://www.ncbi.nlm.nih.gov/entrez/query.fcgi?cmd=Retrieve&db=PubMed&dopt=Abstract&list_uids=8102427
http://www.ncbi.nlm.nih.gov/entrez/query.fcgi?cmd=Retrieve&db=PubMed&dopt=Abstract&list_uids=8102427
http://www.ncbi.nlm.nih.gov/entrez/query.fcgi?cmd=Retrieve&db=PubMed&dopt=Abstract&list_uids=9114186
http://www.ncbi.nlm.nih.gov/entrez/query.fcgi?cmd=Retrieve&db=PubMed&dopt=Abstract&list_uids=9114186
http://www.ncbi.nlm.nih.gov/entrez/query.fcgi?cmd=Retrieve&db=PubMed&dopt=Abstract&list_uids=8400585
http://www.ncbi.nlm.nih.gov/entrez/query.fcgi?cmd=Retrieve&db=PubMed&dopt=Abstract&list_uids=8400585
http://www.ncbi.nlm.nih.gov/entrez/query.fcgi?cmd=Retrieve&db=PubMed&dopt=Abstract&list_uids=1806113
BMC Infectious Diseases 2007, 7:91 http://www.biomedcentral.com/1471-2334/7/91
Publish with BioMed Central and every scientist can read your work free of charge
"BioMed Central will be the most significant development for disseminating the results of biomedical research in our lifetime."
Sir Paul Nurse, Cancer Research UK
Your research papers will be:
available free of charge to the entire biomedical community
peer reviewed and published immediately upon acceptance
cited in PubMed and archived on PubMed Central
yours — you keep the copyright
Submit your manuscript here:http://www.biomedcentral.com/info/publishing_adv.asp
BioMedcentral
28. Leach AJ, Shelby-James TM, Mayo M, Gratten M, Laming AC, CurrieBJ, Mathews JD: A prospective study of the impact of commu-nity-based azithromycin treatment of trachoma on carriageand resistance of Streptococcus pneumoniae. Clin Infect Dis1997, 24(3):356-362.
29. Solomon AW, Mohammed Z, Massae PA, Shao JF, Foster A, MabeyDC, Peeling RW: Impact of mass distribution of azithromycinon the antibiotic susceptibilities of ocular Chlamydia tracho-matis. Antimicrob Agents Chemother 2005, 49(11):4804-4806.
30. Fry AM, Jha HC, Lietman TM, Chaudhary JS, Bhatta RC, Elliott J, HydeT, Schuchat A, Gaynor B, Dowell SF: Adverse and beneficial sec-ondary effects of mass treatment with azithromycin to elim-inate blindness due to trachoma in Nepal. Clin Infect Dis 2002,35(4):395-402.
31. West S, Munoz B, Lynch M, Kayongoya A, Chilangwa Z, Mmbaga BB,Taylor HR: Impact of face-washing on trachoma in Kongwa,Tanzania. Lancet 1995, 345(8943):155-158.
32. Emerson PM, Cairncross S, Bailey RL, Mabey DC: Review of the evi-dence base for the 'F' and 'E' components of the SAFE strat-egy for trachoma control. Trop Med Int Health 2000,5(8):515-527.
33. Emerson PM, Lindsay SW, Alexander N, Bah M, Dibba SM, Faal HB,Lowe KO, McAdam KP, Ratcliffe AA, Walraven GE, Bailey RL: Roleof flies and provision of latrines in trachoma control: cluster-randomised controlled trial. Lancet 2004,363(9415):1093-1098.
34. Miller K, Pakpour N, Yi E, Melese M, Alemayehu W, Bird M, SchmidtG, Cevallos V, Olinger L, Chidambaram J, Gaynor B, Whitcher J, Liet-man T: Pesky trachoma suspect finally caught. The British journalof ophthalmology 2004, 88(6):750-751.
35. Chidambaram JD, Bird M, Schiedler V, Fry AM, Porco T, Bhatta RC,Jha H, Chaudary JSP, Gaynor B, Yi E, Whitcher JP, Osaki-Holm S, Liet-man TM: Trachoma Decline and Widespread Use of Antimi-crobial Drugs. Emerg Infect Dis 2004, 10(11):1895-1899.
36. Dolin PJ, Faal H, Johnson GJ, Minassian D, Sowa S, Day S, Ajewole J,Mohamed AA, Foster A: Reduction of trachoma in a sub-Saha-ran village in absence of a disease control programme. Lancet1997, 349(9064):1511-1512.
37. Hoechsmann A, Metcalfe N, Kanjaloti S, Godia H, Mtambo O, Chio-peta T, Barrows J, Witte C, Courtright P: Reduction of trachomain the absence of antibiotic treatment: Evidence from a pop-ulation-based survey in Malawi. Ophthalmic Epidemiology 2001,8(2-3):145-153.
38. Jha H, Chaudary JSP, Bhatta R, Miao Y, Osaki-Holm S, Gaynor B,Zegans M, Bird M, Yi E, Holbrook K, Whitcher JP, Lietman. T: Disap-pearance of trachoma in western Nepal. Clinical Infectious Dis-eases 2002, 35(6):765-768.
Pre-publication historyThe pre-publication history for this paper can be accessedhere:
http://www.biomedcentral.com/1471-2334/7/91/prepub
Page 10 of 10(page number not for citation purposes)
http://www.ncbi.nlm.nih.gov/entrez/query.fcgi?cmd=Retrieve&db=PubMed&dopt=Abstract&list_uids=9114185
http://www.ncbi.nlm.nih.gov/entrez/query.fcgi?cmd=Retrieve&db=PubMed&dopt=Abstract&list_uids=9114185
http://www.ncbi.nlm.nih.gov/entrez/query.fcgi?cmd=Retrieve&db=PubMed&dopt=Abstract&list_uids=9114185
http://www.ncbi.nlm.nih.gov/entrez/query.fcgi?cmd=Retrieve&db=PubMed&dopt=Abstract&list_uids=7823670
http://www.ncbi.nlm.nih.gov/entrez/query.fcgi?cmd=Retrieve&db=PubMed&dopt=Abstract&list_uids=7823670
http://www.ncbi.nlm.nih.gov/entrez/query.fcgi?cmd=Retrieve&db=PubMed&dopt=Abstract&list_uids=9167460