A QUANTITATIVE TEM ANALYSIS OF THE LAMELLAR MICROSTRUCTURE IN TiAl BASED ALLOYS
11
Actamater. Vol. 45,No.7,pp. 3005-3015, 1997 (0 1997 ActaMetallumica Inc. Pergamon Published by Elsevier%ike Ltd PII: S1359-6454(96)00398-9 Printed in Great Britain.All rights reserved. 1359-6454/97 $17.00+ 0.00 A QUANTITATIVE TEM ANALYSIS OF THE LAMELLAR MICROSTRUCTURE IN TiAl BASED ALLOYS S. ZGHAL1,S. NAKA2and A. COURET1 ICEMES-CNRS,29 rue J. Marvig, BP. 4347, 31055Toulouse, Cedex4, France and 20NERA, 29, Av. de la Division Leclerc, 92322Ch5tillon Cedex, France (Received30 May 1996;accepted6 September 1996) Abstract—The microstructure of lamellar TiAl alloys was analysed by transmissionelectron microscopy. Two alloys (a PST crystal and a TiSi–A]d6 alloy) were investigated. The microstructure is formed by a, and y lamellaewhichare very long and very thin with respect to their length.The proportion of y lamellae is higher than that of al lamellae, The orientation relationships associated with the y–y interfaces are examined:they correspond to the order domain, twin and pseudo-twinrelationships. Statistical analyses have been performed on the volumefraction of the two phases, on the orientation of the y Iamellaeand on the nature of the y–yinterfaces. These results are used to have a better understandingof the structural transformation (hexagonalphase -> face centred cubic phase) and the orderingprocess whichare active in the process of formation of the microstructure during cooling. ~ 1997ActuA4etallurgicaInc. R&um&Nousavonsanalys~lamicrostructure d’alliages TiAllamellaires par microscopic electronique a transmission. Deuxtypesd’alliages (1’alliage PSTet un alliagede compositionTiS~–Al~C) ont ete etudi& La microstructureest formeede lamellescoand y qui sent longueset trk finespar rapport a leur longueur, La proportion de lamellesyest plus importanceque cellede lamellescu.Nous avonsdeterminelesrelations d’orientation associ6esaux interfaces y–yqui sent de diff6rentstypes : domaine d’ordre, macle et pseudo macle. Nous avons mene une &tudestatistique portant sur les fractions volumiquesde chaque phase, sur les orientations des lamelles y et sur la nature des interfaces y–y. Ces r&ultats sent interpr&% clansle but de mieux comprendre la transformation structural (phase hexagonale -> phase cubique a faces centrees)et les processusde mise en ordre qui sent mis eu jeu lors de la formation de cette microstructure durant Ie refroidissement. 1. INTRODUCTION Two-phase TiAl alloys are nowadays attracting a great deal of interest. This is due in particular to their potential for aerospace applications based on their excellent specific mechanical strength and good oxidation resistance at high temperatures. A con- siderable research effort is devoted to the detailed characterization of the mechanical properties of this type of alloy in relation to the microstructure. It is indeed well known that there exists a great variety of microstructure which result from numerous trans- formation modes occurring during various heat treatments and that the mechanical properties are strongly affected by the microstructure. It has been clearly established that the lamellar microstructure offers good creep properties and an acceptable fracture toughness, whereas the duplex microstruc- ture comprising both lamellar and monolithic y grains provides a better ductility [1].In view of the expected application range, creep and toughness are the most relevant properties and a developmenteffort is now directed toward obtaining alloys exhibiting a near lamella structure with a small grain size. In the authors’ opinion, however, one of the critical issues in achieving such an optimum microstructure is to gain a deep insight into the nature of the lamellar structure through quantitative analyses of this microstructure. This is the aim of the present paper. 2. CRYSTALLOGRAPHY During cooling, the y + cqlamellar microstructure is formed by the decomposition of the u phase (hexagonalstructure, A3) into lamellar precipitatesof y phase [orderedtetragonal structures Ll,—Fig. l(a)] and by the orderingof the residual a phase, givingrise to lamellae of w phase [orderedhexagonal structure, DO,~—Fig.l(b)] [2]. All the LX* lamellae in a given grain have the same orientation, since there is only one possible orientation variant for the M+W transformation. The y precipitation process leads to the following orientation relationship between the two phases: {111},//(OOOl)cG and <1~),//(ll~)ct, [3].It is worth noting that the habit planes are the most compact planes of the two structures: (0001) in the case of cu phase and {111}in the y phase. Note that fur- ther details in the crystallography of the lamellar microstructure are available in numerous papers (see for instance Ref. [4]). During this transformation, the ABABAB.. . 3005
-
Upload
independent -
Category
Documents
-
view
3 -
download
0
Transcript of A QUANTITATIVE TEM ANALYSIS OF THE LAMELLAR MICROSTRUCTURE IN TiAl BASED ALLOYS

Actamater.Vol.45,No.7,pp. 3005-3015,1997(0 1997ActaMetallumicaInc.Pergamon Publishedby Elsevier%ike Ltd
PII: S1359-6454(96)00398-9 Printed in Great Britain.All rights reserved.1359-6454/97$17.00+ 0.00
A QUANTITATIVE TEM ANALYSIS OF THE LAMELLARMICROSTRUCTURE IN TiAl BASED ALLOYS
S. ZGHAL1,S. NAKA2and A. COURET1ICEMES-CNRS,29 rue J. Marvig, BP. 4347,31055Toulouse, Cedex4, France and 20NERA, 29, Av.
de la Division Leclerc, 92322Ch5tillon Cedex, France
(Received30 May 1996;accepted6 September 1996)
Abstract—Themicrostructure of lamellar TiAl alloyswas analysedby transmissionelectron microscopy.Two alloys (a PST crystal and a TiSi–A]d6alloy) were investigated.The microstructure is formed by a,and y lamellaewhichare very long and very thin with respect to their length.The proportion of y lamellaeis higher than that of al lamellae, The orientation relationships associated with the y–y interfaces areexamined:they correspond to the order domain, twin and pseudo-twinrelationships. Statistical analyseshave been performed on the volumefraction of the two phases, on the orientation of the y Iamellaeandon the nature of the y–yinterfaces.Theseresults are used to have a better understandingof the structuraltransformation (hexagonalphase -> face centred cubicphase) and the orderingprocesswhichare activein the process of formation of the microstructure during cooling. ~ 1997Actu A4etallurgicaInc.
R&um&Nousavonsanalys~la microstructured’alliagesTiAllamellairespar microscopicelectroniquea transmission.Deuxtypesd’alliages(1’alliagePSTet un alliagede compositionTiS~–Al~C)ont ete etudi&La microstructureest formeede lamellescoand yqui sent longueset trk finespar rapport a leur longueur,La proportion de lamellesyest plus importanceque cellede lamellescu.Nous avonsdeterminelesrelationsd’orientation associ6esaux interfaces y–yqui sent de diff6rentstypes : domaine d’ordre, macle et pseudomacle. Nous avons mene une &tudestatistique portant sur les fractions volumiquesde chaque phase, surles orientations des lamelles y et sur la nature des interfaces y–y. Ces r&ultats sent interpr&% clanslebut de mieux comprendre la transformation structural (phase hexagonale -> phase cubique a facescentrees)et les processusde miseen ordre qui sent mis eujeu lors de la formation de cette microstructuredurant Ie refroidissement.
1. INTRODUCTION
Two-phase TiAl alloys are nowadays attracting agreat deal of interest. This is due in particular to theirpotential for aerospace applications based on theirexcellent specific mechanical strength and goodoxidation resistance at high temperatures. A con-siderable research effort is devoted to the detailedcharacterization of the mechanical properties of thistype of alloy in relation to the microstructure. It isindeed wellknown that there exists a great variety ofmicrostructure which result from numerous trans-formation modes occurring during various heattreatments and that the mechanical properties arestrongly affected by the microstructure. It has beenclearly established that the lamellar microstructureoffers good creep properties and an acceptablefracture toughness, whereas the duplex microstruc-ture comprising both lamellar and monolithic ygrains provides a better ductility [1]. In view of theexpected application range, creep and toughness arethe most relevantproperties and a developmenteffortis now directed toward obtaining alloys exhibiting anear lamella structure with a small grain size. In theauthors’ opinion, however, one of the critical issuesin achieving such an optimum microstructure is to
gain a deep insight into the nature of the lamellarstructure through quantitative analyses of thismicrostructure. This is the aim of the present paper.
2. CRYSTALLOGRAPHY
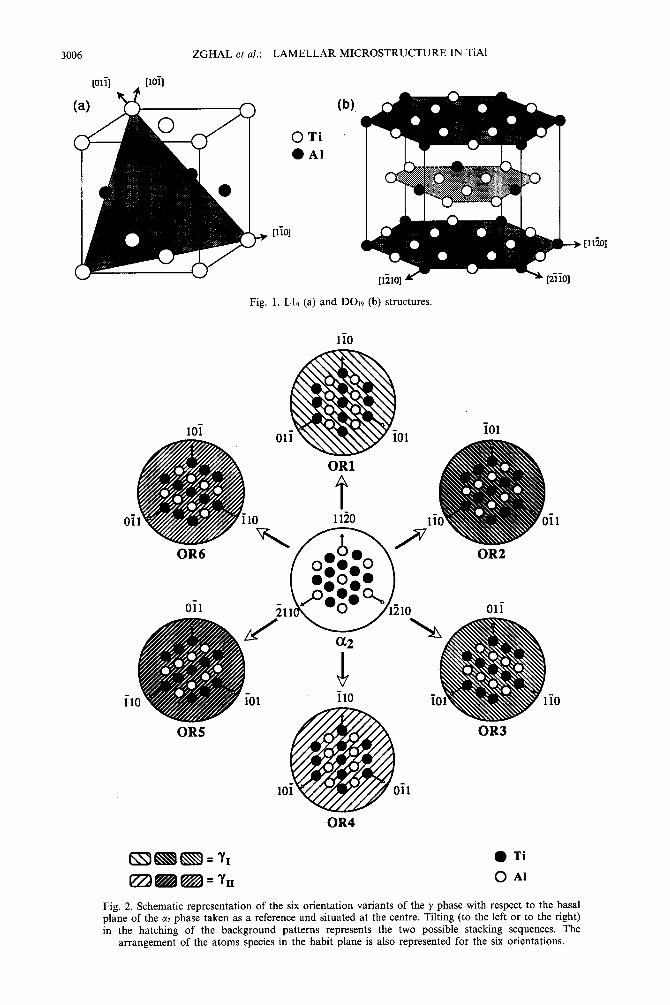
During cooling, the y + cqlamellar microstructureis formed by the decomposition of the u phase(hexagonalstructure,A3) into lamellarprecipitatesofy phase [orderedtetragonal structures Ll,—Fig. l(a)]and by the orderingof the residuala phase, givingriseto lamellae of w phase [orderedhexagonal structure,DO,~—Fig.l(b)] [2]. All the LX*lamellae in a givengrain have the same orientation, since there is onlyone possible orientation variant for the M+Wtransformation.
The y precipitation process leads to the followingorientation relationship between the two phases:{111},//(OOOl)cGand <1~),//(ll~)ct, [3].It is worthnoting that the habit planes are the most compactplanes of the two structures: (0001) in the case ofcu phase and {111} in the y phase. Note that fur-ther details in the crystallography of the lamellarmicrostructure are available in numerous papers (seefor instance Ref. [4]).
During this transformation, the ABABAB.. .
3005
3006 ZGHAL et al.: LAMELLAR MICROSTRUCTURE IN TiAl
(.)[O1’]G
Fig. 1. L1o(a) and D019(b) structures.
lio
OR4
Fig.2. Schematicrepresentation of the six orientation variants of the y phase with respect to the basalplane of the w phase taken as a referenceand situated at the centre. Tilting (to the left or to the right)in the hatching of the background patterns represents the two possible stacking sequences. The
arrangement of the atoms species in the habit plane is also represented for the six orientations.
ZGHAL et al.: LAMELLAR MICROSTRUCTURE IN TiAl 3007
stacking sequence of the hexagonal structure isshiftedinto the ABCABC. . stackingsequenceof thef.c.c. structure, and the ordering of the f.c.c. latticeleads to the introduction of the tetragonality of theLl, structure [5,6]. Concerning the f.c.c. stackingsequence, either ABCABC or ACBACB can beobtained. In what follows, the orientations oflamellae for which the sequence is ABCABC arereferred to as the group of orientations yI, those forwhich the sequences ACBACB as the group oforientations yII(Fig. 2). Due to the tetragonality inthe L1Ostructure, the (1 10]direction and the othertwo (011]directionsare not equivalent to each other.The mixed notations {hkl) and (m-v] introducedin Ref. [7] are used to differentiate the first twoindices from the third one, which is not equivalent.Figure 1(a)showsthat the atomic rowsparallel to the(110] direction consist of only one type of atomwhereas those parallel to the (011] directions areconstituted by alternating Ti and Al atoms. Theordering of the f.c.c. lattice into the L1Ostructure isfollowed by a decrease in crystal symmetry givingrise, for a given stacking sequence, to the formationof three different orientation variants correspondingto the three possible positioning of the (110]direction in the habit plane (Fig. 2). It follows thatthere exists, in a given grain, six possible orientationvariants for the y lamellae.Theseorientation variantsare denoted OR1, OR2, OR3, OR4, OR5 and OR6;three of them OR1, OR2 and OR3, belong to thegroup y, and the others, OR4, OR5 and OR6 togroup MI.
Four orientation relationships between two yvariants are therefore possible: perfect fitting(OR1/ORl, OR2/0R2, OR3/0R3, OR4/0R4, OR5/OR5 and OR6/0R6); order domain related (OR1/OR2, OR1/0R3, OR2/0R3, OR4/OR5/OR4/OR6and OR5/0R6); twin related (OR1/0R4, OR2/0R5and OR3/0R6) and pseudo-twinrelated (OR1/0R5,OR1/0R6, OR2/0R4, OR2/0R6, OR3/0R4 andoR3/oR5).
3. EXPERIMENTALPROCEDURE
In the present study, microstructure analyseshave been performed on a PST crystal (Ti,i3.~Al,,.,)provided by Yamaguchi’sgroup (Kyoto university),who prepared the crystal using an ASGAL FZ-SS35W optical-floating zone furnace [8], and on apolycrystalline ingot of Ti,,–A& alloy prepared atONERA using the vacuum arc melting technique.These alloyswere studied in the as-cast state withoutany subsequent heat treatment.
Thin foils for TEM were prepared using a jetelectropolishing technique in a polishing solutionbased on a perchloric acid–methanol mixture.Observations were performed in a JEOL 200CXelectron microscope operating at 200kV.
The orientations of the different lamellae weredeterminedthrough conventionaldiffractionanalyses
by controlling the diffracting areas in the dark-fieldmode. Experimental difficulties of this work arisefrom the fact that examinationshave sometimesto beperformed on very thin lamellae. In such a case, thehabit plane has to be kept edge on as much aspossiblein order to avoid the superpositionof severalIamellae and interfaces on the images.
Our experimental procedure is described in whatfollowswith referenceto Fig. 3, which showsan areacontaining 20 lamellae under different image con-ditions in the Ti,,-A& alloy:
● 1st step (view a): in the bright-field mode, thehabit plane which is edge on is the reflectingplane. This enablesthe identificationof interfacesand lamellae;
● 2nd step (viewb): in the dark-fieldmode, the De-flectingplane is a plane of the a, phase (g= 1011in case of view b). This step enables theidentification of the w lamellae, which are inbright contrast;
● 3rd step (viewsc and d): in the dark-field mode,the reflectingplanes are, respectively,plangsof y,and ~11(g = 002 for y]on viewc and g = 111forYIIonviewd). This step separates y lamellae intothe two groups of orientations yl and y~r;
● 4th step (views~h): in the dark-fieldmode, thereflectingplanes are of (220) or (002) types andthe imagesare always formed with a superlatticereflectionoperating. Each image thus allows theidentificationof the areas which have one of thesix orientations. For instance, images e (g = 110of OR2) and f (g = 001 of OR3) show thelamellae of y,, which have the orientations 2 and3, respectively. Images g and h allow theidentification of the lamellae of yrr withorientations 4 and 6, respectively. Some aJlamellaeare also in bright contrast in viewh; sucha situation cannot be avoided totally duringimage formation. Note that the ordered domainsin lamellae 2, 4, 6, 7, 14 and 16 are clearlyidentified in view i.
The way to determinethe number of lamellae, theirorientations, the interfaces and the correspondingorientation relationships is described by referencetoFig. 4. Some interfaces extend only over a limitedlength (for instance1,1,in the caseof y–yinterfaceand1,1,and I,,, in the casesof two y–cqinterfaces).In suchcases,we consider that the interface goesthrough theentire area investigated, and that, when it is notvisible,it separates two areas with the same structureand orientation. Because of the presence of ordereddomains in a y lamella (for instance LSand L,J), theorientation relationships determining y–y interfacesmay change along the interface (for instance, theinterface I,,,IZ corresponds partly to the twinrelationship and partly to the pseudo-twin relation-ship). In such a case, we consider that there are twodistinct interfaces and both of them are taken intoaccount in the statistical measurement.
.—

3008 ZGHAL et al.: LAMELLAR MICROSTRUCTUREIN TiAl
a) g = 111- habit plane
b) g = loil – az
c) g = ()()2 – y]
Figure 3. Caption on facing page.

ZGHAL et al.: LAMELLAR
Fig. 3. Illustration of the experimentalprocedureusedin thepresent work. An area of 20 y lamellaein the Tis4–Ali,alloyis shown under eight different imaging conditions (viewsa–h, see the text for details). Here, (i) is a schematic
representation of this area.
Following the experimental procedure and thecounting method as described above, we haveconducted a statistical analysisof variousmicrostruc-tural parameters: the number of the two kinds oflamella a, and y, of the six orientation variants andof the different interfaces; the area fraction of theseinterfacesand the volume fractions of the two phasesand of the orientation variants. It should be notedthat difficultiesarise in the TiM–AIMalloy from thenarrowness of some lamellae (some a2 lamellae are10nm thick), whereas a statistical analysis requires,in the PST alloy, examination of several large areasbelongingto differentthin foils (the typical sizeof thestudied area is 20 ,um by 30pm).
4. EXPERIMENTALRESULTS
4.1. Qualitative description of the microstructure of theTiwAl,, and PST alloys
Figure 5 shows a typical microstructure of theTi,,–Al,, alloy. Here, the habit plane is edge on. Theinterfaces are very flat lying parallel to each other.The lamellae are very thin. Some a, lamellae do notrun across the entire area (seefor examplethe lamellanoted Lx). Sandwiched between two aj lamellae are
11/2
IR
.1
12r3,13/4,111
+41
f
OM
L2 L3
8 b 111,12\
(
\
If
+ OR5
L7 L9 LIO
IN
Lll
bq
OR6
ORS
LIZ
Fig. 4. Schematic illustration of the method used forcounting the lamellae, their orientation and the interfacerelationships,as employedin the present work. (L: lamellae,1: interfaces, OD: order domains, T: twins and PT:
pseudo-twins.)
MICROSTRUCTURE IN TiAl 3009
generallybetween one and three y lamellae. Betweentwo y lamellae, the interfacesare order domain, twinand pseudo-twin boundaries, but none of themcorrespondsto a perfect fitting. Inside a lamella thereare also order domain boundaries separating thelamella into several areas having different orien-tations and belongingto the same orientation group.Note that such order domain boundaries are wavy,contrary to those found for lamellar interfaces.
A typical microstructure of the PST alloy is shownin Fig. 6. Very frequently, areas without w lamellaewere observedextendingover some dozens of squaremicrometers while containing more than 10 ylamellae. It is interesting to note that the magnifi-cation of the image of Fig. 6 is 10times smaller thanthat of Fig. 5. The thicknessof y lamellaeis markedlylarger than that of the Ti,,–Al,b alloy. As in theTi~4–Alq~alloy, the thickness of the lamellae is quitesmall compared with their length. Also, as in theTi,,–A14alloy, their interfaces are very flat compris-ing the three types of boundaries (order domain, twinand pseudo-twin)and wavyorder domain boundariescut a y lamella in differentareas. Note that an orderdomain boundary noted ODI cuts successivelythreeadjacent lamellae. Inside lamellae, some dislocationsand twins can be observed, introduced probablyduring the cooling of the alloy after solidificationorthe sample preparation. The present results repro-duce very well the previous observations of Inuiet al. [4].
4.2. Quantitative analysis of the microstructure of theTiTAl,, and PST alloys
4.2.1. Ti54–A14talloy. A quantitative analysis wasmade on an area 6.4pm by 9.5pm. The length(9.5,um) is parallel to the habit plane. This areacontains 116 Iamellae, 39 of which are cq lamellae.Note that Fig. 5 shows a part (3.2pm by 4.6 pm) ofthis area.
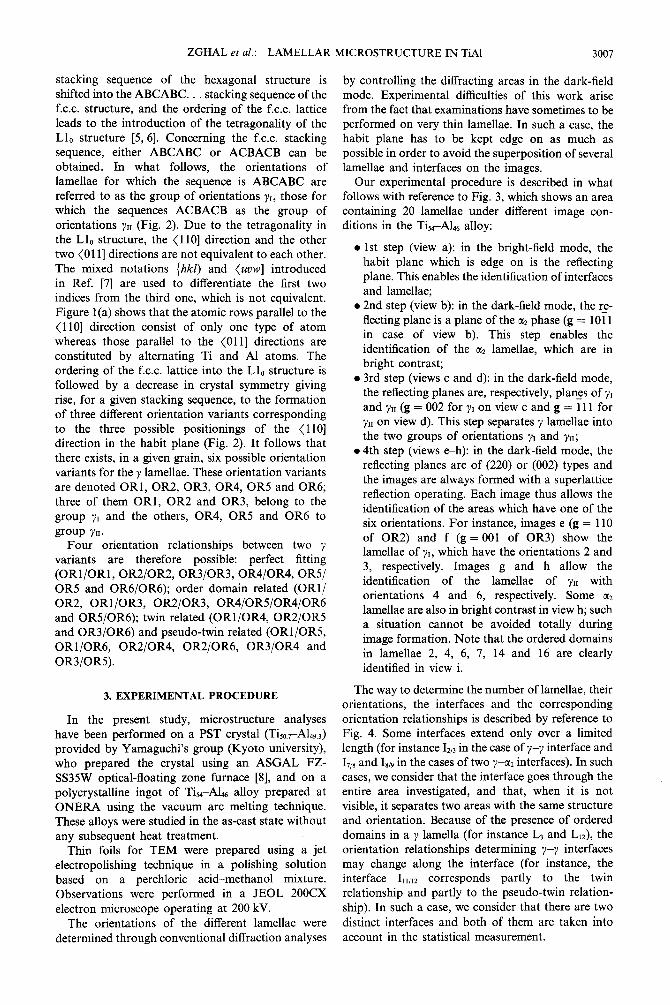
From the measurement of the thickness and thelength of all the lamellae the volume fractions F, ofthe two phases were determined: F,az= 17Y0andF,, = 83Y0. Figure 7 shows histograms of thethickness of y and a, lamellae. For the case of the ylamellae, their number decreaseswith an increasingthickness in an exponential manner, whereas aGaussian type variation is found for the case of a,lamellae. The average thickness is 73nm for the ylamellae and 32nm for the a, lamellae.
For the case of y lamellae, the orientation group towhich the lamellae belong was determined first.Table 1givesthe correspondingresults. It is clear that50?4.of the y lamellae belong to group I and 507. togroup II.
The 77 y lamellae are distributed as follows:
● 22 single lamellae which are bordered by two mlamellae;
● nine pairs, each pair forming an y–y interface;


ZGHAL et al.: LAMELLAR MICROSTRUCTURE IN TiAl
AAA A AAAAA A
Fig. 6. Mic~.ostructure of the PST alloy (OD: order domains; T: twins and PT: psc -twi
3011
.ns).
3012 ZGHAL et al.: LAMELLAR MICROSTRUCTURE IN TiAl
(a)20: 1
‘z
T (rim)(b)
15 , I
; averagethickness=32nrnt
12j t
9-
Z
6-
3-
00 5 15 25 35 45 55 65 75
T (rim)Fig. 7. Measurementsof the lamella thicknesswhereNis thenumber of Iamellaehavinga thicknessT. Tisd–A14salloY:(a)
y lamellae; (b) m lamellae.
● four triplets, each triplet forming two y–yinterfaces;
● two quadruplets, each quadruplet forming threey–y interfaces;
● a 0.45 pm thick area containing five lamellaejoined together, thus forming four y–y interfaces;
● a 0.5 ~m thick area containing 12lamellaejoinedtogether, thus forming 11 y–y interfaces.
Among the 38 y–y interfaces thus obtained, 11(representing29%) are bordered by lamellae belong-ing to the samegroup while27(representing71°/0)arebordered by two lamellae belonging to a groupopposite to each other.
Examining now the two neighbors of each UZlamella, it was found that 24 (representing63Yo)were
Table 1. Distribution in number and volume fraction of the twogroups of orientations(Y1and y,,);Tix–ALsallOy
)’1 YI1 Totals
Number of IamellaeNo 42 35 77“/0 54.5 45.5 100
VolumefractionVolume(pm’) 7.68 7.47 15.15% 50.7 49.3 100
Table 2. Distribution in number and volume fraction of the sixorientationvariants; Ti~–Ak alloy
OR1 OR2 OR3 OR4 OR5 OR6
Number of lamellaeNo 22 48 22 34 54 25% 10.7 23.5 10.7 16.6 26.5 12
Vohnnefractionvolume(pm]) 0.66 5.82 1.2 0,87 4.68 1.92“/0 4.5 38.5 8 5.5 31 12.5
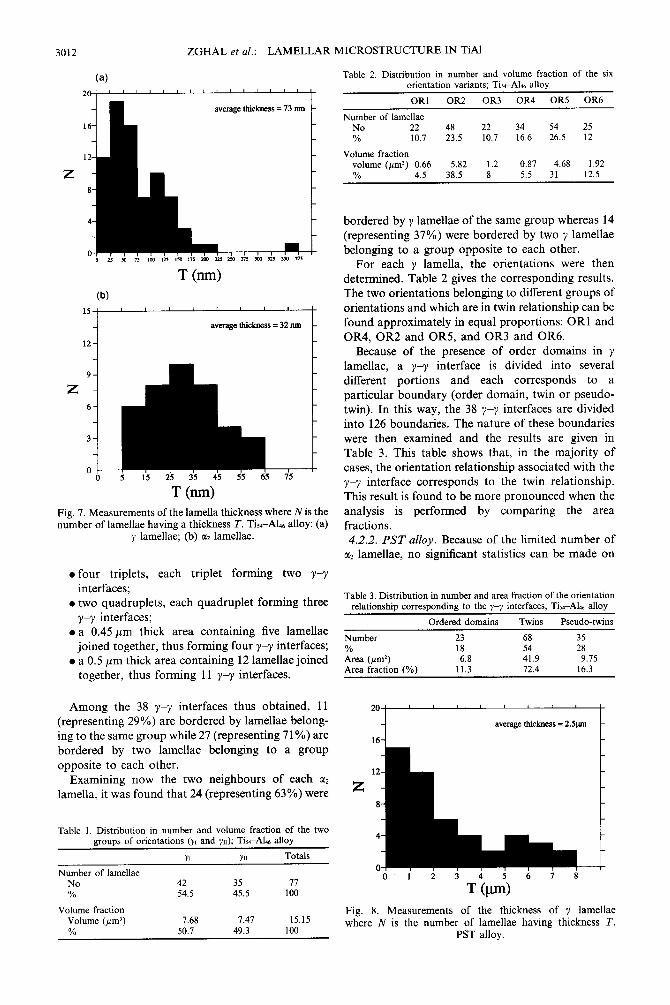
bordered by y lamellaeof the same group whereas 14(representing37!4.)were bordered by two Ylamellaebelonging to a group opposite to each other.
For each y lamella, the orientations were thendetermined. Table 2 gives the corresponding results.The two orientations belongingto differentgroups oforientations and whichare in twin relationshipcan befound approximatelyin equal proportions: OR1 andOR4, OR2 and OR5, and OR3 and OR6.
Because of the presence of order domains in ylamellae, a y–y interface is divided into severaldifferent portions and each corresponds to aparticular boundary (order domain, twin or pseudo-twin). In this way, the 38 y–y interfaces are dividedinto 126boundaries. The nature of these boundarieswere then examined and the results are given inTable 3. This table shows that, in the majority ofcases, the orientation relationship associatedwith theY–Yinterface corresponds to the twin relationship.This result is found to be more pronounced when theanalysis is performed by comparing the areafractions.4.2.2. PST alloy. Becauseof the limited number of
U2lamellae, no significantstatistics can be made on
Table 3. Distributionin numberand area fractionof the orientationrelationshipcorrespondingto the y–yinterfaces;Tij~–Al~~alloy
Ordered domains Twins Pseudo-twins
Number 23 68 35% 18 54 28A~ea(pm’) 6.8 41.9 9.75Area fraction (%) 11.3 72.4 16.3
I averageOrickness= 2.5wrr
16 [
12
z
8
4
0012345678
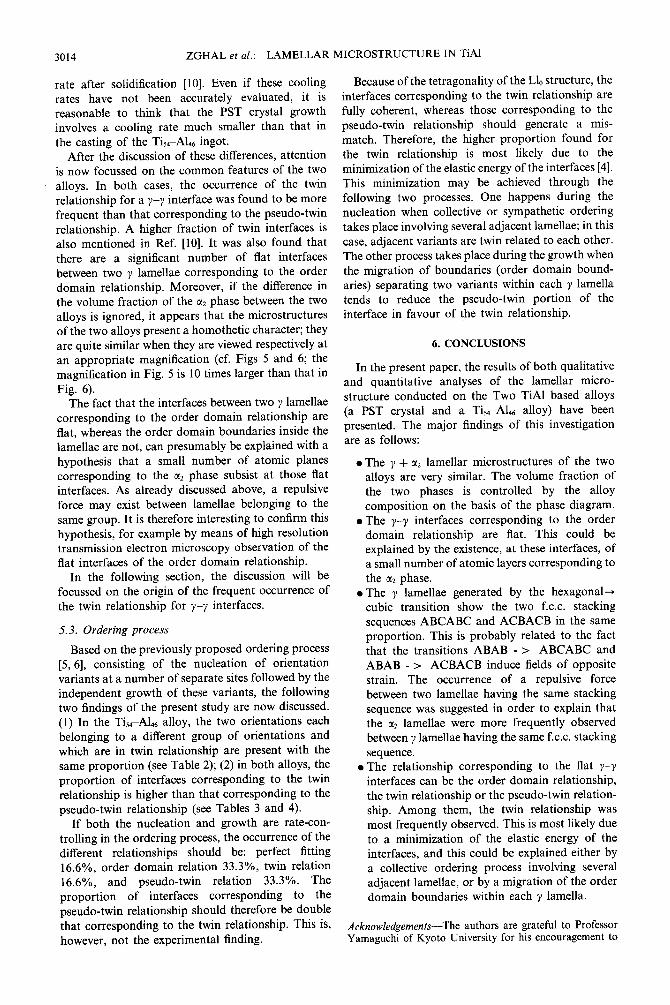
T Qun)Fig. 8. Measurements of the thickness of y Iamellaewhere N is the number of Iamellae having thickness T.
PST alloy.
ZGHAL et al.: LAMELLAR MICROSTRUCTURE IN TiAl 3013
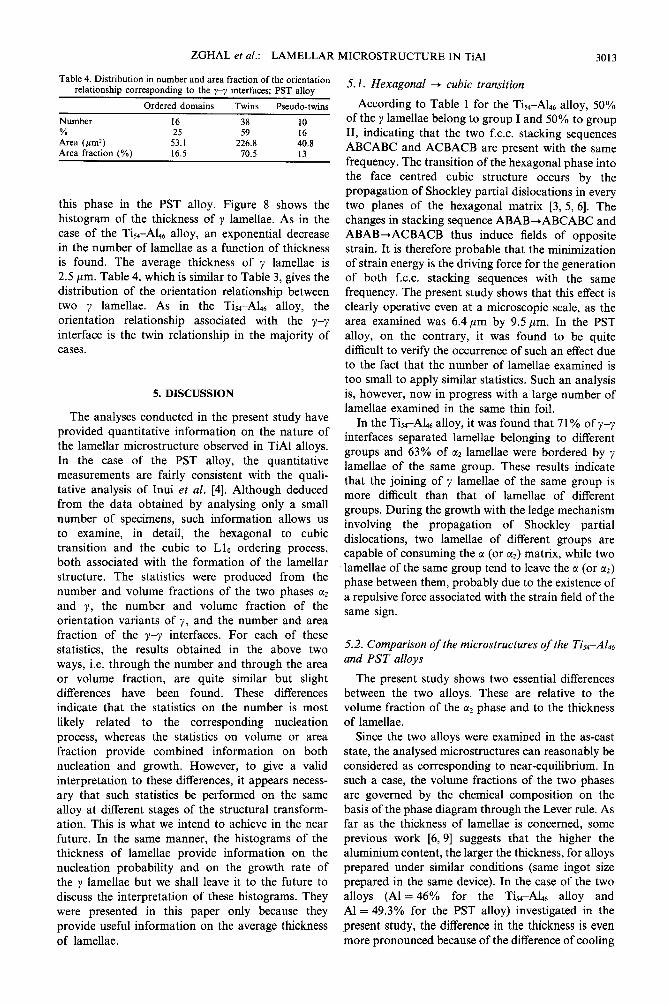
Table4. Distributionin numberand area fractionof the orientationrelationshipcorrespondingto the y–yinterfaces;PST alloy
Ordered domains Twins Pseudo-twins
Number 16 38 10% 25 59 16Area (#mz) 53.1 226.8 40.8Area fraction (%) 16.5 70.5 13
this phase in the PST alloy. Figure 8 shows thehistogram of the thickness of y lamellae. As in thecase of the Ti~4–A14dalloy, an exponential decreasein the number of lamellae as a function of thicknessis found. The average thickness of y lamellae is2.5~m. Table 4, whichis similar to Table 3, givesthedistribution of the orientation relationship betweentwo y lamellae. As in the Ti~–A~6 alloy, theorientation relationship associated with the y–yinterface is the twin relationship in the majority ofcases.
5. DISCUSSION
The analyses conducted in the present study haveprovided quantitative information on the nature ofthe lamellar microstructure observed in TiAl alloys.In the case of the PST alloy, the quantitativemeasurements are fairly consistent with the quali-tative analysis of Inui et al. [4]. Although deducedfrom the data obtained by analysing only a smallnumber of specimens, such information allows usto examine, in detail, the hexagonal to cubictransition and the cubic to L1Oordering process,both associated with the formation of the lamellarstructure. The statistics were produced from thenumber and volume fractions of the two phases cz~and y, the number and volume fraction of theorientation variants of y, and the number and areafraction of the y–y interfaces. For each of thesestatistics, the results obtained in the above twoways, i.e. through the number and through the areaor volume fraction, are quite similar but slightdifferences have been found. These differencesindicate that the statistics on the number is mostlikely related to the corresponding nucleationprocess, whereas the statistics on volume or areafraction provide combined information on bothnucleation and growth. However, to give a validinterpretation to these differences,it appears necess-ary that such statistics be performed on the samealloy at different stages of the structural transforma-tion. This is what we intend to achieve in the nearfuture. In the same manner, the histograms of thethickness of lamellae provide information on thenucleation probability and on the growth rate ofthe y lamellae but we shall leave it to the future todiscuss the interpretation of these histograms. Theywere presented in this paper only because theyprovide useful information on the average thicknessof lamellae.
5.1. Hexagonal + cubic transition
According to Table 1 for the Ti,,–Al,, alloy, 50V0of the y lamellaebelongto group I and sOO/oto groupII, indicating that the two f.c.c. stacking sequencesABCABC and ACBACB are present with the samefrequency.The transition of the hexagonalphase intothe face centred cubic structure occurs by thepropagation of Shockleypartial dislocationsin everytwo planes of the hexagonal matrix [3,5, 6]. Thechangesin stackingsequenceABAB*ABcABc andABAB-ACBACB thus induce fields of oppositestrain. It is therefore probable that the minimizationof strain energyis the drivingforcefor the generationof both f.c.c. stacking sequences with the samefrequency.The present study showsthat this effectisclearly operative even at a microscopic scale, as thearea examined was 6.4pm by 9.5pm. In the PSTalloy, on the contrary, it was found to be quitedifficultto verifythe occurrenceof such an effectdueto the fact that the number of lamellae examined istoo small to apply similar statistics. Such an analysisis, however,now in progress with a large number oflamellae examined in the same thin foil.
In the Ti,,–Al,, alloy, it was found that 71% of y–yinterfaces separated lamellae belonging to differentgroups and 63% of a, lamellae were bordered by ylamellae of the same group. These results indicatethat the joining of y lamellae of the same group ismore difficult than that of lamellae of differentgroups. During the growth with the ledgemechanisminvolving the propagation of Shockley partialdislocations, two lamellae of different groups arecapable of consumingthe a (or W)matrix, while twolamellaeof the same group tend to leave the u (or a2)phase betweenthem, probably due to the existenceofa repulsiveforceassociatedwith the strain fieldof thesame sign.
5.2. Comparison of the microstructure of the Tiid–Aldtand PST alloys
The present study shows two essential differencesbetween the two alloys. These are relative to thevolume fraction of the a~phase and to the thicknessof lamellae.
Since the two alloys were examined in the as-caststate, the analysedmicrostructure can reasonably beconsidered as corresponding to near-equilibrium. Insuch a case, the volume fractions of the two phasesare governed by the chemical composition on thebasis of the phase diagram through the Leverrule. Asfar as the thickness of lamellae is concerned, someprevious work [6,9] suggests that the higher thealuminiumcontent, the larger the thickness,for alloysprepared under similar conditions (same ingot sizeprepared in the same device). In the case of the twoalloys (Al = 46Y0 for the Ti~–A& alloy andAl = 49.3Y0for the PST alloy) investigated in thepresent study, the differencein the thickness is evenmore pronouncedbecauseof the differenceof cooling
3014 ZGHAL et al.: LAMELLAR MICROSTRUCTURE IN TiAl
rate after solidification [10]. Even if these coolingrates have not been accurately evaluated, it isreasonable to think that the PST crystal growthinvolves a cooling rate much smaller than that inthe casting of the Tisi–& ingot.
After the discussion of these differences, attentionis now focussed on the common features of the twoalloys. In both cases, the occurrence of the twinrelationship for a y–y interface was found to be morefrequent than that corresponding to the pseudo-twinrelationship. A higher fraction of twin interfaces isalso mentioned in Ref. [10]. It was also found thatthere are a significant number of flat interfacesbetween two y lamellae corresponding to the orderdomain relationship. Moreover, if the difference inthe volume fraction of the w phase between the twoalloys is ignored, it appears that the microstructureof the two alloys present a homothetic character; theyare quite similar when they are viewed respectively atan appropriate magnification (cf. Figs 5 and 6; themagnification in Fig. 5 is 10 times larger than that inFig. 6).
The fact that the interfaces between two y lamellaecorresponding to the order domain relationship areflat, whereas the order domain boundaries inside theIamellae are not, can presumably be explained with ahypothesis that a small number of atomic planescorresponding to the LMphase subsist at those flatinterfaces. As already discussed above, a repulsiveforce may exist between lamellae belonging to thesame group. It is therefore interesting to confirm thishypothesis, for example by means of high resolutiontransmission electron microscopy observation of theflat interfaces of the order domain relationship.
In the following section, the discussion will befocussed on the origin of the frequent occurrence ofthe twin relationship for y–y interfaces.
5.3. Ordering process
Basedon the previouslyproposed orderingprocess[5,6], consisting of the nucleation of orientationvariants at a number of separate sites followedby theindependent growth of these variants, the followingtwo findingsof the present study are now discussed.(1) In the Ti,,-Ali~ alloy, the two orientations eachbelonging to a different group of orientations andwhich are in twin relationship are present with thesame proportion (seeTable 2); (2) in both alloys, theproportion of interfaces corresponding to the twinrelationship is higher than that correspondingto the’pseudo-twin relationship (see Tables 3 and 4).
If both the nucleation and growth are rate-con-trolling in the orderingprocess, the occurrenceof thedifferent relationships should be: perfect fitting16.6Y0,order domain relation 33.3V0,twin relation16.6Y0, and pseudo-twin relation 33.3°10. Theproportion of interfaces corresponding to thepseudo-twin relationship should therefore be doublethat corresponding to the twin relationship. This is,however, not the experimental finding.
Becauseof the tetragonality of the Ll, structure, theinterfaces correspondingto the twin relationship arefully coherent, whereas those corresponding to thepseudo-twin relationship should generate a mis-match. Therefore, the higher proportion found forthe twin relationship is most likely due to theminimizationof the elasticenergyof the interfaces[4].This minimization may be achieved through thefollowing two processes. One happens during thenucleation when collective or sympathetic orderingtakes place involvingseveraladjacent lamellae;in thiscase, adjacent variants are twin related to each other.The other processtakes placeduringthe growthwhenthe migration of boundaries (order domain bound-aries) separating two variants within each y lamellatends to reduce the pseudo-twin portion of theinterface in favour of the twin relationship.
6. CONCLUSIONS
In the present paper, the results of both qualitativeand quantitative analyses of the lamellar micro-structure conducted on the Two TiAl based alloys(a PST crystal and a Ti,i-Al,, alloY) have beenpresented. The major findings of this investigationare as follows:
. The ~ + ~z lamellar microstructure of the twoalloys are very similar. The volume fraction ofthe two phases is controlled by the alloycomposition on the basis of the phase diagram.
● The y–y interfaces corresponding to the orderdomain relationship are flat. This could beexplainedby the existence,at these interfaces, ofa smallnumber of atomic layerscorrespondingtothe LXZphase.
● The y lamellae generated by the hexagonal+cubic transition show the two f.c.c. stackingsequencesABCABC and ACBACB in the sameproportion. This is probably related to the factthat the transitions ABAB -> ABCABC andABAB -> ACBACB induce fields of oppositestrain. The occurrence of a repulsive forcebetween two lamellae having the same stackingsequencewas suggestedin order to explain thatthe U2lamellae were more frequently observedbetweenylamellaehavingthe samef.c.c.stackingsequence.
● The relationship corresponding to the flat y–yinterfaces can be the order domain relationship,the twin relationship or the pseudo-twinrelation-ship. Among them, the twin relationship wasmost frequentlyobserved.This is most likelydueto a minimization of the elastic energy of theinterfaces, and this could be explained either bya collective ordering process involving severaladjacent lamellae, or by a migration of the orderdomain boundaries within each y lamella.
Acknowledgements—Theauthors are grateful to ProfessorYamaguchi of Kyoto Universityfor his encouragementto

ZGHAL et al,: LAMELLAR MICROSTRUCTURE IN TiAl 3015
conduct this work by providing us with a PST crystal 5,prepared in his laboratory.
6.
REFERENCES 7.1. Kim, Y. W., Acta metall. mater., 1992,40, 1121.2. McCullough, C., Valencia, J. J. and Mehrabian, R., 8.
Acta metall., 1989,37, 1321.3. Blackburn, M. J., The Science, Technology and
Applicationsof Titanium,Vol. 633,ed. R. I. Jaffee and 9.N. E. Promisel. Pergamon Press, Oxford, 1970.
4. Inui, H,, Oh, M. H., Nakamura, A. and Yamaguchi, 10.M., Phil. Mug. A, 1992,66, 539.
Denkin, A. and Naka, S., Acta mater., 1996,44, 343and 353.Denkin,A., Thesede doctorate,Universiti6de Line,No 1295,1994.Hug, G,, Loiseau, A. and Veyssi&re,P., Phil. Mug. A,1988,57, 499.Fujiwara, T., Nakamura, A., Hosomi, M., Nishitani,S. R., Shirai, Y. and Yamaguchi, M., Phil. Mug. A,1990,61, 591.Umakoshi, Y., Nakano, T. and Yamane, T., Mater.Sci. EngngA, 1992,152,81.Dimiduk, D., Sun, Y, Q. and Hazzledine, P., Mater.Res. Soc. Proc., 1995,364, 599.