A preliminary pressure-impact analysis applied in the Pinios river basin (Thessaly, Central Greece
10
A preliminary pressure–impact analysis applied in the Pinios river basin (Thessaly, Central Greece) Alexis Ioannou 1 , Yorgos Chatzinikolaou 1,2 & Maria Lazaridou 1 1 Laboratory of Zoology, Department of Biology, Aristotle University of Thessaloniki, Thessaloniki, Greece and 2 Institute of Inland Waters, Hellenic Centre for Marine Research, Anavissos, Greece Keywords hydromorphology; IMPRESS analysis; pollution; risk assessment; river basin management; River Habitat Survey; River Pinios; Water Framework Directive. Correspondence Alexis Ioannou, Laboratory of Zoology, Department of Biology, Aristotle University of Thessaloniki, GR-54124 Thessaloniki, Greece. Email: [email protected] doi:10.1111/j.1747-6593.2008.00130.x Abstract Greece has not yet undertaken one of the first and most important tasks required by the Water Framework Directive (WFD: the integrated review of the impact of human activity on the status of surface waters for each river basin – the IMPRESS analysis. Owing to the lack of a national methodology, a preliminary analysis was carried out for the Pinios river basin, applying a combination of different methodologies refined to suit the particularities of the Greek freshwater environment and to accommodate the limited availability of data. Pressures caused by the main pollution sources, point and nonpoint, were quantified in terms of pollution loads with the use of emission factors. The existing limited biological and physicochemical monitoring data were used to assess impacts. Additionally, we identified pressures caused by alterations from land-use data; we carried out a River Habitat Survey (RHS) and estimated the hydromorphological impacts through the calculation of a Habitat Modification Score (HMS). Our results suggest that the probability of the Pinios river basin failing to achieve good ecological quality by 2015 due to pollution is high, and due to hydromorphological pressures is moderate. Introduction The key objective of the Water Framework Directive 2000/60 (WFD) is to achieve good ecological and chemi- cal conditions by 2015 for all European Union (EU) natural inland waters (European Union Council 2000). Pressure (defined here as the quantification of an anthro- pogenic activity that may have an effect on the environ- ment, that is the pollution load produced by an industrial unit) and impact (IMPRESS) analysis plays a key role in this process as it evaluates the likelihood that a water body will fail to meet set objectives (CIS Working Group 2.1: IMPRESS 2003). This analysis is carried out according to the Driving force–Pressure–State–Impact–Response (DPSIR) framework that represents the ways in which society, the economy and the natural environment inter- act (Kristensen 2004). On this basis, the regulatory authorities can create a focused monitoring programme for regions in danger and adjust the River Basin Manage- ment Plan (RBMP) accordingly. There are four stages to IMPRESS analysis: (a) identifi- cation of driving forces and pressures, (b) identification of potentially significant pressures, (c) impact assessment and (d) evaluation of the likelihood of failing to meet the environmental objectives. The first stage is the evaluation of driving forces and the pressures they exert. Specifically, these pressures are from point sources (industry and housing), nonpoint sources (e.g. livestock grazing, arable farming, forestry) and hydromorphological alterations. Although most types of pressures should be assessed, due to the preliminary nature of the analysis, only the most important ones were calculated. Pressures arising from habitats that are very likely to affect community struc- ture, including the loss of rare or hydromorphological alterations, can result in a loss or change in endangered species. Secondly, there is a need to identify whether current pressures are significant, that is, pressures that cause an impact that may lead to a failure to achieve the specified objectives (CIS Working Group 2.1: IMPRESS 2003). One simple but effective approach is to compare the magnitude of the pressure with a criterion or a threshold. After having identified the significant pres- sures, estimation and quantification of the impacts on the water should be carried out – a step that uses results from existing monitoring programmes. Moreover, it must be kept in mind that most pressures do not create a Water and Environment Journal 23 (2009) 200–209 c 2008 The Authors. Journal compilation c 2008 CIWEM. 200 Water and Environment Journal. Print ISSN 1747-6585
-
Upload
roehampton-online -
Category
Documents
-
view
1 -
download
0
Transcript of A preliminary pressure-impact analysis applied in the Pinios river basin (Thessaly, Central Greece

A preliminary pressure–impact analysis applied in the Pinios riverbasin (Thessaly, Central Greece)
Alexis Ioannou1, Yorgos Chatzinikolaou1,2 & Maria Lazaridou1
1Laboratory of Zoology, Department of Biology, Aristotle University of Thessaloniki, Thessaloniki, Greece and 2Institute of Inland Waters, Hellenic Centre
for Marine Research, Anavissos, Greece
Keywords
hydromorphology; IMPRESS analysis; pollution;
risk assessment; river basin management; River
Habitat Survey; River Pinios; Water Framework
Directive.
Correspondence
Alexis Ioannou, Laboratory of Zoology,
Department of Biology, Aristotle University of
Thessaloniki, GR-54124 Thessaloniki, Greece.
Email: [email protected]
doi:10.1111/j.1747-6593.2008.00130.x
Abstract
Greece has not yet undertaken one of the first and most important tasks
required by the Water Framework Directive (WFD: the integrated review of the
impact of human activity on the status of surface waters for each river basin –
the IMPRESS analysis. Owing to the lack of a national methodology, a
preliminary analysis was carried out for the Pinios river basin, applying a
combination of different methodologies refined to suit the particularities of the
Greek freshwater environment and to accommodate the limited availability of
data. Pressures caused by the main pollution sources, point and nonpoint, were
quantified in terms of pollution loads with the use of emission factors. The
existing limited biological and physicochemical monitoring data were used to
assess impacts. Additionally, we identified pressures caused by alterations from
land-use data; we carried out a River Habitat Survey (RHS) and estimated the
hydromorphological impacts through the calculation of a Habitat Modification
Score (HMS). Our results suggest that the probability of the Pinios river basin
failing to achieve good ecological quality by 2015 due to pollution is high, and
due to hydromorphological pressures is moderate.
Introduction
The key objective of the Water Framework Directive
2000/60 (WFD) is to achieve good ecological and chemi-
cal conditions by 2015 for all European Union (EU)
natural inland waters (European Union Council 2000).
Pressure (defined here as the quantification of an anthro-
pogenic activity that may have an effect on the environ-
ment, that is the pollution load produced by an industrial
unit) and impact (IMPRESS) analysis plays a key role in
this process as it evaluates the likelihood that a water
body will fail to meet set objectives (CIS Working Group
2.1: IMPRESS 2003). This analysis is carried out according
to the Driving force–Pressure–State–Impact–Response
(DPSIR) framework that represents the ways in which
society, the economy and the natural environment inter-
act (Kristensen 2004). On this basis, the regulatory
authorities can create a focused monitoring programme
for regions in danger and adjust the River Basin Manage-
ment Plan (RBMP) accordingly.
There are four stages to IMPRESS analysis: (a) identifi-
cation of driving forces and pressures, (b) identification of
potentially significant pressures, (c) impact assessment
and (d) evaluation of the likelihood of failing to meet the
environmental objectives. The first stage is the evaluation
of driving forces and the pressures they exert. Specifically,
these pressures are from point sources (industry and
housing), nonpoint sources (e.g. livestock grazing, arable
farming, forestry) and hydromorphological alterations.
Although most types of pressures should be assessed, due
to the preliminary nature of the analysis, only the most
important ones were calculated. Pressures arising from
habitats that are very likely to affect community struc-
ture, including the loss of rare or hydromorphological
alterations, can result in a loss or change in endangered
species. Secondly, there is a need to identify whether
current pressures are significant, that is, pressures that
cause an impact that may lead to a failure to achieve the
specified objectives (CIS Working Group 2.1: IMPRESS
2003). One simple but effective approach is to compare
the magnitude of the pressure with a criterion or a
threshold. After having identified the significant pres-
sures, estimation and quantification of the impacts
on the water should be carried out – a step that uses
results from existing monitoring programmes. Moreover,
it must be kept in mind that most pressures do not create a
Water and Environment Journal 23 (2009) 200–209 c� 2008 The Authors. Journal compilation c� 2008 CIWEM.200
Water and Environment Journal. Print ISSN 1747-6585

clear-cut impact, but substantially change the probability
of adverse conditions (CIS Working Group 2.1: IMPRESS
2003). Finally, the evaluation of the likelihood of failing
to meet the objectives is a risk assessment process and,
ideally, it should be estimated by comparing the ecological
state of the waters with threshold values. Because these
threshold values are not currently available, it is neces-
sary to compare the mean preliminary values with the
assessed impacts and, taking into account whether the
pressures applied are significant or not, derive two or
three risk levels.
The aims of the present study are: (i) to produce a
preliminary methodology for IMPRESS analysis of Greek
rivers, (ii) to identify and evaluate different methodolo-
gies used in other EU Member States and to apply them to
the Pinios river basin and (iii) to identify data deficiencies
and methodological improvements. It is important to note
that as this is a preliminary evaluation based on approx-
imate quantification of pressures and limited monitoring
data, it is likely to contain many uncertainties (UKTAG
2004). As more data are acquired and as more IMPRESS
analyses are carried out the greater will be the accuracy of
subsequent evaluations.
Study area
The Basin of the Pinios River is situated in the Water
District of Thessaly (391340N, 22180E), Greece. Figure 1
shows a map of the basin together with the sampling sites
listed in Table 8. The analysis was performed for the entire
river basin instead of for each separate water body as
recommended (CIS Working Group 2.1: IMPRESS 2003)
due to lack of adequate data for each water body. It was
assumed that the river basin contains the administrative
regions at the NUTS3 level that belong to the Water
District minus all regions of the Magnesia Prefecture.
Administrative divisions were used instead of hydrological
ones because all existing pressure data are available at this
level. The total extent of the Pinios river basin is
11 318 km2 (including the former Karla Lake basin) and
the mean water discharge is 86.1 m3/s according to the
Greek National Bank of Hydrological and Meteorological
Information. The largest part of the river flows through
the country’s largest cultivated plain and has predomi-
nantly smooth gradients. The largest part of the river basin
is used for the intensive cultivation of cotton, corn and
sugar. The cultivation of these crops requires large quan-
tities of water, 96% of which is drawn from the Pinios
(Greek Ministry of Development 2003). The industrial
sector, on the other hand, is not very developed and
consists mainly of food processing. The main water uses,
as designated by Trikala Prefectural Decision 4813/98
(1998), are irrigation and machine cooling. All other uses
are also approved except drinking, swimming and fishing.
Methods
Pressures from pollution sources
The conceptual model used to describe the process of
production and transport of wastewater from point and
diffuse sources is presented in Fig. 2. Water users are
separated into three groups: domestic, industrial and
agricultural (including livestock rearing). Each produces
a certain amount of wastewater expressed in kg/day and
designated as emissions. The amount of each emission
that enters surface waters after dispersal, transportation
and/or purification is called ‘input’. Inputs are then
compared with the maximum permitted input loads
[environmental quality standards (EQS) as defined for
irrigation, drinking and fish life multiplied by the mean
daily discharge of the Pinios] to determine the reduction
Fig. 1. Location of the 13 sampling stations on
the Pinios River basin, Greece.
Water and Environment Journal 23 (2009) 200–209 c� 2008 The Authors. Journal compilation c� 2008 CIWEM. 201
IMPRESS analysis applied in the Pinios river basinA. Ioannou et al.

in input loads required to comply with different environ-
mental management goals. The loads’ calculation is based
on the use of emission factors and is done for the entire
river basin for organic pollution [biological oxygen de-
mand (BOD)] and eutrophication (Total N, Total P).
Point sources of pollution
The loads produced by industrial units were taken directly
from the Greek national census of liquid wastes (LDK EPE
et al. 2001), which includes the largest and most polluting
units but unfortunately not all of the remainder. In order
to calculate emissions from domestic housing, the resi-
dent population was divided into three groups: those
served by a Waste Water Treatment Plant (WWTP) those
who are connected to a drainage network but not to a
WWTP and those who process their wastes independently
using septic tanks. Emissions to and inputs from WWTPs
were taken directly from Argyrouli et al. (2005). For the
calculation of the inputs of the other two groups, the
emission factors in Table 1 were used (Fribourg Blanc &
Courbet 2004; Argyrouli et al. 2005) after making the
assumption that in the drainage networks there are no
losses and decomposition of the wastes does not occur.
Nonpoint sources of pollution
Nonpoint sources of pollution were diffuse pollutants
derived from the different land uses and livestock breed-
ing. The different land uses are as determined by Corine
Land Cover 2000 (EEA 2007). They are grouped into five
categories (Table 2) and each category is assigned to a
different input factor. The emissions produced from live-
stock breeding activities were calculated based on the
number and species of breeding animals (data from Greek
National Statistical Service) using the emission factors
shown in Table 3. Of the emissions produced according
to these factors, 20% of the BOD, 15% of N and 3% of P
form the inputs and are assumed to be transported in
the surface waters (Central Greek Water Agency 2006;
Andreadakis et al. 2007).
Hydromorphological alteration pressures
A River Habitat Survey (RHS) was conducted at 402 sites
of 500 m length each along the main channel of the Pinios
during the summer of 2003. RHS is a system for evaluat-
ing the character and quality of the natural structure of a
river and was developed by the UK Environment Agency
(Raven et al. 1998). In order to identify the main hydro-
morphological alteration pressures, the following steps
were undertaken: data were collected in the field using a
modification of the RHS protocol developed by the UK
Environment Agency (pers. comm. with M. Naura on
standard RHS 2003 protocol) and then inserted into the
standard RHS database. Rare features, defined as features
Drivingforces
Emission
Impact
Inputreduction
Surfacewaterquality
Input
Emission reduction
Pressure
ResponseMeasures
State
Fig. 2. The conceptual model used in relation to the DPSIR model
(modified from VMM 2001).
Table 1 Emission factors for urban wastewater and septic tanks
(Fribourg Blanc & Courbet 2004)
Pollutant Network (g/inhab. day) Tanks (g/inhab. day)
BOD 63 36
Total N 11 10.8
Total P 4.5 2.4
BOD, biological oxygen demand.
Table 2 Nutrient export coefficients for each land use category (WL-Delft
et al. 2005)
Land use Total N (kg/ha year) Total P (kg/ha year)
Surface waters 1.2 0.01
Forested areas 3 0.1
Grasslands 5 0.5
Agricultural area 30 0.5
Urban area 5 1
Table 3 Emission factors for livestock breeding
Animal type
Emission factor (g/animal day)
BOD Total N Total P
Bovines 675 202.5 22.5
Sheep and goats 100.2 24.6 4.2
Pigs 80 38.4 11.2
Horses 381.5 31.5 7
Poultry 3.825 0.825 0.55
BOD, biological oxygen demand.
Water and Environment Journal 23 (2009) 200–209 c� 2008 The Authors. Journal compilation c� 2008 CIWEM.202
IMPRESS analysis applied in the Pinios river basin A. Ioannou et al.
of important ecological value present in o5% of the sites,
were identified.
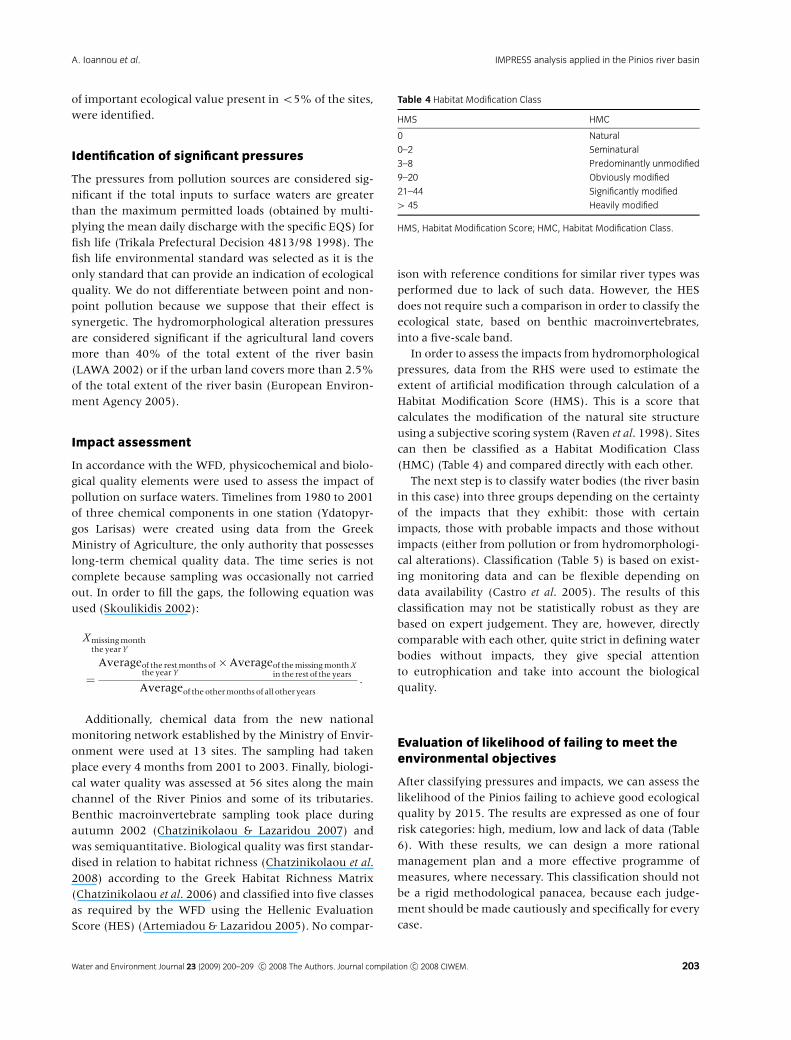
Identification of significant pressures
The pressures from pollution sources are considered sig-
nificant if the total inputs to surface waters are greater
than the maximum permitted loads (obtained by multi-
plying the mean daily discharge with the specific EQS) for
fish life (Trikala Prefectural Decision 4813/98 1998). The
fish life environmental standard was selected as it is the
only standard that can provide an indication of ecological
quality. We do not differentiate between point and non-
point pollution because we suppose that their effect is
synergetic. The hydromorphological alteration pressures
are considered significant if the agricultural land covers
more than 40% of the total extent of the river basin
(LAWA 2002) or if the urban land covers more than 2.5%
of the total extent of the river basin (European Environ-
ment Agency 2005).
Impact assessment
In accordance with the WFD, physicochemical and biolo-
gical quality elements were used to assess the impact of
pollution on surface waters. Timelines from 1980 to 2001
of three chemical components in one station (Ydatopyr-
gos Larisas) were created using data from the Greek
Ministry of Agriculture, the only authority that possesses
long-term chemical quality data. The time series is not
complete because sampling was occasionally not carried
out. In order to fill the gaps, the following equation was
used (Skoulikidis 2002):
Xmissing monththe year Y
¼Averageof the rest months of
the year Y�Averageof the missing month X
in the rest of the years
Averageof the other months of all other years
:
Additionally, chemical data from the new national
monitoring network established by the Ministry of Envir-
onment were used at 13 sites. The sampling had taken
place every 4 months from 2001 to 2003. Finally, biologi-
cal water quality was assessed at 56 sites along the main
channel of the River Pinios and some of its tributaries.
Benthic macroinvertebrate sampling took place during
autumn 2002 (Chatzinikolaou & Lazaridou 2007) and
was semiquantitative. Biological quality was first standar-
dised in relation to habitat richness (Chatzinikolaou et al.
2008) according to the Greek Habitat Richness Matrix
(Chatzinikolaou et al. 2006) and classified into five classes
as required by the WFD using the Hellenic Evaluation
Score (HES) (Artemiadou & Lazaridou 2005). No compar-
ison with reference conditions for similar river types was
performed due to lack of such data. However, the HES
does not require such a comparison in order to classify the
ecological state, based on benthic macroinvertebrates,
into a five-scale band.
In order to assess the impacts from hydromorphological
pressures, data from the RHS were used to estimate the
extent of artificial modification through calculation of a
Habitat Modification Score (HMS). This is a score that
calculates the modification of the natural site structure
using a subjective scoring system (Raven et al. 1998). Sites
can then be classified as a Habitat Modification Class
(HMC) (Table 4) and compared directly with each other.
The next step is to classify water bodies (the river basin
in this case) into three groups depending on the certainty
of the impacts that they exhibit: those with certain
impacts, those with probable impacts and those without
impacts (either from pollution or from hydromorphologi-
cal alterations). Classification (Table 5) is based on exist-
ing monitoring data and can be flexible depending on
data availability (Castro et al. 2005). The results of this
classification may not be statistically robust as they are
based on expert judgement. They are, however, directly
comparable with each other, quite strict in defining water
bodies without impacts, they give special attention
to eutrophication and take into account the biological
quality.
Evaluation of likelihood of failing to meet theenvironmental objectives
After classifying pressures and impacts, we can assess the
likelihood of the Pinios failing to achieve good ecological
quality by 2015. The results are expressed as one of four
risk categories: high, medium, low and lack of data (Table
6). With these results, we can design a more rational
management plan and a more effective programme of
measures, where necessary. This classification should not
be a rigid methodological panacea, because each judge-
ment should be made cautiously and specifically for every
case.
Table 4 Habitat Modification Class
HMS HMC
0 Natural
0–2 Seminatural
3–8 Predominantly unmodified
9–20 Obviously modified
21–44 Significantly modified
4 45 Heavily modified
HMS, Habitat Modification Score; HMC, Habitat Modification Class.
Water and Environment Journal 23 (2009) 200–209 c� 2008 The Authors. Journal compilation c� 2008 CIWEM. 203
IMPRESS analysis applied in the Pinios river basinA. Ioannou et al.

Results and discussion
Pressures from pollution sources
The total emission, input loads produced within the Pinios
river basin and the EQS for irrigation and fish life are
calculated (Table 7). The inputs of all three pollutants are
higher than the quality standards for fish life. It is
important to note that the river has a nutrient retention
capacity, trapping part of the inputs in the sediment and
metabolising the remainder. It is possible to calculate the
necessary input load reduction in order to comply with
standards for fish life. These correspond to 36 553 kg BOD/
day, 218 877 kg N/day and 1523 kg P/day load reduction.
It is evident that with regard to BOD and nitrogen
inputs, livestock breeding is the most polluting
activity (Fig. 3). The urban point pollution sources
(untreated domestic wastewater) also significantly con-
tribute to organic pollution (20%) and are the most
important source of phosphorus inputs. Diffuse land-use
pressures are responsible for 17.5% of nitrogen inputs
and for 40% of phosphorus; thus, it is demonstrated that
agriculture is a very important activity with respect to
eutrophication in the river basin, with phosphorus being
the limiting nutrient. The WWTPs play an important role
in reducing pollution loads to the Pinios basin surface
waters, except phosphorus, as none of the WWTPs
include the tertiary treatment required to remove this
element.
Industry (largely food manufacturing and processing)
does not pose a serious threat to the river as it only
contributes a relatively small amount to the total pollu-
tant load according to the available data. Industry is,
however, concentrated in certain parts of the Pinios
catchment, and thus can result in serious localised pollu-
tion pressures. As livestock breeding appears to be the
most polluting activity, there is a certain amount of
uncertainty involved in predicting their environmental
impact due to lack of data concerning the location of
livestock farms and associated pasture land, their antipol-
lution measures (if any) and methods for the disposal of
pollutants into the environment.
Hydromorphological alteration pressures
The rarest features were wetland, open water, underwater
roots, braided channels and riverside vegetation. It is
evident that intensive agriculture seriously constrains
the extent of natural land use and riverside vegetation.
Furthermore, the extent of flood phenomena is modified
by the presence of embankments (Leyer 2004). Many
illegal direct water abstractions were present in 70% of
Table 6 Hierarchical categories (coloured accordingly) of the failure
probability meeting environmental objectives risk assessment (Castro
et al. 2005)
Impacts
Certain Probable Absent No data
Significant
pressures
Yes High Medium Low Medium
No High Medium Nonexistent Low
No data High Medium Low Not estimable
Table 5 Classification of water bodies in relation to the certainty of the apparent impacts also characterised by a specific shading (Castro et al. 2005)
Pollution pressures
Morphological alteration
pressures (Environment
Agency 2005)
If all the following statements are true:
Certain Mean biological quality
inferior to good
Nutrient timelines of
increasing concentration
Average values of chemical
parameters exceeding
standards for irrigation
Mean HMS 4 8
If at least two of the following statements are true:
Impacts Probable Mean biological quality
inferior to good
Nutrient timelines of
increasing concentration
Average values of chemical
parameters exceeding
standards for potable water
2oMean HMS � 8
If all the following statements are true:
Absent Mean biological quality
superior to good
Nutrient timelines stable or of
decreasing concentration
Average values of chemical
parameters inferior to
standards for fish life
Mean HMS � 2
Table 7 Comparison of emissions and inputs, with maximum permitted
input loads
Emissions Inputs
Irrigation
standards
Fish life
standards
BOD (kg/day) 245 811 58 870 185 976 22 317
Total N (kg/day) 1 468 296 263 586 390 550 44 709
Total P (kg/day) 13 652 3011 5207 1488
BOD, biological oxygen demand.
Water and Environment Journal 23 (2009) 200–209 c� 2008 The Authors. Journal compilation c� 2008 CIWEM.204
IMPRESS analysis applied in the Pinios river basin A. Ioannou et al.

the sites, and many impoundments and temporary dams
were also found that withhold the water so as to be
abstracted. Water impoundment is a serious pressure
mainly during the summer months (Shiao & Wu 2004)
when discharge is low. In many cases, zero flow was
observed, which is likely to increase pollutant concentra-
tions in the water and severely deplete available oxygen.
Identification of significant pressures
As stated previously, inputs for all three pollutants exceed
the maximum permitted loads for fish life, and hence we
can conclude that the pressures from pollution sources
are significant. Based on Corine Land Cover data, the
agricultural land use occupies nearly 50% of the area of
the entire river basin and so the hydromorphological
alteration pressures are also significant (see Table 5).
Impact assessment
It is evident that the most important factor resulting in
eutrophication is nitrate due to the increased use of
nitrogen fertilisers. Total phosphorus remained approxi-
mately constant, showing only small fluctuations and no
temporal trend. Ammonia shows a gradual and steady
decrease in concentration from 1989 to the present. This
corresponds to the opening of the WWTP at Larisa. The
increase in nitrate concentration is so large and its impact
so great that uncertainties regarding the minor impacts of
the other nutrients are unimportant (Fig. 4).
The mean values and standard deviations of some
chemical parameters – from the national monitoring net-
work – are calculated (Table 8). The location of each site is
depicted in Fig. 1. The mean dissolved oxygen concentra-
tions exceed the fish life limit, except at a single tributary
(Kalentzis station, 08.14.02), which is downstream of the
Karditsa WWTP. In the same station – as well as in two
others downstream of Larisa city (08.11.07 and 08.11.09)
– high values of COD occur probably for the same reason.
Nutrient concentrations are all quite elevated and above
the EQS for fish life (Trikala Prefectural Decision 4813/98
1998). Total phosphorus even surpasses the irrigation
standards at most stations.
In summary, impacts from excessive fertiliser use are
present at many points along the River Pinios and tribu-
taries and contribute to eutrophication while organic
pollution seems to be not as important. More detailed
data for the chemical quality of the River Pinios can be
found in various papers (Chatzichristidis et al. 1991;
Fytianos et al. 2002; Bellos et al. 2004; Bellos & Sawidis
40%
10% 9%
11%
1%
29%
Total P
17.5%1.3%
0.3%0.1%
0.3%
80.5%
Total NBOD
70%
2%
20%
8%
Urban pointUrban diffuseWWTP
IndustryLivestockDiffuse-agriculture
Fig. 3. BOD, total phosphorus (P) and total nitro-
gen (N) inputs that originate from each activity.
Years
0.20
Con
cent
ratio
n 0.15
0.10
0.05
0.00
1980
1981
1982
1983
1984
1985
1986
1987
1988
1989
1990
1991
1992
1993
1994
1995
1996
1997
1998
1999
2000
2001
Ammonia (mg/L) Total P (mg/L) NO3 (dg/L)
Fig. 4. Long term (1980–2001) fluctuations of
mean yearly concentration of nitrates, ammo-
nium ions and total phosphorus at the Ydatopyr-
gos Larisa site on the River Pinios.
Water and Environment Journal 23 (2009) 200–209 c� 2008 The Authors. Journal compilation c� 2008 CIWEM. 205
IMPRESS analysis applied in the Pinios river basinA. Ioannou et al.
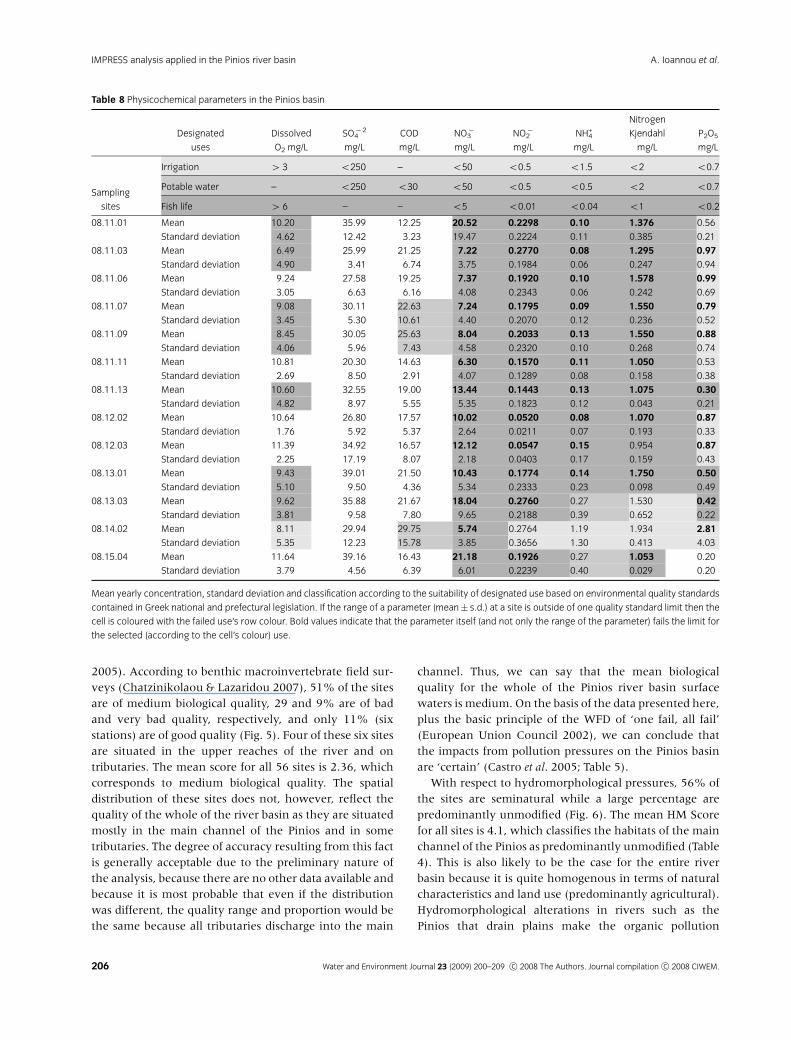
2005). According to benthic macroinvertebrate field sur-
veys (Chatzinikolaou & Lazaridou 2007), 51% of the sites
are of medium biological quality, 29 and 9% are of bad
and very bad quality, respectively, and only 11% (six
stations) are of good quality (Fig. 5). Four of these six sites
are situated in the upper reaches of the river and on
tributaries. The mean score for all 56 sites is 2.36, which
corresponds to medium biological quality. The spatial
distribution of these sites does not, however, reflect the
quality of the whole of the river basin as they are situated
mostly in the main channel of the Pinios and in some
tributaries. The degree of accuracy resulting from this fact
is generally acceptable due to the preliminary nature of
the analysis, because there are no other data available and
because it is most probable that even if the distribution
was different, the quality range and proportion would be
the same because all tributaries discharge into the main
channel. Thus, we can say that the mean biological
quality for the whole of the Pinios river basin surface
waters is medium. On the basis of the data presented here,
plus the basic principle of the WFD of ‘one fail, all fail’
(European Union Council 2002), we can conclude that
the impacts from pollution pressures on the Pinios basin
are ‘certain’ (Castro et al. 2005; Table 5).
With respect to hydromorphological pressures, 56% of
the sites are seminatural while a large percentage are
predominantly unmodified (Fig. 6). The mean HM Score
for all sites is 4.1, which classifies the habitats of the main
channel of the Pinios as predominantly unmodified (Table
4). This is also likely to be the case for the entire river
basin because it is quite homogenous in terms of natural
characteristics and land use (predominantly agricultural).
Hydromorphological alterations in rivers such as the
Pinios that drain plains make the organic pollution
Table 8 Physicochemical parameters in the Pinios basin
Designated
uses
Dissolved
O2 mg/L
SO4� 2
mg/L
COD
mg/L
NO3�
mg/L
NO2�
mg/L
NH4+
mg/L
Nitrogen
Kjendahl
mg/L
P2O5
mg/L
Sampling
sites
Irrigation 4 3 o250 – o50 o0.5 o1.5 o2 o0.7
Potable water – o250 o30 o50 o0.5 o0.5 o2 o0.7
Fish life 4 6 – – o5 o0.01 o0.04 o1 o0.2
08.11.01 Mean 10.20 35.99 12.25 20.52 0.2298 0.10 1.376 0.56
Standard deviation 4.62 12.42 3.23 19.47 0.2224 0.11 0.385 0.21
08.11.03 Mean 6.49 25.99 21.25 7.22 0.2770 0.08 1.295 0.97
Standard deviation 4.90 3.41 6.74 3.75 0.1984 0.06 0.247 0.94
08.11.06 Mean 9.24 27.58 19.25 7.37 0.1920 0.10 1.578 0.99
Standard deviation 3.05 6.63 6.16 4.08 0.2343 0.06 0.242 0.69
08.11.07 Mean 9.08 30.11 22.63 7.24 0.1795 0.09 1.550 0.79
Standard deviation 3.45 5.30 10.61 4.40 0.2070 0.12 0.236 0.52
08.11.09 Mean 8.45 30.05 25.63 8.04 0.2033 0.13 1.550 0.88
Standard deviation 4.06 5.96 7.43 4.58 0.2320 0.10 0.268 0.74
08.11.11 Mean 10.81 20.30 14.63 6.30 0.1570 0.11 1.050 0.53
Standard deviation 2.69 8.50 2.91 4.07 0.1289 0.08 0.158 0.38
08.11.13 Mean 10.60 32.55 19.00 13.44 0.1443 0.13 1.075 0.30
Standard deviation 4.82 8.97 5.55 5.35 0.1823 0.12 0.043 0.21
08.12.02 Mean 10.64 26.80 17.57 10.02 0.0520 0.08 1.070 0.87
Standard deviation 1.76 5.92 5.37 2.64 0.0211 0.07 0.193 0.33
08.12.03 Mean 11.39 34.92 16.57 12.12 0.0547 0.15 0.954 0.87
Standard deviation 2.25 17.19 8.07 2.18 0.0403 0.17 0.159 0.43
08.13.01 Mean 9.43 39.01 21.50 10.43 0.1774 0.14 1.750 0.50
Standard deviation 5.10 9.50 4.36 5.34 0.2333 0.23 0.098 0.49
08.13.03 Mean 9.62 35.88 21.67 18.04 0.2760 0.27 1.530 0.42
Standard deviation 3.81 9.58 7.80 9.65 0.2188 0.39 0.652 0.22
08.14.02 Mean 8.11 29.94 29.75 5.74 0.2764 1.19 1.934 2.81
Standard deviation 5.35 12.23 15.78 3.85 0.3656 1.30 0.413 4.03
08.15.04 Mean 11.64 39.16 16.43 21.18 0.1926 0.27 1.053 0.20
Standard deviation 3.79 4.56 6.39 6.01 0.2239 0.40 0.029 0.20
Mean yearly concentration, standard deviation and classification according to the suitability of designated use based on environmental quality standards
contained in Greek national and prefectural legislation. If the range of a parameter (mean� s.d.) at a site is outside of one quality standard limit then the
cell is coloured with the failed use’s row colour. Bold values indicate that the parameter itself (and not only the range of the parameter) fails the limit for
the selected (according to the cell’s colour) use.
Water and Environment Journal 23 (2009) 200–209 c� 2008 The Authors. Journal compilation c� 2008 CIWEM.206
IMPRESS analysis applied in the Pinios river basin A. Ioannou et al.

impacts worse (Buffagni et al. 2002) and thus render their
biological communities more sensitive to possible distur-
bance (Gazzera et al. 1991). According to the previous
analysis (Table 5), the impacts from hydromorphological
alteration pressures are probable.
Evaluation of likelihood of failing to meet theenvironmental objectives
We can conclude that the risk of failing the environmen-
tal objectives for the entire river basin due to pollution
pressures is high (Table 6), whereas the risk of failure due
to hydromorphological alteration pressures is medium.
The measures that should be applied in each case can be
seen in Table 9. We suggest that measures are immediately
put in place to reduce pollution inputs and to reinforce the
river’s self-purification capability. In addition, a more in-
depth IMPRESS analysis should also be undertaken with
more detailed methodologies and with more extended
monitoring data. These data could come from operational
monitoring programmes (CIS Working Group 2.7: Mon-
itoring 2003) based on the results of the IMPRESS analysis.
A long-term programme of measures should also be ap-
plied that would have as its main goal to educate the
farmers in codes of sustainable agricultural practice.
As this is the first IMPRESS analysis undertaken on the
Pinios, it is based on already existing data and on approx-
imate environmental pressure quantification. Its depth
and its precision depend considerably on the availability
of data and methodologies. It does not use a statistically
robust methodology as it is highly based on expert judge-
ment – and because it was designed to suit the available
data. However, the results are directly comparable with
each other, provided that there is the same amount of
data available for each different analysis. The methodolo-
gical limitations derive from the limited data availability
with respect to the quantification of pollution loads, the
nonexistence or limited official monitoring networks and
from the fact that the hydrographic network has not yet
been separated into water bodies as required by the WFD.
The most serious problem is the limited environmental
pressure data used to undertake the IMPRESS analysis.
The methodology used was devised to utilise already
available data sets. Data deficiencies are observed in many
areas compared with other EU countries. The industry
census inventory is not complete and does not to include
all enterprises. The exact type of septic tank, as well as
their location and their proximity to watercourses is
unknown. Not all WWTPs provide a detailed index of the
pollution loads that each emits to the environment. The
antipolluting technologies (if any) used by livestock
breeding farms are not known, nor is the final destination
of their liquid and solid wastes. The amount of fertiliser
Table 9 Measures for risk management according to each risk category from Table 6 (Modified from Castro et al. 2005)
Impacts
Certain Probable Absent No data
Significant
pressures
Yes Immediate application of a
programme of measures
Long-term programme
of measures
Surveillance monitoring Operational monitoring
NoAdditional IMPRESS
analysis Operational
monitoring
Prevention of deterioration Surveillance monitoring
No
dataOperational monitoring
Surveillance monitoringImmediate additional IMPRESS
analysis
Biological water quality
29%
9%0% 11%
51%
High
Good
Moderate
Poor
Bad
Fig. 5. Biological quality at 56 sites on the River Pinios.
31%
9%3%
1%
56%
Seminatural
Modification class
Predominantly unmodified
Obviously modified
Significantly modified
Heavily modified
Fig. 6. Habitat Modification Class distribution at 402 sites along the main
channel of the River Pinios.
Water and Environment Journal 23 (2009) 200–209 c� 2008 The Authors. Journal compilation c� 2008 CIWEM. 207
IMPRESS analysis applied in the Pinios river basinA. Ioannou et al.

used in cultivated areas is not registered but is considered
certain that it usually exceeds the recommended limit.
Furthermore, GIS-based deterministic models should be
created for the estimation of diffuse pollution loads. In
order for this to become feasible many of the following data
deficiencies should be addressed: antipollution technolo-
gies and the exact location of livestock breeding farms;
aquifer height, soil types and their permeability; exact
amounts of fertiliser used; and the river’s self-purification
capacity. A presentation and comparison of models used in
other EU Member States can be found in De Paepe (2000).
Another very important deficiency is that Greece has
not yet developed a method for identifying the ecological
river status (Chatzinikolaou et al. 2008). The use of biota in
freshwater quality assessment is one of the most important
and innovative aspects of the WFD and should be a top
priority in Greece’s water management agenda, especially
when most EU countries already use biological assessment
methods (European Environment Agency 2003). Hydro-
morphological elements, which the WFD states that should
be used to define the borders of good and excellent
ecological status, are equally important to monitor as they
form the biota’s habitat. In the United Kingdom, for
example, there exists an extensive monitoring network
that includes an assessment of the hydromorphology of
numerous sites within each major river catchment. RHSs
using a standard protocol are thus carried out on a regular
basis in the United Kingdom (EA 2003).
The EQS set by European legislation should be adapted
to the Greek environment to reflect more accurately the
special conditions that affect ecological quality. Up to
now, relevant European legislation EQS were defined for
three uses: irrigation, drinking and fish life. The first two
refer to the quality required for anthropocentric uses and
not for the preservation of the ecosystem functions. The
third reflects conditions necessary for the survival of
certain fish species and not the general ecological condi-
tions under which the entire fluvial ecosystem functions
naturally. Greek catchments are marked by high spatial
differences in morphological, climatic, hydrographic, pet-
rographic and vegetative features, plus large variations in
the amount and type of pollution. Furthermore, river and
stream habitat, hydrochemical regime and biocommunity
structure show considerable spatial variability (Skouliki-
dis 2002). These characteristics indicate that a different
EQS should be defined for each river type that will reflect
general ecological conditions.
In conclusion, we suggest that the following im-
provement should be incorporated into the methodology
of subsequent IMPRESS analysis carried out in
Greece:
� Water bodies ought to be identified, categorised into
types and an IMPRESS analysis should be conducted for
each type. This would of course require monitoring data
for the entire river basin – something that is currently not
available in Greece. If these data were available, the
results of the IMPRESS analysis would be more easily
comprehensible, and could identify that part of the river
or stream at greatest risk and where operational monitor-
ing should be applied.
� The EQS should be updated and a model-based ap-
proach should be used for the quantification of diffuse
pressures as mentioned above.
� Finally, statistical methods should be used to assign
confidence scales in each category classification.
Although this first analysis involved a major degree of
uncertainty – something acceptable within the WFD –
and could be characterised as a risk screening, these
improvements are expected to improve the depth and
precision of the next series of IMPRESS analyses mark-
edly. It is anticipated that the assessment would then be
sufficiently detailed and specific to allow the classification
of the water body into the two key categories: at risk and
not at risk (CIS Working Group 2.1: IMPRESS 2003).
Acknowledgements
The field surveys of both RHS and water quality were
funded by a grant from the Greek Ministry of Education
for the project ‘HRAKLEITOS: Effect of management
practices on the water quality and ecology of rivers in
Greece’, Contract number: MIS 88740 (8/11/2002). The
authors are also grateful to the reviewers for their com-
ments that significantly improved the manuscript.
References
Andreadakis, A., Gavalakis, E., Kaliakatsos, L., Noutsopoulos,
C. and Tzimas, A. (2007) The implementation of the Water
Framework Directive (WFD) at the river basin of Anthe-
mountas with emphasis on the pressures and impacts ana-
lysis. In: Proceedings of the 9th International Conference on
Environmental Science and Technology, Rhodes Island, Greece.
Argyrouli, F., Kaltsa, E., Mousios, X., Dolmes, S. and Papakon-
stantinou, A. (2005) Study on the usefulness and distribu-
tion of WWTPs for turistic and coastal areas of Thessaly,
District of Thessaly (in Greek).
Artemiadou, V. and Lazaridou, M. (2005) Evaluation Score and
Interpretation Index of the Ecological Quality of Running
Waters in Central and Northern Hellas. Environ. Monit.
Assess., 110 (1–3), 1–40.
Bellos, D. and Sawidis, T. (2005) Chemical Pollution Monitor-
ing of the River Pinios (Thessalia – Greece). J. Environ.
Manage., 76, 282–292.
Bellos, D., Sawidis, T. and Tsekos, I. (2004) Nutrient Chemistry
of River Pinios (Thessalia, Greece). Environ. Int., 30,
105–115.
Buffagni, A., Alber, R., Bielli, E., Erba, S., Kemp, J.L., Cazzola,
M., Albrigo, V., Mutschlechner, A. and Pagnotta, R. (2002) Il
Water and Environment Journal 23 (2009) 200–209 c� 2008 The Authors. Journal compilation c� 2008 CIWEM.208
IMPRESS analysis applied in the Pinios river basin A. Ioannou et al.

progetto AQEM in Italia: aree studiate, metodologia di
campionamentoe potenziali interazioni con altri settori di
indagine. Studi Trent. Sci. Natl. Acta Biol., 78 (1), 181–193.
Castro, C.D., Infante, A.P., Rodriguez, J.R., Lerma, R.S.X. and
Martinez, F.J.S. (2005) Manual para la identificacion de las
presiones y analisis del impacto en aguas superficiales. Centro de
Publicaciones, Ministerio de Medio Ambiente – Direccion
General del Agua, Madrid, Spain.
Central Greek Water Agency. (2006) Report on the Pressures
and Qualitative Characteristics of Water Bodies in the Water
Districts of Greece and a Methodological Approach for
Further Analysis. Ministry of Environment, Physical
Planning and Public Works, Hellenic Republic, Athens
(in Greek).
Chatzichristidis, K., Beltsios, S. and Papakonstantinou, A.
(1991) Quality measurements in Pinios river water. In
Proceedings of the 2nd Environmental Science and Technology
Conference, University of the Aegean, Lesvos, Greece.
Chatzinikolaou, Y. and Lazaridou, M. (2007) Identification of
the Self-Purification Stretches of the Pinios River, Central
Greece. Medit. Mar. Sci., 8/2, 19–32.
Chatzinikolaou, Y., Dakos, V. and Lazaridou, M. (2006) Long-
itudinal Impacts of Anthropogenic Pressures on Benthic
Macroinvertebrate Assemblages in a Large Transboundary
Mediterranean River During the Low Flow Period. Acta
Hydrochim. Hydrobiol., 34, 453–463.
Chatzinikolaou, Y., Dakos, V. and Lazaridou, M. (2008) Asses-
sing the Ecological Integrity of a Major Transboundary
Mediterranean River Based on Environmental Habitat
Variables and Benthic Macroinvertebrates (Aoos-Vjose
River, Greece-Albania). Intl. Rev. Hydrobiol., 93, 73–87.
CIS Working Group 2.1: IMPRESS. (2003) Guidance on the
Analysis of Pressures and Impacts. Office for Official
Publications of the European Communities, Luxembourg.
CIS Working Group 2.7: Monitoring. (2003) Guidance on
Monitoring for the Water Framework Directive. Office for
Official Publications of the European Communities,
Luxembourg.
De Paepe, V. (2000) Nutrient emissions to inland waters: compar-
ability of assessments undertaken within a number of European
Union Member States. Ecole Nationale du Genie de l’ Eau et de
l’ Environment de Strasbourg – European Topic Centre on
Inland Waters.
Environment Agency. (2003) River Habitat Survey in Britain and
Ireland: Field Survey Guidance Manual. River Habitat Survey
Manual: 2003 Version. Environment Agency, Bristol.
Environment Agency. (2005) Technical Assessment Method for
Morphological Alterations in Rivers. Water Framework Direc-
tive Program – Environment Agency, Bristol.
European Environment Agency. (2003) Waters in Europe: An
Indicator Based Assessment – Summary. Office for Official
Publications of the European Communities, Luxembourg.
European Environment Agency. (2007) Corine land cover 2000.
EEA, Copenhagen. http://www.eea.europa.eu [accessed
March 2007].
European Union Council. (2000) Directive of the European
Parliament and the Council Establishing a Framework for
Community Action in the Field of Water Policy, 2000/60/
EC. Off. J. Eur. Commun., 43 (L327), 1–72.
Fribourg Blanc, B. and Courbet, C. (2004) Calcul des emissions de
polluants organiques et de fertilisants dans l’eau, Second lot:
collecte et mise en forme des informations de base necessaires au
calcul des emissions urbaines et industrielles repertoriees, dispersees
et surfaciques. Office International de l’Eau, Paris, France.
Fytianos, K., Siumka, A., Zachariadis, G.A. and Beltsios, S.
(2002) Assessment of the Quality Characteristics of Pinios
River, Greece. Water Air Soil Pollut., 136, 317–329.
Gazzera, S., Cummins, K.W. and Salmoiraghi, G. (1991) A
Comparison of Leaf Litter Processing in Maryland
and Italian Streams. Verh. int. Verein. Limnol., 24,
1703–1706.
Greek Ministry of Development. (2003) Master Management Plan for
National Water Resources. Directorate of Hydrology and Natural
Resources, Ministry of Development, Athens (in Greek).
Kristensen, P. (2004) The DPSIR Framework, UN Workshop on a
Comprehensive Assessment of the Vulnerability of Water Resources
to Environmental Change in Africa Using River Basin Approach.
UNEP Headquarters, Kenya.
LAWA. (2002) German Guidance Document for the Implementation
of the EC Water Framework Directive.
Landerarbeitsgemeinschaft Wasser, Mainz, Germany.
LDK EPE, EPEM EPE.Enveco, A.E., Syvilla, E.P.E. and Exergia,
A.E. (2001) Census of gases, liquid and solid wastes from the
industry and emission from the central heating. Greek Ministry
of Environment, Regional Planning and Public Works,
Athens, Greece (in Greek).
Leyer, I. (2004) Effects of Dykes on Plant Species Composition
in a Large Lowland River Floodplain. River Res. Appl., 20,
813–827.
Raven, P.J., Holmes, N.T.H., Dawson, F.H., Fox, P.J.A., Everard,
M., Fozzard, I.R. and Rouen, K.J. (1998) River Habitat
Quality: The Physical Character of Rivers and Streams in the UK
and Isle of Man. UK Environment Agency, Bristol, UK.
Shiao, J.T. and Wu, F.C. (2004) Assessment of Hydrologic
Alterations Caused by a Chi-Chi Diversion Weir in
Chou-Shui Creek, Taiwan: Opportunities for Restoring Nat-
ural Flow Conditions. River Res. Appl., 20, 401–412.
Skoulikidis, N.T. (2002) Hydrochemical Character and
Spatiotemporal Variations in a Heavily Modified River of
Western Greece. J. Environ. Qual., 24, 106–111.
Trikala Prefectural Decision 4813/98. (1998) Determination of
usage of surface waters and special terms for waste disposal in
natural receivers at Trikala Prefecture. FEK-575B/11-6-1998.
National Press (Government Newspaper (FEK) & Publica-
tions), Athens (in Greek).
UKTAG. (2004) Guidance on General Principles for Pressures &
Impacts Analysis. UK Technical Advisory Group on the Water
Framework Directive, United Kingdom.
VMM. (2001) General Water Quality Plans. Vlaamse Milieu-
maatschappij, Aalst, Belgium.
WL-Delft.Enveco, S.A. and Argyropoulos, D. (2005) Water
Framework Directive summary report for articles 5 & 6. Cyprus
Ministry of Agriculture, Natural Resources and
Environment, Republic of Cyprus.
Water and Environment Journal 23 (2009) 200–209 c� 2008 The Authors. Journal compilation c� 2008 CIWEM. 209
IMPRESS analysis applied in the Pinios river basinA. Ioannou et al.


![“Yunanistan” [Greece]](https://static.fdokumen.com/doc/165x107/63250e4a85efe380f30680d9/yunanistan-greece.jpg)