A Portrait of Well-Being in Early Adulthood - National ...
77
15505 A Portrait of Well-Being in Early Adulthood: A Report to the William and Flora Hewlett Foundation Michael Wald, Program Officer Chi Brett Brown, Kristin Moore, and Sharon Bzostek Child Trends October 2003 www.childtrends.org
-
Upload
khangminh22 -
Category
Documents
-
view
0 -
download
0
Transcript of A Portrait of Well-Being in Early Adulthood - National ...

15505
A Portrait of Well-Being in Early Adulthood: A Report to the William and Flora Hewlett Foundation
Michael Wald, Program Officer
Chi
Brett Brown, Kristin Moore, and Sharon Bzostek Child Trends
October 2003
www.childtrends.org

INTRODUCTION
In this paper we provide a descriptive portrait of the status and well-being of young adults in the U.S. who are approximately age 25. The portrait is broad and includes such policy-relevant areas as education and self-sufficiency, family formation, health, and civic involvement. Particular attention is given to differences across key social communities (as defmed by race and ethnicity, immigration status, and geographic location), and to young adults who seem to be facing major problems. We examine differences among these groups across individual measures of well-being and also explore the distinct patterns of strength and need that emerge for each group as one looks across these broad sets of outcomes.
In addition, we provide projections for selected young adult outcomes for the year 2025 to estimate the levels of need that may face policymakers and the public if gains are not made in the interim. The paper concludes by discussing the implications of these findings for child and youth programs and public policy in the coming decade, and the research that will be needed to support them.
These analyses have been designed to maximize their value to policy makers and planners focused on meeting the evolving challenges society will face in helping youth to make a successful transition to adulthood. Immigration will continue to have a substantial impact on the characteristics of young adults in the U.S., particularly those in the Asian and Hispanic communities. The racial and ethnic profile of young adults in the U.S. is expected to change substantially over the next several decades. Moreover, the geographic distribution of young adults is not random, giving each geographic region its own set of challenges. Understanding the unique strengths and needs of each of these distinct population subgroups will support the development of effective policy.
We focus on outcomes during early adulthood even though our primary concern is to inform policies affecting children and youth. This is because a primary goal of most social policy directed at children and youth is to facilitate their development into wellrounded, self-sufficient adults. A clear portrait ofthis endpoint of child and youth deVelopment should provide policymakers and foundations with valuable insights as they plan future investments in child and youth-focused programs and research.
2

AN INTRODUCTORY NOTE ON METHODOLOGY AND DATA
One of the challenges of producing a report of this sort is the near absence of published data specifically on 25-year-olds. Most published data sources use age ranges of 10 years or more for young adults (15-24 or 20-29, for example) when they provide age-specific estimates at all. For this reason, and in order to provide a well-rounded and consistent portrait of young adults, most of the estimates provided here are based on our own original analyses of survey data. In addition, in order to obtain the sample sizes needed to produce relatively stable estimates, it was often necessary to combine several years worth of data, and/or increase the age range (e.g., ages 24-26 rather than just age 25.) This was particularly necessary in order to support separate estimates by race and Hispanic origin, immigrant statns (where possible), and geographic region. These actions are noted in the tables and are discussed for each data source in the Appendix.
The data sources for this paper include the Current Population Surveys (March, October, and November), National Health Interview Survey, National Household Survey of Drug Abuse, the Census Population Projections, Youth Risk Behavior Survey, and the National Prison Statistics Annual Survey of Jails.
There has been substantial discussion within youth policy and research as to when youth ends and young adulthood begins, with cutoffs ranging from age 18 to age 30 or more depending on the purpose. We have chosen age 25 as our target age for young adulthood. Though somewhat arbitrary, it is an age when most young people have completed their full-time education, joined the labor force, established households independent of their parents, attained all legal rights and responsibilities accorded adults, and taken on other roles of adults in this society.
CHARACTERISTICS OF YOUNG ADULTS
Population Estimates and Projections, 2000 and 20251
The U.S. Census Bureau estimates that there were 3.72 million 25-year-olds in the United States in the year 2000. By the year 2025, Child Trends estimates that the number may increase by over 20 percent to 4.6 million. During that time, new immigration is expected to continue its strong contribution to those numbers.
1 Year 2000 estimates come from bridged race estimates produced by the U.S. Census Bureau based on the 2000 decennial Census. Projections for 2025 were produced by Child Trends. The most recent projections for 2025 available from the U.S. Census at the time this paper was completed were based on pre-Census 2000 estimates that underestimated the current number of Hispanic 25-year-olds by as much as 30 percent. Presumably this would also result in an under-estimate of Hispanics in 2025. In order to produce more reasonable estimates, we took the percentage change in racelHispanic specific populations between 2000 and 2025 that were in the original projections, and applied them to the new 2000 Census-based numbers in order to come up with our own projections.
3

Between 2000 and 2025, the percent of 25-year-olds who are white and non-Hispanic is, according to Child Trends estimates, expected to decline from 61.4 percent to 50.6 percent, while Hispanics will rise from 18.9 to 27.2 percent, and Asians are expected to increase from 5.5 to 8.6 percent. (See Figure 1.) Black non-Hispanics and American Indian non-Hispanics are expected to maintain close to their 2000 proportions.
When seen in terms of absolute numbers, the gains for Hispanics and Asians are even more impressive. The number of Hispanics age 25 will increase by about three-quarters, from 700,448 to 1,248,752, and the number of Asians will nearly double to 397,495. (See Table 1.)
Significantly, while new immigration will continue to playa substantial role in this growth, the proportion of Hispanics and Asians in this age group who are foreign-born is expected to decline by about one-half. This is very important for understanding the future needs of these groups, since the needs, strengths and behaviors of immigrants and native born can be very different. Among Hispanics, the percentage of 25-year olds who are foreign born is expected to decline from 44 percent in 2000 to 21 percent by 2025. Among Asians the drop is from 70 percent to 36 percent? (See Figure 2.) This reflects the large number of immigrants of childbearing age who are now having children in the u.S.
Educational Attainment and English Fluency
The relationship between educational attainment and nearly every facet of adult wellbeing is very strong and very well documented. The tables in this paper show repeatedly the strong relationship of education to such things as employment and earnings; drug, alcohol, and cigarette use; general health and health limitations; civic involvement; and even religious activity.
Overall, nearly nine in ten 25-year-olds had graduated from high school or obtained a GED in 2000, though less than 3 in 10 had graduated with a Bachelor's degree. These percentages can vary substantially by race and immigrant status. (See Table 3.)
High School Dropout. The percent of young adults (ages 24-26) in 2000 who failed to graduate from high school or obtain a GED3 is relatively low at II percent. For some groups, however, high school graduation is still a major stumbling block. For example,
2 The percent foreign born presented here are based on population projections produced prior to the 2000 decennial census. 2000 estimates based on the 2000 decennial Census showed a substantially higher number of Hispanic 25-year-olds overall than previously estimated, which may indicate a higher percentage foreign born than the estimates presented here, Unfortunately, Census 2000 estimates of the foreign born for this age group were not available at the time this paper was written. 3 For the remainder of this paper, unless otherwise specified, those obtaining a GED are considered to have graduated from high school. Research indicates, however, that a GED is not equal to a high school degree in tenns of future earning power. (Boesel, D., Alsalam, N, and Smith, T. 1998. Research synthesis: Educational and labor market perfonnance of GED recipients. U.S. Department of Education. http://www.ed.gov/pubs/GED/
4

30 percent of all innnigrants in this age group lack a high school degree. Among Hispanic immigrants it is over one-half(5l percent).
Over one-third of Hispanics and one-quarter of Native Americans have failed to graduate from high school, compared to about one in eight black non-Hispanics and one in 20 Asian and white non-Hispanics. (See Figure 3.) The Hispanic rates are strongly affected by immigration. The rate for Hispanic innnigrants is 51 percent, while for native-born Hispanics it is much lower at 17 percent. Regional differences are modest, ranging from 8 to 13 percent4 Rates in metropolitan areas are modestly lower than in nonmetropolitan areas (11 percent versus 14 percent). (See Table 3.)
Bachelor's Degree. Over a quarter (28 percent) of young adults had bachelor's degrees in 2000. Across race and ethnicity groups, Hispanics are by far the least likely to have a college degree (10 percent), and Asians are the most likely (51 percent.) Overall, the foreign born (who have greatly swelled the ranks of both Asian and Hispanic young adults) are only modestly less likely than native born to have a college degree (25 versus 29 percent). However, there are distinct streams of poorly and highly educated young immigrants coming to the U.S. The Asian innnigrant stream is dominated by more highly educated young adults (over half have a Bachelor's degree) and are at least as educated as their native-born counterparts. Among Hispanics, however, only 4 percent of immigrants have a Bachelor's degree, compared to 16 percent of the native-born. (See Table 4.)
English Facility. Given the large number of innnigrants, we look at English facility, since difficulty with speaking English can be a major barrier to educational and employment success, and even to civic involvement and access to health care5 Recent high rates of immigration among the young have produced a substantial proportion of young adults (ages 20-24) who report speaking English less than "very well," about 8 percent overall in 1999. Among the foreign born this rises to over one-half (53 percent). (See Table 5.)
Population groups have been differentially affected by the influx of immigrants not fluent in English. More than 40 percent of all Hispanic adults ages 20-24 report speaking English less than very well, compared to 17 percent of Asian or Pacific Islander, 9 percent of American Indian,6 and 1 percent of white non-Hispanic and black nonHispanic young adults. It is notable that difficulty speaking English among Hispanics is not confmed to the immigrant population. Thirteen percent of Hispanic 20-24 year olds who are native born reported speaking English less than very well. (See Table 5.)
4 These regional differences are driven to some extent by demographic differences. The West, which has the highest percentage of high school dropouts, also has the highest proportion of Hispanic immigrants, over half of whom lack a high school degree. For data on the regional distribution of Hispanic immigrants, see U.S. Census. Profile ofthe foreign-born population in the United States, 2000. Detailed tables (PPL-145), Table 4-lD. http://www.census.gov/population/soedemo/foreign/ppl-145/tab04-lD.pdf 5 Hernandez, D. and Charney, E. (1998). From Generation to Generation: The Health and Well-Being of Children in Immigrant Families. Washington, D.C., National Academy Press. page 8. 6 Analyses reveal that most of the American Indians who report speaking English less than very well are immigrants born outside the U.S.
5

Across the four regions, the West is by far the most affected, with 17 percent speaking English less than very well, reflecting the large proportion of immigrants in these states. The Midwest is the least affected at 3 percent, followed by the South and the Northeast at 6 and 7 percent, respectively. Metropolitan areas are more affected than nonmetropolitan areas (10 percent versus 4 percent). Interestingly, within metropolitan areas, suburbs are nearly as affected as central cities (9 percent versus 11 percent.) (See Table 5.)
Family Formation
In the transition to adulthood there are several well recognized milestones related to family formation, including leaving the parental home, getting married, and having children. None of these is strictly necessary to a successful transition to adulthood; done out of order, they can even present a barrier to independence7 Nevertheless, they are important and common milestones.
Living with Parents. By the time people reach their mid-twenties,8 nearly four in five are no longer living with either of their parents. Males are somewhat more likely than females to be living with a parent (27 versus 19 percent). (See Table 6.) American Indians have the lowest percentage and black non-Hispanics the highest percentage living with a parent, though the difference is not very large (20 versus 28 percent.) Among Hispanics, the foreign born arc less than half as likely as native born to live with parents (14 percent compared to 32 percent.) This difference probably reflects the fact that more of the foreign born Hispanics left their natal countries as youth to work in the United States, leaving parents behind.
There is a substantial regional difference, with those living in the Northeast (34 percent) far more likely to be living with a parent those in the Midwest (22 percent), West (21 percent), or South (19 percent). (See Table 6.)
Getting Married. By the mid-twenties (ages 24-26), marriage is a common experience, though a majority (59 percent) has never been married. A little more than a third are married, and about one in 20 is already divorced, separated, or widowed. (See Table 7.)
The percentage that has ever been married is highest among Hispanics (46 percent) and lowest among Asians (32 percent) and black non-Hispanics (26 percent). (See Table 7.) Marriage at this age is less common among those with bachelor's degrees than among those with less education. (See Figure 4.)
Marriage is more common among young adults living in the South than in other regions, particularly compared with the Northeast. (See Figure 5.) In nonmetropolitan areas a
7 Mal;'nard, R. A. (ed). (1997). Kids Having Kids: Economic Costs and Social Consequences olTeen Pregnancy. Washington, D.C.: The Urban Institute. McLanahan, S. S., & Sandefur, G. (1994). Growing Up with a Single Parent: What Hurts, What Helps. Cambridge: Harvard University Press. 8 Ages 23 -27 for this analysis.
6

majority of young adults (55 percent) have been married, compared to only 33 percent in central cities and 39 percent in the suburbs. (See Table 7.)
Cohabitation. Cohabitation is a common precursor to marriage and is increasingly an alternative to marriage for young adults, at least for a while. In 2002, 12 percent of men and women ages 24-26 were cohabiting with an opposite sex partner. (See Table 8.) Cohabitation is much less common among foreign-born adults than among native-born (8 percent versus 13 percent). That difference is roughly the same for both men and women. Hispanics as a group are less likely than white and black non-Hispanics to cohabitate, though the difference is larger for foreign-born Hispanics and smaller for the native-born. (See Table 8.)
Having Children. Early childbearing is associated with negative consequences for both mother and child.9 Research indicates that children bear the greatest burdens associated with early childbearing, followed by the young mothers, and then by the fathers, families and taxpayers.l0 Teen parents tend to come from more disadvantaged backgrounds to begin with, and the challenges imposed by childrearing during the teen years further
d h · 11 ero e t elf prospects.
Rates of teen childbearing are much higher among Hispanics and blacks than among nonHispanic whites. Indeed, of the three groups, Hispanics now have the highest teen birth rate, at 92 births per 1,000 Hispanic females ages 15-19 in 2001, compared with a rate of 73 for black teens and 66 for Native American teens. Non-Hispanic white teens have a birth rate of 30 per 1,000 females ages 15-19, while Asians have a rate of21 . (See Table 9.)
Among young adults ages 23 through 27, nearly half of all women and about a third of all men report that they have had at least one child. Having had a child is very strongly related to income level and educational attainment for both sexes. Among women, for example, 84 percent of high school dropouts have had at least one child, compared to 16 percent of those with a bachelor's degree. For men, the numbers are 54 percent and II percent, respectively. Nearly three-quarters of women below the poverty level have had a child, compared to about 30 percent of those in families with incomes at 300 percent or more above poverty. (See Table 10.)
Black non-Hispanic and Hispanic adults in this age group are far more likely to have had a child than white non-Hispanic and other (mostly Asian) adults of this age. (See Figure 6.) Interestingly, there is almost no difference between foreign born and native born adults, though this is likely a reflection of the fact the foreign born includes Hispanics who tend to have children early, and Asians, who tend to have them much later.
9 Maynard, R. A. (ed). (1997). Kids Having Kids: Economic Costs and Social Consequences o(Teen Pregnancy. Washington, D.C.: The Urban Institute. 10 Ibid. 11 Ibid. Also see Moore, K., Myers, D., Morrison, D., Nord, C., Brown, B., and Edmunston, B. (1993). Age at first childbirth and later poverty. Journal of Research on Adolescence. 3(4) 393-422.
7

Marriage and Children Together. Among adults ages 24-26, a majority (55 percent) are truly single in the sense of being unmarried and not living with one of their own children. This status is more common among men (67 percent) than women (44 percent). Over half of the young adults in every race/ethnicity group are unmarried and not living with any children, with the exception of Hispanics. (See Figure 7.) Hispanics are far more likely than other groups to be both married and living with children. Black non-Hispanics are more likely than other groups to be unmarried but living with one of more of their own children. (See Table II.)
Self-Sufficiency, Disengagement, and Receipt of Government Supports
For most young adults, steady employment is the path to a decent income and an independent adulthood. 12 Some stumble on that path, becoming disengaged from the world of work; some spend time in prison. Others find that work cannot provide adequate income and require access to governmental supports such as food stamps and public assistance.
Employment. By their mid-twenties, the great majority of young adults have made the transition to the workforce. In 2002, 92 percent of males and 81 percent of females reported working in the previous year. Among those who worked, the vast majority reported working full-time, with males somewhat more likely than females to report fulltime work. (See Figure 8.) Nearly two thirds of all males (65 percent) and one-half of females were working full-time/full year. (See Table 12.)
Male high school dropouts are somewhat less likely to be employed than those with higher levels of education, though 87 percent reported working during the previous year. Among women, education is a very strong predictor of work experience. While just 55 percent of female high school dropouts reported working, work activity increases to 78 percent for those with only a high school diploma, and to 90 percent for those with Bachelor's degrees. (See Table 12.) Marriage is also related to employment among women, with 75 percent of married women employed in the previous year, compared to 85 percent of single women. Among foreign born young women, the difference is much larger: 56 percent of the married versus 73 percent of the single were employed. (See Table 13.)
Among young women, there are wide disparities by race in work activity. White nonHispanic, black non-Hispanic, and American Indian women have the highest percentage who work, and Hispanics and Asians have lower rates, with percentages ranging from 86 percent down to 69 percent. 13 (See Figure 9.) This pattern is even more pronounced among married women. Among single women, white non-Hispanics are somewhat more likely to have been employed than blacks and Hispanics. (See Table 13.)
12 For some this path can be indirect through the employment oftheir spouse. 13 Differences with American Indians were not significant due to small sample sizes.
8

Among young men there is a somewhat different pattern. White non-Hispanic and Hispanic men are the most likely to have worked (94 and 93 percent, respectively), while black non-Hispanic and Asian men are less likely to have worked (84 and 85 percent, respectively).
Foreign-born young women were much less likely than native-born women to report working in the previous year: 64 percent versus 84 percent. (See Table 12.)
Earnings. In 2001, median earnings among young adult workers!4 were $20,800. Those with Bachelor's degrees had twice the earnings of high school dropouts. American Indian, Hispanic and black non-Hispanic workers earned much less than Asian and white non-Hispanic workers. (See Figure 10.) Foreign born workers had median earnings of about $18,000, compared to $22,000 for the native born. Median earnings among young workers were lower in nonmetropo1itan areas than among those in the suburbs ($18,200 versus $24,000), and somewhat lower than those living in the central cities ($20,700). (See Table 14.)
Disengagement. There are a number of roles that young adults may adopt to be considered as independent adults, or at least on the road to independence. These roles include worker, student, or spouse to someone who is employed or going to school.!5 Those who do not occupy such roles as young adults are often referred to as idle, dependent, disconnected, or disengaged.
To operationalize this concept of disengagement, we identified the percentage of 23- to 27-year-olds in the civilian po~ulation!6 who were not in school, not in the labor force, not married, and not disabled. 7 Overall, less than 5 percent were disengaged, about 800,000 in all. (See Table 15.) High school dropouts are particularly at risk of being disengaged, especially women dropouts. Eighteen percent of women who are high school dropouts were disengaged, compared to 7 percent of those with only a high school diploma. (See Table 15.) Among men the difference is much smaller, with 5 percent of high school dropouts disengaged, compared to 4 percent of those with only high school diplomas.
Among women, white non-Hispanics and Asians are the least likely to be disengaged at around five percent, while rates among black non-Hispanic and Native American women are around nine percent. Among men the pattern is a little different, with white nonHispanic and Hispanic men the least likely to be disengaged at around three percent, compared to rates of six to seven percent among black, Asian, and Native American men.
14 Ages 24 to 26. 15 Brown, B. and Bmig, C. (1999). Prevalence, patterns, and outcomes. In America's Disconnected Youth. Washington, D.C.: The Child Welfare League of America. 16 The civilian population specifically excludes all those who are in prison or other institutional facilities, as well as those on active duty in the Anned Forces. 17 These refer to activities or statuses in the week prior to the survey. As such, this does not constitute an ideal operationalization of the construct, as one would like to be able to capture those who were disconnected over longer periods aftime. In addition, this definition will classify some adults as disconnected who are being financially supported by an unmarried partner.
9

(See Table 15.) Rates of disengagement among foreign-born men and women are only slightly higher than those among the native bom.
Among men, disengagement is more common among those living in central cities compared to the suburbs and the nonmetropolitan areas. Women show a different pattern, with those in nonmetropolitan areas about as likely as those in central cities to be disengaged. (See Figure II.)
Foods Stamps and Public Assistance Receipt. In 200 I, 7 percent of young adults 18 lived in households receiving food stamps, and 3 percent in households receiving public assistance (primarily TANF). (See Table 16.)
Educational attainment is a strong predictor of who will receive publicly subsidized sources of support. (See Figure 12.) Among young adult college graduates, one percent lived in households receiving food stamps and fewer than one percent lived in households receiving public assistance. In contrast, among high school dropouts, 17 percent lived in households receiving food stamps and 7 percent received public assistance. (See Table 16.)
Receipt is relatively low among white non-Hispanics and Asians, and much higher among blacks, Hispanics, and Native Americans. For example, three percent of Asians and five percent of white non-Hispanics lived in households receiving food stamps, compared to nine percent of Hispanics, 13 percent of Native Americans, and 15 percent of black non-Hispanics. 19 (See Figure13.)
Females are about twice as likely as males to live in households receiving food stamps and public assistance. This is not surprising, since these programs are targeted to families with children, and such families are commonly headed by single women.
Receipt of food stamps in households where young adults live is more than 50 percent higher in nonmetropolitan areas than in metropolitan areas. (See Figure 14.) Within metropolitan areas, receipt is higher in the central cities than in the suburbs, though still lower than nonmetropolitan areas. Receipt of public assistance is somewhat higher in the central cities than in nonmetropolitan areas (4.2 percent compared to 3.2 percent), though overall rates are similar for nonmetropolitan and metropolitan areas (3.2 in both cases). (See Table 16.)
Prison. Those young adults who find themselves in prison have clearly failed in making the transition to an independent and productive adulthood. What is more, once released, they often have a very difficult time gaining and sustaining legitimate employment, and many eventually find themselves back in prison?O
18 Ages 24-26 in March 2002. 19 Differences with American Indians not significant at .05 level, probably due to small sample sizes. 20 Travis, J., Solomon, A., and Waul, M. (2001). From prison to home: The dimensions and consequences of prisoner reentry. Washington, D.C.: The Urban Institute. See also Langan, P., and Levin, D. (2002). Recidivism of prisoners released in 1994. Bureau of Justice Statistics Special Report.
10

Prison experience is much more likely for males than for females. In 2002,3.6 percent of males and 0.3 percent of females ages 25-29 were resident in state or federal prisons and local jails. Among males, a staggering 13 percent of blacks ages 25-29 were incarcerated, compared to four percent among Hispanics and two percent among white non-Hispanics. (See Table 17.) Among females, 0.8 percent of blacks ages 25-29 were incarcerated, compared to 0.3 percent among Hispanics and 0.2 percent among white non-Hispanics. (See Table 17.)
Social Engagement
Citizenship and Voting. The role of active citizen is a critical adult role in a democracy. Civic engagement is essential for the health of the society, for the representation of key social groups in the political process, and for the empowerment of the individual.
Among young adults ages 24 to 26, one in eight is not a U.S. citizen. Non-citizens do not enjoy the same political rights as citizens, are not eligible for the same social supports,21 and are unable to exercise the vote in the country where they live. Among Hispanics and Asians, nearly half of 24- to 26-year-olds are non-citizens. Among the foreign born, only one in five has attained citizenship status in this age group. Also, nearly four in ten U.S. residents in this age group who lack a high school education in this country also do not have citizenship.
For these reasons, about one in five Hispanic and Asian young adults voted in the 2000 elections, compared to 53 percent of black non-Hispanics and 48 percent of white nonHispanics. Native Americans fell in between these two groups at 32 percent.22 (See Figure 15.)
Among the foreign born, around six percent voted. And, among young adults with less than a high school diploma, only one in ten voted, compared to 31 percent of those with only a high school diploma, and 62 percent of those with a bachelor's degree. (See Table 18.)
There are significant regional difference in both citizenship status and voting behaviors, in part the result of immigrant settlement patterns. In the Midwest, 93 percent of adults ages 24 to 26 were citizens, compared to just 81 percent in the West. Differences in the percentage that voted follow the same pattern. (See Table 18.)
Religious Attendance. Involvement in local religious institutions is associated with a number of important benefits for young adults, including better mental and physical health and overall life satisfaction?3
21 Restrictions on Food Stamp eligibility for legal aliens is one example. 22 Differences with American Indians not significant at .05 level, probably due to small sample sizes. 23 Bridges, L. and Moore, K. (2002). Religion and spirituality in childhood and adolescence. Page 2. Washington, D.C.: Child Trends.
11

While about three-quarters (72 percent) of all young adults (ages 24-25) report that religion plays a very important role in their lives, only a fifth attend religious services regularly (defined as 25 or more times in the previous year). Over a third had not attended at all in the past year. Attendance does vary somewhat across different social groups. Young women were somewhat more likely to attend regularly than were young men; and those with bachelor's degrees were more likely to attend than those with a high school degree or less. (See Table 19.)
Health Outcomes and Behaviors
Even though they are generally quite healthy, young adults may suffer from a variety of negative health conditions and behaviors that substantially reduce their quality oflife, represent threats to long-term well-being, and may make it much more difficult for them to achieve and sustain a successful transition to adulthood.
Health Status Measures. In this section we examine three health outcomes: I) limitations that affect one's ability to do daily tasks (such as working; walking a quarter mile; standing for 2 or more hours; stooping, bending, or kneeling); 2) symptoms of depression;24 and 3) fair to poor general health. Disability and depression are, of course, major health concerns in their own right,25 and can substantially interfere with overall well-being, as well as one's ability to earn a living and perform other important daily functions required of independent adults 26 The third measure, a general health status measure, has been shown to be a strong indicator of health and well-being27
Overall, few young adults28 suffer from these health problems: no more than 5 percent for anyone of the three. Some groups are, however, substantially more likely to be affected than others. There is a strong and consistent link between educational attainment and health as measured by these outcomes. Among high school dropouts, for example, nine percent report being in fair to poor health, eight percent report limitations that interfere with their ability to do daily tasks, and eight percent report symptoms of depression. Among those with a bachelor's degree, by contrast, the rates are three percent or less. (See Table 20.)
24 Young adults were defined as having symptoms of depression if they reported having me or more of the following emotional conditions all or most of the time during the prior 30 days: sad, hopeless, nervous, worthless, restless, or that everything was an effort. This should not be confused with a clinical diagnosis of depression, which requires much more extensive evaluation. 25 U.S. Department of Health and Human Services. (2000). Healthy People 2010. 2nd Edition. With Understanding aud Improving Health and Objectives for Improving Health. 2 vols. (focus areas 6 and 18) Washington, D.C.: U.S. GPO. 26 U.S. Department of Health and Human Services. (1999). Mental Health: A Report of the Surgeon General. U.S. Department of Health and Human Services, Substance Abuse and Mental Health Services Administration, Center for Mental Health Services, National Institutes of Health, National Institute of Mental Health. 27 Bowling, A. (1997). Measuring Health: a Review of Quality of Life Measurement Scales. 2nd edition, page 38. Philadelphia: Open University Press. 28 Ages 24-26.
12

If immigrants are excluded (immigrants are only a third as likely as native born to report limitations), the percentage is even higher. Among non-immigrants, over 12 percent of all high school dropouts have a functional limitation.
Finally, problems of limitation and depression are more common among those in nonmetropolitan areas than among those in metropolitan areas, though even in nonmetropolitan areas the incidence is only about eight percent. (See Table 20.)
Drug Use, Binge Drinking, and Cigarette Use. Those who abuse drugs and alcohol often have difficulties getting and keeping jobs?9 Such activities can also make it difficult to fulfill family roles of parent and spouse, and are related to higher rates of domestic violence.3o They are also related to later health problems including cancer, heart attack, and premature death3l Cigarette smoking has even been shown to be related to lost economic productivity in addition to its well documented effects on health?2
Nearly one out of seven young adults is a current user of illicit drugs (14 percent)33 Twelve percent of young adults reported using marijuana within the last month, and five percent reported using other types of illicit drugs.34 (See Table 21.) About nine percent reported regular heavy drinking of alcohol, and 27 percent reported being a current smoker. 35 (See Table 22.)
Young men are, overall, substantially more likely than women to engage in these behaviors. They are almost twice as likely to use illicit drugs (18 percent versus 10 percent), and over four times as likely to report regular heavy drinking (14 percent versus 3 percent). The gender gap in cigarette smoking is smaller but still evident (31 percent versus 23 percent. (See Tables 21 and 22.)
Those with bachelor's degrees have significantly lower rates of cigarette use than those with less education. (See Table 22.) Only 16 percent of those with bachelor's degrees are
29 Bryant, R., Jayawardhana, A., Samaranayake, V., and Wilhite, A. (1996). The impact of alcohol and drug use on employment: A labor market study using the National Longitudinal Survey of Youth. Institute for Research on Poverty Discussion Paper no. 1092-96. Madison: Institute for Research on Poverty, University of Wisconsin. 30 U.S. Department of Health and Human Services. (2000). Healthy People 2010. 2nd Edition. With Understanding and Improving Health and Objectives for Improving Health. 2 vols. (focus area 26) Washington, D.C.: U.S. GPO 31 Ibid. 32 U.S. Department of Health and Human Services. (2000). Healthy People 2010. 2nd Edition. With Understanding and Improving Health and Objectives for Improving Health. 2 vols. (focus area 27) Washington, D.C.: U.S. GPO. Centers for Disease Control and Prevention. (2001). Annual smoking-attributable mortality, years of potential life lost, and economic costs - United States, 1995-1999. MMWR 51: 300-303. 33 Current user is defined here as having used an illicit drug within the last month. 34 Some, obviously, reported using both marijuana and other illicit drugs. 35 Regular heavy drinking is defined as having five or more drinks in a row an average of at least once per week in the last year. Current smokers are identified as those who have smoked 100 or more cigarettes in their life, and currently smoke every day or some days (for more on this definition, see National Center for Health Statistics, http://www.cde.gov/nchs/aboutJmajor/nhis/released200209/fi .. ureOS3.htm)
13

smokers, compared to between 27 and 36 percent of those with less education. They are also less likely than those with a high school degree to drink heavily.
Hispanic and black non-Hispanic young adults are much less likely than non-Hispanic white adults to smoke cigarettes (17 and 18 percent versus 32 percent). (See Table 22.) Foreign-born young adults are less than half as likely as their native-born counterparts to report drug use, and nearly half as likely to report smoking cigarettes or regular heavy drinking. (See Table 21.) Native-born Hispanics, in fact, show rates of smoking, binge drinking, and illicit drug use that are much closer to those of non-Hispanic whites. (See Tables 21 and 22.)
Obesity and Physical Activity. Obesity and regular physical activity are both important health indicators for young adults as they relate to both the current quality of life and long-term health. Overall, 17 percent of young adults are obese, and 41 percent engage in regular leisure-time physical activity.
There is a clear relationship between both of these measures and educational attainment. The percentage engaged in regular physical activity increases steadily with education level, from 23 percent among high school dropouts to 53 percent among those with bachelor's degrees. The relationship of education to obesity is a little different, with seven percent obese among those with bachelor's degrees compared to between 19 and 23 percent among those with lower levels of education. (See Table 23.)
Across racial and ethnicity groups, non-Hispanic "other" (primarily Asian) young adults are by far the least likely to be obese (6 percent), followed by white non-Hispanic (16 percent), Hispanic (20 percent) and black non-Hispanic (24 percent) young adults. (See Table 23.)
Rape. The negative consequences of rape are often substantial and long lasting. Problems relevant to a successful transition to adulthood include a greater likelihood of depression and eating disorders, a higher risk of suicide, and a greater likelihood of substance abuse.36
By age 25, we estimate that nearly one in five women and more than one in twenty men will have been raped. Rates are higher for Hispanics and black non-Hispanics than for white non-Hispanics. Among men, rates are highest for black non-Hispanics at 12 percent, nearly three times the rate for white non-Hispanics. (See Table 24.)
Sexually Transmitted Diseases. STDs can have serious health consequences for individuals and their newborn children. Gonorrhea and chlamydia can lead to infertility and other fertility-related problems. Syphilis can facilitate HIV transmission, and has its
36 National Center for Injury Prevention and Control. Rape fact sheet. Accessed 2/7/03. Centers for
Disease Control and Prevention. http://www.cdc.gov/ncipc/factsheets/rape.htm Also Miller, B., Monson, B., and Norton, M. (1995). The effects of forces sexual intercourse on white female adolescents. Child Abuse and Neglect. 19(10) 1289-1301.
14

own devastating health consequences ifleft untreated37 Overall, very few young adults (ages 25-29) have STDs in any given year: less than one percent.
Among young adults, chlamydia is the most common of the three STDs, affecting 558 per 100,00025- to 29-year-olds in 2001. Gonorrhea rates are 289 per 100,000 for this age group. Syphilis is the least common, affecting only 5 per 100,000. Rates for all three forms of STDs are far higher among black non-Hispanics than among other race/ethnicity groups, with rates about four to six times higher than the national average. (See Table 25.)
Portraits for Key Population Subgroups
There are many paths to becoming a fully functioning and independent adult, and different groups face distinct challenges to making a successful transition. In addition, different cultural and historical experiences can influence these patterns. Policies designed to aid that transition are often targeted to particular communities defined both culturally and geographically. This is so for a number of reasons, including the cultural appropriateness of interventions, geographic concentration, and a targeting of resources to areas of specific need.
In the transition to adulthood, the mix and level of problems faced by minorities, the foreign born, and those living in different parts of the country can be quite different. Understanding those differences is an important step in crafting effective policies to smooth their transitions to becoming independent adults.
In what follows, we draw brief portraits of young adulthood for Hispanic young adults, major (non-Hispanic) racial groups, immigrants, and those living in particular regions and areas of the country. We draw selectively from the measures of adult outcomes reviewed above in order to emphasize the essential assets and challenges facing each group.
The White Portrait. Non-Hispanic white young adults have relatively high rates of educational attainment, employment, and income, significantly exceeding outcomes for non-Asian minorities38 They have low rates of imprisonment, and teen fertility rates less than half those of Hispanics, black non-Hispanics, and Native Americans, though still high relative to Asians.
From a policy perspective, however, it is important to note the sheer size of this group: 61 percent of all 25-year-olds in the year 2000. This means that even low rates of problems can represent large numbers of white non-Hispanic young people who are struggling. For
37 U.S. Department of Health and Hnman Services. (2000). Healthy People 2010. 2nd Edition. With Understanding and Improving Health and Objectives for Improving Health. 2 vols. (focus area 25) Washington, D.C.: U.S. GPO 38 The difference between non-Hispanic whites and American Indians for the percentage working was large but not significant at the .05 level, probably due to the small sample sizes
15

example, though the percent of non-Hispanic white young adults who are disengaged (not in school, not in the labor force, not disabled and not married) is low, the absolute number who are disengaged exceeds those of blacks, Asians, Hispanics, and Native Americans combined. In addition, non-Hispanic white young adults constitute a third of all high school dropouts and over 40 percent of those receiving food stamps in their age group.
One area where young non-Hispanic white adults struggle is in drug and alcohol use. The proportion of non-Hispanic white adults engaged in heavy drinking, smoking, and use of illicit drugs is as high as or higher than any of the other race/ethnicity groups. Among poorly educated whites, problems with cigarette addiction and the use of illicit drugs other than marijuana are even more pronounced.
The Hispanic Portrait. The portrait of Hispanic young adults is strongly influenced by the fact that over 40 percent were born outside the United States. So, while it is important to look at Hispanics as a group, it is also important to look separately at native and foreign born, who often have dramatically different characteristics.
Limited education, limited English proficiency, high early fertility rates and non-citizen status are major factors limiting the success of young Hispanic adults. Less than one in five votes. More than 40 percent speak English less than very well. Thirty-five percent lack a high school diploma, the highest rate of any group and much higher than the average of II percent. Only ten percent have a bachelor's degree, far lower than the percentage for non-Hispanic blacks (18 percent) and less than a third of the percentage for non-Hispanic whites. (See Table 3.)
Hispanic teens have by far the highest annual birth rate of any race/ethnicity group: 92 births per 1,000 females ages 15-19. This is higher than the next highest rate of73 per 1,000 among blacks, and much higher than the white non-Hispanic rate of30 per 1,000 and the even lower Asian rate of21 per 1,000. (See Table 9.) Such early fertility has been found to have negative consequences for the future well-being of the mothers, and even greater negative consequences for children.39 By their mid-twenties, two-thirds of Hispanic females have had at least one child, much higher than Asians and non-Hispanic whites, and about the same as non-Hispanic blacks. (See Table 10.)
Young Hispanic men and women have a significantly different relationship to the labor force. The young men are by and large quite successful in attaching themselves to the labor force despite their lack of education and language limitations. The percentage that is disengaged and the percentage working are similar to the average for all males. Hispanic women, on the other hand, have higher rates of disengagement than the average (7.1 percent versus 5.7 percent), and are less likely to be working (68.9 percent versus 80.9 percent). This gender difference in worker status may in part reflect more traditional family roles in the Hispanic community, where young women are more likely to be at home and taking care of children.
39 Maynard, R. A. (ed). (1997). Kids Having Kids: Economic Costs and Social Consequences of Teen Pregnancy. Washington, D.C.: The Urban Institute.
16

Young Hispanic workers are among the lowest earners, with median earnings of $17,500 in 2001 compared to $23,400 for white non-Hispanics.
Hispanics are advantaged in several important health outcomes. For example, they are much less likely than white non-Hispanics to smoke or to report limitations affecting their ability to perform daily tasks. (See Tables 20 and 22.)
The characteristics of native-born and foreign-born Hispanic young adults are often very different. The foreign born are three times as likely to have less than a high school degree (51 percent versus 17 percent) and one-quarter as likely to have a Bachelor's degree (4 percent versus 16 percent). Over two-thirds of foreign-born Hispanic young adults report speaking English less than very well. This compares with about one in eight native-born, a much lower though still surprisingly high proportion. (See Table 5.)
The gap in work experience between native- and foreign-born Hispanic women is particularly large. Native-born women are more likely to have been employed in the previous year (79 percent versus 58 percent) and far more likely to have been employed full-time/full-year (50 percent versus 34 percent). (See Table 12.)
Foreign-born Hispanic young adults are more likely than the native-born to be married (46 percent versus 37 percent) but about equally likely to cohabit (9 percent versus 10 percent). (See Tables 7 and 8.) They are less than half as likely to be living with their parents (14 versus 32 percent). (See Table 6.)
Finally, foreign-born Hispanic young adults are a little more than half as likely as the native-born to smoke cigarettes, and about one quarter as likely to use marijuana. (See Tables 21 and 22.)
The Black Portrait. In 2002, more than one in every eight black non-Hispanic men ages 25-29 were in prison or jail (13 percent). That is triple the rate for Hispanics (the next most likely to be incarcerated), and more than seven times the rate for white nonHispanic young men. (See Table 17.) What's more, this is not a problem confmed to young black men: the percent in prison or jail does not fall below 10 percent until after age 40.40
When you combine those who are in prison or jail with those who are not injail but who are disengaged (5.7 percent), the result is that nearly one in five young black nonHispanic men are clearly not on the path to becoming an independent and self-sufficient adult. Clearly the two statuses are not independent either, as men with prison records have a lot more difficulty getting a job41 While these problems are certainly not unique to black men, they are experienced by them to a far greater degree, with profound economic and social effects for the whole black community.
40 U.S. Department of Justice. (2003). Prison and Jail Inmates at Midyear 2002. Table 14. U.S. DOl 41 Travis, J., Solomon, A., and Waul, M. (2001). From prison to home: The dimensions and consequences of prisoner reentry. Washington, D.C.: The Urban Institute. See also Langan, P., and Levin, D. (2002).
17

The birth rate for black teens has decreased substantially in the last several years to 73 per 1,000 in 2001, but it is still more than twice that of white non-Hispanics, and second only to Hispanic rates (92 per 1,000). (See Table 9.) And, because of their low rates of marriage, by their mid-twenties young black adults are by far the most likely to be single parents (23 percent). (See Table 11.) This in turn is related to high rates of disengagement and dependence among young black women.
Young black adults are, as a group, far better educated than their Hispanic counterparts, but still lag far behind white non-Hispanics and Asians. While 18 percent of black adults ages 24 to 26 have a bachelor's degree, the rate is 33 percent for white non-Hispanics and 51 percent for Asians. (See Table 3.) They hold a similar middle ground in earning power. (See Table 14.)
With regard to health outcomes, young black adults are more likely than white nonHispanics and "others" (mostly Asian) to report being in fair-to-poor health. (See Table 20.) Their rates of STDs are orders of magnitude higher than those of other race and ethnic groups. (See Table 25.) And, among the men, young black adults are more likely to have been raped than white and Hispanic males, a fact which may be related to their higher rates of incarceration. (See Table 24.) Rates of cigarette use among young black adults are much lower than among white non-Hispanics (18 percent compared to 32 percent) and are comparable with rates among Hispanics. (See Table 22.)
The Native American Portrait. A quarter of young Native American adults failed to graduate from high school, second only to Hispanics (35 percent). Hispanic estimates are profoundly affected by immigration, however, and when one compares only among the native born, Native Americans have the highest percent failing to graduate from high schoo1.42 (See Table 4.)
Eight percent of young Native American adults are disengaged, higher than Asians and non-Hispanic whites, and similar to non-Hispanics blacks (7.4 percent). Those who work have a median income of about $18,000, considerably less than Asians ($24,000) and non-Hispanic whites ($23,400), though comparable with non-Hispanic blacks ($18,250) and Hispanics ($17,500). (See Table 14.)
Teen birth rates in 2001 were 66 per 1,000, lower than for blacks and Hispanics but twice the rate for white non-Hispanics. As young adults, Native Americans are, at 15 percent, the second most likely to report being single parents.43 (See Tables 9 and 11.)
In addition to the these challenges, young Native American adults, virtually all of whom are American citizens, are much less likely to be registered to vote than their white nonHispanic and black non-Hispanic counterparts. (See Figure 16.)
42 Differences between American Indians and Blacks and Hispanics were not statistically significant at the .05 level. 43 The difference between Native Americans and Hispanics was not significant at the .05 level, probably due to small sample sizes.
18
Unfortunately, we do not have Native American estimates for most of the health outcomes and behaviors covered in this report due to small sample sizes. We also lack prison data, as the Federal sources we had available to us did not include estimates for them.
The Asian Portrait. By most of the measures presented in this report, young Asian adults are, as a group, thriving. One-half (51 percent) have a bachelors' degree, far higher than any other group.44 Asian workers report the highest median incomes. They have the lowest rates of dependence on government assistance, the lowest rates of teen fertility, and are the least likely to be single parents as young adults. Data on health outcomes and behaviors show them to be among the healthiest on most outcomes. The experience of young Asian adults, like that of Hispanics, is strongly influenced by immigration. Like Hispanics, nearly one-half are not U.S. citizens, and few (about 20 percent) voted in the 2000 elections. Young Asian adults, however, are considerably less likely than Hispanics to be limited in their ability to speak English (17 percent vs. 41 percent). In addition, Asian immigrants, unlike Hispanic immigrants, are at least as well educated as their native-born counterparts.
Asian adults ages 24 to 26 have a lower percentage of workers than either non-Hispanic blacks or whites. It is difficult to know what this means, however, given the very high rates of education and low rates of dependence. It may be that a significant proportion are still engaged in full-time schooling, pursuing advanced degrees. This is something that merits additional research.
The Immigrant Portrait. The young adult immigrant population is a mix with a little over one-half being Hispanic, a quarter Asian, and the rest non-Hispanic white and black. (See Table 2.) Foreign-born young adults are, as a whole, a healthier group of people than their native-born counterparts. They are much less likely to be obese, use marijuana, drink heavily, or smoke cigarettes than are U.S.-born young adults. They are also much less likely to report limitations that interfere with their ability to do daily tasks (two percent versus five percent overall). These positive health behaviors and characteristics are valuable in and of themselves, and many are positively related to work success. (See Tables 20 through 23.)
On the other hand, immigrants do experience certain nceds and challenges that can negatively affect their ability to thrive as fully-functioning and independent adults in our society. Three in ten foreign-born young adults lack a high school diploma (compared to eight percent among native born), and more than half speak English less than very well. Interestingly, the education gap between native-born and foreign-born is much smaller when considering the percentage that has a Bachelor's degree (29 percent versus 25 percent). This reflects a bimodal pattern of immigration that includes large percentages of highly educated (mostly Asian, white, and black) and highly under-educated (overwhelmingly Hispanic) foreign-born. (See Table 4.) The earnings of young foreign-
44 The difference between Asians and American Indians was large but not significant at the .05 level, probably due to the small sample sizes.
19
born workers are considerably less than their U.S.-born peers, reflecting in part their overall educational disadvantage and, quite probably, the language barrier. Young foreign-born adults are less likely to be in houses receiving food stamps, though these differences are clearly affected by eligibility requirements that are not directly related to need. (See Table 16.)
While rates of working are similar among foreign-born and native-born young adult males, the pattern is very different for their female counterparts. Eighty-four percent of young native-born females reported working in the previous year compared to only 64 percent of the foreign-born. (See Figure 17.) This may well reflect more traditional cultural family patterns among the foreign-born, but may also reflect differences in work eligibility. Whatever the cause or causes, it has important policy implications, as foreign-born young women are much less likely to be gaining an employment history or to be generating income for themselves and their families.
Finally, about one in five foreign-born adults ages 24-26 is a U.S. citizen, and fewer that one in fifteen voted in the 2000 election (compared to half ofthe native-born). (See Table 18.)This lack of civic connection via citizenship and voting is, at the very least, a cause for concern.
Regional Patterns: North, South, East, and West. Regional differences in the well-being of young adults may have many causes. The distributions of minorities and immigrants are not equal across the four major regions, with Hispanics and immigrants far more likely to live in the West, and blacks more likely to live in the South. Differences in financial resources, employment opportunities, and in state policies also undoubtedly playa role. When considering policy responses to these regional differences, all these factors should be kept in mind.
In an area as fundamental to adult success as education, regional differences are significant. In the Northeast, 35 percent of adults ages 24-26 have at least a bachelor's degree compared to between 26 and 28 percent for the other regions. In addition to lower educational attainment, the West has a much higher percentage of young adults who speak English less than very well: 17 percent in the West versus 3 to 7 percent in the other regions. Rates of citizenship and voting among young adults are also lower in the West than elsewhere.
It is also important to note regional differences in the family formation outcomes of young adults. The Northeast stands out as having young adults who are less likely to have married, less likely to have had children, and far more likely to be living with their parents than those in other regions. (See Tables 6, 7, and 10.)
Metropolitan and Nonmetropolitan Areas. Differences between young adults living in metropolitan and nonmetropolitan areas are also striking. Though young adults in nonmetropolitan areas are slightly less likely than those in metropolitan areas to have
20

graduated from high school, they are nearly one-half as likely to have graduated from college (18 percent versus 32 percent).45 (See Table 3.)
Nonmetropolitan young people are also more likely to suffer from a number of health conditions that may affect their ability to work and to function. They are more likely to be obese (23 percent versus 16 percent), more likely to report symptoms of depression (8 percent versus 4 percent), and more likely to report a limitation that interferes with their ability to perform daily tasks (8 percent versus 4 percent). (See Tables 20 and 23.)Young adults in nonmetropolitan areas are more likely to be living in households receiving food stamps (11 percent versus 6 percent)46 (See Table 16.) Young adults in nonmetropolitan areas who work also earn less than those in metropolitan areas, with median earnings of $18,200 versus $22,000. (See Table 14.)
The news is certainly not all one direction, however. Young adults living in nonmetropolitan areas are about as likely to be productively engaged as their peers in metropolitan areas. They are more likely to be citizens, and they are less likely to have problems speaking English than those living in metro areas.
Gazing Into the Future: The Status of Young Adults in 2025
Immigration has brought substantial changes in the composition of our young adult population. The Census Bureau has estimated that, in 2000, one in every eight 25-yearolds was born outside of the United States. Twenty-five years later, we estimate that the population of 25-year-olds will grow by 884,000 to nearly 4.6 million, with over 60 percent of that growth due to immigration. Hispanics and Asians are expected to continue to grow as a proportion of that population, from 19 to 27 percent and from six to nine percent, respectively. The percentage of young adults who are white and nonHispanic is expected to fall from 61 percent to 51 percent. (See Table 1.)
The people who will be 25 years old in the U.S. in 2025 are now about 2 years old. About 90 percent of them live in the United States now. We have the opportunity to affect their development in ways that will produce better outcomes for them as young adults. To understand a little more thoroughly what is at stake if we do nothing different between now and then, we have projected selected outcomes, adjusting for overall population growth and for expected changes in the racial, ethnic, and immigrant composition of the young adult population between now and then. The technique requires assumptions to be sure, but we believe that it gives us a better picture of what to expect than simply relying on the (mostly) year 2000 estimates that we have described up to this point.
The results arc presented in Table 26, including estimates related to educational attainment, work, dependency, marriage and children, drug use, and obesity. Overall, the
45 This finding undoubtedly reflects in part the outmigration to metropolitan areas of the college educated and those attending college. 46 Additional analyses (not shown) also indicate that young adults in nonrnetropolitan areas are far more likely to live in households receiving Medicaid.
21

percentages change only modestly from their values in 2000, and not always in the same direction. Several changes are worth noting. Levels of food stamp and public assistance receipt increase modestly from 7.3 to 8.1 percent and from 3.1 to 3.7 percent, respectively. The percentage of young adults who are unmarried parents is also projected to increase from 9.5 to 10.1 percent.
The percent failing to complete high school or get a GED is expected to increase modestly from 11.2 to 11.7 percent. We also project a modest decline in the percent who obtain a bachelor's degree, from 28.3 to 26.7 percent.
The percentage who use illicit drugs is expected to increase very modestly from 13.7 to 13.9 percent. We also project a small increase in the percentage who are heavy drinkers (from 8.6 to 8.9 percent), and a small drop in the percentage who smoke, from 27.3 to 26.5 percent.
In the employment area we project little or no change in the percentage of all young adults who are workers and the percent disengaged.
Finally, there is expected to be a modest decrease in the percentage who have difficulty speaking English, and modest increases in citizenship, all consistent with the expected overall reduction in the percentage of young adults who are foreign born.
Perhaps more important from a policy perspective, however, is the expected increase in the absolute number of young adults with negative outcomes. The projected 24 percent increase in the population of 25-year-olds means that, in many cases, even where there is no increase in the percentage of young adults with poor outcomes, we can expect substantial increases in the absolute number with such problems. For example, the number of high school dropouts among 25-year-olds is expected to increase from 411,000 to 537,000 even though the actual percentage of young adults without a high school diploma is expected to increase by only a half a percentage point (from 11.2 to 11.7 percent).
In addition, we expect substantial increases in the number of 25-year-olds who are dependent on needs-based government supports:
• from 275,000 to 373,000 for food stamps (36 percent increase); • from 116,000 to 169,000 for public assistance (46 percent increase).
The social and financial costs that are associated with these increases may be substantial. In addition, the percentage of the population who will be of retirement age is expected to increase from 13 percent in 2000 to over 18 percent in 2025. Thus the needs of the young may be competing for attention and government dollars with a rapidly growing elderly population throughout the period.
22

SUMMARY AND IMPLICA nONS FOR FUTURE RESEARCH AND POLICY
Summary
In this report we have used social indicator data to paint a portrait of young adulthood across multiple areas including demography, self-sufficiency and dependence, family formation, health, and civic involvement. We have compared the well-being of young adults across groups defined by such characteristics as race and Hispanic origin, gender, educational attainment, immigrant status, and geographic location so that the particular needs of each group could be highlighted. Finally, we have used demographic projections in order to estimate the well-being of the 2000 cohort in 2025, taking into account expected changes in the immigrant, racial and ethnic composition of that cohort as well as overall population growth.
Our key findings include the following:
No population group we studied has a corner on any particular social problem or set of problems.
While we found a number of distinct patterns of difficulty in particular groups, and some groups had more than their share, no group was free of problems. For example, more than a third of all non-Hispanic whites failed to advance beyond a high school diploma. While this is only one-half the rate of Hispanics, in absolute terms whites that fail to go to college outnumber Hispanics and blacks combined. Even in the case of speaking English less than very well, a problem that one might casually assume to be limited to the foreign born, we found that 13 percent of native-born Hispanics have this problem.
Race/ethnicity groups have distinct patterns of challenges in the transition to adulthood.
With over 40 percent foreign born, the challenges facing young Hispanic adults as a group are strongly shaped by the characteristics of most Hispanic immigrants: low education, early childbearing, difficulties with the language, and a lack of civic engagement, but also low rates of drug, alcohol and cigarette use, and high rates of employment among the males.
The differences between native- and foreign-born young adults are many and often dramatic. From a policy perspective it is important to understand the different needs of these two groups. It is also important for those looking to the future to understand these differences. Over the next 25 years, the proportion of young Hispanic adults who are foreign born will shrink by one-half to about 21 percent. All else being equal, that trend should produce some dramatic gains for young Hispanic adults in education, income, and in greater levels of civic engagement. It may also have a downside in the form of greater use of cigarettes, alcohol, and illicit drugs.
23

Young black adults also face significant problems with early fertility and low educational attainment, though to a lesser degree than Hispanics. However, that one in five young black male adults is in prison or disengaged from schooling and employment, and the ripple effects that has on black family formation and dependence, makes this a defining fact for the black transition to adulthood. Health issues, including higher rates of STDs and poorer general health relative to other groups, are also evident.
The socioeconomic struggles of young Native American adults are consistent across outcomes and substantial. They have the highest rates of disengagement. Among the native born they also have the lowest rates of high school completion. And, though they are all citizens, they are only half as likely as white or black non-Hispanics to be registered to vote.
While white non-Hispanic young adults are better off socioeconomically than all other groups except Asians, they are numerous, and this is important where policy is concerned. Even by 2025, they will be slightly more numerous than blacks, Hispanics, and Native Americans combined. So, though there are less of them who struggle in percentage terms relative other groups, in absolute numbers they may exceed the number of minorities who are struggling for certain important outcomes. In other areas, such as cigarette and drug use, white non-Hispanics have the most problems in percentage as well as absolute terms. Among the poorly educated in this group, these problems are even greater.
Young Asian adults are, by most measures of well-being, at or near the top. This is true for educational attainment and earnings, and for all health-related measures with the notable exception of cigarette smoking. Where young Asian adults are most likely to struggle are the immigrant-related areas oflanguage mastery and civic involvement.
Immigration has been and will continue to be apowerfolforce affecting outcomesfor young adults, though in different ways for different groups.
Immigration has been a driving force shaping the current well-being of young adults. New immigrants are expected to account for over 60 percent of the population growth among 25-year-olds between 2000 and 2025. Hispanic and Asian populations in this age group arc expected to increase by over 75 percent during that period, due in large part to a combination of future and recent immigration.
Immigration does not affect these groups similarly, however. While Asian immigrants are at least as highly educated as native-born Asians, Hispanic immigrants are much less well educated than their native-born counterparts, and differ in other important ways described above.
These two migration streams are also having very different impacts on well-being measures for the population as a whole. For example, immigrants composed over 40 percent of all high school dropouts in the U.S. in 2000, and the vast majority of those were Hispanic immigrants. This fact is crucial for anyone looking at simple bivariate
24

relationships between high school dropout and other aspects of young adult well-being, since it will be heavily affected.
The assets and the needs of young adults are not evenly distributed in space. Regional and metropolitan differences are sometime quite large.
Notable differences in this regard include the large deficit of college educated young adults in nonmetropolitan areas (50 percent lower than metropolitan areas), the higher concentration of the college educated in the East, the very high percentage of young adults in the West who do not speak English well, and the high percentage in the South who have had children by age 25.
Ifwe do nothing different between now and 2025, the absolute number of young adults who are struggling will go up for most of the outcomes we have looked at. sometimes substantially.
Due in large part to the expected 20 percent increase in the number of25-year-olds between 2000 and 2025, the absolute level of need among young adults can be expected to increase between now and 2025, even in areas where the percentage of young adults experiencing a particular problem is expected to drop. In areas where percentages are projected to increase, such as receipt of public benefits, the absolute increase may reach a third or higher.
Research and Data Recommendations
The descriptive portrait that we have offered in this paper points to a number of important next steps for research and data development that can better inform child and youth policies needed to improve adult outcomes for those who are growing up between now and 2025.
The need for longitudinal research to link child and youth development to adult outcomes
Longitudinal research is needed to identity the personal and social factors in earlier stages of development that are strong predictors of success or failure in the transition to adulthood. Such analyses should include all of the stages preceding the transition from infancy to early childhood, middle childhood, and adolescence. The identification of early markers can lead to more effective targeting of early interventions, and a better understanding of the social processes
Most research of this sort to date has focused on relating characteristics in adolescence (about ages 12-17) to early fertility, educational attainment, and employment and earnings outcomes. Less work has been done on other important outcomes such as disengagement, going to prison, health, citizenship and civic involvement. Even less work exists relating factors in early and middle childhood to adult outcomes. This is in
25

part a data issue, as few longitudinal surveys start that early, and those that do often do not follow their respondents into adulthood.
The NLSY -97 began interviewing youth in 1997 when they were 12 to 16, and data are now available through age 21 for the oldest respondents. Respondents will be reinterviewed annually until at least 2007 and probably for many years after that, providing a rich data resource for identifying the personal and social factors in adolescence that most influence key adult outcomes such as educational attainment, fertility, going to prison, disengagement/disconnection, and voting behavior. While analyses of adult outcomes at age 25 will have to wait for several years, analyses of early adult transitions and behaviors are possible now.
The National Longitudinal Survey of Adolescent Health (Add-Health) should serve as an excellent platform for linking key personal and social characteristics in adolescence to early adult outcomes, especially health outcomes Data from the third wave, which includes data on correspondents at ages 20 to 25, are now available for analysis.
The 1979 National Longitudinal Survey of Youth - Child Supplement represents another major resource for examining how early childhood and adolescent experiences translate into outcomes among young adults. New babies are no longer being added to the sample; but all babies born to women in the NLSY79 sample up through 2001 are being followed into early adulthood. The unusual design of the study provides detailed information about the mother herself as an adolescent, including some information about her parents and the family in which she grew up. Most important, data were collected every other year for nearly all of the children born to women in the study. This means that detailed and prospective information are available for each child. Moreover, these data are available for all children born to or adopted by a mother, so comparisons across children who are siblings can be made. In addition, since the original NLSY79 sample included many sisters, the sample includes many children who are cousins. These features allow for the estimation of fixed effects models. The liability of the Child Supplement is that the sample is not representative of contemporary children, but of children born to a cohort of mothers. This means that the data cannot be used to describe the population. However, because of the sampling structure, the older children in the sample are the children who were born to teen mothers. These relatively disadvantaged families provide an important analytic sample for studying the transition of at-risk children into adulthood.
Further descriptive work on the timing of immigration for particular cohorts.
Policy directed at improving outcomes for immigrants within a cohort must first understand something about the inflow of those immigrants over time: what proportion come with their parents when they are infants or in early childhood; what proportion come as adolescents; and what proportion come as adults. The strategies for intervening will be very different at these different ages for reasons related to developmental stage and institutional opportunity. Such an analysis should be possible based on the model used by the U.S. Census to produce their population projections. We recommend that this
26

be done separately for Hispanics and Asians, as their patterns of inflow may differ substantially.
Additional descriptive analyses of young adult outcomes for Hispanics, but separately for foreign born and native born.
In this paper we have done a limited number of analyses looking separately at nativeand foreign-born young adults within the Hispanic population. Those analyses revealed substantial differences between the two groups in education, work, family formation, civic engagement, and even drug use. We recommend that a systematic comparison of foreign-born and native-born adults be undertaken for both Hispanics and Asians in order to better understand what may lay ahead as the proportion of these groups who are foreign born shrinks dramatically between now and 2025.
Additional descriptive analyses that correct estimates of the characteristics of young adults, especially males, accountingfor the proportion that are in prison and the military.
A lot of what we know about the characteristics of young adults we know from surveys of the civilian, noninstitutional population. This is not much of a problem for young women, since very few are in prison and relatively few are in the military. However, the failure to account for young men who are in prison or the military is a shortcoming when it comes to indicators of male well-being, and a major problem when it comes to black men. Leaving such persons out of analyses that look at health outcomes or education outcomes, as we have had to do for portions of this paper, creates something of a distorted picture.
The 2000 decennial census is one of the few data sets that allow one to include those in prison and those in the military in basic descriptive analyses. Census microdata that can be used to support such analyses became available in Spring 2003. There are a lot of data that it will not provide, but it does allow one to include those in prison, and to look at selected characteristics like educational attainment.
One possible solution to this problem more generally would be to include those in prison and the military in our general population surveys. If this is not practical, then a regularly fielded survey of prison inmates and military personnel that provided parallel information on health, socioeconomic background, and other outcomes of interest would allow researchers to "adjust" the estimates generated from existing national surveys.
Sustain and support the American Community Survey.
The nation may be better served to the extent that the geography of politics and the geography of need coincide when national policy is being formulated. One step in making that happen is to assure that the distribution of need across the country is well documented and readily available to lawmakers at the state and local levels. The U.S. Census Bureau is poised to make a historic step in this direction with the American
27

Community Survey. The survey is intended to eventually take the place of the Census long-fonn data, containing a wealth of demographic and socioeconomic information. It is a continuous survey that will produce accurate estimates at the state level and below each year, and estimates down to the census tract level every five years. This survey was scheduled to be fielded throughout the country in 2003, but full implementation has been delayed due to funding shortages. The survey promises to provide data that are invaluable for program and policy planning for children, young adults, and for the entire population. It is vital that the survey be fully and stably funded.
Implications for Programs and Policies
Consulting the data should and does have multiple implications for developing better programs and policies. One basic but often overlooked fact is that most young adults are developing well. For virtually every outcome we examined, the majority are showing success in the transition to adulthood. This suggests that sufficient resources should be available to assist the minority of youth who are having problems.
A second implication that is often overlooked is the ongoing nature of the needs of teens and young adults. Even if most are succeeding in the transition to adulthood, many are not. Regrettably, the current emphasis on the importance of the early childhood years has been, to some extent, at the expense of a program or policy focus on adolescents and young adults.47 However, the data make it clear that significant minorities of the youth population would benefit from some form of assistance.
One crucial type of assistance appears to be job training and support. Since welfare refonn, substantial resources have gone to help welfare recipients leave welfare and find jobs. However, these programs are not meeting the needs of women who are not mothers, mothers who are not welfare recipients and most men, both fathers and those who are not fathers. This creates an unfortunate competition for resources among groups that share many challenges. In addition, there is a shortage of effective strategies for fostering economic independence and bringing low-skill workers into secure jobs that lift them out of poverty. To address this issue, it is necessary to develop better models for building skills, obtaining good jobs, helping workers retain jobs and advance, and providing routes out of poverty. It is also necessary to make such assistance more widely available.
Helping teens and young adults avoid early childbearing and single parenthood represents another important task. While there is substantial recognition at the Federal level of the importance of delaying early childbearing and avoiding non-marital childbearing, the focus is on abstinence and marriage. While abstinence is an important strategy for reducing the risk of sexually transmitted disease as well as unintended pregnancy, it cannot be the only approach for young adults, most of who are sexually active. Similarly,
47 (Duncan, G. and Magnussen, K. (2003). Promoting the healthy development of young children. In Isabel Sawhill, Ed., One Percent for the Kids: New Policies, Brighter Futures for America's Children. Washington, D.C.: Brookings Institution.
28

while it is critical to encourage the formation and maintenance of healthy marriages,48 little is known about how to achieve this goal, particularly among disadvantaged populations. Providing job training and education may represent important elements of preventing early childbearing and encouraging healthy marriage. Again, developing models for effective programs is critical. In particular, delaying parenthood past the teen years and reducing subsequent childbearing remain concerns, given how early and high fertility are linked with a more difficult transition to adulthood.
Another extremely high risk group is prisoners and former prisoners. Given the number of young men, particularly young black males, who fall into this group and the disadvantages that they face, it is clear that much more attention needs to be paid to job training, education, social support and counseling for this population. Again, proven models for meeting the needs of this group are in short supply.
The needs of rural youth represent another clear take-away point. While a large proportion ofthe population has migrated to cities, and the focus of policy makers and reformers has centered on urban areas, the needs of the remaining rural population remain significant. These needs undoubtedly vary from place to place, however, and addressing them will require flexible, place-based strategies that have adequate funding.
Similarly, the unique needs of Native Americans and Hispanic youth, particularly Hispanic immigrant youth, require attention. Programs that build upon the strengths of these communities and help them succeed in the 21 st century need to be developed and implemented.
It is the case, of course, that many or perhaps even most youth, even in these high-risk groups, do not require unusual amounts of assistance through the transition to adulthood. Accordingly, there is a need to develop better markers to identify adolescents who are going to face major difficulties, so that scarce resources can be effectively and efficiently deployed to assist those who need it most. These markers need to distinguish adolescents who require modest interventions from those who face serious challenges, so that appropriate levels and types of resources can be targeted to those adolescents who are having or who will have difficulty making the transition into adulthood.
If we do nothing different, the social and financial costs associated with poor outcomes for adults will continue to climb as the population increases. In the case of dependence on social support programs, we project that the costs are likely to outpace population growth. If we are going to improve the lives of young adults in 2025, and reduce the social costs associated with poor outcomes, we have the opportunity to start now, while they are still young.
48 Moore, Kristin A., Susan M. Jekielek and Carol Emig. 2002. Marriage from a Child's Perspective: How Does Family Structure Affect Children, and What Can We Do about it? Washington, D.C.: Child Trends.
29

Figure 1
c: 0 ;; ..!!! :::l c. 0 a. iii ... 0 .... .... 0 ... c: CIl 0 ... CIl a.
Population Distribution of 25 Year-Olds, by Race and Hispanic Origin, 2000 and 2025
100.0.----------------------------------------------------------------------.
80.0
61.4 60.0
40.0
20.0
0.0 White, non-Hispanic Black, non-Hispanic
fll!12000 112025
Hispanic Asian and Pacific Islander, non
Hispanic
0.9 0.9
American Indian, Eskimo, and Aleut,
non-Hispanic Source: Estimates for 2000 are based on the "Bridged-Race Vintage 2001 Postcensal File" for July 1,2000 from the Centers for Disease Control and Prevention, National Center for Health Statistics. Estimates for 2025 are based on simple calculations by Child Trends. The ratio of the projected 2025 population to the 2000 population (as estimated using 1990 Census-based population projections) was applied to the new 2000 Census-based estimates for July 1, creating a new projected estimate for 2025. These calculations were performed because there have not been new projections for 2025 based on Census 2000 data released to date by the Census Bureau.

Figure 2
... s:: Q) (.) ... Q)
D..
Percentage of 25-Year-Olds Who are Foreign-Born, by Race and Hispanic Origin, 2000 and 2025
100.0 TI---------------------~
80.0
60.0 1
40.0
20.0 +1---------------
2.8
0.0 -l-I --'lll1Ii White, non-Hispanic Black, non-Hispanic Hispanic
69.6
1_
2.4 2.4
Asian and Pacific American Indian, Islander, non-Hispanic Eskimo, and Aleut, non
Hispanic
Source: 1990-based Census Population Projections of the Resident and Foreign Born Populations for July 1, 2000 and July 1, 2025
i!Il2000
11l1li2025

Figure 3
-c: CI)
f::! CI)
Il.
Percentage of Young Adults (Ages 24-26) Who Failed to Graduate from High School, by Race and Hispanic Origin, 2000
1oo.o T1---------------------------------------------------------------------------.
80.0+1--------------------------------------------------------------~
60.0+1----------------------------------------------------------------~
40.011--------------------------------~3~5.no---------------------------------~
20.0 +1 ------------------------------12.2
5.8
0.0 +1---
White, non-Hispanic Black, non-Hispanic Hispanic
5.6
Asian or Pacific Islander
25.9
American Indian, Aleut Eskimo
Source: Original analysis by Child Trends of 2000 October Current Population Survey data
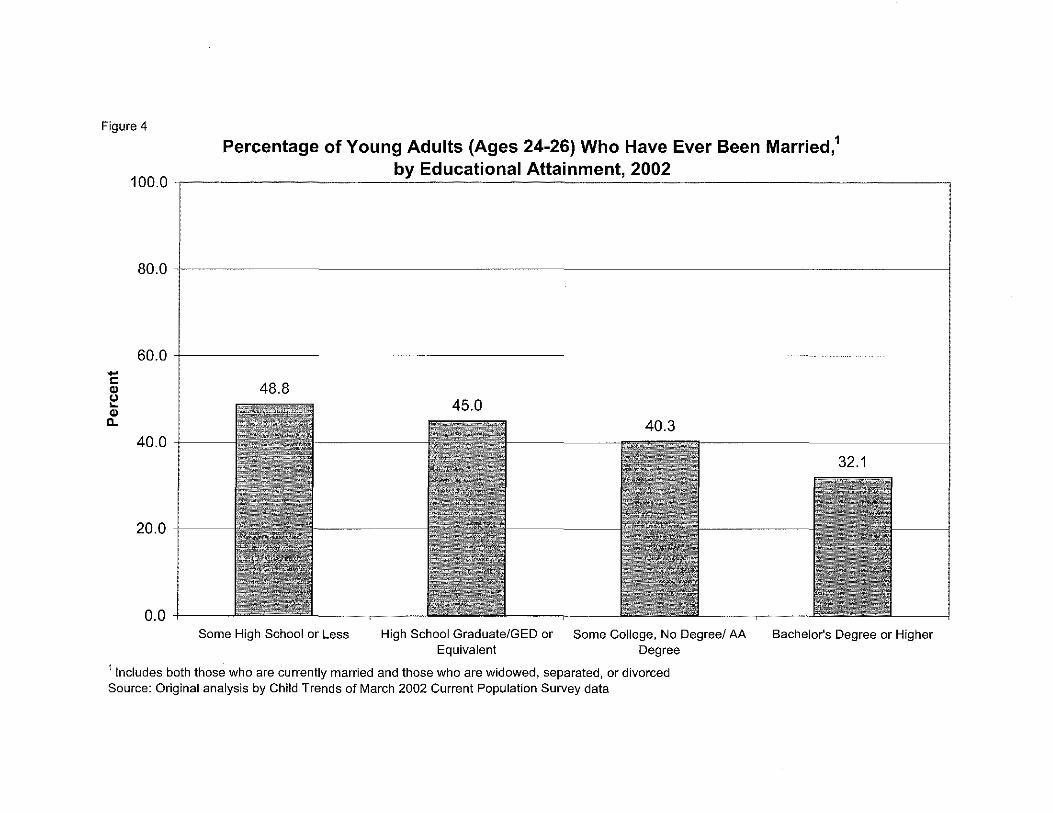
Figure 4
-c:
~ Q)
a.
Percentage of Young Adults (Ages 24-26) Who Have Ever Been Married,1 by Educational Attainment, 2002
100.0 TI--------------------~----------------~----------------------------_,
80.0 +----
60.0 +1 ------------------- --------------------------------
48.8
40.0+1--
20.0+1--
0.0+1--Some High School or Less
45.0
High School Graduate/GED or Equivalent
40.3
Some College, No Degree/ AA Degree
32.1
Bachelor's Degree or Higher
1 Includes both those who are currently married and those who are widowed, separated, or divorced Source: Original analysis by Child Trends of March 2002 Current Population Survey data

Figure 5 Percentage of Young Adults (Ages 24-26) Who Have Ever Been Married,1
by Region, 2002 100.0,--------------------------------------------------------------------,
80.0 +1------------------
60.0+1-------------------------------------------------------------------~ ... c:
~ Gl c..
39.2 40.0 +1 -----------------------,~~~;;;;;_---------
27.3
20.0 +1 ------j
0.0+1--Northeast Midwest
47.3
South
1 Includes both those who are currently married and those who are widowed, separated, or divorced Source: Original analysis by Child Trends of March 2002 Current Population Survey data
41.9
West

Figure 6
.... c:: G) o .... G) c..
Percentage of Young Adults (Ages 23-27) Who Have Ever Had a Child, by Race and Hispanic Origin, 2000
100.0T'-----------------------------------------------------------------------------------------,
80.0 +I-----~---------------------- ----------
60.0 1 58.7 cc 1"\
40.0 +1---------------------------34.0
20.5 20.0+1---
0.0+1---White, non-Hispanic Black, non-Hispanic Hispanic Non-Hispanic Other
Source: Original analysis by Child Trends of 2000 National Health Interview Survey data

Figure 7
.... c: Gl
~ Gl
D..
Percentage of Young Adults (Ages 24-26) Who Are Not Married and Do Not Have Children Living With Them, by Race and Hispanic Origin, 2002
100.0TI---------------------------------------------------------------------,
80.0+1------------------------------------------------------
68.4
56.6 60.0 1 55.0
47.9
40.0 +1---
20.0 +1---
0.0 +1---White, Non-Hispanic Black, Non-Hispanic Hispanic Asian or Pacific Islander American Indian, Aleut
Eskimo
Source: Original analysis by Child Trends of 2002 March Current Population Survey data

Figure 8
Percentage of 25 Year-Olds Who Worked1 in 2001, By Gender 100.0,-~~~~~~~~~~~~~~~~~~~~~~~~~~~-----,
92.0 89.7
80.9 79.3 80.0+1--
60.0 -c
'" ~ WlliiITotal
.Male
'" a.
40.0
20.0
0.0 +1----'
Worker Full-lime worker (among all workers) 1 Analysis includes part-year and full-year workers. Full-time employment is defined as at least 35 hours per week during a majority of weeks worked in past year. Full time workers are the percentage of those working who work full time. Full-time, full-year workers are those who worked at least 35 hours per week for at least 50 weeks in the past year. Source: Original analysis by Child Trends of March 2002 Current Population Survey data
DFemale
II

Figure 9
100.0
80.0
60.0
-I: CI> U .. CI> c..
40.0
20.0 +1--
O.O+--
86.0
WinS Eiiffil iDDlru
Percentage of Young Women Who Worked in 2001, by Race and Hispanic Origin
80.9
68.9 68.6
White, Non-Hispanic Black, Non-Hispanic Hispanic Asian or Pacific Islander
Source: Original analysis by Child Trends of March 2002 Current Population Survey data
82.4
American Indian, Aleut Eskimo

Figure 10
Median Earnings of Young Adult Workers (Ages 24-26) in 2001, by Race and Hispanic Origin
$30,000 ,------------------------
$25,000 I $24,000
F $20,000 -j----; .!l! "0 e-tA C'l
.~ $15,000 -j---, ~
'" W I:
'" '6 ~ $10,000 +I------j
$5,000 +1 ---1
$0 +1---'
$17,500 $18,000
White, Non-Hispanic Black, Non-Hispanic Hispanic Asian or Pacific Islander American Indian, Aleut Eskimo
Source: Original analysis by Child Trends of March 2002 Current Population Survey data

Figure 11 Percentage of Young Adults (Ages 23-27) Who Are Disengaged,1
by Metropolitan Status2 and Gender, 2000 10.0 T1----------------------------------------------------------------------,
2.0 +1---1
0.0 -l-----" Male
1 Includes those who are not in the labor force, not in school, not disabled, and not married
2 Suburbs refer to all parts of a metropolitan area that are not inside central cities.
Source: Original analysis by Child Trends of October 2000 Current Population Survey data
Female
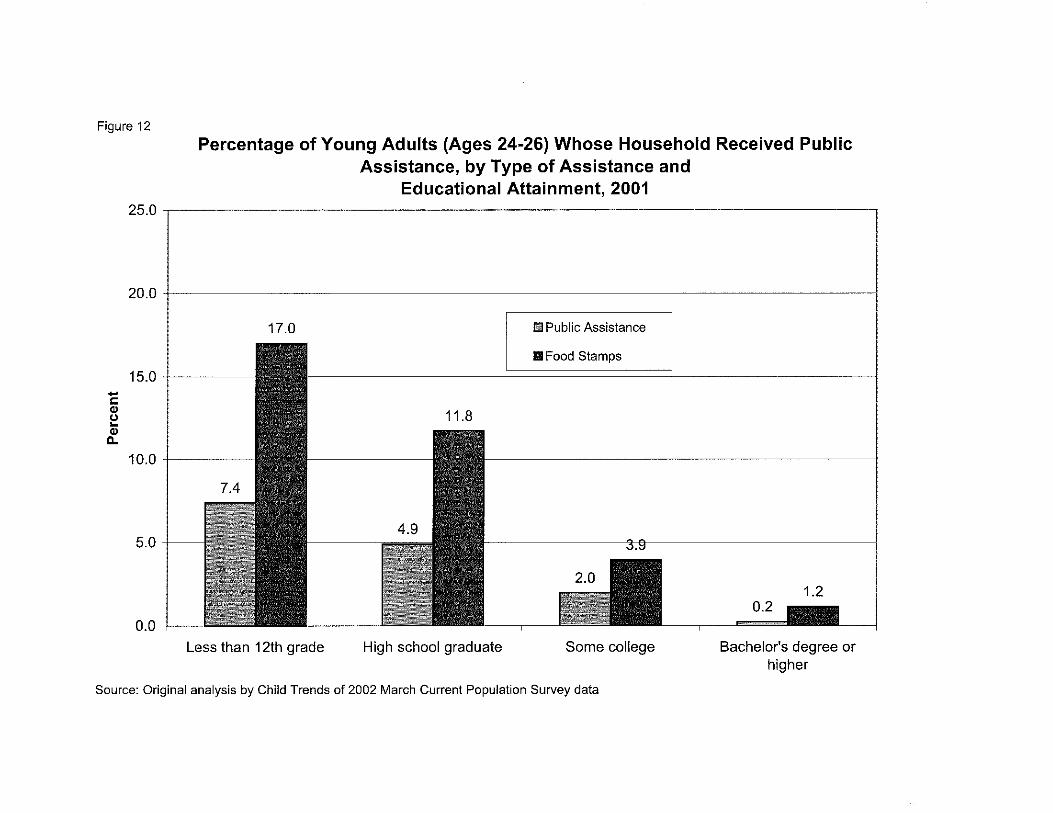
Figure 12
-s::: Q)
!:! Q)
c..
Percentage of Young Adults (Ages 24-26) Whose Household Received Public Assistance, by Type of Assistance and
Educational Attainment, 2001 25.0,-----------------------------------------------------·-------------,
20.0 1 i
17.0
15.0 +-.-------,
11.8
10.0 +1 -------
5.0 +1----1
0.0 +1---' Less than 12th grade High school graduate
I!lI Public Assistance
III Food Stamps
Some college
1.2 0.2
Bachelor's degree or higher
Source: Original analysis by Child Trends of 2002 March Current Population Survey data

Figure 13
-t: CI)
~ CI)
a.
Percentage of Young Adults (Ages 24-26) Whose Households Received Public Assistance, by Type of Assistance and
Race and Hispanic Origin, 2001
25.0,-----
20.0+1-----------------------------~
15.0 +1------------,
10.0 +1-----------1
5.0 +1 -----j
0.0
14.9
llifl Public Assistance I 1111 Food Stamps I
White, Non- Black, Non- Hispanic Asian or Pacific Islander Hispanic Hispanic
American Indian, Aleut Eskimo
Source: Original analysis by Child Trends of 2002 March Current Population Survey data

Figure 14 Percentage of Young Adults (Ages 24-26) Whose Households Received Public
Assistance, by Type of Assistance
-c: Q) o .. Q)
D..
and Metropolitan Status, 2001 25.0,--------------------------------------------------------------------,
Illl Metropolitan
20.0 I ,. Non-Metropolitan, .--1
15.0+1---------------------------·--------------------------·--------~
11.2
10.0+1----------------------------------------- ---~
5.0 +I----------~------____j 3.2 3.2
0.0+1---Public Assistance Food Stamps
Source: Original analysis by Child Trends of 2002 March Current Population Survey data

Figure 15
-C III
~ III
11.
Percentage of Young Adults (Ages 24-26) Who Voted in the 2000 Election, by Race and Hispanic Origin
100.0,-------------------------------------------------------------------,
80.0 +1---------------------------------------------------
60.0 +1---------------------------------1 53.1
48.0
40.0 +1---1
20.0 +I---j
0.0 +I--.J White, Non-Hispanic Black, Non-Hispanic
17.0
Hispanic
19.8
Asian or Pacific Islander
31.7
American Indian, Aleut Eskimo
Source: Original analysis by Child Trends of 2000 November Current Population Survey data

Figure 16
.... c:
~ CIl c..
Percentage of Young Adults (Ages 24-26) Who Were Registered to Vote in the 2000 Election, by Race and Hispanic Origin
100.0,..---------------------
80.0+1-----------------------------
70.5 65.4
60.0 +1---1
40.0 +1---1
25.4 27.1
20.0 +1---1
0.0 +-----J
36.2
White, Non-Hispanic Black, Non-Hispanic Hispanic Asian or Pacific Islander
American Indian, Aleut Eskimo
Source: Original analysis by Child Trends of 2000 November Current Population Survey data

Figure 17
Percentage of 25 Year-Olds Who Worked in 2001, by Gender and Nativity
100.0 -,--------
90.9 92.2 88.1 I!!I Foreign Born
II1II Not Foreign Born I 84.2
... !:
~ Q)
a.
80.0 +1 ----'-=-=--
60.0 +1--
40.0 +1--
20.0 +1--
0.0 +---Total Male
Source: Original analysis by Child Trends of March 2002 Current Population Survey data
Female

Table I
POPULATION OF 25-YEAR OLDS IN 2000 and Projected 2025
non-Hispanic
and Pacific Islander, non-Hispanic
Indian, Eskimo, and Aleut, non-
Revised July 1. 20001
Percentage of Number total popullationl
3,715,147
495,198
700,448
205,809
33,029
Revised July 1, 20251
New 2025 Percentage of Estimate total
4,599,033
585,412
1,248,752
397,495
41,055
Year 2000 estimates corne from bridged race estimates produced by the U.S. Census Bureau based on the 2000 Census. Projections for 2025 were produced by Child Trends. The most recent projections for 2025 av:aihlbl,,1
the U.S. Census at the time tbis paper was completed were based on pre-Census 2000 estimates that underlestirrlat"d the current number of Hispanic 25-year-olds by as much as 30 percent. Presumably this would also result in
under-estimate of Hispanics in 2025. In order to produce more reasonable estimates, we took the percentage ch,mg"1 race!Hispanic specific populations between 2000 and 2025 that were in the original projections, and applied them to new 2000 Census-based numbers in order to come up with our own projections
Persons of Hispanic origin may be of any race
ISe,ure:e:: Revised estimates for 2000: National Center for Health Statistics. Estimates of the July 1, 2000 United States Iresident population from the Vintage 2001 postcensal series by year, age, sex, race, and Hispanic origin, prepared
a collaborative arrangement with the U.S. Census Bureau. Available on the Internet at: Ihttp:.I/wwvv.c.dc .. go'dn.ch5,/ac.outlrrlaj(lrl<lvs,lpopbiridllei]JOI.bridge.htm 2003; Revised estimates for 2025: Child Trends
footnote 1 above for more

Table 2
POPULATION OF FOREIGN-BORN 25-YEAR OLDS IN 2000 and Projected 2025 July 1, 2000' July 1,20251
Percentage of foreign-Percentage of total
Percentage of foreign-Percentage of total
Number population Number population born population
(n~3,715,147) born population
(n~4,599,033)
553,301 100.0 14.9 540,101 100.0 II.
Black, non-Hispanic 37,795 6.8 1.0 51,306 9.5
Hispanic 307,107 55.5 8.3 265,578 49.2
Asian and Pacific Islander, non-Hispanic 143,253 25.9 3.9 144,839 26.8 3.
American Indian, Eskimo, and Aleut, non-Hispanic 804 0.1 0.0 970 0.2 <0.
Total population estimates for 2000 by race were taken from the 2000 Census-based bridged-race population estimates (as used in the revised estimates in Table 1). The numbers of born young adults in 2000 and 2025 by race were calculated by applying proportions derived from the 1990 Census-based population projections to the new population estimates
race for 2000. The total number of foreign born young adults in 2000 and 2025 are the sums of the foreign born populations by race for 2000 and 2025. These calculations were
!erfOnned because, to date, the u.s. Census Bureau has not released 2000 Census-based population projections or estimates of the foreign-born population by age.
Persons of Hispanic origin may be of any race Source: 2000 population estimates by race: National Center for Health Statistics. Estimates of the July 1,2000 United States resident population from the Vintage 2001 postcensal series
year, age, sex, race, and Hispanic origin, prepared under a collaborative arrangement with the U.S. Census Bureau. Available on the Internet at: Ihtto:llwww.cdc.gov/nchs/aboutJrnajor/dvs/popbridge/popbridge.htrn. 2003; All other data: Child Trends calculations based on 1990 Census-based Population Projections of Foreign-Born

Table 3
or Pacific Islander
Central City
Suburbs)
EDUCATIONAL ATTAINMENT Educational Attainment of Young Adults (Ages 24-26), 2000
Some High School or Less
11.2
12.2
35.0 51.4
16.5
5.6 25.9
29.9 7.8
10.9
8.3 11.9
12.8
8.7
13.6
GED Recipient
4.8
5.6 6.7 5.8
7.8 1.3 4.4
3.8
5.0 5.1
4.2
6.0
2.9 7.3
High School Graduate
25.9
28.1 27.1 23.2
31.5 12.3
40.8
19.6
18.5
26.4 35.2
Some College, No Degree/AA Degree
36.3 21.4 15.3
28.3
29.6
30.0
31.0 26.1
Persons of Hispanic origin may be of any race
Bachelor's Degree or
Higher
17.8
9.8 4.3
16.0
51.2
32.7
31.1 17.9
Total Population
Missing data were proportionally redistributed into subgroups to derive population estimates. Due to rounding, population subgroup estimates may not sum to the total population size.

Table 4
EDUCATIONAL ATTAINMENT Educational Attainment Among Foreign Born and Native Born Young Adults (Ages 24-26)
by Race and Hispanic Origin
Some High School or High School Some College, No Bachelor's Degree or Less GED Recipient Graduate Degree/AA Degree Higher
Foreign Born 29.9 3.8 19.6 22.0 24.7
Race/Ethnicity' White, non-Hispanic 10.0 0.0 13.8 33.0 43.3 Black, non-Hispanic 9.1 3.9 30.6 29.5 26.9 Hispanic 51.4 5.8 23.2 15.3 4.3 Asian or Pacific Islander 6.1 1.9 11.3 26.0 54.7 American Indian, Aleut Eskim02
Native Born 7.8 5.0 27.0 31.3 28.9
Race/Ethnicity' White, non-Hispanic 5.7 4.6 26.4 31.0 32.4 Black, non-Hispanic 12.6 5.9 27.8 37.2 16.6 Hispanic 16.5 7.8 31.5 28.3 16.0 Asian or Pacific Islander 4.6 0.0 14.5 37.7 43.3 American Indian, Aleut Eskimo 25.9 4.4 40.8 13.9 15.0
1 People of Hispanic origin may be of any race
Estimates were not included due to extremely small sample sizes of foreign born American Indian and Aleut Eskimo young adults. Source: Ori inal anal sis b Child Trends ofO~!ober 2000 Current Po~ulation Survey Data

DIFFICULTY SPEAKING ENGLISH
Percentage of 20-24 year-aIds who speak a language other than English at
home and have difficulty speaking English 1, 1999
or Pacific Islander
IAme:rican Indian, Aleut Eskimo
school graduate
college IBI.ch,elm:'s degree or higher
White, Non-Hispanic Black, Non-Hispanic
Hispanic Asian or Pacific Islander American Indian, Aleut Eskimo
Foreign Born White, Non-Hispanic
Black, Non-Hispanic Hispanic Asian or Pacific Islander American Indian, Aleut Eskimo
Total POIJUh.tionl
40.4 19.0 67.2 29.1
na
1.3 15,67 0.2 0.4
12.5
1.6 0.0
7.3 2.7 6.1
16.7
10.2 11.2
9.4
3.5
" indicates that estimates were not included due to extremely small sample sizes of foreign American Indian and Aleut Eskimo young adults.
1'''Di1'fioul" 'l,,,ki".g !;ngli,l,' is defined as those who spoke a language other than English at and were reported to speak English less than "Very well."
Persons of Hispanic origin may be of any race
Missing data were proportionally redistributed into subgroups to derive population estimates. to rounding, population subgroup estimates may not sum to the total population size.
r ',,,I,,,,lh, refer to all parts of the metropolitan area that are not inside central cities. October

Table 6
LIVING WITH PARENTS
Percentage of 23-27 Year-OIds Living With at Least One ParentI, 2002
White, Non-Hispanic Black, Non-Hispanic Hispanic Asian or Pacific Islander American Indian, Aleut Eskimo
College or More White, Non-Hispanic Black, Non-Hispanic Hispanic Asian or Pacific Islander American Indian, Aleut Eskimo
Central City
Suburbs4
28.1 22.6 14.0 32.3 24.2
23.5 26.3 17.8 28.9 19.2
21.3 29.8 33.1 23.2 21.2
34.1 21.8 19.0 21.4
23.4 19.6
26.4 20.4
Young adults who are either householders or spouses of householders living with their parents are included in the denominator as not
, of Hispanic origin may be of any race
data were proportionally redistributed into subgroups to derive population cstimates. Due to rounding, population subgroup may not sum to the total population size. r ';ubm,,,,,,r,, to all parts ofthe metropolitan area that are not inside central cities.
Child

Table 7
MARITAL STATUS Current Marital Status of Young Adults (Ages 24-26), 2002
Foreign Born Not Foreign Born
or Pacific Islander Indian, Aleut Eskimo
High School or Less School Graduate/GED or
College, No Degree/AA
Central City
Suburbs3
Never Married
73.6 53.8 51.5 56.5 67.6 58.6
55.0
59.7 67.9
66.8
60.8 44.9
Persons of Hispanic origin may be of any race
Married
22.3 41.7 45.7 37.2 29.4 29.4
36.7
35.1 30.5
34.9 45.9
Widowed, Divorced, or
Separated 5.4
4.5 2.8 6.3 3.0
12.0
8.3
5.2 1.6
4.3
4.3 9.3
Total Population
11,150,01
Missing data were proportionally redistributed into subgroups to derive population estimates. Due to rounding, population Isulbgr'oup estimates may not sum to the total population size.
Suburbs refer to all parts of the metropolitan area that are not inside central cities. . Current data

Table 8
Cohabitation Young Adults who are Cohabitingl (Ages 24-26), 2002
non-Hispanic
or Pacific Islander
College, No Degree/AA
Central City
Suburbs4
9.6 8.8
10.4 6.1
14.2
11.3
12.2
12.0
11.3 11.7
14.3 9.5 8.0
11.5
3.1 13.4
12.7
12.6
10.3
11.6
11.0 13.1
Female
8.6 9.7
10.2
9.3 9.0
11.7
12.4
11.7 10.4
Cohabitation was defined in accordance with an indirect measure developed by the Census Bureau in 1999. POSSLQ
of the Opposite Sex Sharing Living Quarters) was designed in an attempt to correct for the under-reporting of
Ic"h'\'it'tion that results from using the Current Population Survey's direct measure of cohabitation. For more infonnation the definition ofPOSSLQ, please see Lynne Casper, Philip Cohen, and Tavia Simmons (1999). "How Does POSSLQ
IM.e"me Up? Historical Estimates ofCohabitatioll." U.S. Census Bureau, Population Division Working Paper. Persons of Hispanic origin may be of any race Missing data were proportionally redistributed into subgroups to derive population estimates. Due to rounding, population
estimates may not sum to the total population size. refer to all parts of the metropolitan area that are not inside central cities.
2002

Table 9
BIRTH RATES AMONG YOUNG WOMEN AGES 15-19
Birth Rates Among Yonng Women, Ages 15-19 (per 1,000 women), 2000 and 2001
2000 2001 All races 48.5 45.9 White, non-Hispanic 32.5 30.2
Black) 79.4 73.1
American Indian )
67.8 65.7
Asian or Pacific Islander) 21.6 20.5 Hispanic 94.4 92.4
) Race and Hispanic origin are reported separately on the birth certificate. Data for persons of Hispanic origin are also included in the data for each race group, according to the mother's reported ace.
Source: National Vital Statistics Report, Vol. 50, No. 10, June 6, 2002. Reproduced from Table 1.

Table 10
YOUNG ADULTS WHO HAVE HAD CHILDREN
Percentage of Young Adults (Ages 23-27) Who Have Ever Had a Child, 2000
Total 40.1
58.7 55.0 57.0 51.8
54.0
35.2
Male 31.9
42.0 43.8 38.7
44.5
22.4
37.7
Female Total Population 48.2 17
61.8 66.9 70.7 61.7
66.9
46.4
55.4
r ~1issingdata were proportionally redistributed into subgroups to derive population estimates. roumdi.ng, population subgroup estimates may not sum to the total population size.
Health data

PRESENCE OF CHILDREN UNDER AGE 18 BY MARITAL STATUS, 2002 Percentage of 24-26 year-olds with their own children under age 18 living in household
Total Percent Total Percent Married Not Married
Married with 1+ Children
No Children 1+ Children No Children 1+ Children
35.3 30.1 14.6 20.7 55.3 9.5
29.7 20.6 12.7 17.0 66.8 3.5
39.9
26.7 Non-Hispanic 22.3 38.7 6.4 16.0 55.0 22.7
41.7 40.3 11.9 29.8 47.9 10.4
45.7 39.9 13.7 32.1 46.5 7.8 37.2 40.7 9.9 27.3 49.5 13.3
or Pacific Islander 29.4 14.0 17.6 11.8 68.4 2.2 Indian, Aleut Eskimo 29.4 36.2 8.5 20.9 55.4 15.2
41.5 47.1 9.6 31.9 43.3 15.2 36.7 39.6 ILl 25.6 49.3 14.0
35.1 30.8 13.9 21.3 55.3 9.5 degree or higher 30.5 10.2 21.8 8.8 68.1 1.4
41.3 30.8 16.8 24.5 52.4 6.3 34.0 30.0 14.1 19.9 55.9 10.1
24.9 20.6 I\.4 13.5 68.0 7.2 33.0 30.4 14.8 18.1 54.8 12.2
40.4 34.8 16.5 23.9 48.7 10.9
37.2 30.0 13.8 23.3 56.2 6.6
32.2 26.1
28.9 26.2
34.9 26.1
45.9 42.4
of Hispanic ethnicity may be of any race data were proportionally redistributed into subgroups to derive population estimates. Due to rounding, population subgroup estimates may not sum to the total population size.
refer to all parts of the metropolitan area that are not inside centra! cities.
11,150,01
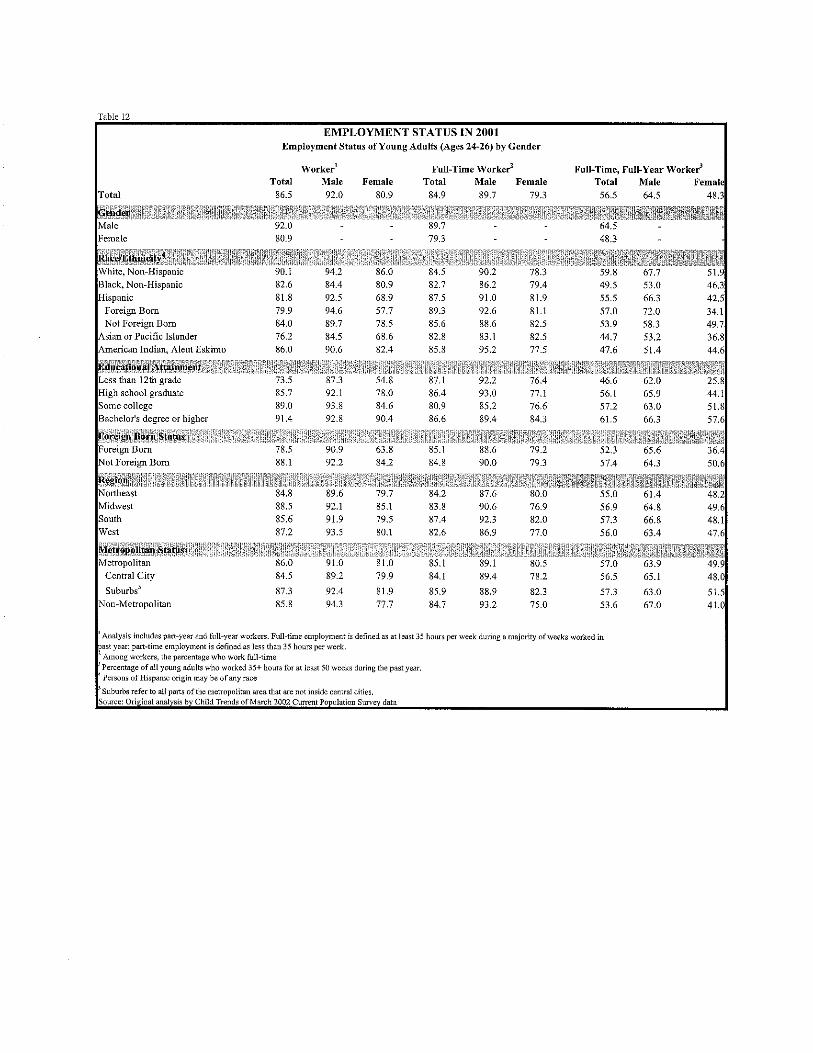
Table 12
Indian, Aleut Eskimo
degree or higher
Central City
Suburbs5
EMPLOYMENT STATUS IN 2001 Employment Status of Young Adults (Ages 24-26) by Gender
Total 86.5
81.8 79.9 84.0 76.2 86.0
85.7 89.0 91.4
88.1
88.5 85.6 87.2
84.5
87.3 85.8
Worker! Male 92.0
84.4 92.5 94.6 89.7 84.5
90.6
92.1 93.8 92.8
90.9 92.2
92.1 91.9 93.5
91.0 89.2
92.4 94.3
Female 80.9
80.9 68.9 57.7 78.5 68.6 82.4
78.0 84.6 90.4
63.8 84.2
79.7 85.1 79.5 80.1
81.0
79.9
81.9 77.7
Full-Time Worker2
Total Male Female 84.9 89.7 79.3
82.7 86.2 87.5 91.0 89.3 92.6 81.1 85.6 88.6 82.5 82.8 83.1 82.5 85.8 95.2 77.5
86.4 93.0 77.1 80.9 85.2 76.6 86.6 89.4 84.3
85.1 79.2 84.8 90.0 79.3
84.2 83.8 90.6 76.9 87.4 92.3 82.0 82.6 86.9 77.0
80.5 84.1 89.4 78.2
85.9 88.9 82.3 84.7 93.2 75.0
Full-Time, Full-Year Worker3
Total Male 56.5 64.5
49.5 53.0 55.5 66.3
57.0 72.0 53.9 58.3 44.7 53.2 47.6 51.4
46.6 62.0 56.1 65.9 57.2 63.0 61.5 66.3
52.3
57.4
55.0
56.9 57.3 56.0
57.3 63.0 53.6 67.0
Analysis includes part-year and full-year workers. Full-time employment is defined as at least 35 hours per week during a majority of weeks worked in year; part-time employment is defined as less than 35 hours per week.
, the percentage who work full-time 1 who worked 35+ hours for at least 50 weeks during the past year. may be of any race
area that are not inside central cities.
51. 41.

Table 13
EMPLOYMENT STATUS IN 200] Employment Status of Young Adults (Ages 24-26)
Full-Time Worke~ Male Female
Total Married Single Total Married Singl Total 86.5 92.0 95.8 90.3 80.9 75.2 84.9 89.7 94.6 87.5 79.3 77.9 80.1
80.9 79.3
Black, Non-Hispanic 82.6 84.4 90.8 82.7 80.9 81.9 82.7 86.2 92.0 84.4 79.4 85.7 77.5 Hispanic 81.8 92.5 96.0 90.6 68.9 64.1 87.5 91.0 94.4 88.9 81.9 79.4 84.1
Foreign Born 79.9 94.6 95.1 94.3 57.7 52.6 89.3 92.6 95.9 90.7 81.1 82.4 79.6 Not Foreign Born 84.0 89.7 97.2 85.9 78.5 78.6 85.6 88.6 92.3 86.4 82.5 77.0 86.2
Asian or Pacific Islander 76.2 84.5 86.2 84.2 68.6 52.4 82.8 83.1 "' 82.3 82.5 77.9 84.8 American Indian, Aleut Eskimo 86.0 90.6 " 88.5 82.4 " 85.8 95.2 "' 94.5 77.5 "' 77.0
High school graduate 85.7 92.1 96.0 90.4 78.0 86.4 93.0 94.8 92.1 77.1 74.1 79.1 Some college 89.0 93.8 97.4 92.3 84.6 80.9 85.2 95.9 80.4 76.6 75.6 77.1 Bachelor's degree Or higher 91.4 92.8 95.6 91.9 90.4 86.6 89.4 91.5 88.7 84.3 84.2 84.3
Not Foreign Born 88.1 92.2 96.6 90.4 84.8 90.0 94.5 87.9 79.3 77.9 80.1
Midwest 76.9 77.5 76. South 92.3 96.5 89.8 82.0 81.6 82. West 86.9 90.5 85.3 77.0 73.9 79.3
Central City 89.4 93.7 87.8 78.2 78.2 78.
Suburbs5 95.1 91.4 81.9 75.5 88.9 94.4 86.7 82.3 82.5 82.3 Non-Metropolitan 85.8 94.3 97.3 92.3 77.7 75.8 93.2 94.5 92.2 75.0 70.5 79.5
"n'" indic'les that e.stima!es were no! included due to extremely small sample ,iz",
1 Analy,is include, part_year .nd full.ye,r worke .... Fun·time employment is defined as at least 35 bon" per week during a majurity ufwcrks worked in past year; port-lime employmeot is defined a, Ie", than 35 hours per week. Among wUTke", thc percentage who work full-time Perc"ntage ofyuung ad~ll> who worked 35+ hours for al least 50 weeks during the past year. Persons ofHispanio origin may be uf.ny race Suburbs referm all parts of the Inetropolitan an:. that'Tenot in,ide contral cities.
SUUn:c,Ori ·nol anal si, b Chil~ Trend. ofMa,eh 2002 Curl",,1 Po ,dation Surv dala

EMPLOYMENT AND Employment Status and Median Earnings of Young Adults (Ages 24-26) in 2001
or Pacific Islander
school graduate
college ,
degree or higher
Born
Central City
Suburbs4
Nonworker
17.4
18.2 20.1 16.0
23.8 14.0
26.5 14.3
11.0
8.6
21.5
15.5
12.7
14.2
Full-time
Workerl
68.3
71.6 71.4
71.9 63.1 73.8
64.0
74.1
72.1 79.1
66.9
71.0
75.0 72.7
Part-time
Worker1
13.1
14.3
10.2
8.5 12.1 13.1
17.0 12.3
13.5
12.3
13.1
Median Earnings
$20,800
$24,000
$18,200
I'F"Il-timeempJoyment is defined as at least 35 hours per week during a majority of weeks worked in past year; part-time employment is defined as less than 35 per week. Analysis includes part-year and full-year workers.
of Hispanic origin may be of any race t' ',"","" data were proportionally redistributed into subgroups to derive population estimates. Due to rounding, population subgroup estimates may not sum to
total population size.
rS,ebu,b,,,'octo aU parts of the metropolitan area that are not inside central cities.

Table 15
DISENGAGED YOUNG ADULTS Percentage of 23-27 year-olds Who Are Not in Labor Force or in School, Not
Disabled, and Not Married, 2000
Central City
Suburbs'
Persons of Hispanic origin may be of any race
7.4 5.2 4.6 6.0
5.6
3.4 4.7
5.7 3.2 1.3 6.0 5.5
4.5
2.8 2.2
7.1 8.3
6.0 5.3
3.9 7.0
Total
Missing data were proportionally redistributed into subgroups to derive population estimates. to rounding, population subgroup estimates may not sum to the total population size.
Suburbs refer to all parts of the metropolitan area that are not inside central cities.
Child Trends Current data

Table 16
HOUSEHOLD PUBLIC
Percentage of Young Adults (Ages 24-26) Who Lived in a Household In Which Someone Received Public Assistance and/or Food Stamps, 2001
Foreign Bam Not Foreign Born
or Pacific Islander IAlmel:icam Indian, Aleut Eskimo
Central City
Suburbs3
1 Persons of Hispanic origin may be of any race
Pnblic Assistance
5.4 4.2 6.8 1.5
4.2
2.4 3.2
Food Stamps
8.8 5.3
12.6 3.2
8.0
4.9 11.2
Total
Missing data were proportionallY redistributed into subgroups to derive population estimates. Due to rounding, population subgroup .,stim,,!es may not sum to the total population size.
Suburbs refer to all parts of the metropolitan area that are not inside central cities.

Table 17
Prison
Percentage of Adnlts in State or Federal Prisons and Local Jails, by Age, Jnne 30, 2002
Includes all races. Excludes Hispanics
Total1 White2
Male
BJack2
Female
Hispanic Totae White2 Black2 Hispanic
: Based on the latest available estimates ofthe U.S. resident population for July 1, 2002, from the 2000 census (by gender, race and Hispanic lorigin) and 1990 census, adjusted for undercount (by age).

Table 18
CITIZENSHIP, VOTING AND VOTING REGISTRATION Percentage of 24-26 year-olds who are U.S. citizens, who voted and who were registered to vote in
November of 2000
Not Foreign Born or Pacific Islander
Central City
Suburbs3
Persons of Hispanic origin may be of any race
U.S. Citizens
93.2 50.6
9.5 100.0 54.8
80.6
86.8 96.4
Voted
53.1 17.0 2.3
36.9 19.8
42.5 41.5
Registered to Vote Total Population
70.5 25.4
3.9 55.6 27.1
53.5
57.5 63.2
1,473,612 1,626.091
887,521 738,571 604,586
51
Missing data were proportionally redistributed into subgroups to derive population estimates. Due to rounding, population estimates may not sum to the total population size.
Suburbs refer to all parts of the metropolitan area that are not inside central cities.
Calculations for the percent who registered to vote and who voted includes non-citizens in the denominator.

RELIGION
Frequency of Religious Service Attendance and Importance of Religious Beliefs Among Young Adults (Ages 24-25), 2001
in a MSA with 1 million or more
in a MSA with fewer than 1 million
Religious Attendance (in Previous Year)
o Times 39.6
29.3
48.9
37.0
41.0
33.3
49.4
44.6 37.6
40.8
39.1
37.5
1-24 Times
40.9
48.1
39.0
41.9
39.5
44.1
38.3 41.7
42.0
40.9
38.4
25 or More Times
19.5
22.6
12.2
21.1
19.5
22.6
12.4
17.2 20.7
17.2
20.0
24.1
Religious Importancel
Religion Very Important in Young Adult's Life
71.7
82.8
64.6
78.0
74.1
81.7
72.7
71.9
73.8
75.8
68.6
73.5
75.4
Percent who responded "Agree" or "Strongly Agree" to the statement that "My religious beliefs are a very important part of my life" Persons of Hispanic origin may be of any race
f l'op,ul"tioo ,,,"""',,do not add to population total, as three racial subgroups with small sample sizes were excluded from this analysis.
not include Native Hawaiian or other Pacific Islanders
Total Population
r ),r;,,,ino data were proportionally redistributed into subgroups to derive population estimates. Due to rounding, population subgroup estimates may not sum to

Table 20
HEALTH STATUS INDICATORS General Health Status, Activity Limitations, and Symptoms of Depression Among Young Adults (Ages 24-26), 2000-2001
Limitations that Affect Ability to do Daily Tasks
4.5
3.0 2.2 4.1
5.9
3.9
7.6
Fair or Poor General Health
Status
6.2 4.6 4.4 4.8
4.5
3.4
Total Population from Person-Level
File 10,637,402
2,986,982
Symptoms of Depression!
4.8
5.1
Total Population from Sample
Adult-Level File 10,777
Subjects were considered to have exhibited symptoms of depression if they reported feeling at least two of the following emotions aU of the time or most of the during the past 30 days: sad, hopeless, nervous, worthless, restless, or that everything was an effort.
Persons of Hispanic origin may be of any race
Missing data were proportionally redistributed into subgroups to derive population estimates. Due to rounding, population subgroup estimates may 110t sum to total population size.
: Limitations and general health status: Person-Level File (n=7,950); Symptoms of Depression: Sample Adult Core (n=3,539) of the 2000 and 2001

Table 21
DRUG USE
Illicit Drug Use in Past Month Among Young Adults Ages 24-25 (in Percents), 2001
All Illicit Drugs 13.7
16.4
15.2
11.9
14.6
9.2
6.8
7.8
6.6
9.5
6.3
14.5
13.3
5.9
13.2
5.4
14.6
15.6
8.5
Marijuana 11.6
16.
13.0
10.0
12.6
7.5
5.6
7.8
5.2
7.2
4.4
11.7
11.5
3.2
11.6
3.5
12.7
12.5
7.7
Illicit Drugs Other Than Marijuana
5.1
6.7
5.8
2.9
3.6
2.2
1.8
0.9
1.9
3.2
2.8
3.9
2.3
5.1
6.1
3.4
Total Population
6,634,53
Population estimates do not add to population total, as three racial subgroups with small sample sizes were excluded from this analysis.
not include Native Hawaiian or other Pacific lslanders
n<i«ino data were proportionally redistributed into subgroups to derive population estimates. Due to rounding, population subgroup estimates may total population size.

HEAVY DRINKING AND
Heavy Drinking and Smoking Among Young Adults (Ages 24-26), 2000-2001
Drank 5+ drinks at least once a week on average in past
year Total Male Female
8.6 14.2 3.2 14.2
8.5 12.9 4.3 5.4 9.8 1.5 7.8 15.5 0.4 3.6 5.3 2.2
7.8 14.1 2.3 7.6 12.6 2.0 7.7 17.9 2.7
6.2 1l.6 0.5 10.0 18.3 4.3
4.1 7.6 0.5 9.4
8.6 13.8 3.9 , " indicates that estimates were not included due to extremely small sample sizes.
Current smokers l
Total Male Female 27.3 31.3 23.3 31.3
45.5 50.3 39.8 25.3 26.8 23.8 18.1 24.4 12.6 25.1 32.4 18.2 11.8 15.8 8.7 16.9 2l.9 12.4 17.3 20.9 12.9 15.9 24.7 11.4
12.9 17.0 8.5 22.5 30.5 16.9 22.8 27.6 17.8 40.7
34.4 37.1 3l.9
I'cum,nt "mc,"" are defined as those who have ever smoked 1 00 cigarettes and currently smoke everyday or some days.
Persons of Hispanic origin may be of any race
Total Population
data were proportionally redistributed into subgroups to derive population estimates. Due to rounding, population subgroup estimates may not sum to the

PHYSICAL ACTIVITY AND OBESITY
Leisure-Time Physical Activity and Obesity Among Young Adults (Ages 24-26), 2000-2001
Percent Participating in Leisure-Time Physical
Activityl
38.0 26.0 22.1 31.4
37.4
Percent Obese2
19.6 12.6 29.3
Total Population I
1 Leisure-time physical activity is defined as moderate activity at least 5 times per week for at least 30 minutes each time or vigorous at least 3 times per week for at least 20 minutes each time.
is defined as having a Body Mass Index (BMl) of at least 30. Overweight is defined as having a BMI of at least 25 and less For example, an adult who is six feet tall would be considered obese ifhe or she weighed at least 221 pounds.
of Hispanic origin may be of any race
I'rvli.,,'n. data were proportionally redistributed into subgroups to delive population estimates. Due to rounding, population subgroup

Table 24
RAPE Percentage of males and females who have been raped by grade 12 (1999) and have been/are
likely to be raped before age 25
non-Hispanic
non-Hispanic non-Hispanic
IHisp,mic
indicates data not available
Source: 1999 Youth Risk Behavior Survey
Persons of Hispanic origin may be of any race
Total
6.7 11.6
3.5 9.7
4.3 12.0 7.3
Based on calculations by Child Trends using estimates from YRBS and NVA W reports. The NVA W report includes of the percentage of male and female rape victims by age at first rape. By dividing the percentage of students who
been raped by grade 12 (from YRBS) by the percentage of rape victims who are likely to have been raped before age 18 NVA W), we were able to get a multiplier that was then used in an equation with the percentage likely to be raped by age
to find the percentage of students interviewed in YRBS who are likely to be raped before age 25. Please see the follo~'in,: I
12th gmde) INCVS (0, 17) (O,:'4)"(N'CV~ 0,17) + (NCVS 18,24)
Youth Risk Behavior Survey, as found in Centers for Disease Control and Prevention. CDC Surveillance 9,2000. MMWR 2000;49(No. SS-5); National Violence Against Women Survey, as found in Full Report
h,v"/,,,ee. Incidence, and Consequences o/Violence Against Women (2000), National Institute of Justice, U.S.

Table 25
SEXUALLY TRANSMITTED DISEASES
Sexually Transmitted Diseases Among Young Adults (Ages 25-29), 2001
Reported Cases and Rates per 100,000
Gonorrhea Cases Rate
32,186
23,899
1,954
281
231
124
219
328.5
249.4
125.3
54.4
43.2
160.3
284.3
Chlamydial
Cases Rate
t~~~;~t~
373
1,605 2,193.9
Syphilis2
Cases Rate
6
11Estimates for Chlamydia may be substantially lower than actual cases, as many women who are at risk for this infection are still not being tested, rcflcctin!l lack of awareness among some health care providers and the limited resources available to support screening.
;ludes primary and secondary syphilis
: These numbers should be used only for race/ethnicity comparisons, not for overall totals or gender totals. "This is because if age or racc/cthnicity specified, cases were prorated according to the distribution of cases for which these variables were specified." For 2001, CO, DC, MD, NJ, NY "did
Ireport age and/or racc/cthnicity for most cases and were excluded:"
: National

Table 26
Population estimates and percentages of young adults exhibiting various characteristics, 2000 and 2025 20001 2025
Total Foreign Born Native Born Total Foreign Born Native Born Characteristic A,. % Number % Number % Number % Number % Number % Number
Educational Attllinment 25 Some high school or less 11.2 411,018 29,9 165,658 7.8 245,359 11.7 537,176 29.2 157,800 9.3 379,375
GED recipient 4." 179,213 3.8 20,804 5.0 158,408 5.0 231,929 3.7 20,079 5.2 211,850 High School graduate 25.9 962,517 19.6 108,502 27.0 854,015 26.3 1,208,399 19.3 104,387 27.2 1,104,012
Some eol!ege/AA degree 29.9 1,111,605 22.0 121,948 31.3 989,658 30.3 1,392,410 22.0 118,975 31.4 1,273,435 Bachelor's degree [If more 28.3 1,050,478 24.7 136,389 28.9 914,090 26.7 1,228,173 25.5 137,909 26.9 1,090,263
Marital Statu. 25
Never Married 59.3 2,208,174 55.4 306,640 60.1 1,901,534 60.4 2,778,600 56.4 304,518 61.0 2,474,081 Married 35.3 1,303,486 41.3 228,458 34.0 1,075,028 34.1 1,569,659 40.4 218,406 33.3 1,351,253 Widowed, Divorced or Separated 5.4 203,488 3.3 18,204 5.9 185,284 5.5 250,801 3.2 17,204 5.8 233,597
Citizenship and Voting 25
U.S. Citizens 87.3 3,268,190 19.2 106,344 100.0 3,161,846 90.6 4,165,271 19.7 106,339 100.0 4,058,932 Voted 42.2 1,600,659 6.3 34,913 49.5 1,565,746 42.0 1,931,755 6.8 36,987 46.7 1,894,768 Registered to Vote 57.7 2,191,687 8.2 45,426 67.9 2,146,261 58.6 2,694,032 8.7 46,950 65.2 2,647,082
Heavy Drinking and Smoking (2000 and 2001)
Drank 5+ at least once/week 25 8.6 325,701 4.9 27,222 9.4 298,478 8.9 407,371 4.5 24,208 9.4 383,163 Current Smokers 25 27.3 1,032,324 14.7 81,557 30.1 950,767 26.5 1,217,835 14.8 79,951 28.0 1,137,884
Health Status Indicators (2000 and 2001)
Limitations 25 4.5 172,897 1.6 8,797 5.2 164,100 4.4 204,155 L6 8,544 4.8 195,6J1 Fairll'oor Generall!ealth 25 3.7 139,041 3.3 18,259 3.8 120,783 3.9 177,736 3.2 17,377 4.0 160,359 Depression 25 4.8 180,035 4.1 22,575 5.0 157,460 5.0 229,789 4.0 21,616 5.' 208,173
Household Public A~~istance
Public Assistance 25 3.' 116,079 3.2 17,429 3.' 98,650 3.7 169,396 2.9 15,870 3.8 153,526 Food Stamps 25 7.3 275,190 4.4 24,456 7.9 250,734 8.' 373,309 4.2 22,939 8.6 350,370
Employment Status
Worker 25 86.7 3,221,414 78.5 434,563 88.1 2,786,851 86.4 3,973,826 78.1 421,837 87.5 3,551,989
FuH·time worker' 25 84.9 3,152,903 85.1 471,025 84.8 2,681,878 85.0 3,908,518 84.0 453,610 85.1 3,454,908
Children by Marital Status Total Percent Married 25 35.3 1,303,486 41.3 228,458 34.0 1,075,028 34.1 1,569,659 40.4 218,406 33.3 1,351,253 Total Percent with 1+ Children 25 30.1 1,119,121 30.8 170,251 30.0 948,870 30.9 1,421,569 28.9 156,118 31.2 1,265,452 Married wiNo Children 25 14.6 539,036 16.8 92,899 14.1 446,136 13.4 614,924 17.3 93,457 12,8 521,467 Married w/l+ Children 25 20,7 764,505 24.5 135,614 19.9 628,891 20.8 954,702 23.1 124,941 20.4 829,761 Not Married wiNo Childrell 25 55.3 2,056,991 52.4 290,151 55.9 1,766,839 55.7 2,562,449 53.8 290,538 56,0 2,271,911 Not Marricd w/l+ Children 25 9.5 354,671 6.3 34,692 10.1 319,979 10.1 466,725 5.8 31,157 10.7 435,568
Livillg with Parenti 25 22.8 854,967 17.0 94,227 24.1 760,740 25.0 1,151,803 17.7 95,655 26.0 1,056,148
Ever Had a Child (fl"llm NHIS) (2000) 25 40.1 1,486,312 41.0 226,632 39.8 1,259,679 40.6 1,868,860 39.1 211,005 40.8 1,657,855
Not in School, Not in LF, Not Disabled, Not Married 25 4.5 168,027 5.' 28,274 4.4 139,754 4.6 213,589 5.2 28,205 4.6 185,384
Oiffiruity Speaking English 22 8.' 297,172 53.3 255,372 L3 41,800 7.6 347,704 48.5 211,679 3.3 136,025
Drug Use (2001)'
All Illicit Drugs 24-25 13.7 1.023,755 5.4 58,047 15.3 965,708 13.9 1,243,763 5.4 55,737 14.6 1,188,027 Marijuana 11.6 870,783 3.5 37,623 13.2 833,160 11.7 1,044,268 3.4 35,643 12.4 1,008,625 Illicit Drugs Other Than Marijuana 5.' 377,248 2.8 30,098 5.5 347,150 4.8 429,084 2.7 28,026 4.9 401,059
j Data are trom the most recent year available, which is in many caseS more recent than 2000. Plcase see preceding tables for more details about specific years.
'Among workers, the percentage who work full time
i Data from National Household Survey on Drug Abuse online analysis system. Census estimates for non-Hispanic Asians include Native Hawaiian and other Pacific Islanders, but percentages from the National Household Survey on Drug Abuse do not include these groups.
Note: Estimates ofthe population of25-year-olds by race were taken from the Estimates of the .fuly 1,2000 United States resident population from the Vintage 2001 posteensal series by year, age, sex, race, and Hispanic origin, prepared by the National Center for Health Statistics under a collaborative arrangement with the U.S. Census Burcau. Using proportions drawn from the 1990 Census-based population projections created by the Census Bureau, Child Trends was able to calculate both the number/percent offorcign born 25-year-olds in 2000, and the estimated growth in the total population and the population of foreign born youllg adults that would occur between 2000 and 2025. These estimates were created both at the aggregate level and by individual raceIHispanic origin categories.
Population projections were created in order to estimate the total number and perccntages of young adults expected to exhibit certain characteristics in 2025, assuming no changes other than those due to overall population growth, shifts in the racial composition of the population, and changes in the proportion of young aduUs that are foreign born. Percentages for 2000 for each racCiHispanic origin combination were lllultipliDd by new population estimates for 2000 and 2025 for each group to get the frequency of young adults who exhibited these characteristics in 2000 and are expected to exhibit these characteristics in 2025. Percentages for 2000 are from original analyses by Child Trends. Percentages for 2025 were derived by summing the frequencies from eaeh raceffiispanic origin group and then dividing this number by the total population in 2025.
Source: Population estimates are from the Bridged Raee Estimates of the July I, 2000 United States re~ident population prepared by the National Center for Health Statistics under a collaborative arrangem~'llt with the U.S. Census Bureau. The proportion of the population that is foreign born and the population growth expected between 2000 and 2025 were derived from Child Trends calculations using 1990-based Ccnsus Population Projections from the U.S. C~'llSuS Bureau. Percentages for 2000, except where otherwise noted, arc trom origin"1 analyses by Child Trends of various data sources using data from the most recent year available. Percentages for 2025 were calculated by projecting how the 2000 percentages would change over 25 years, given predicted changes in the racial composition and nativity status of the population of25-year-olds living in the United States.

Appendix
Data Sonrce Descriptions
Cnrrent Popnlation Snrvey The Current Population Survey (CPS) is a monthly survey conducted by the Bureau of Labor Statistics for the U.S. Census Bureau. Data are collected from approximately 50,000 households each year. The survey contains a core monthly component that is administered each month, as well as monthly supplements that focus on specific topics. Analyses for this paper were based on data from the core monthly component, as well as the March 2002 demographic supplement, October 1999 supplement (which included questions about difficulty speaking English), the October 2000 school supplement, and the November 2000 voting supplement. In certain cases, age ranges were expanded in order to make sample sizes large enough to ensure stable estimates. Some racial and ethnic groups (i.e. Native Americans, etc) were not included in certain tables due to small sample sizes.
Information about the CPS can be found online at: http://www.bls.census.gov/CPS/CPSmain.htm
National Health Interview Survey The National Health Interview Survey (NHIS) is an annual survey conducted by the National Center for Health Statistics of the Centers for Disease Control and Prevention. The survey was redesigned in 1997, and now interviews approximately 100,000 individuals within about 39,000 families each year. In addition to responding to questions about each person, one adult and one child within each household are randomly selected to respond to the Sample Adult and Sample Child questionnaires, which survey approximately 32,000 and 13,000 persons, respectively, each year.
For this paper, data from the 2000 and 2001 NHIS were used to estimate various healthrelated characteristics of young adults. Sample sizes from the NHIS varied from one analysis to another, depending on if the given characteristics of interest were obtained for all persons surveyed, or only for one sample adult in each surveyed household. In some cases, age ranges were expanded and two years of data were combined in order to make sample sizes large enough to ensure stable estimates. In certain tables, estimates for some races/ethnic groups (Native American, etc) were not included in tables due to very small sample sizes.
Information about the NHIS can be found online at: http://www.cdc.gov/nchs/nhis.htm

National Household Survey on Drug Abuse The National Household Survey on Drug Abuse (NHSDA) is an annual survey that collects information about patterns of drug use among the civilian population ages 12 and over. Each year, the NHSDA surveys approximately 54,000 individuals across the country.
Analyses for this paper were based on the 2001 NHSDA, and were conducted online using the Substance Abuse and Mental Health Data Archive (SAMDHA) Online Analysis system. Some racial and ethnic groups were excluded from tables due to extremely small sample sizes.
Information about the NHSDA can be found online at: http://www.icpsr.umich.edu:SOSO/SAMHDA-SERIES/00064.xml
U.S. Census Bureau Population Projections Based in part on data from the Decennial Census, the U.S. Census Bureau produces quarterly projections of the future resident population of the United States and annual projections of the future foreign-born population of the United States. In order to obtain comparable estimates, the population of25 year-olds in 2000 was taken from the population projections rather than from the 2000 Decennial Census.
Information about the U.S. Census Bureau Population Projections can be found online at: http://www . census. gov /population/www /proj ections/popproj .html
2001 Bridged Race Population Estimates Estimates of the July I, 2000 popUlation by age and race/ethnicity were taken from the Bridged Race Vintage 2001 postcensal series prepared by the National Center for Health Statistics under a collaborative arrangement with the U.S. Census Bureau. These estimates collapsed the new race categories included in the 2000 Census to allow for comparison with prior years of data by race/ethnicity.
More information about these estimates can be found online at: http://www.cdc.gov/nchs/data/series/sr 02/sr02 135.pdf
Young Adults in Prison Estimates of the percentage of young adults in prison were obtained from a report by the U.S. Department of Justice entitled "Prison and Jail Inmates at Midyear 2002," published in the spring of2003. The report was based on data from custody counts from National Prisoners Statistics (NPS I-A), the Annual Survey of Jails, and estimates by age from the Survey ofInmates in Local Jails and the Survey ofInmates in State and Federal Correctional Facilities. Percentages were calculated using estimates of the U.S. resident population on July 1, 2000, and were adjusted for the 1990 census undercount.
This report can be found online at: http://www.ojp.usdoj.gov/bjs/abstract/pjimOO.htm

Youth Risk Behavior Survey and National Violence Against Women Survey Estimates of the percentage of young adults who are likely to be raped before reaching age 25 were derived using data from the 1999 Youth Risk Behavior Survey (YRBS) and the National Violence Against Women Survey (NY A WS). The YRBS is a biannual school-based survey of high school students that focuses on health-related risk behaviors. The survey, which was developed by the Centers for Disease Control and Prevention, samples over 15,000 students on the national level. State and local health and education agencies also conduct smaller-scale surveys. The NV A WS was a national survey cosponsored by the National Institute of Justice and the Centers for Disease Control and Prevention. Focused on gathering information about victims of violence, the survey was conducted through a grant to the Center for Policy Research and collected data from 8,000 men and 8,000 women in the United States.
Information about the YRB S can be found online at: http://www.cdc.gov/nccdphp/dasb/yrbs/
Information about the NV A WS can be found online at: http://www.ncjrs.org/pdffilesllnij/181867.pdf
From the YRBS, we were able to identify the percentage of white non-Hispanic, black non-Hispanic, and Hispanic students that had been raped by grade 12. This percentage was then divided by the percentage of each of all rape victims who are likely to be raped before age 18 (from the NVAWS). Next, we multiplied the quotient derived above by the percentage of all rape victims likely to be raped by age 24 to find the percentage of youth interviewed in the YRBS that are likely to be raped by age 24, assuming that this is (in broad terms) an accurate estimation of all young adults.
X=YRBS (by 12th grade) INCVS (0-17) NCVS (0-24) = (NCVS 0-17) + (NCVS 18-24) YRBS (0-24) =NCVS (0-24)*X

Methods Used
Methods used in creating new population estimates and projections (Tables 1 and 2) Estimates of the population of25-year-olds by race were taken from the Estimates of the July 1,2000 United States resident population from the Vintage 2001 postcensal series by year, age, sex, race, and Hispanic origin, prepared by the National Center for Health Statistics under a collaborative arrangement with the U.S. Census Bureau. Using proportions drawn from the 1990 Census-based popUlation projections created by the Census Bureau, Child Trends was able to calculate both the number/percent of foreign born 25-year-olds in 2000, and the estimated growth in the total popUlation and the popUlation of foreign born young adults that would occur between 2000 and 2025. These estimates were created both at the aggregate level and by individual race/Hispanic origin categories.
Methods used in projections of various characteristics to 2025 (Table 26) The goal ofthis exercise was to be able to estimate the total number and percentages of young adults expected to exhibit certain characteristics in 2025, assuming no changes other tban those due to overall popUlation growth, shifts in the racial composition of the population, and changes in the proportion of young adults that are foreign born. Percentages for 2000 for each race/Hispanic origin combination were multiplied by new population estimates for 2000 and 2025 to get the frequency of young adults that are expected to exhibit those characteristics in 25 years.
Proportional redistribution of missing data for population estimates (All other tables)
In order to obtain accurate estimates of the total population, it was sometimes necessary to redistribute respondents who had missing values for race. This was done by multiplying the total number of young adults by the percentage in each race category and then adding the products to each respective race category to get estimates of the total popUlation of each race.
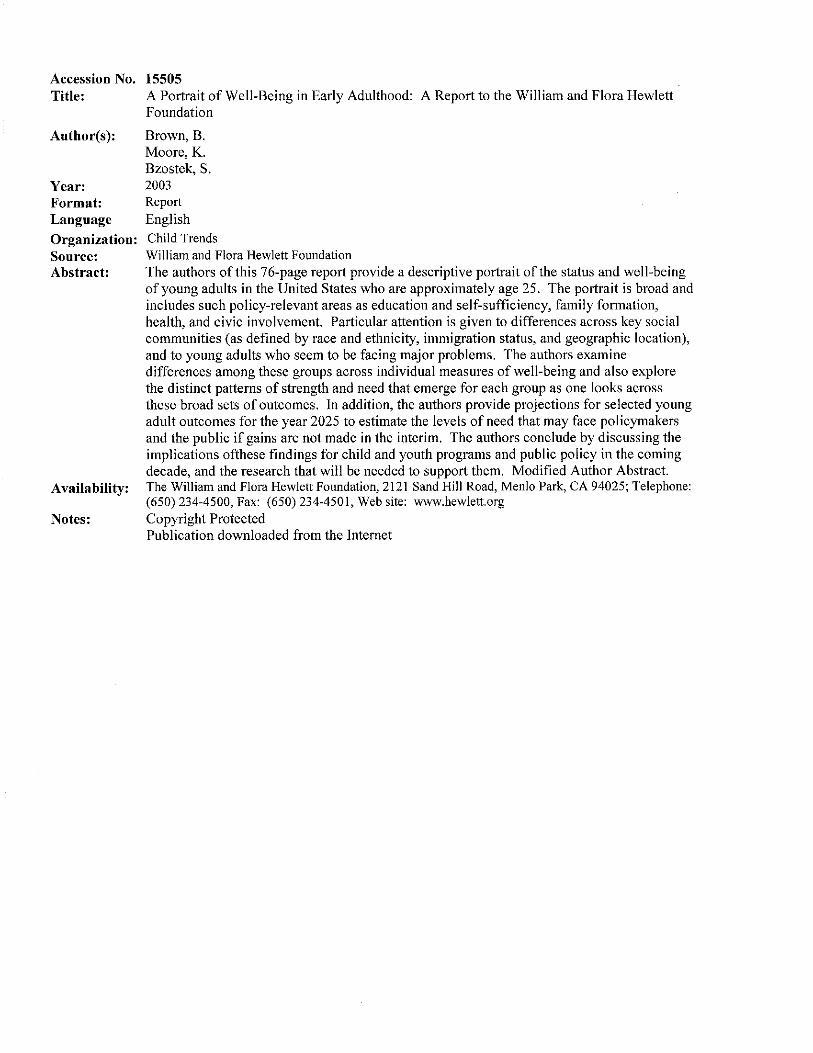
Accession No. 15505 Title: A Portrait of Well-Being in Early Adulthood: A Report to the William and Flora Hewlett
Foundation
Author(s):
Year: Format: Language
Organization: Source: Abstract:
Availability:
Notes:
Brown, B. Moore, K. Bzostek, S. 2003 Report English Child Trends William and Flora Hewlett Foundation The authors of this 76-page report provide a descriptive portrait ofthe status and well-being of young adults in the United States who are approximately age 25. The portrait is broad and includes such policy-relevant areas as education and self-sufficiency, family formation, health, and civic involvement. Particular attention is given to differences across key social communities (as defined by race and ethnicity, immigration status, and geographic location), and to young adults who seem to be facing major problems. The authors examine differences among these groups across individual measures of well-being and also explore the distinct patterns of strength and need that emerge for each group as one looks across these broad sets of outcomes. In addition, the authors provide projections for selected young adult outcomes for the year 2025 to estimate the levels of need that may face policymakers and the public if gains are not made in the interim. The authors conclude by discussing the implications ofthese findings for child and youth programs and public policy in the coming decade, and the research that will be needed to support them. Modified Author Abstract. The William and Flora Hewlett Foundation, 2121 Sand Hill Road, Menlo Park, CA 94025; Telephone: (650) 234-4500, Fax: (650) 234-4501, Web site: www.hewlett.org Copyright Protected Publication downloaded from the Internet