A PARAMETRIC APPROACH TO PARTIAL LEAST SQUARE STRUCTURAL EQUATION MODELING OF MULTIGROUP ANALYSIS...
15
International Journal of Economics, Commerce and Management United Kingdom Vol. II, Issue 10, Oct 2014 Licensed under Creative Common Page 1 http://ijecm.co.uk/ ISSN 2348 0386 A PARAMETRIC APPROACH TO PARTIAL LEAST SQUARE STRUCTURAL EQUATION MODELING OF MULTIGROUP ANALYSIS (PLS-MGA) Afthanorhan, Asyraf Department of Mathematics, Faculty of Science and Technology University Malaysia Terengganu, Kuala Terengganu, Malaysia [email protected] Nazim, Ahmad Malaysia National Population and Family Development Board Ministry of Women, Family and Community Development, Kuala Lumpur, Malaysia. [email protected] Ahmad, Sabri Department of Mathematics, Faculty of Science and Technology University Malaysia Terengganu, Kuala Terengganu, Malaysia Abstract Recently, Partial Least Square Structural Equation Modeling (PLS-SEM) has become pervasive among the scholar in variety of areas to examine or predict selected variables in order to achieve the goals that have been set based on the issues faced by researchers. Thus, vary of method has been performed to ascertain the researchers attain the necessity of their survey in more holistic. The main objective of this empirical works to provide a step by step approach to anyone whom interested to perform a multi-group analysis (moderating effect). In particular, the author practice the parametric approach that has been proposed by previous research using two different methods of equal and unequal variances. For this instances, five variables selected which are Benefit, Barrier, Government, Challenge and Motivation introduced to practice of these both approach. All of these variables have been tested with the existence of moderating
-
Upload
independent -
Category
Documents
-
view
1 -
download
0
Transcript of A PARAMETRIC APPROACH TO PARTIAL LEAST SQUARE STRUCTURAL EQUATION MODELING OF MULTIGROUP ANALYSIS...

International Journal of Economics, Commerce and Management United Kingdom Vol. II, Issue 10, Oct 2014
Licensed under Creative Common Page 1
http://ijecm.co.uk/ ISSN 2348 0386
A PARAMETRIC APPROACH TO PARTIAL LEAST SQUARE
STRUCTURAL EQUATION MODELING OF MULTIGROUP
ANALYSIS (PLS-MGA)
Afthanorhan, Asyraf
Department of Mathematics, Faculty of Science and Technology
University Malaysia Terengganu, Kuala Terengganu, Malaysia
Nazim, Ahmad
Malaysia National Population and Family Development Board
Ministry of Women, Family and Community Development, Kuala Lumpur, Malaysia.
Ahmad, Sabri
Department of Mathematics, Faculty of Science and Technology
University Malaysia Terengganu, Kuala Terengganu, Malaysia
Abstract
Recently, Partial Least Square Structural Equation Modeling (PLS-SEM) has become pervasive
among the scholar in variety of areas to examine or predict selected variables in order to
achieve the goals that have been set based on the issues faced by researchers. Thus, vary of
method has been performed to ascertain the researchers attain the necessity of their survey in
more holistic. The main objective of this empirical works to provide a step by step approach to
anyone whom interested to perform a multi-group analysis (moderating effect). In particular, the
author practice the parametric approach that has been proposed by previous research using
two different methods of equal and unequal variances. For this instances, five variables selected
which are Benefit, Barrier, Government, Challenge and Motivation introduced to practice of
these both approach. All of these variables have been tested with the existence of moderating

© Afthanorhan, Nazim & Ahmad
Licensed under Creative Common Page 2
effect (gender variable) to identify whether of particular moderator variable has a potential to
affect the impact of causal effect in PLS-SEM. Of rely on both differences methods, the PLS
suggest that gender variable is not a main issue whether of improve or impairs the impact of the
survey implemented.
Keywords: Partial Least Square Structural Equation Modeling, Multi-group analysis, Moderating
effect, equal and unequal variances, parametric approach
INTRODUCTION
In behavioral research, multi-group analysis has been prominent among scholars to advance
their statistical methodology conformity to their main objective provided. Nevertheless,
researchers nowadays interest to stress their research using covariance based structural
equation modeling (CB-SEM) with statistical package launched rather than partial least square
structural equation modeling (PLS-SEM). In fact, PLS-SEM has a comprehensive potential to
cover the loopholes of CB-SEM likely permissive to undertake the parametric and
nonparametric analysis grounded on type of data attained. In CB-SEM, the scholars should be
complementary the requirement and necessity at first before to undertake the subsequent step.
This method is quite cumbersome since the evaluation of measurement model has become a
major thrust in findings compare to our main targeted (Afthanorhan, 2014).
Unlikely of PLS-SEM interest to press on methodological of statistical analysis in order to
assists scholars attained what in more need for their research (Afthanorhan, 2014). Of
addressing on multi-group analysis using partial least square with SMARTPLS 2.0 M3 as a main
of this research work, the author would to reveal the two types of approach namely equal and
unequal variance to identify whether the continuous or discrete variables are possible to
moderates the influences of exogenous on endogenous constructs (Hair et. 2013).
Both of these approaches are shift in a same route as a parametric approach in multi-
group analysis (moderating effect). This particular technique has become a pervasive among
scholar to provide a better understanding on the contribution of the research work. Meanwhile,
the ways of the researchers to convey or present the direction of the work has become
substantive.
In this research paper, the author practice four exogenous construct (Government
support, Benefits, Challenge, and Barrier) imposing on one endogenous construct (Motivation).

International Journal of Economics, Commerce and Management, United Kingdom
Licensed under Creative Common Page 3
There are several research hypotheses that have been identified through the knowledge of
author to carry on the further analysis. The research hypotheses are stated as below:
H1: Government support has a causal effect on Motivation
H2: Benefit has a causal effect on Motivation
H3: Challenge has a causal effect on Motivation
H4: Barrier has a causal effect on Motivation
H5: Gender moderates the causal effect of Government support on Motivation
H6: Gender moderates the causal effect of Benefits on Motivation
H7: Gender moderates the causal effect of Challenge on Motivation
H8: Gender moderates the causal effect of Barrier on Motivation
MEASUREMENT INVARIANCE
In order to carry on the multi-group analysis, the measurement invariance approach should be
carry on first to ensure this analysis should be conducted to achieve our main objective
research. However, measurement invariance is rarely been used in PLS-SEM rather than CB-
SEM in other statistical research due to the facts that probability to attain a less invariance in
modeling is prone to CB-SEM. A less measurement invariance is emanates from the
requirement of sample size is larger than PLS-SEM to judge Structural Equation Modeling
(SEM) approach. In social science, this method has been substantive to apply due to the
scholars enjoy to compare the selected group influences on their theoretical framework thus far.
Testing for measurement invariance, that is, identify if items used in survey of material is mean
the same thing across the group provided (Cheung & Rensvold, 2002). In particular, if the
measurement invariance failed to be proved, the findings concerning of multi-group analysis has
become ambiguous.
Thus, this testing so far is very closely related to be carrying on once the scholars be
going to compare groups (multi-group analysis). There are two types of invariance that has
been proposed by Little (1977) namely measurement scales, and includes configural
invariances (Buss & Royce, 1975; Irvine 1969; Suzuki & Rancer, 1994), metric invariance (Horn
& McArdle, 1992) and scalar metric (Steenkamp & Baumgartner, 1998). One of the criteria that
should be first undertakes is the model should be measurement invariance. However,
Steenkamp & Baumgartner (1998) suggest that this entails when the scholars does not have
evidence to justify it. In other words, if the scholars or researchers have a proof to imply that
moderator effect is restricted to which parameter, thus, does not entail group-related difference
in the item loadings.

© Afthanorhan, Nazim & Ahmad
Licensed under Creative Common Page 4
PARTIAL LEAST SQUARE MULTI-GROUP ANALYSIS (PLS-MGA)
Partial Least Square Multi-group-Analysis (PLS-MGA) can be known as moderating effect to
moderates the causal effect between exogenous and endogenous constructs (Afthanorhan &
Ahmad, 2014). Three approaches to multi-group analysis have been proposed within the PLS
path modeling lately by infamous researchers whom expert in their fields likely parametric,
nonparametric and permutation approaches. In the accordance of Keil et. al (2000), the
standardized error or standardized deviation for each sample is prevailed to yield the outcome
of probability value (p-value). As usual, p-value often is being used in statistical analysis to test
the potential of our analysis. In other words, these values are deemed as a threshold to decide
the significant of the case study applied.
In particular, these approaches entail a resampling technique (bootstrapping method) as
a source in multi-group analysis to provide a standard error for each sample tested. This
method generally is considered as a parametric approach since the circumstance of this
behavior approach is inappropriate to be nonparametric approach (Henseler & Sarstedt, 2007).
Of a main of this research to focus on parametric approach, the author claims to guide the steps
for the readers to establish the parametric approach in multi-group analysis using PLS-SEM
with SmartPLS 2.0 M3.
PARAMETRIC APPROACH
The parametric approach was initially been proposed by Keil (2000) and then has been modified
by Chin (2003) to improve the potential of independent t-test in multi-group analysis. However,
since this techniques is considered as a parametric approach, thus, the data provided should be
achieve the requirement to be known as normally distributed. The data which contrary the
necessity of normally distributed should be eluding since the findings will become ambiguities.
Consequently, the researchers will conduct the normality test such as Kolmogorov-Smirnov,
Shapiro Wilks, Liliefors correction (Mooi & Sarstedt, 2011) or other test related to identify the
distribution of data. All of these data can be conducted using various statistical package such as
SPSS, Eviews, Minitab, Matlab and so forth.
In CB-SEM, the researchers has been introduced to Mahalanobis Distances to
determine the normality of data provided contrary of PLS-SEM, in particular, has been
developed to overhaul the limitation of CB-SEM (data should be larger than 200 samples). In
the accordance of Arshad et. al (2003), Shapiro Wilks test is perceived the most powerful
approach for normality test especially in a small sample size composite approximately below 50.
In this case, the author uses Kolmogorov Smirnov to examine the normality of the data. In the
nature of statistical analysis, parametric approach can be handled once the data achieve the
International Journal of Economics, Commerce and Management, United Kingdom
Licensed under Creative Common Page 5
requisite sample size. However, Byrne (2010) stated that the data which failed to meet the
requirement assumption can be assists with the existence of resampling technique
(bootstrapping method) that has been proposed by Monte Carlo (Arellano & Bond, 1991). Of
stressing on the resampling technique, many eminent authors namely Mackinnon (2000), AF
Hayes (2009), Byrne (2010), Kenny (1998), Afthanorhan (2014) use this aforementioned
approach to perform their analysis conformity of the objective research.
On the conformity of the purpose empirical studies, the author performs equal variance
and unequal variance (sattherwite test) of studentditized t-test. This method has been justified
by Henseler (2007) to announce this approach has potential to play an important role as a
parametric approach. Indeed, both of these approaches should be identified first once to
implement to remedy the bias result. Henseler & Hair (2014) and Kock (2012) confirmed to
apply of this particular method namely equal and unequal variance respectively. These authors
use a different software which is SmartPls 2.0 (equal variance) and WarpPls 3.0 (unequal
variance) to perform multi-group analysis. However, that’s not a big matter to argue of these
different approaches since both of them are classified from the same route.
Equal Variance
Equal variances studentditized t-test has been consider as parametric approach by Henseler
(2007) when to apply in multi-group analysis. Usually, equal variance has been practices once
the groups will be tested more than one and ta the same the sample size should be same.
Otherwise, the finding will become incorrectly since contradict the assumption of statistical
analysis. In addition, this particular test often assumes the analyses are normally distributed. In
this case, the author had applied the Kolmogorov-Smirnov to determine the pattern of
distribution whether be classify as normality or not.
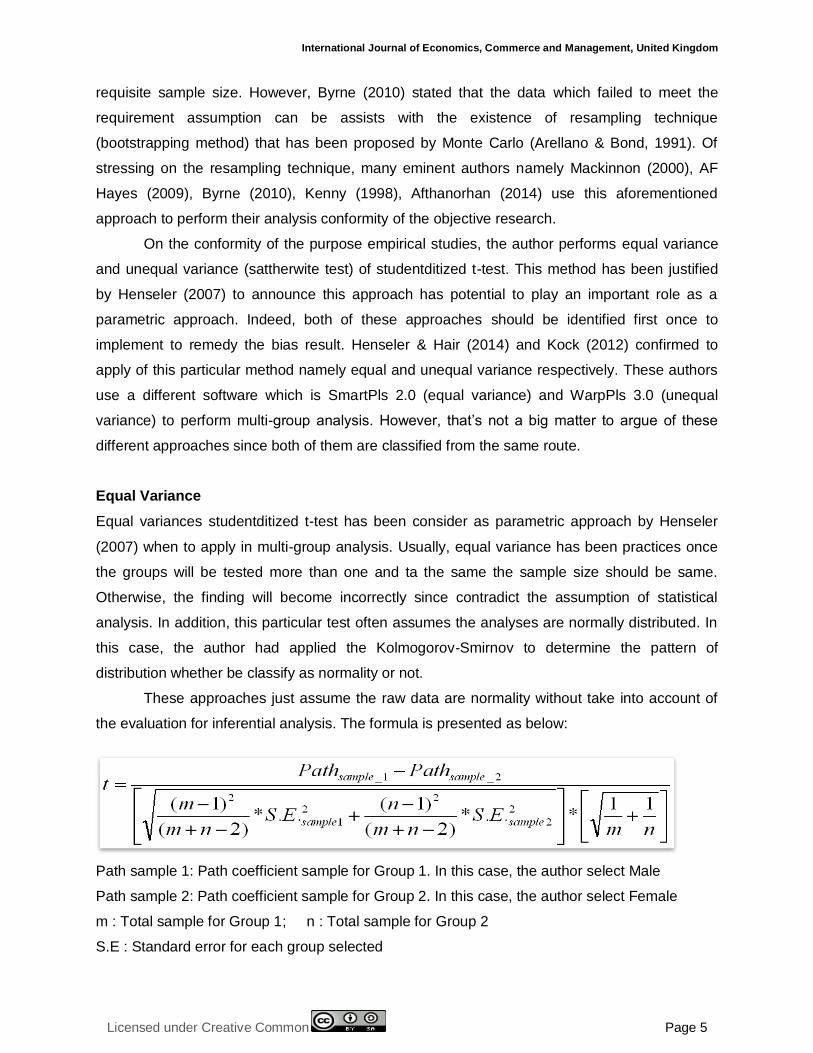
These approaches just assume the raw data are normality without take into account of
the evaluation for inferential analysis. The formula is presented as below:
Path sample 1: Path coefficient sample for Group 1. In this case, the author select Male
Path sample 2: Path coefficient sample for Group 2. In this case, the author select Female
m : Total sample for Group 1; n : Total sample for Group 2
S.E : Standard error for each group selected
© Afthanorhan, Nazim & Ahmad
Licensed under Creative Common Page 6
UNEQUAL VARIANCE
Unequal variance can be known as Sattherwite test to determine the significant of path effect
when to compare groups (more than one). According to N Kock (2013), unequal variance test is
appropriate to be tested once to apply multi-group analysis (modeling the moderating effect).
This is perceived more relevant compare the equal variance since this test just not assumes all
the data are normally distributed. Nevertheless, this test is limited in several package such as
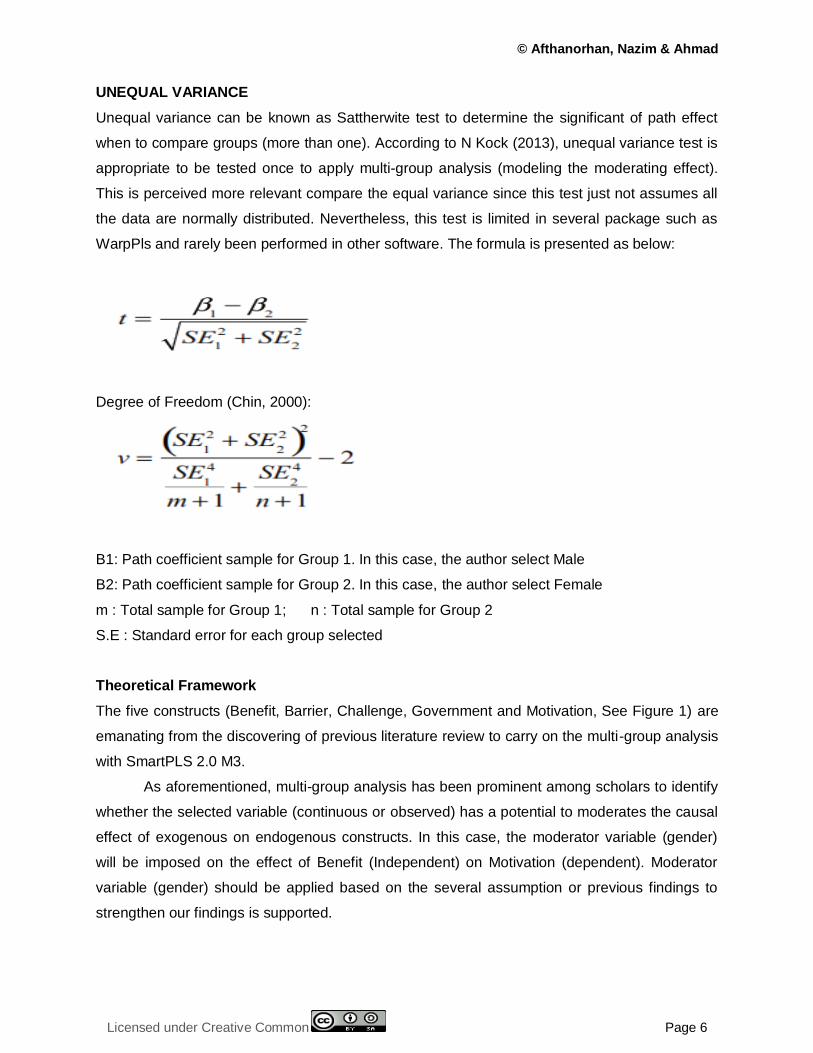
WarpPls and rarely been performed in other software. The formula is presented as below:
Degree of Freedom (Chin, 2000):
B1: Path coefficient sample for Group 1. In this case, the author select Male
B2: Path coefficient sample for Group 2. In this case, the author select Female
m : Total sample for Group 1; n : Total sample for Group 2
S.E : Standard error for each group selected
Theoretical Framework
The five constructs (Benefit, Barrier, Challenge, Government and Motivation, See Figure 1) are
emanating from the discovering of previous literature review to carry on the multi-group analysis
with SmartPLS 2.0 M3.
As aforementioned, multi-group analysis has been prominent among scholars to identify
whether the selected variable (continuous or observed) has a potential to moderates the causal
effect of exogenous on endogenous constructs. In this case, the moderator variable (gender)
will be imposed on the effect of Benefit (Independent) on Motivation (dependent). Moderator
variable (gender) should be applied based on the several assumption or previous findings to
strengthen our findings is supported.

International Journal of Economics, Commerce and Management, United Kingdom
Licensed under Creative Common Page 7
Figure 1: Theoretical Framework
In other words, this paper intend to use gender as recommended from ex-research to justify our
proof in which gender is perceived to moderates the causal effect of whether of enhance or
deteriorates the influences of independent on dependent variable. Moderator variable can be
applied on other path but should be devoursa strong evidence to support our analysis as well as
to dodge the contrary of theory in statistics. In this case, the author interest to apply moderator
variable between Benefit and Motivation using parametric approach which is equal and unequal
variance of t-test.
ANALYSIS & FINDINGS
In further analysis, the researchers should build their constructs based on the theoretical
framework. In this case, the four exogenous construct exerting on endogenous construct. The
multi-group analysis can be further once this approach achieves the requirement of partial least
square namely traditional structural model. List of steps is stated as below:
1. Build of latent construct according to the theoretical framework as well as insert the
indicators (items) in each latent construct. The researchers can choose either one to be
hide or appear in framework
2. Execute PLS algorithm to acquire the factor loading and the path effect. Factor loading
below than 0.60 should be drop since they have been consider bringing a less
contribution.
3. Then, execute bootstrap to determine the t-statistics and standard error.

© Afthanorhan, Nazim & Ahmad
Licensed under Creative Common Page 8
4. Make sure the entire requirement such as Cronbach Alpha (Nunally, 1978), Composite
Reliability (Nunally & Bernstein 1994), Average Variance Extracted (Fornell & Larcker,
1982), and Discriminant Validity (Fornell, 1988, Afthanorhan et. al 2014).
Figure 2: Estimated Path Coefficients
Table 1: Path Coefficients (Mean, STDEV, T-Values)
Original
Sample (O)
Sample Mean
(M)
Standard Error
(STERR)
T Statistics
(|O/STERR|)
Barrier ->
Motivation
0.082066 0.083236 0.031514 2.604121
Benefit ->
Motivation
0.683311 0.681209 0.037681 18.133986
Challenge ->
Motivation
0.017979 0.022381 0.031034 0.579353
Government ->
Motivation
0.127794 0.129892 0.035932 3.556564
Table 1 present the path coefficient of exogenous on endogenous construct once execute PLS
algorithm and bootstrap to provide the beta coefficient, sample mean, standard error and t-
statistics for each causal effect. In this case, beta coefficient can be known as original sample.
By inspecting through for each row in a Table 1, factor Benefits (0.683) is expected to be the
highest effect on Motivation follow by Government (0.127), Barrier (0.0821) and Challenge
(0.0180).In further steps, the scholars should stress on t-statistics as a guide of whether to
accept or reject our research hypothesis.

International Journal of Economics, Commerce and Management, United Kingdom
Licensed under Creative Common Page 9
H1: Barrier has a causal effect on Motivation
The finding suggests that Barrier significantly has a causal effect on Motivation. It can be
perceived when the outcome of t-statistics is higher than 1.96 (P-value = 0.05). Thus, one can
be conclude that the research hypothesis is supported.
H2: Benefits has a causal effect on Motivation
The finding suggests that Benefit is highly significant impact on Motivation. It can be perceived
when the outcome of t-statistics is higher than 1.96 (P-value = 0.05). Thus, one can be conclude
that the research hypothesis is supported.
H3: Challenge has a causal effect on Motivation
The finding suggest that Challenge is does not has significant impact on Motivation. It can be
perceived when the outcome of t-statistics is below than 1.96 (P-value = 0.05). Thus, one can
be conclude that the research hypothesis is not supported and totally contradict the theory of
previous research.
H4: Government has a causal effect on Motivation
The finding suggests that Government significantly has a causal effect on Motivation. It can be
perceived when the outcome of t-statistics is higher than 1.96 (P-value = 0.05). Thus, one can
be conclude that the research hypothesis is supported.
MULTI-GROUP ANALYSIS (MODELING THE MODERATING VARIABLE) EQUAL VARIANCE APPROACH
Now, the multi-group analyses were conducted to each causal path that has been provided in
theoretical framework. The procedure to implement of this approach is quite simple rather than
CB-SEM. The first part makes sure the researcher build the construct based on theoretical
framework in order to prevent contradict of research hypothesis. List of steps is stated as below:
1. Database is split in two groups according the moderator variable. In this case, the author
split the sample size for gender group.
2. The model is executed twice, one for each database, and the beta parameter is
estimated in groups as well as the t-values, standard error and standard deviation. All of
these result is existence in a same table
3. Outcome for t-statistics can be appears once the research executes the resampling
technique (bootstrapping).

© Afthanorhan, Nazim & Ahmad
Licensed under Creative Common Page 10
4. If B1 and B2 are the estimated coefficient, SE1 and SE2 are their standard error, whilst
m and n is total sample size for each group selected.
5. The following of t-statistics is built to test the null hypothesis (a family pairwise error rate)
that both parameter are the same
Table 2: Male and Female (Moderating Variable)
Male Female
Benefit
B1 = 0.688298 B2 = 0.683311
SE1 = 0.064688 SE2 = 0.047275
M = 159 N = 293 t-value (Male) = 10.640206 t- value (Female) = 14.453983
Government
B1 = 0.124517 B2 = 0.127794
SE1 = 0.061750 SE2 = 0.044570
M = 159 N = 293 t-value (Male) = 2.016464 t- value (Female) = 2.867268
Challenge
B1 = 0.012209 B2 = 0.017979
SE1 = 0.054873 SE2 = 0.037983
M = 159 N = 293 t-value (Male) = 0.222503 t- value (Female) = 0.473355
Barrier
B1 = 0.078119 B2 = 0.082066
SE1 = 0.052801 SE2 = 0.037980
M = 159 N = 293 t-value (Male) = 1.479489 t- value (Female) = 2.160795
International Journal of Economics, Commerce and Management, United Kingdom
Licensed under Creative Common Page 11
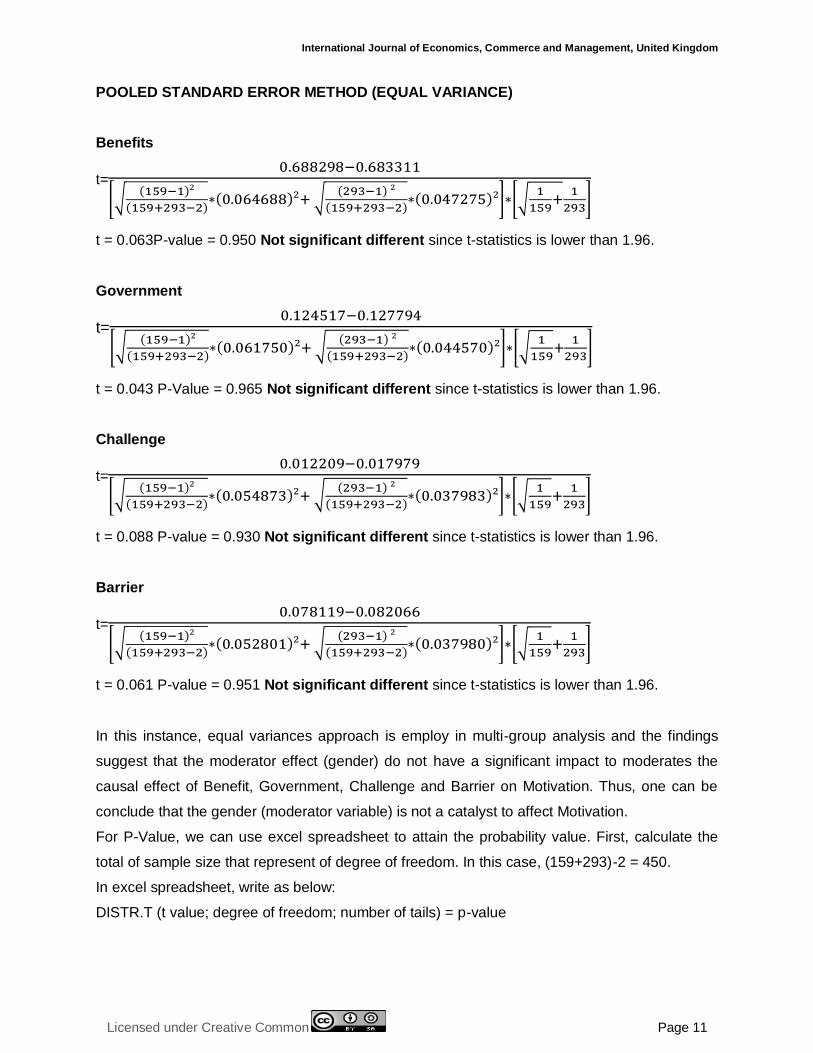
POOLED STANDARD ERROR METHOD (EQUAL VARIANCE)
Benefits
t=
t = 0.063P-value = 0.950 Not significant different since t-statistics is lower than 1.96.
Government
t=
t = 0.043 P-Value = 0.965 Not significant different since t-statistics is lower than 1.96.
Challenge
t=
t = 0.088 P-value = 0.930 Not significant different since t-statistics is lower than 1.96.
Barrier
t=
t = 0.061 P-value = 0.951 Not significant different since t-statistics is lower than 1.96.
In this instance, equal variances approach is employ in multi-group analysis and the findings
suggest that the moderator effect (gender) do not have a significant impact to moderates the
causal effect of Benefit, Government, Challenge and Barrier on Motivation. Thus, one can be
conclude that the gender (moderator variable) is not a catalyst to affect Motivation.
For P-Value, we can use excel spreadsheet to attain the probability value. First, calculate the
total of sample size that represent of degree of freedom. In this case, (159+293)-2 = 450.
In excel spreadsheet, write as below:
DISTR.T (t value; degree of freedom; number of tails) = p-value

© Afthanorhan, Nazim & Ahmad
Licensed under Creative Common Page 12
MULTI-GROUP ANALYSIS PARAMETRIC APPROACH (UNEQUAL VARIANCE)
The procedure for unequal variance approach is similar to the previous of equal variance
approach. Researchers deserve to choose either one of the approach that looks comfort for
them because both of these approach will benefited at the same outcome. The next step is to
present the calculation of unequal variances in multi-group analysis.
SATTHERWITE METHOD (UNEQUAL VARIANCE)
Benefit
t =
v =
t = 0.0622 P-value = 0.9504 Not significant different since t-statistics is lower than 1.96.
Government
t =
v =
t = 0.0434 P-Value = 0.9657 Not significant different since t-statistics is lower than 1.96.
Challenge
t =
v =
t = 0.0865 P-Value = 0.9311 Not significant different since t-statistics is lower than 1.96.
International Journal of Economics, Commerce and Management, United Kingdom
Licensed under Creative Common Page 13
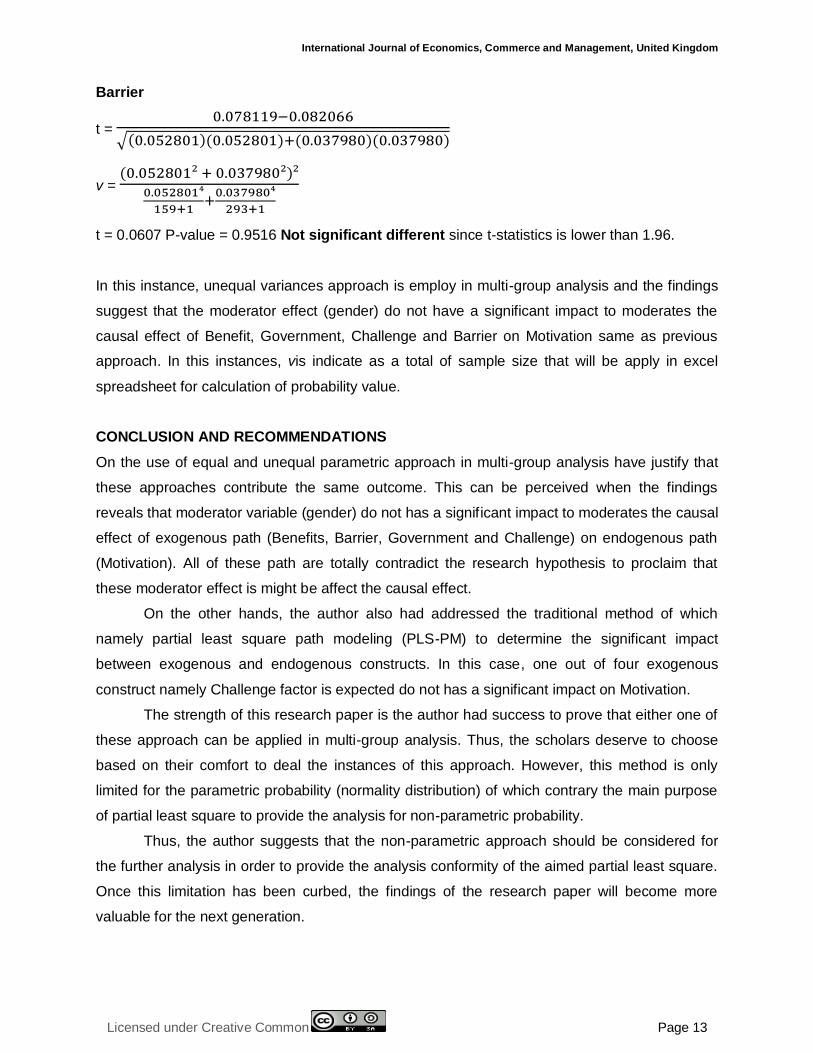
Barrier
t =
v =
t = 0.0607 P-value = 0.9516 Not significant different since t-statistics is lower than 1.96.
In this instance, unequal variances approach is employ in multi-group analysis and the findings
suggest that the moderator effect (gender) do not have a significant impact to moderates the
causal effect of Benefit, Government, Challenge and Barrier on Motivation same as previous
approach. In this instances, vis indicate as a total of sample size that will be apply in excel
spreadsheet for calculation of probability value.
CONCLUSION AND RECOMMENDATIONS
On the use of equal and unequal parametric approach in multi-group analysis have justify that
these approaches contribute the same outcome. This can be perceived when the findings
reveals that moderator variable (gender) do not has a significant impact to moderates the causal
effect of exogenous path (Benefits, Barrier, Government and Challenge) on endogenous path
(Motivation). All of these path are totally contradict the research hypothesis to proclaim that
these moderator effect is might be affect the causal effect.
On the other hands, the author also had addressed the traditional method of which
namely partial least square path modeling (PLS-PM) to determine the significant impact
between exogenous and endogenous constructs. In this case, one out of four exogenous
construct namely Challenge factor is expected do not has a significant impact on Motivation.
The strength of this research paper is the author had success to prove that either one of
these approach can be applied in multi-group analysis. Thus, the scholars deserve to choose
based on their comfort to deal the instances of this approach. However, this method is only
limited for the parametric probability (normality distribution) of which contrary the main purpose
of partial least square to provide the analysis for non-parametric probability.
Thus, the author suggests that the non-parametric approach should be considered for
the further analysis in order to provide the analysis conformity of the aimed partial least square.
Once this limitation has been curbed, the findings of the research paper will become more
valuable for the next generation.

© Afthanorhan, Nazim & Ahmad
Licensed under Creative Common Page 14
REFERENCES
Afthanorhan, W. M. A. B. W. (2014). Hierarchical Component Using Reflective-Formative Measurement Model In Partial Least Square Structural Equation Modeling (Pls-Sem). International Journal of Mathematics and Statistics Invention (IJMSI), 2(2), 55-71.
Afthanorhan, W. M. A. B. W., & Ahmad, S. (2013). Modelling the Multi-group Moderator-Mediator on Motivation among Youth in Higher Education Institution towards Volunteerism Program. International Journal of Scientific & Engineering Research (IJSER), 4(7), 5.
Afthanorhan, W. M. A. B. W., & Ahmad, S. (2014). Path Analysis in Covariance-Based Structural Equation Modeling with Amos 18.0. European Journal of Business and Social Sciences 2(6), 10.
Afthanorhan, W. M. A. B. W., Ahmad, S., &Mamat, I. (2014). Pooled Confirmatory Factor Analysis (PCFA) Using Structural Equation Modeling on Volunteerism Program: A Step by Step Approach. International Journal of Asian Social Science, 4(5), 642-653.
Afthanorhan, W. M. A. W. (2014). Modeling The Multiple Indirect Effect Among Latent Constructs By Using Structural Equation Modeling: Volunteerism Program. International Journal of Advances in Applied Sciences, 3(1), 25-32.
Arellano, M., & Bond, S. (1991). Some tests of specification for panel data: Monte Carlo evidence and an application to employment equations. The review of economic studies, 58(2), 277-297.
Arshad, S. H., Bateman, B., & Matthews, S. M. (2003). Primary prevention of asthma and atopy during childhood by allergen avoidance in infancy: a randomised controlled study. Thorax, 58(6), 489-493.
Buss, A. R., & Royce, J. R. (1975). Detecting cross-cultural commonalities and differences: Intergroup factor analysis. Psychological Bulletin, 82(1), 128.
Byrne, B. M. (2013). Structural equation modeling with AMOS: Basic concepts, applications, and programming. Routledge.
Cheung, G. W., &Rensvold, R. B. (2002). Evaluating goodness-of-fit indexes for testing measurement invariance. Structural equation modeling, 9(2), 233-255.
Chin, W. W., Marcolin, B. L., &Newsted, P. R. (2003). A partial least squares latent variable modeling approach for measuring interaction effects: Results from a Monte Carlo simulation study and an electronic-mail emotion/adoption study.Information systems research, 14(2), 189-217.
Fornell, C., &Bookstein, F. L. (1982). Two structural equation models: LISREL and PLS applied to consumer exit-voice theory. Journal of Marketing research, 440-452.
Hair, J. F., Ringle, C. M., &Sarstedt, M. (2013). Editorial-Partial Least Squares Structural Equation Modeling: Rigorous Applications, Better Results and Higher Acceptance. Long Range Planning, 46(1-2), 1-12.
Hayes, A. F. (2009). Beyond Baron and Kenny: Statistical mediation analysis in the new millennium. Communication Monographs, 76(4), 408-420.
Henseler, J., Ringle, C. M., &Sinkovics, R. R. (2009). The use of partial least squares path modeling in international marketing. Advances in international marketing, 20, 277-319.
Henseler, J., Ringle, C. M., &Sinkovics, R. R. (2009). The use of partial least squares path modeling in international marketing. Advances in international marketing, 20, 277-319.
Horn, J. L., &McArdle, J. J. (1992). A practical and theoretical guide to measurement invariance in aging research. Experimental aging research, 18(3), 117-144.
Irvine, W. J., Chan, M. M., &Scarth, L. (1969). The further characterization of autoantibodies reactive with extra-adrenal steroid-producing cells in patients with adrenal disorders. Clinical and experimental immunology, 4(5), 489.
Keil, A., Bradley, M. M., Hauk, O., Rockstroh, B., Elbert, T., & Lang, P. J. (2002). Large‐scale neural correlates of affective picture processing.Psychophysiology, 39(5), 641-649.

International Journal of Economics, Commerce and Management, United Kingdom
Licensed under Creative Common Page 15
Kenny, D. A., Kashy, D. A., & Bolger, N. (1998). Data analysis in social psychology. The handbook of social psychology, 1(4), 233-265.
Kock, N. (2011). Using WarpPLS in e-collaboration studies: Mediating effects, control and second order variables, and algorithm choices. International Journal of e-Collaboration (IJeC), 7(3), 1-13.
Kock, N., & Lynn, G. S. (2012). Lateral collinearity and misleading results in variance-based SEM: An illustration and recommendations. Journal of the Association for Information Systems, 13(7), 546-580.
Little, R. E. (1977). Moderate alcohol use during pregnancy and decreased infant birth weight. American Journal of Public Health, 67(12), 1154-1156.
MacKinnon, D. P., Fairchild, A. J., & Fritz, M. S. (2007). Mediation analysis.Annual review of psychology, 58, 593.
Mooi, E., &Sarstedt, M. (2011). A concise guide to market research: The process, data, and methods using IBM SPSS statistics. Springer.
Nunally, J. C., & Bernstein, I. H. (1978). Psychometric theory.
Nunnally, J. C., & Bernstein, I. H. (1994). Psychometric Theory (3) McGraw-Hill.New York.
Ringle, C. M., Wende, S., & Will, A. (2005). SmartPLS 2.0 (beta).
Sarstedt, M., Henseler, J., &Ringle, C. M. (2011). Multigroup analysis in partial least squares (PLS) path modeling: Alternative methods and empirical results.Advances in International Marketing, 22, 195-218.
Sarstedt, M., Ringle, C. M., Henseler, J., & Hair, J. F. (2014). On the emancipation of PLS-SEM: A commentary on Rigdon (2012). Long Range Planning, 47(3), 154-160.
Steenkamp, J. B. E., & Baumgartner, H. (1998). Assessing measurement invariance in cross-national consumer research. Journal of consumer research,25(1), 78-107.
Suzuki, S., &Rancer, A. S. (1994). Argumentativeness and verbal aggressiveness: Testing for conceptual and measurement equivalence across cultures. Communications Monographs, 61(3), 256-279.
Tellis, G. J., &Fornell, C. (1988). The relationship between advertising and product quality over the product life cycle: A contingency theory. Journal of Marketing Research, 64-71.
Wilson, B., &Henseler, J. (2007, December). Modeling reflective higher-order constructs using three approaches with PLS path modeling: a Monte Carlo comparison. In Australian and New Zealand Marketing Academy Conference (pp. 791-800).


![[mga-nvr ru]-ces-5 0](https://static.fdokumen.com/doc/165x107/631c012dd5372c006e043975/mga-nvr-ru-ces-5-0.jpg)