Bayesian Fusion for Indoor Positioning Using Bluetooth Fingerprints
Upload
independentCategory
view
5download
0
A Novel Non-Stochastic Quadratic Fingerprints-based Approach for the “in silico”
Discovery of New Antitrypanosomal Compounds.
Alina Montero-Torres,1* María Celeste Vega,2 Yovani Marrero-Ponce,1,3 Miriam Rolón,2
Alicia Gómez-Barrio,2 José Antonio Escario,2 Vicente J. Arán,4 Antonio R. Martínez-
Fernández,2 Alfredo Meneses-Marcel.5
1 Department of Synthesis and Drug Design, Chemical Bioactive Center. Central University of
Las Villas, Santa Clara, 54830, Villa Clara, Cuba. 2 Department of Parasitology, Faculty of Pharmacy, UCM, 28040, Madrid, Spain. 3 Department of Pharmacy, Faculty of Chemistry and Pharmacy. Central University of Las
Villas, Santa Clara, 54830, Villa Clara, Cuba. 4 Institute of Medicinal Chemistry, CSIC, 28006, Madrid, Spain. 5 Department of Parasitology, Chemical Bioactive Center. Central University of Las Villas,
Santa Clara, 54830, Villa Clara, Cuba. *e-mail: [email protected] or [email protected]
Abstract
A Non-Stochastic Quadratic Fingerprints-based approach is introduced to classify and design, in a rational way, new antitrypanosomal compounds. A data set of 153 organic-chemicals; 62 with antitrypanosomal activity and 91 having other clinical uses, was processed by a k-means cluster analysis in order to design training and predicting data sets. Afterwards, a linear classification function was derived allowing the discrimination between active and inactive compounds. The model classifies correctly more than 93% of chemicals in both training and external prediction groups. The predictability of this discriminant function was also assessed by a leave-group-out experiment, in which 10% of the compounds were removed at random at each time and their activity a posteriori predicted. Also a comparison with models generated using four well-known families of 2D molecular descriptors was carried out. As an experiment of virtual lead generation, the present TOMOCOMD approach was finally satisfactorily applied on the virtual evaluation of ten already synthesized compounds. The in vitro antitrypanosomal activity of this series against epimastigotes forms of T. cruzi was assayed. The model was able to predict correctly the behaviour of these compounds in 90% of the cases.
Keywords: Antitrypanosomal Compounds, Chagas’Disease, LDA-based-QSAR-Model, Non-Stochastic Quadratic Indices, QSAR, TOMOCOMD Software.
1. Introduction
Once an almost exclusively rural disease in Latin America, Chagas’ disease, is now
undergoing a change in its epidemiological profile due to rising levels of urbanization and
migration. Latest data from de WHO indicates that over 24 million peoples are infected or at
least serologically positive for Trypanosoma cruzi, which is the causative agent of such
infection. This quantity roughly represents 8% of the total Latin America population. Another
factor, blood transfusion is considered the second most frequent route of transmission in
endemic countries, given parasites may survive in whole blood stored for more than 21 days at
4º C and detection techniques are not always strictly applied.1
Medication for Chagas’ disease is usually effective when it is given during the acute stage of
infection. No medication has been proven to be effective once the disease has progressed to
later stages. Moreover, synthetic drugs such as nifurtimox and benznidazole have severe side
effects, including cardiac and/or renal toxicity. This explains the need for discovering new
effective chemotherapeutic and chemoprophylactic agents against T. cruzi.2,3 In this sense,
medicinal chemists are called to find new effective drugs in a fast and non-expensive way. In
the last decades computer-aided drug design approaches have emerged as promising tools to
be used to solve this problematic. 4-10 With the use of such design strategies it is possible the
handling and screening of large databases in order to find reduced sets of potential new drug
candidates.11,12 Thus, the development of computational approaches based on discrimination
functions plays an important role, allowing the identification from large chemical libraries of
structural subsystems responsible for a property or biological activity, and in this way, the
classification of active compounds from inactive ones.
In this context, our research group has recently developed a novel scheme to generate
molecular fingerprints based on the application of discrete mathematics and linear algebra
theory, which permits to perform rational in silico molecular design (selection/identification)
and QSAR/QSPR studies. Known as TOMOCOMD (acronym of TOpological MOlecular
COMputer Design),13-16 this approach has been successfully applied to the prediction of
several physical, physicochemical, chemical, pharmacokinetical as well as biological
properties.17-19 It was, for instance, successfully used on the virtual screening of novel
antihelminthic compounds, which were then synthesized and in vivo evaluated on Fasciola
hepatica.20,21 Other studies for the rational discovery of novel paramphistomicides, 22
antimalarial 23 and antibacterial 24 compounds were also conducted with the TOMOCOMD
approach. This method has been extended to consider three-dimensional features of
small/medium-sized molecules upon the base of the application of a trigonometric 3D-
chirality correction factor.25
In the present study, TOMOCOMD strategy is used to find a classification model which
allows discriminating antitrypanosomal compounds from inactive ones. It is also an objective
of the present work to assess the model robustness and predictive power by using external and
internal cross-validation techniques. The in silico evaluation of ten new heterocyclic
compounds is finally performed, and their in vitro antitrypanosomal activity against
epimastigotes forms of T. cruzi investigated. The results of the current study are presented as
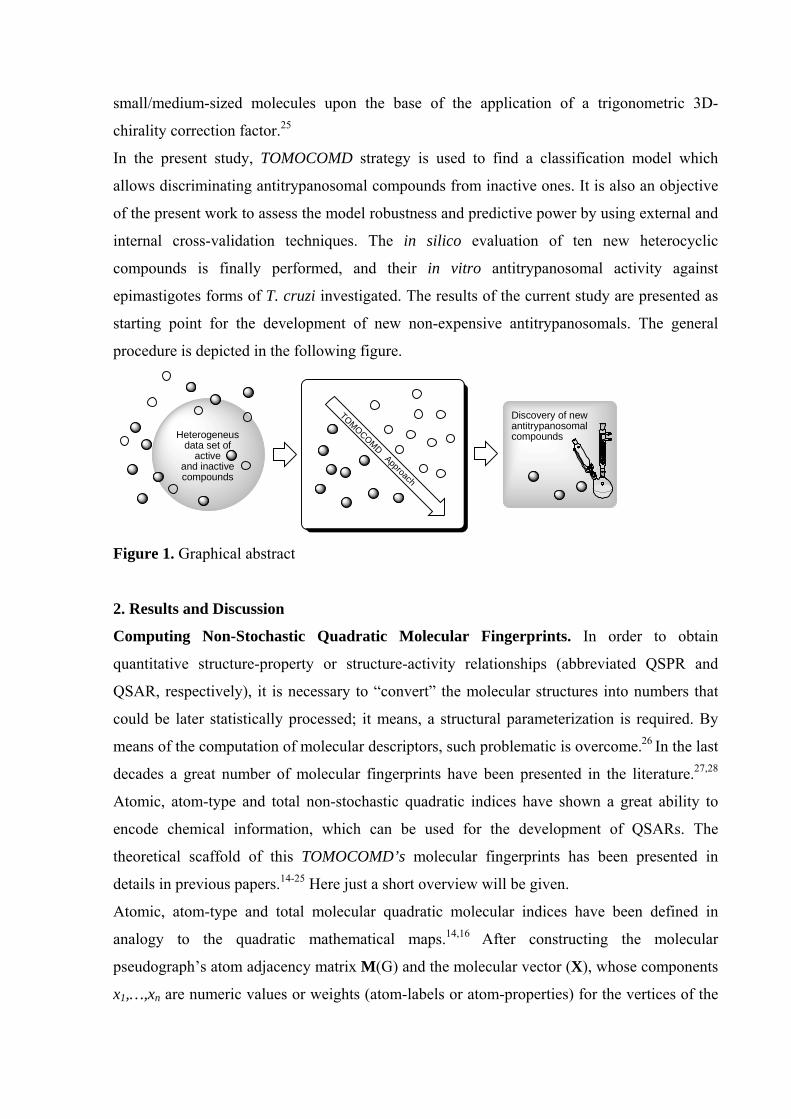
starting point for the development of new non-expensive antitrypanosomals. The general
procedure is depicted in the following figure.
TOMOCOMD Approach
Heterogeneus data set of
active and inactive compounds
Discovery of new antitrypanosomal compounds
Figure 1. Graphical abstract
2. Results and Discussion
Computing Non-Stochastic Quadratic Molecular Fingerprints. In order to obtain
quantitative structure-property or structure-activity relationships (abbreviated QSPR and
QSAR, respectively), it is necessary to “convert” the molecular structures into numbers that
could be later statistically processed; it means, a structural parameterization is required. By
means of the computation of molecular descriptors, such problematic is overcome.26 In the last
decades a great number of molecular fingerprints have been presented in the literature.27,28
Atomic, atom-type and total non-stochastic quadratic indices have shown a great ability to
encode chemical information, which can be used for the development of QSARs. The
theoretical scaffold of this TOMOCOMD’s molecular fingerprints has been presented in
details in previous papers.14-25 Here just a short overview will be given.
Atomic, atom-type and total molecular quadratic molecular indices have been defined in
analogy to the quadratic mathematical maps.14,16 After constructing the molecular
pseudograph’s atom adjacency matrix M(G) and the molecular vector (X), whose components
x1,…,xn are numeric values or weights (atom-labels or atom-properties) for the vertices of the
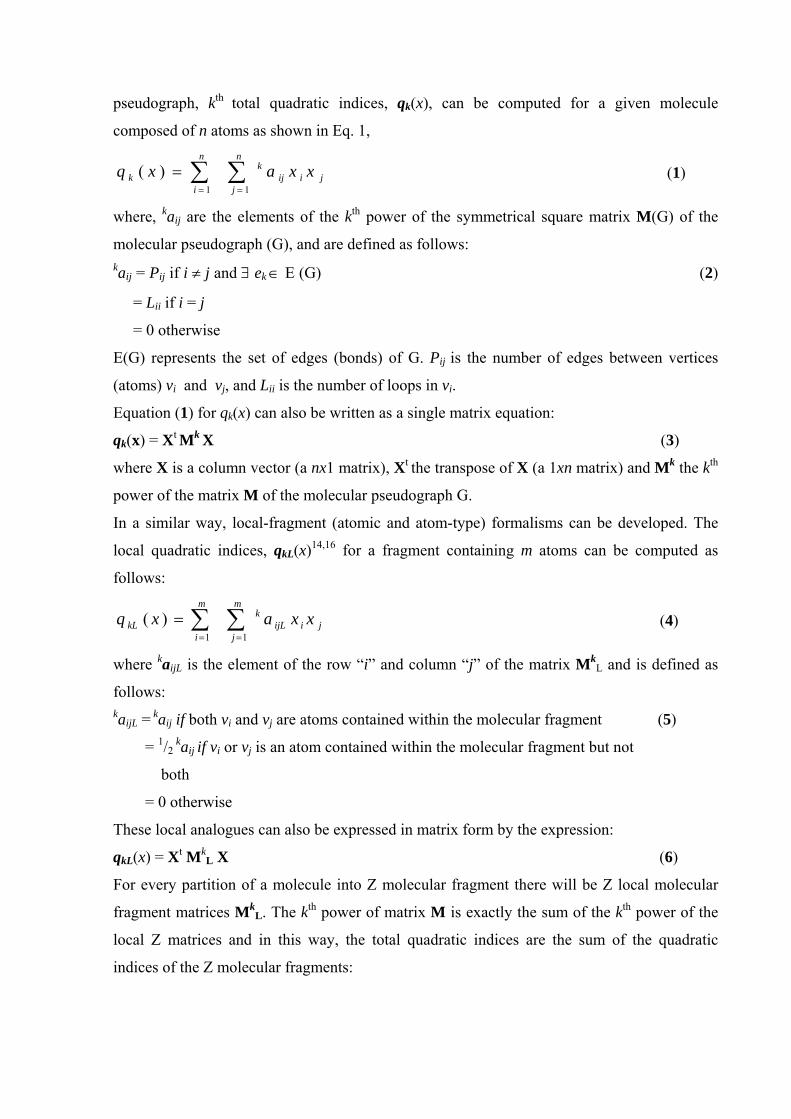
pseudograph, kth total quadratic indices, qk(x), can be computed for a given molecule
composed of n atoms as shown in Eq. 1,
∑∑==
=n
jjiij
kn
ik xxaxq
11
)( (1)
where, kaij are the elements of the kth power of the symmetrical square matrix M(G) of the
molecular pseudograph (G), and are defined as follows: kaij = Pij if i ≠ j and ∃ ek ∈ E (G) (2)
= Lii if i = j
= 0 otherwise
E(G) represents the set of edges (bonds) of G. Pij is the number of edges between vertices
(atoms) vi and vj, and Lii is the number of loops in vi.
Equation (1) for qk(x) can also be written as a single matrix equation:
qk(x) = Xt Mk X (3)
where X is a column vector (a nx1 matrix), Xt the transpose of X (a 1xn matrix) and Mk the kth
power of the matrix M of the molecular pseudograph G.
In a similar way, local-fragment (atomic and atom-type) formalisms can be developed. The
local quadratic indices, qkL(x)14,16 for a fragment containing m atoms can be computed as
follows:
∑∑==
=m
jjiijL
km
ikL xxaxq
11)( (4)
where kaijL is the element of the row “i” and column “j” of the matrix MkL and is defined as
follows: kaijL = kaij if both vi and vj are atoms contained within the molecular fragment (5)
= 1/2 kaij if vi or vj is an atom contained within the molecular fragment but not
both
= 0 otherwise
These local analogues can also be expressed in matrix form by the expression:
qkL(x) = Xt MkL X (6)
For every partition of a molecule into Z molecular fragment there will be Z local molecular
fragment matrices MkL. The kth power of matrix M is exactly the sum of the kth power of the
local Z matrices and in this way, the total quadratic indices are the sum of the quadratic
indices of the Z molecular fragments:
qk(x) = (7) )(1
xqZ
LkL∑
=
Atom and atom-type quadratic fingerprints are specific cases of local quadratic indices. In the
atom-type quadratic indices formalism, each atom in the molecule is classified into an atom-
type (fragment), such as heteroatoms, hydrogen bonding (H-bonding) to heteroatoms (O, N
and S), halogen atoms, etc. For all data sets, considering those with a common molecular
scaffold as well as those with diverse ones, the kth atom-type quadratic indices have
demonstrated to enclose important structural information.
In the current work, the kth total quadratic indices [qk(x) and qkH(x)] and the kth local ones
(atom-type = heteroatoms: S, N, O) [qkL(xE) and qkLH(xE)] not considering and considering H-
atoms respectively were computed.
Training and test sets design. In order to obtain mathematical expressions capable of
discriminating between active and inactive compounds, the chemical information contained in
a great number of compounds with and without the desired biological activity must be
statistically processed. Taking into account that the most critical aspect on the construction of
a training data set is the molecular diversity of the included compounds, we selected a group
of 153 organic chemicals having as much structural variability as possible. The
antitrypanosomals considered on this study are representatives of families with diverse
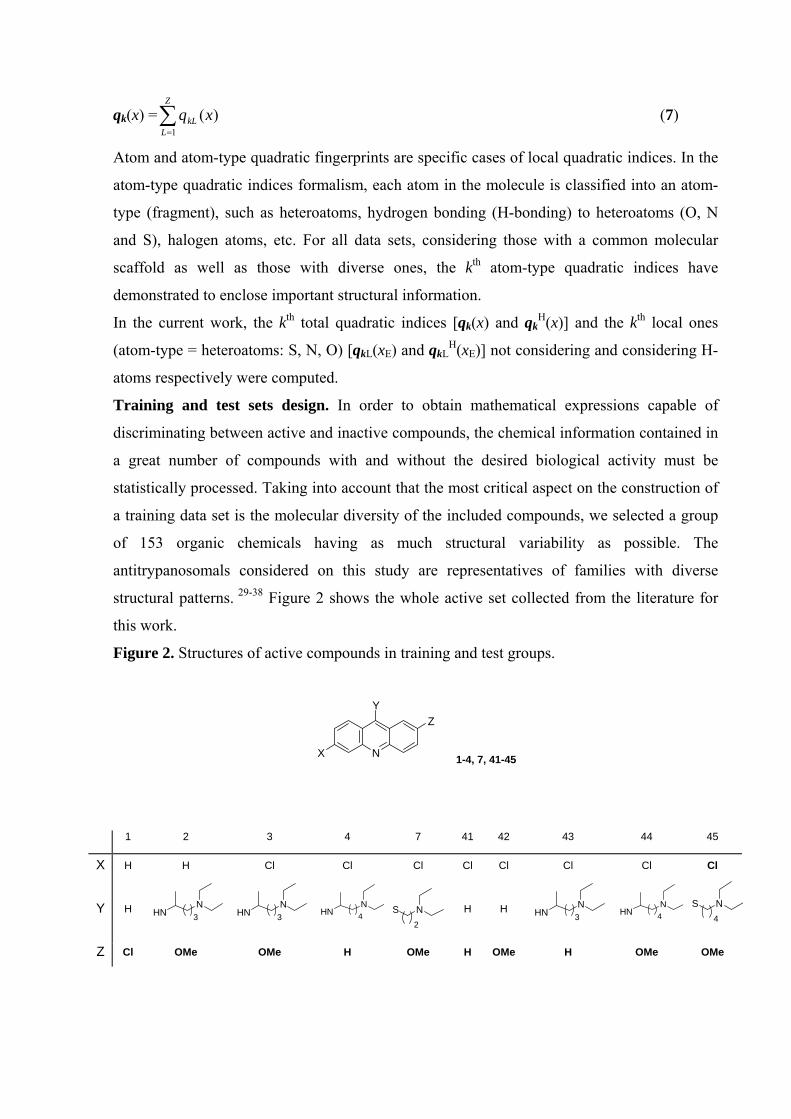
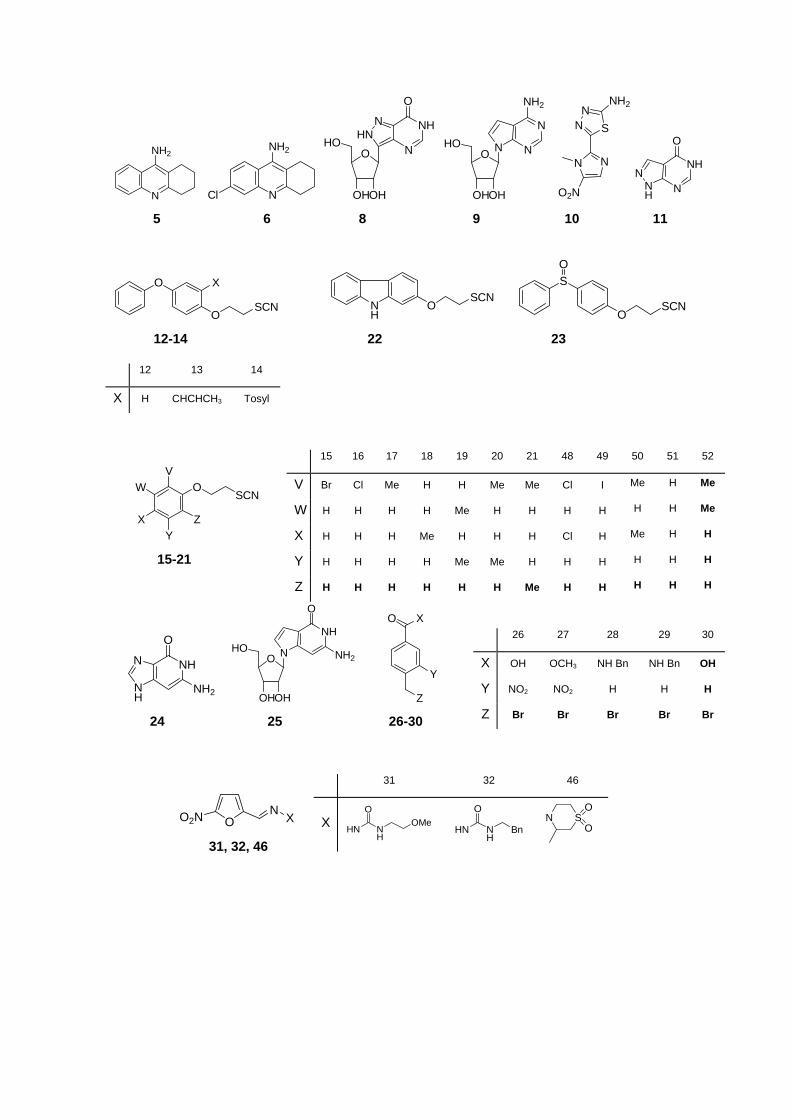
structural patterns. 29-38 Figure 2 shows the whole active set collected from the literature for
this work.
Figure 2. Structures of active compounds in training and test groups.
N
Y
X
Z
1-4, 7, 41-45
1 2 3 4 7 41 42 43 44 45
X H H Cl Cl Cl Cl Cl Cl Cl Cl
Y H NHN 3
NHN 3
NHN 4
NS2
H H NHN 3
NHN 4
NS4
Z Cl OMe OMe H OMe H OMe H OMe OMe
N
NH2
N
NH2
Cl
OHO
OHOH
NHN
N
NH
O
N N
N
NH2
OHO
OHOH
NN
SN
N
O2N
NH2
NH
NN
NH
O
5 6 8 9 10 11
O
OSCN
X
O
SCNNH
S
OSCN
O
12-14 22 23
12 13 14
X H CHCHCH3 Tosyl
OSCN
V
XY
Z
W
15-21
NH
N NH
O
NH2
OHO
OHOH
N
NH
O
NH2
XO
Y
Z
15 16 17 18 19 20 21 48 49 50 51 52
V Br Cl Me H H Me Me Cl I Me H Me
W H H H H Me H H H H H H Me
X H H H Me H H H Cl H Me H H
Y H H H H Me Me H H H H H H
Z H H H H H H Me H H H H H
26 27 28 29 30
X OH OCH3 NH Bn NH Bn OH
Y NO2 NO2 H H H
Z Br Br Br Br Br 24 25 26-30
OO2N N X 31, 32, 46
31 32 46
X HN NH
OOMe
HN N
HBn
O
SNO
O
CF3
O
NH+
OMe
33
NNH
NH2
S
X
YZ
34, 35, 58
34 35 58
X Br CF3 Cl
Y H H Cl
Z H CF3 H
NN NH2
S
Y
Y
X N N
Y
X
37, 38, 59-61 38-40, 62
36 37 59 60 61 38 39 40 62
X Me Me Me H H X H H H CN
Y Cl CF3 Br Cl CF3 Y OMel H NO2 OMe
Z Cl H H Cl H
NN
NH
NO2O
HN
OSCN
O
ONH
O
47 53 54
NH
NNH
O
NH2 N
N
S
NNO2N
NH
N
OH
OH
N
N
ONH2
H2N 55 56 57
The selected inactive group included antivirals, sedative/hypnotics, diuretics,
anticonvulsivants, hemostatics, oral hypoglycemics, antihypertensives, antihelminthics,
anticancer compounds as well as some other kinds of drugs, guaranteeing at the same time a
great structural variability.39
In order to split the whole group into two data sets (training and predicting ones), two k-
MCA40,41 were performed for antitrypanosomal and inactive compounds respectively. In this
sense, a partition of either active or inactive series of chemicals in several statistically
representative classes of compounds is performed. This process ensures that any chemical
class identified by the k-MCA will be represented in both, training and test sets.
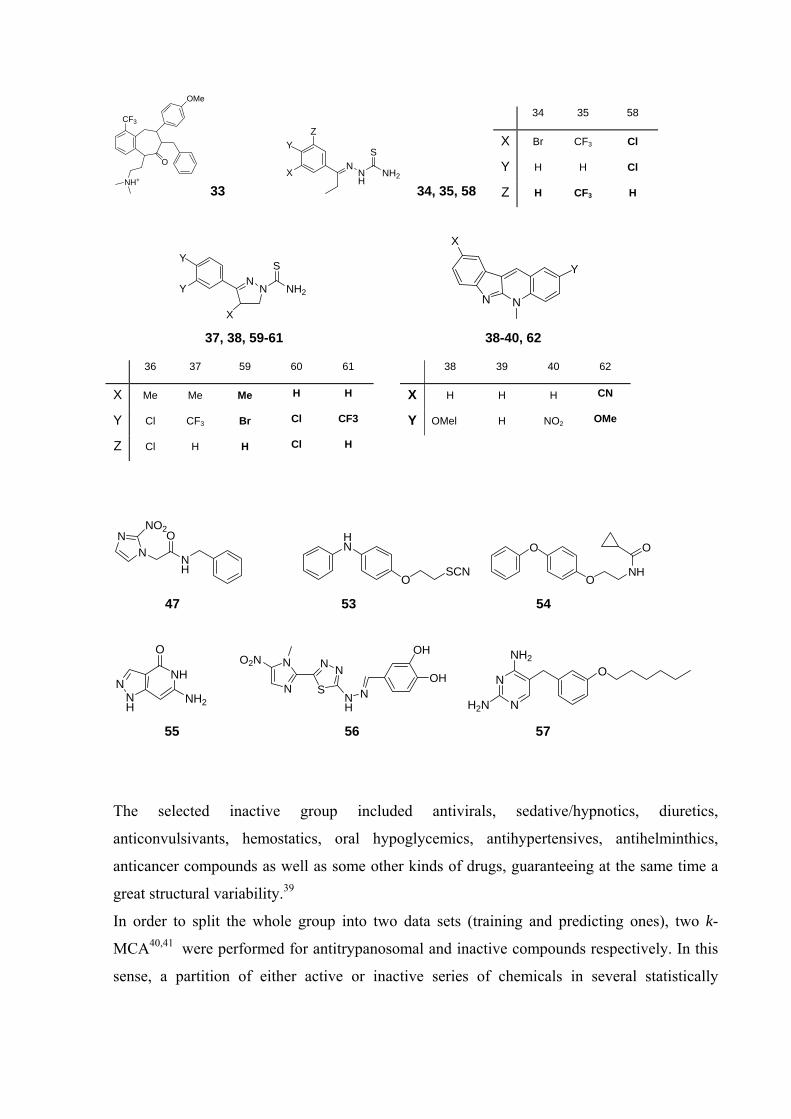
A first k-MCA (I) split antitrypanosomals in 6 clusters with 12, 3, 2, 13, 13 and 19 members.
The inactive compound series was also partitioned by a second k-MCA (II) into 6 clusters
with 17, 12, 14, 19, 18 and 11 compounds in each one.
Afterwards, the selection of the training and prediction sets was performed taking compounds
belonging to each cluster at random. From these 153 chemicals, 101 were chosen to form the
training set, being 40 of them actives and 61 inactive ones. The remaining group composed of
20 antitrypanosomals and 32 compounds with other different biological properties were
prepared as test sets for the external model validation process. These 52 compounds were not
used in the development of the classification model. Figure 3 graphically illustrates the above-
described procedure.
Figure 3. Training and test data sets design throughout k-means cluster analysis.
Cluster 1 Cluster 2 ... Cluster 6
Active Compounds(40)
Active Compounds(22)
Cluster 1 Cluster 2 ... Cluster 6
Inactive Compounds(61)
Inactive Compounds(30)
Test Data Set
(52)
Training Data Set
(101)
Antitrypanosomal Compounds Inactive Compounds
k-MCA I k-MCA II
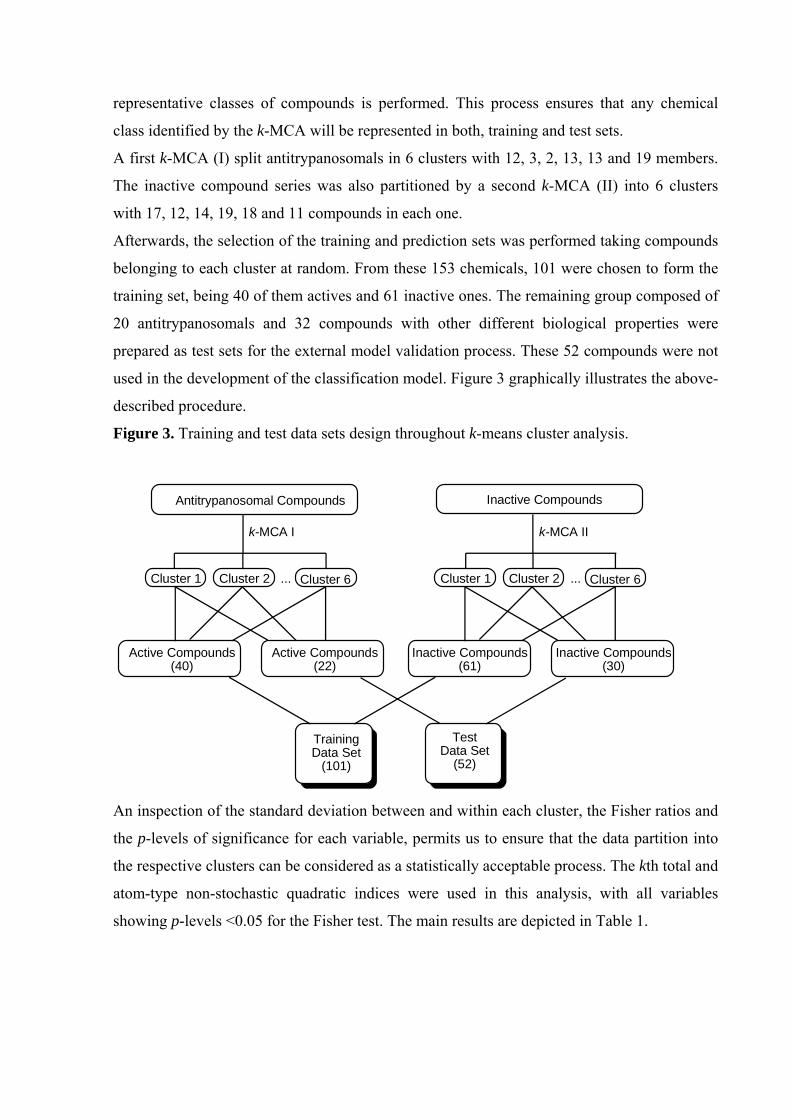
An inspection of the standard deviation between and within each cluster, the Fisher ratios and
the p-levels of significance for each variable, permits us to ensure that the data partition into
the respective clusters can be considered as a statistically acceptable process. The kth total and
atom-type non-stochastic quadratic indices were used in this analysis, with all variables
showing p-levels <0.05 for the Fisher test. The main results are depicted in Table 1.
Table 1. Main results of the k-means cluster analysis, for antitrypanosomal and inactive
compounds.
Analysis of Variance
Total and atom-type quadratic indices
Between SSa
Within SSb
Fisher ratio (F)
p-levelc
Antitrypanosomal agents clusters (k-MCA I) q6(x) 29.27 3.03 108.10 0.00 q7(x) 32.78 3.25 112.91 0.00 q8(x) 35.06 3.34 117.24 0.00 q9(x) 38.80 4.01 108.24 0.00 q10(x) 41.12 4.37 105.37 0.00 q13L(xE) 21.07 4.90 48.10 0.00 q14L(xE) 19.53 4.81 45.38 0.00 q15L(xE) 21.38 4.60 51.96 0.00 q4
H(x) 27.35 6.92 44.23 0.00 q8
H(x) 34.81 3.82 102.06 0.00 q9
H(x) 37.28 3.60 115.76 0.00 q10
H(x) 39.06 3.47 126.07 0.00 q11
H(x) 41.68 3.52 132.52 0.00 q12
H(x) 43.61 3.58 136.16 0.00 Non-antitrypanosomal agents clusters (k-MCA II)
q6(x) 60.14 9.33 109.57 0.00 q7(x) 53.57 9.60 94.82 0.00 q8(x) 56.86 9.70 99.64 0.00 q9(x) 52.16 10.34 85.73 0.00 q10(x) 55.78 10.44 90.76 0.00 q13L(xE) 121.32 11.01 187.23 0.00 q14L(xE) 126.71 10.94 196.72 0.00 q15L(xE) 123.22 14.02 149.32 0.00 q4
H(x) 77.20 16.76 78.27 0.00 q8
H(x) 58.04 11.25 87.66 0.00 q9
H(x) 53.15 11.47 78.74 0.00 q10
H(x) 52.98 11.46 78.57 0.00 q11
H(x) 49.55 11.96 70.39 0.00 q12
H(x) 50.01 12.18 69.75 0.00 aVariability between groups. bVariability within groups. cLevel of significance.
In this sense, it can be concluded that the data set of antitrypanosomal compounds considered
for this study encloses compounds of six general structural patterns codified by TOMOCOMD
descriptors and recognized by a k-means cluster analysis.
Developing a Discriminant Function. Linear discriminant analysis (LDA) has become an
important tool for the prediction of chemicals properties. On the basis of the simplicity of this
method many useful discriminant models have been developed and presented by different
authors in the literature.7-10 Being the election technique used on the generation of the
TOMOCOMD approaches reported to date,20-24 LDA was also employed in the current work
to generate a discriminant function. The principle of parsimony (Occam's razor) was taken
into account as strategy for model selection.42 It means, that we select the model with higher
statistical signification but having as few parameters (ak) as possible.
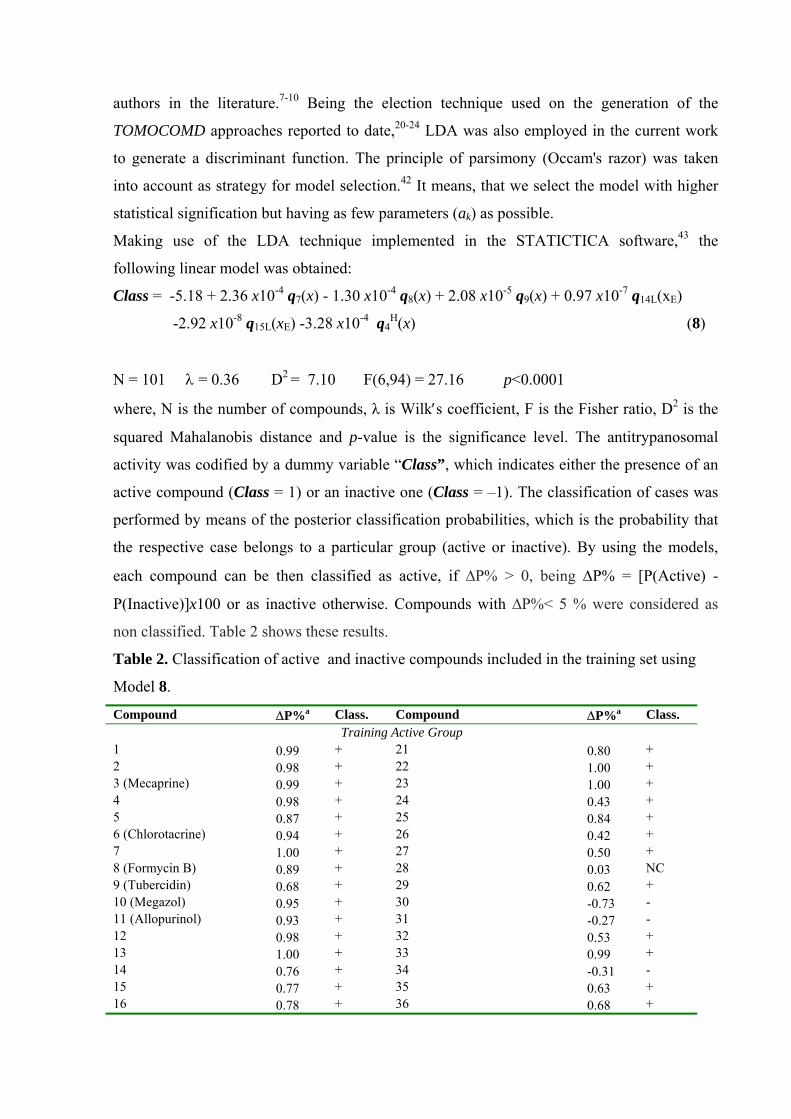
Making use of the LDA technique implemented in the STATICTICA software,43 the
following linear model was obtained:
Class = -5.18 + 2.36 x10⁻⁴ q7(x) - 1.30 x10⁻⁴ q8(x) + 2.08 x10⁻⁵ q9(x) + 0.97 x10⁻⁷ q14L(xE)
-2.92 x10⁻⁸ q15L(xE) -3.28 x10⁻⁴ q4H(x) (8)
N = 101 λ = 0.36 D2 = 7.10 F(6,94) = 27.16 p<0.0001
where, N is the number of compounds, λ is Wilk′s coefficient, F is the Fisher ratio, D2 is the
squared Mahalanobis distance and p-value is the significance level. The antitrypanosomal
activity was codified by a dummy variable “Class”, which indicates either the presence of an
active compound (Class = 1) or an inactive one (Class = –1). The classification of cases was
performed by means of the posterior classification probabilities, which is the probability that
the respective case belongs to a particular group (active or inactive). By using the models,
each compound can be then classified as active, if ∆P% > 0, being ∆P% = [P(Active) -
P(Inactive)]x100 or as inactive otherwise. Compounds with ∆P%< 5 % were considered as
non classified. Table 2 shows these results.
Table 2. Classification of active and inactive compounds included in the training set using
Model 8.
Compound ∆P%a Class. Compound ∆P%a Class. Training Active Group
1 0.99 + 21 0.80 + 2 0.98 + 22 1.00 + 3 (Mecaprine) 0.99 + 23 1.00 + 4 0.98 + 24 0.43 + 5 0.87 + 25 0.84 + 6 (Chlorotacrine) 0.94 + 26 0.42 + 7 1.00 + 27 0.50 + 8 (Formycin B) 0.89 + 28 0.03 NC 9 (Tubercidin) 0.68 + 29 0.62 + 10 (Megazol) 0.95 + 30 -0.73 - 11 (Allopurinol) 0.93 + 31 -0.27 - 12 0.98 + 32 0.53 + 13 1.00 + 33 0.99 + 14 0.76 + 34 -0.31 - 15 0.77 + 35 0.63 + 16 0.78 + 36 0.68 +
17 0.65 + 37 0.52 + 18 0.60 + 38 1.00 + 19 0.75 + 39 1.00 + 20 0.77 + 40 1.00 +
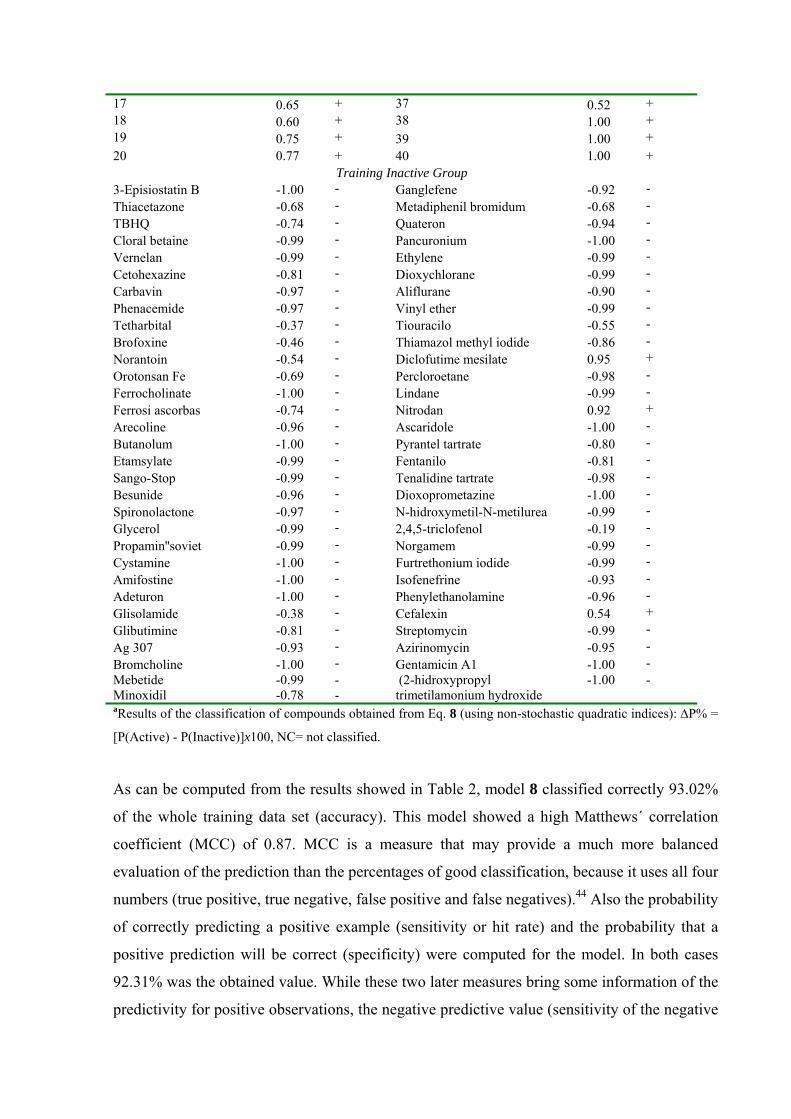
Training Inactive Group 3-Episiostatin B -1.00 - Ganglefene -0.92 - Thiacetazone -0.68 - Metadiphenil bromidum -0.68 - TBHQ -0.74 - Quateron -0.94 - Cloral betaine -0.99 - Pancuronium -1.00 - Vernelan -0.99 - Ethylene -0.99 - Cetohexazine -0.81 - Dioxychlorane -0.99 - Carbavin -0.97 - Aliflurane -0.90 - Phenacemide -0.97 - Vinyl ether -0.99 - Tetharbital -0.37 - Tiouracilo -0.55 - Brofoxine -0.46 - Thiamazol methyl iodide -0.86 - Norantoin -0.54 - Diclofutime mesilate 0.95 + Orotonsan Fe -0.69 - Percloroetane -0.98 - Ferrocholinate -1.00 - Lindane -0.99 - Ferrosi ascorbas -0.74 - Nitrodan 0.92 + Arecoline -0.96 - Ascaridole -1.00 - Butanolum -1.00 - Pyrantel tartrate -0.80 - Etamsylate -0.99 - Fentanilo -0.81 - Sango-Stop -0.99 - Tenalidine tartrate -0.98 - Besunide -0.96 - Dioxoprometazine -1.00 - Spironolactone -0.97 - N-hidroxymetil-N-metilurea -0.99 - Glycerol -0.99 - 2,4,5-triclofenol -0.19 - Propamin''soviet -0.99 - Norgamem -0.99 - Cystamine -1.00 - Furtrethonium iodide -0.99 - Amifostine -1.00 - Isofenefrine -0.93 - Adeturon -1.00 - Phenylethanolamine -0.96 - Glisolamide -0.38 - Cefalexin 0.54 + Glibutimine -0.81 - Streptomycin -0.99 - Ag 307 -0.93 - Azirinomycin -0.95 - Bromcholine -1.00 - Gentamicin A1 -1.00 - Mebetide Minoxidil
-0.99 -0.78
- -
(2-hidroxypropyl trimetilamonium hydroxide
-1.00 -
aResults of the classification of compounds obtained from Eq. 8 (using non-stochastic quadratic indices): ∆P% =
[P(Active) - P(Inactive)]x100, NC= not classified.
As can be computed from the results showed in Table 2, model 8 classified correctly 93.02%
of the whole training data set (accuracy). This model showed a high Matthews´ correlation
coefficient (MCC) of 0.87. MCC is a measure that may provide a much more balanced
evaluation of the prediction than the percentages of good classification, because it uses all four
numbers (true positive, true negative, false positive and false negatives).44 Also the probability
of correctly predicting a positive example (sensitivity or hit rate) and the probability that a
positive prediction will be correct (specificity) were computed for the model. In both cases
92.31% was the obtained value. While these two later measures bring some information of the
predictivity for positive observations, the negative predictive value (sensitivity of the negative
category) gives a criterion of good classification for the inactive group. In this case a 95.08%
was observed.44 These results, as well as the “false positive rate” (false alarm rate) are
depicted in Table 3.
Every statistical model which is generated based on a previously selected data set of
observations, includes information of just a portion of the universe and has an error range,
which the researcher tries to minimize during the modeling process. In this sense, the false
positive rate, as well as the false negative rate, are used as measures of the error range and the
confiability of the model. A correct selection of a training data sets can reduce the magnitude
of both measures. We took this aspect into consideration and built a training data set choosing
chemicals with so much structural variability as possible. Despite of the previous precaution,
it can happen that the combination of some structural paterns of a positive case, for instance,
results in mathematical values wich are closer to those obtained from the combination of
structural fragments in a negative observation. In such a case the model will not recognize the
true class of the observation. In the present study, three active and three inactive compounds
were missclasified. Here it is also important to note, that the declaration of each non-
antitrypanosomal compound as “inactive” does not mean that there not exist antitrypanosomal
side-effects, given it can include organic drugs for which antitrypanosomal activity has been
left undetected so far. In this sense, any discriminant model can be continuously transformed
and improved, taking into consideration unavailable information at the time of the model’s
development. This problem can affect in some degree the results of further classification. Just
testing the biological activity of them it is possible to ensure the absence of antitrypanosomal
effects. In this sense, we can recommend carrying out the biological assays for previously
declared “inactive” compounds, for which the model give a positive classification.
Considering that a discriminant model could be accepted or rejected depending on its
predictive power, it is clear to see that validation processes constitute obligated steps for the
assessment of any structure-activity relationship. As Golbraikh and Tropsha emphasized, the
predictive ability of a QSAR model can only be estimated using an external test set of
compounds which were never used for the development of the model.45 In this sense, it is
important to secure, that the prediction algorithm is able to perform well on novel data from
the same data domain. In our case, as first validation experiment, an external prediction data
set was evaluated. The computation of some performance measures such as Matthews
correlation coefficient, percentage of global good classification (accuracy), sensitivity,
specificity, false alarm rate and negative predictive value (sensitivity of the negative category)
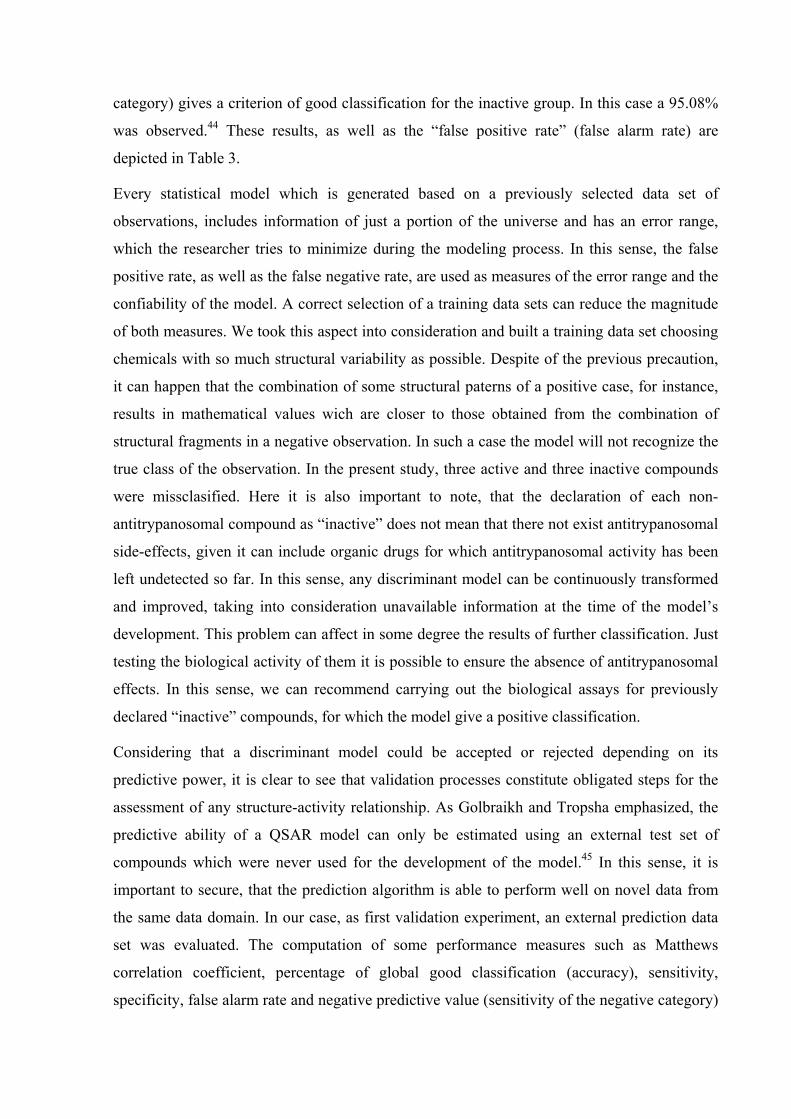
permitted us to carry out the assessment of the model. In Table 3 are also depicted the results
for this validation process.
Table 3. Overall measures of accuracy obtained in the training and prediction sets for the
model 7.
Matthews Corr.
Coefficient
Accuracy
(%)
Sensitivity
(hit rate%)
Specificity
(%)
False alarm
rate (%)
Predictive
value (-) (%)
Training set 0.87 93.06 92.31 92.31 4.92 95.08
Test set 0.88 94.23 90.91 95.24 3.33 96.67
The classification’s results using model 8 for active and inactive compounds in the selected
test set are shown in Table 4.
Table 4. Classification of active and inactive compounds included in test series using the
model 8.
Compound ∆P%a Class. Compound ∆P%a Class. Test Active Set
41 1.00 + 52 0.79 + 42 1.00 + 53 0.97 + 43 0.98 + 54 -0.07 - 44 0.99 + 55 0.99 + 45 0.99 + 56 (Brazilizone A) 1.00 + 46 (Nifurtimox) -0.95 - 57 0.58 + 47 (Benznidazol) 0.42 + 58 0.22 + 48 0.91 + 59 0.29 + 49 0.76 + 60 0.59 + 50 0.77 + 61 0.41 + 51 0.43 + 62 1.00 +
Test Inactive Set Amantadine -1.00 - Cyclopropane -0.99 - Mizoribine -0.16 - Basedol -0.95 - Triclofos -1.00 - Mipimazole -0.99 - Nitroinosite -0.92 - Didym levulinate -1.00 - Methenamine -0.99 - Metriponate -1.00 - Cobalti glutamas -1.00 - Prasterone -0.98 - Cobalti besilas -1.00 - Febensamin -1.00 - Canrenone -0.92 - Guanazole -0.99 - Urea -1.00 - Fluorembichin -1.00 - Pallirad -0.99 - Mitoguazone -0.99 - Quimbosan -0.99 - Acetylcholine -1.00 - Glicondamide 0.65 + Methacholine chloride -1.00 - RMI 11894 -1.00 - Dopamine -0.78 - Barbismetylii iodidum -0.59 - Ampicillin -0.42 - Frigen 113 -0.98 - Kanamycin A -1.00 - aResults of the classification of compounds obtained from Eq. 8 (using non-stochastic quadratic indices): ∆P% =
[P(Active) - P(Inactive)]x100, NC= not classified.
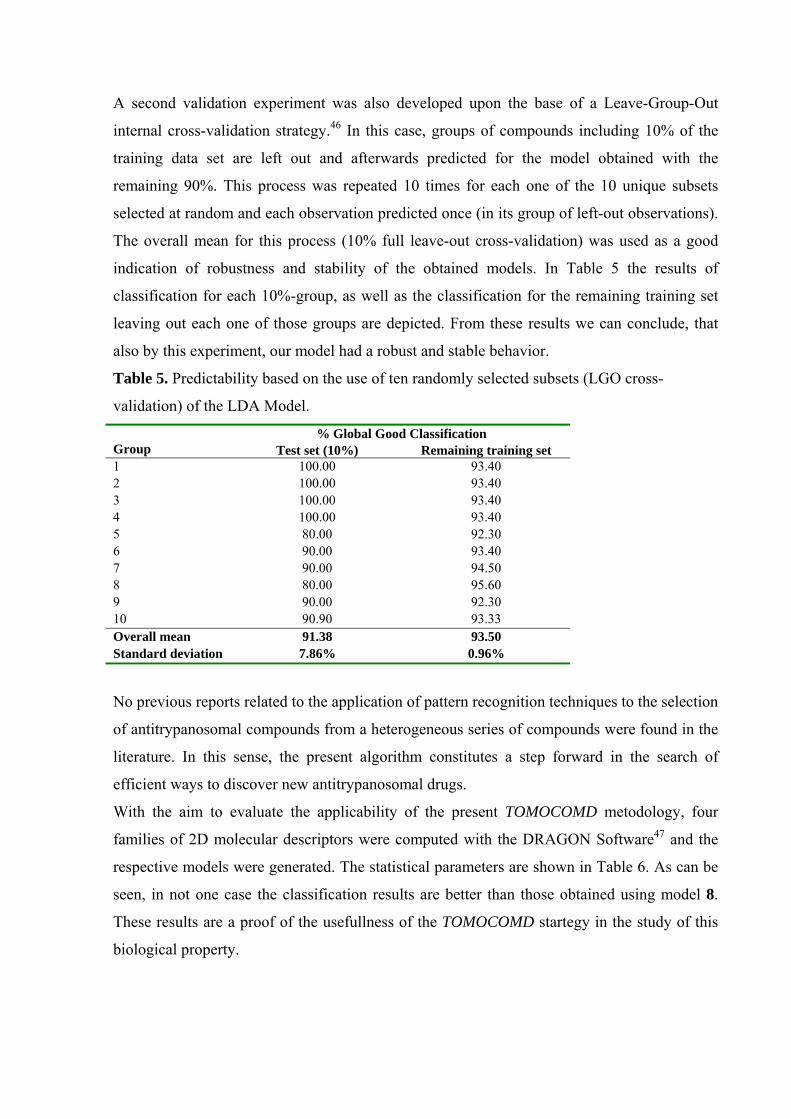
A second validation experiment was also developed upon the base of a Leave-Group-Out
internal cross-validation strategy.46 In this case, groups of compounds including 10% of the
training data set are left out and afterwards predicted for the model obtained with the
remaining 90%. This process was repeated 10 times for each one of the 10 unique subsets
selected at random and each observation predicted once (in its group of left-out observations).
The overall mean for this process (10% full leave-out cross-validation) was used as a good
indication of robustness and stability of the obtained models. In Table 5 the results of
classification for each 10%-group, as well as the classification for the remaining training set
leaving out each one of those groups are depicted. From these results we can conclude, that
also by this experiment, our model had a robust and stable behavior.
Table 5. Predictability based on the use of ten randomly selected subsets (LGO cross-
validation) of the LDA Model.
% Global Good Classification Group Test set (10%) Remaining training set 1 100.00 93.40 2 100.00 93.40 3 100.00 93.40 4 100.00 93.40 5 80.00 92.30 6 90.00 93.40 7 90.00 94.50 8 80.00 95.60 9 90.00 92.30 10 90.90 93.33 Overall mean 91.38 93.50 Standard deviation 7.86% 0.96%
No previous reports related to the application of pattern recognition techniques to the selection
of antitrypanosomal compounds from a heterogeneous series of compounds were found in the
literature. In this sense, the present algorithm constitutes a step forward in the search of
efficient ways to discover new antitrypanosomal drugs.
With the aim to evaluate the applicability of the present TOMOCOMD metodology, four
families of 2D molecular descriptors were computed with the DRAGON Software47 and the
respective models were generated. The statistical parameters are shown in Table 6. As can be
seen, in not one case the classification results are better than those obtained using model 8.
These results are a proof of the usefullness of the TOMOCOMD startegy in the study of this
biological property.
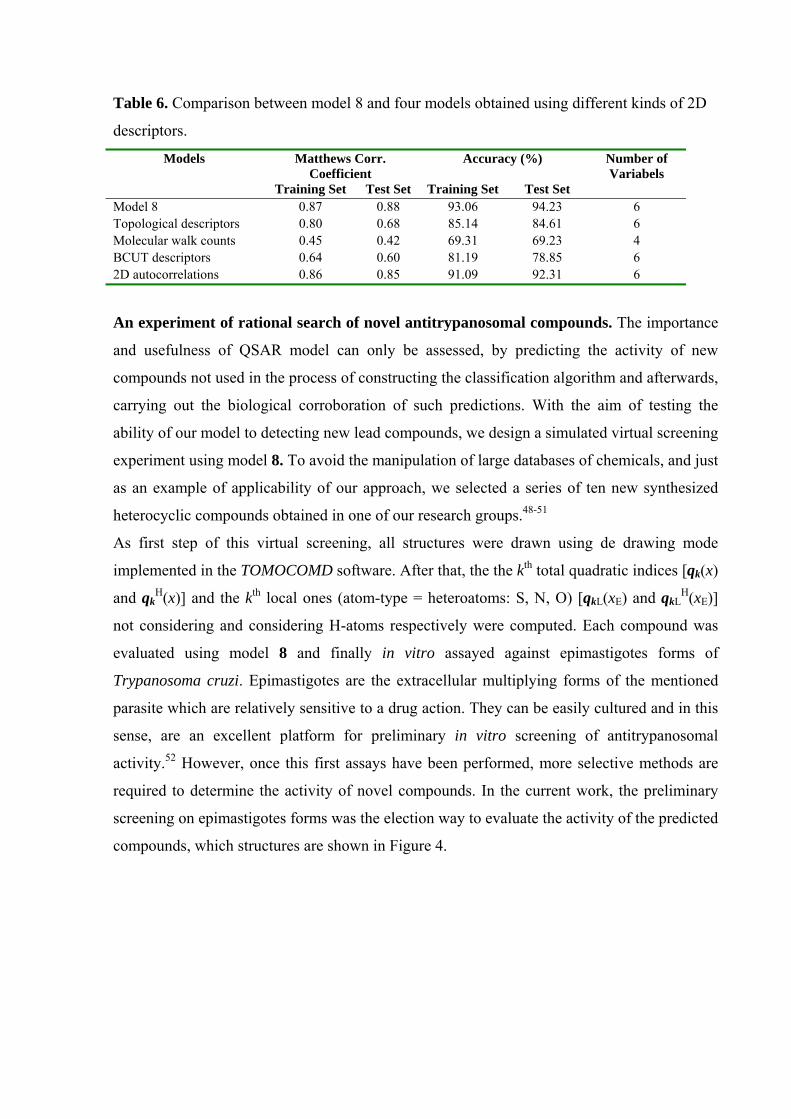
Table 6. Comparison between model 8 and four models obtained using different kinds of 2D
descriptors.
Models Matthews Corr. Coefficient
Accuracy (%) Number of Variabels
Training Set Test Set Training Set Test Set Model 8 0.87 0.88 93.06 94.23 6 Topological descriptors 0.80 0.68 85.14 84.61 6 Molecular walk counts 0.45 0.42 69.31 69.23 4 BCUT descriptors 0.64 0.60 81.19 78.85 6 2D autocorrelations 0.86 0.85 91.09 92.31 6
An experiment of rational search of novel antitrypanosomal compounds. The importance
and usefulness of QSAR model can only be assessed, by predicting the activity of new
compounds not used in the process of constructing the classification algorithm and afterwards,
carrying out the biological corroboration of such predictions. With the aim of testing the
ability of our model to detecting new lead compounds, we design a simulated virtual screening
experiment using model 8. To avoid the manipulation of large databases of chemicals, and just
as an example of applicability of our approach, we selected a series of ten new synthesized
heterocyclic compounds obtained in one of our research groups.48-51
As first step of this virtual screening, all structures were drawn using de drawing mode
implemented in the TOMOCOMD software. After that, the the kth total quadratic indices [qk(x)
and qkH(x)] and the kth local ones (atom-type = heteroatoms: S, N, O) [qkL(xE) and qkL
H(xE)]
not considering and considering H-atoms respectively were computed. Each compound was
evaluated using model 8 and finally in vitro assayed against epimastigotes forms of
Trypanosoma cruzi. Epimastigotes are the extracellular multiplying forms of the mentioned
parasite which are relatively sensitive to a drug action. They can be easily cultured and in this
sense, are an excellent platform for preliminary in vitro screening of antitrypanosomal
activity.52 However, once this first assays have been performed, more selective methods are
required to determine the activity of novel compounds. In the current work, the preliminary
screening on epimastigotes forms was the election way to evaluate the activity of the predicted
compounds, which structures are shown in Figure 4.
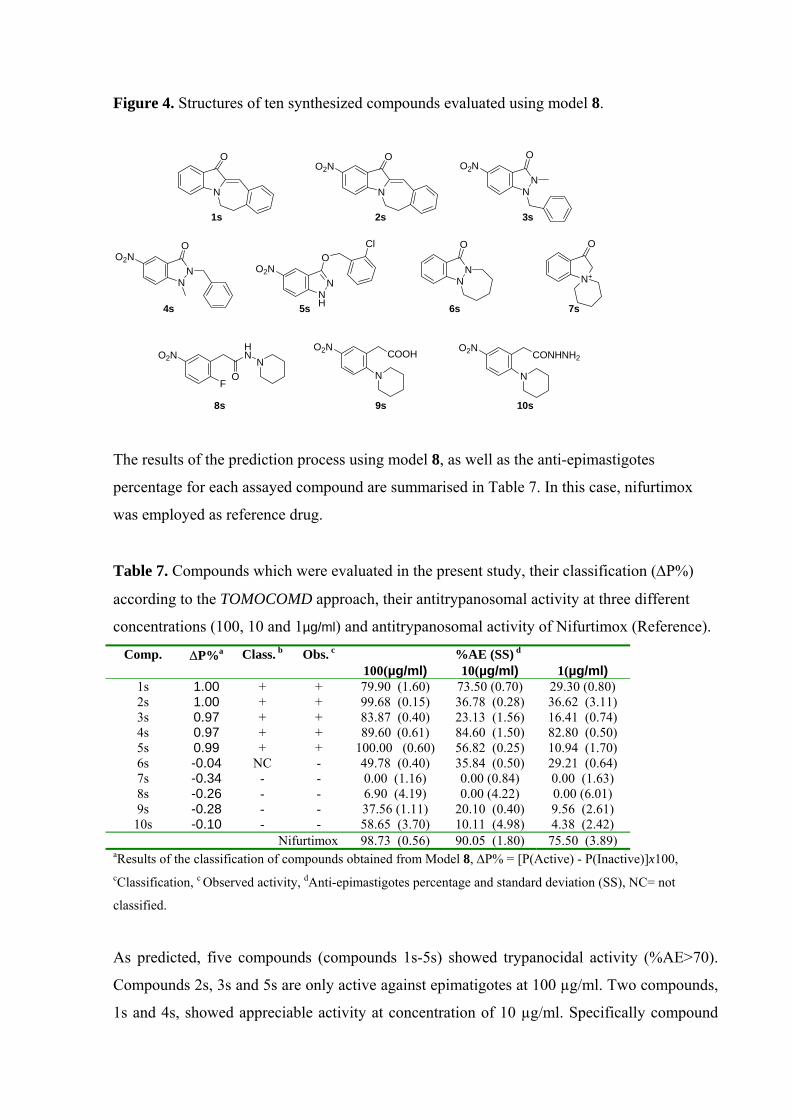
Figure 4. Structures of ten synthesized compounds evaluated using model 8.
NN
O
N+
O
N
O
N
OO2N
NN
OO2N
NN
OO2N
NH
N
OO2N
Cl
HN
NO2N
FO
COOHO2N
N
CONHNH2O2N
N
1s 2s 3s
4s 5s 6s 7s
8s 9s 10s
The results of the prediction process using model 8, as well as the anti-epimastigotes
percentage for each assayed compound are summarised in Table 7. In this case, nifurtimox
was employed as reference drug.
Table 7. Compounds which were evaluated in the present study, their classification (∆P%)
according to the TOMOCOMD approach, their antitrypanosomal activity at three different
concentrations (100, 10 and 1µg/ml) and antitrypanosomal activity of Nifurtimox (Reference).
%AE (SS) dComp. ∆P%a Class. b Obs. c
100(µg/ml) 10(µg/ml) 1(µg/ml) 1s 1.00 + + 79.90 (1.60) 73.50 (0.70) 29.30 (0.80) 2s 1.00 + + 99.68 (0.15) 36.78 (0.28) 36.62 (3.11) 3s 0.97 + + 83.87 (0.40) 23.13 (1.56) 16.41 (0.74) 4s 0.97 + + 89.60 (0.61) 84.60 (1.50) 82.80 (0.50) 5s 0.99 + + 100.00 (0.60) 56.82 (0.25) 10.94 (1.70) 6s -0.04 NC - 49.78 (0.40) 35.84 (0.50) 29.21 (0.64) 7s -0.34 - - 0.00 (1.16) 0.00 (0.84) 0.00 (1.63) 8s -0.26 - - 6.90 (4.19) 0.00 (4.22) 0.00 (6.01) 9s -0.28 - - 37.56 (1.11) 20.10 (0.40) 9.56 (2.61)
10s -0.10 - - 58.65 (3.70) 10.11 (4.98) 4.38 (2.42) Nifurtimox 98.73 (0.56) 90.05 (1.80) 75.50 (3.89)
aResults of the classification of compounds obtained from Model 8, ∆P% = [P(Active) - P(Inactive)]x100, cClassification, c Observed activity, dAnti-epimastigotes percentage and standard deviation (SS), NC= not
classified.
As predicted, five compounds (compounds 1s-5s) showed trypanocidal activity (%AE>70).
Compounds 2s, 3s and 5s are only active against epimatigotes at 100 µg/ml. Two compounds,
1s and 4s, showed appreciable activity at concentration of 10 µg/ml. Specifically compound
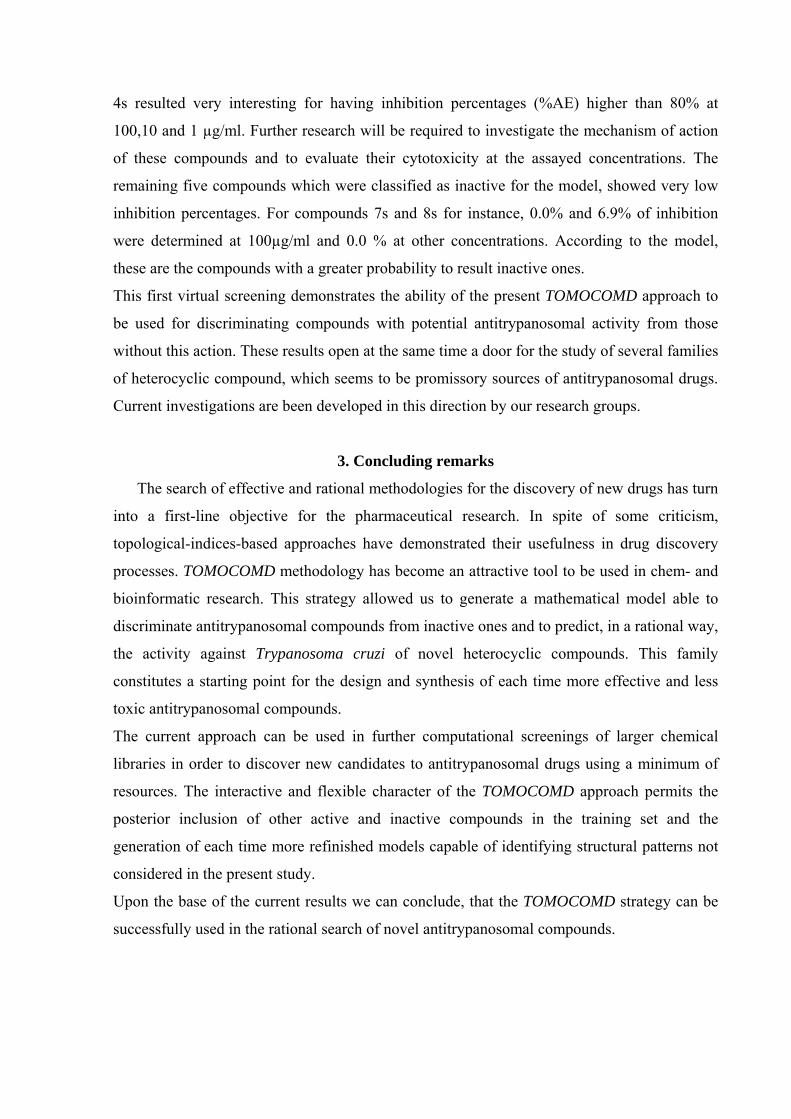
4s resulted very interesting for having inhibition percentages (%AE) higher than 80% at
100,10 and 1 µg/ml. Further research will be required to investigate the mechanism of action
of these compounds and to evaluate their cytotoxicity at the assayed concentrations. The
remaining five compounds which were classified as inactive for the model, showed very low
inhibition percentages. For compounds 7s and 8s for instance, 0.0% and 6.9% of inhibition
were determined at 100µg/ml and 0.0 % at other concentrations. According to the model,
these are the compounds with a greater probability to result inactive ones.
This first virtual screening demonstrates the ability of the present TOMOCOMD approach to
be used for discriminating compounds with potential antitrypanosomal activity from those
without this action. These results open at the same time a door for the study of several families
of heterocyclic compound, which seems to be promissory sources of antitrypanosomal drugs.
Current investigations are been developed in this direction by our research groups.
3. Concluding remarks
The search of effective and rational methodologies for the discovery of new drugs has turn
into a first-line objective for the pharmaceutical research. In spite of some criticism,
topological-indices-based approaches have demonstrated their usefulness in drug discovery
processes. TOMOCOMD methodology has become an attractive tool to be used in chem- and
bioinformatic research. This strategy allowed us to generate a mathematical model able to
discriminate antitrypanosomal compounds from inactive ones and to predict, in a rational way,
the activity against Trypanosoma cruzi of novel heterocyclic compounds. This family
constitutes a starting point for the design and synthesis of each time more effective and less
toxic antitrypanosomal compounds.
The current approach can be used in further computational screenings of larger chemical
libraries in order to discover new candidates to antitrypanosomal drugs using a minimum of
resources. The interactive and flexible character of the TOMOCOMD approach permits the
posterior inclusion of other active and inactive compounds in the training set and the
generation of each time more refinished models capable of identifying structural patterns not
considered in the present study.
Upon the base of the current results we can conclude, that the TOMOCOMD strategy can be
successfully used in the rational search of novel antitrypanosomal compounds.
4. Experimental Section
Computational Approach. Calculations were carried out on a PC Pentium-4 2.0 GHz. The
CARDD-module implemented in the TOMOCOMD Software13 was used to the calculation of
total and local non-stochastic quadratic indices. Pauling electronegativities53 were used as
atomic weights (molecular vector’s components).
Topological descriptors, molecular walk counts, BCUT descriptors and 2D autocorrelations
were calculed by using the DRAGON Software.47 The molecualr structure of each compound
was drawn by using the CHEMDRAW software54 and saved as a .mol file. After optimization
with the MOPAC software55 the structures were saved as a .hin file and then processed by the
DRAGON Software.
Chemometric Method. Linear discriminant analysis (LDA) was performed as implemented
in the STATISTICA 5.5 for Windows package.43 Forward stepwise was fixed as strategy for
variable selection. The quality of the models was determined by examining Wilk’s λ
parameter (U-statistic), square Mahalanobis distance (D2), Fisher ratio (F) and the
corresponding p-level (p(F)) as well as the percentage in training and test sets of global good
classification, Matthews´ correlation coefficient (MCC), sensitivity, specificity, negative
predictive value (sensitivity of the negative category) and false positive rate (false alarm rate).
Models with a proportion between the number of cases and variables in the equation lower
than 4 were rejected. The statistical robustness and predictive power of the obtained model
was assessed using an external prediction (test) set. A leave-group out (10%) cross validation
procedure was also carried out for this proposes.
Parasites and culture procedure. CL strain parasites (clone CL-B5) stably transfected with
the Escherichia coli β-galactosidase gene (LacZ) were used for the assays. Epimastigotes were
grown at 28º C in liver infusion tryptone broth (LIT) with 10% foetal bovine serum (FBS),
penicillin and streptomycin.
Antiepimastigote assay.52 The screening assay was performed in 96-well microplates with
culture that had not reached the stationary phase. Epimastigotes forms, CL strain, were seeded
at concentration of 1 x 10⁵ per ml in 200 µl. The plates were then incubated at 28º C for 72
hours with various concentrations of the drugs (100, 10 and 1 µg/ml), at which time 50 µl of
CPRG solution was added to give a final concentration of 200 µM. The plates were incubated
at 37º C for an additional 6 hrs and were then read at 595 nm. Each concentration was assayed
three times. In order to avoid drawback, medium, negative and drug controls were used in
each test. The anti-epimastigotes percentage (%AE) was calculated as follows:

%AE=[(AE-AEB)/(AC-ACB)] x 100, where AE = absorbance of experimental group; AEB=
blank of compounds; AC=Absorbance of control group; ACB= blank of culture medium.
Stock solutions of the compounds to be assayed were prepared in DMSO, with the final
concentration in a mixture water/DMSO never exceeding 0.2% of the last solvent.
5. References
1. World Health Organization (OMS). Rapport sur la Santé dans le Monde.WHI: Genève,
1998, 49.
2. Muelas, S.; Suárez, M.; Pérez, R..; Rodríguez, H.; Ochoa, C.; Escario, J. A. and Gómez-
Barrio, A. Mem. Inst. Oswaldo Cruz 2002, 97, 269.
3. Muelas-Serrano, S.; Le-Senne, A.; Fernádez-Portillo, C.; Nogal, J. J.; Ochoa, C. and
Gómez-Barrio A. Mem. Inst. Oswaldo Cruz 2002, 97, 553.
4. Gonzalbes, R.; Gálvez, J.; Moreno, A.; García-Domenech, R. J. Pharm. Pharmacol. 1999,
52, 111.
5. Julián-Ortiz, J. V.; Gálvez, J.; Muñoz-Collado, C.; García –Domenech, R.; Gimeno-
Cardona, C. J. Med. Chem. 1999, 42, 3308.
6. McKie, J. H.; Douglas, K. T.; Chan, C.; Roser, S. A.; Yates, R.; Read, M.; Hyde, J. E.;
Dascombe, M. J.; Yuthavong, Y.; Sirawaraporn, W. J. Med. Chem. 1998, 41, 1367.
7. Estrada, E.; Peña, A. Bioorg. Med. Chem. 2000, 8, 2755.
8. Estrada, E.; Uriarte, E.; Montero, A.; Teijeira, M.; Santana, L.; De Clercq, E. J. Med.
Chem. 2000, 43, 1975.
9. González-Díaz, H; Marrero-Ponce, Y.; Hernández, I; Bastida, I; Tenorio, E; Nasco, O;
Uriarte, U; Castañedo, N.; Cabrera, M.A.; Aguila, E.; Marrero, O.; Morales, A.; Pérez, M.
Chem. Res. Toxicol. 2003, 16, 1318.
10. Pérez-González, M.; Dias, L. C.; Morales-Helguera, A.;Morales-Rodríguez, Y.; Gonzaga
de Oliveira, L. Torres-Gómez, L.; González-Díaz, H. Bioorg. Med. Chem. 2004, 12, 4467.
11. Walters, W. P.; Stahl, M. T.; Murcko, M. Drug Discovery Today 1998, 3, 160.
12. Drie, J. H. V.; Lajiness, M. S. Drug Discovery Today, 1998, 3, 274.
13. Marrero-Ponce Y, Romero V (2002) TOMOCOMD software. Central University of Las
Villas. TOMOCOMD (TOpological MOlecular COMputer Design) for Windows, version
1.0.
14. Marrero-Ponce, Y. Molecules. 2003, 8, 687.
15. Marrero-Ponce, Y. J. Chem. Inf. Comput. Sci. 2004, 44, 2010.
16. Marrero-Ponce, Y. Bioorg. Med. Chem. 2004, 12, 6351.
17. Marrero-Ponce, Y.; Castillo-Garit, J. A.; Torrens, F.; Romero-Zaldivar, V.; Castro E.
Molecules. 2004, 9, 1100.
18. Marrero-Ponce, Y.; Cabrera, M., A.; Romero, V.; Ofori, E.; Montero, L. A. Int. J. Mol.
Sci. 2003, 4, 512.
19. Marrero-Ponce, Y.; Cabrera, M. A.; Romero, V.; González, D. H.; Torrens, F. J. Pharm.
Pharm. Sci. 2004, 7, 186.
20. Marrero-Ponce, Y.; Castillo-Garit, J. A.; Olazabal, E.; Serrano, H. S.; Morales, A.;
Castañedo, N.; Ibarra-Velarde, F.; Huesca-Guillen, A.; Jorge, E.; Sánchez, A. M.; Torrens,
F.; Castro, E. A. Bioorg. Med. Chem. 2005, 13, 1005.
21. Marrero-Ponce, Y.; Castillo-Garit, J. A.; Olazabal, E.; Serrano, H. S.; Morales, A.;
Castañedo, N.; Ibarra-Velarde, F.; Huesca-Guillen, A.; Jorge, E.; del Valle, A.; Torrens,
F.; Castro, E. J. Comput. Aided Mol. Des. 2004, 18, 615-633.
22. Marrero-Ponce, Y.; Huesca-Guillen, A.; Ibarra-Velarde, F. J. Theor. Chem.
(THEOCHEM). 2005, 717, 67.
23. Marrero-Ponce, Y.; Montero-Torres, A.; Romero-Zaldivar, C.; Iyarreta-Veitía, I.; Mayón
Peréz, M.; García Sánchez, R. Bioorg. Med. Chem. 2005, 13, 1293.
24. Marrero-Ponce, Y.; Medina-Marrero, R.; Torrens, F.; Martinez, Y.; Romero-Zaldivar, V.;
Castro, E. A. Bioorg. Med. Chem. 2005, 13, 2881.
25. Marrero-Ponce, Y.; González-Díaz, H.; Romero-Zaldivar, V.; Torrens, F.; Castro, E. A.
Bioorg. Med. Chem. 2004, 12, 5331.
26. Milne, G. W. A. J. Chem. Inf. Comput. Sci. 1997, 37, 639.
27. Todeschini, R.; Consonni, V. Handbook of Molecular Descriptors; Wiley-VCH:
Germany, 2000.
28. Karelson, M. Molecular Descriptors in QSAR/QSPR; John Wiley & Sons: New York.
2000.
29. Bonse, S.; Santelli-Rouvier, Ch.; Barbe, J. and Krauth-Siegel, L. J. Med. Chem. 1999, 42,
5448.
30. De Koning, H. P. Int. J. Parasitol. 2001, 31, 512.
31. Elhalem, E.; Bailey, B. N.; Docampo, R.; Ujváry, I.; Szajnman, S. H. and Rodíguez, J. B.
J. Med. Chem. 2002, 45, 3984.
32. Avila, J. L.; Rojas, T.; Avila, A.; Polegre, M. A. and Robins, R. K. Antimicrob. Agents
Chemoter. 1987, 31, 447.
33. Oliveira, R. B.; Passos, A. P. F.; Alves, R. O.; Romanha, A. J.; Prado, M. A. F.; Dias de
Souza Filho, J, Alves, R. J. Mem. Inst. Oswaldo Cruz, 2003, 98,141.
34. Carvalho, S. A.; da Silva, E. F.; Santa-Rita, R. M.; de Castro, S. L. and Fraga, C. A. M.
Bioorg. Med. Chem. Lett., 2004, 14, 5967.
35. Cerecetto, H.; Di Maio, R.; González, M.; Risso, M.; Sagrera, G.; Seoane, G.; Denicola,
A.; Peluffo, G.; Quijano, C.; Stoppani, A. O. M.; Paulino, M.; Olea-Azar, Basombrio, M.
A. Eur. J. Med. Chem. 2000, 35, 343
36. Gilbert, I. H. Bioch. Biophysica Acta, 2002, 1587, 249.
37. Du, X.; Guo, Ch.; Hansell, E.; Doyle, P. S.; Caffrey, C. R.; Holler, T. P.; McKerrow, J. H.
and Cohen, F. E. J. Med. Chem, 2002, 45, 2695.
38. Jonckers, T. H. M.; van Miert, S.; Cimanga, K.; Baillo, Ch.; Colson, P.; De Pauw-Gillet
M. C.; van den Heuvel, H.; Caléis, M.; Lemière, F.; Esmans, E. L.; Rozenski, J.;
Quirijnen, L.; Maes, L.; Dommisse, R.; Lemière, G. L. F.; Vlietinck, A. and Pieters, L. J.
Med. Chem, 2002, 45, 3497.
39. Negwer, M. Organic-Chemical Drugs and their Synonyms; Akademie-Verlag: Berlin,
1987.
40. Mc Farland, J. W.; Gans, D. J. Cluster Significance Analysis. In Chemometric Methods in
Molecular Design; van Waterbeemd, H., Ed.; VCH Publishers: New York, 1995; 295–
307.
41. Johnson, R. A.; Wichern, D. W. Applied Multivariate Statistical Analysis: Prentice-Hall,
N.J, 1988.
42. Estrada, E. In Topological Indices and Related Descriptors in QSAR and QSPR; Devillers,
J; Balaban, A. T., Eds.; Gordon and Breach: Amsterdam, 1999, 403-453.
43. STADISTICA, version 5.5; Statsoft Inc., 1999.
44. Baldi, P.; Brunak, S.; Chauvin, Y.; Andersen, C. A.; Nielsen, H. Bioinformatics Review
2000, 16, 412.
45. Golbraikh, A.; Tropsha, A. J. Mol. Graphic Modell. 2002, 20, 269.
46. Wold, S; Erikson, L. Statistical Validation of QSAR Results. Validation Tools. In
Chemometric Methods in Molecular Design; van de Waterbeemd, H., Ed.; VCH
Publishers: New York, 1995; 309-318.
47. Todeschini, R.; Consonni, V.; Pavan, M. DRAGON software version 2.1, 2002.
48. Arán, V. J.; Asensio, J. L.; Ruiz, J. R. and Stud, M. J. Chem. Soc., Perkin Trans. 1 1993,
1119.
49. Ruiz, J. R.; Arán, V. J.; Asensio, J. L.; Flores, M. and Stud, M. Liebigs Ann. Chem. 1994,
679-684.
50. Arán, V. J.; Flores, M.; Muñoz, P.; Páez, J. A.; Sánchez-Verdú, P. and Stud, M. Liebigs
Ann. 1996, 683.
51. Arán, V. J.; Asensio, J. L.; Molina, J.; Muñoz, P.; Ruiz, J. R. and Stud, M. J. Chem. Soc.,
Perkin Trans. 1 1997, 2229.
52. Vega, C.; Rolón, M.; Martinez-Fernández, A. R.; Escario, J. A., Gómez-Barrio, A.
Parasitol. Res. 2005, 29, 296.
53. Pauling, L. The Nature of Chemical Bond; Cornell University Press: New York, 1939; 2-
60.
54. CambrigdeSoft Corpoation. ChemDraw® Ultra. Chemical Structure Drawing standard,
2003.
55. Dewar, M. J. S. J. Mol. Struct. 1983, 41, 100.
Copyright © 2022 FDOKUMEN