A novel integrative method for analyzing eye and hand behaviour during reaching and grasping in an...
10
A novel integrative method for analyzing eye and hand behaviour during reaching and grasping in an MRI environment Jane M. Lawrence & Kamyar Abhari & Steven L. Prime & Benjamin P. Meek & Loni Desanghere & Lee A. Baugh & Jonathan J. Marotta Published online: 18 March 2011 # Psychonomic Society, Inc. 2011 Abstract The development of noninvasive neuroimaging techniques, such as fMRI, has rapidly advanced our understanding of the neural systems underlying the integration of visual and motor information. However, the fMRI experimental design is restricted by several environmental elements, such as the presence of the magnetic field and the restricted view of the participant, making it difficult to monitor and measure behaviour. The present article describes a novel, specialized soft- ware package developed in our laboratory called Bio- metric Integration Recording and Analysis (BIRA). BIRA integrates video with kinematic data derived from the hand and eye, acquired using MRI-compatible equipment. The present article demonstrates the acquisi- tion and analysis of eye and hand data using BIRA in a mock (0 Tesla) scanner. A method for collecting and integrating gaze and kinematic data in fMRI studies on visuomotor behaviour has several advantages: Specifically, it will allow for more sophisticated, behaviourally driven analyses and eliminate potential confounds of gaze or kinematic data. Keywords Software analysis package . Visuomotor processes . Eye–hand integration . Functional magnetic resonance imaging . Hand kinematics . Eye kinematics . Motion monitoring Introduction When we reach out to pick up an object, such as a glass of water or a pen, a complex series of actions are performed in order to complete this “simple” task. Our visual system must process information about the object, such as its shape, size, orientation, and location. These qualities are used to extend our arm and to preshape our hand to make an effective grasp (for a review, see Glover, 2004). Our understanding of how vision guides motor actions has been significantly advanced by behavioural studies that use eye- and hand-tracking methods in tandem (Carey, Della Sala, & Ietswaart, 2002). Additionally, our understanding of visuo- motor control has been further augmented by fMRI studies that have investigated the neural correlates of visuomotor behaviour (Culham, Cavina-Pratesi, & Singhal, 2006). Integrating these two experimental paradigms would offer more comprehensive insight into the relationship between visuomotor behaviour and neural activity than either can when performed alone. As more MRI-compatible eye- and hand-tracking methods become available, neuroimaging research on visuomotor processes would greatly benefit from a reliable, affordable, and user-friendly system that records and integrates eye and hand movements. Relative to nonimaging behavioural studies, fMRI investigations of visuomotor processes face two major limitations: the confined space within the bore of the MRI scanner and the presence of a strong magnetic field. Both of these factors limit the apparatus that can be used for presenting stimuli and collecting data on eye position and hand kinematics. One approach to deal with these limi- tations is to present participants with two-dimensional stimuli on a back-projected screen behind the scanner, which participants view through a mirror box attached to J. M. Lawrence (*) : K. Abhari : S. L. Prime : B. P. Meek : L. Desanghere : L. A. Baugh : J. J. Marotta Department of Psychology, University of Manitoba, 190 Dysart Road, Winnipeg, Manitoba R3T 2N2, Canada e-mail: [email protected] Behav Res (2011) 43:399–408 DOI 10.3758/s13428-011-0067-y
-
Upload
independent -
Category
Documents
-
view
3 -
download
0
Transcript of A novel integrative method for analyzing eye and hand behaviour during reaching and grasping in an...

A novel integrative method for analyzing eye and handbehaviour during reaching and graspingin an MRI environment
Jane M. Lawrence & Kamyar Abhari & Steven L. Prime &
Benjamin P. Meek & Loni Desanghere & Lee A. Baugh &
Jonathan J. Marotta
Published online: 18 March 2011# Psychonomic Society, Inc. 2011
Abstract The development of noninvasive neuroimagingtechniques, such as fMRI, has rapidly advanced ourunderstanding of the neural systems underlying theintegration of visual and motor information. However,the fMRI experimental design is restricted by severalenvironmental elements, such as the presence of themagnetic field and the restricted view of the participant,making it difficult to monitor and measure behaviour.The present article describes a novel, specialized soft-ware package developed in our laboratory called Bio-metric Integration Recording and Analysis (BIRA).BIRA integrates video with kinematic data derived fromthe hand and eye, acquired using MRI-compatibleequipment. The present article demonstrates the acquisi-tion and analysis of eye and hand data using BIRA in amock (0 Tesla) scanner. A method for collecting andintegrating gaze and kinematic data in fMRI studies onvisuomotor behaviour has several advantages: Specifically, itwill allow for more sophisticated, behaviourally drivenanalyses and eliminate potential confounds of gaze orkinematic data.
Keywords Software analysis package . Visuomotorprocesses . Eye–hand integration . Functional magneticresonance imaging . Hand kinematics . Eye kinematics .
Motion monitoring
Introduction
When we reach out to pick up an object, such as a glass ofwater or a pen, a complex series of actions are performed inorder to complete this “simple” task. Our visual systemmust process information about the object, such as itsshape, size, orientation, and location. These qualities areused to extend our arm and to preshape our hand to makean effective grasp (for a review, see Glover, 2004). Ourunderstanding of how vision guides motor actions has beensignificantly advanced by behavioural studies that use eye-and hand-tracking methods in tandem (Carey, Della Sala, &Ietswaart, 2002). Additionally, our understanding of visuo-motor control has been further augmented by fMRI studiesthat have investigated the neural correlates of visuomotorbehaviour (Culham, Cavina-Pratesi, & Singhal, 2006).Integrating these two experimental paradigms would offermore comprehensive insight into the relationship betweenvisuomotor behaviour and neural activity than either canwhen performed alone. As more MRI-compatible eye- andhand-tracking methods become available, neuroimagingresearch on visuomotor processes would greatly benefitfrom a reliable, affordable, and user-friendly system thatrecords and integrates eye and hand movements.
Relative to nonimaging behavioural studies, fMRIinvestigations of visuomotor processes face two majorlimitations: the confined space within the bore of the MRIscanner and the presence of a strong magnetic field. Both ofthese factors limit the apparatus that can be used forpresenting stimuli and collecting data on eye position andhand kinematics. One approach to deal with these limi-tations is to present participants with two-dimensionalstimuli on a back-projected screen behind the scanner,which participants view through a mirror box attached to
J. M. Lawrence (*) :K. Abhari : S. L. Prime :B. P. Meek :L. Desanghere : L. A. Baugh : J. J. MarottaDepartment of Psychology, University of Manitoba,190 Dysart Road,Winnipeg, Manitoba R3T 2N2, Canadae-mail: [email protected]
Behav Res (2011) 43:399–408DOI 10.3758/s13428-011-0067-y

the head coil and interact with using an MRI-compatiblecomputer mouse (Ogawa, Inui, & Sugio, 2006), a joystick(Grefkes, Ritzl, Zilles, & Fink, 2004), or a pneumaticrobotic arm (Diedrichsen, Hashambhoy, Rane, & Shadmehr,2005). Other researchers have used MRI-compatible touchscreens for stimulus presentation and data collection (Levy,Schluppeck, Heeger, & Glimcher, 2007). However, in thesestudies, participants do not actually grasp an object, andtherefore kinematic measures of the hand during a typicalreaching or grasping movement (e.g., reach velocity, gripaperture, or reach trajectory) cannot be obtained.
To overcome this difficulty, fMRI investigations ofvisuomotor behaviour have utilized devices such as apneumatically driven rotating barrel (Culham et al., 2003)or a sliding table (Marotta, Mraz, Black, & Graham, 2007)to present graspable objects within an MRI environment.These devices have allowed researchers to move visuomotorparadigms, in which participants look, reach, or grasp three-dimensional objects, into the magnetic field of the scanner. Aswith visuomotor investigations outside such a field, theparticipant is given a cue as to when and how to perform agiven action. Generally, the time of the cue’s presentation isused to identify a model of the expected task-related signalchange in the general linear model analysis of fMRI data. Anadvancement of these paradigms that would allow for thesimultaneous acquisition of combined kinematic and eye datawould enhance fMRI studies of reaching and grasping by (1)allowing monitoring of task performance, (2) enablingquantitative analysis of behaviour, and (3) facilitating compre-hensive data-driven fMRI analyses to contrast activations. Ifkinematic data were collected, behavioural recordings could beentered into a general linear model as covariates (either ofinterest in their own right or as confounds). To date, fMRIstudies of reaching and grasping have not collected simulta-neous kinematic and gaze data, and thus, activation differencesbetween conditions could be due to confounds of kinematicmeasures (e.g., movement time) or gaze (foveal vs. peripheral).
The ability to measure eye and hand behaviour in theMRI environment has, in the past, been impeded by thesame limitations that affect the study design. The simplest,and most common, method to observe motor behaviour inan MRI setting is to use a compatible video camera (e.g.,Marotta et al., 2007; Rocca et al., 2007). However, therecent introduction of MRI-compatible motion-trackingsystems that utilize infrared reflective markers (e.g.,OQUIS MRI; Qualisys, Gotenberg, Sweden), fibre opticribbon (e.g., ShapeClaw; Measureand Inc., Fredricton,Canada), and micro-electro-mechanical gyroscopes(Schaechter, Stokes, Connell, Perdue, & Bonmassar,2006) have improved the reliability and quality of move-ment data collected in an MRI environment. As new MRI-compatible devices capable of acquiring hand and eyemovement data become more accessible, an easy method of
integrating such equipment would represent a significantadvancement in the field. The present article describesspecialized software, the Biometric Integration Recordingand Analysis (BIRA) program, that was designed to record,integrate, and analyse hand and eye kinematic data acquiredsimultaneously from two commercially available trackingsystems, in addition to video-based recording. The ultimategoal of BIRA is not only to measure kinematic behaviourwithin an MRI field but also to use this information tostrengthen and refine the statistical analysis of neuro-imaging data. Before this can happen, we must first assessthe overall behavioural performance of this new system.Here, we demonstrate BIRA’s capability to simultaneouslyrecord and integrate reliable, quantitative measures of eye–hand data in a simple reach-to-grasp task in a mock MRI.
Method
Statement of ethics
This study was approved by the Research Ethics Board ofthe National Research Council Institute for Biodiagnosticsand the Psychology/Sociology Research Ethics Board ofthe University of Manitoba. Informed consent was obtainedfrom participants prior to the study.
General experimental paradigm
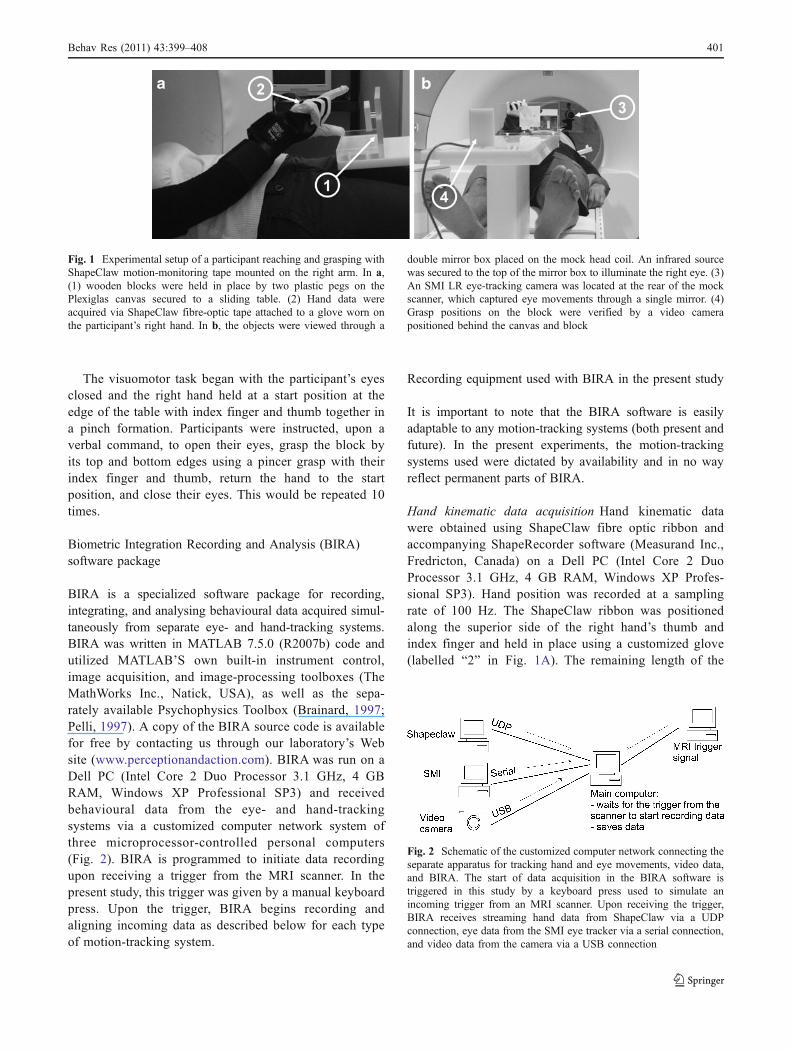
Data were collected from 4 female, right-handed partic-ipants with normal or corrected-to-normal vision (averageage: 29.75 years). Participants were positioned supine onthe bed of a mock MRI scanner (0 Tesla) with their head ina mock head coil. Head motion was minimized by paddingthe head coil with extra foam wedges. An MRI-compatiblesliding table was positioned on the bed at the participant’sfeet and extended over the participant’s thighs so thatobjects were within reach of the right hand (Fig. 1). Theparticipant viewed the table through a double-mirror boxattached to the head coil. The double-mirror box ensuredthat the participant viewed the blocks in the correct, uprightdirection.
Three wooden rectangular blocks, 152 mm (wide) × 42 mm(high), 107 mm × 60 mm, and 80 mm × 80 mm, wereindividually presented to the participant by attaching them to avertical canvas of Plexiglas 90 mm from the edge of the slidingtable (Fig. 1). The blocks were securely attached to thePlexiglas canvas by fitting two pegs that extended from thecanvas into holes in the backs of the blocks. A ruler wasdrawn along the width of the blocks’ top and bottom backedges; the ruler was visible to an MRI-compatible videocamera (MRC Systems, Heidelberg, Germany), but not to theparticipant.
400 Behav Res (2011) 43:399–408
The visuomotor task began with the participant’s eyesclosed and the right hand held at a start position at theedge of the table with index finger and thumb together ina pinch formation. Participants were instructed, upon averbal command, to open their eyes, grasp the block byits top and bottom edges using a pincer grasp with theirindex finger and thumb, return the hand to the startposition, and close their eyes. This would be repeated 10times.
Biometric Integration Recording and Analysis (BIRA)software package
BIRA is a specialized software package for recording,integrating, and analysing behavioural data acquired simul-taneously from separate eye- and hand-tracking systems.BIRA was written in MATLAB 7.5.0 (R2007b) code andutilized MATLAB’S own built-in instrument control,image acquisition, and image-processing toolboxes (TheMathWorks Inc., Natick, USA), as well as the sepa-rately available Psychophysics Toolbox (Brainard, 1997;Pelli, 1997). A copy of the BIRA source code is availablefor free by contacting us through our laboratory’s Website (www.perceptionandaction.com). BIRA was run on aDell PC (Intel Core 2 Duo Processor 3.1 GHz, 4 GBRAM, Windows XP Professional SP3) and receivedbehavioural data from the eye- and hand-trackingsystems via a customized computer network system ofthree microprocessor-controlled personal computers(Fig. 2). BIRA is programmed to initiate data recordingupon receiving a trigger from the MRI scanner. In thepresent study, this trigger was given by a manual keyboardpress. Upon the trigger, BIRA begins recording andaligning incoming data as described below for each typeof motion-tracking system.
Recording equipment used with BIRA in the present study
It is important to note that the BIRA software is easilyadaptable to any motion-tracking systems (both present andfuture). In the present experiments, the motion-trackingsystems used were dictated by availability and in no wayreflect permanent parts of BIRA.
Hand kinematic data acquisition Hand kinematic datawere obtained using ShapeClaw fibre optic ribbon andaccompanying ShapeRecorder software (Measurand Inc.,Fredricton, Canada) on a Dell PC (Intel Core 2 DuoProcessor 3.1 GHz, 4 GB RAM, Windows XP Profes-sional SP3). Hand position was recorded at a samplingrate of 100 Hz. The ShapeClaw ribbon was positionedalong the superior side of the right hand’s thumb andindex finger and held in place using a customized glove(labelled “2” in Fig. 1A). The remaining length of the
Fig. 1 Experimental setup of a participant reaching and grasping withShapeClaw motion-monitoring tape mounted on the right arm. In a,(1) wooden blocks were held in place by two plastic pegs on thePlexiglas canvas secured to a sliding table. (2) Hand data wereacquired via ShapeClaw fibre-optic tape attached to a glove worn onthe participant’s right hand. In b, the objects were viewed through a
double mirror box placed on the mock head coil. An infrared sourcewas secured to the top of the mirror box to illuminate the right eye. (3)An SMI LR eye-tracking camera was located at the rear of the mockscanner, which captured eye movements through a single mirror. (4)Grasp positions on the block were verified by a video camerapositioned behind the canvas and block
Fig. 2 Schematic of the customized computer network connecting theseparate apparatus for tracking hand and eye movements, video data,and BIRA. The start of data acquisition in the BIRA software istriggered in this study by a keyboard press used to simulate anincoming trigger from an MRI scanner. Upon receiving the trigger,BIRA receives streaming hand data from ShapeClaw via a UDPconnection, eye data from the SMI eye tracker via a serial connection,and video data from the camera via a USB connection
Behav Res (2011) 43:399–408 401
ribbon ran up the participant’s arm and was secured usingan arm-length nylon sleeve with additional arm bandsbelow the elbow and shoulder. Prior to data collection,hand data were calibrated as per the ShapeClaw systeminstructions (see the Appendix). Upon the initiation ofdata recording, hand data were streamed to the Dell PC onwhich BIRA was operating through a network connection.
Eye kinematic data acquisition Eye position data wereacquired from the right eye using a monocular MRI-compatible video-based eye-tracking system (SensoMotoricInstruments, Teltow, Germany). The camera was positionedbehind the scanner, aimed down the bore, and focusedon a mirror box attached to the head coil, whichprovided a reflection of the participant’s eyes (Fig. 1B).Eye data were recorded with a spatial resolution of ~1ºand at a sampling rate of 60 Hz. Prior to data collection,eye data were calibrated using a 13-point calibration board(152 mm wide × 123 mm high, 1,280 × 1,024 pixelresolution). Upon the initiation of recording, data from theeye-tracking system were streamed to the Dell PC onwhich BIRA was operating via a serial connection.
Video acquisition An MRI-compatible video camera(MRC Systems, Heidelberg, Germany) was used to recordthe entire study. The video camera had an 8.8-mm focallength, a resolution of 176 × 144 pixels, and a sample rateof 60 Hz. The camera was secured on the top of thesliding table 42 cm behind the vertical Plexiglas canvas toobtain a clear view of the block and the participant’sfingers at the final grasp position (Fig. 1B). The videosignal was obtained via a USB connection through a cinchcable to a Hauppauge WinTV-HVR-950 video capturecard connection to the master computer on which BIRAwas operating.
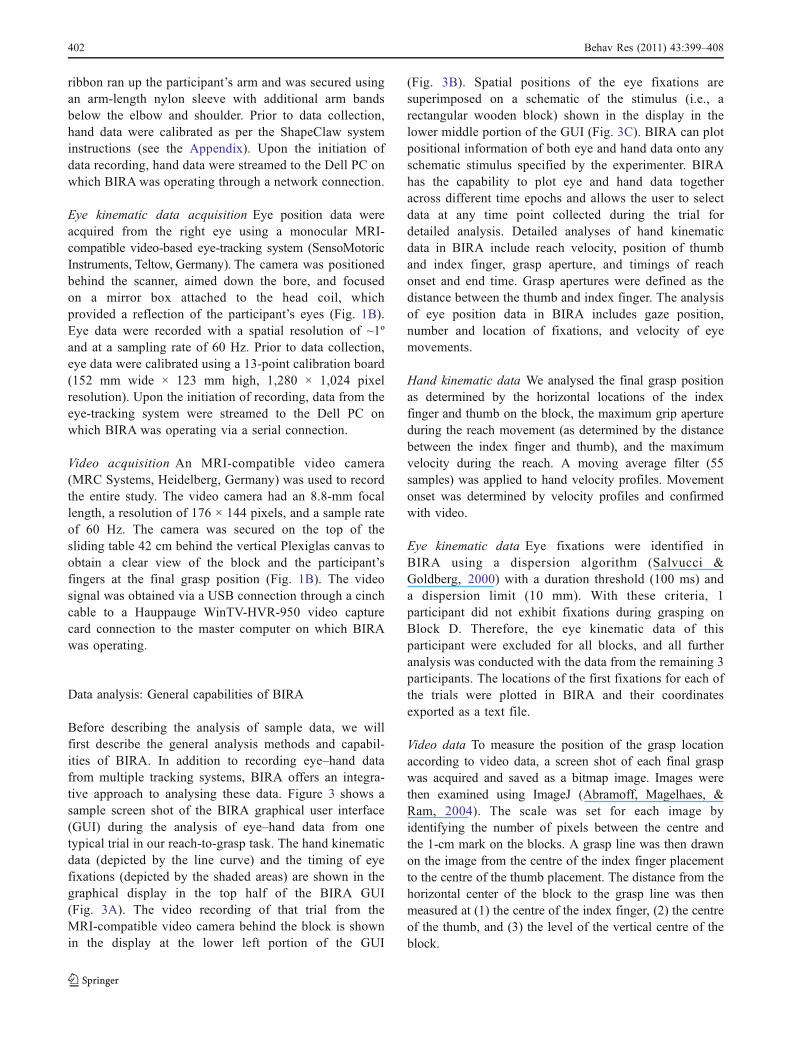
Data analysis: General capabilities of BIRA
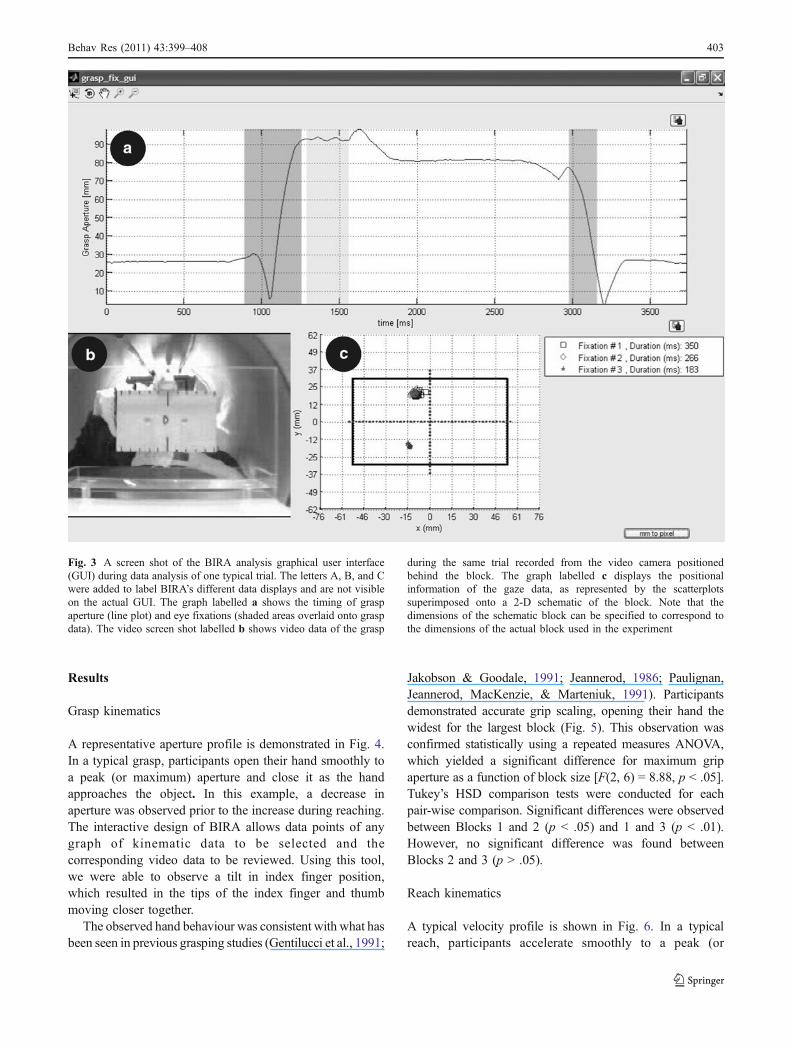
Before describing the analysis of sample data, we willfirst describe the general analysis methods and capabil-ities of BIRA. In addition to recording eye–hand datafrom multiple tracking systems, BIRA offers an integra-tive approach to analysing these data. Figure 3 shows asample screen shot of the BIRA graphical user interface(GUI) during the analysis of eye–hand data from onetypical trial in our reach-to-grasp task. The hand kinematicdata (depicted by the line curve) and the timing of eyefixations (depicted by the shaded areas) are shown in thegraphical display in the top half of the BIRA GUI(Fig. 3A). The video recording of that trial from theMRI-compatible video camera behind the block is shownin the display at the lower left portion of the GUI
(Fig. 3B). Spatial positions of the eye fixations aresuperimposed on a schematic of the stimulus (i.e., arectangular wooden block) shown in the display in thelower middle portion of the GUI (Fig. 3C). BIRA can plotpositional information of both eye and hand data onto anyschematic stimulus specified by the experimenter. BIRAhas the capability to plot eye and hand data togetheracross different time epochs and allows the user to selectdata at any time point collected during the trial fordetailed analysis. Detailed analyses of hand kinematicdata in BIRA include reach velocity, position of thumband index finger, grasp aperture, and timings of reachonset and end time. Grasp apertures were defined as thedistance between the thumb and index finger. The analysisof eye position data in BIRA includes gaze position,number and location of fixations, and velocity of eyemovements.
Hand kinematic data We analysed the final grasp positionas determined by the horizontal locations of the indexfinger and thumb on the block, the maximum grip apertureduring the reach movement (as determined by the distancebetween the index finger and thumb), and the maximumvelocity during the reach. A moving average filter (55samples) was applied to hand velocity profiles. Movementonset was determined by velocity profiles and confirmedwith video.
Eye kinematic data Eye fixations were identified inBIRA using a dispersion algorithm (Salvucci &Goldberg, 2000) with a duration threshold (100 ms) anda dispersion limit (10 mm). With these criteria, 1participant did not exhibit fixations during grasping onBlock D. Therefore, the eye kinematic data of thisparticipant were excluded for all blocks, and all furtheranalysis was conducted with the data from the remaining 3participants. The locations of the first fixations for each ofthe trials were plotted in BIRA and their coordinatesexported as a text file.
Video data To measure the position of the grasp locationaccording to video data, a screen shot of each final graspwas acquired and saved as a bitmap image. Images werethen examined using ImageJ (Abramoff, Magelhaes, &Ram, 2004). The scale was set for each image byidentifying the number of pixels between the centre andthe 1-cm mark on the blocks. A grasp line was then drawnon the image from the centre of the index finger placementto the centre of the thumb placement. The distance from thehorizontal center of the block to the grasp line was thenmeasured at (1) the centre of the index finger, (2) the centreof the thumb, and (3) the level of the vertical centre of theblock.
402 Behav Res (2011) 43:399–408
Results
Grasp kinematics
A representative aperture profile is demonstrated in Fig. 4.In a typical grasp, participants open their hand smoothly toa peak (or maximum) aperture and close it as the handapproaches the object. In this example, a decrease inaperture was observed prior to the increase during reaching.The interactive design of BIRA allows data points of anygraph of kinematic data to be selected and thecorresponding video data to be reviewed. Using this tool,we were able to observe a tilt in index finger position,which resulted in the tips of the index finger and thumbmoving closer together.
The observed hand behaviour was consistent with what hasbeen seen in previous grasping studies (Gentilucci et al., 1991;
Jakobson & Goodale, 1991; Jeannerod, 1986; Paulignan,Jeannerod, MacKenzie, & Marteniuk, 1991). Participantsdemonstrated accurate grip scaling, opening their hand thewidest for the largest block (Fig. 5). This observation wasconfirmed statistically using a repeated measures ANOVA,which yielded a significant difference for maximum gripaperture as a function of block size [F(2, 6) = 8.88, p < .05].Tukey’s HSD comparison tests were conducted for eachpair-wise comparison. Significant differences were observedbetween Blocks 1 and 2 (p < .05) and 1 and 3 (p < .01).However, no significant difference was found betweenBlocks 2 and 3 (p > .05).
Reach kinematics
A typical velocity profile is shown in Fig. 6. In a typicalreach, participants accelerate smoothly to a peak (or
Fig. 3 A screen shot of the BIRA analysis graphical user interface(GUI) during data analysis of one typical trial. The letters A, B, and Cwere added to label BIRA’s different data displays and are not visibleon the actual GUI. The graph labelled a shows the timing of graspaperture (line plot) and eye fixations (shaded areas overlaid onto graspdata). The video screen shot labelled b shows video data of the grasp
during the same trial recorded from the video camera positionedbehind the block. The graph labelled c displays the positionalinformation of the gaze data, as represented by the scatterplotssuperimposed onto a 2-D schematic of the block. Note that thedimensions of the schematic block can be specified to correspond tothe dimensions of the actual block used in the experiment
Behav Res (2011) 43:399–408 403

maximum) velocity and then decelerate as their handapproaches the object to be grasped. Once the grasp is over,a new velocity peak will be seen as the hand travels back toits “home” position. From the velocity profiles, BIRA allowstraditional reach kinematics to be observed. As examples, theaverage onset time to start of the hand movement of allparticipants in all blocks was found to be 0.7 ± 0.05 s, andthe average peak velocity was 0.48 ± 0.02 m/s.
Gaze fixations
The detected first fixation locations are plotted in Fig. 7.The locations of the first fixations fell along the verticalmidline of the object, with no significant difference inlaterality across blocks [F(2, 4) = 0.043, p > .05]. Thevertical position shifted upwards as block size increased[F(2, 4) = 18.599, p < .01]. This behaviour is consistentwith measurements observed outside the MRI environmentin previous work in our laboratory (Desanghere & Marotta,2008).
Eye–hand interactions
In order to demonstrate the advantages of BIRA’s capabil-ities to integrate independent eye and hand data duringanalysis, we overlaid plots of the fixation and grasplocations from a single participant during grasping of Block2 (Fig. 8). In general, the participant’s first fixation waslocated near the midline of the object and the grasp site ofindex finger. The mean fixation location was 2.8 mm fromthe horizontal centre of the block and 28.2 mm from thevertical midline (1.8 mm from the top edge of the block).The mean horizontal values of index finger placement onBlock 2 were found to be 11.2 mm left of the middle by theShapeClaw and 2.8 mm left of the midline of the object by
the video. Grasp stability was determined by the distancefrom the mean grasp line to the centre of mass (COM) ofBlock 2. The distance of the mean grasp line from the COMof Block 2 obtained by the ShapeClaw (indicated by thesolid line in Fig. 8) was 3.0 mm left of the COM, whereasthe mean grasp line obtained through measurements madeusing the video (indicated by the dashed line in Fig. 8) was0.9 mm to the right of the COM.
We also used BIRA to analyse the time course ofsynchronized eye position and grip aperture data obtainedfrom one typical trial (Fig. 9). These synchronized datashow the participant open her eyes and make a saccadewithin the first second of the trial, followed by eye fixationduring the reach and grasp. Grip aperture data show thatmaximum grip aperture was 91 mm (B in Fig. 9) atapproximately 1,800 ms from the start of the trial, and
Fig. 4 A representative plot of grip aperture over the course of one trial. In BIRA, a data point can be selected and the corresponding videoreviewed frame-by-frame. In the figure, screen shots of the video are overlaid onto the plot with the time point identified
0
20
40
60
80
100
120
140
160
1 2 3
Gri
p A
per
ture
(m
m)
Block
Mean Maximum Grip Aperture
Fig. 5 Mean maximum grip apertures obtained during grasping ofBlocks 1, 2, and 3. These results show scaling of maximum gripapertures as a function of block height. Error bars indicate standarderrors
404 Behav Res (2011) 43:399–408

aperture during grasping of the block was 49 mm from2,400 to 3,400 ms (between C and D in Fig. 9).
Discussion
The present article describes a specialized softwarepackage we developed, the BIRA program, which wasdesigned to record, integrate, and analyse eye and handkinematic data acquired simultaneously from twocommercially available tracking systems, in addition tovideo-based recording. To demonstrate this, we presentedthe available kinematic data in a simple grasping task
conducted with healthy participants. The purpose of thisproof-of-concept experiment was to show the types ofbehavioural information that would be obtainable in anMRI setting. Since the equipment utilized in the presentstudy is commercially available, each of these types ofbehavioural data can already be acquired individually.However, a literature review of reaching and grasping fMRIstudies reveals that they are seldom implemented. Importantly,we present the ability to collect these comprehensivekinematic grasping data using an MRI-friendly method. Thissoftware development provides a novel and exciting way tointegrate these data, allowing for a comprehensive picture ofeye and hand data in an MRI-compatible design.
Time (ms)
Vel
ocity
(m
/s)
Smoothed Velocity
Fig. 6 A typical velocity profile of 1 participant during one grasping trial. The first peak in velocity corresponds to the movement of the handtowards the block. The second peak corresponds to the movement of the hand back to the “home” position
-80
-60
-40
-20
0
20
40
60
80
-80 -60 -40 -20 0 20 40 60 80
Dis
tan
ce (
mm
)
Distance (mm)
First fixation locations
Block 1 first fixations
Block 2 first fixation
Block 3 first fixations
1
3
2
Fig. 7 Plot of all of theobserved first fixation locationsduring grasping of three blocks.Block dimensions are identifiedby the solid outlines. Dashedlines represent vertical andhorizontal midlines. Diamondsrepresent first fixations duringthe presentation of Block 1.Squares represent first fixationsduring the presentation of Block2. Triangles represent the firstfixations during the presentationof Block 3
Behav Res (2011) 43:399–408 405

Our analysis with BIRA revealed hand behaviourconsistent with previous findings from grasping studies(Gentilucci et al., 1991; Jakobson & Goodale, 1991;Jeannerod, 1986; Paulignan et al., 1991). Maximum gripaperture increased with increasing block size. Significant
differences in maximum grip aperture were observedbetween Blocks 1 and 2 and Blocks 1 and 3, but notbetween Blocks 2 and 3. Larger variations were observedduring Blocks 2 and 3, which may be due, in part, to thenature and sensitivity of the ShapeClaw equipment. We
-40
-30
-20
-10
0
10
20
30
40
50
60
-60 -50 -40 -30 -20 -10 0 10 20 30 40 50 60
Dis
tan
ce (m
m)
Distance (mm)
First fixations and grasp data during block 2
First fixations
Mean first fixation
Video hand data
Mean video grasp line
Shapeclaw hand data
Mean ShapeClaw grasp line
Fig. 8 Eye and hand kinematic data acquired from 10 grasps of Block 2from a representative participant. Block 2 is represented by therectangular 2-D schematic outline. First fixations for each grasp areshown by the individual grey circles. Mean fixation position is indicatedby the black circle. Index finger and thumb locations for each grasp asdetermined by video data are represented by the diamonds. Index finger
and thumb locations for each grasp as determined by ShapeClaw data arerepresented by the grey squares. The mean grasp lines, derived bydrawing a line connecting the mean index finger position with the meanthumb position on the block, are shown. The dashed line indicates themean grasp line of the video data, and the solid line indicates the meangrasp line of the ShapeClaw data
A
B
C D
E
Fig. 9 Plot of eye position andgrip aperture with respect totime from one typical trial. Amedian filter was applied to thedata. The blue-coloured scale onthe left ordinate axis measuresgrip aperture (blue line plot) inmillimetres. Events of handbehaviour during the trial arelabelled as (a) the start of handmovement, (b) maximum gripaperture, (c) grasp of the block,(d) release of the block, and (e)return of hand to the “home”position. The green- and red-coloured scales on the rightordinate axis measure horizontaleye position (green line plot)and vertical eye position(red line plot) in a coordinatesystem with 0, 0 representingthe centre of the block. Shadedregions indicate fixations of theeye position
406 Behav Res (2011) 43:399–408
found ShapeClaw measurements of aperture during graspingof the block (a final aperture that should be equal to blocksize) to be generally within 20 mm (data not shown). Thisfinding can be explained by the structure of the ShapeClaw,with tapelets sitting on the superior surface of the indexfinger and thumb and held in place by a golf glove. This iswhy, in Fig. 8, index finger positions appear 10–20 mmabove the block, since the coordinate is taken from above theindex finger. It follows, therefore, that this measurement isinfluenced by hand shaping. For example, if a block isgrasped by the edge so that the index finger tilts up, thecoordinate will have a greater y value than if the participantclamps down on the block. However, in the exampleprovided in Fig. 8, the lateral positions of the index fingeraccording to the ShapeClaw measurements and theirverification on video are within 8 mm of each other. Fromthese trials, we determined that the data from theShapeClaw are very sensitive to finger position. One ofthe advantages of BIRA is the ability to modify theequipment utilized. With the development of newtechnologies, the program can be adapted without havingto replace all components of the experimental setup (i.e.,the eye-tracking and video equipment).
Inspection of the eye kinematic data revealedbehaviour consistent with our recent behavioural studyinvestigating gaze strategies while grasping (Desanghere& Marotta, 2008). We have previously demonstrated thatfirst fixations land near the superior midline of an objectprior to hand placement, with subsequent fixationsdrifting downwards. When we examine eye behaviouracross the whole trial in conjunction with hand behaviour,we can observe the gaze direction drifting downwardsafter the grasp (Fig. 8). This analysis is a demonstration ofBIRA’s ability to integrate eye and hand data. WithoutBIRA software, these two sets of kinematic data would beevaluated separately and would be subject to timingerrors. BIRA software easily plots both hand and eyekinematic information together to allow for a comprehen-sive view of behaviour.
Even though the eye- and hand-tracking systems weused in the present study could be utilized individually andthe data they obtain analysed independently, BIRA offers areadily available system for integrating and analysing datafrom any tandem of eye- and hand-tracking systems. Theuse of this multimodal approach allows for the constructionof more comprehensive behavioural information, as illus-trated in Figs. 8 and 9. Even though this study design hadbeen widely available in a lab setting, to the best of ourknowledge such a detailed approach has not been utilized inan MRI environment. The present report is the first step inaddressing this gap, by describing the development ofsoftware that makes the execution of these studies easier,using available independent systems.
The development of software that uses independentmotion-tracking systems offers further advantages. First,it allows laboratories to utilize their existing motion-tracking equipment. Second, it allows for replacement ofany of the individual motion-tracking systems as moreadvanced equipment becomes available. For example, oureye-tracking system only offers monocular tracking andrequires attaching an additional mirror to the head coil.However, BIRA can easily be adapted to record data froma binocular eye-tracking system.
In addition to being easily adaptable to other trackingsystems, BIRA offers several other advantages forvisuomotor research. BIRA is a freely available (www.perceptionandaction.com), easy-to-learn system. It is userfriendly, with a “point-and-click” graphical interface, anddoes not require any background in computer program-ming. However, BIRA’s code is open source, allowingresearchers to customize BIRA to meet their specificresearch needs (e.g., adding more kinematic parametersand analyses), and these modifications can be sharedamongst the research community. Further, BIRA can runon a common PC laptop, so its portability is only limitedby the laboratory’s tracking systems. The versatility ofBIRA lends itself to a much broader range of applications.For example, BIRA can be used with portable eye- andhand-tracking monitors in non-MRI, applied visuomotorstudies outside the laboratory environment (e.g., eye–handcoordination in a driving task). Furthermore, the experi-mental setup can be modified for the integration ofalternative or additional equipment to expand the applica-tions that BIRA could be used for. In the present setup, amodified golf glove was used to secure the ShapeClawtapelets to the superior surface of the index finger andthumb. With a simple modification to the glove so that theinferior surfaces of the finger tips are exposed, inves-tigations of the influence of tactile input on motor controlcould also be advanced using the BIRA paradigm.
Notwithstanding other potential experimental applica-tions, BIRA is perfectly suited for fMRI research onvisuomotor behaviour. As MRI-compatible eye- andhand-tracking systems become more common, fMRIresearch will benefit from this kind of integrativemethod of recording and analysing gaze and kinematicdata from separate tracking systems. BIRA’s integrativemethod offers additional sophisticated gaze and handanalyses over existing, equipment-specific software,which can complement fMRI analysis. For example,BIRA’s enhanced analyses allow one to eliminatepotential confounds of gaze and hand data that mightelicit significant differences in brain activation betweenexperimental conditions. Moreover, the gaze and kine-matic data obtained by BIRA can be entered ascovariates in a general linear model.
Behav Res (2011) 43:399–408 407

Conclusion
In the present article, we demonstrated a novel softwareprogram that records, integrates, and analyses reliable eye–hand kinematic data. Future studies will assess the benefits ofusing BIRA for the analysis of fMRI studies of reaching andgrasping. The application of such a multimodal approach willprovide a more comprehensive method for studying visuomo-tor control and the function of the underlying neural networks.
Author Note This work was supported by a Natural Sciences andEngineering Research Council of Canada (NSERC) Research Toolsand Instruments Grant and a Canada Foundation for Innovation (CFI)New Opportunities Grant to J.J.M. J.M.L. is supported by a MHRCresearch fellowship. B.P.M., L.D., and L.A.B. are recipients of MHRCgraduate studentships. We gratefully acknowledge Kris Malisza andthe National Research Council, Institute for Biodiagnostics, for the useof their mock MRI scanner.
Appendix
Calibrating ShapeClawShapeClaw (Measureand, Fredricton, NB) is a fibre-optic-
based hand motion-tracking system. ShapeClaw consists offibre-optic cables set in two flexible ribbons. The ShapeClawribbons are secured to the participant’s index finger and thumbby a special glove and run up the entire length of the arm (shownin Fig. 1A). ShapeClaw captures the position and movement ofthe index finger and thumb, including the orientation andposition of the hand and forearm. ShapeClaw’s calibration wasperformed using its native software, the ShapeRecorderprogram. We describe the calibration procedure below.
ShapeClaw was first calibrated in the “flat tape” positionwith the ShapeClaw ribbons laid completely flat on the floor.The ShapeClaw was then affixed to the participant using thespecial glove and arm straps. In addition to the arm strapsprovided with the ShapeClaw, we also used a nylon armbandthat covered the whole length of the arm, to further ensure thatthe ShapeClaw ribbons were secured to the participant. Prior tocalibration, measurements of the participant’s hand width, wristwidth, wrist thickness, arm length, finger and thumb lengths,shoulder breadth, and body girth were entered into Shape-Recorder. ShapeRecorder co-registered these anatomicalmeasurements with the length and position of the ShapeClawribbons when they were attached to the participant’s hand andarm. ShapeClaw was then calibrated at different hand andfinger positions. The sequence of hand/finger positions washand palm with fingers straight, closed fist, fingers splayed,fingers flat with thumb pointing downward, wrist bent up, wristbent down, and thumb touching index finger. All positions weredone with the arm straight at the participant’s side. In an effortto ensure reliable grasp data during data collection, we repeatedthe calibration sequence before each block of trials.
References
Abramoff, M. D., Magelhaes, P. J., & Ram, S. J. (2004). Imageprocessing with ImageJ. Biophotonics International, 11, 36–42.
Brainard, D. H. (1997). The psychophysics toolbox. Spatial Vision, 10,433–436.
Carey, D. P., Della Sala, S., & Ietswaart, M. (2002). Neuropsychologicalperspectives on eye–hand coordination in visually-guided reaching.Progress in Brain Research, 140, 311–327.
Culham, J. C., Cavina-Pratesi, C., & Singhal, A. (2006). The role ofparietal cortex in visuomotor control: What have we learned fromneuroimaging? Neuropsychologia, 44, 2668–2684.
Culham, J. C., Danckert, S. L., DeSouza, J. F., Gati, J. S., Menon, R.S., & Goodale, M. A. (2003). Visually guided grasping producesfMRI activation in dorsal but not ventral stream brain areas.Experimental Brain Research, 153, 180–189.
Desanghere, L., & Marotta, J. J. (2008). Gaze strategies while grasping:What are you looking at?! [Abstract]. Journal of Vision, 8(6), 495a.
Diedrichsen, J., Hashambhoy, Y., Rane, T., & Shadmehr, R. (2005).Neural correlates of reach errors. The Journal of Neuroscience, 25,9919–9931.
Gentilucci, M., Castiello, U., Corradini, M. L., Scarpa, M., Umiltà, C., &Rizzolatti, G. (1991). Influence of different types of grasping on thetransport component of prehension movements. Neuropsychologia,29, 361–378.
Glover, S. (2004). Separate visual representations in the planning andcontrol of action. The Behavioral and Brain Sciences, 27, 3–24.
Grefkes, C., Ritzl, A., Zilles, K., & Fink, G. R. (2004). Human medialintraparietal cortex subserves visuomotor coordinate transforma-tion. Neuroimage, 23, 1494–1506.
Jakobson, L. S., & Goodale, M. A. (1991). Factors affecting higher-order movement planning: A kinematic analysis of humanprehension. Experimental Brain Research, 86, 199–208.
Jeannerod, M. (1986). The formation of finger grip during prehension:A cortically mediated visuomotor pattern. Behavioural BrainResearch, 19, 99–116.
Levy, I., Schluppeck, D., Heeger, D. J., & Glimcher, P. W. (2007).Specificity of human cortical areas for reaches and saccades. TheJournal of Neuroscience, 27, 4687–4696.
Marotta, J. J., Mraz, R., Black, S. E., & Graham, S. J. (2007). AnfMRI investigation of grasping in the elderly and in stroke.Neuroimage, 36, S51.
Ogawa, K., Inui, T., & Sugio, T. (2006). Separating brain regionsinvolved in internally guided and visual feedback control ofmoving effectors: An event-related fMRI study. Neuroimage, 32,1760–1770.
Paulignan, Y., Jeannerod, M., MacKenzie, C., & Marteniuk, R.(1991). Selective perturbation of visual input during prehensionmovements: 2. The effects of changing object size. ExperimentalBrain Researc, 87, 407–420.
Pelli, D. G. (1997). The VideoToolbox software for visualpsychophysics: Transforming numbers into movies. SpatialVision, 10, 437–442.
Rocca, M. A., Gatti, R., Agosta, F., Tortorella, P., Riboldi, E.,Broglia, P., et al. (2007). Influence of body segment positionduring in-phase and antiphase hand and foot movements: Akinematic and functional MRI study. Human Brain Mapping,28, 218–227.
Salvucci, D. D., & Goldberg, J. H. (2000). Identifying fixations andsaccades in eye-tracking protocols. In Proceedings of the 2000symposium on eye tracking research and applications symposium(pp. 71–78). New York: ACM Press.
Schaechter, J. D., Stokes, C., Connell, B. D., Perdue, K., &Bonmassar, G. (2006). Finger motion sensors for fMRI motorstudies. Neuroimage, 31, 1549–1559.
408 Behav Res (2011) 43:399–408