a New Perspective on the Evolution of Flowering Plant Seeds
133
Reproduction and Seed Development in the Water Lily Nymphaea Thermarum – a New Perspective on the Evolution of Flowering Plant Seeds Citation Povilus, Rebecca Ann. 2017. Reproduction and Seed Development in the Water Lily Nymphaea Thermarum – a New Perspective on the Evolution of Flowering Plant Seeds. Doctoral dissertation, Harvard University, Graduate School of Arts & Sciences. Permanent link http://nrs.harvard.edu/urn-3:HUL.InstRepos:42061466 Terms of Use This article was downloaded from Harvard University’s DASH repository, and is made available under the terms and conditions applicable to Other Posted Material, as set forth at http:// nrs.harvard.edu/urn-3:HUL.InstRepos:dash.current.terms-of-use#LAA Share Your Story The Harvard community has made this article openly available. Please share how this access benefits you. Submit a story . Accessibility
-
Upload
khangminh22 -
Category
Documents
-
view
1 -
download
0
Transcript of a New Perspective on the Evolution of Flowering Plant Seeds
Reproduction and Seed Development in the Water Lily Nymphaea Thermarum – a New Perspective on the Evolution of Flowering Plant Seeds
CitationPovilus, Rebecca Ann. 2017. Reproduction and Seed Development in the Water Lily Nymphaea Thermarum – a New Perspective on the Evolution of Flowering Plant Seeds. Doctoral dissertation, Harvard University, Graduate School of Arts & Sciences.
Permanent linkhttp://nrs.harvard.edu/urn-3:HUL.InstRepos:42061466
Terms of UseThis article was downloaded from Harvard University’s DASH repository, and is made available under the terms and conditions applicable to Other Posted Material, as set forth at http://nrs.harvard.edu/urn-3:HUL.InstRepos:dash.current.terms-of-use#LAA
Share Your StoryThe Harvard community has made this article openly available.Please share how this access benefits you. Submit a story .
Accessibility
Reproduction and Seed Development in the Water Lily Nymphaea thermarum –
a New Perspective on the Evolution of Flowering Plant Seeds
A dissertation presented
by
Rebecca Ann Povilus
to
The Department of Organismic and Evolutionary Biology
In partial fulfillment of the requirements
for the degree of
Doctor of Philosophy
in the subject of
Biology
Harvard University
Cambridge, Massachusettes
July 2017

© 2017 Rebecca Ann PovilusAll rights reserved.
iii
Dissertation Advisor: Professor William Friedman Rebecca Ann Povilus
Reproduction and Seed Development in the Water Lily Nymphaea thermarum –
a New Perspective on the Evolution of Flowering Plant Seeds
Abstract
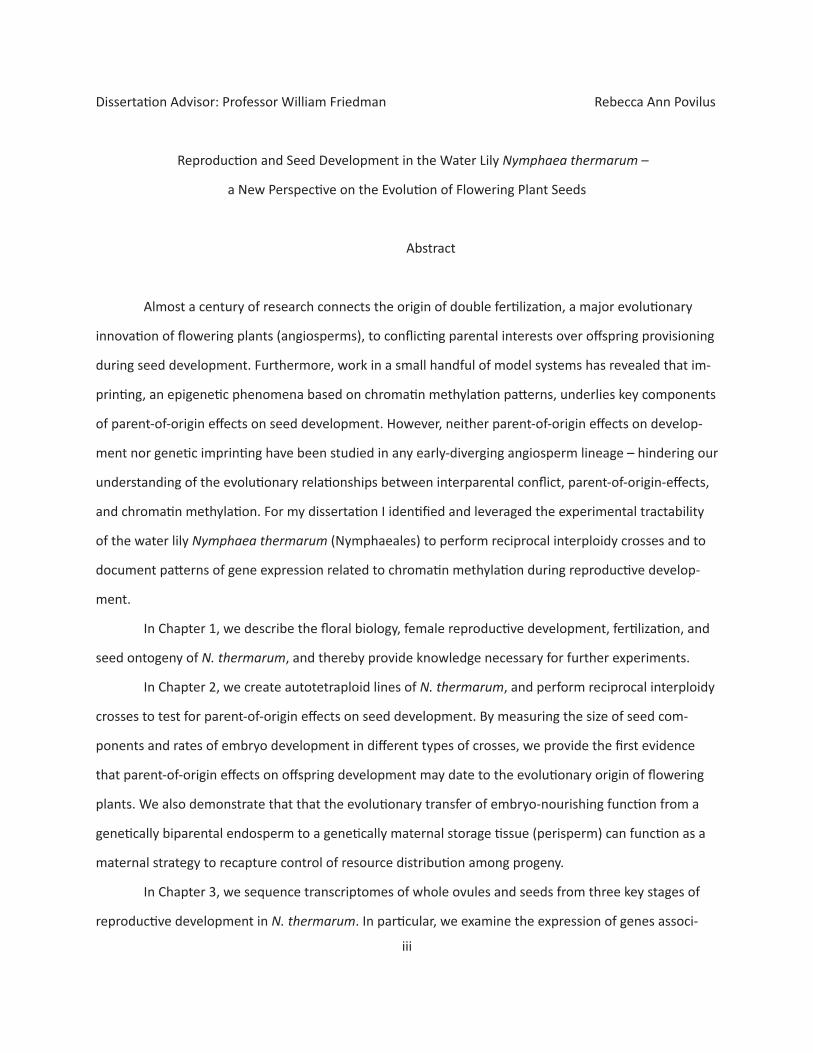
Almost a century of research connects the origin of double fertilization, a major evolutionary
innovation of flowering plants (angiosperms), to conflicting parental interests over offspring provisioning
during seed development. Furthermore, work in a small handful of model systems has revealed that im-
printing, an epigenetic phenomena based on chromatin methylation patterns, underlies key components
of parent-of-origin effects on seed development. However, neither parent-of-origin effects on develop-
ment nor genetic imprinting have been studied in any early-diverging angiosperm lineage – hindering our
understanding of the evolutionary relationships between interparental conflict, parent-of-origin-effects,
and chromatin methylation. For my dissertation I identified and leveraged the experimental tractability
of the water lily Nymphaea thermarum (Nymphaeales) to perform reciprocal interploidy crosses and to
document patterns of gene expression related to chromatin methylation during reproductive develop-
ment.
In Chapter 1, we describe the floral biology, female reproductive development, fertilization, and
seed ontogeny of N. thermarum, and thereby provide knowledge necessary for further experiments.
In Chapter 2, we create autotetraploid lines of N. thermarum, and perform reciprocal interploidy
crosses to test for parent-of-origin effects on seed development. By measuring the size of seed com-
ponents and rates of embryo development in different types of crosses, we provide the first evidence
that parent-of-origin effects on offspring development may date to the evolutionary origin of flowering
plants. We also demonstrate that that the evolutionary transfer of embryo-nourishing function from a
genetically biparental endosperm to a genetically maternal storage tissue (perisperm) can function as a
maternal strategy to recapture control of resource distribution among progeny.
In Chapter 3, we sequence transcriptomes of whole ovules and seeds from three key stages of
reproductive development in N. thermarum. In particular, we examine the expression of genes associ-

iv
ated with chromatin methylation – processes known to be essential for parent-of-origin effects on seed
development in other angiosperms. We find evidence for a dynamic chromatin methylation landscape
during reproductive development. However, genes involved in establishing, maintaining, and removing
methylation marks associated with genetic imprinting show a mix of conserved and unique expression
patterns between N. thermarum and other angiosperms, providing perspective on how the regulation of
imprinting has changed throughout angiosperm evolution.

v
Table of Contents
Page i Title Page
ii Copyright Page
iii Abstract
v Table of Contents
vi Acknowledgements
1 Dissertation
1 Introductory Chapter
15 Chapter 1
51 Chapter 2
72 Chapter 3
111 Appendix: Supplementary Material
112 Chapter 2 Supplementary Material
124 Chapter 3 Supplementary Material

vi
Acknowledgements
Beyond my coauthors, graduate committee members, and the individuals and entities men-
tioned in the acknowledgements at the end of each chapter, I would like to thank the many individuals
who offered timely moral support and/or who were especially generous with their time in teaching me
the techniques essential to completing my dissertation work. In particular, this includes Julien Bachelier,
Robert L. Baker, Stephanie Conway, Michael Brent Hawkins, Laura Lagomarsino, Juan Losada, and Lache-
zar Nikolov. Finally, I would like to thank my husband, Jonathan Allen Kittel, for his relentless support dur-
ing my graduate studies; I look forward to returning the favor.
1
Introductory Chapter
Seeds are complex structures that fulfill several functions - they house the embryo that is next
sporophyte generation, contain nutrients to fuel germination and early seedling growth, and protect the
embryo and nutrients until germination. Remarkably, these functions are carried out via the coordinated
development of multiple seed components. The seeds of angiosperms (flowering plants) are particularly
complex, in that they contain the products of two separate fertilization events: the embryo and the en-
dosperm. Endosperm is a major evolutionary innovation of angiosperms; in the last common ancestor of
flowering plants and non-flowering seed plants the embryo was surrounded by, and directly dependent
on, the female gametophyte or sporophyte. The evolutionary origin of the endosperm fundamentally
altered the dynamics of resource distribution in a seed, as nutrient flux is no longer simply a matter of
flowing from the mother to an embryo. Endosperm is present in the vast majority of angiosperm lineag-
es (having only been lost when selection favors an extreme reduction in seed size, as for the “dust seeds”
of orchids), suggesting that the presence of endosperm is beneficial. Why endosperm, as an additional
biparental seed component, should increase the fitness of either the parents or offspring has been ques-
tion for botanists and evolutionary biologists ever since the discovery of double fertilization.
The theory of interparental conflict proposes that endosperm became an essential part of an-
giosperm seeds because parents (the maternal and paternal sporophytes) can have different interests in
how maternal resources are distributed among offspring (Charnov 1979; Haig 1987; Smith and Fretwell,
1974;Trivers 1974; Queller 1983). If resources are limited and a mother supports the growth of multiple
seeds that do not necessarily have the same father, then maternal fitness is maximized by distributing
resources among a subset of most-fit offspring. Paternal fitness, in contrast, is maximized by encouraging
resource investment into the seed it has contributed genetic material to. The origin of endosperm can
therefore be interpreted as the insertion of paternal genome into a seed tissue that is able to mediate
the flow of nutrients from a mother to the embryo, and thus provides an additional opportunity for the
paternal interests to influence resource dynamics. Both the embryo and endosperm possess maternal
and paternal genome complements, but the embryo is under high selective pressure to become a func-
tional sporophyte and extreme perturbations to its development should be minimized. Thus, it has been
2
suggested that the evolutionary origin of endosperm is significant because it creates an arena for inter-
parental conflict.
Much of the experimental evidence that provides the foundation for the central role of endo-
sperm in interparental conflict comes from reciprocal interploidy crosses (Haig and Westoby, 1991)(Haig
2013). Interploidy crosses with genetically homogeneous lines are a way to alter the ploidy and the ratio
of maternal and paternal genome complements of the embryo and endosperm, thereby making it pos-
sible to test for parent-of-origin effects on offspring development. Interploidy crosses have been per-
formed using a phylogenetically wide sampling of angiosperms, and common suite of experimental phe-
notypes has emerged. In maternal excess crosses (mother is a tetraploid, father is a diploid), endosperm
proliferation is suppressed, while in paternal excess crosses (mother is a diploid, father is a tetraploid),
endosperm proliferation is promoted. Since endosperm influences embryogenesis (Hehenberger et al.,
2012; Lafon-Placette and Köhler, 2014), nutrient acquisition (Zhang et al., 2007), and seed coat matura-
tion (Ingouff et al., 2006), changes to endosperm development can profoundly impact seed development
as a whole.
Work in Arabidopsis, maize, and rice has revealed that genetic imprinting, via chromatin methyl-
ation marks on maternal or paternal alleles underlies key parent-of-origin effects on endosperm develop-
ment (Haig and Westoby, 1991; Köhler et al., 2012; Gehring and Satyaki, 2017). While the consistency of
parent-of-origin effects on endosperm development across a phylogenetically broad sampling suggests
that interparental conflict may be a fundamental component to endosperm development, the mecha-
nisms by which imprinting occurs appears to vary between the relatively small number of monocots and
eudicots which have been studied (Springer et al., 2002; Butenko and Ohad, 2011; Gleason and Kramer,
2012; Köhler et al., 2012; Haig 2013; Jiang and Ramachandran, 2016; Gehring and Satyaki, 2017). The
question then becomes, what is the evolutionary relationship between interparental conflict, parent-of-
origin effects on seed development, and imprinting via chromatin methylation?
Studies have begun to synthesize information from monocots and eudicots (Springer et al., 2002;
Butenko and Ohad, 2011; Köhler et al., 2012; Haig 2013; Jiang and Ramachandran, 2016; Gehring and
Satyaki, 2017), but information from the early-diverging angiosperm lineages (those whose origins pre-
dates the divergence of monocots and eudicots) is needed to provide an complete evolutionary perspec-
tive. However, parent-of-origin effects on seed development has not been studied in any member of an
3
early-diverging angiosperm lineage, either via interploidy crosses or by characterizing imprinting-related
methylation dynamics. For my dissertation I identify and leverage the experimental tractability of the
water lily Nymphaea thermarum (a member of the most ancient angiosperm lineages, the Nymphaeales)
to address whether the relationships between interparental conflict, parent-of-origin-effects on seed
development, and chromatin methylation predate the divergence of monocots and eudicots.
This Introductory Chapter describes key concepts in the development and diversity of angio-
sperm seeds, summarizes results from almost 100 years of reciprocal interploidy crosses, reviews the
current model for how imprinting-related chromatin methylation patterns are regulated, and finally
introduces N. thermarum as a new ‘model organism’ for studying angiosperm evolution. Chapter 1 pro-
vides a comprehensive description of floral biology, female reproductive development, and seed devel-
opment in N. thermarum – providing a knowledge base for subsequent chapters. Chapter 2 involves the
creation of autotetraploid lines of N. thermarum and their use (along with and diploid lines) to preform
reciprocal interploidy crosses. Finally, in Chapter 3, RNA-seq datasets for three key stages of seed devel-
opment in N. thermarum are generated and analyzed, with a particular focus on the activity of genes
known to regulate chromatin methylation.
Typicalontogenyofendospermandseeddevelopmentinangiosperms,andothervariations
Most flowering plants have triploid endosperm that undergoes free-nuclear development. For
these species, the second fertilization event involves one haploid sperm nucleus fusing with the diploid
central cell nucleus. The central cell is diploid due to the partitioning of two haploid nuclei into a single
cell during female gametophyte development. Soon after double fertilization to create biparental em-
bryo and endosperm, the endosperm begins to expand and undergo free-nuclear divisions. During this
syncytial phase of endosperm development, embryo development is relatively quiescent. Also during
this time, the surrounding maternal sporophytic tissues remaining from the ovule are either replaced
by endosperm expansion (as can be true for the nucellus) or develop to accommodate the growing
endosperm (as with the integuments). The syncytial phase of endosperm development is known to be
important for drawing resources into the seed, with suggestions that the large central vacuole of the
endosperm syncytium functions as a powerful nutrient sink (Zhang et al., 2007).
However, at some point during development cell walls are formed and partition the endosperm
4
nuclei into separate cells. Besides marking the beginning of cellular endosperm divisions, endosperm
cellularization is also known to be an important checkpoint for embryo development: where it has been
studied, morphological development of the embryo does not procced past a certain stage until the endo-
sperm has cellularized (Hehenberger et al., 2012; Lafon-Placette and Köhler, 2014). During and after cel-
lularization, the endosperm typically differentiates into distinct regions (such as micropylar and chalazal
domains). Meanwhile, the expansion of the embryo begins to replace space previously occupied by the
endosperm. The degree of embryo growth and development is highly variable, as is the further develop-
ment of the endosperm. In species where the endosperm is the site of nutrient storage, embryo devel-
opment is either arrested at an early stage and/or the embryo is relatively small, and the endosperm
cells fill with nutrient reserves. In species where nutrients are stored in the embryo, continued growth
and morphogenesis of the embryo eventually displaces the majority of the endosperm.
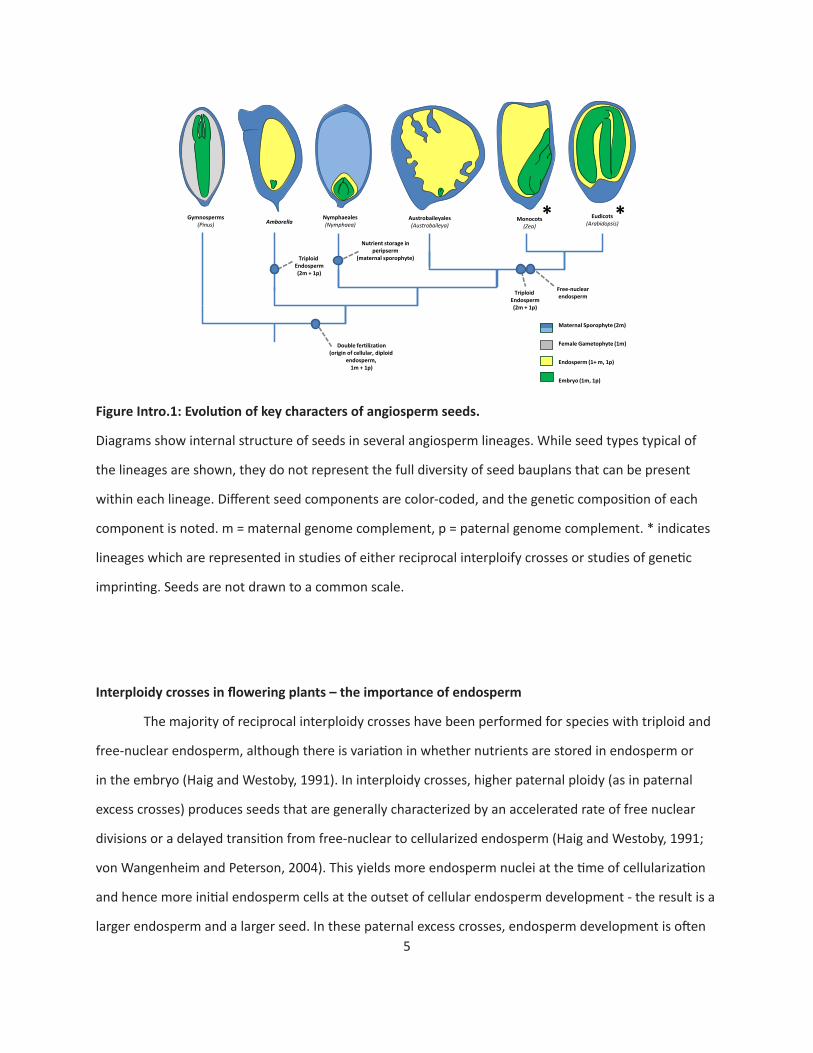
While this describes the most common mode of seed development in angiosperms, it by no
means represents the full spectrum of structural and genetic variation in how seeds are constructed
[Macheshwari 1950). In particular, both free-nuclear endosperm and triploid endosperm are understood
to be derived characters for angiosperm (Floyd and Friedman, 2000; Geeta 2002; Williams and Friedman,
2002; Friedman and Ryerson, 2009)(Figure Intro.1). Most of the early-diverging lineages are character-
ized by diploid (Nymphaeales, Austrobaileyales) and/or cellular (Amborella, Nymphaeales, Austrobailey-
ales) endosperm. In addition, in these early-diverging lineages plus magnollids, it is more common for
nutrients to be stored in either the endosperm or a tissue derived from the maternal sporophyte, but
not in the embryo (Losada et al., 2017). The Nymphaeales in particular is characterized by a unique suite
of seed characters: a diploid, cellular endosperm, with nutrients stored in a tissue called the perisperm
(which is derived from the maternal sporophyte).
5
Maternal Sporophyte (2m)
Female Gametophyte (1m)
Endosperm (1+ m, 1p)
Embryo (1m, 1p)
Gymnosperms (Pinus) Amborella
Nymphaeales (Nymphaea)
Austrobaileyales (Austrobaileya)
Monocots (Zea)
Eudicots (Arabidopsis)
Double fertilization (origin of cellular, diploid
endosperm, 1m + 1p)
Triploid Endosperm (2m + 1p)
Triploid Endosperm (2m + 1p)
Free-nuclear endosperm
Nutrient storage in peripserm
(maternal sporophyte)
* *
FigureIntro.1:Evolutionofkeycharactersofangiospermseeds.
Diagrams show internal structure of seeds in several angiosperm lineages. While seed types typical of
the lineages are shown, they do not represent the full diversity of seed bauplans that can be present
within each lineage. Different seed components are color-coded, and the genetic composition of each
component is noted. m = maternal genome complement, p = paternal genome complement. * indicates
lineages which are represented in studies of either reciprocal interploify crosses or studies of genetic
imprinting. Seeds are not drawn to a common scale.
Interploidycrossesinfloweringplants–theimportanceofendosperm
The majority of reciprocal interploidy crosses have been performed for species with triploid and
free-nuclear endosperm, although there is variation in whether nutrients are stored in endosperm or
in the embryo (Haig and Westoby, 1991). In interploidy crosses, higher paternal ploidy (as in paternal
excess crosses) produces seeds that are generally characterized by an accelerated rate of free nuclear
divisions or a delayed transition from free-nuclear to cellularized endosperm (Haig and Westoby, 1991;
von Wangenheim and Peterson, 2004). This yields more endosperm nuclei at the time of cellularization
and hence more initial endosperm cells at the outset of cellular endosperm development - the result is a
larger endosperm and a larger seed. In these paternal excess crosses, endosperm development is often
6
so perturbed that seed filling is disrupted or seeds are aborted. Conversely, the effect of relatively higher
maternal ploidy is precocious endosperm cellularization or a slower rate of nuclear division, leading to
fewer initial endosperm nuclei and cells at the onset of cellular development. Ultimately, this produces
smaller endosperm and smaller seeds. Studies in maize have explicitly demonstrated that it is changes to
the ratio of maternal to paternal genome complements, rather than total ploidy, that triggers these de-
velopmental responses (Lin 1984). The evolutionary transition from free-nuclear to cellular endosperm
can therefore been viewed as an important character for how the effects of altered parental genome
dosage become apparent during seed development (Haig and Westoby, 1991; Gehring and Satyaki,
2017).
Changes to the ontogeny of the endosperm then echo throughout the rest of seed develop-
ment. For example, endosperm cellularization is important for the advancement of embryo development
in Arabidopsis (Hehenberger et al., 2012; Lafon-Placette and Köhler, 2014), as embryo development is
often impaired or altogether arrested in paternal-excess crosses (Scott et al., 1998). In other species,
early endosperm cellularization in maternal-excess crosses appears to trigger early advancement of
embryo morphogenesis (rice (Zhang et al., 2016), Brassica (Stoute et al., 2012)). These developmentally
advanced embryos can, counterintuitively, be smaller at the time of seed maturity (Scott et al., 1998); in
some seeds, the maximum size of the endosperm (which would be smaller due to early cellularization) is
an important determinant of maximum embryo size. Unfortunately, embryo growth (changes to size) and
morphogenesis (changes to form) are not always reported separately in interploidy-cross studies, which
can lead to inconsistencies in how effects on the embryo are discussed.
Interploidy crosses have also been performed for a few taxa with either diploid or cellular
endosperm, but none have been performed for any species with both diploid and cellular endosperm,
nor for any species with perisperm (Haig and Westoby, 1991; von Wangenheim and Peterson, 2004).
Oenothera hookeri has diploid, free-nuclear endosperm, and both positive effects of higher paternal
ploidy and negative effect of higher maternal ploidy were found for endosperm nuclei/cell number (von
Wangenheim 1962). Galeopsis pubescens (Håkansson 1952), Datura stramonium (Sansome et al., 1942),
Solanum pimpinellifolium (Cooper and Brink, 1945), and S. acaule (von Wangenheim 1957) have cellular
endosperm, and paternal-excess seeds in these interploidy crosses were characterized by high rates of
endosperm failure and seed abortion during early development. Interestingly, von Wangenheim (von
7
Wangenheim 1957) observed an initial free-nuclear phase of endosperm development in paternal-excess
crosses in S. acaule. Seed set was typically less severely impacted in the maternal-excess crosses, in
which endosperm proliferation was consistently repressed. Altogether, the effects of higher maternal
and paternal ploidy in these crosses (with diploid or cellular endosperm) are fundamentally similar to
crosses in species with triploid, free-nuclear endosperm. This suggests that endosperm development is
still the primary arena of the relationship between parental genome complements in species with diploid
or cellular endosperm, and that neither free-nuclear endosperm development nor triploid endosperm is
actually required for parent-of-origin effects on offspring development to occur. If true, then it is pos-
sible that interparental conflict could be influencing seed development in the early-diverging angiosperm
lineages, whose origins predate the evolution of free-nuclear or triploid endosperm (Figure Intro.1).
Imprintingviachromatinmethylationunderliesparent-of-origineffectsonseeddevelopment
Interploidy crosses with genetically homogenous lines make it clear that parent-of-origin of
genetic material matters for development, and so there must be an underlying molecular mechanism
that allows otherwise identical parental alleles to be transcriptionally distinguished from one another
(Haig and Westoby, 1991). Studies of Arabidopsis and a small number of monocots have revealed that
genetic imprinting is the underlying mechanism of parent-of-origin effects on seed development. Im-
printing involves the establishment, maintainance, and removal of DNA and histone methylation marks
during gamete development, which are carried through fertilization (Gehring and Satyaki, 2017). Im-
portantly, patterns or levels of DNA methylation differ between gametes – for example, the egg cell is
globally hypermethylated while the central cell is globally hypomethyled (Gutiérrez-Marcos et al., 2006).
Methylation patterns also differ between male and female gametes (Trasler, 2006). After fertilization, the
establishment and editing of histone methylation marks can occur at specific loci. Since methylation of
DNA and histones at a locus can affect the expression of that locus, an otherwise identical allele can be
expressed differently, depending on whether it came from a male or female gamete (Zilberman et al.,
2006). Interestingly, some of the components of processes that control histone methylation are them-
selves imprinted, often such that they are expressed only from the maternal allele (Gehring and Satyaki,
2017).
The genes and processes involved in chromatin methylation during reproductive development
8
are best understood in Arabidopsis. DNA methylation occurs in different contexts, via the action of
different DNA cytosine methyltransferases (Sharma et al., 2009; Gehring and Satyaki, 2017). CHROMO-
METHYLASE proteins (CMT) establish and maintain methylation in the CNG context, while members of
the DNA METHYLTRANSFERASE family (MET) maintain CG methylation. In balance with maintenance of
methylation marks, the DNA glycosylase DEMETER (DME) removes methylation established by MET1
[35]. Members of these three families are active during gamete formation, and through the early stages
of seed development [34]. The POLYCOMB REPRESSIVE COMPLEX 2 (PRC2) is comprised of MEDEA
(MEA), FERTILIZATION-INDEPENDENT SEED2 (FIS2), FERTILIZATION-INDEPENDENT ENDOSPERM (FIE), and
MULTICOPY SUPRESSOR OF IRA1 (MSI1), and trimethylates histone H3 on lysine 2 (a mark primarily as-
sociated with transcriptional silencing). PRC2 activity is important for regulating the expression of genes
during endosperm development and function. For example, in Arabidopsis PHERES (PHE1) is under the
control of both DME-mediated DNA methylation and PRC2-mediated histone methylation, and controls
the onset of the free-nuclear to cellular transition during endosperm development (Köhler et al., 2012;
Gehring and Satyaki, 2017) – a key aspect of the experimental phenotypes observed during reciprocal
interploidy crosses.
While chromatin methylation dynamics are associated with genetic imprinting and parent-of-
origin effects on gene expression, DNA and histone methylation are involved in other processes during
reproductive development. For example, the RNA-directed DNA methylation (RdDM) is responsible for
repressing transposon activity in the egg cell and embryo (Ingouff et al., 2017), but has not been shown
to be important for genetic imprinting (Köhler et al., 2012). However, our understanding of how imprint-
ing-related chromatin methylation is regulated during reproductive development is far from complete in
any model system. Additional, yet undiscovered, genes and processes may be important – a point high-
lighted by some of the differences between PRC2 activity in Arabidopsis, other eudicots (Gleason and
Kramer, 2012), and monocots like Oryza sativa (rice; Nallamilli et al., 2013; Furihata et al., 2016). There is
little evidence that PRC2 as a whole is important for seed development in rice, yet imprinting occurs via
histone-methylation marks in monocots, and impacts endosperm development (Luo et al., 2009; Nalla-
milli et al., 2013). Beyond building more complete models of how chromatin methylation is regulated in
these model systems, understanding methylation dynamics in other species can help identify the evolu-
tionarily conserved, and therefore functionally essential, components of these mechanisms.

9
Nymphaea thermarumasamodelsystemfromwithinanearly-divergingangiospermlineage.
The study of early-diverging lineages is necessary to understand the evolution of angiosperm
reproductive biology. A recent resurgence in descriptive work among these lineages has already provided
new perspectives on how reproductive characters evolved in angiosperms (Floyd and Friedman, 2001;
Friedman et al., 2003a; Friedman and Williams, 2003b; Friedman 2006; Friedman et al., 2008; Friedman
and Ryerson, 2009; Rudall et al., 2009; Endress 2010; Bachelier and Friedman, 2011; Friedman et al.,
2012; Losada et al., 2017). However, the vast majority of species within the Amborellales, Nymphaeales,
and Austrobaileyales are not amenable to being used as experimental or genetic model systems. Most
are long-lived trees, shrubs, lianas, or aquatic plants that are difficult to maintain in large numbers and
under conditions necessary for performing controlled pollinations. In addition, genome size within these
lineages can be dauntingly large (for example, the genome of Austrobaileya scandens is estimate to be
>9 Gbp (Leitch and Hanson, 2002)), few genetic resources exist, and no protocols for transient or stable
transformation have been developed for any constituent species. A few species have been suggested for
their potential as model systems (Rudall et al., 2009; Vialette-Guiraud et al., 2011; Bliss et al., 2013), but
they have yet to be adopted for wide-spread use.
A B
Figure Intro.2: Nymphaea thermarum as a tractable model system
Images of N. thermarum, showing habit and reproductive features, as well as growth in a greenhouse.
A) N. thermarum individuals support only a single open flower at a time, but flowering continuously
throughout the year. In this image, one open flower, one older (fertilized) flower (top left), and one pre-
anthesis floral bud (bottom, middle) are evident. B) Multiple individuals can be grown in individual pots,
in a single 7-gallon plastic tub - no other specialized equipment is necessary.
10
Nymphaea thermarum, however, is a minute water lily that displays remarkable potential as
an experimental/genetic model system (Figure Intro.2). It requires only shallow water (and thus little
specialized equipment to grow), and is small enough that dozens to hundreds can be grown on a single
greenhouse bench. We show that N. thermarum is pre-disposed to self-fertilization (Chapter 1), yet it can
be emasculated and out-crossed in a controlled manner. Hundreds of seeds with high germination rates
are produced in a single fruit, and plants flower continuously throughout the year. The generation time
is 4-5 months, but individual plants can live for 5+ years - making it possible to maintain genetic lines
without constant propagation. Finally, N. thermarum has one of the smallest genomes yet found within
an early-diverging lineage: ~500 Mbp (Pellicer et al., 2013)(which is on par with other model systems,
such as Aquilegia). A project is underway to sequence, assemble, and annotate the genomes of N. ther-
marum, and transcriptomes of several tissues have already been produced.
The importance of organismic biology
While N. thermarum certainly shows potential as a model system, it was only recently described
as a species relatively recently (Fischer 1988) and has been little studied since. Therefore, before any
experiments are preformed, it is necessary to precisely understand the biology of the characters in ques-
tion in this particular system. The ultimate aim of this dissertation is to provide a new perspective on
how interparental conflict, parent-of-origin effects on seed development, and the regulation of chroma-
tin methylation have been connected during the evolution of seed development in angiosperms. It is
only appropriate then, that this dissertation begins with a study of how reproduction and reproductive
development occurs in this species.
References
Bachelier JB, Friedman WE (2011) Female gametophyte competition in an ancient angiosperm lineage. Proc Natl Acad Sci U S A 108(30):12360-12365.
Bliss BJ, Wanke S, Barakat A, Ayyampalayam S, Wickett N, Wall PK, Jiao Y, Landherr L, Ralph PE, Hu Y, Neinhuis C, Leebens-Mack J, Arumuganathan K, Clifton SW, Maximova SN, Ma H, dePamphilis CW (2013) Characterization of the basal angiosperm Aristolochia fimbriata: a potential experimental system for genetic studies. BMC Plant Biol 13:12.
Butenko Y, Ohad N (2011) Polycomb-group mediated epigenetic mechanisms through plant evolution. Biochim Biophys Acta, Gen Regul Mech 1809(8):395-406.
11
Charnov EL (1979) Simultaneous hermaphroditism and sexual selection. Proc Natl Acad Sci U S A 76: 2480-2484.
Cooper DC, Brink RA (1945) Seed collapse following matings between diploid and tetraploid races of Lycopersicon pimpinellifolium. Genetics 30(4):376-401.
Endress PK (2010) The evolution of floral biology in basal angiosperms. Phil Trans Royal Soc Lond B Biol Sci 365:411-421.
Fischer E (1988) Beiträge zur Flora Zentralafrikas I. Eine neue Nymphaea sowie ein neuer Streptocarpus aus Rwanda. Feddes Repert 99:385-390.
Floyd SK, Friedman WE (2000) Evolution of Endosperm Developmental Patterns among Basal Flowering Plants. Int J Plant Sci 161(S6)S57-S81.
Floyd SK, Friedman WE (2001) Developmental evolution of endosperm in basal angiosperms: evidence from Amborella (Amborellaceae), Nuphar (Nymphaeaceae), and Illicium (Illiciaceae). Plant Syst Evol 228:153-169.
Friedman WE (2006) Embryological evidence for developmental lability during early angiosperm evolu-tion. Nature 41:337-340.
Friedman WE (2008) Hydatellaceae are water lilies with gymnospermous tendencies. Nature 453:94-97.
Friedman WE, Bachelier JB, Hormaza JI (2012) Embryology in Trithuria submersa (Hydatellaceae) and relationships between embryo, endosperm, and perisperm in early-diverging flowering plants. Am J Bot 99:1083-1095.
Friedman WE, Gallup WN, Williams JH (2003a) Gametophyte development in Kadsura: implications for Schisandraceae, Austrobaileyales, and the early evolution of flowering plants. Int J Plant Sci 164:S293-305.
Friedman We, Ryerson KC (2009) Reconstructing the ancient female gametophyte in angiosperms: in-sights from Amborella and other ancient lineages of flowering plant. Am J Bot 96:129-143.
Friedman WE, Williams JH (2003b) Modularity of the angiosperm female gametophyte and its bearing on the early evolution of endosperm in flowering plants. Evolution 57:216-230.
Furihata HY, Suenaga K, Kawanabe T, Yoshida T, Kawabe A (2016) Gene duplication, silencing, and expres-sion alteration govern the molecular evolution of PRC2 genes in plants. Genes Genet Syst 91(2):85-95.
Geeta R (2002) The origin and maintenance of nuclear endosperms: viewing development through a phylogenetic lens. Proc R Soc Lond B Biol Sci 270:29-35.
Gehring M, Satyaki PR (2017) Endosperm and imprinting, inextricably linked. Plant Physiol 173:143-154
Gleason EJ, Kramer EM (2012) “Characterization of Aquilegia Polycomb Repressive Complex 2 Homologs Reveals Absence of Imprinting.” Gene 507(1):54–60.
12
Gutiérrez-Marcos JF, Costa LM, Dal Prà M, Scholten S, Kranz E, Perez P, Dickinson HG. (2006) Epigenetic asymmetry of imprinted genes in plant gametes. Nat Genet 38(8):876-878.
Haig D (1987) Kin conflict in seed plants. Trends Ecol Evol 2(11):337–340.
Haig D (2013) Kin conflict in seed development: an interdependent but fractious collective. Annu Rev Cell Dev Biol 29:189-211.
Haig D, Westoby M (1991) Genomic imprinting in endosperm: its effects on seed development in crosses between species and between different ploidies of the same species, and its implications for the evolu-tion of apomixis. Phil Trans R Soc Lond B Biol Sci 333:1–13.
Håkansson A (1952) Seed development after 2x,4x crosses in Galeopsis pubescens. Hereditas 38:425-448.
Hehenberger E, Kradolfer D, Köhler C (2012) Endosperm cellularization defines an important develop-mental transition for embryo development. Development 139(11):2031-2039.
Hsieh TF, Shin J, Uzawa R, Silva P, Cohen S, Bauer MJ, Hashimoto M, Kirkbride RD, Harada JJ, Ziberman D, Fischer RL (2012) Regulation of imprinted gene expression in Arabidopsis endosperm. Proc Natl Acad Sci U S A 108(5):1755-1762.
Ingouff M, Jullien PE, Berger F (2006). The female gametophyte and the endosperm control cell prolifera-tion and differentiation of the seed coat in Arabidopsis. Plant Cell 18(12):3491-3501.
Ingouff M, Selles B, Michaud C, Vu TM, Berger F, Schorn AJ, Autran D, Van Durme M, Nowack MK, Mar-tienssen RA, Grimanelli D (2017) Live-cell analysis of DNA methylation during sexual reproduction in Arabidopsis reveals context and sex-specific dynamics controlled by noncanonical RdDM. Genes Dev 31(1):72-83.
Jiang SY, Ramachandran S (2016) Expansion mechanisms and evolutionary history on genes encoding DNA glycosylases and their involvement in stress and hormone signaling. Genome Biol Evol 8(4):1165-1184.
Köhler C, Wolff P, Spillane C (2012) Epigenetic mechanisms underlying genomic imprinting in plants. Annu Rev of Plant Biol 63:331-352.
Lafon-Placette C, Köhler C (2014) Embryo and endosperm, partners in seed development. Curr Opin Plant Biol 17:64-69.
Leitch IJ, Hanson L (2002) DNA C-values in seven families fill phylogenetic gaps in the basal angiosperms. Bot J Linn Soc (2002) 140(2):175-179.
Lin BY (1984) Ploidy barrier to endosperm development in maize. Genetics 107(1):103-115.
Losada JM , Bachelier JB, Friedman WE (2017) Prolonged embryogenesis in Austrobaileya scandens (Aus-trobaileyaceae): its ecological and evolutionary significance. New Phytol 215(2):851-864.
Luo M, Platten D, Chaudhury A, Peacock WJ, Dennis ES (2009) Expression, imprinting, and evolution of rice homologs of the polycomb group genes. Mol Plant 2:711–723.
13
Maheshwari P (1950) An Introduction to the Embryology of Angiosperms (McGraw-Hill Book Company, New York).
Nallamilli BRR, Zhang J, Mujahid H, Malone BM, Bridges SM, et al. (2013) Polycomb group gene OSFIE2 regulates rice (Oryza sativa) seed development and grain filling via a mechanism distinct from Arabidop-sis. PLoS Genet 9(3): e1003322.
Pellicer J, Kelly LJ, Magdalena C, Leitch IJ (2013) Insights into the dynamics of genome size and chromo-some evolution in the early diverging angiosperm lineage Nymphaeales (water lilies). Genome 56:1-13.
Queller DC (1983) Kin selection and conflict in seed maturation. J Theor Biol 100(1):153–172.
Rudall PJ,Eldridge T, Tratt J, et al. (2009) Seed fertilization, development, and germination in Hydatellace-ae (Nymphaeales): implications for endosperm evolution in early angiosperms. Am J Bot 96:1581–1593.
Sansome ER, Satina S, Blakeslee AF (1942) Disintegration of ovules in tetraploid-diploid and in incompat-able species crosses in Datura. Bull Torrey Bot Club 69(9):405-420.
Scott RJ, Spielman M, Baily J, Dickinson HG (1998) Parent-of-origin effects on seed development in Arabi-dopsis thaliana. Development 125:3329-3341.
Sharma R, Mohan Singh RK, Malik G, Deveshwar P, Tyagi AK, Kapoor S, Kapoor M (2009) Rice cytosine DNA methyltransferases - gene expression profiling during reproductive development and abiotic stress. FEBS J 276(21):6301-6311.
Smith CC, Fretwell, SD (1974) The optimal balance between size and number of offspring. Am Nat 108:499-506.
Springer NM, Danilevskaya ON, Hermon P, Helentjaris TG, Phillips RL, Kaeppler HF, Kaeppler SM (2002) Sequence relationships, conserved domains, and expression patterns for maize homologs of the poly-comb group genes E(z), esc, and E(Pc). Plant Physiol 128(4):1332-1345.
Stoute AI, Varenko V, King GJ, Scott RJ, Kurup S (2012) Parental genome imbalance in Brassica oleracea causes asymmetric triploid block. Plant J 71(3):503-516.
Trasler JM (2006) Gamete imprinting: setting epigenetic patterns for the next generation. Reprod Fertil Dev 18(1-2):63-69.
Trivers RL (1974) Parent-offspring conflict. Am Zool 14:249-264.
Vialette-Guiraud AC, Alaux M, Legeai F, Finet C, Chambrier P, Brown SC, Chauvet A, Magdalena C, Rudall PJ, Scutt CP (2011) Cabomba as a model for studies of early angiosperm evolution. Ann Bot 108(4):589-598.
von Wangenheim KH (1957) Untersuchungen über den Zusammenhang zwischen Chromosomenzhal und Kreuzbarkeit bei Solanum-Arten. Z induct Abstamm u Vererb Lehre 88:21-37.
14
von Wangenheim KH (1962) Zur Ursache der Abortion von Samenanlagen in Diploid-Polyploid-Kreuzun-gen: II. Untershiedliche Differenzierung von Endospermen mit glechem Genom. Z Vererb Lehre 93:319-334.
von Wangenheim KH, Peterson HP (2004) Aberrant endosperm development in interploidy crosses re-veals a timer of differentiation. Dev Biol 270(2)277-289.
Williams JH, Friedman WE (2002) Identification of diploid endosperm in an early angiosperm lineage. Nature 415(6871):522-526.
Zhang H, Luo M, Johnson SD, Zhu X, Liu L, Huang F, Liu Y, Xu P, Wu X (2016) Parental genome imbalance causes post-zygotic lethality and deregulates imprinting in rice. Rice 9:43-55.
Zhang WH, Zhou Y, Dibley KE, Tyerman SD, Furbank RT, Patrick JW (2007) Nutrient loading of developing seeds. Funct Plant Biol 34:314-331.
Zilberman D, Gehring M, Tran RK, Ballinger T, Henikoff S (2006) Genome-wide analysis of Arabidopsis thaliana DNA methylation uncovers an interdependence between methylation and transcription. Nat Genet 39:61-69.
15
Chapter 1
Title: Floral biology and ovule and seed ontogeny of Nymphaea thermarum, a water lily at the brink of
extinction with potential as a model system for basal angiosperms
Authors: Rebecca A. Povilus1,3*, Juan M. Losada1,3, William E. Friedman1, 2
1 Department of Organismic and Evolutionary Biology, Harvard University, 26 Oxford Street, Cambridge,
Massachusetts 02138 USA; 2 Arnold Arboretum of Harvard University, 1300 Centre Street, Boston, Mas-
sachusetts 02131 USA; 3Contributed equally
Published as:
Povilus, R. A., J. M. Losada, and W. E. Friedman. ‘Floral Biology And Ovule And Seed Ontogeny Of Nym-
phaea thermarum, A Water Lily At The Brink Of Extinction With Potential As A Model System For Basal
Angiosperms’. Annals of Botany 115.2 (2014): 211-226
16
Abstract
Background and Aims: Nymphaea thermarum is a member of the Nymphaeales, of one of the most
ancient lineages of flowering plants. This species was only recently described and then declared extinct
in the wild, so little is known about its reproductive biology. In general, the complete ontogeny of ovules
and seeds is not well documented among species of Nymphaea, and has never been studied in the sub-
genus Brachyceras, the clade to which N. thermarum belongs.
Methods: Flowers and fruits were processed for brightfield, epifluorescence, and confocal microscopy.
Flower morphology, with emphasis on the timing of male and female functions, was correlated with key
developmental stages of the ovule and the female gametophyte. Development of the seed tissues and
dynamics of polysaccharide reserves in the endosperm, perisperm, and embryo were examined.
Key Results: Pollen release in N. thermarum starts before the flower opens. Cells walls of the micropylar
nucellus show layering of callose and cellulose in a manner reminiscent of transfer cell wall pattern-
ing. Endosperm development is ab initio cellular, with micropylar and chalazal domains that embark on
distinct developmental trajectories. The surrounding maternal perisperm occupies the majority of seed
volume, and accumulates starch centrifugally. In mature seeds, a minute but fully developed embryo is
surrounded by a single persistent layer of endosperm.
Conclusions: Early male and female function indicate that N. thermarum is predisposed towards self-
pollination, a phenomenon that is likely to have evolved multiple times within Nymphaea. While forma-
tion of distinct micropylar and chalazal developmental domains in the endosperm along with a copious
perisperm, characterize the seeds of most members of the Nymphaeales, seed ontogenies vary between
and among the constituent families. Floral biology, life history traits, and small genome size make N.
thermarum uniquely promising as an early-divergent angiosperm model system for genetic and molecu-
lar studies.
Key words: embryo, endosperm, female gametophyte, flower biology, megagametogenesis, megasporo-
genesis, Nymphaea thermarum, Nymphaeales, perisperm, protogyny, seed development, stigma.
17
Introduction
Nymphaea thermarum, a member of one of the most ancient lineages of flowering plants, is a
remarkable species from many perspectives. This annual, miniature water lily was originally described
from a restricted hot-spring habitat in Rwanda (Fischer, 1988), and was recently declared as extinct in the
wild (Fischer and Magdalena-Rodriguez, 2010). With little known about its physiology or reproductive
biology, germplasm is currently maintained in just a few botanical collections worldwide. Far from being
written off as a botanical curiosity and evolutionary dead-end, however, we propose that N. thermarum
is uniquely poised to help unravel many long-standing questions about the origin and early evolution of
angiosperms, the clade which includes the majority of land plant diversity.
Early diverging angiosperm lineages are particularly poor in species amenable to genetic experi-
mentation. Most taxa are woody and perennial (e.g. Amborella, Austrobaileyales, Chloranthales and the
vast majority of magnoliids), and even the aquatic and typically perennial life history of most members
of Nymphaeales make them difficult to maintain in large numbers in a controlled environment. Nym-
phaea thermarum, while aquatic, requires only shallow water, has a relatively short generation time of
5-6 months, and is small enough that hundreds of individuals can be grown in a single greenhouse room.
Like Arabidopsis thaliana, N. thermarum self-fertilizes, is also capable of outcrossing, and reproduces
prolifically by seed. Finally, N. thermarum has a genome size that is on a par with other established flow-
ering plant model systems (roughly twice as large as the genome of A. thaliana) (Pellicer et al., 2013).
Any attempt to develop this species into a model system, including creation of isogenic lines and devel-
opment of stable transformation protocols, would benefit from a detailed knowledge of its reproductive
biology. In addition, such information will be invaluable for conservation efforts, such as propagation and
maintenance of remaining genetic diversity, with the potential to reintroduce this species into its native
habitats.
Nymphaeales is one of the most ancient angiosperm lineages, either sister to all flowering plants
except Amborella or sister to Amborella and together forming the sister group to all other flowering
plants (Maia et al., 2014; Ruhfel et al., 2014). While all members of Nymphaeales are aquatic, there has
nonetheless been considerable evolutionary diversification over the nearly 125 million years of history
documented in the fossil record (Qiu et al., 1999; Friis et al., 2001; 2006; 2011; Magallon et al., 2013;
Doyle and Endress, 2014; Iles et al., 2014). Recent molecular dating studies corroborate the ancient
18
age of Nymphaeales, with Hydatellaceae diverging from its sister group Nymphaeaceae plus Cabomba-
ceae roughly 127 million years ago (Saarela et al., 2007; Iles et al., 2014). Thus, studies within the clade
present a unique opportunity to examine how reproductive characters have diversified in these aquatic
plants since the Early Cretaceous.
Fortunately, the historical popularity of Nymphaea flowers for ornamental and cultural uses
means that the macroscopic (morphological) aspects of reproductive biology have been documented for
many taxa (Moseley, 1961; Wiersema, 1988 and references herein; Endress, 2010). Protogyny (female
receptivity occurring before shedding of pollen within the same flower) is the norm in Nymphaea flowers
(Schneider and Chaney, 1981; Schneider, 1982; Capperino and Schneider, 1985; Williams et al., 2010),
as is true of the vast majority of hermaphroditic basal angiosperms. For Nymphaea, the separate female
and male phases are punctuated by floral movements – the flower opens one day or evening as func-
tionally female, closes, and reopens as functionally male. Intriguingly, many of the exceptions to protog-
yny that have been documented among basal angiosperm lineages with hermaphroditic flowers involve
taxa within Nymphaea (Endress, 2010). Nymphaea thermarum is a member of the Brachyceras subgenus
(Borsch et al., 2011), a pan-tropical clade that is often referred to as the tropical day-blooming water
lilies, while the several other subgenera in Nymphaea are circumscribed according to biogeography and
whether flowering is nocturnal or diurnal. There are about 46 extant species in Nymphaea, making it is
the largest genus in Nymphaeaceae, which with 58 species is by far the largest family within Nympha-
eales, compared to 10 species in Hydatellaceae and 6 in Cabombaceae (Stevens, 2001 onwards).
The developmental morphology of flowers and fruits within Nymphaeales has been documented
in most genera and subgenera (Chifflot, 1902; Heslop-Harrison, 1955a,b; Moseley, 1961; Khanna, 1964b;
Ramji and Padmanabhan, 1965; Schneider, 1976; 1982; 1983; Schneider and Moore, 1977; Schneider
and Chaney, 1981; Moseley et al., 1984; Williamson and Moseley, 1989; Schneider et al., 2003; Endress
2001; 2005; Grob et al., 2006; Rudall et al., 2007; Zhou and Fu, 2007; Hu et al., 2009; Rudall et al., 2009;
Sokoloff et al., 2009; 2010; Vialette-Guiard et al., 2011). Features of female gametophyte development,
fertilization, and seed development have also been studied, but are scattered across a century of em-
bryological literature (Cook, 1902; 1906; 1909; Conard 1905; Seaton 1908; Martin, 1946; Meyer, 1960;
Khanna, 1964a,b; 1965; 1967; Valtzeva and Savich, 1965; Schneider, 1978; Schneider and Ford, 1978;
Batygina et al., 1980, 1982; Schneider and Jeter, 1982; Winter and Shamrov 1991; Van Miegroet and
19
Dujardin, 1992; Orban and Bouharmont, 1998; Bonilla-Barbosa et al., 2000; Floyd and Friedman, 2000;
2001; Yamada 2001; Williams and Friedman, 2002; Baskin and Baskin 2007; Friedman, 2008; Zhou and
Fu, 2008; Rudall et al., 2008, 2009; Friedman et al., 2012). An integrative approach to the ontogenies of
the gametophyte, embryo, endosperm, and perisperm in Nymphaea thermarum will fill a conspicuous
gap in our knowledge of ovule and seed development within Nymphaeales.
In this study, we document reproductive development of N. thermarum, from floral bud emer-
gence through fertilization and seed development, up to germination. The goals are to correlate the tim-
ing of key events during floral and ovule development with pollination and seed development in order to
provide an integrated view of the reproductive biology of N. thermarum. This, we hope, can be used as
a reference for future experimental and genetic work and/or conservation efforts. In addition, we seek to
document in detail the ontogeny and nutritional status of the endosperm, embryo, and maternal tissues
during seed development. In turn, these embryological features of N. thermarum are used to examine
the evolutionary-developmental history of a suite of reproductive characters within the broader compar-
ative context of the Nymphaelaes. As will be seen, heterochronic alterations in floral development have
been an important force in the evolutionary history of the clade and specifically in the origin of a set of
apomorphic features in N. thermarum.
Materials and Methods
Plant material
Nymphaea thermarum seeds from the Botanische Gärten der Universität Bonn (Bonn, Germany)
were sown and plants grown at the greenhouses of the Arnold Arboretum of Harvard University, accord-
ing to the guidelines of Fischer and Magdalena-Rodriguez (2010). To study female gametophyte devel-
opment, flowers were collected at different developmental stages from flower bud to flower opening.
Flowers were measured over the 12 days between floral bud emergence and first day of anthesis in
order to generate a correlation between bud length and number of days until anthesis. To evaluate seed
development, self-fertilized flowers and fruits were collected at daily intervals after first flower opening
until seed set and release. Seeds were allowed to germinate in a petri dish filled with water and kept
at room temperature and collected at regular intervals until the emergence of the first leaf. Collected
material was fixed in 4% v/v acrolein (Polysciences, New Orleans, Louisiana, USA) in 1X PIPES buffer (50
20
mmol/L PIPES, 1 mmol/L MgSO4, 5 mmol/L EGTA) pH 6.8, for 24 hours. Fixed material was then rinsed
three times one hour each with 1X PIPES buffer, dehydrated through a graded ethanol series, and stored
in 70% ethanol.
Microscopy
Samples for sectioning were dehydrated though a graded ethanol series up to 100% ethanol,
then infiltrated with and embedded in glycol methacrylate (JB-4 Embedding Kit, Electron Microscopy
Sciences, Hatfield, Pennsylvania, USA). Embedded materials were serially sectioned at 4 μm thick ribbons
with a Leica RM2155 rotary microtome and mounted onto slides. Sections were stained with a periodic
acid-Schiff’s (PAS) reagent for insoluble polysaccharides (Feder & O´Brien, 1969), counterstained with
Toludine Blue for general tissue structure (Feder & O´Brien, 1969). To detect the β-glucan callose, 0.1%
aniline blue in 0.1N K3PO4 (Currier, 1957). To visualize cellulose and other polysaccharides in cell walls,
slides were stained with an aqueous solution of 0.07% calcofluor white (Hughes and McCully, 1975).
Bright field and differential interference contrast images were recorded with a Zeiss Axio Imager
Z2 microscope equipped with a Zeiss HR Axiocam digital camera (Zeiss, Oberkochen, Germany). Imaging
of callose was done with a Zeiss Axiophot microscope with epifluorescence (HBO 100) connected to a
MRC Axiocam Zeiss digital camera and a cube filter with 365nm excitation, and 465nm long pass barrier
emission wavelengths. Calcofluor-stained sections were imaged on a Zeiss LSM700 Confocal Micro-
scope, equipped with an AxioCam HRc camera (Zeiss, Oberkochen, Germany), excitation at 405nm and a
emission-detection at 465nm wavelength.
Whole-mount samples for confocal microscopy were dissected to less than 2mm in any dimen-
sion. Samples were rehydrated though a graded ethanol series to 100% aqueous, and stained for the
Fuelgen reaction according to Barrell and Grossniklaus (2005), with incubation times adjusted for size of
the samples. Samples were then dehydrated in a graded ethanol series to 100% ethanol. In the case of
pre-fertilization and early post-fertiliztion ovules, samples were cleared by graded infiltration with Im-
mersol 518f (Zeiss, Oberkochen, Germany). For older fertilized ovules and seeds, samples were infiltrated
with and embedded JB-4 glycol methacrylate (Electron Microscopy Sciences, Hatfield, Pennsylvania,
USA). Blocks were cut by hand with razor blades to remove superfluous tissue layers. Samples were
mounted in a drop of Immersol 518f on custom well-slides and imaged with a Zeiss LSM700 Confocal
21
Microscope, equipped with an AxioCam HRc camera (Zeiss, Oberkochen, Germany). A two-pass, three-
channel acquisition mode was used to maximize histochemical information: Pass one = excitation at 405
and 488 nm, emission detection between 400-520 nm (Channel 1) and 520-700 (Channel 2). Pass two =
excitation at 638 nm, emission detection between 520-700 nm (Channel 3).
Digital Image Processing
Pictures, line drawings, and figures were processed using either Image J (http://rsbweb.nih.gov/
ij/index.html)or Adobe Creative Suite 5 (Adobe Systems, San Jose, California, USA). For light microscopy,
image manipulations were restricted to operations that were applied to the entire image. For confocal
z-stacks, loss of signal with tissue depth was compensated for by using the Stack Contrast Adjustment
Plugin for Image J (Čapek et al., 2006). In the cases where uneven thickness of overlying tissue resulted
in uneven signal brightness within an optical section, channels were adjusted manually to compensate,
resulting in even signal levels across an optical section.
Maximum projections of confocal z-stacks were generated in Image J using the 3D-Project tool.
3-D surface models were created with the 3D-Viewer plugin in Image J, using the “Surface” setting on
z-stacks in which each zone of interest had been manually outlined from each optical slice.
Results
Floral and ovule morphogenesis
Flowers of Nymphaea thermarum are hermaphroditic (Fig. 1.1). Floral buds emerge from the
ground-level shoot apical meristem about twelve days before anthesis. At this stage, the outermost
tepals are green and the immature inner tepals have a white/cream coloration. Two ranks of anthers sur-
round 6-11 separate carpels. Stigmatic surfaces are delimited by upturned carpel tips and are oriented
towards the ventral side of the gynoecium. Carpels are characterized by parietal placentation with nu-
merous ovule primordia per carpel (data not shown). At six days before anthesis, anthers develop a light
yellow coloration, carpel walls begin to fuse, and their tips reflex. Ovules enlarge, with both integuments
present and the inner integument extends beyond the outer. Two days before flower opening, anthers
increase in yellow pigmentation and papillate stigmatic surfaces are completely exposed. Ovule growth
continues and an endostomic micropyle is formed.
22
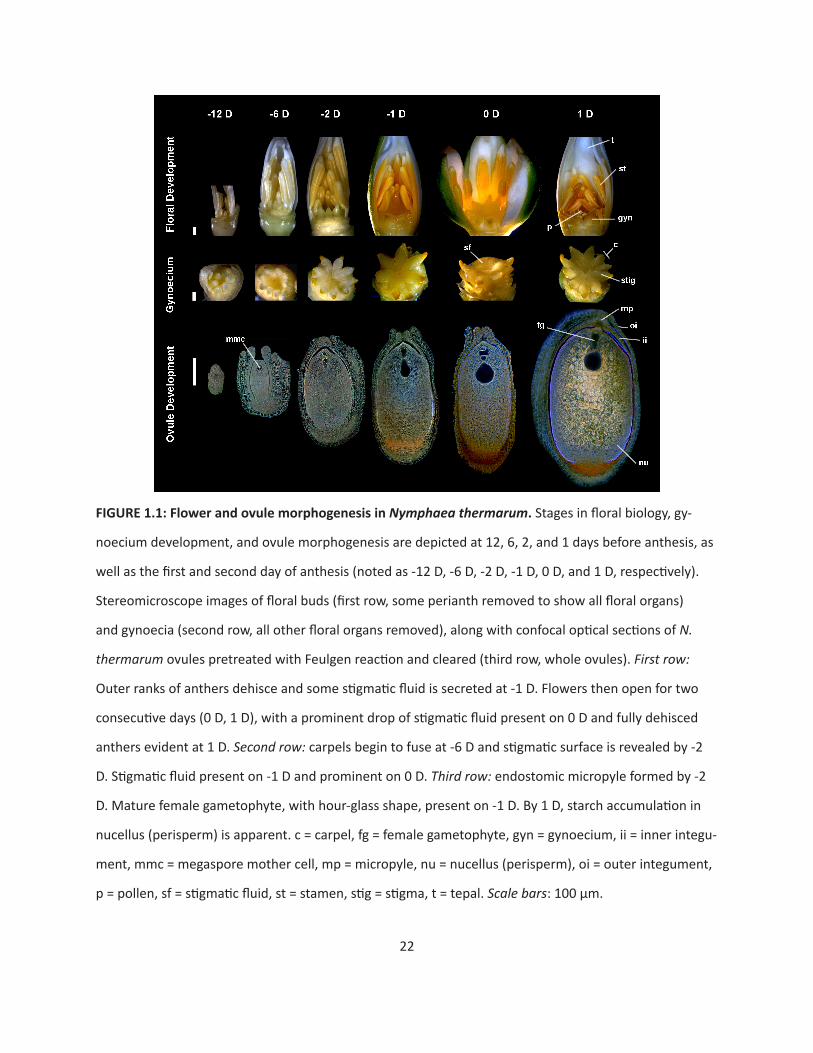
FIGURE 1.1: Flower and ovule morphogenesis in Nymphaea thermarum. Stages in floral biology, gy-
noecium development, and ovule morphogenesis are depicted at 12, 6, 2, and 1 days before anthesis, as
well as the first and second day of anthesis (noted as -12 D, -6 D, -2 D, -1 D, 0 D, and 1 D, respectively).
Stereomicroscope images of floral buds (first row, some perianth removed to show all floral organs)
and gynoecia (second row, all other floral organs removed), along with confocal optical sections of N.
thermarum ovules pretreated with Feulgen reaction and cleared (third row, whole ovules). First row:
Outer ranks of anthers dehisce and some stigmatic fluid is secreted at -1 D. Flowers then open for two
consecutive days (0 D, 1 D), with a prominent drop of stigmatic fluid present on 0 D and fully dehisced
anthers evident at 1 D. Second row: carpels begin to fuse at -6 D and stigmatic surface is revealed by -2
D. Stigmatic fluid present on -1 D and prominent on 0 D. Third row: endostomic micropyle formed by -2
D. Mature female gametophyte, with hour-glass shape, present on -1 D. By 1 D, starch accumulation in
nucellus (perisperm) is apparent. c = carpel, fg = female gametophyte, gyn = gynoecium, ii = inner integu-
ment, mmc = megaspore mother cell, mp = micropyle, nu = nucellus (perisperm), oi = outer integument,
p = pollen, sf = stigmatic fluid, st = stamen, stig = stigma, t = tepal. Scale bars: 100 µm.
23
One day before flower opening, the outer rank of anthers dehisces and stigmatic fluid is secreted
from the suture of each carpel. On the first day of anthesis, flowers usually open in the morning and co-
pious stigmatic fluid is present on the surface of the gynoecium. Ovules are mature, and are anatropous,
bitegmic, and crassinucellate. Flowers close in the afternoon. On the second morning of anthesis, flowers
re-open and the remaining anthers dehisce to release loosely aggregated pollen, while the stigmatic sur-
face is dry and discolored. Fertilized ovules show a dramatic increase in size and starch content. Flowers
re-close typically in the afternoon of the second day. Flowers may open for one or more additional days
with continued pollen release. After that, the pedicel curls to draw the closed flower down to the soil
level, often partially burying the developing fruit.
Female gametophyte development
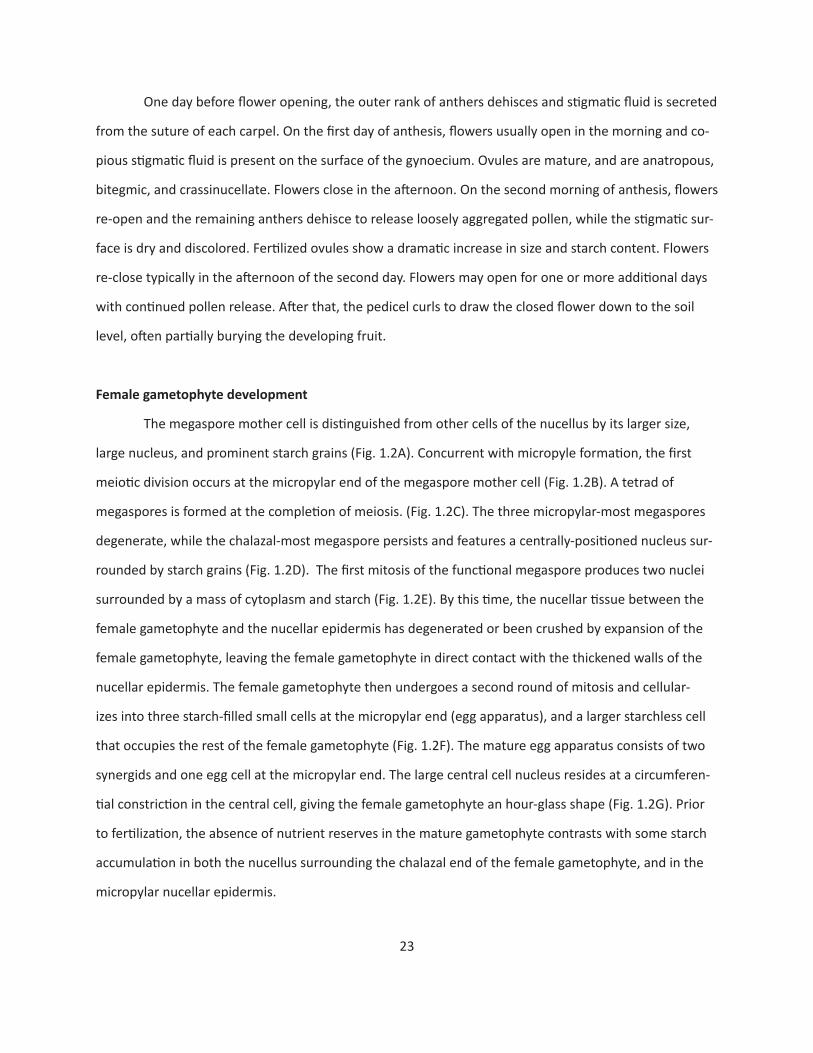
The megaspore mother cell is distinguished from other cells of the nucellus by its larger size,
large nucleus, and prominent starch grains (Fig. 1.2A). Concurrent with micropyle formation, the first
meiotic division occurs at the micropylar end of the megaspore mother cell (Fig. 1.2B). A tetrad of
megaspores is formed at the completion of meiosis. (Fig. 1.2C). The three micropylar-most megaspores
degenerate, while the chalazal-most megaspore persists and features a centrally-positioned nucleus sur-
rounded by starch grains (Fig. 1.2D). The first mitosis of the functional megaspore produces two nuclei
surrounded by a mass of cytoplasm and starch (Fig. 1.2E). By this time, the nucellar tissue between the
female gametophyte and the nucellar epidermis has degenerated or been crushed by expansion of the
female gametophyte, leaving the female gametophyte in direct contact with the thickened walls of the
nucellar epidermis. The female gametophyte then undergoes a second round of mitosis and cellular-
izes into three starch-filled small cells at the micropylar end (egg apparatus), and a larger starchless cell
that occupies the rest of the female gametophyte (Fig. 1.2F). The mature egg apparatus consists of two
synergids and one egg cell at the micropylar end. The large central cell nucleus resides at a circumferen-
tial constriction in the central cell, giving the female gametophyte an hour-glass shape (Fig. 1.2G). Prior
to fertilization, the absence of nutrient reserves in the mature gametophyte contrasts with some starch
accumulation in both the nucellus surrounding the chalazal end of the female gametophyte, and in the
micropylar nucellar epidermis.
24
FIGURE 1.2: Female gametophyte development in Nymphaea thermarum. Material embedded in JB-4
resin, sectioned at 4 µm, and stained with Periodic acid Shiffs-PAS reagent and toluidine blue. (A) Mega-
spore mother cell, starch granules present in cytoplasm. (B) First meiotic division showing chromosomes
(arrow) at the micropylar pole and starch granules at the chalazal pole. (C) Linear tetrad of four cellular
megaspores. (D) Functional megaspore, formed from the chalazal-most megaspore, with degenerating
micropylar megaspore. (E) Two nucleate female gametophyte, with starch surrounding the nuclei. This
image represents a composite of two sequential sections. (F) Immature 4-celled female gametophyte,
with three cells at the micropylar end and one (the central cell) that occupies the rest of the female
gametophyte. (G) Mature female gametophyte, devoid of starch and showing an hour glass shape. Scale
bar: 10 µm.
25
Cells of the micropylar nucellar epidermis feature a highly elaborated inner face of the chalazal-
most, periclinal wall, with discrete layers of cellulose and callose. The nucellar epidermis begins to form
this distinct layer about six days before anthesis (Fig. 1.3A). The inner periclinal walls, which contact or
flank the developing female gametophyte, thicken and develop a convoluted appearance that persists
through fertilization (Fig. 1.3B-D). This wall does not stain strongly with toluidine blue. Cellulose deposi-
tion coincides with elaboration of the inner periclinal wall six days before anthesis (Fig. 1.3E). Cellulose
continues to accumulate up to anthesis (Fig. 1.3F-G). After fertilization, cellulose is absent from the site
of pollen tube penetration (Fig. 1.3H, arrow). A discrete layer of callose is present on the micropylar-
most face of this transfer cell-like wall approximately three days before anthesis (Fig. 1.3J-K), but is
conspicuously absent after fertilization (Fig. 1.3L).

26
FIGURE 1.3: Micropylar nucellar epidermis in Nymphaea thermarum developing ovules. Ovules from 6
days before anthesis (“-6 D”, megaspore mother cell stage; A, E, I), 3 days before anthesis (“-3 D”, imma-
ture 4-celled female gametophyte stage; B, F, J), first day of anthesis (“0 D”, mature female gametophyte
stage; C, G, K), and two days after anthesis (“2 D”, post-fertilization; D, H, L). Material was embedded in
JB-4 resin, sectioned at 4 µm, and stained for general structure (toluidine blue; A-D), cellulose and other
polysaccharides (calcofluor white; E-H), or callose (aniline blue; I-L). The inner tangential wall of the
nucellar epidermis did not stain strongly with toluidine blue throughout ovule development (A-D), but
did stain strongly for cellulose starting at the megaspore mother cell stage (E) with cell wall elaboration
reaching a maximum by 0 D (G). After fertilization, cellulose was absent at the site of pollen tube pen-
etration (arrowhead) (H). Callose did not accumulate until -3 D (I), but subsequently formed a discrete
layer just interior to the cellulosic wall convolutions of the inner tangential wall (J-K). This callose layer
was not present after pollination (L). Scale bar: 10 µm.
27
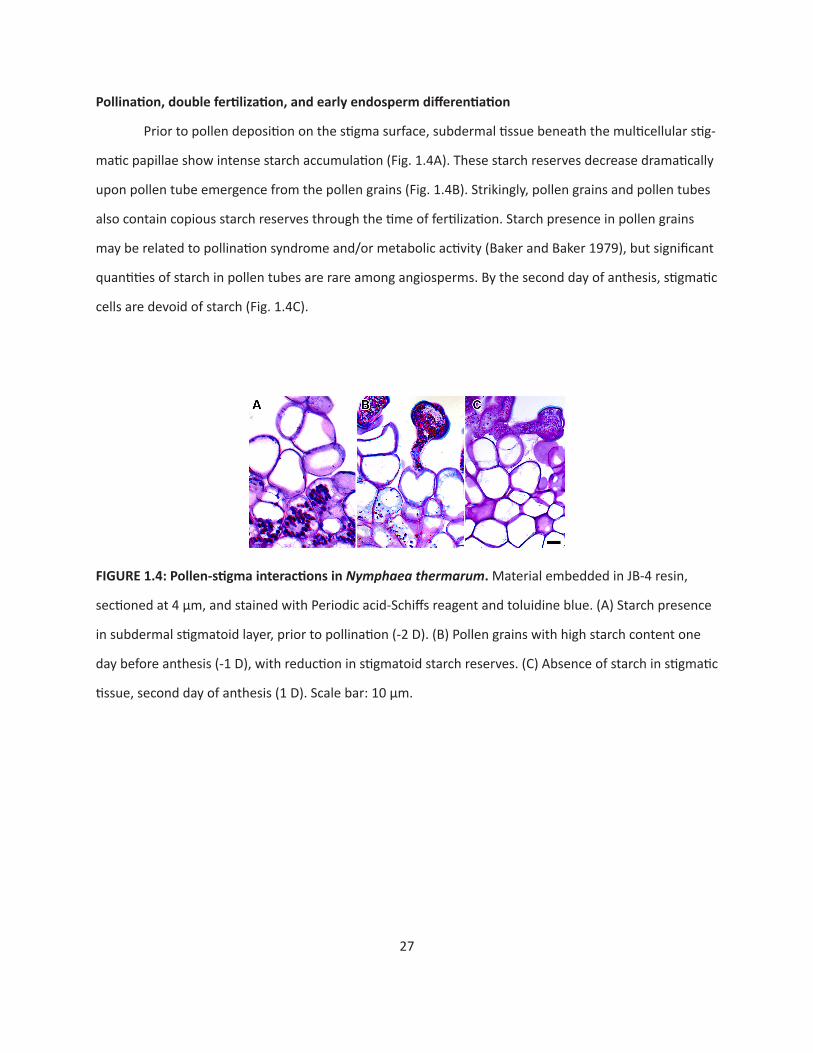
Pollination,doublefertilization,andearlyendospermdifferentiation
Prior to pollen deposition on the stigma surface, subdermal tissue beneath the multicellular stig-
matic papillae show intense starch accumulation (Fig. 1.4A). These starch reserves decrease dramatically
upon pollen tube emergence from the pollen grains (Fig. 1.4B). Strikingly, pollen grains and pollen tubes
also contain copious starch reserves through the time of fertilization. Starch presence in pollen grains
may be related to pollination syndrome and/or metabolic activity (Baker and Baker 1979), but significant
quantities of starch in pollen tubes are rare among angiosperms. By the second day of anthesis, stigmatic
cells are devoid of starch (Fig. 1.4C).
FIGURE 1.4: Pollen-stigmainteractionsinNymphaea thermarum. Material embedded in JB-4 resin,
sectioned at 4 µm, and stained with Periodic acid-Schiffs reagent and toluidine blue. (A) Starch presence
in subdermal stigmatoid layer, prior to pollination (-2 D). (B) Pollen grains with high starch content one
day before anthesis (-1 D), with reduction in stigmatoid starch reserves. (C) Absence of starch in stigmatic
tissue, second day of anthesis (1 D). Scale bar: 10 µm.
28
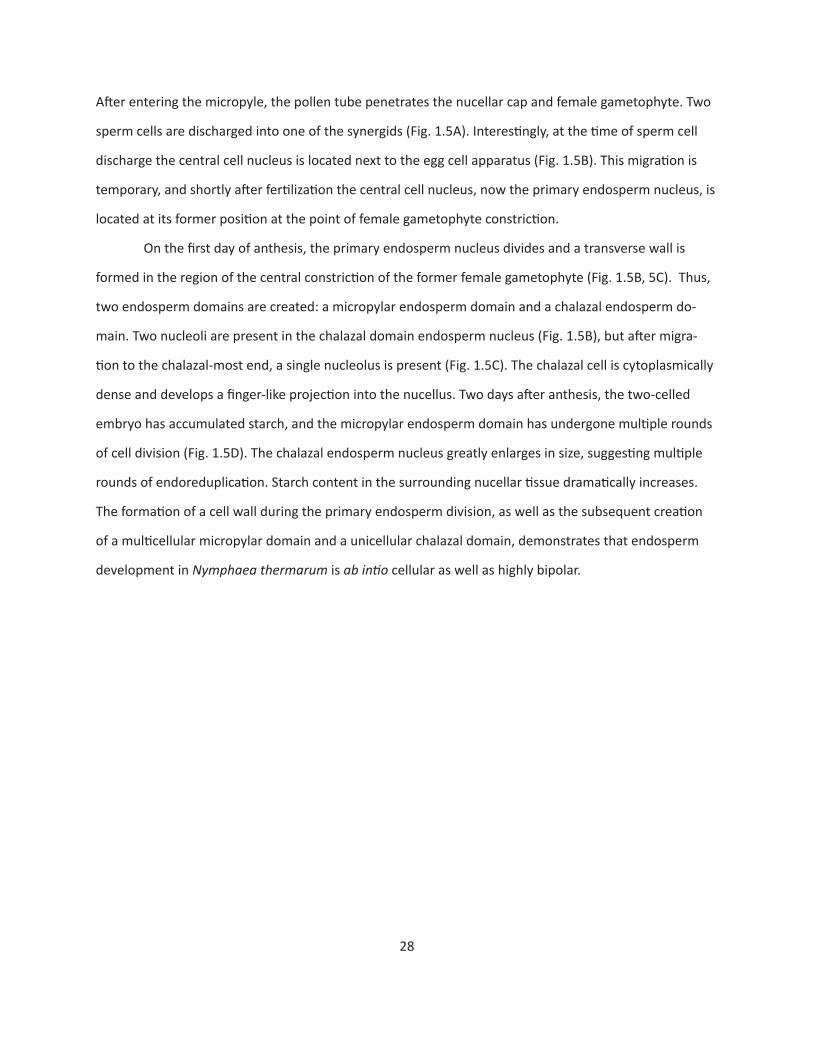
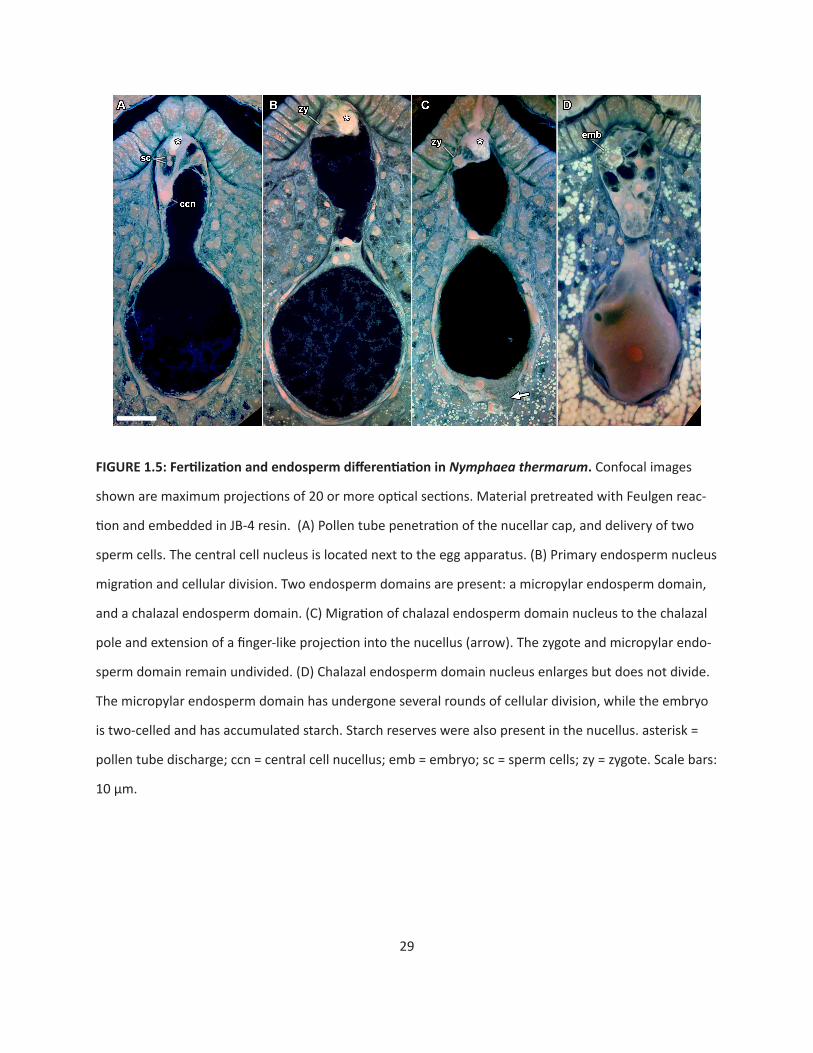
After entering the micropyle, the pollen tube penetrates the nucellar cap and female gametophyte. Two
sperm cells are discharged into one of the synergids (Fig. 1.5A). Interestingly, at the time of sperm cell
discharge the central cell nucleus is located next to the egg cell apparatus (Fig. 1.5B). This migration is
temporary, and shortly after fertilization the central cell nucleus, now the primary endosperm nucleus, is
located at its former position at the point of female gametophyte constriction.
On the first day of anthesis, the primary endosperm nucleus divides and a transverse wall is
formed in the region of the central constriction of the former female gametophyte (Fig. 1.5B, 5C). Thus,
two endosperm domains are created: a micropylar endosperm domain and a chalazal endosperm do-
main. Two nucleoli are present in the chalazal domain endosperm nucleus (Fig. 1.5B), but after migra-
tion to the chalazal-most end, a single nucleolus is present (Fig. 1.5C). The chalazal cell is cytoplasmically
dense and develops a finger-like projection into the nucellus. Two days after anthesis, the two-celled
embryo has accumulated starch, and the micropylar endosperm domain has undergone multiple rounds
of cell division (Fig. 1.5D). The chalazal endosperm nucleus greatly enlarges in size, suggesting multiple
rounds of endoreduplication. Starch content in the surrounding nucellar tissue dramatically increases.
The formation of a cell wall during the primary endosperm division, as well as the subsequent creation
of a multicellular micropylar domain and a unicellular chalazal domain, demonstrates that endosperm
development in Nymphaea thermarum is ab intio cellular as well as highly bipolar.
29
FIGURE1.5:FertilizationandendospermdifferentiationinNymphaea thermarum. Confocal images
shown are maximum projections of 20 or more optical sections. Material pretreated with Feulgen reac-
tion and embedded in JB-4 resin. (A) Pollen tube penetration of the nucellar cap, and delivery of two
sperm cells. The central cell nucleus is located next to the egg apparatus. (B) Primary endosperm nucleus
migration and cellular division. Two endosperm domains are present: a micropylar endosperm domain,
and a chalazal endosperm domain. (C) Migration of chalazal endosperm domain nucleus to the chalazal
pole and extension of a finger-like projection into the nucellus (arrow). The zygote and micropylar endo-
sperm domain remain undivided. (D) Chalazal endosperm domain nucleus enlarges but does not divide.
The micropylar endosperm domain has undergone several rounds of cellular division, while the embryo
is two-celled and has accumulated starch. Starch reserves were also present in the nucellus. asterisk =
pollen tube discharge; ccn = central cell nucellus; emb = embryo; sc = sperm cells; zy = zygote. Scale bars:
10 µm.
30
Seed development
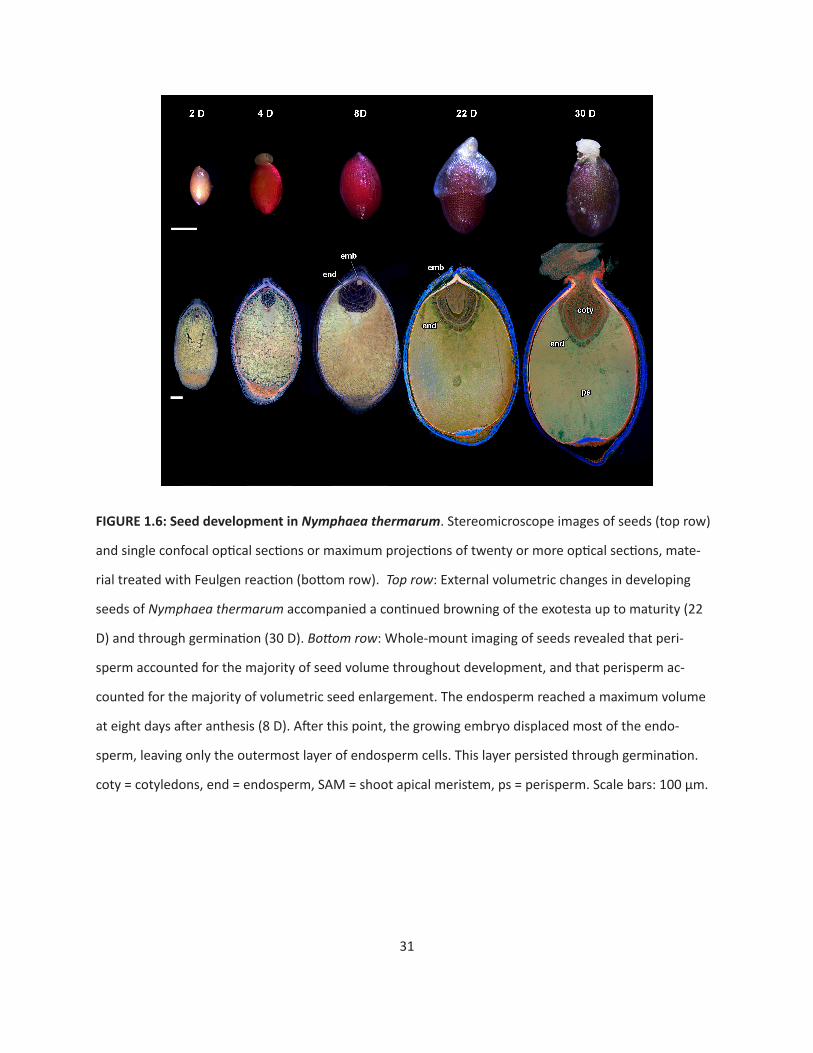
After fertilization, volumetric increase of the developing seed is accompanied by changes in the
color of the seed coat: fertilized ovules progress from colorless, to bright red, and then brown in mature
seeds (Fig. 1.6, top row). At maturity (and until germination) a floating aril encompasses the micropylar
half of the seed.
To examine the rate and pattern of volumetric increase of the embryo, endosperm and peri-
sperm during seed maturation, whole seeds were evaluated with confocal imaging (Fig. 1.6, bottom
row). Maternal tissue (perisperm and seed coat) accounts for the greatest proportion of seed volume
throughout seed development. The micropylar endosperm domain reaches its maximum area by eight
days after anthesis. The outermost layer of the micropylar endosperm begins to differentiate at this
time, with the rest of the micropylar endosperm cells becoming more vacuolate. The outer micropylar
endosperm layer persists though seed maturity (around 22D), while the rest of the space is eventually
occupied by the expanding embryo. Eight or more days later (30D), seed germination begins with the
fracturing of the seed coat near the micropyle and subsequent emergence of the root apical meristem.
Cotyledon expansion drives epicotyl emergence. The cotyledon tips remain in the seed and in direct
contact with the single persistent layer of endosperm cells throughout germination.
31
FIGURE 1.6: Seed development in Nymphaea thermarum. Stereomicroscope images of seeds (top row)
and single confocal optical sections or maximum projections of twenty or more optical sections, mate-
rial treated with Feulgen reaction (bottom row). Top row: External volumetric changes in developing
seeds of Nymphaea thermarum accompanied a continued browning of the exotesta up to maturity (22
D) and through germination (30 D). Bottom row: Whole-mount imaging of seeds revealed that peri-
sperm accounted for the majority of seed volume throughout development, and that perisperm ac-
counted for the majority of volumetric seed enlargement. The endosperm reached a maximum volume
at eight days after anthesis (8 D). After this point, the growing embryo displaced most of the endo-
sperm, leaving only the outermost layer of endosperm cells. This layer persisted through germination.
coty = cotyledons, end = endosperm, SAM = shoot apical meristem, ps = perisperm. Scale bars: 100 µm.
32
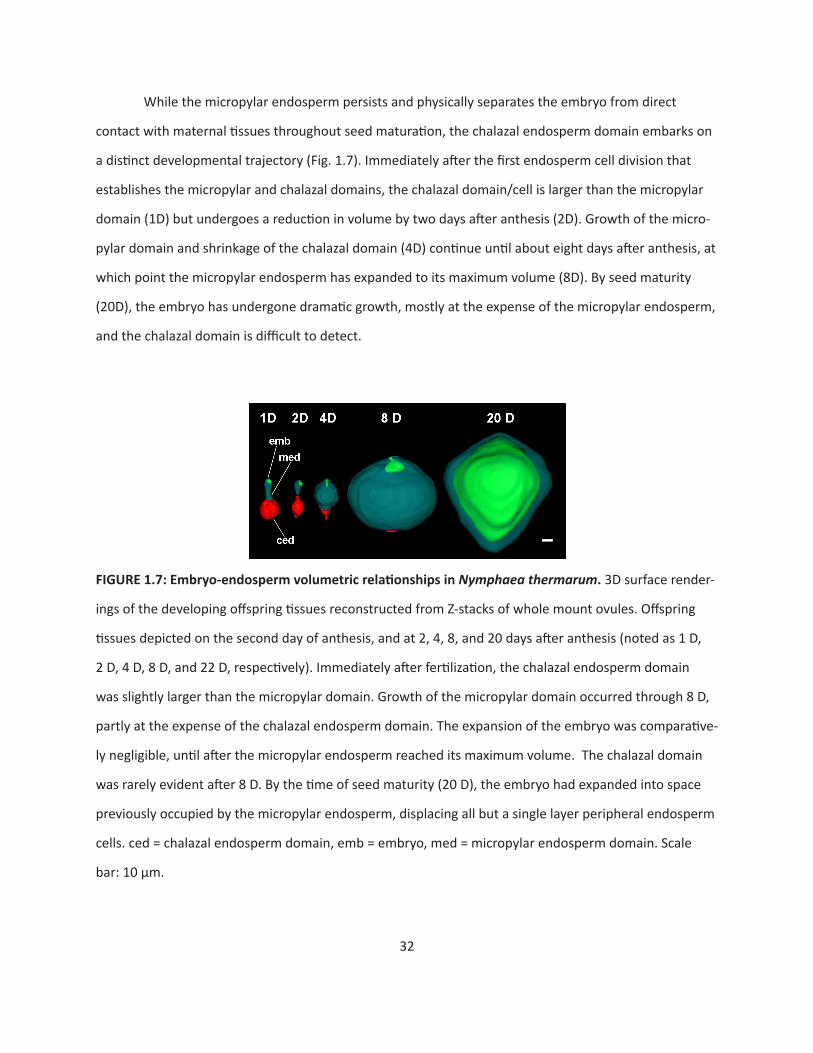
While the micropylar endosperm persists and physically separates the embryo from direct
contact with maternal tissues throughout seed maturation, the chalazal endosperm domain embarks on
a distinct developmental trajectory (Fig. 1.7). Immediately after the first endosperm cell division that
establishes the micropylar and chalazal domains, the chalazal domain/cell is larger than the micropylar
domain (1D) but undergoes a reduction in volume by two days after anthesis (2D). Growth of the micro-
pylar domain and shrinkage of the chalazal domain (4D) continue until about eight days after anthesis, at
which point the micropylar endosperm has expanded to its maximum volume (8D). By seed maturity
(20D), the embryo has undergone dramatic growth, mostly at the expense of the micropylar endosperm,
and the chalazal domain is difficult to detect.
FIGURE1.7:Embryo-endospermvolumetricrelationshipsinNymphaea thermarum. 3D surface render-
ings of the developing offspring tissues reconstructed from Z-stacks of whole mount ovules. Offspring
tissues depicted on the second day of anthesis, and at 2, 4, 8, and 20 days after anthesis (noted as 1 D,
2 D, 4 D, 8 D, and 22 D, respectively). Immediately after fertilization, the chalazal endosperm domain
was slightly larger than the micropylar domain. Growth of the micropylar domain occurred through 8 D,
partly at the expense of the chalazal endosperm domain. The expansion of the embryo was comparative-
ly negligible, until after the micropylar endosperm reached its maximum volume. The chalazal domain
was rarely evident after 8 D. By the time of seed maturity (20 D), the embryo had expanded into space
previously occupied by the micropylar endosperm, displacing all but a single layer peripheral endosperm
cells. ced = chalazal endosperm domain, emb = embryo, med = micropylar endosperm domain. Scale
bar: 10 µm.
33
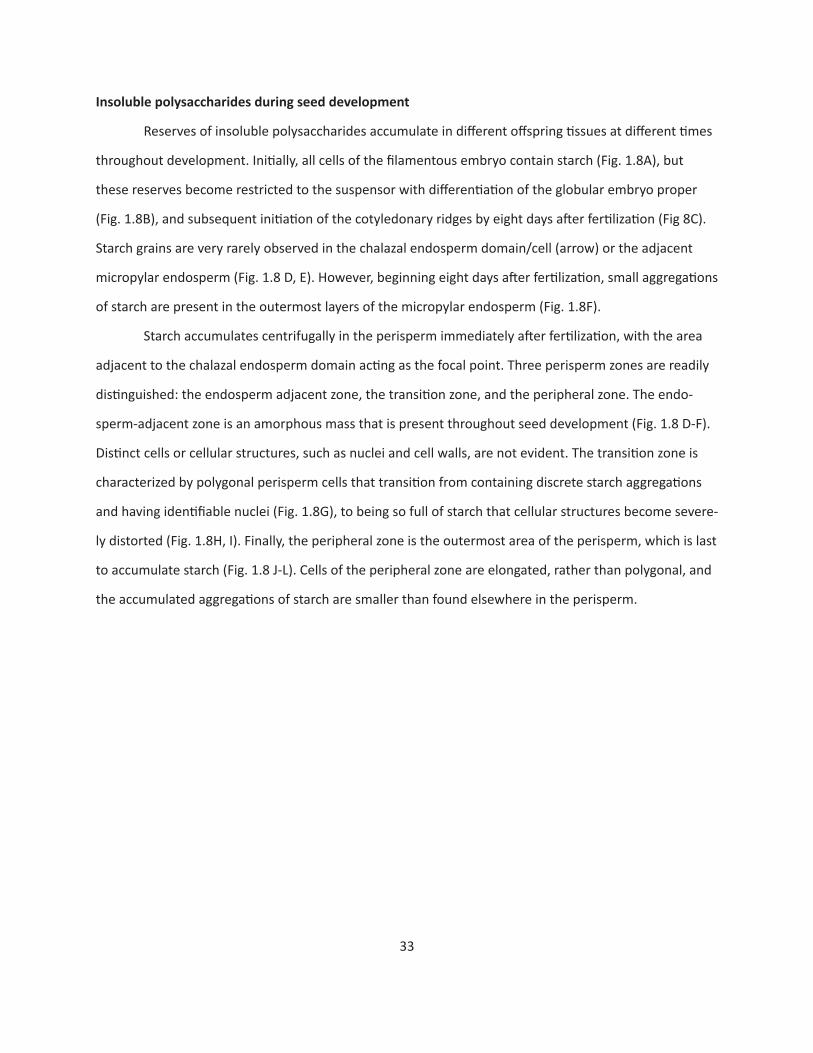
Insoluble polysaccharides during seed development
Reserves of insoluble polysaccharides accumulate in different offspring tissues at different times
throughout development. Initially, all cells of the filamentous embryo contain starch (Fig. 1.8A), but
these reserves become restricted to the suspensor with differentiation of the globular embryo proper
(Fig. 1.8B), and subsequent initiation of the cotyledonary ridges by eight days after fertilization (Fig 8C).
Starch grains are very rarely observed in the chalazal endosperm domain/cell (arrow) or the adjacent
micropylar endosperm (Fig. 1.8 D, E). However, beginning eight days after fertilization, small aggregations
of starch are present in the outermost layers of the micropylar endosperm (Fig. 1.8F).
Starch accumulates centrifugally in the perisperm immediately after fertilization, with the area
adjacent to the chalazal endosperm domain acting as the focal point. Three perisperm zones are readily
distinguished: the endosperm adjacent zone, the transition zone, and the peripheral zone. The endo-
sperm-adjacent zone is an amorphous mass that is present throughout seed development (Fig. 1.8 D-F).
Distinct cells or cellular structures, such as nuclei and cell walls, are not evident. The transition zone is
characterized by polygonal perisperm cells that transition from containing discrete starch aggregations
and having identifiable nuclei (Fig. 1.8G), to being so full of starch that cellular structures become severe-
ly distorted (Fig. 1.8H, I). Finally, the peripheral zone is the outermost area of the perisperm, which is last
to accumulate starch (Fig. 1.8 J-L). Cells of the peripheral zone are elongated, rather than polygonal, and
the accumulated aggregations of starch are smaller than found elsewhere in the perisperm.
34
FIGURE1.8:InsolublepolysaccharideszonationinNymphaea thermarum developing seeds. Mate-
rial embedded in JB-4 resin, sectioned at 4 µm, and stained with Periodic acid Shiffs-PAS reagent and
toluidine blue. N. thermarum seeds, examined at 3 (A, D, G, J), 4 (B, E, H, K), and 8 (C, F, I, L) days after
anthesis (noted as 3 D, 4 D, and 8 D, respectively). (A) Initially, starch is present throughout the filamen-
tous embryo, but is later restricted to the suspensor and nascent root pole in the late-globular embryo
(B). Inception of the cotyledonary ridges (C). (D) Early and dense accumulation of starch in the endo-
sperm adjacent zone of the perisperm. (D-F) Starch is consistently absent from the chalazal endosperm
(arrow), but is present in the peripheral layers of the micropylar endosperm at 8 days after anthesis. (G-I)
Perisperm transition zone, in which cells progressively accumulate starch. (J) Perisperm peripheral zone
with some multinucleate cells. (J-K) Starch accumulation is delayed relative to other perisperm zones. (L)
Starch aggregations remain discrete, even at 8 days after anthesis. Scale bar: 10 µm
35
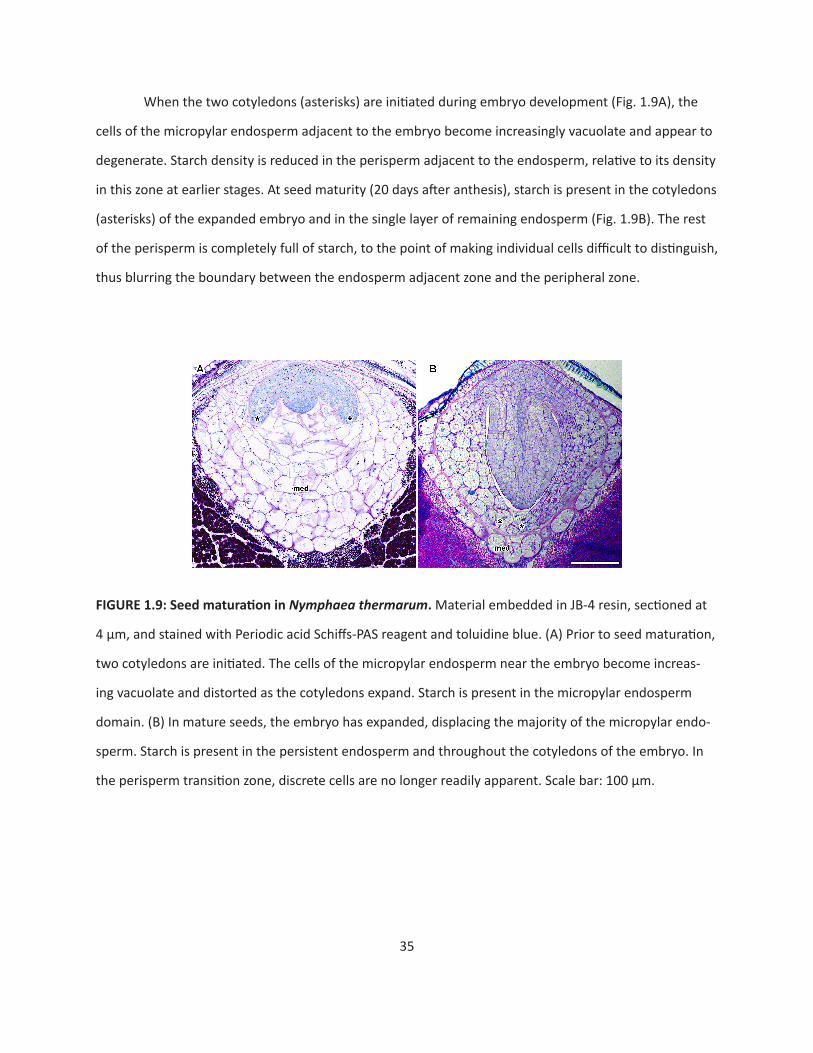
When the two cotyledons (asterisks) are initiated during embryo development (Fig. 1.9A), the
cells of the micropylar endosperm adjacent to the embryo become increasingly vacuolate and appear to
degenerate. Starch density is reduced in the perisperm adjacent to the endosperm, relative to its density
in this zone at earlier stages. At seed maturity (20 days after anthesis), starch is present in the cotyledons
(asterisks) of the expanded embryo and in the single layer of remaining endosperm (Fig. 1.9B). The rest
of the perisperm is completely full of starch, to the point of making individual cells difficult to distinguish,
thus blurring the boundary between the endosperm adjacent zone and the peripheral zone.
FIGURE1.9:SeedmaturationinNymphaea thermarum. Material embedded in JB-4 resin, sectioned at
4 µm, and stained with Periodic acid Schiffs-PAS reagent and toluidine blue. (A) Prior to seed maturation,
two cotyledons are initiated. The cells of the micropylar endosperm near the embryo become increas-
ing vacuolate and distorted as the cotyledons expand. Starch is present in the micropylar endosperm
domain. (B) In mature seeds, the embryo has expanded, displacing the majority of the micropylar endo-
sperm. Starch is present in the persistent endosperm and throughout the cotyledons of the embryo. In
the perisperm transition zone, discrete cells are no longer readily apparent. Scale bar: 100 µm.
36
Discussion
FlowerandpollinationbiologyofNymphaea thermarum
The majority of extant basal angiosperm lineages with hermaphroditic flowers are protogynous
(Thien et al., 2009; Endress, 2010). In most members of the Nymphaeaceae and Cabombaceae, pro-
togyny is manifest as a discrete temporal separation between female and male phases, punctuated by
the closing and re-opening of the flower each day or night of anthesis (reviewed in Wiersema 1988). In
the day-blooming subgenus Brachyceras (of which Nymphaea thermarum is a member), this sequence
occurs over two or more days: the flower opens on the first day as functionally female, with stigmatic se-
cretion present and the stigmatic surface receptive, and then closes in the evening. The following morn-
ing, the flower reopens for one or more days as functionally male, as the anthers dehisce to disperse pol-
len (Heslop-Harrison, 1955a; Prance and Anderson 1976; Wiersema 1988; Orban and Bouharmont, 1995;
Thien et al., 2009; Williams et al., 2010). Although flowers of N. thermarum open, close, and reopen as
is typical for water lilies with separate female and male phases, they are incompletely protogynous. The
overlap of female and male function in N. thermarum is a consequence of the dehiscence of the outer-
most whorl(s) of anthers prior to anthesis, contemporaneous with the onset of stigmatic secretion. This
advancement of male development relative to other floral ontogenetic events creates overlap between
female and male function. Furthermore, N. thermarum resembles other hermaphroditic members of
Nymphaeales in that it is capable of self-pollination (Wiersema, 1988). Since pollen is released before
the flower opens, and thus before the opportunity for the flower to receive out-crossing pollen, N. ther-
marum is not only capable of self-pollination, but is very likely predisposed to it.
Pollen release in bud has been described in three genera of Nymphaeaceae (Borsch et al., 2008):
the monotypic genus Euryale (Okada and Otaya, 1930; Okada, 1938; Kadono and Schneider 1987),
Barclaya (Williamson and Schneider, 1994), and several species of Nymphaea, including N. capensis
Thunb. var. zanzibarensis (Prance and Anderson, 1976; Orban and Bouharmont 1995), N. ampla (Prance
and Anderson, 1976), N. minuta (Landon et al., 2007), and N. thermarum, as shown in the current work.
The four Nymphaea species all belong to the tropical subgenus Brachyceras (Borsch, 2011), suggesting
that acceleration of male development may be a trait that evolved in a common ancestor of this group.
Overlap between female and male function has been reported in other species of Nymphaea (N. alba,
N. amazonum, N. conardii, N. jamesoniana, N. ligulata, N. rudgeana) , but in contrast to what we found
37
in N. thermarum, can be due to late or prolonged female function, rather than necessarily early male
function (Wiersema 1988). Assuming that protogyny is plesiomorphic for Nymphaeaceae, the partial
breakdown of this dichogamous pattern appears to have evolved independently several times within the
family, and can involve different heterochronic mechanisms that affect the relative timing of either or
both female and male development events.
A biological predisposition towards self-pollination can have profound effects on population
dynamics, and thus the evolutionary history of a species. On one hand, self-compatibility can be ad-
vantageous in guaranteeing fruit production under unfavorable conditions such as pollinator scarcity
or in fragmented populations with few individuals in small patches (Pang and Saunders, 2014). Since
N. thermarum is extinct in the wild, pollinator interactions are unknown, but populations were known
to be fragmented (Fischer, 1988; Fischer and Magdalena-Rodriguez, 2010). On the other hand, wide-
spread selfing may have actually played a role in the demise of the species. Generations of inbreeding
can decrease the amount of genetic, and thus phenotypic, variation in small populations, leading to
decreased times to population extinction (Brook et al., 2002; Frankham, 2005; Reed, 2005; Dornier et al.,
2012). This effect, compounded by the fact that population size was already constrained by specialization
for a limited habitat (hot springs), may have rendered N. thermarum unable to cope with rapid habitat
loss. Understanding how the floral biology of N. thermarum may have factored into its near-extinction
can help conservation efforts and prevent a similar fate for other tropical and non-tropical water lilies
(Nierbauer et al., 2014). Other members of the subgenus Brachyceras that are similarly inclined towards
self-pollination and found within limited ranges, such as the Madagascar endemic N. minuta (Landon et
al., 2007), are therefore of particular concern.
Ovule development in Nymphaea thermarum
Development of the female gametophyte and ovule of N. thermarum is generally in accor-
dance with what is known from other members of the Nymphaeales. The female gametophyte of N.
thermarum is of the Nuphar/Schisandra type, in that it is monosporic and four-nucleate, four-celled at
maturity. This type of female gametophyte is characteristic of the most ancient flowering plant lineages
described to date (Nymphaeales: Orban and Bouharmont, 1998; Williams and Friedman, 2002; Fried-
man, 2006; 2008; Rudall et al., 2008. Austrobaileyales: Williams and Friedman, 2004; Friedman et al.,
38
2003; Tobe et al., 2007; Bachelier and Friedman, 2011), with the exception of Amborella trichopoda
which has a unique nine-nucleate, eight-celled female gametophyte (Friedman and Ryerson, 2009). Our
observations of N. thermarum provide further support for the hypothesis that the Nuphar/Schisandra-
type female gametophyte is the only type to be found among the Nymphaeales, despite decades of
earlier reports that described occurrence of the more complex and ubiquitous Polygonum type. These
reports have been shown to almost certainly be erroneous (Williams and Friedman, 2002; Friedman and
Williams, 2003).
During the free-nuclear stages of female gametophyte development in N. thermarum, simulta-
neous enlargement of the female gametophyte and degeneration of the micropylar nucellus puts the
female gametophyte in direct contact with the single persistent layer of nucellar epidermis. The interior
periclinal cell walls of this nucellar epidermal layer thicken and become convoluted in a manner remi-
niscent of transfer cell morphology. Similarly differentiated tissue in the micropylar part of the ovule has
been referred to as epistase, but this phenomena appears to be unusual and is poorly understood in
terms of both development and function (Maheshwari, 1950). Wall thickening of the nucellar epidermis
has been described in three additional species within Nymphaea (N. advena, N. gigantea, N. odorata),
and in Victoria amazonica, (Nymphaeaceae) (Cook, 1902; 1906; Winther and Sharmov, 1991), but was
(likely mistakenly) attributed to sclerification. Cytological examination of N. thermarum reveals that
these prominent convoluted cell walls are distinct from the filiform apparatus, and are composed of dif-
ferent layers of cellulose and callose that accumulate throughout ovule maturation.
Prolonged cellulose synthesis to create wall invaginations increases surface area of the plasma-
lemma, and thus capacity for solute transfer, and is a common feature of transfer cell walls (Talbot et al.,
2007). Callose is also associated with a number of transfer cell types: the gametophyte/sporophyte inter-
face in mosses (Ofler et al.,2003), nodules of legumes (Dahiya and Brewin 2000), and endosperm tissue
in cereal grains (Zheng and Wang, 2011; Thiel et al., 2012; Thiel, 2014). The dramatic disappearance of
callose from this layer of nucellus upon pollen tube penetration in N. thermarum suggests that this layer
might have a discrete function associated with pollen tube attraction, fertilization, and/or early offspring
growth. Our examination of the broader literature on angiosperm ovules indicates that this type of cell
wall patterning in the nucellus adjacent to the egg apparatus (and separate from the filiform apparatus)
is either unique to water lilies or significantly under-reported (see Maheshwari 1950).
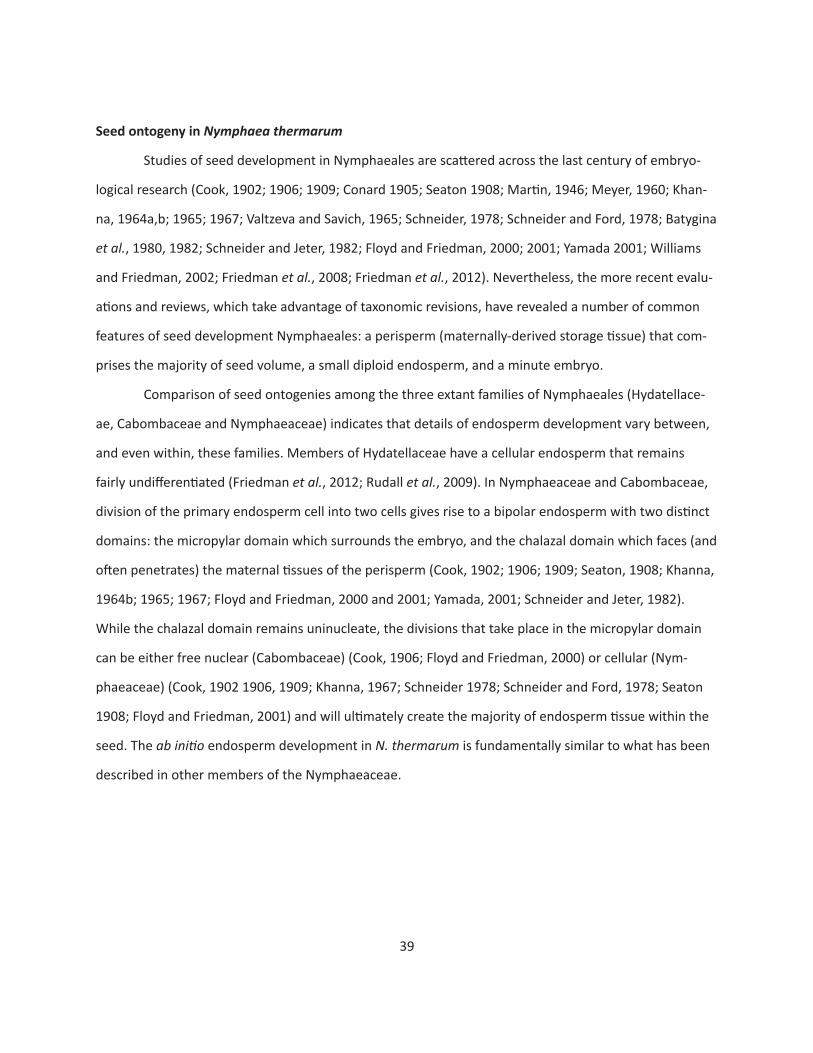
39
Seed ontogeny in Nymphaea thermarum
Studies of seed development in Nymphaeales are scattered across the last century of embryo-
logical research (Cook, 1902; 1906; 1909; Conard 1905; Seaton 1908; Martin, 1946; Meyer, 1960; Khan-
na, 1964a,b; 1965; 1967; Valtzeva and Savich, 1965; Schneider, 1978; Schneider and Ford, 1978; Batygina
et al., 1980, 1982; Schneider and Jeter, 1982; Floyd and Friedman, 2000; 2001; Yamada 2001; Williams
and Friedman, 2002; Friedman et al., 2008; Friedman et al., 2012). Nevertheless, the more recent evalu-
ations and reviews, which take advantage of taxonomic revisions, have revealed a number of common
features of seed development Nymphaeales: a perisperm (maternally-derived storage tissue) that com-
prises the majority of seed volume, a small diploid endosperm, and a minute embryo.
Comparison of seed ontogenies among the three extant families of Nymphaeales (Hydatellace-
ae, Cabombaceae and Nymphaeaceae) indicates that details of endosperm development vary between,
and even within, these families. Members of Hydatellaceae have a cellular endosperm that remains
fairly undifferentiated (Friedman et al., 2012; Rudall et al., 2009). In Nymphaeaceae and Cabombaceae,
division of the primary endosperm cell into two cells gives rise to a bipolar endosperm with two distinct
domains: the micropylar domain which surrounds the embryo, and the chalazal domain which faces (and
often penetrates) the maternal tissues of the perisperm (Cook, 1902; 1906; 1909; Seaton, 1908; Khanna,
1964b; 1965; 1967; Floyd and Friedman, 2000 and 2001; Yamada, 2001; Schneider and Jeter, 1982).
While the chalazal domain remains uninucleate, the divisions that take place in the micropylar domain
can be either free nuclear (Cabombaceae) (Cook, 1906; Floyd and Friedman, 2000) or cellular (Nym-
phaeaceae) (Cook, 1902 1906, 1909; Khanna, 1967; Schneider 1978; Schneider and Ford, 1978; Seaton
1908; Floyd and Friedman, 2001) and will ultimately create the majority of endosperm tissue within the
seed. The ab initio endosperm development in N. thermarum is fundamentally similar to what has been
described in other members of the Nymphaeaceae.
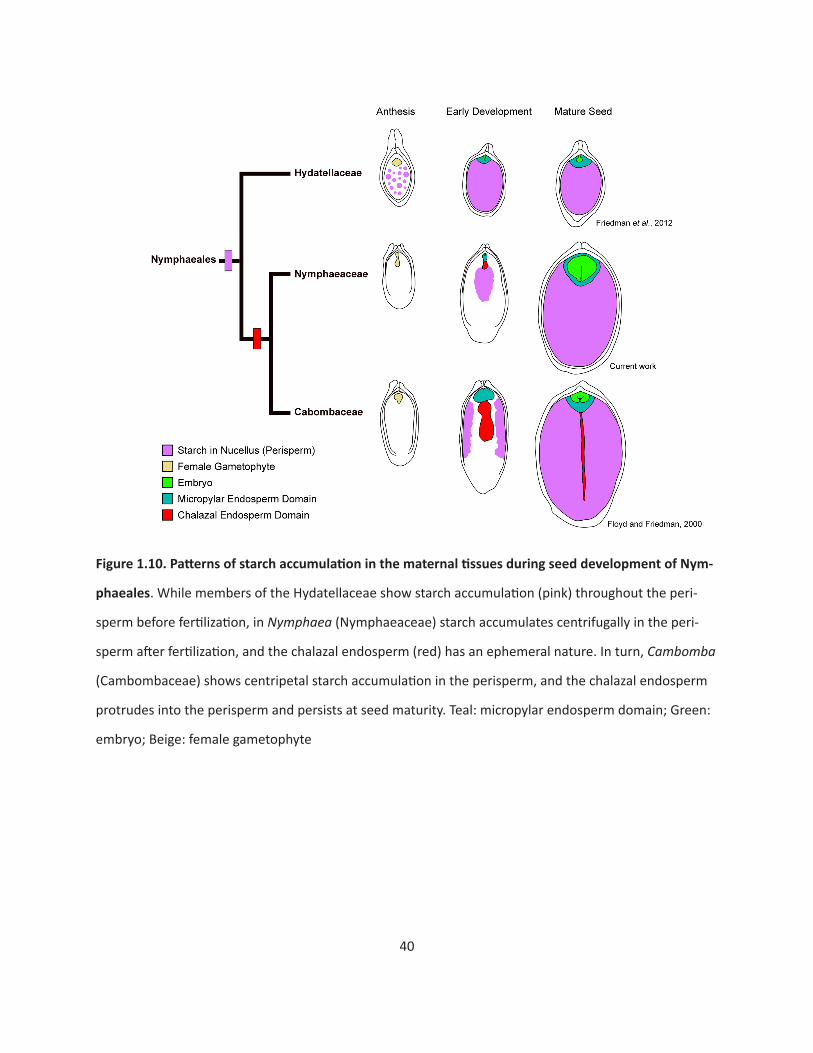
40
Figure1.10.PatternsofstarchaccumulationinthematernaltissuesduringseeddevelopmentofNym-
phaeales. While members of the Hydatellaceae show starch accumulation (pink) throughout the peri-
sperm before fertilization, in Nymphaea (Nymphaeaceae) starch accumulates centrifugally in the peri-
sperm after fertilization, and the chalazal endosperm (red) has an ephemeral nature. In turn, Cambomba
(Cambombaceae) shows centripetal starch accumulation in the perisperm, and the chalazal endosperm
protrudes into the perisperm and persists at seed maturity. Teal: micropylar endosperm domain; Green:
embryo; Beige: female gametophyte
41
Studies of seeds in Nymphaea typically have not recorded the complete ontogeny of the different tissues
(Cook, 1902, 1906, 1909; Seaton, 1908; Khanna, 1964a, 1967; Batygina, 1980; Valtzeva and Savich, 1965;
Rudall et al., 2009), and many have overlooked the development of the ephemeral chalazal endosperm
domain. Our study of N. thermarum provides the most complete ontogeny of the chalazal endosperm
domain in any species of Nymphaea. Notably, while the domain remains unicellular and uninucleate, it
produces a single, minute projection that protrudes into the perisperm. The presence and extent of de-
velopment of a chalazal endosperm protrusion varies across Nymphaeales (Fig. 1.10). In Hydatellaceae,
the chalazal endosperm domain is not apparent and is in fact difficult to distinguish at all (Friedman et
al., 2012). In Cabombaceae and Nuphar (Nymphaeaceae), the chalazal endosperm domain (protrusion)
forms a large tube-like structure that penetrates through the perisperm, almost to the chalazal end of
the seed, and persists at seed maturity (Cook, 1902; 1906; 1909; Seaton, 1908; Khanna, 1964b; 1965;
1967; Schneider and Jeter 1982; Floyd and Friedman, 2000 and 2001; Yamada 2001).
The chalazal endosperm domain of several members of the Nymphaeales has been referred
to as a haustorial structure, based primarily on its proximity to and apparent interaction with the peri-
sperm tissue (Cook 1902, 1906; Khanna, 1965; 1967; Valtzeva and Savich, 1965; Schneider and Jeter,
1982; Floyd and Friedman 2000). We note that throughout Nymphaeales the degree of protrusion of
the chalazal endosperm appears to correlate inversely with the presence of starch in the immediately
adjacent perisperm at the time of chalazal endosperm development. Patterns of perisperm starch ac-
cumulation vary both spatially and temporally, and may contribute to variation in chalazal endosperm
development. Before fertilization in Hydatellaceae, the entire perisperm is filled with starch (Friedman,
2008: Friedman et al., 2012). In Cabombaceae, post-fertilization starch accumulation in the perisperm is
centripetal (Figure 10). In Nymphaea (this study), starch first accumulates after fertilization at the center
of the perisperm and proceeds in a centrifugal pattern. While we cannot establish a causal link between
centrifugal perisperm filling and ‘stunted’ chalazal endosperm development in N. thermarum compared
with centripetal perisperm filling and prolonged chalazal development in Cabomba, our observations
support the idea that chalazal endosperm development, and probably function, is intimately linked to
nutrient dynamics within the seed.
42
Nymphaea thermarumasaModelSystemforIlluminatingEarlyEvolutionofKeyAngiospermTraits
Extensive study of eudicot and monocot “model” taxa has revealed much about the molecular
biology and gene interactions that underlie flower and seed development (reviewed, for example, in
Zanis 2007; Litt and Kramer 2010; Ruan et al., 2012; Dresselhaus and Doughty, 2014; Lafon-Placette and
Köhler, 2014; Ó’Maoiléidigh et al., 2014). However, we know relatively little about how these processes
operate in early-diverging angiosperm lineages (Soltis et al., 2007; Chanderbali et al., 2010). Conse-
quently, it has not been possible to reconstruct the molecular development of flowers and reproductive
processes during the earliest phases of angiosperm evolution.
The lack of genetic and molecular studies in the most ancient angiosperm lineages is not without
good reason: the majority of taxa in these clades are woody and long-lived, which makes them unsuit-
able as subjects for molecular and genetic experiments. During the last five years, three herbaceous
members of basal angiosperm lineages have been suggested as possible model systems: Trithuria (Hy-
datellaceae) (Rudall et al., 2009), Cabomba caroliniana (Cabombaceae) (Vialette-Guiraud et al., 2011),
and Aristolochia fimbriata (Aristolochiaceae, Piperales) (Bliss et al., 2013). As of now, none of these taxa
has been embraced as a major “model” system. We suggest that Nymphaea thermarum has a unique
potential for development into a model system. Many of its growth requirements have already been
established (Fisher and Magdalena Rodriguez, 2010). The diminutive size of N. thermarum means that
large numbers of individuals can be maintained in greenhouses or growth chambers, and although they
are “aquatic,” these plants can be raised in individual pots placed in shallow tanks or tubs. Importantly,
N. thermarum has a short life cycle of 5-6 months from seed germination to seed production, a genera-
tional timeframe that is exceedingly rare among basal angiosperms. Each flower can produce hundreds
of seeds following either self-pollination or, if the maternal flower is emasculated at least one full day
before anthesis, cross-pollination. A small genome size (1 C = 0.51 pg, only about twice the size of Ara-
bidopsis thaliana) further makes this system tractable for genetic experimentation (Pellicer et al., 2013).
Indeed, work is underway to 1) produce transcriptomes from a variety of tissues, 2) generate isogenic
lines, and 3) develop stable transformation protocols. An annotated genome would complete the pack-
age of creating a model system taxon rooted deeply at the base of the flowering plant phylogeny.
Finally, the results from this study establish a timeline for female reproductive development,
floral biology, and seed development. A firm understanding of the reproductive biology of N. thermarum,
43
combined with information on remaining genetic diversity maintained in ex situ collections, will be es-
sential for any attempt to reintroduce populations into the wild and conserve this remarkable species.
References
Bachelier JB, Friedman WE (2011) Female gamete competition in an ancient angiosperm lineage. Proc-Natl Acad Sci U S A 180: 12360–12365.
Baker HG, Baker I (1979) Starch in angiosperm pollen grains and its evolutionary significance. Am J Bot 66: 591–600.
Barrell P, Grossniklaus U (2005) Confocal microscopy of whole ovules for analysis of reproductive devel-opment: the elongate1 mutant affects meiosis II. Plant J 43: 309-320.
Baskin CC, Baskin JM (2007) Nymphaeaceae: a basal angiosperm family (ANITA grade) with a fully devel-oped embryo. Seed Sci Res 17: 293–296.
Batygina TB, Kravtsova TI, Shamrov II (1980) The comparative embryology of some representatives of the orders Nymphaeales and Nelumbolales. Botanicheskii Zhurnal 65: 1071–1086.
Batygina TB, Shamrov II, Kolesova GE (1982) Embryology of the Nymphaeales and Nelumbonales II. The development of the female embryonic structures. Botanicheskii Zhurnal 67: 117S–119S.
Bliss BJ, Wanke S, Barakat A, et al (2013) Characterization of the basal angiosperm Aristolochia fimbriata: a potential experimental system for genetic studies. BMC Plant Biol 13: 13. doi:10.1186/1471-2229-13-13.
Bonilla-Barbosa J, Novelo A, Orozco YH, Márquez-Guzmán J (2000) Comparative seed morphology of Mexican Nymphaea species. Aquat Bot 68: 189–204.
Borsch T, Löhne C, Mbaye MS, Wiersema J (2011) Towards a complete species tree of Nymphaea: shed-ding further light on subg. Brachyceras and its relationship to the Australian water-lilies. Telopea 13: 193–217.
Borsch T, Löhne C, Wiersema J (2008) Phylogeny and evolutionary patterns in Nymphaeales: integrating genes, genomes and morphology. Taxon 57: 1052–1081.
Brook BW, Tonkyn DW, Q´Grady JJ, Frankham R (2002) Contribution of inbreeding depression to extinc-tion risk in threatened species. Conserv Ecol 6(1): 16.
Čapek, M., J. Janáček, Kubìnová L (2006) Methods of compensation of the light attenuation with depth of images captured by a confocal microscope. Microsc Res Tech 69: 624-635.
Capperino ME, Schneider EL (1985) Floral biology of Nymphaea Mexicana Zucc (Nymphaeaceae). Aquat Bot 23: 83–93.
44
Chanderbali AS, Yoo M, Zahn LM, et al (2010) Conservation and canalization of gene expression during angiosperm diversification accompany the origin and evolution of the flower. Proc Natl Acad Sci U S A 107: 22570-22575.
Chiflot JBJ (1902) Contributions a l’etude de la classe des Nympheinees. Annales de L’Université de Lyon, nouvelle série. 10: 1–294.
Conard HS (1905) The water lilies: A monograph of the genus Nymphaea. Washington: Carnegie Institu-tion of Washington.
Cook MT (1902) Development of the Embryo-Sac and Embryo of Castalia odorata and Nymphaea advena Author. Bull Torrey Bot Club 29: 211–220.
Cook MT (1906) The embryogeny of some Cuban Nymphaeaceae. Bot Gaz 42: 376–392.
Cook MT (1909) Notes on the embryology of Nympaeaceae. Bot Gaz 48: 56-59.
Currier HB (1957) Callose substance in plant cells. Am J Bot 44: 478–488.
Dahiya P, Brewin NJ (2000) Immunogold localization of callose and other cell wall components in pea nodule transfer cells. Protoplasma 214: 210–218.
Davis CC, XI Z, Mathews S (2014) Plastid phylogenomics and green plant phylogeny: almost full circle but not quite there. BMC Biol 12:11.
Dornier A, Cheptou P (2012) Determinants of extinction in fragmented plant populations: Crepis sancta (asteraceae) in urban environments. Oecologia 169: 703–712.
Doyle JA, Endress PK (2014) Integrating early Cretaceious fossils into the phylogeny of living angio-sperms: ANITA lines and relatives of Chloranthaceae. Int J Plant Sci 175: 555–600.
Dresselhaus T, Doughty J (2014) Regulation of fertilization and early seed development. Biochem Soc Trans 42: 309-312.
Endress PK (2001) The flowers in extant basal angiosperms and inferences on ancestral flowers. Int J Plant Sci 162: 1111–1140.
Endress PK (2005) Carpels in Brasenia (Cabombaceae) are completely ascidiate despite a long stigmatic crest. Ann Bot 96: 209–215.
Endress PK (2010) The evolution of floral biology in basal angiosperms. Philos Trans of the R Soc B Biol Sci 365: 411–421.
Feder N, O’Brien TP (1968) Plant microtechnique: some principles and new methods. Am J Bot 55: 123–142.

45
Fischer E, Magdalena-Rodriguez C (2010) Nymphaea thermarum (Nymphaeaceae). Curtis Bot Mag 27:318–327.
Fischer, E (1988) Beitr¨age zur Flora Zentralafrikas I. Eine neue Nymphaea sowie ein neuer Streptocarpus aus Rwanda. Feddes Repert 99: 385–390.
Floyd SK, Friedman WE (2000) Evolution of endosperm developmental patterns among basal flowering plants. Int J Plant Sci 16: S57–S81.
Floyd SK, Friedman WE (2001) Developmental evolution of endosperm in basal angiosperms: Evidence from Amborella (Amborellaceae), Nuphar (Nymphaeaceae), and Illicium (Illiciaceae). Plant Syst Evol 228: 153–169.
Frankham R (2005) Genetics and extinction. Biol Conserv 126(6): 131–140.
Friedman WE, Bachelier JB, Hormaza JI (2012) Embryology in Trithuria submersa (Hydatellaceae) and relationships between embryo, endosperm, and perisperm in early-diverging flowering plants. Am J Bot 99: 1083–1095.
Friedman WE, Gallup WN, Williams JH (2003) Gametophyte development in Kadsura: implications for Schisandraceae, Austrobaileyales, and the early evolution of flowering plants. Int J PLant Sci 164: S293–S305.
Friedman WE, Ryerson KC (2009) Reconstructing the ancient female gametophyte in angiosperms: in-sights from Amborella and other ancient lineages of flowering plants. Am J Bot 96: 129–143.
Friedman WE, Williams JH (2003) Modularity of the angiosperm female gametophyte and its bearing on the early evolution of endosperm in flowering plants. Evolution 57: 216–230.
Friedman WE (2006) Embryological evidence for developmental labiality during early angiosperm evolu-tion. Nature 441: 337–340.
Friedman, WE (2008) Hydatellaceae are water lilies with gymnospermous tendencies. Nature 453: 94 – 97.
Friis EM, Crane PR, Pedersen KR (2011) Early flowers and angiosperm evolution. Cambridge: Cambridge University Press.
Friis EM, Pedersen KR, Crane PR (2006) Cretaceous angiosperm flowers: innovation and evolution in plant reproduction. Palaeo 232: 251–293.
Friis EM, Pedersen KR, Crane, PR (2001) Fossil evidence of water lilies (Nymphaeales) in the Early Creta-ceous. Nature 410: 357–360.
Grob V, Moline P, Pfeifer E, Novelo AR, Rutishauser R (2006) Developmental morphology of branching flowers in Nymphaea prolifera. J Plant Res 119: 561–570.
Heslop-Harrison Y (1955a) Biological flora of the British Isles. Nuphar Sm. J Ecol 43: 342–364.
46
Heslop-Harrison Y (1955b) Biological flora of the British Isles. J Ecol 42: 719–734.
Hu GW, Lei LG, Liu KM, Long CL (2009) Floral development in Nymphaea tetragona (Nymphaeaceae). Bot J Linn Soc 159: 211–221.
Hughes J, McCully ME (1975) The use of an optical brightener in the study of plant structure. Stain Tech-nol 50: 319–329.
Iles WD, Lee C, Sokoloff DD, et al (2014) Reconstructing the age and historical biogeography of the ancient flowering-plant family Hydatellaceae (Nymphaeales). BMC Evol Biol 14:120. doi:10.1186/1471-2148-14-102.
Kadono Y, Schneider EL (1987) The life history of Euryale ferox Salisb. In Southwestern Japan with special reference to reproductive ecology. Plant Species Biol 2: 109–115
Khanna P (1964a) Some interesting observations in Euryale ferox Salisb. Curr Sci 33: 152.
Khanna P (1964b) Morphological and embryological studies in Nymphaeaceae. I. Euryale ferox Salisb. P Indian Acad Sci Plant Sci 59: 237–244.
Khanna P (1965) Morphological and embryological studies in Nymphaeaceae II. Brasenia scherebei Gmel. and Nelumbo nucifera Gaertin. Aust J Bot 13: 379–387.
Khanna P (1967) Morphological and embryological studies in Nymphaeaceae III. Victoria cruziana D´Orb., and Nymphaea stellate Willd. Bot Mag Tokyo 80: 305–312.
Lafon-Placette C, Köhler C (2014) Embryo and endosperm, partners in seed development. Curr Opin Plant Biol 17: 64–69.
Landon K, Nozaic PI, Edwards RA (2007) A new species of water lily (Nymphaea minuta: Nymphaeaceae) from Madagascar. Water Garden Journal 22: 5–10.
Litt A, Kramer, EM (2010) The ABC model and the diversification of floral organ identity. Semin Cell Dev Biol 21: 129–137.
Magallón S, Hilu KW, Quandt D (2013) Land plant evolutionary timeline: gene effects are secondary to fossil constraints in relaxed clock estimation of age and substitution rates. Am J Bot 100: 556–573.
Maheshwari P (1950) An introduction to the embryology of angiosperms. Mc Graw Hill Book Company, New York.
Maia VH, Gitzendanner MA, Soltis PA, Wong GK, Soltis DE (2014) Angiosperm Phylogeny Based on 18S/26S rDNA Sequence Data: Constructing a Large Data Set Using Next-Generation Sequence Data. Int J Plant Sci 75: 613–650.
Martin AC (1946) The comparative internal morphology of seeds. Am Midland Natur 36: 513–660.
47
Meyer KI. 1960. On the embryology of Nuphar luteum SM. Bull of Moscow Soc Natur Biol Series 65: 48–60.
Moseley MF, Mehta IJ, Williamson PS, Kosakai H (1984) Morphological Studies of the Nymphaeaceae (Sensu Lato). XIII. Contributions to the Vegetative and Floral Structure of Cabomba. Am J Bot 71: 902–924.
Moseley MF (1961) Morphological studies of the Nymphaeaceae II. The flower of Nymphaea. Bot Gaz 122: 233–259.
Nierbauer KU, Kanz B, Zizka G (2014) The widespread naturalization of Nymphaea hybrids is masking the decline of wild-type Nymphaea alba in Hesse, Germany. Flora - Morphology, Distribution, Functional Ecol Plants 209: 122–130.
Ó’Maoiléidigh DS, Graciet E, Wellmer F (2014) Gene networks controlling Arabidopsis thaliana flower development. New Phytol 201: 16–30.
Offler CE, McCurdy DW, Patrick JW, Talbot MJ (2003) Transfer cells: cells specialized for a special purpose. Ann Rev Plant Biol 54: 431–454.
Okada Y, Otaya T (1930) Study of Euryale ferox Salisb. VI. Cleistogamous versus chasmogamous flower. Bot Mag Tokyo 44: 369–373.
Okada, Y (1938) On chasmogamous flowers of Euryale ferox Salisb. Eco Rev 4: 159–163.
Orban I, Bouharmont J (1995) Reproductive biology of Nymphaea capensis Thunb. var. zanzibariensis (Casp.) Verdc (Nymphaeaceae). Bot J Linn Soc 119: 35–43.
Orban I, Bouharmont J (1998) Megagametophyte development of Nymphaea nouchali Burm. F (Nympha-eaceae). Bot J Linn Soc 126: 339–348.
Pang C, Saunders RMK (2014) The evolution of alternative mechanisms that promote outcrossing in An-nonaceae, a self-compatible family of early-divergent angiosperms. Bot J Linn Soc 174: 93–109.
Pellicer J, Kelly LJ, Magdalena C, Leitch IJ (2013) Insights into the dynamics of genome size and chromo-some evolution in the early diverging angiosperm lineage Nymphaeales (water lilies). Genome 56: 1–13.
Prance GT, Anderson AB (1976) Studies of the floral biology of tropical Nymphaeaceae. Acta Amazonica 6: 163–170.
Qiu YL, Lee J, Bernasconi-Quadroni F, et al (1999) The earliest angiosperms: evidence from mitochon-drial, plastid and nuclear genomes. Nature 402: 404–407.
Ramji MV, Padmanabhan D (1965) Developmental studies on Cabomba caroliniana Gray I. Ovule and carpel. Proc Indian Acad Sci Section B 62: 215–223.
Reed DH (2005) Relationship between Population Size and Fitness. Conserv Biol 19:563–568.
48
Ruan Y, Patrick JW, Bouzayen M, Fernie AR (2012) Molecular regulation of seed and fruit set. Trends Plant Sci 17:656–665
Rudall PJ, MV Remizowa, A. S. Beer, E. Bradshaw, D.W. Stevenson, T. D. Macfarlane, R. E. Tuckett , et al (2008) Comparative ovule and megagametophyte development in Hydatellaceae and water lilies reveal a mosaic of features among the earliest angiosperms. Ann Bot 101: 941–956 .
Rudall PJ, Eldridge T, Tratt J et al (2009) Seed fertilization, development, and germination in Hydatellace-ae (Nymphaeales): implications for endosperm evolution in early angiosperms. Am J Bot 96: 1581–1593.
Rudall PJ, Sarkoloff DD, Remizowa MV, et al (2007) Morphology of Hydatellaceae, an anomalous aquatic family recently recognized as an early-divergent angiosperm lineage. Am J Bot 94: 1073–1092.
Ruhfel BR, Gitzendanner MA, Soltis PS, Soltis DE, Burleigh JG (2014) From algae to angiosperms–inferring the phylogeny of green plants (Viridiplantae) from 360 plastid genomes. BMC Evol Biol 14: 23.
Saarela JM, Rai HS, Doyle JA, et al (2007) Hydatellaceae identified as a new branch near the base of the angiosperm phylogenetic tree. Nature 446: 312–315.
Schneider EL, Chaney T (1981) The floral biology of Nymphaea odorata (Nymphaeaceae). The Southwest-ern Nat 26: 159–165.
Schneider EL, Ford EG (1978) Morphological studies of the Nymphaeacee. X. The seed of Ondinea pur-purea Den Hartog. Bull Torrey Bot Club 105: 192–200.
Schneider EL, Jeter JM (1982) Morphological studies of the Nymphaeaceae XII. The Floral Biology of Ca-bomba caroliniana. Am J Bot 69: 1410–1419.
Schneider EL, Moore LA (1977) Morphological studies of the Nymphaeaceae. VII. The floral biology of Nuphar lutea subsp. Macrophylla. Brittonia 29: 88–99.
Schneider EL, Tucker SC, Williamson PS (2003) Floral development in the Nymphaeales. Int J Plant Sci 164: S279–S292.
Schneider EL (1976) The floral anatomy of Victoria Schomb (Nymphaeaceae). Bot J Linn Soc 72: 115–148.
Schneider EL (1978) Morphological studies of the Nymphaeaceae IX. The seed of Barclaya longifolia Wall. Bot Gaz 139: 223–230.
Schneider EL (1983) Gross morphology and floral biology of Ondinea purpurea den Hartog. Aust J Bot 31: 371–382.
Schneider, EL (1982) Observations on the pollination biology of Nymphaea gigantea WJ Hooker (Nym-phaeaceae). West Aust Nat 15: 71–72.
Seaton S (1908) The development of the embryo-sac of Nymphaea advena. Bull Torrey Bot Club 35: 283–290.
49
Sokoloff DD, Remizowa MV, Briggs BG, et al (2009) Shoot architecture and branching pattern in perennial Hydatellaceae (Nymphaeales). Int J Plant Sci 170: 869–884.
Sokoloff DD, Remizowa MV, Yadav SR, et al (2010) Development of reproductive structures in the sole Indian species of Hydatellaceae, Trithuria konkanensis, and its morphological differences from Australian taxa. Aust Syst Bot 23: 217–228.
Soltis DE, Chanderbali AS, Kim S, Buzgo M, Soltis PS (2007) The ABC model and its applicability to basal angiosperms. Ann Bot 100: 155–163.
Stevens PF (2001) Angiosperm Phylogeny Website. http://www.mobot.org/MOBOT/research/APweb/. 16 July 2014.
Talbot MJ, Wasteneys GO, Ofler CE, McCurdy DW (2007) Cellulose synthesis is required for deposition of reticulate wall ingrowths in transfer cells. Plant Cell Physiol 48: 147–158.
Thiel J, Riewe D, Rutten T, et al (2012) Differentiation of endosperm transfer cells of barley: a compre-hensive analysis at the micro-scale. Plant J 71: 639–655.
Thiel J (2014) Development of endosperm transfer cells in barley. Front Plant Sci 5: 108. doi: 10.3389/fpls.2014.00108
Thien LB, Bernhardt P, Devall MS, et al (2009) Pollination biology of basal angiosperms (ANITA grade). Am J Bot 96: 166–182.
Tobe H, Kimoto Y, Prakash N (2007) Development and structure of the female gametophyte in Austrobai-leya scandens (Austrobaileyaceae). J PLant Res 120: 431–436.
Valtzeva OV, Savich EI (1965) Development of embryo in Nymphaea candida Presl. and N. tetragona Georgi. Botanicheskii Zhurnal 50: 1323–1326.
Van Miegroet F, Dujardin M (1992) Cytologie et histolgie de la reproduction chez le Nymphaea heudelotii. Canad J Bot 70: 1991–1996.
Vialette-Guiraud ACM, Alaux M, Legeai F, et al (2011) Cabomba as a model for studies of early angio-sperm evolution. Ann Bot 108: 589–598.
Wiersema JH (1988) Reproductive biology of Nymphaea (Nymphaeaceae). Ann Missouri Bot Gard 75: 795–804.
Williams JH , Friedman WE (2002) Identification of diploid endosperm in an early angiosperm lineage. Nature 415: 522–526.
Williams JH, Friedman WE (2004) The four-celled female gametophyte of Illicium (Illiciaceae; Austrobai-leyales): Implications for understanding the origin and early evolution of monocots, eumagnoliids, and eudicots. Am J Bot 91: 332–357.
Williams JH, McNeilage RT, Lettre MT, et al (2010) Pollen tube growth and the pollen-tube pathway of
50
Nymphaea odorata (Nymphaeaceae). Bot J Linn Soc 162: 581–593.
Williamson PS, Moseley MF (1989) Morphological Studies of the Nymphaeaceae Sensu Lato. XVII. Floral Anatomy of Ondinea purpurea Subspecies Purpurea (Nymphaeaceae). Am J Bot 76: 1779–1794.
Williamson PS, Schneider EL (1994) Floral aspects of Barclaya (Nymphaeaceae): pollination, ontogeny and structure. Plant Syst Evol 8: 159–173.
Winter AN, Shamrov II (1991) Megasporogenesis and embryo sac development in representatives of the genera Nymphaea and Victoria (Nymphaeaceae). Botanicheskii Zhurnal 76: 1716–1728.
Yamada T, Imaichi R, Kato, M (2001) Developmental morphology of ovules and seeds of Nymphaeales. Am J Bot 88: 963-974.
Zanis MJ (2007) Grass spikelet genetics and duplicate gene comparisons. Int J Plant Sci 168:93–110.
Zheng Y, and Wang Z (2011) Contrast observation and investigation of wheat endosperm transfer cells and nucellar projection transfer cells. Plant Cell Rep 30: 1281–1288.
Zhou Q, Fu D (2007) Floral biology of Nuphar pumila (Timm) DC (Nymphaeaceae) in China. Plant Syst Evol 264: 101–108.
Zhou Q, Fu D (2008) Reproductive morphology of Nuphar (Nymphaeaceae), a member of basal angio-sperms. Plant Syst Evol 272: 79–96.
FundingInformation
This work was supported by a grant from the NSF [grant number IOS-S-0919986] to W.E.F.
Acknowledgements
We thank Ekaterina Morozova for help with sectioning, and the staff of Botanische Gärten der Univer-
sität Bonn for providing plant material for propagation.
51
Chapter 2
Title: Reciprocal interploidy crosses in Nymphaea thermarum: a new perspective on interparental con-
flict and flowering plant evolution
Authors: Rebecca Povilusa, Pamela K. Diggleb, William E. Friedmana,c
a Department of Organismic and Evolutionary Biology, Harvard University, 26 Oxford Street, Cambridge,
MA 02138, USA; b Department of Ecology and Evolutionary Biology, University of Connecticut, Storrs, CT
06269-3043, USA c Arnold Arboretum of Harvard University, 1300 Centre Street, Boston, MA 02131, USA
Manuscript in review at the Proceedings of the Royal Society of London B - Biological Sciences.
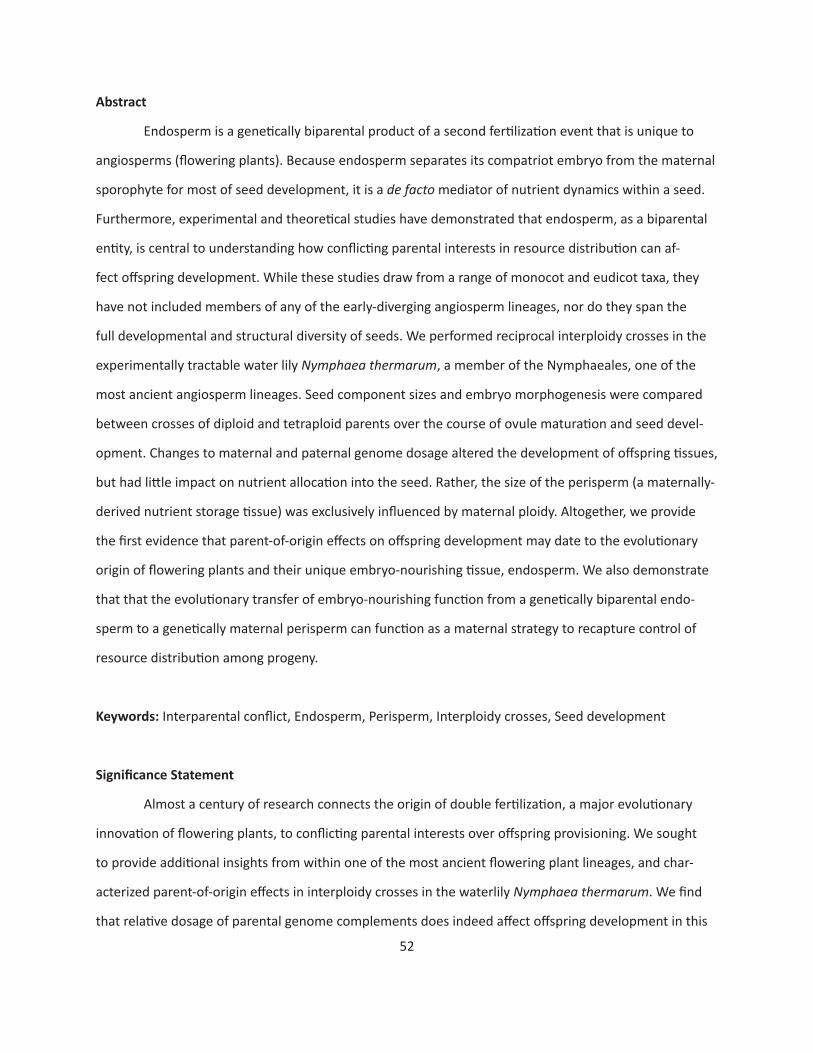
52
Abstract
Endosperm is a genetically biparental product of a second fertilization event that is unique to
angiosperms (flowering plants). Because endosperm separates its compatriot embryo from the maternal
sporophyte for most of seed development, it is a de facto mediator of nutrient dynamics within a seed.
Furthermore, experimental and theoretical studies have demonstrated that endosperm, as a biparental
entity, is central to understanding how conflicting parental interests in resource distribution can af-
fect offspring development. While these studies draw from a range of monocot and eudicot taxa, they
have not included members of any of the early-diverging angiosperm lineages, nor do they span the
full developmental and structural diversity of seeds. We performed reciprocal interploidy crosses in the
experimentally tractable water lily Nymphaea thermarum, a member of the Nymphaeales, one of the
most ancient angiosperm lineages. Seed component sizes and embryo morphogenesis were compared
between crosses of diploid and tetraploid parents over the course of ovule maturation and seed devel-
opment. Changes to maternal and paternal genome dosage altered the development of offspring tissues,
but had little impact on nutrient allocation into the seed. Rather, the size of the perisperm (a maternally-
derived nutrient storage tissue) was exclusively influenced by maternal ploidy. Altogether, we provide
the first evidence that parent-of-origin effects on offspring development may date to the evolutionary
origin of flowering plants and their unique embryo-nourishing tissue, endosperm. We also demonstrate
that that the evolutionary transfer of embryo-nourishing function from a genetically biparental endo-
sperm to a genetically maternal perisperm can function as a maternal strategy to recapture control of
resource distribution among progeny.
Keywords: Interparental conflict, Endosperm, Perisperm, Interploidy crosses, Seed development
SignificanceStatement
Almost a century of research connects the origin of double fertilization, a major evolutionary
innovation of flowering plants, to conflicting parental interests over offspring provisioning. We sought
to provide additional insights from within one of the most ancient flowering plant lineages, and char-
acterized parent-of-origin effects in interploidy crosses in the waterlily Nymphaea thermarum. We find
that relative dosage of parental genome complements does indeed affect offspring development in this
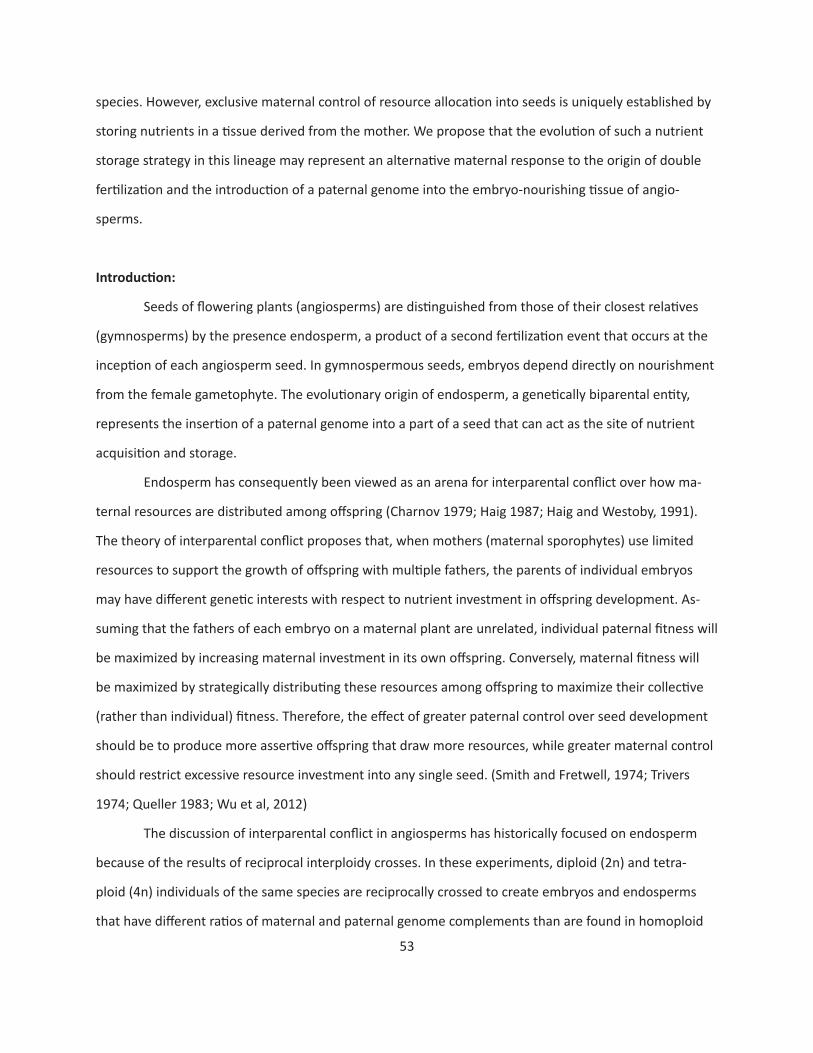
53
species. However, exclusive maternal control of resource allocation into seeds is uniquely established by
storing nutrients in a tissue derived from the mother. We propose that the evolution of such a nutrient
storage strategy in this lineage may represent an alternative maternal response to the origin of double
fertilization and the introduction of a paternal genome into the embryo-nourishing tissue of angio-
sperms.
Introduction:
Seeds of flowering plants (angiosperms) are distinguished from those of their closest relatives
(gymnosperms) by the presence endosperm, a product of a second fertilization event that occurs at the
inception of each angiosperm seed. In gymnospermous seeds, embryos depend directly on nourishment
from the female gametophyte. The evolutionary origin of endosperm, a genetically biparental entity,
represents the insertion of a paternal genome into a part of a seed that can act as the site of nutrient
acquisition and storage.
Endosperm has consequently been viewed as an arena for interparental conflict over how ma-
ternal resources are distributed among offspring (Charnov 1979; Haig 1987; Haig and Westoby, 1991).
The theory of interparental conflict proposes that, when mothers (maternal sporophytes) use limited
resources to support the growth of offspring with multiple fathers, the parents of individual embryos
may have different genetic interests with respect to nutrient investment in offspring development. As-
suming that the fathers of each embryo on a maternal plant are unrelated, individual paternal fitness will
be maximized by increasing maternal investment in its own offspring. Conversely, maternal fitness will
be maximized by strategically distributing these resources among offspring to maximize their collective
(rather than individual) fitness. Therefore, the effect of greater paternal control over seed development
should be to produce more assertive offspring that draw more resources, while greater maternal control
should restrict excessive resource investment into any single seed. (Smith and Fretwell, 1974; Trivers
1974; Queller 1983; Wu et al, 2012)
The discussion of interparental conflict in angiosperms has historically focused on endosperm
because of the results of reciprocal interploidy crosses. In these experiments, diploid (2n) and tetra-
ploid (4n) individuals of the same species are reciprocally crossed to create embryos and endosperms
that have different ratios of maternal and paternal genome complements than are found in homoploid

54
(2x2 and 4x4) crosses. If the parental origin of a genome complement matters, the potential for greater
maternal or paternal control over offspring development is introduced. Results of interploidy crosses
are remarkably consistent across a diversity of angiosperm species: in maternal-excess crosses (4x2),
endosperm proliferation is suppressed, while in paternal-excess crosses (2x4), endosperm proliferation
is promoted (Haig and Westoby, 1991). Specifically, changes to the timing of endosperm cellulariza-
tion (Lafon-Placette and Köhler, 2014) and/or changes to the rates of nuclear or cellular divisions in the
endosperm (von Wagenheim 1957; von Wagenheim 1962) result in the observed parent-of-origin effects
on development. Because endosperm plays a significant role in the regulation of embryo development
(Lafon-Placette and Köhler, 2014), seed coat development (Ingouff et al., 2006), and resource acquisition
from the maternal sporophyte (Zhang et al., 2007), changes to endosperm development have far-reach-
ing consequences for seed development as a whole. In many cases, particularly with paternal-excess
crosses, endosperm development is sufficiently perturbed that seeds abort (Haig and Westoby, 1991).
The consistency of parent-of-origin effects on endosperm proliferation across a wide diversity
of monocot and eudicot angiosperms has led to the suggestion that interparental conflict has affected
the evolution of seeds ever since the origin of angiosperms (Haig 1987; Friedman et al., 2008). However,
interploidy crosses have not been performed with any species from clades whose origins predate the di-
vergence of monocots and eudicots. This perhaps is not surprising, as robust interploidy crosses require
genetically homogeneous lines of multiple ploidy levels, as well as reproductive systems and growing
conditions in which controlled cross-pollinations are possible. The vast majority of early-diverging angio-
sperm species are long-lived trees, lianas, or aquatic plants, and do not satisfy these requirements.
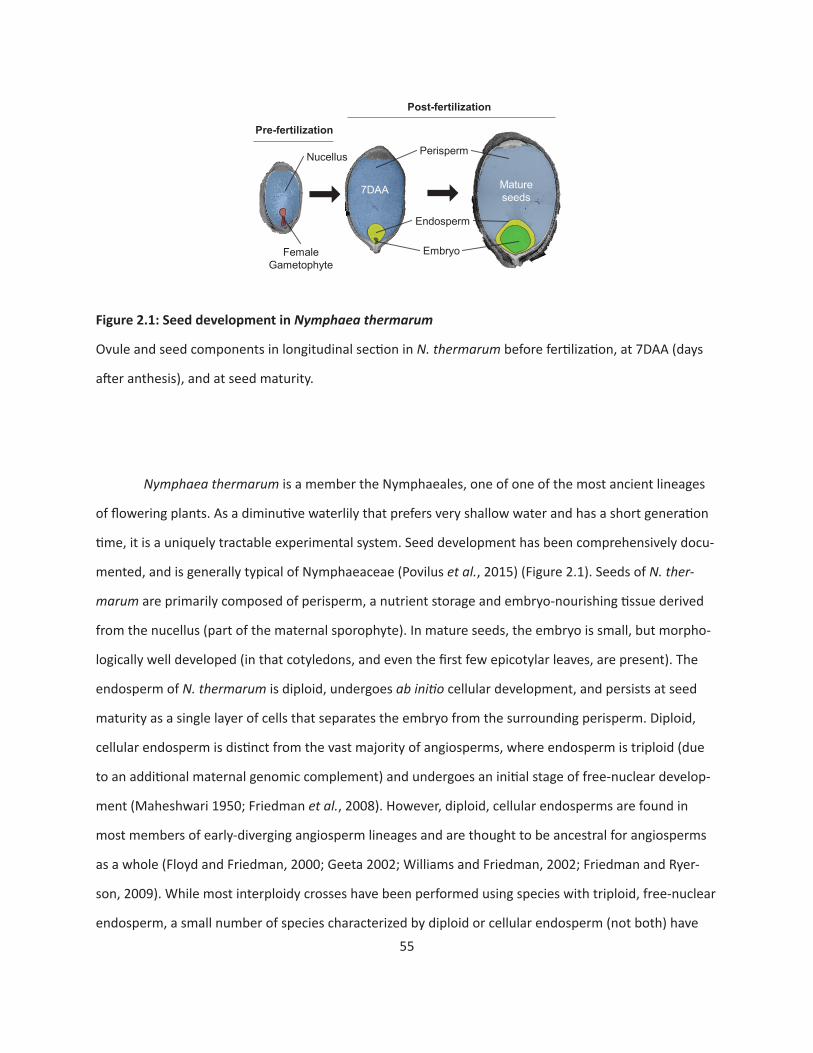
55
Mature seeds
Perisperm
Embryo
Endosperm
7DAA
Female Gametophyte
Nucellus
Pre-fertilization
Post-fertilization
Figure 2.1: Seed development in Nymphaea thermarum
Ovule and seed components in longitudinal section in N. thermarum before fertilization, at 7DAA (days
after anthesis), and at seed maturity.
Nymphaea thermarum is a member the Nymphaeales, one of one of the most ancient lineages
of flowering plants. As a diminutive waterlily that prefers very shallow water and has a short generation
time, it is a uniquely tractable experimental system. Seed development has been comprehensively docu-
mented, and is generally typical of Nymphaeaceae (Povilus et al., 2015) (Figure 2.1). Seeds of N. ther-
marum are primarily composed of perisperm, a nutrient storage and embryo-nourishing tissue derived
from the nucellus (part of the maternal sporophyte). In mature seeds, the embryo is small, but morpho-
logically well developed (in that cotyledons, and even the first few epicotylar leaves, are present). The
endosperm of N. thermarum is diploid, undergoes ab initio cellular development, and persists at seed
maturity as a single layer of cells that separates the embryo from the surrounding perisperm. Diploid,
cellular endosperm is distinct from the vast majority of angiosperms, where endosperm is triploid (due
to an additional maternal genomic complement) and undergoes an initial stage of free-nuclear develop-
ment (Maheshwari 1950; Friedman et al., 2008). However, diploid, cellular endosperms are found in
most members of early-diverging angiosperm lineages and are thought to be ancestral for angiosperms
as a whole (Floyd and Friedman, 2000; Geeta 2002; Williams and Friedman, 2002; Friedman and Ryer-
son, 2009). While most interploidy crosses have been performed using species with triploid, free-nuclear
endosperm, a small number of species characterized by diploid or cellular endosperm (not both) have
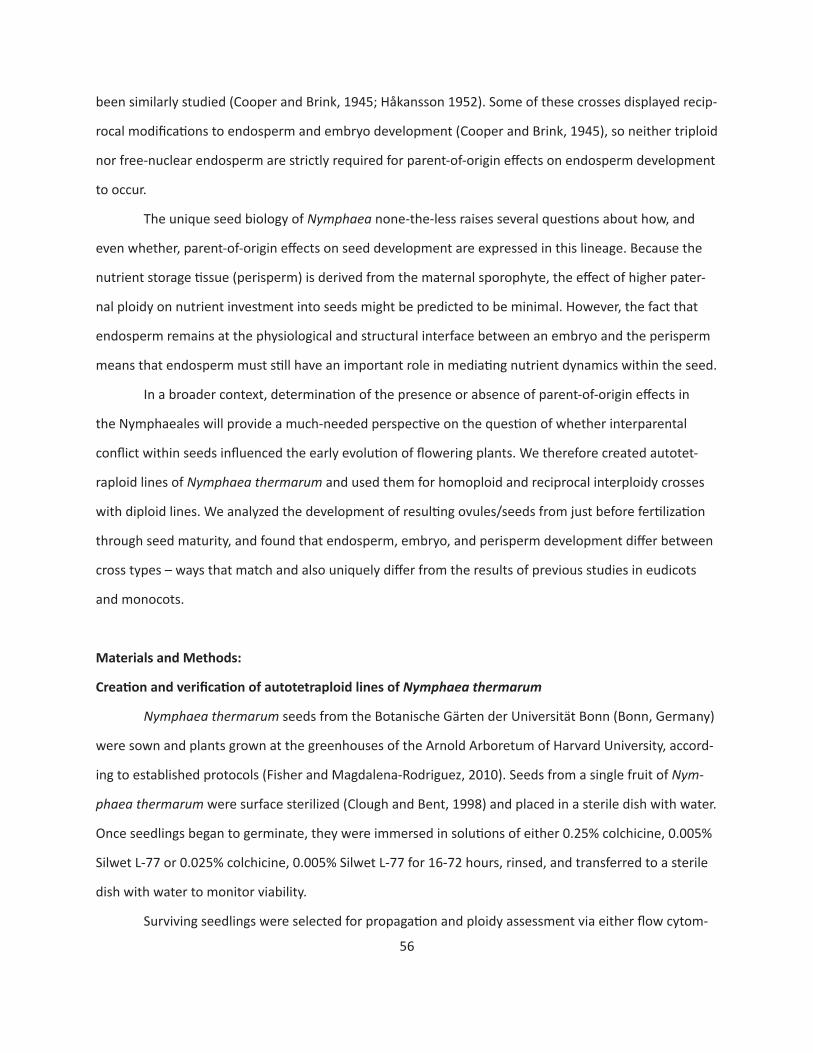
56
been similarly studied (Cooper and Brink, 1945; Håkansson 1952). Some of these crosses displayed recip-
rocal modifications to endosperm and embryo development (Cooper and Brink, 1945), so neither triploid
nor free-nuclear endosperm are strictly required for parent-of-origin effects on endosperm development
to occur.
The unique seed biology of Nymphaea none-the-less raises several questions about how, and
even whether, parent-of-origin effects on seed development are expressed in this lineage. Because the
nutrient storage tissue (perisperm) is derived from the maternal sporophyte, the effect of higher pater-
nal ploidy on nutrient investment into seeds might be predicted to be minimal. However, the fact that
endosperm remains at the physiological and structural interface between an embryo and the perisperm
means that endosperm must still have an important role in mediating nutrient dynamics within the seed.
In a broader context, determination of the presence or absence of parent-of-origin effects in
the Nymphaeales will provide a much-needed perspective on the question of whether interparental
conflict within seeds influenced the early evolution of flowering plants. We therefore created autotet-
raploid lines of Nymphaea thermarum and used them for homoploid and reciprocal interploidy crosses
with diploid lines. We analyzed the development of resulting ovules/seeds from just before fertilization
through seed maturity, and found that endosperm, embryo, and perisperm development differ between
cross types – ways that match and also uniquely differ from the results of previous studies in eudicots
and monocots.
Materials and Methods:
CreationandverificationofautotetraploidlinesofNymphaea thermarum
Nymphaea thermarum seeds from the Botanische Gärten der Universität Bonn (Bonn, Germany)
were sown and plants grown at the greenhouses of the Arnold Arboretum of Harvard University, accord-
ing to established protocols (Fisher and Magdalena-Rodriguez, 2010). Seeds from a single fruit of Nym-
phaea thermarum were surface sterilized (Clough and Bent, 1998) and placed in a sterile dish with water.
Once seedlings began to germinate, they were immersed in solutions of either 0.25% colchicine, 0.005%
Silwet L-77 or 0.025% colchicine, 0.005% Silwet L-77 for 16-72 hours, rinsed, and transferred to a sterile
dish with water to monitor viability.
Surviving seedlings were selected for propagation and ploidy assessment via either flow cytom-
57
etry and/or chromosome counting, as were embryos from some of the subsequent interploidy crosses
(SI Materials and Methods) (Doležel et al., 2007; Povilus et al., 2015). Tetraploid individuals were allowed
to self-fertilize to produce additional tetraploid plants to act as parents for the interploidy crosses.
CrossesandCollectionofplantmaterial
Multiple controlled crosses were performed for each cross type (2x2, 2x4, 4x2, 4x4), from July
2014 to November 2015 (SI Materials and Methods) and fruits were collected at 7 DAA (days after anthe-
sis), at 13 DAA, and at seed maturity (25-32 DAA). In addition, flowers of diploid and tetraploid individu-
als were allowed to self-pollinate, and fruits were collected at seed maturity (SI Materials and Methods).
Diploid and tetraploid flowers were collected the day before anthesis. Material collected for microscopy
was fixed in 4% v/v acrolein (Polysciences, New Orleans, Louisiana, USA) in 1X PIPES buffer (50 mmol/L
PIPES, 1 mmol/L MgSO4, 5 mmol/L EGTA) pH 6.8, for 24 hours. Fixed material was then rinsed three
times (one hour per rinse) with 1X PIPES buffer, dehydrated through a graded ethanol series, and stored
in 70% ethanol.
SeedCountsandSeedGermination
For mature fruits, seeds were removed from surrounding fruit tissues and counted. Seeds that
were not fixed for histological analysis were surface sterilized (Clough and Bent, 1998) and placed in a
dish with water. Seed germination was monitored weekly for up to a month after collection. Once addi-
tional seeds no longer germinated, the numbers of germinated and ungerminated seeds were counted.
Microscopy for Seed Tissue Measurements and Embryo Morphology
Samples were prepared for confocal microscopy and imaged according to Povilus et al, 2015 (SI
Materials and Methods) (Povilus et al., 2015). Measurements (maximum area of the nucellus, female
gametophyte, perisperm, endosperm, and embryo in longitudinal section) and descriptions of embryo
morphology were made from either single optical sections, 3D projections, or from digital median longi-
tudinal sections produced by digital re-cutting of z-stacks. Measurements of at least 10 ovules/seeds per
fruit were attempted, but in cases where 10 healthy-looking ovules/seeds were not available, as many
seeds as possible were processed and measured.
58
Data analysis
We took a conservative approach to assessing the significance of results. Developmentally
anomalous outliers were defined as being greater than 3 standard deviations from the grand mean (cal-
culated using all data points per tissue type), and omitted from subsequent analysis (Baker et al., 2017).
Average endosperm cell size at 7 DAA was calculated for each seed by dividing the endosperm size (maxi-
mum area in longitudinal section) by the number of endosperm cells. Significance level α = 0.05 was
used to assess effect p-values. Datasets are available in Datasets S1.
The number of 4x4 fruits that set enough mature seed to test both seed germination efficiency
and perform histological analysis was too low to allow for conclusions about that cross type. However,
seeds from self-fertilized diploid and tetraploid plants were readily available, and were not significantly
different from seeds produced via cross-pollination (or the magnitude of the difference was very small,
< 5%), for seed germination and for all seed component measurements (SI Materials and Methods). We
therefore included measurements from 2n and 4n self-fertilized seeds in (respectively) the 2x2 and 4x4
datasets for seed germination and seed component sizes.
Mixed linear effect models, generalized linear effect models, or zero-inflated generalized linear
models were used to fit data on (respectively) ovule or seed component sizes, embryo morphological
development, seed germination, and number of seeds per fruit. For each model, either cross type or
parental ploidies and their interaction were used as fixed effects. When components from multiple indi-
vidual seeds from the same fruit were measured, fruit ID was included as a random effect. Full descrip-
tions of models are provided in SI Materials and Methods (Fournier et al., 2012; Zeileis et al., 2008; Bates
et al., 2015). For all mixed or general linear models, visual inspection of residual plots did not reveal any
obvious deviations from homoscedasticity or normality. Average effect sizes were calculated from the
intercept and effect estimates from the model outputs.
Results
Externalappearanceofmatureseedsdoesnotdifferbetweencrosstypes,butnumberofseedsper
fruit and seed viability does
Mature seeds from the four cross types (2x2, 2x4, 4x2, 4x4) displayed no obvious differences in
external appearance (Figure S2.1). Cross type also did not significantly affect whether whole fruits abort-
59
ed (produced no seeds). For fruits that did not abort, however, the number of mature seeds per fruit was
significantly lower in 2x4, 4x2, and 4x4 crosses, as compared with 2x2 crosses (Table S2.1). Seeds derived
from 4x2 and 4x4 crosses that reached maturity were less likely to germinate than seeds of 2x2 crosses
(Table S2.1).
Seedcomponentsizesinmatureseeds
In mature seeds (Figure 2.2A, FigureS2.2,Table S2.2), perisperm size was not significantly differ-
ent between 2x2 crosses and any other cross type. Endosperms of 2x4 and 4x2 crosses were significantly
larger (by 21% and 19%, respectively) than endosperms of 2x2 crosses. Endosperms of 4x4 crosses were
not significantly different from endosperms of 2x2 crosses. Embryos of 2x4 crosses were larger than
embryos of 2x2 crosses (by 19%), while 4x2 and 2x2 embryos were not significantly different. Embryos of
4x4 crosses were not significantly different from embryos of 2x2 crosses or 4x2 crosses.
Seedcomponentsizesandendospermcharactersduringearlyseeddevelopment
Because offspring size varied between cross types at maturity, we wanted to understand how
and when during development these patterns were initiated. We analyzed seeds at 7 DAA, when the
endosperm is proliferating (Figure 2.2A, Figure S2.2, Table S2.4). At this early stage, all seed components
(perisperm, endosperm, and embryo) from 4x2 crosses were significantly larger than their counterparts
in 2x2 crosses (by, respectively, 11%, 63%, and 22%). At 7 DAA, seed components of 2x4 crosses were not
significantly different than those from 2x2 crosses, nor were seed components of 4x4 crosses (4x4 seed
component sizes also had relatively high variation, as evidenced by high standard errors for model coef-
ficients in Table S2.4).
As the data suggested that maternal ploidy, distinct from cross type (a combination of maternal
and paternal ploidy), may influence seed component sizes at 7DAA, we fitted a model to test whether
maternal ploidy, paternal ploidy, or the interaction of maternal and paternal ploidy had an effect on the
sizes of seed components (Figure 2.2B, Table S2.6). Seed components with tetraploid mothers were larg-
er by 11% (perisperm), 63% (endosperm), and 22% (embryo) when compared to tissues from seeds with
diploid mothers. Paternal ploidy alone was not a significant factor for the size of any tissue at 7 DAA, nor
was the interaction of maternal and paternal ploidy.
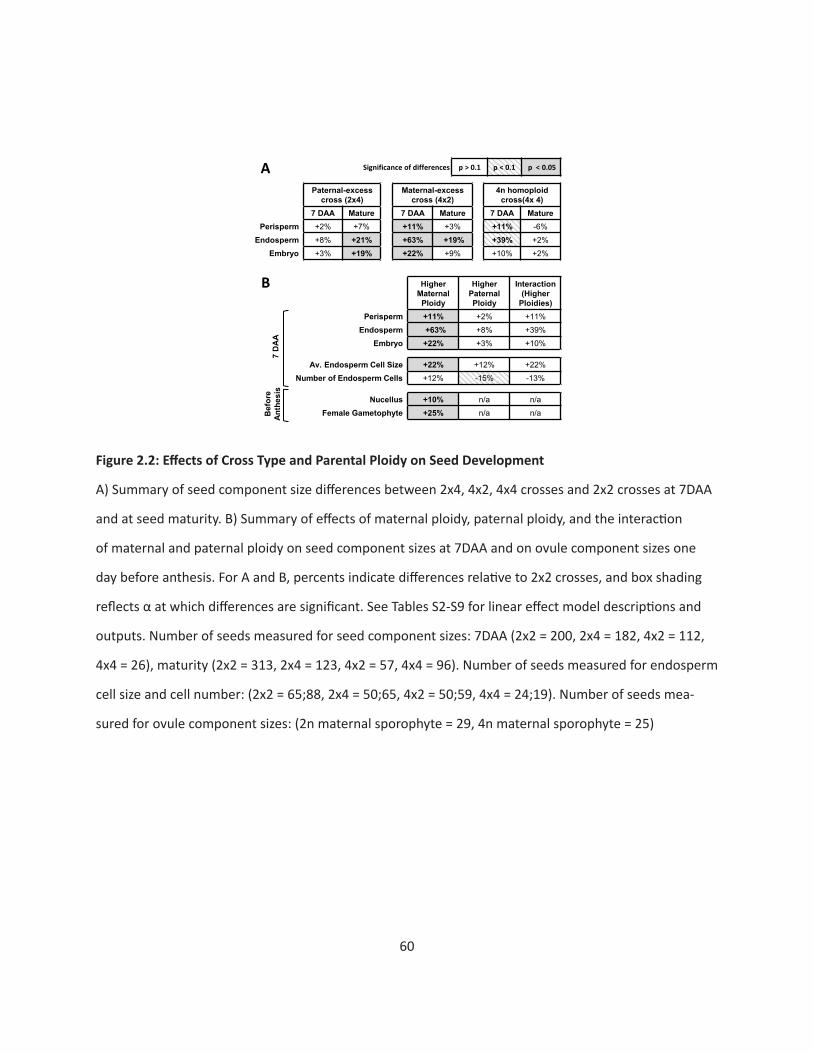
60
Paternal-excess cross (2x4)
Maternal-excess cross (4x2)
4n homoploid cross(4x 4)
7 DAA Mature 7 DAA Mature 7 DAA Mature Perisperm +2% +7% +11% +3% +11% -6%
Endosperm +8% +21% +63% +19% +39% +2% Embryo +3% +19% +22% +9% +10% +2%
A
Higher Maternal
Ploidy
Higher Paternal Ploidy
Interaction (Higher
Ploidies) Perisperm +11% +2% +11%
Endosperm +63% +8% +39% Embryo +22% +3% +10%
Av. Endosperm Cell Size +22% +12% +22% Number of Endosperm Cells +12% -15% -13%
Nucellus +10% n/a n/a Female Gametophyte +25% n/a n/a
B B
efor
e An
thes
is
7 D
AA
Significance of differences p > 0.1 p < 0.1 p < 0.05
Figure2.2:EffectsofCrossTypeandParentalPloidyonSeedDevelopment
A) Summary of seed component size differences between 2x4, 4x2, 4x4 crosses and 2x2 crosses at 7DAA
and at seed maturity. B) Summary of effects of maternal ploidy, paternal ploidy, and the interaction
of maternal and paternal ploidy on seed component sizes at 7DAA and on ovule component sizes one
day before anthesis. For A and B, percents indicate differences relative to 2x2 crosses, and box shading
reflects α at which differences are significant. See Tables S2-S9 for linear effect model descriptions and
outputs. Number of seeds measured for seed component sizes: 7DAA (2x2 = 200, 2x4 = 182, 4x2 = 112,
4x4 = 26), maturity (2x2 = 313, 2x4 = 123, 4x2 = 57, 4x4 = 96). Number of seeds measured for endosperm
cell size and cell number: (2x2 = 65;88, 2x4 = 50;65, 4x2 = 50;59, 4x4 = 24;19). Number of seeds mea-
sured for ovule component sizes: (2n maternal sporophyte = 29, 4n maternal sporophyte = 25)
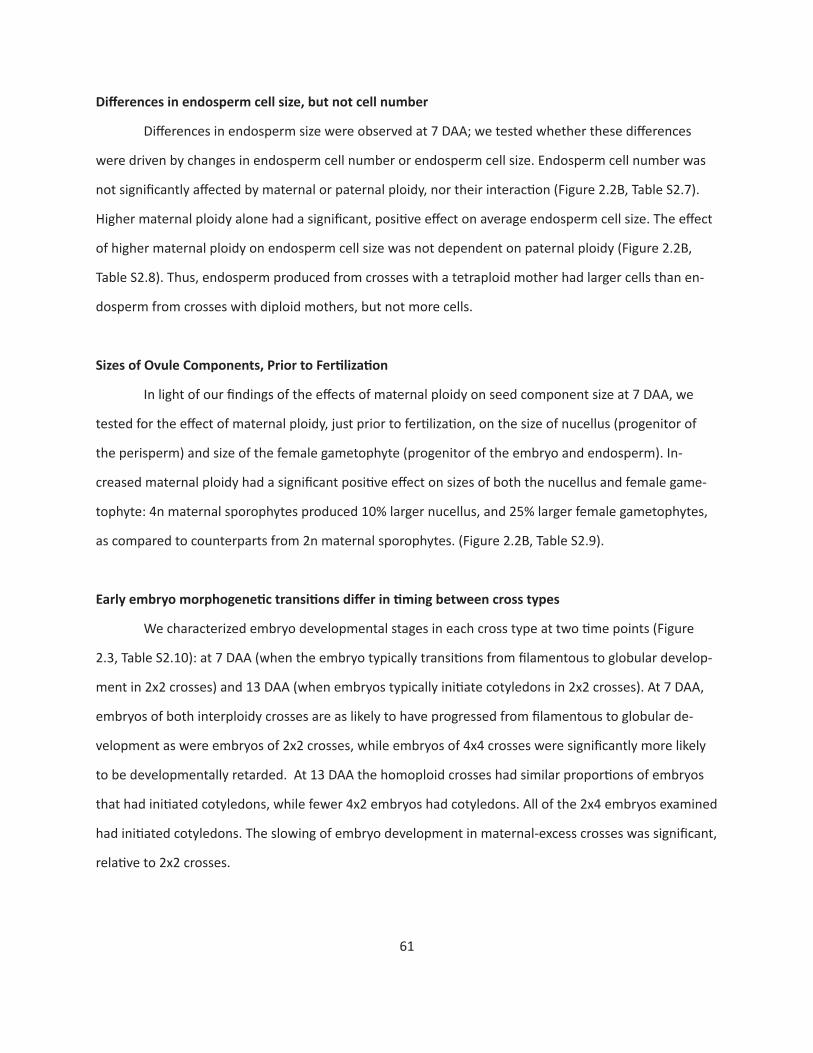
61
Differencesinendospermcellsize,butnotcellnumber
Differences in endosperm size were observed at 7 DAA; we tested whether these differences
were driven by changes in endosperm cell number or endosperm cell size. Endosperm cell number was
not significantly affected by maternal or paternal ploidy, nor their interaction (Figure 2.2B, Table S2.7).
Higher maternal ploidy alone had a significant, positive effect on average endosperm cell size. The effect
of higher maternal ploidy on endosperm cell size was not dependent on paternal ploidy (Figure 2.2B,
Table S2.8). Thus, endosperm produced from crosses with a tetraploid mother had larger cells than en-
dosperm from crosses with diploid mothers, but not more cells.
SizesofOvuleComponents,PriortoFertilization
In light of our findings of the effects of maternal ploidy on seed component size at 7 DAA, we
tested for the effect of maternal ploidy, just prior to fertilization, on the size of nucellus (progenitor of
the perisperm) and size of the female gametophyte (progenitor of the embryo and endosperm). In-
creased maternal ploidy had a significant positive effect on sizes of both the nucellus and female game-
tophyte: 4n maternal sporophytes produced 10% larger nucellus, and 25% larger female gametophytes,
as compared to counterparts from 2n maternal sporophytes. (Figure 2.2B, Table S2.9).
Earlyembryomorphogenetictransitionsdifferintimingbetweencrosstypes
We characterized embryo developmental stages in each cross type at two time points (Figure
2.3, Table S2.10): at 7 DAA (when the embryo typically transitions from filamentous to globular develop-
ment in 2x2 crosses) and 13 DAA (when embryos typically initiate cotyledons in 2x2 crosses). At 7 DAA,
embryos of both interploidy crosses are as likely to have progressed from filamentous to globular de-
velopment as were embryos of 2x2 crosses, while embryos of 4x4 crosses were significantly more likely
to be developmentally retarded. At 13 DAA the homoploid crosses had similar proportions of embryos
that had initiated cotyledons, while fewer 4x2 embryos had cotyledons. All of the 2x4 embryos examined
had initiated cotyledons. The slowing of embryo development in maternal-excess crosses was significant,
relative to 2x2 crosses.
62
Figure2.3:RatesofMorphogeneticTransitionsofEmbryoDevelopment
Proportions of embryos in each cross type that achieved a specific morphological transition at 7DAA and
13 DAA. At 7DAA, embryos were either filamentous or globular. At 13DAA, embryos were either globular
or had initiated cotyledons. Arrows represent rate shifts between 7 and 13 DAA, relative to the 2x2 cross
type; white arrows are non-significant shifts, black arrow is a significant shift. Description and output of
the model used to test for significance of shifts is available in Supplementary Table 8.
Discussion
Overview
The present study of reciprocal interploidy crosses in Nymphaea thermarum provides the first
evidence of both parent-of-origin effects on offspring development, and of interparental conflict dur-
ing seed development in an early-diverging angiosperm lineage. Similar to what has been seen in other
angiosperms (Haig and Westoby, 1991), we find an excess of paternal genome complements in N.
thermarum leads to larger endosperms and larger embryos at seed maturity. Meanwhile, an excess of
maternal genome complements retards the pace of embryo development with respect to key morphoge-
netic transitions (which differs from what has been observed in other angiosperms).
63
Importantly, we found that paternal ploidy does not influence the size of the nutrient storage
tissue (perisperm), while maternal ploidy does. Exclusive maternal control of nutrient allocation is con-
sistent with the prediction that maternal fitness benefits from the ability to restrict paternal strategies
to selfishly increase resource investment into any particular seed. This study therefore provides the first
experimental demonstration that the response of maternal sporophytes to the insertion of an additional
paternal genome into the seed need not operate only through modifications of offspring development,
but rather can involve tissues derived from the maternal sporophyte.
OvuleandEarlySeedDevelopmentareAffectedbyMaternalPloidy
In order to accurately assess how seeds differ between cross types at maturity, it is essential to
understand whether early development differs between cross types. In N. thermarum, ovules and female
gametophytes of 4n maternal sporophytes are larger than those of 2n maternal sporophytes at the
time of pollination. A positive relationship between ploidy and cell/tissue/organ size is widely observed
among plants (Kondorosi et al., 2000; Mizukami 2001), so we interpret the positive effect of higher
maternal ploidy on ovule size as an effect of ploidy ‘per se’. The positive effects of maternal ploidy per
se are still readily apparent 7 days after anthesis for all seed components (perisperm being 11% larger,
endosperm being 63% larger, and the embryo being 25% larger, when the mother is a tetraploid). The
continued relationship between ploidy of the maternal sporophyte and perisperm size might be expect-
ed, as the perisperm is derived from the maternal sporophyte. Additionally, the endosperm and embryo
develop within a space initially blocked out by the female gametophyte; the size of the primary endo-
sperm cell is de facto related to female gametophyte size. Accordingly, we note that early differences in
endosperm size between cross types were driven by differences in cell size, but not cell number – again,
suggesting that effects of maternal ploidy per se are not modifications of endosperm developmental
processes (such as rate of cell division or differentiation), but rather, are residual effects of the positive
relationship between female gametophyte size and ploidy.
MaternalandPaternalEffectsonEndospermDevelopment
Mature 3n endosperms of N. thermarum derived from reciprocal interploidy crosses (4x2 and
2x4) are each ~20% larger than the 2n endosperms of 2x2 crosses. Endosperm growth, however, does
64
not simply scale with endosperm ploidy, as the 4n endosperms of 4x4 crosses were no larger than the
2n endosperms of 2x2 crosses. Similarly, there is no simple relationship between mature endosperm size
and the ratio of maternal and paternal genome complements: endosperms of 4x2 crosses (which has a
2:1 m:p ratio) and 2x4 crosses (1:2 m:p ratio) were both larger than endosperm of the homoploid 2x2
crosses (1:1 m:p ratio).
Here it is essential to consider mature endosperm size within the context of early endosperm
development. While endosperms of maternal excess 4x2 crosses are larger than endosperms of 2x2
crosses at seed maturity (a 19% difference), the difference is much less than what was observed at 7DAA
(a 63% difference). Higher maternal ploidy therefore has a negative effect on endosperm growth rate,
even though it only acts relatively late in development. Meanwhile, 2x4 endosperms are 21% larger at
maturity than 2x2 endosperms, even though sizes of endosperm from 2x4 and 2x2 crosses were not sig-
nificantly different at 7 DAA. An excess of paternal genome complements therefore increases endosperm
growth rate.
MaternalandPaternalEffectsonEmbryoDevelopment
Paternal-excess embryos of N. thermarum are significantly larger than embryos of homoploid or
maternal-excess crosses. As the embryo eventually displaces the majority of the endosperm chamber in
N. thermarum, larger paternal-excess embryos may be a result of the previously discussed positive effect
of paternal-excess on endosperm size. Maternal-excess embryos, however, are not larger than 2x2 em-
bryos, despite being similarly accompanied by relatively larger endosperms. Accordingly, we show that
the ontogenetic progression of maternal-excess embryos slows between 7 and 13 DAA, relative to the
rate of embryo development in 2x2 crosses during the same time frame. Thus, while paternal-excess em-
bryos are able to utilize the additional space afforded by larger endosperms, the more slowly-developing
maternal-excess embryos do not.
In interploidy crosses performed with other angiosperms, changes in embryo development are
tightly linked to modifications of endosperm proliferation (Lafon-Placette and Köhler, 2014), either in
terms of maximum embryo size (if the embryo fills most of the mature seed) or ontogenetic progression.
In Arabidopsis and other species with an initial phase of free-nuclear endosperm development, embryo
development generally does not proceed beyond the heart or globular stages until the endosperm cel-
65
lularizes (Scott et al., 1998). In maternal-excess crosses in rice (in which embryos do not displace the
majority of the endosperm at seed maturity), precocious cellularization of the free nuclear endosperm
is correlated with larger embryos at seed maturity, suggesting that embryo growth is accelerated or
prolonged (Zhang et al., 2016). In Solanum, which is similar to Nymphaea in that it has ab initio cellular
endosperm that is mostly displaced by embryo growth, there was a positive correlation between endo-
sperm size and embryo size (both being smaller in maternal-excess crosses) (Cooper and Brink, 1945).
The effect of maternal-excess in N. thermarum is therefore unique, as both embryo developmental rate
is slowed (not accelerated), and changes in endosperm size do not necessarily coincide with changes in
embryo size.
PerispermSizedoesnotDifferamongCrossTypes
At seed maturity, perisperm size does not differ between 2x2 crosses and any other cross type.
As the perisperm is the primary site of nutrient acquisition and storage within N. thermarum seeds,
investment of maternal resources into seeds is also ultimately similar across all cross types. The lack of
a positive relationship between maternal ploidy and perisperm size, however, represents a negation of
a relationship present earlier in development (when perisperms from 4n maternal sporophytes were
significantly larger than perisperms from 2n maternal sporophytes). Thus, perisperm size and nutrient
investment into any particular seed are negatively, albeit subtly, affected by higher maternal ploidy - sug-
gesting an important maternal control on resource allocation during seed development.
Meanwhile, perisperm growth is not affected by paternal ploidy: mature perisperm size does not
differ between 2x2 and 2x4 crosses. Furthermore, at 7DAA paternal ploidy has no significant effect on
perisperm size, nor does it modulate the effect of maternal ploidy. That paternal ploidy does not affect
perisperm development is not unexpected, as perisperm is a maternal tissue that does not receive a pa-
ternal genome contribution from the fertilization process. The fact that paternal genome dosages in the
embryo and endosperm also have no effect on perisperm size confirms that the father cannot influence
the bulk of nutrient acquisition into Nymphaea through the modification of offspring development. In
N. thermarum, having nutrient acquisition and storage occur in a maternal tissue (as opposed to endo-
sperm) therefore establishes exclusive maternal control over resource allocation into mature seeds.
66
InterparentalConflictandEvolutionofAngiospermSeeds:MaternalControlviaEndospermorPeri-
sperm
The peculiar seed biology and ~139 million years (Magallón et al., 2015) of independent evo-
lutionary history of the Nymphaeales present a unique perspective on how the relationships between
seed components have evolved among flowering plants (Figure 2.4). In angiosperms, enhanced maternal
control over seed development can be interpreted as an evolved developmental reaction to the origin
of double fertilization (Westoby and Rice, 1982). In the last common ancestor of angiosperms and their
closest gymnospermous relatives, nutrients were likely stored in a large haploid female gametophyte.
The origin of endosperm (in the last common ancestor of angiosperms) inserted a paternal genome com-
plement into a seed tissue that separates the embryo from the maternal nutrient source, and therefore
provided an additional opportunity for paternal interests in offspring development to enact. Consistent
with this conceptual framework, we observe that higher paternal genome dosage has a positive effect on
endosperm growth in N. thermarum.
Increased paternal control over resource investment in a seed, however, can be detrimental to
maternal fitness if unchecked. The predicted maternal response to the presence of a paternal genome in
the embryo-nourishing tissue (endosperm) is to reduce paternal influence on resource allocation (Char-
nov 1979; Haig 1987; Haig and Westoby, 1991). This can be accomplished by increasing maternal control
of gene expression during endosperm development, and/or transferring the function of nutrient acquisi-
tion back to a maternal tissue. Most angiosperm taxa appear use the first strategy, and increase maternal
influence of gene expression via two mechanisms. One mechanism has been to increase absolute mater-
nal genome dosage, as is seen with the addition of maternal complement(s) in triploid or higher ploidy
endosperm (Friedman et al., 2008). The second mechanism involves increasing the effective maternal
genetic dosage through genetic imprinting of chromatin methylation patterns. Several genes critical for
offspring (and specifically endosperm development) are imprinted, and expressed differentially depend-
ing on the parent of origin (Dilkes and Comai, 2004; Patten et al., 2014; Gehring and Satyaki, 2017).
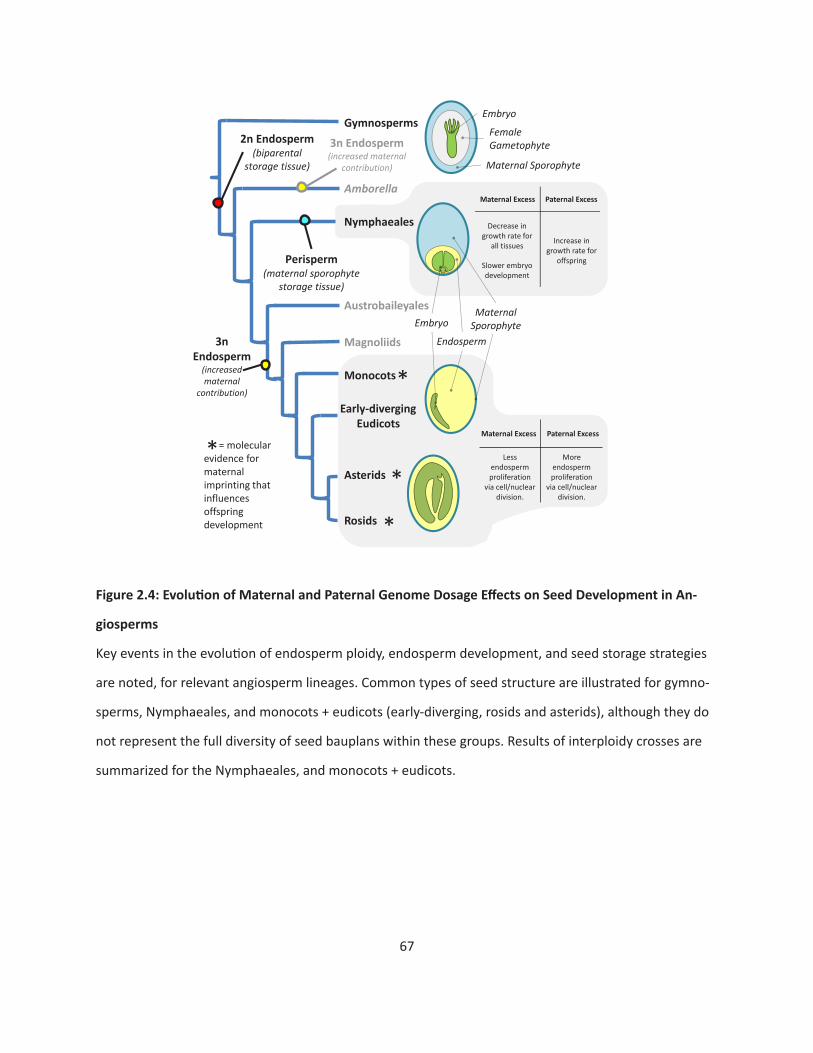
67
3n Endosperm
(increased maternal
contribution)
Perisperm (maternal sporophyte
storage tissue)
2n Endosperm (biparental
storage tissue)
Maternal Excess Paternal Excess
Decrease in growth rate for
all tissues
Slower embryo development
Increase in growth rate for
offspring
Embryo Maternal
Sporophyte Endosperm
Maternal Sporophyte
Embryo
Female Gametophyte
Gymnosperms
Amborella
Nymphaeales
Austrobaileyales
Magnoliids
Monocots
Early-diverging Eudicots
Asterids
Rosids
Maternal Excess Paternal Excess
Less endosperm proliferation
via cell/nuclear division.
More endosperm proliferation
via cell/nuclear division.
3n Endosperm (increased maternal
contribution)
*
*
*
* = molecular evidence for maternal imprinting that influences offspring development
Figure2.4:EvolutionofMaternalandPaternalGenomeDosageEffectsonSeedDevelopmentinAn-
giosperms
Key events in the evolution of endosperm ploidy, endosperm development, and seed storage strategies
are noted, for relevant angiosperm lineages. Common types of seed structure are illustrated for gymno-
sperms, Nymphaeales, and monocots + eudicots (early-diverging, rosids and asterids), although they do
not represent the full diversity of seed bauplans within these groups. Results of interploidy crosses are
summarized for the Nymphaeales, and monocots + eudicots.
68
Higher maternal genome dosage affects embryo and endosperm development in Nymphaea
thermarum. As the Nymphaeales have diploid endosperm (and thus do not have higher absolute ma-
ternal genome dosage), the effective maternal genetic dosage is likely being altered via imprinting. If so,
the question arises: does imprinting in N. thermarum share the same underlying mechanisms, and thus
potentially a common origin, with imprinting in other angiosperms?
Even though offspring development is subject to maternal and paternal parent-of-origin effects
in N. thermarum, maternal control of resource allocation is clearly established by having nutrient acquisi-
tion and storage occur in a tissue of the maternal sporophyte (perisperm). While it has been proposed
that other maternal seed tissues could participate in interparental conflict (Westoby and Rice, 1982), we
provide the first experimental evidence involving perisperm. Perisperm has evolved in multiple, distantly
related angiosperm lineages (Povilus et al., 2015; Lersten 2004), and this homoplasy is suggestive of
some adaptive value. To date there has been no discussion as to why storing nutrients in a non-biparen-
tal seed tissue would be advantageous. We propose that, at least in the Nymphaeales, the evolution of
perisperm represents a maternal response to the increase of paternal influence over resource distribu-
tion that is inherent to the origin and establishment of endosperm as a major arbiter of offspring interac-
tions with the mother. That the mechanism of maternal control in N. thermarum does not rely solely on
modifications to endosperm development means that interparental conflict has influenced the evolution
of not just endosperm development since the origin of angiosperms, but the evolution of seed biology as
a whole.
References
Baker RL, Yarkhunova Y, Vidal K, Ewers BE, Weinig C (2017) Polyploidy and the relationship between leaf structure and function: implications for correlated evolution of anatomy, morphology, and physiology in Brassica. BMC Plant Biol 17:3-15
Bates D, Maechler M, Bolker B, Walker S (2015) Fitting linear mixed-effects models using lme4. J Stat Softw 67(1):1-48.
Charnov EL (1979) Simultaneous hermaphroditism and sexual selection. Proc Natl Acad Sci U S A 76: 2480-2484.
Clough SJ, Bent AF (1998) Floral dip: a simplified method for Agrobacterium-mediated transformation of Arabidopsis thaliana. Plant J 16:735-743.
69
Cooper DC, Brink RA (1945) Seed collapse following matings betweteen diploid and tetraploid races of Lycopersicon pimpinellifolium. Genetics 30:376-401.
Dilkes BP, Comai L (2004) A differential dosage hypothesis for parental effects in seed development. Plant Cell 16: 3174–3180 .
Doležel J, Greilbufer J, Suda J (2007) Estimation of nuclear SNA content in plants using flow cytometry. Nat Protoc 2:2233-2244.
Fischer E, Magdalena-Rodriguez C (2010) Nymphaea thermarum (Nymphaeaceae). Curtis Bot Mag 27:318–327.
Floyd SK, Friedman WE (2000) Evolution of Endosperm Developmental Patterns among Basal Flowering Plants. Int J Plant Sci 161(S6)S57-S81.
Fournier DA, Skaug HJ, Ancheta J, Ianelli J, Magnusson A, Maunder M, Neilsen A, Silbert J (2012) AD model builder: using automatic differentiation for statistical inference of highly parameterized complex nonlinear models. Optim Methods Softw 27(233-249)
Friedman WE, Madrid EN, Williams JH (2008) Origin of the fittest and survival of the fittest: relating fe-male gametophyte development to endosperm genetics. Int J Plant Sci 169(1):79-92.
Friedman WE, Ryerson KC (2009) Reconstructing the ancestral female gametophyte of angiosperms: Insights from Amborella and other ancient lineages of flowering plants. Am J Bot 96(1):129-43.
Geeta R (2002) The origin and maintenance of nuclear endosperms: viewing development through a phylogenetic lens. Proc R Soc Lond B 270:29-35.
Gehring M, Satyaki PR (2017) Endosperm and imprinting, inextricably linked. Plant Physiol 173:143-154.
Haig D (1987) Kin conflict in seed plants. Trends Ecol Evol 2(11):337–340.
Haig D, Westoby M (1991) Genomic imprinting in endosperm: its effects on seed development in crosses between species and between different ploidies of the same species, and its implications for the evolu-tion of apomixis. Phil Trans R Soc B 333:1–13.
Håkansson A (1952) Seed development after 2x, 4x crosses in Galeopsis pubescens. Hereditas 38:425-448.
Ingouff M, Jullien PE, Berger F (2006). The Female Gametophyte and the Endosperm Control Cell Prolif-eration and Differentiation of the Seed Coat in Arabidopsis. Plant Cell 18(12):3491-3501.
Kondorosi E, Roudier F, Gendreau E (2000) Plant cell-size control: growing by ploidy. Curr Opin Plant Biol 3(6):488-492.
Lafon-Placette C, Köhler C (2014) Embryo and Endosperm, partners in seed development. Curr Opin Plant Biol 17:64-69.

70
Lersten NR (2004) Endosperm. Flowering Plant Embryology (Blackwell Publishing), pp 161-163.
Magallón A, Gómez-Acevedo S, Sánchez-Reyes LL, Hernández-Hernández T (2015) A metacalibrated time-tree documents the early rise of flowering plant phylogenetic diversity. New Phytol 207(2):437-453
Maheshwari P (1950) An Introduction to the Embryology of Angiosperms (McGraw-Hill Book Company, New York).
Mizukami Y (2001) A matter of size: developmental control of organ size in plants. Curr Opin Plant Biol 4:533-539.
Patten MM, Ross L, Curley JP, Queller DC, Bonduriansky R, Wolf JB (2014) The evolution of genomic im-printing: theories, predictions and empirical tests. Heredity (Edinb) 113: 119–128.
Povilus RA, Losada JM, Friedman WE (2015) Floral biology and ovule and seed ontogeny of Nymphaea thermarum, a water lily at the brink of extinction with potential as a model system for basal angio-sperms. Ann Bot 115:211-226
Queller DC (1983) Kin selection and conflict in seed maturation. J Theor Biol 100(1):153–172.
Scott RJ, Spielman M, Baily J, Dickinson HG (1998) Parent-of-origin effects on seed development in Arabi-dopsis thaliana. Development 125:3329-3341.
Smith CC, Fretwell, SD (1974) The optimal balance between size and number of offspring. Am Nat 108:499-506.
Trivers RL (1974) Parent-offspring conflict. Am Zool 14:249-264.
von Wangenheim KH (1957) Untersuchungen über den Zusammenhang zwischen Chromosomenzhal und Kreuzbarkeit bei Solanum-Arten. Z induct Abstamm u Vererb Lehre 88:21-37.
von Wangenheim KH (1962) Zur Ursache der Abortion von Samenanlagen in Diploid-Polyploid-Kreuzun-gen: II. Untershiedliche Differenzierung von Endospermen mit glechem Genom. Z Vererb Lehre 93:319-334.
Westoby M, Rice B (1982) Evolution of the seed plants and inclusive fitness of plant tissues. Evolution 36(4):713–724.
Williams JH, Friedman WE (2002) Identification of diploid endosperm in an early angiosperm lineage. Nature 415(6871):522-526.
Wu CC, Diggle PK, Friedman WE (2012) Kin recognition within a seed and the effect of genetic related-ness of an endosperm to its compatriot embryo on maize seed development. Proc Natl Acad Sci U S A 110(6):2217-2222
Zeileis A, Kleiber C, Jackman S (2008) Regression Models for Count Data in R. J Stat Softw 27(8).
Zhang H, Luo M, Johnson SD, Zhu X, Liu L, Huang F, Liu Y, Xu P, Wu X (2016) Parental genome imbalance causes post-zygotic lethality and deregulates imprinting in rice. Rice 9:43-55

71
Zhang WH, Zhou Y, Dibley KE, Tyerman SD, Furbank RT, Patrick JW (2007) Nutrient loading of developing seeds. Funct Plant Biol 34:314-331.
FundingInformation
This work was supported by funds from the Department of Organismic and Evolutionary Biology,
at Harvard University.
Acknowledgments
We thank Grace Yu for help with crossing experiments and seed imaging, Dr. David Haig for help-
ful discussions, and the staff of Botanische Gärten der Universität Bonn for providing plant material for
propagation.
72
Chapter 3
Title: RNA-seq of seed development in the water lily Nymphaea thermarum (Nymphaeales), and the
expression of imprinting-related and non-imprinting-related chromatin methylation regulators.
Authors: Rebecca Povilusa, William E. Friedmana,b
a Department of Organismic and Evolutionary Biology, Harvard University, 26 Oxford Street, Cambridge,
MA 02138, USA; b Arnold Arboretum of Harvard University, 1300 Centre Street, Boston, MA 02131, USA
73
Abstract
RNA-seq datasets offer unparalleled opportunities to discover genes and processes that are
important for seed development. Such datasets have already been generated for a growing collection of
species from a phylogenetically broad sampling of flowering plants (angiosperms). However, information
on gene expression during seed development is minimal for those angiosperm lineages whose origins
predate the divergence of monocots and eudicots. In order to provide a new perspective on the early
evolution of seed development in flowering plants, we sequenced transcriptomes of whole ovules and
seeds from three key stages of reproductive development in the waterlily Nymphaea thermarum, an
experimentally-tractable member of one of the earliest-diverging angiosperm lineages. We first explore
general patterns of gene expression, beginning with mature ovules and continuing through fertiliza-
tion into early- and mid-seed developmental stages. We then examine the expression of genes associ-
ated with DNA and histone methylation – processes known to be essential for seed development, but
mechanistically variable in distantly-related monocots and eudicots. Around 60% of transcripts putatively
homologous to chromatin methylation modifiers are differentially expressed during seed development
in N. thermarum, suggesting that the importance of dynamic chromatin methylation during seed devel-
opment dates to the earliest phases of angiosperm evolution. However, genes involved in establishing,
maintaining, and removing methylation marks associated with genetic imprinting show a mix of con-
served and unique expression patterns between N. thermarum and other flowering plants. Our data sug-
gests that the regulation of imprinting has likely changed throughout angiosperm evolution, and further-
more identifies genes that merit further characterization in any angiosperm model system.
Introduction
Fertilization and seed development are critical parts of plant development that require exten-
sive transcriptional reprogramming. Seed development in flowering plants (angiosperms) is of particular
interest, as it uniquely involves two separate fertilization events that produce two distinct offspring.
Double fertilization in angiosperms occurs when a pollen tube successfully reaches a mature ovule and
delivers two sperm cells into the female gametophyte. Each sperm cell fuses with one of the two female
gametes, the egg cell and the central cell, to produce (respectively) the embryo and the embryo-nourish-
ing endosperm. While endosperm does not necessarily persist past seed germination, it surrounds the

74
embryo throughout seed development, and is a crucial mediator of the relationship between an embryo
and its maternal sporophyte.
Given that seeds, and specifically endosperm, are the cornerstone of human diets, there has
been much effort to understand the dynamic transcriptional landscape of seed development in a vari-
ety of economically important (maize (Li et al., 2014; Chen et al., 2014), rice (Xu et al., 2014; Gao et al.,
2013), soybean (Jones and Vodkin, 2013), peanut (Zhang et al., 2011), camelina (Nguyen et al., 2013),
Brassica (Gao et al., 2014)) or model system (Arabidopsis (Girke et al., 2000)) plants. Yet little informa-
tion exists from within early diverging angiosperm lineages, hindering any understanding the evolution
of processes involved in seed development. While this undoubtedly is related to the difficulty of working
with the vast majority of species within these lineages (e.g., Amborella, Nymphaeales, Austrobaileyales,
Chloranthales, Ceratophyllales, magnoliids, which are typically long-lived trees, shrubs, lianas, or aquatic
plants), a genetically and experimentally tractable species from within one of the most-early diverging
lineages has recently been identified (Povilus et al., 2015). Nymphaea thermarum (Nymphaeales) is a
minute waterlily with a relatively short generation time, simple erect growth habit, and a growing toolkit
of genetic resources – as such, it is poised to help illuminate questions about the evolution of flowering
plant reproduction.
A common thread has emerged from studies of seed development in a wide variety of angio-
sperms: imprinting is important for seed development, and particularly for endosperm development
(Haig and Westoby, 1991; Haig 2013; Gehring and Satyaki, 2017). Imprinting is an epigenetic phenom-
enon that results in alleles with identical nucleotide sequences that have different expression patterns,
depending on which parent the allele was inherited from (a “parent-of-origin” effect). In flowering
plants, imprinting is largely understood to occur via the establishment of chromatin methylation patterns
during gamete and seed development. Because methylation of DNA or histones can affect how a locus
is expressed, different methylation patterns established during the development of different gametes
can mean that certain loci are expressed only from the maternally- or paternally-inherited copy of the
allele (Zilberman et al., 2006). Imprinting has been noted to be particularly important for the ability of
endosperm to function as a nutritional mediator between the embryo and maternal sporophyte (Haig
and Westoby, 1991; Gehring and Satyaki, 2017). However, some of the mechanisms that control chroma-
tin methylation patterns appear to differ between monocots and eudicots (Gleason and Kramer, 2012;
75
Köhler et al., 2012; Nalaamilli 2013; Furihata et al., 2016), leading to the question of how and when im-
printing and chromatin methylation became important aspects of seed development in flowering plants.
Chromatin methylation during reproductive development is best understood in Arabidopsis, and
involves the coordination of DNA methylation/demethylation, histone methylation, and RNA-dependent
DNA methylation (Gehring and Satyaki, 2017). Members of the DNA METHYLTRANSFERASE family
(MET) maintain CG methylation, while CHROMOMETHYLASE proteins (CMT) establish or maintain CNG
methylation. METs and CMT are known to be expressed both in developing female gametophytes of
Arabidopsis, as well as in offspring tissues after fertilization (Jullien 2012; Köhler et al., 2012). DEMETER
(DME) is a DNA glycosylase that removes methylation established by MET1 and is active mostly during
female gametophyte development. DME activity determines expression of some of the components of
the POLYCOMB REPRESSIVE COMPLEX 2 (PRC2) (Hsieh et al., 2012). PRC2 is comprised of MEDEA (MEA),
FERTILIZATION-INDEPENDENT SEED2 (FIS2), FERTILIZATION-INDEPENDENT ENDOSPERM (FIE), and MUL-
TICOPY SUPRESSOR OF IRA1 (MSI1), and is active in both the central cell of the female gametophyte and
in endosperm (Furihata et al., 2016). The PRC2 complex participates in histone methylation, and in doing
so regulates the expression of several genes known to be important for seed development (Hsieh et al.,
2012). Together, METs, CMTs, DME, and PRC2 regulate methylation patterns necessary for imprinting
of parent-or-origin specific expression patterns. Methylation processes not necessarily associated with
imprinting, such as RNA-directed DNA methylation (RdDM), are also active during reproductive develop-
ment and have been tied to repression of transposon activity in the egg cell and embryo (Köhler et al.,
2012; Ingouff et al., 2017).
In order to shed light on whether imprinting via chromatin methylation could be responsible for
recently discovered parent-of-origin effects on endosperm and embryo development in N. thermarum
(Povilus et al., 2015), we examined the expression patterns of genes involved in DNA and histone methyl-
ation, and in particular those known to be important for imprinting. By obtaining comprehensive libraries
of gene expression during important stages of seed development in the water lily Nymphaea thermarum,
we provide the first such dataset from within any early-diverging angiosperm lineage. We compare the
expression profiles of chromatin methylation regulators in N. thermarum with those of their homologs in
monocots and Arabidopsis. In doing so, we identify processes of chromatin methylation that have likely
been involved in seed development since the earliest stages of angiosperm evolution, and demonstrate
76
that all of the molecular processes known to be involved in imprinting are indeed expressed before and
after fertilization – meaning that imprinting is certainly possible in N. thermarum, even if its regulation
likely varies from the current Arabidopsis-based model.
Materials and methods
Plant Material and Sequencing
The Nymphaea thermarum plants sampled for this study were grown in a greenhouse at the
Arnold Arboretum of Harvard University (Boston, MA, United States) according to previously established
protocols (Fischer and Magdalena-Rodriguez, 2010). Flowers were allowed to self-fertilize. All samples
were collected between 10 and 11 am on their respective collection days. Ovules and seeds were quickly
dissected from surrounding carpel or fruit tissue, weighed, then immediately frozen in liquid nitrogen,
and stored at -80 C. For 0 DAA (days after anthesis), each biological replicate represents material from
3-4 individual flowers from different plants. For 7 and 15 DAA, each biological replicate includes material
from a single fruit.
RNA extractions were performed with modified protocol, originally developed for use on maize
kernels (Wang et al., 2012)(Supplementary Materials and Methods 3). RNA seq libraries were prepared
by the Whitehead Genome Sequencing Core, according to the manufacturer protocols of the Illumina
Standard mRNA-seq library preparation kit (Illumina), using poly A selection, and were sequenced at the
Baur Core of Harvard University to generate 125-bp, paired-end reads on a Illumina HiSeq Platform. All
12 libraries were multiplexed and sequenced on 3 lanes.
Readmappinganddifferentialexpressionanalysis
For each sample, kallisto (Bray et al., 2016) was used to pseudo-align reads to the Nymphaea
thermarum genome (manuscript in preparation) and quantify transcript abundances. 100 mapping boot-
straps were performed, using default parameters for paired-end reads. Kallisto reports both estimated
number of transcript reads per sample (EST), as well as transcript abundance per million reads (TPM,
normalized for transcript length and number of reads per sample)(Supplemental Dataset 3.1). Transcripts
that are differentially expressed (DE) between time points were identified using sleuth (Pimentel et al.,
2017)(Supplemental Dataset 3.2). The primary DE analysis modeled the effect of time, for all time points,

77
on transcript abundance. Subsequent DE analysis was conducted for pair-wise comparisons between
time points (for this analysis, multiple testing was accounted for by requiring transcripts to be significant-
ly DE according to the primary DE analysis). Sleuth incorporates information from bootstraps performed
by kallisto to estimate the inferential variance of each transcript; the adjusted variances were used to de-
termine differential expression for each transcript. Transcripts were considered differentially expressed
if time point (DAA) was a significant factor for transcript abundance, according to both a conservative
likelihood ratio test and a Wald test (multiple-testing corrected p-value < 0.01).
PCA and Clustering of Biological Replicates
Analyses were performed with R (version 3.4.0, (R Core Team, 2017)). To assess similarity of
biological replicates, EST values for each transcript that was differentially expressed were centered and
scaled (according to transcript means across all samples), using the scale function. Dimensional expres-
sion data was reduced to two dimensions by PCA using the prcomp function. K-means clustering within
PCA space was performed by the kmeans function, with cluster number set to 3 (number chosen to
reflect the number of sampled time points).
Expressionpatternclusterdefinitionandanalysis
Analyses were performed with R (version 3.4.0, (R Core Team, 2017)). K-means clustering of gene
expression patterns was performed with sample TPM values, using the kmeans function. The cluster
number was set to 9, as the use of higher cluster numbers failed to identify additional unique expres-
sion patterns. Only transcripts that were differentially expressed were used for k-means clustering. The
z-score was calculated for each gene per sample, using the scale function. Only genes whose expression
patterns correlated with the average profile of each cluster (Pearson correlation > 0.9) were used in fur-
ther analysis (Supplementary Dataset 3.3).
GO (molecular function) enrichment for each expression pattern cluster was performed with
agriGO (Tian et al., 2017), using Arabidopsis thaliana TAIR 10 annotation as the background, with hy-
pergeometric or chi-squared tests (chi-squared was only performed if the query list had relatively few
intersections with the reference list, and is noted separately), Yekutieli (FDR under dependency) multiple
corrections testing adjustment, and significance level = 0.1. Putative A. thaliana homologs of N. ther-

78
marum transcripts were identified via BLASTX for each N. thermarum transcript against a database of all
TAIR 10 Arabidopsis transcript amino acid sequences (downloaded from Phytozome (Goodstein et al.,
2012)), using the hit with the lowest e-value as the putative homolog match (e-value cutoff = 1e-15).
Identificationandanalysisoftranscriptionfactors
Putative transcription factors (and their respective family type) were identified from the Nym-
phaea thermarum genome using the ‘Prediction’ tool available from the Plant Transcription Factor
Database v4.0 (Jin et al., 2017). Enrichment analysis for TF families among the set of DE TFs in each ex-
pression cluster was performed in R with Fisher’s exact test; adjusted p-values (FDR) <0.1 and <0.05 are
noted.
IdentificationofgenesinvolvedinhistoneandDNAmethylation
To comprehensively identify putative homologs of genes known to be involved in regulation of
DNA and chromatin methylation during seed development in other angiosperms, we estimated gene-
family phylogenies for gene families of particular interest (CMT, MET, DME, components of the PCR2
complex). For each gene family, amino acid sequences for Arabidopsis members were aligned with
MUSCLE (Edgar 2004) and used as the input for HMMER searches (e-value cutoff = 1e-15) (Eddy, 2011)
to identify putative homologs from the genomes of Physcomitrella patens (Physcomitrella patens v3.3,
DOE-JGI, http://phytozome.jgi.doe.gov/), Amborella trichopoda (Amborella Genome Project 2013), Nym-
phaea thermarum (manuscript in preparation), Aquilegia coerulea (Aquilegia coerulea Genome Sequenc-
ing Project, http://phytozome.jgi.doe.gov/), Oryza sativa (Ouyang et al., 2007), Zea mays (Hirsch et al.,
2016), Arabidopsis thaliana (Lanesch et al., 2012), and Solanum lycopersicum (Tomato Genome Consor-
tium 2012). The latest versions of all annotated genome datasets, except for N. thermaurm, were down-
loaded from Phytozome (Goodstein et al., 2012). Putative homologs were also identified from within
the de-novo assembled, immature-ovule and non-seed transcriptomes of N. thermarum (which includes
tissues from roots, floral buds, leaves, and pre-meiotic ovules)(manuscript in preparation). The amino
acid sequences for the set of all putative homologs for a gene family were aligned with MUSCLE (Edgar,
2004), alignments were manually trimmed to represent highly conserved regions, and phylogenetic tree
estimation and bootstrapping (n=100) was performed with RAxML under the PROTGAMMAGTR amino-
79
acid substitution model (Stamataki, 2014). During further discussion we took a conservative approach,
using a relatively broad definition as to which members were included in particular gene sub-families of
interest.
All Arabidopsis genes annotated as being involved with either DNA methylation (GO:0006306)
and histone methylation (GO:0016571) were collected using QuickGO (http://www.ebi.ac.uk/). Putative
N. thermarum homologs of A. thaliana transcripts were identified via BLASTX for each N. thermarum
transcript against a database of all TAIR 10 Arabidopsis transcript amino acid sequences (Lanesch et al.,
2012), using the hit with the lowest e-value as the putative homolog match (e-value cutoff = 1e-15).
Histology and Microscopy
Material collected for microscopy was fixed in 4% v/v acrolein (Polysciences, New Orleans, Louisiana,
USA) in 1X PIPES buffer (50 mmol/L PIPES, 1 mmol/L MgSO4, 5 mmol/L EGTA) pH 6.8, for 24 hours. Fixed
material was then rinsed three times (one hour per rinse) with 1X PIPES buffer, dehydrated through a
graded ethanol series, and stored in 70% ethanol. Samples were prepared for confocal microscopy and
imaged according previously established protocols (Povilus et al., 2015). Briefly: tissues were stained
according the Fuelgen method, and then infiltrated with and embedded in JB-4 glycol methacrylate
(Electron Microscopy Sciences, Hatfield, PA, USA). Blocks were cut by hand with razor blades to remove
superfluous tissue layers. Samples were mounted in a drop of Immersol 518f (Zeiss, Oberkochen, Ger-
many) on custom well slides and imaged with a Zeiss LSM700 Confocal Microscope, equipped with an
AxioCam HRc camera (Zeiss, Oberkochen, Germany). Excitation/emission detection settings: excitation at
405 and 488 nm, emission detection between 400-520 nm (Channel 1) and 520-700 (Channel 2).
Results
GenerationandanalysisofRNA-seqData
In order to investigate the transcriptional landscape of seed development in N. thermarum, we
generated RNA-seq libraries of whole ovules or seeds at 3 times points. The three stages sampled repre-
sent unique suites of developmental processes (Figure 3.1)(Povilus et al., 2015). The first stage (0 DAA)
consists of whole, unfertilized ovules. The second stage is whole seeds at 7 DAA, when the endosperm
is expanding but the embryo is relatively quiescent. Nutrients are actively being acquired by, and stored
80
in, a tissue called the perisperm (which is a maternal sporophyte tissue derived from the nucellus). The
third stage sampled is whole seeds at 15 DAA, when endosperm expansion and differentiation is nearly
complete. The embryo begins to undergo significant growth and morphogenesis, displacing space occu-
pied by degenerating endosperm cells. The perisperm continues to acquire and store nutrient reserves.
Thus, while seed components were not spatially dissected from each other, the selected time points
capture different developmental landmarks.
Between 66 and 100 million high quality reads were generated for each sample, for a total
of 940 million reads. 76.2% of the reads pseudo-mapped to the Nymphaea thermarum genome, and
uniquely mapped reads were used to estimate normalized transcript abundance as TPM (transcripts per
million) (Supplementary Table 3.1). Biological replicates of each time point clustered with each other
(and not with samples of other time points) during PCA and k-means analysis of expression patterns of
the 4000 most highly expressed transcripts, except for one sample of 0 DAA seeds that clustered instead
with 7 DAA samples (Figure 3.2A). This sample was removed from further analysis. When PCA and k-
means clustering were performed with the remaining 11 samples, samples clustered according to collec-
tion time point.
In total, 19,412 unique transcripts with at least a minimum abundance of 1 TPM were present
during the sampled time points (Supplemental Dataset 3.1). This represents 74.4% of the 25,760 genes
identified from the Nymphaea thermaurm genome (Figure 3.2B). 16,329 transcripts were present at
all three ovule/seed developmental stages. 0 DAA had the most unique transcripts, and 7 DAA had the
fewest. Among transcripts present in two stages, 0 DAA and 7 DAA shared the most transcripts, while 7
DAA and 15 DAA shared the fewest. The majority of transcript expression levels fell within a similar range
across all three stages (Figure 3.2C). However, the expression levels of the 0.1% most highly expressed
transcripts increased significantly over time (Supplementary Table 3.2).
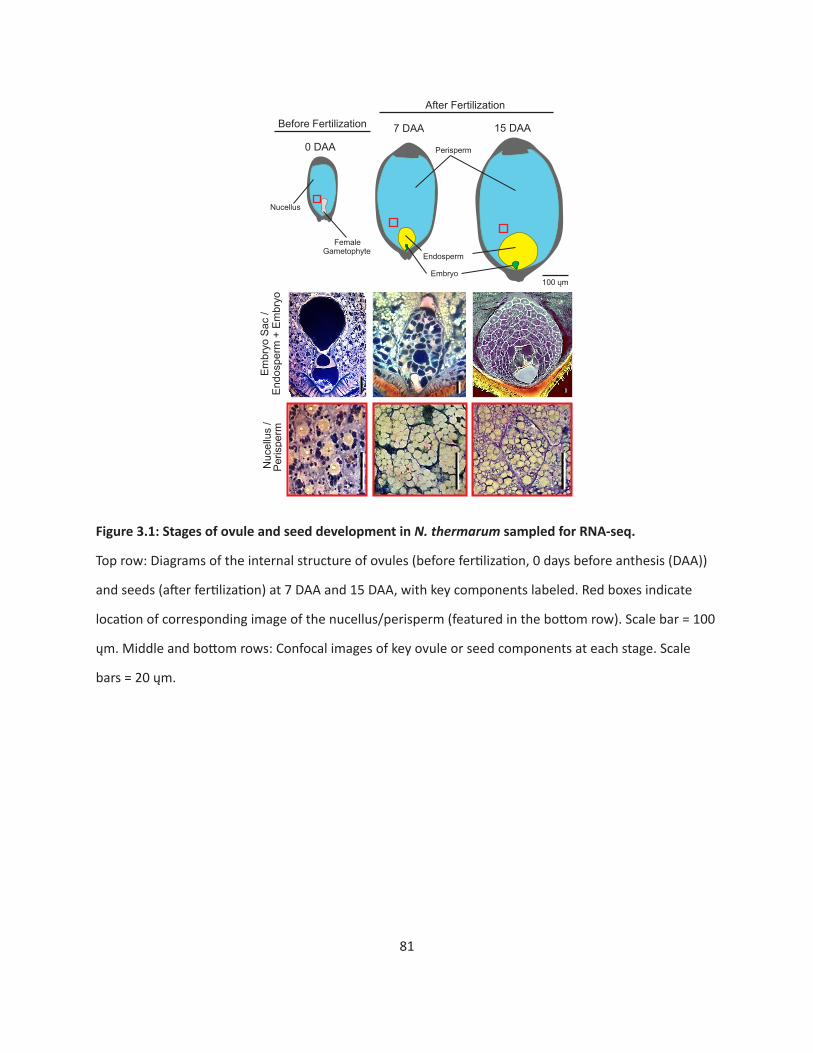
81
Embr
yo S
ac /
Endo
sper
m +
Em
bryo
Nuc
ellu
s /
Peris
perm
0 DAA
7 DAA 15 DAA
100 ųm
Perisperm
Endosperm
Embryo
Nucellus
Female
Gametophyte
Before Fertilization
After Fertilization
Figure 3.1: Stages of ovule and seed development in N. thermarumsampledforRNA-seq.
Top row: Diagrams of the internal structure of ovules (before fertilization, 0 days before anthesis (DAA))
and seeds (after fertilization) at 7 DAA and 15 DAA, with key components labeled. Red boxes indicate
location of corresponding image of the nucellus/perisperm (featured in the bottom row). Scale bar = 100
ųm. Middle and bottom rows: Confocal images of key ovule or seed components at each stage. Scale
bars = 20 ųm.
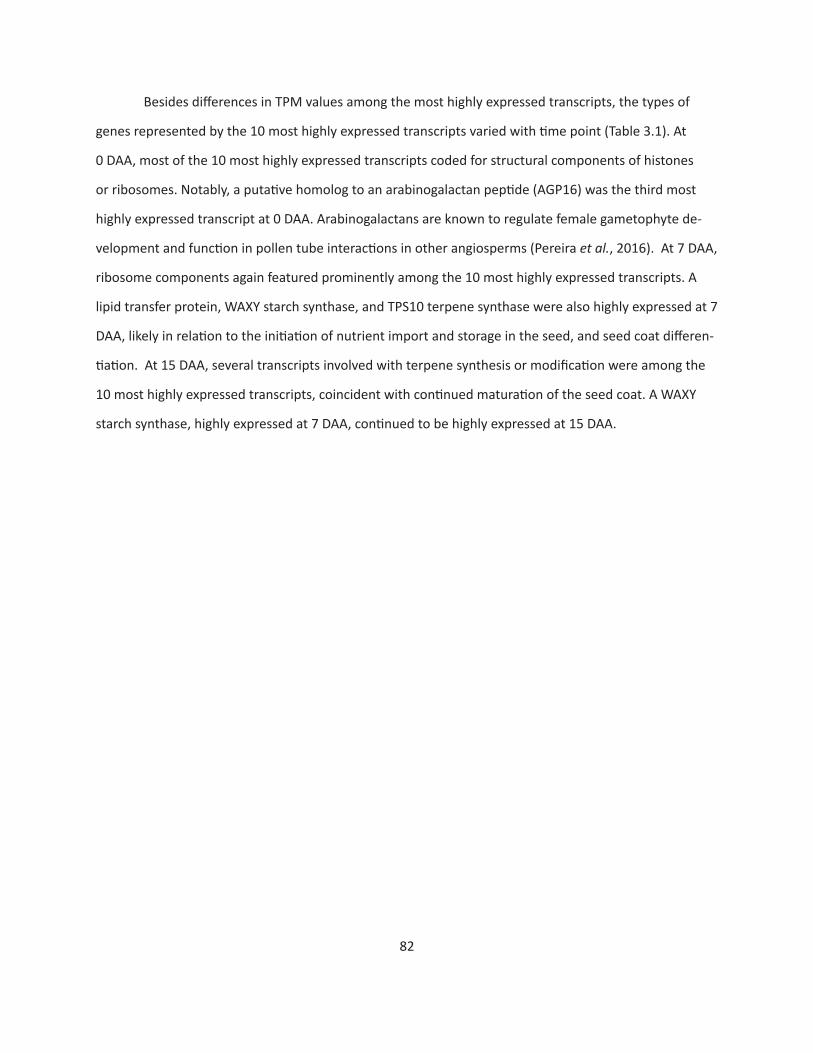
82
Besides differences in TPM values among the most highly expressed transcripts, the types of
genes represented by the 10 most highly expressed transcripts varied with time point (Table 3.1). At
0 DAA, most of the 10 most highly expressed transcripts coded for structural components of histones
or ribosomes. Notably, a putative homolog to an arabinogalactan peptide (AGP16) was the third most
highly expressed transcript at 0 DAA. Arabinogalactans are known to regulate female gametophyte de-
velopment and function in pollen tube interactions in other angiosperms (Pereira et al., 2016). At 7 DAA,
ribosome components again featured prominently among the 10 most highly expressed transcripts. A
lipid transfer protein, WAXY starch synthase, and TPS10 terpene synthase were also highly expressed at 7
DAA, likely in relation to the initiation of nutrient import and storage in the seed, and seed coat differen-
tiation. At 15 DAA, several transcripts involved with terpene synthesis or modification were among the
10 most highly expressed transcripts, coincident with continued maturation of the seed coat. A WAXY
starch synthase, highly expressed at 7 DAA, continued to be highly expressed at 15 DAA.
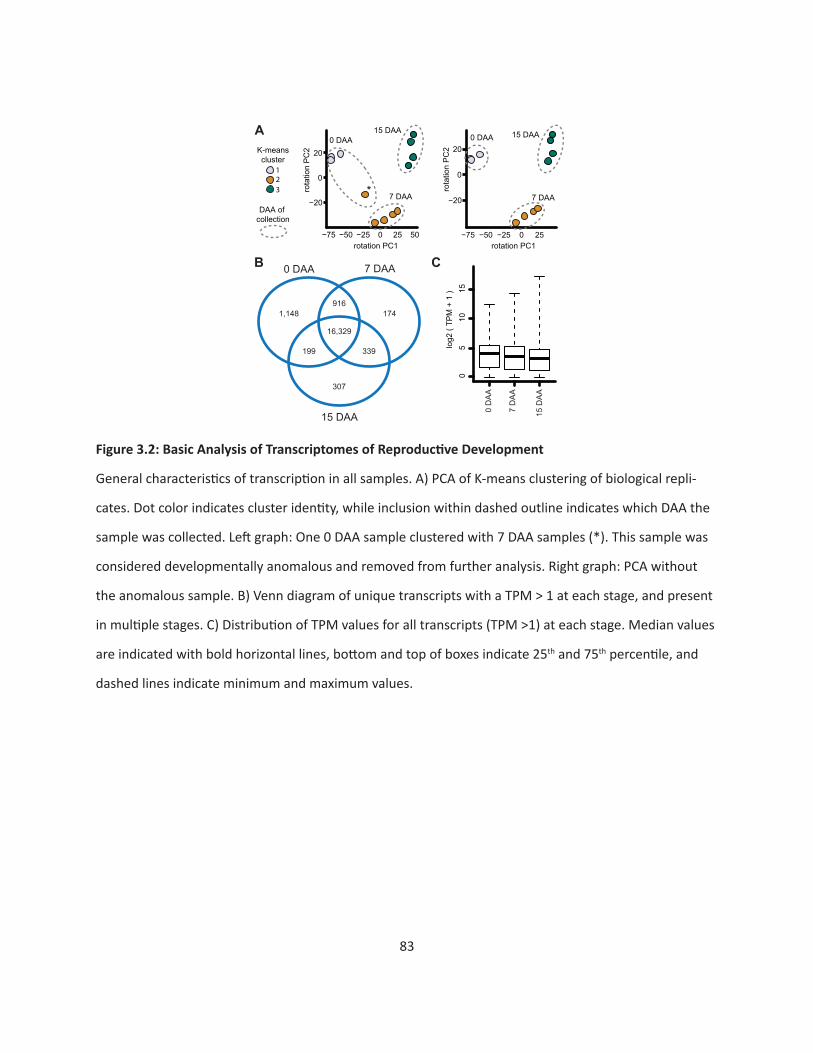
83
−20
0
20
−75 −50 −25 0 25 50rotation PC1
rota
tion
PC2K-means
cluster123
DAA of collection
0 DAA15 DAA
7 DAA −20
0
20
−75 −50 −25 0 25rotation PC1
rota
tion
PC2
0 DAA 15 DAA
7 DAA*
0 DAA 7 DAA
1,148 174916
339199
16,329
307
05
1015
log2
( TP
M +
1 )
A
B C
15 DAA
0 D
AA
7 D
AA
15 D
AA
Figure3.2:BasicAnalysisofTranscriptomesofReproductiveDevelopment
General characteristics of transcription in all samples. A) PCA of K-means clustering of biological repli-
cates. Dot color indicates cluster identity, while inclusion within dashed outline indicates which DAA the
sample was collected. Left graph: One 0 DAA sample clustered with 7 DAA samples (*). This sample was
considered developmentally anomalous and removed from further analysis. Right graph: PCA without
the anomalous sample. B) Venn diagram of unique transcripts with a TPM > 1 at each stage, and present
in multiple stages. C) Distribution of TPM values for all transcripts (TPM >1) at each stage. Median values
are indicated with bold horizontal lines, bottom and top of boxes indicate 25th and 75th percentile, and
dashed lines indicate minimum and maximum values.
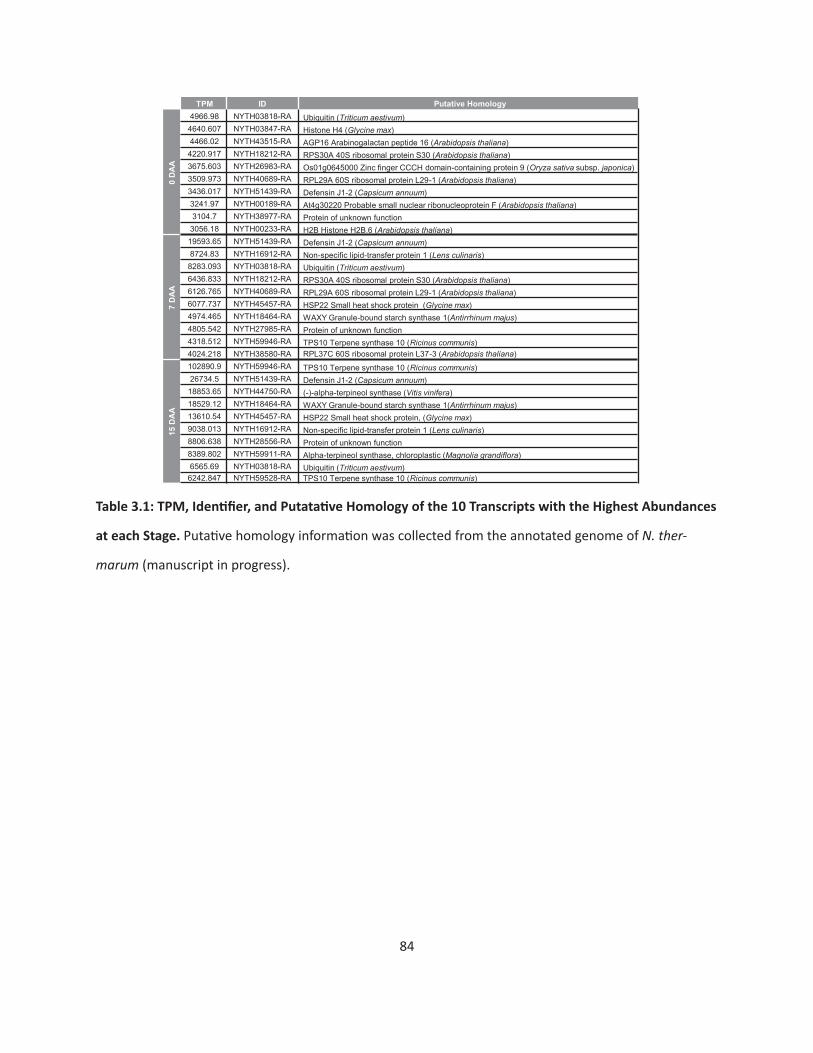
84
TPM ID Putative Homology
0 D
AA
4966.98 NYTH03818-RA Ubiquitin (Triticum aestivum)4640.607 NYTH03847-RA Histone H4 (Glycine max)4466.02 NYTH43515-RA AGP16 Arabinogalactan peptide 16 (Arabidopsis thaliana)
4220.917 NYTH18212-RA RPS30A 40S ribosomal protein S30 (Arabidopsis thaliana)3675.603 NYTH26983-RA Os01g0645000 Zinc finger CCCH domain-containing protein 9 (Oryza sativa subsp. japonica)3509.973 NYTH40689-RA RPL29A 60S ribosomal protein L29-1 (Arabidopsis thaliana)3436.017 NYTH51439-RA Defensin J1-2 (Capsicum annuum)3241.97 NYTH00189-RA At4g30220 Probable small nuclear ribonucleoprotein F (Arabidopsis thaliana)3104.7 NYTH38977-RA Protein of unknown function
3056.18 NYTH00233-RA H2B Histone H2B.6 (Arabidopsis thaliana)
7 D
AA
19593.65 NYTH51439-RA Defensin J1-2 (Capsicum annuum)8724.83 NYTH16912-RA Non-specific lipid-transfer protein 1 (Lens culinaris)
8283.093 NYTH03818-RA Ubiquitin (Triticum aestivum)6436.833 NYTH18212-RA RPS30A 40S ribosomal protein S30 (Arabidopsis thaliana)6126.765 NYTH40689-RA RPL29A 60S ribosomal protein L29-1 (Arabidopsis thaliana)6077.737 NYTH45457-RA HSP22 Small heat shock protein (Glycine max)4974.465 NYTH18464-RA WAXY Granule-bound starch synthase 1(Antirrhinum majus)4805.542 NYTH27985-RA Protein of unknown function4318.512 NYTH59946-RA TPS10 Terpene synthase 10 (Ricinus communis)4024.218 NYTH38580-RA RPL37C 60S ribosomal protein L37-3 (Arabidopsis thaliana)
15 D
AA
102890.9 NYTH59946-RA TPS10 Terpene synthase 10 (Ricinus communis)26734.5 NYTH51439-RA Defensin J1-2 (Capsicum annuum)18853.65 NYTH44750-RA (-)-alpha-terpineol synthase (Vitis vinifera)18529.12 NYTH18464-RA WAXY Granule-bound starch synthase 1(Antirrhinum majus)13610.54 NYTH45457-RA HSP22 Small heat shock protein, (Glycine max)9038.013 NYTH16912-RA Non-specific lipid-transfer protein 1 (Lens culinaris)8806.638 NYTH28556-RA Protein of unknown function8389.802 NYTH59911-RA Alpha-terpineol synthase, chloroplastic (Magnolia grandiflora)6565.69 NYTH03818-RA Ubiquitin (Triticum aestivum)
6242.847 NYTH59528-RA TPS10 Terpene synthase 10 (Ricinus communis)
Table3.1:TPM,Identifier,andPutatativeHomologyofthe10TranscriptswiththeHighestAbundances
at each Stage. Putative homology information was collected from the annotated genome of N. ther-
marum (manuscript in progress).
85
AnalysisofDifferentialGeneExpression
Out of the 19,412 unique transcripts expressed during seed development in N. thermarum,
10,933 were significantly differentially expressed (DE) (Supplementary Dataset 3.2). A stringent definition
of differential expression was used: transcripts had to pass both a Wald and LRT test ( p < 0.01) to test for
DE according to the factor of time (i.e. developmental stage) The set of DE transcripts was used to per-
form hierarchical clustering of all transcripts in all samples (Figure 3.3A). The three main ‘clades’ identi-
fied by hierarchical clustering of samples correlated with the three sampling time points. 7 DAA samples
and 15 DAA samples were more closely related to each other, than to 0 DAA samples.
Two sets of differentially expressed (DE) transcripts were considered during further analysis: a
set of all DE transcripts (“all-DE”), and a set of DE transcripts with very high relative changes in expres-
sion (“highly-DE”). For the latter set, an absolute b-value > 2 for the expression change(s) was used as
the filtering criteria. B-values are reported by sleuth as part of differential gene expression analysis, and
are analogous to fold-change in what a positive or negative value means for the direction of expression
change (Pimentel et al., 2017). However, b-values are derived from the effect size of time point on the
log10-transformed transcript abundances – a b-value is therefore not equivalent to the same value fold-
change (ie: a b-value of 2 does not imply a fold-change of 2).
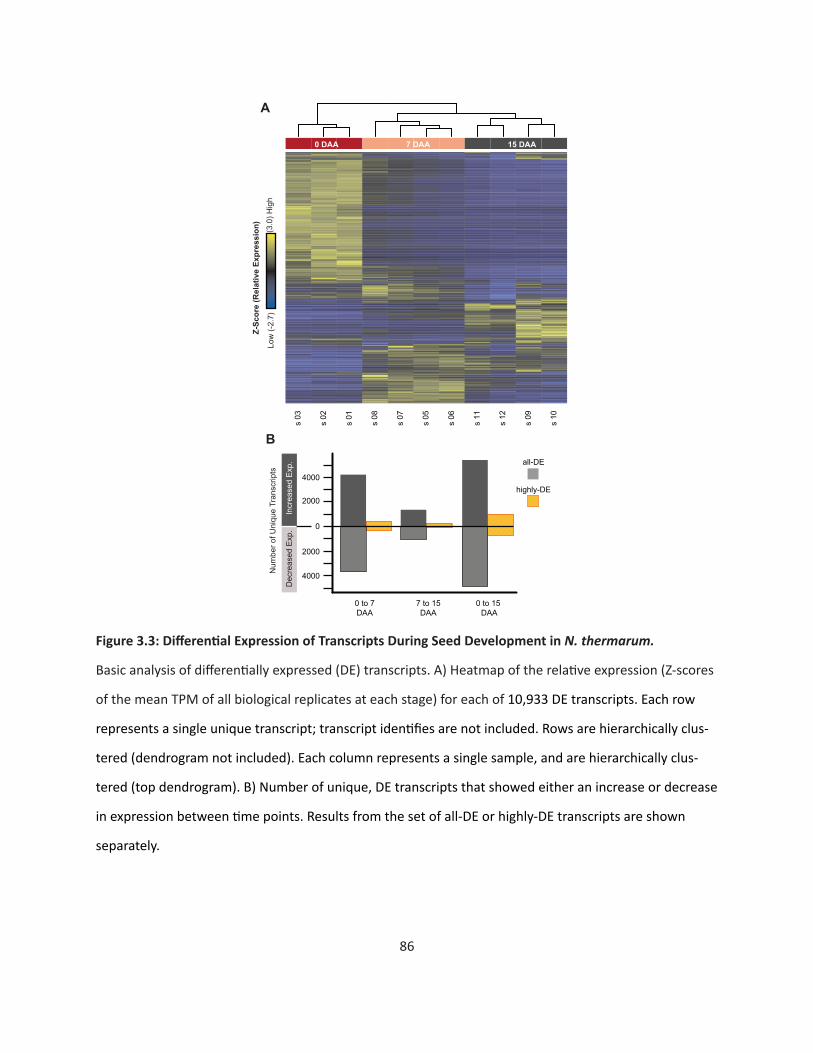
86
s 03
s 02
s 01
s 08
s 07
s 05
s 06
s 11
s 12
s 09
s 10
0 DAA 7 DAA 15 DAA
Z-Sc
ore
(Rel
ativ
e Ex
pres
sion
)
Low
(-2.
7)(3
.0) H
igh
4000
2000
0
2000
4000
0 to 7DAA
7 to 15DAA
0 to 15 DAA
all-DE
highly-DE
Incr
ease
d Ex
p.D
ecre
ased
Exp
.
Num
ber o
f Uni
que
Tran
scrip
ts
B
A
Figure3.3:DifferentialExpressionofTranscriptsDuringSeedDevelopmentinN. thermarum.
Basic analysis of differentially expressed (DE) transcripts. A) Heatmap of the relative expression (Z-scores
of the mean TPM of all biological replicates at each stage) for each of 10,933 DE transcripts. Each row
represents a single unique transcript; transcript identifies are not included. Rows are hierarchically clus-
tered (dendrogram not included). Each column represents a single sample, and are hierarchically clus-
tered (top dendrogram). B) Number of unique, DE transcripts that showed either an increase or decrease
in expression between time points. Results from the set of all-DE or highly-DE transcripts are shown
separately.
87
Among the set of all DE transcripts (10,933 transcripts), more than three times more transcripts
were differentially expressed between 0-7DAA, than between 7-15 DAA, while the number of transcripts
differentially expressed between 0-7 DAA and 0-15 DAA was more similar (Figure 3.3B). For each time-
point comparison in the all-DE set, between 53 and 58% of the significant changes in expression were
due to increases in expression (as opposed to decreases in expression). The set of highly-DE transcripts
was smaller, consisting of 1,865 unique transcripts. The 7-15 DAA transition had the fewest highly-DE
transcripts, with 0-7 DAA having about 2.5 times as many, and 0-15 DAA having about twice as many as
0-7DAA. While the proportion of transcripts that increased expression between 0-7DAA and 0-15 DAA
was similar to what was seen in the set of all DE transcripts (between 54-58%), for 7-15DAA the propor-
tion of highly-DE transcripts that increased expression was much higher (80%, as compared to 58% for
the set of all DE transcripts).
Analysisoftranscriptsgroupedbyexpressionpattern
The expression patterns of all DE transcripts were associated with 9 expression pattern types (or
‘clusters’) using a K-means clustering approach (Figure 3.4A) (Supplementary Table 3.3). The expression
patterns represented by the 9 clusters include: increased or decreased expression across the entire time
sampled (respectively, Clusters A and B), as well as increased or decreased expression to produce a mini-
mum or maximum at each of the 3 time points (increase and decrease, respectively, 0 DAA = Clusters
C,D; 7 DAA = E,F; 15DAA = G,H). The final cluster (cluster I) represented transcripts that, while differen-
tially expressed, displayed a relatively small magnitude of change. 10,450 transcripts (96% of DE tran-
scripts) were strongly correlated with the average profile of their respective clusters (Pearson correlation
> 0.9) and were considered for further analysis.

88
Cluster B
−20
12
daa00 daa07 daa15
Cluster A
Develomental Stage
Rel
ativ
e ex
pres
sion
−20
12
daa00 daa07 daa15
Cluster D−2
01
2
daa00 daa07 daa15
Cluster E
−20
12
daa00 daa07 daa15
Cluster F
−20
12
daa00 daa07 daa15
Cluster I
−20
12
daa00 daa07 daa15
Cluster H
−20
12
daa00 daa07 daa15
Cluster C
−20
12
daa00 daa07 daa15
Cluster G
−20
12
daa00 daa07 daa15
Increase Decrease
0
500
1000
1500
2000
2500
3000
A B C D E F G H IExpression Pattern Cluster
Num
ber o
f Uni
que
Tran
scrip
ts
All DEHighly DE
Gen
eral
Min
/ M
axat
0 D
AAM
in /
Max
at 7
DAA
Min
/ M
axat
15
DAA
Oth
er
A
B
Figure3.4:ExpressionPatternClustersforDE
Transcripts
A) 9 expression pattern clusters, which contain 96%
of all transcripts differentially expressed during
the sampled stages of reproductive development.
Mean TPM values of biological replicates at each
stage were centered and scaled, relative to the
mean transcript expression value over all stages.
Clusters are organized by whether they represent
initial increases or decreases (columns) to achieve
consistent increase or decreased expression, mini-
mum or maximum expression at each stage (rows).
Grey areas represent expression of each transcript
in a cluster (only includes transcripts whose expres-
sion patterns correlated with the average profile
of each cluster (Pearson correlation > 0.9)), while
black lines represent the median expression pat-
tern for each cluster. B) Number of unique tran-
scripts in each cluster. Results from sets of all-DE
and highly-DE transcripts are shown separately.
89
In addition to the set of 10,450 DE transcripts represented in the expression pattern clusters
(“all-DE”), a subset of “highly-DE” transcripts ( b-value > 2 for at least one time point transition: 1,783
transcripts) was considered during further analysis of expression clusters (Figure 3.4B). For the cluster
pairs that represent general change (A,B) or minimum/maximum expression at 0 DAA (C,D), more tran-
scripts showed expression decreases. In contrast, in the cluster pairs that represent minimum/maximum
expression at 7 DAA (E,F) and 15 DAA (G,H), more transcripts showed increased expression. The clusters
with the highest proportion of highly-DE transcripts were Cluster A (consistent expression increase) and
G (maximum expression at 15 DAA).
Functionalenrichmentofexpressionpatternclusters
Each cluster was tested for significant enrichment of GO molecular function terms, based on the
TAIR 10 annotations for the putative A. thaliana homolog of each N. thermarum transcript. All signifi-
cantly enriched child terms (ie: the most specialized of a hierarchy) are reported for each cluster, and
terms of particular interest are further discussed (Figure 3.5).
Clusters with general or time-point-specific increases in expression were found to be generally
enriched for functions related to various types of transmembrane transporter activity. For the set of
all-DE transcripts, Cluster G (maximum at 15 DAA) was additionally enriched for functions that appear
to be related to chloroplast activity (chlorophyll-binding). While it seems unlikely that seeds at this stage
(which are enclosed within opaque fruit walls) would be carrying out photosynthesis, the analogous
stage of embryo development in Arabidopsis is associated with the formation of chloroplasts within
embryo tissues (Mansfield and Briarty, 1991). Among the set of highly-DE transcripts, various trans-
membrane transporter activities were again enriched in Clusters A (general increase) and G (maximum
at 15DAA). Cluster C (increase after 0 DAA) was enriched for lipid binding, and Cluster E (maximum at
7DAA) was enriched for transcription factor activity.
Clusters associated with general or time-point-specific decreases in expression prominently
featured significantly enriched terms related to DNA or chromatin binding and modification. For the set
of all-DE transcripts, Cluster B (general decrease) was enriched for terms related to methyltransferase
activity and Cluster D (decrease after 0 DAA) was enriched for transcription factor activity. Among the set
of highly-DE transcripts, Cluster D (decrease after 0 DAA) was enriched for transcription factor activity.
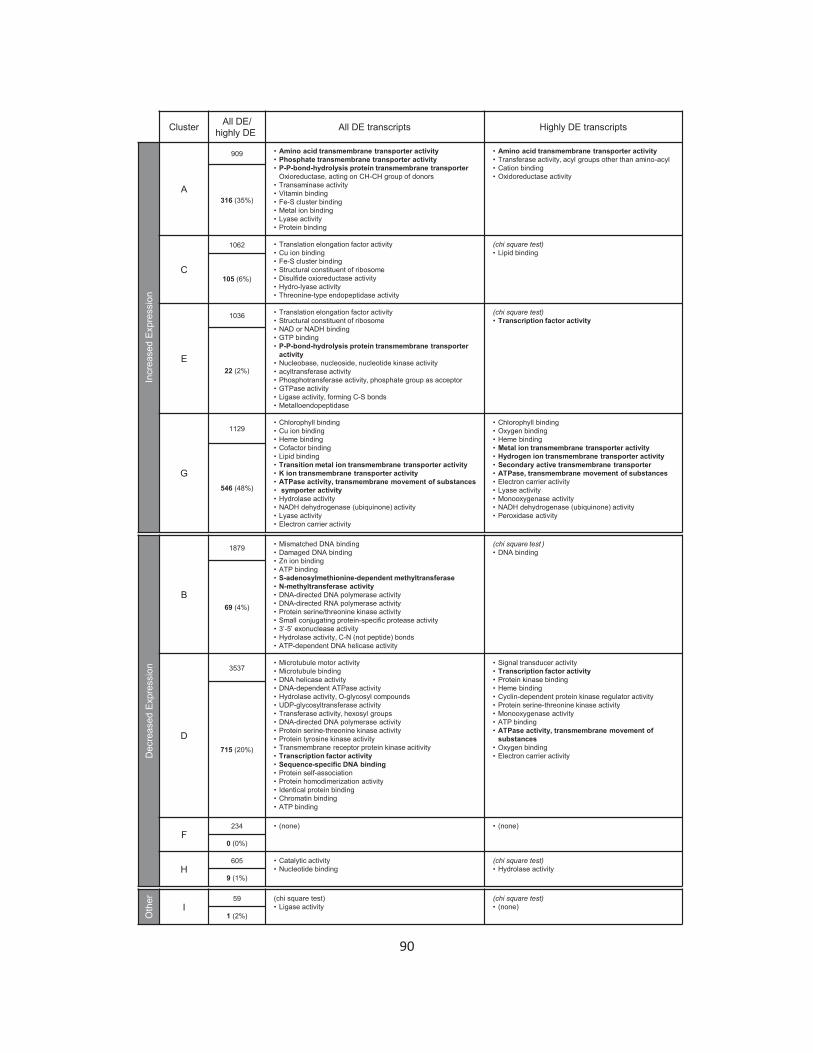
90
Cluster All DE/ highly DE All DE transcripts Highly DE transcripts
noisserpxE desaercnI
A
909 • Amino acid transmembrane transporter activity• Phosphate transmembrane transporter activity• P-P-bond-hydrolysis protein transmembrane transporter
Oxioreductase, acting on CH-CH group of donors• Transaminase activity• Vitamin binding• Fe-S cluster binding• Metal ion binding• Lyase activity• Protein binding
• Amino acid transmembrane transporter activity• Transferase activity, acyl groups other than amino-acyl • Cation binding• Oxidoreductase activity
316 (35%)
C
1062 • Translation elongation factor activity• Cu ion binding• Fe-S cluster binding• Structural constituent of ribosome• Disulfide oxioreductase activity• Hydro-lyase activity• Threonine-type endopeptidase activity
(chi square test)• Lipid binding
105 (6%)
E
1036 • Translation elongation factor activity• Structural constituent of ribosome• NAD or NADH binding• GTP binding• P-P-bond-hydrolysis protein transmembrane transporter
activity• Nucleobase, nucleoside, nucleotide kinase activity• acyltransferase activity• Phosphotransferase activity, phosphate group as acceptor• GTPase activity• Ligase activity, forming C-S bonds• Metalloendopeptidase
(chi square test)• Transcription factor activity
22 (2%)
G
1129• Chlorophyll binding• Cu ion binding• Heme binding• Cofactor binding• Lipid binding• Transition metal ion transmembrane transporter activity• K ion transmembrane transporter activity• ATPase activity, transmembrane movement of substances• symporter activity• Hydrolase activity• NADH dehydrogenase (ubiquinone) activity• Lyase activity• Electron carrier activity
• Chlorophyll binding• Oxygen binding• Heme binding• Metal ion transmembrane transporter activity• Hydrogen ion transmembrane transporter activity• Secondary active transmembrane transporter• ATPase, transmembrane movement of substances• Electron carrier activity• Lyase activity• Monooxygenase activity• NADH dehydrogenase (ubiquinone) activity• Peroxidase activity
546 (48%)
noisserpxE desaerceD
B
1879 • Mismatched DNA binding• Damaged DNA binding• Zn ion binding• ATP binding• S-adenosylmethionine-dependent methyltransferase • N-methyltransferase activity• DNA-directed DNA polymerase activity• DNA-directed RNA polymerase activity• Protein serine/threonine kinase activity• Small conjugating protein-specific protease activity• 3’-5’ exonuclease activity• Hydrolase activity, C-N (not peptide) bonds• ATP-dependent DNA helicase activity
(chi square test )• DNA binding
69 (4%)
D
3537• Microtubule motor activity• Microtubule binding• DNA helicase activity• DNA-dependent ATPase activity• Hydrolase activity, O-glycosyl compounds• UDP-glycosyltransferase activity• Transferase activity, hexosyl groups• DNA-directed DNA polymerase activity• Protein serine-threonine kinase activity• Protein tyrosine kinase activity• Transmembrane receptor protein kinase acitivity• Transcription factor activity• Sequence-specific DNA binding• Protein self-association• Protein homodimerization activity• Identical protein binding• Chromatin binding• ATP binding
• Signal transducer activity• Transcription factor activity• Protein kinase binding• Heme binding• Cyclin-dependent protein kinase regulator activity• Protein serine-threonine kinase activity• Monooxygenase activity• ATP binding• ATPase activity, transmembrane movement of
substances• Oxygen binding• Electron carrier activity
715 (20%)
F234 • (none) • (none)
0 (0%)
H605 • Catalytic activity
• Nucleotide binding(chi square test)• Hydrolase activity
9 (1%)
Oth
er
I59 (chi square test)
• Ligase activity(chi square test)• (none)
1 (2%)
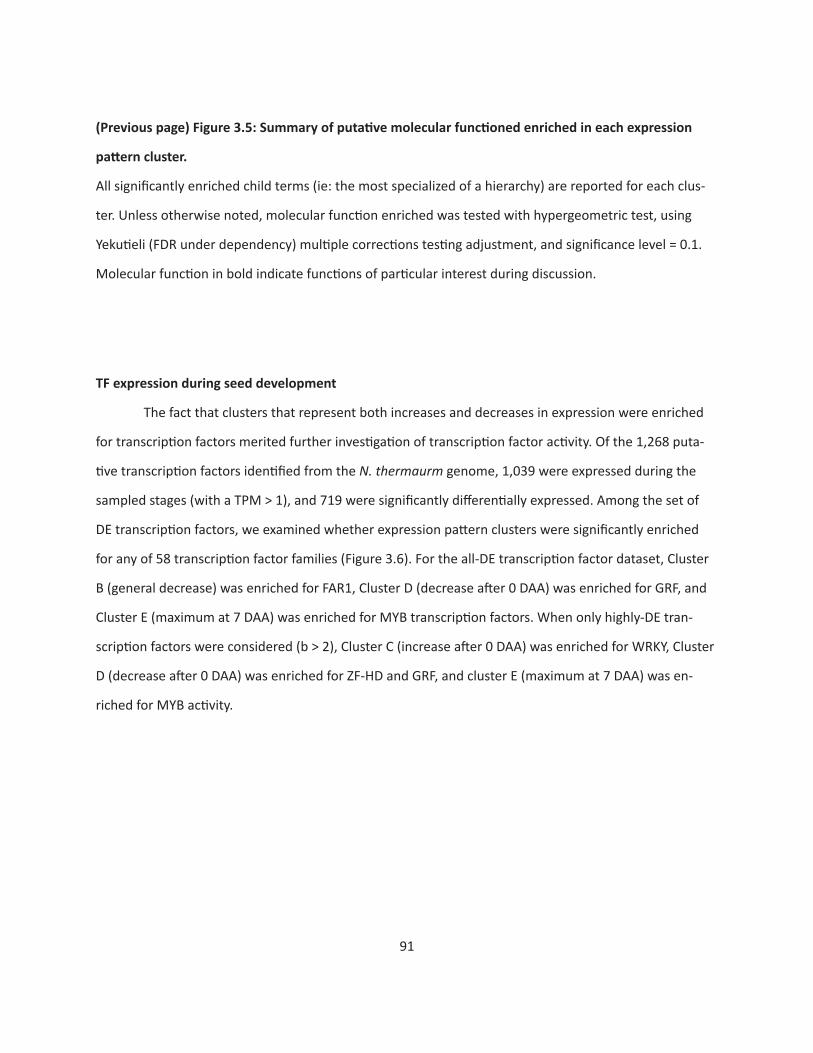
91
(Previouspage)Figure3.5:Summaryofputativemolecularfunctionedenrichedineachexpression
patterncluster.
All significantly enriched child terms (ie: the most specialized of a hierarchy) are reported for each clus-
ter. Unless otherwise noted, molecular function enriched was tested with hypergeometric test, using
Yekutieli (FDR under dependency) multiple corrections testing adjustment, and significance level = 0.1.
Molecular function in bold indicate functions of particular interest during discussion.
TF expression during seed development
The fact that clusters that represent both increases and decreases in expression were enriched
for transcription factors merited further investigation of transcription factor activity. Of the 1,268 puta-
tive transcription factors identified from the N. thermaurm genome, 1,039 were expressed during the
sampled stages (with a TPM > 1), and 719 were significantly differentially expressed. Among the set of
DE transcription factors, we examined whether expression pattern clusters were significantly enriched
for any of 58 transcription factor families (Figure 3.6). For the all-DE transcription factor dataset, Cluster
B (general decrease) was enriched for FAR1, Cluster D (decrease after 0 DAA) was enriched for GRF, and
Cluster E (maximum at 7 DAA) was enriched for MYB transcription factors. When only highly-DE tran-
scription factors were considered (b > 2), Cluster C (increase after 0 DAA) was enriched for WRKY, Cluster
D (decrease after 0 DAA) was enriched for ZF-HD and GRF, and cluster E (maximum at 7 DAA) was en-
riched for MYB activity.
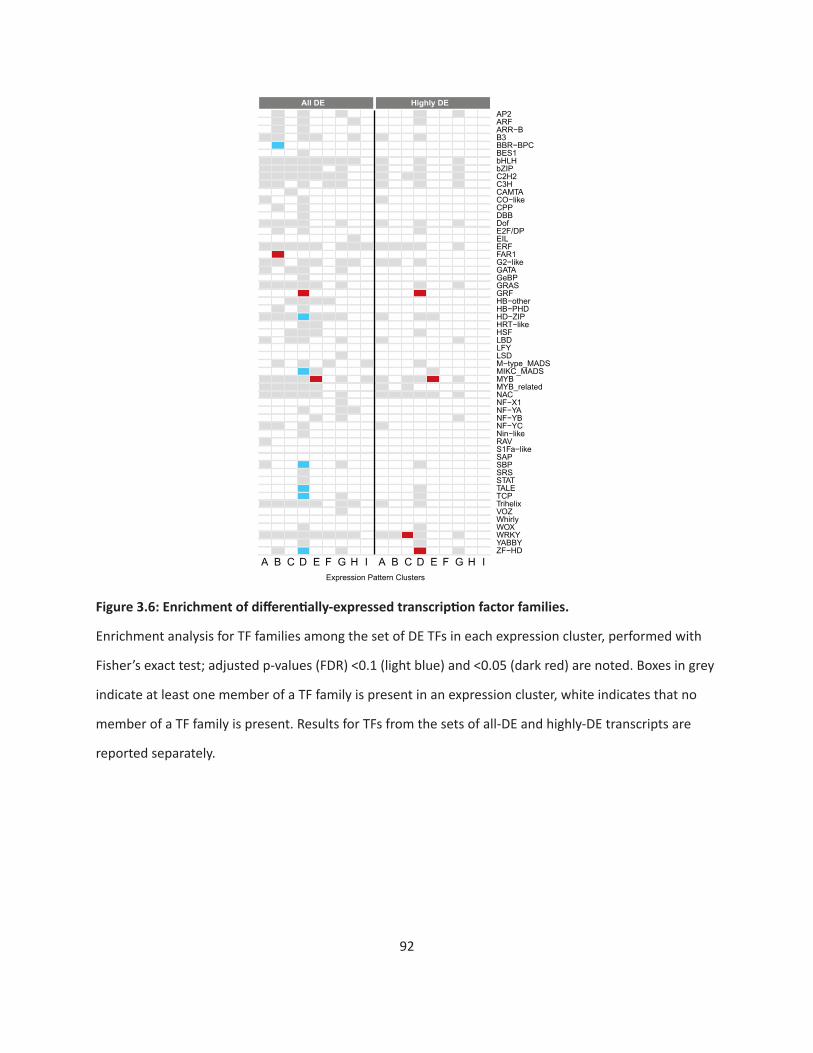
92
A B C D E F G H IZF−HDYABBYWRKYWOXWhirlyVOZTrihelixTCPTALESTATSRSSBPSAPS1Fa−likeRAVNin−likeNF−YCNF−YBNF−YANF−X1NACMYB_relatedMYBMIKC_MADSM−type_MADSLSDLFYLBDHSFHRT−likeHD−ZIPHB−PHDHB−otherGRFGRASGeBPGATAG2−likeFAR1ERFEILE2F/DPDofDBBCPPCO−likeCAMTAC3HC2H2bZIPbHLHBES1BBR−BPCB3ARR−BARFAP2
A B C D E F G H IExpression Pattern Clusters
All DE Highly DE
Figure3.6:Enrichmentofdifferentially-expressedtranscriptionfactorfamilies.
Enrichment analysis for TF families among the set of DE TFs in each expression cluster, performed with
Fisher’s exact test; adjusted p-values (FDR) <0.1 (light blue) and <0.05 (dark red) are noted. Boxes in grey
indicate at least one member of a TF family is present in an expression cluster, white indicates that no
member of a TF family is present. Results for TFs from the sets of all-DE and highly-DE transcripts are
reported separately.
93
ActivityofgenesassociatedwithimprintingviaDNAandhistonemethylation
Methyltransferase-related terms were enriched in cluster B (consistent decrease in expression),
already hinting at a dynamic chromatin methylation landscape during reproductive development in N.
thermarum. We constructed gene family phylogenies for genes that are known to regulate imprinted
patterns in other angiosperms (CMT, MET, DME, and the PCR2 components MEA, FIS, FIE, and MSI), us-
ing sequences from species that represent a wide phylogenetic diversity of angiosperms. Many of the
relationships between gene family members corroborates previous studies (Furihata et al., 2016; Bewick
et al., 2017).
First, we examined genes involved in the establishment or maintenance of imprinting-related
DNA methylation patterns: CMT and MET. Although there are 4 MET homologs in Arabidopsis, they
appear to be the result of clade-specific gene duplications; the two N. thermarum MET homologs are
similarly the result of a clade-specific gene duplication (Figure 3.7A). Only one N. thermarum CMT ho-
molog was identified, although it’s affinity for either of the [CMT2] or [CMT1, CMT3] clades was poorly
resolved (Figure 3.7B). All N. thermarum homologs of CMT and MET were differentially expressed during
reproductive development in N. thermarum, and belonged to expression Cluster D (decrease after 0DAA)
(Figure 3.9).
DME, on the other hand, removes certain types of methylation marks from DNA. We find that
angiosperm DME genes were divided into two poorly-supported clades: one with DME and DML1, and
one with DML2 and DML3 (Figure 3.7C). The N. thermarum DME homologs formed a single well-support-
ed clade, suggesting clade-specific gene duplication events, that was placed (with poor support) within
the [DME, DML1] clade. Three of the four N. thermarum DME homologs were in expression Cluster D
(decrease after 0 DAA). The fourth and most highly expressed DME homolog, while in expression Cluster
H (minimum at 15 DAA), did in fact display a significant increase in expression after 0 DAA (Figure 3.9).
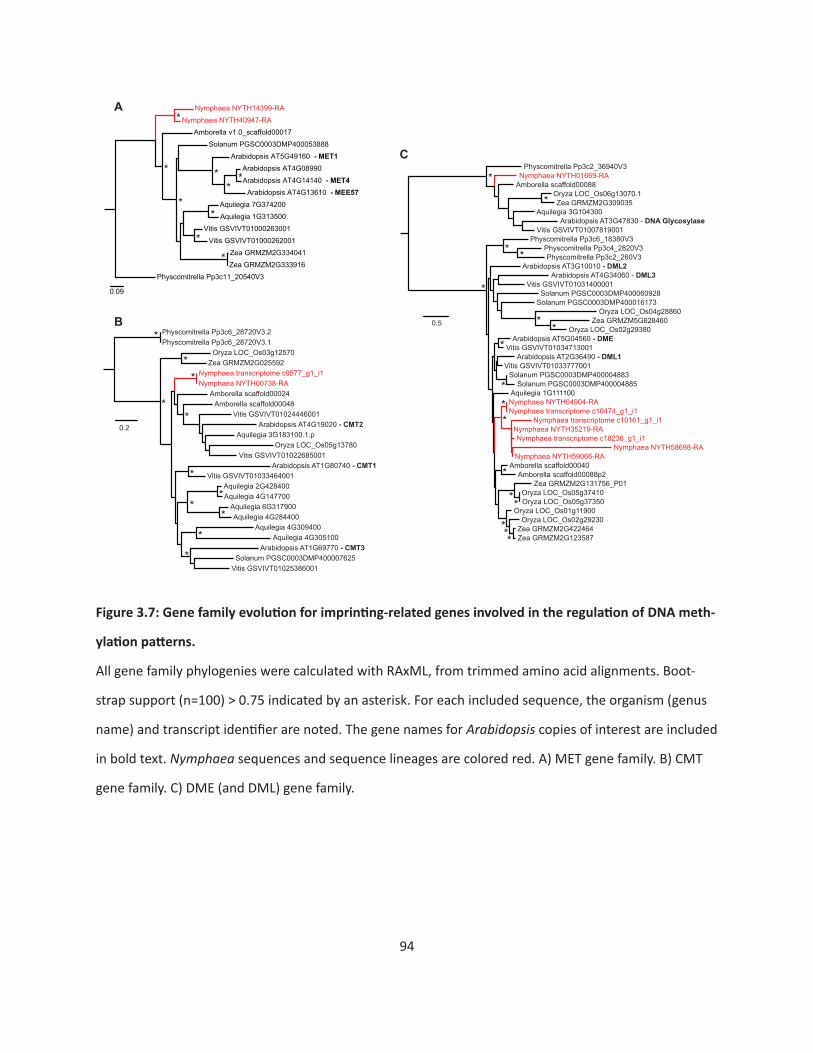
94
0.09
Nymphaea NYTH40947-RA
Arabidopsis AT4G14140 - MET4
Aquilegia 7G374200
Physcomitrella Pp3c11_20540V3
Amborella v1.0_scaffold00017
Zea GRMZM2G333916
Aquilegia 1G313500
Arabidopsis AT5G49160 - MET1Arabidopsis AT4G08990
Vitis GSVIVT01000263001
Solanum PGSC0003DMP400053888
Nymphaea NYTH14399-RA
Arabidopsis AT4G13610 - MEE57
Zea GRMZM2G334041Vitis GSVIVT01000262001
*
* * **
**
**
0.2
Amborella scaffold00048
Aquilegia 4G284400
Oryza LOC_Os05g13780Vitis GSVIVT01022685001
Arabidopsis AT1G69770 - CMT3
Zea GRMZM2G025592Nymphaea transcriptome c9577_g1_i1
Aquilegia 3G183100.1.p
Aquilegia 4G309400
Arabidopsis AT4G19020 - CMT2
Vitis GSVIVT01025386001Solanum PGSC0003DMP400007625
Vitis GSVIVT01024446001
Arabidopsis AT1G80740 - CMT1
Oryza LOC_Os03g12570
Amborella scaffold00024
Physcomitrella Pp3c6_28720V3.1
Aquilegia 6G317900
Aquilegia 2G428400
Physcomitrella Pp3c6_28720V3.2
Vitis GSVIVT01033464001
Nymphaea NYTH00738-RA
Aquilegia 4G147700
Aquilegia 4G305100
*
**
**
*
**
*
*
*
0.5
Vitis GSVIVT01034713001
Amborella scaffold00088
Zea GRMZM2G309035
Nymphaea transcriptome c10474_g1_i1
Nymphaea NYTH35219-RA
Oryza LOC_Os05g37410
Physcomitrella Pp3c2_36940V3
Aquilegia 3G104300
Arabidopsis AT2G36490 - DML1
Oryza LOC_Os04g28860
Oryza LOC_Os06g13070.1
Vitis GSVIVT01007819001
Solanum PGSC0003DMP400004883
Nymphaea transcriptome c10161_g1_i1
Amborella scaffold00040
Nymphaea transcriptome c18236_g1_i1
Nymphaea NYTH59066-RA
Aquilegia 1G111100
Oryza LOC_Os02g29230
Physcomitrella Pp3c6_18380V3
Arabidopsis AT5G04560 - DME
Amborella scaffold00088p2
Physcomitrella Pp3c2_260V3Arabidopsis AT3G10010 - DML2
Arabidopsis AT4G34060 - DML3
Zea GRMZM2G123587
Oryza LOC_Os05g37350
Vitis GSVIVT01031400001
Solanum PGSC0003DMP400016173
Vitis GSVIVT01033777001
Arabidopsis AT3G47830 - DNA Glycosylase
Nymphaea NYTH58698-RA
Oryza LOC_Os02g29380
Solanum PGSC0003DMP400004885
Oryza LOC_Os01g11900
Zea GRMZM5G828460
Physcomitrella Pp3c4_2820V3
Nymphaea NYTH01669-RA
Zea GRMZM2G422464
Zea GRMZM2G131756_P01
Solanum PGSC0003DMP400060928
Nymphaea NYTH04904-RA
*
*
*
* *
* **
*
**
*
**
***
A
B
C
Figure3.7:Genefamilyevolutionforimprinting-relatedgenesinvolvedintheregulationofDNAmeth-
ylationpatterns.
All gene family phylogenies were calculated with RAxML, from trimmed amino acid alignments. Boot-
strap support (n=100) > 0.75 indicated by an asterisk. For each included sequence, the organism (genus
name) and transcript identifier are noted. The gene names for Arabidopsis copies of interest are included
in bold text. Nymphaea sequences and sequence lineages are colored red. A) MET gene family. B) CMT
gene family. C) DME (and DML) gene family.
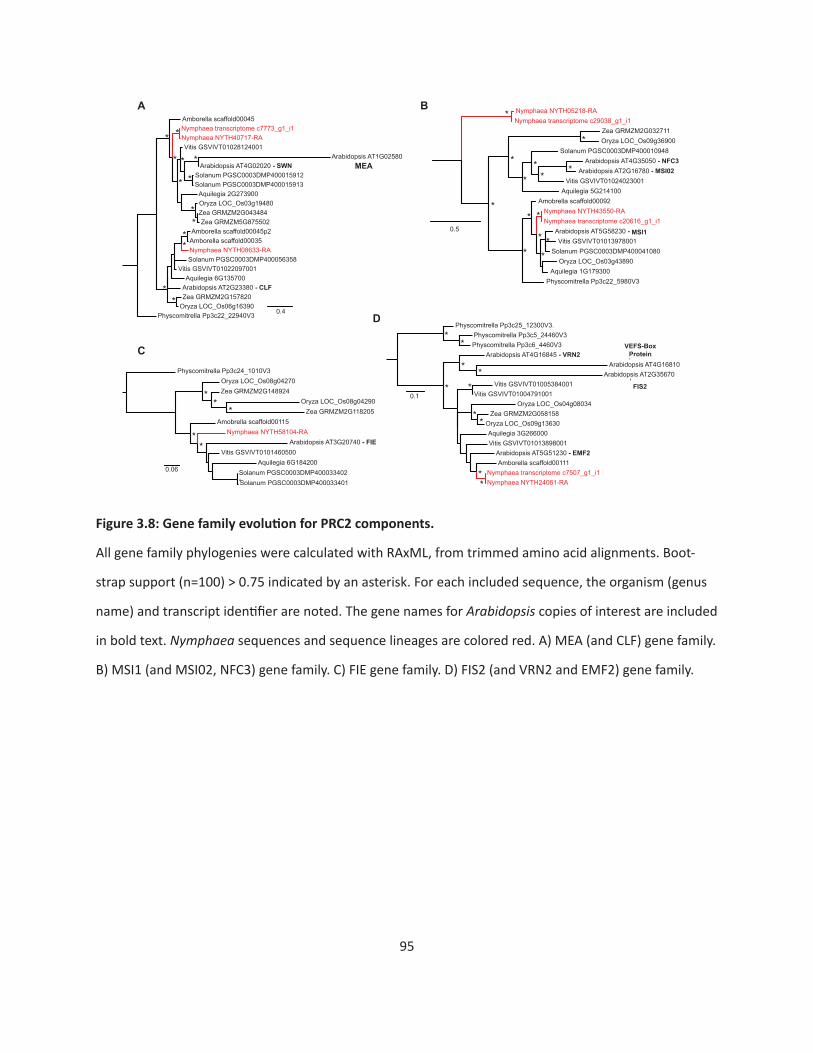
95
0.1
Aquilegia 3G266000
Arabidopsis AT5G51230 - EMF2
Zea GRMZM2G058158
Vitis GSVIVT01005384001
Vitis GSVIVT01013898001
Nymphaea NYTH24061-RA
Amborella scaffold00111
Physcomitrella Pp3c5_24460V3
Nymphaea transcriptome c7507_g1_i1
Arabidopsis AT4G16845 - VRN2
Oryza LOC_Os04g08034
Arabidopsis AT2G35670Arabidopsis AT4G16810
Physcomitrella Pp3c25_12300V3.
Oryza LOC_Os09g13630
Vitis GSVIVT01004791001
Physcomitrella Pp3c6_4460V3*
*
* ** *
**
**
VEFS-BoxProtein
*
FIS2
0.4
Nymphaea NYTH08633-RA
Vitis GSVIVT01028124001
Nymphaea transcriptome c7773_g1_i1
Oryza LOC_Os06g16390
Amborella scaffold00045p2
Vitis GSVIVT01022097001Aquilegia 6G135700
Zea GRMZM5G875502
Arabidopsis AT1G02580
Aquilegia 2G273900
Amborella scaffold00035
Oryza LOC_Os03g19480
Arabidopsis AT2G23380 - CLF
Nymphaea NYTH40717-RA
Physcomitrella Pp3c22_22940V3
Solanum PGSC0003DMP400015912
Zea GRMZM2G043484
Zea GRMZM2G157820
Amborella scaffold00045
Solanum PGSC0003DMP400056358
Solanum PGSC0003DMP400015913
Arabidopsis AT4G02020 - SWN MEA
* *
* *
* *
*
**
**
**
0.06
Oryza LOC_Os08g04290
Solanum PGSC0003DMP400033401
Aquilegia 6G184200
Zea GRMZM2G118205Amobrella scaffold00115
Physcomitrella Pp3c24_1010V3Oryza LOC_Os08g04270
Arabidopsis AT3G20740 - FIE
Solanum PGSC0003DMP400033402
Zea GRMZM2G148924
Nymphaea NYTH58104-RA
Vitis GSVIVT0101460500
**
*
**
*
0.5 Arabidopsis AT5G58230 - MSI1
Physcomitrella Pp3c22_5980V3
Nymphaea NYTH43550-RA
Aquilegia 5G214100
Nymphaea transcriptome c29038_g1_i1
Vitis GSVIVT01024023001
Solanum PGSC0003DMP400041080
Arabidopsis AT4G35050 - NFC3Solanum PGSC0003DMP400010948
Zea GRMZM2G032711
Arabidopsis AT2G16780 - MSI02
Oryza LOC_Os03g43890Aquilegia 1G179300
Vitis GSVIVT01013978001
Nymphaea NYTH05218-RA
Amobrella scaffold00092
Nymphaea transcriptome c20616_g1_i1
Oryza LOC_Os09g36900
*
*
*
*
**
**
*
* *
* **
A
C
B
D
Figure3.8:GenefamilyevolutionforPRC2components.
All gene family phylogenies were calculated with RAxML, from trimmed amino acid alignments. Boot-
strap support (n=100) > 0.75 indicated by an asterisk. For each included sequence, the organism (genus
name) and transcript identifier are noted. The gene names for Arabidopsis copies of interest are included
in bold text. Nymphaea sequences and sequence lineages are colored red. A) MEA (and CLF) gene family.
B) MSI1 (and MSI02, NFC3) gene family. C) FIE gene family. D) FIS2 (and VRN2 and EMF2) gene family.
96
N. thermarum homologs were also identified for all components of PRC2, and all were expressed during
reproductive development. Angiosperm homologs of MEA formed two well-supported clades: one with
MEA and SWN, and one with CLF (Figure 3.8A). Two N. thermarum MEA homologs were identified, with
one present in each of the MEA clades. The N. thermarum homolog within the [MEA, SWN] clade was
expressed during reproductive development, but not differentially expressed; the N. thermarum homo-
log of CLF associated with expression cluster D (decreased expression after 7 DAA) (Figure 3.9). Two N.
thermarum homologs of MSI1 were identified, and both associated with expression cluster B (consistent
decreased expression) (Figures 3.8B, 3.9). The FIE gene family appeared to be relatively simple, with little
indication of gene duplications outside of monocots – one copy of FIE was identified from N. thermarum
(Figure 3.8C). Angiosperm FIS2 genes formed two well-supported clades: one appeared to be specific to
Arabidopsis (and included VRN2 and FIS2), while the other included EMF2. Only one homolog was identi-
fied from N. thermarum, and its placement within the EMF2 clade was poorly supported (Figure 3.8D).
The FIE and FIS2 homologs in N. thermarum were expressed during reproductive development, but not
differentially (Figure 3.9).
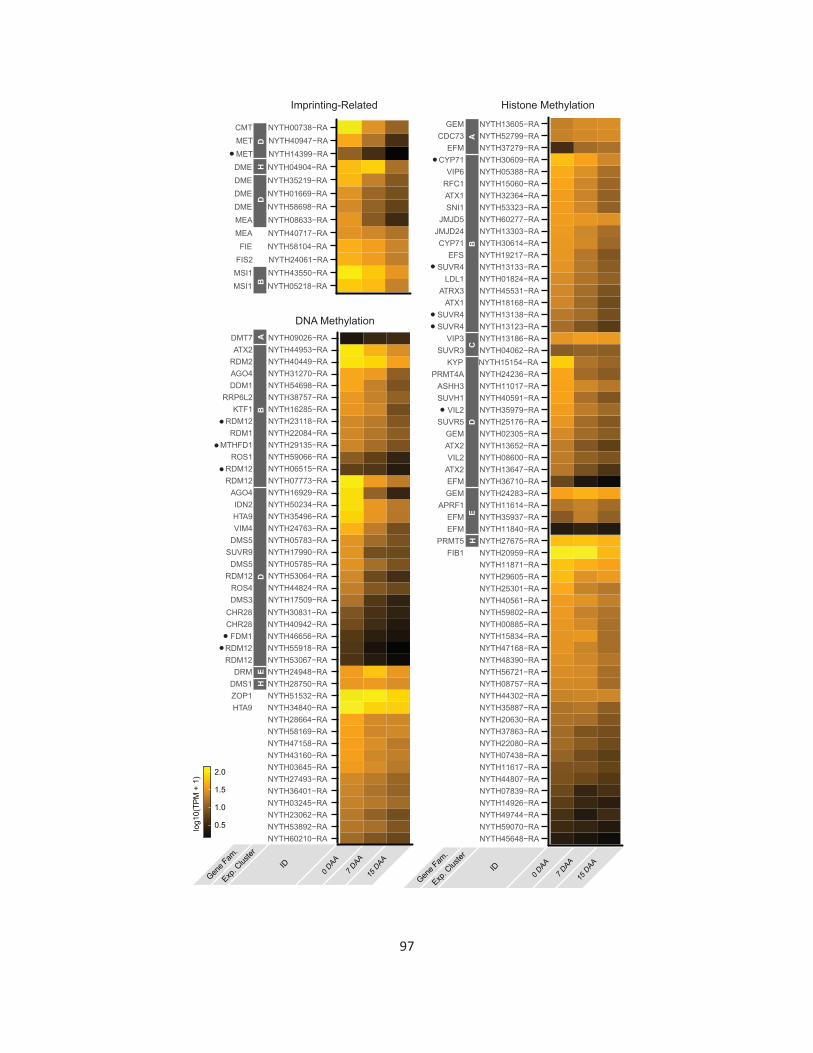
97
PRMT5 NYTH27675−RA
MSI1 NYTH05218−RAMSI1 NYTH43550−RAFIS2 NYTH24061−RAFIE NYTH58104−RA
MEA NYTH40717−RAMEA NYTH08633−RADME NYTH58698−RADME NYTH01669−RADME NYTH35219−RADME NYTH04904−RAMET NYTH14399−RAMET NYTH40947−RACMT NYTH00738−RA
H
0 DAA
7 DAA
15 D
AA
0.5
1.0
1.5
2.0
log1
0(TP
M +
1)
DH
D
Gene F
am.
Exp. C
luster
ID
none NYTH45648−RAnone NYTH59070−RAnone NYTH49744−RAnone NYTH14926−RAnone NYTH07839−RAnone NYTH44807−RAnone NYTH11617−RAnone NYTH07438−RAnone NYTH22080−RAnone NYTH37863−RAnone NYTH20630−RAnone NYTH35887−RAnone NYTH44302−RAnone NYTH08757−RAnone NYTH56721−RAnone NYTH48390−RAnone NYTH47168−RAnone NYTH15834−RAnone NYTH00885−RAnone NYTH59802−RAnone NYTH40561−RAnone NYTH25301−RAnone NYTH29605−RAnone NYTH11871−RAFIB1 NYTH20959−RA
EFM NYTH11840−RAEFM NYTH35937−RA
APRF1 NYTH11614−RAGEM NYTH24283−RAEFM NYTH36710−RAATX2 NYTH13647−RAVIL2 NYTH08600−RA
ATX2 NYTH13652−RAGEM NYTH02305−RA
SUVR5 NYTH25176−RAVIL2 NYTH35979−RA
SUVH1 NYTH40591−RAASHH3 NYTH11017−RA
PRMT4A NYTH24236−RAKYP NYTH15154−RA
SUVR3 NYTH04062−RAVIP3 NYTH13186−RA
SUVR4 NYTH13123−RASUVR4 NYTH13138−RA
ATX1 NYTH18168−RAATRX3 NYTH45531−RA
LDL1 NYTH01824−RASUVR4 NYTH13133−RA
EFS NYTH19217−RACYP71 NYTH30614−RA
JMJD24 NYTH13303−RAJMJD5 NYTH60277−RA
SNI1 NYTH53323−RAATX1 NYTH32364−RARFC1 NYTH15060−RAVIP6 NYTH05388−RA
CYP71 NYTH30609−RAEFM NYTH37279−RA
CDC73 NYTH52799−RAGEM NYTH13605−RA
none NYTH60210−RAnone NYTH53892−RAnone NYTH23062−RAnone NYTH03245−RAnone NYTH36401−RAnone NYTH27493−RAnone NYTH03645−RAnone NYTH43160−RAnone NYTH47158−RAnone NYTH58169−RAnone NYTH28664−RAHTA9 NYTH34840−RAZOP1 NYTH51532−RADMS1 NYTH28750−RADRM NYTH24948−RA
RDM12 NYTH53067−RARDM12 NYTH55918−RA
FDM1 NYTH46656−RACHR28 NYTH40942−RACHR28 NYTH30831−RADMS3 NYTH17509−RAROS4 NYTH44824−RA
RDM12 NYTH53064−RADMS5 NYTH05785−RA
SUVR9 NYTH17990−RADMS5 NYTH05783−RAVIM4 NYTH24763−RAHTA9 NYTH35496−RAIDN2 NYTH50234−RA
AGO4 NYTH16929−RARDM12 NYTH07773−RARDM12 NYTH06515−RA
ROS1 NYTH59066−RAMTHFD1 NYTH29135−RA
RDM1 NYTH22084−RARDM12 NYTH23118−RA
KTF1 NYTH16285−RARRP6L2 NYTH38757−RA
DDM1 NYTH54698−RAAGO4 NYTH31270−RARDM2 NYTH40449−RAATX2 NYTH44953−RA
DMT7 NYTH09026−RA
AB
CD
E
AB
DE
HB
Imprinting-Related
DNA Methylation
Histone Methylation
0 DAA
7 DAA
15 D
AA
Gene F
am.
Exp. C
luster
ID
98
(Previouspage)Figure3.9:ExpressionofN.thermarumtranscriptsputativelyinvolvedinDNAand
histonemethylation.
Transcripts putatively related to imprinting are noted separately from all other transcripts putatively
involved in DNA or histone methylation. For each transcript, the following information is included (from
left to right): gene family the transcript is associated with or the gene name of the most closely-related
Arabidopsis homolog; whether the transcript is present in a DE expression pattern cluster; transcript
identifier; expression at each of the sampled stages of reproductive development. Black dots indicate
transcript is not expressed in roots, leaves, floral buds, or pre-meiotic ovules.
ActivityofgenesassociatedwithDNAandhistonemethylation
We next used a broader approach to examine the expression of any transcript that could be
involved in regulation of methylation patterns (Figure 3.9). 121 loci in Arabidopsis thaliana are annotated
as being involved in DNA or histone methylation; 125 putative homologs were identified from within the
N. thermarum genome using pair-wise blast comparisons. 112 of the Nymphaea methyltransferase-relat-
ed homologs were expressed in mature ovules or during seed development with a TPM >1, and of those
73 were significantly differentially expressed. Of the 112 putative DNA or histone methyltransferase-
related homologs in N. thermarum expressed in mature ovules or developing seeds, 20 of them were not
present in transcriptomes of root tips, leaves, young floral buds, or young ovules (data not shown). 11 of
the mature ovule/seed-development-specific homologs were differentially expressed, including putative
homologs of RDM12, MTHFD1, MET, FDM1, CYP71, SUVR4, and ATX2; all were in the expression-pattern
clusters that represented either general expression decrease (Cluster B), or decreased expression after 0
DAA (Cluster D).
Most of the Nymphaea chromatin methylation-associated transcripts were in expression-pattern
clusters that represented decreased expression or expression minima (Clusters B,D,F,H). Only 11 tran-
scripts were among the increased-expression clusters (A,C,E,G). This included homologs of DTM7, DRM,
GEM, CDC73, EFM, VIP3, SUVR3, and APRF1. Among the set of non-DE transcripts, a few were present
with fairly high abundance, including homologs of ZOP1, HTA9, and FIB1.
99
Discussion
Overview
RNA-seq has proved to be a powerful tool for understanding the genes and processes important
for development. We leverage its ability to move beyond a candidate gene approach, to study seed de-
velopment in the water lily Nymphaea thermarum, and specifically the processes involved in regulating
imprinting-related and non-imprinting-related chromatin methylation. However, we first assess the qual-
ity of the produced RNA seq libraries, and address possible caveats that arise from whole ovule or seed
sampling. We then highlight broad-scale patterns in transcript abundance, expression, and functional
enrichment. Methylation-realted activity is enriched among a certain subset of differentially expressed
genes, supporting the need for further exploration of chromatin-methylation activity.
We describe the activity of both imprinting-related and non-imprinting-related genes involved
in chromatin methylation. In one approach, gene family phylogenies are constructed to identify all
putative homologs of genes known to be involved in regulating imprinting in other angiosperms, and to
understand the evolutionary relationships of those homologs. In a second, broader approach, we as-
sess the expression of putative homologs of all 121 Arabidopsis genes known to be involved in DNA or
histone methylation. We find that all components of known imprinting mechanisms are expressed during
reproductive development in N. thermarum, and that many other chromatin methylation regulators are
differentially expressed (with some increasing expression after fertilization). This indicates that not only
is imprinting possible in N. thermarum, but that the chromatin methylation landscape is almost certainly
dynamic throughout reproductive development. Comparisons with the expression of imprinting regula-
tion in other angiosperms suggests that the current model for how imprinting is regulated, mostly based
on in Arabidopsis, is likely a mix of deeply conserved and eudicot-specific processes. Finally, we are able
to suggest that the function several histone-methylation genes merit further investigation during seed
development in not only N. thermarum, but any model system.
Quality of transcriptomes
A common benchmark for the completeness of RNA seq datasets is their ability to document the
expression of genes with low expression. Achieving sufficiently high sequencing depth, however, often
comes as a trade-off with the inclusion of biological replicates that are necessary for rigorous differential
100
expression analysis (Conesa et al., 2016). We balanced these concerns by using 3-4 biological replicates,
sequenced at high depth, for a small number of developmental stages. Previous studies have suggested
accurate recovery of genes expressed at low levels can require up to 80 million reads per sample (Sims
et al., 2014); the current study generated 66-100 million reads per sample. Transcription factors, which
are regulatory genes that can have relatively large biological effects at relatively low expression levels,
require high sequencing depth to accurately capture. We documented the expression of 1,039 puta-
tive transcription factors (82% of all putative transcription factors in the N. thermarum genome) which
belong to 55 out of the 58 land plant transcription factor families. Importantly, we find that expression
clusters that represent increased expression during key points during early embryo development were
enriched for MYB or WKRY transcription factors. Both MYB and WKRY transcription factors have been as-
sociated with early embryogenesis in Arabidopsis and other angiosperms (Lagacé et al., 2004; Luo et al.,
2005; Dubos et al., 2010; Wickramasuriya and Dunwell, 2015), and the fact that their enrichment tem-
porally coincides with the initiation of embryo development in N. thermarum suggests that our dataset
accurately captures genes with low expression.
Whole seeds were sampled for this study, however, and it is therefore possible that the expres-
sion of embryo- or endosperm-development-related genes are not accurately represented over time.
The embryo and endosperm represent far less than half of the total volume of a seed of Nymphaea
thermarum. After fertilization, the perisperm constitutes most of the seed volume, and becomes meta-
bolically active in terms of nutrient transport, processing, and storage – high levels of gene expression
related to these perisperm-specific processes could be ‘drowning out’ transcriptional information from
the embryo and endosperm. However, three lines of evidence suggest that the relative transcriptional
presence of the embryo and endosperm does not significantly change during seed development. First,
the proportion of the ovule/seed occupied by the perisperm remains fairly constant throughout develop-
ment (Povilus et al., 2015). Second, studies of seed development in other species found that the distribu-
tion of embryo-specific and endosperm-specific gene expression levels are fairly constant across time,
relative to the distribution of transcript expression levels from a whole-seed samples (Chen et al., 2014).
Finally, we recover patterns of increased expression for genes whose homologs are known to be impor-
tant for and/or expressed in the embryo or endosperm in other species (for example: putative homologs
of TITAN-LIKE (Lu et al., 2012) and TOPLESS (Long et al., 2006) are found in expression Cluster E (maxi-
101
mum expression at 7 DAA)(Supplementary Dataset 3.3)). However, further investigation specifically of
embryogenesis and endosperm-development gene networks in N. thermarum should consider physical
dissection of seeds, to separate offspring components from the perisperm.
Patternsofgeneexpressionduringreproductivedevelopment
We find that a large proportion of genes is expressed during reproductive development in N.
thermarum: 74% of the total number of genes predicted from the N. thermarum genome. Furthermore,
56% of the expressed transcripts are differentially expressed. The proportion of genes expressed (either
differentially expressed or not) during reproductive development is similar what has been described in
other species (Chen et al., 2014). The number of unique transcripts in N. thermarum suggests that the
transitions from female gametophyte maturation, through fertilization, and into mid-seed development
require substantial transcriptional reprogramming (Figure 3.2B). While female gametophyte and ovule
maturation involve relatively high numbers of unique genes (1,148), the expression of almost as many
genes (916) appears to carry over into early seed development. 7 and 15 DAA shared the expression of
far fewer genes (339; other than those shared by all three stages) – a surprising result given that 7 and
15 DAA are understood to share more developmental processes than 0 and 7 DAA. However, a previous
study provided evidence for a lingering maternal influence on early seed development in N. thermarum
(Chapter 2 of this dissertation), which is supported by the relatively large number of transcripts shared
between 0 and 7 DAA. Furthermore, when expression pattern (not just presence/absence of transcripts)
is taken into account, 7 and 15 DAA samples were more similar to each other than either were to 0 DAA
samples (Figure 3.3A).
When DE transcripts are clustered by expression pattern, there are clear similarities among the
enriched putative molecular functions for clusters that represent increases or decreases in expression. As
could be predicted by the onset of nutrient import and storage after fertilization, most of the “increased-
expression” clusters were enriched for transporter activities, and a homolog of WAXY starch synthase
1 was among the 10 most highly expressed genes at 7 and 15 DAA. However, we also note patterns of
gene expression associated with the onset of embryogenesis and/or endosperm development: highly-DE
transcripts in Cluster E (maximum expression at 7 DAA) were enriched for transcription factor activity.
Furthermore, the set of DE transcription factors in Cluster C and E were enriched for (respectively) WRKY
102
and MYB genes, which have been associated with embryo and endosperm development in both Arabi-
dopsis and Zea mays (Lagacé et al., 2004; Luo et al., 2005; Dubous 2010; Wickramasuriya and Dunwell,
2015).
Expression pattern clusters that represent a decrease in expression were enriched with an al-
together different set of molecular functions. DNA/chromatin binding, transcription factor activity, and
control of DNA polymerase are featured prominently in both the all-DE and highly-DE datasets. Intrigu-
ingly, expression Cluster D (decrease after 0 DAA) was enriched for GRF and ZF-HD transcription factors,
which are associated with, among other things, cell division and floral development (Omidbakhshfard
2015). We therefore attribute the pattern of decreased DNA-related functions to either the cessation
of cell proliferation and differentiation associated with ovule development, and/or the de-repression of
seed development programs.
Evidencefordynamicmethylationlandscapeduringreproductivedevelopment
In N. thermarum, 125 genes putatively share homology with Arabidopsis genes involved in DNA
or histone methylation. A remarkable 89% of these N. thermarum homologs are expressed in mature
ovules or during seed development (at TPM > 1), with 58% being differentially expressed, suggesting a
dynamic methylation landscape during reproductive development. Most of the DE methylation-related
genes belonged to either expression cluster B (consistent decrease in expression) or expression cluster D
(decreased expression after 0 DAA), which is further supported by the enrichment of methylation-related
activity in expression cluster B.
Among the gene families known to specifically regulate imprinting-related methylation patterns,
MET and CMT homologs were recovered in expression Cluster D (decreased expression after 0 DAA), as
were three-quarters of the DME homologs. Furthermore, one of the MET homologs appears to be specif-
ically expressed during seed development. The fourth N. thermarum DME, while associated with expres-
sion cluster H (decreased expression after 7 DAA), did in fact display a significant increase in expression
after 0 DAA. All components of PRC2 were expressed during reproductive development.
Putative homologs of other chromatin methylation-related genes were also found to be ex-
pressed during reproductive development in N. thermarum. Many components of the RdDM pathway
were present during the sampled developmental stages in N. thermarum. Most fell into expression-pat-
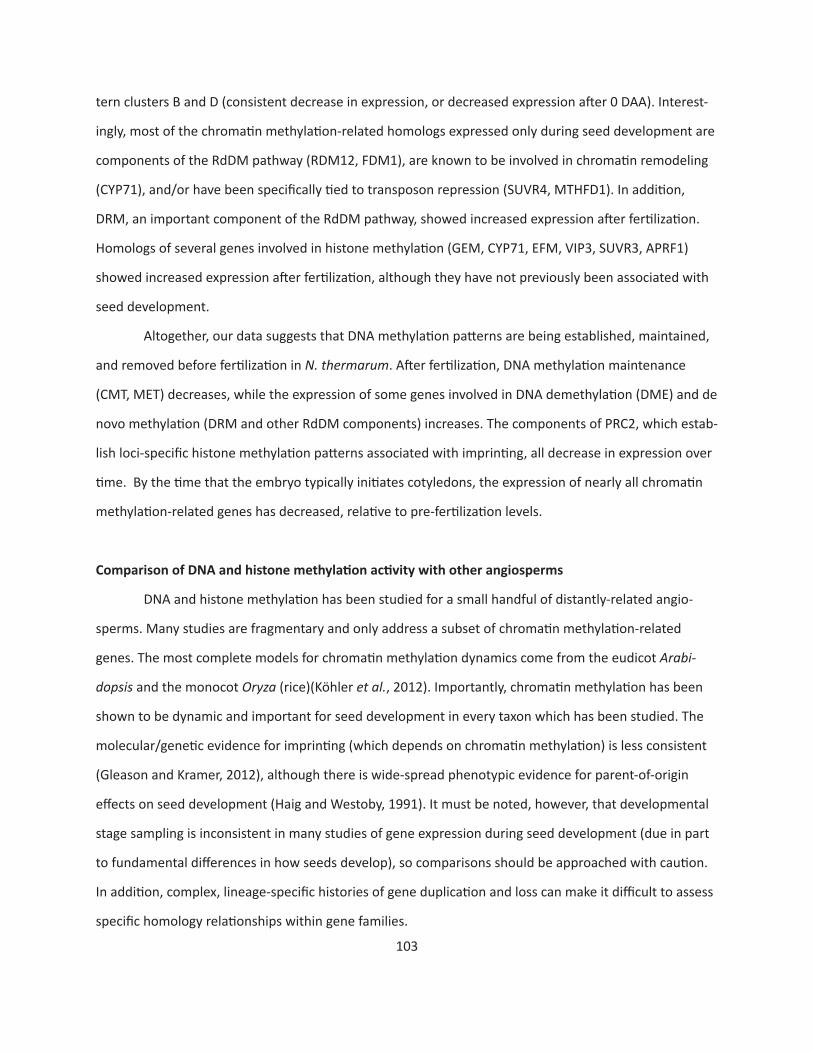
103
tern clusters B and D (consistent decrease in expression, or decreased expression after 0 DAA). Interest-
ingly, most of the chromatin methylation-related homologs expressed only during seed development are
components of the RdDM pathway (RDM12, FDM1), are known to be involved in chromatin remodeling
(CYP71), and/or have been specifically tied to transposon repression (SUVR4, MTHFD1). In addition,
DRM, an important component of the RdDM pathway, showed increased expression after fertilization.
Homologs of several genes involved in histone methylation (GEM, CYP71, EFM, VIP3, SUVR3, APRF1)
showed increased expression after fertilization, although they have not previously been associated with
seed development.
Altogether, our data suggests that DNA methylation patterns are being established, maintained,
and removed before fertilization in N. thermarum. After fertilization, DNA methylation maintenance
(CMT, MET) decreases, while the expression of some genes involved in DNA demethylation (DME) and de
novo methylation (DRM and other RdDM components) increases. The components of PRC2, which estab-
lish loci-specific histone methylation patterns associated with imprinting, all decrease in expression over
time. By the time that the embryo typically initiates cotyledons, the expression of nearly all chromatin
methylation-related genes has decreased, relative to pre-fertilization levels.
ComparisonofDNAandhistonemethylationactivitywithotherangiosperms
DNA and histone methylation has been studied for a small handful of distantly-related angio-
sperms. Many studies are fragmentary and only address a subset of chromatin methylation-related
genes. The most complete models for chromatin methylation dynamics come from the eudicot Arabi-
dopsis and the monocot Oryza (rice)(Köhler et al., 2012). Importantly, chromatin methylation has been
shown to be dynamic and important for seed development in every taxon which has been studied. The
molecular/genetic evidence for imprinting (which depends on chromatin methylation) is less consistent
(Gleason and Kramer, 2012), although there is wide-spread phenotypic evidence for parent-of-origin
effects on seed development (Haig and Westoby, 1991). It must be noted, however, that developmental
stage sampling is inconsistent in many studies of gene expression during seed development (due in part
to fundamental differences in how seeds develop), so comparisons should be approached with caution.
In addition, complex, lineage-specific histories of gene duplication and loss can make it difficult to assess
specific homology relationships within gene families.
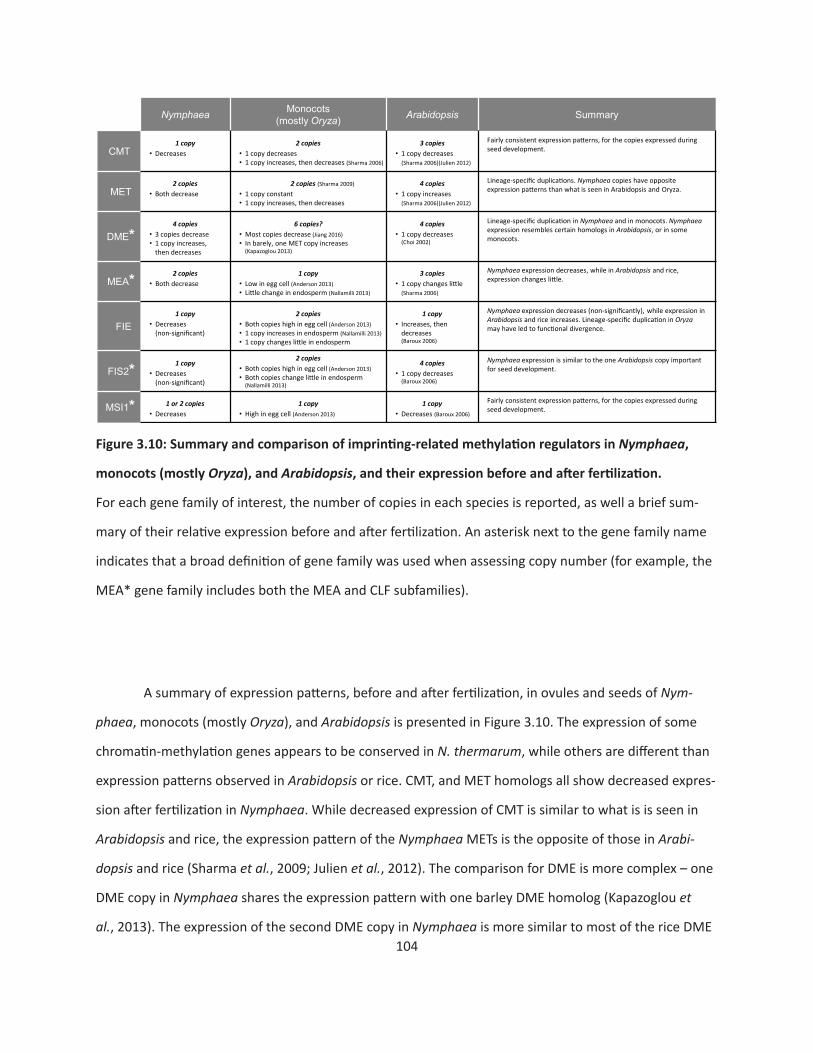
104
Nymphaea Monocots(mostly Oryza) Arabidopsis Summary
CMT1 copy
• Decreases2 copies
• 1 copy decreases• 1 copy increases, then decreases (Sharma 2006)
3 copies• 1 copy decreases
(Sharma 2006)(Julien 2012)
Fairly consistent expression pa�erns, for the copies expressed during seed development.
MET2 copies
• Both decrease2 copies (Sharma 2009)
• 1 copy constant• 1 copy increases, then decreases
4 copies• 1 copy increases
Lineage-specific duplica�ons. Nymphaea copies have opposite expression pa�erns than what is seen in Arabidopsis and Oryza.
DME*4 copies
• 3 copies decrease• 1 copy increases,
then decreases
6 copies?• Most copies decrease (Jiang 2016)• In barely, one MET copy increases
(Kapazoglou 2013)
4 copies• 1 copy decreases
(Choi 2002)
Lineage-specific duplica�on in Nymphaea and in monocots. Nymphaea expression resembles certain homologs in Arabidopsis, or in some monocots.
MEA* 2 copies• Both decrease
1 copy• Low in egg cell (Anderson 2013)• Li�le change in endosperm (Nallamilli 2013)
3 copies• 1 copy changes li�le
(Sharma 2006)
Nymphaea expression decreases, while in Arabidopsis and rice, expression changes li�le.
FIE1 copy
• Decreases(non-significant)
2 copies• Both copies high in egg cell (Anderson 2013)• 1 copy increases in endosperm (Nallamilli 2013)• 1 copy changes li�le in endosperm
1 copy• Increases, then
decreases (Baroux 2006)
Nymphaea expression decreases (non-significantly), while expression in Arabidopsis and rice increases. Lineage-specific duplica�on in Oryzamay have led to func�onal divergence.
FIS2* 1 copy• Decreases(non-significant)
2 copies• Both copies high in egg cell (Anderson 2013)• Both copies change li�le in endosperm
(Nallamilli 2013)
4 copies• 1 copy decreases
(Baroux 2006)
Nymphaea expression is similar to the one Arabidopsis copy important for seed development.
MSI1* 1 or 2 copies• Decreases
1 copy• High in egg cell (Anderson 2013)
1 copy• Decreases (Baroux 2006)
Fairly consistent expression pa�erns, for the copies expressed during seed development.
(Sharma 2006)(Julien 2012)
Figure3.10:Summaryandcomparisonofimprinting-relatedmethylationregulatorsinNymphaea,
monocots (mostly Oryza), and Arabidopsis,andtheirexpressionbeforeandafterfertilization.
For each gene family of interest, the number of copies in each species is reported, as well a brief sum-
mary of their relative expression before and after fertilization. An asterisk next to the gene family name
indicates that a broad definition of gene family was used when assessing copy number (for example, the
MEA* gene family includes both the MEA and CLF subfamilies).
A summary of expression patterns, before and after fertilization, in ovules and seeds of Nym-
phaea, monocots (mostly Oryza), and Arabidopsis is presented in Figure 3.10. The expression of some
chromatin-methylation genes appears to be conserved in N. thermarum, while others are different than
expression patterns observed in Arabidopsis or rice. CMT, and MET homologs all show decreased expres-
sion after fertilization in Nymphaea. While decreased expression of CMT is similar to what is is seen in
Arabidopsis and rice, the expression pattern of the Nymphaea METs is the opposite of those in Arabi-
dopsis and rice (Sharma et al., 2009; Julien et al., 2012). The comparison for DME is more complex – one
DME copy in Nymphaea shares the expression pattern with one barley DME homolog (Kapazoglou et
al., 2013). The expression of the second DME copy in Nymphaea is more similar to most of the rice DME
105
homologs and to the Arabidopsis DME (Choi et al., 2002; Jiang and Ramachandran, 2016). All copies of
PRC2 components decrease in expression after fertilization in Nymphaea, while expression patterns of
individual components show more variation in Arabidopsis and rice (Baroux et al., 2006; Anderson et al.,
2013; Nallamilli et al., 2013).
Based on the complexity of DNA methylation-related activity, we conclude that DNA methyla-
tion is likely as dynamic during reproductive development in N. thermarum, as it is in other angiosperms.
Maintenance of CG methylation by MET may, however, be relatively less important after fertilization,
compared to the role that MET is understood to play during seed development in Arabidopsis. In con-
trast, de novo CG methylation by DRMs may be relatively more important during seed development (as
evidenced by the expression maximum at 7 DAA for a highly-expressed DRM copy). Histone methylation
is also clearly a dynamic process after fertilization in Nymphaea, although it may largely be regulated by
genes other than those of the PRC2 – such as GEM, CYP71, EFM, VIP3, SUVR3, and/or APRF1 (all of which
show increased expression after fertilization).
Couldimprintingoccurduringreproductivedevelopmentinanearlydivergingangiospermlineage?
We conclude that chromatin methylation is actively regulated during reproductive development
in N. thermarum. Importantly, homologs of all of the genes known to be involved in imprinting via chro-
matin methylation are expressed in mature ovules or developing seeds. If imprinting occurs, however, its
regulation is likely different than what is known for Arabidopsis – particularly with respect to the roles of
MET and PRC2. Interestingly, there is little evidence that PRC2 as a whole is important for seed develop-
ment in rice (Luo et al., 2009). Yet imprinting occurs in monocots, and impacts endosperm development
– other molecular machinery must be responsible for regulating and responding to imprinting-related
methylation patterns. Until the functions of the Nymphaea PRC2 homologs can be determined, we
suggest that the role of the PRC2 as whole in regulating imprinting may represent a derived condition
within eudicots.
Finally, this study reveals a list of histone-methylation related genes that show increased expres-
sion after fertilization, but have not before been described as being important for seed development.
We suggest that the functions of these genes (GEM, CYP71, EFM, VIP3, SUVR3, and/or APRF1) deserve
further investigation in not just N. thermaurm, but in model species like Arabidopsis, rice, and maize.
106
The discovery that additional chromatin methylation-related mechanisms may be important for seed
development highlights the profound potential of RNA seq datasets to enrich our understanding of seed
development.
References
Amborella Genome Project (2013) The Amborella genome and the evolution of flowering plants. Science 342:6165
Anderson SN, Johnsom CS, Jones DS, Conrad LJ, Gou X, Russell SD, Sundaresan V (2013) Transcriptomes of isolated Oryza sativa gametes characterized by deep sequencing: evidence for distinct sex-dependent chromatin and epigenetic states before fertilization. Plant J 76(5):729-741.
Baroux C, Gagliardini V, Page DR, Grossniklaus U (2006) Dynamic regulatory interactions of Polycomb group genes: MEDEA autoregulation is required for imprinted gene expression in Arabidopsis. Genes Dev 20(9)1081-1086.
Bewick AJ, Niederhuth CE, Ji L, Rohr NA, Griffin PT, Leebens-Mack J, Schmitz RJ (2017) The evolution of CHROMOMETHYLASES and gene body DNA methylation in plants. Genome Biol 18:65.
Bray NL, Pimentel H, Melsted P, Pachter L (2016) Near-optimal probabilistic RNA-seq quantification. Nat Biotech 34:525–527.
Butenko Y, Ohad N (2011) Polycomb-group mediated epigenetic mechanisms through plant evolution. Biochim Biophys Acta, Gen Regul Mech 1809(8):395-406.
Chen J, Zeng M, Xie S, Wang G, Hauck A, Lai J (2014) Dynamic transcriptome landscape of maize embryo and endosperm development. Plant Physiol 166:252-264.
Choi Y, Gehring M, Johnson L, Hannon M, Harada JJ, Goldberg RB, Jacobsen SE, Fischer RL (2002) DEME-TER, a DNA glycosylase domain protein, is required for endosperm gene imprinting and seed viability in Arabidopsis. Cell 110(11):33-42.
Conesa A, Madrigal P, Tarazona S, Gomez-Cabrero D, Cervera A, McPherson A, Szcześniak MW, Gaffney DJ, Elo L, Zhang X, Mortazavi A (2016) A survey of best practices for RNA-seq data analysis. Genome Biol 17:13.
Dubos C, Stracke R, Grotewold E, Weisshaae B, Martin C, Lepiniec L (2010) MYB transcription factors in Arabidopsis. Trends Plant Sci 15(10):573-581.
Eddy SR (2011) Accelerated profile HMM searches. PLoS Comp Biol 7:e1002195
Edgar RC (2004) MUSCLE: multiple sequence alignment with high accuracy and high throughput. Nucleic Acids Res 32(5), 1792-97.
107
Fischer E, Magdalena-Rodriguez C (2010) Nymphaea thermarum (Nymphaeaceae). Curtis Bot Mag 27:318–327.
Furihata HY, Suenaga K, Kawanabe T, Yoshida T, Kawabe A (2016) Gene duplication, silencing, and expres-sion alteration govern the molecular evolution of PRC2 genes in plants. Genes Genet Syst 91(2):85-95.
Gao Y, Xu H, Shen Y, Wang J (2013) Transcriptome analysis of rice (Oryza sativa) developing endosperm using the RNA-Seq technique. Plant Mol Biol 81(4-5):363-378.
Gao J, Yu X, Ma F, Li J (2014) RNA-seq analysis of transcriptome and glucosinolate metabolism in seeds and sprouts of broccoli (Brassica oleracea var. italic). PLoS ONE 9(2):e88804.
Gehring M, Satyaki PR (2017) Endosperm and imprinting, inextricably linked. Plant Physiol 173:143-154
Girke T, Todd J, Ruuska S, White J, Benning C, Ohirogge J (2000) Microarray analysis of developing Arabi-dopsis seeds. Plant Physiol 124:1570-1581.
Gleason EJ, Kramer EM (2012) Characterization of Aquilegia Polycomb Repressive complex 2 homologs reveals absence of imprinting. Gene 507(1):54–60.
Goodstein DM, Shu S, Howson R, Neupane R, Hayes RD, Fazo J, Mitros T, Dirks W, Hellsten U, Putnam N, Rokhsar DS (2012) Phytozome: a comparative platform for green plant genomics. Nucleic Acids Res 40(Database issue):D1178-1186.
Haig D, Westoby M (1991) Genomic imprinting in endosperm: its effects on seed development in crosses between species and between different ploidies of the same species, and its implications for the evolu-tion of apomixis. Phil Trans R Soc B 333:1–13.
Haig D (2013) Kin conflict in seed development: an interdependent but fractious collective. Annu Rev Cell Dev Biol 29:189-211.
Hirsch C, Hirsch CD, Brohammer AB, Bowman MJ, Soifer I, Barad O, Shem-Tov D, Baruch K, Lu F, Her-nandez AG, Fields CJ, Wright CL, Koehler K, Springer NM, Buckler ES, Buell CR, de Leon N, Kaeppler SM, Childs K, Mikel MA (2016) Draft assembly of elite inbred line PH207 provides insights into genomic and transcriptome diversity in maize. Plant Cell 28(11)2700-2714.
Hsieh TF, Shin J, Uzawa R, Silva P, Cohen S, Bauer MJ, Hashimoto M, Kirkbride RD, Harada JJ, Ziberman D, Fischer RL (2012) Regulation of imprinted gene expression in Arabidopsis endosperm. Proc Natl Acad Sci U S A 108(5):1755-1762.
Jiang SY, Ramachandran S (2016) Expansion mechanisms and evolutionary history on genes encoding DNA glycosylases and their involvement in stress and hormone signaling. Genome Biol Evol 8(4):1165-1184.
Jin JP, Tian F, Yang DC, Meng YQ, Kong L, Luo JC and Gao G. (2017). PlantTFDB 4.0: toward a central hub for transcription factors and regulatory interactions in plants. Nucleic Acids Res 45(D1):D1040-D1045.
Jones SI, Vodkin LO (2013) Using RNA-seq to profile soybean seed development from fertilization to maturity. PLoS ONE 8(3):e59270.

108
Julien PE, Susaki D, Yelagandula R, Higashiyama T, Berger F (2012) DNA methylation dynamics during sexual reproduction in Arabidopsis thaliana. Curr Biol 22(19):1825-1830.
Kapazoglou A, Drosou V, Argiriou A, Tsaftaris AS (2013) The study of a barley epigenetic regulator, HvD-ME, in seed development and under drought. BMC Plant Biol 13:172.
Köhler C, Wolff P, Spillane C (2012) Epigenetic mechanisms underlying genomic imprinting in plants. Ann Rev Plant Biol 63:331-352.
Lagacé M, Matton DP (2004) Characterization of a WRKY transcription factor expressed in late torpedo-stage embryos of Solanum chacoense. Planta 219(1):185-189.
Lamesch P, Berardini TZ, Li D, Swarbreck D, Wilks C, Sasidharan R, Muller R, Dreher K, Alexander DL, Garcia-Hernandez M, Karthikeyan AS, Lee CH, Nelson WD, Ploetz L, Singh S, Wensel A, Huala E (2012) The Arabidopsis Information Resource (TAIR): improved gene annotation and new tools. Nucleic acids res 40(Database issue):D1202-D1210.
Li G, Wang D, Yang R, Logan K, Zhang S, Skaggs M, Lloyd A, Burnette WJ, Laurie JD, Hunter BG, Dan-nenhoffer JM, Larkins BA, Drews GN, Wang X, Yadegari R (2014) Temporal patterns of gene expression in developing maize endosperm identified through transcriptome sequencing. Proc Natl Acad Sci U S A 111(21):7582-7587.
Long JA, Ohno C, Smith ZR, Meyerowitz EM (2006) TOPLESS regulates apical embryonic fate in Arabidop-sis. Science 312(5779):1520-1523.
Lu X, Li Y, Su Y, Liang Q, Meng H, Li S, Shen S, Fan Y, Zhang C (2012) An Arabidopsis gene encoding a C2H2-domain protein with alternatively spliced transcripts is essential for endosperm development. J Exp Bot 63(16):5935-5944.
Luo M, Dennis ES, Berger F, Peacock WJ, Chaudhury A (2005) MINISEED2 (MINI3), a WRKY family gene, and HAIKU2 (IKU2), a leucine-rich repeat (LRR) KINASE gene, are regulators of seed size in Arabidopsis. Proc Natl Acad Sci U S A 102(48):17531-17536.
Luo M, Platten D, Chaudhury A, Peacock WJ, Dennis ES (2009) Expression, imprinting, and evolution of rice homologs of the polycomb group genes. Mol Plant 2:711–723
Mansfield SG, Briarty LG (1991) Early embryogenesis in Arabidopsis thaliana. II. The developing embryo. Canad J Bot 69(3):461-476.
Nallamilli BRR, Zhang J, Mujahid H, Malone BM, Bridges SM, Peng Z (2013) Polycomb group gene OsFIE2 regulates rice (Oryza sativa) deed development and grain filling via a mechanism distinct from Arabidop-sis. PLoS Genet 9(3):e1003322.
Nguyen HT, Silva JE, Podicheti R, Macrander J, Yang W, Nazerenus TJ, Nam JW, Jaworski JG, Lu C, Scheffler BE, Mackaitis K, Cahoon EB (2013) Camelina seed transcriptome: a tool for meal and oil improvement and translational research. Plant Biotech J 11(6):759-769.
109
Ouyang S, Zhu W, Hamilton J, Lin H, Campbell M, Childs K, Thibaud-Nissen F, Malek RL, Lee Y, Zheng L, Orvis J, Haas B, Wortman J, Buell CR (2007)The TIGR Rice Genome Annotation Resource: improvements and new features. Nucleic Acids Res 35(Database issue):D883-D887.
Pereira AM, Lopes AL, Coimbra S (2016) Arabinogalactan proteins as interactors along the crosstalk be-tween the pollen tube and the female tissues. Front Plant Sci 7:1895.
Pimentel HJ, Bray N, Puente S, Melsted P, Pachter L (2017) Differential analysis of RNA-Seq incorporat-ing quantification uncertainty. Nat Methods (2017), advanced access http://dx.doi.org/10.1038/nmeth. 4324.
Povilus RA, Losada JM, Friedman WE (2015) Floral biology and ovule and seed ontogeny of Nymphaea thermarum, a water lily at the brink of extinction with potential as a model system for basal angio-sperms. Ann Bot 115:211-226
R Core Team (2017). R: A language and environment for statistical computing. R Foundation for Statistical Computing, Vienna, Austria. URL https://www.R-project.org/.
Sharma R, Mohan Singh RK, Malik G, Deveshwar P, Tyagi AK, Kapoor S, Kapoor M (2009) Rice cytosine DNA methyltransferases - gene expression profiling during reproductive development and abiotic stress. FEBS J 276(21):6301-6311.
Sims D, Sudbery I, Ilott NE, Heger A, Ponting CP (2014) Sequencing depth and coverage key consider-ations in genome analyses. Nat Rev Genet 15:121-132.
Springer NM, Danilevskaya ON, Hermon P, Helentjaris TG, Phillips RL, Kaeppler HF, Kaeppler SM (2002) Sequence relationships, conserved domains, and expression patterns for maize homologs of the poly-comb group genes E(z), esc, and E(Pc). Plant Physiol 128(4):1332-1345.
Stamatakis A (2014) RAxML Version 8: A tool for phylogenetic analysis and post-analysis of large phylog-enies. Bioinformatics 30(9):1312-1313.
Tian T, Liu T, Yan H, You Q, Yi X, Du H, Xu W, Su Z (2017) agriGO v2.0: a GO analysis toolkit for the agricul-tural community, 2017 update. Nucleic Acids Res 45(W1):W122-W129
Tomato Genome Consortium (2012) The tomato genome sequence provides insights into fleshy fruit evolution. Nature 485(7400): 635-641.
Wang G, Wang G, Zhang X, Wang F, Song R (2012) Isolation of high quality RNA from cereal seeds con-taining high levels of starch. Phytochem Anal 23(2):159-163.
Wickramasuriya AM, Dunwell JM (2015) Global scale transcriptome analysis of Arabidopsis embryogen-esis in vitro. BMC Genomics 16(1):301.
Xu H, Gao Y, Wang J (2014) Transcriptome analysis of rice (Oryza sativa) developing embryos using the RNA-Seq technique. PLoS ONE 7(2):e30646.
110
Zhang J, Shan L, Duan J, Wang J, Chen S, Cheng Z, Zhang Q, Liang X, Li Y (2011) De novo assembly and characterization of the transcriptome during seed development, and generation of genic-SSR markers in peanut (Arachis hypogaea L.). BMC Genomics 13:90-96.
Zilberman D, Gehring M, Tran RK, Ballinger T, Henikoff S (2006) Genome-wide analysis of Arabidopsis thaliana DNA methylation uncovers an interdependence between methylation and transcription. Nature Genet 39:61-69.
FundingInformation
This work was supported by a NSF Doctoral Dissertation Improvement Grant (Grant number
1500963; Evolution of Angiosperm Seed Development: perspectives from Nymphaea thermarum (Nym-
phaeales).
Acknowledgments
We thank the staff of Harvard FAS Informatics for assistance with development of data analysis
strategy, and Morgan Moglein and Johan Jaenisch for their work in key developing aspects of the RNA
extraction protocol used in this study.
111
Appendix: Supplementary Material
Page
112 Chapter 2 Supplementary Material
113 Supplementary Materials and Methods
116 SupplementaryFiguresS2.1-S2.2
118 SupplementaryTablesS2.1-S2.10
123 List of Supplementary Dataset 2.1
124 Chapter 3 Supplementary Material
124 Supplementary Materials and Methods
125 SupplementaryTableS3.1-S3.2
126 ListofSupplementaryDatasets3.1-3.3
112
Chapter2SupplementaryInformation
Supplementary Materials and Methods
Flow Cytometry Chromosome Counts in Whole Mounts
For flow cytometry, prepared samples (Doležel et al., 2007) were analyzed at the Baur Core Facil-
ity of Harvard University on a BD LSR II flow cytometer, using the settings for the Pacific-Blue-A fluro-
chrome, and resulting data were analyzed with BD FACSDiva7.0. Samples from a known diploid individual
of Nymphaea thermarum were used as the control.
For chromosome counting, 2-3 clean, healthy root tips or young shoot apical meristems (in-
cluding young leaf primordia) were collected per plant, incubated in a saturated solution of 1-Bromon-
apthalene for 4 or more hours at room temperature, transferred to a solution of 3:1 95% ethanol and
glacial acetic acid, fixed overnight, and stored at -20 C°. Prior to staining, the clear outer root caps were
removed and remaining root tips stained with the Feulgen reaction, cleared, and imaged (Povilus et al.,
2015) with a 63x lens on a Zeiss LSM700 Confocal Microscope, equipped with an AxioCam HRc camera
(Zeiss, Oberkochen, Germany) (excitation = 405 nm and 488 nm, detection = 405-700 nm, pinhole = 60
ųm). Chromosome counts were performed on z-stacks of complete nuclei in ImageJ or Zeiss LSM Image
Browser, and 3D models of nuclei were created using the 3D Viewer plugin in ImageJ.
Chromosome counts of all samples were within (+/- 1) of expected values for either diploid (2n
= 28) or tetraploid (2n = 56 ) individuals. The +/-1 uncertainty of chromosome number is due to the
very small size of chromosomes in N. thermarum, combined with the somewhat large number of chro-
mosomes. For chromosome counts, multiple cells were counted for each individual; both root tips and
shoot apical meristems cells were observed.
When both methods were used for a single individual, they always gave the same result for the
ploidy of that individual. Similarly, when multiple cells from multiple tissues from the same individual
were analyzed via chromosome counts, the same ploidy was recovered (2n = 28, 4n = 56, 3n = 42). The
consistency of chromosome number between tissue types means that tetraploid plants are unlikely to
be chimeras of diploid and tetraploid cells, and are therefore likely to produce diploid gametes. In order
to verify that gametes produced by tetraploid parents were diploid, we assessed the ploidy of embryos
that resulted from interploidy crosses. Chromosome number was counted for multiple individuals from
113
multiple fruits of each interploidy cross type and 2x2 crosses: the number of chromosomes in all counted
cells from interploidy offspring was 42 (+/- 1), as expected. For cells from embryos that resulted from the
2x2 crosses, the chromosome number was 28 (+/-1), as expected for diploid individuals.
CrossFertilizations
Randomly selected, unopened flower buds were emasculated at least 24 hours before the first
day of anthesis to generate outcrossing female flowers, and any older flowers or fruits were removed.
Pollen (collected the same day from randomly-selected male-phase flowers) was manually added to
stigmatic surfaces of female flowers on the first day of anthesis via paint brush and transfer of whole,
open anthers; efforts were made to transfer roughly equal amounts of pollen for each cross. Controlled
cross-pollinated flowers were bagged with a nylon mesh to prevent spurious cross-pollination from
other plants, and the bag was removed at 7 days after anthesis; fruits were re-bagged at 25 days after
anthesis to facilitate seed collection. All emasculations, pollen collection, and cross-pollinations occurred
between 10 and 11 am on any given day. N. thermarum flowers continuously but only supports one open
flower at a time. If a flower was used as the female in a cross-pollination, all subsequent floral buds were
removed until the fruit of interest was collected.
Self-fertilizations
Flowers were covered with a nylon mesh bag on the morning of the first day of anthesis to
prevent cross-pollination, and any older flowers or fruits were removed. The bag was removed at 7 days
after anthesis; fruits were re-bagged at 25 days after anthesis to facilitate seed collection. If a flower was
allowed to self-pollinate, all subsequent floral buds were removed until the fruit of interest was col-
lected.
Confocal Microscopy of Prepared Samples
Samples were prepared and imaged with previously established methods (Povilus et al., 2015). Briefly:
tissues were stained according the Fuelgen method, and then infiltrated with and embedded in JB-4 gly-
col methacrylate (Electron Microscopy Sciences, Hatfield, PA, USA). Blocks were cut by hand with razor
blades to remove superfluous tissue layers. Samples were mounted in a drop of Immersol 518f (Zeiss,
114
Oberkochen, Germany) on custom well slides and imaged with a Zeiss LSM700 Confocal Microscope,
equipped with an AxioCam HRc camera (Zeiss, Oberkochen, Germany). One of two excitation/detection
settings was used for any given sample: 1) excitation at 405 and 488 nm, emission detection between
400-520 nm (Channel 1) and 520-700 (Channel 2) and 2) excitation at 638 nm, emission detection
between 520-700 nm (Channel 1). Z-stacks of optical sections were collected to include the maximum
longitudinal section of a seed. Zeiss LSM Image Browser was used to obtain seed component measure-
ments.
Data Analysis
Comparisonsofcross-andself-fertilizedseedsfromdiploidparents
Germination rates of seeds from diploid self-fertilizations and 2x2 crosses were not significantly
different (t-test, t = 0.3717, df = 35, p-value = 0.7124). Measurements of perisperm and the endosperm
tissues were not significantly different for seeds from diploid self-fertilizations or 2x2 crosses (perisperm:
t = -1.324, df = 311, p-value = 0.1865; endosperm: t = -1.1305, df = 242.876, p-value = 0.2594). For the
embryo, equality of the means between diploid self-fertilizations and 2x2 crosses could not be rejected (t
= -2.6479, df = 248.899, p-value = 0.008617), but the actual difference in means was very small (95% CI =
0.007 - 0.001 mm2, or an average of 4.2% difference).
LinearEffectModeling
The number of mature seeds per fruit were counted, and these data were fitted with a zero-
inflated generalized linear model with a negative binomial distribution (using the glmmadmb package
(Fournier et al., 2012) and the hurdle function of the pcs1 package in R (Zeileis et al., 2008); cross type
was used as the fixed effect for both components of the zero-inflated model.
The percent of ungerminated seeds was calculated for each fruit, and these data were fitted with
a generalized linear model (glm function in R) with a gamma distribution (as data were exponentially
distributed), using cross type as the fixed effect.
Mixed linear effect models (lmer function of the lme4 package in R) (Bates et al., 2015) were
used to examine the effect of cross type on the sizes of (separately) the perisperm, endosperm, and em-
bryo. For all models, fruit ID was included as a random effect, as multiple seeds per fruit were measured.
115
Embryo and endosperm measurements were log transformed for 7DAA (untransformed model residual
plots displayed obvious skewing; model coefficients were back-transformed before calculation of effect
sizes). Seed component sizes at 7 DAA, as well as endosperm cell number and endosperm average cell
size, were additionally modeled using maternal ploidy, paternal ploidy, and the interaction of maternal
and paternal ploidy as fixed effects. Maternal ploidy was used as the fixed effect to model tissue size in
pre-fertilization ovules (nucellus and female gametophyte). Pairwise comparisons between cross types
were performed using the summary function in R and manually defining the reference cross type to
report all 6 comparisons.
A generalized linear mixed-effect model (glmer function of lme4 package in R) (Bates et al.,
2015) was used to test for effects of cross type, time, and their interaction on the proportion of embryos
of each cross type that had or had not undergone key morphological transitions at a given time point.

116
Supplementary Figures:
Supplementary Figure 2.1: Types of seeds found in mature fruits
Definition of mature seeds, which were included in further analysis: A) In fruits from cross-pollinated or
self-fertilized flowers, typically three types of ovules/seeds could be distinguished by external appear-
ance: 1) mature seeds (brown seed coat, plump), 2) abnormal, ‘young-looking’ seeds (immature pink
seed coat, small size), and 3) unfertilized ovules (pale colored and very small). Abnormal, ‘young-looking’
seeds were processed for confocal microscopy to see whether they were fertilized but aborted seeds.
(Scale bar = 1 mm) B) In all of the abnormal seeds analyzed, starch had accumulated in the perisperm in
a pattern similar to ~7 days after anthesis for a normal seed. Many of these “seeds” had not been fertil-
ized, as degenerating female gametophytes were found and no remnants of a pollen tube or pollen tube
discharge could be seen at the micropyle. (Scale bar = 0.1 mm) C) Occasionally in abnormal seeds, nuclei
or cells were noted in the space normally occupied by offspring tissues, but these were never arranged
in a manner that resembled any stage of viable embryo or endosperm development. Because these
‘abnormal’ seeds were not demonstrably the product of fertilization events, they (and unfertilized seeds)
were omitted from further analysis. (Scale bar = 0.1 mm)
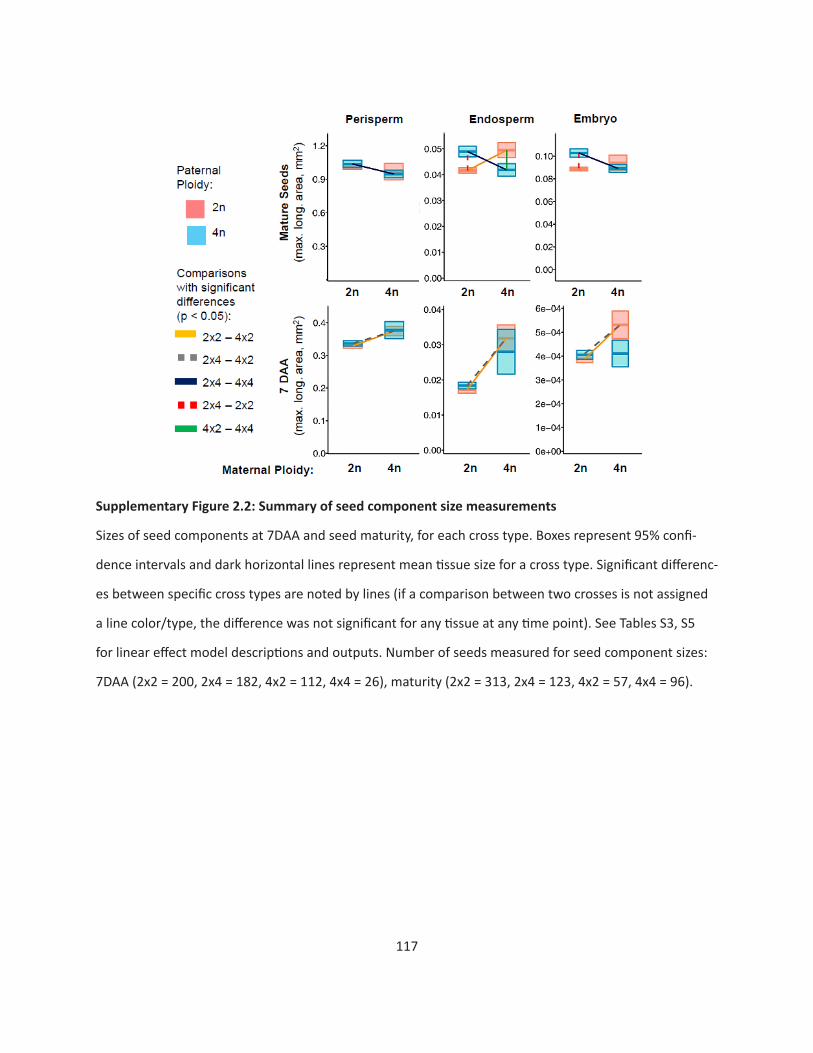
117
SupplementaryFigure2.2:Summaryofseedcomponentsizemeasurements
Sizes of seed components at 7DAA and seed maturity, for each cross type. Boxes represent 95% confi-
dence intervals and dark horizontal lines represent mean tissue size for a cross type. Significant differenc-
es between specific cross types are noted by lines (if a comparison between two crosses is not assigned
a line color/type, the difference was not significant for any tissue at any time point). See Tables S3, S5
for linear effect model descriptions and outputs. Number of seeds measured for seed component sizes:
7DAA (2x2 = 200, 2x4 = 182, 4x2 = 112, 4x4 = 26), maturity (2x2 = 313, 2x4 = 123, 4x2 = 57, 4x4 = 96).
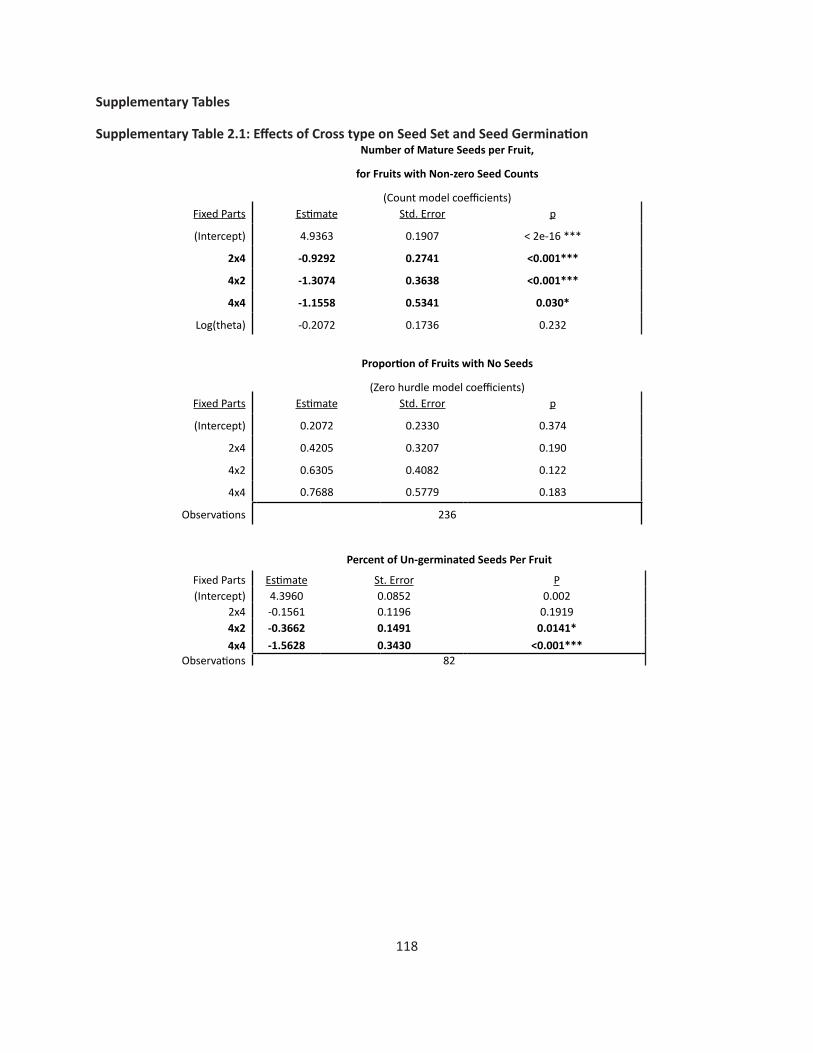
118
Supplementary Tables
SupplementaryTable2.1:EffectsofCrosstypeonSeedSetandSeedGermination
NumberofMatureSeedsperFruit,
forFruitswithNon-zeroSeedCounts
(Count model coefficients)Fixed Parts Estimate Std. Error p
(Intercept) 4.9363 0.1907 < 2e-16 ***
2x4 -0.9292 0.2741 <0.001***
4x2 -1.3074 0.3638 <0.001***
4x4 -1.1558 0.5341 0.030*
Log(theta) -0.2072 0.1736 0.232
ProportionofFruitswithNoSeeds
(Zero hurdle model coefficients)Fixed Parts Estimate Std. Error p
(Intercept) 0.2072 0.2330 0.374
2x4 0.4205 0.3207 0.190
4x2 0.6305 0.4082 0.122
4x4 0.7688 0.5779 0.183
Observations 236
PercentofUn-germinatedSeedsPerFruit
Fixed Parts Estimate St. Error P(Intercept) 4.3960 0.0852 0.002
2x4 -0.1561 0.1196 0.19194x2 -0.3662 0.1491 0.0141*4x4 -1.5628 0.3430 <0.001***
Observations 82
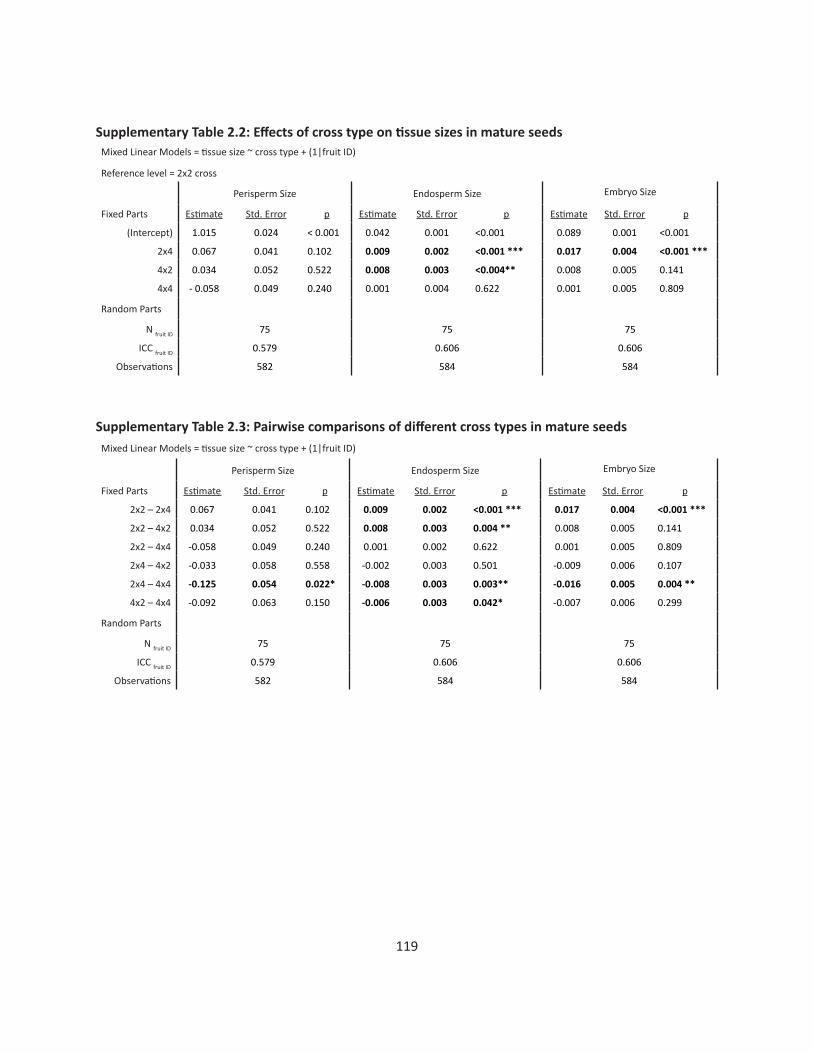
119
SupplementaryTable2.2:EffectsofcrosstypeontissuesizesinmatureseedsMixed Linear Models = tissue size ~ cross type + (1|fruit ID)
Reference level = 2x2 cross
Perisperm Size Endosperm Size Embryo Size
Fixed Parts Estimate Std. Error p Estimate Std. Error p Estimate Std. Error p
(Intercept) 1.015 0.024 < 0.001 0.042 0.001 <0.001 0.089 0.001 <0.001
2x4 0.067 0.041 0.102 0.009 0.002 <0.001 *** 0.017 0.004 <0.001 ***
4x2 0.034 0.052 0.522 0.008 0.003 <0.004** 0.008 0.005 0.141
4x4 - 0.058 0.049 0.240 0.001 0.004 0.622 0.001 0.005 0.809
Random Parts
N fruit ID 75 75 75
ICC fruit ID 0.579 0.606 0.606
Observations 582 584 584
SupplementaryTable2.3:PairwisecomparisonsofdifferentcrosstypesinmatureseedsMixed Linear Models = tissue size ~ cross type + (1|fruit ID)
Perisperm Size Endosperm Size Embryo Size
Fixed Parts Estimate Std. Error p Estimate Std. Error p Estimate Std. Error p
2x2 – 2x4 0.067 0.041 0.102 0.009 0.002 <0.001 *** 0.017 0.004 <0.001 ***
2x2 – 4x2 0.034 0.052 0.522 0.008 0.003 0.004 ** 0.008 0.005 0.141
2x2 – 4x4 -0.058 0.049 0.240 0.001 0.002 0.622 0.001 0.005 0.809
2x4 – 4x2 -0.033 0.058 0.558 -0.002 0.003 0.501 -0.009 0.006 0.107
2x4 – 4x4 -0.125 0.054 0.022* -0.008 0.003 0.003** -0.016 0.005 0.004 **
4x2 – 4x4 -0.092 0.063 0.150 -0.006 0.003 0.042* -0.007 0.006 0.299
Random Parts
N fruit ID 75 75 75
ICC fruit ID 0.579 0.606 0.606
Observations 582 584 584
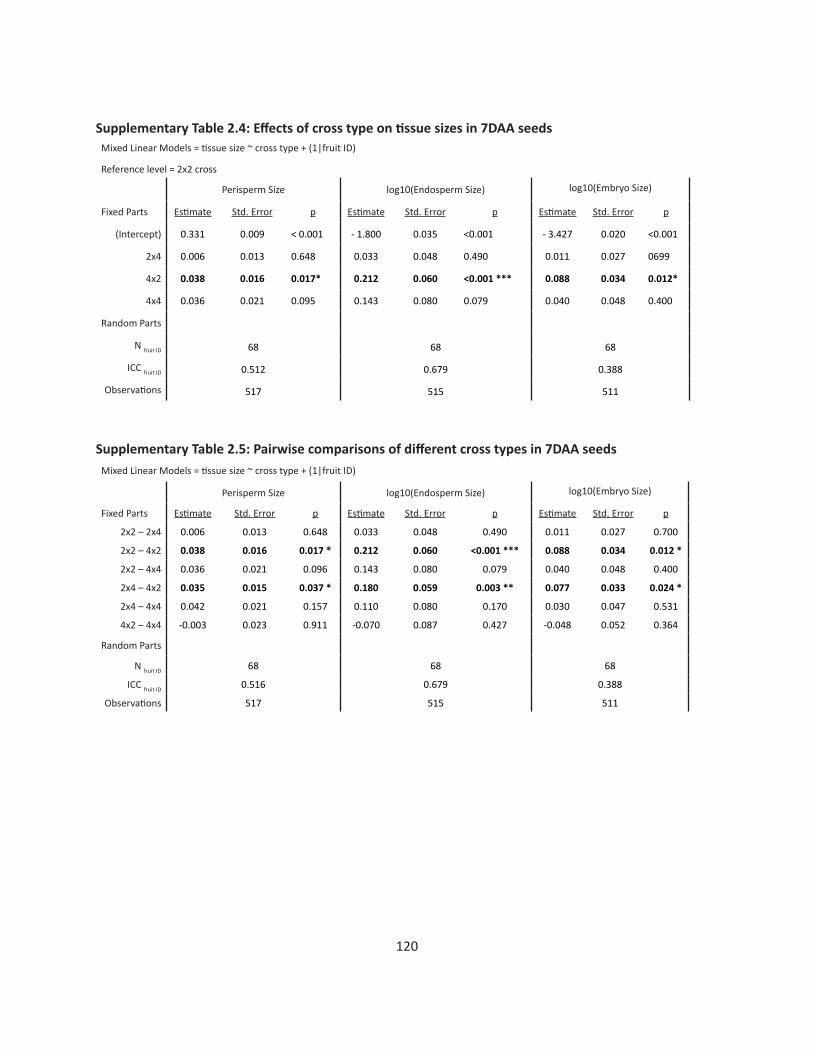
120
SupplementaryTable2.4:Effectsofcrosstypeontissuesizesin7DAAseedsMixed Linear Models = tissue size ~ cross type + (1|fruit ID)
Reference level = 2x2 cross
Perisperm Size log10(Endosperm Size) log10(Embryo Size)
Fixed Parts Estimate Std. Error p Estimate Std. Error p Estimate Std. Error p
(Intercept) 0.331 0.009 < 0.001 - 1.800 0.035 <0.001 - 3.427 0.020 <0.001
2x4 0.006 0.013 0.648 0.033 0.048 0.490 0.011 0.027 0699
4x2 0.038 0.016 0.017* 0.212 0.060 <0.001 *** 0.088 0.034 0.012*
4x4 0.036 0.021 0.095 0.143 0.080 0.079 0.040 0.048 0.400
Random Parts
N fruit ID 68 68 68
ICC fruit ID 0.512 0.679 0.388
Observations 517 515 511
SupplementaryTable2.5:Pairwisecomparisonsofdifferentcrosstypesin7DAAseedsMixed Linear Models = tissue size ~ cross type + (1|fruit ID)
Perisperm Size log10(Endosperm Size) log10(Embryo Size)
Fixed Parts Estimate Std. Error p Estimate Std. Error p Estimate Std. Error p
2x2 – 2x4 0.006 0.013 0.648 0.033 0.048 0.490 0.011 0.027 0.700
2x2 – 4x2 0.038 0.016 0.017 * 0.212 0.060 <0.001 *** 0.088 0.034 0.012 *
2x2 – 4x4 0.036 0.021 0.096 0.143 0.080 0.079 0.040 0.048 0.400
2x4 – 4x2 0.035 0.015 0.037 * 0.180 0.059 0.003 ** 0.077 0.033 0.024 *
2x4 – 4x4 0.042 0.021 0.157 0.110 0.080 0.170 0.030 0.047 0.531
4x2 – 4x4 -0.003 0.023 0.911 -0.070 0.087 0.427 -0.048 0.052 0.364
Random Parts
N fruit ID 68 68 68
ICC fruit ID 0.516 0.679 0.388
Observations 517 515 511
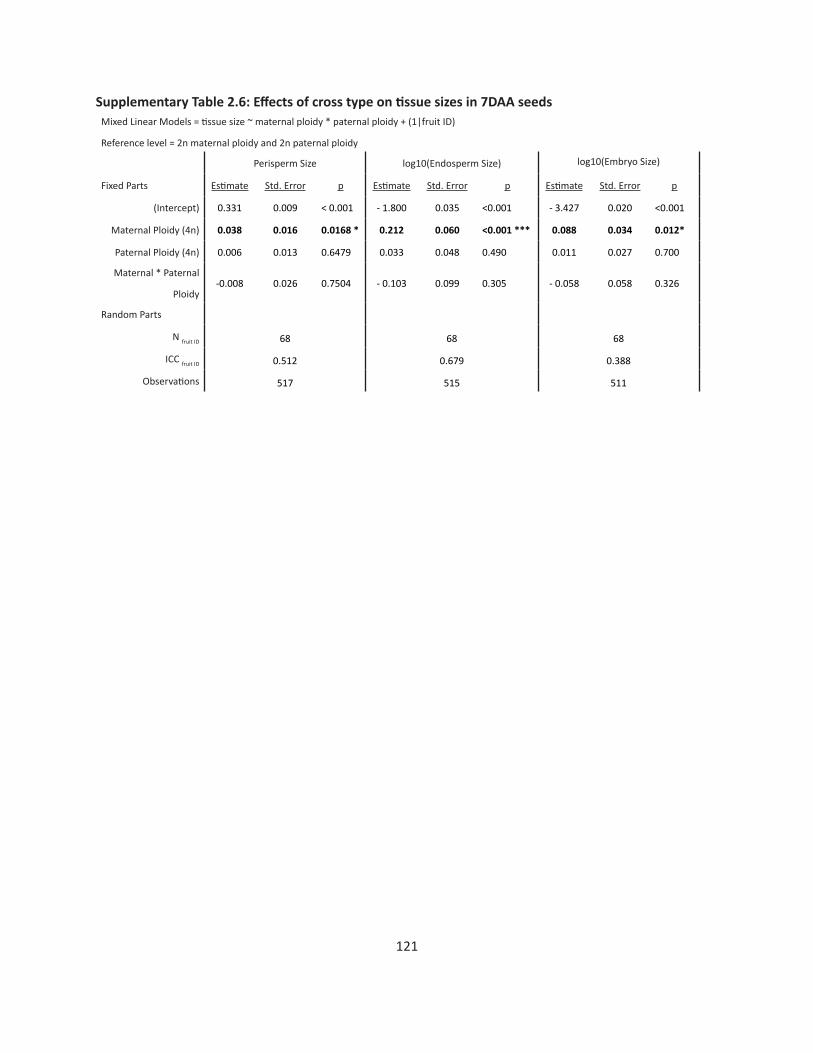
121
SupplementaryTable2.6:Effectsofcrosstypeontissuesizesin7DAAseedsMixed Linear Models = tissue size ~ maternal ploidy * paternal ploidy + (1|fruit ID)
Reference level = 2n maternal ploidy and 2n paternal ploidy
Perisperm Size log10(Endosperm Size) log10(Embryo Size)
Fixed Parts Estimate Std. Error p Estimate Std. Error p Estimate Std. Error p
(Intercept) 0.331 0.009 < 0.001 - 1.800 0.035 <0.001 - 3.427 0.020 <0.001
Maternal Ploidy (4n) 0.038 0.016 0.0168 * 0.212 0.060 <0.001 *** 0.088 0.034 0.012*
Paternal Ploidy (4n) 0.006 0.013 0.6479 0.033 0.048 0.490 0.011 0.027 0.700
Maternal * Paternal
Ploidy-0.008 0.026 0.7504 - 0.103 0.099 0.305 - 0.058 0.058 0.326
Random Parts
N fruit ID 68 68 68
ICC fruit ID 0.512 0.679 0.388
Observations 517 515 511
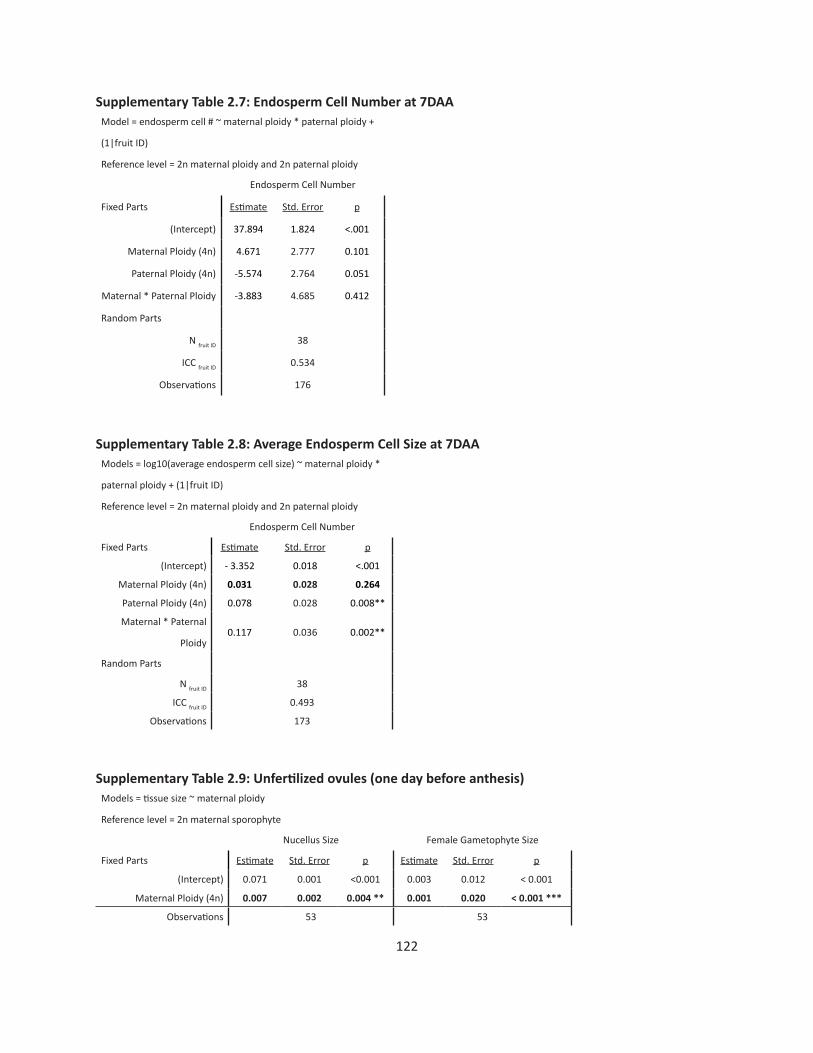
122
SupplementaryTable2.7:EndospermCellNumberat7DAAModel = endosperm cell # ~ maternal ploidy * paternal ploidy +
(1|fruit ID)
Reference level = 2n maternal ploidy and 2n paternal ploidy
Endosperm Cell Number
Fixed Parts Estimate Std. Error p
(Intercept) 37.894 1.824 <.001
Maternal Ploidy (4n) 4.671 2.777 0.101
Paternal Ploidy (4n) -5.574 2.764 0.051
Maternal * Paternal Ploidy -3.883 4.685 0.412
Random Parts
N fruit ID 38
ICC fruit ID 0.534
Observations 176
SupplementaryTable2.8:AverageEndospermCellSizeat7DAAModels = log10(average endosperm cell size) ~ maternal ploidy *
paternal ploidy + (1|fruit ID)
Reference level = 2n maternal ploidy and 2n paternal ploidy
Endosperm Cell Number
Fixed Parts Estimate Std. Error p
(Intercept) - 3.352 0.018 <.001
Maternal Ploidy (4n) 0.031 0.028 0.264
Paternal Ploidy (4n) 0.078 0.028 0.008**
Maternal * Paternal
Ploidy0.117 0.036 0.002**
Random Parts
N fruit ID 38
ICC fruit ID 0.493
Observations 173
SupplementaryTable2.9:Unfertilizedovules(onedaybeforeanthesis)Models = tissue size ~ maternal ploidy
Reference level = 2n maternal sporophyte
Nucellus Size Female Gametophyte Size
Fixed Parts Estimate Std. Error p Estimate Std. Error p
(Intercept) 0.071 0.001 <0.001 0.003 0.012 < 0.001
Maternal Ploidy (4n) 0.007 0.002 0.004 ** 0.001 0.020 < 0.001 ***
Observations 53 53
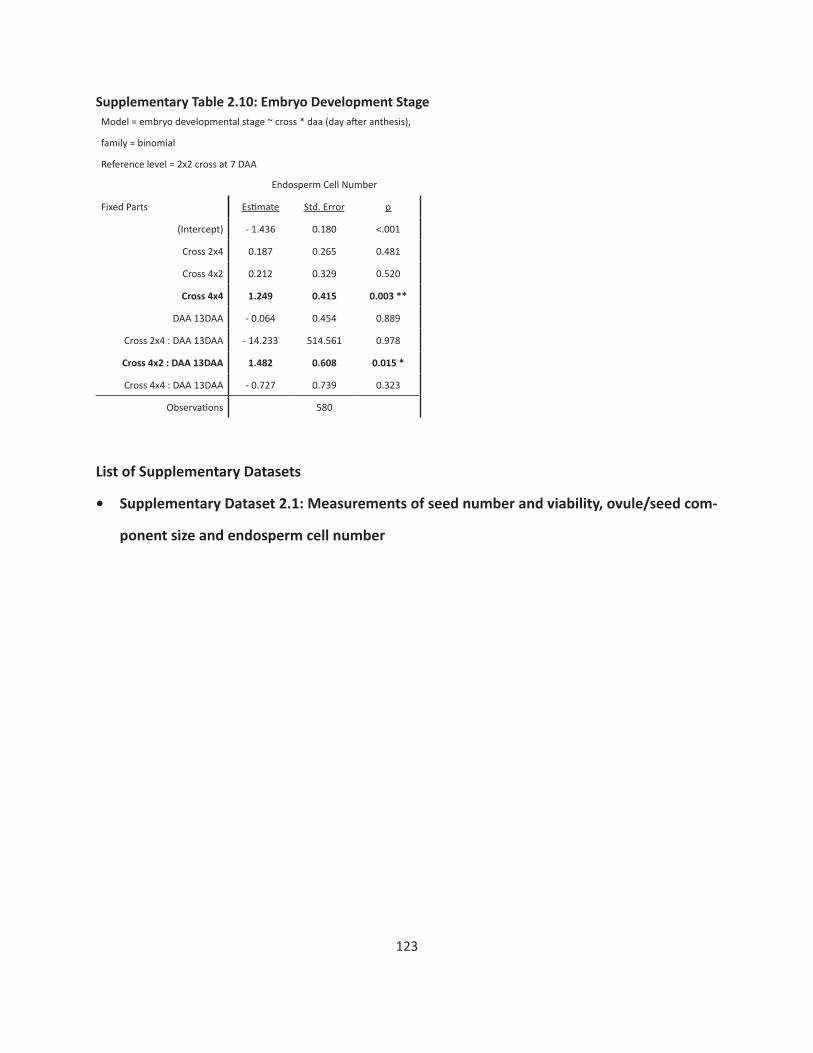
123
Supplementary Table 2.10: Embryo Development StageModel = embryo developmental stage ~ cross * daa (day after anthesis),
family = binomial
Reference level = 2x2 cross at 7 DAA
Endosperm Cell Number
Fixed Parts Estimate Std. Error p
(Intercept) - 1.436 0.180 <.001
Cross 2x4 0.187 0.265 0.481
Cross 4x2 0.212 0.329 0.520
Cross 4x4 1.249 0.415 0.003 **
DAA 13DAA - 0.064 0.454 0.889
Cross 2x4 : DAA 13DAA - 14.233 514.561 0.978
Cross 4x2 : DAA 13DAA 1.482 0.608 0.015 *
Cross 4x4 : DAA 13DAA - 0.727 0.739 0.323
Observations 580
List of Supplementary Datasets
• Supplementary Dataset 2.1: Measurements of seed number and viability, ovule/seed com-
ponentsizeandendospermcellnumber
124
Chapter3SupplementaryInformation
Supplementary Materials and Methods
RNAextractions:
For RNA extractions, 30-50 mg of tissue was ground in liquid nitrogen with a mortar and pestle
before being added to 0.4 mL extraction buffer (100 mM Tris-HCL (pH 9), 2% (v/v) 2-Mercaptoethanol,
2% (w/v) PVP40). 40 ųl 10% SDS was added and samples were centrifuged at 12k g for 10 minutes at 4
C. The aqueous phase was transferred to a new tube with 2 volumes of TRIzol (Invitrogen). 1/5 volume
chloroform was added, samples were centrifuged at 12k g for 10 min at 4 C, and the aqueous phase was
transferred to a new tube. TRIzol extraction was repeated as necessary, up to two more times. An equal
volume of cold isopropanol was added to the final aqueous phase, and samples were precipitated at -20
C for 60 min. Pellets were resuspended in H20, and 2 volumes of saturated acid-phenol:chloroform (5:1)
were added. Samples were centrifuged at 12k g for 20 min at 4 C, and the aqueous phase was trans-
ferred to a new tube. The acid-phenol extraction was repeated as necessary, up to two more times. If
necessary, an additional hot (60 C) acid-phenol phase extraction was performed. For 15 DAA, samples
were further purified with a column-based clean-up, using RNeasy Plant Mini Kit (Qiagen) spin columns,
according to manufacturer protocol.
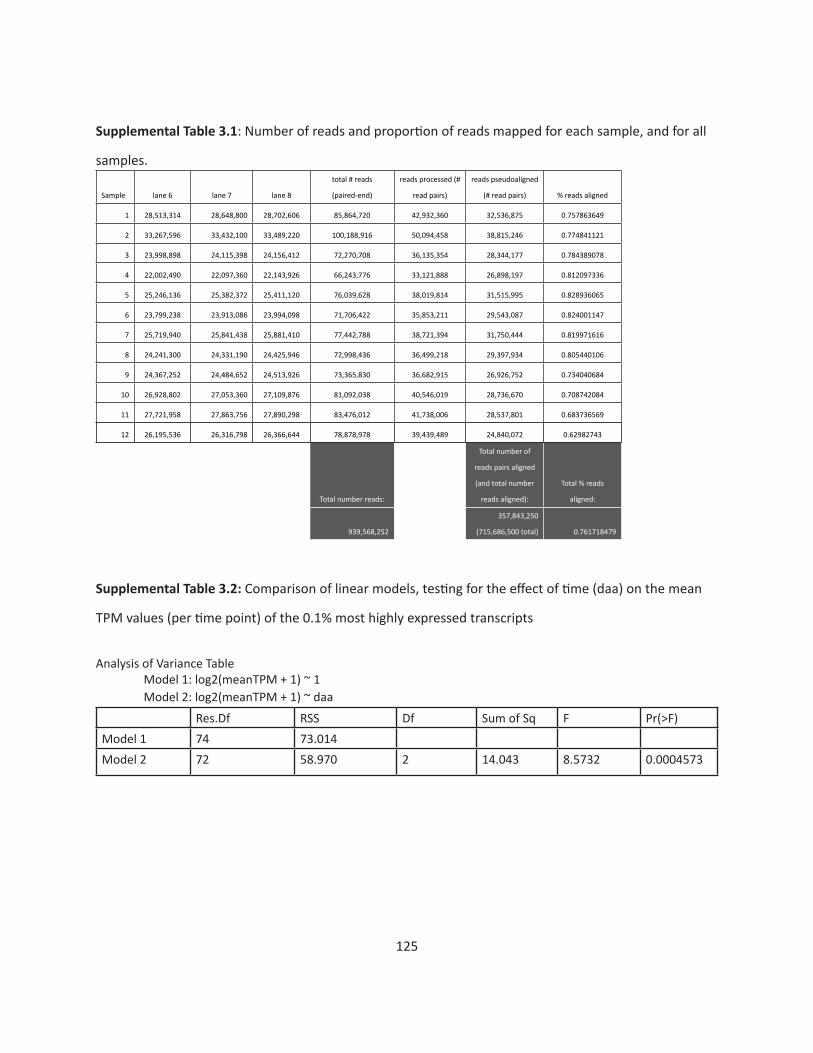
125
Supplemental Table 3.1: Number of reads and proportion of reads mapped for each sample, and for all
samples.
Sample lane 6 lane 7 lane 8
total # reads
(paired-end)
reads processed (#
read pairs)
reads pseudoaligned
(# read pairs) % reads aligned
1 28,513,314 28,648,800 28,702,606 85,864,720 42,932,360 32,536,875 0.757863649
2 33,267,596 33,432,100 33,489,220 100,188,916 50,094,458 38,815,246 0.774841121
3 23,998,898 24,115,398 24,156,412 72,270,708 36,135,354 28,344,177 0.784389078
4 22,002,490 22,097,360 22,143,926 66,243,776 33,121,888 26,898,197 0.812097336
5 25,246,136 25,382,372 25,411,120 76,039,628 38,019,814 31,515,995 0.828936065
6 23,799,238 23,913,086 23,994,098 71,706,422 35,853,211 29,543,087 0.824001147
7 25,719,940 25,841,438 25,881,410 77,442,788 38,721,394 31,750,444 0.819971616
8 24,241,300 24,331,190 24,425,946 72,998,436 36,499,218 29,397,934 0.805440106
9 24,367,252 24,484,652 24,513,926 73,365,830 36,682,915 26,926,752 0.734040684
10 26,928,802 27,053,360 27,109,876 81,092,038 40,546,019 28,736,670 0.708742084
11 27,721,958 27,863,756 27,890,298 83,476,012 41,738,006 28,537,801 0.683736569
12 26,195,536 26,316,798 26,366,644 78,878,978 39,439,489 24,840,072 0.62982743
Total number reads:
Total number of
reads pairs aligned
(and total number
reads aligned):
Total % reads
aligned:
939,568,252
357,843,250
(715,686,500 total) 0.761718479
Supplemental Table 3.2: Comparison of linear models, testing for the effect of time (daa) on the mean
TPM values (per time point) of the 0.1% most highly expressed transcripts
Analysis of Variance Table Model 1: log2(meanTPM + 1) ~ 1 Model 2: log2(meanTPM + 1) ~ daa
Res.Df RSS Df Sum of Sq F Pr(>F) Model 1 74 73.014 Model 2 72 58.970 2 14.043 8.5732 0.0004573

126
List of Supplementary Datasets
• Supplementary Dataset 3.1: Summary of transcript expression values
• SupplementaryDataset3.2:Summaryofdifferentialexpressionanalysis
• SupplementaryDataset3.3:Summaryofexpressionpatternclusters