![A Bíblia como Literatura - Lendo as nar- rativas bíblicas [1]](https://static.fdokumen.com/doc/165x107/63379727fe1f34a1c3009993/a-biblia-como-literatura-lendo-as-nar-rativas-biblicas-1.jpg)
A Bíblia como Literatura - Lendo as nar- rativas bíblicas [1]
Upload
independentCategory
view
5download
0
A new iterative approach for dominant points extraction in planarcurves
CECILIA DI RUBERTOUniversity of Cagliari
Dept. of Mathematics and Comp. ScienceVia Ospedale, 72 09124 Cagliari
ANDREA MORGERAUniversity of Cagliari
Dept. of Mathematics and Comp. ScienceVia Ospedale, 72 09124 Cagliari
Abstract: In this paper the problem of dominant point detection on digital curves is addressed. Based on an initialset of curvature points, our approach adds iteratively significant points by looking for the higher curvature contourpoints. The process continues until all the sums of the distances of contour points in the arcs subtended to thechord between two next dominant points is less then a predefined threshold. A final refinement process adjuststhe position of located dominant points by a minimum integral square error criterion. We test our method bycomparing its performance with other well known dominant point extraction techniques succesfully. In the lastsection some examples of polygonal approximation are shown.
Key–Words:Curvature, Digital Curve, Dominant Points, Polygonal Approximation.
1 Introduction
An important goal in image understanding is to detect,track and label objects of interest present in observedimages [1, 2, 3]. Image objects can be characterized inmany ways according to their colors, textures, shapes,movements and locations. In the field of machine vi-sion applications, the aim of shape recognition is toidentify an object correctly. There are two typical ap-proaches to the problem :global or internal methods,which use all the points of the objects and contour orexternalmethods which are focused on the analysisof contour points of the objects. Planar curves thatrepresent contours of objects have been studied inde-pendently for a long time. An emerging opinion inthe vision community is that global features such asshapes of contours should also be taken into accountfor the successful detection and recognition of objects.The termdominant pointis assigned to points havinga sufficiently high curvature on the boundary of a pla-nar object: their detection is a very important aspect incontour methods since information on the shape of acurve is concentrated at dominant points. This repre-sentation simplifies the analysis of the images by pro-viding a set of feature points containing almost com-plete information of a contour. One of the main advan-tages of a good representation of 2D shapes throughdominant points is the high data reduction and its im-mediately efficiency in feature extraction and shapematching alghoritms. It is well known also that these
points play a dominant role in shape perception by hu-mans.The problem of detecting points of high curvature in2D shapes has been researched since the early 1970’s[4, 5]. Most of these algorithms require one or moreparameters that specify (directly or indirectly) the re-gion of support in order to measure the local proper-ties at each point of the curve.Many methods have been developed to find dominantpoints. Basically they fall in two categories. The firstone directly extracts dominant points from grey levelimages [6, 7, 8]. The second needs a prior edge detec-tion to extract the contour and works afterwards on thechain code formed by the contour [1, 4, 9, 10, 11, 12].This latest category corresponds to our field of inves-tigation.The purpose of this paper is to give a different ap-proach to dominant points extraction. In this workwe will focus on an algorithm that attempts to repre-sent shapes with a limited number of dominant pointslocated along their boundaries. We consider a set ofpoints as a dominant set if is possibile to reconstructthe contour from these points using some methodor interpolation (polygon is the simplest case). Themethod is based on a iterative approach. The first stepis to assign an initial set of points and after detect otherpossible dominant points, i.e. relevant points, apply-ing an iterative selection based on a particular distancecriterion. The results we obtain are then refined bysuppressing some overmuch points in critical regions
WSEAS TRANSACTIONS on COMPUTERS Cecilia Di Ruberto, Andrea Morgera
ISSN: 1109-2750 482 Issue 3, Volume 8, March 2009

of the shape contour and by positioning them in orderto minimize the approximation error. The detectionprocedure is compared with methods proposed by [5],[11], and by [13]. These methods relies on the curva-ture estimation approach and on the determination ofthe region of support. In section 2 a description aboutcurvature both in eculidean space and in discrete spaceis given. The Freeman coding for a digital curve it isalso described. In section 3 we expose our method.In section 3.1 the process to locate initial points setfor the iterative method is explained. Section 3.2 de-scribes the algorithm with its main steps. In section3.3 and 3.4 a refinement technique for a better local-ization of dominant points is proposed. The experi-mental results are shown in section 4 and finally themain conclusions are summarized in section 5.
2 On dominant point detection
Since observing that information of a curve is concen-trated on extreme curvature points, corner detectionis an important research area in contour methods ofshape analisys. For this reasons these points are oftencalleddominant points. In the real Euclidean plane,curvature is defined as the rate of change between thetangent angle and the arc length:
k = dθds
For a curvey = f(x) it can be also expressed in termsof derivatives as:
d2y
dx2[1+( dy
dx)2]3/2
A closed digital curve can be describe by a sequenceof n integer-coordinate points:
C ={pi = (xi, yi), i = 1, ..., n}
wherepi+1 is a neighbor ofpi (modulon). A digi-tal curve can also be represented using the Freeman’schain codes [14]. The Freeman chain code ofC con-sists of then vectors
−→c i = pi−1pi
each corresponding to an integer :
f = 0, ..., 7
as shown in fig. 2 where 1/4πf is the angle betweentheX-axis and the vector. The chain ofC is definedas{−→c i, i = 1, ..., n} and−→c i = −→c i±n. If ci−1 = ci,Pi is a linear point, otherwise it is abreak pointand isa candidate to dominant points.
Figure 1: Freeman’s chain code.
2.1 Previous related works
Although the notion of curvature for continuouscurves is an unambiguously defined concept from dif-ferential calculus that admits precise analytical for-mulations, its digital counterpart lacks a universallyaccepted definition. As a result, research in this fieldhas followed different, but conceptually related, ap-proaches in order to circumvent the problems asso-ciated with digital curvature estimation. Many algo-rithms to find extreme points on digital curves havebeen suggested: one approach tried to define alterna-tive curvature measures based on angles between vec-tors that connect the curve points [4, 9, 10, 11, 15,16, 17]. Other techniques used curvature morphol-ogy [18, 19], local neighborhood of curve points in theplane [20, 21], arc-chord distance [22, 23, 24], curvefitting techniques [25, 26], local symmetry of shape[27], adaptive Gaussian smoothing [28], curvature-guided polygonal approximation [29], direct chaincode analysis [30, 31], neural networks [32, 33], de-viation from smoothness [34], wavelets [35, 36], elec-trostatics [37], fuzzy logic [38], B-splines and genet-ica algorithms [39]. We focused our attention on threeregion of support based algorithms.
2.1.1 Teh-Chin method
Teh and Chin [11] used the ratio of distancedik be-tweenPi and the chordPi−k, Pi+k (denoted withlik)to determine the region of support of a candidate dom-inant point :
rik = likdik
To estimate the length of support region, the processstarts withk = 1, increasesk by one each until oneof the following conditions is satisfied, thenk deter-mines the length of the support region at pointPi:
WSEAS TRANSACTIONS on COMPUTERS Cecilia Di Ruberto, Andrea Morgera
ISSN: 1109-2750 483 Issue 3, Volume 8, March 2009

⋆ lik ≥ lik+1
⋆
{rik ≥ rik+1 for dik > 0rik ≤ rik+1 for dik < 0
This ratio can be considered a measure equivalent tocurvature.After calculating for each pointPi its support region,a significance measure|S(Pi)| is given by one of thefollowing definitions:
• k-cosinemeasure by Rosenfeld-Johnston [4]
• CURik = 1k
∑−1j=−k fi−j − 1
k
∑k−1j=0 fi−j [40]
wheref is one of the possible directions of Free-man coding
• 1-curvatureCURi1 = fi+1 − fi
At this point, a nonmaxima suppression of|S(Pi)| isdone by retaining only those points where|S(Pi)| ≥|S(Pj)| for all j such that|i − j| ≤ ki/2.A sort of ”fine tuning” adjustment in the position ofsome dominant points is made by suppressing thosepoints havingCURi1 = 0. Then a further refinementby suppressing those points with|S(Pi)| minimum isdone. In [12] it is pointed out that Teh and Chin’salgorithm is not robust to noisy contours, due to thefact that the local maximum curvature may be causedby noisy variations on the curve.
2.1.2 Wu methods
Wu [13] proposed a simple measurement to detect cor-ners. He used anadaptive bending valueto determinethe region of support of each point in the contour. Forall break points (described in sect. 2) the bendingvalue is defined as:
bik = max(|(xi−k − xi) + (xi+k − xi)|, |(yi−k −yi) + (yi+k − yi)|)
A support region for theith break point can be esti-mated by the following rule: start withk=1, computethe bending valuebik, increasek by one each until onethe following conditions is satisfied:
• If bik ≤ bik+1 thenk is the length of region ofsupports forPi
• Else if bik = bik+1 then the greatestk that sat-isfies this condition is the length of regions ofsupport forPi
The estimated curvature in the pointPi can be ob-tained by the following smoothing bending value:
bvi = 1ki
∑kij=1 bij
To eliminate the break points from the candidates todominant points the following conditions are used:
• bvi < ǫ whereǫ is a preset threshold;
• bvi < bvj for j=i-1 or j=i+1;
• bvi = bvi−1 andki < ki−1;
• bvi = bvi+1 andki < ki−1;
• bvi = bvi+1 andki = ki−1.
The remaining break points with local maximum overits support region are the dominant points.With another approach [5] Wu proposed a differentmethod for dominant points detection. After a firststep, in which the support region identification foreach break pointPi is similar to the Teh and Chin ap-proach, the curvatures of all of the break points havebeen calculated by using thek-cosine measure. Thenthe points that have local maximum curvature are lo-cated. In addition, the points whose curvature is lessthan a predefined threshold are removed from the setof candidates for dominant points.
3 Proposed algorithm
3.1 Initial point setup
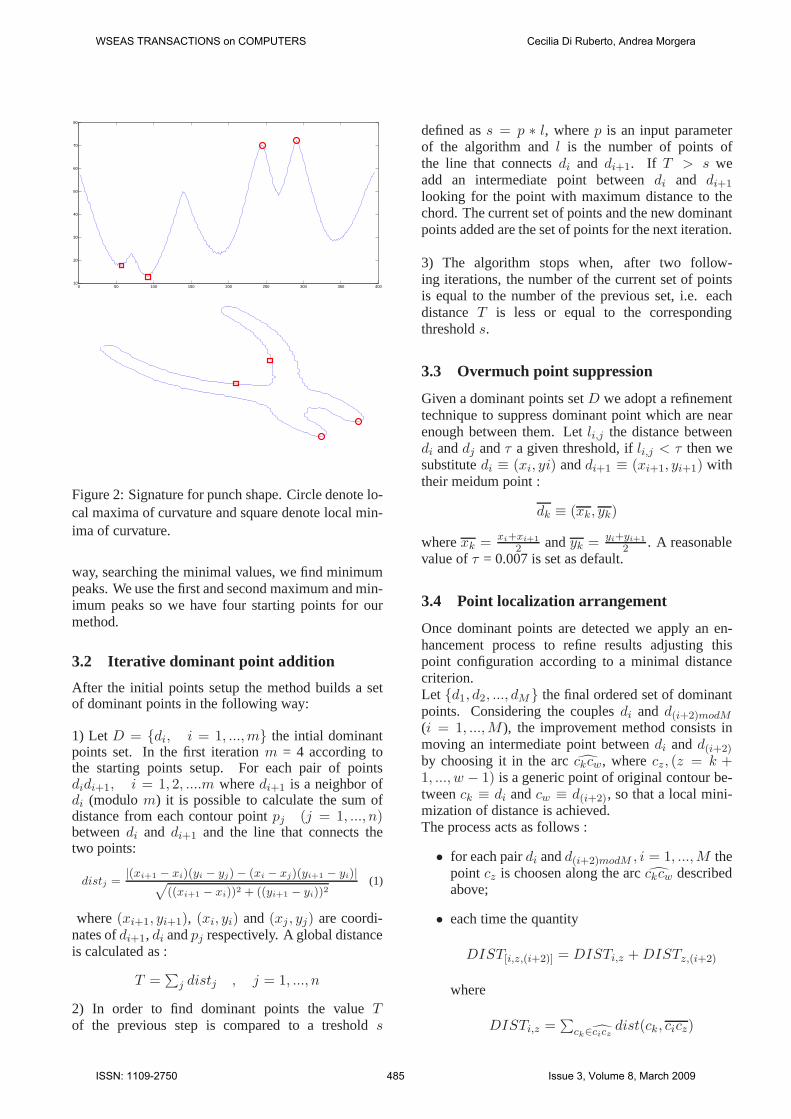
In order to reach a complete set of dominant points ofa given a contour, we need of a initial group of startingpoints. The four vertex theorem [41] stats that a sim-ple closed curve in the plane, other than a circle, musthave at least four “vertices” that is at least four pointswhere the curvature has a local maximum or a localminimum. By the result of this theorem we choose tolocate four initial points by looking for local maximaand minima in the signature of the shape.At first we calculate the centroid of the countour de-fined as:
xc = 1n
∑ni=1 xi , yc = 1
n
∑ni=1 yi
where(xi, yi) are the coordinates of genericPi of then contour points. Then we calculate the signature ofthe contour obtained as:
si =√
(xc − xi)2 + (yc − yi)2, i = 1, 2, ..., n
Given the signature profile of the contour we then cal-culate local maxima and local minima of this function.The values are computed by the following criterion: apoint is considered a maximum peak if it has the max-imal value, and was preceded (to the left) by a valuelower by ∆. In our case we use∆ = 0.5. In such
WSEAS TRANSACTIONS on COMPUTERS Cecilia Di Ruberto, Andrea Morgera
ISSN: 1109-2750 484 Issue 3, Volume 8, March 2009
0 50 100 150 200 250 300 350 40010
20
30
40
50
60
70
80
Figure 2: Signature for punch shape. Circle denote lo-cal maxima of curvature and square denote local min-ima of curvature.
way, searching the minimal values, we find minimumpeaks. We use the first and second maximum and min-imum peaks so we have four starting points for ourmethod.
3.2 Iterative dominant point addition
After the initial points setup the method builds a setof dominant points in the following way:
1) Let D = {di, i = 1, ...,m} the intial dominantpoints set. In the first iterationm = 4 according tothe starting points setup. For each pair of pointsdidi+1, i = 1, 2, ....m wheredi+1 is a neighbor ofdi (modulom) it is possible to calculate the sum ofdistance from each contour pointpj (j = 1, ..., n)betweendi and di+1 and the line that connects thetwo points:
distj =|(xi+1 − xi)(yi − yj) − (xi − xj)(yi+1 − yi)|√
((xi+1 − xi))2 + ((yi+1 − yi))2(1)
where(xi+1, yi+1), (xi, yi) and(xj , yj) are coordi-nates ofdi+1, di andpj respectively. A global distanceis calculated as :
T =∑
j distj , j = 1, ..., n
2) In order to find dominant points the valueTof the previous step is compared to a tresholds
defined ass = p ∗ l, wherep is an input parameterof the algorithm andl is the number of points ofthe line that connectsdi and di+1. If T > s weadd an intermediate point betweendi and di+1
looking for the point with maximum distance to thechord. The current set of points and the new dominantpoints added are the set of points for the next iteration.
3) The algorithm stops when, after two follow-ing iterations, the number of the current set of pointsis equal to the number of the previous set, i.e. eachdistance T is less or equal to the correspondingthresholds.
3.3 Overmuch point suppression
Given a dominant points setD we adopt a refinementtechnique to suppress dominant point which are nearenough between them. Letli,j the distance betweendi anddj andτ a given threshold, ifli,j < τ then wesubstitutedi ≡ (xi, yi) anddi+1 ≡ (xi+1, yi+1) withtheir meidum point :
dk ≡ (xk, yk)
wherexk = xi+xi+1
2 and yk = yi+yi+1
2 . A reasonablevalue ofτ = 0.007 is set as default.
3.4 Point localization arrangement
Once dominant points are detected we apply an en-hancement process to refine results adjusting thispoint configuration according to a minimal distancecriterion.Let {d1, d2, ..., dM} the final ordered set of dominantpoints. Considering the couplesdi and d(i+2)modM
(i = 1, ...,M ), the improvement method consists inmoving an intermediate point betweendi andd(i+2)
by choosing it in the arcckcw, wherecz, (z = k +1, ..., w − 1) is a generic point of original contour be-tweenck ≡ di andcw ≡ d(i+2), so that a local mini-mization of distance is achieved.The process acts as follows :
• for each pairdi andd(i+2)modM , i = 1, ...,M thepoint cz is choosen along the arcckcw describedabove;
• each time the quantity
DIST[i,z,(i+2)] = DISTi,z + DISTz,(i+2)
where
DISTi,z =∑
ck∈ciczdist(ck, cicz)
WSEAS TRANSACTIONS on COMPUTERS Cecilia Di Ruberto, Andrea Morgera
ISSN: 1109-2750 485 Issue 3, Volume 8, March 2009

and
DISTz,(i+2) =∑
ck∈ czc(i+2)dist(ck, czc(i+2))
as described in (1), is evaluated;
• the new index(i + 1)∗ that minimize this sum ischoosen :
(i + 1)∗ = minz DIST[i,z,(i+2)]
• the new dominant pointd(i+1)∗ betweendi andd(i+2) and it is then used in the rest of the pro-cess.
4 Experimental results
In order to test the effectiveness of our method weperform some experiments, both on typical shapes(introduced by [4] and [11] and commonly used inmany studies) and on biological and common toolsshapes. In particular we test four contour commonlyused curves : chromosome, infinity, leaf and semi-circeles curves. Their contour and the set of dominantpoints, obtained by each method and highlighted witha small circle, are shown in figs. 3 - 6. Our methodis compared with others by showing results with thesame or nearest number of dominant points.
The proposed method is compared with the othermethods and results are shown in table 1. We reportsome meaningful measures for each tested method:the number of dominant pointsm, the compressionratio (CR), theE2 error and theE2/CR ratio. CR isdefined as the ratio between the number of dominantpointsm and the number of contour pointsn. TheE2
measure (also known asIntegral Square Error) is tipi-cally used to evaluate the effectiveness of polygonalapproximation. It is defined as:
E2 =∑
j d2j , j = 1, ..., n
where dj is the distance of a contour pointpj ,j = 1, ..., n from the segment betweenp∗i andp∗i+1 ,p∗i , i = 1, ...,m is the i-th of dominant points suchthatp∗i ≤ pl ≤ p∗i+1. We report the value of thresholds choosen also. The results clearly demonstratebetter perfomance of our method respect to othertechniques. Infact theE2 error (and subsequentlythe E2/CR value) is always lower keeping thesame number of dominant points of other methods.Viceversa if we set an acceptable value ofE2 errorour method gives the lowest number of dominantpoints, i.e. well-located points, compared to the other.
After the refinement process described in 3.4 theE2
error decrease some more. The comparison of resultsobtianed applying or not this step are shown in table 2.
We test our method and compare it to the otherdominant points extraction techniques on commonshapes (taken by [42] and [43]) also. In fig. 7 it’spossibile to see some shapes we used in experiments.These images are processed by tresholding camerataken objects and are affected by noise. For eachimage the graph which shows theE2 error trendagainst the dominant point number is plotted. We usethe log scale for the errorE2. We obtain such valuesby varying the input parameter for each methodexcept for the Teh-Chin method which does notrequire any. These graphs confirm the effectiveness ofour method. Worse results of other methods probablyare due to the noise sensitivity.
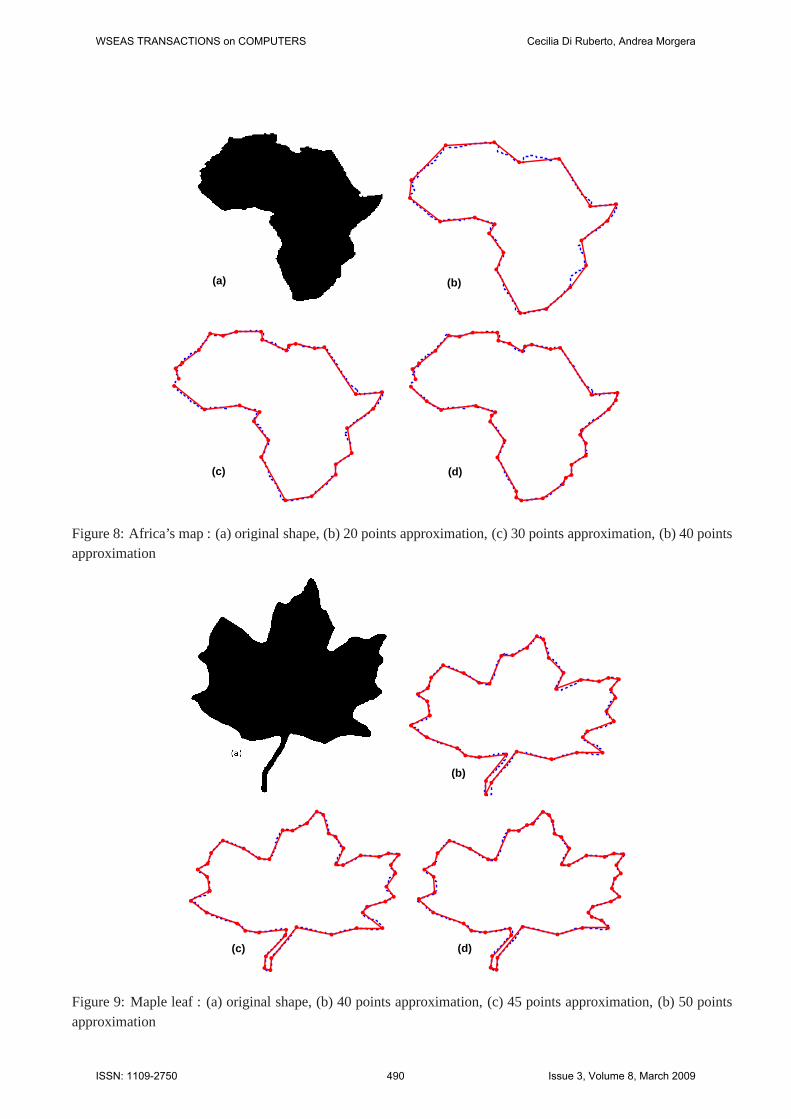
The polygonal approximation for some real im-ages like Africa’s map and maple leaf (taken by [44])are shown in fig. 8 and 9, respectively. We workwith Matlab 2008 running on a Linux 64 bit operatingsystem on AMD64 6000 platform. The Africa’s mapcontour is composed by 1364 points: we calculate theapproximation with 20, 30 and 40 points respectively(the dotted line is the original contour). The result-ing computational time is 0.0756 sec., 0.0731 sec and0.0659 sec. The maple leaf shape is composed by1630 points : we calculate the approximation with 40,45 and 50 points respectively (the dotted line is theoriginal contour). The resulting computational time is0.1343 sec., 0.1449 sec and 0.1895 sec. respectively.
5 Conclusions
The problem to find a fast and accurate method tofind a set of dominant points given a contour shapeis addressed in this paper. The proposed method notonly has a very low computational time and robust-ness to noise but also produces a good polygonal ap-proximation while keeping low theE2 error. By em-pirical evidence we notice that a threshold value in arange around 0.5 give the bestE2/CR value and animprovement of the proposed method by doing with-out the threshold input parameter in future works isplanned.
References:
[1] V. Papic, H. Dujmic, ”A curve matching algo-rithm for dynamic image sequences”, WSEASTransactions on Computers, vol. 4 (11), pp.1713-1717, 2005
WSEAS TRANSACTIONS on COMPUTERS Cecilia Di Ruberto, Andrea Morgera
ISSN: 1109-2750 486 Issue 3, Volume 8, March 2009

(a) (b) (c)
(d) (e) (f)
Figure 3: Chromosome shape (50 points) : (a) Teh-Chin (15 points), (b) Wu BV (16 points), (c) Wu DYN (17points), (d) our method (15 points), (e) our method (16 points), (f) our method (17 points)
(a) (b) (c)
(d)
Figure 4: Infinite shape (45 points) : (a) Teh-Chin (13 points), (b) Wu BV (13 points), (c) Wu DYN (13 points),(d) our method (13 points)
WSEAS TRANSACTIONS on COMPUTERS Cecilia Di Ruberto, Andrea Morgera
ISSN: 1109-2750 487 Issue 3, Volume 8, March 2009

(a) (b) (c)
(d) (e) (f)
Figure 5: Leaf shape (120 points) : (a) Teh-Chin (29 points), (b) Wu BV (24 points), (c) Wu DYN(23 points), (d)our method (23 points), (e) our method (24 points), (f) our method (29 points)
(a) (b) (c)
(d) (e)
Figure 6: Semicircle shape (102 points) : (a) Teh-Chin (22 points), (b) Wu BV (26 points), (c) Wu DYN (27points), (d) our method (23 points), (e) our method (27 points)
WSEAS TRANSACTIONS on COMPUTERS Cecilia Di Ruberto, Andrea Morgera
ISSN: 1109-2750 488 Issue 3, Volume 8, March 2009

0102030405060708010
1
102
103
104
105
106
Dominant points number
E2
(log)
Our method
Wu dynamic
Wu bending value
Teh−Chin
0510152025303540455010
1
102
103
104
105
106
Dominant points number
E2
(log)
Our methodWu dynamicWu bending valueTeh−Chin
010203040506010
1
102
103
104
105
106
Dominant points number
E2
(log)
Our methodWu dynamicWu bending valueTeh−Chin
01020304050607010
2
103
104
105
106
107
Dominant points number
E2
(log)
Our methodWu dynamicWu bending valueTeh−Chin
0102030405060708010
1
102
103
104
105
106
Dominant points number
E2
(log)
Our methodWu dynamicWu bending valueTeh−Chin
01020304050607010
2
103
104
105
106
Dominant points number
E2
(log)
Our methodWu dynamicWu bending valueTeh−Chin
0510152025303540455010
1
102
103
104
105
106
Dominant points number
E2
(log)
Our methodWu dynamicWu bending valueTeh−Chin
0510152025303540455010
1
102
103
104
105
106
Dominant points number
E2
(log)
Our methodWu dynamicWu bending valueTeh−Chin
Figure 7: Shapes used in the experiments.
WSEAS TRANSACTIONS on COMPUTERS Cecilia Di Ruberto, Andrea Morgera
ISSN: 1109-2750 489 Issue 3, Volume 8, March 2009
(a) (b)
(c) (d)
Figure 8: Africa’s map : (a) original shape, (b) 20 points approximation, (c) 30 points approximation, (b) 40 pointsapproximation
(b)
(c) (d)
Figure 9: Maple leaf : (a) original shape, (b) 40 points approximation, (c) 45 points approximation, (b) 50 pointsapproximation
WSEAS TRANSACTIONS on COMPUTERS Cecilia Di Ruberto, Andrea Morgera
ISSN: 1109-2750 490 Issue 3, Volume 8, March 2009

Contour Method m CR E2 s E2/CR
Chromosome (points=60) Our method 15 4 6.5 .5 1.64Our method 16 3.75 4.62 .475 1.23Our method 17 3.53 3.74 .45 1.06Teh-Chin 15 4 7.19 none 1.8Wu bv 16 3.75 4.70 n.a. 1.25Wu dyn 17 3.53 5.01 n.a. 1,42
Leaf (points=120) Our method 23 5.22 14.32 .45 2.74Our method 24 5 12.73 .42 2.55Our method 29 4.14 7.90 .365 1.91Teh-Chin 29 4.14 14.96 none 3.62Wu bv 24 5 17.40 n.a. 3.48Wu dyn 23 5.22 22.44 n.a. 4.3
Semicircle (points=102) Our method 23 4.43 11.65 .4487 2.37Our method 27 3.78 6.85 .44 1.51Teh-Chin 22 4.64 21.86 none 4.45Wu bv 26 3.92 9.04 n.a. 2.18Wu dyn 27 3.78 9.92 n.a. 2.49
Infinite (points=45) Our method 13 3.46 3.65 .4 1.05Teh-Chin 13 3.46 5.93 none 1.71Wu bv 13 3.46 5.40 n.a. 1.56Wu dyn 13 3.46 5.60 n.a. 1.62
Table 1: Comparative results for the proposed method
[2] V. Papic, H. Dujmic, ”A Procedure for TracingSimple Curves in Image Sequences”, WSEASTransactions on Information Science & Appli-cations, vol. 3 (1), pp. 192-198, 2005
[3] C. Y. Liu and R. Du, ”Expert Label Pattern De-sign System”, WSEAS Transactions on Com-puters, Vol. 5 (9), pp. 2077-2083, 2006
[4] A. Rosenfeld, E. Johnston, ”Angle detection ondigital curves”,IEEE Trans. Comput., vol. C-22,pp. 875-878, Sept. 1973
[5] W. Y. Wu, ”A dynamic method for dominantpoint detection”,Graphical Models, vol. 64, pp.304-315, 2003
[6] R. Mehrotra, S. Nichany, ”Corner detection”,Pattern Recognition vol. 23 pp. 12231233, 1990
[7] X. Xie, ”Corner detection by a cost minimiza-tion approach”, Pattern Recognition vol. 26 pp.12351243, 1993.
[8] Z. Zheng, H. Wang, E.K. Teoh, ”Analysis ofgray level corner detection”, Pattern RecognitionLetters vol. 20 pp. 149162, 1999
[9] H. Freeman, L. S. Davis, ”A corner-finding al-gorithm for chain-coded curves”,IEEE Trans.Comput., vol. C-26, pp. 297-303, Mar. 1977
[10] A. Rosenfeld, J. S. Weszka, ”An improvedmethod of angle detection in digital curves”,IEEE Trans. Comput., vol. C-24, pp. 940-941,Sept. 1975
[11] C. Teh, T. Chin, ”On the detection of. dominantpoints on digital curves”,IEEE Trans. Pattern
WSEAS TRANSACTIONS on COMPUTERS Cecilia Di Ruberto, Andrea Morgera
ISSN: 1109-2750 491 Issue 3, Volume 8, March 2009

Contour Without With
Chromosome (15 pts.) 6.5 4.21Chromosome (16 pts.) 4.62 3.78Chromosome (17 pts.) 3.74 3.59
Leaf (23 pts.) 14.32 12.47Leaf (24 pts.) 12.73 12.12Leaf (29 pts.) 7.90 7.84
Semicircle (23 pts.) 11.65 9.14Semicircle (27 pts.) 6.85 5.61
Infinite (13 pts.) 3.65 2.88
Table 2:E2 comparative results for the proposed method with and without the final refinement process
Anal. Machine Intelligence, vol. 11, pp. 859-872, Aug. 1989
[12] P. Cornic, ”Another look at dominant point de-tection of digital curves”, Pattern RecognitionLetters vol.18 pp-13-25, 1997
[13] W. Y. Wu, ”Dominant point detection usingadaptive bending value”,Image and VisionComp., vol. 21, pp. 517-525, 2003
[14] H. Freeman, ”On the encoding of arbitrary ge-ometric configurations”, IRE Transactions onElectronic Computers, vol. 10, pp. 260-268,1961
[15] B. K. Ray, K. S. Ray, ”An algorithm for detec-tion of dominant points and polygonal approxi-mation of digitized curves”,Pattern Rec. Letters,vol. 13, N. 12, pp. 849-856, 1992
[16] B. K. Ray, K. S. Ray, ”Detection of significantpoints and polygonal approximation of digitizedcurves”, Pattern Recognition Letters, vol. 12, pp.443-452, 1992
[17] D. Chetverikov, Z. Szabo, ”A simple and effi-cient algorithm for detection of high curvaturepoints in planar curves”, Proc. of the 23rd Work-shop of the Austrian Pattern Recognition Group,pp. 174-184, 1999
[18] F. Leymarie, M.D. Levine, ”Curvature Morphol-ogy”, TR-CIM-88-26, Center of Intelligent Ma-chines, McGill University, Montreal, Canada,1988
[19] X. Zhang, D. Zhao, ”A parallel algorithm fordetecting dominant points on multiple digi-tal curves”, Pattern Recognition, vol. 30 pp.239244, 1997
[20] P.V. Sankar, C.V. Sharma, ”A parallel procedurefor the detection of dominant points on a digitalcurve”, Comput. Graphics Image Process. vol. 7pp. 403412, 1978
[21] K.H. Cheng, W.H. Hsu, ”Parallel algorithmsfor corner following on digital curves”, PatternRecognition Letters Vol. 8 pp. 4753, 1988
[22] T.Y. Phillips, A. Rosenfeld, ”A method for curvepartitioning using arc-chord distance”, PatternRecognition Letters Vol. 5(4) pp. 285288, 1987
[23] M.A. Fischler, H.C. Wolf, ”Locating percep-tually salient points on planar curves”, IEEETrans. Pattern Anal. Mach. Intell. vol. 16 (2) pp.113129, 1994.
[24] J.H. Han, T. Poston, ”Chord-to-point distanceaccumulation and planar curvature: a new ap-proach to discrete curvature”, Pattern Recogni-tion Letters Vol. 22 pp. 11331144, 2001
[25] G. Medioni, Y. Yasumoto, ”Corner detectionand curve representation using cubic B-splines”,Comput. Vision Graphics Image Process. vol. 39pp. 267278, 1987
[26] D.M. Tsai, M.F. Chen, ”Curve fitting approachfor tangent angle and curvature measurement”,Pattern Recognition vol. 27 (5) pp. 699711,(1994)
[27] H. Ogawa, ”Corner detection on digital curvesbased on local symmetry of the shape”, PatternRecognition vol. 22 pp. 351357, 1989
[28] N. Ansari, K.W. Huang, ”Non-parametric dom-inant point detection”, Pattern Recognition vol.24 pp. 849862, 1991
[29] N. Ansari, J. Delp, ”On detecting dominantpoints”, Pattern Recognition vol. 24 pp. 414415,1991
[30] D. Sarkar, ”A simple algorithm for detectionof significant vertices for polygonal approxima-tion of chain-coded curves”, Pattern RecognitionLetters vol. 14 pp. 959964, 1993
[31] J. Koplowitz, S. Plante, ”Corner detection forchain coded curves”, Pattern Recognition vol. 28pp. 843852, 1995
WSEAS TRANSACTIONS on COMPUTERS Cecilia Di Ruberto, Andrea Morgera
ISSN: 1109-2750 492 Issue 3, Volume 8, March 2009

[32] C.H. Chang, S.Y. Hwang, ”2D curve partitioningby Kohonen Feature Maps”, J. Visual Comm.Image Rep. vol. 5 (2) pp. 148155, 1994
[33] Du-Ming Tsai, ”Boundary-based corner detec-tion using neural networks”, Pattern Recognitionvol. 30 pp. 8597, 1997
[34] X.C. Pei, J.H. Horng, ”Corner point detectionusing nest moving averages”, Pattern Recogni-tion vol. 27 pp. 15331537, 1994
[35] J.S. Lee, Y.N. Sun, C.H. Chen, C.T. Tsai,”Wavelet based corner detection”, PatternRecognition vol. 26 pp. 853865, 1993
[36] A. Quddus, M.M. Fahmy, ”Fast wavelet-basedcorner detection technique”, Electron. Lett. vol,35 (4) 287288, pp. 1999
[37] K. Wu, M. Levine, ”2D shape segmentation: anew approach”, Pattern Recognition Letters vol.7 pp. 133140, 1996
[38] L. Li, W. Chen, ”Corner detection and interpre-tation on planar curves using fuzzy reasoning”,IEEE Trans. PAMI vol. 21 (11) pp. 12041210,1999
[39] P. Phokharatkul, S. Kamnuanchai, C. Kimpan,S. Phaiboon, ”Comparative Study of B-Splineand Cardinal Spline with Genetic Algorithm forInvariant Shape Object Recognition”, WSEASTransactions on Computers, vol. 5 (3), pp.536-543, 2006
[40] F.C.A: Groan, P.W. Verbeek, ”Freeman-codeprobabilities of object boundary quantized con-tours”, Comput. Vision, Graphics, Image Pro-cessing, vol. 7 pp.391-402, 1978
[41] D. DeTurck, H. Gluck, D. Pomerleano, D. S.Vick, ”The four vertex theorem and its con-verse”,Notice of the AMS, vol. 54, n. 2, pp. 192-207, Feb. 2007
[42] http://www.cs.rutgers.edu/pub/sven/rutgers-tools/
[43] http://www.lems.brown.edu/vision/software/[44] A. Masood, ”Dominant point detection by re-
verse polygonization of digital curves”,Imageand Vision Comp., vol. 26, pp. 702-715, 2008
WSEAS TRANSACTIONS on COMPUTERS Cecilia Di Ruberto, Andrea Morgera
ISSN: 1109-2750 493 Issue 3, Volume 8, March 2009
Copyright © 2022 FDOKUMEN