
Rain water harvesting - International Journal of Advancements ...
Upload
independentCategory
view
7download
0
PLANT-ANIMAL INTERACTIONS - ORIGINAL PAPER
A network analysis of plant–pollinator interactions in temperaterain forests of Chiloe Island, Chile
Rodrigo Ramos-Jiliberto Æ Abraham A. Albornoz ÆFernanda S. Valdovinos Æ Cecilia Smith-Ramırez ÆMatıas Arim Æ Juan J. Armesto Æ Pablo A. Marquet
Received: 15 September 2008 / Accepted: 26 March 2009 / Published online: 24 April 2009
� Springer-Verlag 2009
Abstract This study characterizes the structure of a
plant–pollinator network in a temperate rain forest of
Chiloe Island, southern Chile, where woody species are
strongly dependent on biotic pollinators, and analyzes its
robustness to the loss of participating species. Degree
distribution, nestedness, and expected species persistence
were evaluated. In addition, we assessed the roles of
predefined subsets of plants (classified by life forms) and
pollinators (grouped by taxonomic orders) in the network’s
structure and dynamics. For this, we simulated the com-
plete removal of each plant and pollinator subset and
analyzed the resultant connectivity patterns, as well as the
expected long-term species losses by running a stochastic
model. Finally, we evaluated the sensitivity of the network
structure to the loss of single species in order to identify
potential targets for conservation. Our results show that the
plant–pollinator network of this Chilean temperate rain
forest exhibits a nested structure of interactions, with a
degree distribution best described by a power law model.
Model simulations revealed the importance of trees and
hymenopterans as pivotal groups that maintain the core
structure of the pollination network and guarantee overall
species persistence. The hymenopterans Bombus dahlbomii
and Diphaglossa gayi, the shrubs Tepualia stipularis and
Ugni molinae, the vines Mitraria coccinea and Asteran-
thera ovata, and the entire set of tree species exerted a
disproportionately large influence on the preservation of
network structure and should be considered as focal species
for conservation programs given current threats from
selective logging and habitat loss.
Keywords Mutualistic networks � Pollination web �Degree distribution � Nestedness � Network dynamics
Introduction
Underlying the functioning of biological systems is a
complex network of interactions and exchange of energy,
materials and information. Thus, analysis of the network
structure of ecological systems has emerged as a funda-
mental approach to gain better insights into community
Communicated by Miguel Franco.
R. Ramos-Jiliberto (&) � F. S. Valdovinos
Departamento de Ciencias Ecologicas, Facultad de Ciencias,
Universidad de Chile, Casilla 653,
Santiago, Chile
e-mail: [email protected]
Present Address:R. Ramos-Jiliberto
Centro Nacional del Medio Ambiente (A Foundation
of Universidad de Chile), Av. Larraın, 9975
La Reina, Santiago, Chile
A. A. Albornoz
Departamento de Silvicultura, Facultad de Ciencias Forestales,
Universidad de Chile, Casilla, 9206 Santiago, Chile
C. Smith-Ramırez � M. Arim � J. J. Armesto � P. A. Marquet
Departamento de Ecologıa, Facultad de Ciencias Biologicas
and Center for Advanced Studies in Ecology and Biodiversity
(CASEB), Pontificia Universidad Catolica de Chile,
CP 6513677 Santiago, Chile
C. Smith-Ramırez � M. Arim � J. J. Armesto � P. A. Marquet
Instituto de Ecologıa y Biodiversidad (IEB),
Casilla 653, Santiago, Chile
M. Arim
Seccion Zoologıa Vertebrados, Facultad de Ciencias,
Universidad de la Republica, Igua 4225 Piso 9 Sur,
Montevideo, Uruguay
123
Oecologia (2009) 160:697–706
DOI 10.1007/s00442-009-1344-7
function, and as a simple way of dealing with complex,
many-species systems (see Pascual and Dunne 2006).
Recently, network theory has been applied to the analysis
of complex ecological interaction networks, both as a
testing ground for topological relationships found in other
complex networks and as a tool to gain understanding on
their structure and functioning. These applications have
dealt primarily with the analysis of food webs (Martinez
1992; Williams and Martinez 2000; Montoya and Sole
2003; Pascual and Dunne 2006) and plant–pollinator sys-
tems (Jordano 1987; Memmott 1999; Bascompte et al.
2003; Jordano et al. 2003; Bascompte and Jordano 2007).
The structure of species-rich pollination webs is typi-
cally represented as bipartite graphs whose nodes represent
one out of two categories (animals or plants). The fragility
of plant–pollinator networks has been shown to be
dependent on their topology, i.e. the specific pattern of
connections among nodes (Memmott et al. 2004). Conse-
quently, both structure and dynamics of pollination net-
works ought to be considered in order to evaluate the
community robustness to current or future environmental
perturbations (Bascompte and Jordano 2007).
In this work we characterize and analyze a well-defined
pollination network from temperate rain forests of northern
Chiloe Island, southern Chile. In this ecosystem most
woody species are strongly dependent upon biotic pollina-
tion for reproduction (Armesto et al. 1996; Smith-Ramırez
et al. 2005). We first characterize the structure of the pol-
lination network through the evaluation of two basic topo-
logical properties: degree distribution and nestedness. Then,
we discern the potential importance of selected groups of
species, as well as of individual species, on maintaining the
structure and diversity of the studied network.
‘‘Degree distribution’’ is the frequency of species with a
given number of links, and for pollination networks it
follows a skewed distribution best described by functions
such as power law or truncated power law with exponential
decay (Jordano et al. 2003; Vazquez 2005). Networks
exhibiting skewed degree distributions tend to be robust to
random node loss and susceptible to loss of high-degree
nodes (Albert et al. 2000; Dunne et al. 2002b). This pattern
will be more pronounced in networks with greater skew.
The second topological property analyzed here is ‘‘nest-
edness’’. In a perfectly nested network the more specialized
species interact with species that are proper subsets of
those species interacting with the more generalist ones
(Bascompte et al. 2003). Thus, a small number of gener-
alists form the core of interactions in the network. Nest-
edness is also related to robustness of mutualistic networks
to random species extinctions (Memmott et al. 2004).
In order to discern the importance of predefined subsets
of plants and pollinators in maintaining the network
structure and species diversity, we deconstruct the
pollination network (Marquet et al. 2004) by simulating the
loss of different subsets of plants (according to their life
form) and pollinators (according to their taxonomic order).
For each of the remnant subwebs we analyze their topo-
logical properties and project, by means of a dynamic
model, the expected amount of long-term species extinc-
tions. Finally, and given that members of each removed
species group can differ markedly in their connectivity
attributes, we evaluate the sensitivity of the network
structure to the loss of individual species. This allows the
identification of key network components for the mainte-
nance of community integrity, which may be sensible tar-
gets for local conservation efforts.
Materials and methods
Study site and network sampling
Records of flower visitors were obtained during three con-
secutive reproductive seasons, October 1999–January 2000,
October 2000–March 2001, and October 2001–February
2002, in a mosaic of old-growth and second-growth forest
patches, within a rural landscape in northern Chiloe Island,
southern Chile (428S, 738350W, 30 m above sea level).
Floristic composition of forest fragments is typical of the
highly endemic Valdivian and North Patagonian rain forests
(Heywood 1995; Aravena et al. 2002), some of the richest
forest associations in southern South America. The forests
are dominated by evergreen broad-leaved tree species, with
a profuse cover of vines and epiphytes, and receive about
2,050 mm of rain per year under a cool-temperate climate
moderated by oceanic influence. Additional climatic, geo-
graphic and biological information on the study system has
been provided elsewhere (Smith-Ramırez et al. 2005)
To assess the identity, number, and frequency of animal
pollinators visiting the flowers, field observations were
concentrated during the period (approximately 1 week) of
maximum flowering of each plant species, anticipated from
previous phenological records in the same study area
(Smith-Ramırez and Armesto 1994). Floral visitors to each
plant species that contacted the anthers and/or stigmas of
the flowers were recorded during several 20-min observa-
tion periods (sample unit). Observations were made on
flowers from ground level up to 3.5 m above ground (in the
case of trees). Observation periods were uniformly dis-
tributed between 10 a.m. and 6 p.m. each day. During each
20-min period, a single plant species was observed from a
fixed point by one observer and each pollinator visit to a
previously defined number of visible (exposed) open
flowers was recorded. With the exception of one hum-
mingbird species, all flower visitors were insects. Addi-
tional methods, as well as the complete plant and pollinator
698 Oecologia (2009) 160:697–706
123

species list and network, can be found in Smith-Ramırez
et al. (2005).
Pollinator network statistics
Degree distribution describes the frequency with which
species with different numbers of links occur in any given
network (Newman 2005). To assess the form of this dis-
tribution, it is customary to use the cumulative probability
of the number of links (Amaral et al. 2000; Strogatz 2001)
to avoid the problem of the arbitrary exclusion of null bins,
thus improving the estimation for small and noisy datasets
(Dunne et al. 2002a).
For each observed distribution, we fitted three alterna-
tive models: exponential P Kð Þ� e�aKð Þ, power law
P Kð Þ�K�cð Þ and truncated power law P Kð Þ�K�cðe�K=KcÞ where a and c are the fitted constants and Kc is the
truncation value that defines the exponential cut-off. The
truncated power law is the most general of these models. If
c is zero, the truncated power law model is equivalent to
the exponential model, and if Kc is higher than the maxi-
mum observed degree, the truncated power law approaches
the power law model in the positive quadrant (Valdovinos
et al. 2009). The Akaike information criterion (AIC) was
used to select the best model describing the observed
degree distribution (Burnham and Anderson 2004). To
avoid over fitting, we used the corrected AIC, which con-
verges to AIC as sample size increases.
Nestedness was measured through the matrix tempera-
ture (T), with values ranging from 0 for perfectly nested
networks to 100 for perfectly non-nested networks (Atmar
and Patterson 1993). A perfectly nested network implies
that the more specialist species interact with species that
are proper subsets of those species interacting with the
more generalist ones (Bascompte et al. 2003). In order to
evaluate the statistical significance of observed nestedness,
we compared the T value of each network matrix against
the distribution of T obtained from 1,000 networks with
equal numbers of animals and plants, generated from a null
model which assumes that each plant–animal pair interacts
with a probability proportional to the observed number of
interactions of both species (Bascompte et al. 2003).
Nestedness was estimated using the program BINMAT-
NEST (Rodrıguez-Girones and Santamarıa 2006). For
comparison of nestedness between the full network and the
subwebs produced by the removal of species we used a
batch version of BINMATNEST, specially developed to
perform rapid analysis of many matrices. This version of
the software is available upon request from its author M. A.
Rodrıguez-Girones.
The probability of ‘‘species persistence’’ was assessed
by connecting the observed qualitative pattern of mutual-
istic interactions to a stochastic dynamic model (Fortuna
and Bascompte 2006). The model considers mutualists
inhabiting a landscape consisting of an infinite number of
identical, well-mixed patches. The interaction is obligate
for the animals, while the plants are able to survive in the
absence of animals, but cannot reproduce without them.
The temporal dynamics of the fractions of total available
patches occupied by plant i, pi, and animal j, aj, are
described by:
dpi
dt¼Xn
j¼1
cijpiaj
Xj
� �1� pið Þ � eipi
daj
dt¼ cjaj Xj � aj
� �� ejaj
where cij is the per capita colonization rate of plant i when
pollinated by animal j, and cj is the per capita colonization
rate of animal j. Per capita extinction rates for plant i and
animal j are given respectively by ei and ej. It is assumed
that the extinction of plants from a patch causes the sec-
ondary extinction of the animal depending exclusively on
those plants. Parameter Xj (see Fortuna and Bascompte
2006 for details) is the union of patches occupied by n plant
species interacting with the same j animal species (i.e. the
total available patches for the j animal).
Following Fortuna and Bascompte (2006), we randomly
sampled the value of e/c from a uniform distribution cen-
tered on kp = ei/ci for plants and ka = ej/cj for animals,
with an interval size of 0.1. Initial conditions for each
species in the network were also randomly sampled from a
uniform distribution in the unit interval. A species was
considered extinct when the proportion of occupied patches
fell below a threshold value of 0.001. Each pollination
network was run for 2,000 iterations and then the fraction
of extinct species was recorded. Parameter values used
were k = 0.25, k = 0.5 and k = 0.75.
For each combination of parameter values, 1,000 model
realizations were run for each analyzed network. These
were: the complete observed network P, and the networks
in which we removed the species of vines (V), shrubs (S),
trees (T), hymenopterans (H), dipterans (D), and coleopt-
erans (C). In order to control for changes in network size,
we also ran the model (1,000 realizations each) for net-
works in which an equal number of randomly chosen
species were removed. These null networks were labeled,
accordingly, as V0, S0, T0, H0, D0, and C0.
The effects of individual species loss on the network
topology were assessed through measuring network tem-
perature and the value of the fitted exponent of the degree
distribution, after deleting with replacement each of the
participant species. These manipulations include the sec-
ondary loss of those specialists directly linked only with
the deleted species, together with the subtraction of one
degree from all other species directly linked with the
deleted one.
Oecologia (2009) 160:697–706 699
123
Results
The pollination network involved 128 pollinator and 26
plant species displaying 313 mutualistic interactions
(Table 1). Among the plants there were 11 shrub species,
nine tree species, and five vines; insect species were
dominated by 21 hymenopterans, 52 dipterans, and 47
coleopterans.
Degree distribution and nestedness
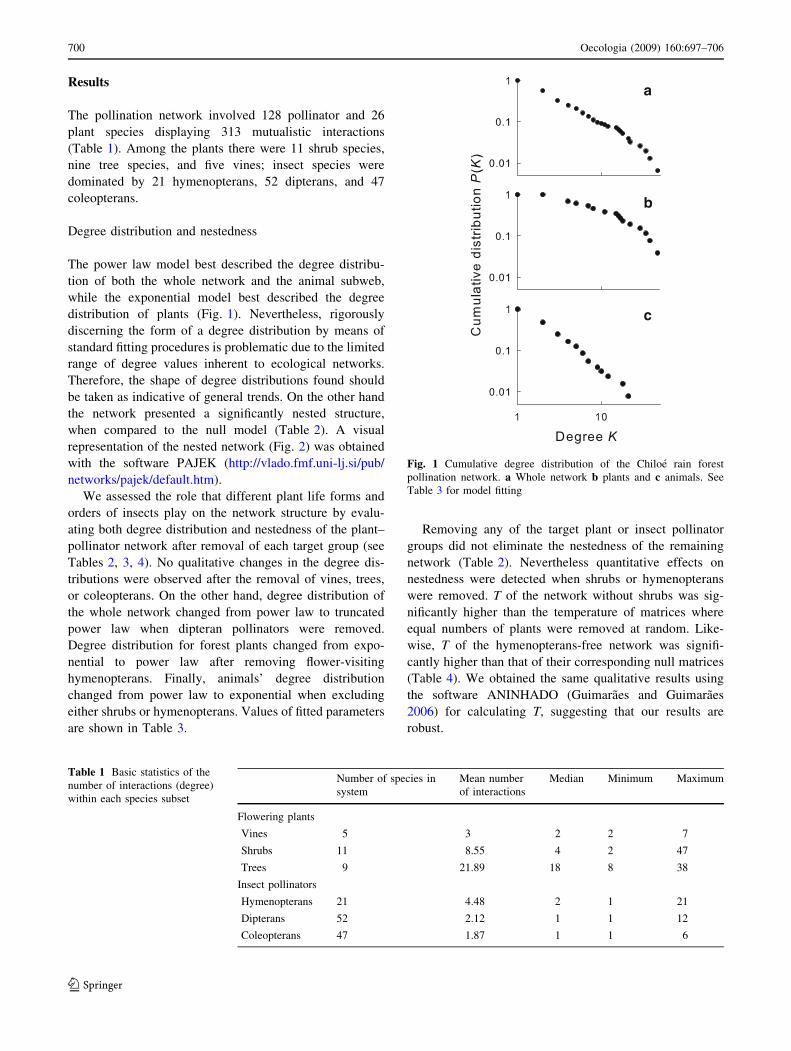
The power law model best described the degree distribu-
tion of both the whole network and the animal subweb,
while the exponential model best described the degree
distribution of plants (Fig. 1). Nevertheless, rigorously
discerning the form of a degree distribution by means of
standard fitting procedures is problematic due to the limited
range of degree values inherent to ecological networks.
Therefore, the shape of degree distributions found should
be taken as indicative of general trends. On the other hand
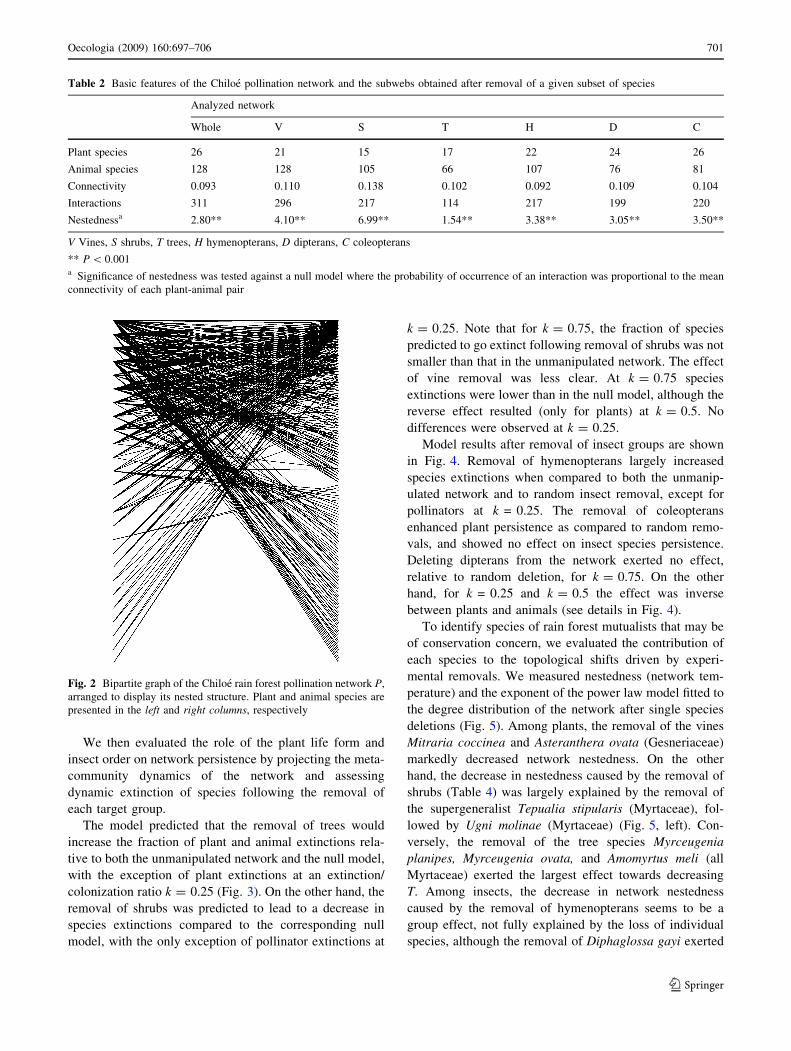
the network presented a significantly nested structure,
when compared to the null model (Table 2). A visual
representation of the nested network (Fig. 2) was obtained
with the software PAJEK (http://vlado.fmf.uni-lj.si/pub/
networks/pajek/default.htm).
We assessed the role that different plant life forms and
orders of insects play on the network structure by evalu-
ating both degree distribution and nestedness of the plant–
pollinator network after removal of each target group (see
Tables 2, 3, 4). No qualitative changes in the degree dis-
tributions were observed after the removal of vines, trees,
or coleopterans. On the other hand, degree distribution of
the whole network changed from power law to truncated
power law when dipteran pollinators were removed.
Degree distribution for forest plants changed from expo-
nential to power law after removing flower-visiting
hymenopterans. Finally, animals’ degree distribution
changed from power law to exponential when excluding
either shrubs or hymenopterans. Values of fitted parameters
are shown in Table 3.
Removing any of the target plant or insect pollinator
groups did not eliminate the nestedness of the remaining
network (Table 2). Nevertheless quantitative effects on
nestedness were detected when shrubs or hymenopterans
were removed. T of the network without shrubs was sig-
nificantly higher than the temperature of matrices where
equal numbers of plants were removed at random. Like-
wise, T of the hymenopterans-free network was signifi-
cantly higher than that of their corresponding null matrices
(Table 4). We obtained the same qualitative results using
the software ANINHADO (Guimaraes and Guimaraes
2006) for calculating T, suggesting that our results are
robust.
Table 1 Basic statistics of the
number of interactions (degree)
within each species subset
Number of species in
system
Mean number
of interactions
Median Minimum Maximum
Flowering plants
Vines 5 3 2 2 7
Shrubs 11 8.55 4 2 47
Trees 9 21.89 18 8 38
Insect pollinators
Hymenopterans 21 4.48 2 1 21
Dipterans 52 2.12 1 1 12
Coleopterans 47 1.87 1 1 6
a
b
c
Fig. 1 Cumulative degree distribution of the Chiloe rain forest
pollination network. a Whole network b plants and c animals. See
Table 3 for model fitting
700 Oecologia (2009) 160:697–706
123
We then evaluated the role of the plant life form and
insect order on network persistence by projecting the meta-
community dynamics of the network and assessing
dynamic extinction of species following the removal of
each target group.
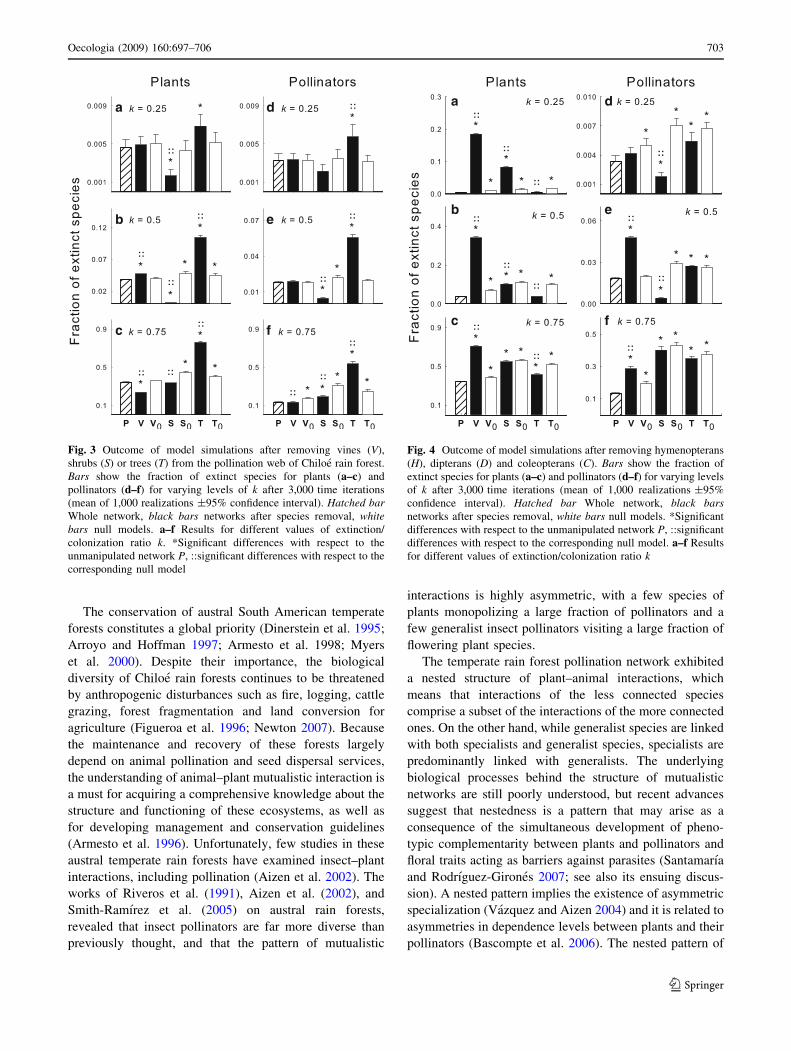
The model predicted that the removal of trees would
increase the fraction of plant and animal extinctions rela-
tive to both the unmanipulated network and the null model,
with the exception of plant extinctions at an extinction/
colonization ratio k = 0.25 (Fig. 3). On the other hand, the
removal of shrubs was predicted to lead to a decrease in
species extinctions compared to the corresponding null
model, with the only exception of pollinator extinctions at
k = 0.25. Note that for k = 0.75, the fraction of species
predicted to go extinct following removal of shrubs was not
smaller than that in the unmanipulated network. The effect
of vine removal was less clear. At k = 0.75 species
extinctions were lower than in the null model, although the
reverse effect resulted (only for plants) at k = 0.5. No
differences were observed at k = 0.25.
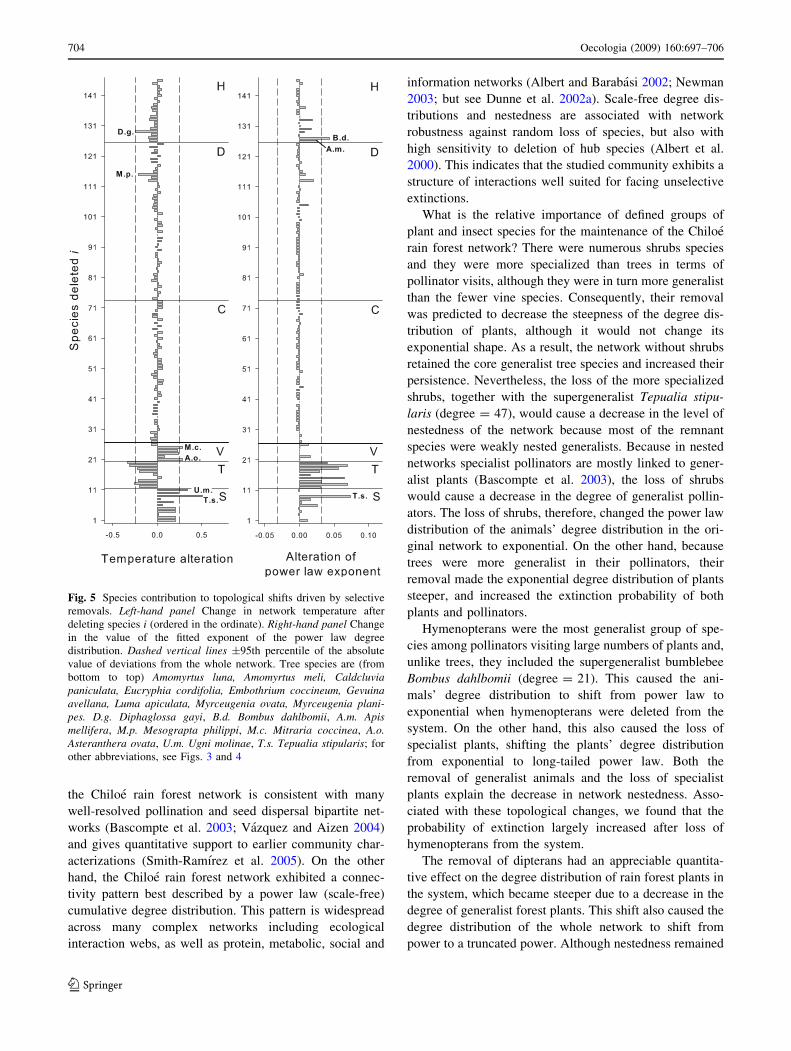
Model results after removal of insect groups are shown
in Fig. 4. Removal of hymenopterans largely increased
species extinctions when compared to both the unmanip-
ulated network and to random insect removal, except for
pollinators at k = 0.25. The removal of coleopterans
enhanced plant persistence as compared to random remo-
vals, and showed no effect on insect species persistence.
Deleting dipterans from the network exerted no effect,
relative to random deletion, for k = 0.75. On the other
hand, for k = 0.25 and k = 0.5 the effect was inverse
between plants and animals (see details in Fig. 4).
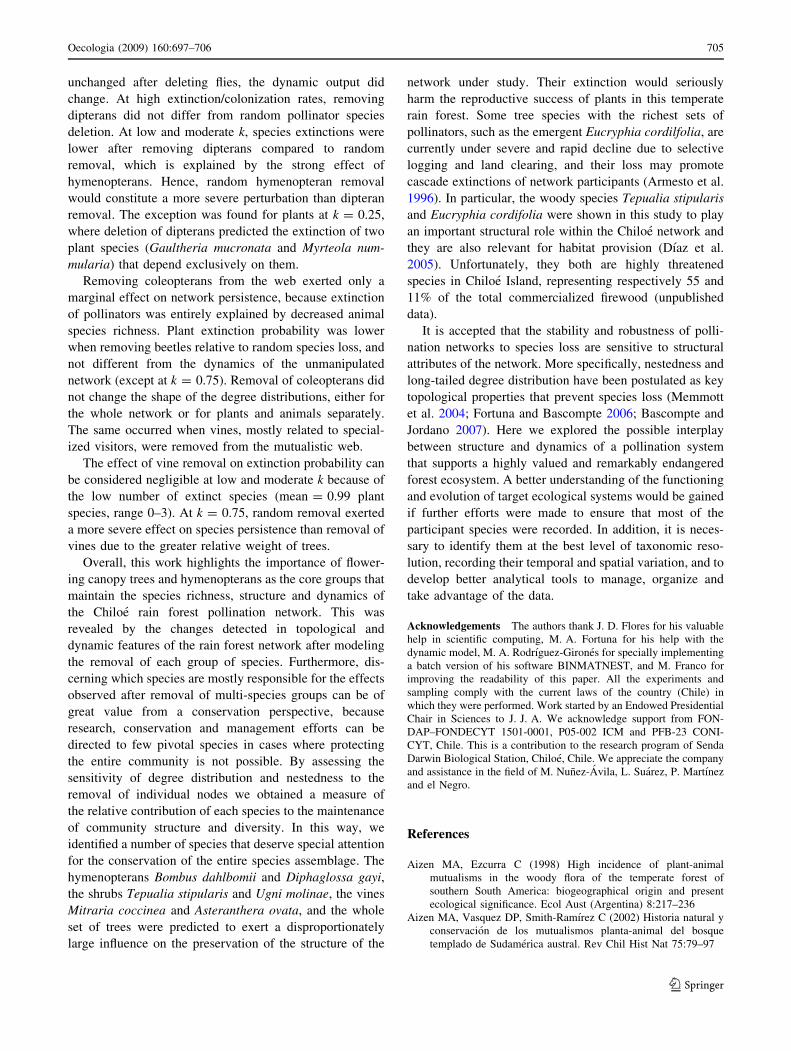
To identify species of rain forest mutualists that may be
of conservation concern, we evaluated the contribution of
each species to the topological shifts driven by experi-
mental removals. We measured nestedness (network tem-
perature) and the exponent of the power law model fitted to
the degree distribution of the network after single species
deletions (Fig. 5). Among plants, the removal of the vines
Mitraria coccinea and Asteranthera ovata (Gesneriaceae)
markedly decreased network nestedness. On the other
hand, the decrease in nestedness caused by the removal of
shrubs (Table 4) was largely explained by the removal of
the supergeneralist Tepualia stipularis (Myrtaceae), fol-
lowed by Ugni molinae (Myrtaceae) (Fig. 5, left). Con-
versely, the removal of the tree species Myrceugenia
planipes, Myrceugenia ovata, and Amomyrtus meli (all
Myrtaceae) exerted the largest effect towards decreasing
T. Among insects, the decrease in network nestedness
caused by the removal of hymenopterans seems to be a
group effect, not fully explained by the loss of individual
species, although the removal of Diphaglossa gayi exerted
Table 2 Basic features of the Chiloe pollination network and the subwebs obtained after removal of a given subset of species
Analyzed network
Whole V S T H D C
Plant species 26 21 15 17 22 24 26
Animal species 128 128 105 66 107 76 81
Connectivity 0.093 0.110 0.138 0.102 0.092 0.109 0.104
Interactions 311 296 217 114 217 199 220
Nestednessa 2.80** 4.10** 6.99** 1.54** 3.38** 3.05** 3.50**
V Vines, S shrubs, T trees, H hymenopterans, D dipterans, C coleopterans
** P \ 0.001a Significance of nestedness was tested against a null model where the probability of occurrence of an interaction was proportional to the mean
connectivity of each plant-animal pair
Fig. 2 Bipartite graph of the Chiloe rain forest pollination network P,
arranged to display its nested structure. Plant and animal species are
presented in the left and right columns, respectively
Oecologia (2009) 160:697–706 701
123
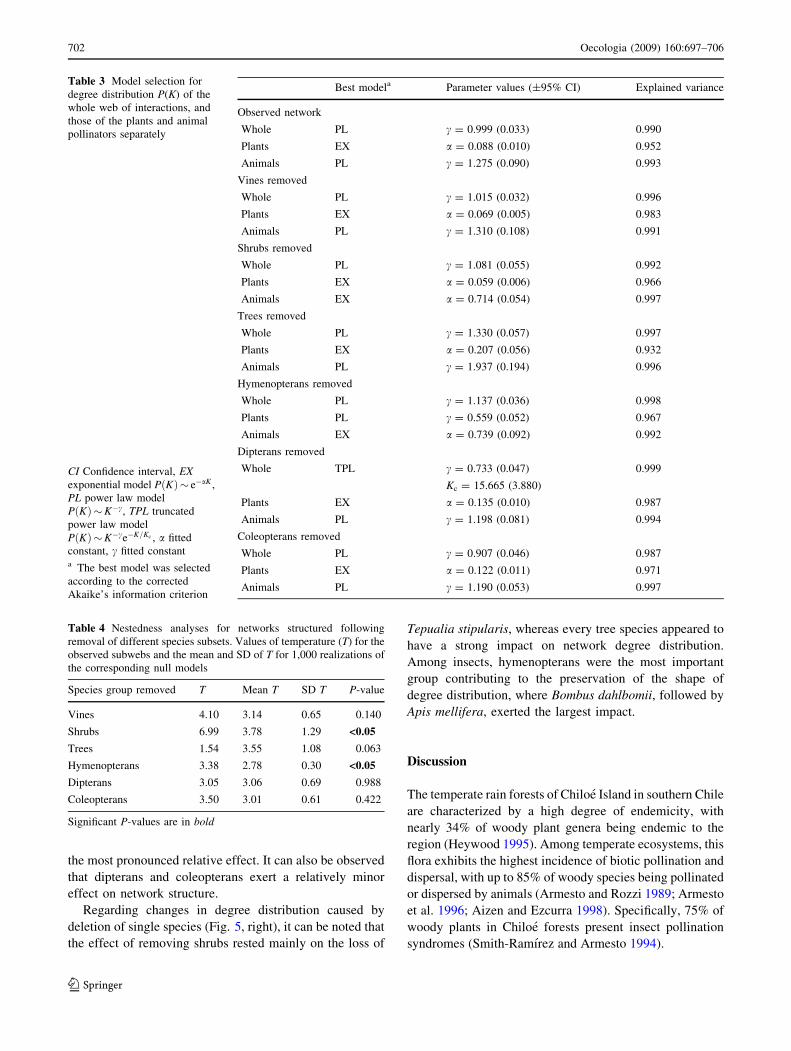
the most pronounced relative effect. It can also be observed
that dipterans and coleopterans exert a relatively minor
effect on network structure.
Regarding changes in degree distribution caused by
deletion of single species (Fig. 5, right), it can be noted that
the effect of removing shrubs rested mainly on the loss of
Tepualia stipularis, whereas every tree species appeared to
have a strong impact on network degree distribution.
Among insects, hymenopterans were the most important
group contributing to the preservation of the shape of
degree distribution, where Bombus dahlbomii, followed by
Apis mellifera, exerted the largest impact.
Discussion
The temperate rain forests of Chiloe Island in southern Chile
are characterized by a high degree of endemicity, with
nearly 34% of woody plant genera being endemic to the
region (Heywood 1995). Among temperate ecosystems, this
flora exhibits the highest incidence of biotic pollination and
dispersal, with up to 85% of woody species being pollinated
or dispersed by animals (Armesto and Rozzi 1989; Armesto
et al. 1996; Aizen and Ezcurra 1998). Specifically, 75% of
woody plants in Chiloe forests present insect pollination
syndromes (Smith-Ramırez and Armesto 1994).
Table 3 Model selection for
degree distribution P(K) of the
whole web of interactions, and
those of the plants and animal
pollinators separately
CI Confidence interval, EXexponential model P Kð Þ� e�aK ,
PL power law model
P Kð Þ�K�c, TPL truncated
power law model
P Kð Þ�K�ce�K=Kc , a fitted
constant, c fitted constanta The best model was selected
according to the corrected
Akaike’s information criterion
Best modela Parameter values (±95% CI) Explained variance
Observed network
Whole PL c = 0.999 (0.033) 0.990
Plants EX a = 0.088 (0.010) 0.952
Animals PL c = 1.275 (0.090) 0.993
Vines removed
Whole PL c = 1.015 (0.032) 0.996
Plants EX a = 0.069 (0.005) 0.983
Animals PL c = 1.310 (0.108) 0.991
Shrubs removed
Whole PL c = 1.081 (0.055) 0.992
Plants EX a = 0.059 (0.006) 0.966
Animals EX a = 0.714 (0.054) 0.997
Trees removed
Whole PL c = 1.330 (0.057) 0.997
Plants EX a = 0.207 (0.056) 0.932
Animals PL c = 1.937 (0.194) 0.996
Hymenopterans removed
Whole PL c = 1.137 (0.036) 0.998
Plants PL c = 0.559 (0.052) 0.967
Animals EX a = 0.739 (0.092) 0.992
Dipterans removed
Whole TPL c = 0.733 (0.047) 0.999
Kc = 15.665 (3.880)
Plants EX a = 0.135 (0.010) 0.987
Animals PL c = 1.198 (0.081) 0.994
Coleopterans removed
Whole PL c = 0.907 (0.046) 0.987
Plants EX a = 0.122 (0.011) 0.971
Animals PL c = 1.190 (0.053) 0.997
Table 4 Nestedness analyses for networks structured following
removal of different species subsets. Values of temperature (T) for the
observed subwebs and the mean and SD of T for 1,000 realizations of
the corresponding null models
Species group removed T Mean T SD T P-value
Vines 4.10 3.14 0.65 0.140
Shrubs 6.99 3.78 1.29 <0.05
Trees 1.54 3.55 1.08 0.063
Hymenopterans 3.38 2.78 0.30 <0.05
Dipterans 3.05 3.06 0.69 0.988
Coleopterans 3.50 3.01 0.61 0.422
Significant P-values are in bold
702 Oecologia (2009) 160:697–706
123
The conservation of austral South American temperate
forests constitutes a global priority (Dinerstein et al. 1995;
Arroyo and Hoffman 1997; Armesto et al. 1998; Myers
et al. 2000). Despite their importance, the biological
diversity of Chiloe rain forests continues to be threatened
by anthropogenic disturbances such as fire, logging, cattle
grazing, forest fragmentation and land conversion for
agriculture (Figueroa et al. 1996; Newton 2007). Because
the maintenance and recovery of these forests largely
depend on animal pollination and seed dispersal services,
the understanding of animal–plant mutualistic interaction is
a must for acquiring a comprehensive knowledge about the
structure and functioning of these ecosystems, as well as
for developing management and conservation guidelines
(Armesto et al. 1996). Unfortunately, few studies in these
austral temperate rain forests have examined insect–plant
interactions, including pollination (Aizen et al. 2002). The
works of Riveros et al. (1991), Aizen et al. (2002), and
Smith-Ramırez et al. (2005) on austral rain forests,
revealed that insect pollinators are far more diverse than
previously thought, and that the pattern of mutualistic
interactions is highly asymmetric, with a few species of
plants monopolizing a large fraction of pollinators and a
few generalist insect pollinators visiting a large fraction of
flowering plant species.
The temperate rain forest pollination network exhibited
a nested structure of plant–animal interactions, which
means that interactions of the less connected species
comprise a subset of the interactions of the more connected
ones. On the other hand, while generalist species are linked
with both specialists and generalist species, specialists are
predominantly linked with generalists. The underlying
biological processes behind the structure of mutualistic
networks are still poorly understood, but recent advances
suggest that nestedness is a pattern that may arise as a
consequence of the simultaneous development of pheno-
typic complementarity between plants and pollinators and
floral traits acting as barriers against parasites (Santamarıa
and Rodrıguez-Girones 2007; see also its ensuing discus-
sion). A nested pattern implies the existence of asymmetric
specialization (Vazquez and Aizen 2004) and it is related to
asymmetries in dependence levels between plants and their
pollinators (Bascompte et al. 2006). The nested pattern of
a
b
c
d
e
f
Fig. 3 Outcome of model simulations after removing vines (V),
shrubs (S) or trees (T) from the pollination web of Chiloe rain forest.
Bars show the fraction of extinct species for plants (a–c) and
pollinators (d–f) for varying levels of k after 3,000 time iterations
(mean of 1,000 realizations ±95% confidence interval). Hatched barWhole network, black bars networks after species removal, whitebars null models. a–f Results for different values of extinction/
colonization ratio k. *Significant differences with respect to the
unmanipulated network P, ::significant differences with respect to the
corresponding null model
a
b
c
d
e
f
Fig. 4 Outcome of model simulations after removing hymenopterans
(H), dipterans (D) and coleopterans (C). Bars show the fraction of
extinct species for plants (a–c) and pollinators (d–f) for varying levels
of k after 3,000 time iterations (mean of 1,000 realizations ±95%
confidence interval). Hatched bar Whole network, black barsnetworks after species removal, white bars null models. *Significant
differences with respect to the unmanipulated network P, ::significant
differences with respect to the corresponding null model. a–f Results
for different values of extinction/colonization ratio k
Oecologia (2009) 160:697–706 703
123
the Chiloe rain forest network is consistent with many
well-resolved pollination and seed dispersal bipartite net-
works (Bascompte et al. 2003; Vazquez and Aizen 2004)
and gives quantitative support to earlier community char-
acterizations (Smith-Ramırez et al. 2005). On the other
hand, the Chiloe rain forest network exhibited a connec-
tivity pattern best described by a power law (scale-free)
cumulative degree distribution. This pattern is widespread
across many complex networks including ecological
interaction webs, as well as protein, metabolic, social and
information networks (Albert and Barabasi 2002; Newman
2003; but see Dunne et al. 2002a). Scale-free degree dis-
tributions and nestedness are associated with network
robustness against random loss of species, but also with
high sensitivity to deletion of hub species (Albert et al.
2000). This indicates that the studied community exhibits a
structure of interactions well suited for facing unselective
extinctions.
What is the relative importance of defined groups of
plant and insect species for the maintenance of the Chiloe
rain forest network? There were numerous shrubs species
and they were more specialized than trees in terms of
pollinator visits, although they were in turn more generalist
than the fewer vine species. Consequently, their removal
was predicted to decrease the steepness of the degree dis-
tribution of plants, although it would not change its
exponential shape. As a result, the network without shrubs
retained the core generalist tree species and increased their
persistence. Nevertheless, the loss of the more specialized
shrubs, together with the supergeneralist Tepualia stipu-
laris (degree = 47), would cause a decrease in the level of
nestedness of the network because most of the remnant
species were weakly nested generalists. Because in nested
networks specialist pollinators are mostly linked to gener-
alist plants (Bascompte et al. 2003), the loss of shrubs
would cause a decrease in the degree of generalist pollin-
ators. The loss of shrubs, therefore, changed the power law
distribution of the animals’ degree distribution in the ori-
ginal network to exponential. On the other hand, because
trees were more generalist in their pollinators, their
removal made the exponential degree distribution of plants
steeper, and increased the extinction probability of both
plants and pollinators.
Hymenopterans were the most generalist group of spe-
cies among pollinators visiting large numbers of plants and,
unlike trees, they included the supergeneralist bumblebee
Bombus dahlbomii (degree = 21). This caused the ani-
mals’ degree distribution to shift from power law to
exponential when hymenopterans were deleted from the
system. On the other hand, this also caused the loss of
specialist plants, shifting the plants’ degree distribution
from exponential to long-tailed power law. Both the
removal of generalist animals and the loss of specialist
plants explain the decrease in network nestedness. Asso-
ciated with these topological changes, we found that the
probability of extinction largely increased after loss of
hymenopterans from the system.
The removal of dipterans had an appreciable quantita-
tive effect on the degree distribution of rain forest plants in
the system, which became steeper due to a decrease in the
degree of generalist forest plants. This shift also caused the
degree distribution of the whole network to shift from
power to a truncated power. Although nestedness remained
Fig. 5 Species contribution to topological shifts driven by selective
removals. Left-hand panel Change in network temperature after
deleting species i (ordered in the ordinate). Right-hand panel Change
in the value of the fitted exponent of the power law degree
distribution. Dashed vertical lines ±95th percentile of the absolute
value of deviations from the whole network. Tree species are (from
bottom to top) Amomyrtus luna, Amomyrtus meli, Caldcluviapaniculata, Eucryphia cordifolia, Embothrium coccineum, Gevuinaavellana, Luma apiculata, Myrceugenia ovata, Myrceugenia plani-pes. D.g. Diphaglossa gayi, B.d. Bombus dahlbomii, A.m. Apismellifera, M.p. Mesograpta philippi, M.c. Mitraria coccinea, A.o.Asteranthera ovata, U.m. Ugni molinae, T.s. Tepualia stipularis; for
other abbreviations, see Figs. 3 and 4
704 Oecologia (2009) 160:697–706
123
unchanged after deleting flies, the dynamic output did
change. At high extinction/colonization rates, removing
dipterans did not differ from random pollinator species
deletion. At low and moderate k, species extinctions were
lower after removing dipterans compared to random
removal, which is explained by the strong effect of
hymenopterans. Hence, random hymenopteran removal
would constitute a more severe perturbation than dipteran
removal. The exception was found for plants at k = 0.25,
where deletion of dipterans predicted the extinction of two
plant species (Gaultheria mucronata and Myrteola num-
mularia) that depend exclusively on them.
Removing coleopterans from the web exerted only a
marginal effect on network persistence, because extinction
of pollinators was entirely explained by decreased animal
species richness. Plant extinction probability was lower
when removing beetles relative to random species loss, and
not different from the dynamics of the unmanipulated
network (except at k = 0.75). Removal of coleopterans did
not change the shape of the degree distributions, either for
the whole network or for plants and animals separately.
The same occurred when vines, mostly related to special-
ized visitors, were removed from the mutualistic web.
The effect of vine removal on extinction probability can
be considered negligible at low and moderate k because of
the low number of extinct species (mean = 0.99 plant
species, range 0–3). At k = 0.75, random removal exerted
a more severe effect on species persistence than removal of
vines due to the greater relative weight of trees.
Overall, this work highlights the importance of flower-
ing canopy trees and hymenopterans as the core groups that
maintain the species richness, structure and dynamics of
the Chiloe rain forest pollination network. This was
revealed by the changes detected in topological and
dynamic features of the rain forest network after modeling
the removal of each group of species. Furthermore, dis-
cerning which species are mostly responsible for the effects
observed after removal of multi-species groups can be of
great value from a conservation perspective, because
research, conservation and management efforts can be
directed to few pivotal species in cases where protecting
the entire community is not possible. By assessing the
sensitivity of degree distribution and nestedness to the
removal of individual nodes we obtained a measure of
the relative contribution of each species to the maintenance
of community structure and diversity. In this way, we
identified a number of species that deserve special attention
for the conservation of the entire species assemblage. The
hymenopterans Bombus dahlbomii and Diphaglossa gayi,
the shrubs Tepualia stipularis and Ugni molinae, the vines
Mitraria coccinea and Asteranthera ovata, and the whole
set of trees were predicted to exert a disproportionately
large influence on the preservation of the structure of the
network under study. Their extinction would seriously
harm the reproductive success of plants in this temperate
rain forest. Some tree species with the richest sets of
pollinators, such as the emergent Eucryphia cordilfolia, are
currently under severe and rapid decline due to selective
logging and land clearing, and their loss may promote
cascade extinctions of network participants (Armesto et al.
1996). In particular, the woody species Tepualia stipularis
and Eucryphia cordifolia were shown in this study to play
an important structural role within the Chiloe network and
they are also relevant for habitat provision (Dıaz et al.
2005). Unfortunately, they both are highly threatened
species in Chiloe Island, representing respectively 55 and
11% of the total commercialized firewood (unpublished
data).
It is accepted that the stability and robustness of polli-
nation networks to species loss are sensitive to structural
attributes of the network. More specifically, nestedness and
long-tailed degree distribution have been postulated as key
topological properties that prevent species loss (Memmott
et al. 2004; Fortuna and Bascompte 2006; Bascompte and
Jordano 2007). Here we explored the possible interplay
between structure and dynamics of a pollination system
that supports a highly valued and remarkably endangered
forest ecosystem. A better understanding of the functioning
and evolution of target ecological systems would be gained
if further efforts were made to ensure that most of the
participant species were recorded. In addition, it is neces-
sary to identify them at the best level of taxonomic reso-
lution, recording their temporal and spatial variation, and to
develop better analytical tools to manage, organize and
take advantage of the data.
Acknowledgements The authors thank J. D. Flores for his valuable
help in scientific computing, M. A. Fortuna for his help with the
dynamic model, M. A. Rodrıguez-Girones for specially implementing
a batch version of his software BINMATNEST, and M. Franco for
improving the readability of this paper. All the experiments and
sampling comply with the current laws of the country (Chile) in
which they were performed. Work started by an Endowed Presidential
Chair in Sciences to J. J. A. We acknowledge support from FON-
DAP–FONDECYT 1501-0001, P05-002 ICM and PFB-23 CONI-
CYT, Chile. This is a contribution to the research program of Senda
Darwin Biological Station, Chiloe, Chile. We appreciate the company
and assistance in the field of M. Nunez-Avila, L. Suarez, P. Martınez
and el Negro.
References
Aizen MA, Ezcurra C (1998) High incidence of plant-animal
mutualisms in the woody flora of the temperate forest of
southern South America: biogeographical origin and present
ecological significance. Ecol Aust (Argentina) 8:217–236
Aizen MA, Vasquez DP, Smith-Ramırez C (2002) Historia natural y
conservacion de los mutualismos planta-animal del bosque
templado de Sudamerica austral. Rev Chil Hist Nat 75:79–97
Oecologia (2009) 160:697–706 705
123
Albert R, Barabasi A-L (2002) Statistical mechanics of complex
networks. Rev Mod Phys 74:47–97
Albert R, Jeong H, Barabasi A-L (2000) Error and attack tolerance of
complex networks. Nature 406:378–382
Amaral LA, Scala A, Barthelemy M, Stanley HE (2000) Classes of
small-world networks. PNAS 97:11149–11152
Aravena JC, Carmona M, Perez C, Armesto JJ (2002) Changes in tree
species richness, stand structure and soil properties in a
successional chronosequence in northern Chiloe Island. Chile
Rev Chil Hist Nat 75:339–360
Armesto JJ, Rozzi R (1989) Seed dispersal syndromes in the rain
forest of Chiloe: evidence for the importance of biotic dispersal
in a temperate rain forest. J Biogeogr 16:219–226
Armesto JJ, Smith-Ramırez C, Sabag C (1996) The importance of
plant-bird mutualism in the temperate rainforest of southern
South America. In: Lawford RG, Alaback PB, Fuentes E (eds)
High latitude rain forests and associated ecosystems of the west
coast of the Americas: climate, hydrology, ecology and conser-
vation. Springer, Berlin, pp 248–265
Arroyo MTK, Hoffman AE (1997) Temperate rain forest of Chile. In:
Davis SD, Herrera-MacBryde O, Villa-Lobos J, Hamilton AC
(eds) Centres of plant diversity, vol 3. The Americas. World
Wildlife Fund and International Union for Conservation of
Nature, New York, pp 542–548
Atmar W, Patterson BD (1993) The measure of order and disorder in
the distribution of species in fragmented habitat. Oecologia
96:373–382
Bascompte J, Jordano P (2007) Plant-animal mutualistic networks:
the architecture of biodiversity. Annu Rev Ecol Evol Syst
38:567–593
Bascompte J, Jordano P, Melian CJ, Olesen JM (2003) The nested
assembly of plant–animal mutualistic networks. PNAS
100:9383–9387
Bascompte J, Jordano P, Olesen JM (2006) Asymmetric coevolu-
tionary networks facilitate biodiversity maintenance. Science
312:431–433
Burnham KP, Anderson DR (2004) Multimodel inference: under-
standing AIC and BIC in model selection. Soc Meth Res 33:261–
304
Dıaz IA, Armesto JJ, Reid S, Sieving KE, Willson MF (2005) Linking
forest structure and composition: avian diversity in successional
forests of Chiloe Island. Chile Biol Conserv 123:91–101
Dinerstein E, Olson DM, Graham DJ, Webster AL, Primm SA,
Bookinder MP, Ledec G (1995) Una evaluacion del estado de
conservacion de las ecorregiones terrestres de America Latina y
el Caribe. Banco Mundial, World Wildlife Fund
Dunne JA, Williams RJ, Martınez ND (2002a) Food-web structure
and network theory: the role of connectance and size. PNAS
99:2917–12922
Dunne JA, Williams RJ, Martınez ND (2002b) Network structure and
biodiversity loss in food webs: robustness increases with
connectance. Ecol Lett 5:558–567
Figueroa J, Armesto JJ, Hernandez JF (1996) Estrategias de
germinacion y latencia de semillas en especies del bosque
templado de Chiloe. Chile Rev Chil Hist Nat 69:243–251
Fortuna MA, Bascompte J (2006) Habitat loss and the structure of
plant–animal mutualistic networks. Ecol Lett 9:281–286
Guimaraes PR, Guimaraes P (2006) Improving the analyses of
nestedness for large sets of matrices. Environ Modell Softw
21:1512–1513
Heywood VH (1995) Global biodiversity assessment. Cambridge
University Press, Cambridge
Jordano P (1987) Patterns of mutualistic interactions in pollination
and seed dispersal: connectance, dependence asymmetries, and
coevolution. Am Nat 129:657–677
Jordano P, Bascompte J, Olesen JM (2003) Invariant properties in
coevolutionary networks of plant–animal interactions. Ecol Lett
6:69–81
Marquet PA, Fernandez M, Navarrete SA, Valdovinos C (2004)
Diversity emerging: toward a deconstruction of biodiversity
patterns. In: Lomolino M, Heaney LR (eds) Frontiers of
biogeography: new directions in the geography of nature.
Sinauer Associates, Massachusetts, pp 191–209
Martinez ND (1992) Constant connectance in community food webs.
Am Nat 139:1208–1218
Memmott J (1999) The structure of a plant–pollinator food web. Ecol
Lett 2:276–280
Memmott J, Waser NM, Price MV (2004) Tolerance of pollination
networks to species extinctions. Proc R Soc B Biol Sci
271:2605–2611
Montoya JM, Sole RV (2003) Topological properties of food webs:
from real data to community assembly models. Oikos 102:614–622
Myers N, Mittermeier RA, da Fonseca GAB, Kent J (2000) Biodiversity
hotspots for conservation priorities. Nature 403:853–858
Newman MEJ (2003) The structure and function of complex
networks. SIAM Rev 45:167–256
Newman MEJ (2005) Power laws, Pareto distributions and Zipf’s law.
Contemp Phys 46:323–351
Newton A (2007) Biodiversity loss and conservation in fragmented
forest landscapes: evidence from Mexican montane forests and
the temperate rainforests of South America. CABI, UK
Pascual M, Dunne JA (2006) Ecological networks: linking structure
to dynamics in food webs. Oxford University Press, UK
Riveros M, Humana AM, Lanfranco D (1991) Actividad de los
polinizadores en el Parque Nacional Puyehue, X Region, Chile.
Medio Ambiente (Chile) 11:5–12
Rodrıguez-Girones MA, Santamarıa L (2006) A new algorithm to
calculate the nestedness temperature of presence–absence matri-
ces. J Biogeogr 33:924–935
Santamarıa L, Rodrıguez-Girones MA (2007) Linkage rules for
plant–pollinator networks: trait complementarity or exploitation
barriers? PLoS Biol 5:e31. doi:10.1371/journal.pbio.0050031
Smith-Ramırez C, Armesto JJ (1994) Flowering and fruiting patterns
in the temperate rainforest of Chiloe, Chile—ecologies and
climatic contraints. J Ecol 82:353–365
Smith-Ramırez C, Martınez P, Nunez M, Gonzalez C, Armesto JJ
(2005) Diversity, flower visitation frequency, and generalism of
pollinators in temperate rain forests of Chiloe island. Chile Bot J
Linn Soc 147:399–416
Strogatz SH (2001) Exploring complex networks. Nature 410:268–
276
Valdovinos FS, Ramos-Jiliberto R, Flores JD, Espinoza C, Lopez G
(2009) Structure and dynamics of pollination networks: the role
of alien plants. Oikos (in press). doi:10.1111/j.1600-0706.2009.
17364.x
Vazquez DP (2005) Degree distribution in plant–animal mutualistic
networks: forbidden links or random interactions? Oikos 108:
421–426
Vazquez DP, Aizen MA (2004) Asymmetric specialization: a
pervasive feature of plant–pollinator interactions. Ecology 85:
1251–1257
Williams RJ, Martinez ND (2000) Simple rules yield complex food
webs. Nature 404:180–183
706 Oecologia (2009) 160:697–706
123
Copyright © 2022 FDOKUMEN