A multivariate approach for identification of optimal locations with in Ethiopia’s wheat market to...
33
Electronic copy available at: http://ssrn.com/abstract=1506078 Electronic copy available at: http://ssrn.com/abstract=1506078 1 A multivariate approach for identification of optimal locations with in Ethiopia’s wheat market to tackle soaring inflation on food price I. Introduction After years of low and some times negative inflation, Ethiopia was experiencing soaring food and general inflation in period of 2003 to 2009. In 2000 the level of inflation in consumer price index was 6.2%. In the following two years of 2001 and 2002, a deflation rate of 5.2% and 7.2%, respectively, was observed (WB, 2008/9). This pattern was common pattern in the entire period extended from 1991 to 2002. However in recent years and mainly since 2006, the country was experiencing double digit inflation, reaching more than 40% in 2008. (IMF, 2008) The inflation, of the period, is mainly related to ever soaring food prices. (IMF, 2008 and Loening et al., 2009). What is puzzling is that the unprecedented level of inflation on food prices is observed when the data (NBE, 2008 and MoFED, 2008a) is showing that the country was having a pamper harvest of agricultural products. Given the unprecedented and speedy rise on crude oil and internal food prices, at the time, it is very tempting to associate the rise in domestic prices with international dynamics. Actually, a study by Loening et al (2009) did found that the main causes of inflation in the long run are the foreign exchange rate and the international price of food and none food items. In short run, supply shocks and inflation inertia followed by money supply growth are strong determinants of inflation. It is hard to swallow the above result, when most of the inflation is observed in staple grains; which are none tradable for the country 1 and when domestic oil price is increasingly subsidized by state, with every increase in international price of oil. Moreover a study by Ulimwengu et al (2009) did show that domestic maize price are not cointegrated with international maize price; which support the view that Ethiopian food inflation, which is the major cause of the over all inflation, is not caused by Global or regional factors but by domestic factors. If this conclusion was wrong, there should be a correlation between Ethiopia’s and similar countries’ inflation. But still the level of inflation observed in the country is much higher than the inflation observed in neighboring countries (IMF, 2008) and Sub Saharan African Countries (MoFED, 2008b). Understanding the real source of the problem can improve the effectiveness of any intervention. However agreement does not seem to exist, between stakeholders, about the real source of the problem and associated solution to the problem (see IMF, 2008). One of the possible solutions forwarded by government is to intervene in grain markets, through international purchase and distribution of white wheat in to the domestic economy (MoFED, 2008b). Such intervention, in order to be effective and efficient, needs to be targeted in optimal locations; where effective stabilizing intervention can be done with least possible cost. In this paper such locations are identified by using a vector error correction model (VECM) developed by Johansen (1988, 1991, 1992) with search 1 The same study by Loening et al (2009) did state that food imports are less than 5% of agricultural GDP, for example.
Transcript of A multivariate approach for identification of optimal locations with in Ethiopia’s wheat market to...
Electronic copy available at: http://ssrn.com/abstract=1506078Electronic copy available at: http://ssrn.com/abstract=1506078
1
A multivariate approach for identification of optimal locations with in
Ethiopia’s wheat market to tackle soaring inflation on food price
I. Introduction
After years of low and some times negative inflation, Ethiopia was experiencing soaring
food and general inflation in period of 2003 to 2009. In 2000 the level of inflation in
consumer price index was 6.2%. In the following two years of 2001 and 2002, a deflation
rate of 5.2% and 7.2%, respectively, was observed (WB, 2008/9). This pattern was
common pattern in the entire period extended from 1991 to 2002. However in recent
years and mainly since 2006, the country was experiencing double digit inflation,
reaching more than 40% in 2008. (IMF, 2008)
The inflation, of the period, is mainly related to ever soaring food prices. (IMF, 2008 and
Loening et al., 2009). What is puzzling is that the unprecedented level of inflation on
food prices is observed when the data (NBE, 2008 and MoFED, 2008a) is showing that
the country was having a pamper harvest of agricultural products.
Given the unprecedented and speedy rise on crude oil and internal food prices, at the
time, it is very tempting to associate the rise in domestic prices with international
dynamics. Actually, a study by Loening et al (2009) did found that the main causes of
inflation in the long run are the foreign exchange rate and the international price of food
and none food items. In short run, supply shocks and inflation inertia followed by money
supply growth are strong determinants of inflation. It is hard to swallow the above result,
when most of the inflation is observed in staple grains; which are none tradable for the
country1 and when domestic oil price is increasingly subsidized by state, with every
increase in international price of oil. Moreover a study by Ulimwengu et al (2009) did
show that domestic maize price are not cointegrated with international maize price; which
support the view that Ethiopian food inflation, which is the major cause of the over all
inflation, is not caused by Global or regional factors but by domestic factors. If this
conclusion was wrong, there should be a correlation between Ethiopia’s and similar
countries’ inflation. But still the level of inflation observed in the country is much higher
than the inflation observed in neighboring countries (IMF, 2008) and Sub Saharan
African Countries (MoFED, 2008b).
Understanding the real source of the problem can improve the effectiveness of any
intervention. However agreement does not seem to exist, between stakeholders, about the
real source of the problem and associated solution to the problem (see IMF, 2008). One
of the possible solutions forwarded by government is to intervene in grain markets,
through international purchase and distribution of white wheat in to the domestic
economy (MoFED, 2008b). Such intervention, in order to be effective and efficient,
needs to be targeted in optimal locations; where effective stabilizing intervention can be
done with least possible cost. In this paper such locations are identified by using a vector
error correction model (VECM) developed by Johansen (1988, 1991, 1992) with search
1 The same study by Loening et al (2009) did state that food imports are less than 5% of agricultural GDP,
for example.
Electronic copy available at: http://ssrn.com/abstract=1506078Electronic copy available at: http://ssrn.com/abstract=1506078
2
criteria for one common trend introduced by Gonzalez – Rivera and Helfand (2001). The
short run dynamics of the market are articulated by analyzing the adjustment parameters
estimated in VECM and persistence profile for system level shock developed by Pesaran
and Shin (1996). Additionally markets which are having major impact on the long run
common trend, which in turn is keeping the prices under rule of one price, is estimated by
following Gonzalo and Granger (1995) common trend estimation methodology.
The data used for this paper is collected by European Union and is obtained from
Ethiopian Grain Trade Enterprise (EGTE). The data is extended from 1980 to 2003.
Unfortunately, most of the data for pre 1996 was highly incomplete and less reliable,
since it is compiled from different secondary sources. However for 8 wholesale markets,
more or less, complete monthly data is found from 1996 to 2003. There are few randomly
missing values but they are extrapolated from the data. To extrapolate the missing values,
first the price is regressed on monthly dummy and year. Then the predicted values are
used as initial value. Then given monthly nature of the data auto regressive model with
15 lags or AR(15) is fitted and the predicted values are replaced for the originally missing
values. And recursive estimation, prediction and replacement are done until the
difference between previously used value and new predicted value becomes
approximately zero. The basic idea is to extrapolate the needed information from the data
itself, by using the information contained on the lagged values of the level price.
Following this introductory part, the theoretical base of the analysis and methodology
used in this paper will be explained in part 2 and 3, respectively. In part 4 results of data
analysis will be presented, to be followed by conclusion and policy implication in part 5.
II. Theoretical framework for spatial cointegration of prices
Theoretically, the difference between spatial price margin and the transaction cost of
creating space utility will determine the market boundary of a given out put. Following
the price bound model, there will be profitable price arbitration between two locations, if
the price margin between the two locations is higher than the transaction cost of creating
space utility (Baulch, 1997; Sexton et al.; 1991 and Spiller and Wood, 1988). In highly
competitive market, with adequate flow of information and highly functional credit
market, contract enforcement institutional setup, risk management capabiltiy and
marketing infrastructure, the most important transaction cost in creating space utility is
transportation cost. In such location, assuming transportation infrastructure, distribution
of transportation service and distribution of demand is highly homogenous, the boundary
of a given firm’s market will be determined by distance only. As result there will be high
level of price arbitration between closely located markets compared to distantly located
markets. This is the logical base of early spatial models of Christaller (1933), Isard
(1956), Losch (1954), Von Thunen (1826) and Weber (1909).
The problem is that the world, and especially the developing side of the world, is not as
simple as the classical or neoclassical models assumed it to be. There is widely
documented evidence to support that grain trading in developing economies is
constrained by lack of finance, adequate storage facility, adequate marketing
infrastructure, modern marketing skill, efficient contract enforcement mechanism,
3
adequate risk management capacity and adequate information (Rapsomanikis and
Karfakis, 2007; Gabre-Madhin, 2001 , 2001b; Gabre-Madhin et al.; 2003, Fafchamps and
Minten; 1999, 1999b; Fafchamps, 1996, 2003; Jayne et al., 2002; Bigsten et al., 1998;
Barrett, 1997; Rauch and Casella, 1998; Bryceson, 1994; World Bank, 2002 and
McMillan and Woodruff, 1998).
However institutional economists and sociologists (Stiglitz, 2000; Gabre-Madhin, 2001;
Grootaert, 1998; Durlauf and Fafchamps, 2004; Guiso et al, 2000; Fafchamps and
Minten, 1999, 2002; Fafchamps, 1996, 2002, 2006; Greif, 1993; Platteau, 1994 and
McMillan and Woodruff, 2000) did show that when the market and the state are not well
developed, to provide Pareto optimal incentive to coordination economic agents to ward
optimal goals, local institutions will develop to fill part of the gap. The widely
documented alternative institutional response in (grain) trading, labor market and
consumption smoothing is networking (Fafchamps and Minten, 1999, 1999b, 2002;
Fafchamps et al., 1994; Durlauf and Fafchamps, 2004; Fafchamps, 1996, 1997, 2002;
Gabre-Madhin, 2001, 2001b; Gabre-Madhin et al., 2003; World Bank, 2002; Grootaert,
1998; Overa, 2006; Lyon, 2000; Greif, 1993; Coleman, 1988; Rauch and Casella, 1998;
Moore, 1999; Kranton and Minehart, 2000; Kranton, 1996; Edwards and Ogilvie, 2009;
Barr, 2000; Harbord, 2006; Palaskas and Harriss-white, 1993 and McMillan and
Woodruff, 1998). Traders by developing networks based on social capital of trust and
(collective or bilateral) sanction will not only able to improve their liquidity, but also the
level of information that they can collect from different locations. By working as family
worker in currently networked trader/s, they will gain the necessary skills and reputation
they need to function in highly imperfect market. Networks can minimize the formal
contract enforcement cost of trading and credit provision, by depending on trust and
collective or bilateral sanction. Moreover networks can reduce search and screening cost
to transform the grain market from less efficient flee market to ward more efficient
reputation based market. So, well developed trade under highly imperfect market
structure will be possible, if and only if the necessary informal institutions are developed
to fill the gap of the formal sectors. If not the market will end up being a flee market
(Fafchamps, 2002; Fafchamps and Minten, 1999, 1999b and Minten and Kyle, 1999).
The million dollar question is ‘what factors determine the development of such
institutions?’ The critical juncture hypothesis assumes that historical factors will mainly
determine the development of local institutions (Fedderke, 2001 and Acemoglu et al.
2009). In areas with history of wide spread trust and intergenerational trading culture,
there are large chances that there will be adequate social capital to facilitate trade (Greif
1993). In simple words it means institutional development is path dependent and history
does matter! (Durlauf and Fafchamps, 2004; Lyon, 2000; Kranton, 1996; Greif, 1993 and
Fedderke, 2001)
However additional research on game theory by Fafchamps (2002), Ghosh and Ray
(1996) and Bala and Goyal (2000) did show that the level of expected trading gain in
addition to networking cost will determine the level of spontaneous trust based market
development. Means when the expected gain from trade is very high, which is related to
structure of production and consumption, there will be high chance of cooperative
4
outcome based on trust. The second important variable is networking cost. The cost
involved in creating and maintaining link with other traders. There are two but related
costs. One cost is related to trustworthy traders and another is the networking cost of the
cheaters. So social capital will be effective, if the networking cost of the trustworthy
trader is very low (Fafchamps, 2002) and the networking cost of the cheater is very high
(Fafchamps, 2002; Kranton, 1996; Greif, 1993 and Coleman, 1988). If the networking
cost of the trustworthy trader is very low, he/she can use bilateral or collective sanction
(Fafchamps, 2002; Kranton and Minehart, 2000; Greif, 1993; McMillan and Woodruff,
2000 and Harbord, 2006) or can demand compensation (Harbord, 2006) to achieve
cooperative out come. Sanctions or compensation by imposing higher future networking
cost for the cheater will result on more cooperation and efficiency (Fafchamps, 2002;
Moore, 1999; Kranton, 1996; Greif, 1993; Coleman, 1988; McMillan and Woodruff,
1998, 2000 and Harbord, 2006,). However as shown by Fafchamps (2002) neither
sanction nor compensation are necessary for cooperative out come. When the search cost
is very high (which will increase the networking cost of trustworthy trader) compensation
or sanction can seriously affect the future profit of the trustworthy trader. However, if the
gain from trade is very high, the existence of large number of cheaters in market will
improve cooperation among trustworthy traders (Fafchamps, 2002 and Ghosh and Ray,
1996). But the out come would be much efficient, if collective sanctions or
compensations are used (Fafchamps, 2002; Ghosh and Ray, 1996 and Harbord, 2006). As
result, in general, factors which determine the networking cost of both trustworthy and
untrustworthy trader will determine the development of networks.
Socio-cultural and historical factors have important role to play in determination of these
costs. Studies did found that ethnic, family, linguistic and religious similarity, in addition
to generic personal relationship, can be effective in promoting meso level trust.
(Fafchamps, 1997, 1999; Moore, 1999; Overa, 2006; Lyon, 2000; Greif, 1993; Coleman,
1988; Barr, 2000; Platteau, 1994, 1994b; McMillan and Woodruff, 1998, 2000; World
Bank, 2002; Bryceson, 1994; Fafchamps and Lund, 2003; Fafchamps and Gubert, 2007
and Palaskas and Harriss-white, 1993). However additional studies did show that
religious, (Fafchamps, 1996, 2003; Fafchamps and Minten, 1999b; Minten and Kyle,
1999 and Alesinaa and La Ferrara, 2002) linguistic (Fafchamps and Minten, 1999b) and
ethnic (Fafchamps and Minten, 1999, 1999b; Fafchamps, 2003; Minten and Kyle, 1999;
Bigsten et al., 1998; Edwards and Ogilvie, 2009; Alesinaa and La Ferrara, 2002;
McMillan and Woodruff and 1998, Gabre-Madhin, 2001b) similarity are not effective in
facilitating trade in all locations and all cases. Means religion, language and ethnicity can
be important in some locations and times, but not in all locations and times.
Other factors that can promote trust includes frequency of interaction and associated
reputation development (Stiglitz, 2000; Glaeser et al., 1999, 2000; Fafchamps and
Minten, 1999, 1999b, 2001; Fafchamps, 2002; Moore, 1999; Overa, 2006; Lyon, 2000;
Greif, 1993; Platteau, 1994; McMillan and Woodruff, 1998, 2000; World Bank, 2002 and
Gabre-Madhin 2001b), distance (Glaeser et al., 2000; Overa, 2006; McMillan and
Woodruff, 2000; Fafchamps and Lund, 2003 and Fafchamps and Gubert, 2007) and
quality of transportation and communication infrastructure (Overa, 2006). Normally,
people which are frequently dealing with each other, located in close distance and are

5
able to communicate and interact easily will have better capacity to monitor the behivor
of each other. As result they will have better capacity to develop trust based networks.
Again as stated above history did matter for development of networks. Networks and
trusts can be inherited from generation to generation not only with in families, but also
with communities through statistical discrimination (Fafchamps and Minten, 2001;
Fafchamps, 1999; Greif, 1993; Coleman, 1988 and Platteau, 1994).
Additionally big traders and rich people have more chance of having dense networks than
poor or small scale traders. (Glaeser et al., 1999, 2000; Fafchamps and Minten, 1999,
1999b; Fafchamps and Gubert, 2007; Fafchamps, 1997; Alesinaa and La Ferrara, 2002
and Gabre-Madhin et al., 2003). Education and age (up to a limit) are observed to
increase social capital (Glaeser et al., 1999, 2000; Alesinaa and La Ferrara, 2002 and
Fafchamps and Gubert, 2007). However Guiso et al (2000) in Italia found that meso and
micro level social capital is negatively related to education. And Barr (2000) found that
small scale, poor investors, will invest more on social capital. Similar results are also
found in Vietnam by McMillan and Woodruff (1998). In general the effect capital,
education, wealth, ethnicity and religion on development of social capital are found to be
sample specific.
Moreover, the development of trading network in one commodity is expected to be
highly affected by the general development of networks, dealing in other commodities of
the same location. This is so, since the development of social capital, marketing
infrastructure and trading skill is dependent on the over all, past and present, trade flow
of the area. In areas with adequate in flow and out flow of goods, there will be conducive
environment for development of both formal and informal institutions. If the location is a
major coffee exporter for example, the dominant export commodity for Ethiopia, social
capital and storage facility will be relatively well developed in that location. Given
critical shortage of foreign exchange, the state has more incentive to invest on marketing
infrastructure of such location. The skill developed and experience gained in coffee
market will be also useful for functioning and operating profitable trading enterprise in
other related commodities and markets. At the same time historical factors, like the
pattern of colonial expansion and early trading history of the area will determine, not
only the level of social capital in given area, but also the level of both marketing
infrastructure and trading skill of a given area.
The general point is that, in line with critical juncture hypothesis history does matter! But
every thing is not about history (Glaeser et al., 1999; Fafchamps and Minten. 2001 and
Fafchamps, 1999). Spontaneous trust can also develop, if the gain from trading is very
high and there are right economic conditions to promote network development. For
example a study by Palaskas and Harriss-white (1993) in West Bengal did show that new
markets can easily out perform established markets, when things are right. Given these
facts it is logical to conclude that markets with long lasting trading history, high flow of
products, high level of potential arbitrage benefit, adequate formal and informal
marketing infrastructures will have stronger cointegration with other markets and will
have speed-full correction of shocks.
6
Unfortunately social capital is not productive in all cases. An analysis by Arnott and
Stiglitz (1988) in insurance market pointed the fact that local institutions could be
functional, but are not necessarily Pareto optimal. To make things worst they can,
possibly, kill the development potential of much efficient market institutions. Many
researchers either based on theoretical reasoning (Stiglitz, 2000; Grootaert, 1998;
Durlauf and Fafchamps, 2002, 2004, 2006; Lyon, 2000; Kranton and Minehart, 2000;
Kranton, 1996; Platteau, 1994, 1994b; Rauch and Casella, 1998 and World Bank, 2002)
or empirical evidence (Fafchamps, 1996, 1999; Guiso et al, 2000; Fafchamps and Minten,
1999; Barr, 2000; Barrett, 1997; McMillan and Woodruff, 1998, 2000; Fafchamps and
Lund, 2003; Fafchamps and Gubert, 2007; Weerdt and Dercon, 2006b; Palaskas and
Harriss-white, 1993; Gabre-Madhin, 2001b and Gabre-Madhin et al., 2003) did clearly
support the above conclusion.
As proved by Fafchamps (2002), if the gain from trade is very low, there will be low
level of networking in the market. As result some locations will be dominated by few
networked traders, if the search cost is high (ibid). Unfortunately, the existence of social
capital and market failures in that area, by deterring entry, will sustain uncompetitive
behivor of the few traders, unchecked by competition. Means areas with out adequate
trade flow or being excluded from the main trading route may show low level of
cointegration with other markets, even if they are located in close proximity to other
markets. And this is shown to be the case in Niger livestock market (Fafchamps and
Gavian, 1996). Under such reality, transportation convinces is not the only factors which
determine the cointegration of market prices and the ‘border’ of one price system. It is
possible a market in short distance from the trading center but with low trade flow and
dysfunctional institutions to be dominated by few traders, with manipulative behavior.
This hypothesis is clearly backed by studies which show that even though transportation
infrastructure is very important for market integration, transportation convince alone
can’t explain market integration and efficiency (Rapsomanikis and Karfakis, 2007;
Fafchamps, 1996; Fafchamps and Gavian, 1996 and Palaskas and Harriss-white, 1993).
This is so since customers facing high transaction cost can’t make frequent and small
quantity purchase from the near by market. But again hording of goods is not optional
due to liquidity problem related to low income and dysfunctional credit market.
However once the markets are cointegrated under rule of one price, implying they are
having functional institutions, the speed of adjustment to system wide shock will depend
to higher extent on transportation convince and to some extent on efficiency of local
institutions. If markets are cointegrated under rule of one price, it means the local
institutions are functional. However functionality, in opposite to optimality, is a relative
term. So, still areas with relatively more functional institutions will be much efficient in
correcting shocks than areas with relatively less functional institutions. As result
transportation convinces, given its important share in transaction cost of developing
economies (Minten and Kyle, 1999; Fafchamps and Hill, 2008 and Gabre-Madhin,
2001b), will become more important factor in determination of speed of adjustment. In
general, it is very logical to expect the fact that market integration, in contrary to speed of
adjustment after system wide shocks, to be less dependent on transportation cost. And
this is found to be the case in this paper.

7
III. Econometric methodology
3.1. Introduction to econometric methodology
The main focus of the paper is to determine the long run and short run relationship that
exists between spatially dispersed wheat market prices, based on vector error correction
model (VECM). The level of integration of wheat markets, located in different parts of
the country, under the rule of one price is very informative in guiding stabilization efforts
in to optimal locations. The stabilization policy in wheat markets, which was
implemented by state, even though was found to be effective in slowing the inflationary
tendency, it was not found to be very effective in solving the inflationary problem (
). So, still there is need for identification of optimal locations in order to guide current
and future interventions in grain market.
If markets, located in different locations, are highly integrated, few or even one market/s
can be used to stabilize the whole country. If there are many markets under rule of one
price, the market/s place where optimal intervention can be targeted can be identified
depending on the statistical significance of the adjustment parameters, the speed of
adjustment of each market to ward equilibrium and the relative importance of each
market in determination of the single common trend. But, if the markets are not
integrated under rule of one price, optimal stabilization will demand simultaneous
intervention in different part of the country.
The prices of the same grain discovered in different markets are expected to have an
equilibrium long run relationship, which can be modeled by VECM. The conventional
approach to VECM is first, to determine the appropriate lag, by one of the few
information criterions. And then, by using the above selected lag in the VECM, to
determine the number of cointegration vectors found among the prices. (Johansen, 1988,
1991, 1992) Assuming that there are theoretical bases, which can identify the
cointegration equations from the space spanned by them, the above procedure is simple,
but fruitful two step procedure.
If 1n − cointegration relations (vectors) are found among n prices, there is no
identification problem, as all markets are pair wise cointegrated and all are following a
single common trend2 (Gonzalez – Rivera and Helfand, 2001). But, if the number of
cointegration relationships are less than 1n − , there will be identification problem; in
which neither theory nor empirical evidence will be any help. Empirical evidence or
specifically the estimated parameters identify the space spanned by the cointegrating
vectors, not the true cointegrating vectors. Normally, theory is used in order to fix the
restrictions needed to identify the cointegration equations. Theoretically, unless
transaction costs, of creating space utility, are very high, all market prices are expected to
be pair wise cointegrated. This theoretical view point is too general to identify the
cointegration vectors. This very fact will create identification problem, if there are more
than one common trend between n prices.
2 Still out of 2
nC cointegration vectors only 1n − are relevant and others are redundant.
8
Despite high possibility of omitted variable bias, on estimated parameters (ibid); the
above mentioned identification problem is the reason why most cointegration analysis on
market prices have been limited to biveriate analysis. Fortunately, a simple grid search
procedure is proposed by Gonzalez –Rivera and Helfand (2001) to solve the
identification problem. The grid search procedure and the needed modification on it are
explained below.
3.2. Methodological base of the grid search process
If given number of market locations are following, one common trend, each location will
be pair wise cointegrated with every other location. However, all bivariete vectors need
to be estimated in full dimension. When higher dimension cointegration is estimated
using lower dimension or bivariate cointegrations, specification bias will be introduced
due to omitted error terms (Gonzalez – Rivera and Helfand, 2001). Therefore, the
concentration of most research papers, which includes Dawson and Dey (2002), Gali and
Brown (2002), Fafchamps and Gavian (1996), Dercon (1995), Palaskas and Harriss-white
(1993) and soon, on bivariate analysis is not sound; though understandable given the
identification problem that can be expected, if all markets are not pair wise cointegrated.
Innovate methodology, to solve this problem, was proposed and used in Brazil rice
market by Gonzalez – Rivera and Helfand (2001). The ideas it to start from m well
connected markets which are following one common trend. And sequentially to add more
markets, given all included markets are sharing one common trend. In Brazil rice market
distance was found to be an important determinant factor for order of inclusion; when the
search is started from 10 markets to build a network of 15 markets. This methodology is
adapted by Rashid (2004) to Uganda Maize market. Starting from capital city of Uganda,
Kampala, and other major trading center, Jinja, additional markets are included in to the
rule of one price system based on their distance from capital city.
There are two problems to the methodology proposed by Gonzalez – Rivera and Helfand
(2001). Let’s start from the first one. Since lower dimension estimation of higher
dimension system can introduce omitted variable bias, the search procedure is
theoretically unsound. Omitted variable bias expected in lower dimension estimation will
make cointegration analysis none transitive. It is theoretically possible that three markets,
which are not cointegrated at biveriate level, to be cointegrated at third dimension. And
such occurrence was wrongly interpreted by Rapsomanikis and Karfakis (2007) to be
caused by specification bias and data problem.
Second, even if, in relatively more advanced economy of Brazil distance is found to be
the main determinant factor for order of inclusion, why it should be the case in relatively
less developed market of Uganda? It is true that distance matters for market efficiency
and cointegration (Goletti et al., 1995; Rapsomanikis and Karfakis, 2007; Overa, 2006
and Fafchamps and Gavian, 1996). But spatial arbitration is not only about transporting
goods in space. To quote North, as cited in Gabre-Madhin (2001:1)

9
“There have always been gains from trade . . . but so too have there been obstacles to
realizing these gains. If transport costs were the only obstacle, then we would observe
through history an inverse relationship between transport costs, on the one hand, and
trade and exchange and the well-being of societies on the other.”
This is a clear point to show the fact that creating space utility is not about transporting
goods, only. This is so, even if roads and efficient transportation facility can contribute
for distributional efficiency and economic growth, as shown by Dercon (2006). Actually
a study by Gabre-Madhin et al. (2003) did show that in Ethiopia transportation cost, even
for long distance traders, is not as high as sacking and handling cost. High sacking and
handling cost is caused by lack of trust and it can be reduced by development of
networks. The same is the case for search cost, which is found to be as high as 17% of
transaction cost in Ethiopia (Gabre-Madhin, 2001 and Gabre-Madhin, 2001b). So, given
the fact that Ethiopia is one of the countries in Africa with least road density (Gabre-
Madhin et al., 2003 and Gabre-Madhin, 2001b) and still in Ethiopia other transaction
costs are, at least, as important as distance, it is not sound to think order of inclusion in
Uganda or other developing economies will be determined by distance only. This
hypothesis is in line with findings of some researchers. Studies did clearly show that
spatial arbitration and its efficiency is not sole function of distance. (Rapsomanikis and
Karfakis, 2007 and Fafchamps and Gavian, 1996)
Let’s focus in the first challenge and actual application of the methodology on real data.
The omitted variable bias will be a series problem in two special and extreme cases, only.
In first case, the problem will be series when all locations are highly cointegrated and
each location is correcting the shocks ignited in every other location. In such case most of
the shock initiated in two pair of locations will be corrected by all locations. Unless this
fact is taken in to account, in the estimation processes, bias on estimated parameters will
be very series. As result, not only we may wrongly reject cointegration relation ship
between prices, but also the error vector may not be white nose. In the second case, series
omitted variable bias will be observed when the country is having two groups of
cointegrated market locations, which are not cointegrated to each other. In which one of
the two must be highly cointegrated and the other need to be less cointegrated. So, the
search procedure will identify the weak group, since there will not be a series omitted
variable bias. Unfortunately, it will fail to identify the second group; since, by the
implicit assumption of the search procedure, higher dimension cointegrations have to be
based on lower dimension cointegrations. Excluding these two extreme possibilities,
which are less probable in developing economies, without series and localized civil or
military conflict, the omitted variable bias will not be a series problem.
In actual markets found in developing economies, some market combinations will not
have perfect cointegration with every market, in the rule of one price. As result, they may
solely correct their own shocks. If these markets are exogenous to other markets, their
cointegration at lower dimension will not introduce omitted variable bias. And the grid
search process will build the system of one price by adding the next market location,
which is dependent on those cointegrated market locations and itself only. Finally, highly
cointegrated market locations will be identified, in the last part of the search process. It is
10
possible that identifiable cointegrated market locations could be more than 2 and it is
necessary to keep searching, until the minimum cointegrated dimensions are found. Or as
alternative, it is possible to start the search process from large number of markets, which
are expected to be highly cointegrated to each other, as is done by Gonzalez – Rivera and
Helfand (2001), on their analysis of Brazil rice market. In addition, if at given dimension,
markets are not found to have one common trend, the search has to continue, until all
combination at each dimension are tested. This is so, since lower dimension estimation of
higher dimension systems will introduce omitted variable bias. So the failure to find one
common trend in lower dimensions could be due to omitted variable bias.
There are three, additional factors, which could influence the search result. First is the
level of external shocks, like food aid, injected in to the market. If there is high level of
external shock injected into some markets, it can possibility break the co-moment
between these market prices and others. This is especially true, if these markets are price
takers. Second, if the level data of some locations are not white nose, they may need fully
specified higher dimension cointegration model, in order to have white nose error terms.
As result, normality, serial correlation or ARCH/GARCH testes will, wrongly, reject
their cointegration with others; even when one common trend is found. The third factor is
related to the relative importance of a given grain in portfolio of the local traders. If the
traders are highly engaging in other more important commodities, say coffee or chat in
Ethiopia case, and grain trade is not the most important source of profit, they may fail to
react for each grain price deviation from equilibrium. And he/she may not exert full effort
to develop and sustain grain trading networks (Greif 1993). This will affect both the
probability of being part of the rule of one price system and speed of adjustment to
system wide shocks, if they are part of the system. If such market is found to be
cointegrated with other markets; shocks ignited in this market will be corrected by other
markets. This will make the market weakly exogenous. In the search processes, this
market will not be able to be identified, unless all important markets are included in the
vector of market prices. However, if the weakly exogenous market is the central market
and the shocks are corrected by the specific redial market only, it will be an ideal central
market for identification in the search process.
As strategy, it is important to start the search process from central market and important
but relatively isolated market, with white nose level data. The market must be highly
dependent on the central market, but not directly on other markets. Moreover, it is
preferable, if the central market is weakly exogenous to shocks coming from other
markets, if the local traders’ profits in radial market are highly dependent on the
dynamics of specific grain price; if there is efficient marketing infrastructure; if the
location has long history of trade link and so on. This is farther refinement of Gonzalez –
Rivera and Helfand (2001) and Rashid (2004) search methodology, based on theoretical
development of new institutional economics.
The finding (Gonzalez – Rivera and Helfand, 2001) and assumption (Rashid, 2004) of the
t=wo early papers is that order of inclusion in to the rule of one price is sole function of
distance from capital city or central hub market of the country. This is assumption is the

11
second short coming of the proposed grid search procedure and it is going to be
addressed, below.
Order of inclusion, in to the rule of one price, is not directly related to strength of
cointegration. Order of inclusion is related to existence of conditions, which minimize the
specification bias. Among them, one is low level cointegration with all market locations,
except the central hub. Moreover, strength of cointegration is not sole function of
distance. So, distance can’t be used as the only determinant factor in order of inclusion.
However, if the markets are under the rule of one price, the speed of correction to system
wide shocks may be highly dependent on transportation cost. If they are part of the rule
of one price system, they will normally have functional institutions, storage facilities and
transpiration services. As result distance will be a very critical, but not the only, factor for
speed of error correction following the occurrence of system wide shocks.
Unfortunately, this fact can’t necessarily apply to adjustment parameters. If the system is
facing high amount of shocks, that can’t be easily digested, it will fail to have
cointegration under one common trend. So, if there are markets in the one price system,
in which their shock is hard to digest, there must be very small amount of shocks coming
from these markets. As result the variance related to these markets will be small and their
contribution to the system wide shock will be small. In such scenario, these markets’
speed of adjustment to system wide shock will be related, mostly, to shocks coming from
other markets. These markets can have quick adjustment to system wide shock, if they
are closely located to the central market. However, if their own shock is taken in to
account, by measuring adjustment parameters, they may have very slow adjustment
process, since the system can’t easily digits shocks coming from these markets.
The main hypothesis of this part of the paper is that the grid search methodology used by
early papers to search for cointegratd markets, which are ruled by one price system, is
theoretically unsound; but practically can be very useful. However, distance can’t be the
main determinant factor for order of inclusion of markets, in to the rule of one price. In
this paper to prove or disprove the above hypothesis, a routine search is made on all
possible permutation of markets starting from 2nd
dimension up to 8th
dimension,
maximum number of dimension considered under this study. And the routine search
procedure followed in this paper was able to generate the same network of markets that
can be found, if we follow the simple Gonzalez – Rivera and Helfand (2001) grid search
methodology, with modifications given above. This will be very useful step in justifying
the methodology proposed by Gonzalez – Rivera and Helfand (2001); which can improve
the applicability of multivariate cointegration analysis for market prices. Given this
methodological facts related to the search process, the econometric models used in this
paper are explained below.
12
3.3. Econometric models
3.3.1. Vector Error Correction Model (VECM)
The log price ( )P of a commodity, in given market ( )i , can be presented by variable iP .
And all n numbered log prices, in n locations, can be presented by n dimensional
vector P .
[ ]1 2 . . . nP P P='P …………..…………………..……….…...……………….1
If the prices are cointegrated, based on Granger representation theorem (Engle and
Granger 1987), they will have the following error correction representation.
'
1 1 2 2 1 1 1 .... t t t P t p t t− − − − + −∆ = + ∆ + ∆ + + ∆ − +P α + γt ζ P ζ P ζ P βA P ε ..……….……….2
Vector tε is a white nose n dimension vector, with variance covariance matrix of Ω . In
which ( )' 0tE τ =ε ε for t τ≠ , means the error vector is serially independent, and
( )'
tE τ = Ωε ε for t τ= , means there error vector has constant variance covariance
matrix. The ( )n h× matrix of A is the cointegrating vector, which defines the long run
relationship between 1h + prices. The number of cointegration equations or vectors ( )h
will be identified by using trace statistics, developed by Johansen (1988, 1991, 1992).
The ( )n h× matrix of β represents adjustment parameters. The adjustment parameters
are measures of the speed of adjustment to ward equilibrium, after any shock.
The cointegration equations are estimated based on the assumption of normally,
independently and identically distributed error vector (Johansen, 1988, 1991, 1992 and
Hamilton, 1994). But as was developed in Johansen (1988, 1991, 1992) and clearly
explained in Hamilton (1994), the most critical assumption is the serial independence of
the error vector. Asymptotically, normality and homoskedasticy of the variance are not
binding assumptions. In this paper, even though the time period is 8 years (1996 – 2003),
which is not very small for cointegration analysis, the use of monthly data did restrict the
number of observations to just 96. So normality, independence and constancy of the
variance are demanded in each VECM estimated in the grid search process.
For normality Jarque and Bera (1980, 1981) or J-B test and for serial correlation LM test
developed by Breusch (1978), Breusch and Pagan (1980) and Godfrey (1978) are used.
This is justifiable given Demiroglu (2000) for J-B test and Brüggermann et al (2006) for
LM test did show the fact that these testes are robust for testing the distribution
assumption of cointegrated series. The Johansen VECM and related rank testes are
asymptotically applicable for both homoskedastic and heteroskedastic errors (Johansen,
1988, 1991, 1992; Hamilton, 1994; Cavaliere et al, 2009 and Lee and Tse, 1996).
However, in small and moderately small samples heteroskedasticity is observed to reduce
the power of rank testes, marginally (Lee and Tse, 1996 and Cavaliere et al, 2009). To
test for auto regressive conditional heteroskedasticity (ARCH) effect, discovered by
Engle (1982), or its extension to generalized auto regressive conditional
13
heteroskedasticity (GARCH), discovered by Bollerslev (1986), we can use the residuals
from the vector error correction model. The test for ARCH(q) or GARCh(p, q) = ARCh(p
+ q) will follow conventional distributions, under the null of white nose errors. Once the
cointegration equations are estimated, the next step is to estimate the main determinants
of the common trend. This is done by following Gonzalo and Granger (1995)
methodology, explained below.
3.3.2. Estimation of common trend
If n markets are under rule of one price, there will be 1n h− = cointegration relations
and 1 common trend. The estimation of this single common trend will be useful, in order
to understand the importance of a given market in determination of the common trend. A
market (1) which is highly cointegrated with other markets, (2) which is having
significant impact on the common trend, (3) which is having short persistence of shocks
and (4) which is more or less weakly exogenous will be the market where efficient
stabilization can be done, in cost effective manure. The estimation of the long run trend
will be done using Gonzalo and Granger (1995) linear decomposition of price vector in to
permanent and temporary component as
1 tt tf= +P A P …………………………………………………………...……………..3
Where tP , 1A and tP are n dimension vectors and tf is a scalar of common trend. So
the prices are function of permanent component ( )tf loaded by loading vector ( )1A plus
temporary component ( )tP . The basic assumption imposed, by Gonzalo and Granger
(1995), and used to estimate the common trend is that, first f is linear on observed prices
and second, the temporary component does not have permanent impact on prices.
Formally the first assumption implies
'
t tf ⊥= a P ……………………………………………………………………………4
The vector of coefficient in equation 4 or '
⊥a is related to the null space of the
cointegrated vectors, as shown by Gonzalo and Granger (1995). The statistical and
numeric significance of '
⊥a will be used to identify price makers and price takers in the
rule of one price system. And as proved by Gonzalo and Granger (1995) a conventional
Wald test can be applied to coefficients in equation 4, given the vector error correction
model is correctly specified, identified and estimated by Johansen (1988, 1991, 1992)
VECM frame work. Or alternatively, we can use the following log likelihood test
( ) ( )( )1
ln 1 / 1P
P i P
i r
LL T λ λ−
= +
= − − −∑ ………………………………………………………5
Where pλ is the smallest Eigen value in the unrestricted model and p iλ − is smallest
Eigen value, when the impact of i markets is constrained at zero. The above statistics
will follow Chi2 distribution, with p m− degree of freedom. Where p and m are
number of Eigen values in unrestricted and restricted models, respectively.
14
3.3.3. Estimation of persistence profile
As rightly stated by Pesaran and Shin (1996) researches which simply focus in long run
may not be complete and may not be able to generate very useful recommendation for
policy makers, unless their long run analysis is complemented by short run analysis. So,
in order to measure short run dynamics of prices, a persistence profile developed by
Pesaran and Shin (1996) and the adjustment parameters, estimated in VECM, are used in
this paper. The idea behind persistence profile is explained below.
In bivariate error correction model the size of the adjustment parameters and the
statistical significance of the adjustment parameters will be used to analyze the short run
dynamics of the market. If an adjustment parameter is -0.33, it means it will take 3 (=
1/0.33) periods for the market to correct shocks initiated in its long run relationship with
the other market in the bivariate analysis. Moreover, if a market’s equation has shorter
lag, it means the market is having short memory of past shocks or to follow Ravallion
(1988) thinking it is strongly cointegrated with the other market, in the bivariate analysis.
To summarize the impact of both short run groups of parameters, impulse response
functions are widely used in literature. However, impulse response functions are found to
be less informative, if shocks happening to different prices are correlated. And the
orthogonaization method used to solve the problem is found to be inconclusive, since it is
order sensitive (Pesaran and Shin, 1996).
Following Pesaran and Shin (1996), persistence profiles are used to measure short run
behavior of markets. The advantage of persistence profile is related to the fact that it is
order insensitive, when measuring the temporal impact of system wide shock, equal to 'Α ΩΑ , injected in to the cointegration vector. Where Α is the cointegrating vector and
Ω is the variance covariance matrix. Following a system wide shock equal to 'Α ΩΑ , at
period zero, the change in variance of forecast error, in period n , is given by ' '
n nΑ Α ΩΑ Α . At a limit, given Α is a cointegrating vector, ' '
n nΑ Α ΩΑ Α will approach
zero. So, the temporal adjustment process, following a system wide shock equal to 'Α ΩΑ , can be presented, in relative terns, by the relative persistence profile given by
( ) ( )( )1' '
n nn−
= × 'h Α Α ΩΑ Α Diag Α ΩΑ …………………………………………………..6
The value of ( )nh will range from 1, when 0n = , to 0, when n = ∞ . The value of ( )nh ,
at given period of n , will measure a fraction of the initial system wide shock ( 'Α ΩΑ ),
which is persisting at that period. For example, if ( )2 0.3=h , it means 30% of the system
wide shock is not corrected at second period or similarly 70% of the system wide shock is
corrected at second period.
In this paper weighted mean and first month persistence are used, as summery measures
of persistence profile. Weighted mean is the simple weighted average of all periods from
0 to 30, the weight being the level of persistence in each period. Moreover given most the
shock is observed to evaporate in first month, first month than median persistence
advocated by Gonz´alez-Rivera and Helfand (2001) is used.
15
IV. Discussion and analysis
4.1. Introduction to Discussion and analysis
Before presenting result of analysis, there is a need to emphasize the importance of
appropriate lag selection for VECM. In theory, the VECM is estimated assuming the
appropriate lag for the model is known in advance. Unfortunately, this is not the case in
real empirical estimation of the model. The true lag of the model is estimated by using
different information criterions proposed in literature. The most commonly used four
information criterions are, also, used in this paper. These are Hannan and Quinn
information criterion (HQIC), Final prediction error (FPE), Schwartz's Bayesian
information criterion (SBIC) and Akaike's information criterion (AIC). However, it is
common to find different lags been selected by different information criterions; as was
the case in this paper. This will complicate the modeling process, because not only none
of the information criterions is theoretically superior to other criterions, for all data
generating process3; but also, because, the VECM is very sensitive to both over
identification and under identification problem (Winker and Maringer, 2004). Study by
Ho and Sørensen (1996), for example, indicated the fact that when longer lags are used
inappropriately, Johansen’s rank testes have tendency to over estimate the number of
cointegration vectors found in the model. In this paper, the criterions are taken not as
perfect predictors of the true lag, but as lag band width selectors. Means the maximum
and minimum lag used in VECM will be related to the maximum and minimum lags
selected by any of the information criterions. And the specific lag, with in the above
band, is selected based on the white nosiness of the error vector.
The second problem is related to the fact that: lag selected by all information criterions is
found to be very sensitive to the maximum lag allowed in the lag searching process. In
theory the maximum lag is assumed to be known, in advance. But this is not the case, in
actual empirical analysis. When inappropriate and shorter maximum lag is allowed, the
information criterions can under fit the right model. And when inappropriate and longer
lag is used, the criterions have tendency to pick the maximum lag4. In this paper different
maximum lags are allowed and the frequently selected (modal) lag is used, in the
estimation of the VECM. This procedure has two advantages. First, it will not result on
highly under fitted model since longer maximum lags, as well as shorter maximum lags,
are allowed. Second, it will reduce the probability of over fitting and mainly over fitting
that can result from the use of inappropriate and longer maximum lag. Given these facts,
it is time to present result of analysis below.
4.2. Identification of markets under rule of one price
The first step, in cointegration analysis, is to find number of unit roots found in each price
(variables). Unit root tests are done in both level and first difference of prices, by using
3 See Winker and Maringer (2004), Ho and Sørensen (1996), Khim and Liew (2004), Gutiérrez et al (2007),
Chao and Phillips (1999) and others for conflicting result. But more robust analysis with diverse data
generating process is found in study by Gonzalo and Pitarakis (2000). 4 Study by Gonzalo and Pitarakis (2000) did show that when longer lags are allowed in small or moderate
samples, all information criterions have tendency to pick the maximum lag allowed. And this is widely
observed in this paper.
16
Augmented Dick and Fuller test and related F- Version testes (Dickey and Fuller, 1979).
Following the recommendation of, both, Hamilton (1994) and Peterson (2000), general to
specific search for number of unit roots that can be found in each price is done. In
addition to F – version testes, graphic or visual inspection of the data is used to select the
appropriate ADF test. For brevity, the test results are not presented here. In the unit root
testes, that are done, all prices are found to be difference stationery. Establishing the fact
that all prices are following one unit root, it is time to find how many of them are
following one common trend.
As stated above, since the information criterions are observed to pick different lags and
there is no theoretical reason to select one over the other, the information criterions are
taken as lag band width selectors than the right lag selectors. This is logical, since some
of them are more probable to have down ward bias and others are more probable to have
up ward bias. The specific lag with in the band is selected based on distribution of the
error terms and the number of common trends found in vector of prices. If one common
trend can’t be found or if the distributional assumptions are not attained, with in the
aforementioned band, the combination will be dropped as unfit.
The logical VECM models for grain prices are restricted constant, unrestricted constant
and restricted trend (Dawson and Dey, 2002). Based on log likelihood test, the restricted
constant model is found to be the most appropriate model from the three appropriate
models. However in order to isolate the effect of seasonal variation, a restricted constant
model is used in this paper5. Market combinations which are found to have one common
trend with right identification assumption are reported in table 1, below. Again for
brevity normality, serial correlation and heteroskedasticity (ARCH/GARCH) test results
are not reported here, even though these testes are done at each stage. J-B test of
normality is found to be highly order sensitive, so all permutations, than combinations, of
markets are tested for normality. The permutations of markets given in table 1, below, are
related to order of markets with highest J-B statistics.
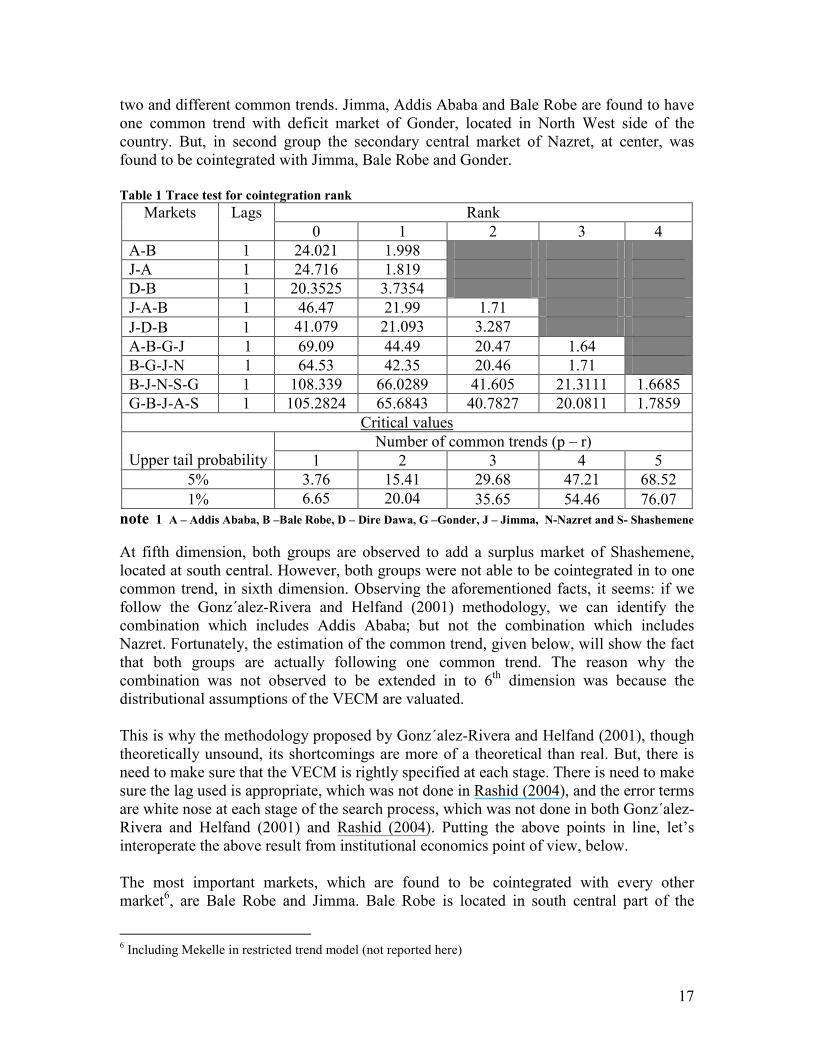
Table 1, below, clearly shows the fact that for all combinations the null of more than one
common trend is rejected at 1%. But, the null of one common trend can’t be rejected at
5%, let alone at 1%. So, it is logical to accept all combinations, given in table 1 below,
are following one common trend. At second dimension, the central market of Addis
Ababa was found to be cointegrated with surplus market of Bale Robe, at South, and
Deficit market of Jimma, at south West. Moreover, the deficit market Dire Dawa, at east,
was found to be cointegrated with surplus market of Bale Robe. At third dimension, the
above four markets are observed to follow two common trends. Jimma and Bale Robe, in
one direction, with central market of Addis Ababa and, in other direction, with deficit
market of Dire Dawa are found to have a single common trend. However, in fourth
dimension, Dire Dawa was dropped and two groups of markets are observed to follow
5 Actually the three models are estimated. The difference between restricted constant and unrestricted
constant models is related to the fact that the restricted constant model was not able to be extended in to
fifth dimension. And restricted trend model was not able to be extended behind third dimension. Mekelle is
found to be cointegrated with Addis Ababa, Bale Robe and Jimma but not others when restricted trend
model is used.
17
two and different common trends. Jimma, Addis Ababa and Bale Robe are found to have
one common trend with deficit market of Gonder, located in North West side of the
country. But, in second group the secondary central market of Nazret, at center, was
found to be cointegrated with Jimma, Bale Robe and Gonder.
Table 1 Trace test for cointegration rank
Rank Markets
Lags
0 1 2 3 4
A-B 1 24.021 1.998
J-A 1 24.716 1.819
D-B 1 20.3525 3.7354
J-A-B 1 46.47 21.99 1.71
J-D-B 1 41.079 21.093 3.287
A-B-G-J 1 69.09 44.49 20.47 1.64
B-G-J-N 1 64.53 42.35 20.46 1.71
B-J-N-S-G 1 108.339 66.0289 41.605 21.3111 1.6685
G-B-J-A-S 1 105.2824 65.6843 40.7827 20.0811 1.7859
Critical values
Number of common trends (p – r)
Upper tail probability 1 2 3 4 5
5% 3.76 15.41 29.68 47.21 68.52
1% 6.65 20.04 35.65 54.46 76.07
note 1 A – Addis Ababa, B –Bale Robe, D – Dire Dawa, G –Gonder, J – Jimma, N-Nazret and S- Shashemene
At fifth dimension, both groups are observed to add a surplus market of Shashemene,
located at south central. However, both groups were not able to be cointegrated in to one
common trend, in sixth dimension. Observing the aforementioned facts, it seems: if we
follow the Gonz´alez-Rivera and Helfand (2001) methodology, we can identify the
combination which includes Addis Ababa; but not the combination which includes
Nazret. Fortunately, the estimation of the common trend, given below, will show the fact
that both groups are actually following one common trend. The reason why the
combination was not observed to be extended in to 6th
dimension was because the
distributional assumptions of the VECM are valuated.
This is why the methodology proposed by Gonz´alez-Rivera and Helfand (2001), though
theoretically unsound, its shortcomings are more of a theoretical than real. But, there is
need to make sure that the VECM is rightly specified at each stage. There is need to make
sure the lag used is appropriate, which was not done in Rashid (2004), and the error terms
are white nose at each stage of the search process, which was not done in both Gonz´alez-
Rivera and Helfand (2001) and Rashid (2004). Putting the above points in line, let’s
interoperate the above result from institutional economics point of view, below.
The most important markets, which are found to be cointegrated with every other
market6, are Bale Robe and Jimma. Bale Robe is located in south central part of the
6 Including Mekelle in restricted trend model (not reported here)
18
country, which is known for its wheat production. There were huge investments done, by
pre 1991 government, in production and marketing infrastructural of the area, under Arsi
Bale Rural Development unit – ABRDU (Nichola, 1985). When significant investments
are done, in such high potential areas, it will open high potential gain from for future
trade. That is why effective grain trade was easily established in short period of time,
after 1989’s liberalization of the grain market, despite the fact that private trade used to
be banned for years (Gabre-Madhin, 2001b). These fact shows that, when the potential
gain from trade is very high, grain trade can spontaneously develop in short period of
time, in line with Fafchamps (2002). This is additional evidence about the fact that
institutional development is not solely determined by history, but by structure of
production and consumption, too.
Jimma, located in south west side of the country, is a major source of coffee and Chat
export revenue for the country7. Moreover, historically, Jimma is one of the most
important trade hubs of the country, since 19th
and early 20th
century (Seifu, 2002). So,
following path of history or following the structure of production, it is not only very
logical to expect high level of marketing infrastructure, social capital, trading networks
and trading skill, but also highly effective demand for wheat. Given the location is major
source of coffee and Chat, the two most important export commodity of the country at
that time (NBE, 2005), and both are mainly produced by small scale farmers (Petty et al.,
2003), there will be highly effective demand for stable grains, like white wheat.
The fact that distance can’t be the most important factor for order of inclusion was clearly
shown in 4th
and 5th
dimensions. Shashemene, which is the next closely located market to
the central hub of Addis Ababa following Nazret, was identified at 5th
dimension.
Actually, to reach Bale Robe from Addis Ababa, you have to pass through Shashemene;
but Bale Robe was identified at 2nd
dimension, before Shashemene. Since most roads of
the country are built as redial from Addis Ababa (Gabre-Madhin, 2001b), it was not
possible to make such analysis in other markets. However Gonder, which was not only
located in relatively longer distance from Addis Ababa, but also connected with the
center by one of the worst roads in the country, at that time, is included in to the one price
system in 4th
dimension. Means at the same dimension with Nazret, which is located with
in 100 km from the capital city! So, it is clear by now other factors, in addition to
transportation cost, are playing important role in the order of inclusion.
Shashemene is a central hub for Coffee and Chat export originating from Southern part of
the country. Since the location is surplus market not only in wheat, but also in coffee and
chat, traders may not try to develop adequate social capital in wheat traders; if wheat is
not the most important commodity in their profit (Greif 1993). At the same time, if wheat
trade is generating a very small share of their profit, they may fail to adjust their prices
with every shock in the market. If the market is price maker, it will be, still, cointegrated
with other markets. Since the market is weakly exogenous, it may not be able to be
identified in lower dimension, unless the entire structure is taken in to account. These
facts are observed to be true for Shashemene, as can been seen in the analysis of common
7 Un published Ministry of Agriculture and Rural Development (MoARD) data shows that Jimma
contributed 11% of the coffee supplied to the market in the period of 1996 to 2003
19
trend and short run dynamics, given below. In case of Jimma, since it is a surplus market
in Coffee and Chat and deficit market in wheat, the wheat market will not be crowded out
by the export commodities. Actually, it will benefit from the trading externality generated
by the export commodities.
Additionally, Addis Ababa, Bale Robe and Jimma are observed to have more white-
nosily distributed level data, compared to others. Whenever, one common trend is found
between these markets, the distribution of their error vector is observed to be white nose,
in most cases. Since additive transformation of normally distributed price by constant or
other normally distributed prices will always generate a normal variable, it is very
logical, if the search is started from the more normally distributed prices.
4.3. Identification of single common trend and its determinants
Once markets which are following one common trend are identified, the next logical step
is to estimate the common trend and its determinants. Market locations which are the
most important determinants of the common trend are price makers and others are price
takers. So, state intervention with objective of price stabilization, in order to be effective,
has to target these price making locations. The methodology used here is based on
permanent and transitory decomposition of variables, developed by Gonzalo and Granger
(1995).
In the analysis below, AF means the common trend which is cointegrating the first group
of five markets, which includes the central market of Addis Ababa. NF means the
common trend which is keeping the second group of five markets, which includes the
secondary central market of Nazret, under rule of one price. For the first combination of
markets, which includes Addis Ababa, the common trend is estimated as following
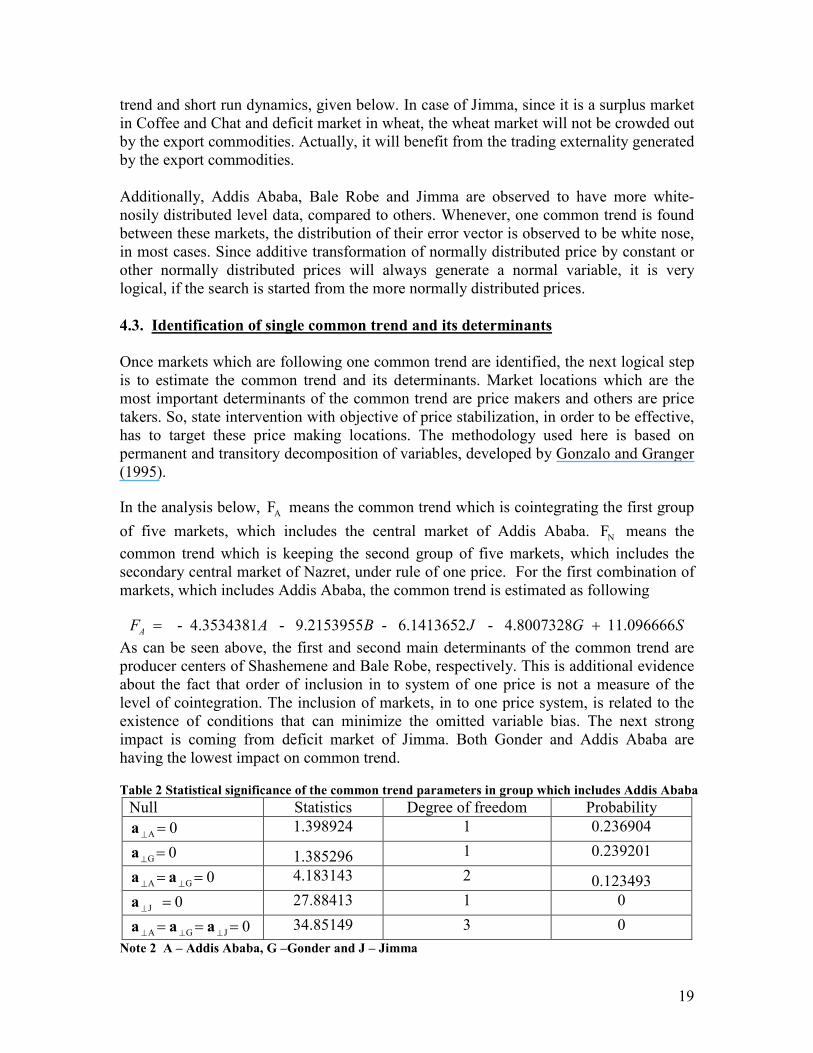
- 4.3534381 - 9.2153955 - 6.1413652 - 4.8007328 11.096666AF A B J G S= +
As can be seen above, the first and second main determinants of the common trend are
producer centers of Shashemene and Bale Robe, respectively. This is additional evidence
about the fact that order of inclusion in to system of one price is not a measure of the
level of cointegration. The inclusion of markets, in to one price system, is related to the
existence of conditions that can minimize the omitted variable bias. The next strong
impact is coming from deficit market of Jimma. Both Gonder and Addis Ababa are
having the lowest impact on common trend.
Table 2 Statistical significance of the common trend parameters in group which includes Addis Ababa
Null Statistics Degree of freedom Probability
A 0⊥=a 1.398924 1 0.236904
G 0⊥=a 1.385296 1 0.239201
A G 0⊥ ⊥= =a a 4.183143 2 0.123493
J 0⊥
=a 27.88413 1 0
A G J 0⊥ ⊥ ⊥= = =a a a 34.85149 3 0
Note 2 A – Addis Ababa, G –Gonder and J – Jimma
20
Table 2, above, clearly shows the fact that the impact of both Addis Ababa and Gonder in
the common cointegrating trend is statistically insignificant. The economic implication is
that the deficit market of Gonder and the central market of Addis Ababa are price takers.
In other words, the market clearing price is mainly discovered in surplus markets of
Shashemene and Bale Robe and one deficit market of Jimma, in the period of 1996 to
2003. This is against the early perception and conclusion of some researchers, who
conclude that the central market of Addis Ababa is the main price marker and weakly
exogenous to others8 (Dercon, 1995 and Gabre-Madhin, 2001b).
When the second combination, which includes Nazret, is considered, producer centers,
again, are observed to have more say in price formation of the one price system. The
highest impact is coming from surplus market of Shashemene, followed by another
surplus market of Bale Robe.
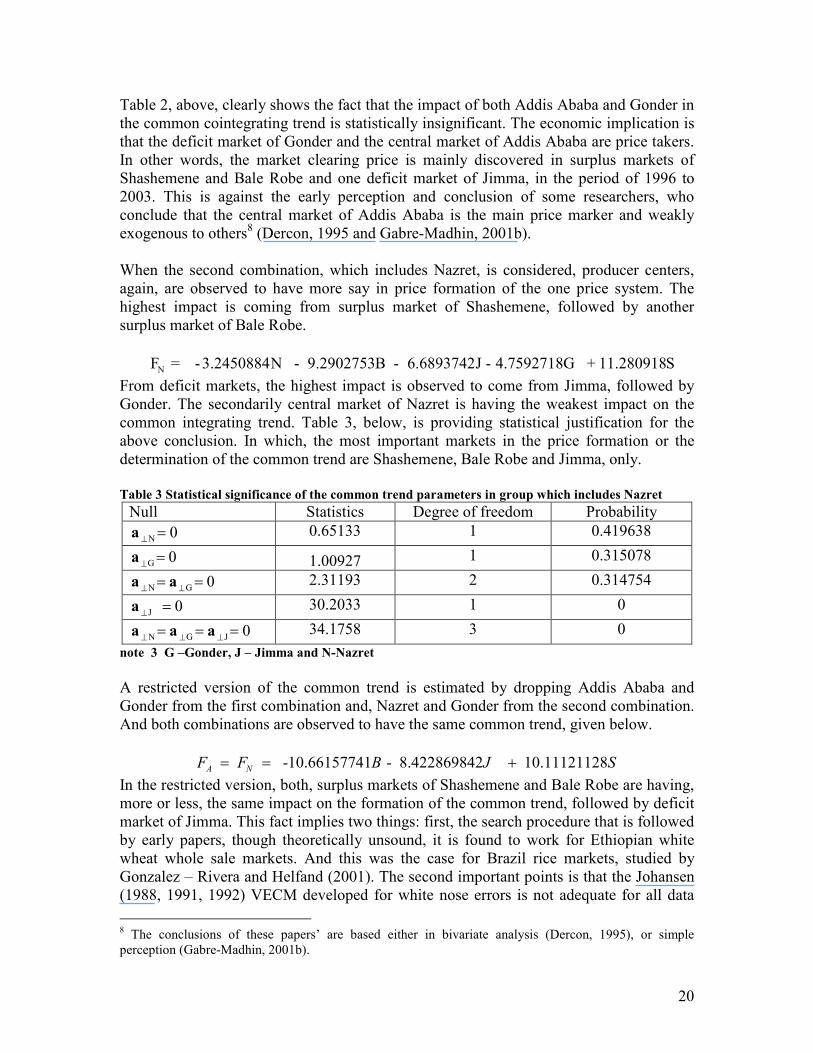
N F = -3.2450884N - 9.2902753B - 6.6893742J - 4.7592718G + 11.280918S
From deficit markets, the highest impact is observed to come from Jimma, followed by
Gonder. The secondarily central market of Nazret is having the weakest impact on the
common integrating trend. Table 3, below, is providing statistical justification for the
above conclusion. In which, the most important markets in the price formation or the
determination of the common trend are Shashemene, Bale Robe and Jimma, only.
Table 3 Statistical significance of the common trend parameters in group which includes Nazret
Null Statistics Degree of freedom Probability
N 0⊥=a 0.65133 1 0.419638
G 0⊥=a 1.00927 1 0.315078
N G 0⊥ ⊥= =a a 2.31193 2 0.314754
J 0⊥
=a 30.2033 1 0
N G J 0⊥ ⊥ ⊥= = =a a a 34.1758 3 0
note 3 G –Gonder, J – Jimma and N-Nazret
A restricted version of the common trend is estimated by dropping Addis Ababa and
Gonder from the first combination and, Nazret and Gonder from the second combination.
And both combinations are observed to have the same common trend, given below.
-10.66157741 - 8.422869842 10.11121128A NF F B J S= = +
In the restricted version, both, surplus markets of Shashemene and Bale Robe are having,
more or less, the same impact on the formation of the common trend, followed by deficit
market of Jimma. This fact implies two things: first, the search procedure that is followed
by early papers, though theoretically unsound, it is found to work for Ethiopian white
wheat whole sale markets. And this was the case for Brazil rice markets, studied by
Gonzalez – Rivera and Helfand (2001). The second important points is that the Johansen
(1988, 1991, 1992) VECM developed for white nose errors is not adequate for all data
8 The conclusions of these papers’ are based either in bivariate analysis (Dercon, 1995), or simple
perception (Gabre-Madhin, 2001b).
21
generating processes. We may reject cointegrated markets as un-cointegrated, if the error
vector is not having white nose distribution. Having good understanding of the long run
process, it is now time to analyze the short run dynamics of the markets.
4.4. Persistence profile and adjustment parameters among cointegrated markets
The use of persistence profile (Pesaran and Shin, 1996) has two basic advantages. One is
related to its capability to summarize the impact of both adjustment parameters and
lagged shocks in to single index. Second its magnitudes are not effected by order of
markets in VECM, for given identification assumption. However it is sensitive to
identification assumption, imposed in the model. In this paper there are two choices for
identification assumptions. One is to use identification assumption with highest
probability of normality, as they are reported in preceding tables. The second option is to
use identification assumption against the central market, which is found to be an
important transit market in early studies (Dessalegn, 1997 and Dercon, 2005). The second
one is very useful; but the first one is more logical given the over all VECM is dependent
on white nose-ness of the error vector’s distribution. Fortunately, significant difference
was not observed in both options, so the most informative identification against central
markets is given below.
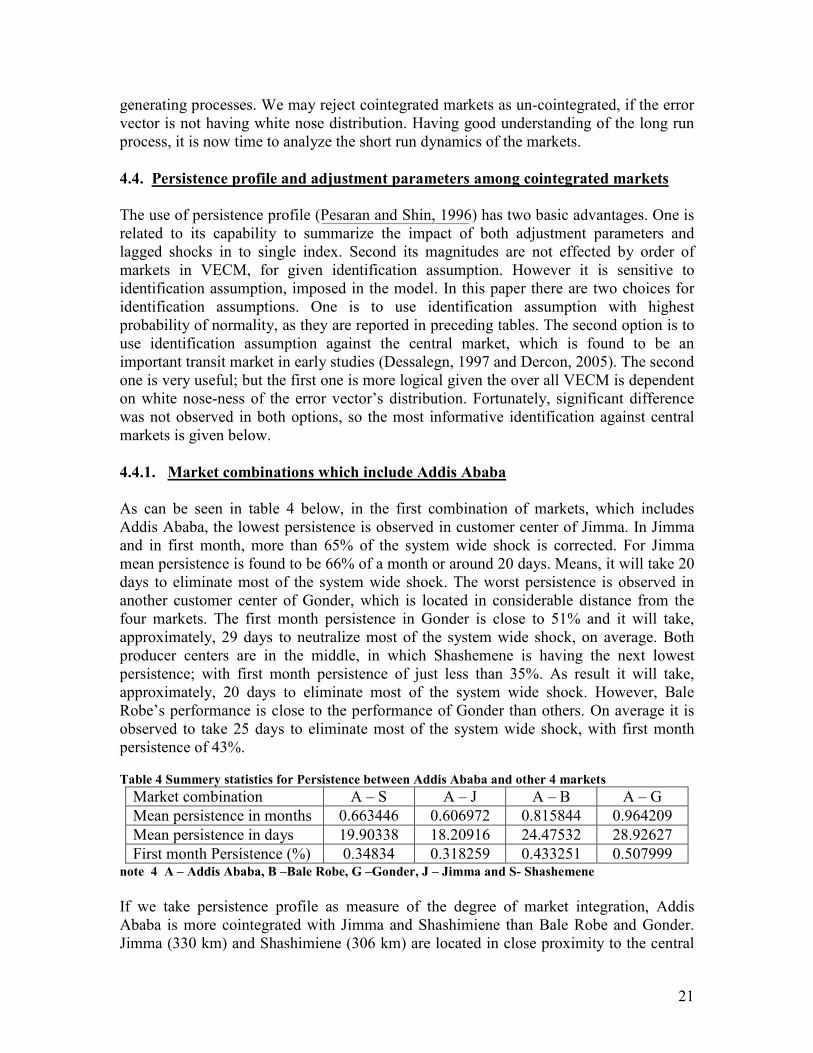
4.4.1. Market combinations which include Addis Ababa
As can be seen in table 4 below, in the first combination of markets, which includes
Addis Ababa, the lowest persistence is observed in customer center of Jimma. In Jimma
and in first month, more than 65% of the system wide shock is corrected. For Jimma
mean persistence is found to be 66% of a month or around 20 days. Means, it will take 20
days to eliminate most of the system wide shock. The worst persistence is observed in
another customer center of Gonder, which is located in considerable distance from the
four markets. The first month persistence in Gonder is close to 51% and it will take,
approximately, 29 days to neutralize most of the system wide shock, on average. Both
producer centers are in the middle, in which Shashemene is having the next lowest
persistence; with first month persistence of just less than 35%. As result it will take,
approximately, 20 days to eliminate most of the system wide shock. However, Bale
Robe’s performance is close to the performance of Gonder than others. On average it is
observed to take 25 days to eliminate most of the system wide shock, with first month
persistence of 43%.
Table 4 Summery statistics for Persistence between Addis Ababa and other 4 markets
Market combination A – S A – J A – B A – G
Mean persistence in months 0.663446 0.606972 0.815844 0.964209
Mean persistence in days 19.90338 18.20916 24.47532 28.92627
First month Persistence (%) 0.34834 0.318259 0.433251 0.507999 note 4 A – Addis Ababa, B –Bale Robe, G –Gonder, J – Jimma and S- Shashemene
If we take persistence profile as measure of the degree of market integration, Addis
Ababa is more cointegrated with Jimma and Shashimiene than Bale Robe and Gonder.
Jimma (330 km) and Shashimiene (306 km) are located in close proximity to the central
22
market of Addis Ababa, compared to both Gonder (379 km) and Bale Robe (430 km). So
distance seems to be important factor for degree of integration. In addition to distance,
road quality, also, seems to play a very important role. Given the fact that both Jimma
and Shashimiene are strategically important to the major export market of coffee and
chat, they are supplied with relatively better quality roads, at that time. So, even though
distance and road quality are not the critical factors determining order of inclusion of
markets in to the rule of one price; once the markets are under rule of one price and the
more closely located they are, the more cointegrated they will be. This is in line with
earlier hypothesis, given in the theoretical part of this paper.
Adjustment parameters focus in short run reaction of markets to shocks initiated in given
cointegrating vector of two markets. These parameters are useful in identifying weakly
exogenous markets. Such markets are preferable locations to intervene. This is so, since
every change in the location’s price is related to change on long run market clearing price
not to the short run random shocks.
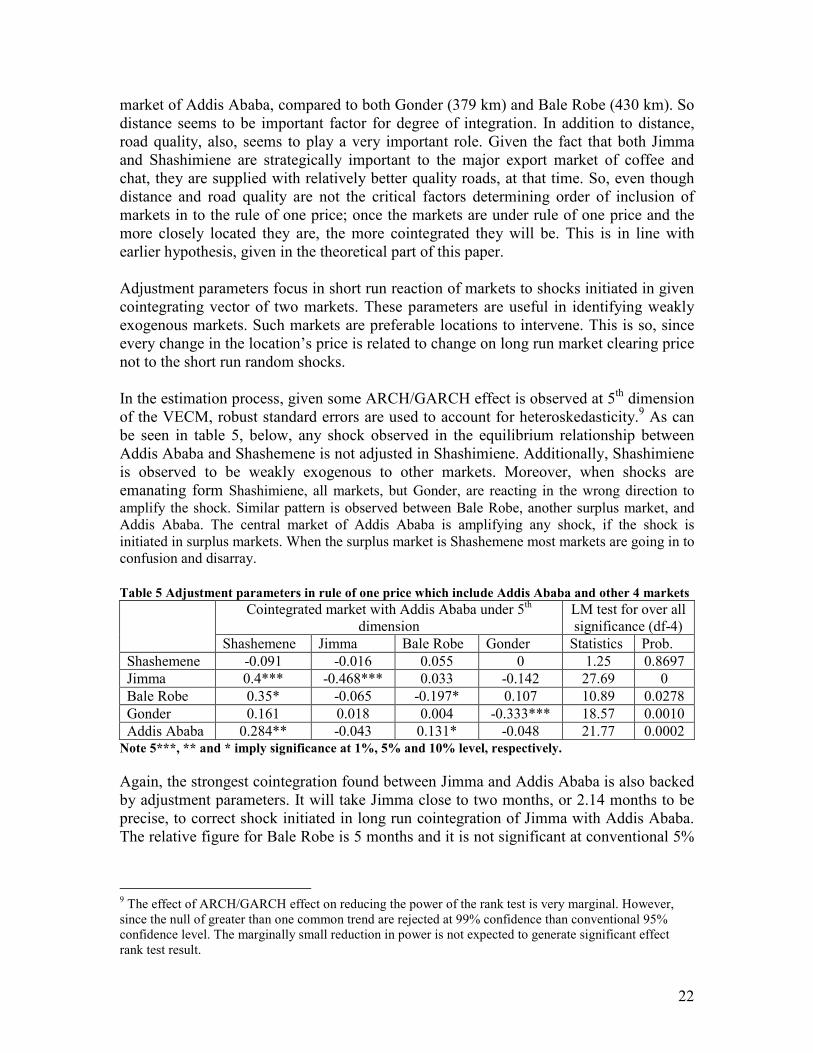
In the estimation process, given some ARCH/GARCH effect is observed at 5th
dimension
of the VECM, robust standard errors are used to account for heteroskedasticity.9 As can
be seen in table 5, below, any shock observed in the equilibrium relationship between
Addis Ababa and Shashemene is not adjusted in Shashimiene. Additionally, Shashimiene
is observed to be weakly exogenous to other markets. Moreover, when shocks are
emanating form Shashimiene, all markets, but Gonder, are reacting in the wrong direction to
amplify the shock. Similar pattern is observed between Bale Robe, another surplus market, and
Addis Ababa. The central market of Addis Ababa is amplifying any shock, if the shock is
initiated in surplus markets. When the surplus market is Shashemene most markets are going in to
confusion and disarray.
Table 5 Adjustment parameters in rule of one price which include Addis Ababa and other 4 markets
Cointegrated market with Addis Ababa under 5th
dimension
LM test for over all
significance (df-4)
Shashemene Jimma Bale Robe Gonder Statistics Prob.
Shashemene -0.091 -0.016 0.055 0 1.25 0.8697
Jimma 0.4*** -0.468*** 0.033 -0.142 27.69 0
Bale Robe 0.35* -0.065 -0.197* 0.107 10.89 0.0278
Gonder 0.161 0.018 0.004 -0.333*** 18.57 0.0010
Addis Ababa 0.284** -0.043 0.131* -0.048 21.77 0.0002 Note 5***, ** and * imply significance at 1%, 5% and 10% level, respectively.
Again, the strongest cointegration found between Jimma and Addis Ababa is also backed
by adjustment parameters. It will take Jimma close to two months, or 2.14 months to be
precise, to correct shock initiated in long run cointegration of Jimma with Addis Ababa.
The relative figure for Bale Robe is 5 months and it is not significant at conventional 5%
9 The effect of ARCH/GARCH effect on reducing the power of the rank test is very marginal. However,
since the null of greater than one common trend are rejected at 99% confidence than conventional 95%
confidence level. The marginally small reduction in power is not expected to generate significant effect
rank test result.

23
level, but at 10% level. For Gonder, it will take 3 months to correct shocks initiated in the
long run relationship between Addis Ababa and Gonder.
In general, the customer centers of Jimma and Gonder have better information flow with
Addis Ababa, than surplus markets of Shashemene and Bale Robe. Other markets are
observed to inter in to confusion and disarray, when shocks are initiated in surplus
markets. Focusing in theoretical implications: first, transportation convinces did not seem
to be a critical factor for speed of adjustment, following a shock initiated in given
cointegrating vector. Second, despite its significance in the determination of the single
common trend, Shashemene was identified in the fifth dimension only. This is so,
because the market is weakly exogenous to other markets and will not be identified
unless the entire structure is taken in to account. Every result, stated above, is inline with
each and every aforementioned hypothesis.
4.4.2. Market combinations which include Nazret
The short run dynamics in Nazret’s cointegration with other four markets, that is Jimma
and Gonder, as deficit markets, and Shashemene and Bale Robe, as surplus markets, is
analyzed and presented below. For presentation convince, Nazret is chosen as
normalizing variable, given its service as secondarily central market (Gabre-Madhin,
2001b).
The lowest first month persistence is observed in Jimma and Shashimiene, followed by
Bale Robe and Gonder. One interesting point about Shashemene is that: even though 65%
of the system wide is shock is corrected in first month, it is observed to take 25 days to
eliminate most of the shock. Means, the remaining shocks are having long memory and it
will take longer time to eliminate them. The relative figure for Jimma is 18 days, for Bale
Robe 22 days and for Gonder 25 days.
Table 6 Persistence between Nazret and other 4 markets ruled by one price
Market combination N – S N – J N – B N – G
Mean persistence in months 0.835542 0.615152 0.730741 0.831335
Mean persistence in days 25.06626 18.45456 21.92223 24.94005
First month Persistence (%) 0.353012 0.320257 0.437202 0.440079 note 6 B –Bale Robe, G –Gonder, J – Jimma, N-Nazret and S- Shashemene
One important point to note is that: given Nazret is 100 km apart from Addis Ababa and
the same markets are observed to have strong cointegration with Nazret as with Addis
Ababa, it is clear that distance is an important factor for strength of cointegration.
However Shashemene relative to Jimma and Bale Robe relative to Gonder are having
more persistence, even though they are more closely located to both Nazret and Addis
Ababa. This is in line with early hypothesis that, even though distance is expected to be
more important factor for strength of cointegration (persistence of shocks), still strength
of cointegration is not all about distance or transportation cost only.
And table 7 below, shows that the fact that: even with in this group, Shashemene is
weakly exogenous to other markets. Shashemene is not correcting any deviations from
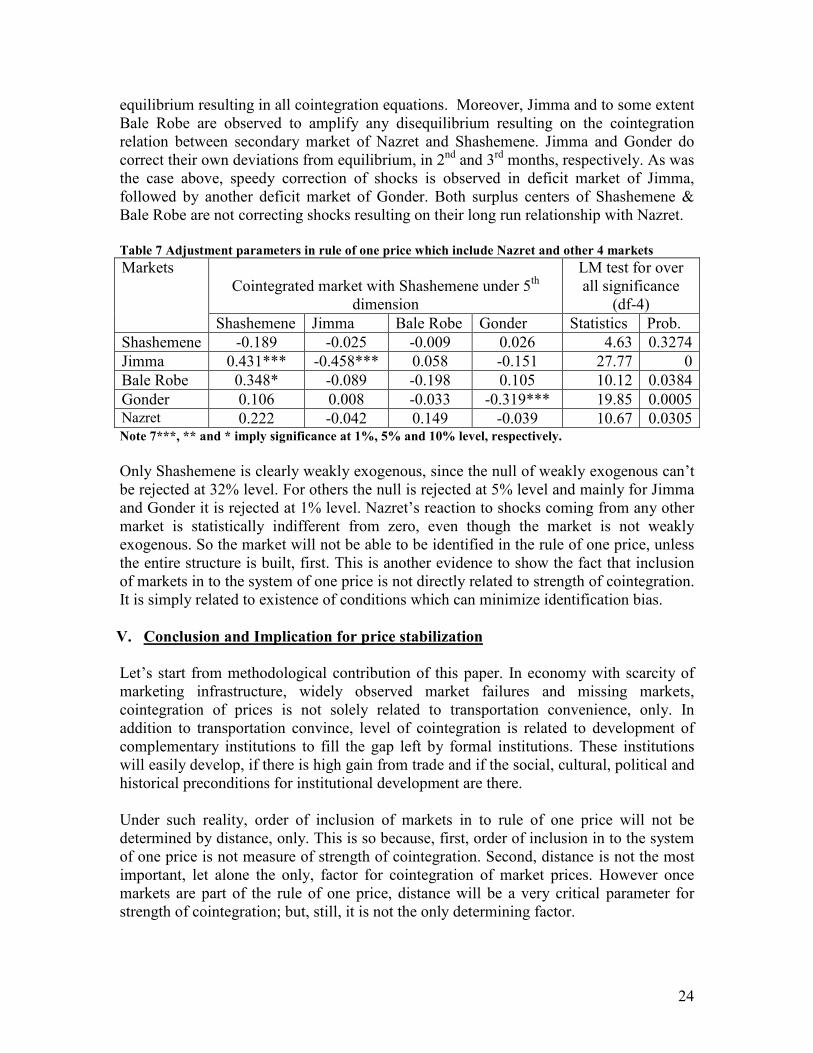
24
equilibrium resulting in all cointegration equations. Moreover, Jimma and to some extent
Bale Robe are observed to amplify any disequilibrium resulting on the cointegration
relation between secondary market of Nazret and Shashemene. Jimma and Gonder do
correct their own deviations from equilibrium, in 2nd
and 3rd
months, respectively. As was
the case above, speedy correction of shocks is observed in deficit market of Jimma,
followed by another deficit market of Gonder. Both surplus centers of Shashemene &
Bale Robe are not correcting shocks resulting on their long run relationship with Nazret.
Table 7 Adjustment parameters in rule of one price which include Nazret and other 4 markets
Cointegrated market with Shashemene under 5th
dimension
LM test for over
all significance
(df-4)
Markets
Shashemene Jimma Bale Robe Gonder Statistics Prob.
Shashemene -0.189 -0.025 -0.009 0.026 4.63 0.3274
Jimma 0.431*** -0.458*** 0.058 -0.151 27.77 0
Bale Robe 0.348* -0.089 -0.198 0.105 10.12 0.0384
Gonder 0.106 0.008 -0.033 -0.319*** 19.85 0.0005 Nazret 0.222 -0.042 0.149 -0.039 10.67 0.0305 Note 7***, ** and * imply significance at 1%, 5% and 10% level, respectively.
Only Shashemene is clearly weakly exogenous, since the null of weakly exogenous can’t
be rejected at 32% level. For others the null is rejected at 5% level and mainly for Jimma
and Gonder it is rejected at 1% level. Nazret’s reaction to shocks coming from any other
market is statistically indifferent from zero, even though the market is not weakly
exogenous. So the market will not be able to be identified in the rule of one price, unless
the entire structure is built, first. This is another evidence to show the fact that inclusion
of markets in to the system of one price is not directly related to strength of cointegration.
It is simply related to existence of conditions which can minimize identification bias.
V. Conclusion and Implication for price stabilization
Let’s start from methodological contribution of this paper. In economy with scarcity of
marketing infrastructure, widely observed market failures and missing markets,
cointegration of prices is not solely related to transportation convenience, only. In
addition to transportation convince, level of cointegration is related to development of
complementary institutions to fill the gap left by formal institutions. These institutions
will easily develop, if there is high gain from trade and if the social, cultural, political and
historical preconditions for institutional development are there.
Under such reality, order of inclusion of markets in to rule of one price will not be
determined by distance, only. This is so because, first, order of inclusion in to the system
of one price is not measure of strength of cointegration. Second, distance is not the most
important, let alone the only, factor for cointegration of market prices. However once
markets are part of the rule of one price, distance will be a very critical parameter for
strength of cointegration; but, still, it is not the only determining factor.
25
The grid search methodology proposed by Gonzalez – Rivera and Helfand (2001) though
theoretically unsound, practically the problems are not expected to be that series. This
conclusion is observed to be right in Brazil rice market (ibid) and proved to be right in
this paper. So, the methodology is important step in solving the unnecessary
concentration of most research works in bivariate analysis.
Now it is time to focus in price stabilization effort of the state. Out of the 8 markets
considered in the study 7 are observed to have some form of cointegration with few or all
markets, assuming there is no trend in transaction cost data. The exception being
Mekelle, located in North drought porn area of the country. However, if trended
transaction cost is allowed in the model, it was observed that even Mekelle is also having
cointegration with important markets like Addis Ababa, Jimma and Bale Robe (not
reported here). So, Ethiopian wheat market prices are clearly cointegrated to one another,
in a sense that any change in one market price will be felt in other markets, some way or
another.
However, only 6 markets are found to follow a rule of one price. These markets include
two central markets of Nazret and Addis Ababa, two surplus markets of Shashimiene and
Bale Robe and two deficit markets of Gonder and Jimma. The two markets excluded
from the rule of one price are Mekelle, which is food deficit market in north, and Dire
Dawa, another food deficit market in East. Both markets are known for their large food
aid dependent population and food aid has been blamed for distorting prices by some
researchers (Jayne and Molla, 1995 and Amha et al, 1997). So, even though it need
farther research, it is possible that both markets are found not to be part of the one price
system, partially due to unmanageable shocks injected by food aid. This conclusion will
make farther sense, if we consider the fact that the two deficit markets which are part of
the one price system are Gonder and Jimma. Gonder is located in high potential North
West part of the country and Jimma is populated by Chat and coffee producing small
scale farmers. Population living in both areas has better purchasing power compared to
population living in either Mekelle or Dire Dawa. Additionally, studies did also show that
there is high level of inefficiency in Dire Dawa grain market (Dercon 1995 and Gabre-
Madhin et al. 2003). Mekelle was seriously affected by long civil war before 1991 &
border war with Eritrea since 1998, which can negatively effect the development of the
market. When there are limited gains from trade, such shocks can easily destroy the
spontaneous development of markets, as predicted by Fafchamps (2002).
With in 6 markets ruled by one price, market clearing price is discovered in two surplus
markets of Bale Robe and Shashimiene and one deficit market of Jimma. Unfortunately,
any shock initiated in both surplus markets of Bale Robe and Shashimiene is observed to
take the system in to confusion and disarray, before it gets sorted out. Means wheat
markets have better capacity to handle shocks coming from deficit markets than surplus
markets. Additionally, though Shashemene is observed to be weakly exogenous to other
markets, it is observed to has volatility cluster problem (not reported here for brevity).
Focusing on persistence of shocks, it is observed persistence of system wide shock is
higher in Gonder and Bale Robe, followed by Shashimiene and Jimma, respectively.
26
Based on the above facts, the logical policy implication is that
1. If the focus of state intervention is in long run price stabilization, the intervention
should concentrate in the two surplus markets of Bale Robe and Shashimiene. In short
run, however, the national market will go in to disarray. Moreover, it may not be
politically feasible to dump grain in surplus markets.
2. Other option is to dump grains in deficit market of Jimma. By crowding out demand
generated by export sector, it is possible to stabilize the grain market. Additional
advantage of Jimma is that it will not create any significant short term volatility, as
was the case for surplus markets. However, since the market is not weakly
exogenous, there is need for dynamic national wide assessment of markets, before
and after implementation of the stabilization policy. Fortunately, in the information
age, that we live, this may not be a hard business to handle. Intervening in Jimma,
however, is like giving subsidy to the relatively better off part of the society. As result
it may not be politically feasible to implement such policy.
3. Therefore, there is need to complement any intervention in Jimma, by subsidized
distribution of food grains in food deficit areas without effective demand.
Intervention in deficit markets, except Jimma, may be needed for equity purpose, but
not for efficiency. This fact may also explain why the current price stabilization
policy, which focuses in providing subsidized white wheat to the poor, fails to reverse
the inflationary trend.
Last but not the least point is that the data used in this paper is collected from 1996 to
2003. The assumption is that the grain market structure is not altered then after. So any
one who assumes that the structure is significantly altered, since then, has logical ground
to doubt the conclusion and can possibly make similar analysis on current prices.
However holding this assumption and result of this paper in prospective; it would not
possible to expect such unprecedented increase in price level, when there was pamper
harvest and low export revenue. This is why; result of this paper should not be taken at its
face value, but as base line for future research.
27
Reference
1. Acemoglu, Daron, Robinson, James A. and Johnson, Simon (2009) “Reevaluating the
Modernization Hypothesis” Journal of Monetary Economic, Author’s Accepted
Manuscript
2. Alesinaa, Alberto and Ferrara, Eliana La (2002) “Who trusts others?”, Journal of
Public Economics, 85: 207–234
3. Amha, W.; J. Stepanek, T. S. Jayne and A. Negassa (1997), Meeting food aid and
price stabilization objectives through local grain purchase: a review of the 1996
experience, Grain market research project working paper 7
http://www.aec.msu.edu/fs2/Ethiopia/wp7.pdf
4. Arnott, Richard and Stiglitz, Joseph (1988) “Dysfunctional none market institutions
and the market” NBER working paper, 2666
5. Bala, Venkatesh and Goyal, Sanjeev (2000) “A noncooperative model of network
formation”, Econometrica, 68 – 5: 1181 - 1229
6. Barr, Abigail (2000) “Social capital and technical information flows in the Ghanaian
Manufacturing sector” oxford economic papers, 52: 539 -559
7. Barrett, Christopher (1997), “Food Marketing Liberalization and Trader Entry:
Evidence from Madagascar”, World Development, 25 – 5: 763-177
8. Baulch, Bob (1997) “Testing for food market integration revisited”, The Journal of
Development Studies, 33 – 4: 512-534
9. Baulch, R. Transfer Costs, Spatial Arbitrage, and Testing for Food Market
Integration. American Journal of Agricultural Economics 79 (May 1997): 477-487.
10. Bigsten, Arne, Collier, Paul, Dercon, Stefan, Fafchamps, Marcel, Gauthier, Bernard,
Gunning, Willem, Oduro, Abena, Oostendorp, Remco, Pattillo, Cathy, Soderbom,
Mans, Teal, Francis and Zeufack, Albert (1998) “ Contract flexibility and conflict
resolution: evidence from African manufacturing”, WPS/98-21 (1998)
11. Bollerslev, T. (1986) ‘Generalized Autoregressive Conditional Heteroskedasticity’,
Journal of Econometrics, 31: 307-327
12. Breusch, T. S. (1978) ‘Testing for Autocorrelation in Dynamic Linear Models’,
Australian Economic Papers, 17: 334-55,
13. Breusch, T.S. and A.R. Pagan, 1980, 'The Lagrange Multiplier Test and Its
Application to Model Specification in Econometrics', Review of Economic Studies,
Vol. 47, pp. 239-53.
14. Brüggermann, R.; H. Lütkepohl and P. Saikkonen (2006) ‘Residual autocorrelation
testing for vector error correction models’, Journal of Econometrics, 134: 579–604
15. Bryceson, Debaorah Fahy (1994) “Too Many Assumptions: Researching Grain
Markets in Tanzania”, Nordic Journal of African Studies, 3 -1 : 29 – 44
16. Cavaliere, G.; A. Rahbek and A. M. R. Taylor (2009) Co-integration Rank Testing
under Conditional Heteroskedasticity, CREATES Research Paper 22
ftp://ftp.econ.au.dk/creates/rp/09/rp09_22.pdf
17. Chao, J. C. and P. C. B. Phillips (1999) ‘model selection in partially none stationery
vector autoregressive process with reduced rank structure’, Journal of Econometrics,
91: 227-271
18. Christaller, Walter (1933), Central Place in Southern Germeny, Prentice-Hall edition
(1966)
28
19. Coleman, James S. (1988) “Social capital and the creation of human capital”, the
American Journal of Sociology, 94: S95 - S21
20. Dawson, P. J. and Dey P. K. (2002) “testing the low of one price: rice market
integration in Bangladesh”, Journal of International Development, 14: 473–484
21. Demiroglu, Ufuk (2000) ‘Residual-Based Tests for Normality in Auto regressions:
Asymptotic Theory and Simulation Evidence’, Journal of Business & Economic
Statistics, January (2000)
22. Dercon, Stefan (1995) “On market integration and liberalisation: Method and
application to Ethiopia”, The Journal of Development Studies, 32 – l: 112-143
23. Dercon, Stefan (2006) “Economic reform, growth and the poor: Evidence from rural
Ethiopia” Journal of Development Economics, 81: 1 – 24
24. Dessalegn G. ; T. S. Jayne and J. D. Shaffer (1998) Market structure, conduct and
performance: constraints in performance of Ethiopian grain markets, Grain Market
Research Project working paper 8
http://www.aec.msu.edu/fs2/Ethiopia/wp8.pdf
25. Dickey, D. A. and W. A. Fuller (1979) ‘Distribution of the Estimators for
Autoregressive Time Series with a Unit Root’, Journal of the American Statistical
Association, 74: 427–431
26. Durlauf, Steven N. and Blume, Lawrence E. (2008) “Social Norms” in the New
Palgrave Dictionary of Economics, Second Edition, London: Macmillan.
27. Durlauf, Steven N. and Fafchamps, Marcel (2004) “Social capital”, NBER working
paper series 10485
28. Edwards, Jeremy and Ogilvie, Sheilagh (2009) “Contract Enforcement, Institutions
and Social Capital: the Maghribi Traders Reappraised”,
29. Engle, R. F. (1982) ‘Autoregressive conditional heteroskedasticity with estimates of
the variance of U.K. inflation’, Econometrica, 50: 987-1008.
30. Engle, R. F. and C. W. J. Granger (1987) ‘Co-Integration and Error Correction:
Representation, Estimation, and Testing’, Econometrica, 55: 251-276
31. Fafchamps, Marcel (1996) “The Enforcement of Commercial Contracts in Ghana”,
World Development, 24 – 3: 427 -448
32. _______________ (1997) “Trade Credit in Zimbabwean Manufacturing”, World
Development, 25 – 5: 795-815
33. _______________ (1997b) “Introduction: Markets in Sub-Saharan Africa” World
development, 25 – 5: 733-734
34. _______________ (1999) “Ethnicity and Credit in African Manufacturing”
35. _______________ (2002) “Spontaneous Market Emergence”. Topics in Theoretical
Economics. 2 -1 Berkeley Electronic Press at www.bepress.com
36. _______________ (2003) “Ethnicity and Networks in African Trade”, Contributions
to Economic Analysis & Policy, 2 – 1: 1 - 51
37. _______________ (2006), “Development and social capital”, Journal of
Development Studies, 42 – 7: 1180 – 1198
38. Fafchamps, Marcel, Biggs, Tyler, Conning, Jonathan and Srivastava, Pradeep (1994)
“Enterprise finance in Kenya” Report to Regional Program on Enterprise
Development Africa Region, The World Bank
39. Fafchamps, Marcel and Gavian, Sarah (1996) “The Spatial Integration of Livestock
Markets in Niger”, Journal of African economics, 5 – 3: 366-405
29
40. Fafchamps, Marcel and Gubert, Flore “The formation of risk sharing networks”,
Journal of Development Economics, 83: 326–350
41. Fafchamps, Marcel and Hill, Ruth Vargas (2008) “Price Transmission and Trader
Entry in Domestic Commodity Markets”, Economic Development and Cultural
Change, 56: 729-766
42. Fafchamps, Marcel and Lund, Susan (2003) “Risk-sharing networks in rural
Philippines”, Journal of Development Economics, 71: 261– 287
43. Fafchamps, Marcel and Minten, Bart (1999), “Relationships and Traders in
Madagascar” The Journal of Development Studies, 35 - 6: 1-35
44. __________________________________ (1999b) “Property Rights in a Flea Market
Economy”, Center for the Study of African Economies, Department of Economics,
University of Oxford – memo
45. __________________________________ (2001), “Social Capital and Agricultural
Trade”, American Journal of Agricultural Economics, 83 -3: 680–685
46. __________________________________ (2002), “Return to social network capital
among traders”, oxford economic papers, 54: 173 -206
47. Fedderke, Johannes (2001) “Growth and institutions” Journal of international
development, 13: 645 – 670
48. Gabre-Madhin, Eleni Z. (2001), “The role of intermediaries in enhancing market
efficiency in the Ethiopian grain market”, Agricultural Economics 25: 311–320
49. Gabre-Madhin, Eleni Z. (2001b) “Market Institutions, Transaction Costs, and Social
Capital in the Ethiopian Grain Market”, IFPRI, research report number124
www.ifpri.org/pubs/abstract/124/rr124.pdf
50. Gabre-Madhin, Eleni Z., Amha, Wolday, Tafara, Ethiopis, Schluter, John, Teshome,
Tilahun and Kilkile, Getinet (2003) “Getting Markets Right in Ethiopia: An
Institutional and Legal Analysis of Grain and Coffee Marketing”, Final report, IFPRI
- IFAD
51. Gali, V. Jyothi and Brown, C.G. (2002) “ Price Relationships in the Queensland
Barley Market”, Agribusiness, 18 -2: 181–196
52. Ghosh, Madhusudan (2003) “Spatial Integration of Wheat Markets in India: Evidence
from Cointegration Tests”, Oxford Development Studies, 31 – 2: 159 – 171
53. Ghosh, P., and Ray, D (1996) “Cooperation in Community Interaction without
Information Flows”, Review of Economic Studies, 63 - 3: 491-519
54. Glaeser, Edward L., Laibson, David and Sacerdote, Bruce (2000) “the economic
approach to social capital”, NBER working paper 7728,
55. Glaeser, Edward L., Laibson, David, Scheinkman, Jose A. and Soutter, Christine L.
(1999), “What is social capital? The determinants of trust and trustworthiness, NBER
working paper 7216
56. Godfrey, L. G., (1978) ‘Testing for Higher Order Serial Correlation in Regression
Equations When the Repressors Include Lagged Dependent Variables’,
Econometrica, 46: 1303-1310
57. Goletti, Francesco, Ahmed, Raisuddin and Farid, Naser (1995), “structural
determinates of market integration: The case of rice markets in Bangladesh”, The
Developing Economies, XXXIII-2 (June 1995),
58. Gonzalo, J. and C. Granger (1995) ‘Estimation of common long memory components
in cointegrated systems’, Journal of Business and Economic Statistics, 13: 27-33
30
59. Gonzalo, J. and J. Pitarakis (2000) Lag Length Estimation in Large Dimensional
Systems, EconWPA 0108003
www.http://129.3.20.41/eps/em/papers/0108/0108002.pdf
60. Gonz´alez-Rivera, G. and S. M. Helfand (2001) ‘The Extent, Pattern, and Degree of
Market Integration: A Multivariate Approach for the Brazilian Rice Market’
American Journal of Agricultural Economics, 83: 576–592
61. Greif, Avner (1993) “Contract enforceability and economic institutions in early trade:
the Maghribi traders’ coalition”, The American Economic Review, 83 – 3: 525-548.
62. Grootaert, Christiaan (1998) “Social capital: the missing link?”, Social Capital
Initiative Working Paper No. 3
63. Guiso, Luigi, Sapienza, Paola and Zingales, Luigi (2000) “The role of social capital
in financial development”, NBER Working Paper 7563
64. Gutiérrez, C. E. C.; R. C. Souza and O. T. C. Guillén (2007) ‘Selection of optimal
lag length in cointegrated VAR models with weak form of common cyclical features’,
Brazil central bank working paper series 139
65. Hamilton, J. D. (1994) Time Series Analysis, Princeton University Press, Princeton,
New jersey
66. Harbord, David (2006) “Enforcing cooperation among medieval merchants: The
Maghribi traders revisited”, MPRA working Paper No. 1889
67. Ho, M. S. and B. E. Sørensen (1996) ‘Finding cointegrating rank in high dimensional
systems using the Johansen test: an illustration using data based Monte Carlo
simulations’, Review of Economics and Statistics, 78 (4): 726–732.
68. IMF (2008) The Federal Democratic Republic of Ethiopia: Selected Issues, IMF
Country Report 08/259
http://imf.org/external/pubs/ft/scr/2008/cr08259.pdf
69. Isard, Walter (1956) Location and Space Economy, MIT press – Cambridge
70. Jarque, C. M. and A. K. Bera (1980) ‘Efficient tests for normality, homoscedasticity
and serial independence of regression residuals’, Economics Letters, 6: 255–259
71. __________ (1981) ‘Efficient tests for normality, homoscedasticity and serial
independence of regression residuals: Monte Carlo evidence’, Economics Letters, 7:
313–318
72. Jayne, T. S. and D. Molla (1995) Toward a research agenda to promote household
access to food in Ethiopia, Food security research project working paper 2
http://www.aec.msu.edu/fs2/Ethiopia/wp2.pdf
73. Jayne, T. S., Govereh, J., Mwanaumo, A., Nyoro, K and Chapoto, A. (2002) “False
Promise or False Premise? The Experience of Food and Input Market Reform in
Eastern and Southern Africa”, World Development, 30 - 11: 1967–1985
74. Johansen, S. (1988) ‘Statistical analysis of cointegration vectors’ Journal of
Economic Dynamics and Control, 12: 231–254.
75. __________ (1991) ‘estimation and hypothesis testing of cointegration vectors in
Gaussian vector autoregressive models’, Econometrica, 59: 1551-1580
76. __________ (1992) ‘Determination of cointegration rank in the presence of linear
trend’, Oxford Bulletin of Economics and Statistics, 54: 383 - 397
77. John, Humphrey and Schmitz, Hubert (1998) “Trust and Inter-Firm Relations in
Developing and Transition Economies”, The Journal of Development Studies, 34 – 4:
32-61
31
78. Johnson, Simon, McMillan, John, and Woodruff, Christopher (1999) “Entrepreneurs
and the ordering of institutional reform: Poland, Romania, Russia, the Slovak
Republic and Ukraine compared”, European bank of reconstruction and development,
Working paper No 44
79. Khim, V. and S. Liew (2004) ‘Which Lag Length Selection Criteria Should We
Employ?’, Economics Bulletin, 3: 1−9
80. Kranton, Rachel E. (1996) “Reciprocal Exchange: A Self-Sustaining System”, The
American Economic Review, 86 – 4: 830-851
81. Kranton, Rachel E. and Minehart, Deborah F. (2000) “A Theory of Buyer-Seller
Networks”,
82. Lee, T. and Y. Tse (1996) ‘Cointegration tests with conditional heteroskedasticity’,
Journal of Econometrics, 73: 401-410
83. Loening, J. L.; D. Durevall and Y. A. Birru (2009) Inflation Dynamics and Food
Prices in an Agricultural Economy: The Case of Ethiopia, World bank Policy
Research Working Paper 4969
http://papers.ssrn.com/sol3/papers.cfm?abstract_id=1427629
84. Losch, August (1954) The Economics of Location, Yale University Press, New
Haven
85. Lyon, Fergus (2000), “Trust, Networks and Norms: The Creation of Social Capital in
Agricultural Economies in Ghana”, World Development, 28 – 4: 663-681
86. McMillan, John and Woodruff, Christopher (1998) “Inter-firm relationships and
informal credit in Vietnam”, The William Davidson Institute working paper number
132
87. McMillan, John and Woodruff, Christopher (2000) “Private Order under
Dysfunctional Public Order”
88. Minten, Bart and Kyle, Steven (1999) “The effect of distance and road quality on
food collection, marketing margins, and traders’ wages: evidence from the former
Zaire”, Journal of Development Economics, 60: 467–495
89. MoFED (2008a) “Ethiopia: progress towards achieving the millennium development
goals: successes, challenges and prospects” Ministry of Finance and Economic
Development (MoFED)
http://www.mofed.gov.et
90. MoFED (2008b) “Ethiopian Government budget for 2008/9”, Ministry of Finance
Economic Development (MoFED), Volume 1
http://www.mofed.gov.et/images/document/2001budgetvolumI.pdf
91. Moore, Mick (1999) “Truth, trust and market transactions: What do we know?”,
Journal of Development Studies, 36 – 1: 74 — 88
92. NBE (2005) “National Bank of Ethiopia Annual Report 2004/2005”
http://www.nbe.gov.et/publications/annualreport.htm
93. NBE (2008) “National Bank of Ethiopia Annual Report 2007/2008”
http://www.nbe.gov.et/publications/annualreport.htm
94. Nichola, Tennassie (1985) “Agricultural research and extension in Ethiopia, the state
of art”, Institute of Development Research (IDR) research report number 22
95. Overa, Ragnhild (2006) “Networks, Distance, and Trust: Telecommunications
Development and Changing Trading Practices in Ghana”, World Development 34 - 7:
1301–1315
32
96. Palaskas, Theodosios B. and Harriss-white, Barbara (1993) “Testing market
integration: New approaches with case material from the West Bengal food
economy”, The Journal of Development Studies, 30 – l: 1-57
97. Pesaran, M. H. and Y. Shin (1996) ‘Cointegration and speed of convergence to
equilibrium’, Journal of Econometrics, 71: 117- 143
98. Peterson, K. (2000) An Introduction to Applied Econometrics: Time Series
Approach, Palgrave Macmillan – New York
99. Petty, Celia; Seaman, John & Majid, Nisar (2003) “Coffee and House hold poverty: A
study of coffee & household economy in two districts of Ethiopia”, Save the children,
http://www.savethechildren.org.uk/en/docs/coffee_economy_in_ethiopia.pdf
100. Platteau, Jean-Philippe (1994) “Behind the market stage where real societies exist -
Part I: The role of public and private order institutions,” Journal of Development
Studies, 30 – 3: 533-577
101. Platteau, Jean-Philippe (1994b) “Behind the Market Stage Where Real Societies
Exist - Part II: The Role of Moral Norms”, The Journal of Development Studies, 30 –
3: 753-817
102. Rapsomanikis, George and Karfakis, Panayiotis (2007) “Margins Across Time and
Space: Threshold Cointegration and Spatial Pricing Applications to Commodity
Markets in Tanzania”, Paper presented in the Workshop on Staple Food Trade and
Market Policy Options for Promoting Development in Eastern and Southern Africa,
Rome, 1 and 2 March 2007
103. Rashid, S. (2004) ‘spatial integration of maize markets in post-liberalized Uganda’,
Journal of African Economies, 13: 102-133
104. Rauch, James E. and Casella, Alessandra (1998) “overcoming information barriers
to international resource allocation: prices and group ties”
105. Ravallion, M. (1986) ‘Testing market integration’, American Journal of
Agricultural Economics, 68: 102 –109
106. Seifu, Yonas (2002), “A historic survey of Jimma Town (1936-1974)”, A Thesis
Presented to the School of Graduate Studies of Addis Ababa University in Partial
Fulfillment of the Requirements for the Degree of Master of Arts in History, June -
2002
107. Sexton, R., C. Kling, and H. Carman. Market Integration, Efficiency of Arbitrage
and Imperfect Competition: Methodology and Application to U.S. Celery. American
Journal of Agricultural Economics 73 (May 1991): 568-80.
108. Spiller, P., and Wood. R. “The Estimation of Transaction Costs in Arbitrage
Models. Journal of Econometrics 39 (1988): 309-326.
109. Stiglitz , Joseph E. (2000) “Formal and informal institutions”, in Social capital: A
Multifaceted perspective, P. Dasgupta and F. Serageldin, eds, World Bank –
Washington D.C.
110. Ulimwengu, J. M.; S. Workneh and Z. Paulos (2009) Impact of Soaring Food Price
in Ethiopia: Does Location Matter?, IFPRI Discussion Paper 00846
http://www.ifpri.org/sites/default/files/publications/ifpridp00846.pdf
111. Von Thünen, Johann Heinrich (1826) Isolated State, English translation by Carla
M. Wartenberg, Pergamon Press. 1966.
112. Weber, Alfred (1909) Theory of the location of industries, The university of
Chicago Press - Chicago
33
113. Weerdt, Joachim De and Dercon, Stefan (2006) “Risk-sharing networks and
insurance against illness”, Journal of Development Economics, 81: 337–356
114. Winker, P. and D. Maringer (2004) ‘Optimal Lag Structure Selection in VEC
Models’, Computing in Economics and Finance, 155
115. World Bank (2002), World Development report: Building institutions for market,
Oxford University Press
116. __________ (2008/9) Africa development Indicators, the International Bank for
Reconstruction and Development/The World Bank, Washington, D.C.- U.S.A.